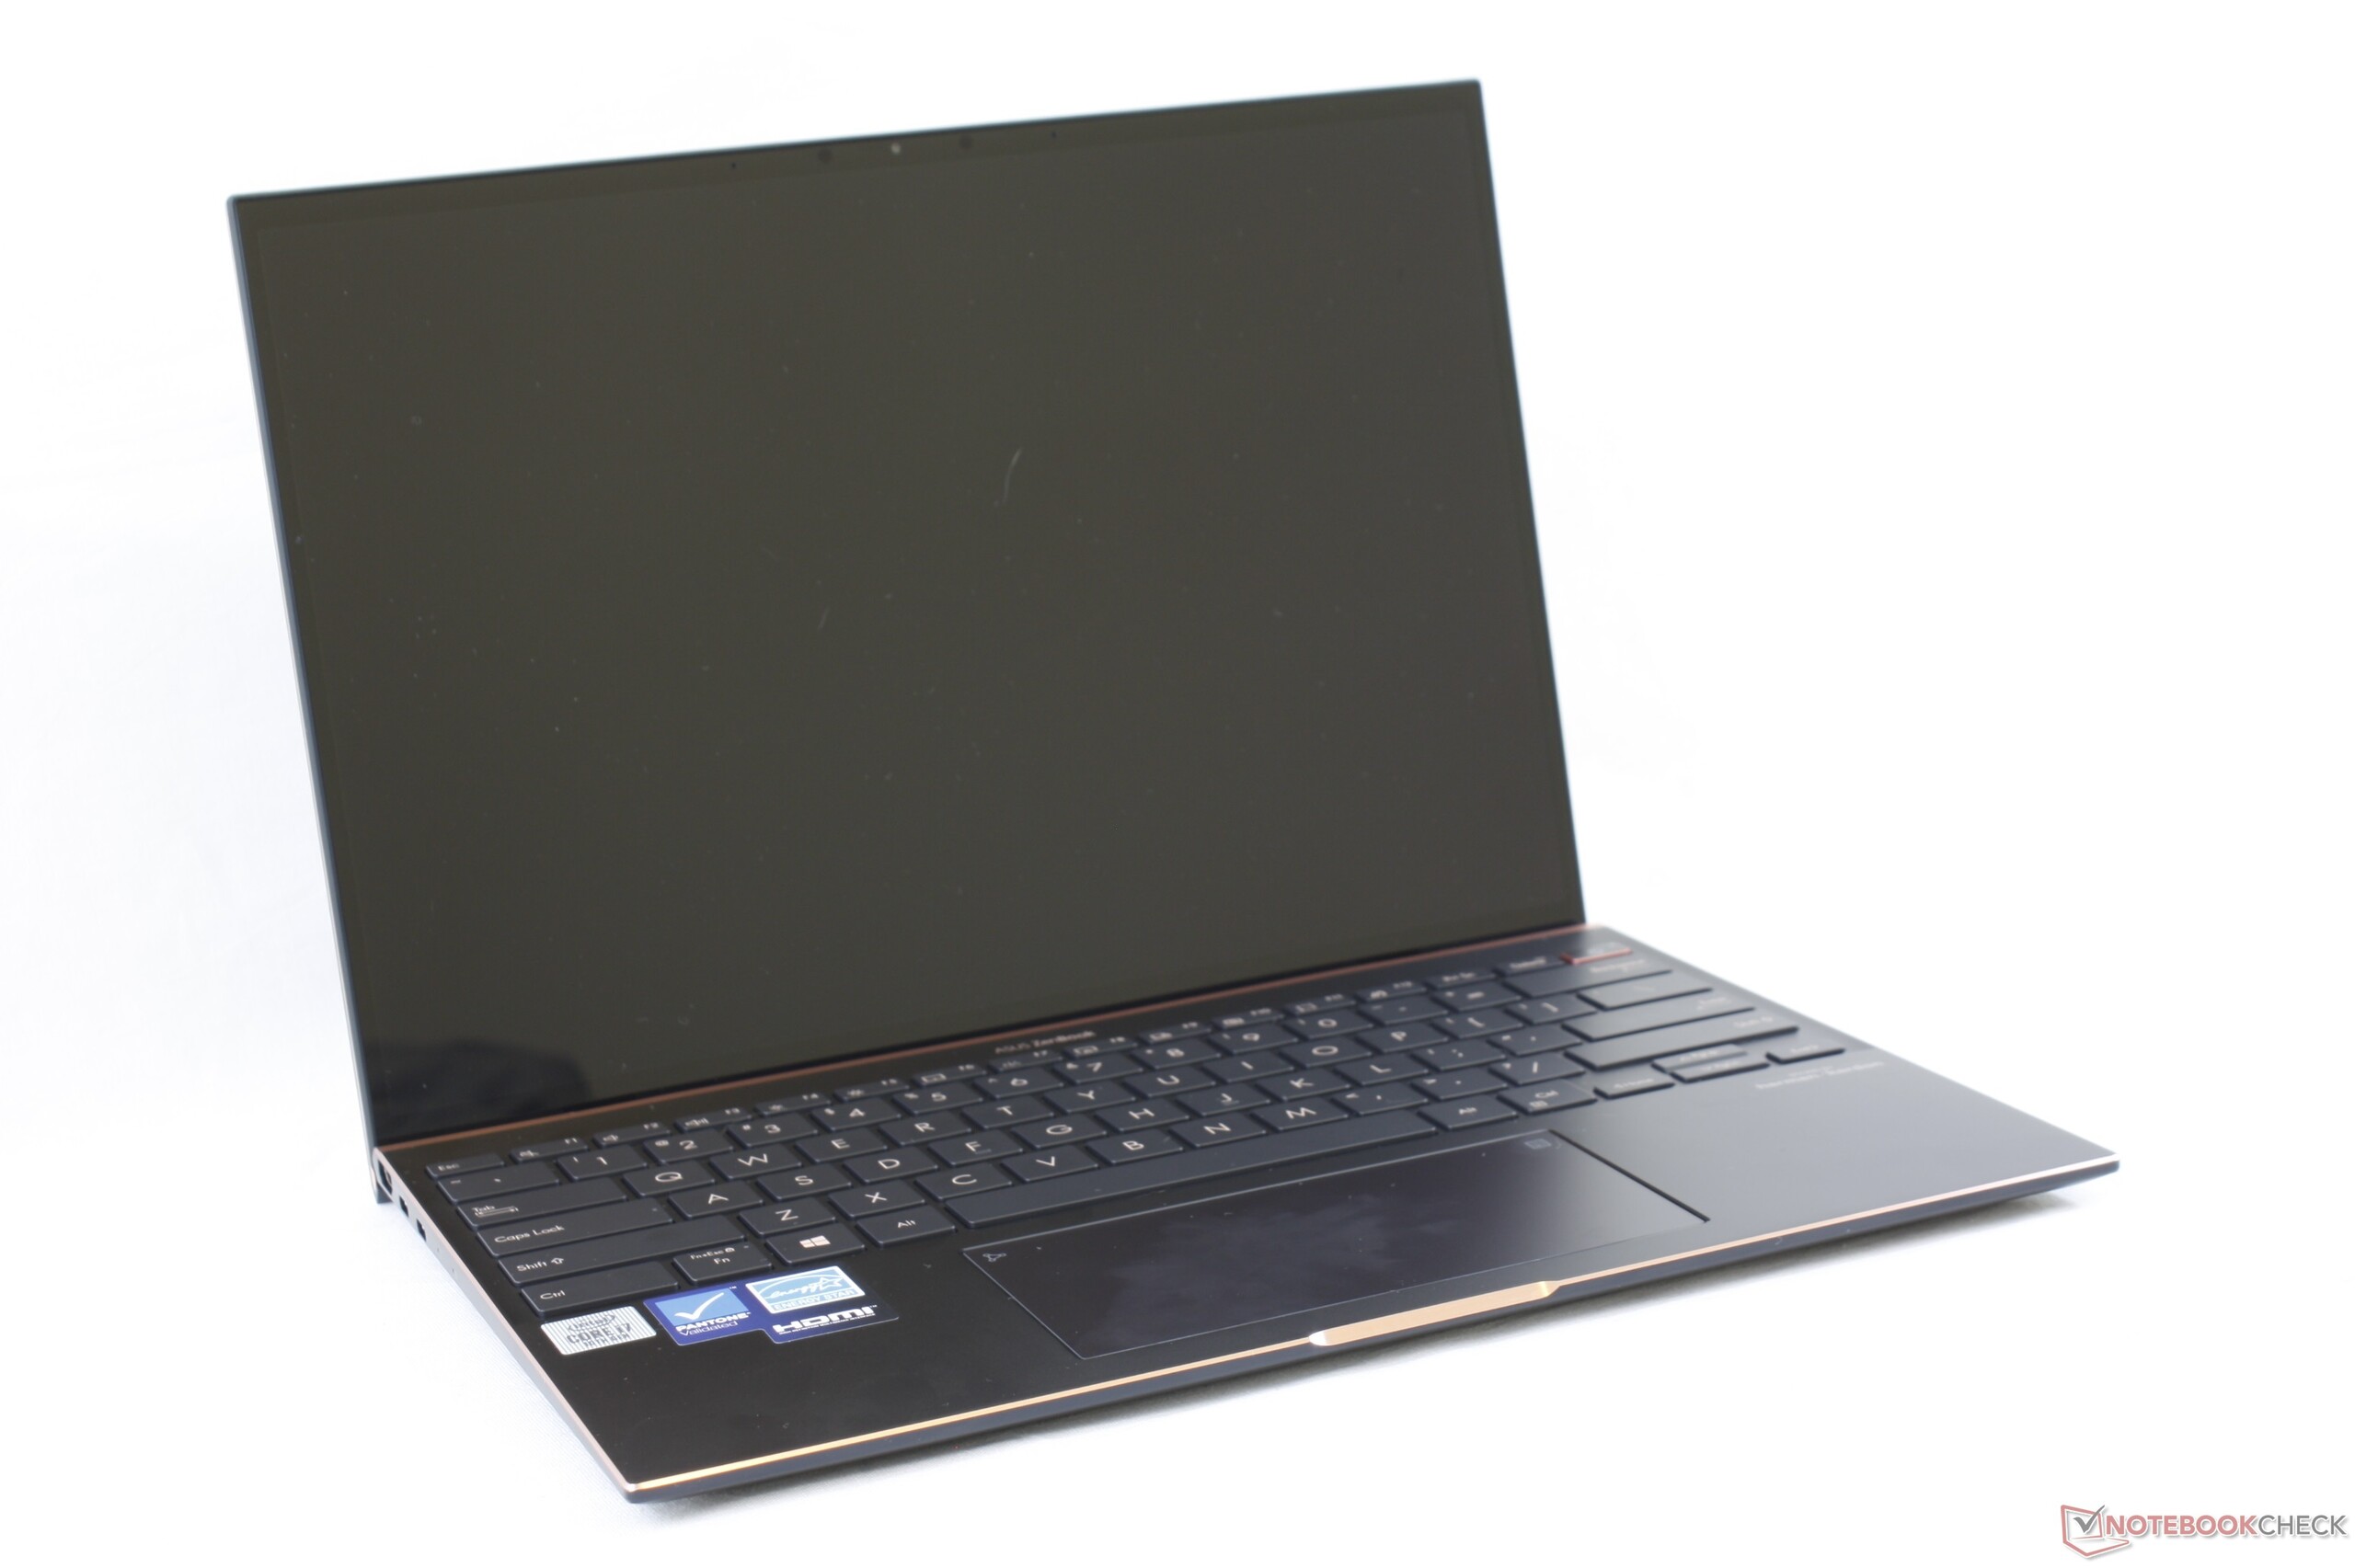
Test de l'Asus Zenbook S UX393JA (i7-1065G7, 4K UHD) : l'alternative à la Microsoft Surface
Note | Date | Modèle | Poids | Épaisseur | Taille | Résolution | Prix |
|---|---|---|---|---|---|---|---|
| 85.1 % v7 (old) | 10/20 | Asus Zenbook S UX393JA i7-1065G7, Iris Plus Graphics G7 (Ice Lake 64 EU) | 1.4 kg | 15.7 mm | 13.90" | 3300x2200 | |
| 86.9 % v7 (old) | 08/20 | Microsoft Surface Book 3 13.5 i7-1065G7, GeForce GTX 1650 Max-Q | 1.6 kg | 23 mm | 13.50" | 3000x2000 | |
| 87.4 % v7 (old) | 07/20 | Huawei MateBook X Pro 2020 i7 i7-10510U, GeForce MX250 | 1.3 kg | 14.6 mm | 13.90" | 3000x2000 | |
| 86.6 % v6 (old) | 05/19 | Asus ZenBook S13 UX392FN i7-8565U, GeForce MX150 | 1.1 kg | 12.9 mm | 13.90" | 1920x1080 | |
| 84.4 % v7 (old) | 11/20 | Lenovo Yoga Slim 7-14IIL05 i7-1065G7, GeForce MX350 | 1.4 kg | 14.9 mm | 14.00" | 1920x1080 | |
| 88.9 % v7 (old) | 04/20 | Dell XPS 13 9300 Core i7-1065G7 i7-1065G7, Iris Plus Graphics G7 (Ice Lake 64 EU) | 1.2 kg | 14.8 mm | 13.40" | 1920x1200 |
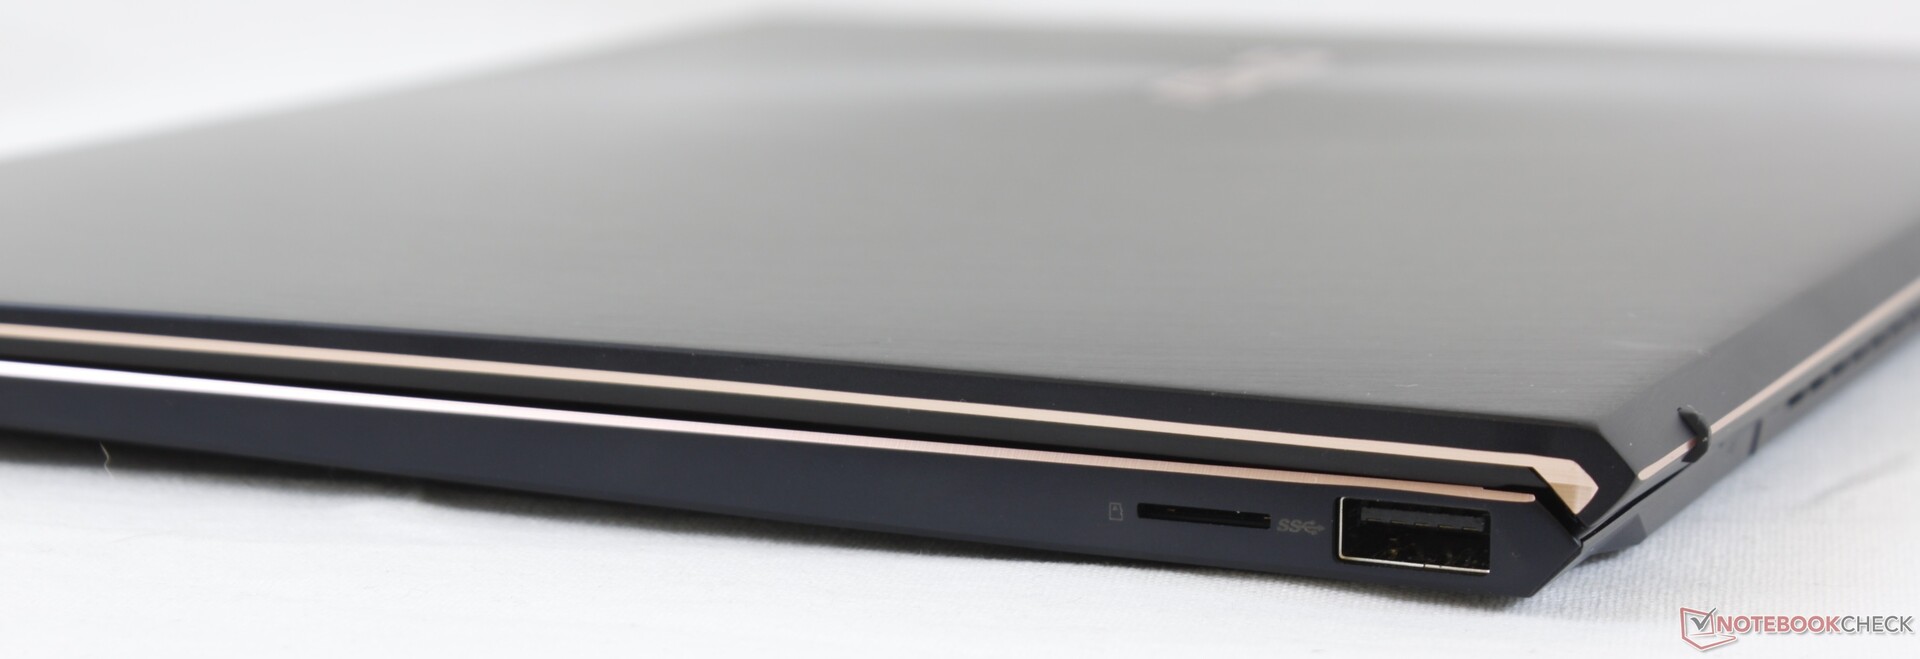
| SD Card Reader | |
| average JPG Copy Test (av. of 3 runs) | |
| Dell XPS 13 9300 Core i7-1065G7 (Toshiba Exceria Pro M501 64 GB UHS-II) | |
| Microsoft Surface Book 3 13.5 (Toshiba Exceria Pro M501 microSDXC 64GB) | |
| Asus ZenBook S13 UX392FN (Toshiba Exceria Pro M501 64 GB UHS-II) | |
| Asus Zenbook S UX393JA (Toshiba Exceria Pro M501 64 GB UHS-II) | |
| Lenovo Yoga Slim 7-14IIL05 (Toshiba Exceria Pro M501 64 GB UHS-II) | |
| maximum AS SSD Seq Read Test (1GB) | |
| Microsoft Surface Book 3 13.5 (Toshiba Exceria Pro M501 microSDXC 64GB) | |
| Dell XPS 13 9300 Core i7-1065G7 (Toshiba Exceria Pro M501 64 GB UHS-II) | |
| Asus ZenBook S13 UX392FN (Toshiba Exceria Pro M501 64 GB UHS-II) | |
| Asus Zenbook S UX393JA (Toshiba Exceria Pro M501 64 GB UHS-II) | |
| Lenovo Yoga Slim 7-14IIL05 (Toshiba Exceria Pro M501 64 GB UHS-II) | |

, i7-1065G7, Intel SSD 660p 1TB SSDPEKNW010T8")
, i7-1065G7, Intel SSD 660p 1TB SSDPEKNW010T8")
| |||||||||||||||||||||||||
Homogénéité de la luminosité: 89 %
Valeur mesurée au centre, sur batterie: 444.1 cd/m²
Contraste: 1200:1 (Valeurs des noirs: 0.37 cd/m²)
ΔE ColorChecker Calman: 2.94 | ∀{0.5-29.43 Ø4.73}
calibrated: 3.05
ΔE Greyscale Calman: 2.9 | ∀{0.09-98 Ø4.97}
99.8% sRGB (Argyll 1.6.3 3D)
78.2% AdobeRGB 1998 (Argyll 1.6.3 3D)
87.9% AdobeRGB 1998 (Argyll 3D)
99.8% sRGB (Argyll 3D)
97.7% Display P3 (Argyll 3D)
Gamma: 2.1
CCT: 6766 K
| Asus Zenbook S UX393JA AU Optronics B139KAN01.0, IPS, 13.9", 3300x2200 | Microsoft Surface Laptop 3 13 Core i5-1035G7 Sharp LQ135P1JX51, IPS, 13.5", 2256x1504 | Huawei MateBook X Pro 2020 i7 JDI LPM139M422A, LTPS, 13.9", 3000x2000 | Asus ZenBook S13 UX392FN Tianma XM, IPS, 13.9", 1920x1080 | Lenovo Yoga Slim 7-14IIL05 N140HCG-EQ1, , 14", 1920x1080 | Dell XPS 13 9300 Core i7-1065G7 Sharp LQ134N1, IPS, 13.4", 1920x1200 | |
|---|---|---|---|---|---|---|
| Display | -19% | -18% | -19% | -18% | -19% | |
| Display P3 Coverage (%) | 97.7 | 65.7 -33% | 66.6 -32% | 67.5 -31% | 66.4 -32% | 66.3 -32% |
| sRGB Coverage (%) | 99.8 | 98.6 -1% | 99.4 0% | 95.8 -4% | 98.8 -1% | 97.3 -3% |
| AdobeRGB 1998 Coverage (%) | 87.9 | 67.8 -23% | 68.6 -22% | 69 -22% | 68.4 -22% | 68.5 -22% |
| Response Times | -6% | 17% | 26% | 9% | 13% | |
| Response Time Grey 50% / Grey 80% * (ms) | 56.4 ? | 59.2 ? -5% | 49.6 ? 12% | 47.2 ? 16% | 51.2 ? 9% | 50 ? 11% |
| Response Time Black / White * (ms) | 38.8 ? | 41.6 ? -7% | 30.8 ? 21% | 24.8 ? 36% | 35.2 ? 9% | 33.2 ? 14% |
| PWM Frequency (Hz) | 21740 ? | 29070 ? | 2500 ? | |||
| Screen | 21% | 28% | 16% | 11% | 3% | |
| Brightness middle (cd/m²) | 444.1 | 403.4 -9% | 557 25% | 466 5% | 289 -35% | 607.6 37% |
| Brightness (cd/m²) | 423 | 397 -6% | 532 26% | 462 9% | 286 -32% | 595 41% |
| Brightness Distribution (%) | 89 | 89 0% | 87 -2% | 90 1% | 92 3% | 96 8% |
| Black Level * (cd/m²) | 0.37 | 0.34 8% | 0.33 11% | 0.33 11% | 0.17 54% | 0.4 -8% |
| Contrast (:1) | 1200 | 1186 -1% | 1688 41% | 1412 18% | 1700 42% | 1519 27% |
| Colorchecker dE 2000 * | 2.94 | 0.94 68% | 1.4 52% | 1.93 34% | 2.5 15% | 3.23 -10% |
| Colorchecker dE 2000 max. * | 7.37 | 2.92 60% | 2.5 66% | 4.26 42% | 4.7 36% | 8.67 -18% |
| Colorchecker dE 2000 calibrated * | 3.05 | 0.99 68% | 0.7 77% | 1.99 35% | 0.6 80% | 1.01 67% |
| Greyscale dE 2000 * | 2.9 | 0.9 69% | 2 31% | 1.7 41% | 3.4 -17% | 5.5 -90% |
| Gamma | 2.1 105% | 2.13 103% | 2.14 103% | 2.15 102% | 1.98 111% | 2.12 104% |
| CCT | 6766 96% | 6620 98% | 6689 97% | 6382 102% | 7005 93% | 6413 101% |
| Color Space (Percent of AdobeRGB 1998) (%) | 78.2 | 62.3 -20% | 62.5 -20% | 62.2 -20% | 62.6 -20% | 63 -19% |
| Color Space (Percent of sRGB) (%) | 99.8 | 98.7 -1% | 99.5 0% | 95.7 -4% | 98.9 -1% | 97.5 -2% |
| Moyenne finale (programmes/paramètres) | -1% /
10% | 9% /
18% | 8% /
10% | 1% /
6% | -1% /
0% |
* ... Moindre est la valeur, meilleures sont les performances
Temps de réponse de l'écran
| ↔ Temps de réponse noir à blanc | ||
|---|---|---|
| 38.8 ms ... hausse ↗ et chute ↘ combinées | ↗ 23.2 ms hausse | 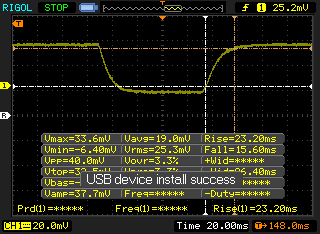 |
| ↘ 15.6 ms chute | ||
| L'écran souffre de latences très élevées, à éviter pour le jeu. En comparaison, tous les appareils testés affichent entre 0.1 (minimum) et 240 (maximum) ms. » 96 % des appareils testés affichent de meilleures performances. Cela signifie que les latences relevées sont moins bonnes que la moyenne (19.9 ms) de tous les appareils testés. | ||
| ↔ Temps de réponse gris 50% à gris 80% | ||
| 56.4 ms ... hausse ↗ et chute ↘ combinées | ↗ 26.4 ms hausse | 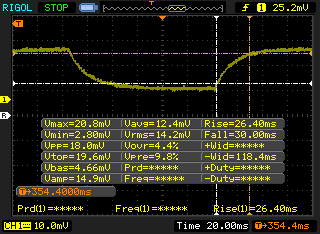 |
| ↘ 30 ms chute | ||
| L'écran souffre de latences très élevées, à éviter pour le jeu. En comparaison, tous les appareils testés affichent entre 0.165 (minimum) et 636 (maximum) ms. » 93 % des appareils testés affichent de meilleures performances. Cela signifie que les latences relevées sont moins bonnes que la moyenne (31.1 ms) de tous les appareils testés. | ||
Scintillement / MLI (Modulation de largeur d'impulsion)
| Scintillement / MLI (Modulation de largeur d'impulsion) non décelé | 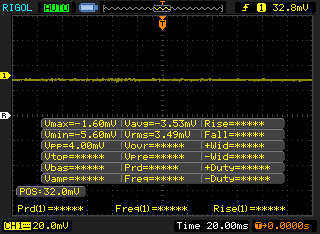 | ||
En comparaison, 52 % des appareils testés n'emploient pas MDI pour assombrir leur écran. Nous avons relevé une moyenne à 7798 (minimum : 5 - maximum : 343500) Hz dans le cas où une MDI était active. | |||
Cinebench R15: CPU Multi 64Bit | CPU Single 64Bit
Blender: v2.79 BMW27 CPU
7-Zip 18.03: 7z b 4 -mmt1 | 7z b 4
Geekbench 5.5: Single-Core | Multi-Core
HWBOT x265 Benchmark v2.2: 4k Preset
LibreOffice : 20 Documents To PDF
R Benchmark 2.5: Overall mean
| Geekbench 5.5 / Single-Core | |
| Asus ZenBook 14 UX425EA | |
| Asus Zenbook S UX393JA | |
| Moyenne Intel Core i7-1065G7 (948 - 1348, n=18) | |
| Asus ZenBook 14 UX434FL-DB77 | |
| Lenovo Yoga Slim 7-14ARE | |
| Lenovo Yoga Slim 7-14ARE | |
| Acer Swift 3 SF314-42-R4XJ | |
| Lenovo IdeaPad 5 14ARE05 | |
| Acer Swift 3 SF314-42-R27B | |
| Geekbench 5.5 / Multi-Core | |
| Lenovo Yoga Slim 7-14ARE | |
| Lenovo Yoga Slim 7-14ARE | |
| Asus ZenBook 14 UX425EA | |
| Acer Swift 3 SF314-42-R4XJ | |
| Lenovo IdeaPad 5 14ARE05 | |
| Asus Zenbook S UX393JA | |
| Moyenne Intel Core i7-1065G7 (2464 - 4855, n=18) | |
| Acer Swift 3 SF314-42-R27B | |
| Asus ZenBook 14 UX434FL-DB77 | |
| HWBOT x265 Benchmark v2.2 / 4k Preset | |
| Lenovo Yoga Slim 7-14ARE | |
| Acer Swift 3 SF314-42-R4XJ | |
| Lenovo IdeaPad 5 14ARE05 | |
| Asus ZenBook 14 UX425EA | |
| Asus ZenBook 14 UX434FL-DB77 | |
| Microsoft Surface Laptop 3 13 Core i5-1035G7 | |
| Asus Zenbook S UX393JA | |
| Moyenne Intel Core i7-1065G7 (2.2 - 6.38, n=22) | |
| Acer Swift 3 SF314-42-R27B | |
| HP Envy x360 13-ar0601ng | |
| LibreOffice / 20 Documents To PDF | |
| Asus ZenBook 14 UX434FL-DB77 | |
| Acer Swift 3 SF314-42-R27B | |
| Moyenne Intel Core i7-1065G7 (46.9 - 85.3, n=19) | |
| Acer Swift 3 SF314-42-R4XJ | |
| Lenovo IdeaPad 5 14ARE05 | |
| Lenovo Yoga Slim 7-14ARE | |
| Asus Zenbook S UX393JA | |
| Asus ZenBook 14 UX425EA | |
| R Benchmark 2.5 / Overall mean | |
| Asus ZenBook 14 UX434FL-DB77 | |
| Moyenne Intel Core i7-1065G7 (0.661 - 0.798, n=18) | |
| Acer Swift 3 SF314-42-R27B | |
| Asus Zenbook S UX393JA | |
| Lenovo IdeaPad 5 14ARE05 | |
| Acer Swift 3 SF314-42-R4XJ | |
| Lenovo Yoga Slim 7-14ARE | |
| Asus ZenBook 14 UX425EA | |
* ... Moindre est la valeur, meilleures sont les performances
| PCMark 8 Home Score Accelerated v2 | 3457 points | |
| PCMark 8 Work Score Accelerated v2 | 2460 points | |
| PCMark 10 Score | 4182 points | |
Aide | ||
| DPC Latencies / LatencyMon - interrupt to process latency (max), Web, Youtube, Prime95 | |
| Dell XPS 13 9300 Core i7-1065G7 | |
| Asus Zenbook S UX393JA | |
| Microsoft Surface Book 3 13.5 | |
| Lenovo Yoga Slim 7-14IIL05 | |
* ... Moindre est la valeur, meilleures sont les performances
| Asus Zenbook S UX393JA Intel SSD 660p 1TB SSDPEKNW010T8 | Microsoft Surface Book 3 13.5 SK Hynix BC501 HFM512GDJTNG | Huawei MateBook X Pro 2020 i7 Samsung PM981a MZVLB1T0HBLR | Asus ZenBook S13 UX392FN WDC PC SN520 SDAPNUW-512G | Dell XPS 13 9300 Core i7-1065G7 Intel SSDPEMKF512G8 NVMe SSD | |
|---|---|---|---|---|---|
| AS SSD | -13% | 87% | 13% | -9% | |
| Seq Read (MB/s) | 1405 | 1707 21% | 2737 95% | 1224 -13% | 1956 39% |
| Seq Write (MB/s) | 1062 | 510 -52% | 2530 138% | 907 -15% | 1227 16% |
| 4K Read (MB/s) | 50.8 | 38.77 -24% | 54 6% | 41.46 -18% | 63 24% |
| 4K Write (MB/s) | 124.9 | 100.9 -19% | 152.5 22% | 126.2 1% | 156.6 25% |
| 4K-64 Read (MB/s) | 590 | 630 7% | 2011 241% | 1021 73% | 475.6 -19% |
| 4K-64 Write (MB/s) | 840 | 707 -16% | 1260 50% | 1251 49% | 539 -36% |
| Access Time Read * (ms) | 0.041 | 0.085 -107% | 0.066 -61% | 0.053 -29% | 0.042 -2% |
| Access Time Write * (ms) | 0.118 | 0.035 70% | 0.024 80% | 0.027 77% | 0.105 11% |
| Score Read (Points) | 781 | 839 7% | 2339 199% | 1185 52% | 734 -6% |
| Score Write (Points) | 1071 | 859 -20% | 1666 56% | 1468 37% | 818 -24% |
| Score Total (Points) | 2251 | 2077 -8% | 5191 131% | 3250 44% | 1915 -15% |
| Copy ISO MB/s (MB/s) | 1459 | 1404 -4% | 1022 -30% | ||
| Copy Program MB/s (MB/s) | 600 | 402.4 -33% | 302.8 -50% | ||
| Copy Game MB/s (MB/s) | 1411 | 902 -36% | 491.4 -65% | ||
| CrystalDiskMark 5.2 / 6 | -27% | 42% | 5% | 33% | |
| Write 4K (MB/s) | 129.5 | 88.4 -32% | 165.6 28% | 149.2 15% | 186.8 44% |
| Read 4K (MB/s) | 54 | 39.53 -27% | 50.2 -7% | 47.18 -13% | 71.4 32% |
| Write Seq (MB/s) | 1265 | 691 -45% | 1905 51% | 750 -41% | 1203 -5% |
| Read Seq (MB/s) | 1410 | 1032 -27% | 1669 18% | 1137 -19% | 2600 84% |
| Write 4K Q32T1 (MB/s) | 420.3 | 279.6 -33% | 474.6 13% | 749 78% | 514 22% |
| Read 4K Q32T1 (MB/s) | 357.7 | 261.6 -27% | 508 42% | 478.7 34% | 570 59% |
| Write Seq Q32T1 (MB/s) | 1799 | 868 -52% | 3007 67% | 1453 -19% | 786 -56% |
| Read Seq Q32T1 (MB/s) | 1616 | 2075 28% | 3556 120% | 1713 6% | 2947 82% |
| Moyenne finale (programmes/paramètres) | -20% /
-19% | 65% /
68% | 9% /
10% | 12% /
6% |
* ... Moindre est la valeur, meilleures sont les performances

Disk Throttling: DiskSpd Read Loop, Queue Depth 8
| 3DMark 11 Performance | 4461 points | |
| 3DMark Cloud Gate Standard Score | 13064 points | |
| 3DMark Fire Strike Score | 2669 points | |
| 3DMark Time Spy Score | 957 points | |
Aide | ||
| Bas | Moyen | Élevé | Ultra | |
|---|---|---|---|---|
| The Witcher 3 (2015) | 50.5 | 31.4 | 18.1 | 9 |
| Dota 2 Reborn (2015) | 96 | 59.2 | 36.4 | 33 |
| Final Fantasy XV Benchmark (2018) | 20.7 | 11.3 | 8.09 | |
| X-Plane 11.11 (2018) | 38.9 | 20.9 | 19.2 | |
| Strange Brigade (2018) | 50.7 | 21.4 | 17.3 | 15.2 |
| Asus Zenbook S UX393JA Iris Plus Graphics G7 (Ice Lake 64 EU), i7-1065G7, Intel SSD 660p 1TB SSDPEKNW010T8 | Microsoft Surface Laptop 3 13 Core i5-1035G7 Iris Plus Graphics G7 (Ice Lake 64 EU), i5-1035G7, SK hynix BC501 HFM256GDGTNG | Huawei MateBook X Pro 2020 i7 GeForce MX250, i7-10510U, Samsung PM981a MZVLB1T0HBLR | Asus ZenBook S13 UX392FN GeForce MX150, i7-8565U, WDC PC SN520 SDAPNUW-512G | Lenovo Yoga Slim 7-14IIL05 GeForce MX350, i7-1065G7, WDC PC SN730 SDBPNTY-512G | Dell XPS 13 9300 Core i7-1065G7 Iris Plus Graphics G7 (Ice Lake 64 EU), i7-1065G7, Intel SSDPEMKF512G8 NVMe SSD | |
|---|---|---|---|---|---|---|
| Noise | 2% | -2% | -2% | -6% | 2% | |
| arrêt / environnement * (dB) | 26.9 | 28.5 -6% | 29.6 -10% | 28.1 -4% | 29.3 -9% | 28.3 -5% |
| Idle Minimum * (dB) | 26.9 | 28.5 -6% | 29.6 -10% | 28.1 -4% | 29.3 -9% | 28.3 -5% |
| Idle Average * (dB) | 29 | 28.5 2% | 29.6 -2% | 28.1 3% | 29.3 -1% | 28.3 2% |
| Idle Maximum * (dB) | 31.1 | 28.5 8% | 30.3 3% | 29 7% | 30.5 2% | 28.3 9% |
| Load Average * (dB) | 37.7 | 28.5 24% | 38 -1% | 41.1 -9% | 41.5 -10% | 32.5 14% |
| Witcher 3 ultra * (dB) | 40.2 | 40.4 -0% | 38 5% | 41.1 -2% | 41.5 -3% | 39.3 2% |
| Load Maximum * (dB) | 38.1 | 40.4 -6% | 38 -0% | 41.1 -8% | 41.5 -9% | 39.3 -3% |
* ... Moindre est la valeur, meilleures sont les performances
Degré de la nuisance sonore
| Au repos |
| 26.9 / 29 / 31.1 dB(A) |
| Fortement sollicité |
| 37.7 / 38.1 dB(A) |
 | ||
30 dB silencieux 40 dB(A) audible 50 dB(A) bruyant |
||
min: | ||
(±) La température maximale du côté supérieur est de 42 °C / 108 F, par rapport à la moyenne de 35.9 °C / 97 F, allant de 21.4 à 59 °C pour la classe Subnotebook.
(-) Le fond chauffe jusqu'à un maximum de 48.6 °C / 119 F, contre une moyenne de 39.2 °C / 103 F
(+) En utilisation inactive, la température moyenne du côté supérieur est de 25.5 °C / 78 F, par rapport à la moyenne du dispositif de 30.8 °C / 87 F.
(±) En jouant à The Witcher 3, la température moyenne du côté supérieur est de 32.8 °C / 91 F, alors que la moyenne de l'appareil est de 30.8 °C / 87 F.
(+) Les repose-poignets et le pavé tactile sont plus froids que la température de la peau avec un maximum de 31 °C / 87.8 F et sont donc froids au toucher.
(-) La température moyenne de la zone de l'appui-paume de dispositifs similaires était de 28.2 °C / 82.8 F (-2.8 °C / #-5 F).
Asus Zenbook S UX393JA analyse audio
(+) | les haut-parleurs peuvent jouer relativement fort (89.2# dB)
Basses 100 - 315 Hz
(±) | basse réduite - en moyenne 14.9% inférieure à la médiane
(±) | la linéarité des basses est moyenne (9.6% delta à la fréquence précédente)
Médiums 400 - 2000 Hz
(+) | médiane équilibrée - seulement 3% de la médiane
(+) | les médiums sont linéaires (3% delta à la fréquence précédente)
Aiguës 2 - 16 kHz
(+) | des sommets équilibrés - à seulement 4.8% de la médiane
(+) | les aigus sont linéaires (3.5% delta à la fréquence précédente)
Globalement 100 - 16 000 Hz
(+) | le son global est linéaire (13.1% différence à la médiane)
Par rapport à la même classe
» 21% de tous les appareils testés de cette catégorie étaient meilleurs, 5% similaires, 75% pires
» Le meilleur avait un delta de 5%, la moyenne était de 18%, le pire était de 53%.
Par rapport à tous les appareils testés
» 13% de tous les appareils testés étaient meilleurs, 3% similaires, 84% pires
» Le meilleur avait un delta de 4%, la moyenne était de 24%, le pire était de 134%.
Apple MacBook 12 (Early 2016) 1.1 GHz analyse audio
(+) | les haut-parleurs peuvent jouer relativement fort (83.6# dB)
Basses 100 - 315 Hz
(±) | basse réduite - en moyenne 11.3% inférieure à la médiane
(±) | la linéarité des basses est moyenne (14.2% delta à la fréquence précédente)
Médiums 400 - 2000 Hz
(+) | médiane équilibrée - seulement 2.4% de la médiane
(+) | les médiums sont linéaires (5.5% delta à la fréquence précédente)
Aiguës 2 - 16 kHz
(+) | des sommets équilibrés - à seulement 2% de la médiane
(+) | les aigus sont linéaires (4.5% delta à la fréquence précédente)
Globalement 100 - 16 000 Hz
(+) | le son global est linéaire (10.2% différence à la médiane)
Par rapport à la même classe
» 7% de tous les appareils testés de cette catégorie étaient meilleurs, 2% similaires, 91% pires
» Le meilleur avait un delta de 5%, la moyenne était de 18%, le pire était de 53%.
Par rapport à tous les appareils testés
» 5% de tous les appareils testés étaient meilleurs, 1% similaires, 94% pires
» Le meilleur avait un delta de 4%, la moyenne était de 24%, le pire était de 134%.
| Éteint/en veille | |
| Au repos | |
| Fortement sollicité |
|
Légende:
min: | |
| Asus Zenbook S UX393JA i7-1065G7, Iris Plus Graphics G7 (Ice Lake 64 EU), Intel SSD 660p 1TB SSDPEKNW010T8, IPS, 3300x2200, 13.9" | Microsoft Surface Laptop 3 15 i7-1065G7 i7-1065G7, Iris Plus Graphics G7 (Ice Lake 64 EU), Toshiba KBG40ZNS256G NVMe, IPS, 2496x1664, 15" | Huawei MateBook X Pro 2020 i7 i7-10510U, GeForce MX250, Samsung PM981a MZVLB1T0HBLR, LTPS, 3000x2000, 13.9" | Asus ZenBook S13 UX392FN i7-8565U, GeForce MX150, WDC PC SN520 SDAPNUW-512G, IPS, 1920x1080, 13.9" | Lenovo Yoga Slim 7-14IIL05 i7-1065G7, GeForce MX350, WDC PC SN730 SDBPNTY-512G, , 1920x1080, 14" | Dell XPS 13 9300 Core i7-1065G7 i7-1065G7, Iris Plus Graphics G7 (Ice Lake 64 EU), Intel SSDPEMKF512G8 NVMe SSD, IPS, 1920x1200, 13.4" | |
|---|---|---|---|---|---|---|
| Power Consumption | -8% | -21% | -5% | -15% | 9% | |
| Idle Minimum * (Watt) | 4.1 | 4.4 -7% | 4.3 -5% | 3.4 17% | 3.7 10% | 4.2 -2% |
| Idle Average * (Watt) | 7.5 | 8.3 -11% | 8.5 -13% | 6.3 16% | 5.7 24% | 6.9 8% |
| Idle Maximum * (Watt) | 8.5 | 8.6 -1% | 12 -41% | 10.4 -22% | 8.2 4% | 7.5 12% |
| Load Average * (Watt) | 36.8 | 43.6 -18% | 54.8 -49% | 51 -39% | 57.1 -55% | 33.3 10% |
| Witcher 3 ultra * (Watt) | 39.2 | 41.5 -6% | 47.1 -20% | 39 1% | 54 -38% | 37.1 5% |
| Load Maximum * (Watt) | 61.6 | 64.4 -5% | 61.5 -0% | 62.7 -2% | 82.8 -34% | 48.4 21% |
* ... Moindre est la valeur, meilleures sont les performances
| Asus Zenbook S UX393JA i7-1065G7, Iris Plus Graphics G7 (Ice Lake 64 EU), 67 Wh | Microsoft Surface Book 3 13.5 i7-1065G7, GeForce GTX 1650 Max-Q, 69 Wh | Huawei MateBook X Pro 2020 i7 i7-10510U, GeForce MX250, 57.4 Wh | Asus ZenBook S13 UX392FN i7-8565U, GeForce MX150, 50 Wh | Lenovo Yoga Slim 7-14IIL05 i7-1065G7, GeForce MX350, 61 Wh | Dell XPS 13 9300 Core i7-1065G7 i7-1065G7, Iris Plus Graphics G7 (Ice Lake 64 EU), 52 Wh | |
|---|---|---|---|---|---|---|
| Autonomie de la batterie | -21% | 7% | -21% | -15% | 53% | |
| Reader / Idle (h) | 38.4 | 16.5 -57% | 28.5 -26% | |||
| WiFi v1.3 (h) | 8.3 | 6.6 -20% | 10.4 25% | 8.4 1% | 9.9 19% | 12.7 53% |
| Load (h) | 2.7 | 3.1 15% | 2.4 -11% | 1.7 -37% | 1.4 -48% |
Points positifs
Points négatifs
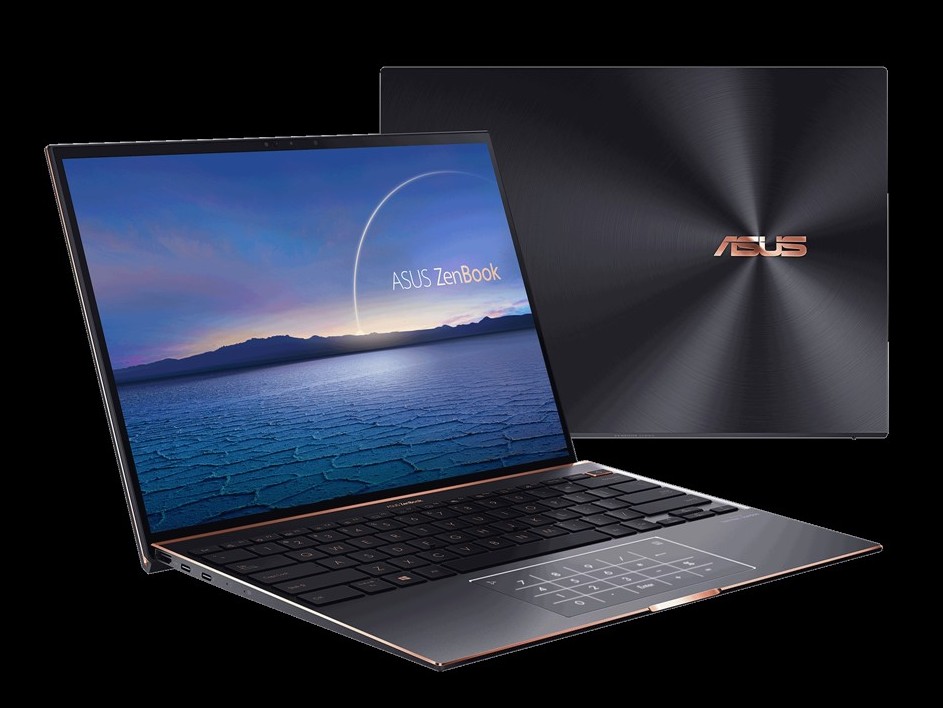
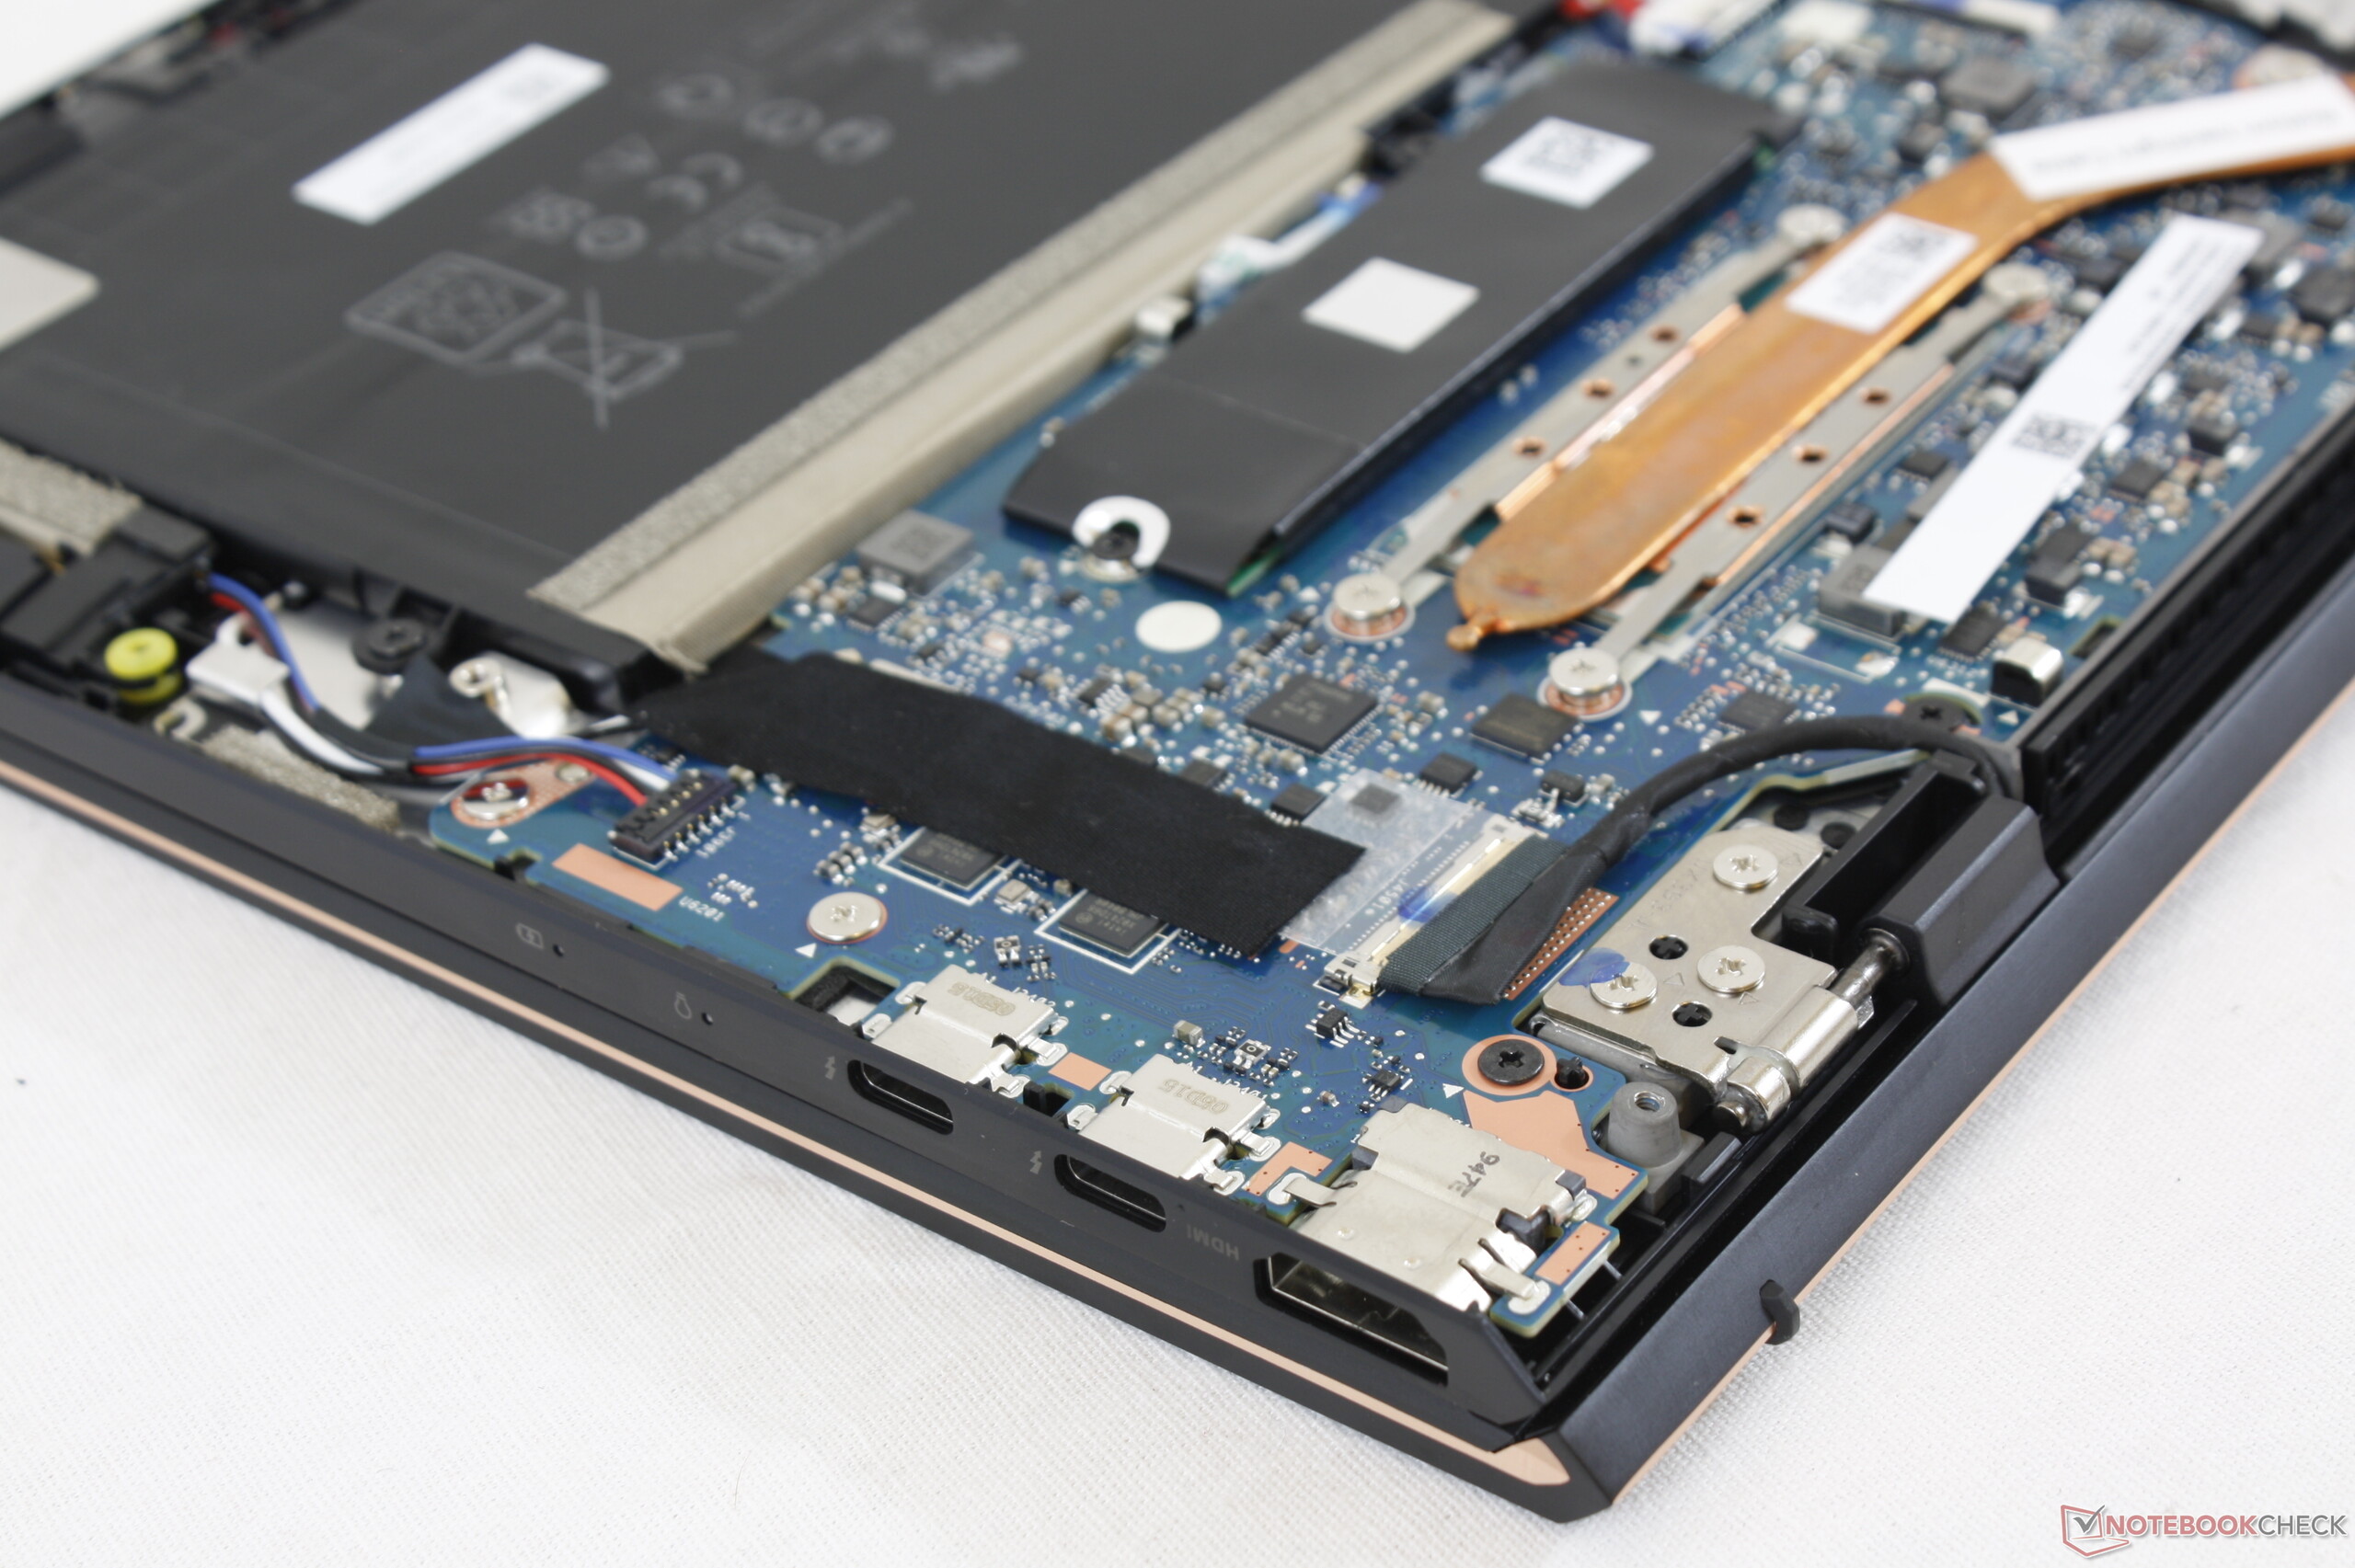
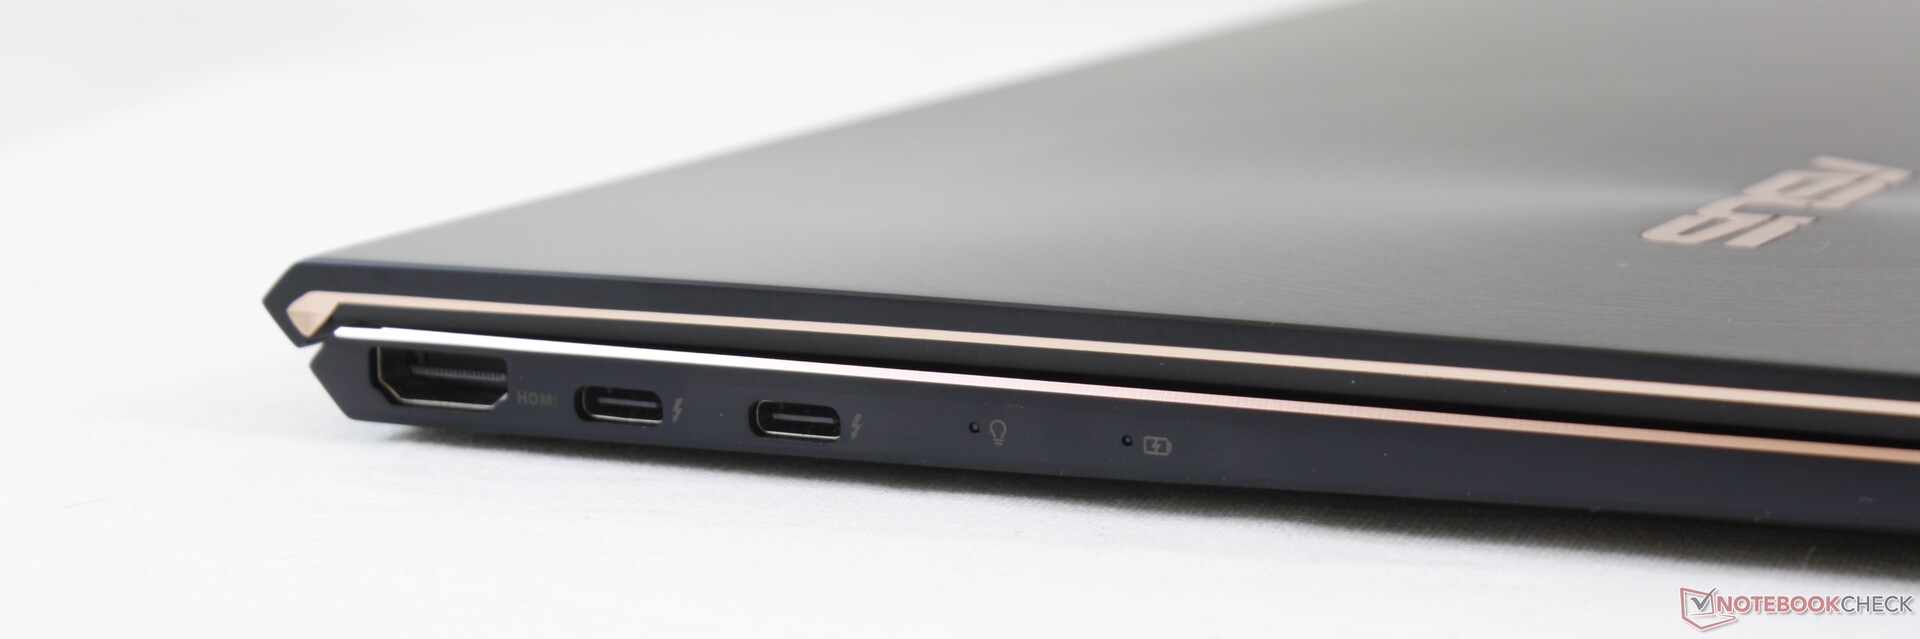
Le ZenBook S UX393 a beaucoup de qualités, et beaucoup de choses qui pourraient être améliorées. Quand on le compare au Surface Laptop 3 13, l'Asus l'enfonce, afec un écran plus grand, plus lumineux, aux meilleures couleurs et à la résolution plus élevée dans un châssis de même taille. Il possède aussi plus de ports que le portable Microsoft, qui ne possède pas de Thunderbolt 3, ni de HDMI, ni de SSD accessible facilement. Le Surface Laptop 3 prend soudainement un coup de vieux...
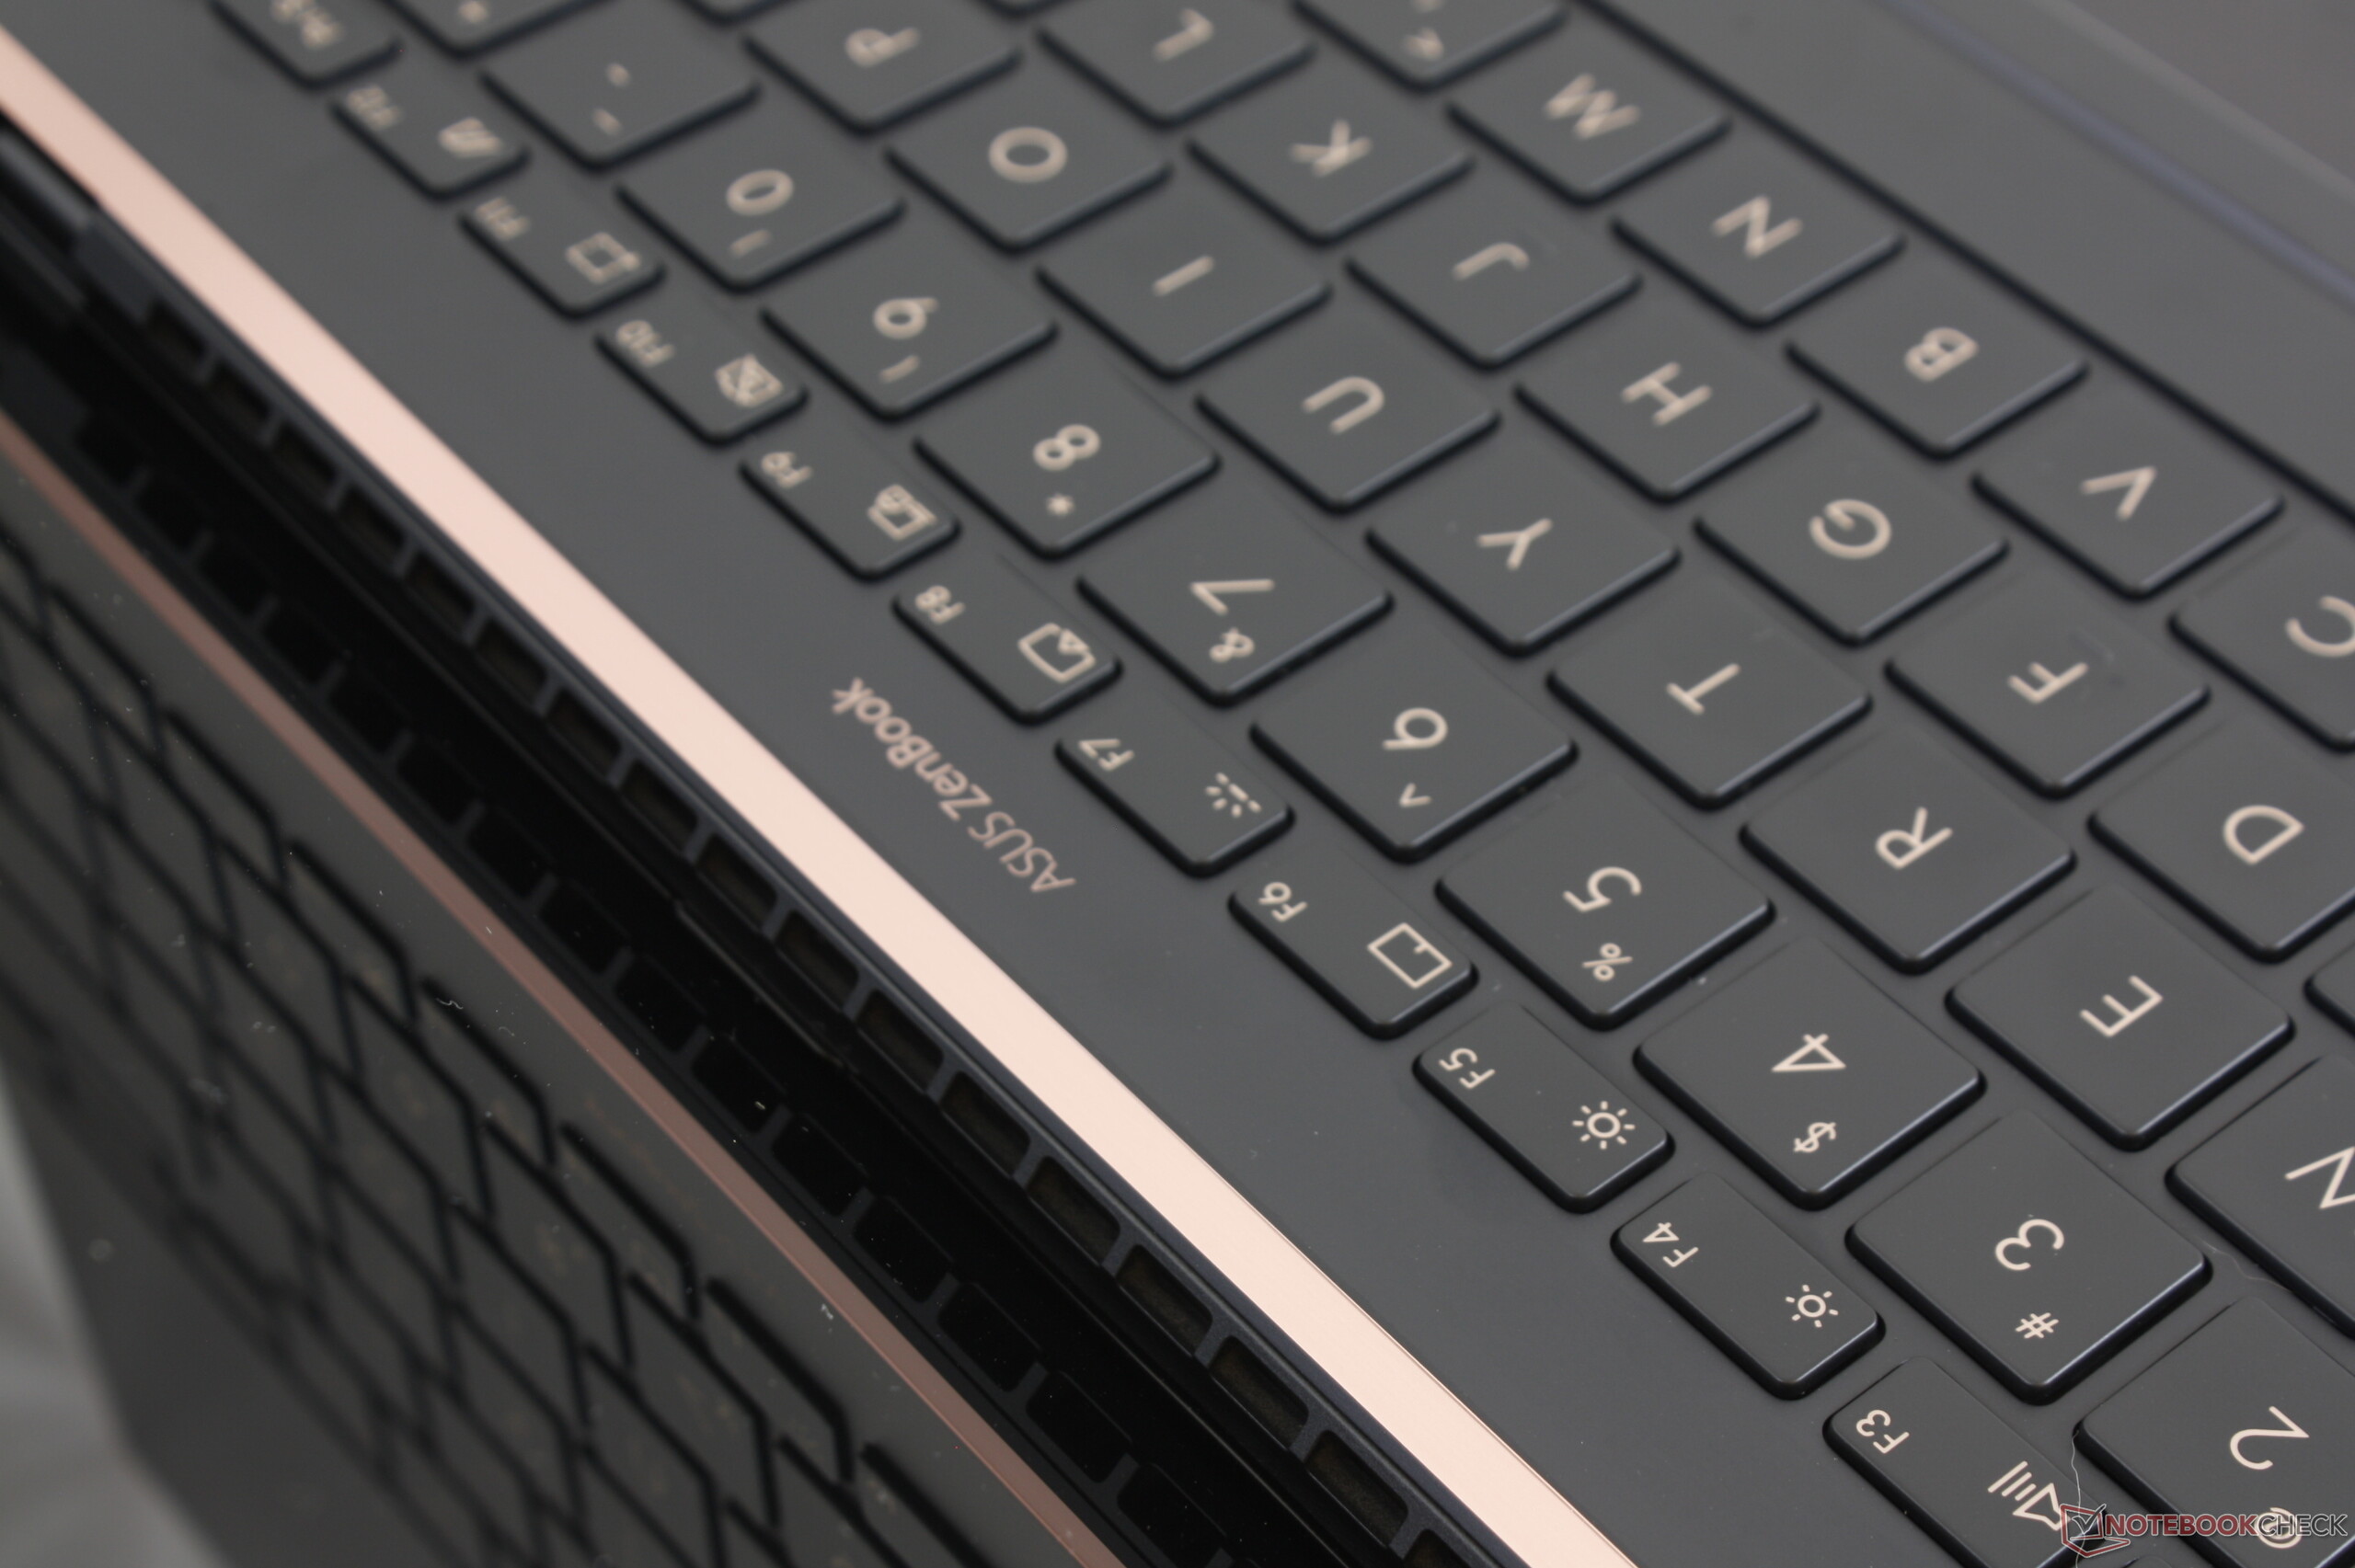
Les avantages ne sont pas aussi nets face au Huawei MateBook X Pro. La machine Huawei est indéniablement plus puissante graphiquement, puisqu'elle intègre des cartes Nvidia MX intégrées, et son clavier est plus ferme et plus confortable à utiliser. L'absence de cache de webcam et de prise jack sur l'Asus est gênante, et le lecteur micro SD lent décevra les créatifs. L'UX393 est néanmoins une amélioration notable de l'UX392, malgré la hausse de taille, des températures et des performances Ice Lake.
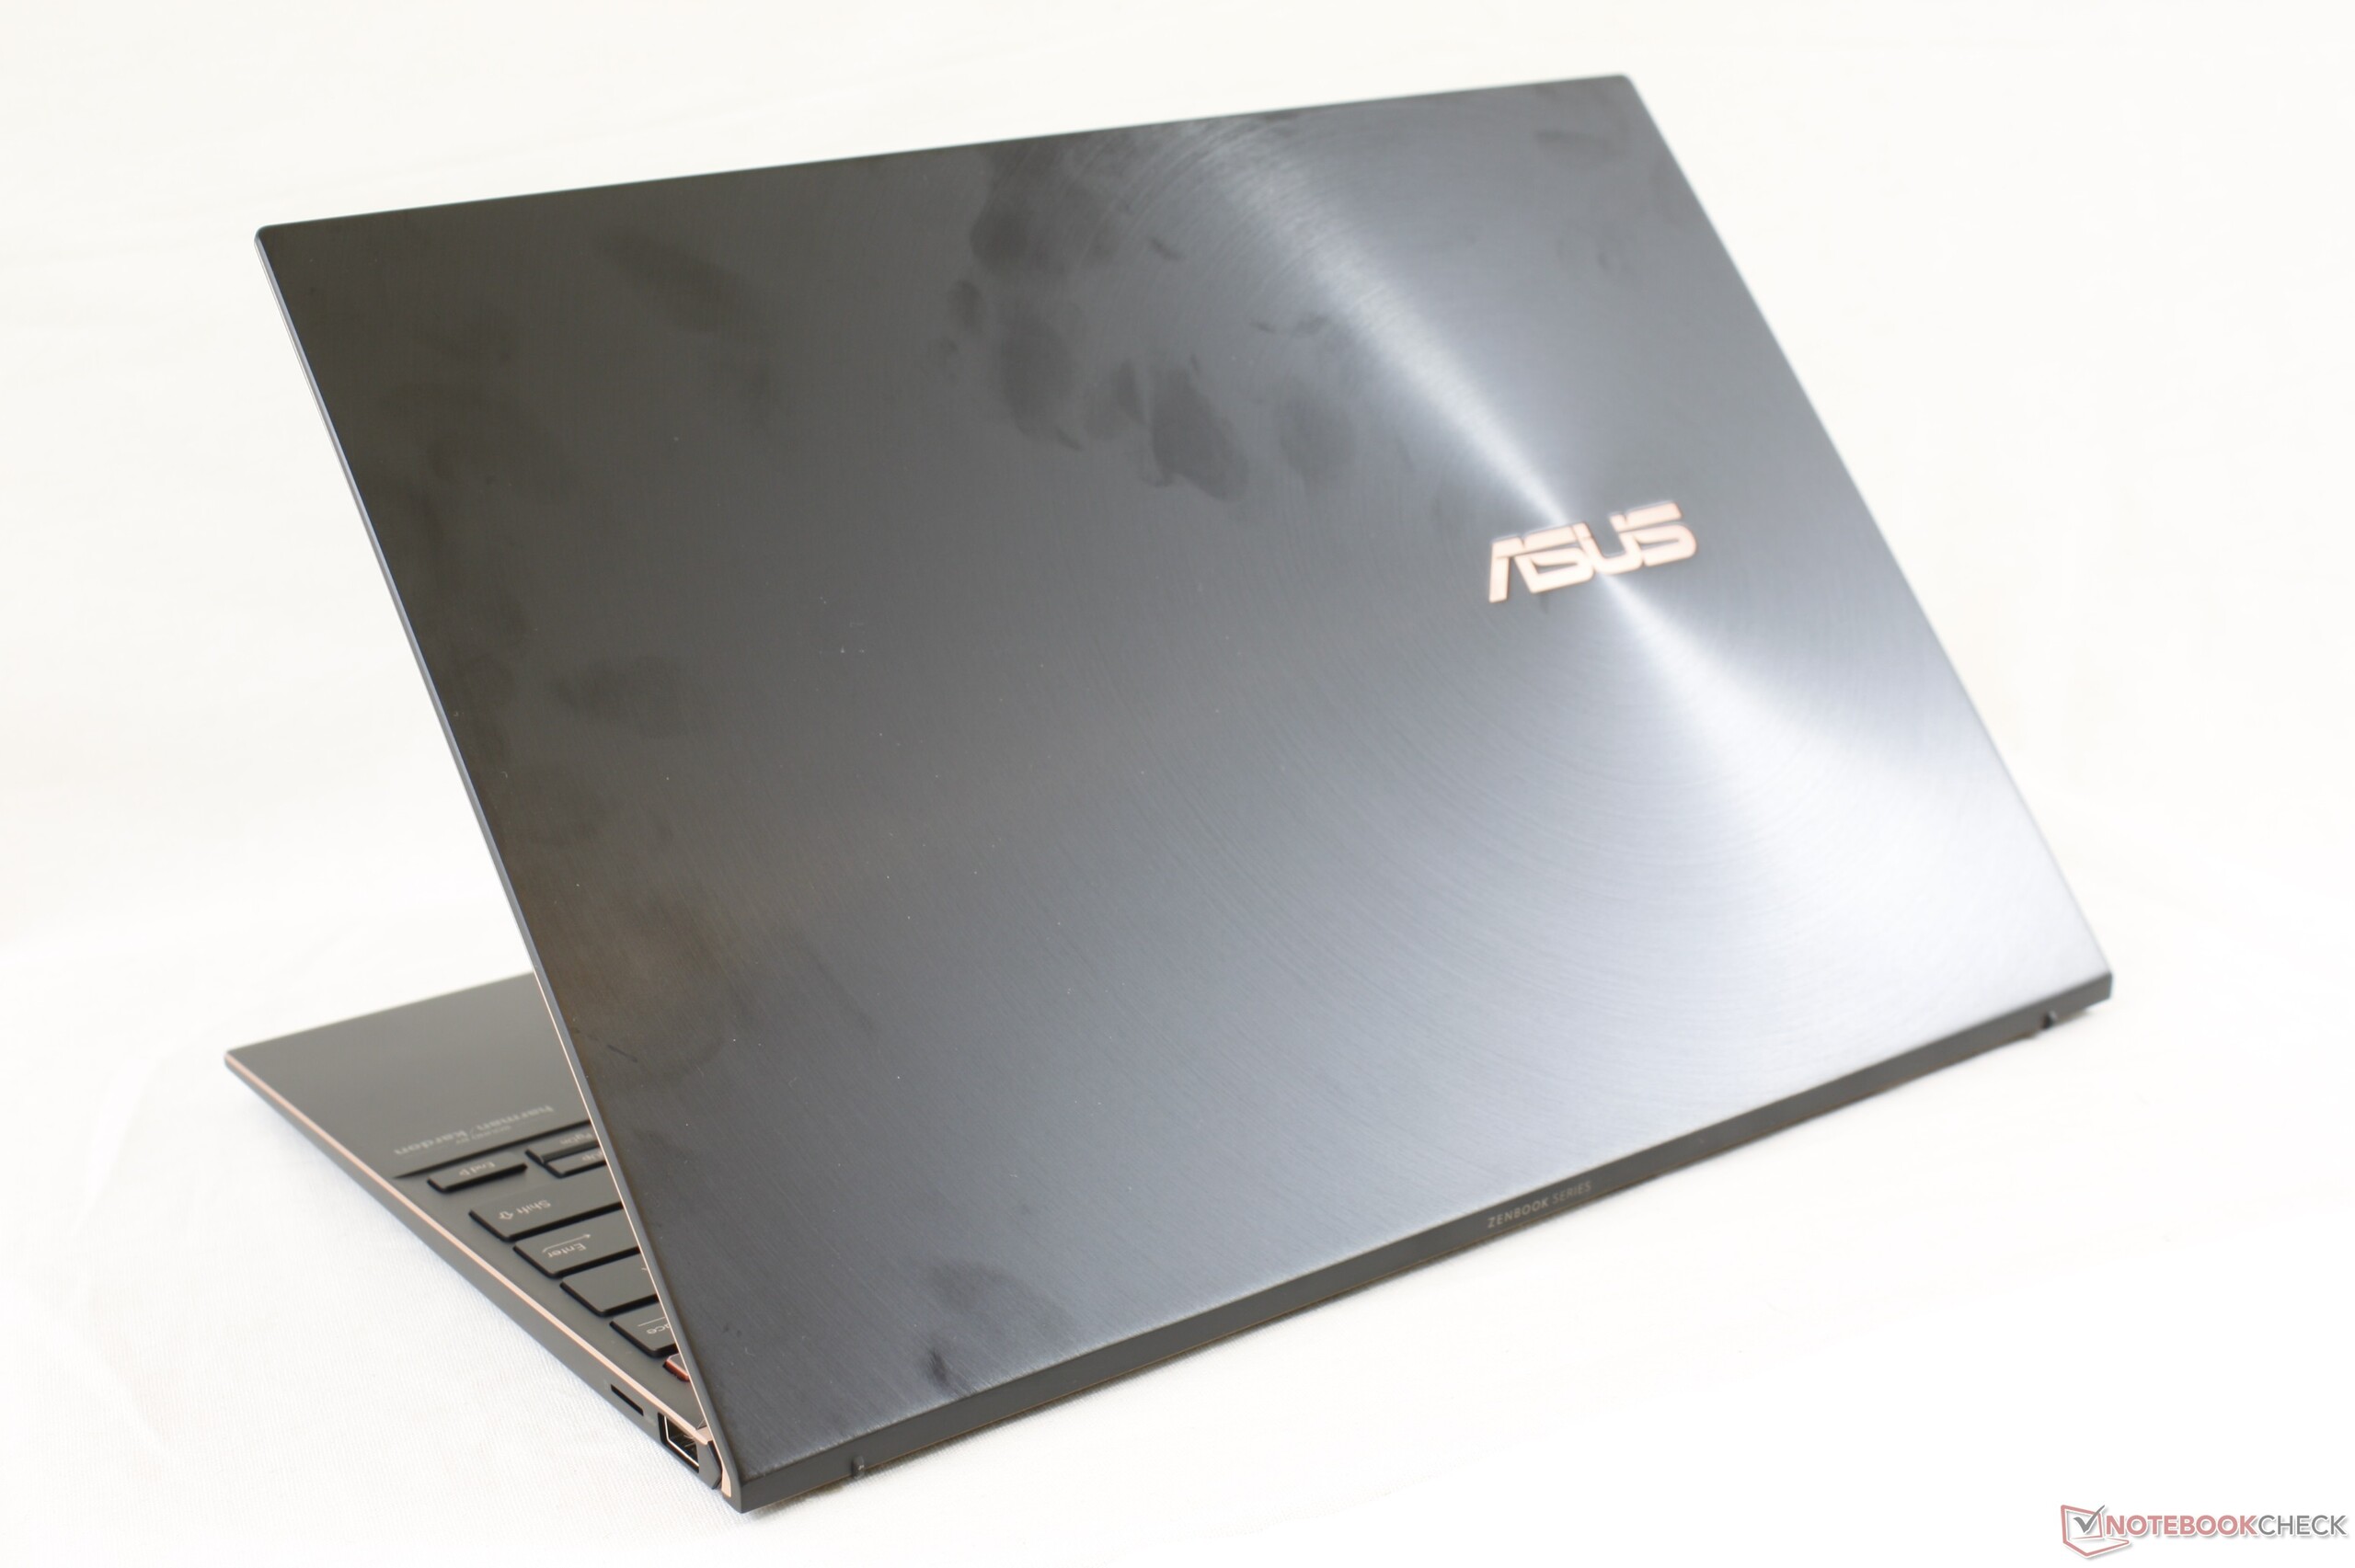
Il fait bon transporter l' Asus ZenBook S UX393 haut de gamme, et son écran 3/2 est impressionnant. Nous aurions cependant apprécié avoir des versions GeForce MX et Ryzen, plutôt que de ne pouvoir compter que sur des CPU Ice Lake.
L’intégralité de cette critique est disponible en anglais en suivant ce lien.
Asus Zenbook S UX393JA
- 10/14/2020 v7 (old)
Allen Ngo
Price comparison
