Notebookcheck Logo

Test du Mini PC Impact Display Solutions IMP-3654-B1-R : Core i9 refroidi passivement

Core i9-9900T 35 W en action. Peut-on faire tourner un processeur Core i9 8 cœurs et 16 threads avec rien de plus qu’un énorme dissipateur thermique ? Nous avons testé le mini PC Impact Display Solutions IMP-3654-B1-R pour voir dans quelle mesure il est possible de pousser le système avant que le throttling s’invite.
Impact Display Solutions IMP-3654-B1-R Core i9-9900T
Processeur
Intel Core i9-9900T 8 x 2.1 - 4.4 GHz, Coffee Lake-R
Carte graphique
Intel UHD Graphics 630, 26.20.100.7755
Mémoire
32 Go 
, Avant DDR4-2400, 17-17-17-39, double canal
Carte mère
Intel H310 (Cannon Lake-H)
Disque dur
EDGE NextGen SSD 1TB, 1024 Go 
Carte son
Intel Cannon Lake-H/S - cAVS (Audio, Voice, Speech)
Connexions
4 USB 2.0, 8 USB 3.0 / 3.1 Gen1, 1 HDMI, 1 DisplayPort
Réseau
Realtek RTL8168/8111 Gigabit-LAN (10/100/1000MBit/s), Intel Wireless-AC 9260 (a/b/g/n = Wi-Fi 4/ac = Wi-Fi 5/), Bluetooth 5
Taille
Hauteur x Largeur x Profondeur (en mm): 80 x 188 x 153
Système d'exploitation
Microsoft Windows 10 Pro 64 Bit
Fonctionnalités additionnelles
sans ventilateur
Poids
2 kg, Alimentation: 323 g
Remarque : le fabricant peut utiliser des composants provenant de différents fournisseurs, notamment des panneaux d'affichage, des lecteurs ou des clés USB ayant des spécifications similaires.


0306090120150180210240270300330360390420450480510540Tooltip
Impact Display Solutions IMP-3654-B1-R Core i9-9900T; iperf3 receive AX12; iperf 3.1.3: Ø526 (494-548)
Impact Display Solutions IMP-3654-B1-R Core i9-9900T; iperf3 transmit AX12; iperf 3.1.3: Ø176.7 (84-313)
0651301952603253904555205856507157808459109751040110511701235Tooltip
Impact Display Solutions IMP-3654-B1-R Core i9-9900T UHD Graphics 630, i9-9900T, EDGE NextGen SSD 1TB; CPU Multi 64Bit: Ø939 (350.72-1113.77)
Lenovo Legion Y740-17IRHg-81UJ001VGE GeForce RTX 2080 Max-Q, i7-9750H, Samsung SSD PM981 MZVLB1T0HALR; CPU Multi 64Bit: Ø1123 (1105.49-1224.89)
Walmart EVOO Gaming 17 GeForce RTX 2060 Mobile, i7-9750H, Intel SSD 660p 1TB SSDPEKNW010T8; CPU Multi 64Bit: Ø1260 (1250.7-1281.39)
Cinebench R20
CPU (Single Core)
Medion Erazer X15805
Intel Core i9-8950HK
498 Points +13%
Corsair One i160
Intel Core i9-9900K
495 Points +13%
Asus Zephyrus G14 GA401IV
AMD Ryzen 9 4900HS
495 Points +13%
Intel NUC10i7FNH
Intel Core i7-10710U
480 Points +9%
Alienware m17 R2 P41E
Intel Core i9-9980HK
478 Points +9%
MSI GE65 Raider 9SF-049US
Intel Core i9-9880H
474 Points +8%
Impact Display Solutions IMP-3654-B1-R Core i9-9900T
Intel Core i9-9900T
440 Points
Lenovo Yoga C940-15IRH
Intel Core i7-9750H
434 Points -1%
SCHENKER XMG Neo 15 Turing
Intel Core i7-8750H
418 Points -5%
MSI GF63 Thin 9SC
Intel Core i5-9300H
418 Points -5%
Intel Hades Canyon NUC8i7HVK
Intel Core i7-8809G
404 Points -8%
CPU (Multi Core)
Corsair One i160
Intel Core i9-9900K
4816 Points +83%
Asus Zephyrus G14 GA401IV
AMD Ryzen 9 4900HS
4288 Points +63%
Alienware m17 R2 P41E
Intel Core i9-9980HK
4136 Points +58%
MSI GE65 Raider 9SF-049US
Intel Core i9-9880H
3505 Points +33%
Medion Erazer X15805
Intel Core i9-8950HK
2924 Points +11%
Lenovo Yoga C940-15IRH
Intel Core i7-9750H
2643 Points +1%
Impact Display Solutions IMP-3654-B1-R Core i9-9900T
Intel Core i9-9900T
2626 Points
SCHENKER XMG Neo 15 Turing
Intel Core i7-8750H
2340 Points -11%
Intel NUC10i7FNH
Intel Core i7-10710U
2303 Points -12%
Intel Hades Canyon NUC8i7HVK
Intel Core i7-8809G
2005 Points -24%
MSI GF63 Thin 9SC
Intel Core i5-9300H
1737 Points -34%
Cinebench R15
CPU Single 64Bit
Medion Erazer X15805
Intel Core i9-8950HK
203 Points +10%
Corsair One i160
Intel Core i9-9900K
203 Points +10%
MSI GE65 Raider 9SF-049US
Intel Core i9-9880H
198 Points +7%
Alienware m17 R2 P41E
Intel Core i9-9980HK
195 Points +5%
Intel NUC10i7FNH
Intel Core i7-10710U
194 Points +5%
Asus Zephyrus G14 GA401IV
AMD Ryzen 9 4900HS
193 Points +4%
Impact Display Solutions IMP-3654-B1-R Core i9-9900T
Intel Core i9-9900T
185 Points
Lenovo Yoga C940-15IRH
Intel Core i7-9750H
184 Points -1%
Intel Hades Canyon NUC8i7HVK
Intel Core i7-8809G
178 Points -4%
SCHENKER XMG Neo 15 Turing
Intel Core i7-8750H
174 Points -6%
MSI GF63 Thin 9SC
Intel Core i5-9300H
173 Points -6%
CPU Multi 64Bit
Corsair One i160
Intel Core i9-9900K
1987 Points +79%
Asus Zephyrus G14 GA401IV
AMD Ryzen 9 4900HS
1863 Points +68%
Alienware m17 R2 P41E
Intel Core i9-9980HK
1754 Points +58%
MSI GE65 Raider 9SF-049US
Intel Core i9-9880H
1623 Points +46%
Lenovo Yoga C940-15IRH
Intel Core i7-9750H
1231 Points +11%
Medion Erazer X15805
Intel Core i9-8950HK
1217 Points +9%
Impact Display Solutions IMP-3654-B1-R Core i9-9900T
Intel Core i9-9900T
1112 (349.67min - 1112.32max) Points
SCHENKER XMG Neo 15 Turing
Intel Core i7-8750H
1079 Points -3%
Intel NUC10i7FNH
Intel Core i7-10710U
1067 Points -4%
Intel Hades Canyon NUC8i7HVK
Intel Core i7-8809G
864 Points -22%
MSI GF63 Thin 9SC
Intel Core i5-9300H
797 Points -28%
Cinebench R11.5
CPU Single 64Bit
Corsair One i160
Intel Core i9-9900K
2.33 Points +11%
Asus Zephyrus G14 GA401IV
AMD Ryzen 9 4900HS
2.23 Points +7%
Intel NUC10i7FNH
Intel Core i7-10710U
2.19 Points +5%
Impact Display Solutions IMP-3654-B1-R Core i9-9900T
Intel Core i9-9900T
2.09 Points
Intel Hades Canyon NUC8i7HVK
Intel Core i7-8809G
1.99 Points -5%
CPU Multi 64Bit
Corsair One i160
Intel Core i9-9900K
21.76 Points +76%
Asus Zephyrus G14 GA401IV
AMD Ryzen 9 4900HS
18.21 Points +47%
Impact Display Solutions IMP-3654-B1-R Core i9-9900T
Intel Core i9-9900T
12.38 Points
Intel NUC10i7FNH
Intel Core i7-10710U
10.89 Points -12%
Intel Hades Canyon NUC8i7HVK
Intel Core i7-8809G
9.41 Points -24%
Cinebench R10
Rendering Multiple CPUs 32Bit
Corsair One i160
Intel Core i9-9900K
49142 Points +57%
Asus Zephyrus G14 GA401IV
AMD Ryzen 9 4900HS
37938 Points +21%
Medion Erazer X15805
Intel Core i9-8950HK
36591 Points +17%
SCHENKER XMG Neo 15 Turing
Intel Core i7-8750H
31800 Points +1%
Impact Display Solutions IMP-3654-B1-R Core i9-9900T
Intel Core i9-9900T
31357 Points
Intel Hades Canyon NUC8i7HVK
Intel Core i7-8809G
25809 Points -18%
Rendering Single 32Bit
Corsair One i160
Intel Core i9-9900K
7786 Points +15%
Medion Erazer X15805
Intel Core i9-8950HK
7735 Points +14%
Impact Display Solutions IMP-3654-B1-R Core i9-9900T
Intel Core i9-9900T
6758 Points
Intel Hades Canyon NUC8i7HVK
Intel Core i7-8809G
6668 Points -1%
SCHENKER XMG Neo 15 Turing
Intel Core i7-8750H
6645 Points -2%
Asus Zephyrus G14 GA401IV
AMD Ryzen 9 4900HS
5866 Points -13%
wPrime 2.10 - 1024m
Intel Hades Canyon NUC8i7HVK
Intel Core i7-8809G
186.7 s * -15%
Intel NUC10i7FNH
Intel Core i7-10710U
177.4 s * -9%
Impact Display Solutions IMP-3654-B1-R Core i9-9900T
Intel Core i9-9900T
162.1 s *
Corsair One i160
Intel Core i9-9900K
91.3 s * +44%
Asus Zephyrus G14 GA401IV
AMD Ryzen 9 4900HS
88.2 s * +46%

* ... Moindre est la valeur, meilleures sont les performances

Cinebench R10 Shading 32Bit
10037
Cinebench R10 Rendering Multiple CPUs 32Bit
31357
Cinebench R10 Rendering Single 32Bit
6758
Cinebench R11.5 OpenGL 64Bit
48.35 fps
Cinebench R11.5 CPU Multi 64Bit
12.38 Points
Cinebench R11.5 CPU Single 64Bit
2.09 Points
Cinebench R15 CPU Single 64Bit
185 Points
Cinebench R15 Ref. Match 64Bit
97.8 %
Cinebench R15 OpenGL 64Bit
59.2 fps
Cinebench R15 CPU Multi 64Bit
1112 Points
Aide
PCMark 10
Score
Intel Hades Canyon NUC8i7HVK
Vega M GH, i7-8809G, Intel Optane 120 GB SSDPEK1W120GA
5301 Points +25%
Intel NUC10i7FNH
UHD Graphics 620, i7-10710U, Kingston RBUSNS8154P3256GJ1
4418 Points +4%
Impact Display Solutions IMP-3654-B1-R Core i9-9900T
UHD Graphics 630, i9-9900T, EDGE NextGen SSD 1TB
4236 Points
Dell XPS 13 7390 Core i7-10710U
UHD Graphics 620, i7-10710U, SK Hynix PC601 NVMe 512 GB
4161 Points -2%
Dell XPS 13 9300 Core i7-1065G7
Iris Plus Graphics G7 (Ice Lake 64 EU), i7-1065G7, Intel SSDPEMKF512G8 NVMe SSD
4154 Points -2%
Essentials
Dell XPS 13 7390 Core i7-10710U
UHD Graphics 620, i7-10710U, SK Hynix PC601 NVMe 512 GB
9160 Points +7%
Intel Hades Canyon NUC8i7HVK
Vega M GH, i7-8809G, Intel Optane 120 GB SSDPEK1W120GA
9125 Points +6%
Intel NUC10i7FNH
UHD Graphics 620, i7-10710U, Kingston RBUSNS8154P3256GJ1
9013 Points +5%
Dell XPS 13 9300 Core i7-1065G7
Iris Plus Graphics G7 (Ice Lake 64 EU), i7-1065G7, Intel SSDPEMKF512G8 NVMe SSD
8763 Points +2%
Impact Display Solutions IMP-3654-B1-R Core i9-9900T
UHD Graphics 630, i9-9900T, EDGE NextGen SSD 1TB
8585 Points
Productivity
Intel Hades Canyon NUC8i7HVK
Vega M GH, i7-8809G, Intel Optane 120 GB SSDPEK1W120GA
7915 Points +13%
Impact Display Solutions IMP-3654-B1-R Core i9-9900T
UHD Graphics 630, i9-9900T, EDGE NextGen SSD 1TB
7035 Points
Intel NUC10i7FNH
UHD Graphics 620, i7-10710U, Kingston RBUSNS8154P3256GJ1
6876 Points -2%
Dell XPS 13 7390 Core i7-10710U
UHD Graphics 620, i7-10710U, SK Hynix PC601 NVMe 512 GB
5816 Points -17%
Dell XPS 13 9300 Core i7-1065G7
Iris Plus Graphics G7 (Ice Lake 64 EU), i7-1065G7, Intel SSDPEMKF512G8 NVMe SSD
5759 Points -18%
Digital Content Creation
Intel Hades Canyon NUC8i7HVK
Vega M GH, i7-8809G, Intel Optane 120 GB SSDPEK1W120GA
5598 Points +64%
Dell XPS 13 9300 Core i7-1065G7
Iris Plus Graphics G7 (Ice Lake 64 EU), i7-1065G7, Intel SSDPEMKF512G8 NVMe SSD
3856 Points +13%
Intel NUC10i7FNH
UHD Graphics 620, i7-10710U, Kingston RBUSNS8154P3256GJ1
3777 Points +11%
Dell XPS 13 7390 Core i7-10710U
UHD Graphics 620, i7-10710U, SK Hynix PC601 NVMe 512 GB
3671 Points +7%
Impact Display Solutions IMP-3654-B1-R Core i9-9900T
UHD Graphics 630, i9-9900T, EDGE NextGen SSD 1TB
3415 Points
PCMark 8
Home Score Accelerated v2
Intel Hades Canyon NUC8i7HVK
Vega M GH, i7-8809G, Intel Optane 120 GB SSDPEK1W120GA
4833 Points +24%
Intel NUC10i7FNH
UHD Graphics 620, i7-10710U, Kingston RBUSNS8154P3256GJ1
3938 Points +1%
Impact Display Solutions IMP-3654-B1-R Core i9-9900T
UHD Graphics 630, i9-9900T, EDGE NextGen SSD 1TB
3899 Points
Dell XPS 13 9300 Core i7-1065G7
Iris Plus Graphics G7 (Ice Lake 64 EU), i7-1065G7, Intel SSDPEMKF512G8 NVMe SSD
3825 Points -2%
Dell XPS 13 7390 Core i7-10710U
UHD Graphics 620, i7-10710U, SK Hynix PC601 NVMe 512 GB
3442 Points -12%
Work Score Accelerated v2
Intel Hades Canyon NUC8i7HVK
Vega M GH, i7-8809G, Intel Optane 120 GB SSDPEK1W120GA
5454 Points +6%
Impact Display Solutions IMP-3654-B1-R Core i9-9900T
UHD Graphics 630, i9-9900T, EDGE NextGen SSD 1TB
5154 Points
Dell XPS 13 9300 Core i7-1065G7
Iris Plus Graphics G7 (Ice Lake 64 EU), i7-1065G7, Intel SSDPEMKF512G8 NVMe SSD
5039 Points -2%
Intel NUC10i7FNH
UHD Graphics 620, i7-10710U, Kingston RBUSNS8154P3256GJ1
4631 Points -10%
Dell XPS 13 7390 Core i7-10710U
UHD Graphics 620, i7-10710U, SK Hynix PC601 NVMe 512 GB
4578 Points -11%
PCMark 8 Home Score Accelerated v2
3899 points
PCMark 8 Work Score Accelerated v2
5154 points
PCMark 10 Score
4236 points
Aide
Impact Display Solutions IMP-3654-B1-R Core i9-9900T
EDGE NextGen SSD 1TB
Lenovo ThinkPad T490 20RY0002US
Sabrent Rocket Q 1TB RKT30Q.1
Walmart EVOO Gaming 17
Intel SSD 660p 1TB SSDPEKNW010T8
Porsche Design Ultra One
FORESEE P902F001TB
SCHENKER XMG Neo 15 Turing
Samsung SSD 970 EVO Plus 1TB
AS SSD
94%
34%
-32%
118%
Seq Read
1218
2073
70%
1038
-15%
1285
6%
2173
78%
Seq Write
1306
1865
43%
1604
23%
754
-42%
2587
98%
4K Read
25.97
50.9
96%
42.9
65%
40.63
56%
44.84
73%
4K Write
43.25
157.6
264%
107.4
148%
100.2
132%
100.4
132%
4K-64 Read
578
689
19%
583
1%
304.2
-47%
1584
174%
4K-64 Write
520
1615
211%
725
39%
196.2
-62%
2329
348%
Access Time Read *
0.118
0.043
64%
0.045
62%
0.453
-284%
0.048
59%
Access Time Write *
0.286
0.07
76%
0.127
56%
0.263
8%
0.036
87%
Score Read
726
947
30%
730
1%
473
-35%
1846
154%
Score Write
694
1959
182%
992
43%
372
-46%
2688
287%
Score Total
1800
3394
89%
2137
19%
1076
-40%
5500
206%
Copy ISO MB/s
2082
3024
45%
1612
-23%
1710
-18%
Copy Program MB/s
422.8
715
69%
564
33%
390.5
-8%
Copy Game MB/s
1072
1650
54%
1328
24%
802
-25%
CrystalDiskMark 5.2 / 6
38%
13%
-27%
14%
Write 4K
111.8
227.2
103%
134
20%
109.3
-2%
92.5
-17%
Read 4K
56.8
55.3
-3%
55.5
-2%
43.56
-23%
40.45
-29%
Write Seq
1148
1411
23%
1292
13%
518
-55%
1197
4%
Read Seq
1522
1046
-31%
1476
-3%
1118
-27%
1018
-33%
Write 4K Q32T1
399.7
643
61%
545
36%
310.4
-22%
288.6
-28%
Read 4K Q32T1
570
625
10%
582
2%
345.6
-39%
332
-42%
Write Seq Q32T1
1375
1972
43%
1746
27%
926
-33%
3317
141%
Read Seq Q32T1
1626
3247
100%
1793
10%
1431
-12%
3515
116%
Moyenne finale (programmes/paramètres)
66% / 74%
24% / 26%
-30% / -30%
66% / 80%

* ... Moindre est la valeur, meilleures sont les performances

EDGE NextGen SSD 1TB
CDM 5/6 Read Seq Q32T1: 1626 MB/s
CDM 5/6 Write Seq Q32T1: 1375 MB/s
CDM 5/6 Read 4K Q32T1: 570 MB/s
CDM 5/6 Write 4K Q32T1: 399.7 MB/s
CDM 5 Read Seq: 1522 MB/s
CDM 5 Write Seq: 1148 MB/s
CDM 5/6 Read 4K: 56.8 MB/s
CDM 5/6 Write 4K: 111.8 MB/s
3DMark
1280x720 Cloud Gate Standard Graphics
Intel Hades Canyon NUC8i7HVK
AMD Radeon RX Vega M GH, i7-8809G
59162 Points +1432%
Dell Inspiron 15 5000 5585
AMD Radeon RX Vega 10, R7 3700U
20784 Points +438%
Microsoft Surface Laptop 3 15 Ryzen 5 3580U
AMD Radeon RX Vega 9, R5 3580U
19255 Points +398%
Microsoft Surface Pro 7
Intel Iris Plus Graphics G7 (Ice Lake 64 EU), i7-1065G7
17872 Points +363%
Dell XPS 13 9300 Core i7-1065G7
Intel Iris Plus Graphics G7 (Ice Lake 64 EU), i7-1065G7
17803 Points +361%
Dell XPS 13 9300 i5 FHD
Intel UHD Graphics G1 (Ice Lake 32 EU), i5-1035G1
12698 Points +229%
Intel NUC10i7FNH
Intel UHD Graphics 620, i7-10710U
11065 Points +186%
Lenovo ThinkPad T490 20RY0002US
Intel UHD Graphics 620, i7-10510U
10450 Points +171%
Impact Display Solutions IMP-3654-B1-R Core i9-9900T
Intel UHD Graphics 630, i9-9900T
3863 Points
1920x1080 Fire Strike Graphics
Intel Hades Canyon NUC8i7HVK
AMD Radeon RX Vega M GH, i7-8809G
10248 Points +1319%
Microsoft Surface Pro 7
Intel Iris Plus Graphics G7 (Ice Lake 64 EU), i7-1065G7
3026 Points +319%
Dell Inspiron 15 5000 5585
AMD Radeon RX Vega 10, R7 3700U
2999 Points +315%
Dell XPS 13 9300 Core i7-1065G7
Intel Iris Plus Graphics G7 (Ice Lake 64 EU), i7-1065G7
2950 Points +309%
Microsoft Surface Laptop 3 15 Ryzen 5 3580U
AMD Radeon RX Vega 9, R5 3580U
2789 Points +286%
Dell XPS 13 9300 i5 FHD
Intel UHD Graphics G1 (Ice Lake 32 EU), i5-1035G1
1755 Points +143%
Intel NUC10i7FNH
Intel UHD Graphics 620, i7-10710U
1418 Points +96%
Lenovo ThinkPad T490 20RY0002US
Intel UHD Graphics 620, i7-10510U
1353 Points +87%
Impact Display Solutions IMP-3654-B1-R Core i9-9900T
Intel UHD Graphics 630, i9-9900T
722 Points
1920x1080 Ice Storm Extreme Graphics
Intel Hades Canyon NUC8i7HVK
AMD Radeon RX Vega M GH, i7-8809G
282345 Points +1380%
Dell Inspiron 15 5000 5585
AMD Radeon RX Vega 10, R7 3700U
78094 Points +309%
Microsoft Surface Laptop 3 15 Ryzen 5 3580U
AMD Radeon RX Vega 9, R5 3580U
70492 Points +270%
Dell XPS 13 9300 Core i7-1065G7
Intel Iris Plus Graphics G7 (Ice Lake 64 EU), i7-1065G7
59091 Points +210%
Dell XPS 13 9300 i5 FHD
Intel UHD Graphics G1 (Ice Lake 32 EU), i5-1035G1
49814 Points +161%
Intel NUC10i7FNH
Intel UHD Graphics 620, i7-10710U
48446 Points +154%
Lenovo ThinkPad T490 20RY0002US
Intel UHD Graphics 620, i7-10510U
48252 Points +153%
Impact Display Solutions IMP-3654-B1-R Core i9-9900T
Intel UHD Graphics 630, i9-9900T
19075 Points
2560x1440 Time Spy Graphics
Intel Hades Canyon NUC8i7HVK
AMD Radeon RX Vega M GH, i7-8809G
2908 Points +559%
Microsoft Surface Laptop 3 15 Ryzen 5 3580U
AMD Radeon RX Vega 9, R5 3580U
872 Points +98%
Dell Inspiron 15 5000 5585
AMD Radeon RX Vega 10, R7 3700U
852 Points +93%
Dell XPS 13 9300 Core i7-1065G7
Intel Iris Plus Graphics G7 (Ice Lake 64 EU), i7-1065G7
824 Points +87%
Microsoft Surface Pro 7
Intel Iris Plus Graphics G7 (Ice Lake 64 EU), i7-1065G7
708 Points +61%
Dell XPS 13 9300 i5 FHD
Intel UHD Graphics G1 (Ice Lake 32 EU), i5-1035G1
472 Points +7%
Intel NUC10i7FNH
Intel UHD Graphics 620, i7-10710U
443 Points 0%
Impact Display Solutions IMP-3654-B1-R Core i9-9900T
Intel UHD Graphics 630, i9-9900T
441 Points
Lenovo ThinkPad T490 20RY0002US
Intel UHD Graphics 620, i7-10510U
428 Points -3%
3DMark 11
1280x720 Performance GPU
Intel Hades Canyon NUC8i7HVK
AMD Radeon RX Vega M GH, i7-8809G
14302 Points +2128%
Dell XPS 13 9300 Core i7-1065G7
Intel Iris Plus Graphics G7 (Ice Lake 64 EU), i7-1065G7
4508 Points +602%
Microsoft Surface Laptop 3 15 Ryzen 5 3580U
AMD Radeon RX Vega 9, R5 3580U
4380 Points +582%
Microsoft Surface Pro 7
Intel Iris Plus Graphics G7 (Ice Lake 64 EU), i7-1065G7
4297 Points +569%
Dell Inspiron 15 5000 5585
AMD Radeon RX Vega 10, R7 3700U
4165 Points +549%
Dell XPS 13 9300 i5 FHD
Intel UHD Graphics G1 (Ice Lake 32 EU), i5-1035G1
2578 Points +302%
Intel NUC10i7FNH
Intel UHD Graphics 620, i7-10710U
1983 Points +209%
Lenovo ThinkPad T490 20RY0002US
Intel UHD Graphics 620, i7-10510U
1942 Points +202%
Impact Display Solutions IMP-3654-B1-R Core i9-9900T
Intel UHD Graphics 630, i9-9900T
642 Points
1280x720 Performance Combined
Intel Hades Canyon NUC8i7HVK
AMD Radeon RX Vega M GH, i7-8809G
10391 Points +517%
Dell XPS 13 9300 Core i7-1065G7
Intel Iris Plus Graphics G7 (Ice Lake 64 EU), i7-1065G7
4086 Points +142%
Microsoft Surface Pro 7
Intel Iris Plus Graphics G7 (Ice Lake 64 EU), i7-1065G7
3502 Points +108%
Dell Inspiron 15 5000 5585
AMD Radeon RX Vega 10, R7 3700U
3247 Points +93%
Microsoft Surface Laptop 3 15 Ryzen 5 3580U
AMD Radeon RX Vega 9, R5 3580U
3041 Points +80%
Dell XPS 13 9300 i5 FHD
Intel UHD Graphics G1 (Ice Lake 32 EU), i5-1035G1
2552 Points +51%
Intel NUC10i7FNH
Intel UHD Graphics 620, i7-10710U
2142 Points +27%
Lenovo ThinkPad T490 20RY0002US
Intel UHD Graphics 620, i7-10510U
2088 Points +24%
Impact Display Solutions IMP-3654-B1-R Core i9-9900T
Intel UHD Graphics 630, i9-9900T
1685 Points
3DMark 06 Standard Score
13646 points
3DMark 11 Performance
790 points
3DMark Ice Storm Standard Score
28176 points
3DMark Cloud Gate Standard Score
3712 points
3DMark Fire Strike Score
779 points
3DMark Time Spy Score
512 points
Aide
Bas Moyen Élevé Ultra
Dota 2 Reborn (2015) 70.4 44.8 7.8 6.8
X-Plane 11.11 (2018) 12.7 11 11
Consommation énergétique
Éteint/en veilledarklight 0.6 / 1.28 Watts
Au reposdarkmidlight 6.6 / 8.3 / 8.8 Watts
Fortement sollicité midlight 46.2 / 69.7 Watts
 color bar
Légende: min: dark, med: mid, max: light        Metrahit Energy
Currently we use the Metrahit Energy, a professional single phase power quality and energy measurement digital multimeter, for our measurements. Find out more about it here. All of our test methods can be found here.
Impact Display Solutions IMP-3654-B1-R Core i9-9900T
i9-9900T, UHD Graphics 630, EDGE NextGen SSD 1TB, , x,
Zotac ZBOX-QK7P3000
i7-7700T, Quadro P3000, Samsung SSD 960 Pro 512 GB m.2, , x,
Zotac ZBOX Magnus EK71080
i7-7700HQ, GeForce GTX 1080 (Desktop), Samsung PM961 MZVLW256HEHP, , x, 0.00
Intel Hades Canyon NUC8i7HVK
i7-8809G, Vega M GH, Intel Optane 120 GB SSDPEK1W120GA, , x,
Lenovo Yoga C940-15IRH
i7-9750H, GeForce GTX 1650 Max-Q, Intel Optane Memory H10 with Solid State Storage 32GB + 512GB HBRPEKNX0202A(L/H), IPS, 1920x1080, 15.60
Apple MacBook Pro 16 2019 i9 5500M
i9-9880H, Radeon Pro 5500M, Apple SSD AP1024 7171, IPS, 3072x1920, 16.00
Power Consumption
-137%
-211%
-110%
-74%
-48%
Idle Minimum *
6.6
19.9
-202%
27.1
-311%
15.5
-135%
5.2
21%
3.7
44%
Idle Average *
8.3
20.3
-145%
27.4
-230%
16.2
-95%
10.7
-29%
12.1
-46%
Idle Maximum *
8.8
27.6
-214%
28.8
-227%
16.5
-88%
24.3
-176%
17
-93%
Load Average *
46.2
86.2
-87%
100.4
-117%
83.4
-81%
84.4
-83%
91.5
-98%
Load Maximum *
69.7
96.3
-38%
186.7
-168%
173.5
-149%
142.8
-105%
102.3
-47%
Witcher 3 ultra *
114.4
243.1
121.7
83.9
103

* ... Moindre est la valeur, meilleures sont les performances

En test : le Mini PC Impact Display Solution IMP-3654-B1-R. Modèle de test fourni par Impact.

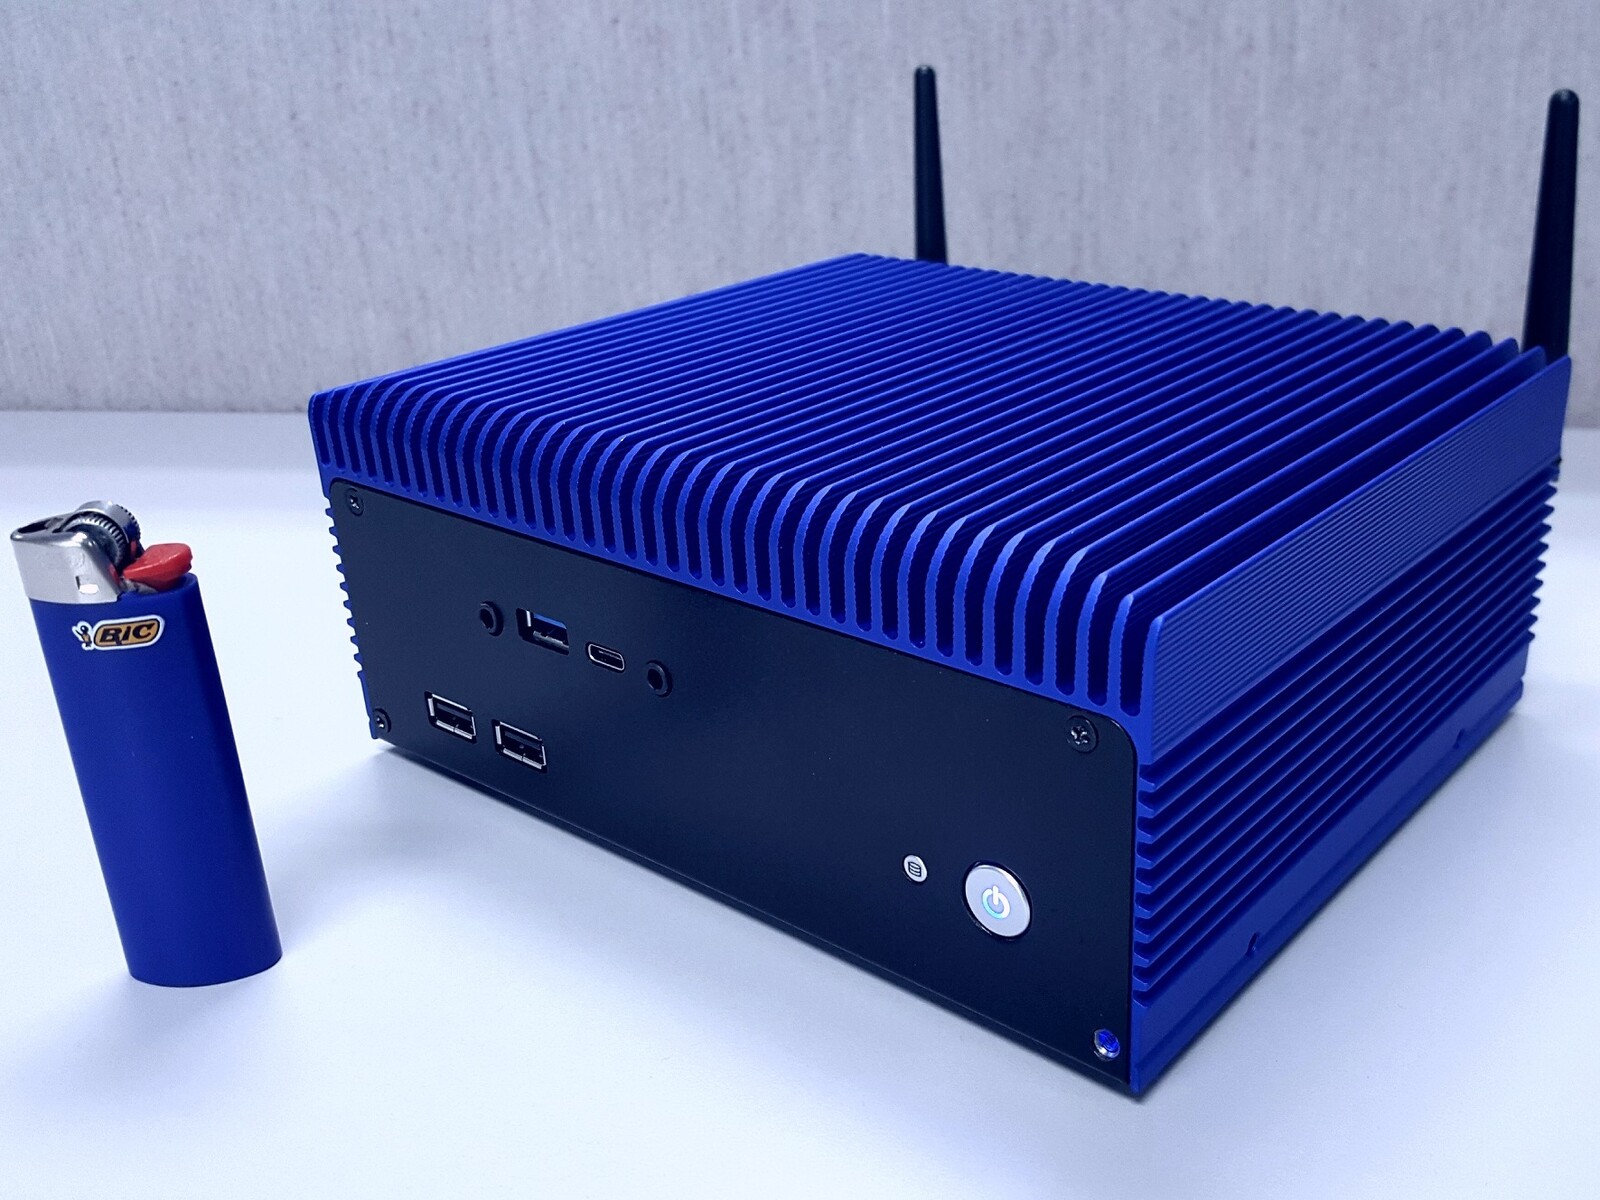
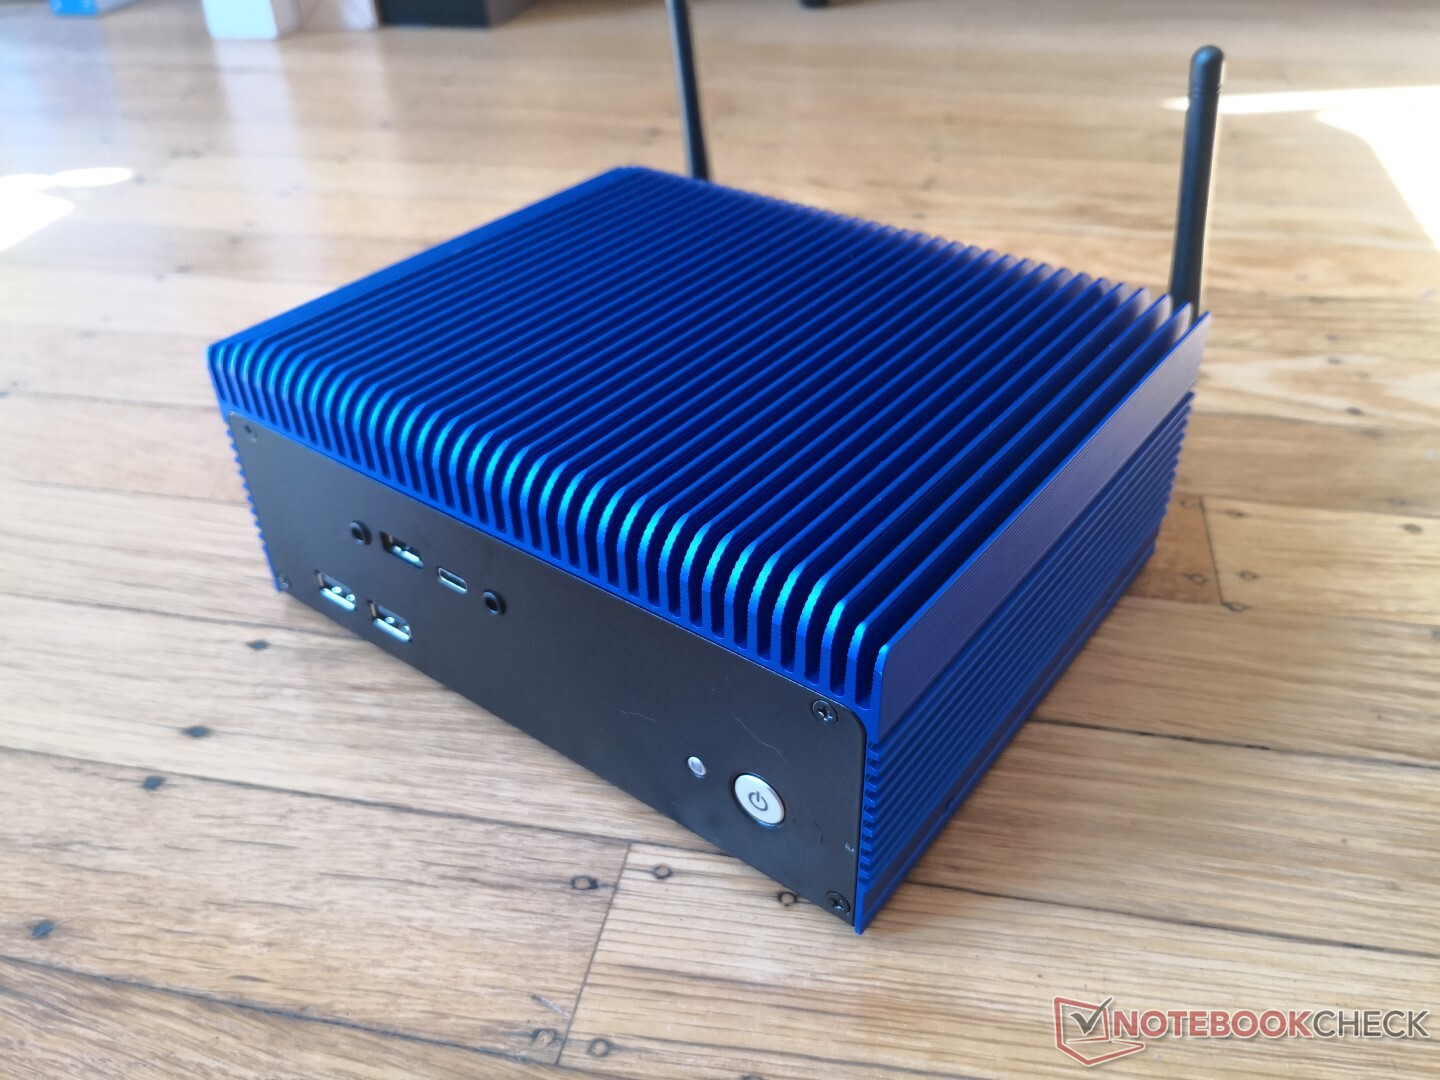
Le mini PC Impact IMP-3654-B1-R peut-il faire tourner un processeur Core i9 avec uniquement un dissipateur thermique ? La réponse est oui, mais seulement pour un temps limité. Quand le système est sollicité pour une longue période, la fréquence va baisser, comme le soulignent nos nombreux tests ci-dessous. Au mieux, la fréquence se stabilise autour des 2,5 Ghz pour un niveau de performances multicoeur similaire à celui du Core i7-9750H hexacoeur de 45 W, même si le Core i9-9900T est un processeur octocoeur de 35 W. C’est l’un des mini PC les plus silencieux que l’on peut trouver.

Si vous ne pensez pas avoir des tâches exigeantes sur de longues périodes, et n’avez besoin que du bref boost de performances permis par un processeur Core i9, alors le Mini PC IMP-3654-B1-R silencieux devrait faire l’affaire. Un port Thunderbolt 3 ou un lecteur de carte SD aurait amélioré la polyvalence du mini PC.

L’intégralité de cette critique est disponible en anglais en suivant ce lien.

Please share our article, every link counts!
> Revues et rapports de ordinateurs portatifs et smartphones, ordiphones > Critiques > Test du Mini PC Impact Display Solutions IMP-3654-B1-R : Core i9 refroidi passivement
Allen Ngo, 2020-05- 7 (Update: 2020-05- 7)