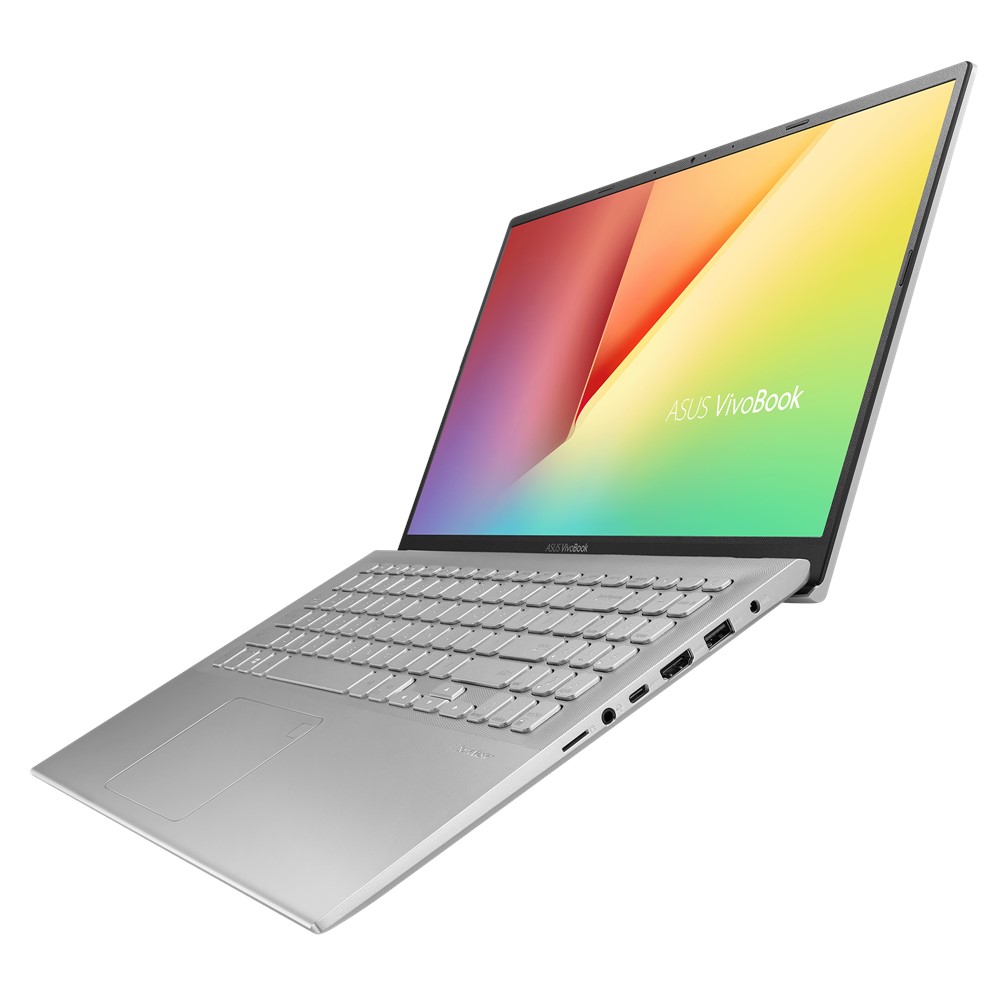
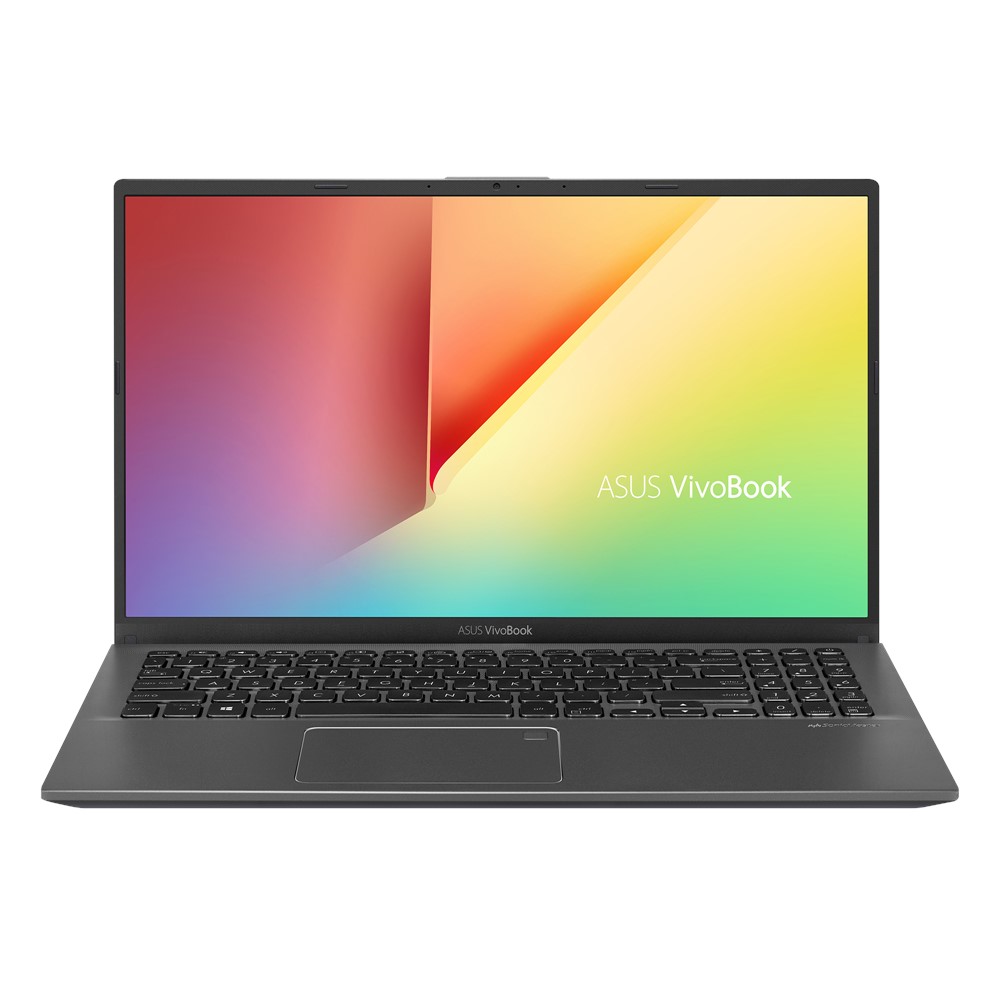
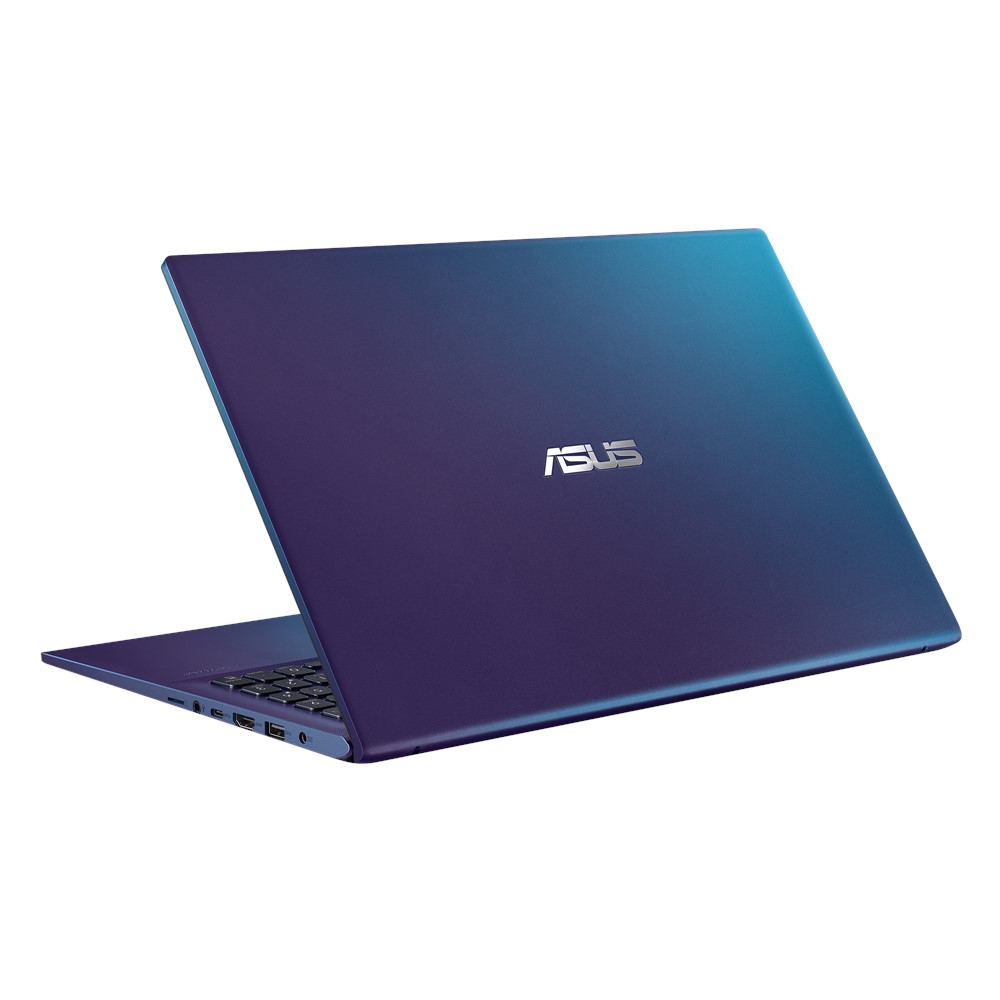
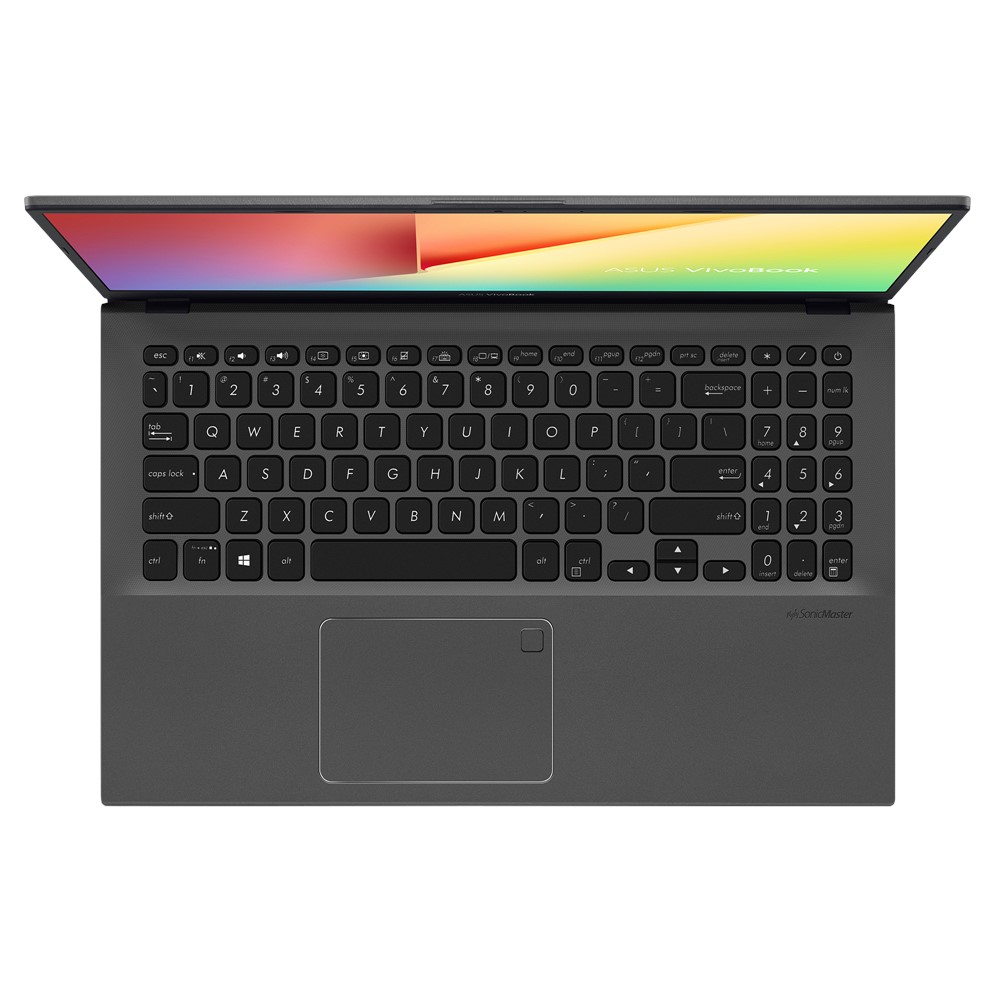
Test de l'Asus Vivobook 15 F512DA (Ryzen 3, RX Vega 3, FHD) : bon processeur à petit prix
Note | Date | Modèle | Poids | Épaisseur | Taille | Résolution | Prix |
|---|---|---|---|---|---|---|---|
| 73.1 % v7 (old) | 05/20 | Asus Vivobook 15 F512DA-SH31 R3 3200U, Vega 3 | 1.8 kg | 19.9 mm | 15.60" | 1920x1080 | |
| 79.4 % v7 (old) | 03/20 | Lenovo Ideapad S340-15IIL i7-1065G7, Iris Plus Graphics G7 (Ice Lake 64 EU) | 1.8 kg | 17.9 mm | 15.60" | 1920x1080 | |
| 78.4 % v7 (old) | 11/19 | Acer Aspire 5 A515-43-R6WW R5 3500U, Vega 8 | 1.8 kg | 18 mm | 15.60" | 1920x1080 | |
| 77.6 % v6 (old) | 06/19 | Dell Inspiron 15 3585 (2300U, Vega 6) R3 2300U, Vega 6 | 1.9 kg | 20 mm | 15.60" | 1920x1080 | |
| 85.2 % v7 (old) | 03/20 | Huawei MateBook D 15-53010TUY R5 3500U, Vega 8 | 1.5 kg | 16.9 mm | 15.60" | 1920x1080 |

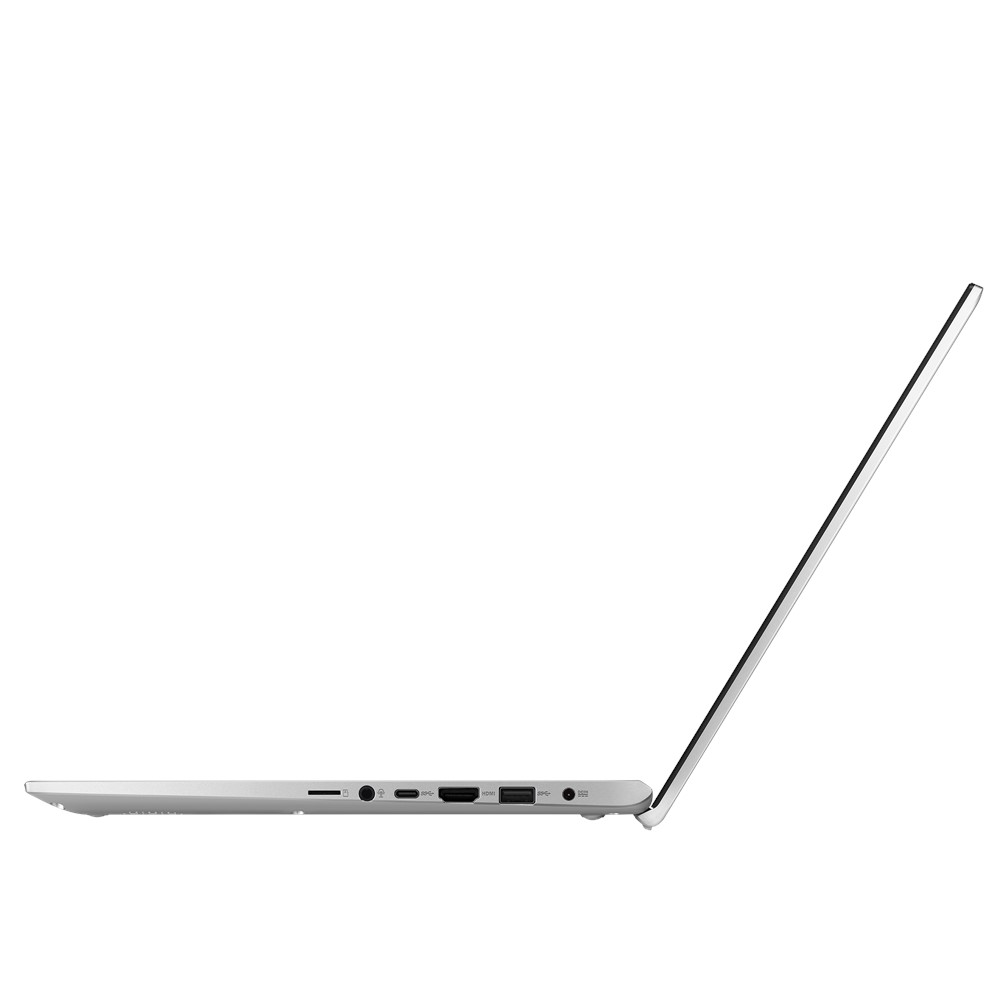
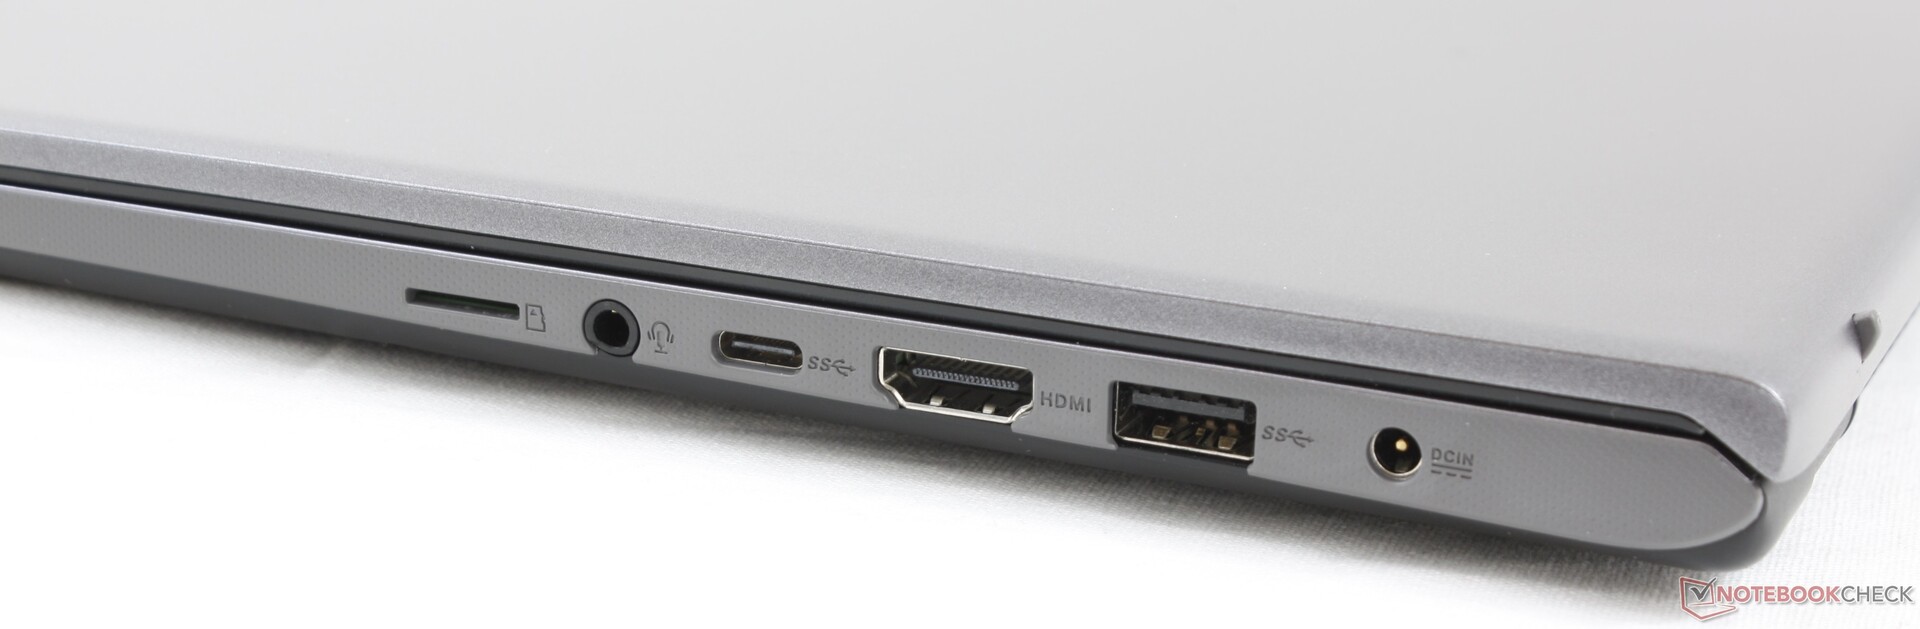
| SD Card Reader | |
| average JPG Copy Test (av. of 3 runs) | |
| Dell XPS 15 9570 Core i9 UHD (Toshiba Exceria Pro SDXC 64 GB UHS-II) | |
| Lenovo Ideapad S340-15IIL (Toshiba Exceria Pro SDXC 64 GB UHS-II) | |
| Dell Inspiron 15 3585 (2300U, Vega 6) (Toshiba Exceria Pro SDXC 64 GB UHS-II) | |
| Asus Vivobook 15 F512DA-SH31 (Toshiba Exceria Pro M501 64 GB UHS-II) | |
| maximum AS SSD Seq Read Test (1GB) | |
| Dell XPS 15 9570 Core i9 UHD (Toshiba Exceria Pro SDXC 64 GB UHS-II) | |
| Lenovo Ideapad S340-15IIL (Toshiba Exceria Pro SDXC 64 GB UHS-II) | |
| Asus Vivobook 15 F512DA-SH31 (Toshiba Exceria Pro M501 64 GB UHS-II) | |
| Dell Inspiron 15 3585 (2300U, Vega 6) (Toshiba Exceria Pro SDXC 64 GB UHS-II) | |


| |||||||||||||||||||||||||
Homogénéité de la luminosité: 89 %
Valeur mesurée au centre, sur batterie: 216.3 cd/m²
Contraste: 294:1 (Valeurs des noirs: 0.86 cd/m²)
ΔE ColorChecker Calman: 4.83 | ∀{0.5-29.43 Ø4.73}
calibrated: 3.78
ΔE Greyscale Calman: 4.6 | ∀{0.09-98 Ø4.97}
58.1% sRGB (Argyll 1.6.3 3D)
36.9% AdobeRGB 1998 (Argyll 1.6.3 3D)
40% AdobeRGB 1998 (Argyll 3D)
58.2% sRGB (Argyll 3D)
38.71% Display P3 (Argyll 3D)
Gamma: 2.34
CCT: 6841 K
| Asus Vivobook 15 F512DA-SH31 AU Optronics B156HAN02.1, IPS, 15.6", 1920x1080 | Lenovo Ideapad S340-15IIL BOE CQ NV156FHM-T03, IPS, 15.6", 1920x1080 | Acer Aspire 5 A515-43-R6WW CEC PANDA LM156LF-CL07, IPS, 15.6", 1920x1080 | Dell Inspiron 15 3585 (2300U, Vega 6) BOE0802, TN, 15.6", 1920x1080 | Asus ZenBook 15 UX534FTC-A8190T BOE CQ NV156FHM-N63, IPS, 15.6", 1920x1080 | Huawei MateBook D 15-53010TUY AU Optronics AUO28ED, IPS, 15.6", 1920x1080 | |
|---|---|---|---|---|---|---|
| Display | 3% | 2% | 1% | 58% | 5% | |
| Display P3 Coverage (%) | 38.71 | 40.43 4% | 39.53 2% | 39.22 1% | 65 68% | 40.49 5% |
| sRGB Coverage (%) | 58.2 | 58.8 1% | 59.5 2% | 58.9 1% | 86.2 48% | 60.9 5% |
| AdobeRGB 1998 Coverage (%) | 40 | 41.77 4% | 40.84 2% | 40.52 1% | 62.9 57% | 41.84 5% |
| Response Times | -24% | 8% | 26% | -17% | -13% | |
| Response Time Grey 50% / Grey 80% * (ms) | 36 ? | 46.4 ? -29% | 36 ? -0% | 39 ? -8% | 45 ? -25% | 43.6 ? -21% |
| Response Time Black / White * (ms) | 29.6 ? | 35.2 ? -19% | 25 ? 16% | 12 ? 59% | 32 ? -8% | 31.2 ? -5% |
| PWM Frequency (Hz) | 178 ? | 250 ? | ||||
| Screen | 23% | 35% | -22% | 67% | 58% | |
| Brightness middle (cd/m²) | 252.8 | 320.8 27% | 250 -1% | 225 -11% | 299 18% | 271 7% |
| Brightness (cd/m²) | 237 | 309 30% | 228 -4% | 213 -10% | 280 18% | 256 8% |
| Brightness Distribution (%) | 89 | 87 -2% | 83 -7% | 88 -1% | 89 0% | 90 1% |
| Black Level * (cd/m²) | 0.86 | 0.27 69% | 0.205 76% | 0.535 38% | 0.21 76% | 0.15 83% |
| Contrast (:1) | 294 | 1188 304% | 1220 315% | 421 43% | 1424 384% | 1807 515% |
| Colorchecker dE 2000 * | 4.83 | 7.68 -59% | 5.65 -17% | 10.37 -115% | 4.76 1% | 4.7 3% |
| Colorchecker dE 2000 max. * | 16.38 | 21.97 -34% | 13.7 16% | 19.75 -21% | 9 45% | 20.4 -25% |
| Colorchecker dE 2000 calibrated * | 3.78 | 4.65 -23% | 3.89 -3% | 4.6 -22% | ||
| Greyscale dE 2000 * | 4.6 | 7.3 -59% | 6.32 -37% | 12.09 -163% | 3.53 23% | 1.6 65% |
| Gamma | 2.34 94% | 2.12 104% | 2.45 90% | 2.72 81% | 2.3 96% | 2.17 101% |
| CCT | 6841 95% | 6213 105% | 7287 89% | 13335 49% | 7228 90% | 6649 98% |
| Color Space (Percent of AdobeRGB 1998) (%) | 36.9 | 37.8 2% | 38 3% | 37 0% | 56 52% | 38.5 4% |
| Color Space (Percent of sRGB) (%) | 58.1 | 58.3 0% | 59 2% | 59 2% | 86 48% | 60.6 4% |
| Moyenne finale (programmes/paramètres) | 1% /
14% | 15% /
25% | 2% /
-12% | 36% /
54% | 17% /
40% |
* ... Moindre est la valeur, meilleures sont les performances
Temps de réponse de l'écran
| ↔ Temps de réponse noir à blanc | ||
|---|---|---|
| 29.6 ms ... hausse ↗ et chute ↘ combinées | ↗ 18 ms hausse | 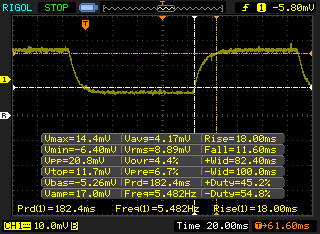 |
| ↘ 11.6 ms chute | ||
| L'écran souffre de latences relativement élevées, insuffisant pour le jeu. En comparaison, tous les appareils testés affichent entre 0.1 (minimum) et 240 (maximum) ms. » 79 % des appareils testés affichent de meilleures performances. Cela signifie que les latences relevées sont moins bonnes que la moyenne (19.9 ms) de tous les appareils testés. | ||
| ↔ Temps de réponse gris 50% à gris 80% | ||
| 36 ms ... hausse ↗ et chute ↘ combinées | ↗ 20 ms hausse | 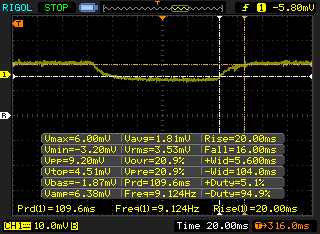 |
| ↘ 16 ms chute | ||
| L'écran souffre de latences très élevées, à éviter pour le jeu. En comparaison, tous les appareils testés affichent entre 0.165 (minimum) et 636 (maximum) ms. » 50 % des appareils testés affichent de meilleures performances. Cela signifie que les latences relevées sont moins bonnes que la moyenne (31.1 ms) de tous les appareils testés. | ||
Scintillement / MLI (Modulation de largeur d'impulsion)
| Scintillement / MLI (Modulation de largeur d'impulsion) non décelé | 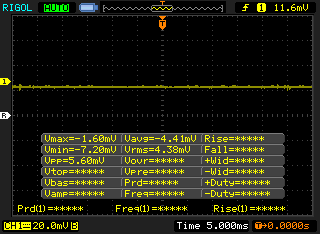 | ||
En comparaison, 52 % des appareils testés n'emploient pas MDI pour assombrir leur écran. Nous avons relevé une moyenne à 7791 (minimum : 5 - maximum : 343500) Hz dans le cas où une MDI était active. | |||
| Cinebench R11.5 | |
| CPU Single 64Bit | |
| Dell XPS 13 7390 2-in-1 Core i3 | |
| Dell Inspiron 15 5000 5585 | |
| Chuwi LapBook Plus | |
| CPU Multi 64Bit | |
| Dell Inspiron 15 5000 5585 | |
| Dell XPS 13 7390 2-in-1 Core i3 | |
| Chuwi LapBook Plus | |
| wPrime 2.10 - 1024m | |
| Chuwi LapBook Plus | |
| HP ProBook x360 11 G4 | |
| Intel NUC5i3RYK | |
| Moyenne AMD Ryzen 3 3200U (n=1) | |
| Dell XPS 13 7390 2-in-1 Core i3 | |
* ... Moindre est la valeur, meilleures sont les performances
| PCMark 8 Home Score Accelerated v2 | 2742 points | |
| PCMark 8 Work Score Accelerated v2 | 4239 points | |
| PCMark 10 Score | 3028 points | |
Aide | ||
| DPC Latencies / LatencyMon - interrupt to process latency (max), Web, Youtube, Prime95 | |
| Asus Vivobook 15 F512DA-SH31 | |
* ... Moindre est la valeur, meilleures sont les performances
| Asus Vivobook 15 F512DA-SH31 SanDisk X600 SD9SN8W-128G | Lenovo Ideapad S340-15IIL Intel SSD 660p SSDPEKNW512G8 | Acer Aspire 5 A515-43-R6WW Intel SSD 660p 1TB SSDPEKNW010T8 | Dell Inspiron 15 3585 (2300U, Vega 6) Toshiba BG3 KBG30ZMS256G | Asus ZenBook 15 UX534FTC-A8190T Samsung SSD PM981 MZVLB1T0HALR | Huawei MateBook D 15-53010TUY Samsung SSD PM981 MZVLB256HAHQ | |
|---|---|---|---|---|---|---|
| AS SSD | 444% | 357% | 153% | 773% | 530% | |
| Seq Read (MB/s) | 341.4 | 1447 324% | 1358 298% | 1291 278% | 2643 674% | 2613 665% |
| Seq Write (MB/s) | 134.2 | 926 590% | 1300 869% | 688 413% | 1533 1042% | 1549 1054% |
| 4K Read (MB/s) | 27.83 | 40.06 44% | 44.88 61% | 21.87 -21% | 49.12 77% | 47.15 69% |
| 4K Write (MB/s) | 54.9 | 97.9 78% | 77.5 41% | 35.62 -35% | 134.7 145% | 111.6 103% |
| 4K-64 Read (MB/s) | 217.1 | 323.7 49% | 586 170% | 632 191% | 1028 374% | 748 245% |
| 4K-64 Write (MB/s) | 68.1 | 791 1062% | 738 984% | 221.2 225% | 1353 1887% | 1275 1772% |
| Access Time Read * (ms) | 0.153 | 0.06 61% | 0.33 -116% | 0.033 78% | 0.062 59% | |
| Access Time Write * (ms) | 1.075 | 0.144 87% | 0.057 95% | 0.234 78% | 0.028 97% | 0.042 96% |
| Score Read (Points) | 279 | 508 82% | 767 175% | 783 181% | 1342 381% | 1057 279% |
| Score Write (Points) | 136 | 982 622% | 945 595% | 326 140% | 1641 1107% | 1542 1034% |
| Score Total (Points) | 559 | 1738 211% | 2115 278% | 1489 166% | 3622 548% | 3097 454% |
| Copy ISO MB/s (MB/s) | 115.9 | 943 714% | 432.6 273% | 2226 1821% | ||
| Copy Program MB/s (MB/s) | 44.51 | 612 1275% | 95.6 115% | 506 1037% | ||
| Copy Game MB/s (MB/s) | 74.3 | 826 1012% | 263.4 255% | 1230 1555% | ||
| CrystalDiskMark 5.2 / 6 | 198% | 204% | 96% | 395% | 314% | |
| Write 4K (MB/s) | 65.2 | 130.8 101% | 114.9 76% | 87.3 34% | 138.1 112% | 134.8 107% |
| Read 4K (MB/s) | 31.22 | 54.8 76% | 52.7 69% | 23.54 -25% | 45.89 47% | 41.68 34% |
| Write Seq (MB/s) | 284.8 | 978 243% | 1361 378% | 824 189% | 2147 654% | 1651 480% |
| Read Seq (MB/s) | 497.5 | 1627 227% | 1385 178% | 715 44% | 2188 340% | 2300 362% |
| Write 4K Q32T1 (MB/s) | 164 | 450.1 174% | 181.1 10% | 147.8 -10% | 427.8 161% | 260 59% |
| Read 4K Q32T1 (MB/s) | 230.2 | 345.9 50% | 340.5 48% | 256.1 11% | 404 75% | 335.1 46% |
| Write Seq Q32T1 (MB/s) | 221.7 | 982 343% | 1519 585% | 733 231% | 2396 981% | 1641 640% |
| Read Seq Q32T1 (MB/s) | 389.7 | 1842 373% | 1515 289% | 1525 291% | 3454 786% | 3452 786% |
| Moyenne finale (programmes/paramètres) | 321% /
354% | 281% /
289% | 125% /
132% | 584% /
635% | 422% /
439% |
* ... Moindre est la valeur, meilleures sont les performances

| 3DMark 11 Performance | 1794 points | |
| 3DMark Ice Storm Standard Score | 61617 points | |
| 3DMark Cloud Gate Standard Score | 5975 points | |
| 3DMark Fire Strike Score | 943 points | |
| 3DMark Time Spy Score | 340 points | |
Aide | ||
| Dota 2 Reborn | |
| 1280x720 min (0/3) fastest | |
| Acer Aspire 5 A515-54G | |
| Lenovo ThinkBook 15 | |
| Dell XPS 13 9300 i5 FHD | |
| Asus VivoBook S15 S510UA | |
| Lenovo ThinkPad X1 Yoga 20SA000GUS | |
| Intel NUC5i3RYK | |
| Huawei MateBook D 15-53010TUY | |
| HP Pavilion 15-cw1212ng | |
| Asus Vivobook 15 F512DA-SH31 | |
| 1366x768 med (1/3) | |
| Acer Aspire 5 A515-54G | |
| Huawei MateBook D 15-53010TUY | |
| Asus VivoBook S15 S510UA | |
| Lenovo ThinkBook 15 | |
| Lenovo ThinkPad X1 Yoga 20SA000GUS | |
| Dell XPS 13 9300 i5 FHD | |
| HP Pavilion 15-cw1212ng | |
| Asus Vivobook 15 F512DA-SH31 | |
| Intel NUC5i3RYK | |
| Bas | Moyen | Élevé | Ultra | |
|---|---|---|---|---|
| Dota 2 Reborn (2015) | 60.8 | 38.8 | 18.2 | 16.9 |
| X-Plane 11.11 (2018) | 18.3 | 12.3 | 11.1 |
| Asus Vivobook 15 F512DA-SH31 Vega 3, R3 3200U, SanDisk X600 SD9SN8W-128G | Lenovo Ideapad S340-15IIL Iris Plus Graphics G7 (Ice Lake 64 EU), i7-1065G7, Intel SSD 660p SSDPEKNW512G8 | Acer Aspire 5 A515-43-R6WW Vega 8, R5 3500U, Intel SSD 660p 1TB SSDPEKNW010T8 | Dell Inspiron 15 3585 (2300U, Vega 6) Vega 6, R3 2300U, Toshiba BG3 KBG30ZMS256G | Asus ZenBook 15 UX534FTC-A8190T GeForce GTX 1650 Max-Q, i7-10510U, Samsung SSD PM981 MZVLB1T0HALR | Huawei MateBook D 15-53010TUY Vega 8, R5 3500U, Samsung SSD PM981 MZVLB256HAHQ | |
|---|---|---|---|---|---|---|
| Noise | 1% | -7% | -10% | -6% | -1% | |
| arrêt / environnement * (dB) | 29.2 | 28.5 2% | 30.2 -3% | 30.6 -5% | 30.3 -4% | 29.6 -1% |
| Idle Minimum * (dB) | 29.2 | 28.5 2% | 30.2 -3% | 30.6 -5% | 30.3 -4% | 29.6 -1% |
| Idle Average * (dB) | 29.2 | 28.5 2% | 30.2 -3% | 30.6 -5% | 30.3 -4% | 29.6 -1% |
| Idle Maximum * (dB) | 29.2 | 28.5 2% | 30.2 -3% | 30.6 -5% | 30.9 -6% | 29.6 -1% |
| Load Average * (dB) | 30.5 | 30.3 1% | 34.8 -14% | 36.7 -20% | 31.3 -3% | 30.6 -0% |
| Load Maximum * (dB) | 34 | 35.5 -4% | 39.5 -16% | 41.1 -21% | 38.2 -12% | 33.8 1% |
| Witcher 3 ultra * (dB) | 38.1 |
* ... Moindre est la valeur, meilleures sont les performances
Degré de la nuisance sonore
| Au repos |
| 29.2 / 29.2 / 29.2 dB(A) |
| Fortement sollicité |
| 30.5 / 34 dB(A) |
 | ||
30 dB silencieux 40 dB(A) audible 50 dB(A) bruyant |
||
min: | ||
(+) La température maximale du côté supérieur est de 33 °C / 91 F, par rapport à la moyenne de 36.8 °C / 98 F, allant de 21 à 71 °C pour la classe Multimedia.
(±) Le fond chauffe jusqu'à un maximum de 41.4 °C / 107 F, contre une moyenne de 39.1 °C / 102 F
(+) En utilisation inactive, la température moyenne du côté supérieur est de 25.8 °C / 78 F, par rapport à la moyenne du dispositif de 31.3 °C / 88 F.
(+) Les repose-poignets et le pavé tactile sont plus froids que la température de la peau avec un maximum de 24.2 °C / 75.6 F et sont donc froids au toucher.
(+) La température moyenne de la zone de l'appui-paume de dispositifs similaires était de 28.7 °C / 83.7 F (+4.5 °C / #8.1 F).
Asus Vivobook 15 F512DA-SH31 analyse audio
(±) | le niveau sonore du haut-parleur est moyen mais bon (78.6# dB)
Basses 100 - 315 Hz
(±) | basse réduite - en moyenne 13.6% inférieure à la médiane
(±) | la linéarité des basses est moyenne (13.9% delta à la fréquence précédente)
Médiums 400 - 2000 Hz
(+) | médiane équilibrée - seulement 3.7% de la médiane
(+) | les médiums sont linéaires (5% delta à la fréquence précédente)
Aiguës 2 - 16 kHz
(+) | des sommets équilibrés - à seulement 3% de la médiane
(+) | les aigus sont linéaires (6.2% delta à la fréquence précédente)
Globalement 100 - 16 000 Hz
(±) | la linéarité du son global est moyenne (18.9% de différence avec la médiane)
Par rapport à la même classe
» 59% de tous les appareils testés de cette catégorie étaient meilleurs, 7% similaires, 33% pires
» Le meilleur avait un delta de 5%, la moyenne était de 17%, le pire était de 45%.
Par rapport à tous les appareils testés
» 44% de tous les appareils testés étaient meilleurs, 8% similaires, 48% pires
» Le meilleur avait un delta de 4%, la moyenne était de 24%, le pire était de 134%.
Apple MacBook 12 (Early 2016) 1.1 GHz analyse audio
(+) | les haut-parleurs peuvent jouer relativement fort (83.6# dB)
Basses 100 - 315 Hz
(±) | basse réduite - en moyenne 11.3% inférieure à la médiane
(±) | la linéarité des basses est moyenne (14.2% delta à la fréquence précédente)
Médiums 400 - 2000 Hz
(+) | médiane équilibrée - seulement 2.4% de la médiane
(+) | les médiums sont linéaires (5.5% delta à la fréquence précédente)
Aiguës 2 - 16 kHz
(+) | des sommets équilibrés - à seulement 2% de la médiane
(+) | les aigus sont linéaires (4.5% delta à la fréquence précédente)
Globalement 100 - 16 000 Hz
(+) | le son global est linéaire (10.2% différence à la médiane)
Par rapport à la même classe
» 7% de tous les appareils testés de cette catégorie étaient meilleurs, 2% similaires, 91% pires
» Le meilleur avait un delta de 5%, la moyenne était de 18%, le pire était de 53%.
Par rapport à tous les appareils testés
» 5% de tous les appareils testés étaient meilleurs, 1% similaires, 94% pires
» Le meilleur avait un delta de 4%, la moyenne était de 24%, le pire était de 134%.
| Éteint/en veille | |
| Au repos | |
| Fortement sollicité |
|
Légende:
min: | |
| Asus Vivobook 15 F512DA-SH31 R3 3200U, Vega 3, SanDisk X600 SD9SN8W-128G, IPS, 1920x1080, 15.6" | Lenovo Ideapad S340-15IIL i7-1065G7, Iris Plus Graphics G7 (Ice Lake 64 EU), Intel SSD 660p SSDPEKNW512G8, IPS, 1920x1080, 15.6" | Acer Aspire 5 A515-43-R6WW R5 3500U, Vega 8, Intel SSD 660p 1TB SSDPEKNW010T8, IPS, 1920x1080, 15.6" | Dell Inspiron 15 3585 (2300U, Vega 6) R3 2300U, Vega 6, Toshiba BG3 KBG30ZMS256G, TN, 1920x1080, 15.6" | Asus ZenBook 15 UX534FTC-A8190T i7-10510U, GeForce GTX 1650 Max-Q, Samsung SSD PM981 MZVLB1T0HALR, IPS, 1920x1080, 15.6" | Huawei MateBook D 15-53010TUY R5 3500U, Vega 8, Samsung SSD PM981 MZVLB256HAHQ, IPS, 1920x1080, 15.6" | |
|---|---|---|---|---|---|---|
| Power Consumption | -19% | -3% | -37% | -65% | -33% | |
| Idle Minimum * (Watt) | 3.2 | 3.8 -19% | 3.7 -16% | 6.3 -97% | 2.8 13% | 5.2 -63% |
| Idle Average * (Watt) | 6.8 | 6.9 -1% | 6.2 9% | 9.2 -35% | 7.7 -13% | 8.8 -29% |
| Idle Maximum * (Watt) | 7.7 | 7.7 -0% | 8.4 -9% | 9.6 -25% | 9.4 -22% | 10.2 -32% |
| Load Average * (Watt) | 30.3 | 43.3 -43% | 31.1 -3% | 38 -25% | 57 -88% | 37.5 -24% |
| Witcher 3 ultra * (Watt) | 28.2 | 40.4 -43% | 62 -120% | |||
| Load Maximum * (Watt) | 44.4 | 47.5 -7% | 43.1 3% | 46 -4% | 116 -161% | 50.9 -15% |
* ... Moindre est la valeur, meilleures sont les performances
| Asus Vivobook 15 F512DA-SH31 R3 3200U, Vega 3, 37 Wh | Lenovo Ideapad S340-15IIL i7-1065G7, Iris Plus Graphics G7 (Ice Lake 64 EU), 36 Wh | Acer Aspire 5 A515-43-R6WW R5 3500U, Vega 8, 48 Wh | Dell Inspiron 15 3585 (2300U, Vega 6) R3 2300U, Vega 6, 42 Wh | Asus ZenBook 15 UX534FTC-A8190T i7-10510U, GeForce GTX 1650 Max-Q, 71 Wh | Huawei MateBook D 15-53010TUY R5 3500U, Vega 8, 42 Wh | |
|---|---|---|---|---|---|---|
| Autonomie de la batterie | -28% | 30% | -12% | 107% | 30% | |
| WiFi v1.3 (h) | 6 | 4.3 -28% | 7.8 30% | 5.3 -12% | 12.4 107% | 7.8 30% |
| Reader / Idle (h) | 10 | 17.7 | 7.3 | 27.2 | ||
| Load (h) | 1.1 | 2.2 | 1.8 | 2.4 | 1.3 |
Points positifs
Points négatifs
Notre configuration Ryzen 3 est vendue pour moins de 100 € que la version Intel Core i3, tout en ayant presque les mêmes performances. C’est un bon exemple de la supériorité d’AMD en ce qui concerne les performances par euro, face à Intel, même dans le bas de gamme. Parmi les défauts de la machine, on peut noter la RAM limitée à 4 Go et le stockage lent, mais ce VivoBook est étonnamment facile à faire évoluer, ce qui permet au système d’avoir plus d’une corde à son arc, et de faire baisser le prix d’entrée.
Ceux qui seraient prêts à mettre environ 200 € de plus peuvent regarder du côté du Huawei MateBook D 15 AMD, surtout ceux qui se déplacent beaucoup avec leur appareil. L’écran pas assez lumineux du Vivobook le rend difficile à utiliser dans la plupart des conditions. Si vous travaillez ou regardez des vidéos principalement à l’intérieur, alors le VivoBook de base peut faire le job. Assurez-vous que votre connexion sans-fil est stable, la nôtre ayant eu des problèmes.
L’intégralité de cette critique est disponible en anglais en suivant ce lien.
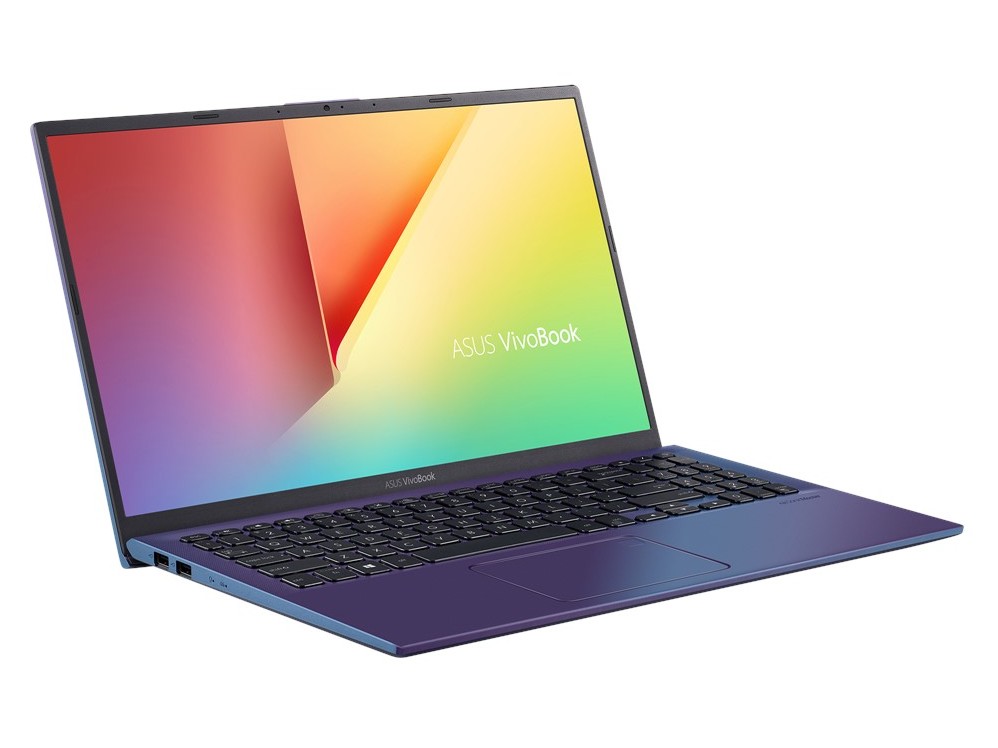
Asus Vivobook 15 F512DA-SH31
- 04/20/2020 v7 (old)
Allen Ngo
Price comparison
