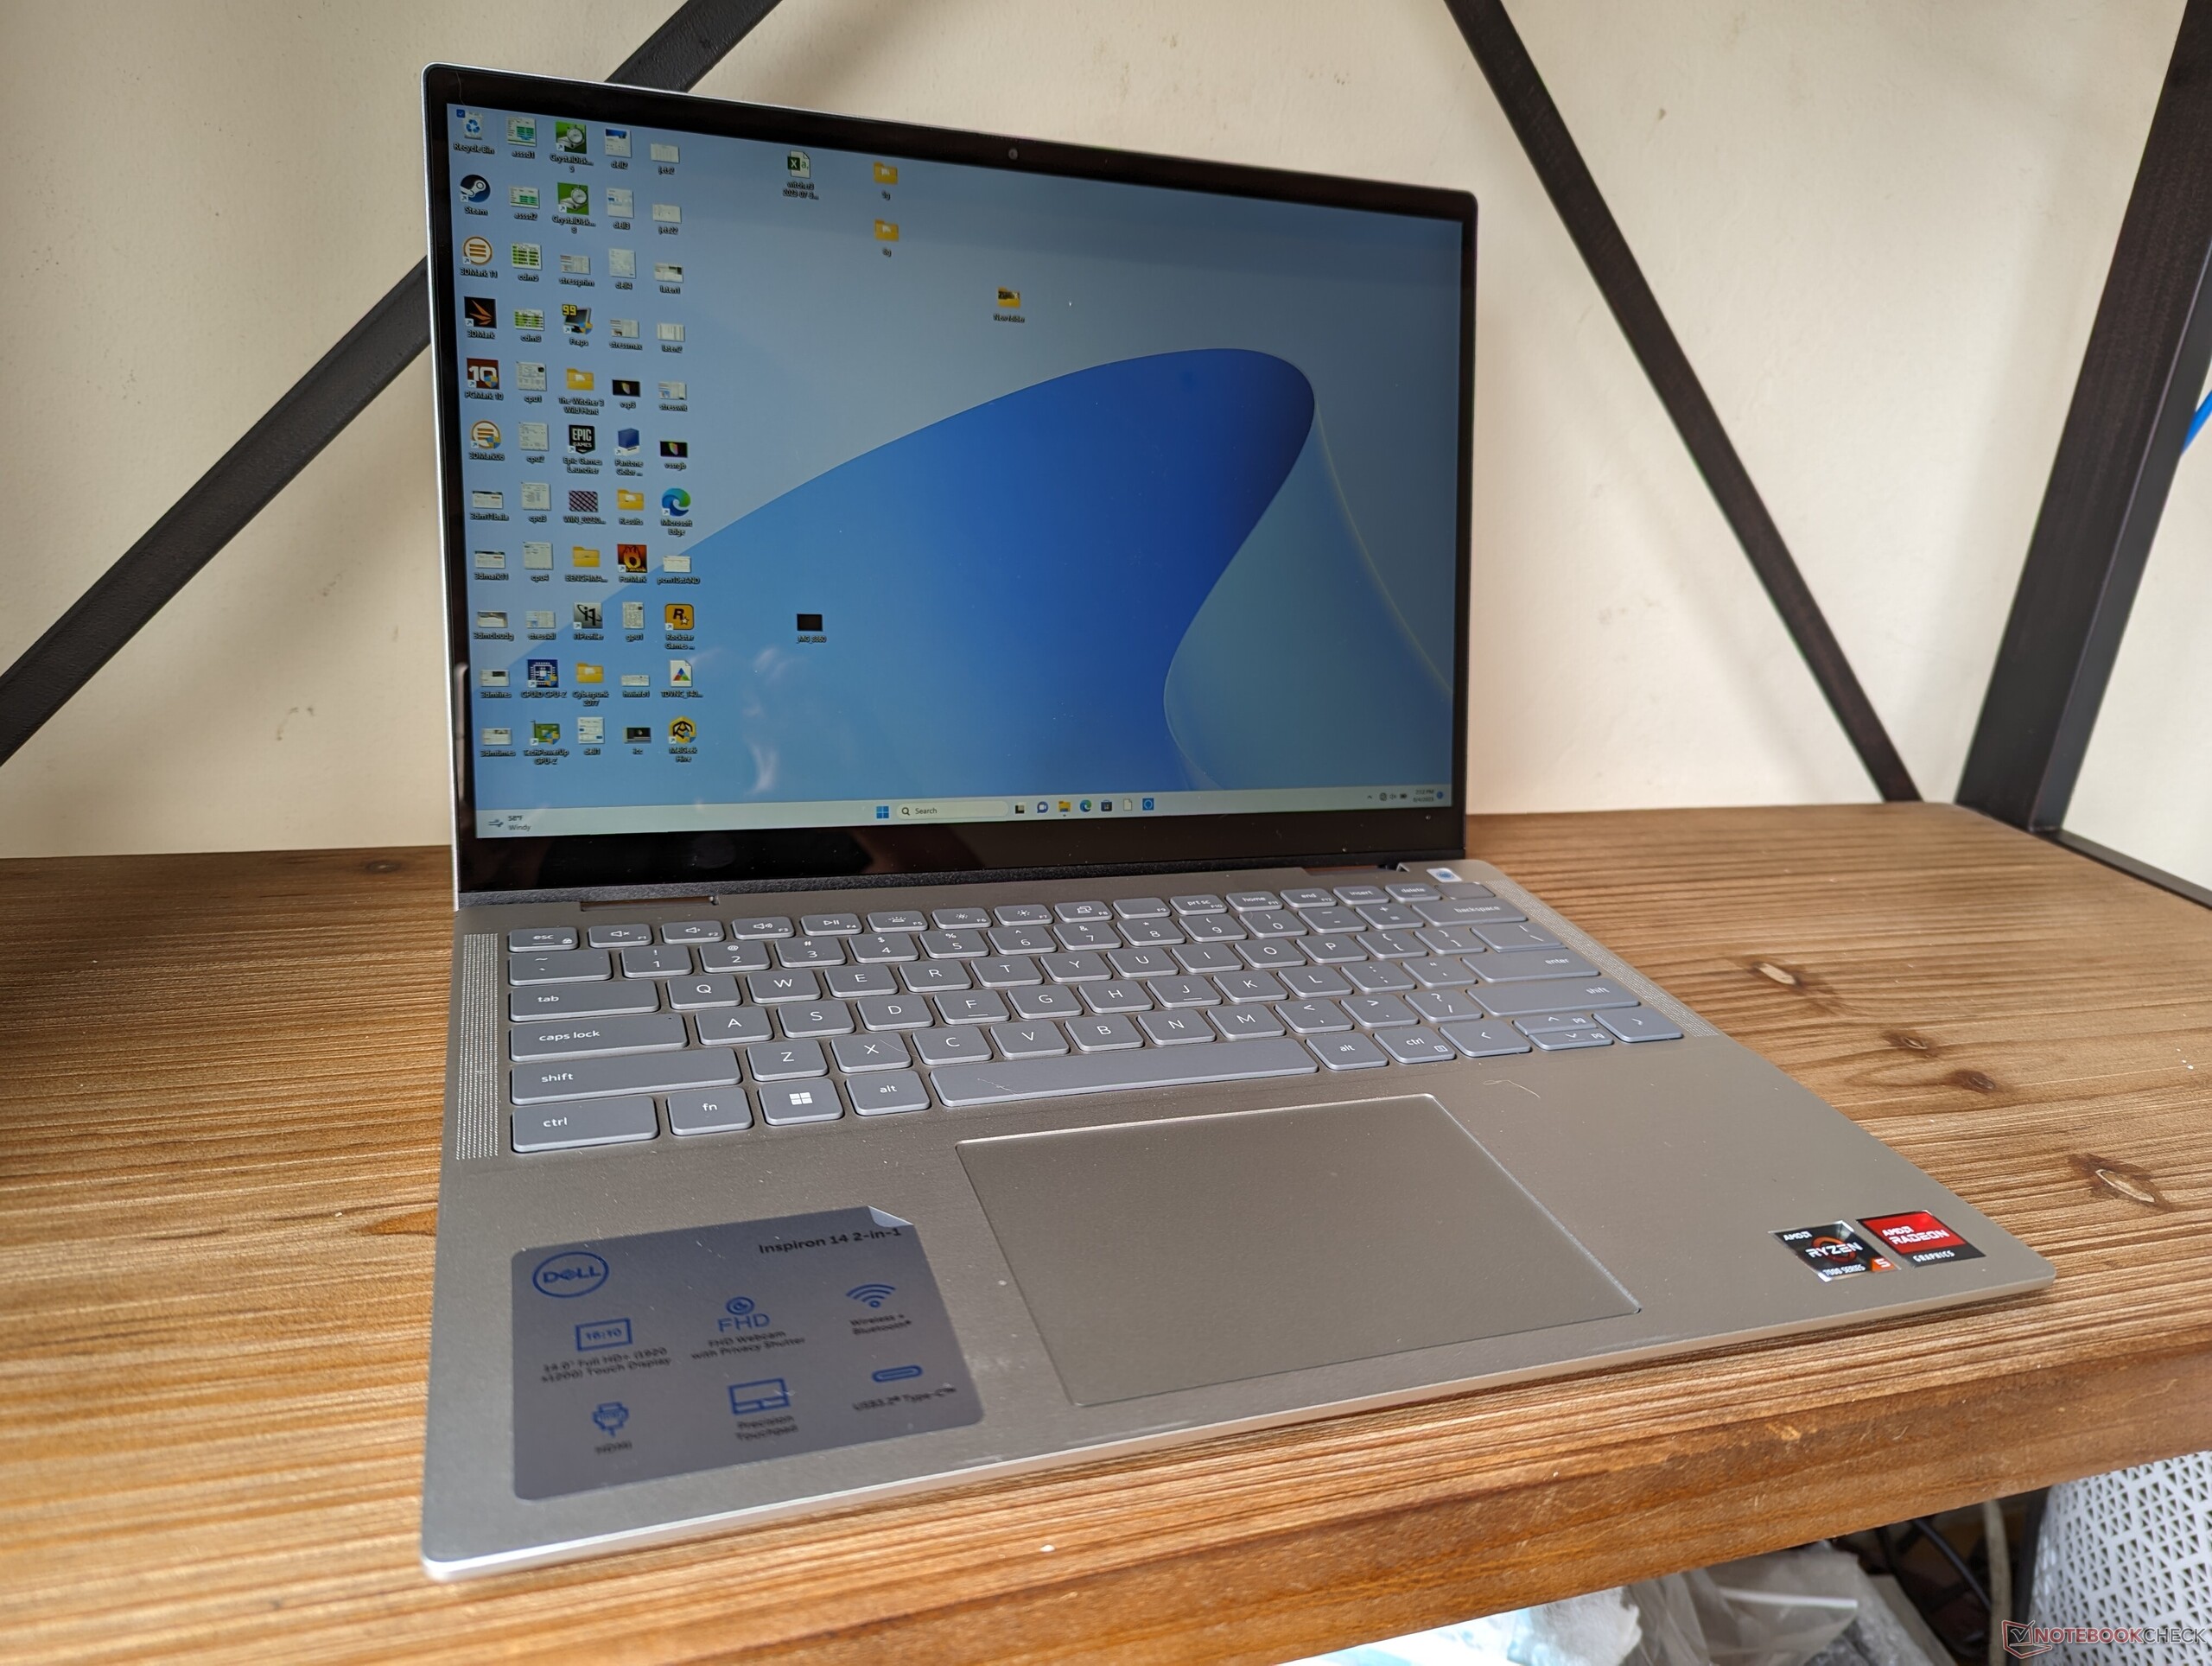
Test du Dell Inspiron 14 7435 2-en-1 : Ryzen 5 7530U pour petits budgets

L'Inspiron 14 7435 2-en-1 est la version AMD de l'Inspiron 14 7430 2-en-1 basé sur Intel. Il remplace directement l'Inspiron 14 7420 2-en-1 de l'année dernière Inspiron 14 7420 2-en-1 de l'année dernière, avec des améliorations internes et externes.
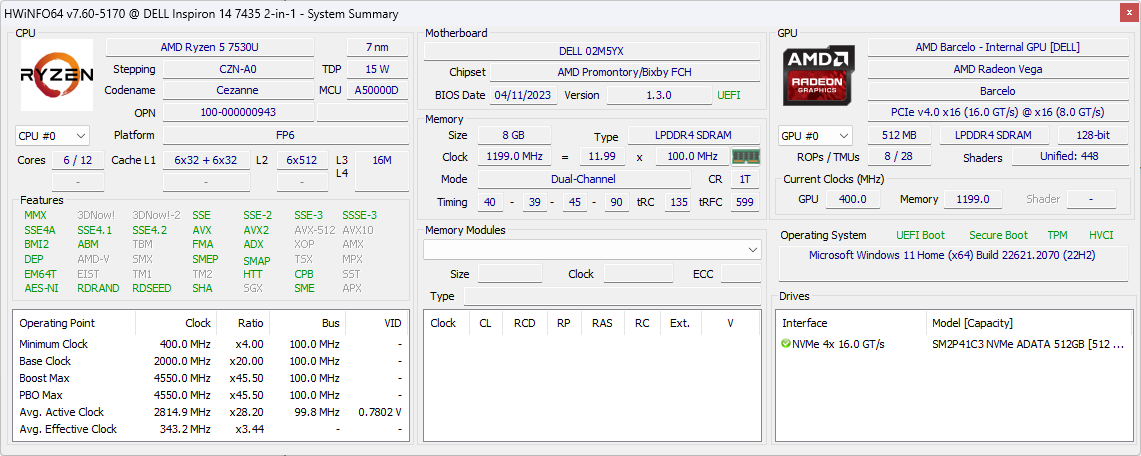
Notre configuration spécifique est une version bas de gamme avec le processeur Ryzen 5 7530U et 8 Go de RAM LPDDR4x-4266 soudée pour seulement 550 USD. Une version plus haut de gamme avec le double de RAM et le processeur Ryzen 7 7730U est également disponible, mais toutes les configurations sont dotées du même écran tactile IPS 1200p et de la carte graphique Radeon Vega intégrée.
Parmi les concurrents, on trouve d'autres modèles convertibles à petit budget, comme le Acer Aspire 5 Spin 14,Lenovo IdeaPad Flex 7ilenovo IdeaPad Flex 7i HP Pavilion x360 14. Une version 16 pouces de ce modèle existe sous le nom de Inspiron 16 7635 2-en-1.
Plus d'avis sur Dell :
Comparaison avec les concurrents potentiels
Note | Date | Modèle | Poids | Épaisseur | Taille | Résolution | Prix |
|---|---|---|---|---|---|---|---|
| 84.5 % v7 (old) | 08/23 | Dell Inspiron 14 7435 2-in-1 R5 7530U, Vega 7 | 1.6 kg | 18.6 mm | 14.00" | 1920x1200 | |
| 83.7 % v7 (old) | 06/22 | Dell Inspiron 14 7420 2-in-1 i7-1255U, Iris Xe G7 96EUs | 1.6 kg | 17.86 mm | 14.00" | 1920x1200 | |
| 83.2 % v7 (old) | 12/22 | Lenovo IdeaPad Flex 7i 14IAU7 i7-1255U, Iris Xe G7 96EUs | 1.5 kg | 18.9 mm | 14.00" | 2240x1400 | |
| 82.2 % v7 (old) | 06/23 | Acer Aspire 5 Spin 14 i5-1335U, Iris Xe G7 80EUs | 1.6 kg | 17.99 mm | 14.00" | 1920x1200 | |
| 87.5 % v7 (old) | 05/22 | LG Gram 14T90P i5-1135G7, Iris Xe G7 80EUs | 1.2 kg | 17 mm | 14.00" | 1900x1200 | |
| 81.8 % v7 (old) | 07/21 | HP Pavilion x360 14-dy0157ng i5-1135G7, Iris Xe G7 80EUs | 1.5 kg | 19.9 mm | 14.00" | 1920x1080 |
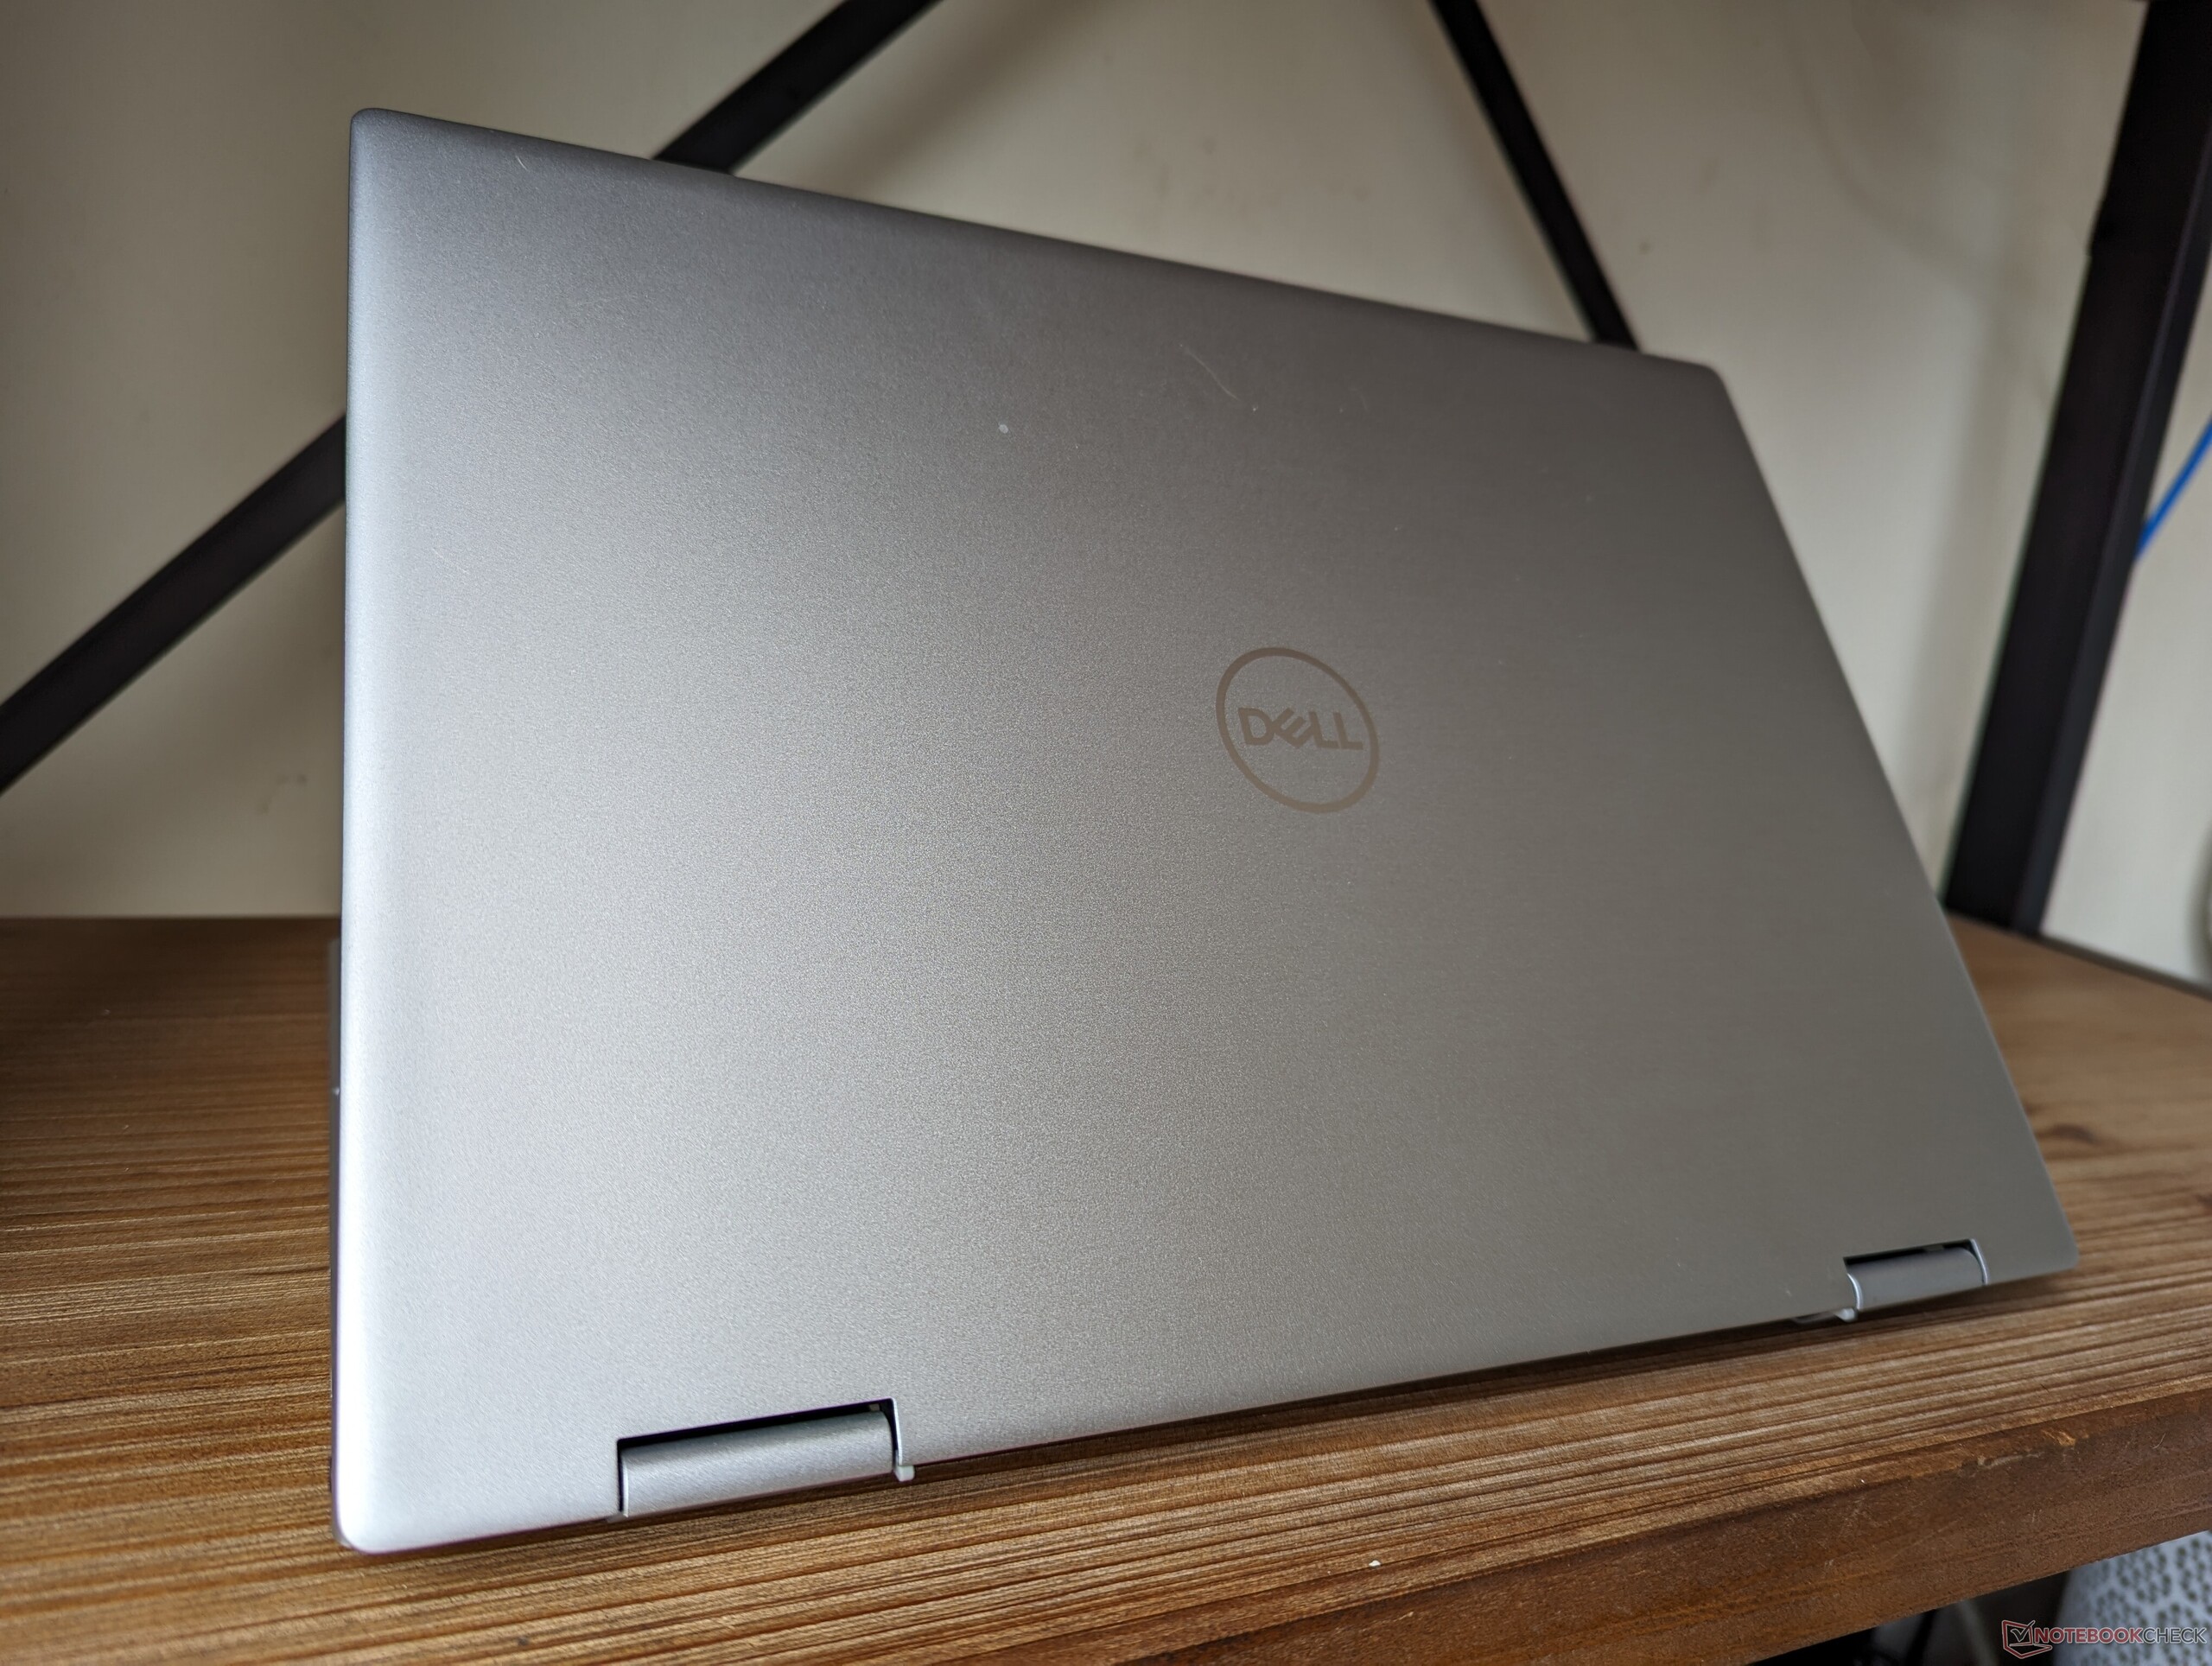
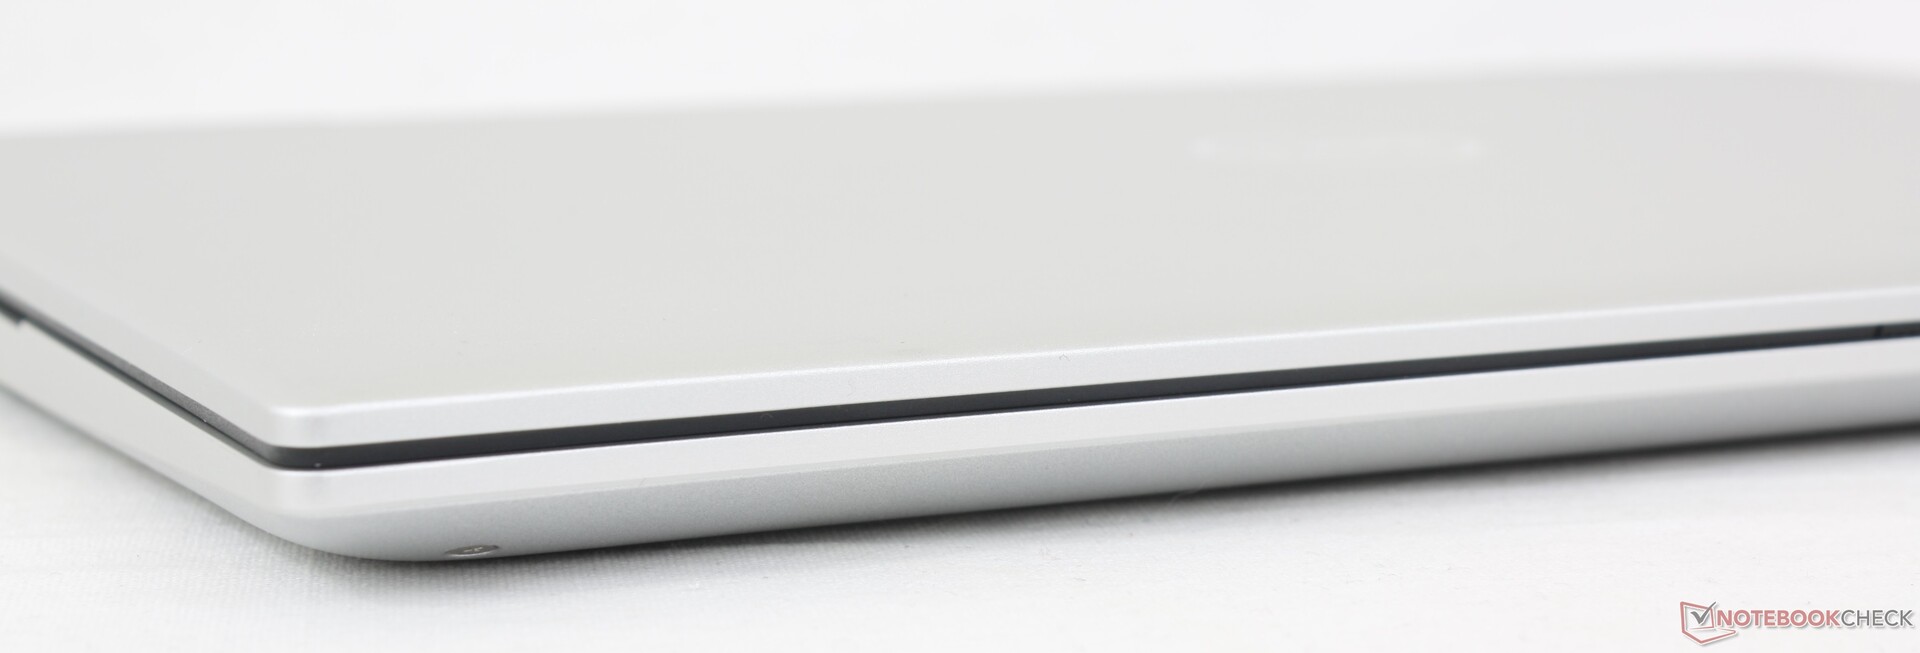
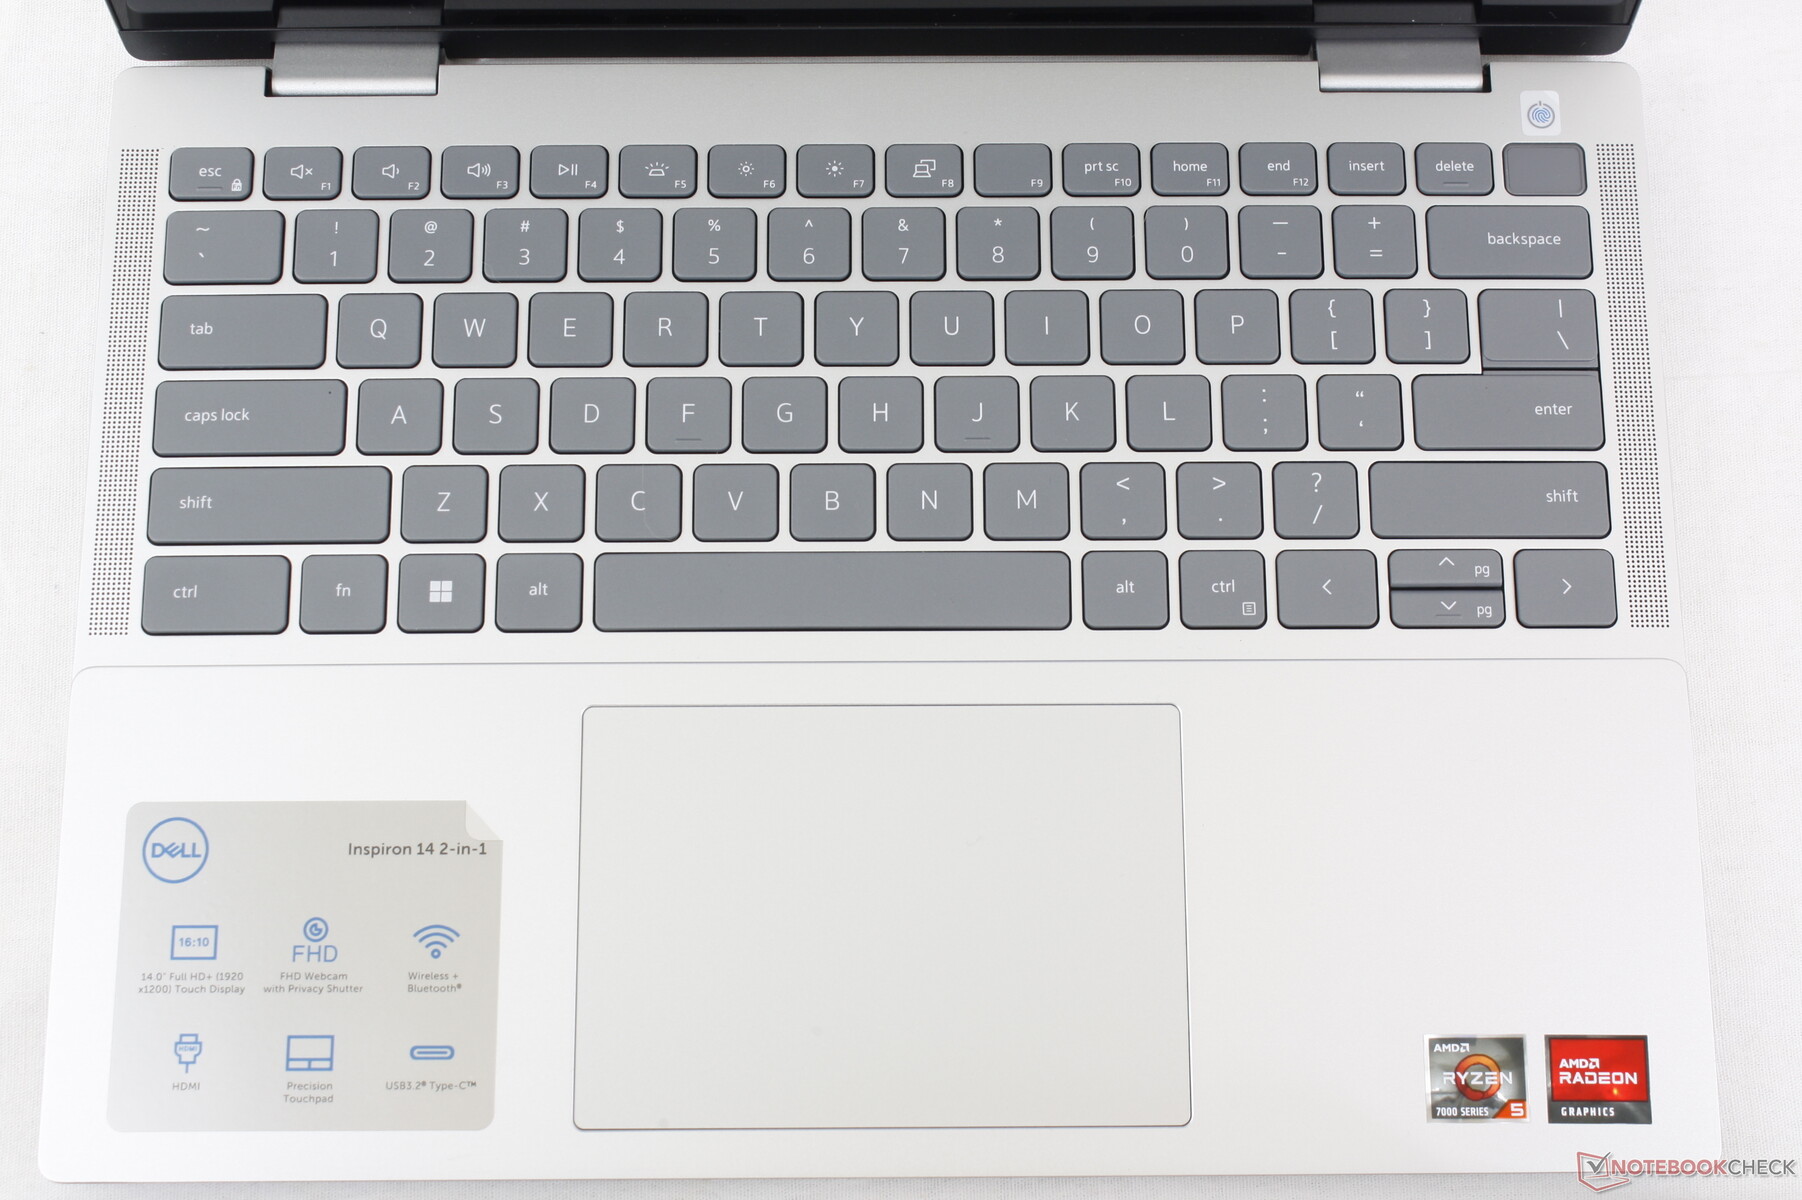
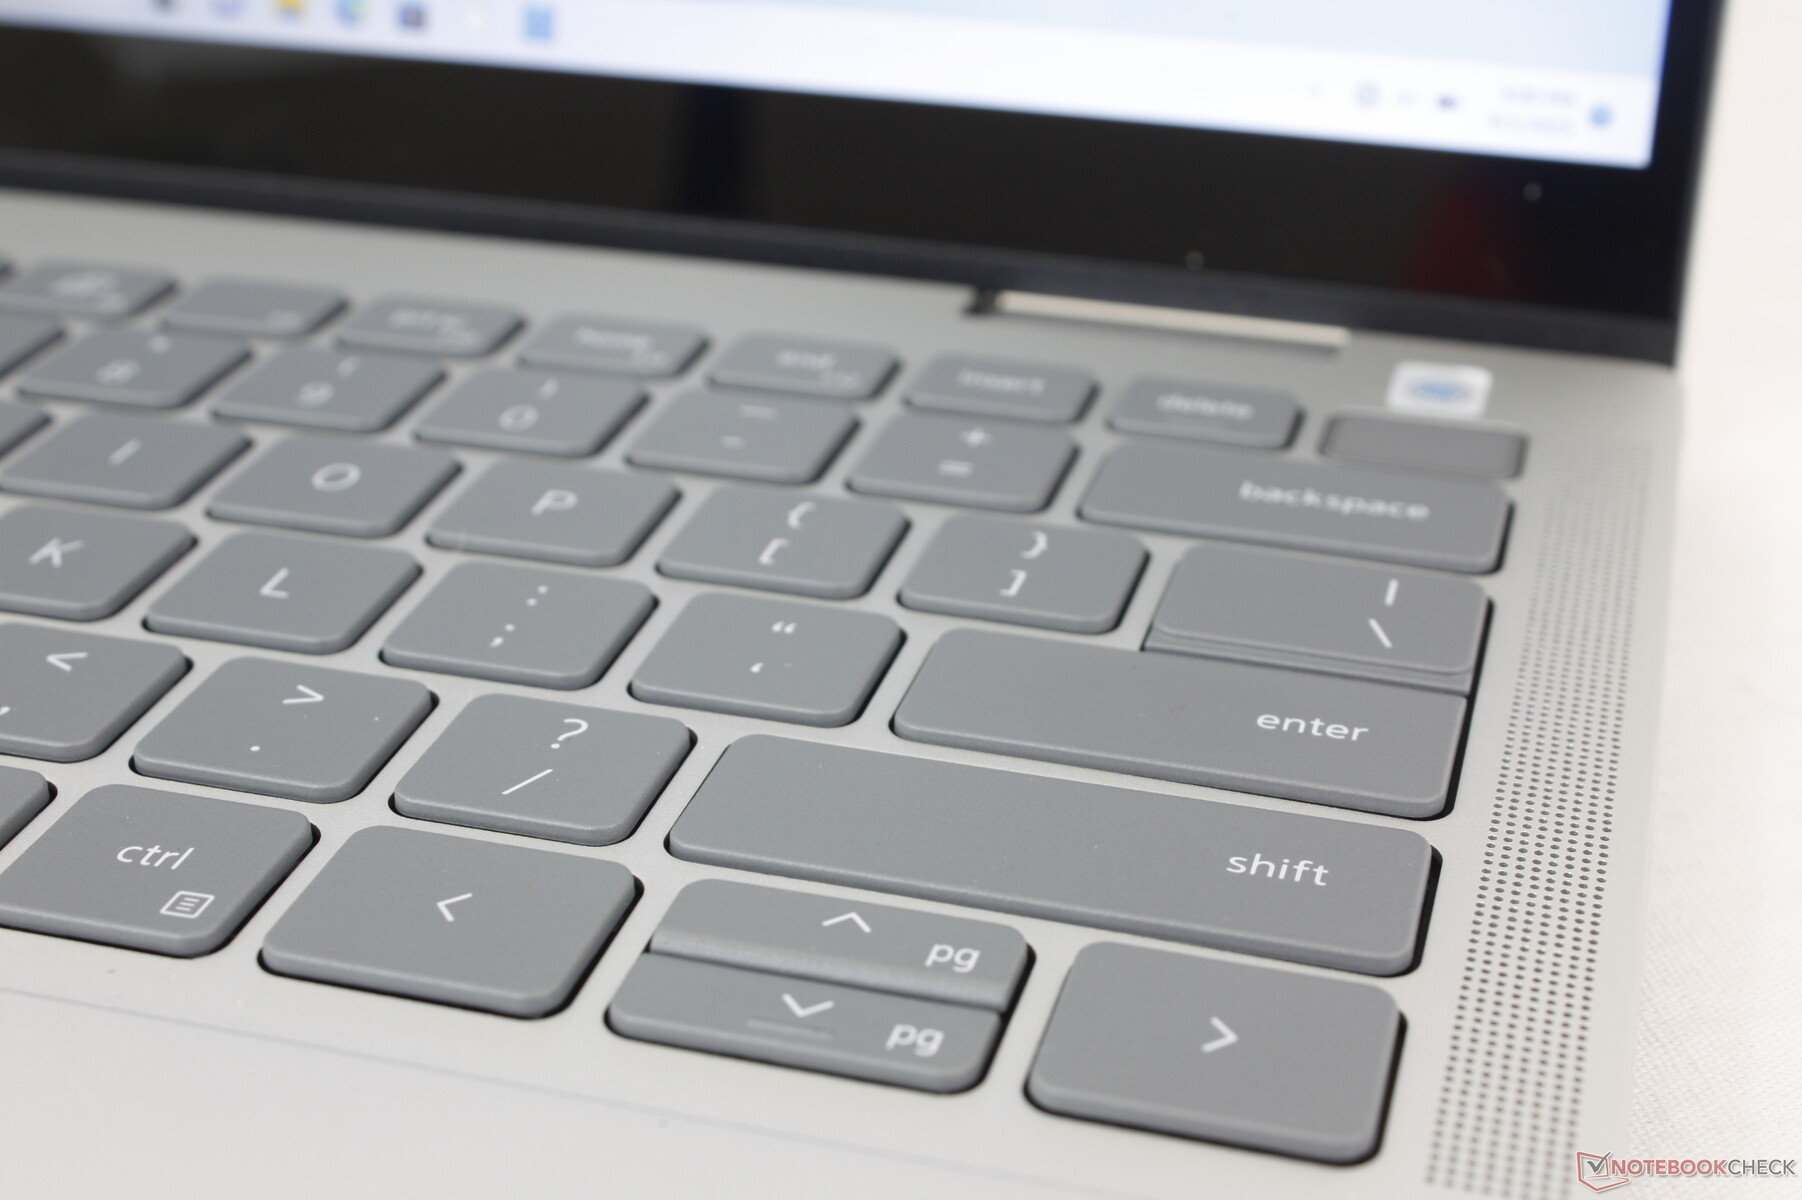
Boîtier - Enceintes et charnières révisées
Bien qu'il soit identique à l'Inspiron 14 7620 2022 Inspiron 14 7620 2-en-1 à première vue, plusieurs différences sont perceptibles après un examen plus approfondi. Tout d'abord, les repose-poignets en Mylar, très appréciés, ont été supprimés au profit d'un plastique ABS. Ce matériau spécial était censé protéger les repose-poignets et le pavé tactile de l'accumulation de graisse, mais il s'est finalement avéré inutile sur un ordinateur portable économique comme celui-ci. Ensuite, les charnières ont été redessinées pour être légèrement plus grandes et plus plates, ce qui devrait améliorer la longévité. Enfin, les haut-parleurs ont été repositionnés des coins avant du châssis vers les bords du clavier et sont désormais orientés vers le haut, directement vers l'utilisateur.
La rigidité du châssis reste à peu près la même qu'auparavant en raison de la similitude des squelettes et du choix des matériaux plastiques.
Les dimensions et le poids sont pratiquement identiques à ceux du modèle de l'année dernière, malgré tous les changements externes et internes. Ce n'est pas nécessairement une mauvaise chose puisque le modèle est toujours comparable à des alternatives comme le Pavilion x360 14 ou l'IdeaPad Flex 14 7i, mais Dell aurait pu faire un effort supplémentaire pour rendre l'Inspiron encore plus portable et lucratif pour les acheteurs potentiels.
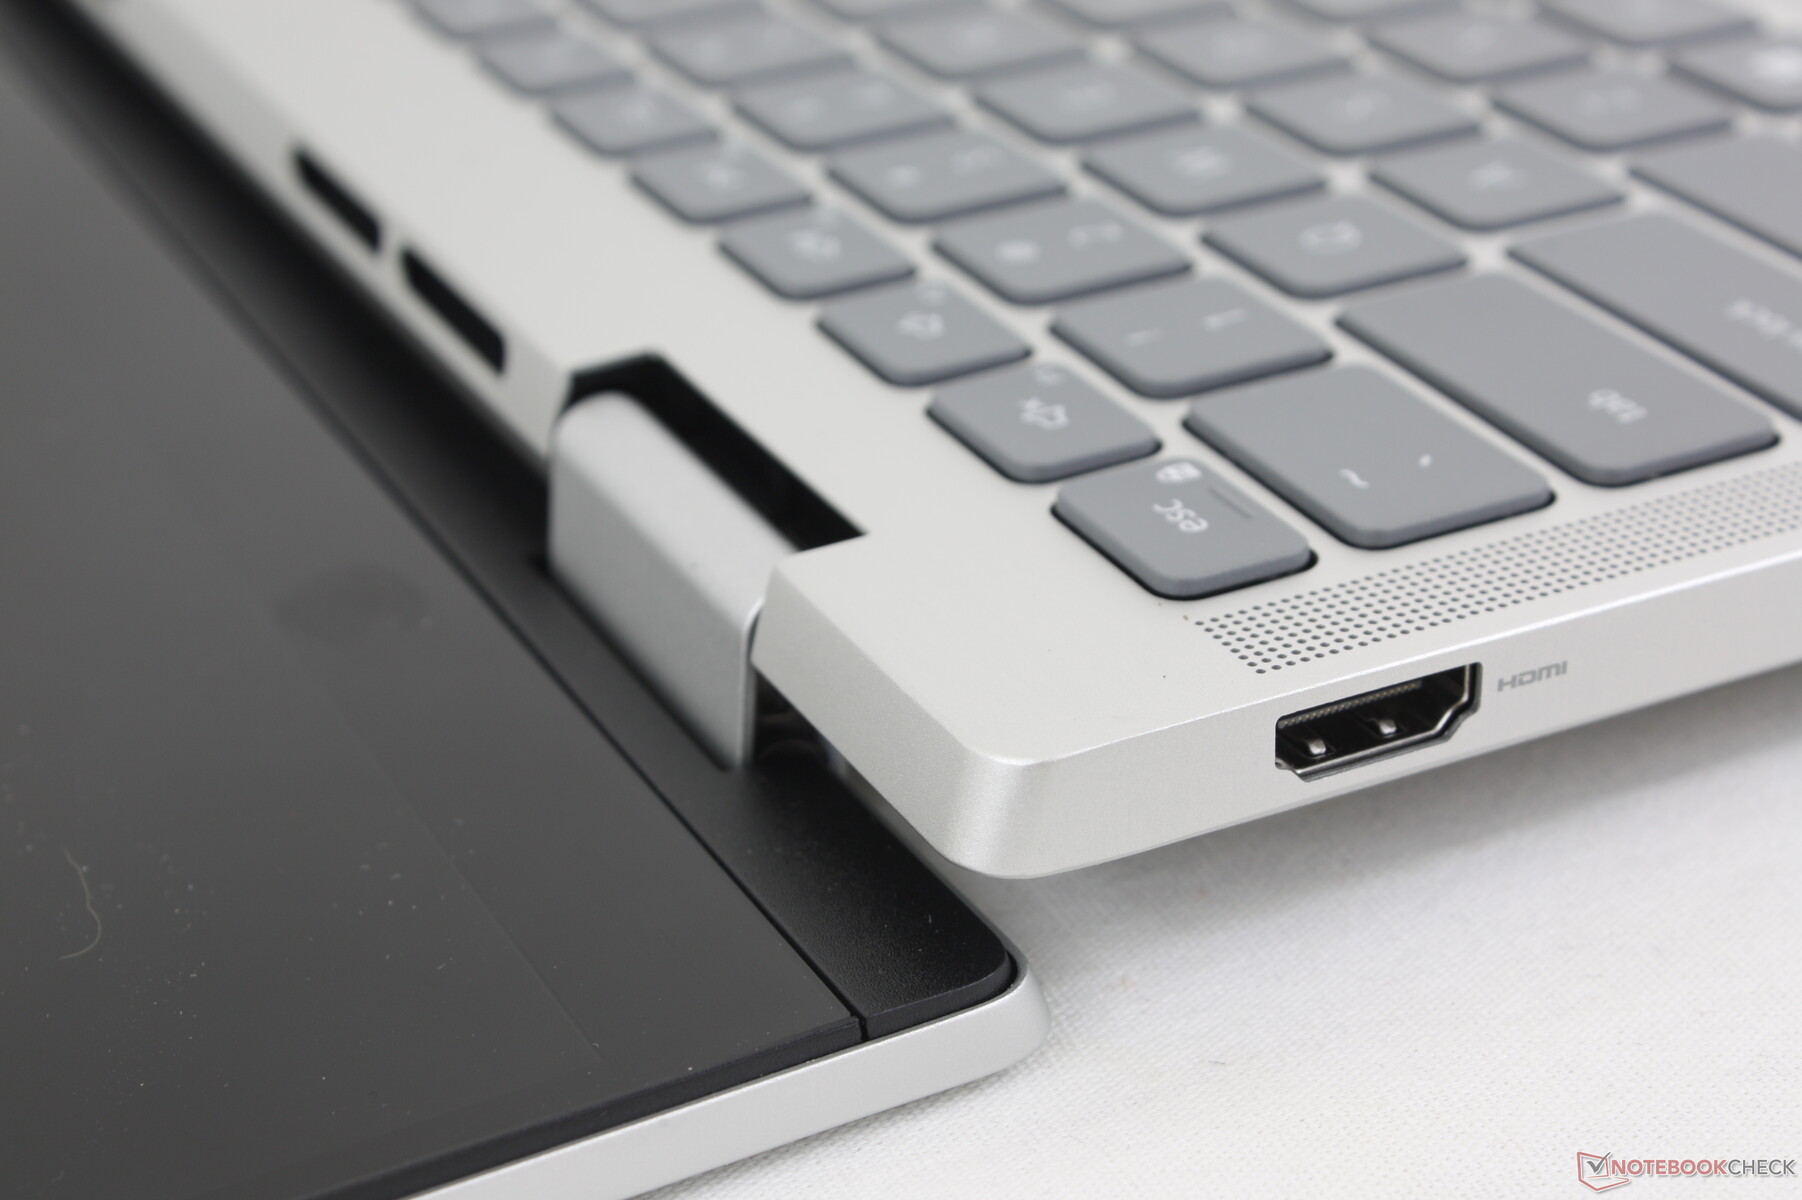
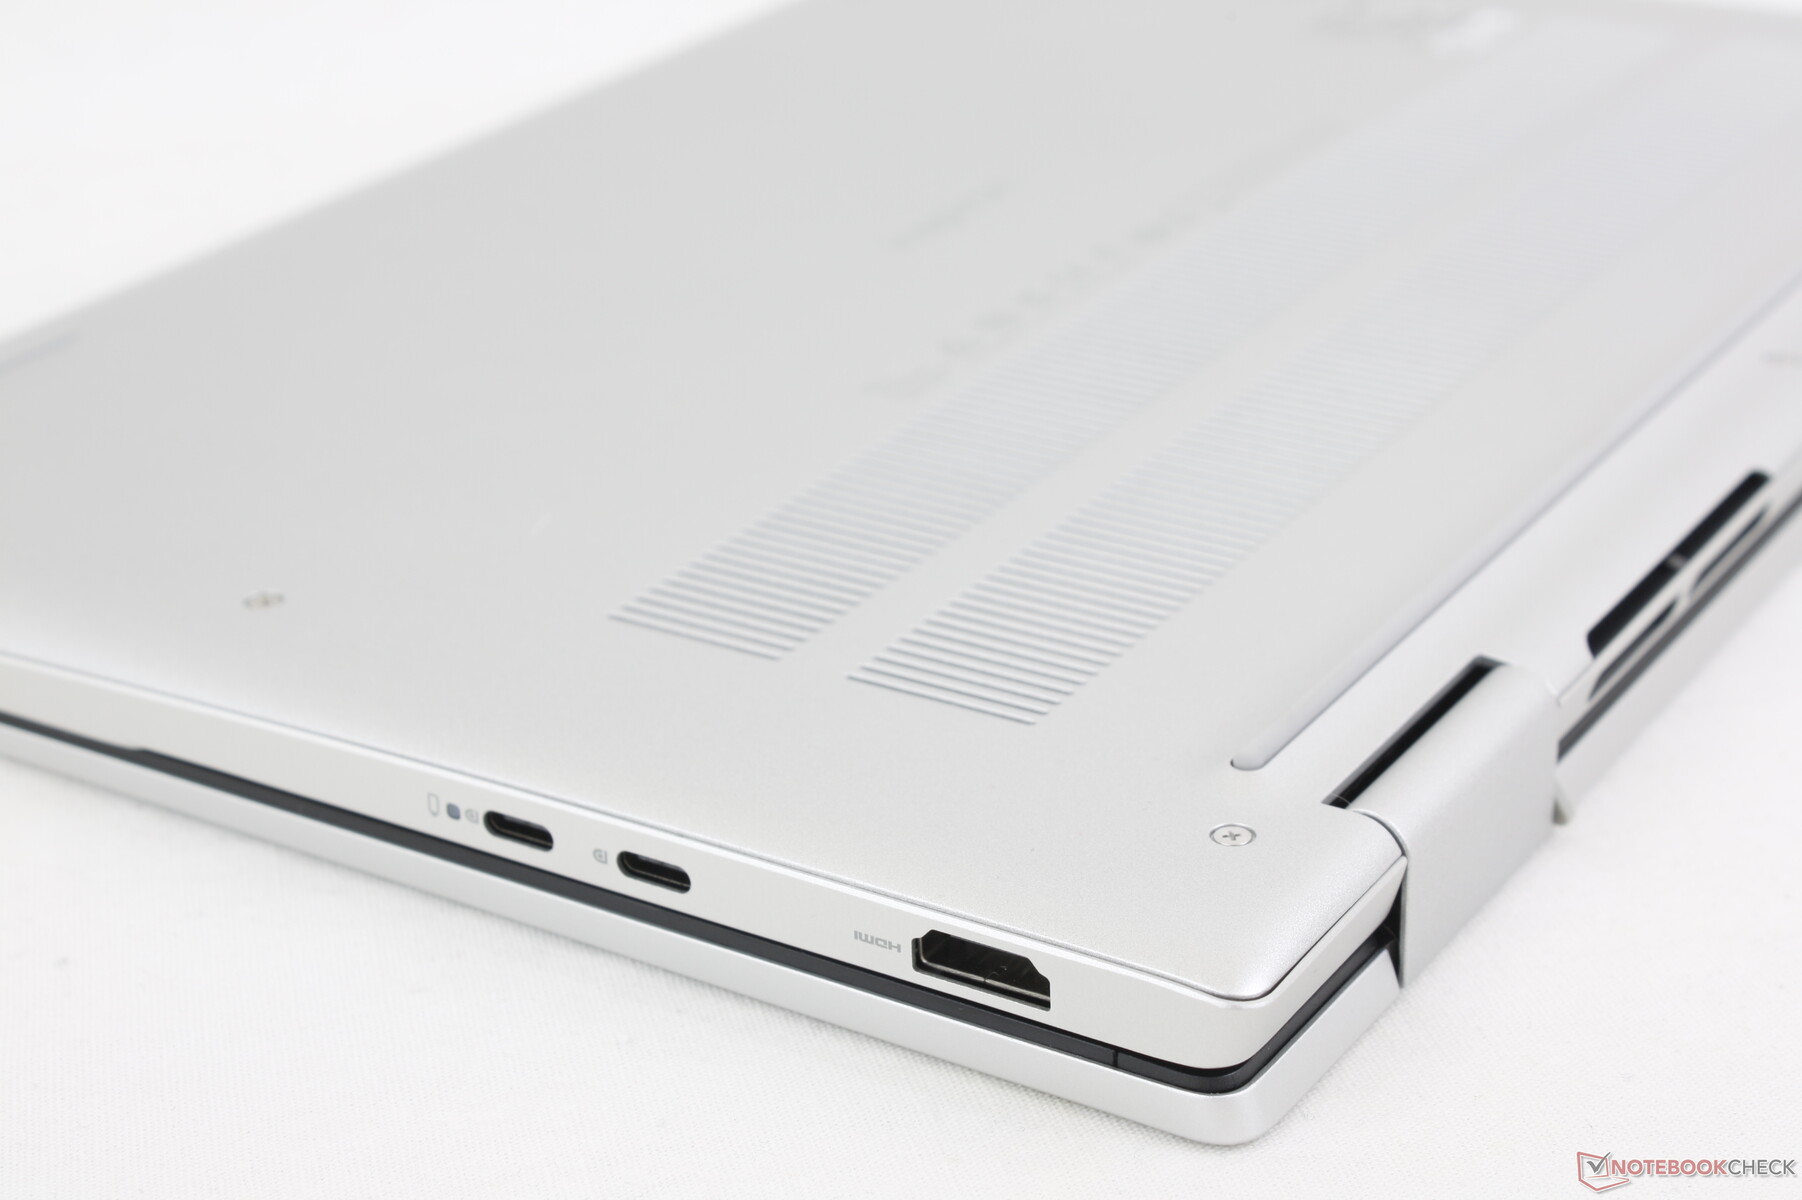
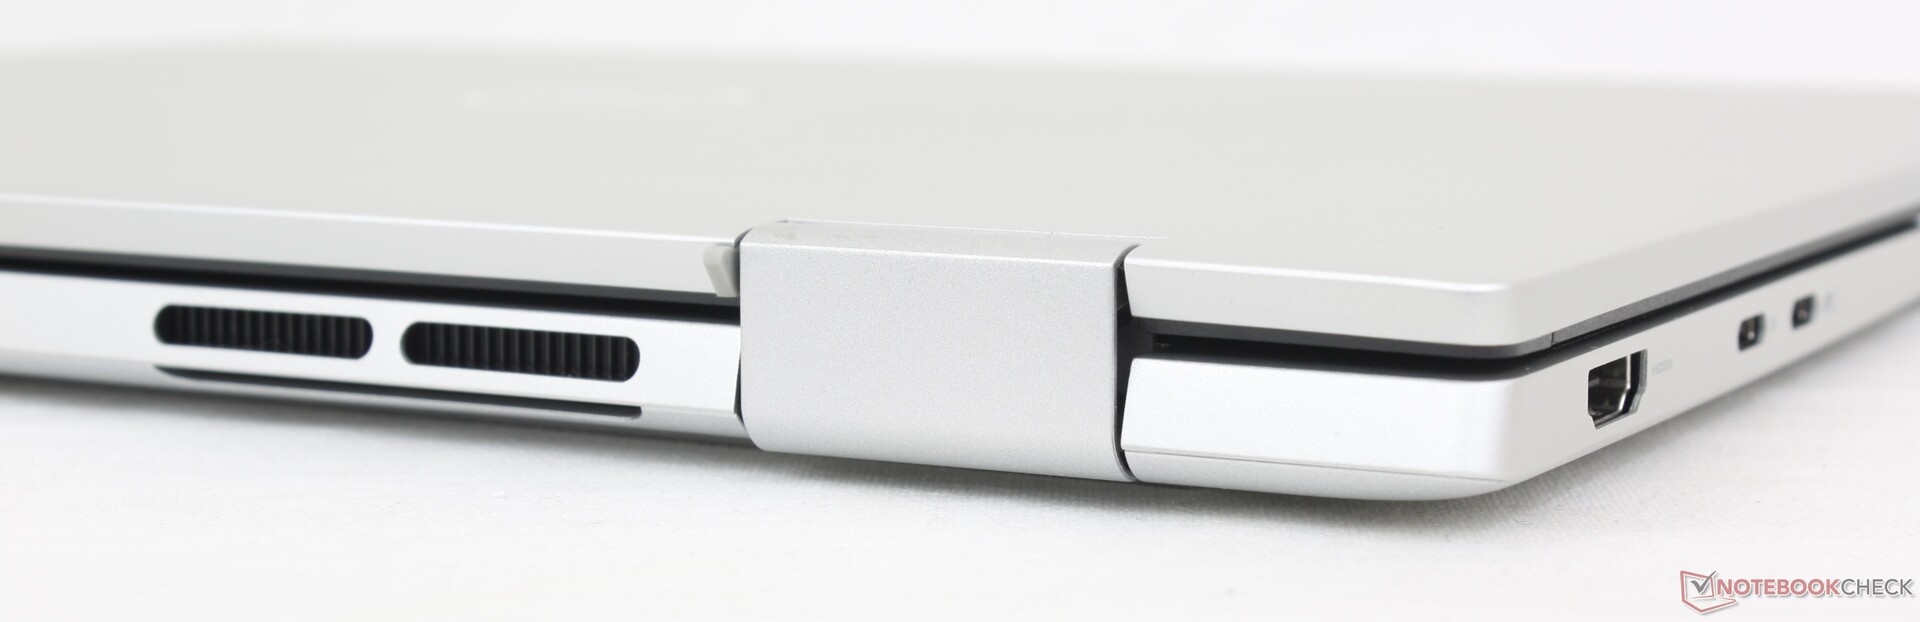
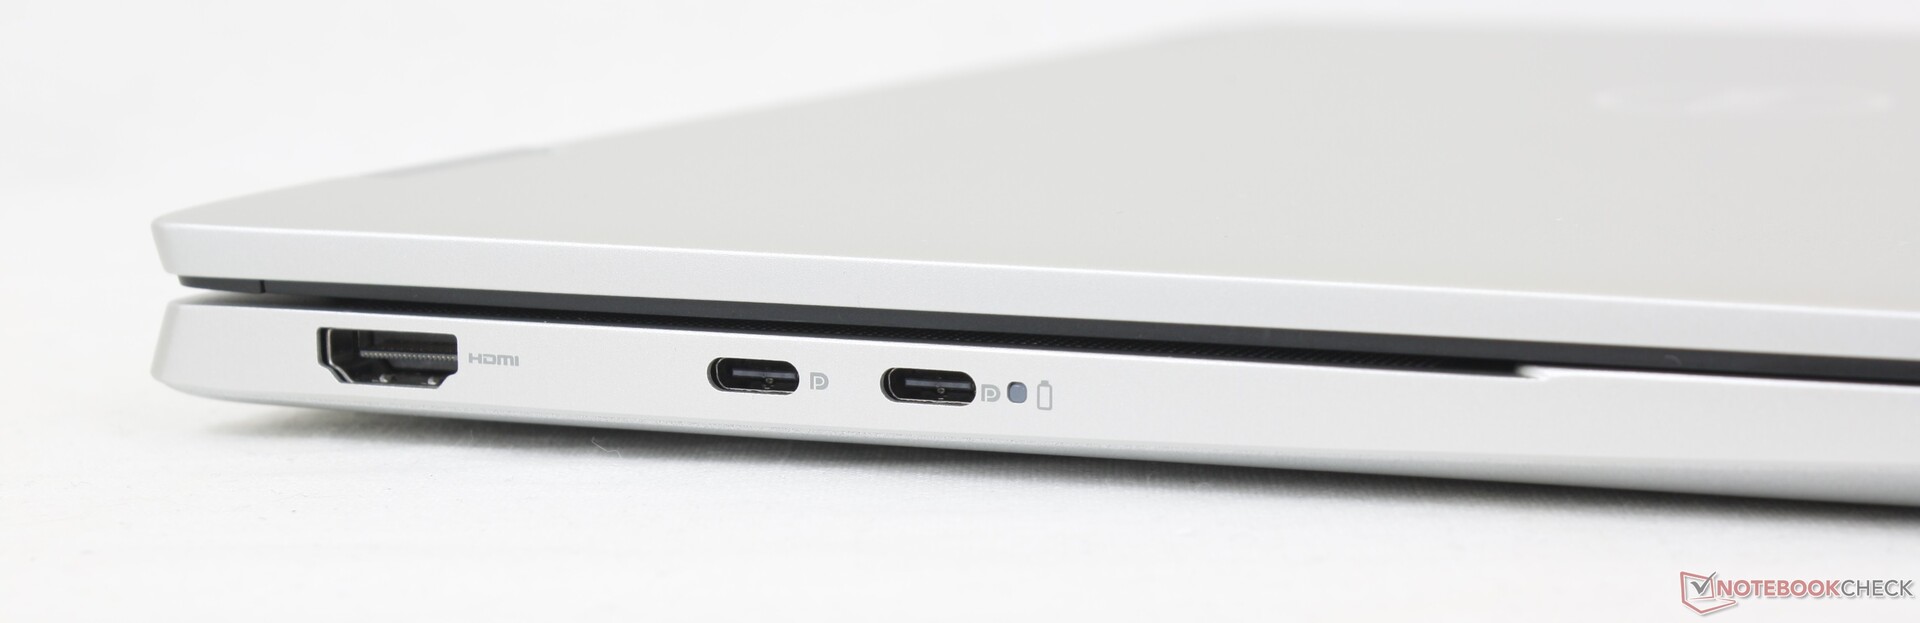
Connectivité
Les options de port sont comparables à celles de l'IdeaPad Flex 5i 14 et du Pavilion x360 14, avec de légères différences dans le nombre de ports USB. Gardez à l'esprit que les ports USB-C de notre configuration AMD ne prennent pas en charge Thunderbolt, contrairement à l'Inspiron 7430 2-en-1 alimenté par Intel.
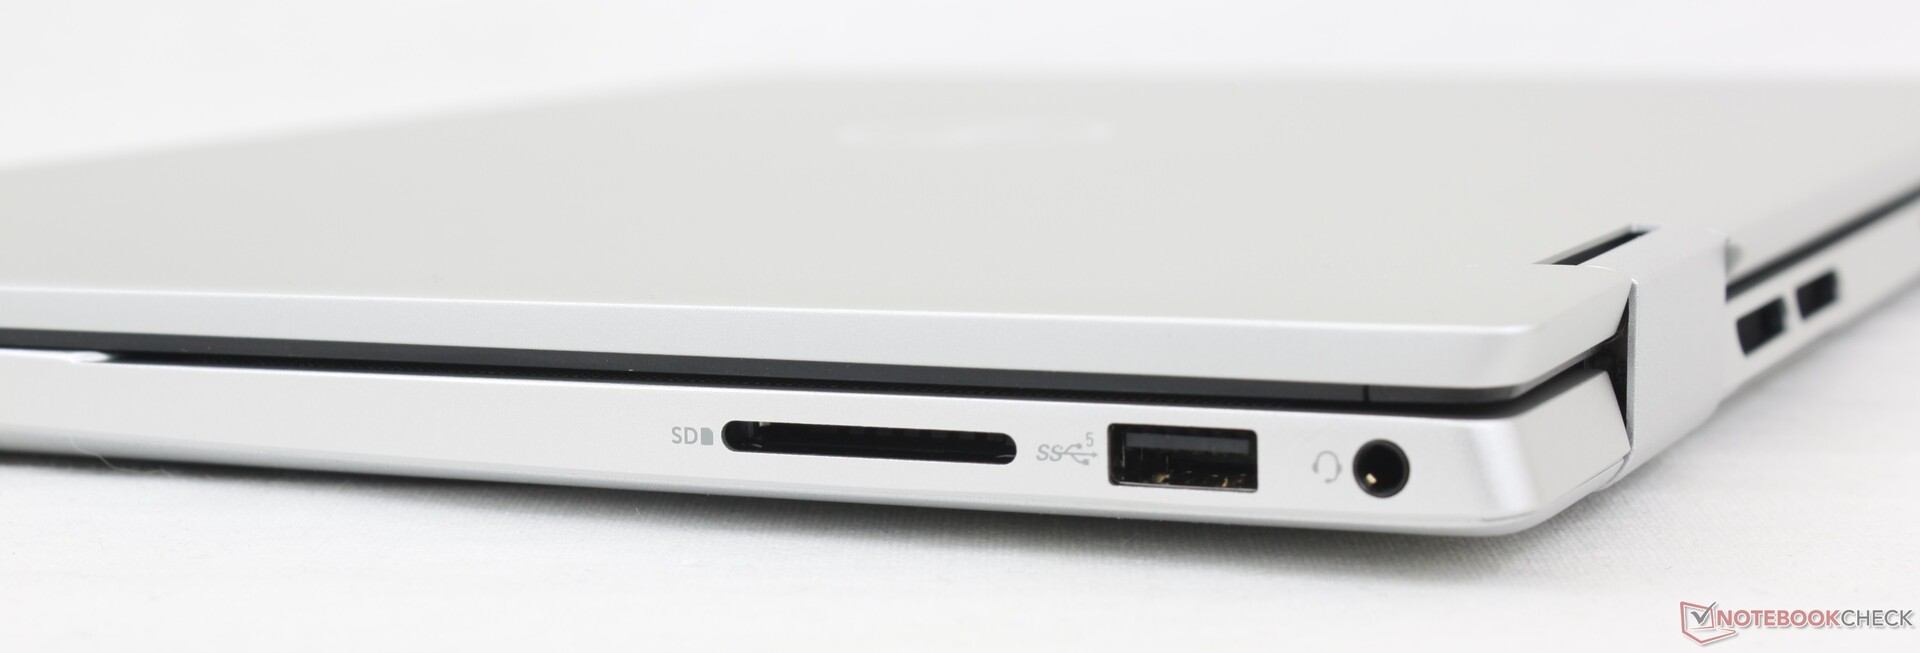
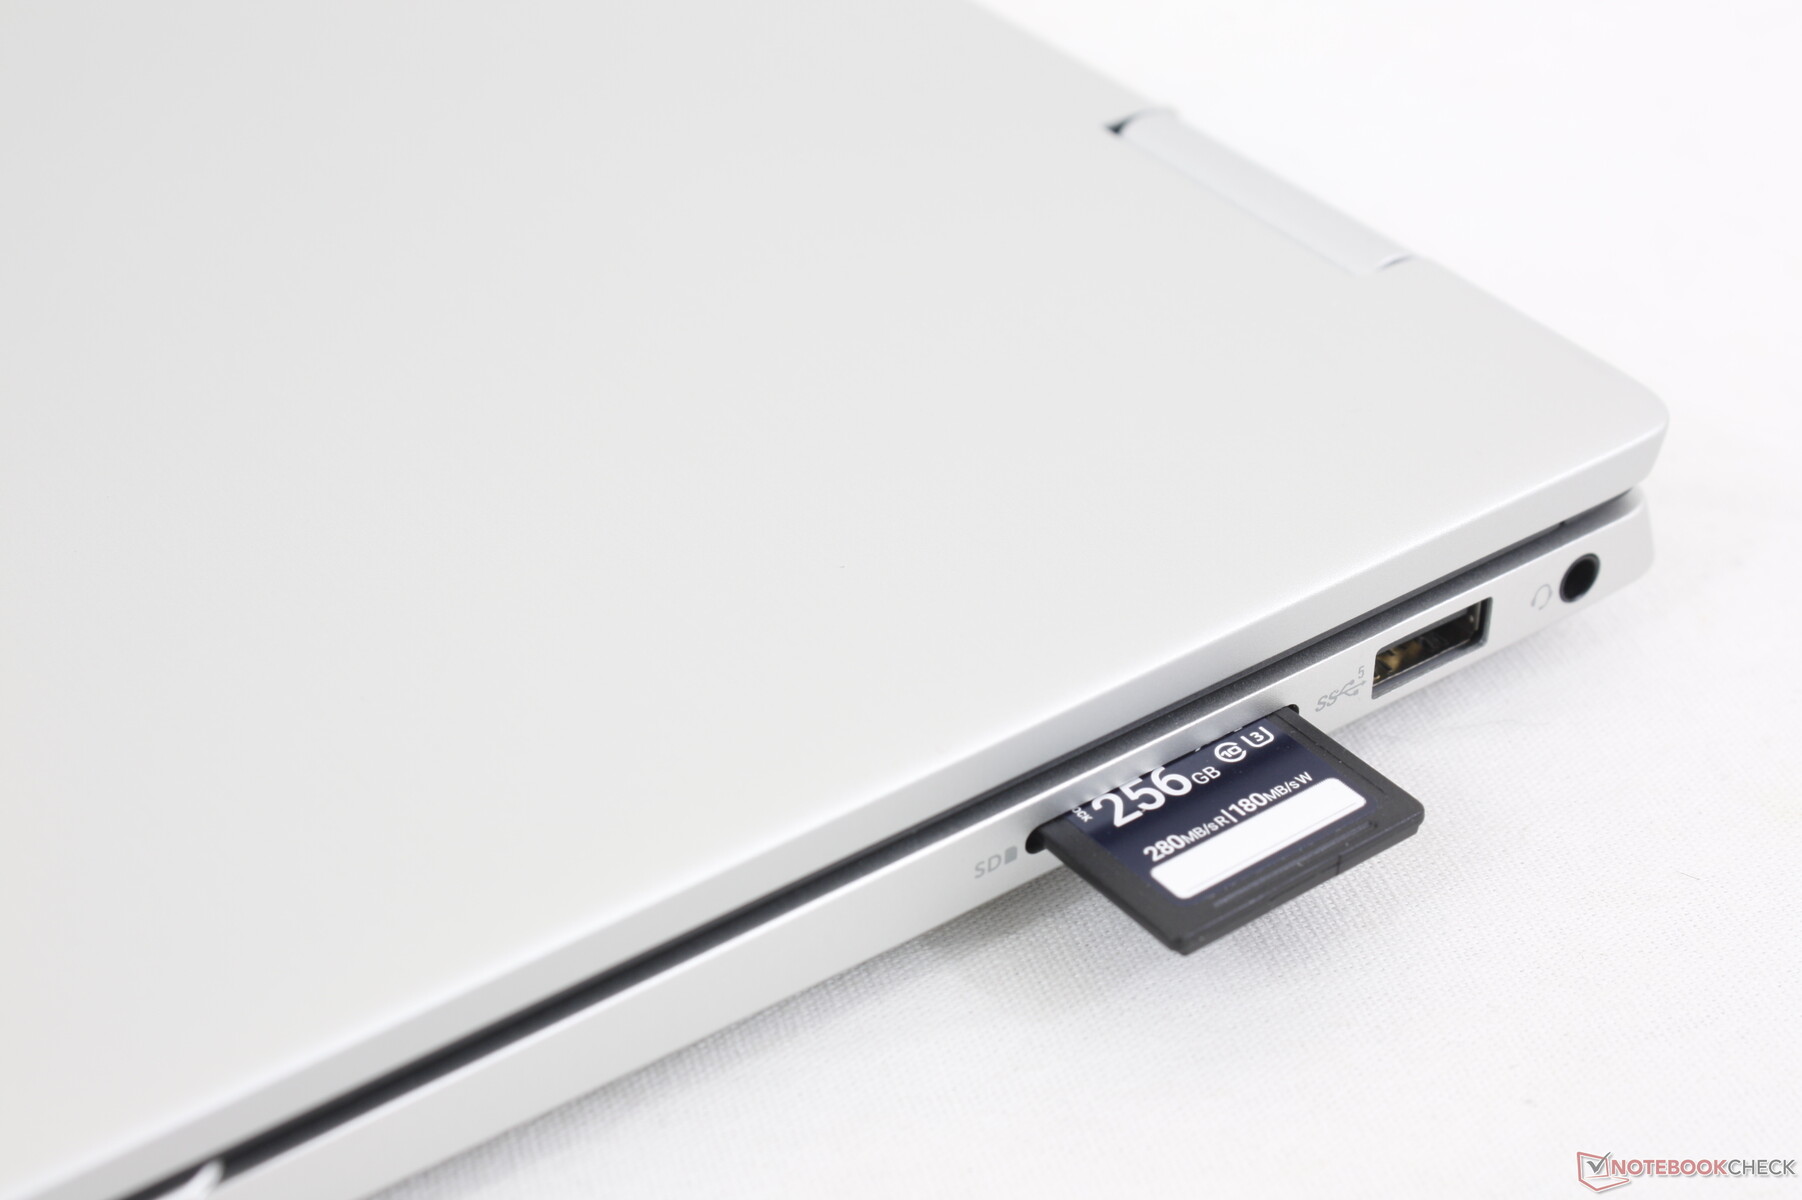
Lecteur de carte SD
Les taux de transfert du lecteur de carte SD intégré se sont légèrement améliorés, passant de 20 Mo/s sur l'Inspiron 7420 de l'année dernière à 35 Mo/s sur notre dernier modèle. Malgré cela, les lecteurs de cartes SD des modèles concurrents comme le IdeaPad Flex 7i ou Pavilion x360 14 sont beaucoup plus rapides, de plus de 2 fois.
| SD Card Reader | |
| average JPG Copy Test (av. of 3 runs) | |
| Lenovo IdeaPad Flex 7i 14IAU7 (Toshiba Exceria Pro SDXC 64 GB UHS-II) | |
| HP Pavilion x360 14-dy0157ng (Toshiba Exceria Pro M501 microSDXC 64GB) | |
| LG Gram 14T90P (AV Pro V60) | |
| Dell Inspiron 14 7435 2-in-1 (PNY EliteX-Pro60 V60 256 GB) | |
| Dell Inspiron 14 7420 2-in-1 (Toshiba Exceria Pro SDXC 64 GB UHS-II) | |
| maximum AS SSD Seq Read Test (1GB) | |
| Lenovo IdeaPad Flex 7i 14IAU7 (Toshiba Exceria Pro SDXC 64 GB UHS-II) | |
| LG Gram 14T90P (AV Pro V60) | |
| HP Pavilion x360 14-dy0157ng (Toshiba Exceria Pro M501 microSDXC 64GB) | |
| Dell Inspiron 14 7435 2-in-1 (PNY EliteX-Pro60 V60 256 GB) | |
| Dell Inspiron 14 7420 2-in-1 (Toshiba Exceria Pro SDXC 64 GB UHS-II) | |
Communication
Nous sommes surpris de voir le support Wi-Fi6E sur notre configuration de base. Les taux de transfert sont stables lorsqu'ils sont couplés à notre réseau Asus AXE11000 6 GHz, mais les taux de réception sont nettement plus lents que prévu, de près de la moitié, par rapport aux ordinateurs portables équipés de l'Intel AX211.
| Networking | |
| iperf3 transmit AX12 | |
| HP Pavilion x360 14-dy0157ng | |
| iperf3 receive AX12 | |
| HP Pavilion x360 14-dy0157ng | |
| iperf3 transmit AXE11000 | |
| Acer Aspire 5 Spin 14 | |
| Dell Inspiron 14 7435 2-in-1 | |
| Lenovo IdeaPad Flex 7i 14IAU7 | |
| LG Gram 14T90P | |
| iperf3 receive AXE11000 | |
| Acer Aspire 5 Spin 14 | |
| LG Gram 14T90P | |
| Lenovo IdeaPad Flex 7i 14IAU7 | |
| Dell Inspiron 14 7435 2-in-1 | |
| iperf3 transmit AXE11000 6GHz | |
| Dell Inspiron 14 7435 2-in-1 | |
| Acer Aspire 5 Spin 14 | |
| Lenovo IdeaPad Flex 7i 14IAU7 | |
| Dell Inspiron 14 7420 2-in-1 | |
| iperf3 receive AXE11000 6GHz | |
| Acer Aspire 5 Spin 14 | |
| Dell Inspiron 14 7420 2-in-1 | |
| Lenovo IdeaPad Flex 7i 14IAU7 | |
| Dell Inspiron 14 7435 2-in-1 | |
Webcam
Dell n'a apporté aucune modification à la webcam de 2 MP ou 1080p. Un obturateur de confidentialité est inclus, tandis que l'IR continue d'être omis pour réduire les coûts.


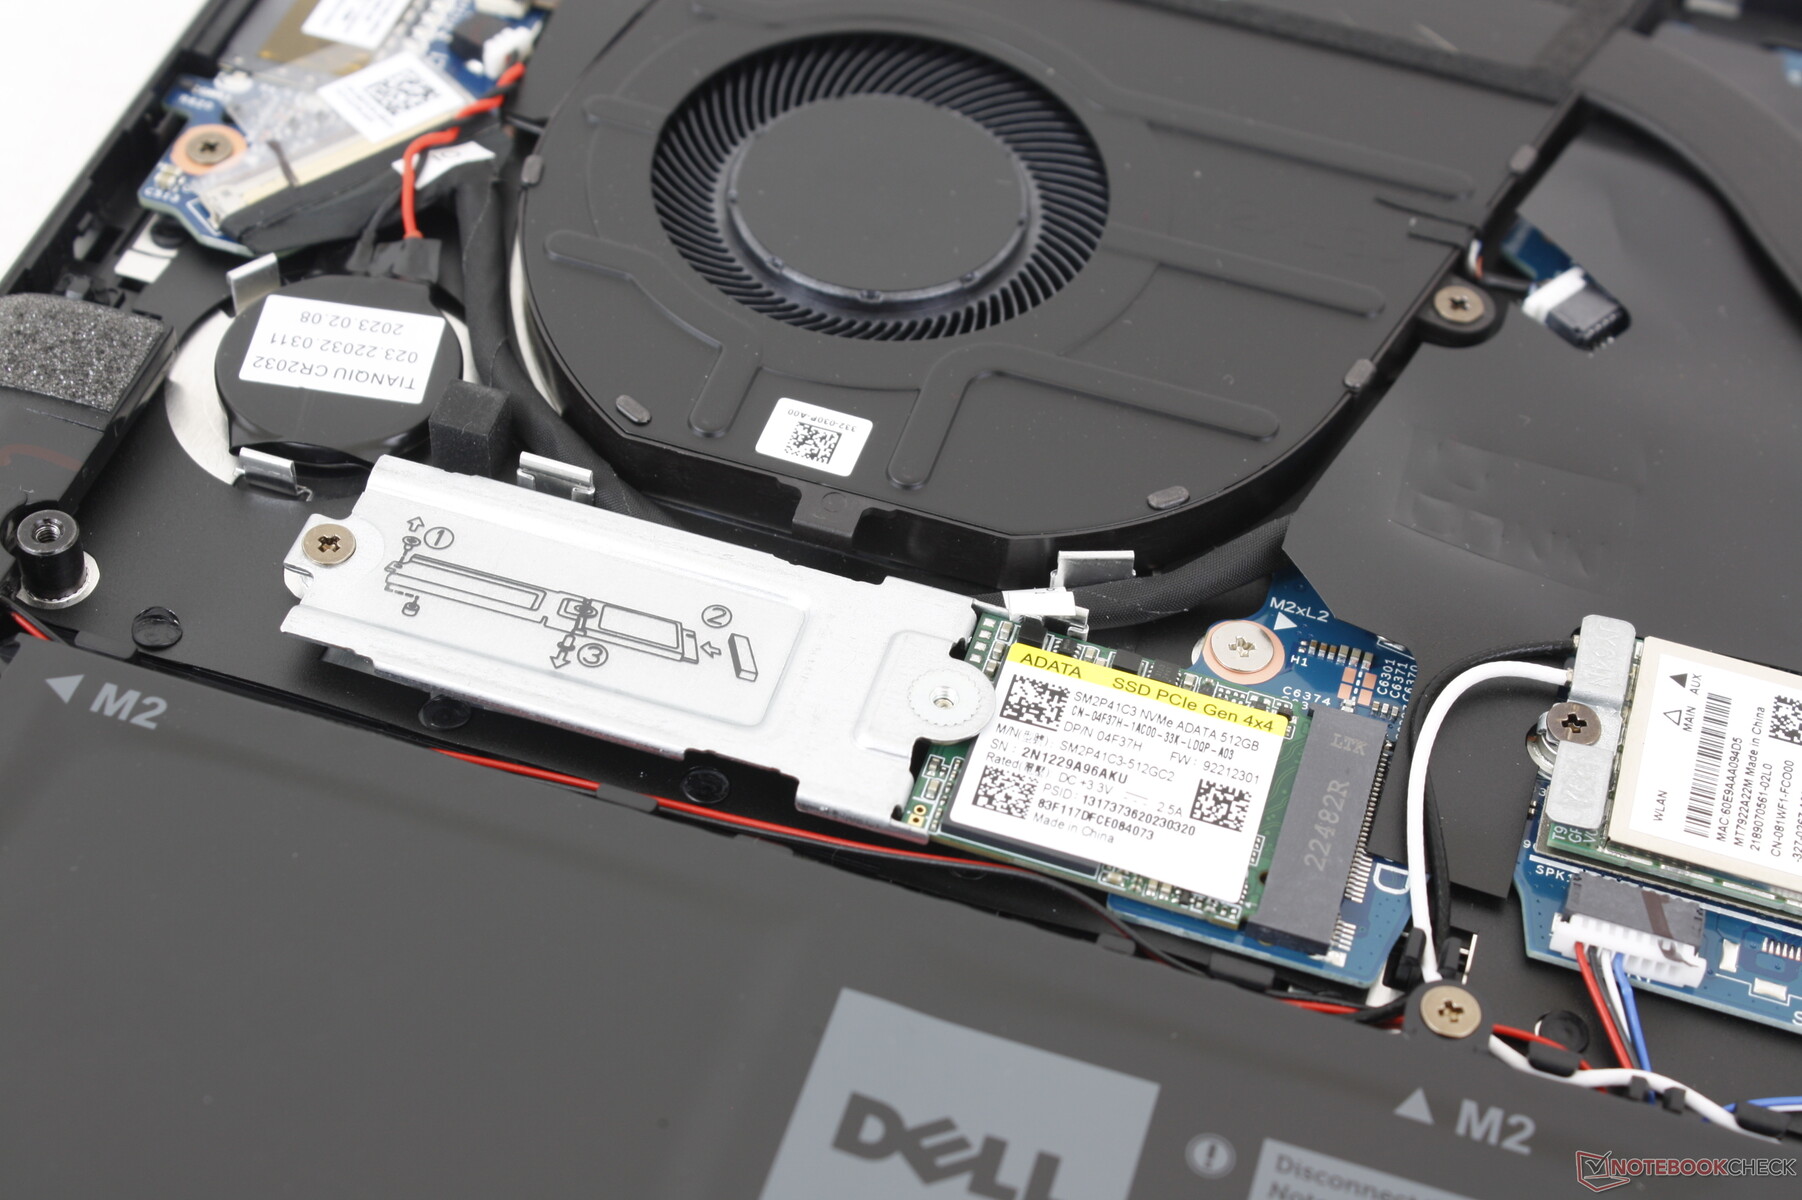
Maintenance
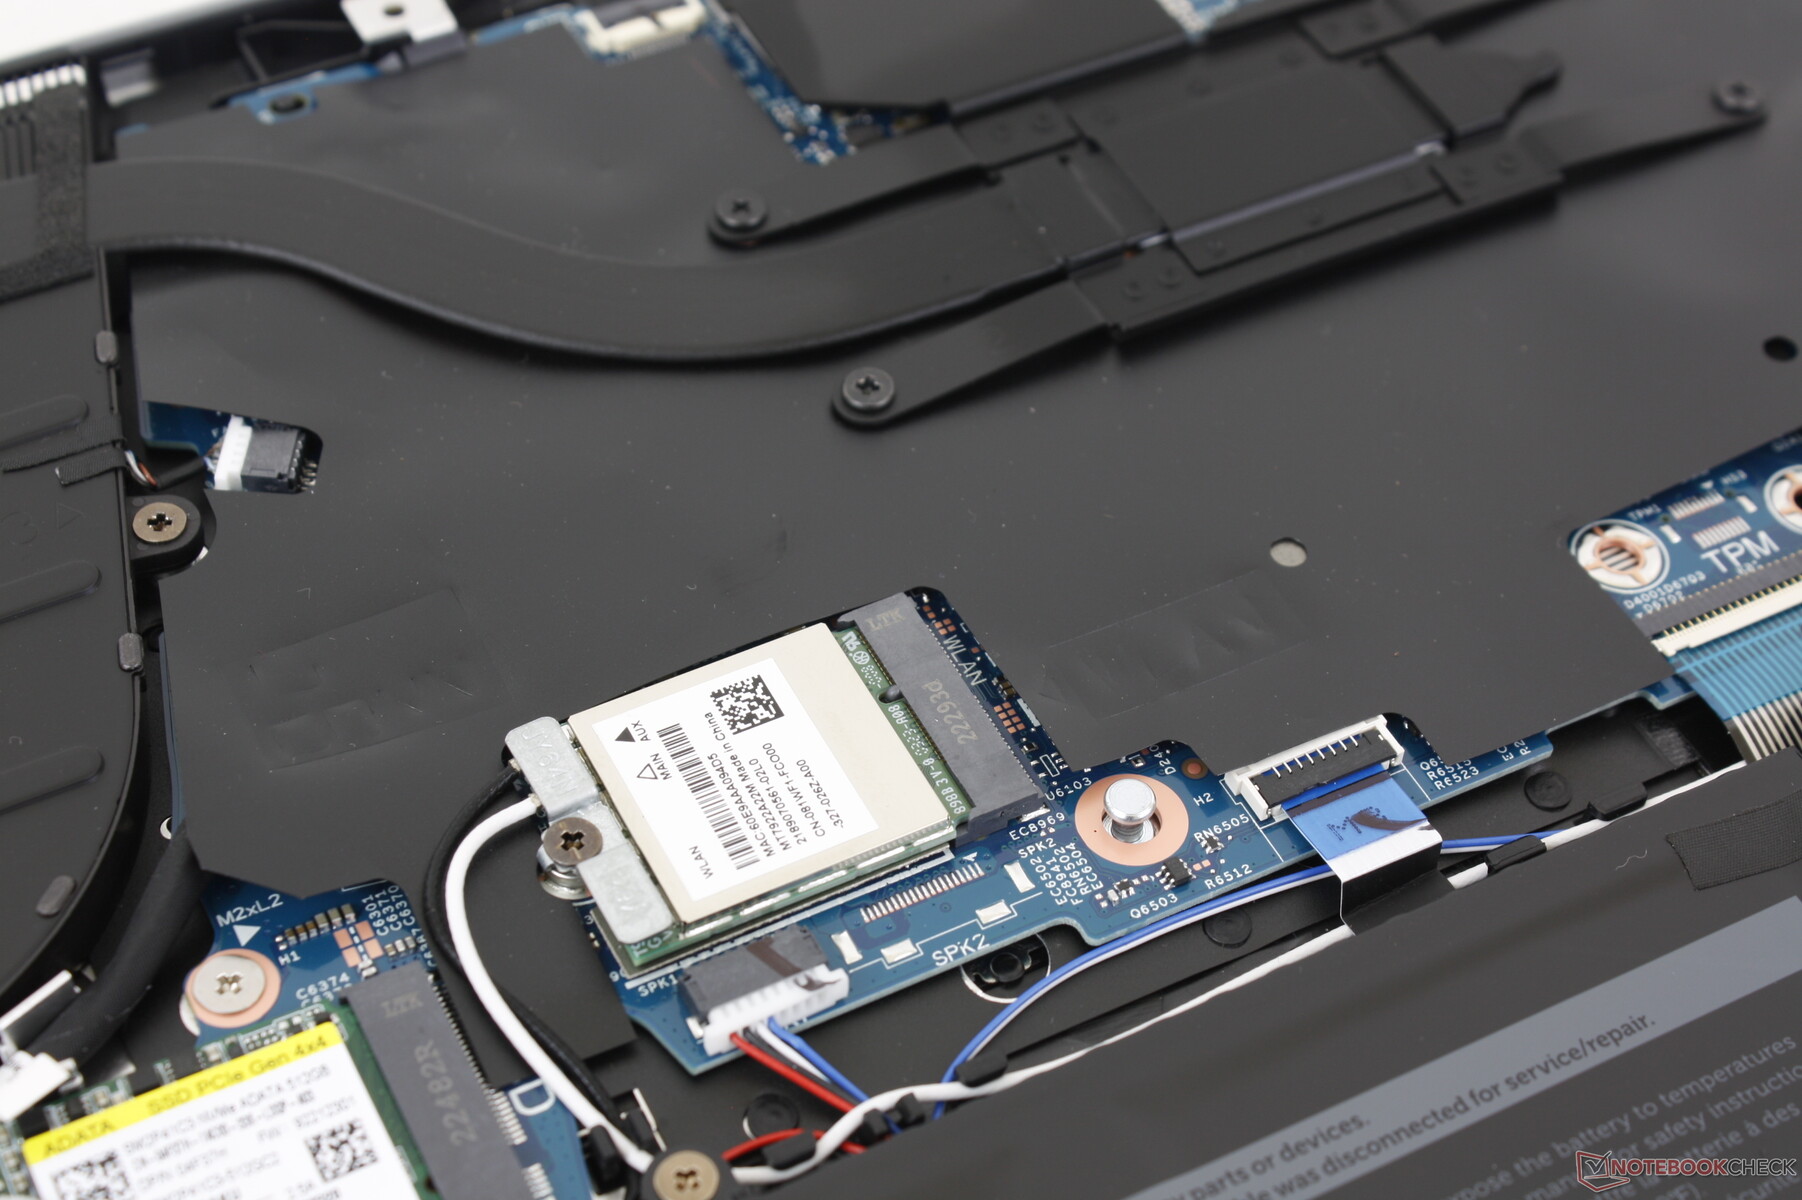
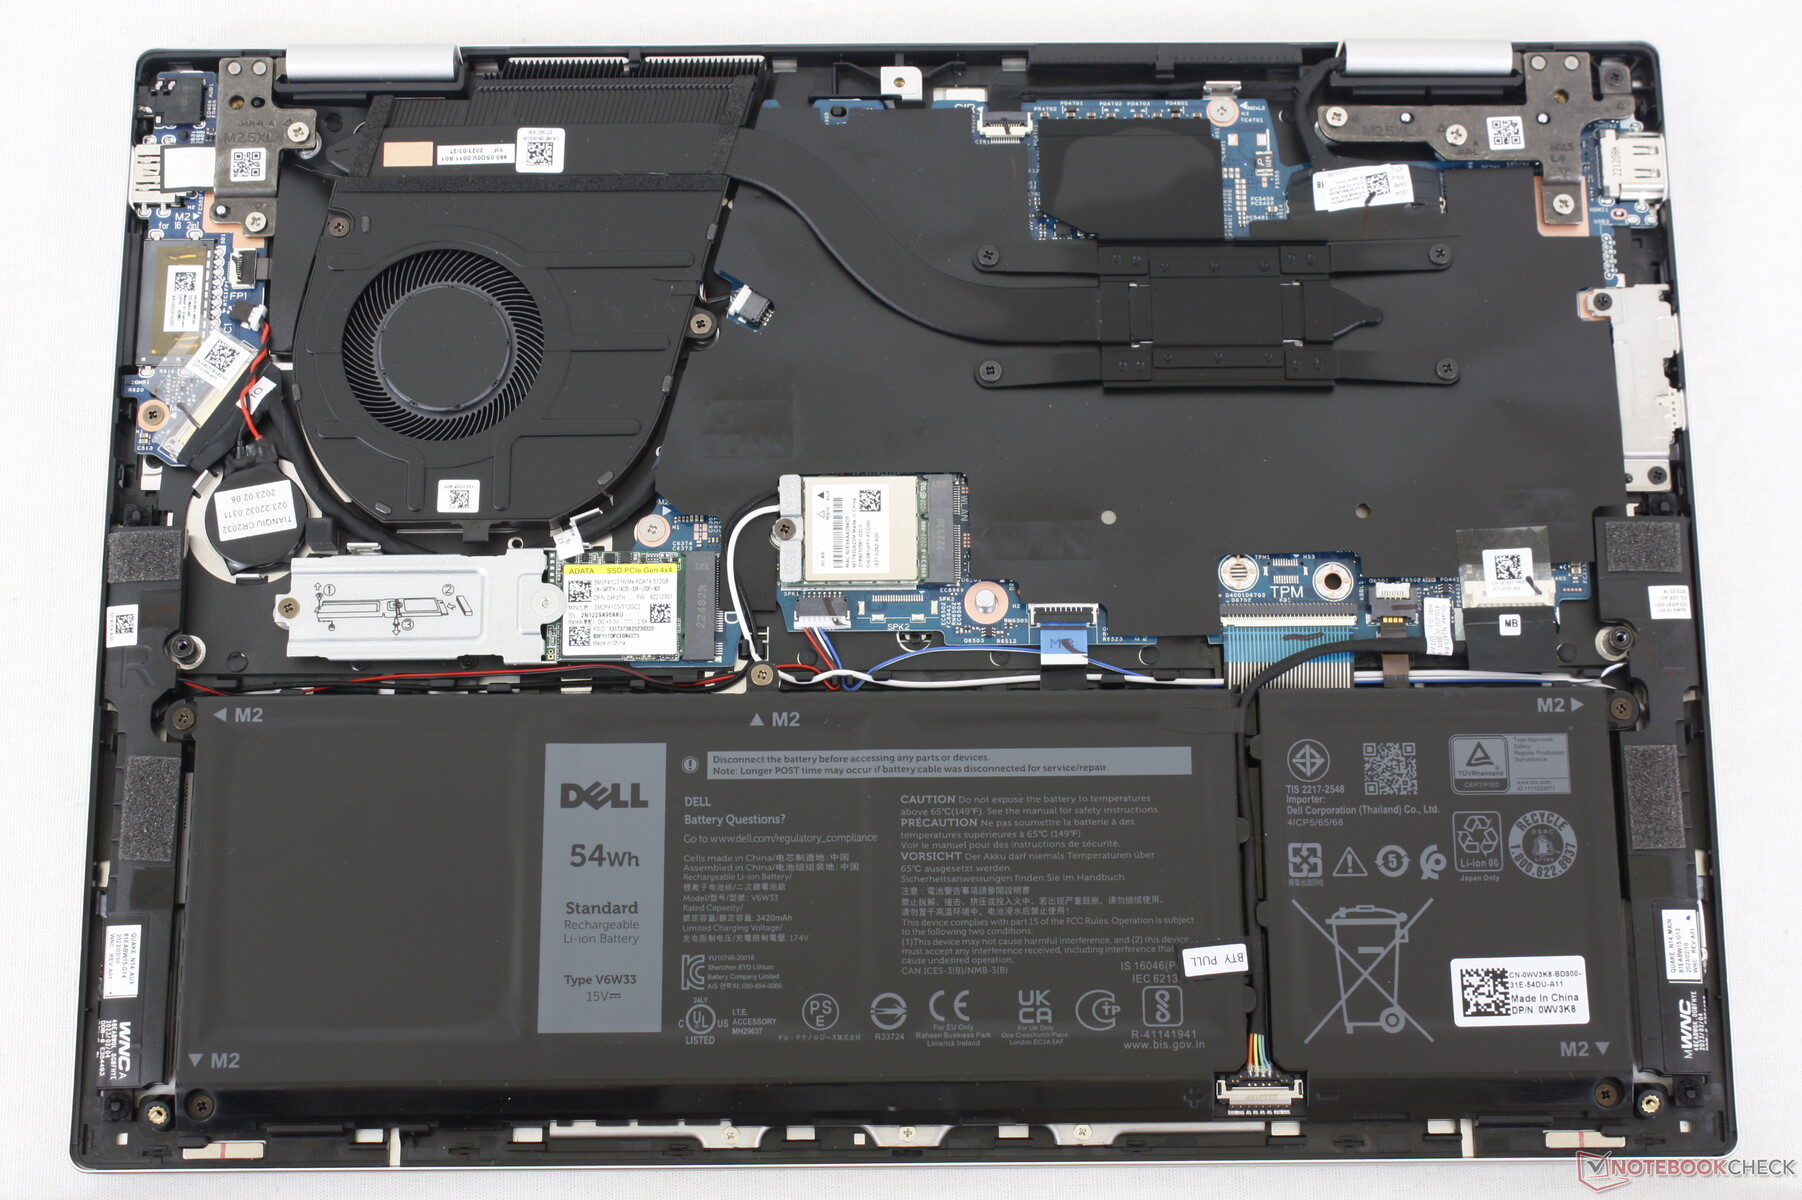
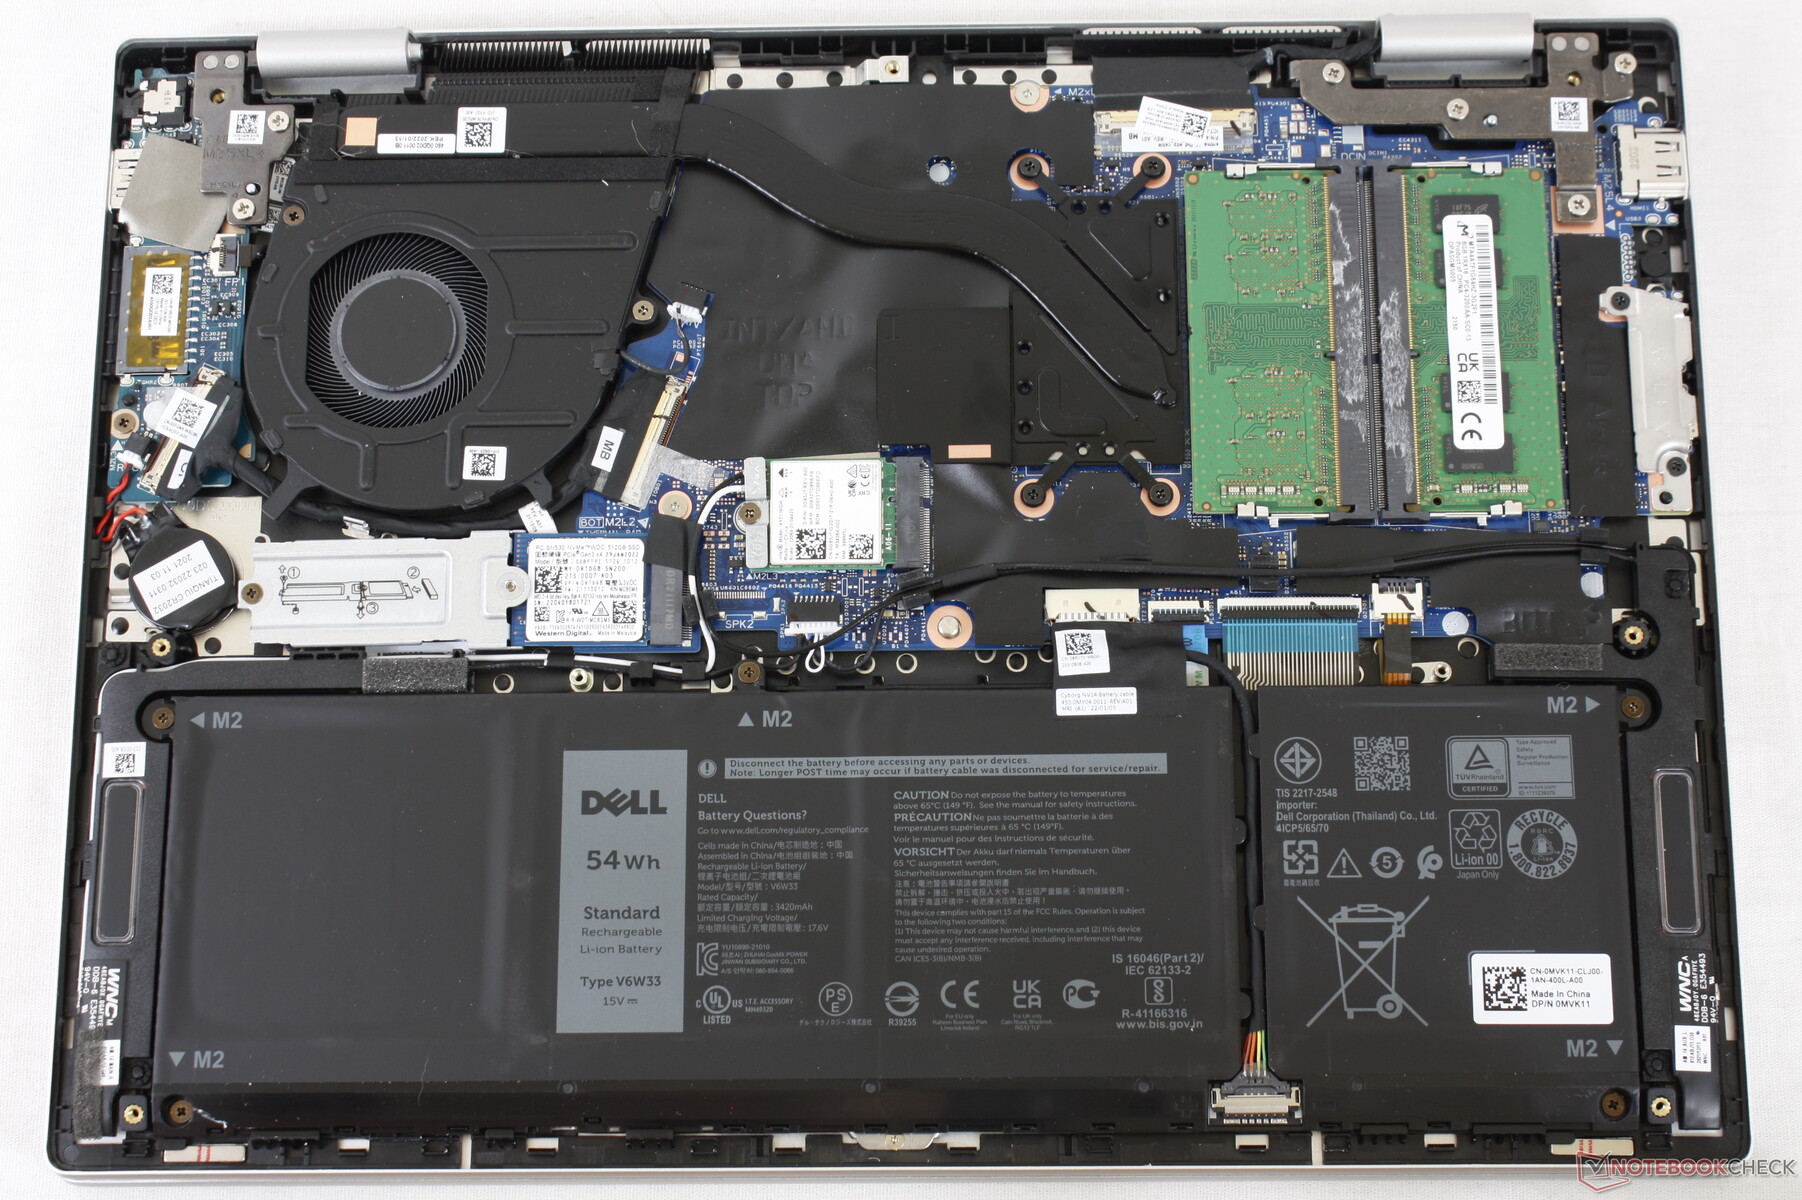
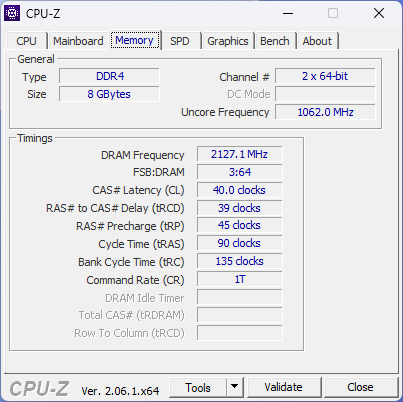
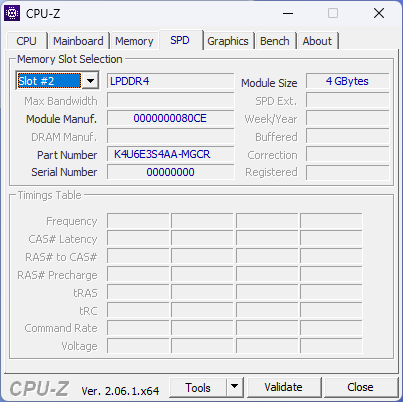
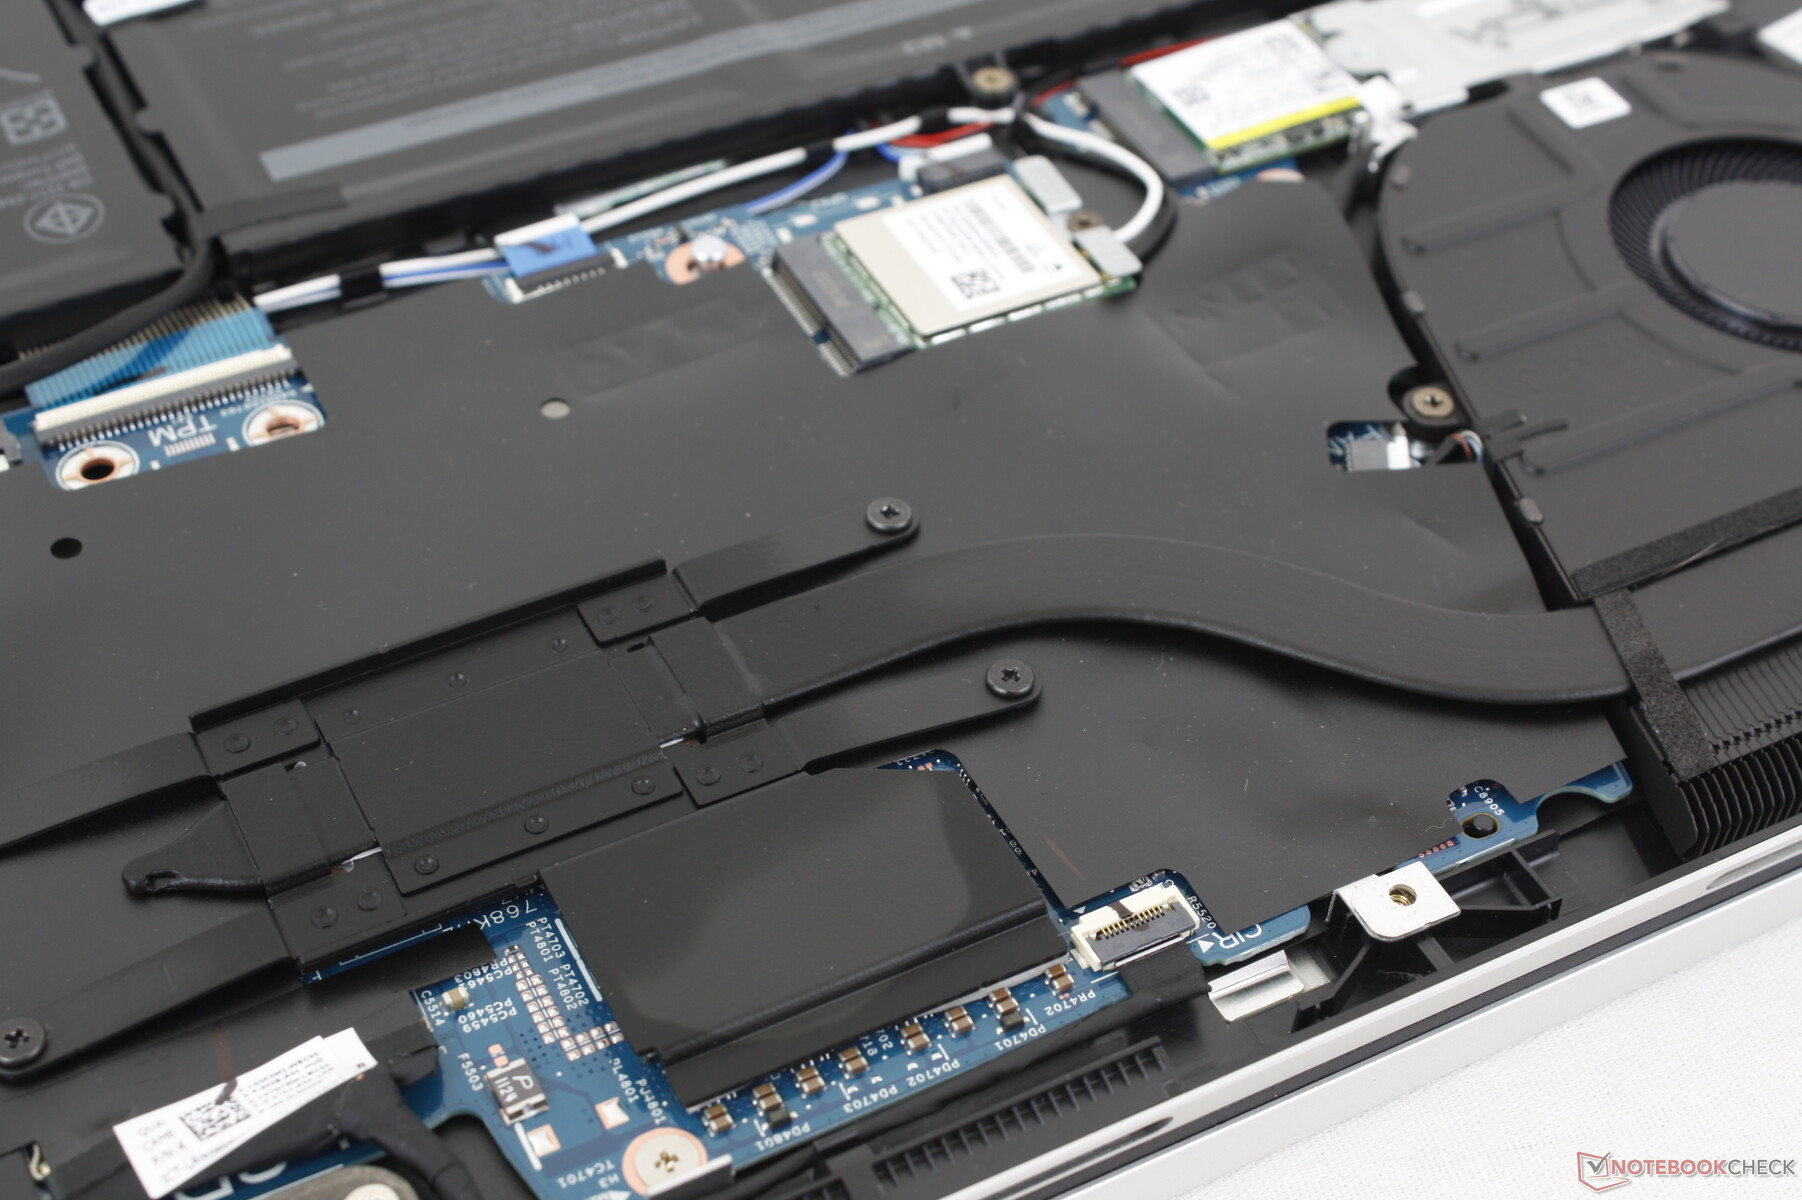
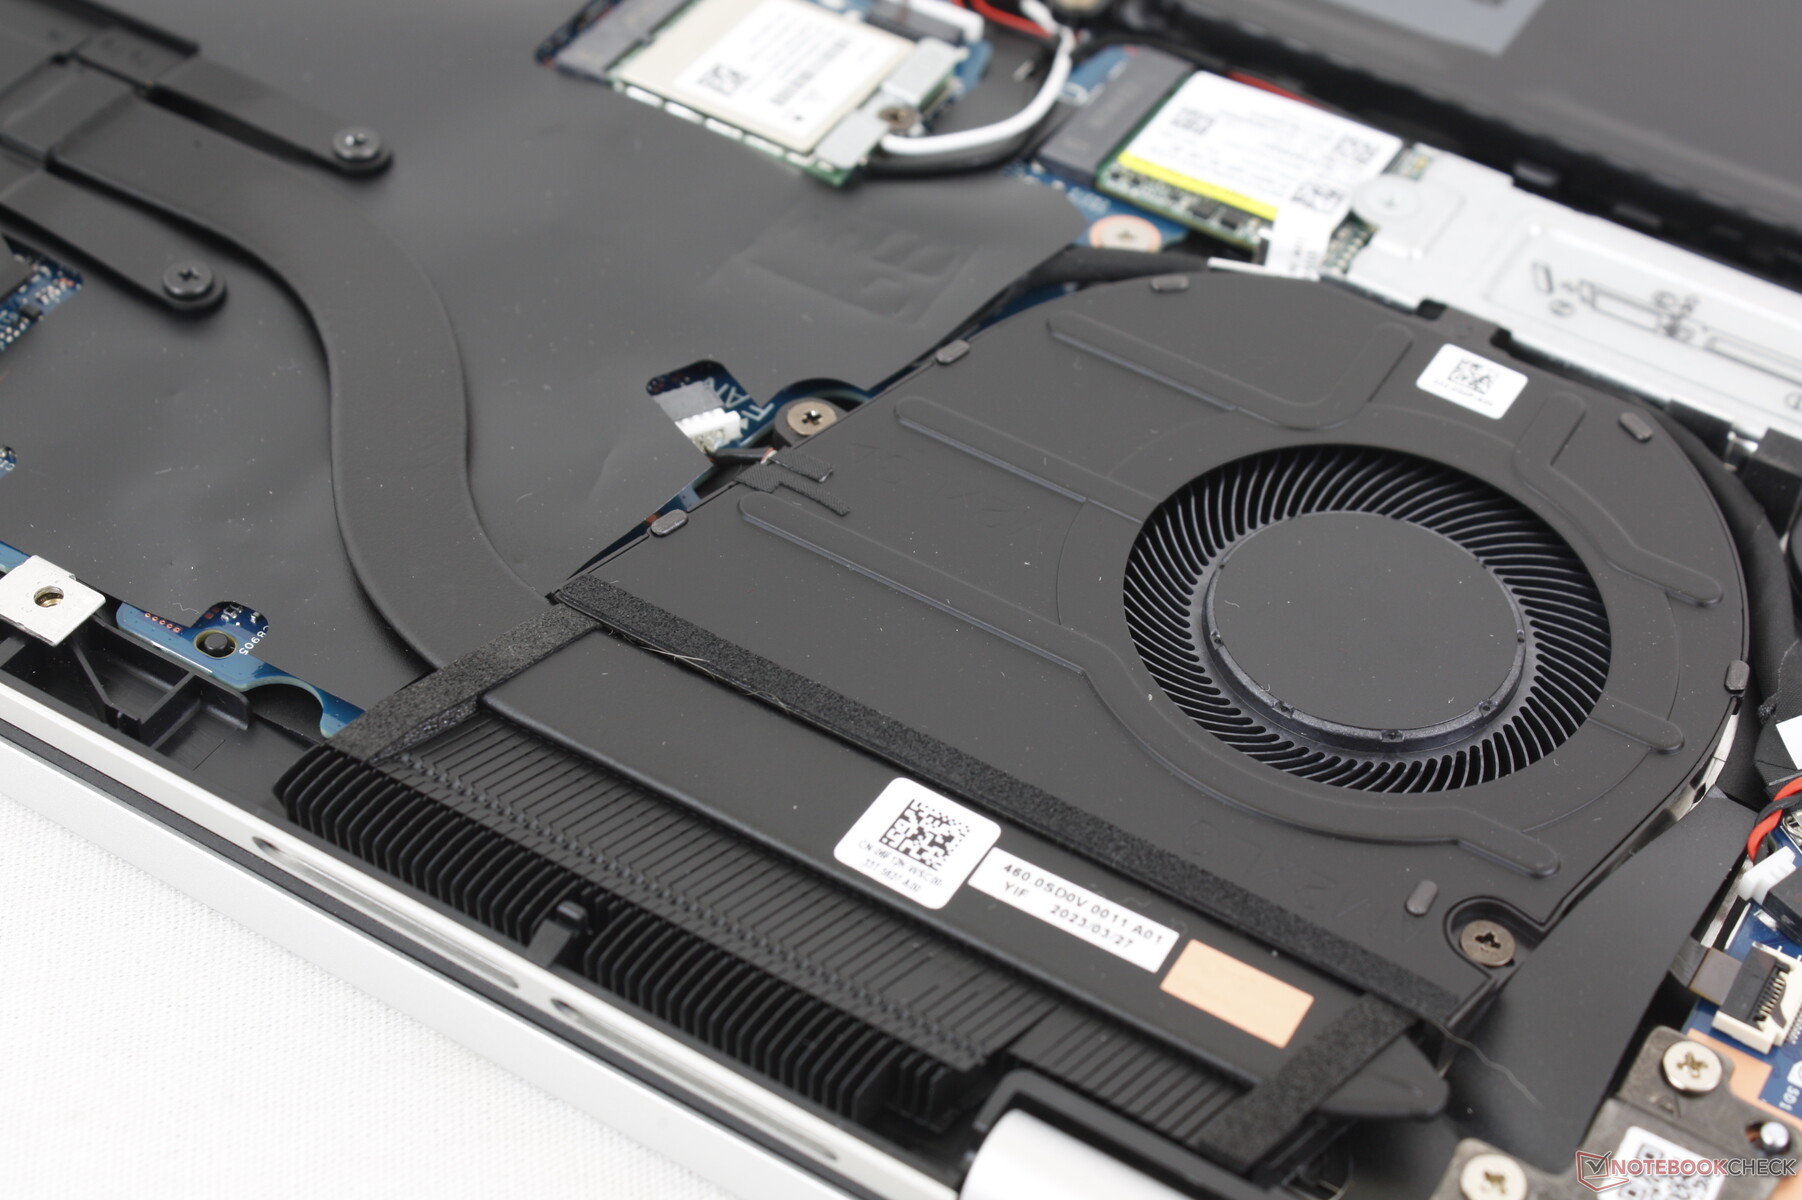
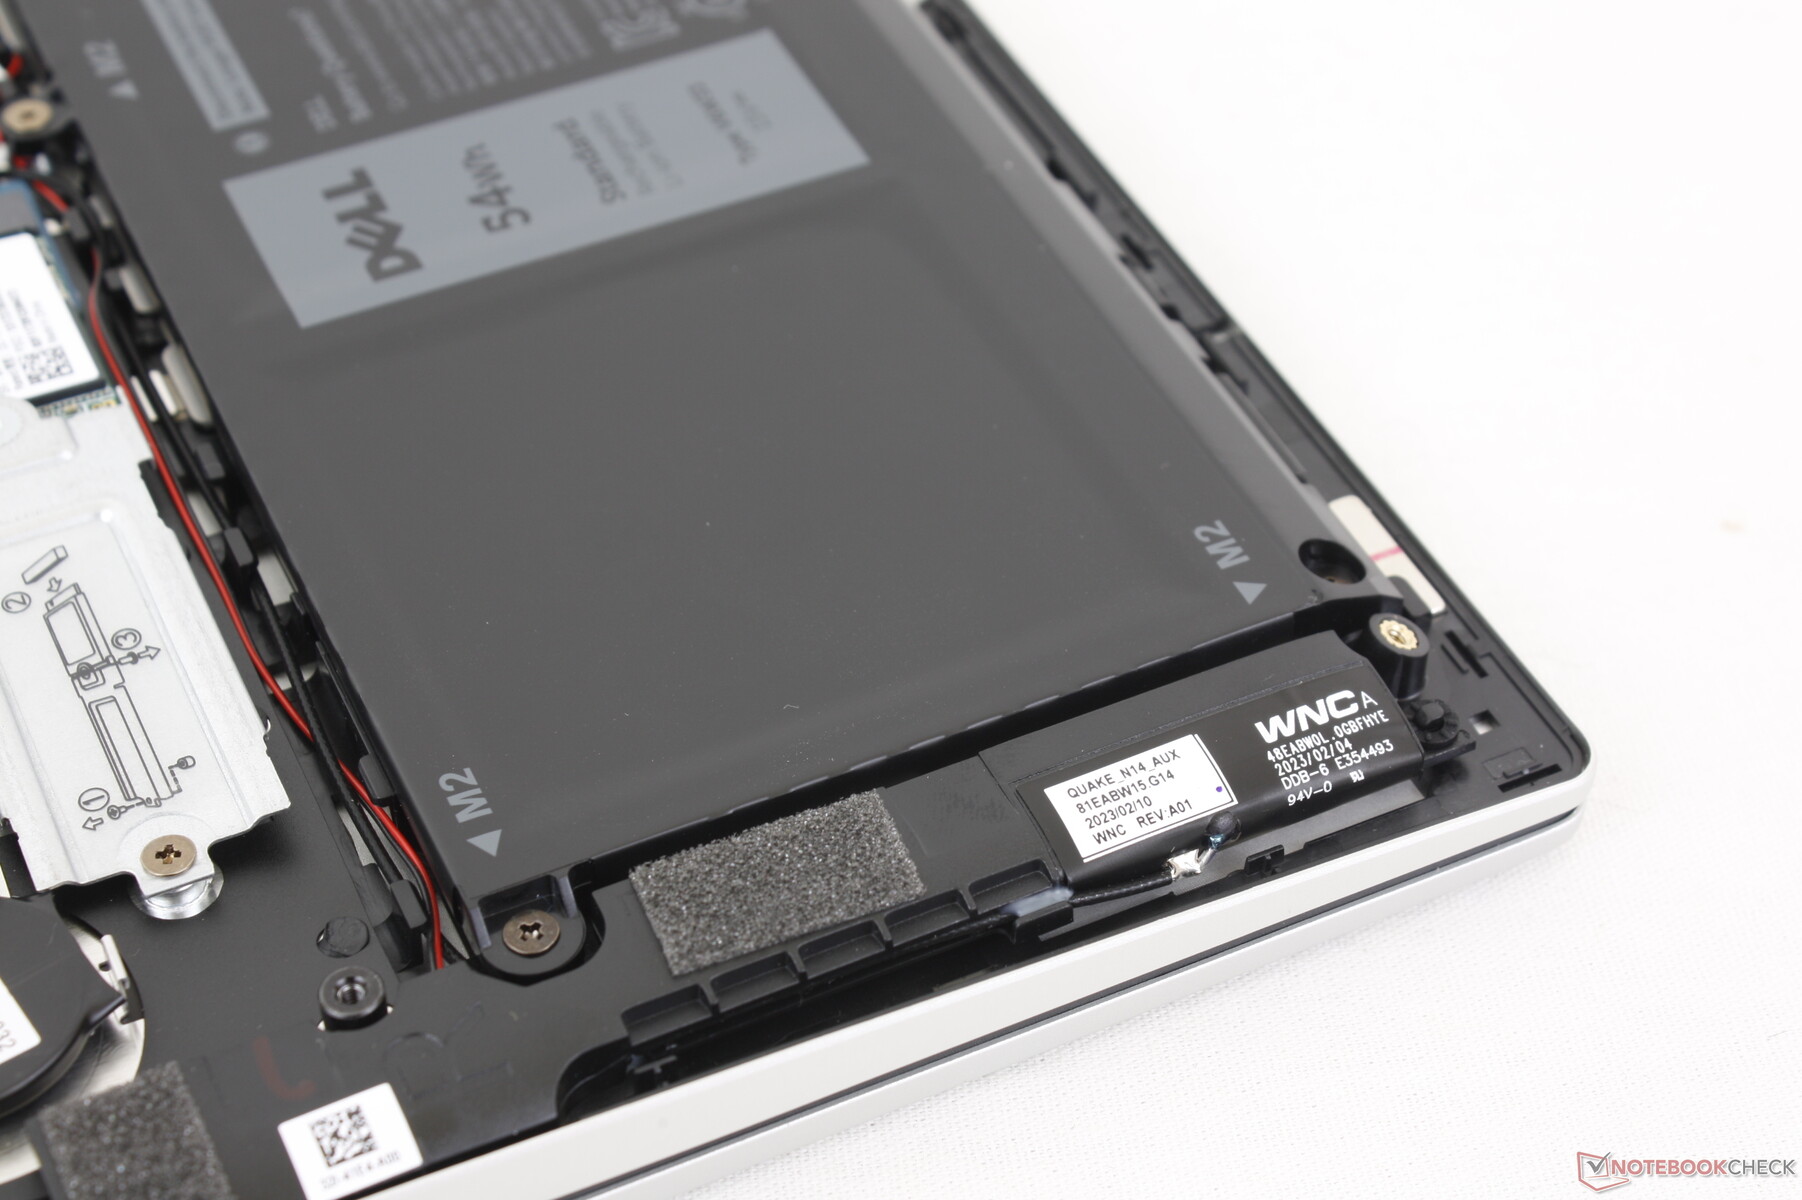
Dell a apporté un changement majeur à la carte mère par rapport à l'année dernière : La RAM est désormais soudée au lieu d'être encastrée, comme le montrent les images ci-dessous. Bien que cela soit regrettable, la RAM soudée est courante sur d'autres convertibles économiques comme l'IdeaPad Flex 7 ou l'Acer Aspire 5 Spin 14.Acer Aspire 5 Spin 14.
Accessoires et garantie
L'emballage ne contient rien d'autre que l'adaptateur secteur et la documentation. La garantie limitée habituelle d'un an du fabricant s'applique.
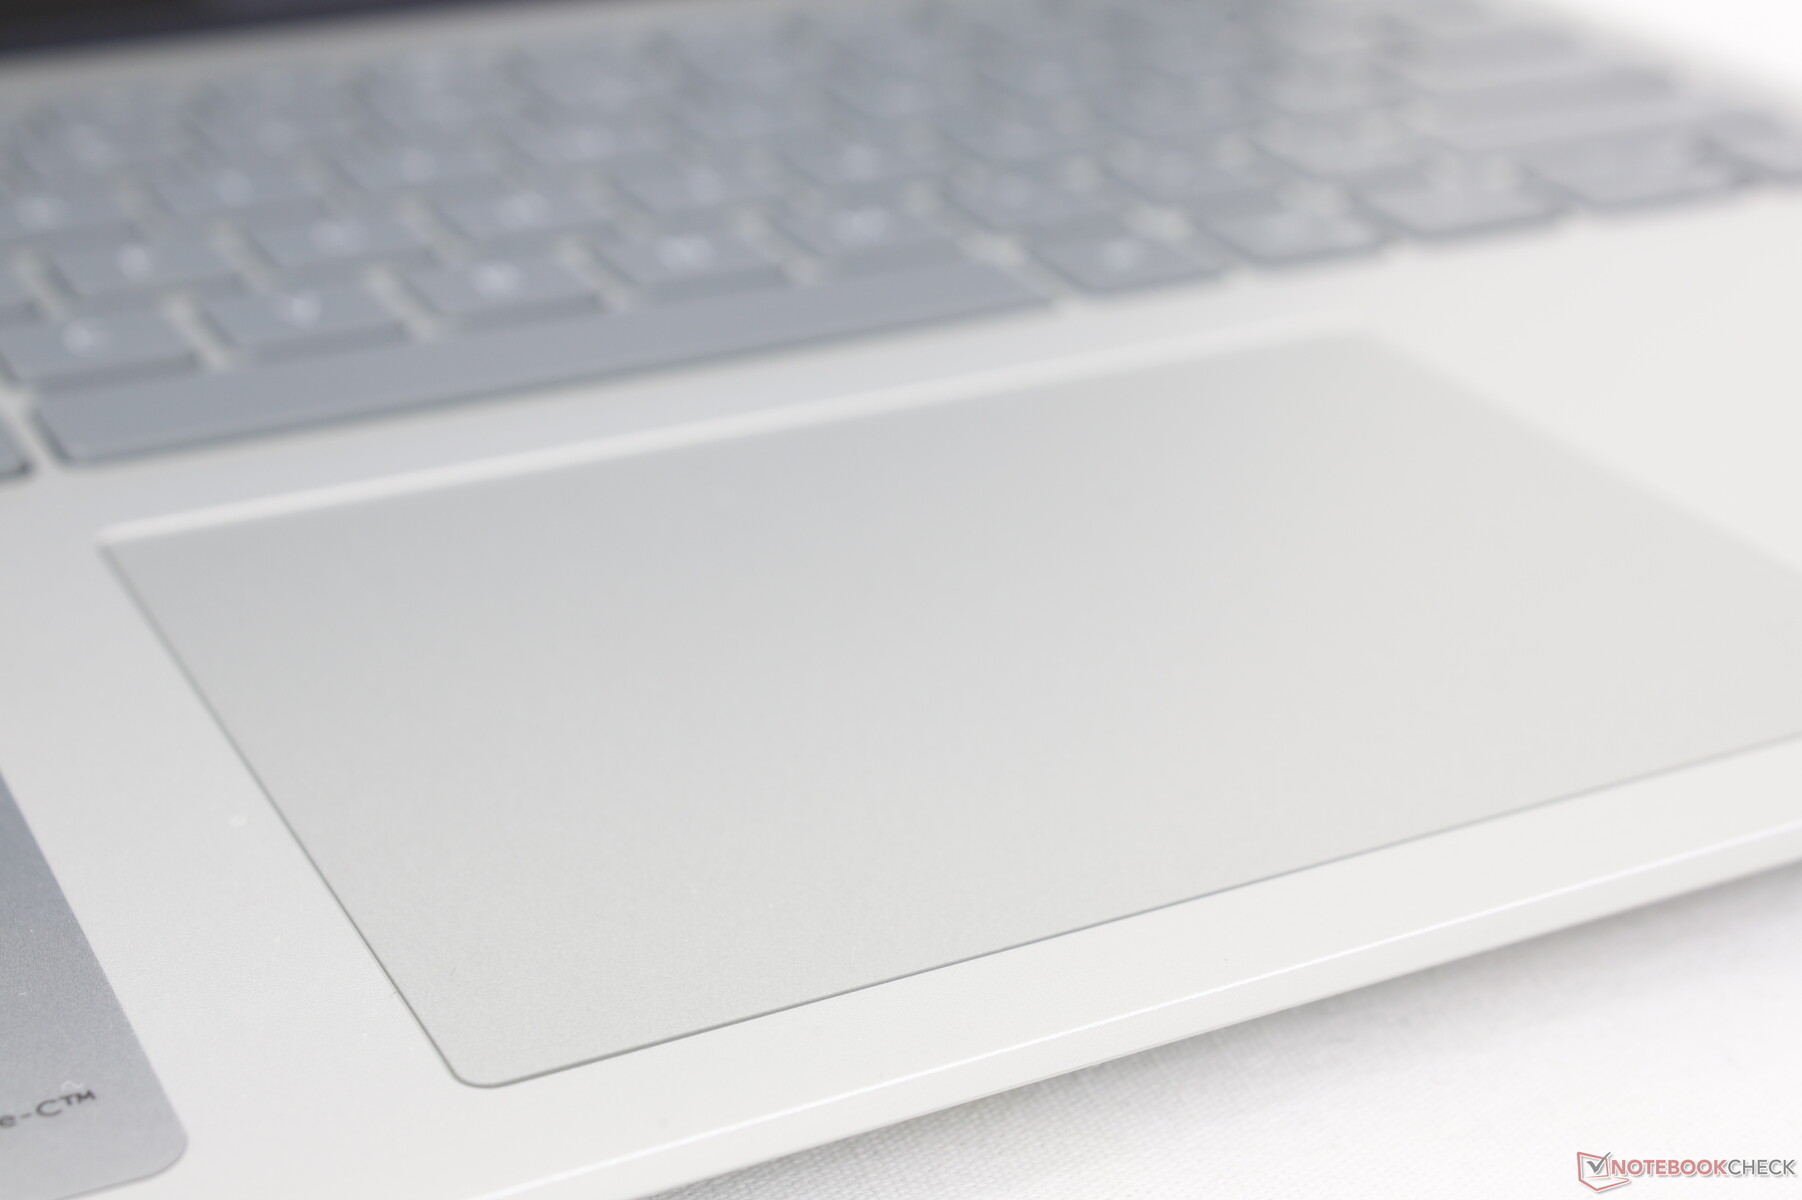
Dispositifs d'entrée - Plus de Mylar
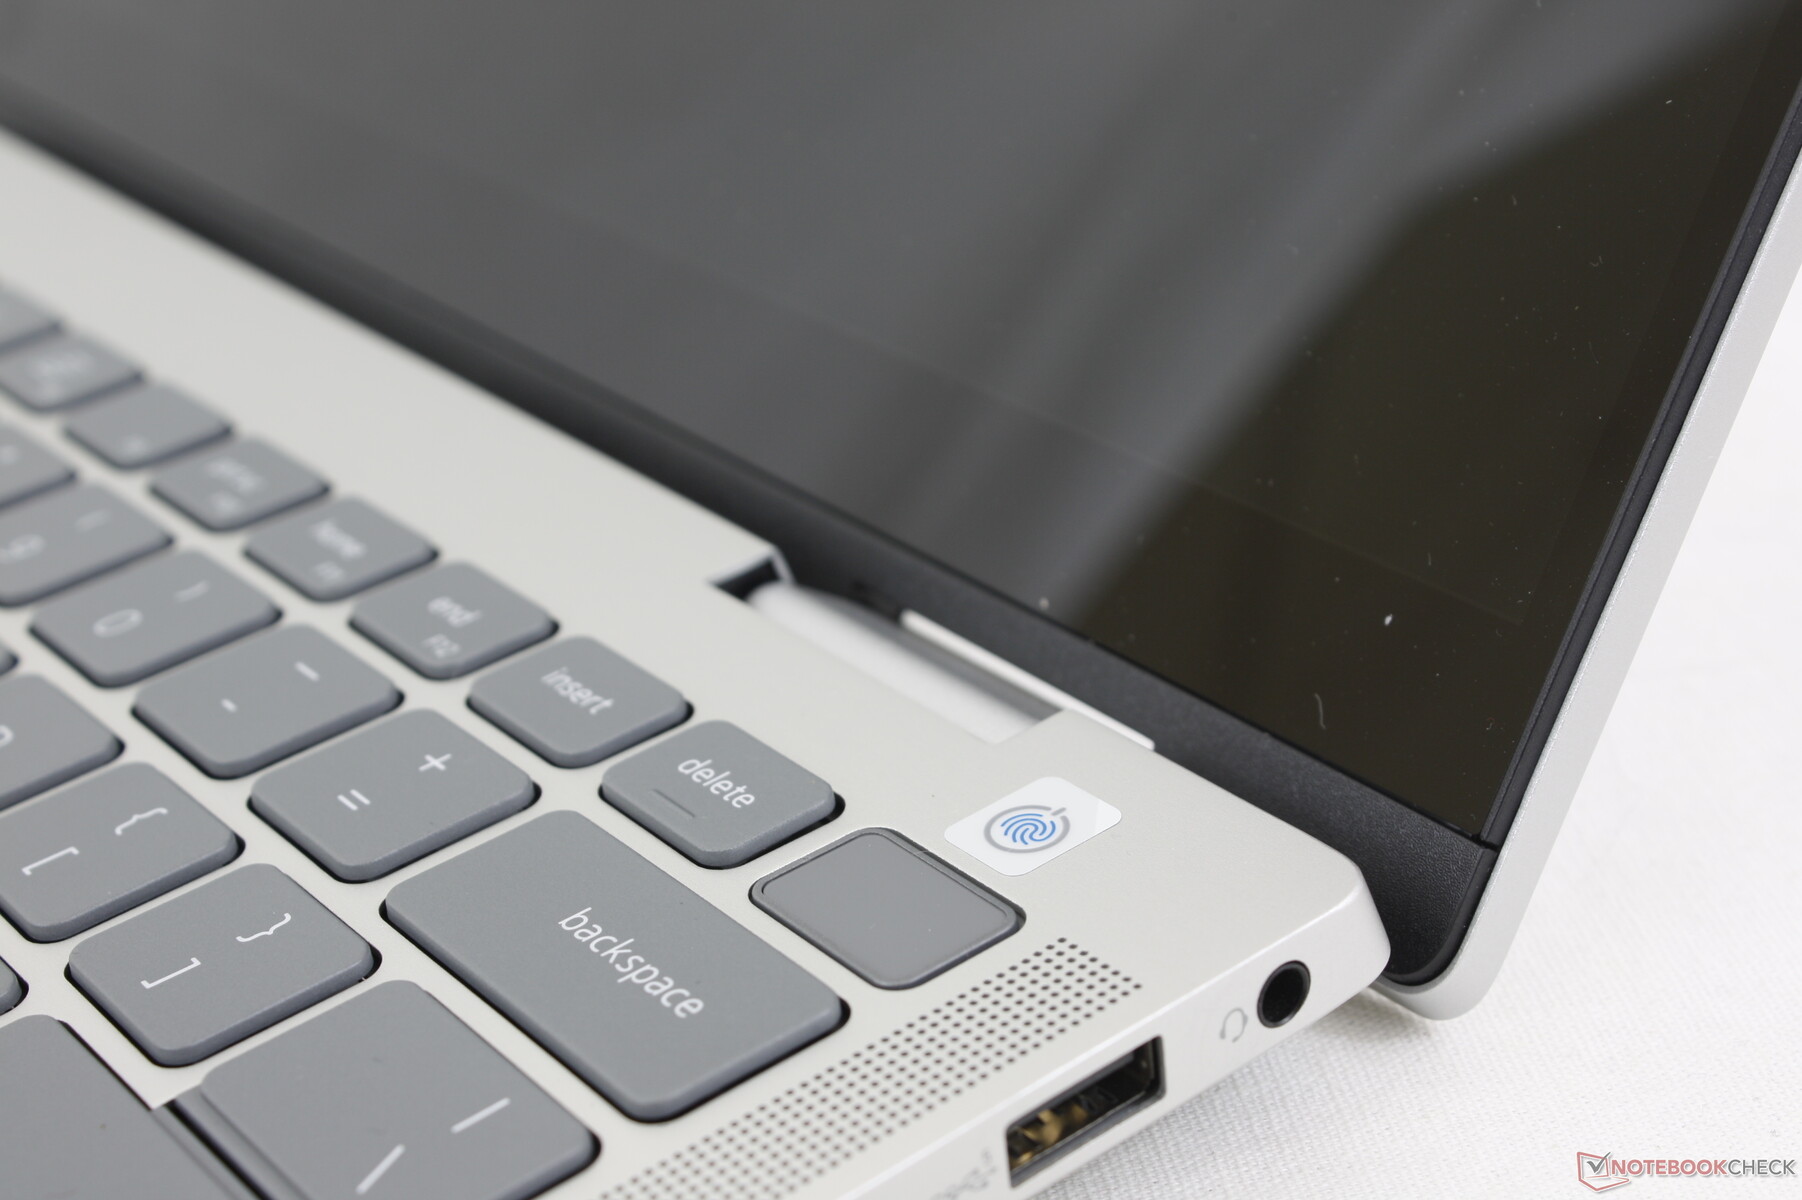
Clavier et pavé tactile
Si l'expérience de frappe au clavier reste la même que sur l'Inspiron 14 7420 de l'année dernière, il n'en va pas de même pour les autres modèles Inspiron 14 7420l'Inspiron 14 7420 de l'année dernière, le design du clickpad a changé en raison de la suppression de la couche de Mylar. Il arbore désormais une apparence plus traditionnelle tout en conservant la surface d'origine de 11,5 x 8 cm. Malheureusement, le retour d'information lors du clic ne s'est pas amélioré, car il est toujours spongieux et un peu trop superficiel.

Affichage - 60 Hz, 45% NTSC, 1200p, 16:10
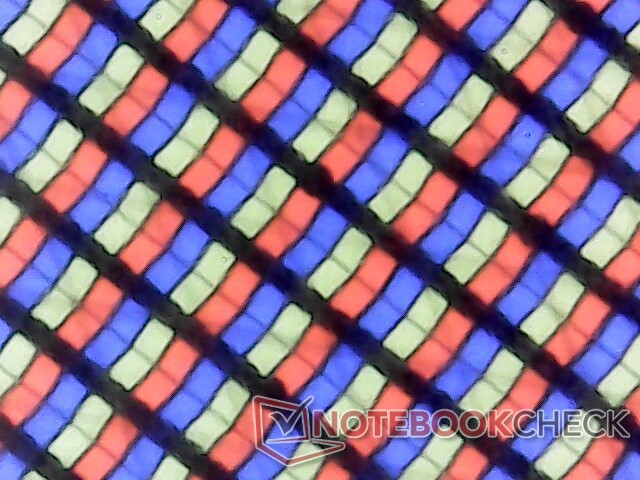
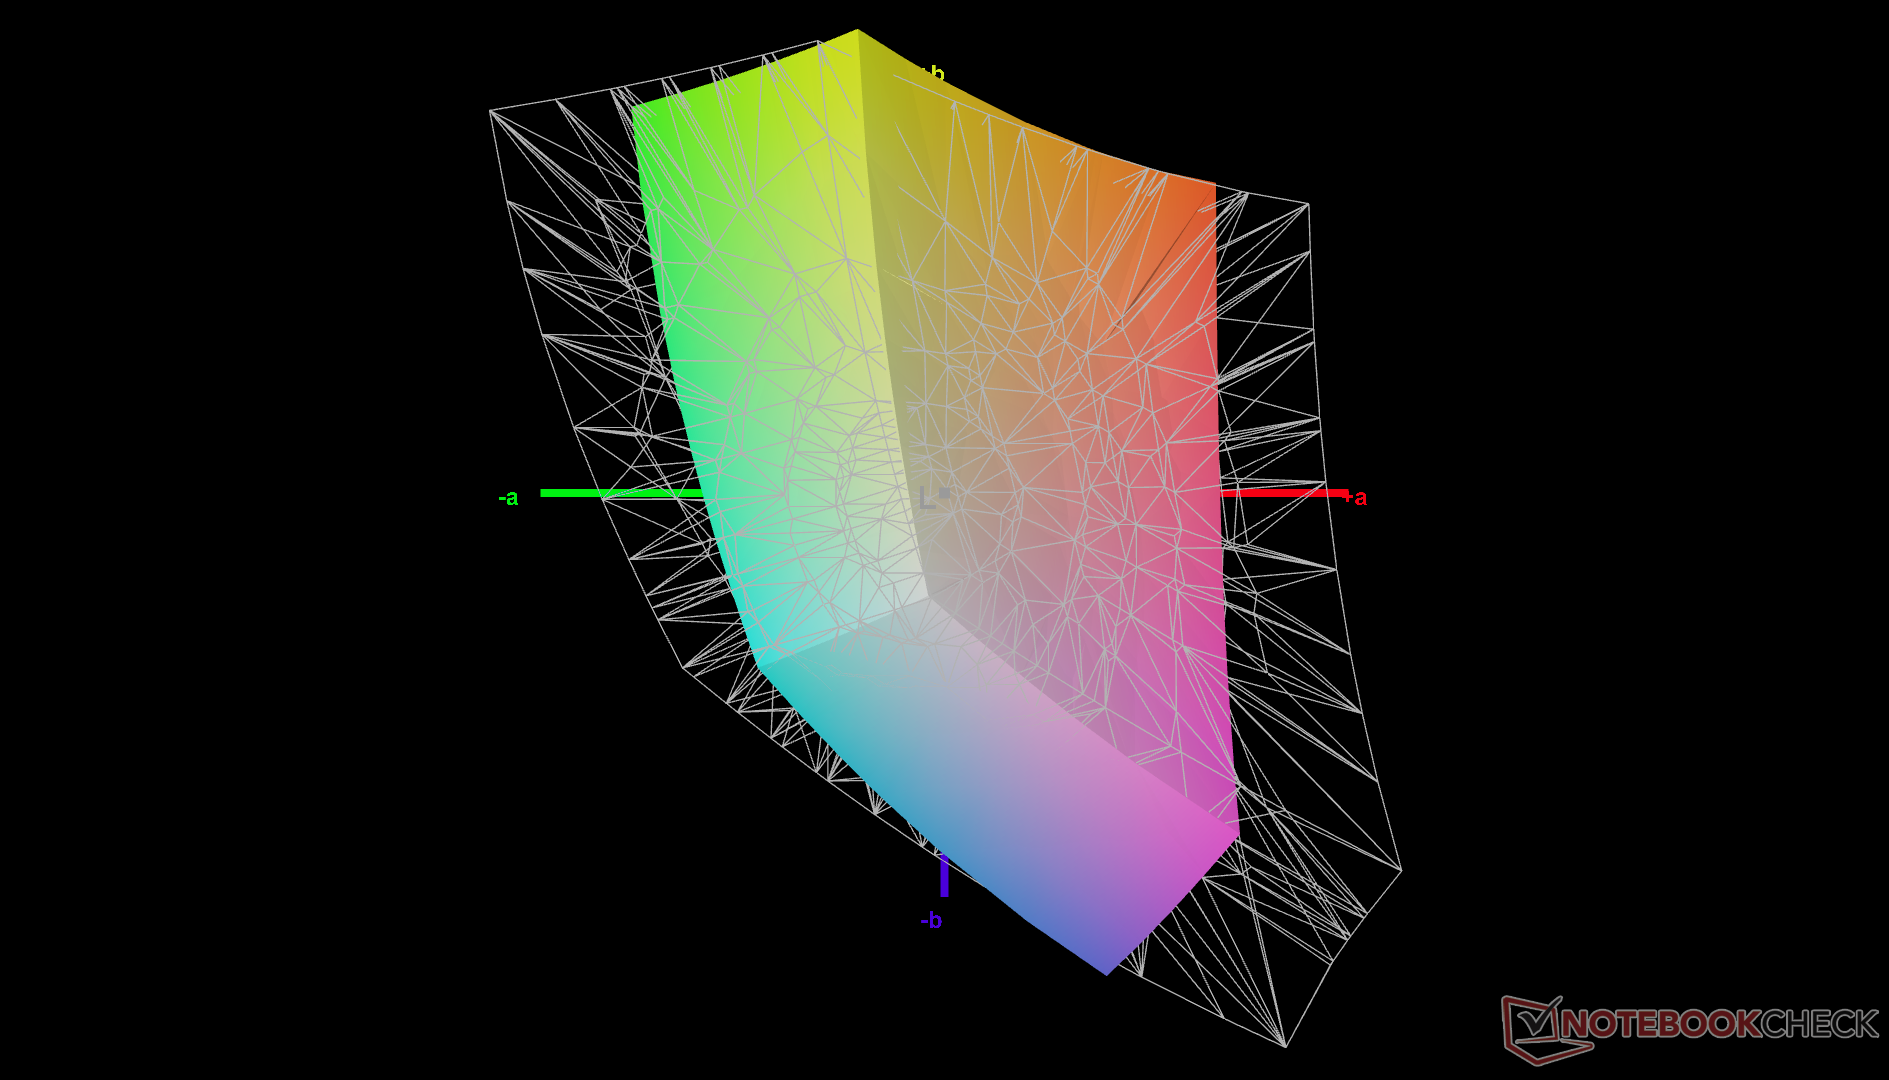
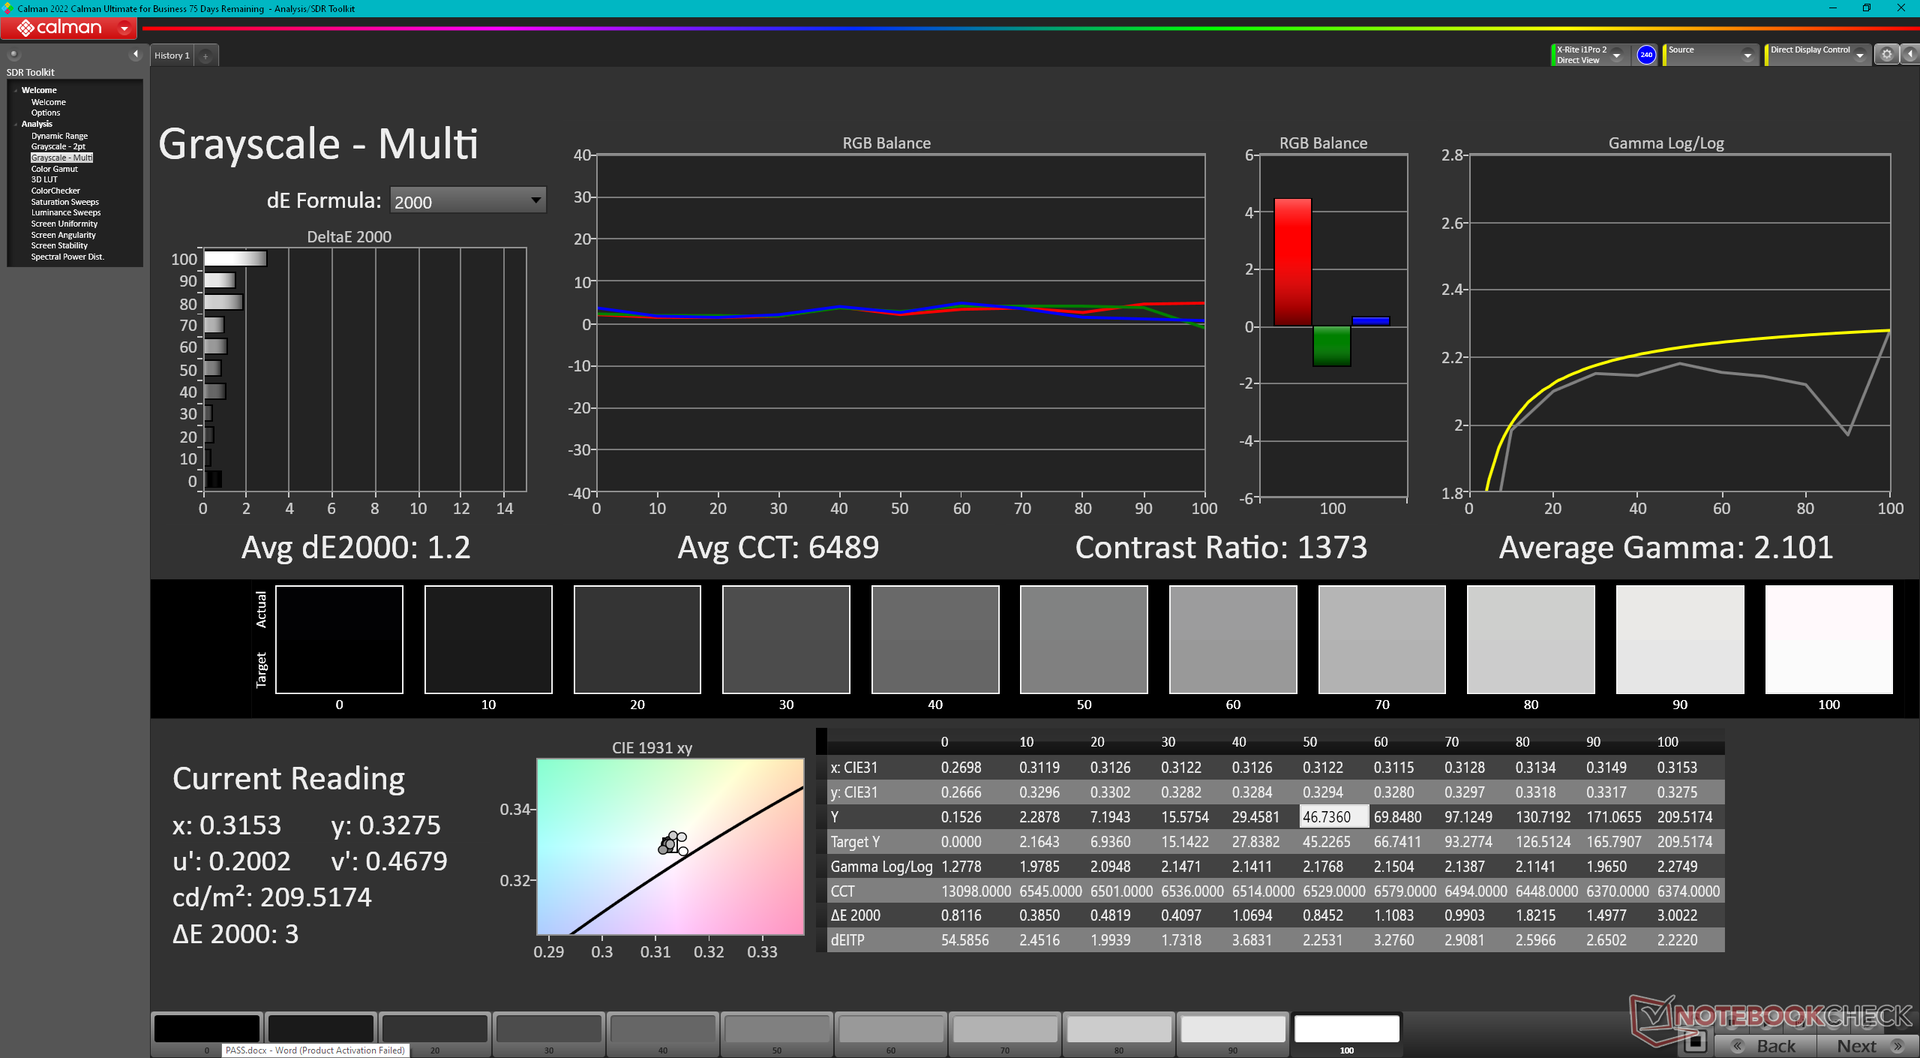
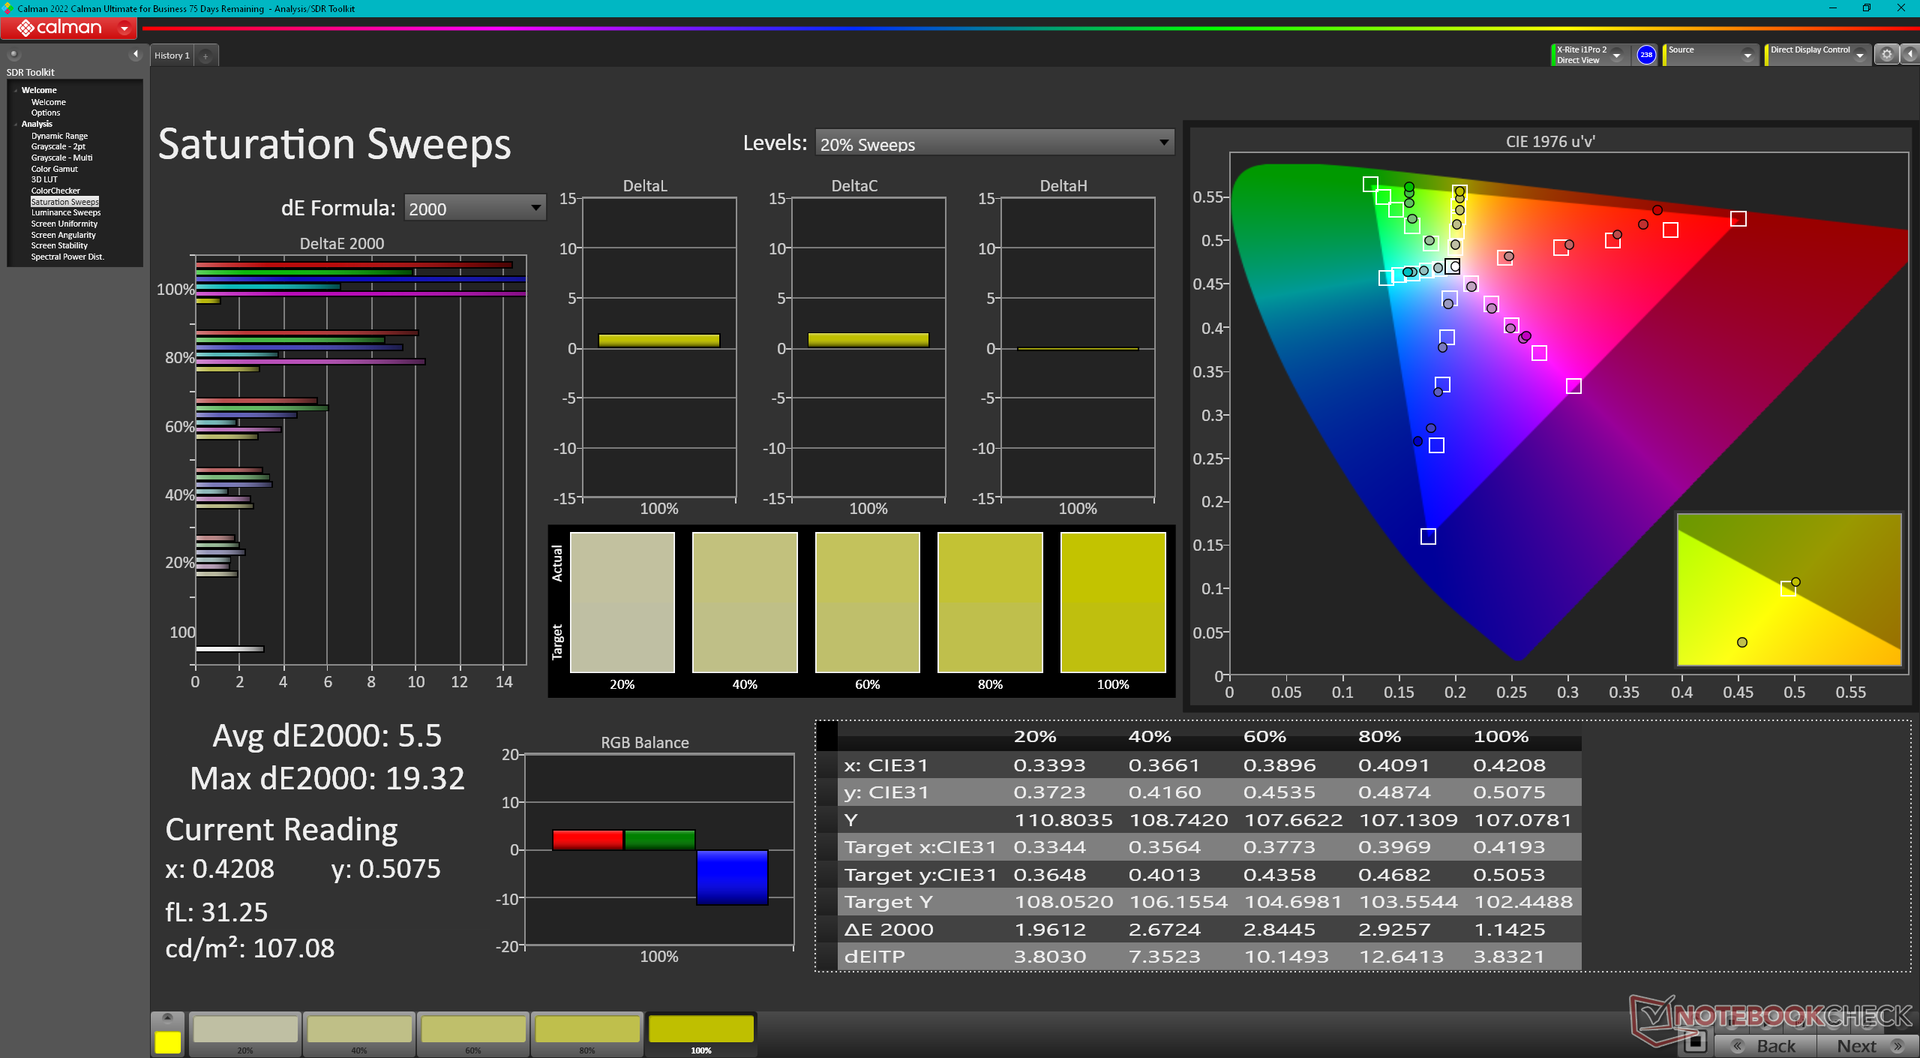
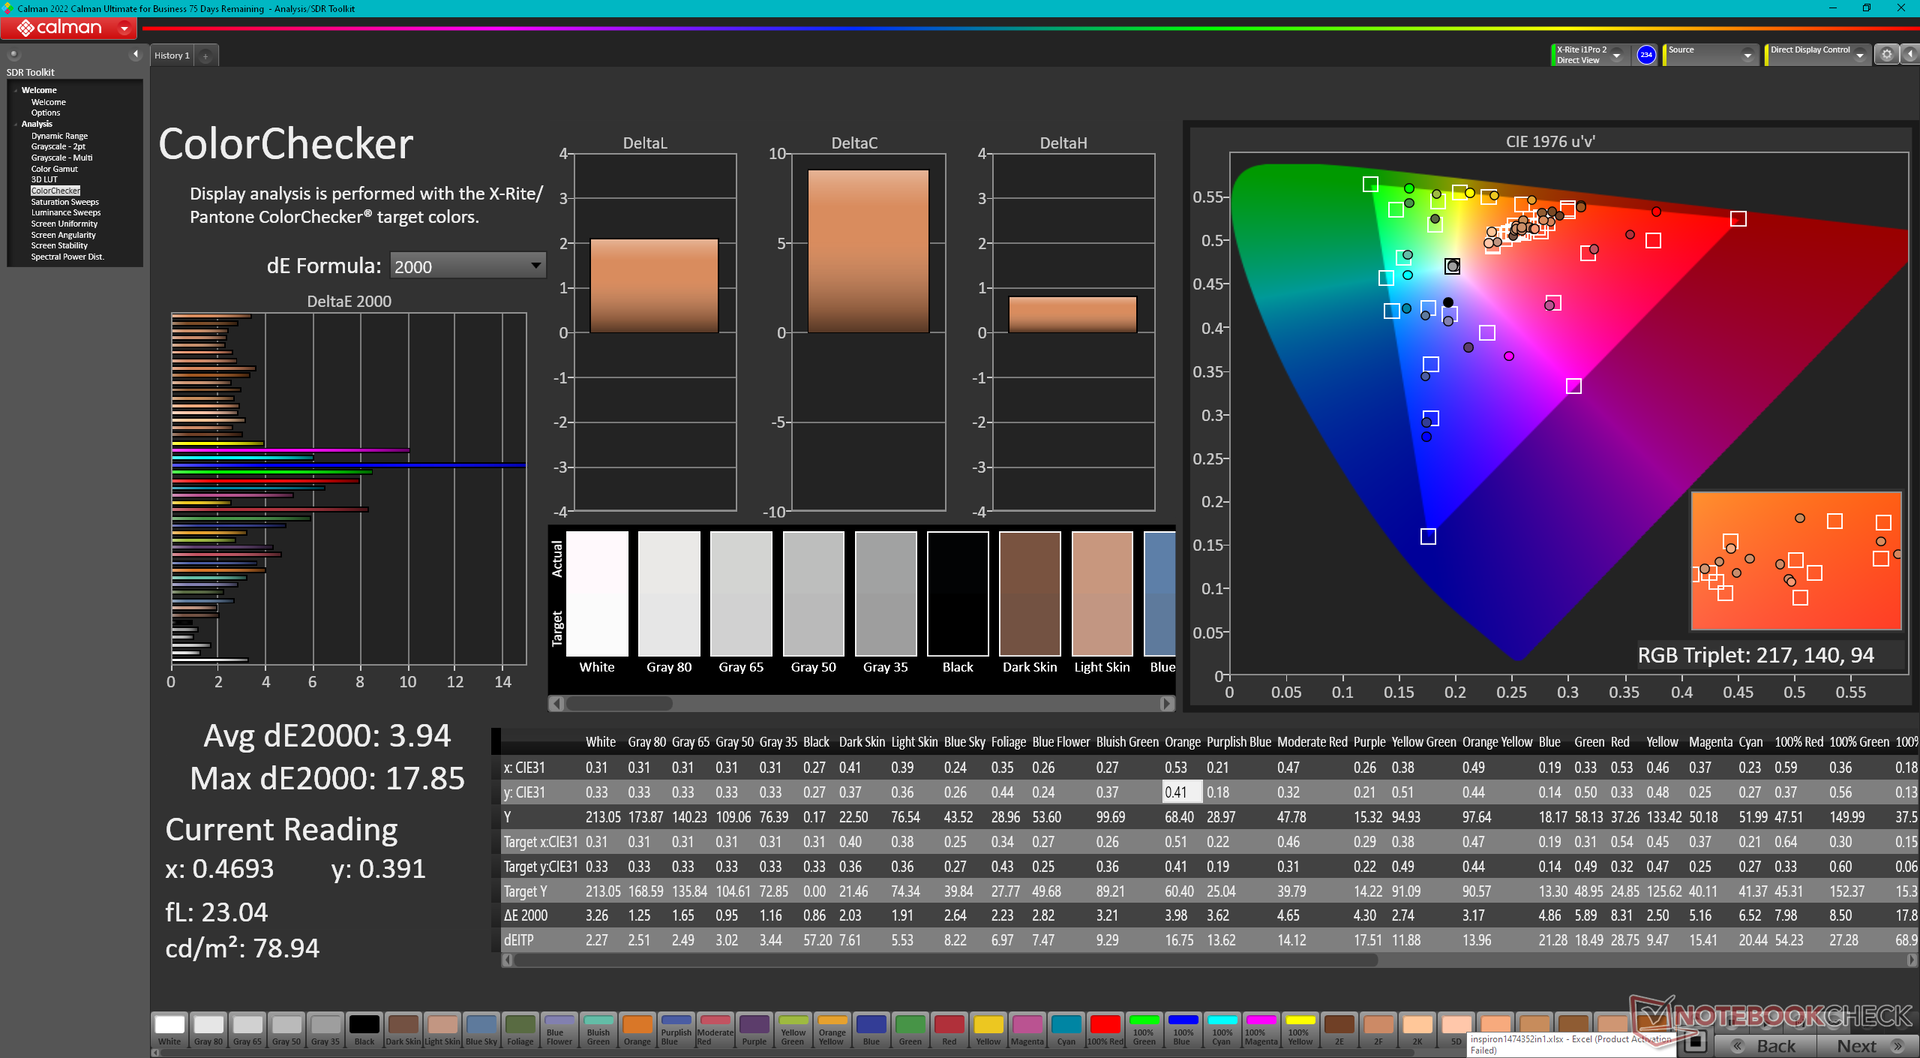
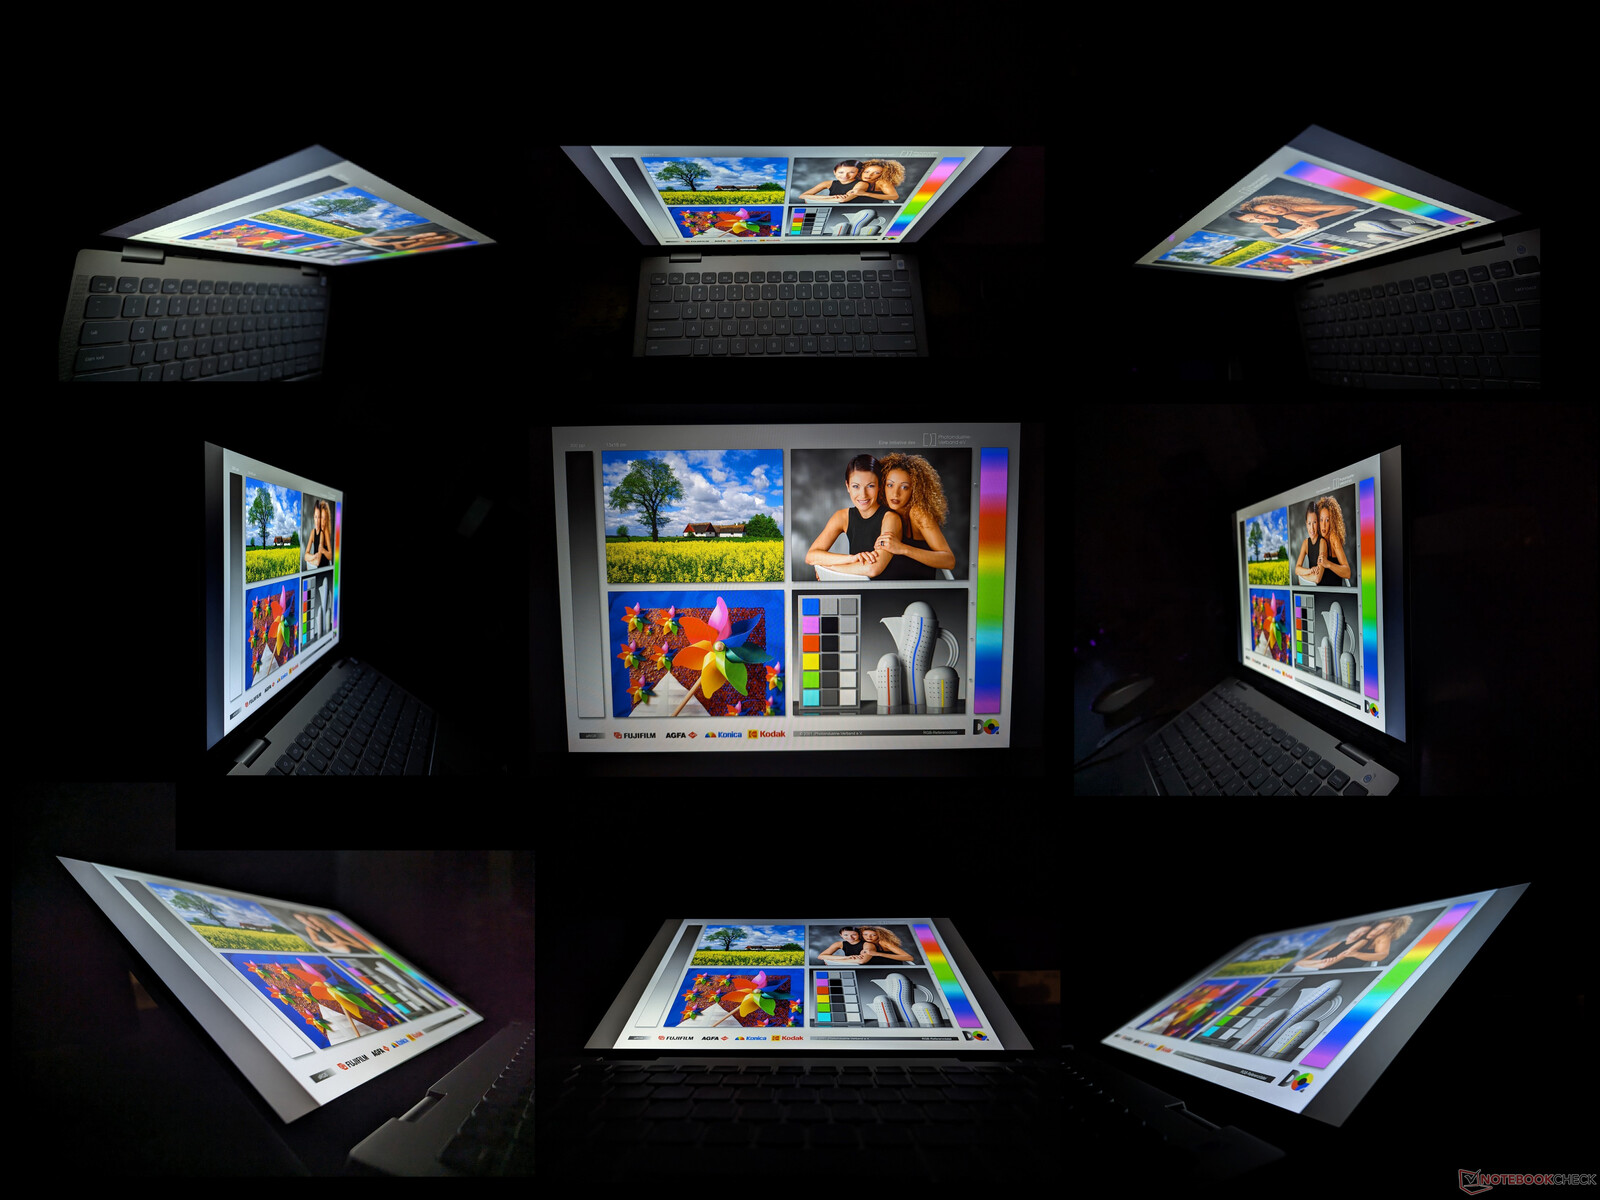
Le modèle de cette année est équipé d'un écran IPS LG Philips 140WU2 qui remplace l'écran BOE NV14N42 de l'Inspiron 14 9420 2-en-1 de l'année dernière. Les attributs principaux sont par ailleurs presque identiques, ce qui garantit une expérience visuelle similaire. La gamme de couleurs étroite, les temps de réponse moyens et le rapport de contraste médiocre sont habituels dans cette gamme de prix.
Un aspect qui aurait mérité plus d'attention est la faible luminosité de l'écran tactile. La faible plage de 200 nits est suffisante pour les environnements intérieurs, mais nos attentes sont plus élevées pour les cabriolets car leurs propriétaires sont plus susceptibles de les utiliser en voyage ou dans des conditions extérieures plus lumineuses. Si la visibilité en extérieur est un problème, les acheteurs potentiels devraient se tourner vers le modèle plus onéreux, le XPS 13 9315 2-en-1 plus cher, qui est deux fois plus lumineux que notre Inspiron.
| |||||||||||||||||||||||||
Homogénéité de la luminosité: 87 %
Valeur mesurée au centre, sur batterie: 231.8 cd/m²
Contraste: 859:1 (Valeurs des noirs: 0.27 cd/m²)
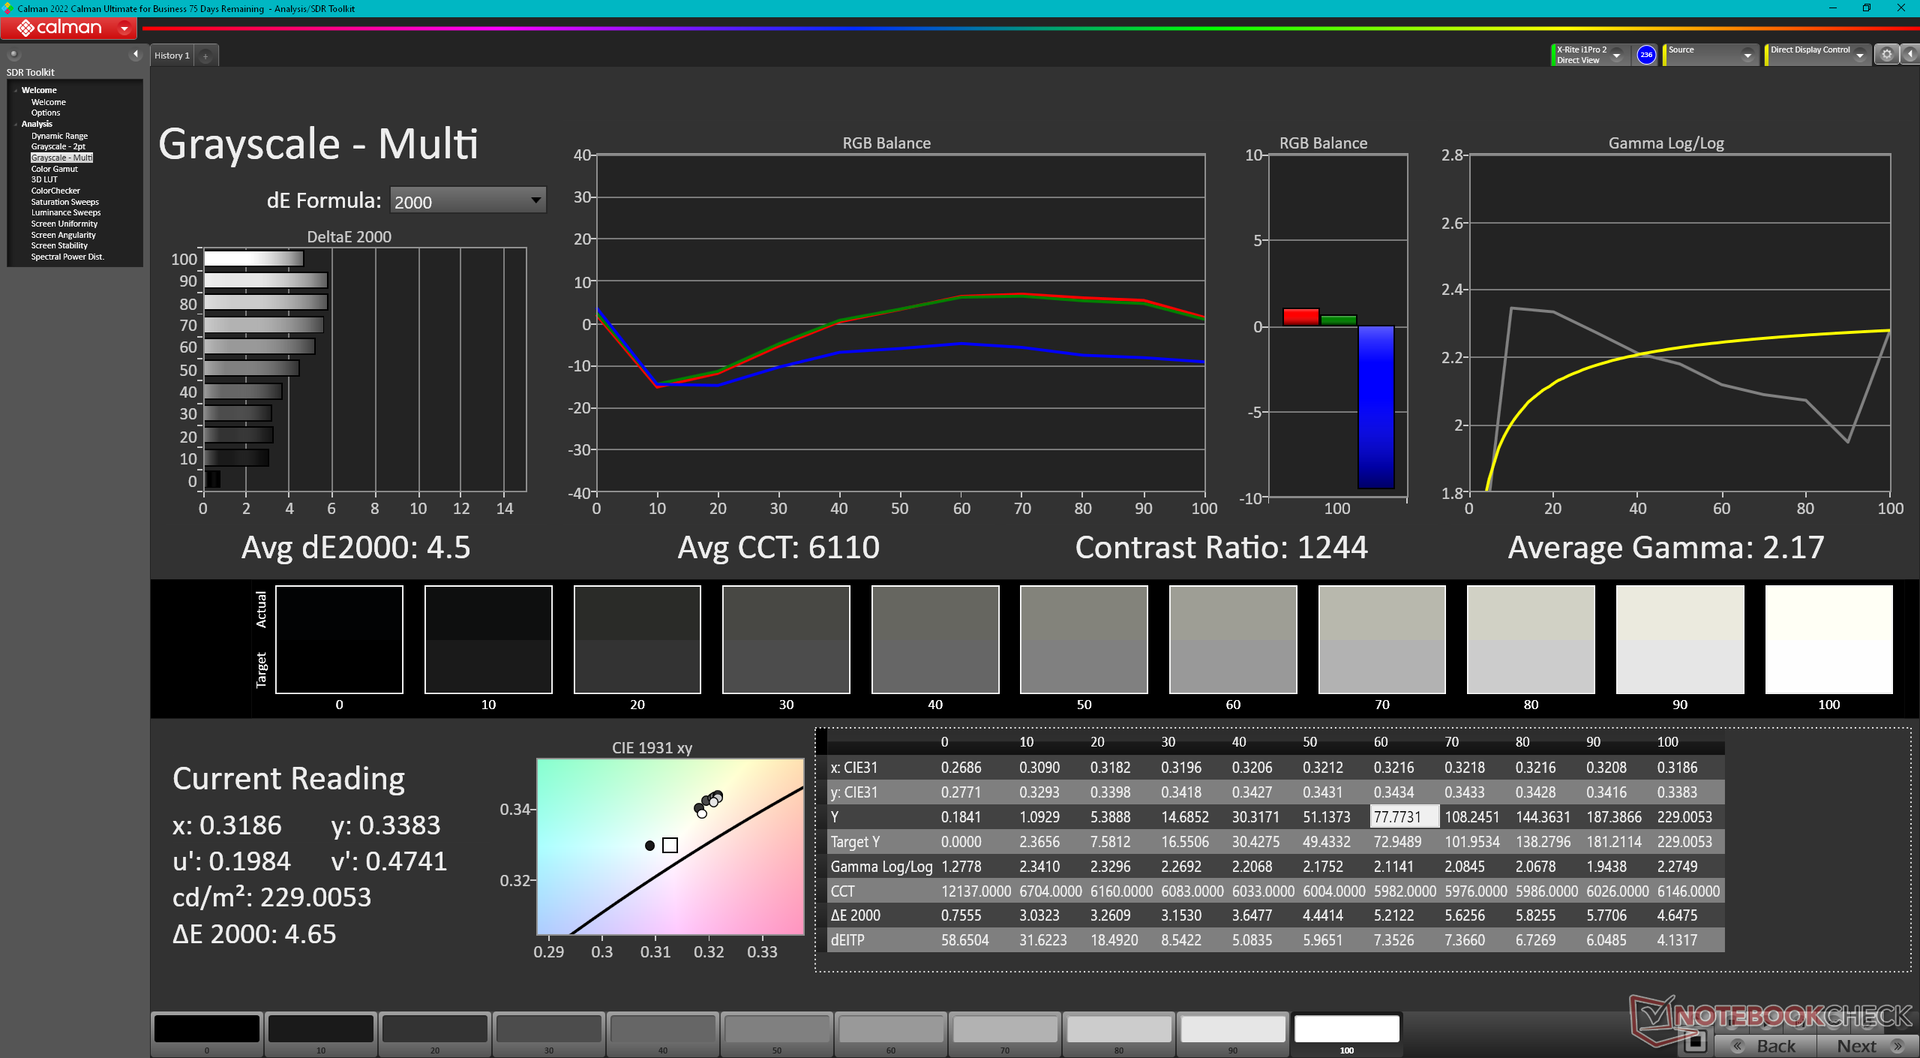
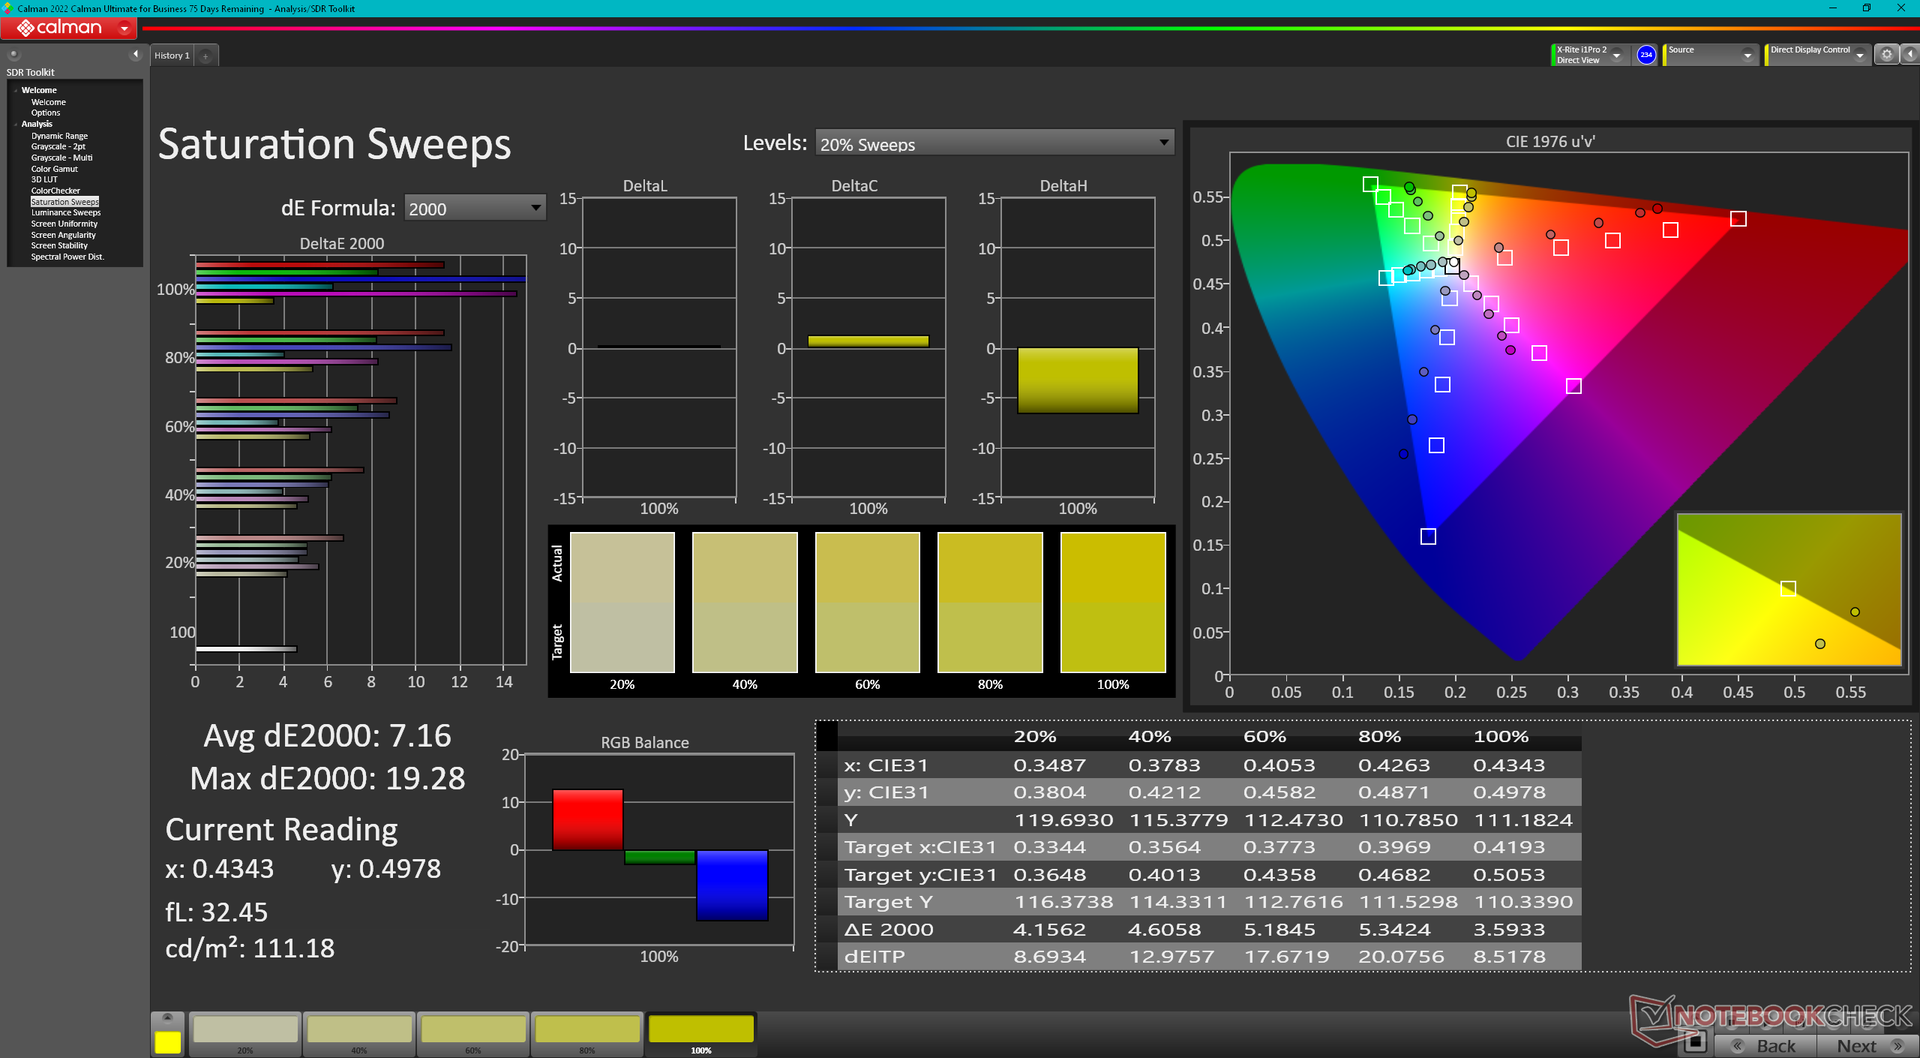
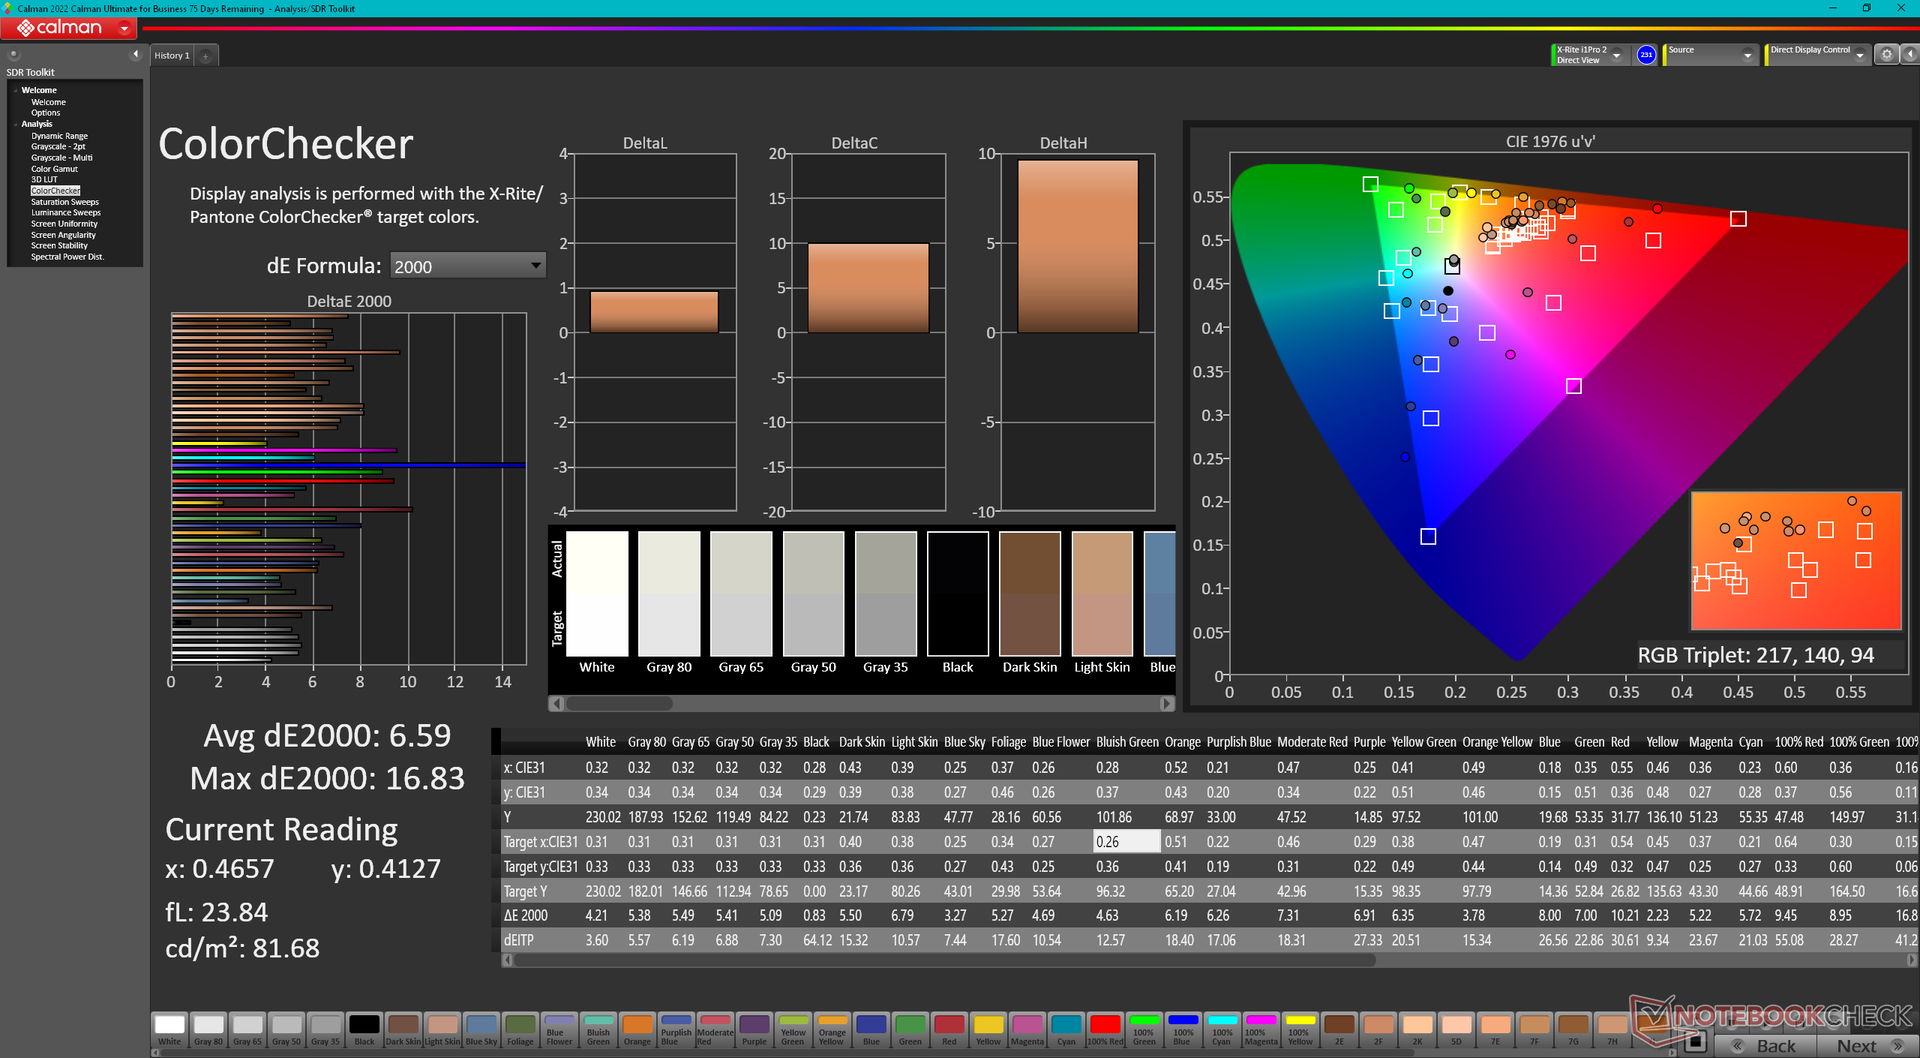
ΔE ColorChecker Calman: 6.59 | ∀{0.5-29.43 Ø4.71}
calibrated: 3.94
ΔE Greyscale Calman: 4.5 | ∀{0.09-98 Ø4.96}
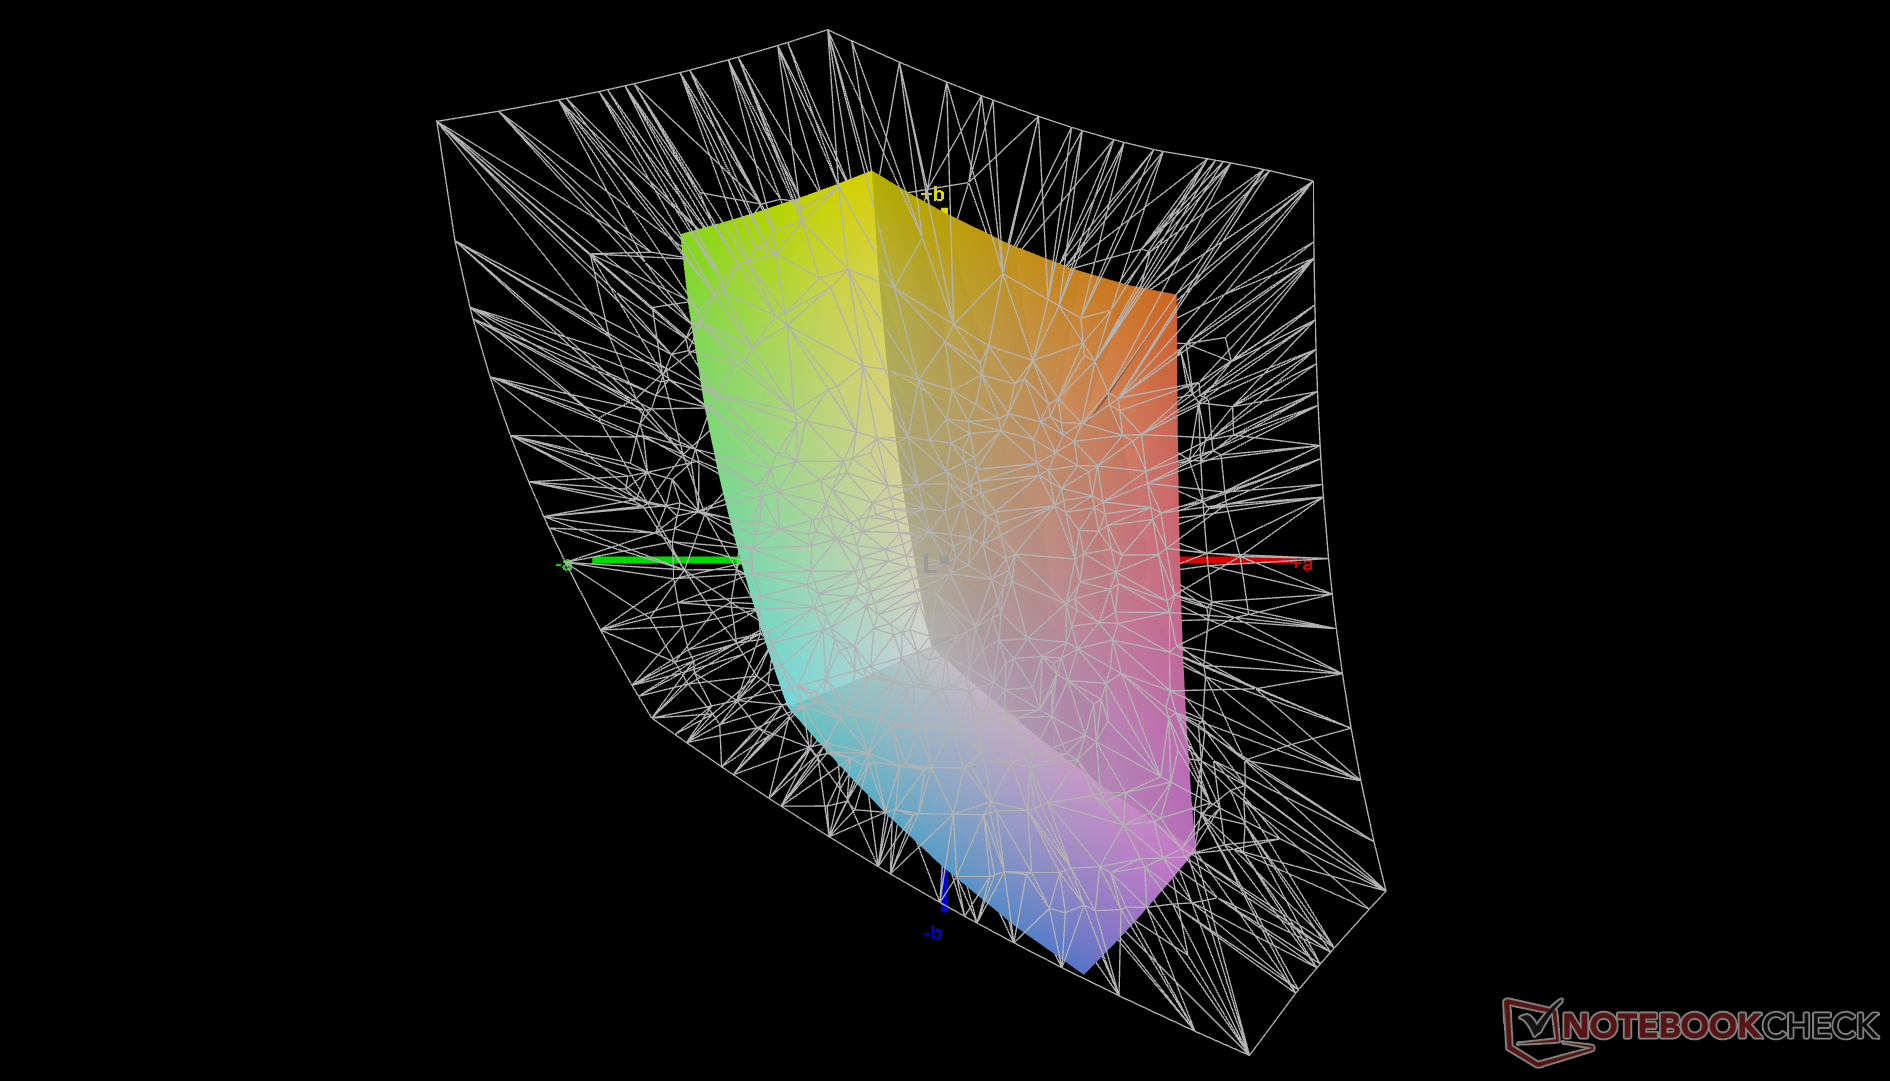
45.8% AdobeRGB 1998 (Argyll 3D)
64.4% sRGB (Argyll 3D)
44.4% Display P3 (Argyll 3D)
Gamma: 2.17
CCT: 6110 K
| Dell Inspiron 14 7435 2-in-1 LG Philips 140WU2, IPS, 1920x1200, 14" | Dell Inspiron 14 7420 2-in-1 BOE NV14N42, IPS, 1920x1200, 14" | Lenovo IdeaPad Flex 7i 14IAU7 BOE CQ NV140DRM-162, IPS, 2240x1400, 14" | Acer Aspire 5 Spin 14 BOE CQ NV140WUM-N41, IPS, 1920x1200, 14" | LG Gram 14T90P LG Philips LP140WU1-SPA1, IPS, 1900x1200, 14" | HP Pavilion x360 14-dy0157ng Chi Mei N140HCA-E5B, IPS, 1920x1080, 14" | |
|---|---|---|---|---|---|---|
| Display | -13% | 56% | -12% | 89% | -3% | |
| Display P3 Coverage (%) | 44.4 | 38.6 -13% | 69.8 57% | 38.5 -13% | 98.8 123% | 42.7 -4% |
| sRGB Coverage (%) | 64.4 | 56.2 -13% | 98 52% | 57.3 -11% | 100 55% | 63.7 -1% |
| AdobeRGB 1998 Coverage (%) | 45.8 | 39.9 -13% | 72.2 58% | 39.8 -13% | 44.2 -3% | |
| Response Times | -24% | -101% | -23% | -90% | -39% | |
| Response Time Grey 50% / Grey 80% * (ms) | 19.6 ? | 27.2 ? -39% | 44.4 ? -127% | 29 ? -48% | 44 ? -124% | 32 ? -63% |
| Response Time Black / White * (ms) | 19.3 ? | 20.8 ? -8% | 33.6 ? -74% | 19 ? 2% | 30 ? -55% | 22 ? -14% |
| PWM Frequency (Hz) | ||||||
| Screen | -6% | 31% | 12% | 34% | 39% | |
| Brightness middle (cd/m²) | 231.8 | 269.4 16% | 317.3 37% | 249 7% | 305.5 32% | 269 16% |
| Brightness (cd/m²) | 216 | 260 20% | 301 39% | 235 9% | 289 34% | 241 12% |
| Brightness Distribution (%) | 87 | 89 2% | 90 3% | 85 -2% | 87 0% | 82 -6% |
| Black Level * (cd/m²) | 0.27 | 0.41 -52% | 0.22 19% | 0.27 -0% | 0.27 -0% | 0.11 59% |
| Contrast (:1) | 859 | 657 -24% | 1442 68% | 922 7% | 1131 32% | 2445 185% |
| Colorchecker dE 2000 * | 6.59 | 6.53 1% | 3.99 39% | 5 24% | 3.31 50% | 5.68 14% |
| Colorchecker dE 2000 max. * | 16.83 | 19.76 -17% | 9.34 45% | 8.32 51% | 6.12 64% | 9.61 43% |
| Colorchecker dE 2000 calibrated * | 3.94 | 3.13 21% | 0.6 85% | 5.06 -28% | ||
| Greyscale dE 2000 * | 4.5 | 5.4 -20% | 6.9 -53% | 2.86 36% | 1.9 58% | 4.95 -10% |
| Gamma | 2.17 101% | 2.05 107% | 2.19 100% | 2.19 100% | 2.04 108% | 2.17 101% |
| CCT | 6110 106% | 6007 108% | 6161 106% | 6419 101% | 6706 97% | 6628 98% |
| Color Space (Percent of AdobeRGB 1998) (%) | 44.2 | |||||
| Color Space (Percent of sRGB) (%) | 63.7 | |||||
| Moyenne finale (programmes/paramètres) | -14% /
-10% | -5% /
18% | -8% /
2% | 11% /
22% | -1% /
18% |
* ... Moindre est la valeur, meilleures sont les performances
La température des couleurs est légèrement trop chaude à la sortie de l'emballage. Un étalonnage avec notre colorimètre X-Rite permet de résoudre ce problème et d'obtenir des couleurs plus précises dans l'ensemble. Notez toutefois que les couleurs resteront imprécises à des niveaux de saturation plus élevés en raison de la couverture sRGB limitée mentionnée ci-dessus.
Temps de réponse de l'écran
| ↔ Temps de réponse noir à blanc | ||
|---|---|---|
| 19.3 ms ... hausse ↗ et chute ↘ combinées | ↗ 10.6 ms hausse | 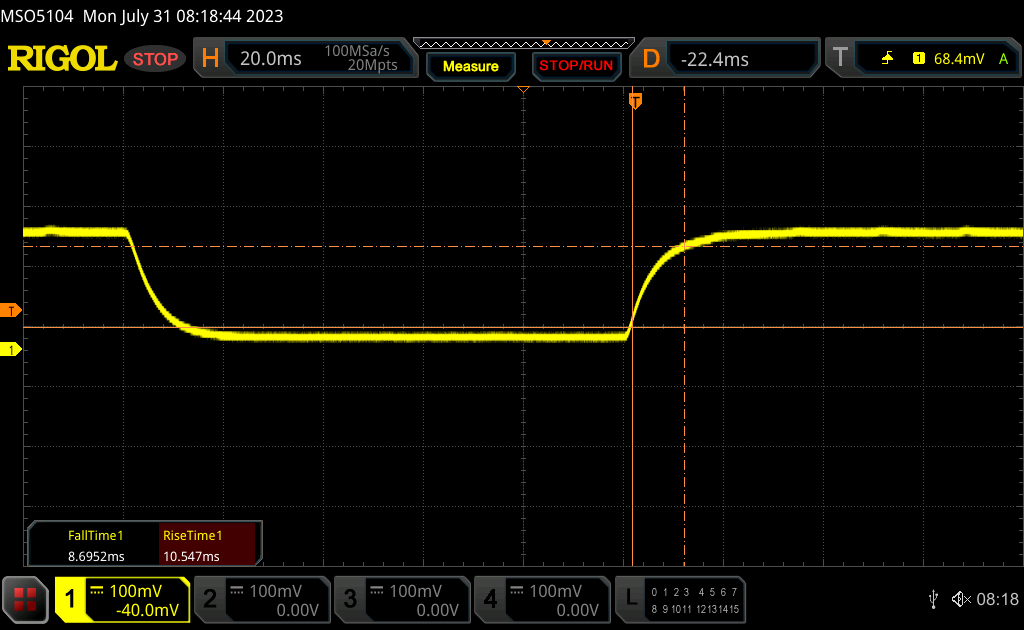 |
| ↘ 8.7 ms chute | ||
| L'écran montre de bons temps de réponse, mais insuffisant pour du jeu compétitif. En comparaison, tous les appareils testés affichent entre 0.1 (minimum) et 240 (maximum) ms. » 43 % des appareils testés affichent de meilleures performances. Cela signifie que les latences relevées sont similaires à la moyenne (19.8 ms) de tous les appareils testés. | ||
| ↔ Temps de réponse gris 50% à gris 80% | ||
| 19.6 ms ... hausse ↗ et chute ↘ combinées | ↗ 13.6 ms hausse | 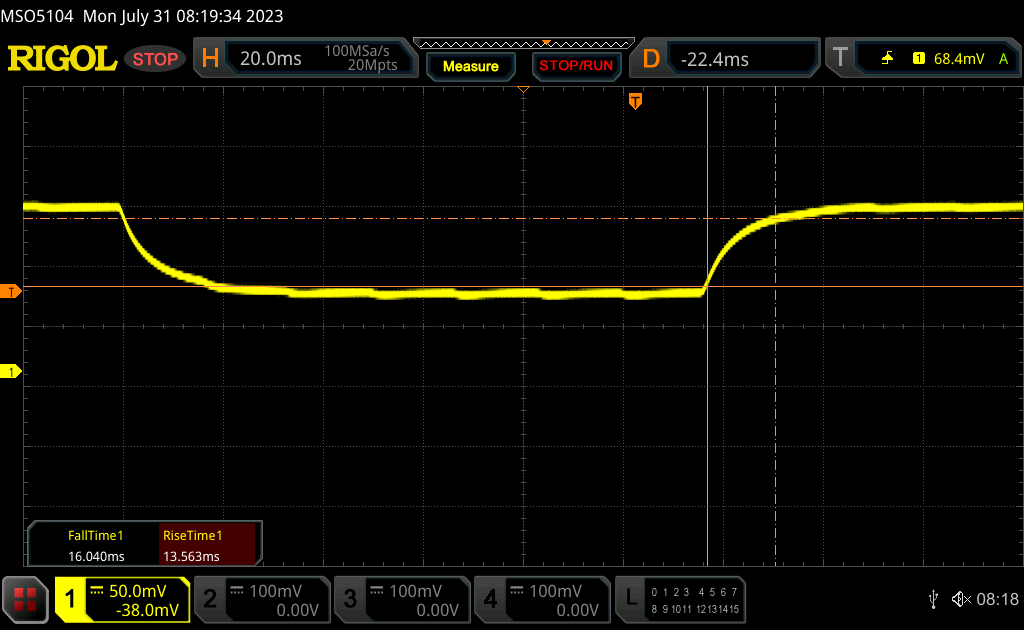 |
| ↘ 16 ms chute | ||
| L'écran montre de bons temps de réponse, mais insuffisant pour du jeu compétitif. En comparaison, tous les appareils testés affichent entre 0.165 (minimum) et 636 (maximum) ms. » 33 % des appareils testés affichent de meilleures performances. Cela signifie que les latences relevées sont meilleures que la moyenne (30.9 ms) de tous les appareils testés. | ||
Scintillement / MLI (Modulation de largeur d'impulsion)
| Scintillement / MLI (Modulation de largeur d'impulsion) non décelé | 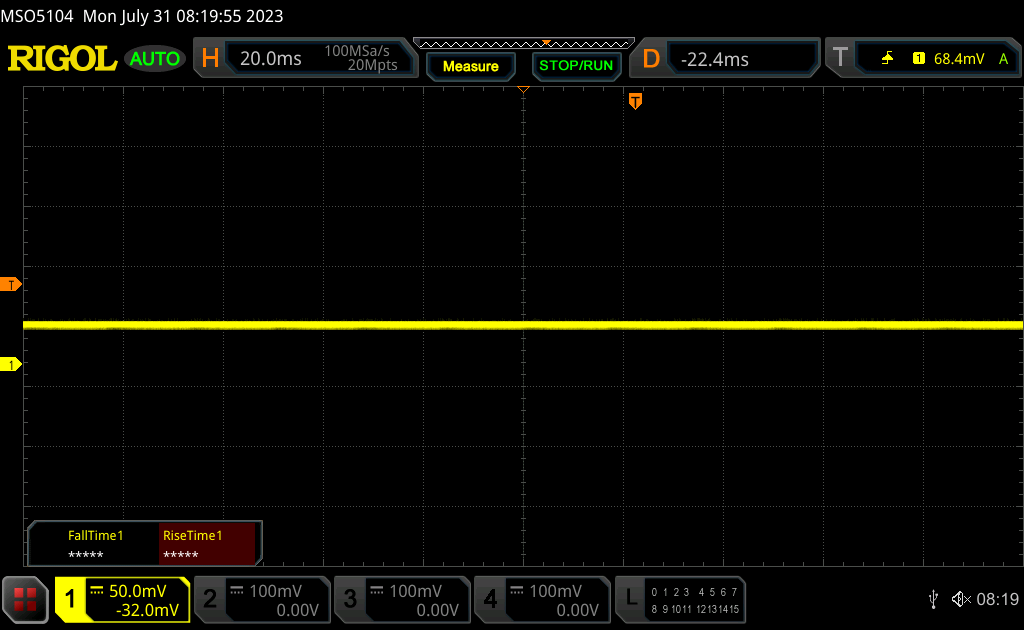 | ||
En comparaison, 52 % des appareils testés n'emploient pas MDI pour assombrir leur écran. Nous avons relevé une moyenne à 7744 (minimum : 5 - maximum : 343500) Hz dans le cas où une MDI était active. | |||
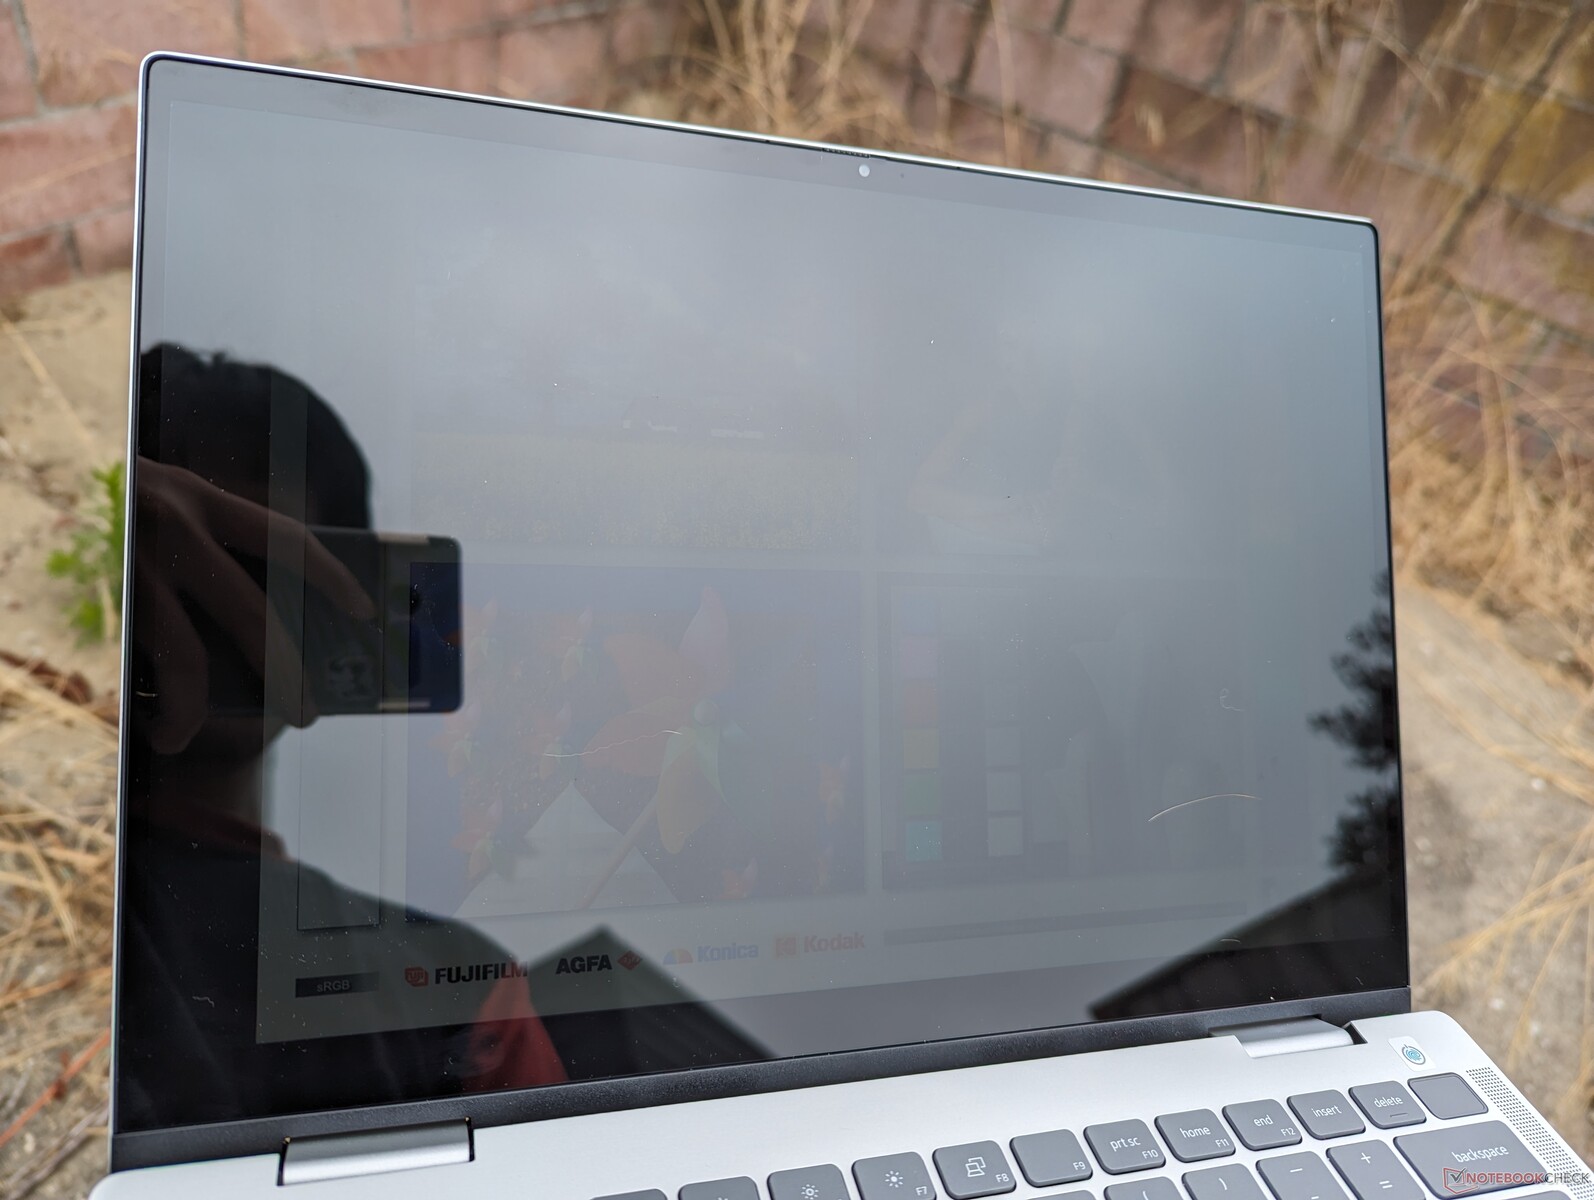
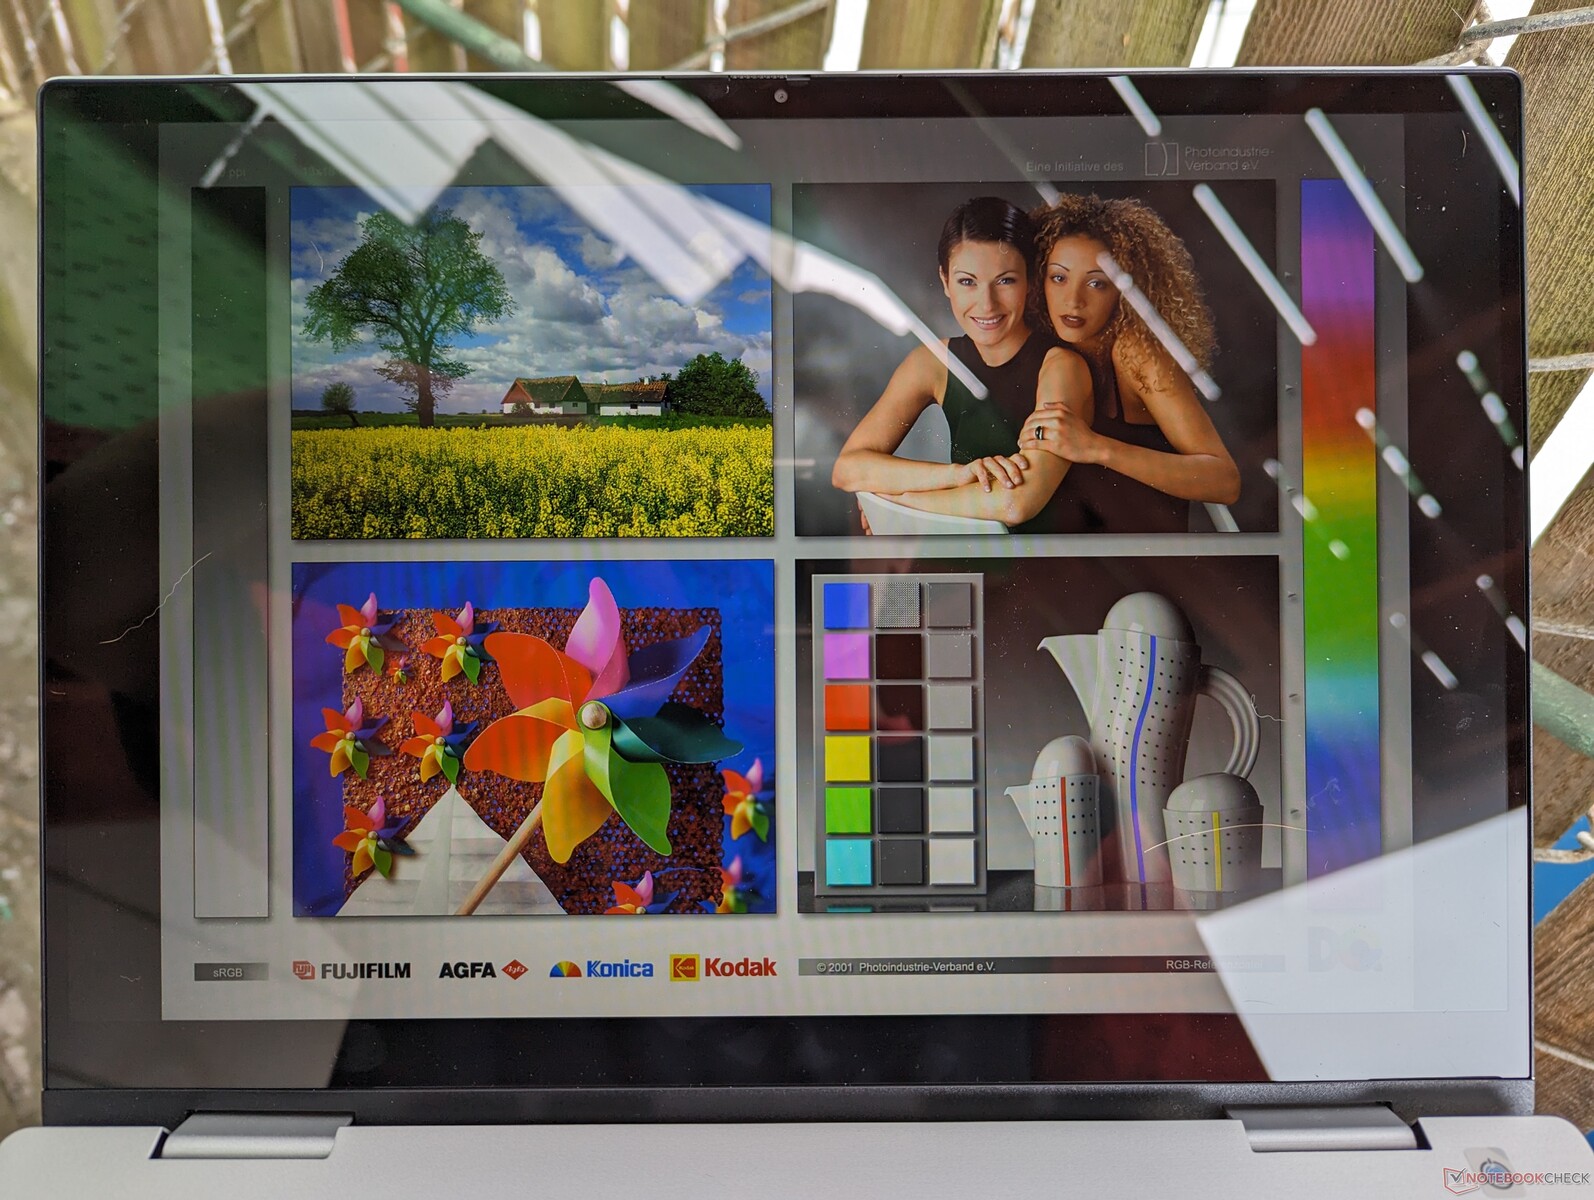
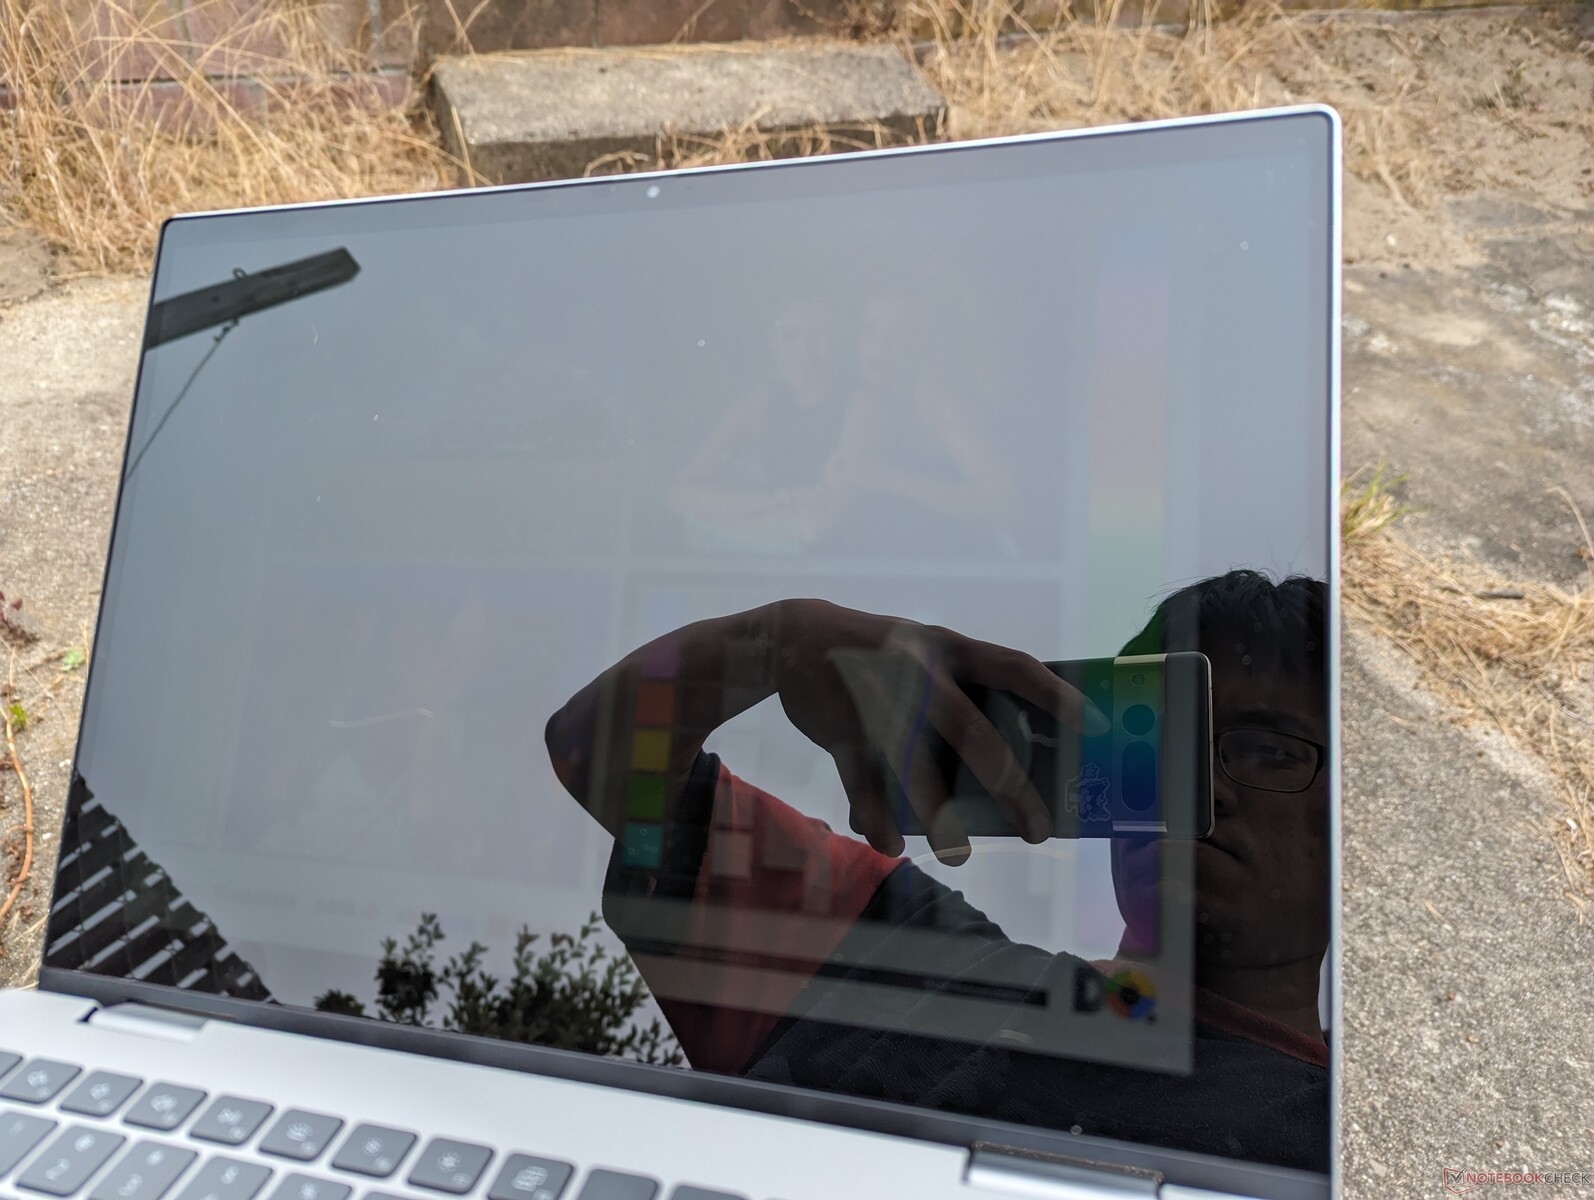
Les reflets sont perceptibles même lorsque l'ordinateur portable est utilisé à l'intérieur ou à l'ombre. Le faible rétroéclairage n'est pas en mesure de compenser une grande partie de l'éblouissement causé par la couche brillante, ce qui nuit gravement à la visibilité dans des conditions extérieures.
Performances - AMD Zen 3 At Heart
Conditions d'essai
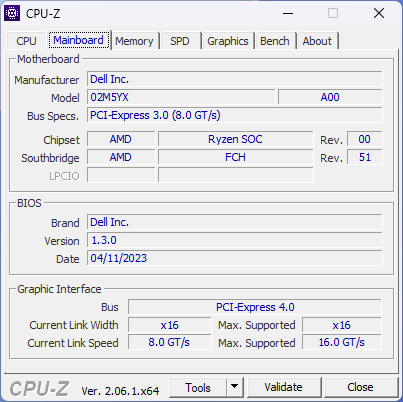
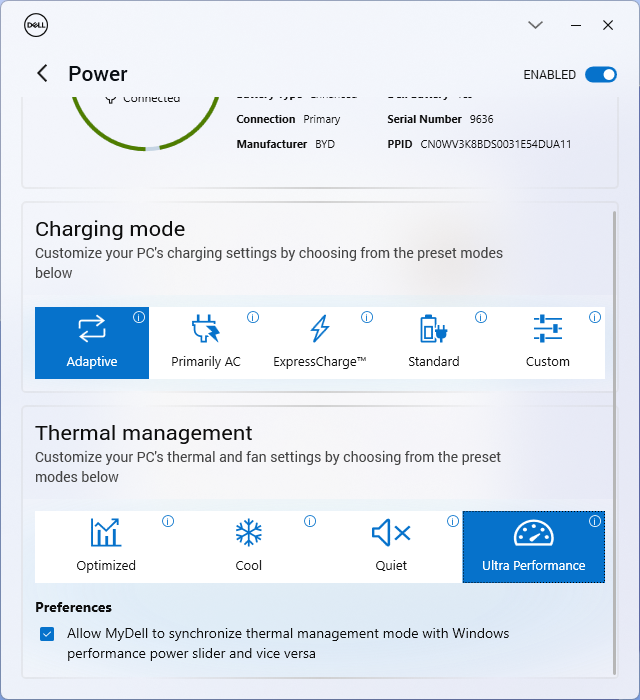
Nous avons réglé notre appareil en mode Performance via le logiciel MyDell avant d'effectuer les tests ci-dessous. De manière pratique, les profils d'alimentation MyDell sont synchronisés avec les profils d'alimentation Windows, contrairement à la plupart des autres modèles de fabricants concurrents.
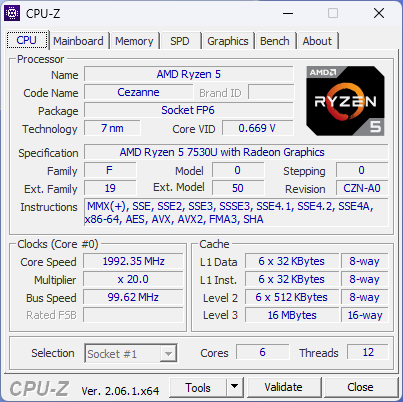
Processeur
Le modèle à 6 cœurs Ryzen 5 7530U a des performances presque identiques à celles duRyzen 5 6600U puisqu'ils sont tous deux basés sur l'architecture Zen 3. Les performances globales sont comparables à celles du Core i5-1335U que l'on trouve sur des modèles comme leAcer Aspire 5 Spin 14 tout en étant bien supérieure à n'importe quelle solution mobile Core i3. AMD a mis au point ce processeur pour qu'il soit compétitif par rapport à la série Core i5, à la fois en termes de performances et de prix.
Passer au processeur 8 cœurs Ryzen 7 7730U devrait améliorer les performances multithread d'environ 30 à 40 %, d'après notre expérience avec le Zenbook 14 d'Asus Asus Zenbook 14.
Cinebench R15 Multi Loop
Cinebench R23: Multi Core | Single Core
Cinebench R20: CPU (Multi Core) | CPU (Single Core)
Cinebench R15: CPU Multi 64Bit | CPU Single 64Bit
Blender: v2.79 BMW27 CPU
7-Zip 18.03: 7z b 4 | 7z b 4 -mmt1
Geekbench 5.5: Multi-Core | Single-Core
HWBOT x265 Benchmark v2.2: 4k Preset
LibreOffice : 20 Documents To PDF
R Benchmark 2.5: Overall mean
* ... Moindre est la valeur, meilleures sont les performances
* ... Moindre est la valeur, meilleures sont les performances
AIDA64: FP32 Ray-Trace | FPU Julia | CPU SHA3 | CPU Queen | FPU SinJulia | FPU Mandel | CPU AES | CPU ZLib | FP64 Ray-Trace | CPU PhotoWorxx
| Performance rating | |
| Moyenne AMD Ryzen 5 7530U | |
| Dell Inspiron 14 7435 2-in-1 | |
| Lenovo IdeaPad Flex 7i 14IAU7 | |
| Acer Aspire 5 Spin 14 | |
| LG Gram 14T90P | |
| HP Pavilion x360 14-dy0157ng | |
| Dell Inspiron 14 7420 2-in-1 | |
| AIDA64 / FP32 Ray-Trace | |
| Dell Inspiron 14 7435 2-in-1 | |
| Moyenne AMD Ryzen 5 7530U (7609 - 10970, n=9) | |
| Lenovo IdeaPad Flex 7i 14IAU7 | |
| Acer Aspire 5 Spin 14 | |
| LG Gram 14T90P | |
| HP Pavilion x360 14-dy0157ng | |
| Dell Inspiron 14 7420 2-in-1 | |
| AIDA64 / FPU Julia | |
| Dell Inspiron 14 7435 2-in-1 | |
| Moyenne AMD Ryzen 5 7530U (48473 - 68384, n=9) | |
| Lenovo IdeaPad Flex 7i 14IAU7 | |
| Acer Aspire 5 Spin 14 | |
| LG Gram 14T90P | |
| HP Pavilion x360 14-dy0157ng | |
| Dell Inspiron 14 7420 2-in-1 | |
| AIDA64 / CPU SHA3 | |
| Moyenne AMD Ryzen 5 7530U (1591 - 2323, n=9) | |
| Lenovo IdeaPad Flex 7i 14IAU7 | |
| Dell Inspiron 14 7435 2-in-1 | |
| LG Gram 14T90P | |
| Acer Aspire 5 Spin 14 | |
| HP Pavilion x360 14-dy0157ng | |
| Dell Inspiron 14 7420 2-in-1 | |
| AIDA64 / CPU Queen | |
| Dell Inspiron 14 7435 2-in-1 | |
| Moyenne AMD Ryzen 5 7530U (66646 - 78105, n=8) | |
| Lenovo IdeaPad Flex 7i 14IAU7 | |
| Dell Inspiron 14 7420 2-in-1 | |
| Acer Aspire 5 Spin 14 | |
| LG Gram 14T90P | |
| HP Pavilion x360 14-dy0157ng | |
| AIDA64 / FPU SinJulia | |
| Dell Inspiron 14 7435 2-in-1 | |
| Moyenne AMD Ryzen 5 7530U (7611 - 9248, n=9) | |
| Lenovo IdeaPad Flex 7i 14IAU7 | |
| Dell Inspiron 14 7420 2-in-1 | |
| LG Gram 14T90P | |
| Acer Aspire 5 Spin 14 | |
| HP Pavilion x360 14-dy0157ng | |
| AIDA64 / FPU Mandel | |
| Dell Inspiron 14 7435 2-in-1 | |
| Moyenne AMD Ryzen 5 7530U (26912 - 37624, n=9) | |
| Lenovo IdeaPad Flex 7i 14IAU7 | |
| LG Gram 14T90P | |
| Acer Aspire 5 Spin 14 | |
| HP Pavilion x360 14-dy0157ng | |
| Dell Inspiron 14 7420 2-in-1 | |
| AIDA64 / CPU AES | |
| Acer Aspire 5 Spin 14 | |
| LG Gram 14T90P | |
| HP Pavilion x360 14-dy0157ng | |
| Moyenne AMD Ryzen 5 7530U (33314 - 92360, n=9) | |
| Lenovo IdeaPad Flex 7i 14IAU7 | |
| Dell Inspiron 14 7435 2-in-1 | |
| Dell Inspiron 14 7420 2-in-1 | |
| AIDA64 / CPU ZLib | |
| Acer Aspire 5 Spin 14 | |
| Lenovo IdeaPad Flex 7i 14IAU7 | |
| Dell Inspiron 14 7420 2-in-1 | |
| Dell Inspiron 14 7435 2-in-1 | |
| Moyenne AMD Ryzen 5 7530U (443 - 612, n=9) | |
| LG Gram 14T90P | |
| HP Pavilion x360 14-dy0157ng | |
| AIDA64 / FP64 Ray-Trace | |
| Dell Inspiron 14 7435 2-in-1 | |
| Moyenne AMD Ryzen 5 7530U (4008 - 5738, n=9) | |
| Lenovo IdeaPad Flex 7i 14IAU7 | |
| LG Gram 14T90P | |
| Acer Aspire 5 Spin 14 | |
| HP Pavilion x360 14-dy0157ng | |
| Dell Inspiron 14 7420 2-in-1 | |
| AIDA64 / CPU PhotoWorxx | |
| Lenovo IdeaPad Flex 7i 14IAU7 | |
| LG Gram 14T90P | |
| Acer Aspire 5 Spin 14 | |
| HP Pavilion x360 14-dy0157ng | |
| Dell Inspiron 14 7420 2-in-1 | |
| Dell Inspiron 14 7435 2-in-1 | |
| Moyenne AMD Ryzen 5 7530U (9832 - 19525, n=9) | |
Performance du système
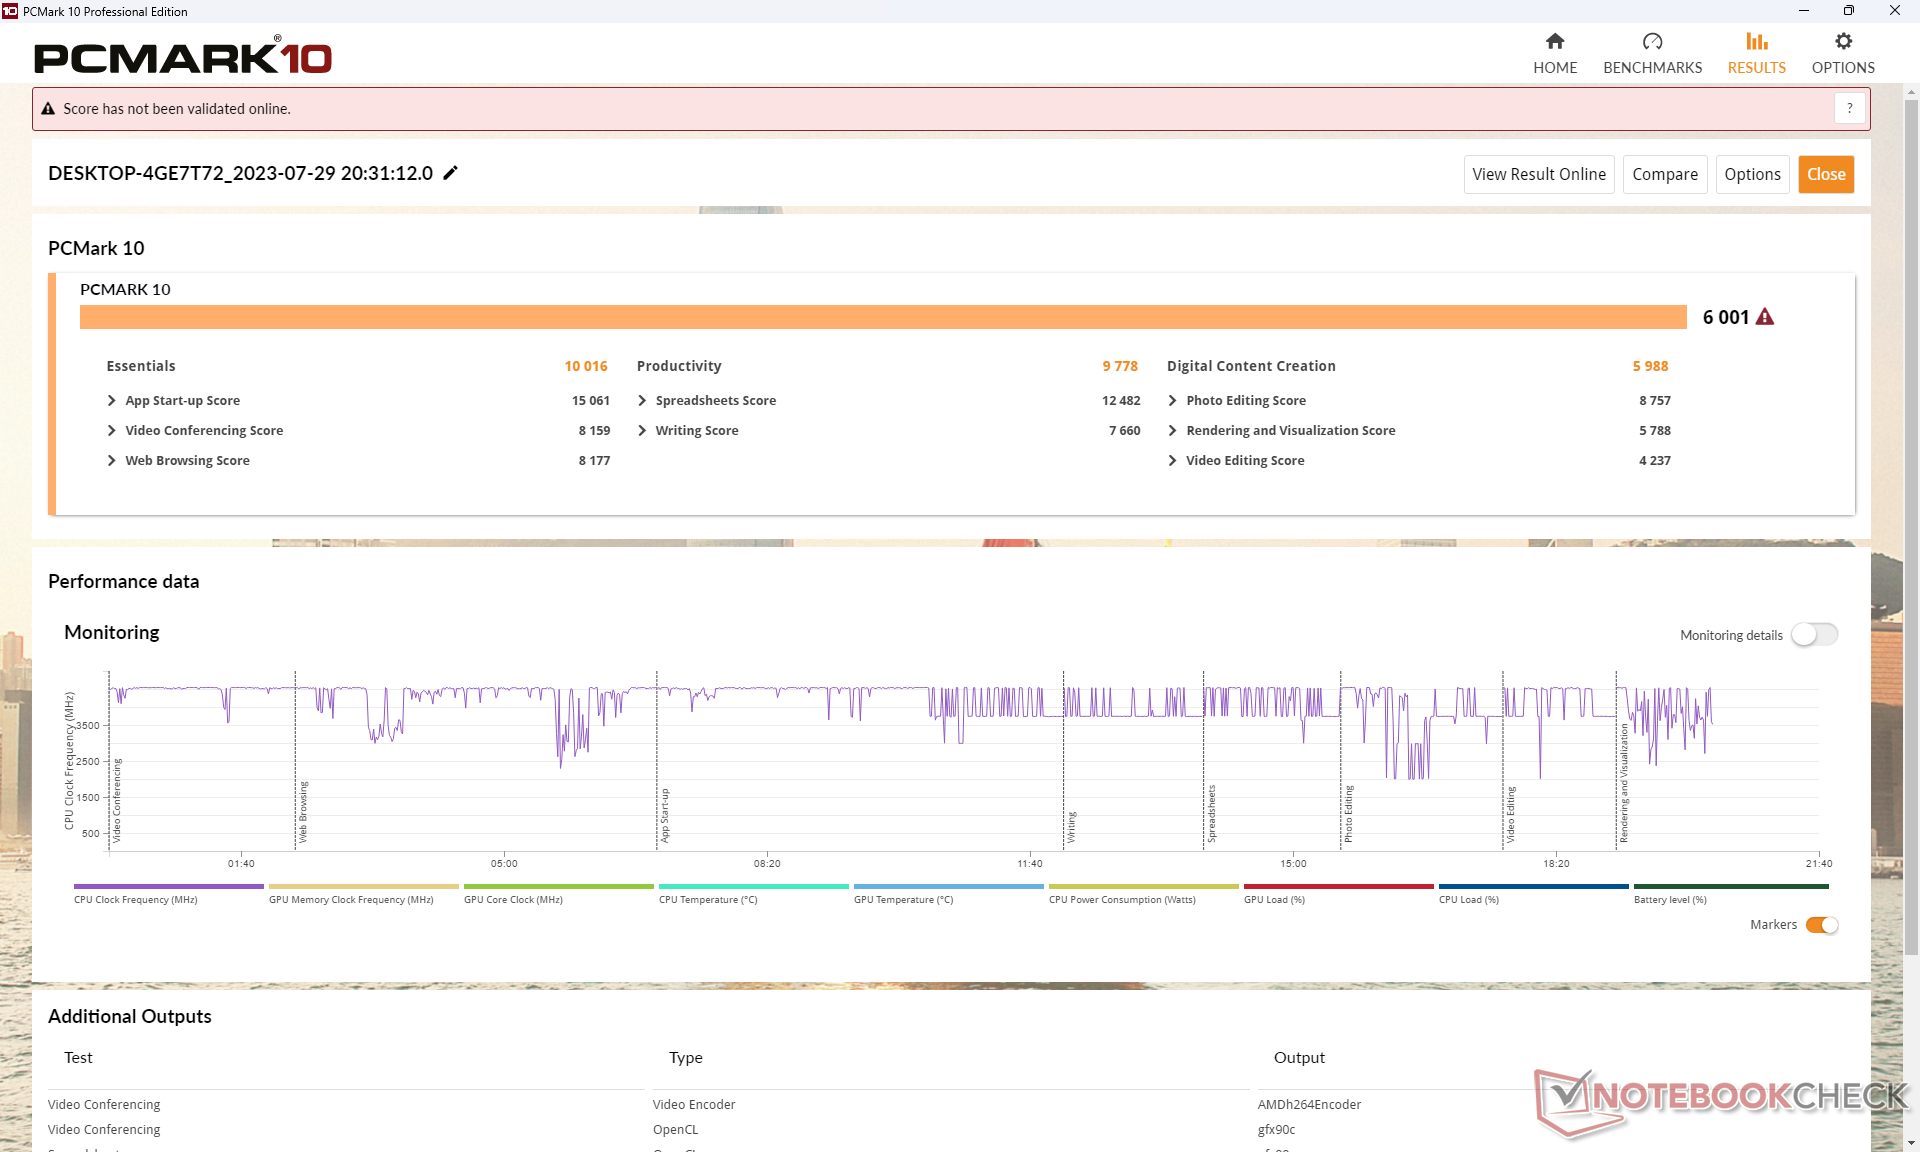
Les scores PCMark sont plus élevés que sur la plupart des autres ordinateurs portables bon marché, en particulier dans le sous-test Productivité. Nous pensons que cela est dû à la configuration 6 cœurs/12 threads du processeur qui peut avoir une plus grande influence sur le benchmark que les configurations P-core et E-Core des processeurs Intel.
CrossMark: Overall | Productivity | Creativity | Responsiveness
| PCMark 10 / Score | |
| Dell Inspiron 14 7435 2-in-1 | |
| Moyenne AMD Ryzen 5 7530U, AMD Radeon RX Vega 7 (5686 - 6209, n=8) | |
| Lenovo IdeaPad Flex 7i 14IAU7 | |
| Dell Inspiron 14 7420 2-in-1 | |
| Acer Aspire 5 Spin 14 | |
| LG Gram 14T90P | |
| HP Pavilion x360 14-dy0157ng | |
| PCMark 10 / Essentials | |
| Lenovo IdeaPad Flex 7i 14IAU7 | |
| Moyenne AMD Ryzen 5 7530U, AMD Radeon RX Vega 7 (9183 - 11242, n=8) | |
| Acer Aspire 5 Spin 14 | |
| Dell Inspiron 14 7420 2-in-1 | |
| Dell Inspiron 14 7435 2-in-1 | |
| LG Gram 14T90P | |
| HP Pavilion x360 14-dy0157ng | |
| PCMark 10 / Productivity | |
| Moyenne AMD Ryzen 5 7530U, AMD Radeon RX Vega 7 (8983 - 14037, n=8) | |
| Dell Inspiron 14 7435 2-in-1 | |
| Lenovo IdeaPad Flex 7i 14IAU7 | |
| Acer Aspire 5 Spin 14 | |
| Dell Inspiron 14 7420 2-in-1 | |
| LG Gram 14T90P | |
| HP Pavilion x360 14-dy0157ng | |
| PCMark 10 / Digital Content Creation | |
| Dell Inspiron 14 7435 2-in-1 | |
| Dell Inspiron 14 7420 2-in-1 | |
| Lenovo IdeaPad Flex 7i 14IAU7 | |
| Acer Aspire 5 Spin 14 | |
| Moyenne AMD Ryzen 5 7530U, AMD Radeon RX Vega 7 (4941 - 6093, n=8) | |
| HP Pavilion x360 14-dy0157ng | |
| LG Gram 14T90P | |
| CrossMark / Overall | |
| Acer Aspire 5 Spin 14 | |
| Lenovo IdeaPad Flex 7i 14IAU7 | |
| Dell Inspiron 14 7420 2-in-1 | |
| LG Gram 14T90P | |
| Moyenne AMD Ryzen 5 7530U, AMD Radeon RX Vega 7 (1029 - 1336, n=7) | |
| Dell Inspiron 14 7435 2-in-1 | |
| CrossMark / Productivity | |
| Acer Aspire 5 Spin 14 | |
| Dell Inspiron 14 7420 2-in-1 | |
| Lenovo IdeaPad Flex 7i 14IAU7 | |
| LG Gram 14T90P | |
| Moyenne AMD Ryzen 5 7530U, AMD Radeon RX Vega 7 (1115 - 1370, n=7) | |
| Dell Inspiron 14 7435 2-in-1 | |
| CrossMark / Creativity | |
| Lenovo IdeaPad Flex 7i 14IAU7 | |
| Dell Inspiron 14 7420 2-in-1 | |
| Acer Aspire 5 Spin 14 | |
| Moyenne AMD Ryzen 5 7530U, AMD Radeon RX Vega 7 (992 - 1390, n=7) | |
| Dell Inspiron 14 7435 2-in-1 | |
| LG Gram 14T90P | |
| CrossMark / Responsiveness | |
| Acer Aspire 5 Spin 14 | |
| LG Gram 14T90P | |
| Dell Inspiron 14 7420 2-in-1 | |
| Lenovo IdeaPad Flex 7i 14IAU7 | |
| Dell Inspiron 14 7435 2-in-1 | |
| Moyenne AMD Ryzen 5 7530U, AMD Radeon RX Vega 7 (900 - 1096, n=7) | |
| PCMark 10 Score | 6001 points | |
Aide | ||
| AIDA64 / Memory Copy | |
| LG Gram 14T90P | |
| Lenovo IdeaPad Flex 7i 14IAU7 | |
| Acer Aspire 5 Spin 14 | |
| HP Pavilion x360 14-dy0157ng | |
| Dell Inspiron 14 7420 2-in-1 | |
| Dell Inspiron 14 7435 2-in-1 | |
| Moyenne AMD Ryzen 5 7530U (20155 - 42853, n=9) | |
| AIDA64 / Memory Read | |
| LG Gram 14T90P | |
| Lenovo IdeaPad Flex 7i 14IAU7 | |
| HP Pavilion x360 14-dy0157ng | |
| Acer Aspire 5 Spin 14 | |
| Dell Inspiron 14 7420 2-in-1 | |
| Dell Inspiron 14 7435 2-in-1 | |
| Moyenne AMD Ryzen 5 7530U (23068 - 40270, n=9) | |
| AIDA64 / Memory Write | |
| Acer Aspire 5 Spin 14 | |
| LG Gram 14T90P | |
| Lenovo IdeaPad Flex 7i 14IAU7 | |
| HP Pavilion x360 14-dy0157ng | |
| Dell Inspiron 14 7420 2-in-1 | |
| Dell Inspiron 14 7435 2-in-1 | |
| Moyenne AMD Ryzen 5 7530U (22954 - 41838, n=9) | |
| AIDA64 / Memory Latency | |
| Dell Inspiron 14 7435 2-in-1 | |
| Acer Aspire 5 Spin 14 | |
| Moyenne AMD Ryzen 5 7530U (88.1 - 110.8, n=9) | |
| Lenovo IdeaPad Flex 7i 14IAU7 | |
| LG Gram 14T90P | |
| HP Pavilion x360 14-dy0157ng | |
| Dell Inspiron 14 7420 2-in-1 | |
* ... Moindre est la valeur, meilleures sont les performances
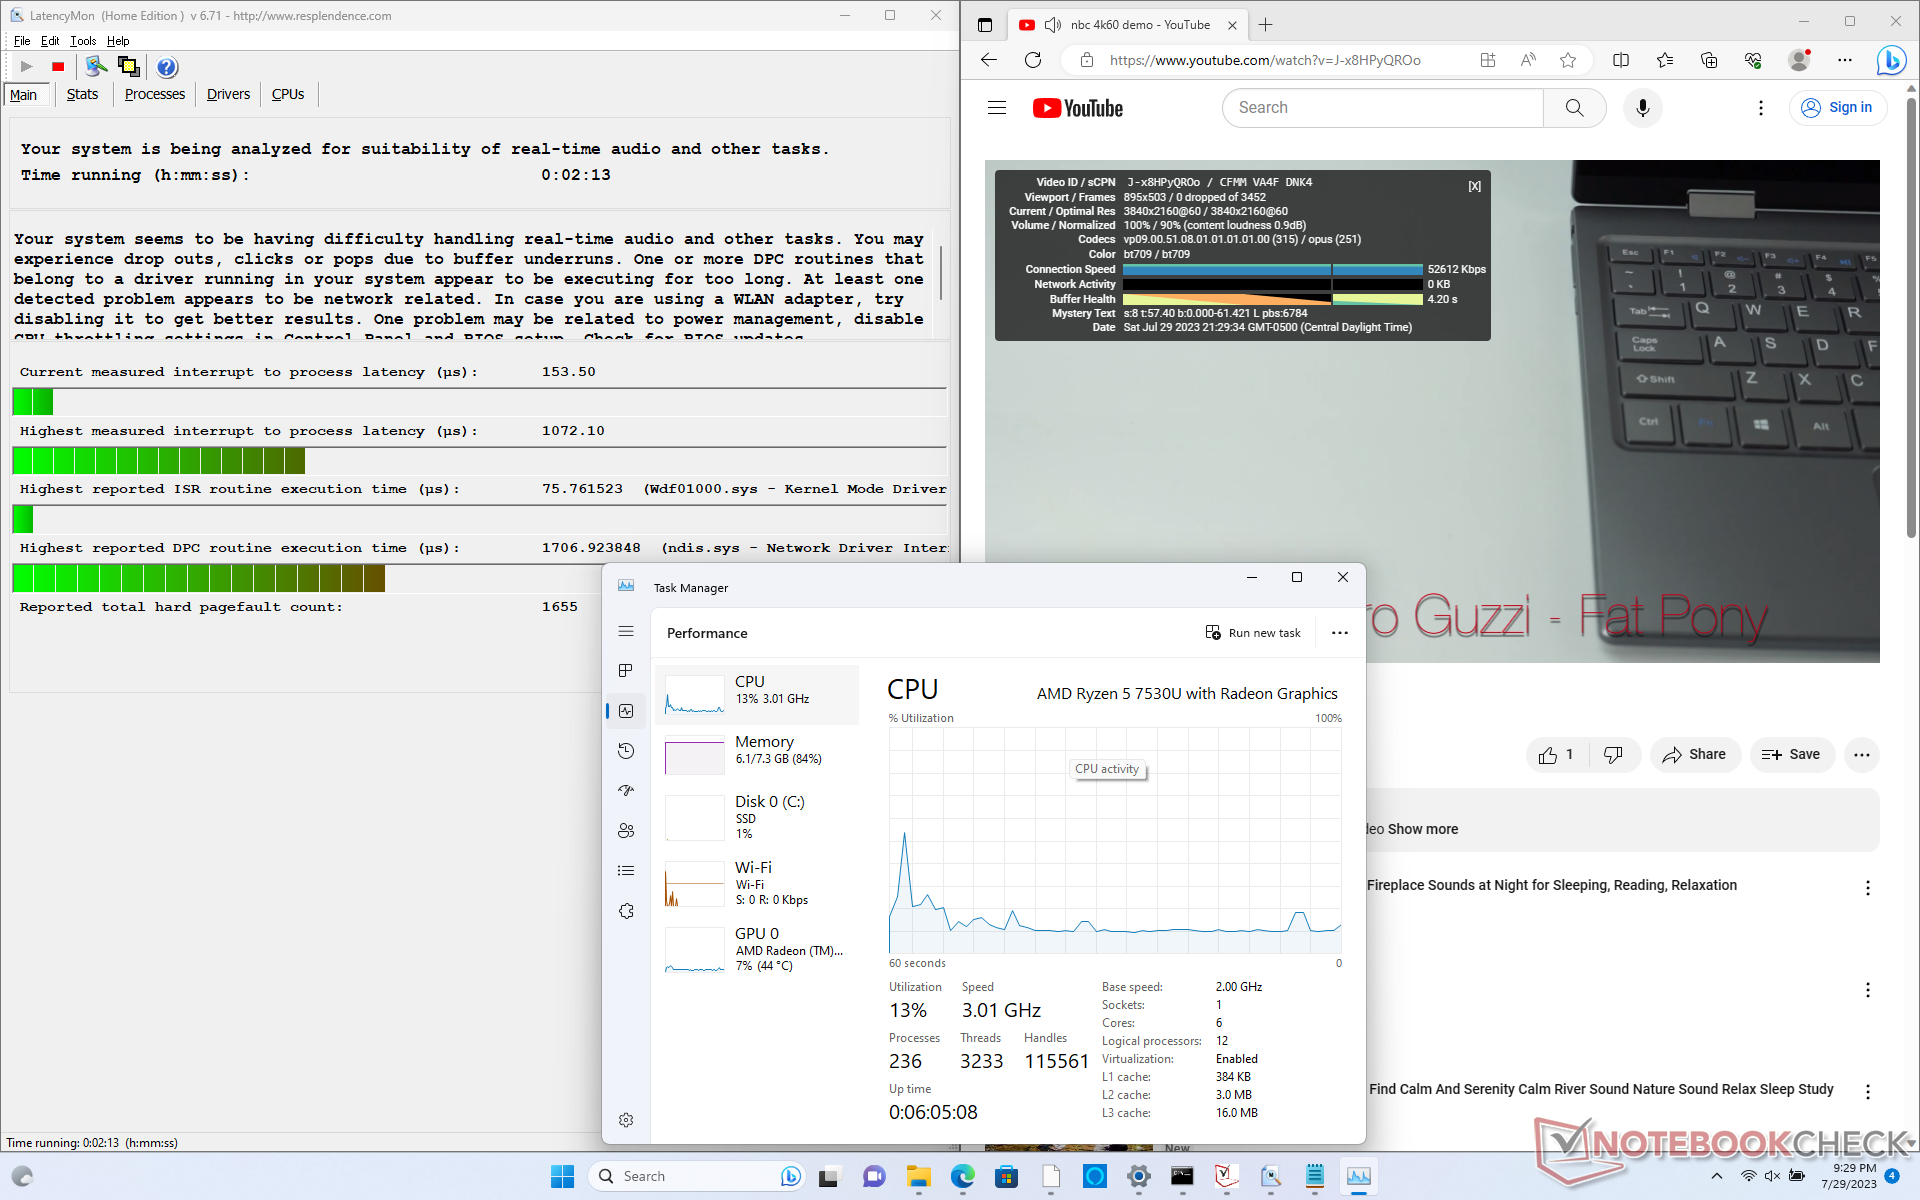
Latence DPC
LatencyMon révèle des problèmes mineurs de DPC lors de l'ouverture de plusieurs onglets de notre page d'accueil. la lecture de vidéos 4K à 60 FPS est par ailleurs parfaite, sans aucune perte d'images.
| DPC Latencies / LatencyMon - interrupt to process latency (max), Web, Youtube, Prime95 | |
| Acer Aspire 5 Spin 14 | |
| Dell Inspiron 14 7435 2-in-1 | |
| LG Gram 14T90P | |
| HP Pavilion x360 14-dy0157ng | |
| Lenovo IdeaPad Flex 7i 14IAU7 | |
| Dell Inspiron 14 7420 2-in-1 | |
* ... Moindre est la valeur, meilleures sont les performances
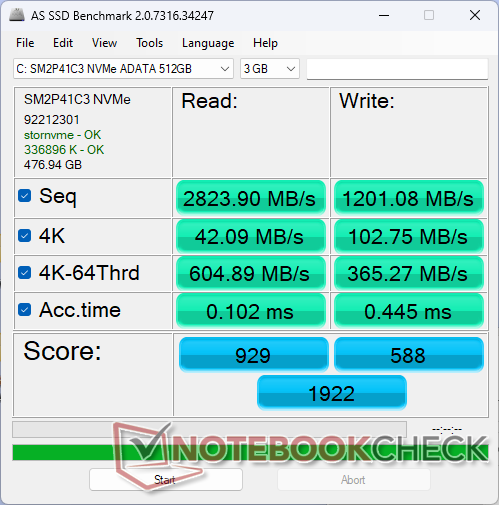
Dispositifs de stockage
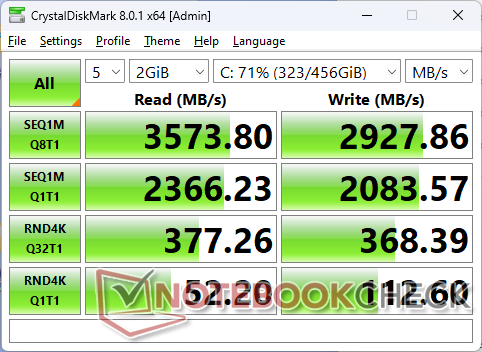
Notre unité de test est livrée avec un disque dur économique de 512 Go ADATA SM2P41C3 PCIe4 x4 NVMe SSD offrant des taux de lecture et d'écriture allant jusqu'à 3600 Mo/s et 3000 Mo/s, respectivement. Il s'accorde bien avec le processeur Ryzen 5 puisque les SSD super rapides ne sont pas très utiles pour les utilisateurs occasionnels à domicile ou les étudiants.
Il n'y a pas d'option de SSD secondaire interne, contrairement aux modèles plus chers que sont lesLG Gram 14T90P convertible.

| Drive Performance rating - Percent | |
| Acer Aspire 5 Spin 14 | |
| LG Gram 14T90P | |
| Lenovo IdeaPad Flex 7i 14IAU7 | |
| HP Pavilion x360 14-dy0157ng | |
| Dell Inspiron 14 7420 2-in-1 | |
| Dell Inspiron 14 7435 2-in-1 | |
* ... Moindre est la valeur, meilleures sont les performances
Disk Throttling: DiskSpd Read Loop, Queue Depth 8
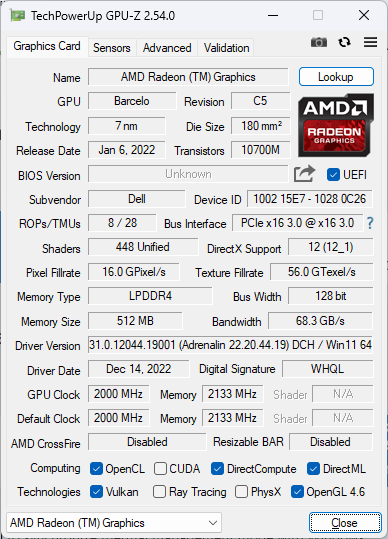
Performances du GPU - Radeon RX Vega plus ancienne
Les Ryzen 5 7530U et Ryzen 7 7730U fonctionnent avec des cartes graphiques intégrées plus anciennes, les Radeon RX Vega intégrées au lieu de la nouvelle Radeon 680M ou 780M ce qui est dommage car les nouvelles solutions peuvent être jusqu'à 2 à 2,5 fois plus rapides. A part des jeux très peu exigeants comme Dota 2 Reborn, le système ne peut pas gérer les titres modernes, surtout si l'on considère ses 8 Go de RAM limités. F1 22, par exemple, ne pouvait fonctionner qu'avec des paramètres très bas, car tout ce qui était plus élevé plantait.
Le taux de rafraîchissement descend périodiquement à 50 % avant de remonter à 60 % lorsque le jeu tourne au ralenti Witcher 3. Les baisses se produisent à intervalles réguliers, comme le montre notre graphique FPS ci-dessous, ce qui suggère une mauvaise gestion des applications actives en arrière-plan.
Les performances globales sont réduites d'environ 10 % en mode équilibré, comme le montre le tableau 3DMark 11 ci-dessous.
| Profil de puissance | Score graphique | Score physique | Score combiné |
| Batterie | 5798 (-4%) | 11906 (-5%) | 4161 (-6%) |
| Équilibré | 5472 (-9%) | 10908 (-13%) | 4195 (-5%) |
| Performance | 6024 | 12492 | 4419 |
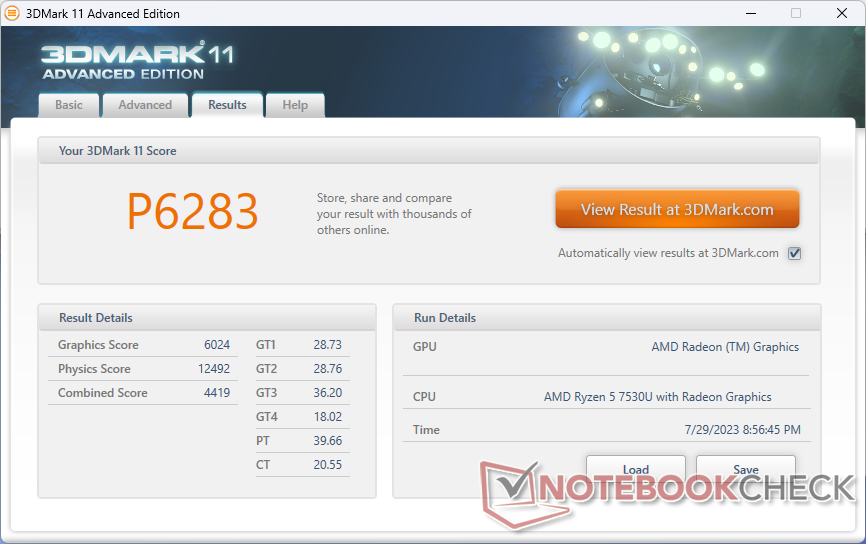
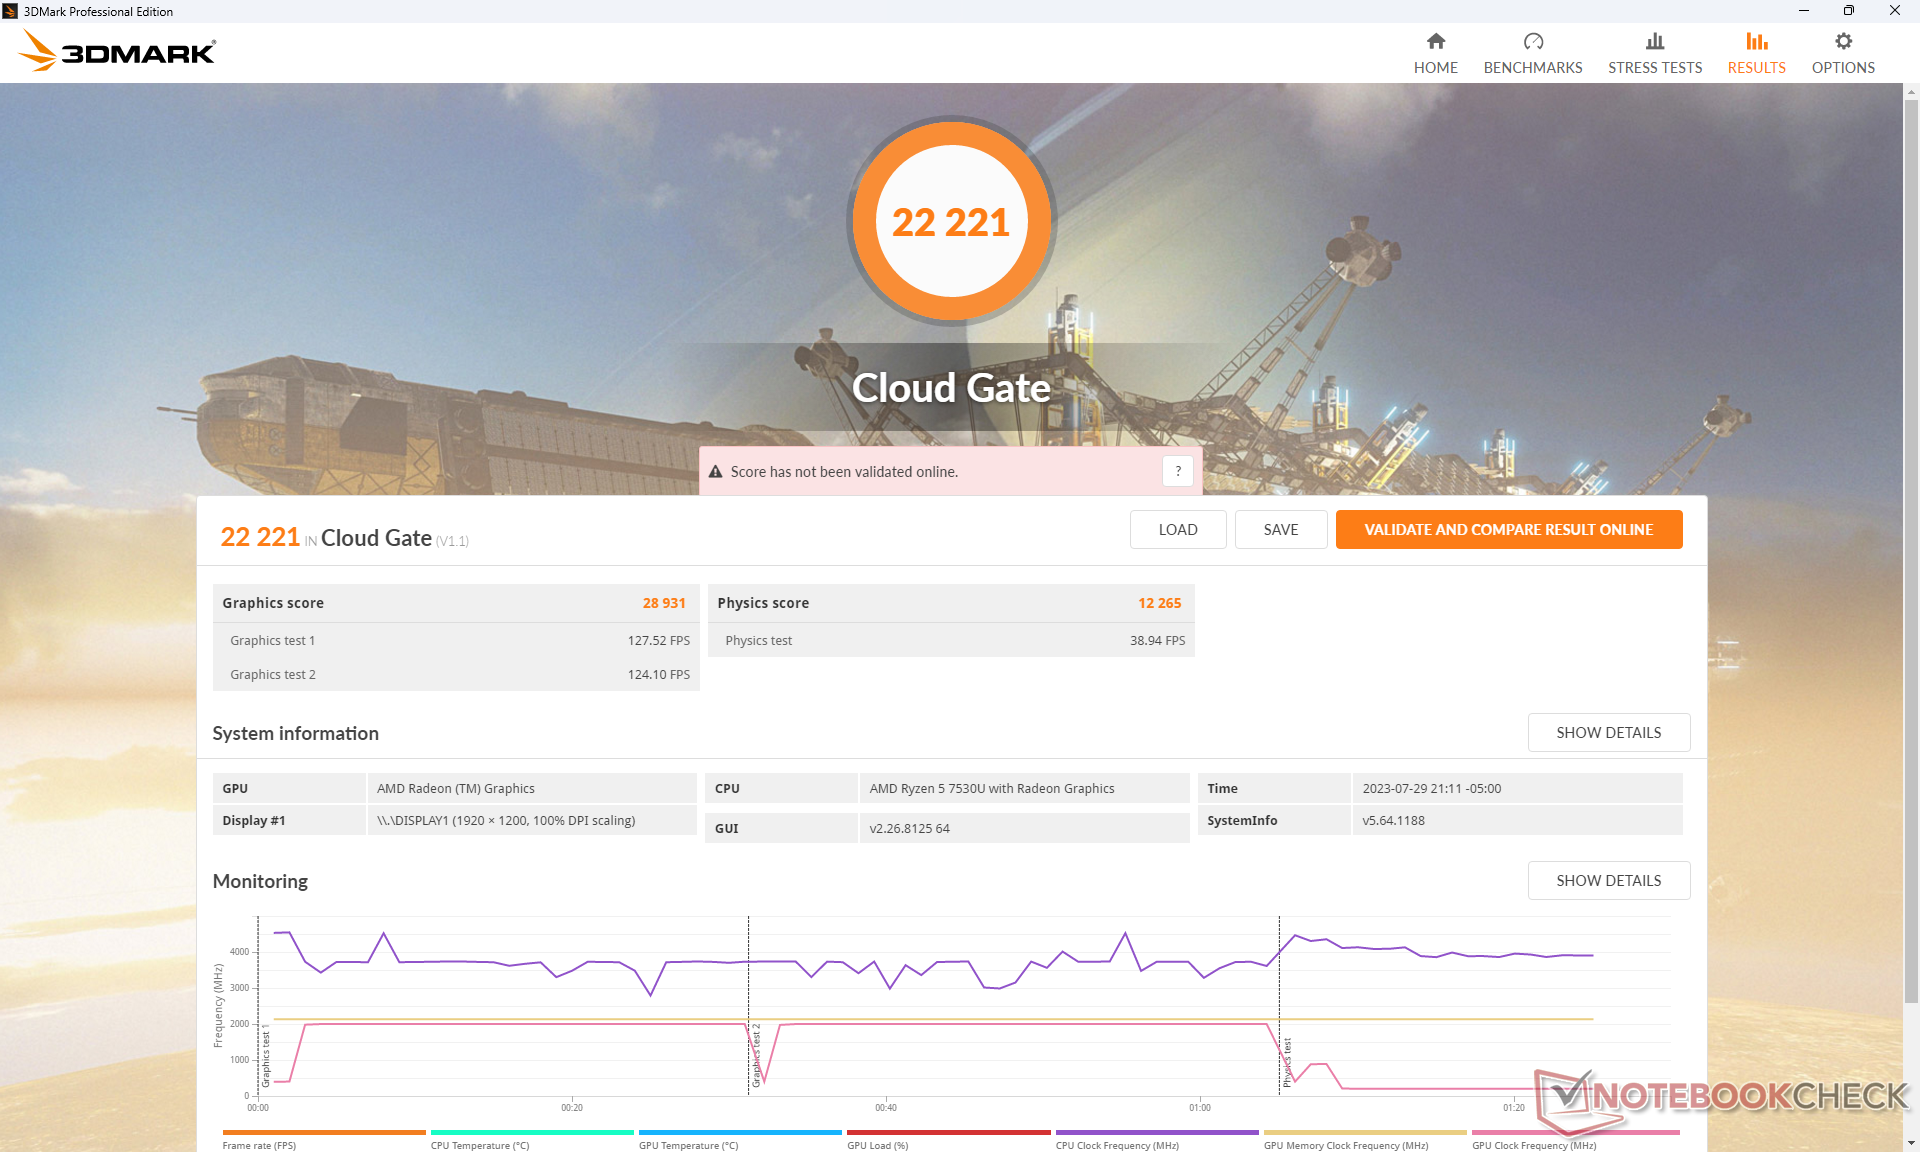
| 3DMark 11 Performance | 6283 points | |
| 3DMark Cloud Gate Standard Score | 22221 points | |
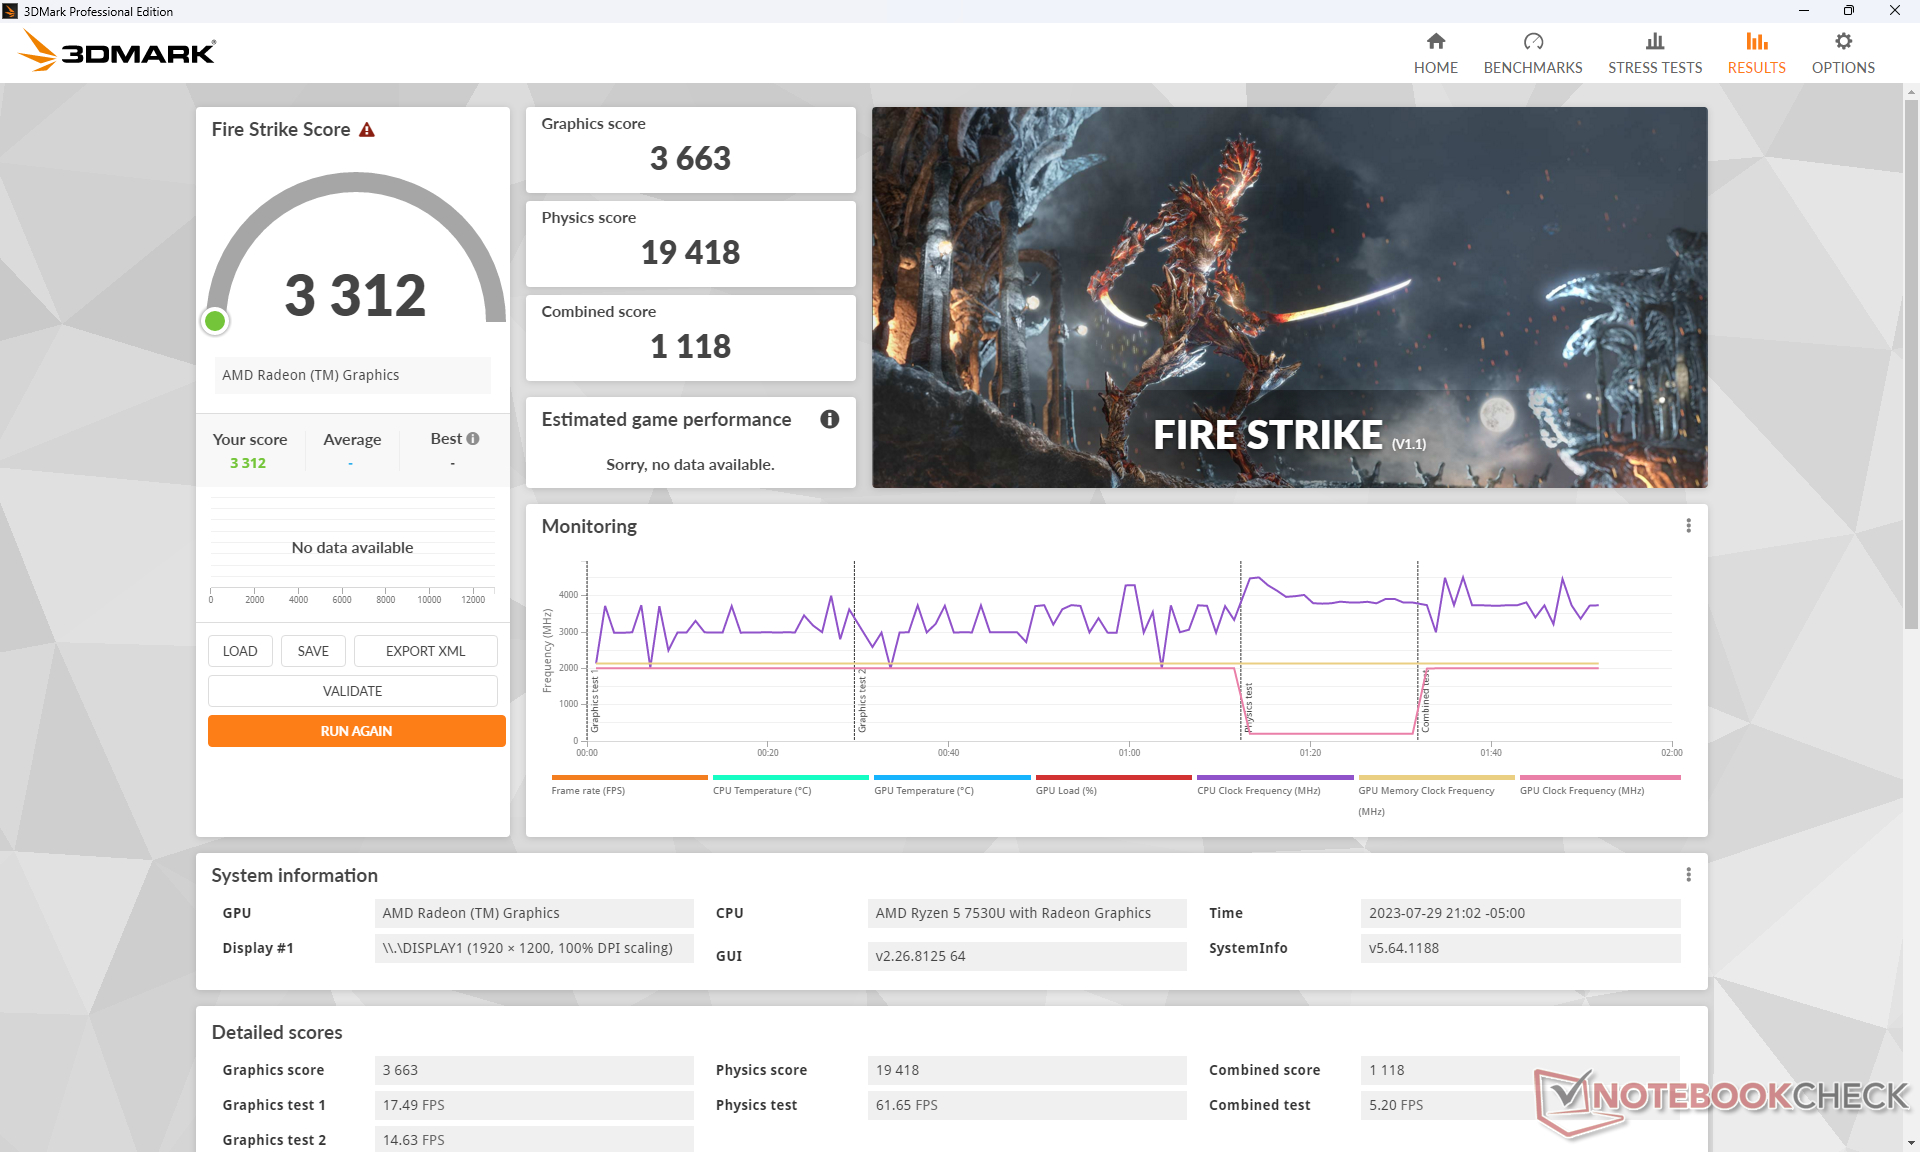
| 3DMark Fire Strike Score | 3312 points | |
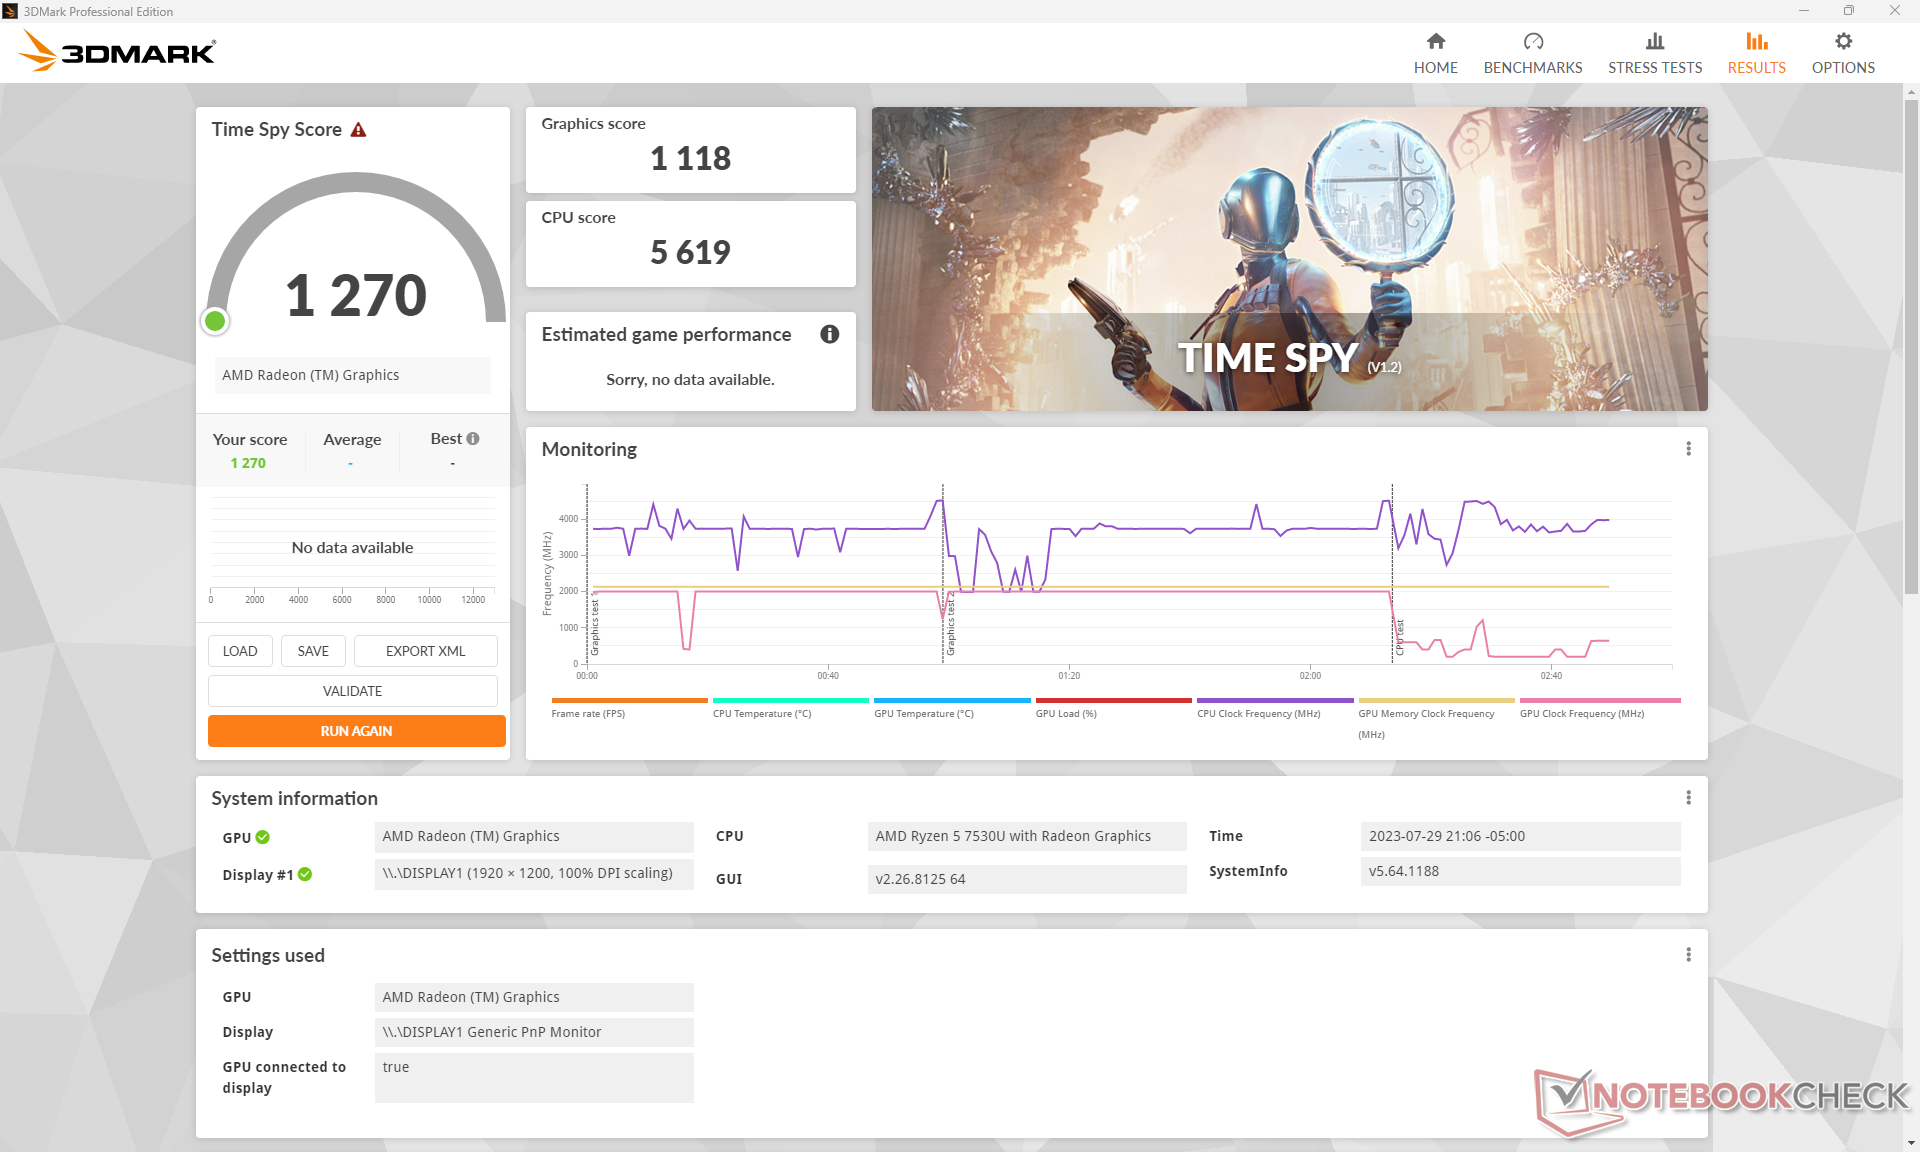
| 3DMark Time Spy Score | 1270 points | |
Aide | ||
| F1 22 - 1280x720 Ultra Low Preset AA:T AF:16x | |
| Dell Latitude 9440 2-in-1 | |
| Lenovo ThinkPad X1 Yoga G8 i7-1355U | |
| Moyenne AMD Radeon RX Vega 7 (43.6 - 80.8, n=11) | |
| Dell Inspiron 14 7435 2-in-1 | |
| Tiny Tina's Wonderlands - 1280x720 Lowest Preset (DX12) | |
| Moyenne AMD Radeon RX Vega 7 (49.7 - 70.4, n=7) | |
| Dell Inspiron 14 7435 2-in-1 | |
| Dell Latitude 9440 2-in-1 | |
| Lenovo ThinkPad X1 Yoga G8 i7-1355U | |
Witcher 3 FPS Chart
| Bas | Moyen | Élevé | Ultra | |
|---|---|---|---|---|
| GTA V (2015) | 107.7 | 25.7 | 10.2 | |
| The Witcher 3 (2015) | 76 | 21.5 | 14.5 | |
| Dota 2 Reborn (2015) | 107.4 | 87.3 | 49.9 | 47.1 |
| Final Fantasy XV Benchmark (2018) | 35.1 | 17.5 | 12.1 | |
| X-Plane 11.11 (2018) | 37.4 | 29.5 | 26.4 | |
| Strange Brigade (2018) | 79.5 | 31.4 | 25.6 | 22.3 |
| Cyberpunk 2077 1.6 (2022) | 16.3 | 12.8 | 8.9 | 6.7 |
| Tiny Tina's Wonderlands (2022) | 26.5 | |||
| F1 22 (2022) |
Émissions
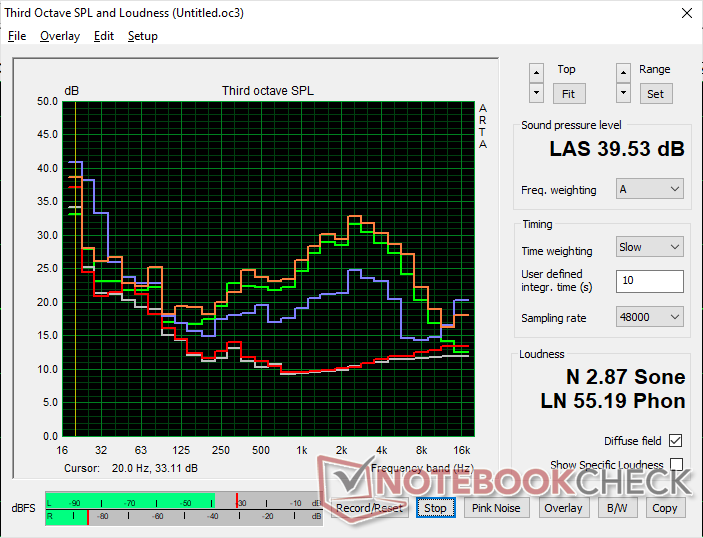
Bruit du système
Le ventilateur interne a tendance à pulser entre le ralenti et 33,3 dB(A) lorsque l'on navigue sur le web ou que l'on visionne des vidéos en streaming. Les augmentations du bruit du ventilateur ont tendance à être soudaines et nettes plutôt que progressives, ce qui rend malheureusement le bruit plus perceptible.
Des charges élevées constantes comme les jeux induiraient un bruit de ventilateur de près de 41 dB(A) en mode Performance. En mode équilibré, le bruit du ventilateur descend légèrement à 39,8 dB(A).
Nous avons pu remarquer un léger bruit de bobine ou un bruit électronique sur notre unité de test, qui n'est donc jamais vraiment silencieuse, même lorsque le ventilateur est à l'arrêt. La plage basse de 40 dB(A) est plus silencieuse que celle de l'Acer Aspire 5 Spin 14 tout en étant plus bruyante que celle du LG Gram 14T90P.LG Gram 14T90P.
Degré de la nuisance sonore
| Au repos |
| 23.2 / 23.2 / 23.2 dB(A) |
| Fortement sollicité |
| 33 / 41.3 dB(A) |
 | ||
30 dB silencieux 40 dB(A) audible 50 dB(A) bruyant |
||
min: | ||
| Dell Inspiron 14 7435 2-in-1 Vega 7, R5 7530U | Dell Inspiron 14 7420 2-in-1 Iris Xe G7 96EUs, i7-1255U, WDC PC SN530 SDBPMPZ-512G | Lenovo IdeaPad Flex 7i 14IAU7 Iris Xe G7 96EUs, i7-1255U, Samsung PM9B1 512GB MZAL4512HBLU | Acer Aspire 5 Spin 14 Iris Xe G7 80EUs, i5-1335U, Micron 2450 512GB MTFDKBA512TFK | LG Gram 14T90P Iris Xe G7 80EUs, i5-1135G7, Samsung SSD PM981a MZVLB512HBJQ | HP Pavilion x360 14-dy0157ng Iris Xe G7 80EUs, i5-1135G7, Toshiba KBG40ZNV512G | |
|---|---|---|---|---|---|---|
| Noise | -3% | 1% | -22% | 0% | -10% | |
| arrêt / environnement * (dB) | 22.8 | 23.1 -1% | 23.3 -2% | 26 -14% | 25.4 -11% | 27 -18% |
| Idle Minimum * (dB) | 23.2 | 24.7 -6% | 23.3 -0% | 27.7 -19% | 25.5 -10% | 27 -16% |
| Idle Average * (dB) | 23.2 | 24.7 -6% | 23.3 -0% | 27.7 -19% | 25.5 -10% | 27 -16% |
| Idle Maximum * (dB) | 23.2 | 24.7 -6% | 23.3 -0% | 29.7 -28% | 25.5 -10% | 27 -16% |
| Load Average * (dB) | 33 | 27.7 16% | 34.3 -4% | 46.3 -40% | 28.3 14% | 38.3 -16% |
| Witcher 3 ultra * (dB) | 40.9 | 45.1 -10% | 37.8 8% | 35 14% | ||
| Load Maximum * (dB) | 41.3 | 45.1 -9% | 37.8 8% | 45.4 -10% | 35 15% | 33.2 20% |
* ... Moindre est la valeur, meilleures sont les performances
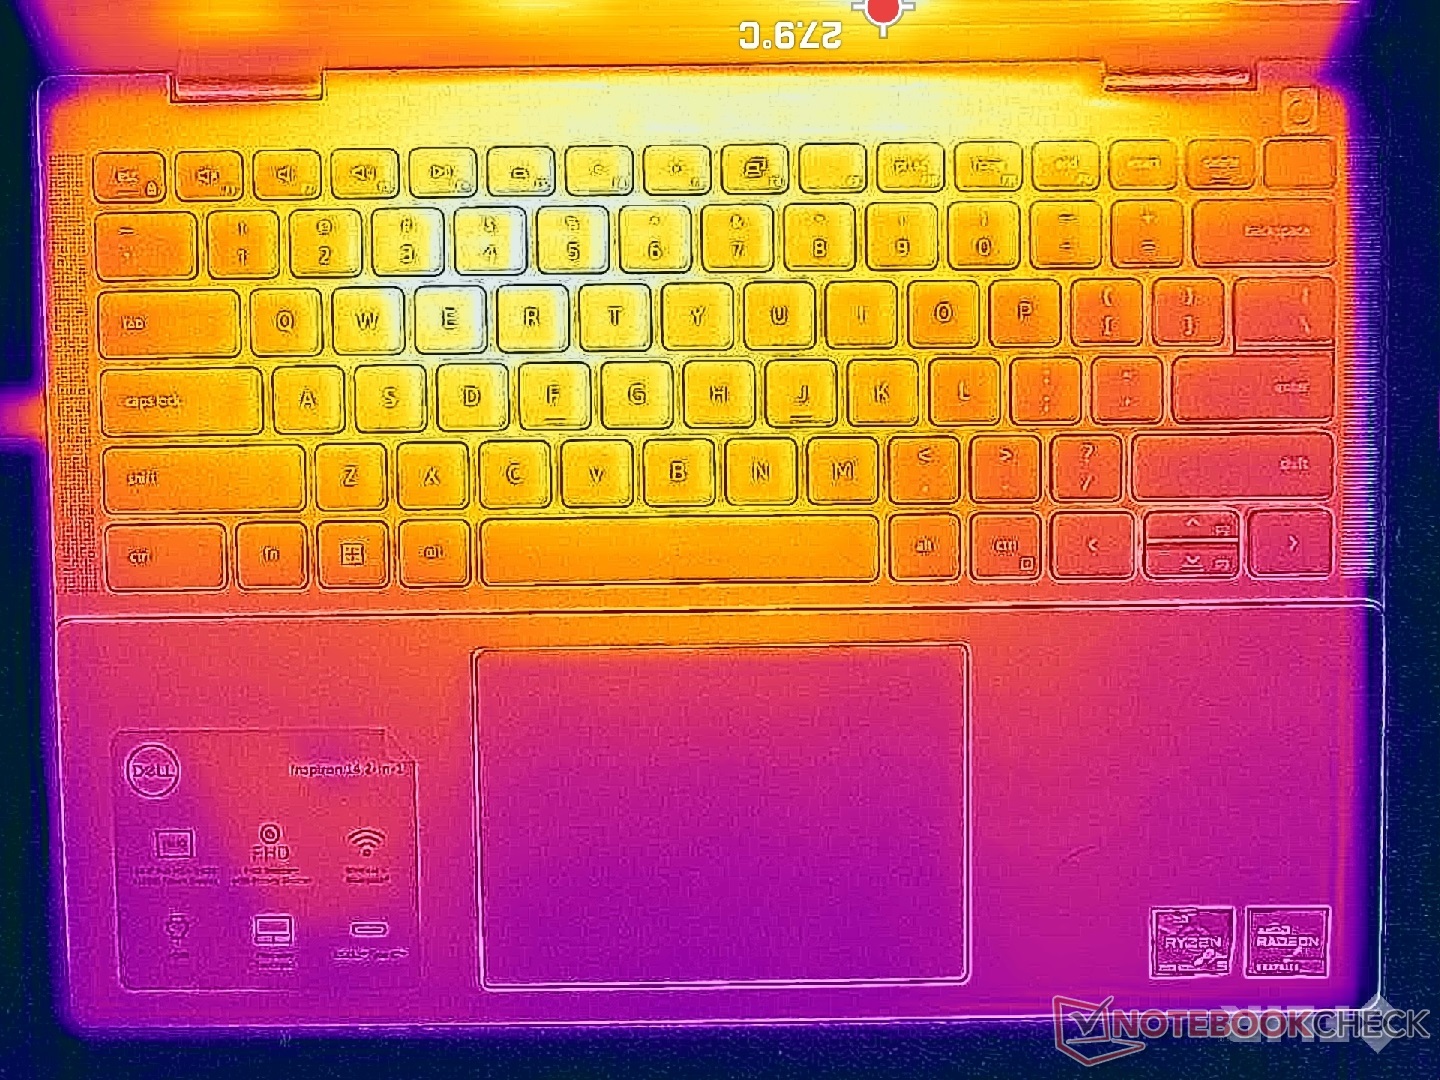
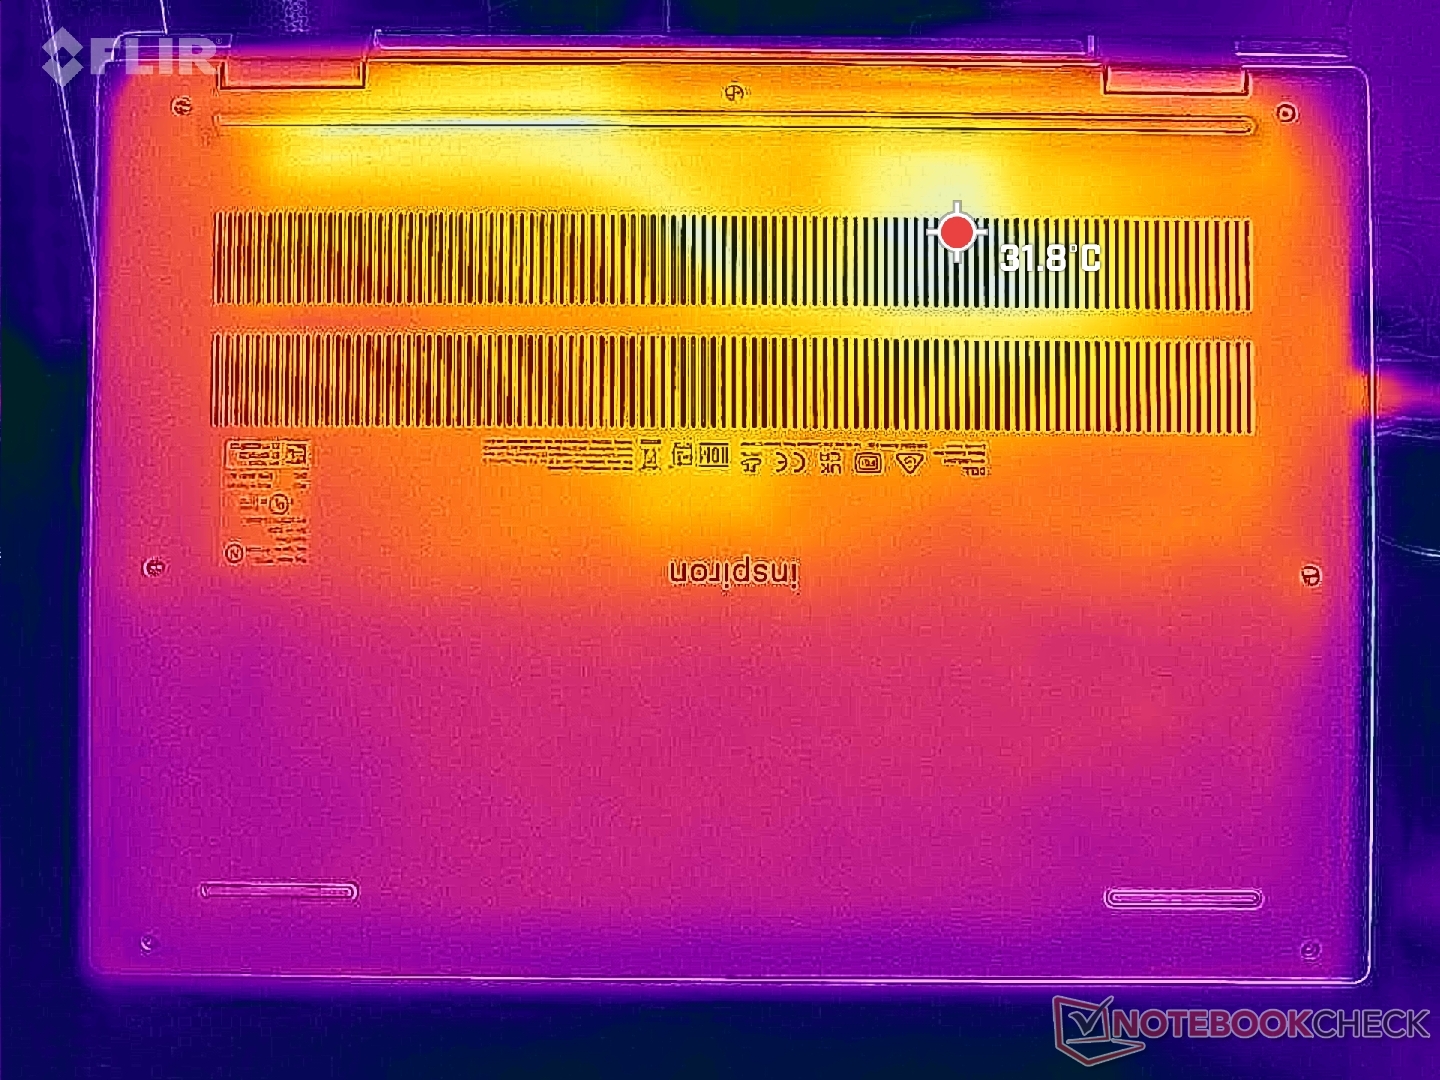
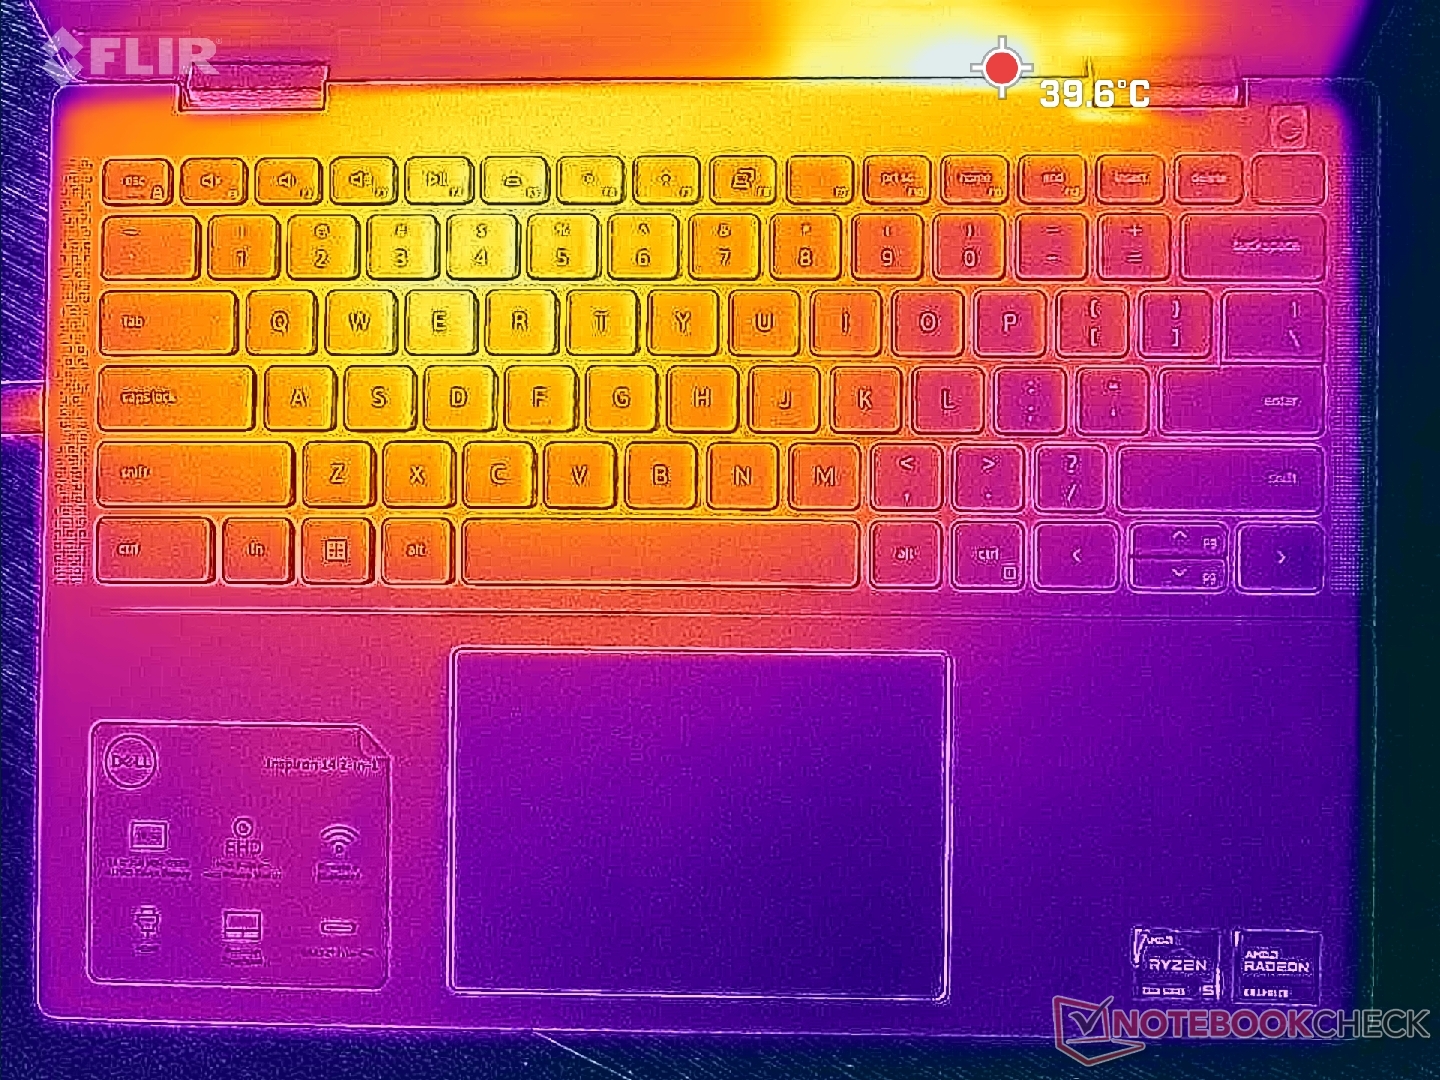
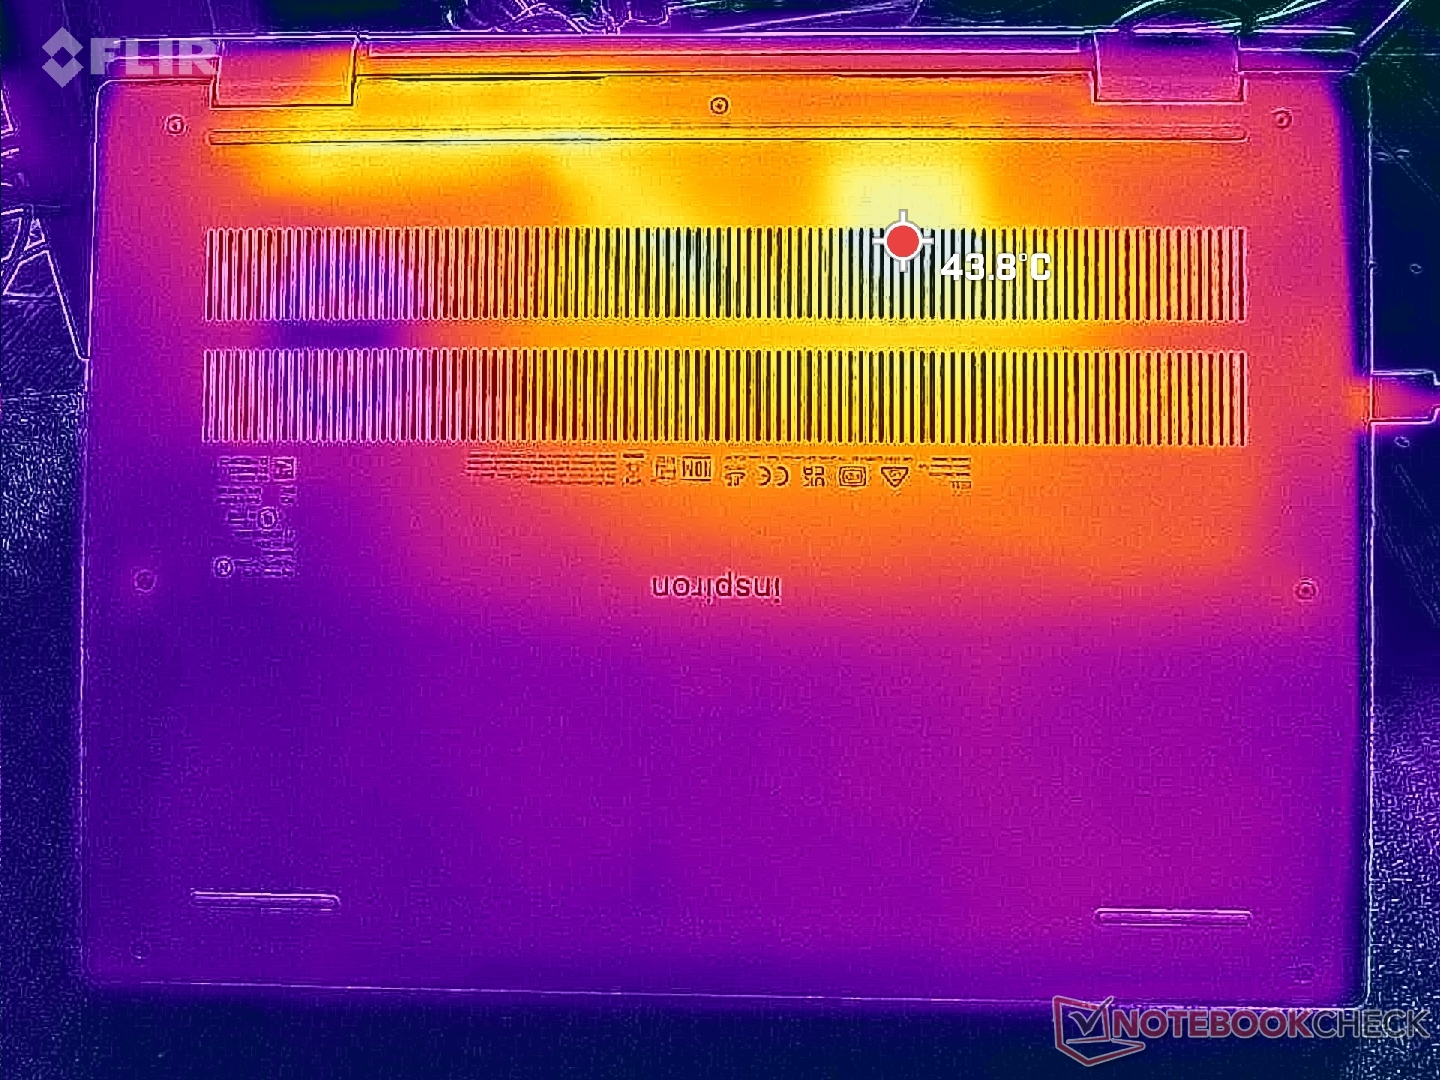
Température
Les températures de surface sont inférieures à celles enregistrées sur l'Inspiron 14 7620 2-en-1 de l'année dernière. En charge, par exemple, les points chauds en haut et en bas approchent respectivement 36 et 39°C, contre 46°C sur le modèle de l'année dernière. La fourchette haute de 30 °C est comparable à celle de modèles comme l'IdeaPad Flex 7i 14.
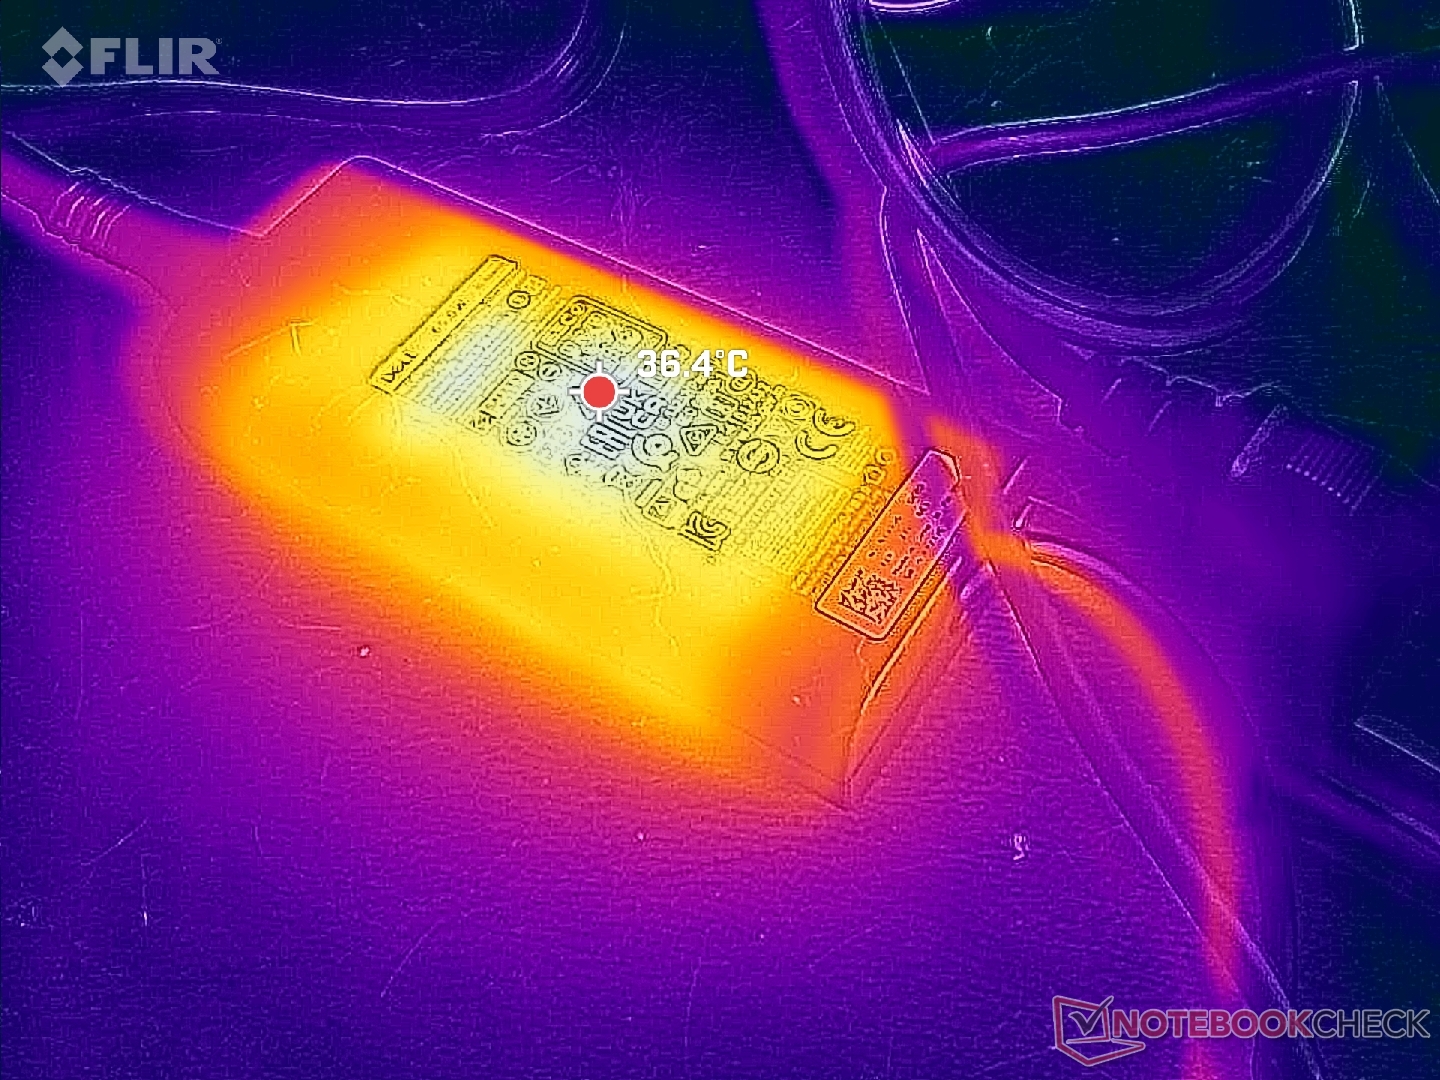
L'adaptateur secteur fonctionnerait également plus froidement, à environ 36 C au lieu de 46 C.
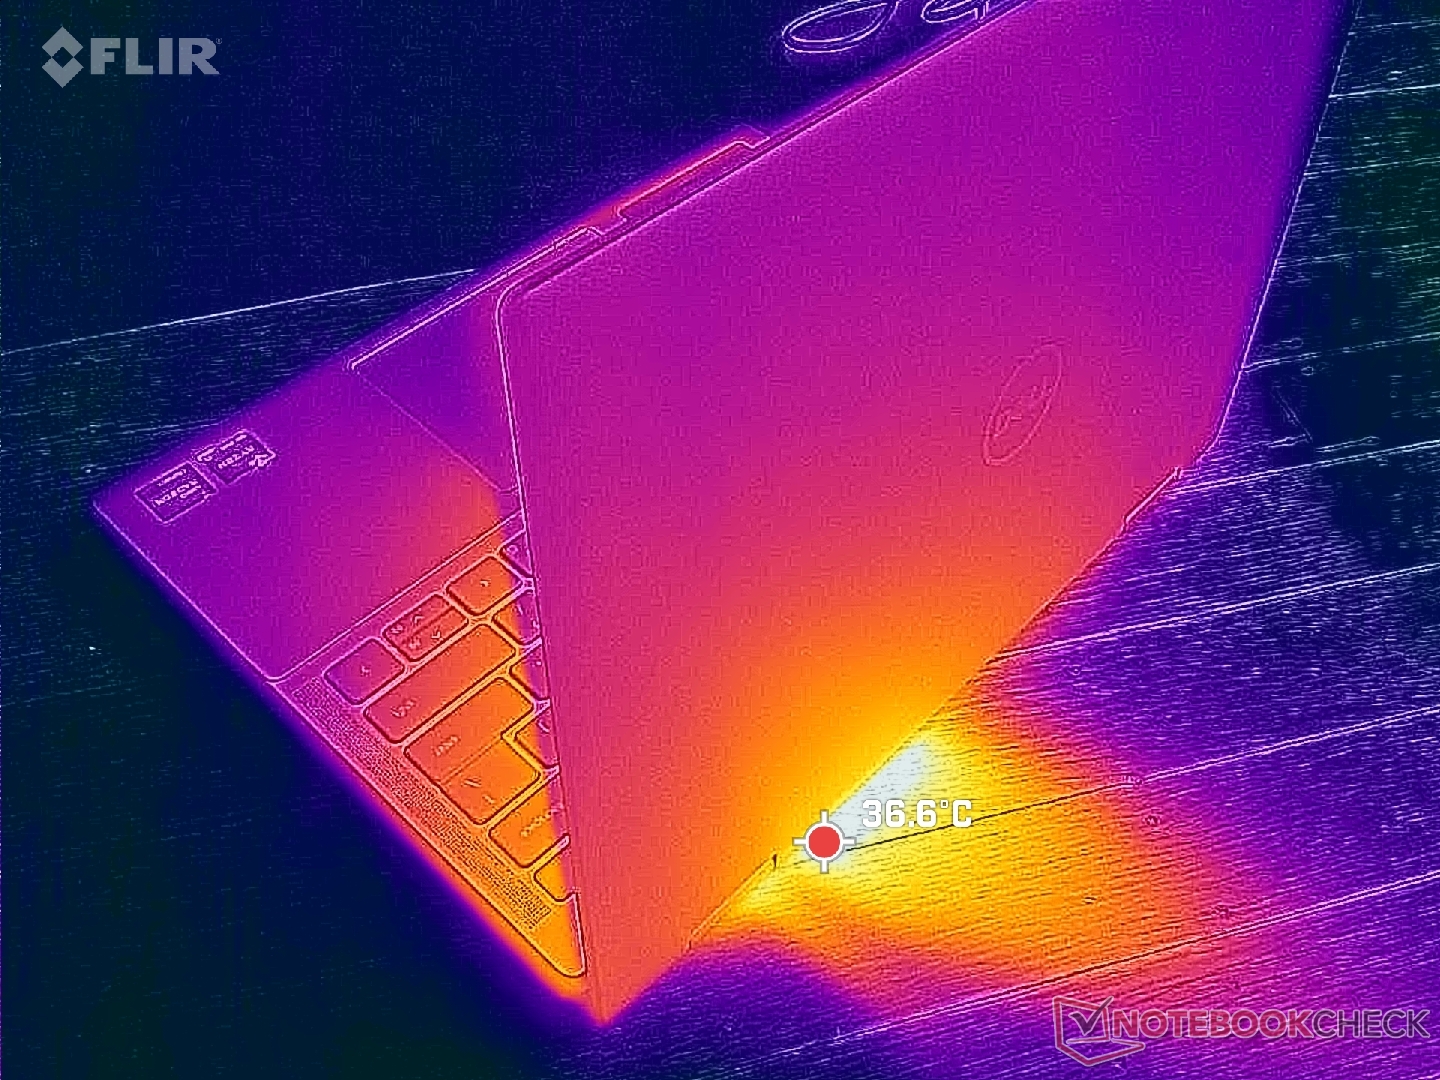
(+) La température maximale du côté supérieur est de 35.2 °C / 95 F, par rapport à la moyenne de 35.4 °C / 96 F, allant de 19.6 à 60 °C pour la classe Convertible.
(+) Le fond chauffe jusqu'à un maximum de 38.2 °C / 101 F, contre une moyenne de 36.9 °C / 98 F
(+) En utilisation inactive, la température moyenne du côté supérieur est de 28.7 °C / 84 F, par rapport à la moyenne du dispositif de 30.3 °C / 87 F.
(+) Les repose-poignets et le pavé tactile sont plus froids que la température de la peau avec un maximum de 26.6 °C / 79.9 F et sont donc froids au toucher.
(±) La température moyenne de la zone de l'appui-paume de dispositifs similaires était de 28 °C / 82.4 F (+1.4 °C / #2.5 F).
| Dell Inspiron 14 7435 2-in-1 AMD Ryzen 5 7530U, AMD Radeon RX Vega 7 | Dell Inspiron 14 7420 2-in-1 Intel Core i7-1255U, Intel Iris Xe Graphics G7 96EUs | Lenovo IdeaPad Flex 7i 14IAU7 Intel Core i7-1255U, Intel Iris Xe Graphics G7 96EUs | Acer Aspire 5 Spin 14 Intel Core i5-1335U, Intel Iris Xe Graphics G7 80EUs | LG Gram 14T90P Intel Core i5-1135G7, Intel Iris Xe Graphics G7 80EUs | HP Pavilion x360 14-dy0157ng Intel Core i5-1135G7, Intel Iris Xe Graphics G7 80EUs | |
|---|---|---|---|---|---|---|
| Heat | -2% | 11% | -14% | 3% | -2% | |
| Maximum Upper Side * (°C) | 35.2 | 38.2 -9% | 35.4 -1% | 41.7 -18% | 41.6 -18% | 38.9 -11% |
| Maximum Bottom * (°C) | 38.2 | 45.6 -19% | 38.8 -2% | 54.4 -42% | 46.2 -21% | 40.3 -5% |
| Idle Upper Side * (°C) | 31.2 | 27.4 12% | 22.6 28% | 30.4 3% | 22.6 28% | 31.8 -2% |
| Idle Bottom * (°C) | 30.4 | 28.4 7% | 24.2 20% | 29.8 2% | 23.2 24% | 27.4 10% |
* ... Moindre est la valeur, meilleures sont les performances
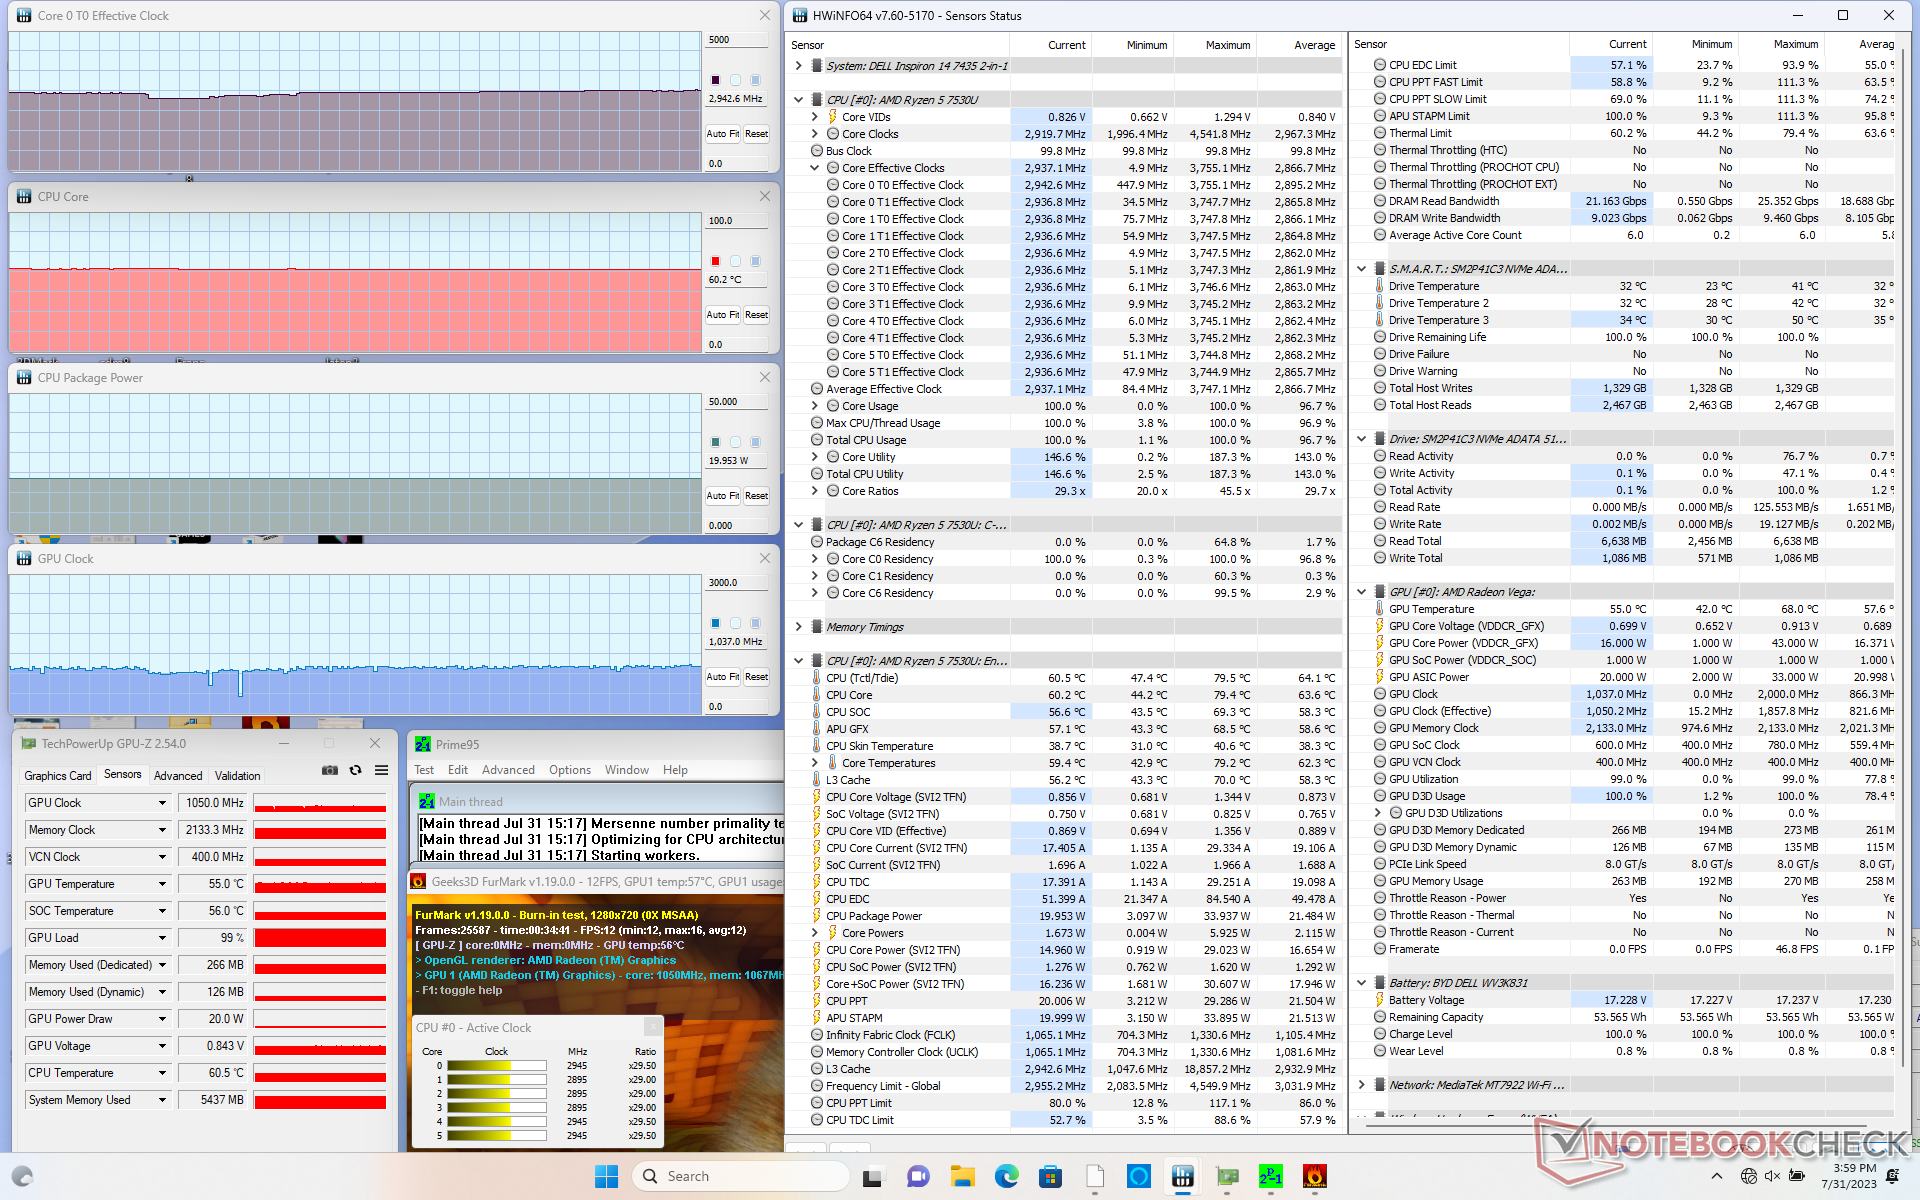
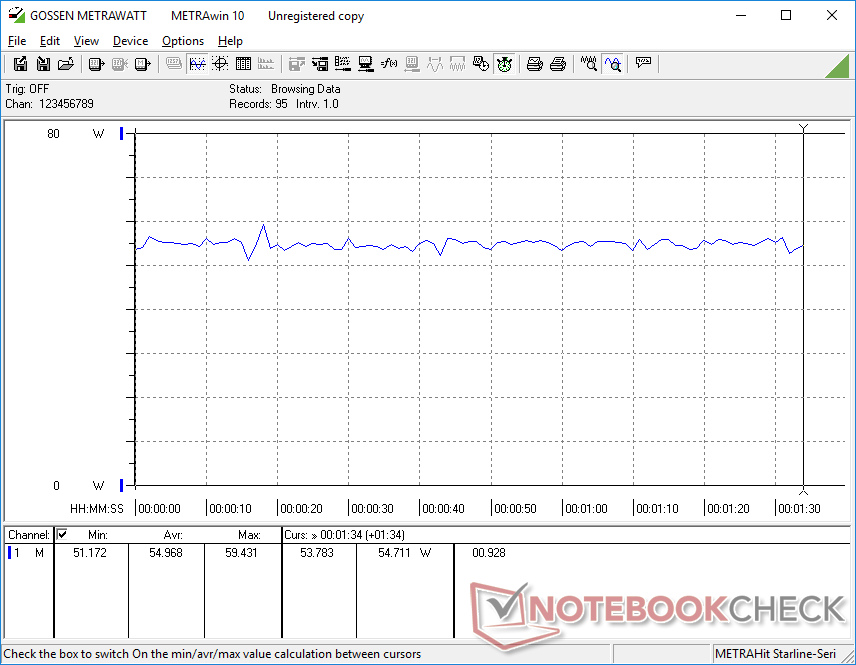
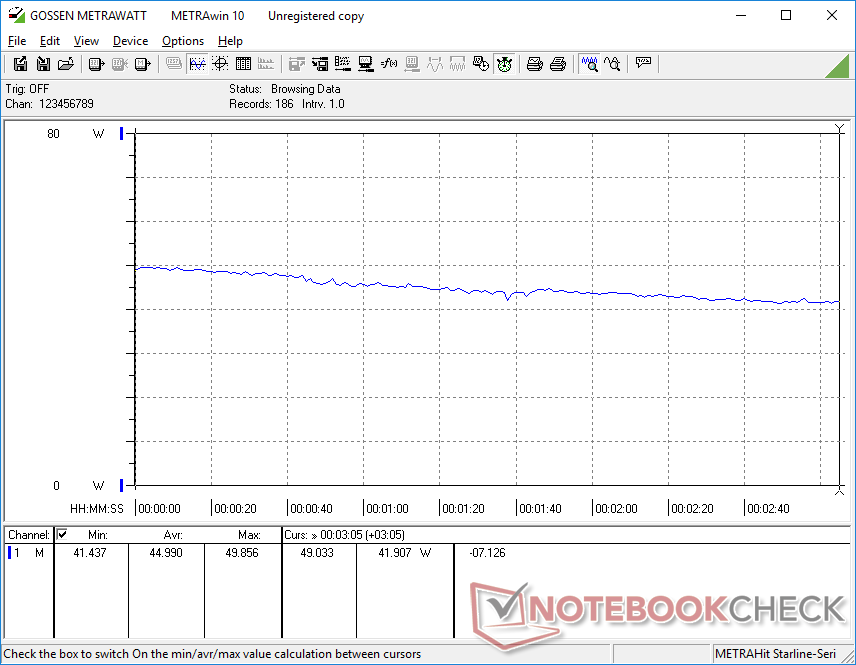
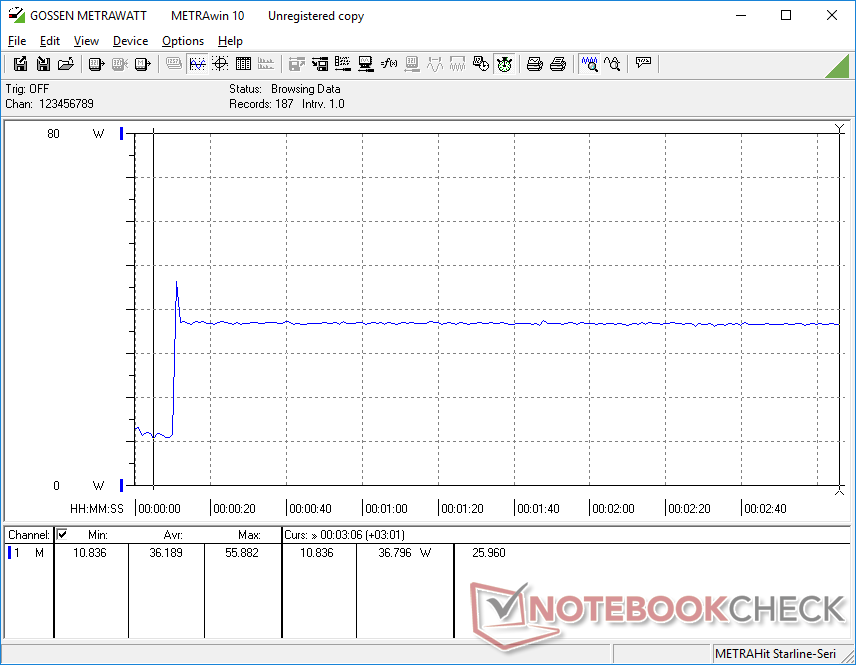
Test de stress
Lors de l'exécution de Prime95, le CPU a atteint 3,8 GHz et 34 W pendant quelques secondes avant de redescendre et de se stabiliser à 2,7 GHz et 20 W. La température du cœur est restée relativement froide à 66 C même sous charge, ce qui est comparable à l'Inspiron 14 7420 2-en-1 alimenté par Intel dans des conditions similaires. Nous soupçonnons que les Ryzen 7 ou Core i7 haut de gamme fonctionneraient plus chaudement que ce que nous avons enregistré sur notre configuration Ryzen 5 de base.
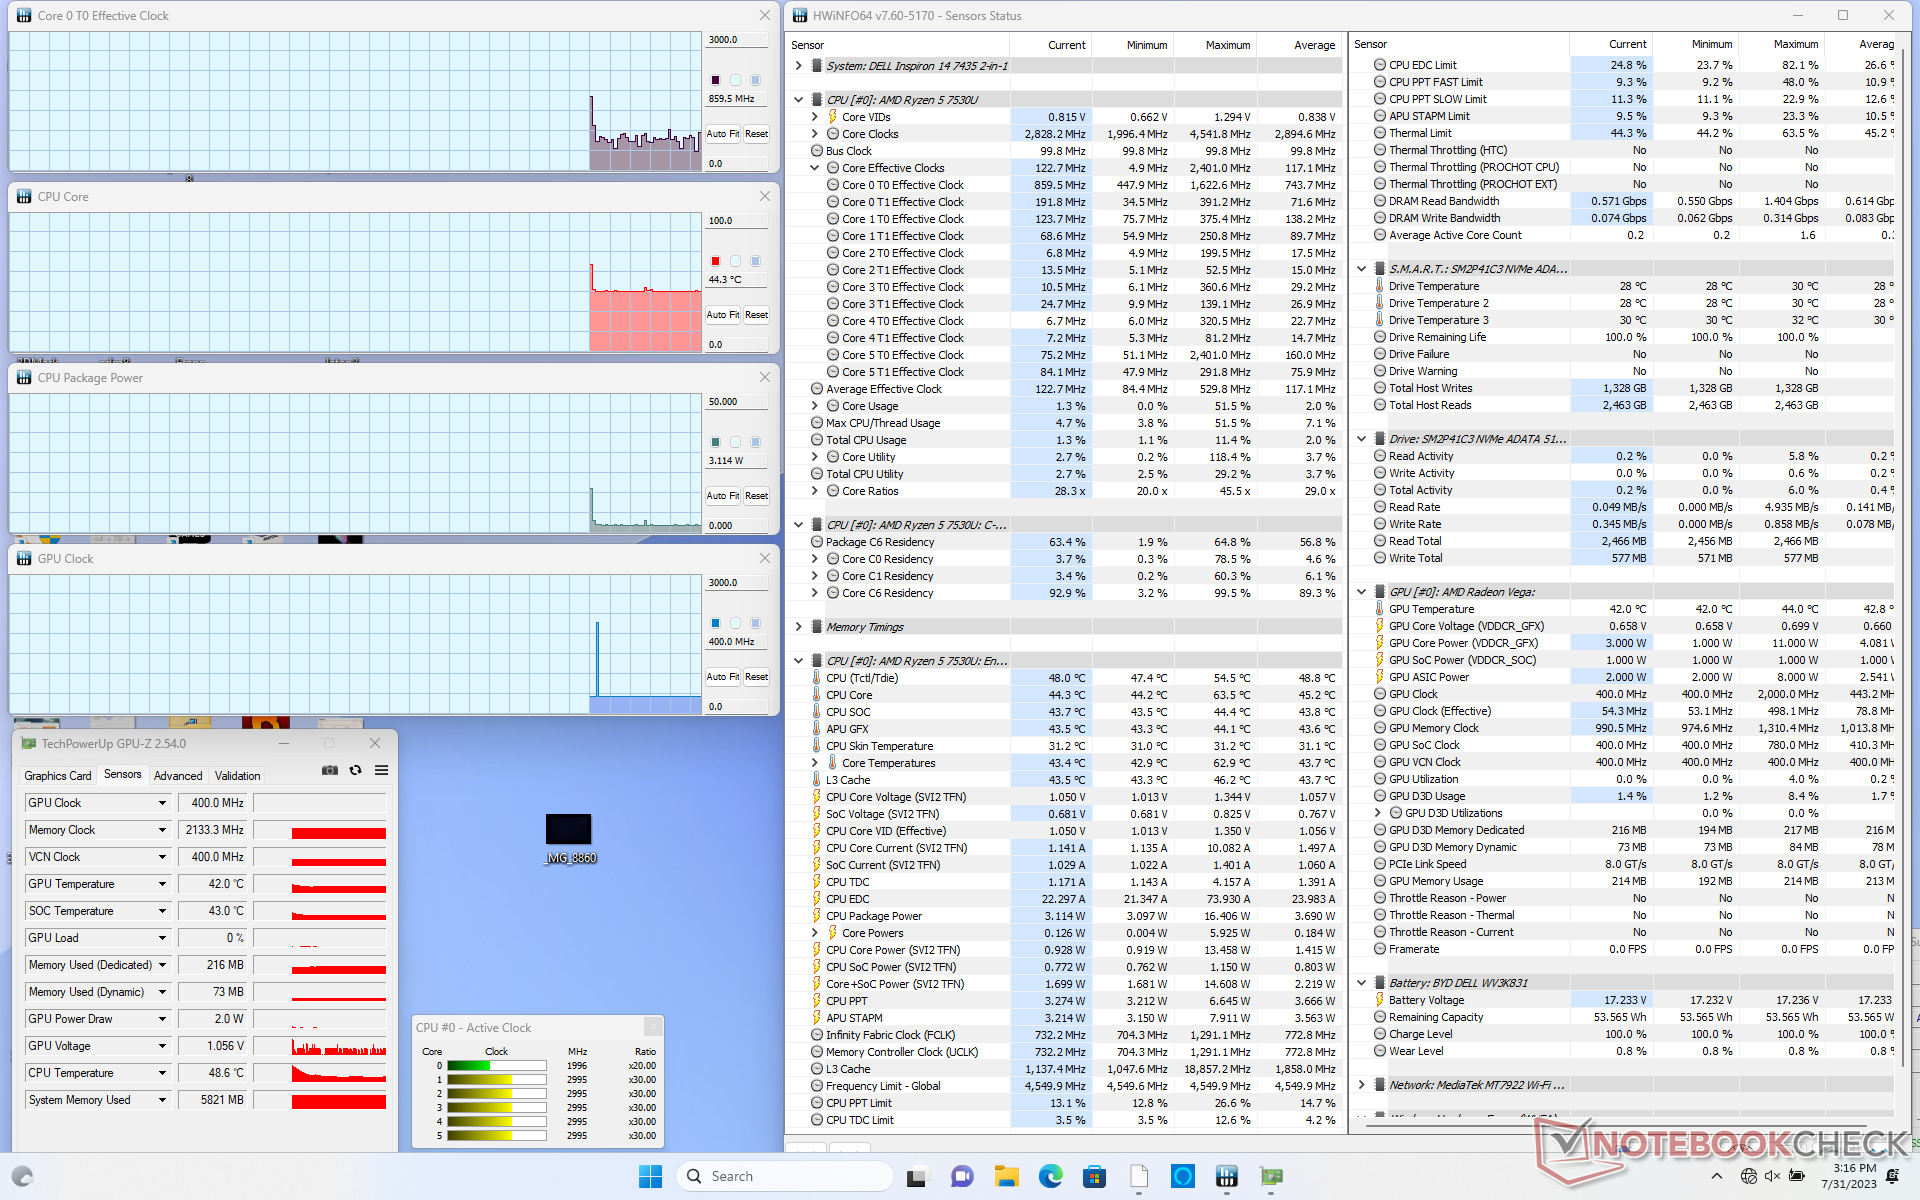
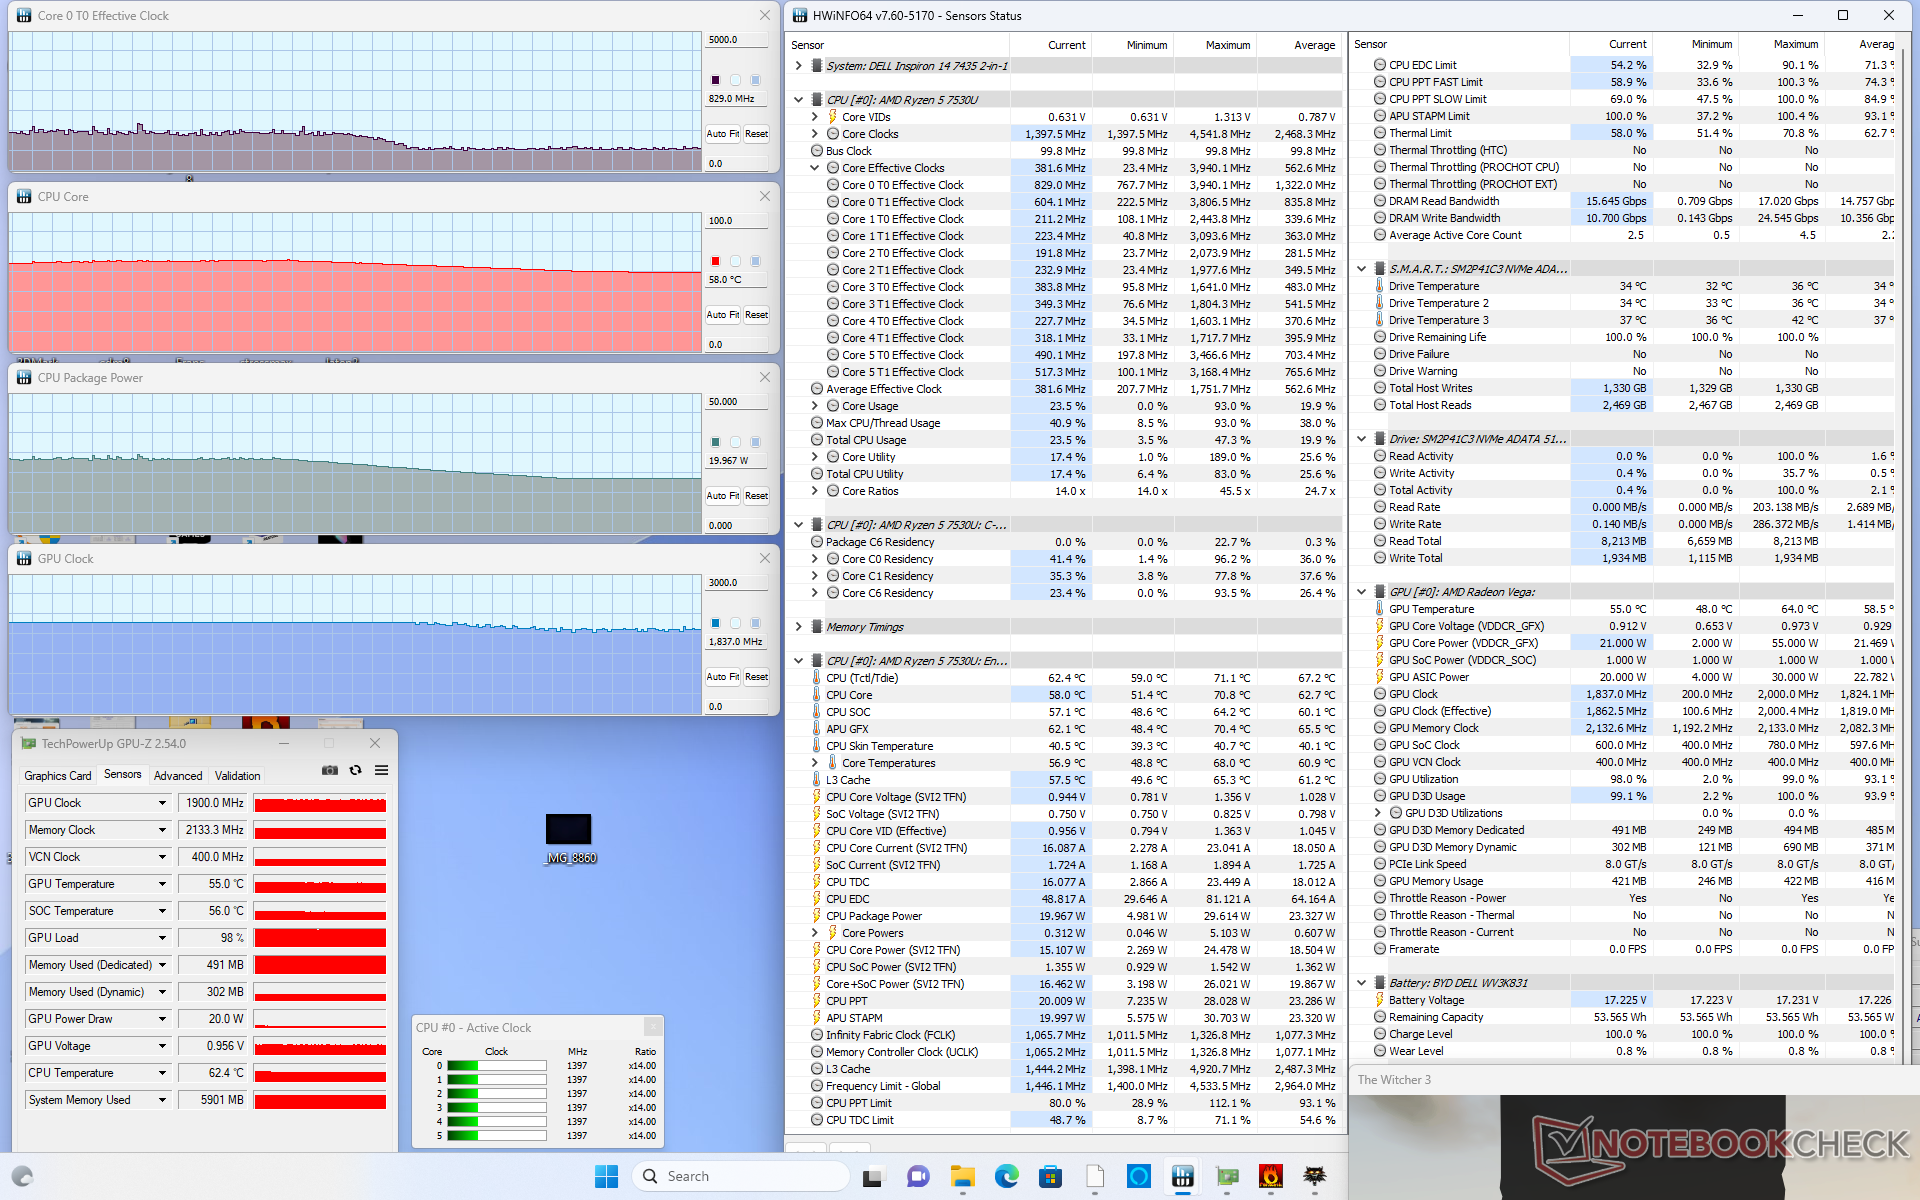
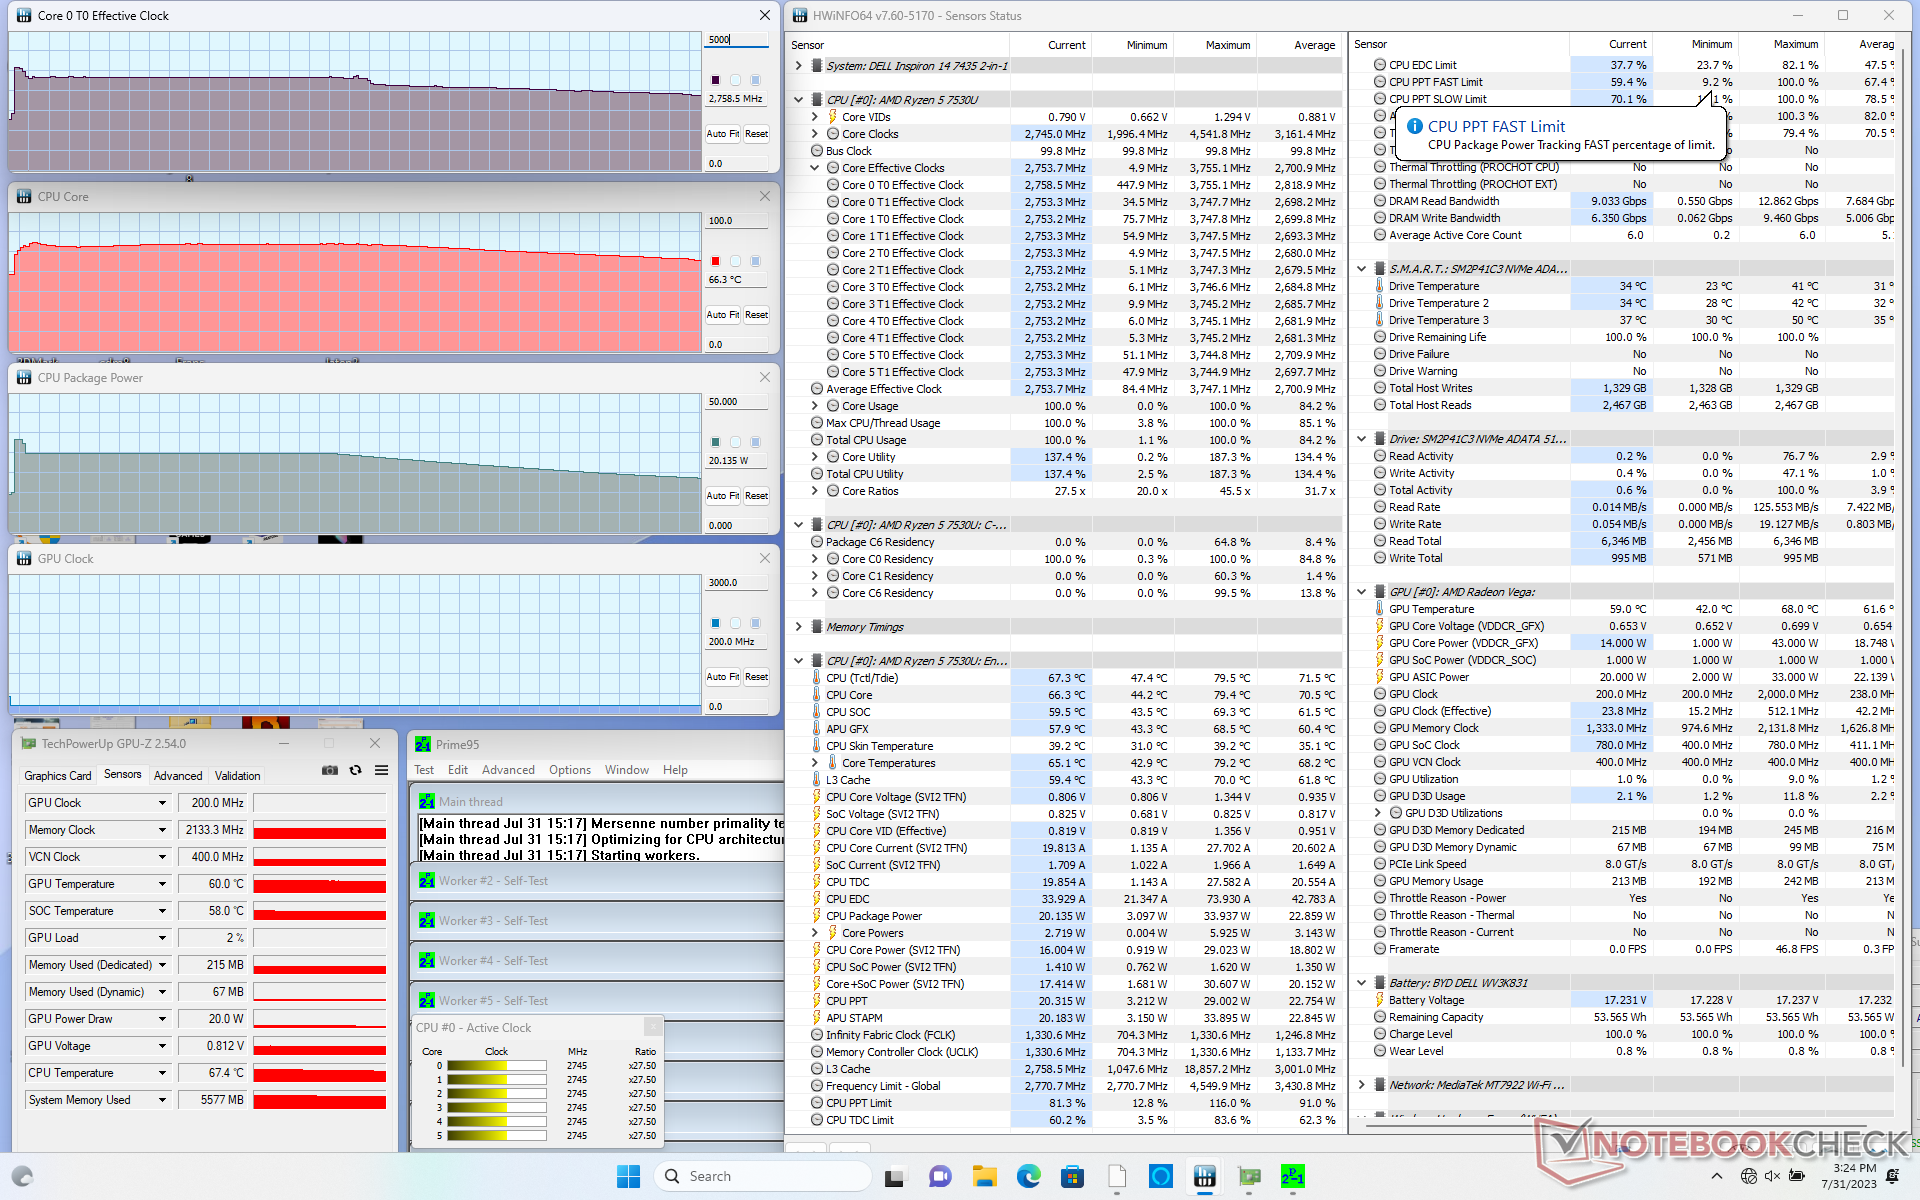
| Horloge du CPU (GHz) | Horloge du GPU (MHz) | Température moyenne du CPU (°C) | |
| Système au repos | -- | -- | 44 |
| Prime95 Stress | 2.7 | -- | 66 |
| Prime95 + FurMark Stress | 2.9 | 1050 | 60 |
| Witcher 3 Stress | 0.8 | 1900 | 58 |
Intervenants
Dell Inspiron 14 7435 2-in-1 analyse audio
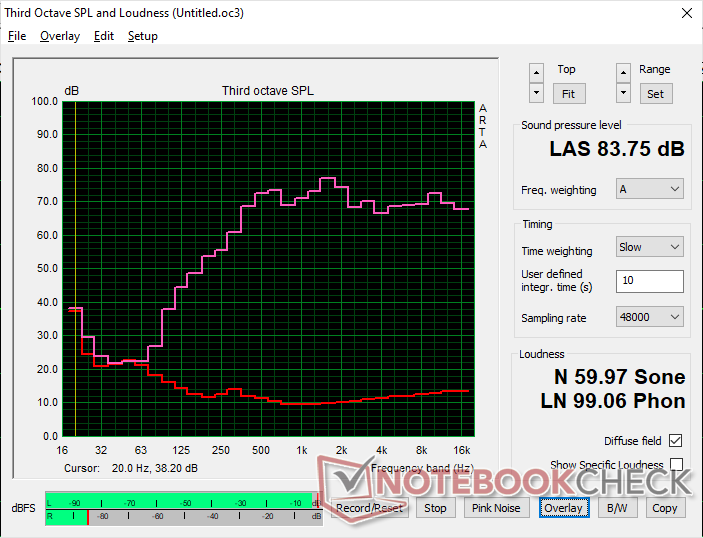
(+) | les haut-parleurs peuvent jouer relativement fort (83.8# dB)
Basses 100 - 315 Hz
(-) | presque aucune basse - en moyenne 18.8% plus bas que la médiane
(±) | la linéarité des basses est moyenne (9.9% delta à la fréquence précédente)
Médiums 400 - 2000 Hz
(+) | médiane équilibrée - seulement 3.5% de la médiane
(+) | les médiums sont linéaires (6.1% delta à la fréquence précédente)
Aiguës 2 - 16 kHz
(+) | des sommets équilibrés - à seulement 1.2% de la médiane
(+) | les aigus sont linéaires (4.4% delta à la fréquence précédente)
Globalement 100 - 16 000 Hz
(+) | le son global est linéaire (12.3% différence à la médiane)
Par rapport à la même classe
» 14% de tous les appareils testés de cette catégorie étaient meilleurs, 3% similaires, 83% pires
» Le meilleur avait un delta de 6%, la moyenne était de 20%, le pire était de 57%.
Par rapport à tous les appareils testés
» 10% de tous les appareils testés étaient meilleurs, 3% similaires, 87% pires
» Le meilleur avait un delta de 4%, la moyenne était de 23%, le pire était de 134%.
Apple MacBook Pro 16 2021 M1 Pro analyse audio
(+) | les haut-parleurs peuvent jouer relativement fort (84.7# dB)
Basses 100 - 315 Hz
(+) | bonne basse - seulement 3.8% loin de la médiane
(+) | les basses sont linéaires (5.2% delta à la fréquence précédente)
Médiums 400 - 2000 Hz
(+) | médiane équilibrée - seulement 1.3% de la médiane
(+) | les médiums sont linéaires (2.1% delta à la fréquence précédente)
Aiguës 2 - 16 kHz
(+) | des sommets équilibrés - à seulement 1.9% de la médiane
(+) | les aigus sont linéaires (2.7% delta à la fréquence précédente)
Globalement 100 - 16 000 Hz
(+) | le son global est linéaire (4.6% différence à la médiane)
Par rapport à la même classe
» 0% de tous les appareils testés de cette catégorie étaient meilleurs, 0% similaires, 100% pires
» Le meilleur avait un delta de 5%, la moyenne était de 17%, le pire était de 45%.
Par rapport à tous les appareils testés
» 0% de tous les appareils testés étaient meilleurs, 0% similaires, 100% pires
» Le meilleur avait un delta de 4%, la moyenne était de 23%, le pire était de 134%.
Gestion de l'énergie
Consommation électrique
La consommation d'énergie est comparable à celle de l'Inspiron 14 7420 d'Intel lors de l'exécution de charges peu exigeantes, mais elle est constamment plus élevée lors de l'exécution de charges plus exigeantes telles que les jeux. Cela suggère que le GPU AMD intégré est légèrement moins économe en énergie que l'Iris Xe 96 EU concurrent, alors que les performances par watt du CPU sont plus similaires.
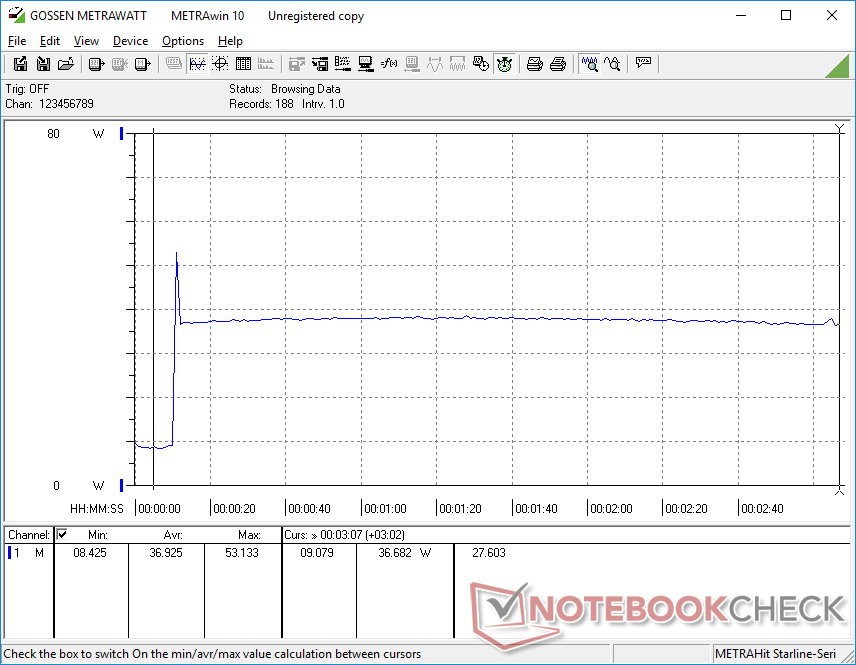
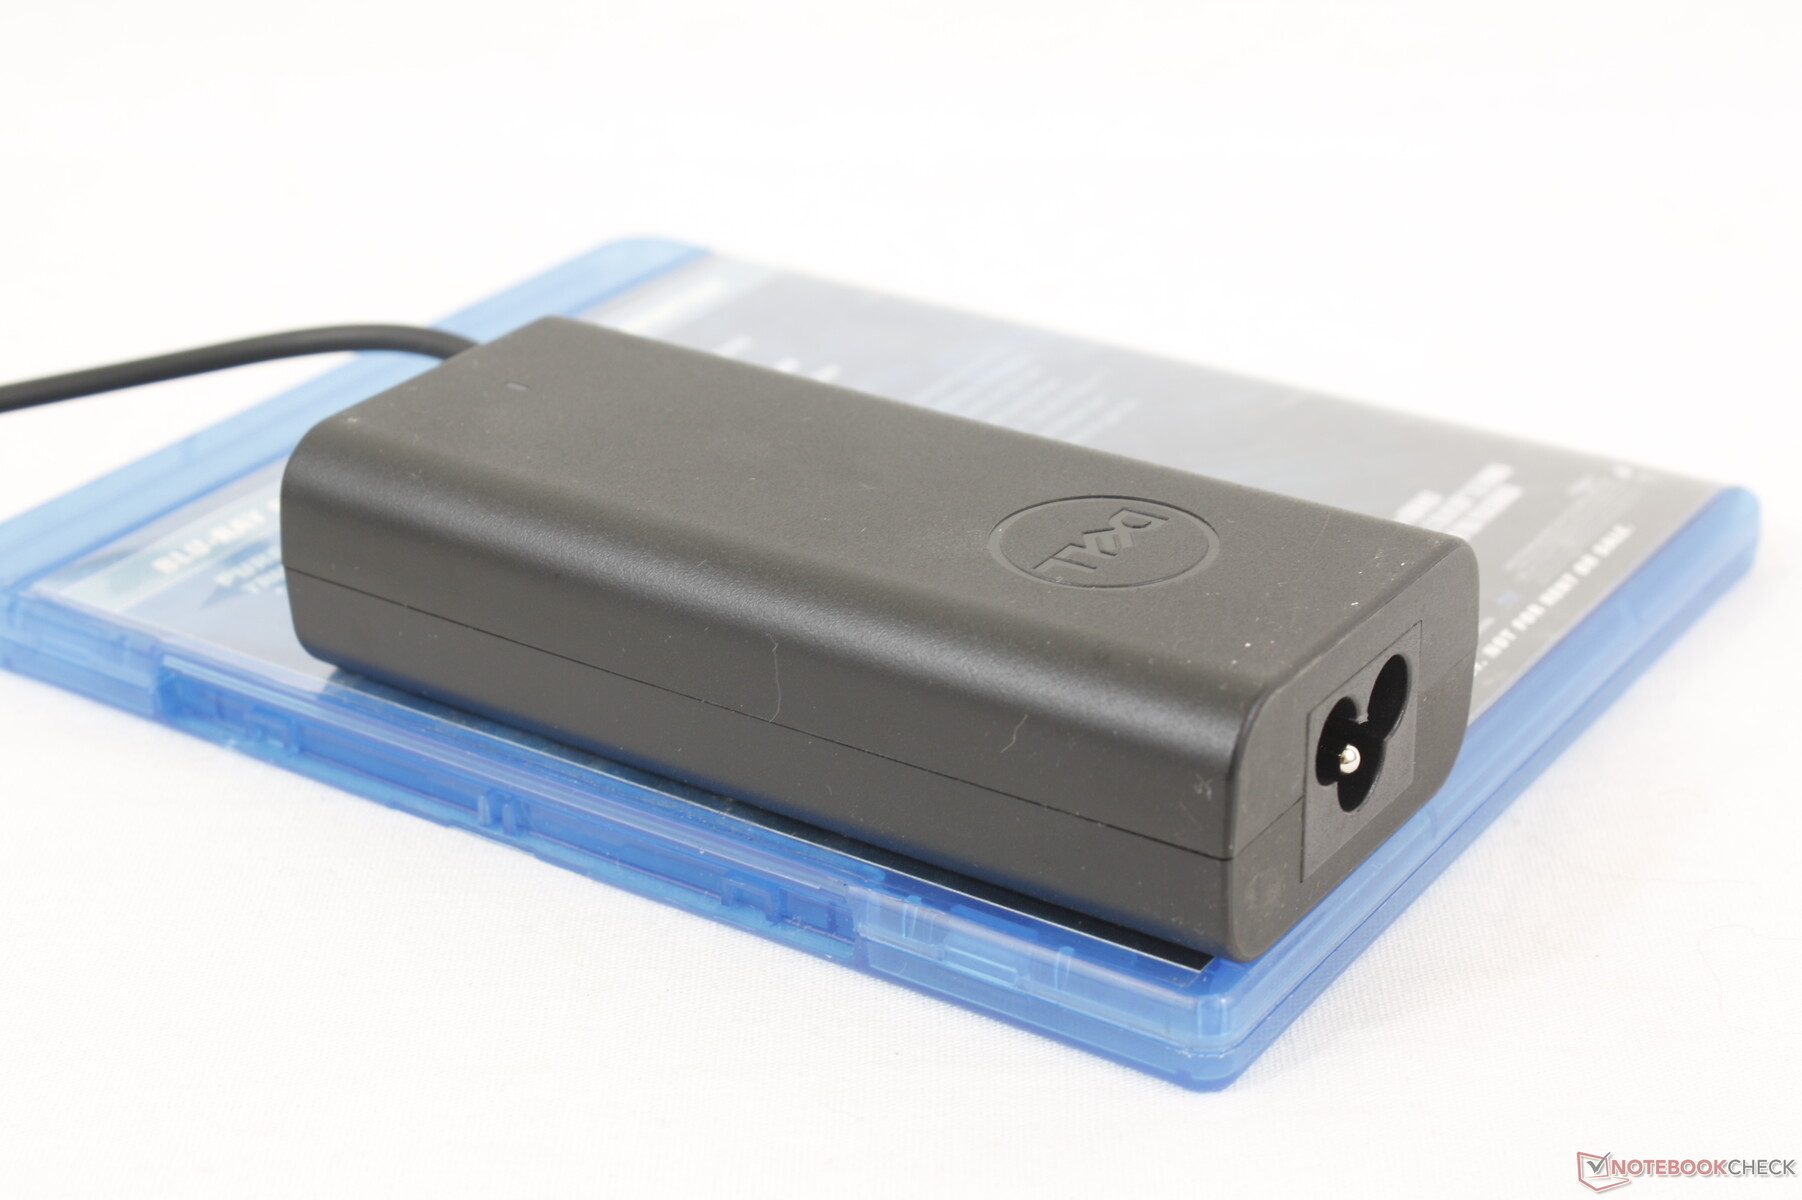
Nous sommes en mesure de mesurer une consommation maximale de 56 W à partir du petit (11,1 x 5,1 x 2,8 cm) adaptateur USB-C 65 W lorsque le CPU est à 100 % d'utilisation. Cependant, ce taux est très éphémère comme le montrent nos captures d'écran ci-dessous en raison du potentiel Turbo Boost limité du système.
| Éteint/en veille | |
| Au repos | |
| Fortement sollicité |
|
Légende:
min: | |
| Dell Inspiron 14 7435 2-in-1 R5 7530U, Vega 7, , IPS, 1920x1200, 14" | Dell Inspiron 14 7420 2-in-1 i7-1255U, Iris Xe G7 96EUs, WDC PC SN530 SDBPMPZ-512G, IPS, 1920x1200, 14" | Lenovo IdeaPad Flex 7i 14IAU7 i7-1255U, Iris Xe G7 96EUs, Samsung PM9B1 512GB MZAL4512HBLU, IPS, 2240x1400, 14" | Acer Aspire 5 Spin 14 i5-1335U, Iris Xe G7 80EUs, Micron 2450 512GB MTFDKBA512TFK, IPS, 1920x1200, 14" | LG Gram 14T90P i5-1135G7, Iris Xe G7 80EUs, Samsung SSD PM981a MZVLB512HBJQ, IPS, 1900x1200, 14" | HP Pavilion x360 14-dy0157ng i5-1135G7, Iris Xe G7 80EUs, Toshiba KBG40ZNV512G, IPS, 1920x1080, 14" | |
|---|---|---|---|---|---|---|
| Power Consumption | 6% | -10% | 12% | 24% | 33% | |
| Idle Minimum * (Watt) | 5.3 | 5.2 2% | 7.1 -34% | 4.3 19% | 2.8 47% | 4 25% |
| Idle Average * (Watt) | 9.1 | 8.2 10% | 11 -21% | 5.8 36% | 5.5 40% | 6.7 26% |
| Idle Maximum * (Watt) | 9.4 | 9.9 -5% | 11.4 -21% | 8.8 6% | 6.4 32% | 8.2 13% |
| Load Average * (Watt) | 54.9 | 44.4 19% | 43.7 20% | 44 20% | 45.4 17% | 29.6 46% |
| Witcher 3 ultra * (Watt) | 45 | 35 22% | 35.1 22% | 41.5 8% | 34 24% | 29.6 34% |
| Load Maximum * (Watt) | 55.8 | 62.5 -12% | 71 -27% | 67 -20% | 65.9 -18% | 26.7 52% |
* ... Moindre est la valeur, meilleures sont les performances
Power Consumption Witcher 3 / Stresstest
Power Consumption external Monitor
Autonomie de la batterie
Les durées d'utilisation ont sensiblement augmenté d'une année sur l'autre, bien que la capacité de la batterie n'ait pas été modifiée. Nous avons pu enregistrer 11 heures de navigation WLAN dans le monde réel sur notre unité alimentée par AMD, contre 7,5 heures sur le modèle de l'année dernière alimenté par Intel. L'Inspiron 14 7435 2-en-1 est donc plus endurant que beaucoup d'autres subnotebooks dans sa gamme de prix.
Il faut environ deux heures pour recharger l'ordinateur de sa capacité maximale.
| Dell Inspiron 14 7435 2-in-1 R5 7530U, Vega 7, 54 Wh | Dell Inspiron 14 7420 2-in-1 i7-1255U, Iris Xe G7 96EUs, 54 Wh | Lenovo IdeaPad Flex 7i 14IAU7 i7-1255U, Iris Xe G7 96EUs, 59 Wh | Acer Aspire 5 Spin 14 i5-1335U, Iris Xe G7 80EUs, 54.6 Wh | LG Gram 14T90P i5-1135G7, Iris Xe G7 80EUs, 72 Wh | HP Pavilion x360 14-dy0157ng i5-1135G7, Iris Xe G7 80EUs, 43 Wh | |
|---|---|---|---|---|---|---|
| Autonomie de la batterie | -16% | -32% | 0% | 12% | -22% | |
| Reader / Idle (h) | 19.9 | 15.9 -20% | 17.7 -11% | |||
| WiFi v1.3 (h) | 11.1 | 7.6 -32% | 7.6 -32% | 11.1 0% | 12.1 9% | 7.1 -36% |
| Load (h) | 2 | 2.1 5% | 2.3 15% | 1.6 -20% | ||
| H.264 (h) | 8.9 |
Points positifs
Points négatifs
Verdict - De bonnes performances pour le prix, mais l'affichage pourrait être amélioré
Du point de vue des performances, notre Inspiron 14 7435 2-en-1 Ryzen 5 à 550 USD est aussi performant que l'Inspiron 14 7430 2-en-1 Core i5 à 800 USD, sans aucun compromis sur l'autonomie de la batterie, la qualité de l'affichage, les haut-parleurs ou d'autres caractéristiques physiques. Si la prise en charge de Thunderbolt n'est pas une priorité pour vous, vous pouvez économiser près de 200 $ en optant pour AMD au lieu d'Intel pour ce modèle.
La configuration Ryzen 5 est parfaitement adaptée pour être aussi performante que la configuration Core i5 pour des centaines d'euros de moins. Les mises à jour coûteuses de la mémoire vive et l'écran tactile peu lumineux font cependant baisser un peu le prix de ce modèle.
La mémoire vive soudée est un inconvénient majeur du modèle de cette année, car une simple mise à niveau de 8 à 16 Go coûte au moins 150 dollars de plus. Pour ce qui est censé être un cabriolet économique, cette mise à niveau coûteuse peut rebuter le public cible. Pour le reste, les changements apportés aux haut-parleurs, au pavé tactile et aux charnières sont des améliorations bienvenues.
Nous aimerions que les prochaines versions intègrent des écrans tactiles plus lumineux pour une meilleure visibilité en extérieur. L'écran actuel de 250 nits limite le modèle aux environnements intérieurs, ce qui est regrettable car les acheteurs pourraient vouloir utiliser le convertible de 14 pouces en déplacement. Une telle caractéristique donnerait à l'Inspiron 14 7435 2-en-1 une longueur d'avance sur des concurrents comme le Acer Aspire 5 Spin 14, Lenovo IdeaPad Flex 7ilenovo IdeaPad Flex 7i HP Pavilion x360 14.
Prix et disponibilité
Dell livre dès à présent son Inspiron 14 7435 2-en-1 à partir de 549 USD pour la configuration Ryzen 5 que nous avons testée et jusqu'à 699 USD pour la configuration Ryzen 7. L'Inspiron 14 7430 2-en-1 d'Intel est quant à lui proposé à partir de 799 dollars pour la configuration Core i5.
Dell Inspiron 14 7435 2-in-1
- 08/08/2023 v7 (old)
Allen Ngo
Transparency
La sélection des appareils à examiner est effectuée par notre équipe éditoriale. L'échantillon de test a été prêté à l'auteur par le fabricant ou le détaillant pour les besoins de cet examen. Le prêteur n'a pas eu d'influence sur cette évaluation et le fabricant n'a pas reçu de copie de cette évaluation avant sa publication. Il n'y avait aucune obligation de publier cet article. En tant que média indépendant, Notebookcheck n'est pas soumis à l'autorité des fabricants, des détaillants ou des éditeurs.
Voici comment Notebookcheck teste
Chaque année, Notebookcheck examine de manière indépendante des centaines d'ordinateurs portables et de smartphones en utilisant des procédures standardisées afin de garantir que tous les résultats sont comparables. Nous avons continuellement développé nos méthodes de test depuis environ 20 ans et avons établi des normes industrielles dans le processus. Dans nos laboratoires de test, des équipements de mesure de haute qualité sont utilisés par des techniciens et des rédacteurs expérimentés. Ces tests impliquent un processus de validation en plusieurs étapes. Notre système d'évaluation complexe repose sur des centaines de mesures et de points de référence bien fondés, ce qui garantit l'objectivité.Price comparison

