Test du Dell XPS 13 9315 : la Surface Pro 8 de Dell
Dell a dévoilé trois modèles distincts de XPS 13 au CES 2022 : le XPS 13 9320 Plus à clapet, Le XPS 13 9315 à clapetet le XPS 13 9315 2-en-1. Après avoir passé en revue les deux modèles à clapet, nous sommes maintenant prêts à nous attaquer au modèle 2-en-1 qui se trouve être le premier modèle XPS détachable de la gamme premier modèle XPS détachable depuis presque dix ans.
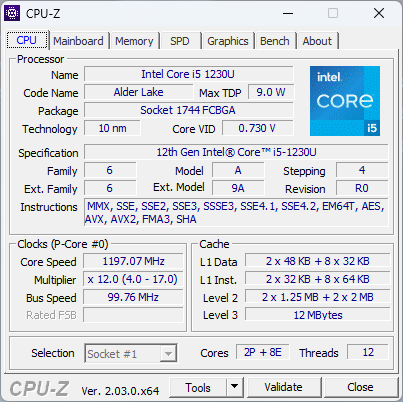
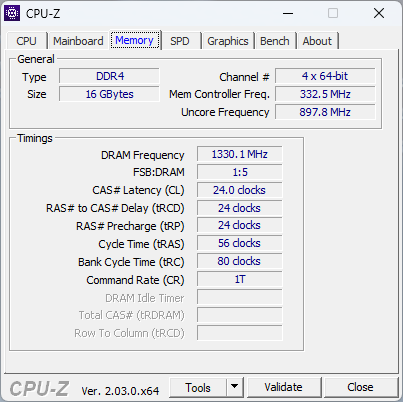
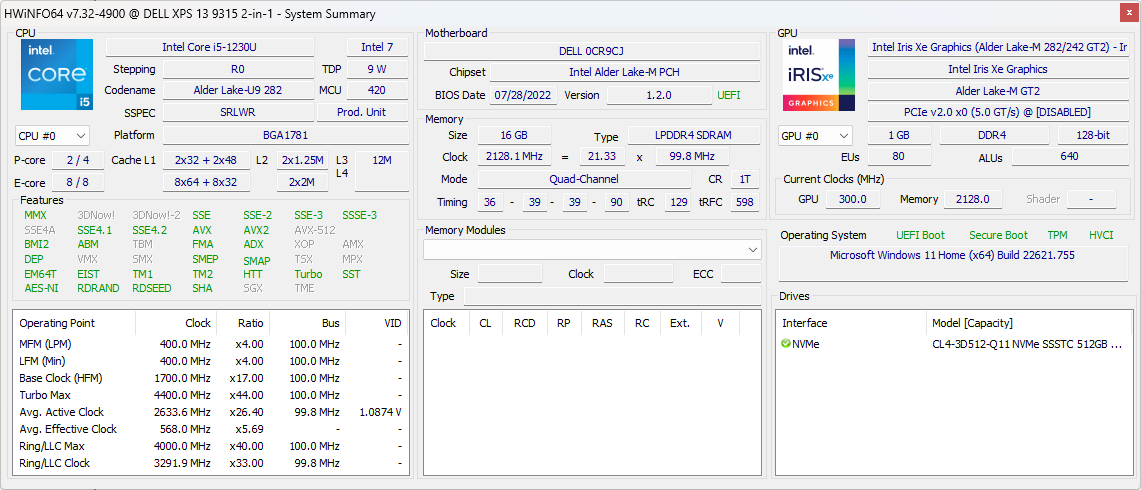
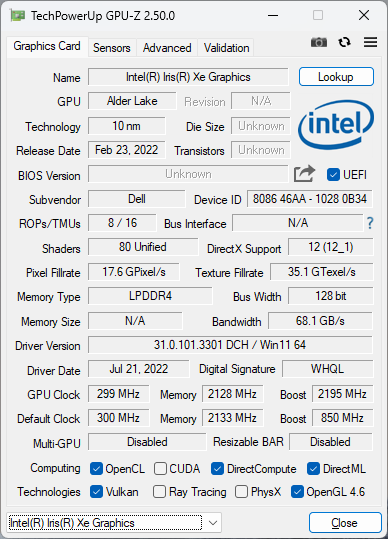
Notre configuration est équipée d'un processeur Core i5-1230U Alder Lake de 12e génération, de 16 Go de RAM LPDDR4x et d'un SSD NVMe de 512 Go pour environ 1400 USD. D'autres SKUs avec le CPU Core i7-1250U, 5G eSIM, et différentes capacités de RAM/SSD sont également disponibles, mais toutes les options sont équipées du même écran tactile IPS 3:2 2880 x 1920.
Les concurrents directs dans cet espace comprennent d'autres tablettes ou détachables Windows, notamment la Microsoft Surface Pro 8 de Microsoft et la plus chère HP Elite x2 dans une moindre mesure.
Plus de critiques sur Dell :
Comparaison avec les concurrents potentiels
Note | Date | Modèle | Poids | Épaisseur | Taille | Résolution | Prix |
|---|---|---|---|---|---|---|---|
| 90.1 % v7 (old) | 11/22 | Dell XPS 13 9315 2-in-1 Core i5-1230U i5-1230U, Iris Xe G7 80EUs | 764 g | 7.4 mm | 13.00" | 2880x1920 | |
| 87.3 % v7 (old) | 09/22 | Dell XPS 13 Plus 9320 i7-1280P OLED i7-1280P, Iris Xe G7 96EUs | 1.3 kg | 15.28 mm | 13.40" | 3456x2160 | |
| 89.1 % v7 (old) | 11/21 | Microsoft Surface Pro 8, i7-1185G7 i7-1185G7, Iris Xe G7 96EUs | 891 g | 8.5 mm | 13.00" | 2880x1920 | |
| 90.3 % v7 (old) | 08/22 | HP Spectre x360 13.5 14t-ef000 i7-1255U, Iris Xe G7 96EUs | 1.4 kg | 17 mm | 13.50" | 3000x2000 | |
| 86.1 % v7 (old) | 10/21 | Lenovo ThinkBook Plus Gen2 Core i5 i5-1130G7, Iris Xe G7 80EUs | 1.2 kg | 13.9 mm | 13.30" | 2560x1600 | |
| 92.3 % v7 (old) | 07/22 | Apple MacBook Air M2 Entry M2, M2 8-Core GPU | 1.2 kg | 11.3 mm | 13.60" | 2560x1664 |
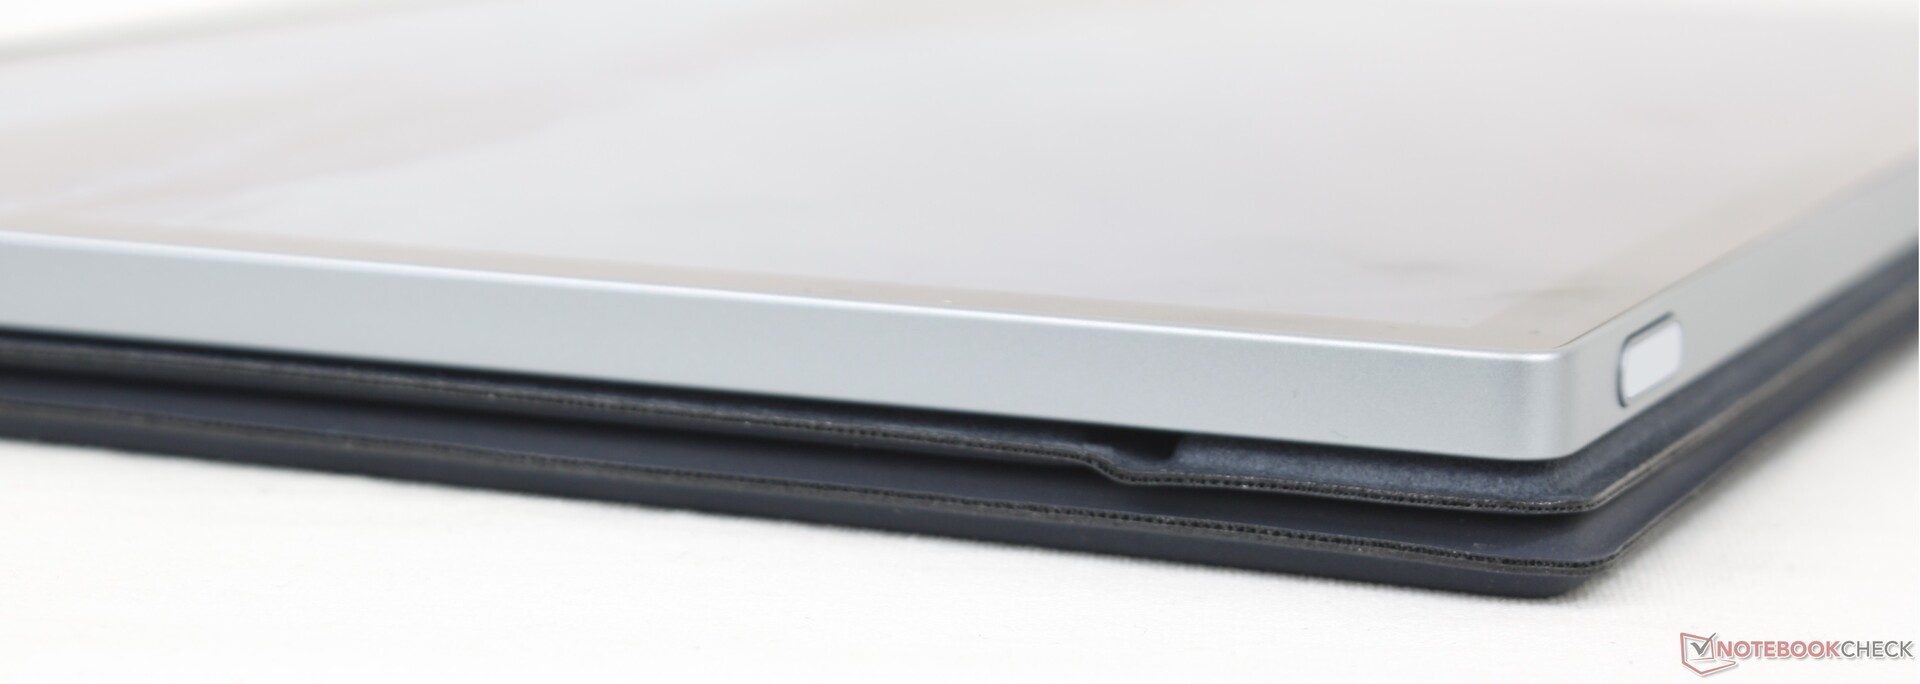
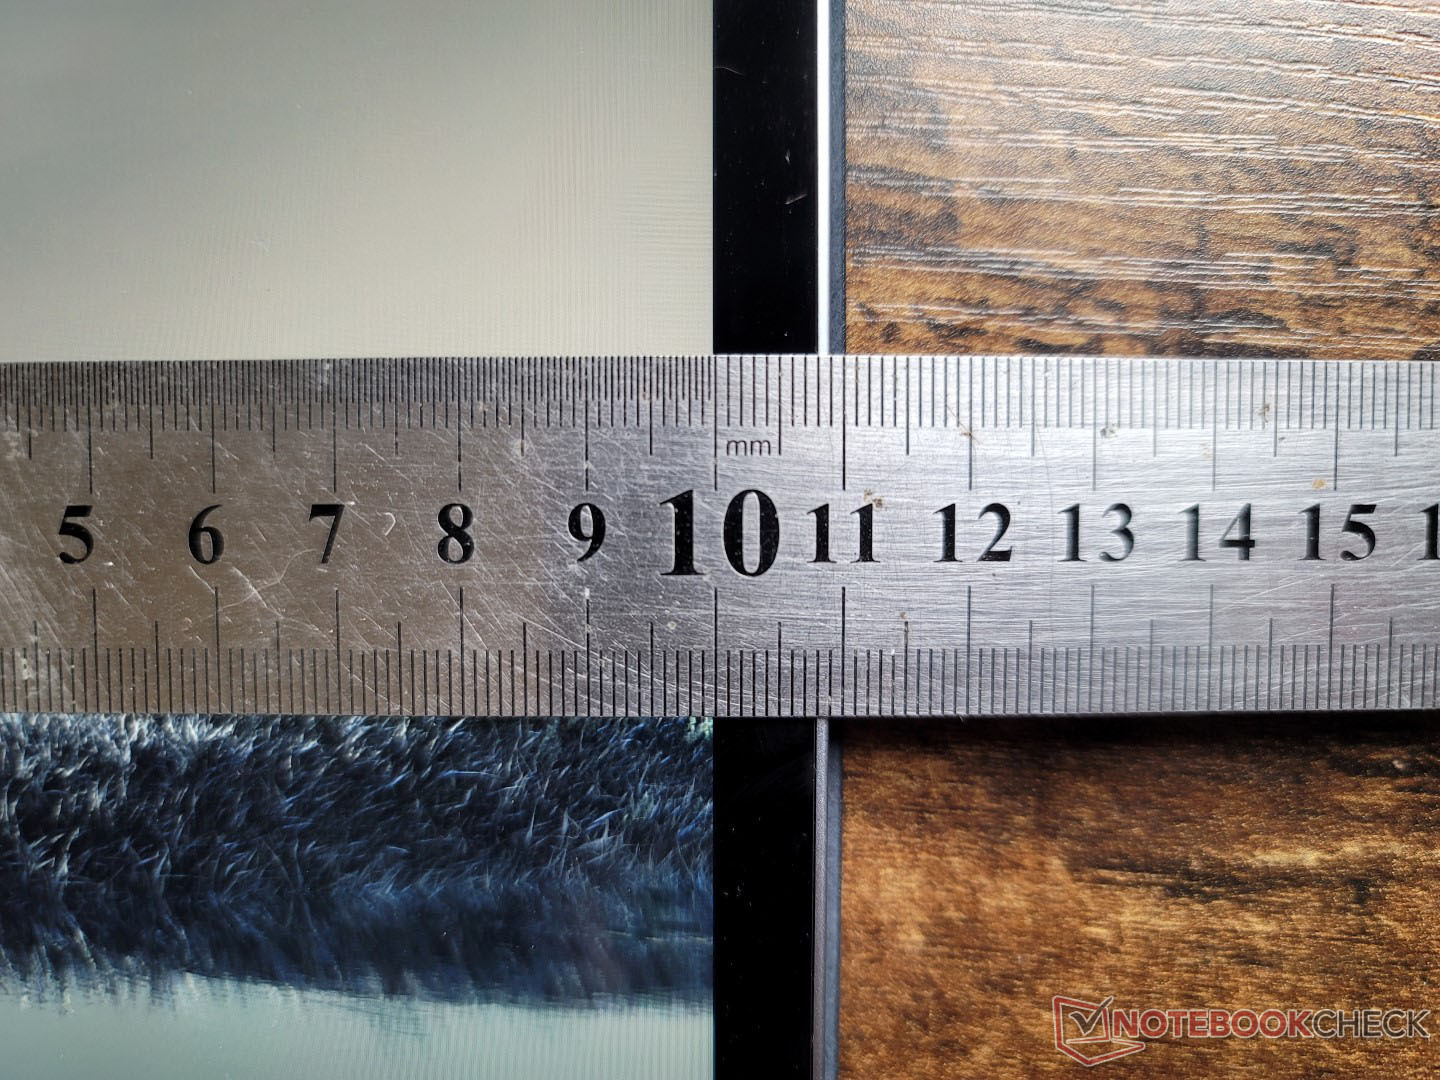
Étui - Plus léger qu'une Surface Pro 8
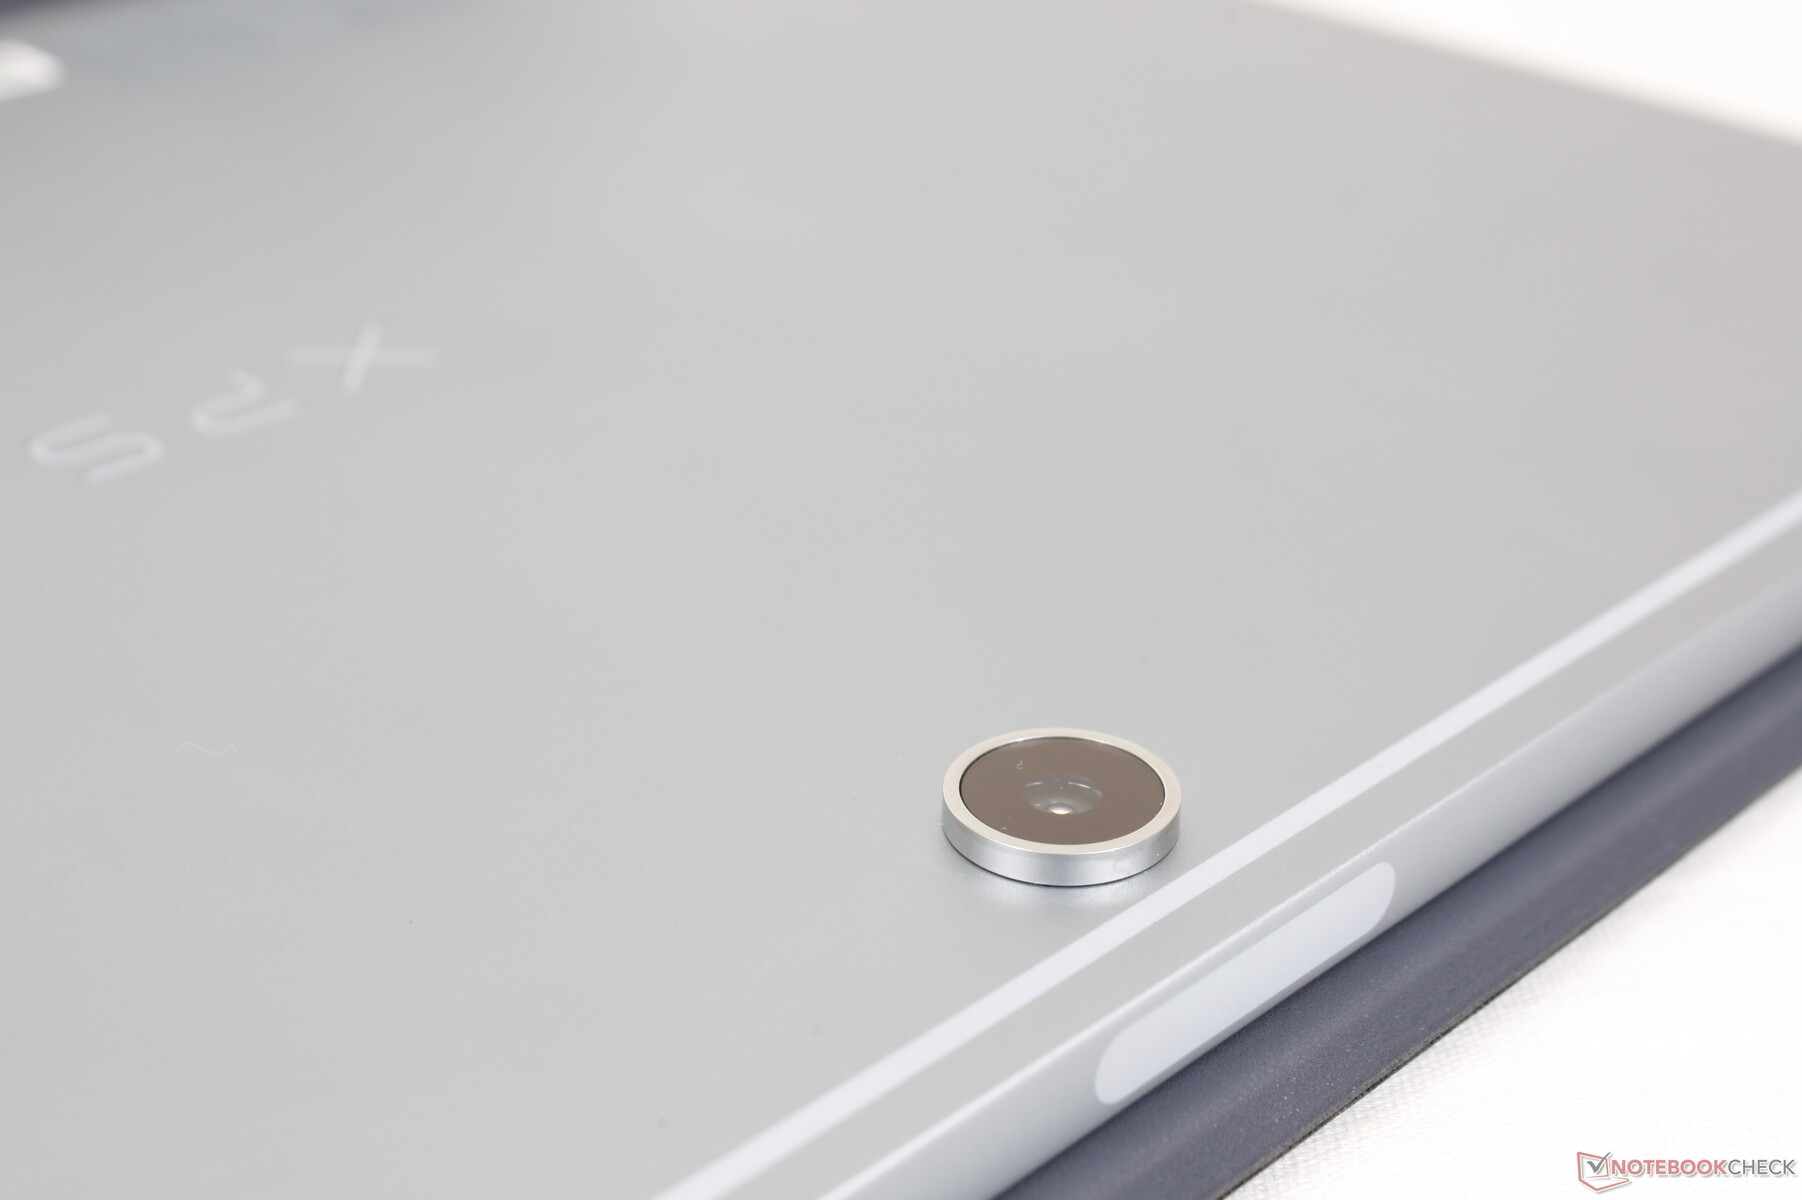
Le squelette est en aluminium à l'arrière et sur les bords, tandis que l'avant est en Gorilla Glass bord à bord. Il s'agit d'une finition mate robuste et de haute qualité, comme on peut s'y attendre, avec une couleur et une texture similaires à celles des couvercles extérieurs du XPS 13 9300 ou de la série XPS 15. Il y a un très léger gauchissement lorsqu'on essaie de tordre l'unité, mais ce n'est pas assez pour être inquiétant.
L'application d'une pression sur le centre du dos entraîne de légères dépressions et des bruits audibles. Cela est probablement dû au petit espace d'air entre la coque extérieure et les composants internes qui, encore une fois, n'a rien d'inquiétant.
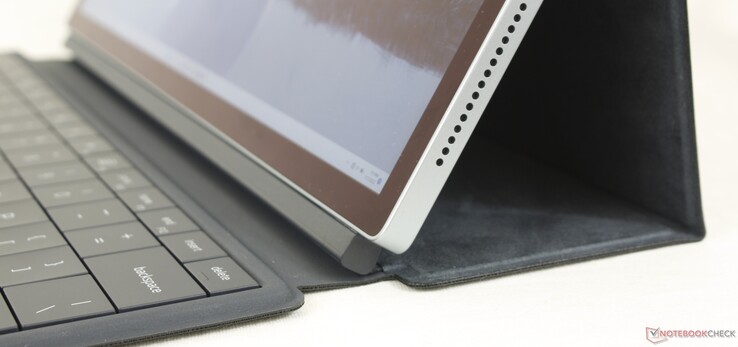
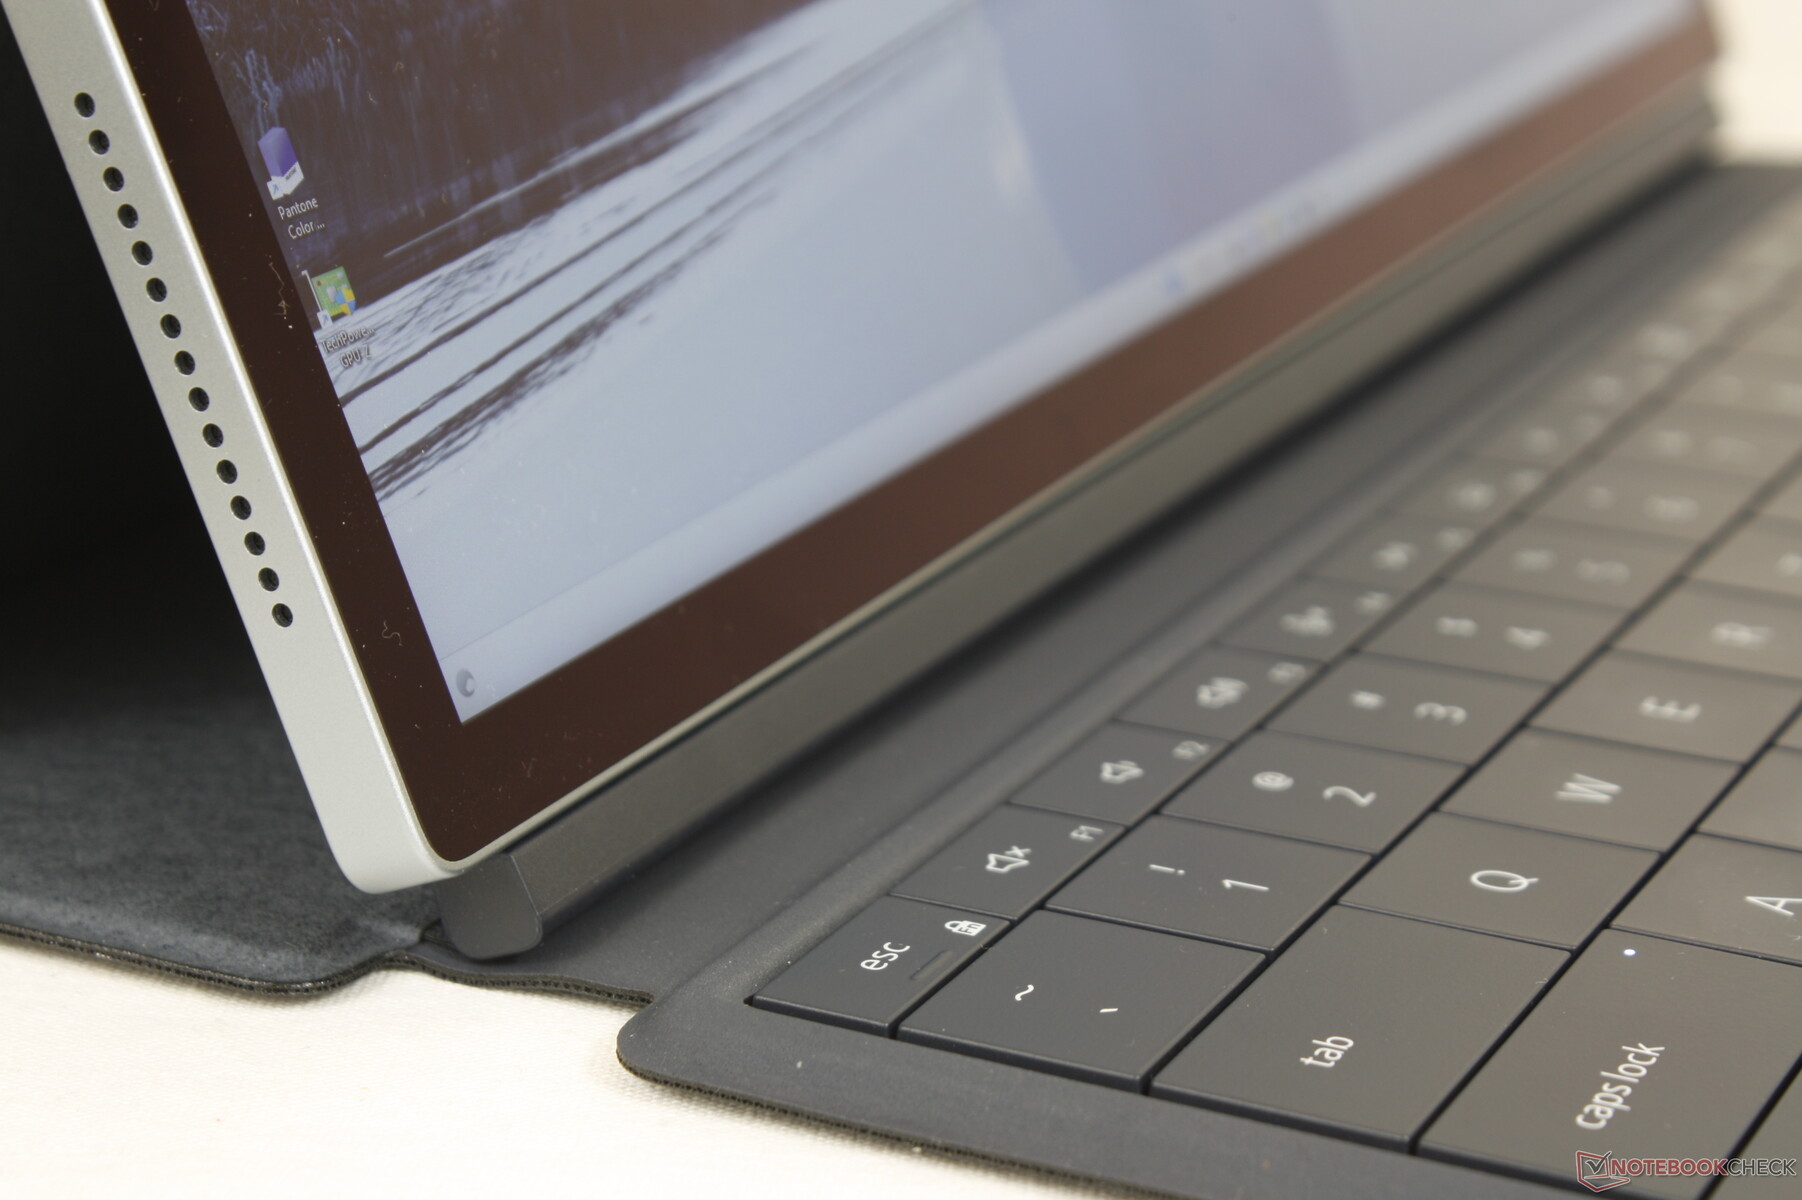
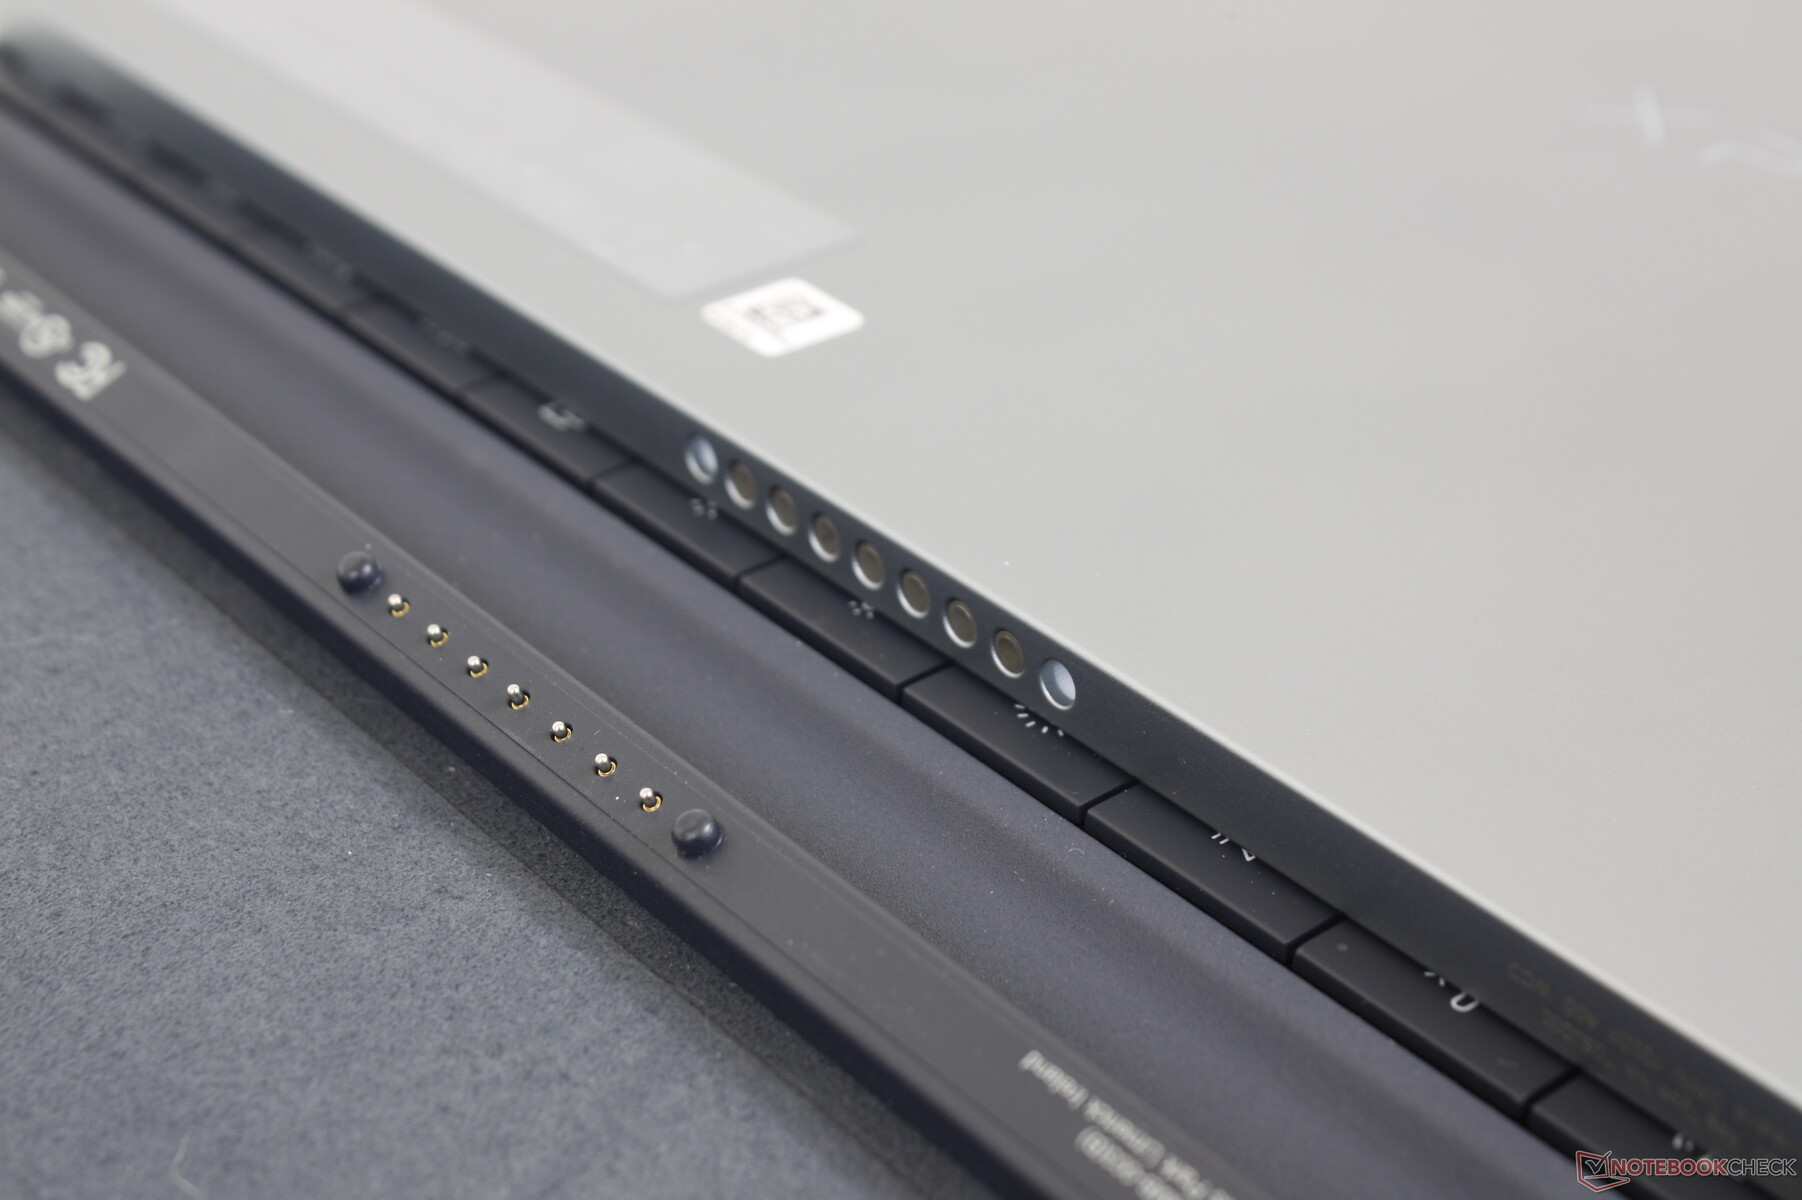
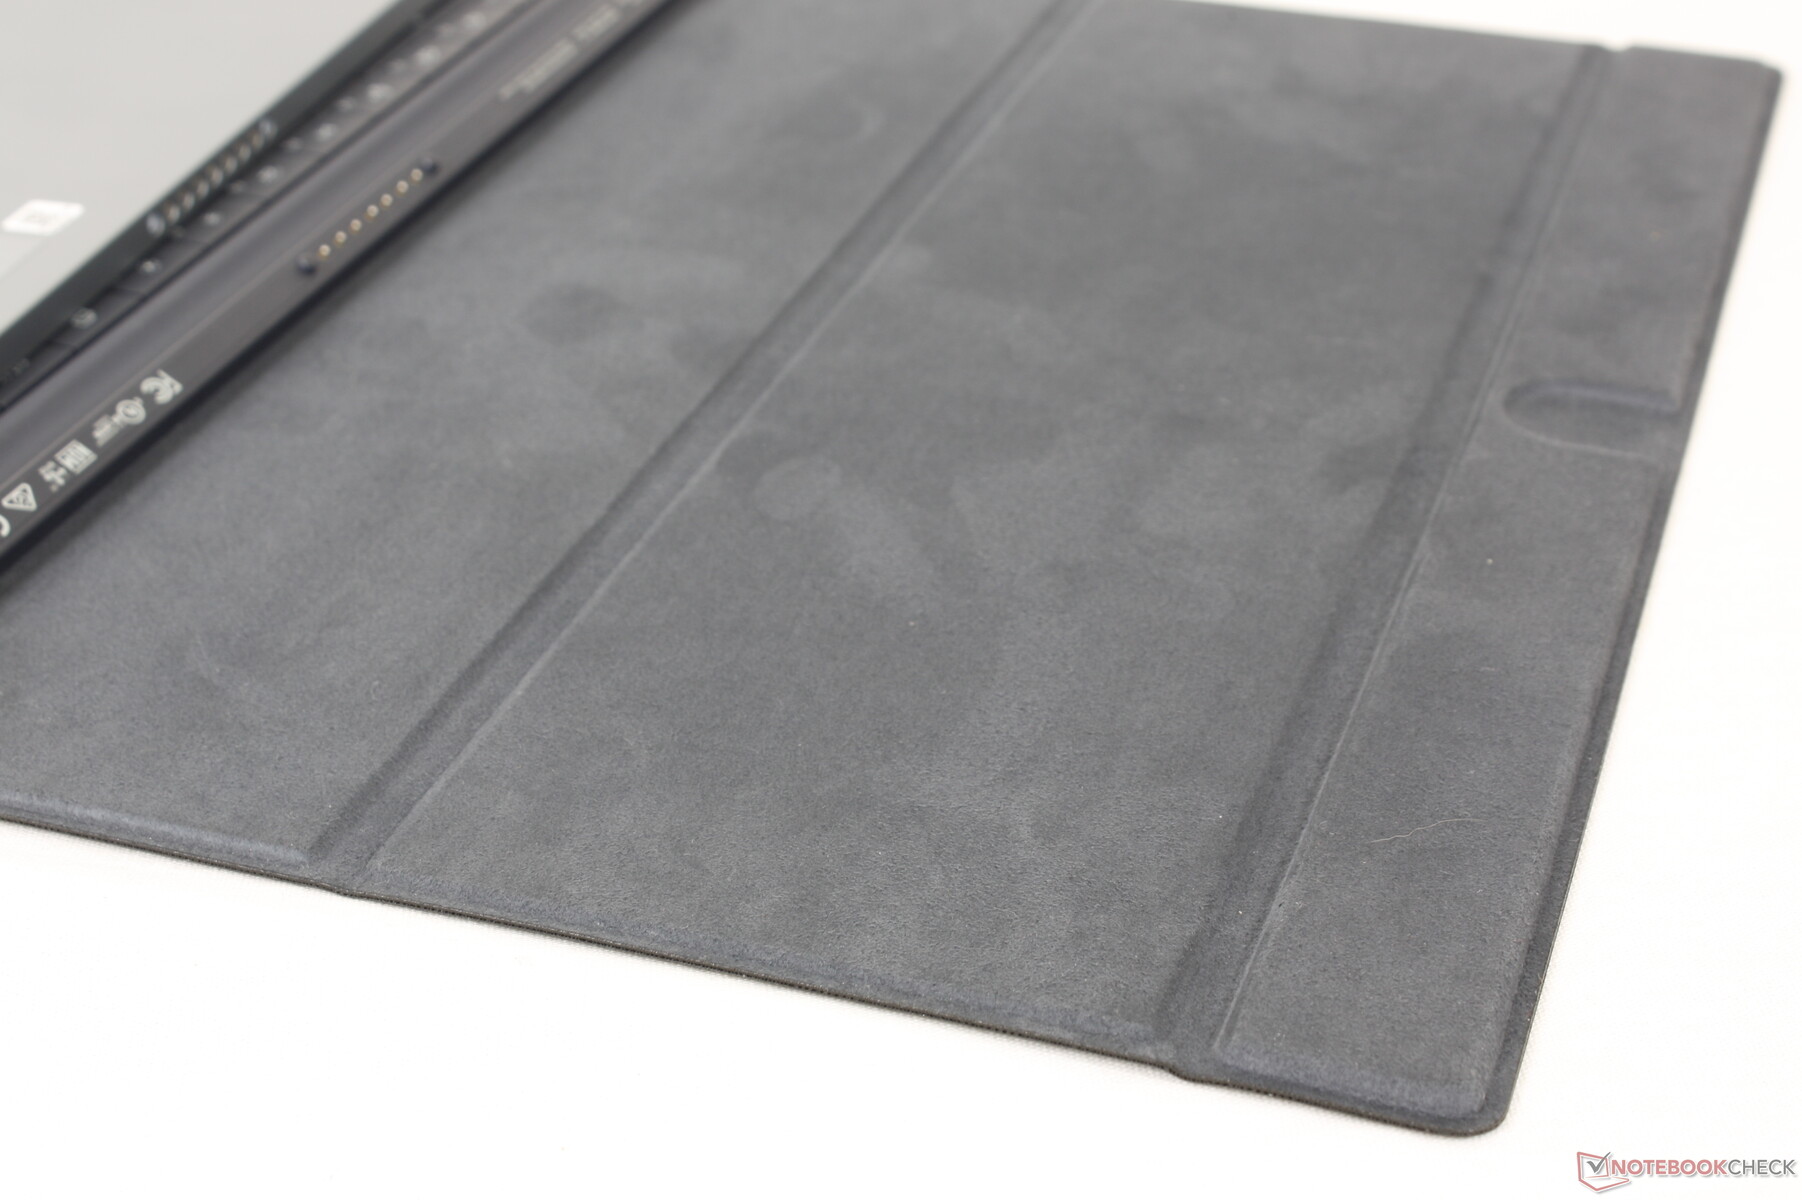
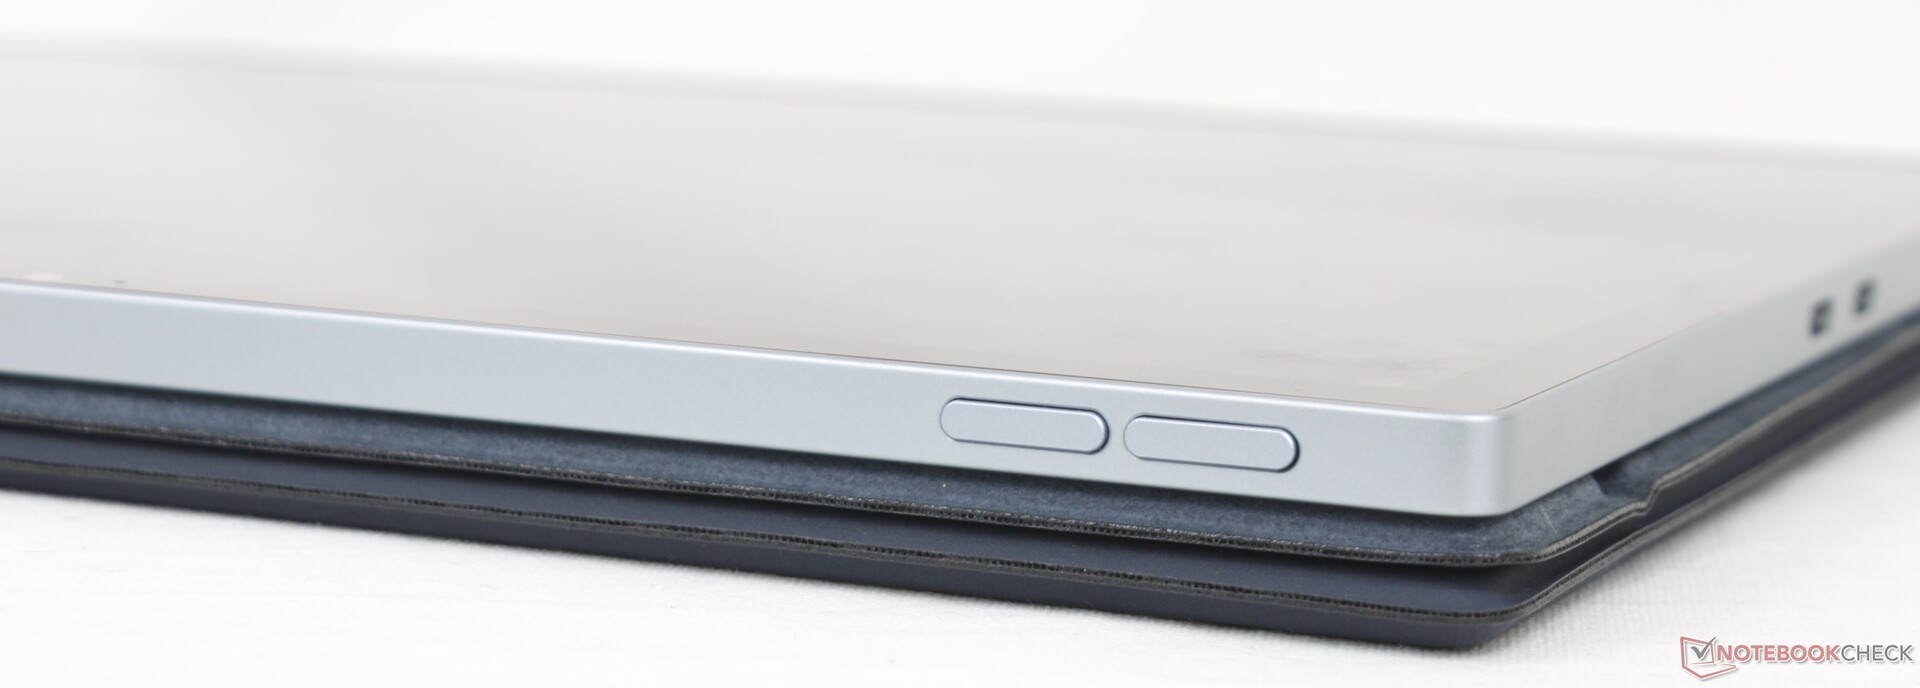
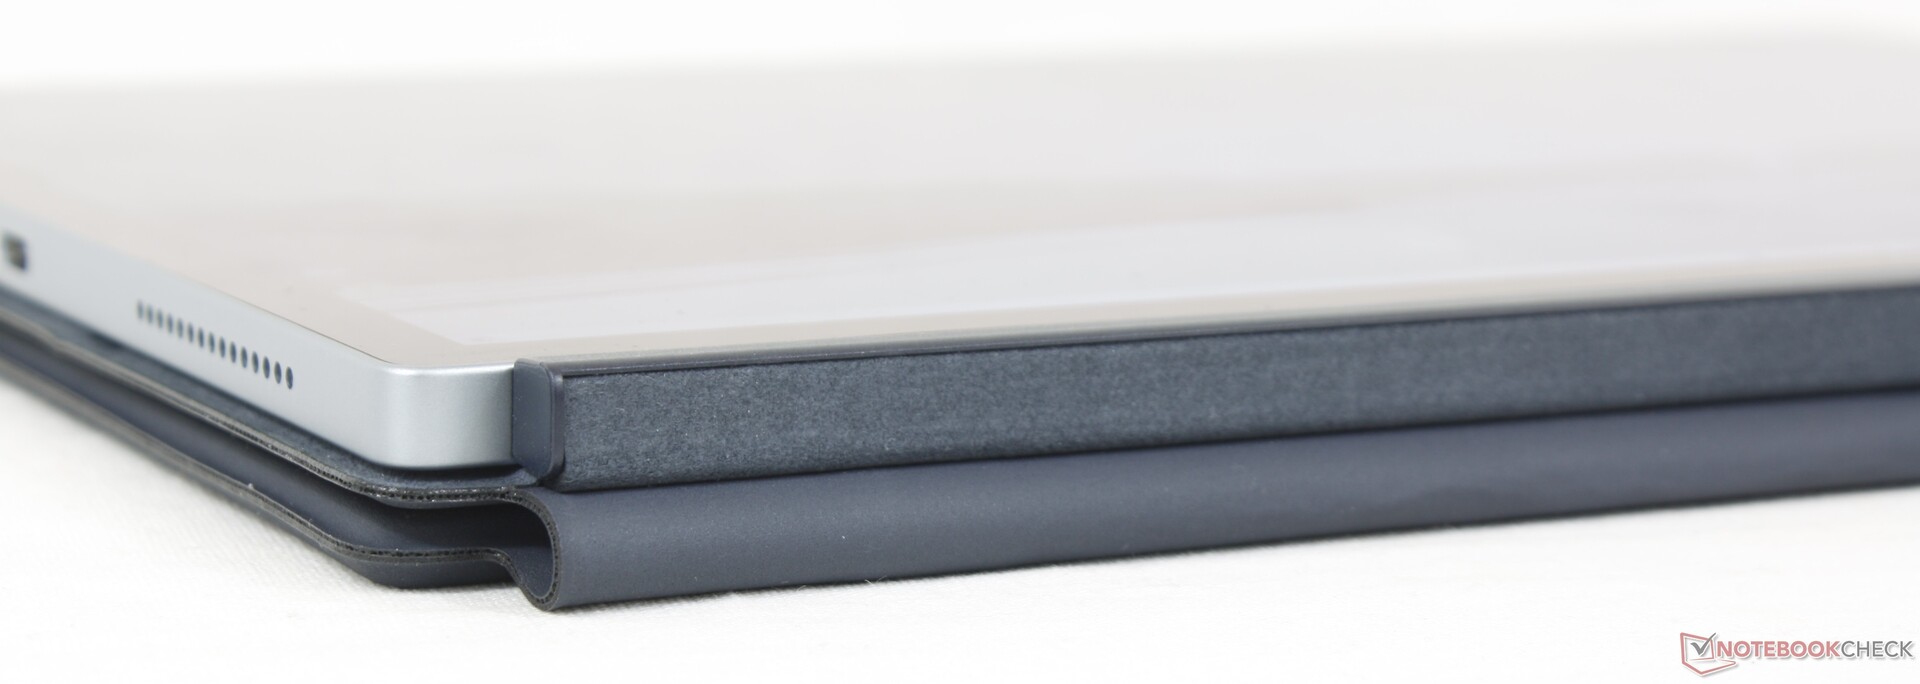
Le dock clavier magnétique (ou folio) est un matériau doux au toucher qui n'est pas sans rappeler les surfaces en Alcantara du dock clavier de la Surface Pro 8. Cependant, la solution Dell diffère sensiblement de la version Microsoft car elle comprend une couverture arrière alors que le Type Cover de la Surface Pro ne comprend que le clavier et le pavé tactile. Cette face arrière offre une protection supplémentaire contre les éraflures et les rayures, au prix d'un poids supplémentaire.
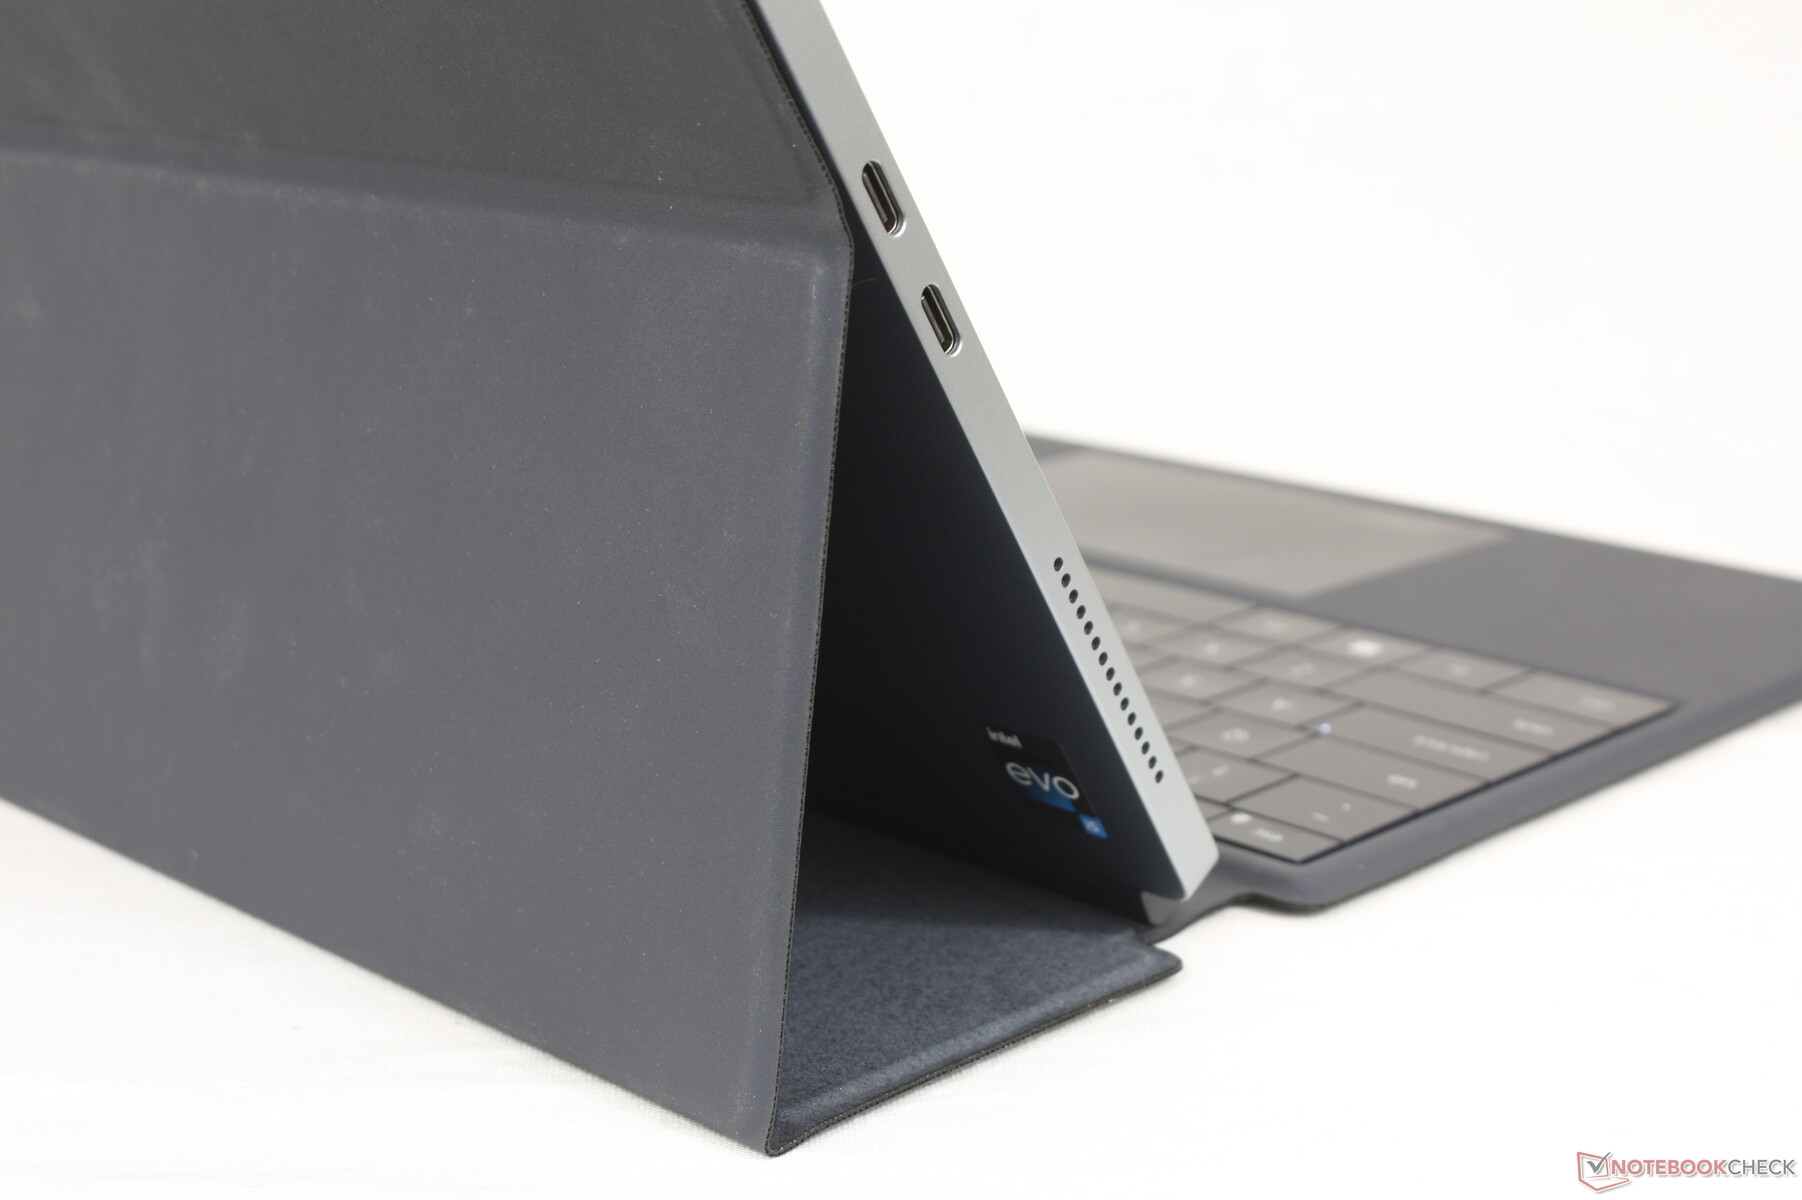
Pour ancrer la tablette Dell en mode ordinateur portable, la face arrière du folio peut être ajustée à 100, 115 et 125 degrés seulement alors que la charnière de la Surface Pro 8 peut bouger plus librement. En d'autres termes, le XPS 13 9315 2-en-1 a besoin du folio dock en option pour se soutenir, alors que la Surface Pro 8 dispose d'un support intégré plus pratique.
La tablette en elle-même est très légère : 764 g seulement, contre près de 900 g pour la Surface Pro 8. Une grande partie du gain de poids peut être attribuée à la conception sans ventilateur de la Dell alors que le modèle de Microsoft intègre un ventilateur pour un meilleur refroidissement. Le poids combiné de la tablette et de l'étui est de 1305 g, ce qui est proche de nombreux modèles à clapet de 13,5 pouces tels que leHP Spectre x360 13.5.
Les configurations 5G du XPS 13 9315 2-en-1 sont légèrement plus épaisses de 4/10ème de millimètre (7,8 contre 7,4 mm). Toutes les options sont toujours plus minces que la Surface Pro 8 d'un cheveu tout en étant presque identiques en longueur et en largeur.
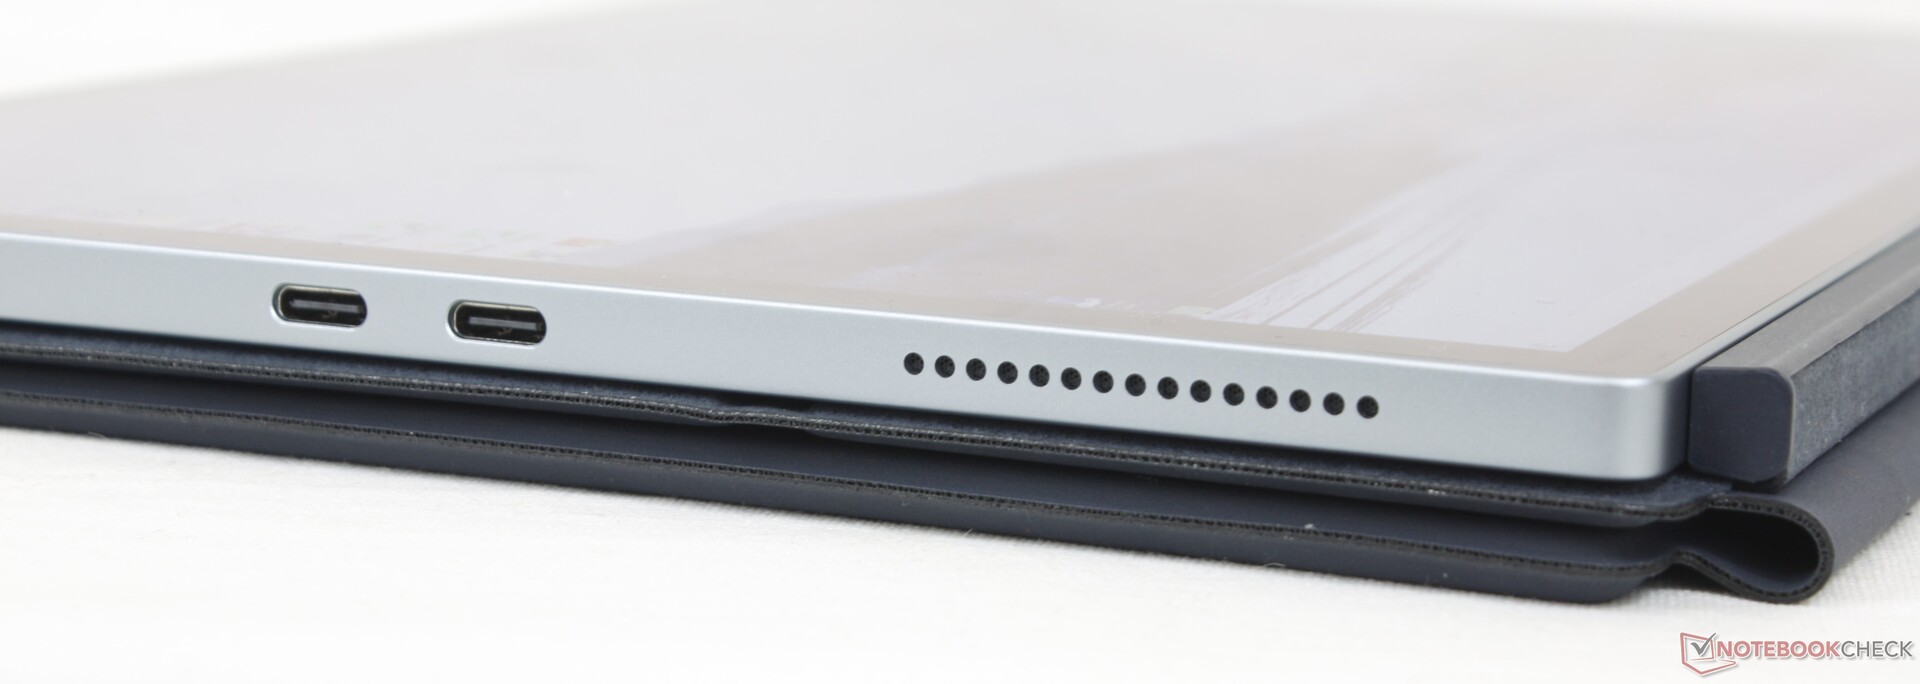
Connectivité - Pas de prise audio
Il n'y a que deux ports USB-C le long du bord gauche, chacun étant compatible avec les appareils Thunderbolt 4. Les utilisateurs devraient disposer de stations d'accueil et d'adaptateurs pour mieux exploiter ces deux ports. Gardez à l'esprit qu'il n'y a même pas de prise audio de 3,5 mm alors que la Surface Pro 8 en comprend une.
Communication
Un Intel 1675 AX211 est fourni en standard pour la compatibilité Wi-Fi 6E et Bluetooth 5.2. Les taux de transfert sont rapides et réguliers lorsqu'ils sont couplés à notre réseau 6 GHz, mais les taux de réception moyens sont un peu plus lents que prévu.
| Networking | |
| iperf3 transmit AX12 | |
| Microsoft Surface Pro 8, i7-1185G7 | |
| Lenovo ThinkBook Plus Gen2 Core i5 | |
| iperf3 receive AX12 | |
| Microsoft Surface Pro 8, i7-1185G7 | |
| Lenovo ThinkBook Plus Gen2 Core i5 | |
| iperf3 receive AXE11000 6GHz | |
| HP Spectre x360 13.5 14t-ef000 | |
| Dell XPS 13 9315 2-in-1 Core i5-1230U | |
| iperf3 receive AXE11000 | |
| Apple MacBook Air M2 Entry | |
| iperf3 transmit AXE11000 | |
| Apple MacBook Air M2 Entry | |
| iperf3 transmit AXE11000 6GHz | |
| HP Spectre x360 13.5 14t-ef000 | |
| Dell XPS 13 9315 2-in-1 Core i5-1230U | |
Webcam
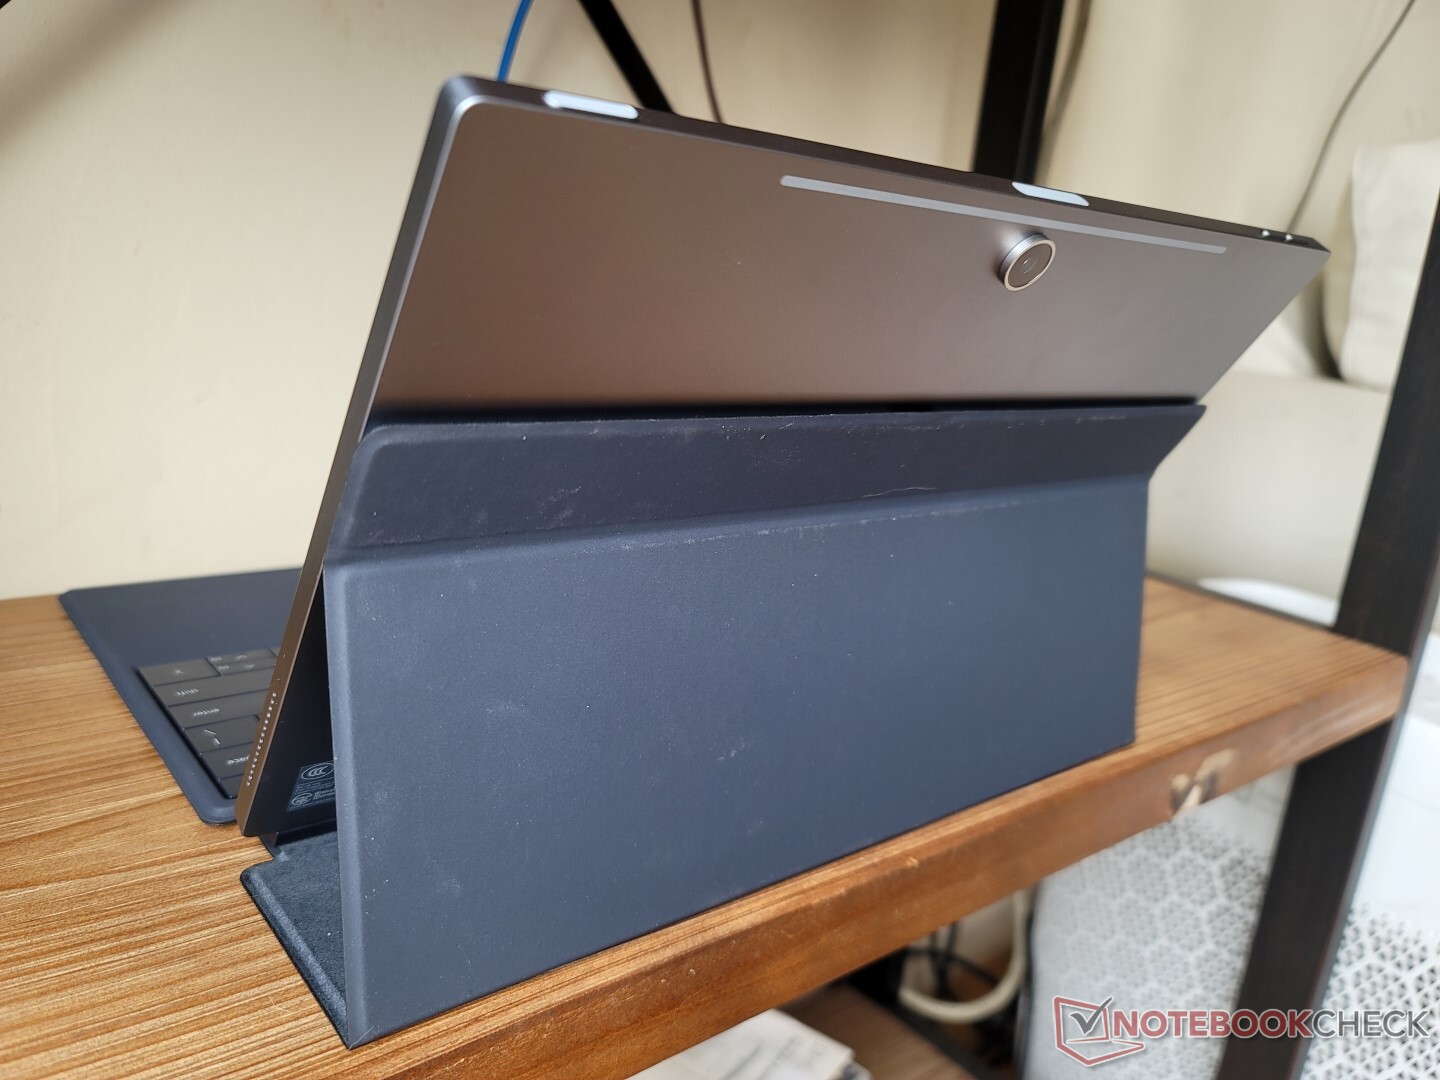
La caméra arrière est de 11 MP, ce qui, peut-être pas par coïncidence, est 1 MP de plus que la caméra de la Surface Pro 8. La qualité de l'image est nettement plus nette que tout ce qui se trouve sur une webcam d'ordinateur portable, même si la précision des couleurs a encore un long chemin à parcourir.
L'IR est présent pour la prise en charge de Windows Hello. Il n'y a malheureusement pas d'obturateur de webcam pour des raisons de confidentialité.


Accessoires et garantie
La boîte de détail comprend deux adaptateurs USB-C pratiques pour la conversion en USB-A et en audio 3,5 mm. Un peu comme Microsoft et sa série de tablettes Surface Pro, cependant, la base de clavier détachable et le stylet actif magnétique sont vendus séparément pour un supplément de 100 dollars américains chacun. En d'autres termes, vous devrez ajouter 200 $ en plus du prix initial si vous voulez à la fois la base du clavier et le stylet.
La garantie standard limitée d'un an du fabricant s'applique si vous l'achetez aux États-Unis.
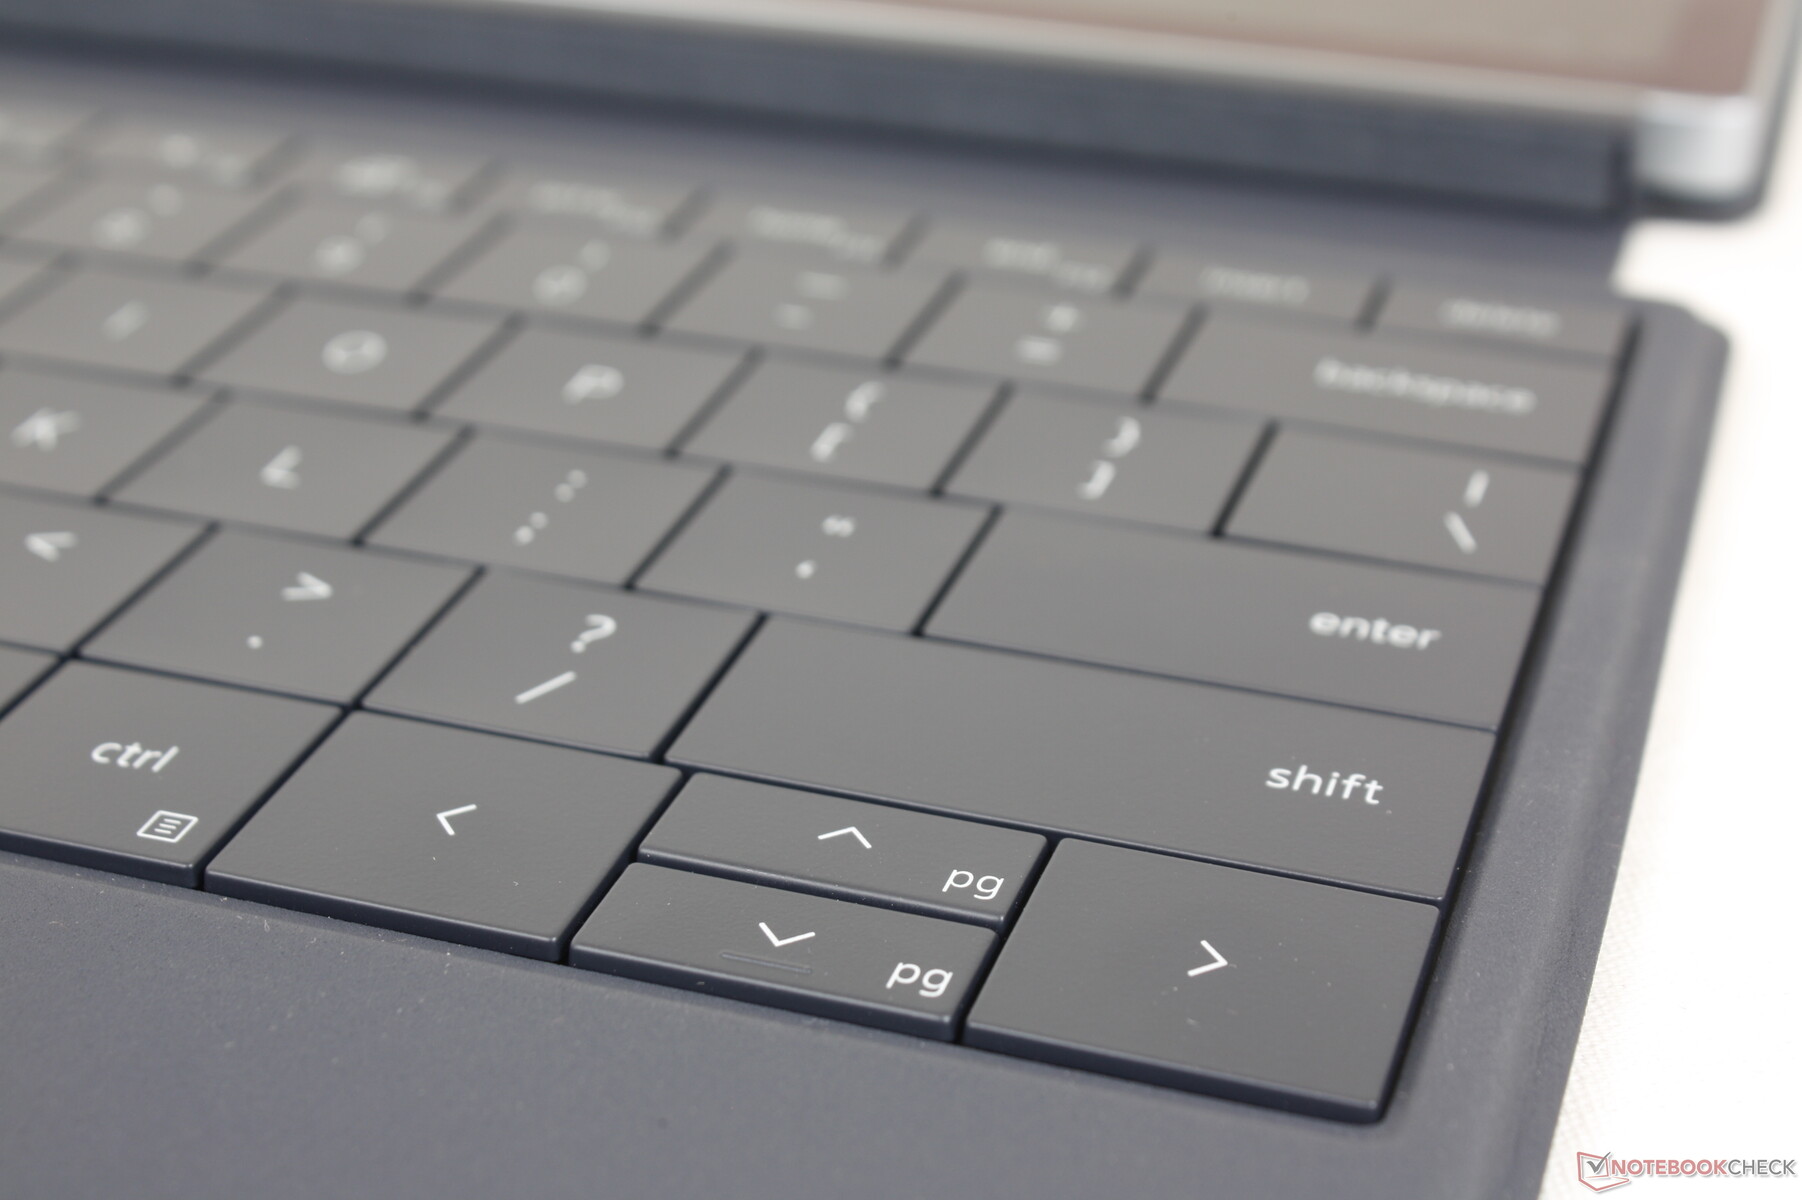
Dispositifs de saisie - L'un des claviers détachables les plus confortables
Clavier
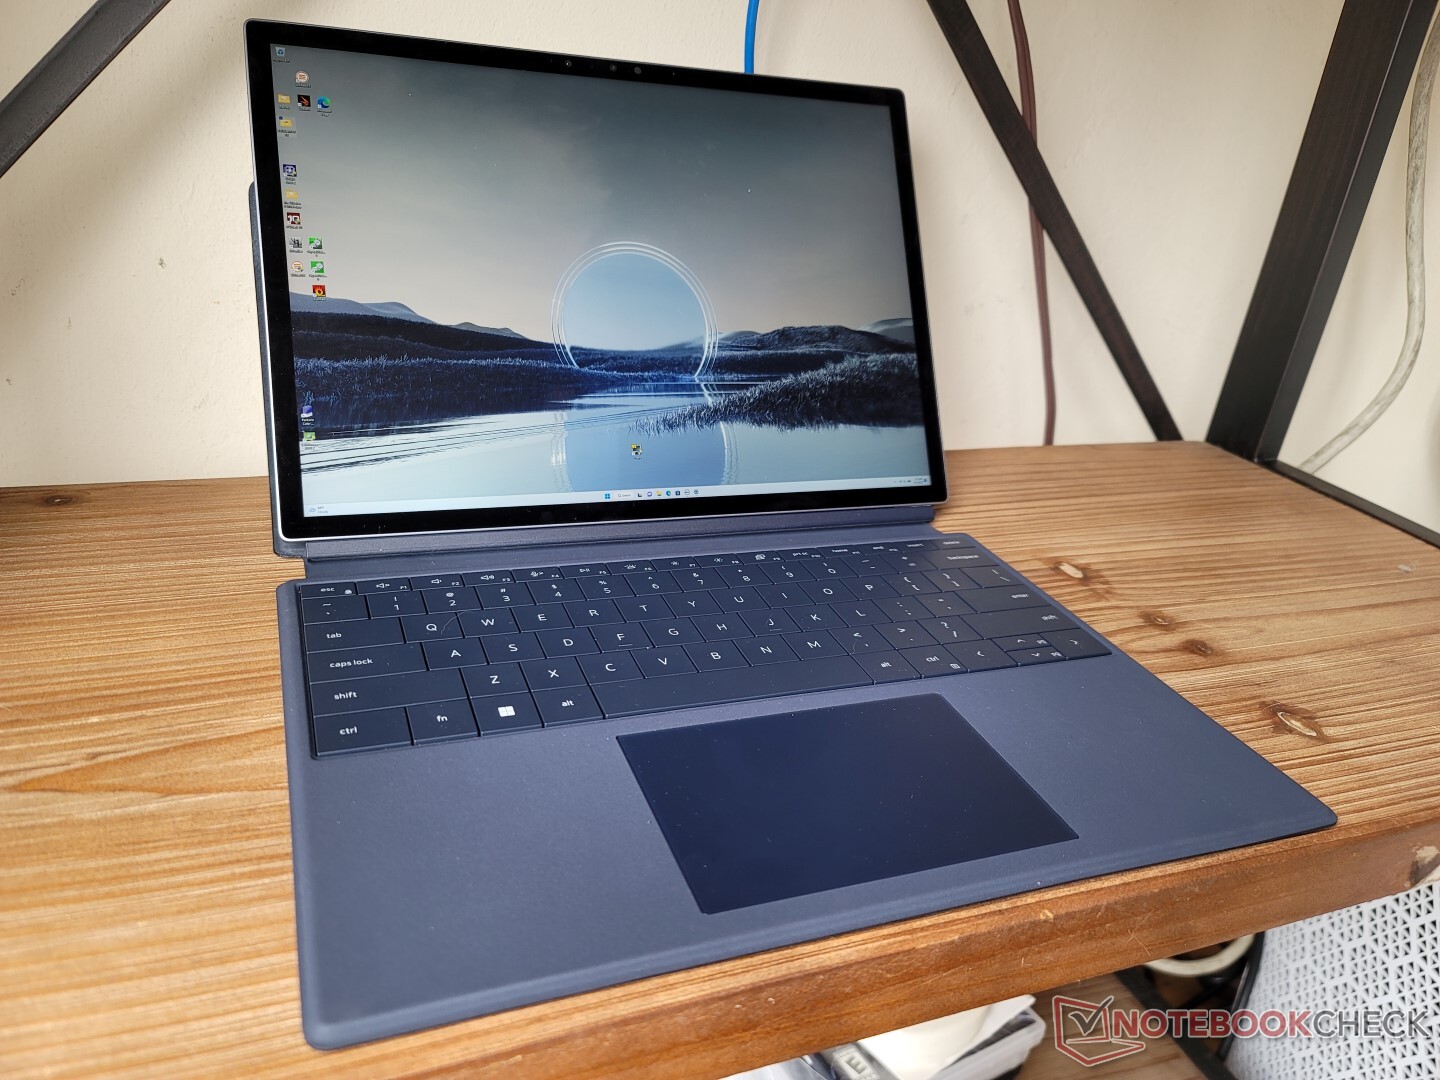
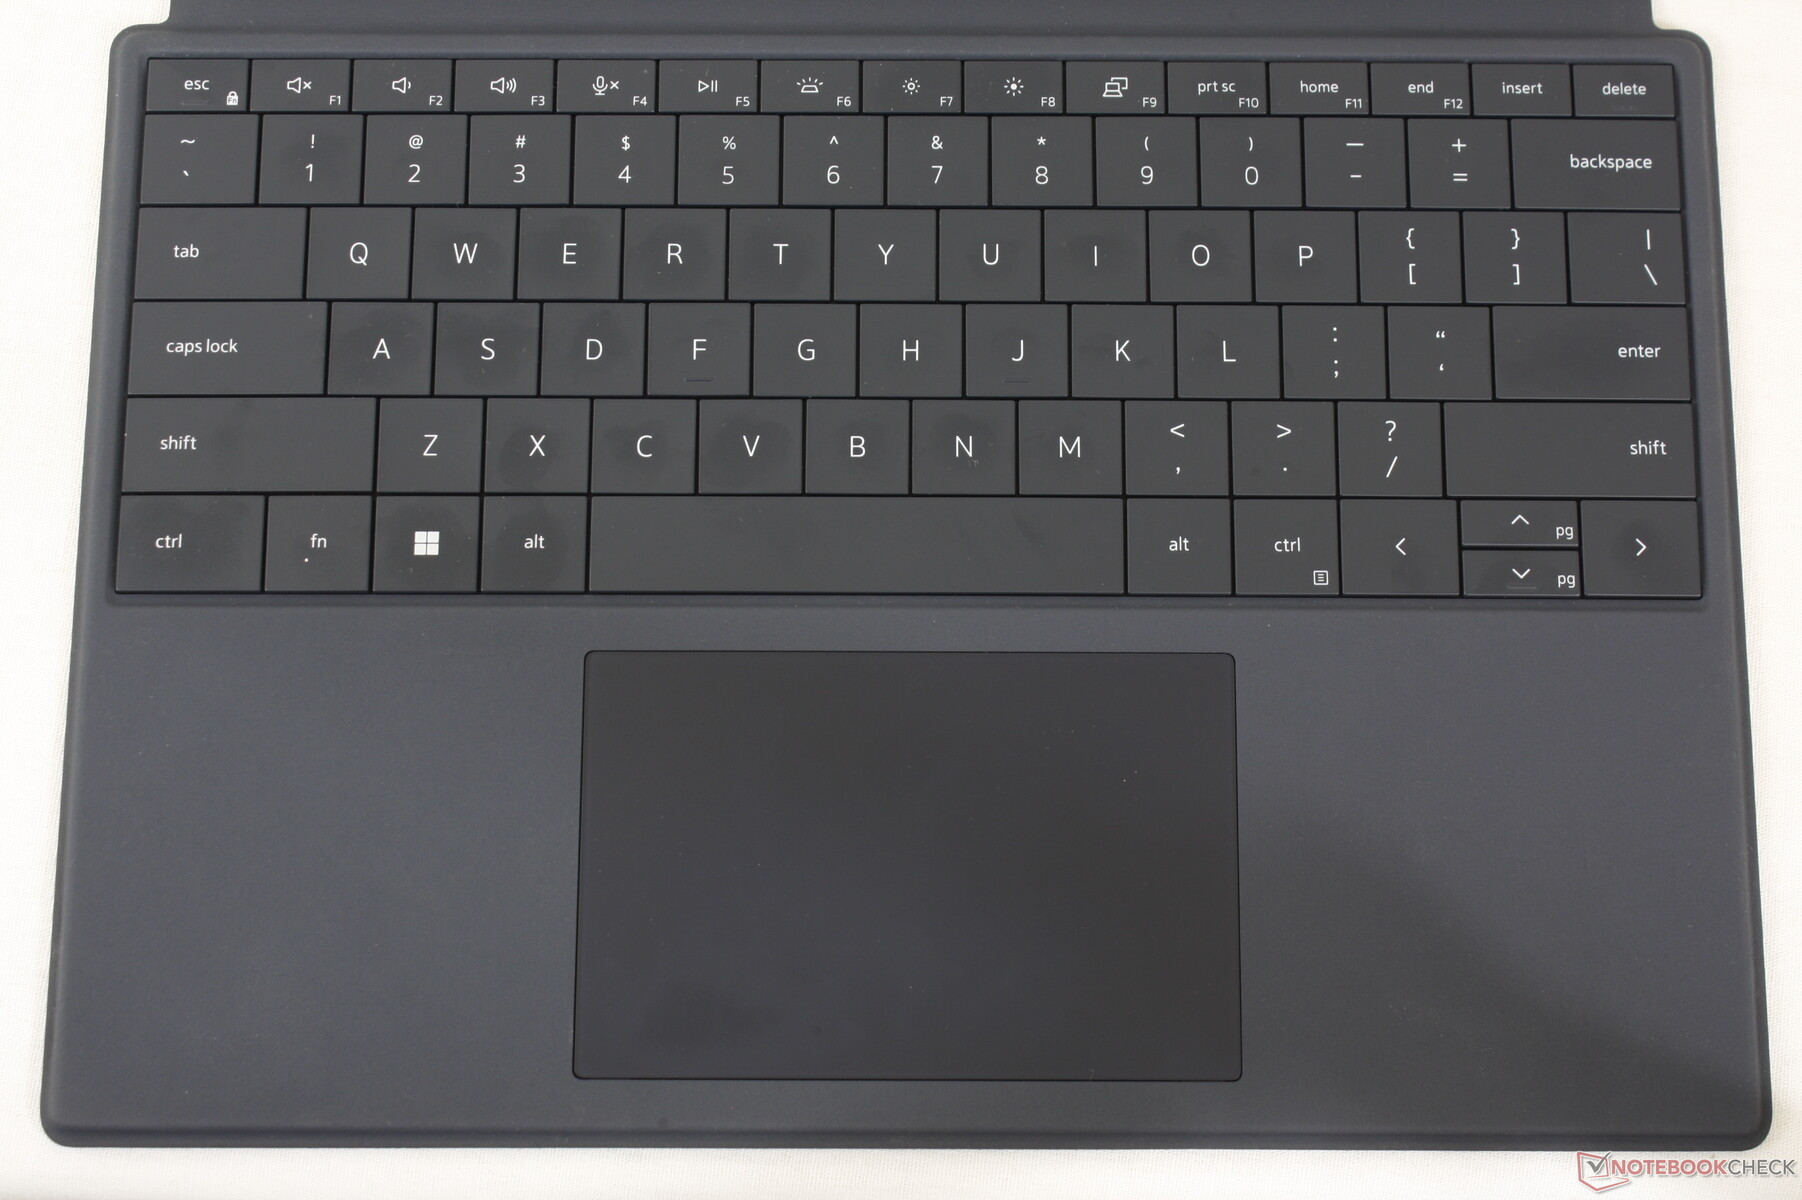
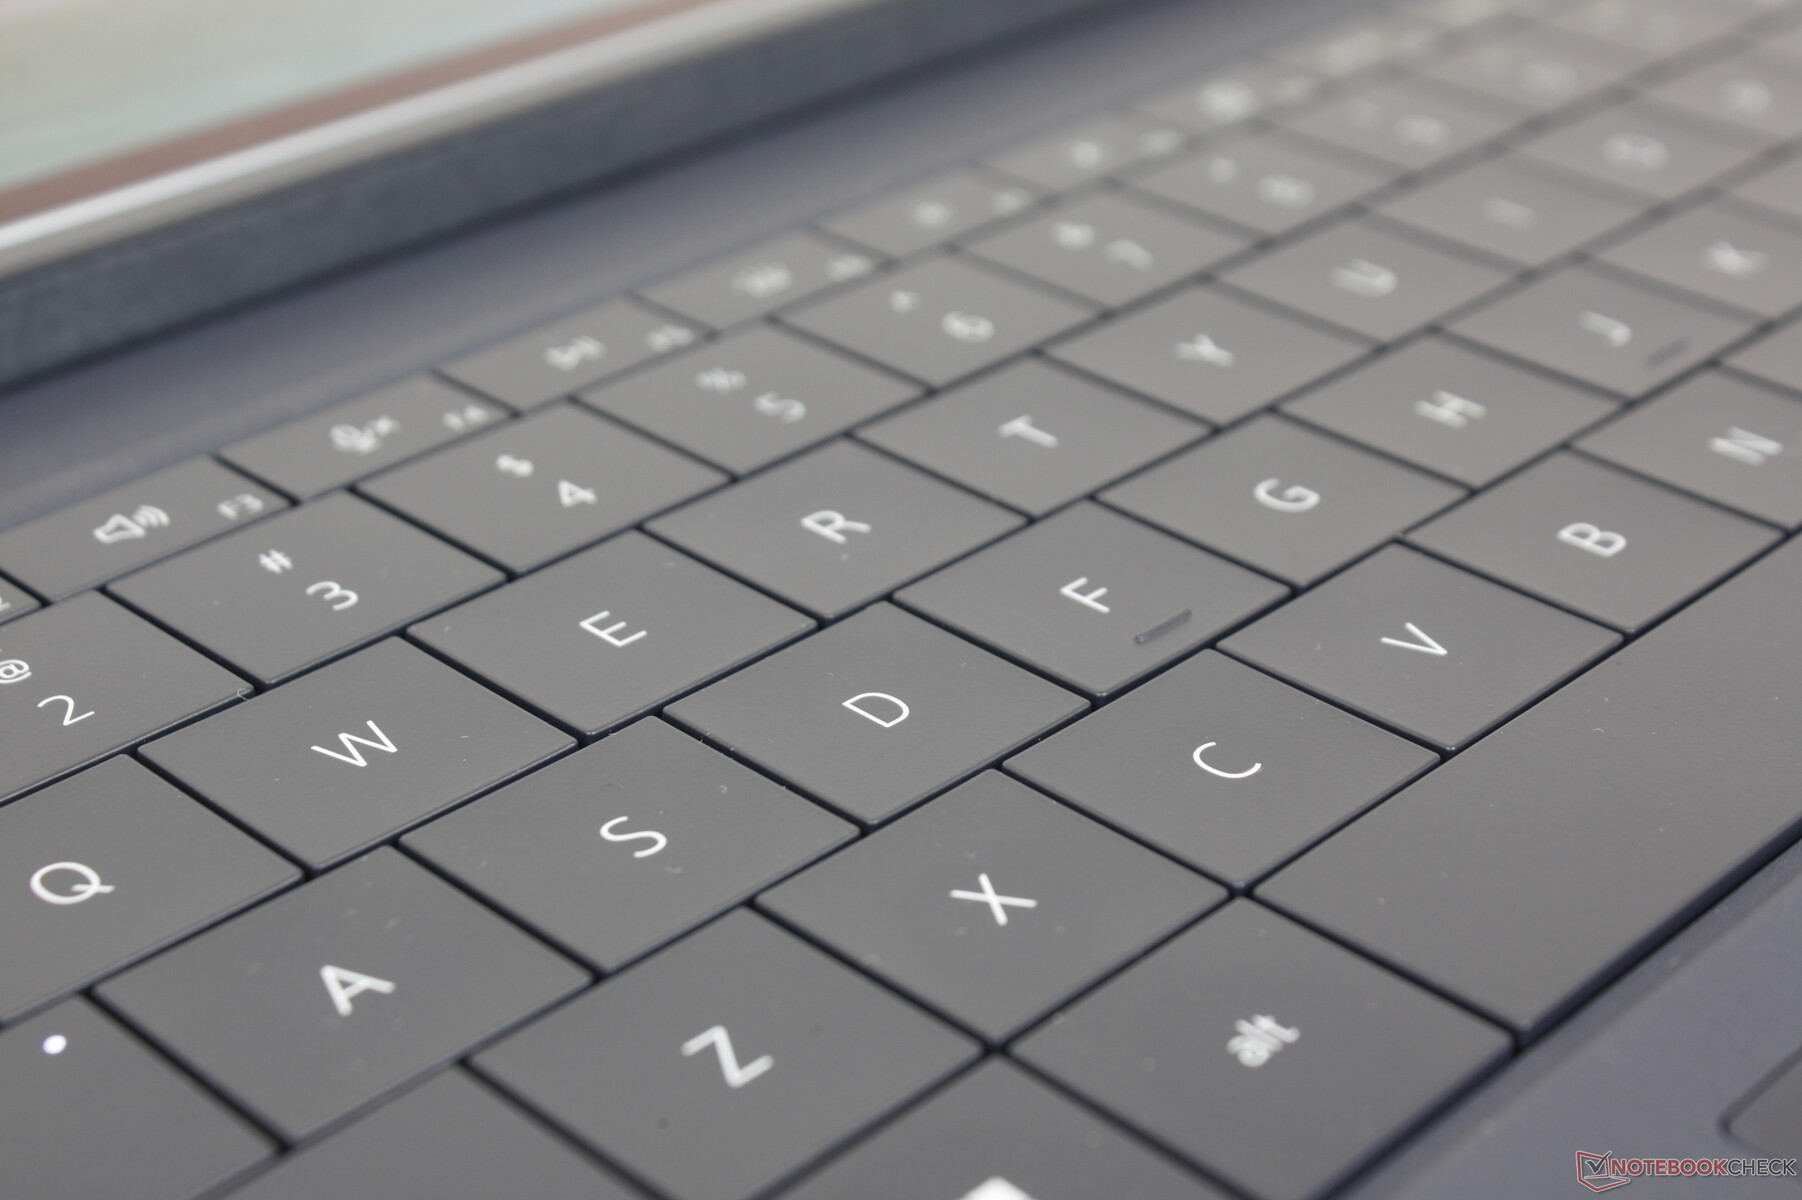
Le clavier est calqué sur celui du XPS 13 Plus 9320 et donc ils se sentent presque identiques en ce qui concerne la course et le retour d'information. Certains trouveront peut-être que la course des touches de 1,0 mm est trop faible, mais la sensation générale est bien meilleure que ce à quoi on s'attendait pour une base amovible, car beaucoup de claviers de cette catégorie sont connus pour leur faible retour d'information, leur sensation bon marché et leurs touches spongieuses. Le clavier du XPS 13 9315 2-en-1 se rapproche le plus jusqu'à présent d'un véritable clavier d'Ultrabook
Cela dit, la disposition du clavier n'est pas identique à celle du XPS 13 Plus 9320. Ce dernier clavier est légèrement plus large tout en intégrant à la fois le bouton d'alimentation et la rangée capacitive de commandes de fonctions. Le style de la police et le rétroéclairage blanc sont essentiellement identiques.
Pavé tactile
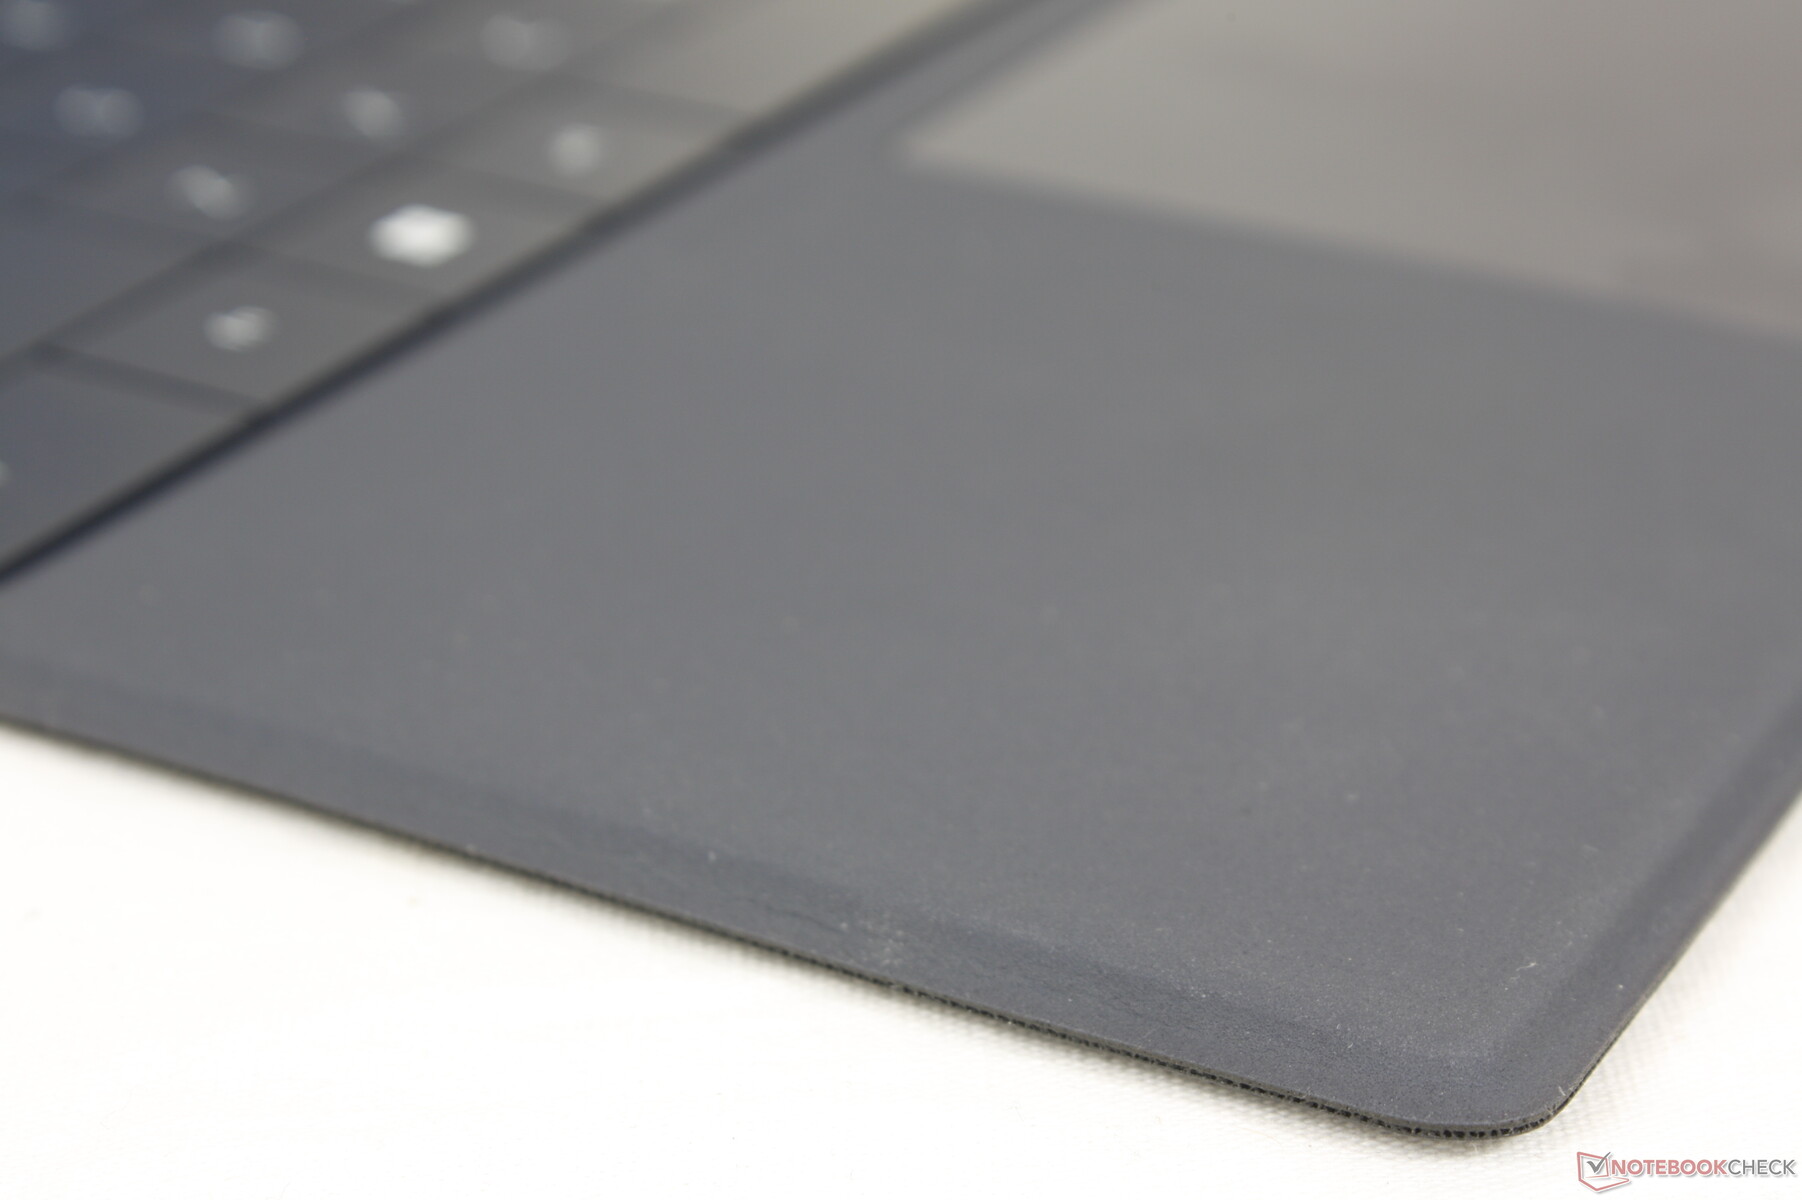
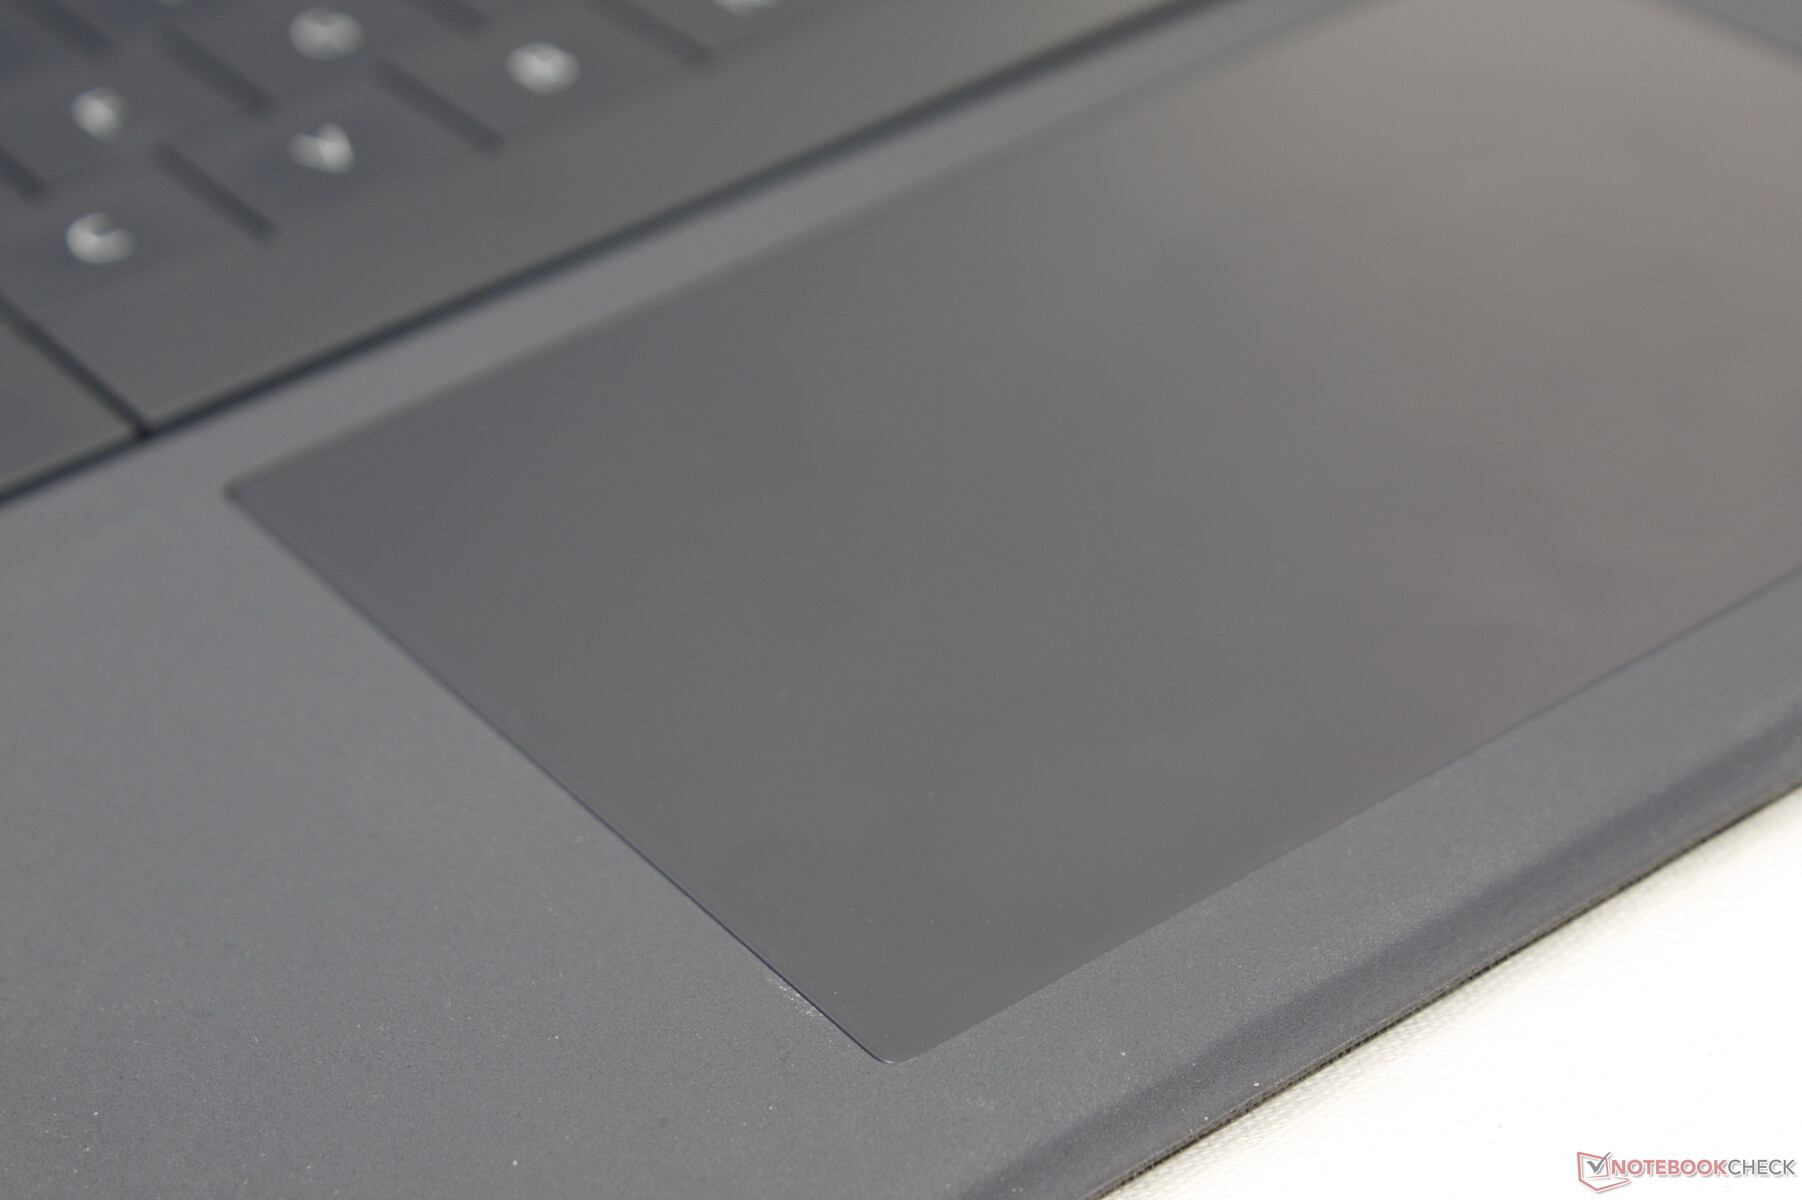
Le pavé tactile est plus grand que celui de la série Surface Pro Série Surface Pro (11,4 x 7,5 contre 10,2 x 5,3 cm) pour faciliter le défilement et les entrées multi-touch. Sa surface est totalement lisse et ne colle que très peu, même en glissant à la vitesse de la douche. Le retour d'information lors des clics est cependant beaucoup plus faible que sur la plupart des ordinateurs portables, et il n'est donc pas aussi satisfaisant à utiliser que le pavé tactile des ordinateurs à clapet plus traditionnels XPS 13 9315 à clapet.
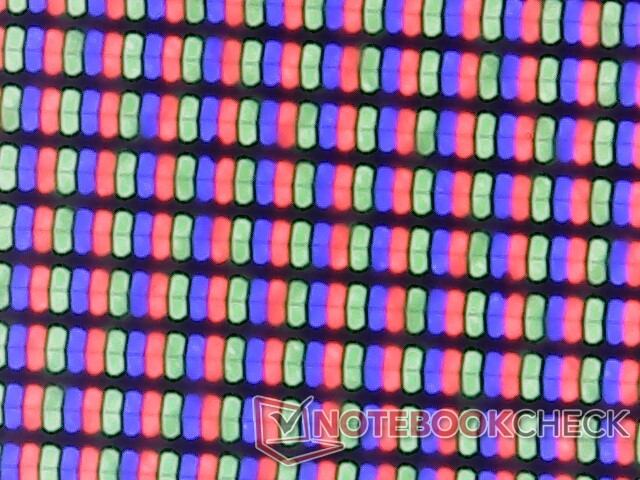
Affichage - 60 Hz uniquement
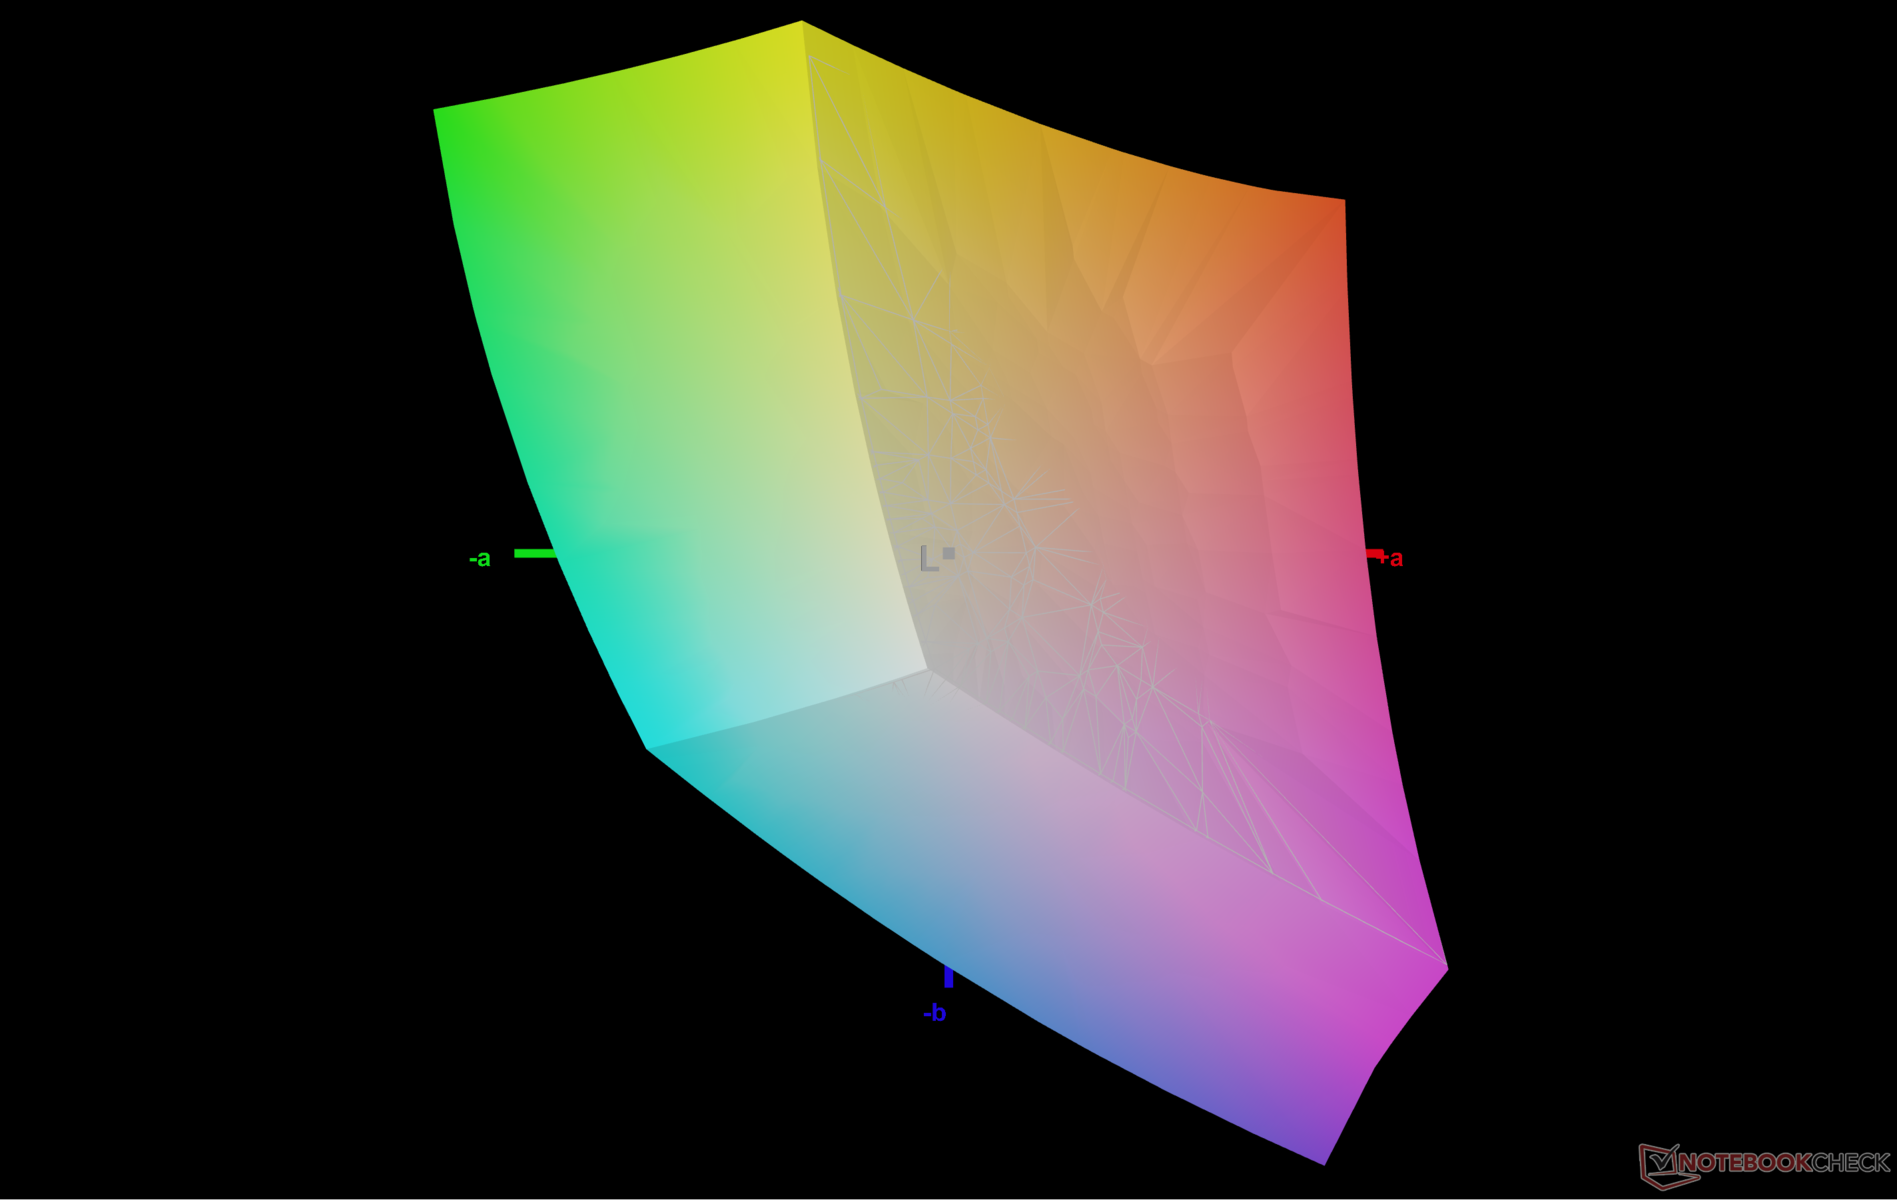
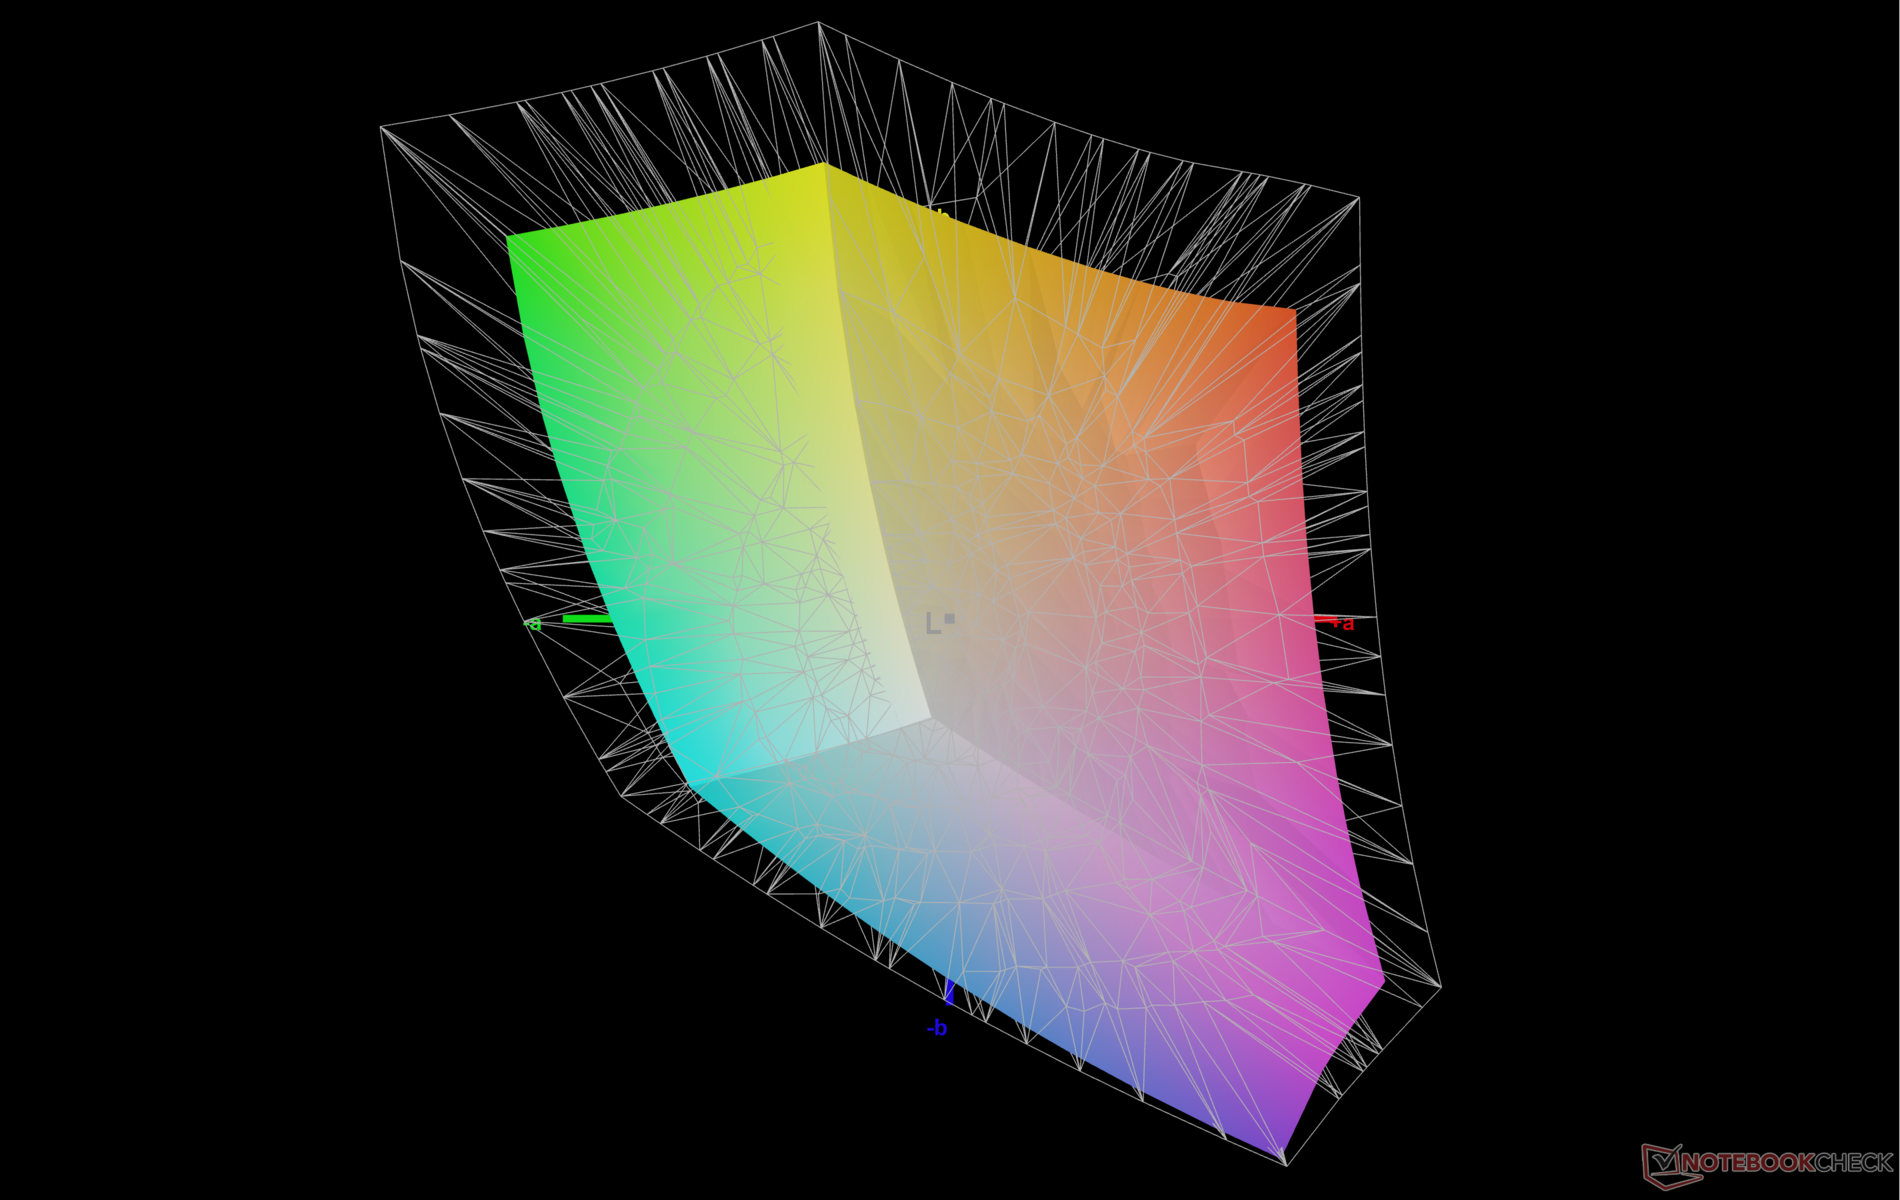
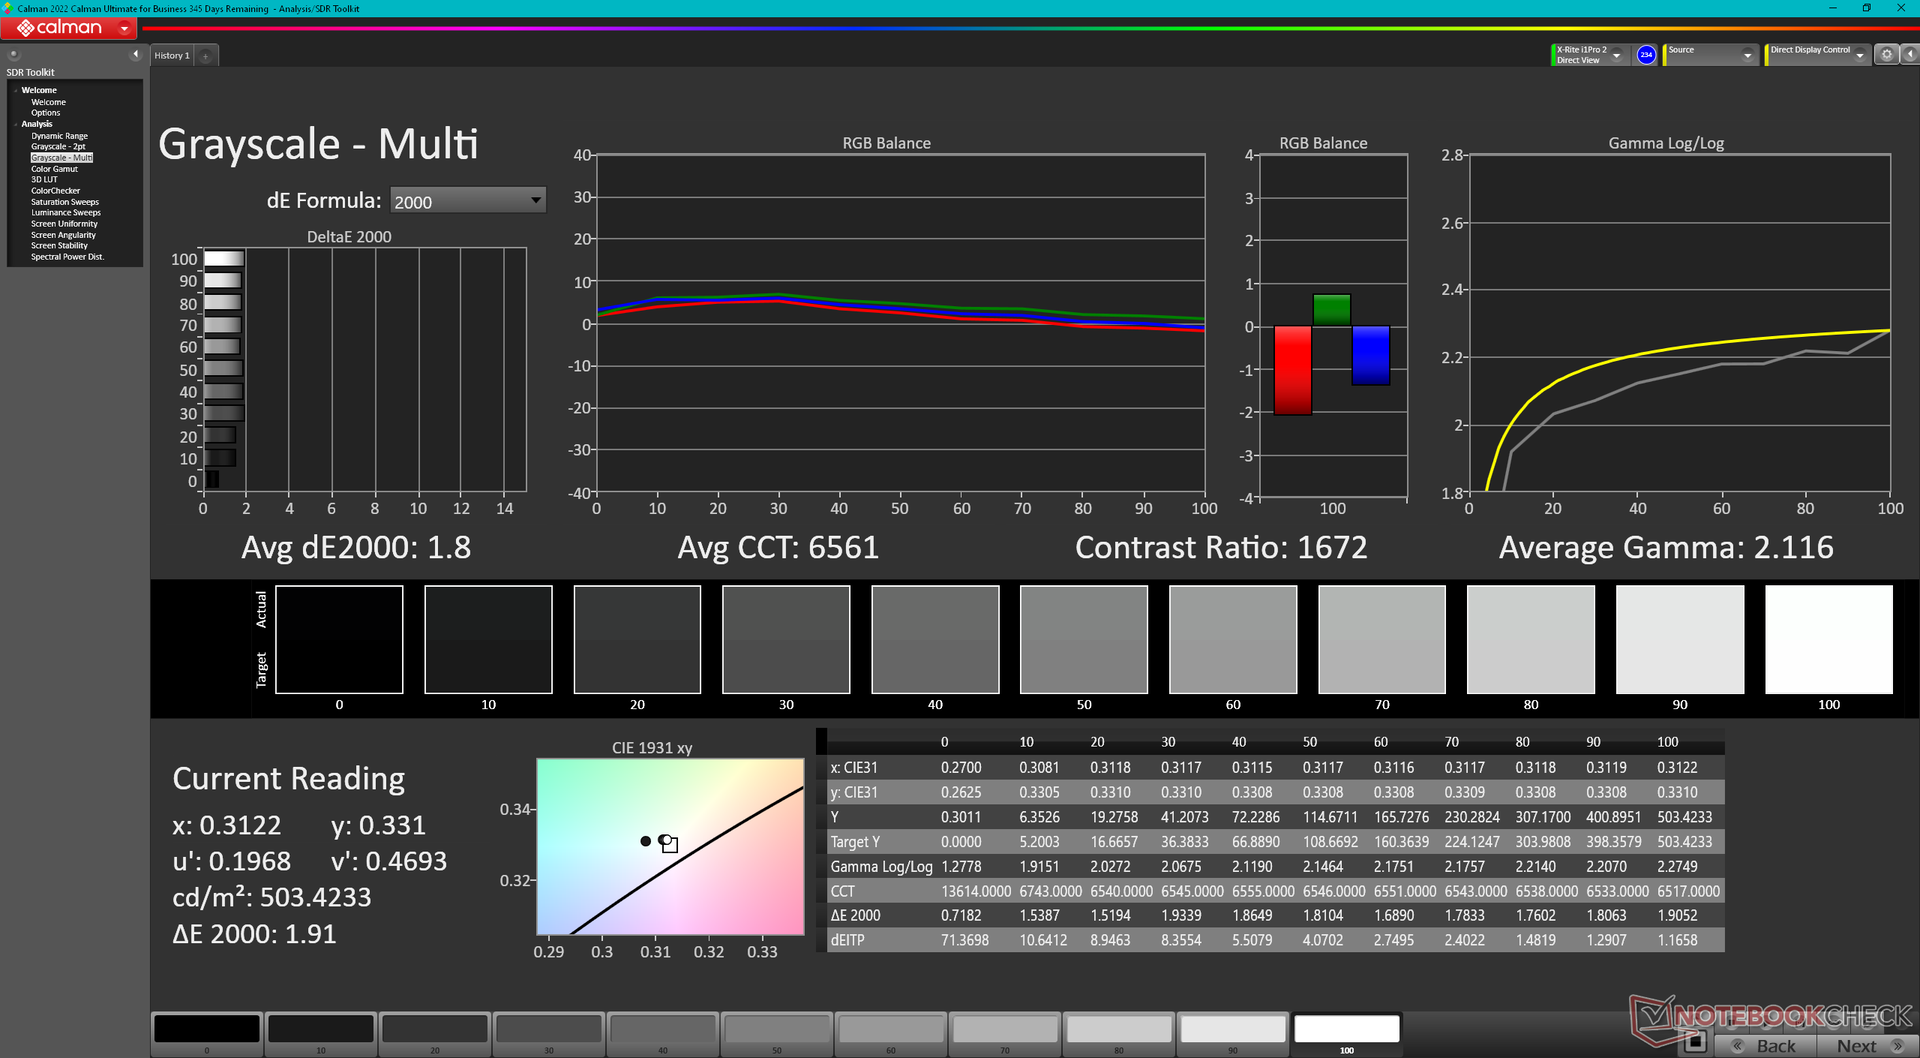
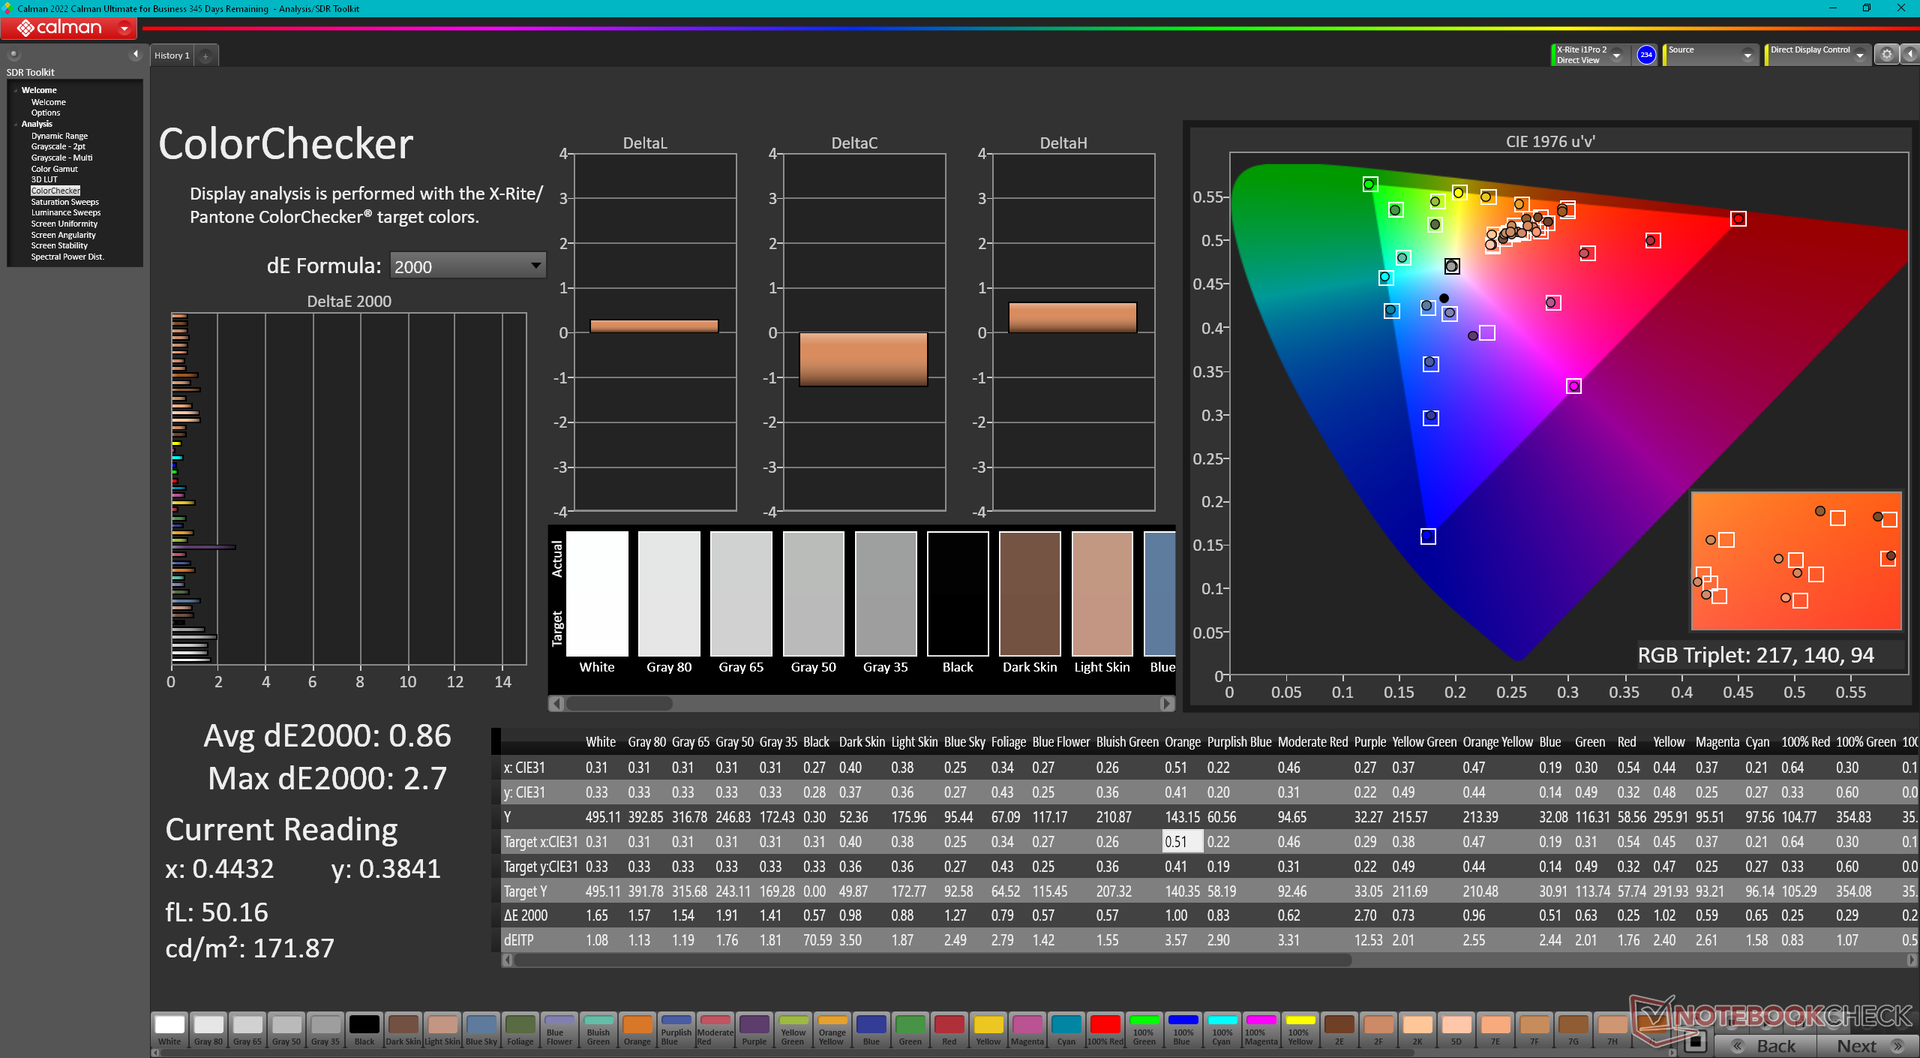
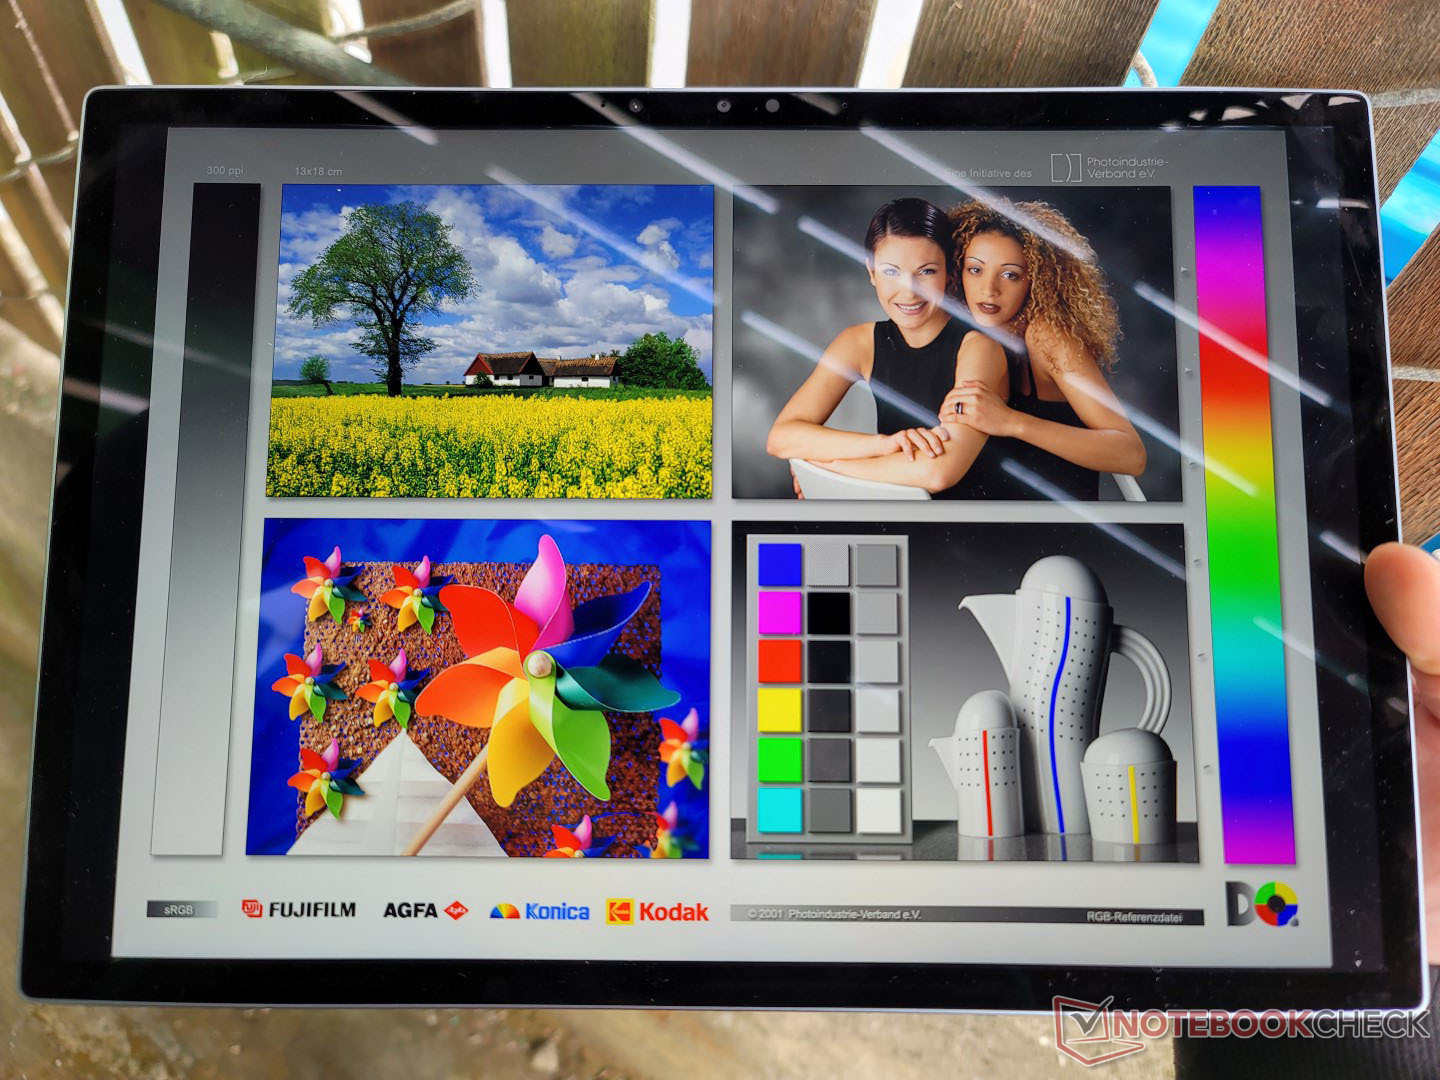
Dell annonce un écran de 500 nits avec une couverture sRGB complète, ce que nous pouvons confirmer par nos propres mesures indépendantes. Le rapport de contraste est également très bon pour un panneau IPS à environ 1500:1 et il n'y a pas de PWM sur les niveaux de luminosité inférieurs contrairement à l'équivalent de Microsoft. L'expérience visuelle est appropriée pour une tablette Windows haut de gamme, du moins à première vue.
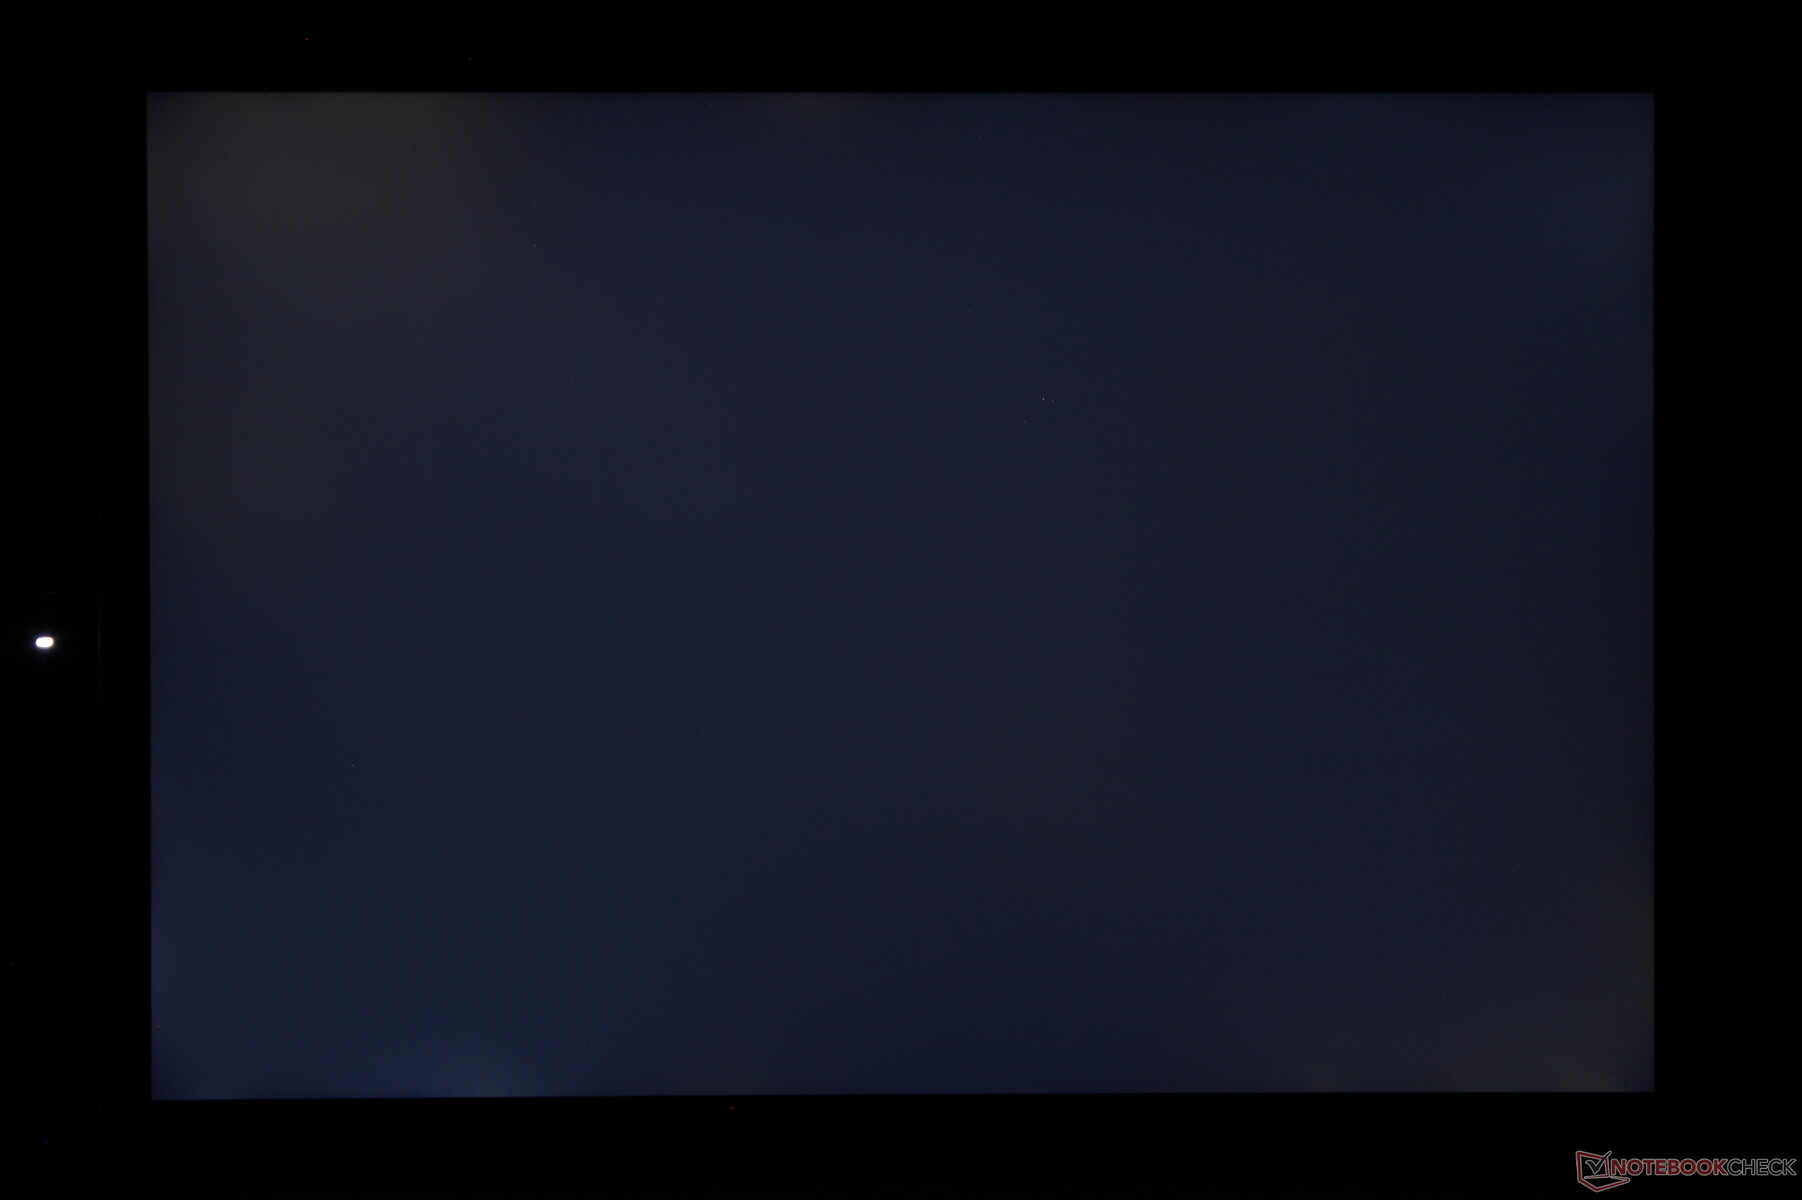
Il y a deux inconvénients notables qui méritent d'être mentionnés. Premièrement, les temps de réponse noir-blanc et gris-gris sont relativement lents pour un ghosting perceptible lors du déplacement du curseur ou du défilement des pages web. Deuxièmement, l'uniformité de la luminosité aurait pu être meilleure, car la partie supérieure gauche de l'écran est environ 50 nits plus lumineuse que la partie inférieure droite. Ce n'est rien de majeur, mais une option OLED aurait pu facilement corriger ces deux inconvénients.
Nous aimerions voir des panneaux à taux de rafraîchissement plus élevé et peut-être des couleurs P3 complètes sur les futures UGS. La Surface Pro 8, par exemple, dispose d'options de taux de rafraîchissement de 120 Hz pour stimuler la réactivité de l'interface utilisateur. En attendant, les utilisateurs devront envisager des ordinateurs portables à clapet comme le Dell XPS 13 Plus 9320 ou le Asus VivoBook pour trouver des fonctionnalités OLED pour le moment.
| |||||||||||||||||||||||||
Homogénéité de la luminosité: 87 %
Valeur mesurée au centre, sur batterie: 507 cd/m²
Contraste: 1491:1 (Valeurs des noirs: 0.34 cd/m²)
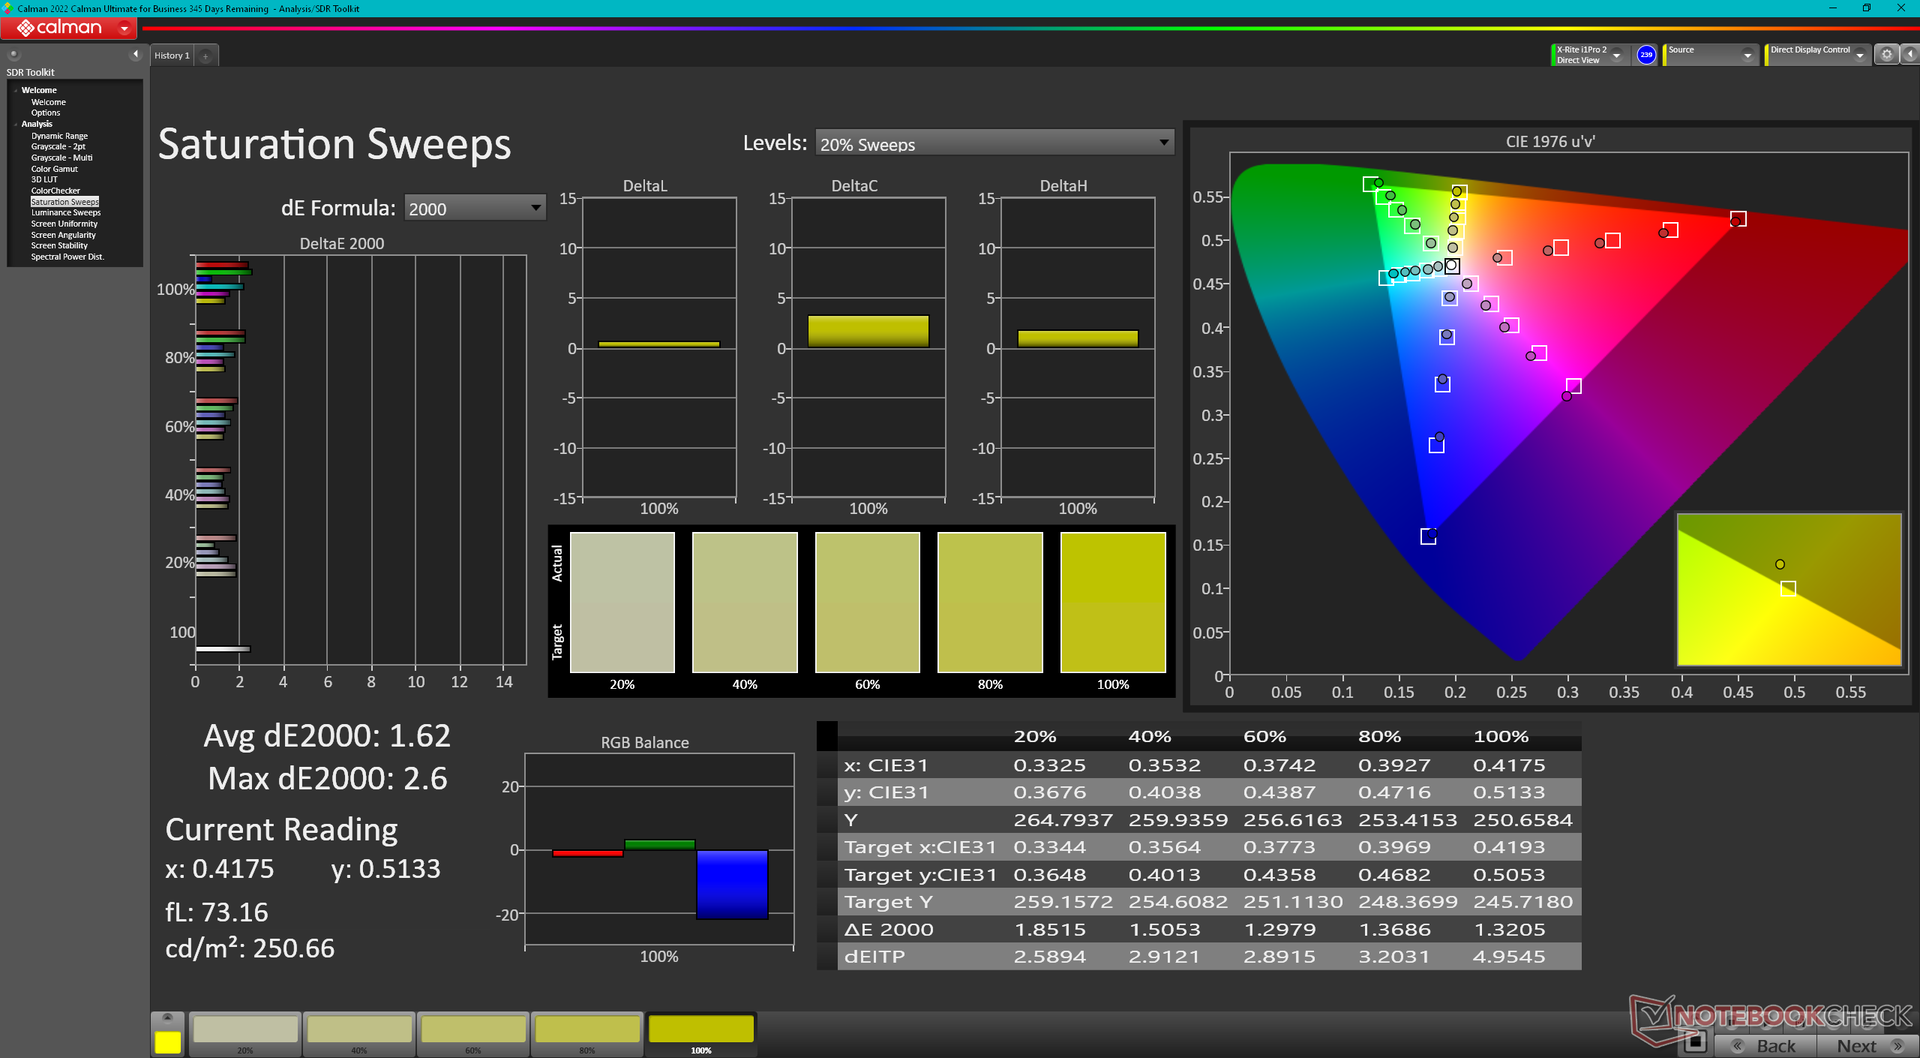
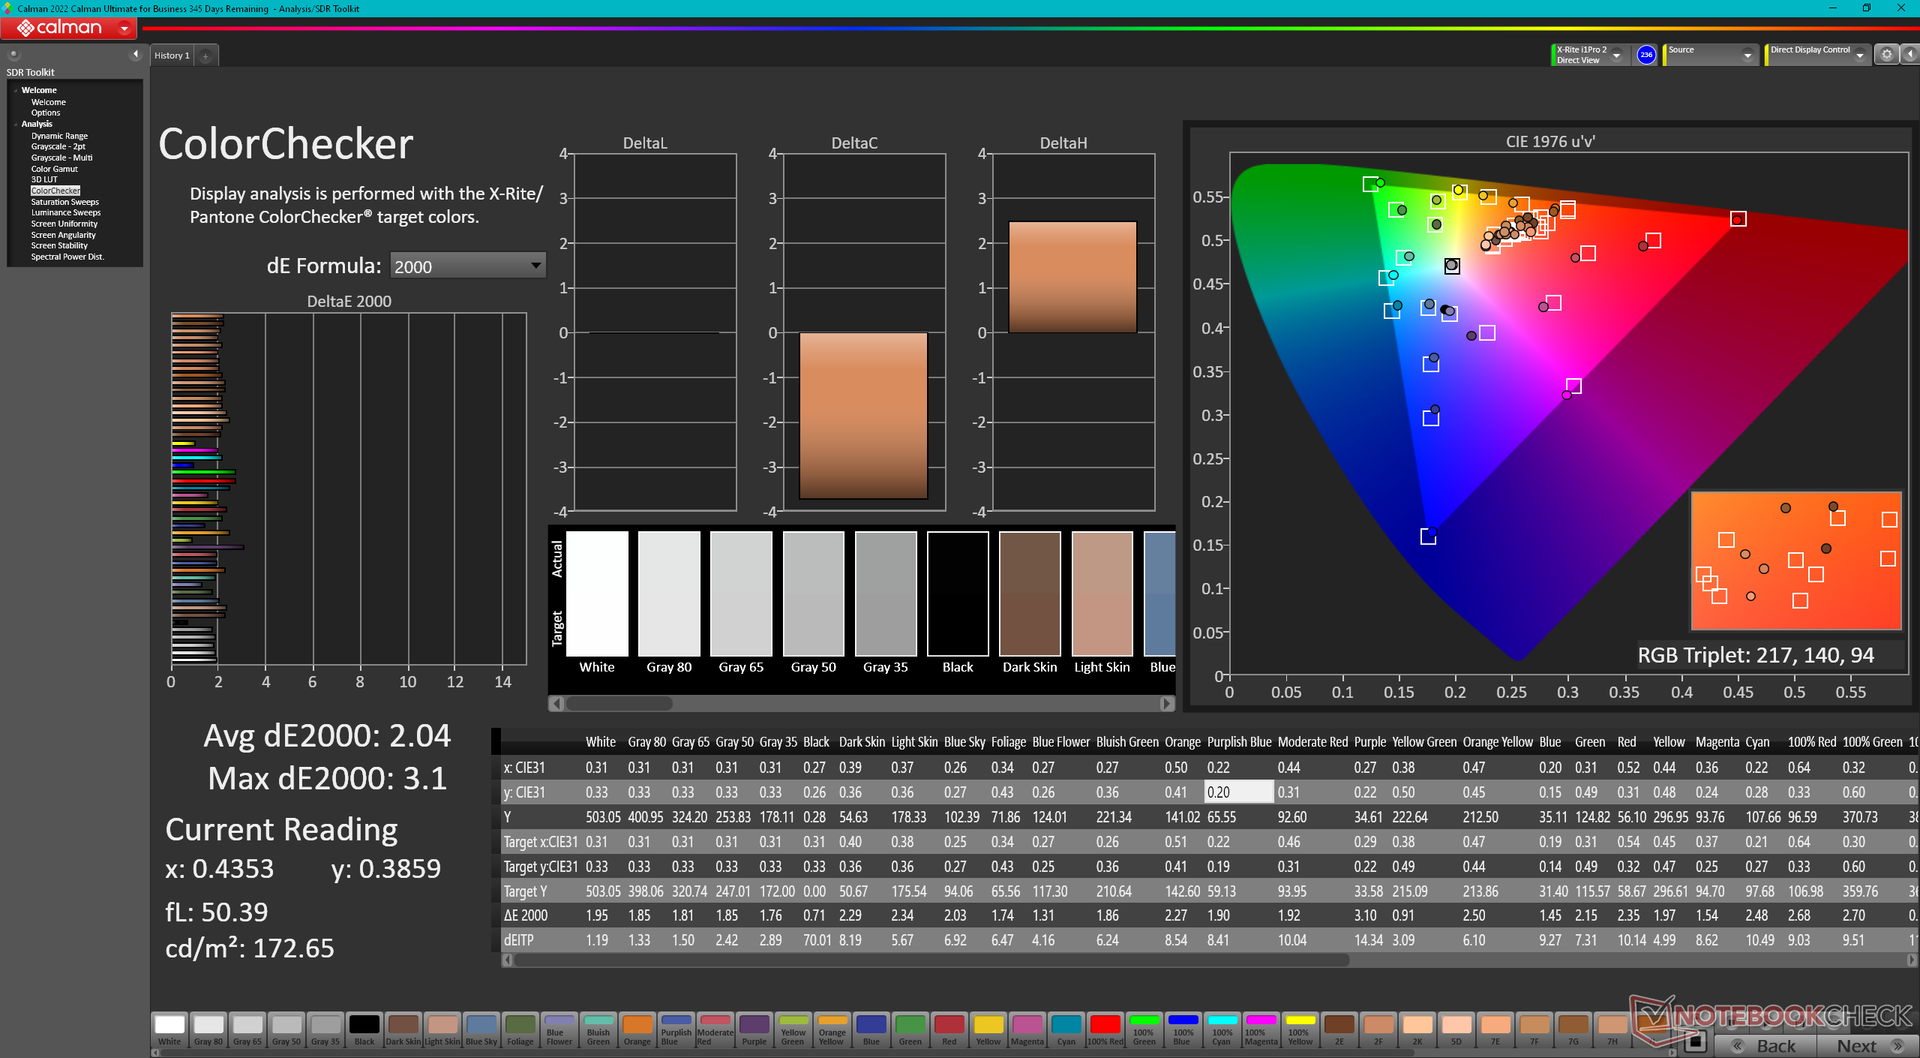
ΔE ColorChecker Calman: 2.04 | ∀{0.5-29.43 Ø4.71}
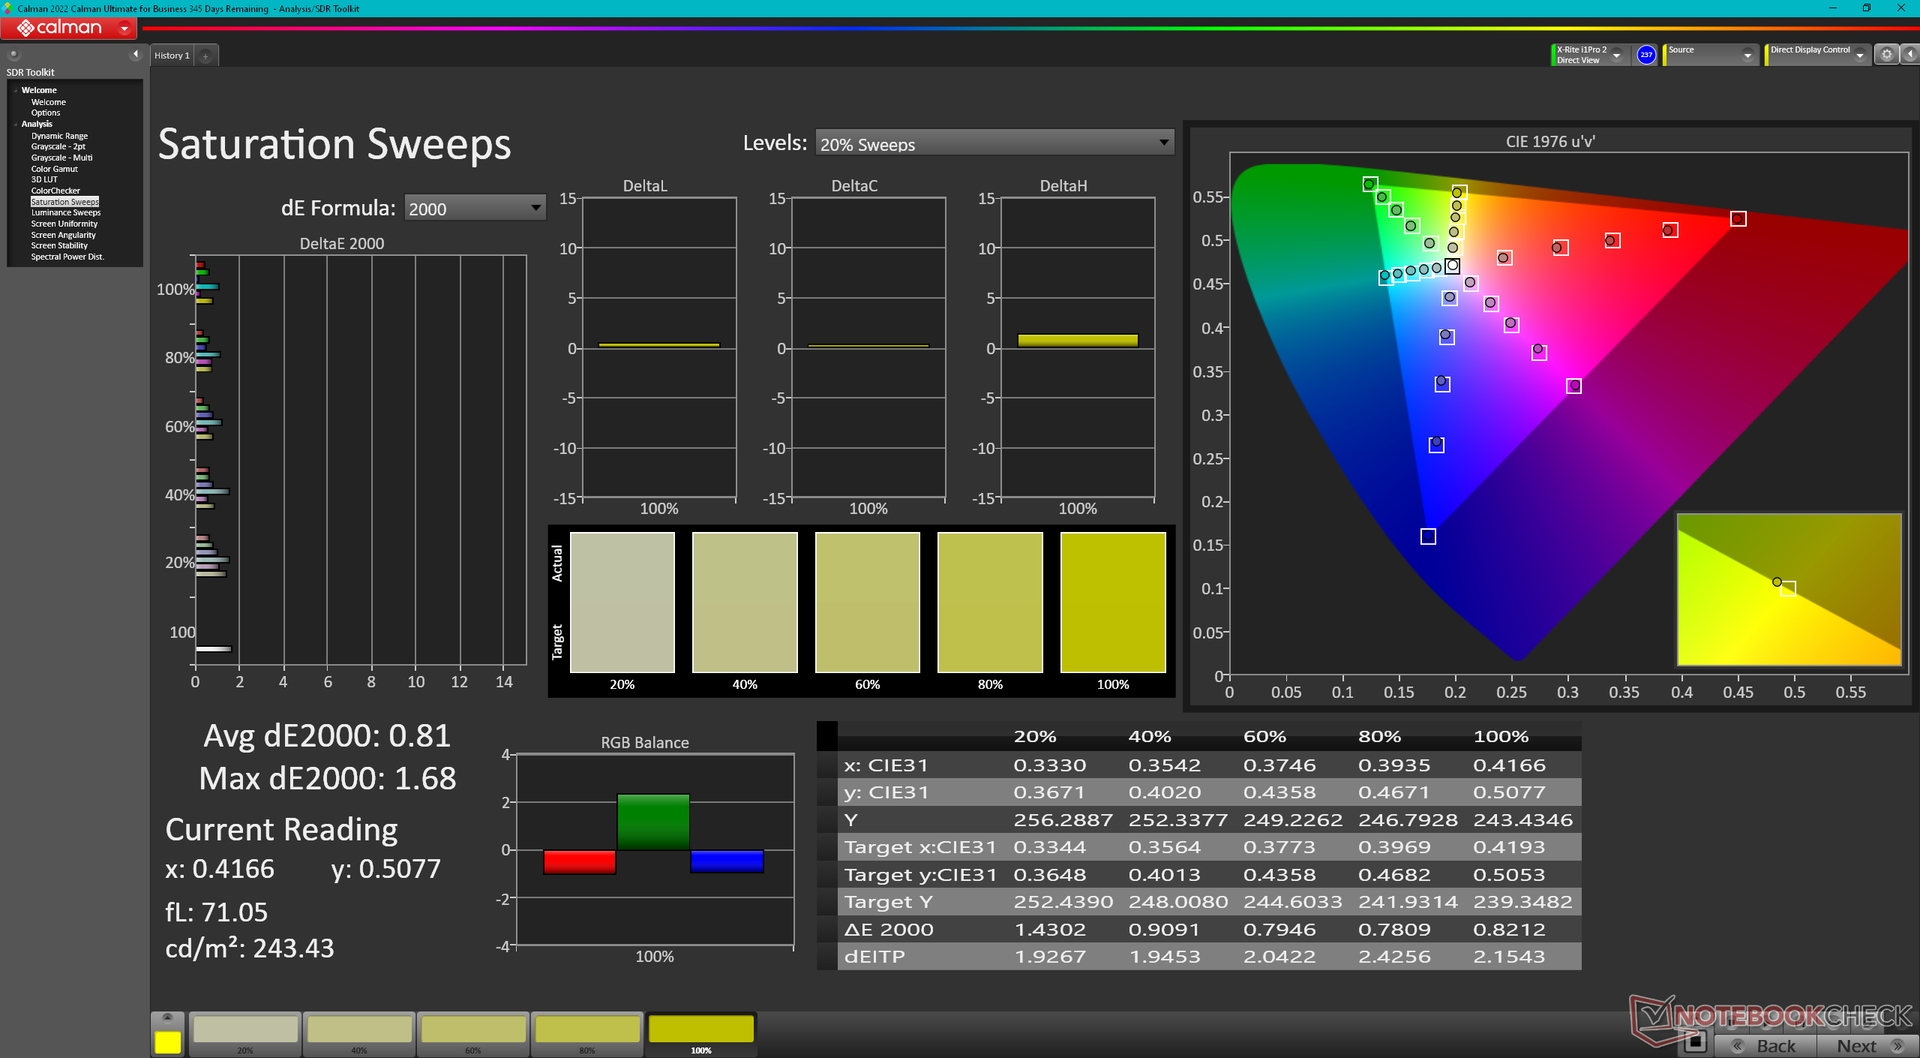
calibrated: 0.86
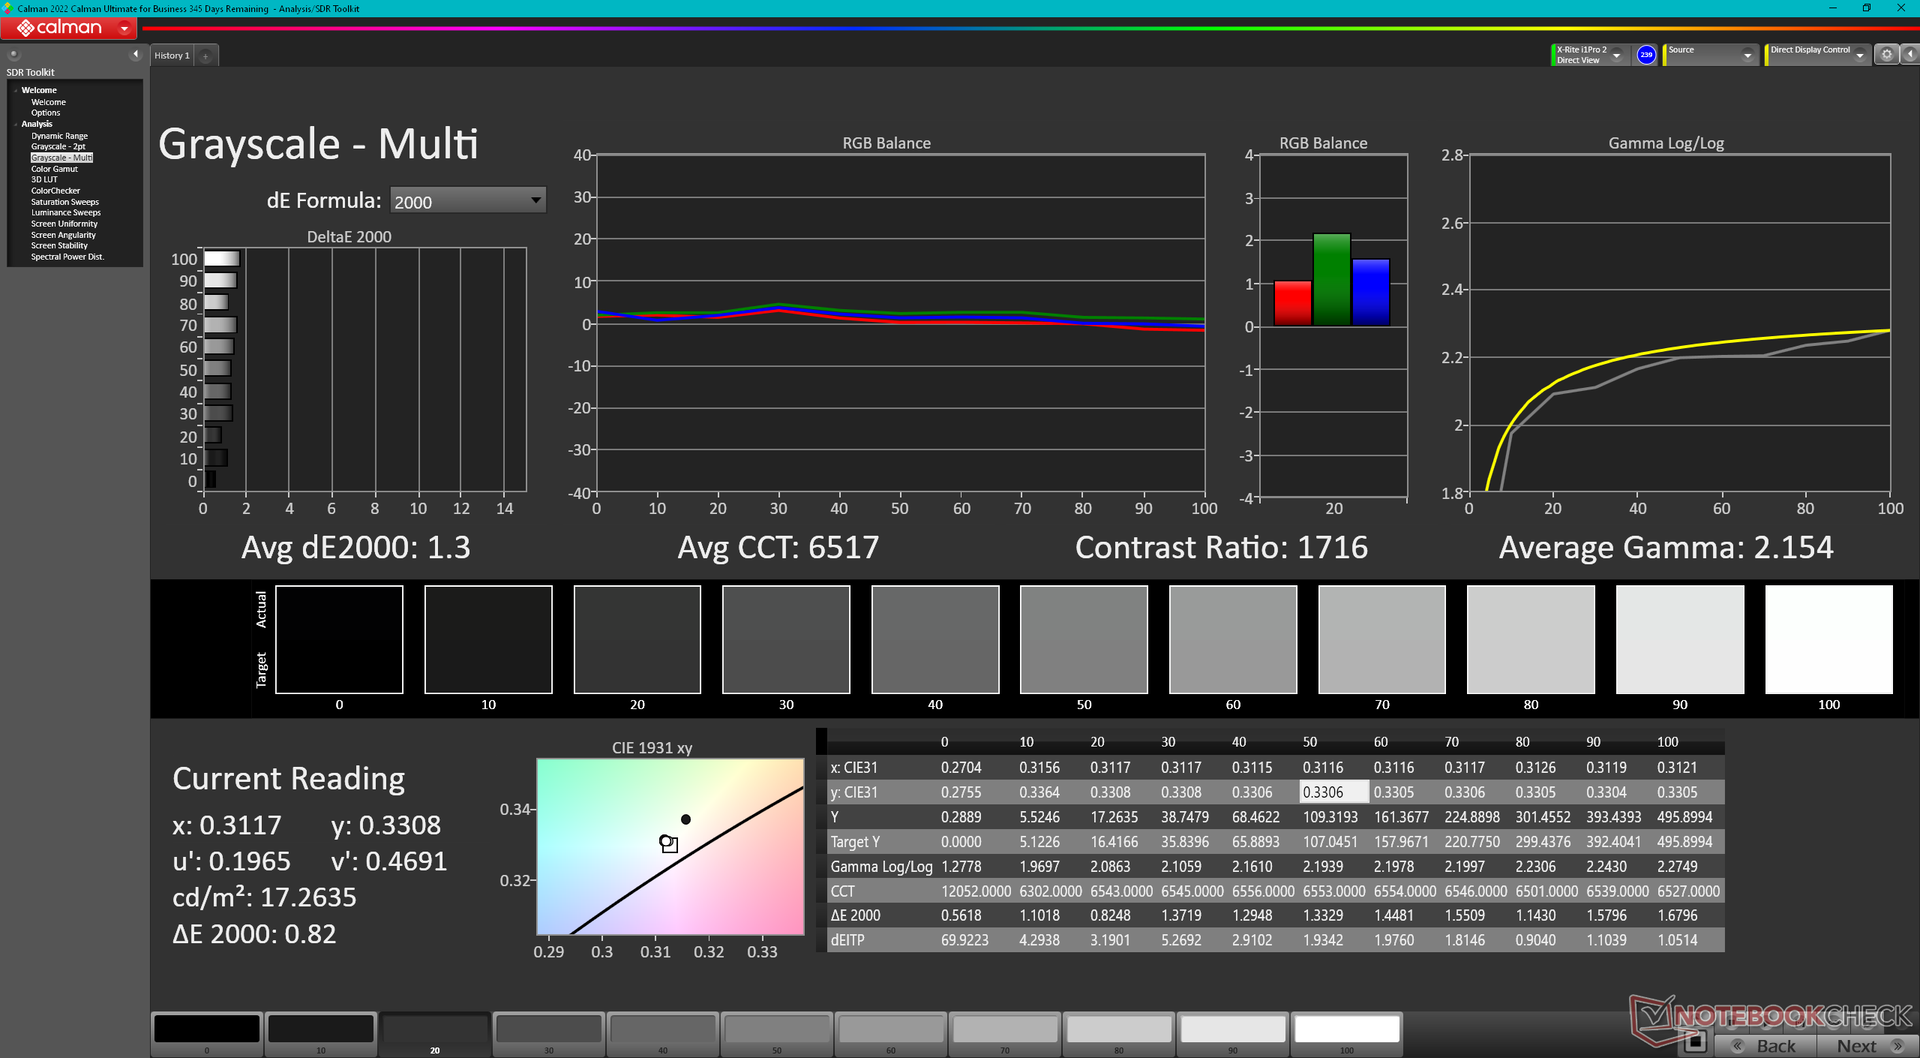
ΔE Greyscale Calman: 1.8 | ∀{0.09-98 Ø4.96}
72.6% AdobeRGB 1998 (Argyll 3D)
99.8% sRGB (Argyll 3D)
70.7% Display P3 (Argyll 3D)
Gamma: 2.12
CCT: 6561 K
| Dell XPS 13 9315 2-in-1 Core i5-1230U BOE NE13A1M, IPS, 2880x1920, 13" | Dell XPS 13 Plus 9320 i7-1280P OLED Samsung 134XK04, OLED, 3456x2160, 13.4" | Microsoft Surface Pro 8, i7-1185G7 LP129WT212166, IPS, 2880x1920, 13" | HP Spectre x360 13.5 14t-ef000 SDC4160, OLED, 3000x2000, 13.5" | Lenovo ThinkBook Plus Gen2 Core i5 CSOT T3 MND307DA1-5 (LCD), IPS, E-Ink, 2560x1600, 13.3" | Apple MacBook Air M2 Entry IPS, 2560x1664, 13.6" | |
|---|---|---|---|---|---|---|
| Display | 26% | 6% | 22% | -1% | 20% | |
| Display P3 Coverage (%) | 70.7 | 99.5 41% | 78.2 11% | 99.9 41% | 70.1 -1% | 98.4 39% |
| sRGB Coverage (%) | 99.8 | 100 0% | 100 0% | 100 0% | 98 -2% | 99.9 0% |
| AdobeRGB 1998 Coverage (%) | 72.6 | 98.4 36% | 77.6 7% | 90.8 25% | 72.2 -1% | 87.6 21% |
| Response Times | 93% | 1% | 94% | -5% | 13% | |
| Response Time Grey 50% / Grey 80% * (ms) | 44 ? | 2.6 ? 94% | 46.4 ? -5% | 1.9 ? 96% | 42.8 ? 3% | 32.9 ? 25% |
| Response Time Black / White * (ms) | 24.8 ? | 2.1 ? 92% | 23.2 ? 6% | 2.16 ? 91% | 28 ? -13% | 24.9 ? -0% |
| PWM Frequency (Hz) | 59.5 | 29760 ? | 60.2 ? | |||
| Screen | -27% | -19% | -29% | -36% | 5% | |
| Brightness middle (cd/m²) | 507 | 371.8 -27% | 444 -12% | 351.7 -31% | 404 -20% | 526 4% |
| Brightness (cd/m²) | 486 | 374 -23% | 451 -7% | 351 -28% | 388 -20% | 486 0% |
| Brightness Distribution (%) | 87 | 98 13% | 91 5% | 87 0% | 94 8% | 87 0% |
| Black Level * (cd/m²) | 0.34 | 0.43 -26% | 0.24 29% | 0.38 -12% | ||
| Contrast (:1) | 1491 | 1033 -31% | 1683 13% | 1384 -7% | ||
| Colorchecker dE 2000 * | 2.04 | 2.37 -16% | 2 2% | 1.78 13% | 3.1 -52% | 1.3 36% |
| Colorchecker dE 2000 max. * | 3.1 | 6.1 -97% | 3.2 -3% | 6.14 -98% | 6.9 -123% | 2.7 13% |
| Colorchecker dE 2000 calibrated * | 0.86 | 1.7 -98% | 1.3 -51% | 0.7 19% | ||
| Greyscale dE 2000 * | 1.8 | 2 -11% | 1.8 -0% | 2.3 -28% | 3.7 -106% | 2 -11% |
| Gamma | 2.12 104% | 2.29 96% | 2.11 104% | 2.11 104% | 2.26 97% | 2.25 98% |
| CCT | 6561 99% | 6261 104% | 6417 101% | 6683 97% | 5936 110% | 6858 95% |
| Moyenne finale (programmes/paramètres) | 31% /
9% | -4% /
-11% | 29% /
7% | -14% /
-24% | 13% /
9% |
* ... Moindre est la valeur, meilleures sont les performances
L'écran est déjà bien calibré dès sa sortie de l'emballage, avec des valeurs DeltaE moyennes pour les niveaux de gris et les couleurs de seulement 1,8 et 2,04, respectivement. Si l'on étalonnait l'écran encore davantage avec un colorimètre X-Rite, les moyennes seraient ramenées à seulement 1,3 et 0,86, mais l'étalonnage par l'utilisateur final ne sera pas nécessaire pour la plupart.
Temps de réponse de l'écran
| ↔ Temps de réponse noir à blanc | ||
|---|---|---|
| 24.8 ms ... hausse ↗ et chute ↘ combinées | ↗ 11.6 ms hausse | 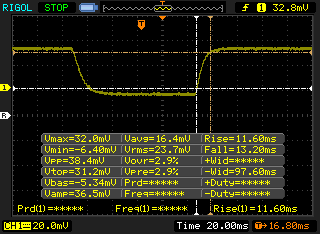 |
| ↘ 13.2 ms chute | ||
| L'écran montre de bons temps de réponse, mais insuffisant pour du jeu compétitif. En comparaison, tous les appareils testés affichent entre 0.1 (minimum) et 240 (maximum) ms. » 58 % des appareils testés affichent de meilleures performances. Cela signifie que les latences relevées sont moins bonnes que la moyenne (19.8 ms) de tous les appareils testés. | ||
| ↔ Temps de réponse gris 50% à gris 80% | ||
| 44 ms ... hausse ↗ et chute ↘ combinées | ↗ 23.6 ms hausse | 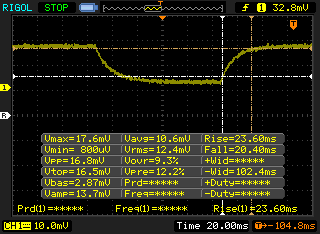 |
| ↘ 20.4 ms chute | ||
| L'écran souffre de latences très élevées, à éviter pour le jeu. En comparaison, tous les appareils testés affichent entre 0.165 (minimum) et 636 (maximum) ms. » 73 % des appareils testés affichent de meilleures performances. Cela signifie que les latences relevées sont moins bonnes que la moyenne (30.9 ms) de tous les appareils testés. | ||
Scintillement / MLI (Modulation de largeur d'impulsion)
| Scintillement / MLI (Modulation de largeur d'impulsion) non décelé | 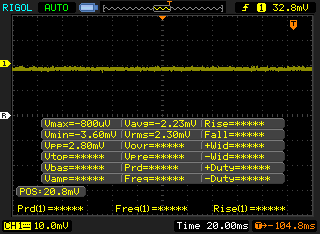 | ||
En comparaison, 52 % des appareils testés n'emploient pas MDI pour assombrir leur écran. Nous avons relevé une moyenne à 7744 (minimum : 5 - maximum : 343500) Hz dans le cas où une MDI était active. | |||
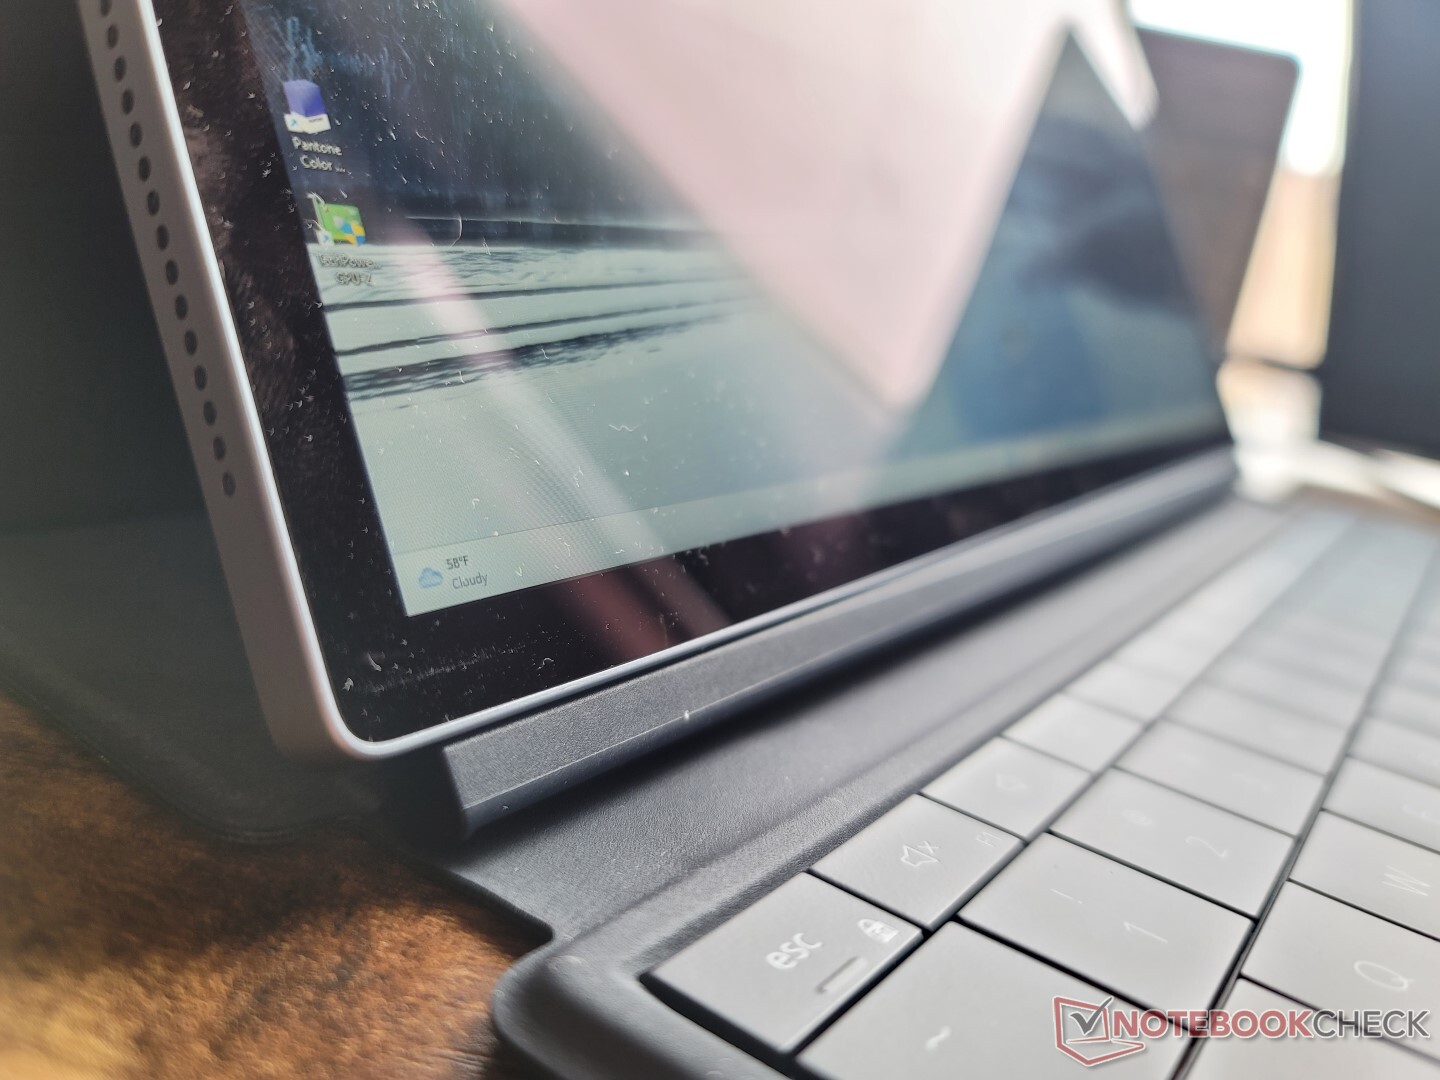
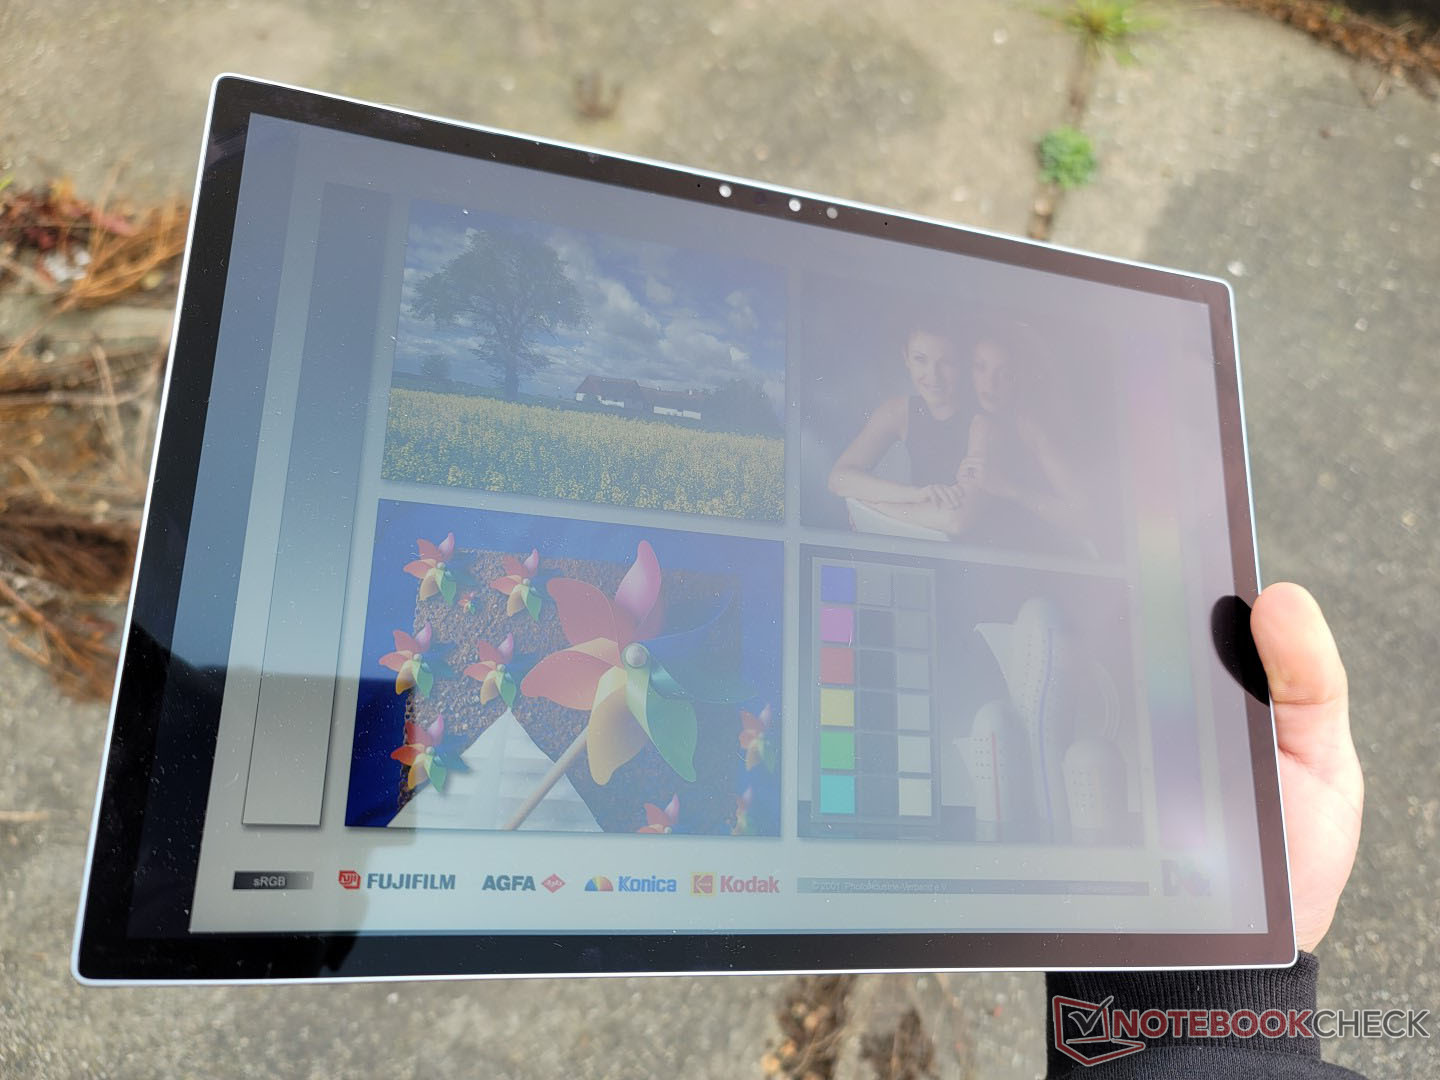
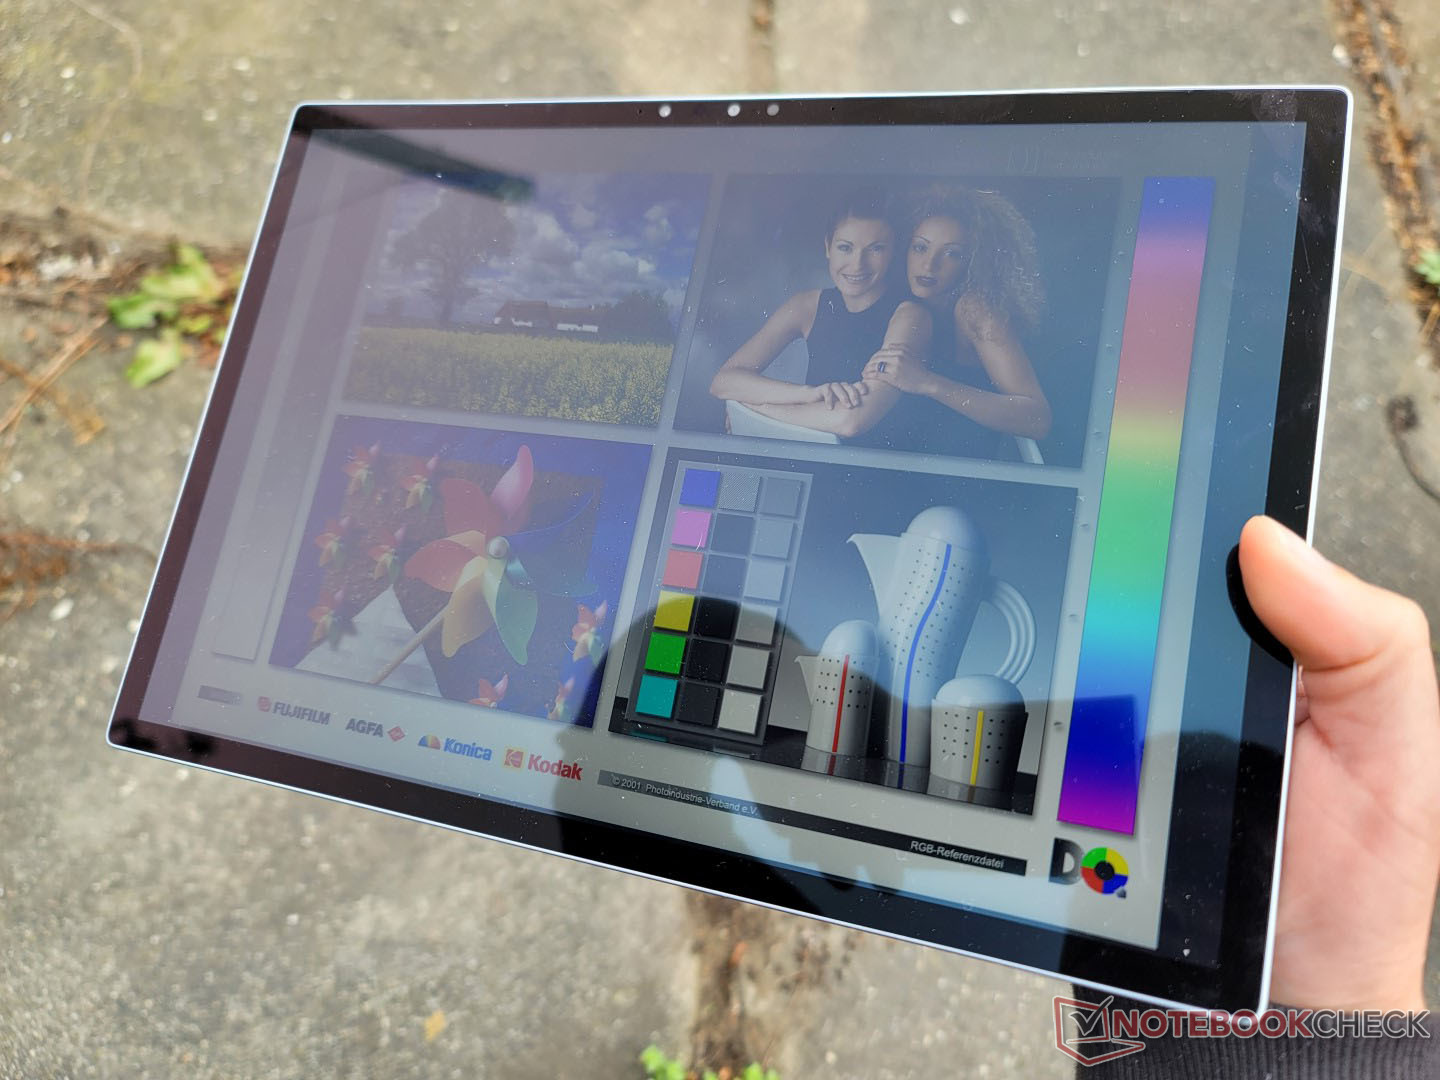
Les reflets sont omniprésents et pratiquement inévitables sur l'écran tactile brillant. Heureusement, l'écran est suffisamment lumineux pour limiter les reflets lorsque l'on travaille à l'ombre en extérieur. En revanche, dans des conditions plus lumineuses, les couleurs et l'expérience visuelle se dégradent rapidement. Certains modèles HP Elite x2 disposent d'options d'affichage de 1000 nits, ce qui le rendrait 2x plus lumineux que le Dell pour une meilleure lisibilité en extérieur.
Performances - Bonnes performances du CPU, moyennes performances du GPU
Conditions d'essai
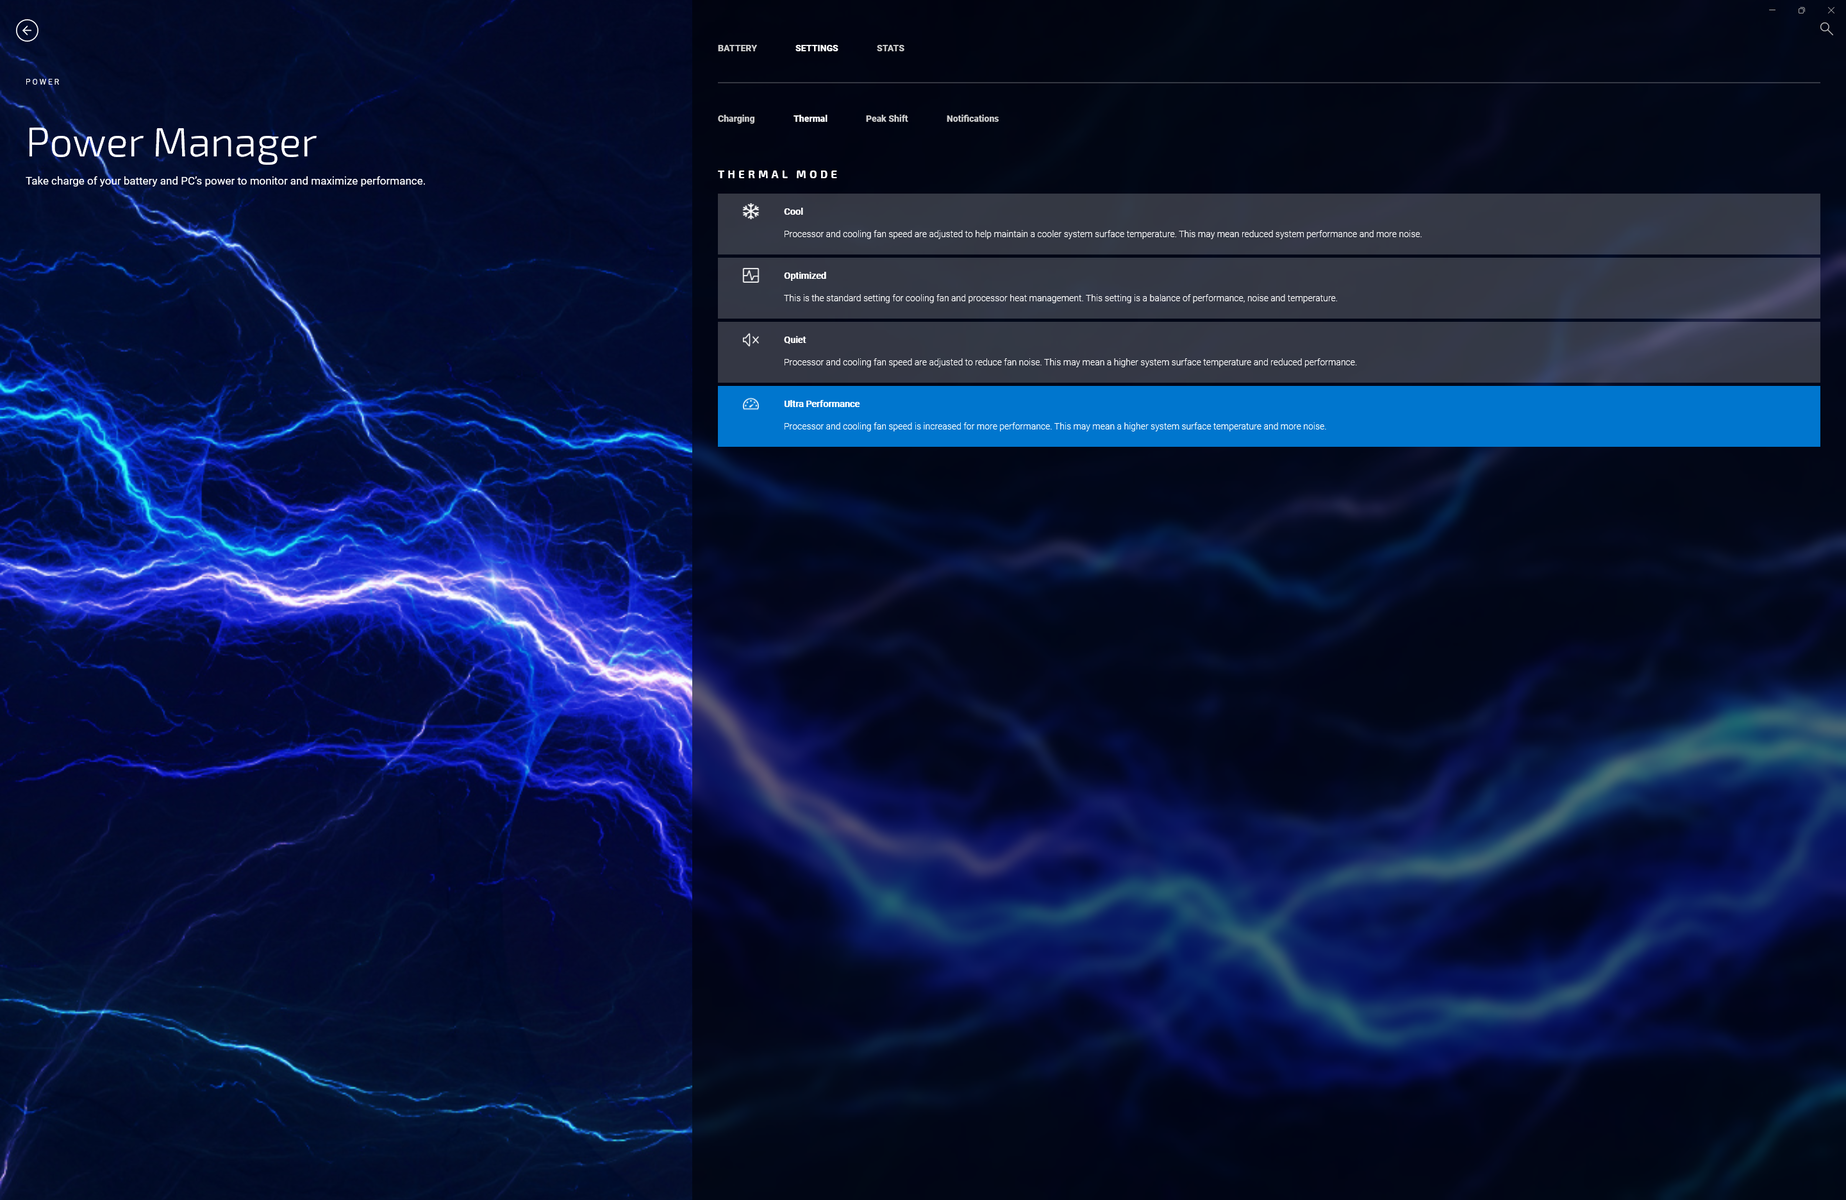
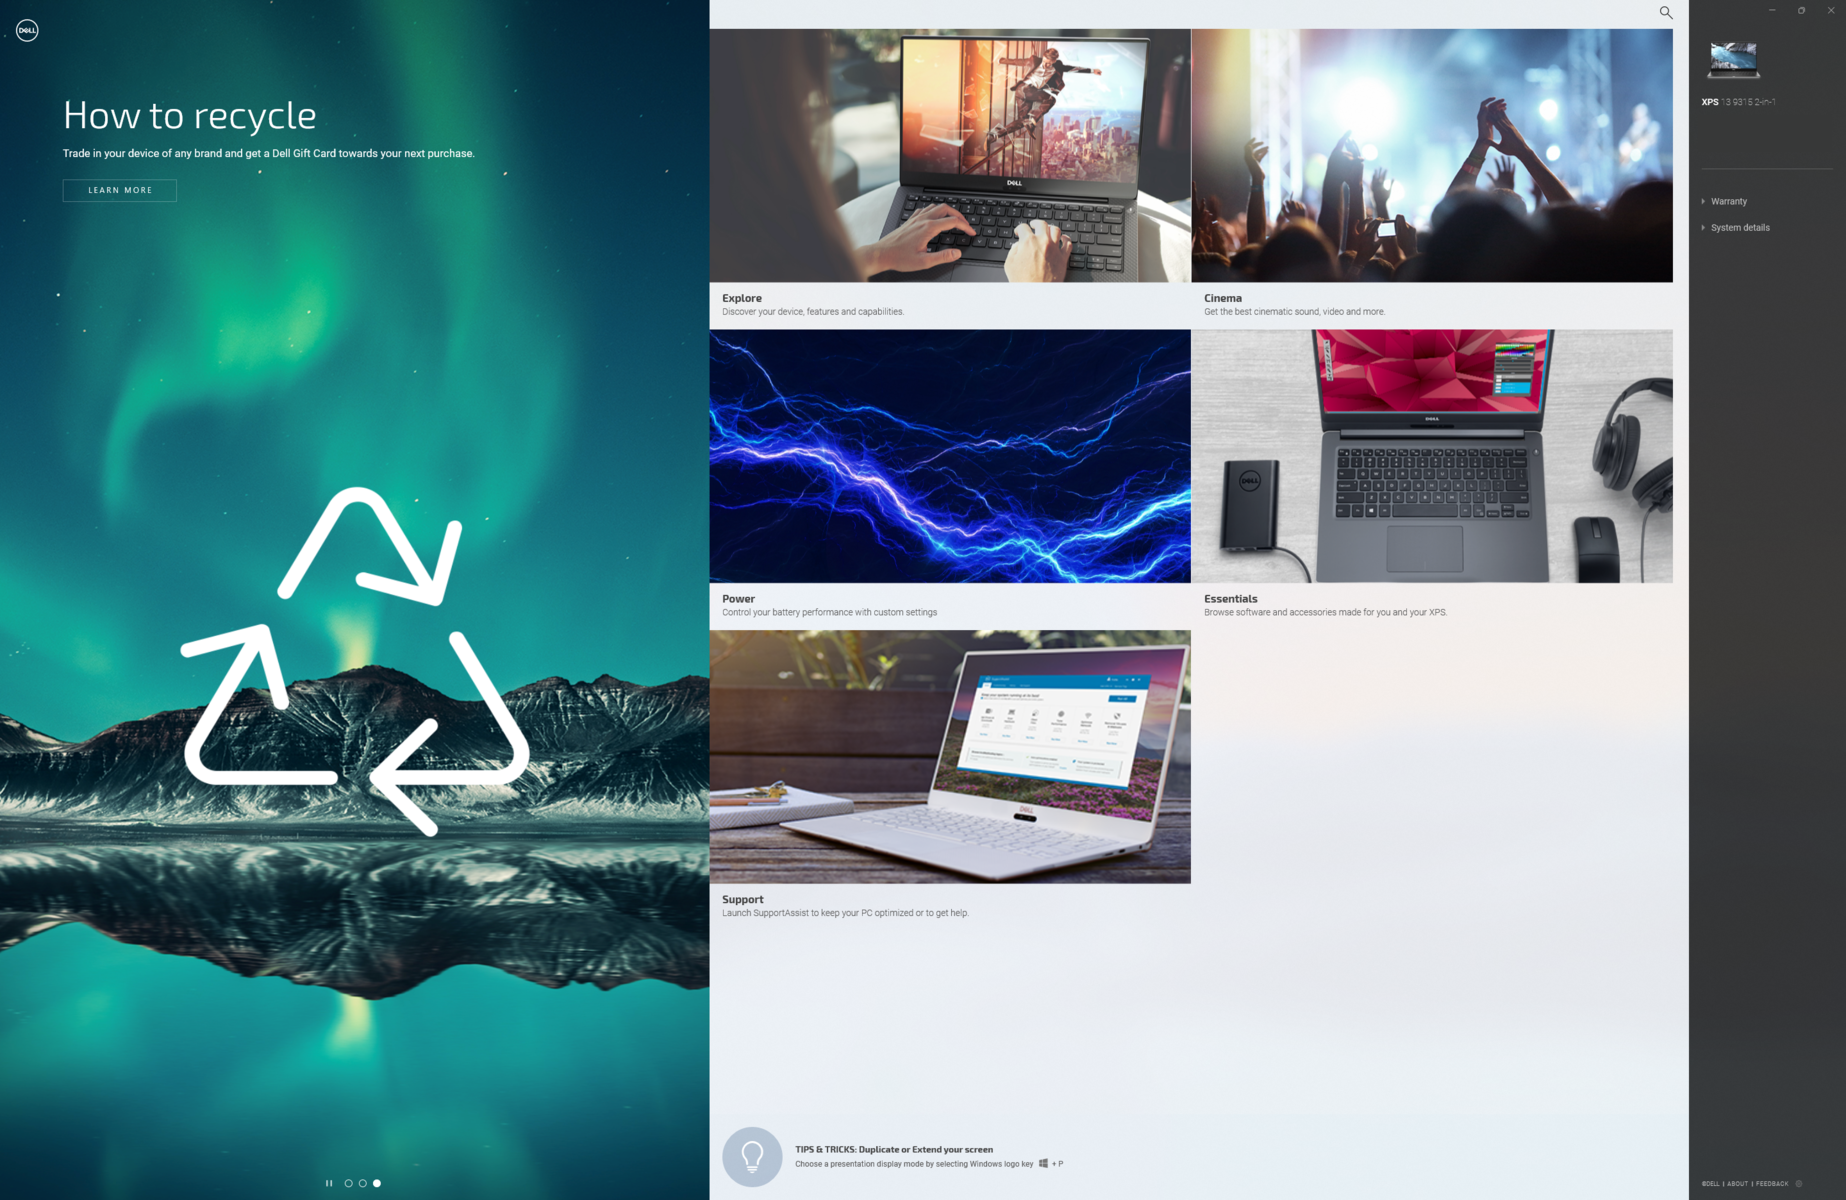
Nous avons réglé notre appareil en mode " Ultra performance " et " Best performance " via Dell Power Manager et Windows, respectivement, avant d'effectuer les tests de référence ci-dessous. Les propriétaires doivent se familiariser avec le logiciel My Dell, car il s'agit du centre de contrôle permettant d'ajuster le comportement de chargement, les performances du système, les notifications et bien plus encore, comme le montrent les captures d'écran ci-dessous.
Processeur
Le XPS 13 9315 2-en-1 partage le même Core i5-1230U Que l'on trouve sur le XPS 13 9315 à coque. On pourrait s'attendre à ce que le modèle à clapet soit un peu plus rapide que le modèle 2-en-1, mais c'est le contraire qui se produit. Nos résultats ci-dessous montrent que le XPS 13 9315 2-en-1 devance systématiquement le XPS 13 9315 clamshell par des marges significatives d'environ 70 % dans les charges de travail multithread. Les résultats sont assez larges pour devancer même le Core i7-1185G7 dans la Surface Pro 8.
La mise à niveau vers le Core i7-1250U Ne devrait augmenter les performances que d'environ 5 % si l'on en croit notre expérience avec le dernier HP Envy x360 13. Pour des performances beaucoup plus rapides, vous voudrez plutôt considérer le XPS 13 Plus 9320 et ses options de CPU de la série P.
La durabilité des performances est limitée sur le XPS 13 9315 2-en-1 puisqu'il s'agit d'une conception sans ventilateur. Lors de l'exécution de CineBench R15 xT en boucle, par exemple, le score initial de 1252 points tombe régulièrement à 750 points au fil du temps, ce qui représente une perte de performance de 40 %. Néanmoins, les performances sont toujours supérieures d'environ 50 % à celles du même processeur dans le XPS 13 9315 à clapet, même en tenant compte de l'étranglement sur les deux machines.
Cinebench R15 Multi Loop
Cinebench R23: Multi Core | Single Core
Cinebench R15: CPU Multi 64Bit | CPU Single 64Bit
Blender: v2.79 BMW27 CPU
7-Zip 18.03: 7z b 4 | 7z b 4 -mmt1
Geekbench 5.5: Multi-Core | Single-Core
HWBOT x265 Benchmark v2.2: 4k Preset
LibreOffice : 20 Documents To PDF
R Benchmark 2.5: Overall mean
| HWBOT x265 Benchmark v2.2 / 4k Preset | |
| Dell XPS 13 Plus 9320 i7-1280P OLED | |
| HP Spectre x360 13.5 14t-ef000 | |
| Dell XPS 13 9315 2-in-1 Core i5-1230U | |
| Microsoft Surface Pro 8, i7-1185G7 | |
* ... Moindre est la valeur, meilleures sont les performances
AIDA64: FP32 Ray-Trace | FPU Julia | CPU SHA3 | CPU Queen | FPU SinJulia | FPU Mandel | CPU AES | CPU ZLib | FP64 Ray-Trace | CPU PhotoWorxx
| Performance rating | |
| Dell XPS 13 Plus 9320 i7-1280P OLED | |
| HP Spectre x360 13.5 14t-ef000 | |
| Microsoft Surface Pro 8, i7-1185G7 | |
| Dell XPS 13 9315 2-in-1 Core i5-1230U | |
| Lenovo ThinkBook Plus Gen2 Core i5 | |
| Moyenne Intel Core i5-1230U | |
| AIDA64 / FP32 Ray-Trace | |
| Dell XPS 13 Plus 9320 i7-1280P OLED | |
| HP Spectre x360 13.5 14t-ef000 | |
| Microsoft Surface Pro 8, i7-1185G7 | |
| Dell XPS 13 9315 2-in-1 Core i5-1230U | |
| Lenovo ThinkBook Plus Gen2 Core i5 | |
| Moyenne Intel Core i5-1230U (2344 - 6360, n=3) | |
| AIDA64 / FPU Julia | |
| Dell XPS 13 Plus 9320 i7-1280P OLED | |
| HP Spectre x360 13.5 14t-ef000 | |
| Dell XPS 13 9315 2-in-1 Core i5-1230U | |
| Microsoft Surface Pro 8, i7-1185G7 | |
| Lenovo ThinkBook Plus Gen2 Core i5 | |
| Moyenne Intel Core i5-1230U (11867 - 31714, n=3) | |
| AIDA64 / CPU SHA3 | |
| Dell XPS 13 Plus 9320 i7-1280P OLED | |
| HP Spectre x360 13.5 14t-ef000 | |
| Microsoft Surface Pro 8, i7-1185G7 | |
| Dell XPS 13 9315 2-in-1 Core i5-1230U | |
| Lenovo ThinkBook Plus Gen2 Core i5 | |
| Moyenne Intel Core i5-1230U (772 - 1711, n=3) | |
| AIDA64 / CPU Queen | |
| Dell XPS 13 Plus 9320 i7-1280P OLED | |
| HP Spectre x360 13.5 14t-ef000 | |
| Dell XPS 13 9315 2-in-1 Core i5-1230U | |
| Microsoft Surface Pro 8, i7-1185G7 | |
| Moyenne Intel Core i5-1230U (30824 - 52533, n=3) | |
| Lenovo ThinkBook Plus Gen2 Core i5 | |
| AIDA64 / FPU SinJulia | |
| Dell XPS 13 Plus 9320 i7-1280P OLED | |
| Microsoft Surface Pro 8, i7-1185G7 | |
| HP Spectre x360 13.5 14t-ef000 | |
| Dell XPS 13 9315 2-in-1 Core i5-1230U | |
| Lenovo ThinkBook Plus Gen2 Core i5 | |
| Moyenne Intel Core i5-1230U (2269 - 3947, n=3) | |
| AIDA64 / FPU Mandel | |
| Dell XPS 13 Plus 9320 i7-1280P OLED | |
| HP Spectre x360 13.5 14t-ef000 | |
| Microsoft Surface Pro 8, i7-1185G7 | |
| Dell XPS 13 9315 2-in-1 Core i5-1230U | |
| Lenovo ThinkBook Plus Gen2 Core i5 | |
| Moyenne Intel Core i5-1230U (6379 - 15896, n=3) | |
| AIDA64 / CPU AES | |
| HP Spectre x360 13.5 14t-ef000 | |
| Lenovo ThinkBook Plus Gen2 Core i5 | |
| Dell XPS 13 Plus 9320 i7-1280P OLED | |
| Microsoft Surface Pro 8, i7-1185G7 | |
| Dell XPS 13 9315 2-in-1 Core i5-1230U | |
| Moyenne Intel Core i5-1230U (18011 - 31941, n=3) | |
| AIDA64 / CPU ZLib | |
| Dell XPS 13 Plus 9320 i7-1280P OLED | |
| HP Spectre x360 13.5 14t-ef000 | |
| Dell XPS 13 9315 2-in-1 Core i5-1230U | |
| Moyenne Intel Core i5-1230U (229 - 495, n=3) | |
| Lenovo ThinkBook Plus Gen2 Core i5 | |
| Microsoft Surface Pro 8, i7-1185G7 | |
| AIDA64 / FP64 Ray-Trace | |
| Dell XPS 13 Plus 9320 i7-1280P OLED | |
| HP Spectre x360 13.5 14t-ef000 | |
| Microsoft Surface Pro 8, i7-1185G7 | |
| Dell XPS 13 9315 2-in-1 Core i5-1230U | |
| Lenovo ThinkBook Plus Gen2 Core i5 | |
| Moyenne Intel Core i5-1230U (1328 - 3305, n=3) | |
| AIDA64 / CPU PhotoWorxx | |
| Dell XPS 13 Plus 9320 i7-1280P OLED | |
| HP Spectre x360 13.5 14t-ef000 | |
| Lenovo ThinkBook Plus Gen2 Core i5 | |
| Microsoft Surface Pro 8, i7-1185G7 | |
| Dell XPS 13 9315 2-in-1 Core i5-1230U | |
| Moyenne Intel Core i5-1230U (17516 - 37042, n=3) | |
Performance du système
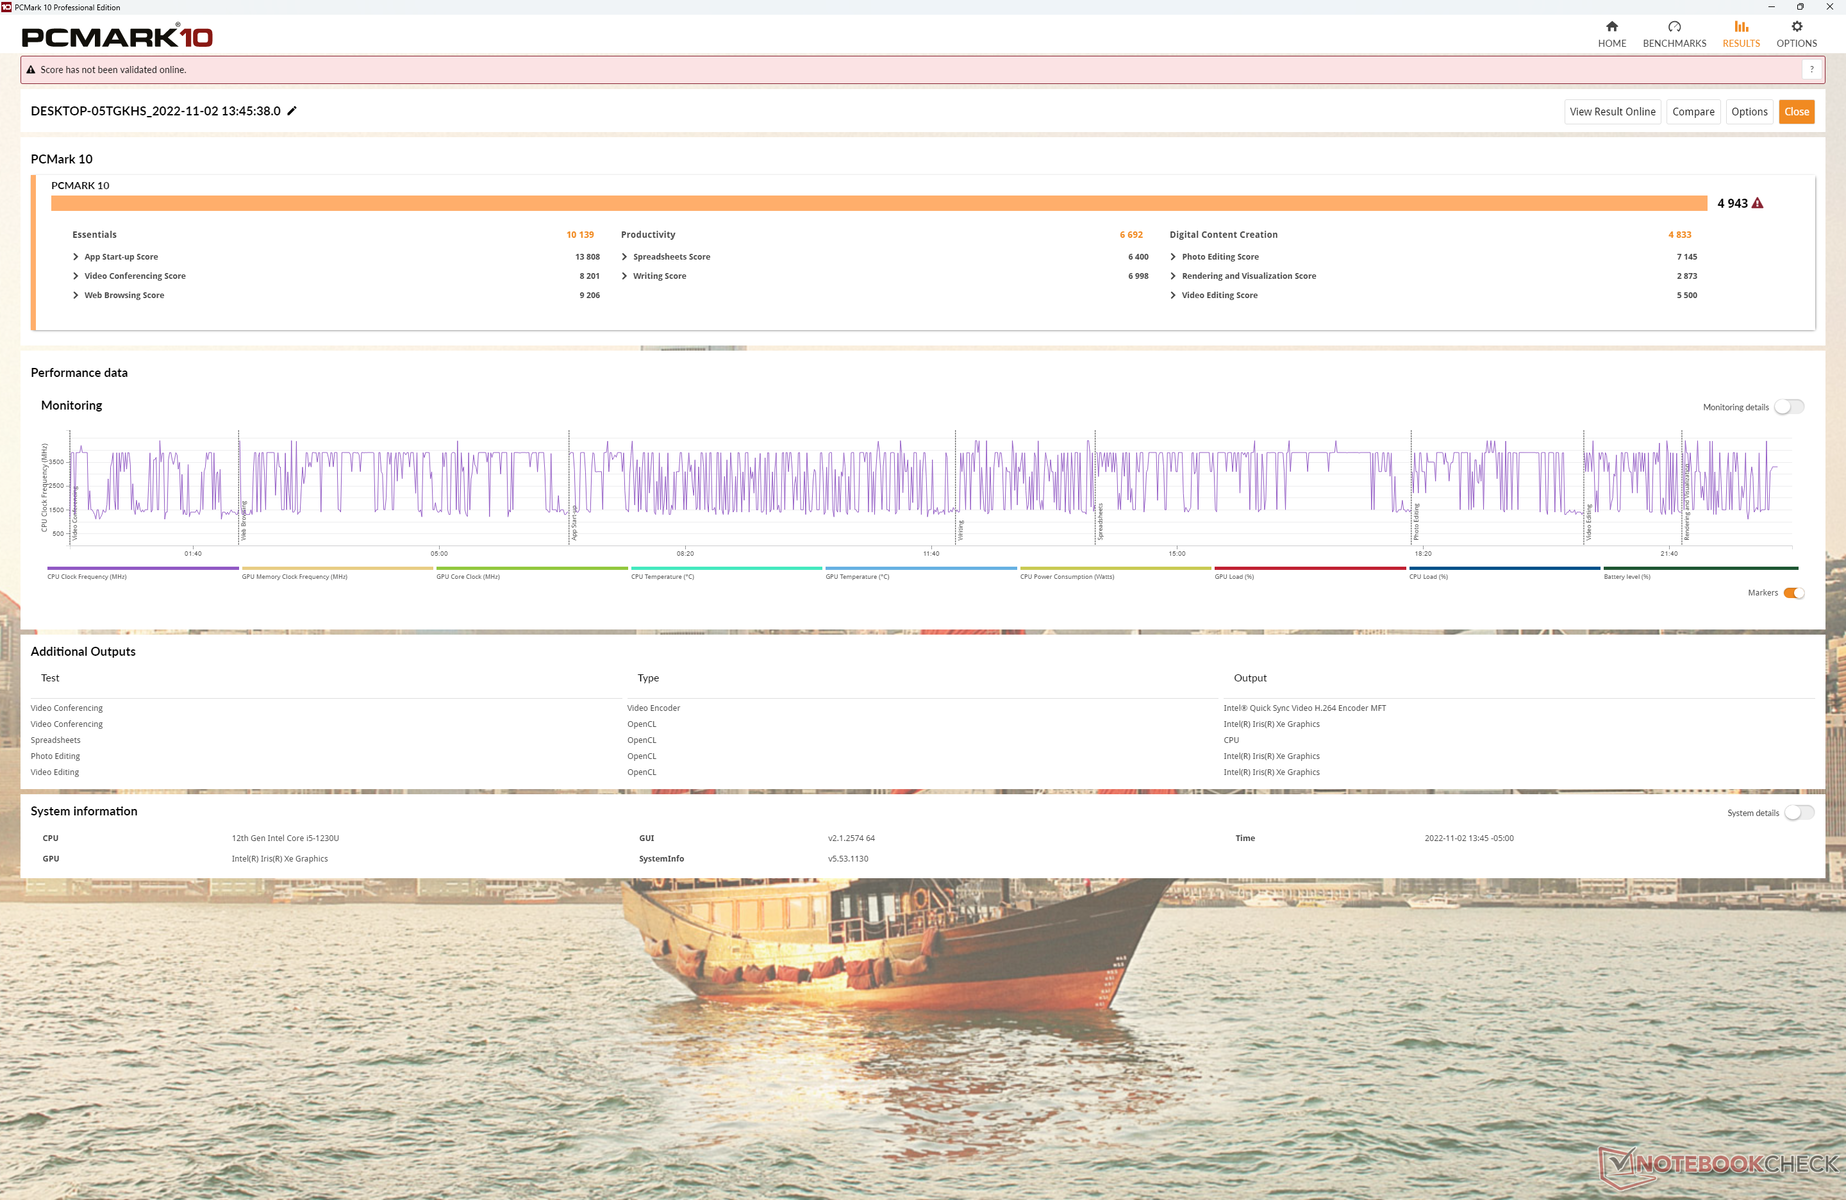
Les résultats de PCMark 10 sont comparables à ceux de la Surface Pro 8, sauf dans le subtest de création de contenu numérique où les performances graphiques sont les plus importantes. Cela correspond aux résultats de notre test GPU ci-dessous, où le XPS 13 9315 2-en-1 présente des performances graphiques inférieures à la moyenne pour cette catégorie.
CrossMark: Overall | Productivity | Creativity | Responsiveness
| PCMark 10 / Score | |
| Dell XPS 13 Plus 9320 i7-1280P OLED | |
| HP Spectre x360 13.5 14t-ef000 | |
| Microsoft Surface Pro 8, i7-1185G7 | |
| Dell XPS 13 9315 2-in-1 Core i5-1230U | |
| Moyenne Intel Core i5-1230U, Intel Iris Xe Graphics G7 80EUs (4001 - 4943, n=3) | |
| Lenovo ThinkBook Plus Gen2 Core i5 | |
| PCMark 10 / Essentials | |
| HP Spectre x360 13.5 14t-ef000 | |
| Dell XPS 13 Plus 9320 i7-1280P OLED | |
| Lenovo ThinkBook Plus Gen2 Core i5 | |
| Dell XPS 13 9315 2-in-1 Core i5-1230U | |
| Microsoft Surface Pro 8, i7-1185G7 | |
| Moyenne Intel Core i5-1230U, Intel Iris Xe Graphics G7 80EUs (8348 - 10139, n=3) | |
| PCMark 10 / Productivity | |
| HP Spectre x360 13.5 14t-ef000 | |
| Dell XPS 13 Plus 9320 i7-1280P OLED | |
| Dell XPS 13 9315 2-in-1 Core i5-1230U | |
| Microsoft Surface Pro 8, i7-1185G7 | |
| Moyenne Intel Core i5-1230U, Intel Iris Xe Graphics G7 80EUs (5735 - 6692, n=3) | |
| Lenovo ThinkBook Plus Gen2 Core i5 | |
| PCMark 10 / Digital Content Creation | |
| Dell XPS 13 Plus 9320 i7-1280P OLED | |
| Microsoft Surface Pro 8, i7-1185G7 | |
| HP Spectre x360 13.5 14t-ef000 | |
| Dell XPS 13 9315 2-in-1 Core i5-1230U | |
| Moyenne Intel Core i5-1230U, Intel Iris Xe Graphics G7 80EUs (3632 - 4833, n=3) | |
| Lenovo ThinkBook Plus Gen2 Core i5 | |
| CrossMark / Overall | |
| Dell XPS 13 Plus 9320 i7-1280P OLED | |
| HP Spectre x360 13.5 14t-ef000 | |
| Apple MacBook Air M2 Entry | |
| Microsoft Surface Pro 8, i7-1185G7 | |
| Dell XPS 13 9315 2-in-1 Core i5-1230U | |
| Moyenne Intel Core i5-1230U, Intel Iris Xe Graphics G7 80EUs (1117 - 1383, n=3) | |
| CrossMark / Productivity | |
| Dell XPS 13 Plus 9320 i7-1280P OLED | |
| HP Spectre x360 13.5 14t-ef000 | |
| Microsoft Surface Pro 8, i7-1185G7 | |
| Apple MacBook Air M2 Entry | |
| Dell XPS 13 9315 2-in-1 Core i5-1230U | |
| Moyenne Intel Core i5-1230U, Intel Iris Xe Graphics G7 80EUs (1187 - 1356, n=3) | |
| CrossMark / Creativity | |
| Dell XPS 13 Plus 9320 i7-1280P OLED | |
| Apple MacBook Air M2 Entry | |
| HP Spectre x360 13.5 14t-ef000 | |
| Microsoft Surface Pro 8, i7-1185G7 | |
| Dell XPS 13 9315 2-in-1 Core i5-1230U | |
| Moyenne Intel Core i5-1230U, Intel Iris Xe Graphics G7 80EUs (1095 - 1469, n=3) | |
| CrossMark / Responsiveness | |
| Dell XPS 13 Plus 9320 i7-1280P OLED | |
| HP Spectre x360 13.5 14t-ef000 | |
| Dell XPS 13 9315 2-in-1 Core i5-1230U | |
| Moyenne Intel Core i5-1230U, Intel Iris Xe Graphics G7 80EUs (990 - 1224, n=3) | |
| Microsoft Surface Pro 8, i7-1185G7 | |
| Apple MacBook Air M2 Entry | |
| PCMark 10 Score | 4943 points | |
Aide | ||
| AIDA64 / Memory Copy | |
| Dell XPS 13 Plus 9320 i7-1280P OLED | |
| HP Spectre x360 13.5 14t-ef000 | |
| Dell XPS 13 9315 2-in-1 Core i5-1230U | |
| Microsoft Surface Pro 8, i7-1185G7 | |
| Lenovo ThinkBook Plus Gen2 Core i5 | |
| Moyenne Intel Core i5-1230U (32539 - 60944, n=3) | |
| AIDA64 / Memory Read | |
| Dell XPS 13 Plus 9320 i7-1280P OLED | |
| Lenovo ThinkBook Plus Gen2 Core i5 | |
| HP Spectre x360 13.5 14t-ef000 | |
| Microsoft Surface Pro 8, i7-1185G7 | |
| Dell XPS 13 9315 2-in-1 Core i5-1230U | |
| Moyenne Intel Core i5-1230U (31342 - 60435, n=3) | |
| AIDA64 / Memory Write | |
| Dell XPS 13 9315 2-in-1 Core i5-1230U | |
| Lenovo ThinkBook Plus Gen2 Core i5 | |
| HP Spectre x360 13.5 14t-ef000 | |
| Dell XPS 13 Plus 9320 i7-1280P OLED | |
| Microsoft Surface Pro 8, i7-1185G7 | |
| Moyenne Intel Core i5-1230U (33224 - 65665, n=3) | |
| AIDA64 / Memory Latency | |
| Dell XPS 13 9315 2-in-1 Core i5-1230U | |
| Dell XPS 13 Plus 9320 i7-1280P OLED | |
| Microsoft Surface Pro 8, i7-1185G7 | |
| HP Spectre x360 13.5 14t-ef000 | |
| Lenovo ThinkBook Plus Gen2 Core i5 | |
| Moyenne Intel Core i5-1230U (104.3 - 105.3, n=3) | |
* ... Moindre est la valeur, meilleures sont les performances
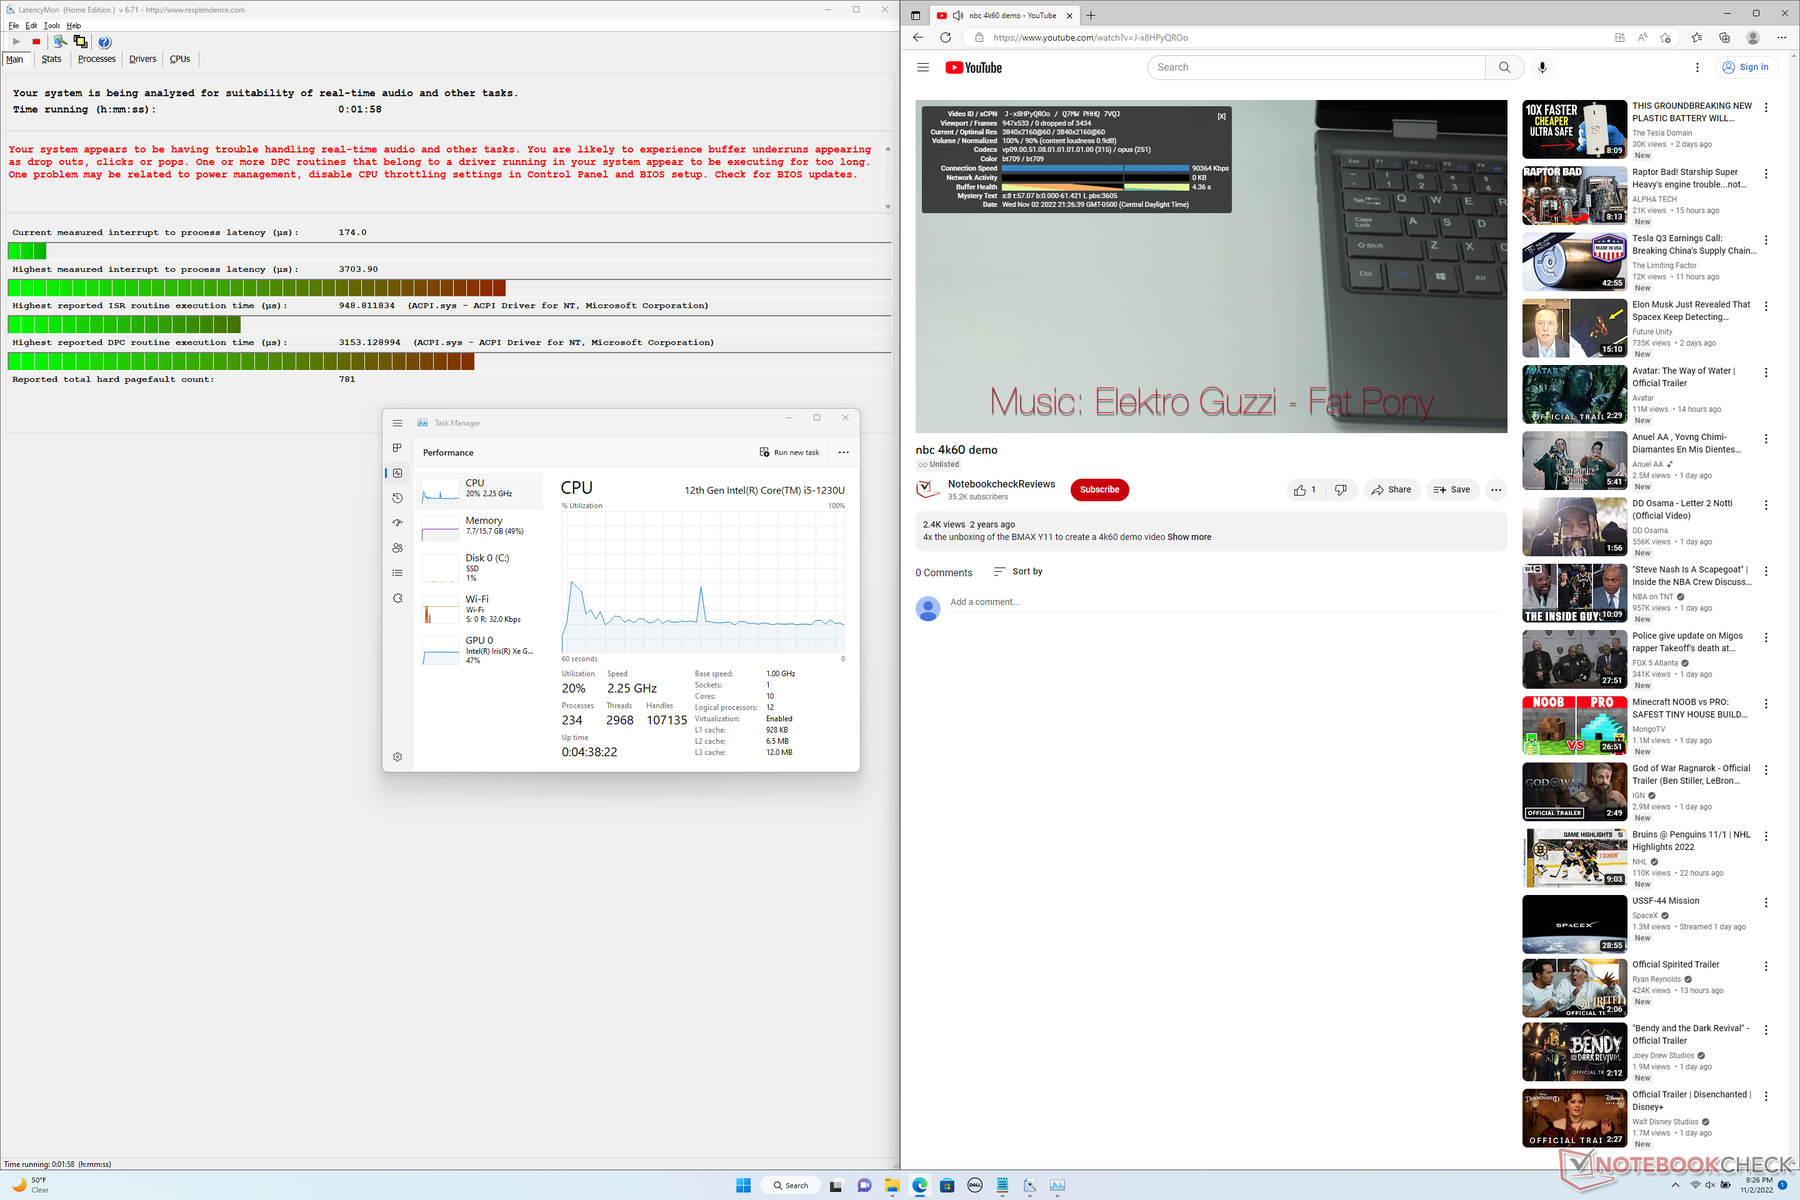
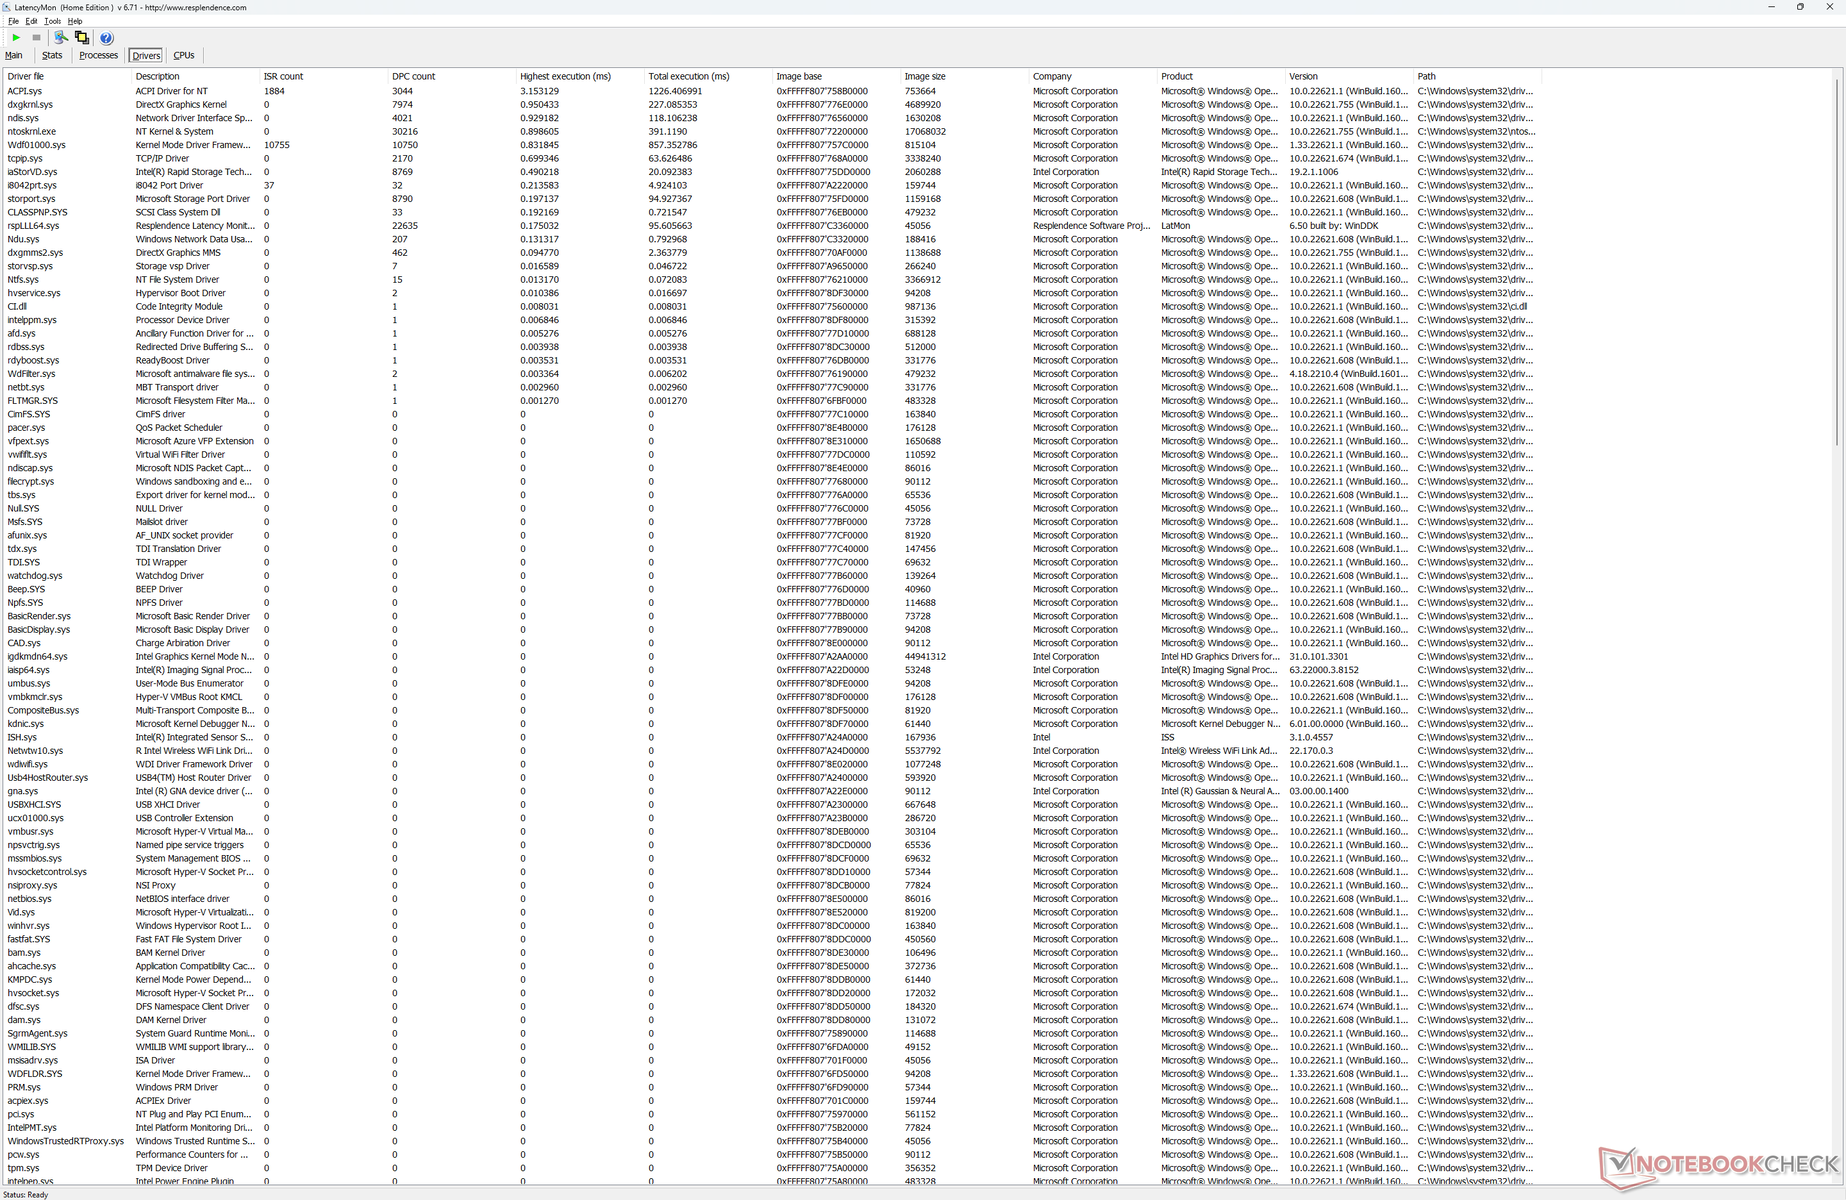
Latence DPC
LatencyMon révèle des problèmes de DPC lors de l'ouverture de plusieurs onglets de navigateur de notre page d'accueil. la lecture de vidéos 4K à 60 FPS est par ailleurs parfaite, sans aucune perte d'images.
| DPC Latencies / LatencyMon - interrupt to process latency (max), Web, Youtube, Prime95 | |
| Dell XPS 13 9315 2-in-1 Core i5-1230U | |
| Lenovo ThinkBook Plus Gen2 Core i5 | |
| HP Spectre x360 13.5 14t-ef000 | |
| Microsoft Surface Pro 8, i7-1185G7 | |
| Dell XPS 13 Plus 9320 i7-1280P OLED | |
* ... Moindre est la valeur, meilleures sont les performances
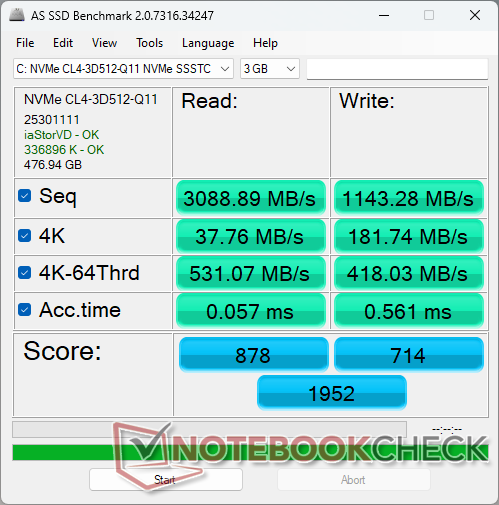
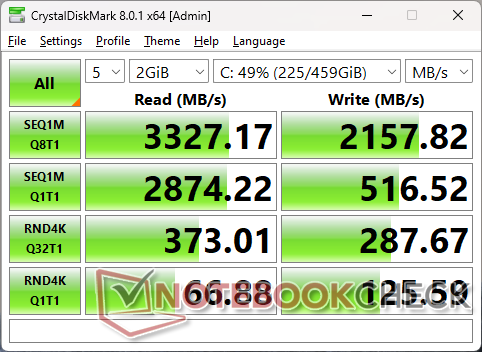
Dispositifs de stockage - PCIe4 à la vitesse de PCIe3
Dell propose des options de stockage PCIe4 x4 de 256 Go, 512 Go et 1 To. Malheureusement, les performances sont plus proches de celles de la plupart des disques PCIe3 x4 que PCIe4 x4. Les tests de référence tels que CrystalDiskMark et DiskSpd montrent des taux de lecture et d'écriture maximums de seulement 3300 Mo/s et 2200 Mo/s, respectivement, contre 7000 Mo/s ou plus sur le Samsung 980 Pro PCIe4 x4 de Samsung. Malgré cela, la fourchette de 3000 Mo/s est plus que suffisante compte tenu du facteur de forme et du CPU Core U-series.

* ... Moindre est la valeur, meilleures sont les performances
Disk Throttling: DiskSpd Read Loop, Queue Depth 8
Performances du GPU
Si les performances du processeur sont meilleures que prévu, les performances graphiques ne sont pas aussi bonnes. les résultats 3DMark sont environ 10 à 20 % plus lents que ceux de l'ordinateur portable moyen de notre base de données avec les mêmes cartes graphiques intégrées Iris Xe 80 EU intégréspour être comparables à ceux desThinkBook Plus Gen 2 de l'année dernièrele jeu est toujours possible, mais uniquement avec les paramètres les plus bas.
Si l'on passe au Core i7-1250U SKU avec l'Iris Xe 96 EUs, le jeu reste possible Iris Xe 96 EUs devrait améliorer les performances graphiques d'environ 36 %, d'après notre expérience avec le HP Envy x360 13. Il existe des configurations avec seulement 8 Go de RAM au lieu de 16 Go, ce que nous ne recommandons pas, sinon les performances graphiques en pâtiraient encore plus.
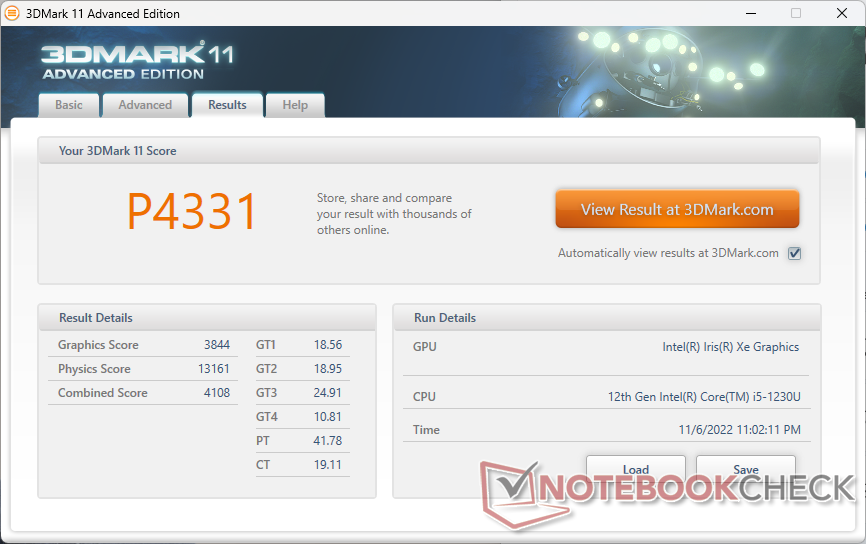
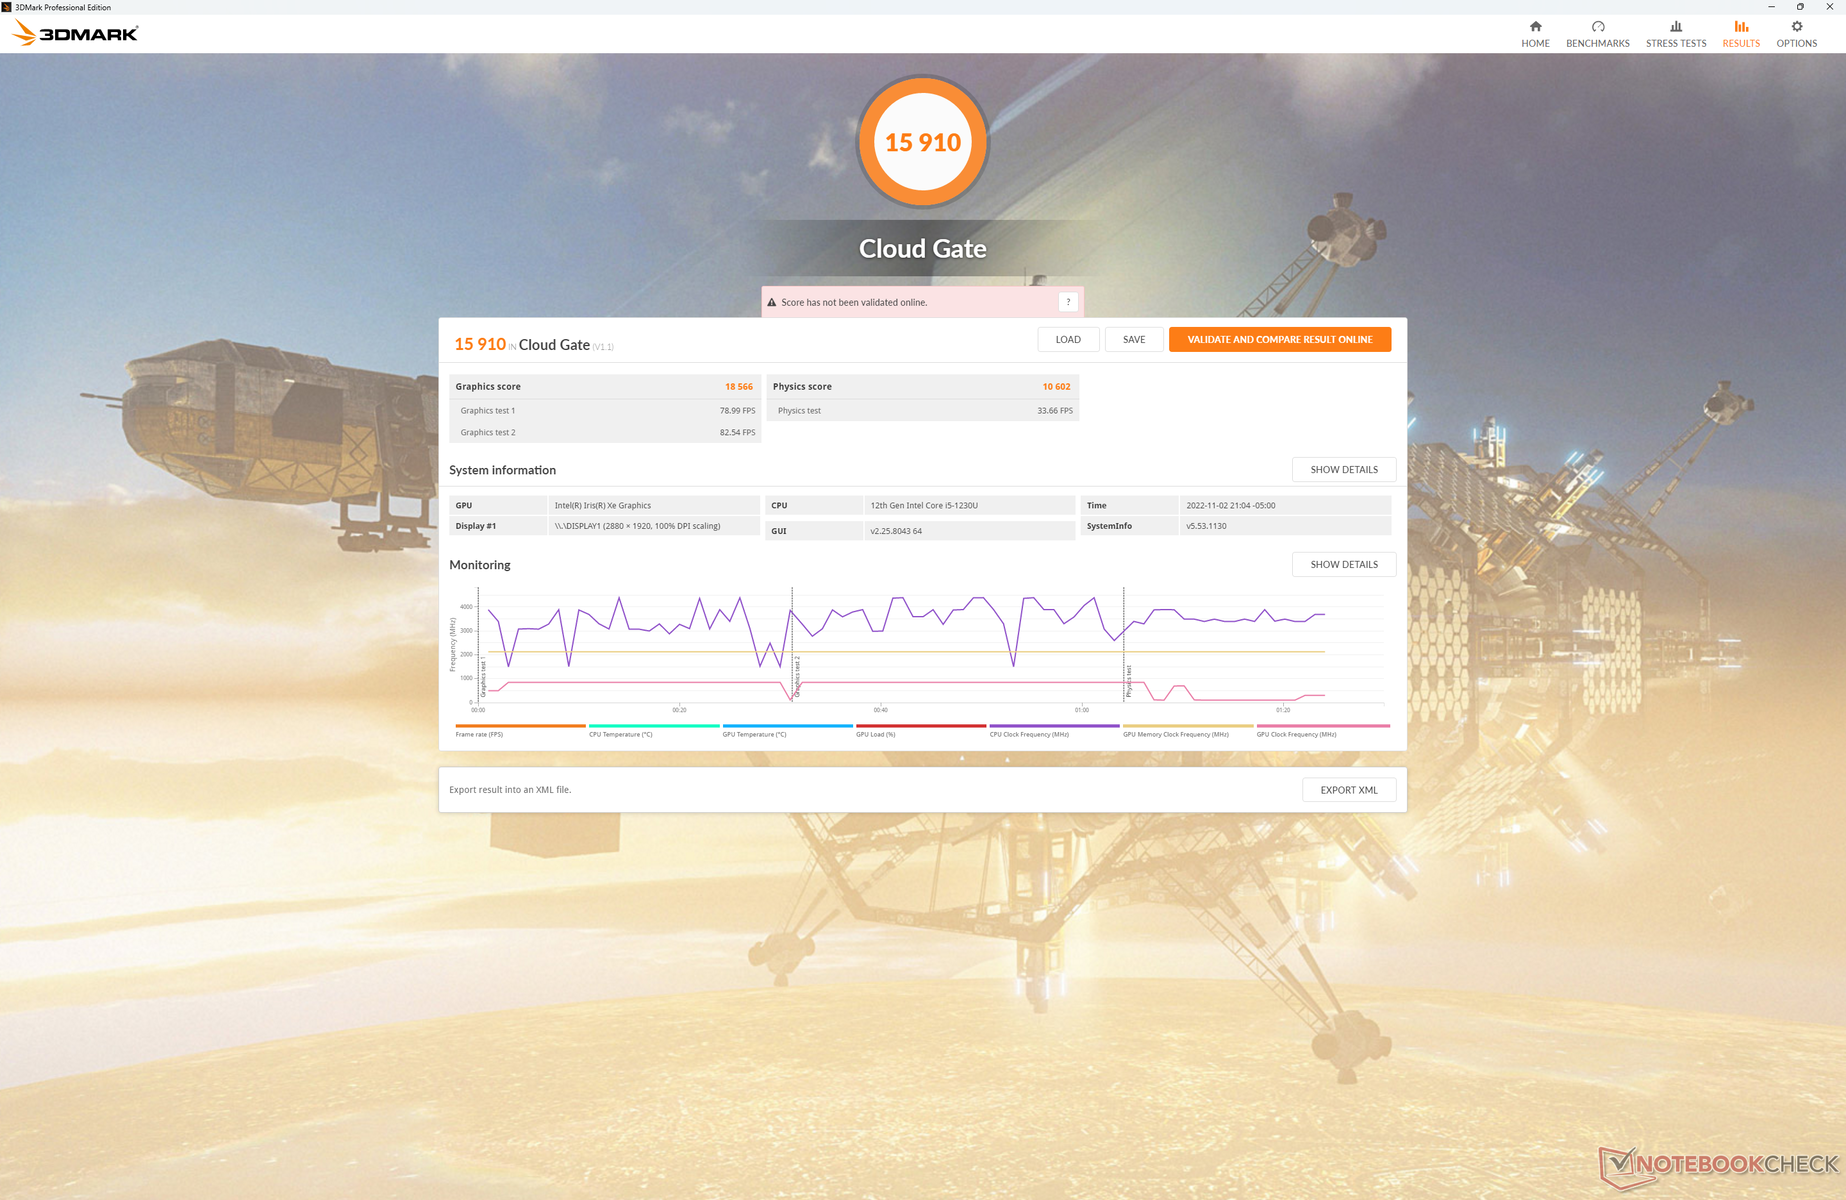
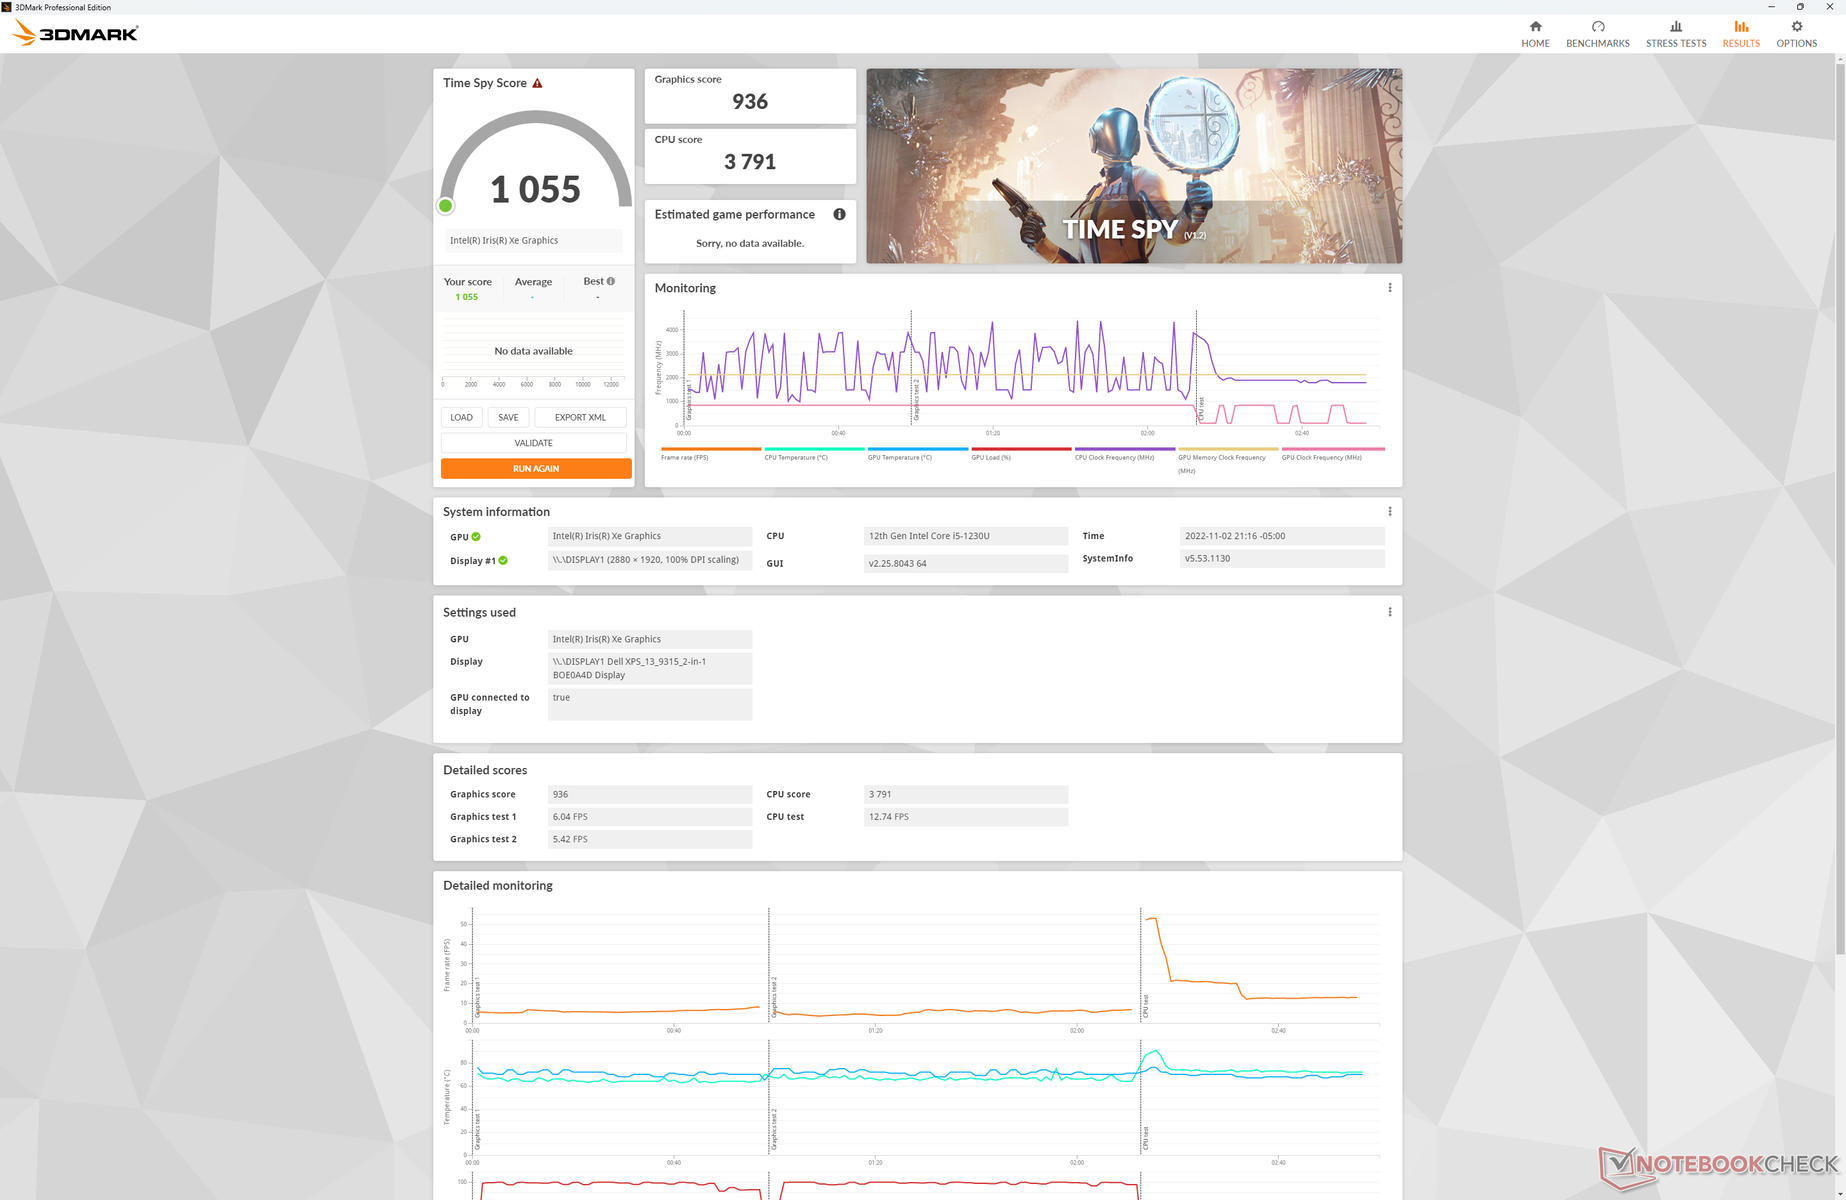
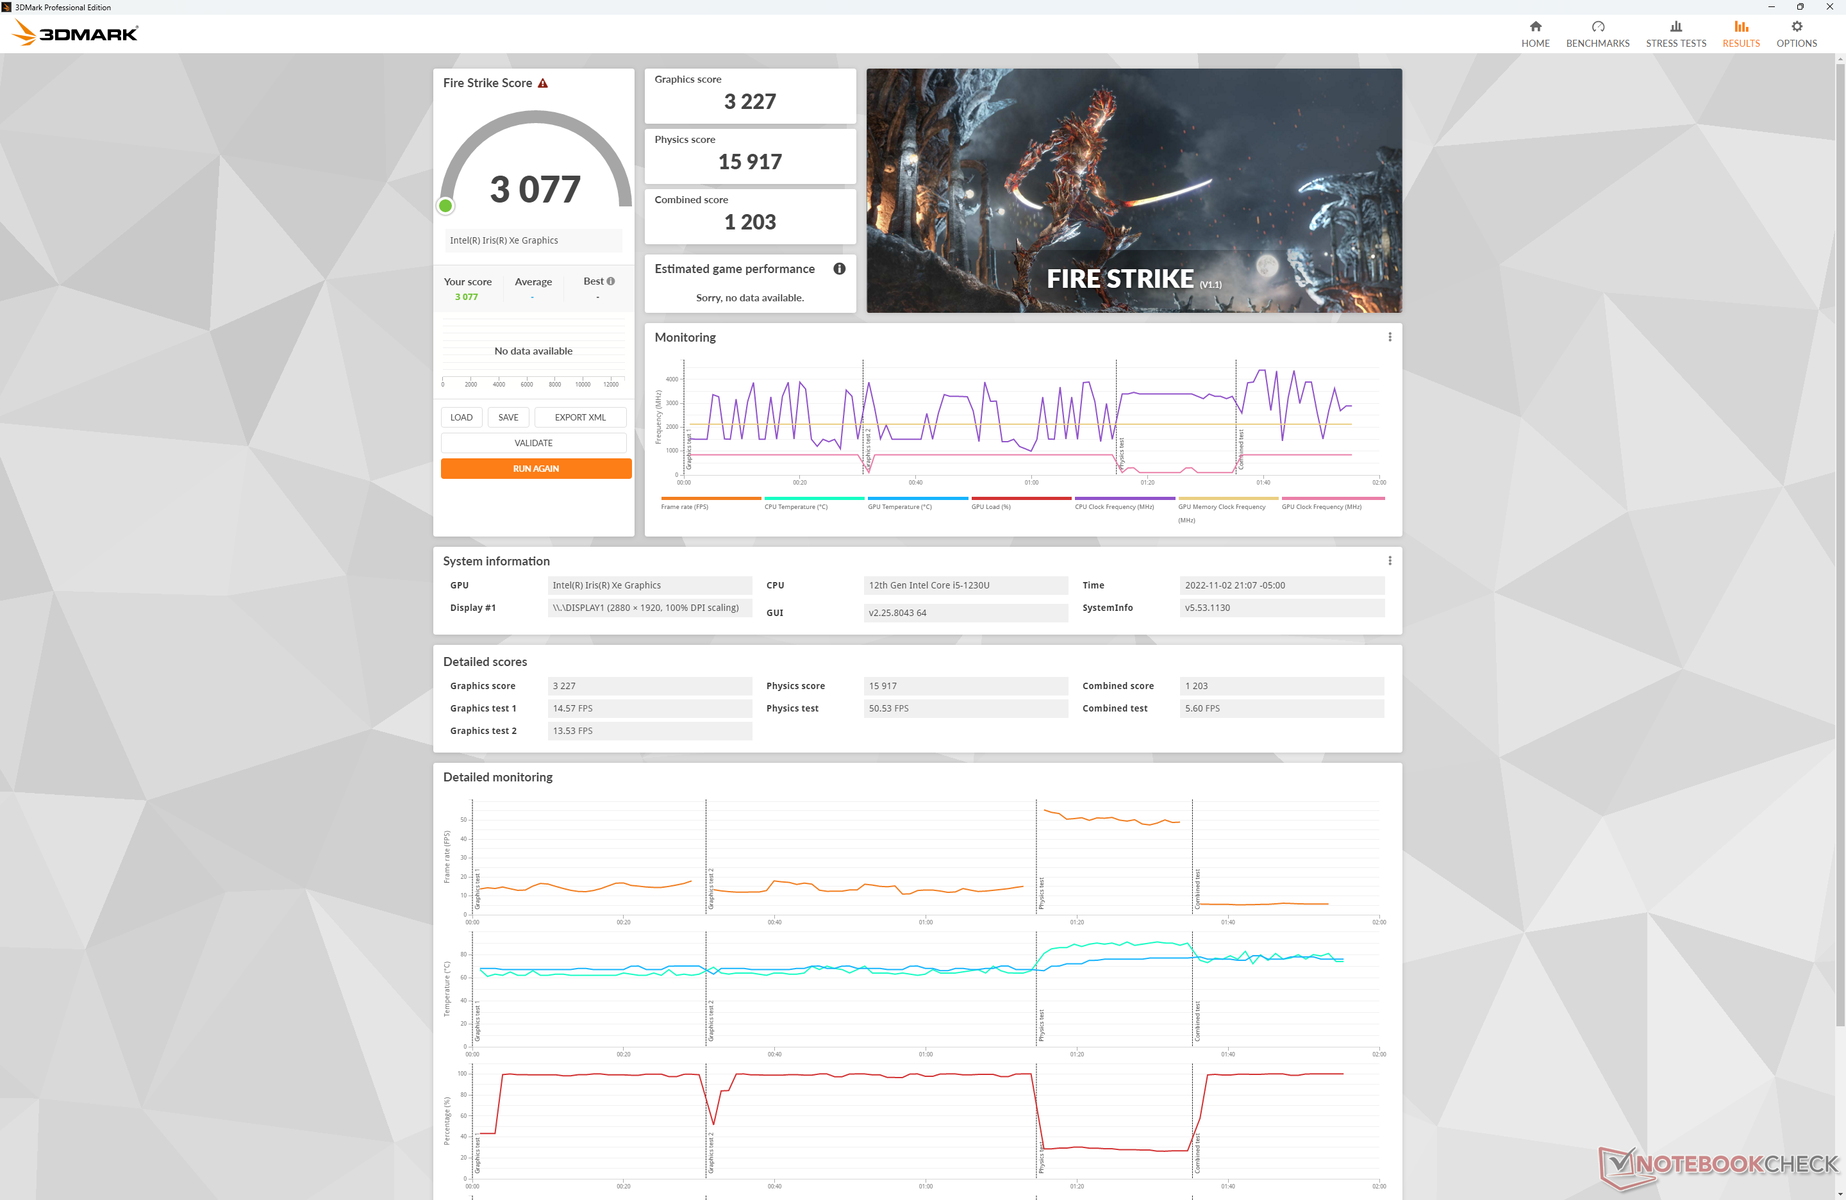
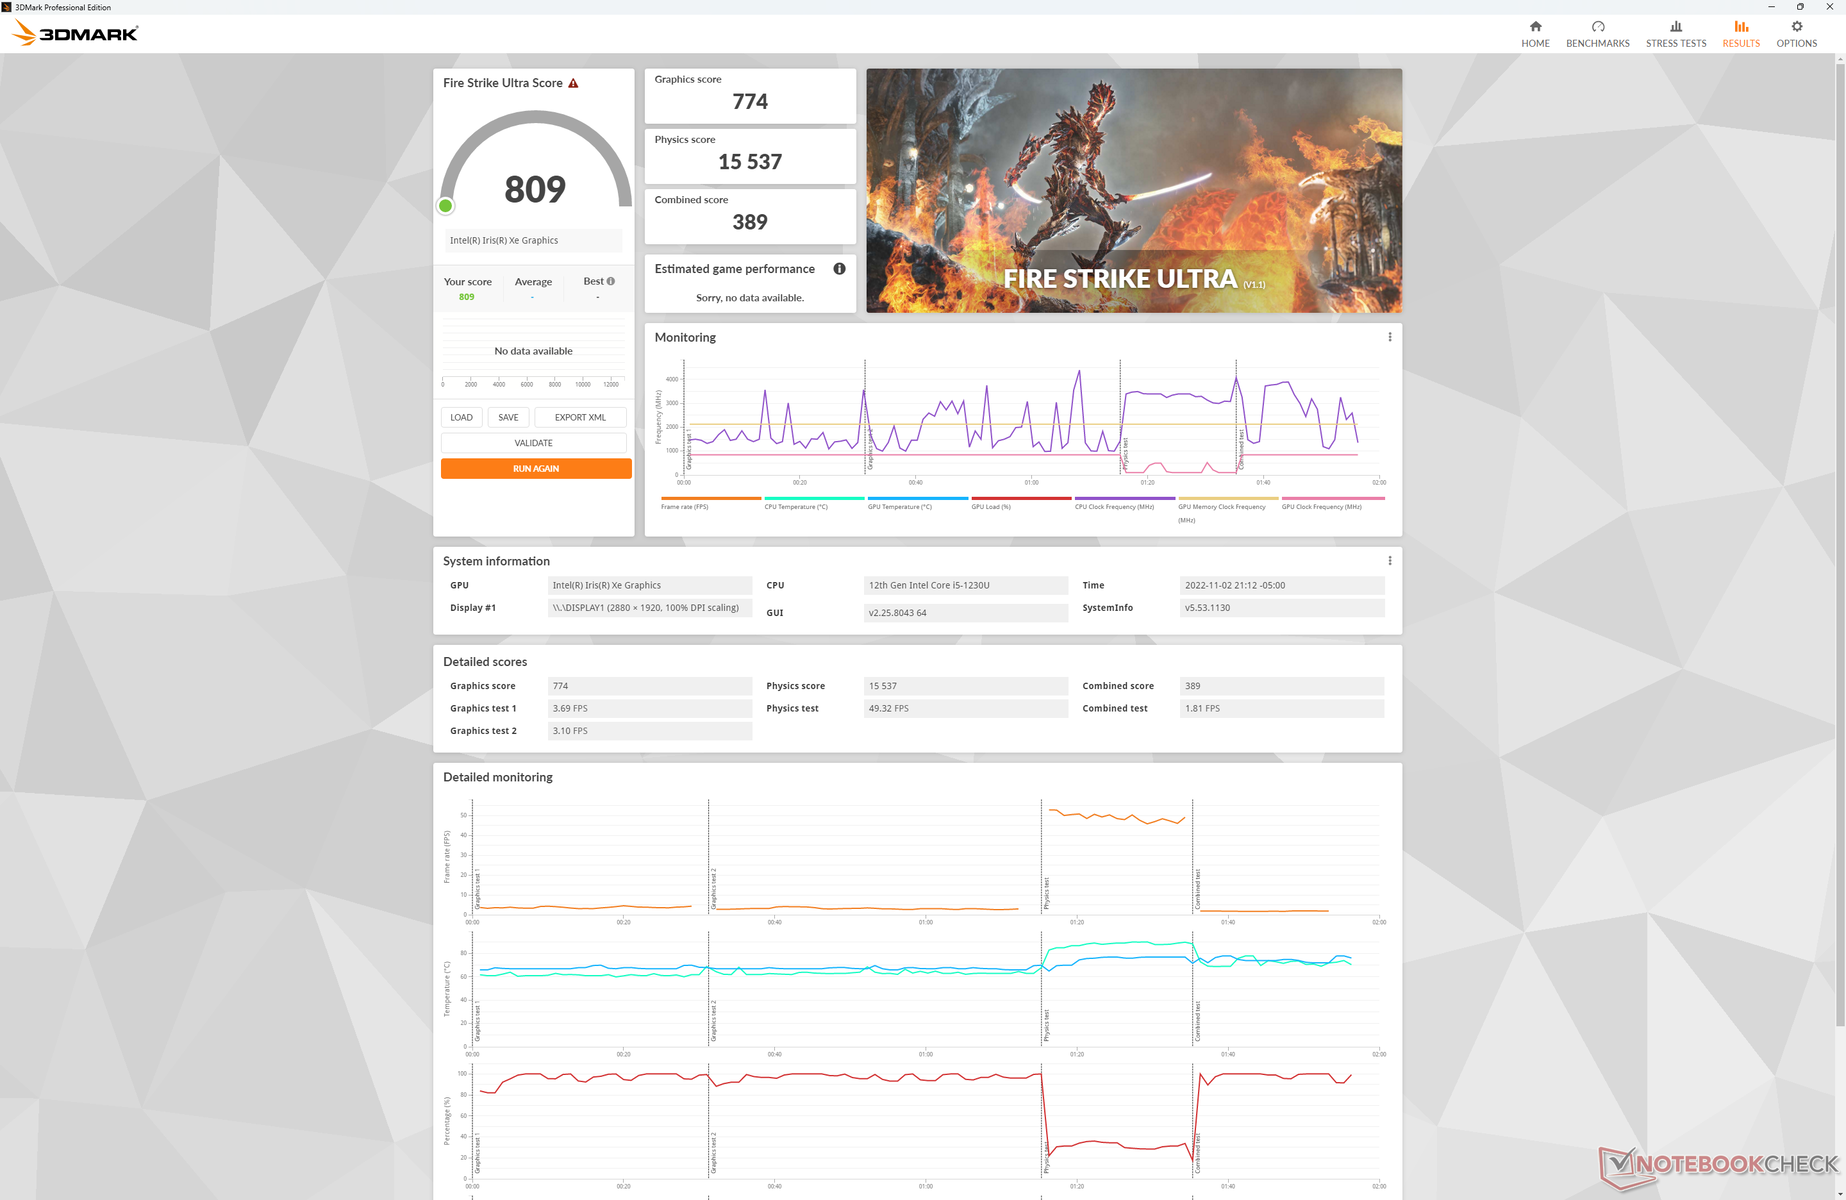
| 3DMark 11 Performance | 4331 points | |
| 3DMark Cloud Gate Standard Score | 15910 points | |
| 3DMark Fire Strike Score | 3077 points | |
| 3DMark Time Spy Score | 1055 points | |
Aide | ||
* ... Moindre est la valeur, meilleures sont les performances
| Final Fantasy XV Benchmark - 1280x720 Lite Quality | |
| Microsoft Surface Pro 8, i7-1185G7 | |
| Dell XPS 13 Plus 9320 i7-1280P OLED | |
| HP Spectre x360 13.5 14t-ef000 | |
| Moyenne Intel Iris Xe Graphics G7 80EUs (8.32 - 45.6, n=107) | |
| Dell XPS 13 9315 2-in-1 Core i5-1230U | |
Les taux de trame sont stables lorsque l'ordinateur tourne au ralenti Witcher 3 ce qui signifie qu'il n'y a pas d'activités majeures en arrière-plan. Nous avons connu un seul cas où les performances ont chuté à 36 FPS avant de remonter à la normale, mais ce n'était heureusement qu'une exception et un modèle.
Witcher 3 FPS Chart
| Bas | Moyen | Élevé | Ultra | |
|---|---|---|---|---|
| GTA V (2015) | 60.9 | 38.4 | 11.7 | 6.06 |
| The Witcher 3 (2015) | 57.7 | 38.9 | 19.9 | 8.5 |
| Dota 2 Reborn (2015) | 101.2 | 75.8 | 37.6 | 34.2 |
| Final Fantasy XV Benchmark (2018) | 27 | |||
| X-Plane 11.11 (2018) | 31.2 | 25.1 | 22 |
Émissions - Pas de ventilateur !
Bruit du système
Alors que la Surface Pro 8 utilise un ventilateur interne pour le refroidissement, le XPS 13 9315 2-en-1 est refroidi passivement pour toutes les configurations, y compris l'UGS Core i7. Il n'y a aucun bruit de ventilateur ou de bobine pour un système totalement silencieux.
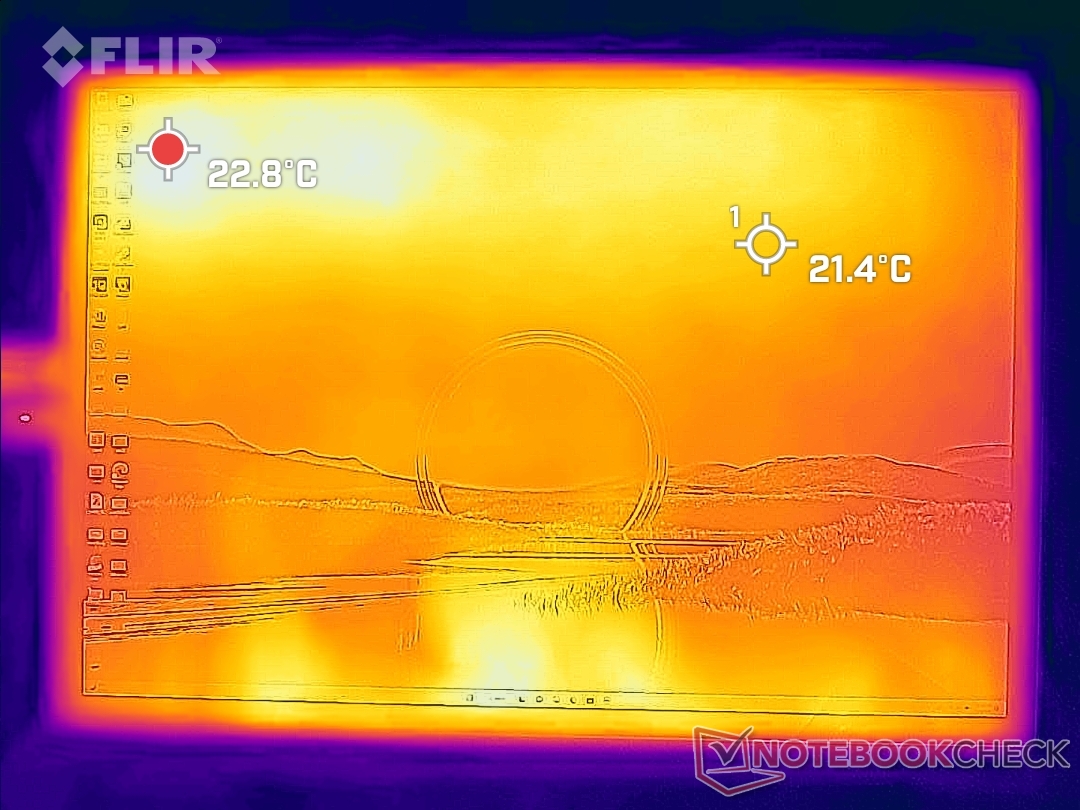
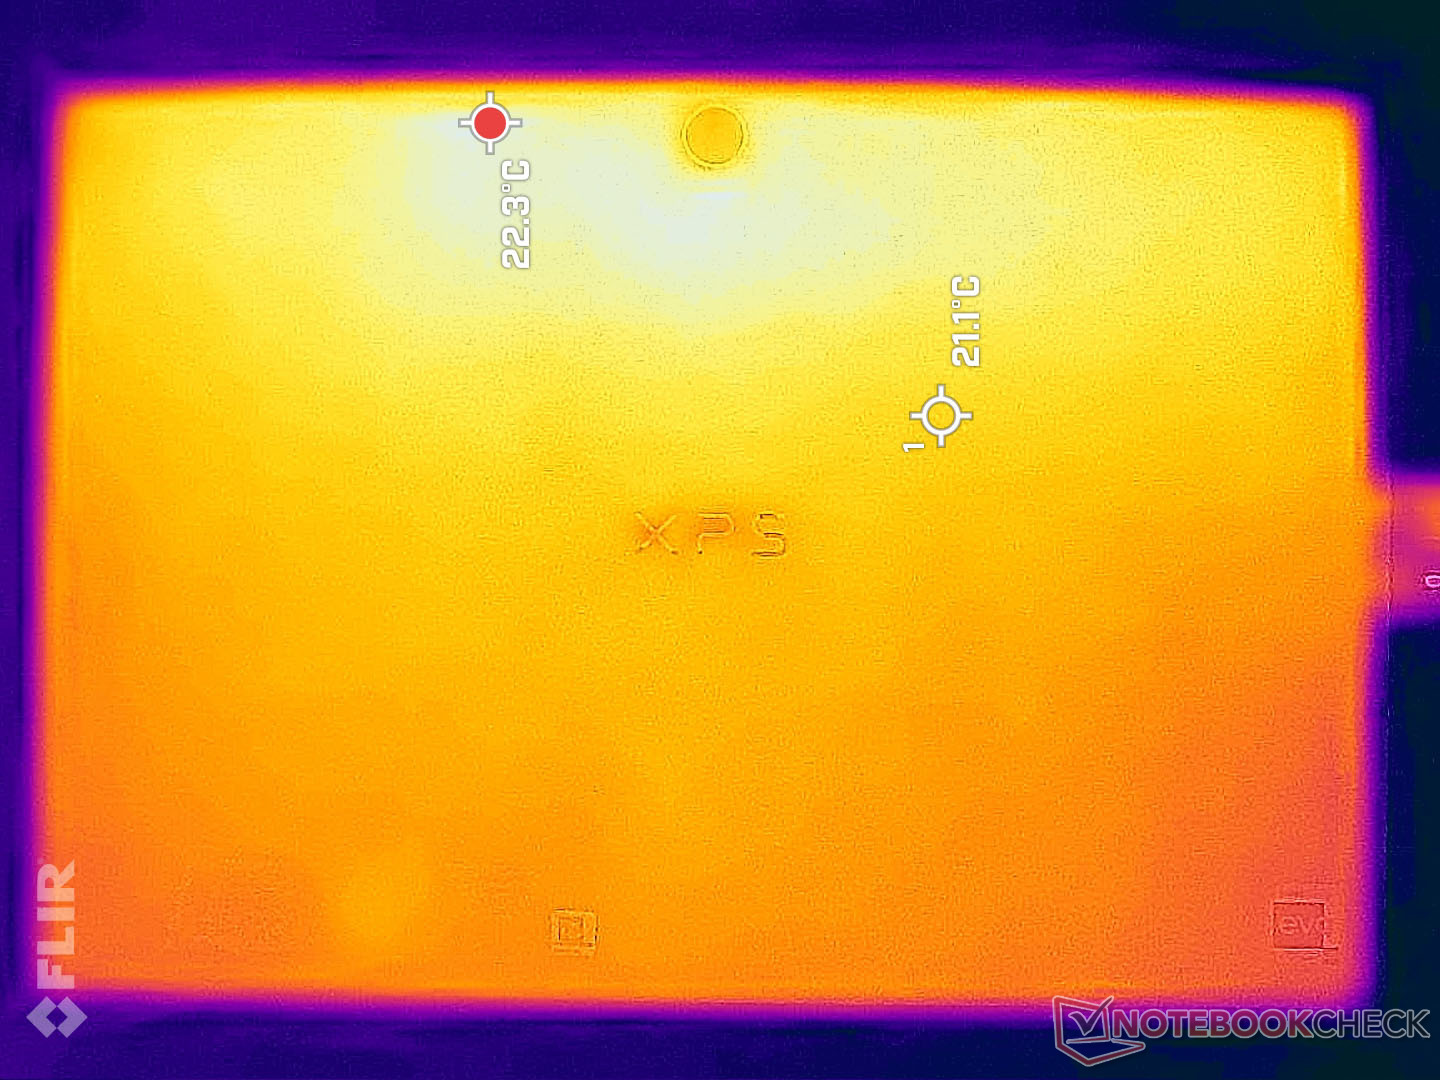
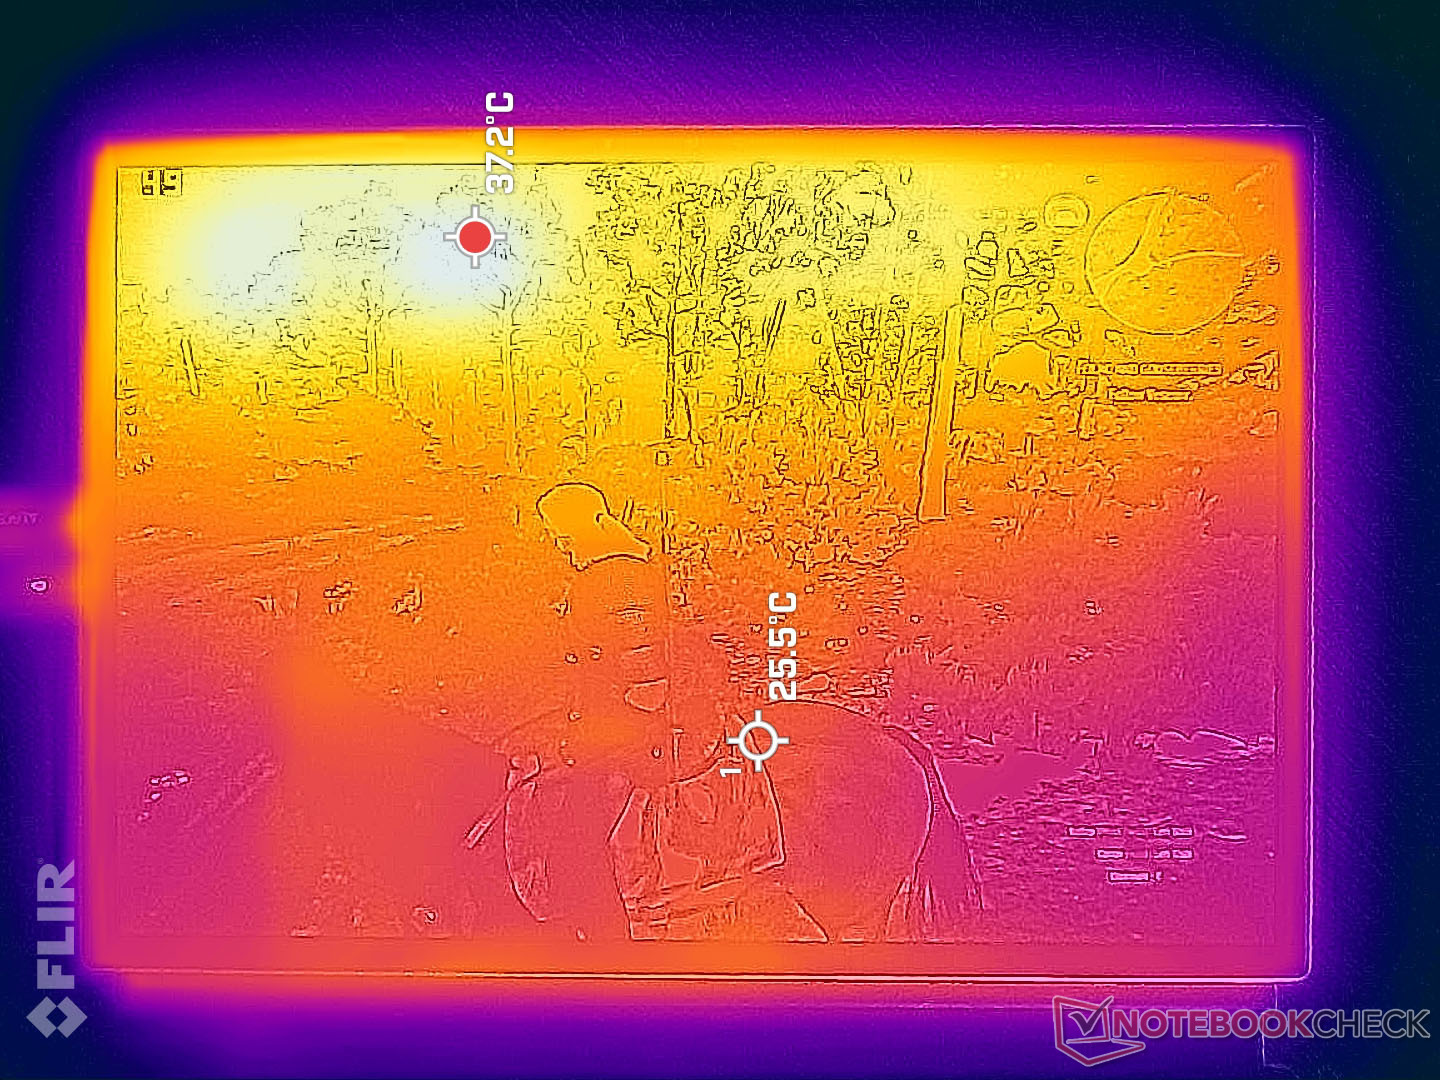
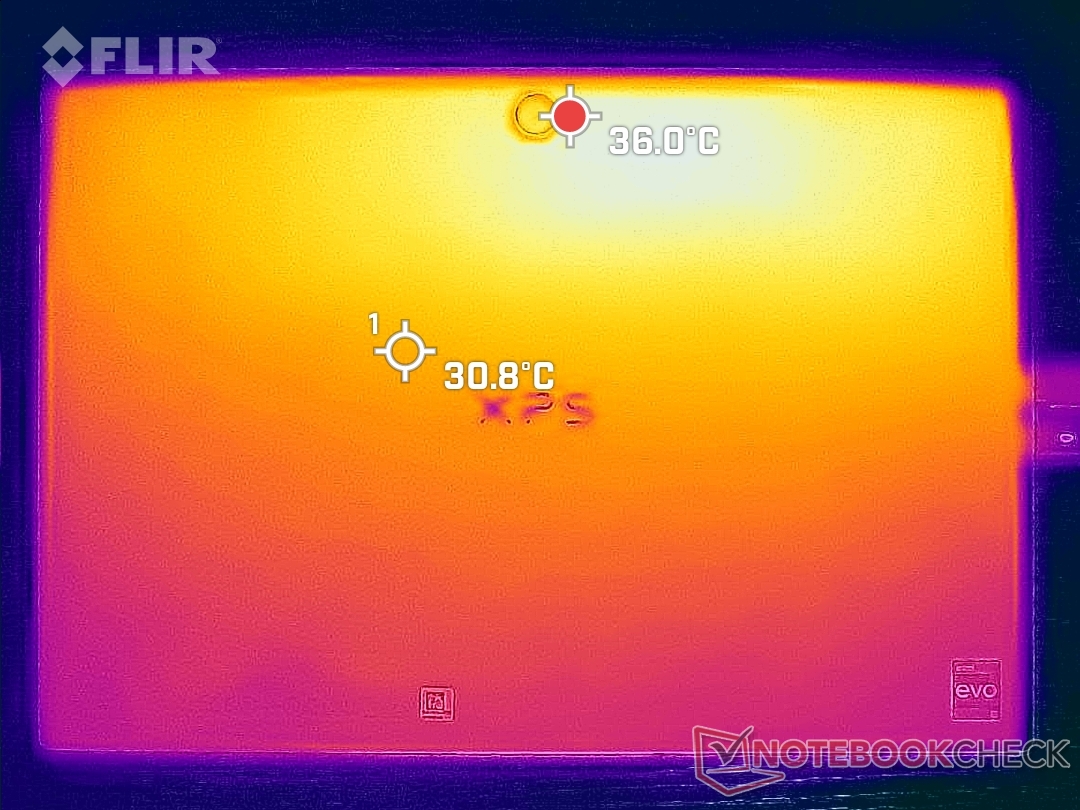
Température
Les températures de surface sont généralement plus chaudes le long de la moitié supérieure de l'unité, tandis que la moitié inférieure est nettement plus froide. Les points chauds à l'avant et à l'arrière peuvent atteindre 42 C et 39 C, respectivement, contre seulement 30 C sur les points plus frais. L'unité ne devient jamais inconfortable à tenir, quelle que soit son orientation ou son positionnement. Les températures globales sont beaucoup plus fraîches que celles que nous avons enregistrées sur la Surface Pro 8, où l'ensemble de l'avant et de l'arrière de l'appareil peut atteindre 43 C à 48 C.
(±) La température maximale du côté supérieur est de 41.8 °C / 107 F, par rapport à la moyenne de 35.4 °C / 96 F, allant de 19.6 à 60 °C pour la classe Convertible.
(+) Le fond chauffe jusqu'à un maximum de 38.2 °C / 101 F, contre une moyenne de 36.9 °C / 98 F
(+) En utilisation inactive, la température moyenne du côté supérieur est de 25.5 °C / 78 F, par rapport à la moyenne du dispositif de 30.3 °C / 87 F.
(+) Les repose-poignets et le pavé tactile sont plus froids que la température de la peau avec un maximum de 29.8 °C / 85.6 F et sont donc froids au toucher.
(±) La température moyenne de la zone de l'appui-paume de dispositifs similaires était de 28 °C / 82.4 F (-1.8 °C / #-3.2 F).
| Dell XPS 13 9315 2-in-1 Core i5-1230U Intel Core i5-1230U, Intel Iris Xe Graphics G7 80EUs | Microsoft Surface Pro 8, i7-1185G7 Intel Core i7-1185G7, Intel Iris Xe Graphics G7 96EUs | HP Spectre x360 13.5 14t-ef000 Intel Core i7-1255U, Intel Iris Xe Graphics G7 96EUs | Lenovo ThinkBook Plus Gen2 Core i5 Intel Core i5-1130G7, Intel Iris Xe Graphics G7 80EUs | Apple MacBook Air M2 Entry Apple M2, Apple M2 8-Core GPU | |
|---|---|---|---|---|---|
| Heat | -2% | 14% | -11% | 1% | |
| Maximum Upper Side * (°C) | 41.8 | 45 -8% | 36.4 13% | 42 -0% | 44.5 -6% |
| Maximum Bottom * (°C) | 38.2 | 47.2 -24% | 37 3% | 44.5 -16% | 44.4 -16% |
| Idle Upper Side * (°C) | 27.4 | 24.1 12% | 20.8 24% | 29.8 -9% | 23.9 13% |
| Idle Bottom * (°C) | 27.2 | 23.4 14% | 22.6 17% | 31.9 -17% | 23.6 13% |
* ... Moindre est la valeur, meilleures sont les performances
Test de stress
Sous l'effet de Prime95, le processeur passe à 2,7 GHz et 29 W pendant environ 20 secondes ou jusqu'à ce que la température du cœur atteigne 90 °C. Ensuite, les fréquences d'horloge et la consommation d'énergie de la carte diminuent régulièrement avant de se stabiliser à 1,4 GHz et 12 W, respectivement, afin de maintenir une température du cœur de 66 °C, beaucoup plus fraîche. Les fréquences d'horloge limitées ne sont pas inattendues si l'on considère la conception sans ventilateur et le facteur de forme de la tablette. Si l'on répète ce test sur la Surface Pro 8 refroidie par ventilateur, la consommation d'énergie du CPU sera plus élevée (26 W), mais la température centrale sera similaire (65 C).
La fréquence d'horloge du GPU se stabilise à 750 MHz lorsqu'il fonctionne sur la batterie Witcher 3 contre 1147 MHz sur le XPS 14 9320 Core i7 clamshell, beaucoup plus rapide.
Les performances du processeur ne sont pas artificiellement réduites lorsqu'il fonctionne sur batterie. les résultats de 3DMark 11 entre la batterie et le secteur sont presque identiques.
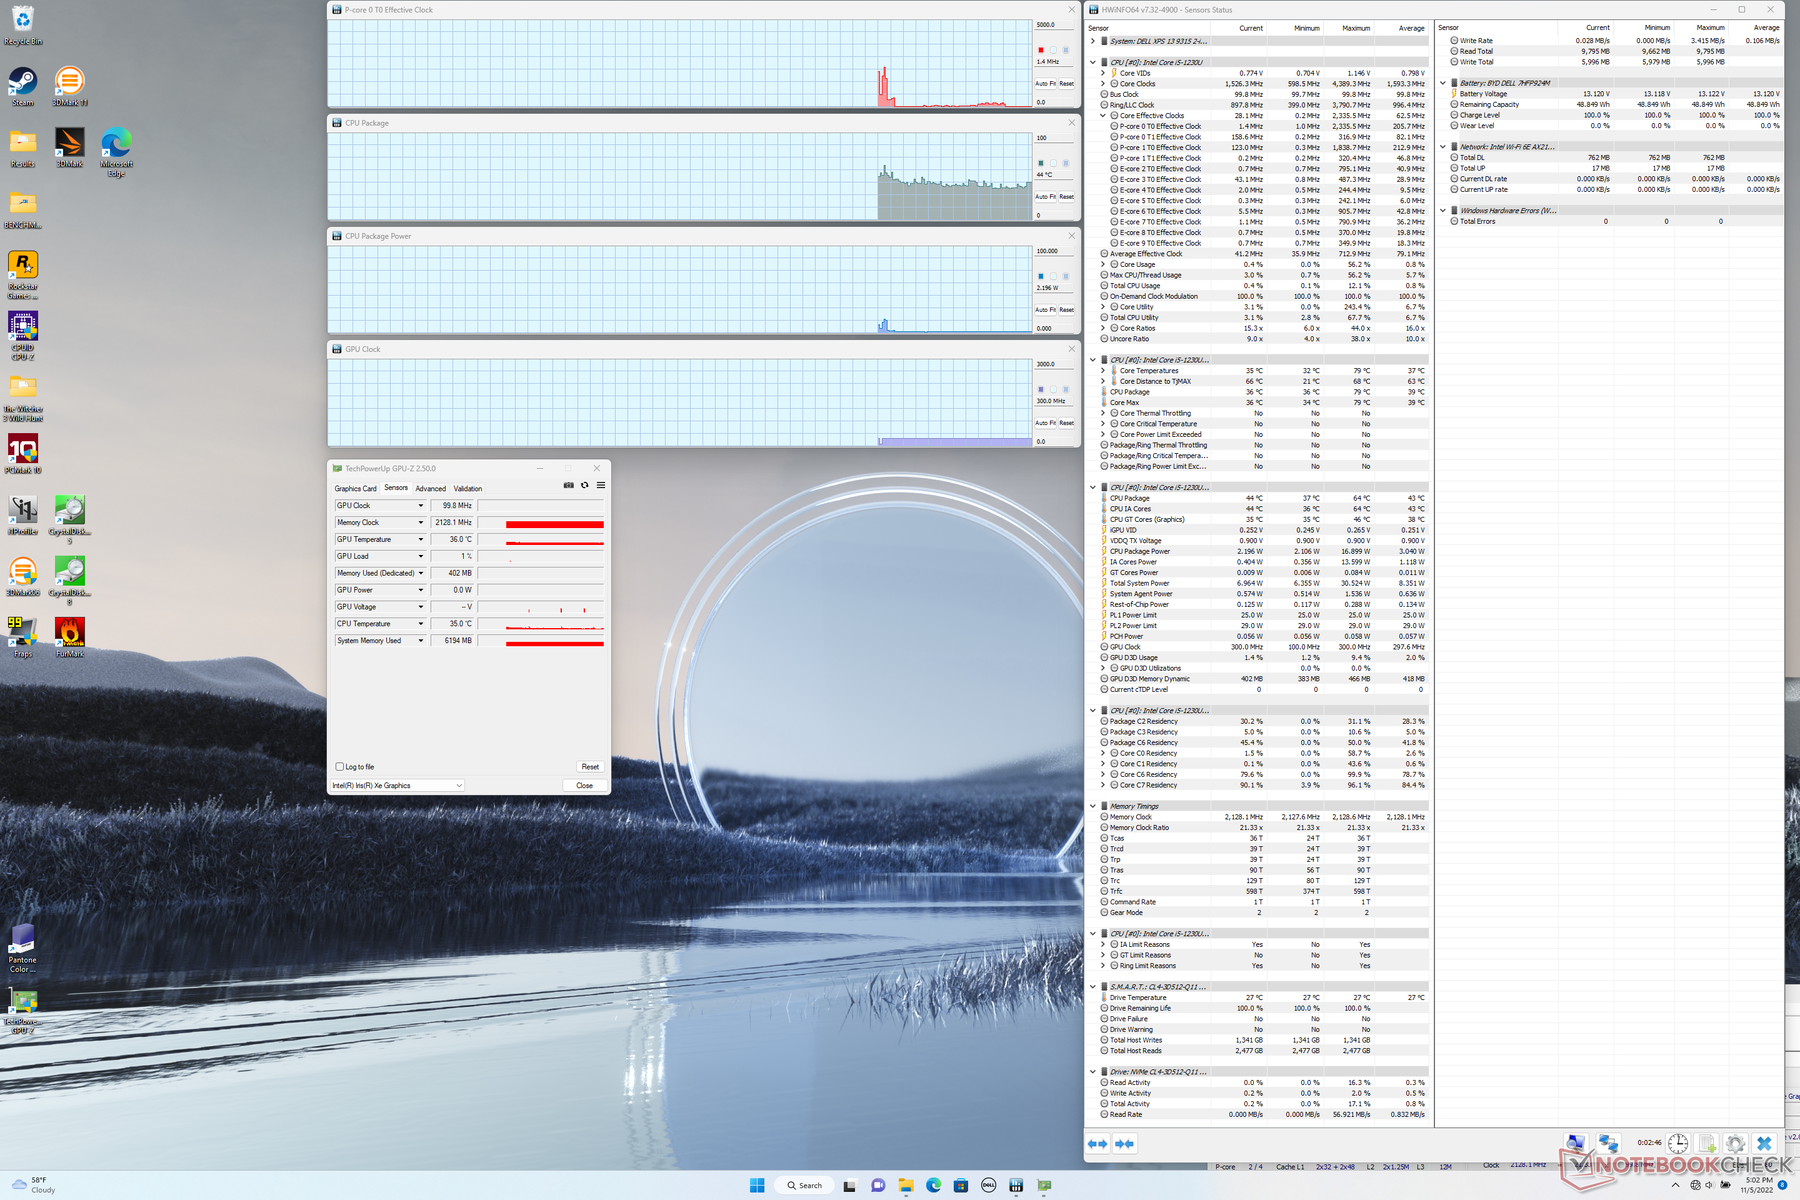
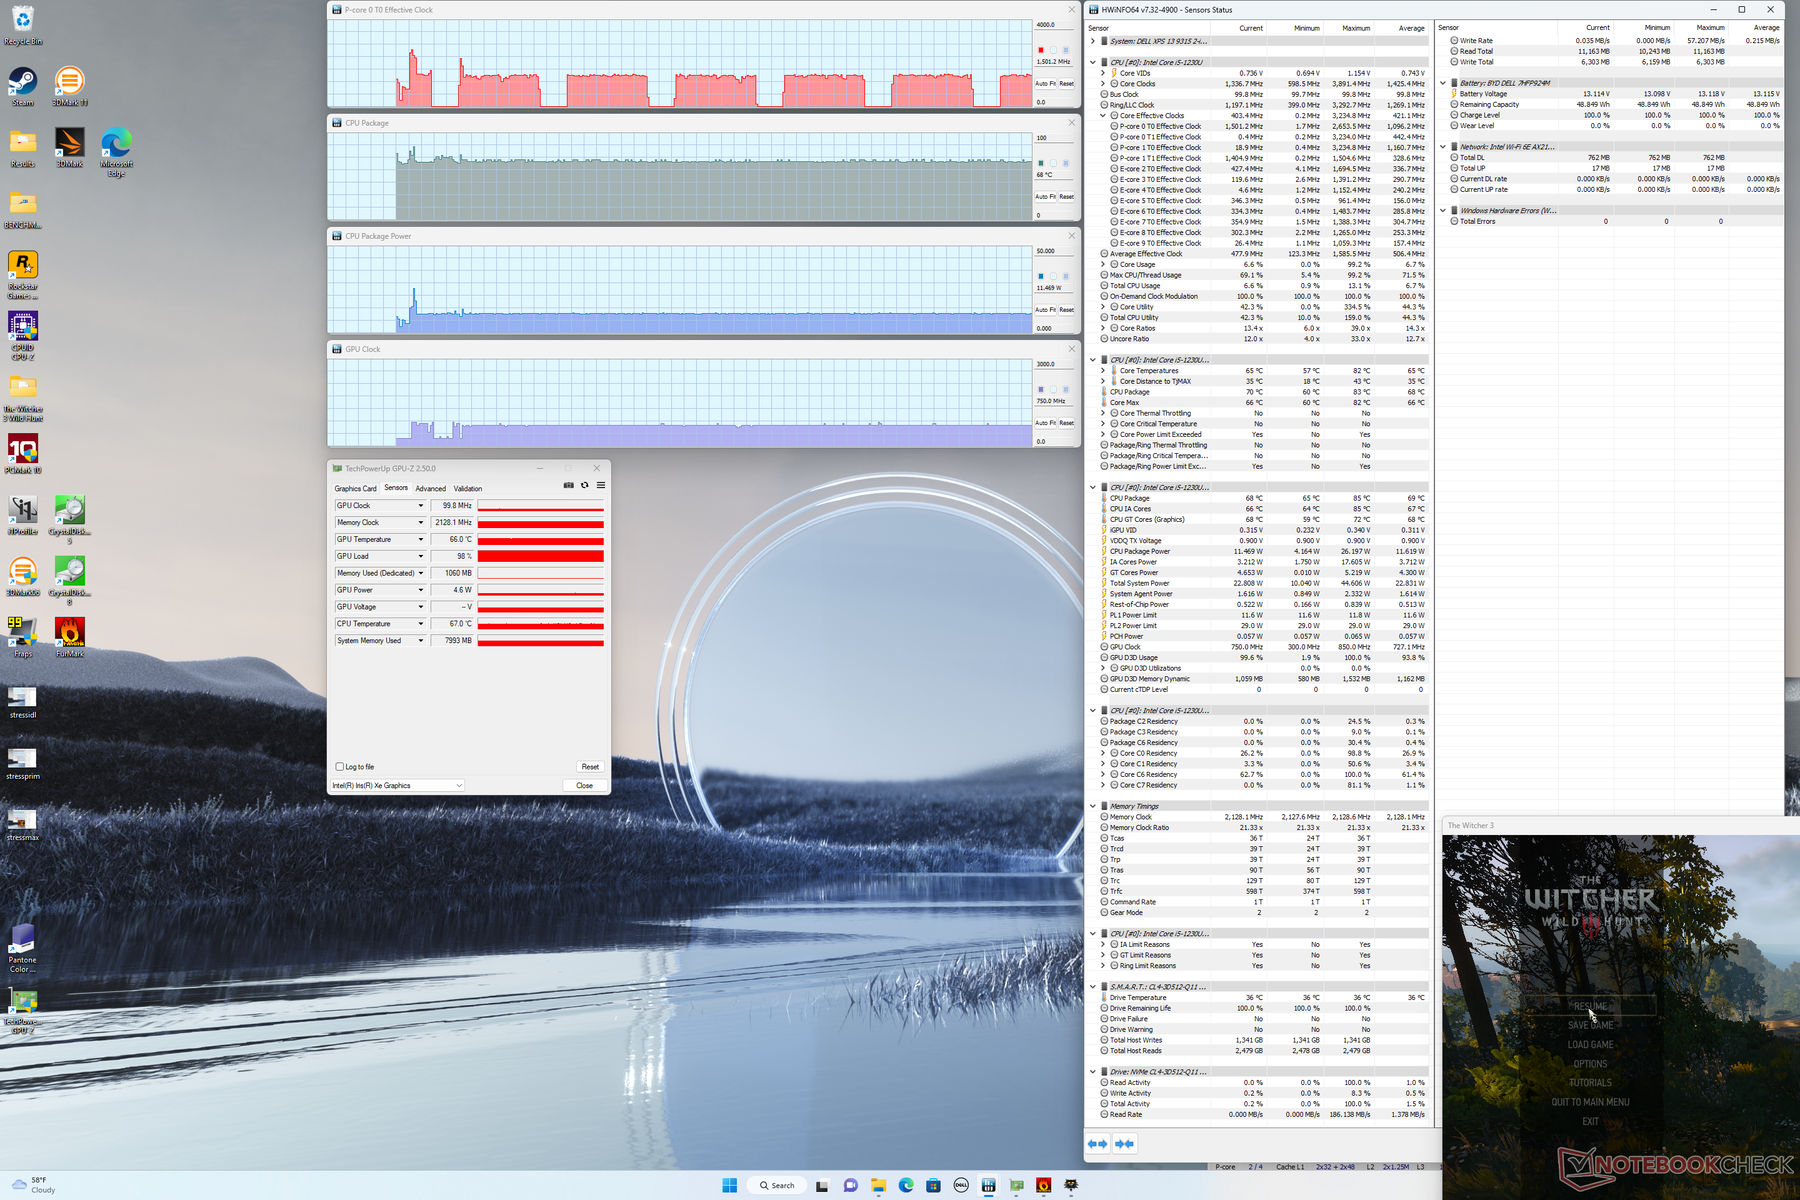
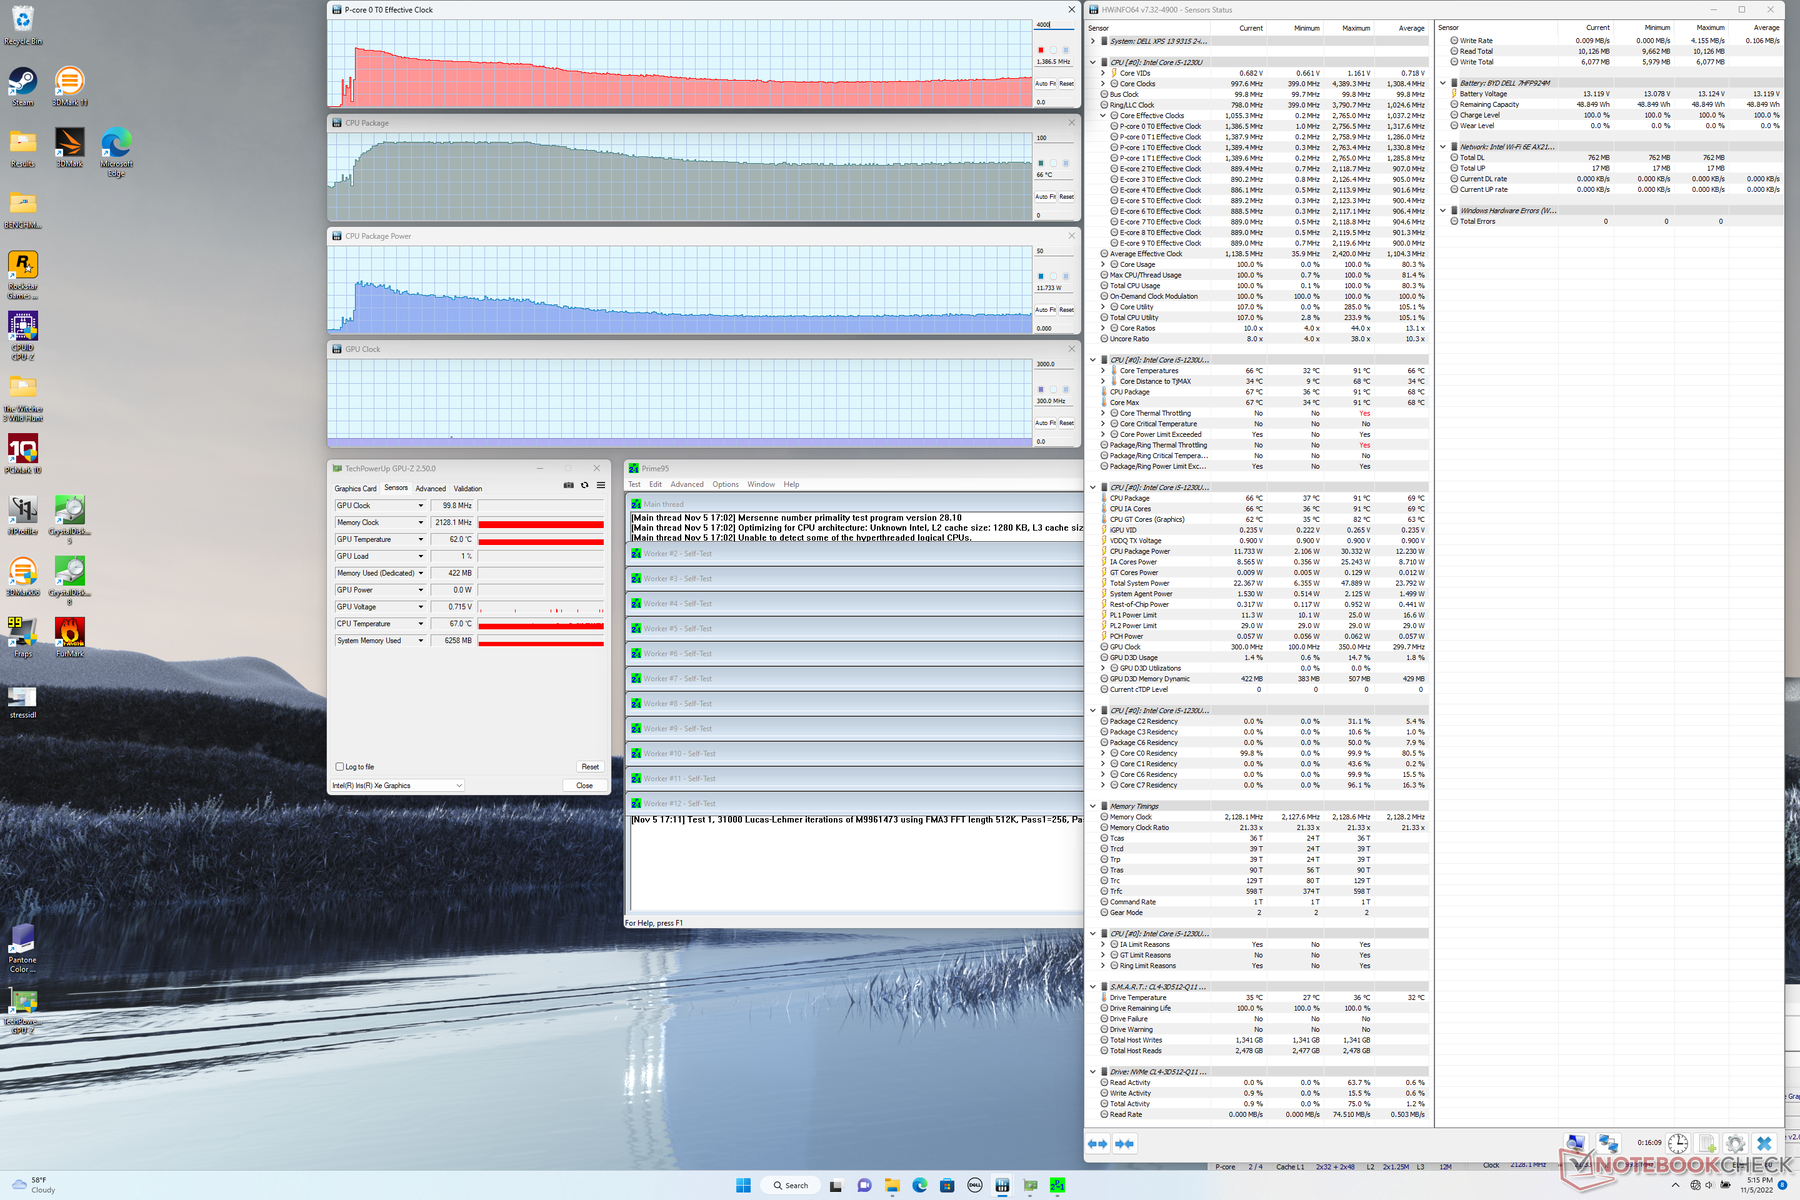
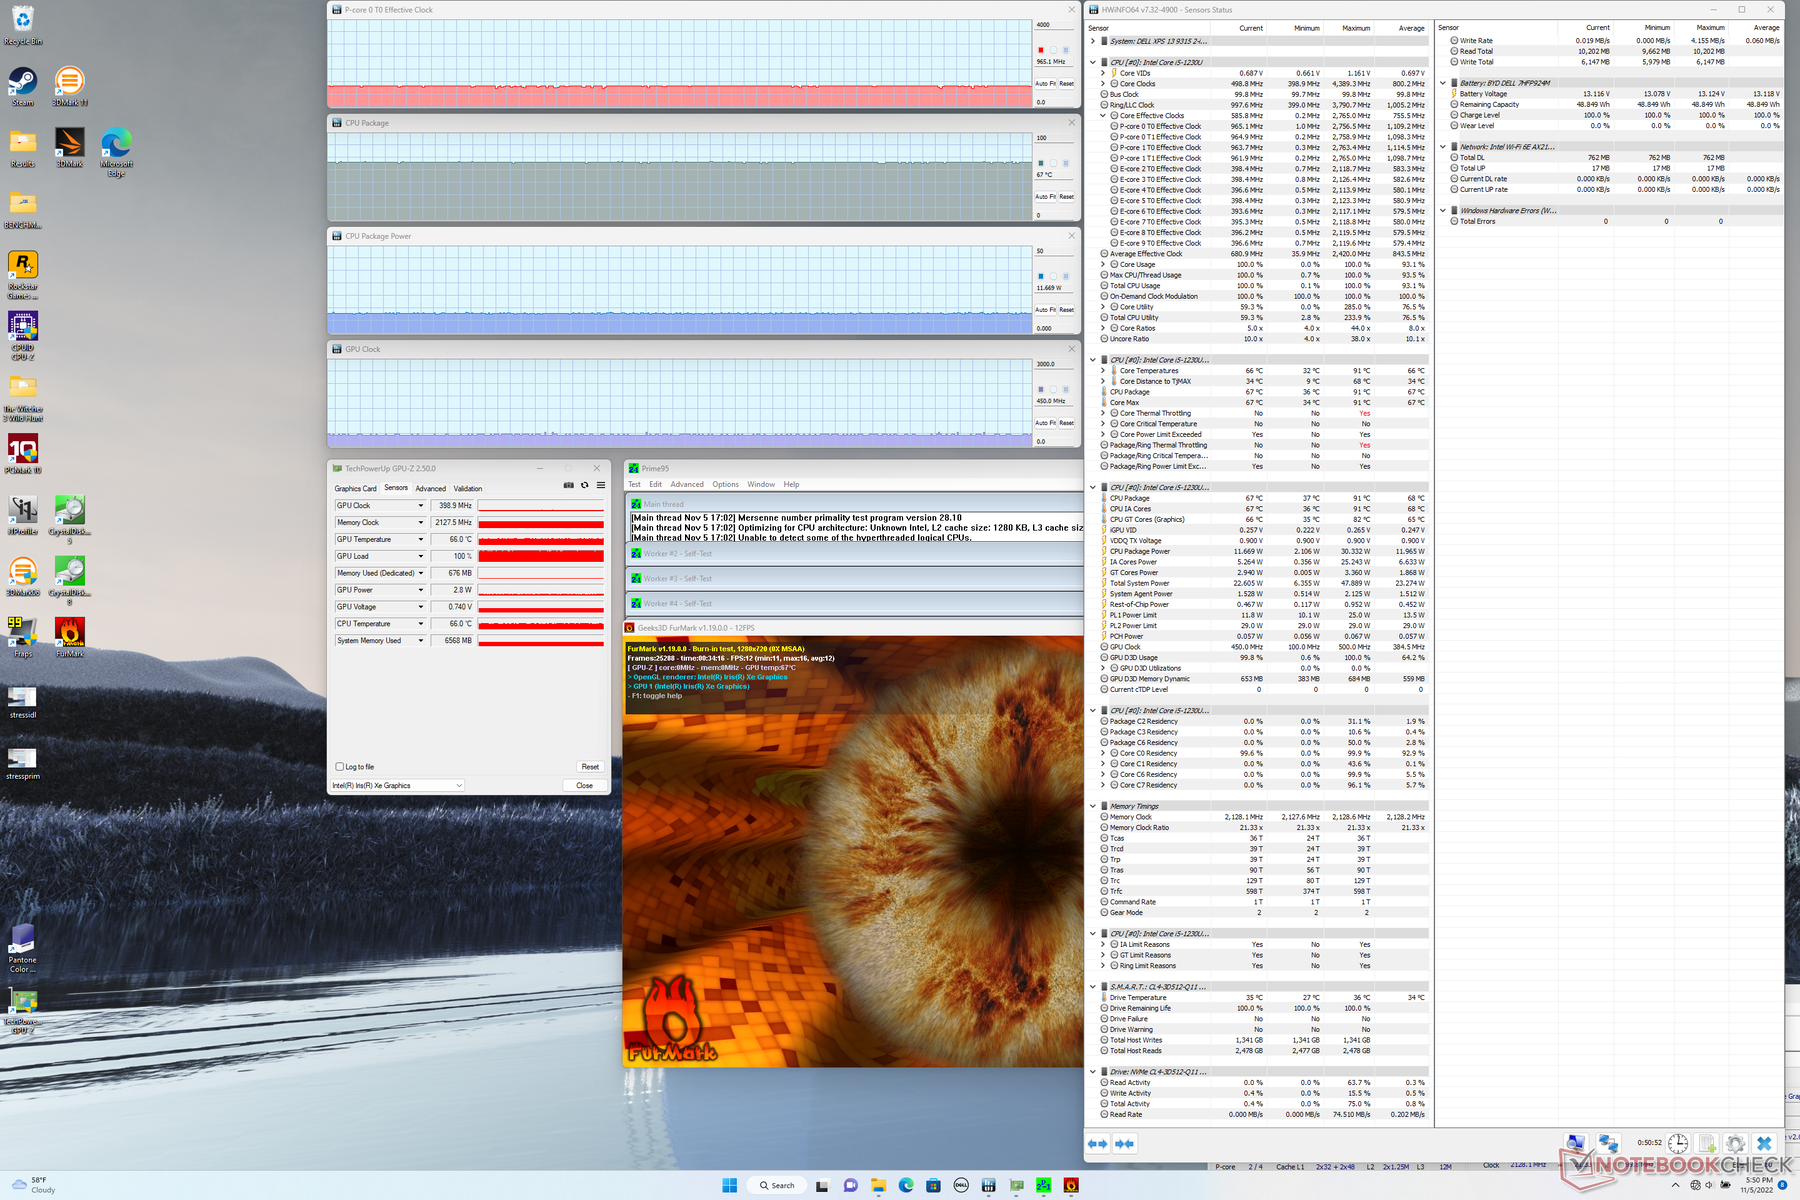
| Fréquence du CPU (GHz) | Fréquence du GPU (MHz) | Température moyenne du CPU (°C) | |
| Système au repos | -- | -- | 44 |
| Prime95 Stress | 1.4 | -- | 66 |
| Prime95 + FurMark Stress | 1.0 | 450 | 67 |
| Witcher 3 Stress | ~1.5 | 750 | 68 |
Haut-parleurs
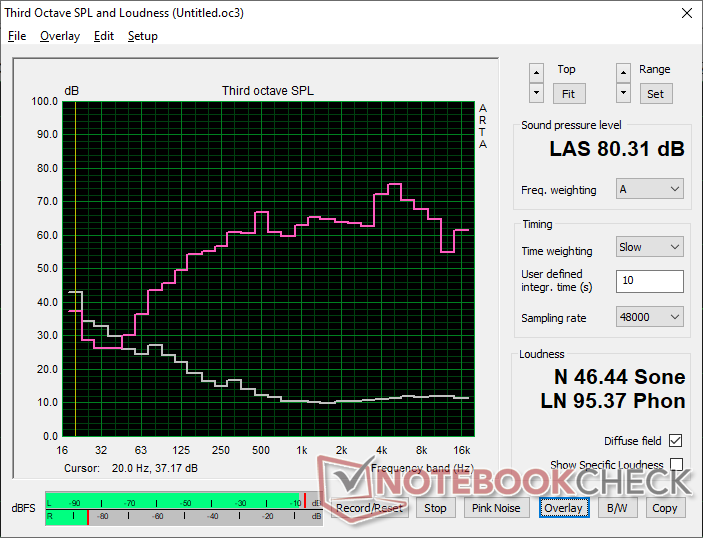
Dell XPS 13 9315 2-in-1 Core i5-1230U analyse audio
(±) | le niveau sonore du haut-parleur est moyen mais bon (80.3# dB)
Basses 100 - 315 Hz
(±) | basse réduite - en moyenne 8.9% inférieure à la médiane
(+) | les basses sont linéaires (5.7% delta à la fréquence précédente)
Médiums 400 - 2000 Hz
(+) | médiane équilibrée - seulement 2.2% de la médiane
(+) | les médiums sont linéaires (5.2% delta à la fréquence précédente)
Aiguës 2 - 16 kHz
(±) | sommets plus élevés - en moyenne 5.5% plus élevés que la médiane
(+) | les aigus sont linéaires (6.8% delta à la fréquence précédente)
Globalement 100 - 16 000 Hz
(+) | le son global est linéaire (11.9% différence à la médiane)
Par rapport à la même classe
» 11% de tous les appareils testés de cette catégorie étaient meilleurs, 3% similaires, 85% pires
» Le meilleur avait un delta de 6%, la moyenne était de 20%, le pire était de 57%.
Par rapport à tous les appareils testés
» 9% de tous les appareils testés étaient meilleurs, 2% similaires, 89% pires
» Le meilleur avait un delta de 4%, la moyenne était de 23%, le pire était de 134%.
Apple MacBook Pro 16 2021 M1 Pro analyse audio
(+) | les haut-parleurs peuvent jouer relativement fort (84.7# dB)
Basses 100 - 315 Hz
(+) | bonne basse - seulement 3.8% loin de la médiane
(+) | les basses sont linéaires (5.2% delta à la fréquence précédente)
Médiums 400 - 2000 Hz
(+) | médiane équilibrée - seulement 1.3% de la médiane
(+) | les médiums sont linéaires (2.1% delta à la fréquence précédente)
Aiguës 2 - 16 kHz
(+) | des sommets équilibrés - à seulement 1.9% de la médiane
(+) | les aigus sont linéaires (2.7% delta à la fréquence précédente)
Globalement 100 - 16 000 Hz
(+) | le son global est linéaire (4.6% différence à la médiane)
Par rapport à la même classe
» 0% de tous les appareils testés de cette catégorie étaient meilleurs, 0% similaires, 100% pires
» Le meilleur avait un delta de 5%, la moyenne était de 17%, le pire était de 45%.
Par rapport à tous les appareils testés
» 0% de tous les appareils testés étaient meilleurs, 0% similaires, 100% pires
» Le meilleur avait un delta de 4%, la moyenne était de 23%, le pire était de 134%.
Gestion de l'énergie - Très économe en énergie
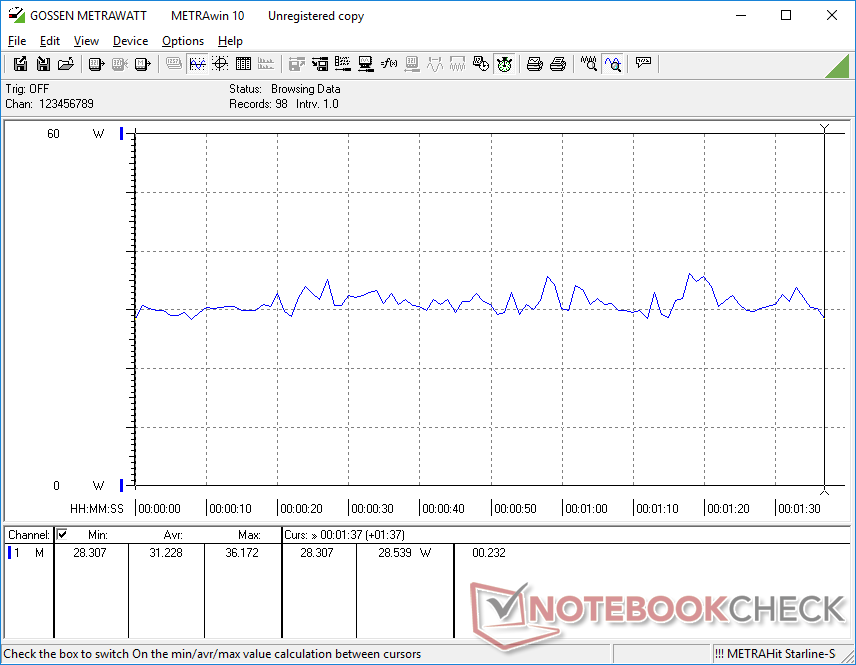
Consommation d'énergie
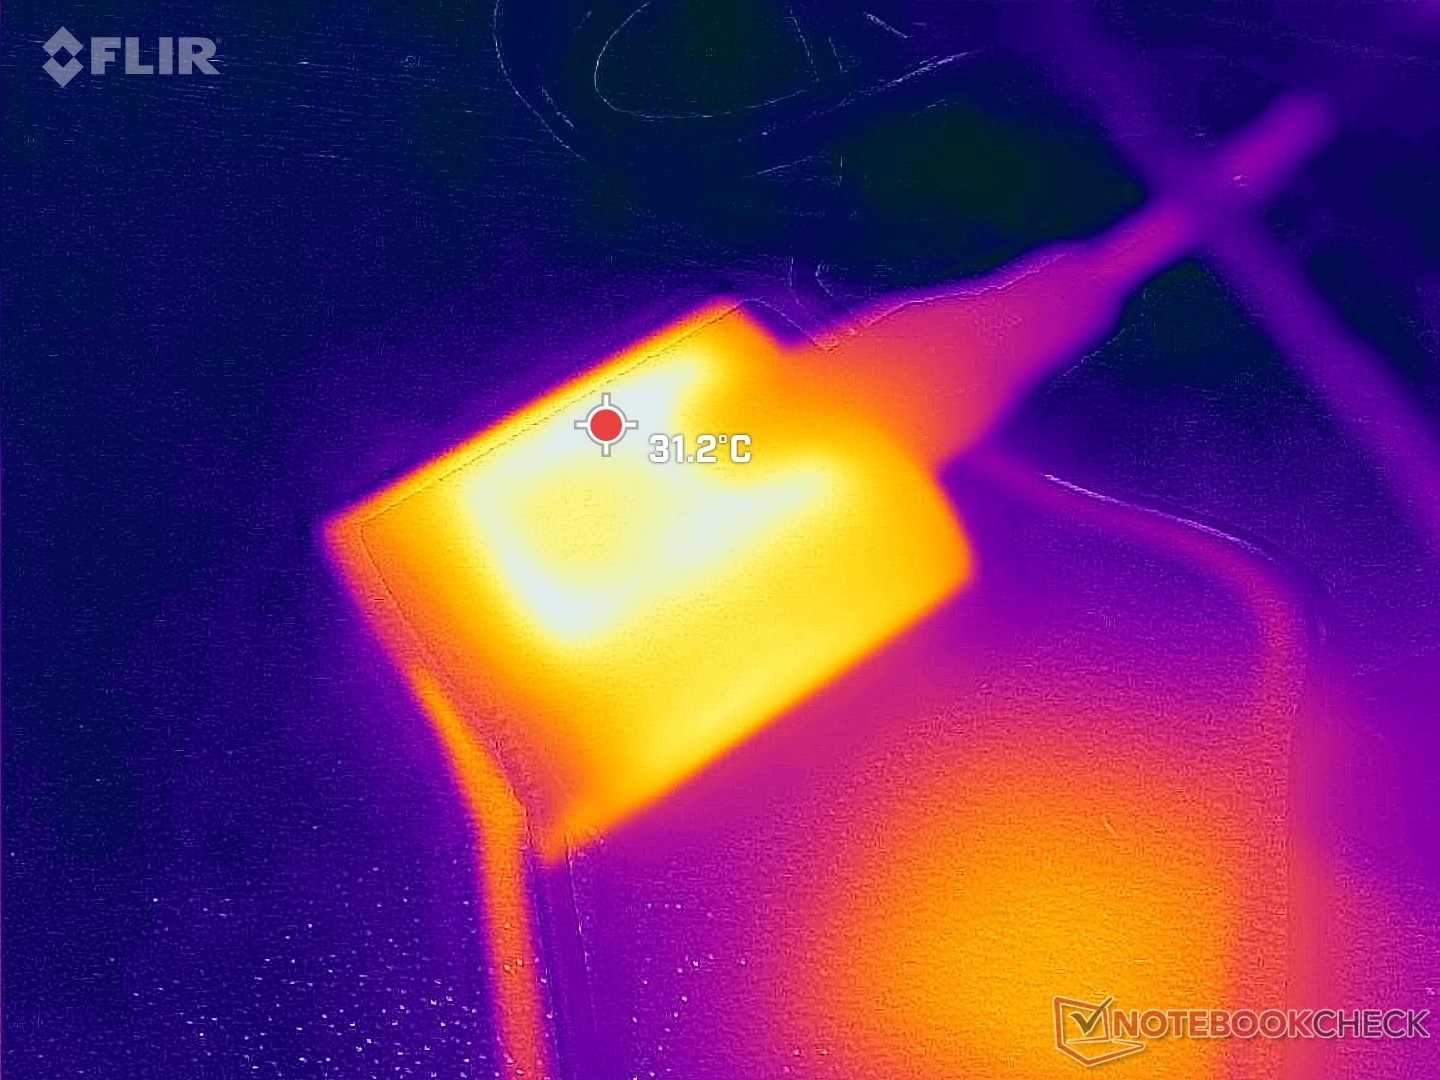
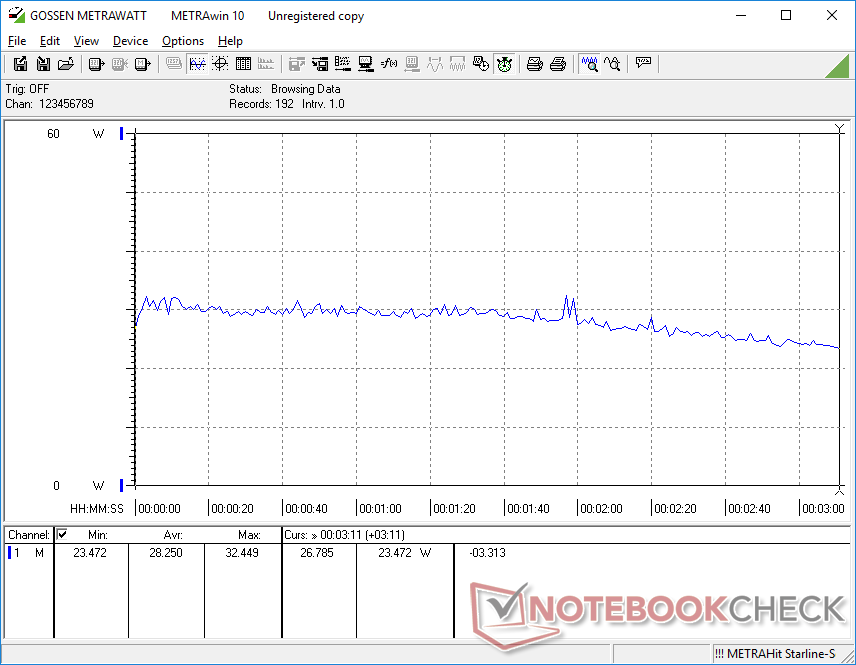
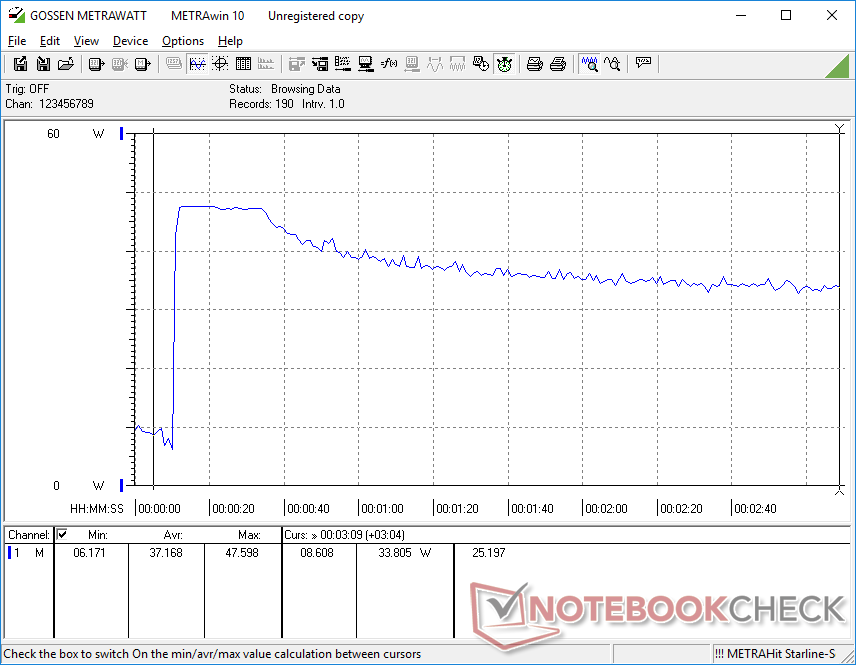
La marche au ralenti sur le bureau avec le réglage de luminosité le plus faible ne consomme que 5 W, alors que le réglage de luminosité maximale demanderait environ 3 W de plus. Les résultats sont très proches de ceux que nous avons enregistrés sur le ThinkBook Plus Gen 2 équipé du même processeur Core i5-1230U, sous des charges similaires. Le processeur Core i7 de la Surface Pro 8 consomme plus de 50 % d'énergie en cas de charge élevée, car il offre des performances graphiques beaucoup plus rapides que le processeur Core i5 de Dell
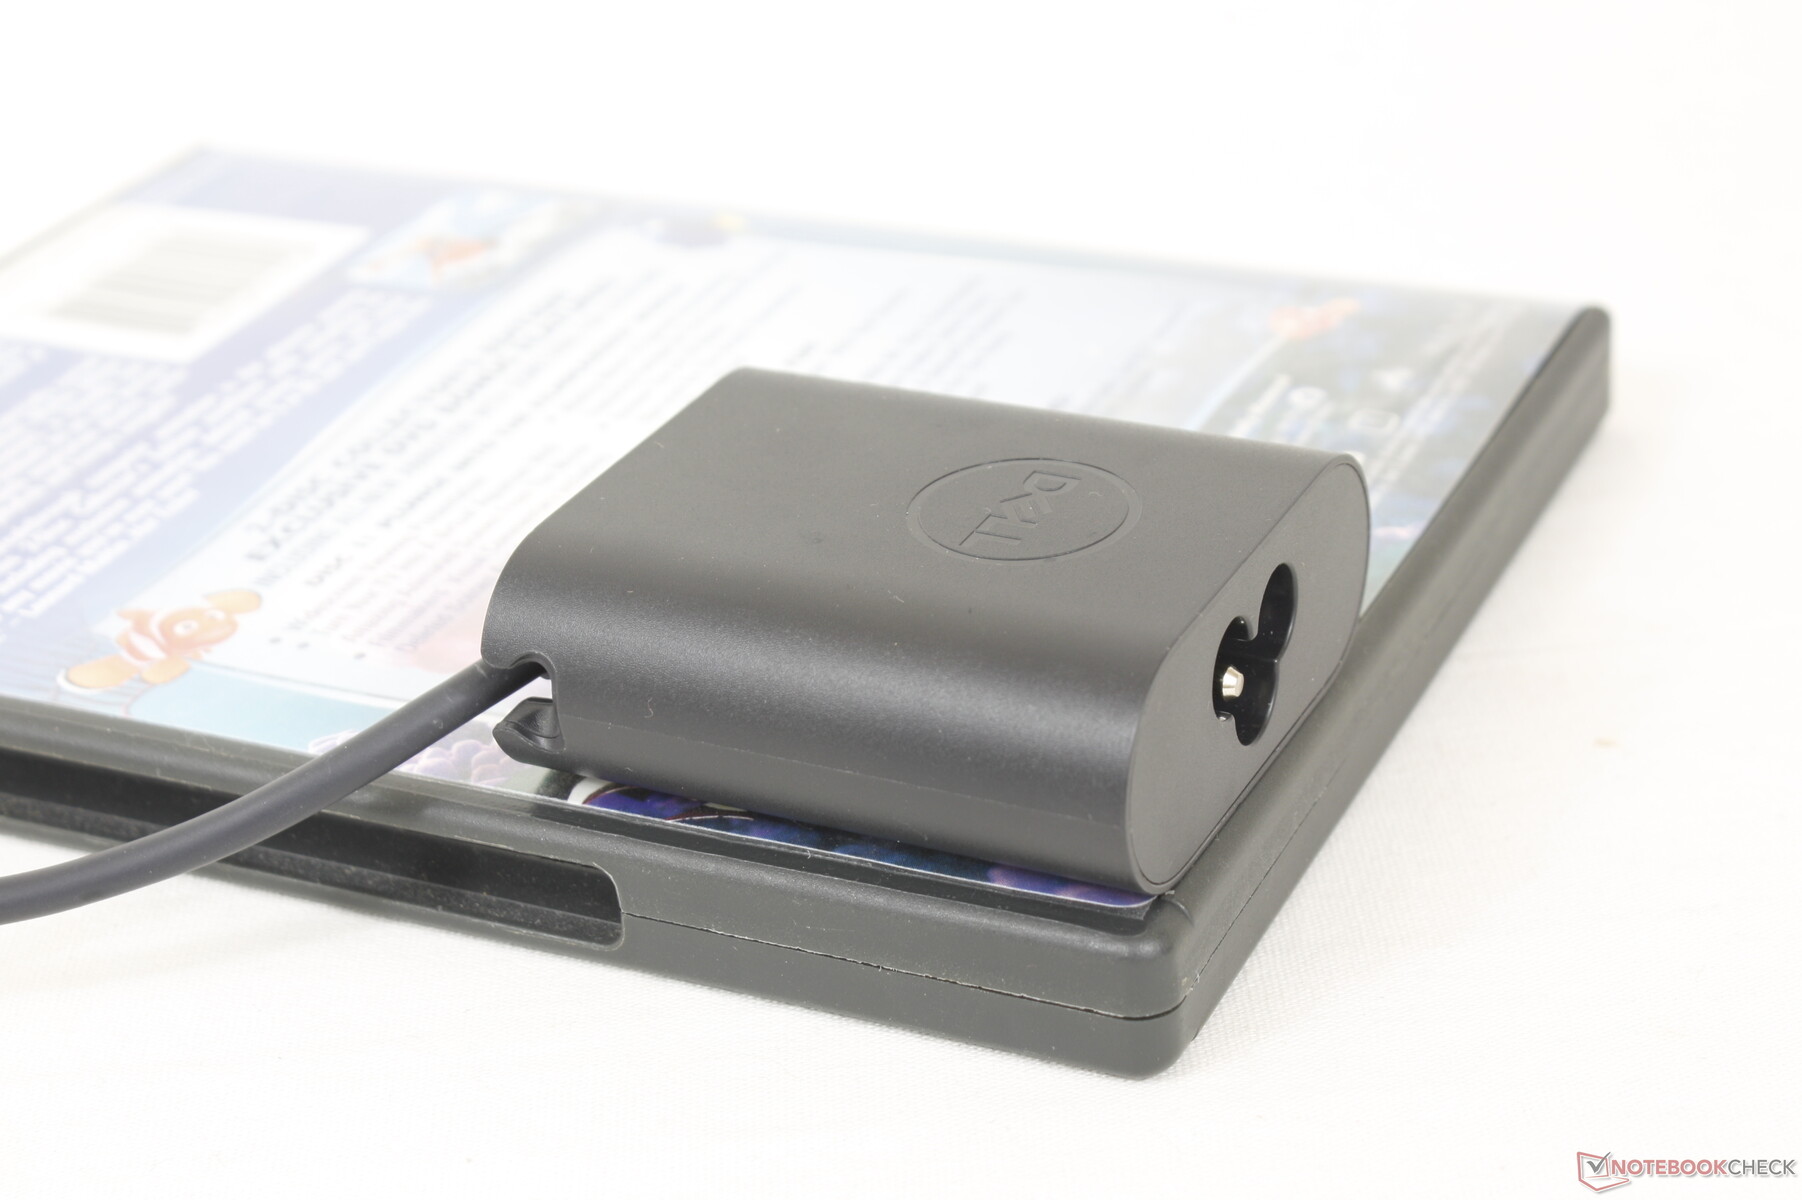
Nous avons pu enregistrer une consommation maximale de 48 W sur le petit adaptateur secteur USB-C de 45 W (~6 x 5,5 x 2,2 cm). Ce taux n'est que temporaire comme le montrent nos graphiques ci-dessous puisque la fonction Turbo Boost du CPU est limitée.

| Éteint/en veille | |
| Au repos | |
| Fortement sollicité |
|
Légende:
min: | |
| Dell XPS 13 9315 2-in-1 Core i5-1230U i5-1230U, Iris Xe G7 80EUs, , IPS, 2880x1920, 13" | Dell XPS 13 Plus 9320 i7-1280P OLED i7-1280P, Iris Xe G7 96EUs, WDC PC SN810 512GB, OLED, 3456x2160, 13.4" | Microsoft Surface Pro 8, i7-1185G7 i7-1185G7, Iris Xe G7 96EUs, Toshiba KBG40ZNS256G NVMe, IPS, 2880x1920, 13" | HP Spectre x360 13.5 14t-ef000 i7-1255U, Iris Xe G7 96EUs, Micron 3400 1TB MTFDKBA1T0TFH, OLED, 3000x2000, 13.5" | Lenovo ThinkBook Plus Gen2 Core i5 i5-1130G7, Iris Xe G7 80EUs, Samsung PM9A1 MZVL2512HCJQ, IPS, E-Ink, 2560x1600, 13.3" | Apple MacBook Air M2 Entry M2, M2 8-Core GPU, Apple SSD AP0256Z, IPS, 2560x1664, 13.6" | |
|---|---|---|---|---|---|---|
| Power Consumption | -46% | -23% | -19% | -5% | 13% | |
| Idle Minimum * (Watt) | 5.2 | 6.5 -25% | 3.9 25% | 4 23% | 5 4% | 1.87 64% |
| Idle Average * (Watt) | 7.9 | 7.8 1% | 8.5 -8% | 4.9 38% | 7.9 -0% | 9.2 -16% |
| Idle Maximum * (Watt) | 8 | 13 -63% | 9.8 -23% | 12.5 -56% | 8.3 -4% | 9.3 -16% |
| Load Average * (Watt) | 31.2 | 56.6 -81% | 48 -54% | 48.1 -54% | 30.9 1% | 28.5 9% |
| Witcher 3 ultra * (Watt) | 28.2 | 49.2 -74% | 41.5 -47% | 35.8 -27% | 25.2 11% | 27.4 3% |
| Load Maximum * (Watt) | 47.6 | 63 -32% | 63 -32% | 65.2 -37% | 66.8 -40% | 31 35% |
* ... Moindre est la valeur, meilleures sont les performances
Power Consumption Witcher 3 / Stresstest
Power Consumption external Monitor
Autonomie de la batterie
La batterie de 49,5 Wh est à peine plus petite que les batteries de 51,5 Wh et 53 Wh de la Surface Pro 8 et du ThinkBook Plus Gen 2, respectivement. Les durées d'exécution sont néanmoins excellentes avec près de 9 heures d'utilisation du WLAN dans le monde réel, contre ~8 heures sur les alternatives Microsoft et Lenovo susmentionnées.
Le chargement d'une batterie vide à sa pleine capacité prend environ 2 à 2,5 heures.
| Dell XPS 13 9315 2-in-1 Core i5-1230U i5-1230U, Iris Xe G7 80EUs, 49.5 Wh | Dell XPS 13 Plus 9320 i7-1280P OLED i7-1280P, Iris Xe G7 96EUs, 55 Wh | Microsoft Surface Pro 8, i7-1185G7 i7-1185G7, Iris Xe G7 96EUs, 51.5 Wh | HP Spectre x360 13.5 14t-ef000 i7-1255U, Iris Xe G7 96EUs, 66 Wh | Lenovo ThinkBook Plus Gen2 Core i5 i5-1130G7, Iris Xe G7 80EUs, 53 Wh | Apple MacBook Air M2 Entry M2, M2 8-Core GPU, 52.6 Wh | |
|---|---|---|---|---|---|---|
| Autonomie de la batterie | -36% | -28% | 16% | -16% | 45% | |
| Reader / Idle (h) | 13.6 | 20.4 50% | ||||
| WiFi v1.3 (h) | 9 | 5.8 -36% | 7.6 -16% | 8 -11% | 7.6 -16% | 15.2 69% |
| Load (h) | 2 | 1.2 -40% | 2.2 10% | 2.4 20% | ||
| H.264 (h) | 10.1 | 16.5 |
Points positifs
Points négatifs
Verdict - XPS ou Surface Pro ?
Le XPS 13 9315 2-en-1 est le meilleur concurrent à ce jour de la Microsoft Surface Pro de Microsoft. Certains aspects sont meilleurs que le modèle de Microsoft tandis que d'autres sont moins bons. La base du clavier détachable, notamment, offre des touches de clavier plus fermes, un pavé tactile plus grand et une meilleure protection contre les rayures. La tablette elle-même est également plus fine et plus légère que la Surface Pro 8 sans qu'il soit nécessaire de faire des coupes drastiques dans les performances du processeur. En fait, le Core i5-1230U de la Dell a des performances similaires à celles du Core i7-1185G7 de la Surface Pro 8, malgré la conception sans ventilateur de la Dell. Le fabricant promet également des SKUs eSIM 5G dans un avenir proche, alors qu'aucune option de ce type n'existe pour la Surface Pro à l'heure où nous écrivons ces lignes
Il y a encore une poignée de raisons de considérer le modèle de Microsoft plutôt que celui de Dell. Tout d'abord, la Surface Pro 8 intègre une prise audio de 3,5 mm que certains utilisateurs pourraient apprécier. Les performances graphiques sont également beaucoup plus rapides, car le GPU du Dell a tendance à être moins performant, même par rapport à d'autres ordinateurs portables dotés de graphismes intégrés similaires. L'absence d'options d'affichage à 120 Hz est peut-être la plus notable, car elle rend la tablette Dell plus maladroite et moins réactive. La limitation à 60 Hz n'était pas un gros problème dans le passé, mais elle devient plus handicapante maintenant que les ordinateurs portables, les écrans et les smartphones à taux de rafraîchissement élevé sont monnaie courante
Une Surface Pro sans le nom Surface Pro. Le XPS 13 9315 2-en-1 surpasse le Type Cover de la Surface Pro de Microsoft en termes de confort, mais l'écran tactile 60 Hz semble dépassé par rapport à la Surface Pro 8 120 Hz.
Si vous avez l'intention de taper et d'envoyer beaucoup d'e-mails, alors le XPS 13 9315 2-en-1 est peut-être la meilleure option pour son dock clavier supérieur. Si vous avez l'intention d'utiliser l'écran tactile en mode tablette plus fréquemment, alors le taux de rafraîchissement plus élevé et la réactivité de l'écran de la Surface Pro sont difficiles à laisser passer. Si Dell peut offrir des options d'affichage supplémentaires à l'avenir, alors sa série XPS 13 9315 2-en-1 peut être une recommandation beaucoup plus facile pour plus de scénarios d'utilisation.
Prix et disponibilité
Le XPS 13 9315 2-en-1 sera largement disponible le 14 novembre. Des détaillants tels qu'Amazon ont déjà mis en ligne certaines UGS en pré-commande. Le meilleur endroit pour commander à l'heure actuelle est Dell, où le prix de commence à 1000 USD sans dock clavier ni stylet.
Dell XPS 13 9315 2-in-1 Core i5-1230U
- 11/08/2022 v7 (old)
Allen Ngo
Price comparison

