Test du LG Gram 14T90P : le challenger des Lenovo Yoga et HP Spectre
Le LG Gram 14T90P 16:10 succède à l'ancienne génération 16:9 Gram 14T90N en introduisant des options de processeurs Intel 11e génération plus rapides et un nouveau design de châssis pour être un rafraîchissement complet de la série. Comme tous les autres modèles Gram, le Gram 14T90P vise à maximiser la qualité d'affichage tout en minimisant le poids pour être l'un des ordinateurs portables Core U-series les plus légers de sa catégorie.
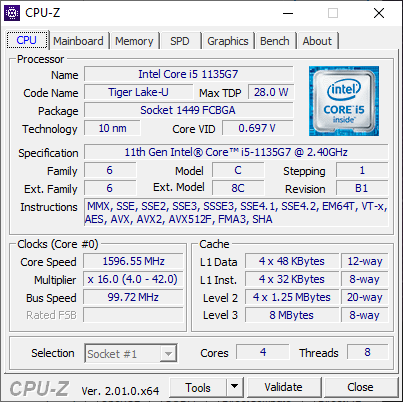
L'unité que nous avons examinée a été configurée avec le processeur Core i5-1135G7, 16 Go de RAM soudée, 512 Go de SSD NVMe et un écran tactile IPS 1200p de 14 pouces pour un prix de détail d'environ 1000 à 1100 dollars américains. D'autres UGS sont disponibles avec le Core i7-1165G7 à la place, mais toutes sont équipées du même panneau 1200p.
Les concurrents directs dans cet espace comprennent d'autres convertibles haut de gamme de type subnotebook comme le Asus Zenbook Flip 14, HP Spectre x360 14, Dell XPS 13 2-en-1, MSI Summit E13 Flipou Lenovo Yoga 9 14.
Plus de commentaires sur LG :
Comparaison avec les concurrents potentiels
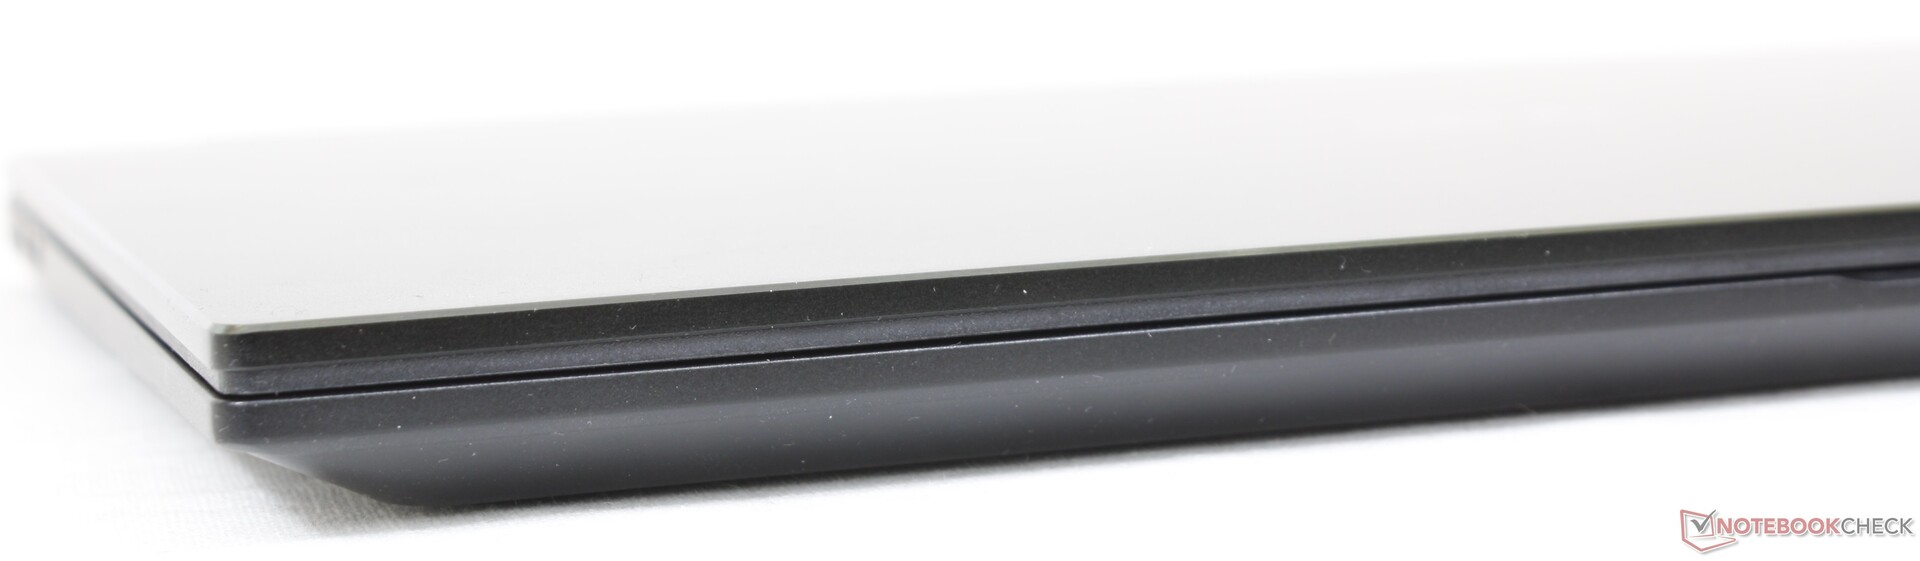
Boîtier - Une amélioration significative par rapport à l'ancienne conception
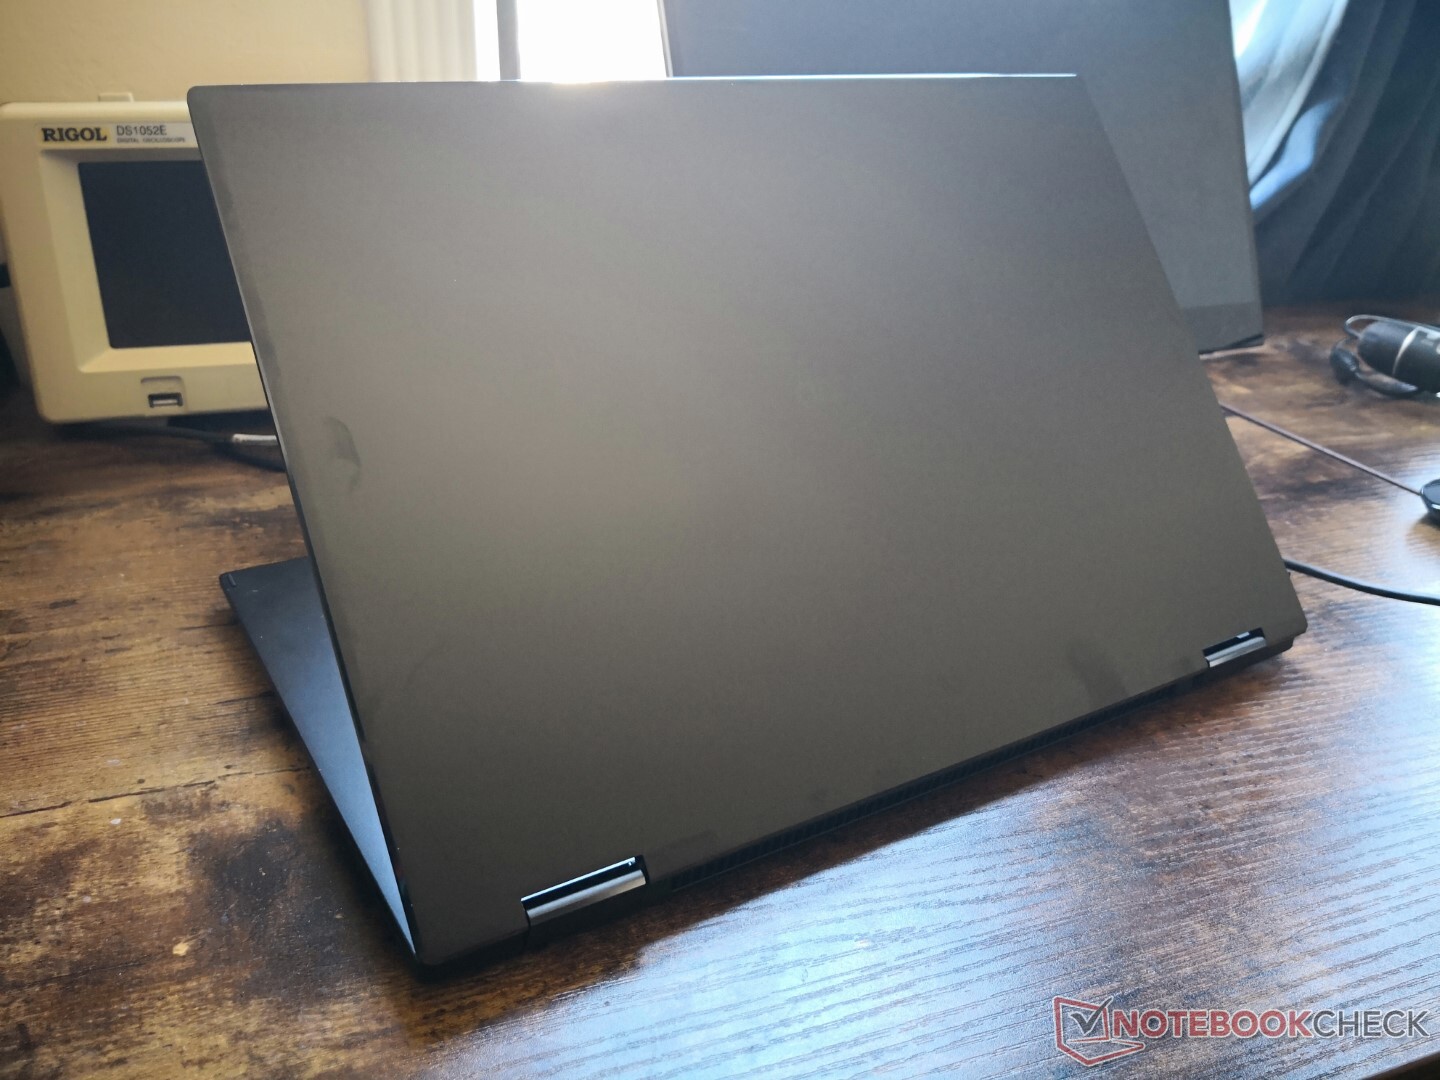
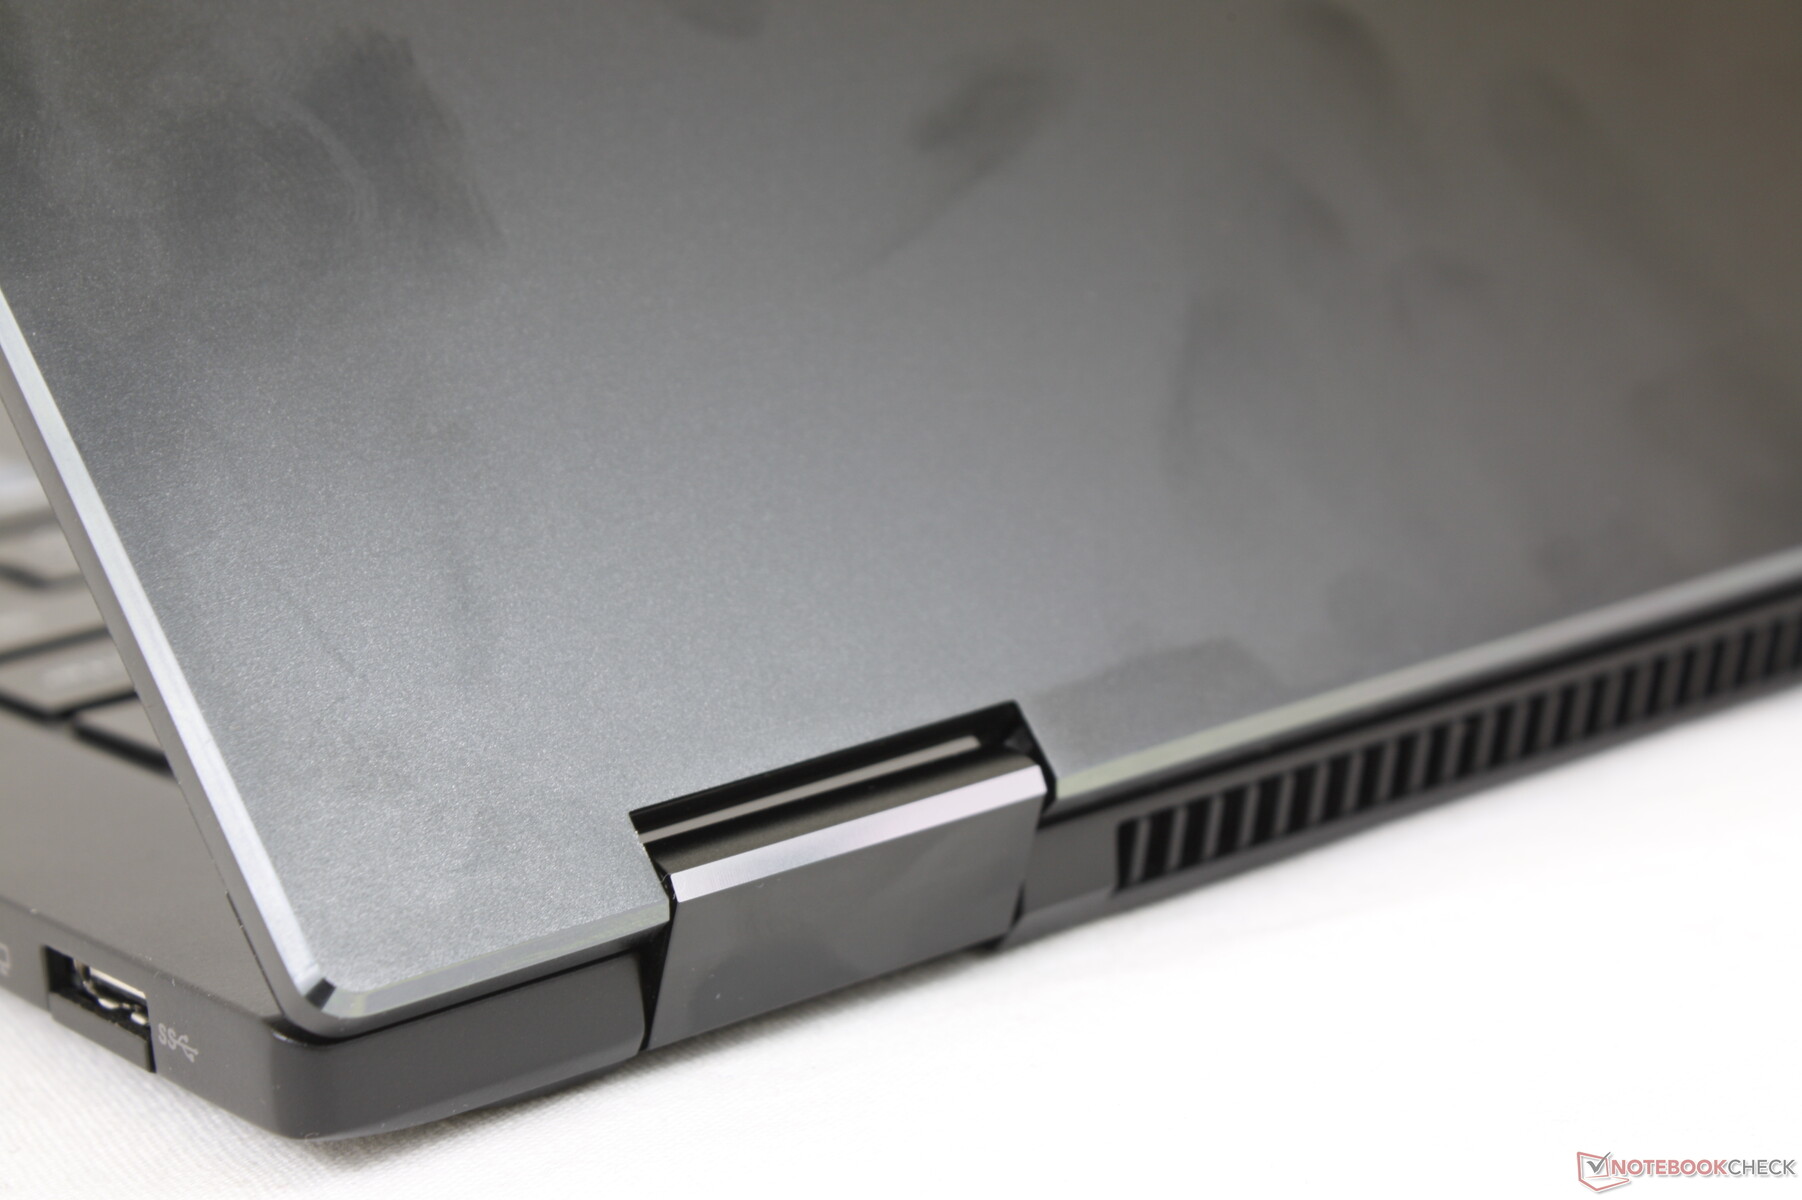
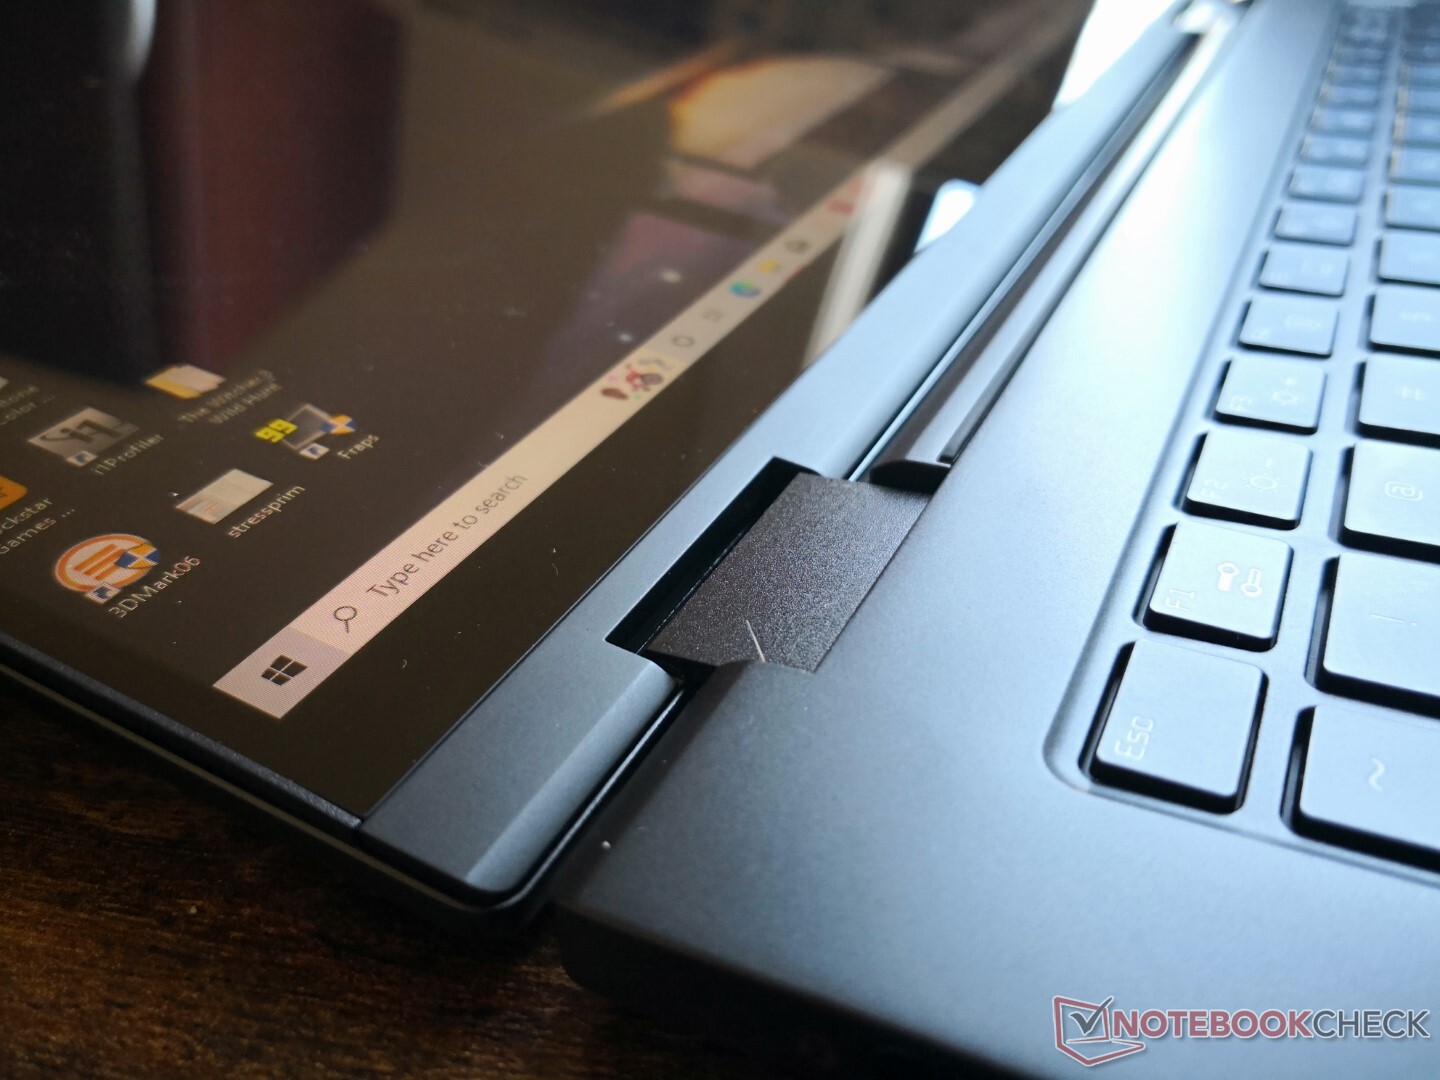
La conception du châssis est essentiellement une version miniaturisée du récent Gram 16 pouces 16T90P. Il n'est peut-être pas aussi frappant visuellement que les séries Dell XPS, HP Spectre ou Asus Zenbook, mais il compense en étant à la fois plus léger et certifié selon les spécifications MIL-STD 810G. Sa base et son couvercle sont également plus fermes que ceux de l'ancien Gram 14T90N, avec un minimum de torsion et aucun grincement, ce qui le rend moins susceptible de fléchir ou d'être endommagé que le Gram 14T90N Samsung Galaxy Book Pro 360 series.
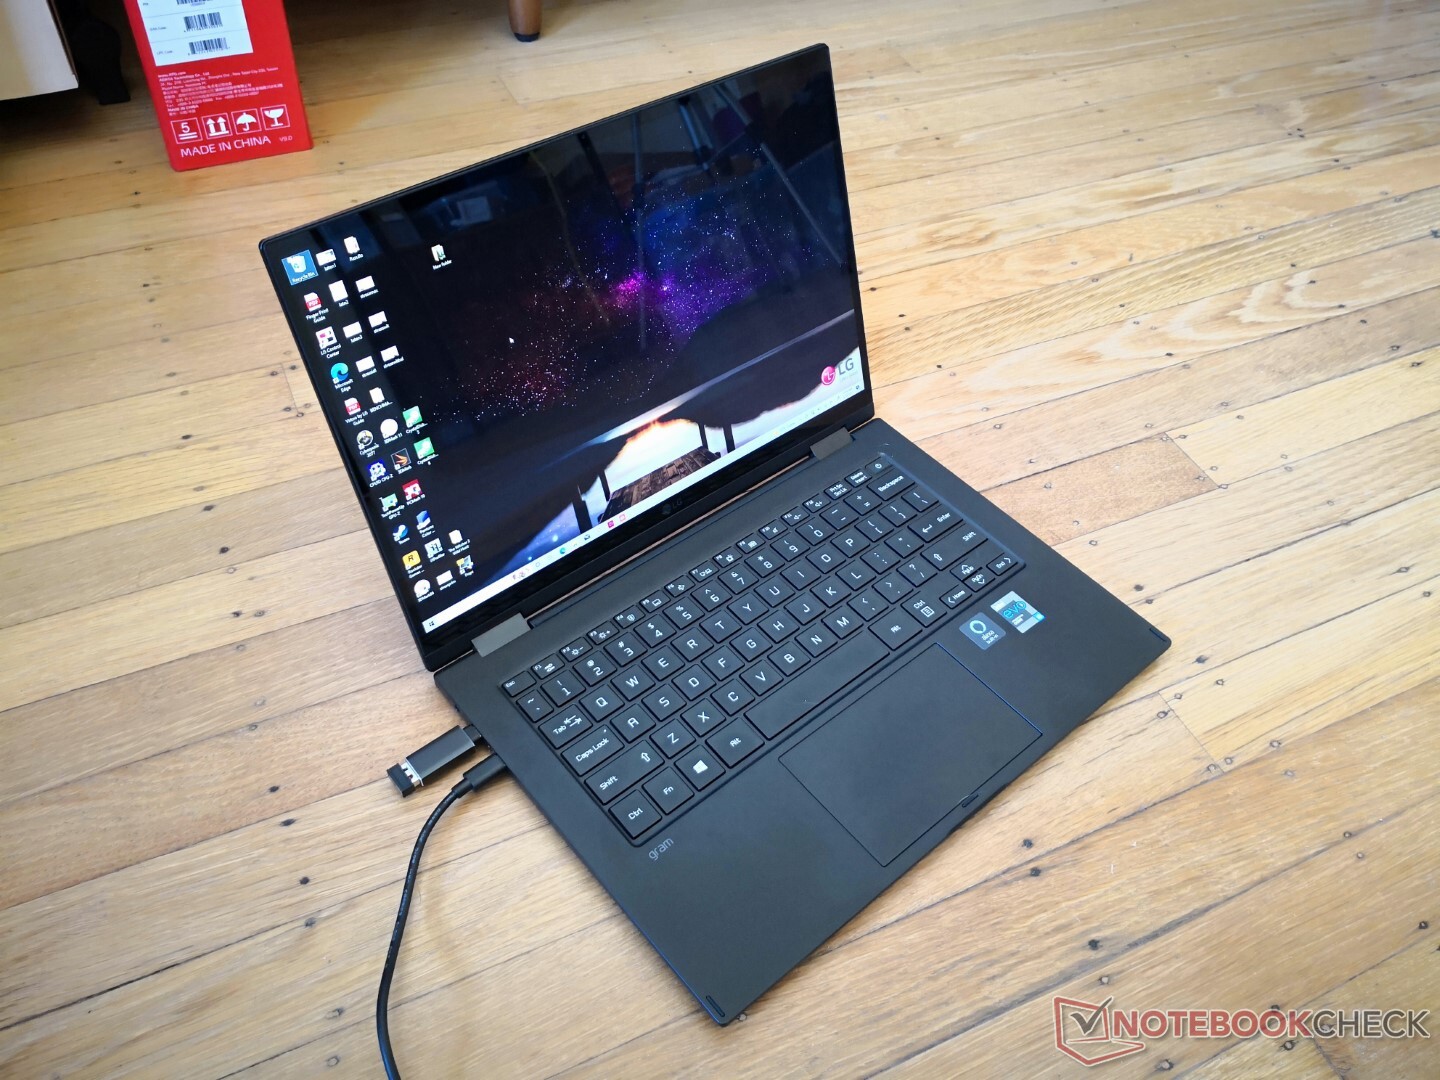
Les dimensions sont légèrement différentes de celles du Gram 14T90N précédent, mais le volume global et le poids sont pratiquement les mêmes. Ainsi, les utilisateurs bénéficient d'un écran tactile 16:10 plus grand sans avoir besoin d'un châssis plus grand ou plus lourd. Le système est également plus léger d'environ 100 g à 200 g que la plupart des convertibles concurrents, ce qui se remarque lors de la manipulation ou des déplacements.
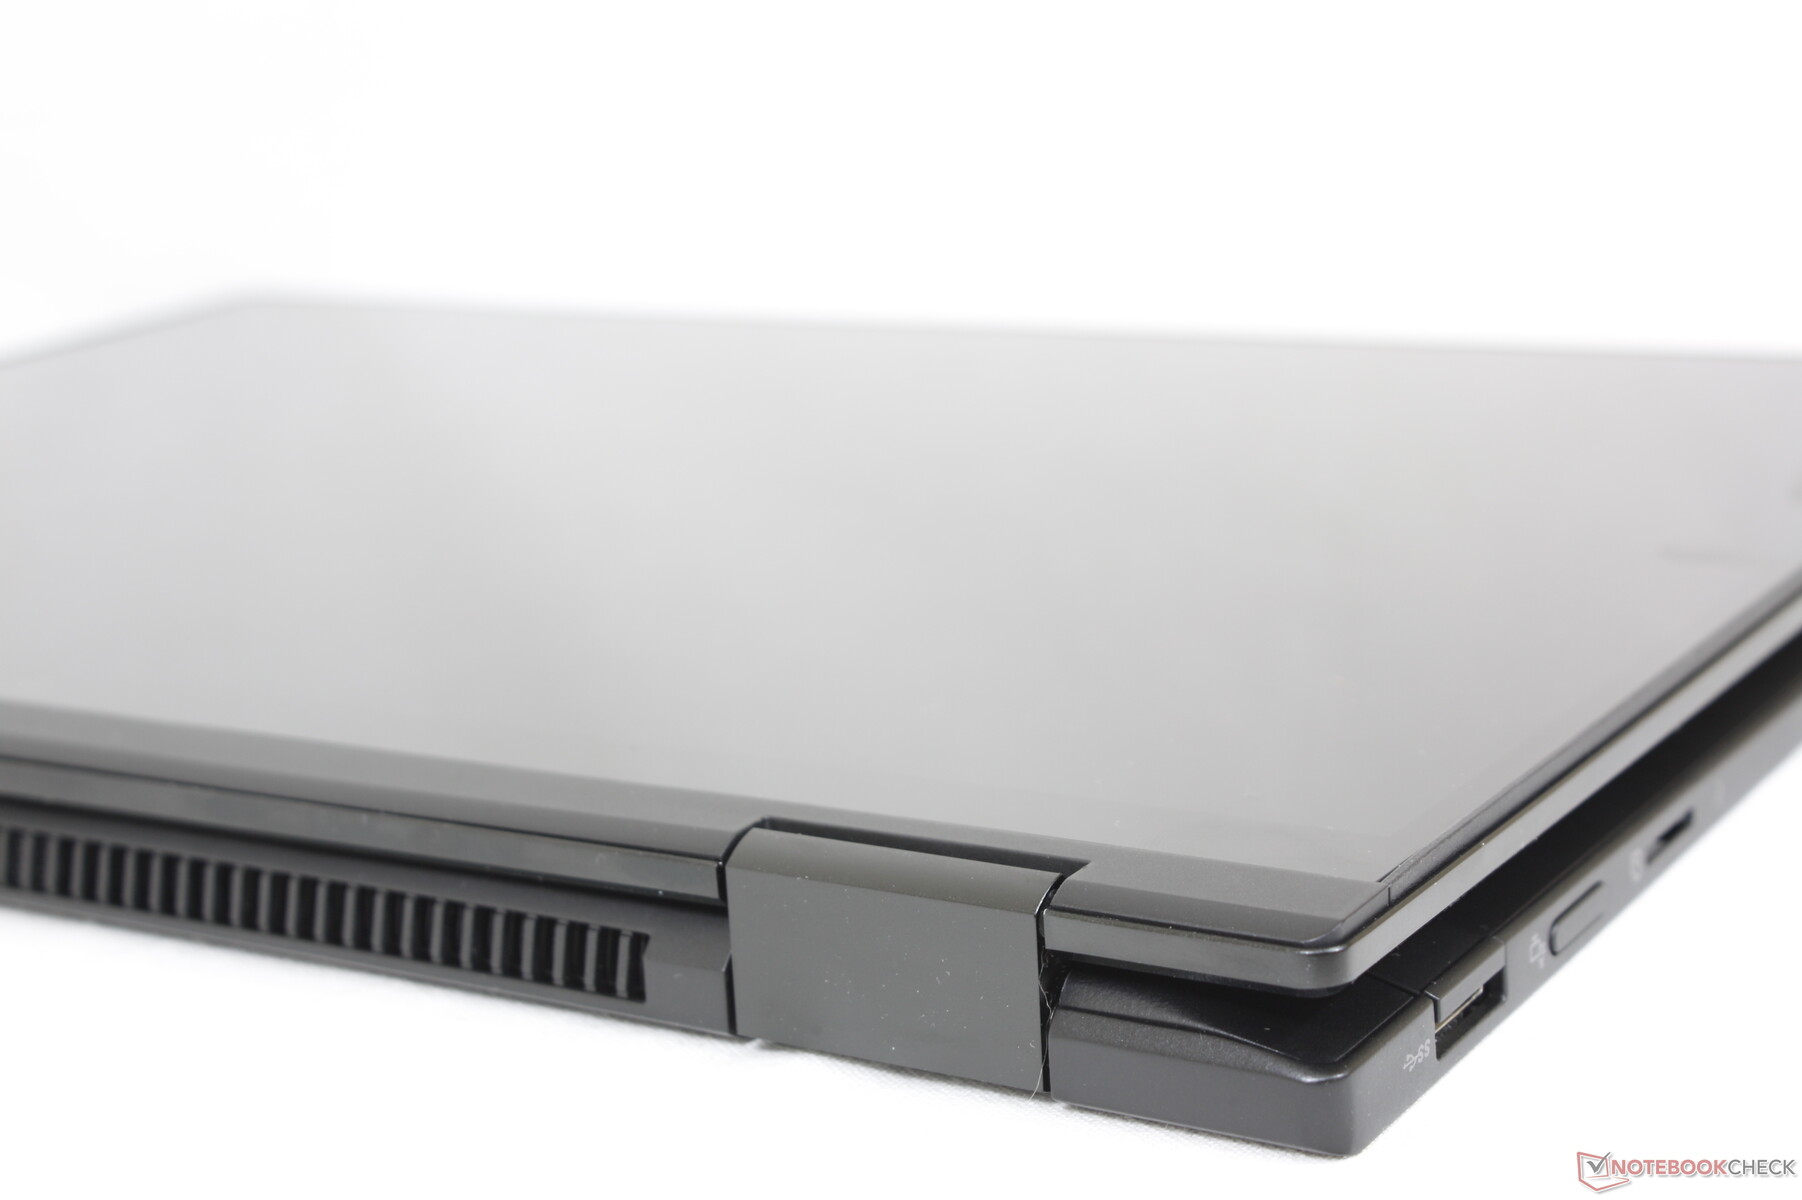
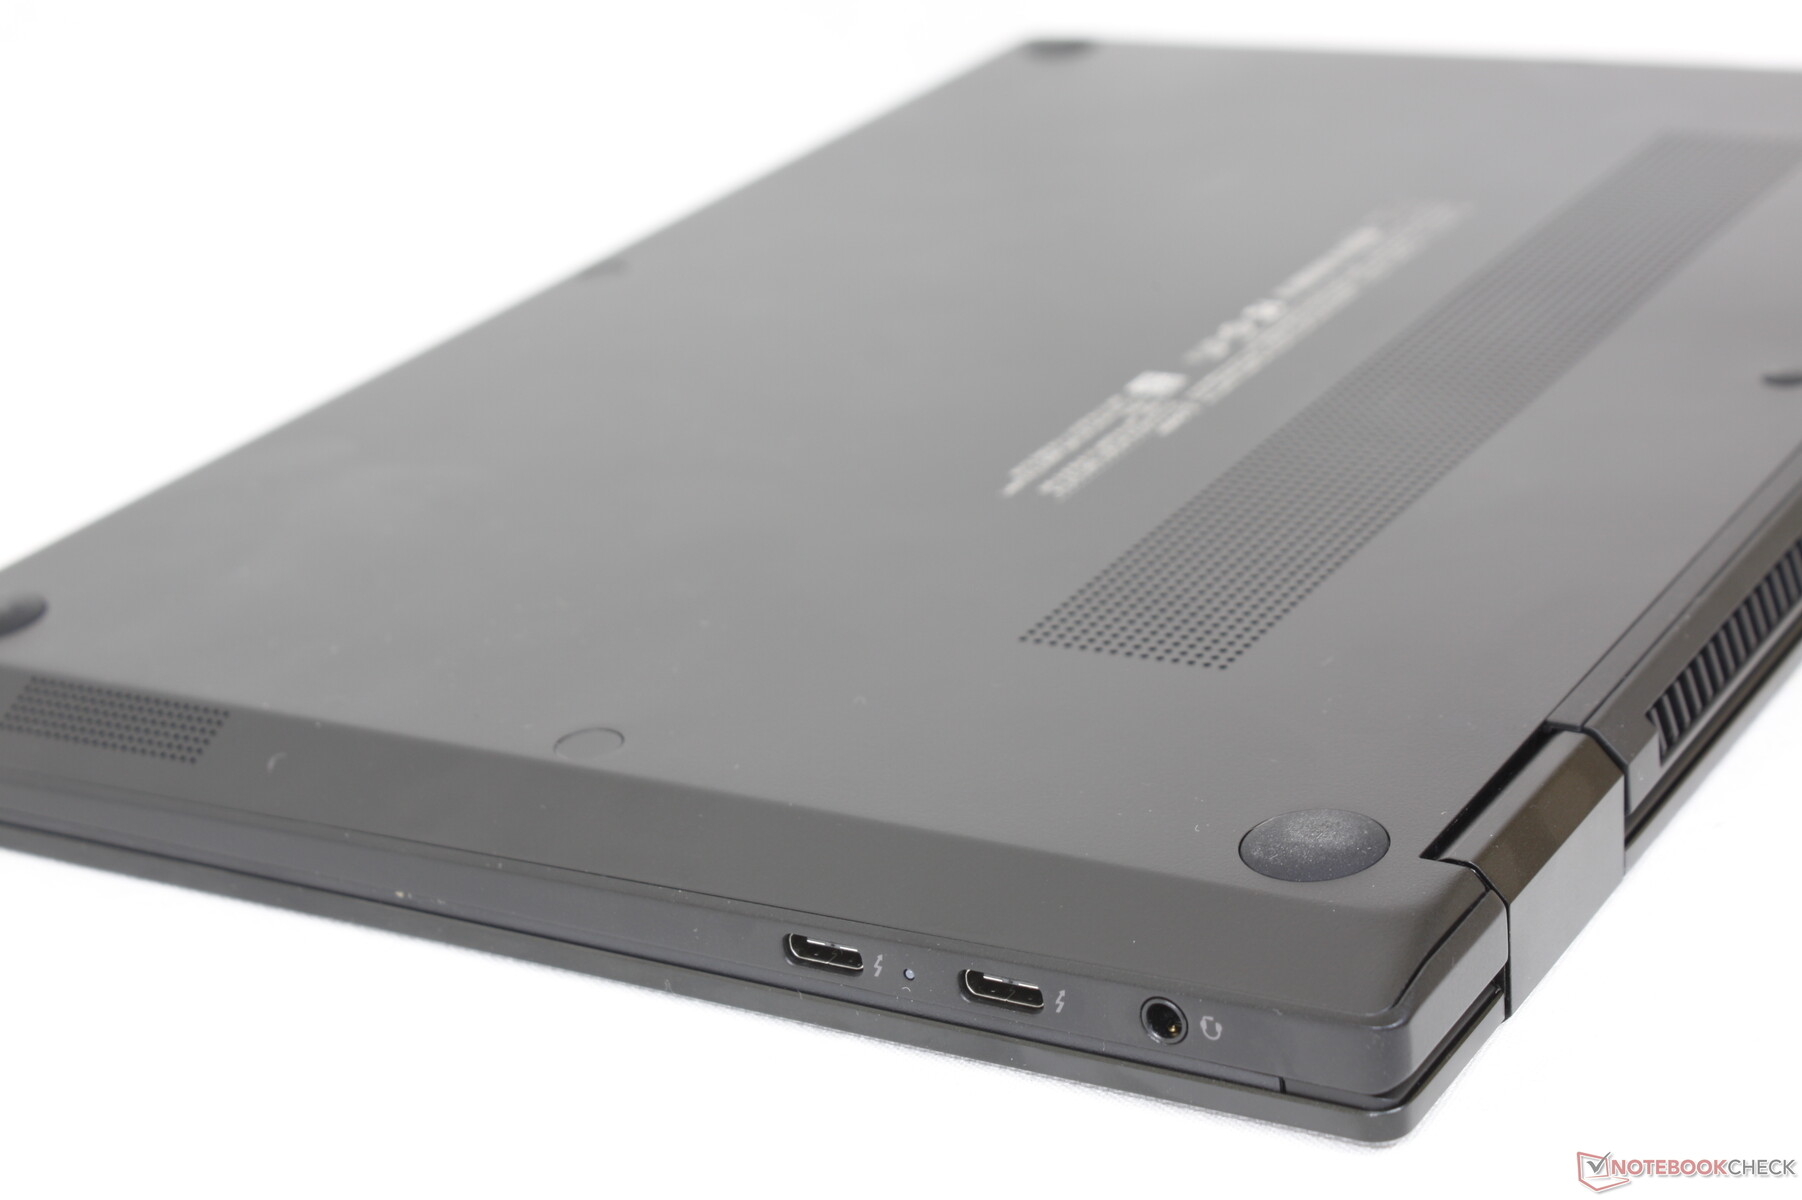
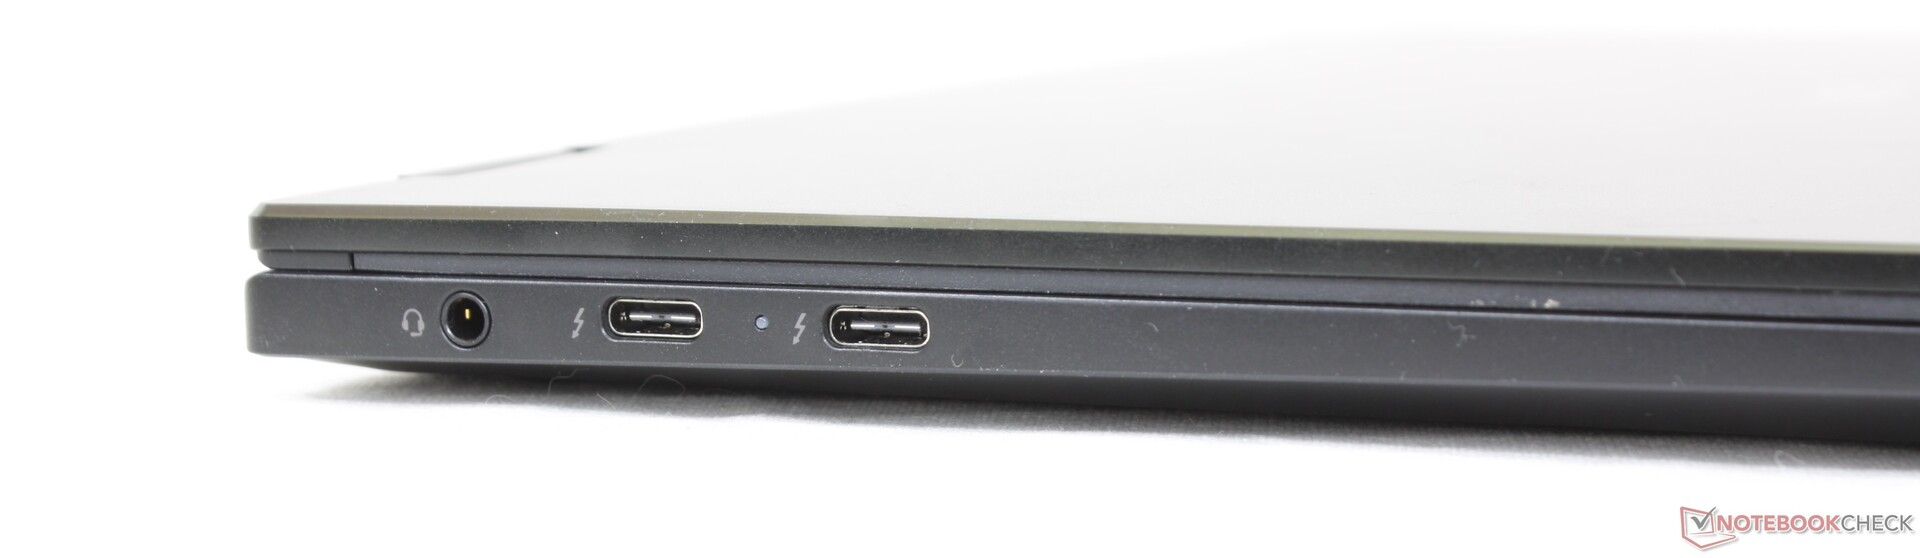
Connectivité - 2x Thunderbolt 4
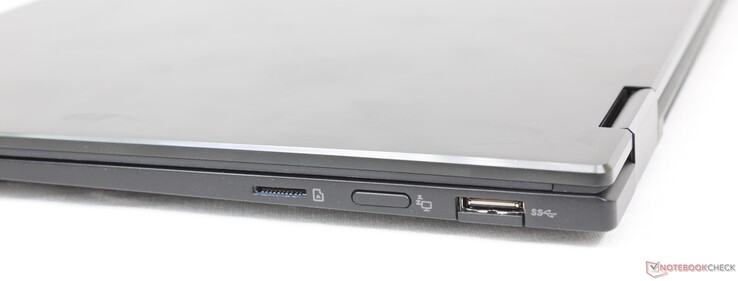
Les options de port sont identiques à celles du Gram 16T90P, plus grand. Le Gram 14T90P a abandonné le port HDMI et la fente de verrouillage Kensington que l'on trouve sur le Gram 14Z90P ou le Gram 14T90N, tout en offrant moins d'options que le 14Z90P. Il n'y a qu'un seul port USB-A de taille normale au lieu de deux, par exemple, ce qui signifie que les propriétaires sont encouragés à utiliser des accessoires USB-C ou des stations d'accueil à la place.
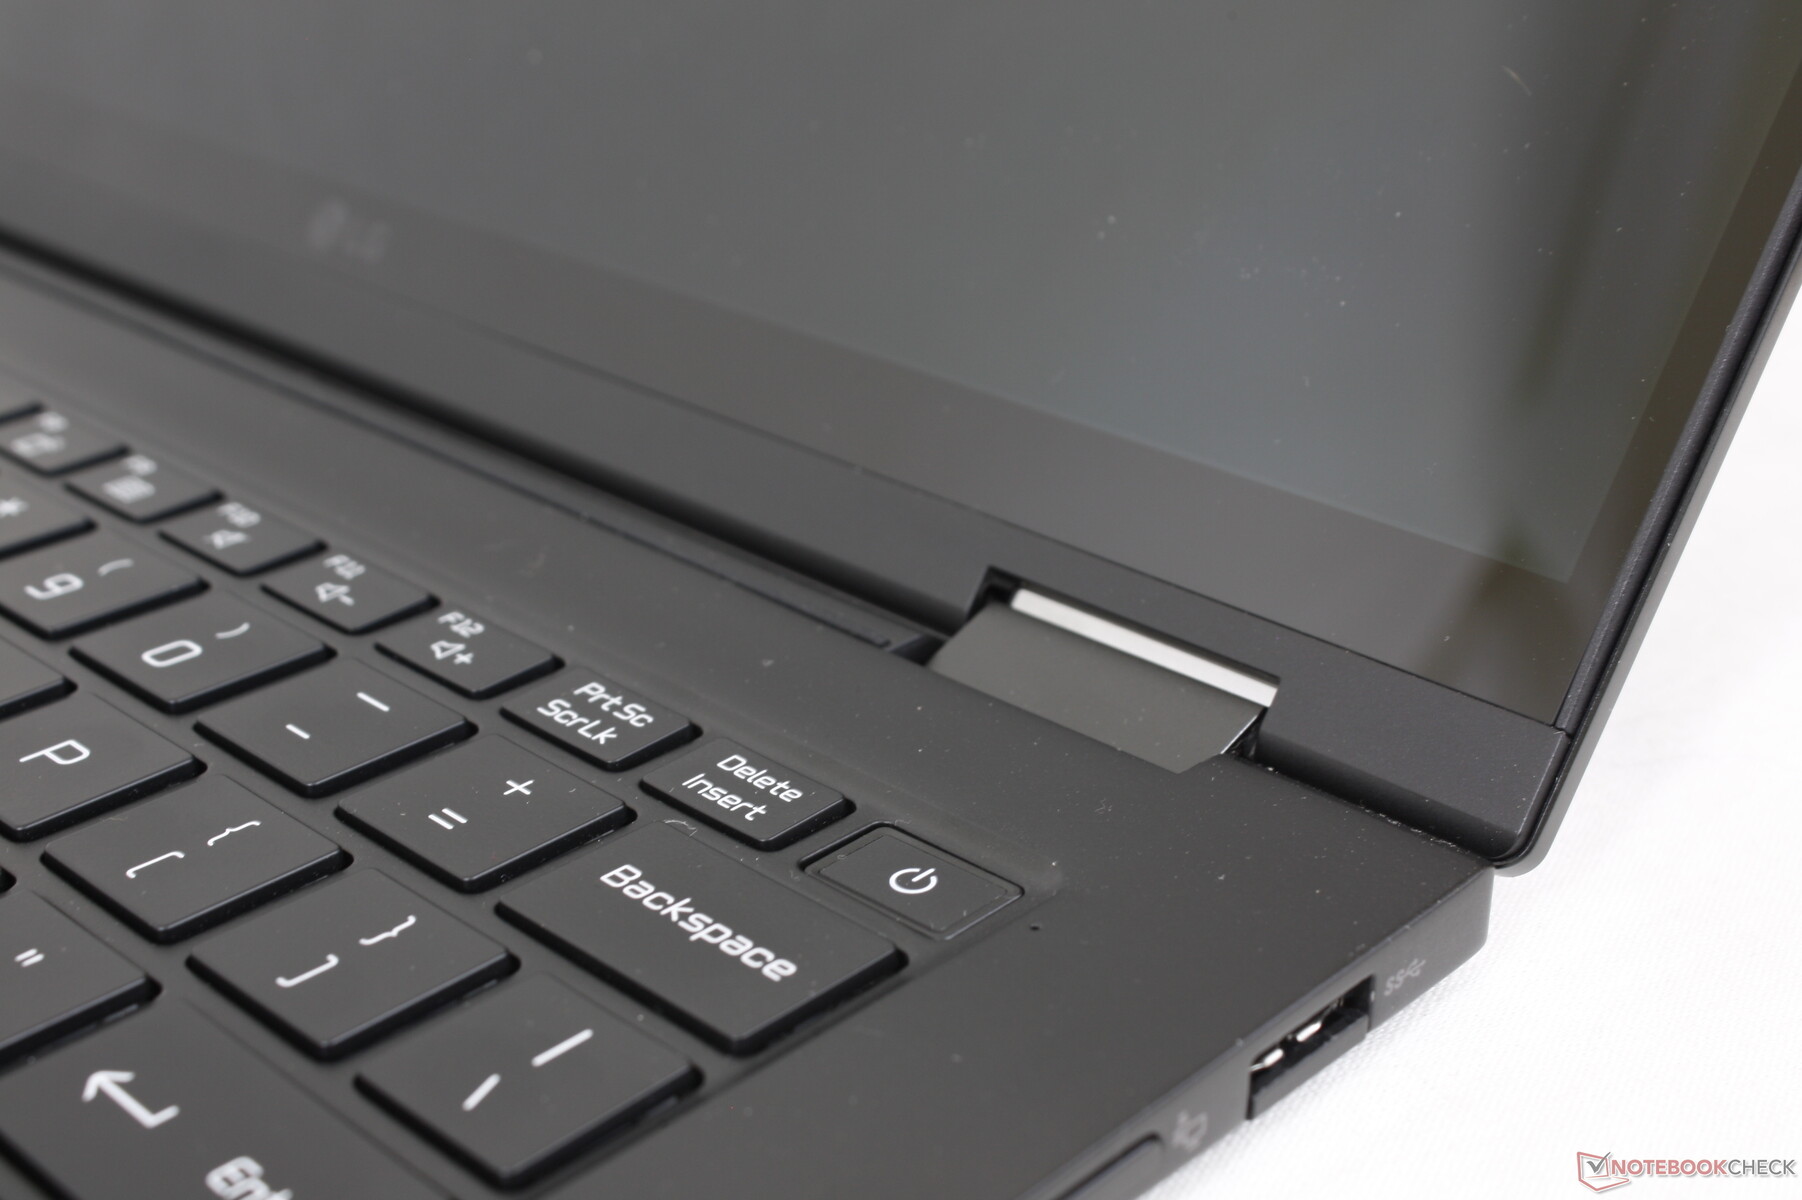
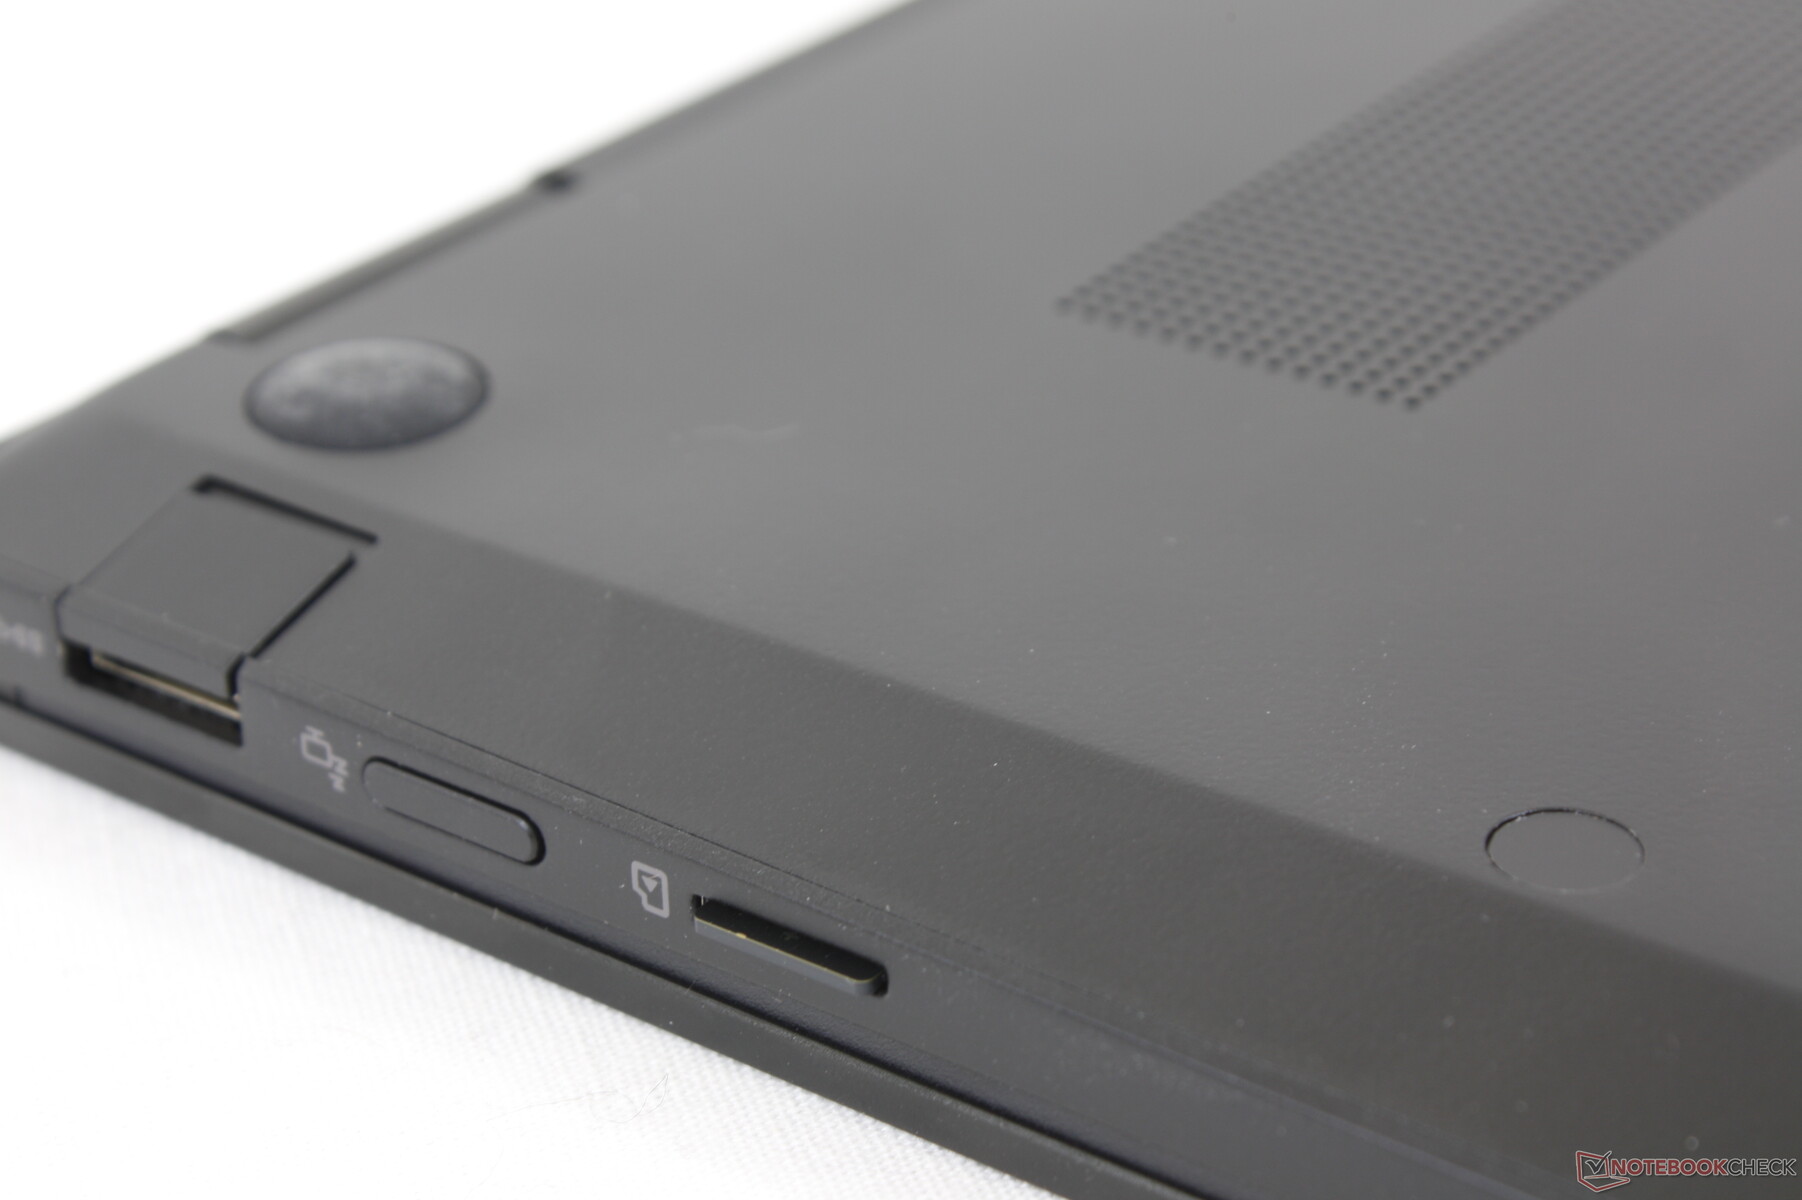
Une pression sur le bouton situé le long du bord droit permet d'allumer ou d'éteindre l'écran. C'est une fonctionnalité étrange que nous ne voyons pas sur beaucoup d'autres convertibles et elle n'est malheureusement pas personnalisable par l'utilisateur.
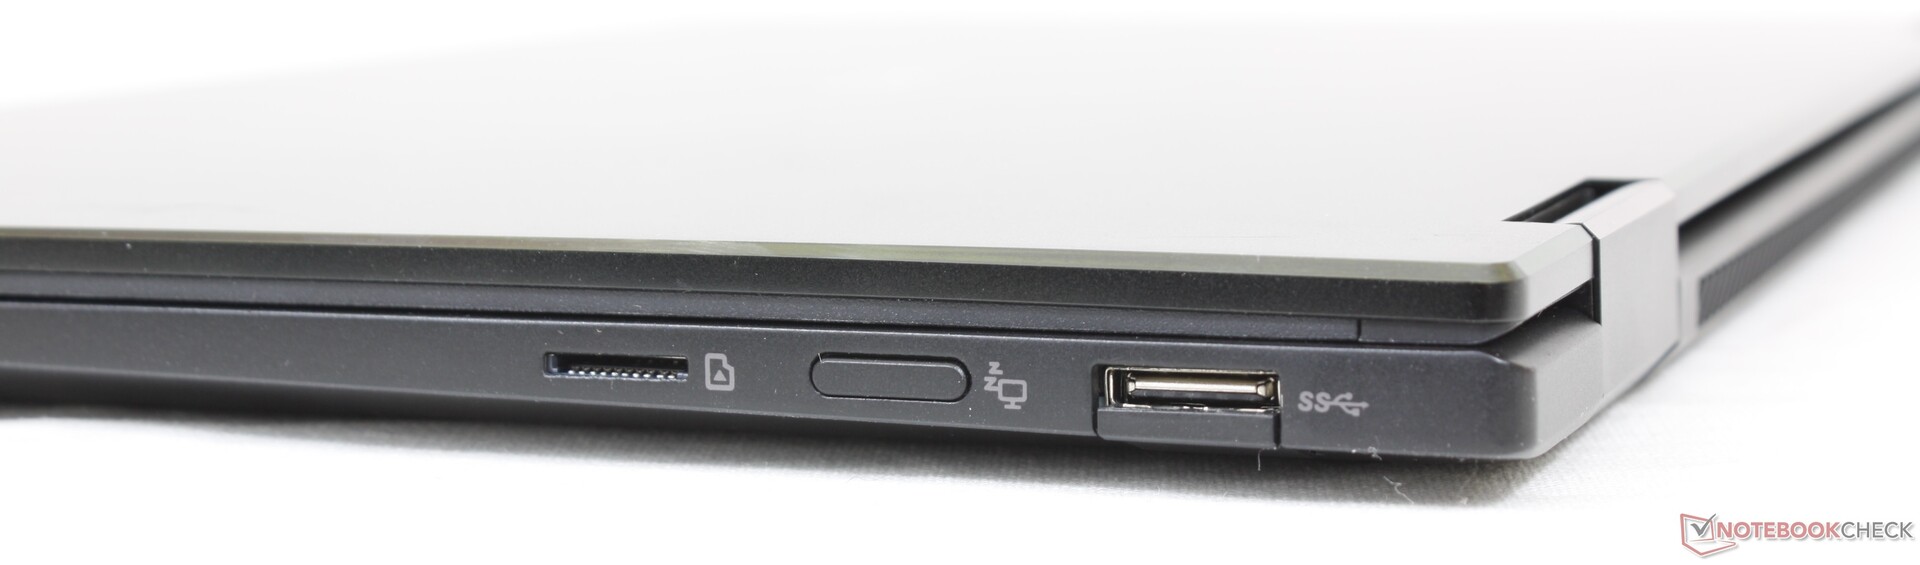
Lecteur de carte SD
Les taux de transfert à partir du lecteur de carte MicroSD à ressort sont moyens, autour de 85 Mo/s. Le transfert de 1 Go de photos de notre carte UHS-II vers le bureau prend environ 15 secondes, ce qui est similaire à tous les autres modèles Gram jusqu'à présent.
| SD Card Reader | |
| average JPG Copy Test (av. of 3 runs) | |
| HP Spectre x360 14-ea0378ng (Toshiba Exceria Pro M501 microSDXC 64GB) | |
| Dell XPS 13 9310 2-in-1 (AV Pro V60) | |
| Asus ZenBook Flip 14 UN5401QA-KN085W (AV Pro SD microSD 128 GB V60) | |
| LG Gram 14T90N (Toshiba Exceria Pro M501 64 GB UHS-II) | |
| MSI Summit E13 Flip Evo A11MT (AV PRO microSD 128 GB V60) | |
| LG Gram 14T90P (AV Pro V60) | |
| maximum AS SSD Seq Read Test (1GB) | |
| HP Spectre x360 14-ea0378ng (Toshiba Exceria Pro M501 microSDXC 64GB) | |
| Dell XPS 13 9310 2-in-1 (AV Pro V60) | |
| Asus ZenBook Flip 14 UN5401QA-KN085W (AV Pro SD microSD 128 GB V60) | |
| LG Gram 14T90P (AV Pro V60) | |
| MSI Summit E13 Flip Evo A11MT (AV PRO microSD 128 GB V60) | |
| LG Gram 14T90N (Toshiba Exceria Pro M501 64 GB UHS-II) | |
Communication
Un Intel AX201 est fourni en standard pour le support du Wi-Fi 6 et du Bluetooth 5.2. Nous n'avons rencontré aucun problème de connectivité lorsqu'il a été couplé à notre Asus GT-AXE11000, contrairement à ce que nous avons observé sur le récent Asus Zenbook Pro 15.
| Networking | |
| iperf3 transmit AX12 | |
| Asus ZenBook Flip 14 UN5401QA-KN085W | |
| Lenovo Yoga 9 14IAP7 82LU0001US | |
| Dell XPS 13 9310 2-in-1 | |
| HP Spectre x360 14-ea0378ng | |
| MSI Summit E13 Flip Evo A11MT | |
| LG Gram 14T90N | |
| iperf3 receive AX12 | |
| Asus ZenBook Flip 14 UN5401QA-KN085W | |
| Dell XPS 13 9310 2-in-1 | |
| Lenovo Yoga 9 14IAP7 82LU0001US | |
| MSI Summit E13 Flip Evo A11MT | |
| LG Gram 14T90N | |
| HP Spectre x360 14-ea0378ng | |
| iperf3 receive AXE11000 | |
| LG Gram 14T90P | |
| iperf3 transmit AXE11000 | |
| LG Gram 14T90P | |
Webcam
L'appareil photo n'est que de 720p et ne prend pas en charge Windows Hello, ni même un obturateur de confidentialité. Ce problème devra être résolu sur les futurs modèles.


Maintenance
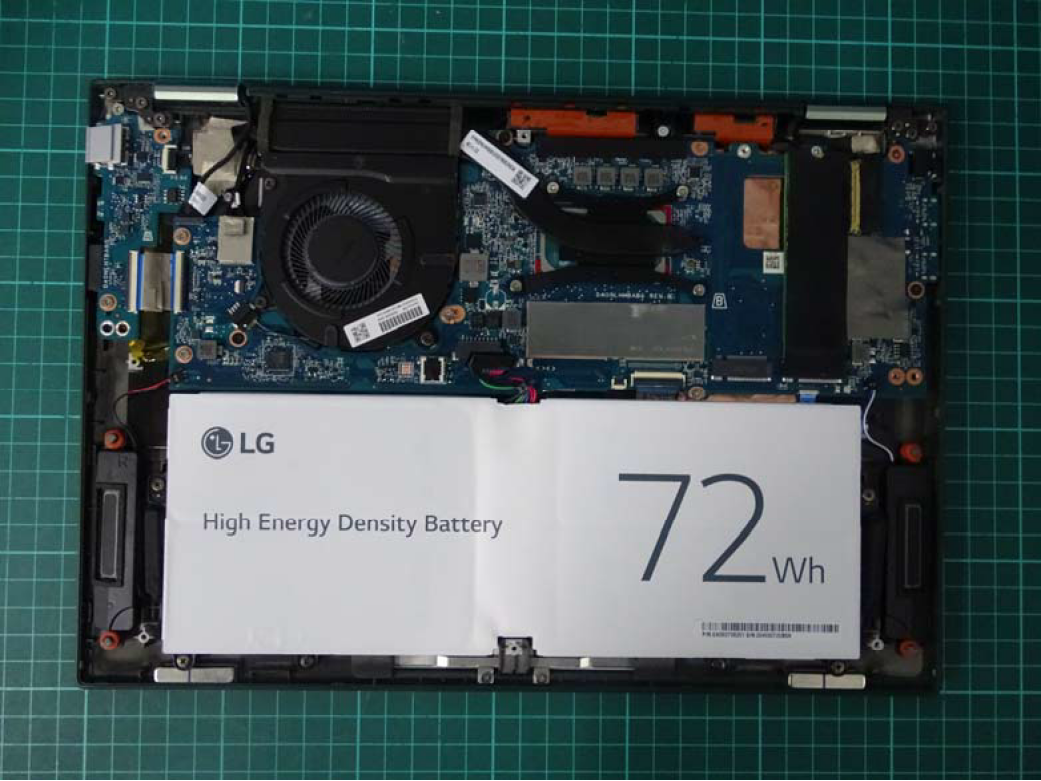
Comme avec tous les autres ordinateurs portables Gram jusqu'à présent, le panneau inférieur a été conçu pour être très difficile à ouvrir, car les vis sont cachées sous des autocollants et des pieds en caoutchouc. C'est dommage car le système peut prendre en charge jusqu'à deux SSD internes M.2 2280 au lieu d'un seul pour un espace de stockage supplémentaire, mais LG a fait en sorte qu'il soit extrêmement difficile pour les propriétaires d'ajouter leurs propres disques
La RAM et le WLAN sont soudés et ne peuvent pas être mis à niveau par l'utilisateur
Puisque nous n'avons pas été en mesure d'ouvrir notre unité de test sans l'endommager, nous pouvons nous référer aux images officielles de la FCC ici.
Accessoires et garantie
La boîte de détail comprend un stylet actif Wacom https://www.lg.com/us/mobile-accessories/lg-aaa77804301-wacom-active-stylus-pen ainsi que les documents habituels et l'adaptateur secteur. La garantie limitée standard d'un an s'applique.
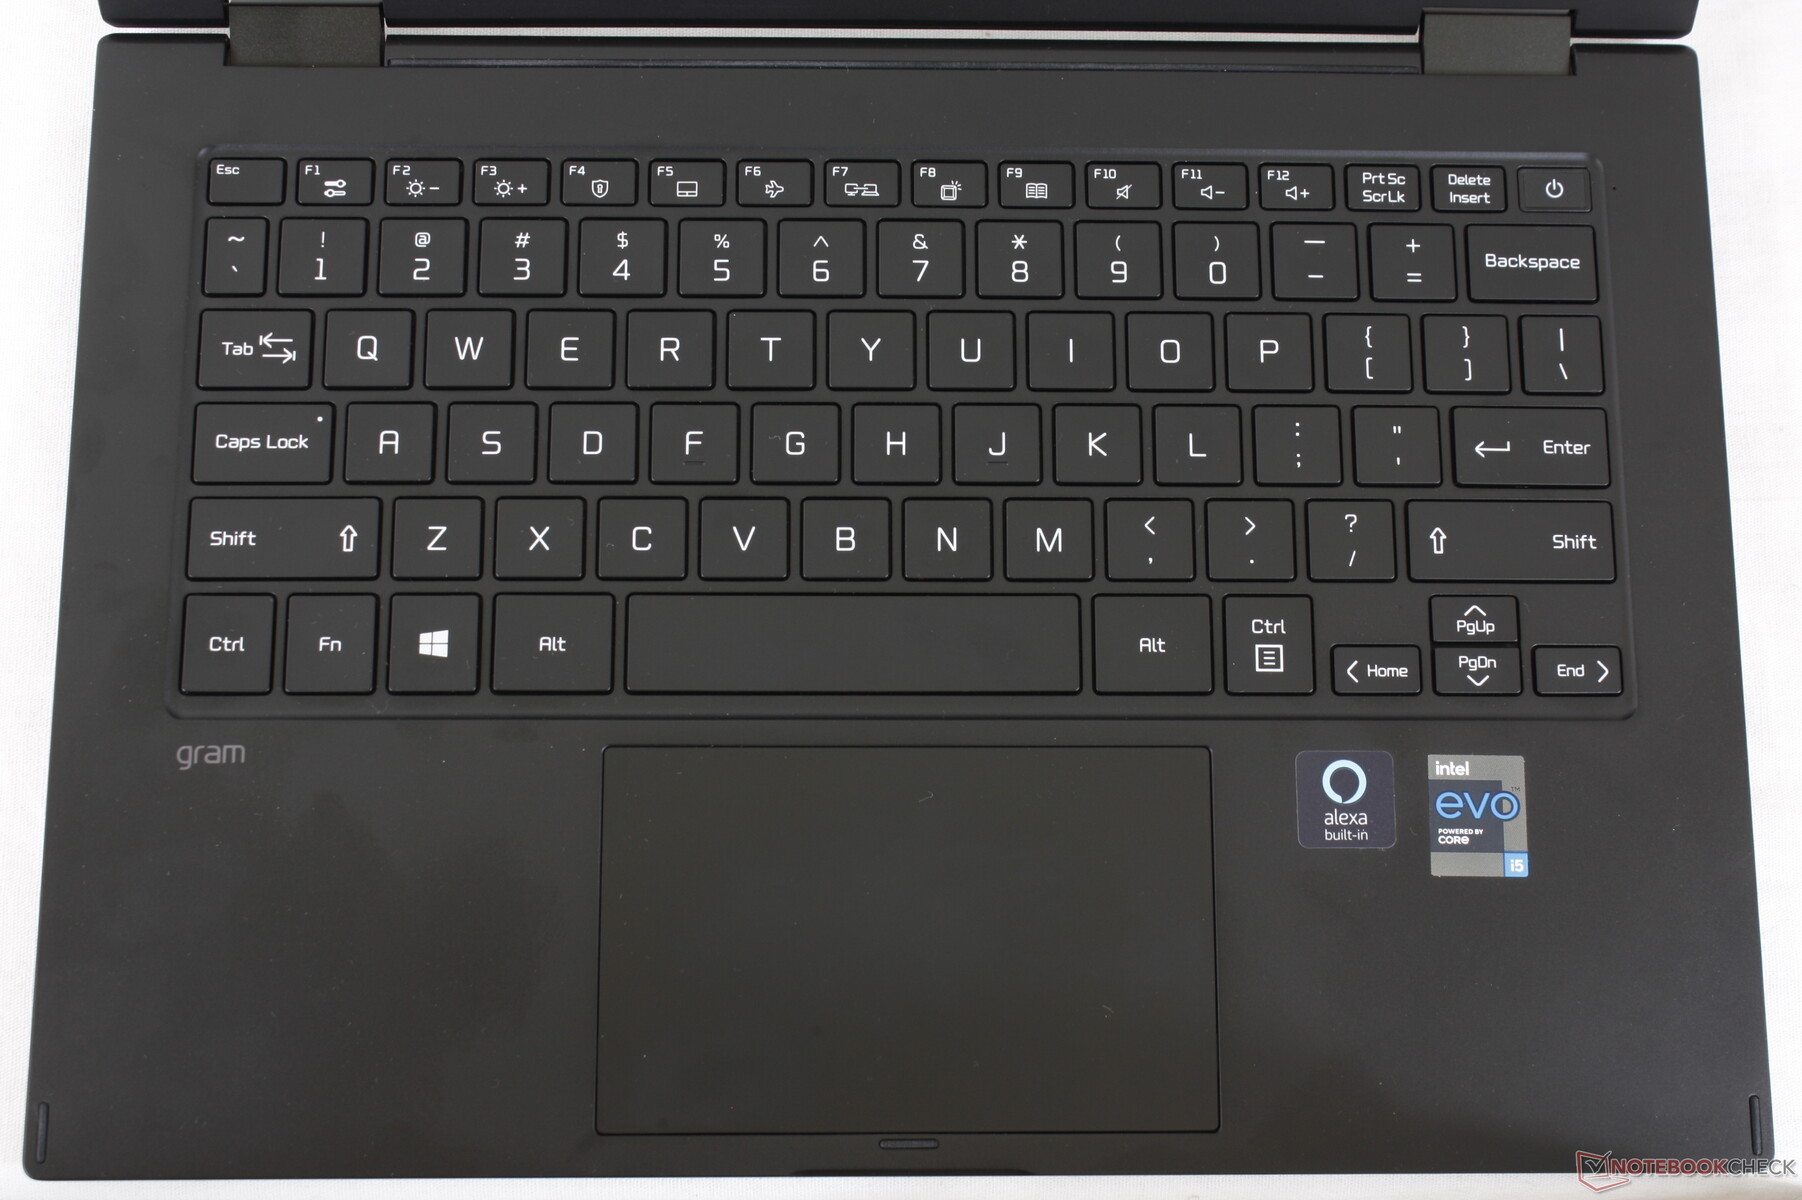
Périphériques d'entrée - Clavier génial, pavé tactile médiocre
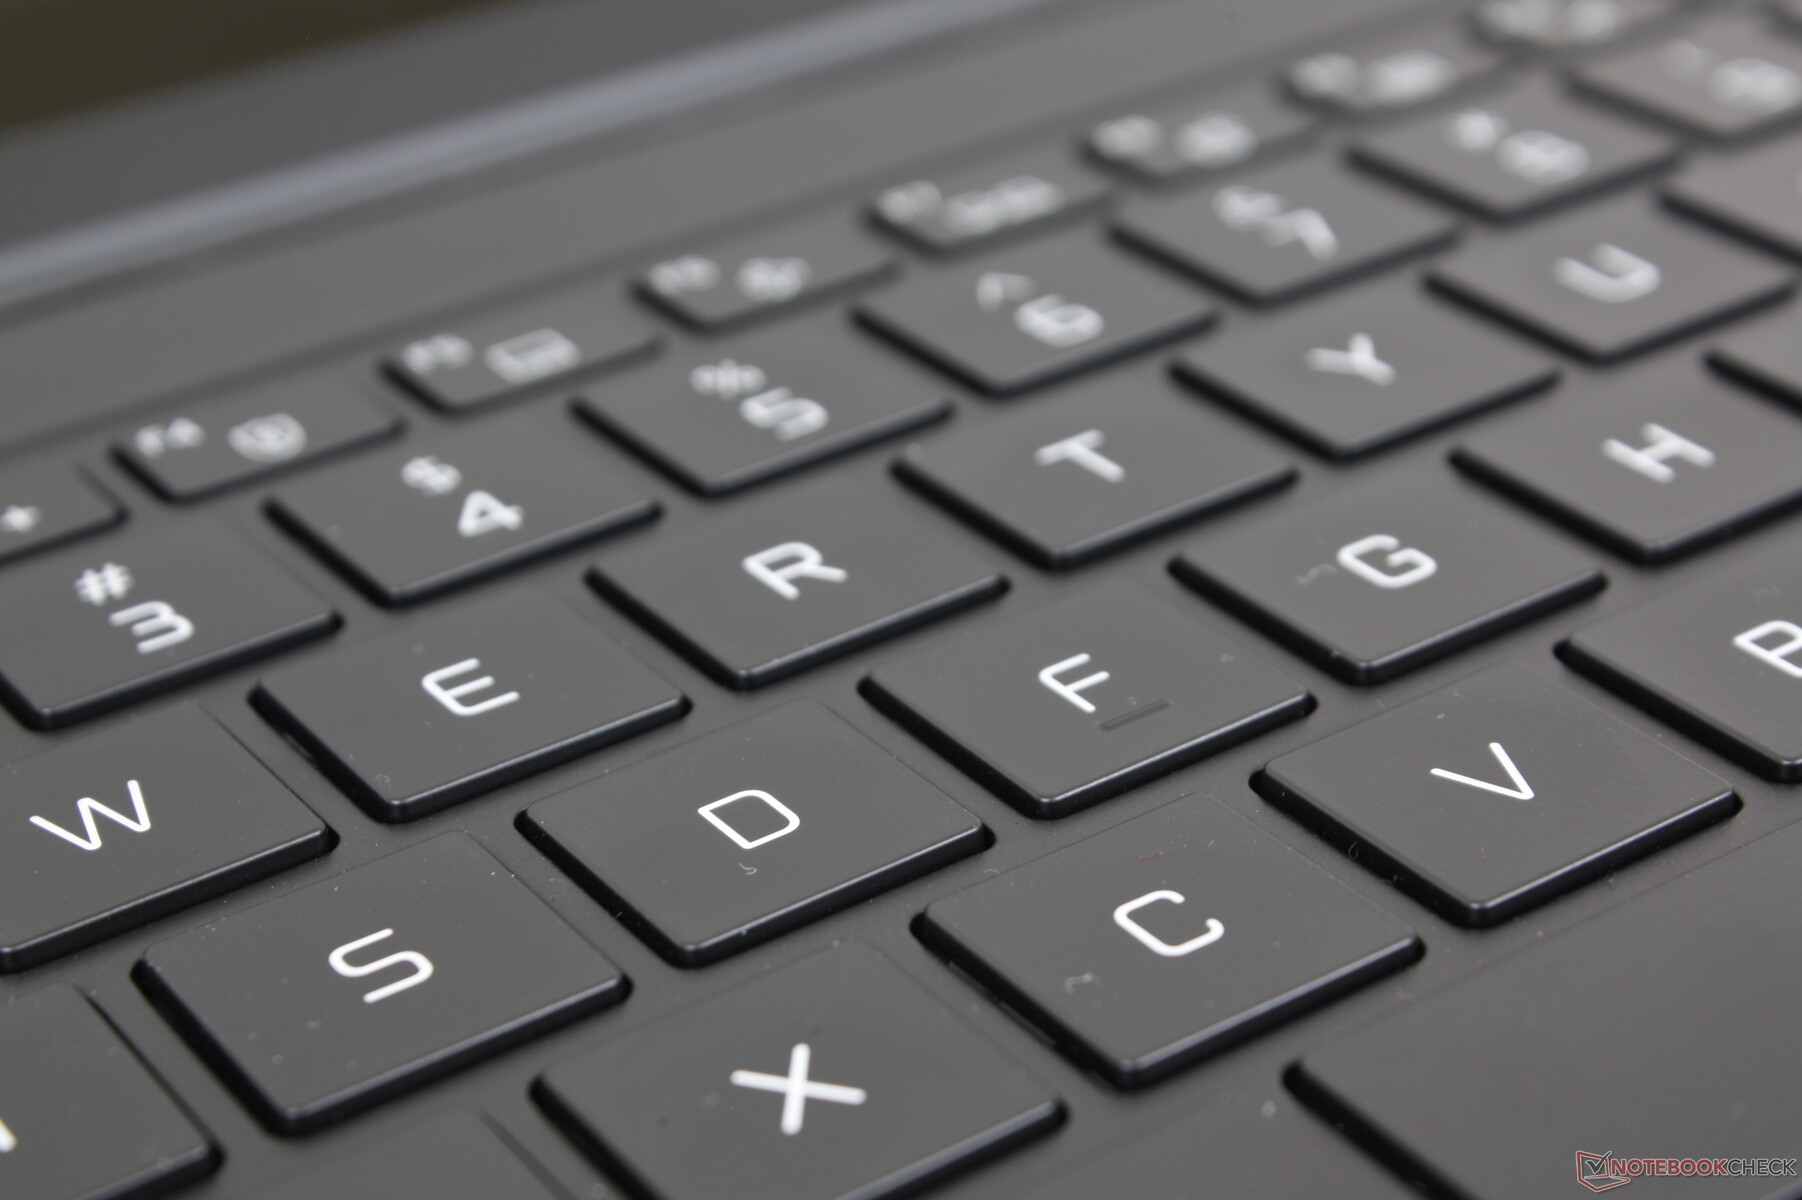
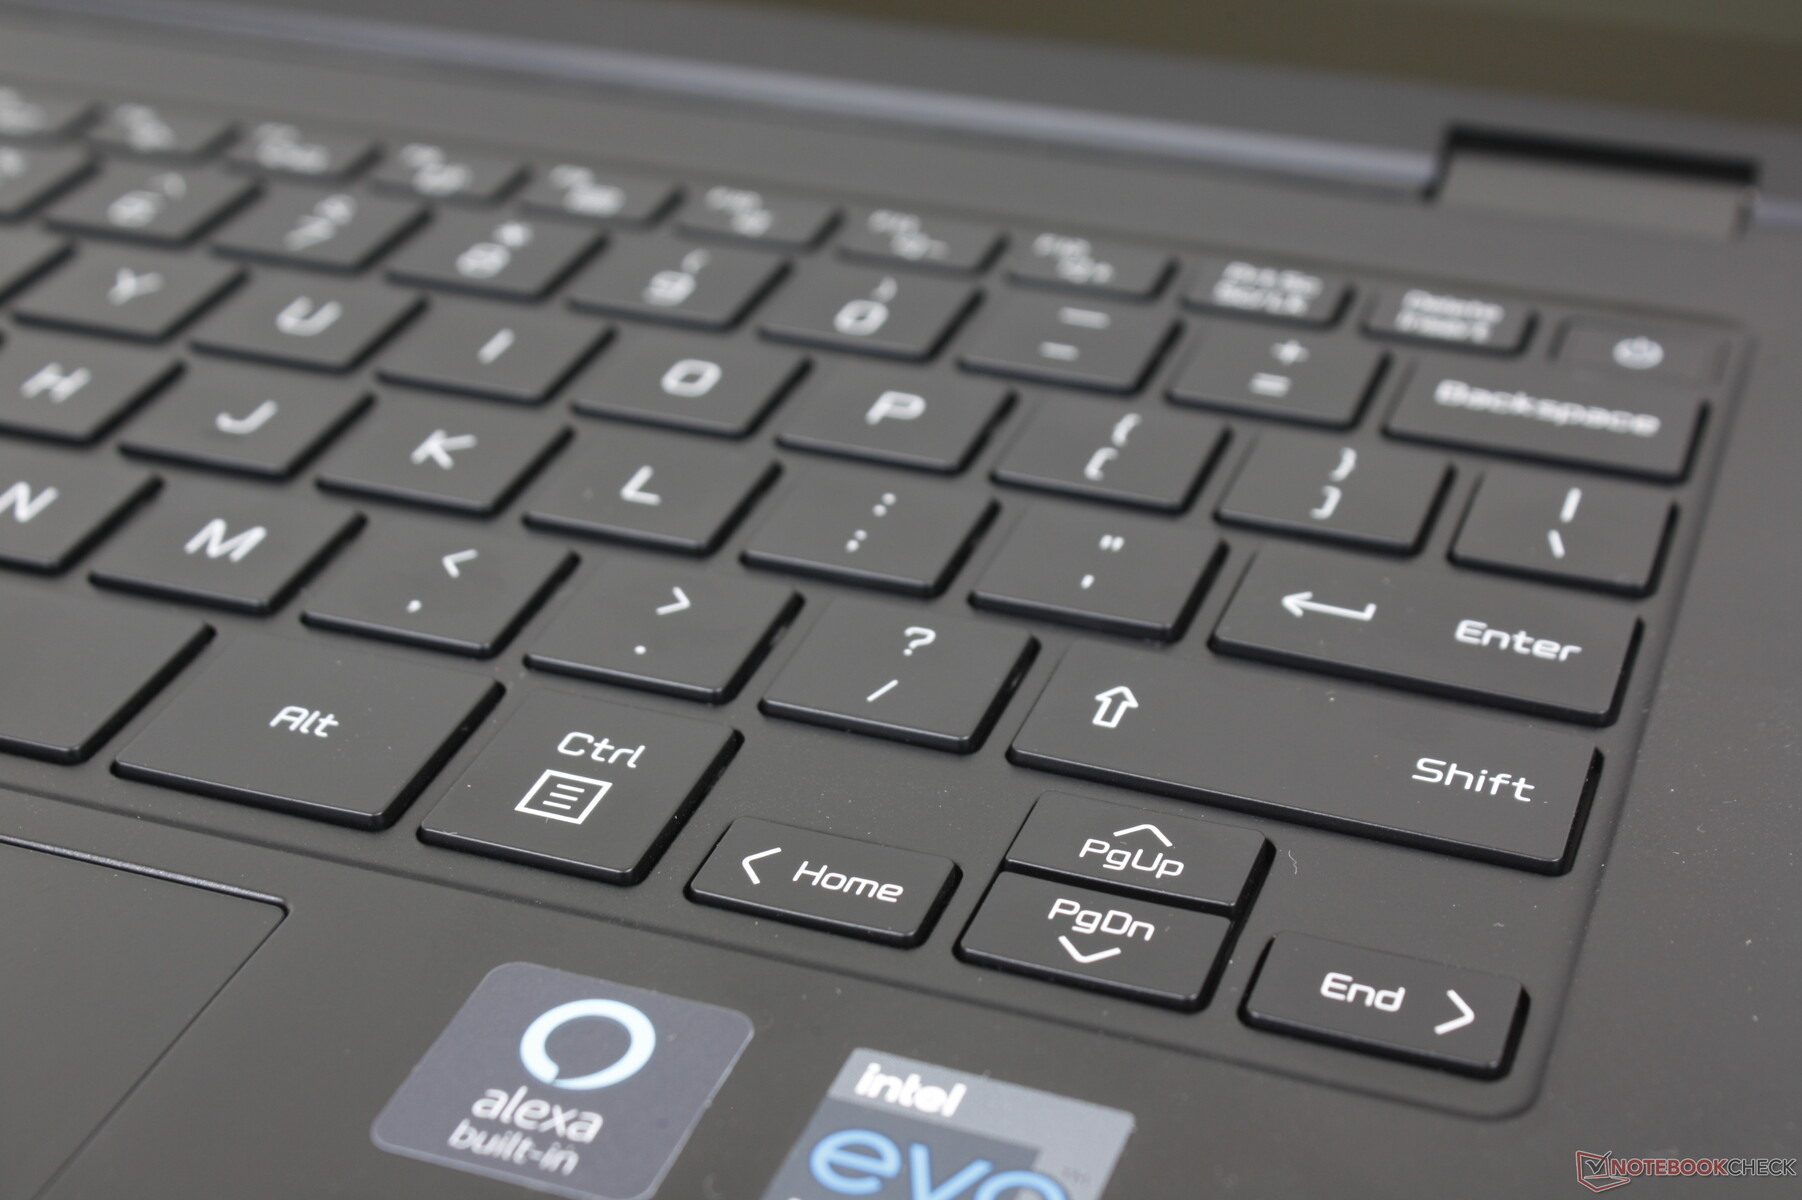
Clavier
Les touches du clavier sont nettement plus fermes et moins spongieuses que sur la plupart des autres ultrabooks. Si vous avez l'habitude de taper sur des touches plus souples comme sur un Asus Vivobook, HP Pavilion, Lenovo IdeaPad, ou même le Razer Blade, vous serez surpris par la rigidité des touches du Gram 14T90P. La conséquence de ces touches plus fermes est un bruit plus fort que la moyenne, ce qui rend la frappe légèrement plus bruyante.
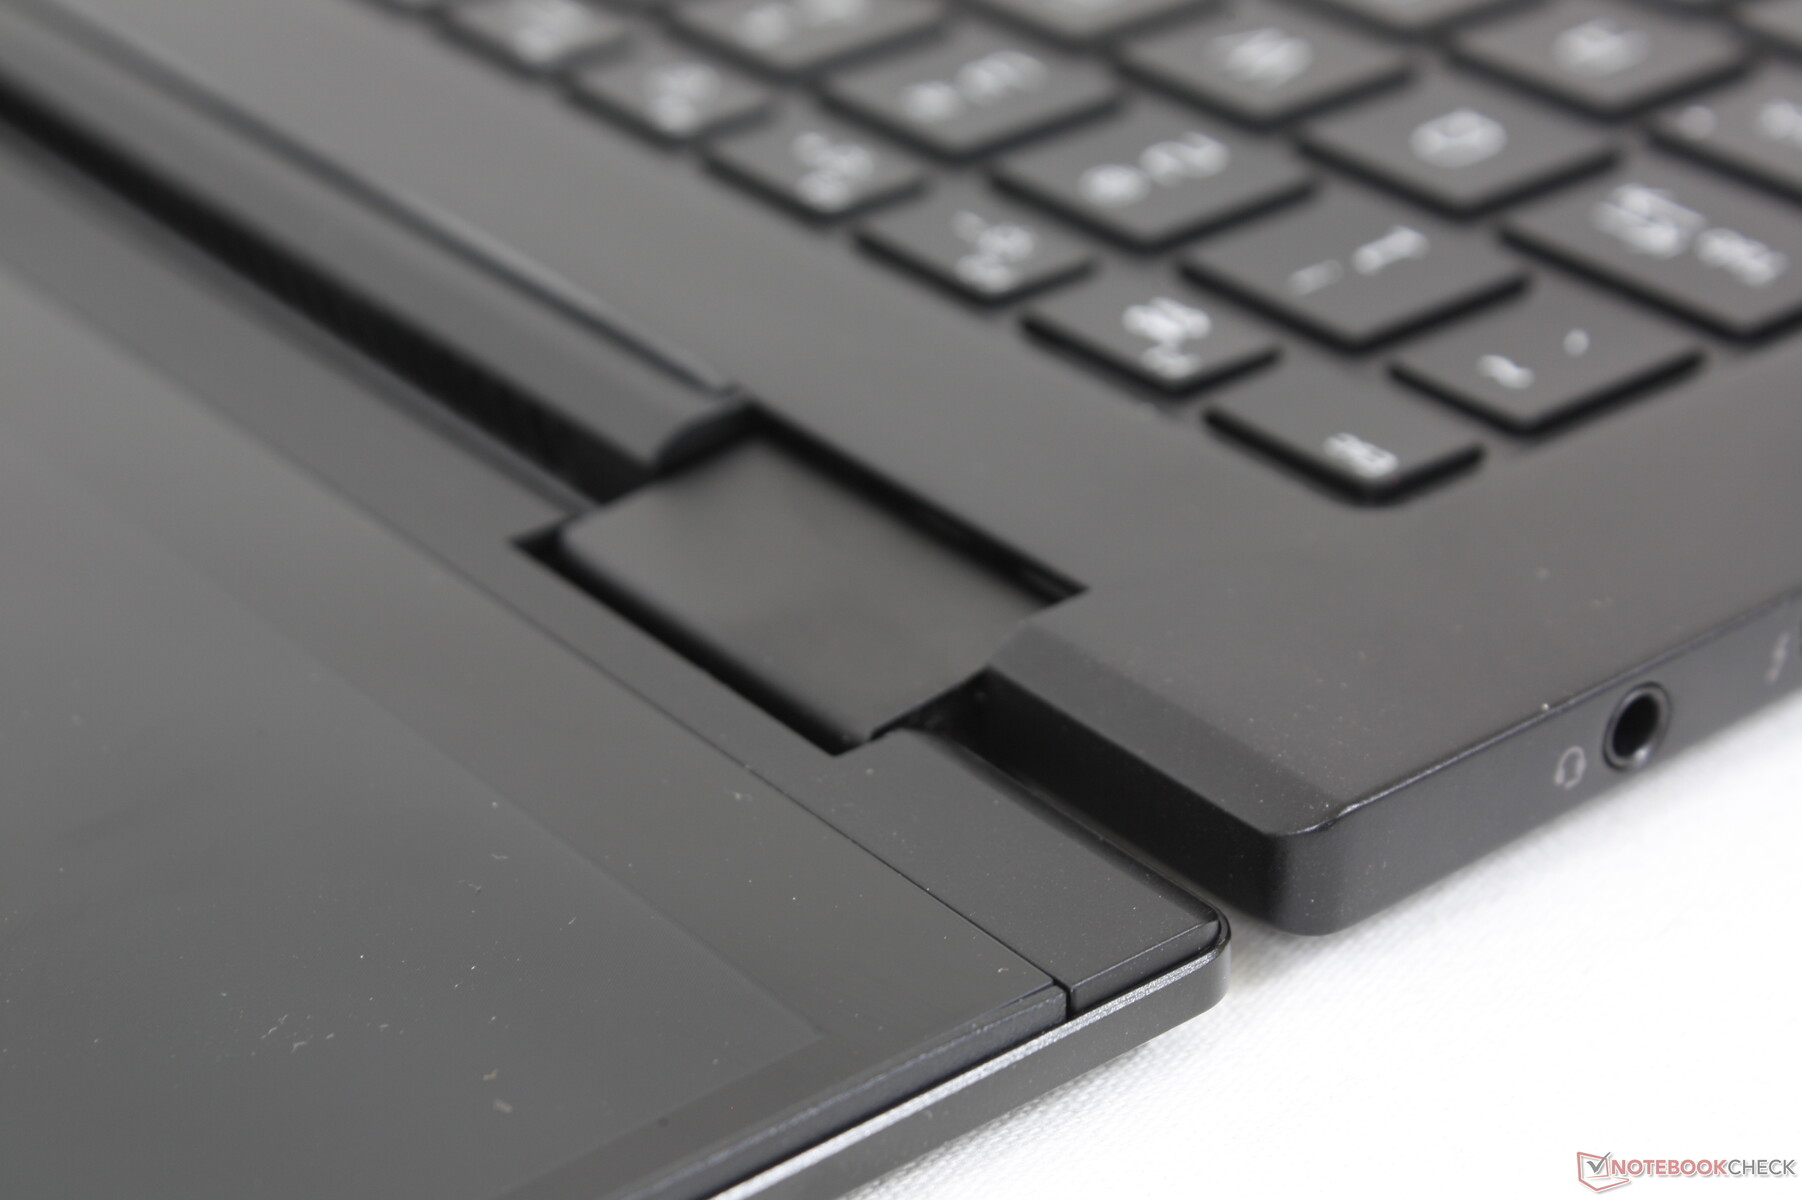
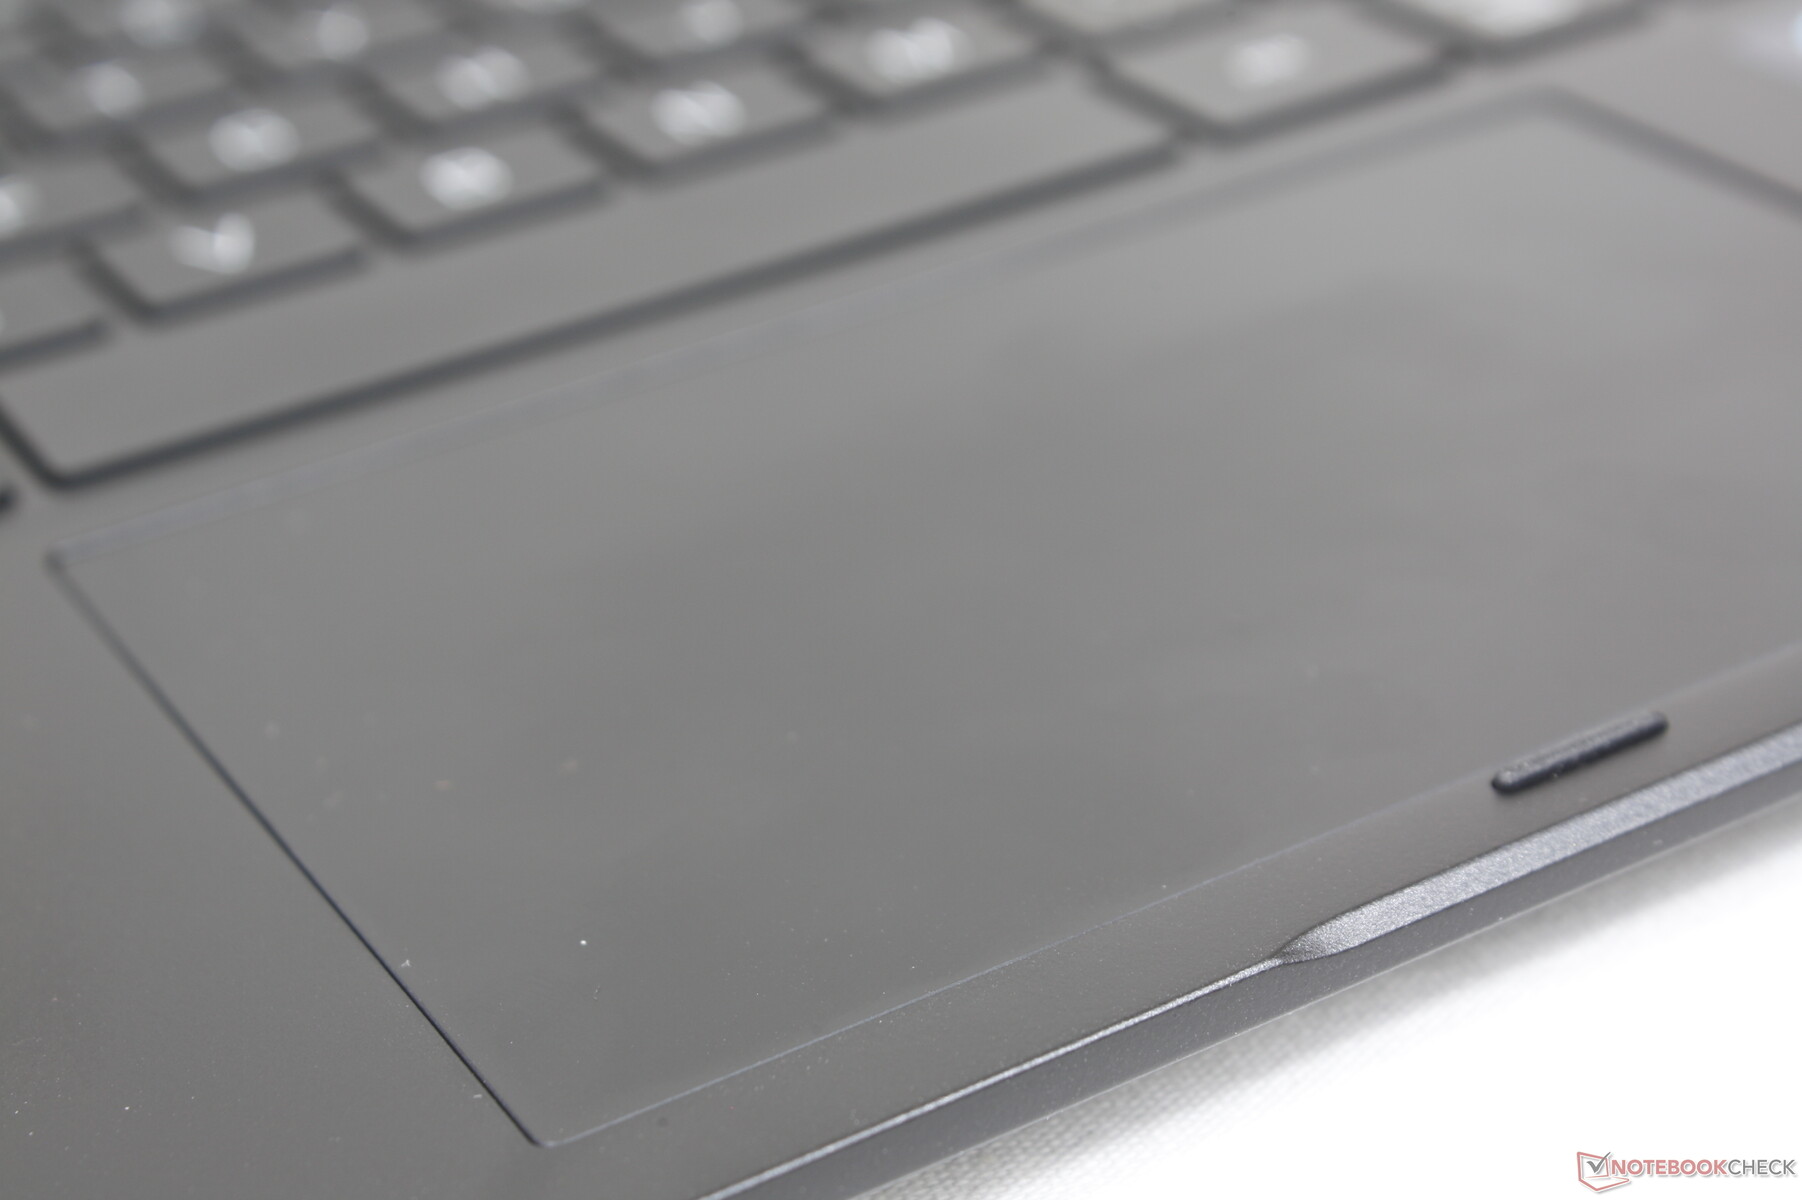
Pavé tactile
Nous sommes moins impressionnés par le clickpad quand on le compare au clavier. Bien qu'il soit plus grand que le pavé tactile du Gram 14T90N (11,3 x 7 cm contre 10,5 x 6,5 cm) pour faciliter le contrôle du curseur et les entrées multi-touch, le retour du clic est trop doux et silencieux. Un retour plus ferme aurait donné une sensation plus satisfaisante.
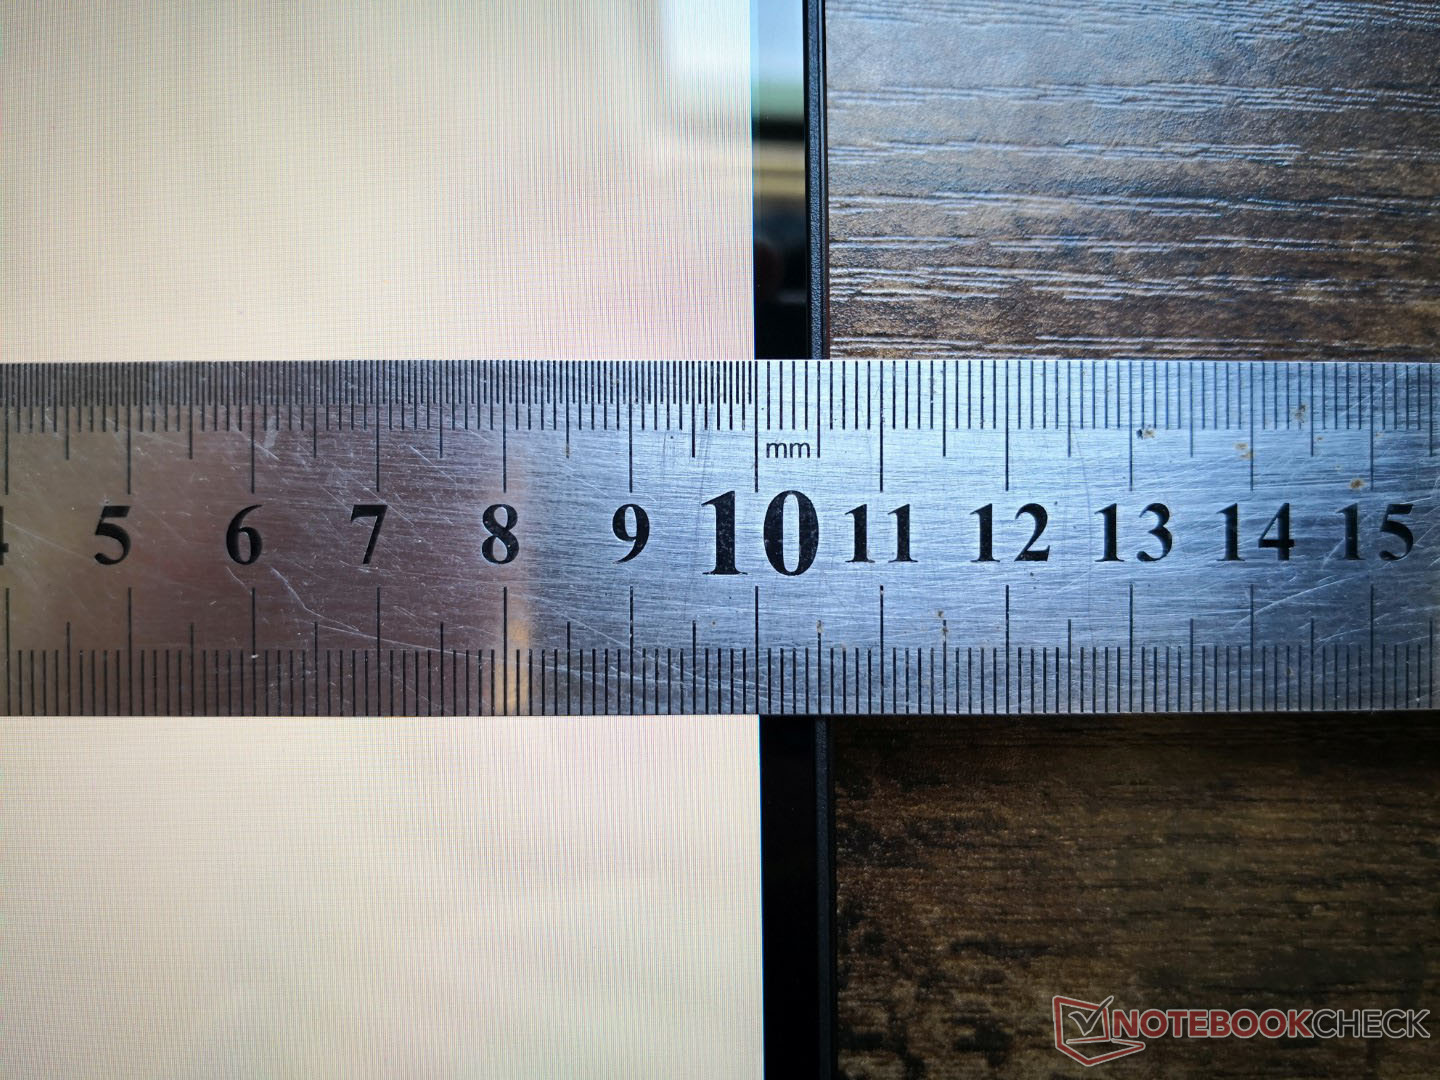
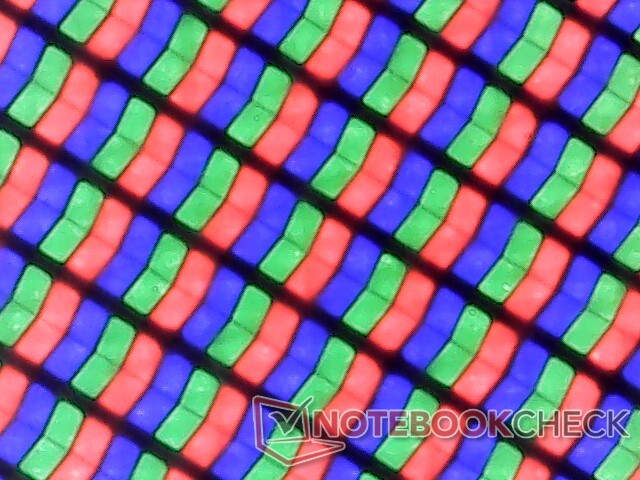
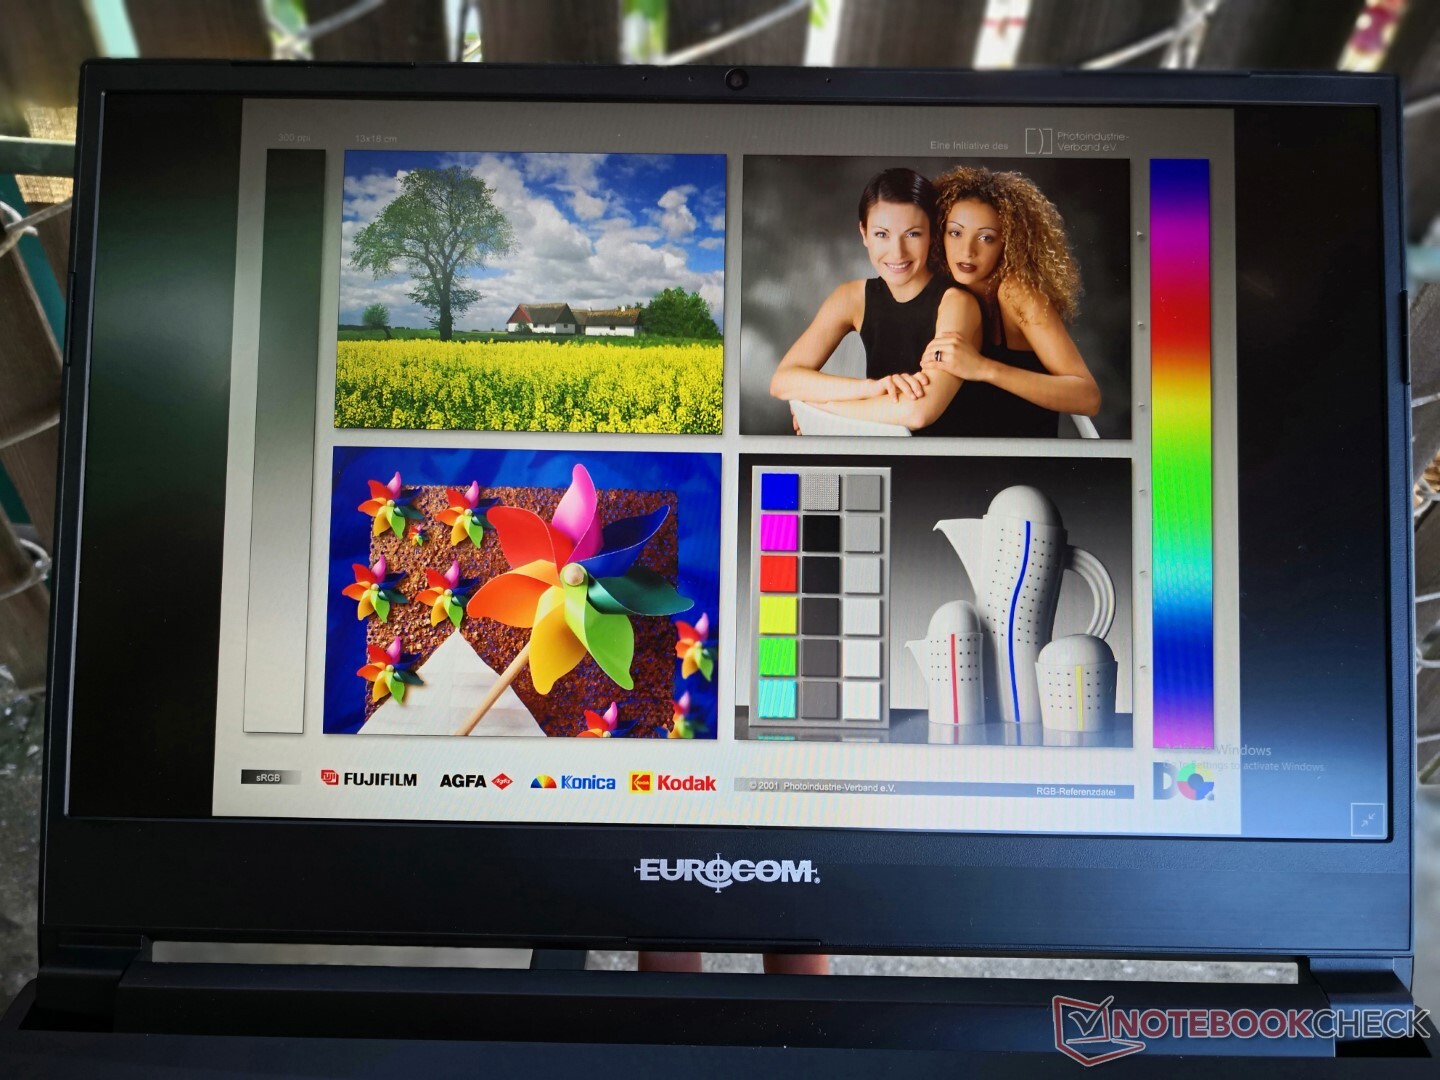
Affichage - net avec des couleurs excellentes
Le LG Gram 14T90P utilise la même dalle IPS LG Philips LP140WU1-SPA1 de haute qualité que celle qui équipe le Gram 14Z90P. Ainsi, les attributs tels que la reproduction des couleurs, les temps de réponse et le contraste sont à peu près identiques entre eux pour une expérience visuelle très similaire.
Par rapport à l'écran du Gram 14T90N, notre Gram 14T90P offre des couleurs plus profondes et des temps de réponse en noir et blanc et en gris légèrement plus rapides, sans impact sur la luminosité ou le contraste. Malgré tout, nous aimerions voir des panneaux OLED et/ou 90 Hz à l'avenir, car ces caractéristiques deviennent la norme sur les ordinateurs portables haut de gamme, comme sur le concurrentAsus Zenbook Flip 14.
| |||||||||||||||||||||||||
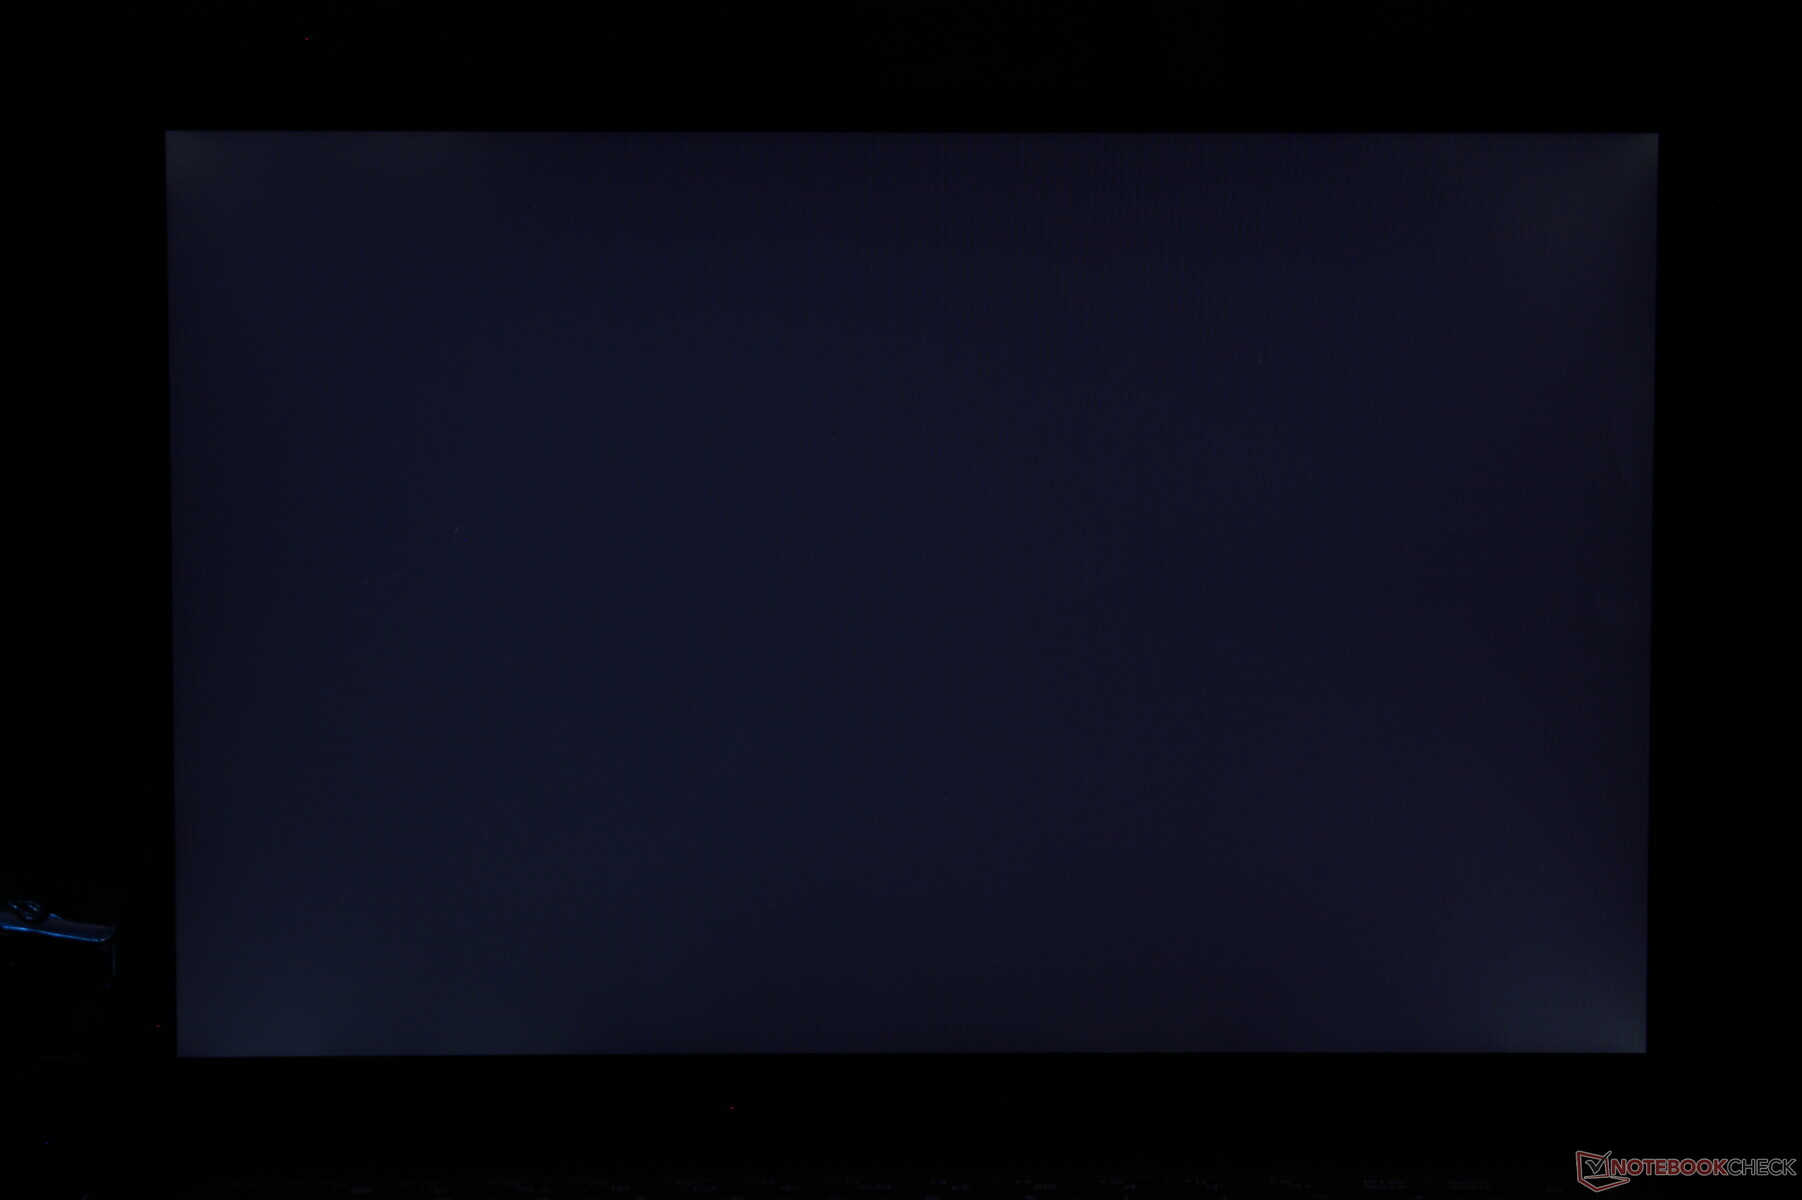
Homogénéité de la luminosité: 87 %
Valeur mesurée au centre, sur batterie: 305.5 cd/m²
Contraste: 1131:1 (Valeurs des noirs: 0.27 cd/m²)
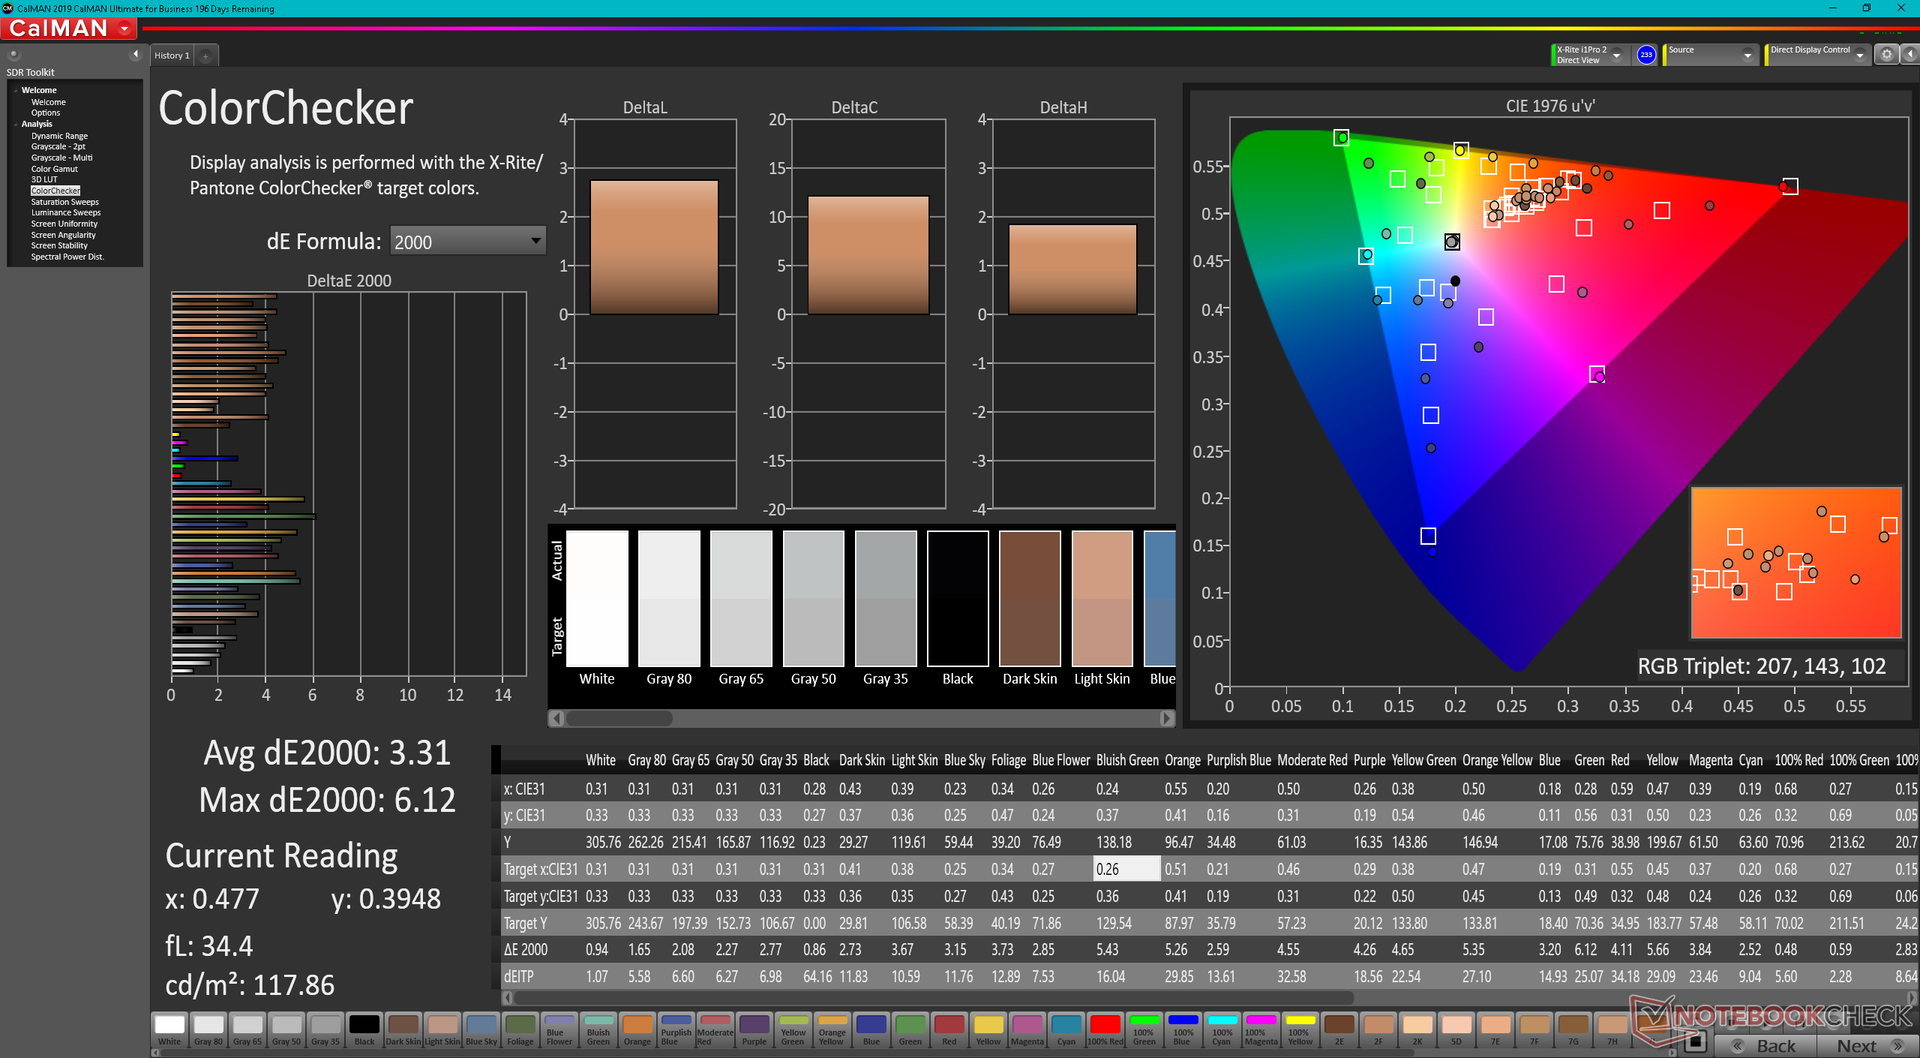
ΔE ColorChecker Calman: 3.31 | ∀{0.5-29.43 Ø4.71}
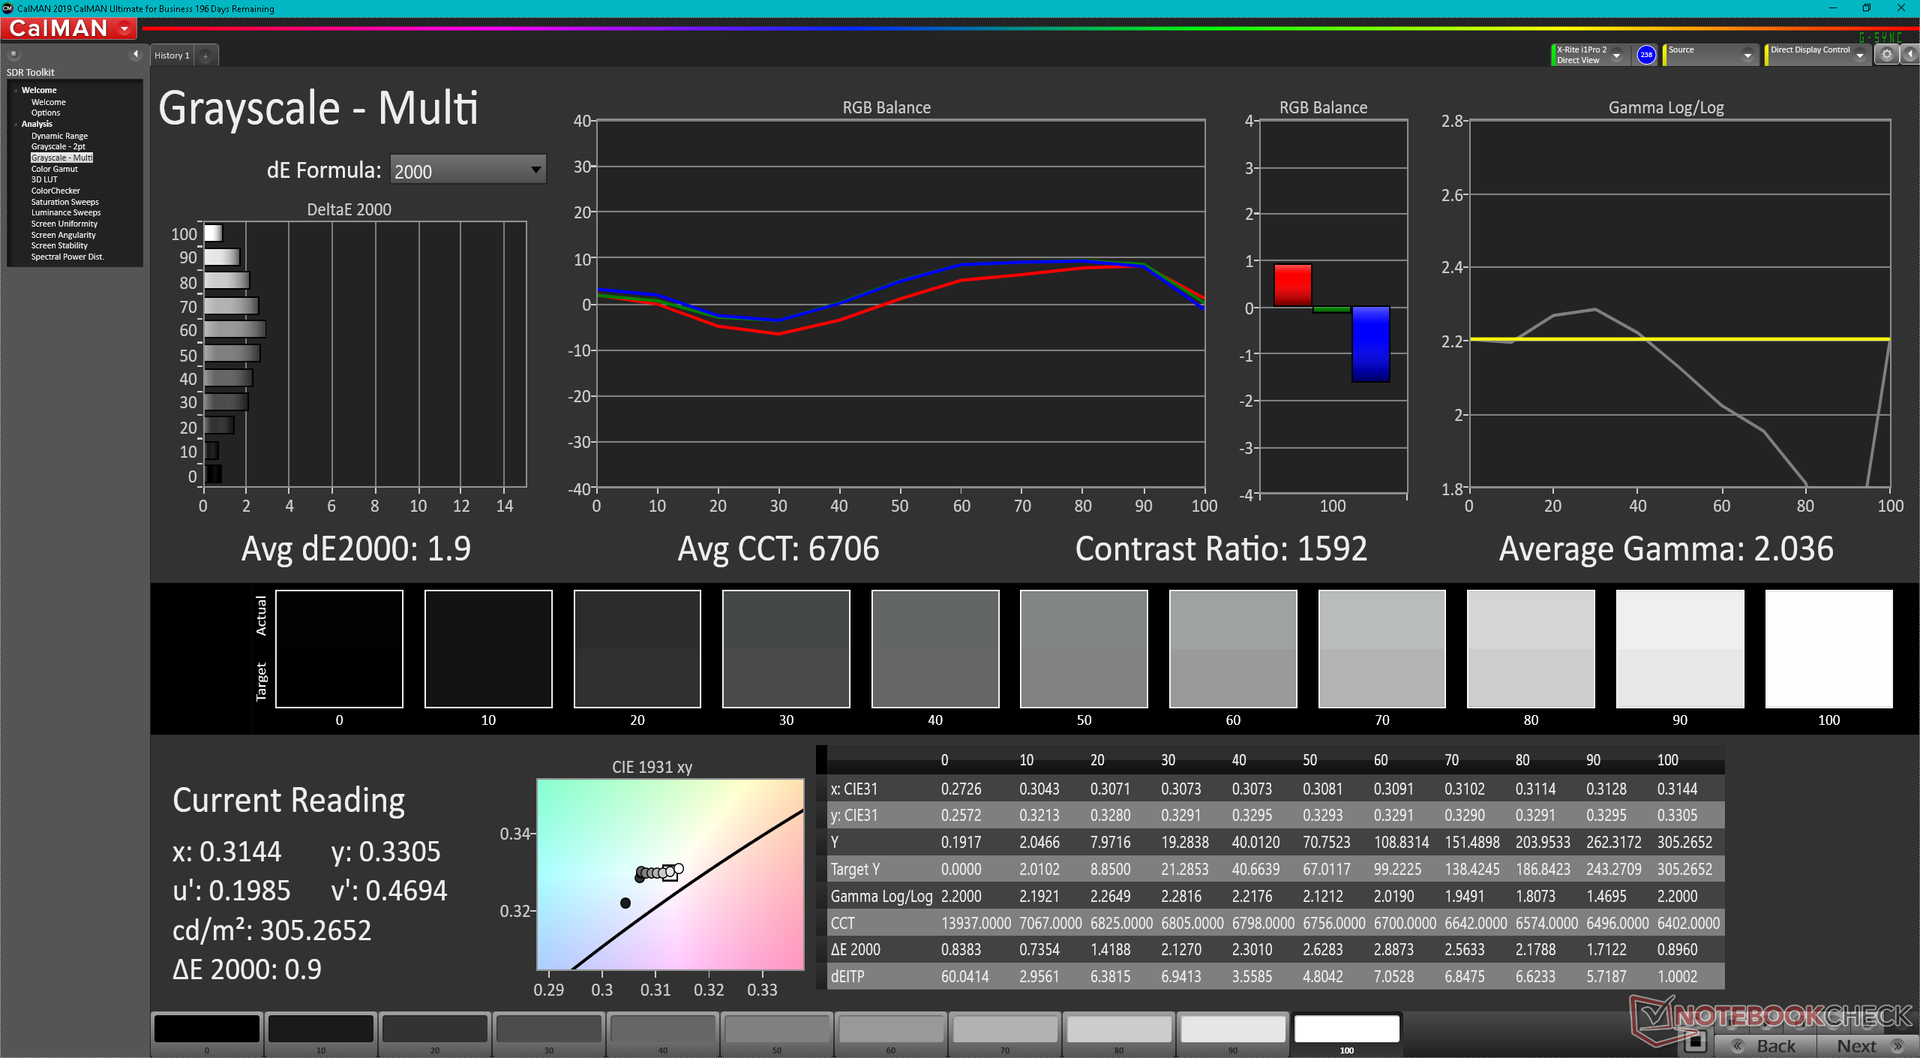
ΔE Greyscale Calman: 1.9 | ∀{0.09-98 Ø4.96}
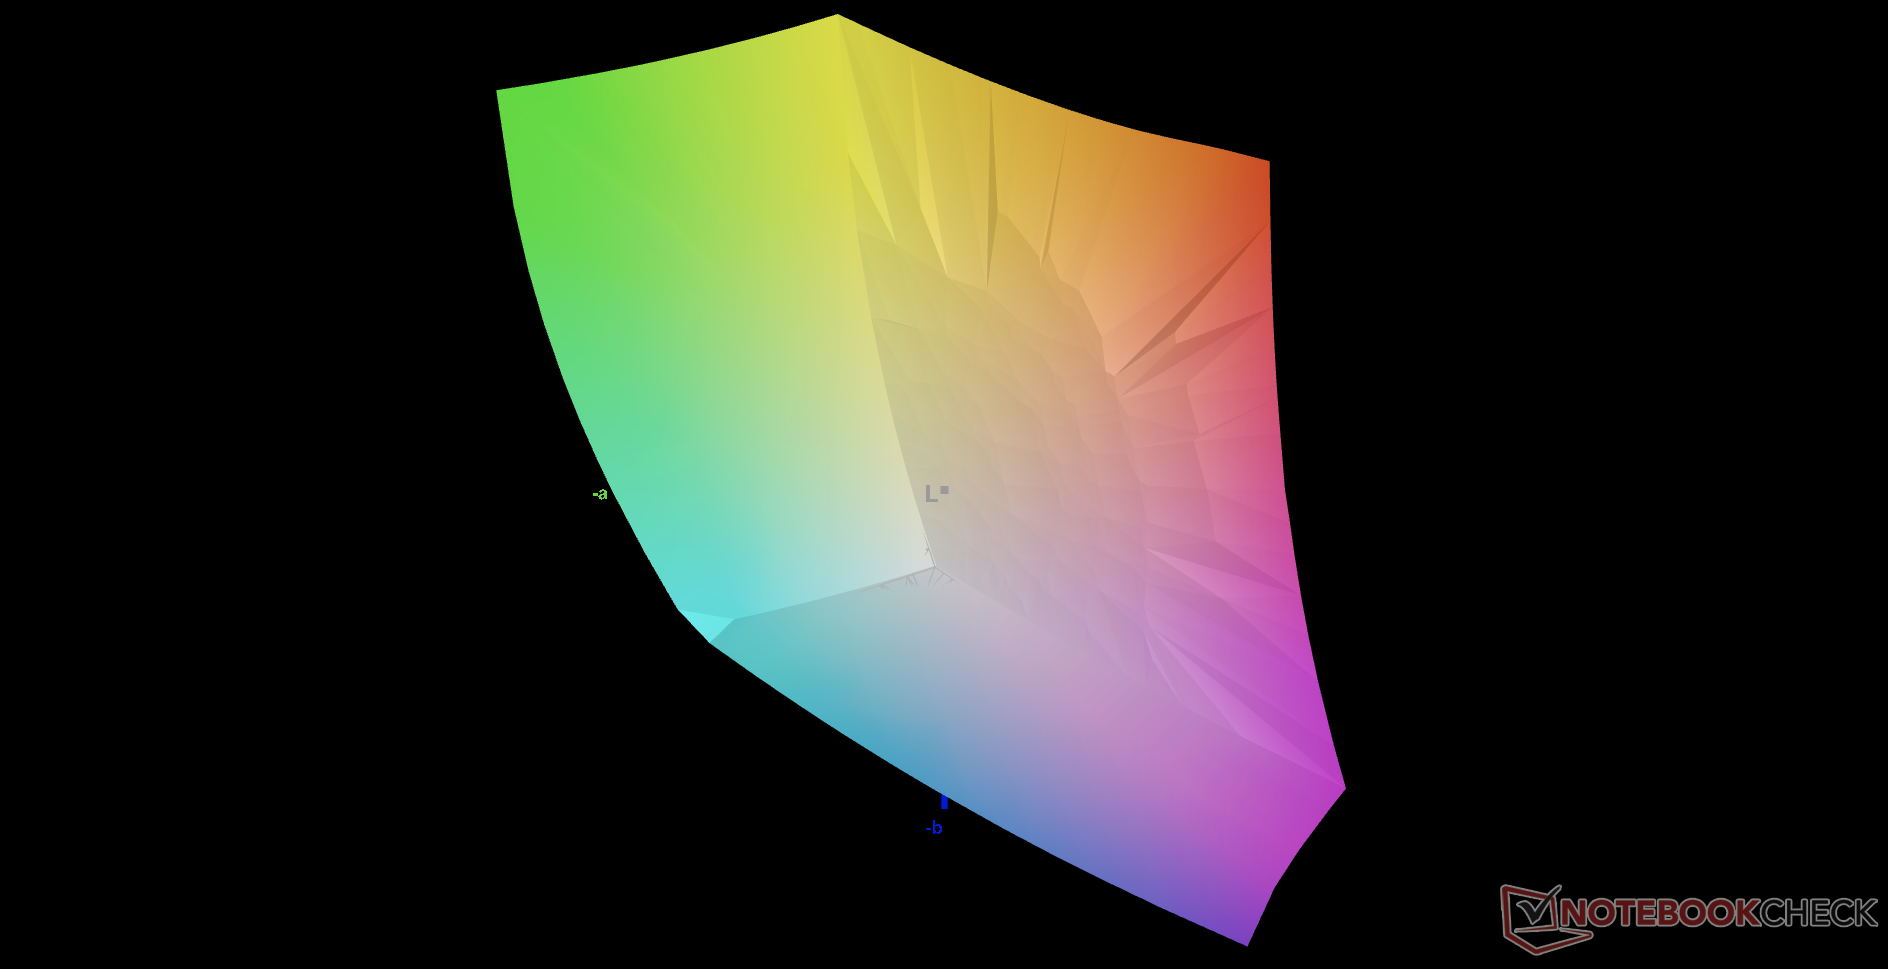
100% sRGB (Argyll 3D)
98.8% Display P3 (Argyll 3D)
Gamma: 2.04
CCT: 6706 K
| LG Gram 14T90P LG Philips LP140WU1-SPA1, IPS, 1900x1200, 14" | Dell XPS 13 9310 2-in-1 Sharp LQ134N1, IPS, 1920x1200, 13.4" | Lenovo Yoga 9 14IAP7 82LU0001US Lenovo LEN140WQ+, OLED, 2880x1800, 14" | Asus ZenBook Flip 14 UN5401QA-KN085W SDC4154, OLED, 2880x1800, 14" | HP Spectre x360 14-ea0378ng Samsung SDC4148, OLED, 3000x2000, 13.5" | MSI Summit E13 Flip Evo A11MT Sharp LQ134N1JW53, IPS, 1920x1200, 13.4" | LG Gram 14T90N LG Philips LP140WFA-SPY1, IPS, 1920x1080, 14" | |
|---|---|---|---|---|---|---|---|
| Display | -15% | 1% | 1% | 1% | -15% | -19% | |
| Display P3 Coverage (%) | 98.8 | 69.7 -29% | 99.8 1% | 99.7 1% | 99.9 1% | 69.8 -29% | 65 -34% |
| sRGB Coverage (%) | 100 | 99 -1% | 100 0% | 100 0% | 100 0% | 98.8 -1% | 95.7 -4% |
| AdobeRGB 1998 Coverage (%) | 71.7 | 98.7 | 98.6 | 96.1 | 70.6 | 66.7 | |
| Response Times | -31% | 97% | 94% | 94% | -46% | -16% | |
| Response Time Grey 50% / Grey 80% * (ms) | 44 ? | 55.6 ? -26% | 1.2 ? 97% | 2 ? 95% | 2 ? 95% | 64 ? -45% | 54 ? -23% |
| Response Time Black / White * (ms) | 30 ? | 40.4 ? -35% | 1.2 ? 96% | 2 ? 93% | 2 ? 93% | 44 ? -47% | 32.8 ? -9% |
| PWM Frequency (Hz) | 2500 ? | 347.2 ? | 250 ? | ||||
| Screen | -16% | -13% | 11% | 419% | 38% | -12% | |
| Brightness middle (cd/m²) | 305.5 | 555.7 82% | 367.3 20% | 366 20% | 370 21% | 551.3 80% | 322.2 5% |
| Brightness (cd/m²) | 289 | 528 83% | 369 28% | 369 28% | 374 29% | 517 79% | 301 4% |
| Brightness Distribution (%) | 87 | 90 3% | 97 11% | 96 10% | 90 3% | 91 5% | 86 -1% |
| Black Level * (cd/m²) | 0.27 | 0.35 -30% | 0.01 96% | 0.37 -37% | 0.25 7% | ||
| Contrast (:1) | 1131 | 1588 40% | 37000 3171% | 1490 32% | 1289 14% | ||
| Colorchecker dE 2000 * | 3.31 | 4.83 -46% | 5.2 -57% | 2.84 14% | 2.57 22% | 1.45 56% | 3.62 -9% |
| Colorchecker dE 2000 max. * | 6.12 | 8.46 -38% | 8.04 -31% | 5.29 14% | 4.52 26% | 2.86 53% | 6.9 -13% |
| Greyscale dE 2000 * | 1.9 | 6.1 -221% | 2.8 -47% | 2.32 -22% | 2.2 -16% | 1.3 32% | 3.9 -105% |
| Gamma | 2.04 108% | 1.98 111% | 2.21 100% | 2.44 90% | 2.36 93% | 2.14 103% | 2.43 91% |
| CCT | 6706 97% | 6686 97% | 5992 108% | 6170 105% | 6154 106% | 6580 99% | 6344 102% |
| Colorchecker dE 2000 calibrated * | 0.76 | 2.81 | 2.31 | 1.7 | 1.22 | ||
| Color Space (Percent of AdobeRGB 1998) (%) | 85.8 | 65 | 61.3 | ||||
| Color Space (Percent of sRGB) (%) | 100 | 99 | 95.6 | ||||
| Moyenne finale (programmes/paramètres) | -21% /
-18% | 28% /
12% | 35% /
25% | 171% /
295% | -8% /
15% | -16% /
-14% |
* ... Moindre est la valeur, meilleures sont les performances
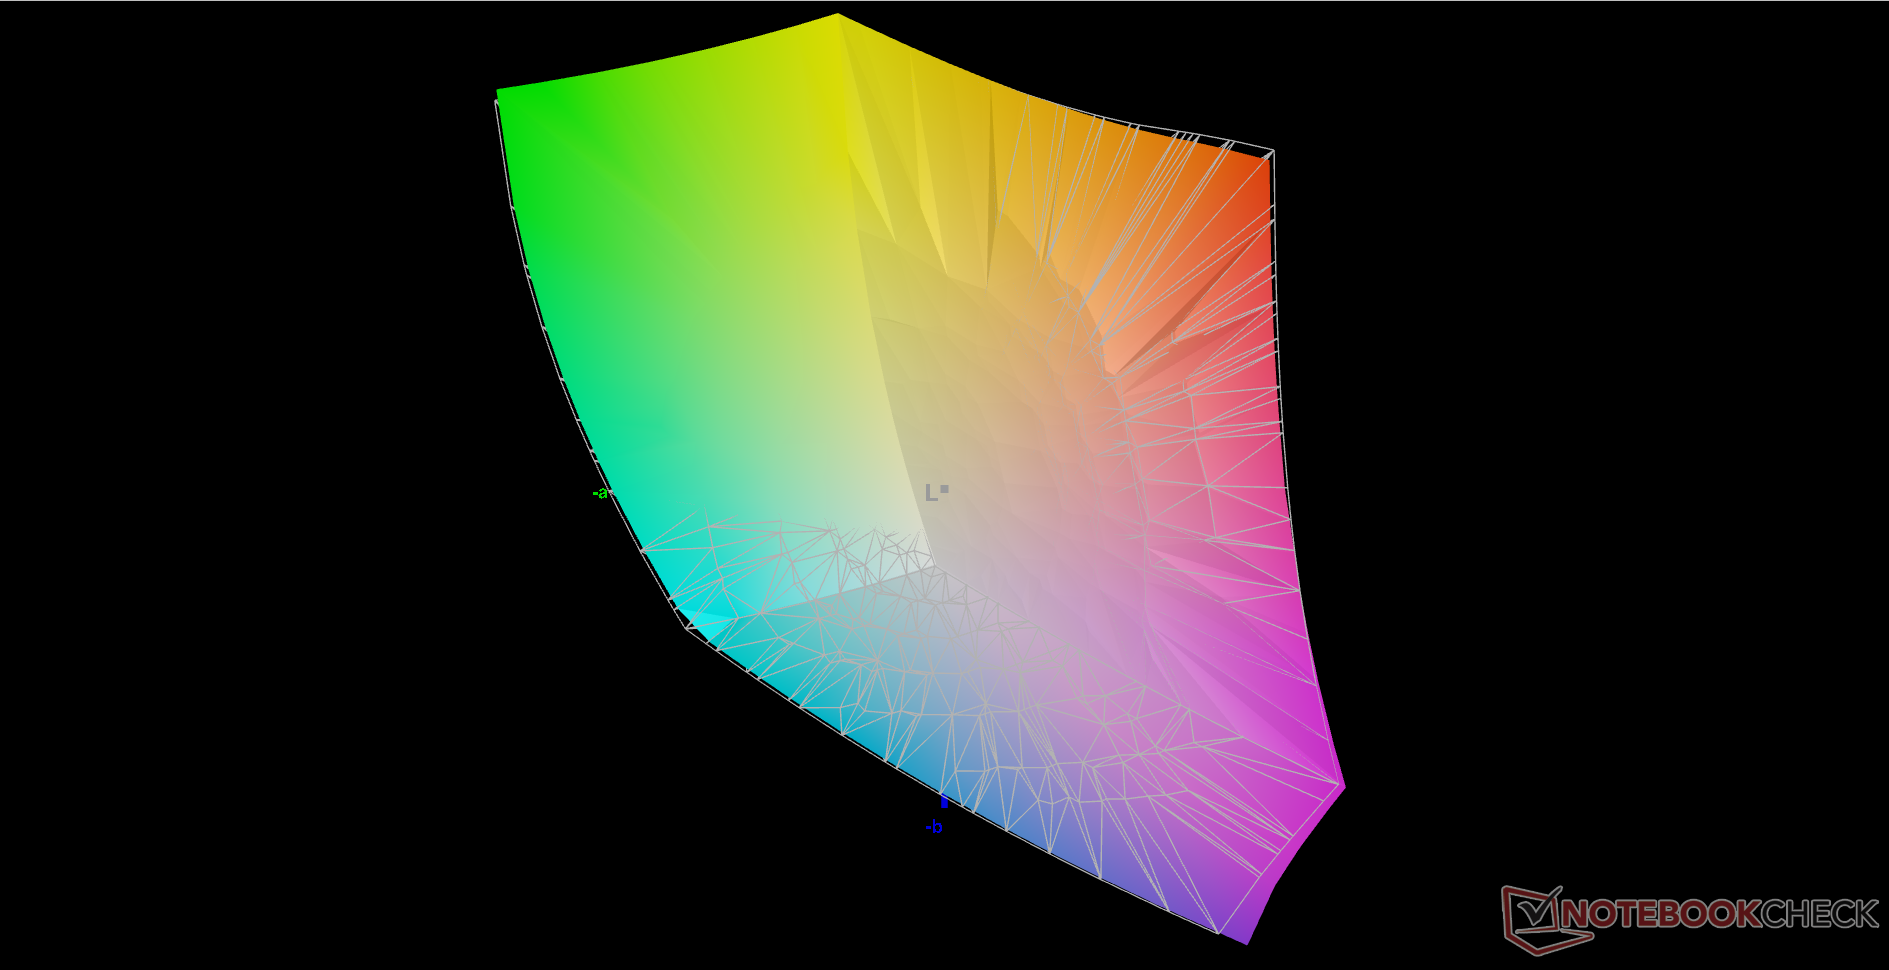
LG annonce une couverture DCI-P3 de 99 % et nous pouvons le confirmer avec notre propre colorimètre X-Rite. Le calcul d'AdobeRGB donne lieu à une erreur, mais la couverture devrait néanmoins être très similaire à ~99%. C'est l'un des rares panneaux IPS 16:10 de 14 pouces à offrir un gamut similaire à celui de la plupart des panneaux OLED.
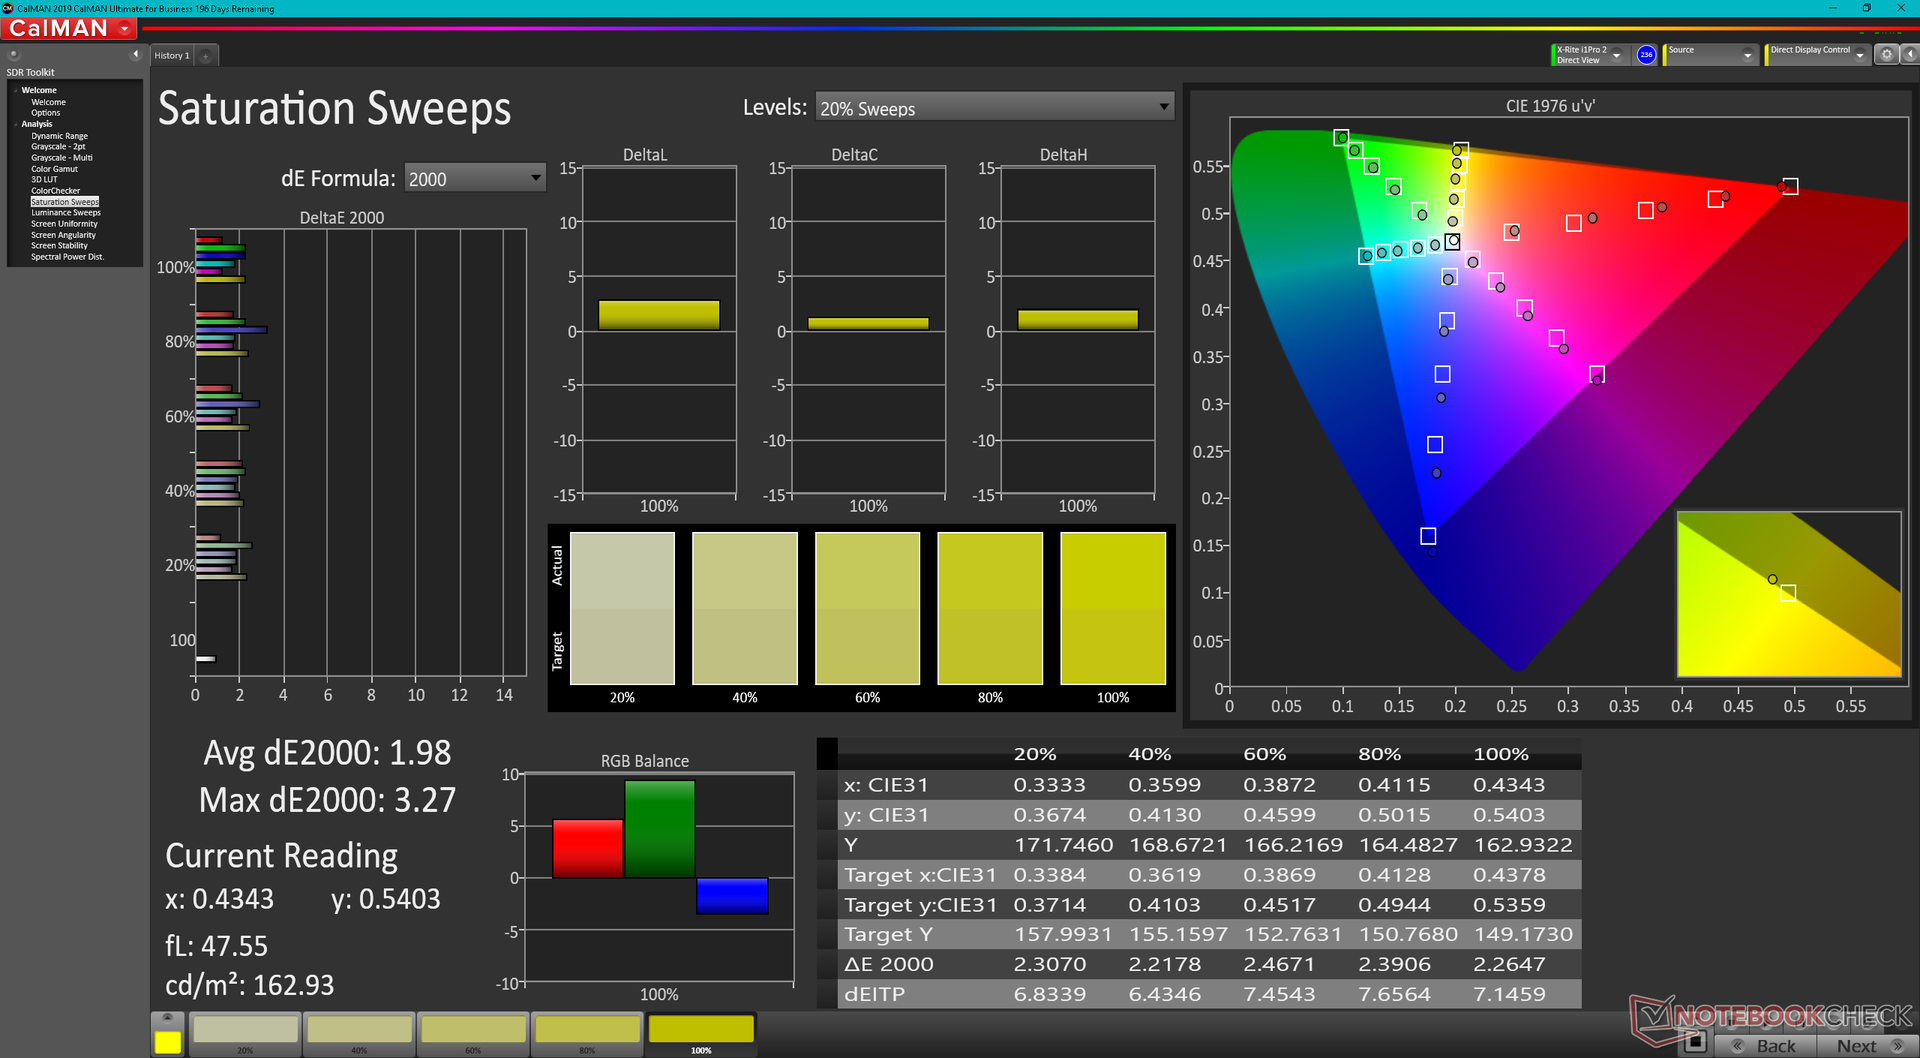
L'écran est correctement calibré dès sa sortie de l'emballage. Les valeurs moyennes de niveaux de gris et de DeltaE de ColorChecker sont respectivement de 1,9 et 3,31.
Temps de réponse de l'écran
| ↔ Temps de réponse noir à blanc | ||
|---|---|---|
| 30 ms ... hausse ↗ et chute ↘ combinées | ↗ 15.2 ms hausse | 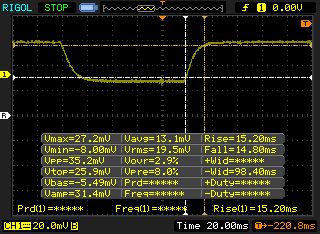 |
| ↘ 14.8 ms chute | ||
| L'écran souffre de latences très élevées, à éviter pour le jeu. En comparaison, tous les appareils testés affichent entre 0.1 (minimum) et 240 (maximum) ms. » 80 % des appareils testés affichent de meilleures performances. Cela signifie que les latences relevées sont moins bonnes que la moyenne (19.8 ms) de tous les appareils testés. | ||
| ↔ Temps de réponse gris 50% à gris 80% | ||
| 44 ms ... hausse ↗ et chute ↘ combinées | ↗ 21.2 ms hausse | 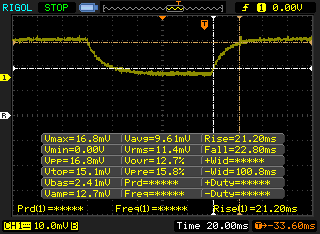 |
| ↘ 22.8 ms chute | ||
| L'écran souffre de latences très élevées, à éviter pour le jeu. En comparaison, tous les appareils testés affichent entre 0.165 (minimum) et 636 (maximum) ms. » 73 % des appareils testés affichent de meilleures performances. Cela signifie que les latences relevées sont moins bonnes que la moyenne (30.9 ms) de tous les appareils testés. | ||
Scintillement / MLI (Modulation de largeur d'impulsion)
| Scintillement / MLI (Modulation de largeur d'impulsion) non décelé | 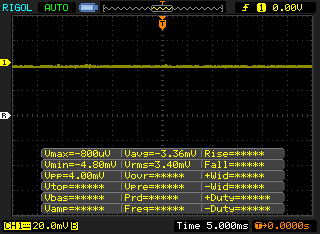 | ||
En comparaison, 52 % des appareils testés n'emploient pas MDI pour assombrir leur écran. Nous avons relevé une moyenne à 7744 (minimum : 5 - maximum : 343500) Hz dans le cas où une MDI était active. | |||
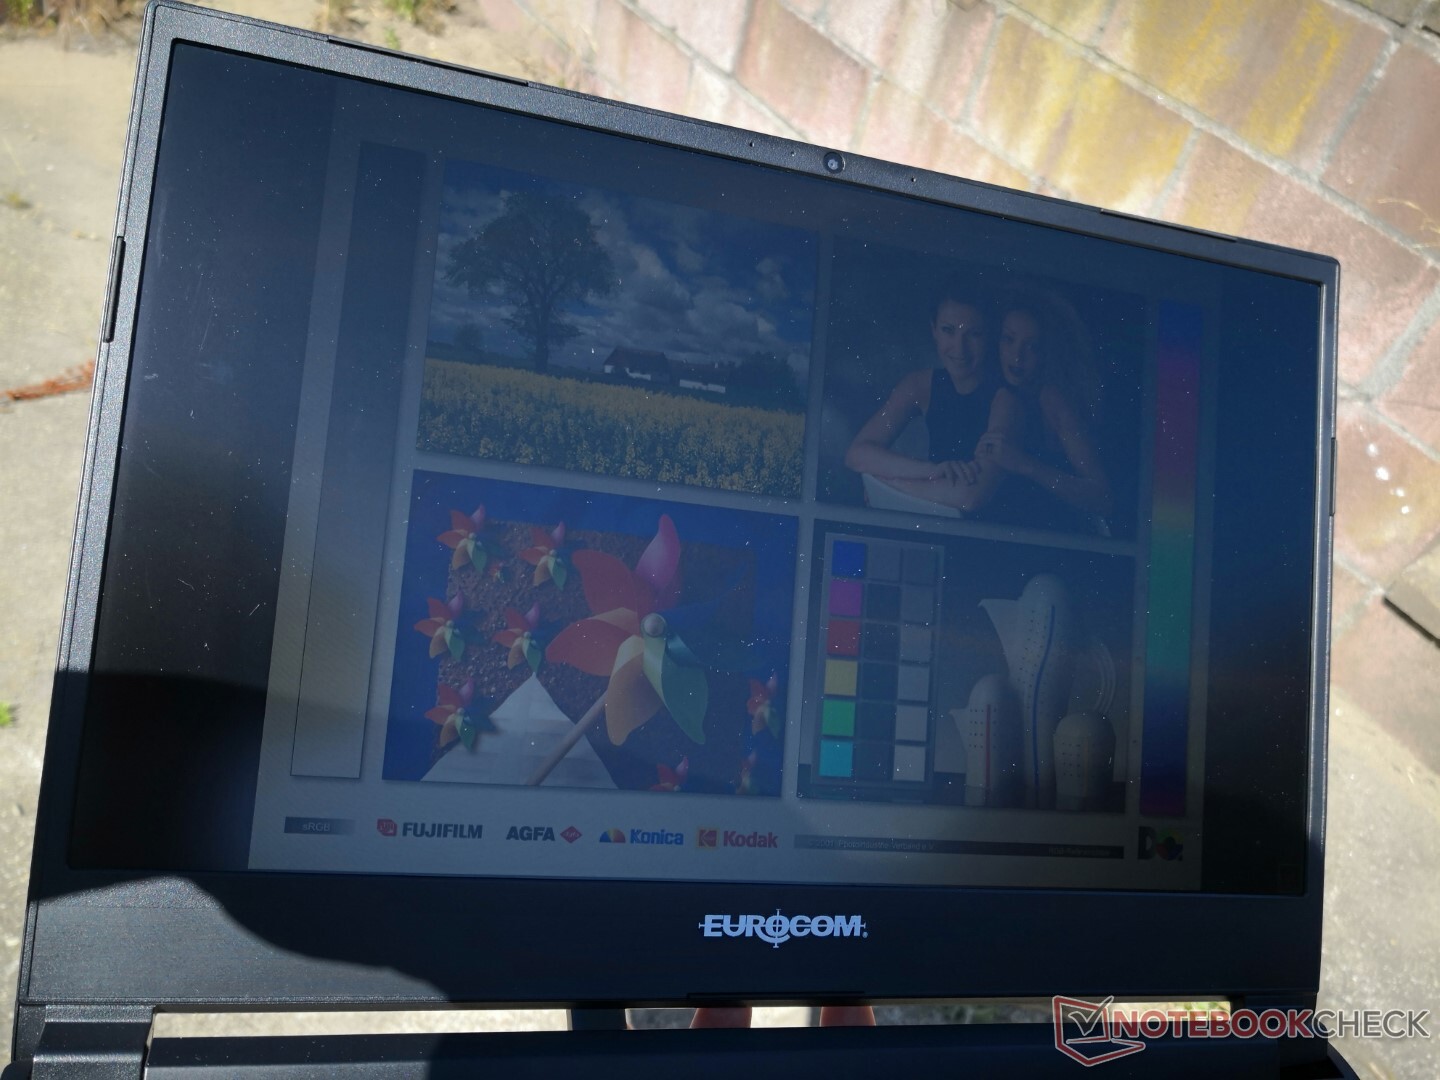
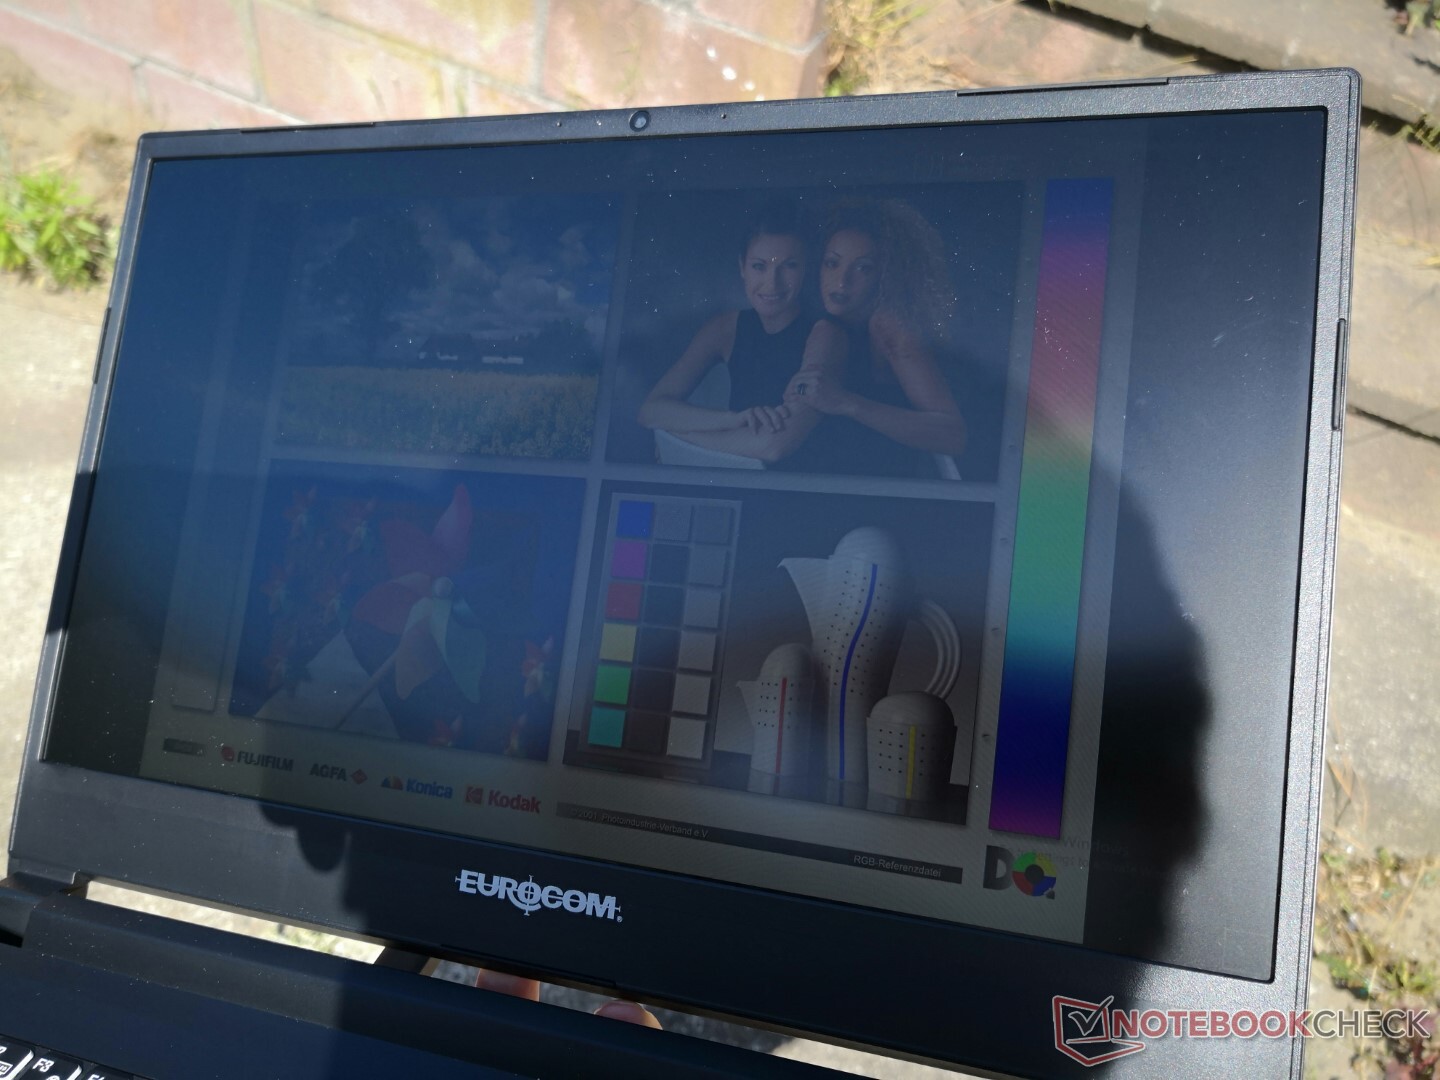
À 300 nits, l'écran est suffisamment lumineux pour les conditions d'intérieur, mais il est loin d'être à la hauteur pour une visualisation confortable en extérieur. Des alternatives comme leDell XPS 13 9310 2-en-1 ou le Summit E13 Flip de MSI ont des écrans beaucoup plus lumineux, avec plus de 500 nits chacun, et sont plus facilement visibles à l'extérieur.
Performances - Intel 11e génération
Conditions d'essai
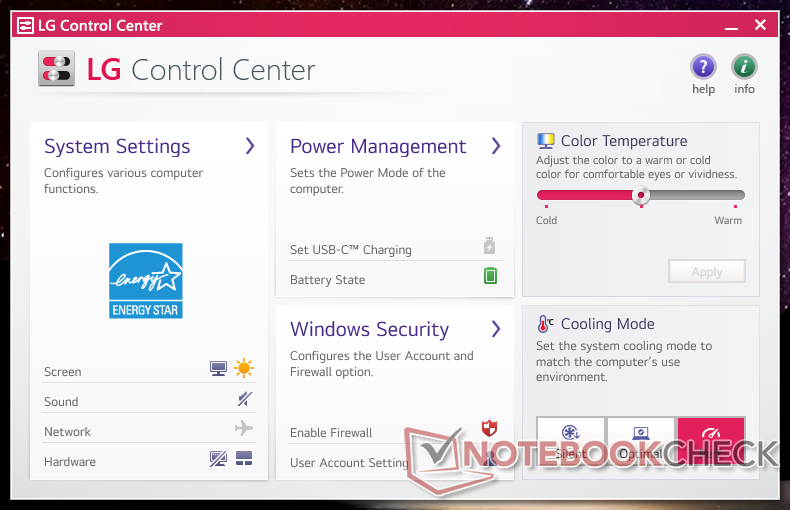
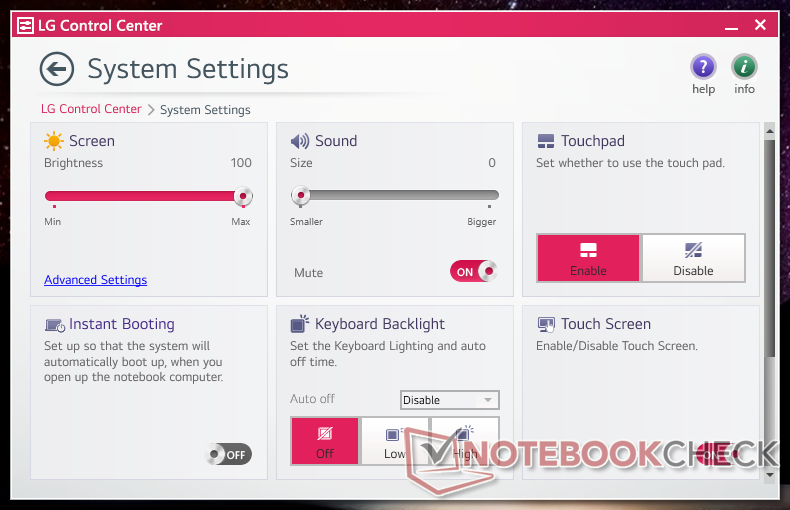
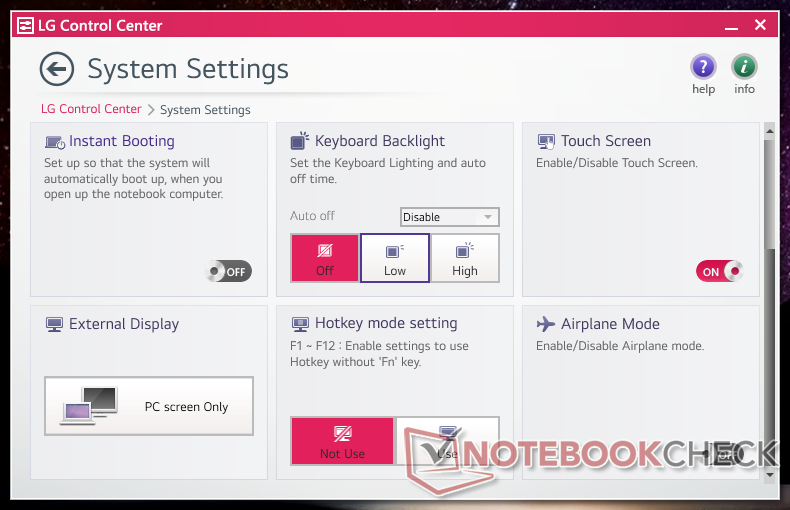
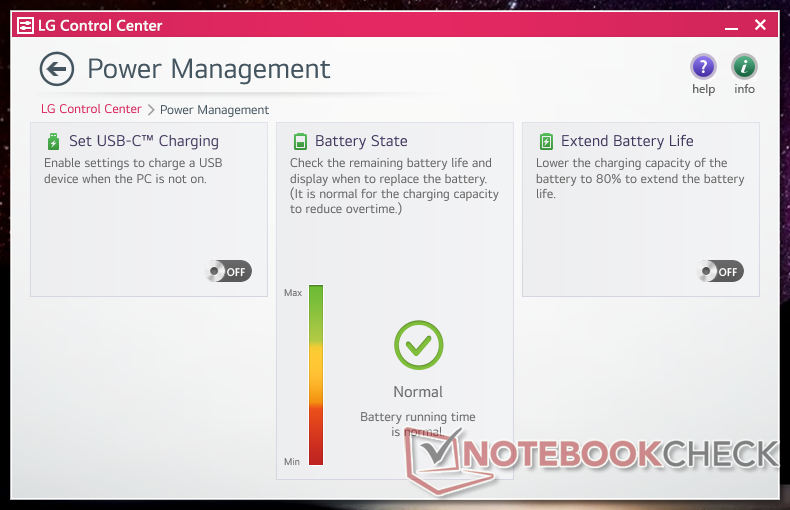
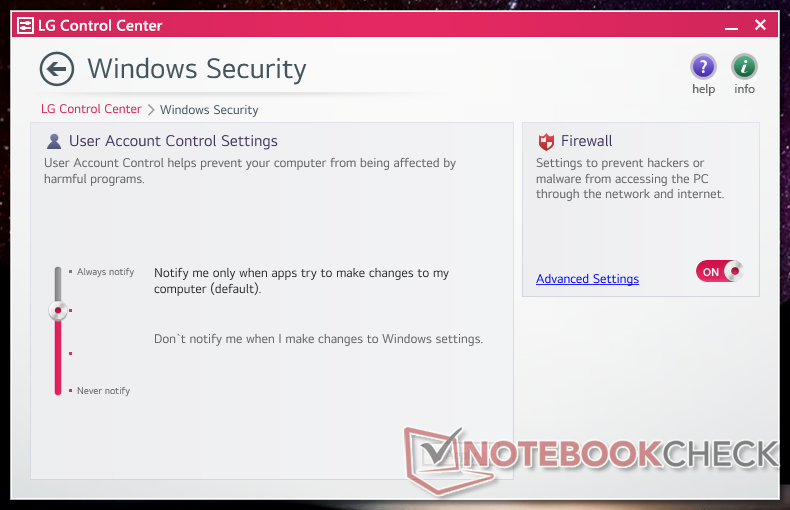
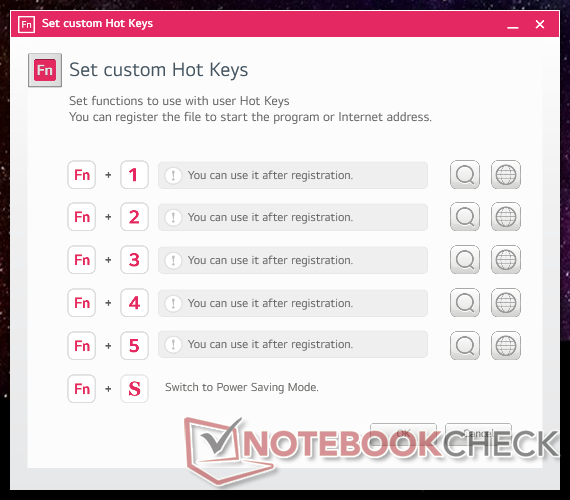
Notre appareil a été réglé en mode Performance avant d'effectuer des tests de performance pour obtenir les meilleurs résultats possibles. Il est fortement recommandé de se familiariser avec le logiciel préinstallé LG Control Center, car les paramètres et les fonctions clés sont basculés ici, comme le montrent les captures d'écran ci-dessous. Malheureusement, l'interface utilisateur du logiciel est très petite et ne peut pas être agrandie
Notez que le système se réinitialise automatiquement en mode Équilibre après chaque redémarrage ou arrêt, même si le profil d'alimentation était préalablement réglé sur Silencieux ou Performance.
Processeur
Les performances du CPU se situent à quelques points de pourcentage près par rapport à celles de l'ordinateur portable moyen de notre base de données équipé du même Core i5-1135G7 de notre base de données. Ainsi, les performances ne sont pas trop réduites juste pour tenir dans un châssis convertible ultraléger. La mise à niveau vers le Core i7-1165G7 A le potentiel d'augmenter les performances multithread jusqu'à 25 %, mais ce sera probablement beaucoup moins car le Core i5 dans notre configuration peut déjà atteindre des températures de plus de 90 °C
La durabilité de Turbo Boost est bonne mais pas parfaite. Lorsque nous avons exécuté CineBench R15 xT en boucle, notre score initial de 796 points a fini par chuter et se stabiliser à environ 666 points, ce qui représente une baisse de performance de 16 % au fil du temps en raison des limitations thermiques. Les deux Dell Latitude 14 etAcer Swift 3 SF314 sont capables de faire fonctionner le même processeur plus rapidement, comme le montre le graphique de comparaison ci-dessous.
Cinebench R15 Multi Loop
Cinebench R23: Multi Core | Single Core
Cinebench R15: CPU Multi 64Bit | CPU Single 64Bit
Blender: v2.79 BMW27 CPU
7-Zip 18.03: 7z b 4 | 7z b 4 -mmt1
Geekbench 5.5: Multi-Core | Single-Core
HWBOT x265 Benchmark v2.2: 4k Preset
LibreOffice : 20 Documents To PDF
R Benchmark 2.5: Overall mean
Cinebench R23: Multi Core | Single Core
Cinebench R15: CPU Multi 64Bit | CPU Single 64Bit
Blender: v2.79 BMW27 CPU
7-Zip 18.03: 7z b 4 | 7z b 4 -mmt1
Geekbench 5.5: Multi-Core | Single-Core
HWBOT x265 Benchmark v2.2: 4k Preset
LibreOffice : 20 Documents To PDF
R Benchmark 2.5: Overall mean
* ... Moindre est la valeur, meilleures sont les performances
AIDA64: FP32 Ray-Trace | FPU Julia | CPU SHA3 | CPU Queen | FPU SinJulia | FPU Mandel | CPU AES | CPU ZLib | FP64 Ray-Trace | CPU PhotoWorxx
| Performance rating | |
| Asus ZenBook Flip 14 UN5401QA-KN085W | |
| Lenovo Yoga 9 14IAP7 82LU0001US | |
| MSI Summit E13 Flip Evo A11MT | |
| LG Gram 14T90P | |
| Dell XPS 13 9310 2-in-1 | |
| Moyenne Intel Core i5-1135G7 | |
| HP Spectre x360 14-ea0378ng | |
| AIDA64 / FP32 Ray-Trace | |
| Asus ZenBook Flip 14 UN5401QA-KN085W | |
| MSI Summit E13 Flip Evo A11MT | |
| LG Gram 14T90P | |
| Dell XPS 13 9310 2-in-1 | |
| Moyenne Intel Core i5-1135G7 (4313 - 7952, n=45) | |
| Lenovo Yoga 9 14IAP7 82LU0001US | |
| HP Spectre x360 14-ea0378ng | |
| AIDA64 / FPU Julia | |
| Asus ZenBook Flip 14 UN5401QA-KN085W | |
| MSI Summit E13 Flip Evo A11MT | |
| Dell XPS 13 9310 2-in-1 | |
| LG Gram 14T90P | |
| Moyenne Intel Core i5-1135G7 (19402 - 32283, n=45) | |
| Lenovo Yoga 9 14IAP7 82LU0001US | |
| HP Spectre x360 14-ea0378ng | |
| AIDA64 / CPU SHA3 | |
| Asus ZenBook Flip 14 UN5401QA-KN085W | |
| MSI Summit E13 Flip Evo A11MT | |
| Dell XPS 13 9310 2-in-1 | |
| LG Gram 14T90P | |
| Lenovo Yoga 9 14IAP7 82LU0001US | |
| Moyenne Intel Core i5-1135G7 (1316 - 2172, n=45) | |
| HP Spectre x360 14-ea0378ng | |
| AIDA64 / CPU Queen | |
| Asus ZenBook Flip 14 UN5401QA-KN085W | |
| Lenovo Yoga 9 14IAP7 82LU0001US | |
| MSI Summit E13 Flip Evo A11MT | |
| HP Spectre x360 14-ea0378ng | |
| Dell XPS 13 9310 2-in-1 | |
| LG Gram 14T90P | |
| Moyenne Intel Core i5-1135G7 (39000 - 46951, n=45) | |
| AIDA64 / FPU SinJulia | |
| Asus ZenBook Flip 14 UN5401QA-KN085W | |
| Lenovo Yoga 9 14IAP7 82LU0001US | |
| MSI Summit E13 Flip Evo A11MT | |
| LG Gram 14T90P | |
| Dell XPS 13 9310 2-in-1 | |
| Moyenne Intel Core i5-1135G7 (3497 - 4445, n=45) | |
| HP Spectre x360 14-ea0378ng | |
| AIDA64 / FPU Mandel | |
| Asus ZenBook Flip 14 UN5401QA-KN085W | |
| MSI Summit E13 Flip Evo A11MT | |
| Dell XPS 13 9310 2-in-1 | |
| LG Gram 14T90P | |
| Moyenne Intel Core i5-1135G7 (12569 - 19635, n=45) | |
| Lenovo Yoga 9 14IAP7 82LU0001US | |
| HP Spectre x360 14-ea0378ng | |
| AIDA64 / CPU AES | |
| Asus ZenBook Flip 14 UN5401QA-KN085W | |
| MSI Summit E13 Flip Evo A11MT | |
| Dell XPS 13 9310 2-in-1 | |
| LG Gram 14T90P | |
| Moyenne Intel Core i5-1135G7 (28988 - 67977, n=45) | |
| HP Spectre x360 14-ea0378ng | |
| Lenovo Yoga 9 14IAP7 82LU0001US | |
| AIDA64 / CPU ZLib | |
| Asus ZenBook Flip 14 UN5401QA-KN085W | |
| Lenovo Yoga 9 14IAP7 82LU0001US | |
| MSI Summit E13 Flip Evo A11MT | |
| LG Gram 14T90P | |
| Dell XPS 13 9310 2-in-1 | |
| Moyenne Intel Core i5-1135G7 (265 - 373, n=51) | |
| HP Spectre x360 14-ea0378ng | |
| AIDA64 / FP64 Ray-Trace | |
| Asus ZenBook Flip 14 UN5401QA-KN085W | |
| MSI Summit E13 Flip Evo A11MT | |
| LG Gram 14T90P | |
| Dell XPS 13 9310 2-in-1 | |
| Moyenne Intel Core i5-1135G7 (2226 - 4291, n=45) | |
| Lenovo Yoga 9 14IAP7 82LU0001US | |
| HP Spectre x360 14-ea0378ng | |
| AIDA64 / CPU PhotoWorxx | |
| Lenovo Yoga 9 14IAP7 82LU0001US | |
| LG Gram 14T90P | |
| MSI Summit E13 Flip Evo A11MT | |
| Dell XPS 13 9310 2-in-1 | |
| HP Spectre x360 14-ea0378ng | |
| Moyenne Intel Core i5-1135G7 (9004 - 45366, n=45) | |
| Asus ZenBook Flip 14 UN5401QA-KN085W | |
Performance du système
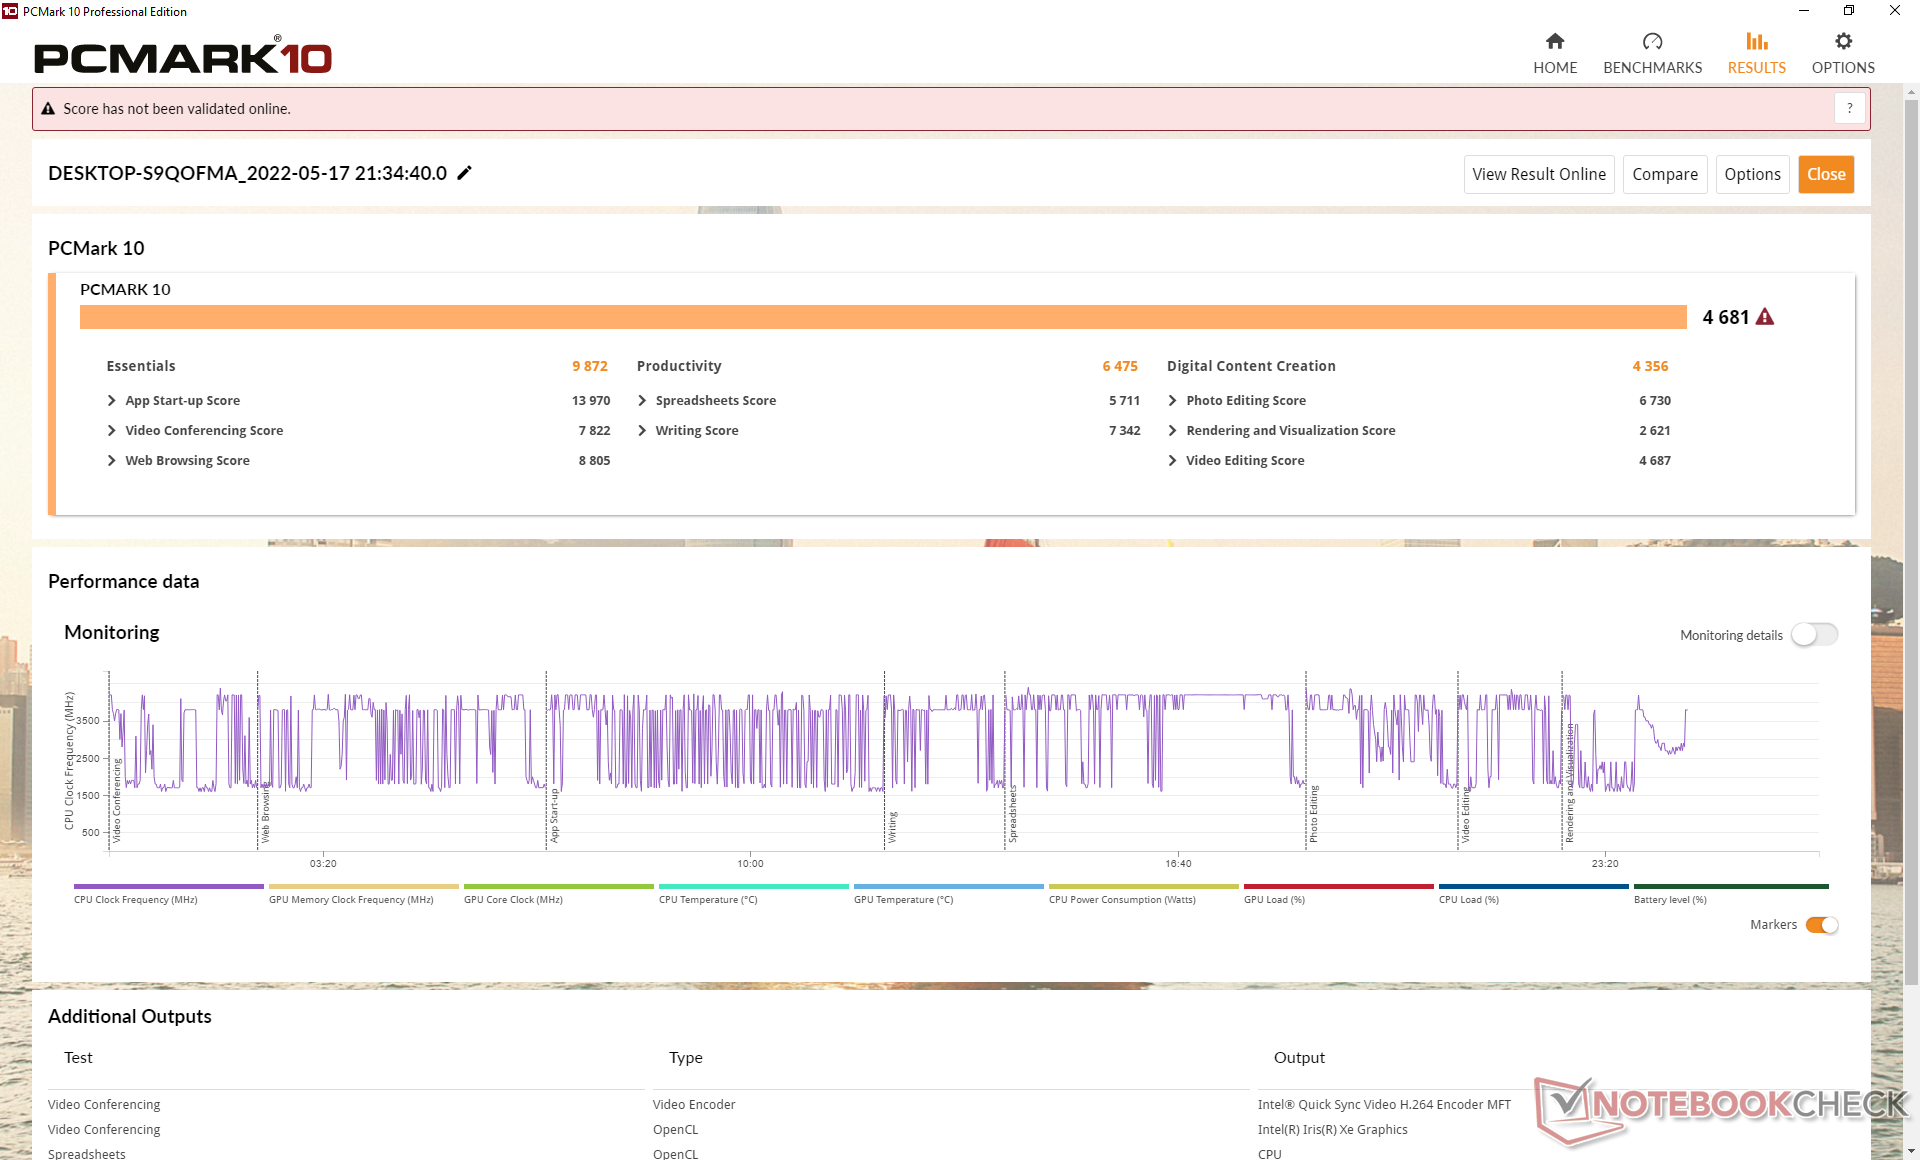
Les résultats de PCMark 10 sont généralement plus élevés que ceux de l'ancien Gram 14T90N, notamment dans le sous-test Création de contenu numérique où les performances du GPU sont favorisées. Notre score de productivité, cependant, est plus bas pour des raisons inconnues.
CrossMark: Overall | Productivity | Creativity | Responsiveness
| PCMark 10 / Score | |
| Asus ZenBook Flip 14 UN5401QA-KN085W | |
| Lenovo Yoga 9 14IAP7 82LU0001US | |
| Dell XPS 13 9310 2-in-1 | |
| MSI Summit E13 Flip Evo A11MT | |
| LG Gram 14T90P | |
| Moyenne Intel Core i5-1135G7, Intel Iris Xe Graphics G7 80EUs (4026 - 4952, n=53) | |
| HP Spectre x360 14-ea0378ng | |
| LG Gram 14T90N | |
| PCMark 10 / Essentials | |
| Lenovo Yoga 9 14IAP7 82LU0001US | |
| Dell XPS 13 9310 2-in-1 | |
| Asus ZenBook Flip 14 UN5401QA-KN085W | |
| LG Gram 14T90P | |
| HP Spectre x360 14-ea0378ng | |
| Moyenne Intel Core i5-1135G7, Intel Iris Xe Graphics G7 80EUs (8149 - 9917, n=53) | |
| LG Gram 14T90N | |
| MSI Summit E13 Flip Evo A11MT | |
| PCMark 10 / Productivity | |
| Asus ZenBook Flip 14 UN5401QA-KN085W | |
| LG Gram 14T90N | |
| MSI Summit E13 Flip Evo A11MT | |
| Dell XPS 13 9310 2-in-1 | |
| LG Gram 14T90P | |
| Lenovo Yoga 9 14IAP7 82LU0001US | |
| HP Spectre x360 14-ea0378ng | |
| Moyenne Intel Core i5-1135G7, Intel Iris Xe Graphics G7 80EUs (5040 - 6619, n=53) | |
| PCMark 10 / Digital Content Creation | |
| Lenovo Yoga 9 14IAP7 82LU0001US | |
| Asus ZenBook Flip 14 UN5401QA-KN085W | |
| Dell XPS 13 9310 2-in-1 | |
| MSI Summit E13 Flip Evo A11MT | |
| Moyenne Intel Core i5-1135G7, Intel Iris Xe Graphics G7 80EUs (3548 - 5255, n=53) | |
| LG Gram 14T90P | |
| HP Spectre x360 14-ea0378ng | |
| LG Gram 14T90N | |
| CrossMark / Overall | |
| Lenovo Yoga 9 14IAP7 82LU0001US | |
| LG Gram 14T90P | |
| Moyenne Intel Core i5-1135G7, Intel Iris Xe Graphics G7 80EUs (1058 - 1293, n=11) | |
| CrossMark / Productivity | |
| Lenovo Yoga 9 14IAP7 82LU0001US | |
| LG Gram 14T90P | |
| Moyenne Intel Core i5-1135G7, Intel Iris Xe Graphics G7 80EUs (1148 - 1332, n=11) | |
| CrossMark / Creativity | |
| Lenovo Yoga 9 14IAP7 82LU0001US | |
| LG Gram 14T90P | |
| Moyenne Intel Core i5-1135G7, Intel Iris Xe Graphics G7 80EUs (895 - 1263, n=11) | |
| CrossMark / Responsiveness | |
| Lenovo Yoga 9 14IAP7 82LU0001US | |
| LG Gram 14T90P | |
| Moyenne Intel Core i5-1135G7, Intel Iris Xe Graphics G7 80EUs (923 - 1320, n=11) | |
| PCMark 10 Score | 4681 points | |
Aide | ||
| AIDA64 / Memory Copy | |
| Lenovo Yoga 9 14IAP7 82LU0001US | |
| LG Gram 14T90P | |
| Dell XPS 13 9310 2-in-1 | |
| MSI Summit E13 Flip Evo A11MT | |
| HP Spectre x360 14-ea0378ng | |
| Moyenne Intel Core i5-1135G7 (17443 - 63889, n=45) | |
| Asus ZenBook Flip 14 UN5401QA-KN085W | |
| AIDA64 / Memory Read | |
| Lenovo Yoga 9 14IAP7 82LU0001US | |
| LG Gram 14T90P | |
| Dell XPS 13 9310 2-in-1 | |
| MSI Summit E13 Flip Evo A11MT | |
| HP Spectre x360 14-ea0378ng | |
| Moyenne Intel Core i5-1135G7 (19716 - 63705, n=45) | |
| Asus ZenBook Flip 14 UN5401QA-KN085W | |
| AIDA64 / Memory Write | |
| LG Gram 14T90P | |
| Dell XPS 13 9310 2-in-1 | |
| Lenovo Yoga 9 14IAP7 82LU0001US | |
| MSI Summit E13 Flip Evo A11MT | |
| HP Spectre x360 14-ea0378ng | |
| Moyenne Intel Core i5-1135G7 (18722 - 66778, n=45) | |
| Asus ZenBook Flip 14 UN5401QA-KN085W | |
| AIDA64 / Memory Latency | |
| Asus ZenBook Flip 14 UN5401QA-KN085W | |
| MSI Summit E13 Flip Evo A11MT | |
| Dell XPS 13 9310 2-in-1 | |
| HP Spectre x360 14-ea0378ng | |
| LG Gram 14T90P | |
| Moyenne Intel Core i5-1135G7 (68.3 - 107, n=51) | |
* ... Moindre est la valeur, meilleures sont les performances
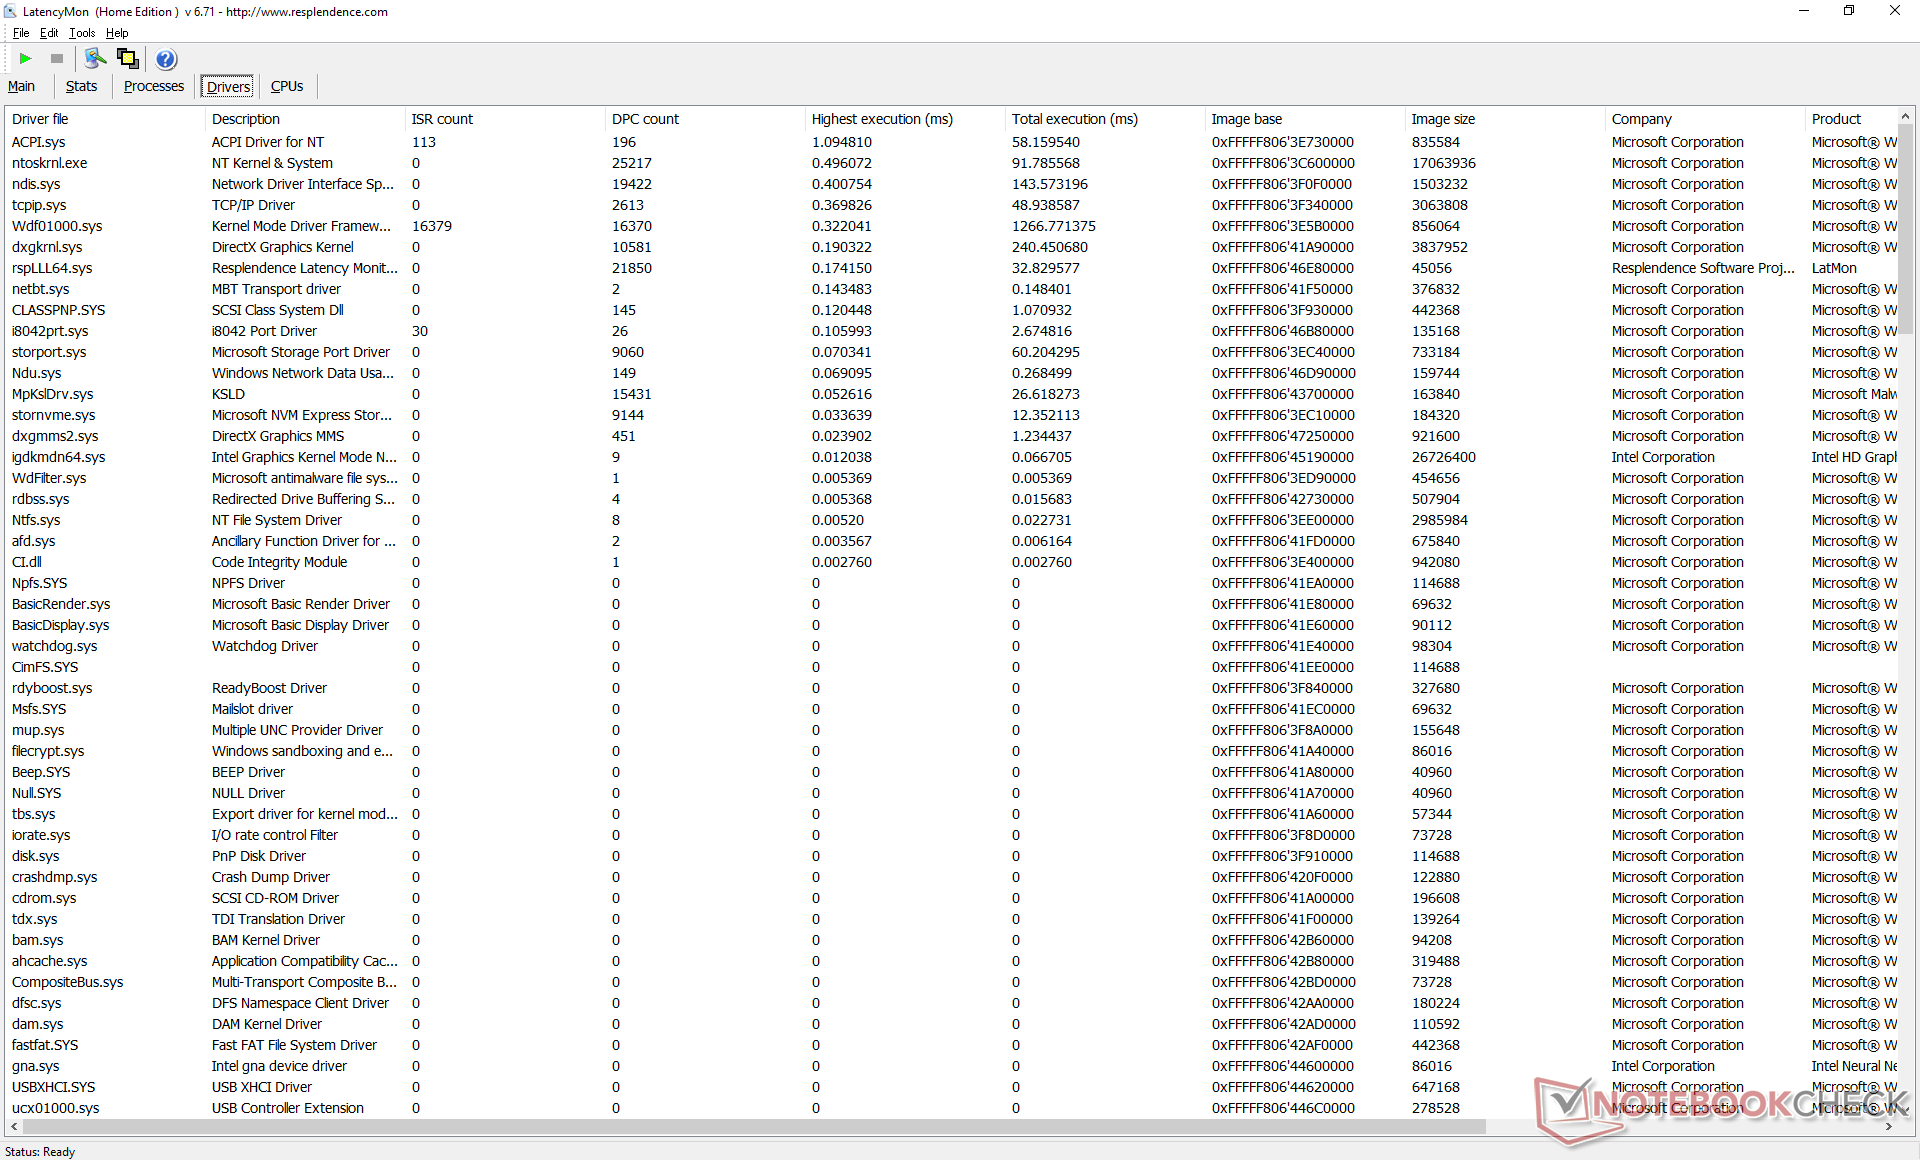
Latence DPC
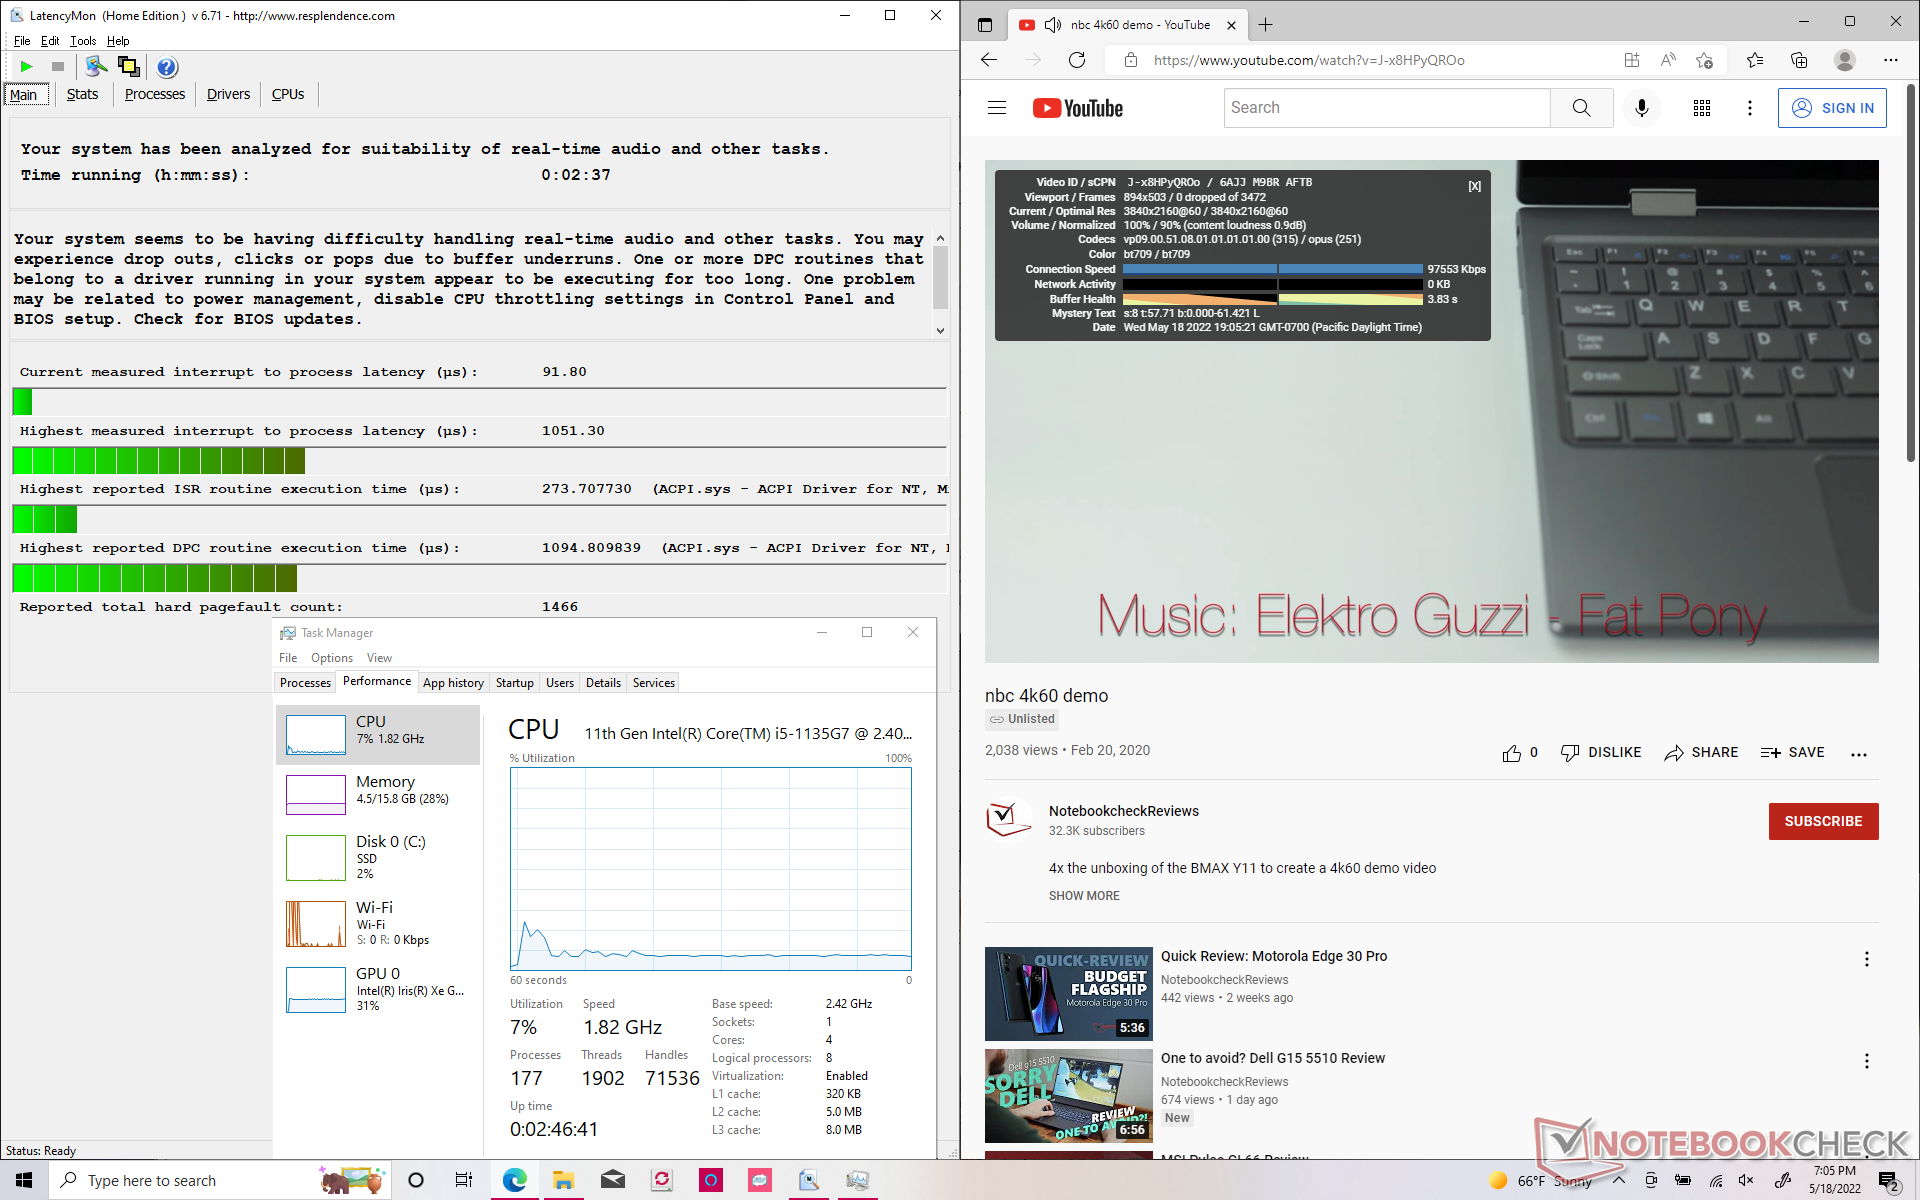
LatencyMon montre des problèmes mineurs de DPC lors de l'ouverture de plusieurs onglets de navigateur sur notre page d'accueil. la lecture de vidéos 4K à 60 FPS est par ailleurs parfaite, sans aucune perte d'images.
| DPC Latencies / LatencyMon - interrupt to process latency (max), Web, Youtube, Prime95 | |
| MSI Summit E13 Flip Evo A11MT | |
| HP Spectre x360 14-ea0378ng | |
| Lenovo Yoga 9 14IAP7 82LU0001US | |
| LG Gram 14T90N | |
| LG Gram 14T90P | |
| Asus ZenBook Flip 14 UN5401QA-KN085W | |
| Dell XPS 13 9310 2-in-1 | |
* ... Moindre est la valeur, meilleures sont les performances
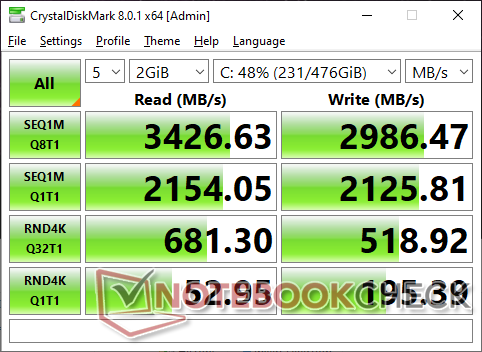
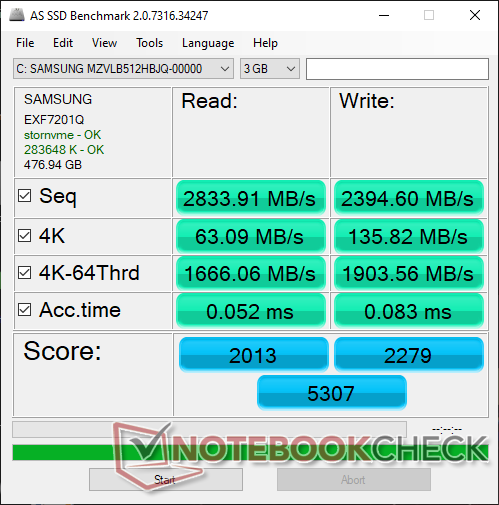
Périphériques de stockage - Livré avec des disques PCIe3
Notre unité est livré avec le même 512 GBSamsung PM981a PCIe3 x4 NVMe SSD que sur le Gram 14T90N, même si la carte mère Tiger Lake-UP3 devrait être en mesure de prendre en charge les mises à niveau PCIe4 x4 de l'utilisateur final pour des vitesses plus rapides. Néanmoins, le PM981a n'a aucun problème à maintenir son taux de transfert maximal de ~3400 Mo/s sur des périodes prolongées dans nos tests. Il reste l'un des disques NVMe PCIe3 les plus rapides pour les consommateurs.

* ... Moindre est la valeur, meilleures sont les performances
Disk Throttling: DiskSpd Read Loop, Queue Depth 8
Performances du GPU
Les performances graphiques des cartes intégrées Iris Xe 80 EUs intégré sont excellentes et plus rapides que sur la plupart des autres ordinateurs portables équipés du même GPU. Par rapport au Core i7 plus courant, l Iris Xe 96 EUsnotre Core i5 Iris Xe 80 EU peut être de 15 à 30 % plus lent. Il s'agit tout de même d'une amélioration significative par rapport au UHD Graphics 620 de l'ancien Gram 14T90N
Malheureusement, les performances ne sont pas aussi régulières que nous le souhaiterions. Lorsque l'appareil tourne au ralenti Witcher 3 avec des paramètres 720p bas, par exemple, les taux de rafraîchissement fluctuaient entre 75 et 85 FPS au lieu de rester stables comme sur la plupart des autres ordinateurs portables. L'exécution de Fire Strike deux fois de suite a également entraîné un écart relativement important dans le score de Physics (10017 points contre 11226 points). Nous recommandons d'activer vsync pour limiter le déchirement de l'écran et les temps de trame instables.
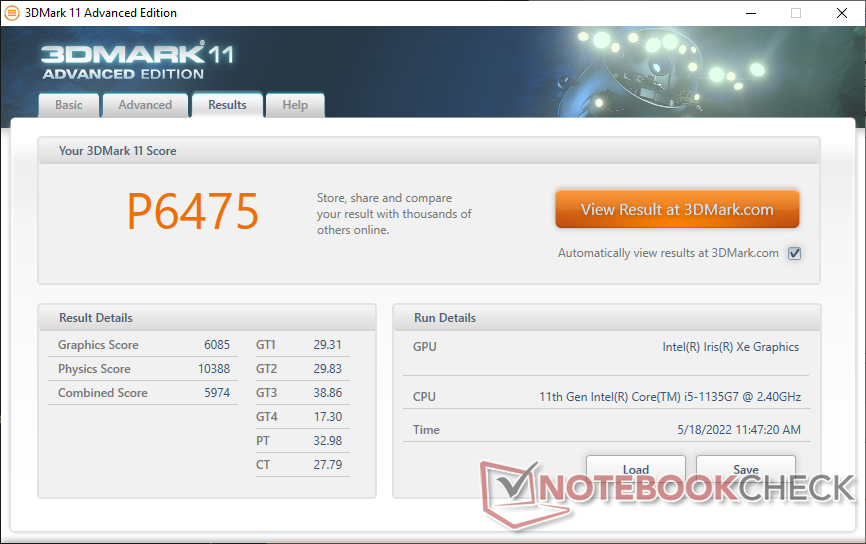
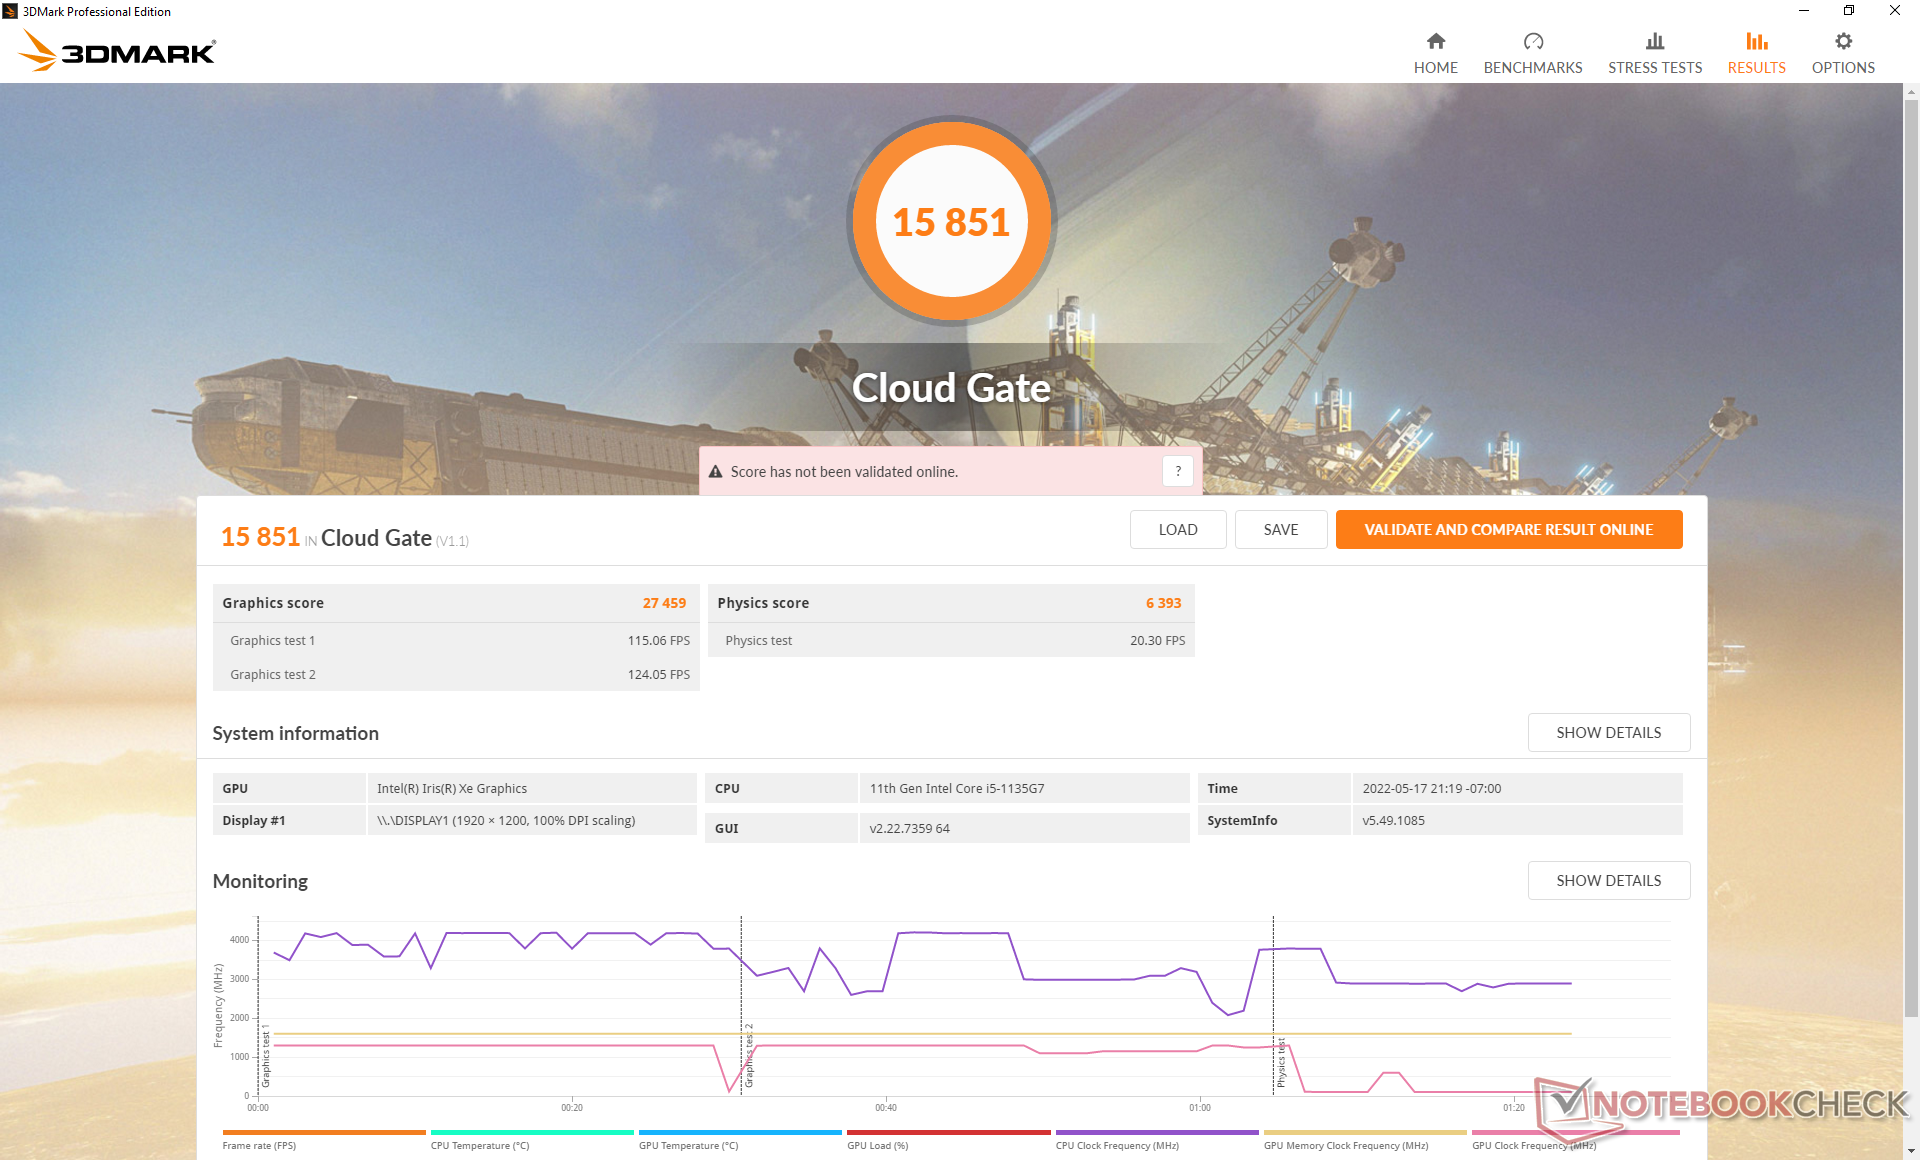
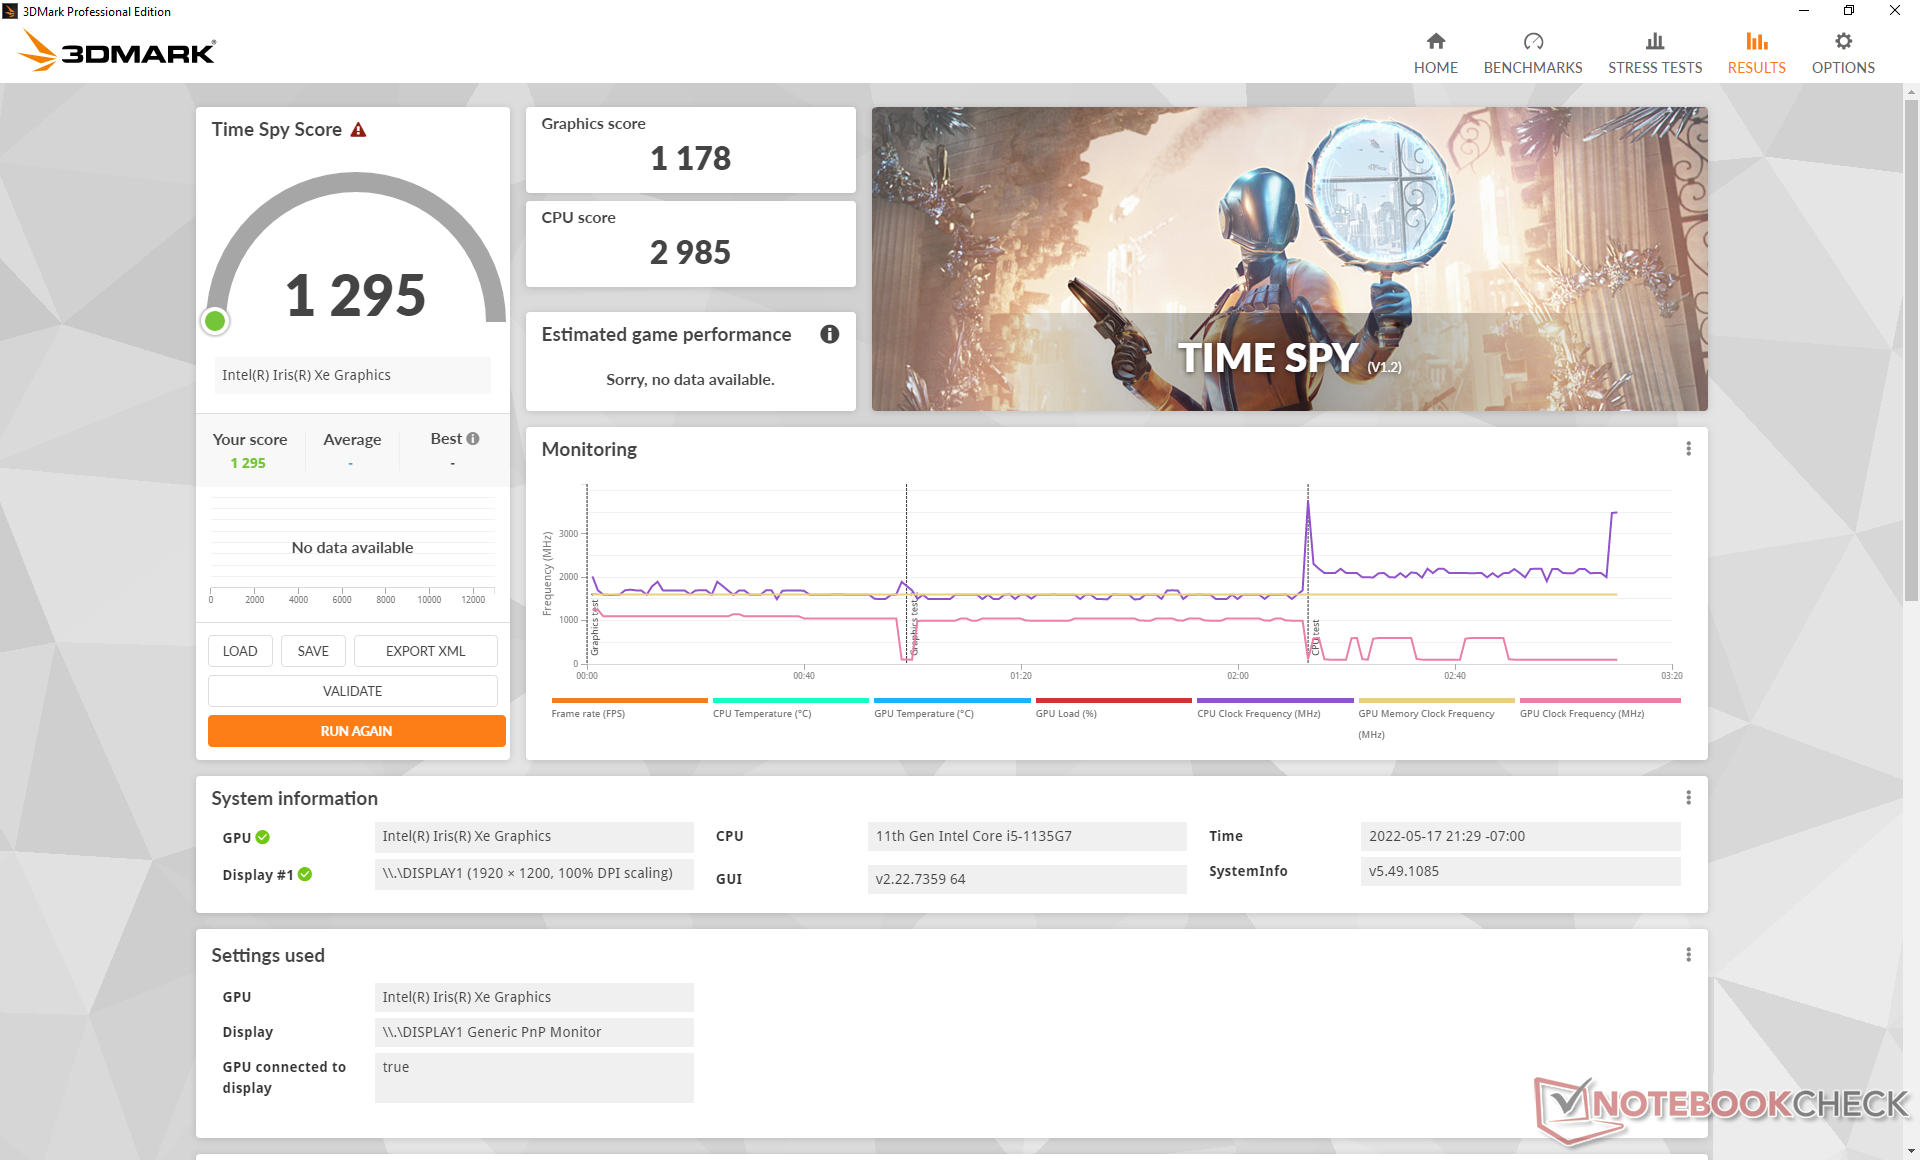
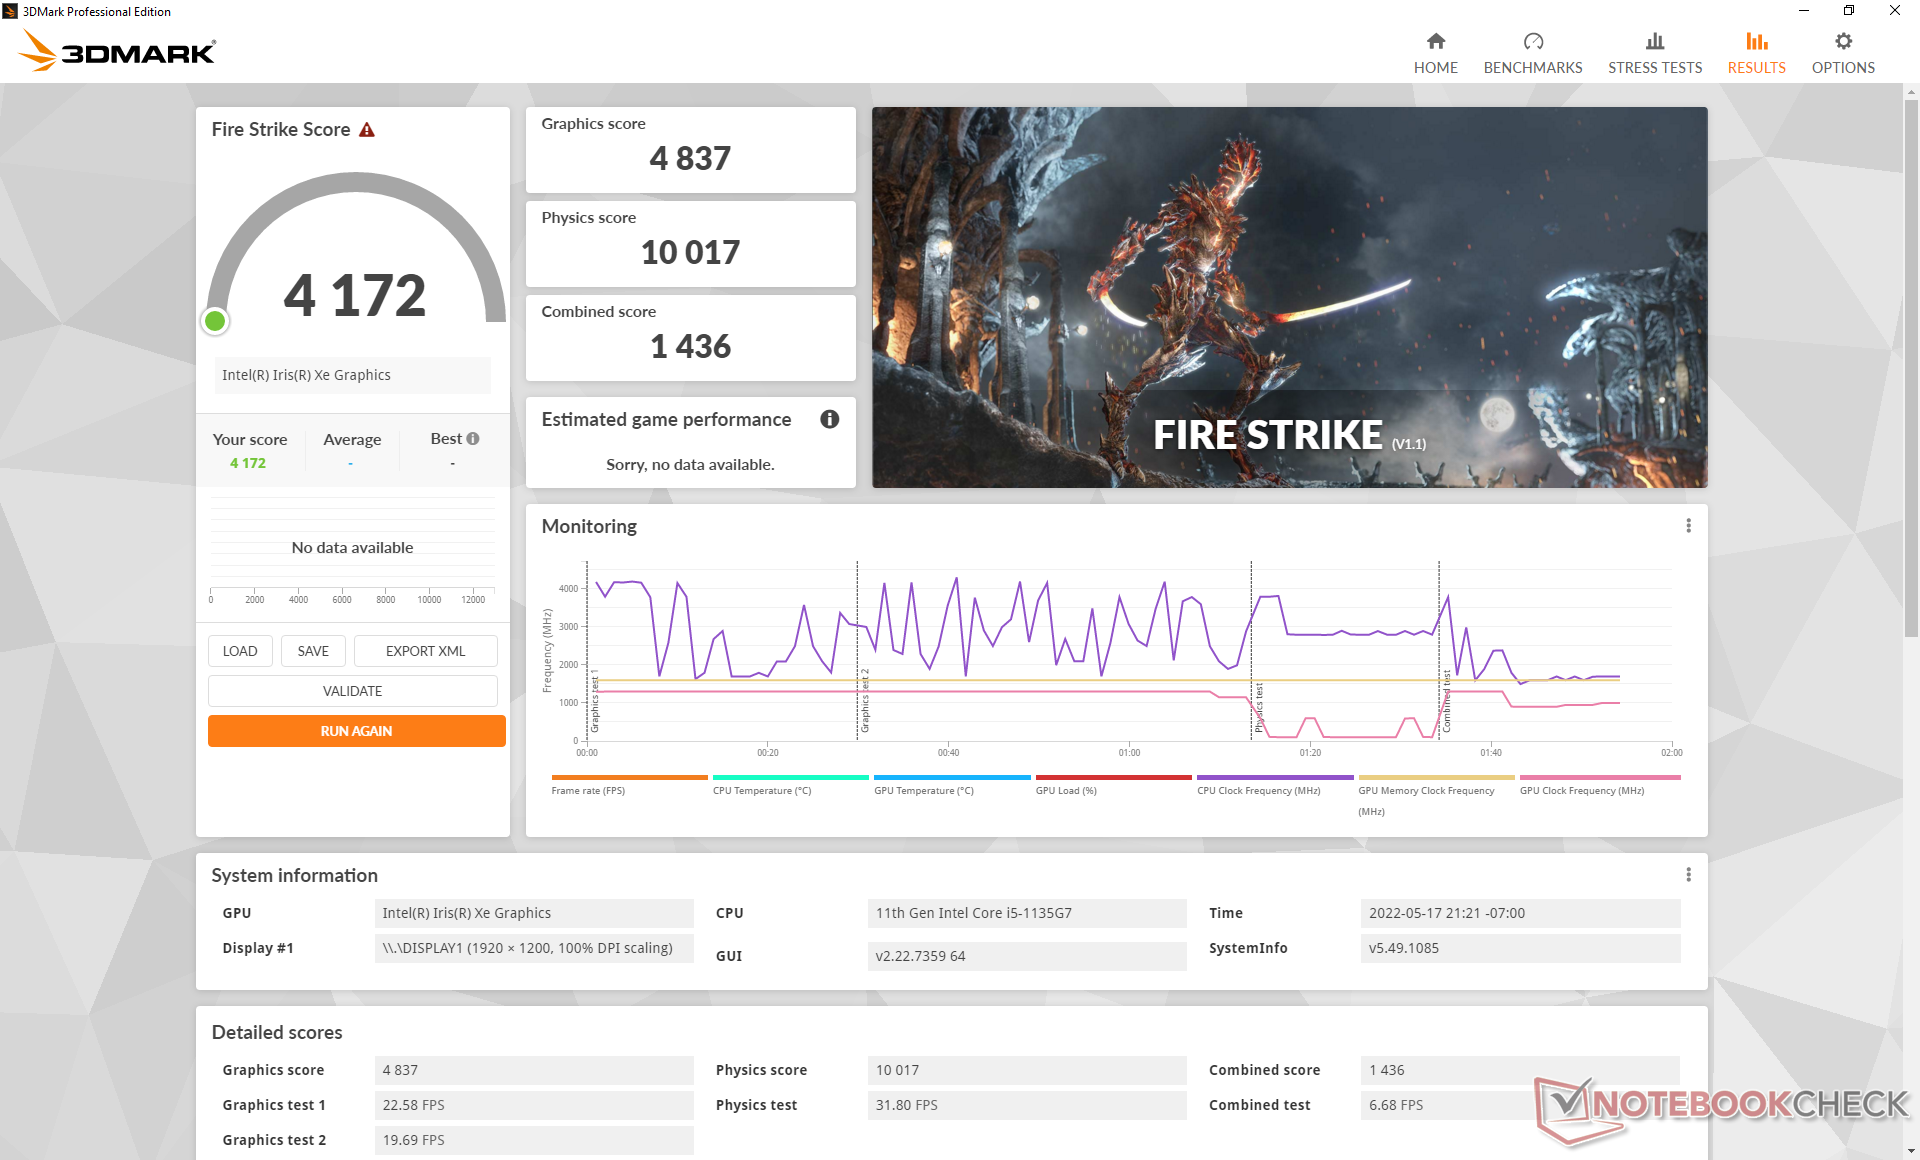
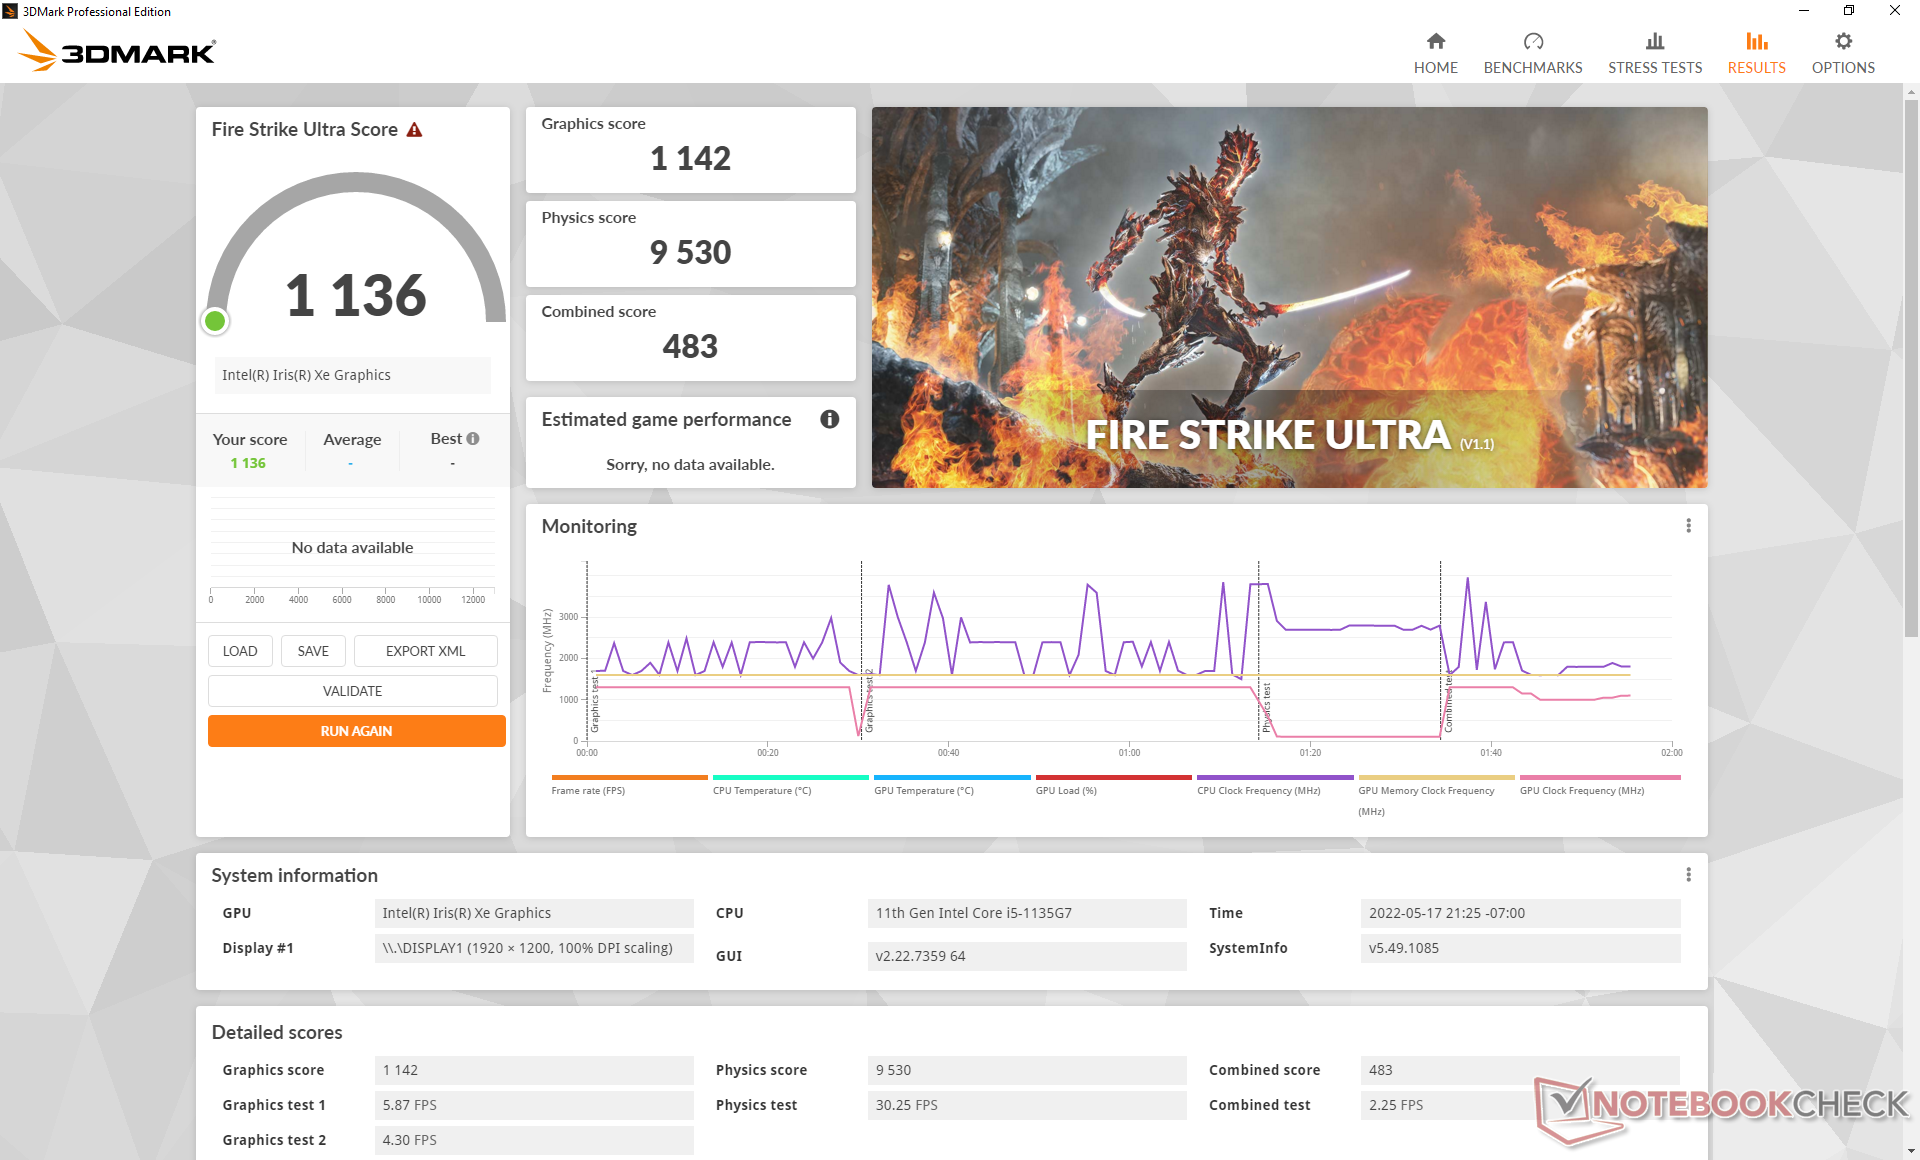
| 3DMark 11 Performance | 6475 points | |
| 3DMark Cloud Gate Standard Score | 15851 points | |
| 3DMark Fire Strike Score | 4172 points | |
| 3DMark Time Spy Score | 1295 points | |
Aide | ||
Witcher 3 FPS Chart
| Bas | Moyen | Élevé | Ultra | |
|---|---|---|---|---|
| GTA V (2015) | 83.3 | 75.1 | 25.9 | 11.4 |
| The Witcher 3 (2015) | 89.8 | 55.6 | 32.3 | 14.1 |
| Dota 2 Reborn (2015) | 85.8 | 73.3 | 46 | 42.2 |
| Final Fantasy XV Benchmark (2018) | 34.4 | 20.1 | 15.6 | |
| X-Plane 11.11 (2018) | 40.5 | 32.8 | 30.2 | |
| Strange Brigade (2018) | 88.3 | 36.3 | 28.4 | 23.2 |
Émissions
Bruit du système - silencieux dans la plupart des conditions
Le bruit du ventilateur est similaire à ce que nous avons observé sur le Gram 14T90N qui était déjà une machine relativement silencieuse. Nous sommes en mesure de mesurer seulement 28,3 dB(A) même après avoir exécuté la première scène de benchmark de 3DMark 06 pour être plus silencieux que le Dell XPS 13, Lenovo Yoga 9 14et Asus ZenBook Flip 14 dans des conditions similaires. Le bruit du ventilateur semble atteindre 35 dB(A) lors des jeux ou si le CPU est utilisé à 100 %.
Degré de la nuisance sonore
| Au repos |
| 25.5 / 25.5 / 25.5 dB(A) |
| Fortement sollicité |
| 28.3 / 35 dB(A) |
 | ||
30 dB silencieux 40 dB(A) audible 50 dB(A) bruyant |
||
min: | ||
| LG Gram 14T90P Iris Xe G7 80EUs, i5-1135G7, Samsung SSD PM981a MZVLB512HBJQ | Dell XPS 13 9310 2-in-1 Iris Xe G7 96EUs, i7-1165G7, Toshiba BG4 KBG40ZPZ512G | Lenovo Yoga 9 14IAP7 82LU0001US Iris Xe G7 96EUs, i7-1260P, Samsung PM9A1 MZVL2512HCJQ | Asus ZenBook Flip 14 UN5401QA-KN085W Vega 8, R7 5800H, Intel SSD 600p SSDPEKKW512G7 | HP Spectre x360 14-ea0378ng Iris Xe G7 96EUs, i7-1165G7, Intel Optane Memory H10 with Solid State Storage 32GB + 1TB HBRPEKNX0203AH(L/H) | MSI Summit E13 Flip Evo A11MT Iris Xe G7 96EUs, i7-1185G7, Phison 1TB SM2801T24GKBB4S-E162 | LG Gram 14T90N UHD Graphics 620, i7-10510U, Samsung SSD PM981a MZVLB512HBJQ | |
|---|---|---|---|---|---|---|---|
| Noise | -7% | -5% | -13% | -8% | -12% | -16% | |
| arrêt / environnement * (dB) | 25.4 | 24.3 4% | 22.9 10% | 26 -2% | 26 -2% | 24.5 4% | 29 -14% |
| Idle Minimum * (dB) | 25.5 | 24.8 3% | 23.3 9% | 26 -2% | 26 -2% | 24.7 3% | 30 -18% |
| Idle Average * (dB) | 25.5 | 24.8 3% | 23.5 8% | 26 -2% | 26 -2% | 24.7 3% | 30 -18% |
| Idle Maximum * (dB) | 25.5 | 24.8 3% | 23.5 8% | 27.3 -7% | 26 -2% | 26.4 -4% | 30 -18% |
| Load Average * (dB) | 28.3 | 38 -34% | 33.2 -17% | 39.8 -41% | 37.5 -33% | 37.8 -34% | 35.2 -24% |
| Witcher 3 ultra * (dB) | 35 | 38 -9% | 44.9 -28% | 41.4 -18% | |||
| Load Maximum * (dB) | 35 | 41.5 -19% | 44.6 -27% | 42.4 -21% | 36.3 -4% | 48.8 -39% | 37 -6% |
* ... Moindre est la valeur, meilleures sont les performances
Température
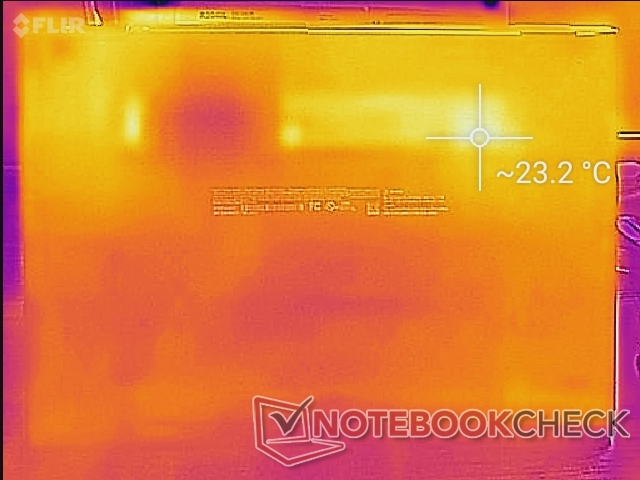
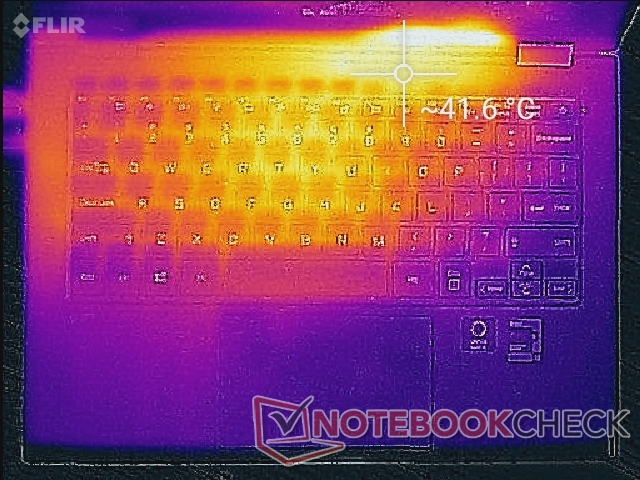
Les températures de surface sont plus fraîches que ce que nous avons observé sur le Lenovo Yoga 9 14IAP7 concurrent lors de l'exécution de charges faibles, tandis qu'elles sont à peu près les mêmes entre eux lors de charges plus exigeantes. Les points chauds sont plus proches du centre du clavier où elle peut atteindre 40 C pour être comparable à celle du Gram 14T90N ou du Lenovo susmentionné.
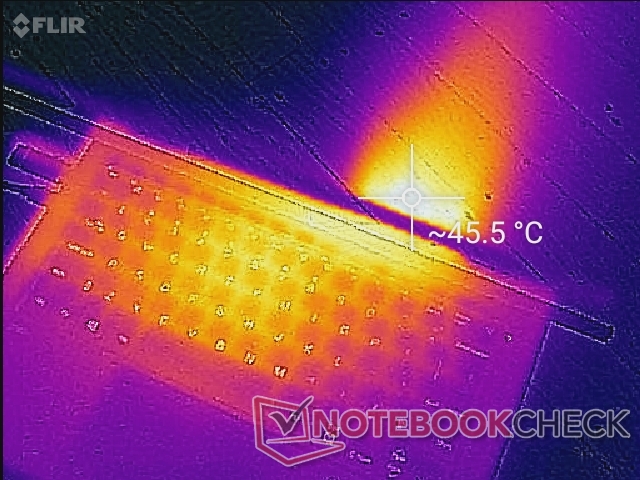
(±) La température maximale du côté supérieur est de 41.6 °C / 107 F, par rapport à la moyenne de 35.4 °C / 96 F, allant de 19.6 à 60 °C pour la classe Convertible.
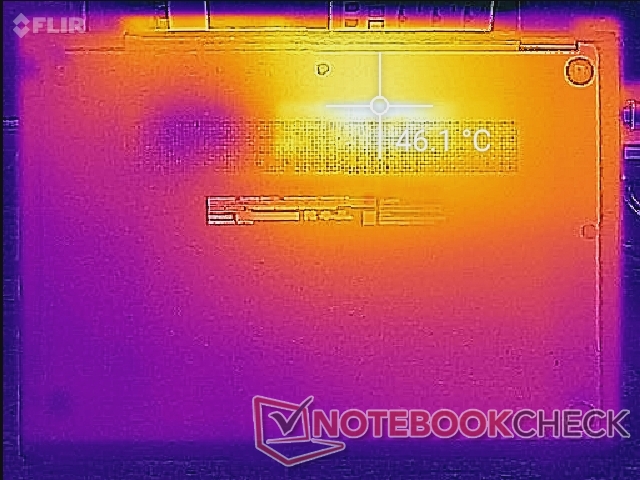
(-) Le fond chauffe jusqu'à un maximum de 46.2 °C / 115 F, contre une moyenne de 36.9 °C / 98 F
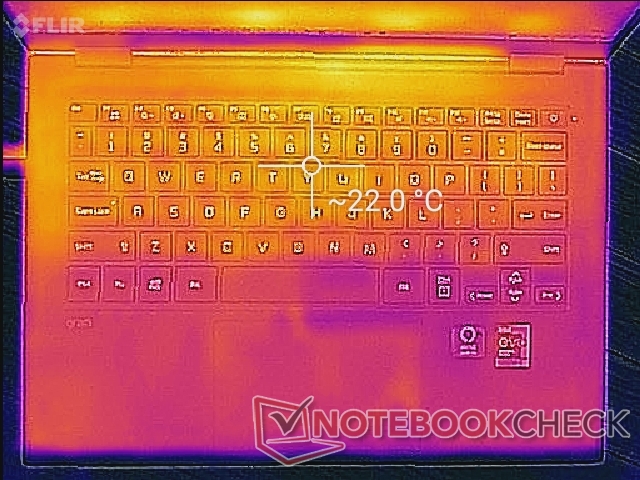
(+) En utilisation inactive, la température moyenne du côté supérieur est de 21.6 °C / 71 F, par rapport à la moyenne du dispositif de 30.3 °C / 87 F.
(+) Les repose-poignets et le pavé tactile sont plus froids que la température de la peau avec un maximum de 26.2 °C / 79.2 F et sont donc froids au toucher.
(±) La température moyenne de la zone de l'appui-paume de dispositifs similaires était de 28 °C / 82.4 F (+1.8 °C / #3.2 F).
| LG Gram 14T90P Intel Core i5-1135G7, Intel Iris Xe Graphics G7 80EUs | Dell XPS 13 9310 2-in-1 Intel Core i7-1165G7, Intel Iris Xe Graphics G7 96EUs | Lenovo Yoga 9 14IAP7 82LU0001US Intel Core i7-1260P, Intel Iris Xe Graphics G7 96EUs | Asus ZenBook Flip 14 UN5401QA-KN085W AMD Ryzen 7 5800H, AMD Radeon RX Vega 8 (Ryzen 4000/5000) | HP Spectre x360 14-ea0378ng Intel Core i7-1165G7, Intel Iris Xe Graphics G7 96EUs | MSI Summit E13 Flip Evo A11MT Intel Core i7-1185G7, Intel Iris Xe Graphics G7 96EUs | LG Gram 14T90N Intel Core i7-10510U, Intel UHD Graphics 620 | |
|---|---|---|---|---|---|---|---|
| Heat | -12% | -29% | -29% | -8% | -33% | -14% | |
| Maximum Upper Side * (°C) | 41.6 | 51 -23% | 43.2 -4% | 42.7 -3% | 37.1 11% | 52 -25% | 43.2 -4% |
| Maximum Bottom * (°C) | 46.2 | 45.4 2% | 45.6 1% | 53.1 -15% | 43.1 7% | 57.4 -24% | 41.6 10% |
| Idle Upper Side * (°C) | 22.6 | 24.4 -8% | 34.6 -53% | 32.9 -46% | 29 -28% | 30.4 -35% | 29.2 -29% |
| Idle Bottom * (°C) | 23.2 | 27.4 -18% | 37 -59% | 35.2 -52% | 28.6 -23% | 34.2 -47% | 30.6 -32% |
* ... Moindre est la valeur, meilleures sont les performances
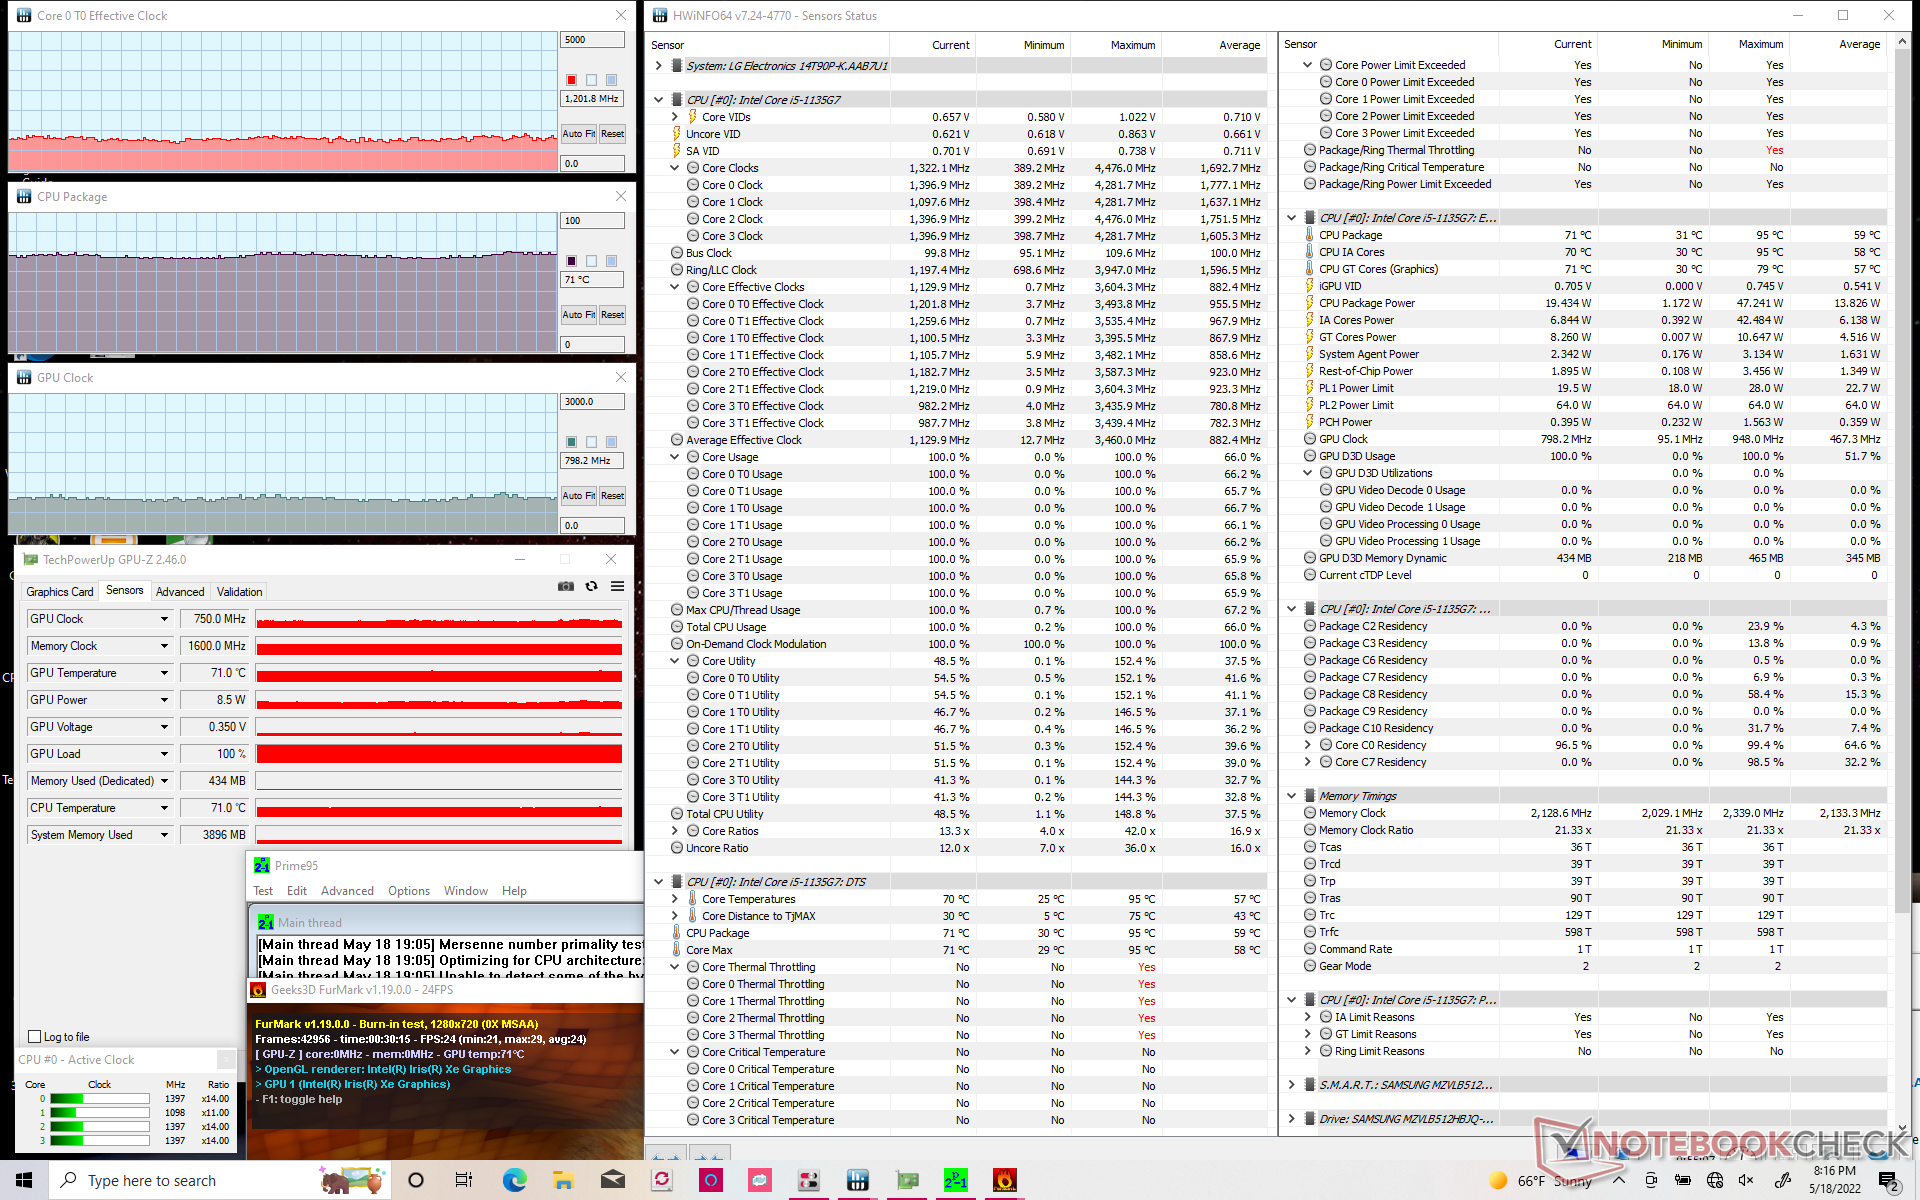
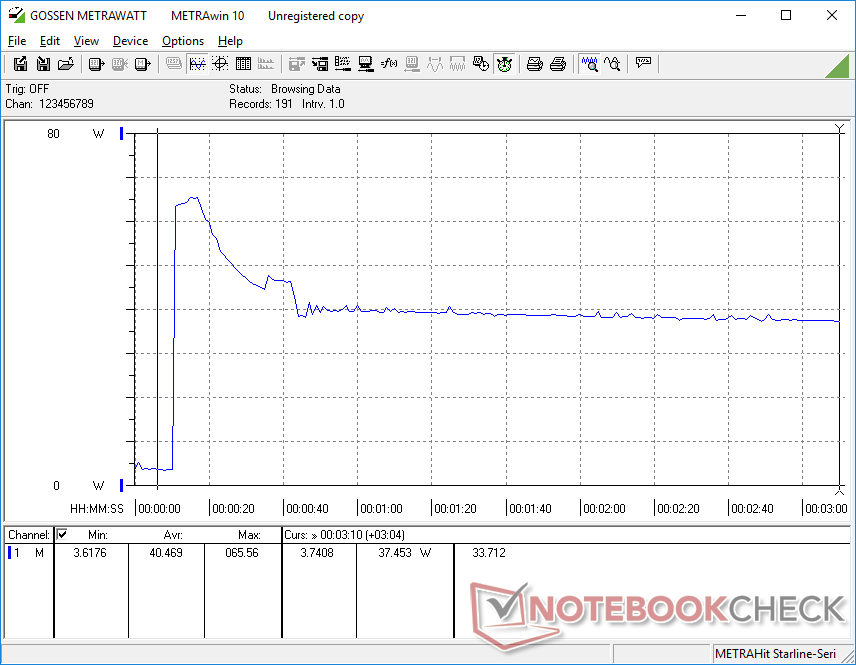
Test de stress
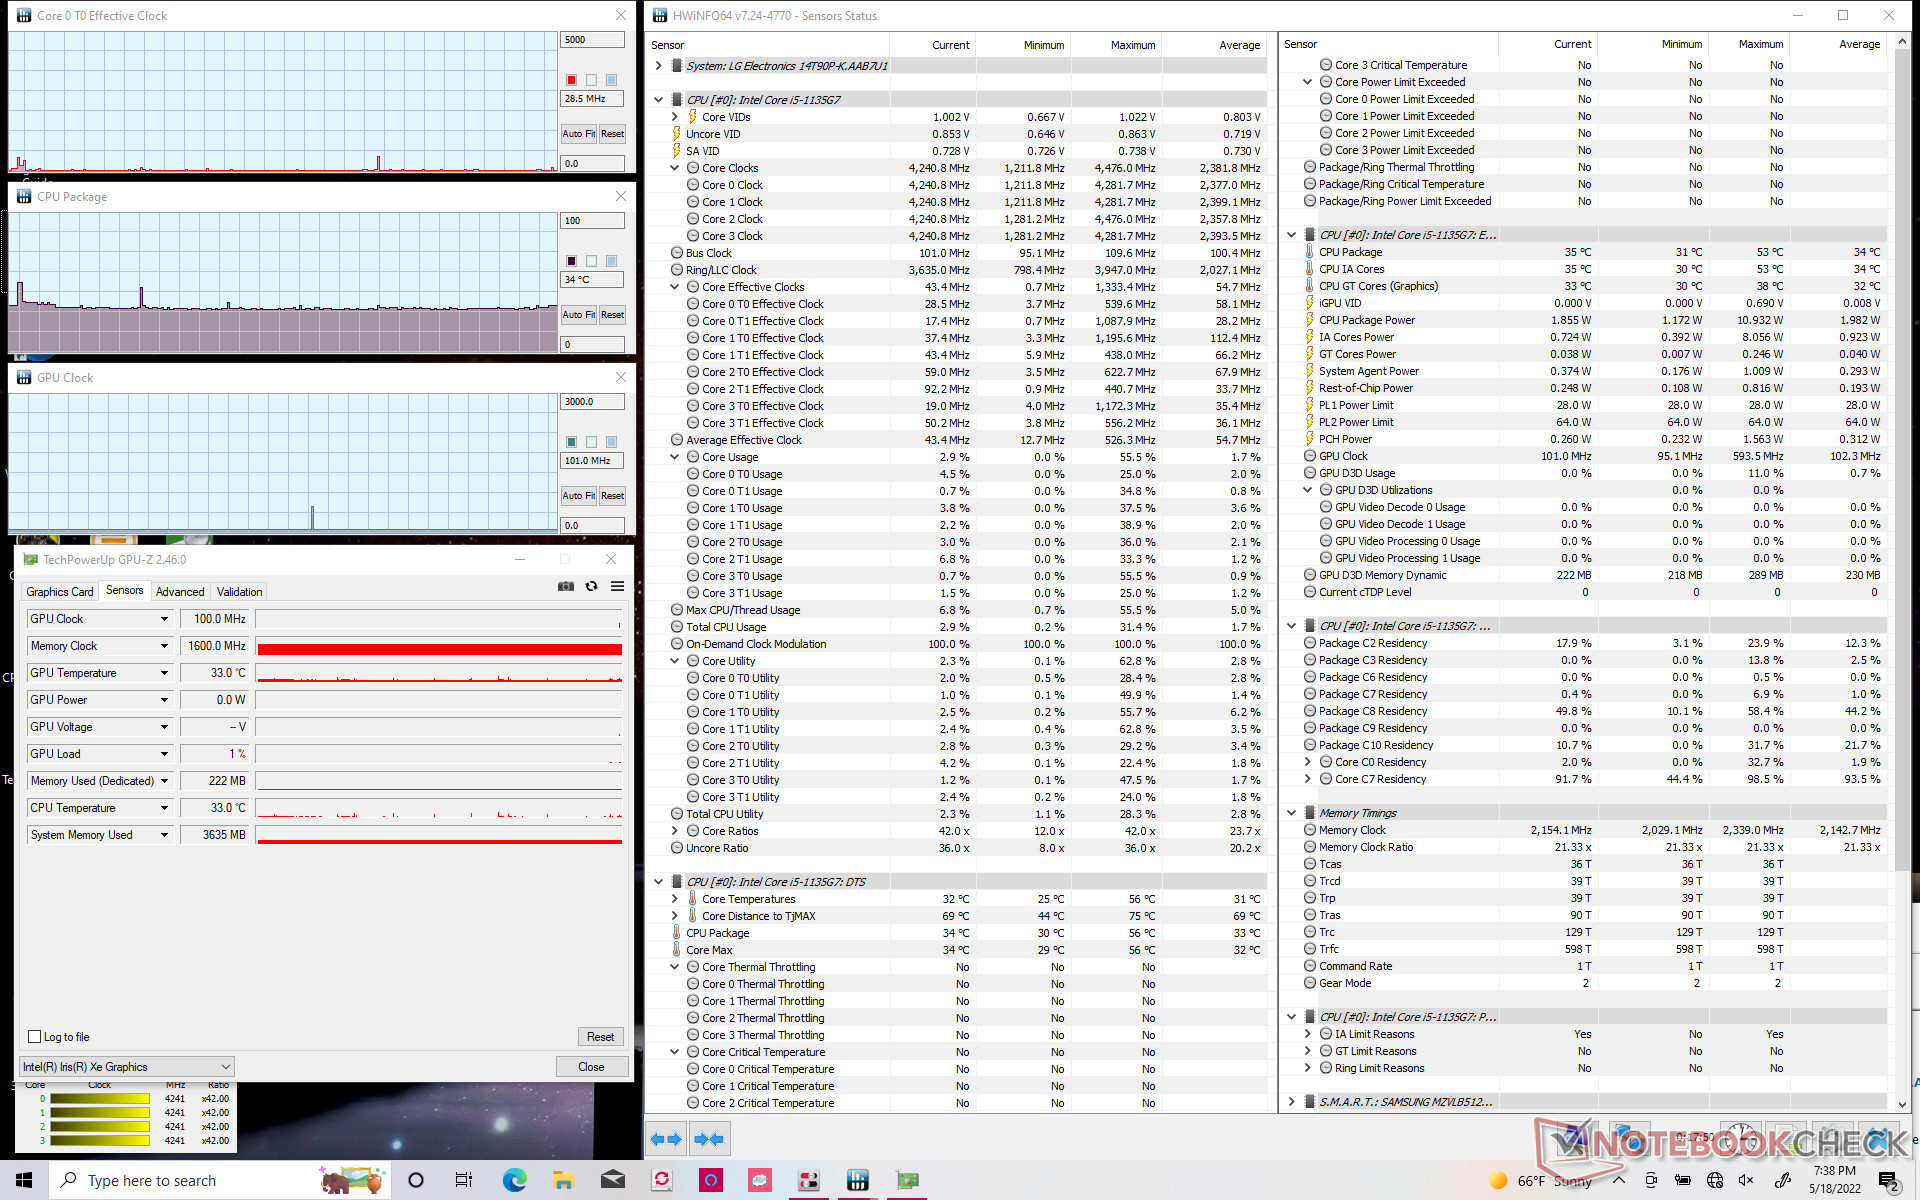
Lorsqu'il est sollicité par Prime95, le CPU monte à 3.5 GHz et 95 C pendant quelques secondes avant de baisser régulièrement et de se stabiliser à 2.1 GHz et 73 C. Nous pensons que le processeur ne se stabilisera pas à des fréquences d'horloge plus élevées pour garder la température de la peau sous contrôle. Le TDP du processeur atteindrait jusqu'à 47 W au début du test avant de se stabiliser à seulement 18 W en conséquence. En comparaison, l'exécution de ce même test sur le HP Spectre x360 14 avec le Core i7-1165G7 se traduirait par une fréquence d'horloge et une température du CPU de 2,1 à 3,4 GHz et de 75 à 95 C, respectivement, pour des performances supérieures en moyenne.
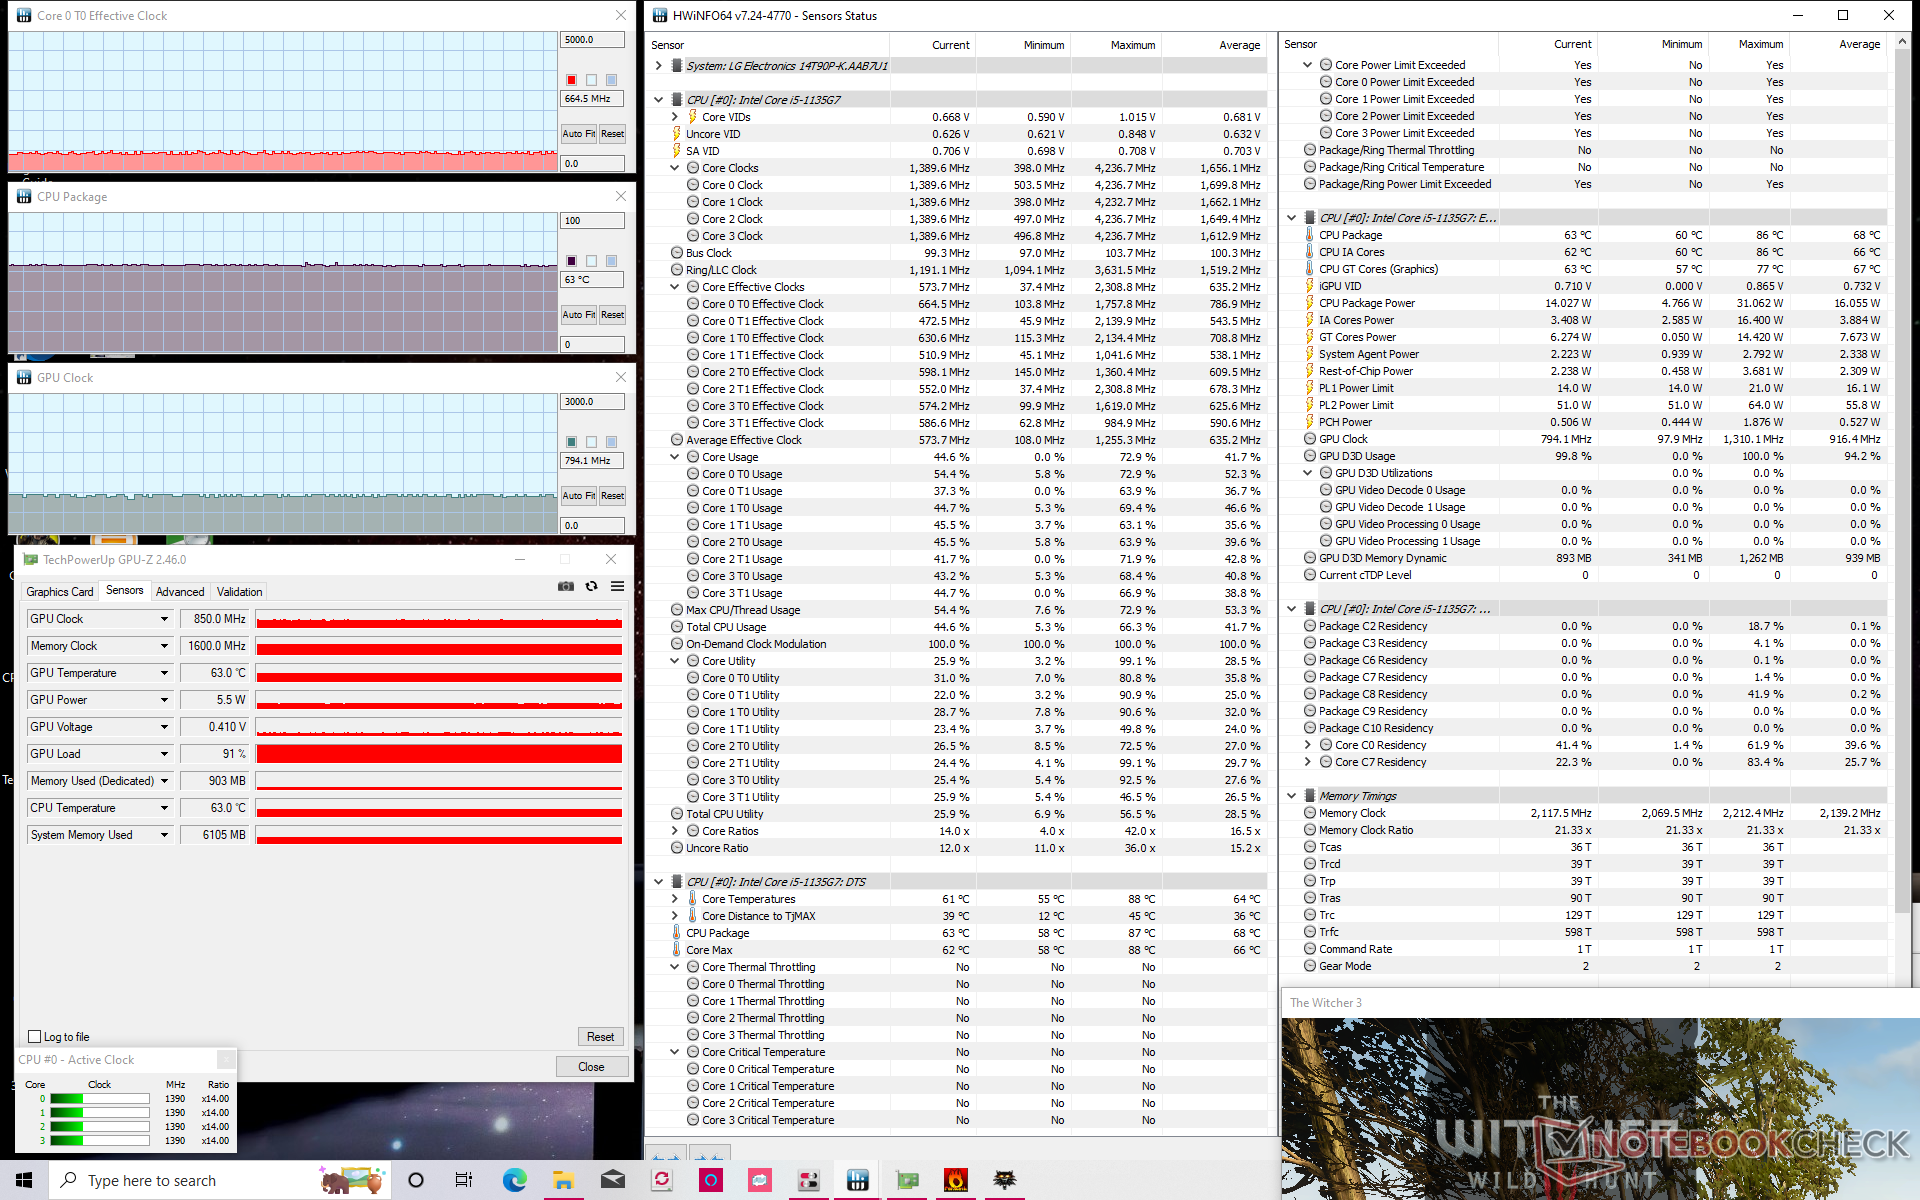
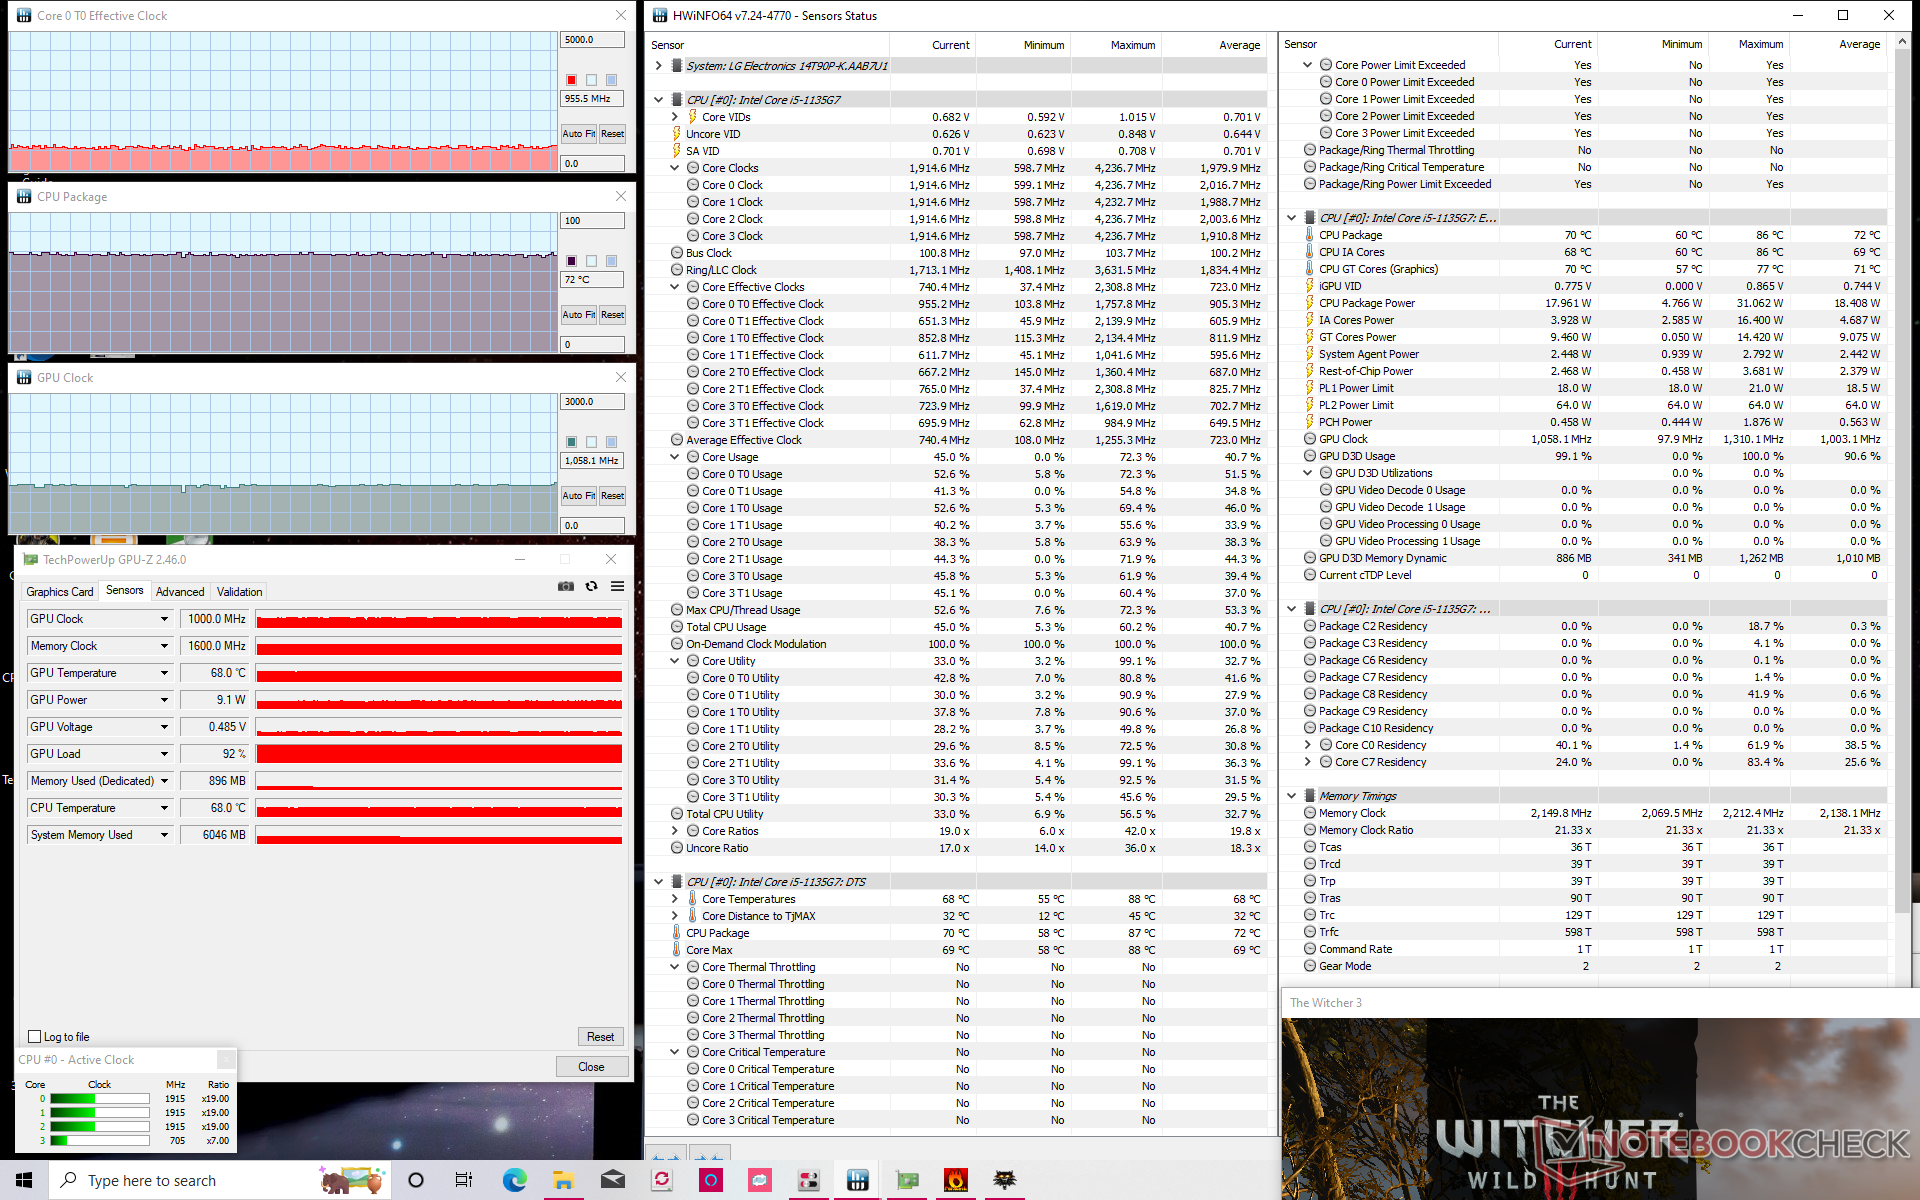
Le fonctionnement en mode Performance entraîne à la fois des fréquences d'horloge et des températures plus élevées, comme le montrent nos graphiques et le tableau ci-dessous.
Les performances ne seront pas limitées si vous utilisez la batterie car les scores de Fire Strike sur secteur et sur batterie sont très similaires.
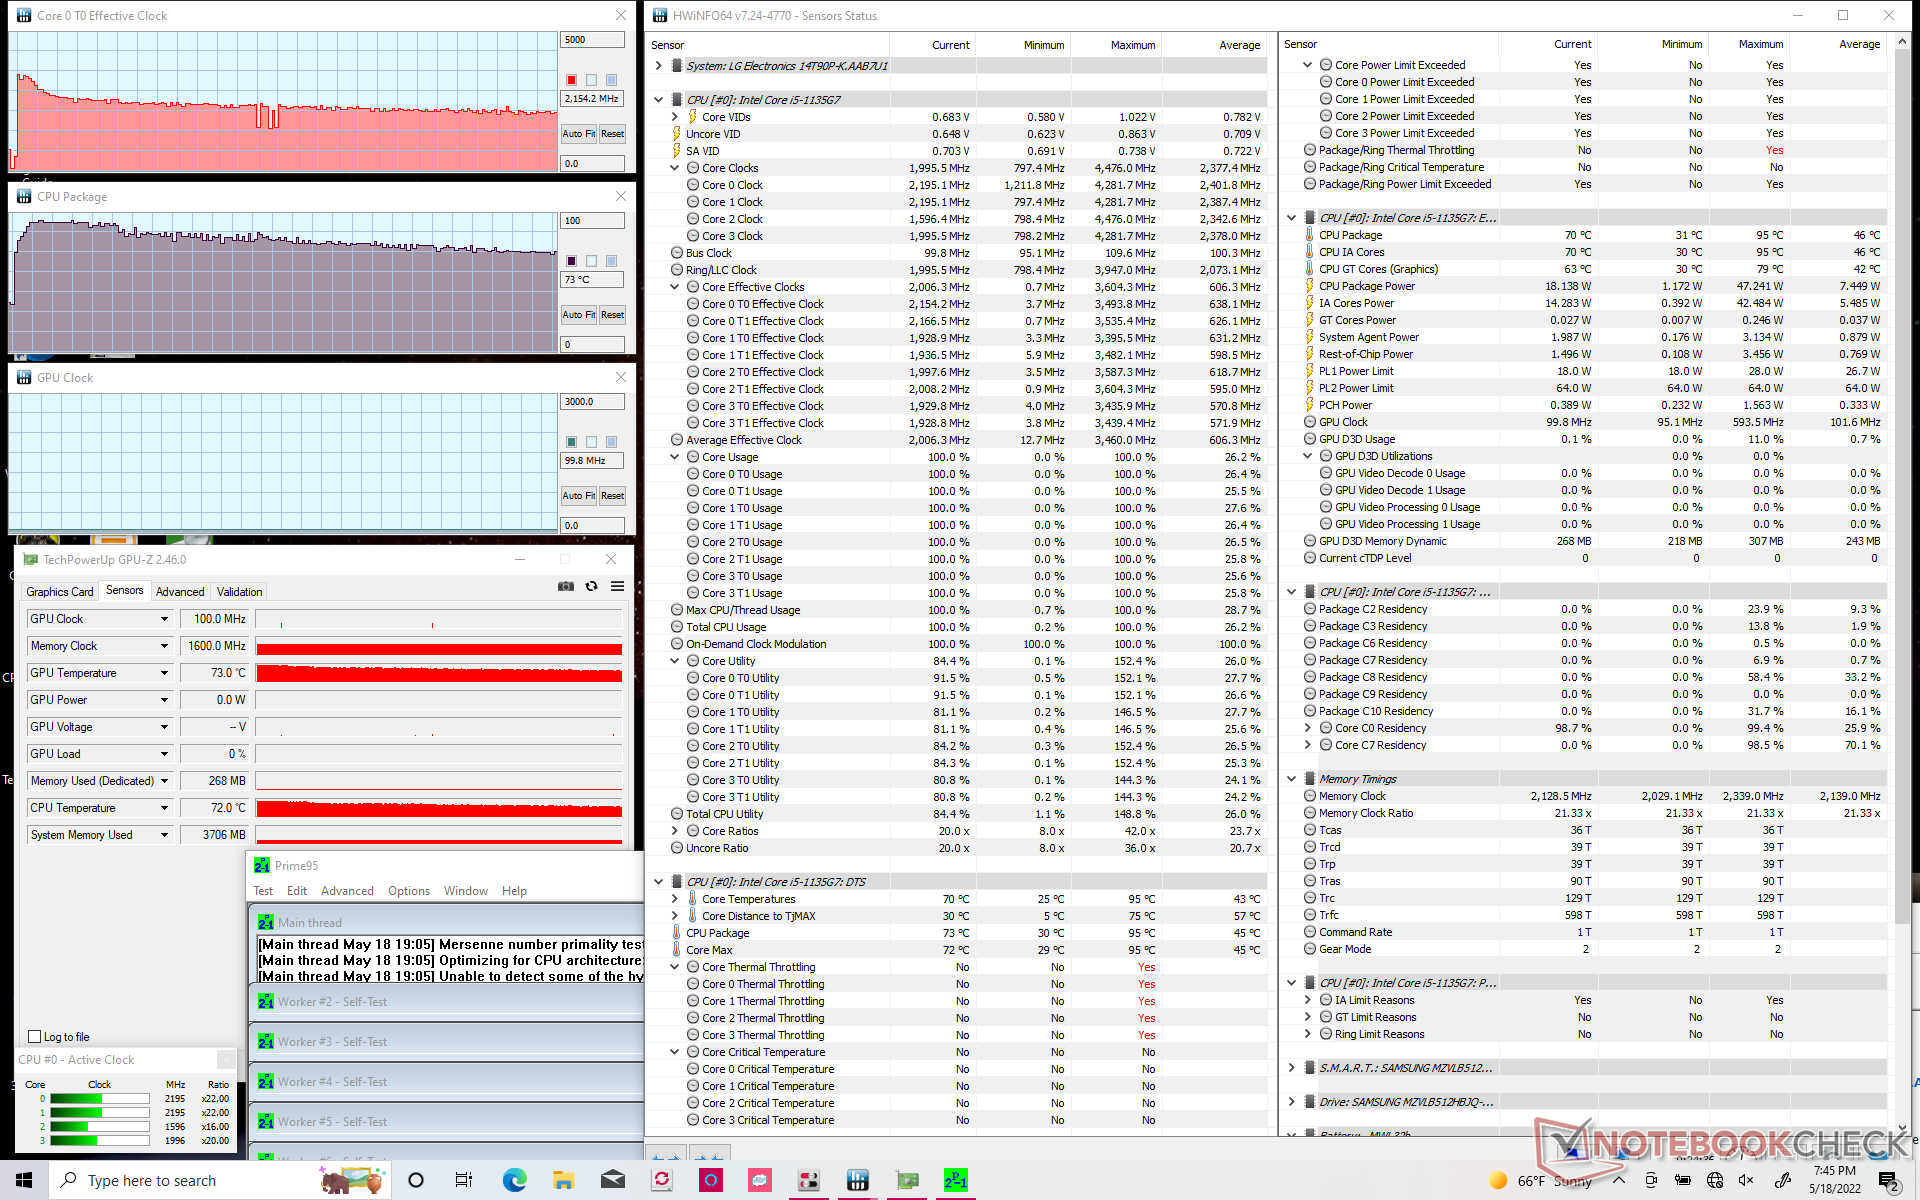
| Fréquence du CPU (GHz) | Fréquence du GPU (MHz) | Température moyenne du CPU (°C) | |
| Système au repos | -- | -- | 34 |
| Prime95 Stress | 2.1 | -- | 73 |
| Prime95 + FurMark Stress | ~1.2 | 750 - 900 | 71 |
| Witcher 3 Stress (profil de puissance équilibré) | 0.6 | 800 | 63 |
| Witcher 3 Stress (profil de puissance Performance) | ~1.0 | 1000 | 72 |
Haut-parleurs
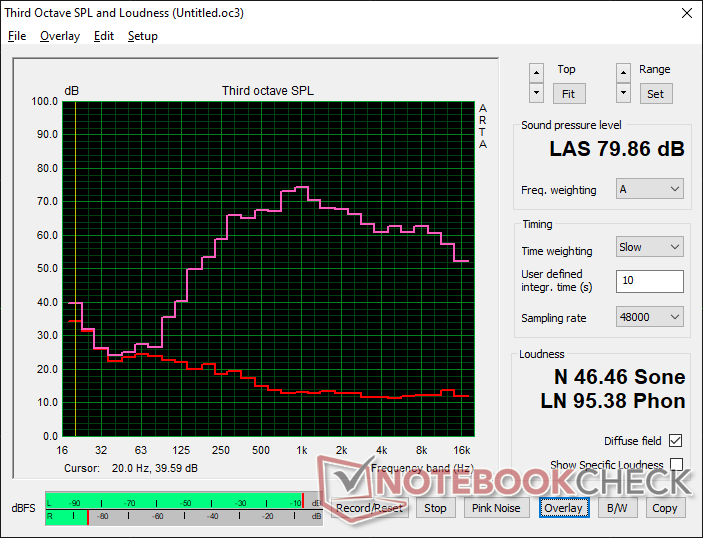
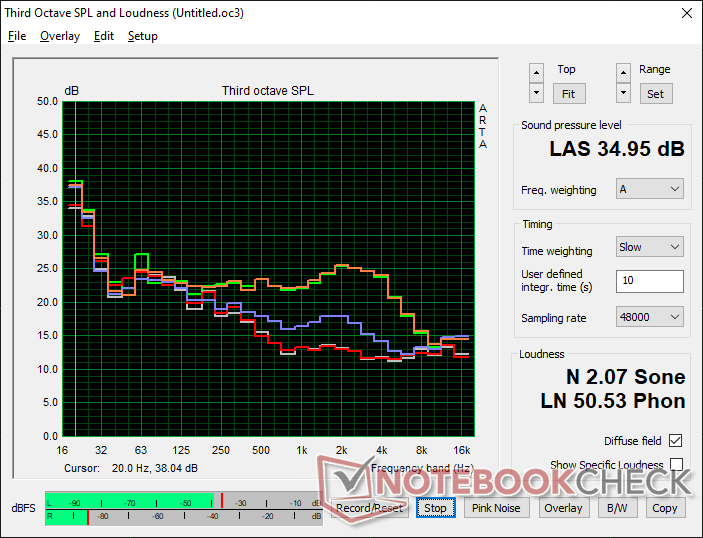
LG Gram 14T90P analyse audio
(±) | le niveau sonore du haut-parleur est moyen mais bon (79.9# dB)
Basses 100 - 315 Hz
(±) | basse réduite - en moyenne 13.1% inférieure à la médiane
(±) | la linéarité des basses est moyenne (13.3% delta à la fréquence précédente)
Médiums 400 - 2000 Hz
(±) | médiane supérieure - en moyenne 6.6% supérieure à la médiane
(+) | les médiums sont linéaires (4.3% delta à la fréquence précédente)
Aiguës 2 - 16 kHz
(+) | des sommets équilibrés - à seulement 1.3% de la médiane
(+) | les aigus sont linéaires (3.9% delta à la fréquence précédente)
Globalement 100 - 16 000 Hz
(±) | la linéarité du son global est moyenne (15.3% de différence avec la médiane)
Par rapport à la même classe
» 25% de tous les appareils testés de cette catégorie étaient meilleurs, 5% similaires, 70% pires
» Le meilleur avait un delta de 6%, la moyenne était de 20%, le pire était de 57%.
Par rapport à tous les appareils testés
» 22% de tous les appareils testés étaient meilleurs, 4% similaires, 74% pires
» Le meilleur avait un delta de 4%, la moyenne était de 23%, le pire était de 134%.
Apple MacBook Pro 16 2021 M1 Pro analyse audio
(+) | les haut-parleurs peuvent jouer relativement fort (84.7# dB)
Basses 100 - 315 Hz
(+) | bonne basse - seulement 3.8% loin de la médiane
(+) | les basses sont linéaires (5.2% delta à la fréquence précédente)
Médiums 400 - 2000 Hz
(+) | médiane équilibrée - seulement 1.3% de la médiane
(+) | les médiums sont linéaires (2.1% delta à la fréquence précédente)
Aiguës 2 - 16 kHz
(+) | des sommets équilibrés - à seulement 1.9% de la médiane
(+) | les aigus sont linéaires (2.7% delta à la fréquence précédente)
Globalement 100 - 16 000 Hz
(+) | le son global est linéaire (4.6% différence à la médiane)
Par rapport à la même classe
» 0% de tous les appareils testés de cette catégorie étaient meilleurs, 0% similaires, 100% pires
» Le meilleur avait un delta de 5%, la moyenne était de 17%, le pire était de 45%.
Par rapport à tous les appareils testés
» 0% de tous les appareils testés étaient meilleurs, 0% similaires, 100% pires
» Le meilleur avait un delta de 4%, la moyenne était de 23%, le pire était de 134%.
Gestion de l'énergie
Consommation d'énergie
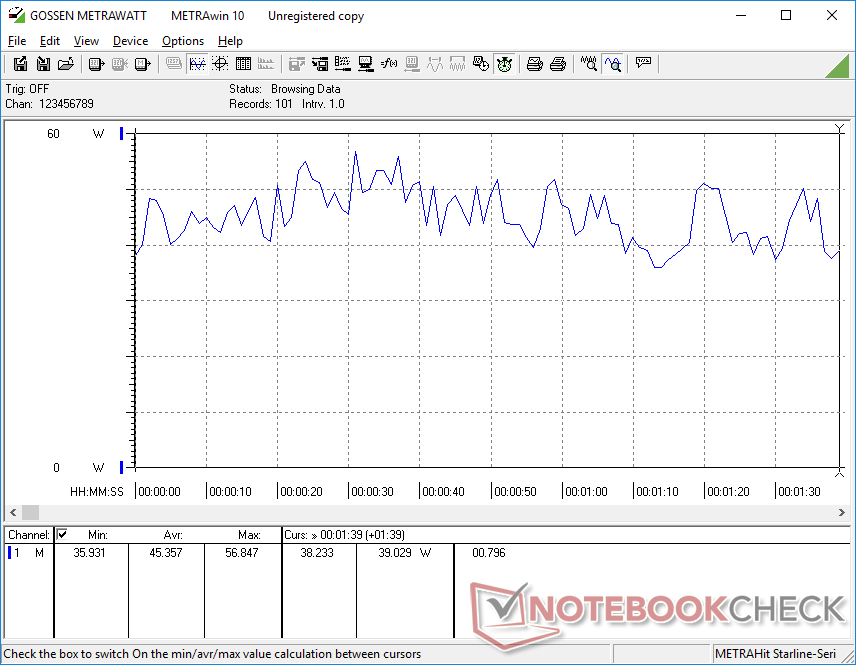
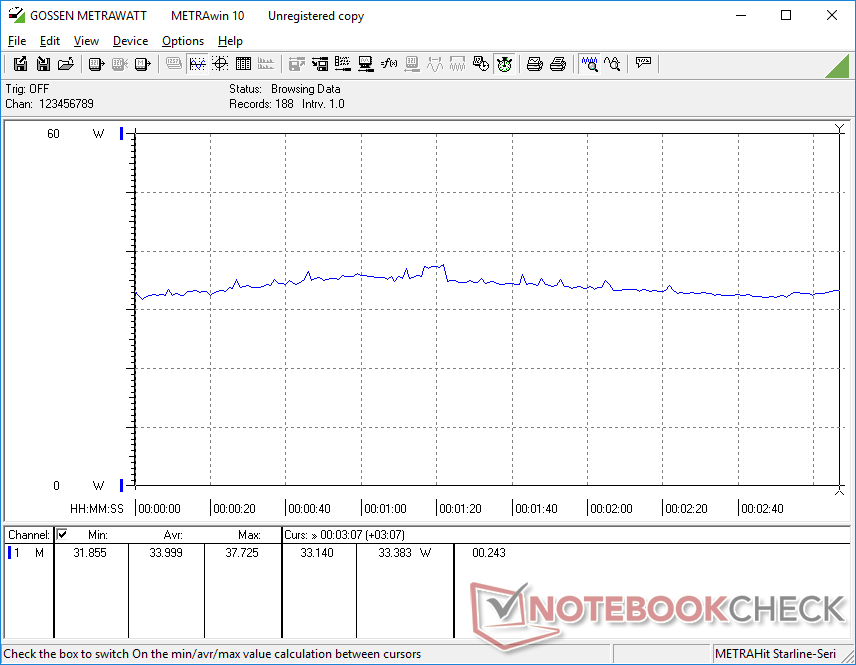
Le système est très économe en énergie et ne consomme que 2 à 7 W en mode veille sur le bureau, selon le profil d'alimentation et le réglage de la luminosité. L'exécution de charges de niveau gaming demandera environ 45 W, soit 36 % de plus que sur le LG Gram 14T90N. Cependant, les performances du GPU sont au moins 2 à 3 fois plus rapides, et la consommation d'énergie plus élevée vaut bien les gains graphiques
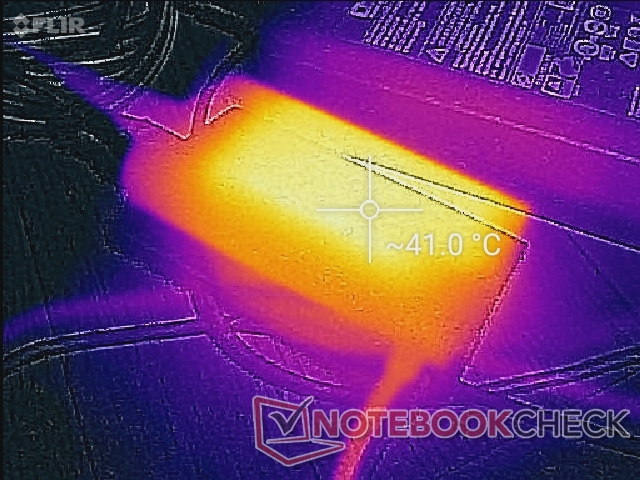
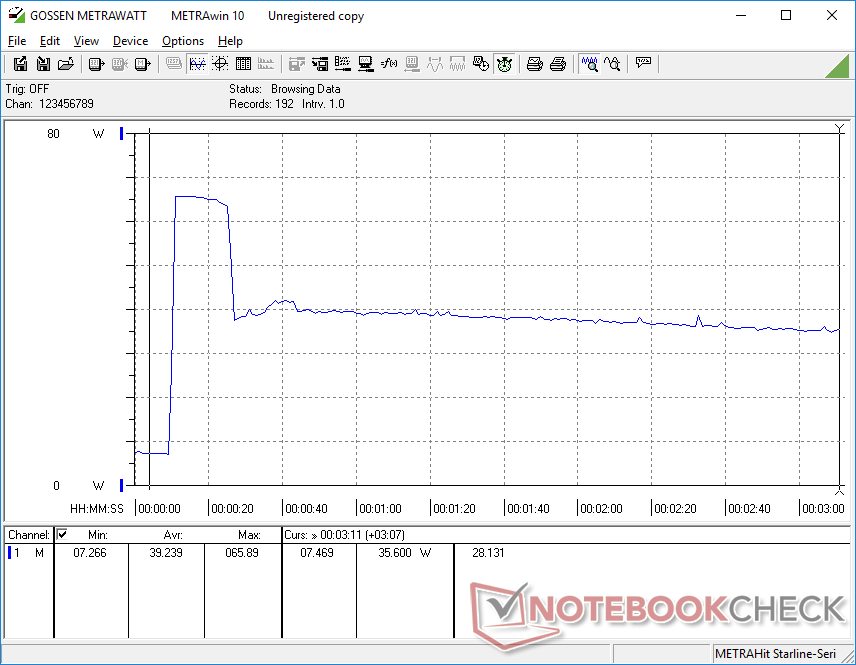
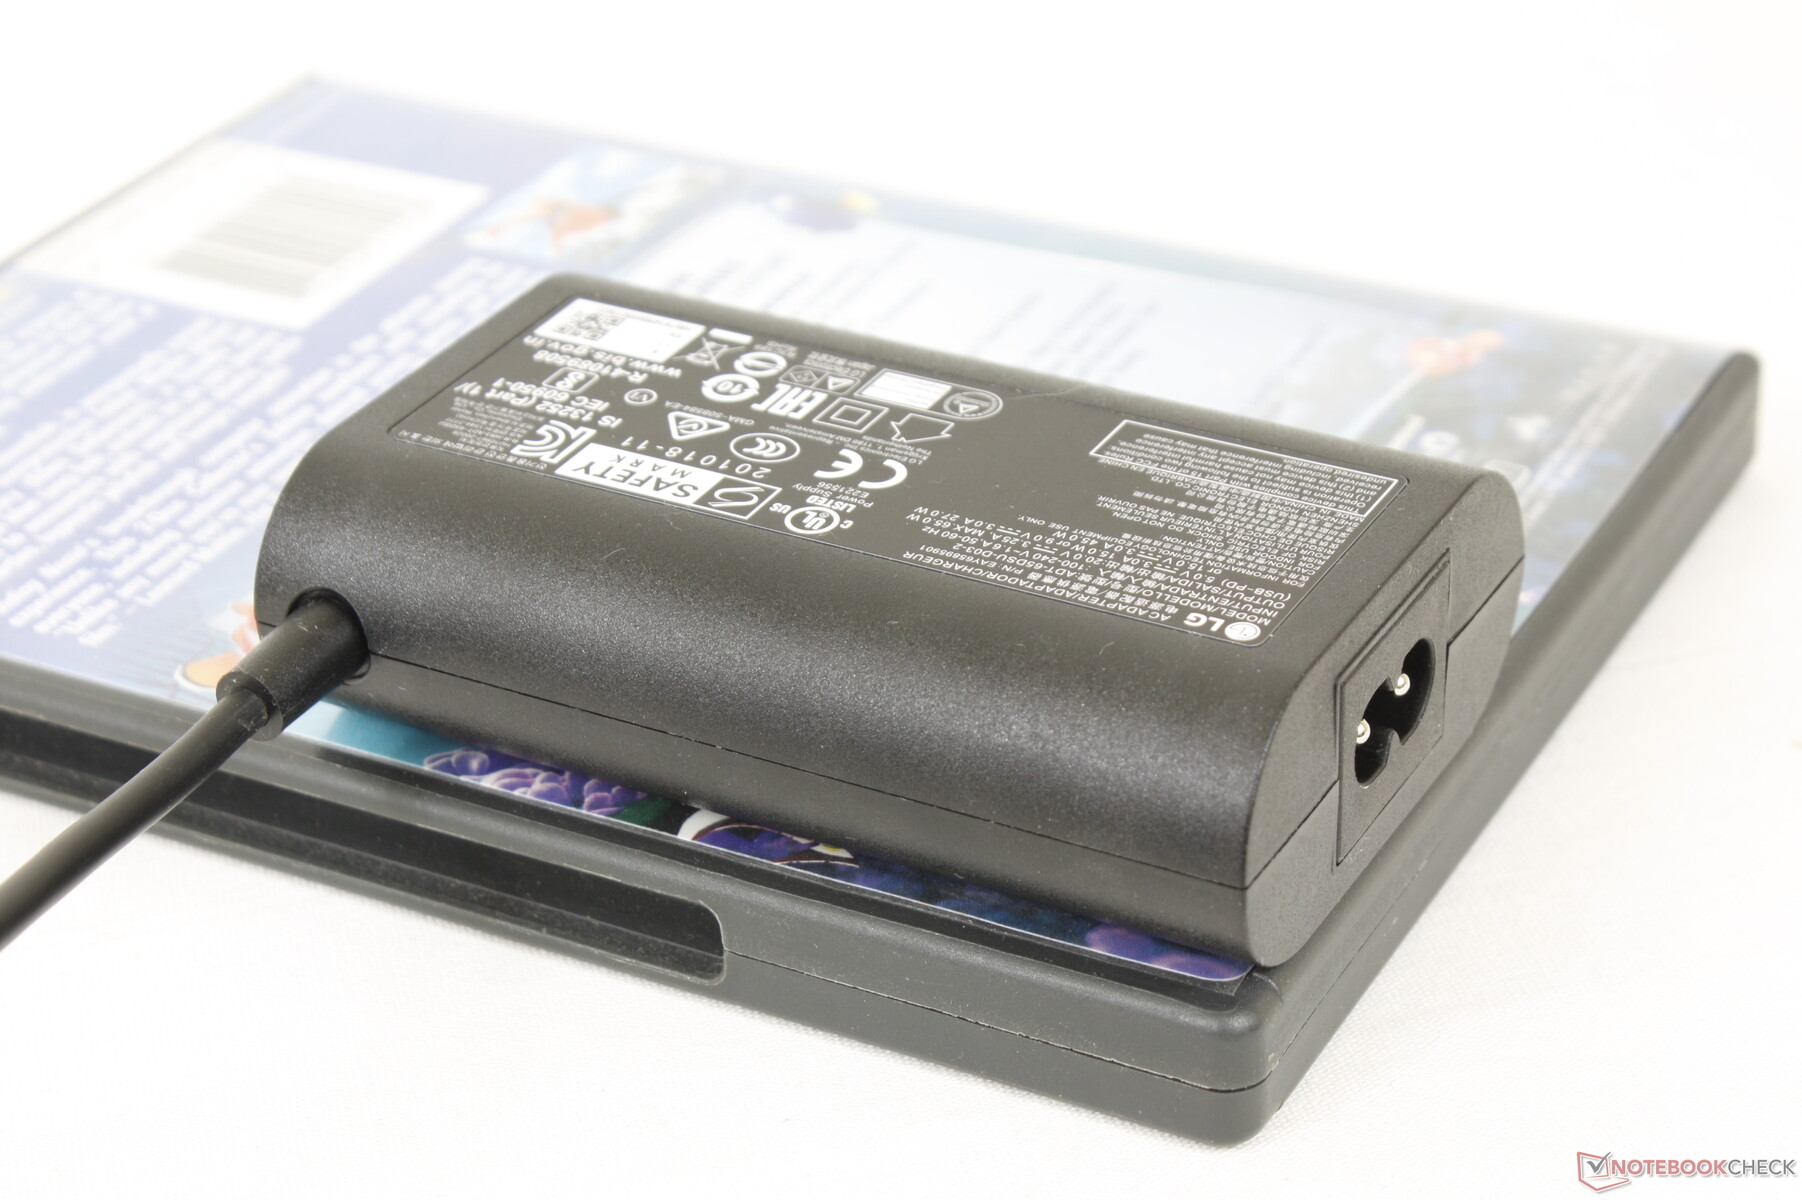
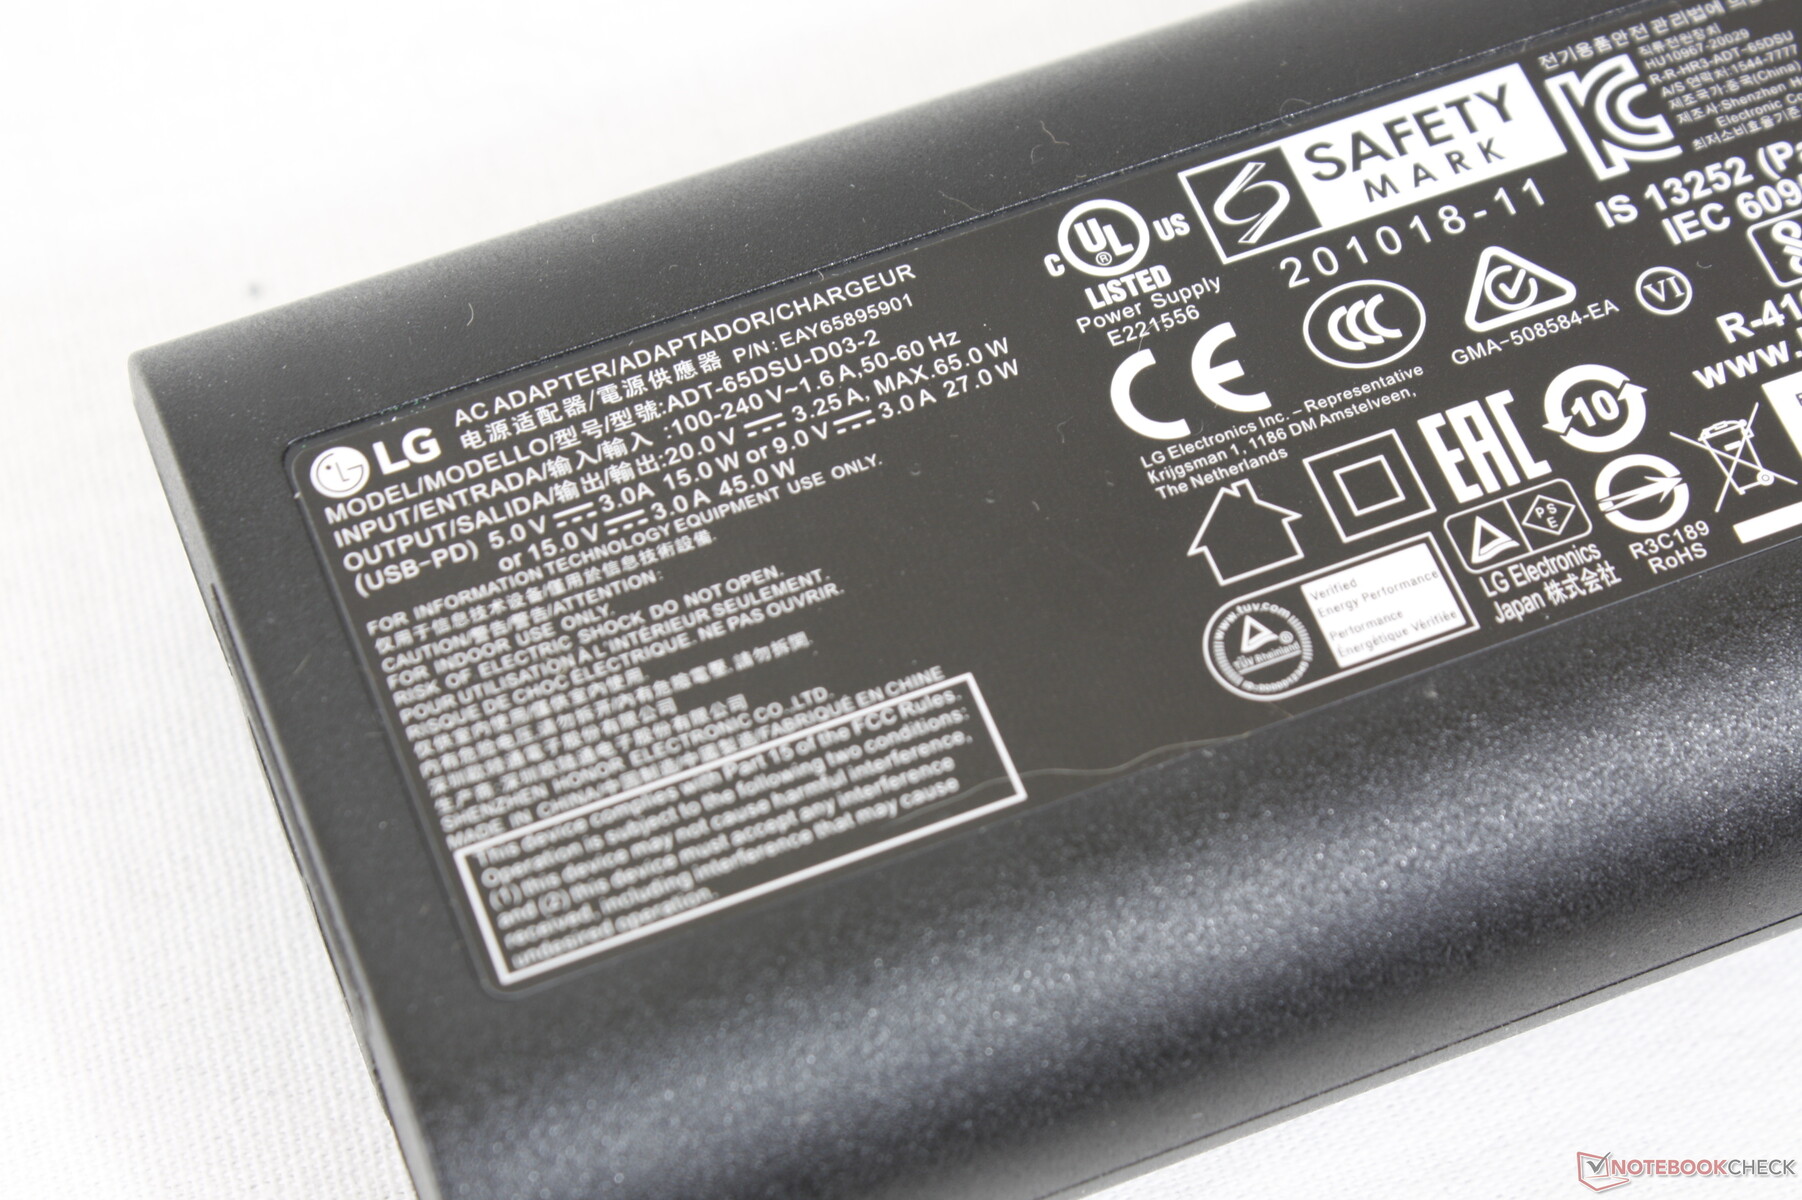
Nous avons pu enregistrer une consommation maximale temporaire de 66 W sur le petit adaptateur secteur USB-C de 65 W (~9,8 x 6 x 2,7 cm) lorsque le processeur est utilisé à 100 %.
| Éteint/en veille | |
| Au repos | |
| Fortement sollicité |
|
Légende:
min: | |
| LG Gram 14T90P i5-1135G7, Iris Xe G7 80EUs, Samsung SSD PM981a MZVLB512HBJQ, IPS, 1900x1200, 14" | Dell XPS 13 9310 2-in-1 i7-1165G7, Iris Xe G7 96EUs, Toshiba BG4 KBG40ZPZ512G, IPS, 1920x1200, 13.4" | Lenovo Yoga 9 14IAP7 82LU0001US i7-1260P, Iris Xe G7 96EUs, Samsung PM9A1 MZVL2512HCJQ, OLED, 2880x1800, 14" | Asus ZenBook Flip 14 UN5401QA-KN085W R7 5800H, Vega 8, Intel SSD 600p SSDPEKKW512G7, OLED, 2880x1800, 14" | HP Spectre x360 14-ea0378ng i7-1165G7, Iris Xe G7 96EUs, Intel Optane Memory H10 with Solid State Storage 32GB + 1TB HBRPEKNX0203AH(L/H), OLED, 3000x2000, 13.5" | MSI Summit E13 Flip Evo A11MT i7-1185G7, Iris Xe G7 96EUs, Phison 1TB SM2801T24GKBB4S-E162, IPS, 1920x1200, 13.4" | LG Gram 14T90N i7-10510U, UHD Graphics 620, Samsung SSD PM981a MZVLB512HBJQ, IPS, 1920x1080, 14" | |
|---|---|---|---|---|---|---|---|
| Power Consumption | 6% | -93% | -57% | -52% | -36% | 10% | |
| Idle Minimum * (Watt) | 2.8 | 2.6 7% | 8 -186% | 6.4 -129% | 6.3 -125% | 4.8 -71% | 2.9 -4% |
| Idle Average * (Watt) | 5.5 | 6.4 -16% | 14 -155% | 9.4 -71% | 11.2 -104% | 8.4 -53% | 5.8 -5% |
| Idle Maximum * (Watt) | 6.4 | 7.7 -20% | 14.4 -125% | 10.7 -67% | 13.3 -108% | 8.6 -34% | 6.2 3% |
| Load Average * (Watt) | 45.4 | 29.9 34% | 59.6 -31% | 52.2 -15% | 32 30% | 47.1 -4% | 32.9 28% |
| Witcher 3 ultra * (Watt) | 34 | 32.2 5% | 53.6 -58% | 53 -56% | 51.6 -52% | ||
| Load Maximum * (Watt) | 65.9 | 47.5 28% | 68.1 -3% | 69 -5% | 35.6 46% | 65.9 -0% | 48.5 26% |
* ... Moindre est la valeur, meilleures sont les performances
Power Consumption Witcher 3 / Stresstest
Power Consumption external Monitor
Autonomie de la batterie - Une journée complète de navigation
La capacité de la batterie est la même que celle de l'ancien Gram 14T90N, soit 72 Wh. Ce n'est peut-être pas un hasard si les durées d'utilisation du WLAN sont également presque identiques, avec un peu plus de 12 heures de navigation dans le monde réel. Il est bon de voir que l'autonomie de la batterie n'a pas souffert, même si les performances du processeur ont augmenté de manière significative par rapport à la 10e génération du Comet Lake-U
Le chargement de la batterie de l'état vide à l'état plein est très lent, 2,5 heures, contre 1,5 heure ou plus sur la plupart des autres Ultrabooks.
| LG Gram 14T90P i5-1135G7, Iris Xe G7 80EUs, 72 Wh | Dell XPS 13 9310 2-in-1 i7-1165G7, Iris Xe G7 96EUs, 51 Wh | Lenovo Yoga 9 14IAP7 82LU0001US i7-1260P, Iris Xe G7 96EUs, 75 Wh | Asus ZenBook Flip 14 UN5401QA-KN085W R7 5800H, Vega 8, 63 Wh | HP Spectre x360 14-ea0378ng i7-1165G7, Iris Xe G7 96EUs, 66 Wh | MSI Summit E13 Flip Evo A11MT i7-1185G7, Iris Xe G7 96EUs, 70 Wh | LG Gram 14T90N i7-10510U, UHD Graphics 620, 72 Wh | |
|---|---|---|---|---|---|---|---|
| Autonomie de la batterie | 18% | -44% | -19% | -12% | -15% | 8% | |
| WiFi v1.3 (h) | 12.1 | 10.7 -12% | 6.8 -44% | 8.7 -28% | 7.8 -36% | 11.2 -7% | 12.5 3% |
| Load (h) | 2.3 | 3.4 48% | 2.1 -9% | 2.6 13% | 1.8 -22% | 2.6 13% | |
| Reader / Idle (h) | 25.4 | 13.4 | 21.1 | 32.8 | |||
| H.264 (h) | 9 | 11.1 |
Points positifs
Points négatifs
Verdict - Le gramme à obtenir
Son poids plus léger que la moyenne, son écran tactile 16:10 DCI-P3 très net et son excellente autonomie sont autant de points forts du Gram 14T90P. Son nouveau design est plus solide sans ajouter de poids pour maintenir l'un des plus grands avantages de la série Gram 14 pouces par rapport à des concurrents comme les plus lourds Lenovo Yoga 9 14, HP Spectre x360 14, ou Dell XPS 13 2-in-1. Le châssis est peut-être légèrement moins rigide, mais le gain de poids peut valoir l'inconvénient pour les voyageurs ou les étudiants.
Le Gram 14T90P est la mise à jour complète dont la série Gram de 14 pouces avait besoin.
Malheureusement, il y a une bonne liste d'écueils que nous aimerions voir améliorés. La lenteur du taux de charge, l'instabilité des fréquences d'images dans les jeux, le pavé tactile spongieux, la luminosité moyenne de l'écran, l'absence de prise en charge de Windows Hello, la difficulté d'entretien et la rigidité moyenne de la charnière sont autant d'éléments qui mettent à mal un convertible 14 pouces par ailleurs excellent. Si LG peut corriger ces inconvénients majeurs tout en maintenant le poids faible, alors le Gram 14 serait facilement à la hauteur des alternatives plus populaires de Dell, Lenovo, ou HP.
Prix et disponibilité
LG Gram 14T90P
- 05/21/2022 v7 (old)
Allen Ngo
Price comparison

