Test du HP Pavilion x360 15-dq0065cl 2019 (i7-8565U, UHD 620, HD) : convertible à éviter
Note | Date | Modèle | Poids | Épaisseur | Taille | Résolution | Prix |
|---|---|---|---|---|---|---|---|
| 72 % v7 (old) | 02/20 | HP Pavilion x360 15-dq0065cl i7-8565U, UHD Graphics 620 | 1.9 kg | 20.6 mm | 15.60" | 1366x768 | |
| 78.9 % v6 (old) | 07/18 | Asus VivoBook Flip 15 TP510UA-E8073T i5-8250U, UHD Graphics 620 | 2.3 kg | 18 mm | 15.60" | 1920x1080 | |
| 82.6 % v7 (old) | 10/19 | Lenovo Ideapad C340-15IWL-81N5004QGE i5-8265U, GeForce MX230 | 2 kg | 20.5 mm | 15.60" | 1920x1080 | |
| 80.1 % v6 (old) | 04/18 | HP Envy x360 15-bq102ng R5 2500U, Vega 8 | 2.1 kg | 19.6 mm | 15.60" | 1920x1080 | |
| 77.6 % v6 (old) | 06/19 | Dell Inspiron 15 3585 (2300U, Vega 6) R3 2300U, Vega 6 | 1.9 kg | 20 mm | 15.60" | 1920x1080 |
| SD Card Reader | |
| average JPG Copy Test (av. of 3 runs) | |
| Dell XPS 15 7590 i5 iGPU FHD (Toshiba Exceria Pro SDXC 64 GB UHS-II) | |
| HP Pavilion x360 15-dq0065cl (Toshiba Exceria Pro SDXC 64 GB UHS-II) | |
| Lenovo Ideapad C340-15IWL-81N5004QGE (Toshiba Exceria Pro SDXC 64 GB UHS-II) | |
| HP Envy x360 15-bq102ng (Toshiba Exceria Pro SDXC 64 GB UHS-II) | |
| Dell Inspiron 15 3585 (2300U, Vega 6) (Toshiba Exceria Pro SDXC 64 GB UHS-II) | |
| Asus VivoBook Flip 15 TP510UA-E8073T (Toshiba Exceria Pro SDXC 64 GB UHS-II) | |
| maximum AS SSD Seq Read Test (1GB) | |
| Dell XPS 15 7590 i5 iGPU FHD (Toshiba Exceria Pro SDXC 64 GB UHS-II) | |
| Lenovo Ideapad C340-15IWL-81N5004QGE (Toshiba Exceria Pro SDXC 64 GB UHS-II) | |
| HP Envy x360 15-bq102ng (Toshiba Exceria Pro SDXC 64 GB UHS-II) | |
| HP Pavilion x360 15-dq0065cl (Toshiba Exceria Pro SDXC 64 GB UHS-II) | |
| Dell Inspiron 15 3585 (2300U, Vega 6) (Toshiba Exceria Pro SDXC 64 GB UHS-II) | |
| Asus VivoBook Flip 15 TP510UA-E8073T (Toshiba Exceria Pro SDXC 64 GB UHS-II) | |
| |||||||||||||||||||||||||
Homogénéité de la luminosité: 88 %
Valeur mesurée au centre, sur batterie: 195.7 cd/m²
Contraste: 288:1 (Valeurs des noirs: 0.68 cd/m²)
ΔE ColorChecker Calman: 11.99 | ∀{0.5-29.43 Ø4.72}
calibrated: 4.63
ΔE Greyscale Calman: 12.8 | ∀{0.09-98 Ø4.97}
57.8% sRGB (Argyll 1.6.3 3D)
36.7% AdobeRGB 1998 (Argyll 1.6.3 3D)
39.93% AdobeRGB 1998 (Argyll 3D)
58.2% sRGB (Argyll 3D)
38.65% Display P3 (Argyll 3D)
Gamma: 2.15
CCT: 14252 K
| HP Pavilion x360 15-dq0065cl BOE076E, TN LED, 15.6", 1366x768 | Asus VivoBook Flip 15 TP510UA-E8073T AU Optronics B156HAN02.1, IPS, 15.6", 1920x1080 | Lenovo Ideapad C340-15IWL-81N5004QGE BOE CQ NV156FHM-N48, IPS, 15.6", 1920x1080 | HP Envy x360 15-bq102ng Chi Mei CM15E9, IPS, 15.6", 1920x1080 | Dell Inspiron 15 3585 (2300U, Vega 6) BOE0802, TN, 15.6", 1920x1080 | Dell XPS 15 7590 i5 iGPU FHD LQ156M1, IPS, 15.6", 1920x1080 | |
|---|---|---|---|---|---|---|
| Display | 1% | 0% | 7% | 1% | 70% | |
| Display P3 Coverage (%) | 38.65 | 39.19 1% | 39.05 1% | 41.36 7% | 39.22 1% | 66.5 72% |
| sRGB Coverage (%) | 58.2 | 58.9 1% | 57.3 -2% | 62.2 7% | 58.9 1% | 98 68% |
| AdobeRGB 1998 Coverage (%) | 39.93 | 40.49 1% | 40.35 1% | 42.74 7% | 40.52 1% | 68.4 71% |
| Response Times | -25% | -48% | -13% | 33% | -41% | |
| Response Time Grey 50% / Grey 80% * (ms) | 68.8 ? | 44 ? 36% | 57 ? 17% | 40 ? 42% | 39 ? 43% | 52.8 ? 23% |
| Response Time Black / White * (ms) | 15.6 ? | 29 ? -86% | 33 ? -112% | 26 ? -67% | 12 ? 23% | 32 ? -105% |
| PWM Frequency (Hz) | 1000 ? | 352 ? | 25000 ? | 250 ? | 1020 ? | |
| Screen | 71% | 64% | 81% | 13% | 118% | |
| Brightness middle (cd/m²) | 195.7 | 229 17% | 266 36% | 221 13% | 225 15% | 588 200% |
| Brightness (cd/m²) | 186 | 221 19% | 251 35% | 207 11% | 213 15% | 555 198% |
| Brightness Distribution (%) | 88 | 76 -14% | 81 -8% | 87 -1% | 88 0% | 89 1% |
| Black Level * (cd/m²) | 0.68 | 0.15 78% | 0.165 76% | 0.15 78% | 0.535 21% | 0.4 41% |
| Contrast (:1) | 288 | 1527 430% | 1612 460% | 1473 411% | 421 46% | 1470 410% |
| Colorchecker dE 2000 * | 11.99 | 5.03 58% | 6.33 47% | 4.35 64% | 10.37 14% | 2.5 79% |
| Colorchecker dE 2000 max. * | 21.31 | 8.89 58% | 21.03 1% | 8.98 58% | 19.75 7% | 6.3 70% |
| Colorchecker dE 2000 calibrated * | 4.63 | 5.23 -13% | 3.89 16% | 0.6 87% | ||
| Greyscale dE 2000 * | 12.8 | 5.56 57% | 3.81 70% | 3.09 76% | 12.09 6% | 4.5 65% |
| Gamma | 2.15 102% | 2.64 83% | 2.38 92% | 2.23 99% | 2.72 81% | 2.2 100% |
| CCT | 14252 46% | 7015 93% | 6057 107% | 6068 107% | 13335 49% | 6836 95% |
| Color Space (Percent of AdobeRGB 1998) (%) | 36.7 | 37 1% | 37 1% | 56 53% | 37 1% | 63.2 72% |
| Color Space (Percent of sRGB) (%) | 57.8 | 59 2% | 57 -1% | 86 49% | 59 2% | 98 70% |
| Moyenne finale (programmes/paramètres) | 16% /
44% | 5% /
38% | 25% /
54% | 16% /
13% | 49% /
89% |
* ... Moindre est la valeur, meilleures sont les performances
Temps de réponse de l'écran
| ↔ Temps de réponse noir à blanc | ||
|---|---|---|
| 15.6 ms ... hausse ↗ et chute ↘ combinées | ↗ 9.2 ms hausse | 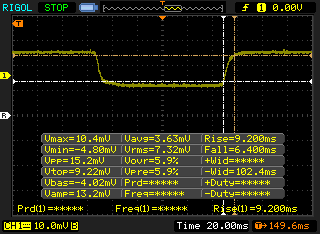 |
| ↘ 6.4 ms chute | ||
| L'écran montre de bons temps de réponse, mais insuffisant pour du jeu compétitif. En comparaison, tous les appareils testés affichent entre 0.1 (minimum) et 240 (maximum) ms. » 37 % des appareils testés affichent de meilleures performances. Cela signifie que les latences relevées sont meilleures que la moyenne (19.8 ms) de tous les appareils testés. | ||
| ↔ Temps de réponse gris 50% à gris 80% | ||
| 68.8 ms ... hausse ↗ et chute ↘ combinées | ↗ 30 ms hausse | 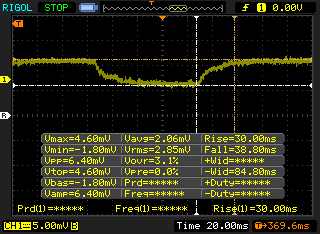 |
| ↘ 38.8 ms chute | ||
| L'écran souffre de latences très élevées, à éviter pour le jeu. En comparaison, tous les appareils testés affichent entre 0.165 (minimum) et 636 (maximum) ms. » 98 % des appareils testés affichent de meilleures performances. Cela signifie que les latences relevées sont moins bonnes que la moyenne (31 ms) de tous les appareils testés. | ||
Scintillement / MLI (Modulation de largeur d'impulsion)
| Scintillement / MLI (Modulation de largeur d'impulsion) décelé | 1000 Hz | ≤ 99 Niveau de luminosité | 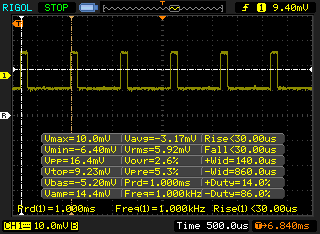 |
Le rétroéclairage de l'écran scintille à la fréquence de 1000 Hz (certainement du fait de l'utilisation d'une MDI - Modulation de largeur d'impulsion) à un niveau de luminosité inférieur ou égal à 99 % . Aucun scintillement ne devrait être perceptible au-dessus de cette valeur. La fréquence de rafraîchissement de 1000 Hz est élevée, la grande majorité des utilisateurs ne devrait pas percevoir de scintillements et être sujette à une fatigue oculaire accrue. En comparaison, 52 % des appareils testés n'emploient pas MDI pour assombrir leur écran. Nous avons relevé une moyenne à 7753 (minimum : 5 - maximum : 343500) Hz dans le cas où une MDI était active. | |||
| Cinebench R10 | |
| Rendering Multiple CPUs 32Bit | |
| Dell XPS 13 7390 Core i7-10710U | |
| Moyenne Intel Core i7-8565U (13806 - 23118, n=16) | |
| Dynabook Portege A30-E-174 | |
| Rendering Single 32Bit | |
| Dell XPS 13 7390 Core i7-10710U | |
| Moyenne Intel Core i7-8565U (2682 - 8906, n=16) | |
| Dynabook Portege A30-E-174 | |
| wPrime 2.10 - 1024m | |
| Moyenne Intel Core i7-8565U (263 - 420, n=7) | |
| Dell XPS 13 7390 Core i7-10710U | |
* ... Moindre est la valeur, meilleures sont les performances
| PCMark 8 Home Score Accelerated v2 | 3335 points | |
| PCMark 8 Work Score Accelerated v2 | 5132 points | |
| PCMark 10 Score | 3787 points | |
Aide | ||
| HP Pavilion x360 15-dq0065cl Intel SSD 660p SSDPEKNW512G8 | Asus VivoBook Flip 15 TP510UA-E8073T SanDisk SD8SN8U128G1002 | Lenovo Ideapad C340-15IWL-81N5004QGE SK hynix BC501 HFM128GDJTNG-831 | HP Envy x360 15-bq102ng Samsung PM961 MZVLW256HEHP | Dell Inspiron 15 3585 (2300U, Vega 6) Toshiba BG3 KBG30ZMS256G | Dell XPS 15 7590 i5 iGPU FHD Toshiba XG6 KXG60ZNV512G | |
|---|---|---|---|---|---|---|
| AS SSD | -60% | -35% | 19% | -73% | 70% | |
| Seq Read (MB/s) | 1301 | 474.8 -64% | 1399 8% | 2465 89% | 1291 -1% | 2357 81% |
| Seq Write (MB/s) | 931 | 229.3 -75% | 369.8 -60% | 1318 42% | 688 -26% | 1235 33% |
| 4K Read (MB/s) | 52.8 | 26.42 -50% | 40 -24% | 42.97 -19% | 21.87 -59% | 43.29 -18% |
| 4K Write (MB/s) | 127.5 | 49.85 -61% | 109.2 -14% | 81.9 -36% | 35.62 -72% | 99.7 -22% |
| 4K-64 Read (MB/s) | 323.4 | 364.5 13% | 264.3 -18% | 1025 217% | 632 95% | 1020 215% |
| 4K-64 Write (MB/s) | 667 | 93.2 -86% | 181.9 -73% | 338.6 -49% | 221.2 -67% | 1502 125% |
| Access Time Read * (ms) | 0.048 | 0.13 -171% | 0.07 -46% | 0.077 -60% | 0.33 -588% | 0.07 -46% |
| Access Time Write * (ms) | 0.136 | 0.088 35% | 0.041 70% | 0.046 66% | 0.234 -72% | 0.039 71% |
| Score Read (Points) | 506 | 438 -13% | 444 -12% | 1314 160% | 783 55% | 1299 157% |
| Score Write (Points) | 887 | 166 -81% | 328 -63% | 552 -38% | 326 -63% | 1726 95% |
| Score Total (Points) | 1655 | 825 -50% | 963 -42% | 2488 50% | 1489 -10% | 3640 120% |
| Copy ISO MB/s (MB/s) | 905 | 317.8 -65% | 265.8 -71% | 700 -23% | 432.6 -52% | 2145 137% |
| Copy Program MB/s (MB/s) | 607 | 80.8 -87% | 158.7 -74% | 167.2 -72% | 95.6 -84% | 565 -7% |
| Copy Game MB/s (MB/s) | 911 | 127.1 -86% | 216.8 -76% | 370.4 -59% | 263.4 -71% | 1320 45% |
| CrystalDiskMark 5.2 / 6 | -39% | 4% | -39% | 32% | ||
| Write 4K (MB/s) | 179 | 105 -41% | 116 -35% | 87.3 -51% | 93.6 -48% | |
| Read 4K (MB/s) | 58.7 | 39.72 -32% | 42.73 -27% | 23.54 -60% | 41.87 -29% | |
| Write Seq (MB/s) | 974 | 326.9 -66% | 1222 25% | 824 -15% | 1698 74% | |
| Read Seq (MB/s) | 1614 | 1033 -36% | 1608 0% | 715 -56% | 1978 23% | |
| Write 4K Q32T1 (MB/s) | 445.4 | 269.1 -40% | 280.1 -37% | 147.8 -67% | 383.1 -14% | |
| Read 4K Q32T1 (MB/s) | 338.7 | 284.8 -16% | 333.6 -2% | 256.1 -24% | 326.9 -3% | |
| Write Seq Q32T1 (MB/s) | 986 | 321 -67% | 1291 31% | 733 -26% | 2778 182% | |
| Read Seq Q32T1 (MB/s) | 1824 | 1606 -12% | 3183 75% | 1525 -16% | 3119 71% | |
| Moyenne finale (programmes/paramètres) | -60% /
-60% | -37% /
-37% | 12% /
14% | -56% /
-60% | 51% /
56% |
* ... Moindre est la valeur, meilleures sont les performances

| 3DMark 11 Performance | 1933 points | |
| 3DMark Cloud Gate Standard Score | 7819 points | |
| 3DMark Fire Strike Score | 1008 points | |
| 3DMark Time Spy Score | 427 points | |
Aide | ||
| Shadow of the Tomb Raider - 1280x720 Lowest Preset | |
| MSI Modern 14 A10RB-459US | |
| Dell Inspiron 15 5000 5585 | |
| Microsoft Surface Laptop 3 15 i7-1065G7 | |
| Dell Inspiron 15 3585 (2300U, Vega 6) | |
| Dell XPS 13 7390 Core i7-10710U | |
| Moyenne Intel UHD Graphics 620 (12 - 21.7, n=13) | |
| Bas | Moyen | Élevé | Ultra | |
|---|---|---|---|---|
| BioShock Infinite (2013) | 49.1 | 30.5 | 24.7 | |
| The Witcher 3 (2015) | 16.8 | 10.5 | ||
| Rocket League (2017) | 62.7 |
| HP Pavilion x360 15-dq0065cl UHD Graphics 620, i7-8565U, Intel SSD 660p SSDPEKNW512G8 | Asus VivoBook Flip 15 TP510UA-E8073T UHD Graphics 620, i5-8250U, SanDisk SD8SN8U128G1002 | Lenovo Ideapad C340-15IWL-81N5004QGE GeForce MX230, i5-8265U, SK hynix BC501 HFM128GDJTNG-831 | HP Envy x360 15-bq102ng Vega 8, R5 2500U, Samsung PM961 MZVLW256HEHP | Dell Inspiron 15 3585 (2300U, Vega 6) Vega 6, R3 2300U, Toshiba BG3 KBG30ZMS256G | Dell XPS 15 7590 i5 iGPU FHD UHD Graphics 630, i5-9300H, Toshiba XG6 KXG60ZNV512G | |
|---|---|---|---|---|---|---|
| Noise | -6% | -8% | -9% | -10% | -3% | |
| arrêt / environnement * (dB) | 28.4 | 30.2 -6% | 30.3 -7% | 30.13 -6% | 30.6 -8% | 29.3 -3% |
| Idle Minimum * (dB) | 28.4 | 30.9 -9% | 30.6 -8% | 30.13 -6% | 30.6 -8% | 29.3 -3% |
| Idle Average * (dB) | 28.4 | 30.9 -9% | 30.6 -8% | 30.13 -6% | 30.6 -8% | 29.3 -3% |
| Idle Maximum * (dB) | 28.4 | 30.9 -9% | 30.6 -8% | 30.13 -6% | 30.6 -8% | 29.8 -5% |
| Load Average * (dB) | 31.5 | 34.2 -9% | 36.4 -16% | 38.8 -23% | 36.7 -17% | 32.4 -3% |
| Load Maximum * (dB) | 37.4 | 34.2 9% | 36.8 2% | 38.8 -4% | 41.1 -10% | 37.2 1% |
* ... Moindre est la valeur, meilleures sont les performances
Degré de la nuisance sonore
| Au repos |
| 28.4 / 28.4 / 28.4 dB(A) |
| Fortement sollicité |
| 31.5 / 37.4 dB(A) |
 | ||
30 dB silencieux 40 dB(A) audible 50 dB(A) bruyant |
||
min: | ||
(+) La température maximale du côté supérieur est de 31.6 °C / 89 F, par rapport à la moyenne de 36.8 °C / 98 F, allant de 21 à 71 °C pour la classe Multimedia.
(±) Le fond chauffe jusqu'à un maximum de 41.6 °C / 107 F, contre une moyenne de 39.1 °C / 102 F
(+) En utilisation inactive, la température moyenne du côté supérieur est de 22.9 °C / 73 F, par rapport à la moyenne du dispositif de 31.3 °C / 88 F.
(+) Les repose-poignets et le pavé tactile sont plus froids que la température de la peau avec un maximum de 29.8 °C / 85.6 F et sont donc froids au toucher.
(±) La température moyenne de la zone de l'appui-paume de dispositifs similaires était de 28.7 °C / 83.7 F (-1.1 °C / #-1.9 F).
HP Pavilion x360 15-dq0065cl analyse audio
(±) | le niveau sonore du haut-parleur est moyen mais bon (80.3# dB)
Basses 100 - 315 Hz
(±) | basse réduite - en moyenne 12.7% inférieure à la médiane
(-) | les basses ne sont pas linéaires (15.3% delta à la fréquence précédente)
Médiums 400 - 2000 Hz
(+) | médiane équilibrée - seulement 3.6% de la médiane
(±) | la linéarité des médiums est moyenne (7% delta à la fréquence précédente)
Aiguës 2 - 16 kHz
(+) | des sommets équilibrés - à seulement 3.6% de la médiane
(±) | la linéarité des aigus est moyenne (7% delta à la fréquence précédente)
Globalement 100 - 16 000 Hz
(±) | la linéarité du son global est moyenne (20.1% de différence avec la médiane)
Par rapport à la même classe
» 67% de tous les appareils testés de cette catégorie étaient meilleurs, 8% similaires, 25% pires
» Le meilleur avait un delta de 5%, la moyenne était de 17%, le pire était de 45%.
Par rapport à tous les appareils testés
» 52% de tous les appareils testés étaient meilleurs, 8% similaires, 40% pires
» Le meilleur avait un delta de 4%, la moyenne était de 23%, le pire était de 134%.
Apple MacBook 12 (Early 2016) 1.1 GHz analyse audio
(+) | les haut-parleurs peuvent jouer relativement fort (83.6# dB)
Basses 100 - 315 Hz
(±) | basse réduite - en moyenne 11.3% inférieure à la médiane
(±) | la linéarité des basses est moyenne (14.2% delta à la fréquence précédente)
Médiums 400 - 2000 Hz
(+) | médiane équilibrée - seulement 2.4% de la médiane
(+) | les médiums sont linéaires (5.5% delta à la fréquence précédente)
Aiguës 2 - 16 kHz
(+) | des sommets équilibrés - à seulement 2% de la médiane
(+) | les aigus sont linéaires (4.5% delta à la fréquence précédente)
Globalement 100 - 16 000 Hz
(+) | le son global est linéaire (10.2% différence à la médiane)
Par rapport à la même classe
» 7% de tous les appareils testés de cette catégorie étaient meilleurs, 2% similaires, 91% pires
» Le meilleur avait un delta de 5%, la moyenne était de 18%, le pire était de 53%.
Par rapport à tous les appareils testés
» 5% de tous les appareils testés étaient meilleurs, 1% similaires, 94% pires
» Le meilleur avait un delta de 4%, la moyenne était de 23%, le pire était de 134%.
| Éteint/en veille | |
| Au repos | |
| Fortement sollicité |
|
Légende:
min: | |
| HP Pavilion x360 15-dq0065cl i7-8565U, UHD Graphics 620, Intel SSD 660p SSDPEKNW512G8, TN LED, 1366x768, 15.6" | Asus VivoBook Flip 15 TP510UA-E8073T i5-8250U, UHD Graphics 620, SanDisk SD8SN8U128G1002, IPS, 1920x1080, 15.6" | Lenovo Ideapad C340-15IWL-81N5004QGE i5-8265U, GeForce MX230, SK hynix BC501 HFM128GDJTNG-831, IPS, 1920x1080, 15.6" | HP Envy x360 15-bq102ng R5 2500U, Vega 8, Samsung PM961 MZVLW256HEHP, IPS, 1920x1080, 15.6" | Dell Inspiron 15 3585 (2300U, Vega 6) R3 2300U, Vega 6, Toshiba BG3 KBG30ZMS256G, TN, 1920x1080, 15.6" | Dell XPS 15 7590 i5 iGPU FHD i5-9300H, UHD Graphics 630, Toshiba XG6 KXG60ZNV512G, IPS, 1920x1080, 15.6" | |
|---|---|---|---|---|---|---|
| Power Consumption | -28% | -48% | -43% | -59% | -96% | |
| Idle Minimum * (Watt) | 3.6 | 3.9 -8% | 3.23 10% | 4.8 -33% | 6.3 -75% | 3.79 -5% |
| Idle Average * (Watt) | 5.4 | 7.2 -33% | 6.3 -17% | 7 -30% | 9.2 -70% | 6.9 -28% |
| Idle Maximum * (Watt) | 6.5 | 9.5 -46% | 8 -23% | 9.5 -46% | 9.6 -48% | 9.2 -42% |
| Load Average * (Watt) | 26.7 | 36.8 -38% | 47 -76% | 40.8 -53% | 38 -42% | 62 -132% |
| Load Maximum * (Watt) | 28.8 | 33.1 -15% | 67.3 -134% | 44.3 -54% | 46 -60% | 108 -275% |
* ... Moindre est la valeur, meilleures sont les performances
| HP Pavilion x360 15-dq0065cl i7-8565U, UHD Graphics 620, 41 Wh | Asus VivoBook Flip 15 TP510UA-E8073T i5-8250U, UHD Graphics 620, 42 Wh | Lenovo Ideapad C340-15IWL-81N5004QGE i5-8265U, GeForce MX230, 52.5 Wh | HP Envy x360 15-bq102ng R5 2500U, Vega 8, 55.8 Wh | Dell Inspiron 15 3585 (2300U, Vega 6) R3 2300U, Vega 6, 42 Wh | Dell XPS 15 7590 i5 iGPU FHD i5-9300H, UHD Graphics 630, 97 Wh | |
|---|---|---|---|---|---|---|
| Autonomie de la batterie | 40% | 100% | 65% | 4% | 125% | |
| Reader / Idle (h) | 12.3 | 7.3 -41% | ||||
| WiFi v1.3 (h) | 4.3 | 6 40% | 8.6 100% | 7.1 65% | 5.3 23% | 14.1 228% |
| Load (h) | 1.4 | 1.8 29% | 1.7 21% |
Points positifs
Points négatifs
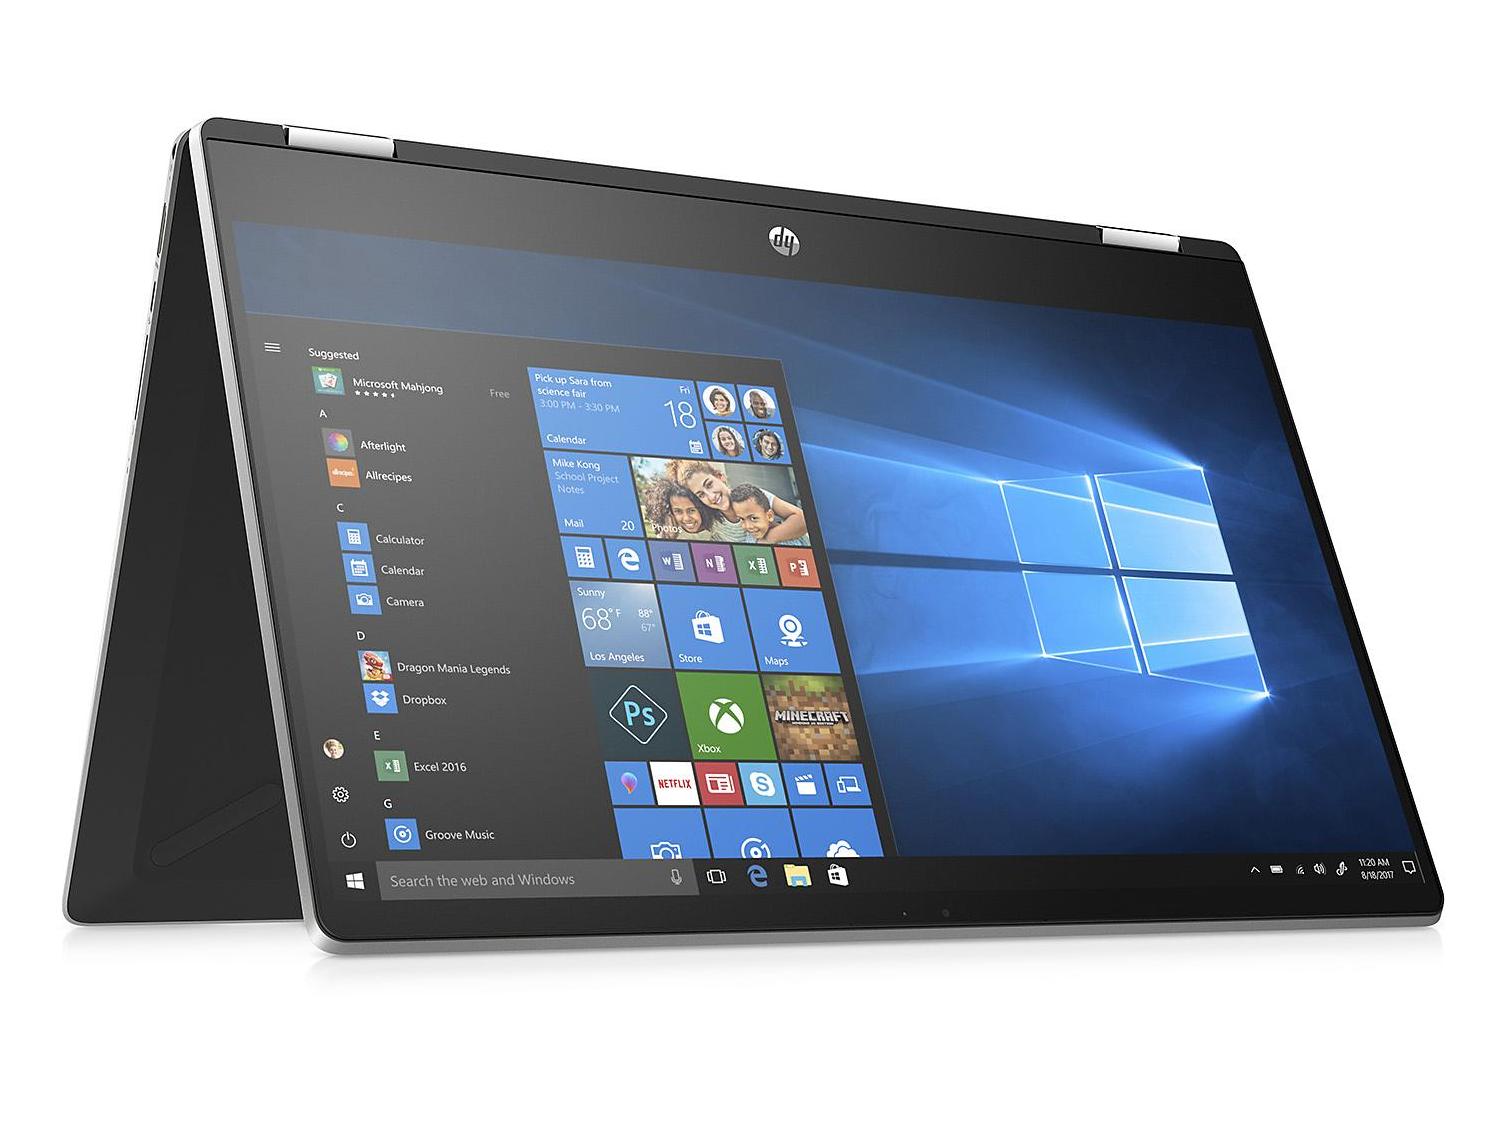
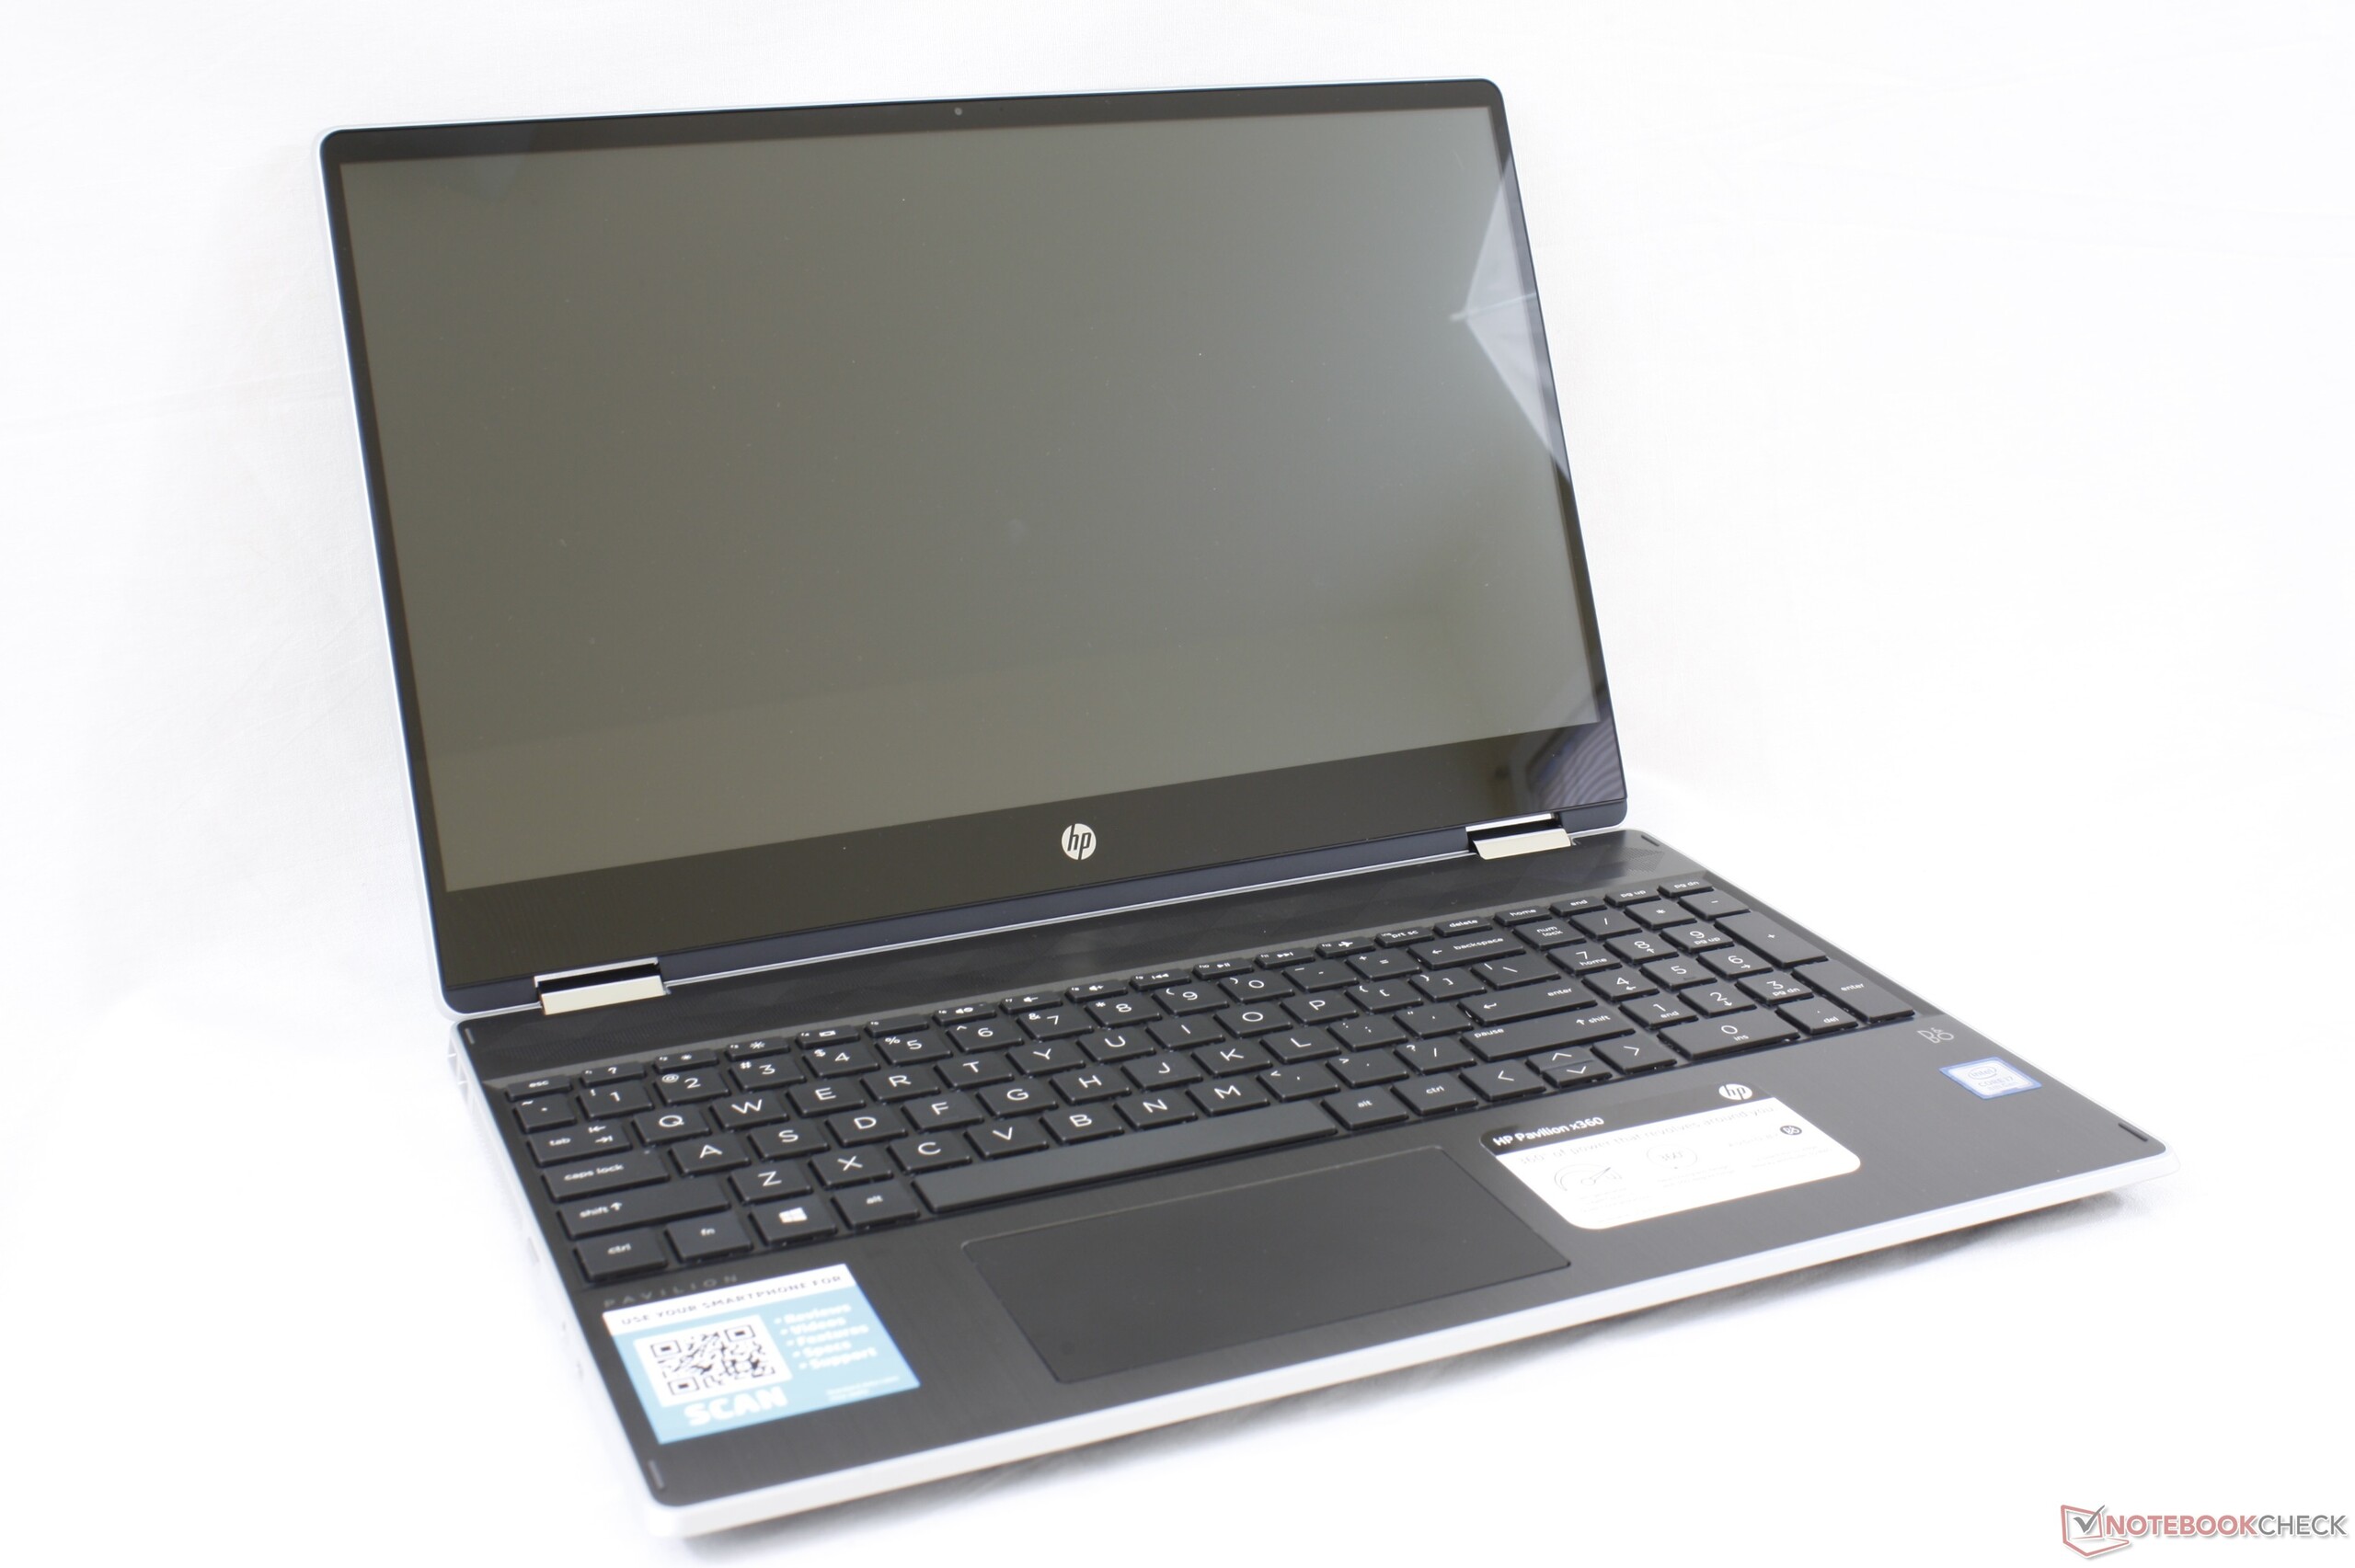
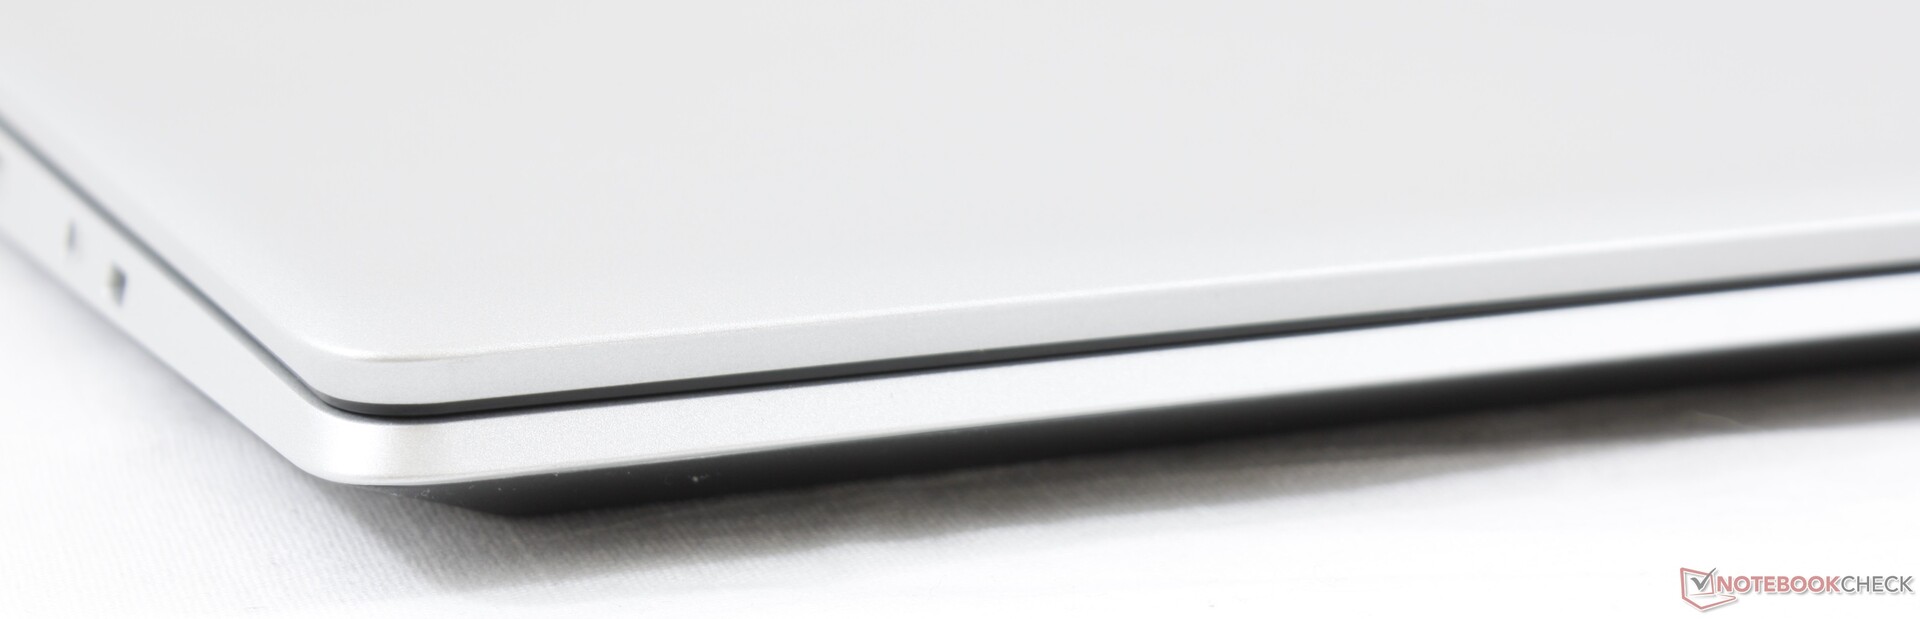
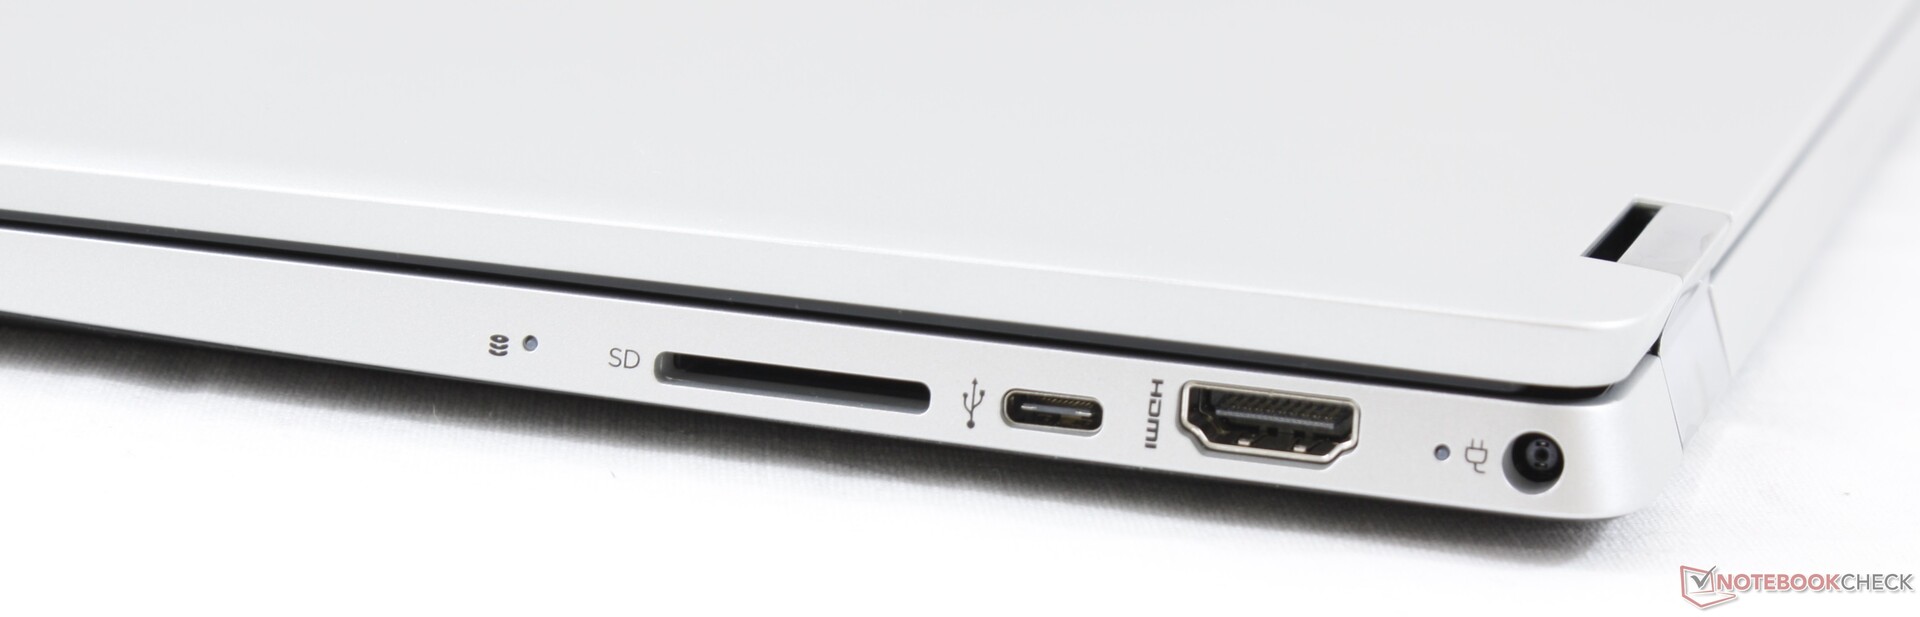
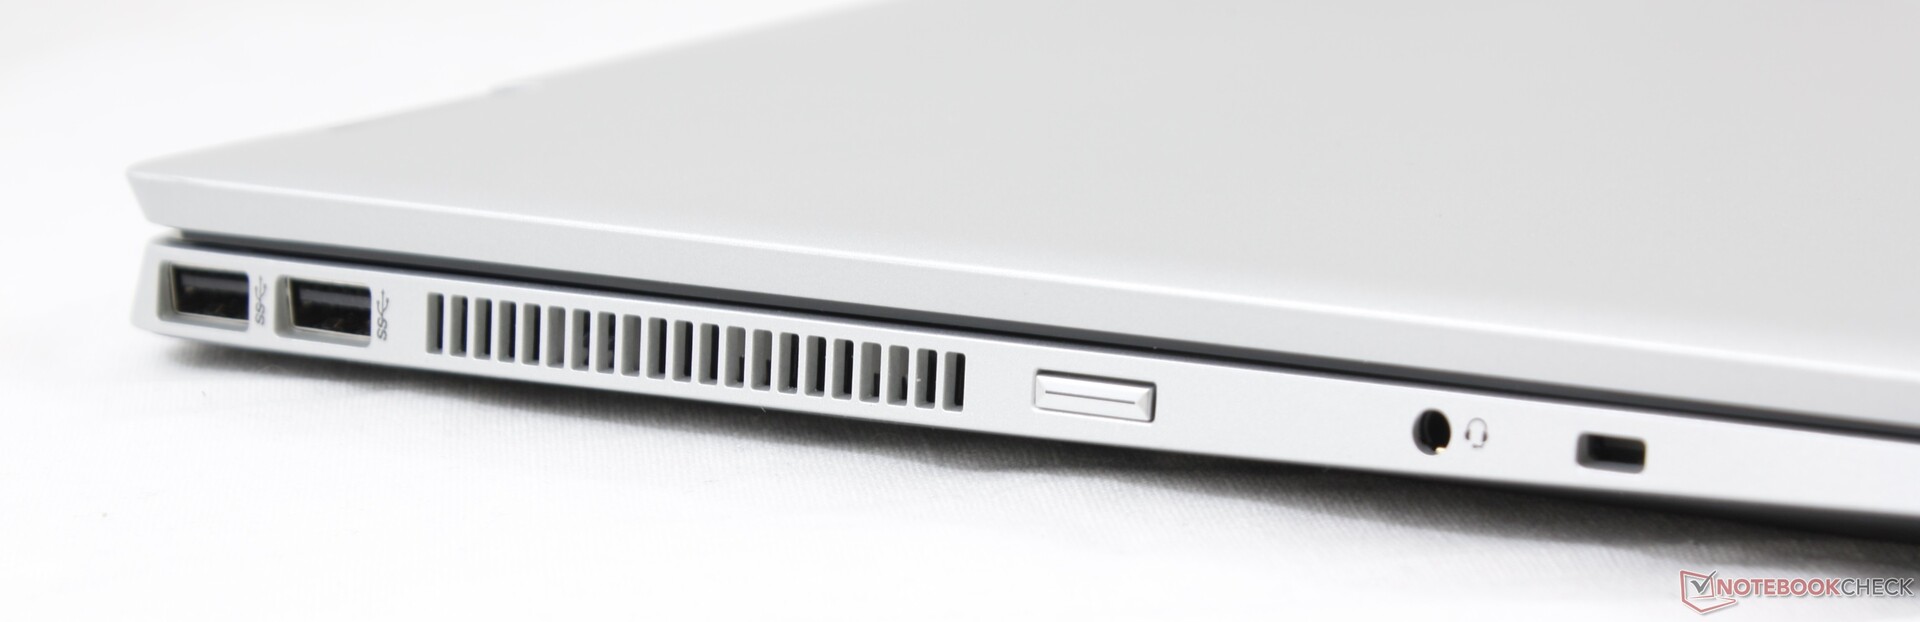
Les éléments qui rattrapent le Pavilion x360 15 2019 sont ses bordures d’écran étroites, son poids réduit, et sa compacité par rapport aux autres convertibles de cette taille. La connectivité est correcte et le bruit du ventilateur discret, grâce au Turbo Boost limité et aux bonnes températures internes.
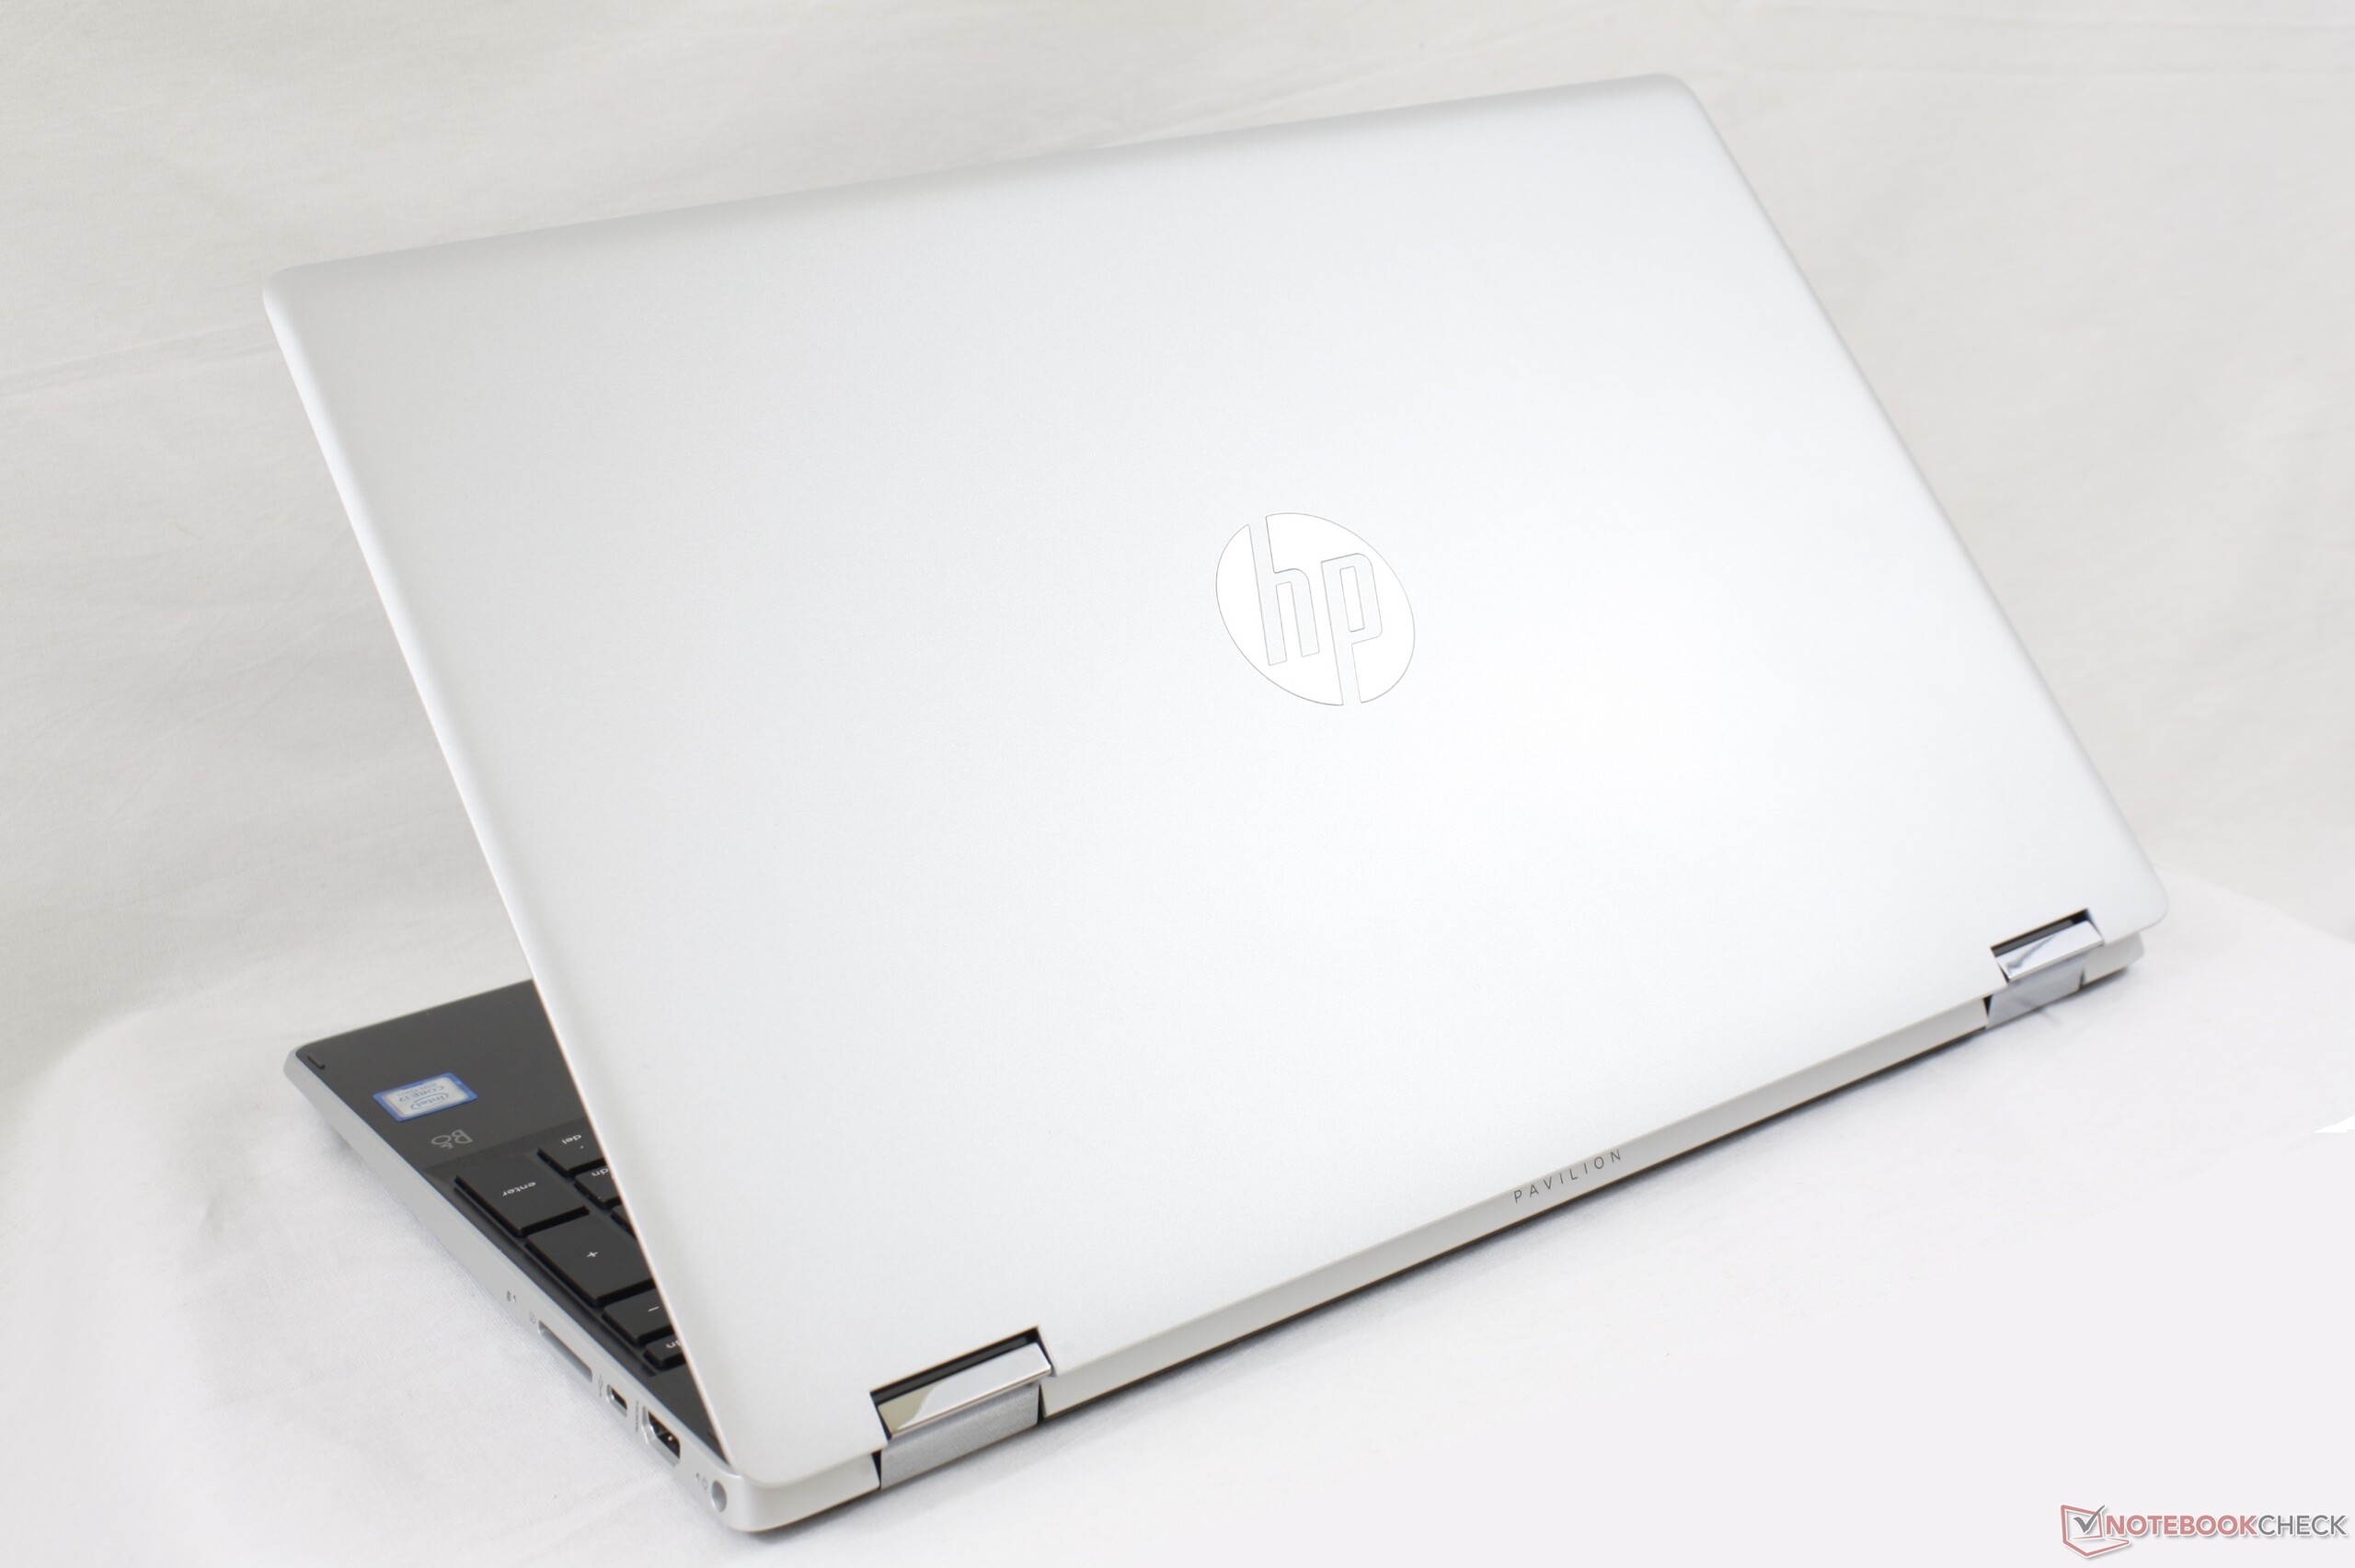
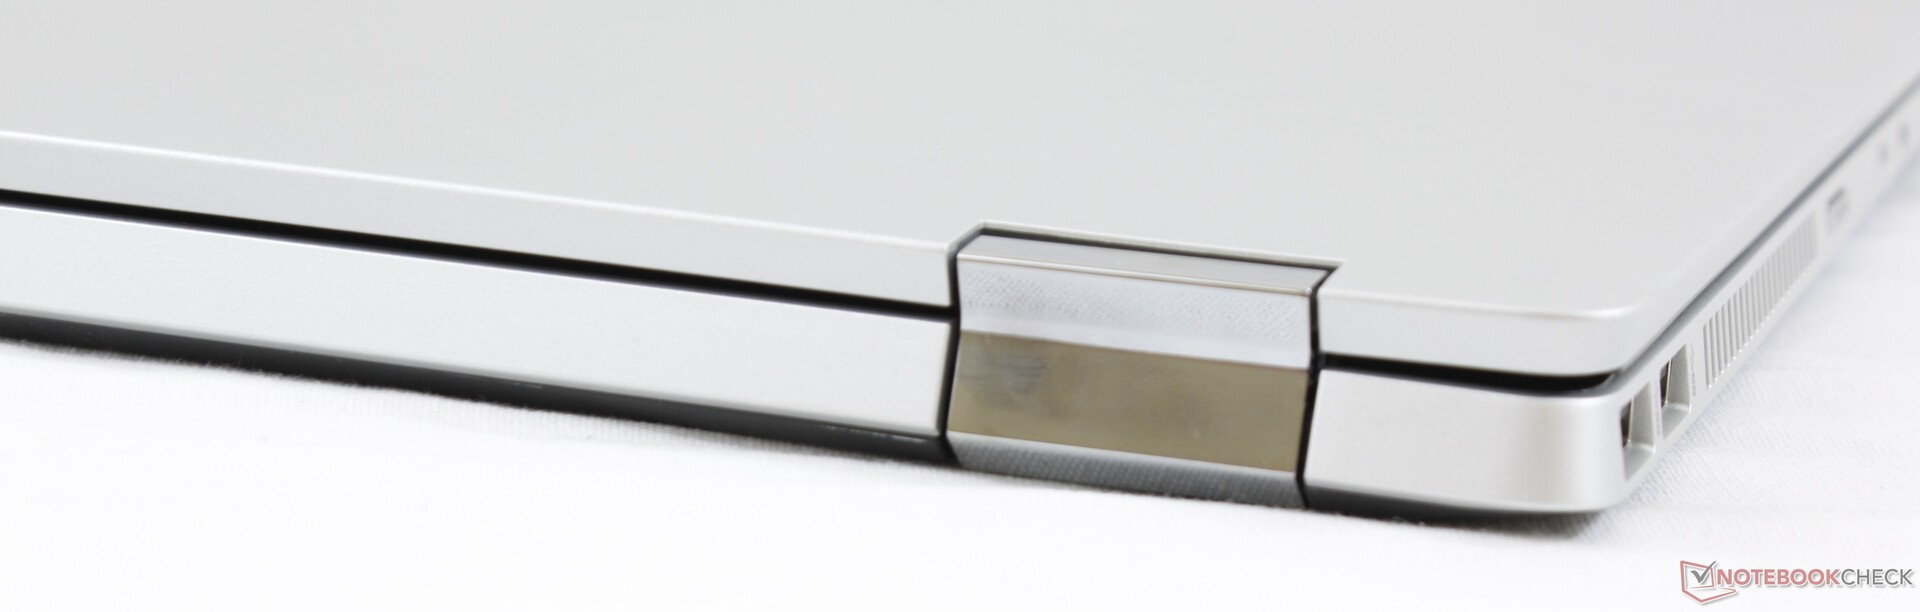
Malheureusement, presque tout le reste est catastrophique. Pour 1 000 €, le Pavilion x30 15 possède une faible autonomie, un châssis fragile, et l’un des pires écrans que l’on peut trouver sur un portable avec un processeur Whiskey Lake U. L’écran est sombre, avec un faible contraste, ses couleurs sont pauvres, et les angles de vision réduits à cause de la dalle TN, et qui réduisent presque à 0 l’avantage du convertible. Une telle configuration ne devrait pas exister à ce niveau de prix.
Ce Pavilion x360 15 n’est cependant pas mauvais pour un portable à petit prix. Les configurations moins haut de gamme se vendent environ 500 €, ce qui est bien plus facile à avaler. Néanmoins, nous recommandons de choisir une version avec un dalle 1080p. Si vous souhaitez avoir un convertible, alors le Walmart Motile pourrait être une bonne alternative.
Ce Pavilion x360 15 ne mérite en aucun cas d’entrer dans le marché des portables à 4 chiffres. Si vous êtes prêts à dépenser 1 000 $ pour un portable, alors merci de regarder du côté HP Envy ou du Spectre.
L’intégralité de cette critique est disponible en anglais en suivant ce lien.
HP Pavilion x360 15-dq0065cl
- 02/09/2020 v7 (old)
Allen Ngo
Price comparison
