Test du MSI Modern 14 A10RB (i5-10210U, MX250, FHD) : plus léger qu'il n'y paraît
Note | Date | Modèle | Poids | Épaisseur | Taille | Résolution | Prix |
|---|---|---|---|---|---|---|---|
| 80.9 % v7 (old) | 02/20 | MSI Modern 14 A10RB-459US i5-10210U, GeForce MX250 | 1.2 kg | 16 mm | 14.00" | 1920x1080 |

| SD Card Reader | |
| average JPG Copy Test (av. of 3 runs) | |
| Dell XPS 15 7590 9980HK GTX 1650 (Toshiba Exceria Pro SDXC 64 GB UHS-II) | |
| Asus ZenBook 15 UX534FT-DB77 (Toshiba Exceria Pro SDXC 64 GB UHS-II) | |
| MSI Modern 14 A10RB-459US (Toshiba Exceria Pro SDXC 64 GB UHS-II) | |
| maximum AS SSD Seq Read Test (1GB) | |
| Dell XPS 15 7590 9980HK GTX 1650 (Toshiba Exceria Pro SDXC 64 GB UHS-II) | |
| Asus ZenBook 15 UX534FT-DB77 (Toshiba Exceria Pro SDXC 64 GB UHS-II) | |
| MSI Modern 14 A10RB-459US (Toshiba Exceria Pro SDXC 64 GB UHS-II) | |
| Networking | |
| iperf3 transmit AX12 | |
| MSI Prestige 15 A10SC | |
| Asus ZenBook 15 UX534FT-DB77 | |
| iperf3 receive AX12 | |
| MSI Prestige 15 A10SC | |
| Asus ZenBook 15 UX534FT-DB77 | |
| |||||||||||||||||||||||||
Homogénéité de la luminosité: 87 %
Valeur mesurée au centre, sur batterie: 324.1 cd/m²
Contraste: 1473:1 (Valeurs des noirs: 0.22 cd/m²)
ΔE ColorChecker Calman: 1.63 | ∀{0.5-29.43 Ø4.72}
calibrated: 1.42
ΔE Greyscale Calman: 2.2 | ∀{0.09-98 Ø4.97}
95% sRGB (Argyll 1.6.3 3D)
60.2% AdobeRGB 1998 (Argyll 1.6.3 3D)
65.4% AdobeRGB 1998 (Argyll 3D)
94.8% sRGB (Argyll 3D)
64.2% Display P3 (Argyll 3D)
Gamma: 2.26
CCT: 6887 K
| MSI Modern 14 A10RB-459US Chi Mei N140HCE-EN2, IPS, 14", 1920x1080 | MSI Prestige 14 i7-10710U AUO123B, , 14", 3840x2160 | Asus ZenBook 15 UX534FT-DB77 BOE NV156FHM-N63, IPS, 15.6", 1920x1080 | Lenovo Yoga C940-14IIL LP140WF9-SPE2, IPS LED, 14", 1920x1080 | Dell XPS 15 7590 9980HK GTX 1650 Samsung 156WR04, SDCA029, OLED, 15.6", 3840x2160 | Apple MacBook Pro 16 2019 i9 5500M APPA044, IPS, 16", 3072x1920 | |
|---|---|---|---|---|---|---|
| Display | 26% | -2% | 3% | 27% | ||
| Display P3 Coverage (%) | 64.2 | 81.5 27% | 66.6 4% | 66 3% | 88.1 37% | |
| sRGB Coverage (%) | 94.8 | 99 4% | 87.7 -7% | 97.9 3% | 99.6 5% | |
| AdobeRGB 1998 Coverage (%) | 65.4 | 95.4 46% | 64.1 -2% | 67.3 3% | 91.8 40% | |
| Response Times | 1% | -6% | 94% | -16% | ||
| Response Time Grey 50% / Grey 80% * (ms) | 39.2 ? | 41.2 ? -5% | 49.6 ? -27% | 2.3 ? 94% | 52.4 ? -34% | |
| Response Time Black / White * (ms) | 35.6 ? | 33.2 ? 7% | 30 ? 16% | 2.4 ? 93% | 34.9 ? 2% | |
| PWM Frequency (Hz) | 25000 ? | 59.5 ? | 131700 | |||
| Screen | -5% | -70% | -9% | -45% | 6% | |
| Brightness middle (cd/m²) | 324.1 | 568 75% | 312.6 -4% | 384 18% | 421.2 30% | 519 60% |
| Brightness (cd/m²) | 301 | 513 70% | 290 -4% | 363 21% | 417 39% | 477 58% |
| Brightness Distribution (%) | 87 | 87 0% | 85 -2% | 90 3% | 94 8% | 86 -1% |
| Black Level * (cd/m²) | 0.22 | 0.28 -27% | 0.31 -41% | 0.17 23% | 0.39 -77% | |
| Contrast (:1) | 1473 | 2029 38% | 1008 -32% | 2259 53% | 1331 -10% | |
| Colorchecker dE 2000 * | 1.63 | 3.18 -95% | 5.78 -255% | 3.5 -115% | 6.06 -272% | 2.28 -40% |
| Colorchecker dE 2000 max. * | 4.25 | 7.01 -65% | 8.86 -108% | 5.5 -29% | 11.89 -180% | 6.54 -54% |
| Colorchecker dE 2000 calibrated * | 1.42 | 1.14 20% | 3.78 -166% | 1 30% | 0.86 39% | |
| Greyscale dE 2000 * | 2.2 | 4.79 -118% | 5.4 -145% | 4.6 -109% | 2.8 -27% | 0.9 59% |
| Gamma | 2.26 97% | 2.49 88% | 2.21 100% | 2.32 95% | 2.15 102% | 2145 0% |
| CCT | 6887 94% | 6488 100% | 7864 83% | 6884 94% | 6235 104% | 6572 99% |
| Color Space (Percent of AdobeRGB 1998) (%) | 60.2 | 85 41% | 57.1 -5% | 62 3% | 81 35% | 78 30% |
| Color Space (Percent of sRGB) (%) | 95 | 99 4% | 87.4 -8% | 97.7 3% | 99.6 5% | |
| Moyenne finale (programmes/paramètres) | 11% /
1% | -24% /
-48% | -4% /
-6% | 25% /
-7% | -5% /
3% |
* ... Moindre est la valeur, meilleures sont les performances
Temps de réponse de l'écran
| ↔ Temps de réponse noir à blanc | ||
|---|---|---|
| 35.6 ms ... hausse ↗ et chute ↘ combinées | ↗ 21.2 ms hausse | 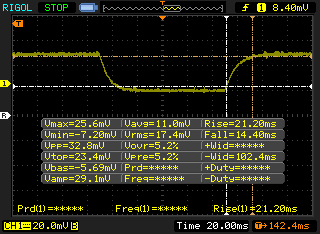 |
| ↘ 14.4 ms chute | ||
| L'écran souffre de latences très élevées, à éviter pour le jeu. En comparaison, tous les appareils testés affichent entre 0.1 (minimum) et 240 (maximum) ms. » 93 % des appareils testés affichent de meilleures performances. Cela signifie que les latences relevées sont moins bonnes que la moyenne (19.8 ms) de tous les appareils testés. | ||
| ↔ Temps de réponse gris 50% à gris 80% | ||
| 39.2 ms ... hausse ↗ et chute ↘ combinées | ↗ 20.8 ms hausse | 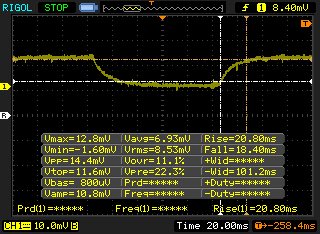 |
| ↘ 18.4 ms chute | ||
| L'écran souffre de latences très élevées, à éviter pour le jeu. En comparaison, tous les appareils testés affichent entre 0.165 (minimum) et 636 (maximum) ms. » 60 % des appareils testés affichent de meilleures performances. Cela signifie que les latences relevées sont moins bonnes que la moyenne (31 ms) de tous les appareils testés. | ||
Scintillement / MLI (Modulation de largeur d'impulsion)
| Scintillement / MLI (Modulation de largeur d'impulsion) décelé | 25000 Hz | ≤ 28 Niveau de luminosité | 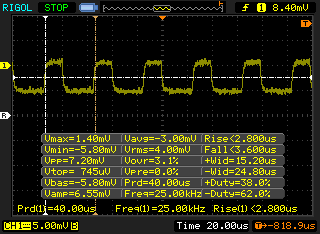 |
Le rétroéclairage de l'écran scintille à la fréquence de 25000 Hz (certainement du fait de l'utilisation d'une MDI - Modulation de largeur d'impulsion) à un niveau de luminosité inférieur ou égal à 28 % . Aucun scintillement ne devrait être perceptible au-dessus de cette valeur. La fréquence de rafraîchissement de 25000 Hz est élevée, la grande majorité des utilisateurs ne devrait pas percevoir de scintillements et être sujette à une fatigue oculaire accrue. En comparaison, 52 % des appareils testés n'emploient pas MDI pour assombrir leur écran. Nous avons relevé une moyenne à 7763 (minimum : 5 - maximum : 343500) Hz dans le cas où une MDI était active. | |||
| wPrime 2.10 - 1024m | |
| Microsoft Surface Laptop 3 15 Ryzen 5 3580U | |
| Moyenne Intel Core i5-10210U (n=1) | |
| Dell XPS 13 7390 Core i7-10710U | |
* ... Moindre est la valeur, meilleures sont les performances
| PCMark 8 Home Score Accelerated v2 | 3464 points | |
| PCMark 8 Work Score Accelerated v2 | 4992 points | |
| PCMark 10 Score | 4497 points | |
Aide | ||
| MSI Modern 14 A10RB-459US Kingston RBUSNS8154P3512GJ | Asus ZenBook 15 UX534FT-DB77 Samsung SSD PM981 MZVLB1T0HALR | Lenovo Yoga C940-14IIL Samsung SSD PM981 MZVLB512HAJQ | Dell XPS 15 7590 9980HK GTX 1650 Toshiba XG6 KXG60ZNV1T02 | Apple MacBook Pro 16 2019 i9 5500M Apple SSD AP1024 7171 | |
|---|---|---|---|---|---|
| AS SSD | 51% | 64% | 73% | 57% | |
| Seq Read (MB/s) | 1061 | 1887 78% | 2525 138% | 1723 62% | 2531 139% |
| Seq Write (MB/s) | 953 | 1432 50% | 1253 31% | 1386 45% | 2289 140% |
| 4K Read (MB/s) | 35.59 | 52.3 47% | 59.1 66% | 43.25 22% | 15.85 -55% |
| 4K Write (MB/s) | 87 | 146 68% | 134.1 54% | 98.3 13% | 39.88 -54% |
| 4K-64 Read (MB/s) | 769 | 969 26% | 1010 31% | 1078 40% | 1267 65% |
| 4K-64 Write (MB/s) | 733 | 1375 88% | 1461 99% | 1456 99% | 1749 139% |
| Access Time Read * (ms) | 0.084 | 0.034 60% | 0.052 38% | 0.05 40% | 0.122 -45% |
| Access Time Write * (ms) | 0.136 | 0.075 45% | 0.029 79% | 0.039 71% | 0.095 30% |
| Score Read (Points) | 911 | 1210 33% | 1322 45% | 1294 42% | 1536 69% |
| Score Write (Points) | 916 | 1664 82% | 1721 88% | 1693 85% | 2018 120% |
| Score Total (Points) | 2294 | 3483 52% | 3670 60% | 3638 59% | 4317 88% |
| Copy ISO MB/s (MB/s) | 956 | 1375 44% | 2016 111% | 3182 233% | 1995 109% |
| Copy Program MB/s (MB/s) | 496.5 | 468 -6% | 542 9% | 984 98% | 584 18% |
| Copy Game MB/s (MB/s) | 872 | 1287 48% | 1278 47% | 1824 109% | 1135 30% |
| CrystalDiskMark 5.2 / 6 | 68% | 66% | 58% | 49% | |
| Write 4K (MB/s) | 107.7 | 141.6 31% | 128.4 19% | 104.3 -3% | 55.5 -48% |
| Read 4K (MB/s) | 39.73 | 45.28 14% | 46.37 17% | 45.23 14% | 16.21 -59% |
| Write Seq (MB/s) | 926 | 1975 113% | 1863 101% | 1729 87% | 1959 112% |
| Read Seq (MB/s) | 1014 | 2272 124% | 2340 131% | 1861 84% | 1763 74% |
| Write 4K Q32T1 (MB/s) | 343.6 | 458.6 33% | 451.1 31% | 509 48% | 398.5 16% |
| Read 4K Q32T1 (MB/s) | 499.1 | 391.4 -22% | 415.3 -17% | 388.5 -22% | 648 30% |
| Write Seq Q32T1 (MB/s) | 1033 | 2393 132% | 2985 189% | 2813 172% | 2727 164% |
| Read Seq Q32T1 (MB/s) | 1604 | 3464 116% | 2565 60% | 2906 81% | 3242 102% |
| Write 4K Q8T8 (MB/s) | 451.4 | ||||
| Read 4K Q8T8 (MB/s) | 1004 | ||||
| Moyenne finale (programmes/paramètres) | 60% /
57% | 65% /
65% | 66% /
67% | 53% /
54% |
* ... Moindre est la valeur, meilleures sont les performances

| 3DMark 11 Performance | 5085 points | |
| 3DMark Cloud Gate Standard Score | 14266 points | |
| 3DMark Fire Strike Score | 3487 points | |
| 3DMark Time Spy Score | 1279 points | |
Aide | ||
| Bas | Moyen | Élevé | Ultra | |
|---|---|---|---|---|
| BioShock Infinite (2013) | 189.7 | 117.5 | 100.5 | 37.8 |
| The Witcher 3 (2015) | 68.1 | 38 | 21.5 | 11.7 |
| Shadow of the Tomb Raider (2018) | 56 | 19 | 12 |
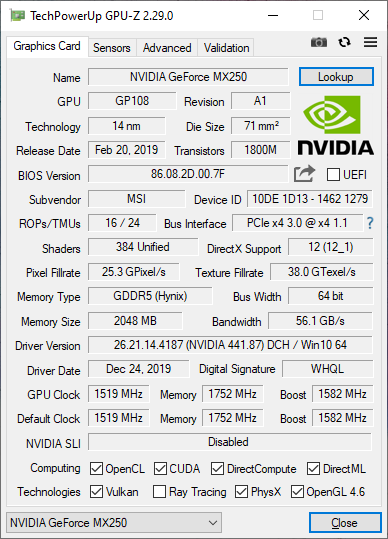
| MSI Modern 14 A10RB-459US GeForce MX250, i5-10210U, Kingston RBUSNS8154P3512GJ | Asus ZenBook 15 UX534FT-DB77 GeForce GTX 1650 Max-Q, i7-8565U, Samsung SSD PM981 MZVLB1T0HALR | Lenovo Yoga C940-14IIL Iris Plus Graphics G7 (Ice Lake 64 EU), i7-1065G7, Samsung SSD PM981 MZVLB512HAJQ | Apple MacBook Pro 16 2019 i9 5500M Radeon Pro 5500M, i9-9880H, Apple SSD AP1024 7171 | Lenovo ThinkPad P43s-20RH001FGE Quadro P520, i7-8565U, WDC PC SN720 SDAQNTW-256G | Lenovo ThinkPad X1 Carbon 2019-20QE000VGE UHD Graphics 620, i7-8665U, WDC PC SN720 SDAQNTW-512G | |
|---|---|---|---|---|---|---|
| Noise | 1% | 3% | -10% | 3% | 6% | |
| arrêt / environnement * (dB) | 28.7 | 28.4 1% | 29.3 -2% | 29.8 -4% | 29.2 -2% | 28.4 1% |
| Idle Minimum * (dB) | 29.5 | 28.4 4% | 29.3 1% | 29.9 -1% | 29.2 1% | 28.4 4% |
| Idle Average * (dB) | 29.5 | 28.4 4% | 29.3 1% | 29.9 -1% | 29.2 1% | 28.4 4% |
| Idle Maximum * (dB) | 29.5 | 28.4 4% | 29.3 1% | 29.9 -1% | 29.2 1% | 28.6 3% |
| Load Average * (dB) | 33.4 | 33.9 -1% | 33.3 -0% | 43 -29% | 33.3 -0% | 31.5 6% |
| Witcher 3 ultra * (dB) | 37.9 | 39.8 -5% | 45.4 -20% | |||
| Load Maximum * (dB) | 40.5 | 40.2 1% | 33.3 18% | 46.1 -14% | 33.3 18% | 33.1 18% |
* ... Moindre est la valeur, meilleures sont les performances
Degré de la nuisance sonore
| Au repos |
| 29.5 / 29.5 / 29.5 dB(A) |
| Fortement sollicité |
| 33.4 / 40.5 dB(A) |
 | ||
30 dB silencieux 40 dB(A) audible 50 dB(A) bruyant |
||
min: | ||
(-) La température maximale du côté supérieur est de 47.6 °C / 118 F, par rapport à la moyenne de 34.3 °C / 94 F, allant de 21.2 à 62.5 °C pour la classe Office.
(-) Le fond chauffe jusqu'à un maximum de 58.2 °C / 137 F, contre une moyenne de 36.8 °C / 98 F
(+) En utilisation inactive, la température moyenne du côté supérieur est de 20.7 °C / 69 F, par rapport à la moyenne du dispositif de 29.5 °C / 85 F.
(+) En jouant à The Witcher 3, la température moyenne du côté supérieur est de 29.1 °C / 84 F, alors que la moyenne de l'appareil est de 29.5 °C / 85 F.
(+) Les repose-poignets et le pavé tactile sont plus froids que la température de la peau avec un maximum de 26.8 °C / 80.2 F et sont donc froids au toucher.
(±) La température moyenne de la zone de l'appui-paume de dispositifs similaires était de 27.5 °C / 81.5 F (+0.7 °C / #1.3 F).
MSI Modern 14 A10RB-459US analyse audio
(+) | les haut-parleurs peuvent jouer relativement fort (84.8# dB)
Basses 100 - 315 Hz
(-) | presque aucune basse - en moyenne 25.7% plus bas que la médiane
(±) | la linéarité des basses est moyenne (11.6% delta à la fréquence précédente)
Médiums 400 - 2000 Hz
(±) | médiane supérieure - en moyenne 8.2% supérieure à la médiane
(±) | la linéarité des médiums est moyenne (10.7% delta à la fréquence précédente)
Aiguës 2 - 16 kHz
(+) | des sommets équilibrés - à seulement 3.2% de la médiane
(±) | la linéarité des aigus est moyenne (7.9% delta à la fréquence précédente)
Globalement 100 - 16 000 Hz
(-) | le son global n'est pas linéaire (30.8% de différence à la médiane)
Par rapport à la même classe
» 92% de tous les appareils testés de cette catégorie étaient meilleurs, 3% similaires, 5% pires
» Le meilleur avait un delta de 7%, la moyenne était de 21%, le pire était de 53%.
Par rapport à tous les appareils testés
» 89% de tous les appareils testés étaient meilleurs, 3% similaires, 8% pires
» Le meilleur avait un delta de 4%, la moyenne était de 23%, le pire était de 134%.
Apple MacBook 12 (Early 2016) 1.1 GHz analyse audio
(+) | les haut-parleurs peuvent jouer relativement fort (83.6# dB)
Basses 100 - 315 Hz
(±) | basse réduite - en moyenne 11.3% inférieure à la médiane
(±) | la linéarité des basses est moyenne (14.2% delta à la fréquence précédente)
Médiums 400 - 2000 Hz
(+) | médiane équilibrée - seulement 2.4% de la médiane
(+) | les médiums sont linéaires (5.5% delta à la fréquence précédente)
Aiguës 2 - 16 kHz
(+) | des sommets équilibrés - à seulement 2% de la médiane
(+) | les aigus sont linéaires (4.5% delta à la fréquence précédente)
Globalement 100 - 16 000 Hz
(+) | le son global est linéaire (10.2% différence à la médiane)
Par rapport à la même classe
» 7% de tous les appareils testés de cette catégorie étaient meilleurs, 2% similaires, 91% pires
» Le meilleur avait un delta de 5%, la moyenne était de 18%, le pire était de 53%.
Par rapport à tous les appareils testés
» 5% de tous les appareils testés étaient meilleurs, 1% similaires, 94% pires
» Le meilleur avait un delta de 4%, la moyenne était de 23%, le pire était de 134%.
| Éteint/en veille | |
| Au repos | |
| Fortement sollicité |
|
Légende:
min: | |
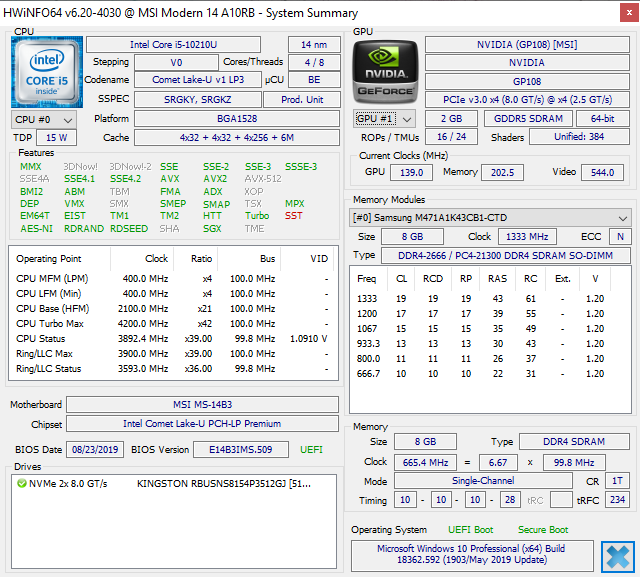
| MSI Modern 14 A10RB-459US i5-10210U, GeForce MX250, Kingston RBUSNS8154P3512GJ, IPS, 1920x1080, 14" | Asus ZenBook 15 UX534FT-DB77 i7-8565U, GeForce GTX 1650 Max-Q, Samsung SSD PM981 MZVLB1T0HALR, IPS, 1920x1080, 15.6" | Lenovo Yoga C940-14IIL i7-1065G7, Iris Plus Graphics G7 (Ice Lake 64 EU), Samsung SSD PM981 MZVLB512HAJQ, IPS LED, 1920x1080, 14" | Dell XPS 15 7590 9980HK GTX 1650 i9-9980HK, GeForce GTX 1650 Mobile, Toshiba XG6 KXG60ZNV1T02, OLED, 3840x2160, 15.6" | Apple MacBook Pro 16 2019 i9 5500M i9-9880H, Radeon Pro 5500M, Apple SSD AP1024 7171, IPS, 3072x1920, 16" | Lenovo ThinkPad X1 Carbon 2019-20QE000VGE i7-8665U, UHD Graphics 620, WDC PC SN720 SDAQNTW-512G, IPS, 2560x1440, 14" | |
|---|---|---|---|---|---|---|
| Power Consumption | -79% | 2% | -90% | -70% | 7% | |
| Idle Minimum * (Watt) | 4.2 | 5 -19% | 3.2 24% | 6.2 -48% | 3.7 12% | 3 29% |
| Idle Average * (Watt) | 5.9 | 13.2 -124% | 7 -19% | 9.6 -63% | 12.1 -105% | 6.3 -7% |
| Idle Maximum * (Watt) | 7.2 | 24 -233% | 8.9 -24% | 21.2 -194% | 17 -136% | 8.9 -24% |
| Load Average * (Watt) | 63.4 | 70 -10% | 47.6 25% | 104.3 -65% | 91.5 -44% | 40.8 36% |
| Witcher 3 ultra * (Watt) | 53.5 | 63.3 -18% | 91.7 -71% | 103 -93% | ||
| Load Maximum * (Watt) | 67.4 | 114 -69% | 63.1 6% | 135.3 -101% | 102.3 -52% | 67.5 -0% |
* ... Moindre est la valeur, meilleures sont les performances
| MSI Modern 14 A10RB-459US i5-10210U, GeForce MX250, 50 Wh | Lenovo ThinkPad X1 Carbon 2018-20KGS5DU00 i5-8550U, UHD Graphics 620, 57 Wh | Asus ZenBook 15 UX534FT-DB77 i7-8565U, GeForce GTX 1650 Max-Q, 71 Wh | Lenovo Yoga C940-14IIL i7-1065G7, Iris Plus Graphics G7 (Ice Lake 64 EU), 60 Wh | Dell XPS 15 7590 9980HK GTX 1650 i9-9980HK, GeForce GTX 1650 Mobile, 97 Wh | Apple MacBook Pro 16 2019 i9 5500M i9-9880H, Radeon Pro 5500M, 99.8 Wh | |
|---|---|---|---|---|---|---|
| Autonomie de la batterie | 5% | 30% | -8% | 22% | -2% | |
| Reader / Idle (h) | 16.4 | 21.5 31% | 15.2 -7% | |||
| WiFi v1.3 (h) | 8.6 | 9 5% | 8.4 -2% | 10.6 23% | 7.8 -9% | 12 40% |
| Load (h) | 1.8 | 2.9 61% | 1.1 -39% | 3.3 83% | 1 -44% | |
| Witcher 3 ultra (h) | 0.9 |
Points positifs
Points négatifs
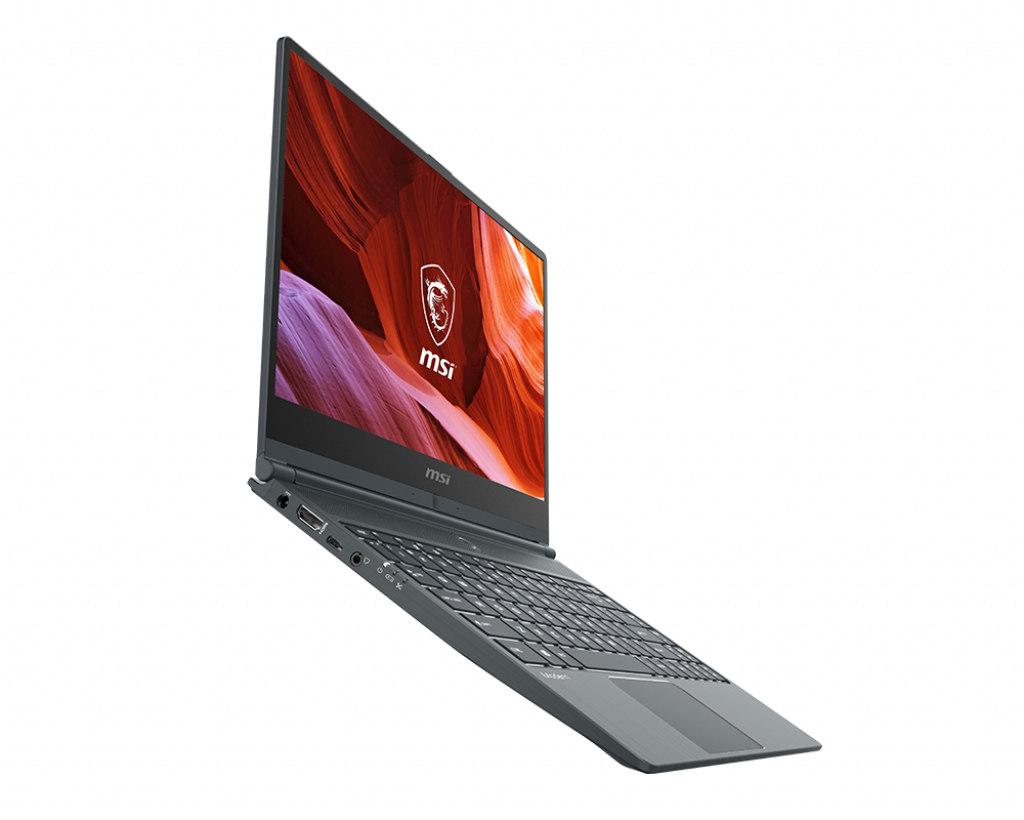

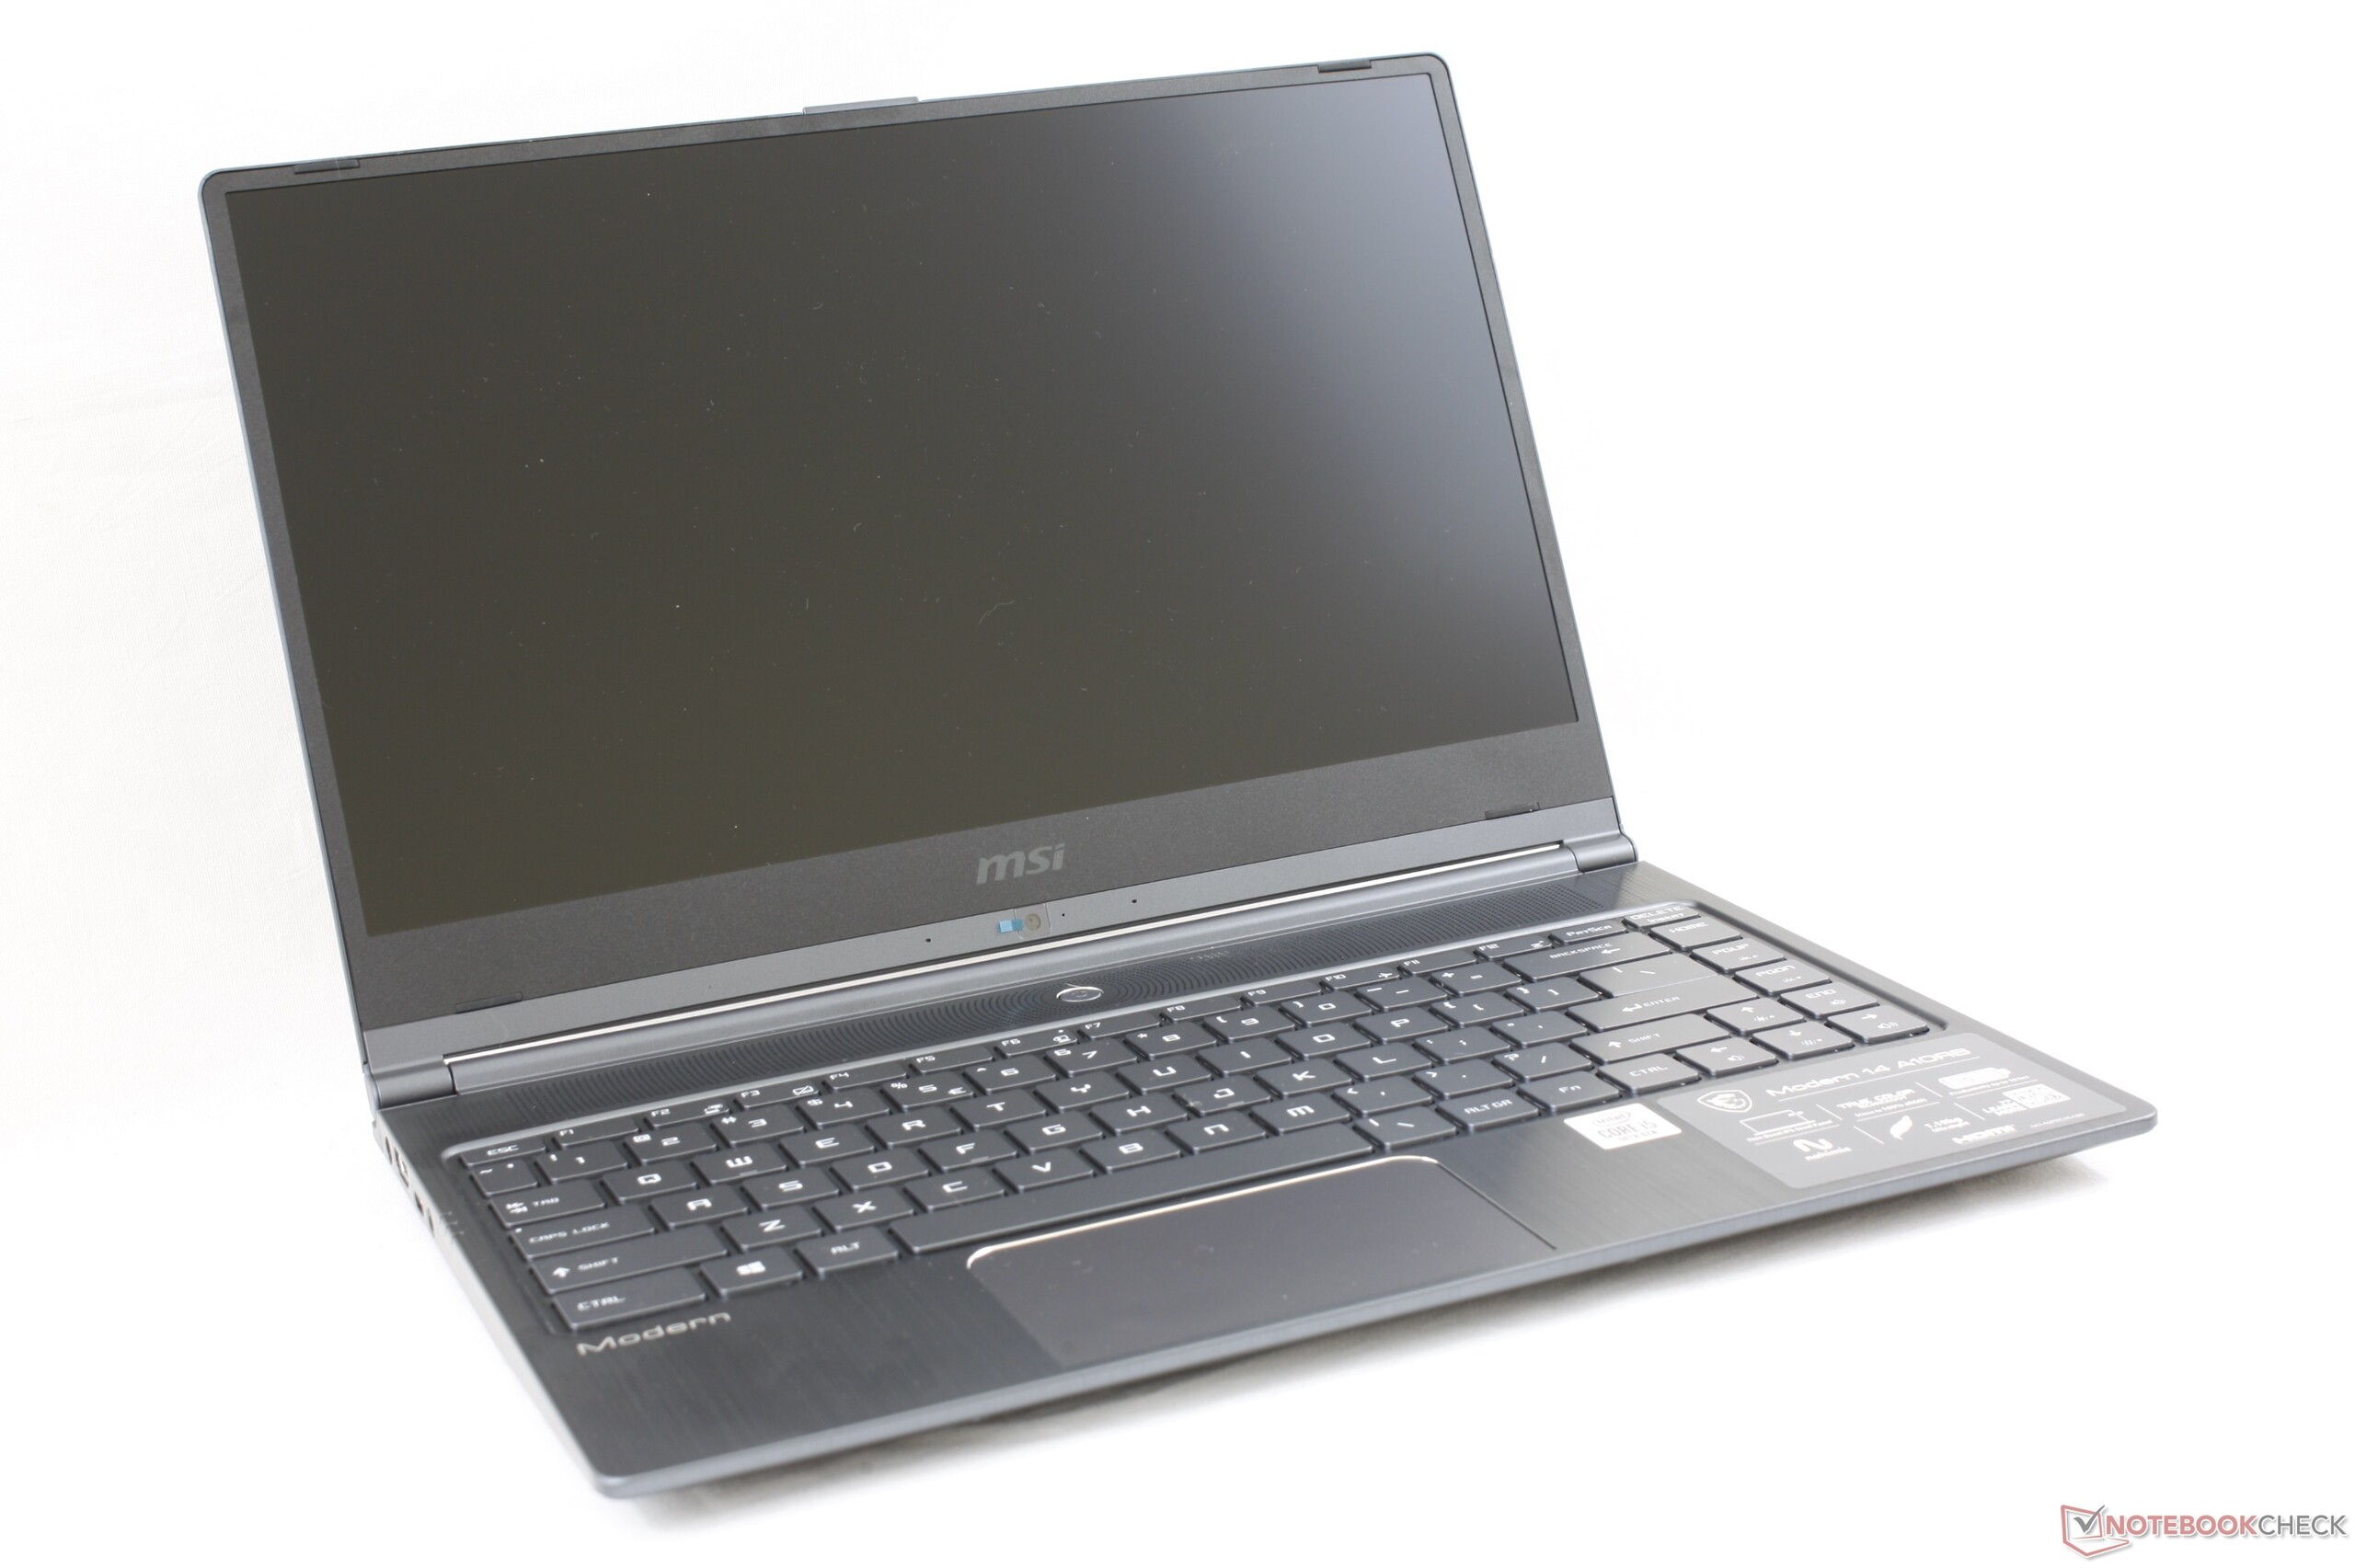
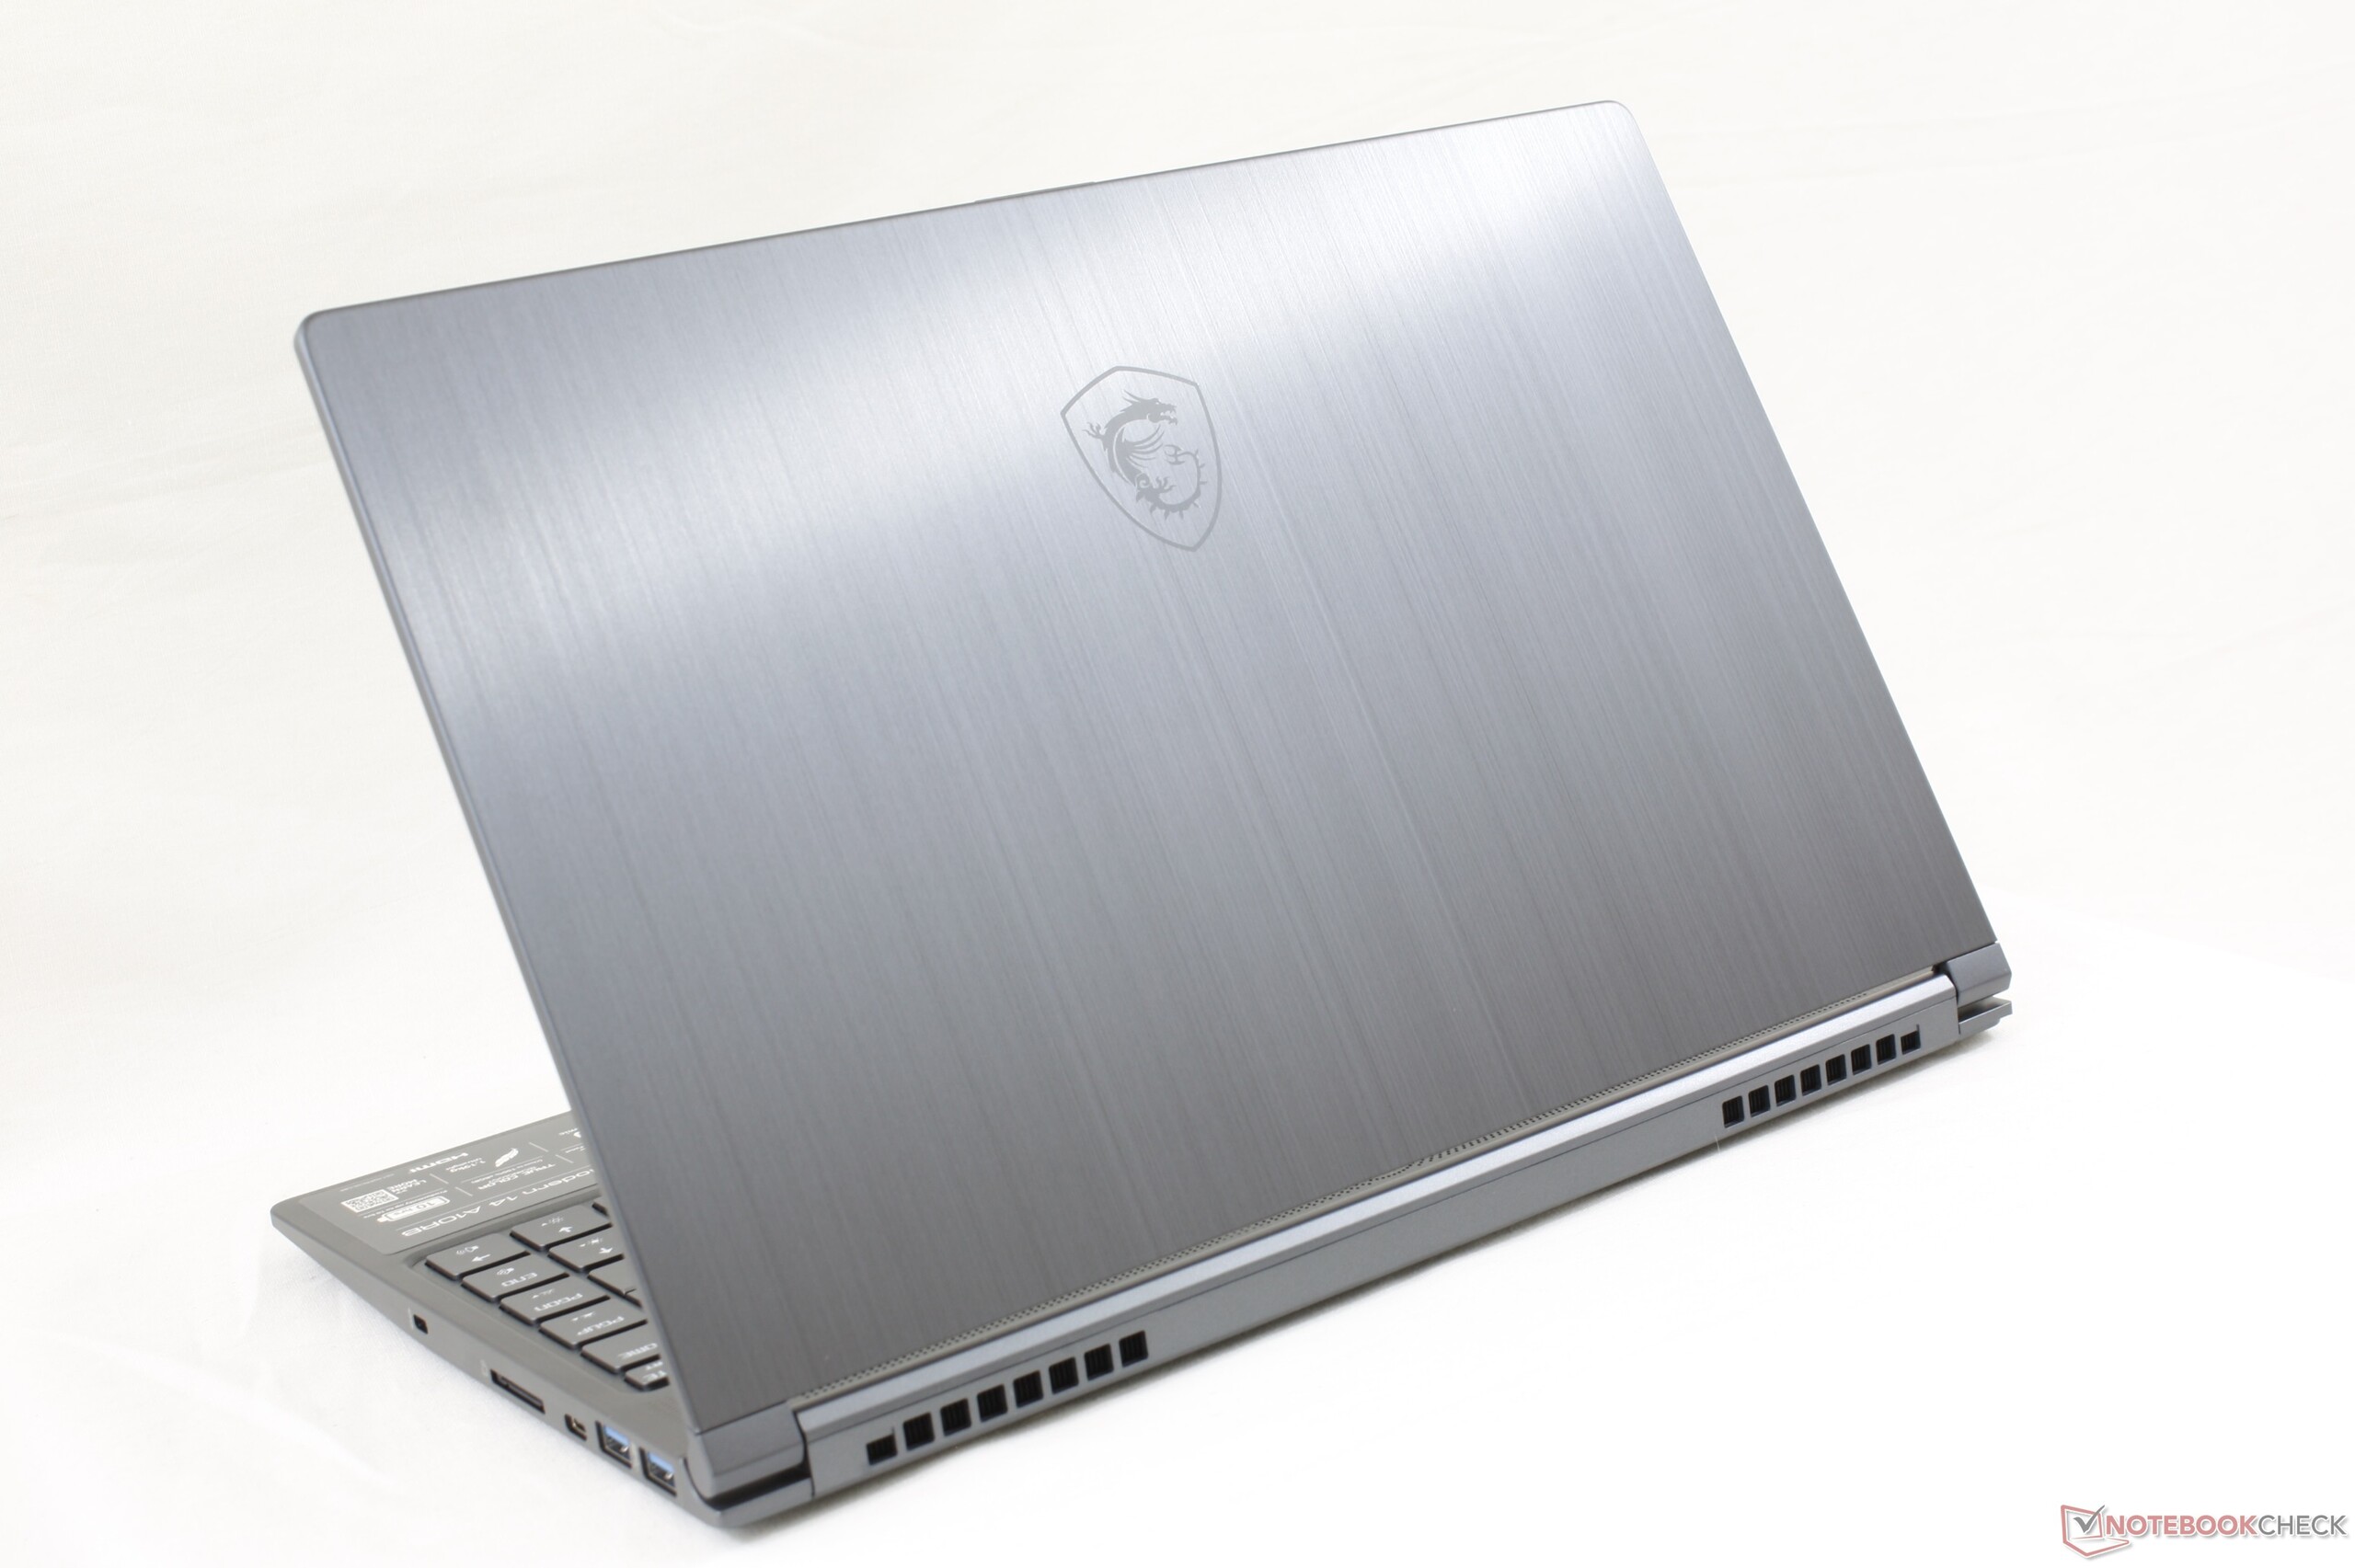
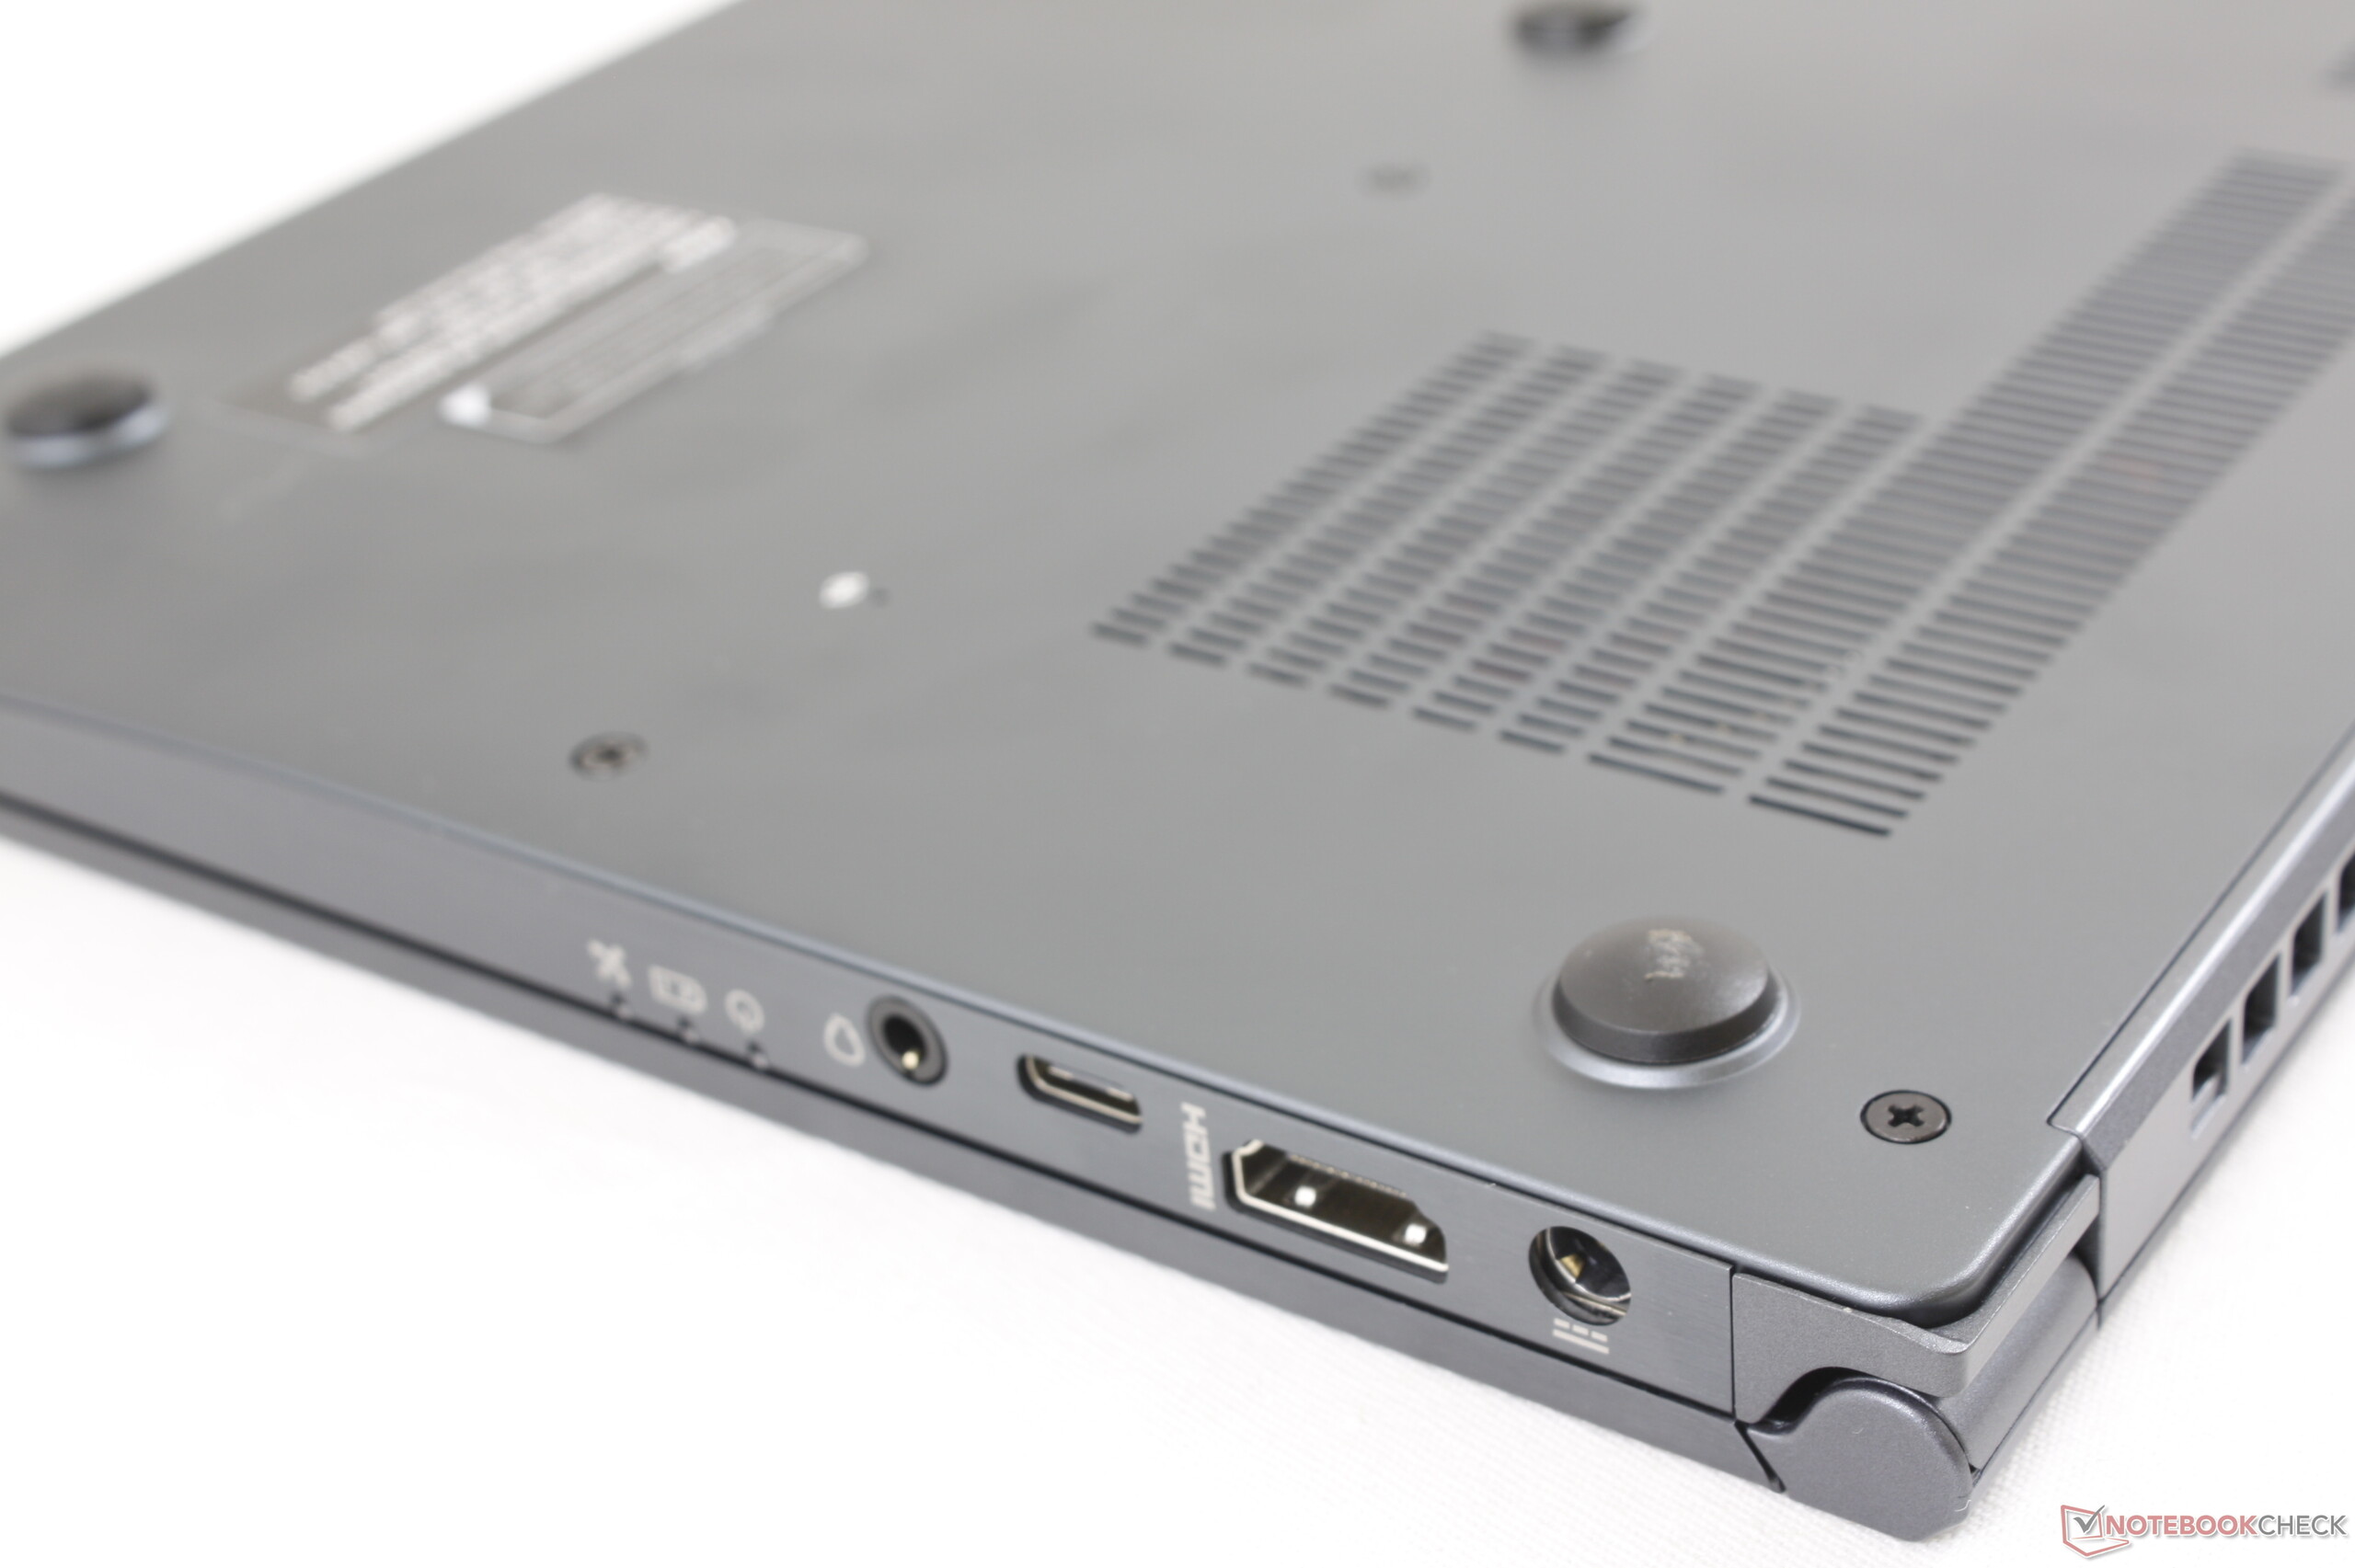
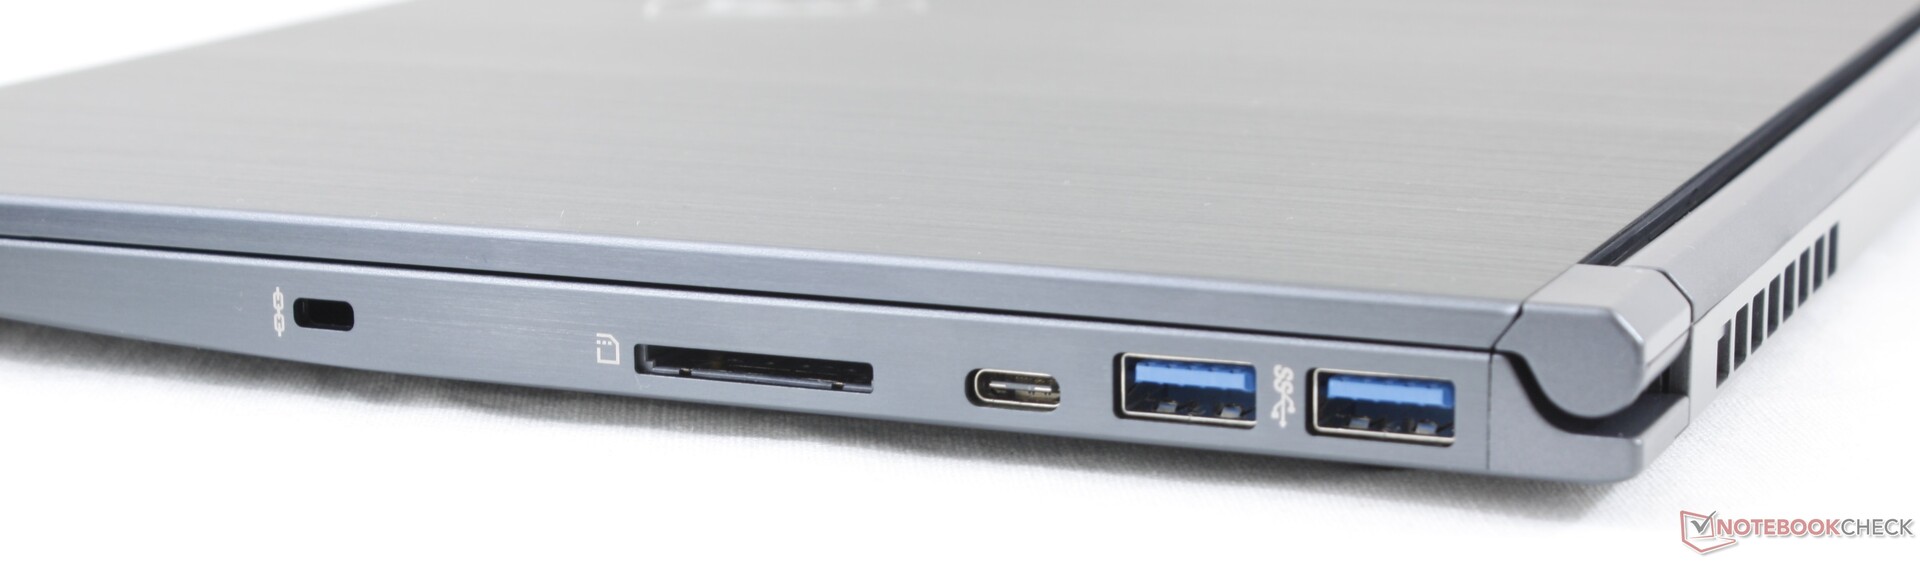
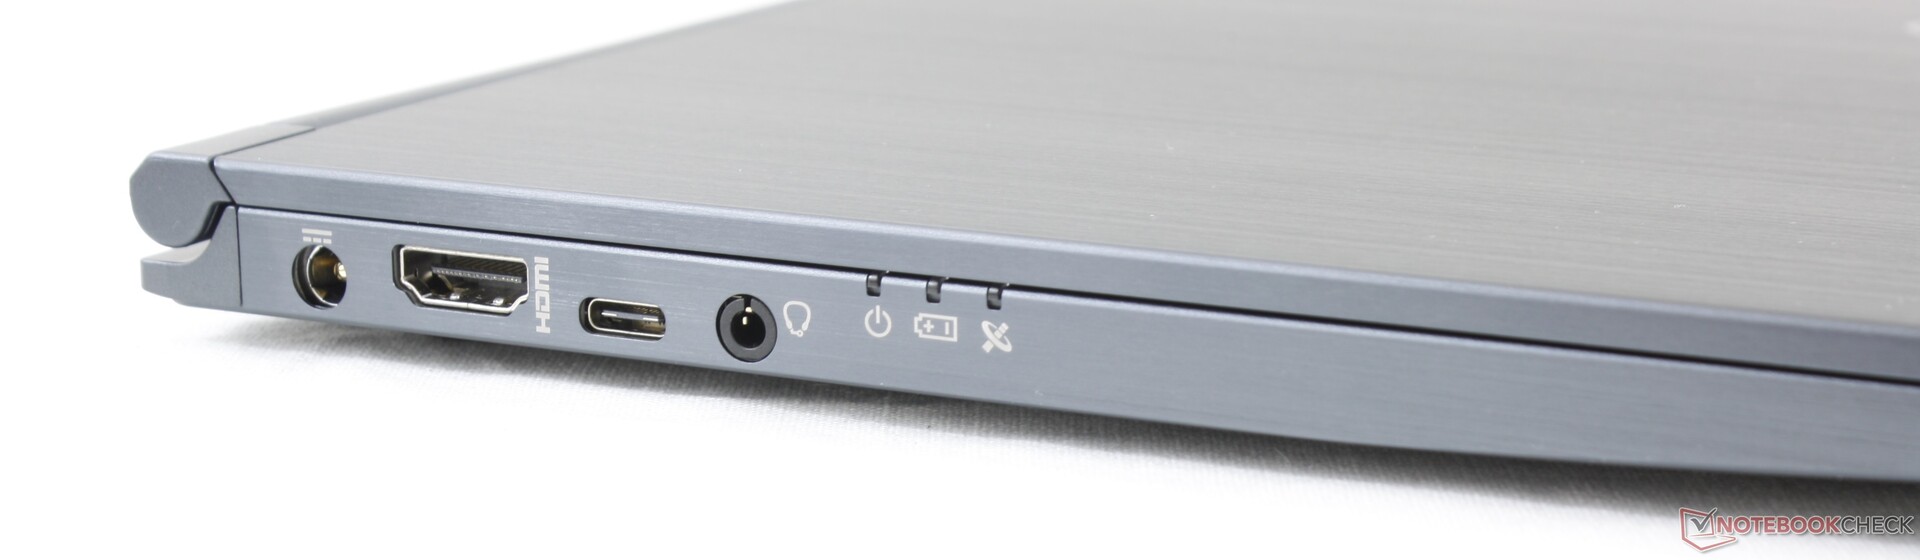
Après s’être si longtemps cantonné aux portables de jeu et aux portables professionnels, MSI est maintenant prêt à percer sur le marché des ultraportables abordables, avec le Modern 14. Ses principaux points forts sont avant tout visuels ; l’écran de 14 pouces est bien calibré et fonctionnel, tandis que son poids plume, sa belle sélection de ports et la GeForce MX250 optionnelle sont des points forts pour l’audience ciblée.
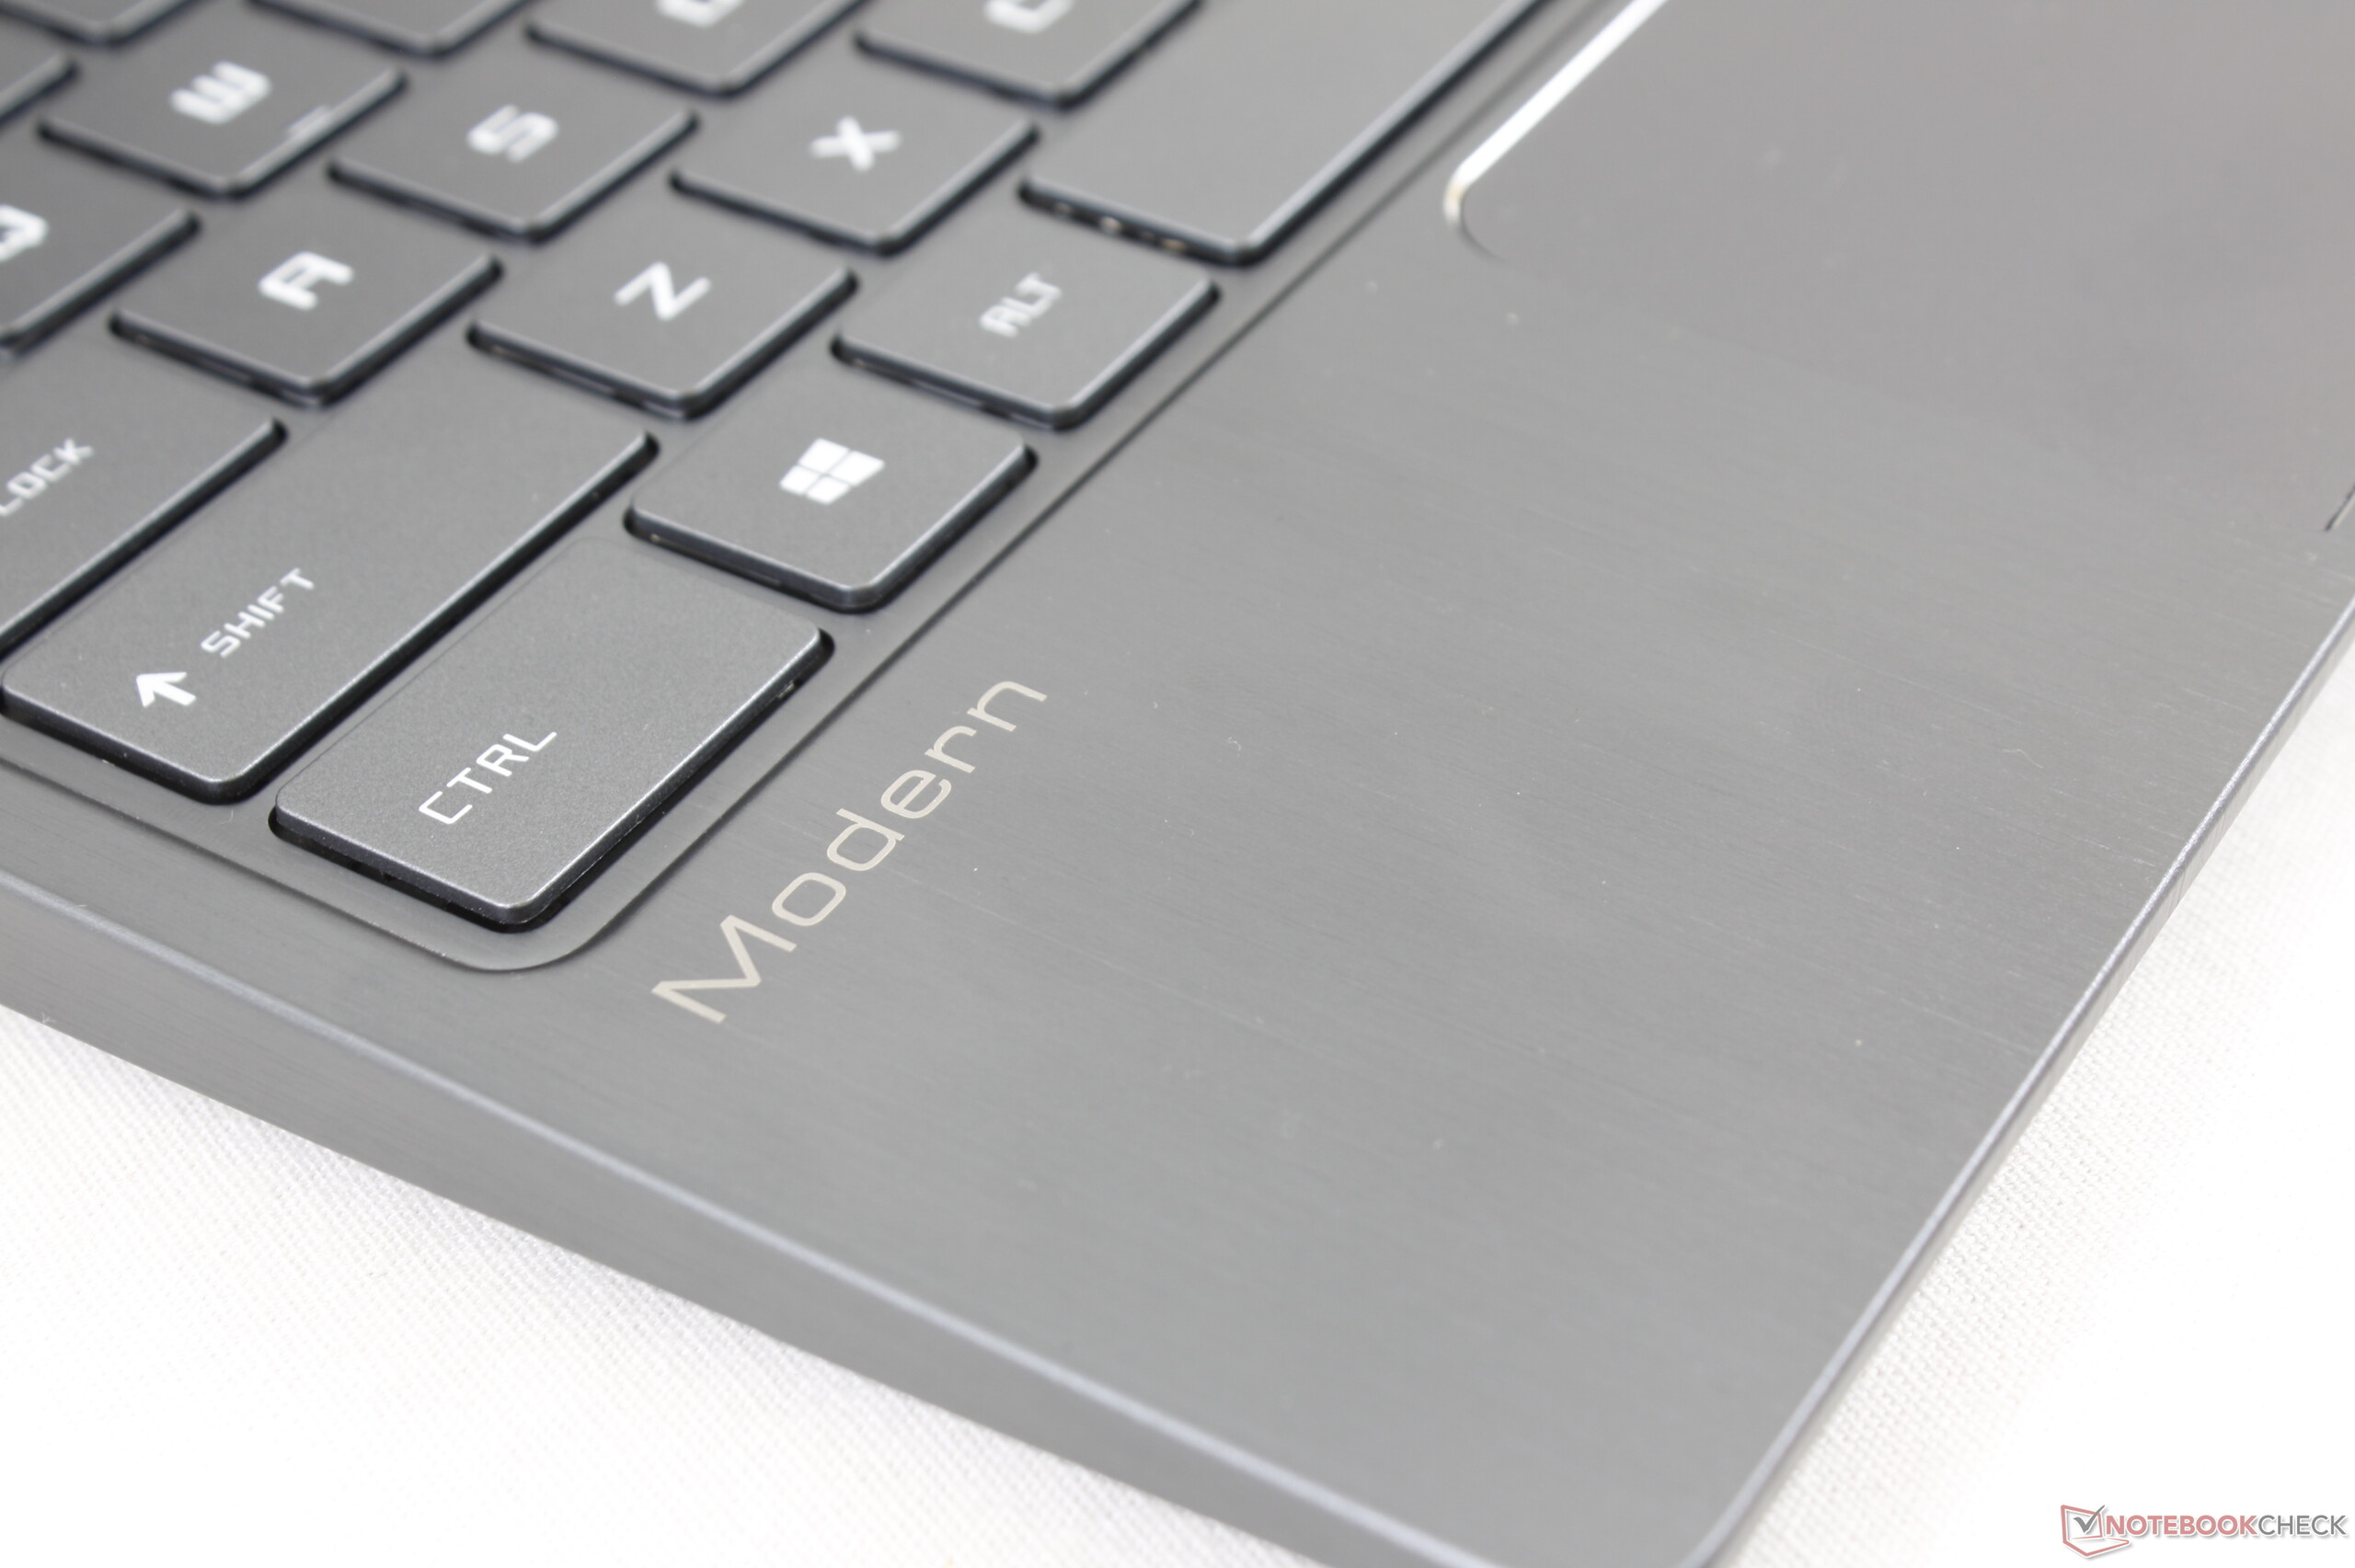
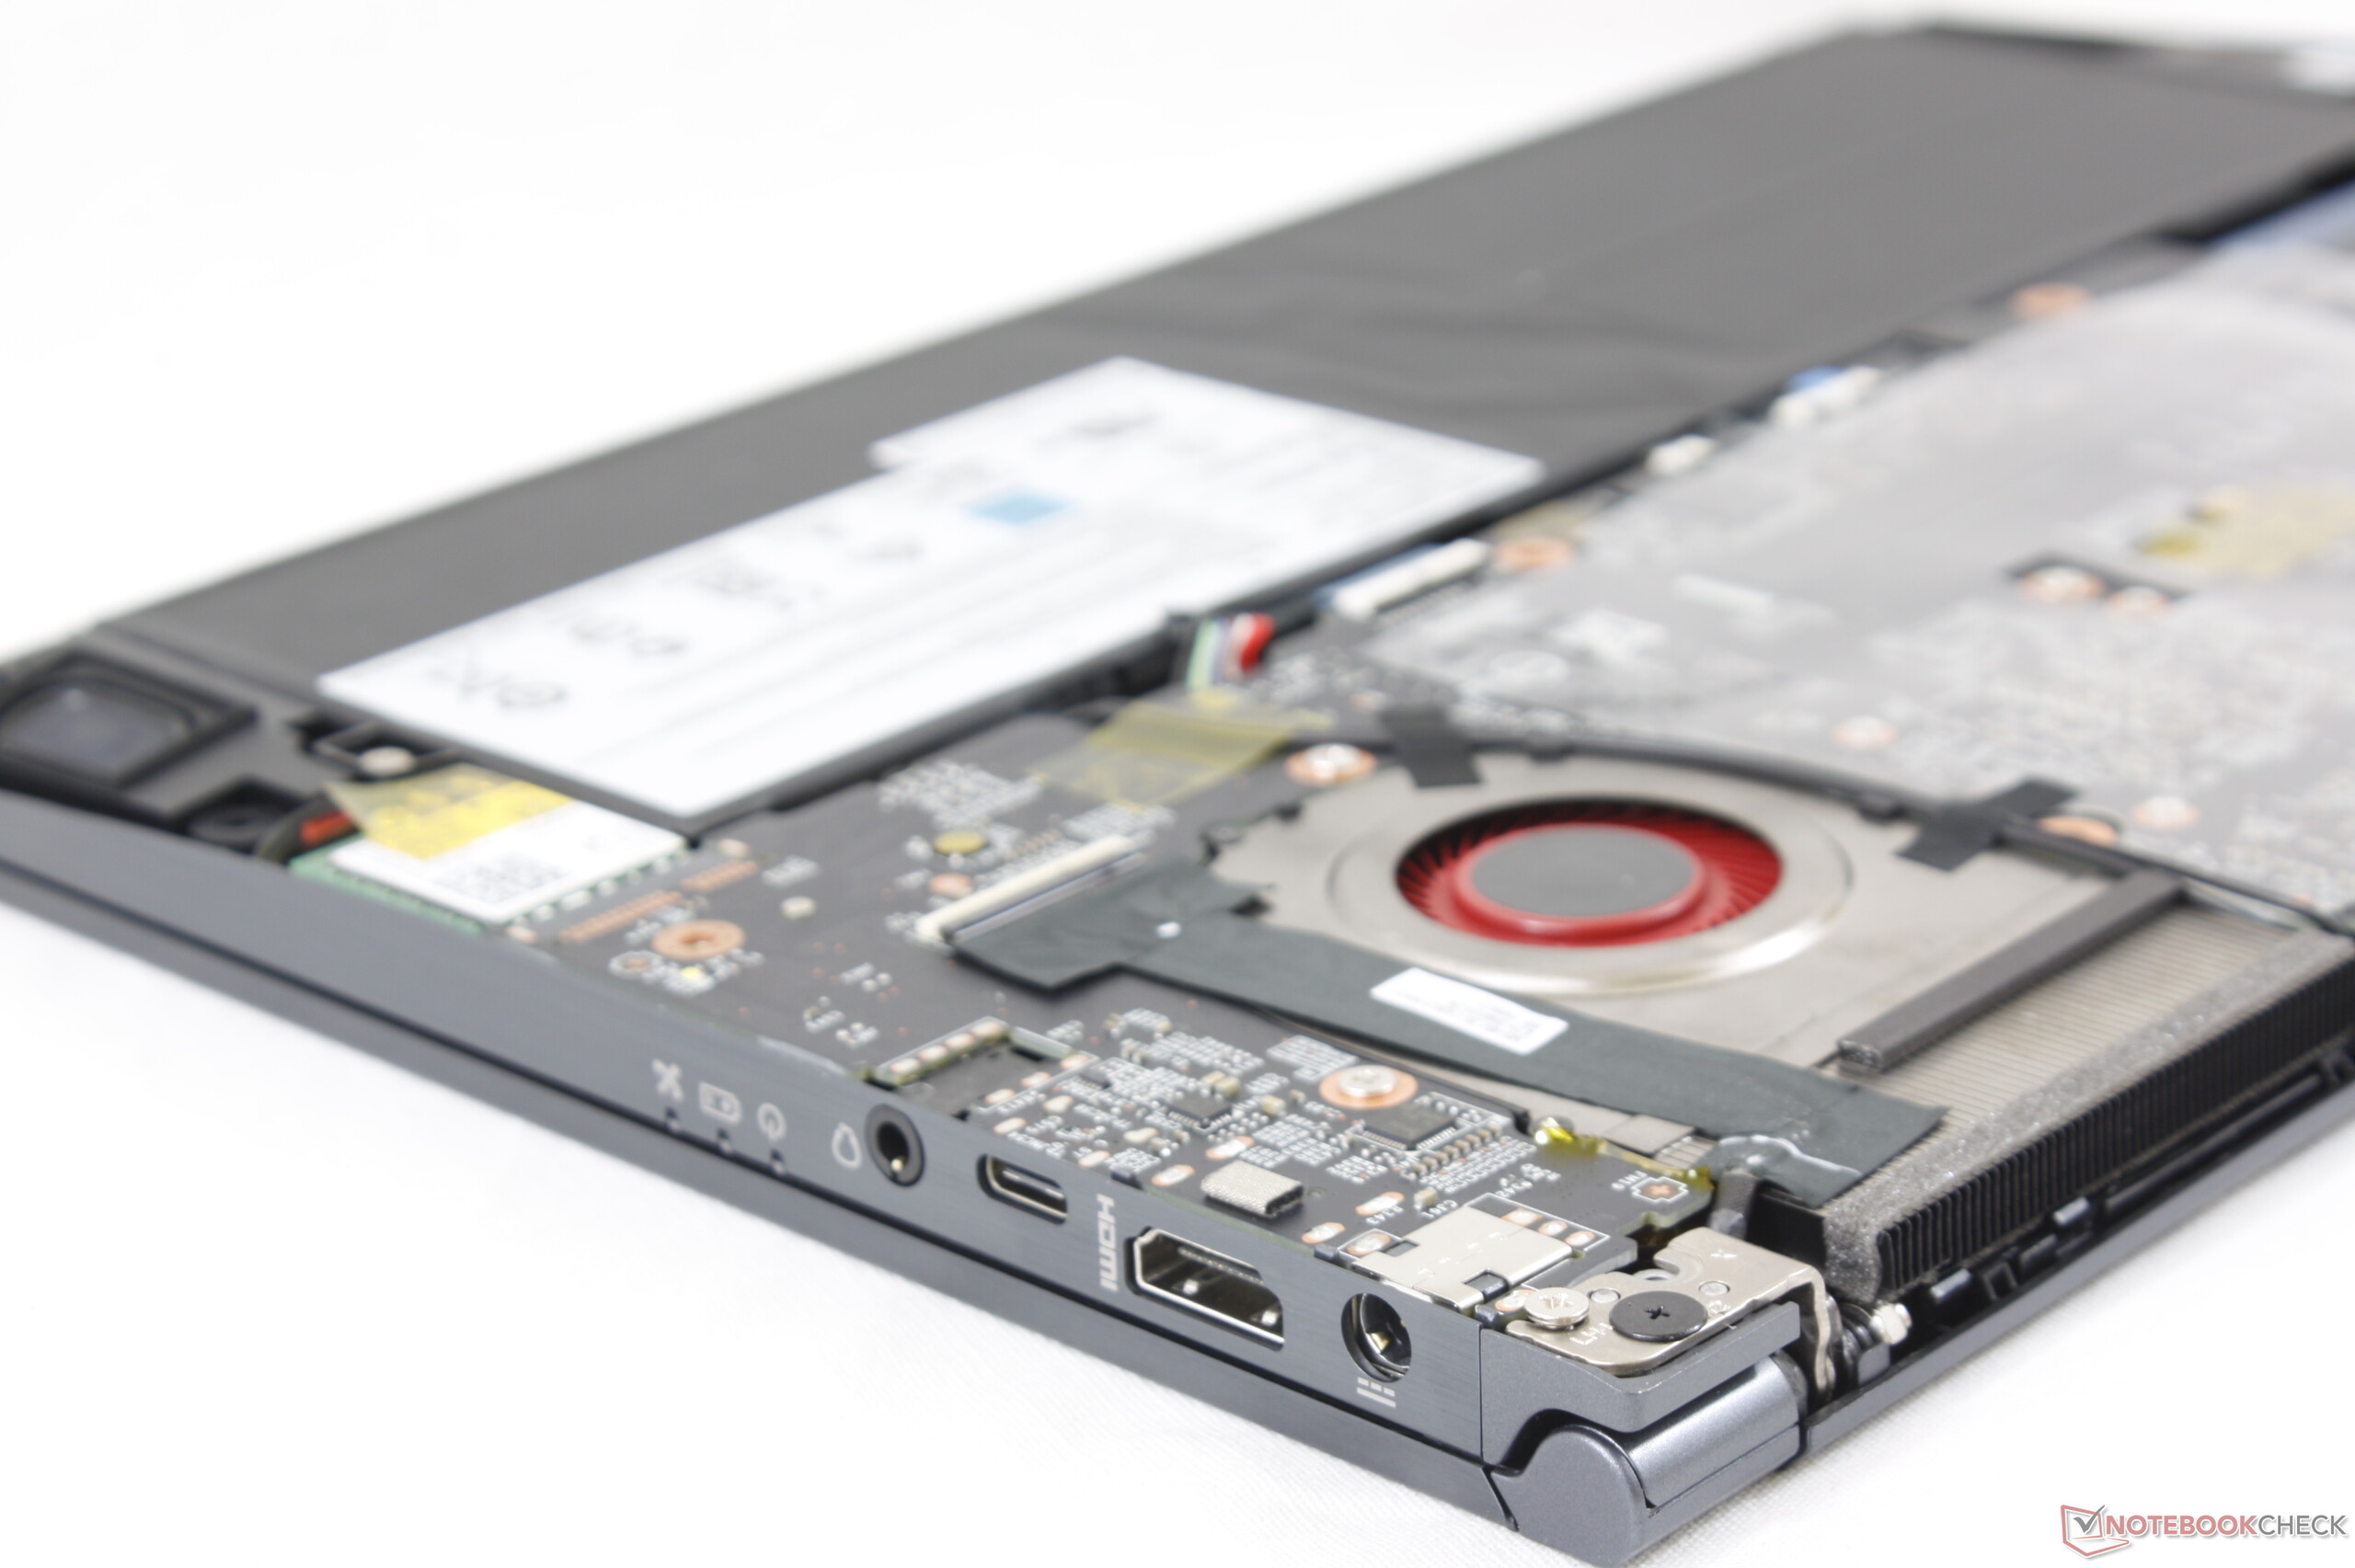
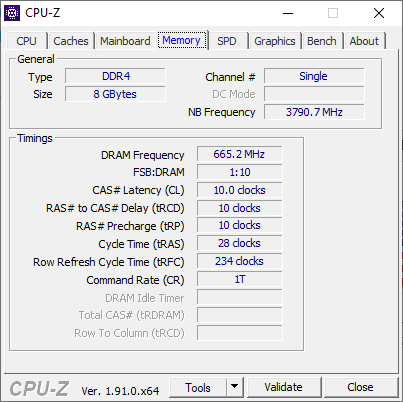
Les principaux points faibles du Modern 14 sont la rigidité du châssis, sa difficulté à évoluer, sa RAM monocanale, et le retour du clavier. Les surfaces ploient et craquent plus que sur la plupart des portables pros de Dell, Lenovo ou HP, tandis que le changement de la RAM ou du stockage est difficile. Les touches du clavier sont molles, et auraient pu tirer profit d’un meilleur retour pour être plus plaisantes aux rédacteurs.
Parmi les autres défauts, on retrouve la webcam située sous l’écran, l’absence de lecteur d’empreintes digitales ou de Thunderbolt 3, la RAM monocanale de seulement 8 Go, et les performances moyennes du processeur pour un Core i5-10210U. Pour moins de 900 $ nous avons néanmoins un bon prix, tant que l’on a conscience des qualités et des défauts de la machine.
Ce n’est pas un portable de bureau pour senior. Le MSI Modern 14 cible les utilisateurs pros plus jeunes et les créatifs, avec son design attractif et son poids réduit par rapport aux solutions de bureau proposées par Dell, HP ou Lenovo.
L’intégralité de cette critique est disponible en anglais en suivant ce lien.
MSI Modern 14 A10RB-459US
- 01/27/2020 v7 (old)
Allen Ngo
Price comparison
