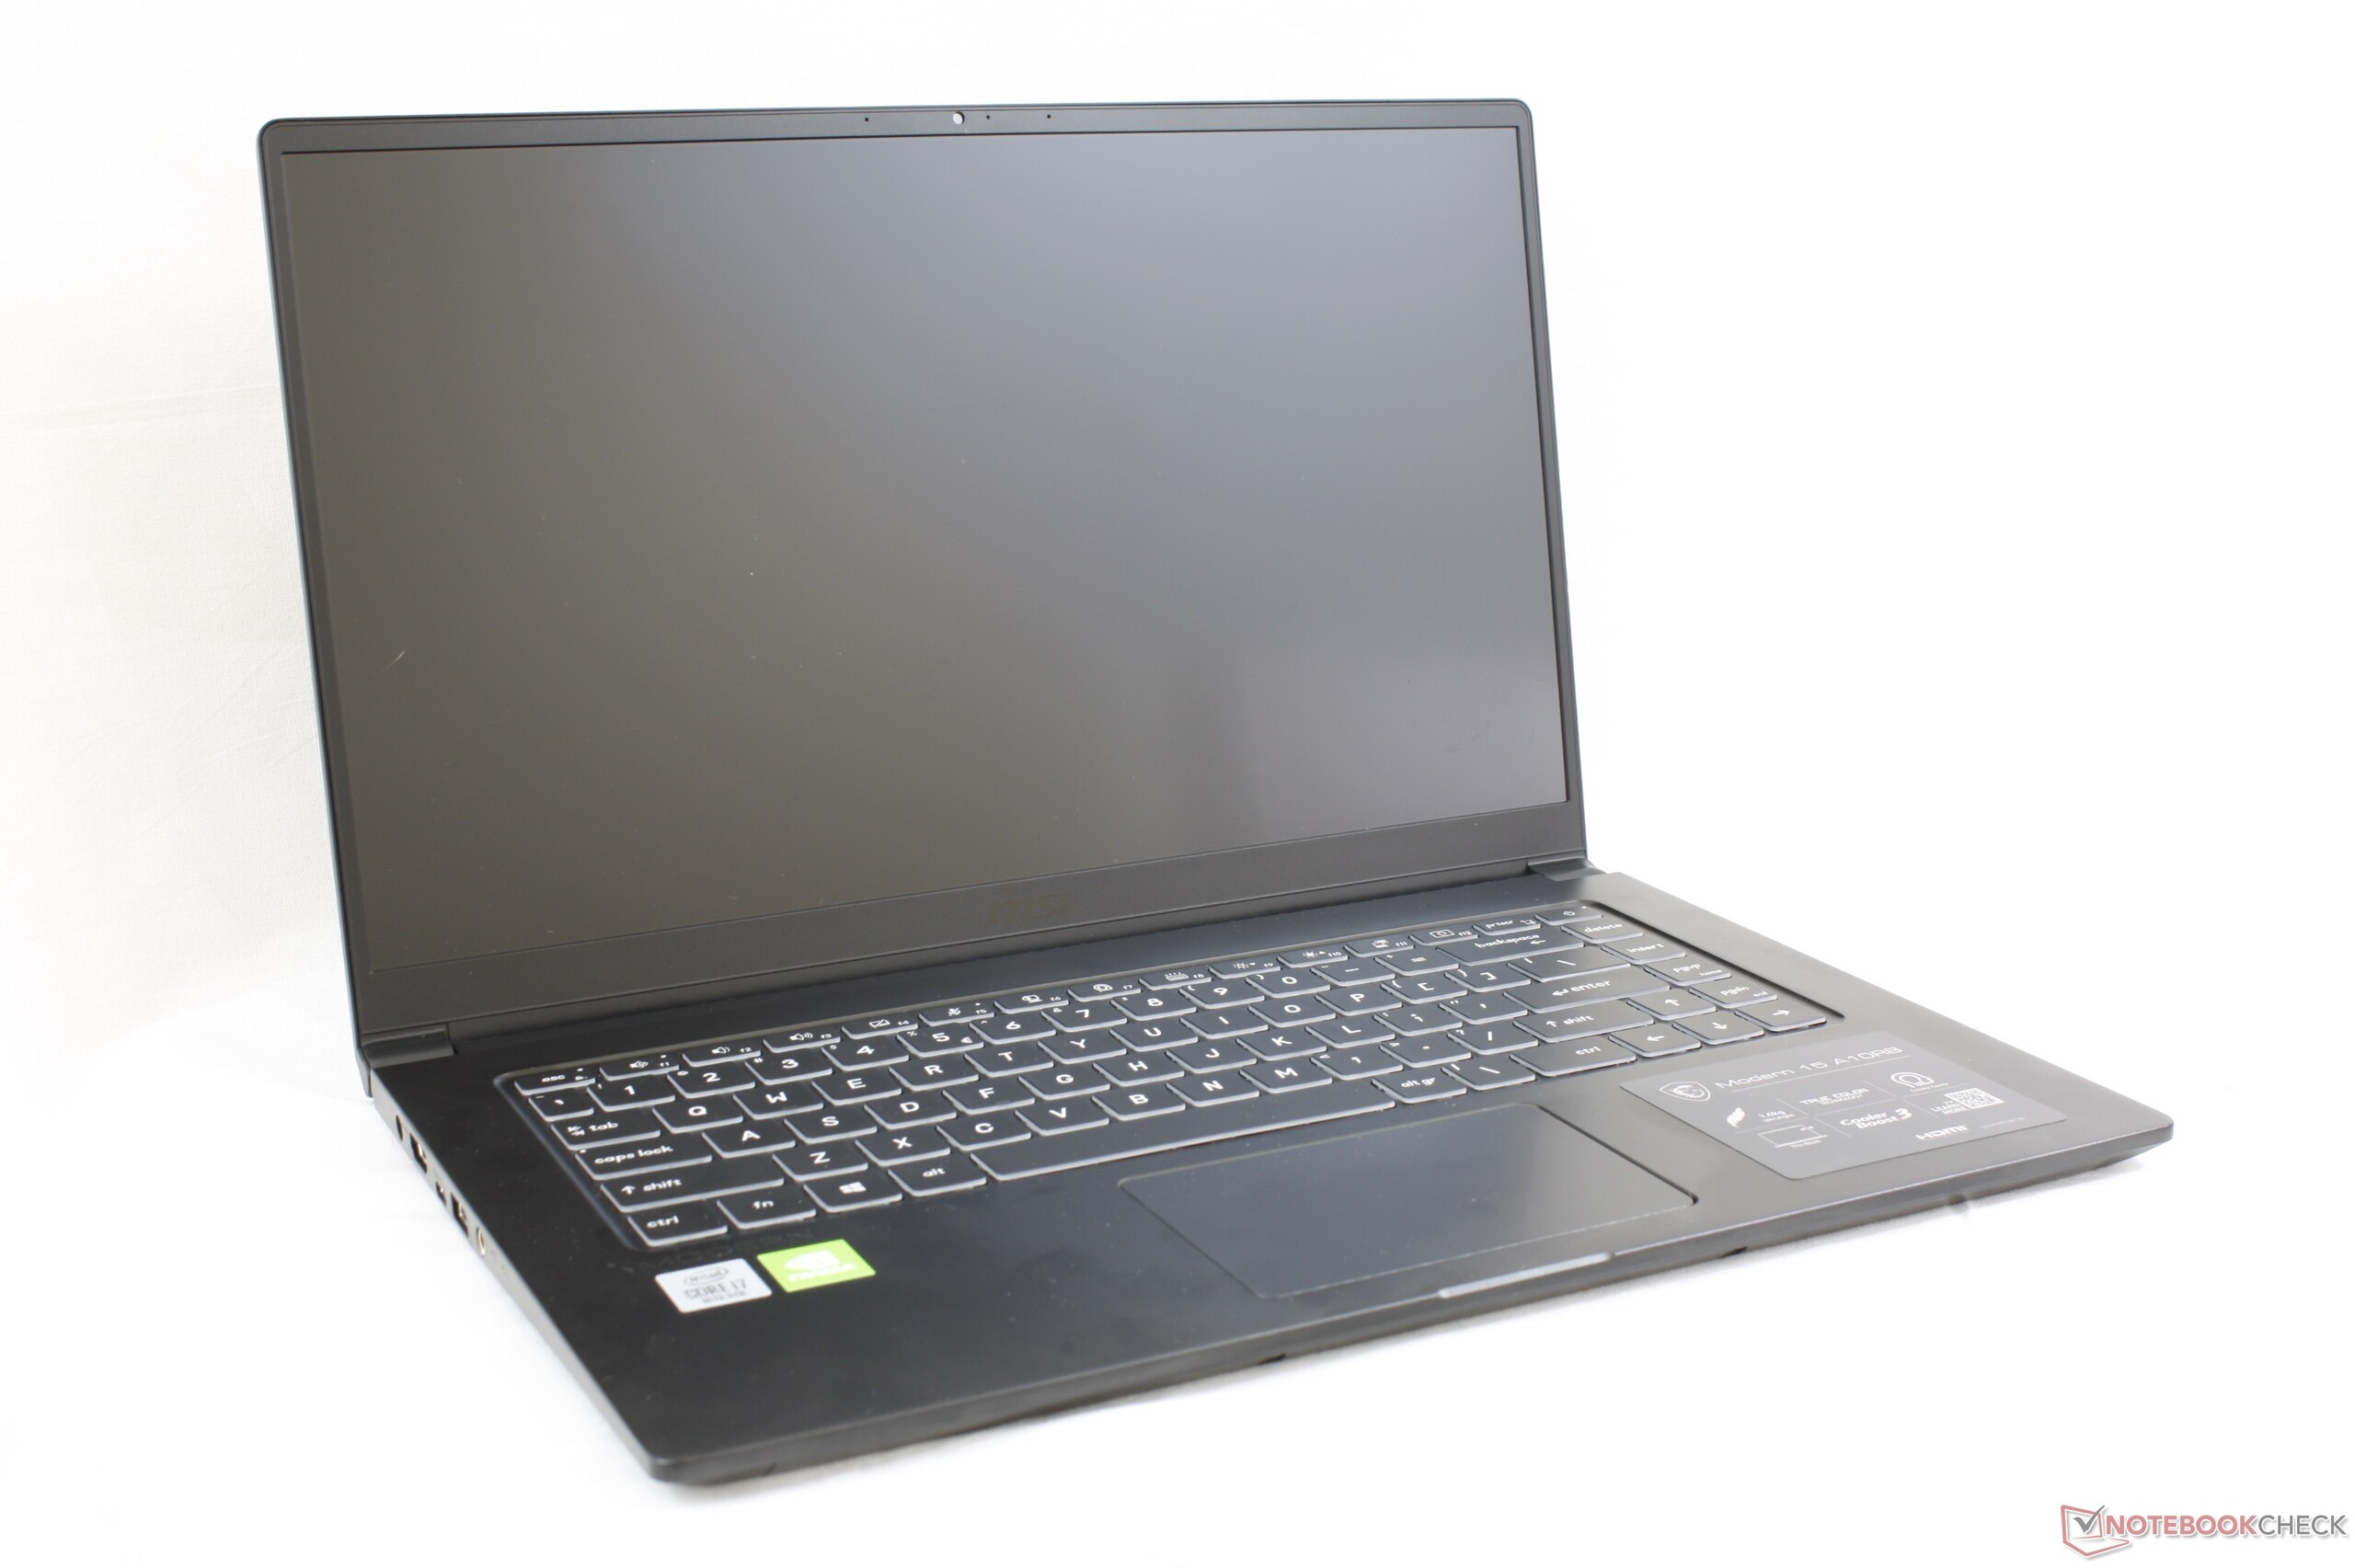
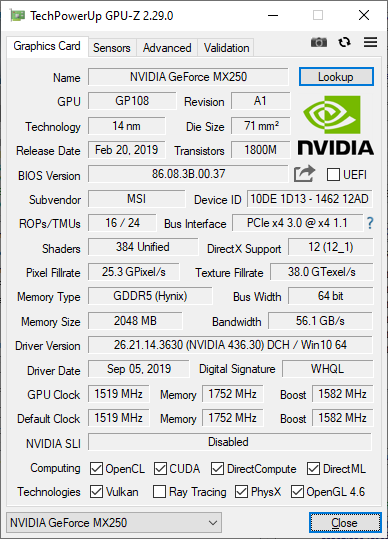
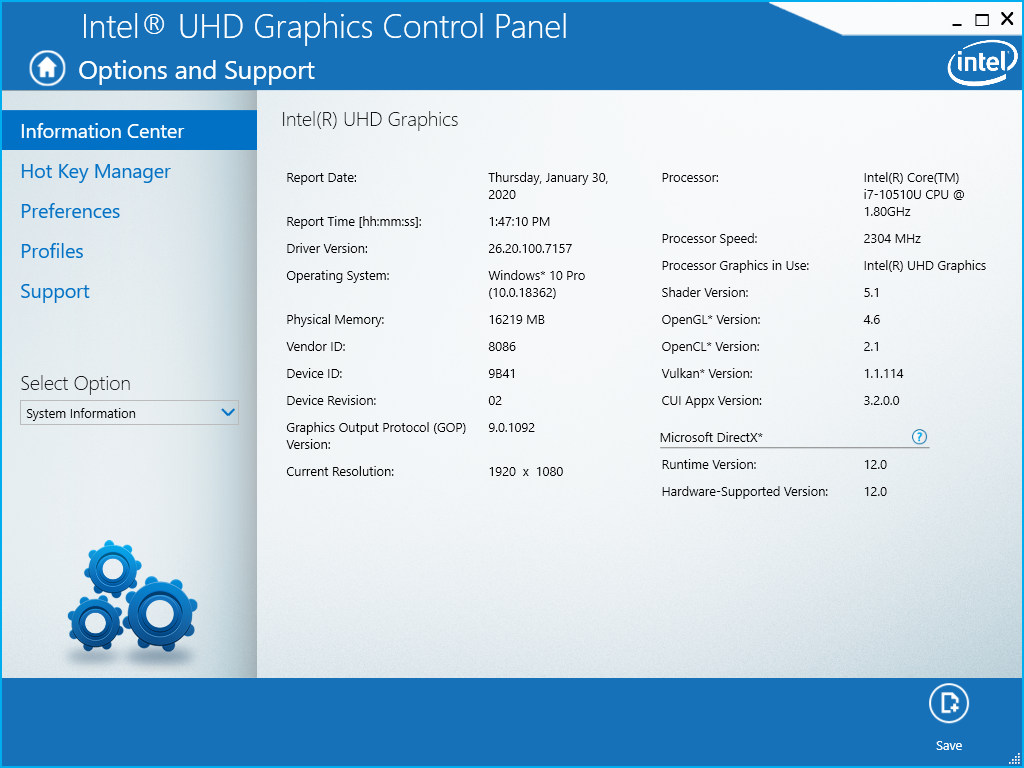
Test du MSI Modern 15 A10RB (i7-10510U, MX250, FHD) : un véritable Dell XPS 15 Lite
Note | Date | Modèle | Poids | Épaisseur | Taille | Résolution | Prix |
|---|---|---|---|---|---|---|---|
| 80.1 % v7 (old) | 02/20 | MSI Modern 15 A10RB i7-10510U, GeForce MX250 | 1.6 kg | 15.9 mm | 15.60" | 1920x1080 | |
| 83.1 % v7 (old) | 12/19 | Asus ZenBook 15 UX534FT-DB77 i7-8565U, GeForce GTX 1650 Max-Q | 1.7 kg | 18.9 mm | 15.60" | 1920x1080 | |
| 86.6 % v7 (old) | 08/19 | Lenovo ThinkPad T590-20N4002VGE i7-8565U, GeForce MX250 | 1.9 kg | 19.95 mm | 15.60" | 1920x1080 | |
| 85 % v7 (old) | 01/20 | HP Spectre X360 15-5ZV31AV i7-10510U, GeForce MX250 | 2.1 kg | 19.3 mm | 15.60" | 3840x2160 | |
| 85.2 % v7 (old) | 11/19 | MSI Prestige 15 A10SC i7-10710U, GeForce GTX 1650 Max-Q | 1.7 kg | 16 mm | 15.60" | 3840x2160 | |
| 83.9 % v7 (old) | 01/20 | Microsoft Surface Laptop 3 15 i7-1065G7 i7-1065G7, Iris Plus Graphics G7 (Ice Lake 64 EU) | 1.5 kg | 14.7 mm | 15.00" | 2496x1664 |
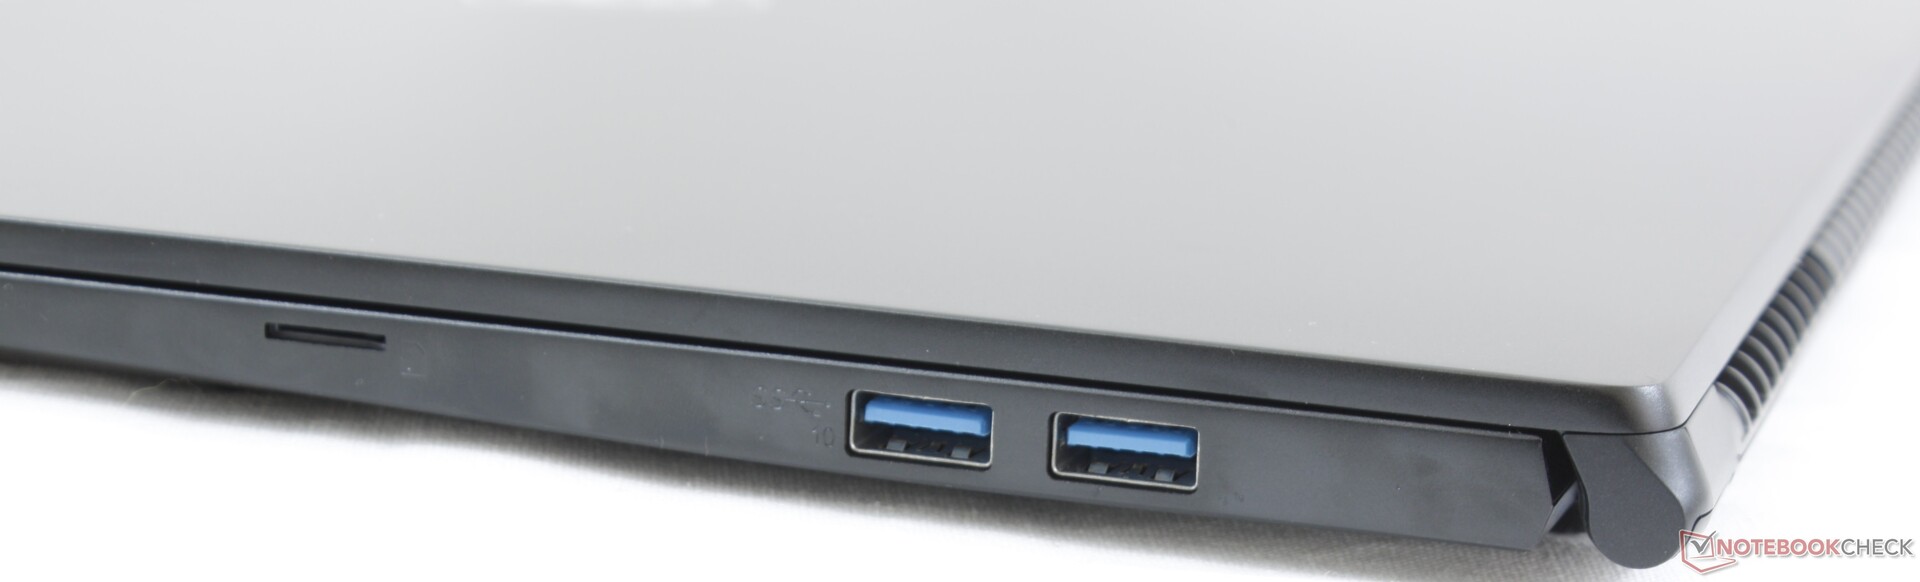
| SD Card Reader | |
| average JPG Copy Test (av. of 3 runs) | |
| Dell XPS 15 7590 i5 iGPU FHD (Toshiba Exceria Pro SDXC 64 GB UHS-II) | |
| MSI Prestige 15 A10SC (Toshiba Exceria Pro M501 UHS-II) | |
| Lenovo ThinkPad T590-20N4002VGE (Toshiba Exceria Pro M501 UHS-II) | |
| Asus ZenBook 15 UX534FT-DB77 (Toshiba Exceria Pro SDXC 64 GB UHS-II) | |
| MSI Modern 15 A10RB (Toshiba Exceria Pro M501 UHS-II) | |
| maximum AS SSD Seq Read Test (1GB) | |
| MSI Prestige 15 A10SC (Toshiba Exceria Pro M501 UHS-II) | |
| Dell XPS 15 7590 i5 iGPU FHD (Toshiba Exceria Pro SDXC 64 GB UHS-II) | |
| Lenovo ThinkPad T590-20N4002VGE (Toshiba Exceria Pro M501 UHS-II) | |
| Asus ZenBook 15 UX534FT-DB77 (Toshiba Exceria Pro SDXC 64 GB UHS-II) | |
| MSI Modern 15 A10RB (Toshiba Exceria Pro M501 UHS-II) | |
| |||||||||||||||||||||||||
Homogénéité de la luminosité: 82 %
Valeur mesurée au centre, sur batterie: 289.4 cd/m²
Contraste: 1072:1 (Valeurs des noirs: 0.27 cd/m²)
ΔE ColorChecker Calman: 2.32 | ∀{0.5-29.43 Ø4.71}
calibrated: 2.49
ΔE Greyscale Calman: 3 | ∀{0.09-98 Ø4.96}
92% sRGB (Argyll 1.6.3 3D)
59.8% AdobeRGB 1998 (Argyll 1.6.3 3D)
66.5% AdobeRGB 1998 (Argyll 3D)
92.1% sRGB (Argyll 3D)
66% Display P3 (Argyll 3D)
Gamma: 2.22
CCT: 6867 K
| MSI Modern 15 A10RB Chi Mei N156HCE-EN1, IPS, 15.6", 1920x1080 | Asus ZenBook 15 UX534FT-DB77 BOE NV156FHM-N63, IPS, 15.6", 1920x1080 | Dell XPS 15 7590 i5 iGPU FHD LQ156M1, IPS, 15.6", 1920x1080 | Lenovo ThinkPad T590-20N4002VGE LP156WFC-SPD1, aSi IPS LED, 15.6", 1920x1080 | HP Spectre X360 15-5ZV31AV AU Optronics AUO30EB, IPS, 15.6", 3840x2160 | MSI Prestige 15 A10SC Sharp LQ156D1JW42, IPS, 15.6", 3840x2160 | |
|---|---|---|---|---|---|---|
| Display | -3% | 3% | -39% | 3% | 25% | |
| Display P3 Coverage (%) | 66 | 66.6 1% | 66.5 1% | 38.79 -41% | 68.3 3% | 82 24% |
| sRGB Coverage (%) | 92.1 | 87.7 -5% | 98 6% | 58.3 -37% | 94.3 2% | 98.3 7% |
| AdobeRGB 1998 Coverage (%) | 66.5 | 64.1 -4% | 68.4 3% | 40.11 -40% | 68.4 3% | 96.2 45% |
| Response Times | 4% | -8% | 18% | -25% | -30% | |
| Response Time Grey 50% / Grey 80% * (ms) | 43.2 ? | 41.2 ? 5% | 52.8 ? -22% | 37.2 ? 14% | 56.8 ? -31% | 60 ? -39% |
| Response Time Black / White * (ms) | 34.4 ? | 33.2 ? 3% | 32 ? 7% | 27.2 ? 21% | 40.8 ? -19% | 41.2 ? -20% |
| PWM Frequency (Hz) | 26040 ? | 1020 ? | 26040 ? | |||
| Screen | -32% | 21% | -42% | -5% | 4% | |
| Brightness middle (cd/m²) | 289.4 | 312.6 8% | 588 103% | 276 -5% | 284.6 -2% | 464.5 61% |
| Brightness (cd/m²) | 273 | 290 6% | 555 103% | 262 -4% | 285 4% | 451 65% |
| Brightness Distribution (%) | 82 | 85 4% | 89 9% | 88 7% | 85 4% | 92 12% |
| Black Level * (cd/m²) | 0.27 | 0.31 -15% | 0.4 -48% | 0.23 15% | 0.25 7% | 0.5 -85% |
| Contrast (:1) | 1072 | 1008 -6% | 1470 37% | 1200 12% | 1138 6% | 929 -13% |
| Colorchecker dE 2000 * | 2.32 | 5.78 -149% | 2.5 -8% | 5.6 -141% | 3.52 -52% | 3.36 -45% |
| Colorchecker dE 2000 max. * | 5.76 | 8.86 -54% | 6.3 -9% | 16.4 -185% | 5.56 3% | 7.06 -23% |
| Colorchecker dE 2000 calibrated * | 2.49 | 3.78 -52% | 0.6 76% | 4.7 -89% | 3 -20% | 3.42 -37% |
| Greyscale dE 2000 * | 3 | 5.4 -80% | 4.5 -50% | 3 -0% | 3.2 -7% | 1.3 57% |
| Gamma | 2.22 99% | 2.21 100% | 2.2 100% | 2.18 101% | 2.28 96% | 2.14 103% |
| CCT | 6867 95% | 7864 83% | 6836 95% | 7075 92% | 7070 92% | 6596 99% |
| Color Space (Percent of AdobeRGB 1998) (%) | 59.8 | 57.1 -5% | 63.2 6% | 36.9 -38% | 61.1 2% | 84.8 42% |
| Color Space (Percent of sRGB) (%) | 92 | 87.4 -5% | 98 7% | 58.1 -37% | 93.8 2% | 98.3 7% |
| Moyenne finale (programmes/paramètres) | -10% /
-22% | 5% /
14% | -21% /
-34% | -9% /
-6% | -0% /
4% |
* ... Moindre est la valeur, meilleures sont les performances
Temps de réponse de l'écran
| ↔ Temps de réponse noir à blanc | ||
|---|---|---|
| 34.4 ms ... hausse ↗ et chute ↘ combinées | ↗ 20.4 ms hausse | 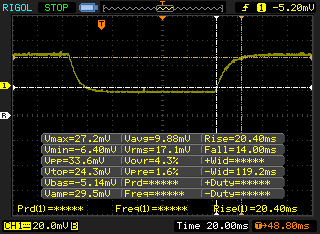 |
| ↘ 14 ms chute | ||
| L'écran souffre de latences très élevées, à éviter pour le jeu. En comparaison, tous les appareils testés affichent entre 0.1 (minimum) et 240 (maximum) ms. » 92 % des appareils testés affichent de meilleures performances. Cela signifie que les latences relevées sont moins bonnes que la moyenne (19.8 ms) de tous les appareils testés. | ||
| ↔ Temps de réponse gris 50% à gris 80% | ||
| 43.2 ms ... hausse ↗ et chute ↘ combinées | ↗ 22.8 ms hausse | 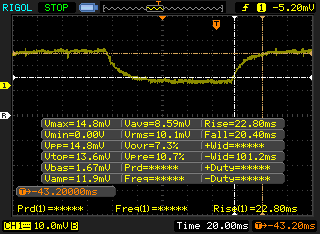 |
| ↘ 20.4 ms chute | ||
| L'écran souffre de latences très élevées, à éviter pour le jeu. En comparaison, tous les appareils testés affichent entre 0.165 (minimum) et 636 (maximum) ms. » 72 % des appareils testés affichent de meilleures performances. Cela signifie que les latences relevées sont moins bonnes que la moyenne (31 ms) de tous les appareils testés. | ||
Scintillement / MLI (Modulation de largeur d'impulsion)
| Scintillement / MLI (Modulation de largeur d'impulsion) décelé | 26040 Hz | ≤ 13 Niveau de luminosité | 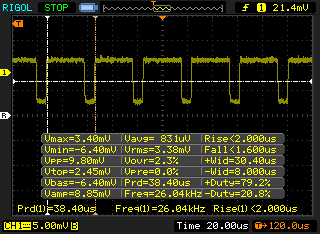 |
Le rétroéclairage de l'écran scintille à la fréquence de 26040 Hz (certainement du fait de l'utilisation d'une MDI - Modulation de largeur d'impulsion) à un niveau de luminosité inférieur ou égal à 13 % . Aucun scintillement ne devrait être perceptible au-dessus de cette valeur. La fréquence de rafraîchissement de 26040 Hz est élevée, la grande majorité des utilisateurs ne devrait pas percevoir de scintillements et être sujette à une fatigue oculaire accrue. En comparaison, 52 % des appareils testés n'emploient pas MDI pour assombrir leur écran. Nous avons relevé une moyenne à 7757 (minimum : 5 - maximum : 343500) Hz dans le cas où une MDI était active. | |||
| wPrime 2.10 - 1024m | |
| Microsoft Surface Laptop 3 15 Ryzen 5 3580U | |
| Dell XPS 13 7390 2-in-1 Core i7 | |
| Dell XPS 13 7390 Core i7-10710U | |
* ... Moindre est la valeur, meilleures sont les performances
| PCMark 8 Home Score Accelerated v2 | 3958 points | |
| PCMark 8 Work Score Accelerated v2 | 5443 points | |
| PCMark 10 Score | 5409 points | |
Aide | ||
| MSI Modern 15 A10RB WDC PC SN730 SDBPNTY-512G | Asus ZenBook 15 UX534FT-DB77 Samsung SSD PM981 MZVLB1T0HALR | Lenovo ThinkPad T590-20N4002VGE Toshiba XG6 KXG60ZNV512G | HP Spectre X360 15-5ZV31AV Intel SSD 660p 2TB SSDPEKNW020T8 | MSI Prestige 15 A10SC Samsung SSD PM981 MZVLB1T0HALR | |
|---|---|---|---|---|---|
| AS SSD | 0% | 21% | -21% | 11% | |
| Seq Read (MB/s) | 2084 | 1887 -9% | 2551 22% | 1220 -41% | 1274 -39% |
| Seq Write (MB/s) | 2442 | 1432 -41% | 2376 -3% | 1152 -53% | 1395 -43% |
| 4K Read (MB/s) | 47.52 | 52.3 10% | 52.7 11% | 52.3 10% | 50.3 6% |
| 4K Write (MB/s) | 135.8 | 146 8% | 153 13% | 146.6 8% | 119.8 -12% |
| 4K-64 Read (MB/s) | 1043 | 969 -7% | 1406 35% | 652 -37% | 1599 53% |
| 4K-64 Write (MB/s) | 955 | 1375 44% | 1439 51% | 847 -11% | 1455 52% |
| Access Time Read * (ms) | 0.062 | 0.034 45% | 0.067 -8% | 0.077 -24% | 0.044 29% |
| Access Time Write * (ms) | 0.076 | 0.075 1% | 0.027 64% | 0.106 -39% | 0.092 -21% |
| Score Read (Points) | 1299 | 1210 -7% | 1714 32% | 826 -36% | 1777 37% |
| Score Write (Points) | 1335 | 1664 25% | 1829 37% | 1109 -17% | 1714 28% |
| Score Total (Points) | 3326 | 3483 5% | 4418 33% | 2371 -29% | 4411 33% |
| Copy ISO MB/s (MB/s) | 1926 | 1375 -29% | 2625 36% | 2070 7% | 2830 47% |
| Copy Program MB/s (MB/s) | 714 | 468 -34% | 495.9 -31% | 571 -20% | 609 -15% |
| Copy Game MB/s (MB/s) | 1425 | 1287 -10% | 1384 -3% | 1219 -14% | 1424 0% |
| CrystalDiskMark 5.2 / 6 | -14% | -22% | -27% | -33% | |
| Write 4K (MB/s) | 208.4 | 141.6 -32% | 126.2 -39% | 151.5 -27% | 150.8 -28% |
| Read 4K (MB/s) | 51 | 45.28 -11% | 48.93 -4% | 59.3 16% | 47.3 -7% |
| Write Seq (MB/s) | 2687 | 1975 -26% | 1345 -50% | 1424 -47% | 981 -63% |
| Read Seq (MB/s) | 2168 | 2272 5% | 1373 -37% | 1609 -26% | 976 -55% |
| Write 4K Q32T1 (MB/s) | 489.2 | 458.6 -6% | 383.8 -22% | 393.6 -20% | 442.7 -10% |
| Read 4K Q32T1 (MB/s) | 600 | 391.4 -35% | 434.8 -28% | 369.4 -38% | 499.7 -17% |
| Write Seq Q32T1 (MB/s) | 2699 | 2393 -11% | 2966 10% | 1946 -28% | 1706 -37% |
| Read Seq Q32T1 (MB/s) | 3374 | 3464 3% | 3230 -4% | 1934 -43% | 1758 -48% |
| Write 4K Q8T8 (MB/s) | 960 | ||||
| Read 4K Q8T8 (MB/s) | 1441 | ||||
| Moyenne finale (programmes/paramètres) | -7% /
-5% | -1% /
5% | -24% /
-23% | -11% /
-5% |
* ... Moindre est la valeur, meilleures sont les performances

| 3DMark 11 Performance | 5302 points | |
| 3DMark Cloud Gate Standard Score | 17955 points | |
| 3DMark Fire Strike Score | 3562 points | |
| 3DMark Time Spy Score | 1308 points | |
Aide | ||
| Shadow of the Tomb Raider | |
| 1280x720 Lowest Preset | |
| Lenovo IdeaPad S740-15IRH | |
| MSI GL72 7QF | |
| MSI Modern 15 A10RB | |
| Moyenne NVIDIA GeForce MX250 (24 - 56, n=8) | |
| Xiaomi Mi Notebook Pro i7 | |
| Dell Inspiron 15 5000 5585 | |
| Microsoft Surface Laptop 3 15 i7-1065G7 | |
| Microsoft Surface Laptop 3 15 Ryzen 5 3580U | |
| 1920x1080 Medium Preset | |
| Lenovo IdeaPad S740-15IRH | |
| MSI GL72 7QF | |
| MSI Modern 15 A10RB | |
| Xiaomi Mi Notebook Pro i7 | |
| Moyenne NVIDIA GeForce MX250 (7 - 19, n=8) | |
| Dell Inspiron 15 5000 5585 | |
| Microsoft Surface Laptop 3 15 Ryzen 5 3580U | |
| 1920x1080 High Preset AA:SM | |
| Asus TUF FX705GM | |
| Lenovo IdeaPad S740-15IRH | |
| MSI GL72 7QF | |
| Dell Inspiron 15 5000 5585 | |
| MSI Modern 15 A10RB | |
| Moyenne NVIDIA GeForce MX250 (12 - 15, n=6) | |
| Xiaomi Mi Notebook Pro i7 | |
| 1920x1080 Highest Preset AA:T | |
| Asus TUF FX705GM | |
| Lenovo IdeaPad S740-15IRH | |
| MSI GL72 7QF | |
| MSI Modern 15 A10RB | |
| Moyenne NVIDIA GeForce MX250 (9 - 10, n=5) | |
| Xiaomi Mi Notebook Pro i7 | |
| Bas | Moyen | Élevé | Ultra | |
|---|---|---|---|---|
| BioShock Infinite (2013) | 212.3 | 114.5 | 98.1 | 37.8 |
| The Witcher 3 (2015) | 70 | 40 | 23.1 | 12 |
| Rocket League (2017) | 182.9 | 91.2 | 60.8 | |
| Shadow of the Tomb Raider (2018) | 55 | 19 | 13 | 10 |
| MSI Modern 15 A10RB GeForce MX250, i7-10510U, WDC PC SN730 SDBPNTY-512G | Asus ZenBook 15 UX534FT-DB77 GeForce GTX 1650 Max-Q, i7-8565U, Samsung SSD PM981 MZVLB1T0HALR | Dell XPS 15 7590 i5 iGPU FHD UHD Graphics 630, i5-9300H, Toshiba XG6 KXG60ZNV512G | Lenovo ThinkPad T590-20N4002VGE GeForce MX250, i7-8565U, Toshiba XG6 KXG60ZNV512G | HP Spectre X360 15-5ZV31AV GeForce MX250, i7-10510U, Intel SSD 660p 2TB SSDPEKNW020T8 | MSI Prestige 15 A10SC GeForce GTX 1650 Max-Q, i7-10710U, Samsung SSD PM981 MZVLB1T0HALR | |
|---|---|---|---|---|---|---|
| Noise | 8% | 9% | 9% | 6% | 5% | |
| arrêt / environnement * (dB) | 28.3 | 28.4 -0% | 29.3 -4% | 29.4 -4% | 30.1 -6% | 29.3 -4% |
| Idle Minimum * (dB) | 32 | 28.4 11% | 29.3 8% | 29.3 8% | 30.1 6% | 30.1 6% |
| Idle Average * (dB) | 32 | 28.4 11% | 29.3 8% | 29.3 8% | 30.1 6% | 30.2 6% |
| Idle Maximum * (dB) | 32 | 28.4 11% | 29.8 7% | 31.8 1% | 30.1 6% | 30.2 6% |
| Load Average * (dB) | 34.5 | 33.9 2% | 32.4 6% | 33.5 3% | 30.1 13% | 31.5 9% |
| Witcher 3 ultra * (dB) | 39.5 | 39.8 -1% | 33.5 15% | 39.7 -1% | 37 6% | |
| Load Maximum * (dB) | 50.9 | 40.2 21% | 37.2 27% | 35.8 30% | 42 17% | 47 8% |
* ... Moindre est la valeur, meilleures sont les performances
Degré de la nuisance sonore
| Au repos |
| 32 / 32 / 32 dB(A) |
| Fortement sollicité |
| 34.5 / 50.9 dB(A) |
 | ||
30 dB silencieux 40 dB(A) audible 50 dB(A) bruyant |
||
min: | ||
(-) La température maximale du côté supérieur est de 54.2 °C / 130 F, par rapport à la moyenne de 34.3 °C / 94 F, allant de 21.2 à 62.5 °C pour la classe Office.
(-) Le fond chauffe jusqu'à un maximum de 59.4 °C / 139 F, contre une moyenne de 36.8 °C / 98 F
(+) En utilisation inactive, la température moyenne du côté supérieur est de 26.2 °C / 79 F, par rapport à la moyenne du dispositif de 29.5 °C / 85 F.
(-) En jouant à The Witcher 3, la température moyenne du côté supérieur est de 39.3 °C / 103 F, alors que la moyenne de l'appareil est de 29.5 °C / 85 F.
(+) Les repose-poignets et le pavé tactile atteignent la température maximale de la peau (33 °C / 91.4 F) et ne sont donc pas chauds.
(-) La température moyenne de la zone de l'appui-paume de dispositifs similaires était de 27.5 °C / 81.5 F (-5.5 °C / #-9.9 F).
MSI Modern 15 A10RB analyse audio
(+) | les haut-parleurs peuvent jouer relativement fort (82.1# dB)
Basses 100 - 315 Hz
(-) | presque aucune basse - en moyenne 19.1% plus bas que la médiane
(±) | la linéarité des basses est moyenne (12.2% delta à la fréquence précédente)
Médiums 400 - 2000 Hz
(+) | médiane équilibrée - seulement 4.4% de la médiane
(±) | la linéarité des médiums est moyenne (10.2% delta à la fréquence précédente)
Aiguës 2 - 16 kHz
(+) | des sommets équilibrés - à seulement 1.3% de la médiane
(+) | les aigus sont linéaires (6.8% delta à la fréquence précédente)
Globalement 100 - 16 000 Hz
(±) | la linéarité du son global est moyenne (20.6% de différence avec la médiane)
Par rapport à la même classe
» 48% de tous les appareils testés de cette catégorie étaient meilleurs, 9% similaires, 43% pires
» Le meilleur avait un delta de 7%, la moyenne était de 21%, le pire était de 53%.
Par rapport à tous les appareils testés
» 55% de tous les appareils testés étaient meilleurs, 8% similaires, 37% pires
» Le meilleur avait un delta de 4%, la moyenne était de 23%, le pire était de 134%.
Apple MacBook 12 (Early 2016) 1.1 GHz analyse audio
(+) | les haut-parleurs peuvent jouer relativement fort (83.6# dB)
Basses 100 - 315 Hz
(±) | basse réduite - en moyenne 11.3% inférieure à la médiane
(±) | la linéarité des basses est moyenne (14.2% delta à la fréquence précédente)
Médiums 400 - 2000 Hz
(+) | médiane équilibrée - seulement 2.4% de la médiane
(+) | les médiums sont linéaires (5.5% delta à la fréquence précédente)
Aiguës 2 - 16 kHz
(+) | des sommets équilibrés - à seulement 2% de la médiane
(+) | les aigus sont linéaires (4.5% delta à la fréquence précédente)
Globalement 100 - 16 000 Hz
(+) | le son global est linéaire (10.2% différence à la médiane)
Par rapport à la même classe
» 7% de tous les appareils testés de cette catégorie étaient meilleurs, 2% similaires, 90% pires
» Le meilleur avait un delta de 5%, la moyenne était de 18%, le pire était de 53%.
Par rapport à tous les appareils testés
» 5% de tous les appareils testés étaient meilleurs, 1% similaires, 94% pires
» Le meilleur avait un delta de 4%, la moyenne était de 23%, le pire était de 134%.
| Éteint/en veille | |
| Au repos | |
| Fortement sollicité |
|
Légende:
min: | |
| MSI Modern 15 A10RB i7-10510U, GeForce MX250, WDC PC SN730 SDBPNTY-512G, IPS, 1920x1080, 15.6" | Asus ZenBook 15 UX534FT-DB77 i7-8565U, GeForce GTX 1650 Max-Q, Samsung SSD PM981 MZVLB1T0HALR, IPS, 1920x1080, 15.6" | Dell XPS 15 7590 i5 iGPU FHD i5-9300H, UHD Graphics 630, Toshiba XG6 KXG60ZNV512G, IPS, 1920x1080, 15.6" | Lenovo ThinkPad T590-20N4002VGE i7-8565U, GeForce MX250, Toshiba XG6 KXG60ZNV512G, aSi IPS LED, 1920x1080, 15.6" | HP Spectre X360 15-5ZV31AV i7-10510U, GeForce MX250, Intel SSD 660p 2TB SSDPEKNW020T8, IPS, 3840x2160, 15.6" | MSI Prestige 15 A10SC i7-10710U, GeForce GTX 1650 Max-Q, Samsung SSD PM981 MZVLB1T0HALR, IPS, 3840x2160, 15.6" | |
|---|---|---|---|---|---|---|
| Power Consumption | -11% | 27% | 24% | 20% | -9% | |
| Idle Minimum * (Watt) | 6.6 | 5 24% | 3.79 43% | 4.1 38% | 5.2 21% | 6.1 8% |
| Idle Average * (Watt) | 9.9 | 13.2 -33% | 6.9 30% | 8.3 16% | 8.5 14% | 13.2 -33% |
| Idle Maximum * (Watt) | 14.7 | 24 -63% | 9.2 37% | 11.8 20% | 8.7 41% | 19.2 -31% |
| Load Average * (Watt) | 82.9 | 70 16% | 62 25% | 61.6 26% | 65.6 21% | 75 10% |
| Witcher 3 ultra * (Watt) | 59.4 | 63.3 -7% | 54.4 8% | 56.5 5% | 74 -25% | |
| Load Maximum * (Watt) | 109.3 | 114 -4% | 108 1% | 69.4 37% | 92.4 15% | 89.7 18% |
* ... Moindre est la valeur, meilleures sont les performances
| MSI Modern 15 A10RB i7-10510U, GeForce MX250, 52 Wh | Asus ZenBook 15 UX534FT-DB77 i7-8565U, GeForce GTX 1650 Max-Q, 71 Wh | Dell XPS 15 7590 i5 iGPU FHD i5-9300H, UHD Graphics 630, 97 Wh | Lenovo ThinkPad T590-20N4002VGE i7-8565U, GeForce MX250, 57 Wh | HP Spectre X360 15-5ZV31AV i7-10510U, GeForce MX250, 84 Wh | MSI Prestige 15 A10SC i7-10710U, GeForce GTX 1650 Max-Q, 82 Wh | |
|---|---|---|---|---|---|---|
| Autonomie de la batterie | 47% | 59% | 84% | 61% | 22% | |
| Reader / Idle (h) | 15.4 | 21.5 40% | 22.6 47% | 19.1 24% | ||
| WiFi v1.3 (h) | 6.5 | 8.4 29% | 14.1 117% | 10.5 62% | 10.8 66% | 7.6 17% |
| Load (h) | 1.7 | 2.9 71% | 1.7 0% | 3.5 106% | 2.9 71% | 2.1 24% |
Points positifs
Points négatifs
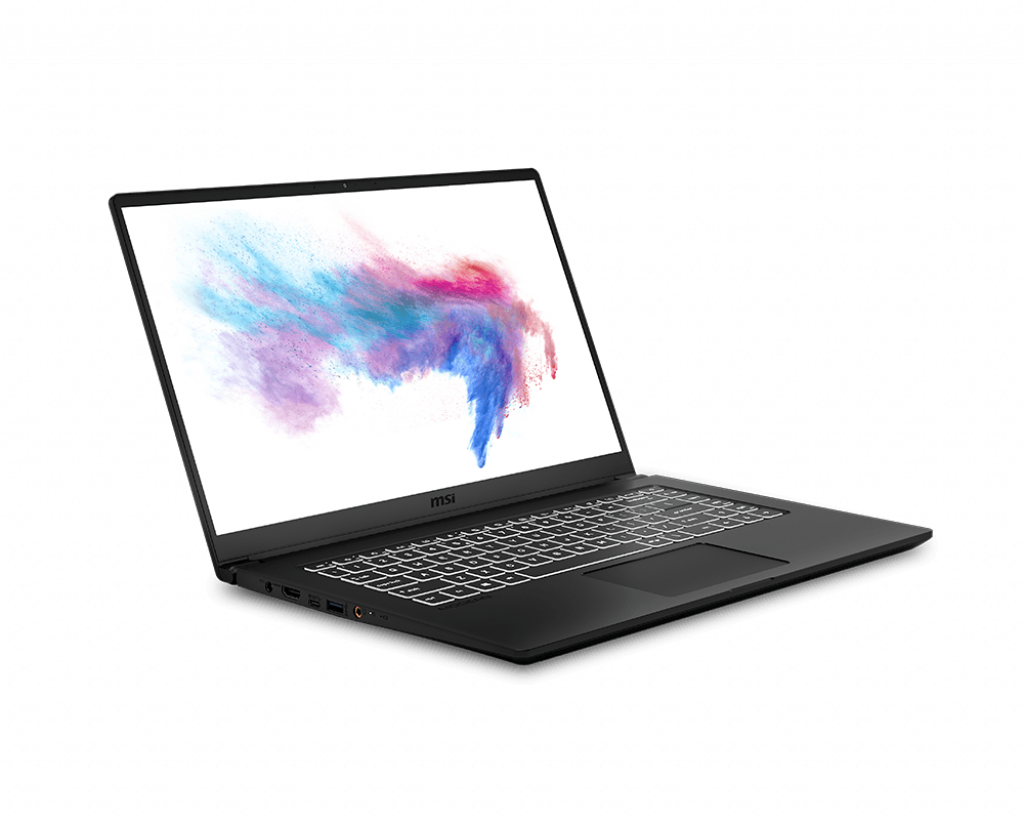
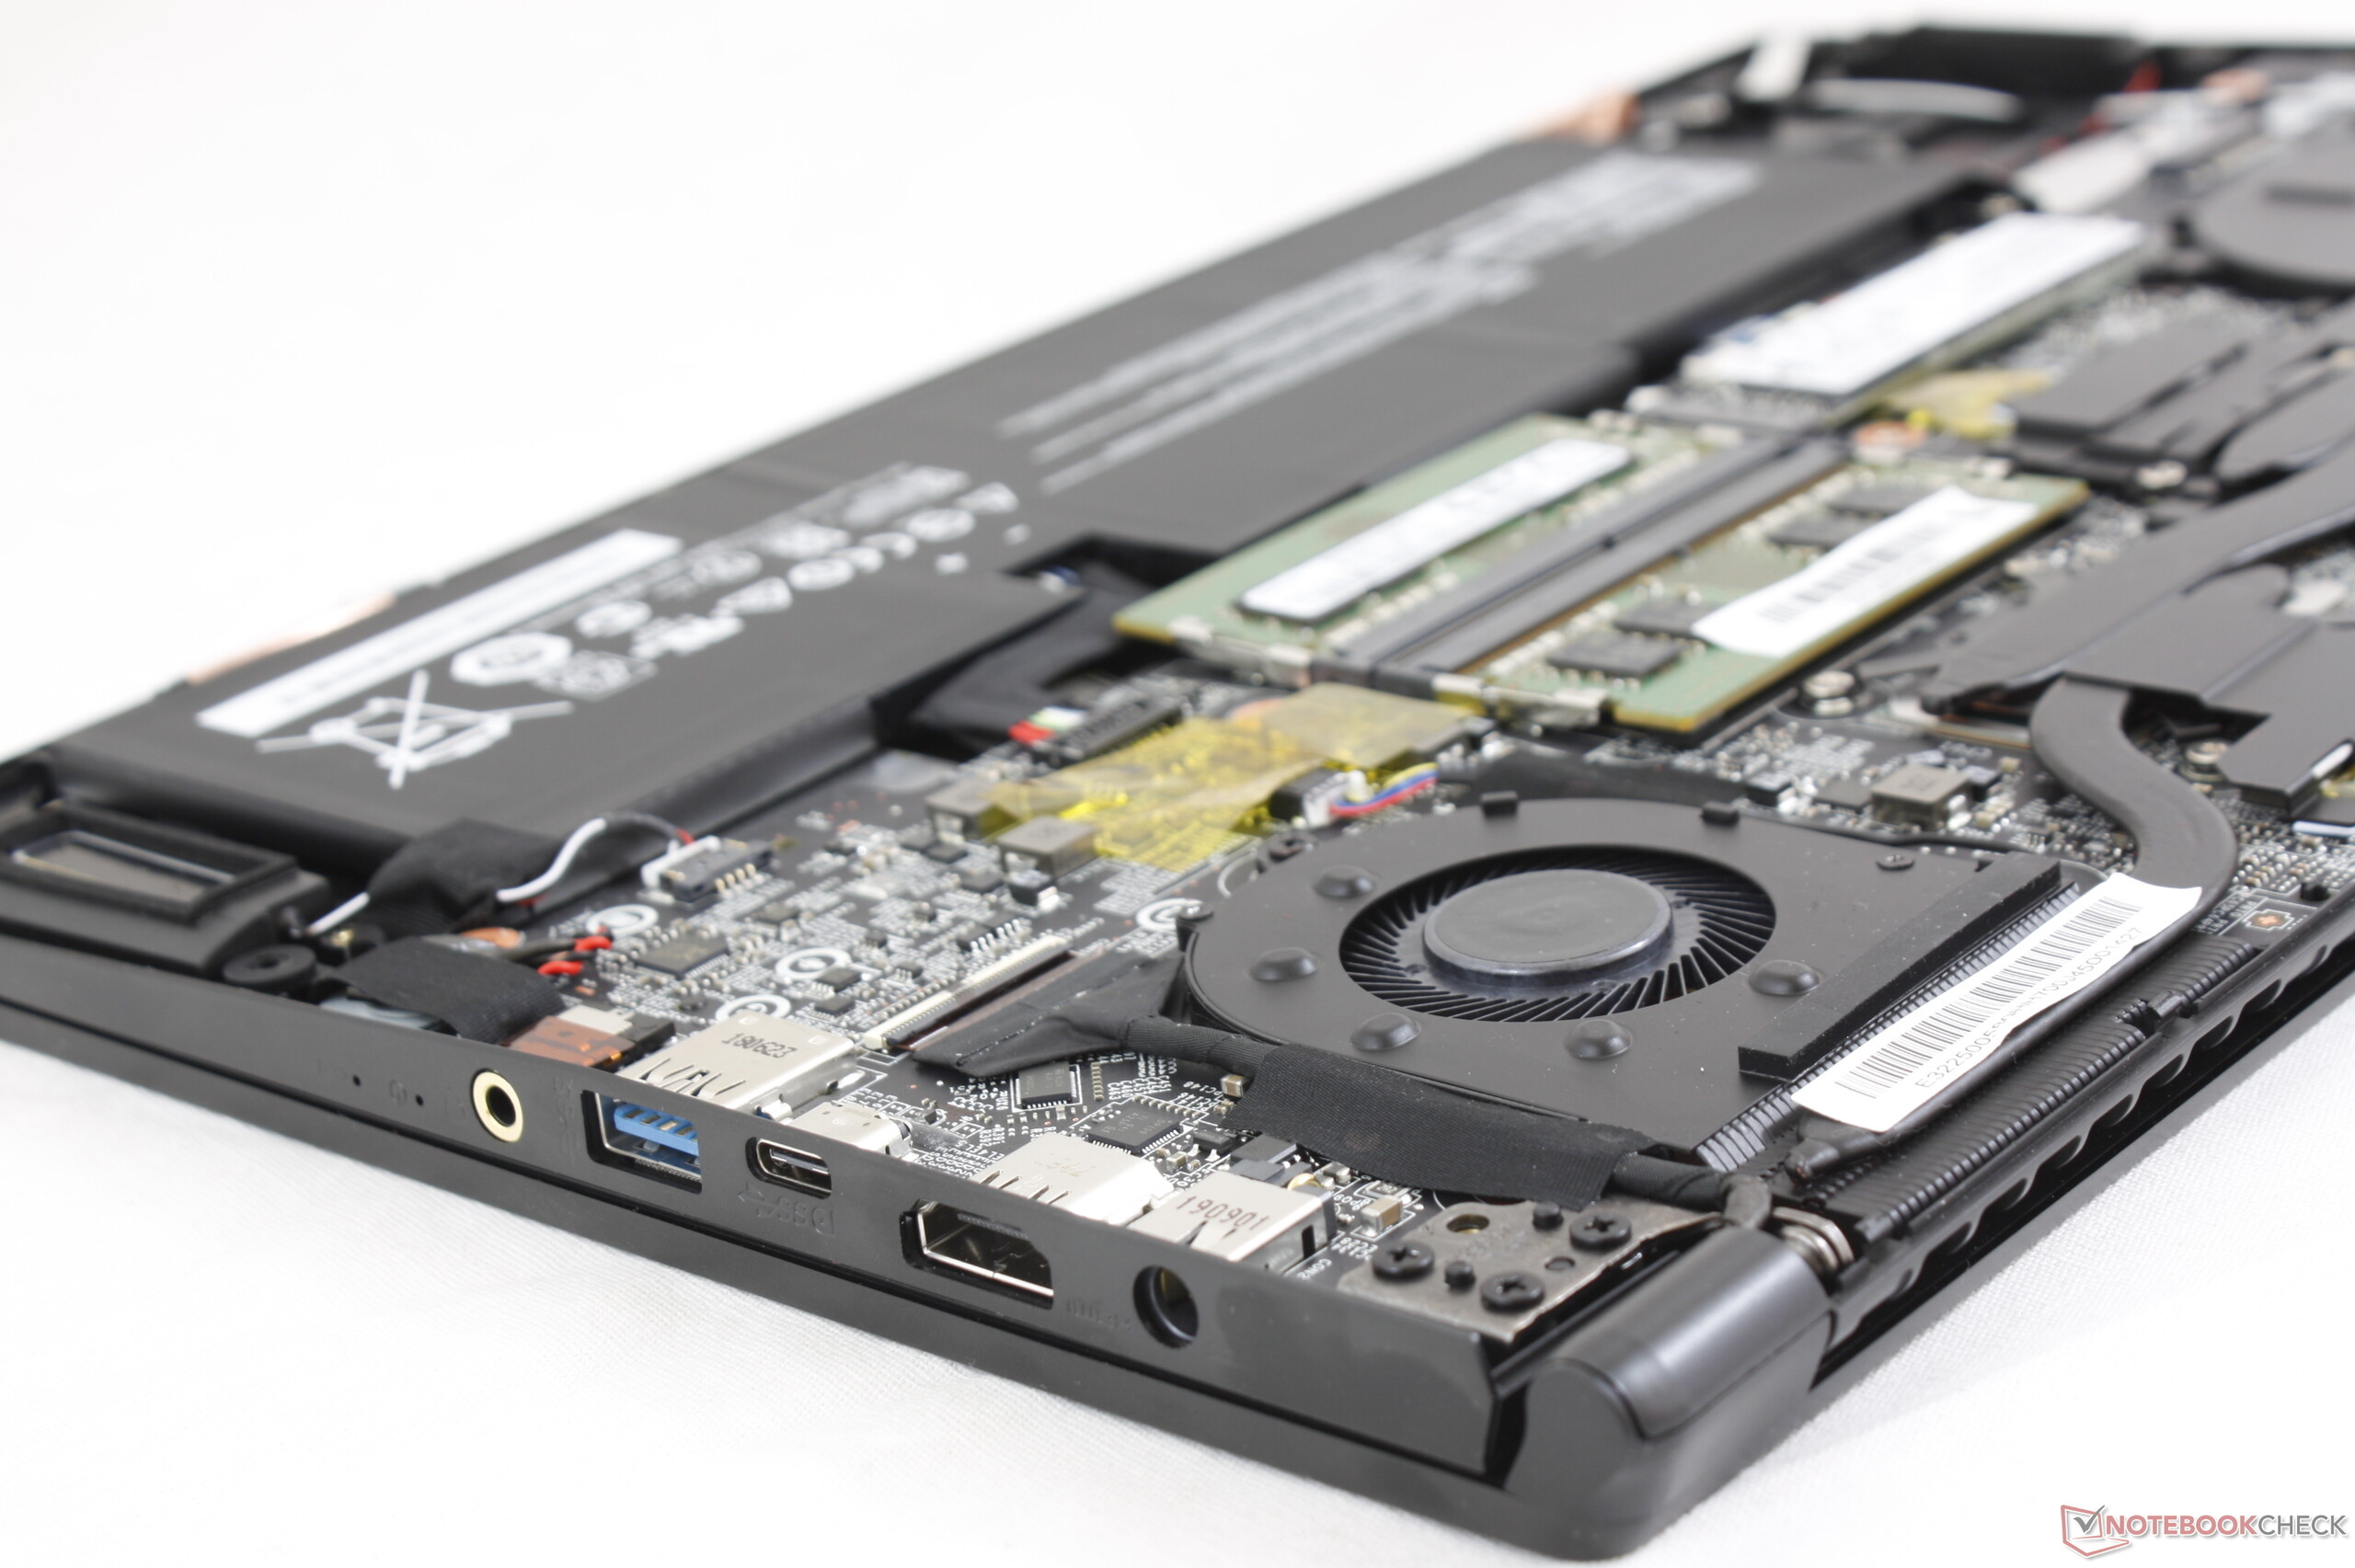
On préférera le Modern 15 à des portables plus répandus comme le Dell XPS 15, le HP Spectre x360 15, le Microsoft Surface Laptop 3 15, ou le MacBook Pro grâce à son poids et à son prix moins élevés, sa RAM et son stockage amovibles facilement, points forts du MSI. Le processeur Core i7-10510U se combine bien avec la carte graphique GeForce MX250, et font ici à eux deux mieux la moyenne.
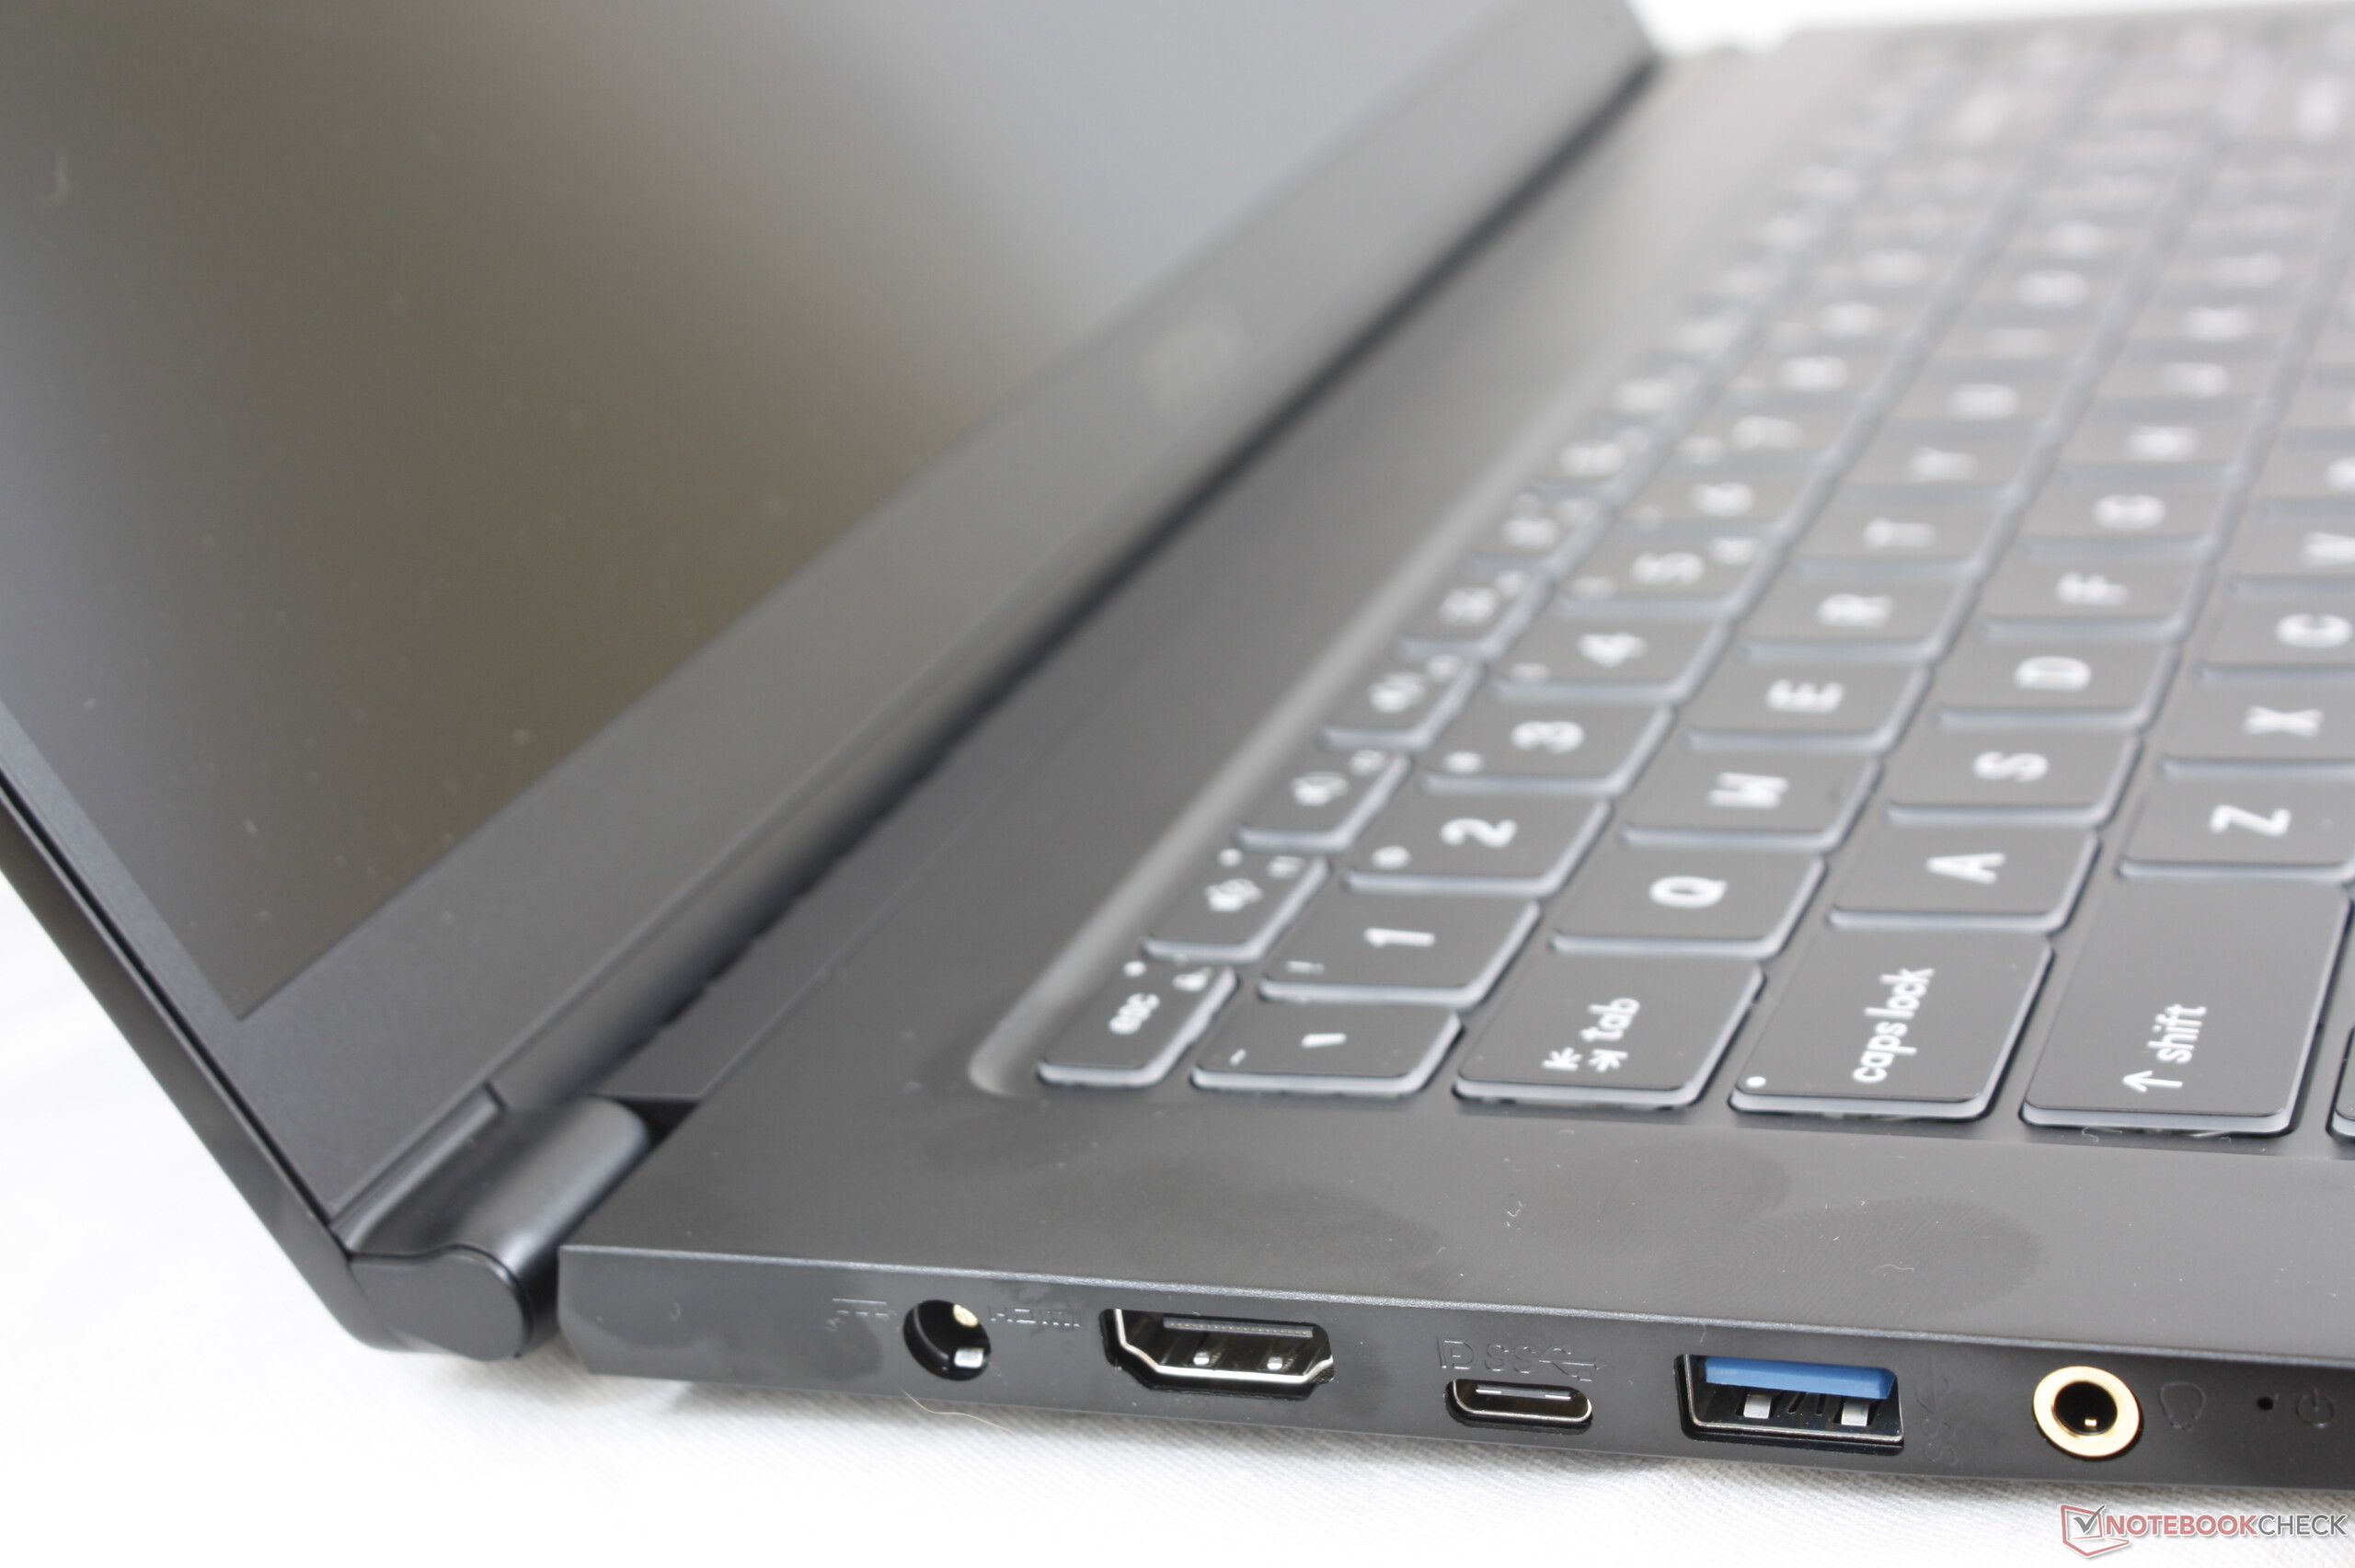
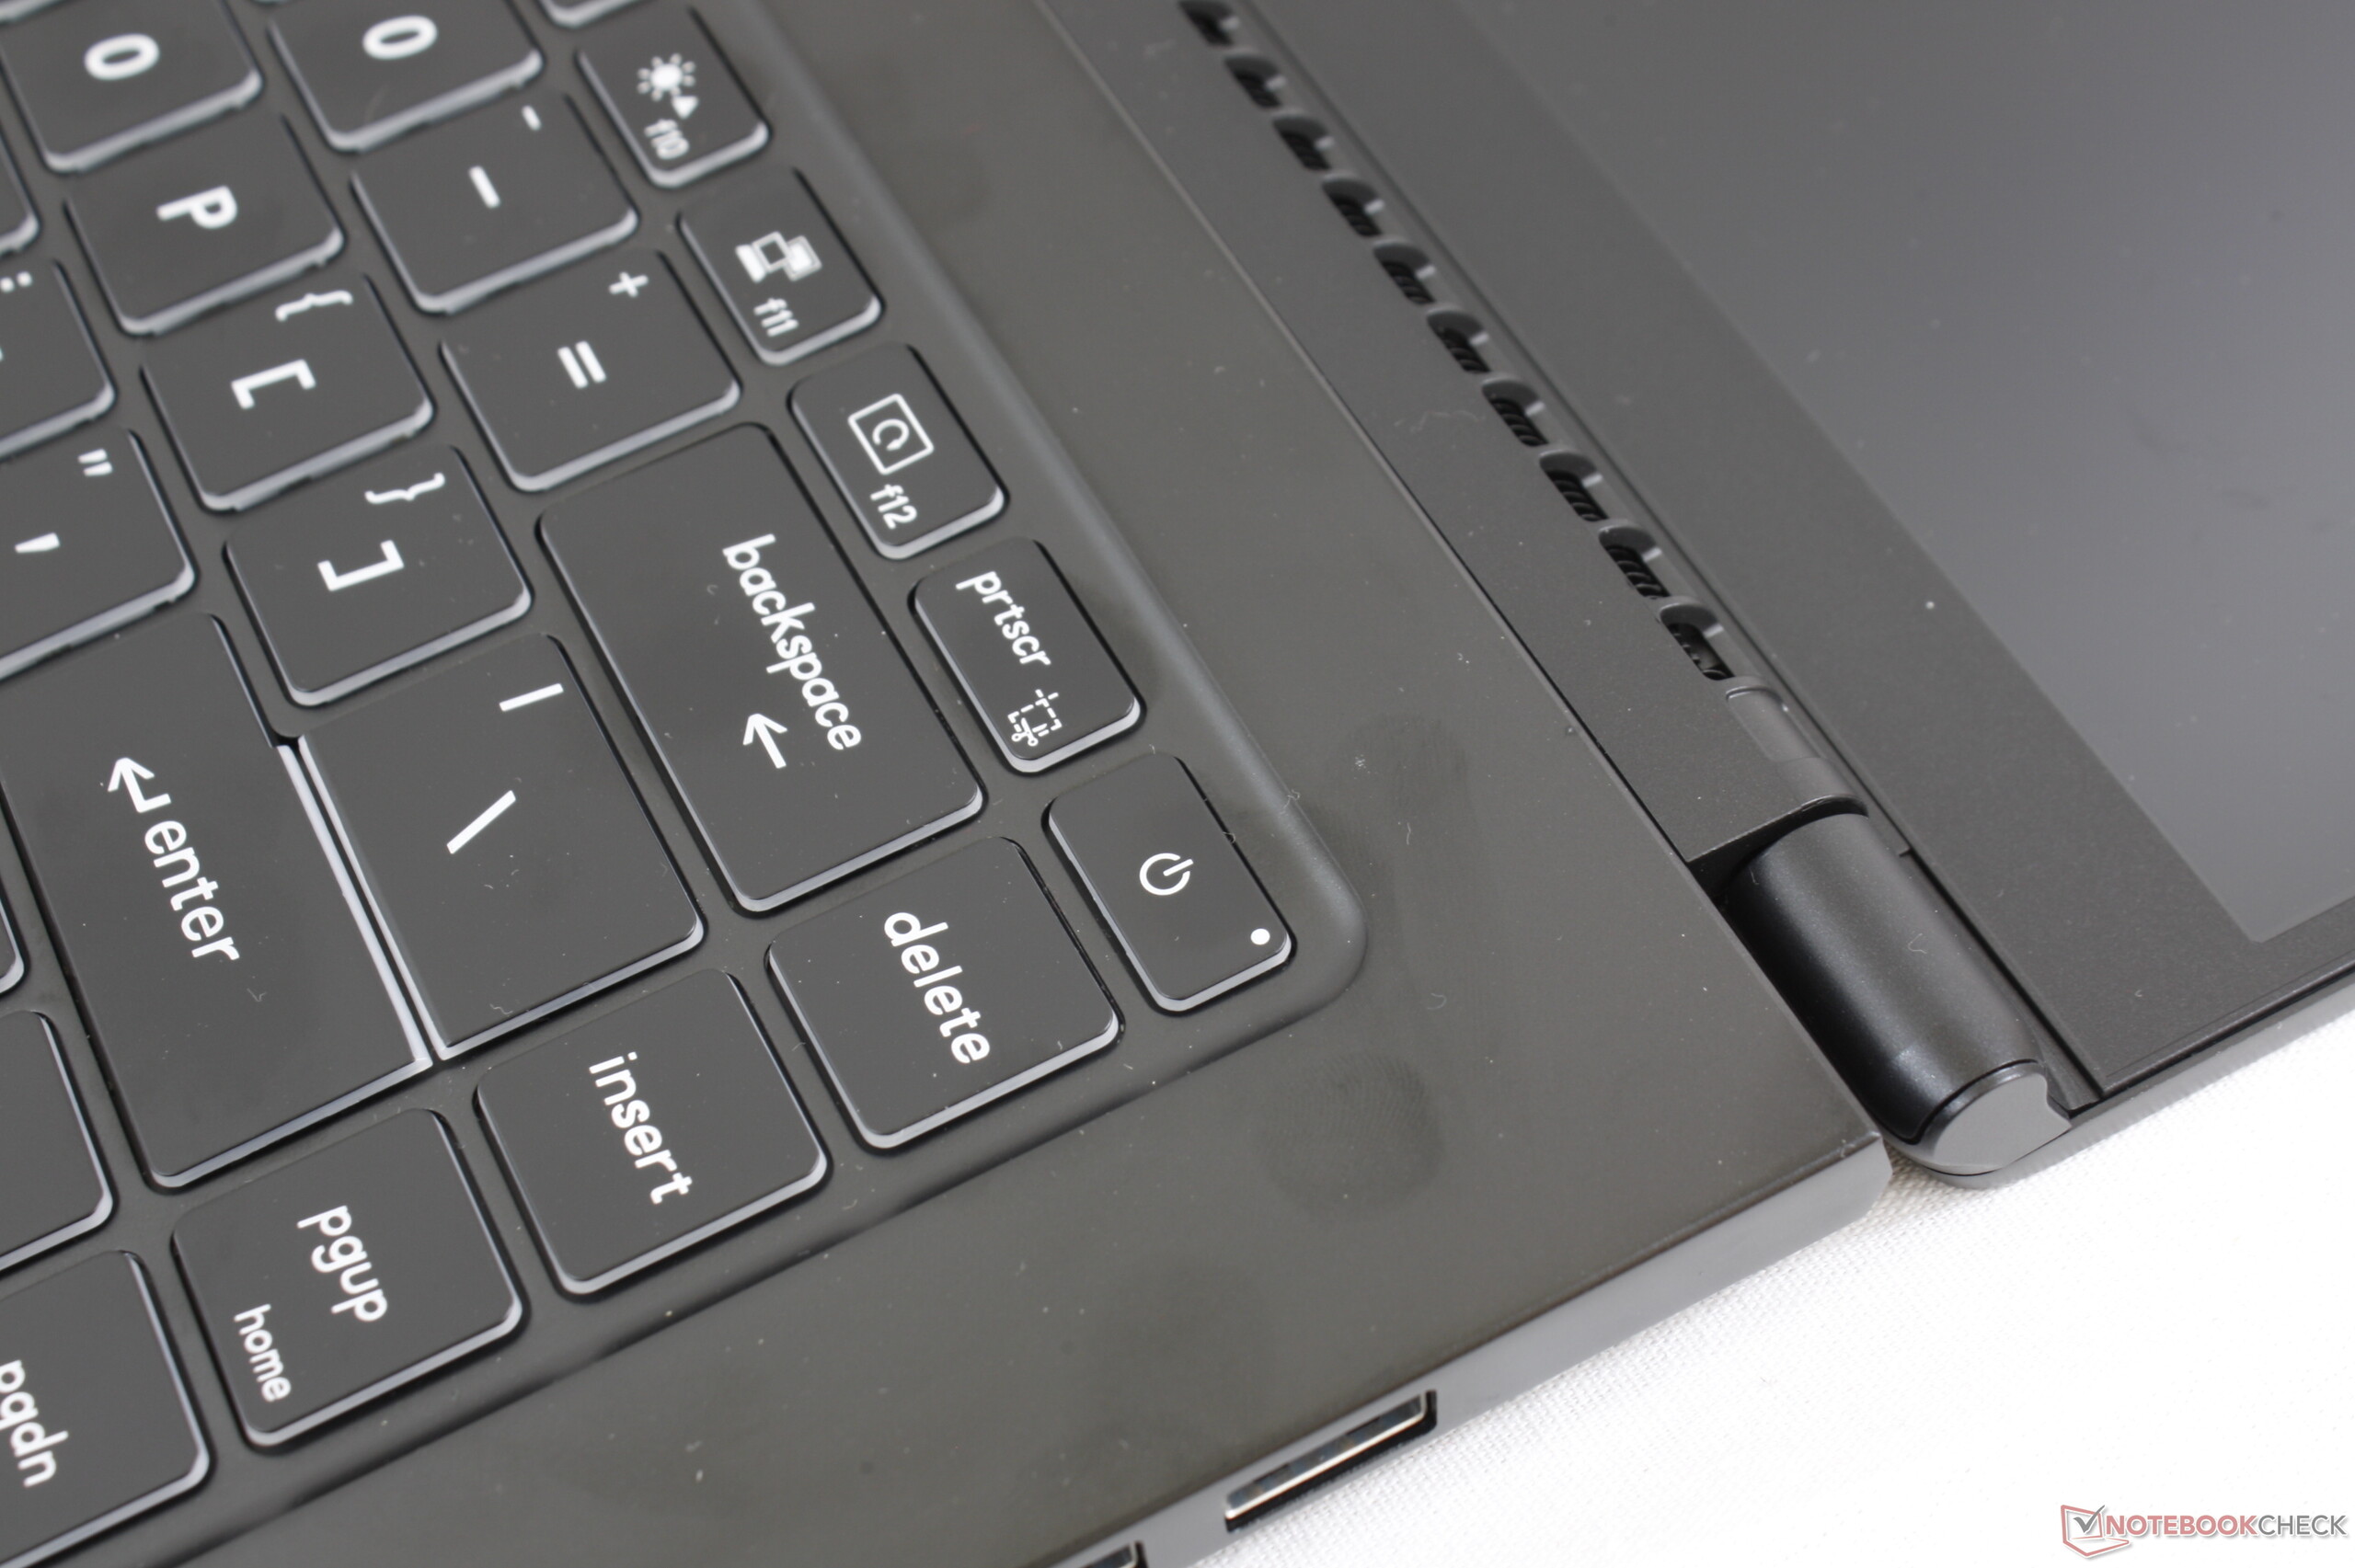
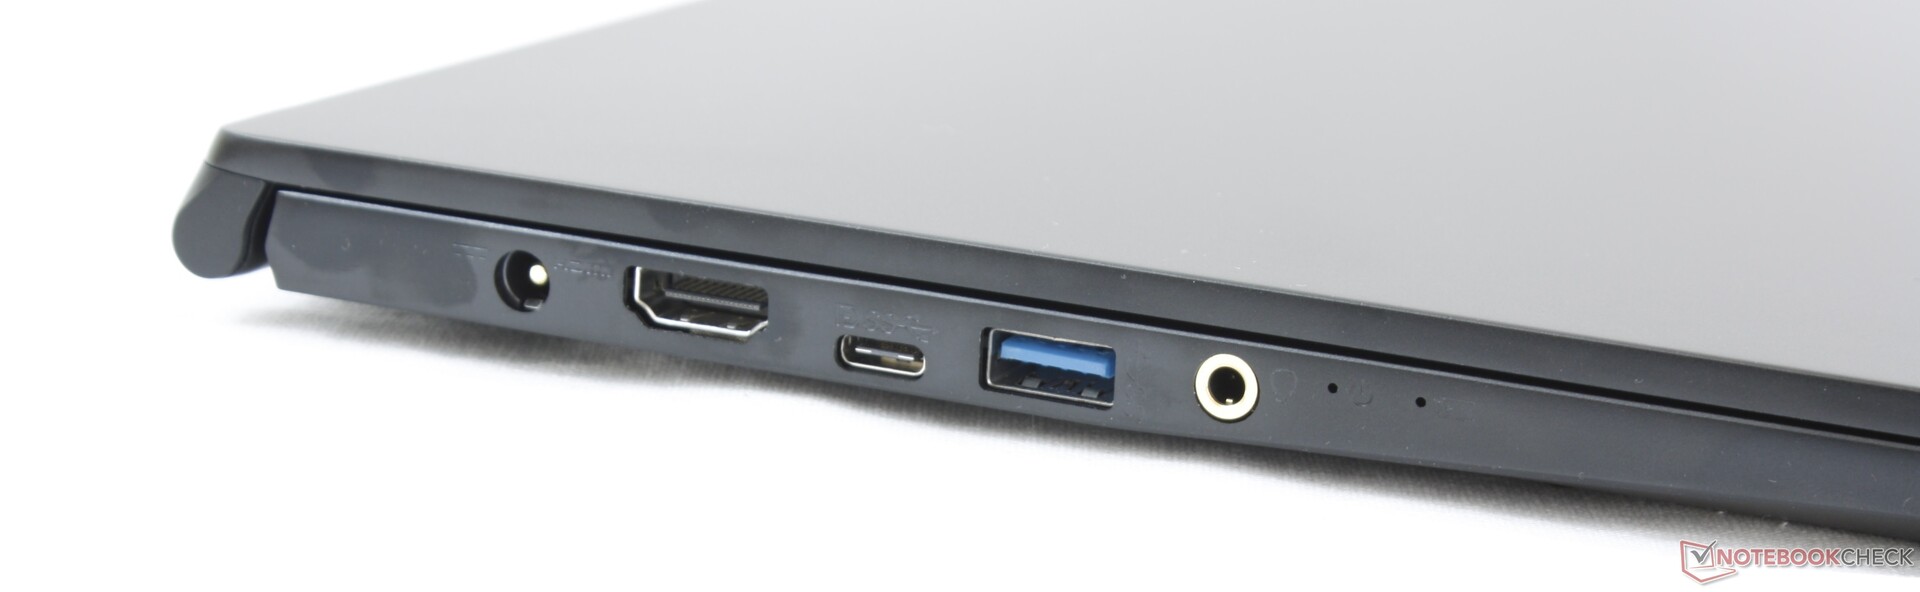
Les principaux défauts à garder à l’esprit sont les performances du processeur, inférieures à celles des appareils équipés de Core H plus puissants, les touches molles, et l’absence de Thunderbolt 3. Le châssis est plus sensible aux torsions et aux dommages, tandis que l’écran n’est pas aussi lumineux que ses alternatives haut de gammes. Après tout, la série Modern est censée être composée de portables abordables du milieu de gamme.
Un aspect gênant qui à notre avis nécessite d’y réfléchir à deux fois est le comportement du ventilateur. Il n’y a pas de raison que celui-ci ne puisse pas être silencieux au ralenti sur le bureau, en mode silencieux ou en mode économie d’énergie. La plupart des portables avec des processeurs de série Core U sont plus discrets dans de telles conditions.
Si vous pouvez composer avec ses faiblesses, alors le Modern 15 s’avérera être un portable performant au vu de sa taille et de son poids. Ceux qui veulent une machine plus puissante ou plus durable devraient cependant regarder du côté du Prestige 15, ou du côté de portables professionnels tels que le HP EliteBook, le ThinkPad X1 Carbon, ou le Dell Latitude 7000.
L’intégralité de cette critique est disponible en anglais en suivant MSI Modern 15 A10RB.
MSI Modern 15 A10RB
- 05/20/2021 v7 (old)
Allen Ngo
Price comparison
