Test du Lenovo ThinkPad P16s G2 AMD : puissance et OLED pour cette station de travail

Si une puce de sécurité supplémentaire, la possibilité d'effectuer une maintenance à distance et un lecteur de cartes à puce ne peuvent intéresser que les entreprises, la puissance, les performances graphiques, l'autonomie et le bel écran de l'ordinateur portable devraient susciter l'intérêt du grand public. Sa puissance AMD Ryzen 7 Pro 7840U attire particulièrement l'attention.
Le ThinkPad P16s G2 convient donc parfaitement au travail à domicile, en déplacement, à l'université ou même aux créatifs. En outre, il n'a pas été nécessaire d'installer un écran OLED et sa RAM et son SSD offrent une bonne gamme d'options de configuration pour presque tous les domaines d'utilisation. En revanche, son aspect visuel peut être qualifié de plutôt conservateur, mais ce n'est pas forcément un point négatif.
Dans le même temps, des concurrents comparables tels que le Microsoft Surface Laptop Studio 2 ou le HP EliteBook 845 G10 ont des designs un peu plus audacieux. Notre analyse montrera si ces modèles sont meilleurs ou pires, ou simplement différents, et si le ThinkPad P16s G2 a encore une marge de progression.
Comparaison avec les concurrents potentiels
Note | Date | Modèle | Poids | Épaisseur | Taille | Résolution | Prix |
|---|---|---|---|---|---|---|---|
| 88.6 % v7 (old) | 01/24 | Lenovo ThinkPad P16s G2 21K9000CGE R7 PRO 7840U, Radeon 780M | 1.8 kg | 24.4 mm | 16.00" | 3840x2400 | |
| 90.1 % v7 (old) | 08/23 | HP EliteBook 845 G10 818N0EA R9 PRO 7940HS, Radeon 780M | 1.5 kg | 17.9 mm | 14.00" | 2560x1600 | |
| 87.8 % v7 (old) | 01/24 | Lenovo ThinkPad P14s G4 21K5000LGE R7 PRO 7840U, Radeon 780M | 1.3 kg | 21.8 mm | 14.00" | 1920x1200 | |
| 88.6 % v7 (old) | 08/23 | Schenker Vision 16 PH6PRX1 i7-13700H, Iris Xe G7 96EUs | 1.5 kg | 17.1 mm | 16.00" | 2560x1600 | |
| 88.6 % v7 (old) | 10/23 | Acer Swift Edge SFE16 Ryzen 7 7840U R7 7840U, Radeon 780M | 1.2 kg | 13 mm | 16.00" | 3200x2000 | |
| 86.2 % v7 (old) | 01/24 | Lenovo ThinkPad P16v G1 AMD R7 PRO 7840HS, RTX A1000 Laptop GPU | 2.3 kg | 24.7 mm | 16.00" | 1920x1200 | |
| 85.5 % v7 (old) | 10/23 | Microsoft Surface Laptop Studio 2 RTX 4060 i7-13700H, GeForce RTX 4060 Laptop GPU | 2 kg | 22 mm | 14.40" | 2400x1600 |
Boîtier - Le ThinkPad gris et robuste
Surface texturée, boîtier gris foncé : Les visuels du ThinkPad sont identifiables à des kilomètres à la ronde. Et comme toujours, le point au-dessus du "I" est éclairé. Le ThinkPad n'est pas élégant et n'est en aucun cas moderne. Au contraire, il semble robuste et durable. Les charnières serrées qui maintiennent l'écran de 16 pouces dans n'importe quel angle et le couvercle qui se ferme presque parfaitement renforcent cette impression de qualité et de stabilité, même sans aucun composant métallique sur le boîtier extérieur.
Naturellement, l'écran relativement grand peut être légèrement tordu. La base, en revanche, reste parfaitement stable dans toutes les situations. Nous n'avons pas non plus pu déceler de bruits dans le boîtier. Après tout, il s'agit d'un ordinateur portable de travail qui ne sera pas toujours manipulé avec soin.
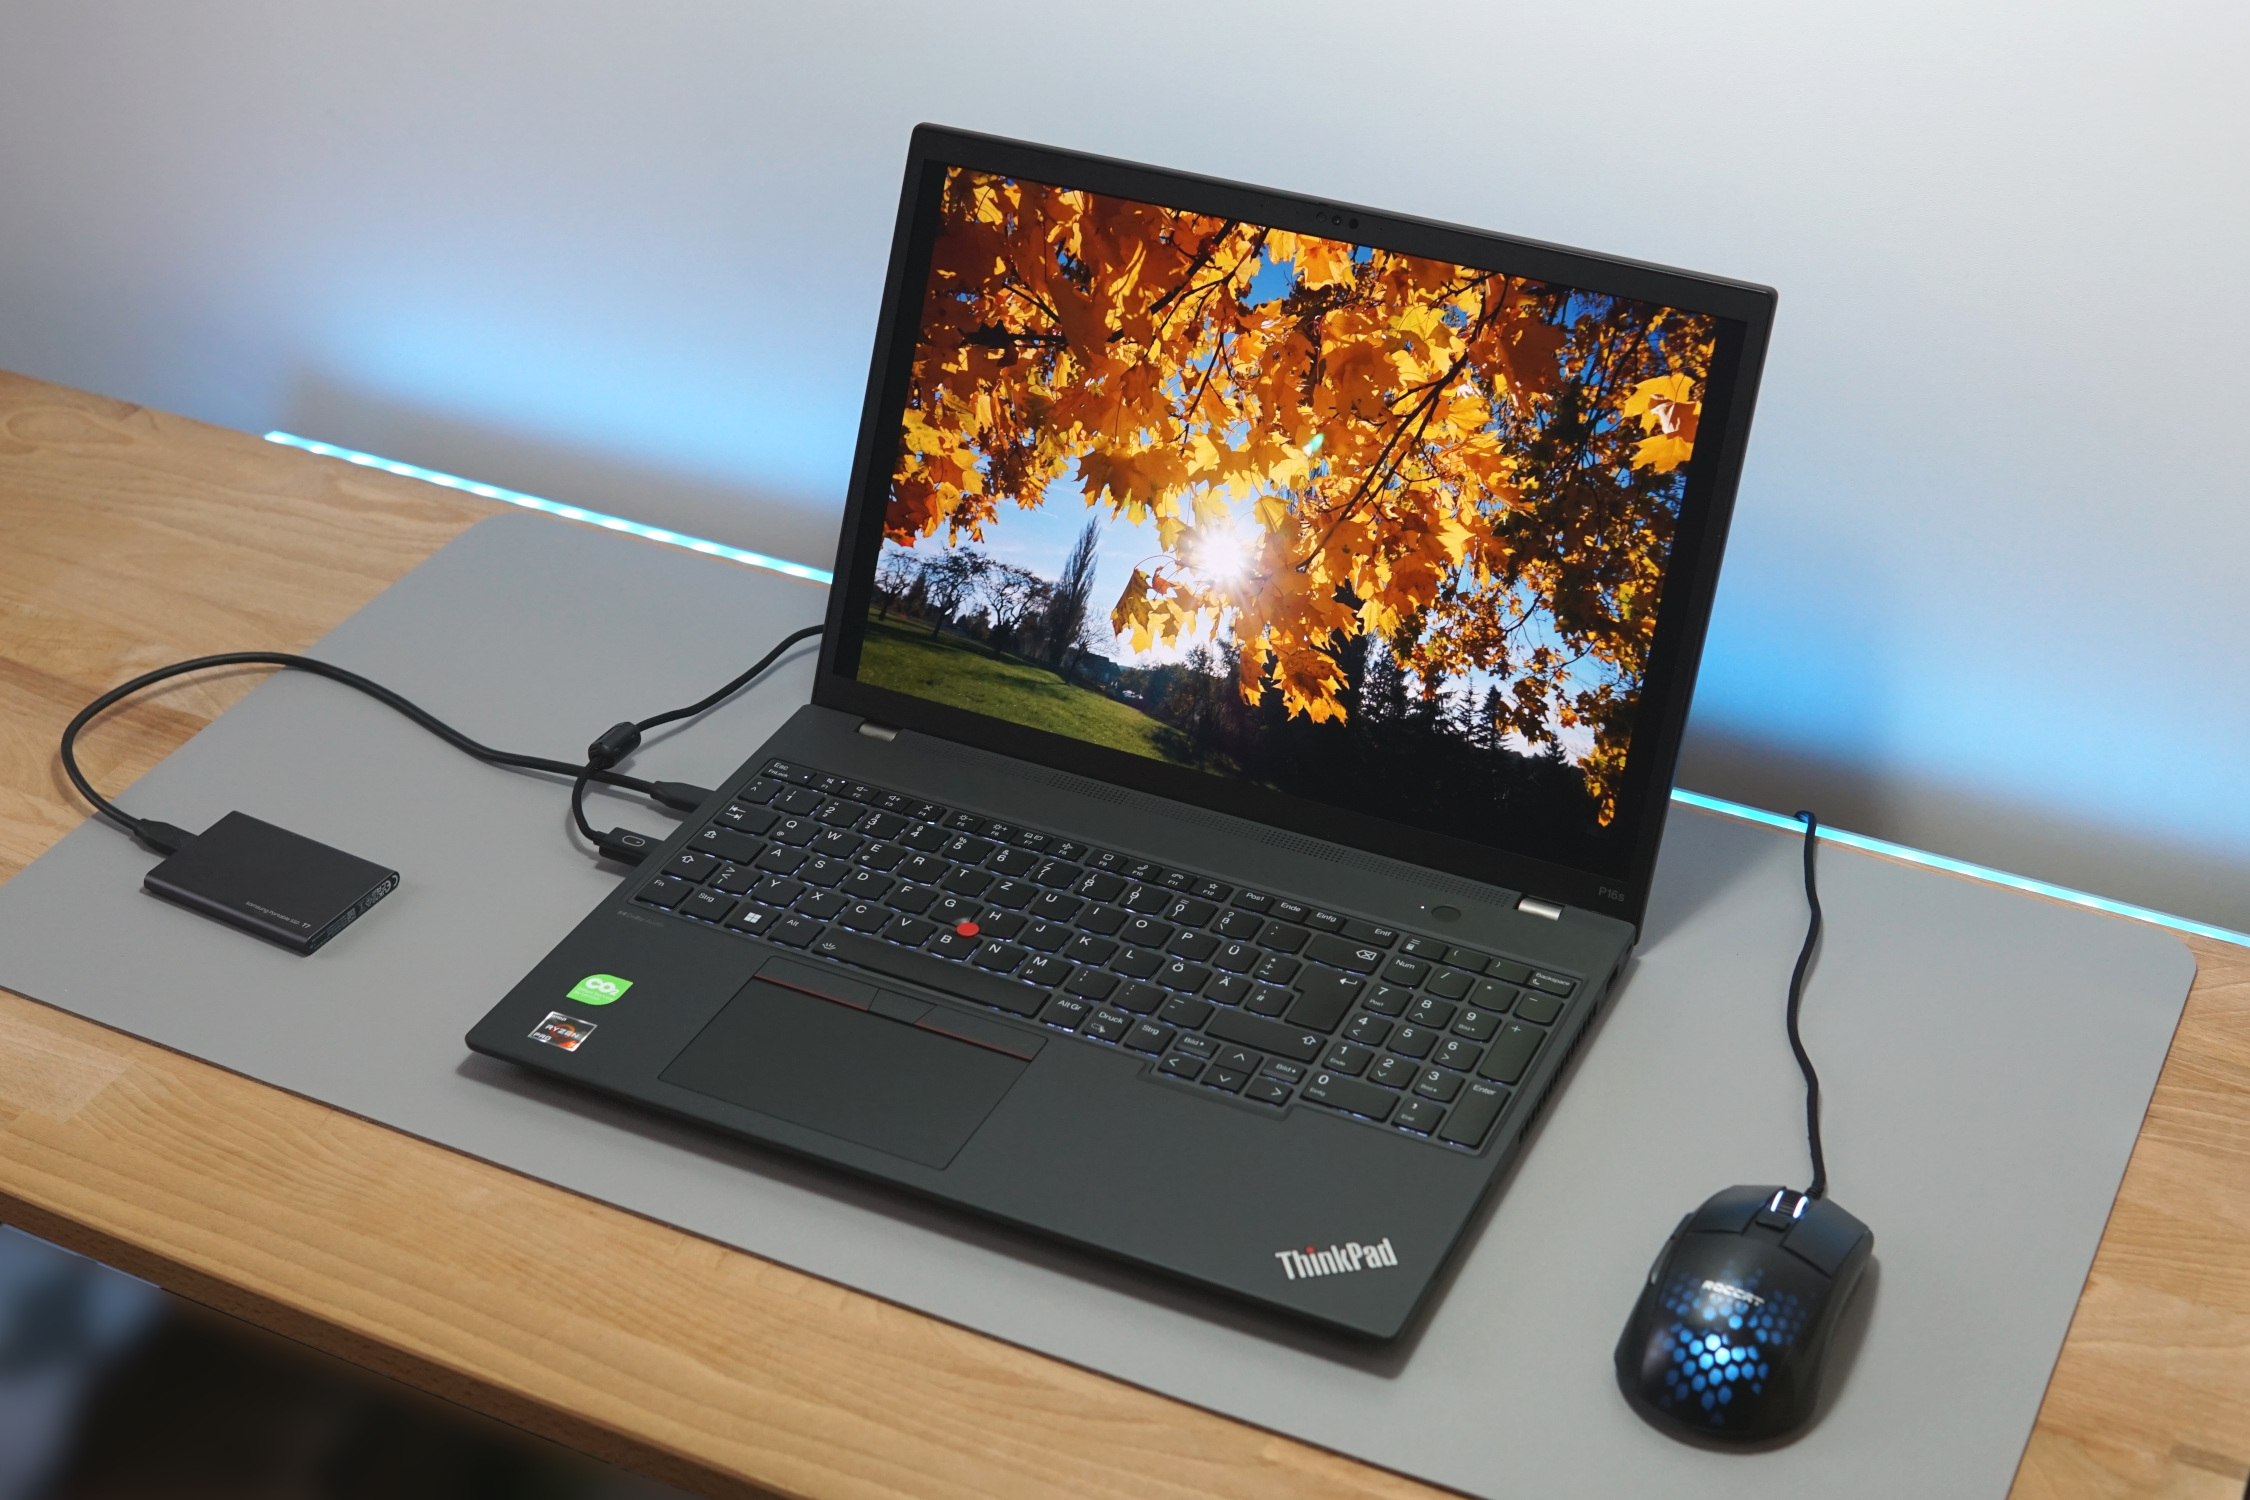
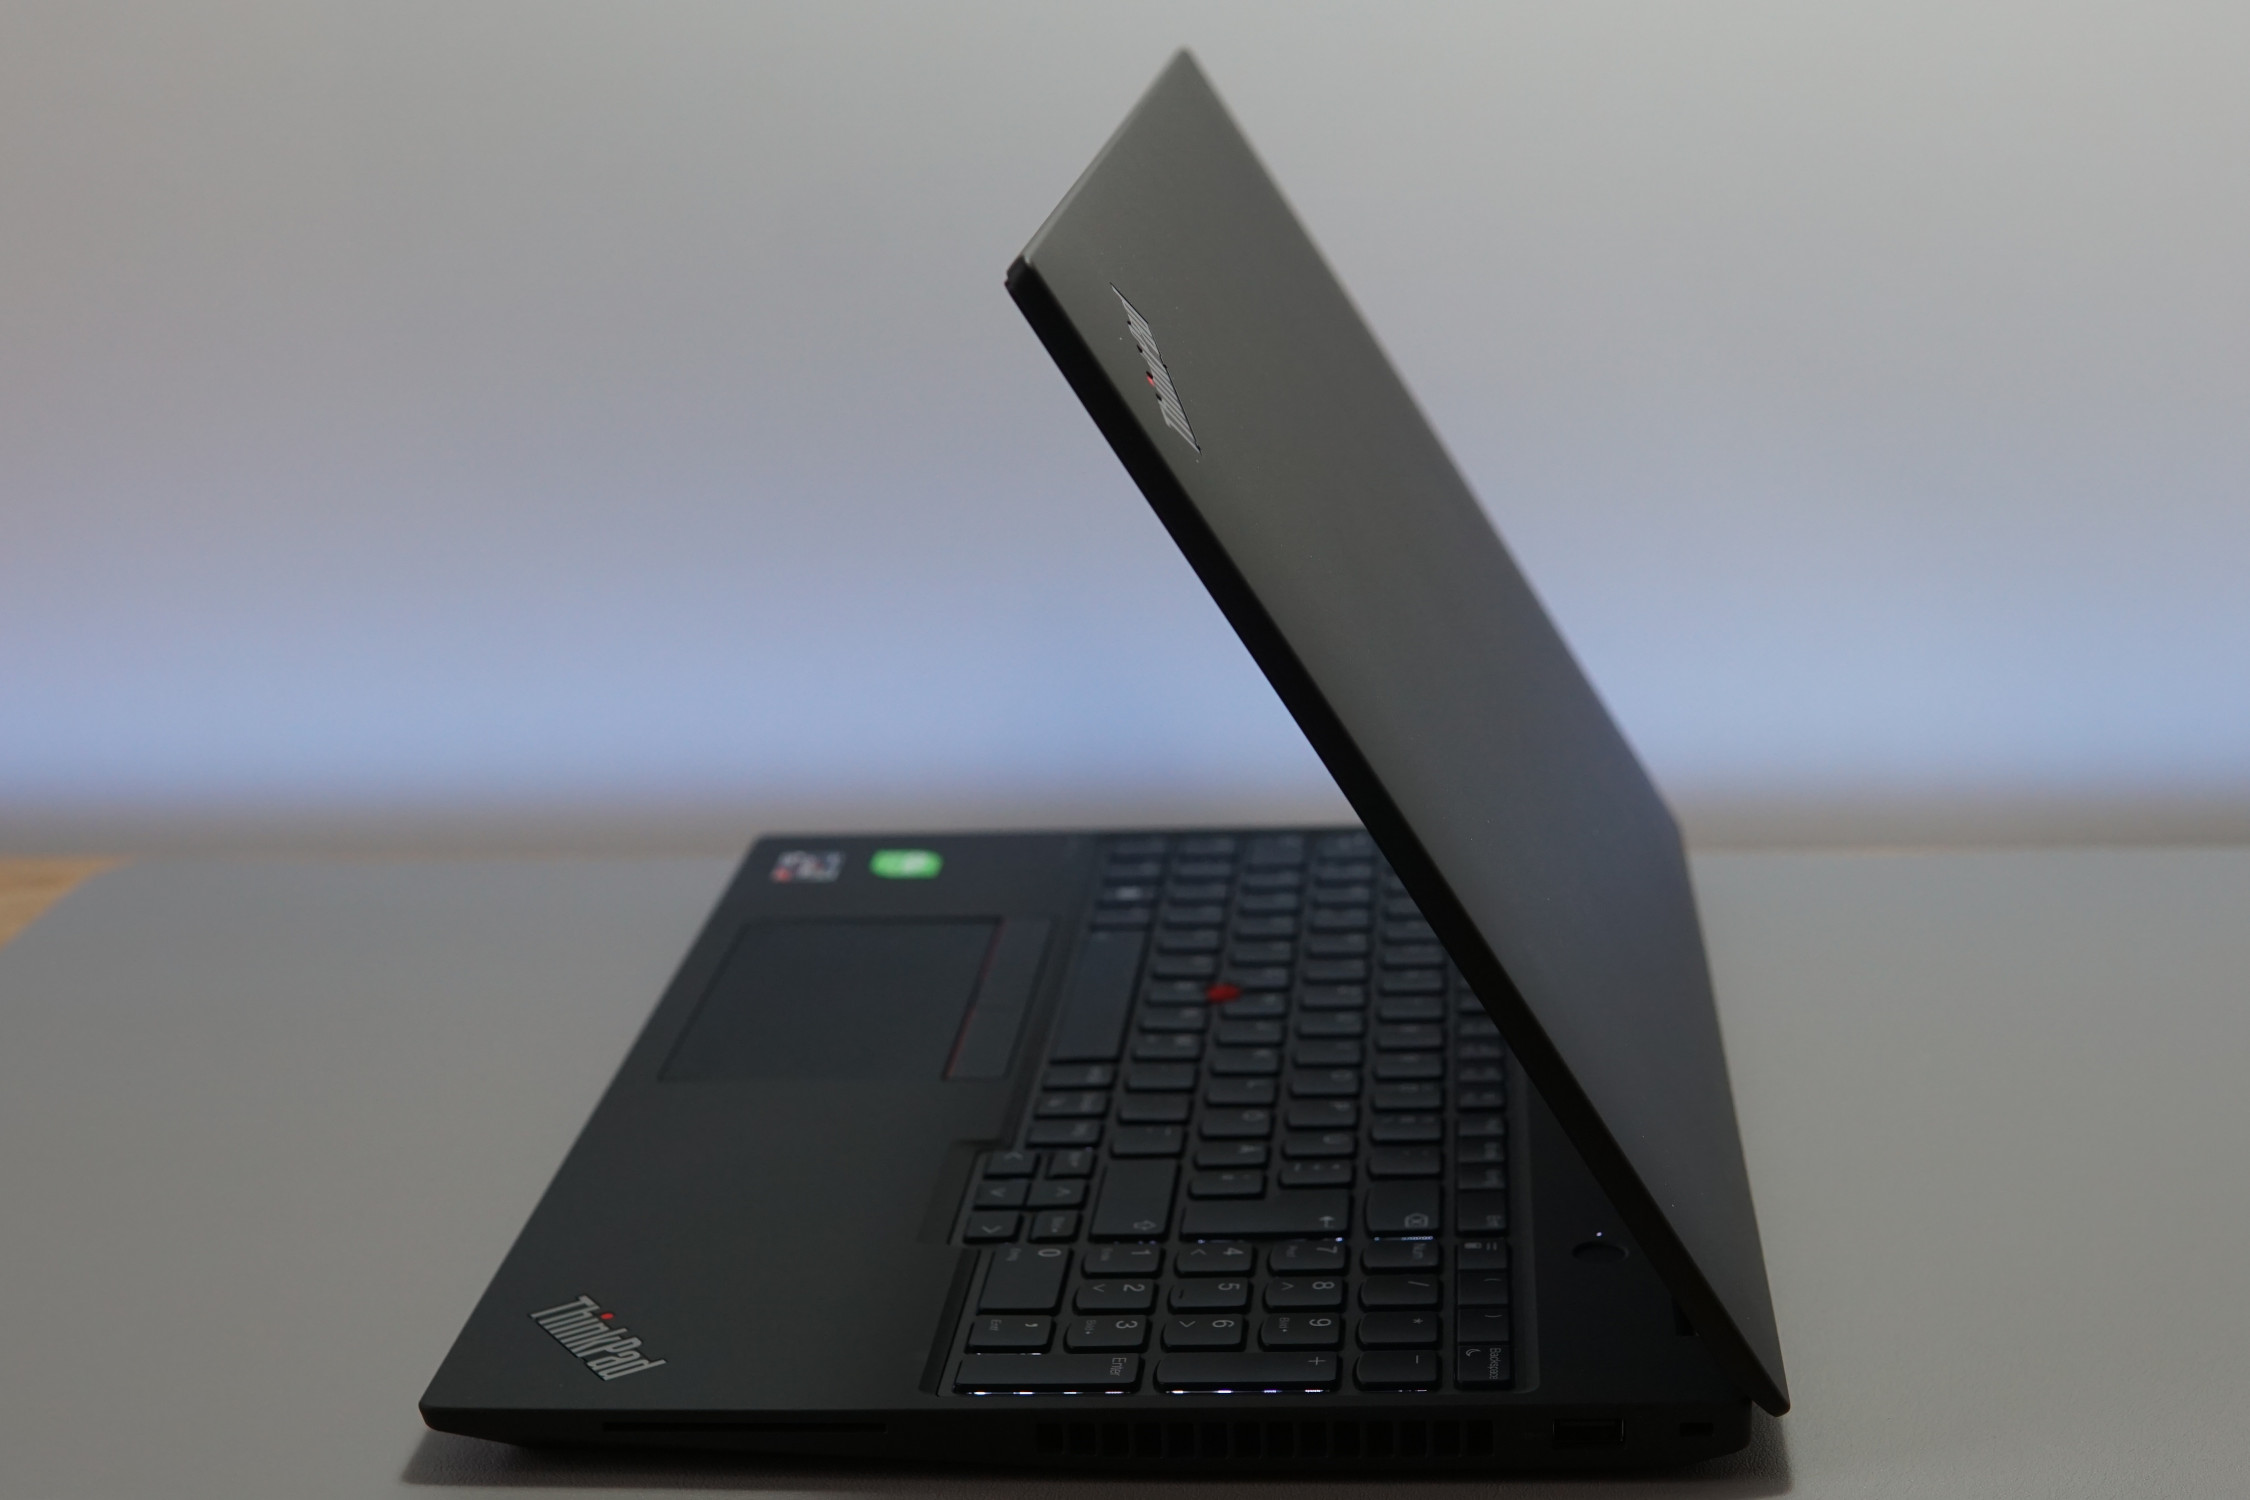
La taille et le poids de l'appareil montrent d'où vient la stabilité. Pour un ordinateur portable sans carte graphique dédiée et entièrement fabriqué en plastique, 1,8 kg est certainement remarquable. L'épaisseur du boîtier, qui mesure près de 24 millimètres, l'est encore plus. Le Swift Edge SFE16 d'Acer, configuré presque à l'identique, a une épaisseur de près de 24 mm Acer Swift Edge SFE16 est à peu près deux fois moins épais et pèse 500 grammes de moins. Par conséquent, il semble un peu plus fragile que le ThinkPad P16.
En outre, un boîtier épais présente quelques autres avantages, que nous aborderons dans la section "performances".
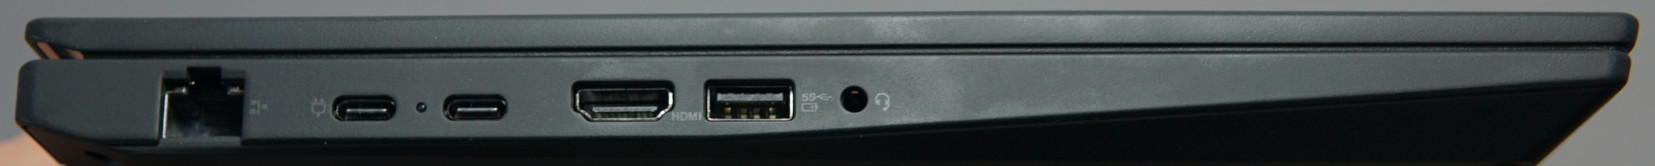
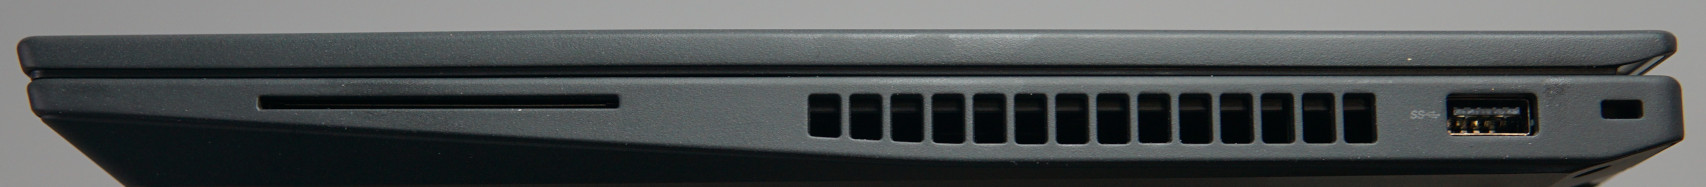
Connectivité - La lumière et un peu d'ombre sur le P16s
La sélection d'options de connectivité de l'ordinateur portable semble être bonne en général. Il dispose d'un port LAN de taille normale sans rabat ni adaptateur. Il y a un port USB-4 rapide et un total de quatre ports USB flexibles, ce qui vous offre de nombreuses options pour les périphériques. Un port HMDI est également installé.
En revanche, un seul port USB-4 n'est pas optimal. Vous devriez généralement avoir la station d'accueil connectée à ce port afin d'accéder à la pleine performance de l'ordinateur portable. Le deuxième port USB-C prend au moins en charge la charge ainsi que le DisplayPort, mais seulement à un quart des vitesses de transfert que l'USB 4 peut atteindre. De plus, les deux autres ports USB pourraient également être un peu plus rapides. Ils sont tous deux connectés via l'USB 3.0, qu'un grand nombre de SSD dépassent aujourd'hui largement.
Connecté à la station d'accueil alors que vous êtes assis sur votre bureau, ces petits défauts ne devraient pas être trop perceptibles. Mais de nombreux ordinateurs portables haut de gamme d'Intel offrent de meilleures options de connectivité. Il s'agit généralement de deux ports TB4. Cependant, les ports USB-A rapides ne sont pas courants ici non plus.
Communication
Les taux de transfert de l'appareil sont un peu faibles en émission, à 5 GHz comme à 6 GHz. En revanche, les taux de réception sont conformes à ce que l'on attend du Wi-Fi 6E. C'est bien mieux que ce que peut offrir un simple câble LAN. De plus, grâce à l'élargissement de la plage de fréquences, vous devriez pouvoir atteindre un taux de transfert élevé avec des réseaux sans fil qui se chevauchent.
Webcam
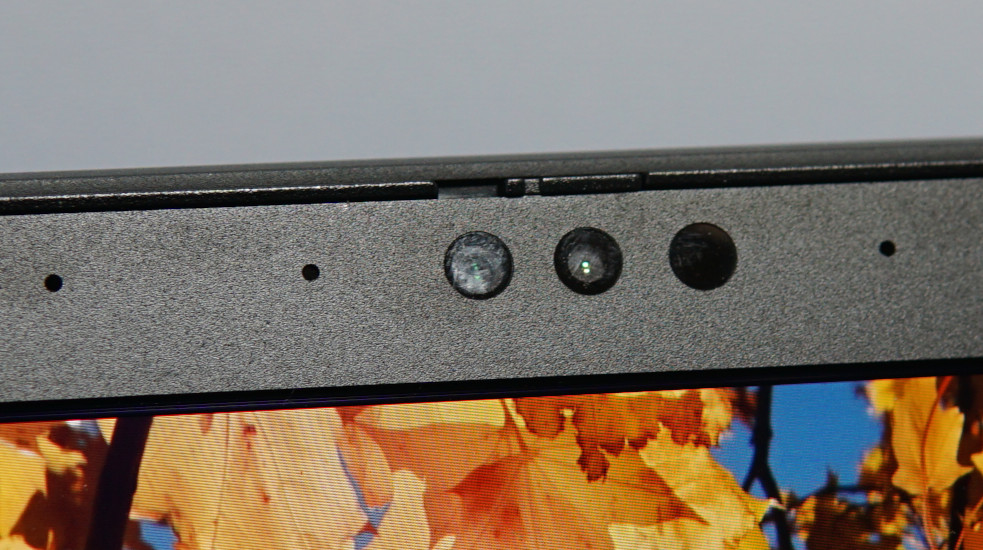
Ses 5 MP garantissent à eux seuls une bonne qualité d'image, ce qui signifie que les personnes à l'autre bout de votre appel vidéo sur un smartphone ne pourront probablement pas dire que vous utilisez la webcam d'un ordinateur portable, contrairement aux webcams HD qui sont si souvent installées et qui n'offrent qu'une fraction de la résolution.
Les écarts de couleur très élevés que nous avons mesurés résultent de l'éclaircissement automatique des images. Et cela fonctionne très bien. Même dans des conditions de faible luminosité, les visages restent reconnaissables. En même temps, l'image devient rapidement assez granuleuse. Malgré cela, la caméra, dans sa forme actuelle, convient parfaitement aux vidéoconférences.
Cela est notamment dû à son excellent microphone à double réseau qui enregistre les voix de manière très précise et à un volume constant, même lorsque la distance et la direction de la parole varient au cours de la conversation.
Un capteur infrarouge permet la reconnaissance faciale via Windows Hello et un cache mécanique pour bloquer l'objectif complète les fonctionnalités de la webcam.


Sécurité
Aucune fonction de sécurité ne devrait vous manquer. Tout est inclus, de la SmartCard au verrou Kensington en passant par les fonctions de connexion biométrique. Vous pouvez utiliser le capteur d'empreintes digitales ou la reconnaissance faciale. À cela s'ajoutent des fonctions supplémentaires telles qu'un BIOS à récupération automatique. Lenovo a regroupé toutes ces fonctions sous le nom de "ThinkShield". Vous trouverez de plus amples informations à l'adresse .
Accessoires
L'ordinateur portable n'est pas livré avec des adaptateurs supplémentaires, un étui ou quoi que ce soit d'autre de ce genre. Au lieu de cela, seul un simple bloc d'alimentation USB-C est inclus. Point positif, l'emballage du ThinkPad est entièrement fabriqué en carton recyclé.
Maintenance
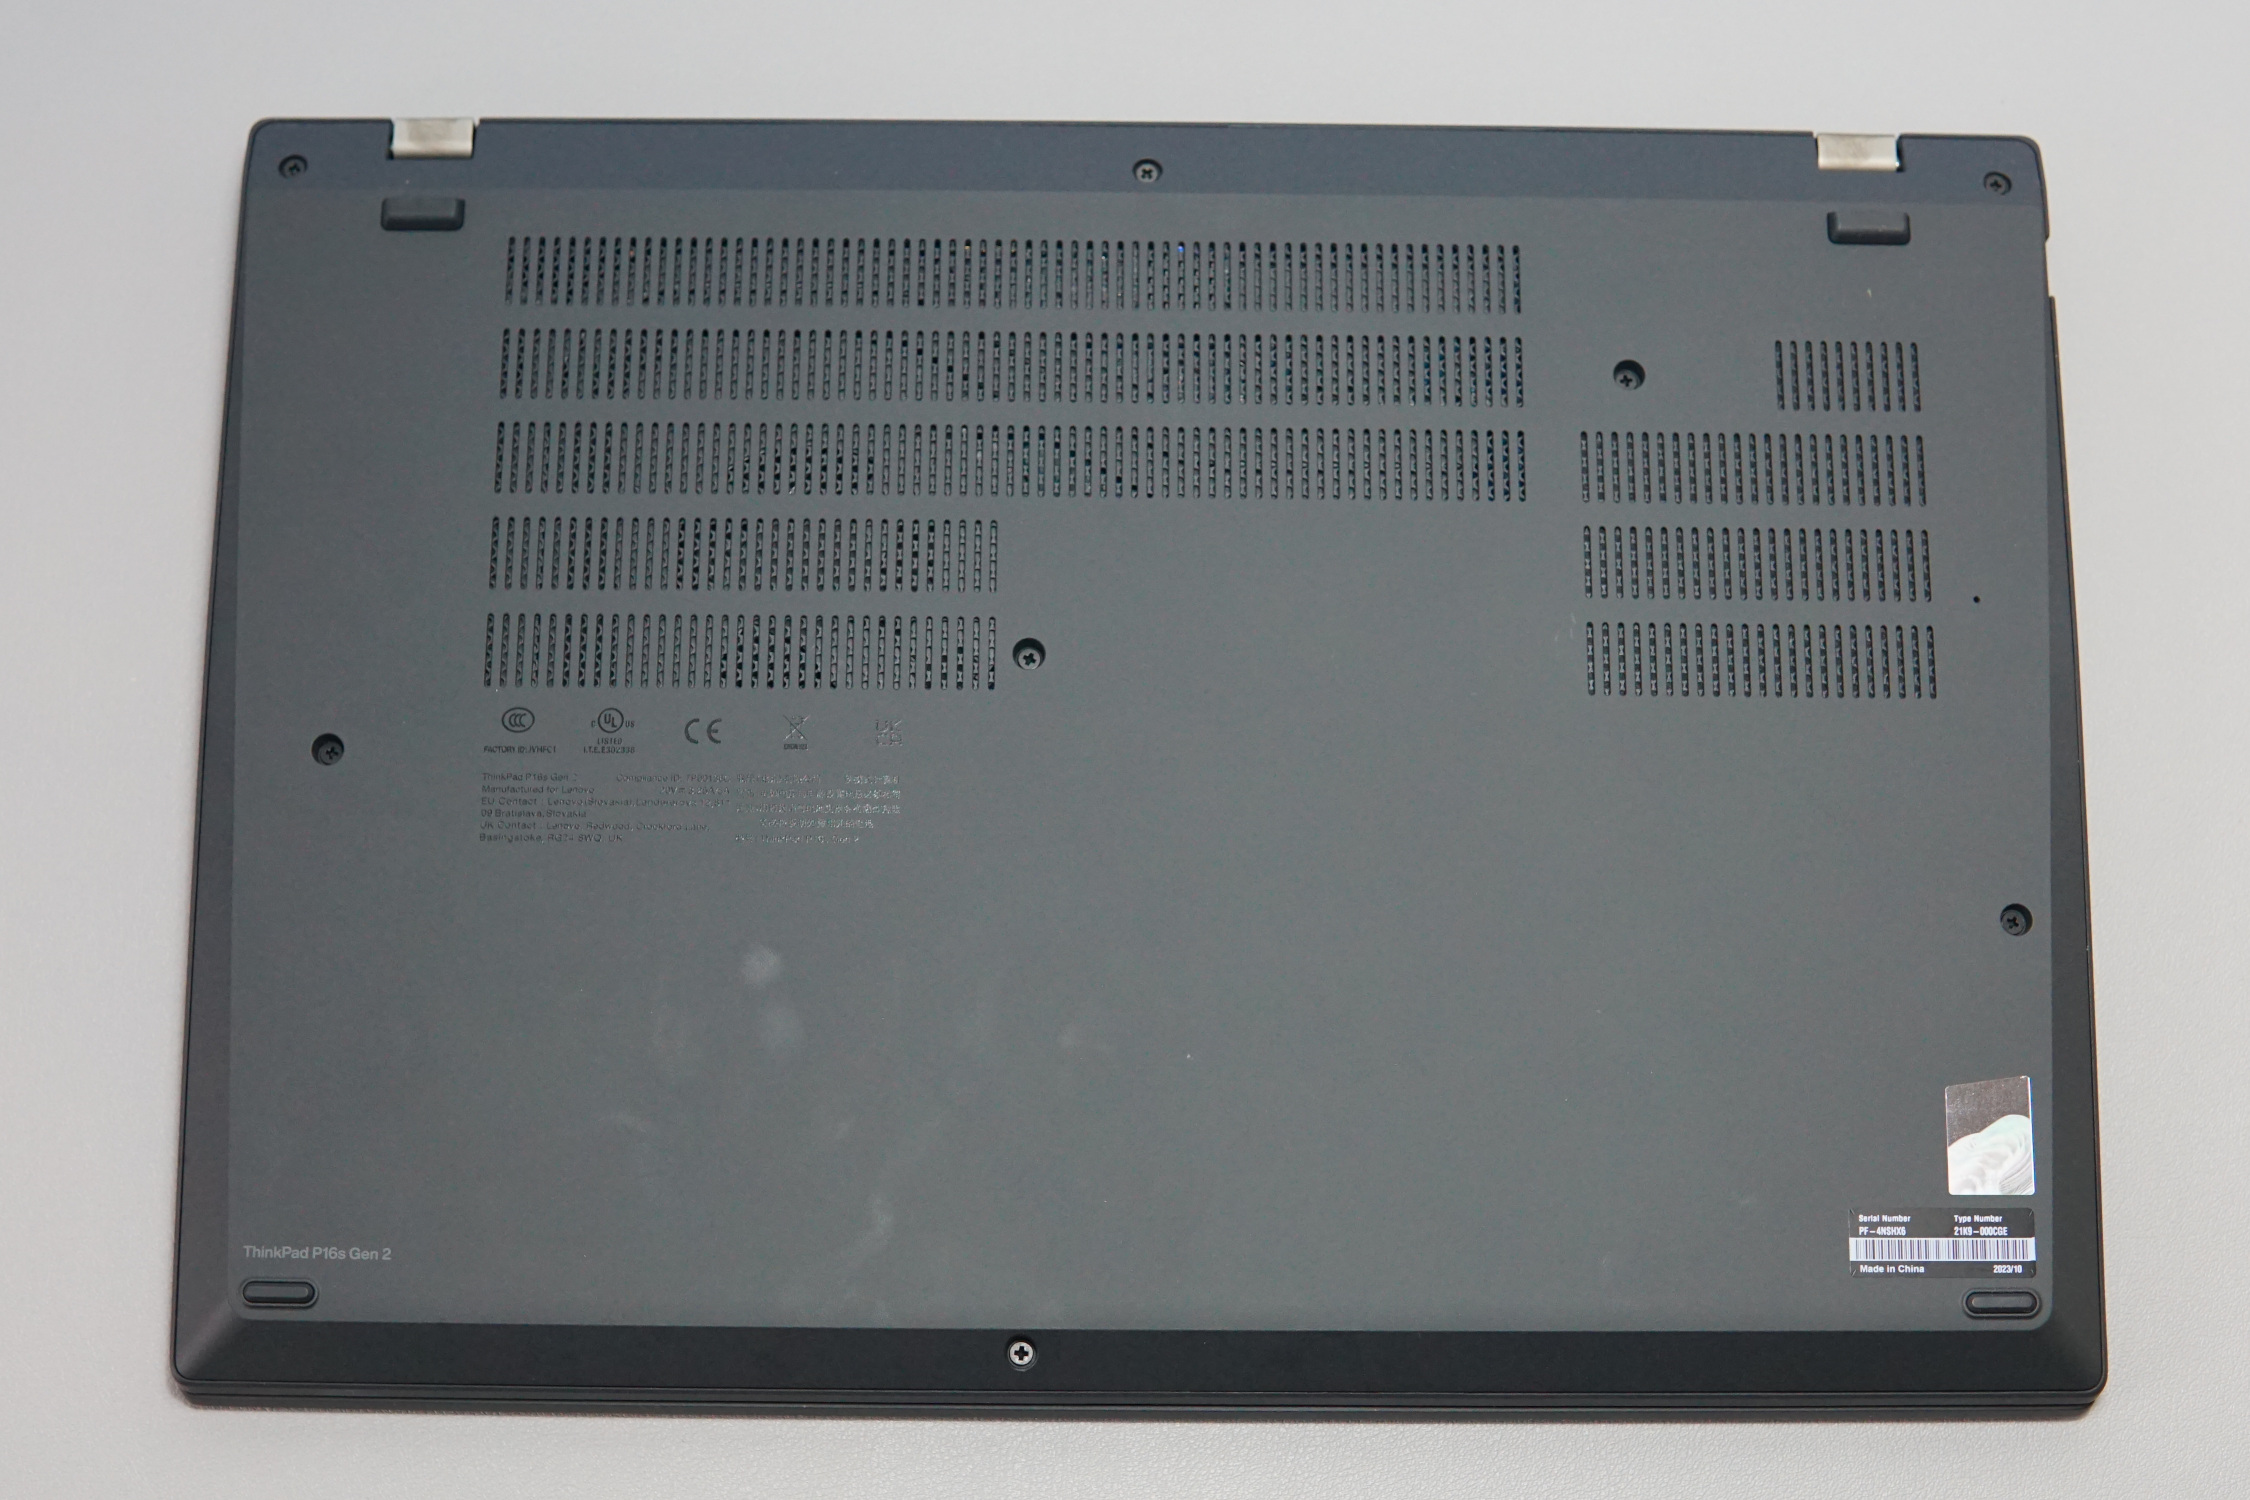
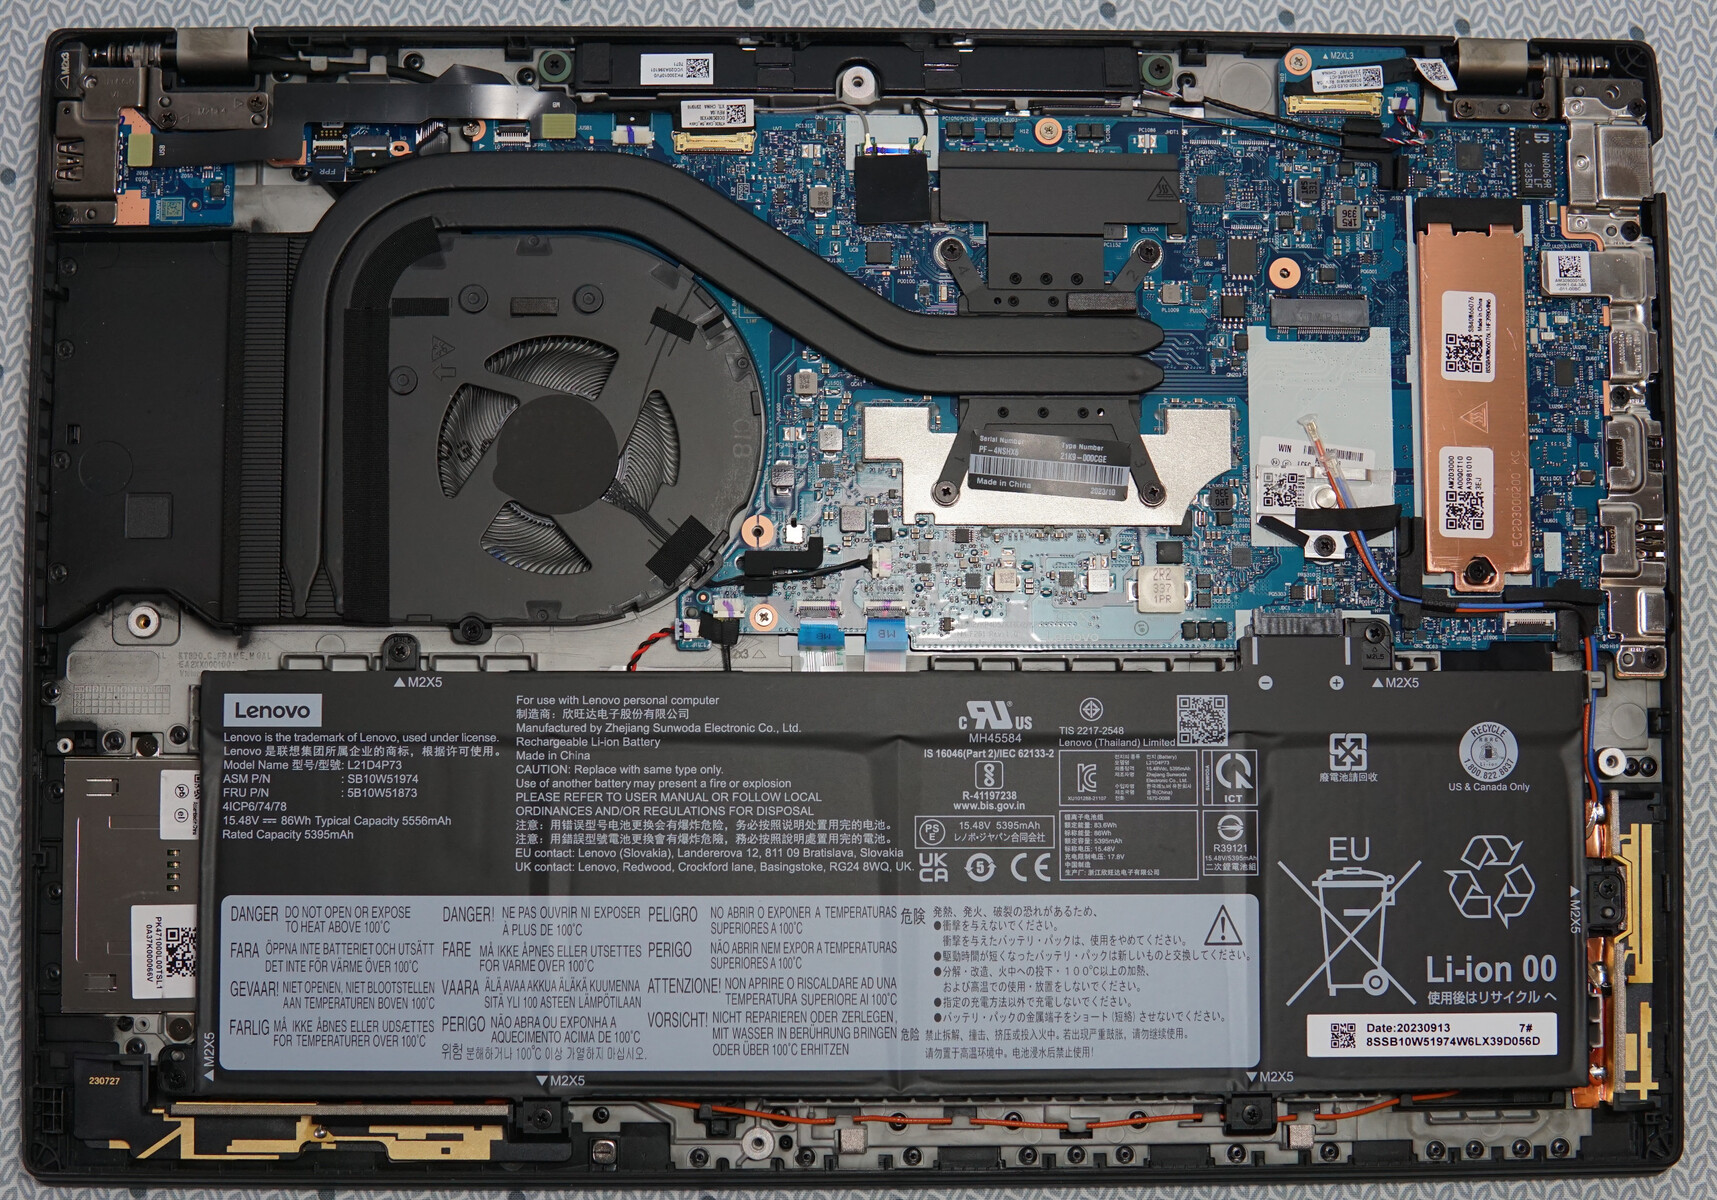
Comme prévu, le ThinkPad P16s G2 AMD s'ouvre facilement et sans problème. Toutes les vis Phillips sont facilement accessibles. Ensuite, vous pouvez retirer la partie inférieure du boîtier avec suffisamment de patience et de force (mais sans avoir besoin de tirer violemment dessus) - et idéalement avec l'aide d'un petit outil de levage.
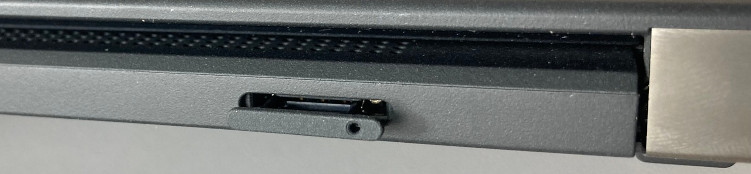
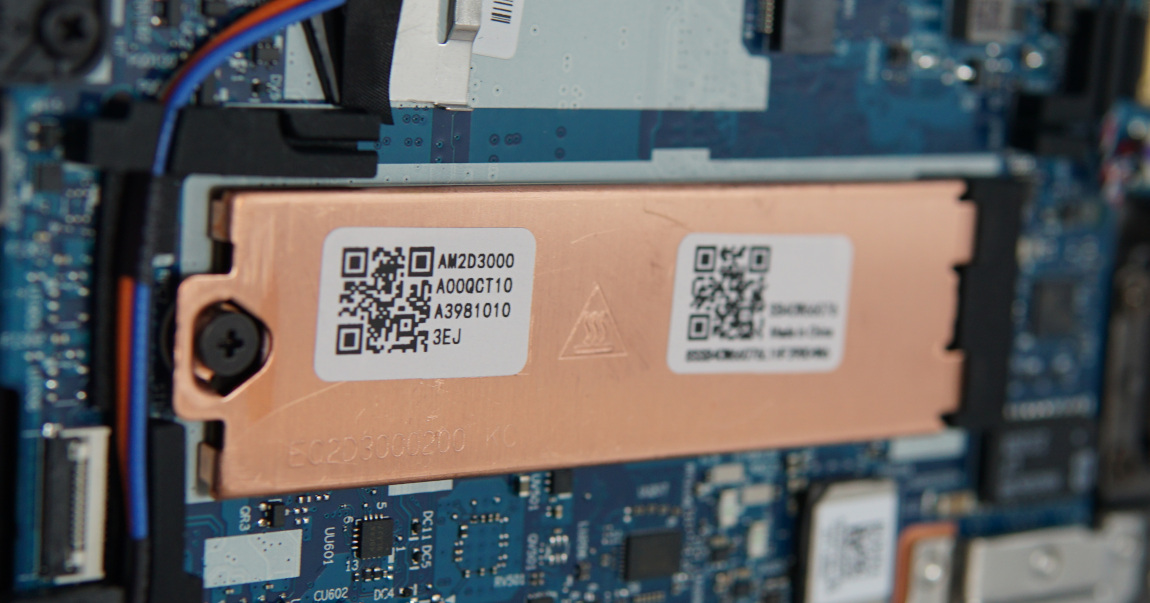
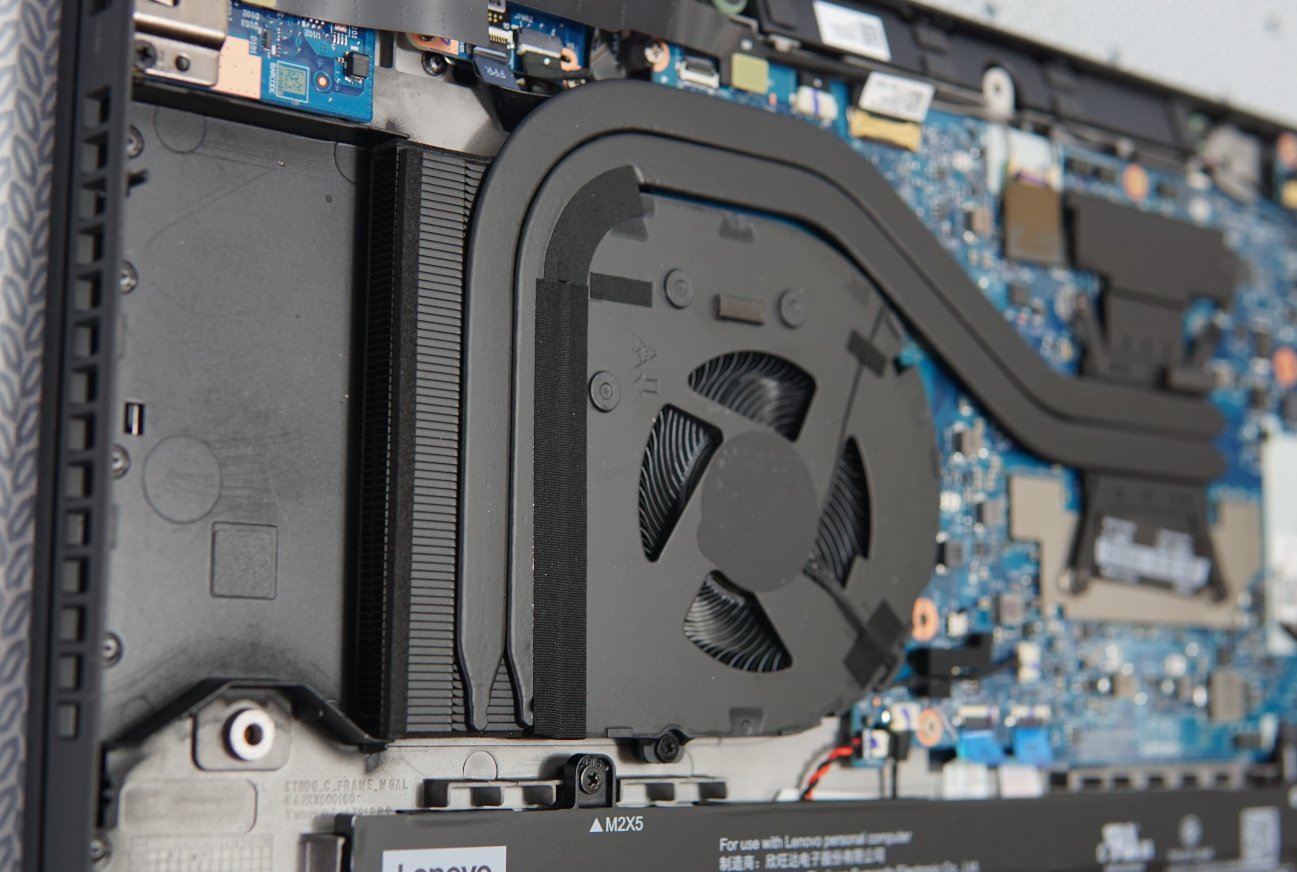
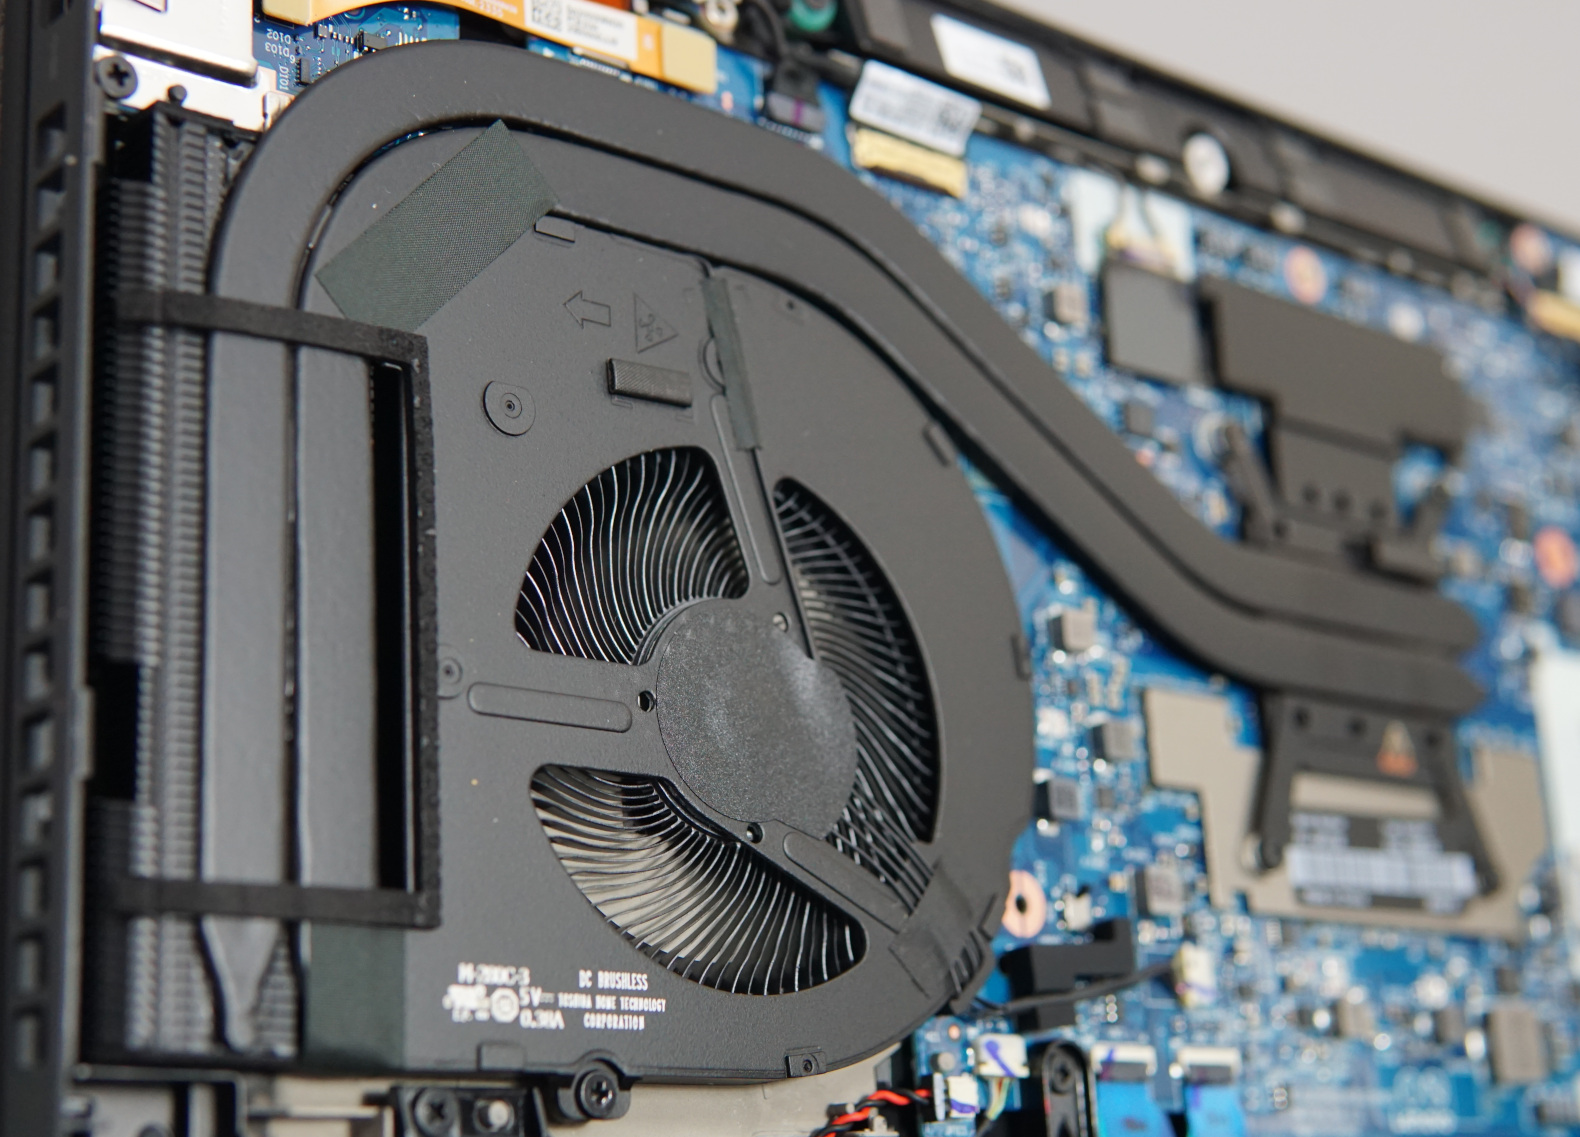
Son SSD NVMe-M.2 peut être remplacé. La batterie et les ventilateurs sont accessibles sans problème. De plus, vous pouvez installer un module 5G/LTE dans le boîtier. Il y a de la place pour cela, les câbles d'antenne sont prêts à être utilisés et un emplacement pour carte SIM est situé à l'arrière.
Malheureusement, les modules WLAN et RAM ont été soudés. Vous souhaiteriez surtout que la mémoire vive soit un peu plus flexible pour un ordinateur portable de station de travail. Cela signifie que lors de l'achat, vous devez vous demander si vous ne souhaitez pas choisir trop de RAM plutôt que trop peu.
Garantie
Lenovo offre un an d'assistance premium qui couvre également les réparations sur site le jour ouvrable suivant. Moyennant un supplément, il est possible d'étendre cette garantie.
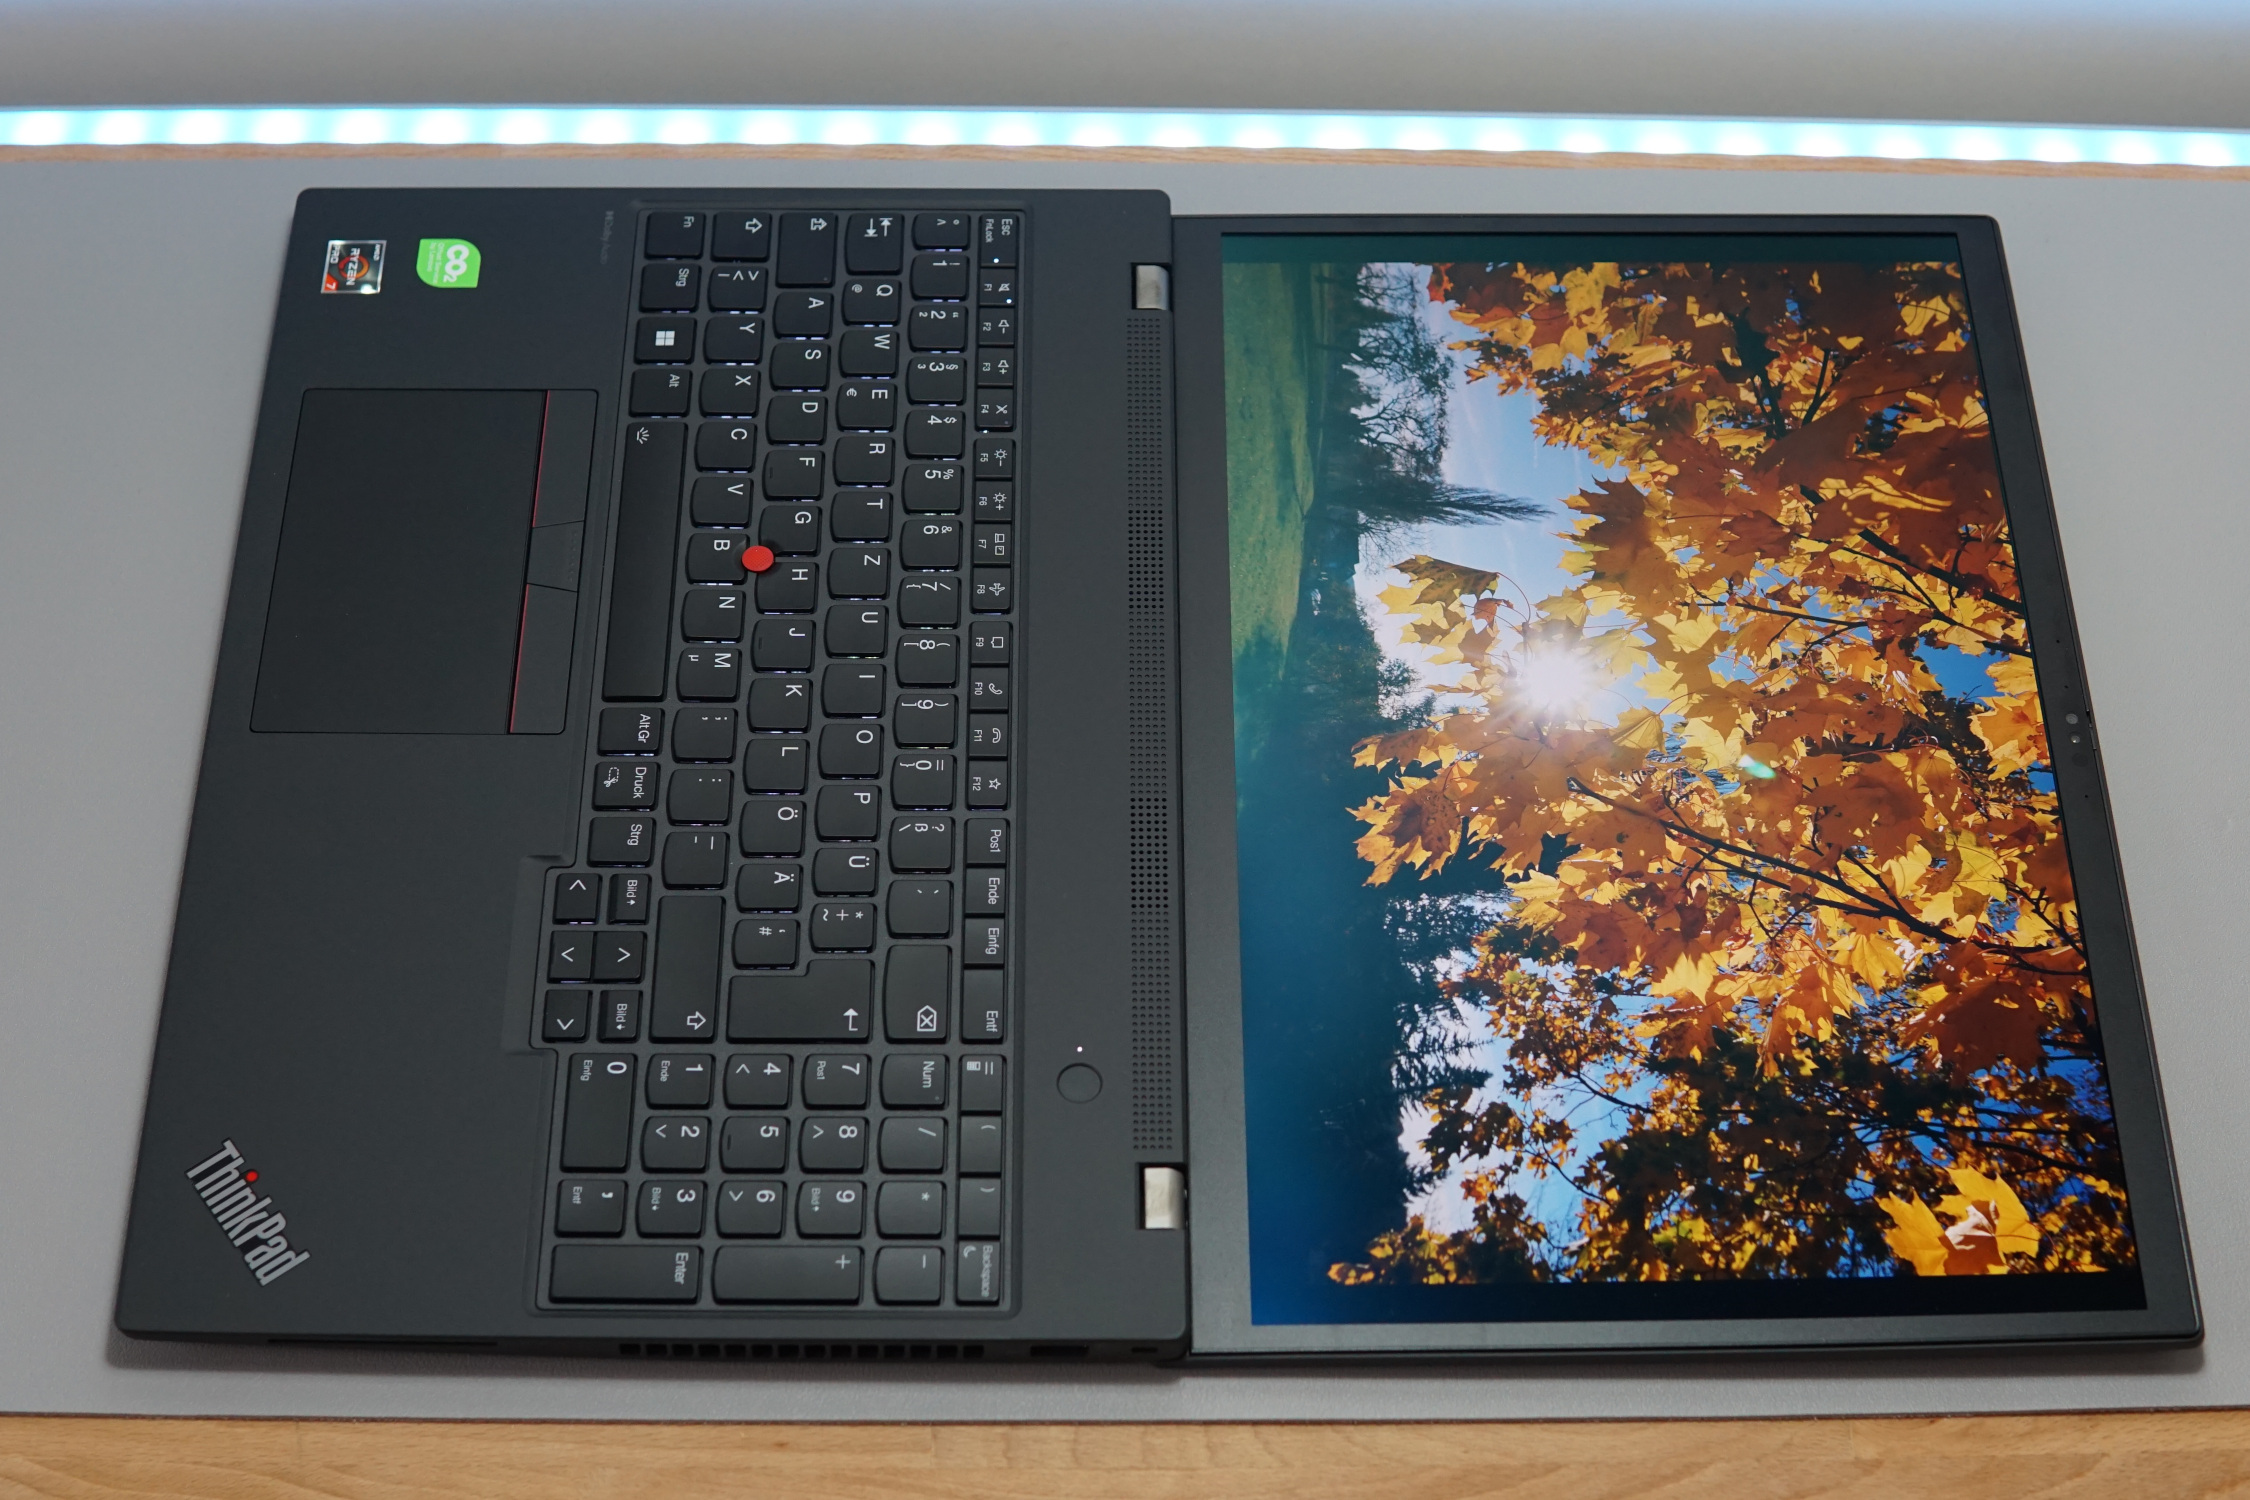
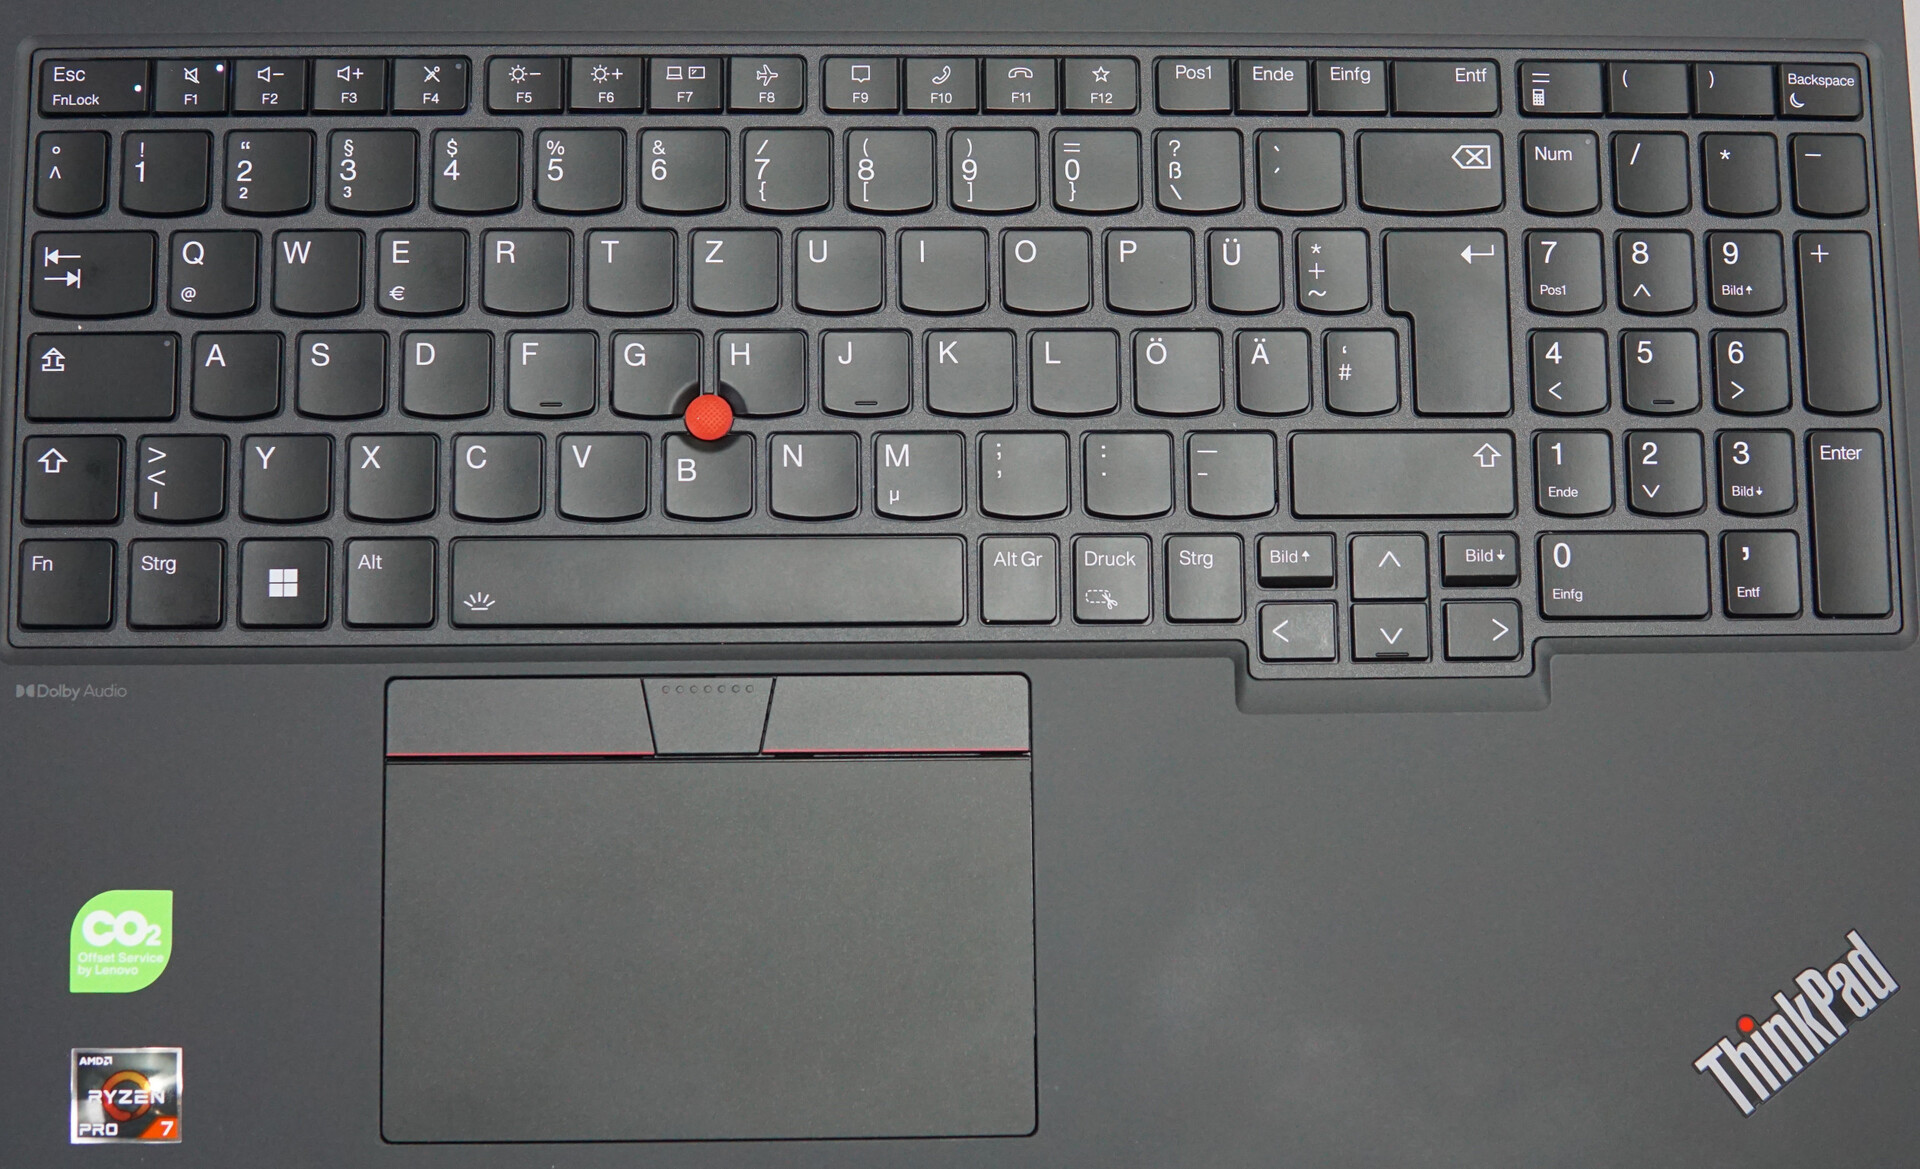
Périphériques d'entrée - Pas parfait, mais un clavier solide pour une station de travail
Le clavier, le pavé tactile et le trackpoint méritent des éloges. Les points de pression satisfaisants, la résistance confortable des touches et la précision des saisies sont autant d'atouts pour un fonctionnement fluide et rapide. Vous ne devriez pas ressentir de fatigue lors de la frappe ou devoir faire un triple clic pour contrôler le pointeur. De plus, le rétroéclairage du clavier, qui dispose de deux niveaux de luminosité, permet de garder les touches lisibles à tout moment.
Cependant, il n'échappe pas à toutes les critiques. Son élévation de 1,5 mm (notre mesure) n'est pas terrible et vous le remarquerez en tapant si vous êtes habitué à une élévation beaucoup plus importante. De plus, le cadre du clavier qui, comme tous les autres composants de la mallette, est en plastique, a un peu de jeu. Vous le remarquerez davantage sur le côté droit que sur le côté gauche. Cependant, vous vous y habituerez et ces problèmes ne devraient pas vraiment vous gêner. Cela signifie toutefois que nous ne pouvons pas lui attribuer la note maximale.
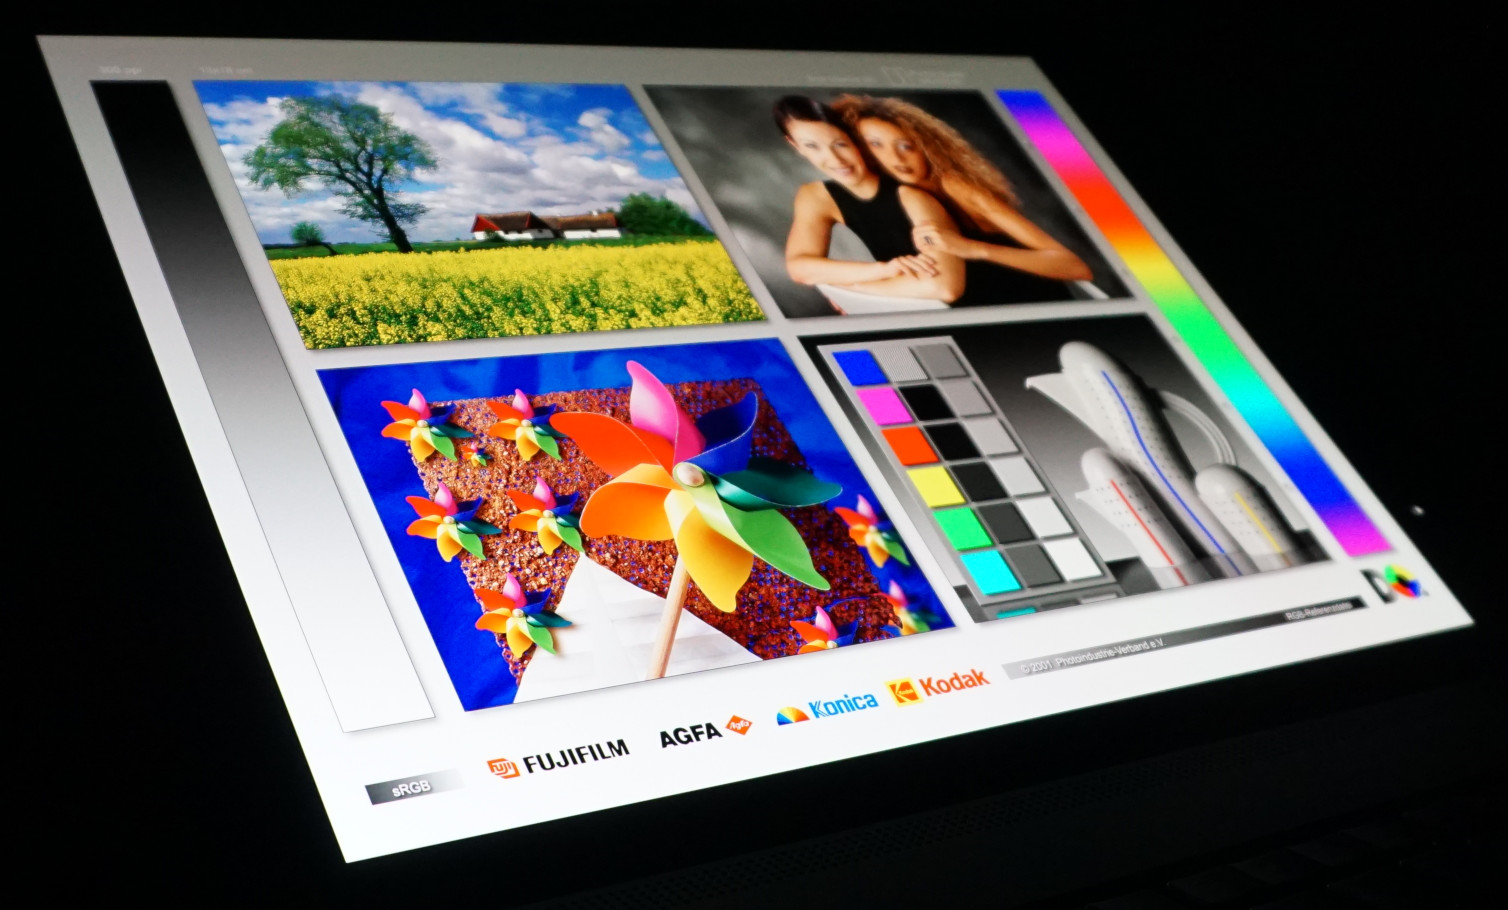
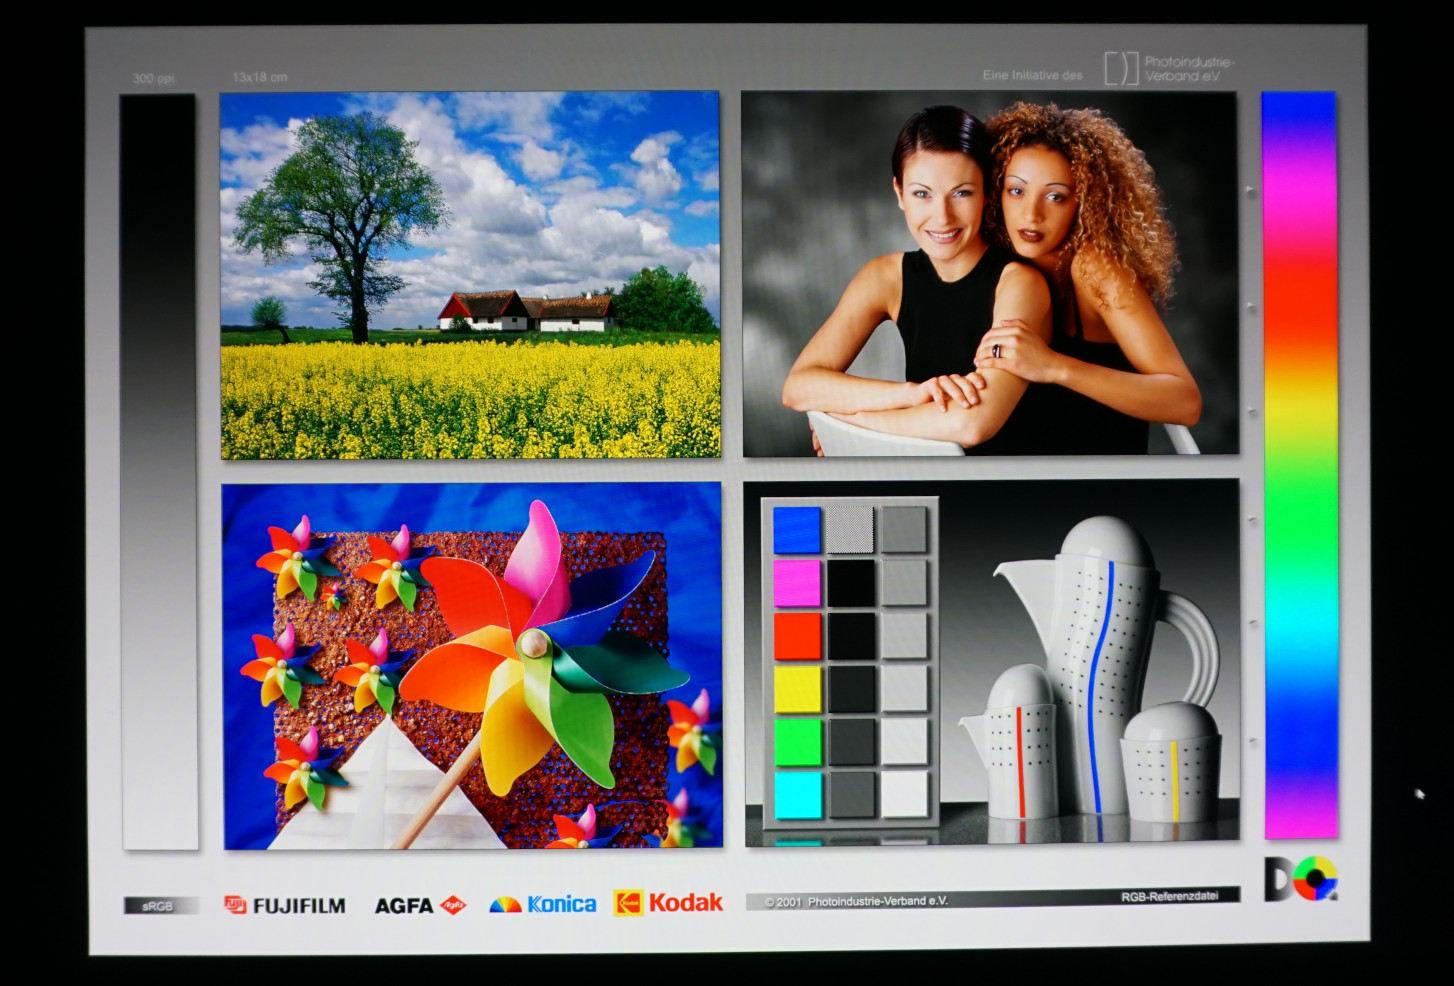
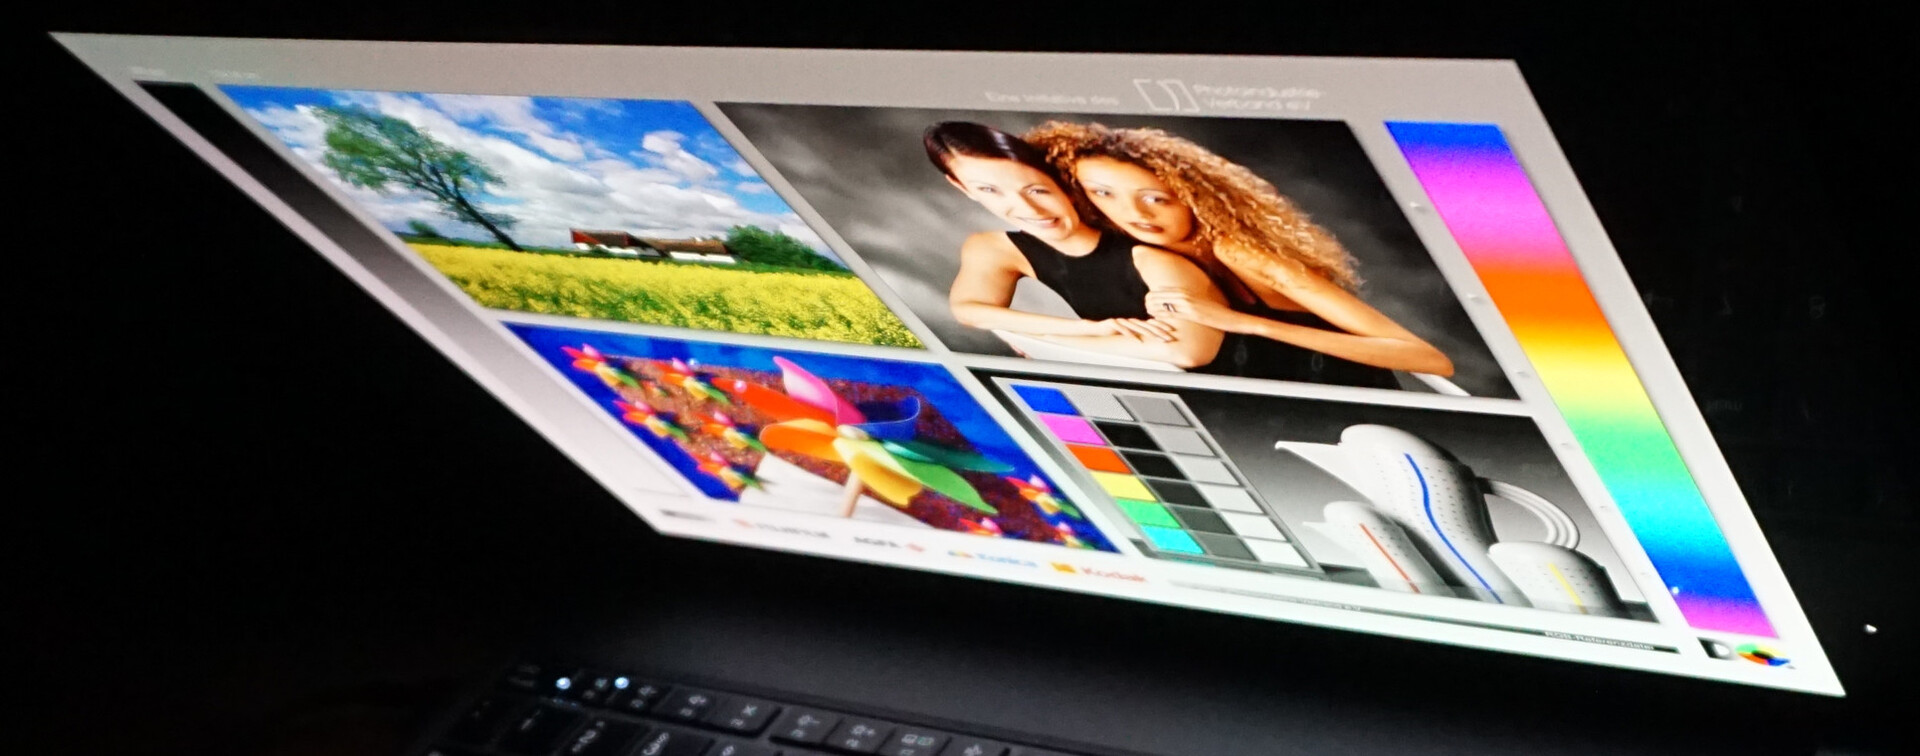
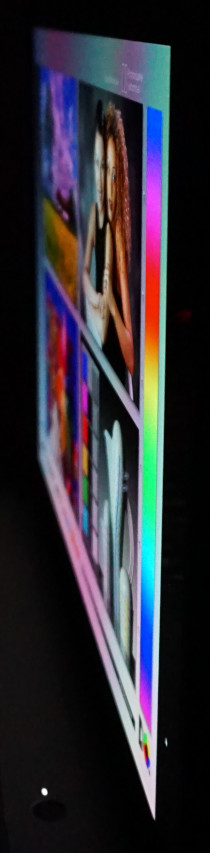
Écran - Le P16s est doté d'un écran OLED vif et lumineux
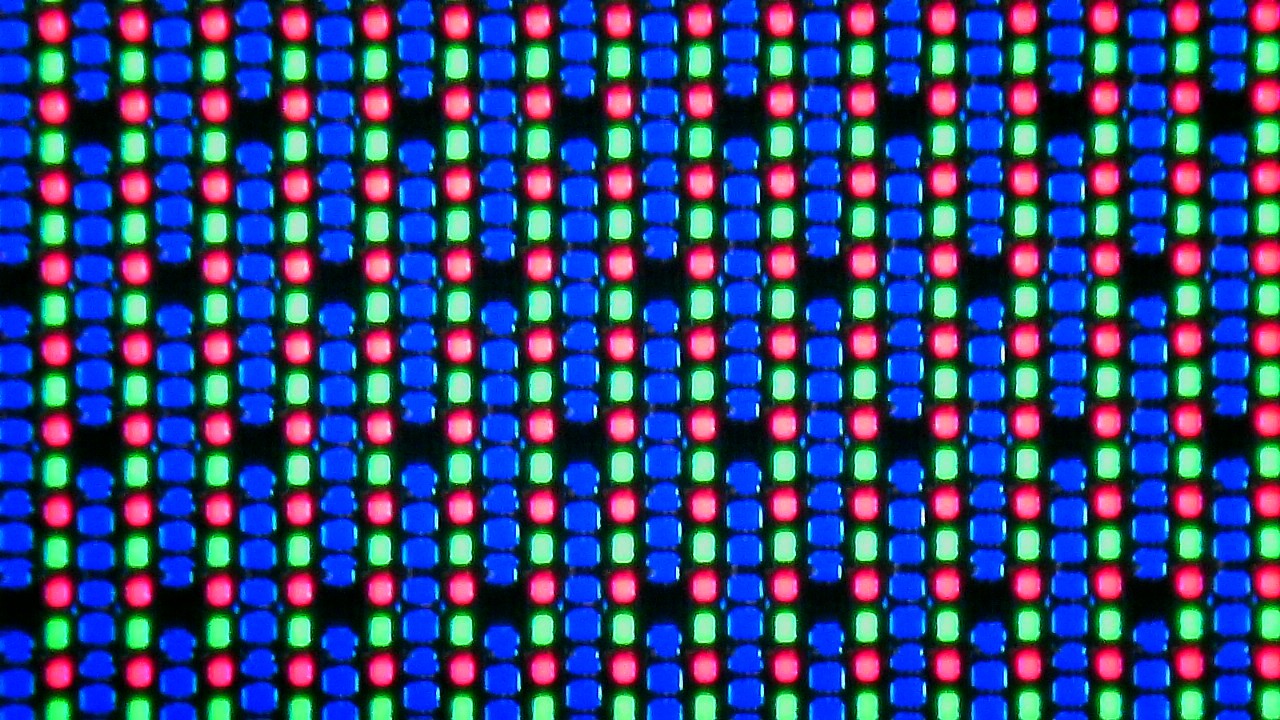
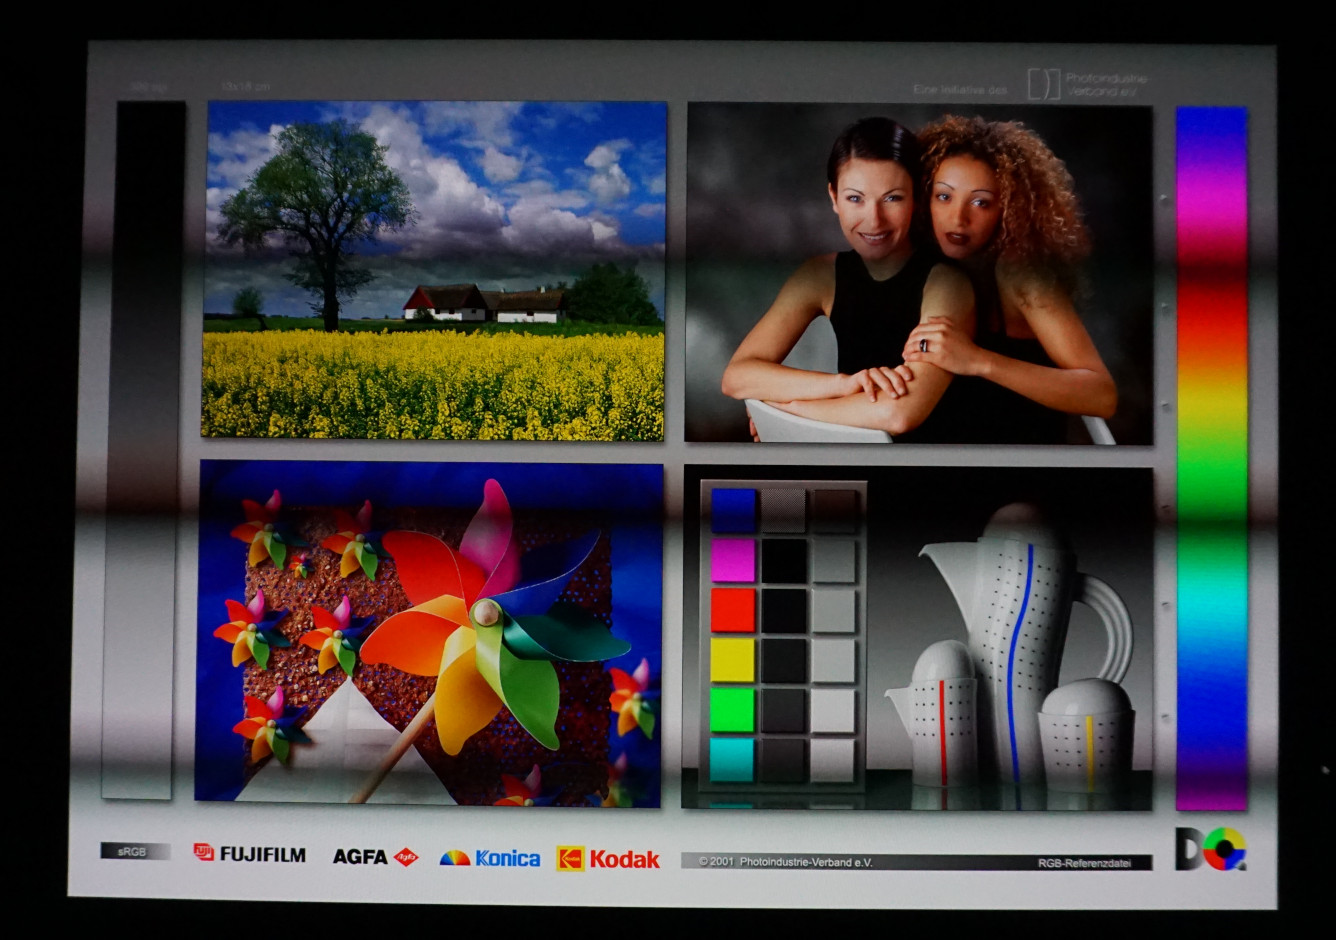
L'écran OLED installé ne devrait pas seulement être intéressant pour le travail créatif. Bien que sa résolution 4K qui, en théorie, couvre l'espace colorimétrique Display P3 dans son intégralité et assure un fort contraste et une grande précision des couleurs, est clairement un bon début pour les applications graphiques exigeantes.
Même en général, le contenu semble intense et radieux sur l'écran de l'ordinateur portable. L'affichage parfois un peu brouillon du texte est compensé par sa résolution extrêmement élevée. Les sous-pixels n'étant pas structurés de manière uniforme, les bords sont parfois flous. En agrandissant le texte à la valeur recommandée de 175 %, ce phénomène n'est pas perceptible.
Vous devez tenir compte de la surface réfléchissante de l'écran lorsqu'il s'agit de la représentation précise des couleurs, ce qui n'est pas idéal lorsque vous utilisez l'appareil à l'extérieur. À l'intérieur, les niveaux de contraste élevés de l'écran compensent cet inconvénient.
De plus, l'écran OLED utilise un type de modulation de largeur d'impulsion. Cette modulation n'est en aucun cas aussi agressive que sur certains anciens moniteurs LCD. Cependant, vous pouvez la remarquer légèrement, car la fréquence que nous avons mesurée à haute luminosité n'était que de 60 Hz.
Pour les utilisateurs sensibles, nous recommandons l'une des nombreuses autres options d'affichage qui utilisent des panneaux IPS et, à leur tour, n'utilisent pas de PWM :
- WUXGA (1920x1200), IPS, 300nits, antireflet, 16:10, 800:1, 45% NTSC
- WUXGA (1920x1200), Multi-touch, IPS, 300 nits, Anti-glare, 16:10, 800:1, 45% NTSC
- WUXGA (1920x1200), IPS, 400 nits, antireflet, 16:10, 1000:1, 100% sRGB
- WUXGA (1920x1200), Multi-touch, IPS, 500 nits, Anti-glare, 16:10, 1000:1, 100% sRGB
| |||||||||||||||||||||||||
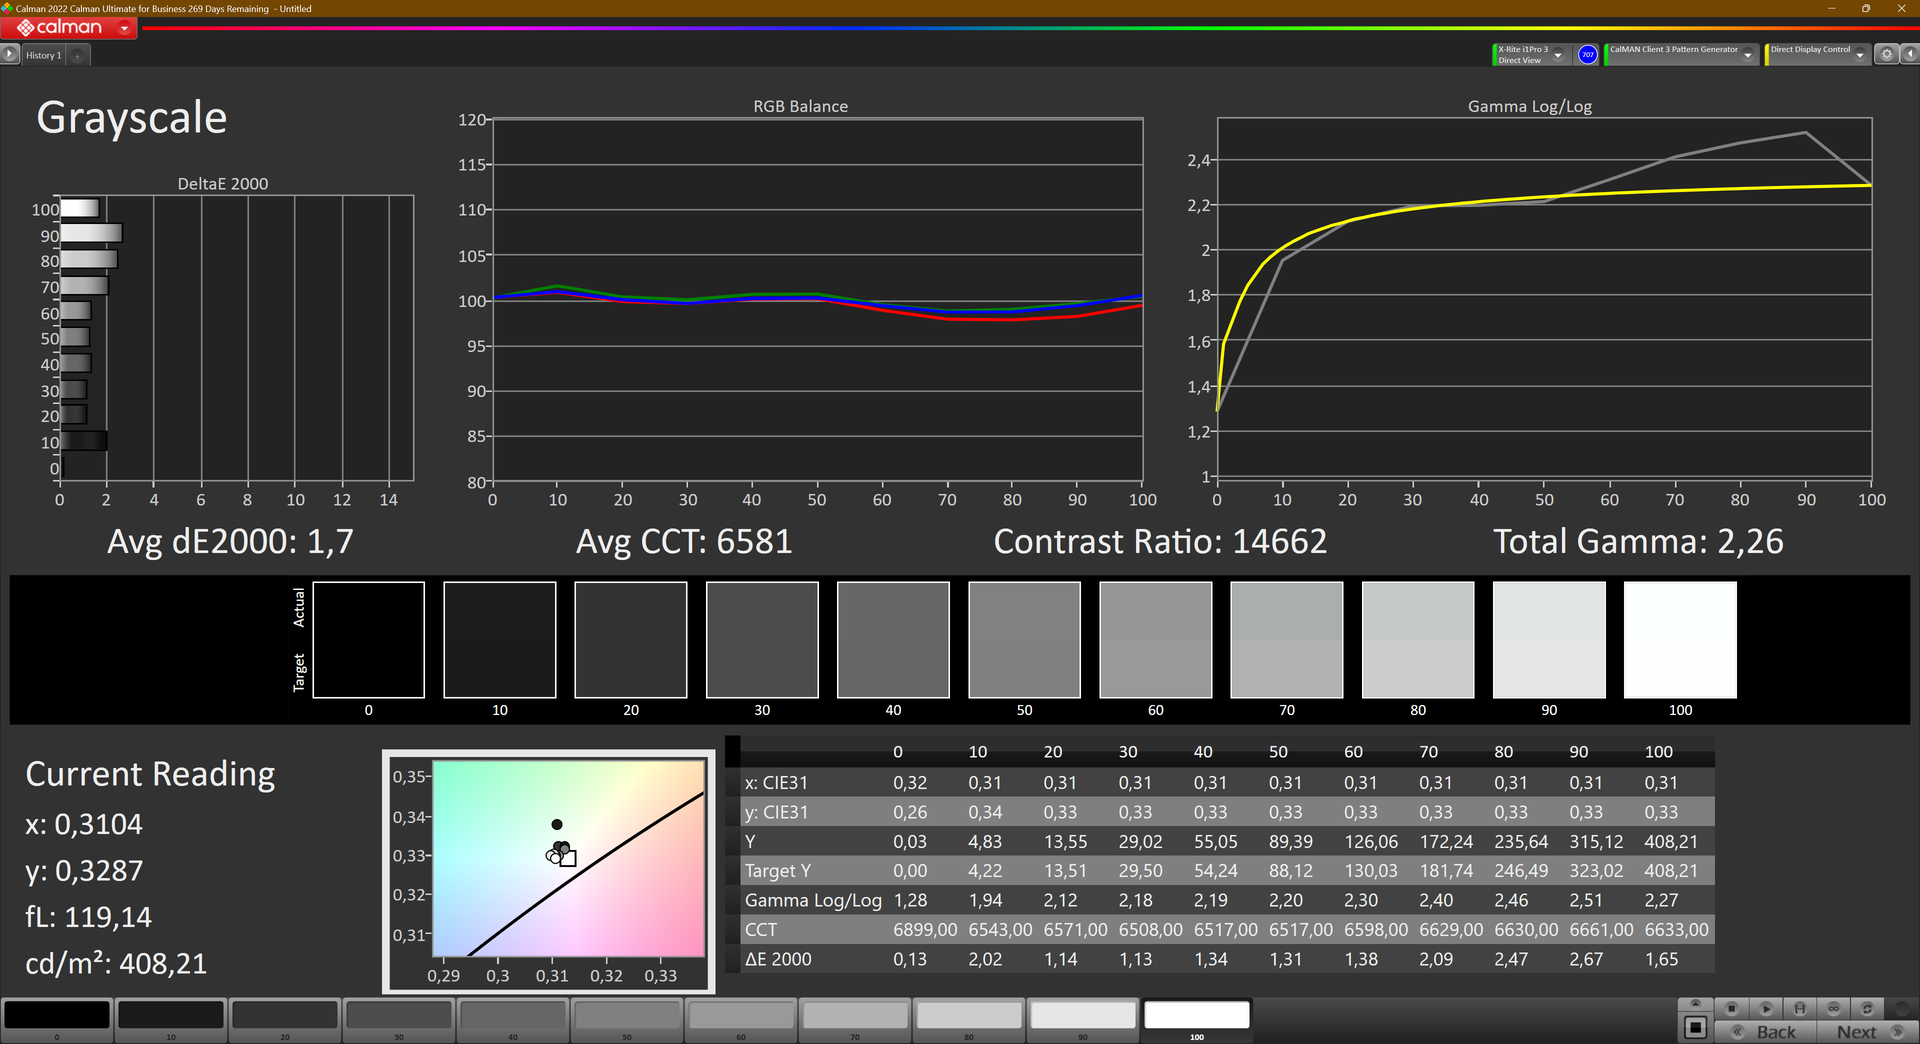
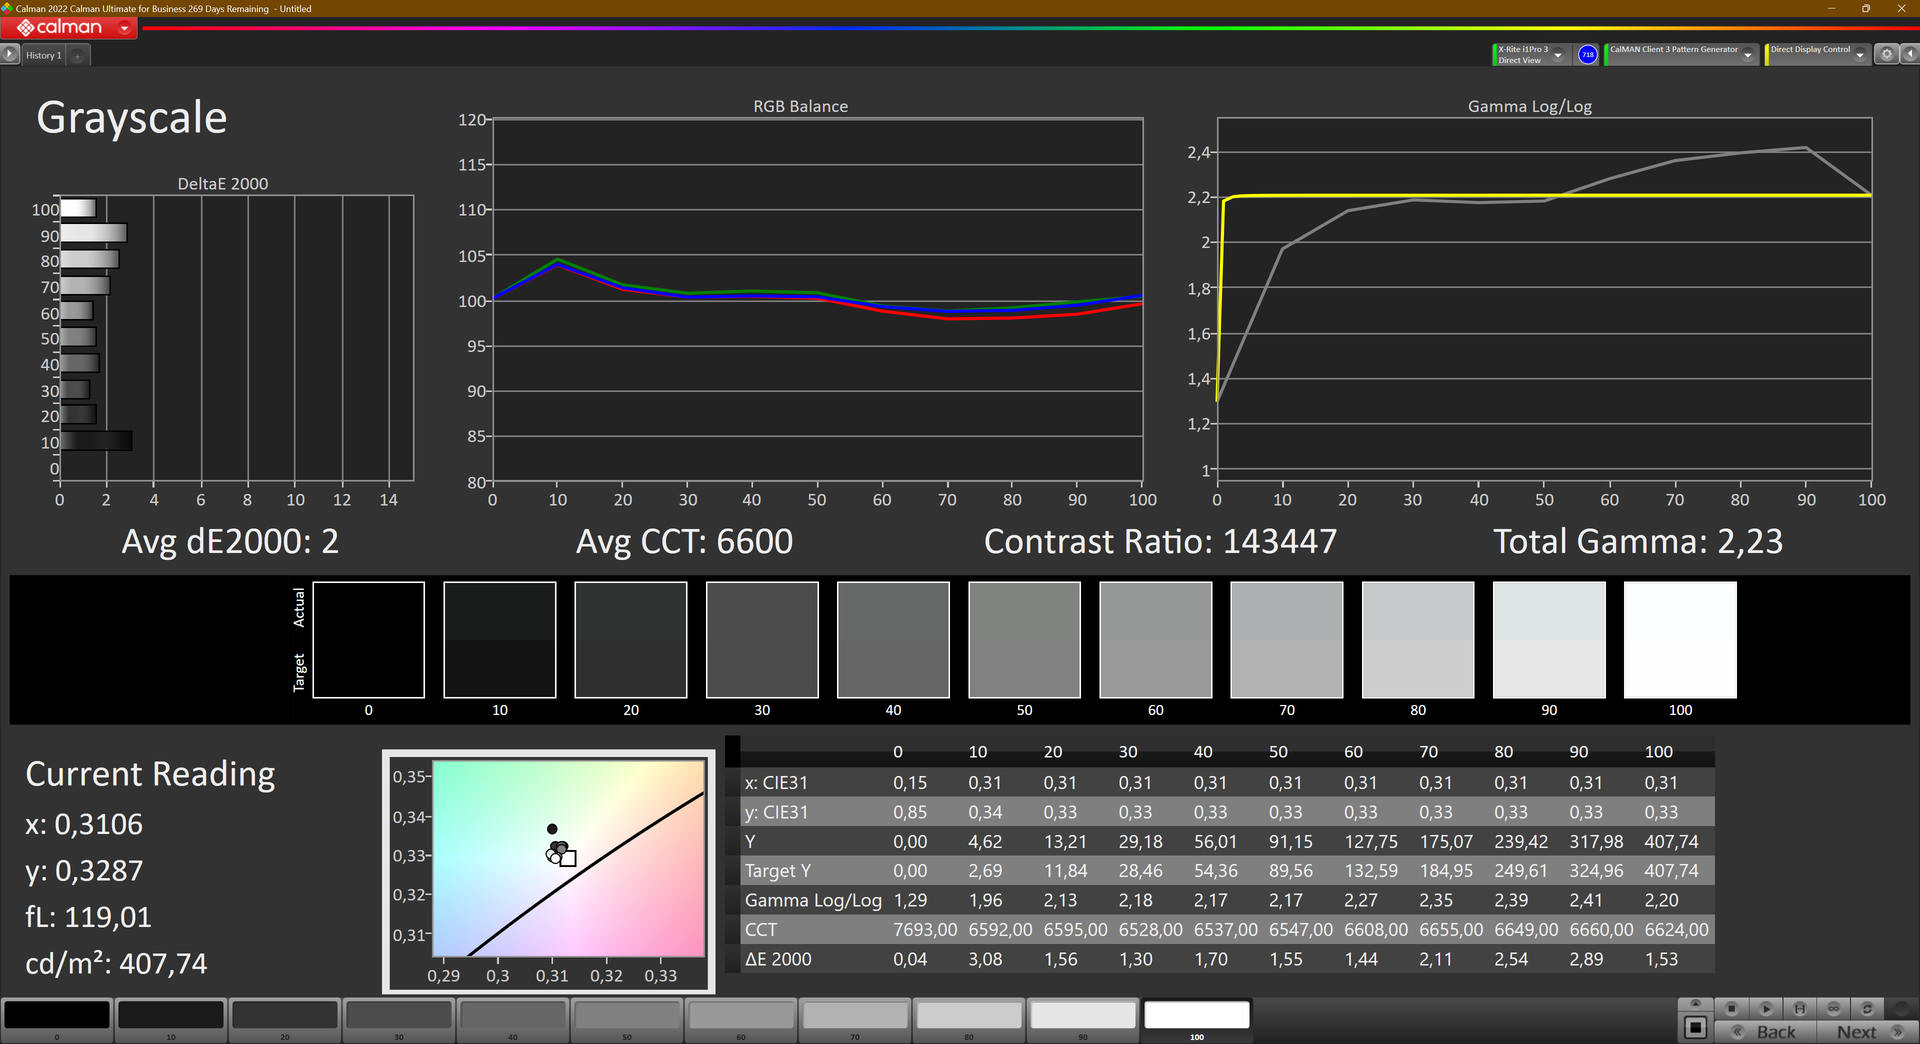
Homogénéité de la luminosité: 98 %
Valeur mesurée au centre, sur batterie: 417 cd/m²
Contraste: ∞:1 (Valeurs des noirs: 0 cd/m²)
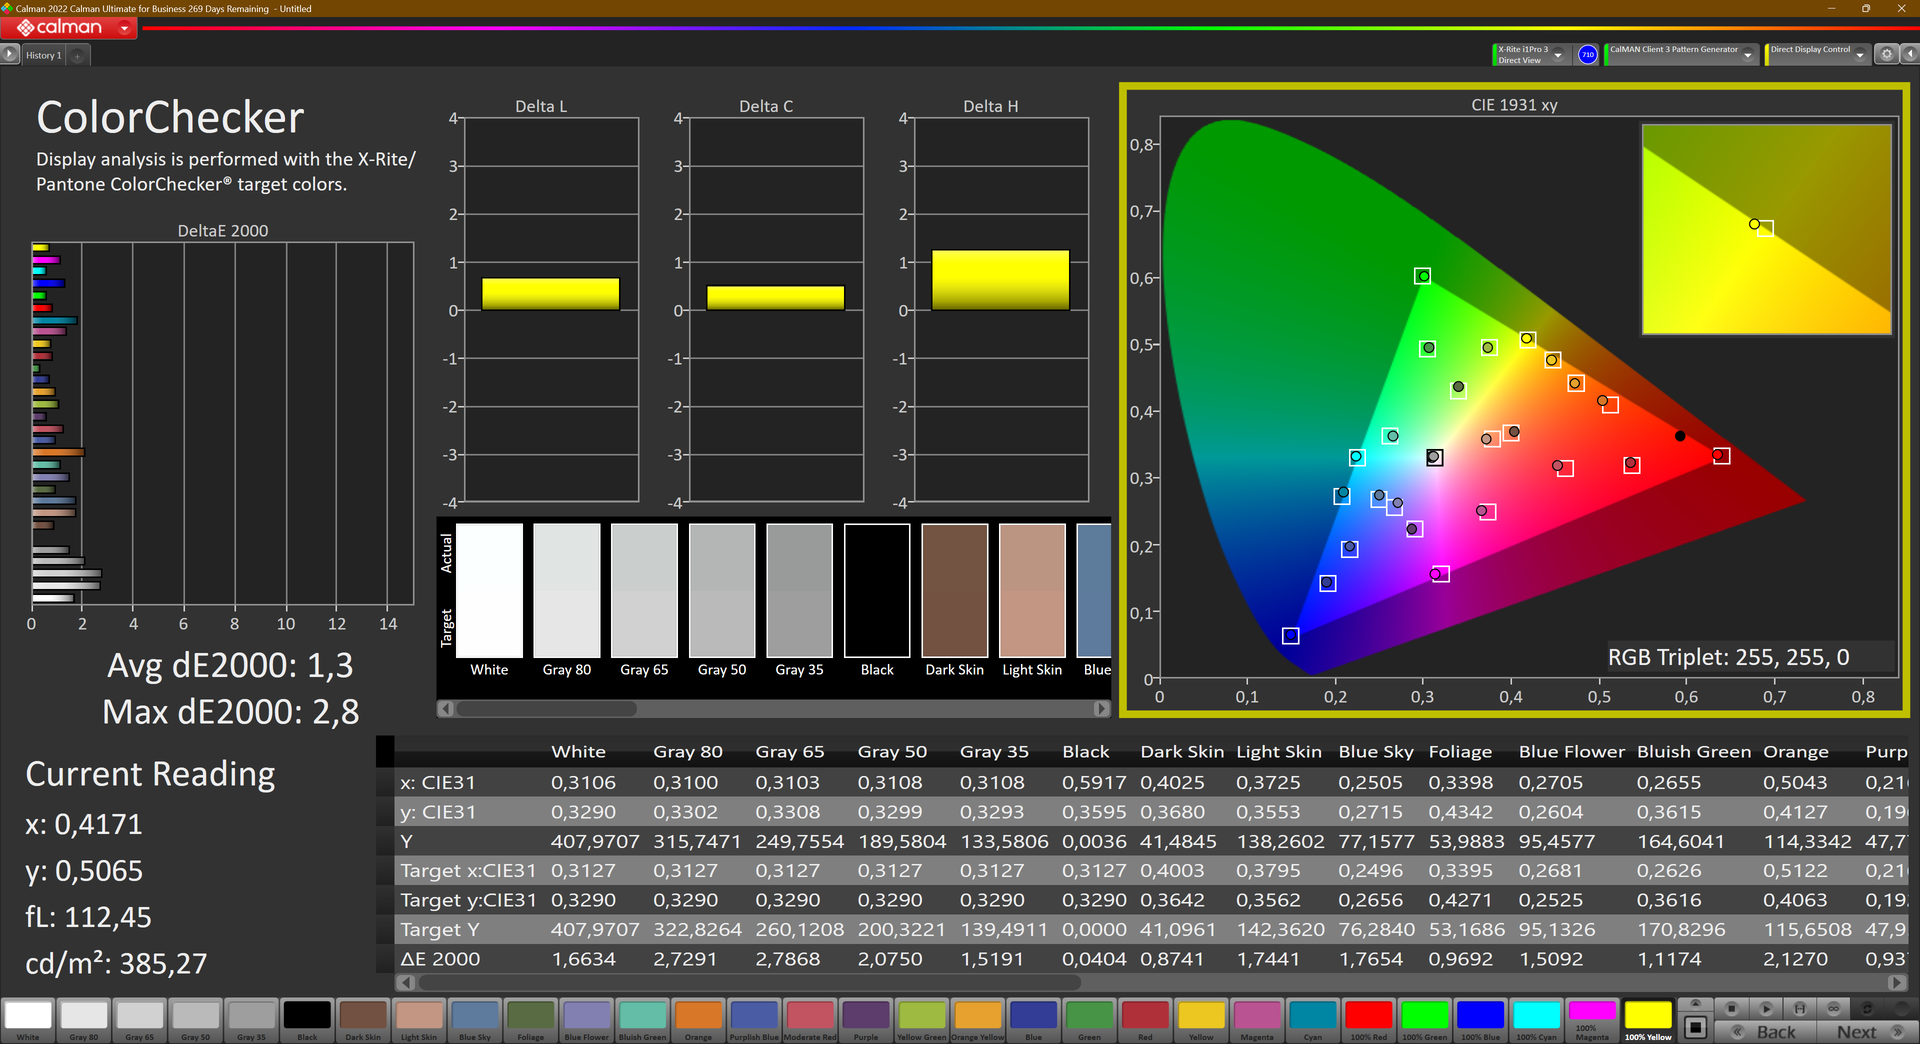
ΔE ColorChecker Calman: 1.3 | ∀{0.5-29.43 Ø4.73}
calibrated: 2.9
ΔE Greyscale Calman: 1.8 | ∀{0.09-98 Ø4.97}
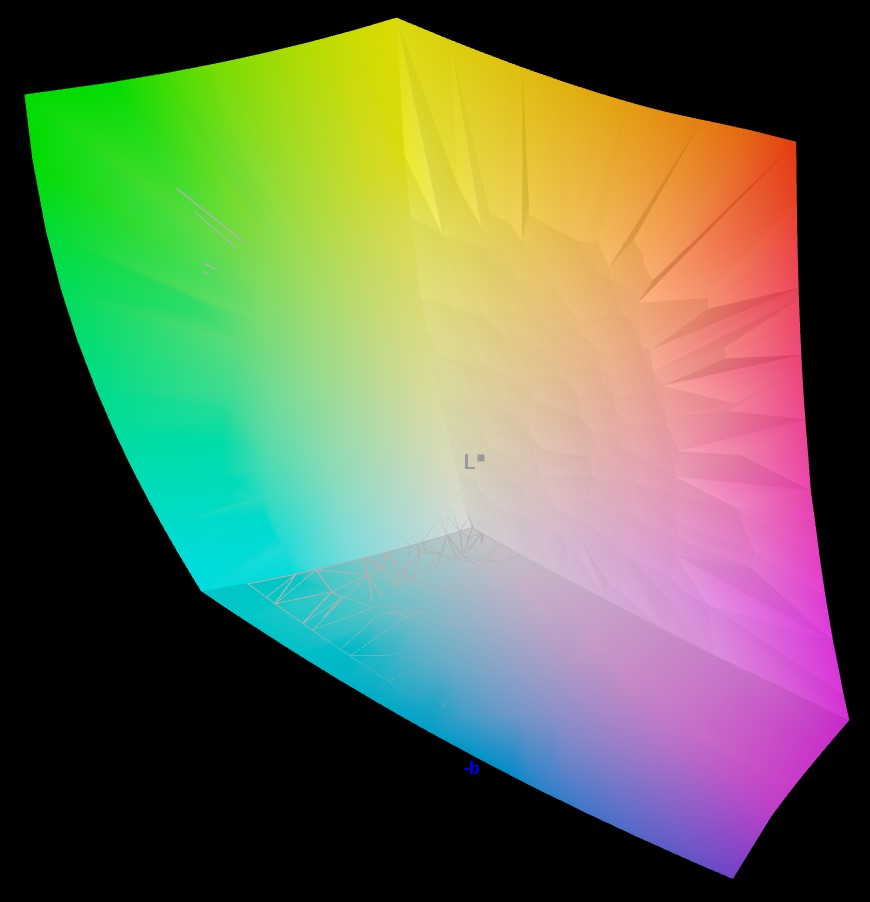
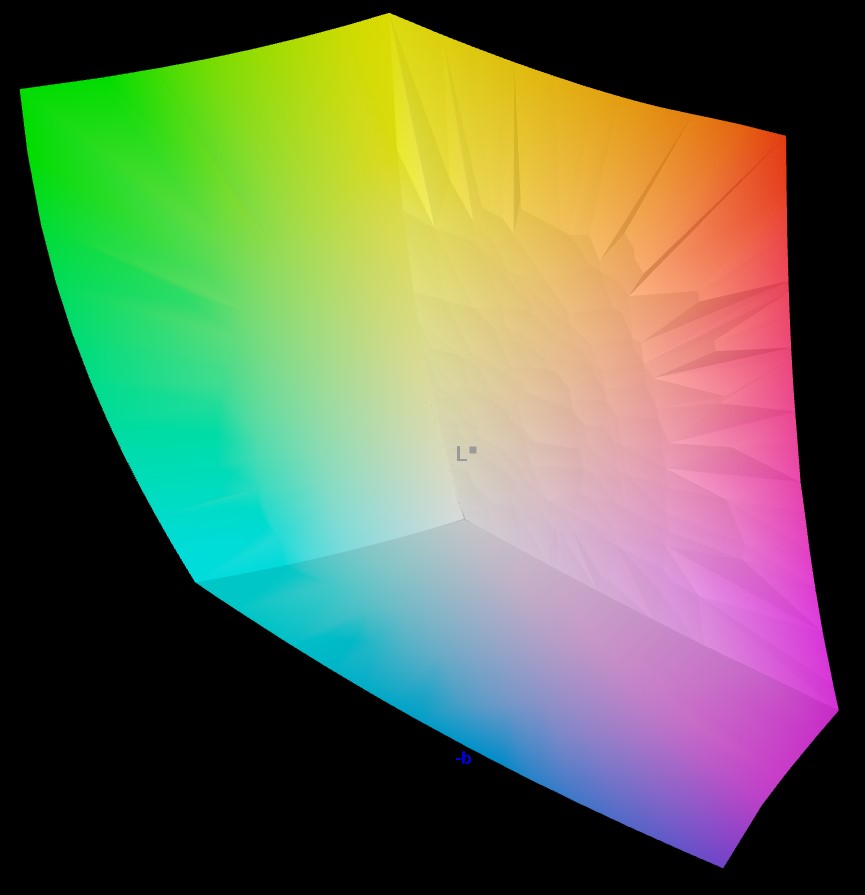
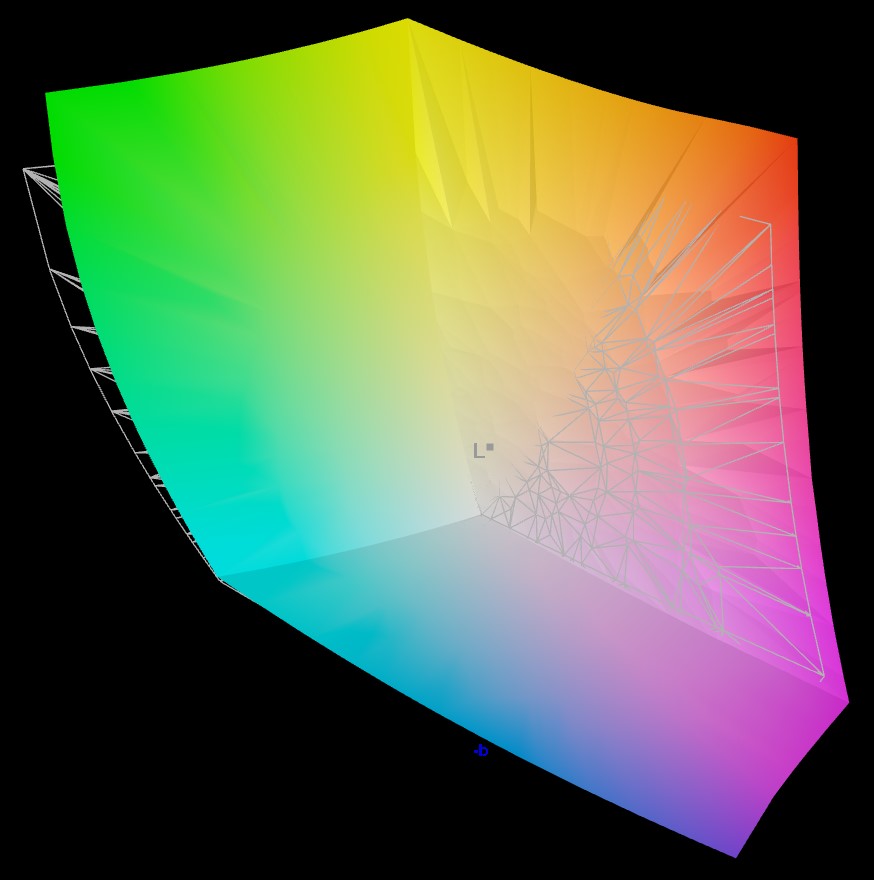
96.9% AdobeRGB 1998 (Argyll 3D)
100% sRGB (Argyll 3D)
99.9% Display P3 (Argyll 3D)
Gamma: 2.25
CCT: 6574 K
| Lenovo ThinkPad P16s G2 21K9000CGE ATNA60YV04-0, OLED, 3840x2400, 16" | HP EliteBook 845 G10 818N0EA AUO6DA8, IPS, 2560x1600, 14" | Lenovo ThinkPad P14s G4 21K5000LGE Lenovo MNE007JA1-1, IPS, 1920x1200, 14" | Schenker Vision 16 PH6PRX1 BOE CQ NE160QDM-NZ1 , IPS, 2560x1600, 16" | Acer Swift Edge SFE16 Ryzen 7 7840U Samsung ATNA60BX03-0, OLED, 3200x2000, 16" | Lenovo ThinkPad P16v G1 AMD NE160WUM-N64, IPS, 1920x1200, 16" | Microsoft Surface Laptop Studio 2 RTX 4060 LQ144P1JX01, IPS, 2400x1600, 14.4" | |
|---|---|---|---|---|---|---|---|
| Display | -4% | -19% | -19% | 1% | -21% | -21% | |
| Display P3 Coverage (%) | 99.9 | 98.3 -2% | 69.4 -31% | 70 -30% | 99.9 0% | 67.8 -32% | 66.7 -33% |
| sRGB Coverage (%) | 100 | 99.8 0% | 99.9 0% | 99.3 -1% | 100 0% | 97.7 -2% | 99 -1% |
| AdobeRGB 1998 Coverage (%) | 96.9 | 86.2 -11% | 71.4 -26% | 71.2 -27% | 100 3% | 69.8 -28% | 68.9 -29% |
| Response Times | -628% | -2611% | -574% | 43% | -2587% | -3806% | |
| Response Time Grey 50% / Grey 80% * (ms) | 1.5 ? | 12.7 ? -747% | 45.9 ? -2960% | 11 ? -633% | 0.57 ? 62% | 50.6 ? -3273% | 77.6 ? -5073% |
| Response Time Black / White * (ms) | 1.3 ? | 7.9 ? -508% | 30.7 ? -2262% | 8 ? -515% | 1 ? 23% | 26 ? -1900% | 34.3 ? -2538% |
| PWM Frequency (Hz) | 60 | 238.8 | 17600 ? | ||||
| Screen | 9% | -11% | 3% | -44% | -51% | 35% | |
| Brightness middle (cd/m²) | 416 | 546 31% | 414 0% | 356 -14% | 379.8 -9% | 355 -15% | 511 23% |
| Brightness (cd/m²) | 421 | 564 34% | 392 -7% | 349 -17% | 383 -9% | 344 -18% | 503 19% |
| Brightness Distribution (%) | 98 | 86 -12% | 89 -9% | 93 -5% | 98 0% | 92 -6% | 89 -9% |
| Black Level * (cd/m²) | 0.38 | 0.26 | 0.28 | 0.17 | 0.26 | ||
| Colorchecker dE 2000 * | 1.3 | 1.3 -0% | 1.9 -46% | 1.7 -31% | 4.7 -262% | 2.9 -123% | 0.5 62% |
| Colorchecker dE 2000 max. * | 2.8 | 5.3 -89% | 3.6 -29% | 3 -7% | 7.51 -168% | 5.6 -100% | 1.1 61% |
| Colorchecker dE 2000 calibrated * | 2.9 | 1.2 59% | 0.8 72% | 1 66% | 0.55 81% | 1 66% | |
| Greyscale dE 2000 * | 1.8 | 1.1 39% | 2.9 -61% | 1.3 28% | 0.8 56% | 4.7 -161% | 0.8 56% |
| Gamma | 2.25 98% | 2.27 97% | 2.26 97% | 2.1 105% | 2.22 99% | 2.12 104% | 2.19 100% |
| CCT | 6574 99% | 6463 101% | 6227 104% | 6625 98% | 6381 102% | 6356 102% | 6650 98% |
| Contrast (:1) | 1437 | 1592 | 1271 | 2088 | 1965 | ||
| Moyenne finale (programmes/paramètres) | -208% /
-101% | -880% /
-447% | -197% /
-99% | 0% /
-19% | -886% /
-466% | -1264% /
-678% |
* ... Moindre est la valeur, meilleures sont les performances
L'écran OLED est aussi généreux que prévu en ce qui concerne la représentation des couleurs. Il couvre entièrement le Display-P3, un espace colorimétrique utilisé pour les productions vidéo professionnelles. Il ne couvre pas tout à fait l'espace AdobeRGB dans son intégralité.
Lors de la mesure de la précision des couleurs de l'écran, nous avons noté des valeurs inférieures à ce qui est perceptible à l'œil nu, même lorsqu'il s'agissait des écarts les plus élevés. En moyenne, les écarts étaient encore plus faibles. Cela signifie que les couleurs sont représentées avec une précision presque parfaite.

Temps de réponse de l'écran
| ↔ Temps de réponse noir à blanc | ||
|---|---|---|
| 1.3 ms ... hausse ↗ et chute ↘ combinées | ↗ 0.7 ms hausse | 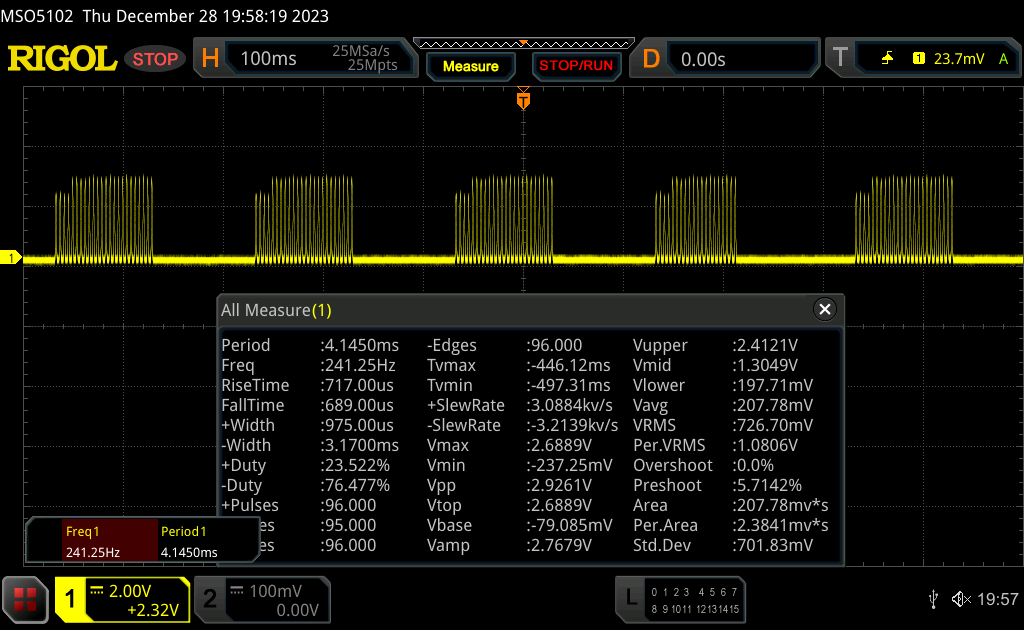 |
| ↘ 0.6 ms chute | ||
| L'écran montre de très faibles temps de réponse, parfait pour le jeu. En comparaison, tous les appareils testés affichent entre 0.1 (minimum) et 240 (maximum) ms. » 7 % des appareils testés affichent de meilleures performances. Cela signifie que les latences relevées sont meilleures que la moyenne (19.9 ms) de tous les appareils testés. | ||
| ↔ Temps de réponse gris 50% à gris 80% | ||
| 1.5 ms ... hausse ↗ et chute ↘ combinées | ↗ 0.8 ms hausse |  |
| ↘ 0.7 ms chute | ||
| L'écran montre de très faibles temps de réponse, parfait pour le jeu. En comparaison, tous les appareils testés affichent entre 0.165 (minimum) et 636 (maximum) ms. » 7 % des appareils testés affichent de meilleures performances. Cela signifie que les latences relevées sont meilleures que la moyenne (31.1 ms) de tous les appareils testés. | ||
Scintillement / MLI (Modulation de largeur d'impulsion)
| Scintillement / MLI (Modulation de largeur d'impulsion) décelé | 60 Hz |  | |
Le rétroéclairage de l'écran scintille à la fréquence de 60 Hz (certainement du fait de l'utilisation d'une MDI - Modulation de largeur d'impulsion) . La fréquence de rafraîchissement de 60 Hz est extrêmement faible, de grands risques de fatigue oculaire accrue et de maux de tête en cas d'utilisation prolongée. En comparaison, 52 % des appareils testés n'emploient pas MDI pour assombrir leur écran. Nous avons relevé une moyenne à 7791 (minimum : 5 - maximum : 343500) Hz dans le cas où une MDI était active. | |||

Les niveaux de contraste élevés et la luminosité de plus de 400 cd/m² garantissent la lisibilité des contenus, même en extérieur. Il est toutefois conseillé de rechercher un endroit ombragé, car les reflets pourraient gêner la lecture.
Les couleurs et la luminosité restent toujours les mêmes, quel que soit l'angle de vue. Les distorsions de couleur typiques des écrans OLED ne se produisent qu'à plus de 80 degrés.
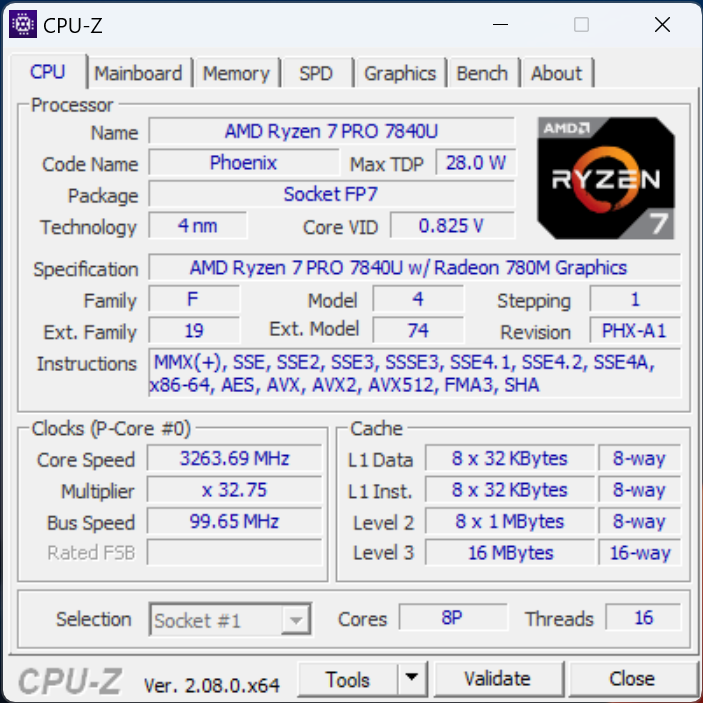
Performances - Ryzen 7 sous tension
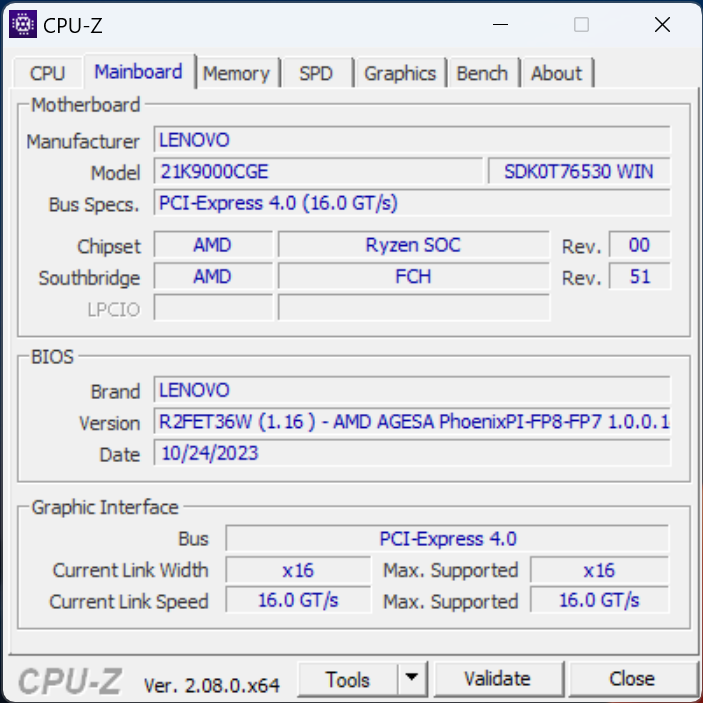
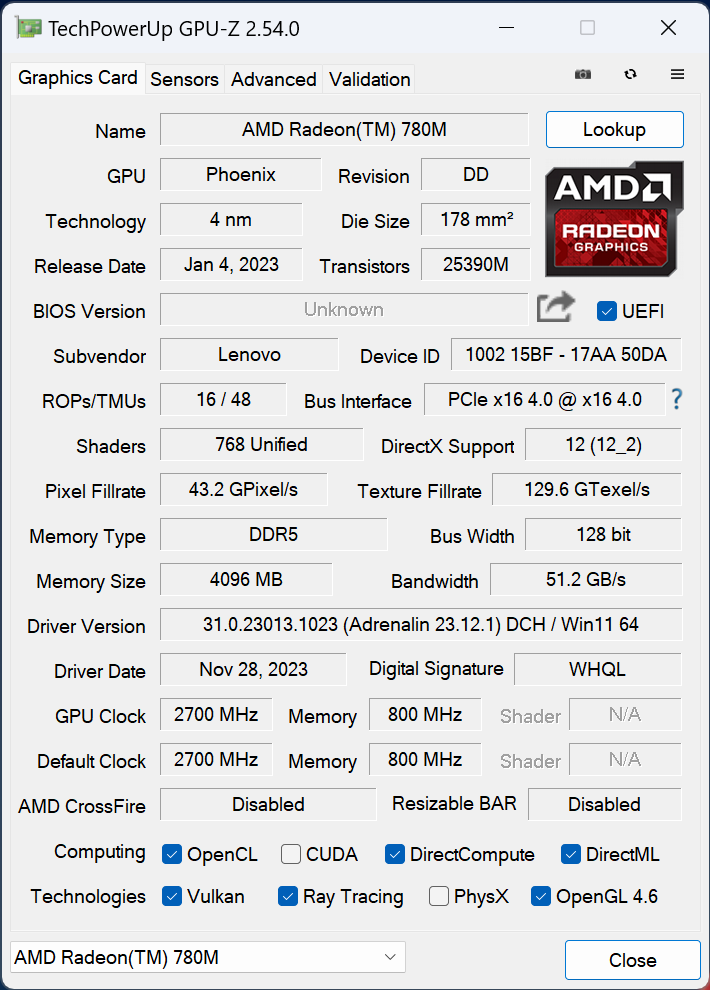
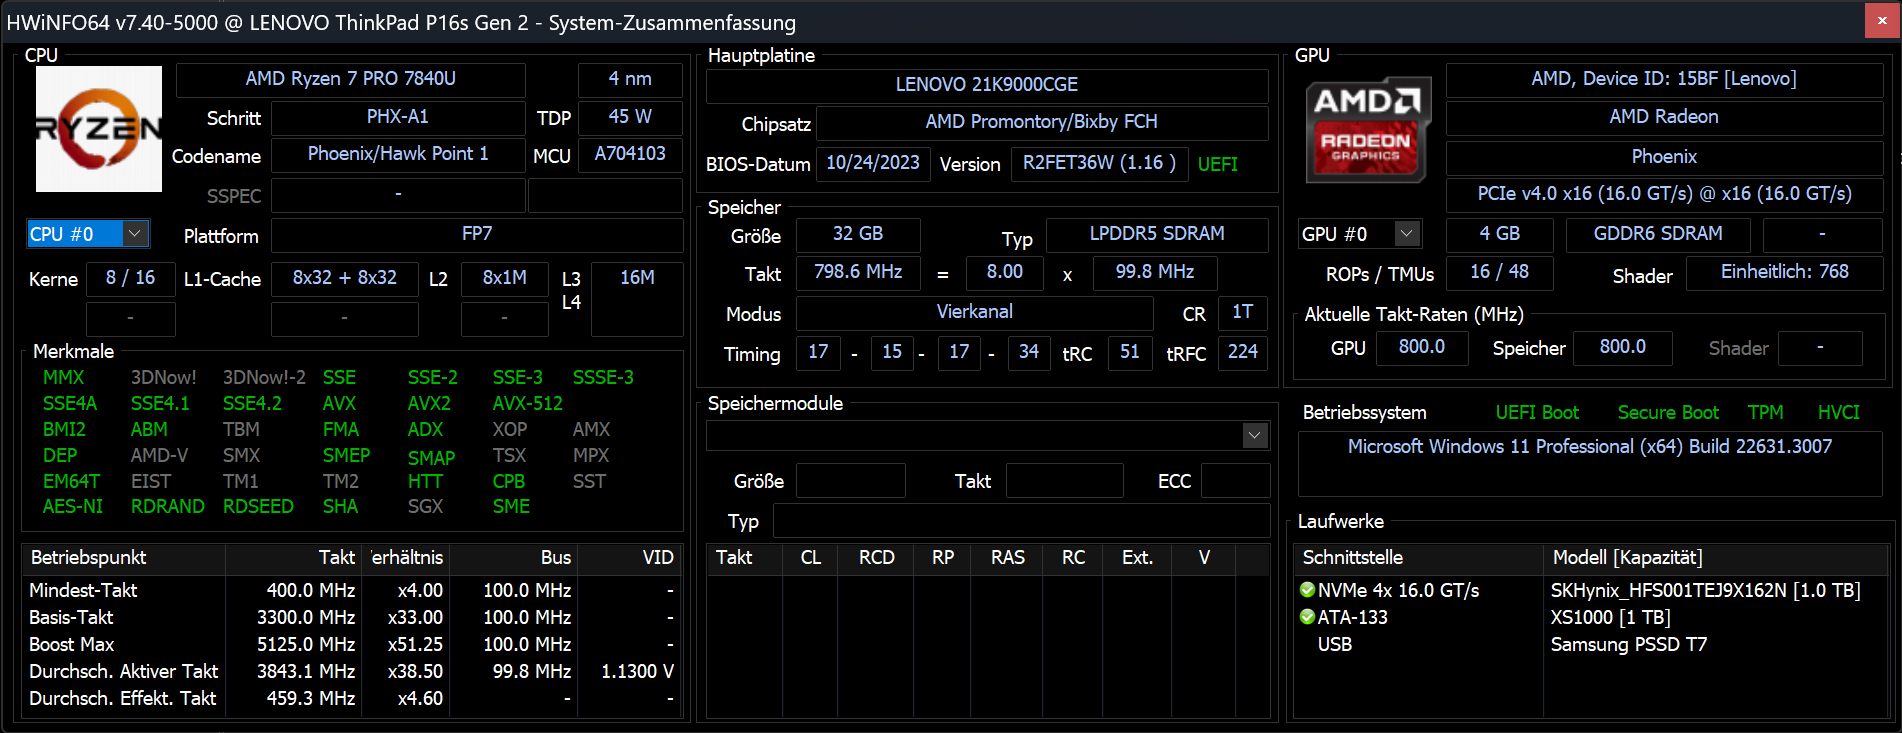
Le AMD Ryzen 7 Pro 7840U est le moteur des ThinkPads P16s G2, avec sa Radeon 780M iGPU. Cette combinaison se traduit non seulement par une puissance de calcul étonnante, mais aussi par de solides performances graphiques, du moins pour un GPU intégré. L'efficacité du système n'est pas en reste. En outre, vous avez également la possibilité de choisir le plus petit des deux modèles suivants : le Ryzen 5 Pro 7540 d'AMD AMD Ryzen 5 Pro 7540U avec le processeur Radeon 740M.
Outre ses performances élevées pour un système mobile, la série Pro dispose également d'une puce de sécurité et de nombreuses options de télémaintenance, ce qui est particulièrement utile pour une utilisation en flotte.
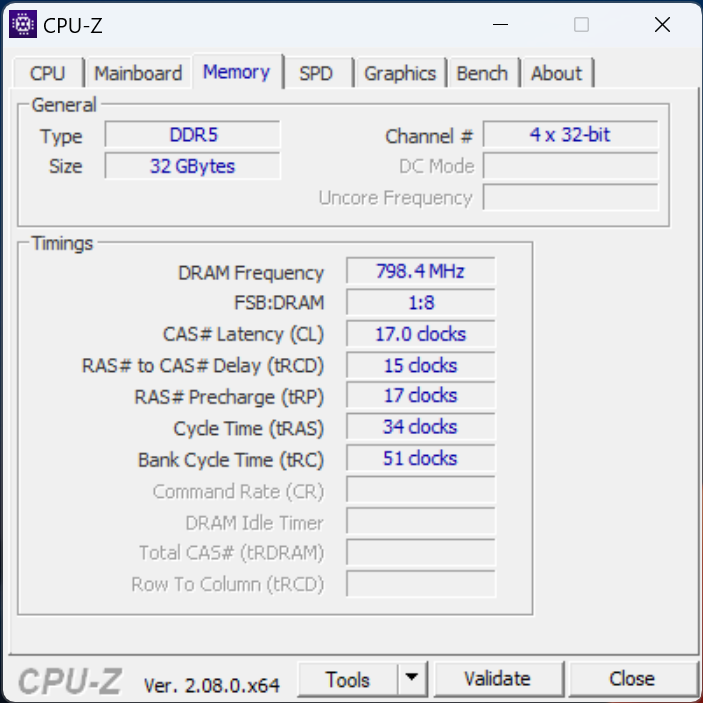
En outre, vous avez le choix entre trois tailles de mémoire vive, à savoir 16, 32 ou 64 Go à 6 400 MHz. Elles sont soudées, ce qui signifie qu'elles ne peuvent pas être remplacées ou étendues.
Conditions d'essai
Les trois modes de performance Windows habituels - performance maximale, équilibré et économie d'énergie maximale - sont disponibles. Grâce au logiciel fourni "Lenovo Commercial Vantage", les performances sont toujours réglées sur le mode le plus élevé. Même en utilisant le réglage le plus bas, la consommation d'énergie du processeur reste assez élevée. Nous avons effectué tous nos tests en utilisant le mode le plus performant.
En revanche, si vous sélectionnez le mode équilibré, la puissance de calcul de l'ordinateur portable est légèrement réduite. Cependant, vous ne devriez pas vous en apercevoir lorsque vous démarrez des applications, surfez sur le web ou effectuez la plupart des autres tâches quotidiennes. De son côté, le bruit du ventilateur ne diminue que légèrement, mais même en utilisant le mode le plus performant, il n'est jamais vraiment gênant. Comme prévu, ses performances diminuent encore en mode d'économie d'énergie . Dans le même temps, ses vitesses de calcul restent assez élevées, même si le démarrage des programmes entraîne un léger retard. De plus, les ventilateurs sont nettement moins bruyants lorsque ce mode est sélectionné.
Si vous débranchez l'appareil, les réglages passent en mode équilibré. Vous pouvez toutefois revenir immédiatement au mode maximum. Vous bénéficiez ainsi des meilleures performances de l'ordinateur portable, même en mode batterie. Le tableau suivant montre comment les limites de puissance changent :
| PL2 | PL1 | |
|---|---|---|
| Performance maximale | 51 watts | 41 watts |
| Équilibré | 40 watts | 36 watts |
| Économique | 32 watts | 30 watts |
Processeur
Comme prévu, les AMD Ryzen 7 Pro 7840U qui est en outre optimisé pour l'efficacité, offre des taux de performance très élevés. Il s'agit de l'un des processeurs mobiles les plus puissants. Avec un total de 16 threads et une fréquence d'horloge maximale supérieure à 5 GHz, il dispose toujours d'une grande réserve pour le multitâche et les utilisations complexes, comme vous l'attendez d'un ordinateur portable de station de travail.
Son alimentation maximale de 51 watts est appropriée pour un modèle de 16 pouces et s'équilibre à 41 watts sur une plus longue période. Le modèle 14 pouces ThinkPad P14s G4 de 14 pouces avec un processeur identique a accès à 20 % d'énergie en moins, par exemple, et s'est donc moins bien comporté dans les tests de référence du processeur.
Mais même le AMD Ryzen 9 Pro 7940HS dans le HP EliteBook 845 G10qui est meilleur sur le papier, n'a pas pu suivre. Le Intel Core i7-13700H se situe également à un niveau similaire, mais dans le Microsoft Surface Laptop Studio 2par exemple, il a fait moins bien en charge permanente. De plus, la consommation d'énergie du i7-13700H est beaucoup plus élevée.
Par conséquent, notre appareil de test a fait une très bonne impression globale tout au long des tests, fournissant des résultats supérieurs à la moyenne avec des valeurs de consommation d'énergie modérées. Le processeur AMD se comporte très bien dans le ThinkPad P16s G2.
Vous trouverez d'autres tests de référence dans notre liste de tests de référence des processeurs http://www.notebookcheck.com/Mobile-Prozessoren-Benchmarkliste.1809.0.html.
Cinebench R15 Multi continuous test
Cinebench R23: Multi Core | Single Core
Cinebench R20: CPU (Multi Core) | CPU (Single Core)
Cinebench R15: CPU Multi 64Bit | CPU Single 64Bit
Blender: v2.79 BMW27 CPU
7-Zip 18.03: 7z b 4 | 7z b 4 -mmt1
Geekbench 5.5: Multi-Core | Single-Core
HWBOT x265 Benchmark v2.2: 4k Preset
LibreOffice : 20 Documents To PDF
R Benchmark 2.5: Overall mean
| CPU Performance rating | |
| Moyenne de la classe Workstation | |
| Microsoft Surface Laptop Studio 2 RTX 4060 | |
| Lenovo ThinkPad P16v G1 AMD | |
| Lenovo ThinkPad P16s G2 21K9000CGE | |
| MSI Prestige 16 B1MG-001US | |
| HP EliteBook 845 G10 818N0EA | |
| Lenovo ThinkPad P14s G4 21K5000LGE | |
| Schenker Vision 16 PH6PRX1 | |
| Moyenne AMD Ryzen 7 PRO 7840U | |
| Acer Swift Edge SFE16 Ryzen 7 7840U | |
| Lenovo ThinkPad X1 Carbon G11 21HNS54T00 | |
| Lenovo ThinkPad P15v G3 21EM001AGE | |
| Cinebench R23 / Single Core | |
| Moyenne de la classe Workstation (1712 - 2228, n=25, 2 dernières années) | |
| Microsoft Surface Laptop Studio 2 RTX 4060 | |
| Schenker Vision 16 PH6PRX1 | |
| Lenovo ThinkPad X1 Carbon G11 21HNS54T00 | |
| MSI Prestige 16 B1MG-001US | |
| Acer Swift Edge SFE16 Ryzen 7 7840U | |
| Moyenne AMD Ryzen 7 PRO 7840U (1703 - 1747, n=5) | |
| Lenovo ThinkPad P14s G4 21K5000LGE | |
| Lenovo ThinkPad P16s G2 21K9000CGE | |
| Lenovo ThinkPad P16v G1 AMD | |
| HP EliteBook 845 G10 818N0EA | |
| Lenovo ThinkPad P15v G3 21EM001AGE | |
| Cinebench R15 / CPU Multi 64Bit | |
| Moyenne de la classe Workstation (2489 - 5810, n=25, 2 dernières années) | |
| Microsoft Surface Laptop Studio 2 RTX 4060 | |
| Lenovo ThinkPad P16s G2 21K9000CGE | |
| MSI Prestige 16 B1MG-001US | |
| Lenovo ThinkPad P16v G1 AMD | |
| HP EliteBook 845 G10 818N0EA | |
| Lenovo ThinkPad P14s G4 21K5000LGE | |
| Moyenne AMD Ryzen 7 PRO 7840U (1590 - 2418, n=5) | |
| Lenovo ThinkPad P15v G3 21EM001AGE | |
| Lenovo ThinkPad X1 Carbon G11 21HNS54T00 | |
| Acer Swift Edge SFE16 Ryzen 7 7840U | |
| Schenker Vision 16 PH6PRX1 | |
| Cinebench R15 / CPU Single 64Bit | |
| Moyenne de la classe Workstation (191.4 - 328, n=25, 2 dernières années) | |
| Microsoft Surface Laptop Studio 2 RTX 4060 | |
| Acer Swift Edge SFE16 Ryzen 7 7840U | |
| Schenker Vision 16 PH6PRX1 | |
| Lenovo ThinkPad P14s G4 21K5000LGE | |
| Lenovo ThinkPad P16s G2 21K9000CGE | |
| Moyenne AMD Ryzen 7 PRO 7840U (247 - 273, n=5) | |
| Lenovo ThinkPad P16v G1 AMD | |
| Lenovo ThinkPad X1 Carbon G11 21HNS54T00 | |
| MSI Prestige 16 B1MG-001US | |
| HP EliteBook 845 G10 818N0EA | |
| Lenovo ThinkPad P15v G3 21EM001AGE | |
| Geekbench 5.5 / Single-Core | |
| Moyenne de la classe Workstation (1781 - 2183, n=25, 2 dernières années) | |
| Acer Swift Edge SFE16 Ryzen 7 7840U | |
| Microsoft Surface Laptop Studio 2 RTX 4060 | |
| Lenovo ThinkPad X1 Carbon G11 21HNS54T00 | |
| Schenker Vision 16 PH6PRX1 | |
| Moyenne AMD Ryzen 7 PRO 7840U (1740 - 1895, n=5) | |
| Lenovo ThinkPad P16v G1 AMD | |
| HP EliteBook 845 G10 818N0EA | |
| MSI Prestige 16 B1MG-001US | |
| Lenovo ThinkPad P16s G2 21K9000CGE | |
| Lenovo ThinkPad P14s G4 21K5000LGE | |
| Lenovo ThinkPad P15v G3 21EM001AGE | |
| HWBOT x265 Benchmark v2.2 / 4k Preset | |
| Moyenne de la classe Workstation (14.4 - 40.5, n=25, 2 dernières années) | |
| Lenovo ThinkPad P16v G1 AMD | |
| Lenovo ThinkPad P16s G2 21K9000CGE | |
| Microsoft Surface Laptop Studio 2 RTX 4060 | |
| HP EliteBook 845 G10 818N0EA | |
| MSI Prestige 16 B1MG-001US | |
| Lenovo ThinkPad P14s G4 21K5000LGE | |
| Moyenne AMD Ryzen 7 PRO 7840U (13.6 - 17.8, n=5) | |
| Acer Swift Edge SFE16 Ryzen 7 7840U | |
| Schenker Vision 16 PH6PRX1 | |
| Lenovo ThinkPad P15v G3 21EM001AGE | |
| Lenovo ThinkPad X1 Carbon G11 21HNS54T00 | |
| LibreOffice / 20 Documents To PDF | |
| Lenovo ThinkPad P15v G3 21EM001AGE | |
| Lenovo ThinkPad P16s G2 21K9000CGE | |
| Lenovo ThinkPad P14s G4 21K5000LGE | |
| HP EliteBook 845 G10 818N0EA | |
| Moyenne AMD Ryzen 7 PRO 7840U (45.8 - 52, n=5) | |
| Moyenne de la classe Workstation (37.1 - 74.7, n=25, 2 dernières années) | |
| MSI Prestige 16 B1MG-001US | |
| Lenovo ThinkPad P16v G1 AMD | |
| Lenovo ThinkPad X1 Carbon G11 21HNS54T00 | |
| Microsoft Surface Laptop Studio 2 RTX 4060 | |
| Acer Swift Edge SFE16 Ryzen 7 7840U | |
| Schenker Vision 16 PH6PRX1 | |
| R Benchmark 2.5 / Overall mean | |
| Lenovo ThinkPad P15v G3 21EM001AGE | |
| HP EliteBook 845 G10 818N0EA | |
| Lenovo ThinkPad P14s G4 21K5000LGE | |
| MSI Prestige 16 B1MG-001US | |
| Moyenne AMD Ryzen 7 PRO 7840U (0.4658 - 0.4807, n=5) | |
| Lenovo ThinkPad P16s G2 21K9000CGE | |
| Lenovo ThinkPad X1 Carbon G11 21HNS54T00 | |
| Acer Swift Edge SFE16 Ryzen 7 7840U | |
| Schenker Vision 16 PH6PRX1 | |
| Lenovo ThinkPad P16v G1 AMD | |
| Microsoft Surface Laptop Studio 2 RTX 4060 | |
| Moyenne de la classe Workstation (0.3825 - 0.603, n=25, 2 dernières années) | |
* ... Moindre est la valeur, meilleures sont les performances
AIDA64: FP32 Ray-Trace | FPU Julia | CPU SHA3 | CPU Queen | FPU SinJulia | FPU Mandel | CPU AES | CPU ZLib | FP64 Ray-Trace | CPU PhotoWorxx
* ... Moindre est la valeur, meilleures sont les performances
Performance du système
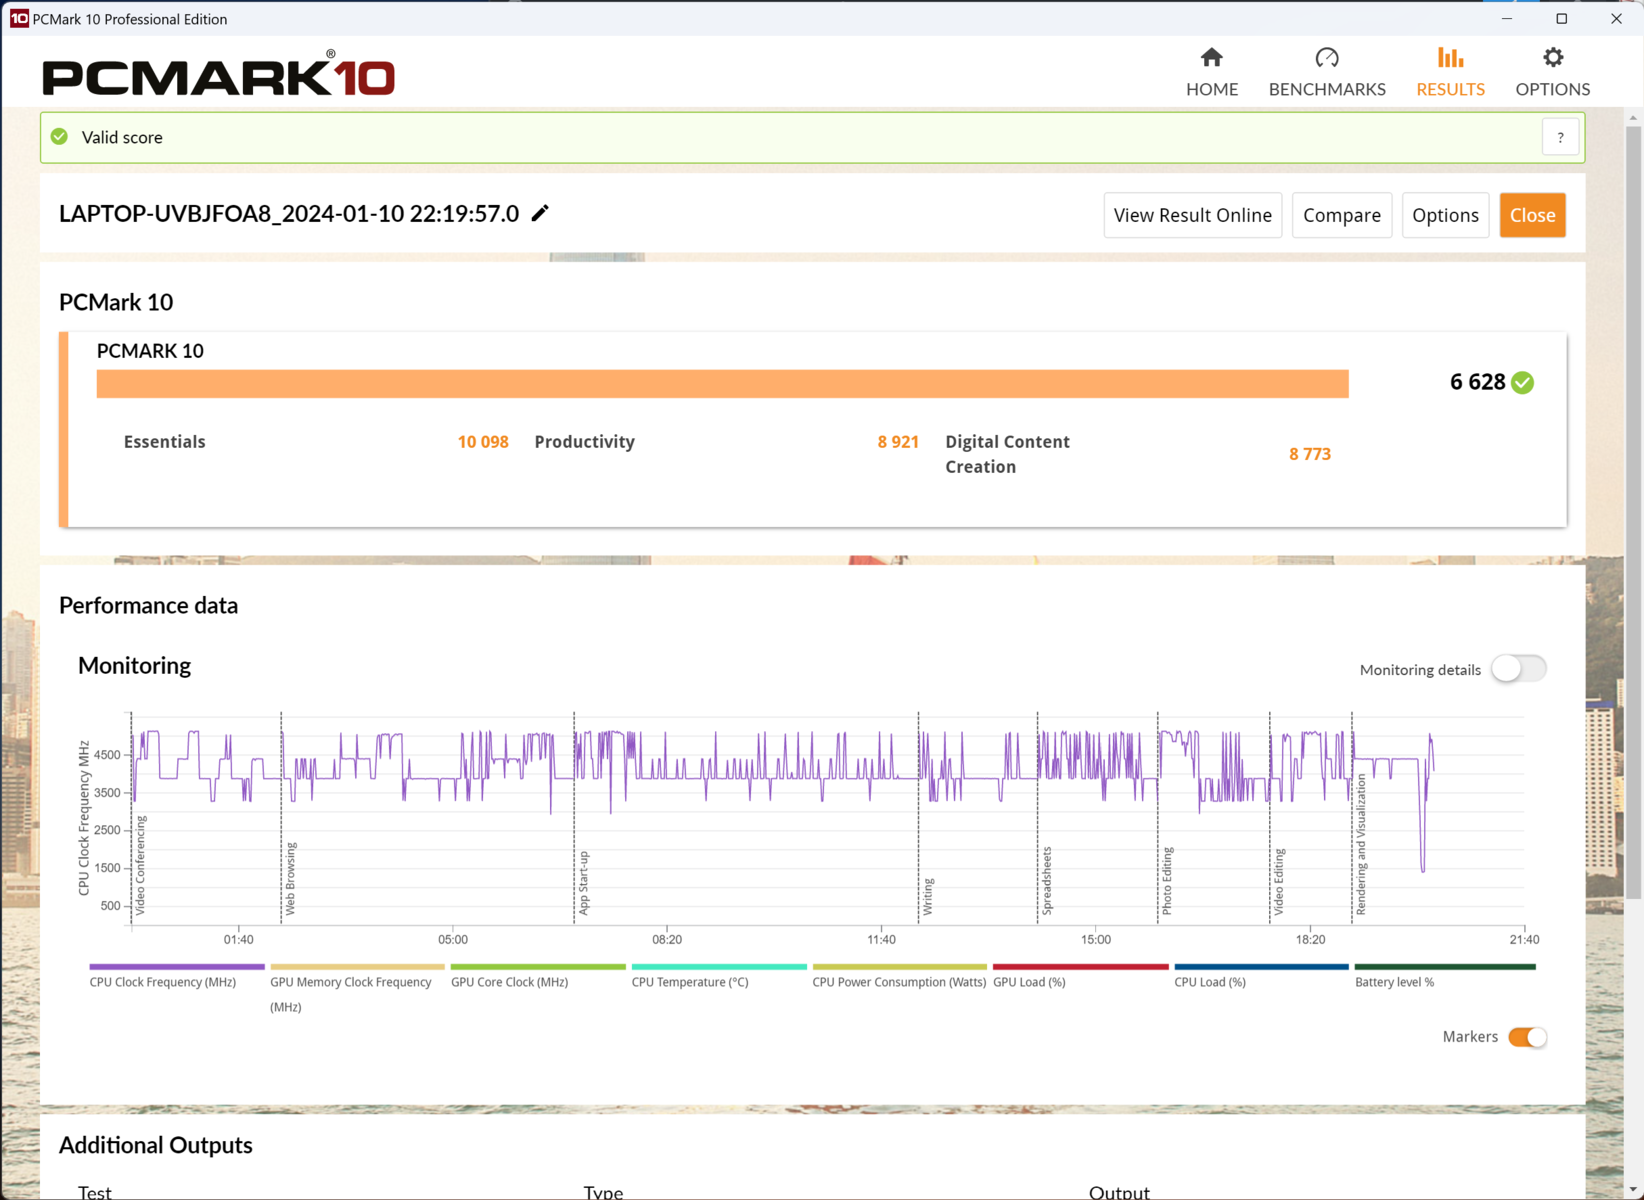
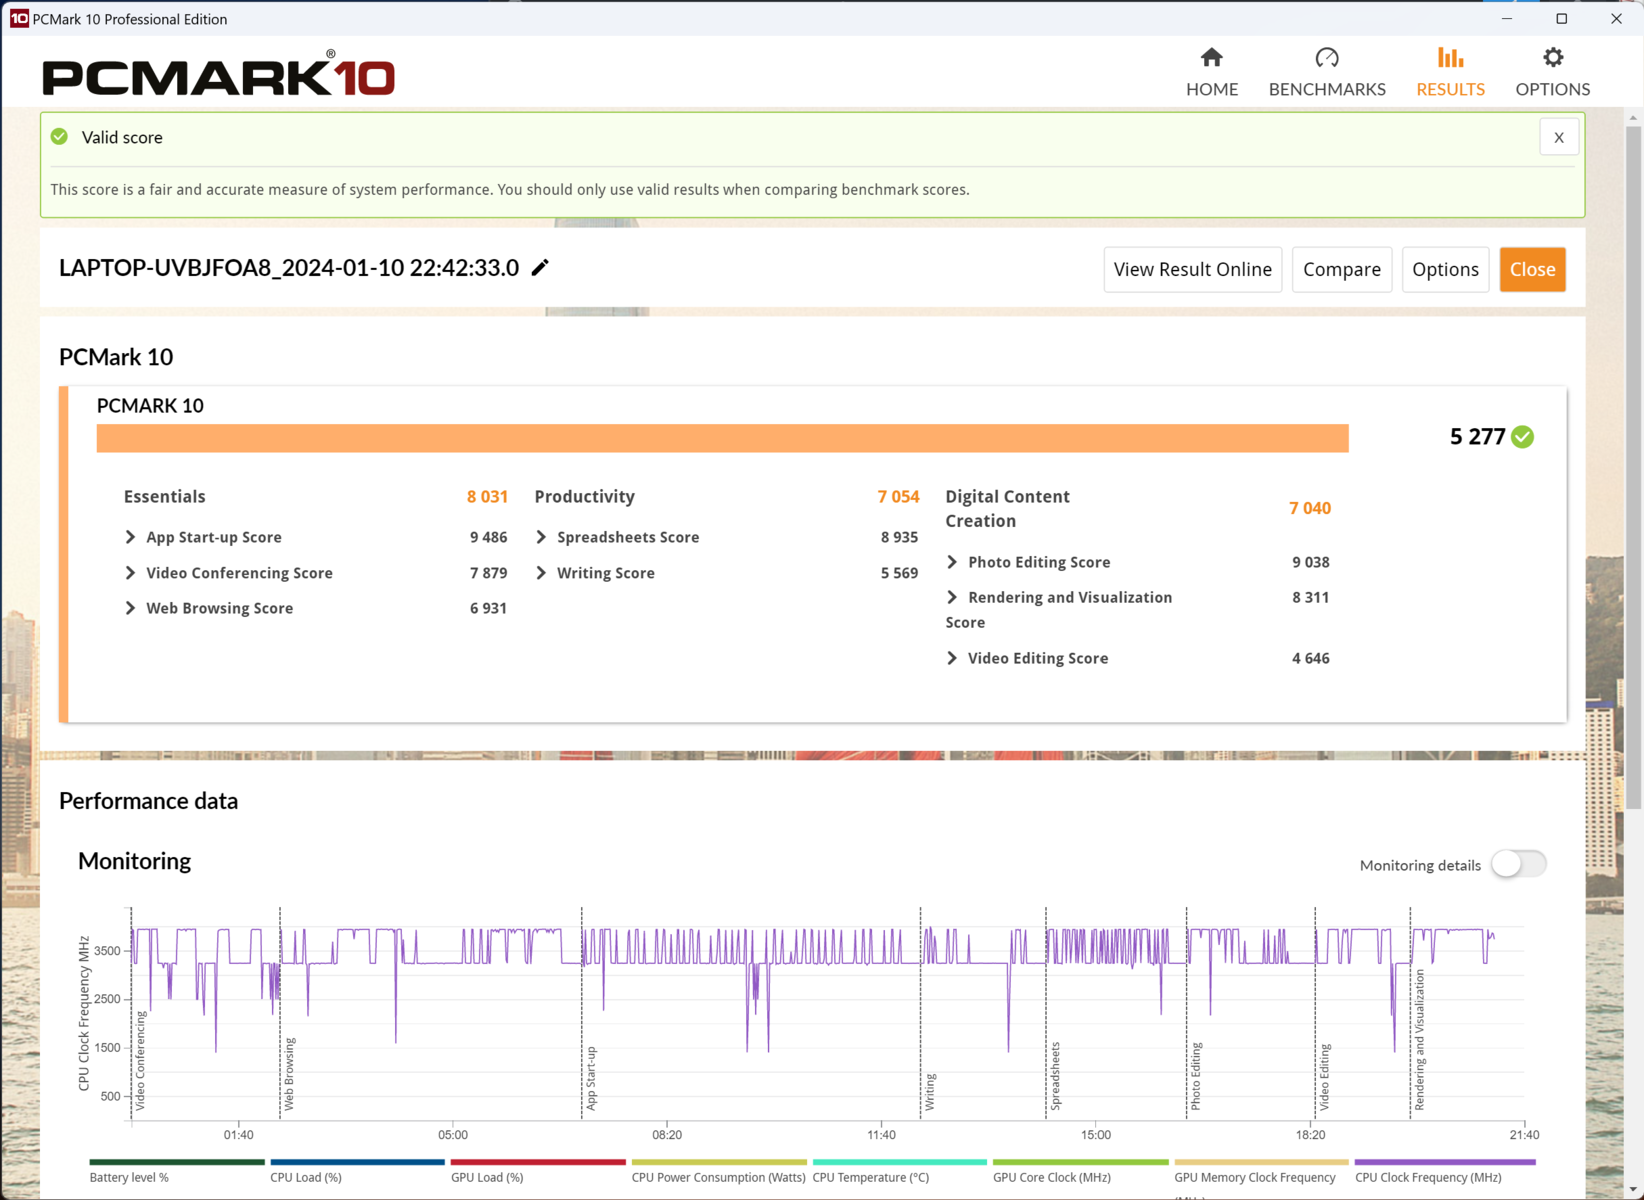
Les performances générales du système du ThinkPad P16s G2 sont de très haut niveau. Il surpasse nettement le Schenker Vision 16 équipé d'un processeur i7-13700Hpar exemple. Et même un ThinkPad P16v mieux configuré Lenovo ThinkPad P16v mieux configuré et doté d'une carte graphique dédiée, n'avait que quelques points de pourcentage d'avance.
Cela signifie que la gestion du P16s G2 AMD est très fluide, presque indépendamment de la charge en cours. Même avec des benchmarks en arrière-plan, l'ordinateur portable peut toujours être utilisé correctement et il réagit rapidement. Vous pouvez utiliser plusieurs programmes en même temps et les processus d'installation ou les tâches complexes peuvent être réalisés en un rien de temps.
CrossMark: Overall | Productivity | Creativity | Responsiveness
WebXPRT 3: Overall
WebXPRT 4: Overall
Mozilla Kraken 1.1: Total
| PCMark 10 / Score | |
| Moyenne de la classe Workstation (6436 - 10409, n=21, 2 dernières années) | |
| Microsoft Surface Laptop Studio 2 RTX 4060 | |
| MSI Prestige 16 B1MG-001US | |
| Lenovo ThinkPad P16v G1 AMD | |
| Acer Swift Edge SFE16 Ryzen 7 7840U | |
| Moyenne AMD Ryzen 7 PRO 7840U, AMD Radeon 780M (6541 - 7012, n=5) | |
| Lenovo ThinkPad P14s G4 21K5000LGE | |
| Lenovo ThinkPad P16s G2 21K9000CGE | |
| HP EliteBook 845 G10 818N0EA | |
| Lenovo ThinkPad P15v G3 21EM001AGE | |
| Schenker Vision 16 PH6PRX1 | |
| Lenovo ThinkPad X1 Carbon G11 21HNS54T00 | |
| PCMark 10 / Essentials | |
| MSI Prestige 16 B1MG-001US | |
| Acer Swift Edge SFE16 Ryzen 7 7840U | |
| Microsoft Surface Laptop Studio 2 RTX 4060 | |
| Lenovo ThinkPad X1 Carbon G11 21HNS54T00 | |
| Moyenne de la classe Workstation (9622 - 11157, n=21, 2 dernières années) | |
| Moyenne AMD Ryzen 7 PRO 7840U, AMD Radeon 780M (10055 - 10934, n=5) | |
| Lenovo ThinkPad P16v G1 AMD | |
| Lenovo ThinkPad P16s G2 21K9000CGE | |
| Lenovo ThinkPad P14s G4 21K5000LGE | |
| Schenker Vision 16 PH6PRX1 | |
| Lenovo ThinkPad P15v G3 21EM001AGE | |
| HP EliteBook 845 G10 818N0EA | |
| PCMark 10 / Productivity | |
| Moyenne de la classe Workstation (8789 - 20616, n=21, 2 dernières années) | |
| Acer Swift Edge SFE16 Ryzen 7 7840U | |
| Lenovo ThinkPad P16v G1 AMD | |
| Moyenne AMD Ryzen 7 PRO 7840U, AMD Radeon 780M (8921 - 9933, n=5) | |
| Microsoft Surface Laptop Studio 2 RTX 4060 | |
| Lenovo ThinkPad P14s G4 21K5000LGE | |
| HP EliteBook 845 G10 818N0EA | |
| Lenovo ThinkPad P16s G2 21K9000CGE | |
| MSI Prestige 16 B1MG-001US | |
| Lenovo ThinkPad P15v G3 21EM001AGE | |
| Lenovo ThinkPad X1 Carbon G11 21HNS54T00 | |
| Schenker Vision 16 PH6PRX1 | |
| PCMark 10 / Digital Content Creation | |
| Moyenne de la classe Workstation (7744 - 15631, n=21, 2 dernières années) | |
| Microsoft Surface Laptop Studio 2 RTX 4060 | |
| MSI Prestige 16 B1MG-001US | |
| Lenovo ThinkPad P16v G1 AMD | |
| Lenovo ThinkPad P16s G2 21K9000CGE | |
| Lenovo ThinkPad P14s G4 21K5000LGE | |
| Lenovo ThinkPad P15v G3 21EM001AGE | |
| Moyenne AMD Ryzen 7 PRO 7840U, AMD Radeon 780M (7806 - 8874, n=5) | |
| Acer Swift Edge SFE16 Ryzen 7 7840U | |
| HP EliteBook 845 G10 818N0EA | |
| Schenker Vision 16 PH6PRX1 | |
| Lenovo ThinkPad X1 Carbon G11 21HNS54T00 | |
| CrossMark / Overall | |
| Moyenne de la classe Workstation (1307 - 2267, n=24, 2 dernières années) | |
| Lenovo ThinkPad X1 Carbon G11 21HNS54T00 | |
| Acer Swift Edge SFE16 Ryzen 7 7840U | |
| MSI Prestige 16 B1MG-001US | |
| Microsoft Surface Laptop Studio 2 RTX 4060 | |
| Schenker Vision 16 PH6PRX1 | |
| Moyenne AMD Ryzen 7 PRO 7840U, AMD Radeon 780M (1533 - 1669, n=5) | |
| Lenovo ThinkPad P16s G2 21K9000CGE | |
| Lenovo ThinkPad P14s G4 21K5000LGE | |
| Lenovo ThinkPad P16v G1 AMD | |
| HP EliteBook 845 G10 818N0EA | |
| Lenovo ThinkPad P15v G3 21EM001AGE | |
| CrossMark / Productivity | |
| Acer Swift Edge SFE16 Ryzen 7 7840U | |
| Moyenne de la classe Workstation (1130 - 2122, n=24, 2 dernières années) | |
| Lenovo ThinkPad X1 Carbon G11 21HNS54T00 | |
| MSI Prestige 16 B1MG-001US | |
| Schenker Vision 16 PH6PRX1 | |
| Microsoft Surface Laptop Studio 2 RTX 4060 | |
| Lenovo ThinkPad P16v G1 AMD | |
| Moyenne AMD Ryzen 7 PRO 7840U, AMD Radeon 780M (1461 - 1624, n=5) | |
| Lenovo ThinkPad P16s G2 21K9000CGE | |
| Lenovo ThinkPad P14s G4 21K5000LGE | |
| Lenovo ThinkPad P15v G3 21EM001AGE | |
| HP EliteBook 845 G10 818N0EA | |
| CrossMark / Creativity | |
| Moyenne de la classe Workstation (1657 - 2725, n=24, 2 dernières années) | |
| Lenovo ThinkPad X1 Carbon G11 21HNS54T00 | |
| Microsoft Surface Laptop Studio 2 RTX 4060 | |
| MSI Prestige 16 B1MG-001US | |
| Acer Swift Edge SFE16 Ryzen 7 7840U | |
| Moyenne AMD Ryzen 7 PRO 7840U, AMD Radeon 780M (1697 - 1824, n=5) | |
| Lenovo ThinkPad P16s G2 21K9000CGE | |
| Schenker Vision 16 PH6PRX1 | |
| Lenovo ThinkPad P14s G4 21K5000LGE | |
| Lenovo ThinkPad P16v G1 AMD | |
| HP EliteBook 845 G10 818N0EA | |
| Lenovo ThinkPad P15v G3 21EM001AGE | |
| CrossMark / Responsiveness | |
| Acer Swift Edge SFE16 Ryzen 7 7840U | |
| Schenker Vision 16 PH6PRX1 | |
| Moyenne de la classe Workstation (993 - 2096, n=24, 2 dernières années) | |
| MSI Prestige 16 B1MG-001US | |
| Lenovo ThinkPad X1 Carbon G11 21HNS54T00 | |
| Microsoft Surface Laptop Studio 2 RTX 4060 | |
| Lenovo ThinkPad P14s G4 21K5000LGE | |
| Lenovo ThinkPad P16v G1 AMD | |
| Lenovo ThinkPad P16s G2 21K9000CGE | |
| Moyenne AMD Ryzen 7 PRO 7840U, AMD Radeon 780M (1049 - 1499, n=5) | |
| Lenovo ThinkPad P15v G3 21EM001AGE | |
| HP EliteBook 845 G10 818N0EA | |
| WebXPRT 3 / Overall | |
| Lenovo ThinkPad P16v G1 AMD | |
| Moyenne de la classe Workstation (260 - 360, n=25, 2 dernières années) | |
| Acer Swift Edge SFE16 Ryzen 7 7840U | |
| Microsoft Surface Laptop Studio 2 RTX 4060 | |
| MSI Prestige 16 B1MG-001US | |
| Lenovo ThinkPad X1 Carbon G11 21HNS54T00 | |
| Lenovo ThinkPad X1 Carbon G11 21HNS54T00 | |
| Moyenne AMD Ryzen 7 PRO 7840U, AMD Radeon 780M (259 - 317, n=5) | |
| HP EliteBook 845 G10 818N0EA | |
| Lenovo ThinkPad P14s G4 21K5000LGE | |
| Lenovo ThinkPad P16s G2 21K9000CGE | |
| Lenovo ThinkPad P15v G3 21EM001AGE | |
| WebXPRT 4 / Overall | |
| Moyenne de la classe Workstation (189.2 - 326, n=25, 2 dernières années) | |
| Microsoft Surface Laptop Studio 2 RTX 4060 | |
| MSI Prestige 16 B1MG-001US | |
| Lenovo ThinkPad P16v G1 AMD | |
| Acer Swift Edge SFE16 Ryzen 7 7840U | |
| Moyenne AMD Ryzen 7 PRO 7840U, AMD Radeon 780M (234 - 245, n=2) | |
| HP EliteBook 845 G10 818N0EA | |
| Lenovo ThinkPad P15v G3 21EM001AGE | |
| Mozilla Kraken 1.1 / Total | |
| Lenovo ThinkPad P15v G3 21EM001AGE | |
| Lenovo ThinkPad P14s G4 21K5000LGE | |
| HP EliteBook 845 G10 818N0EA | |
| Lenovo ThinkPad P16s G2 21K9000CGE | |
| Moyenne AMD Ryzen 7 PRO 7840U, AMD Radeon 780M (523 - 571, n=5) | |
| Lenovo ThinkPad P16v G1 AMD | |
| MSI Prestige 16 B1MG-001US | |
| Acer Swift Edge SFE16 Ryzen 7 7840U | |
| Microsoft Surface Laptop Studio 2 RTX 4060 | |
| Lenovo ThinkPad X1 Carbon G11 21HNS54T00 | |
| Lenovo ThinkPad X1 Carbon G11 21HNS54T00 | |
| Moyenne de la classe Workstation (411 - 538, n=25, 2 dernières années) | |
* ... Moindre est la valeur, meilleures sont les performances
| PCMark 10 Score | 6628 points | |
Aide | ||
| AIDA64 / Memory Copy | |
| Moyenne de la classe Workstation (56003 - 164795, n=25, 2 dernières années) | |
| Acer Swift Edge SFE16 Ryzen 7 7840U | |
| Lenovo ThinkPad P14s G4 21K5000LGE | |
| Moyenne AMD Ryzen 7 PRO 7840U (66487 - 67856, n=5) | |
| Lenovo ThinkPad P16s G2 21K9000CGE | |
| Microsoft Surface Laptop Studio 2 RTX 4060 | |
| Schenker Vision 16 PH6PRX1 | |
| HP EliteBook 845 G10 818N0EA | |
| Lenovo ThinkPad P16v G1 AMD | |
| AIDA64 / Memory Read | |
| Moyenne de la classe Workstation (55795 - 121563, n=25, 2 dernières années) | |
| Schenker Vision 16 PH6PRX1 | |
| Microsoft Surface Laptop Studio 2 RTX 4060 | |
| Lenovo ThinkPad P16s G2 21K9000CGE | |
| Acer Swift Edge SFE16 Ryzen 7 7840U | |
| Moyenne AMD Ryzen 7 PRO 7840U (47725 - 50543, n=5) | |
| Lenovo ThinkPad P14s G4 21K5000LGE | |
| Lenovo ThinkPad P16v G1 AMD | |
| HP EliteBook 845 G10 818N0EA | |
| AIDA64 / Memory Write | |
| Lenovo ThinkPad P14s G4 21K5000LGE | |
| Moyenne AMD Ryzen 7 PRO 7840U (89477 - 94965, n=5) | |
| Acer Swift Edge SFE16 Ryzen 7 7840U | |
| Lenovo ThinkPad P16s G2 21K9000CGE | |
| Moyenne de la classe Workstation (55663 - 214520, n=25, 2 dernières années) | |
| Microsoft Surface Laptop Studio 2 RTX 4060 | |
| Schenker Vision 16 PH6PRX1 | |
| HP EliteBook 845 G10 818N0EA | |
| Lenovo ThinkPad P16v G1 AMD | |
| AIDA64 / Memory Latency | |
| Lenovo ThinkPad P14s G4 21K5000LGE | |
| Moyenne AMD Ryzen 7 PRO 7840U (128.6 - 138.9, n=5) | |
| Lenovo ThinkPad P16s G2 21K9000CGE | |
| Moyenne de la classe Workstation (84.5 - 165.2, n=25, 2 dernières années) | |
| Acer Swift Edge SFE16 Ryzen 7 7840U | |
| HP EliteBook 845 G10 818N0EA | |
| Lenovo ThinkPad P16v G1 AMD | |
| Microsoft Surface Laptop Studio 2 RTX 4060 | |
| Schenker Vision 16 PH6PRX1 | |
* ... Moindre est la valeur, meilleures sont les performances
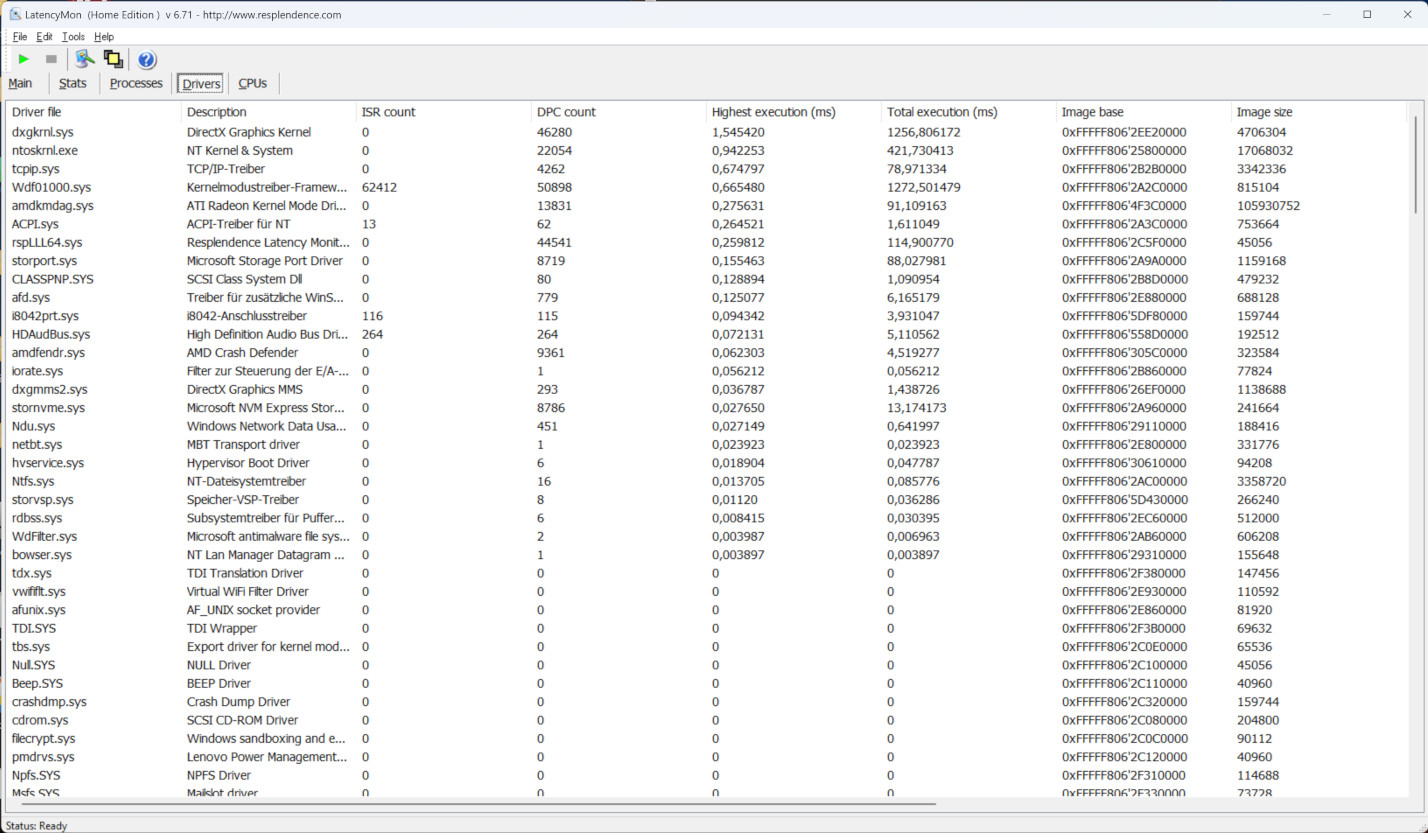
Latence DPC
Les résultats de LatencyMon ne sont pas tout à fait à la hauteur. Au moins, l'édition audio en temps réel pourrait poser quelques problèmes à l'appareil. Il est intéressant de noter que les programmes du pilote DirectX en particulier ont posé quelques problèmes. Une mise à jour résoudrait probablement quelques-uns d'entre eux. En général, les résultats pourraient facilement être modifiés dans les deux sens grâce à une mise à jour des pilotes ou à un nouveau logiciel.
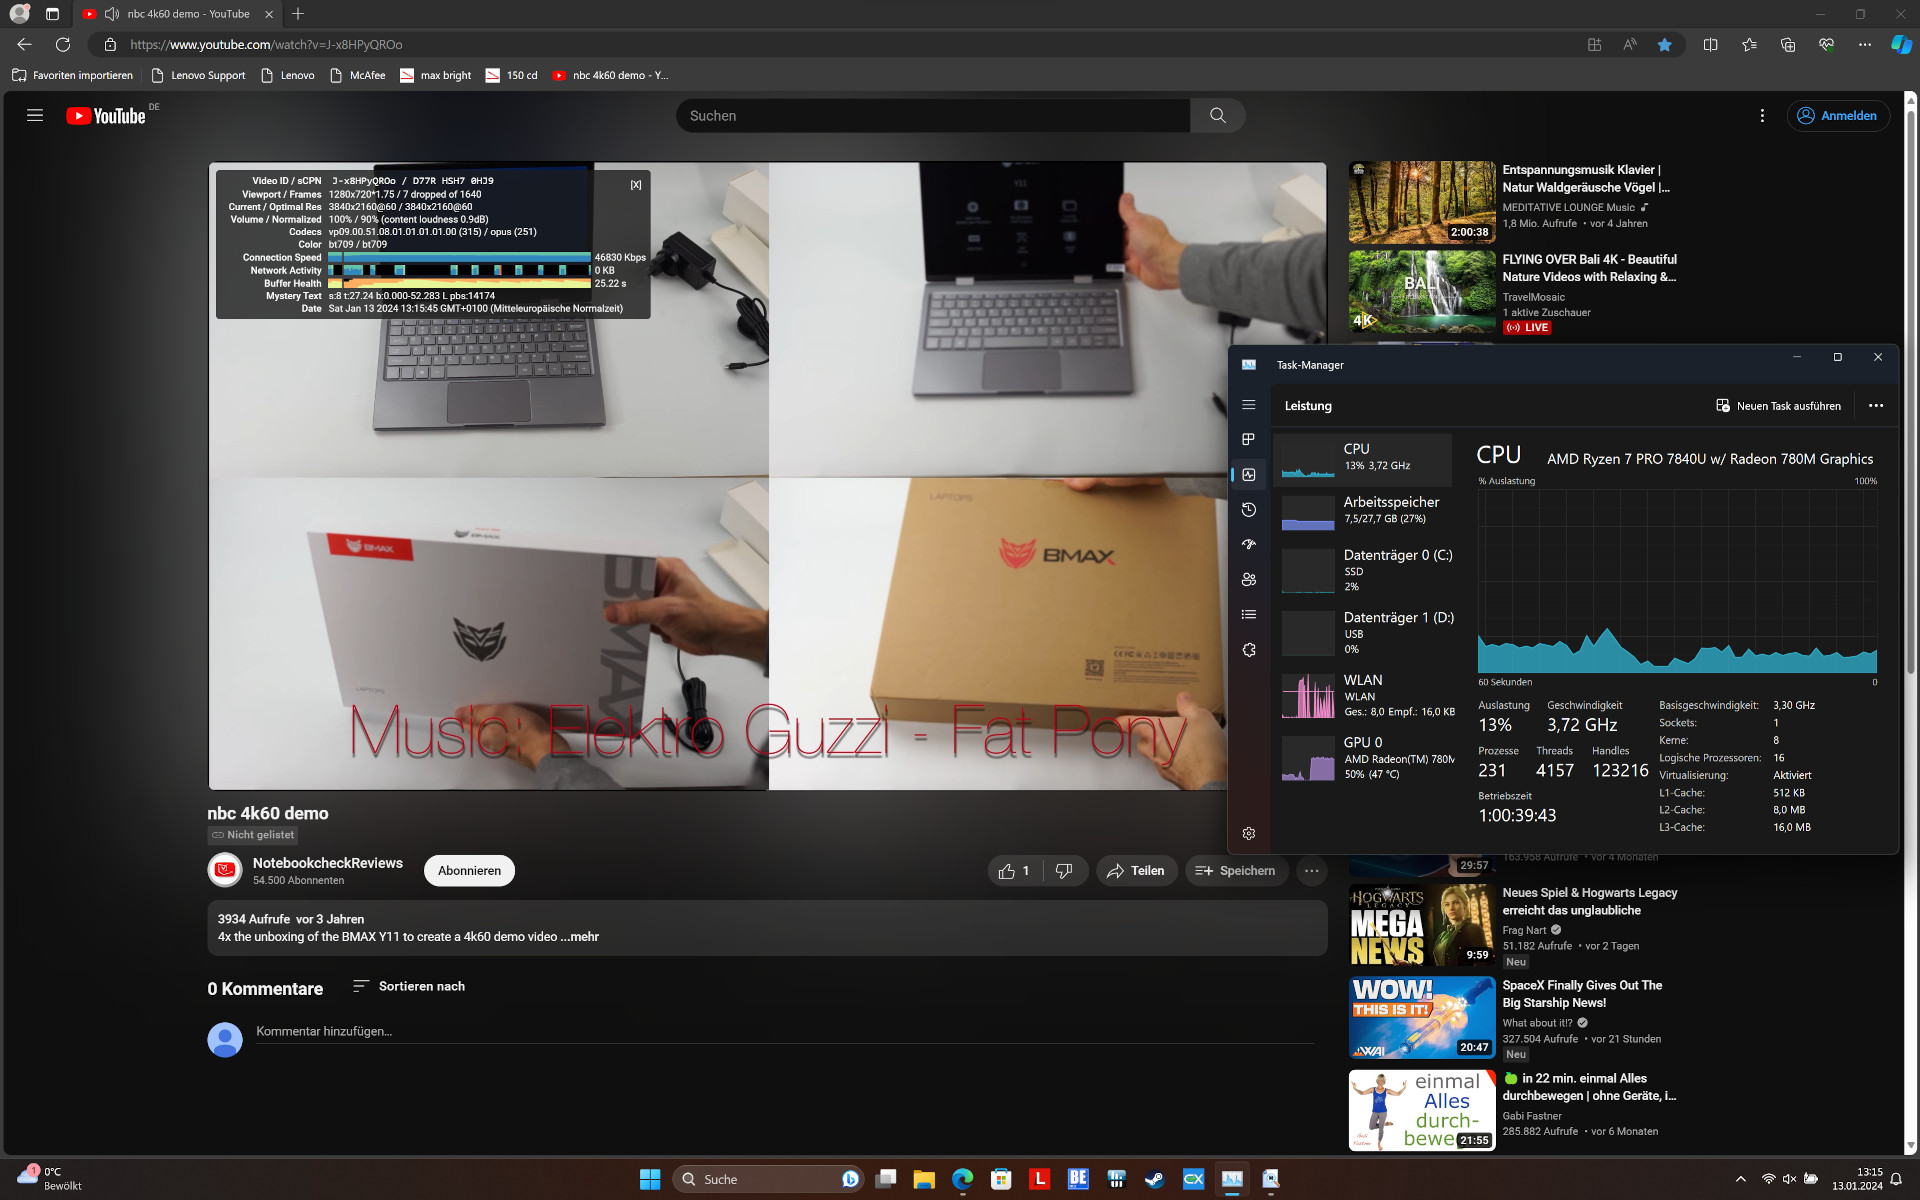
Les résultats en matière de vidéo laissent une marge d'amélioration similaire. Les 15 images perdues sont tout simplement trop nombreuses et une charge du GPU de 50 % montre que le pilote graphique n'a pas encore été réglé de manière idéale (lors de notre test, l'état actuel du pilote datait de 01/2024).
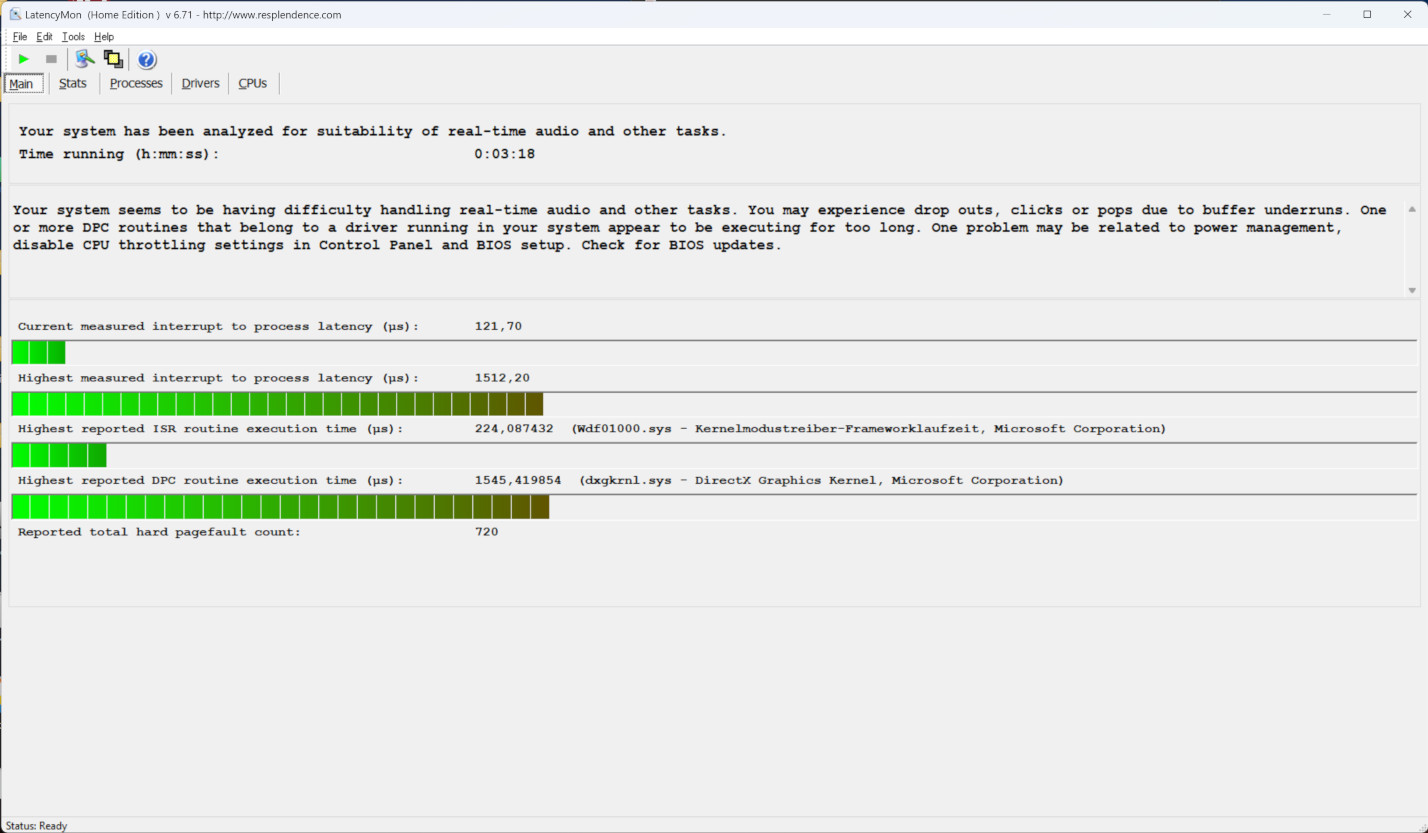
| DPC Latencies / LatencyMon - interrupt to process latency (max), Web, Youtube, Prime95 | |
| Microsoft Surface Laptop Studio 2 RTX 4060 | |
| Schenker Vision 16 PH6PRX1 | |
| Lenovo ThinkPad P16s G2 21K9000CGE | |
| Lenovo ThinkPad P14s G4 21K5000LGE | |
| HP EliteBook 845 G10 818N0EA | |
| Lenovo ThinkPad P16v G1 AMD | |
| Acer Swift Edge SFE16 Ryzen 7 7840U | |
* ... Moindre est la valeur, meilleures sont les performances
Dispositifs de stockage
Le refroidissement élaboré de l'ordinateur portable avec une grande plaque de cuivre a vraiment porté ses fruits lors de notre test en continu. Ses performances en écriture séquentielle sont restées parfaitement stables et élevées sur une longue période.
La carte M.2-SSD de SK Hynix ne peut pas gérer correctement de grandes quantités de petits fichiers avec de nombreux accès parallèles. Toutefois, cela ne devrait avoir qu'un léger effet négatif au démarrage. En utilisation normale, cela ne devrait pas avoir d'impact notable.

* ... Moindre est la valeur, meilleures sont les performances
Reading continuous performance: DiskSpd Read Loop, Queue Depth 8
Carte graphique
Bien sûr, vous ne devez pas attendre trop d'un iGPU, bien que la AMD Radeon 780M s'est généralement bien comportée. Même sans sa propre RAM et avec un matériel et une alimentation limités, elle était à peu près au même niveau qu'une RTX 2050 Mobile. La distance qui la sépare de la Nvidia RTX A1000 ou la RTX 3050 n'était pas non plus trop grande.
Le ThinkPad P16s G2 AMD s'est également bien comporté dans le benchmark SPECviewperf, qui nous donne un aperçu de ses performances avec les logiciels graphiques professionnels. Le ThinkPad P16s G2 AMD a obtenu de bons résultats dans le benchmark SPECviewperf Nvidia T550 a pu être tenu à distance. Et bien que la RTX A1000 a pris environ 50 % d'avance, elle nécessite beaucoup plus de puissance et d'espace, et les ordinateurs portables de station de travail tels que le Dell Precision 5470 sont également beaucoup plus chers.
D'autres iGPU, comme le Intel Iris Xe Graphics G7 96EUs sont beaucoup plus faibles et son prédécesseur, la Radeon 680Mest également loin derrière en ce qui concerne les performances graphiques.
Vous trouverez d'autres mesures, tests et évaluations dans notre liste de référence GPU http://www.notebookcheck.com/Mobile-Grafikkarten-Benchmarkliste.735.0.html.
| 3DMark 11 Performance | 12655 points | |
| 3DMark Cloud Gate Standard Score | 35205 points | |
| 3DMark Fire Strike Score | 7524 points | |
| 3DMark Time Spy Score | 3126 points | |
Aide | ||
| SPECviewperf Performance rating - Percent | |
| Moyenne de la classe Workstation | |
| HP ZBook Power 15 G10 | |
| Lenovo ThinkPad P16v G1 AMD | |
| Dell Precision 5000 5470 | |
| Lenovo ThinkPad P16s G2 21K9000CGE | |
| Moyenne AMD Radeon 780M | |
| HP ZBook Firefly 14 G9-6B8A2EA | |
| Lenovo ThinkPad T14 G3-21CF004NGE | |
Performances des jeux
Le jeu n'est en aucun cas l'un des points forts du P16. Malgré cela, le ThinkPad s'est avéré capable de jouer à la plupart des jeux grâce à son unité graphique intégrée. Même le jeu F1 23, relativement récent, peut être exécuté en Full HD et avec des détails élevés.
Les jeux complexes comme Starfield et, en général, les résolutions élevées et les détails maximums montrent rapidement les limites de l'iGPU. En particulier, sa mémoire vidéo externe n'est alors plus suffisante.
| Starfield | |
| 1920x1080 High Preset | |
| Moyenne AMD Radeon 780M (19 - 21.3, n=3) | |
| Lenovo ThinkPad P16s G2 21K9000CGE | |
| Lenovo ThinkPad P14s G4 21K5000LGE | |
| 1920x1080 Ultra Preset | |
| Moyenne AMD Radeon 780M (15 - 19.1, n=3) | |
| Lenovo ThinkPad P14s G4 21K5000LGE | |
| Lenovo ThinkPad P16s G2 21K9000CGE | |
En utilisant le paramètre de détail le plus élevé, le test continu avec The Witcher 3 s'est déroulé sans problème et sans mauvaise surprise. Cela signifie que ses bonnes performances graphiques restent disponibles sur de longues périodes.
Witcher 3 FPS diagram
| Bas | Moyen | Élevé | Ultra | QHD | 4K | |
|---|---|---|---|---|---|---|
| GTA V (2015) | 140 | 128.7 | 64.5 | 27.3 | 19.1 | 20.7 |
| The Witcher 3 (2015) | 138 | 94 | 47 | 30 | 20 | 15 |
| Dota 2 Reborn (2015) | 117.5 | 89.9 | 82.1 | 69.5 | 31.2 | |
| Final Fantasy XV Benchmark (2018) | 74.9 | 34.3 | 25.2 | 17.7 | 11.2 | |
| X-Plane 11.11 (2018) | 47.1 | 33.2 | 28.1 | 19.2 | ||
| Far Cry 5 (2018) | 69 | 46 | 42 | 40 | 27 | 12 |
| Strange Brigade (2018) | 157.4 | 65.5 | 56.1 | 46.9 | 31.7 | 16.3 |
| F1 23 (2023) | 81.6 | 72.3 | 51.3 | 11.9 | 7.36 | 3.24 |
| Starfield (2023) | 27 | 23 | 19 | 15 | 12 | 7 |
Émissions - Le ThinkPad P16s est toujours réservé
Émissions sonores
Par rapport au plus petit ThinkPad P14s G4le ventilateur de même taille de l'actuel ThinkPad P16s G2 doit faire face à beaucoup plus de chaleur. En outre, il doit franchir une petite distance vers l'extérieur. Ce n'est pas idéal, mais cela a probablement été fait pour économiser de l'argent.
Cela signifie que les émissions sonores de l'appareil sont un peu plus intenses en charge élevée, nous les estimons environ deux fois plus fortes que celles du P14s G4. Nous avons mesuré des émissions sonores maximales de 40 dB, ce qui n'est pas inquiétant. En outre, le P16s offre un peu plus de performances que le P14s G4 équipé du même processeur. Un ventilateur plus grand ou mieux placé aurait permis d'obtenir de bien meilleurs résultats.
Un point positif, en revanche, est la façon dont il se comporte lors de tâches très simples. Le ventilateur reste alors totalement silencieux.
Degré de la nuisance sonore
| Au repos |
| 22.6 / 22.6 / 22.6 dB(A) |
| Fortement sollicité |
| 37.8 / 40.5 dB(A) |
 | ||
30 dB silencieux 40 dB(A) audible 50 dB(A) bruyant |
||
min: | ||
| Lenovo ThinkPad P16s G2 21K9000CGE Radeon 780M, R7 PRO 7840U, SK hynix PC801 HFS001TEJ9X162N | HP EliteBook 845 G10 818N0EA Radeon 780M, R9 PRO 7940HS, SK hynix PC801 HFS001TEJ9X101N | Lenovo ThinkPad P14s G4 21K5000LGE Radeon 780M, R7 PRO 7840U, SK hynix PC801 HFS512GEJ9X162N | Schenker Vision 16 PH6PRX1 Iris Xe G7 96EUs, i7-13700H, Samsung 990 Pro 1 TB | Acer Swift Edge SFE16 Ryzen 7 7840U Radeon 780M, R7 7840U, SK hynix HFS512GEJ9X125N | Lenovo ThinkPad P16v G1 AMD RTX A1000 Laptop GPU, R7 PRO 7840HS, SK hynix PC801 HFS001TEJ9X101N | Microsoft Surface Laptop Studio 2 RTX 4060 GeForce RTX 4060 Laptop GPU, i7-13700H, Kioxia XG8 KXG80ZNV1T02 | |
|---|---|---|---|---|---|---|---|
| Noise | -8% | 4% | -11% | -8% | -8% | -18% | |
| arrêt / environnement * (dB) | 22.6 | 25.3 -12% | 22.4 1% | 25.5 -13% | 23.4 -4% | 24.3 -8% | 23.9 -6% |
| Idle Minimum * (dB) | 22.6 | 25.3 -12% | 22.4 1% | 25.5 -13% | 24.1 -7% | 24.3 -8% | 23.9 -6% |
| Idle Average * (dB) | 22.6 | 25.3 -12% | 22.4 1% | 28.7 -27% | 24.3 -8% | 24.3 -8% | 24.4 -8% |
| Idle Maximum * (dB) | 22.6 | 25.3 -12% | 22.4 1% | 29.1 -29% | 28 -24% | 24.3 -8% | 26.9 -19% |
| Load Average * (dB) | 37.8 | 34.4 9% | 31.3 17% | 33.8 11% | 41 -8% | 35.7 6% | 48.5 -28% |
| Witcher 3 ultra * (dB) | 40.3 | 43.4 -8% | 39.5 2% | 37.6 7% | 40.9 -1% | 43.7 -8% | 51.8 -29% |
| Load Maximum * (dB) | 40.5 | 43.4 -7% | 39.2 3% | 44.9 -11% | 40.9 -1% | 50.2 -24% | 51.8 -28% |
* ... Moindre est la valeur, meilleures sont les performances
Température
Même si les ventilateurs ne sont pas activés, l'ordinateur portable ne chauffe que très peu. C'est le cas tant que vous surfez sur le web, que vous diffusez des informations en continu, que vous effectuez du travail de bureau ou autre. À aucun moment, le boîtier n'atteint les 30 °C dans ces scénarios.
En revanche, le boîtier chauffe beaucoup plus dès que la chaleur doit être dissipée par le processeur. Nous avons mesuré plus de 40 °C sur le clavier et même plus de 47 °C sur le dessous. Cela signifie qu'il peut devenir un peu inconfortable à utiliser à pleine charge.
(±) La température maximale du côté supérieur est de 42.7 °C / 109 F, par rapport à la moyenne de 38.2 °C / 101 F, allant de 22.2 à 69.8 °C pour la classe Workstation.
(-) Le fond chauffe jusqu'à un maximum de 47.2 °C / 117 F, contre une moyenne de 41.1 °C / 106 F
(+) En utilisation inactive, la température moyenne du côté supérieur est de 25.7 °C / 78 F, par rapport à la moyenne du dispositif de 32 °C / 90 F.
(±) En jouant à The Witcher 3, la température moyenne du côté supérieur est de 34.5 °C / 94 F, alors que la moyenne de l'appareil est de 32 °C / 90 F.
(+) Les repose-poignets et le pavé tactile atteignent la température maximale de la peau (32.9 °C / 91.2 F) et ne sont donc pas chauds.
(-) La température moyenne de la zone de l'appui-paume de dispositifs similaires était de 27.8 °C / 82 F (-5.1 °C / #-9.2 F).
| Lenovo ThinkPad P16s G2 21K9000CGE AMD Ryzen 7 PRO 7840U, AMD Radeon 780M | HP EliteBook 845 G10 818N0EA AMD Ryzen 9 PRO 7940HS, AMD Radeon 780M | Lenovo ThinkPad P14s G4 21K5000LGE AMD Ryzen 7 PRO 7840U, AMD Radeon 780M | Schenker Vision 16 PH6PRX1 Intel Core i7-13700H, Intel Iris Xe Graphics G7 96EUs | Acer Swift Edge SFE16 Ryzen 7 7840U AMD Ryzen 7 7840U, AMD Radeon 780M | Lenovo ThinkPad P16v G1 AMD AMD Ryzen 7 PRO 7840HS, NVIDIA RTX A1000 Laptop GPU | Microsoft Surface Laptop Studio 2 RTX 4060 Intel Core i7-13700H, NVIDIA GeForce RTX 4060 Laptop GPU | |
|---|---|---|---|---|---|---|---|
| Heat | -2% | 3% | 5% | -4% | 1% | 6% | |
| Maximum Upper Side * (°C) | 42.7 | 45.6 -7% | 41.1 4% | 41.1 4% | 41.6 3% | 40.9 4% | 40.4 5% |
| Maximum Bottom * (°C) | 47.2 | 51.9 -10% | 48.2 -2% | 42 11% | 46.6 1% | 57.9 -23% | 42.2 11% |
| Idle Upper Side * (°C) | 27.8 | 26.5 5% | 26.5 5% | 28.5 -3% | 30.4 -9% | 24.5 12% | 26.6 4% |
| Idle Bottom * (°C) | 28.4 | 27 5% | 26.9 5% | 26.8 6% | 31 -9% | 25.5 10% | 27 5% |
* ... Moindre est la valeur, meilleures sont les performances
Épreuve d'effort
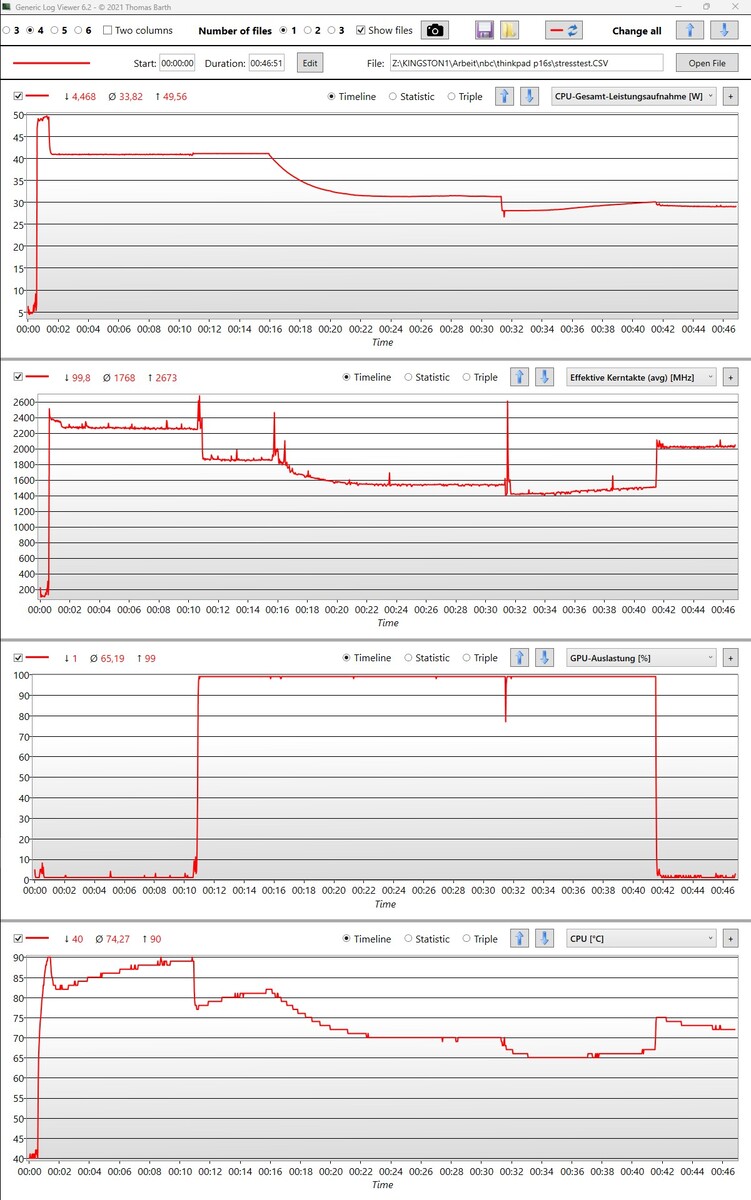
Si le CPU et l'iGPU sont complètement sollicités avec Prime95 et FurMark, l'alimentation reste stable, avec 41 watts pour le processeur. Lorsque vous passez au mode performance, les paramètres s'ajustent en douceur.
L'unité graphique peut être pleinement utilisée en même temps, à travers les différents réglages de puissance. Le ventilateur devient un peu plus silencieux au fur et à mesure que la puissance maximale de l'alimentation est réduite.
La température du processeur que nous avons mesurée n'a atteint 90 °C que pendant une courte période à pleine charge. En économisant le plus d'énergie possible, les températures sont restées à 65 °C malgré le volume réduit du ventilateur. Rien n'empêche d'utiliser le système à tout moment.
Intervenants
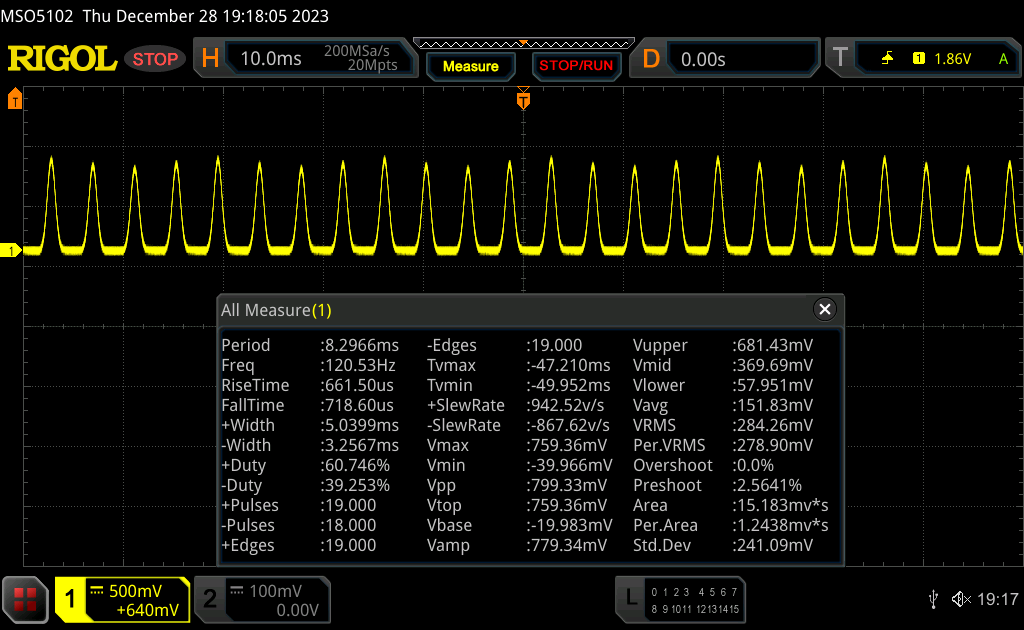
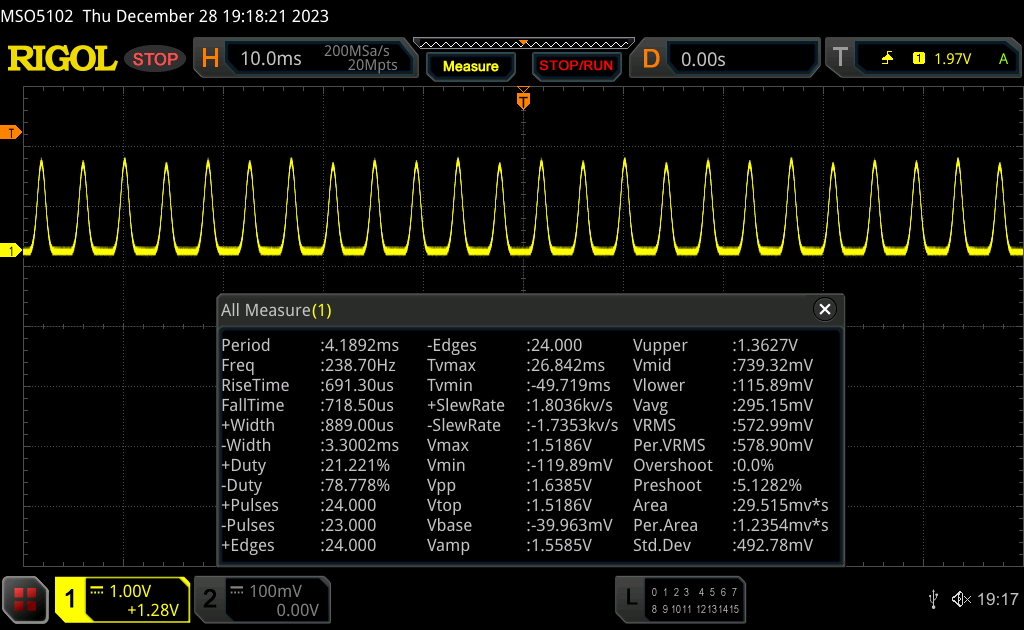
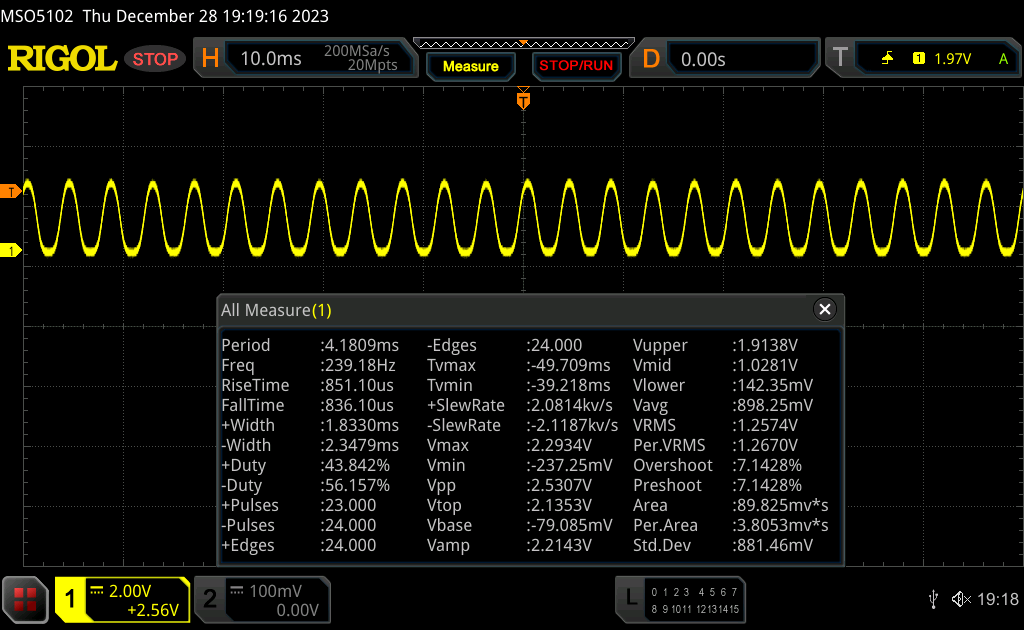
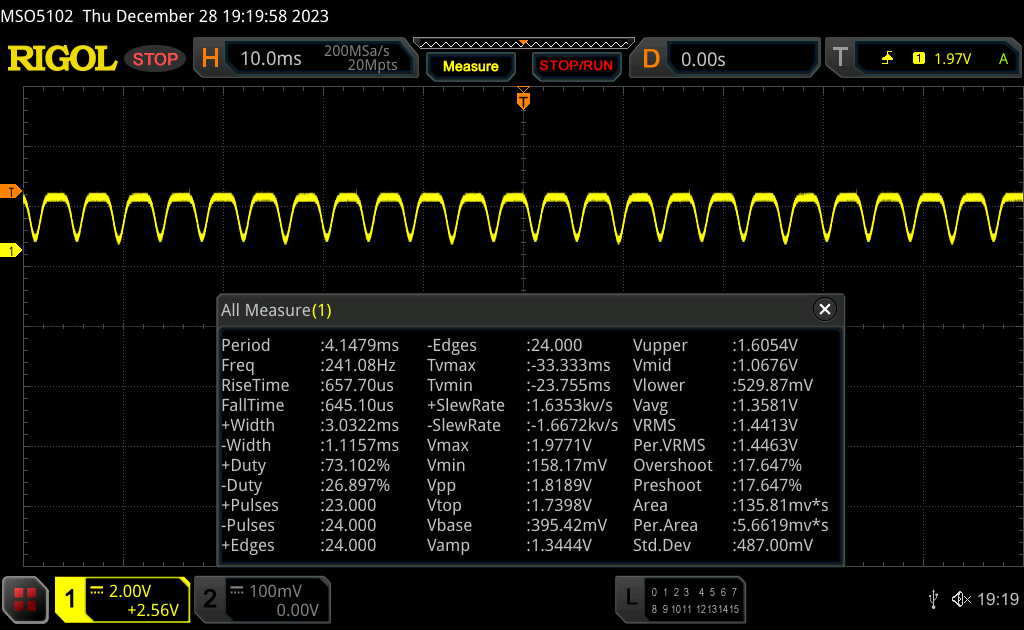
Les haut-parleurs sont faibles - ils manquent de basses. Même les bas médiums sont à peine perceptibles et leur volume maximal pourrait être plus élevé. En outre, ils manquent de détails, bien que les voix soient généralement bien audibles, même pendant les chansons complexes.
Ils sont suffisants pour les appels vidéo, la musique de fond ou le streaming occasionnel. Nous ne nous attendons pas à mieux de la part de simples haut-parleurs d'ordinateur portable, surtout s'il s'agit d'une station de travail.
Lenovo ThinkPad P16s G2 21K9000CGE analyse audio
(±) | le niveau sonore du haut-parleur est moyen mais bon (76.2# dB)
Basses 100 - 315 Hz
(-) | presque aucune basse - en moyenne 26.5% plus bas que la médiane
(±) | la linéarité des basses est moyenne (12.3% delta à la fréquence précédente)
Médiums 400 - 2000 Hz
(+) | médiane équilibrée - seulement 3.9% de la médiane
(+) | les médiums sont linéaires (6.9% delta à la fréquence précédente)
Aiguës 2 - 16 kHz
(+) | des sommets équilibrés - à seulement 3.5% de la médiane
(+) | les aigus sont linéaires (4.8% delta à la fréquence précédente)
Globalement 100 - 16 000 Hz
(±) | la linéarité du son global est moyenne (21.3% de différence avec la médiane)
Par rapport à la même classe
» 77% de tous les appareils testés de cette catégorie étaient meilleurs, 6% similaires, 18% pires
» Le meilleur avait un delta de 7%, la moyenne était de 17%, le pire était de 35%.
Par rapport à tous les appareils testés
» 59% de tous les appareils testés étaient meilleurs, 7% similaires, 33% pires
» Le meilleur avait un delta de 4%, la moyenne était de 24%, le pire était de 134%.
Apple MacBook Pro 16 2021 M1 Pro analyse audio
(+) | les haut-parleurs peuvent jouer relativement fort (84.7# dB)
Basses 100 - 315 Hz
(+) | bonne basse - seulement 3.8% loin de la médiane
(+) | les basses sont linéaires (5.2% delta à la fréquence précédente)
Médiums 400 - 2000 Hz
(+) | médiane équilibrée - seulement 1.3% de la médiane
(+) | les médiums sont linéaires (2.1% delta à la fréquence précédente)
Aiguës 2 - 16 kHz
(+) | des sommets équilibrés - à seulement 1.9% de la médiane
(+) | les aigus sont linéaires (2.7% delta à la fréquence précédente)
Globalement 100 - 16 000 Hz
(+) | le son global est linéaire (4.6% différence à la médiane)
Par rapport à la même classe
» 0% de tous les appareils testés de cette catégorie étaient meilleurs, 0% similaires, 100% pires
» Le meilleur avait un delta de 5%, la moyenne était de 17%, le pire était de 45%.
Par rapport à tous les appareils testés
» 0% de tous les appareils testés étaient meilleurs, 0% similaires, 100% pires
» Le meilleur avait un delta de 4%, la moyenne était de 24%, le pire était de 134%.
Gestion de l'énergie - La station de travail atteint ses limites
Consommation électrique
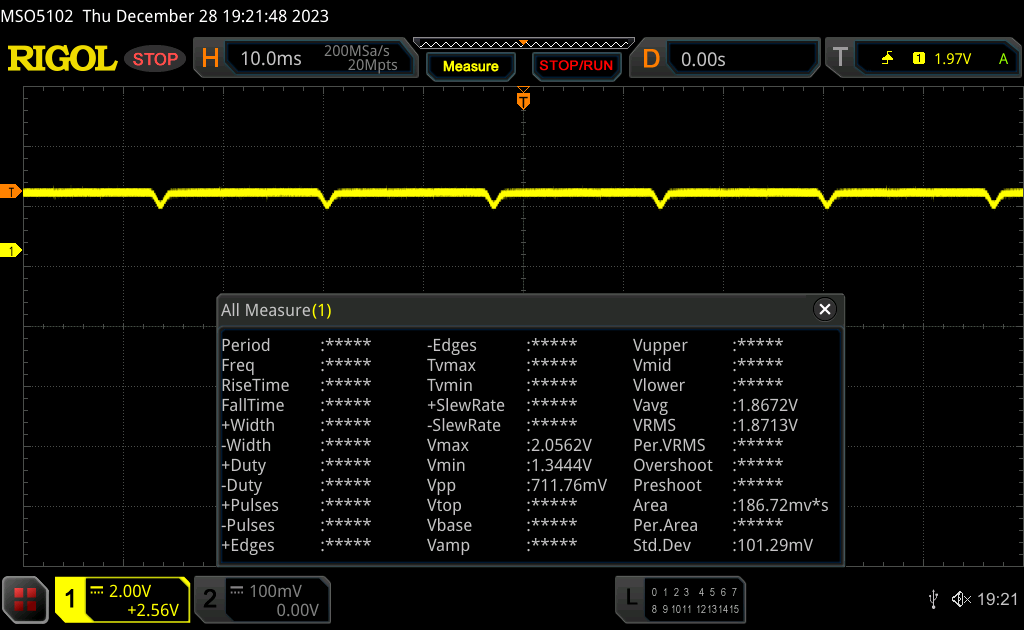
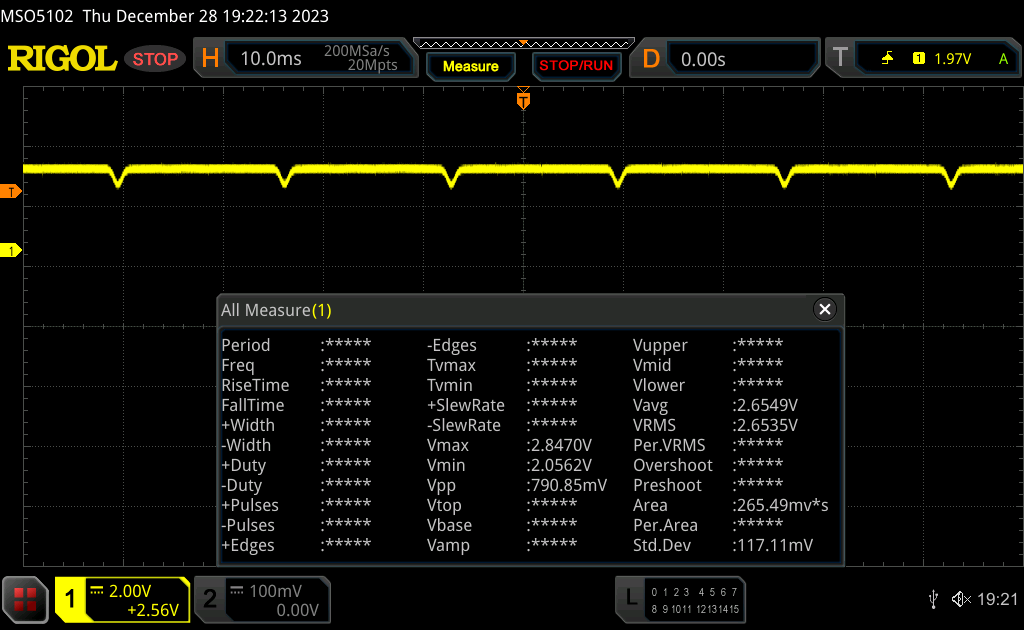
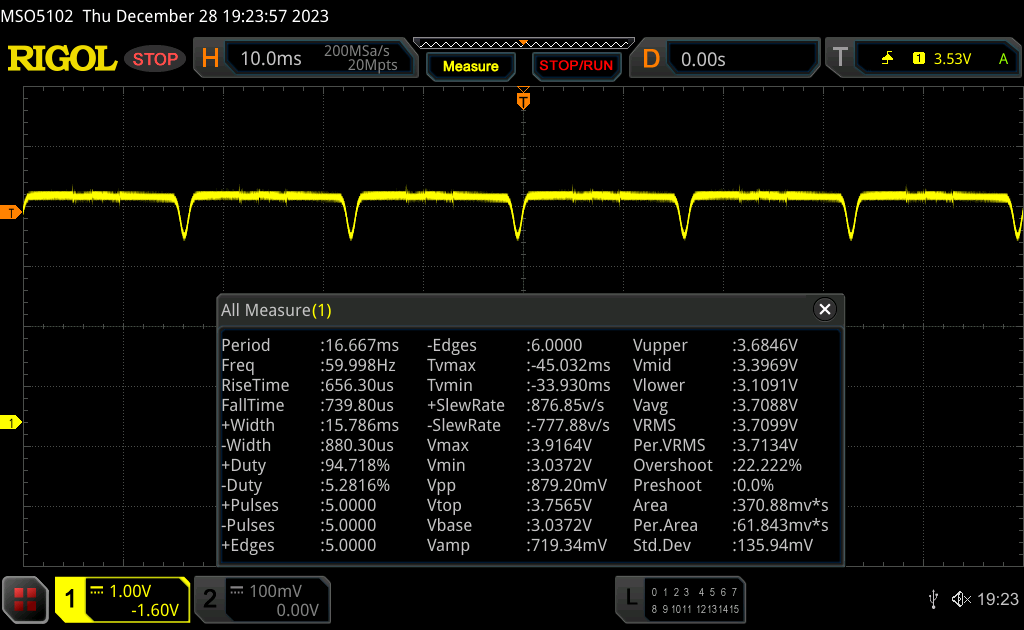
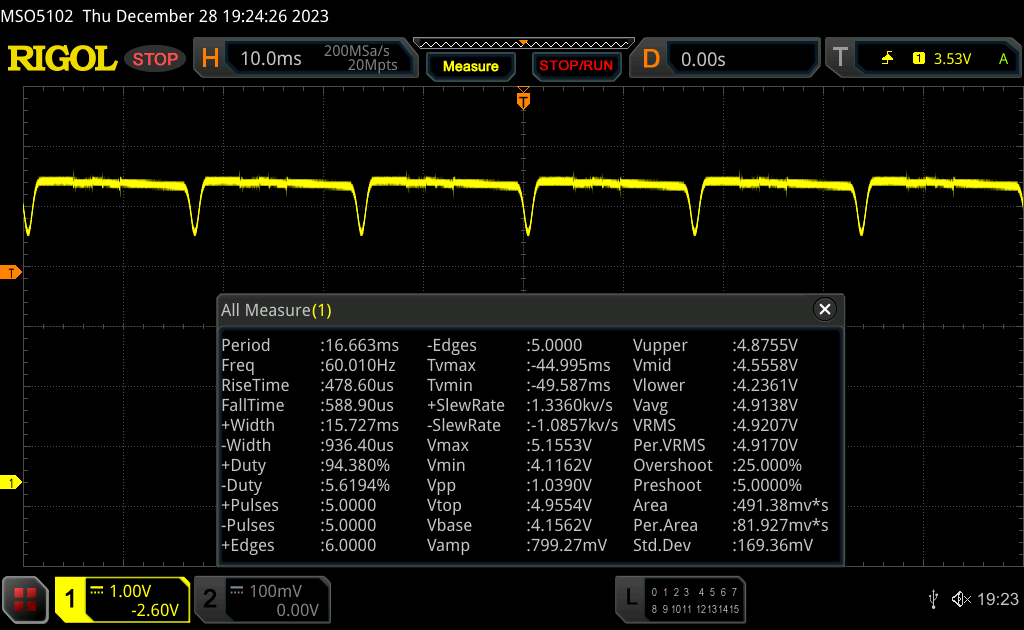
En raison de la forte consommation permanente du système, l'alimentation de 65 watts pourrait atteindre ses limites lorsque le matériel est le plus sollicité. Cependant, les 68 watts que nous avons mesurés devraient être disponibles sans problème. Cependant, il ne dispose pas d'un tampon pour charger l'ordinateur portable. S'il n'a qu'une demi-charge, il en sera ainsi jusqu'à ce que le CPU et le GPU demandent moins d'énergie. En même temps, nous n'avons pas enregistré de décharges intempestives pendant le test de stress.
Le ThinkPad P16s G2 AMD aurait certainement dû être équipé d'un bloc d'alimentation plus puissant de 90 watts.
| Éteint/en veille | |
| Au repos | |
| Fortement sollicité |
|
Légende:
min: | |
| Lenovo ThinkPad P16s G2 21K9000CGE R7 PRO 7840U, Radeon 780M, SK hynix PC801 HFS001TEJ9X162N, OLED, 3840x2400, 16" | HP EliteBook 845 G10 818N0EA R9 PRO 7940HS, Radeon 780M, SK hynix PC801 HFS001TEJ9X101N, IPS, 2560x1600, 14" | Lenovo ThinkPad P14s G4 21K5000LGE R7 PRO 7840U, Radeon 780M, SK hynix PC801 HFS512GEJ9X162N, IPS, 1920x1200, 14" | Schenker Vision 16 PH6PRX1 i7-13700H, Iris Xe G7 96EUs, Samsung 990 Pro 1 TB, IPS, 2560x1600, 16" | Acer Swift Edge SFE16 Ryzen 7 7840U R7 7840U, Radeon 780M, SK hynix HFS512GEJ9X125N, OLED, 3200x2000, 16" | Lenovo ThinkPad P16v G1 AMD R7 PRO 7840HS, RTX A1000 Laptop GPU, SK hynix PC801 HFS001TEJ9X101N, IPS, 1920x1200, 16" | Moyenne AMD Radeon 780M | Moyenne de la classe Workstation | |
|---|---|---|---|---|---|---|---|---|
| Power Consumption | -16% | 22% | -41% | -27% | -20% | -17% | -107% | |
| Idle Minimum * (Watt) | 6.1 | 4.3 30% | 2.9 52% | 6.3 -3% | 7.1 -16% | 4.1 33% | 6.01 ? 1% | 8.94 ? -47% |
| Idle Average * (Watt) | 6.5 | 10.1 -55% | 5.1 22% | 14.4 -122% | 10.1 -55% | 6.5 -0% | 8.15 ? -25% | 13.8 ? -112% |
| Idle Maximum * (Watt) | 7 | 11.2 -60% | 5.6 20% | 16.2 -131% | 18.6 -166% | 6.7 4% | 10.3 ? -47% | 17.5 ? -150% |
| Load Average * (Watt) | 56.6 | 64.4 -14% | 51.2 10% | 46.2 18% | 45.3 20% | 65.2 -15% | 57.6 ? -2% | 95 ? -68% |
| Witcher 3 ultra * (Watt) | 61.2 | 59.4 3% | 49.9 18% | 49.4 19% | 39.5 35% | 77.2 -26% | ||
| Load Maximum * (Watt) | 68.3 | 66.7 2% | 60.2 12% | 85.2 -25% | 52.9 23% | 147 -115% | 77 ? -13% | 175.2 ? -157% |
* ... Moindre est la valeur, meilleures sont les performances
Power consumption Witcher 3 / stress test
Power consumption with external monitor
Délais d'exécution
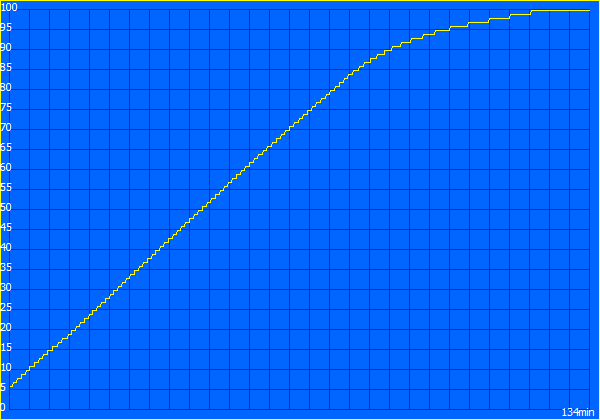
La grande efficacité de l'AMD Ryzen 7 Pro 7840U est quelque peu atténuée par l'écran OLED de l'ordinateur portable. L'autonomie est largement due à la capacité de la batterie de 84 Wh et non pas à sa frugalité en cas de faible charge.
Avec une autonomie de plus de 13 heures et de 10 heures (test de navigation sur Internet), vous pouvez utiliser l'ordinateur portable en déplacement sans aucun problème. Cependant, ce n'est le cas que lorsque la luminosité est réduite. Lors de notre test, celle-ci était réglée à environ 60 %. En revanche, à pleine luminosité, l'écran OLED consomme beaucoup plus d'énergie, si bien que la navigation sur le web épuise la batterie en moins de 7 heures.
Avec un autre écran, par exemple celui du très similaire ThinkPad P14s G4il est possible d'ouvrir des sites web en continu pendant plus de 11 heures, avec une batterie beaucoup plus petite de 52 Wh. Si l'on extrapole soigneusement, le P16s G2, doté d'un écran IPS et d'une représentation moyenne des couleurs, devrait pouvoir être utilisé pendant 16 heures pour surfer.
| Lenovo ThinkPad P16s G2 21K9000CGE R7 PRO 7840U, Radeon 780M, 84 Wh | HP EliteBook 845 G10 818N0EA R9 PRO 7940HS, Radeon 780M, 51 Wh | Schenker Vision 16 PH6PRX1 i7-13700H, Iris Xe G7 96EUs, 80 Wh | Acer Swift Edge SFE16 Ryzen 7 7840U R7 7840U, Radeon 780M, 54 Wh | Lenovo ThinkPad P16v G1 AMD R7 PRO 7840HS, RTX A1000 Laptop GPU, 90 Wh | Microsoft Surface Laptop Studio 2 RTX 4060 i7-13700H, GeForce RTX 4060 Laptop GPU, 58 Wh | Moyenne de la classe Workstation | |
|---|---|---|---|---|---|---|---|
| Autonomie de la batterie | -32% | 24% | -47% | 16% | 3% | -18% | |
| H.264 (h) | 13.3 | 9.3 -30% | 17.8 34% | 11.3 -15% | 9.51 ? -28% | ||
| WiFi v1.3 (h) | 10.6 | 7.9 -25% | 8 -25% | 5.6 -47% | 15 42% | 8.3 -22% | 8.53 ? -20% |
| Load (h) | 1.5 | 0.9 -40% | 2.6 73% | 1.1 -27% | 2.2 47% | 1.429 ? -5% |
Points positifs
Points négatifs
Verdict - Les performances et l'image sont excellentes, le reste est correct


Le ThinkPad P16s G2 AMD offre une variété inhabituelle d'utilisations potentielles. Les performances élevées du processeur, associées à une bonne Radeon 780M permet une utilisation professionnelle, même pour les tâches les plus exigeantes sur le plan graphique. La vitesse n'est peut-être pas aussi élevée que sur un appareil doté d'une carte graphique dédiée, mais l'ordinateur portable de station de travail a d'autres atouts à faire valoir.
Les ventilateurs sont souvent silencieux ou complètement désactivés et, malgré la forte consommation d'énergie de l'écran OLED, il offre des durées d'exécution décentes. De plus, son prix est raisonnable si l'on considère ses performances. Tout cela se traduit par des images brillantes et riches en contrastes, ce qui vous permet d'utiliser l'ordinateur portable pour des tâches créatives. En revanche, sa portabilité pourrait certainement bénéficier d'un écran un peu moins élaboré.
Une grande puissance, des performances graphiques généralement suffisantes et une connectivité décente font du P16s G2 AMD un excellent ordinateur portable pour le travail, l'université ou les travaux créatifs.
De plus, l'appareil est doté d'une pléthore de fonctions de sécurité et sa fonction de télémaintenance pourrait s'avérer très utile pour les appareils de l'entreprise. Son boîtier robuste et son bon clavier en font également un excellent ordinateur portable de travail.
En revanche, les critiques ne sont pas les plus sévères. Bien sûr, un deuxième port USB4 serait utile. Les ventilateurs pourraient être un peu plus efficaces, surtout si l'on considère l'espace inutilisé à l'intérieur. En outre, la puissance fournie par l'alimentation est peut-être un peu juste, mais elle ne devrait pas poser de problèmes majeurs.
Une alternative offrant des performances graphiques supplémentaires pourrait être le Lenovo ThinkPad P16v G1par exemple. Le très similaire ThinkPad P14s G1 offre une meilleure portabilité et des performances légèrement inférieures Lenovo ThinkPad P14s G4 AMD, très similaire-son écran de 14 pouces peut le rendre plus adapté à une utilisation en déplacement.
Prix et disponibilité
La version du ThinkPad P16s G2 dotée d'une mémoire vive de 64 Go et d'un écran OLED est disponible au prix de 1 599 USD sur Amazon.
Lenovo ThinkPad P16s G2 21K9000CGE
- 01/23/2024 v7 (old)
Mario Petzold
Transparency
La sélection des appareils à examiner est effectuée par notre équipe éditoriale. L'échantillon de test a été prêté à l'auteur par le fabricant ou le détaillant pour les besoins de cet examen. Le prêteur n'a pas eu d'influence sur cette évaluation et le fabricant n'a pas reçu de copie de cette évaluation avant sa publication. Il n'y avait aucune obligation de publier cet article. En tant que média indépendant, Notebookcheck n'est pas soumis à l'autorité des fabricants, des détaillants ou des éditeurs.
Voici comment Notebookcheck teste
Chaque année, Notebookcheck examine de manière indépendante des centaines d'ordinateurs portables et de smartphones en utilisant des procédures standardisées afin de garantir que tous les résultats sont comparables. Nous avons continuellement développé nos méthodes de test depuis environ 20 ans et avons établi des normes industrielles dans le processus. Dans nos laboratoires de test, des équipements de mesure de haute qualité sont utilisés par des techniciens et des rédacteurs expérimentés. Ces tests impliquent un processus de validation en plusieurs étapes. Notre système d'évaluation complexe repose sur des centaines de mesures et de points de référence bien fondés, ce qui garantit l'objectivité.Price comparison

