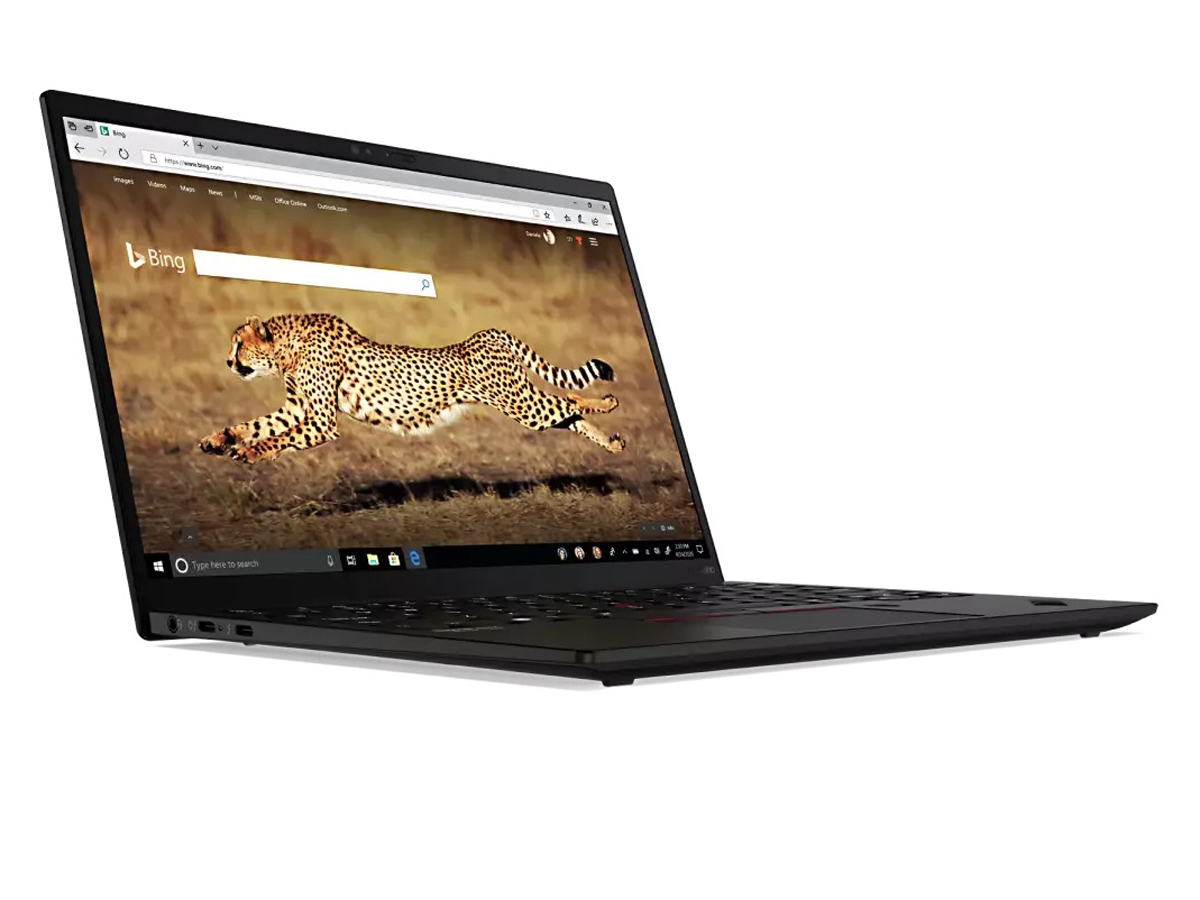
Test du Lenovo ThinkPad X1 Nano Gen 2 : le plus petit ordinateur portable X1 jamais conçu
")
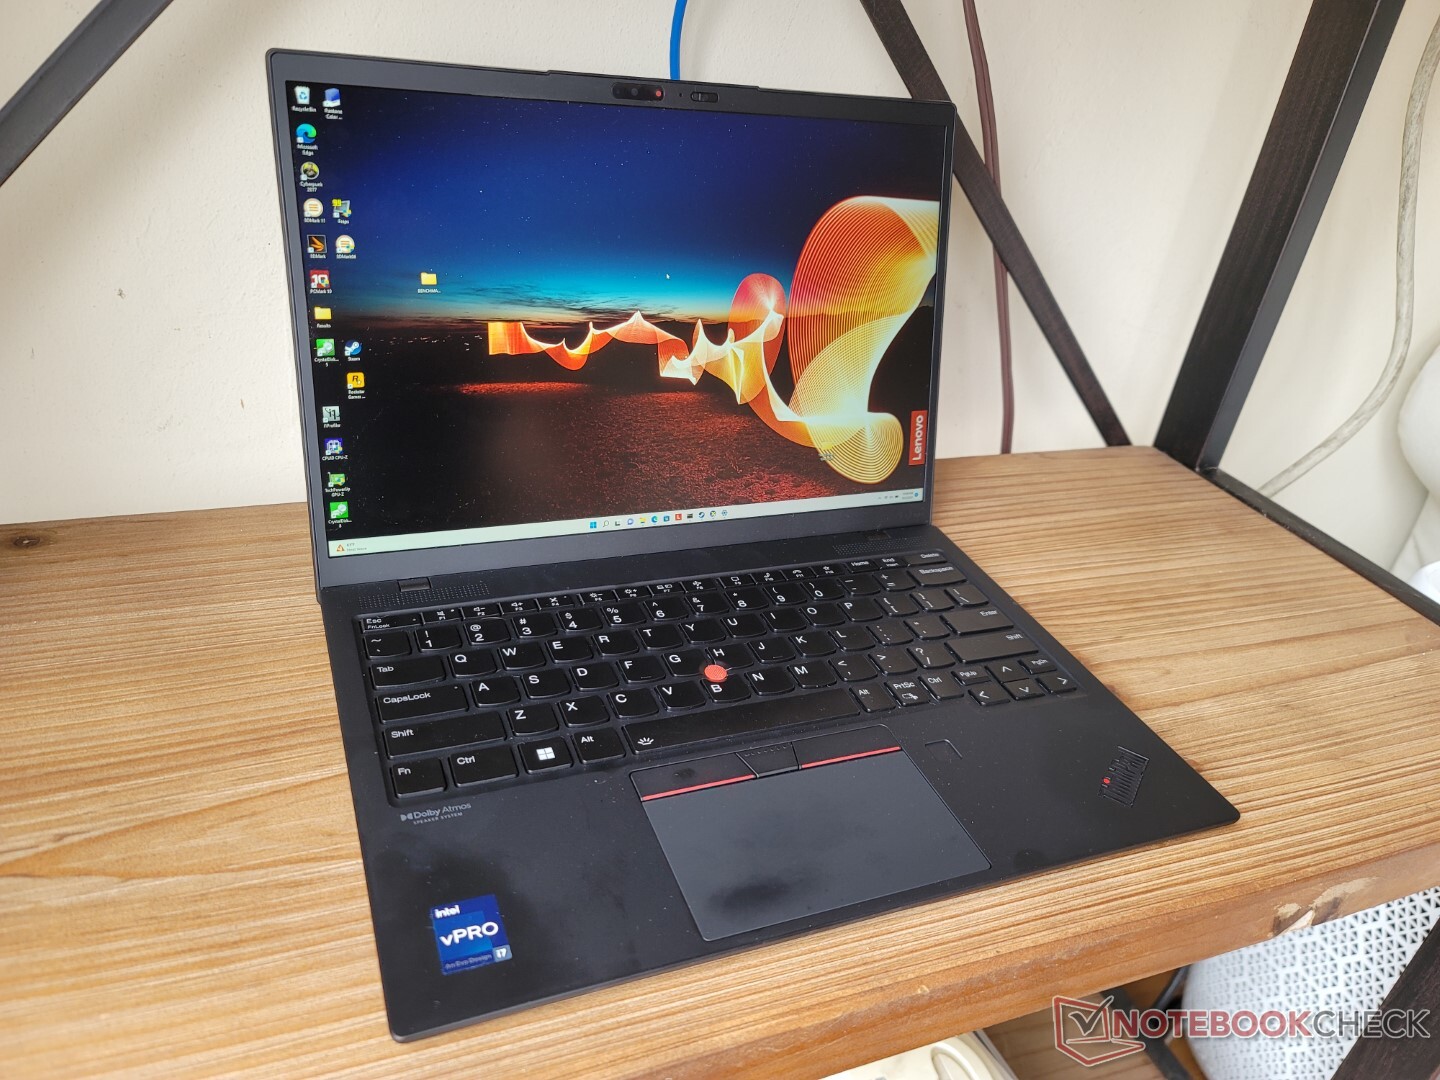
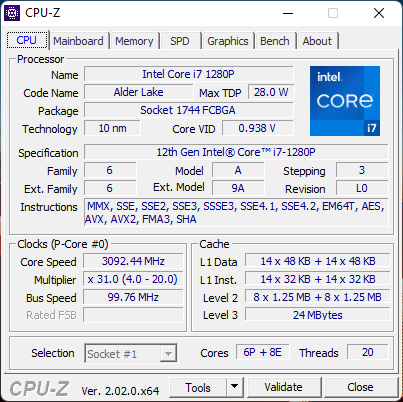
L'une des principales plaintes concernant le ThinkPad X1 Nano Gen 1 était la lenteur de son processeur. Alors que la plupart des autres ordinateurs portables fonctionnaient avec des processeurs Core i5-1135G7 ou i7-1165G7 de 11e génération de 28 W, le Nano Gen 1 était coincé avec le i7-1160G7 de 15 W. Le modèle était peut-être super léger, mais il donnait l'impression que ce faible poids avait un impact direct sur les niveaux de performance. Le nouveau ThinkPad X1 Nano Gen 2 résout ce problème en remplaçant le i7-1160G7 par un véritable i7-1280P vPro de 12e génération, ce qui devrait faire du X1 Nano Gen 2 l'un des ordinateurs portables professionnels de 13 pouces les plus rapides, du moins sur le papier.
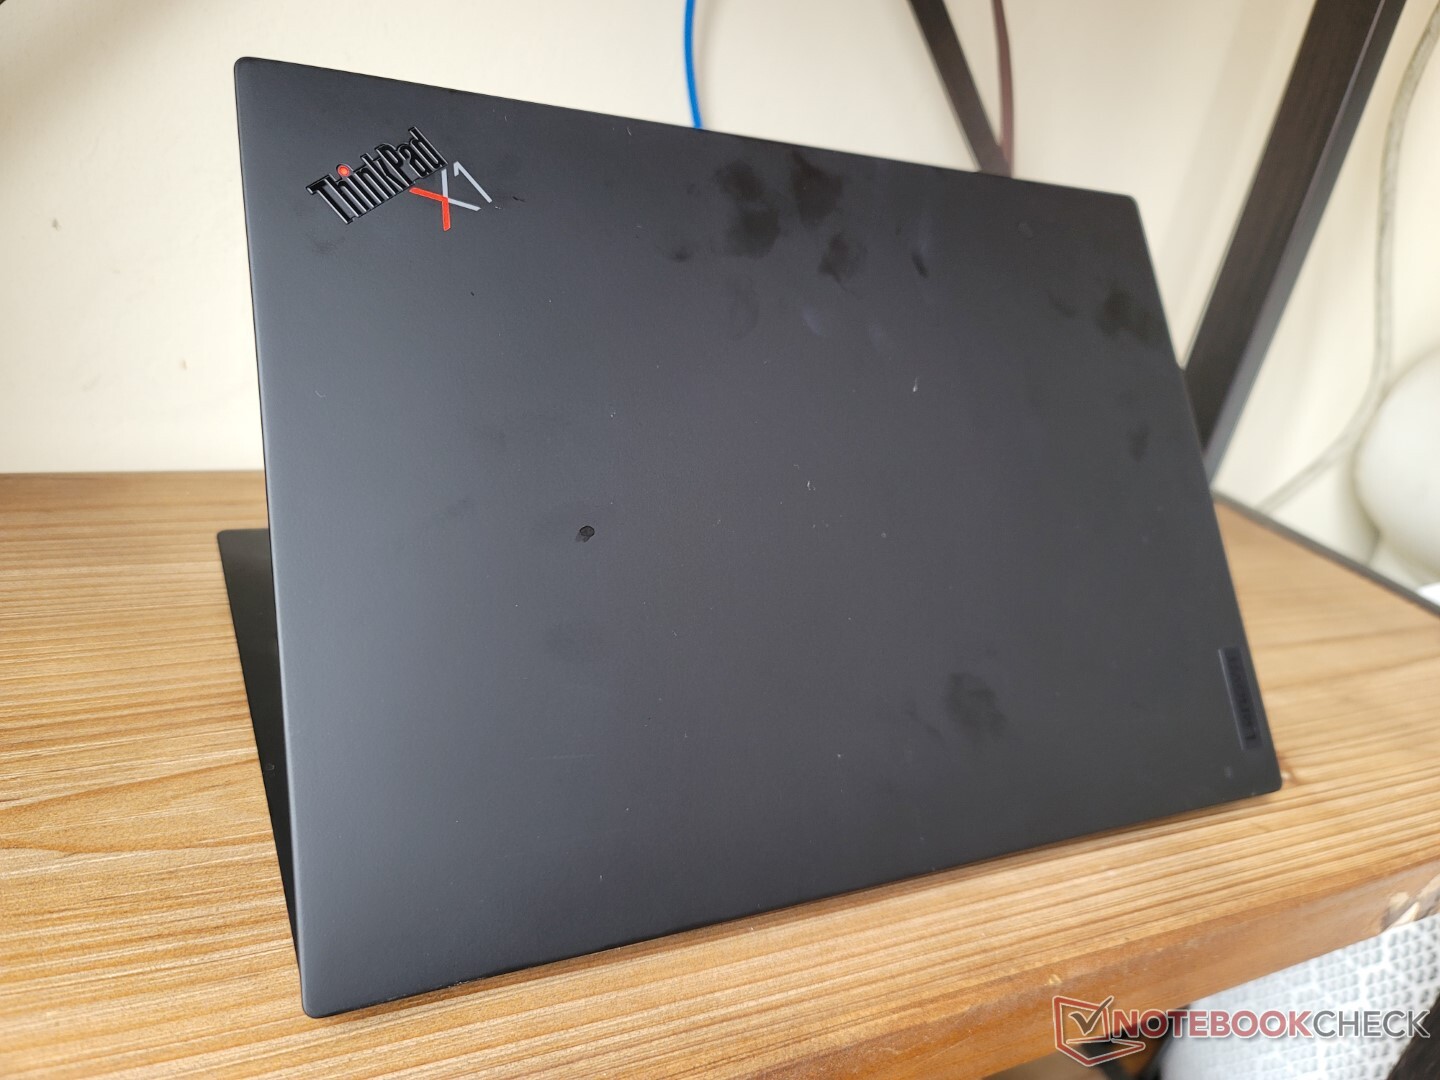
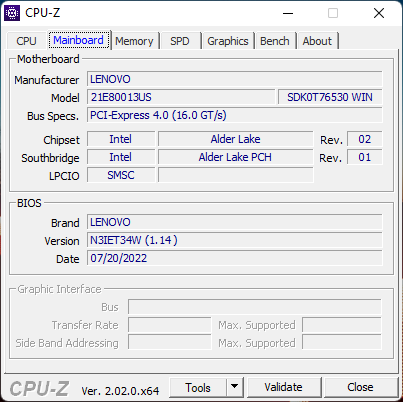
Outre la mise à niveau du processeur, le modèle Gen 2 apporte quelques autres changements, notamment une webcam à plus haute résolution, un Wi-Fi plus rapide et un support WAN 5G. Le design extérieur est par ailleurs identique à celui du modèle 2021 Gen 1. Nous vous recommandons donc de consulter notre article sur le modèle existant pour en savoir plus sur les caractéristiques physiques de l'ordinateur portable.
Parmi les concurrents dans ce domaine, on trouve d'autres ordinateurs portables professionnels super légers de 13 pouces, comme le HP Elite Dragonfly G3 , Dell Latitude 13 7330, la série LG Gram ou le Dynabook Portege X30L Test du Dynabook Portégé X30L-K-139 : le PC portable d'affaires ne pèse que 900 grammes .
Plus de commentaires sur Lenovo
Comparaison avec les concurrents potentiels
Note | Date | Modèle | Poids | Épaisseur | Taille | Résolution | Prix |
|---|---|---|---|---|---|---|---|
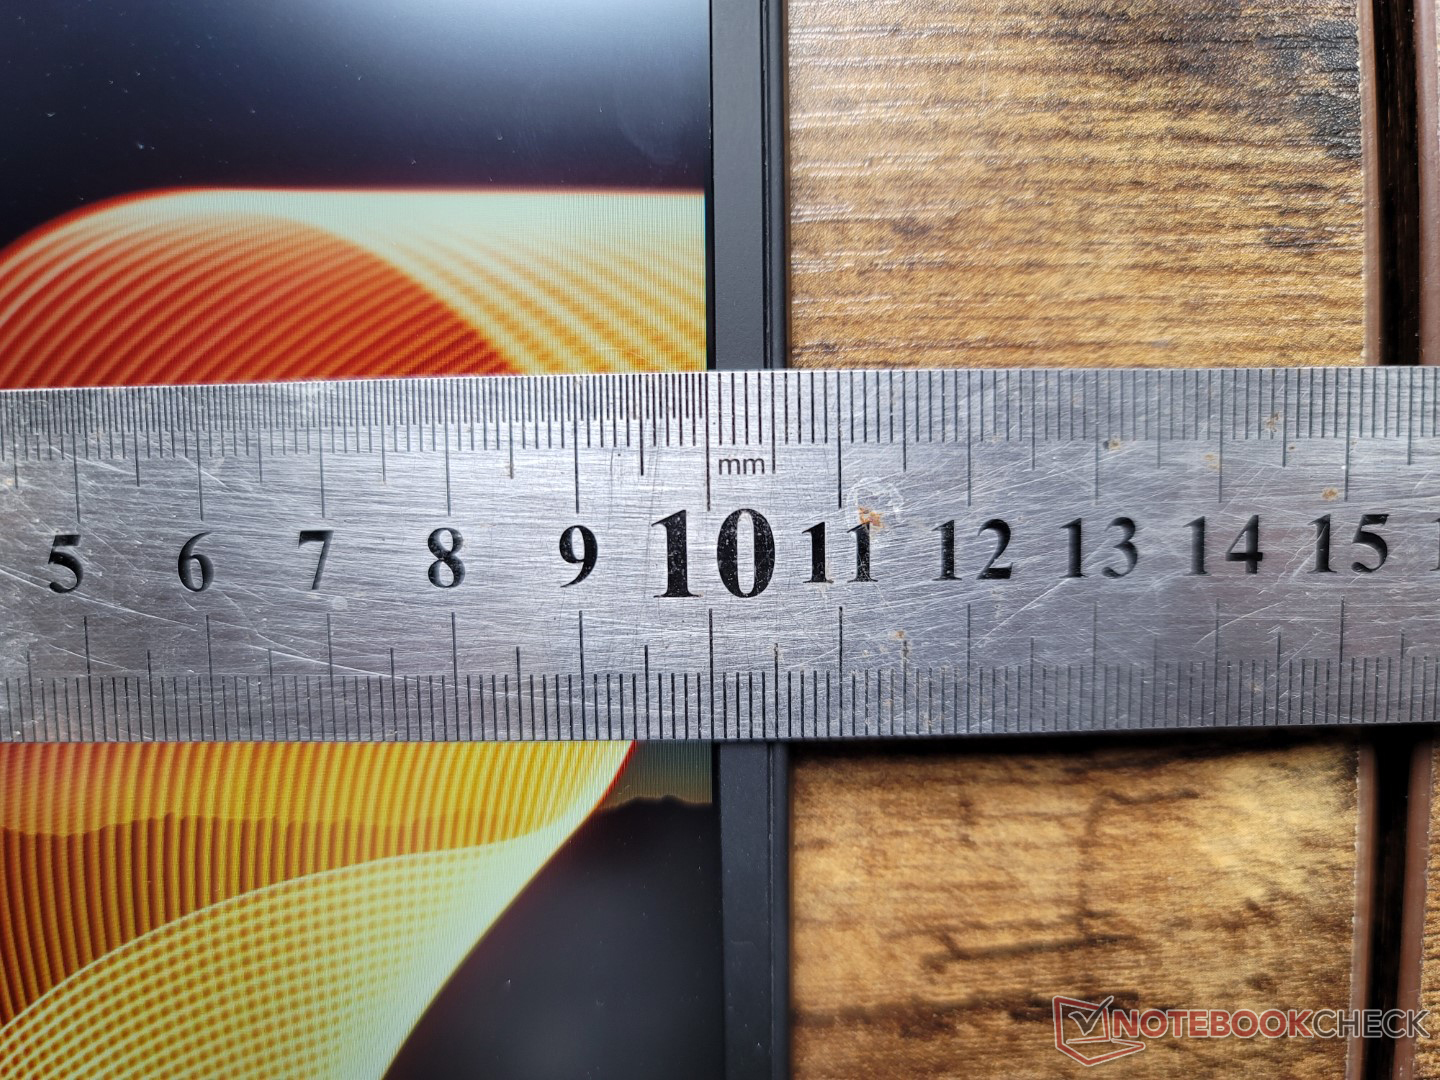
| 88.9 % v7 (old) | 09/22 | Lenovo ThinkPad X1 Nano Gen 2 Core i7-1280P i7-1280P, Iris Xe G7 96EUs | 958 g | 14.4 mm | 13.00" | 2160x1350 | |
| 89.8 % v7 (old) | 02/21 | Lenovo ThinkPad X1 Nano-20UN002UGE i7-1160G7, Iris Xe G7 96EUs | 946 g | 16 mm | 13.00" | 2160x1350 | |
| 91 % v7 (old) | 08/22 | HP Elite Dragonfly G3 i7-1265U, Iris Xe G7 96EUs | 1.2 kg | 16.3 mm | 13.50" | 1920x1280 | |
| 89 % v7 (old) | 07/22 | Dell Latitude 13 7330 i7-1265U, Iris Xe G7 96EUs | 1 kg | 16.96 mm | 13.30" | 1920x1080 | |
| 85.1 % v7 (old) | 07/22 | Framework Laptop 13.5 12th Gen Intel i7-1260P, Iris Xe G7 96EUs | 1.3 kg | 15.85 mm | 13.50" | 2256x1504 | |
| 87.8 % v7 (old) | 03/21 | Huawei MateBook X Pro 2021 i7-1165G7, Iris Xe G7 96EUs | 1.3 kg | 14.6 mm | 13.90" | 3000x2000 |
Cas
Communication
Le module WLAN a été mis à niveau de l'Intel AX201 à l'AX211 pour le support du Wi-Fi 6E. Nous n'avons rencontré aucun problème de connectivité lorsqu'il a été couplé à notre réseau 6 GHz
LTE 5G Cat 20 ou 4G CAT 9 sont des mises à niveau WWAN optionnelles. Il y aura un emplacement Nano-SIM s'il est configuré avec cette fonctionnalité.
| Networking | |
| iperf3 transmit AX12 | |
| Lenovo ThinkPad X1 Nano-20UN002UGE | |
| Huawei MateBook X Pro 2021 | |
| iperf3 receive AX12 | |
| Huawei MateBook X Pro 2021 | |
| Lenovo ThinkPad X1 Nano-20UN002UGE | |
| iperf3 receive AXE11000 6GHz | |
| Framework Laptop 13.5 12th Gen Intel | |
| Lenovo ThinkPad X1 Nano Gen 2 Core i7-1280P | |
| HP Elite Dragonfly G3 | |
| Dell Latitude 13 7330 | |
| iperf3 transmit AXE11000 6GHz | |
| Dell Latitude 13 7330 | |
| Framework Laptop 13.5 12th Gen Intel | |
| HP Elite Dragonfly G3 | |
| Lenovo ThinkPad X1 Nano Gen 2 Core i7-1280P | |
Webcam
Dell a mis à jour la webcam, qui est passée de 720p sur le modèle Gen 1 à 1080p pour la version Gen 2 de cette année. L'image n'est donc pas aussi brouillée, mais les couleurs restent médiocres
L'obturateur IR et l'obturateur physique de la webcam sont tous deux fournis en standard pour assurer la confidentialité.


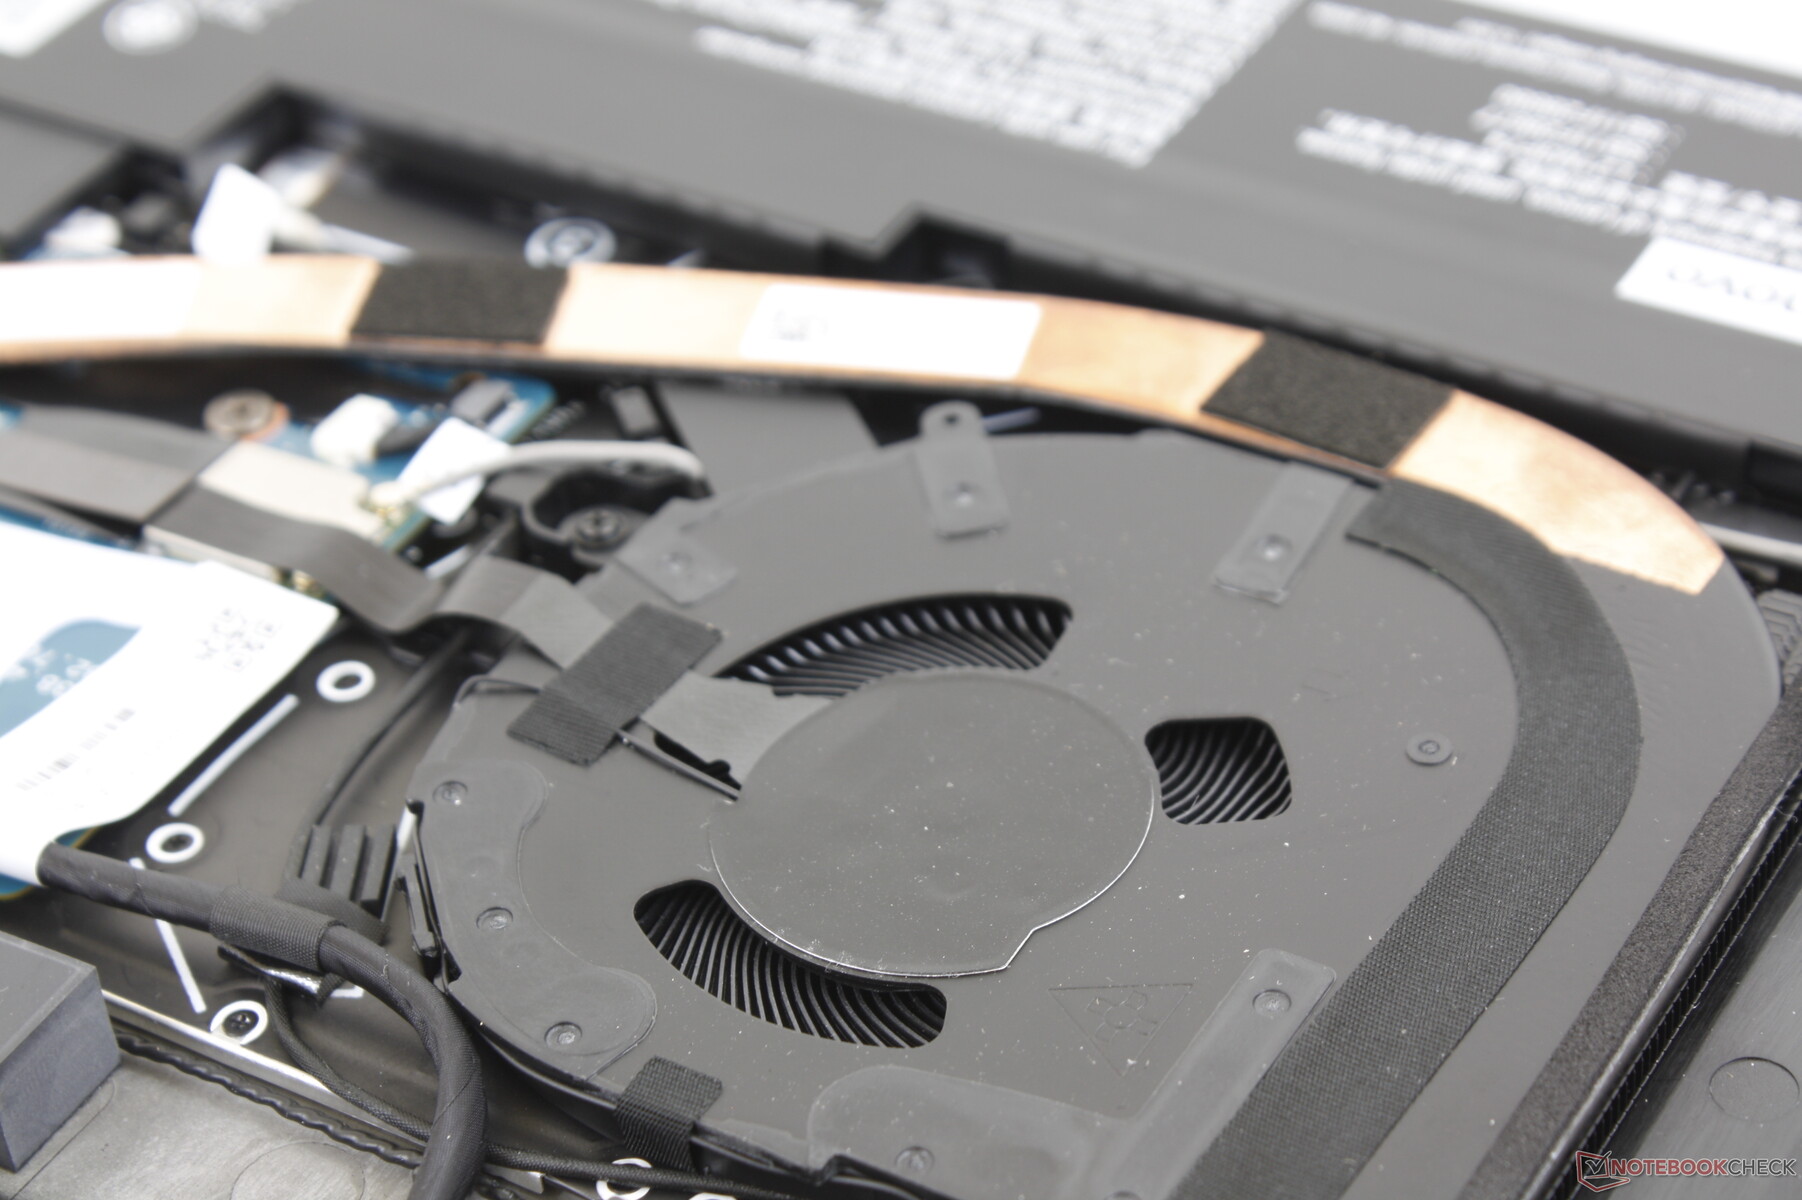
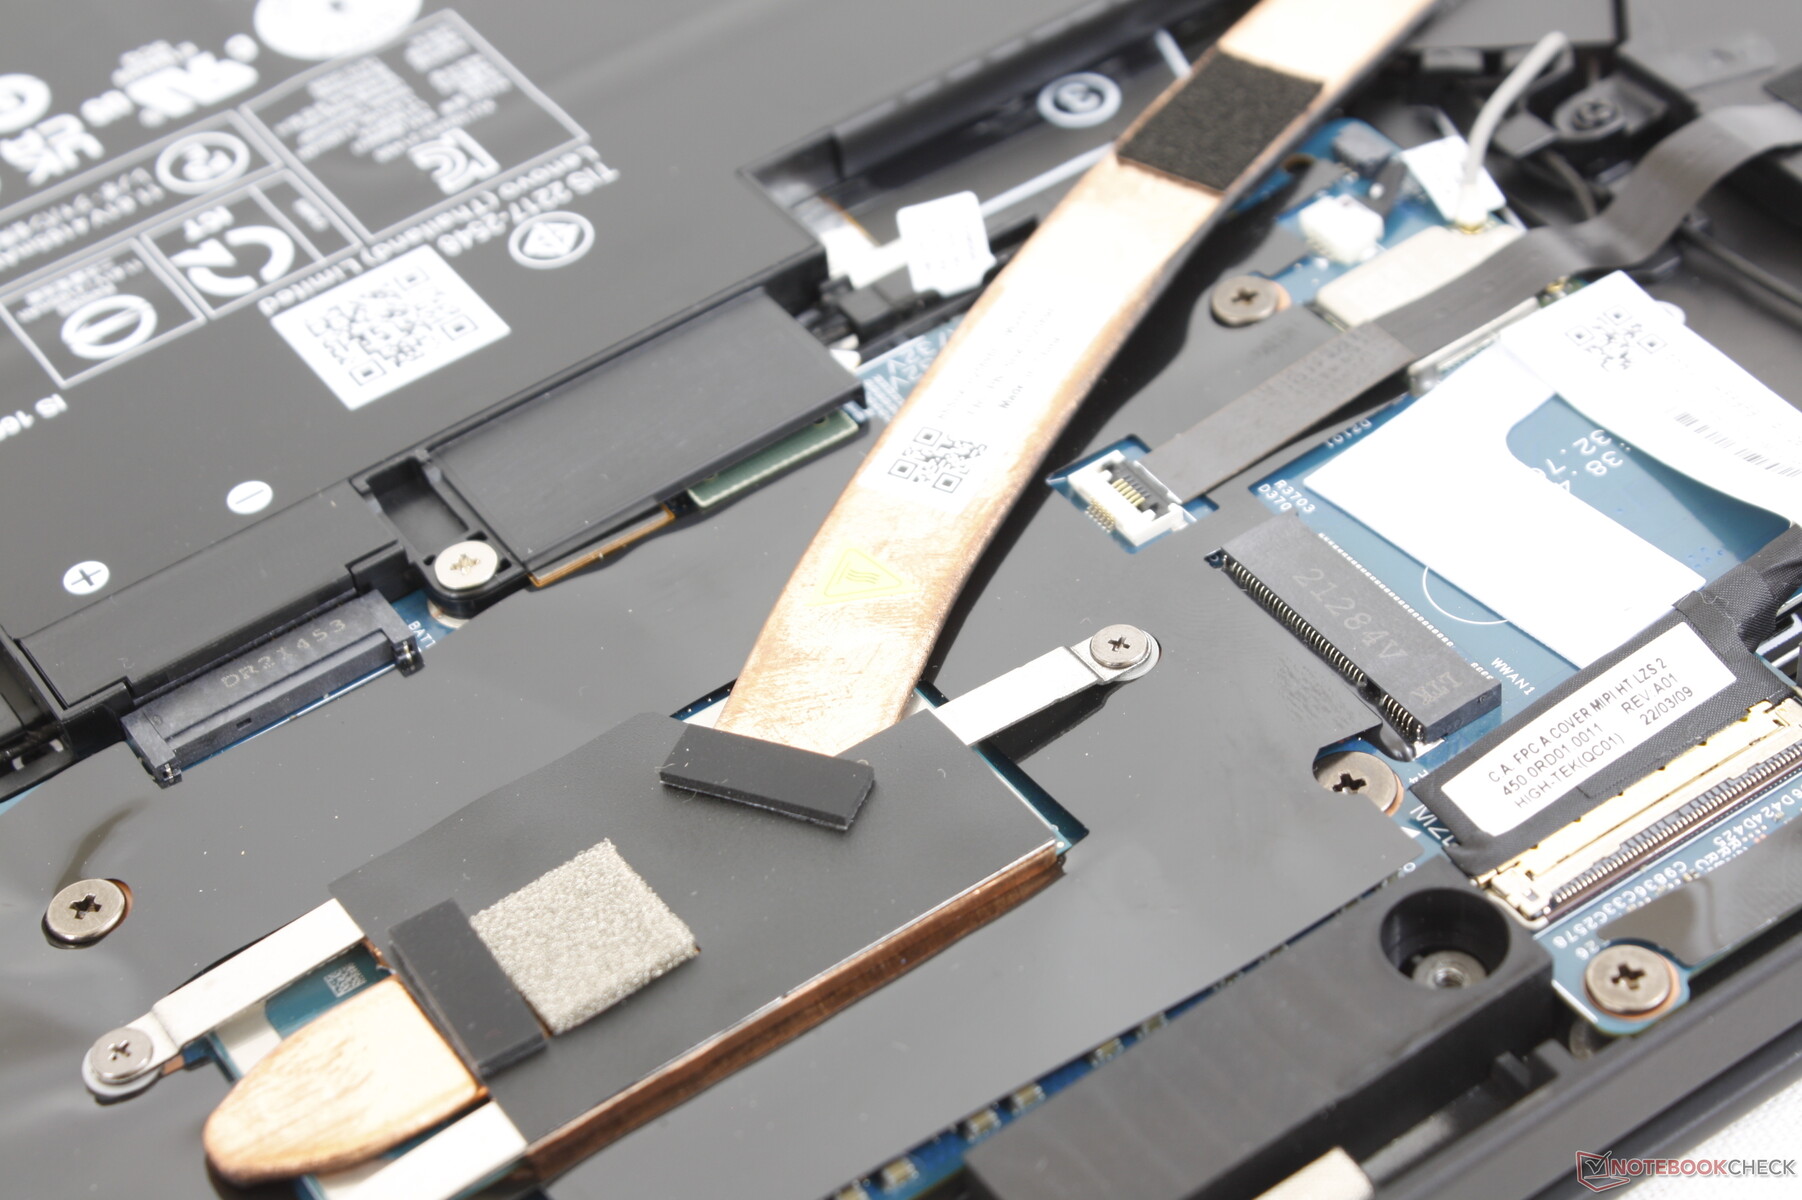
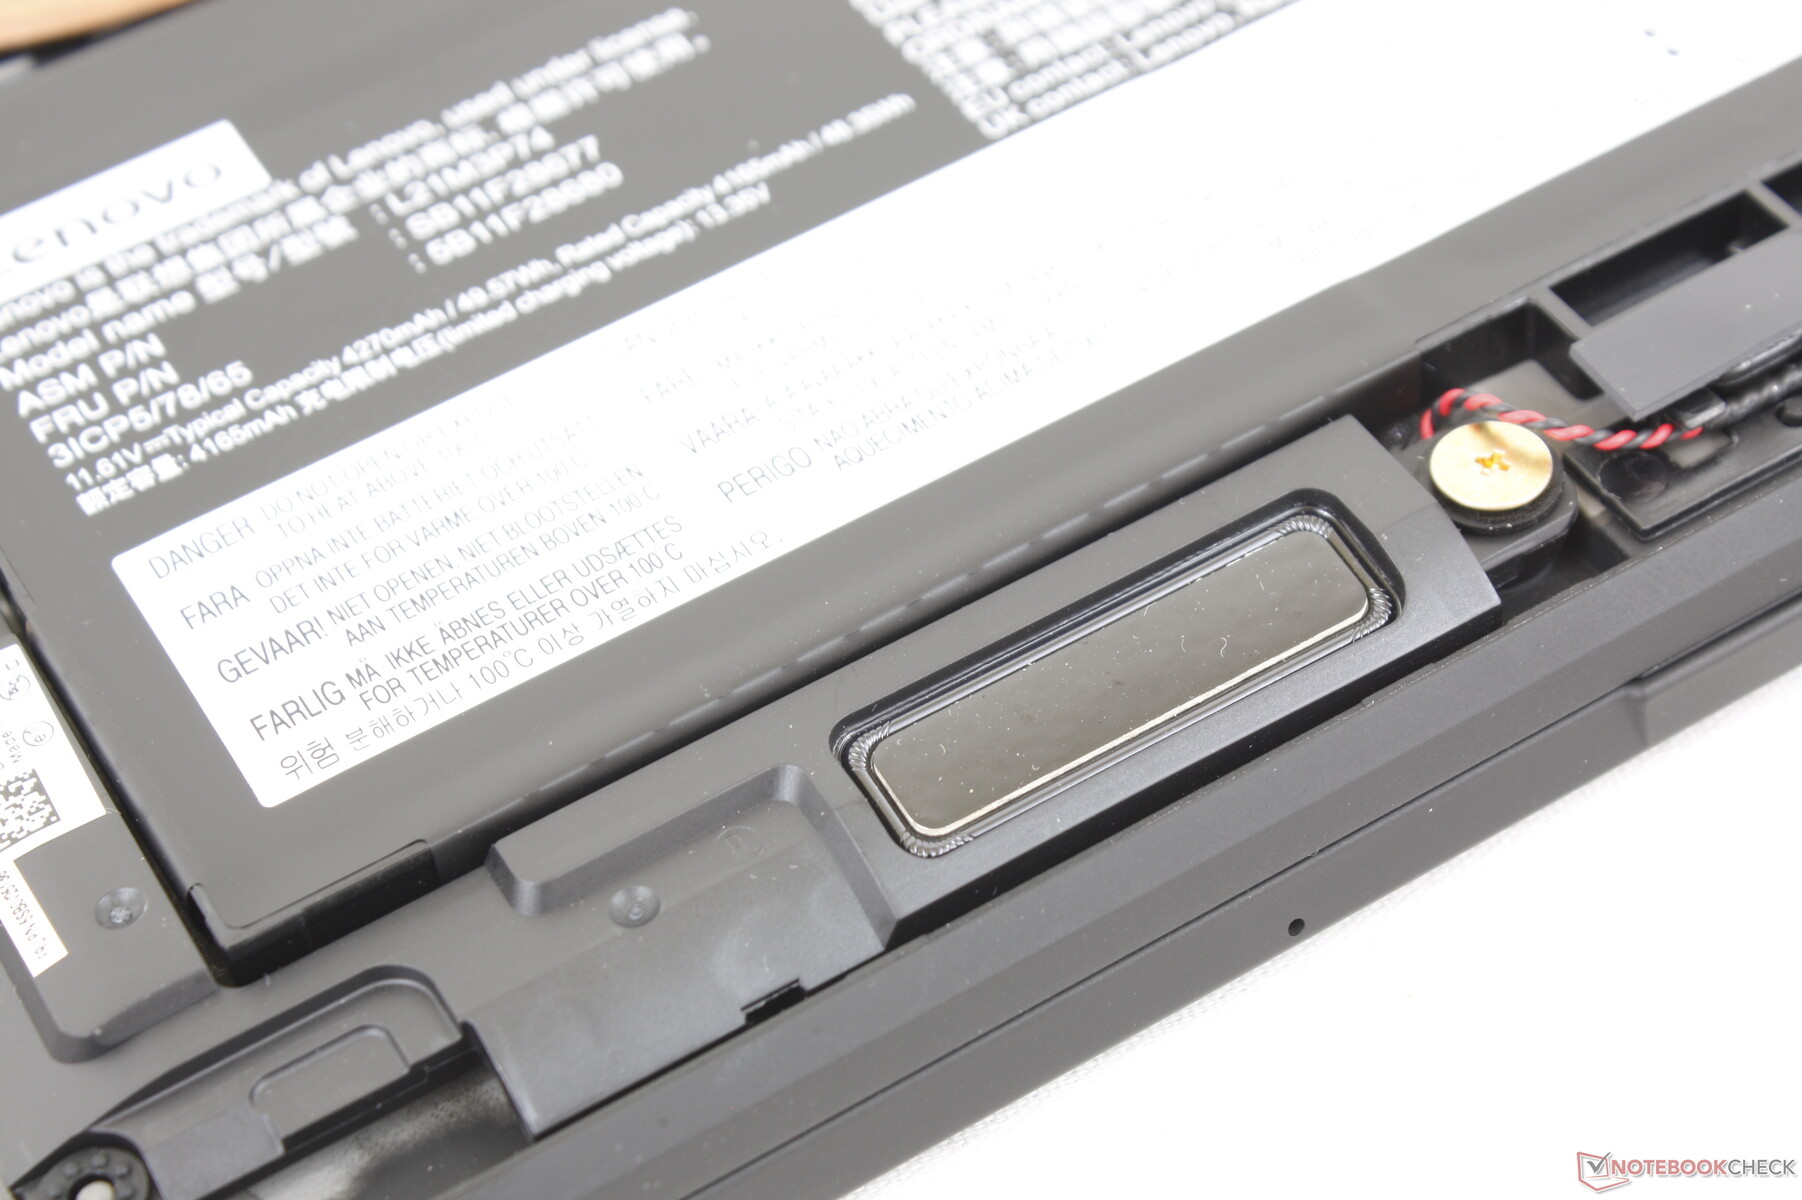
Maintenance
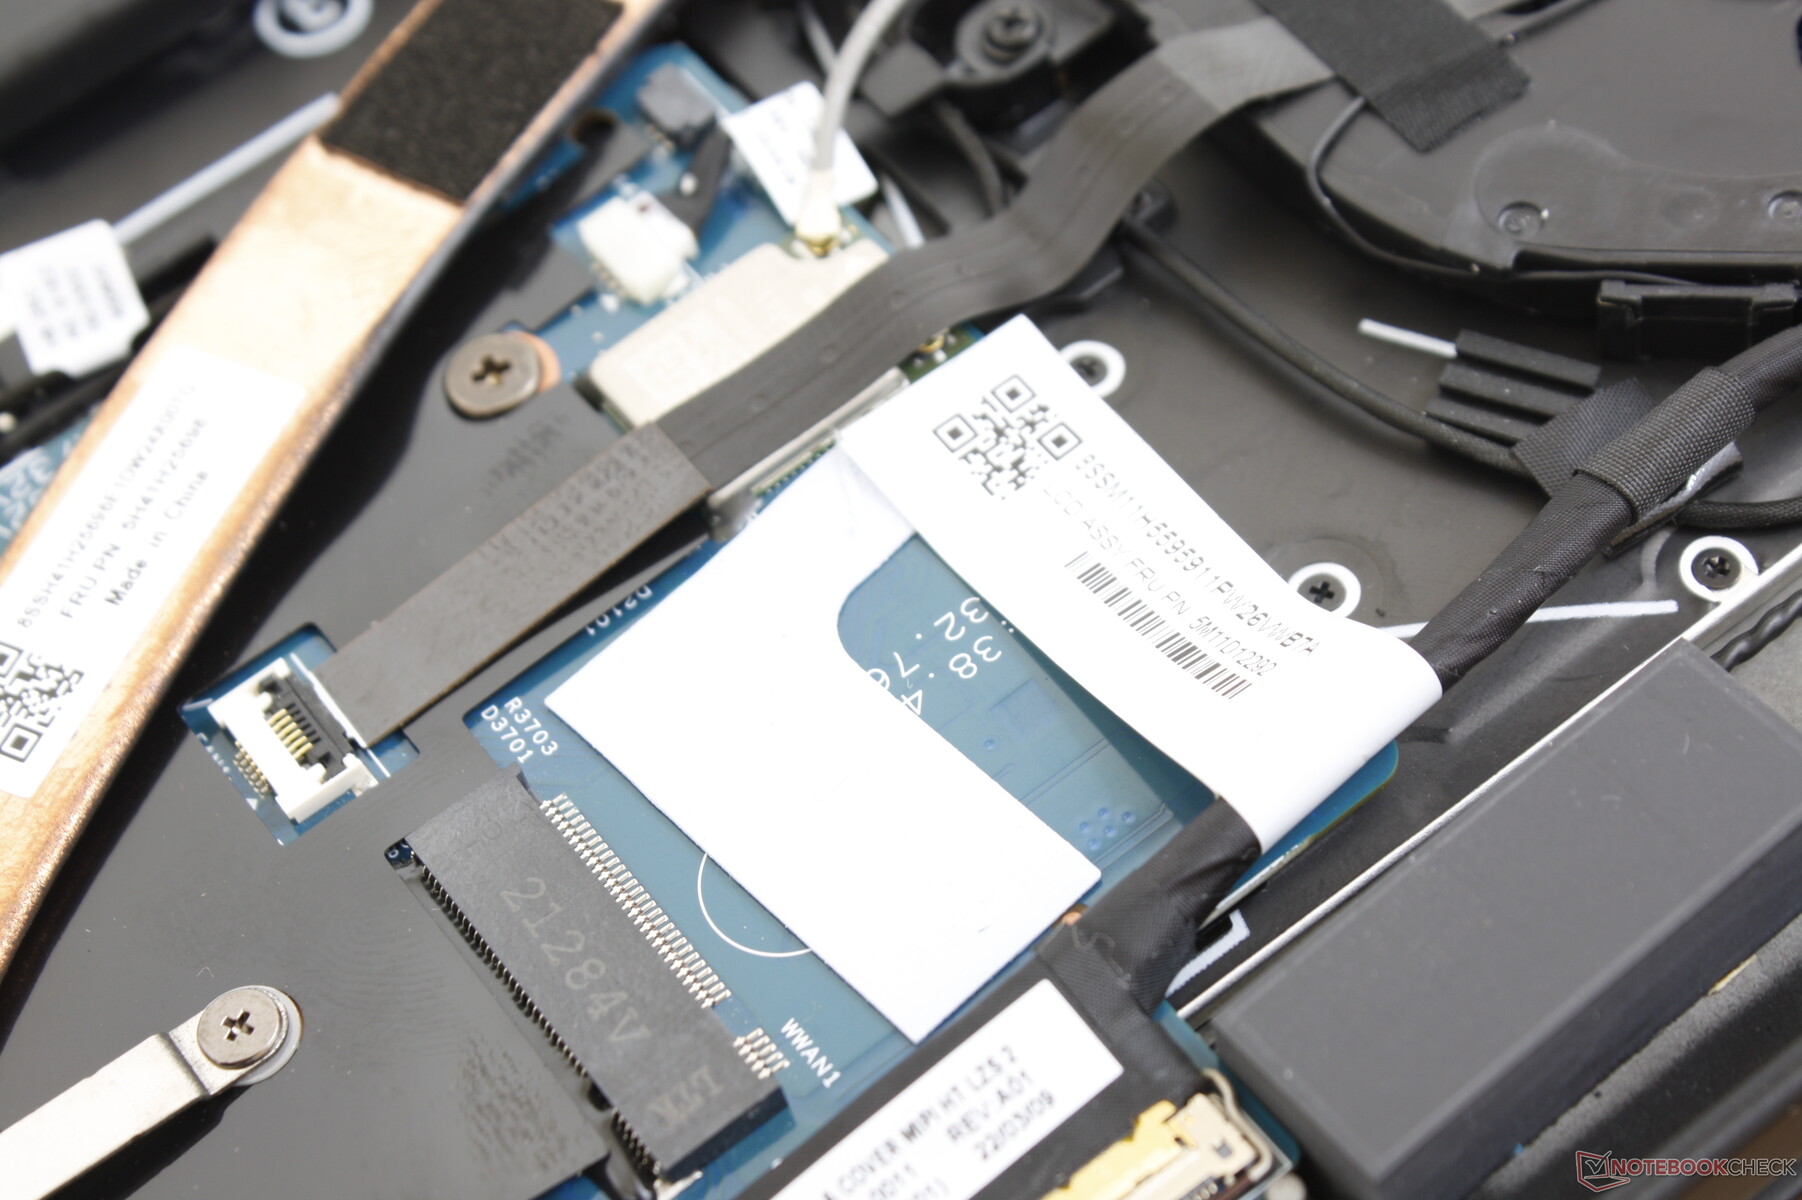
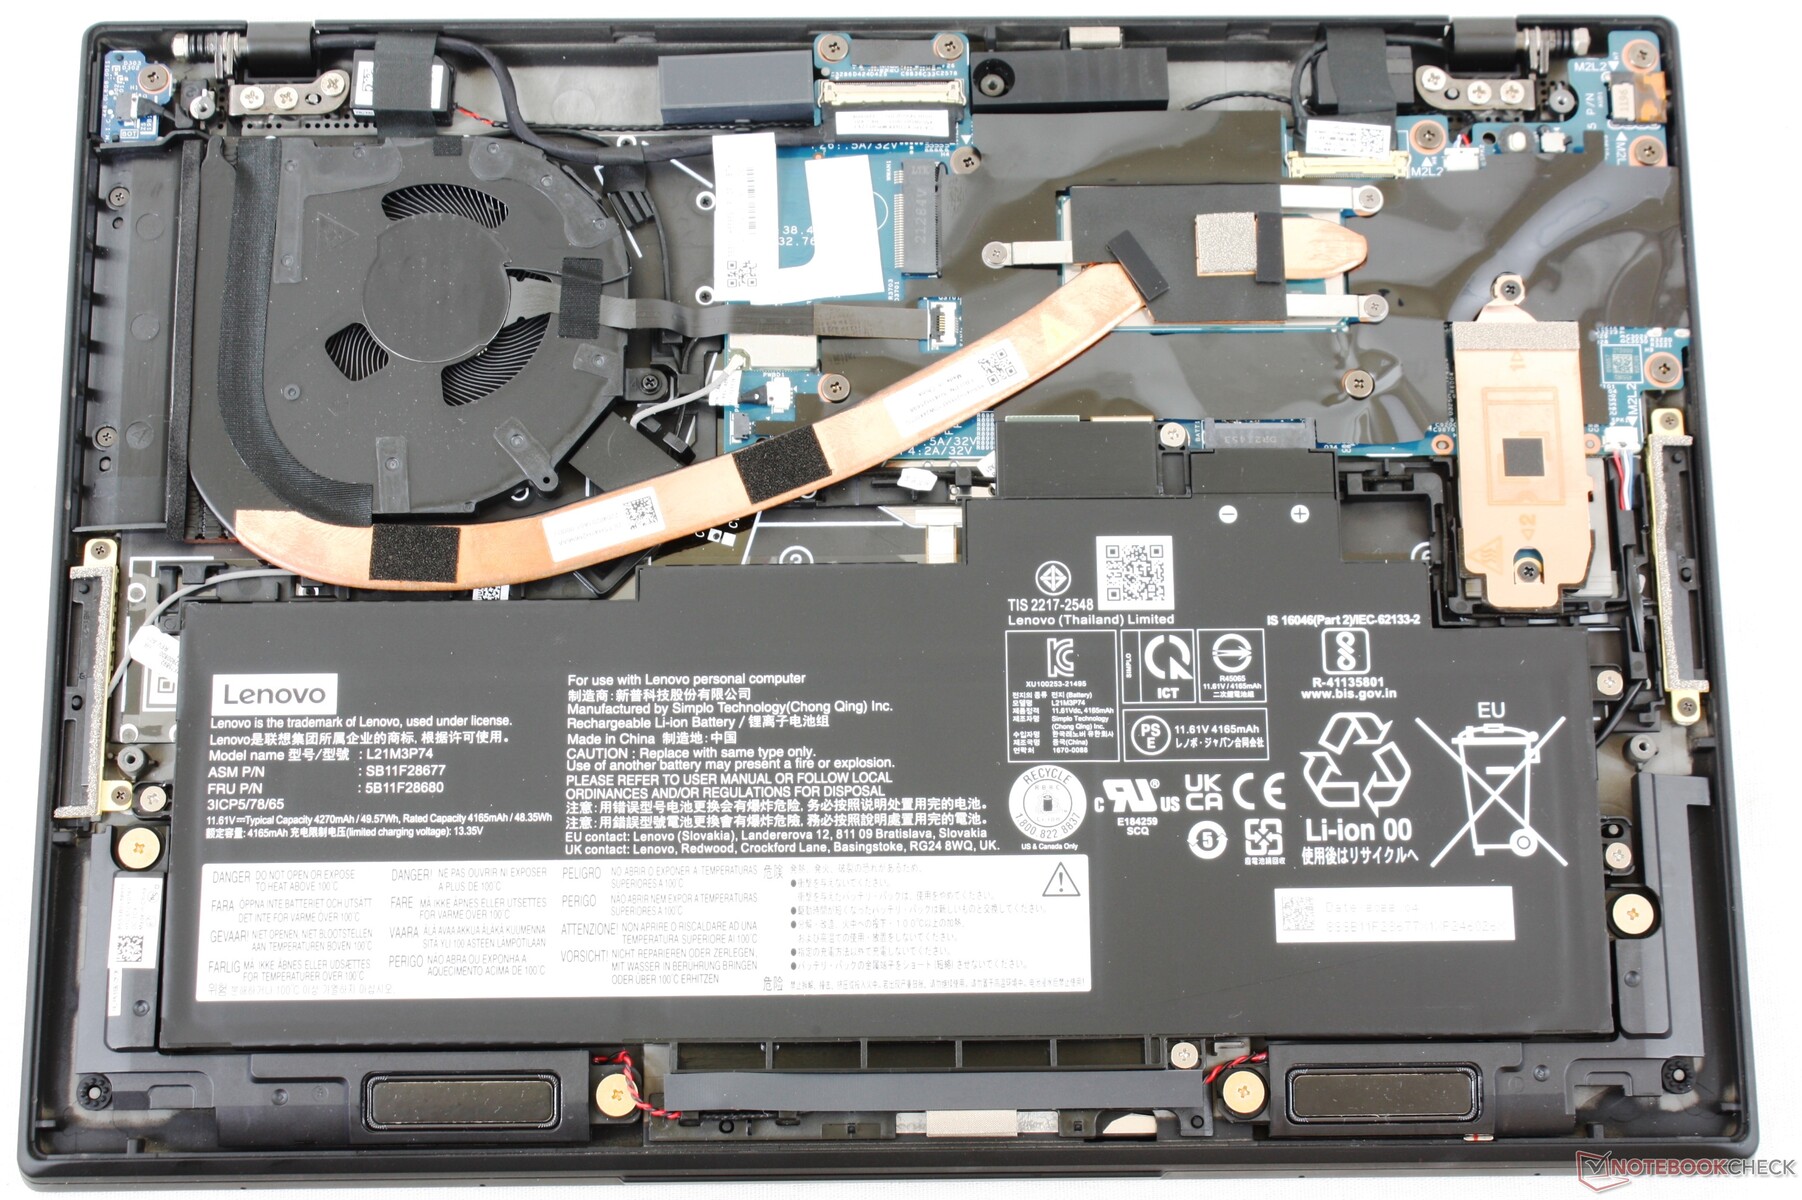
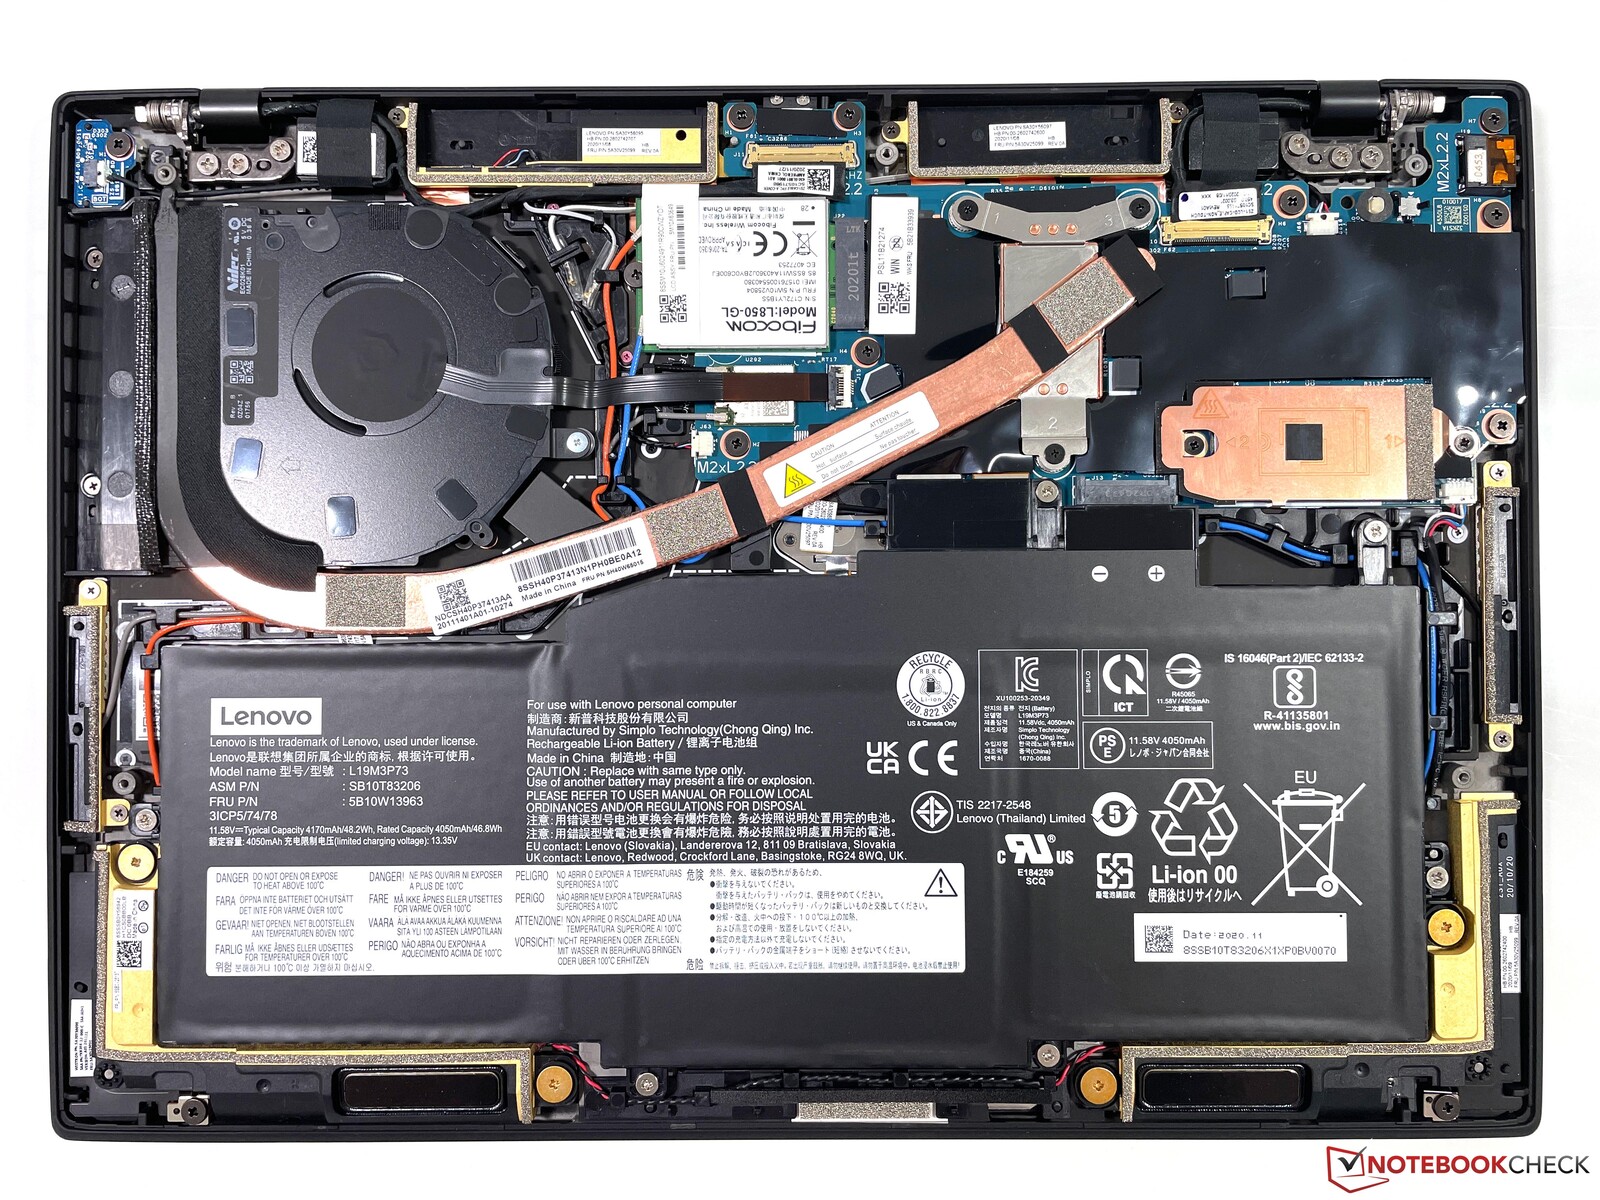
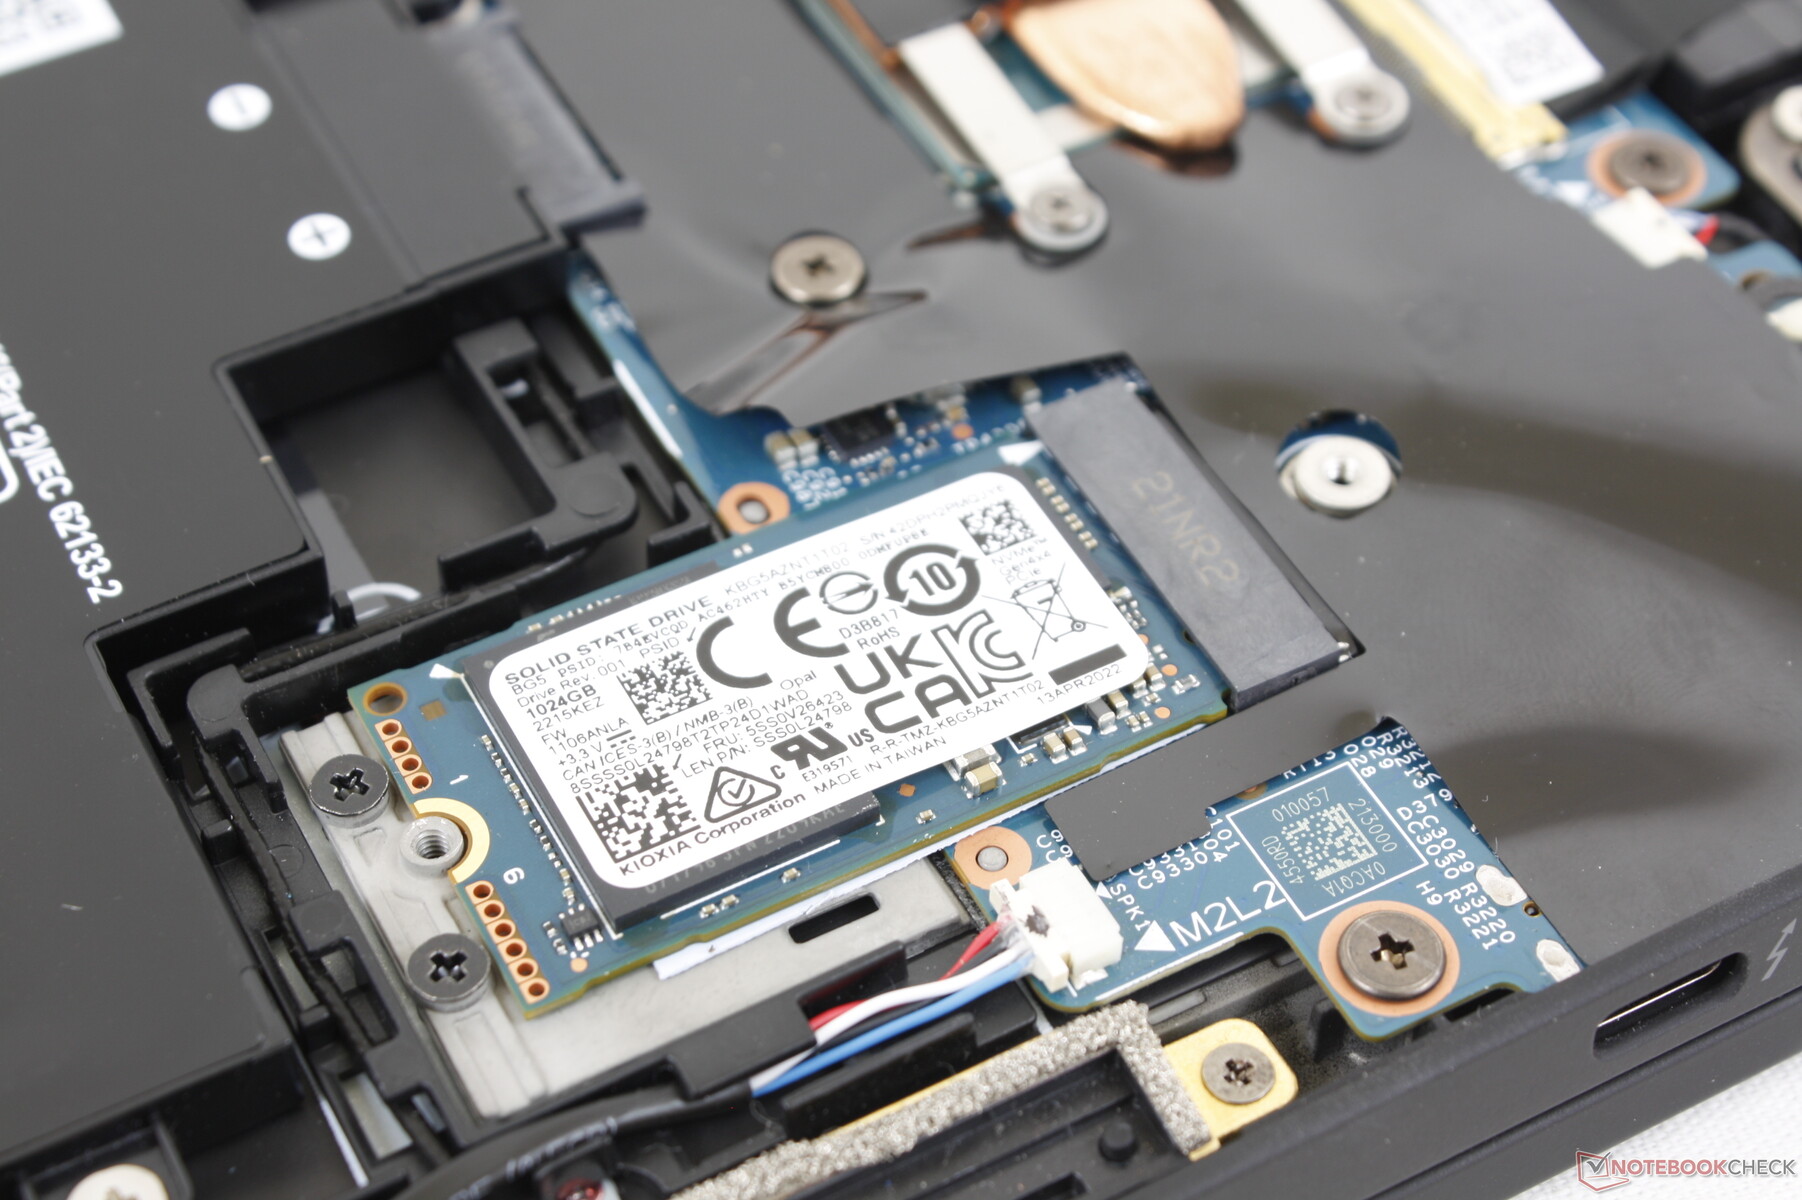
Le panneau inférieur se retire facilement avec un simple tournevis Philips. Les composants internes sont essentiellement les mêmes que ceux du modèle Gen 1, à l'exception du SSD M.2 2242 repositionné et d'autres modifications mineures, comme le montrent les images ci-dessous.
Accessoires et garantie
Il n'y a pas d'autres éléments dans la boîte que l'adaptateur secteur et les documents. La garantie limitée du fabricant est d'un an, ce qui est décevant compte tenu du prix de départ élevé de ce modèle. Une couverture de 3 ans aurait dû être standard.
Afficher
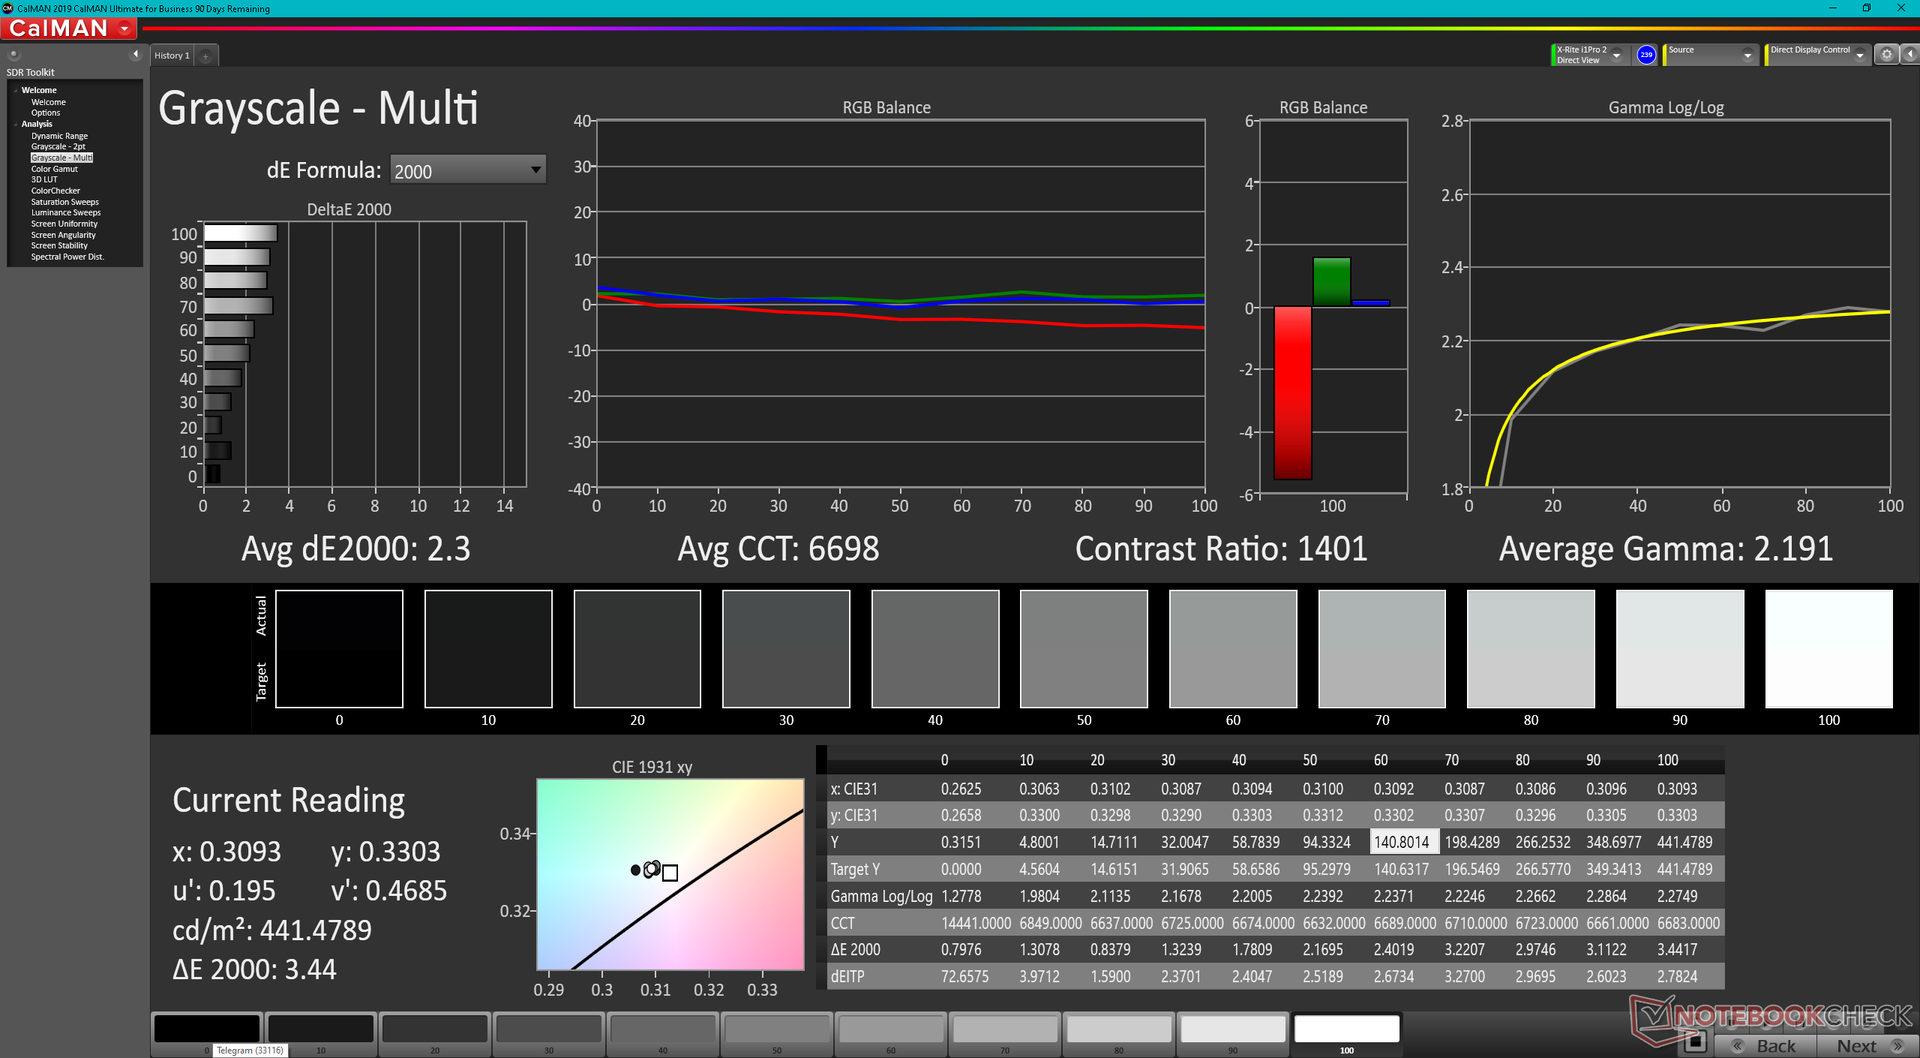
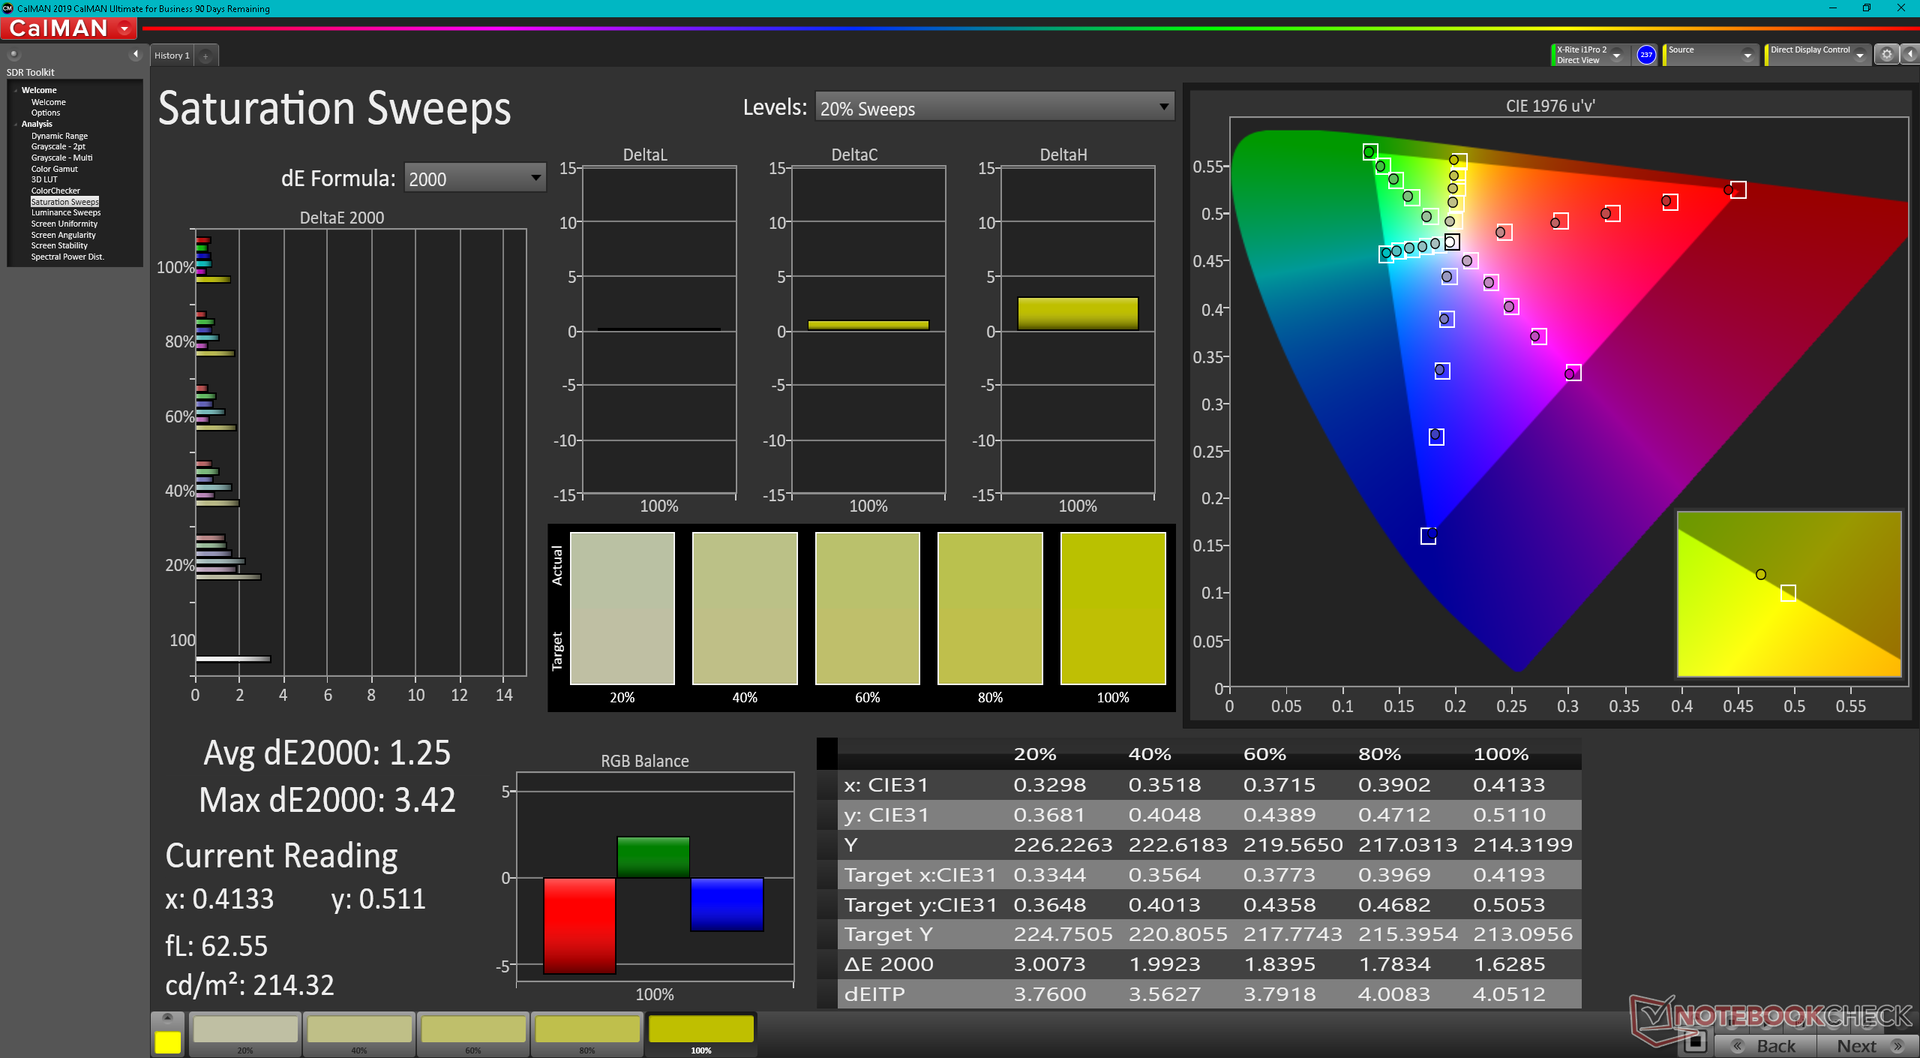
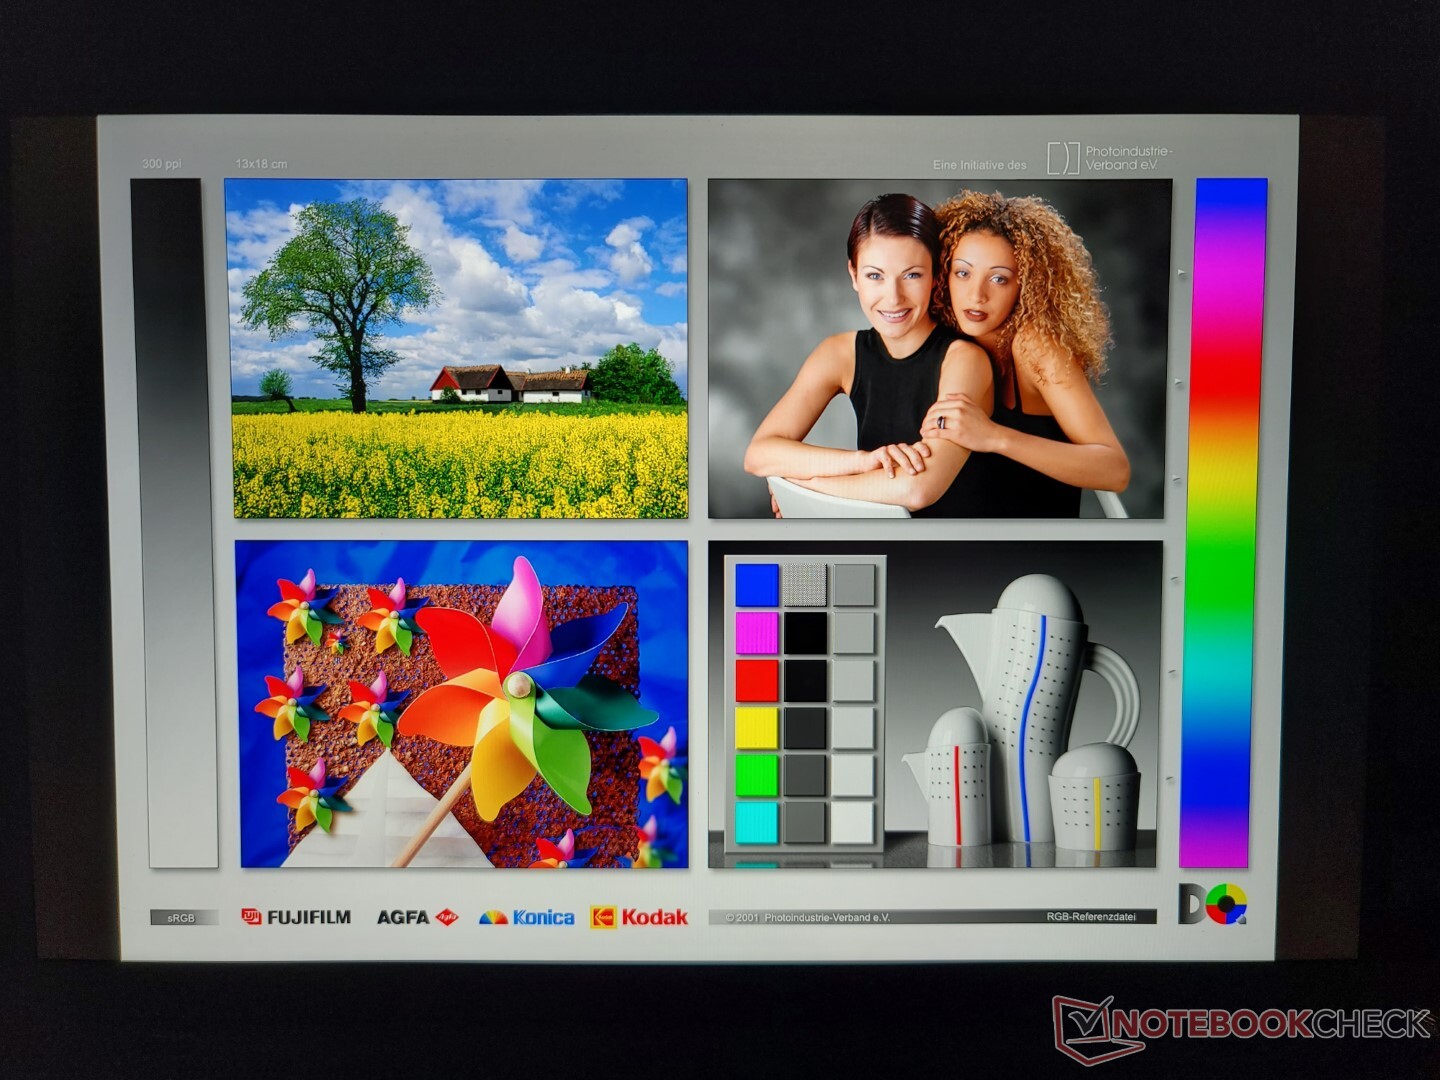
Notre unité de test Gen 2 utilise une dalle IPS différente de celle de la version originale Gen 1 (P101ZFZ-BH2 contre MND007ZA1-2). Néanmoins, leurs attributs de base restent presque identiques pour une expérience visuelle essentiellement identique. Les utilisateurs bénéficient toujours d'une dalle de 450 lumens avec une couverture sRGB complète et un rapport de contraste >1000:1. Les temps de réponse noir-blanc et gris-gris pourraient être meilleurs, mais ce n'est pas un problème pour la navigation ou les charges de travail de type bureautique.


| |||||||||||||||||||||||||
Homogénéité de la luminosité: 94 %
Valeur mesurée au centre, sur batterie: 469.6 cd/m²
Contraste: 1269:1 (Valeurs des noirs: 0.37 cd/m²)
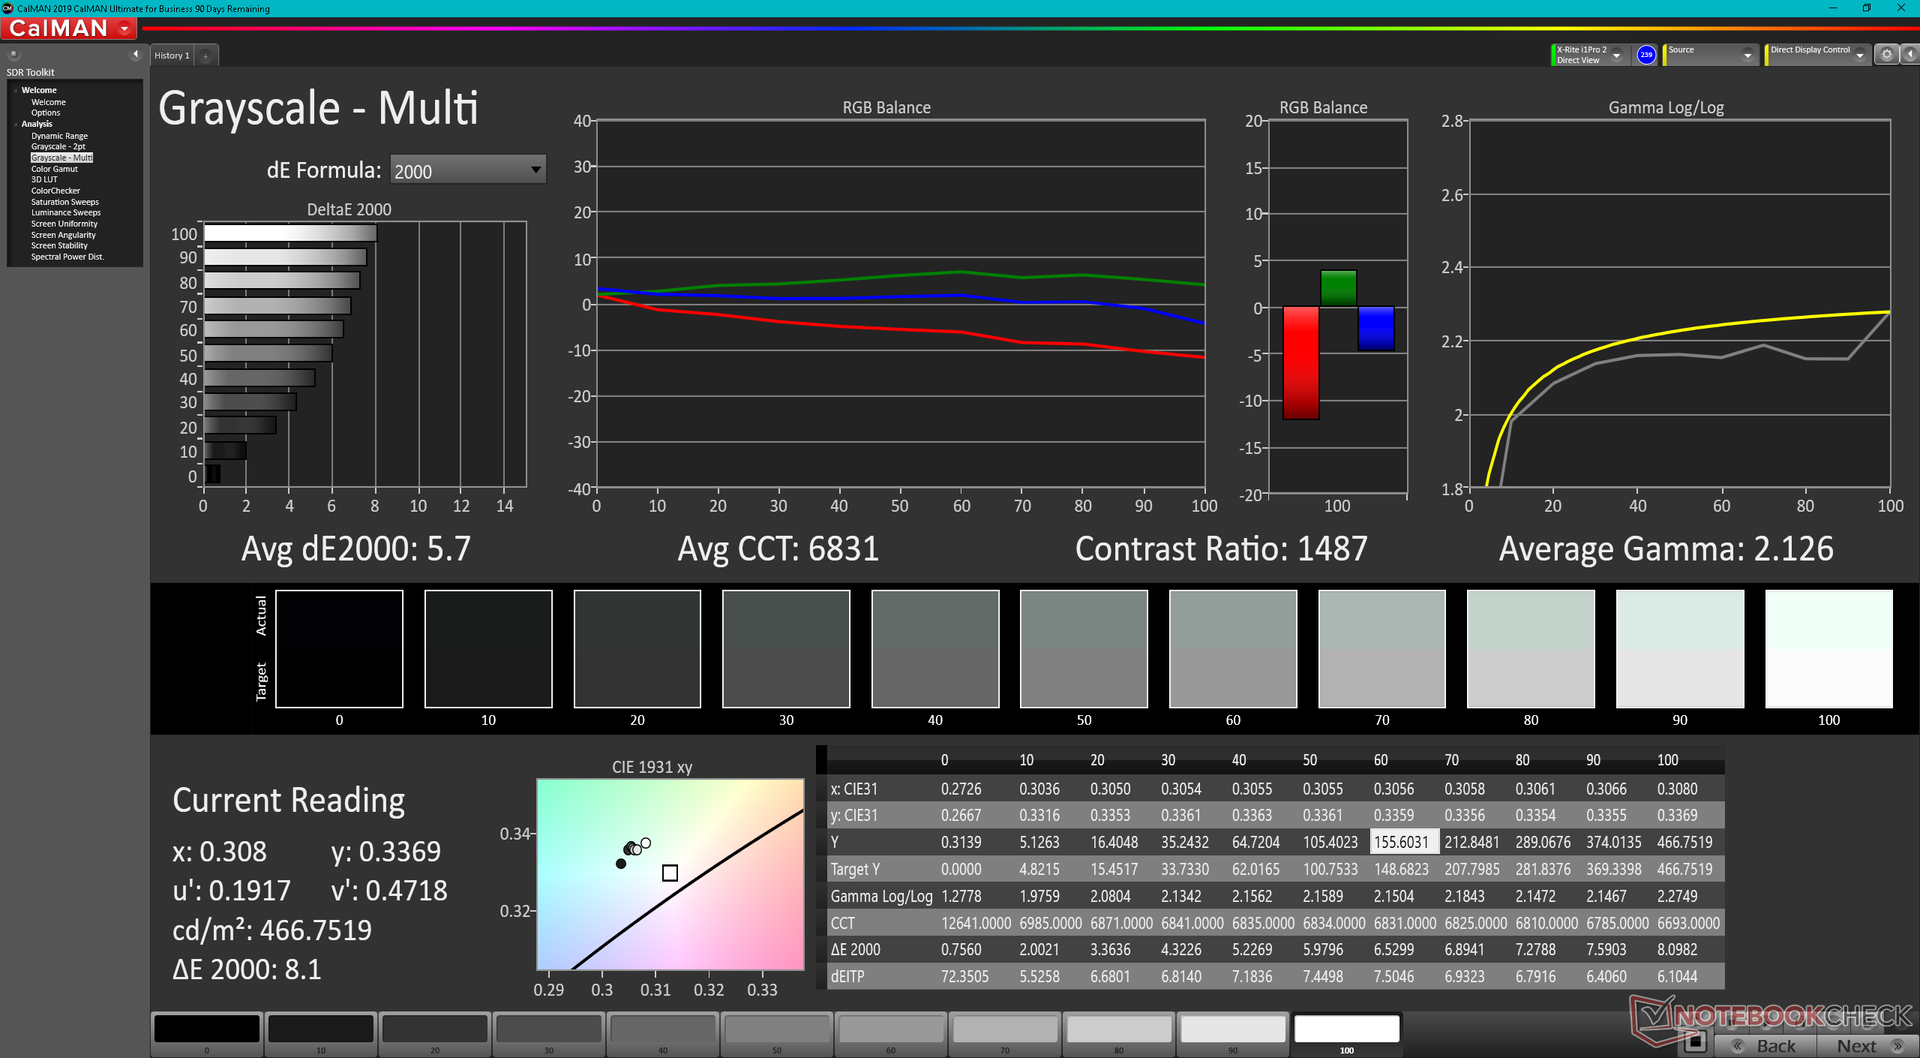
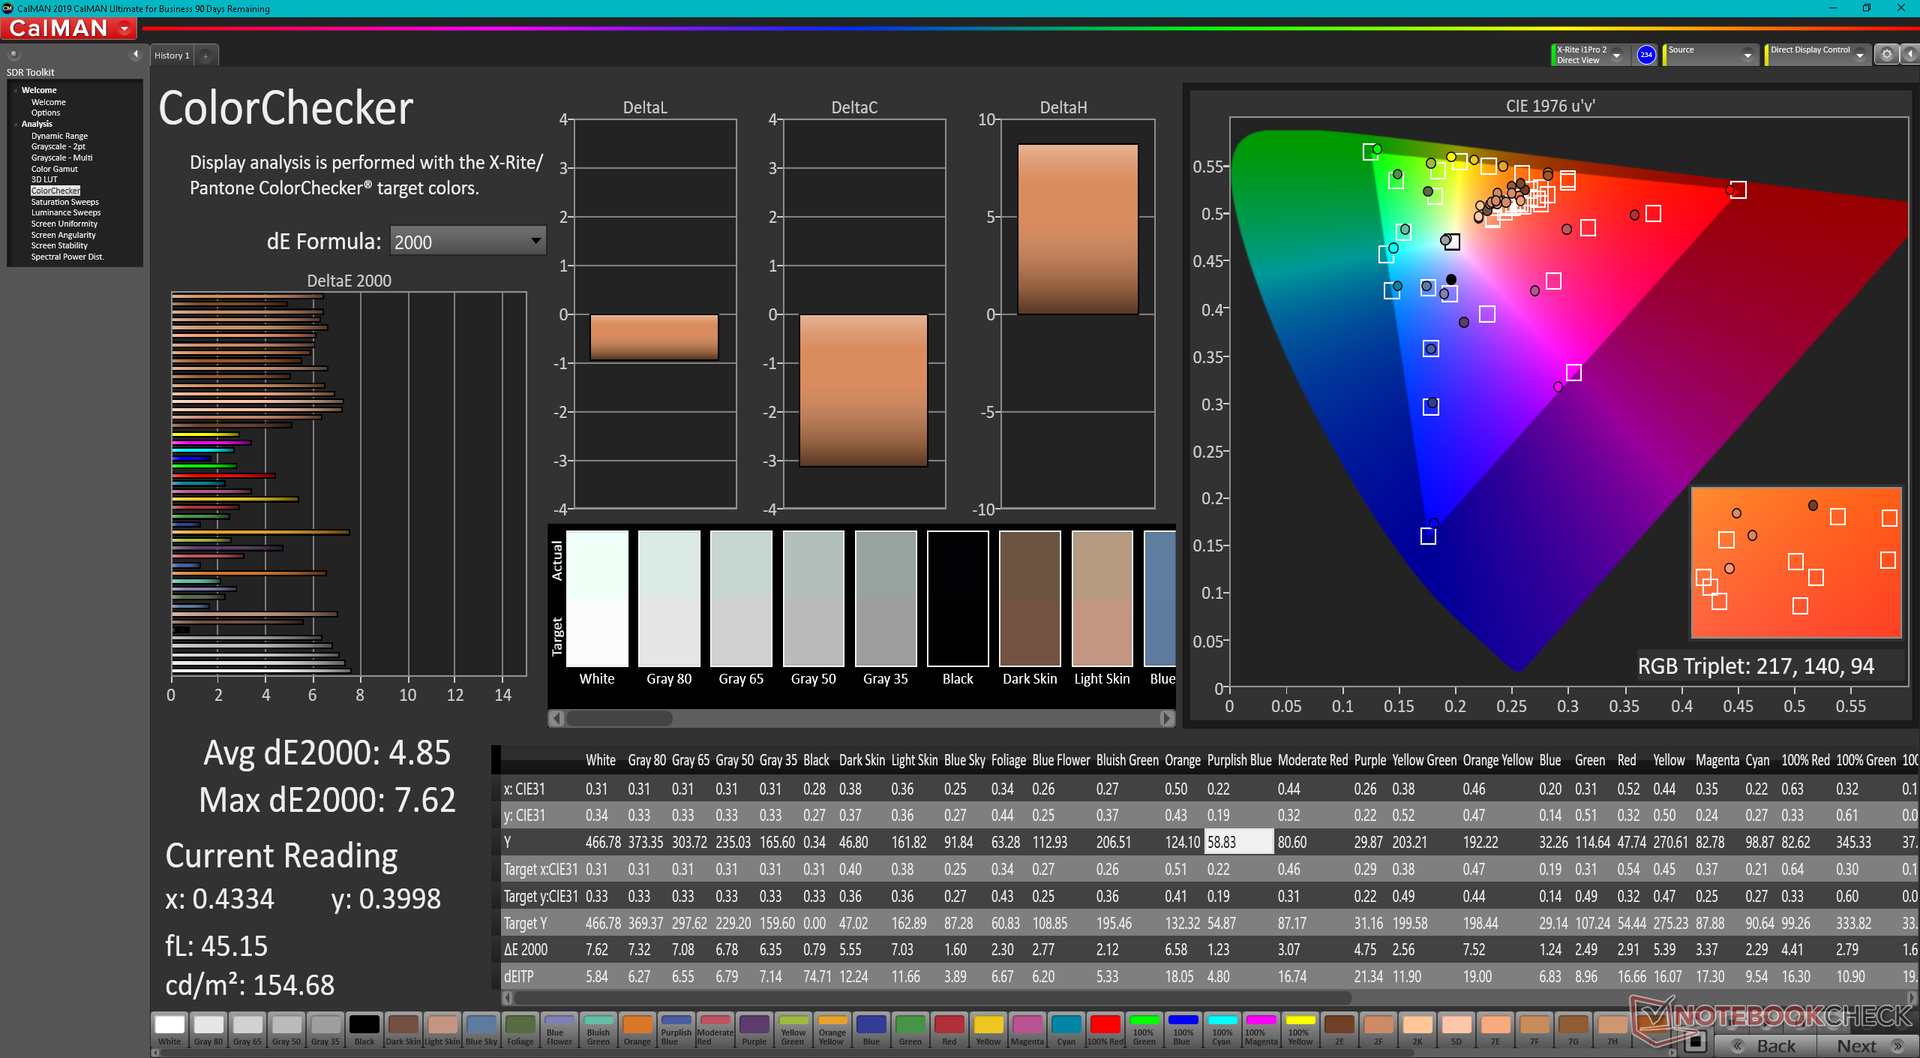
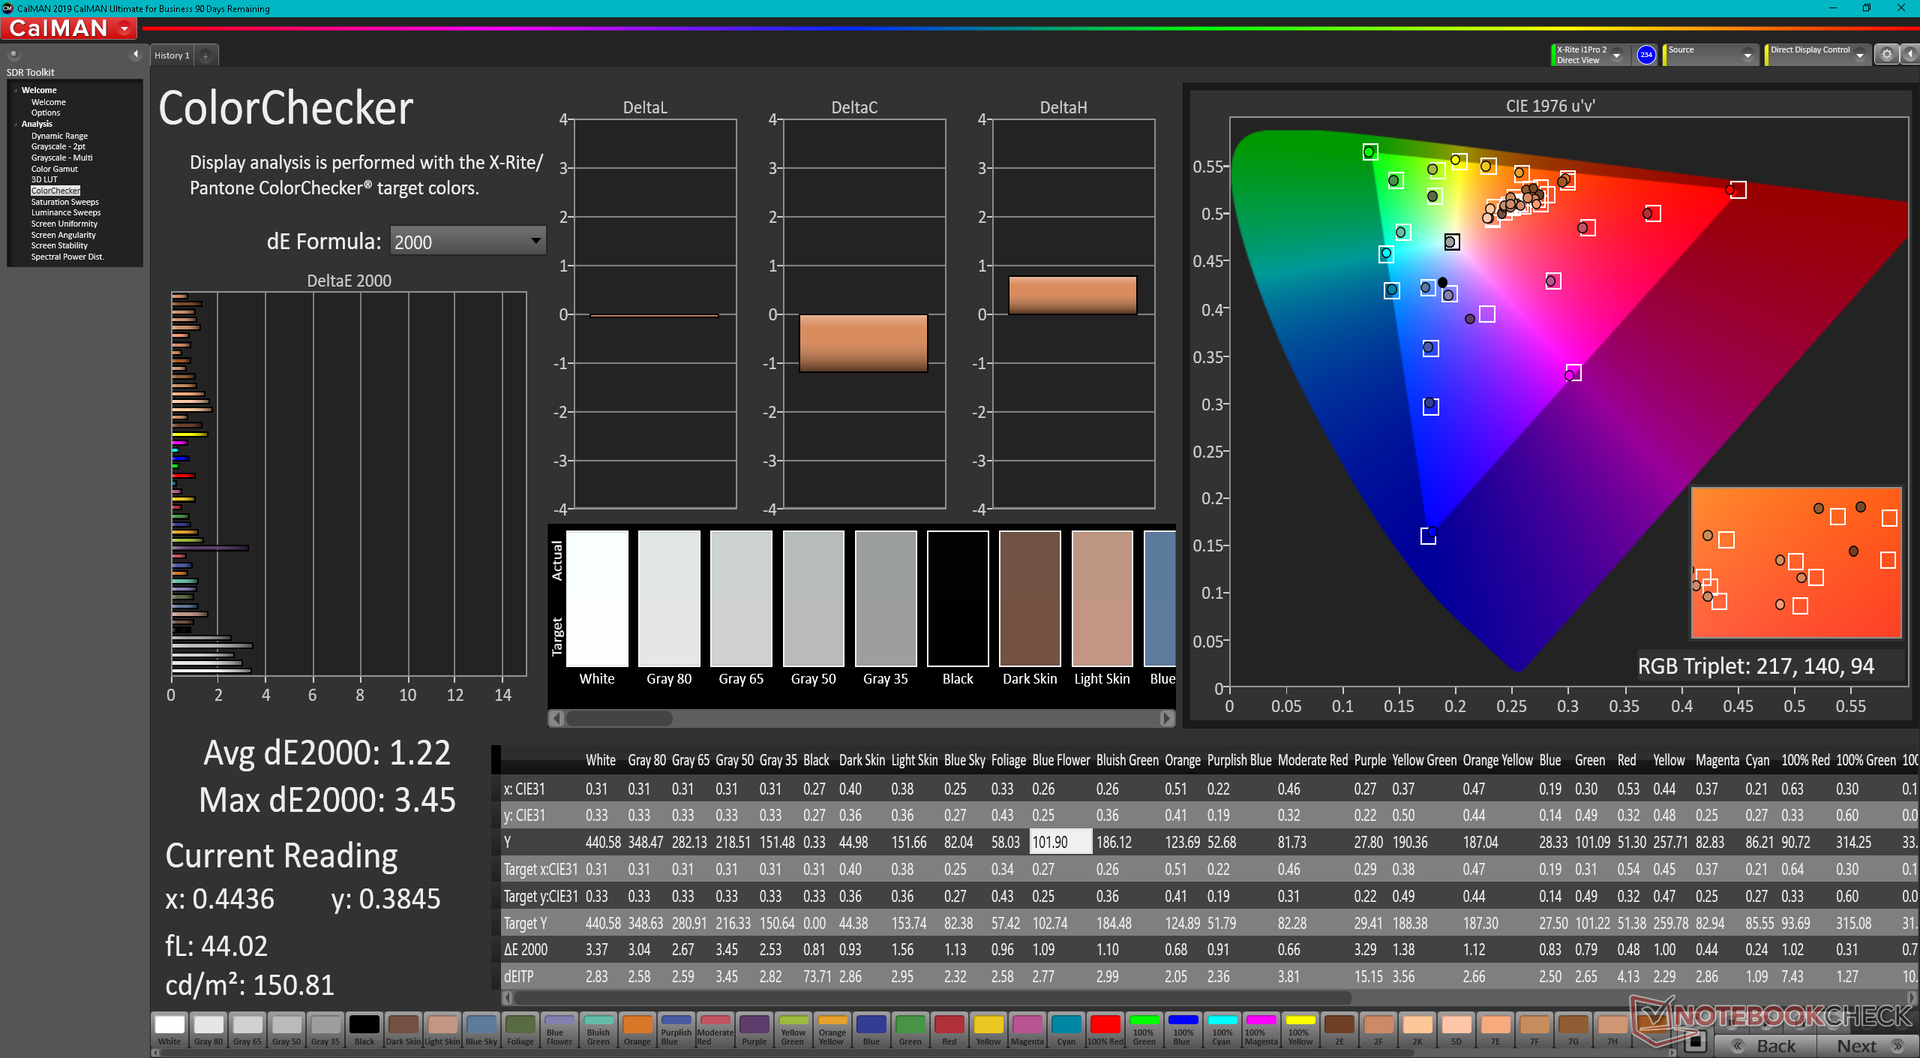
ΔE ColorChecker Calman: 4.85 | ∀{0.5-29.43 Ø4.71}
calibrated: 1.22
ΔE Greyscale Calman: 5.7 | ∀{0.09-98 Ø4.96}
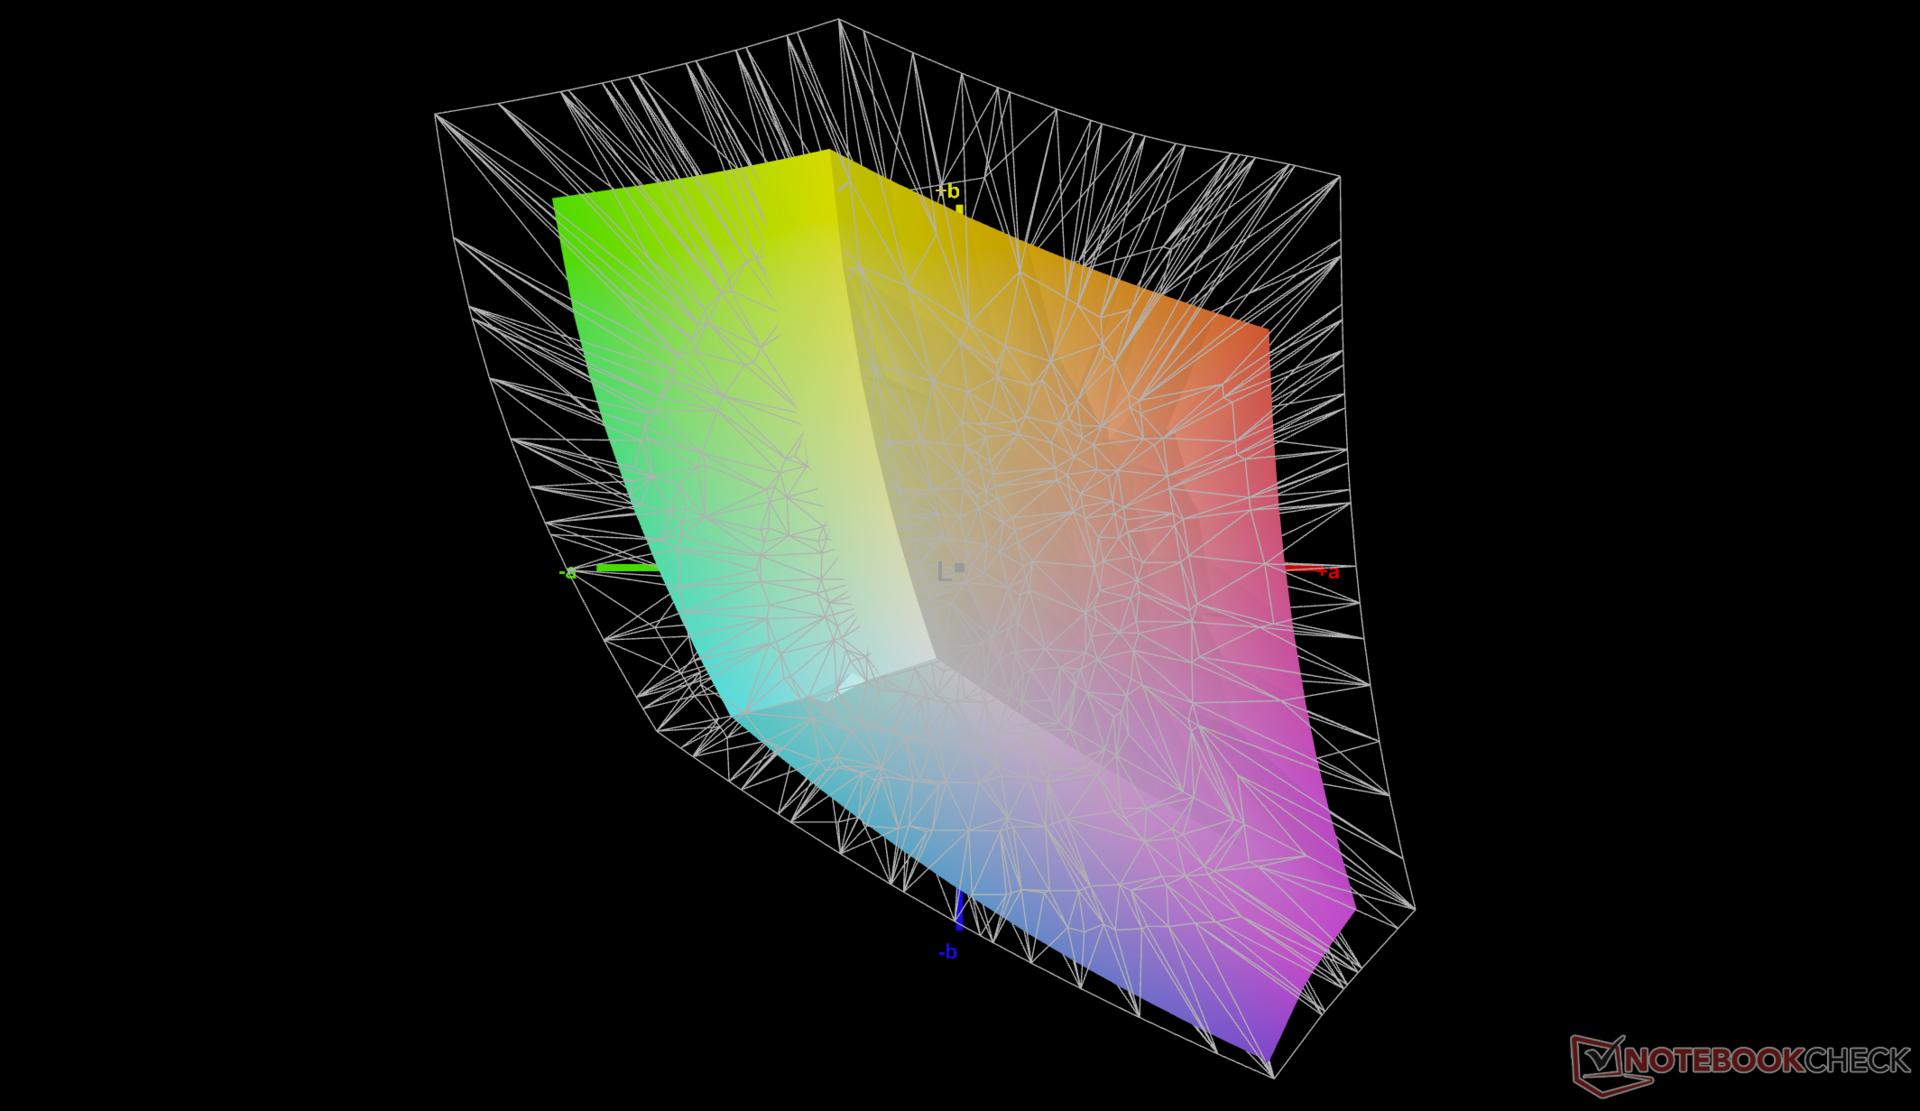
68.3% AdobeRGB 1998 (Argyll 3D)
96.1% sRGB (Argyll 3D)
66.2% Display P3 (Argyll 3D)
Gamma: 2.13
CCT: 6931 K
| Lenovo ThinkPad X1 Nano Gen 2 Core i7-1280P P101ZFZ-BH2, IPS, 2160x1350, 13" | Lenovo ThinkPad X1 Nano-20UN002UGE MND007ZA1-2, IPS, 2160x1350, 13" | HP Elite Dragonfly G3 Chi Mei CMN13C0, IPS, 1920x1280, 13.5" | Dell Latitude 13 7330 LG Philips 133WF9, IPS, 1920x1080, 13.3" | Framework Laptop 13.5 12th Gen Intel BOE CQ NE135FBM-N41, IPS, 2256x1504, 13.5" | Huawei MateBook X Pro 2021 TIANMA XM, IPS, 3000x2000, 13.9" | |
|---|---|---|---|---|---|---|
| Display | 5% | 2% | -1% | 4% | -2% | |
| Display P3 Coverage (%) | 66.2 | 70.4 6% | 68 3% | 66.1 0% | 69.9 6% | 64.9 -2% |
| sRGB Coverage (%) | 96.1 | 99.9 4% | 98.3 2% | 93.5 -3% | 99.4 3% | 94.4 -2% |
| AdobeRGB 1998 Coverage (%) | 68.3 | 72 5% | 69.9 2% | 68.2 0% | 71.1 4% | 66.3 -3% |
| Response Times | -8% | -28% | -14% | 7% | 6% | |
| Response Time Grey 50% / Grey 80% * (ms) | 43.6 ? | 46.8 ? -7% | 50.8 ? -17% | 48.4 ? -11% | 34.7 ? 20% | 37.6 ? 14% |
| Response Time Black / White * (ms) | 25.6 ? | 28 ? -9% | 35.2 ? -38% | 29.6 ? -16% | 27.5 ? -7% | 26.4 ? -3% |
| PWM Frequency (Hz) | ||||||
| Screen | 29% | 19% | 24% | 13% | 26% | |
| Brightness middle (cd/m²) | 469.6 | 460 -2% | 387.2 -18% | 460.1 -2% | 449.6 -4% | 502 7% |
| Brightness (cd/m²) | 460 | 434 -6% | 360 -22% | 445 -3% | 431 -6% | 474 3% |
| Brightness Distribution (%) | 94 | 92 -2% | 80 -15% | 89 -5% | 90 -4% | 89 -5% |
| Black Level * (cd/m²) | 0.37 | 0.27 27% | 0.26 30% | 0.31 16% | 0.31 16% | 0.33 11% |
| Contrast (:1) | 1269 | 1704 34% | 1489 17% | 1484 17% | 1450 14% | 1521 20% |
| Colorchecker dE 2000 * | 4.85 | 1.1 77% | 2.36 51% | 2.42 50% | 2.76 43% | 1.35 72% |
| Colorchecker dE 2000 max. * | 7.62 | 4.5 41% | 4.79 37% | 3.97 48% | 7.96 -4% | 3.67 52% |
| Colorchecker dE 2000 calibrated * | 1.22 | 1 18% | 0.63 48% | 0.77 37% | 0.58 52% | 1.2 2% |
| Greyscale dE 2000 * | 5.7 | 1.6 72% | 3 47% | 2.3 60% | 5.2 9% | 1.7 70% |
| Gamma | 2.13 103% | 2.2 100% | 2.17 101% | 2.23 99% | 2.23 99% | 2.24 98% |
| CCT | 6931 94% | 6475 100% | 6137 106% | 6262 104% | 6475 100% | 6440 101% |
| Color Space (Percent of AdobeRGB 1998) (%) | 65.7 | 61.1 | ||||
| Color Space (Percent of sRGB) (%) | 99.9 | 94.3 | ||||
| Moyenne finale (programmes/paramètres) | 9% /
18% | -2% /
9% | 3% /
13% | 8% /
10% | 10% /
17% |
* ... Moindre est la valeur, meilleures sont les performances
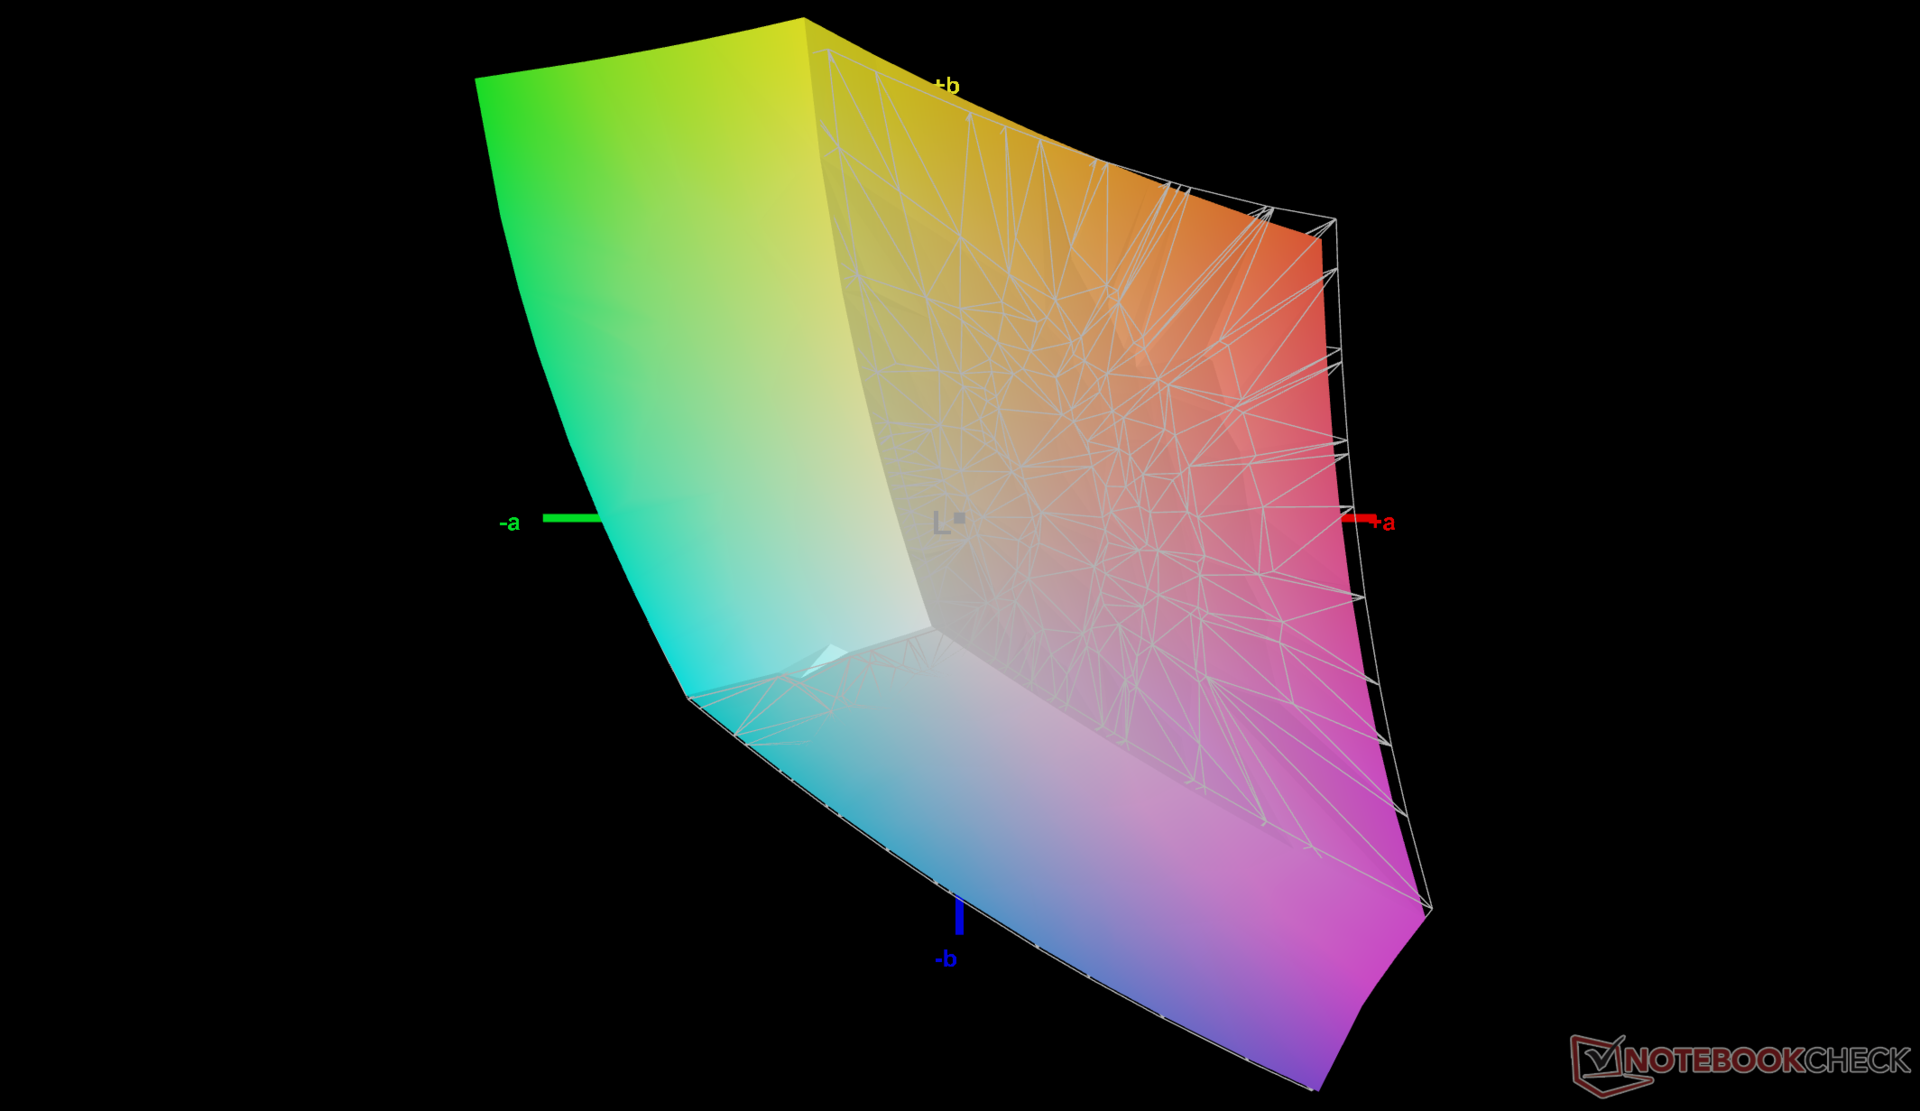
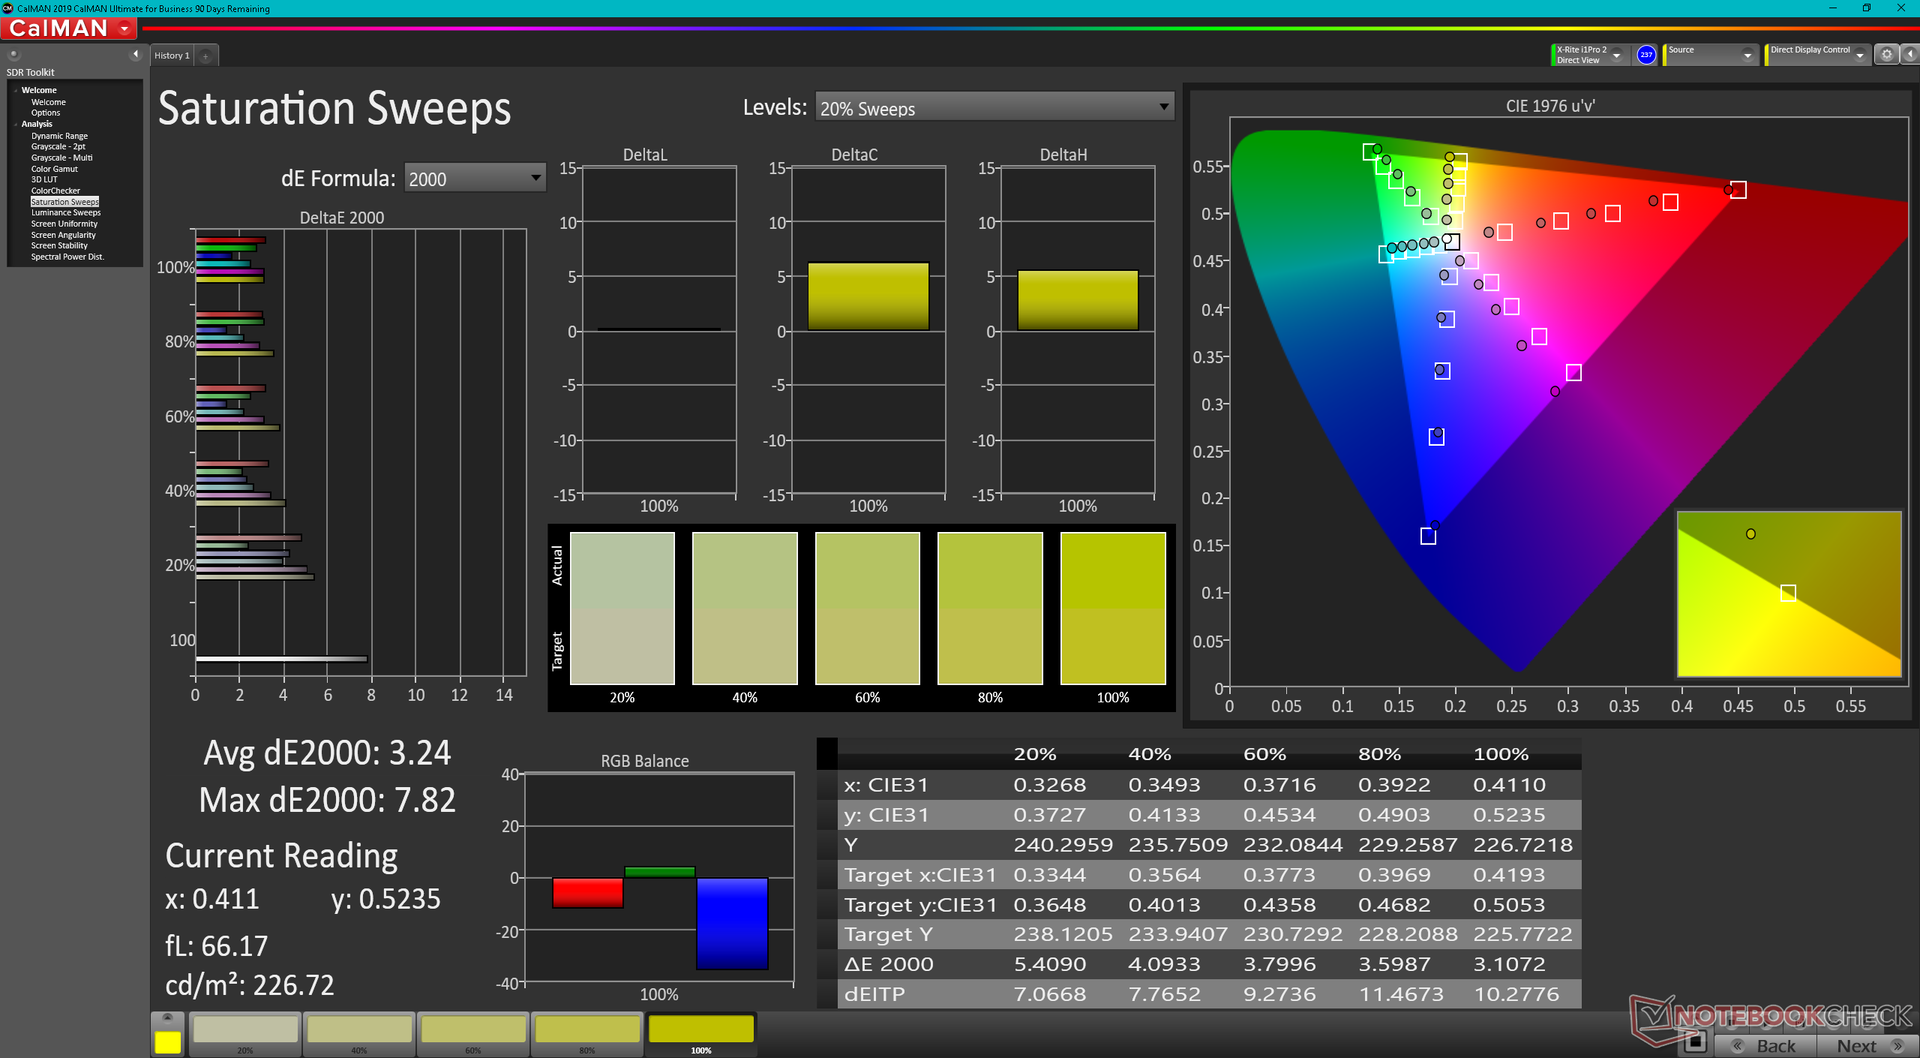
L'écran n'est pas bien calibré à sa sortie de l'emballage. En le calibrant nous-mêmes, nous pourrions améliorer considérablement les valeurs deltaE moyennes des niveaux de gris et des couleurs, qui passeraient de 5,7 et 4,85 à seulement 2,3 et 1,22, respectivement. Nous recommandons un calibrage par l'utilisateur final pour mieux exploiter la couverture sRGB complète du panneau.
Temps de réponse de l'écran
| ↔ Temps de réponse noir à blanc | ||
|---|---|---|
| 25.6 ms ... hausse ↗ et chute ↘ combinées | ↗ 13.2 ms hausse | 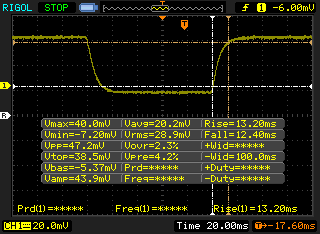 |
| ↘ 12.4 ms chute | ||
| L'écran souffre de latences relativement élevées, insuffisant pour le jeu. En comparaison, tous les appareils testés affichent entre 0.1 (minimum) et 240 (maximum) ms. » 61 % des appareils testés affichent de meilleures performances. Cela signifie que les latences relevées sont moins bonnes que la moyenne (19.8 ms) de tous les appareils testés. | ||
| ↔ Temps de réponse gris 50% à gris 80% | ||
| 43.6 ms ... hausse ↗ et chute ↘ combinées | ↗ 22 ms hausse | 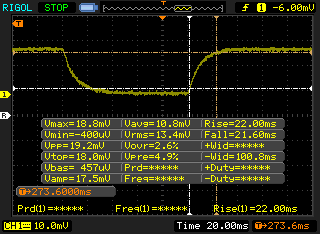 |
| ↘ 21.6 ms chute | ||
| L'écran souffre de latences très élevées, à éviter pour le jeu. En comparaison, tous les appareils testés affichent entre 0.165 (minimum) et 636 (maximum) ms. » 73 % des appareils testés affichent de meilleures performances. Cela signifie que les latences relevées sont moins bonnes que la moyenne (31 ms) de tous les appareils testés. | ||
Scintillement / MLI (Modulation de largeur d'impulsion)
| Scintillement / MLI (Modulation de largeur d'impulsion) non décelé | 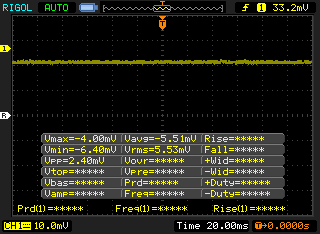 | ||
En comparaison, 52 % des appareils testés n'emploient pas MDI pour assombrir leur écran. Nous avons relevé une moyenne à 7754 (minimum : 5 - maximum : 343500) Hz dans le cas où une MDI était active. | |||
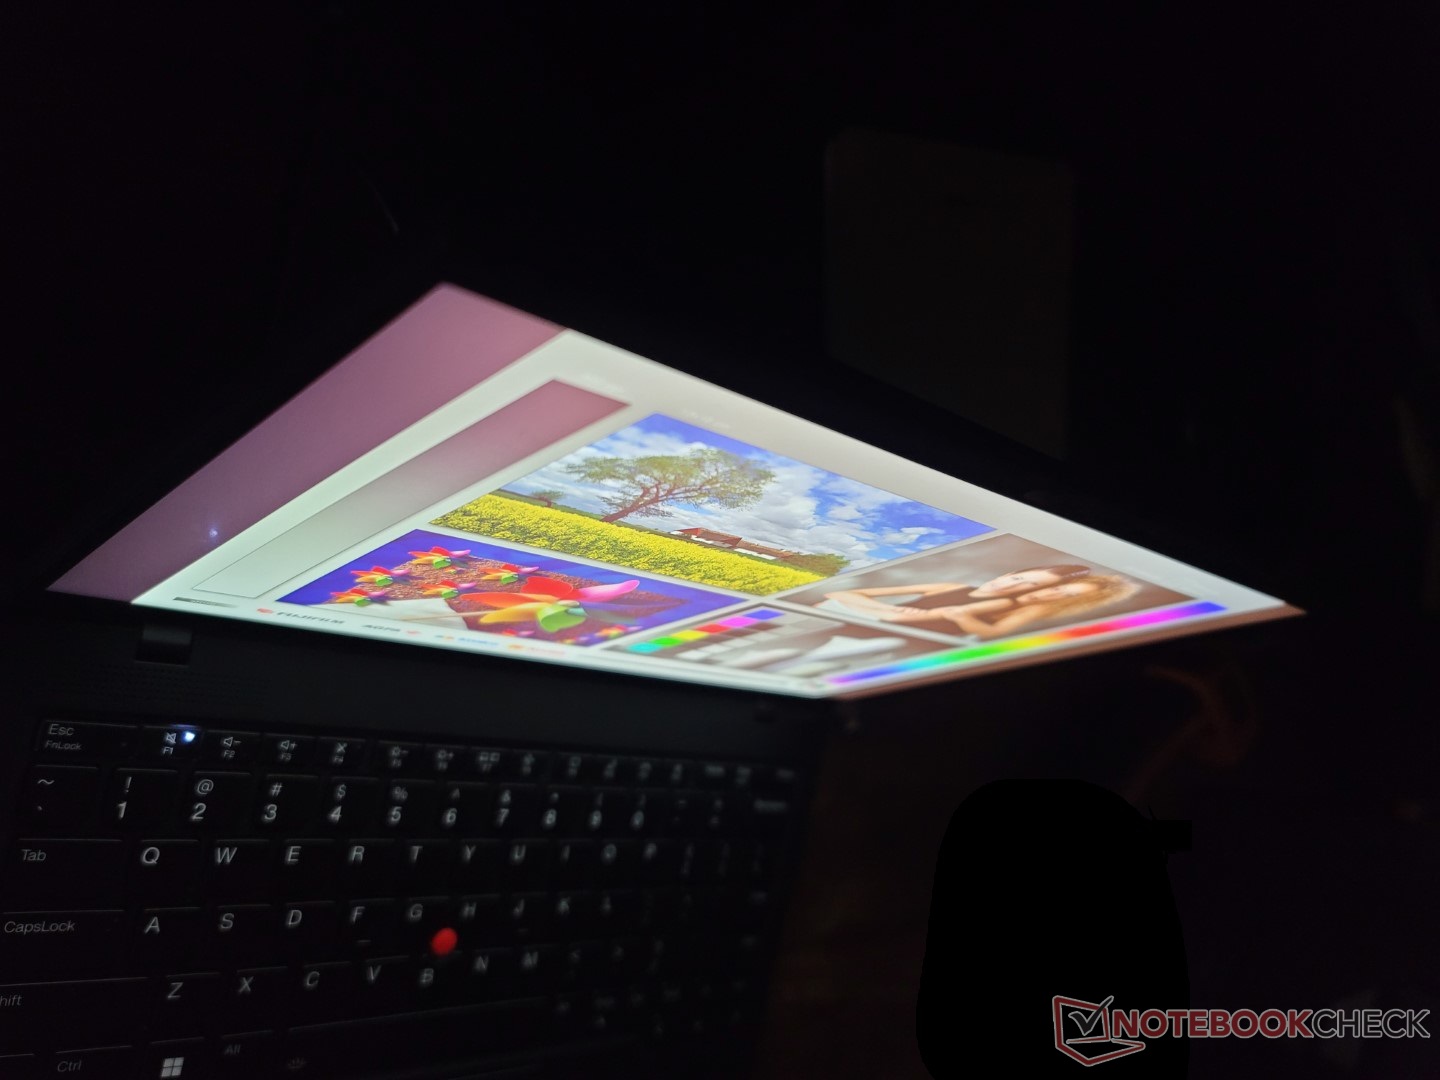
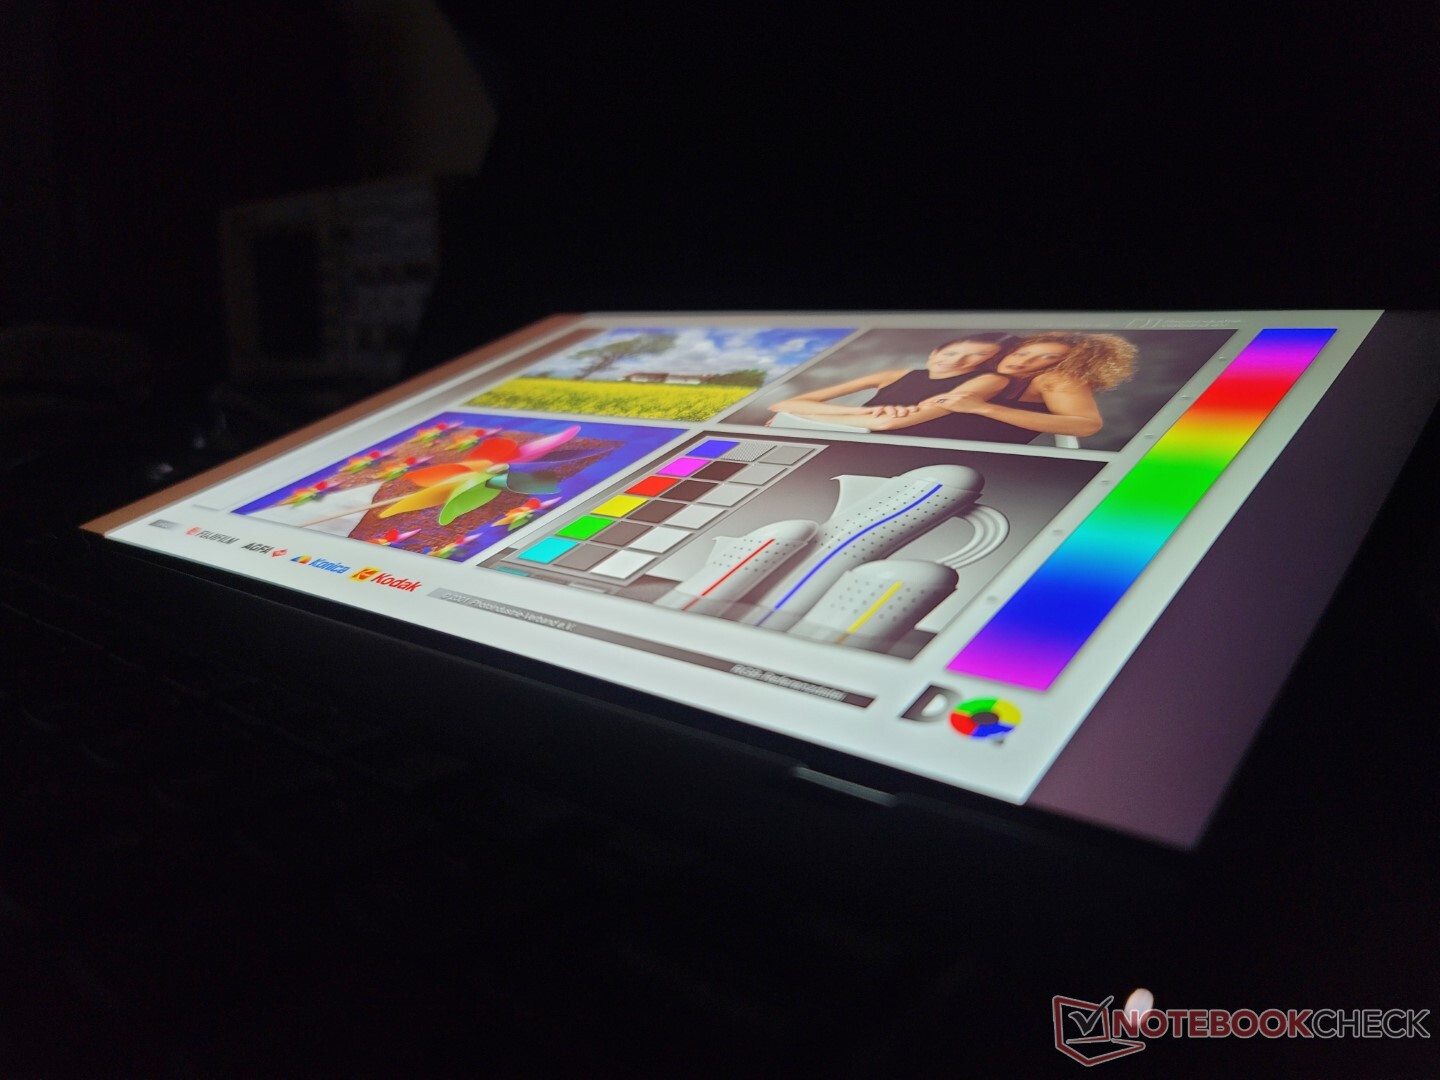
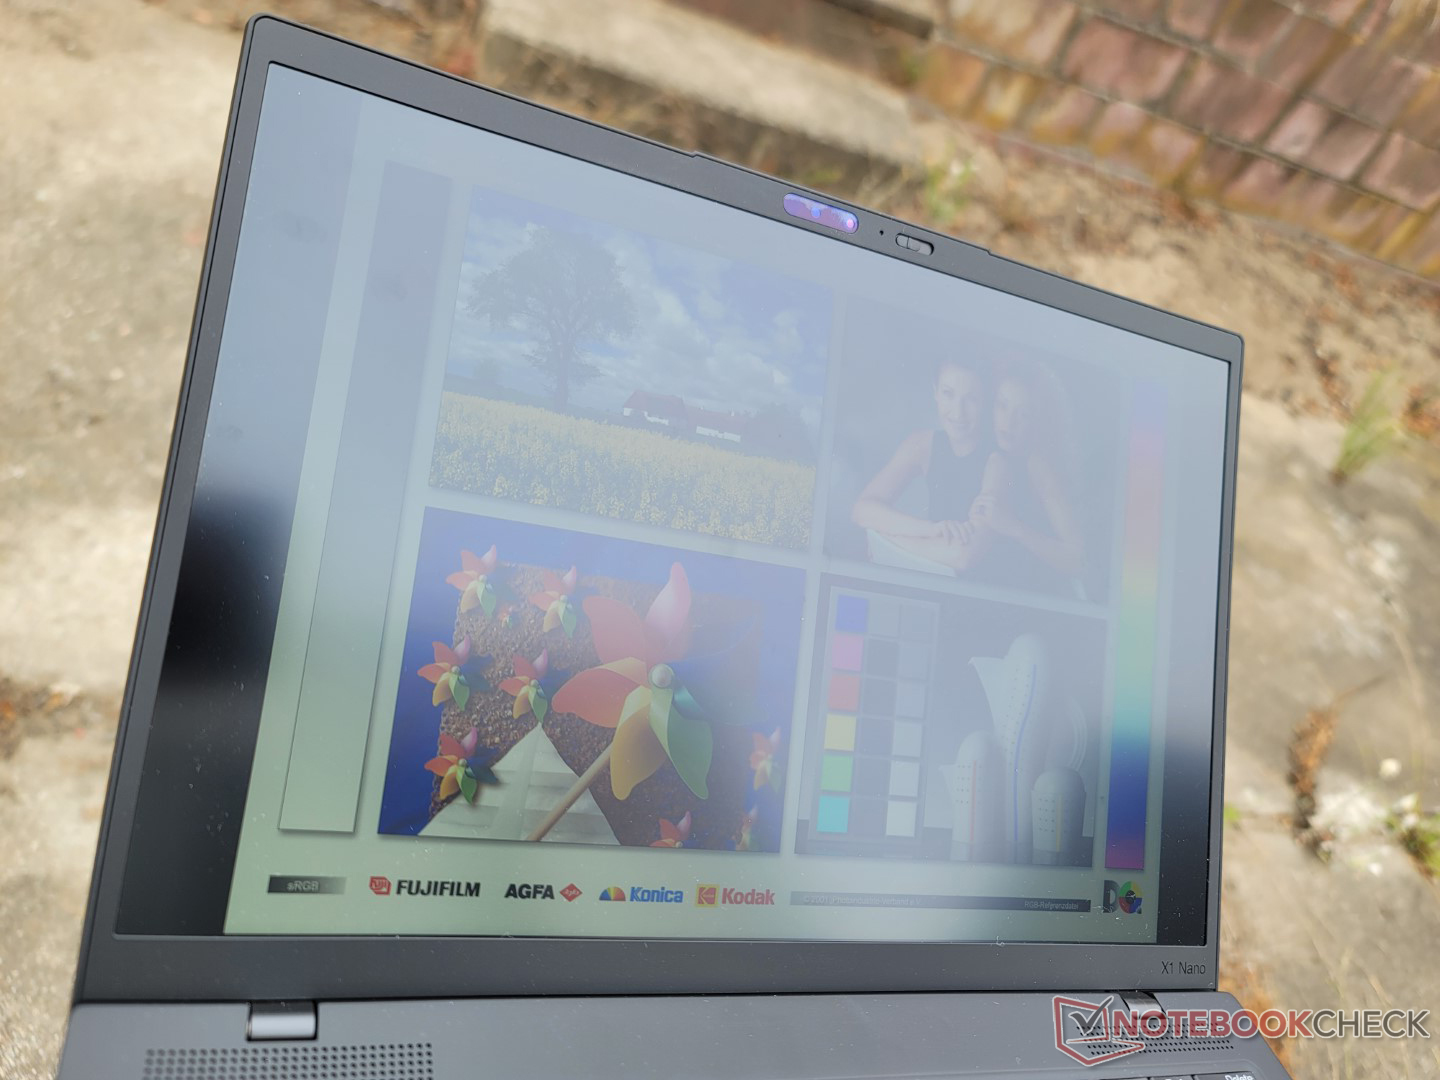
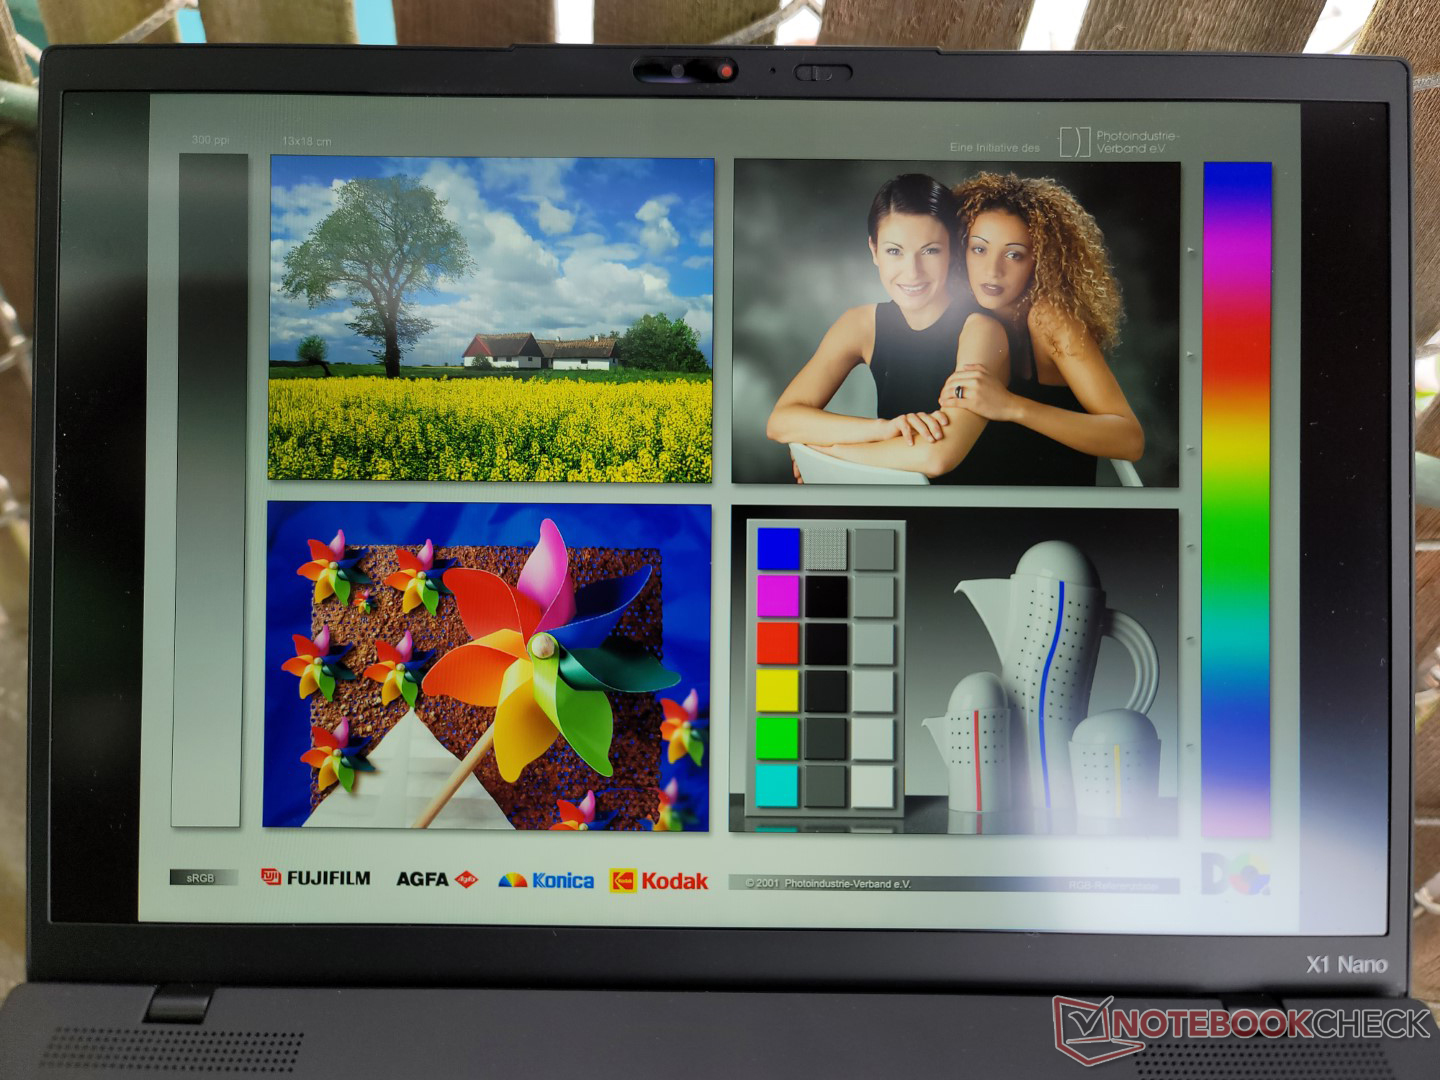
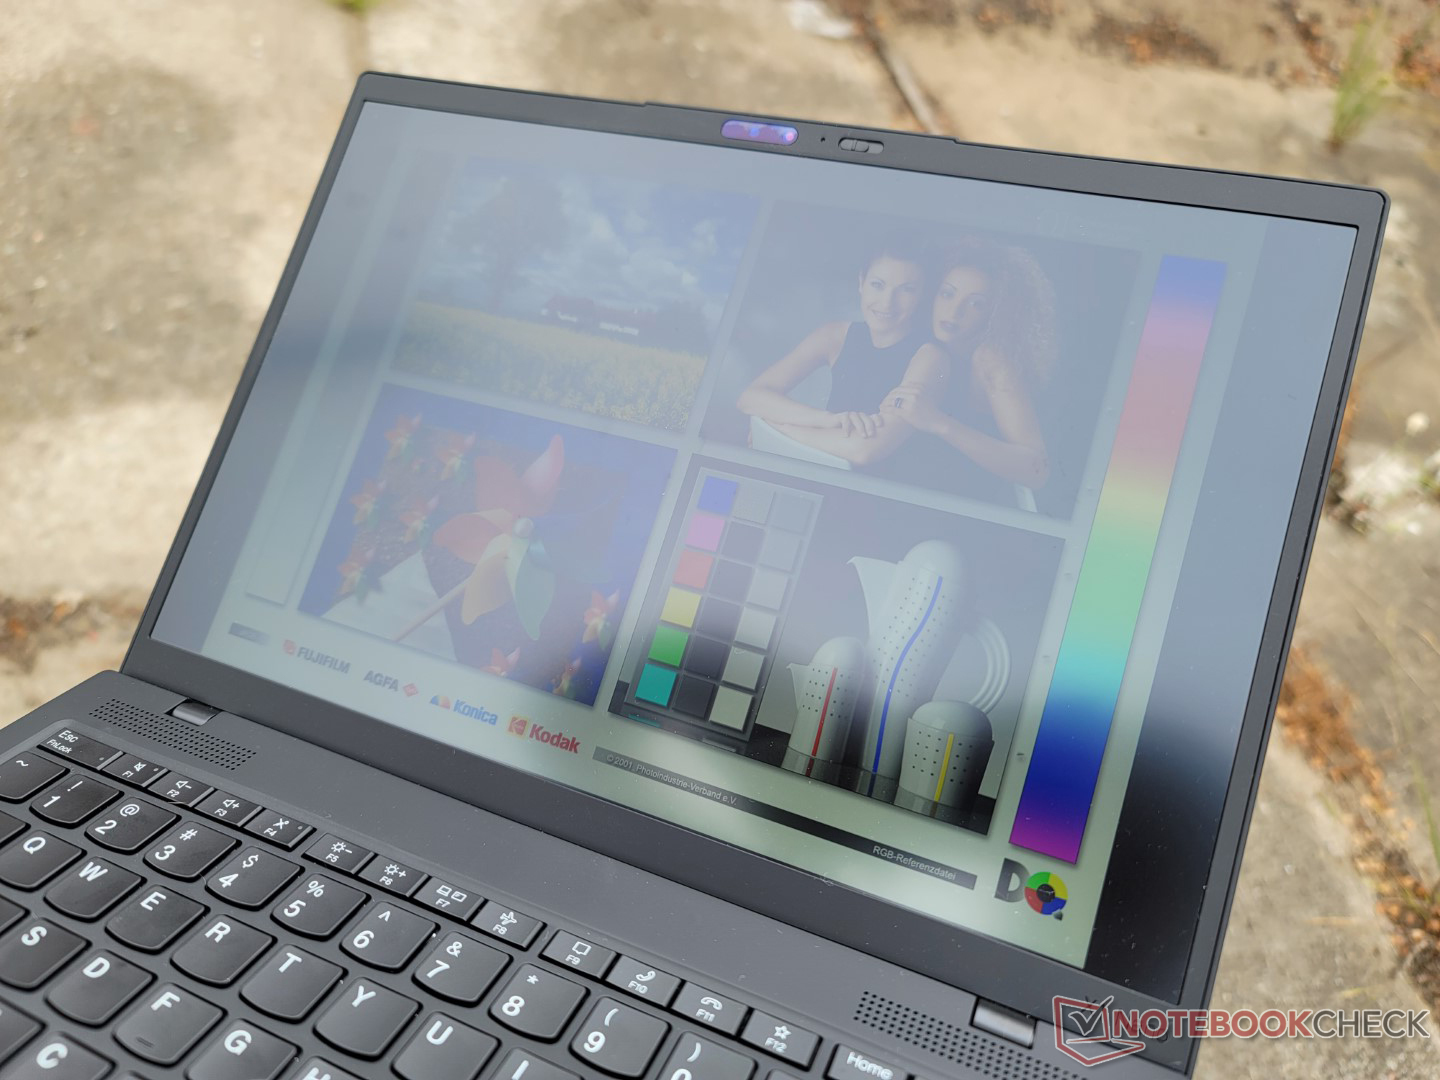
La visibilité en extérieur et les angles de vue restent essentiellement les mêmes que sur le modèle Gen 1, Lenovo n'ayant pas augmenté la luminosité ou le contraste de l'écran pour le modèle de cette année.
Performance
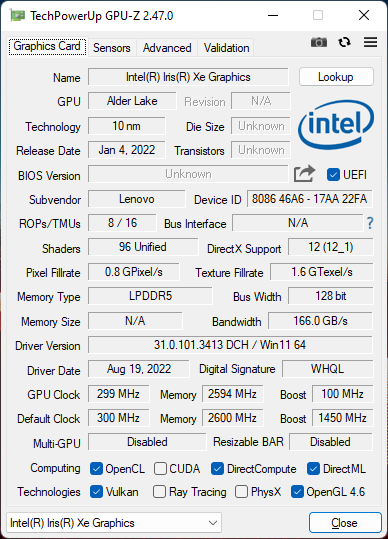
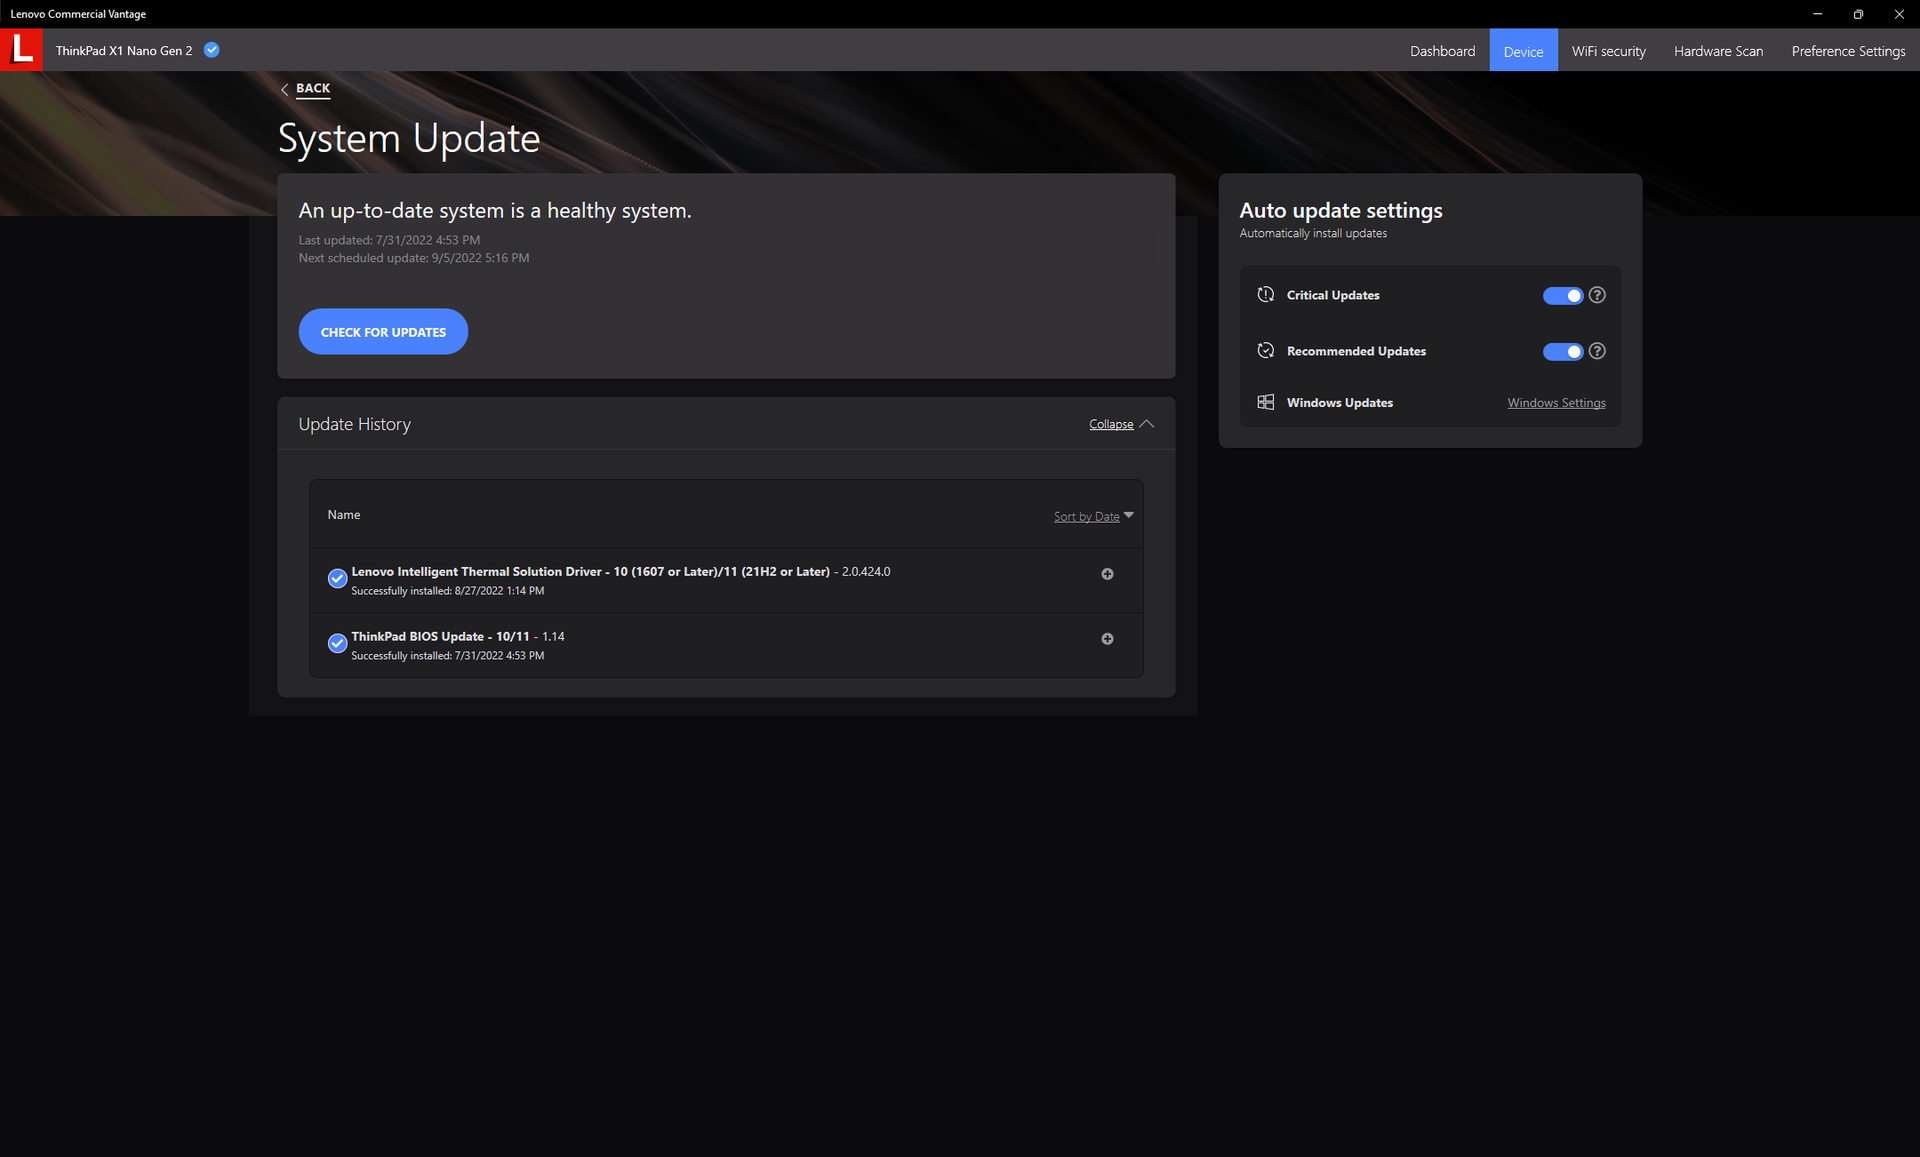
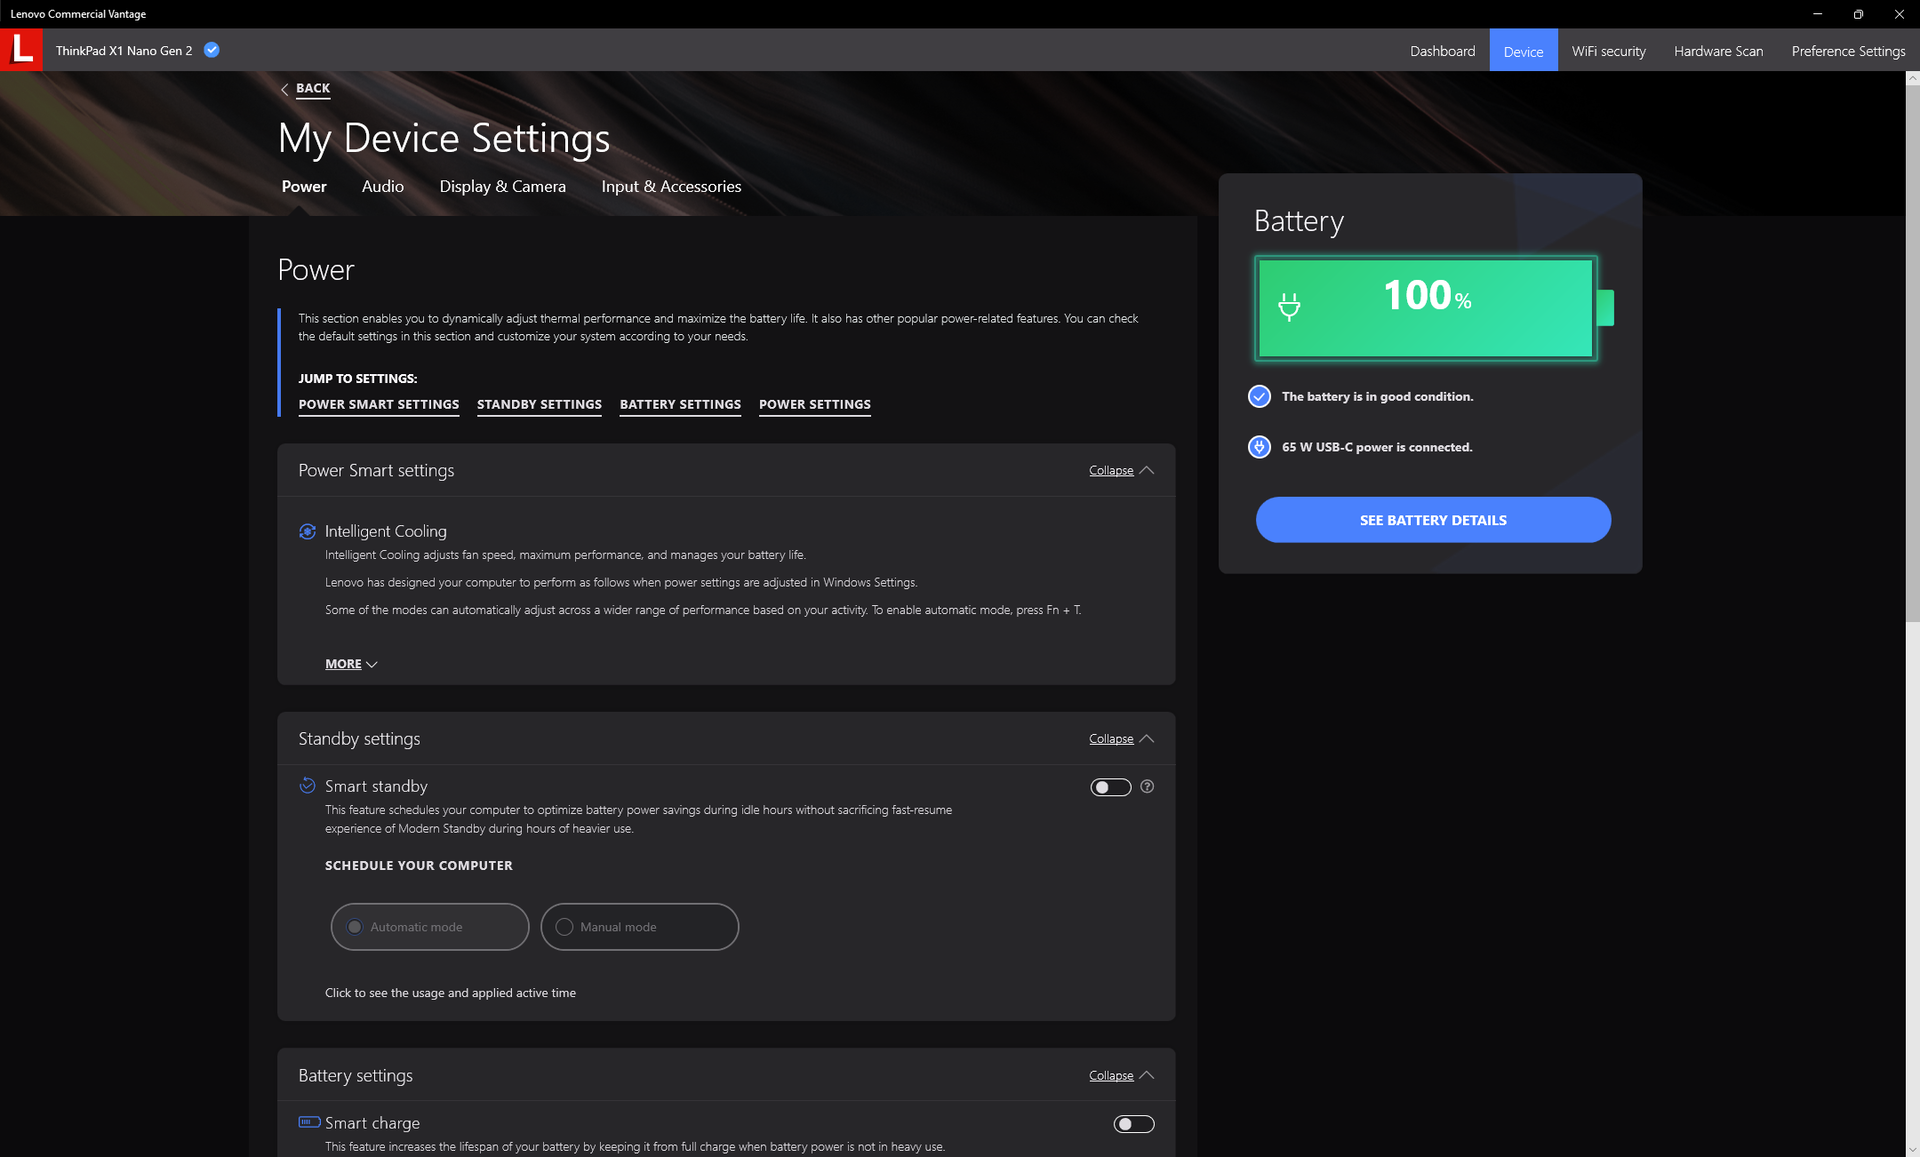
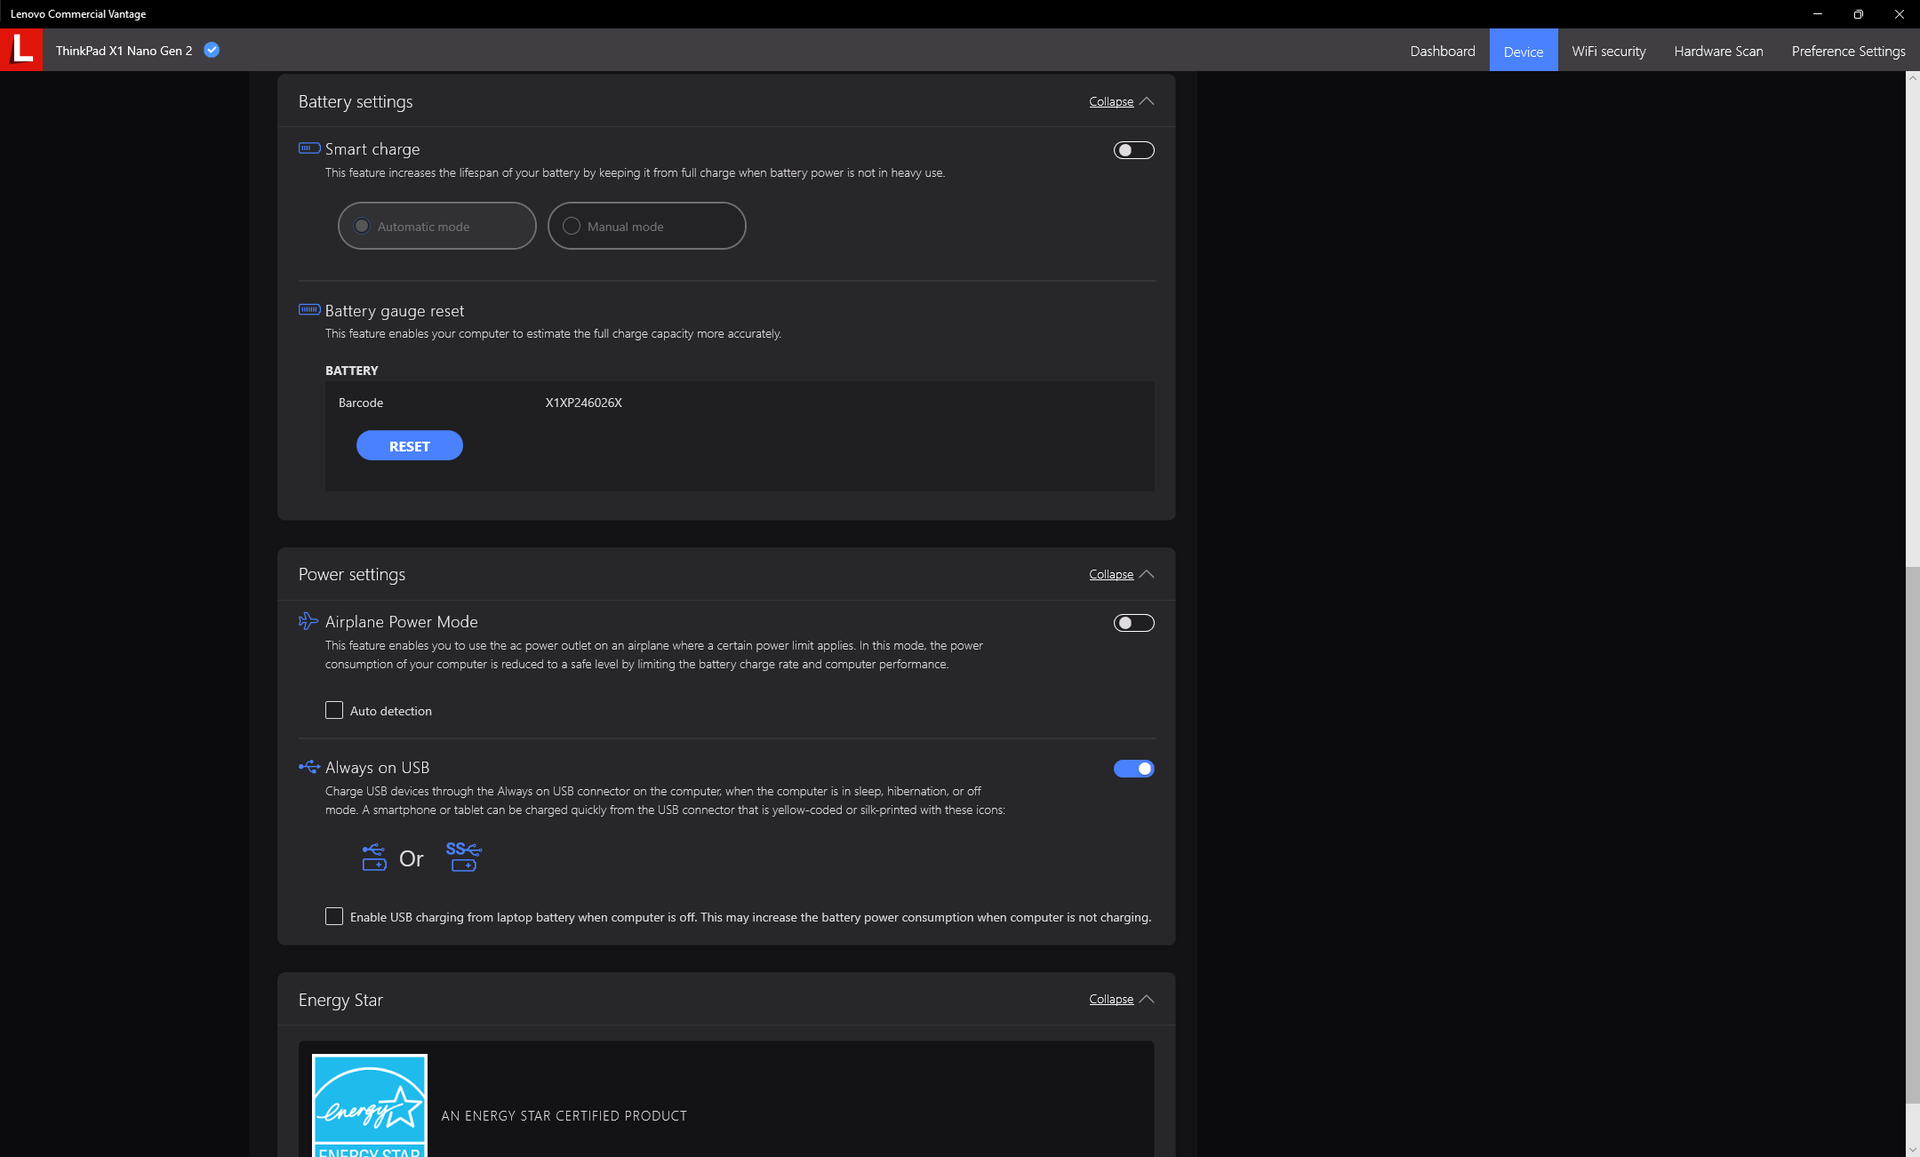
Conditions d'essai
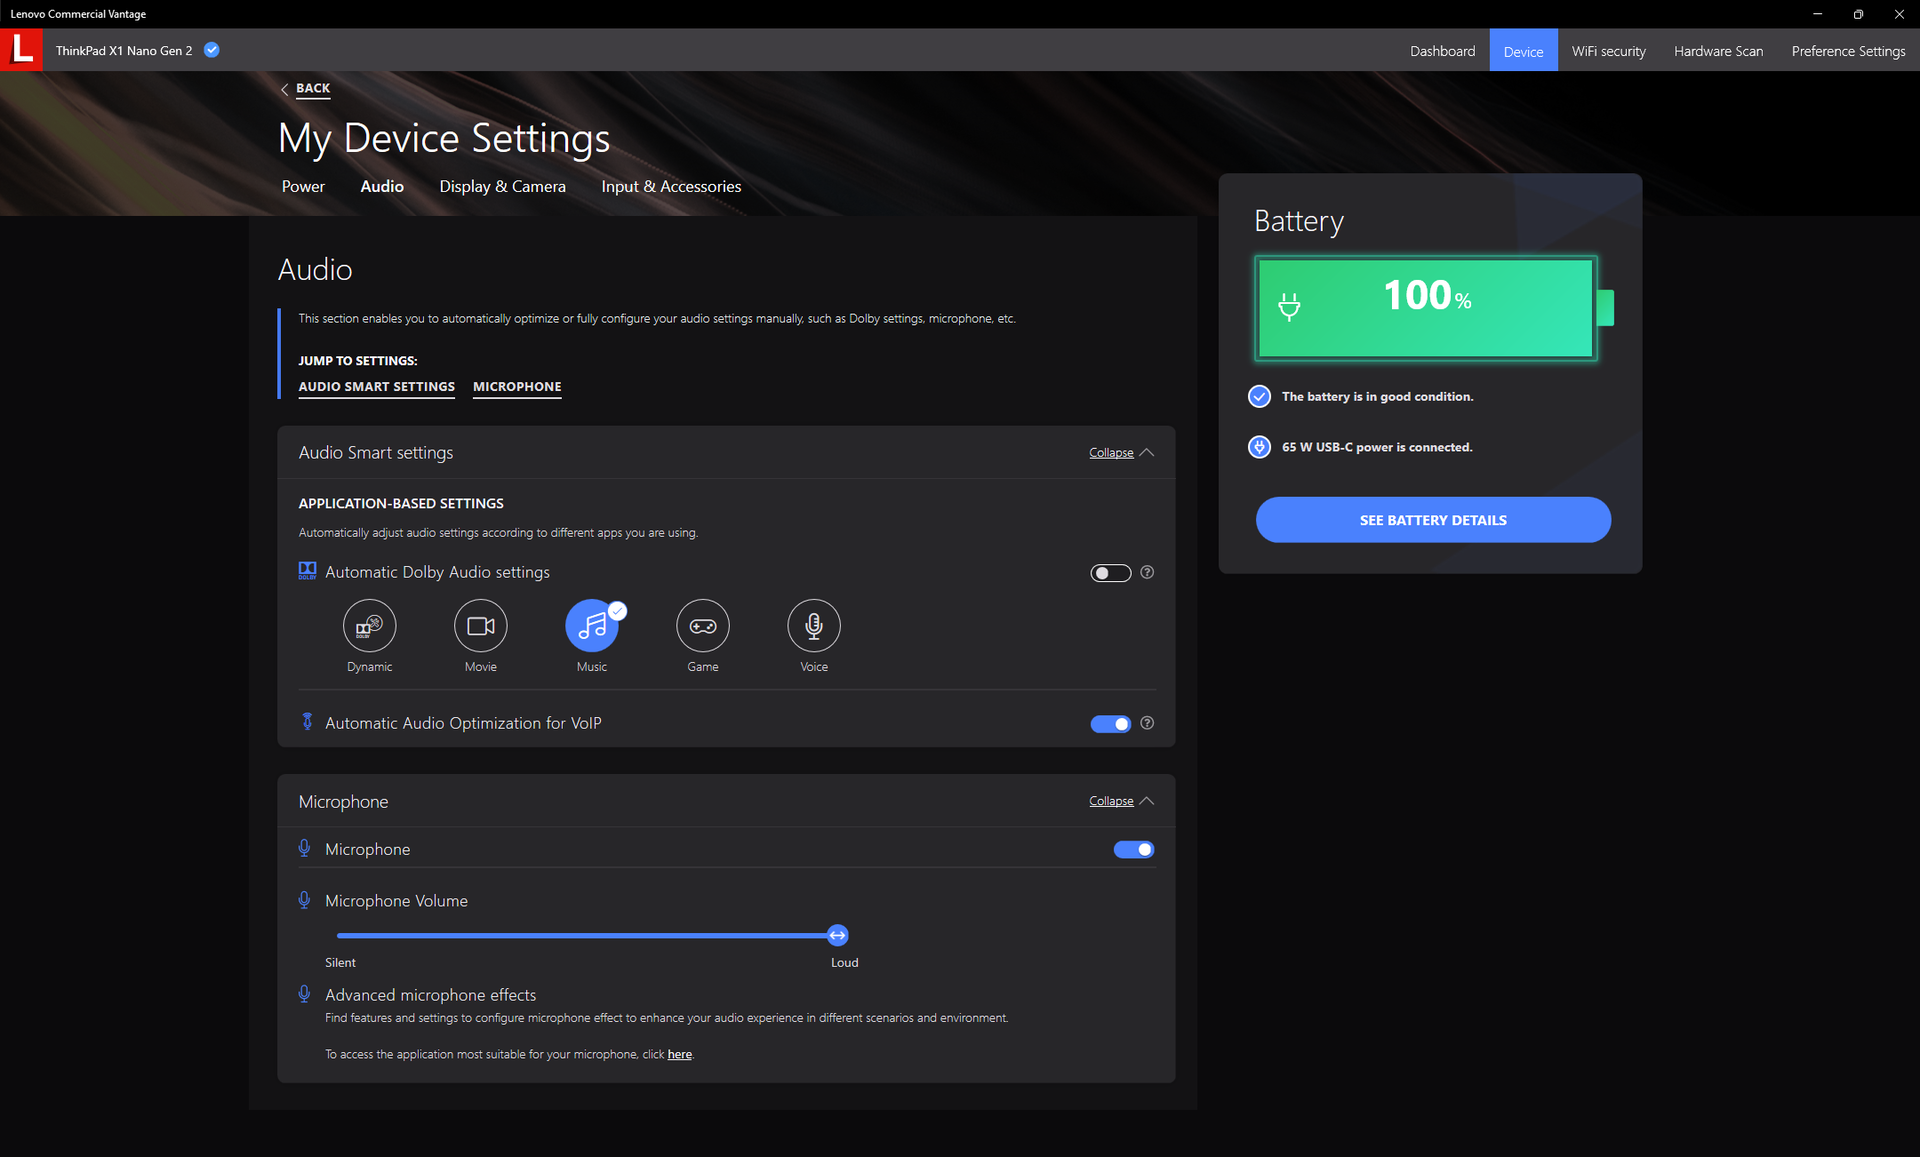
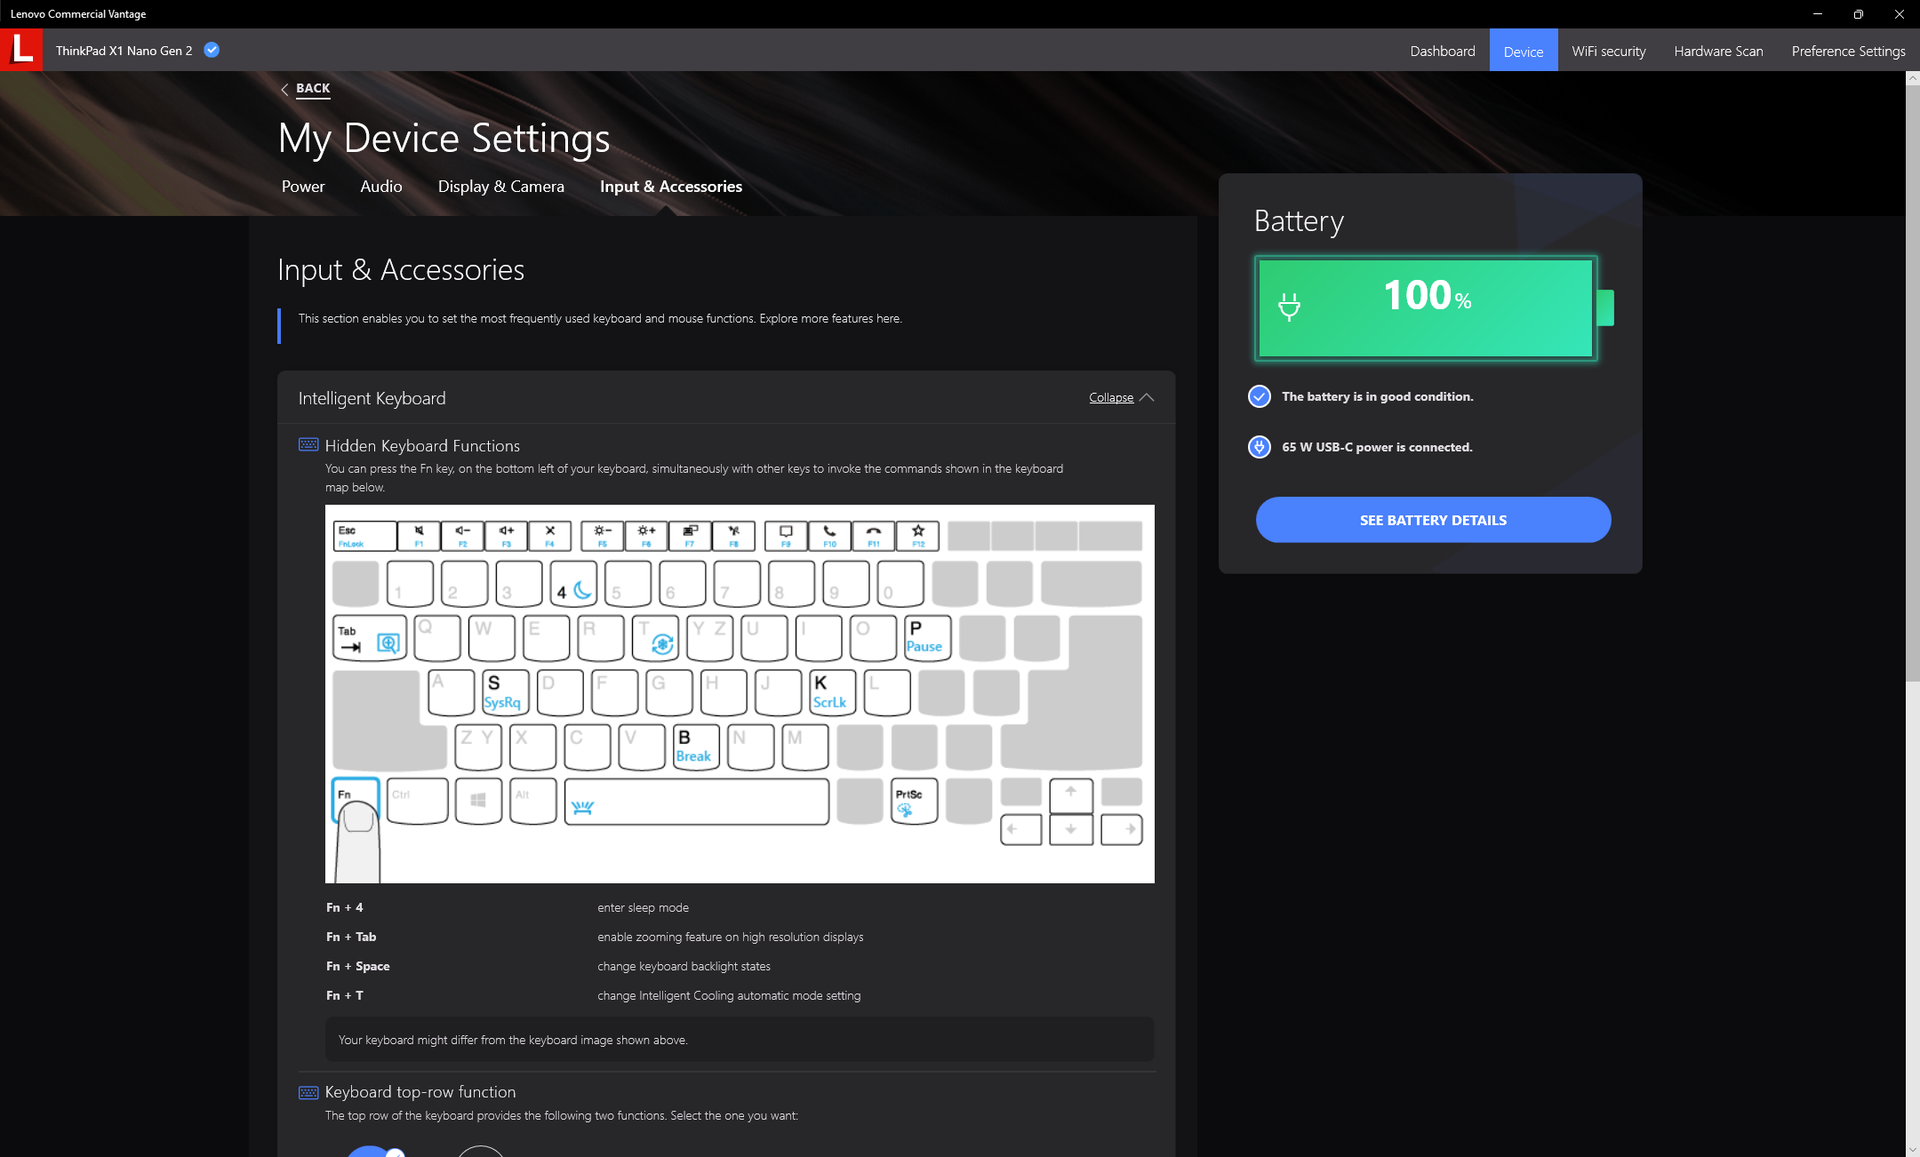
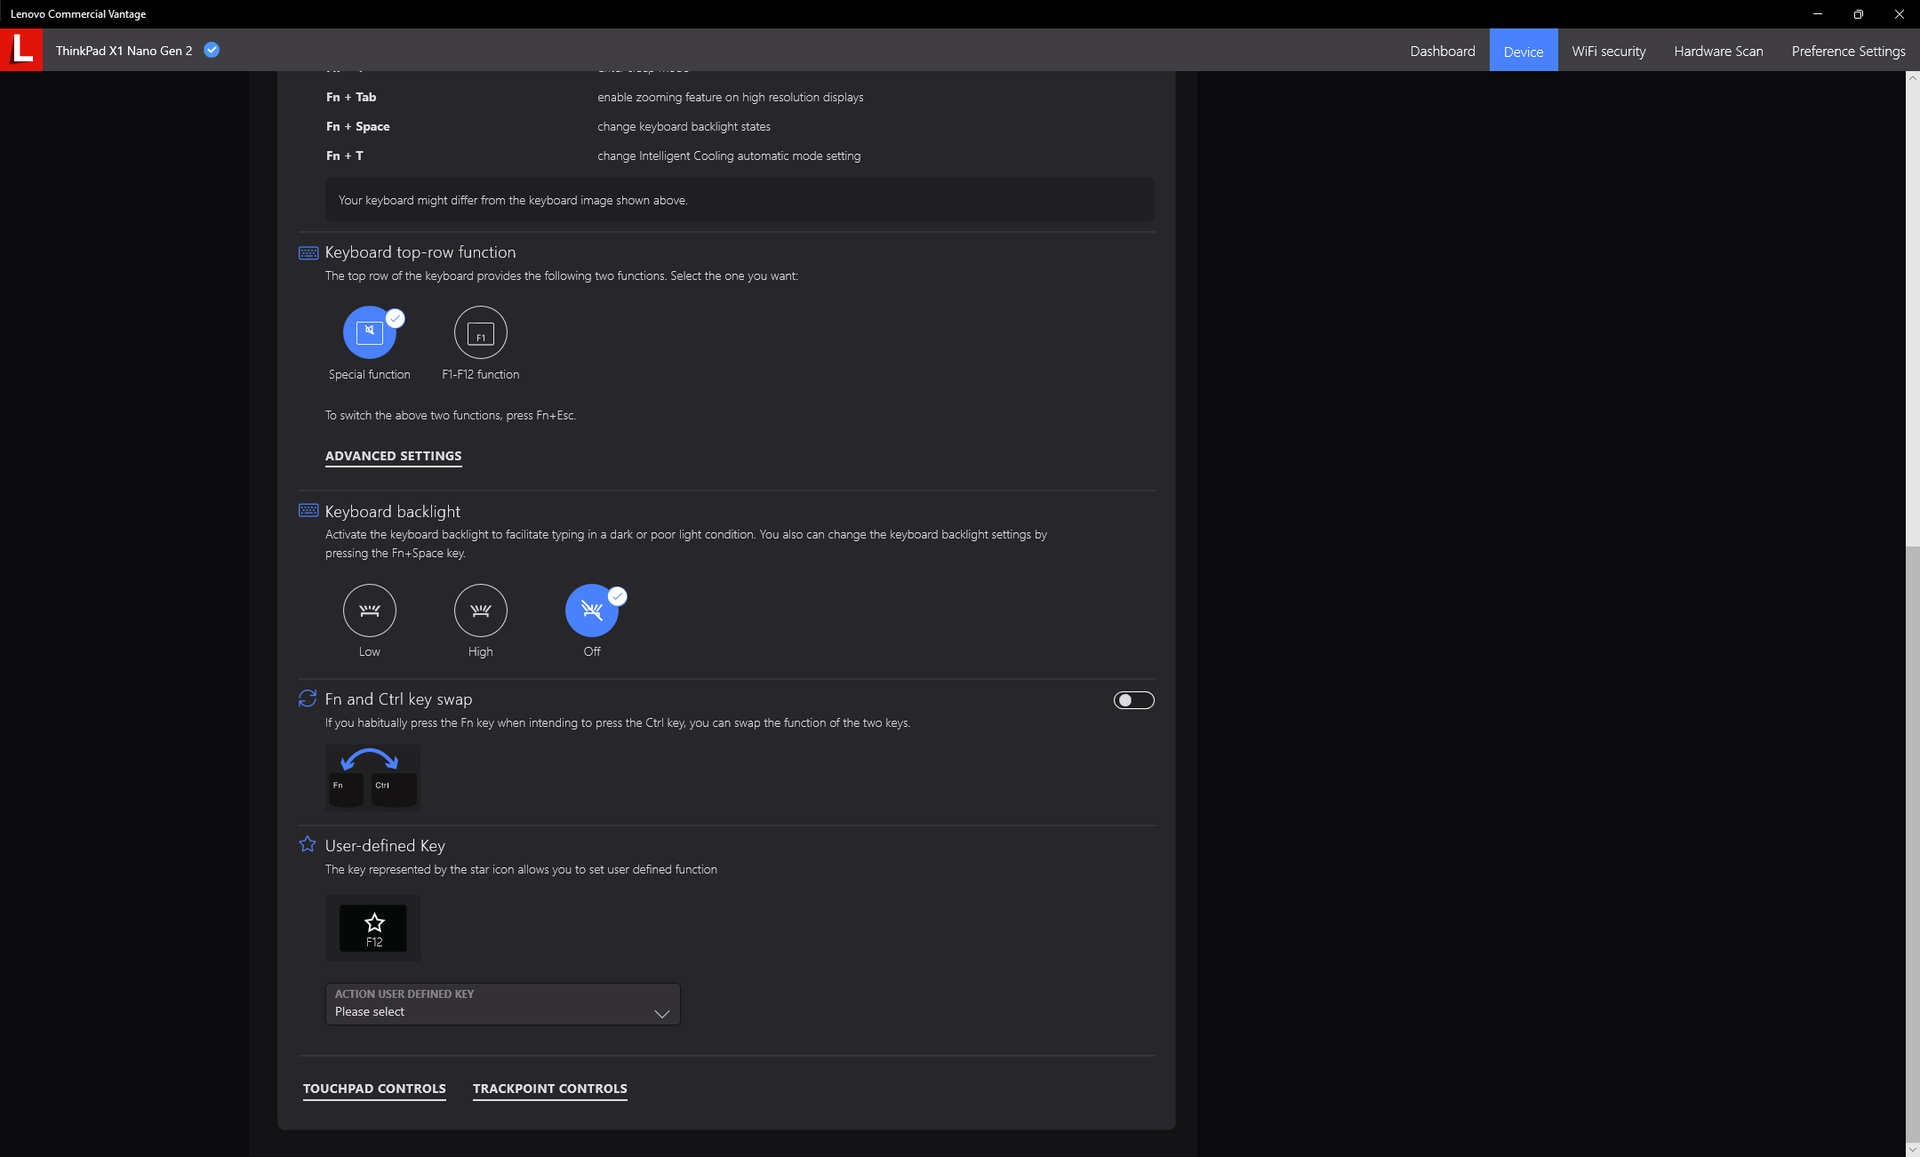
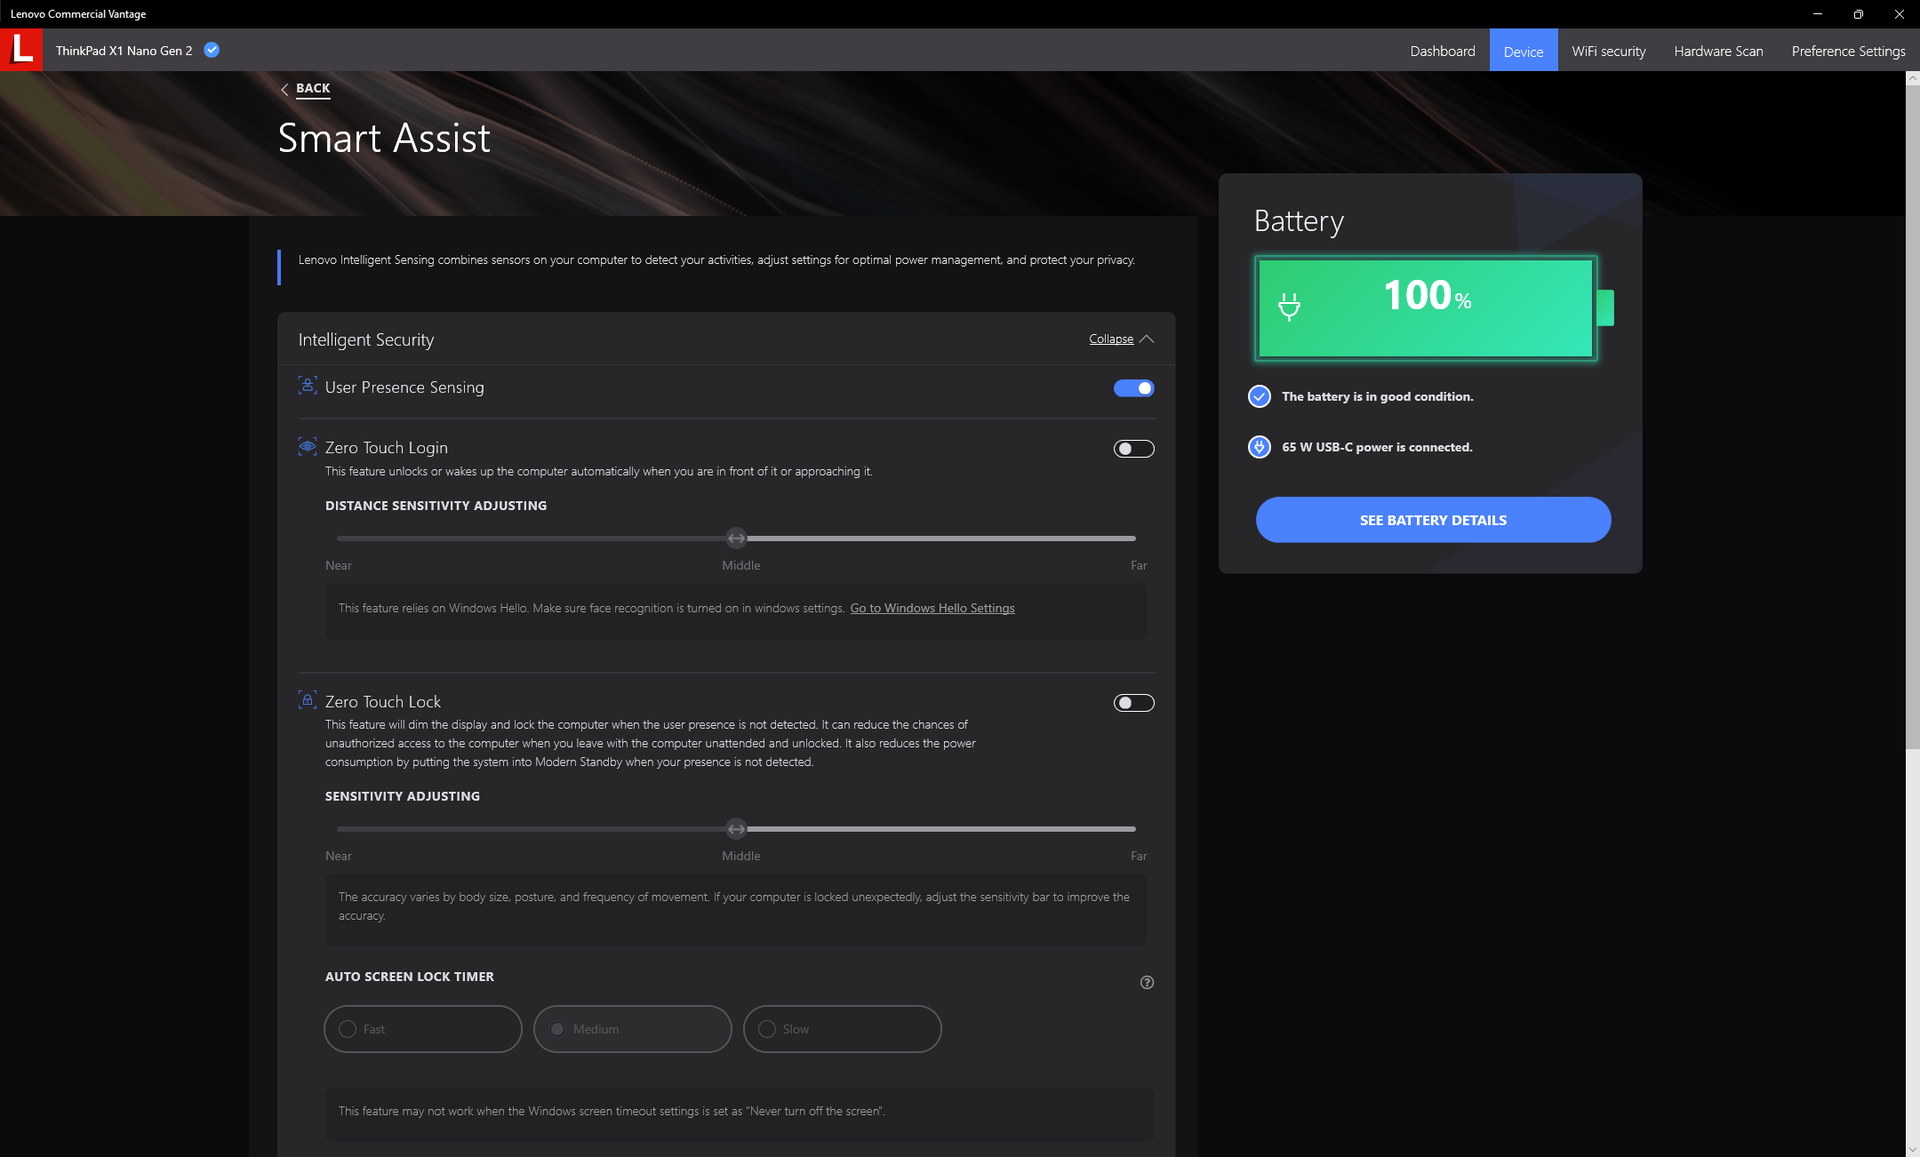
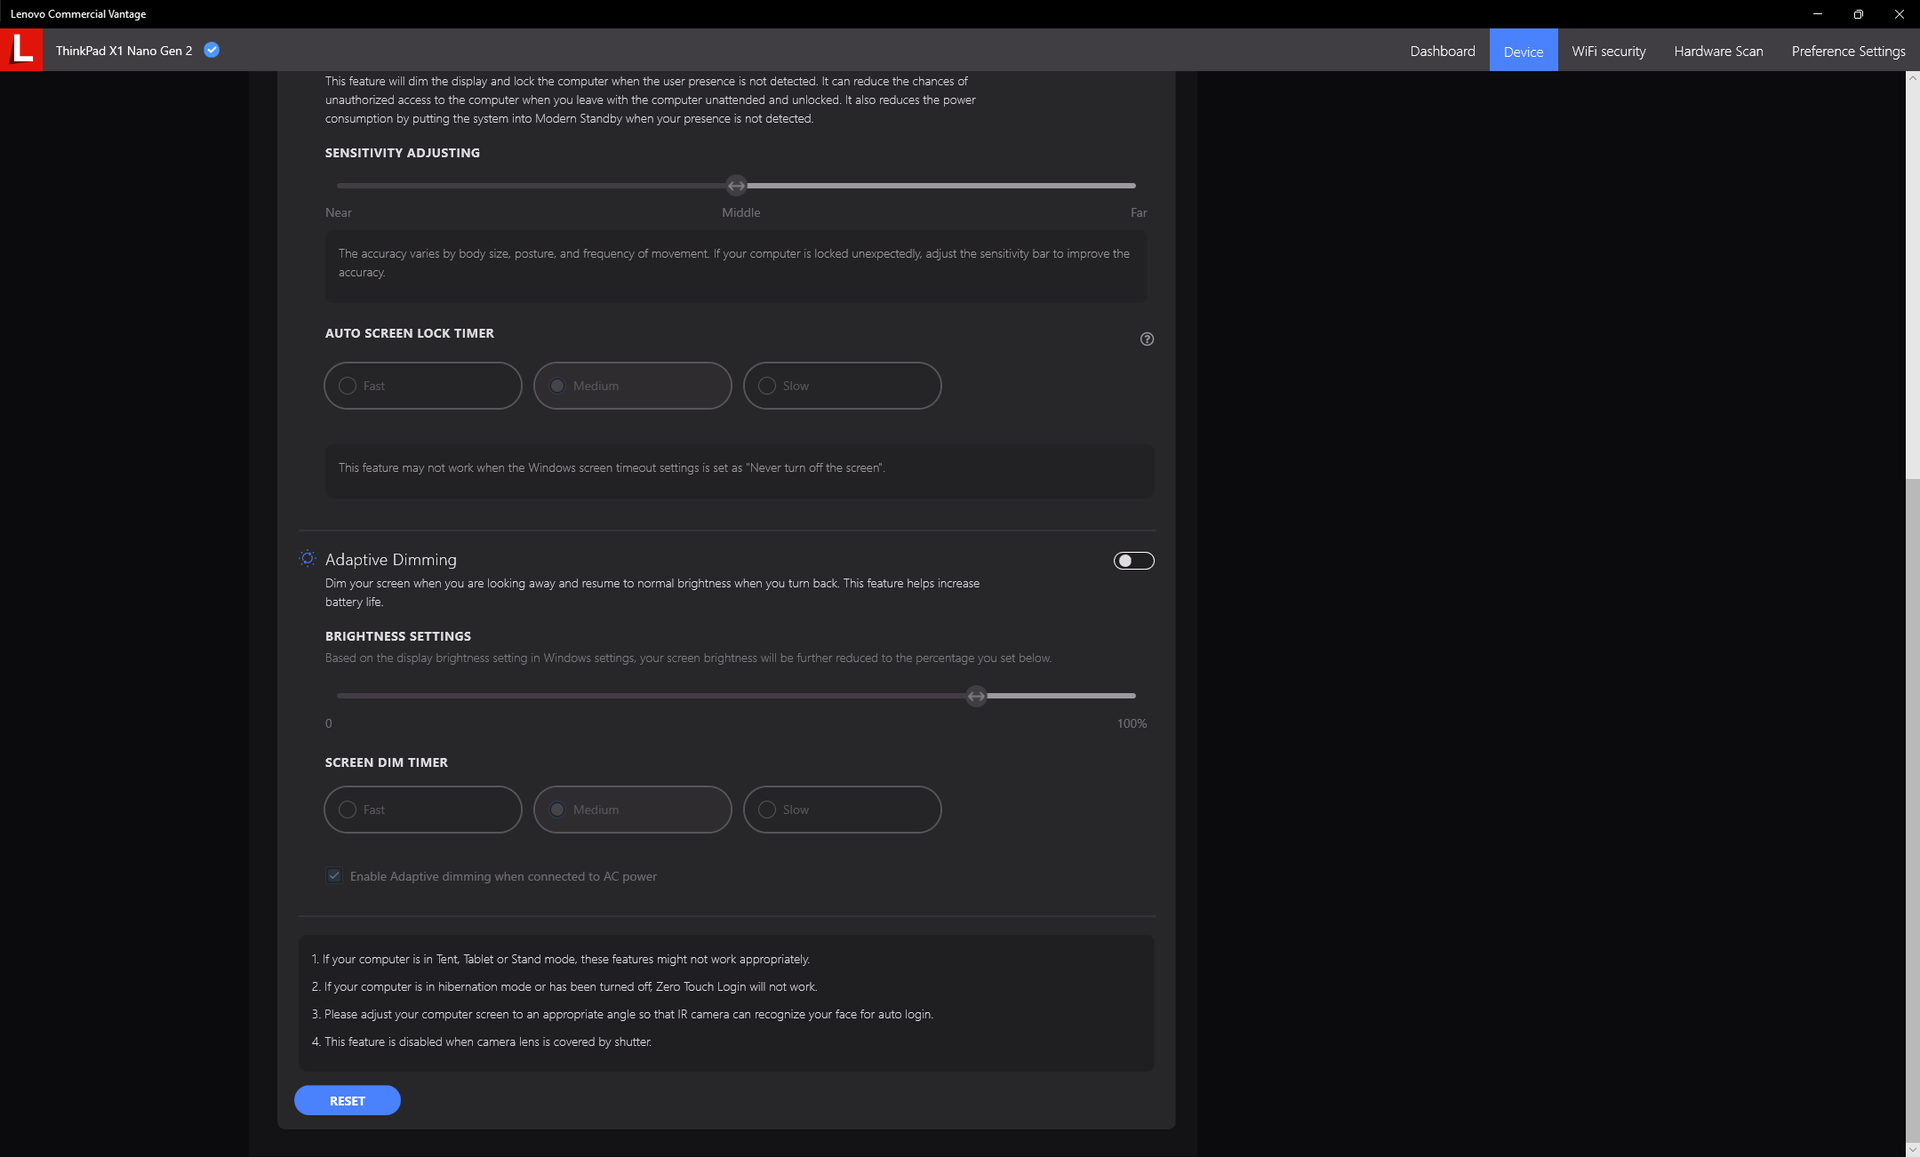
Nous avons réglé notre appareil en mode "Meilleures performances" via Windows avant d'effectuer les tests de performances ci-dessous. Il est recommandé aux utilisateurs de se familiariser avec le logiciel Vantage préinstallé, car de nombreuses mises à jour logicielles et fonctionnalités spécifiques à Lenovo, comme la détection de la présence de l'utilisateur, sont activées ici, comme le montrent les captures d'écran ci-dessous.
Processeur
Les performances du CPU sont mitigées. Le score initial élevé de 2118 points pour le multi-thread de CineBench R15 est excellent, mais il chute dramatiquement à 1485 points après l'exécution consécutive suivante pour représenter une faible durabilité de Turbo Boost et un étranglement plus raide que la plupart des autres ordinateurs portables. En fait, les performances multithread peuvent chuter de 48 % en cas de stress, comme le montre notre test en boucle CineBench R15 xT ci-dessous. Le site Ordinateur portable Framework avec le supposé plus lent Core i7-1260P est capable de surpasser nos performances i7-1280P sur de plus longues périodes. En d'autres termes, les utilisateurs peuvent profiter de la courte poussée initiale de vitesse du i7-1280P dans le Lenovo avant qu'elle ne tombe d'un cran.
Malgré ses performances quelque peu décevantes, notre CPU i7-1280P dans le X1 Nano Gen 2 est toujours nettement plus rapide que le Core i7-1160G7 du X1 Nano Gen 1 d'environ 80 %, même en tenant compte des problèmes d'étranglement.
Cinebench R15 Multi Loop
Cinebench R23: Multi Core | Single Core
Cinebench R15: CPU Multi 64Bit | CPU Single 64Bit
Blender: v2.79 BMW27 CPU
7-Zip 18.03: 7z b 4 | 7z b 4 -mmt1
Geekbench 5.5: Multi-Core | Single-Core
HWBOT x265 Benchmark v2.2: 4k Preset
LibreOffice : 20 Documents To PDF
R Benchmark 2.5: Overall mean
| Cinebench R20 / CPU (Multi Core) | |
| Moyenne Intel Core i7-1280P (3283 - 5415, n=8) | |
| Asus Zenbook S 13 OLED | |
| Framework Laptop 13.5 12th Gen Intel | |
| Lenovo ThinkPad Z13 21D2CTO1WW | |
| Lenovo ThinkPad X1 Nano Gen 2 Core i7-1280P | |
| HP Spectre x360 13.5 14t-ef000 | |
| Lenovo Yoga 6 13ALC6 | |
| HP Elite Dragonfly G3 | |
| Dynabook Portégé X30L-K-139 | |
| Lenovo ThinkPad X1 Nano-20UN002UGE | |
| Lenovo Yoga Slim 7-14IIL05 | |
| Dell Inspiron 13 7306-6TYH5 | |
| Lenovo ThinkPad X1 Titanium Yoga G1 20QB0016GE | |
| Cinebench R20 / CPU (Single Core) | |
| Framework Laptop 13.5 12th Gen Intel | |
| HP Spectre x360 13.5 14t-ef000 | |
| Moyenne Intel Core i7-1280P (615 - 701, n=8) | |
| Lenovo ThinkPad X1 Nano Gen 2 Core i7-1280P | |
| HP Elite Dragonfly G3 | |
| Dynabook Portégé X30L-K-139 | |
| Dell Inspiron 13 7306-6TYH5 | |
| Lenovo ThinkPad Z13 21D2CTO1WW | |
| Asus Zenbook S 13 OLED | |
| Lenovo ThinkPad X1 Nano-20UN002UGE | |
| Lenovo Yoga 6 13ALC6 | |
| Lenovo Yoga Slim 7-14IIL05 | |
| Lenovo ThinkPad X1 Titanium Yoga G1 20QB0016GE | |
| Cinebench R23 / Multi Core | |
| Moyenne Intel Core i7-1280P (8632 - 14803, n=8) | |
| Asus Zenbook S 13 OLED | |
| Framework Laptop 13.5 12th Gen Intel | |
| Lenovo ThinkPad Z13 21D2CTO1WW | |
| Lenovo ThinkPad X1 Nano Gen 2 Core i7-1280P | |
| HP Spectre x360 13.5 14t-ef000 | |
| Lenovo Yoga 6 13ALC6 | |
| HP Elite Dragonfly G3 | |
| Dynabook Portégé X30L-K-139 | |
| Lenovo ThinkPad X1 Nano-20UN002UGE | |
| Dell Inspiron 13 7306-6TYH5 | |
| Lenovo ThinkPad X1 Titanium Yoga G1 20QB0016GE | |
| Cinebench R23 / Single Core | |
| HP Spectre x360 13.5 14t-ef000 | |
| Lenovo ThinkPad X1 Nano Gen 2 Core i7-1280P | |
| Moyenne Intel Core i7-1280P (1609 - 1787, n=7) | |
| Framework Laptop 13.5 12th Gen Intel | |
| HP Elite Dragonfly G3 | |
| Asus Zenbook S 13 OLED | |
| Dell Inspiron 13 7306-6TYH5 | |
| Lenovo ThinkPad Z13 21D2CTO1WW | |
| Dynabook Portégé X30L-K-139 | |
| Lenovo Yoga 6 13ALC6 | |
| Lenovo ThinkPad X1 Titanium Yoga G1 20QB0016GE | |
| Cinebench R15 / CPU Multi 64Bit | |
| Moyenne Intel Core i7-1280P (1905 - 2332, n=7) | |
| Lenovo ThinkPad X1 Nano Gen 2 Core i7-1280P | |
| Asus Zenbook S 13 OLED | |
| Framework Laptop 13.5 12th Gen Intel | |
| Lenovo ThinkPad Z13 21D2CTO1WW | |
| HP Spectre x360 13.5 14t-ef000 | |
| HP Elite Dragonfly G3 | |
| Lenovo Yoga 6 13ALC6 | |
| Dynabook Portégé X30L-K-139 | |
| Lenovo ThinkPad X1 Nano-20UN002UGE | |
| Dell Inspiron 13 7306-6TYH5 | |
| Dell Inspiron 13 7306-6TYH5 | |
| Lenovo Yoga Slim 7-14IIL05 | |
| Lenovo ThinkPad X1 Titanium Yoga G1 20QB0016GE | |
| Cinebench R15 / CPU Single 64Bit | |
| Framework Laptop 13.5 12th Gen Intel | |
| HP Spectre x360 13.5 14t-ef000 | |
| Lenovo ThinkPad X1 Nano Gen 2 Core i7-1280P | |
| Asus Zenbook S 13 OLED | |
| Moyenne Intel Core i7-1280P (203 - 258, n=7) | |
| Lenovo ThinkPad Z13 21D2CTO1WW | |
| Dell Inspiron 13 7306-6TYH5 | |
| Dell Inspiron 13 7306-6TYH5 | |
| HP Elite Dragonfly G3 | |
| Lenovo ThinkPad X1 Nano-20UN002UGE | |
| Lenovo Yoga 6 13ALC6 | |
| Lenovo Yoga Slim 7-14IIL05 | |
| Lenovo ThinkPad X1 Titanium Yoga G1 20QB0016GE | |
| Dynabook Portégé X30L-K-139 | |
| Blender / v2.79 BMW27 CPU | |
| Lenovo ThinkPad X1 Titanium Yoga G1 20QB0016GE | |
| Lenovo Yoga Slim 7-14IIL05 | |
| Dell Inspiron 13 7306-6TYH5 | |
| Lenovo ThinkPad X1 Nano-20UN002UGE | |
| Dynabook Portégé X30L-K-139 | |
| HP Elite Dragonfly G3 | |
| Lenovo ThinkPad Z13 21D2CTO1WW | |
| HP Spectre x360 13.5 14t-ef000 | |
| Lenovo Yoga 6 13ALC6 | |
| Asus Zenbook S 13 OLED | |
| Framework Laptop 13.5 12th Gen Intel | |
| Lenovo ThinkPad X1 Nano Gen 2 Core i7-1280P | |
| Moyenne Intel Core i7-1280P (259 - 309, n=7) | |
| 7-Zip 18.03 / 7z b 4 | |
| Moyenne Intel Core i7-1280P (45292 - 53710, n=7) | |
| Asus Zenbook S 13 OLED | |
| Lenovo ThinkPad X1 Nano Gen 2 Core i7-1280P | |
| Framework Laptop 13.5 12th Gen Intel | |
| Lenovo Yoga 6 13ALC6 | |
| HP Spectre x360 13.5 14t-ef000 | |
| Lenovo ThinkPad Z13 21D2CTO1WW | |
| HP Elite Dragonfly G3 | |
| Dynabook Portégé X30L-K-139 | |
| Lenovo ThinkPad X1 Nano-20UN002UGE | |
| Dell Inspiron 13 7306-6TYH5 | |
| Lenovo Yoga Slim 7-14IIL05 | |
| Lenovo ThinkPad X1 Titanium Yoga G1 20QB0016GE | |
| 7-Zip 18.03 / 7z b 4 -mmt1 | |
| Framework Laptop 13.5 12th Gen Intel | |
| Lenovo ThinkPad X1 Nano Gen 2 Core i7-1280P | |
| Moyenne Intel Core i7-1280P (4995 - 5874, n=7) | |
| HP Spectre x360 13.5 14t-ef000 | |
| Asus Zenbook S 13 OLED | |
| Lenovo ThinkPad Z13 21D2CTO1WW | |
| Dell Inspiron 13 7306-6TYH5 | |
| HP Elite Dragonfly G3 | |
| Lenovo ThinkPad X1 Nano-20UN002UGE | |
| Lenovo Yoga 6 13ALC6 | |
| Dynabook Portégé X30L-K-139 | |
| Lenovo Yoga Slim 7-14IIL05 | |
| Lenovo ThinkPad X1 Titanium Yoga G1 20QB0016GE | |
| Geekbench 5.5 / Multi-Core | |
| Moyenne Intel Core i7-1280P (9623 - 11811, n=7) | |
| Lenovo ThinkPad X1 Nano Gen 2 Core i7-1280P | |
| Framework Laptop 13.5 12th Gen Intel | |
| HP Spectre x360 13.5 14t-ef000 | |
| HP Elite Dragonfly G3 | |
| Asus Zenbook S 13 OLED | |
| Dynabook Portégé X30L-K-139 | |
| Lenovo ThinkPad Z13 21D2CTO1WW | |
| Dell Inspiron 13 7306-6TYH5 | |
| Lenovo ThinkPad X1 Nano-20UN002UGE | |
| Lenovo Yoga Slim 7-14IIL05 | |
| Lenovo ThinkPad X1 Titanium Yoga G1 20QB0016GE | |
| Geekbench 5.5 / Single-Core | |
| Lenovo ThinkPad X1 Nano Gen 2 Core i7-1280P | |
| Framework Laptop 13.5 12th Gen Intel | |
| HP Spectre x360 13.5 14t-ef000 | |
| Moyenne Intel Core i7-1280P (1571 - 1802, n=7) | |
| Dynabook Portégé X30L-K-139 | |
| Dell Inspiron 13 7306-6TYH5 | |
| HP Elite Dragonfly G3 | |
| Asus Zenbook S 13 OLED | |
| Lenovo ThinkPad Z13 21D2CTO1WW | |
| Lenovo ThinkPad X1 Nano-20UN002UGE | |
| Lenovo ThinkPad X1 Titanium Yoga G1 20QB0016GE | |
| Lenovo Yoga Slim 7-14IIL05 | |
| HWBOT x265 Benchmark v2.2 / 4k Preset | |
| Asus Zenbook S 13 OLED | |
| Moyenne Intel Core i7-1280P (9.62 - 14.5, n=5) | |
| Framework Laptop 13.5 12th Gen Intel | |
| HP Spectre x360 13.5 14t-ef000 | |
| Lenovo ThinkPad X1 Nano Gen 2 Core i7-1280P | |
| Lenovo Yoga 6 13ALC6 | |
| Lenovo ThinkPad Z13 21D2CTO1WW | |
| HP Elite Dragonfly G3 | |
| Dynabook Portégé X30L-K-139 | |
| Lenovo ThinkPad X1 Nano-20UN002UGE | |
| Dell Inspiron 13 7306-6TYH5 | |
| Lenovo Yoga Slim 7-14IIL05 | |
| Lenovo ThinkPad X1 Titanium Yoga G1 20QB0016GE | |
| LibreOffice / 20 Documents To PDF | |
| Lenovo Yoga 6 13ALC6 | |
| HP Elite Dragonfly G3 | |
| Lenovo ThinkPad Z13 21D2CTO1WW | |
| Lenovo Yoga Slim 7-14IIL05 | |
| Asus Zenbook S 13 OLED | |
| Lenovo ThinkPad X1 Nano-20UN002UGE | |
| Lenovo ThinkPad X1 Titanium Yoga G1 20QB0016GE | |
| Moyenne Intel Core i7-1280P (41 - 61.6, n=8) | |
| Dynabook Portégé X30L-K-139 | |
| Dell Inspiron 13 7306-6TYH5 | |
| Lenovo ThinkPad X1 Nano Gen 2 Core i7-1280P | |
| HP Spectre x360 13.5 14t-ef000 | |
| Framework Laptop 13.5 12th Gen Intel | |
| R Benchmark 2.5 / Overall mean | |
| Lenovo ThinkPad X1 Titanium Yoga G1 20QB0016GE | |
| Lenovo Yoga Slim 7-14IIL05 | |
| Lenovo ThinkPad X1 Nano-20UN002UGE | |
| Lenovo Yoga 6 13ALC6 | |
| Dell Inspiron 13 7306-6TYH5 | |
| Lenovo ThinkPad Z13 21D2CTO1WW | |
| Dynabook Portégé X30L-K-139 | |
| HP Elite Dragonfly G3 | |
| Asus Zenbook S 13 OLED | |
| HP Spectre x360 13.5 14t-ef000 | |
| Moyenne Intel Core i7-1280P (0.4505 - 0.512, n=7) | |
| Lenovo ThinkPad X1 Nano Gen 2 Core i7-1280P | |
| Framework Laptop 13.5 12th Gen Intel | |
Cinebench R23: Multi Core | Single Core
Cinebench R15: CPU Multi 64Bit | CPU Single 64Bit
Blender: v2.79 BMW27 CPU
7-Zip 18.03: 7z b 4 | 7z b 4 -mmt1
Geekbench 5.5: Multi-Core | Single-Core
HWBOT x265 Benchmark v2.2: 4k Preset
LibreOffice : 20 Documents To PDF
R Benchmark 2.5: Overall mean
* ... Moindre est la valeur, meilleures sont les performances
AIDA64: FP32 Ray-Trace | FPU Julia | CPU SHA3 | CPU Queen | FPU SinJulia | FPU Mandel | CPU AES | CPU ZLib | FP64 Ray-Trace | CPU PhotoWorxx
| Performance rating | |
| Moyenne Intel Core i7-1280P | |
| Lenovo ThinkPad X1 Nano Gen 2 Core i7-1280P | |
| Framework Laptop 13.5 12th Gen Intel | |
| Lenovo ThinkPad X1 Nano-20UN002UGE | |
| Dell Latitude 13 7330 | |
| HP Elite Dragonfly G3 | |
| Huawei MateBook X Pro 2021 | |
| AIDA64 / FP32 Ray-Trace | |
| Moyenne Intel Core i7-1280P (7466 - 13068, n=6) | |
| Lenovo ThinkPad X1 Nano Gen 2 Core i7-1280P | |
| Lenovo ThinkPad X1 Nano-20UN002UGE | |
| Dell Latitude 13 7330 | |
| HP Elite Dragonfly G3 | |
| Framework Laptop 13.5 12th Gen Intel | |
| Huawei MateBook X Pro 2021 | |
| AIDA64 / FPU SinJulia | |
| Moyenne Intel Core i7-1280P (5880 - 8571, n=6) | |
| Framework Laptop 13.5 12th Gen Intel | |
| Lenovo ThinkPad X1 Nano Gen 2 Core i7-1280P | |
| Dell Latitude 13 7330 | |
| HP Elite Dragonfly G3 | |
| Lenovo ThinkPad X1 Nano-20UN002UGE | |
| Huawei MateBook X Pro 2021 | |
| AIDA64 / FPU Mandel | |
| Moyenne Intel Core i7-1280P (18907 - 32766, n=6) | |
| Lenovo ThinkPad X1 Nano Gen 2 Core i7-1280P | |
| Lenovo ThinkPad X1 Nano-20UN002UGE | |
| Dell Latitude 13 7330 | |
| HP Elite Dragonfly G3 | |
| Framework Laptop 13.5 12th Gen Intel | |
| Huawei MateBook X Pro 2021 | |
| AIDA64 / FP64 Ray-Trace | |
| Moyenne Intel Core i7-1280P (4006 - 7184, n=6) | |
| Lenovo ThinkPad X1 Nano Gen 2 Core i7-1280P | |
| Lenovo ThinkPad X1 Nano-20UN002UGE | |
| Dell Latitude 13 7330 | |
| HP Elite Dragonfly G3 | |
| Framework Laptop 13.5 12th Gen Intel | |
| Huawei MateBook X Pro 2021 | |
| AIDA64 / CPU PhotoWorxx | |
| Moyenne Intel Core i7-1280P (36663 - 48416, n=6) | |
| Huawei MateBook X Pro 2021 | |
| Lenovo ThinkPad X1 Nano Gen 2 Core i7-1280P | |
| HP Elite Dragonfly G3 | |
| Lenovo ThinkPad X1 Nano-20UN002UGE | |
| Framework Laptop 13.5 12th Gen Intel | |
| Dell Latitude 13 7330 | |
Performance du système
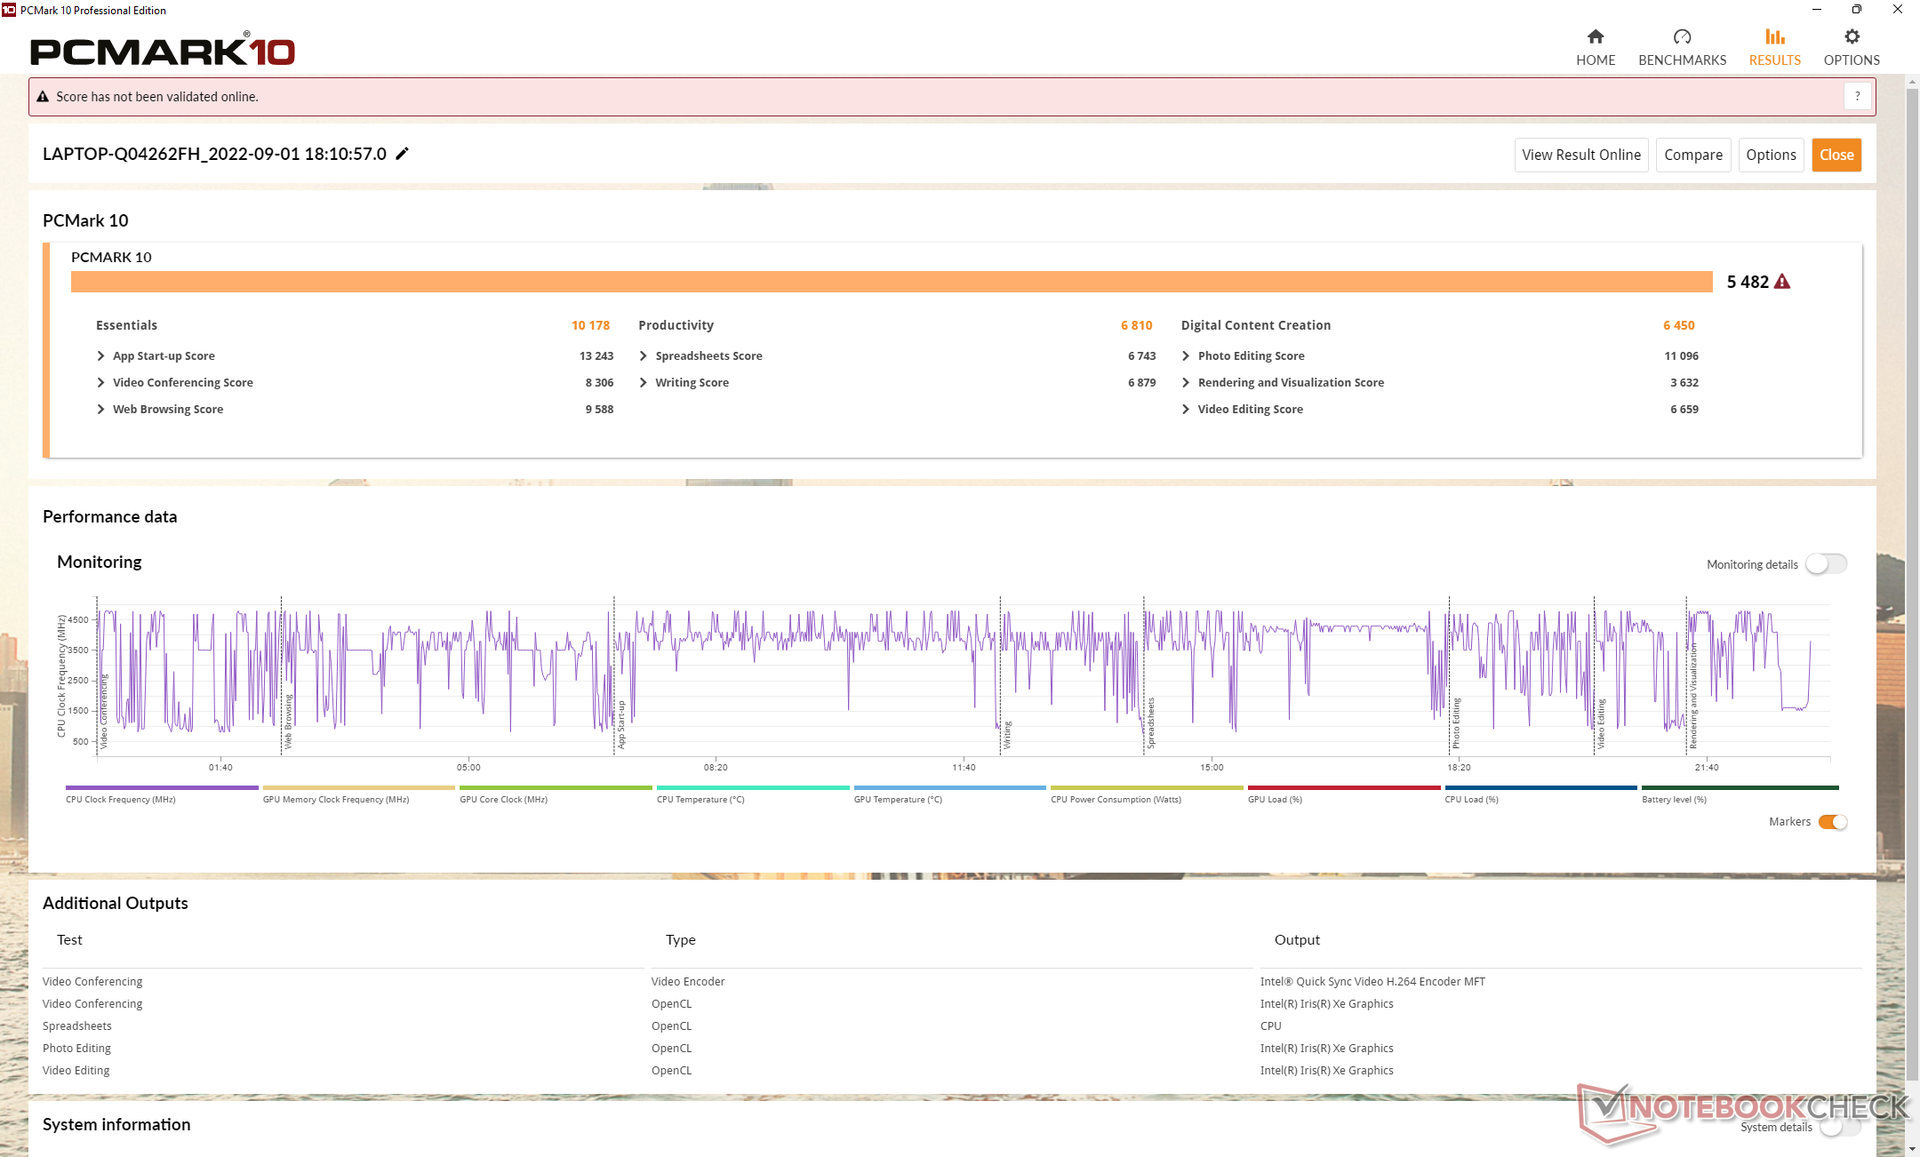
Les résultats de PCMark 10 sont systématiquement supérieurs à ceux du modèle Gen 1 et de la plupart des autres ordinateurs portables de 13,0 pouces, grâce au processeur Core P-series. La différence est la plus importante dans le subtest de création de contenu numérique.
CrossMark: Overall | Productivity | Creativity | Responsiveness
| PCMark 10 / Score | |
| Framework Laptop 13.5 12th Gen Intel | |
| Moyenne Intel Core i7-1280P, Intel Iris Xe Graphics G7 96EUs (5410 - 5994, n=4) | |
| Lenovo ThinkPad X1 Nano Gen 2 Core i7-1280P | |
| Dell Latitude 13 7330 | |
| Huawei MateBook X Pro 2021 | |
| HP Elite Dragonfly G3 | |
| Lenovo ThinkPad X1 Nano-20UN002UGE | |
| PCMark 10 / Essentials | |
| Framework Laptop 13.5 12th Gen Intel | |
| Dell Latitude 13 7330 | |
| Moyenne Intel Core i7-1280P, Intel Iris Xe Graphics G7 96EUs (9719 - 10920, n=4) | |
| Huawei MateBook X Pro 2021 | |
| Lenovo ThinkPad X1 Nano Gen 2 Core i7-1280P | |
| Lenovo ThinkPad X1 Nano-20UN002UGE | |
| HP Elite Dragonfly G3 | |
| PCMark 10 / Productivity | |
| Framework Laptop 13.5 12th Gen Intel | |
| Dell Latitude 13 7330 | |
| Moyenne Intel Core i7-1280P, Intel Iris Xe Graphics G7 96EUs (6301 - 7453, n=4) | |
| Lenovo ThinkPad X1 Nano Gen 2 Core i7-1280P | |
| Huawei MateBook X Pro 2021 | |
| Lenovo ThinkPad X1 Nano-20UN002UGE | |
| HP Elite Dragonfly G3 | |
| PCMark 10 / Digital Content Creation | |
| Moyenne Intel Core i7-1280P, Intel Iris Xe Graphics G7 96EUs (6450 - 7180, n=4) | |
| Framework Laptop 13.5 12th Gen Intel | |
| Lenovo ThinkPad X1 Nano Gen 2 Core i7-1280P | |
| HP Elite Dragonfly G3 | |
| Dell Latitude 13 7330 | |
| Huawei MateBook X Pro 2021 | |
| Lenovo ThinkPad X1 Nano-20UN002UGE | |
| CrossMark / Overall | |
| Moyenne Intel Core i7-1280P, Intel Iris Xe Graphics G7 96EUs (1677 - 1773, n=4) | |
| Lenovo ThinkPad X1 Nano Gen 2 Core i7-1280P | |
| Framework Laptop 13.5 12th Gen Intel | |
| Dell Latitude 13 7330 | |
| HP Elite Dragonfly G3 | |
| CrossMark / Productivity | |
| Moyenne Intel Core i7-1280P, Intel Iris Xe Graphics G7 96EUs (1585 - 1709, n=4) | |
| Framework Laptop 13.5 12th Gen Intel | |
| Lenovo ThinkPad X1 Nano Gen 2 Core i7-1280P | |
| Dell Latitude 13 7330 | |
| HP Elite Dragonfly G3 | |
| CrossMark / Creativity | |
| Lenovo ThinkPad X1 Nano Gen 2 Core i7-1280P | |
| Moyenne Intel Core i7-1280P, Intel Iris Xe Graphics G7 96EUs (1849 - 1928, n=4) | |
| Framework Laptop 13.5 12th Gen Intel | |
| HP Elite Dragonfly G3 | |
| Dell Latitude 13 7330 | |
| CrossMark / Responsiveness | |
| Moyenne Intel Core i7-1280P, Intel Iris Xe Graphics G7 96EUs (1394 - 1746, n=4) | |
| Framework Laptop 13.5 12th Gen Intel | |
| Lenovo ThinkPad X1 Nano Gen 2 Core i7-1280P | |
| Dell Latitude 13 7330 | |
| HP Elite Dragonfly G3 | |
| PCMark 10 Score | 5482 points | |
Aide | ||
| AIDA64 / Memory Copy | |
| Lenovo ThinkPad X1 Nano Gen 2 Core i7-1280P | |
| Moyenne Intel Core i7-1280P (56337 - 73486, n=6) | |
| HP Elite Dragonfly G3 | |
| Huawei MateBook X Pro 2021 | |
| Lenovo ThinkPad X1 Nano-20UN002UGE | |
| Framework Laptop 13.5 12th Gen Intel | |
| Dell Latitude 13 7330 | |
| AIDA64 / Memory Read | |
| Lenovo ThinkPad X1 Nano Gen 2 Core i7-1280P | |
| Moyenne Intel Core i7-1280P (63221 - 73719, n=6) | |
| Huawei MateBook X Pro 2021 | |
| HP Elite Dragonfly G3 | |
| Lenovo ThinkPad X1 Nano-20UN002UGE | |
| Framework Laptop 13.5 12th Gen Intel | |
| Dell Latitude 13 7330 | |
| AIDA64 / Memory Write | |
| Huawei MateBook X Pro 2021 | |
| Lenovo ThinkPad X1 Nano Gen 2 Core i7-1280P | |
| Moyenne Intel Core i7-1280P (58729 - 68247, n=6) | |
| HP Elite Dragonfly G3 | |
| Lenovo ThinkPad X1 Nano-20UN002UGE | |
| Framework Laptop 13.5 12th Gen Intel | |
| Dell Latitude 13 7330 | |
| AIDA64 / Memory Latency | |
| Moyenne Intel Core i7-1280P (93.1 - 153.3, n=6) | |
| HP Elite Dragonfly G3 | |
| Lenovo ThinkPad X1 Nano-20UN002UGE | |
| Lenovo ThinkPad X1 Nano Gen 2 Core i7-1280P | |
| Huawei MateBook X Pro 2021 | |
| Framework Laptop 13.5 12th Gen Intel | |
| Dell Latitude 13 7330 | |
* ... Moindre est la valeur, meilleures sont les performances
Latence DPC
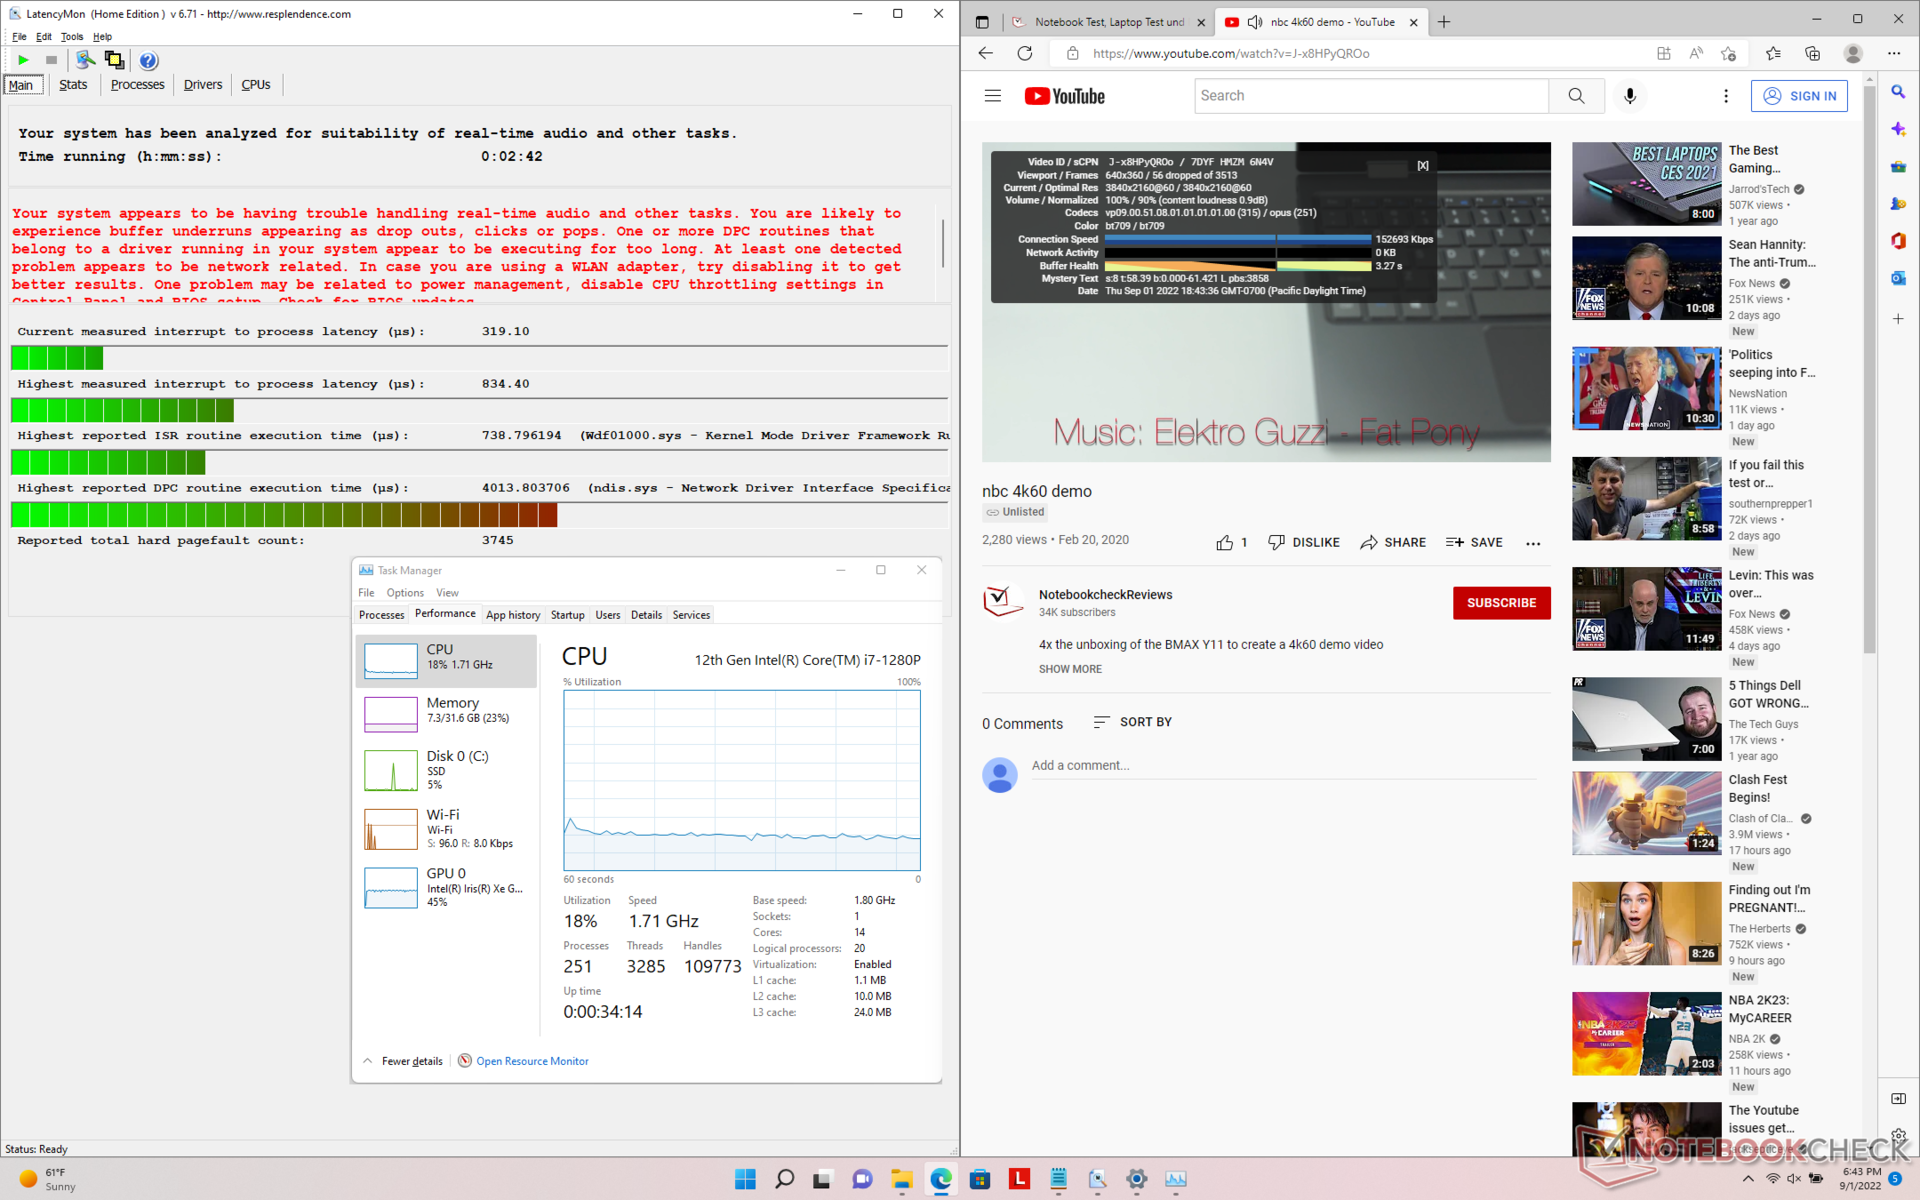
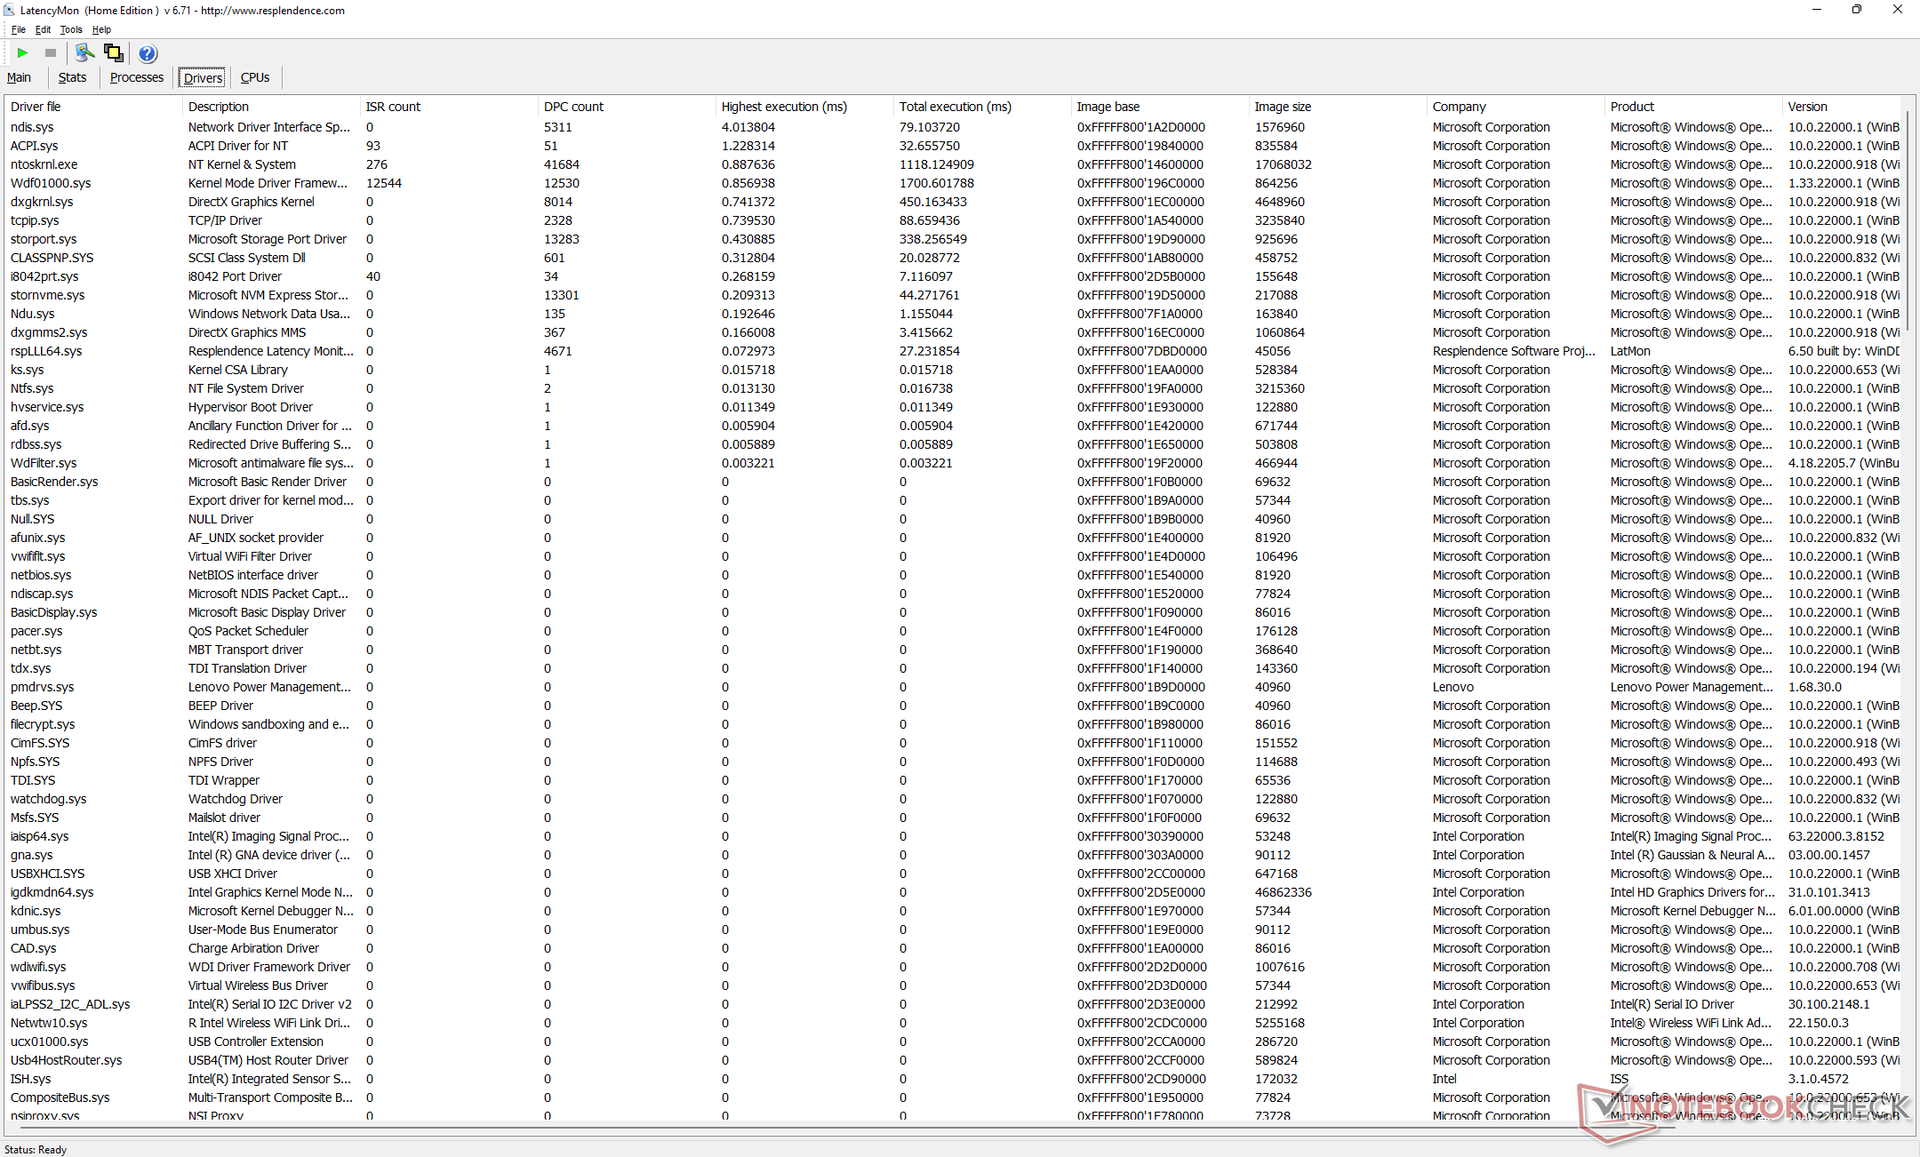
LatencyMon révèle des problèmes de DPC lors de l'ouverture de plusieurs onglets de navigateur sur notre page d'accueil. la lecture de vidéos 4K à 60 FPS aurait pu être meilleure, car nous avons enregistré 56 images perdues pendant notre test vidéo d'une minute, même avec les derniers pilotes graphiques à la date de publication.
| DPC Latencies / LatencyMon - interrupt to process latency (max), Web, Youtube, Prime95 | |
| Lenovo ThinkPad X1 Nano-20UN002UGE | |
| Huawei MateBook X Pro 2021 | |
| Framework Laptop 13.5 12th Gen Intel | |
| Lenovo ThinkPad X1 Nano Gen 2 Core i7-1280P | |
| Dell Latitude 13 7330 | |
| HP Elite Dragonfly G3 | |
* ... Moindre est la valeur, meilleures sont les performances
Périphériques de stockage
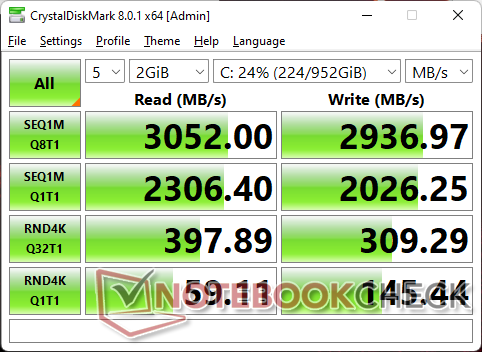
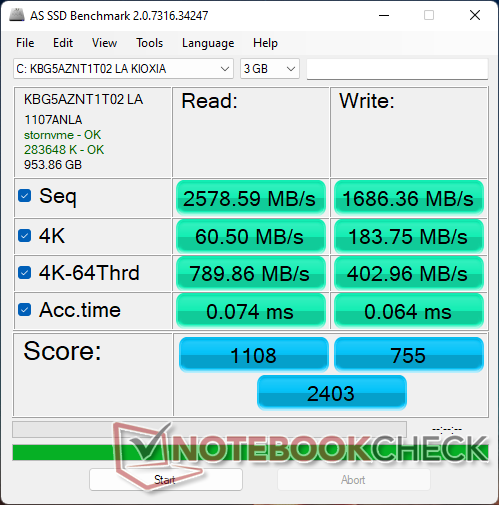
Notre unité de test est équipée du Kioxia KBG5AZNT1T02 PCIe3 NVMe SSD pour des taux de lecture soutenus maximum de 2700 Mo/s. Il est décevant qu'il n'y ait pas d'options PCIe4 à la sortie, compte tenu du prix élevé du ThinkPad X1 Nano, mais au moins le modèle est livré avec une plaque de cuivre sur le SSD pour faciliter la dissipation de la chaleur
N'oubliez pas que les disques M.2 2280 pleine longueur ne sont pas pris en charge.

* ... Moindre est la valeur, meilleures sont les performances
Disk Throttling: DiskSpd Read Loop, Queue Depth 8
Performances du GPU
Les performances graphiques sont décentes malgré la limitation des performances du CPU mentionnée ci-dessus. les scores 3DMark sont là où ils devraient être par rapport à d'autres portables avec les mêmes Iris Xe 96 EUs Mais l'étranglement se fait sentir lors de l'exécution de jeux réels. Par exemple, les taux d'images en mode ralenti sur Witcher 3 avec les paramètres 768p les plus bas peuvent atteindre 106 FPS au début du test avant de tomber rapidement à 80 FPS quelques minutes plus tard, comme le montre le graphique ci-dessous
Les performances graphiques globales sont toujours plus rapides que sur le modèle Gen 1 de l'année dernière, d'environ 30 %, avant de tenir compte de l'étranglement des performances.
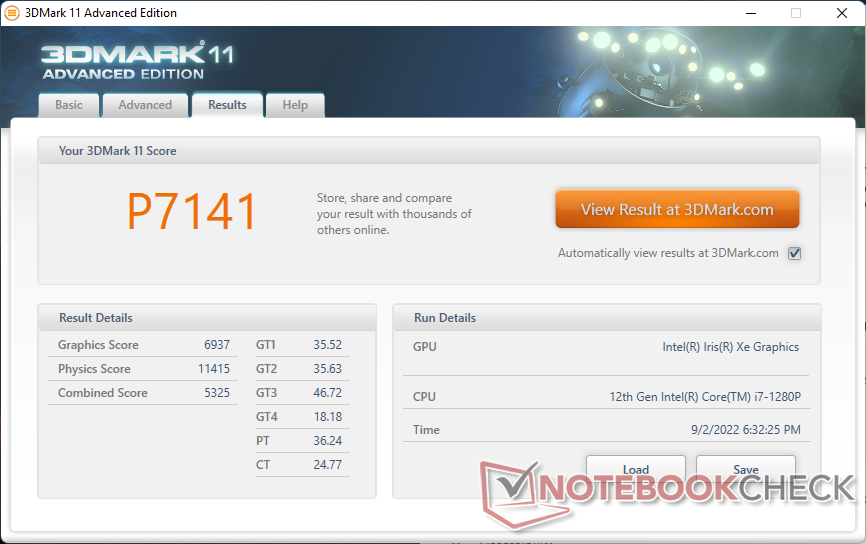
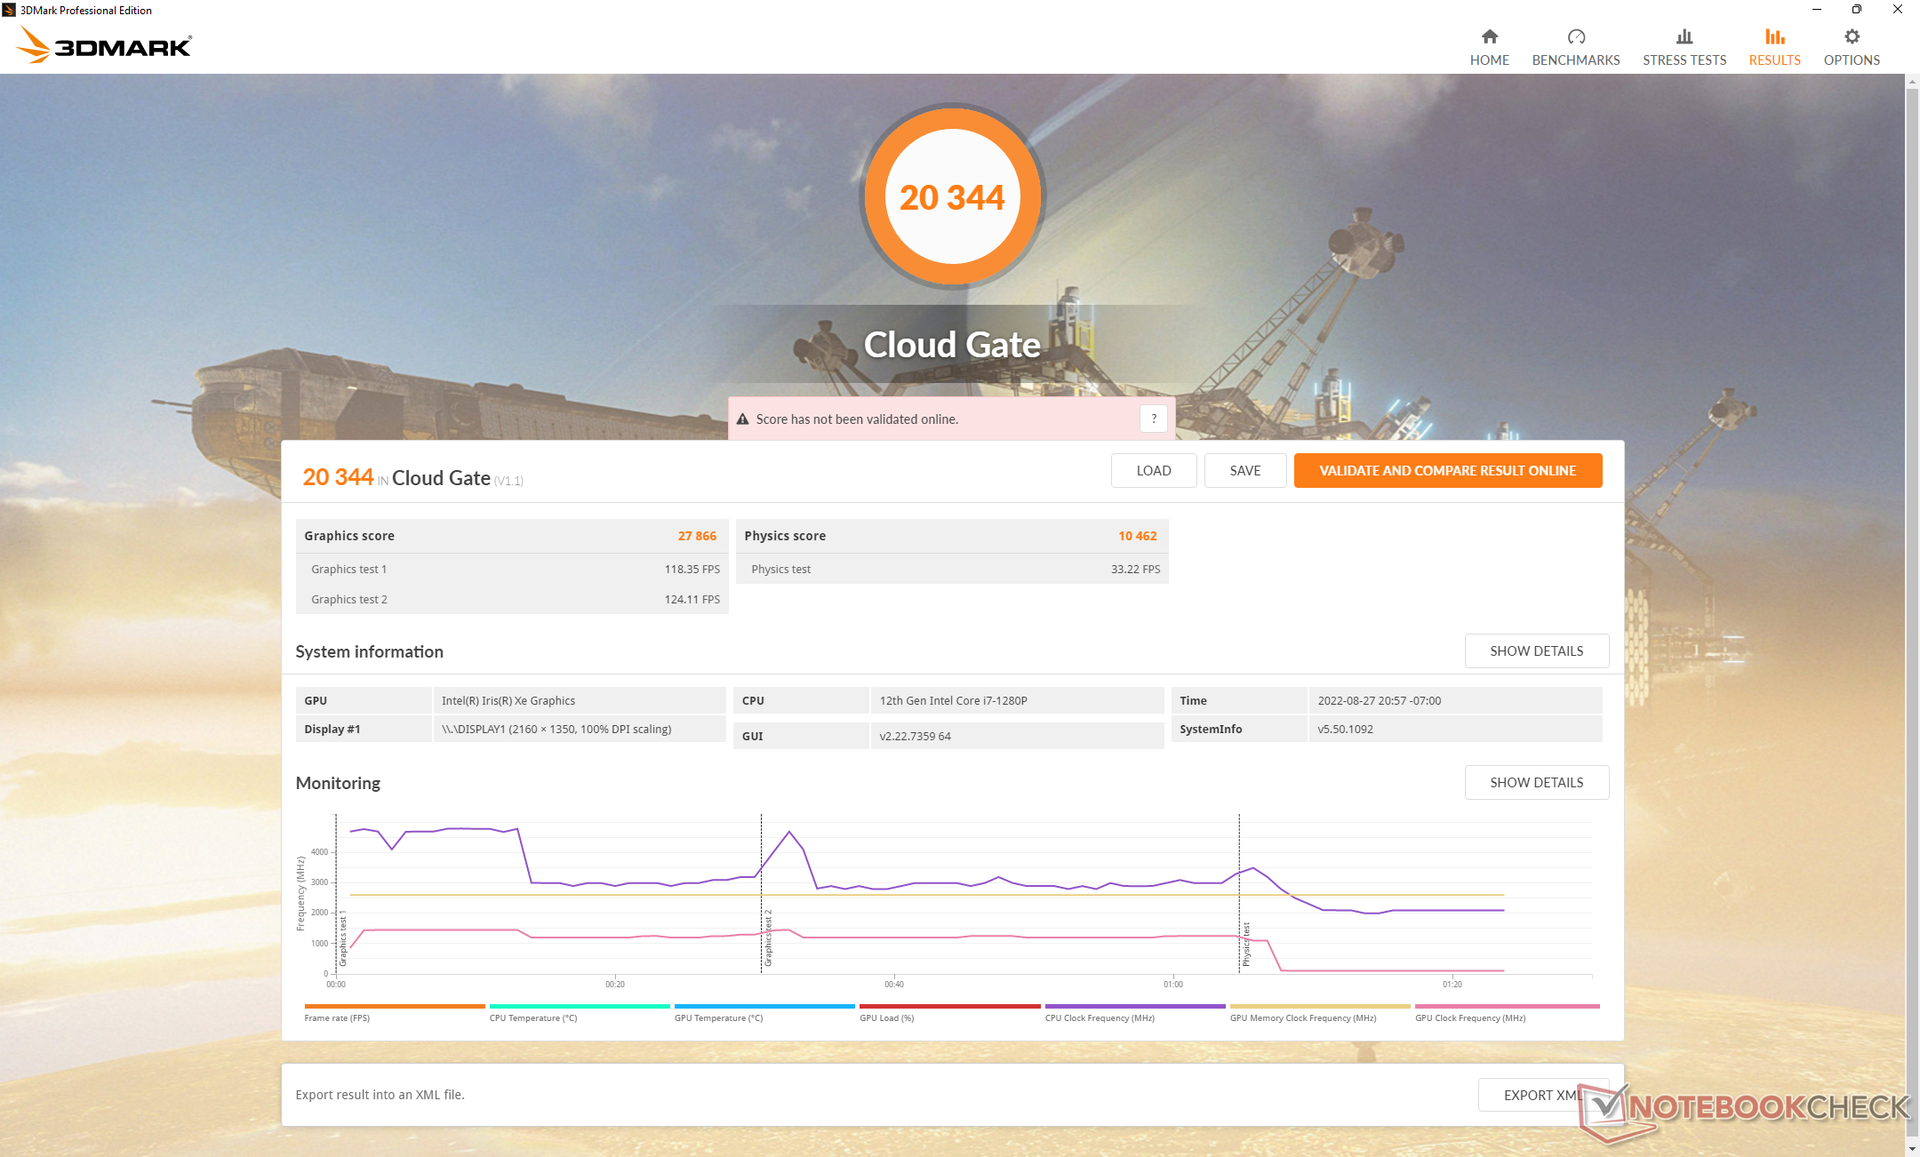
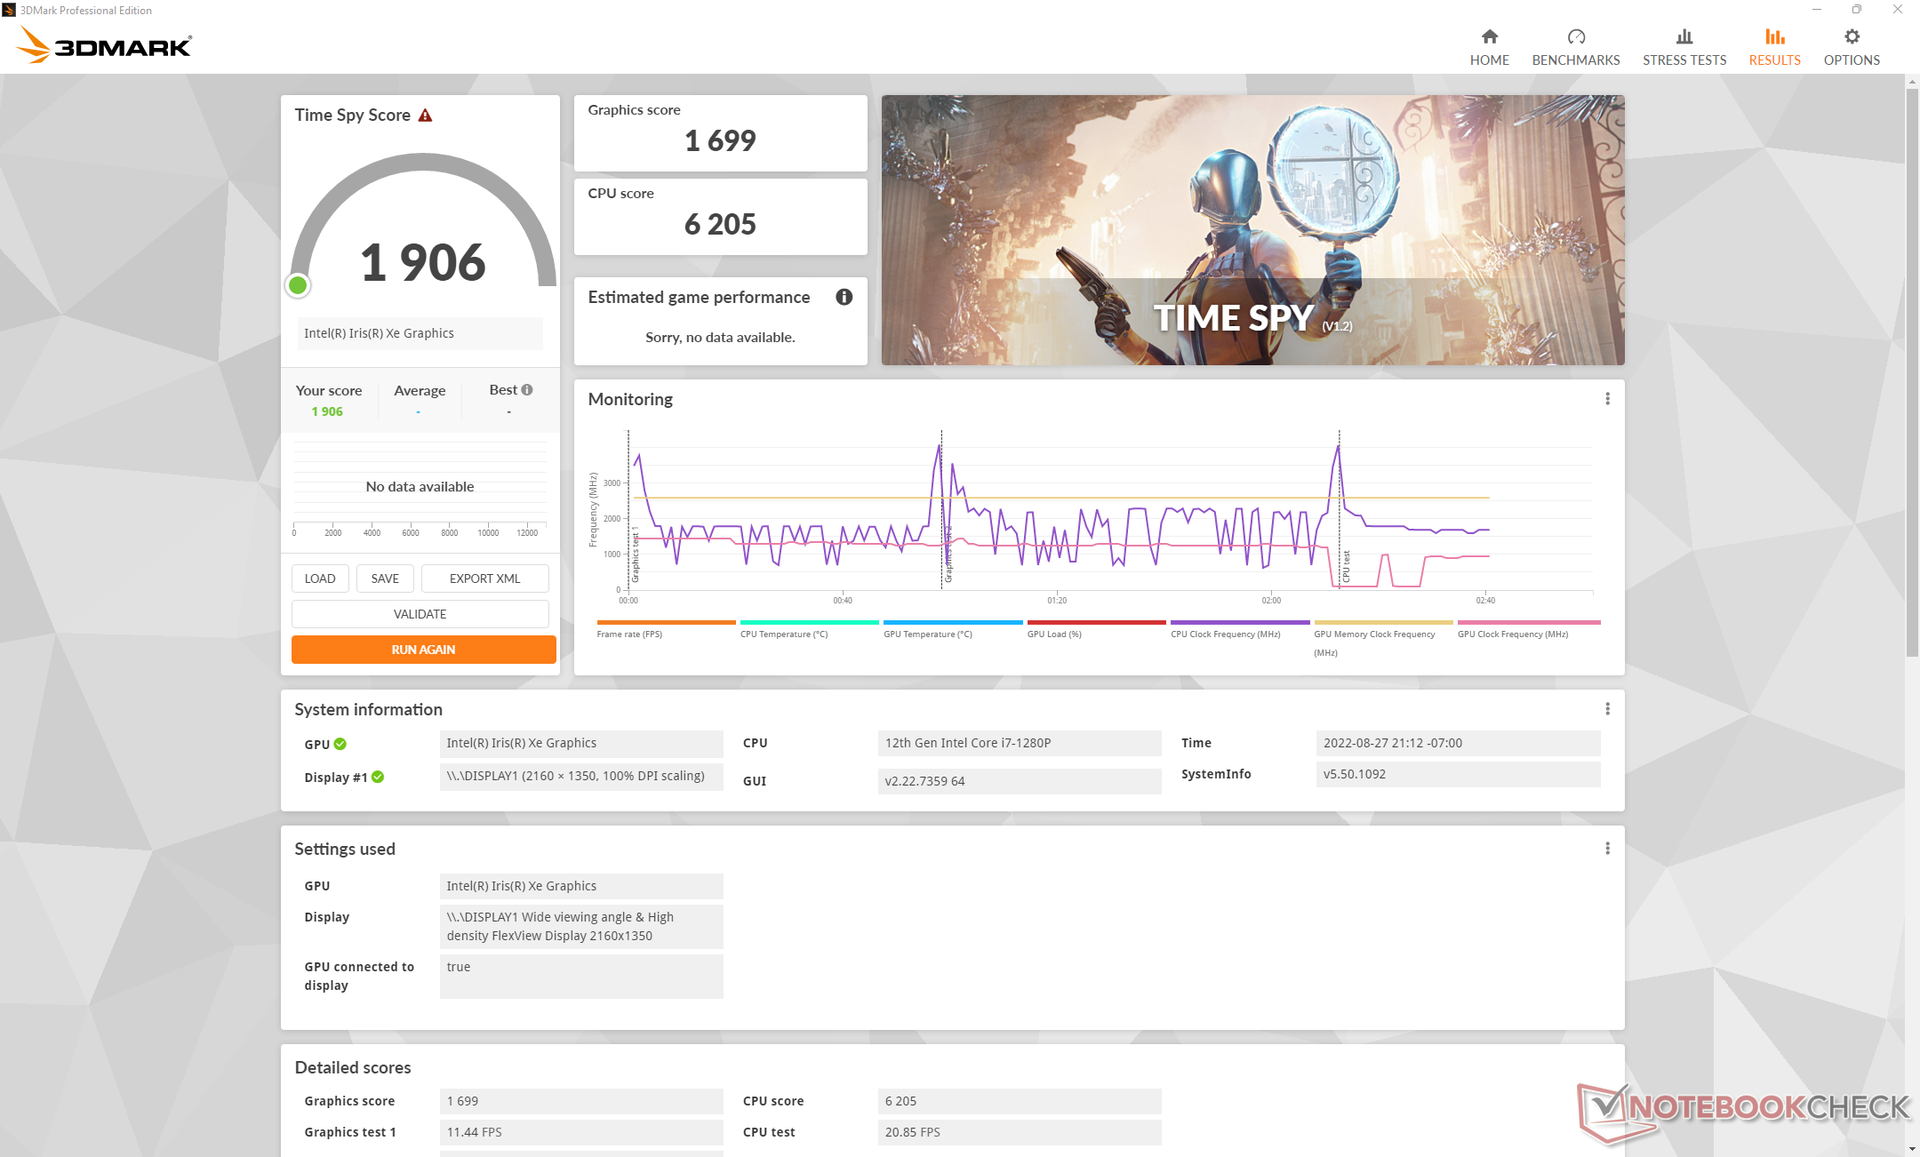
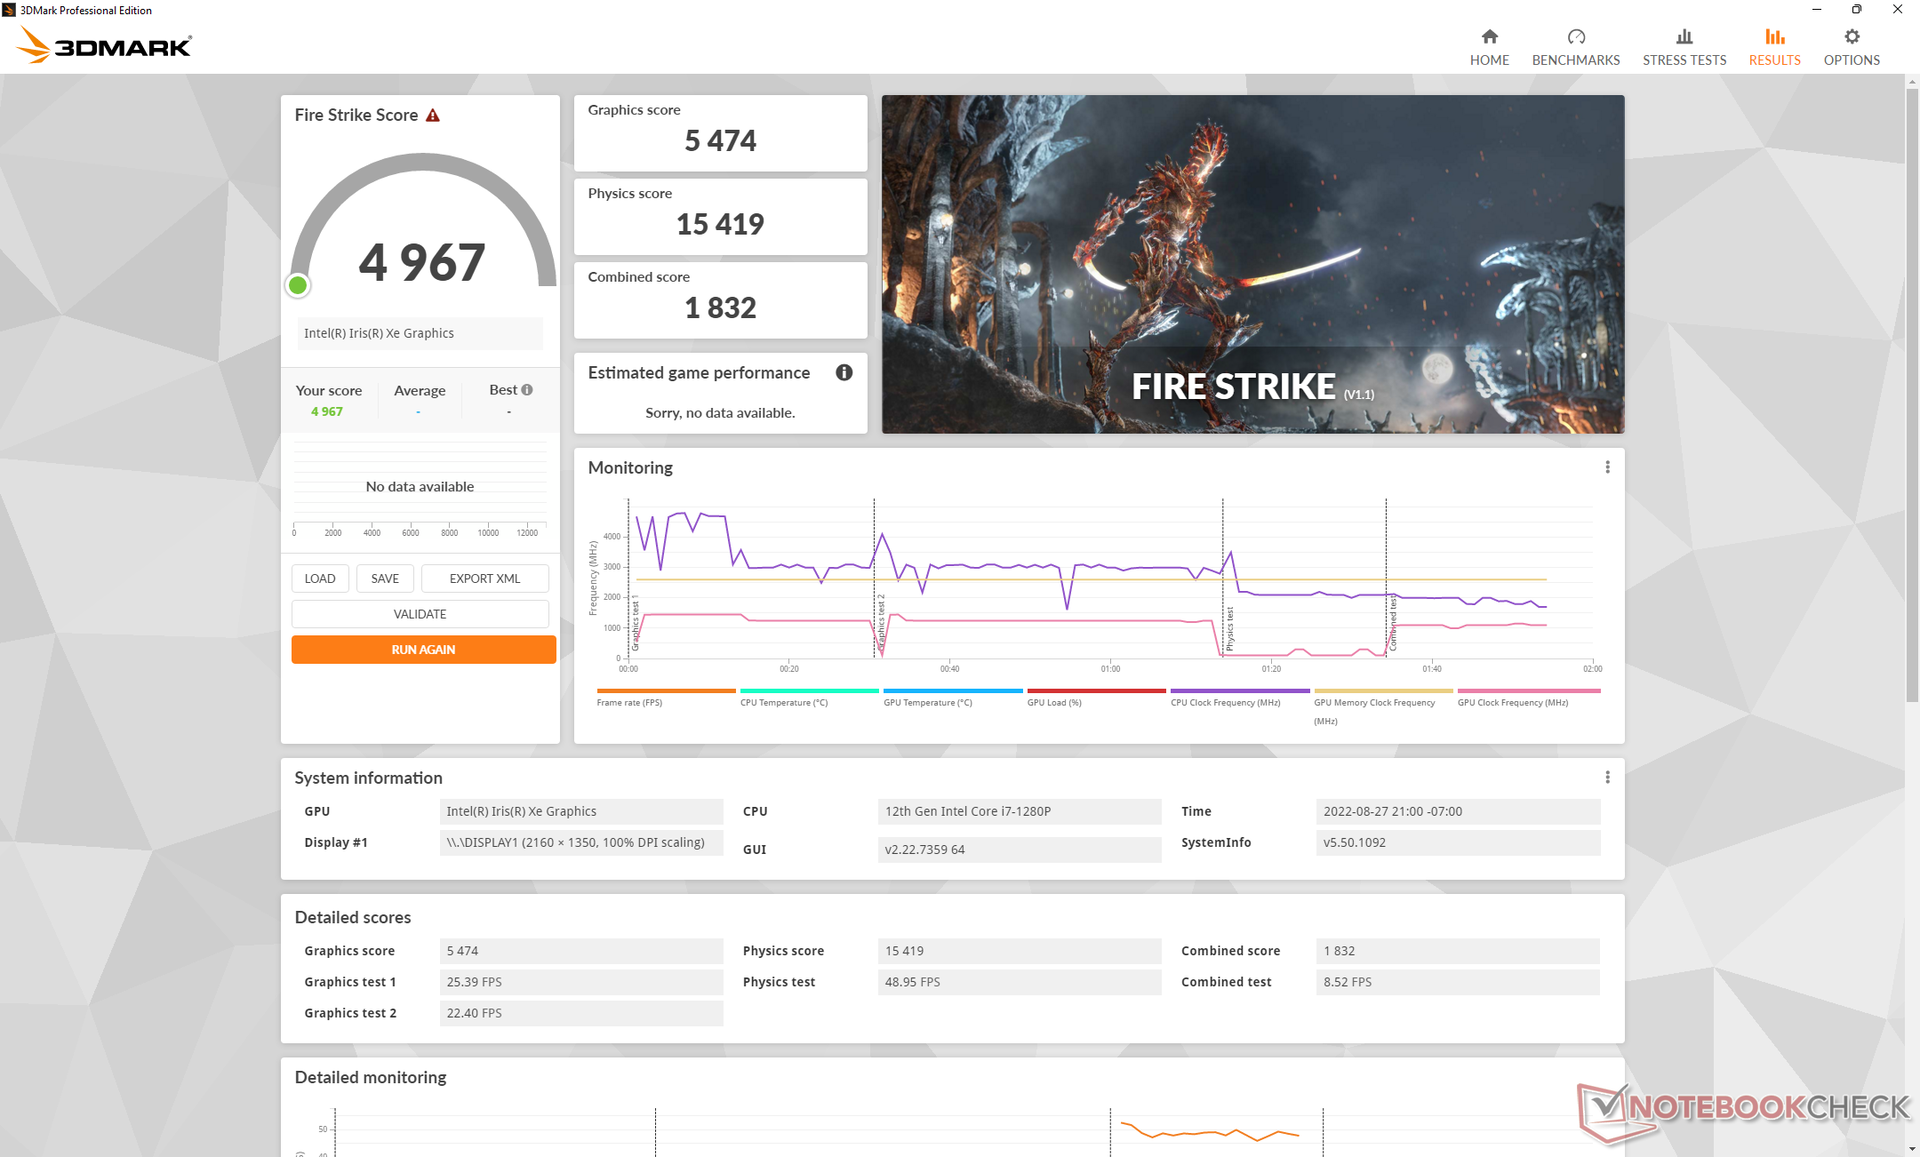
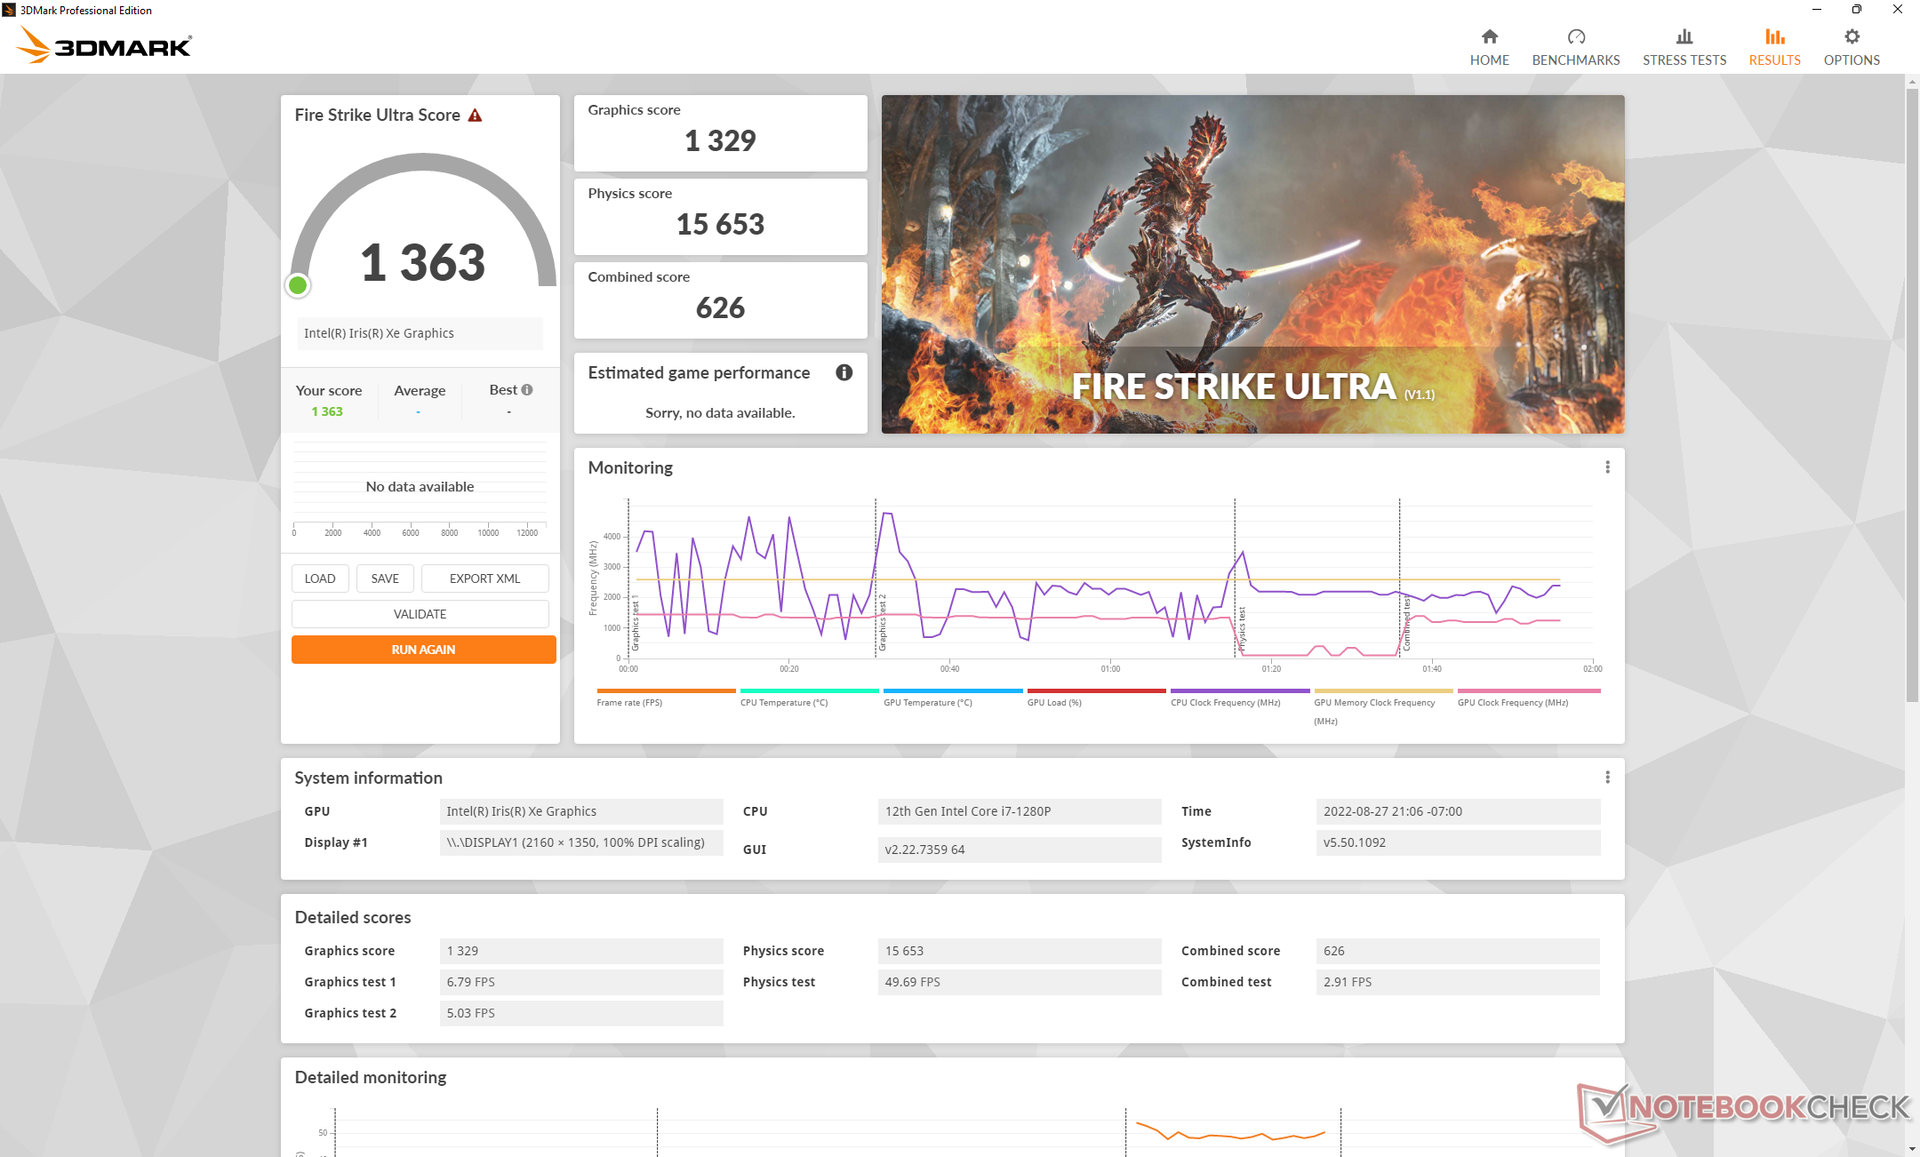
| 3DMark 11 Performance | 7141 points | |
| 3DMark Cloud Gate Standard Score | 20344 points | |
| 3DMark Fire Strike Score | 4967 points | |
| 3DMark Time Spy Score | 1906 points | |
Aide | ||
Witcher 3 FPS Chart
| Bas | Moyen | Élevé | Ultra | |
|---|---|---|---|---|
| GTA V (2015) | 97.2 | 82.3 | 21.9 | 9.84 |
| The Witcher 3 (2015) | 107.2 | 67.3 | 35 | 15.1 |
| Dota 2 Reborn (2015) | 106.1 | 76 | 55.6 | 49 |
| Final Fantasy XV Benchmark (2018) | 35.8 | 20.7 | 20.7 | |
| X-Plane 11.11 (2018) | 38.8 | 39.9 | 35.4 | |
| Strange Brigade (2018) | 88.1 | 41 | 32 | 25.1 |
| Cyberpunk 2077 1.6 (2022) | 18.3 | 16.1 | 12.3 | 9.5 |
Émissions
Bruit du système
Le bruit du ventilateur est lié aux trois profils d'alimentation Lenovo Vantage : Quiet, Balanced or Intelligent Cooling, et Best Performance. Le système est plus silencieux que prévu, même avec le profil Intelligent Cooling par défaut. Lors de l'exécution de la première scène de benchmark de 3DMark 06, par exemple, le ventilateur interne restait très silencieux pendant toute la scène, tout comme ce que nous avons observé sur le Dragonfly G3 ouMateBook X Pro dans des conditions similaires. En revanche, lorsqu'il est réglé sur Meilleures performances, il faut s'attendre à ce que le ventilateur émette des impulsions plus fréquentes, jusqu'à 40 dB(A), lors de l'exécution de charges plus élevées comme les jeux. Sinon, nous vous recommandons de vous en tenir au refroidissement intelligent pour la plupart des scénarios.
Il est intéressant de noter que notre unité de test présentait un bruit électronique ou un grincement de bobine lorsqu'elle tournait au ralenti sur le bureau. Le bruit disparaissait temporairement lors de l'exécution de 3DMark 06, ce qui explique pourquoi nos mesures de bruit lors de l'exécution du benchmark sont inférieures à nos mesures de bruit lors de la marche au ralenti sur le bureau (23,9 contre 23,3 dB(A)).
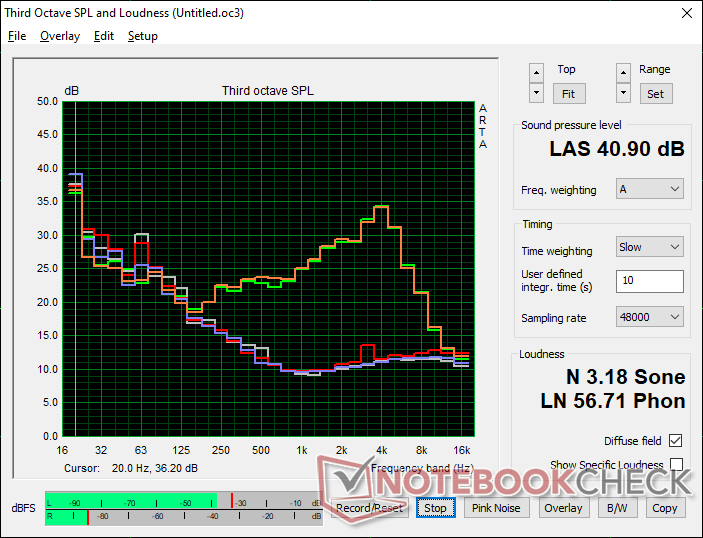
Degré de la nuisance sonore
| Au repos |
| 23.9 / 23.9 / 23.9 dB(A) |
| Fortement sollicité |
| 23.3 / 40.9 dB(A) |
 | ||
30 dB silencieux 40 dB(A) audible 50 dB(A) bruyant |
||
min: | ||
| Lenovo ThinkPad X1 Nano Gen 2 Core i7-1280P Iris Xe G7 96EUs, i7-1280P, Kioxia BG5 KBG5AZNT1T02 | Lenovo ThinkPad X1 Nano-20UN002UGE Iris Xe G7 96EUs, i7-1160G7, WDC PC SN530 SDBPNPZ-512G | HP Elite Dragonfly G3 Iris Xe G7 96EUs, i7-1265U, Micron 3400 MTFDKBA512TFH 512GB | Dell Latitude 13 7330 Iris Xe G7 96EUs, i7-1265U, Toshiba KBG40ZNS512G NVMe | Framework Laptop 13.5 12th Gen Intel Iris Xe G7 96EUs, i7-1260P, WDC PC SN730 SDBPNTY-512G | Huawei MateBook X Pro 2021 Iris Xe G7 96EUs, i7-1165G7, Samsung PM981a MZVLB1T0HBLR | |
|---|---|---|---|---|---|---|
| Noise | -11% | 6% | -8% | -18% | -3% | |
| arrêt / environnement * (dB) | 23.3 | 24.9 -7% | 22.8 2% | 23.4 -0% | 22.8 2% | 25.4 -9% |
| Idle Minimum * (dB) | 23.9 | 24.9 -4% | 23.2 3% | 23.4 2% | 23 4% | 25.6 -7% |
| Idle Average * (dB) | 23.9 | 26.3 -10% | 23.2 3% | 23.4 2% | 23 4% | 25.6 -7% |
| Idle Maximum * (dB) | 23.9 | 31.8 -33% | 23.2 3% | 23.4 2% | 23 4% | 25.6 -7% |
| Load Average * (dB) | 23.3 | 34.3 -47% | 25.1 -8% | 37.8 -62% | 47.3 -103% | 28.7 -23% |
| Witcher 3 ultra * (dB) | 40.9 | 34.3 16% | 32 22% | 39.2 4% | 47.3 -16% | 32 22% |
| Load Maximum * (dB) | 40.9 | 37.5 8% | 35.2 14% | 43 -5% | 49.8 -22% | 38.2 7% |
* ... Moindre est la valeur, meilleures sont les performances
Température
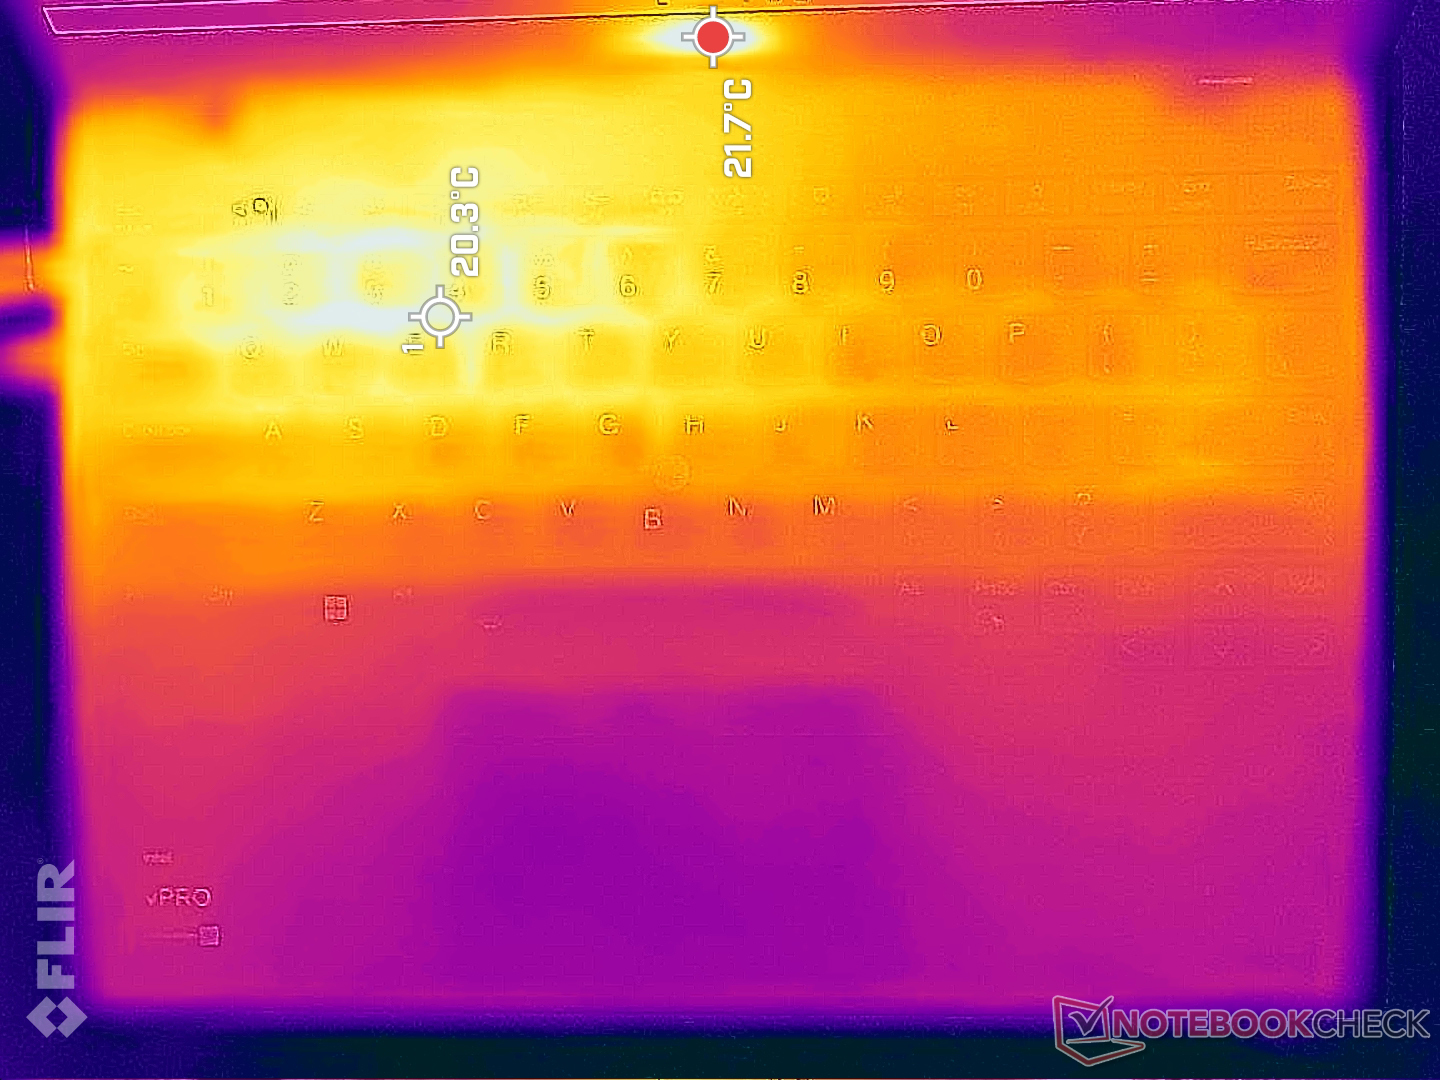
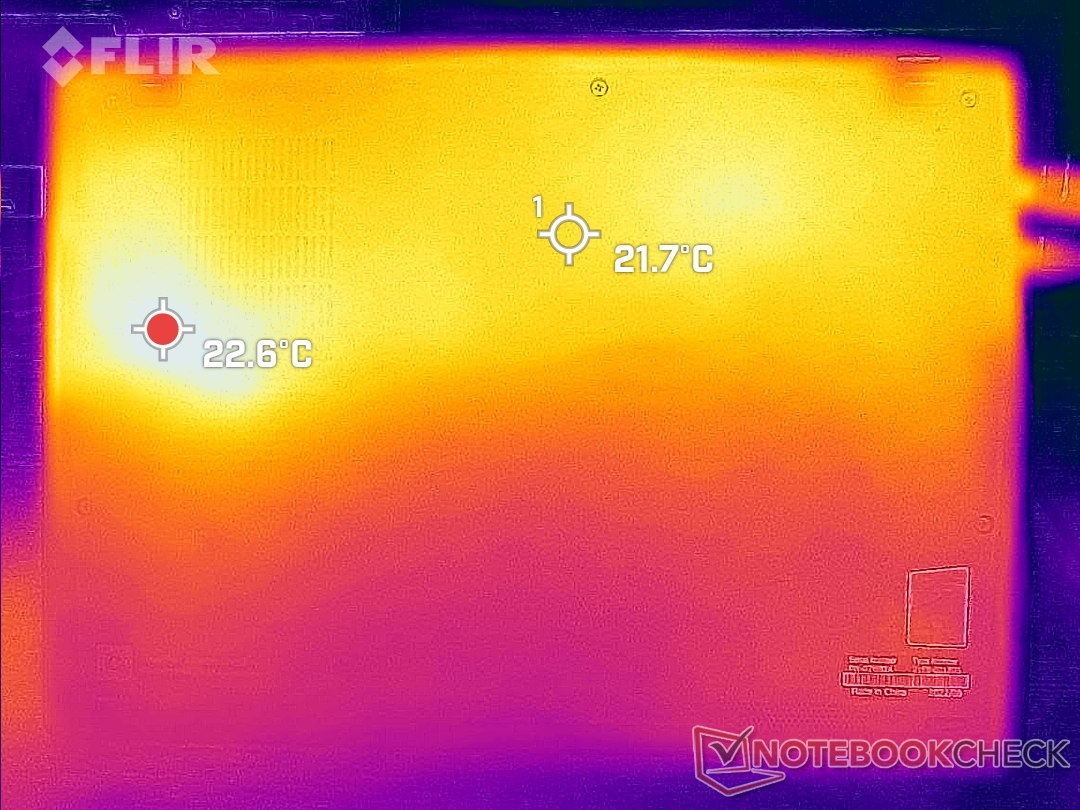
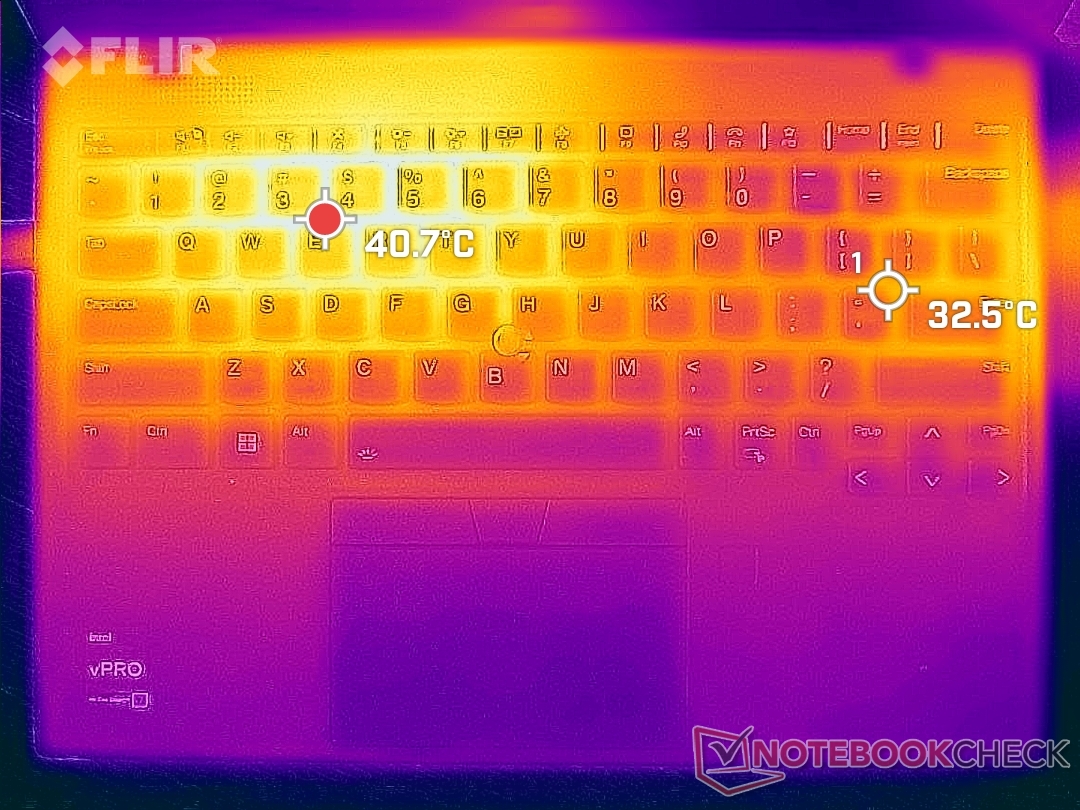
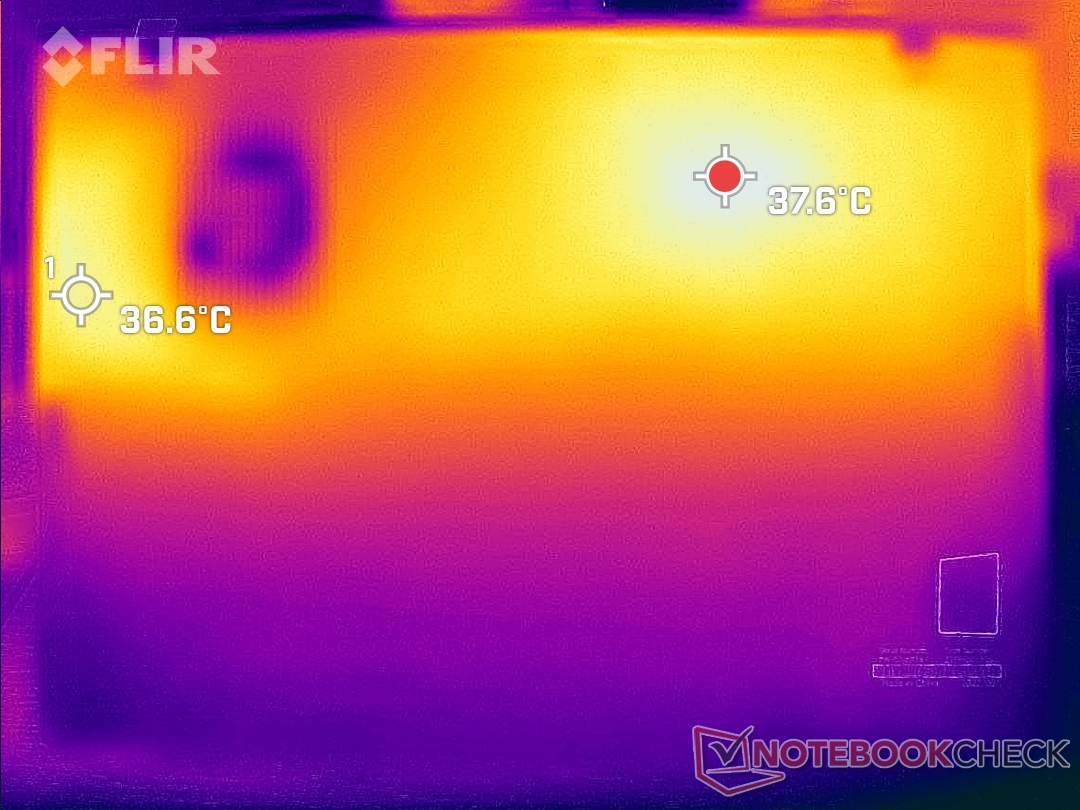
Les températures de surface ne sont pas plus chaudes sur notre nouvel appareil Gen 2 que sur le Gen 1. En fait, le point chaud en bas est plus froid à seulement 40 C contre 48 C sur le modèle de l'année dernière, peut-être en raison de la forte réduction des performances mentionnée ci-dessus. Attendez-vous à ce que la moitié gauche du clavier soit toujours plus chaude que la moitié droite, comme le montrent les cartes de température ci-dessous, puisque le CPU est positionné sur le côté gauche du châssis.
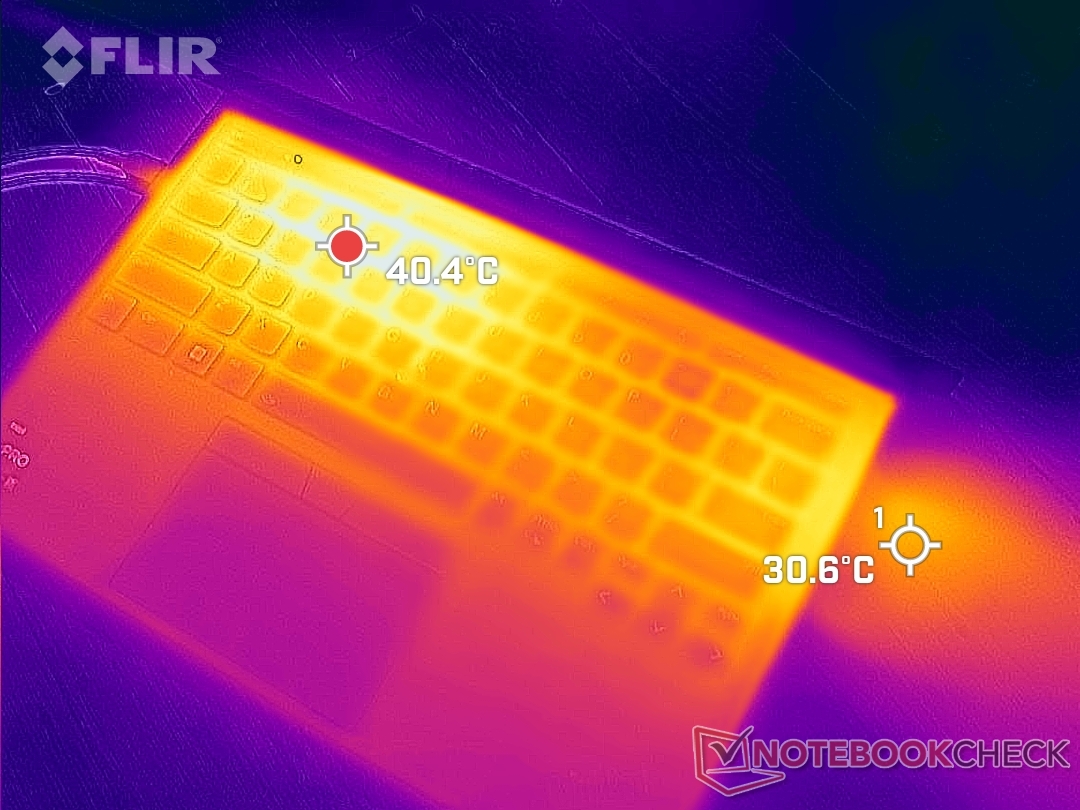
(±) La température maximale du côté supérieur est de 42.4 °C / 108 F, par rapport à la moyenne de 35.9 °C / 97 F, allant de 21.4 à 59 °C pour la classe Subnotebook.
(±) Le fond chauffe jusqu'à un maximum de 40.2 °C / 104 F, contre une moyenne de 39.2 °C / 103 F
(+) En utilisation inactive, la température moyenne du côté supérieur est de 25.3 °C / 78 F, par rapport à la moyenne du dispositif de 30.8 °C / 87 F.
(+) Les repose-poignets et le pavé tactile sont plus froids que la température de la peau avec un maximum de 30.2 °C / 86.4 F et sont donc froids au toucher.
(±) La température moyenne de la zone de l'appui-paume de dispositifs similaires était de 28.2 °C / 82.8 F (-2 °C / #-3.6 F).
| Lenovo ThinkPad X1 Nano Gen 2 Core i7-1280P Intel Core i7-1280P, Intel Iris Xe Graphics G7 96EUs | Lenovo ThinkPad X1 Nano-20UN002UGE Intel Core i7-1160G7, Intel Iris Xe Graphics G7 96EUs | HP Elite Dragonfly G3 Intel Core i7-1265U, Intel Iris Xe Graphics G7 96EUs | Dell Latitude 13 7330 Intel Core i7-1265U, Intel Iris Xe Graphics G7 96EUs | Framework Laptop 13.5 12th Gen Intel Intel Core i7-1260P, Intel Iris Xe Graphics G7 96EUs | Huawei MateBook X Pro 2021 Intel Core i7-1165G7, Intel Iris Xe Graphics G7 96EUs | |
|---|---|---|---|---|---|---|
| Heat | 1% | 2% | 8% | 4% | -7% | |
| Maximum Upper Side * (°C) | 42.4 | 42.2 -0% | 39 8% | 38.6 9% | 36.8 13% | 42.2 -0% |
| Maximum Bottom * (°C) | 40.2 | 47.5 -18% | 42.2 -5% | 42 -4% | 42.4 -5% | 40.4 -0% |
| Idle Upper Side * (°C) | 27.8 | 24.3 13% | 26.8 4% | 23.8 14% | 24.2 13% | 31.2 -12% |
| Idle Bottom * (°C) | 27.8 | 25.3 9% | 28.2 -1% | 24.6 12% | 29 -4% | 32.2 -16% |
* ... Moindre est la valeur, meilleures sont les performances
Test de stress
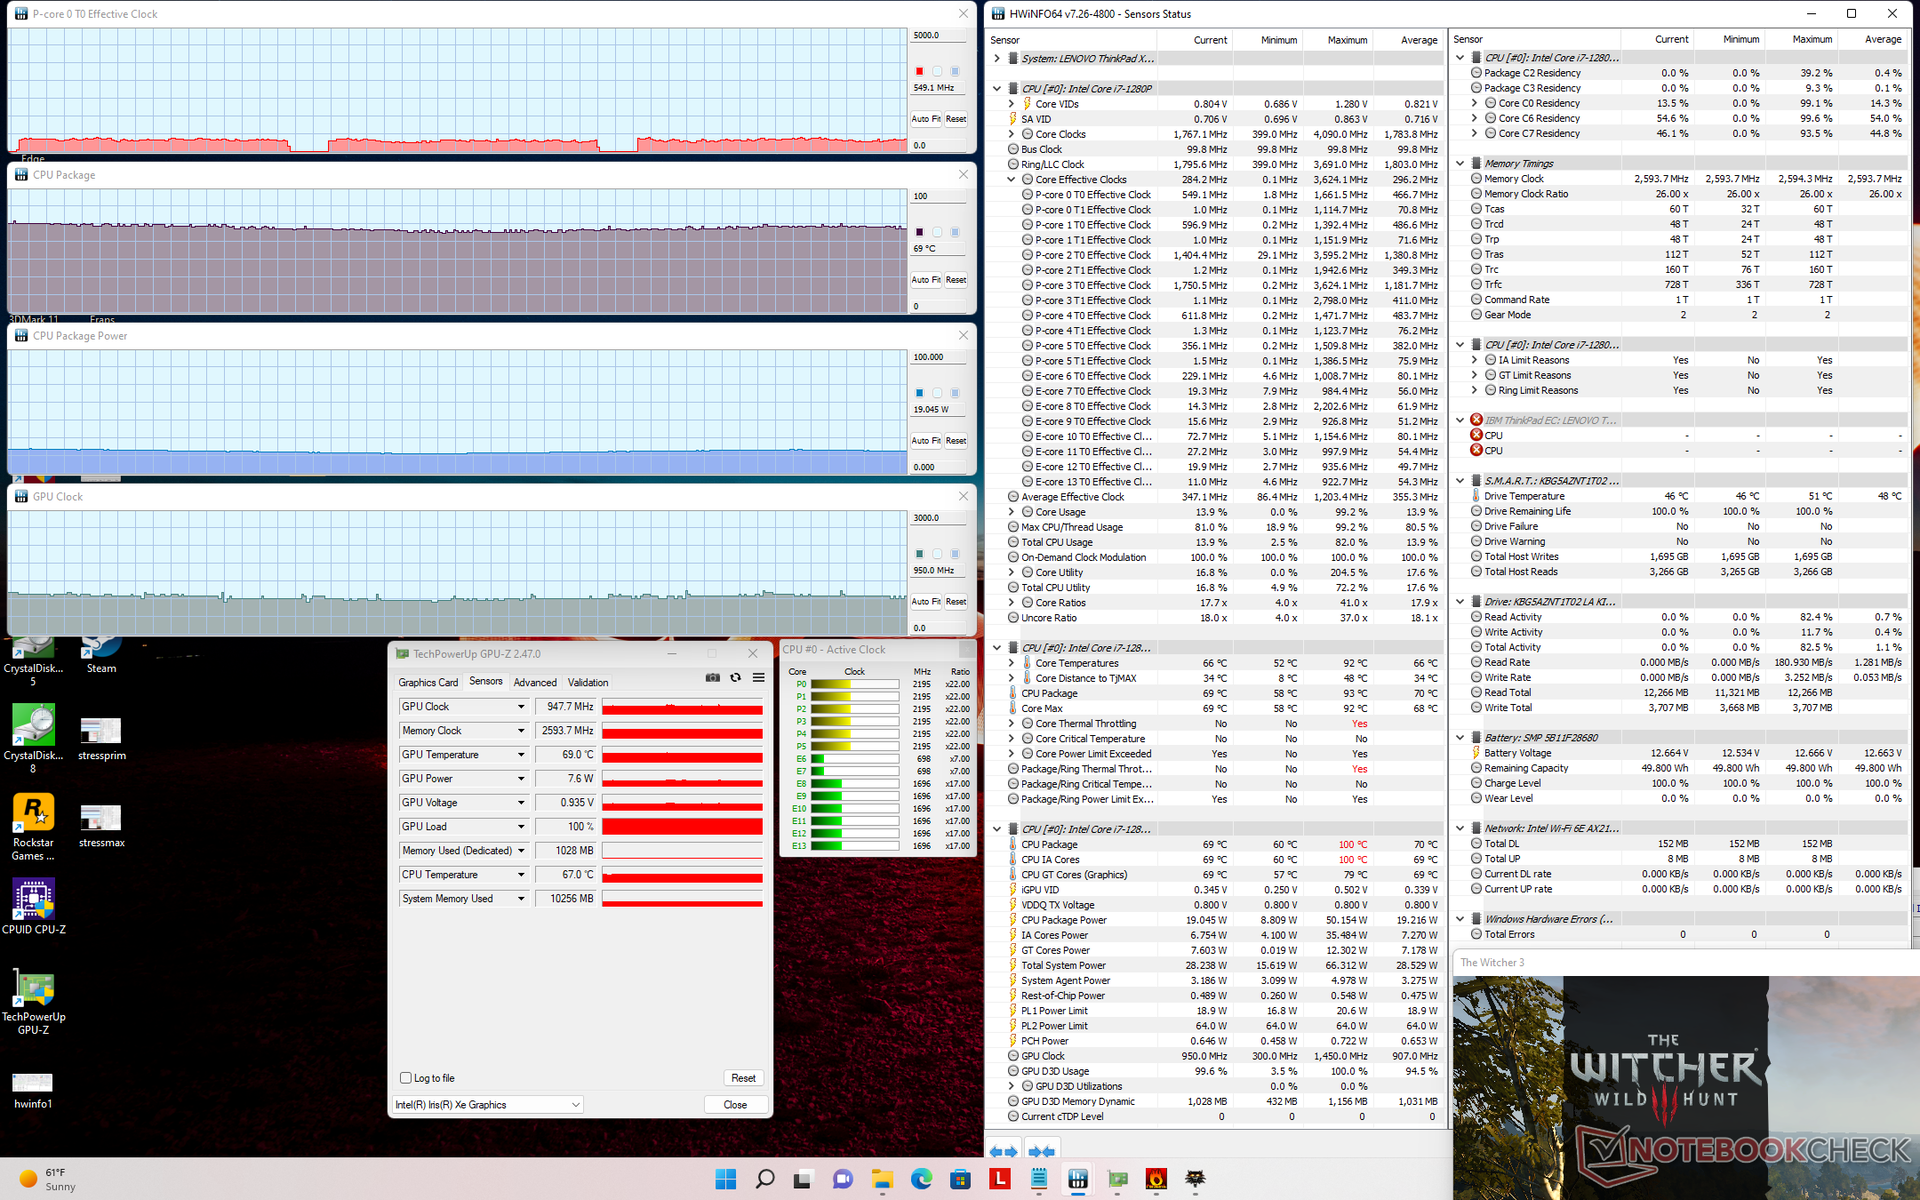
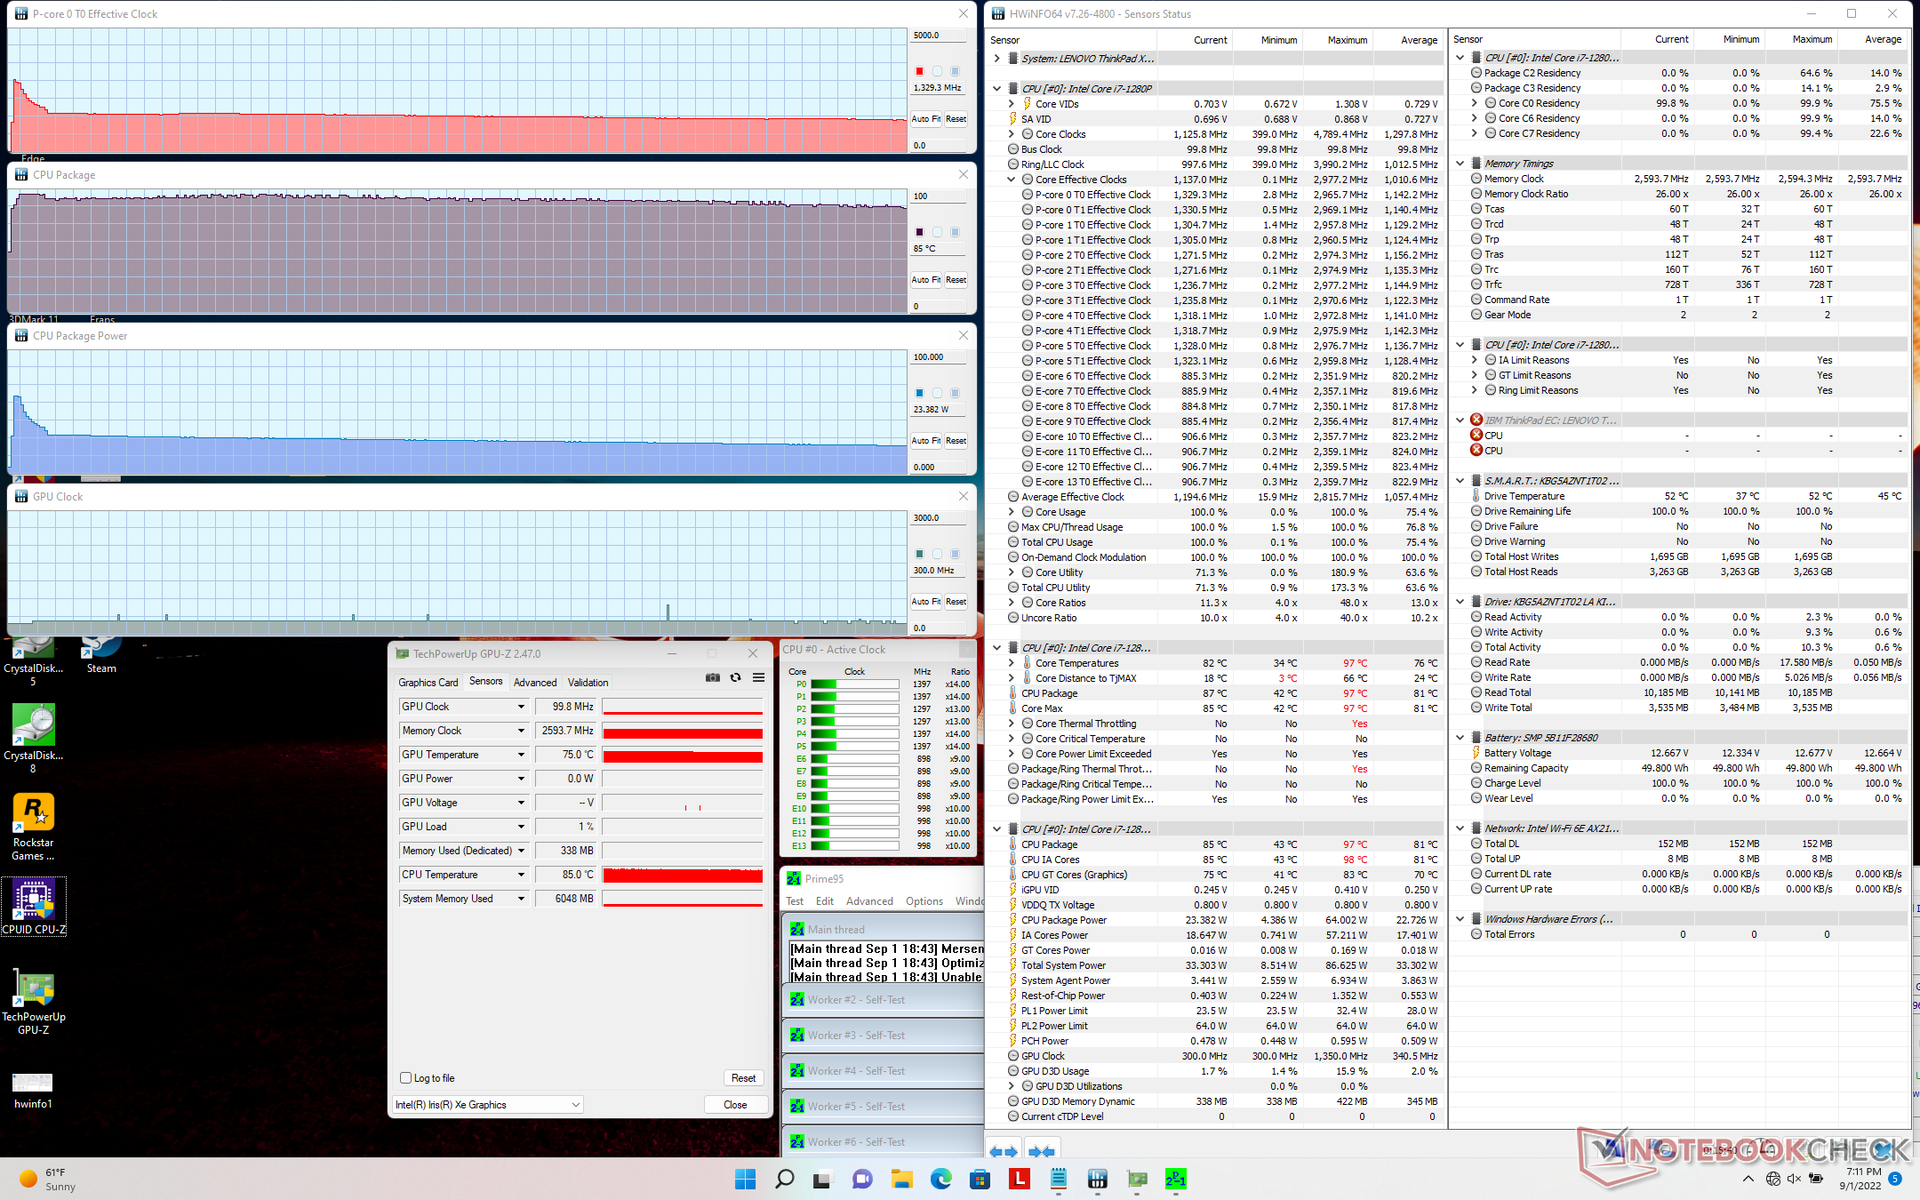
Sous Prime95, les fréquences d'horloge du CPU et la consommation d'énergie de la carte atteignent 3 GHz et 64 W, respectivement. Cependant, la température atteignait également un niveau alarmant de 97°C et ce Turbo Boost maximal ne durait que quelques secondes avant que les fréquences d'horloge et la consommation d'énergie de la carte ne retombent à seulement 1,3 GHz et 23 W, respectivement, pour une température du cœur légèrement plus froide de 85°C. En effectuant ce même test sur le plus grand et plus lourd Framework Laptop équipé du CPU i7-1260P, plus grand et plus lourd, donnerait des fréquences d'horloge stables plus élevées d'environ 2,5 GHz en comparaison.
Les fréquences d'horloge et la température du GPU en fonctionnement Witcher 3 se stabiliseraient à 948 MHz et 69 °C, respectivement, contre 1396 MHz et 83 °C sur le Framework susmentionné.
Les performances ne sont pas réduites en cas de fonctionnement sur batterie. Un test 3DMark 11 sur batterie donne des scores de physique et de graphisme de 13122 et 6668 points, respectivement, contre 11415 et 6937 points sur le secteur.
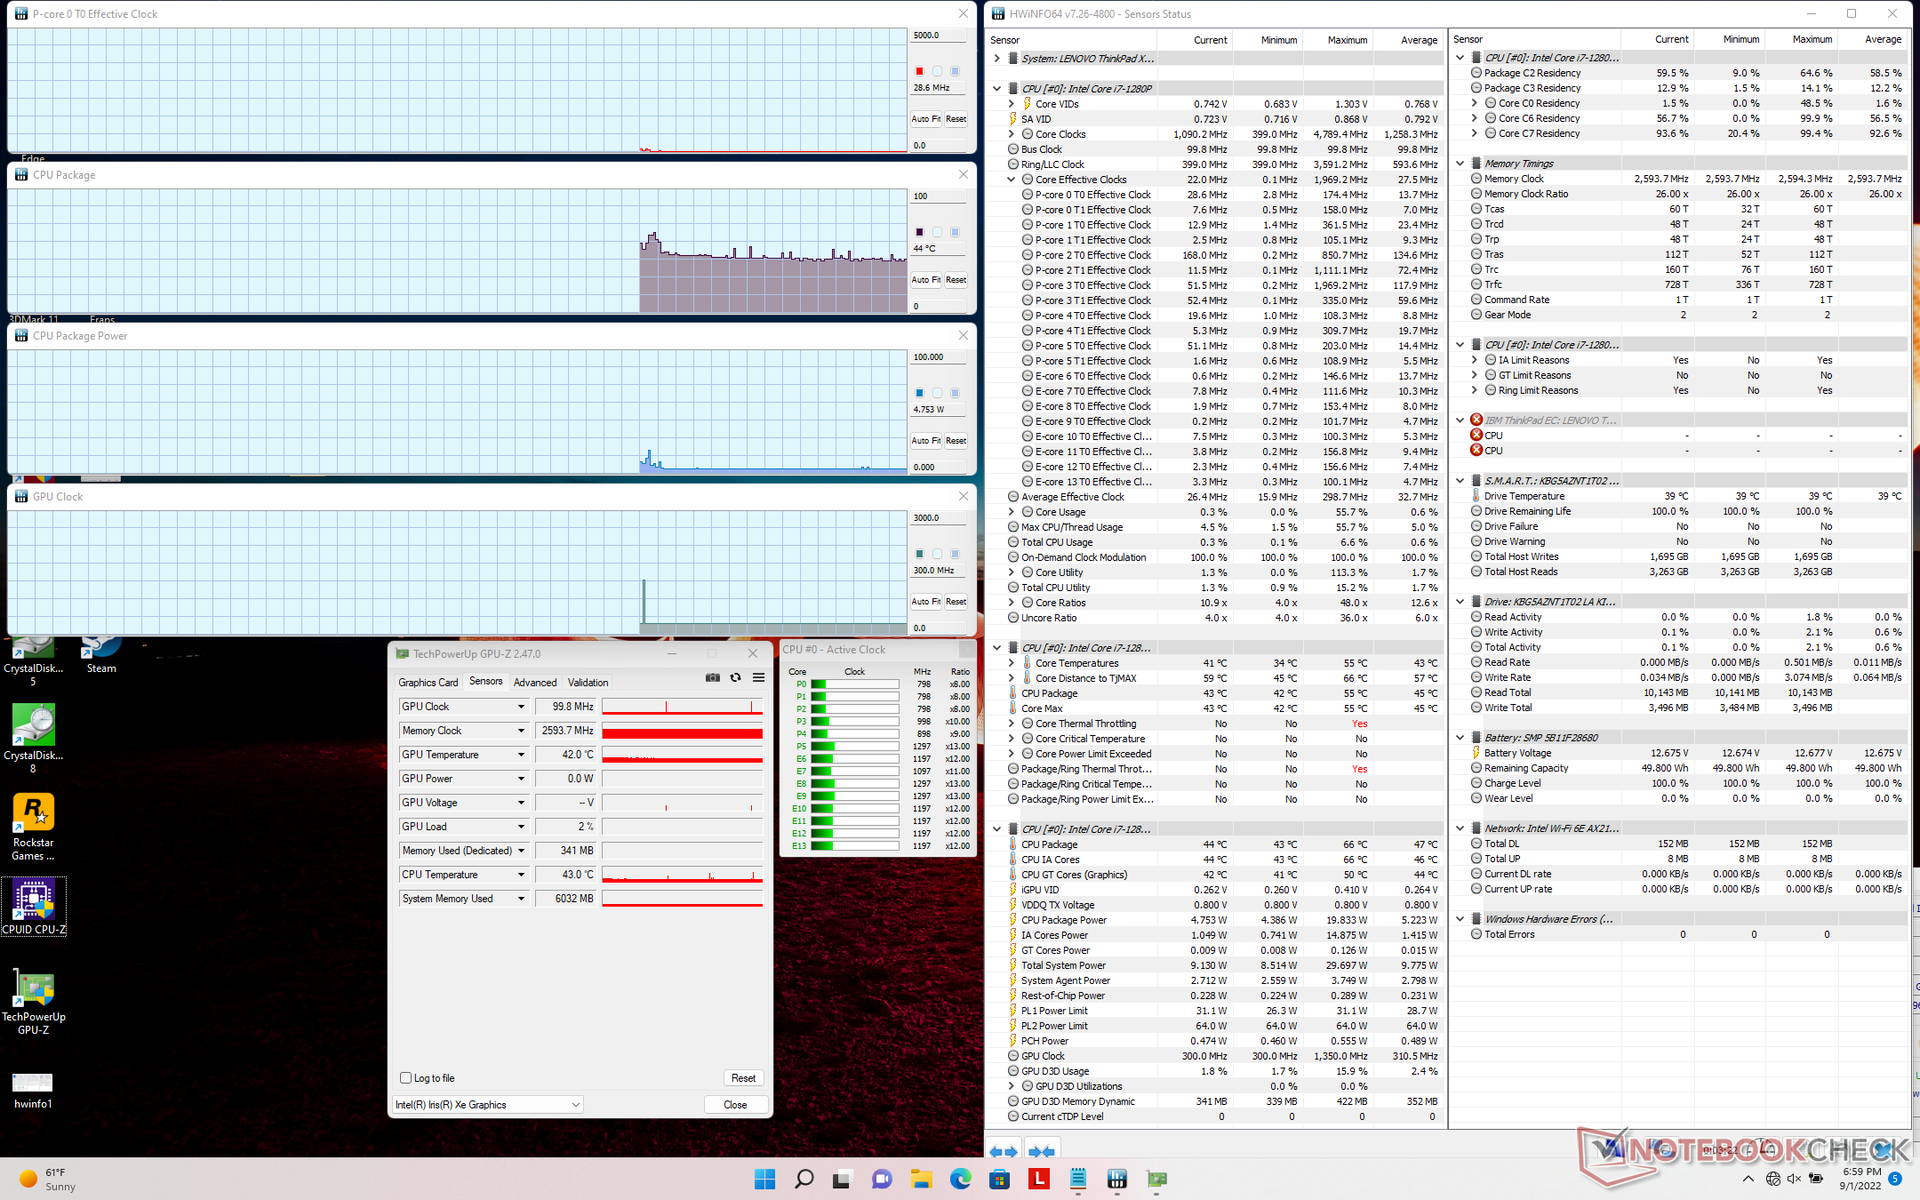
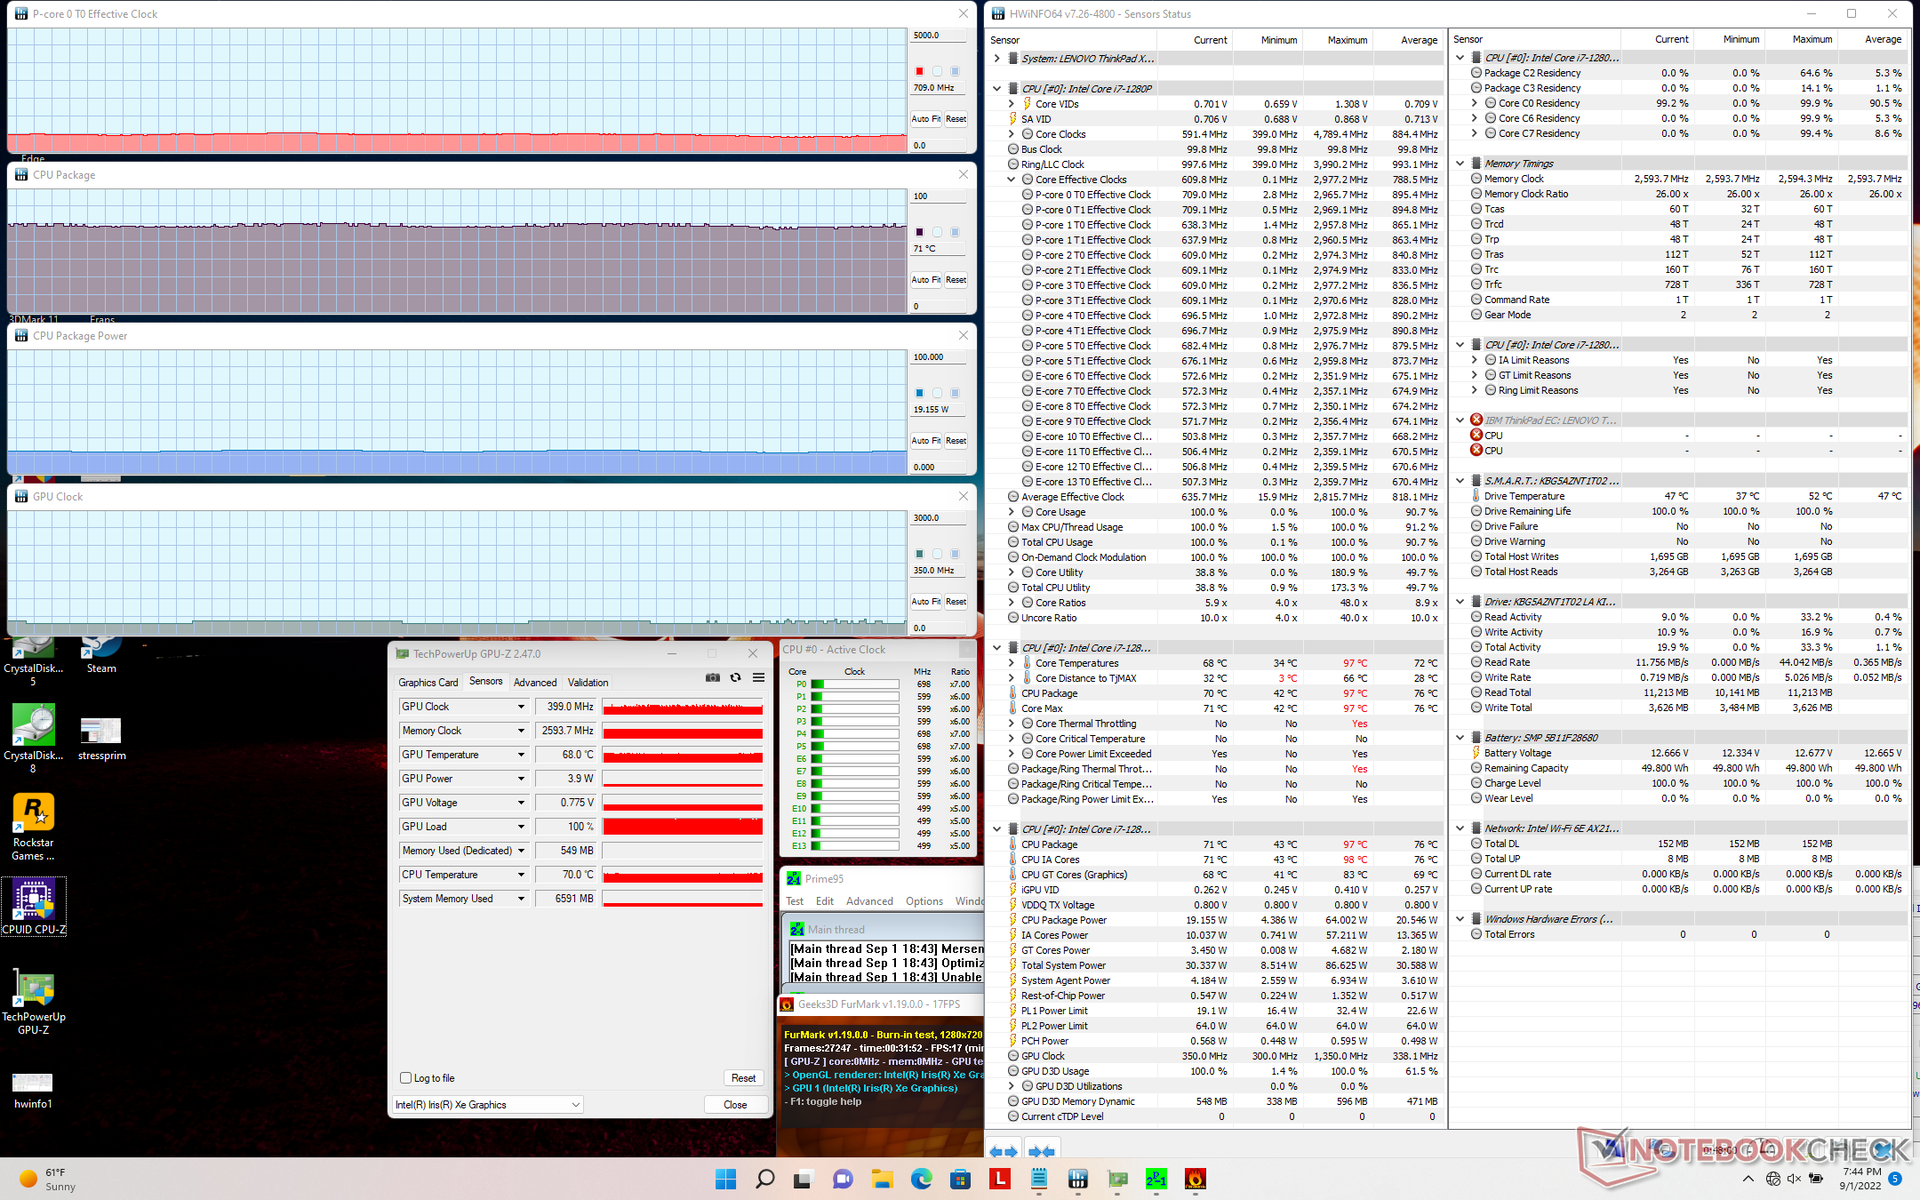
| Fréquence du CPU (GHz) | Fréquence du GPU (MHz) | Température moyenne du CPU (°C) | |
| Système au repos | -- | -- | 44 |
| Prime95 Stress | 1.3 | -- | 85 |
| Prime95 + FurMark Stress | 0.7 | 399 | 71 |
| Witcher 3 Stress | ~0.5 | 948 | 69 |
Haut-parleurs
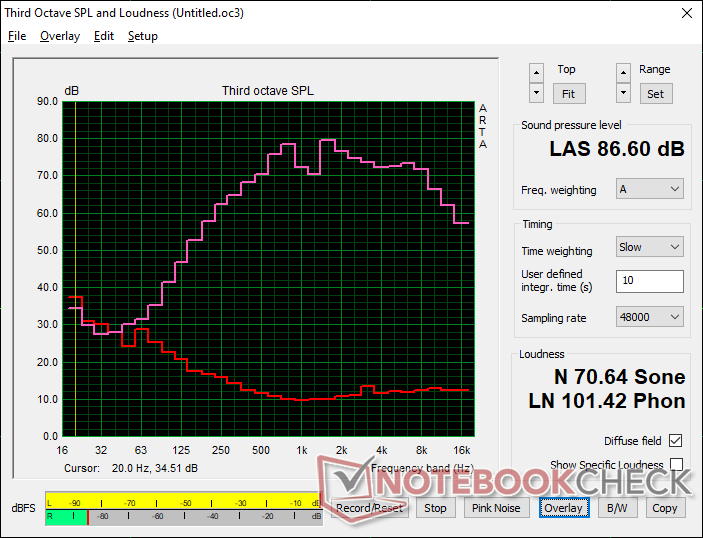
Lenovo ThinkPad X1 Nano Gen 2 Core i7-1280P analyse audio
(+) | les haut-parleurs peuvent jouer relativement fort (86.6# dB)
Basses 100 - 315 Hz
(-) | presque aucune basse - en moyenne 16.3% plus bas que la médiane
(±) | la linéarité des basses est moyenne (8.4% delta à la fréquence précédente)
Médiums 400 - 2000 Hz
(+) | médiane équilibrée - seulement 4% de la médiane
(±) | la linéarité des médiums est moyenne (7.3% delta à la fréquence précédente)
Aiguës 2 - 16 kHz
(+) | des sommets équilibrés - à seulement 2.7% de la médiane
(+) | les aigus sont linéaires (3% delta à la fréquence précédente)
Globalement 100 - 16 000 Hz
(+) | le son global est linéaire (12.8% différence à la médiane)
Par rapport à la même classe
» 19% de tous les appareils testés de cette catégorie étaient meilleurs, 4% similaires, 76% pires
» Le meilleur avait un delta de 5%, la moyenne était de 18%, le pire était de 53%.
Par rapport à tous les appareils testés
» 12% de tous les appareils testés étaient meilleurs, 3% similaires, 85% pires
» Le meilleur avait un delta de 4%, la moyenne était de 23%, le pire était de 134%.
Apple MacBook Pro 16 2021 M1 Pro analyse audio
(+) | les haut-parleurs peuvent jouer relativement fort (84.7# dB)
Basses 100 - 315 Hz
(+) | bonne basse - seulement 3.8% loin de la médiane
(+) | les basses sont linéaires (5.2% delta à la fréquence précédente)
Médiums 400 - 2000 Hz
(+) | médiane équilibrée - seulement 1.3% de la médiane
(+) | les médiums sont linéaires (2.1% delta à la fréquence précédente)
Aiguës 2 - 16 kHz
(+) | des sommets équilibrés - à seulement 1.9% de la médiane
(+) | les aigus sont linéaires (2.7% delta à la fréquence précédente)
Globalement 100 - 16 000 Hz
(+) | le son global est linéaire (4.6% différence à la médiane)
Par rapport à la même classe
» 0% de tous les appareils testés de cette catégorie étaient meilleurs, 0% similaires, 100% pires
» Le meilleur avait un delta de 5%, la moyenne était de 17%, le pire était de 45%.
Par rapport à tous les appareils testés
» 0% de tous les appareils testés étaient meilleurs, 0% similaires, 100% pires
» Le meilleur avait un delta de 4%, la moyenne était de 23%, le pire était de 134%.
Gestion de l'énergie
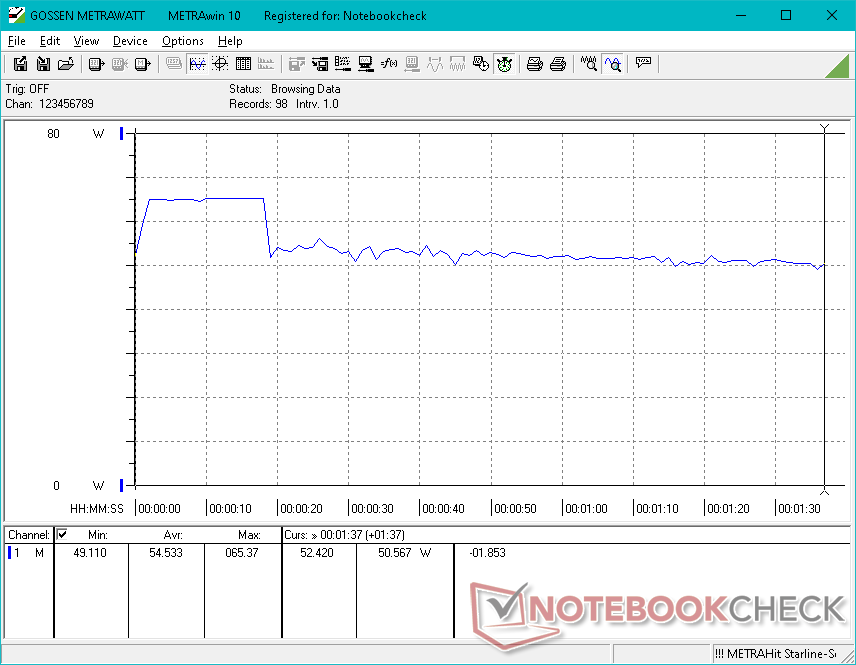
Consommation d'énergie
Le système est généralement plus exigeant que les autres subnotebooks de 13 pouces, car il est l'un des rares à être équipé d'un processeur Core P-series. Le simple fait de tourner au ralenti sur le bureau consomme entre 3 et 15 W alors que le HP Dragonfly G3, Latitude 7330ou le ThinkPad X1 Nano original ne consomment que 7 ou 9 watts dans des conditions similaires
Les différences de consommation d'énergie se creusent encore plus lorsqu'on exécute des charges plus exigeantes. 3DMark 06 ou Witcher 3le ThinkPad X1 Nano, par exemple, consomme entre 44 et 55 W, soit beaucoup plus que le HP, le Dell ou le X1 Nano original susmentionné. Le processeur Core i7-1280P est peut-être plus rapide, mais il a un coût
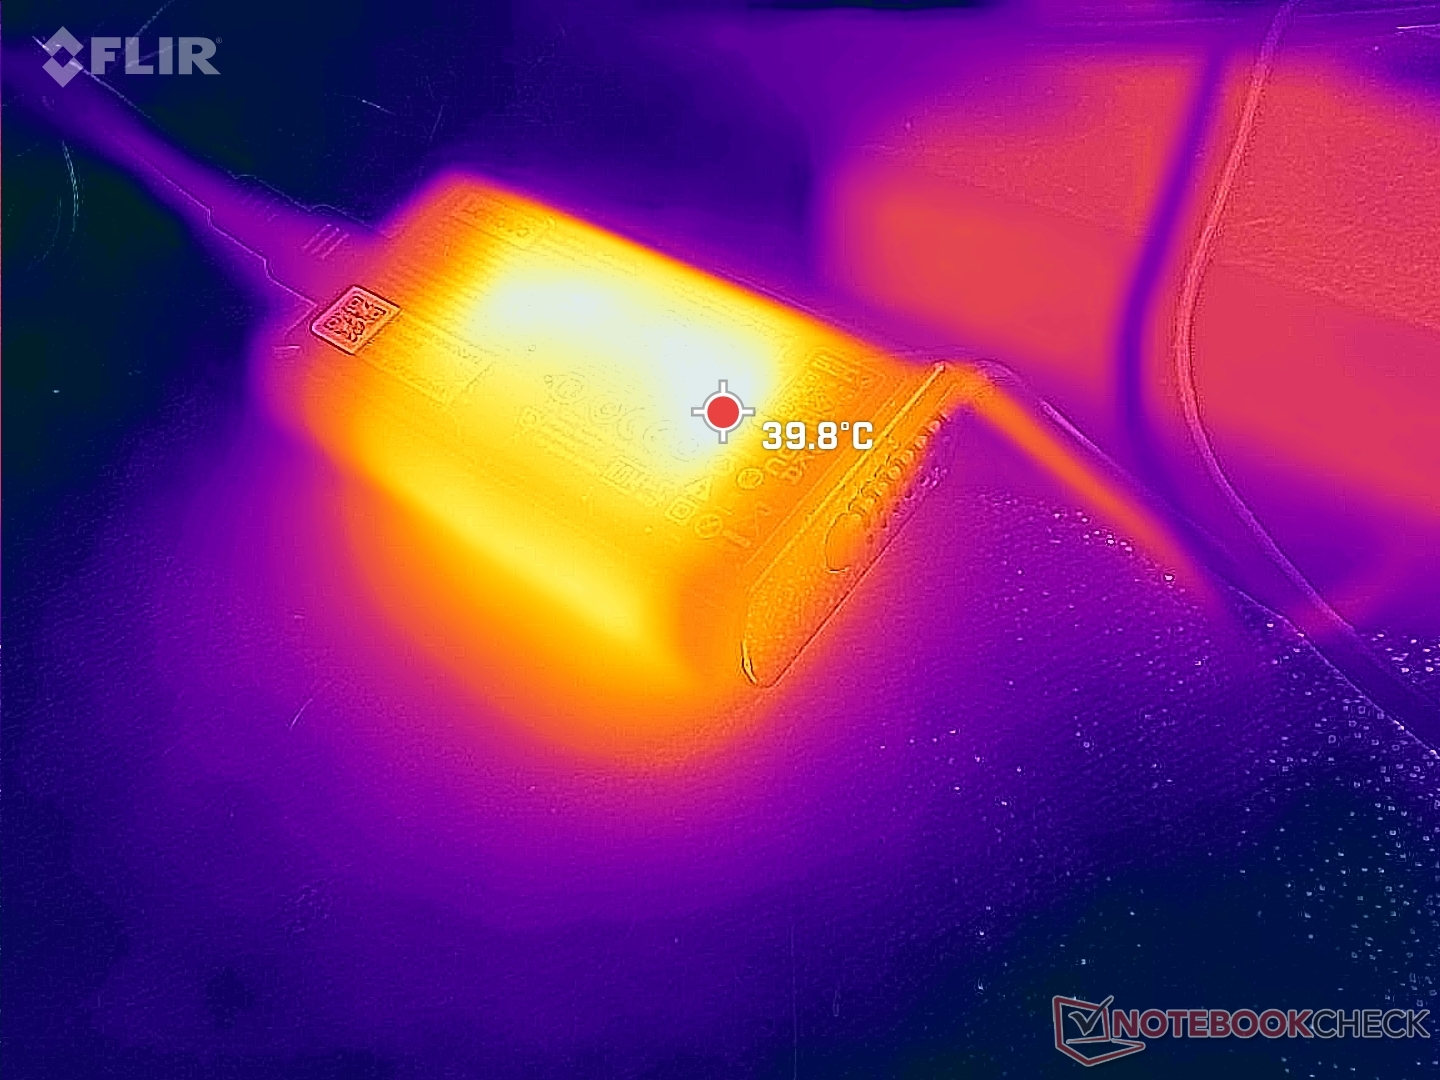
Nous avons pu enregistrer une consommation maximale temporaire de 65,4 W sur le petit adaptateur secteur de 65 W (~8,7 x 5,2 x 2,2 cm) avant que l'étranglement ne se déclenche, comme le montrent les captures d'écran ci-dessous.
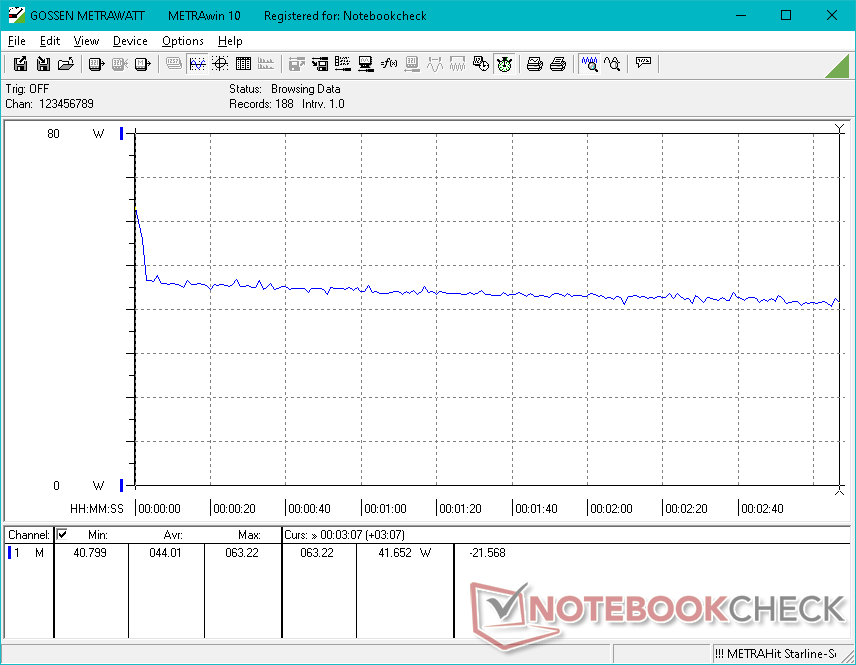
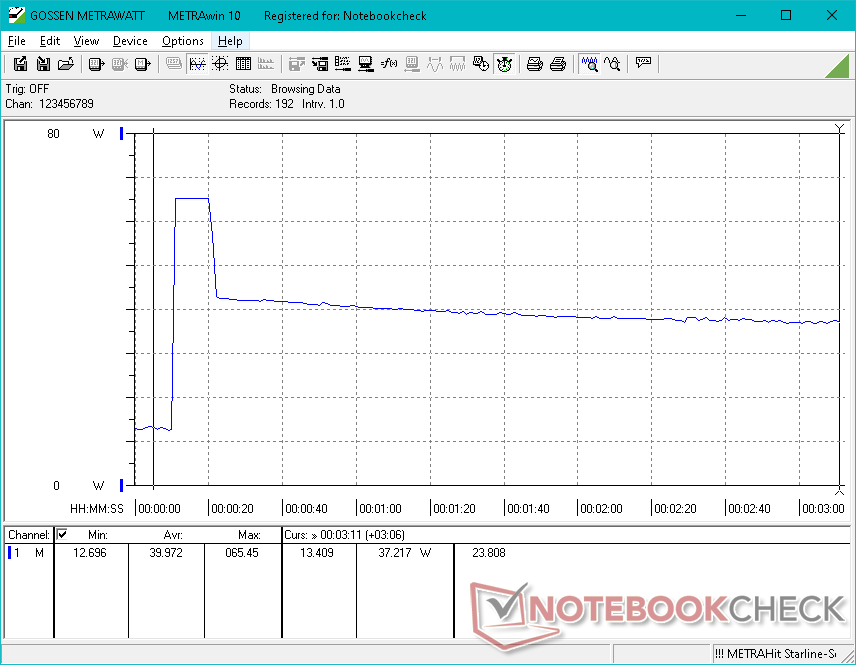
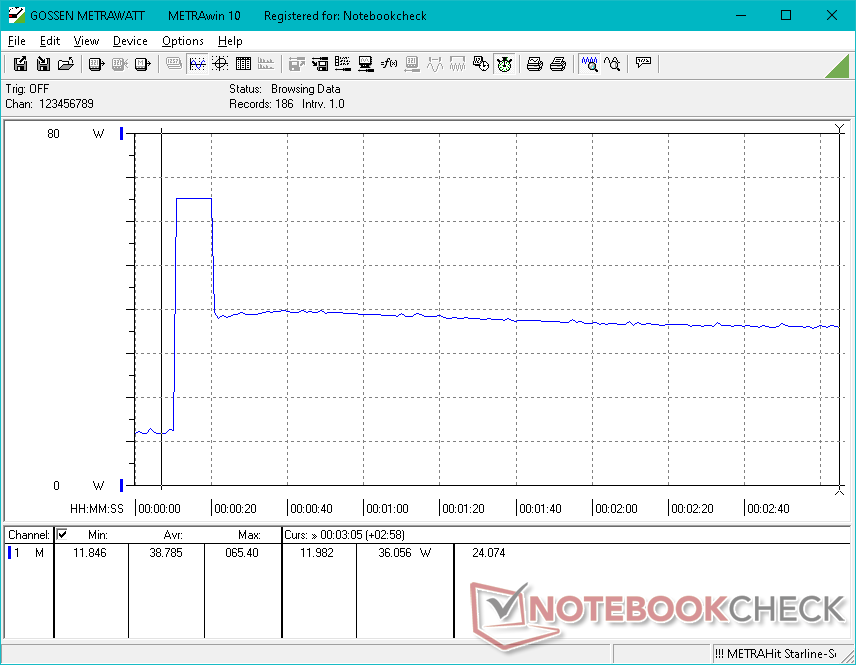
| Éteint/en veille | |
| Au repos | |
| Fortement sollicité |
|
Légende:
min: | |
| Lenovo ThinkPad X1 Nano Gen 2 Core i7-1280P i7-1280P, Iris Xe G7 96EUs, Kioxia BG5 KBG5AZNT1T02, IPS, 2160x1350, 13" | Lenovo ThinkPad X1 Nano-20UN002UGE i7-1160G7, Iris Xe G7 96EUs, WDC PC SN530 SDBPNPZ-512G, IPS, 2160x1350, 13" | HP Elite Dragonfly G3 i7-1265U, Iris Xe G7 96EUs, Micron 3400 MTFDKBA512TFH 512GB, IPS, 1920x1280, 13.5" | Dell Latitude 13 7330 i7-1265U, Iris Xe G7 96EUs, Toshiba KBG40ZNS512G NVMe, IPS, 1920x1080, 13.3" | Framework Laptop 13.5 12th Gen Intel i7-1260P, Iris Xe G7 96EUs, WDC PC SN730 SDBPNTY-512G, IPS, 2256x1504, 13.5" | Huawei MateBook X Pro 2021 i7-1165G7, Iris Xe G7 96EUs, Samsung PM981a MZVLB1T0HBLR, IPS, 3000x2000, 13.9" | |
|---|---|---|---|---|---|---|
| Power Consumption | 25% | 16% | 21% | -11% | -11% | |
| Idle Minimum * (Watt) | 3.4 | 3.3 3% | 3.4 -0% | 2.8 18% | 5.3 -56% | 6.7 -97% |
| Idle Average * (Watt) | 6.5 | 5.7 12% | 5.6 14% | 4.8 26% | 8.4 -29% | 10 -54% |
| Idle Maximum * (Watt) | 14.4 | 9.1 37% | 8.4 42% | 7.3 49% | 11.2 22% | 10.3 28% |
| Load Average * (Watt) | 54.5 | 29.6 46% | 40.8 25% | 48.1 12% | 57.4 -5% | 35.7 34% |
| Witcher 3 ultra * (Watt) | 44 | 27.7 37% | 35.5 19% | 35.4 20% | 46.7 -6% | 32.7 26% |
| Load Maximum * (Watt) | 65.4 | 55.1 16% | 68.4 -5% | 63.6 3% | 61.2 6% | 67.6 -3% |
* ... Moindre est la valeur, meilleures sont les performances
Power Consumption Witcher 3 / Stresstest
Power Consumption external Monitor
Autonomie de la batterie
Les durées d'exécution sont beaucoup plus courtes que sur le modèle de l'année dernière, de près de la moitié ( !), même avec le profil d'alimentation équilibré, probablement en raison du CPU Core P-series plus exigeant. Avec seulement 5 heures d'utilisation réelle du WLAN, le X1 Nano Gen 2 ne va pas durer aussi longtemps que la plupart des autres subnotebooks.
| Lenovo ThinkPad X1 Nano Gen 2 Core i7-1280P i7-1280P, Iris Xe G7 96EUs, 49.5 Wh | Lenovo ThinkPad X1 Nano-20UN002UGE i7-1160G7, Iris Xe G7 96EUs, 48.2 Wh | HP Elite Dragonfly G3 i7-1265U, Iris Xe G7 96EUs, 68 Wh | Dell Latitude 13 7330 i7-1265U, Iris Xe G7 96EUs, 41 Wh | Framework Laptop 13.5 12th Gen Intel i7-1260P, Iris Xe G7 96EUs, 55 Wh | Huawei MateBook X Pro 2021 i7-1165G7, Iris Xe G7 96EUs, 56 Wh | |
|---|---|---|---|---|---|---|
| Autonomie de la batterie | 94% | 131% | 63% | 47% | 106% | |
| WiFi v1.3 (h) | 5.1 | 9.9 94% | 11.8 131% | 8.3 63% | 7.5 47% | 10.5 106% |
| H.264 (h) | 15.4 | |||||
| Load (h) | 1.6 | 3.5 | 1.4 | 3 | ||
| Reader / Idle (h) | 37.8 | 21.9 | 19.5 |
Points positifs
Points négatifs
Verdict - Un sprinter léger, mais pas un marathonien
Le ThinkPad X1 Nano Gen 2 est l'exemple parfait de ce qui se passe lorsque vous remplacez un processeur de 15 W par un processeur de 28 W sur un ordinateur portable conçu à l'origine pour fonctionner avec un processeur de 15 W. Vous obtiendrez des performances plus rapides que le modèle original. Les performances seront plus rapides, mais cette augmentation ne sera que de courte durée en raison des limites de la solution de refroidissement. Le système est donc à son meilleur lorsqu'il s'agit de lancer des applications, de retoucher occasionnellement des images ou de décompresser de petits fichiers. Toutefois, si vous avez l'intention d'utiliser l'ordinateur portable pour des charges de travail intensives pendant de longues périodes, le processeur ne sera pas aussi rapide que vous l'espérez. Gardez à l'esprit qu'il s'agit d'un inconvénient commun à la plupart, sinon à tous les ordinateurs portables super légers (<1 kg) jusqu'à présent, comme le Dragonfly G3, Latitude 7330ou le LG Gram.
Un autre aspect important à prendre en compte est que l'autonomie de la batterie a été considérablement réduite puisque la capacité de la batterie reste essentiellement inchangée malgré le nouveau CPU plus gourmand en énergie. Par conséquent, vous devrez peut-être être plus attentif à la charge lorsque vous voyagez.
Le ThinkPad X1 Nano Gen 2 est indéniablement plus rapide que le modèle original Gen 1, mais cela se fait au prix de durées d'exécution plus courtes et d'un éventuel étranglement des performances.
Malgré la durabilité limitée de Turbo Boost du processeur, le X1 Nano Gen 2 est toujours un système beaucoup plus rapide que l'ancien modèle Gen 1 sans avoir besoin de changer quoi que ce soit au niveau du châssis, de l'écran ou du poids. Les utilisateurs qui cherchent à maximiser les performances du processeur peuvent envisager des ordinateurs portables plus lourds avec des solutions de refroidissement plus puissantes comme les ThinkPad série T à la place.
Prix et disponibilité
Le ThinkPad X1 Nano Gen 2 est maintenant largement disponible chez les revendeurs tels que Amazon et Newegg au prix de 1 700 USD s'il est configuré avec le Core i5 et un écran FHD, jusqu'à 2 300 USD s'il est configuré avec le Core i7 et un écran 2K. Les utilisateurs peuvent également acheter directement auprès de Lenovo.
Lenovo ThinkPad X1 Nano Gen 2 Core i7-1280P
- 09/04/2022 v7 (old)
Allen Ngo
Price comparison

