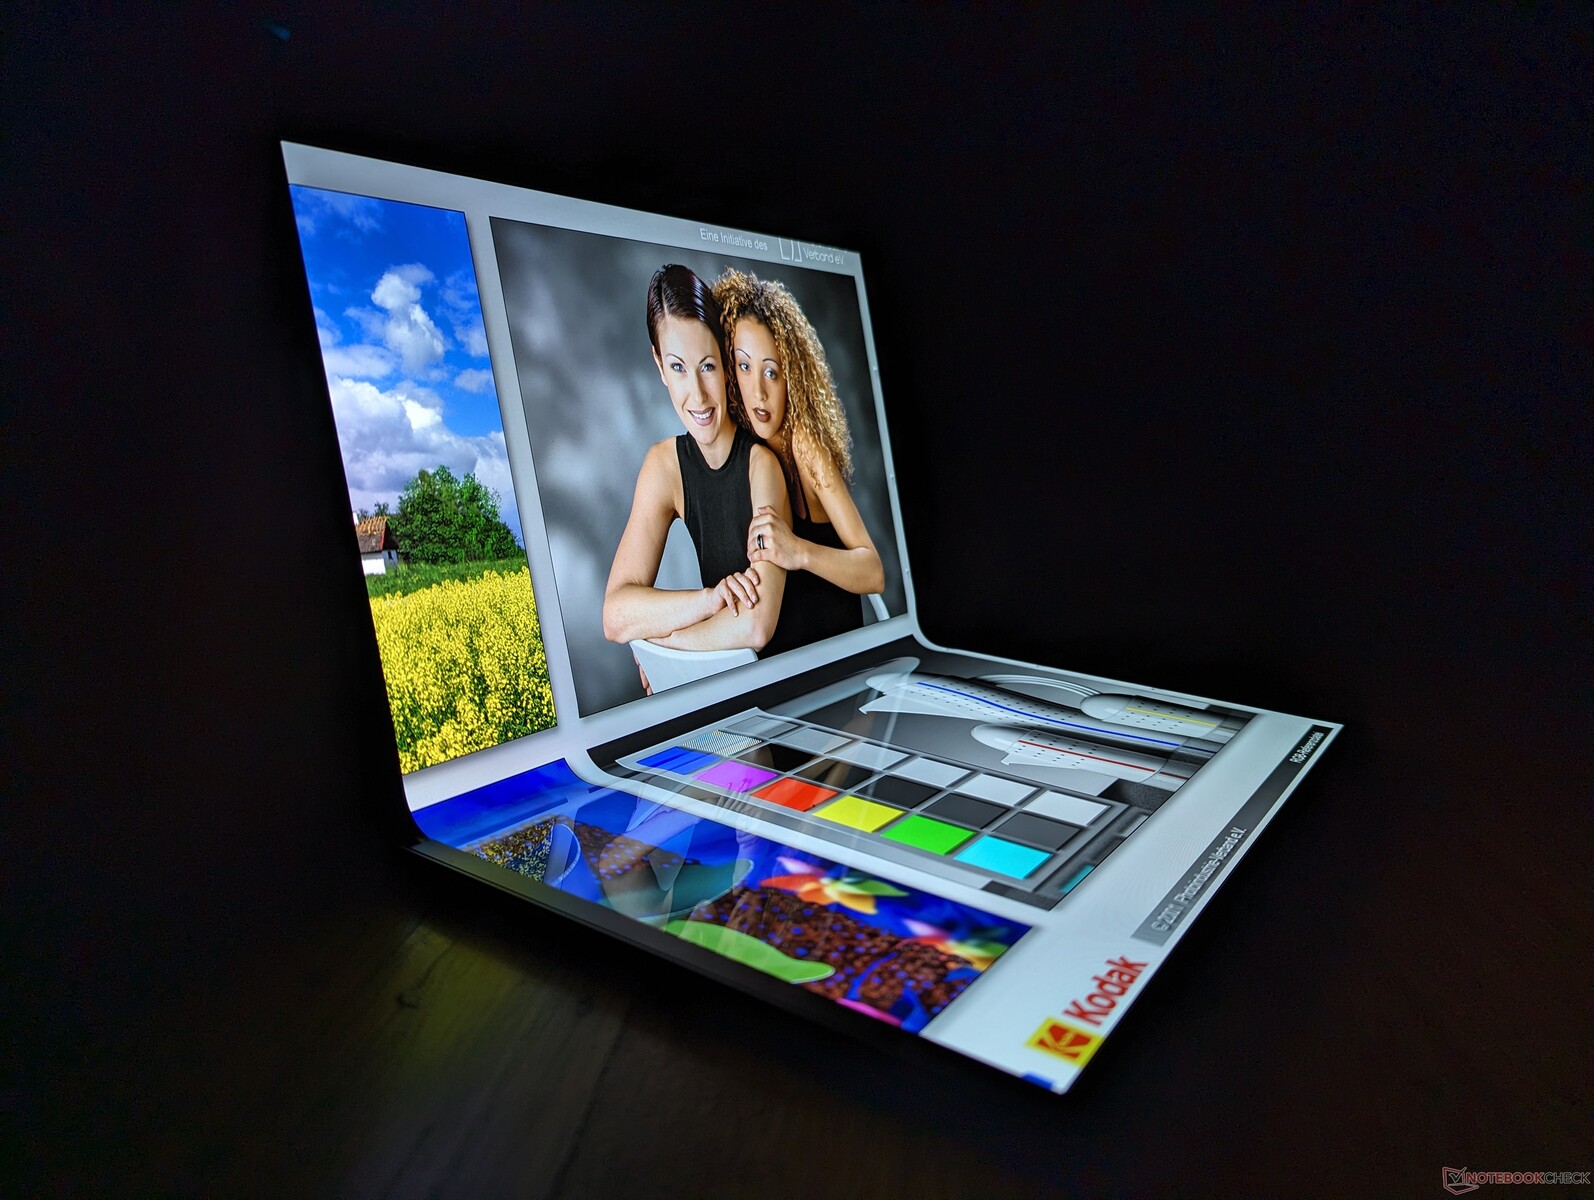
Test du Lenovo ThinkPad X1 Fold 16 : déployer le futur

Lenovo a été l'un des premiers grands fabricants à lancer un ordinateur portable pliable avec le modèle 2021 de 13 pouces ThinkPad X1 Fold 13. Si son côté cool était indéniable, ses performances et son ergonomie limitées donnaient l'impression d'un système plus expérimental que raffiné. En 2024, Lenovo s'est inspiré de tout ce qu'il avait appris sur le ThinkPad X1 Fold 13 pour créer le ThinkPad X1 Fold 16, encore plus grand et au format 4:3.
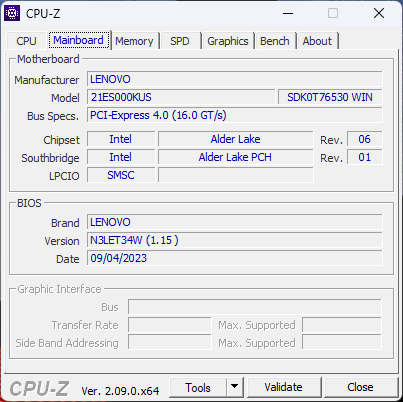
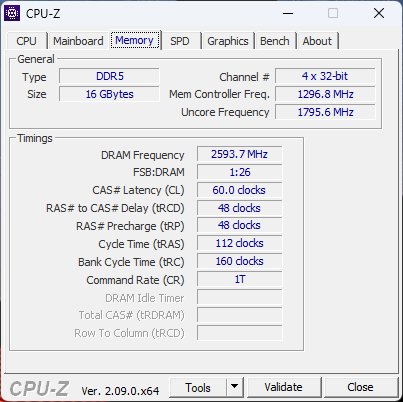
Notre configuration d'évaluation est équipée du Core 7-1250U, mais d'autres SKU sont disponibles avec le Core i7-1260U vPro et WWAN pour séduire les grandes entreprises. Toutes les configurations utilisent le même écran tactile pliable de 16,3 pouces (2 560 x 2 024).
Les concurrents directs du ThinkPad X1 Fold 16 sont les suivants Asus Zenbook 17 Fold et le HP Spectre Foldable 17. Il peut également être considéré comme une alternative à la Série Microsoft Surface Pro.
Plus de commentaires sur Lenovo :
Comparaison avec les concurrents potentiels
Note | Date | Modèle | Poids | Épaisseur | Taille | Résolution | Prix |
|---|---|---|---|---|---|---|---|
| 84.4 % v7 (old) | 02/24 | Lenovo Thinkpad X1 Fold 16 i7-1250U, Iris Xe G7 96EUs | 1.9 kg | 8.6 mm | 16.30" | 2560x2024 | |
| 77.8 % v7 (old) | 04/21 | Lenovo ThinkPad X1 Fold 20RL000FGE i5-L16G7, UHD Graphics G7 (Lakefield GT2 64 EU) | 1.2 kg | 11.5 mm | 13.30" | 2048x1536 | |
| 84.5 % v7 (old) | 10/22 | Asus Zenbook 17 Fold UX9702 i7-1250U, Iris Xe G7 80EUs | 1.8 kg | 12.9 mm | 17.30" | 2560x1920 | |
| 88.4 % v7 (old) | 01/23 | Microsoft Surface Pro 9, i7-1255U i7-1255U, Iris Xe G7 96EUs | 877 g | 9.3 mm | 13.00" | 2880x1920 | |
| 90.3 % v7 (old) | 12/22 | HP Elite Dragonfly Folio 13.5 G3 i7-1265U, Iris Xe G7 96EUs | 1.4 kg | 17.8 mm | 13.50" | 1920x1280 | |
| 89.1 % v7 (old) | 11/23 | Lenovo ThinkPad X1 Carbon G11 21HNS54T00 i7-1370P, Iris Xe G7 96EUs | 1.2 kg | 15.36 mm | 14.00" | 2880x1800 |
Cas - Mettre le livre dans ThinkBook
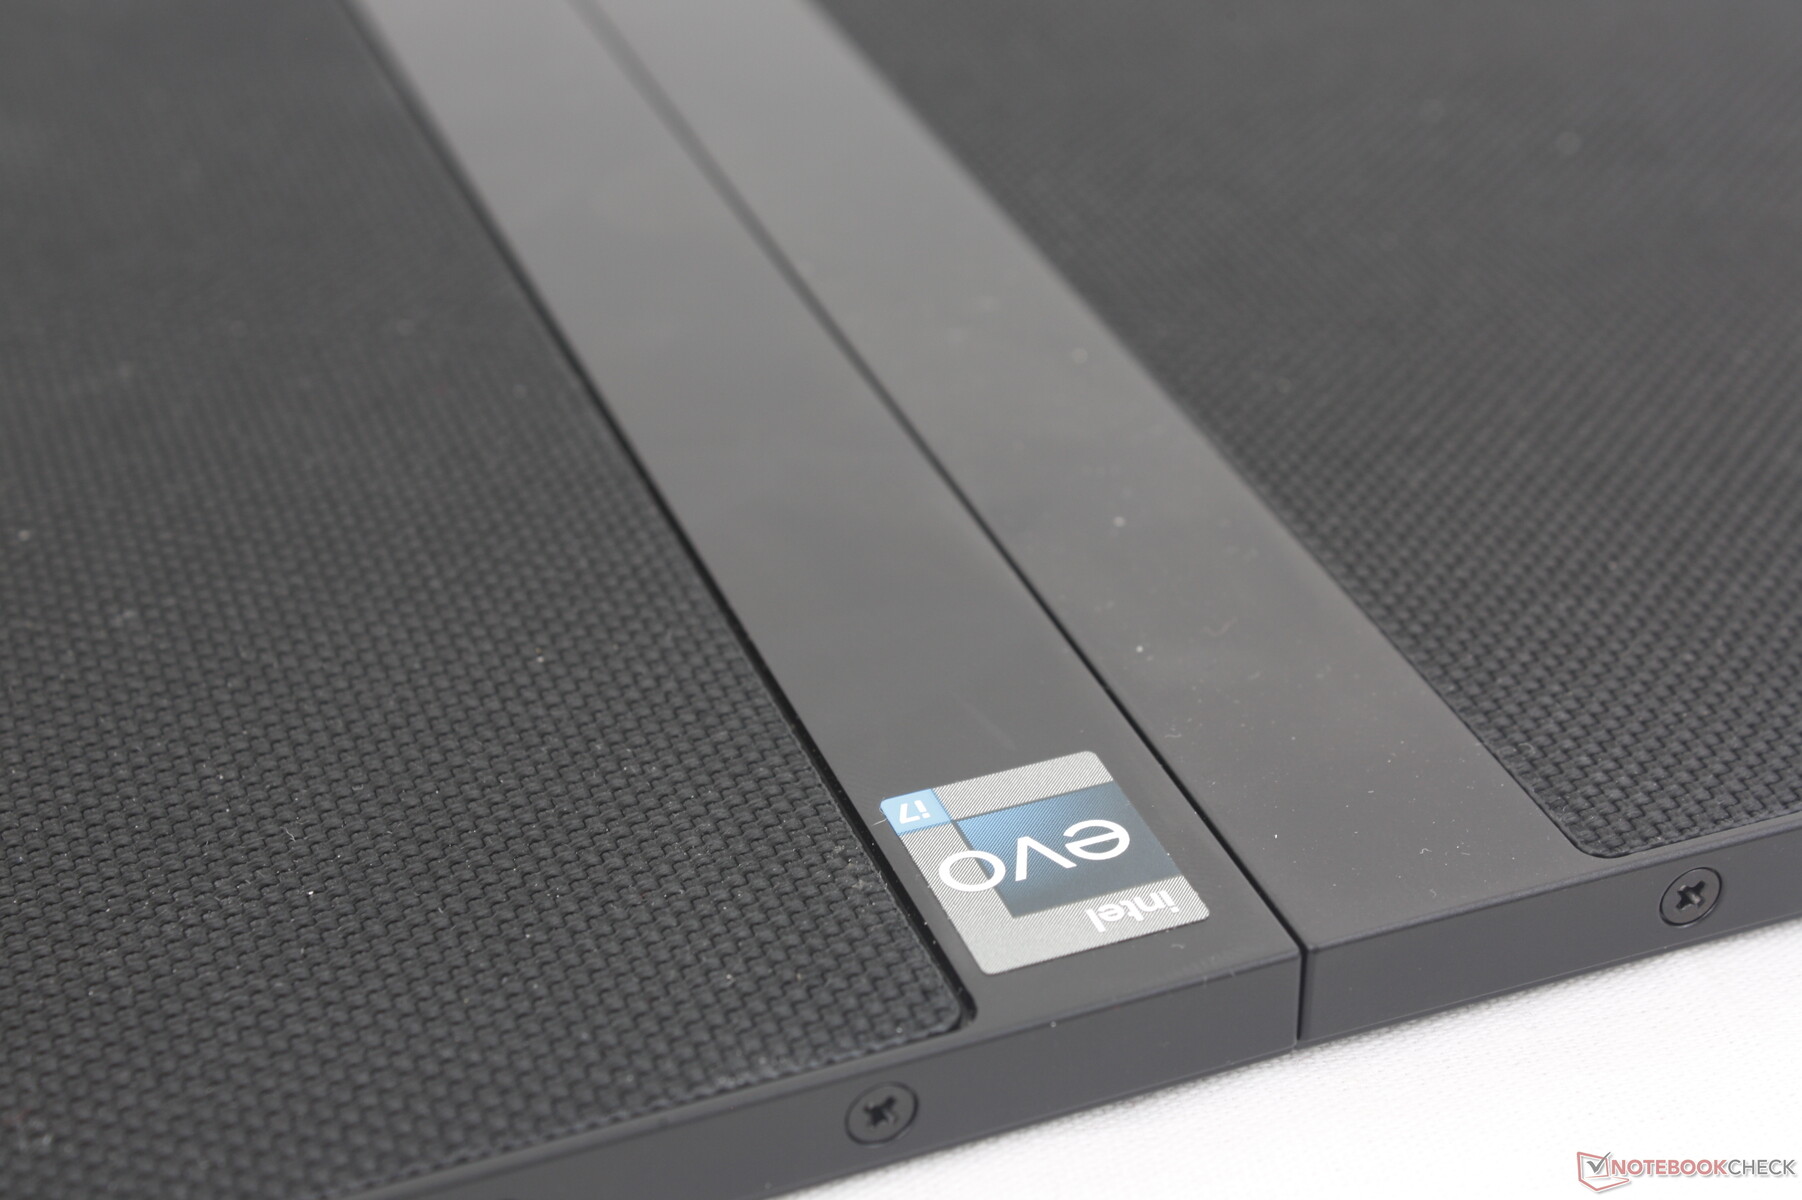
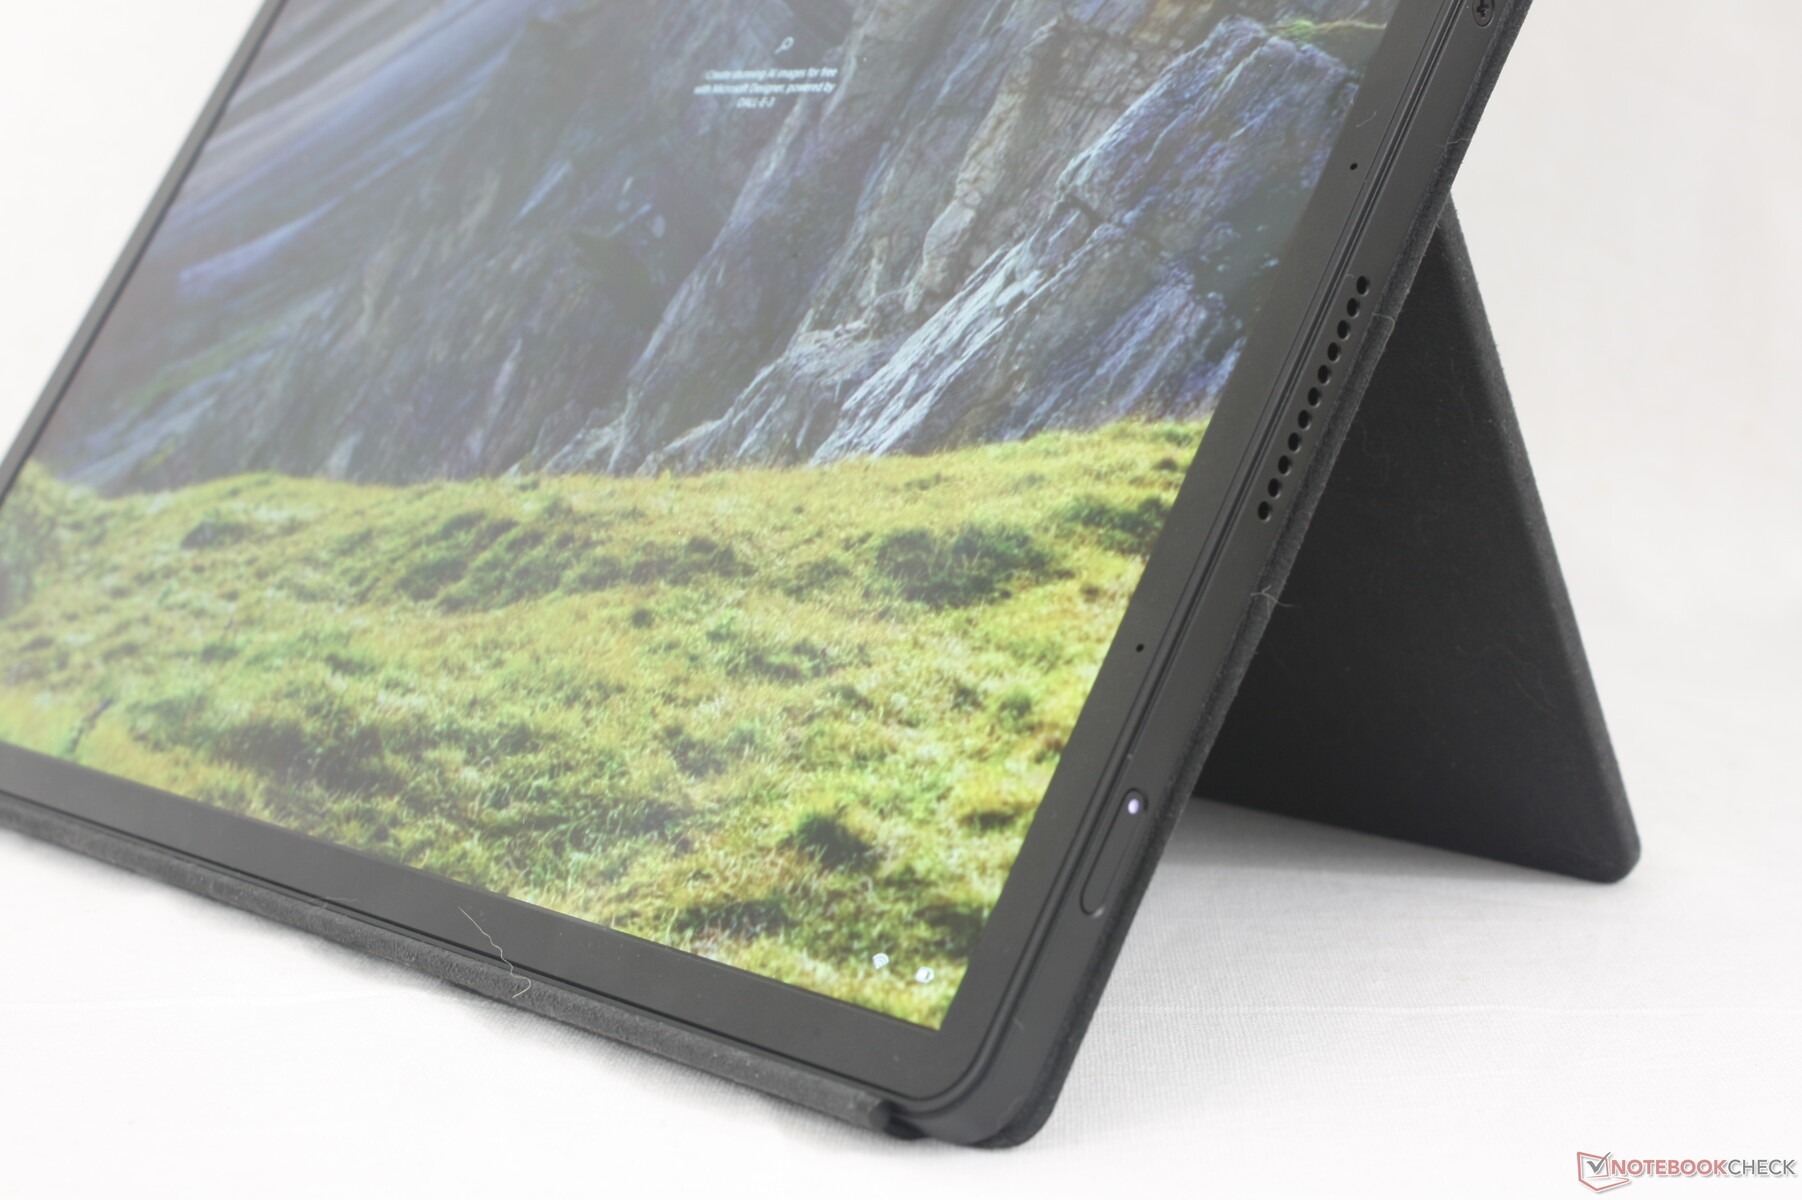
Le châssis conserve le schéma de couleurs noir et gris du modèle 2021, mais avec l'ajout d'un tissu tissé pour une sensation plus professionnelle et "exécutive". En particulier, il n'y a plus d'espace disgracieux entre l'écran en position "livre fermé", ce qui contribue à un design plus plat et plus net.
La rigidité du châssis est également excellente. Il n'y a pratiquement pas de flexion visible lorsque l'on applique une pression sur le dos ou l'écran tactile, ou lorsque l'on tente de tordre l'appareil dans ses coins. Nous pouvons noter un léger grincement audible, mais il est suffisamment mineur pour ne pas être inquiétant. Il va sans dire que la conception visuelle et la rigidité des matériaux ont été grandement améliorées par rapport à l'original.
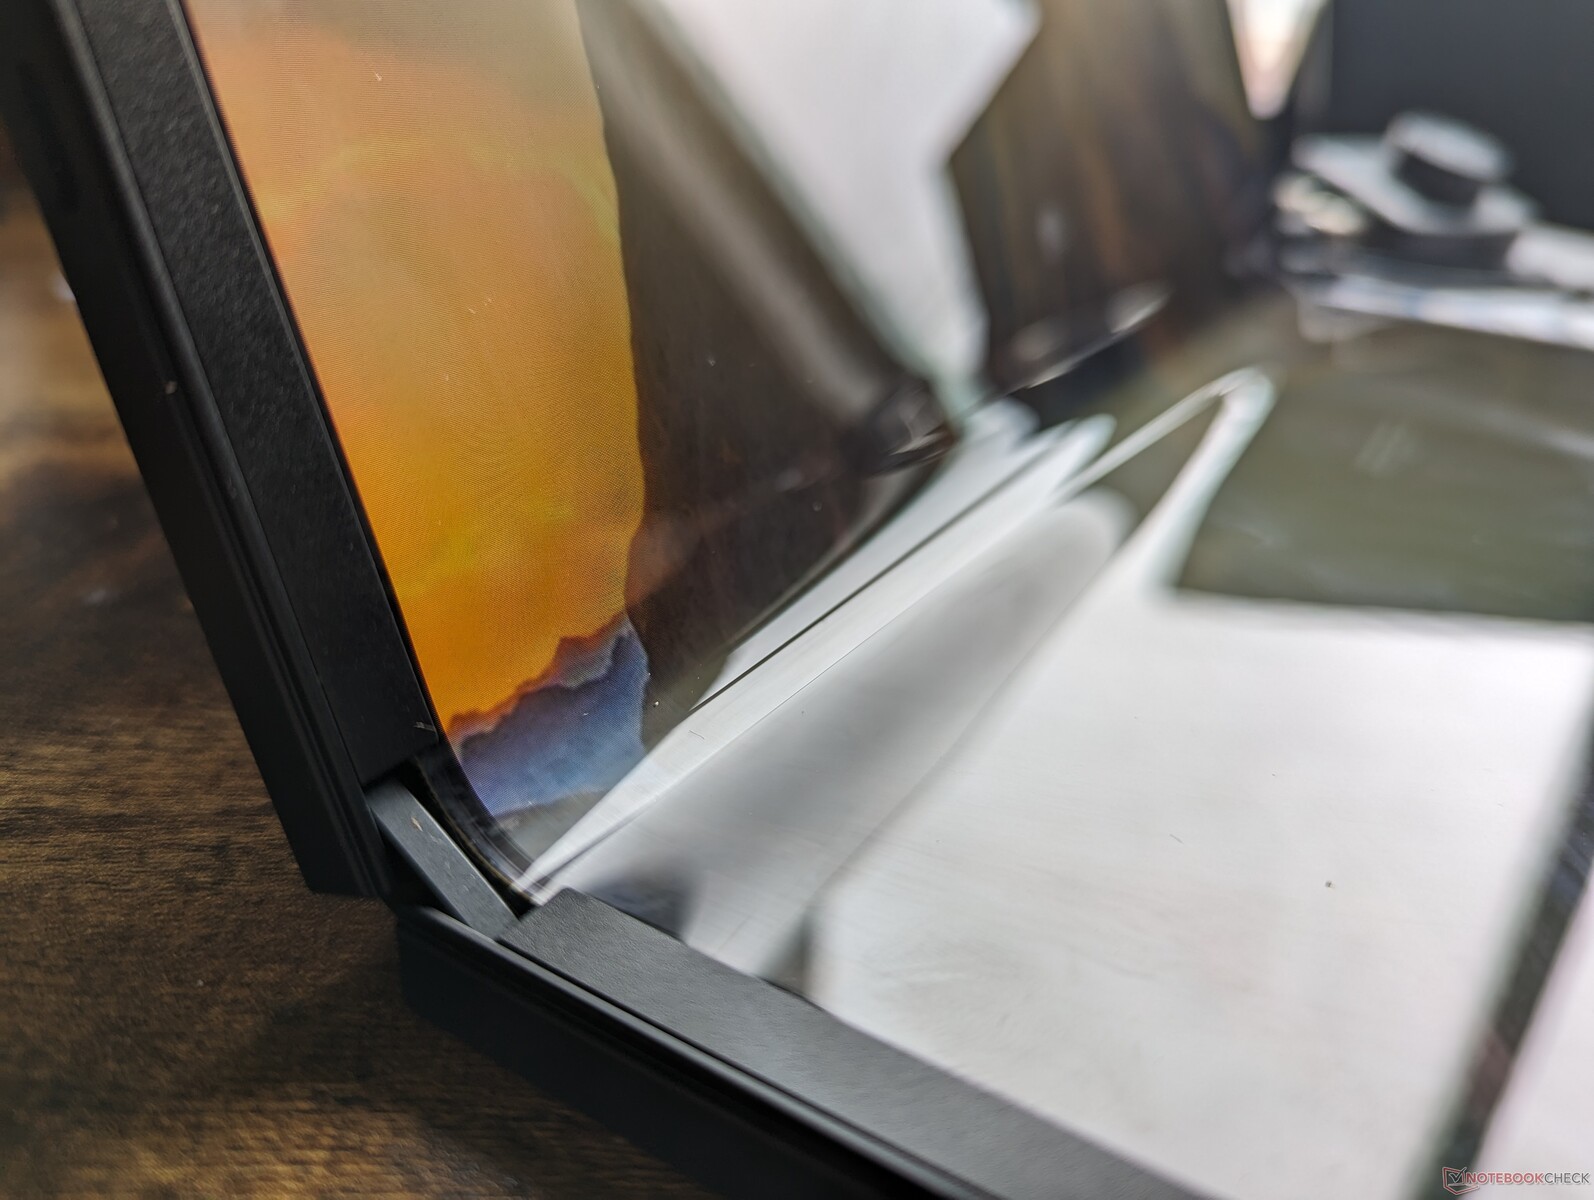
Certains aspects pourraient encore être améliorés. Tout d'abord, l'ouverture de la tablette est plus difficile qu'elle ne devrait l'être, car il n'y a pas de prise sur les bords lisses. Deuxièmement, l'angle maximal des charnières est plus proche de 178 ou 179 degrés que des 180 degrés. Cela semble peu, mais c'est une limitation suffisamment importante pour que le pli au centre soit plus perceptible à l'usage.
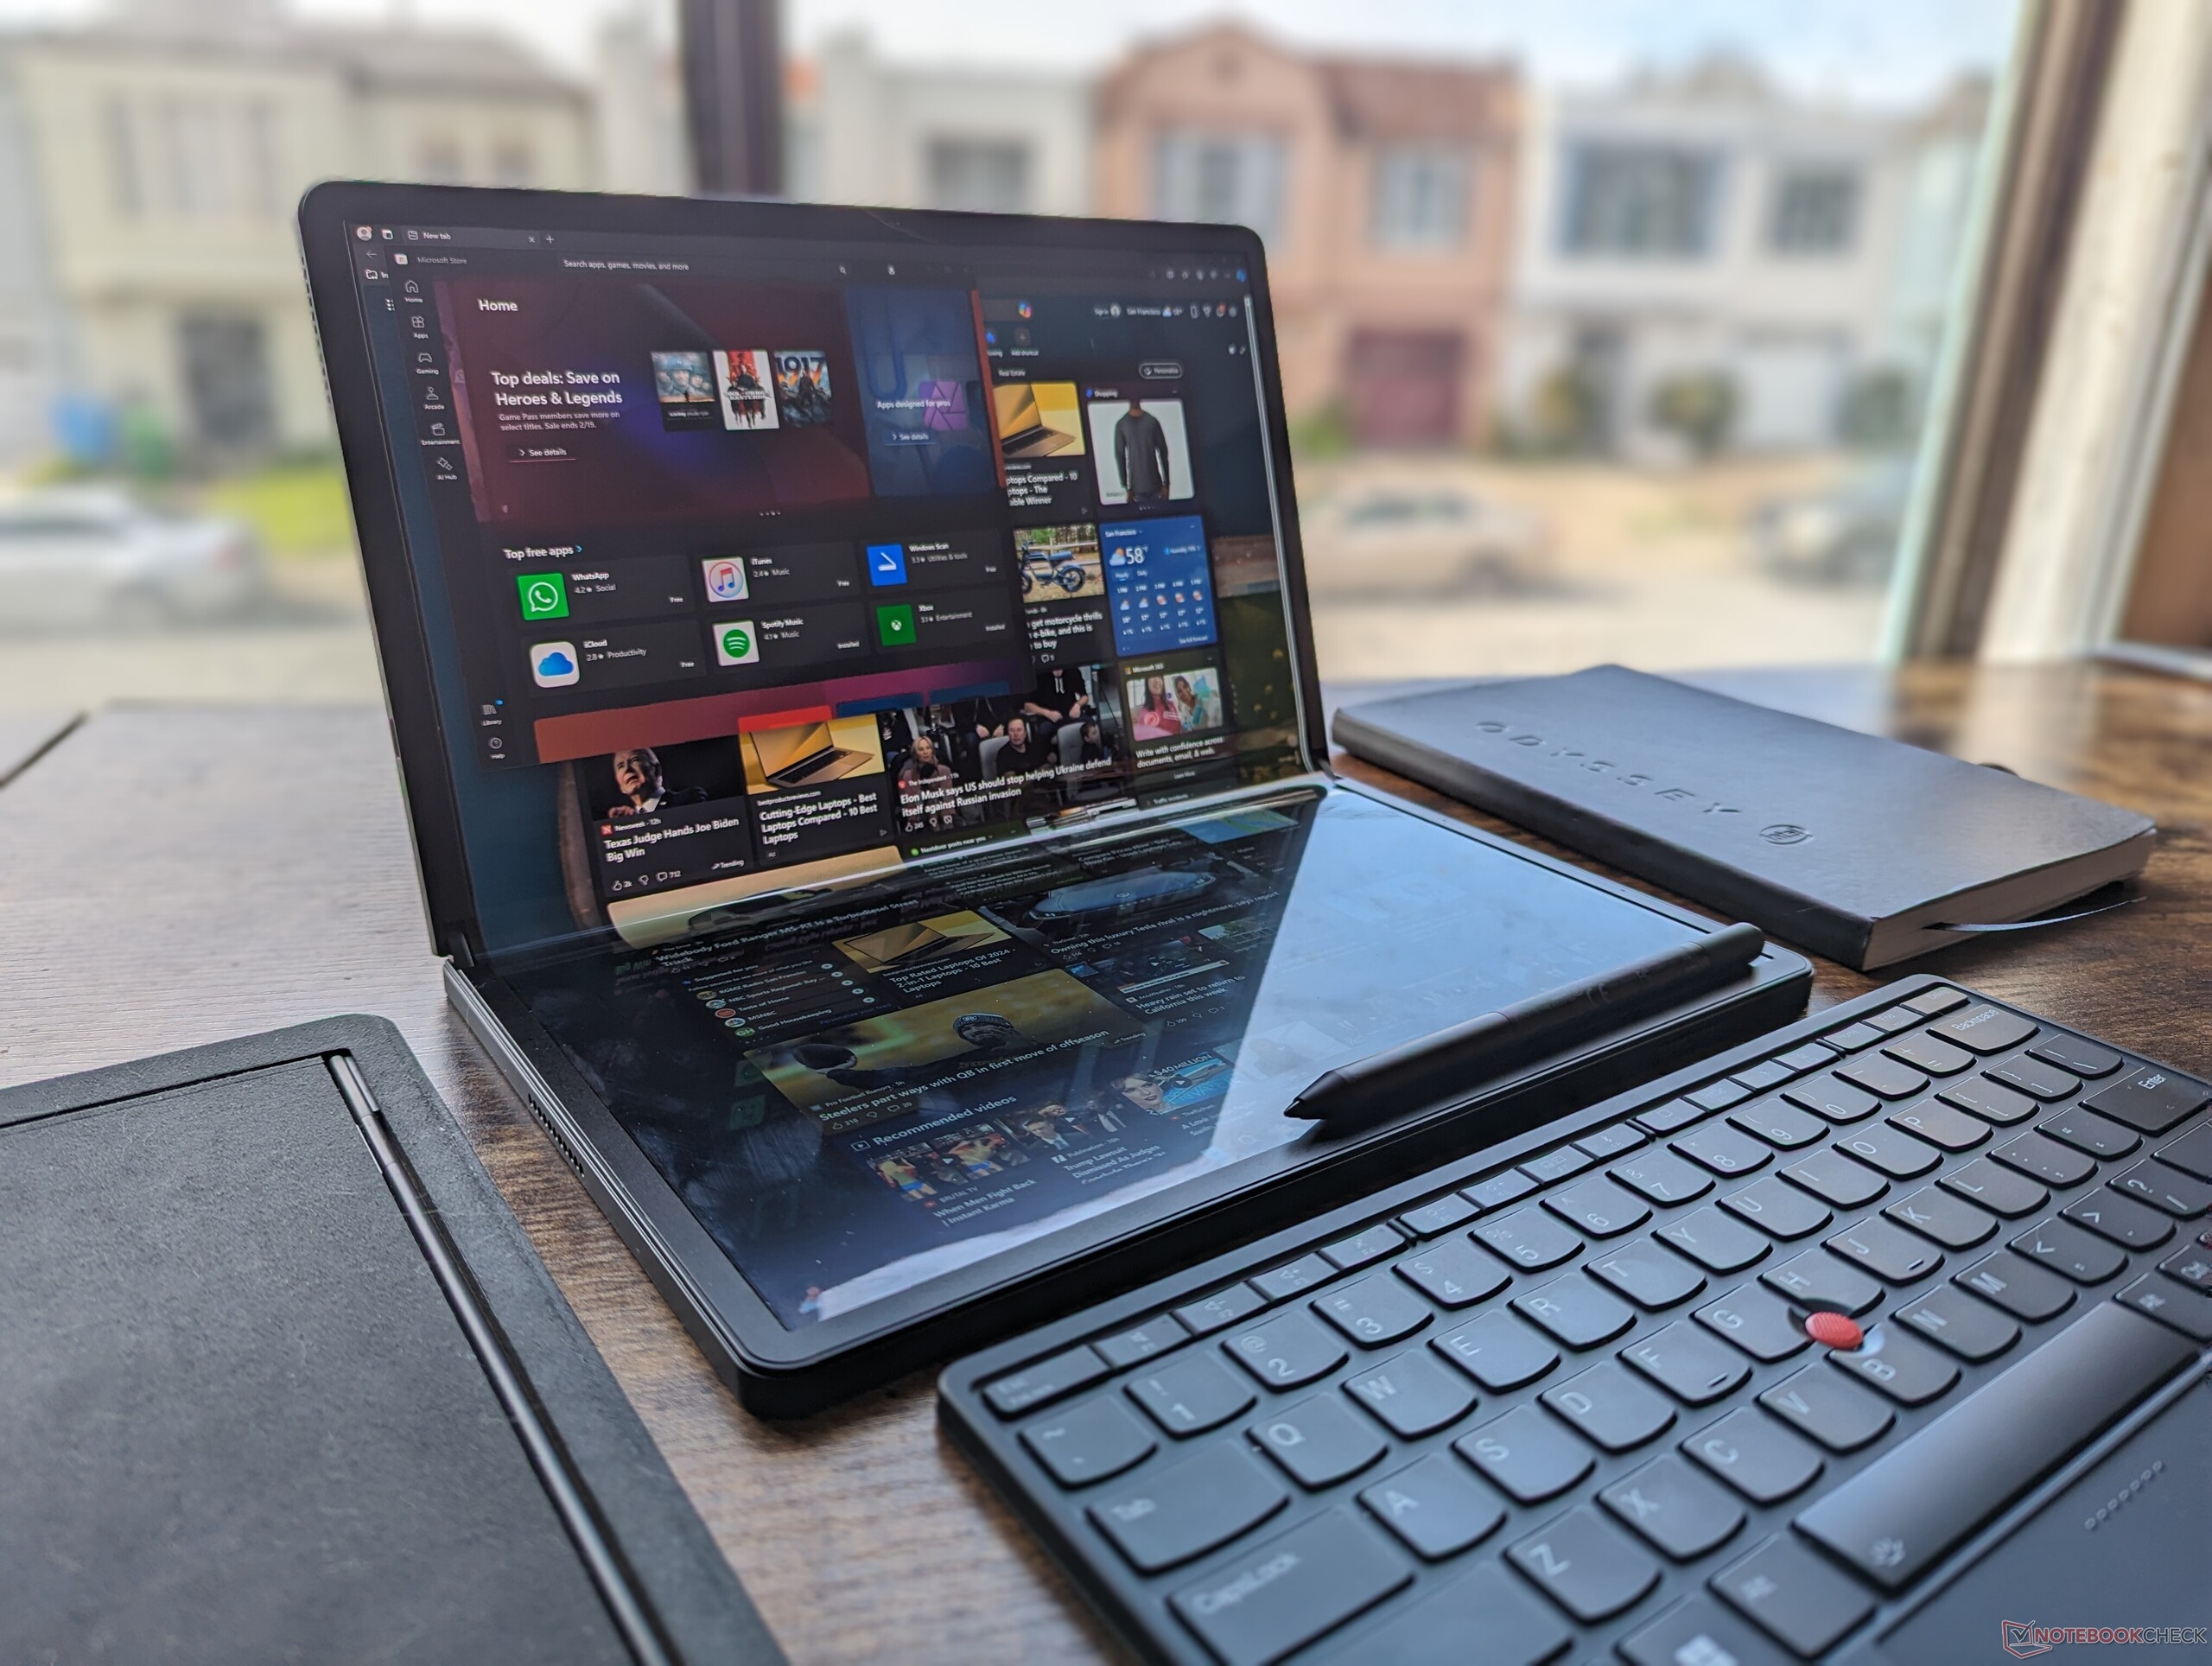
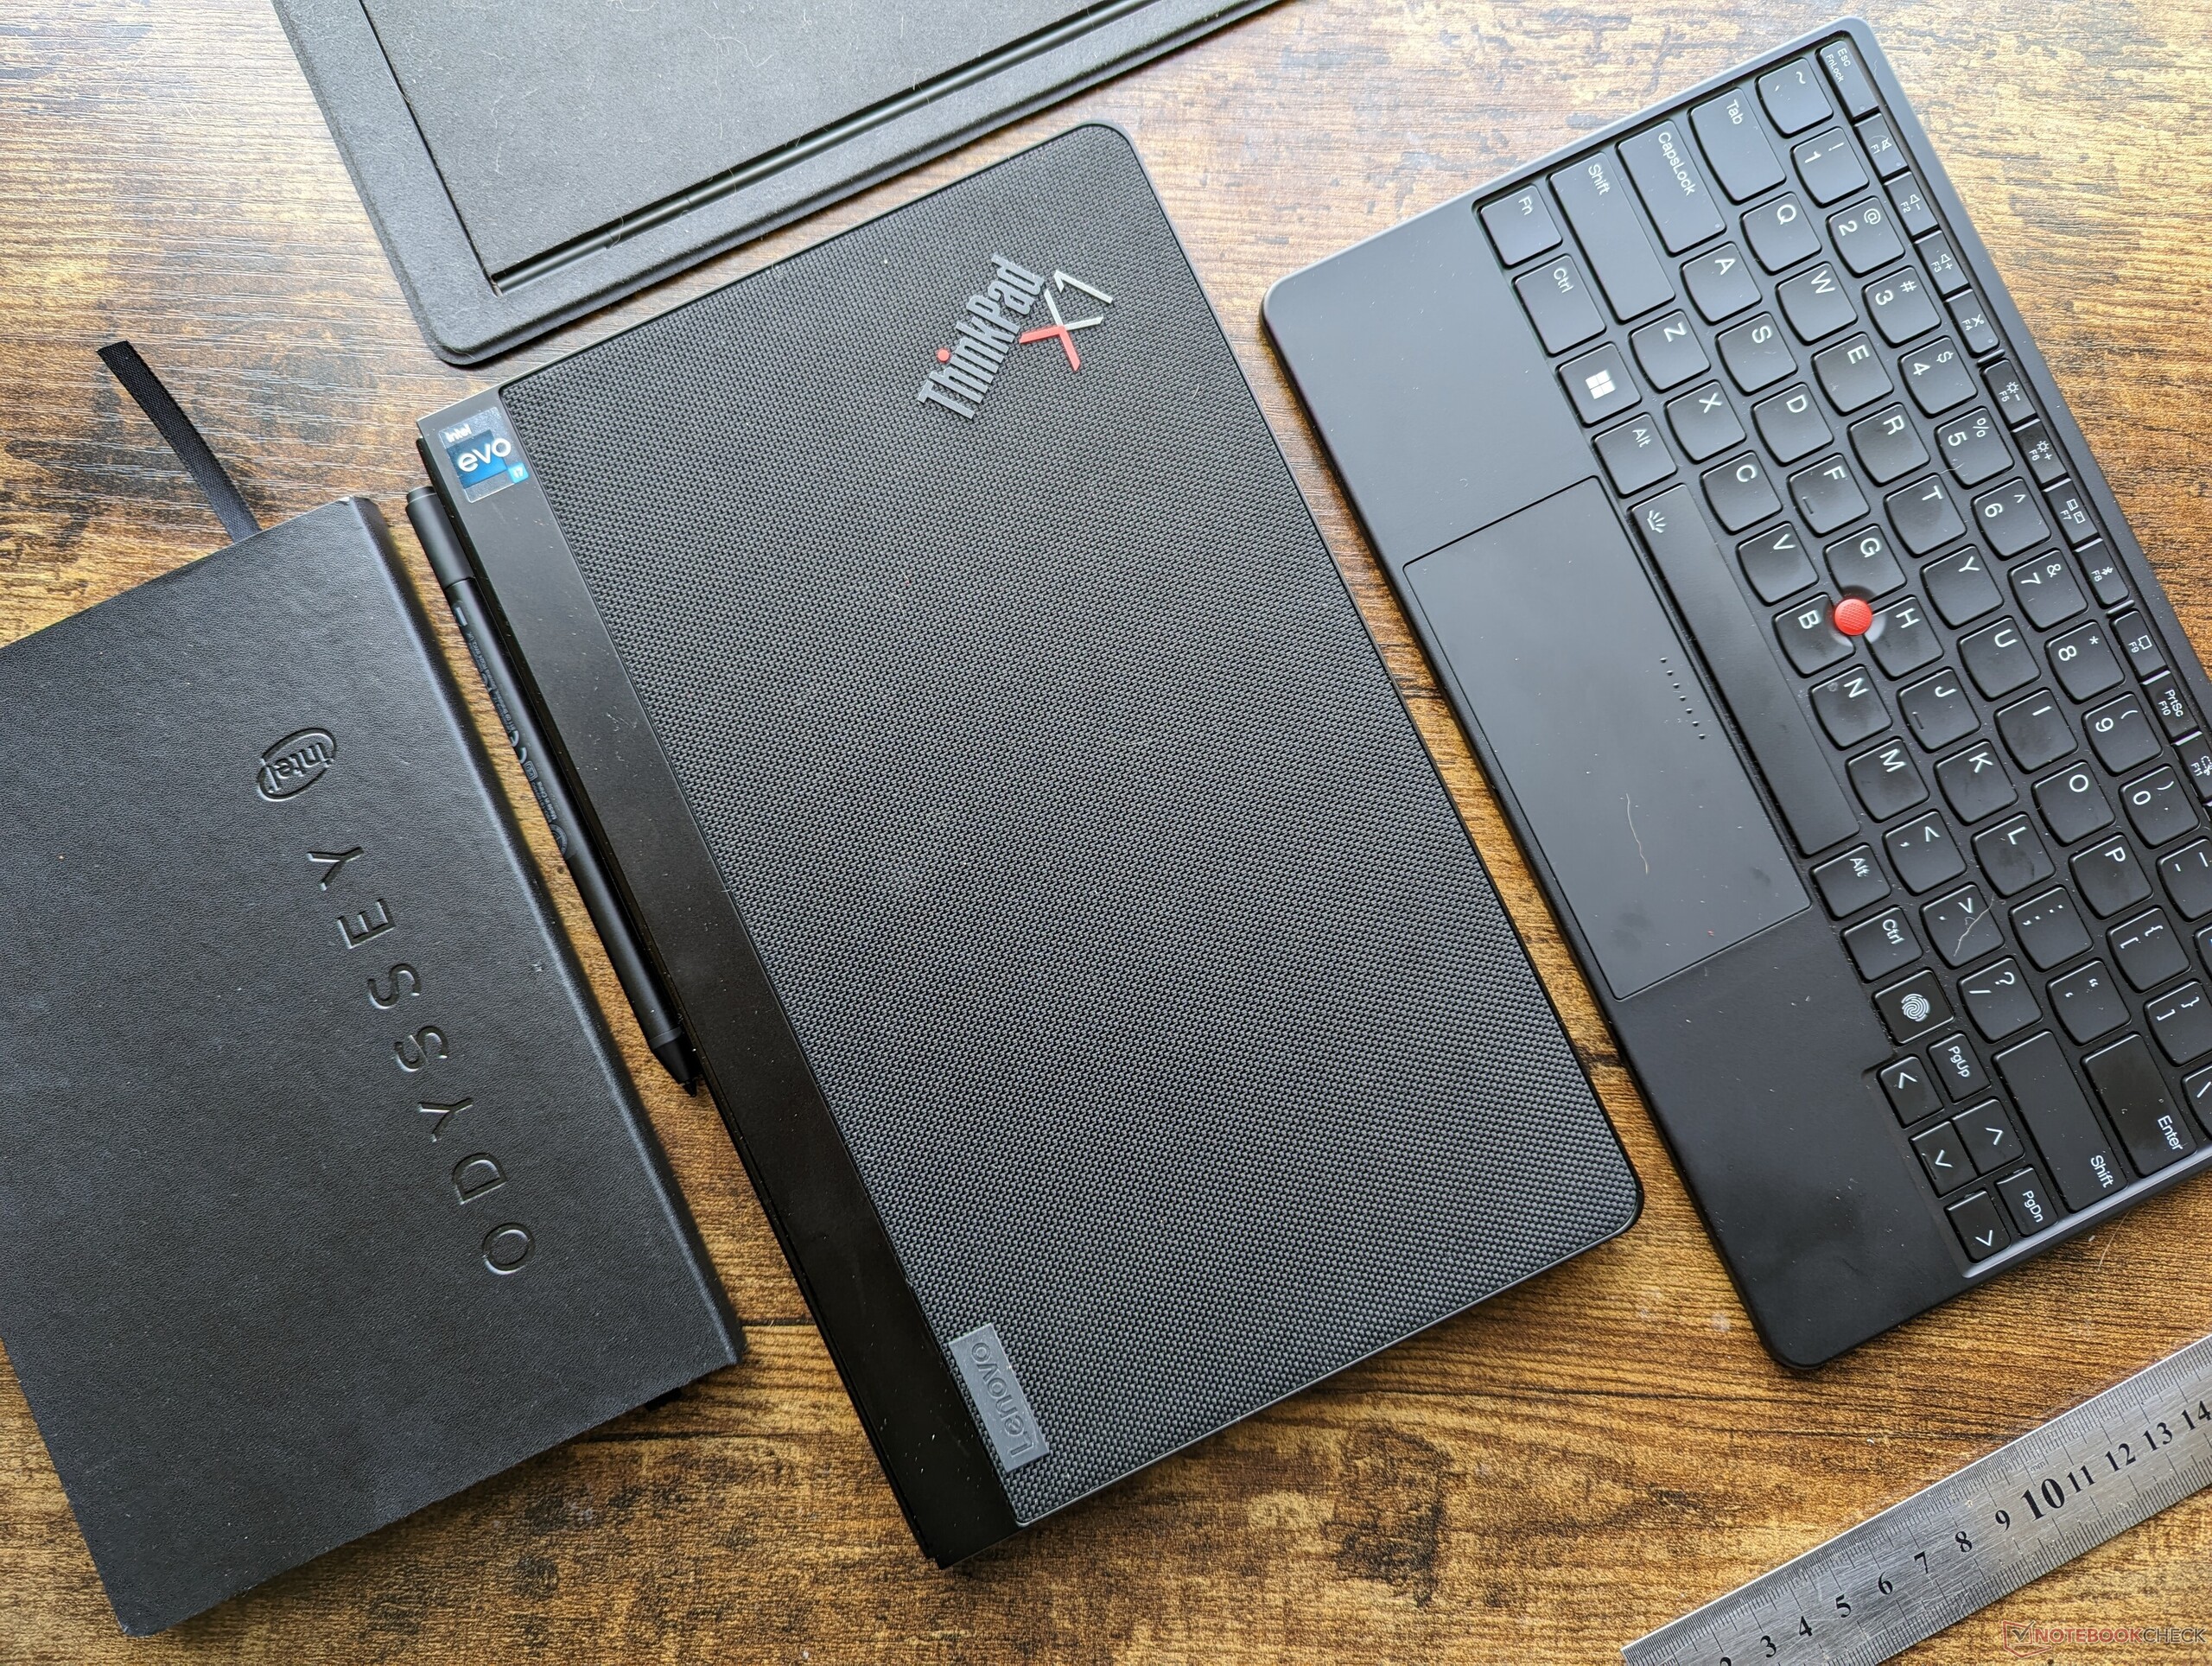
Lorsqu'il est replié, le Lenovo devient aussi fin qu'une tablette traditionnelle, mais il est beaucoup plus grand et un peu plus lourd (1,3 kg). Comme il s'agit d'un appareil Windows, le clavier Bluetooth inclus est essentiel pour l'utilisation, car le système d'exploitation n'est pas aussi optimisé pour le tactile que Android ou iOS. Ainsi, le poids combiné de la tablette, du clavier et de la béquille est en fait aussi lourd que celui d'un ordinateur portable complet comme le Dell XPS 15.
En soi, la partie tablette est environ 200 g plus légère que le Zenbook 17 Fold et est également nettement plus petite et plus fine. Malgré cela, elle n'est pas aussi facile à transporter, car la plupart des utilisateurs voudront emporter le clavier et la béquille séparés.
| Tablette pliable | Clavier Bluetooth | Couverture arrière/support | Total |
| 1299 g | 327 g | 293 g | 1919 g |
Connectivité
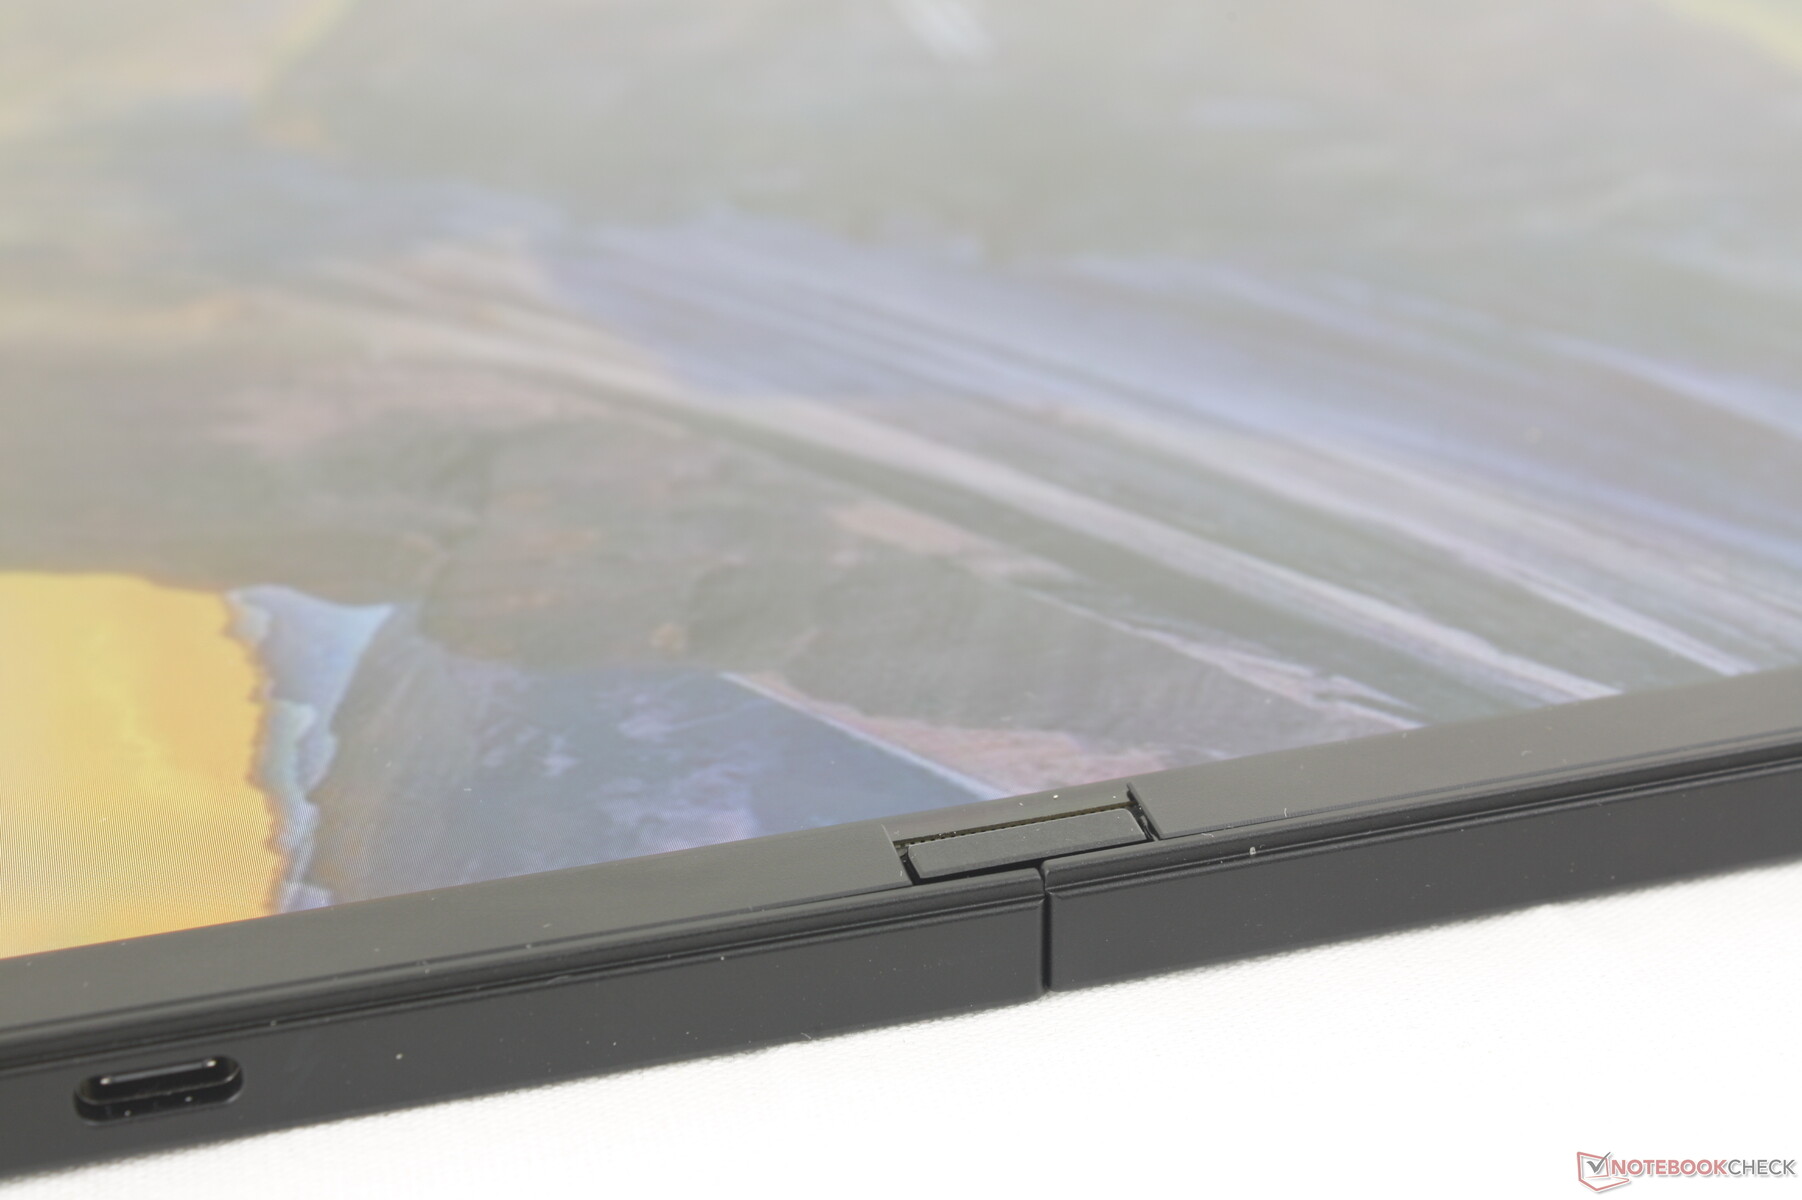
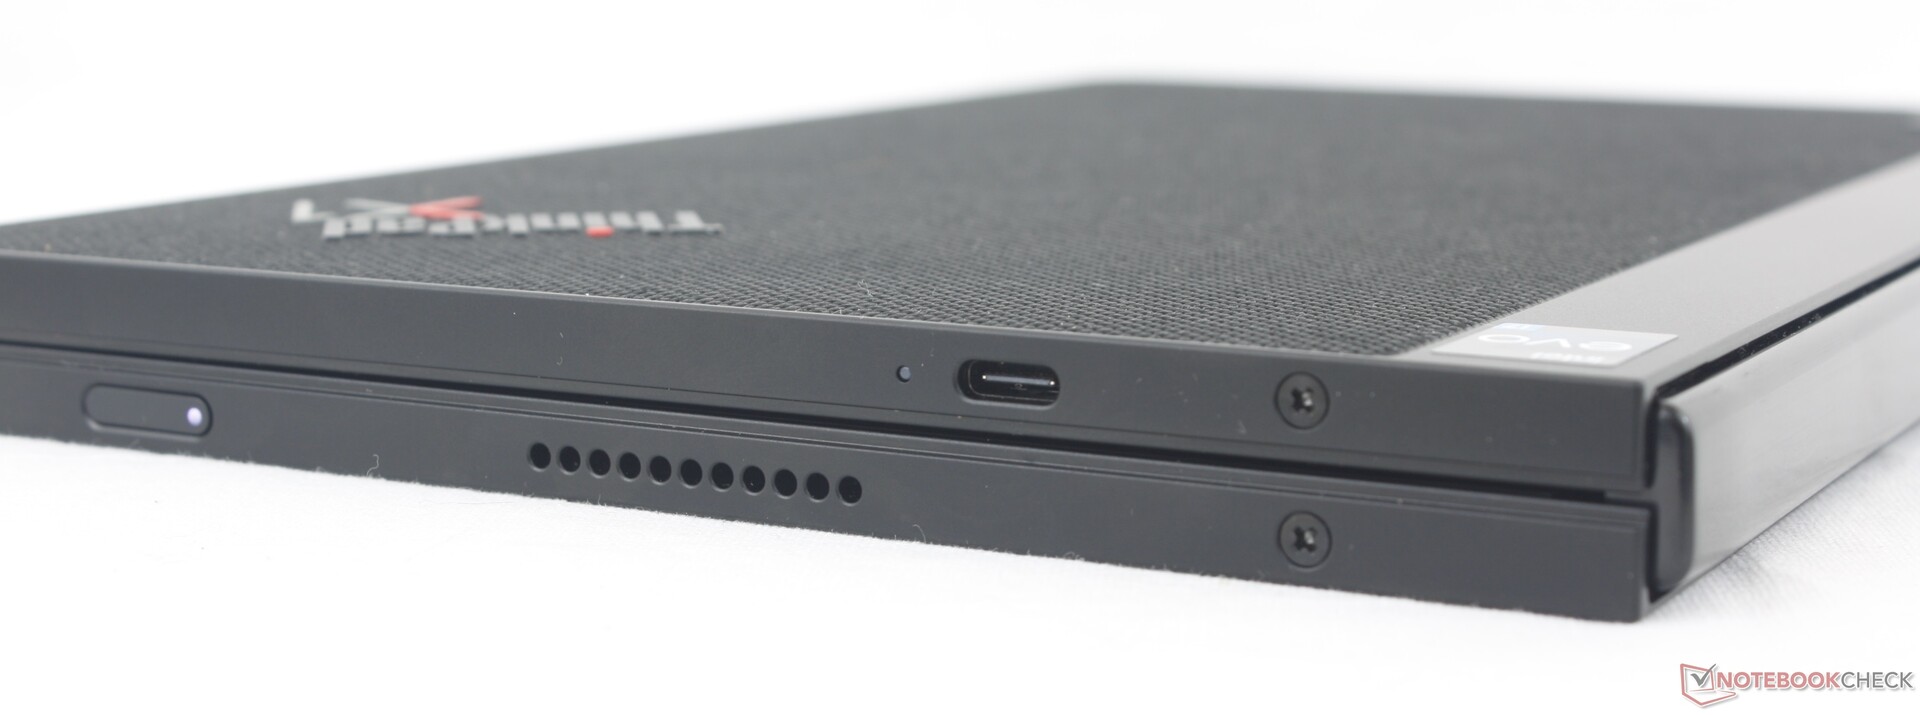
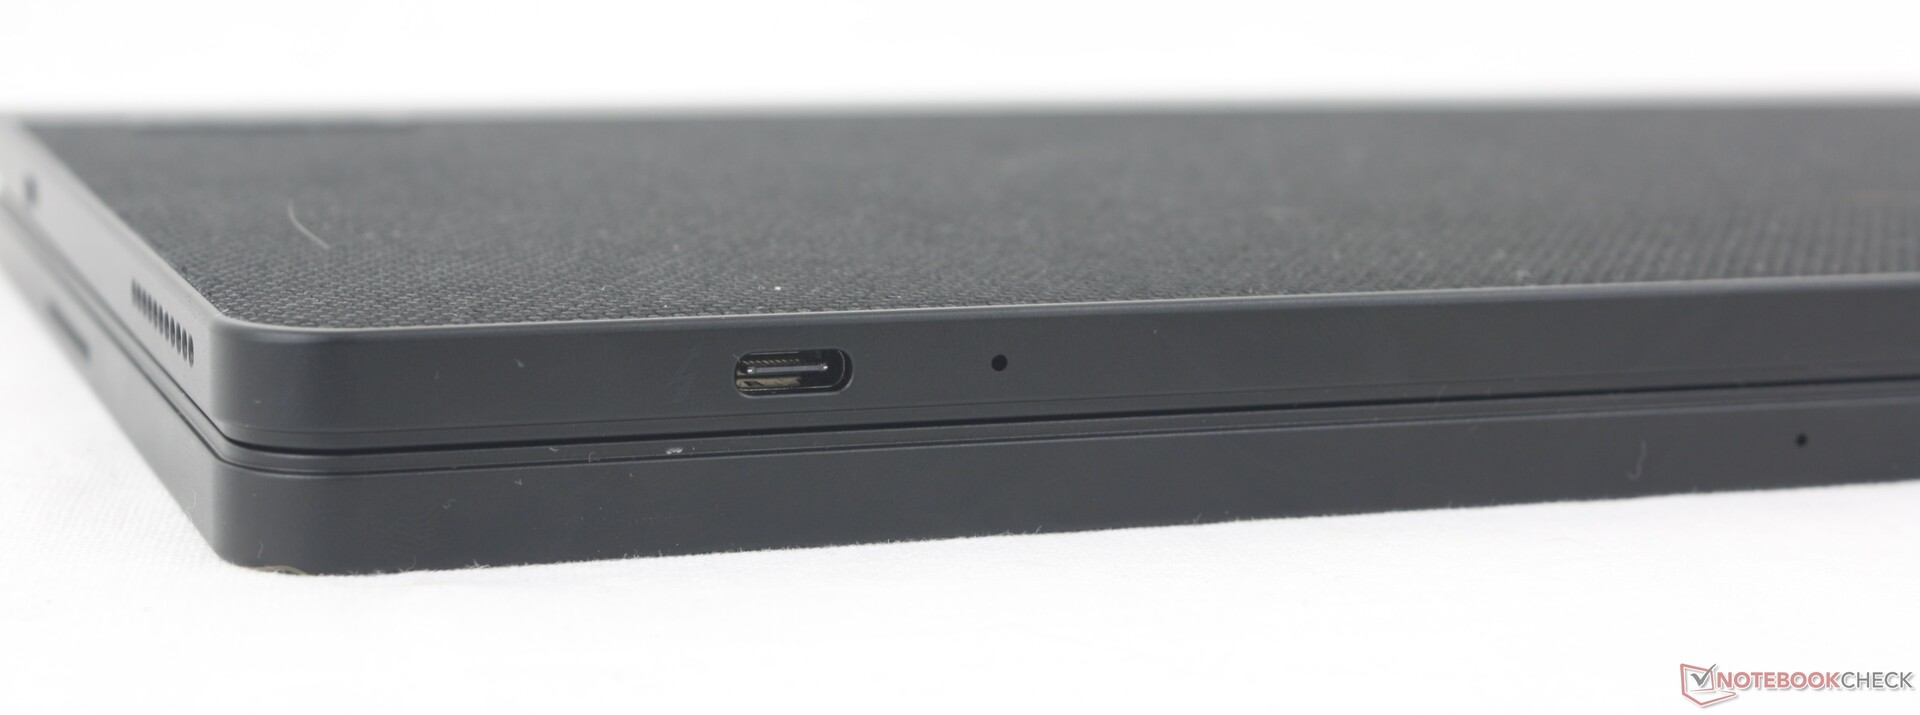
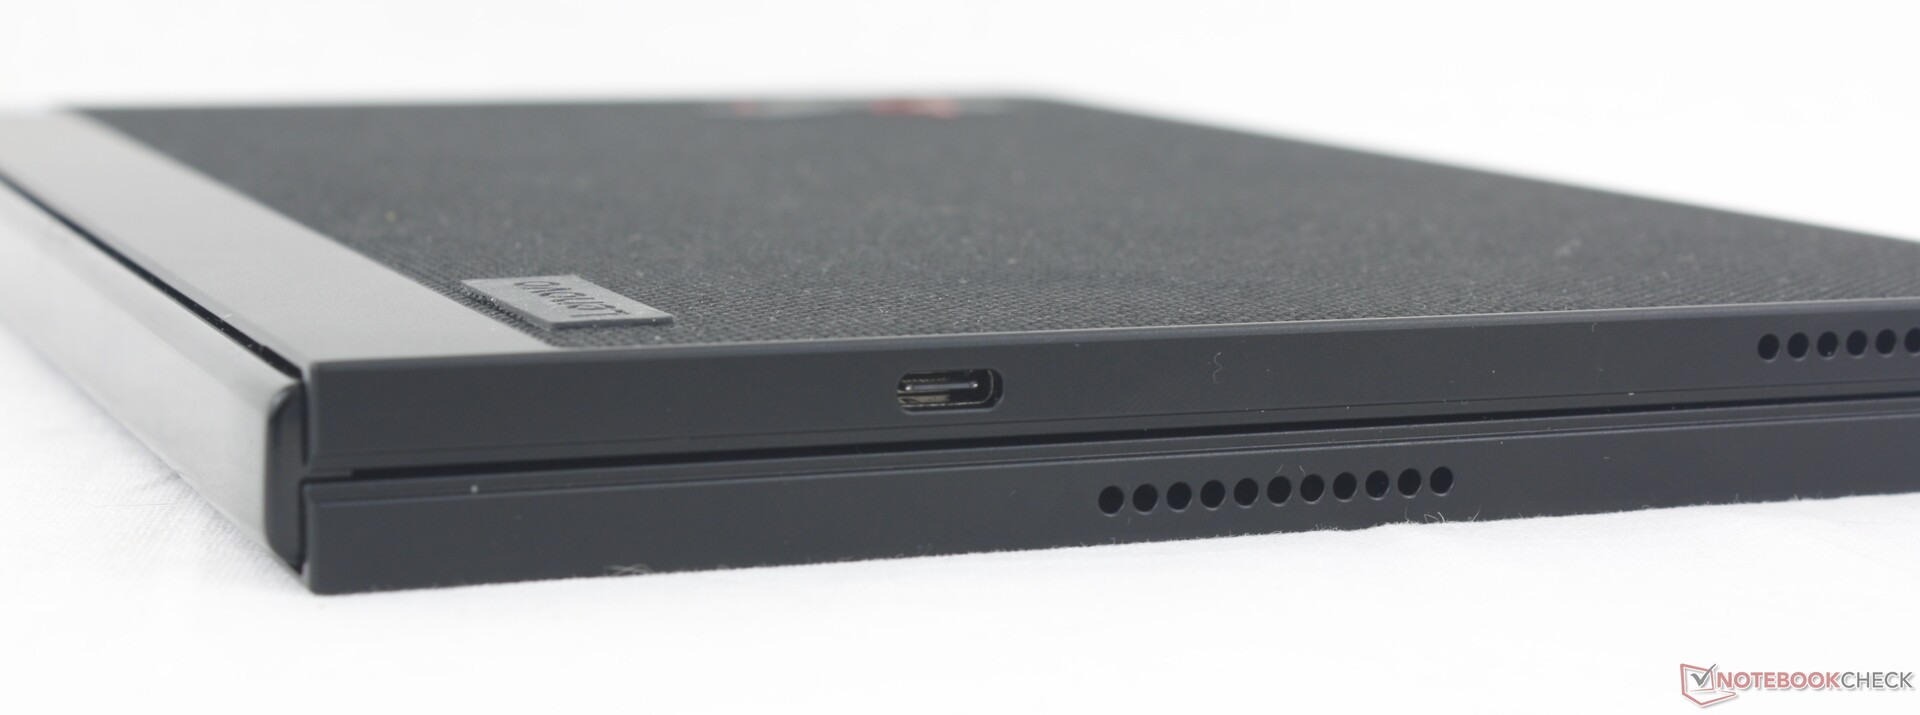
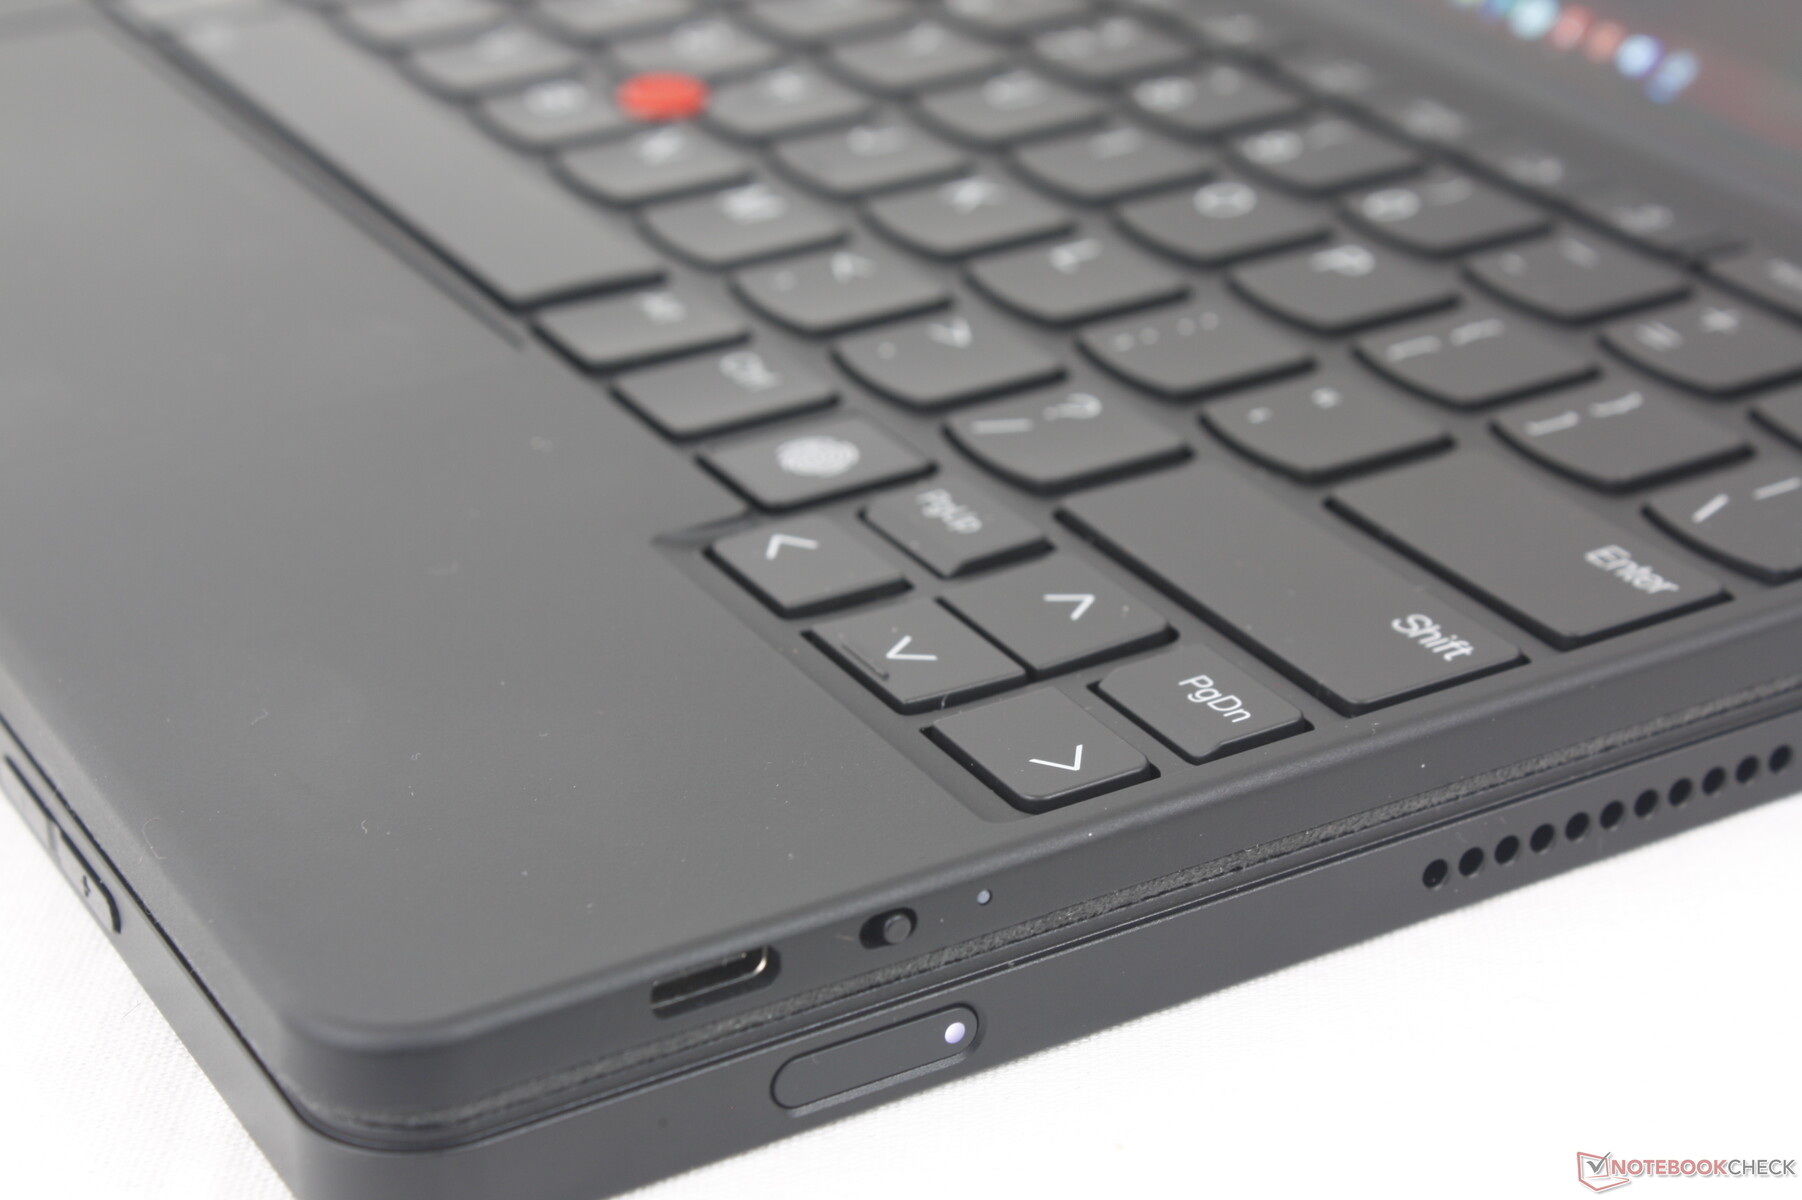
Il y a trois ports USB-C sur le Lenovo, contre seulement deux sur le Zenbook 17 Fold. En contrepartie, le Lenovo est dépourvu de prise audio de 3,5 mm, ce qui pourrait gêner certains utilisateurs. Nous apprécions néanmoins la présence d'un port USB-C de chaque côté de la tablette pour s'adapter aux différents modes et angles de vue du design pliable.
Gardez à l'esprit que seuls deux des trois ports USB-C sont compatibles avec les appareils Thunderbolt 4, mais tout port peut être utilisé pour charger l'appareil ou pour des écrans externes.
Le clavier sans fil dispose également d'un port USB-C, mais uniquement pour la recharge.
Communication
Le modèle est livré avec un Intel AX211 en standard pour un support Wi-Fi 6E alors que le modèle 2021 était limité au Wi-Fi 6. Nous avons constaté des performances et une fiabilité constantes lorsque nous l'avons associé à notre routeur de test Asus AXE11000.
Les modèles WWAN sont équipés d'un emplacement nano-SIM pour la prise en charge de la 4G.
| Networking | |
| iperf3 transmit AX12 | |
| Lenovo ThinkPad X1 Fold 20RL000FGE | |
| iperf3 receive AX12 | |
| Lenovo ThinkPad X1 Fold 20RL000FGE | |
| iperf3 transmit AXE11000 | |
| Lenovo Thinkpad X1 Fold 16 | |
| HP Elite Dragonfly Folio 13.5 G3 | |
| Lenovo ThinkPad X1 Carbon G11 21HNS54T00 | |
| iperf3 receive AXE11000 | |
| Lenovo ThinkPad X1 Carbon G11 21HNS54T00 | |
| Lenovo Thinkpad X1 Fold 16 | |
| HP Elite Dragonfly Folio 13.5 G3 | |
| iperf3 transmit AXE11000 6GHz | |
| Microsoft Surface Pro 9, i7-1255U | |
| Asus Zenbook 17 Fold UX9702 | |
| HP Elite Dragonfly Folio 13.5 G3 | |
| Lenovo Thinkpad X1 Fold 16 | |
| Lenovo ThinkPad X1 Carbon G11 21HNS54T00 | |
| iperf3 receive AXE11000 6GHz | |
| Asus Zenbook 17 Fold UX9702 | |
| Microsoft Surface Pro 9, i7-1255U | |
| Lenovo ThinkPad X1 Carbon G11 21HNS54T00 | |
| HP Elite Dragonfly Folio 13.5 G3 | |
| Lenovo Thinkpad X1 Fold 16 | |
Webcam
Le modèle est équipé d'une webcam de 5 MP avec IR pour la prise en charge de Windows Hello, similaire à la version originale de 2021. Cependant, il n'y a toujours pas d'obturateur pour la webcam, ce qui est une omission étrange pour un produit aussi cher.


Maintenance
Comme la plupart des tablettes, et en particulier les tablettes pliables, le ThinkPad X1 Fold 16 n'est pas conçu pour être facilement réparable par l'utilisateur final. Il n'est pas possible de mettre à niveau la mémoire vive et il n'est pas recommandé de remplacer le disque dur SSD au risque d'annuler la garantie.
Accessoires et garantie
La boîte contient un Lenovo Precision Pen 2, un clavier Bluetooth magnétisé et une couverture arrière magnétisée qui sert de support. Le clavier et le support en particulier sont essentiels à l'utilisation du modèle et nous sommes donc heureux de les voir inclus en standard plutôt qu'en tant qu'accessoires optionnels.
La garantie limitée standard d'un an s'applique si vous achetez l'appareil aux États-Unis.
Périphériques d'entrée - Un peu maladroit en pratique
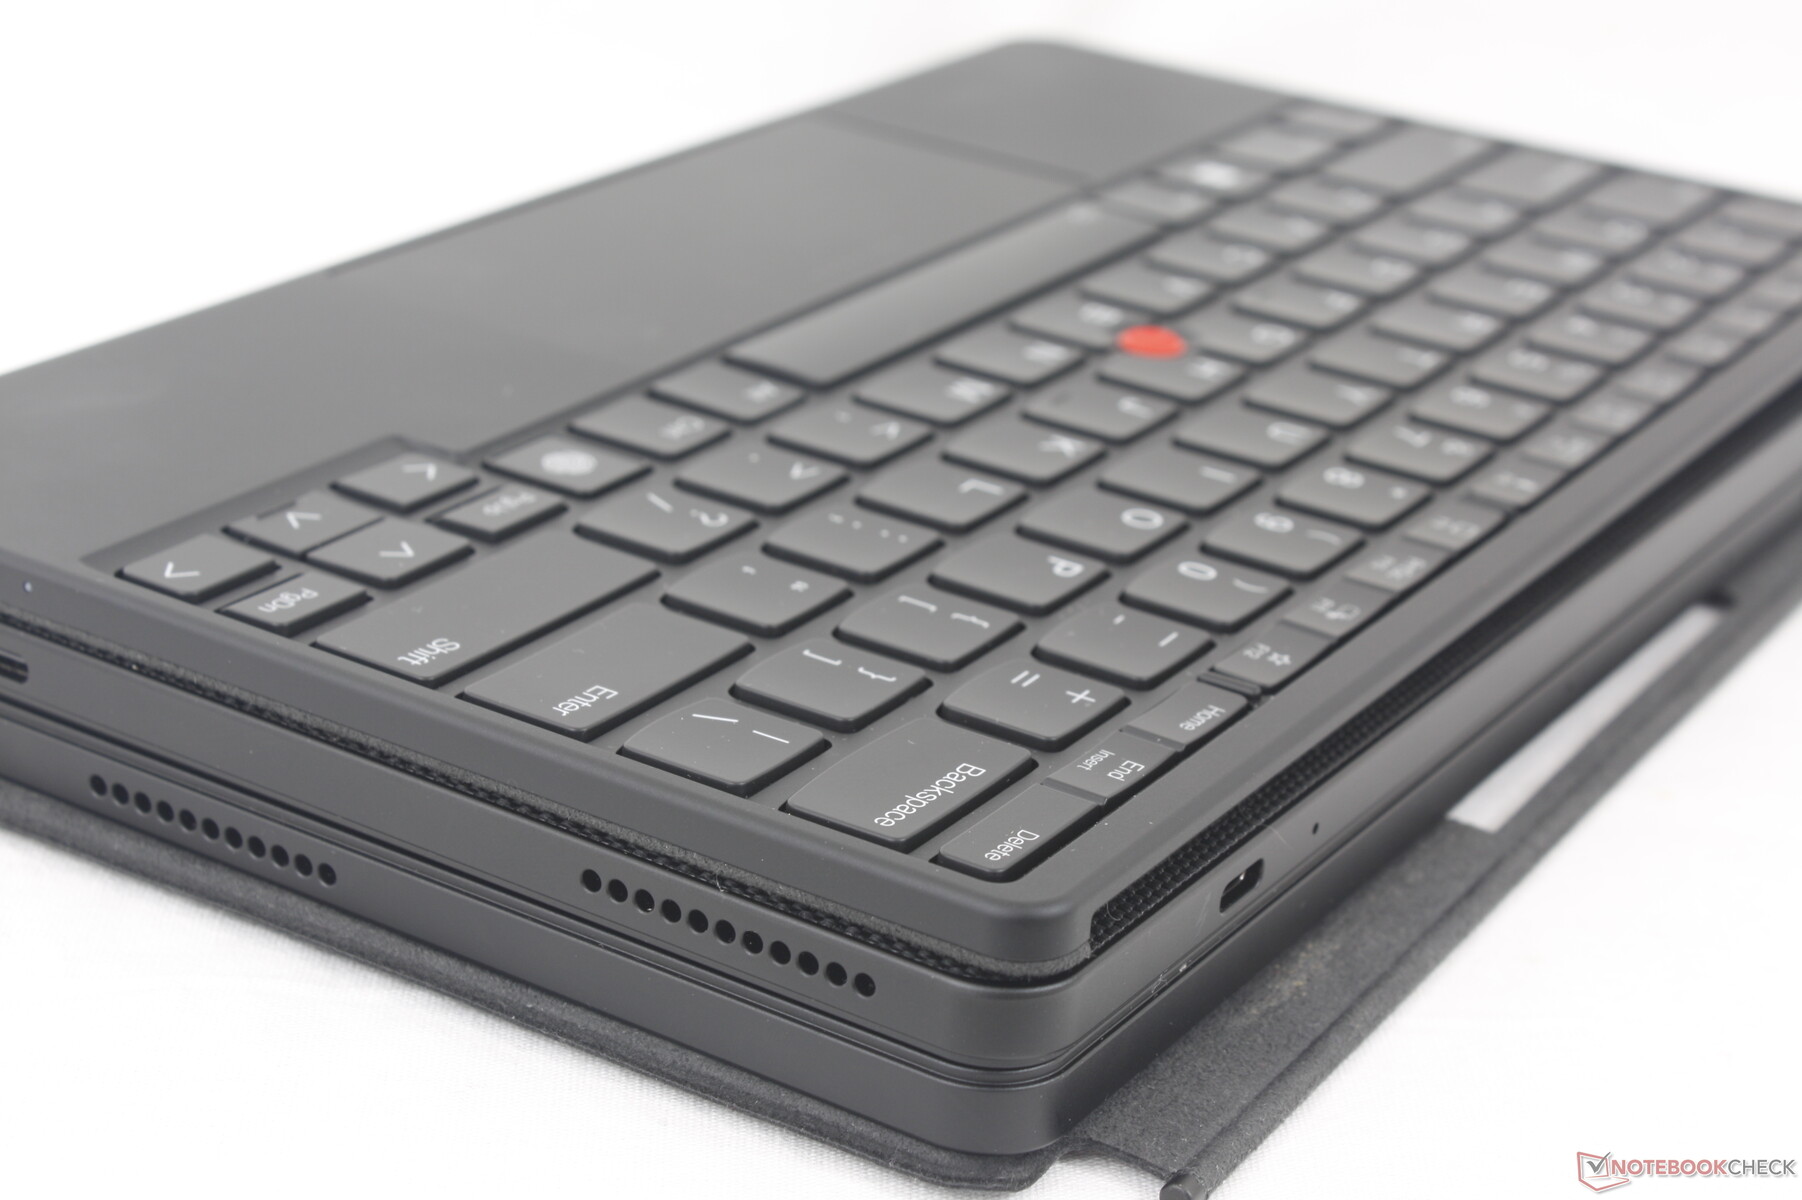
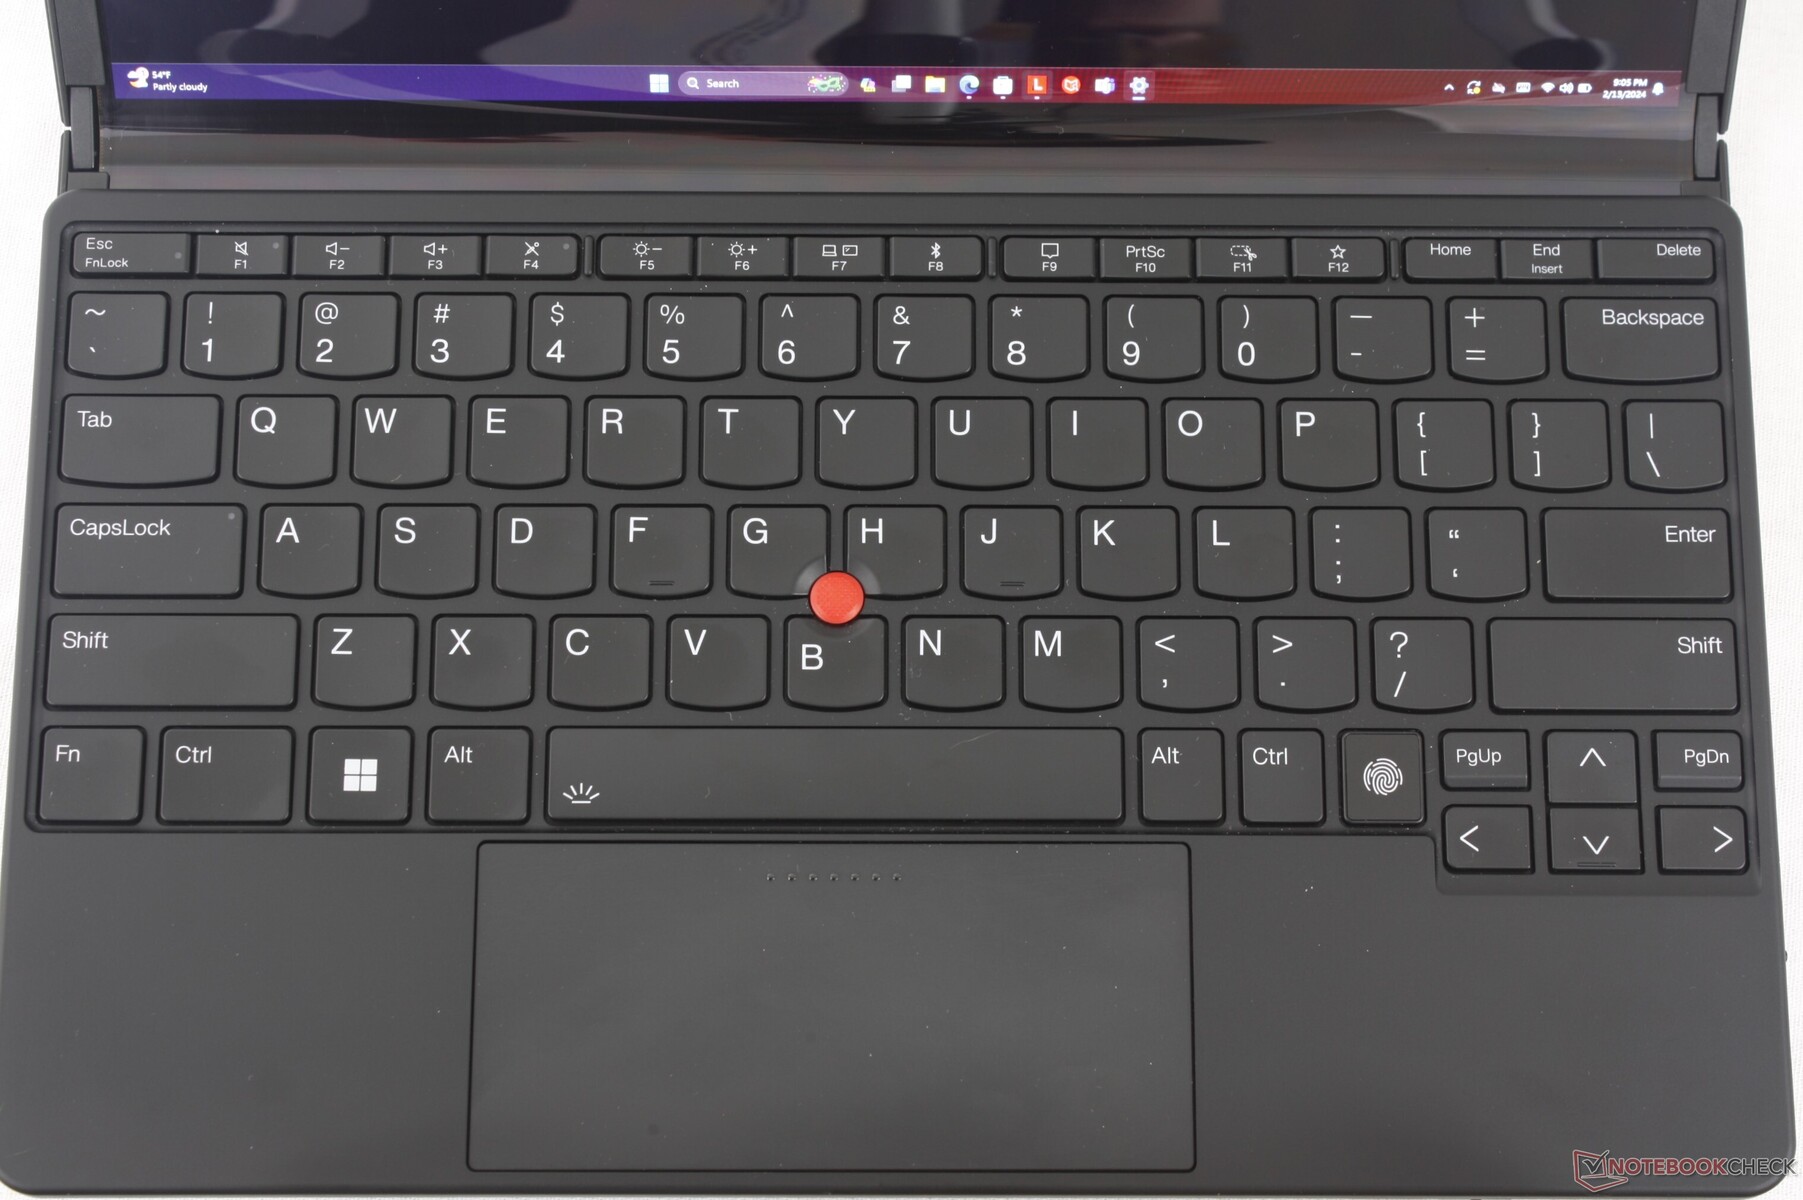
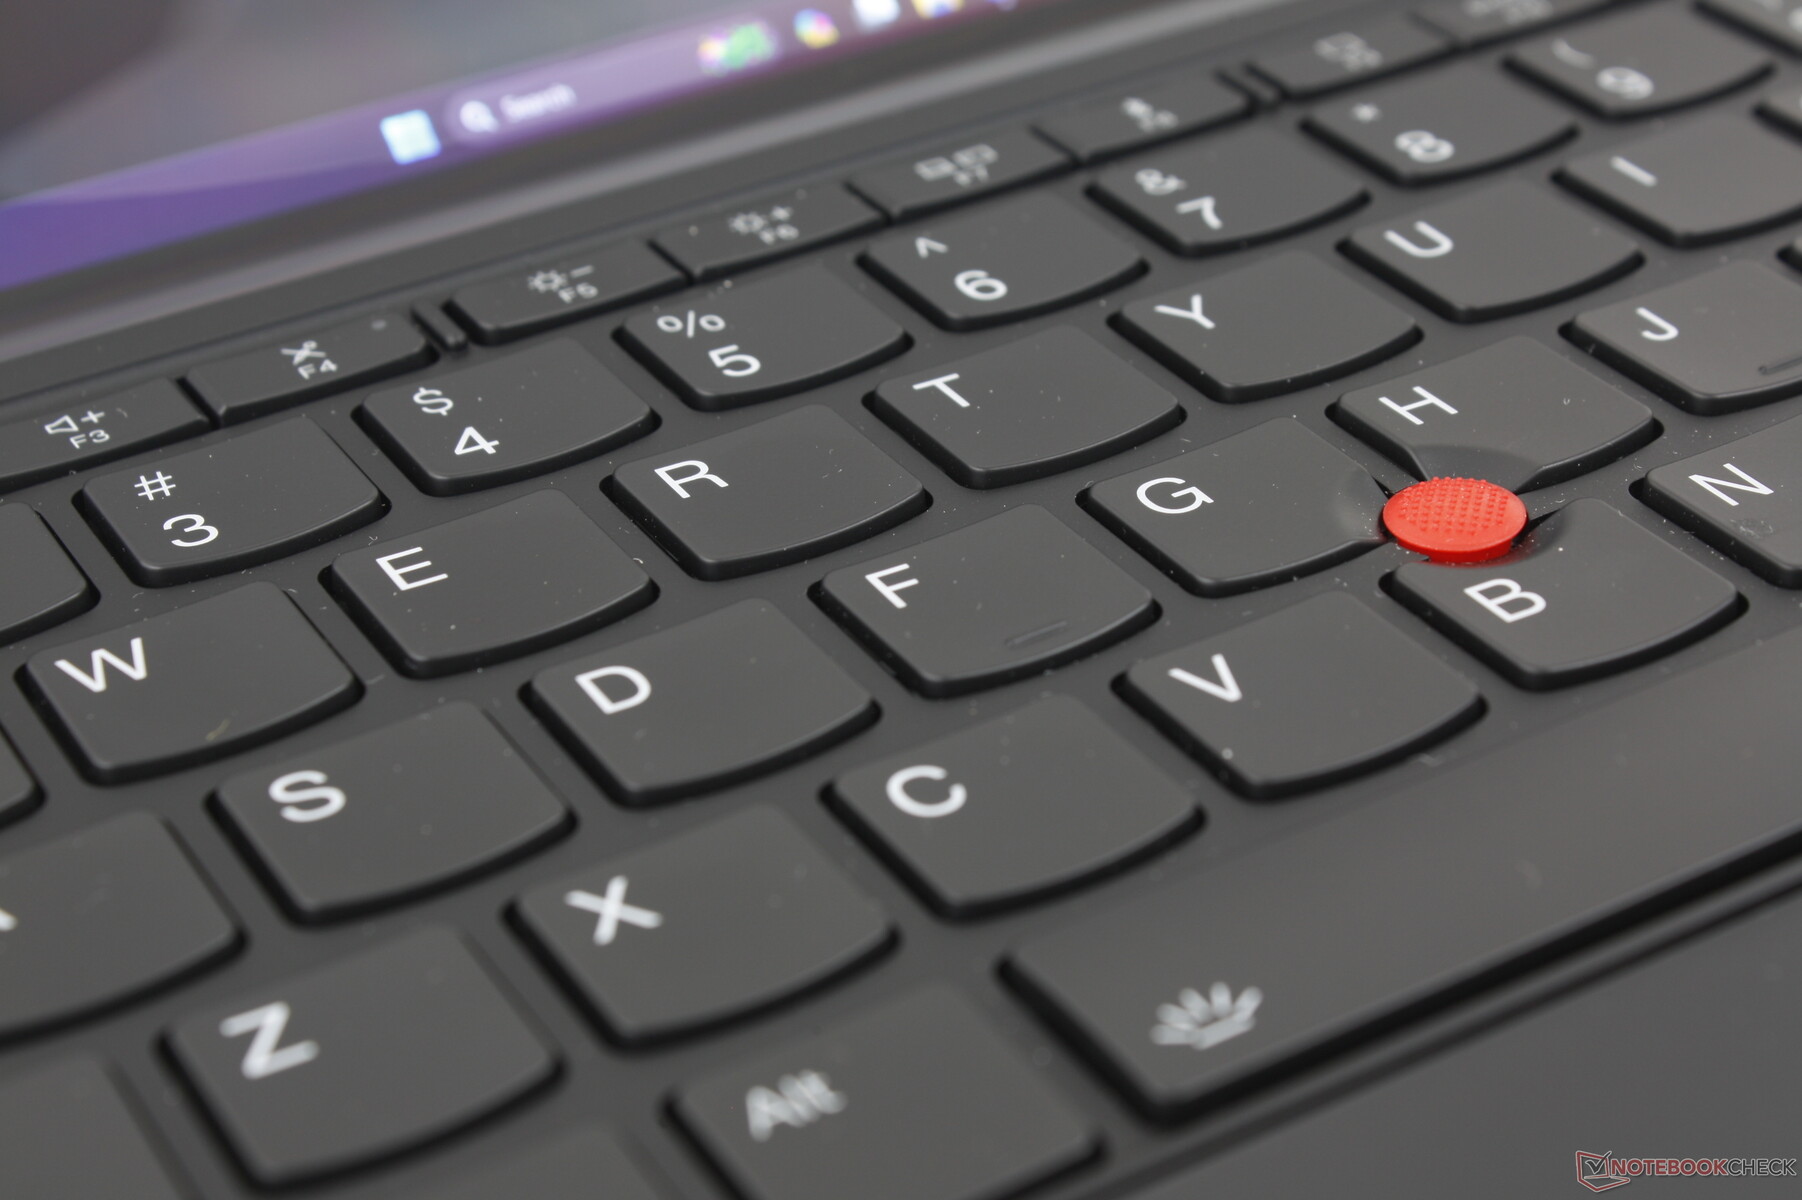
Clavier
La disposition et la taille des touches du clavier rétroéclairé ressemblent à celles du clavier du ThinkPad T14s. Le retour d'information et la course des touches semblent toutefois plus légers et plus proches d'un clavier IdeaPad que d'un clavier ThinkPad traditionnel. Ainsi, si vous avez l'habitude de taper sur un ThinkPad, vous trouverez peut-être les touches un peu plus douces que d'habitude.
Le clavier peut également être utilisé sur d'autres PC via USB et n'est donc pas exclusivement lié au ThinkPad X1 Fold.
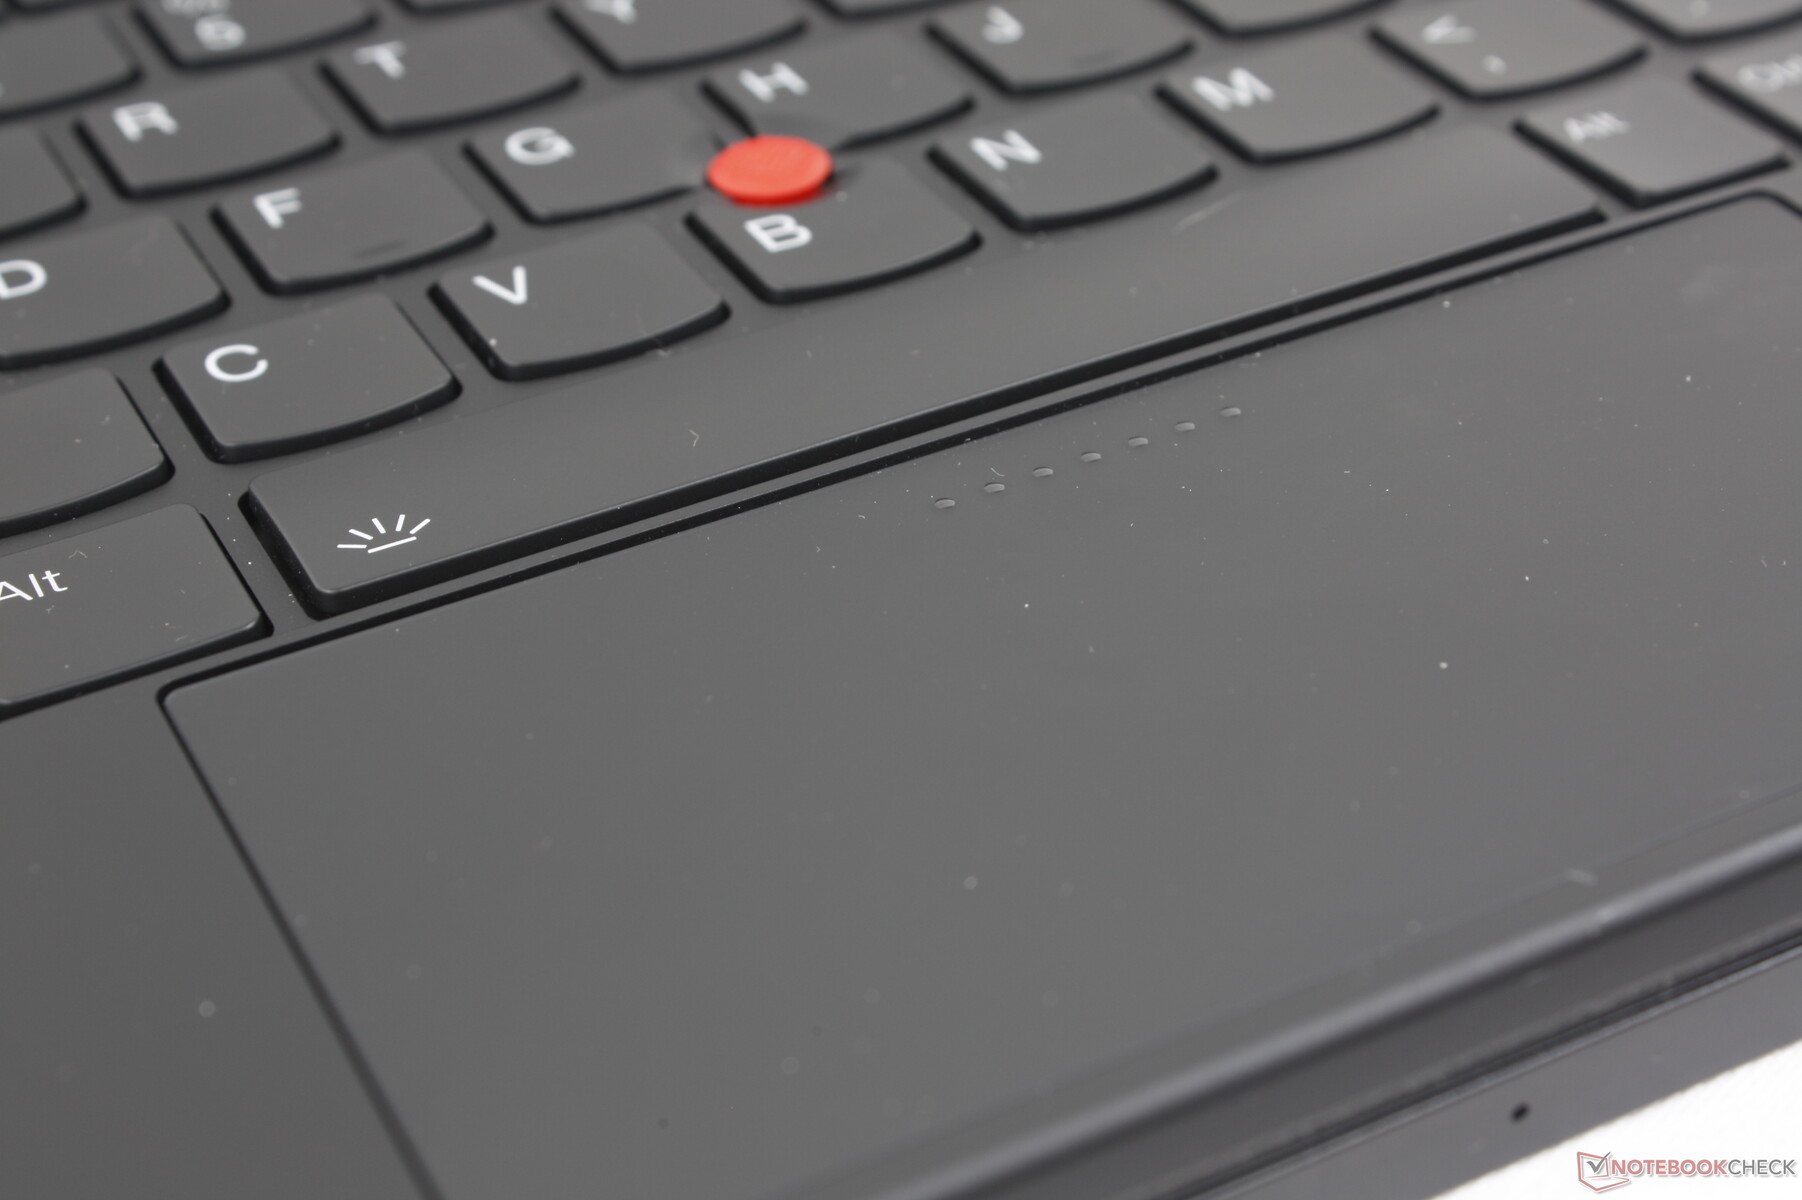
Pavé tactile
Si le clavier est plus confortable que prévu, c'est l'inverse pour le pavé tactile. Sa petite taille (11 x 5 cm) ne s'accorde pas bien avec le grand écran 4:3 et les entrées multi-touch se sentent donc très à l'étroit. De plus, le retour d'information lors du clic est spongieux et extrêmement léger, ce qui rend l'expérience insatisfaisante. Il est clair que Lenovo s'attend à ce que vous ayez une souris à portée de main ou que vous utilisiez l'écran tactile dans la mesure du possible au lieu du minuscule pavé tactile.
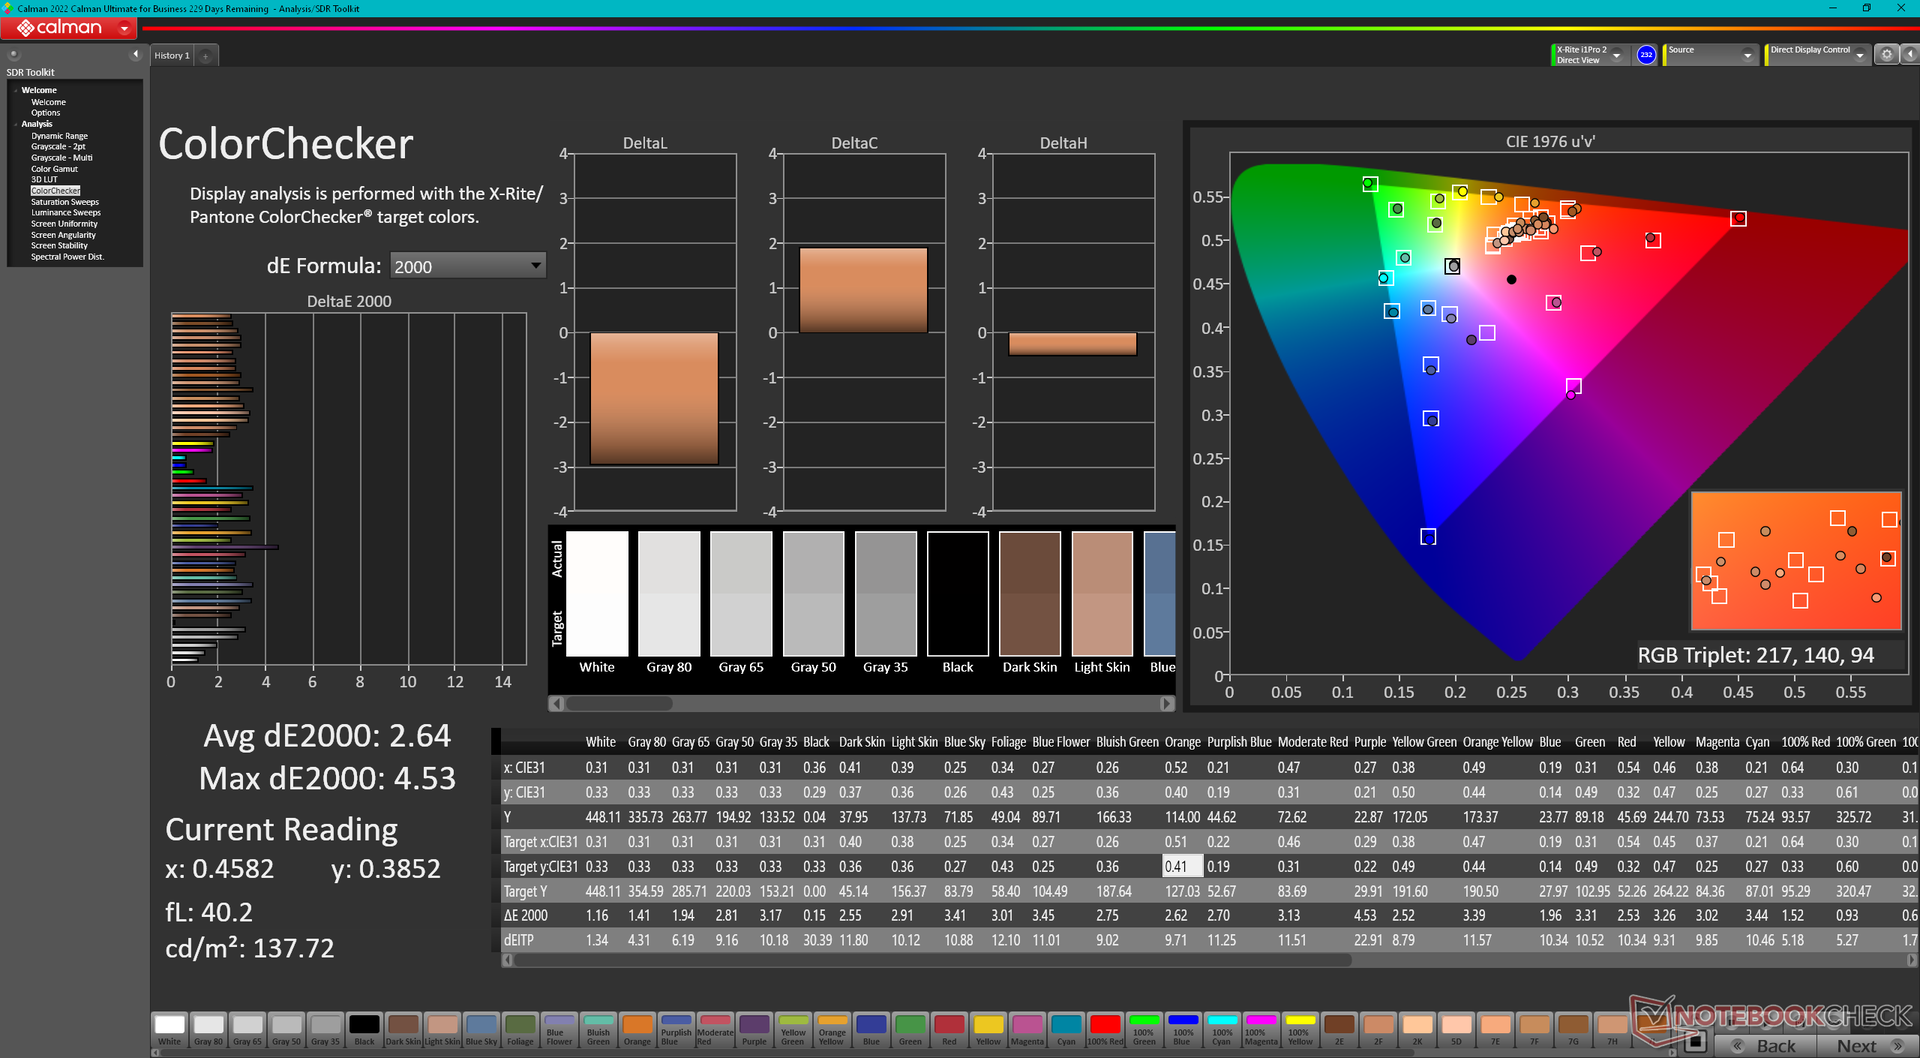
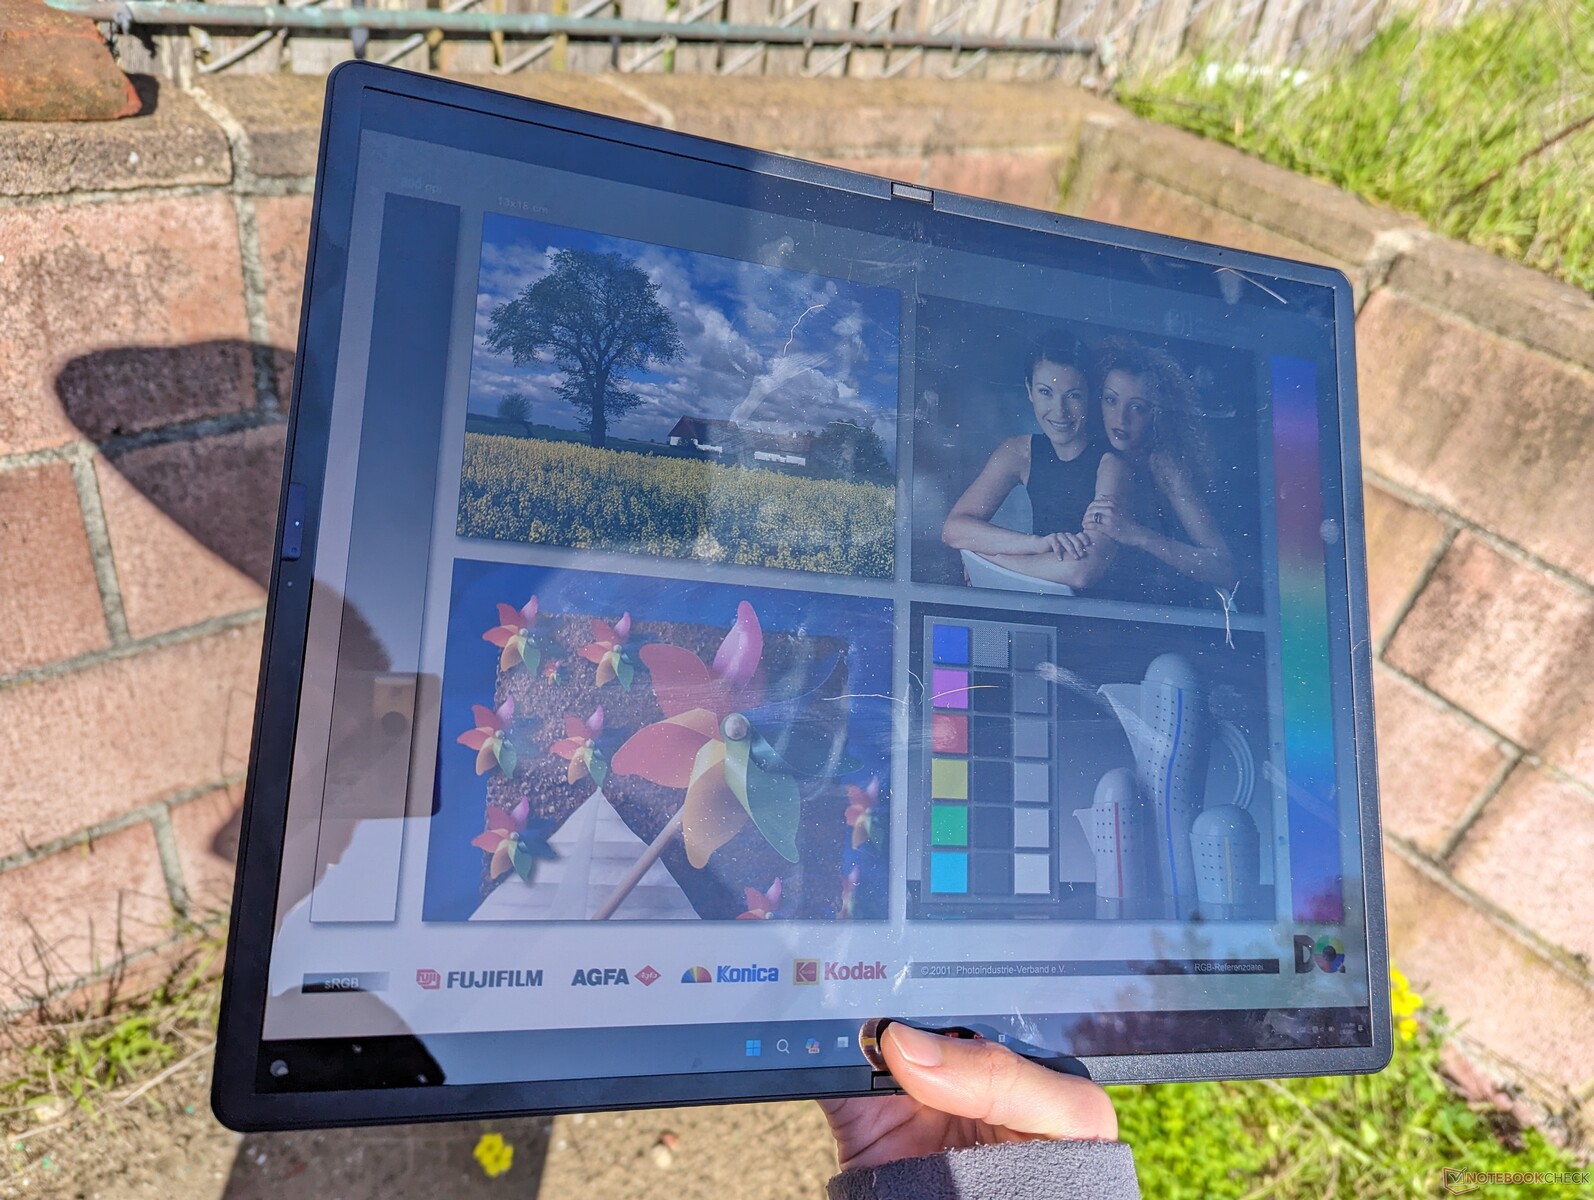
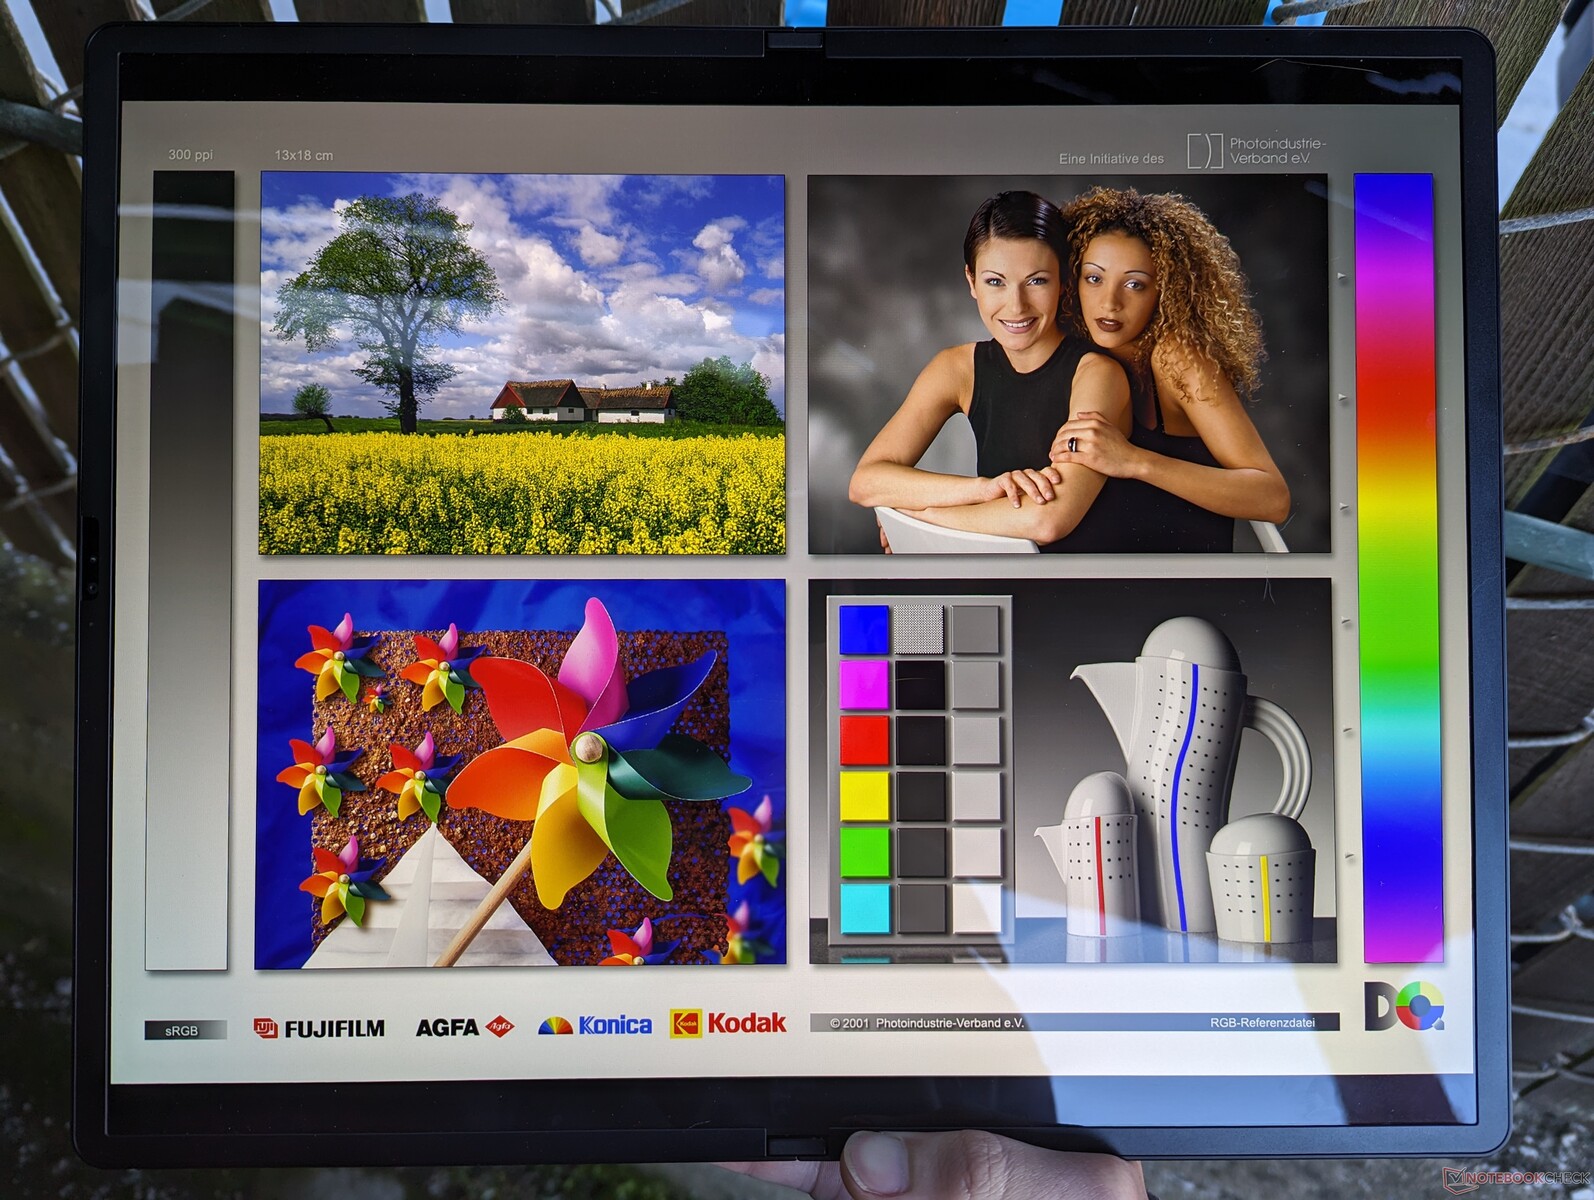
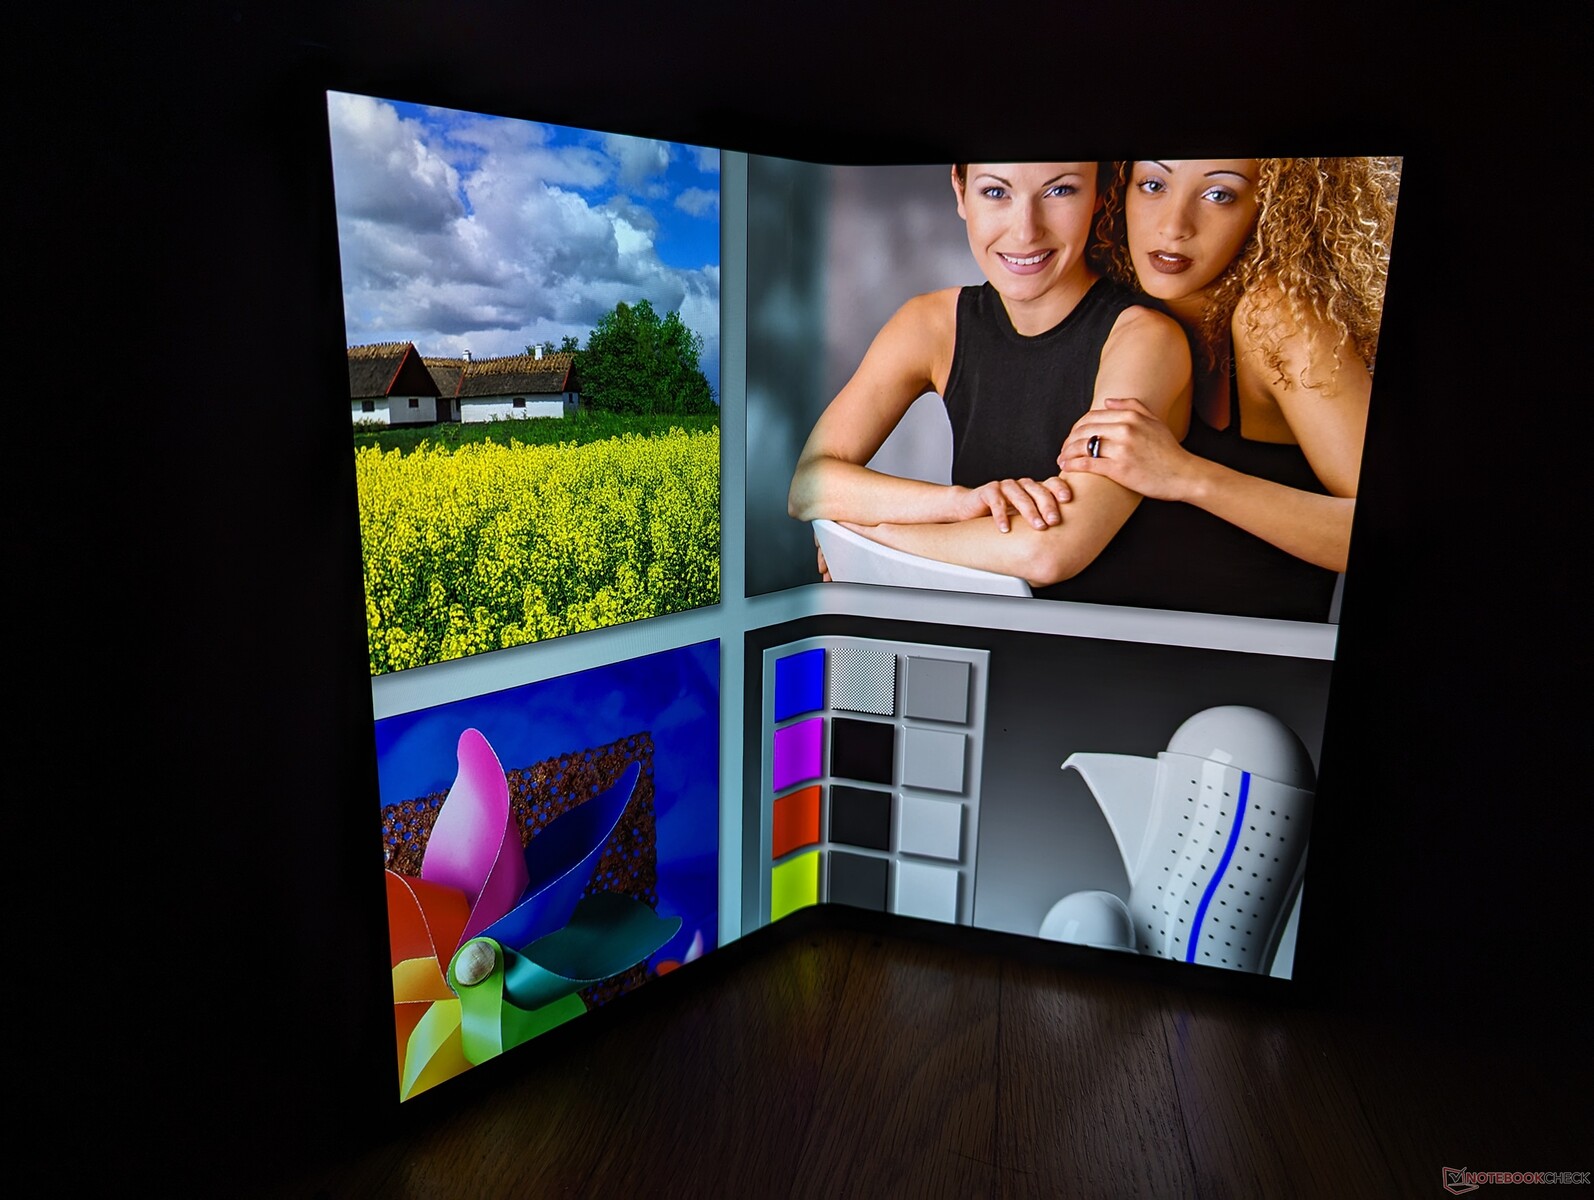
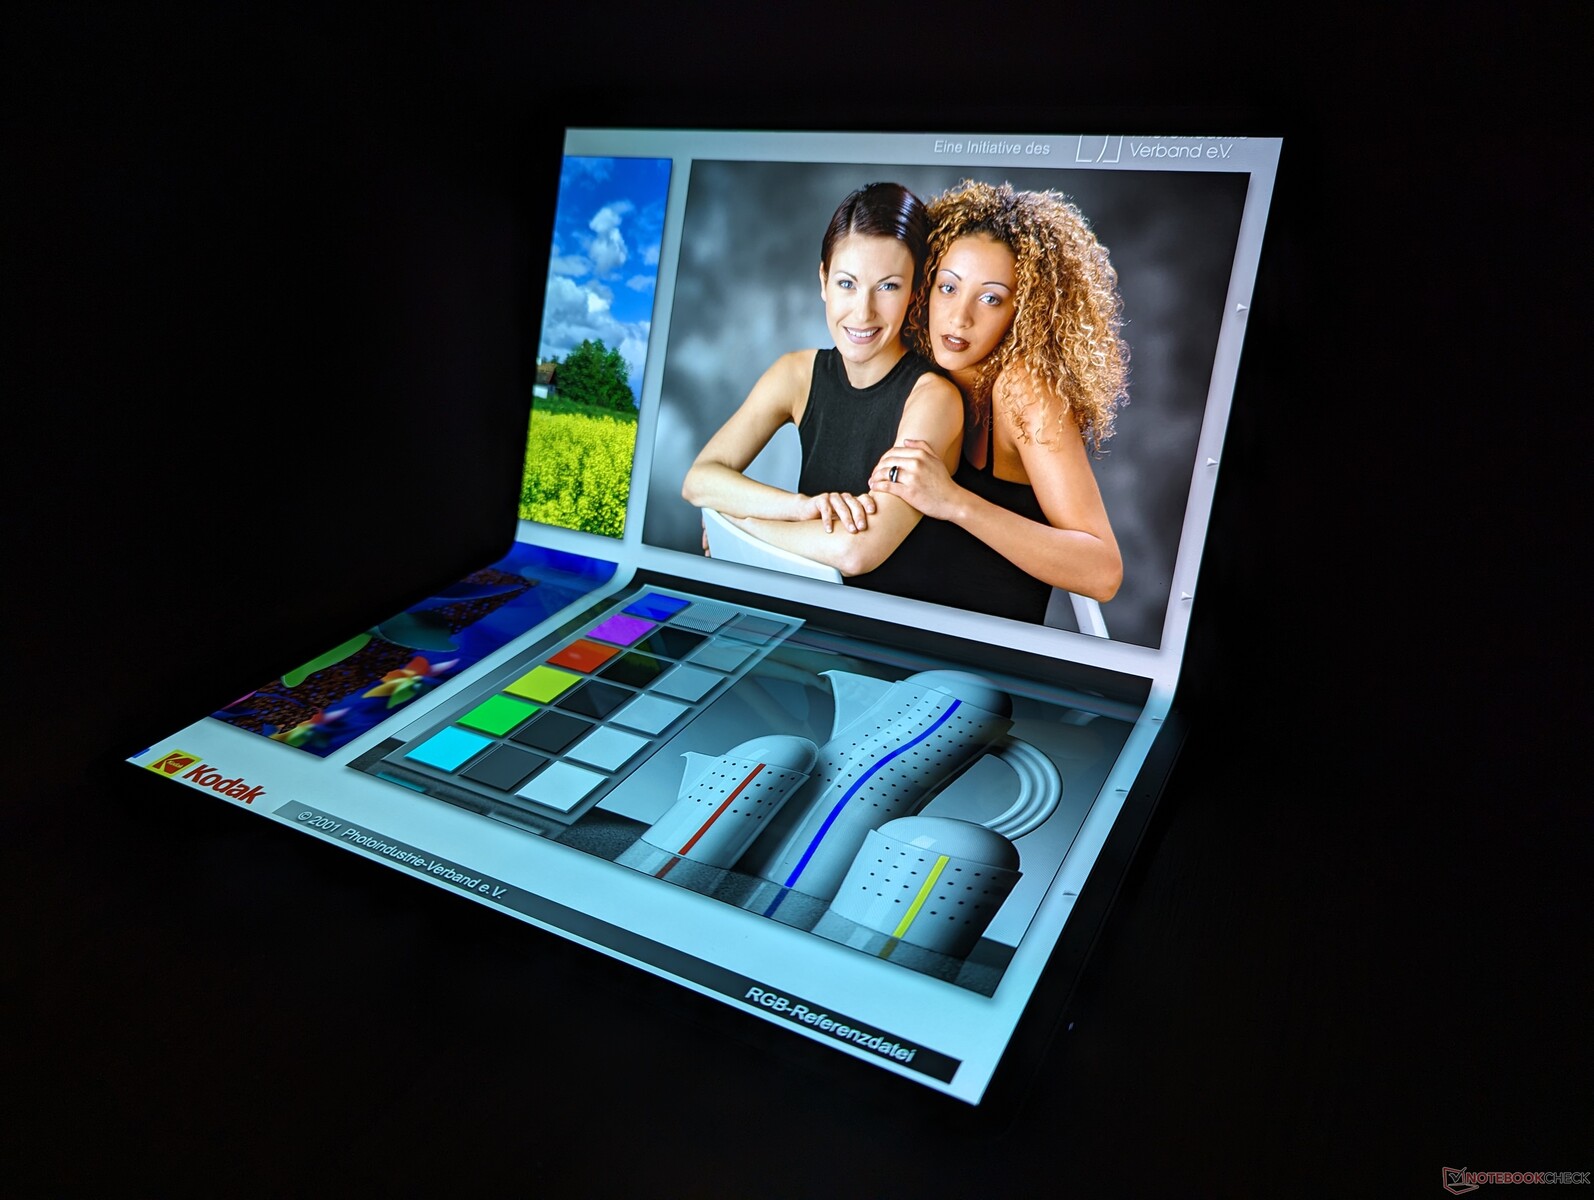
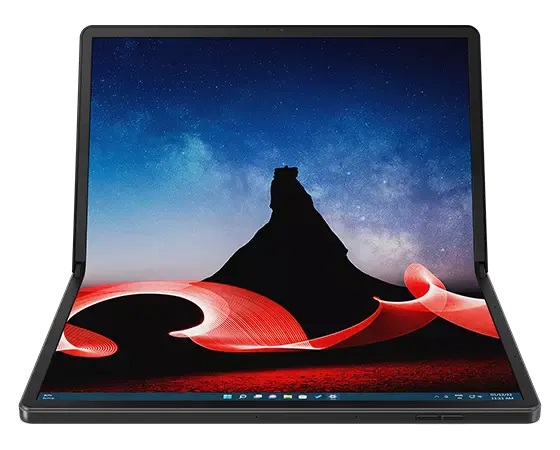
Display - La star du spectacle
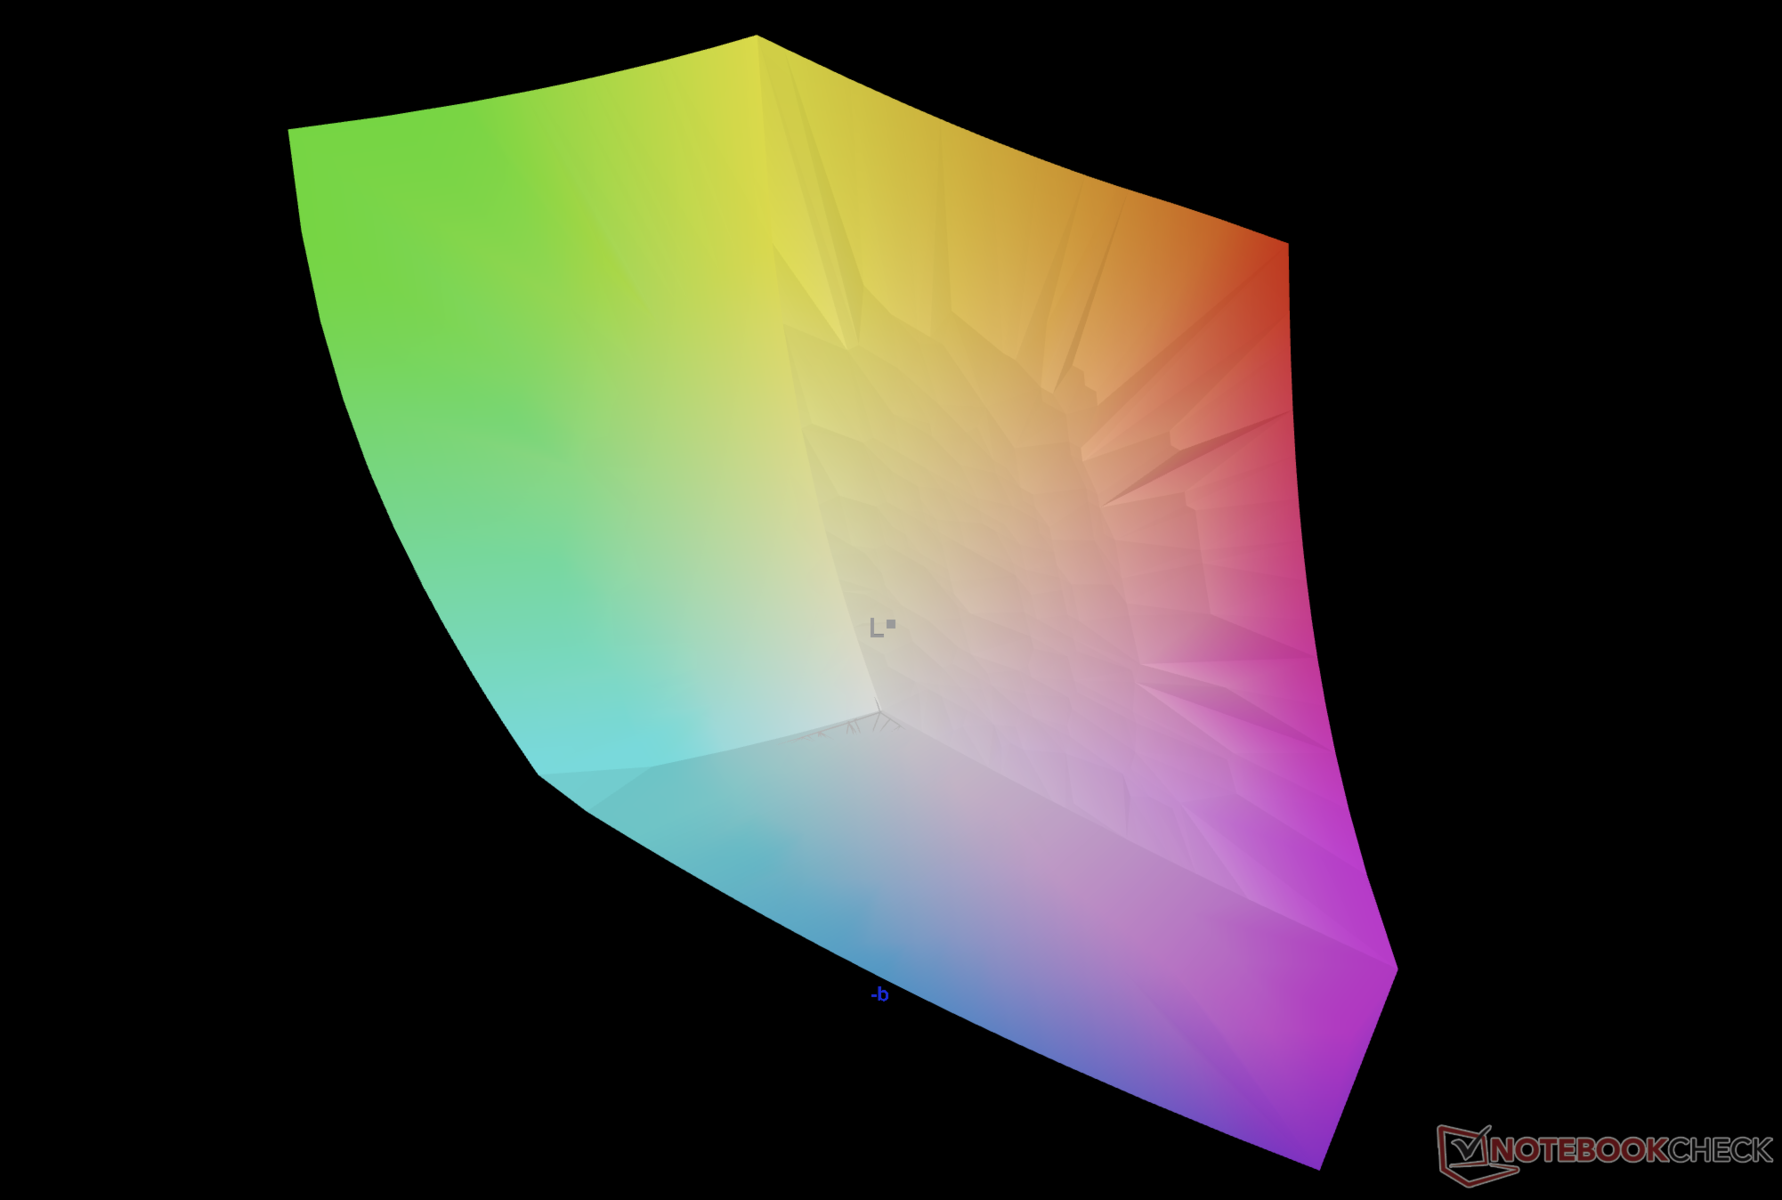
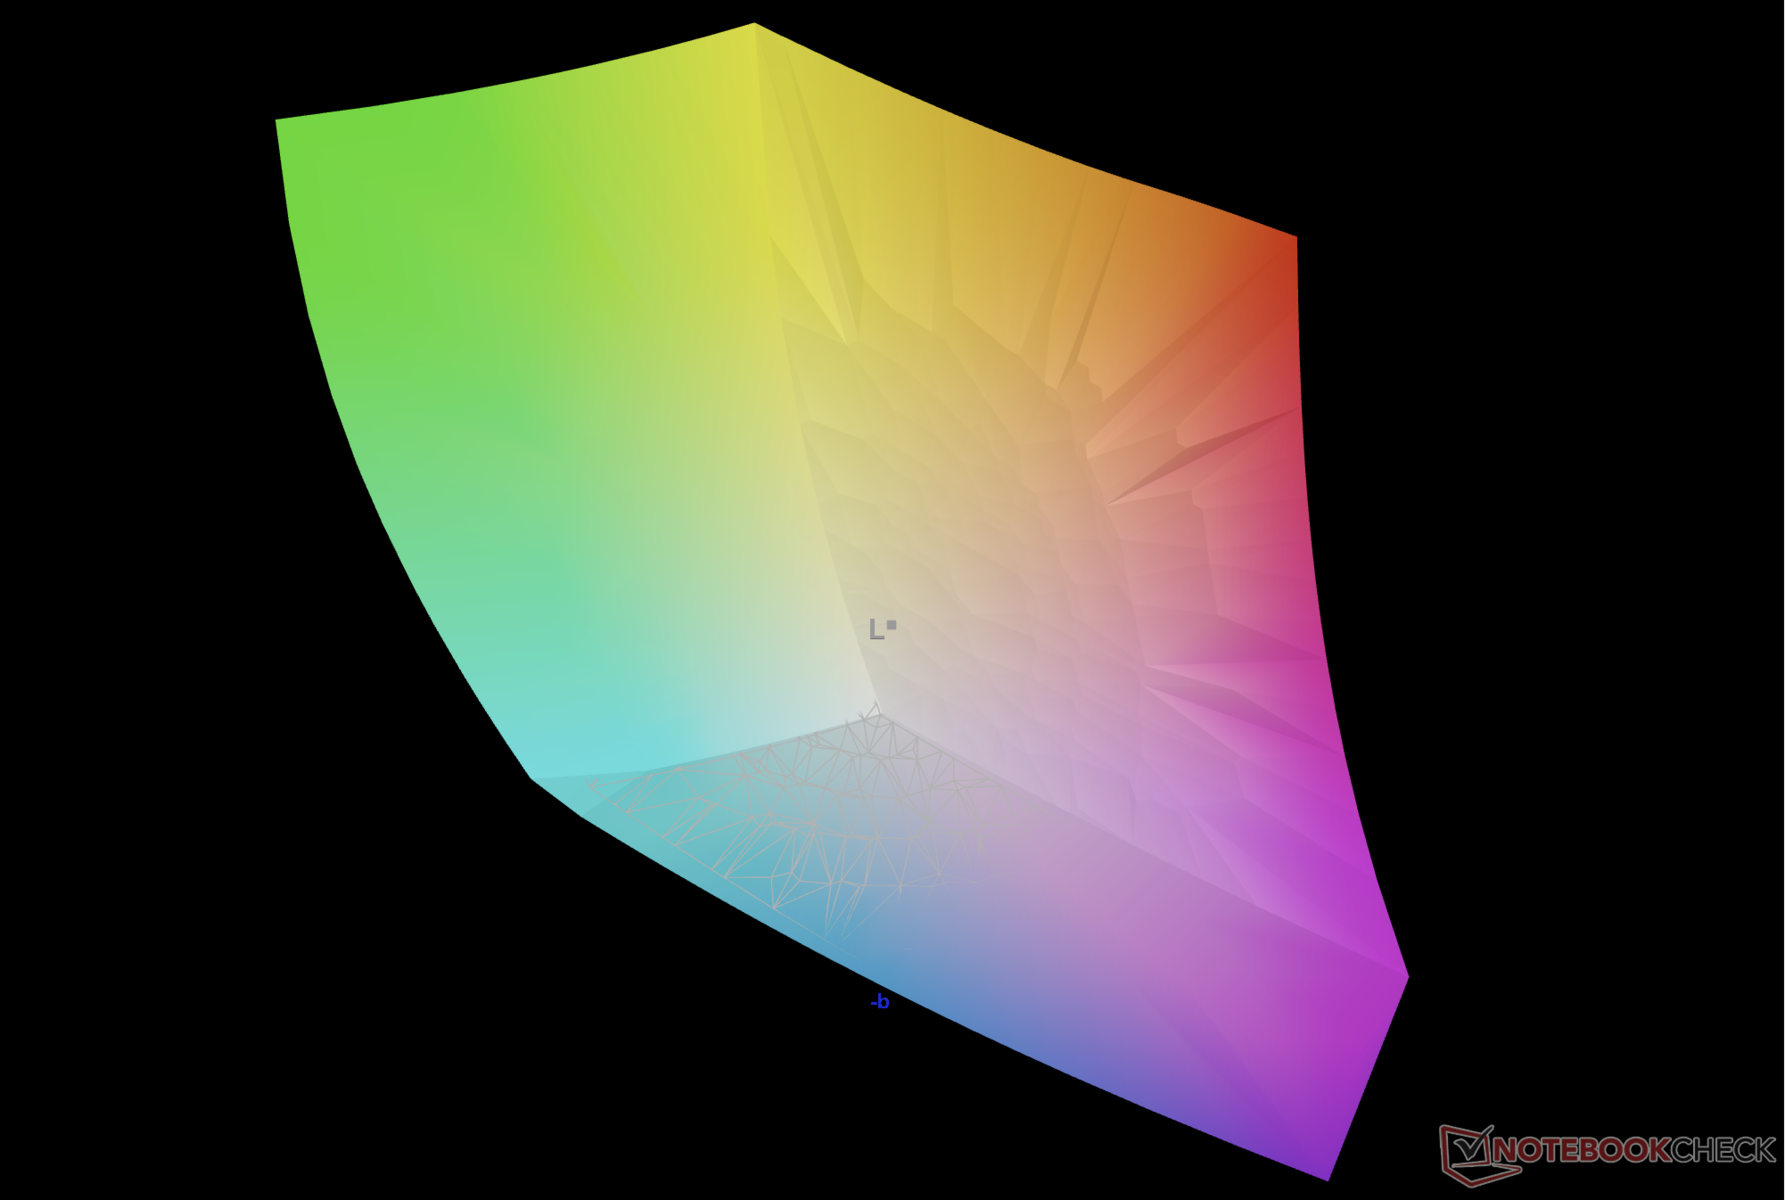
L'écran 60 Hz est un panneau OLED Sharp LJ163B1JX01 que l'on ne trouve sur aucun autre ordinateur portable dans notre base de données au moment où nous écrivons ces lignes. Ce panneau de haute qualité couvre entièrement la norme DCI-P3, ainsi que les avantages habituels de l'OLED, tels que des niveaux de noir parfaits et des temps de réponse rapides. Cependant, contrairement à la plupart des autres panneaux OLED, celui-ci ne comporte pas de couche de verre, ce qui le rend moins résistant aux dommages et plus rugueux lors de l'utilisation du stylet fourni.
Le grand format de 16,3 pouces et le spacieux rapport d'aspect 4:3 sont les points forts de l'écran tactile pliable. Il est néanmoins un peu en retrait en ce qui concerne les taux de rafraîchissement par rapport à des ordinateurs portables comme le Asus VivoBook Pro 16 sont déjà livrés avec des options OLED 120 Hz.
Le HDR600 est pris en charge pour faire du ThinkPad Z1 Fold 16 un excellent lecteur multimédia en mode tablette. Si Windows HDR est désactivé, le contenu SDR normal sera limité à environ 400 nits.
| |||||||||||||||||||||||||
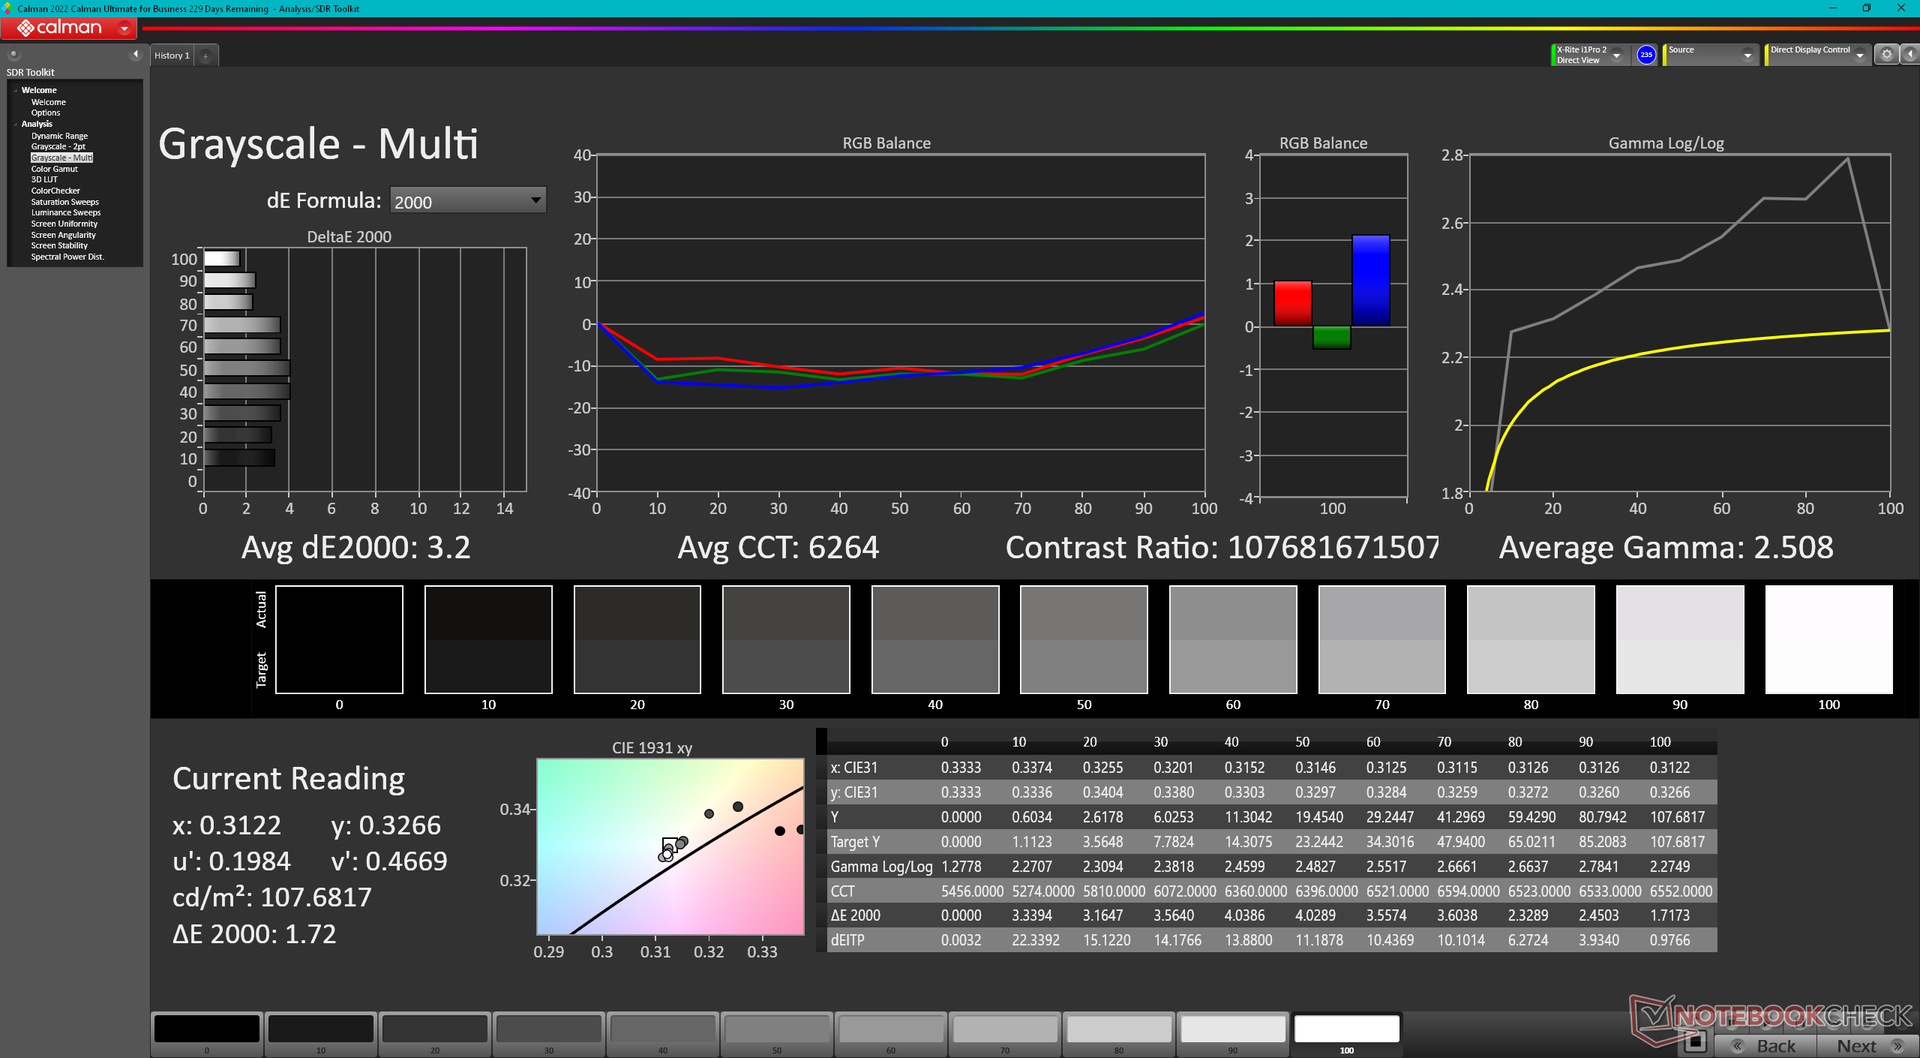
Homogénéité de la luminosité: 89 %
Valeur mesurée au centre, sur batterie: 403.4 cd/m²
Contraste: ∞:1 (Valeurs des noirs: 0 cd/m²)
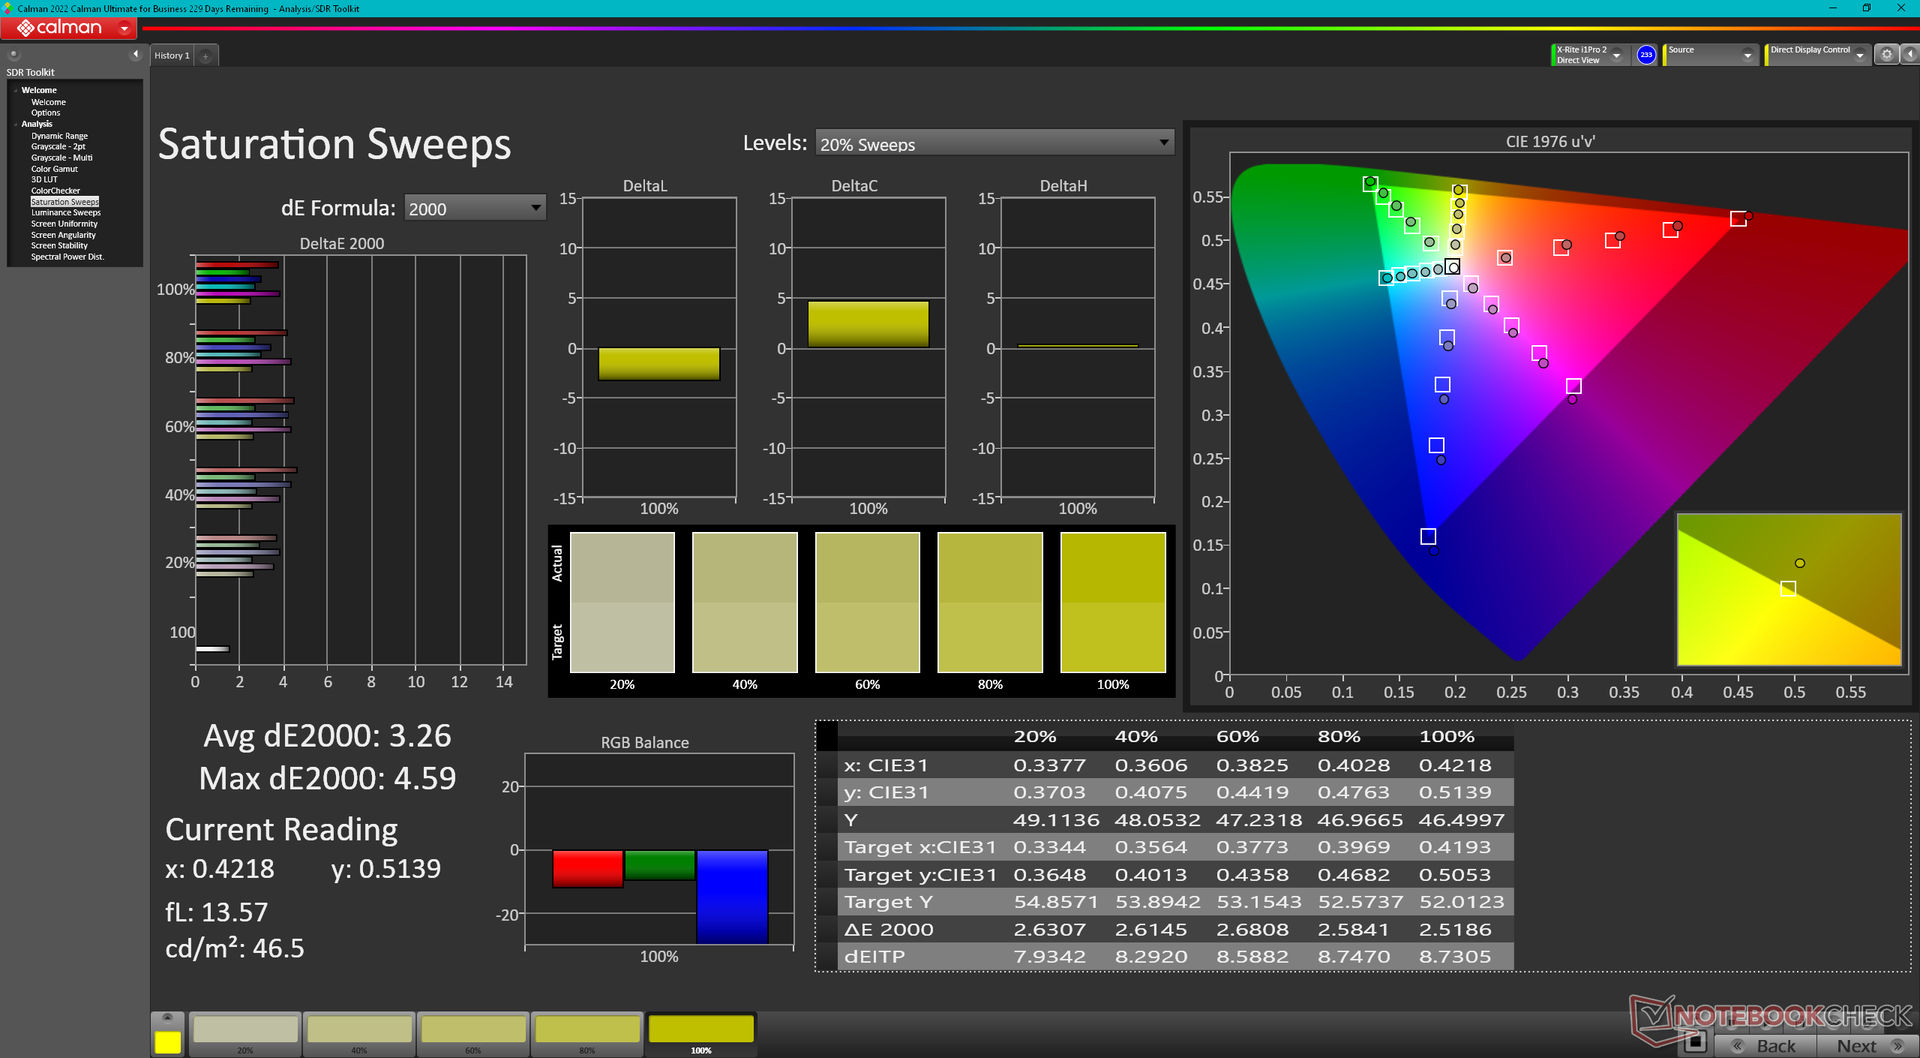
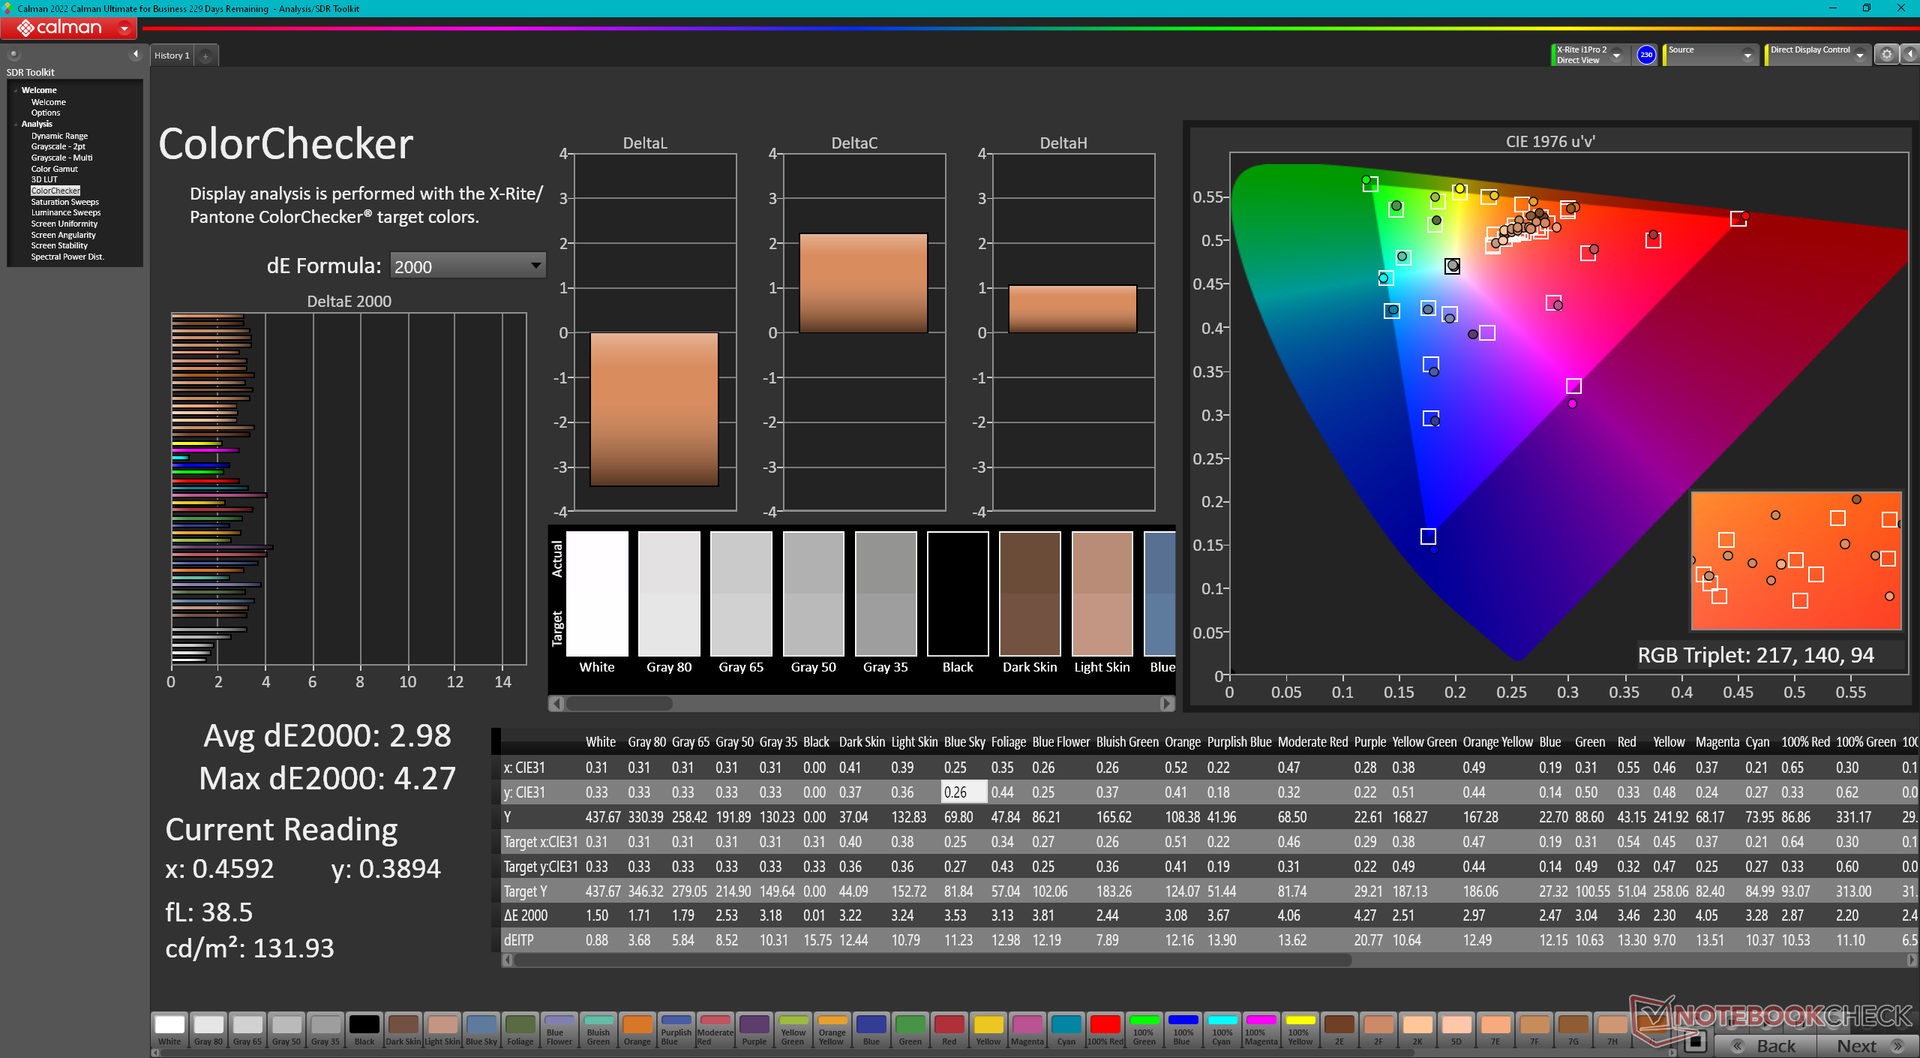
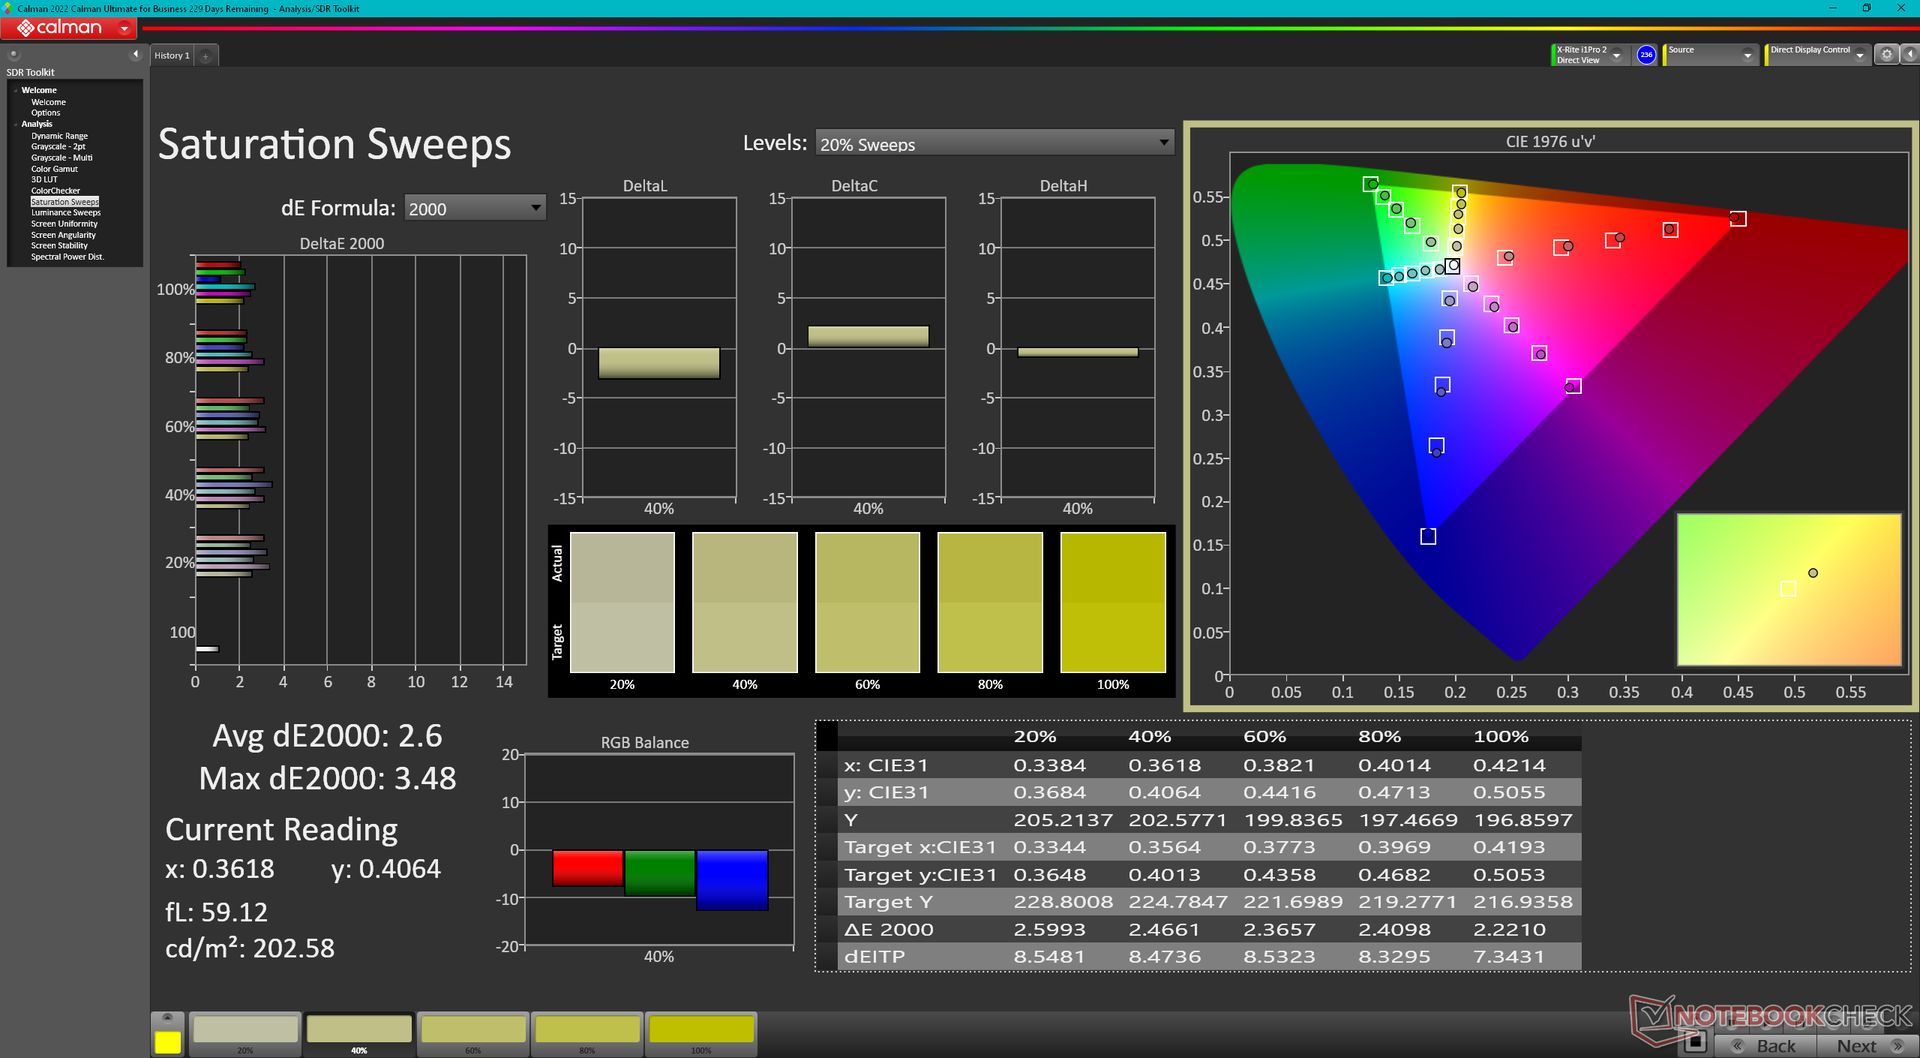
ΔE ColorChecker Calman: 2.98 | ∀{0.5-29.43 Ø4.71}
calibrated: 2.64
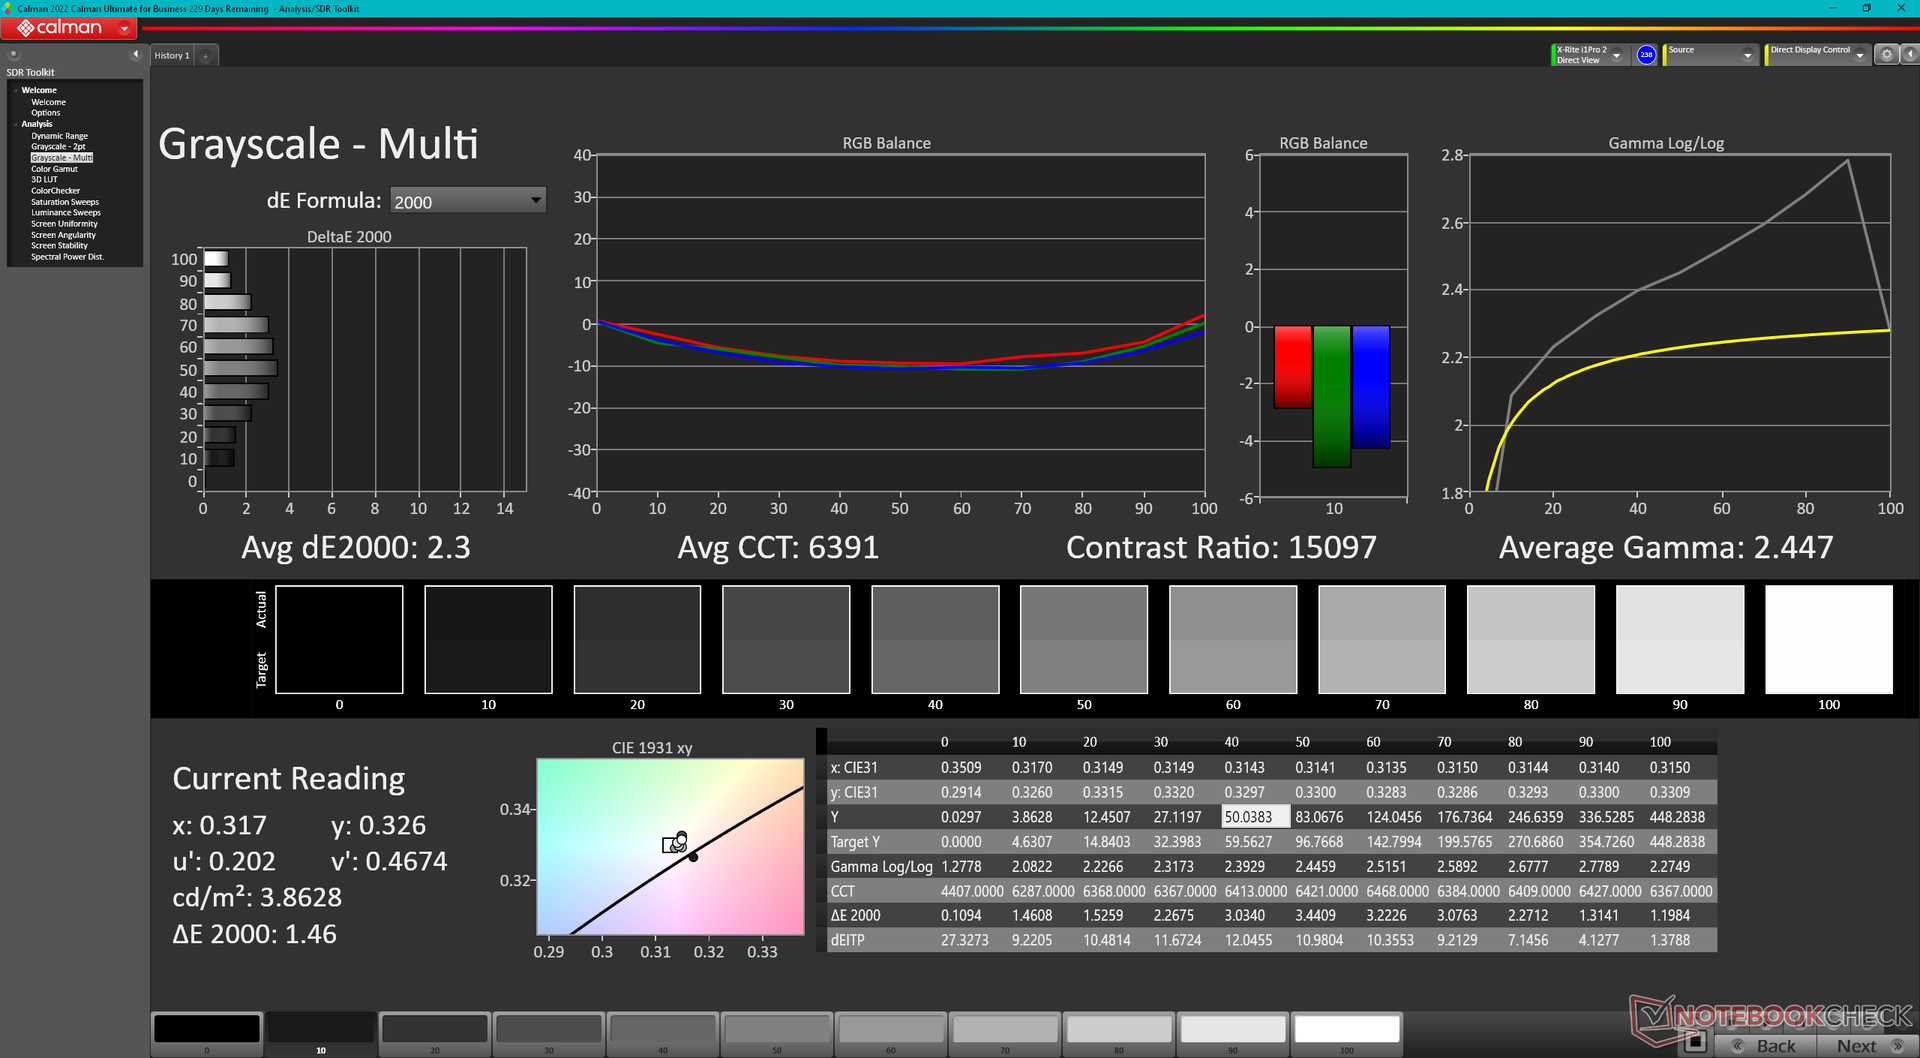
ΔE Greyscale Calman: 3.2 | ∀{0.09-98 Ø4.96}
96% AdobeRGB 1998 (Argyll 3D)
100% sRGB (Argyll 3D)
99.9% Display P3 (Argyll 3D)
Gamma: 2.51
CCT: 6264 K
| Lenovo Thinkpad X1 Fold 16 Sharp LJ163B1JX01, OLED, 2560x2024, 16.3" | Lenovo ThinkPad X1 Fold 20RL000FGE LEN4142, OLED, 2048x1536, 13.3" | Asus Zenbook 17 Fold UX9702 BOE9C40, OLED, 2560x1920, 17.3" | Microsoft Surface Pro 9, i7-1255U LP129WT2-SPA6, IPS, 2880x1920, 13" | HP Elite Dragonfly Folio 13.5 G3 Chi Mei CMN13C0, IPS, 1920x1280, 13.5" | Lenovo ThinkPad X1 Carbon G11 21HNS54T00 ATNA40YK15-0, OLED, 2880x1800, 14" | |
|---|---|---|---|---|---|---|
| Display | -0% | 1% | -22% | -20% | 0% | |
| Display P3 Coverage (%) | 99.9 | 94.6 -5% | 99.9 0% | 65.6 -34% | 68.3 -32% | 99.9 0% |
| sRGB Coverage (%) | 100 | 100 0% | 100 0% | 97.7 -2% | 98.6 -1% | 100 0% |
| AdobeRGB 1998 Coverage (%) | 96 | 100 4% | 99.6 4% | 67.7 -29% | 70.2 -27% | 97 1% |
| Response Times | -156% | -9% | -1489% | -5408% | -41% | |
| Response Time Grey 50% / Grey 80% * (ms) | 0.99 ? | 2.4 ? -142% | 1.12 ? -13% | 13 ? -1213% | 66.8 ? -6647% | 1.19 ? -20% |
| Response Time Black / White * (ms) | 1.04 ? | 2.8 ? -169% | 1.08 ? -4% | 19.4 ? -1765% | 44.4 ? -4169% | 1.68 ? -62% |
| PWM Frequency (Hz) | 240.6 ? | 119 | 240 ? | 29896 ? | 363 ? | |
| Screen | -67% | -15% | 25% | 11% | -24% | |
| Brightness middle (cd/m²) | 403.4 | 239 -41% | 333 -17% | 455 13% | 369.5 -8% | 427 6% |
| Brightness (cd/m²) | 423 | 235 -44% | 327 -23% | 453 7% | 350 -17% | 427 1% |
| Brightness Distribution (%) | 89 | 95 7% | 95 7% | 94 6% | 87 -2% | 98 10% |
| Black Level * (cd/m²) | 0.01 | 0.38 | 0.24 | |||
| Colorchecker dE 2000 * | 2.98 | 6.5 -118% | 3.2 -7% | 1.7 43% | 2.3 23% | 4.5 -51% |
| Colorchecker dE 2000 max. * | 4.27 | 10.3 -141% | 8.6 -101% | 3.8 11% | 4.34 -2% | 9.6 -125% |
| Colorchecker dE 2000 calibrated * | 2.64 | 3.4 -29% | 1.5 43% | 0.6 77% | 5 -89% | |
| Greyscale dE 2000 * | 3.2 | 6.5 -103% | 1.5 53% | 1.5 53% | 3.1 3% | 0.7 78% |
| Gamma | 2.51 88% | 1.79 123% | 2.21 100% | 2.17 101% | 2.1 105% | 2.2 100% |
| CCT | 6264 104% | 6221 104% | 6583 99% | 6761 96% | 6248 104% | 6470 100% |
| Color Space (Percent of AdobeRGB 1998) (%) | 91.9 | |||||
| Color Space (Percent of sRGB) (%) | 100 | |||||
| Contrast (:1) | 33300 | 1197 | 1540 | |||
| Moyenne finale (programmes/paramètres) | -74% /
-65% | -8% /
-9% | -495% /
-239% | -1806% /
-900% | -22% /
-21% |
* ... Moindre est la valeur, meilleures sont les performances
L'écran est réglé sur sRGB par défaut, même s'il prend en charge les couleurs DCI-P3. Il est étalonné de manière satisfaisante par rapport à la norme sRGB, avec des valeurs moyennes d'échelle de gris et de deltaE des couleurs de seulement 3,2 et 2,98, respectivement.
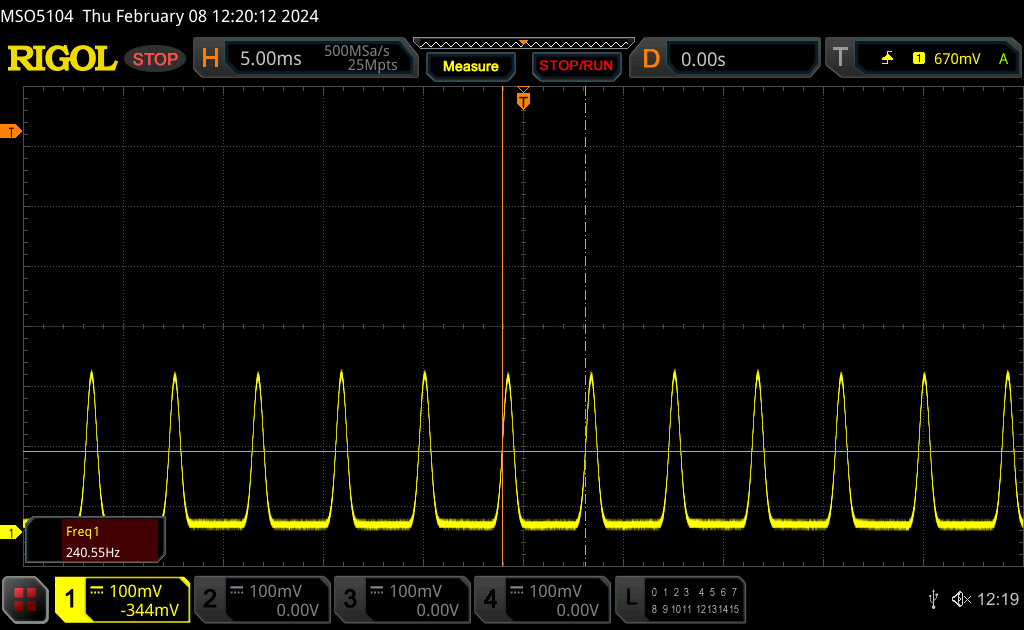
Temps de réponse de l'écran
| ↔ Temps de réponse noir à blanc | ||
|---|---|---|
| 1.04 ms ... hausse ↗ et chute ↘ combinées | ↗ 0.44 ms hausse | 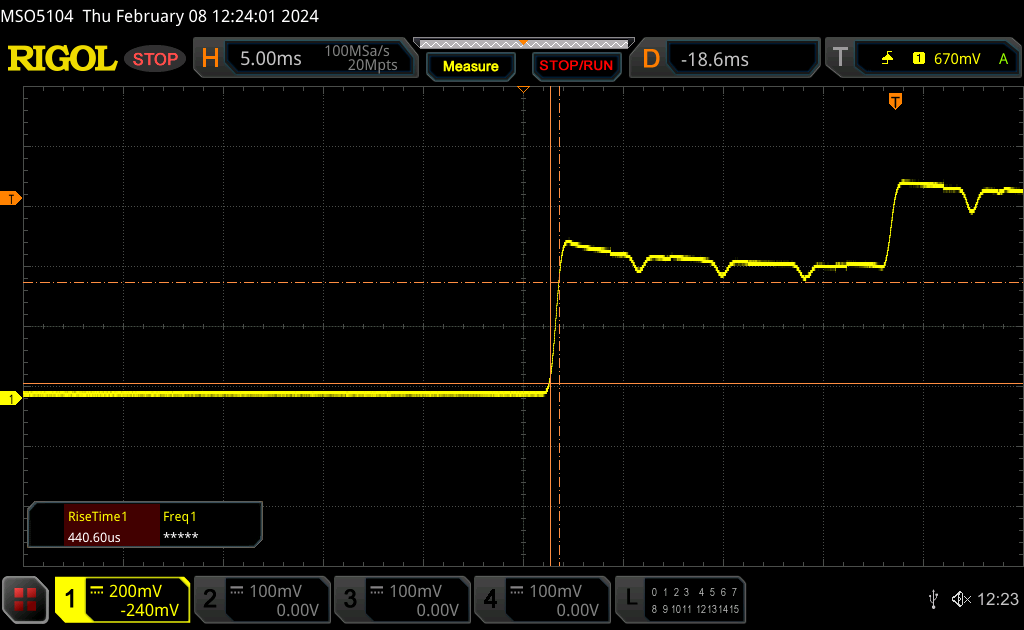 |
| ↘ 0.6 ms chute | ||
| L'écran montre de très faibles temps de réponse, parfait pour le jeu. En comparaison, tous les appareils testés affichent entre 0.1 (minimum) et 240 (maximum) ms. » 4 % des appareils testés affichent de meilleures performances. Cela signifie que les latences relevées sont meilleures que la moyenne (19.8 ms) de tous les appareils testés. | ||
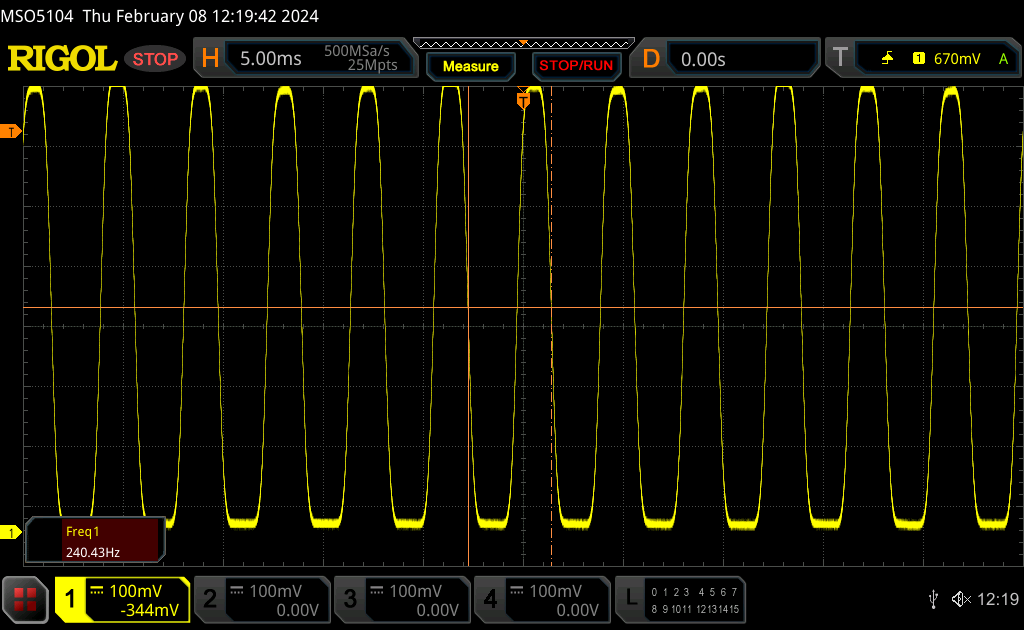
| ↔ Temps de réponse gris 50% à gris 80% | ||
| 0.99 ms ... hausse ↗ et chute ↘ combinées | ↗ 0.5 ms hausse | 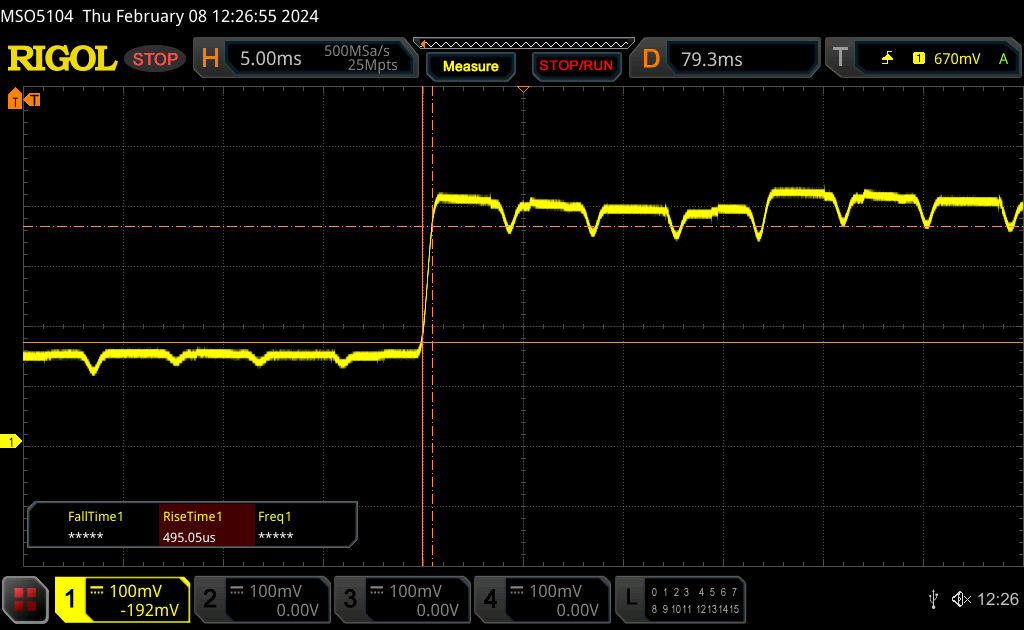 |
| ↘ 0.49 ms chute | ||
| L'écran montre de très faibles temps de réponse, parfait pour le jeu. En comparaison, tous les appareils testés affichent entre 0.165 (minimum) et 636 (maximum) ms. » 4 % des appareils testés affichent de meilleures performances. Cela signifie que les latences relevées sont meilleures que la moyenne (31 ms) de tous les appareils testés. | ||
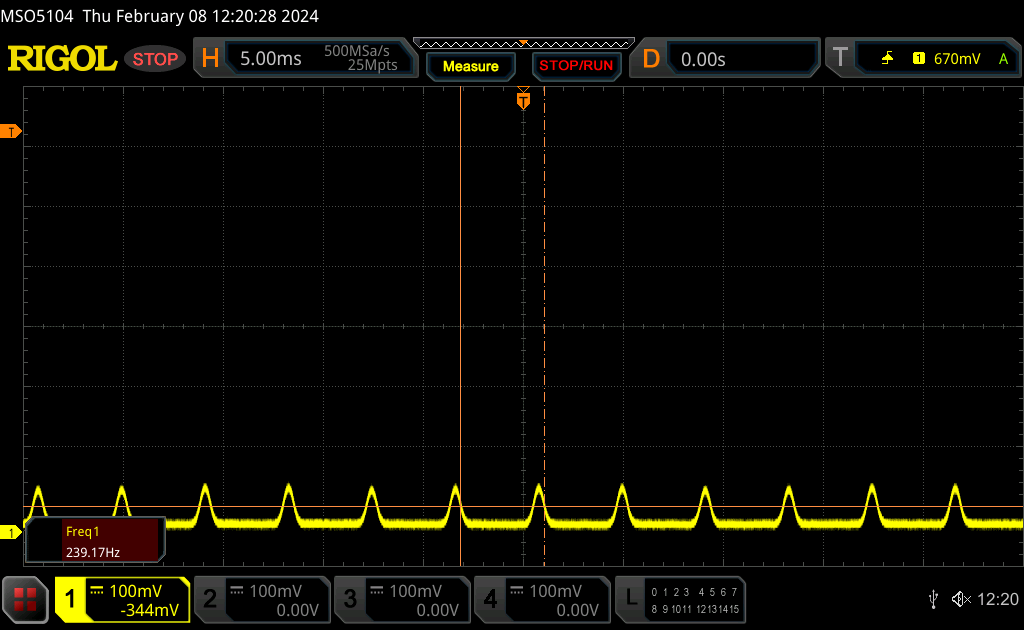
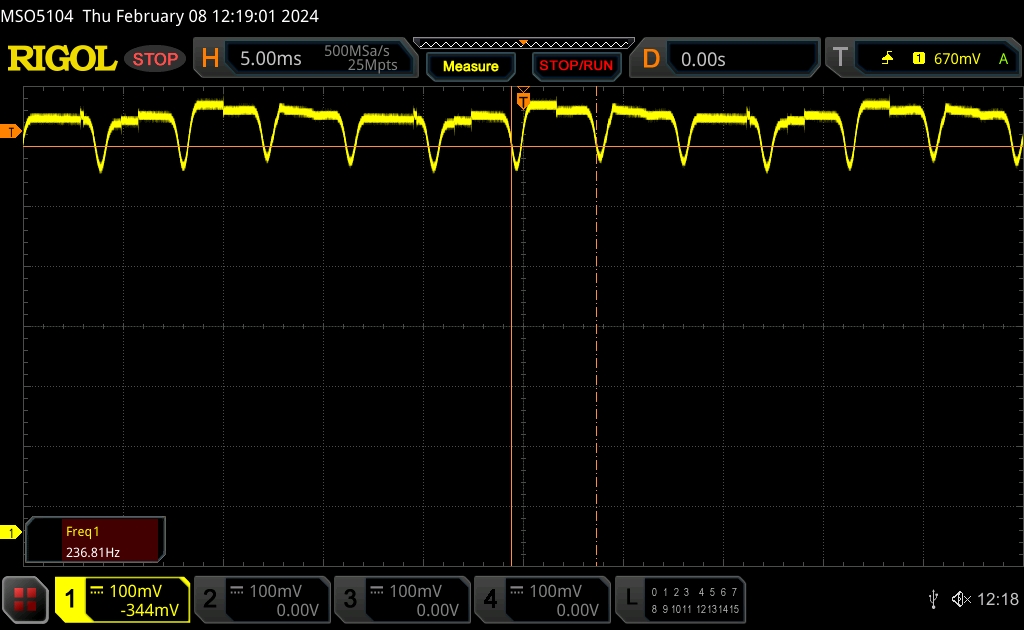
Scintillement / MLI (Modulation de largeur d'impulsion)
| Scintillement / MLI (Modulation de largeur d'impulsion) décelé | 240.6 Hz | ≤ 100 Niveau de luminosité |  |
Le rétroéclairage de l'écran scintille à la fréquence de 240.6 Hz (certainement du fait de l'utilisation d'une MDI - Modulation de largeur d'impulsion) à un niveau de luminosité inférieur ou égal à 100 % . Aucun scintillement ne devrait être perceptible au-dessus de cette valeur. La fréquence de rafraîchissement de 240.6 Hz est relativement faible, les personnes les plus sensibles devraient percevoir un scintillement et être sujettes à une fatigue oculaire accrue (avec le niveau de luminosité indiqué) En comparaison, 52 % des appareils testés n'emploient pas MDI pour assombrir leur écran. Nous avons relevé une moyenne à 7757 (minimum : 5 - maximum : 343500) Hz dans le cas où une MDI était active. | |||
La modulation de la largeur d'impulsion ou le scintillement est présent à 240 Hz à tous les niveaux de luminosité, comme sur le Zenbook 17 Fold.
La visibilité extérieure est correcte à l'ombre, mais médiocre dans des conditions plus lumineuses ou en plein soleil. Avec une luminosité de 400 nits, l'écran est environ 30 % moins lumineux que celui de l iPad Pro 11. Les reflets sont presque toujours présents.
Les angles de vision OLED ont toujours été très larges, mais ils sont mis à l'épreuve sur le ThinkPad X1 Fold. Plus précisément, la moitié inférieure de l'écran en mode ordinateur portable souffre d'une dégradation notable de la luminosité et des couleurs, car l'angle de vision est beaucoup plus large par rapport aux yeux de l'utilisateur. Les différences ne sont pas suffisantes pour rendre les textes ou les pages web illisibles, mais vous devrez conserver les contenus sensibles aux couleurs, comme les éditeurs d'images et les vidéos, sur la moitié supérieure de l'écran pour obtenir les couleurs les plus précises.
Performance - Bonne mais pas excellente
Conditions d'essai
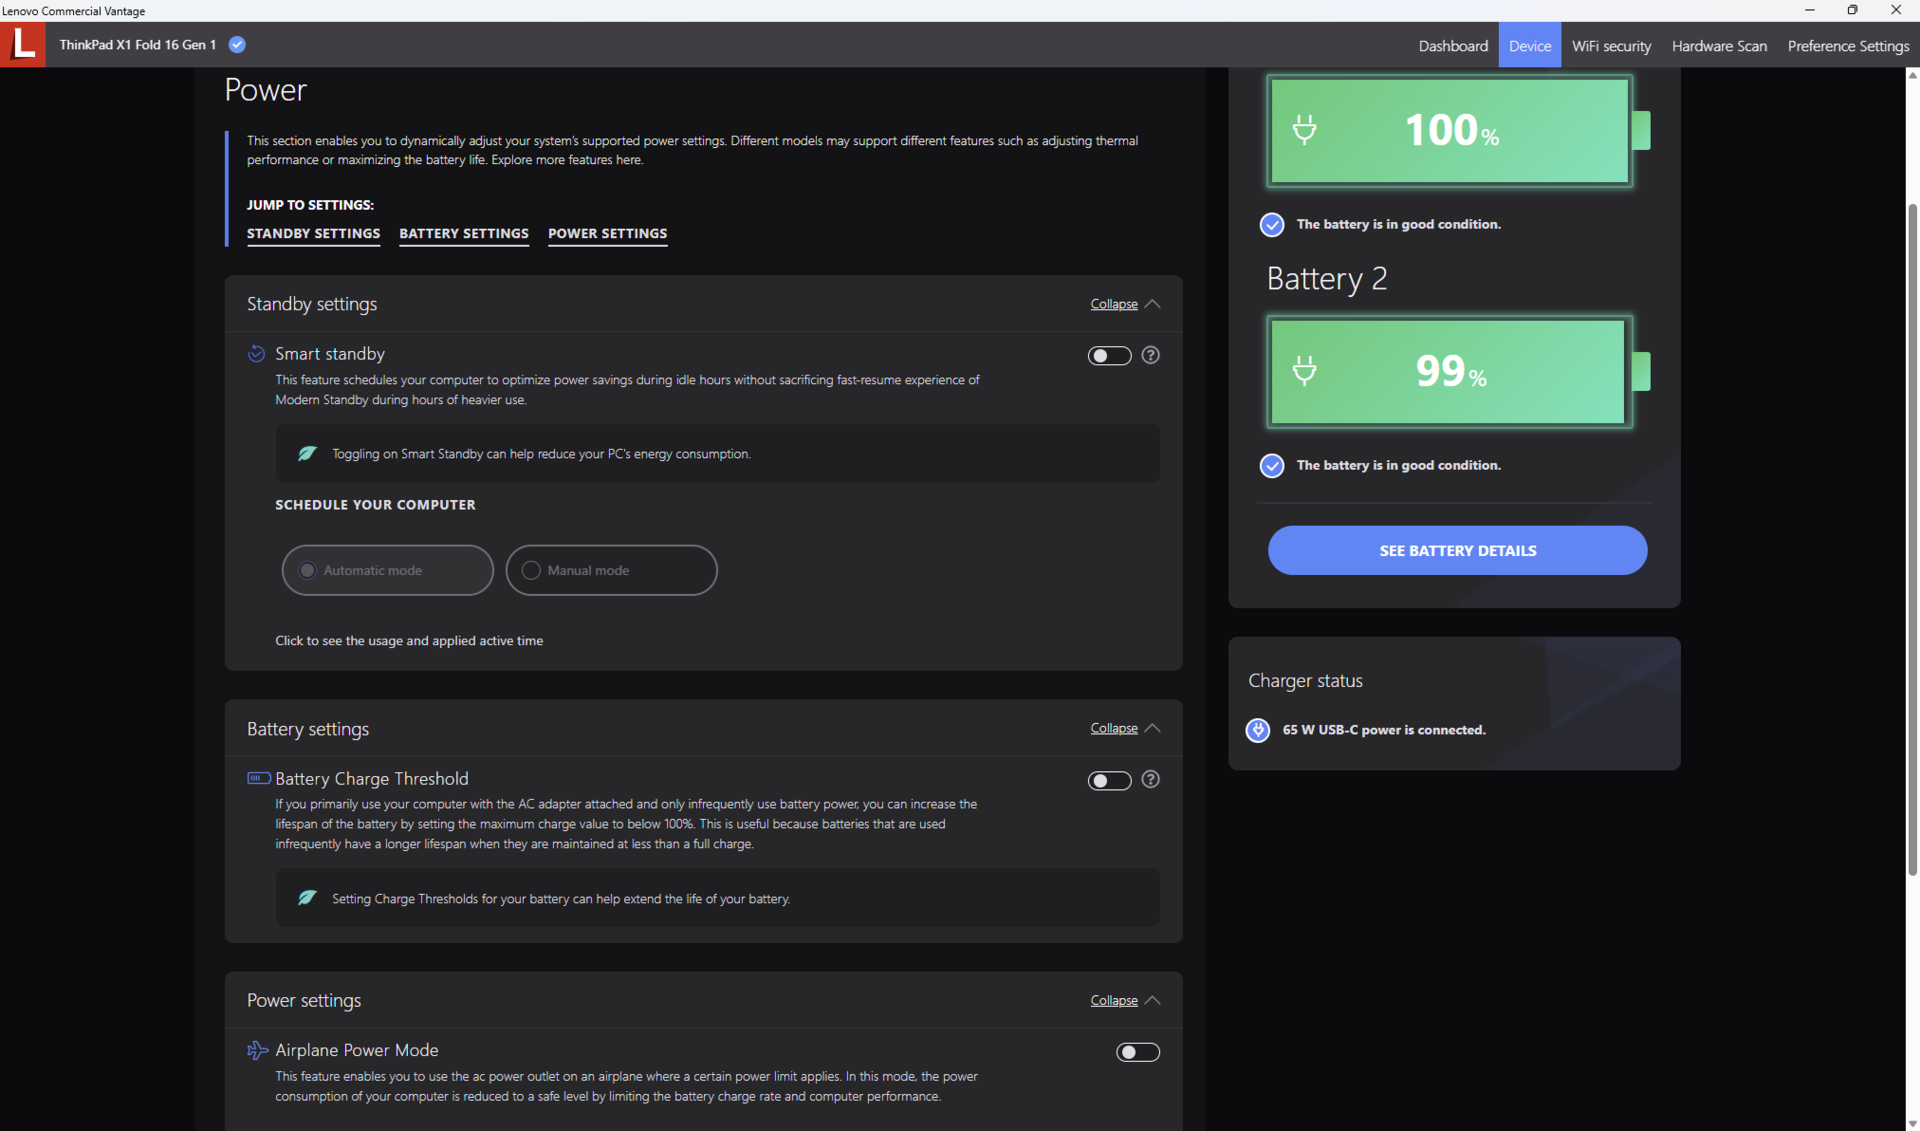
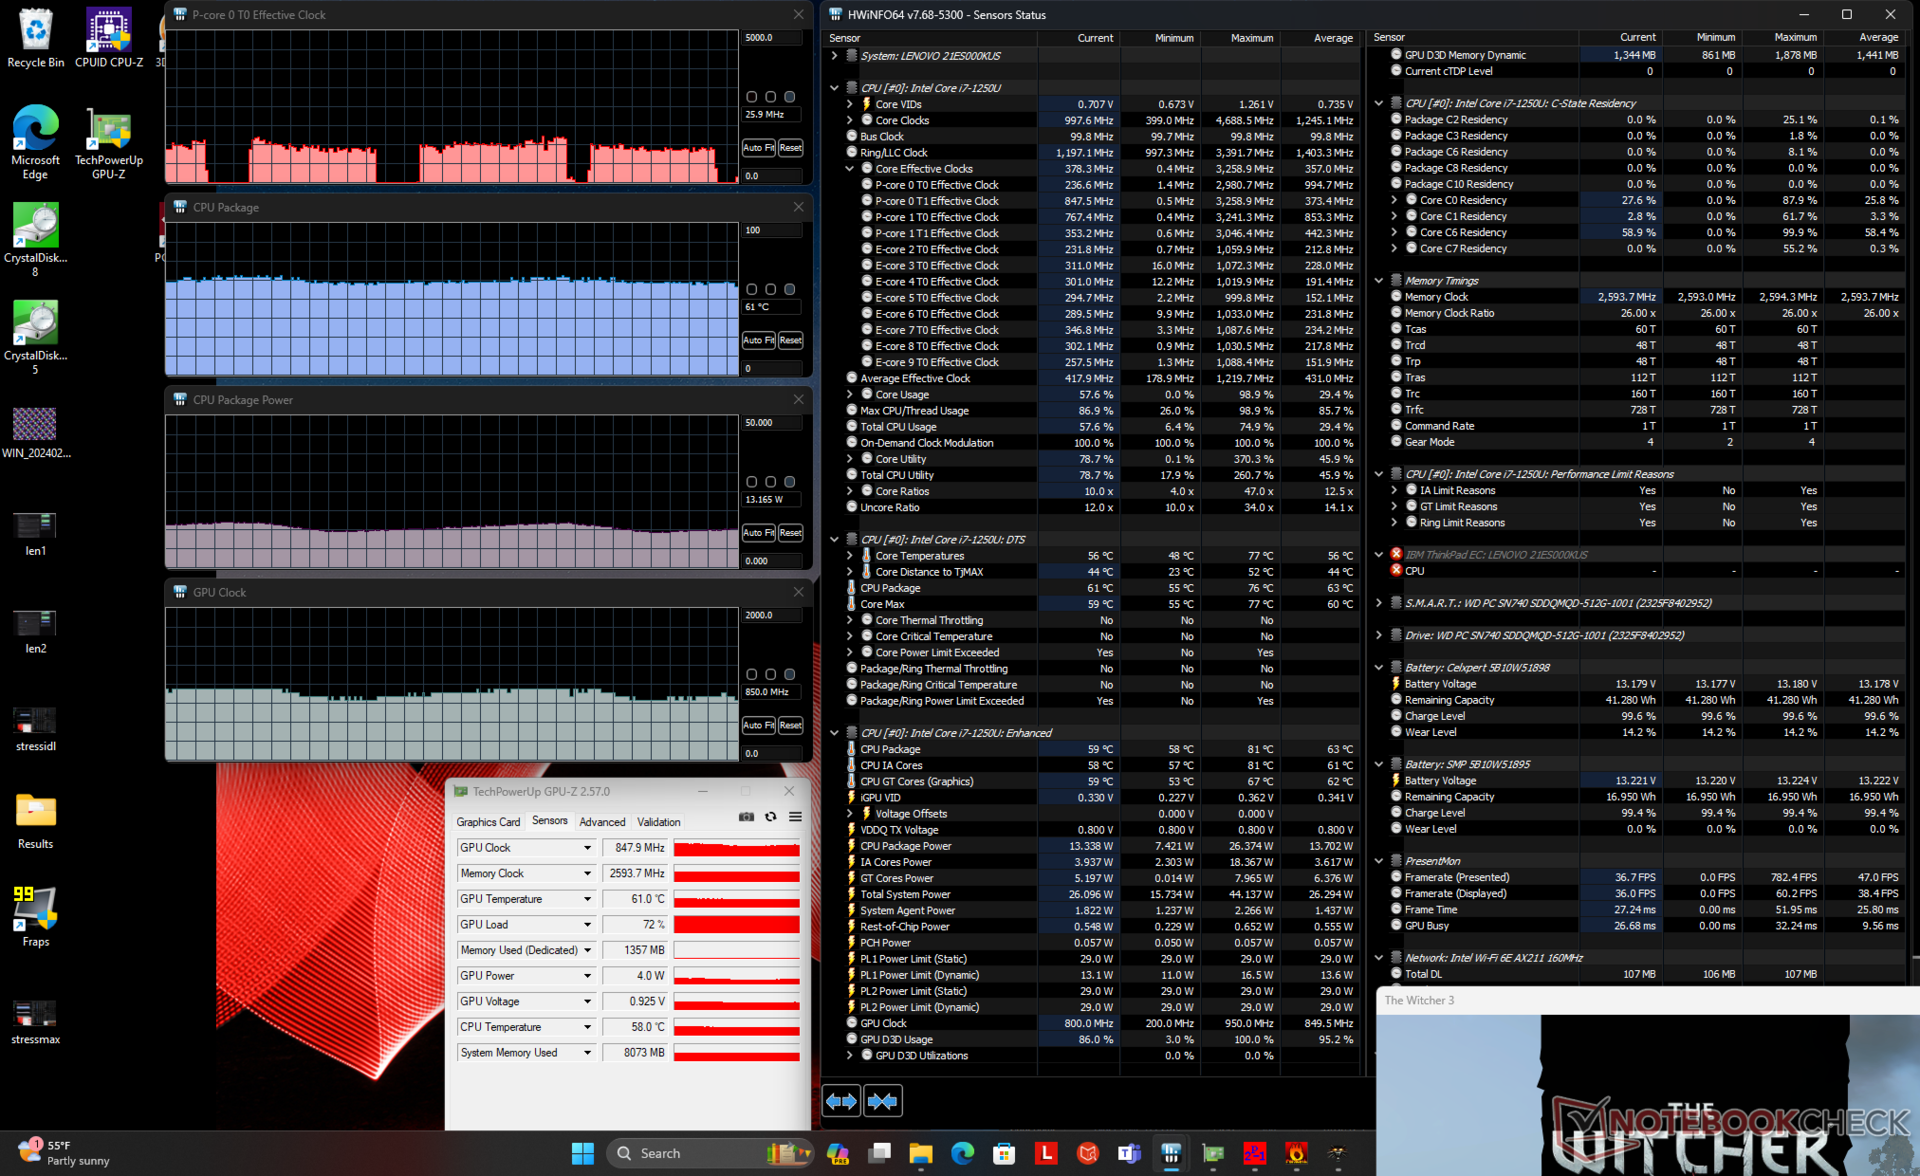
Nous avons réglé Windows sur le mode Performance avant d'exécuter les tests de référence ci-dessous. Les profils d'alimentation Lenovo Commercial Advantage sont synchronisés avec Windows afin de rationaliser le nombre de paramètres pour l'utilisateur final.
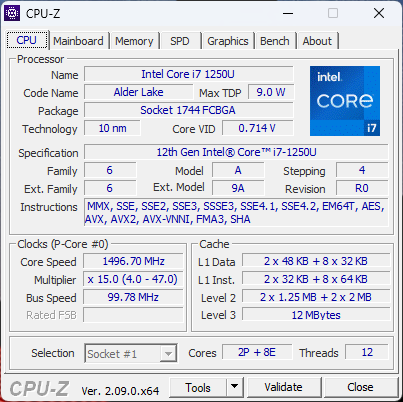
Processeur
L'une des principales critiques formulées à l'encontre de l'ancien modèle 13 pouces était sa lenteur extraordinaire de 7 W Core i5-L16G7 DE 7 W. Lenovo a heureusement entendu les plaintes et a équipé la version 16 pouces d'un processeur de série U de 9 W à la place. Malgré cela, le Core i7-1250U a déjà deux générations de retard et n'a pas très bien vieilli par rapport aux CPU Ryzen de milieu de gamme comme le Ryzen 5 7530U. Il est certes plus rapide que le Core i5-L16G7, mais il est loin d'être aussi rapide que la plupart des ordinateurs portables traditionnels de 15 ou 16 pouces, et il est toujours à la traîne par rapport au Core i5-L16G7 Microsoft Surface Pro 9.
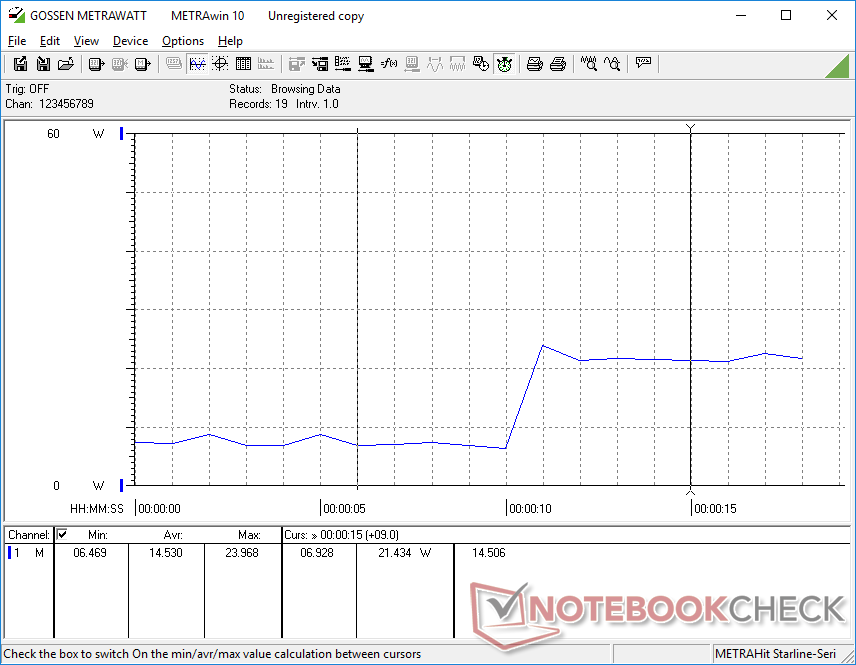
L'approche du refroidissement passif a également un impact sur les performances. Lorsque nous exécutons CineBench R15 xT en boucle, par exemple, notre score initial de 1 085 points tombe à 820 points après 2 ou 3 boucles, ce qui représente une baisse de performance de 25 % au fil du temps. Cela montre que le ThinkPad X1 Fold 16 est plus performant sur de courtes périodes, car des charges plus longues et plus exigeantes peuvent commencer à ralentir le processeur.
Cinebench R15 Multi Loop
Cinebench R23: Multi Core | Single Core
Cinebench R20: CPU (Multi Core) | CPU (Single Core)
Cinebench R15: CPU Multi 64Bit | CPU Single 64Bit
Blender: v2.79 BMW27 CPU
7-Zip 18.03: 7z b 4 | 7z b 4 -mmt1
Geekbench 6.7: Multi-Core | Single-Core
Geekbench 5.5: Multi-Core | Single-Core
HWBOT x265 Benchmark v2.2: 4k Preset
LibreOffice : 20 Documents To PDF
R Benchmark 2.5: Overall mean
| Geekbench 6.7 / Multi-Core | |
| Lenovo ThinkPad X1 Carbon G11 21HNS54T00 | |
| Asus ROG Flow X13 GV302XV | |
| LG Gram 2in1 16 16T90R - G.AA78G | |
| Lenovo Thinkpad X1 Fold 16 | |
| Moyenne Intel Core i7-1250U (n=1) | |
| HP Envy x360 15-fh0077ng | |
| Geekbench 6.7 / Single-Core | |
| Lenovo ThinkPad X1 Carbon G11 21HNS54T00 | |
| Asus ROG Flow X13 GV302XV | |
| LG Gram 2in1 16 16T90R - G.AA78G | |
| Lenovo Thinkpad X1 Fold 16 | |
| Moyenne Intel Core i7-1250U (n=1) | |
| HP Envy x360 15-fh0077ng | |
Cinebench R23: Multi Core | Single Core
Cinebench R20: CPU (Multi Core) | CPU (Single Core)
Cinebench R15: CPU Multi 64Bit | CPU Single 64Bit
Blender: v2.79 BMW27 CPU
7-Zip 18.03: 7z b 4 | 7z b 4 -mmt1
Geekbench 6.7: Multi-Core | Single-Core
Geekbench 5.5: Multi-Core | Single-Core
HWBOT x265 Benchmark v2.2: 4k Preset
LibreOffice : 20 Documents To PDF
R Benchmark 2.5: Overall mean
* ... Moindre est la valeur, meilleures sont les performances
AIDA64: FP32 Ray-Trace | FPU Julia | CPU SHA3 | CPU Queen | FPU SinJulia | FPU Mandel | CPU AES | CPU ZLib | FP64 Ray-Trace | CPU PhotoWorxx
| AIDA64 / FP32 Ray-Trace | |
| Microsoft Surface Pro 9, i7-1255U | |
| HP Elite Dragonfly Folio 13.5 G3 | |
| Moyenne Intel Core i7-1250U (5093 - 7187, n=3) | |
| Asus Zenbook 17 Fold UX9702 | |
| Lenovo ThinkPad X1 Carbon G11 21HNS54T00 | |
| Lenovo Thinkpad X1 Fold 16 | |
| Lenovo ThinkPad X1 Fold 20RL000FGE | |
| AIDA64 / FPU SinJulia | |
| Lenovo ThinkPad X1 Carbon G11 21HNS54T00 | |
| Lenovo ThinkPad X1 Fold 20RL000FGE | |
| Microsoft Surface Pro 9, i7-1255U | |
| HP Elite Dragonfly Folio 13.5 G3 | |
| Moyenne Intel Core i7-1250U (3617 - 4347, n=3) | |
| Asus Zenbook 17 Fold UX9702 | |
| Lenovo Thinkpad X1 Fold 16 | |
| AIDA64 / FP64 Ray-Trace | |
| Microsoft Surface Pro 9, i7-1255U | |
| HP Elite Dragonfly Folio 13.5 G3 | |
| Moyenne Intel Core i7-1250U (2687 - 3755, n=3) | |
| Lenovo ThinkPad X1 Carbon G11 21HNS54T00 | |
| Asus Zenbook 17 Fold UX9702 | |
| Lenovo ThinkPad X1 Fold 20RL000FGE | |
| Lenovo Thinkpad X1 Fold 16 | |
| AIDA64 / CPU PhotoWorxx | |
| Lenovo ThinkPad X1 Fold 20RL000FGE | |
| Microsoft Surface Pro 9, i7-1255U | |
| HP Elite Dragonfly Folio 13.5 G3 | |
| Asus Zenbook 17 Fold UX9702 | |
| Moyenne Intel Core i7-1250U (31653 - 36020, n=3) | |
| Lenovo ThinkPad X1 Carbon G11 21HNS54T00 | |
| Lenovo Thinkpad X1 Fold 16 | |
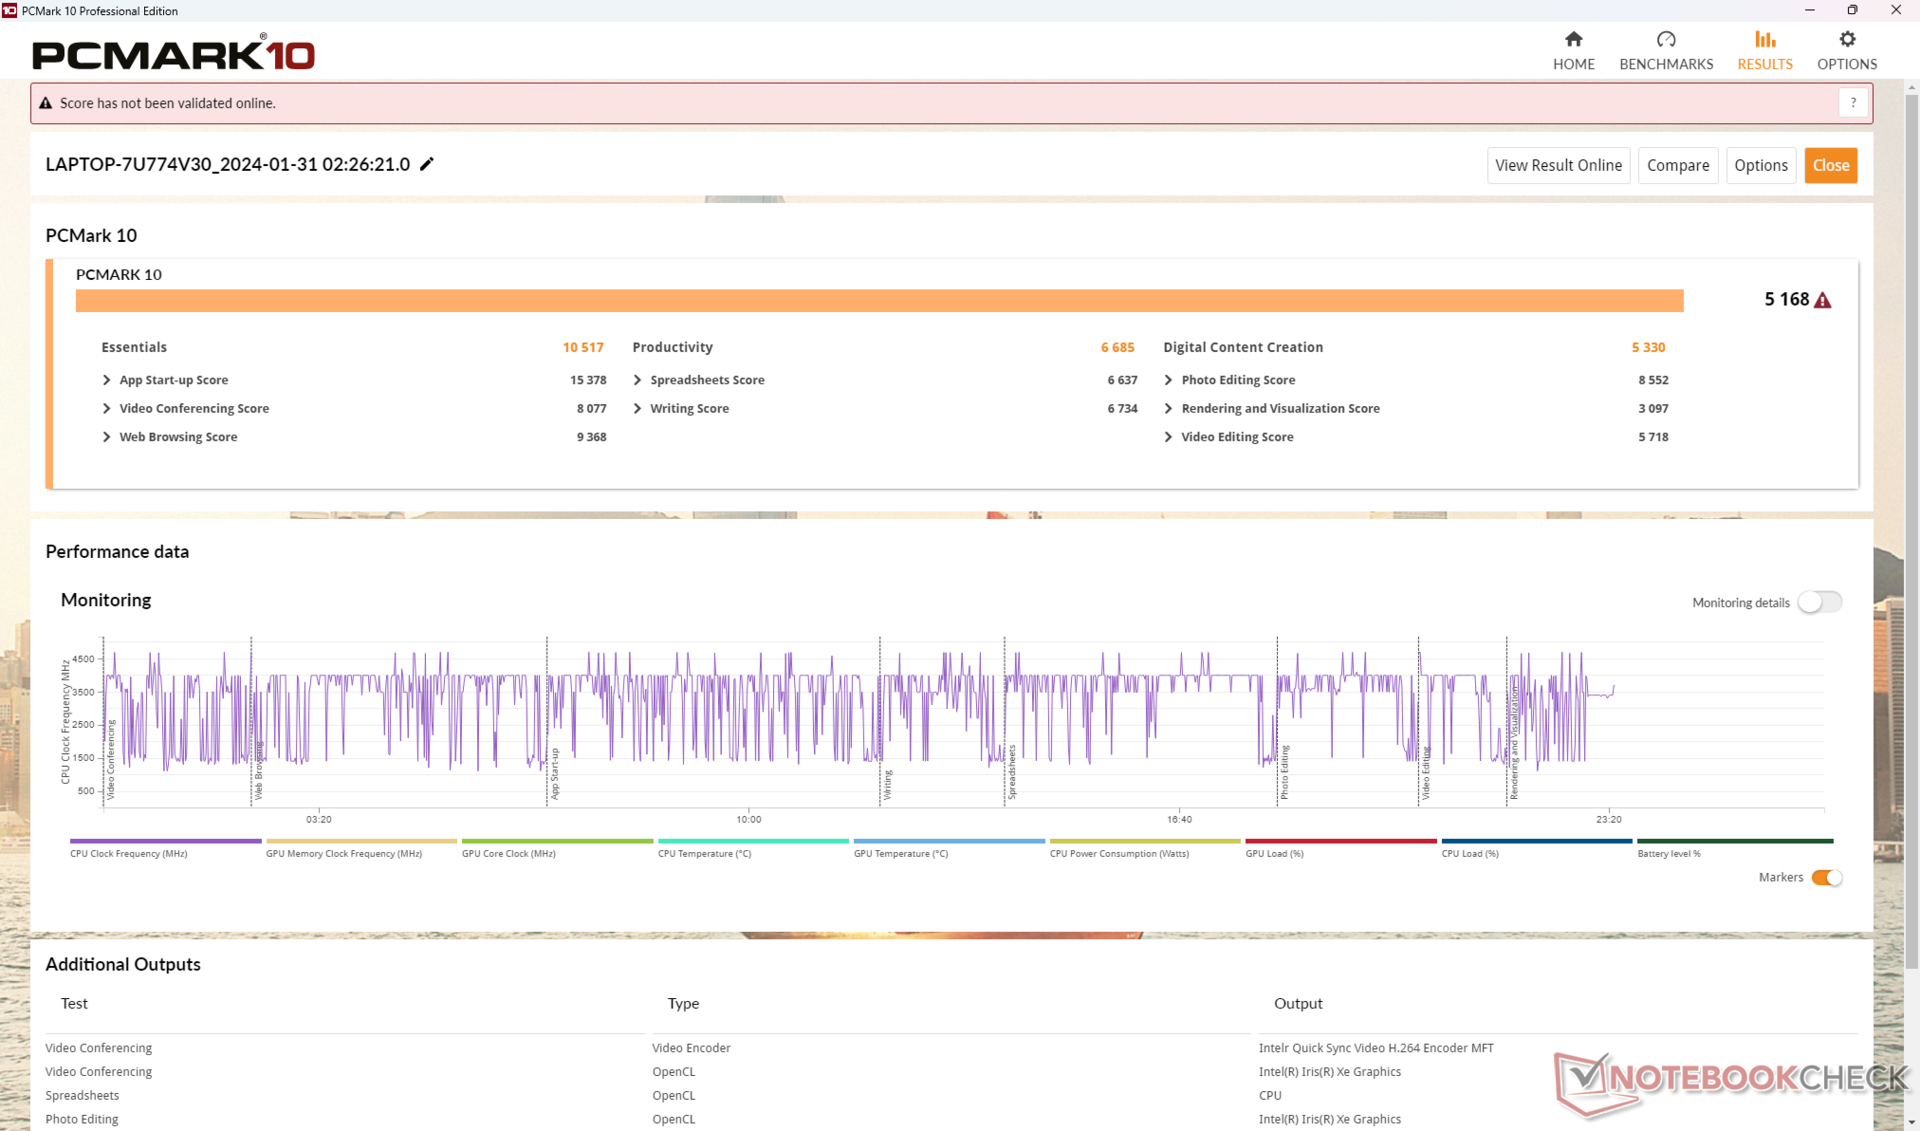
Performance du système
Les résultats de PCMark sont presque 2,5 fois plus élevés en moyenne par rapport au modèle 13 pouces, ce qui représente une amélioration significative des performances. L'écart est suffisamment important pour que les utilisateurs puissent ressentir la différence de vitesse lorsqu'ils naviguent simplement dans Windows, lancent des applications ou passent d'un onglet de navigateur à l'autre. L'expérience globale de l'utilisateur est donc plus proche d'un ordinateur portable classique et beaucoup plus fluide pour les utilisateurs multitâches que ne l'a jamais été le modèle original de 13 pouces.
CrossMark: Overall | Productivity | Creativity | Responsiveness
WebXPRT 3: Overall
WebXPRT 4: Overall
Mozilla Kraken 1.1: Total
| PCMark 10 / Score | |
| HP Elite Dragonfly Folio 13.5 G3 | |
| Lenovo ThinkPad X1 Carbon G11 21HNS54T00 | |
| Microsoft Surface Pro 9, i7-1255U | |
| Moyenne Intel Core i7-1250U, Intel Iris Xe Graphics G7 96EUs (5168 - 5207, n=2) | |
| Lenovo Thinkpad X1 Fold 16 | |
| Asus Zenbook 17 Fold UX9702 | |
| Lenovo ThinkPad X1 Fold 20RL000FGE | |
| PCMark 10 / Essentials | |
| HP Elite Dragonfly Folio 13.5 G3 | |
| Lenovo ThinkPad X1 Carbon G11 21HNS54T00 | |
| Moyenne Intel Core i7-1250U, Intel Iris Xe Graphics G7 96EUs (10517 - 10742, n=2) | |
| Lenovo Thinkpad X1 Fold 16 | |
| Asus Zenbook 17 Fold UX9702 | |
| Microsoft Surface Pro 9, i7-1255U | |
| Lenovo ThinkPad X1 Fold 20RL000FGE | |
| PCMark 10 / Productivity | |
| Lenovo ThinkPad X1 Carbon G11 21HNS54T00 | |
| HP Elite Dragonfly Folio 13.5 G3 | |
| Moyenne Intel Core i7-1250U, Intel Iris Xe Graphics G7 96EUs (6685 - 7062, n=2) | |
| Asus Zenbook 17 Fold UX9702 | |
| Lenovo Thinkpad X1 Fold 16 | |
| Microsoft Surface Pro 9, i7-1255U | |
| Lenovo ThinkPad X1 Fold 20RL000FGE | |
| PCMark 10 / Digital Content Creation | |
| HP Elite Dragonfly Folio 13.5 G3 | |
| Microsoft Surface Pro 9, i7-1255U | |
| Lenovo ThinkPad X1 Carbon G11 21HNS54T00 | |
| Lenovo Thinkpad X1 Fold 16 | |
| Moyenne Intel Core i7-1250U, Intel Iris Xe Graphics G7 96EUs (5052 - 5330, n=2) | |
| Asus Zenbook 17 Fold UX9702 | |
| Lenovo ThinkPad X1 Fold 20RL000FGE | |
| CrossMark / Overall | |
| Lenovo ThinkPad X1 Carbon G11 21HNS54T00 | |
| HP Elite Dragonfly Folio 13.5 G3 | |
| Microsoft Surface Pro 9, i7-1255U | |
| Asus Zenbook 17 Fold UX9702 | |
| Lenovo Thinkpad X1 Fold 16 | |
| Moyenne Intel Core i7-1250U, Intel Iris Xe Graphics G7 96EUs (1338 - 1361, n=2) | |
| CrossMark / Productivity | |
| Lenovo ThinkPad X1 Carbon G11 21HNS54T00 | |
| HP Elite Dragonfly Folio 13.5 G3 | |
| Microsoft Surface Pro 9, i7-1255U | |
| Asus Zenbook 17 Fold UX9702 | |
| Lenovo Thinkpad X1 Fold 16 | |
| Moyenne Intel Core i7-1250U, Intel Iris Xe Graphics G7 96EUs (1333 - 1345, n=2) | |
| CrossMark / Creativity | |
| Lenovo ThinkPad X1 Carbon G11 21HNS54T00 | |
| HP Elite Dragonfly Folio 13.5 G3 | |
| Microsoft Surface Pro 9, i7-1255U | |
| Asus Zenbook 17 Fold UX9702 | |
| Lenovo Thinkpad X1 Fold 16 | |
| Moyenne Intel Core i7-1250U, Intel Iris Xe Graphics G7 96EUs (1400 - 1461, n=2) | |
| CrossMark / Responsiveness | |
| HP Elite Dragonfly Folio 13.5 G3 | |
| Lenovo ThinkPad X1 Carbon G11 21HNS54T00 | |
| Microsoft Surface Pro 9, i7-1255U | |
| Asus Zenbook 17 Fold UX9702 | |
| Moyenne Intel Core i7-1250U, Intel Iris Xe Graphics G7 96EUs (1140 - 1180, n=2) | |
| Lenovo Thinkpad X1 Fold 16 | |
| WebXPRT 3 / Overall | |
| Lenovo ThinkPad X1 Carbon G11 21HNS54T00 | |
| Lenovo ThinkPad X1 Carbon G11 21HNS54T00 | |
| HP Elite Dragonfly Folio 13.5 G3 | |
| Asus Zenbook 17 Fold UX9702 | |
| Moyenne Intel Core i7-1250U, Intel Iris Xe Graphics G7 96EUs (265 - 267, n=2) | |
| Microsoft Surface Pro 9, i7-1255U | |
| Lenovo Thinkpad X1 Fold 16 | |
| Lenovo ThinkPad X1 Fold 20RL000FGE | |
| WebXPRT 4 / Overall | |
| HP Elite Dragonfly Folio 13.5 G3 | |
| Asus Zenbook 17 Fold UX9702 | |
| Moyenne Intel Core i7-1250U, Intel Iris Xe Graphics G7 96EUs (228 - 229, n=2) | |
| Microsoft Surface Pro 9, i7-1255U | |
| Lenovo Thinkpad X1 Fold 16 | |
| Mozilla Kraken 1.1 / Total | |
| Lenovo ThinkPad X1 Fold 20RL000FGE | |
| Moyenne Intel Core i7-1250U, Intel Iris Xe Graphics G7 96EUs (577 - 587, n=2) | |
| Lenovo Thinkpad X1 Fold 16 | |
| Microsoft Surface Pro 9, i7-1255U | |
| Asus Zenbook 17 Fold UX9702 | |
| HP Elite Dragonfly Folio 13.5 G3 | |
| Lenovo ThinkPad X1 Carbon G11 21HNS54T00 | |
| Lenovo ThinkPad X1 Carbon G11 21HNS54T00 | |
* ... Moindre est la valeur, meilleures sont les performances
| PCMark 10 Score | 5168 points | |
Aide | ||
| AIDA64 / Memory Copy | |
| Lenovo ThinkPad X1 Carbon G11 21HNS54T00 | |
| Microsoft Surface Pro 9, i7-1255U | |
| HP Elite Dragonfly Folio 13.5 G3 | |
| Asus Zenbook 17 Fold UX9702 | |
| Moyenne Intel Core i7-1250U (54484 - 61468, n=3) | |
| Lenovo Thinkpad X1 Fold 16 | |
| AIDA64 / Memory Latency | |
| Asus Zenbook 17 Fold UX9702 | |
| Moyenne Intel Core i7-1250U (89.3 - 145.7, n=3) | |
| HP Elite Dragonfly Folio 13.5 G3 | |
| Microsoft Surface Pro 9, i7-1255U | |
| Lenovo ThinkPad X1 Carbon G11 21HNS54T00 | |
| Lenovo Thinkpad X1 Fold 16 | |
| Lenovo ThinkPad X1 Fold 20RL000FGE | |
* ... Moindre est la valeur, meilleures sont les performances
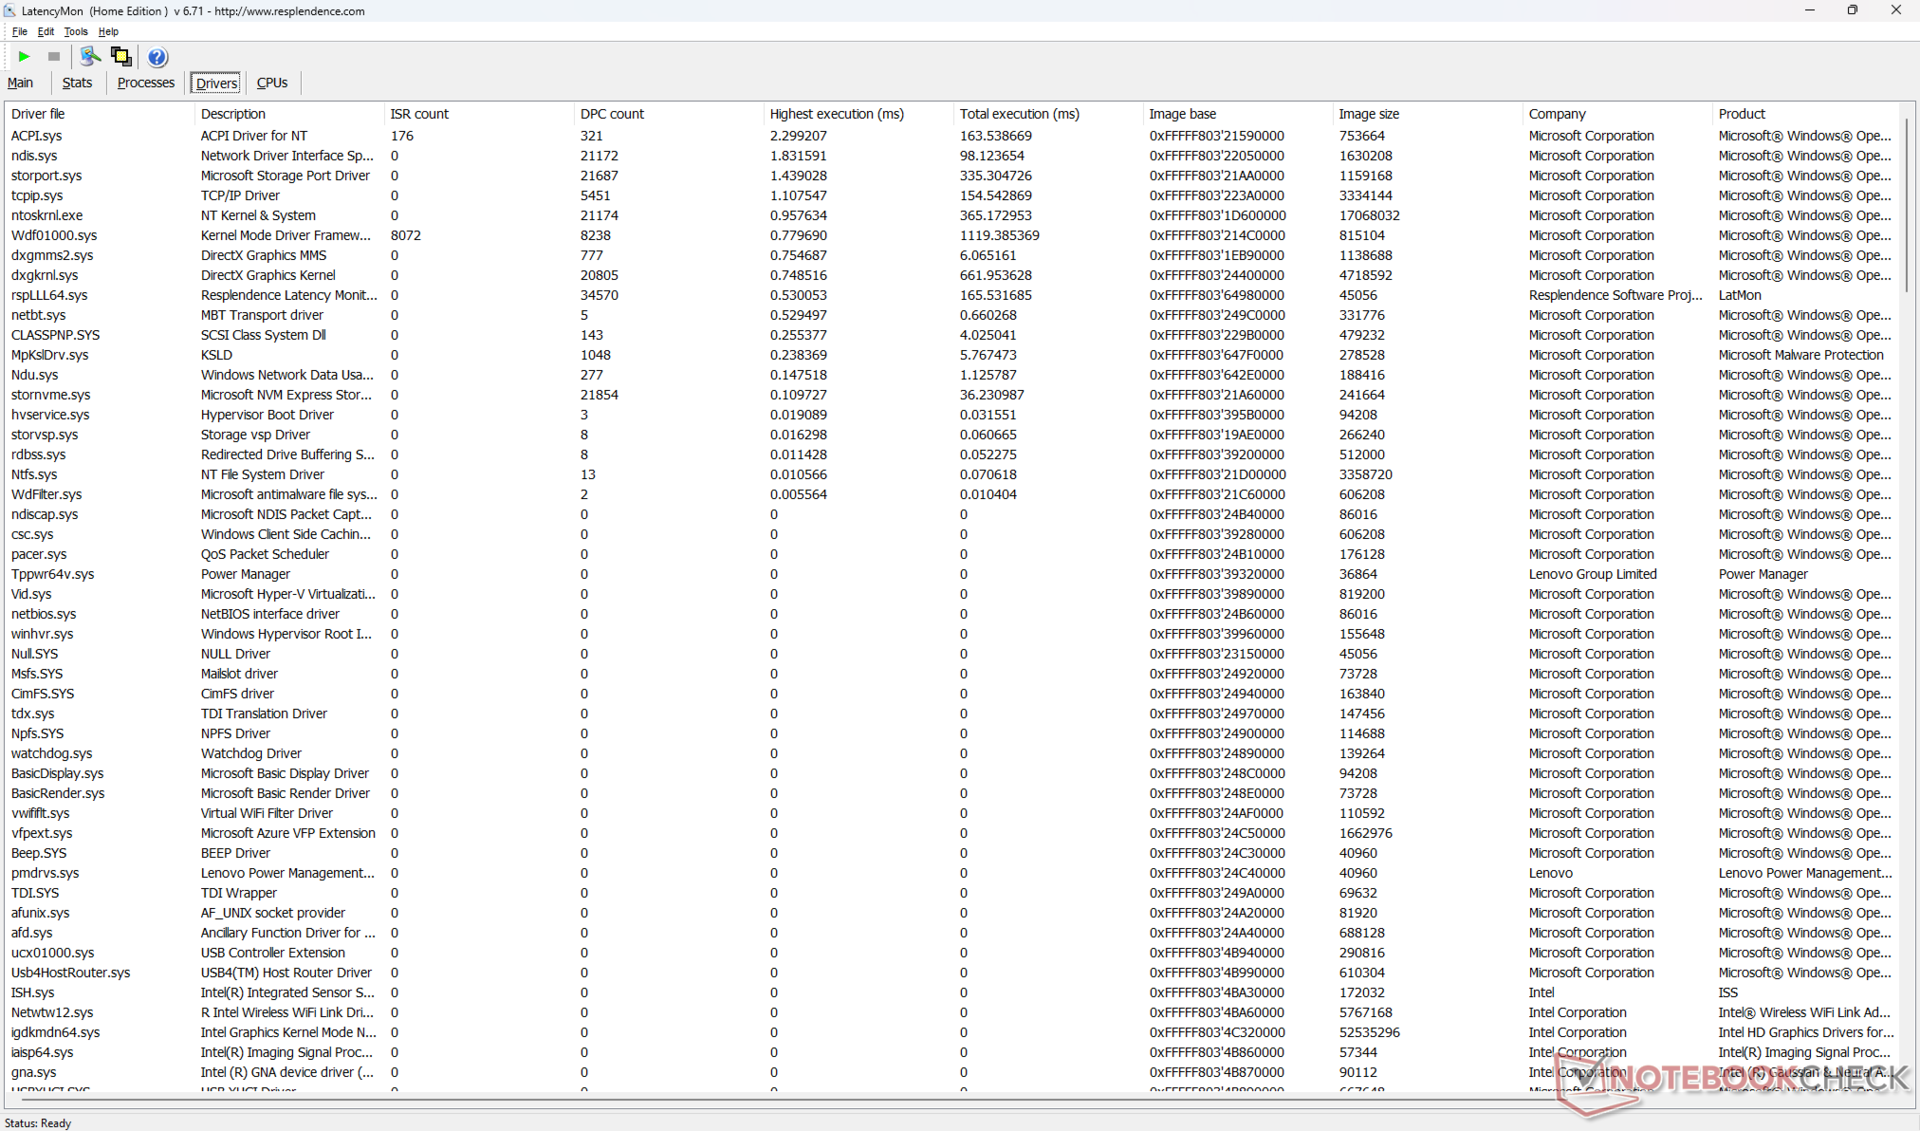
Latence DPC
LatencyMon révèle à la fois des problèmes de DPC et 3 images perdues lors de la lecture de vidéos 4K à 60 FPS. Le premier n'est pas anormal, mais nous nous attendons à ce qu'il n'y ait pas de perte d'images pour un système fonctionnant avec un processeur Core i7 U-series.

| DPC Latencies / LatencyMon - interrupt to process latency (max), Web, Youtube, Prime95 | |
| HP Elite Dragonfly Folio 13.5 G3 | |
| Lenovo ThinkPad X1 Fold 20RL000FGE | |
| Microsoft Surface Pro 9, i7-1255U | |
| Lenovo Thinkpad X1 Fold 16 | |
| Lenovo ThinkPad X1 Carbon G11 21HNS54T00 | |
| Asus Zenbook 17 Fold UX9702 | |
* ... Moindre est la valeur, meilleures sont les performances
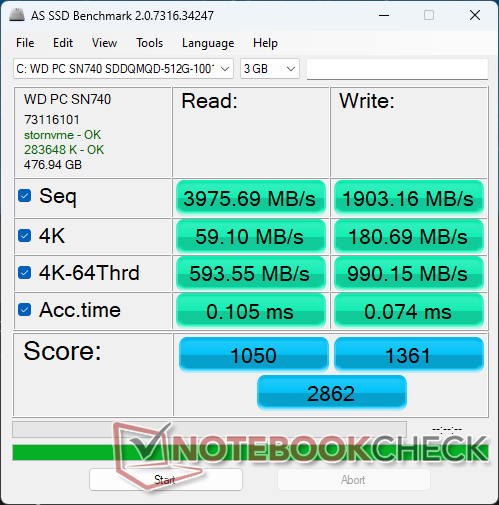
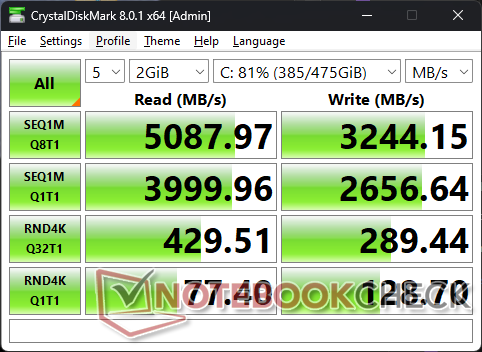
Dispositifs de stockage
Notre appareil est livré avec un disque dur de 512 Go Western Digital SN740 SDDQMQD PCIe4 x4 NVMe SSD pour des taux de lecture séquentielle et d'écriture approchant respectivement 5000 Mo/s et 3200 Mo/s. Le petit disque M.2 2242 ne présenterait aucun problème d'étranglement des performances lorsqu'il est sollicité avec DiskSpd pendant plusieurs minutes.

* ... Moindre est la valeur, meilleures sont les performances
Disk Throttling: DiskSpd Read Loop, Queue Depth 8
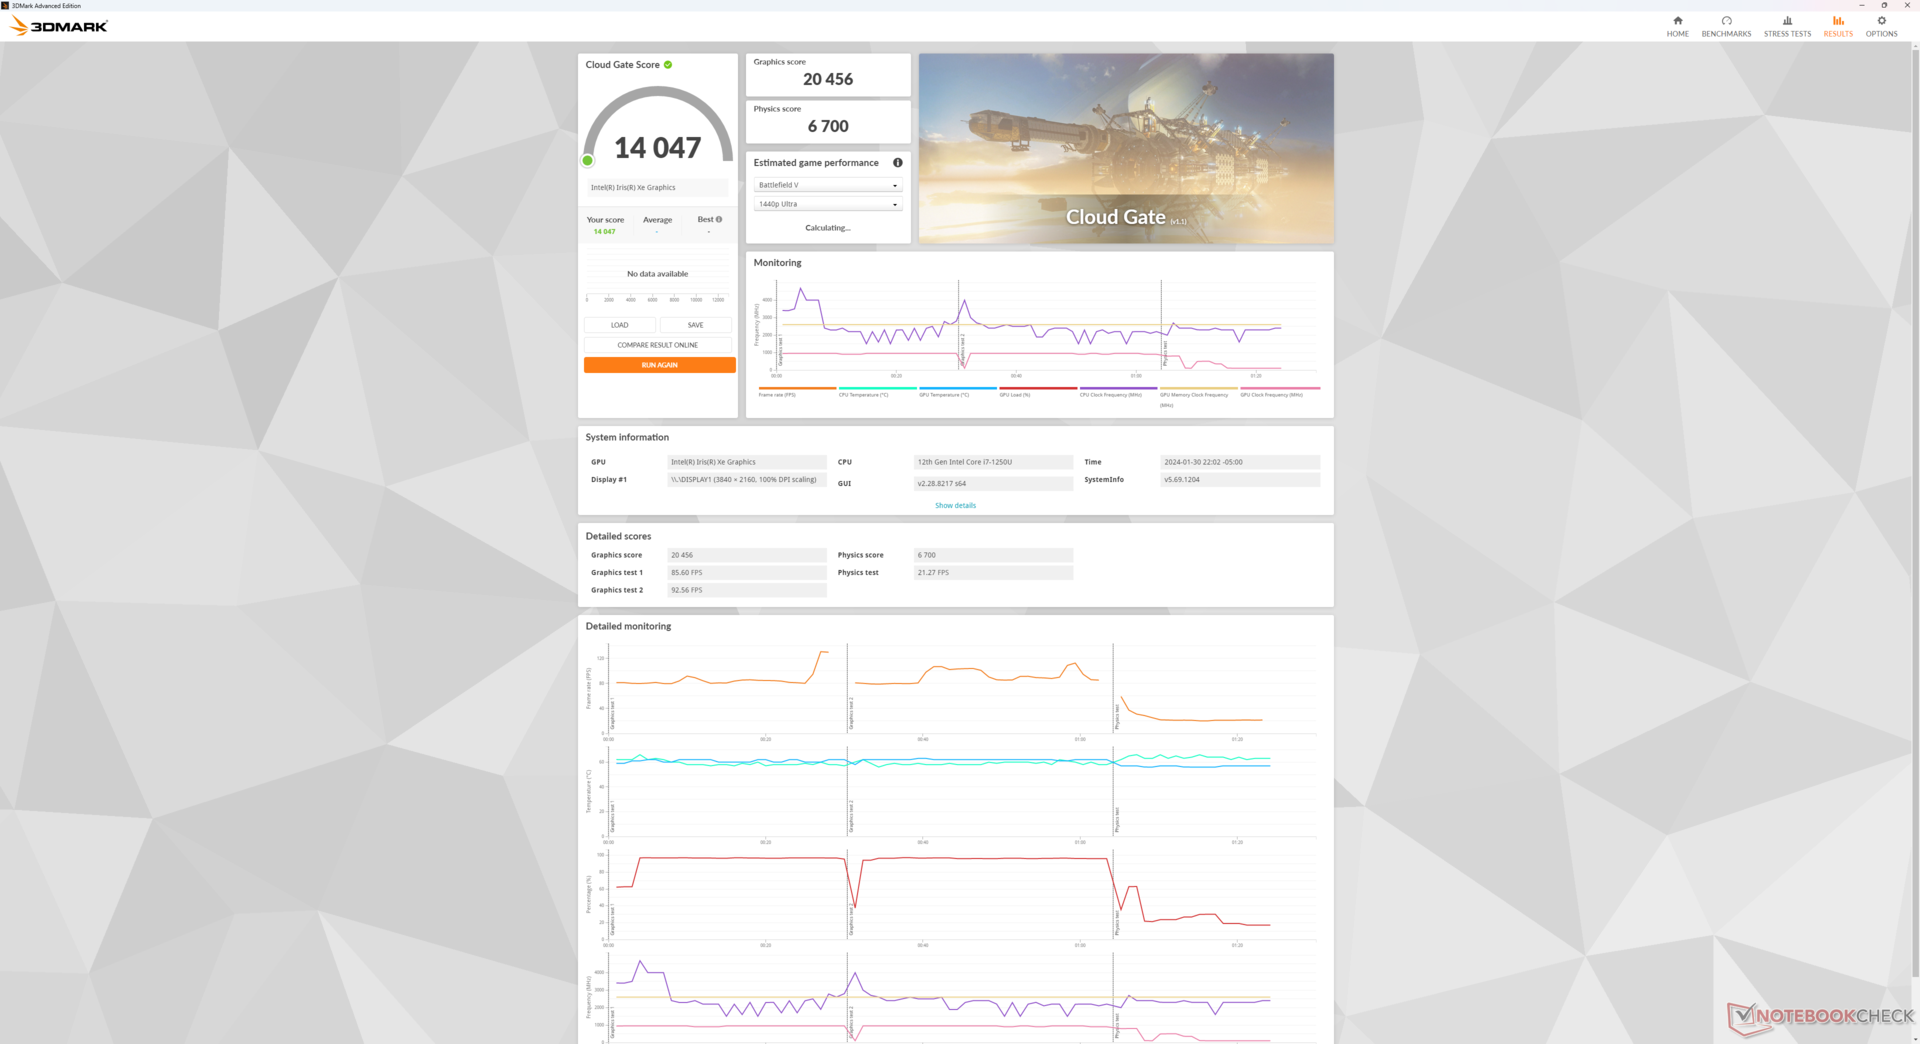
Performance du GPU
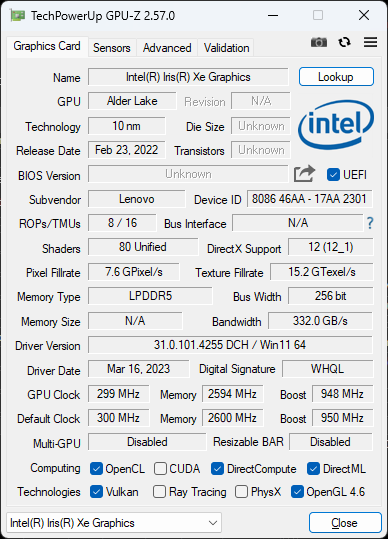
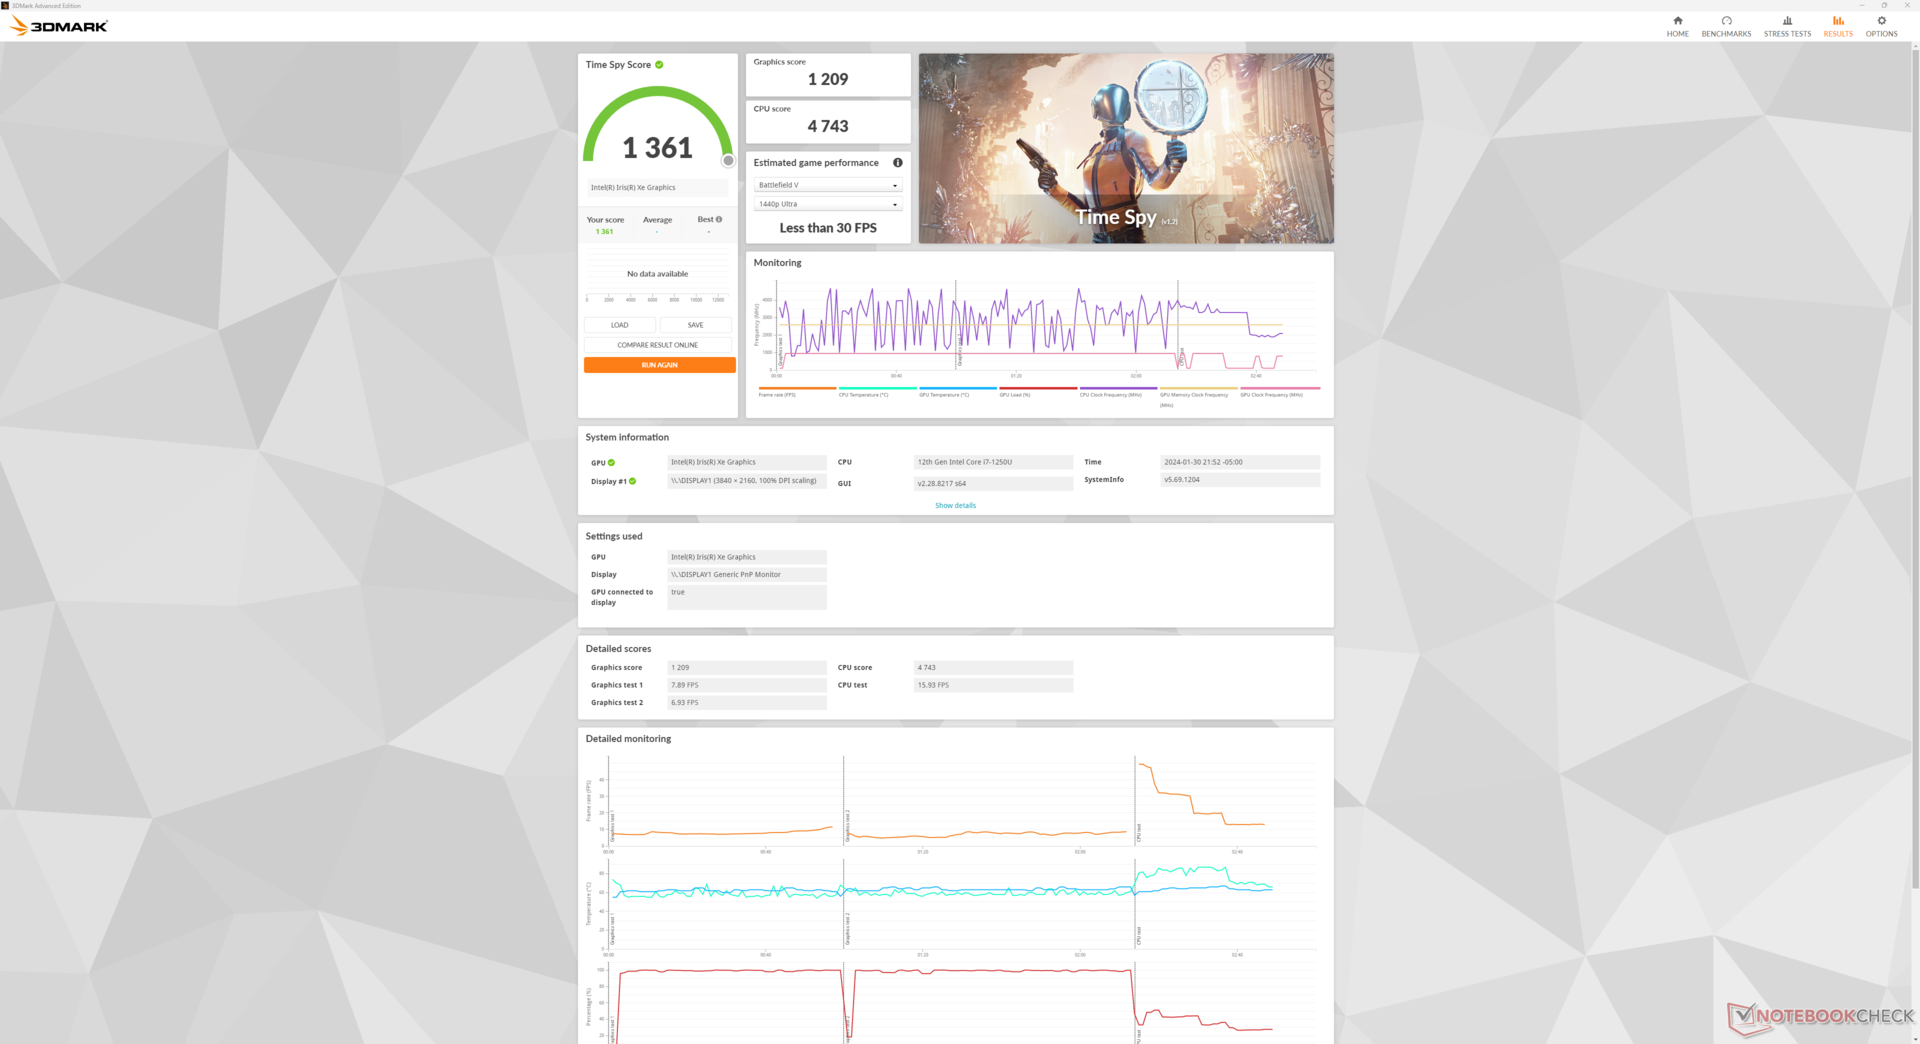
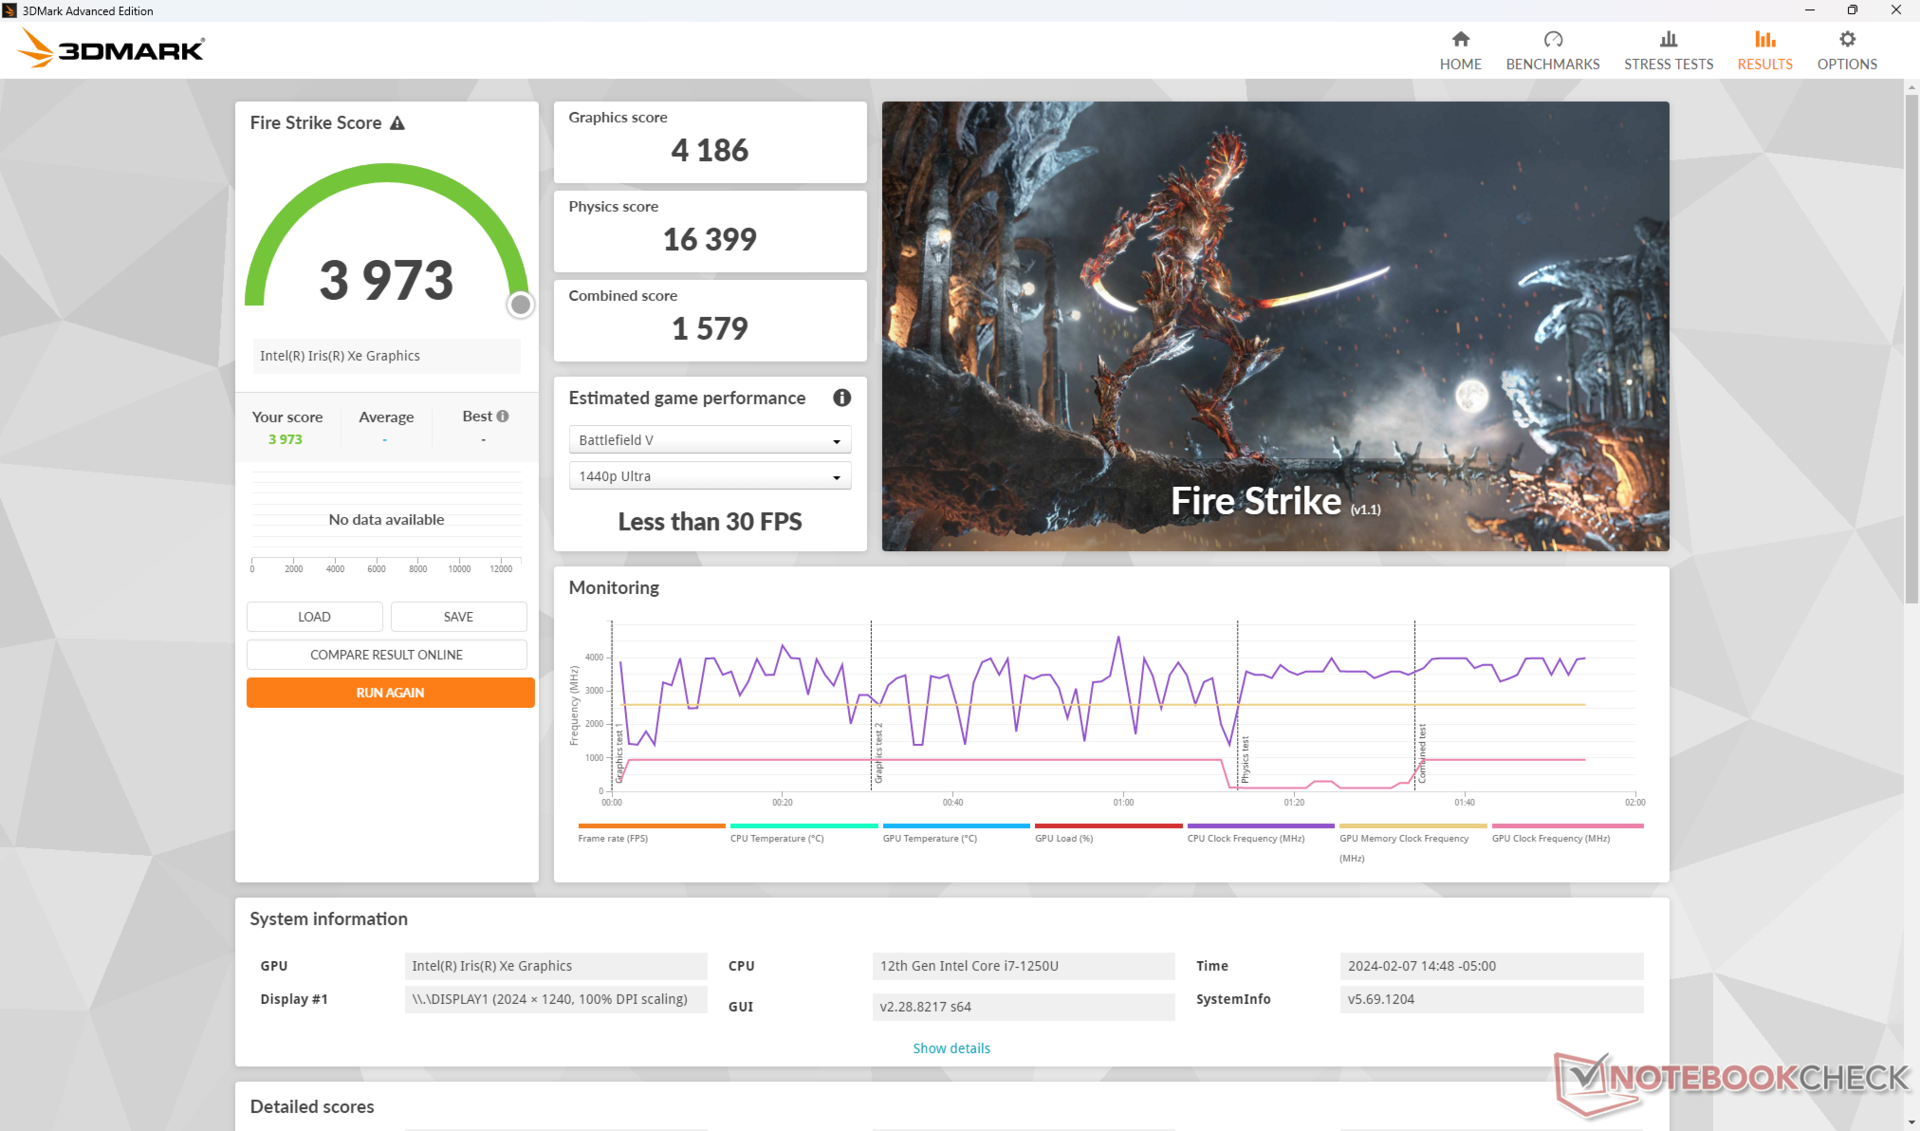
Les performances graphiques sont de nouveau 2 à 3 fois plus rapides que celles de la UHD Graphics de l'ancien ThinkPad Fold de 13 pouces. Cependant, elle est inférieure à celle des ordinateurs portables dotés de la même solution Iris Xe 96 EUs intégrée la même solution Iris Xe 96 EUs intégrée de 15 à 20 % en moyenne. Ce déficit est probablement dû à la conception sans ventilateur et aux performances généralement plus lentes du processeur.
Les performances globales ne sont pas significativement réduites en mode équilibré ou même sur batterie, comme le montre notre tableau de résultats Fire Strike ci-dessous.
| Profil d'alimentation | Score graphique | Score physique | Score combiné |
| Mode Performance | 4186 | 16399 | 1579 |
| Mode équilibré | 4195 | 16489 | 1582 |
| Alimentation par batterie | 4139 | 16246 | 1572 |
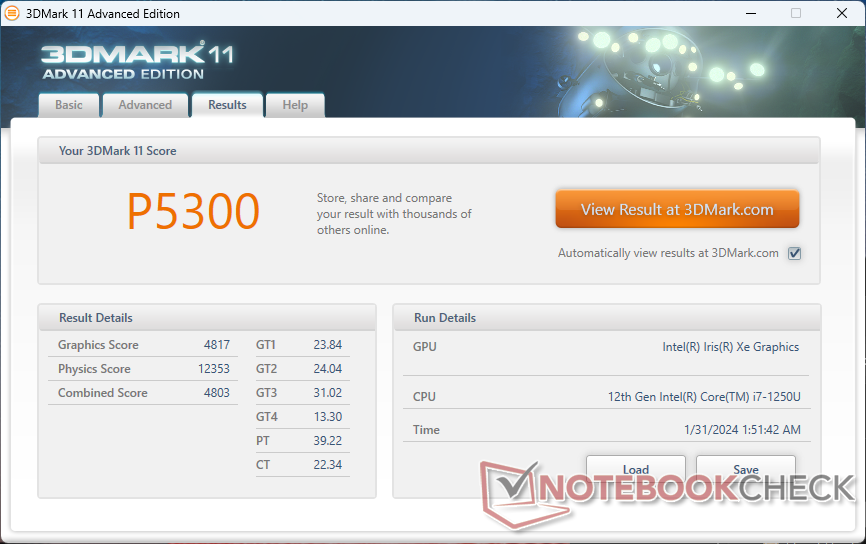
| 3DMark 11 Performance | 5300 points | |
| 3DMark Cloud Gate Standard Score | 14047 points | |
| 3DMark Fire Strike Score | 3973 points | |
| 3DMark Time Spy Score | 1361 points | |
Aide | ||
* ... Moindre est la valeur, meilleures sont les performances
| Cyberpunk 2077 - 1280x720 Low Preset (FSR off) | |
| LG Gram 2in1 16 16T90R - G.AA78G | |
| Moyenne Intel Iris Xe Graphics G7 96EUs (21.4 - 37.3, n=17) | |
| Lenovo Thinkpad X1 Fold 16 | |
Les performances en mode ralenti sur Witcher 3 sur des paramètres bas, le jeu commençait bien avec un taux stable de 75 FPS, mais ce taux chutait après seulement quelques minutes avec des taux d'images fluctuants allant de 50 FPS à 70 FPS. Cette instabilité est due à la fluctuation de la fréquence d'horloge du GPU, comme nous l'expliquons dans la section Test de stress ci-dessous. En comparaison, la plupart des ordinateurs portables dotés d'une carte graphique Iris Xe intégrée affichent des performances plus stables au fil du temps. Ce comportement fluctuant montre que le ThinkPad X1 Fold 16 n'a pas été conçu pour faire tourner la plupart des jeux en mode natif.
Witcher 3 FPS Chart
| Bas | Moyen | Élevé | Ultra | |
|---|---|---|---|---|
| GTA V (2015) | 71.4 | 66.4 | 19.2 | 8.01 |
| The Witcher 3 (2015) | 75.3 | 47.7 | 25.8 | 11.6 |
| Dota 2 Reborn (2015) | 89.8 | 69 | 55.3 | 41.3 |
| Final Fantasy XV Benchmark (2018) | 33.2 | 18.5 | 15.7 | |
| X-Plane 11.11 (2018) | 40.7 | 32 | 28.8 | |
| Far Cry 5 (2018) | 27 | 18 | 16 | 15 |
| Strange Brigade (2018) | 70.2 | 31.5 | 24.1 | 19 |
| F1 22 (2022) | 34.8 | 28 | 22 | 16.1 |
| Cyberpunk 2077 (2023) | 13.1 |
Émissions - Pas de ventilateurs !
Bruit du système
L'une des caractéristiques du ThinkPad X1 Fold 16 est sa conception sans ventilateur par rapport au Zenbook 17 Fold refroidi par ventilateur, Surface Pro 9ou le ThinkPad X1 Fold original de 13 pouces. Nous n'avons remarqué aucun bruit électronique dans notre unité de test, ce qui garantit une expérience utilisateur totalement silencieuse. L'aspect sans ventilateur entre en jeu lors de l'exécution de charges plus exigeantes, car les ventilateurs des modèles Asus ou Microsoft susmentionnés peuvent chacun atteindre plus de 40 dB(A).
| Lenovo Thinkpad X1 Fold 16 Iris Xe G7 96EUs, i7-1250U, WD PC SN740 512GB SDDQMQD-512G | Lenovo ThinkPad X1 Fold 20RL000FGE UHD Graphics G7 (Lakefield GT2 64 EU), i5-L16G7, Toshiba KBG40ZNS256G NVMe | Asus Zenbook 17 Fold UX9702 Iris Xe G7 80EUs, i7-1250U, Samsung PM9A1 MZVL21T0HCLR | Microsoft Surface Pro 9, i7-1255U Iris Xe G7 96EUs, i7-1255U, Samsung MZ9L4512HBLU-00BMV | HP Elite Dragonfly Folio 13.5 G3 Iris Xe G7 96EUs, i7-1265U, Samsung PM9A1 MZVL2512HCJQ | Lenovo ThinkPad X1 Carbon G11 21HNS54T00 Iris Xe G7 96EUs, i7-1370P, WDC PC SN810 2TB | |
|---|---|---|---|---|---|---|
| Noise | ||||||
| arrêt / environnement * (dB) | 25.1 | 23.4 | 24.3 | 24.6 | 23.3 | |
| Idle Minimum * (dB) | 25.1 | 24.3 | 24.3 | 24.6 | 23.3 | |
| Idle Average * (dB) | 25.1 | 24.3 | 24.3 | 24.6 | 23.3 | |
| Idle Maximum * (dB) | 25.1 | 24.3 | 24.3 | 24.6 | 23.3 | |
| Load Average * (dB) | 25.1 | 27.9 | 37.9 | 27.8 | 35.9 | |
| Load Maximum * (dB) | 26.8 | 43.4 | 41.8 | 33.4 | 40.9 | |
| Witcher 3 ultra * (dB) | 43.4 | 39.6 | 33.4 | 41 |
* ... Moindre est la valeur, meilleures sont les performances
Température
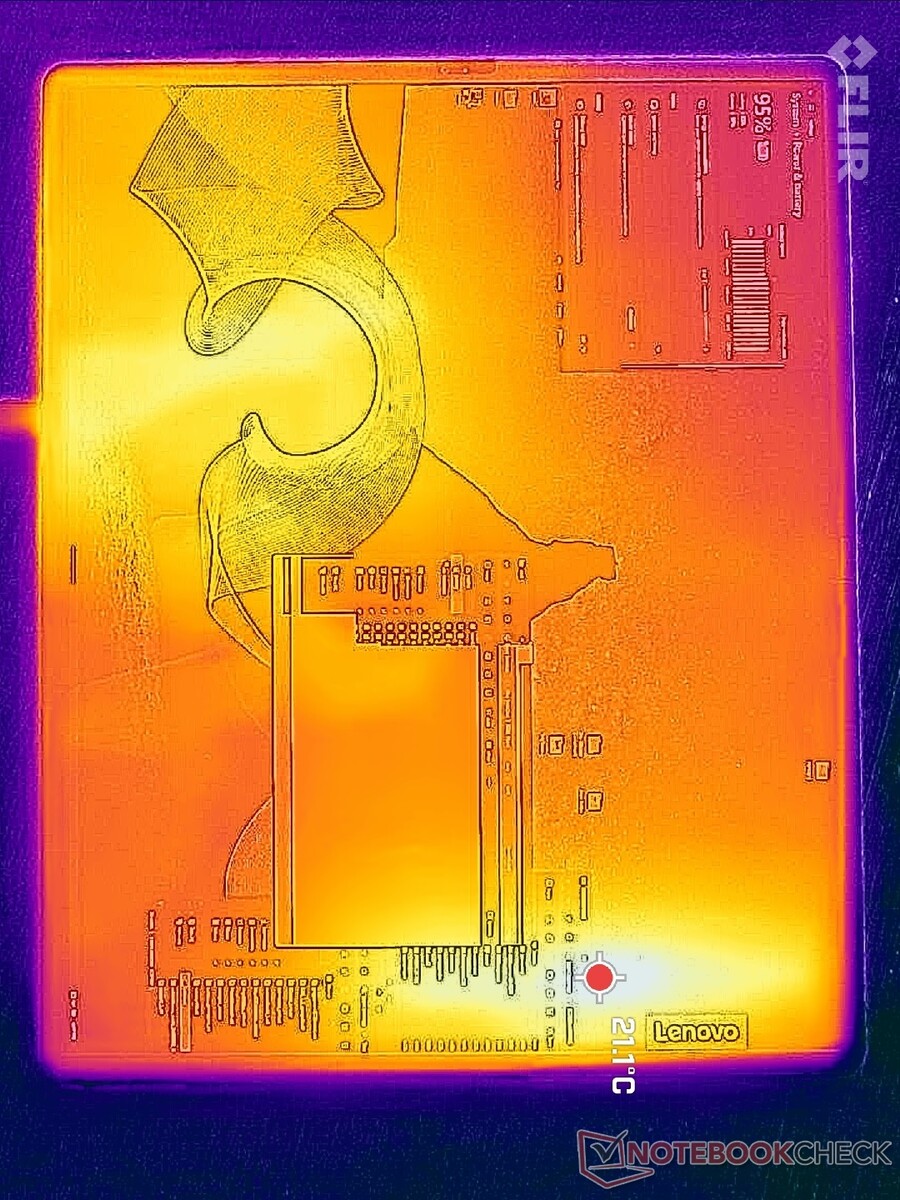
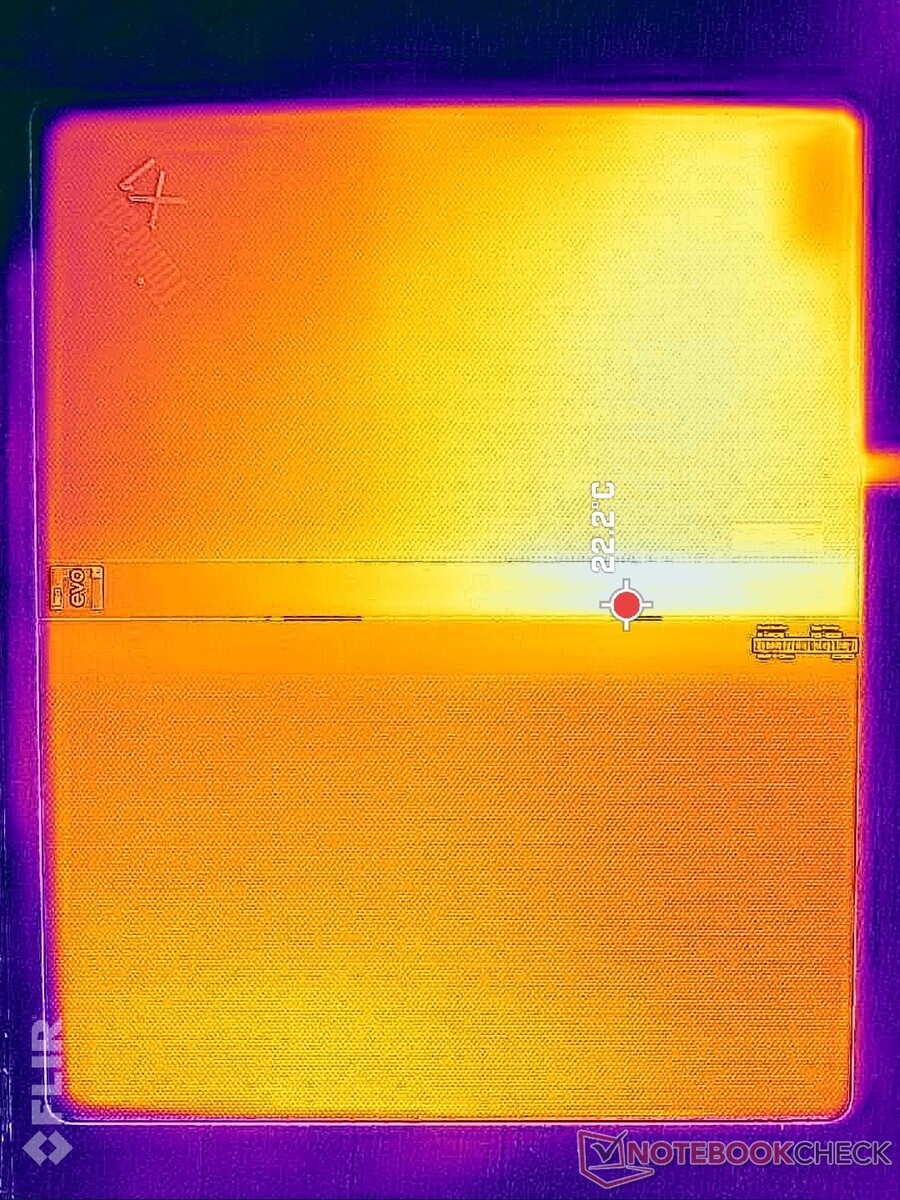
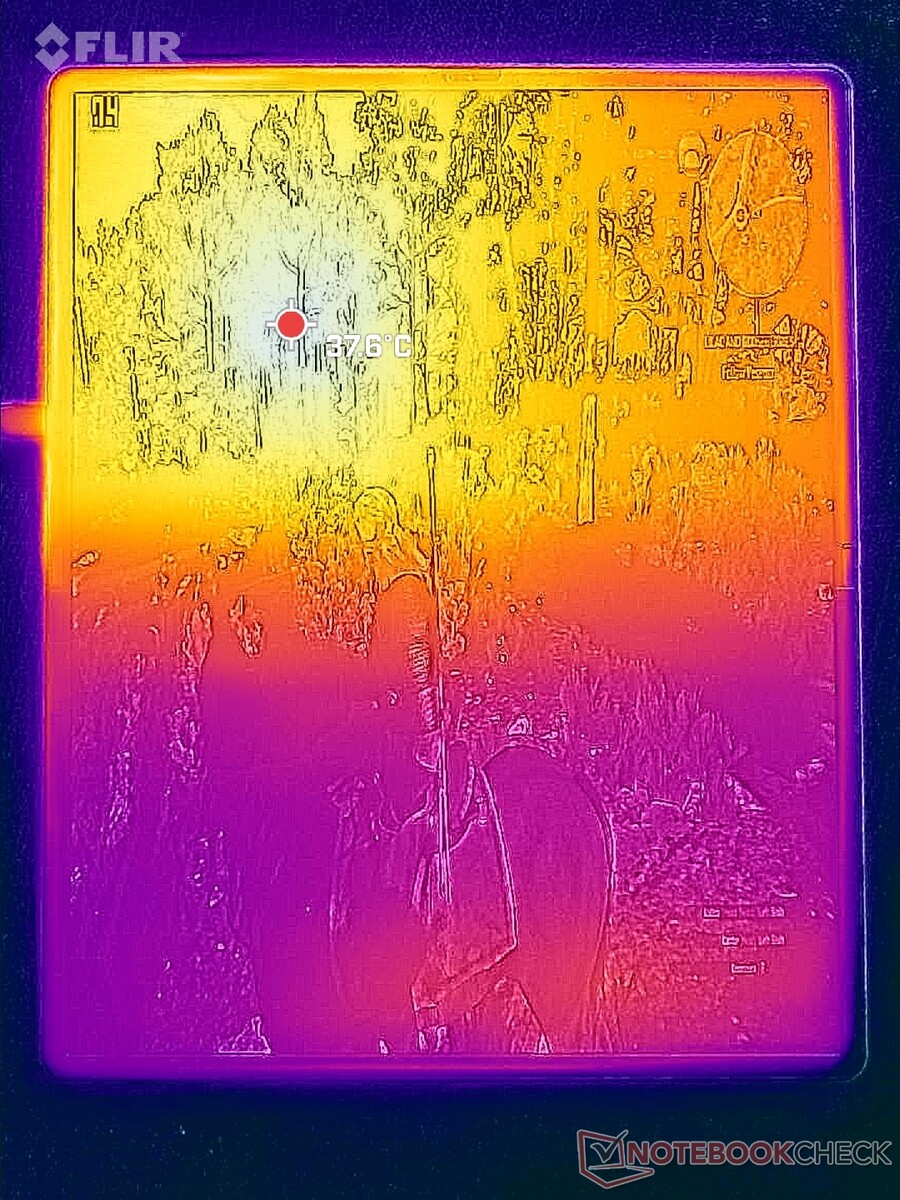
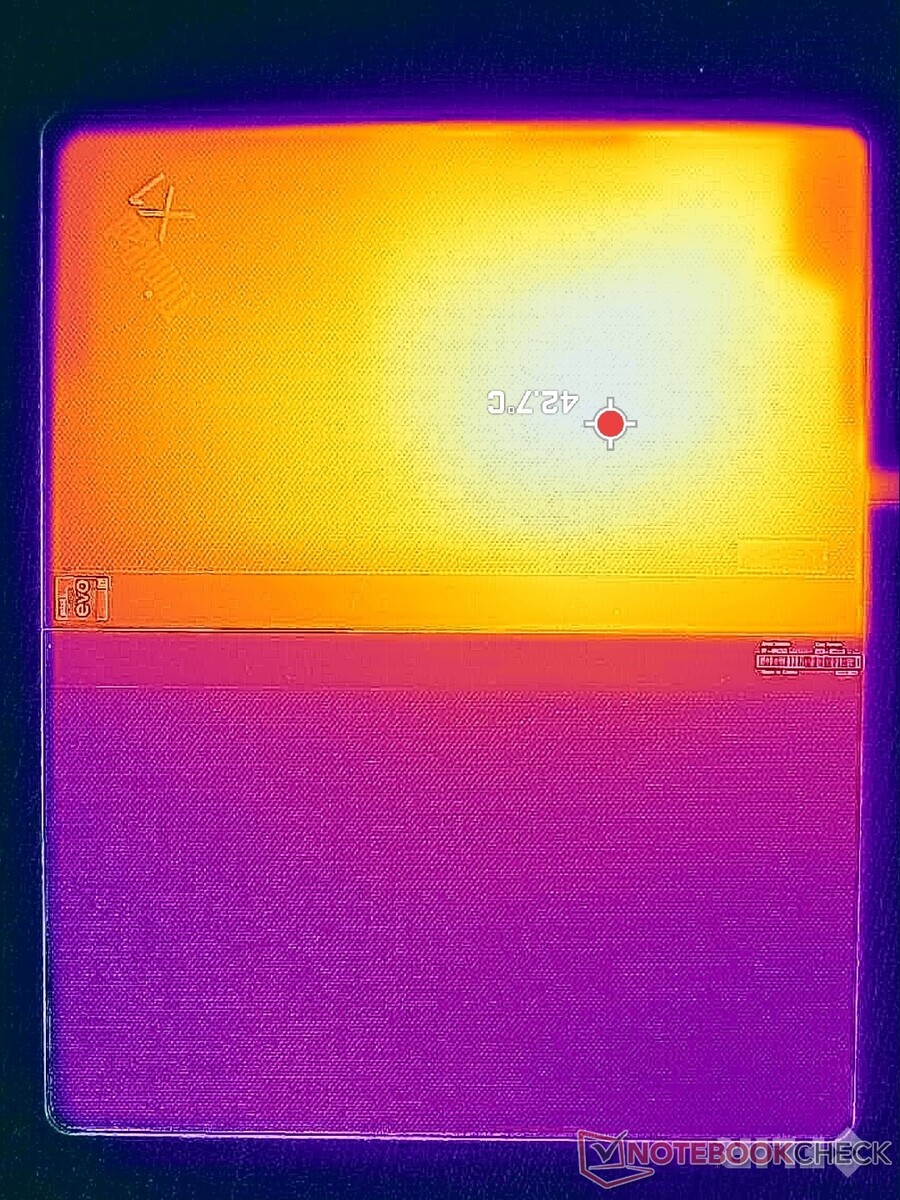
Les températures de surface en mode portrait sont beaucoup plus élevées sur la moitié supérieure que sur la moitié inférieure en raison du positionnement de la carte mère, comme sur le Zenbook 17 Fold. Les points chauds à l'avant et à l'arrière peuvent atteindre jusqu'à 43 °C de chaque côté, comme le montrent les cartes de température ci-dessous. Peut-être sans coïncidence, le Zenbook 17 Fold et la Surface Pro 9 atteignent également des valeurs maximales similaires dans des conditions semblables. Les points chauds se situent au centre de l'écran et les bords ne sont donc jamais désagréables à manipuler en mode tablette.
(±) La température maximale du côté supérieur est de 41.6 °C / 107 F, par rapport à la moyenne de 35.4 °C / 96 F, allant de 19.6 à 60 °C pour la classe Convertible.
(±) Le fond chauffe jusqu'à un maximum de 44.8 °C / 113 F, contre une moyenne de 36.9 °C / 98 F
(+) En utilisation inactive, la température moyenne du côté supérieur est de 26.2 °C / 79 F, par rapport à la moyenne du dispositif de 30.3 °C / 87 F.
(+) Les repose-poignets et le pavé tactile sont plus froids que la température de la peau avec un maximum de 27.6 °C / 81.7 F et sont donc froids au toucher.
(±) La température moyenne de la zone de l'appui-paume de dispositifs similaires était de 28 °C / 82.4 F (+0.4 °C / #0.7 F).
| Lenovo Thinkpad X1 Fold 16 Intel Core i7-1250U, Intel Iris Xe Graphics G7 96EUs | Lenovo ThinkPad X1 Fold 20RL000FGE Intel Core i5-L16G7, Intel UHD Graphics G7 (Lakefield GT2 64 EU) | Asus Zenbook 17 Fold UX9702 Intel Core i7-1250U, Intel Iris Xe Graphics G7 80EUs | Microsoft Surface Pro 9, i7-1255U Intel Core i7-1255U, Intel Iris Xe Graphics G7 96EUs | HP Elite Dragonfly Folio 13.5 G3 Intel Core i7-1265U, Intel Iris Xe Graphics G7 96EUs | Lenovo ThinkPad X1 Carbon G11 21HNS54T00 Intel Core i7-1370P, Intel Iris Xe Graphics G7 96EUs | |
|---|---|---|---|---|---|---|
| Heat | -7% | 0% | 1% | 16% | -11% | |
| Maximum Upper Side * (°C) | 41.6 | 45.1 -8% | 44.5 -7% | 44.6 -7% | 32.8 21% | 42.2 -1% |
| Maximum Bottom * (°C) | 44.8 | 39.8 11% | 41.8 7% | 45.9 -2% | 33.4 25% | 43.8 2% |
| Idle Upper Side * (°C) | 27.2 | 33 -21% | 28.9 -6% | 24.8 9% | 24.6 10% | 32 -18% |
| Idle Bottom * (°C) | 26.4 | 29.2 -11% | 24.7 6% | 25.3 4% | 24.6 7% | 33.7 -28% |
* ... Moindre est la valeur, meilleures sont les performances
Test de stress
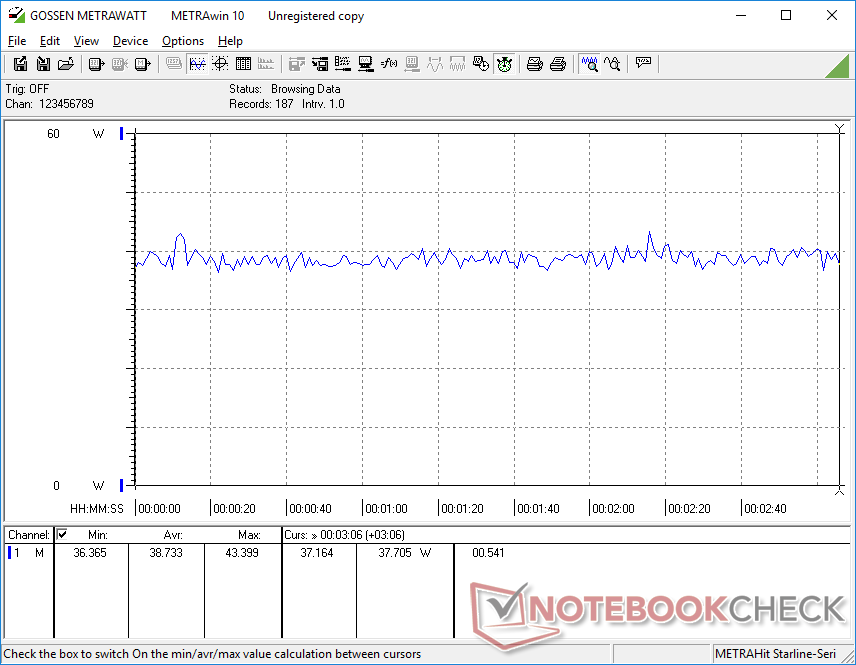
Lorsqu'il est sollicité sous Prime95, le CPU passe à 2,6 GHz et 29 W jusqu'à ce que la température du cœur atteigne 89 C une à deux minutes plus tard. Par la suite, il baisse et se stabilise à 2 GHz et 17 W afin de maintenir la température du cœur à 75 C. Le potentiel limité de Turbo Boost est prévisible pour une conception sans ventilateur et les résultats reflètent les conclusions de CineBench ci-dessus.
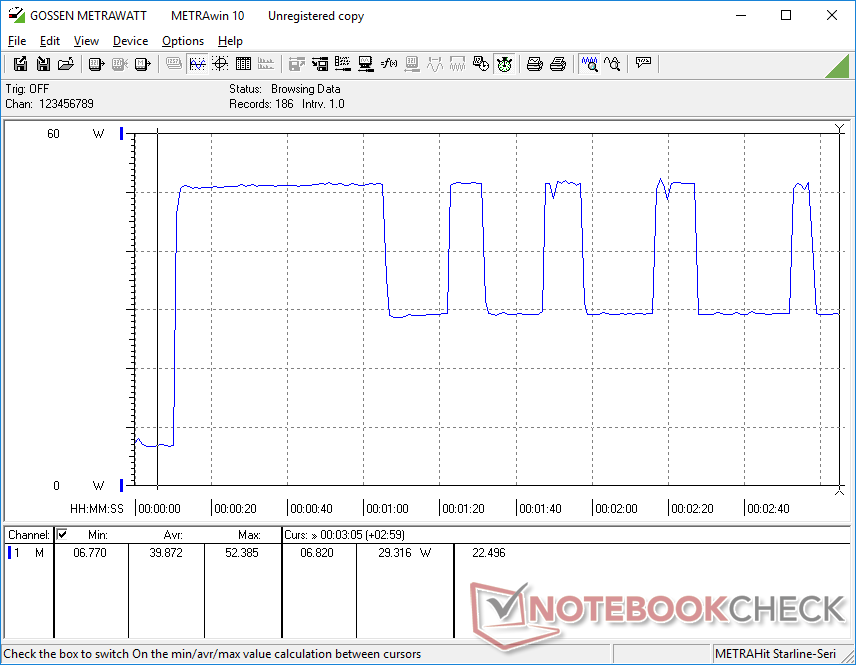
Lors de l'exécution Witcher 3 pour représenter les charges exigeantes du monde réel, le GPU tourne entre 650 et 950 MHz, ce qui correspond aux taux de rafraîchissement mentionnés ci-dessus.
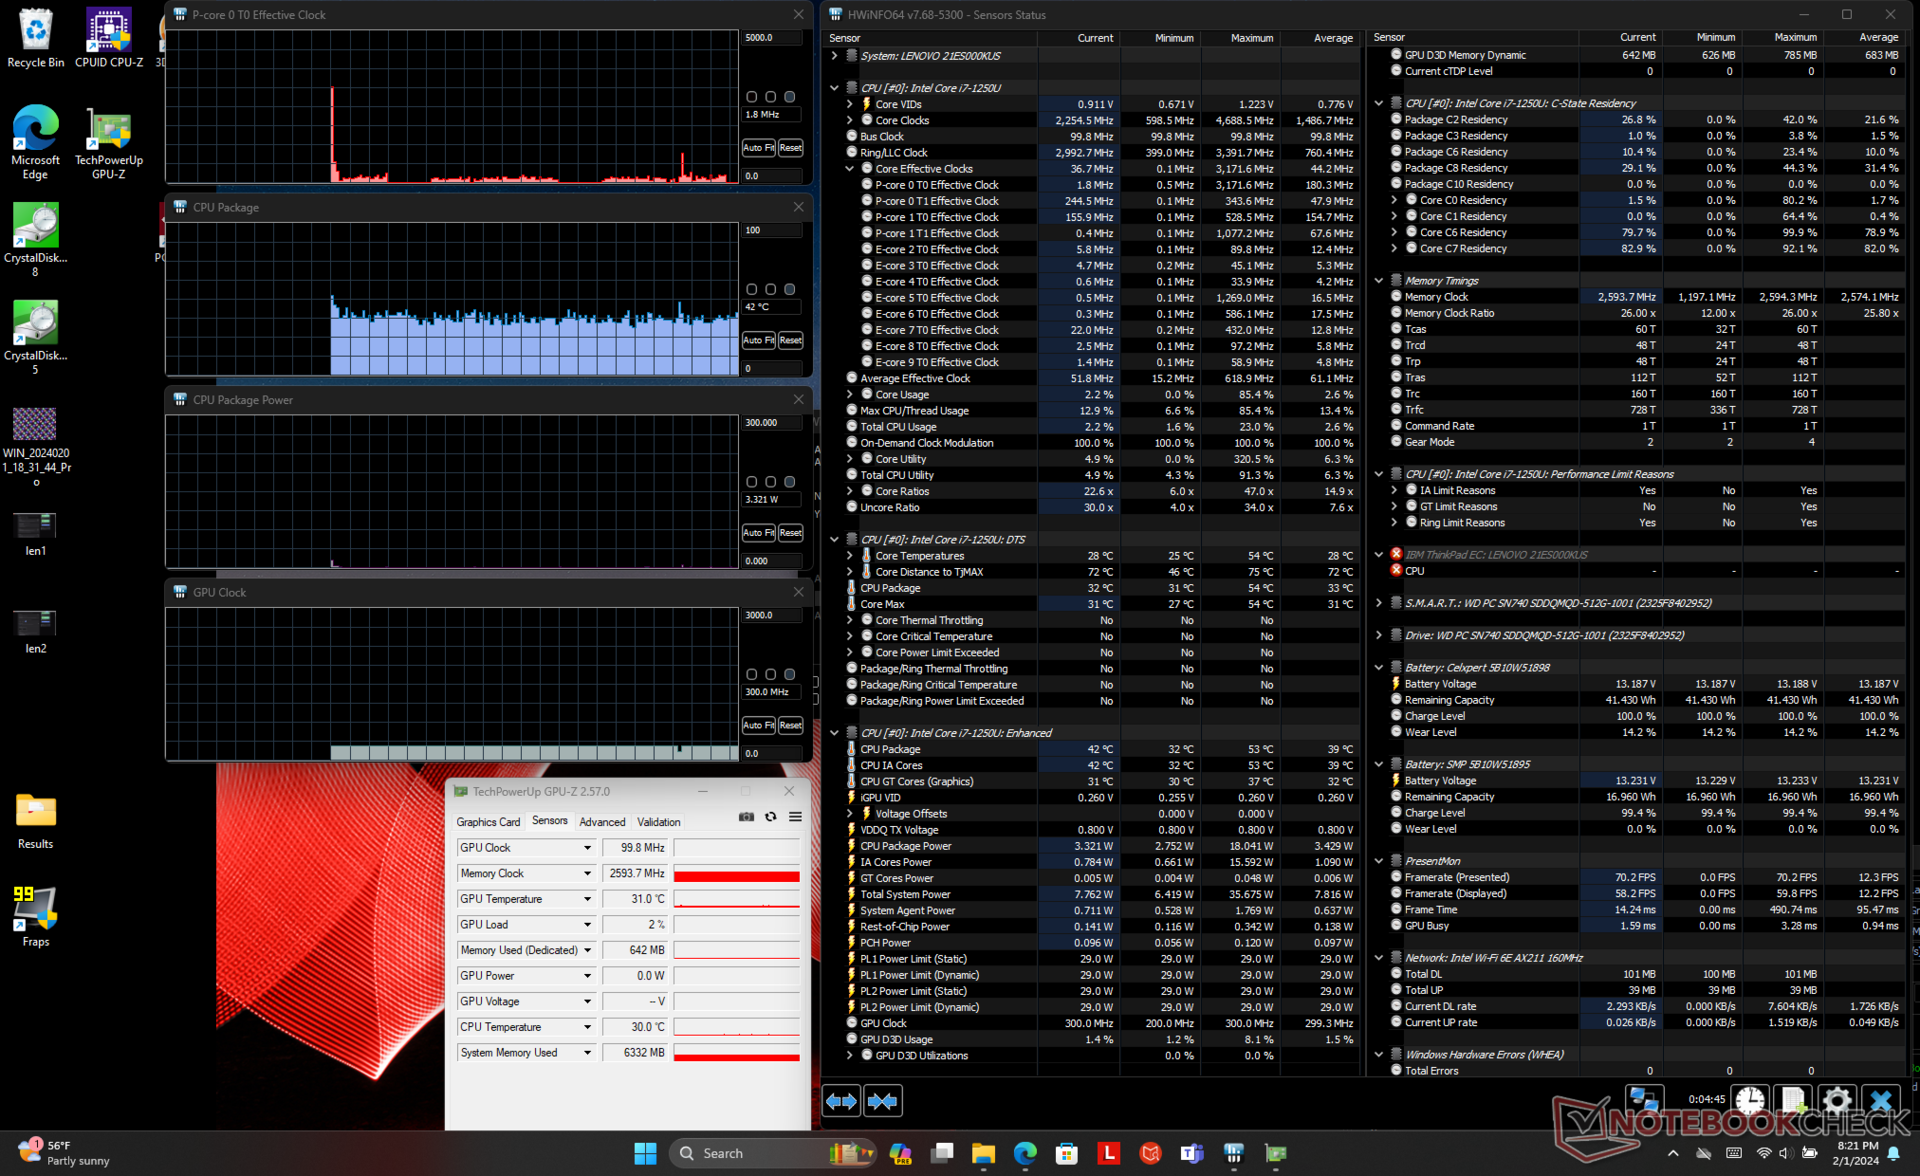
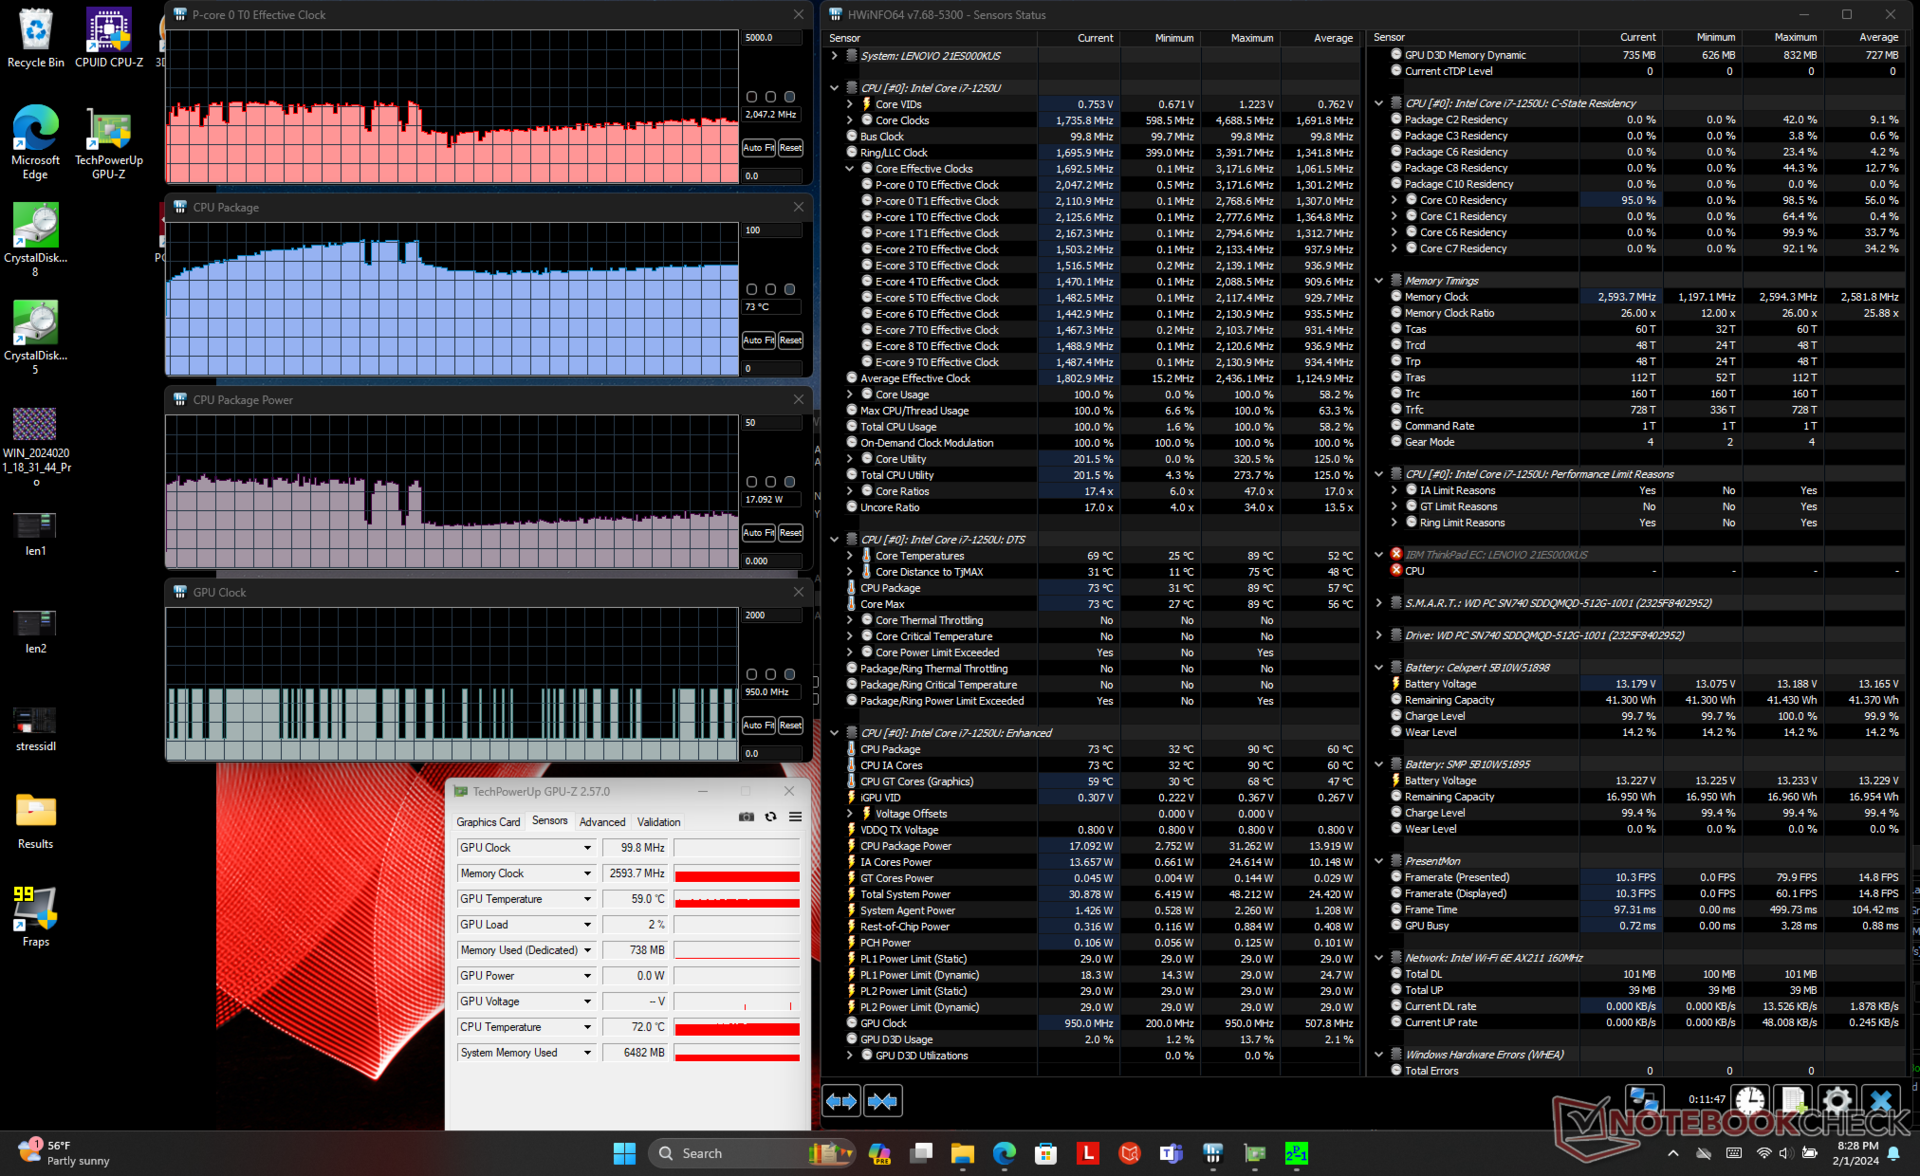
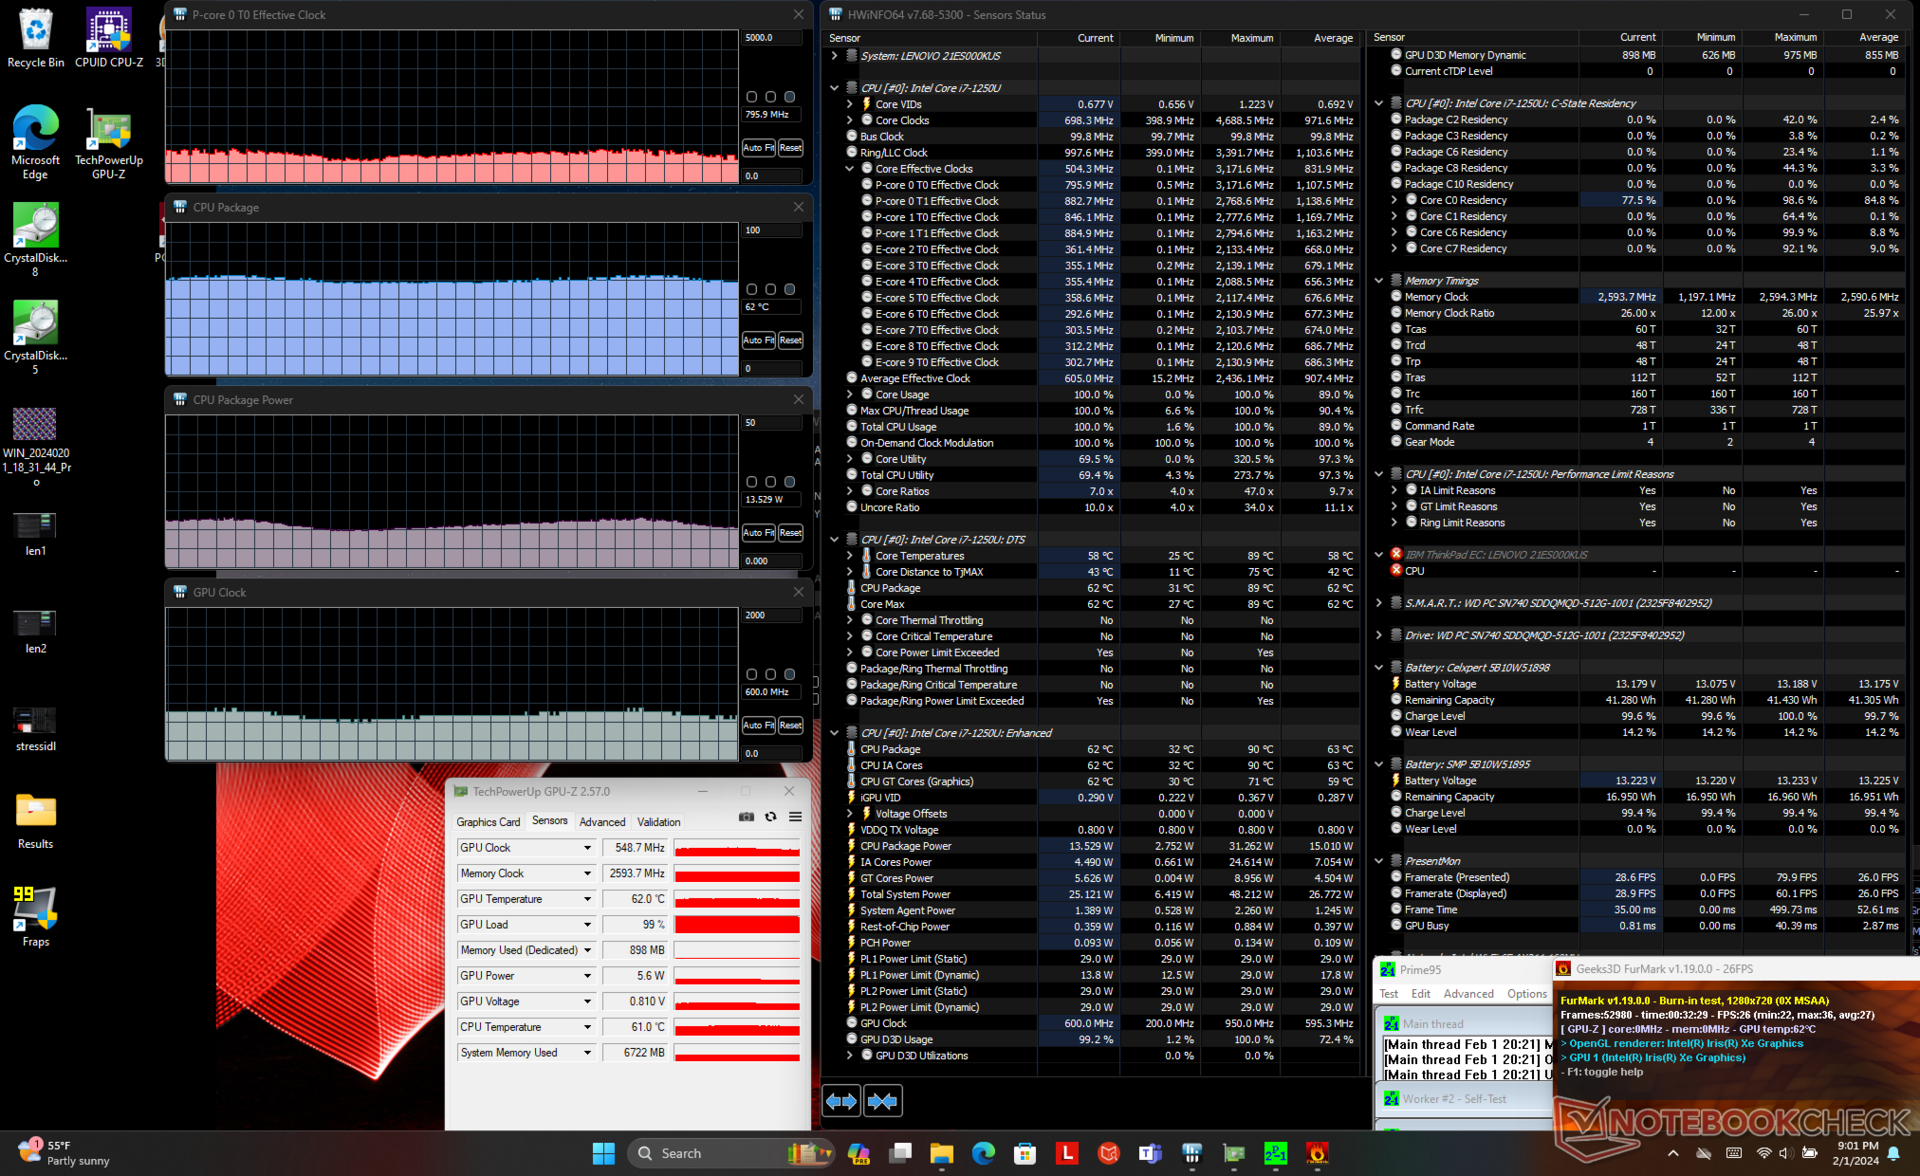
| Horloge du CPU (GHz) | Horloge du GPU (MHz) | Température moyenne du CPU (°C) | |
| Système au repos | -- | -- | 41 |
| Stress Prime95 | 2.0 | -- | 75 |
| Prime95 + FurMark Stress | 0.8 - 1.0 | 500 - 750 | 62 - 65 |
| Witcher 3 Stress | 0.8 | 650 - 950 | 61 |
Intervenants
Le modèle intègre trois haut-parleurs de 2 W, contre deux seulement sur la plupart des autres ordinateurs portables et tablettes. Bien que la qualité audio soit respectable pour la taille de l'appareil, nous aurions aimé que les haut-parleurs soient un peu plus puissants. Les haut-parleurs du Dragonfly Folio 13.5 G3par exemple, atteignent 88 dB(A) contre 82 dB(A) sur notre Lenovo.
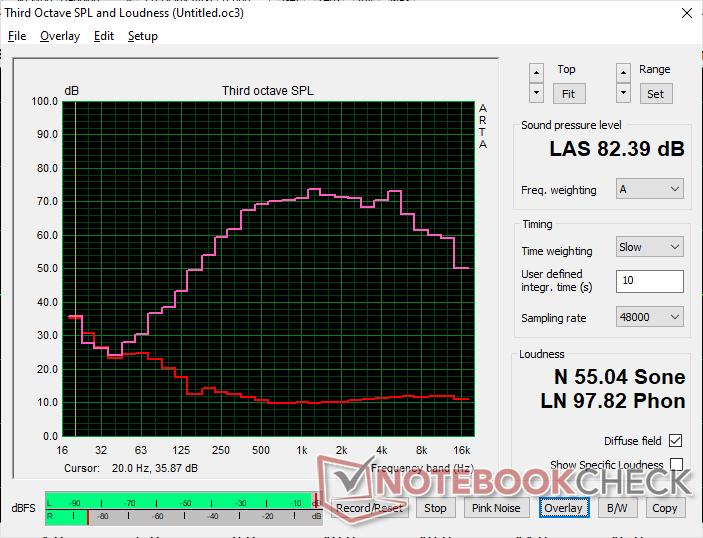
Lenovo Thinkpad X1 Fold 16 analyse audio
(+) | les haut-parleurs peuvent jouer relativement fort (82.4# dB)
Basses 100 - 315 Hz
(-) | presque aucune basse - en moyenne 16.2% plus bas que la médiane
(±) | la linéarité des basses est moyenne (7.6% delta à la fréquence précédente)
Médiums 400 - 2000 Hz
(+) | médiane équilibrée - seulement 3.3% de la médiane
(+) | les médiums sont linéaires (3.2% delta à la fréquence précédente)
Aiguës 2 - 16 kHz
(+) | des sommets équilibrés - à seulement 4% de la médiane
(+) | les aigus sont linéaires (5.3% delta à la fréquence précédente)
Globalement 100 - 16 000 Hz
(+) | le son global est linéaire (14.7% différence à la médiane)
Par rapport à la même classe
» 23% de tous les appareils testés de cette catégorie étaient meilleurs, 3% similaires, 73% pires
» Le meilleur avait un delta de 6%, la moyenne était de 20%, le pire était de 57%.
Par rapport à tous les appareils testés
» 19% de tous les appareils testés étaient meilleurs, 4% similaires, 77% pires
» Le meilleur avait un delta de 4%, la moyenne était de 23%, le pire était de 134%.
Apple MacBook Pro 16 2021 M1 Pro analyse audio
(+) | les haut-parleurs peuvent jouer relativement fort (84.7# dB)
Basses 100 - 315 Hz
(+) | bonne basse - seulement 3.8% loin de la médiane
(+) | les basses sont linéaires (5.2% delta à la fréquence précédente)
Médiums 400 - 2000 Hz
(+) | médiane équilibrée - seulement 1.3% de la médiane
(+) | les médiums sont linéaires (2.1% delta à la fréquence précédente)
Aiguës 2 - 16 kHz
(+) | des sommets équilibrés - à seulement 1.9% de la médiane
(+) | les aigus sont linéaires (2.7% delta à la fréquence précédente)
Globalement 100 - 16 000 Hz
(+) | le son global est linéaire (4.6% différence à la médiane)
Par rapport à la même classe
» 0% de tous les appareils testés de cette catégorie étaient meilleurs, 0% similaires, 100% pires
» Le meilleur avait un delta de 5%, la moyenne était de 17%, le pire était de 45%.
Par rapport à tous les appareils testés
» 0% de tous les appareils testés étaient meilleurs, 0% similaires, 100% pires
» Le meilleur avait un delta de 4%, la moyenne était de 23%, le pire était de 134%.
Gestion de l'énergie - Une grande OLED signifie une grande consommation
Consommation électrique
La consommation d'énergie est généralement conforme à celle des ordinateurs portables traditionnels. Bien que la conception sans ventilateur permette d'économiser de l'énergie, l'écran tactile OLED, grand et exigeant, annule les économies potentielles. Par exemple, l'utilisation d'un écran blanc brillant (comme une page web ou une page Word) en luminosité maximale consomme 22 W sur le ThinkPad X1 Fold, contre seulement 11 W ou 10 W sur l'écran IPS de la Microsoft Surface Pro 9 ou de la HP Elite Dragonfly Folio, qui consomment moins d'énergie HP Elite Dragonfly Folio.
L'exécution de charges plus élevées comme Witcher 3 la consommation du ThinkPad X1 Fold serait aussi élevée que celle des modèles Microsoft ou HP susmentionnés. Cependant, la consommation de notre ThinkPad X1 Fold 16 a fini par osciller entre 30 W et 40 W après seulement quelques minutes de test, tout comme les fréquences d'horloge du GPU mentionnées ci-dessus.
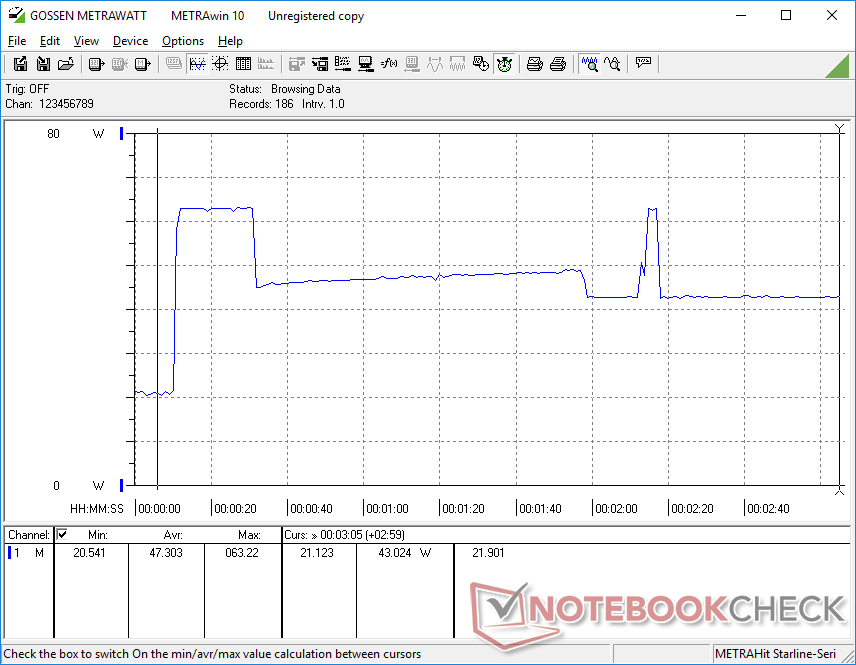
Nous avons pu enregistrer une consommation maximale temporaire de 64 W sur le petit adaptateur secteur USB-C de 65 W (~8,8 x 5 x 2,3 cm) lorsque le CPU et le GPU sont utilisés à 100 %.
| Éteint/en veille | |
| Au repos | |
| Fortement sollicité |
|
Légende:
min: | |
| Lenovo Thinkpad X1 Fold 16 i7-1250U, Iris Xe G7 96EUs, WD PC SN740 512GB SDDQMQD-512G, OLED, 2560x2024, 16.3" | Lenovo ThinkPad X1 Fold 20RL000FGE i5-L16G7, UHD Graphics G7 (Lakefield GT2 64 EU), Toshiba KBG40ZNS256G NVMe, OLED, 2048x1536, 13.3" | Asus Zenbook 17 Fold UX9702 i7-1250U, Iris Xe G7 80EUs, Samsung PM9A1 MZVL21T0HCLR, OLED, 2560x1920, 17.3" | Microsoft Surface Pro 9, i7-1255U i7-1255U, Iris Xe G7 96EUs, Samsung MZ9L4512HBLU-00BMV, IPS, 2880x1920, 13" | HP Elite Dragonfly Folio 13.5 G3 i7-1265U, Iris Xe G7 96EUs, Samsung PM9A1 MZVL2512HCJQ, IPS, 1920x1280, 13.5" | Lenovo ThinkPad X1 Carbon G11 21HNS54T00 i7-1370P, Iris Xe G7 96EUs, WDC PC SN810 2TB, OLED, 2880x1800, 14" | |
|---|---|---|---|---|---|---|
| Power Consumption | 24% | -9% | -4% | 18% | -3% | |
| Idle Minimum * (Watt) | 5.2 | 7.2 -38% | 7.6 -46% | 5.1 2% | 3.4 35% | 7 -35% |
| Idle Average * (Watt) | 6.7 | 7.5 -12% | 12.3 -84% | 9.8 -46% | 4.9 27% | 7.9 -18% |
| Idle Maximum * (Watt) | 22 | 7.7 65% | 12.9 41% | 11.3 49% | 9.3 58% | 8.1 63% |
| Load Average * (Watt) | 36.9 | 20.5 44% | 35.2 5% | 47.5 -29% | 41.9 -14% | 40.5 -10% |
| Witcher 3 ultra * (Watt) | 38.7 | 30.4 21% | 36 7% | 36.4 6% | 43 -11% | |
| Load Maximum * (Watt) | 63.3 | 24.8 61% | 56.6 11% | 68.5 -8% | 67.5 -7% | 66 -4% |
* ... Moindre est la valeur, meilleures sont les performances
Power Consumption Witcher 3 / Stresstest
Power Consumption external Monitor
Autonomie de la batterie
Contrairement au modèle 2021 de 13 pouces, la batterie du modèle de 16 pouces est divisée en deux parties (48 Wh + 16 Wh) pour une meilleure répartition du poids entre les moitiés supérieure et inférieure du design pliable. La capacité combinée de 74 Wh est presque 50 % plus grande que celle de la batterie du modèle 13 pouces, ce qui la rend aussi grande que les batteries de nombreux ordinateurs portables traditionnels.
Cependant, les durées d'utilisation ne sont que moyennes avec environ 5,5 heures de navigation sur le web en mode équilibré, ce qui n'est pas beaucoup plus long que ce que nous avons enregistré sur l'ancien modèle 13 pouces. La plus grande capacité de la batterie est donc compensée par l'écran OLED plus grand et plus exigeant. Vous pouvez certainement atteindre des durées de fonctionnement plus longues en n'utilisant que la moitié de l'écran en mode ordinateur portable, mais cela signifierait renoncer à l'attrait pliable de l'écran tactile.
Le chargement d'une batterie vide à une batterie pleine prend environ 2 heures, ce qui est similaire à la plupart des ordinateurs portables à clapet. Les deux batteries se rechargent simultanément lorsqu'elles sont branchées sur une prise de courant.
| Lenovo Thinkpad X1 Fold 16 i7-1250U, Iris Xe G7 96EUs, 64 Wh | Lenovo ThinkPad X1 Fold 20RL000FGE i5-L16G7, UHD Graphics G7 (Lakefield GT2 64 EU), 50 Wh | Asus Zenbook 17 Fold UX9702 i7-1250U, Iris Xe G7 80EUs, 75 Wh | Microsoft Surface Pro 9, i7-1255U i7-1255U, Iris Xe G7 96EUs, 47.7 Wh | HP Elite Dragonfly Folio 13.5 G3 i7-1265U, Iris Xe G7 96EUs, 53 Wh | Lenovo ThinkPad X1 Carbon G11 21HNS54T00 i7-1370P, Iris Xe G7 96EUs, 57 Wh | |
|---|---|---|---|---|---|---|
| Autonomie de la batterie | 91% | 107% | 22% | 98% | 9% | |
| Reader / Idle (h) | 12.2 | 27.3 124% | ||||
| WiFi v1.3 (h) | 5.5 | 5.3 -4% | 6.7 22% | 7.5 36% | 9.4 71% | 6.5 18% |
| Load (h) | 1.3 | 3.7 185% | 3.8 192% | 1.4 8% | 2.6 100% | 1.3 0% |
| H.264 (h) | 6 | 11 | 9.4 |
Points positifs
Points négatifs
Verdict - Des améliorations considérables, mais des problèmes d'ergonomie difficiles à résoudre
Le ThinkPad X1 Fold 16 est une amélioration considérable par rapport au ThinkPad X1 Fold 13 pouces de 2021 2021 13 pouces original. Des performances à la qualité de fabrication en passant par le clavier, tout a été amélioré pour atteindre des niveaux plus proches de ceux d'un ThinkPad à clapet traditionnel. Au mieux, le ThinkPad X1 Fold 16 offre plus d'espace à l'écran et des couleurs plus profondes qu'une Surface Pro sans être beaucoup plus volumineux dans le sac.
La conception pliable pose encore d'importants problèmes, dont beaucoup sont hérités du modèle original de 2021. Tout d'abord, l'appareil est plus lourd qu'il n'y paraît, surtout lorsqu'il est associé au clavier magnétique sans fil et à la béquille. Deuxièmement, les propriétés de glisse de l'écran OLED sont plus collantes et plus heurtées que celles des écrans en verre complètement plats de la Surface Pro ou de la plupart des tablettes. Si vous aimez faire des croquis ou prendre beaucoup de notes, la surface irrégulière de l'écran pliable peut être gênante. Enfin, le clavier et la béquille séparés ne sont pas pratiques à transporter. À cela s'ajoute le fait qu'en mode ordinateur portable, il faut d'abord retirer le clavier avant de pouvoir fermer l'écran, contrairement à ce qui se passe avec un ordinateur à clapet ou un convertible. Il n'est pas non plus recommandé de voyager sans ces deux accessoires, car ils sont essentiels pour optimiser l'utilisation du X1 Fold.
L'énorme écran OLED pliable est sans aucun doute amusant à utiliser au début, mais le clavier et la béquille séparés, ainsi que le support Windows insuffisant, nuisent à la productivité.
D'autres aspects comme l'autonomie de la batterie et la prise en charge limitée de Windows pour les écrans pliables ne se sont pas améliorés non plus. Les performances, bien que bien meilleures qu'auparavant, restent modestes par rapport au prix élevé demandé.
Il est clair que le prix de 4 000 dollars correspond à la nouveauté d'un écran tactile OLED pliable. Le grand écran pliable peut être utile pour la lecture multimédia dans des espaces restreints comme les longs vols, mais sa productivité repose fortement sur des pièces encombrantes qui ne peuvent tout simplement pas rivaliser avec l'ergonomie d'un ordinateur portable classique ou d'un convertible. Des systèmes plus traditionnels comme la Surface Pro 9 ou le ThinkPad X1 Carbon sont généralement plus légers, plus rapides et plus confortables dans la plupart des scénarios, même s'ils peuvent être "ennuyeux" à utiliser.
Prix et disponibilité
Lenovo livre maintenant le ThinkPad X2 Fold 16 au prix de 3900 USD avec le Core i7-1260U compatible vPro.
Lenovo Thinkpad X1 Fold 16
- 02/14/2024 v7 (old)
Allen Ngo
Transparency
La sélection des appareils à examiner est effectuée par notre équipe éditoriale. L'échantillon de test a été prêté à l'auteur par le fabricant ou le détaillant pour les besoins de cet examen. Le prêteur n'a pas eu d'influence sur cette évaluation et le fabricant n'a pas reçu de copie de cette évaluation avant sa publication. Il n'y avait aucune obligation de publier cet article. En tant que média indépendant, Notebookcheck n'est pas soumis à l'autorité des fabricants, des détaillants ou des éditeurs.
Voici comment Notebookcheck teste
Chaque année, Notebookcheck examine de manière indépendante des centaines d'ordinateurs portables et de smartphones en utilisant des procédures standardisées afin de garantir que tous les résultats sont comparables. Nous avons continuellement développé nos méthodes de test depuis environ 20 ans et avons établi des normes industrielles dans le processus. Dans nos laboratoires de test, des équipements de mesure de haute qualité sont utilisés par des techniciens et des rédacteurs expérimentés. Ces tests impliquent un processus de validation en plusieurs étapes. Notre système d'évaluation complexe repose sur des centaines de mesures et de points de référence bien fondés, ce qui garantit l'objectivité.Price comparison

