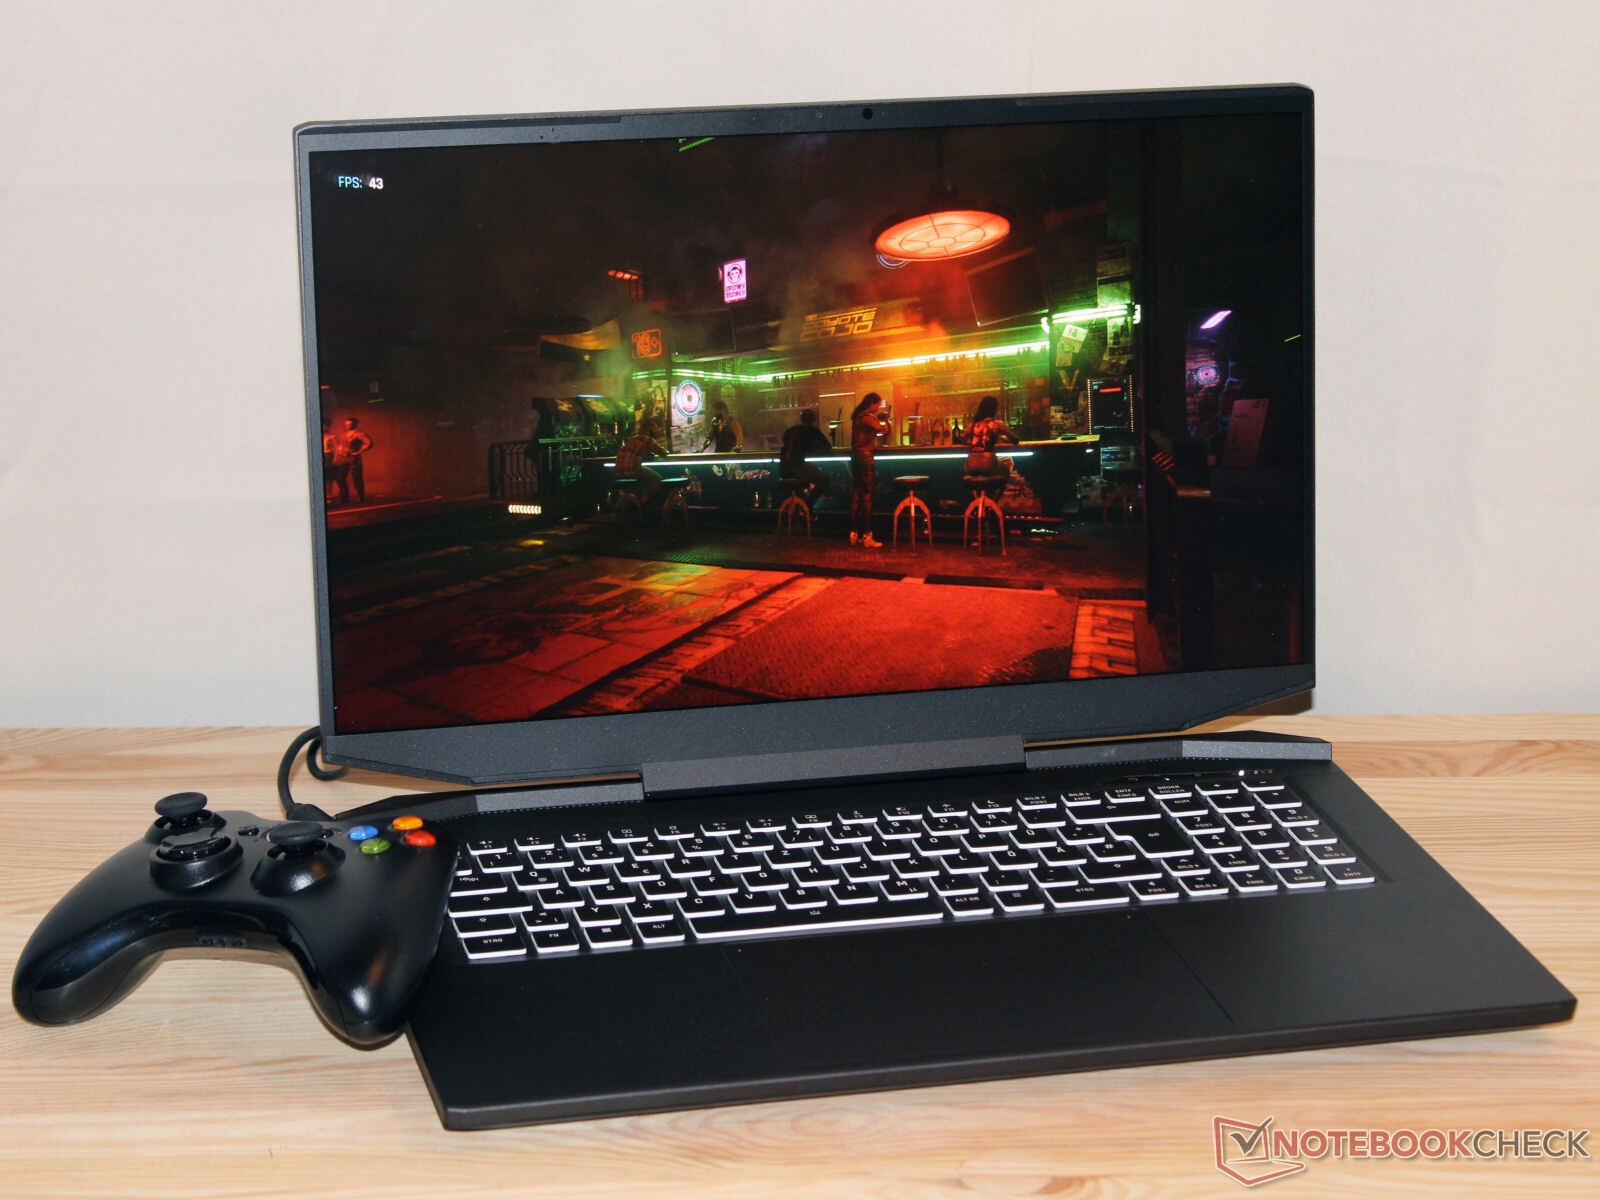
Test du XMG Apex 17 : un ordinateur portable de jeu QHD avec une RTX 4060
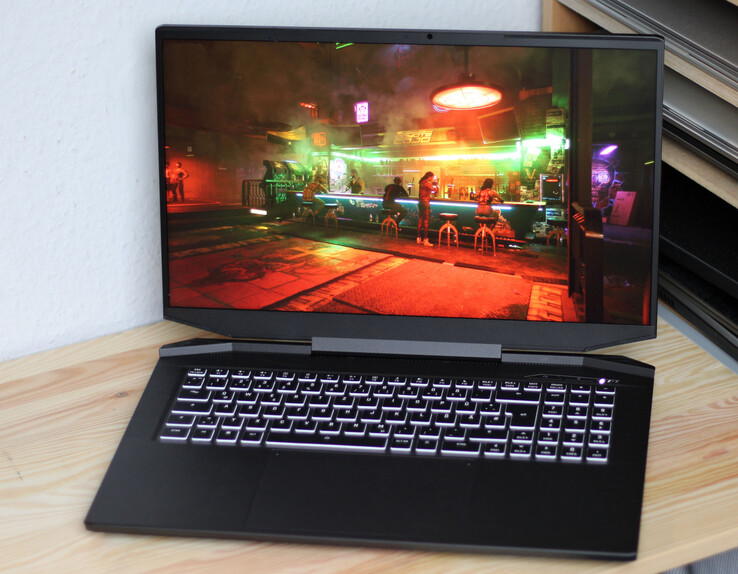
Le XMG Apex 17 (fin 23) est un ordinateur portable de jeu QHD de milieu de gamme basé sur un barebone TongFang (GM7XG0) et est disponible dans cette variante pour un peu moins de 1.800 euros. L'ensemble se compose d'un processeur Ryzen 7 7840HS, GeForce RTX 4060 (alternativement : RTX 4050), 32 Go de RAM et un disque dur SSD de 1 To. La concurrence se trouve sous la forme duAcer Nitro 17 AN17-51et de lAlienware m16 R1l'Alienware m16 R1, leLenovo Legion Pro 5 16IRX8lenovo Pro 5 16IRX8MSI Katana 17 B13VFKet leMedion Erazer Defender P40.
Comparaison avec les concurrents potentiels
Note | Date | Modèle | Poids | Épaisseur | Taille | Résolution | Prix |
|---|---|---|---|---|---|---|---|
| 87.1 % v7 (old) | 10/23 | Schenker XMG Apex 17 (Late 23) R7 7840HS, GeForce RTX 4060 Laptop GPU | 2.5 kg | 24.9 mm | 17.30" | 2560x1440 | |
| 88.3 % v7 (old) | 09/23 | Alienware m16 R1 Intel i7-13700HX, GeForce RTX 4060 Laptop GPU | 3 kg | 25.4 mm | 16.00" | 2560x1600 | |
| 87.9 % v7 (old) | 05/23 | Lenovo Legion Pro 5 16IRX8 i7-13700HX, GeForce RTX 4060 Laptop GPU | 2.5 kg | 26.8 mm | 16.00" | 2560x1600 | |
| 87.2 % v7 (old) | 07/23 | Acer Nitro 17 AN17-51-71ER i7-13700H, GeForce RTX 4060 Laptop GPU | 3 kg | 30.3 mm | 17.30" | 2560x1440 | |
| 84.6 % v7 (old) | 05/23 | Medion Erazer Defender P40 i7-13700HX, GeForce RTX 4060 Laptop GPU | 2.9 kg | 33 mm | 17.30" | 2560x1440 | |
| 82.1 % v7 (old) | 02/23 | MSI Katana 17 B13VFK i7-13620H, GeForce RTX 4060 Laptop GPU | 2.8 kg | 25.2 mm | 17.30" | 1920x1080 |
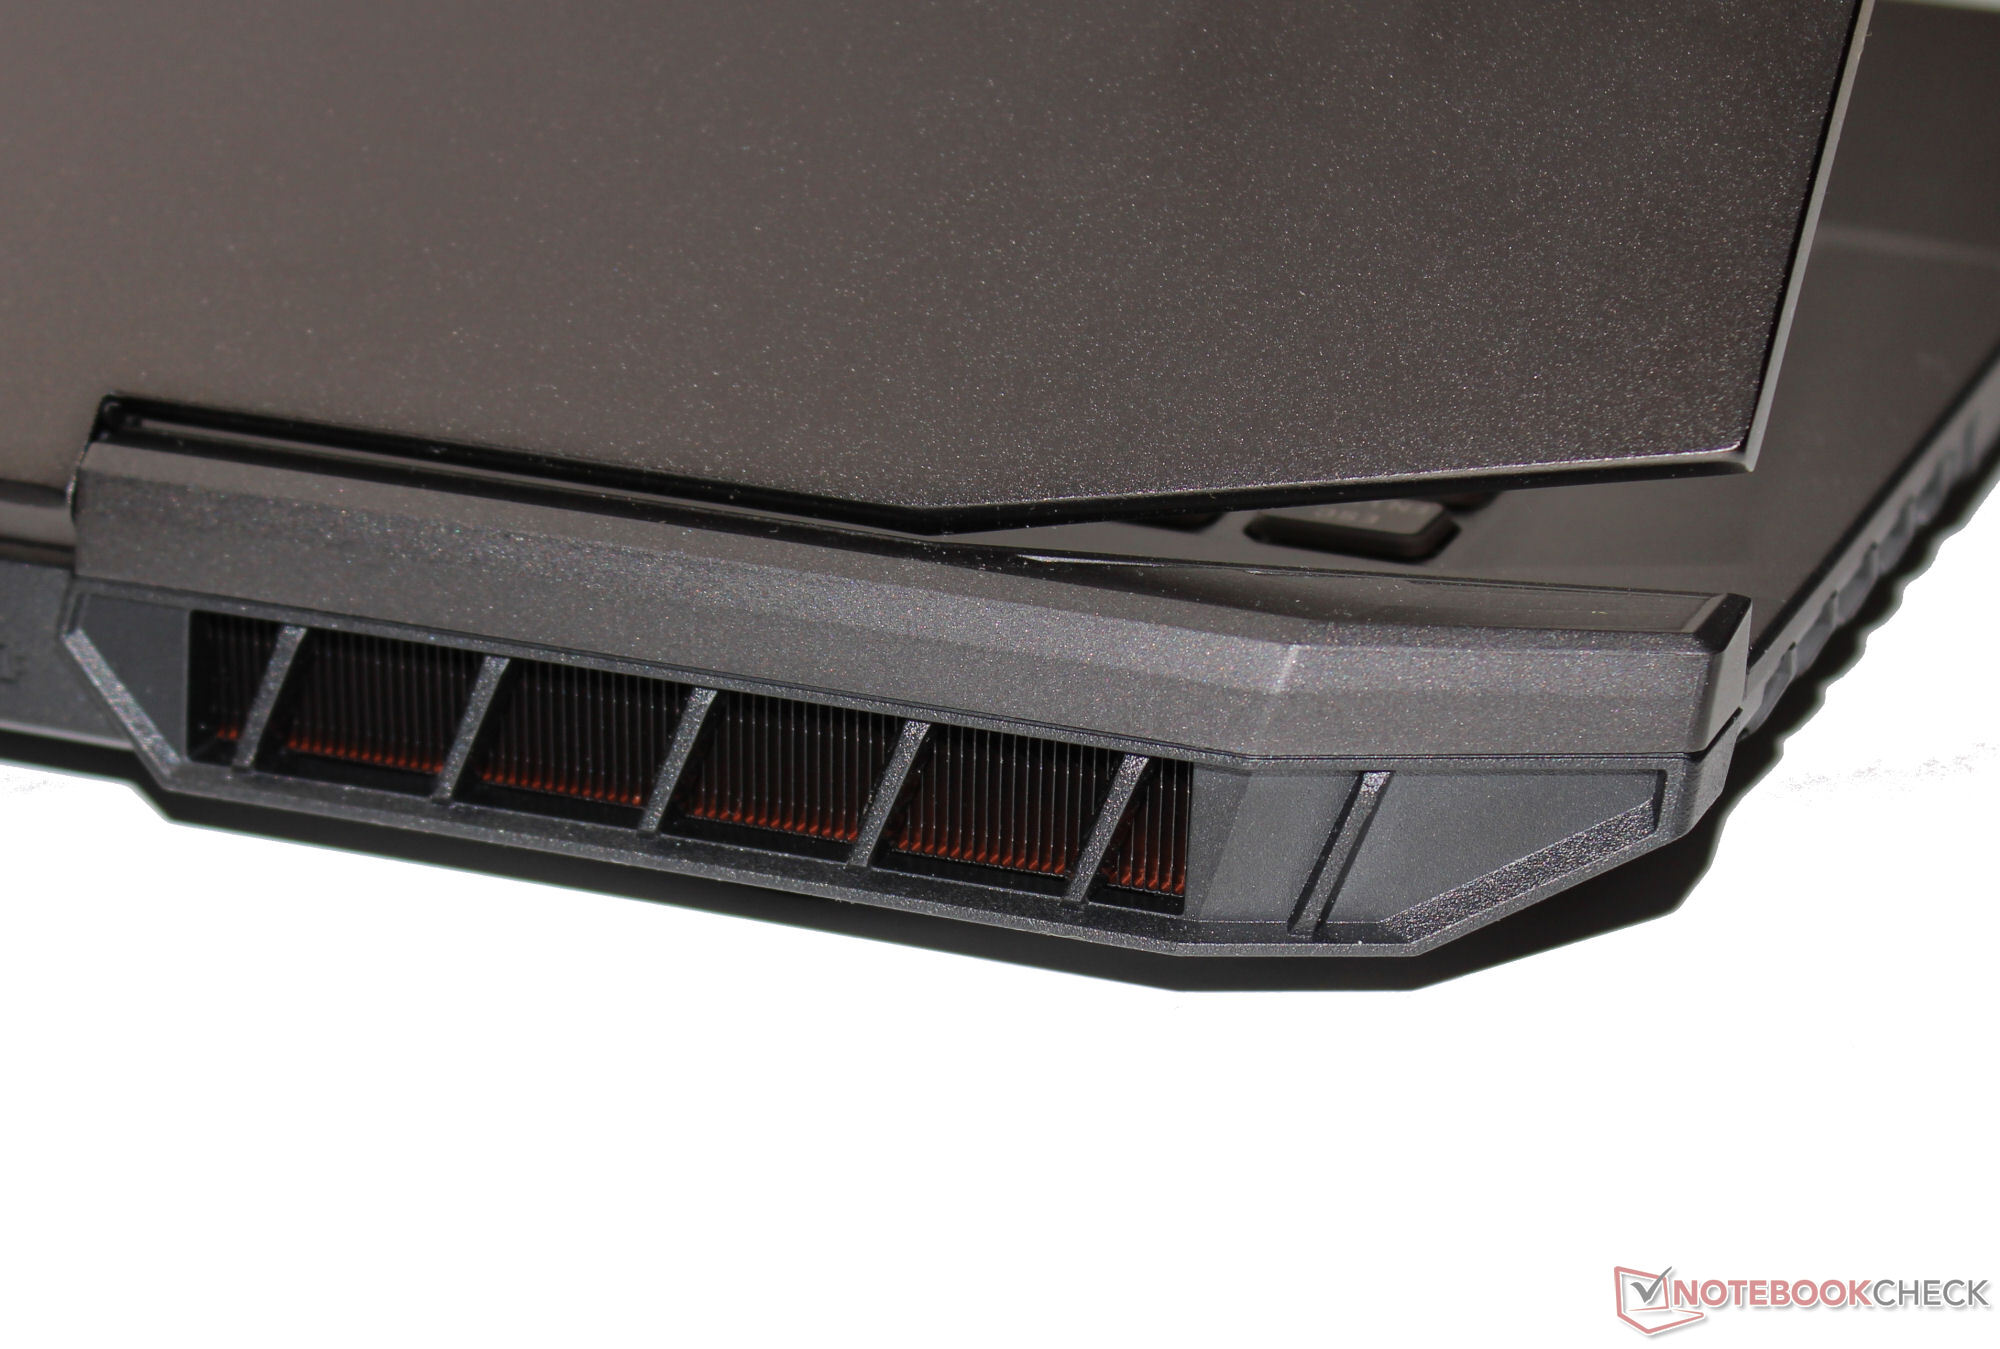
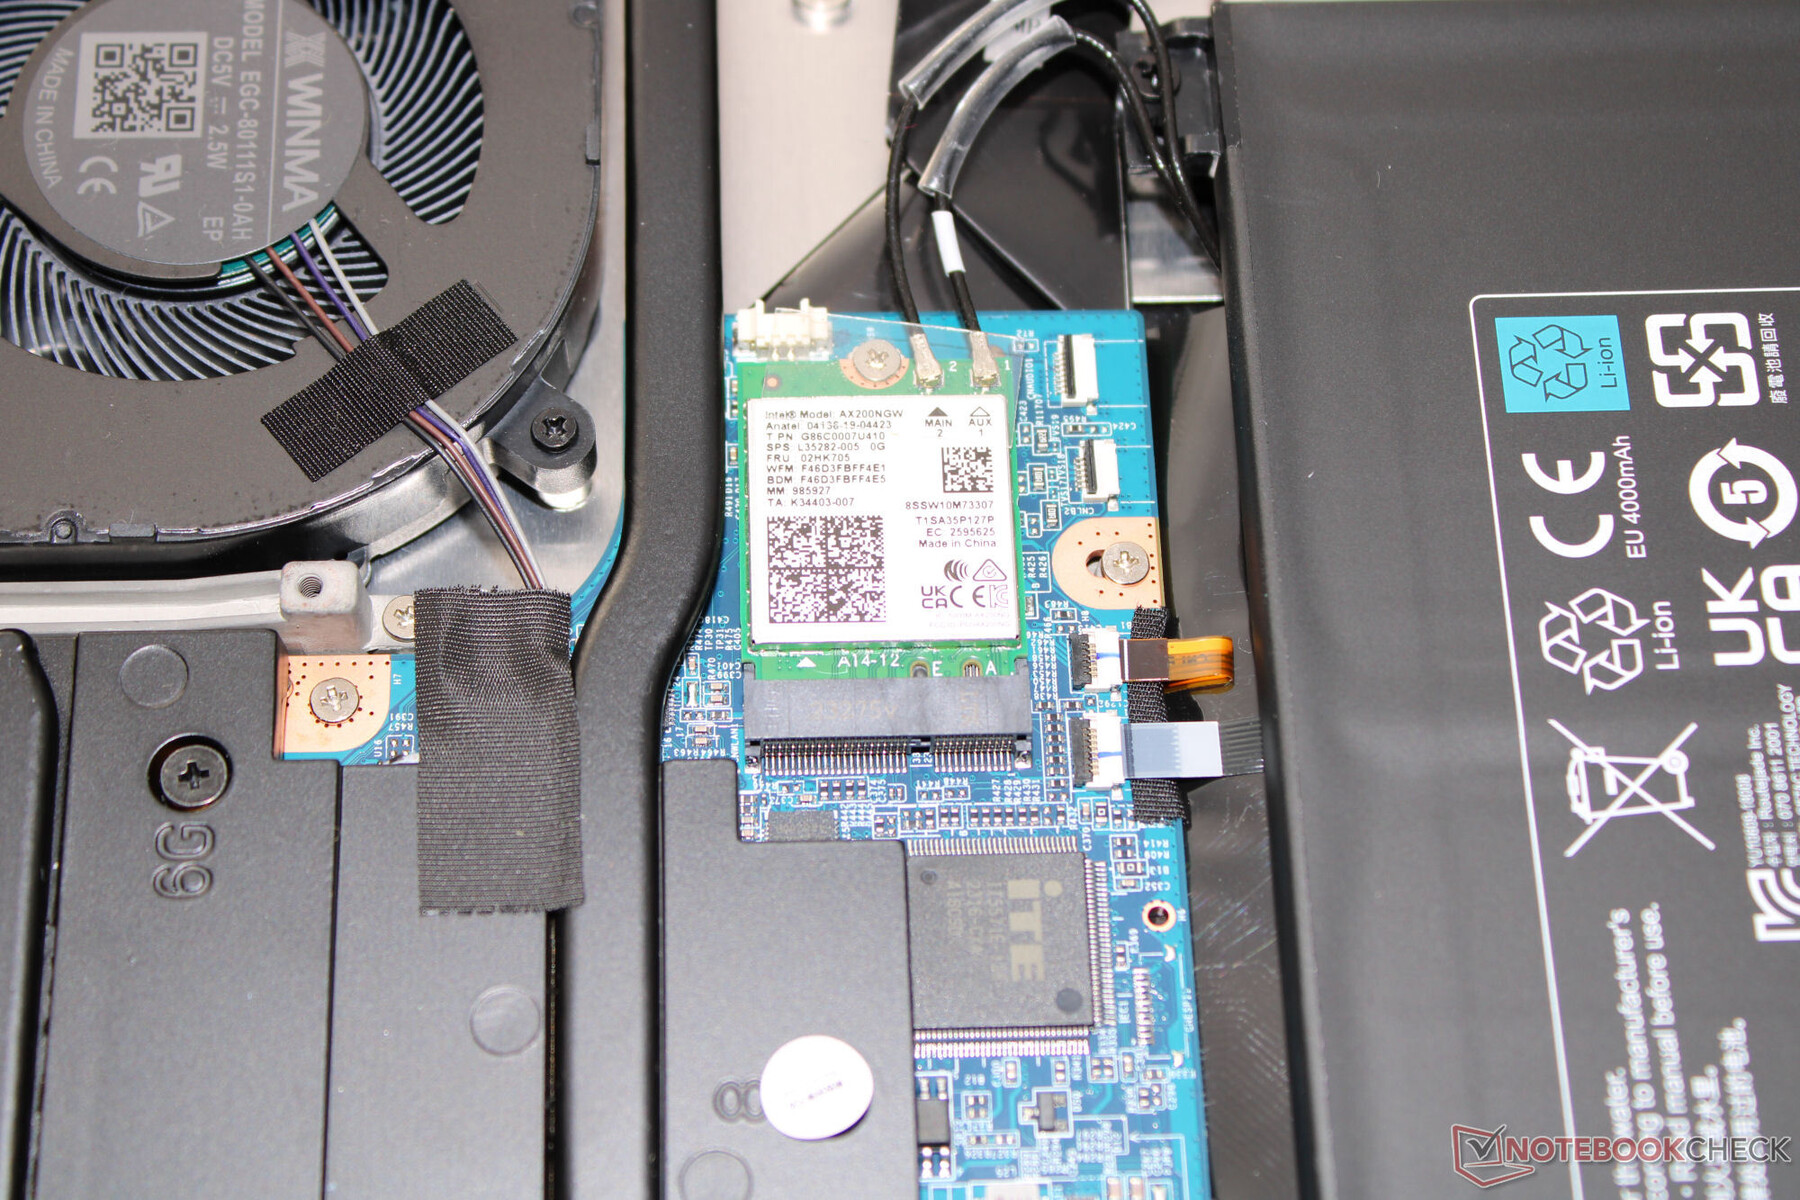
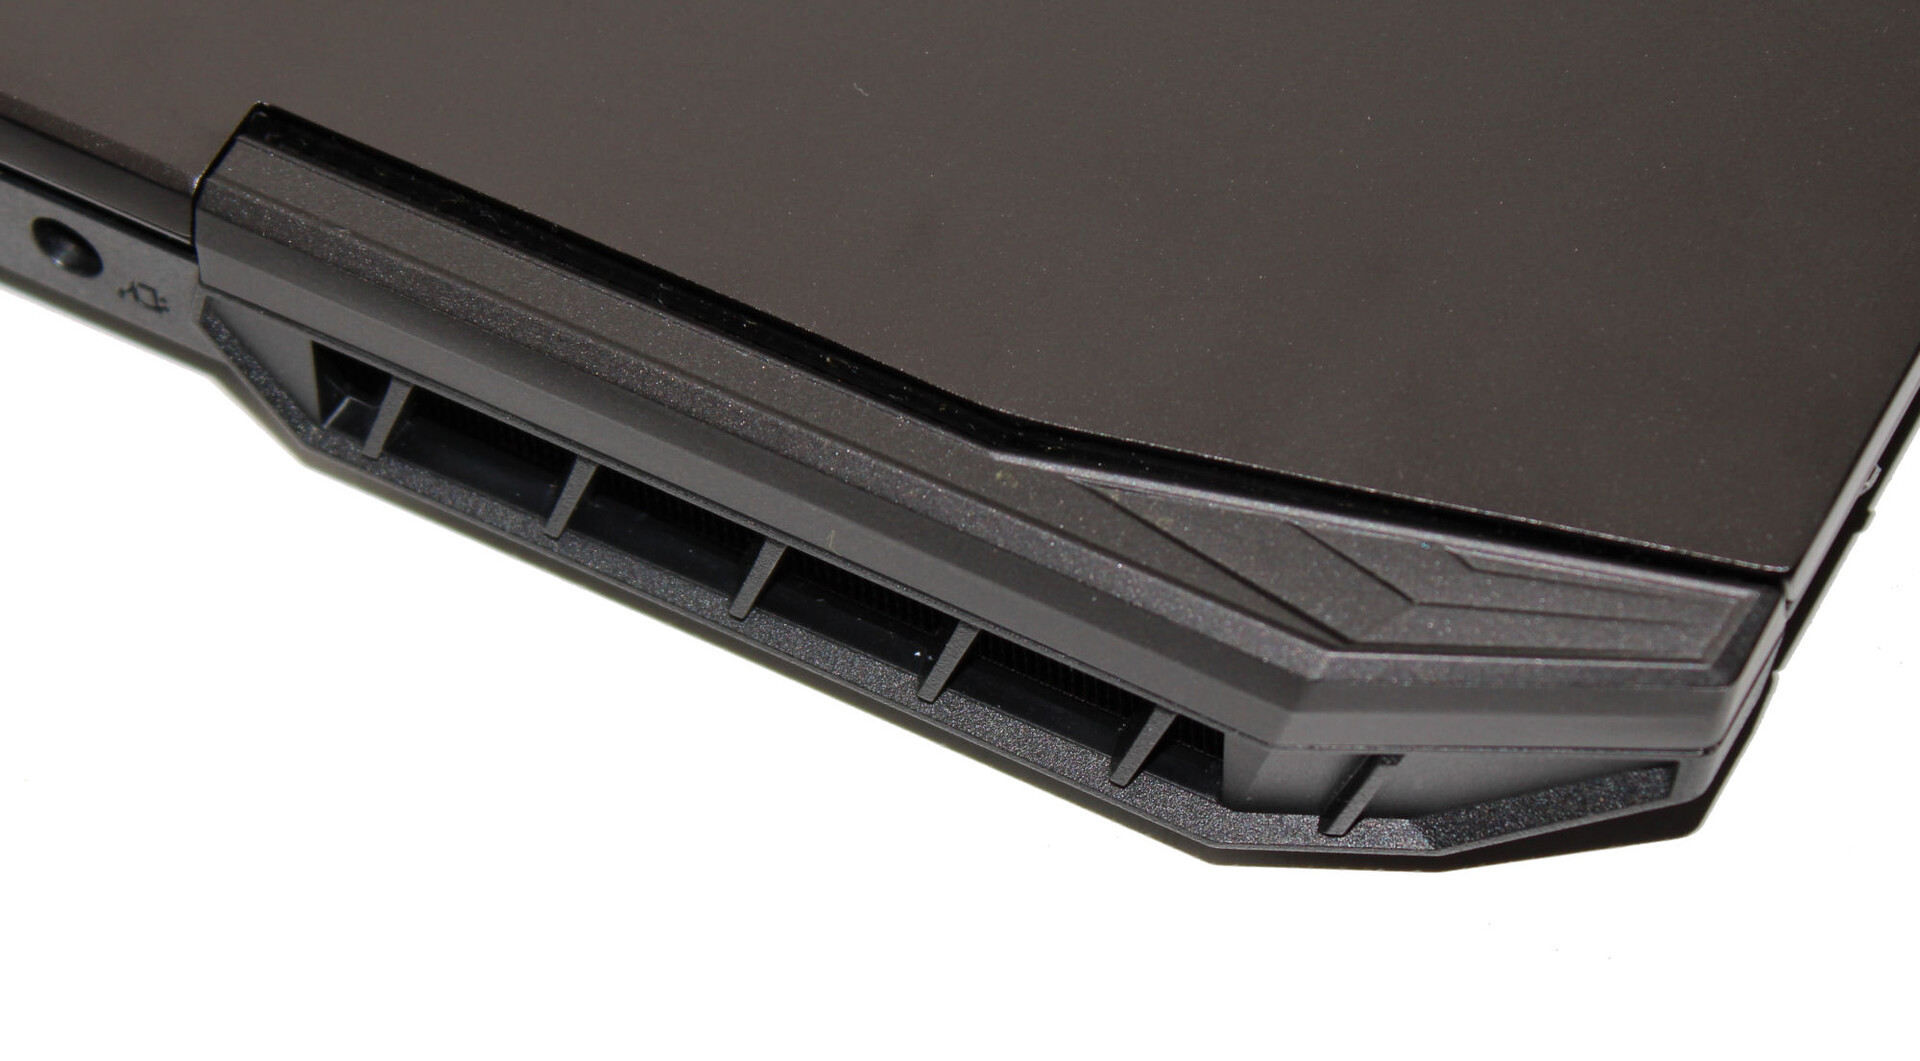
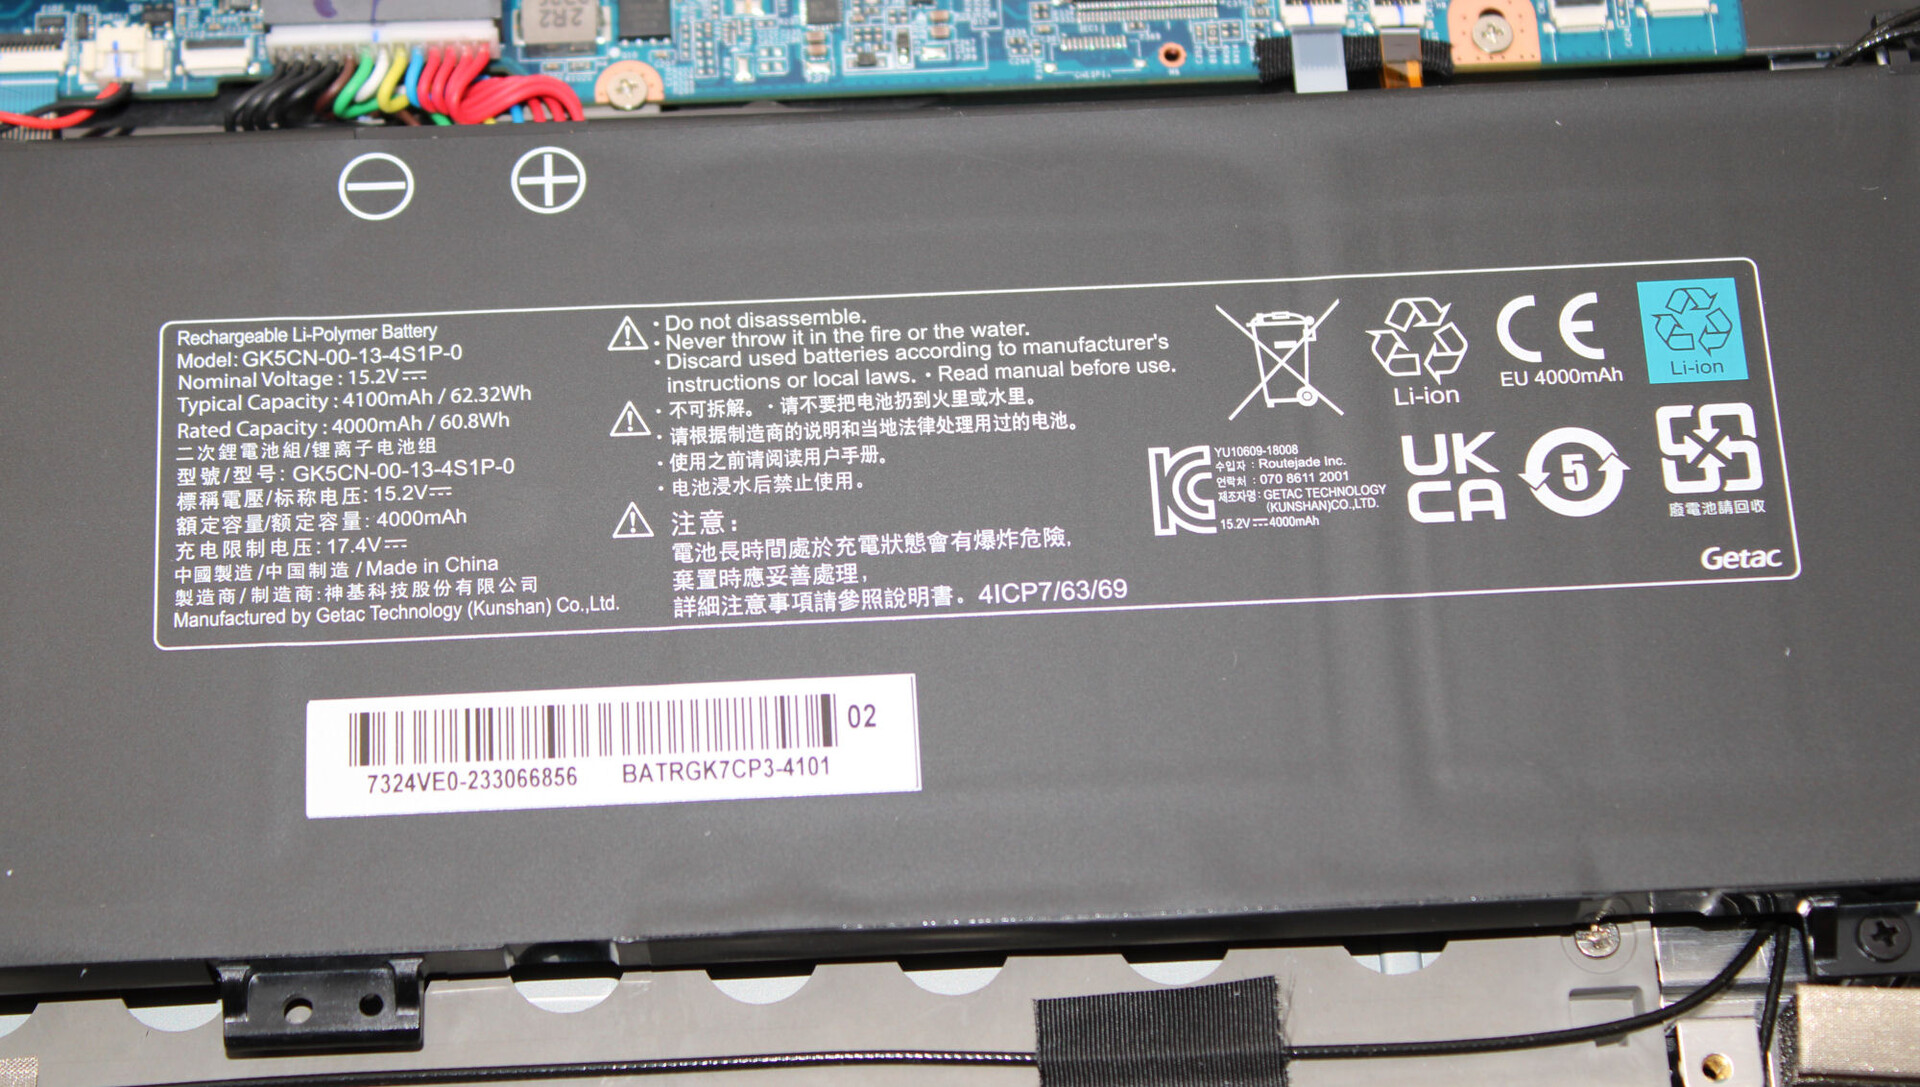
Boîtier - L'arrière du boîtier est en aluminium
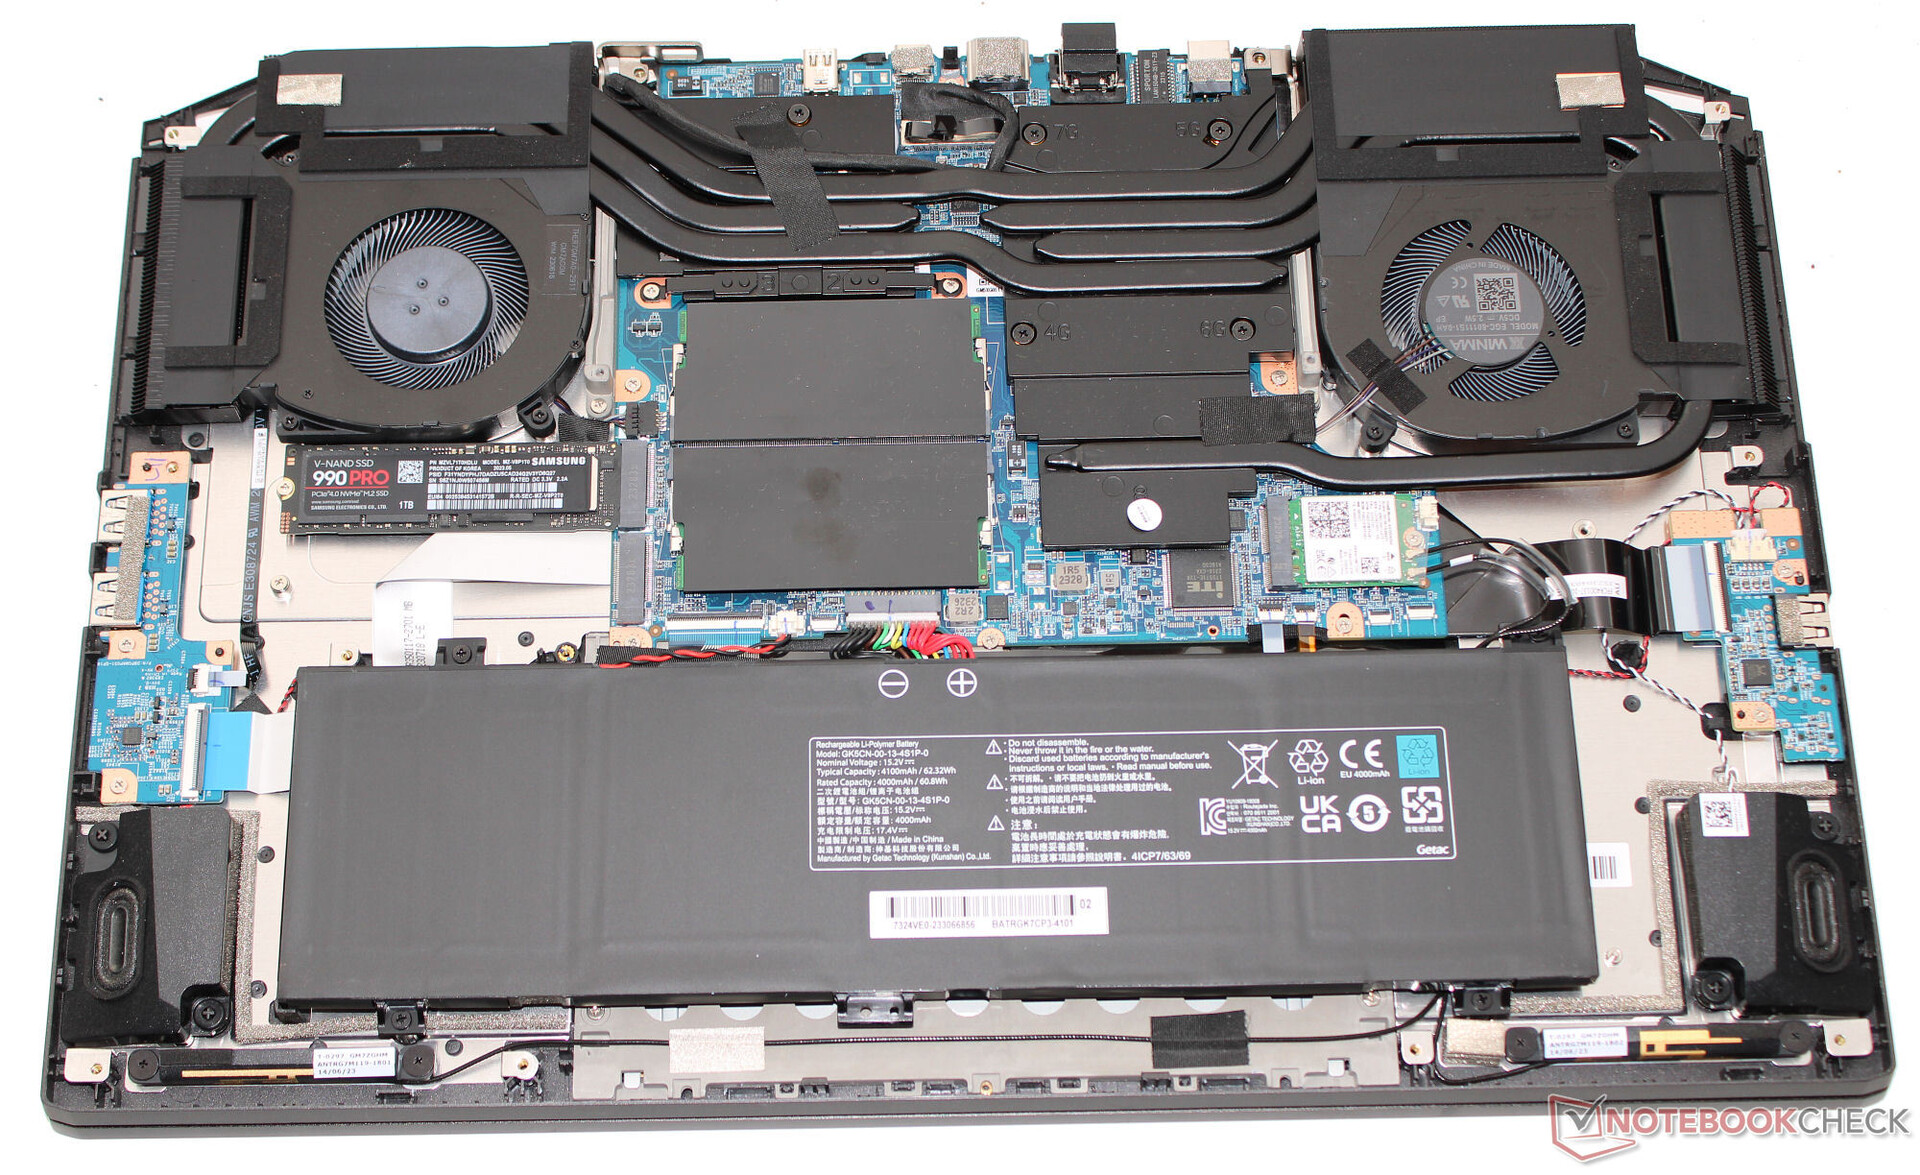
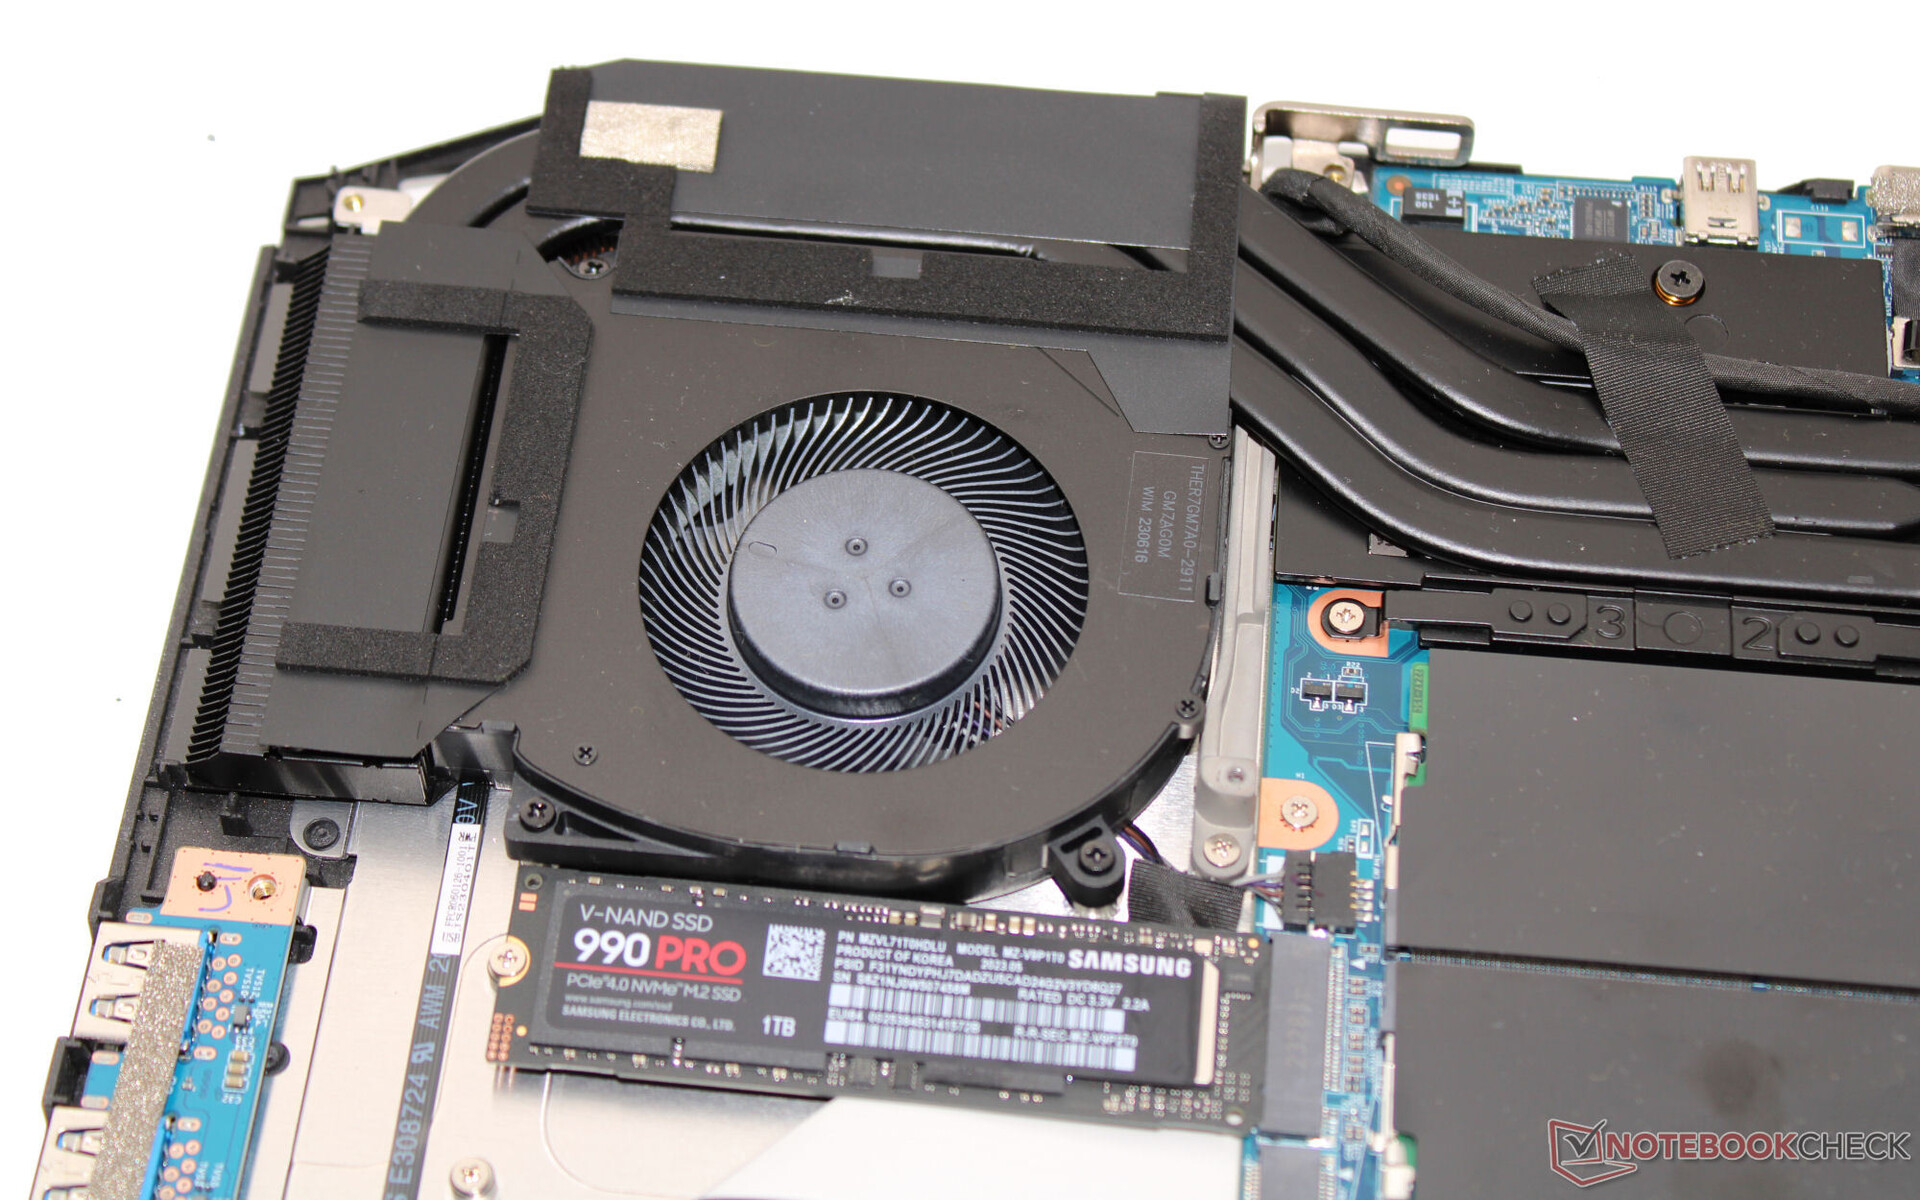
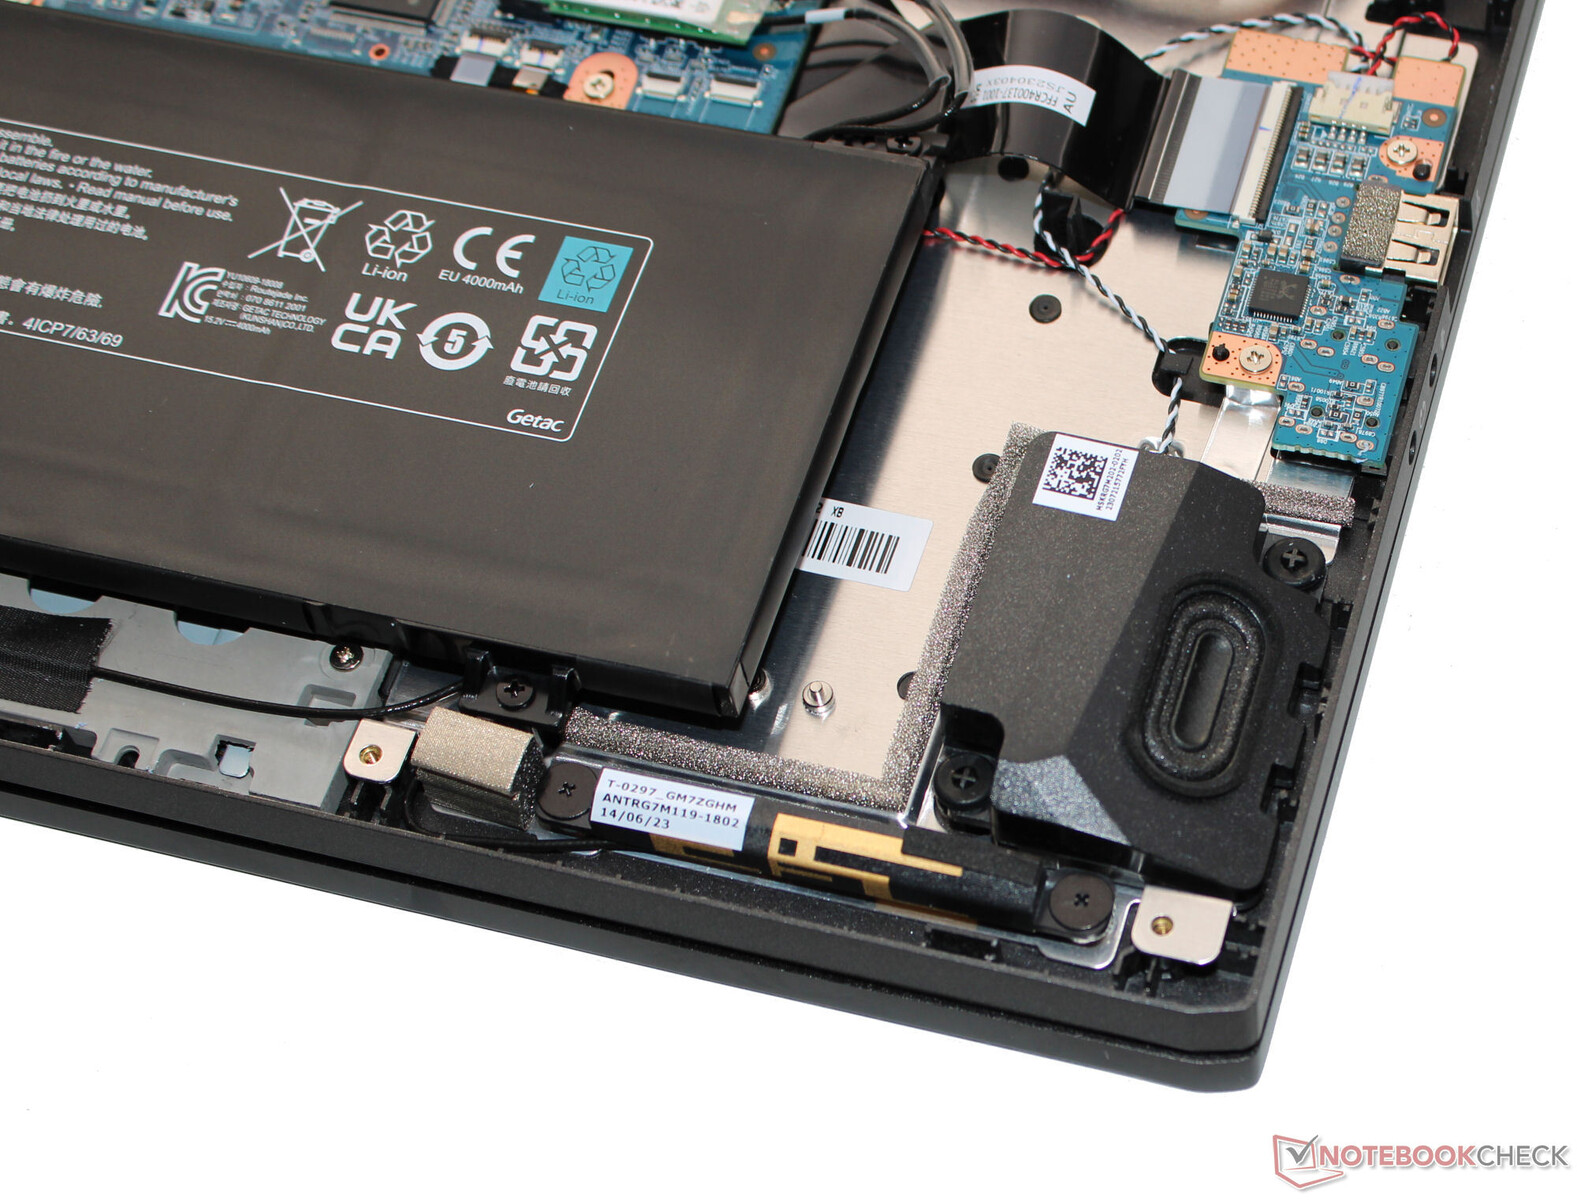
Le boîtier noir mat présente des surfaces lisses (à l'exception de l'unité de base) et aucun élément de design tape-à-l'œil. Les éléments lumineux LED sont absents, à l'exception de l'éclairage des touches. Schenker a opté pour un mélange de matériaux : L'arrière du couvercle en aluminium est complété par des éléments en plastique. Après avoir démonté l'unité de base, la batterie (vissée et non collée) ainsi que le matériel habituel sont exposés.
Les défauts de fabrication ne sont pas perceptibles et les dimensions de l'espace sont bonnes. Le couvercle et l'unité de base peuvent être légèrement tordus, mais dans une fourchette acceptable. Toute pression exercée sur le couvercle n'entraîne pas de distorsion de l'image. Les charnières maintiennent le couvercle bien en place, mais elles oscillent quelque peu. L'angle d'ouverture maximal est de 140 degrés. Il est possible d'ouvrir l'ordinateur portable d'une seule main.
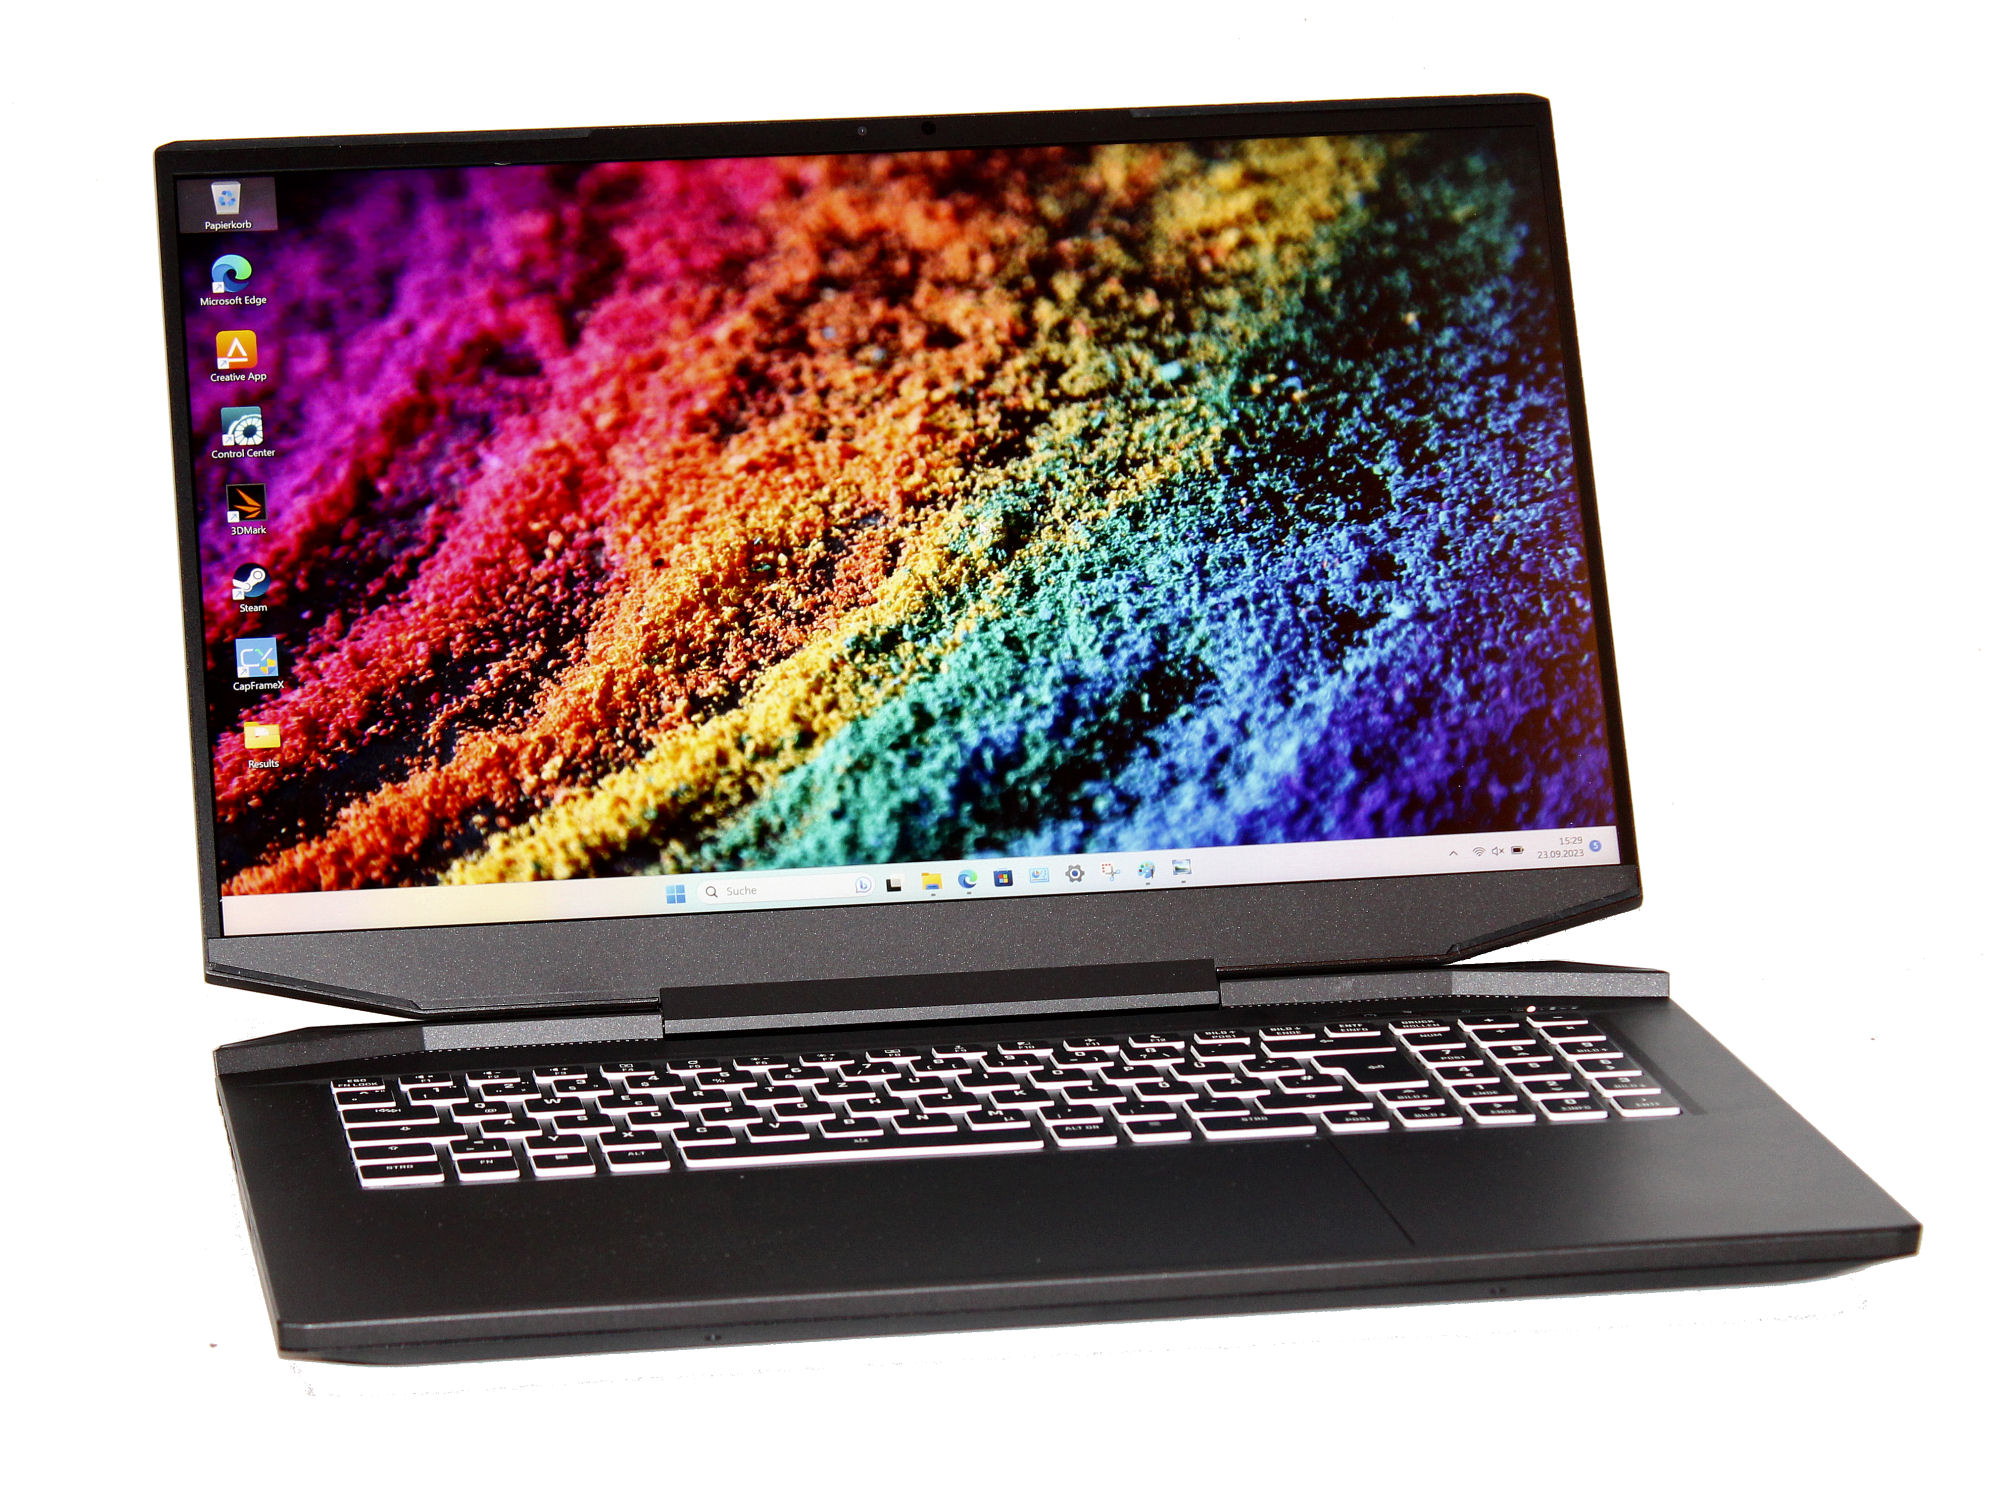
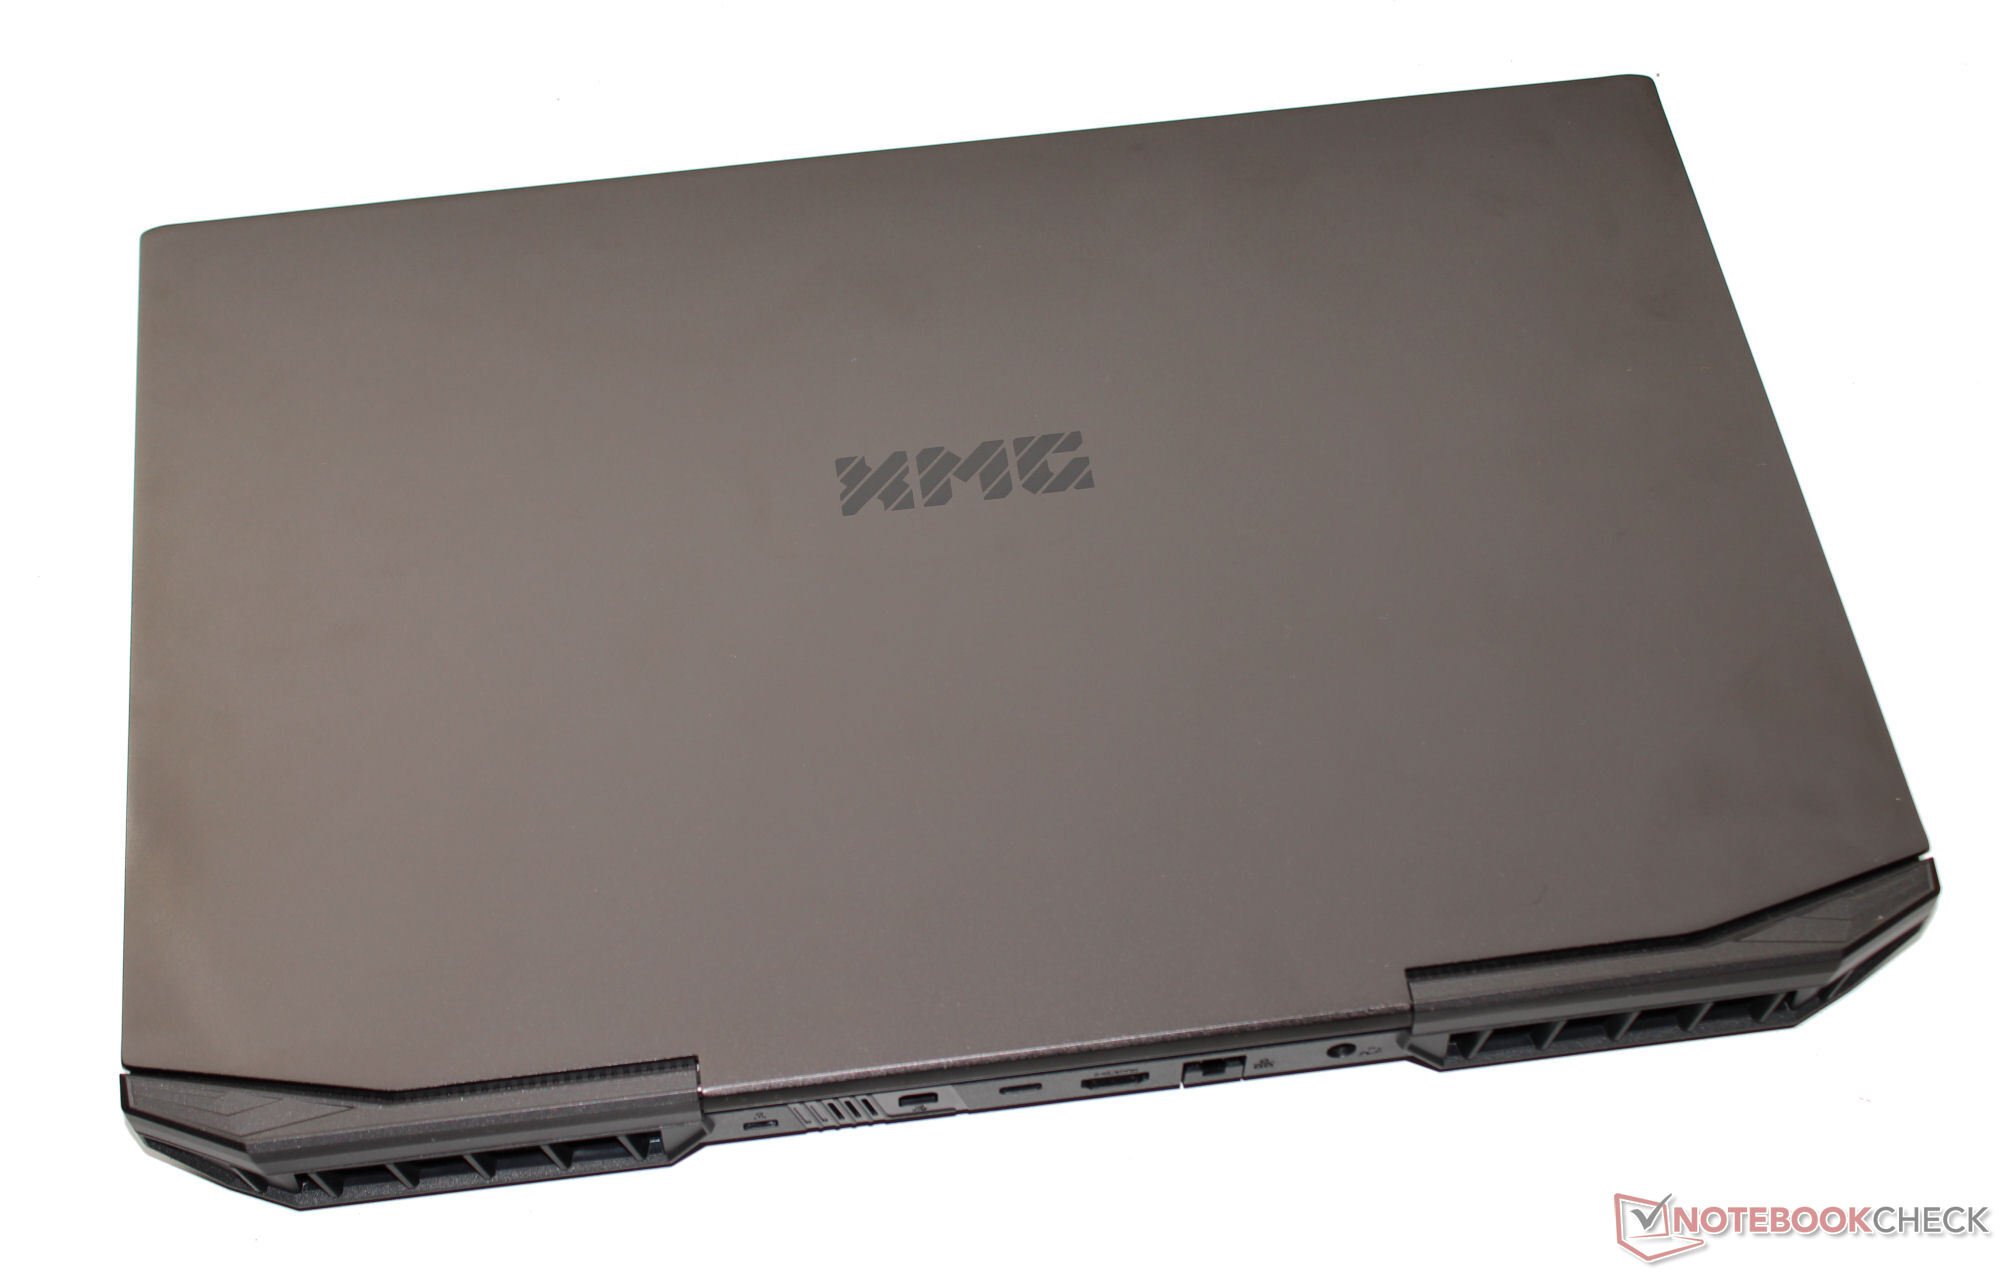
L'ordinateur XMG est le plus léger et le plus compact des ordinateurs portables concurrents de 17,3 pouces. Avec un poids d'environ 2,5 kg, il fait généralement partie des représentants les plus légers de son genre.
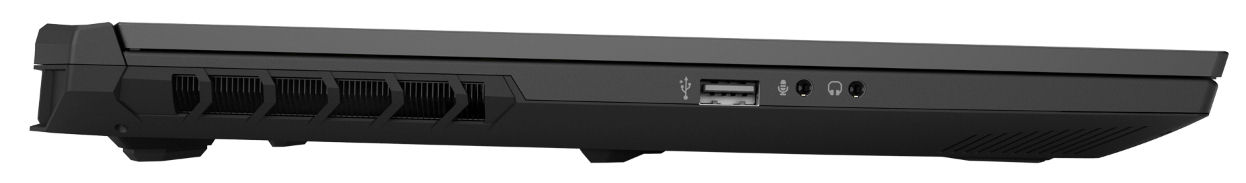
Caractéristiques - L'ordinateur portable XMG est livré sans Thunderbolt
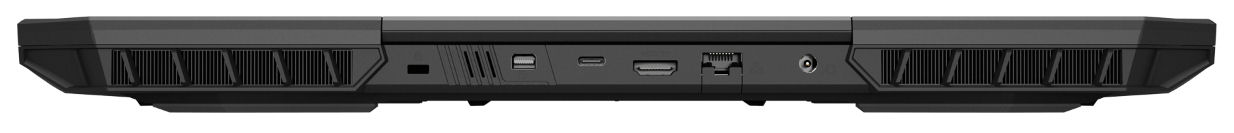
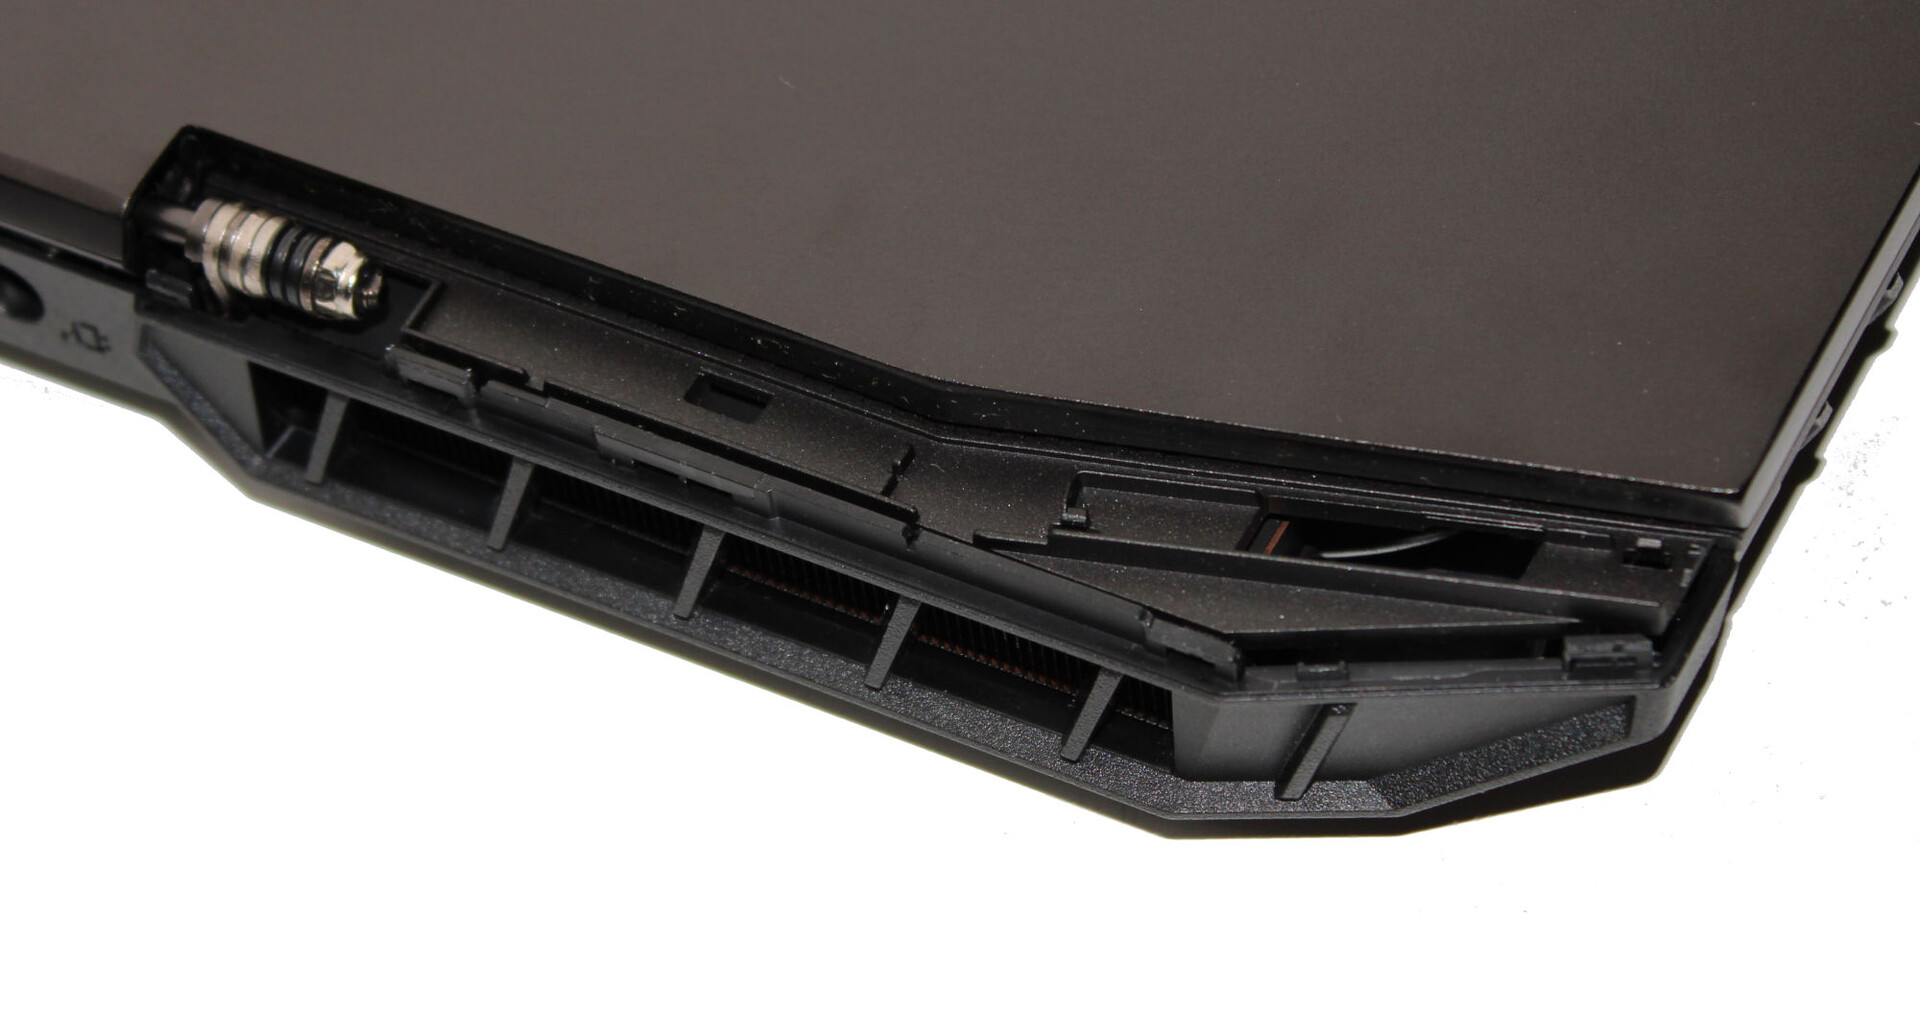
L'Apex dispose de trois ports USB-A (1x USB 2.0, 2x USB 3.2 Gen 1) et d'un port USB-C (USB 3.2 Gen 2). Ce dernier ne peut ni émettre un signal Displayport, ni offrir une prise en charge Power Delivery. Deux sorties vidéo (HDMI 2.1, DP 1.4a), des prises audio et un port Gigabit Ethernet complètent l'ensemble.
Les sorties vidéo, le connecteur d'alimentation et le port LAN se trouvent à l'arrière de l'appareil. Les câbles correspondants passent à l'arrière et ne gênent donc pas.
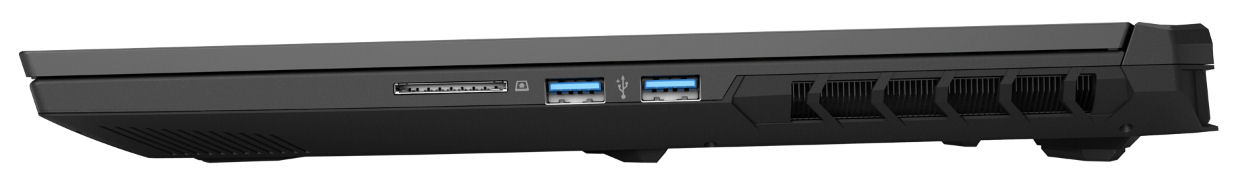
Lecteur de carte SD
Avec une vitesse de transfert maximale de 35 MB/s (transfert de 250 fichiers d'images jpg, d'environ 5 MB chacun) et de 36 MB/s (copie de gros blocs de données), le lecteur de cartes mémoire (carte de référence : AV PRO microSD 128 GB V60) fait partie des modèles lents. À cet égard, la concurrence offre davantage.
| SD Card Reader | |
| average JPG Copy Test (av. of 3 runs) | |
| Alienware m16 R1 Intel (AV PRO microSD 128 GB V60) | |
| Moyenne de la classe Gaming (20.9 - 210, n=54, 2 dernières années) | |
| Medion Erazer Defender P40 (AV PRO microSD 128 GB V60) | |
| Acer Nitro 17 AN17-51-71ER | |
| Schenker XMG Apex 17 (Late 23) (AV PRO microSD 128 GB V60) | |
| maximum AS SSD Seq Read Test (1GB) | |
| Alienware m16 R1 Intel (AV PRO microSD 128 GB V60) | |
| Moyenne de la classe Gaming (25.5 - 261, n=51, 2 dernières années) | |
| Medion Erazer Defender P40 (AV PRO microSD 128 GB V60) | |
| Acer Nitro 17 AN17-51-71ER | |
| Schenker XMG Apex 17 (Late 23) (AV PRO microSD 128 GB V60) | |
Communication
Dans des conditions optimales (pas d'appareils Wi-Fi à proximité, une courte distance entre l'ordinateur portable et le PC serveur), il est possible d'atteindre des vitesses de données Wi-Fi bonnes à très bonnes. L'ordinateur portable Schenker utilise une puce Wi-Fi 6E (Intel AX200). Un contrôleur Realtek (RTL8168/8111 ; 1 GBit/s) se charge des connexions filaires.
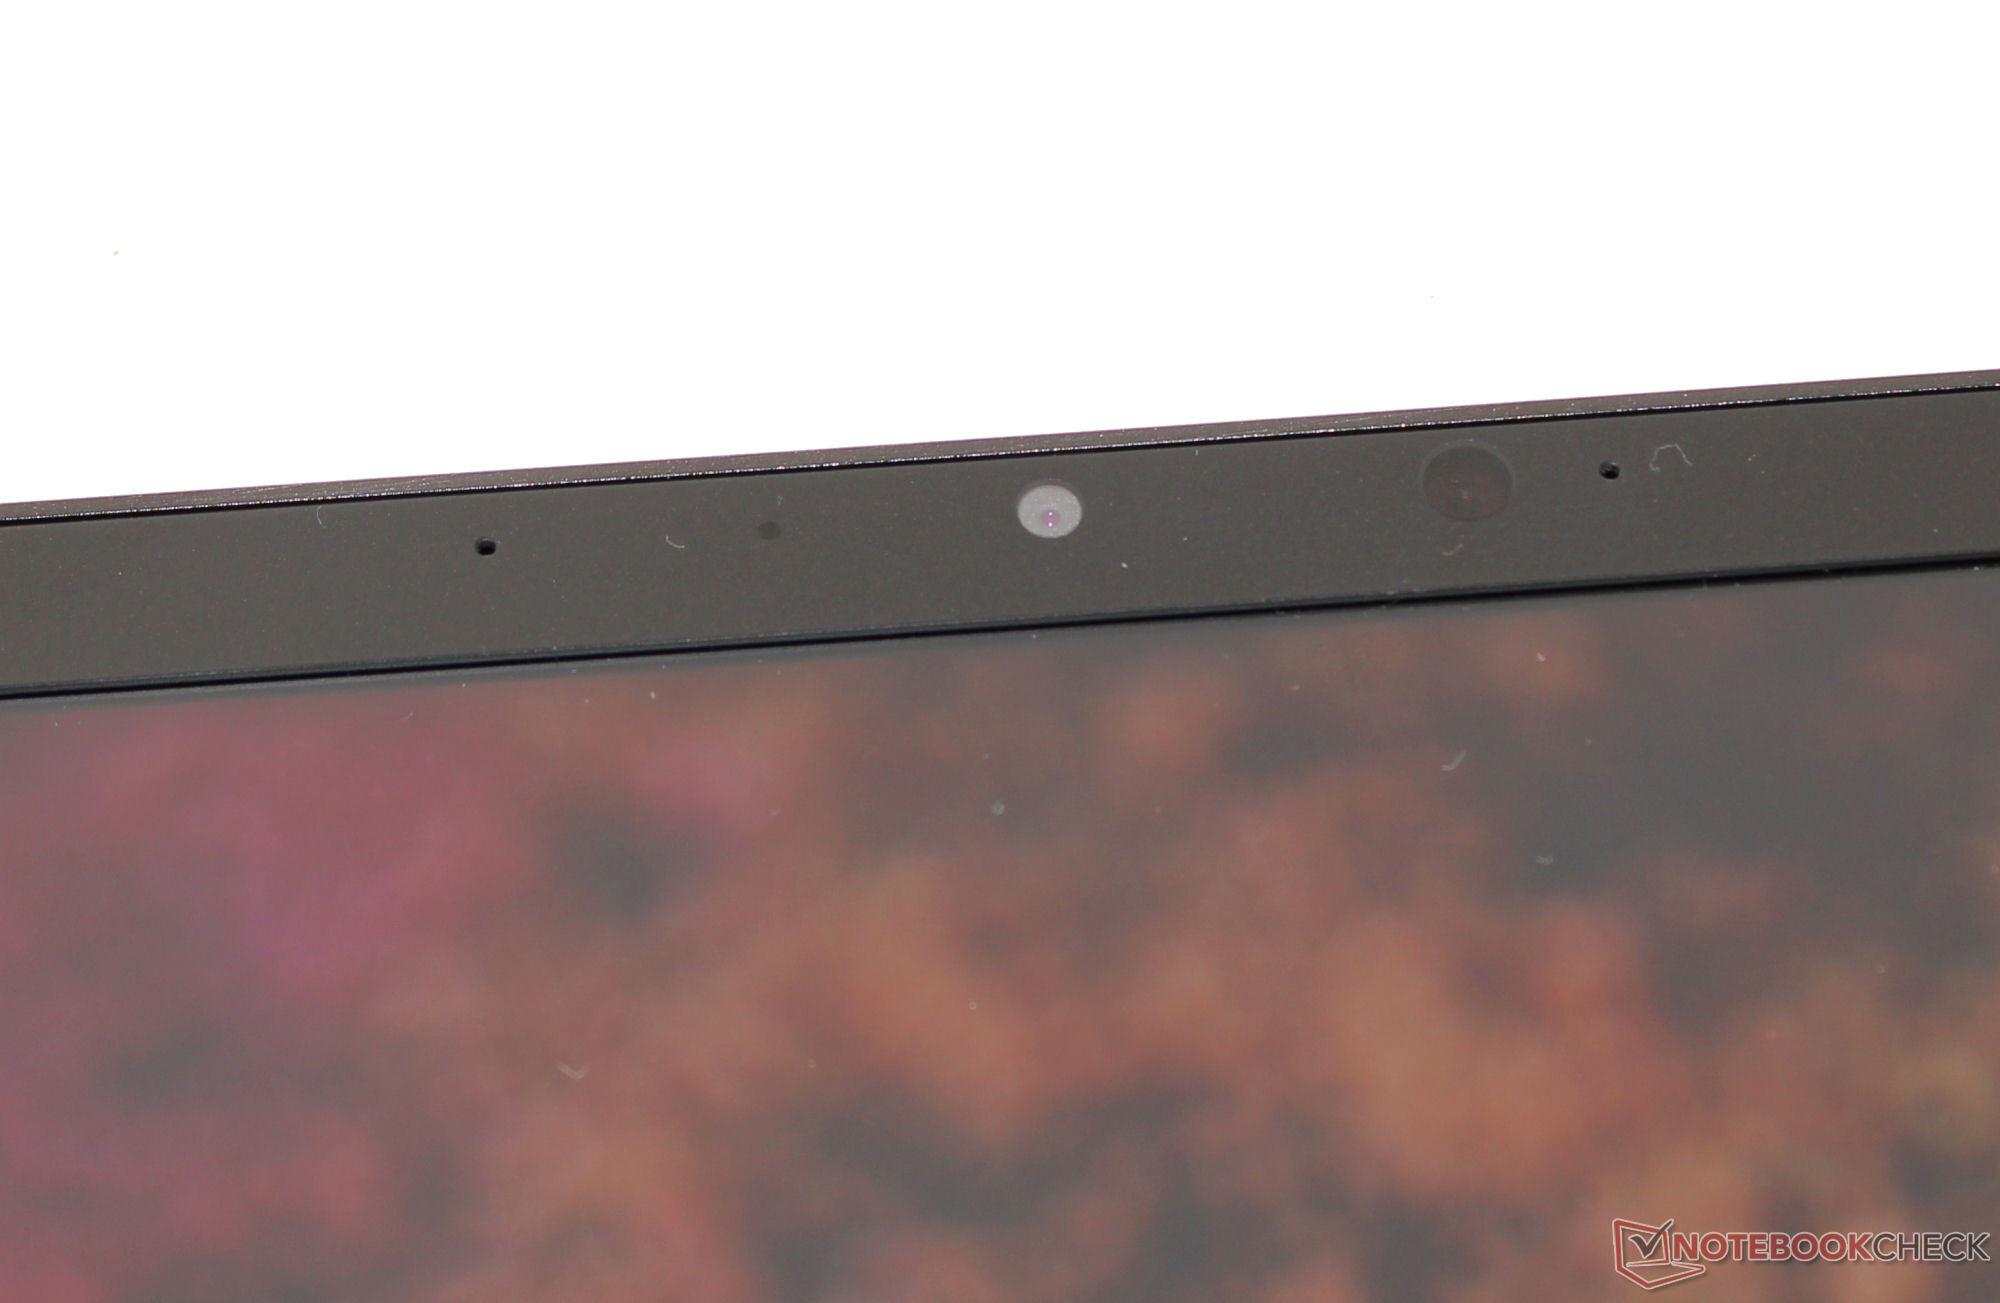
Webcam
Du point de vue de la qualité, la webcam (2,1 MP, max. 1 920 x 1 080 pixels) est standard. Une déviation des couleurs d'environ 8,7 (objectif : DeltaE < 3) est tout à fait décente. La caméra n'offre pas d'obturateur mécanique.

 GeForce RTX 4060 Laptop GPU, R7 7840HS, Samsung 990 Pro 1 TB")
 GeForce RTX 4060 Laptop GPU, R7 7840HS, Samsung 990 Pro 1 TB")
Accessoires
Outre les documents habituels, l'ordinateur portable est livré avec une clé USB (pilotes, logiciels), un porte-clés comprenant un décapsuleur et un grand tapis de souris.
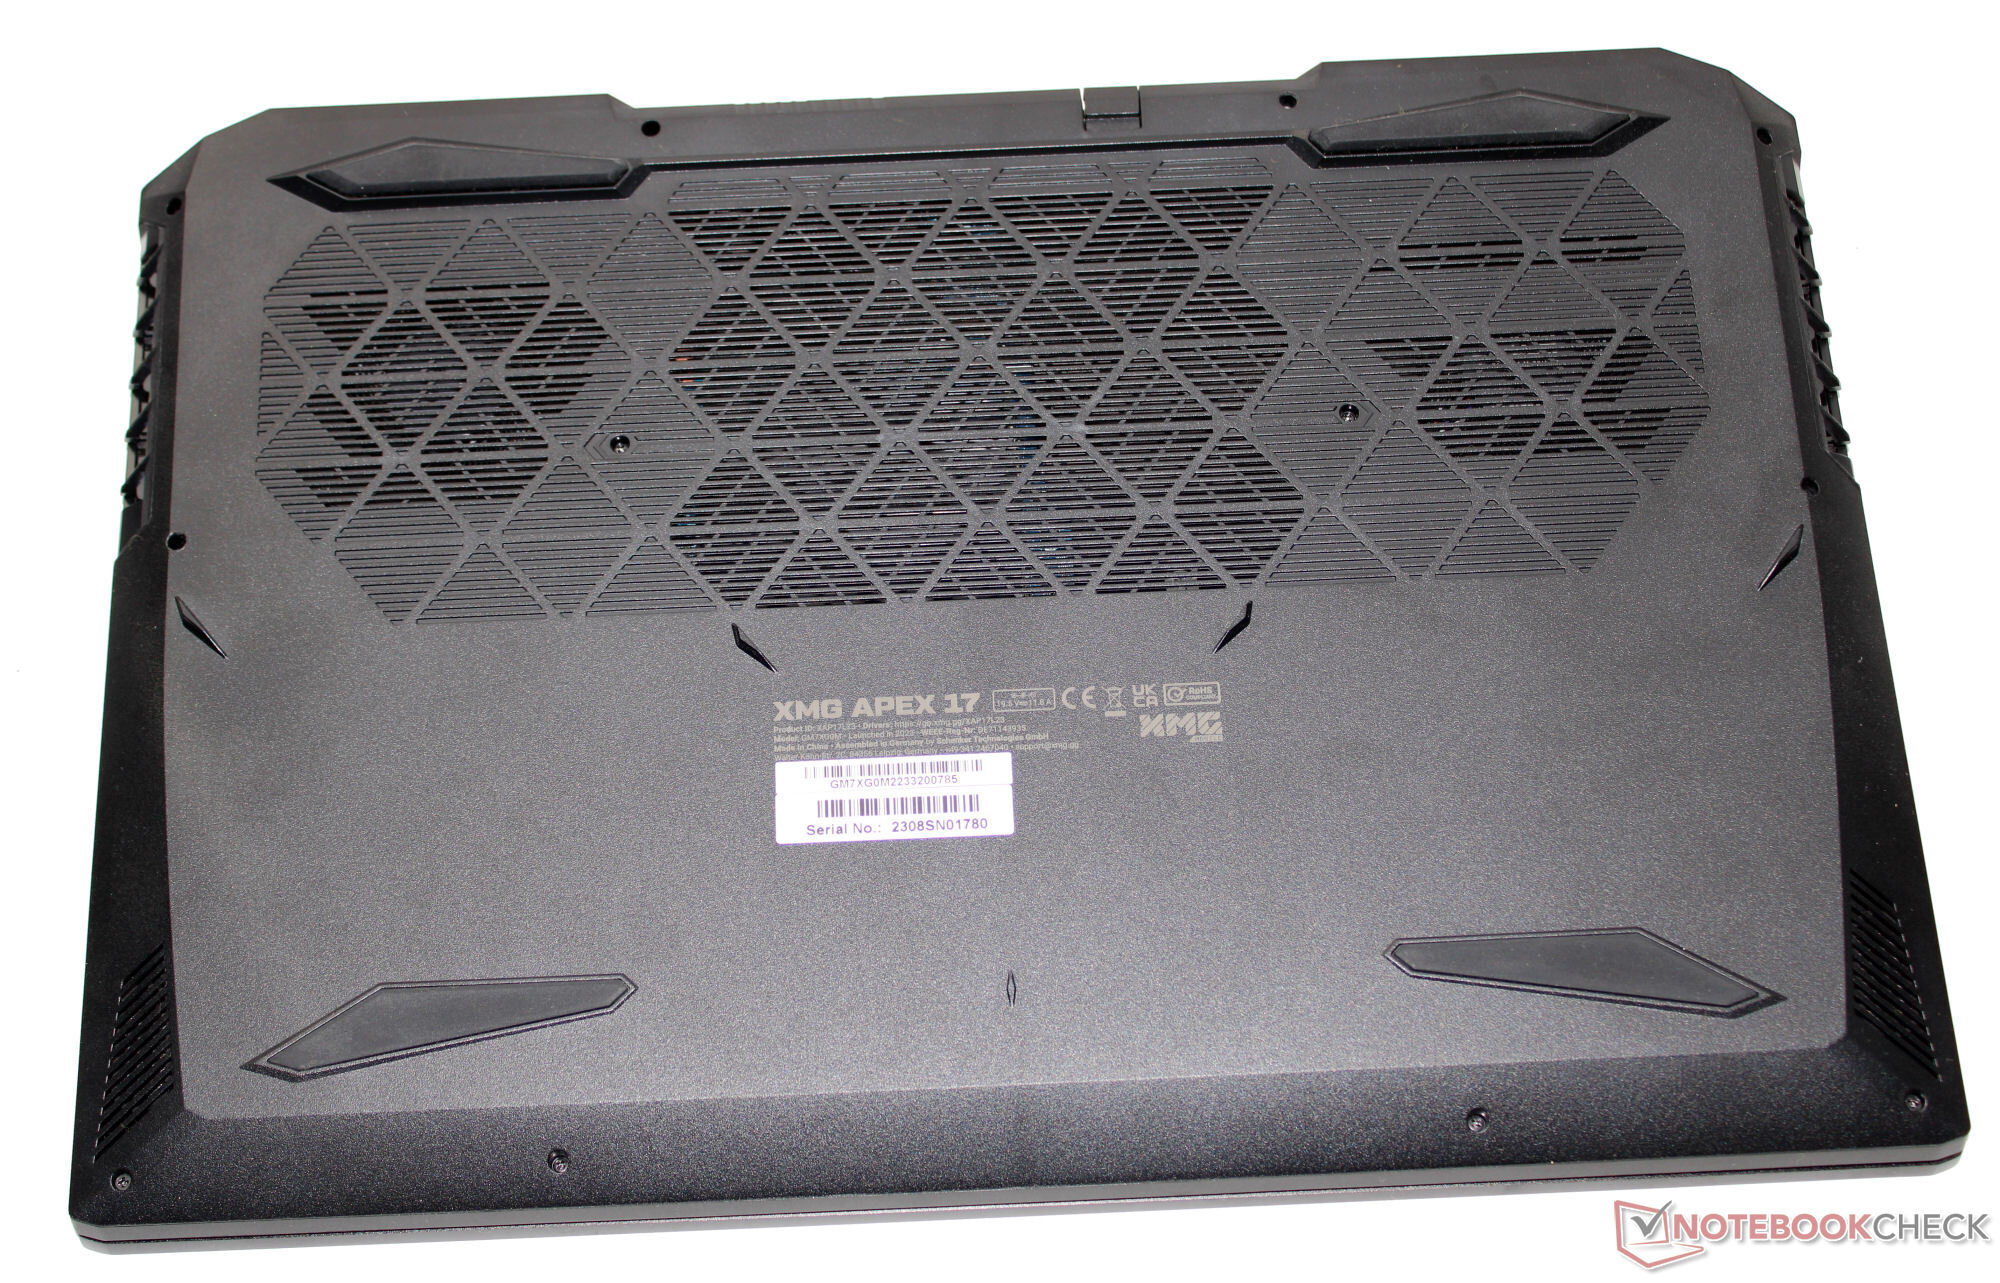
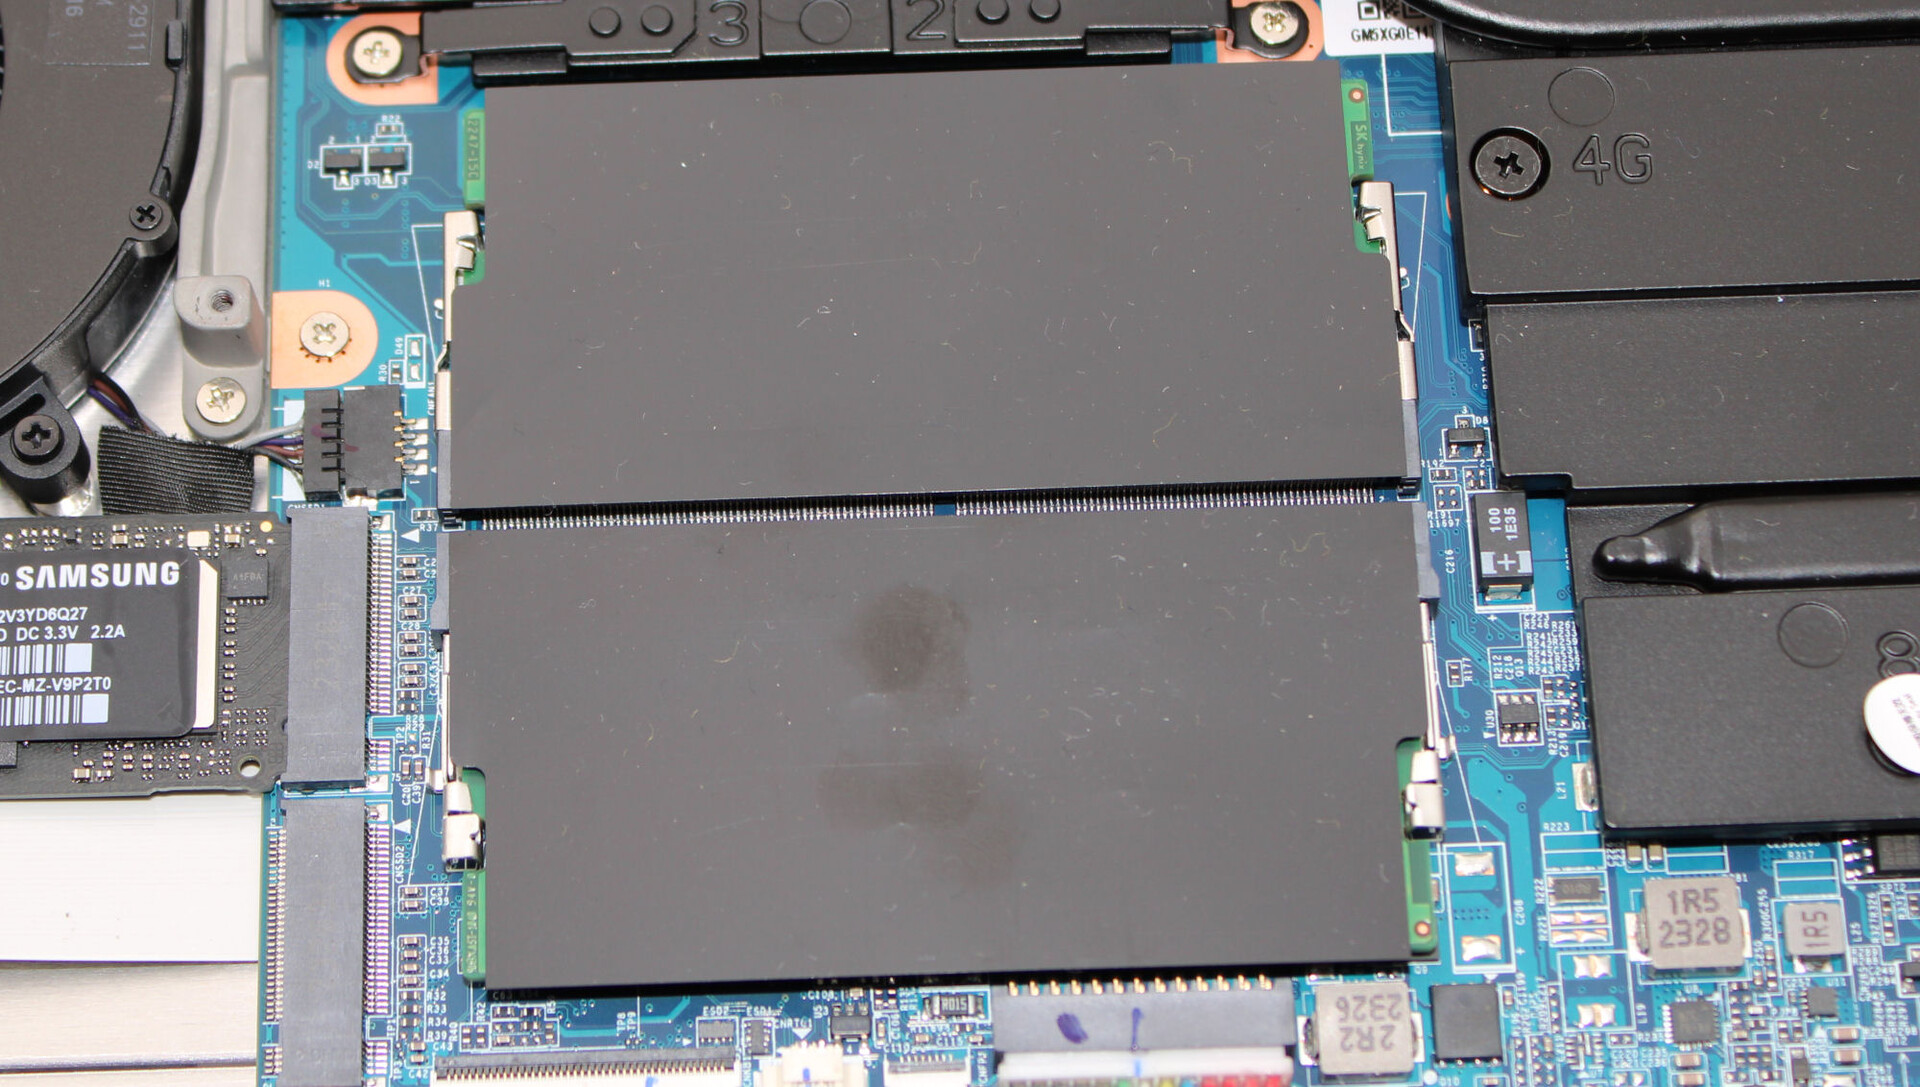
Maintenance
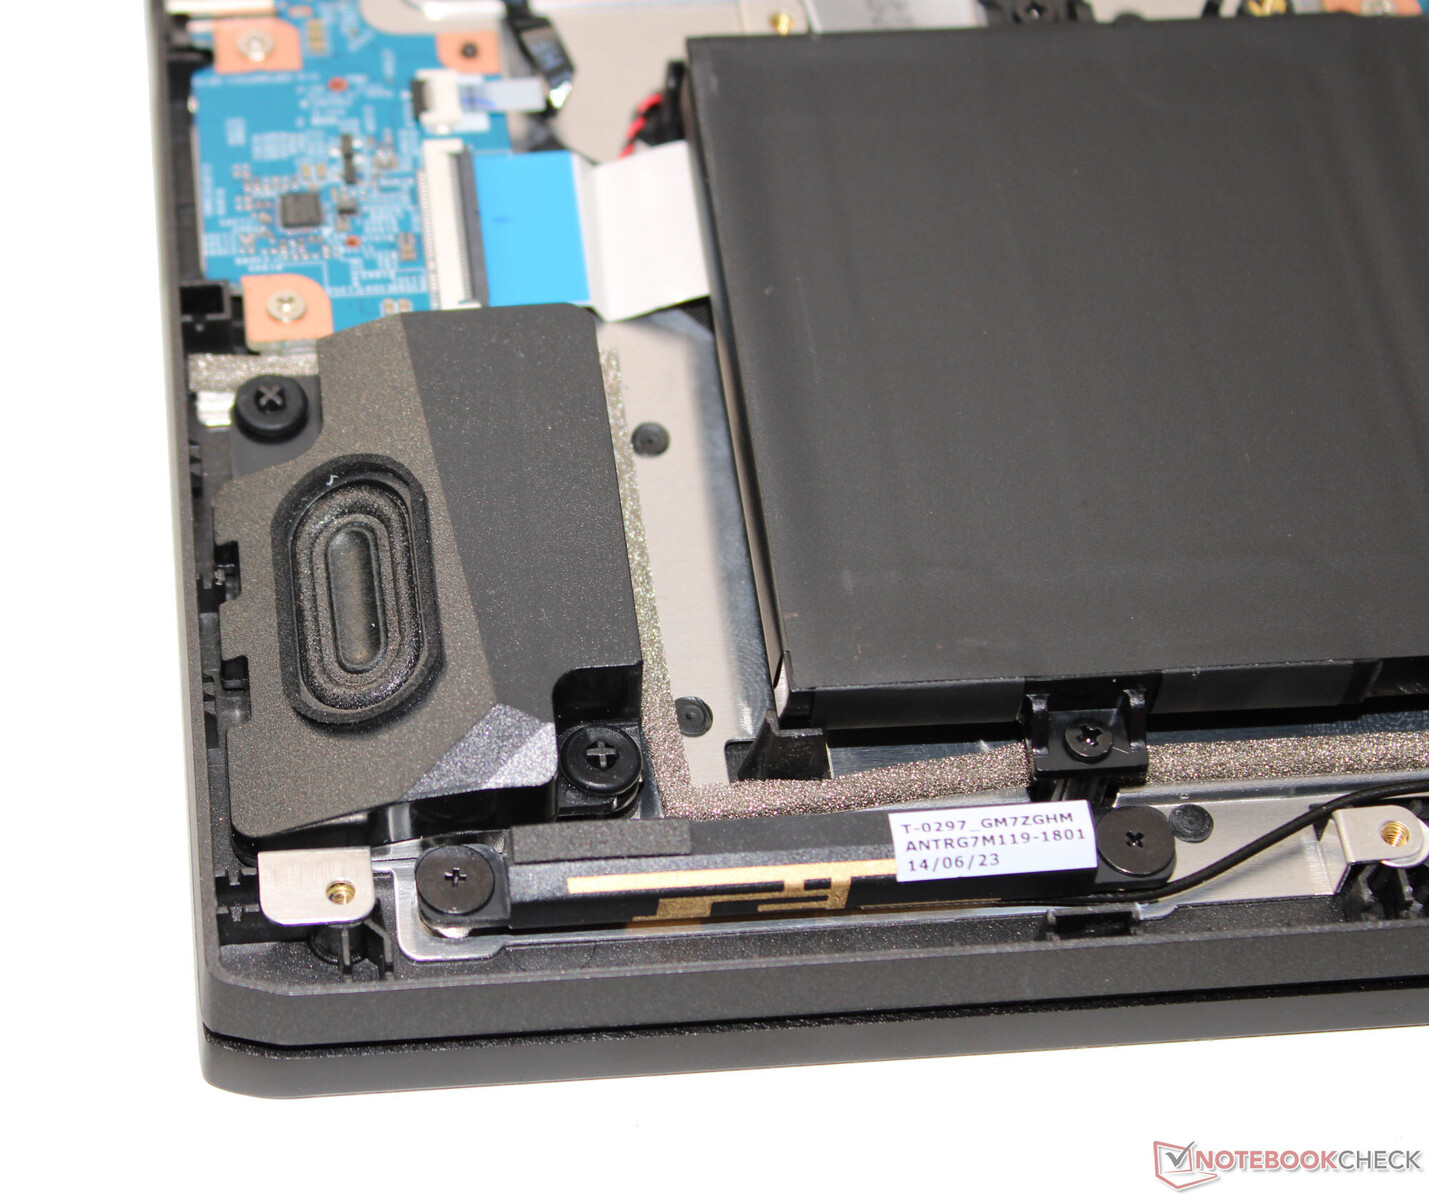
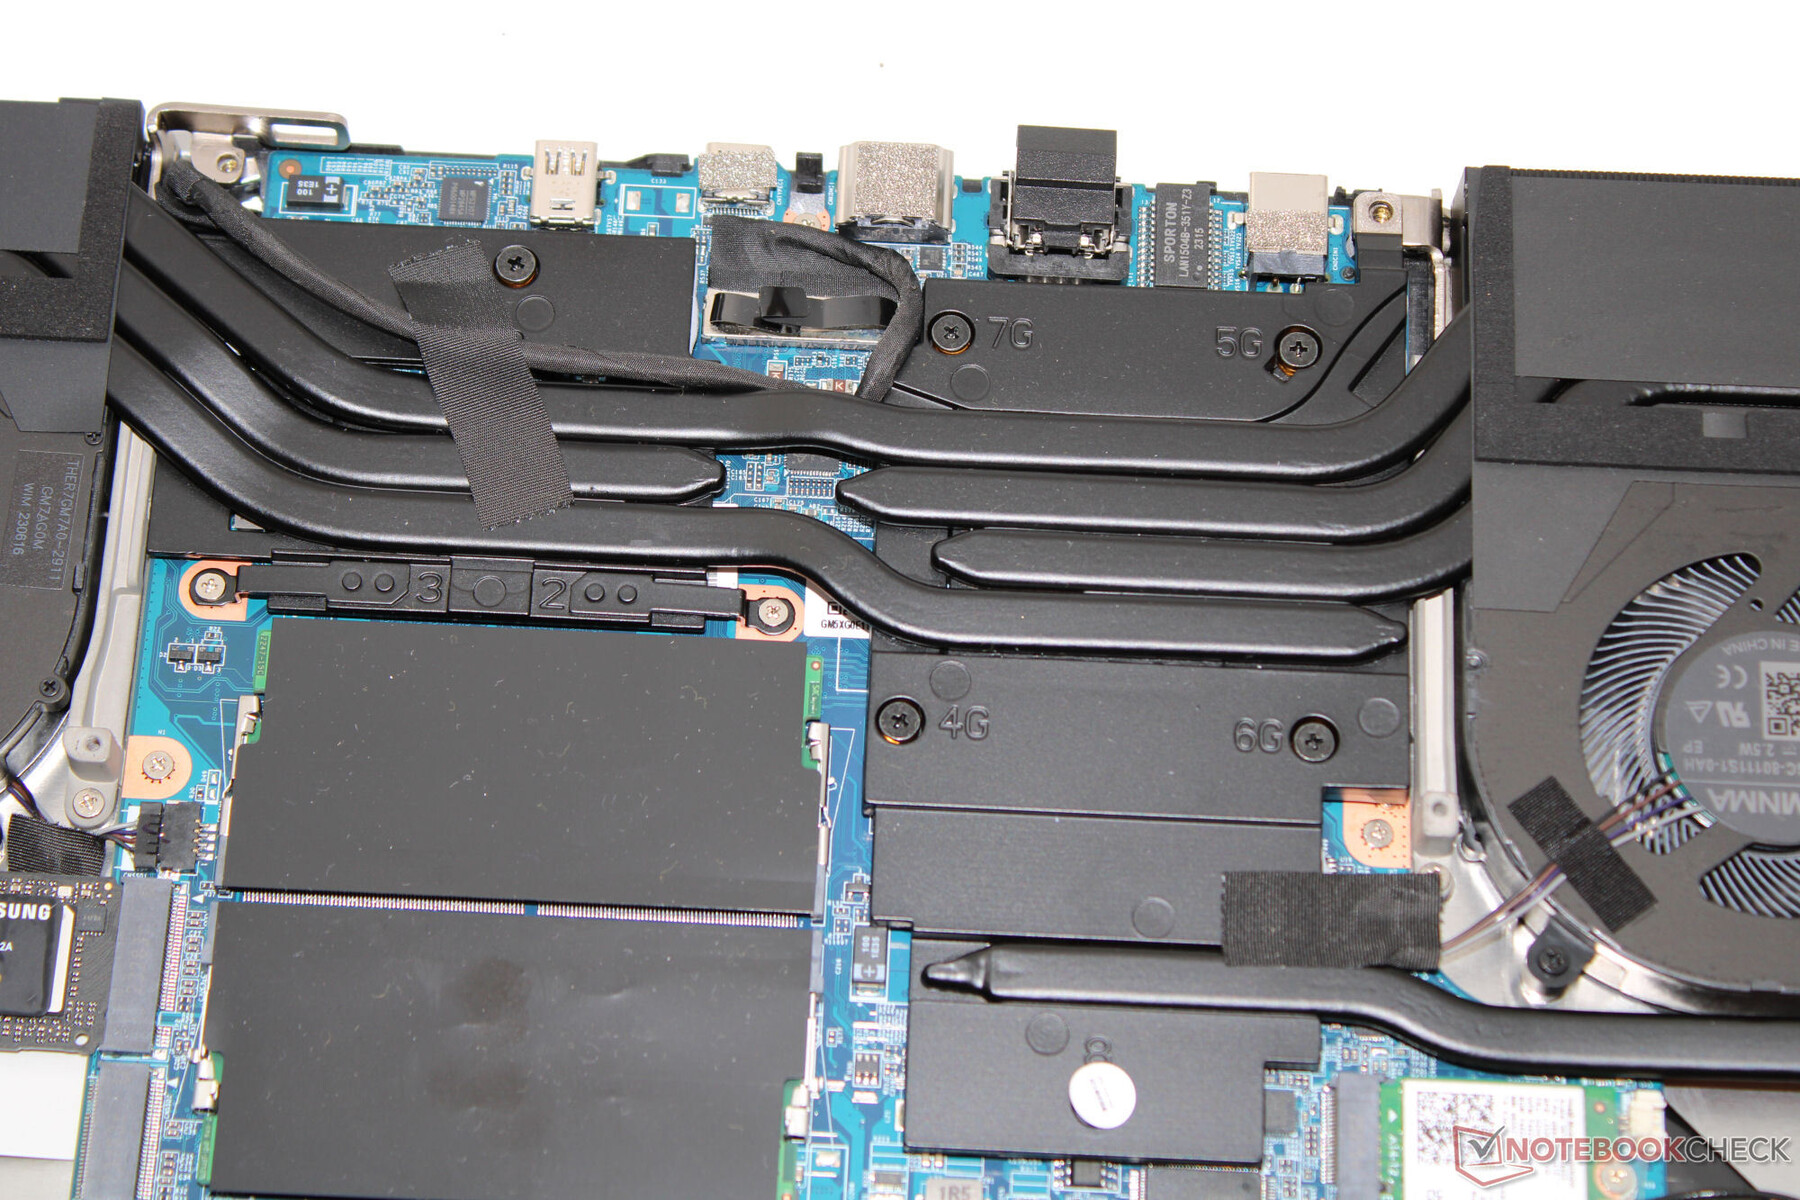
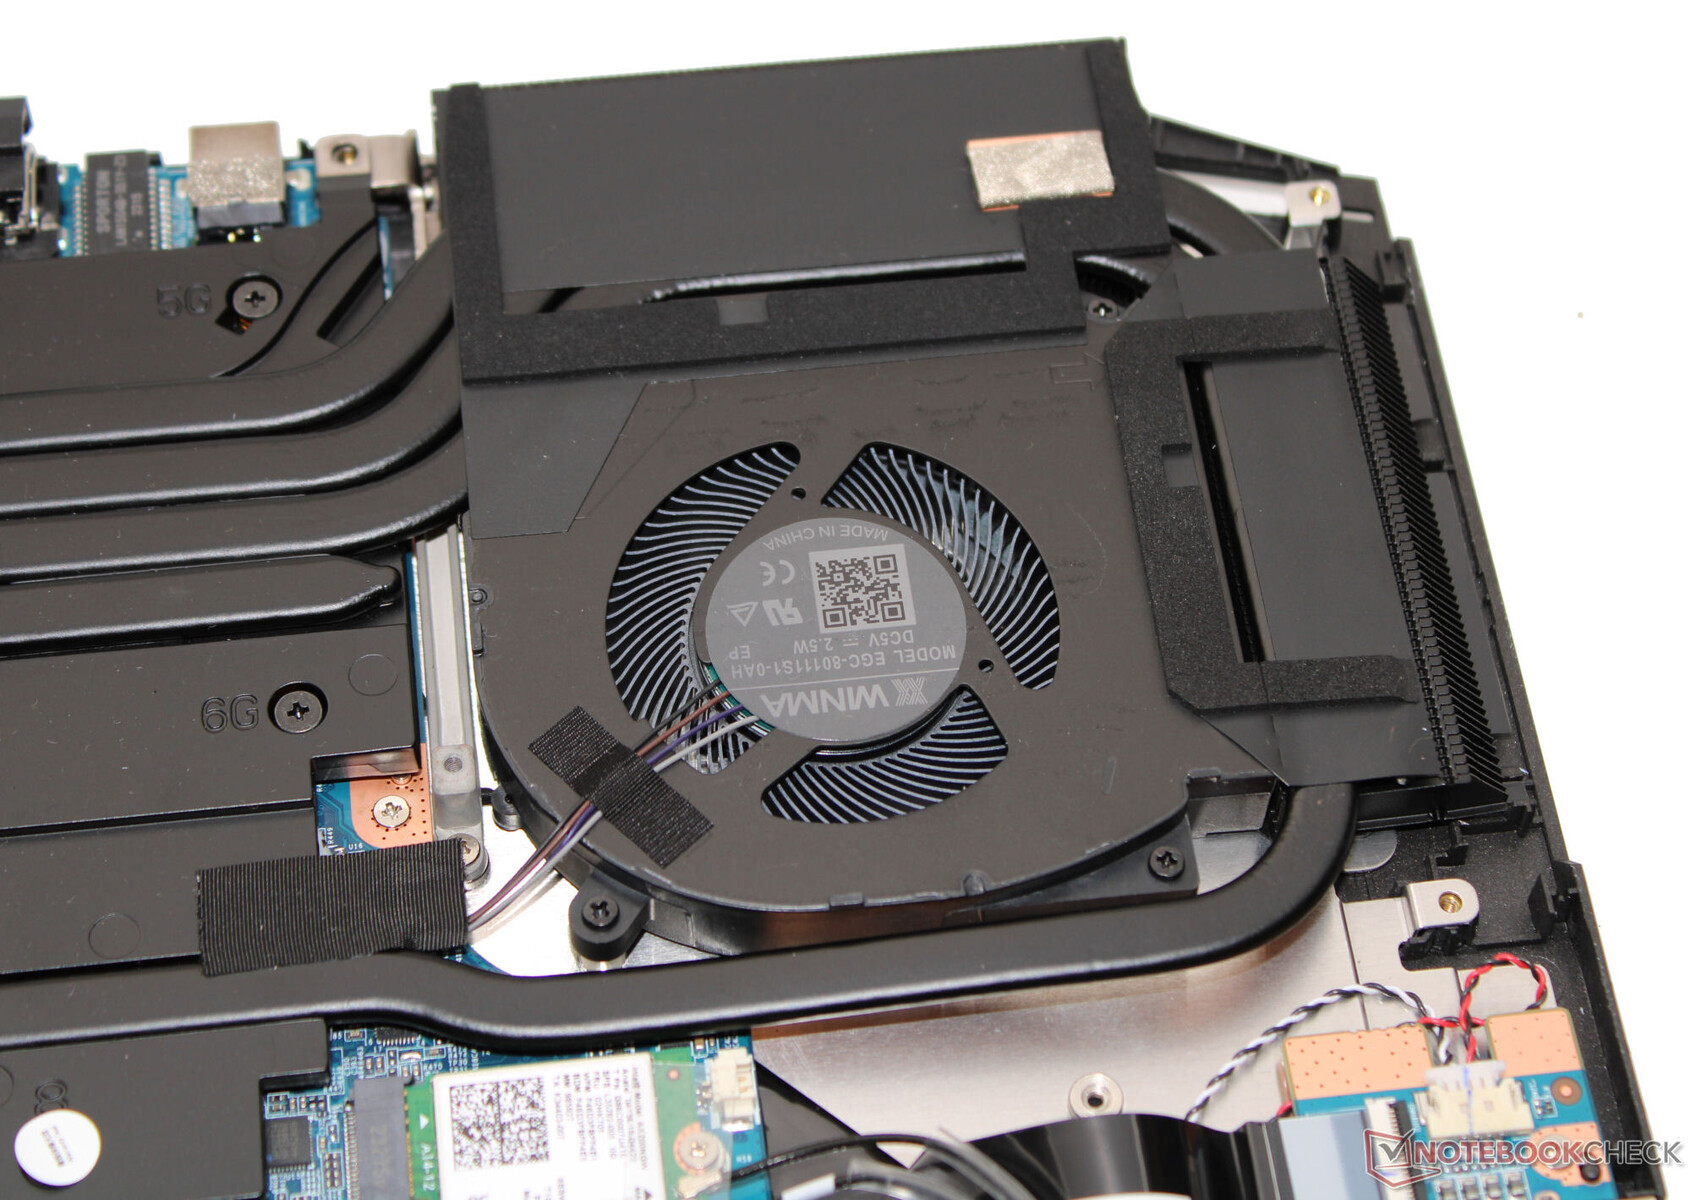
Après avoir démonté la plaque de base, le matériel devient accessible. La première étape consiste à retirer les couvercles des charnières (au-dessus des bouches d'aération). Ceux-ci ne sont que fendus et non vissés. Ensuite, en retirant toutes les vis au bas de l'appareil, il est possible de séparer la coque de base du reste de l'appareil à l'aide d'une spatule fine ou d'un médiator. On accède alors aux banques de mémoire (toutes deux occupées), au SSD (PCIe 4, M.2 2280), au second slot SSD (PCIe 4, M.2 2280), au module Wi-Fi, à la batterie BIOS, aux ventilateurs et à la batterie.
Garantie
La garantie de base est de deux ans et comprend un service d'enlèvement et six mois de réparation rapide (réparation dans les 48 heures). En Allemagne, le prix demandé pour une garantie de 36 mois est compris entre 80 et 119 euros, en fonction de la durée de réparation rapide choisie.
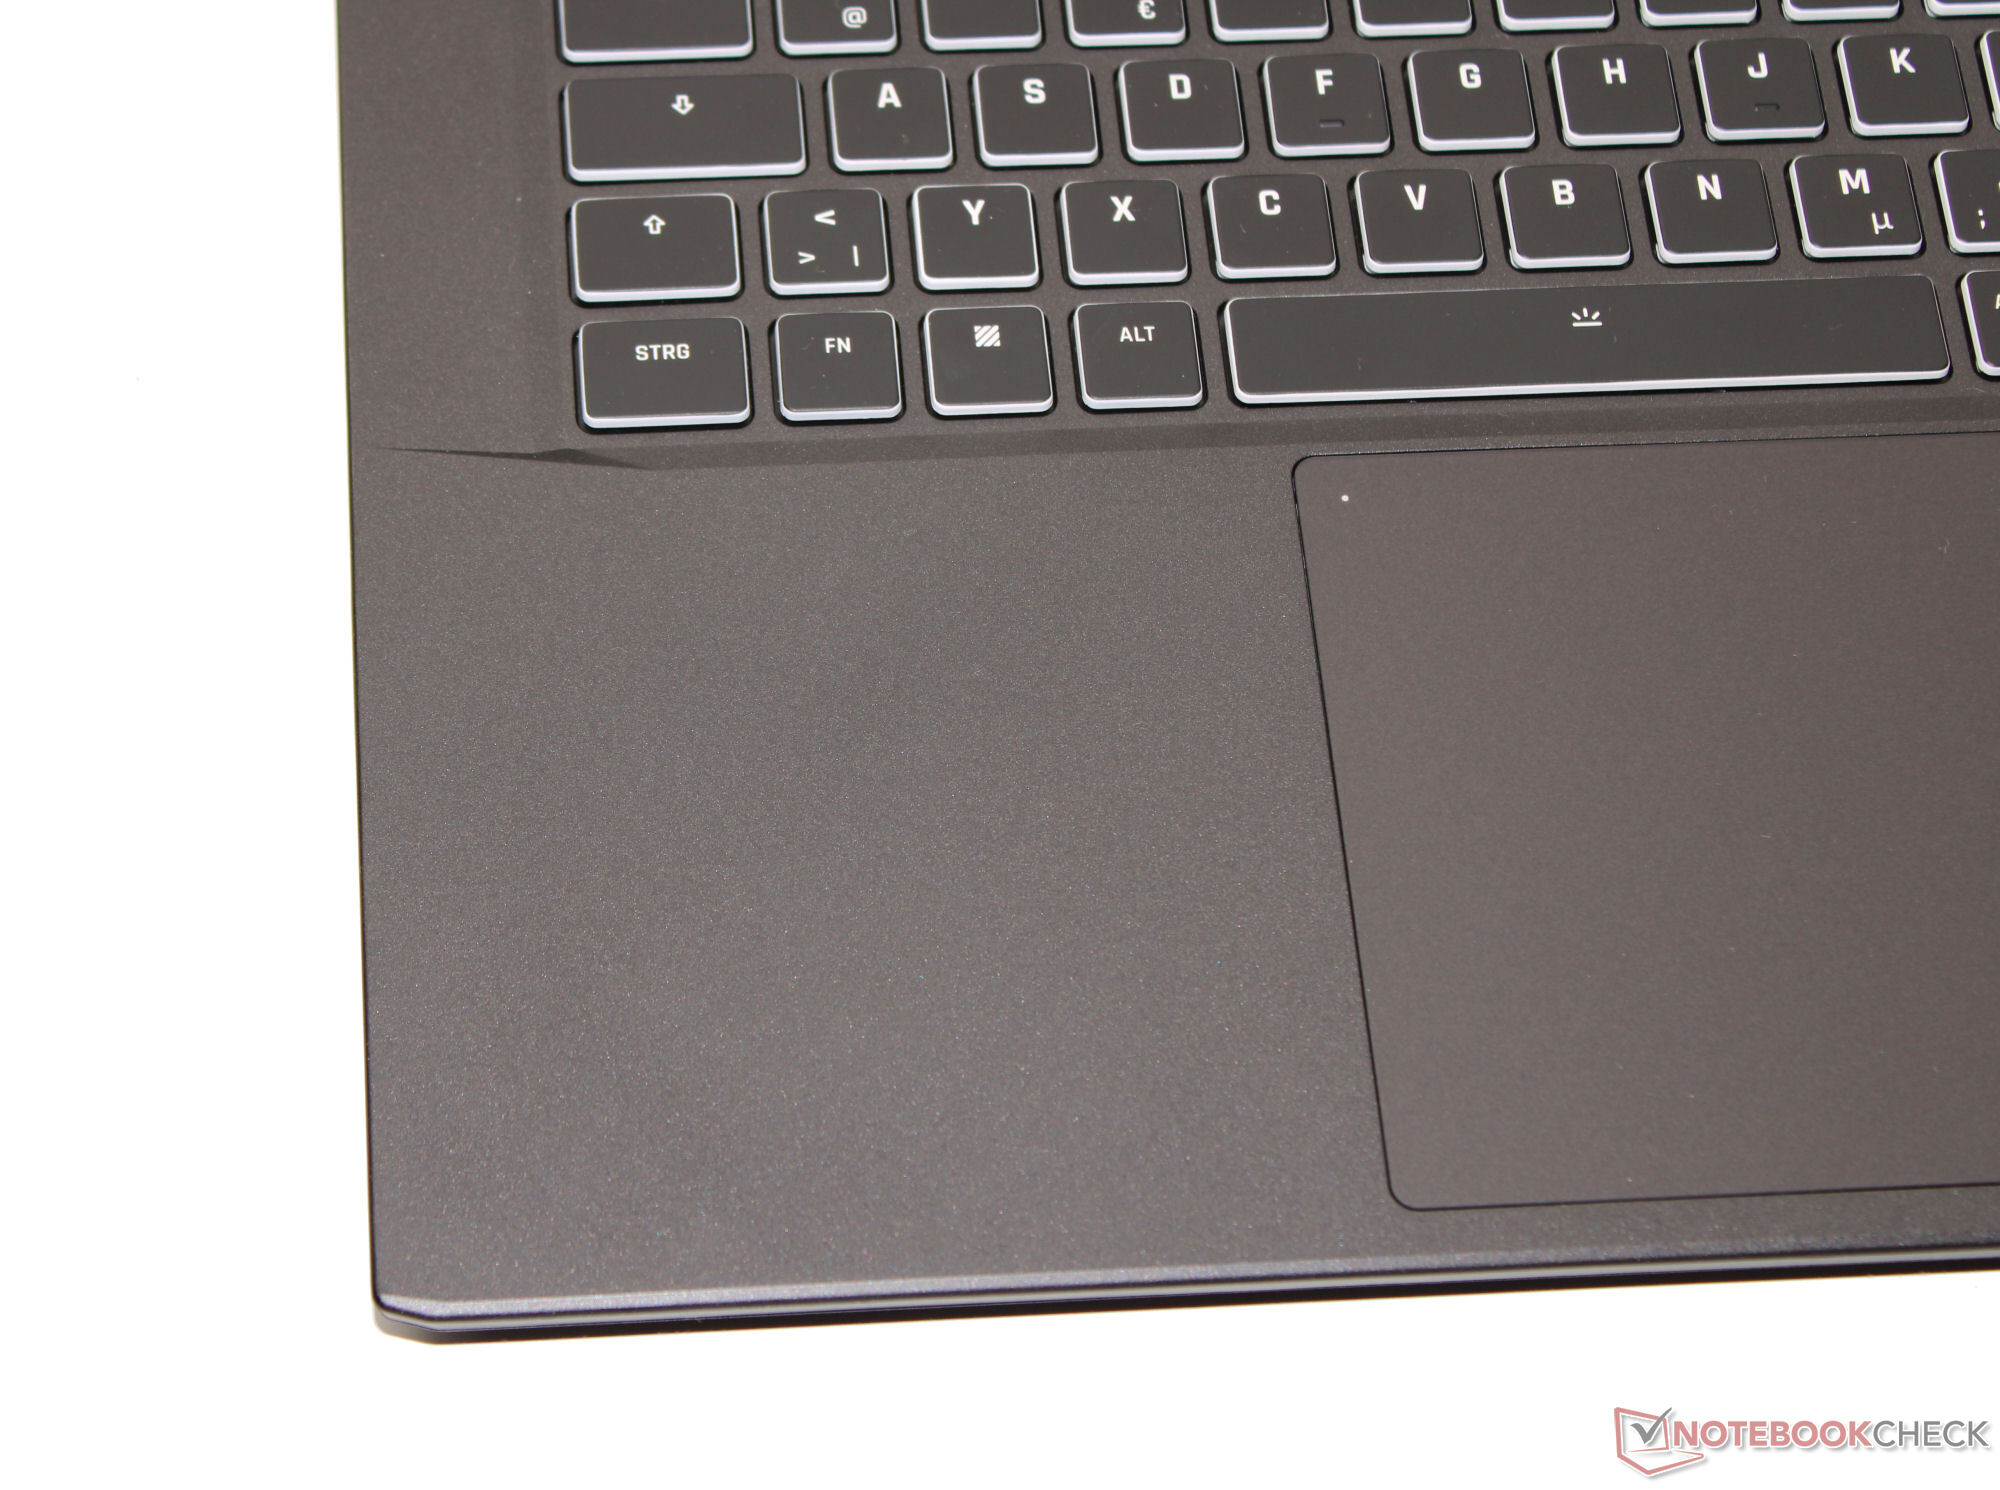
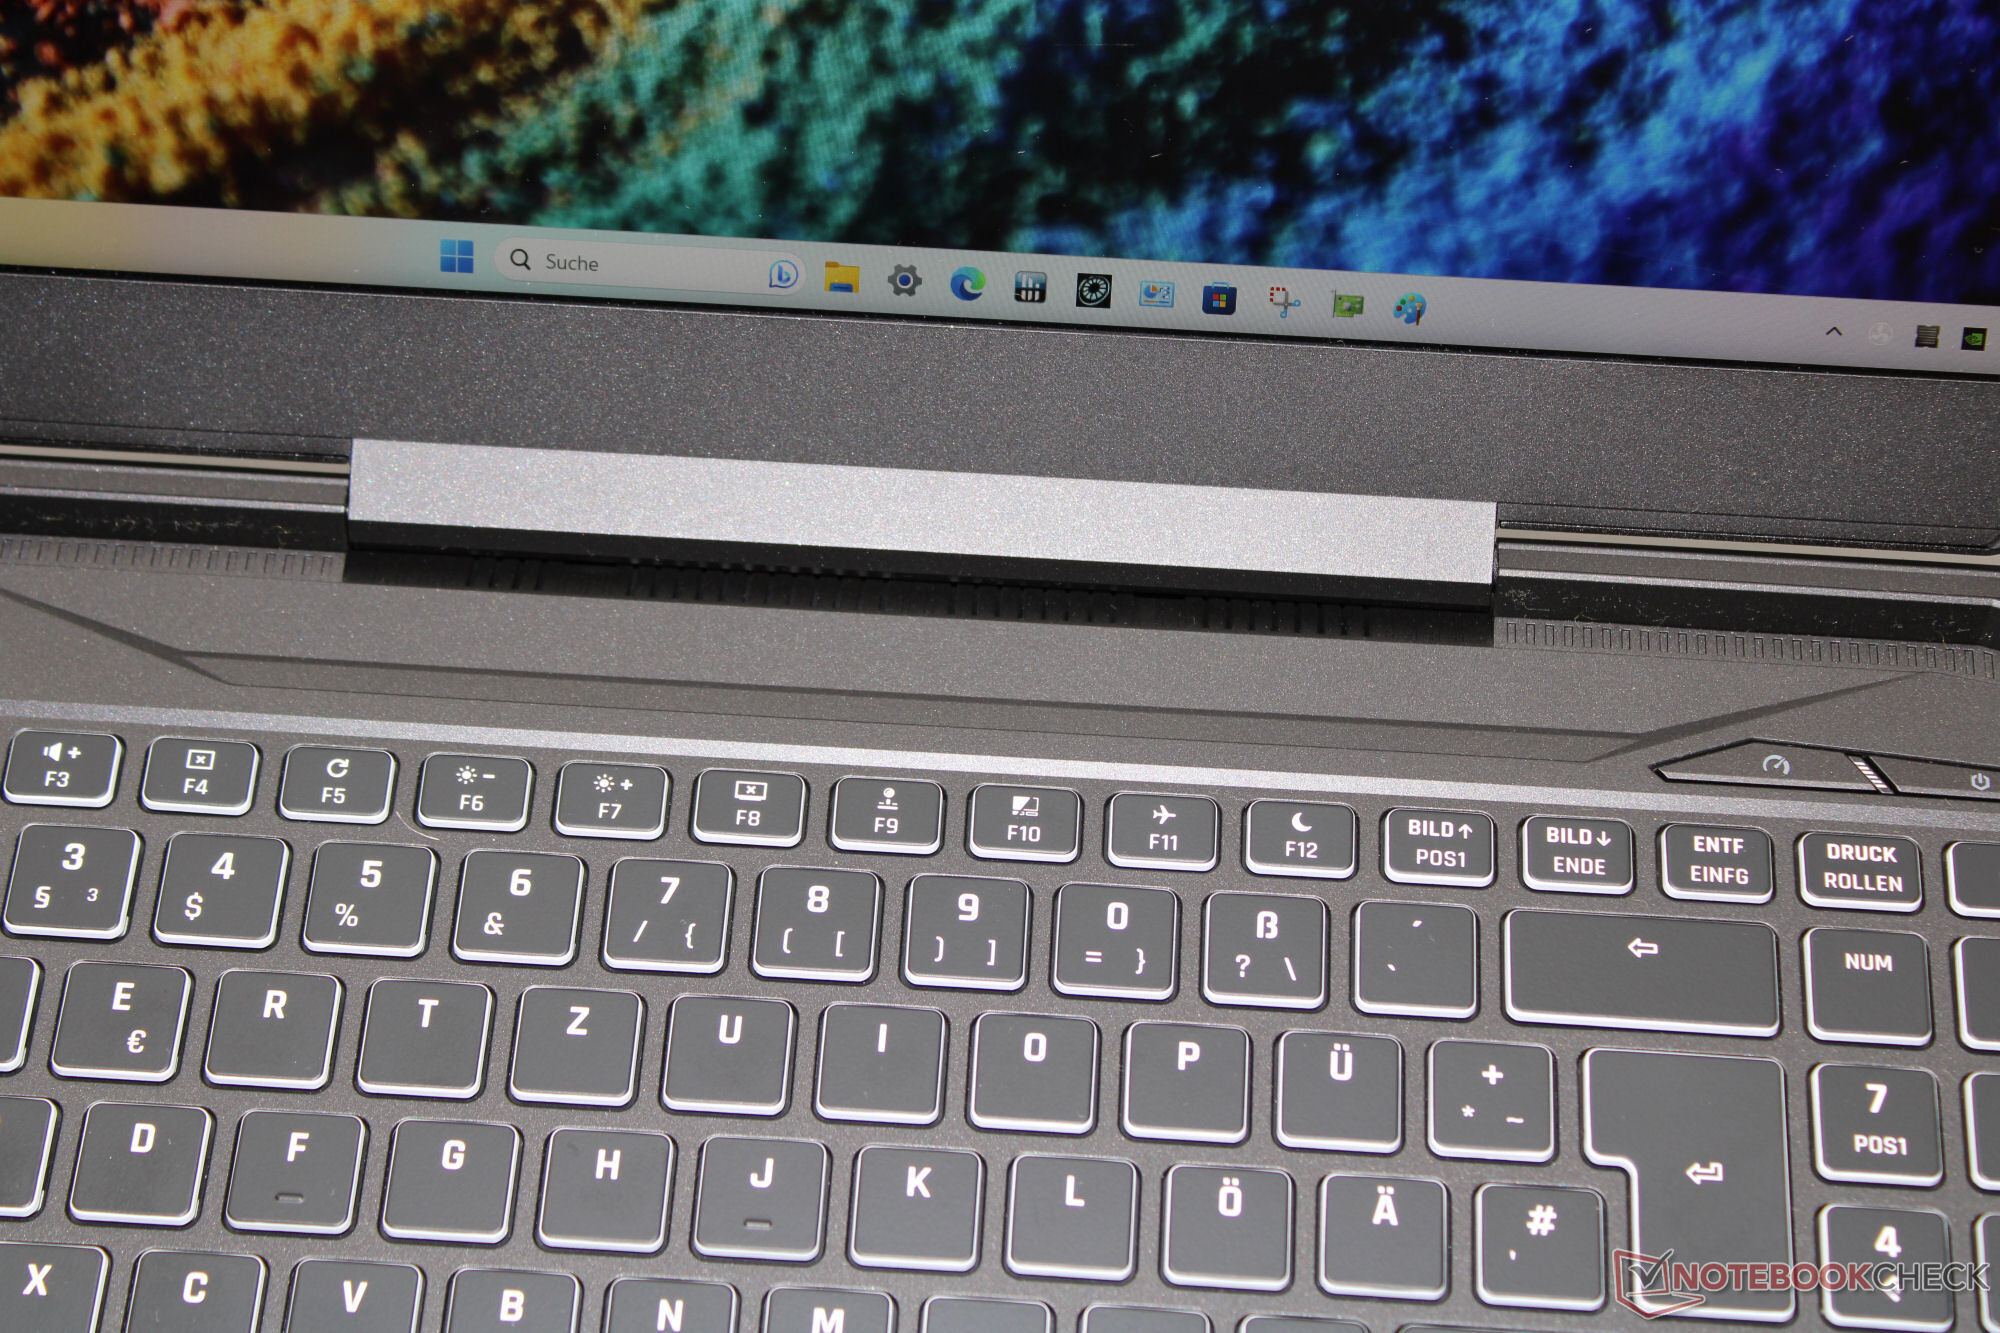
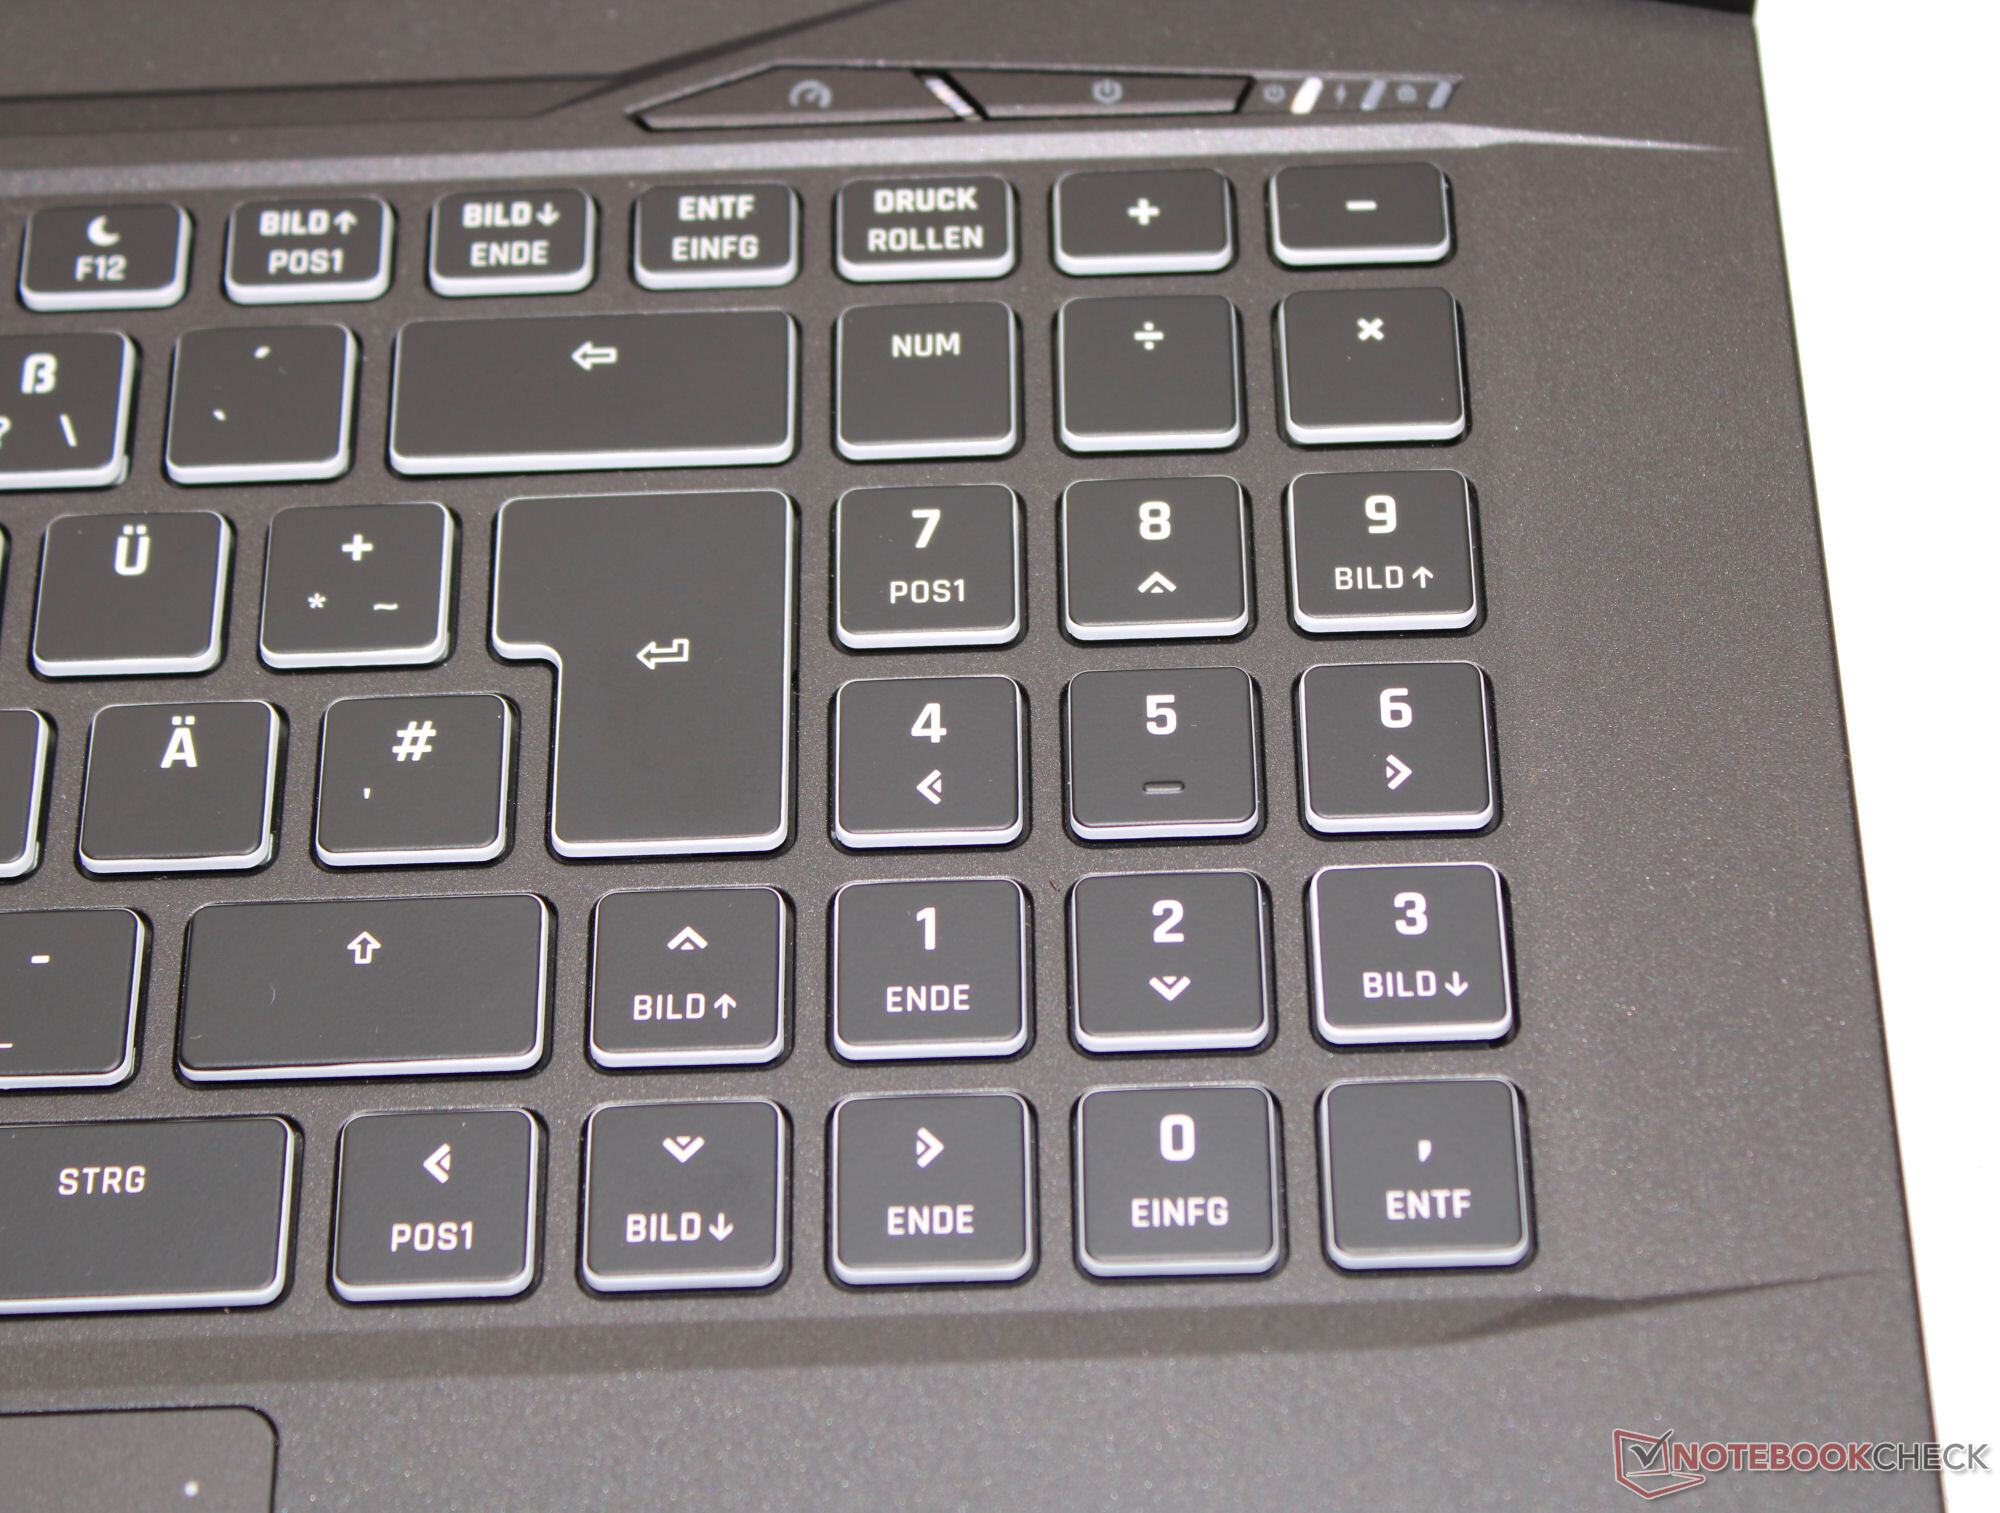
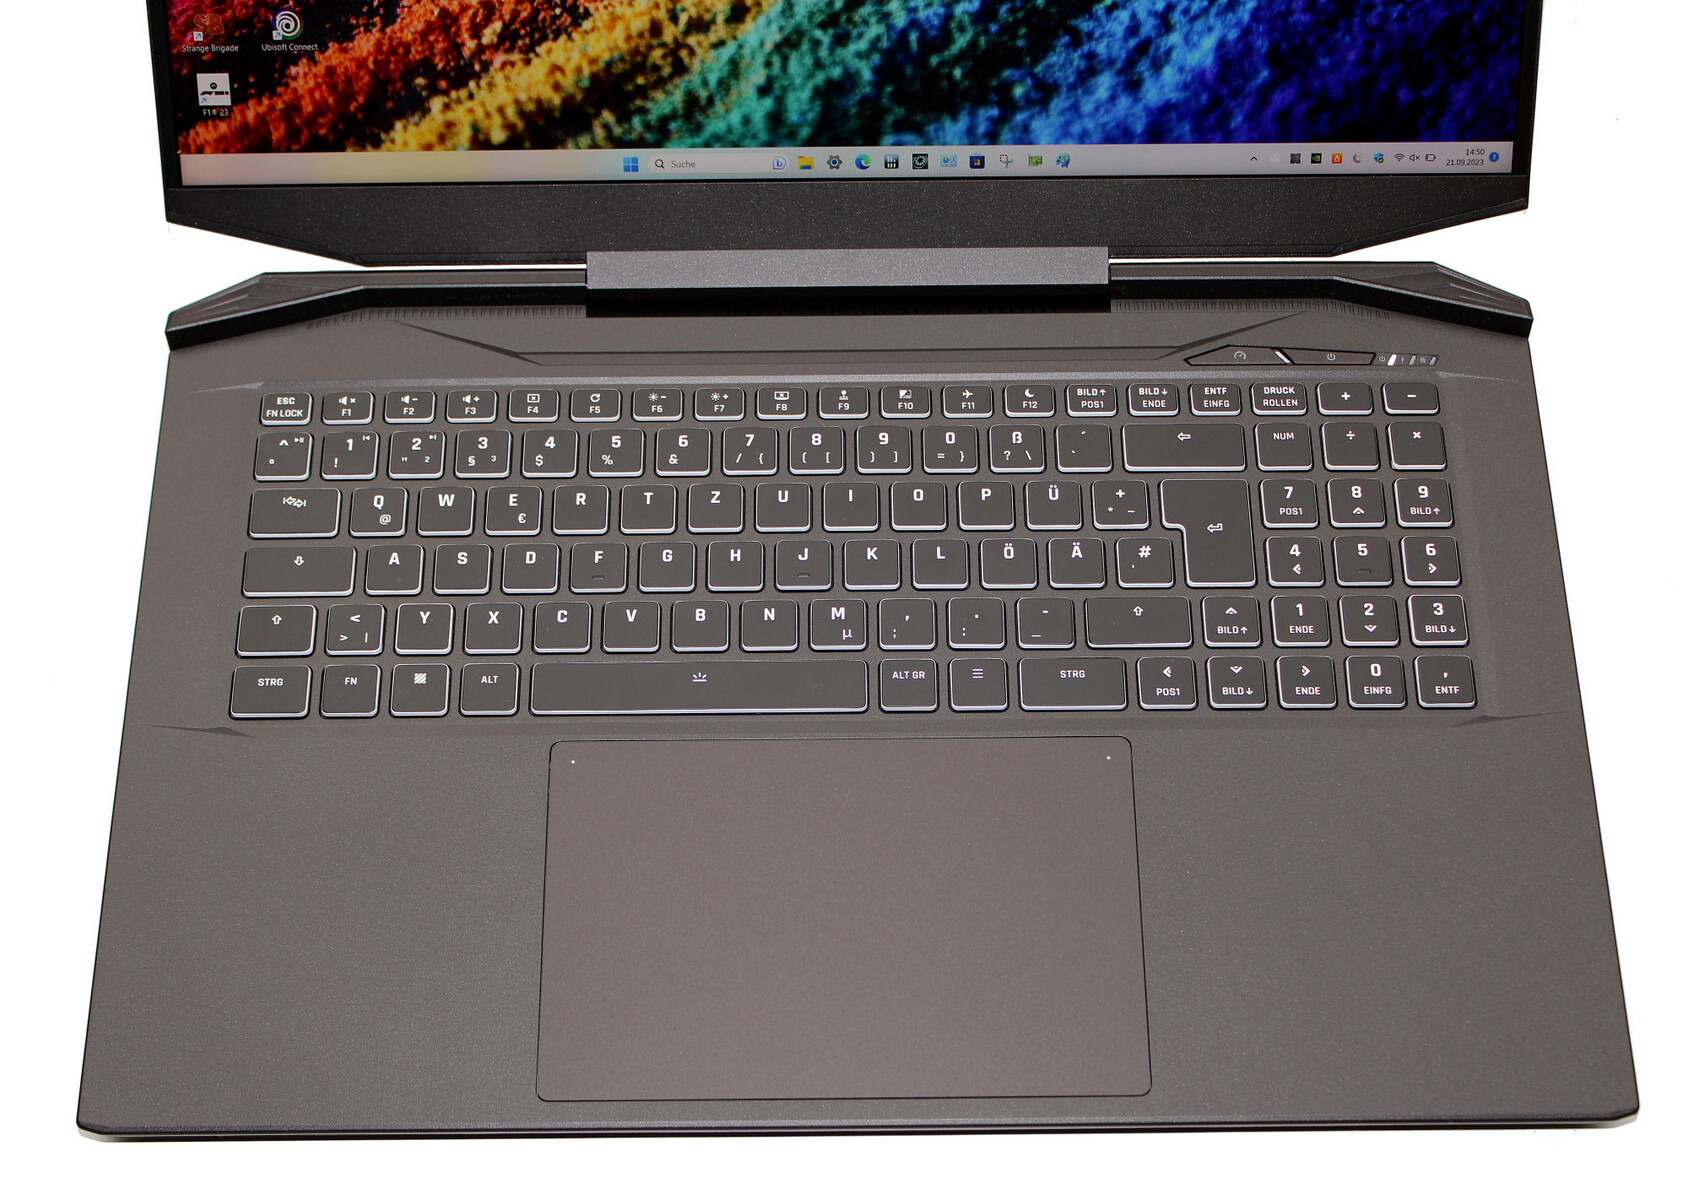
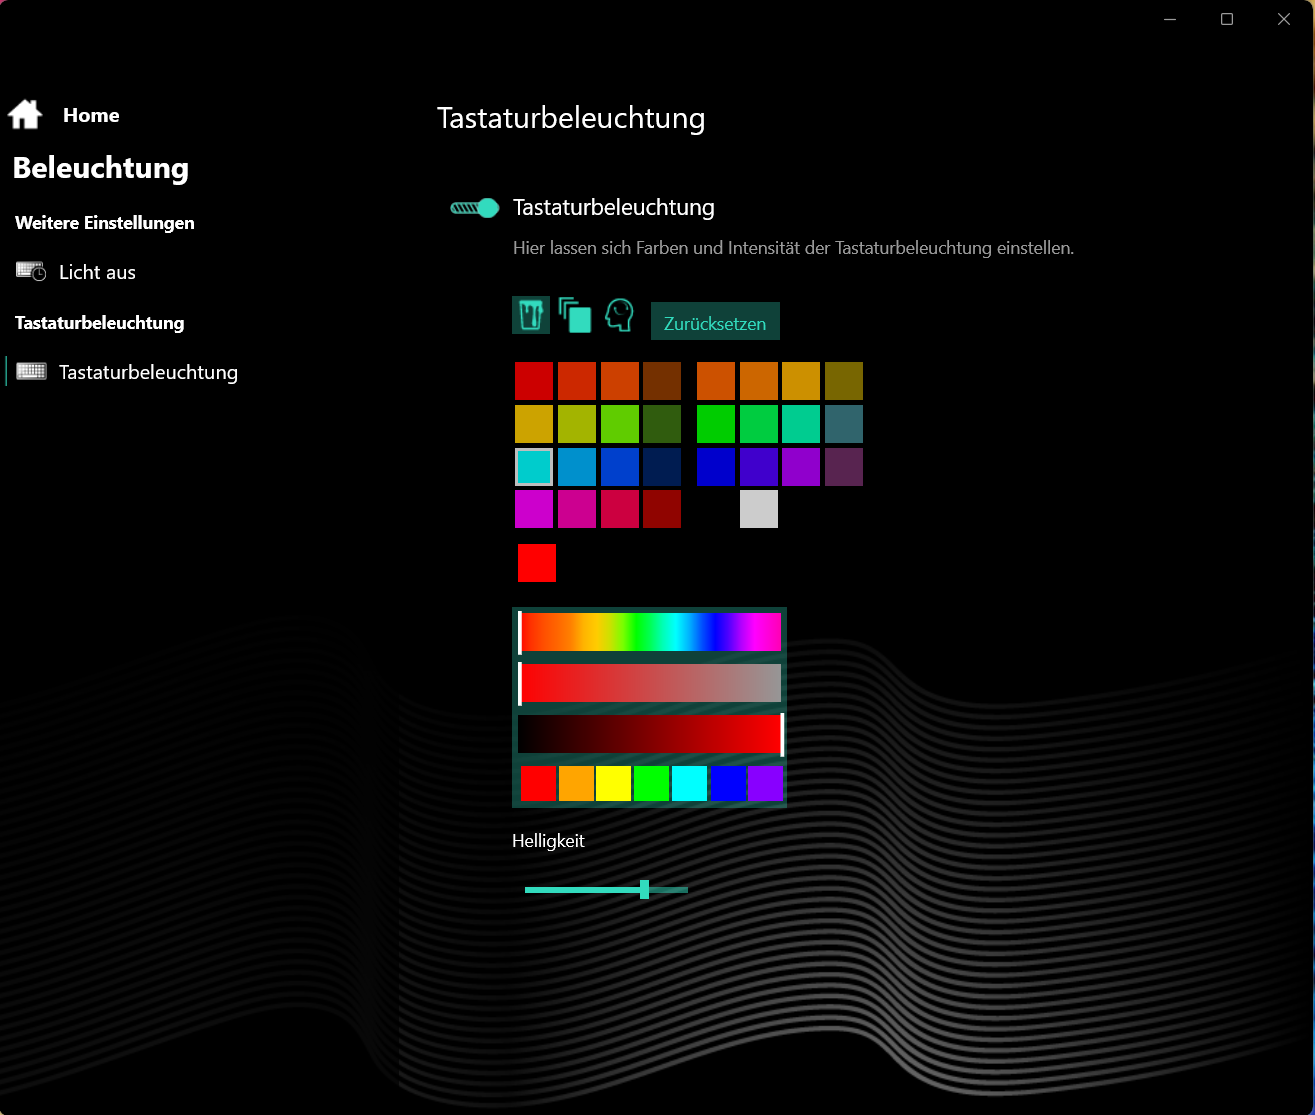
Périphériques d'entrée - L'Apex 17 dispose d'un éclairage des touches RVB
Clavier
Les touches plates et lisses du clavier chiclet rétroéclairé (RGB) bénéficient d'une course moyenne, d'un point de pression distinct et d'une bonne résistance. Lors de la frappe, le clavier ne cède pas. Dans l'ensemble, vous obtenez un clavier adapté à une utilisation quotidienne.
Pavé tactile
Le Clickpad (environ 15,4 x 10 cm) est un substitut de la souris, avec une course courte et un point de pression bien défini. Une pression sur le voyant situé dans le coin supérieur gauche permet d'éteindre ou d'allumer l'ensemble du pavé. Une pression sur le voyant situé dans le coin supérieur droit permet d'éteindre ou d'allumer le côté droit du pavé.
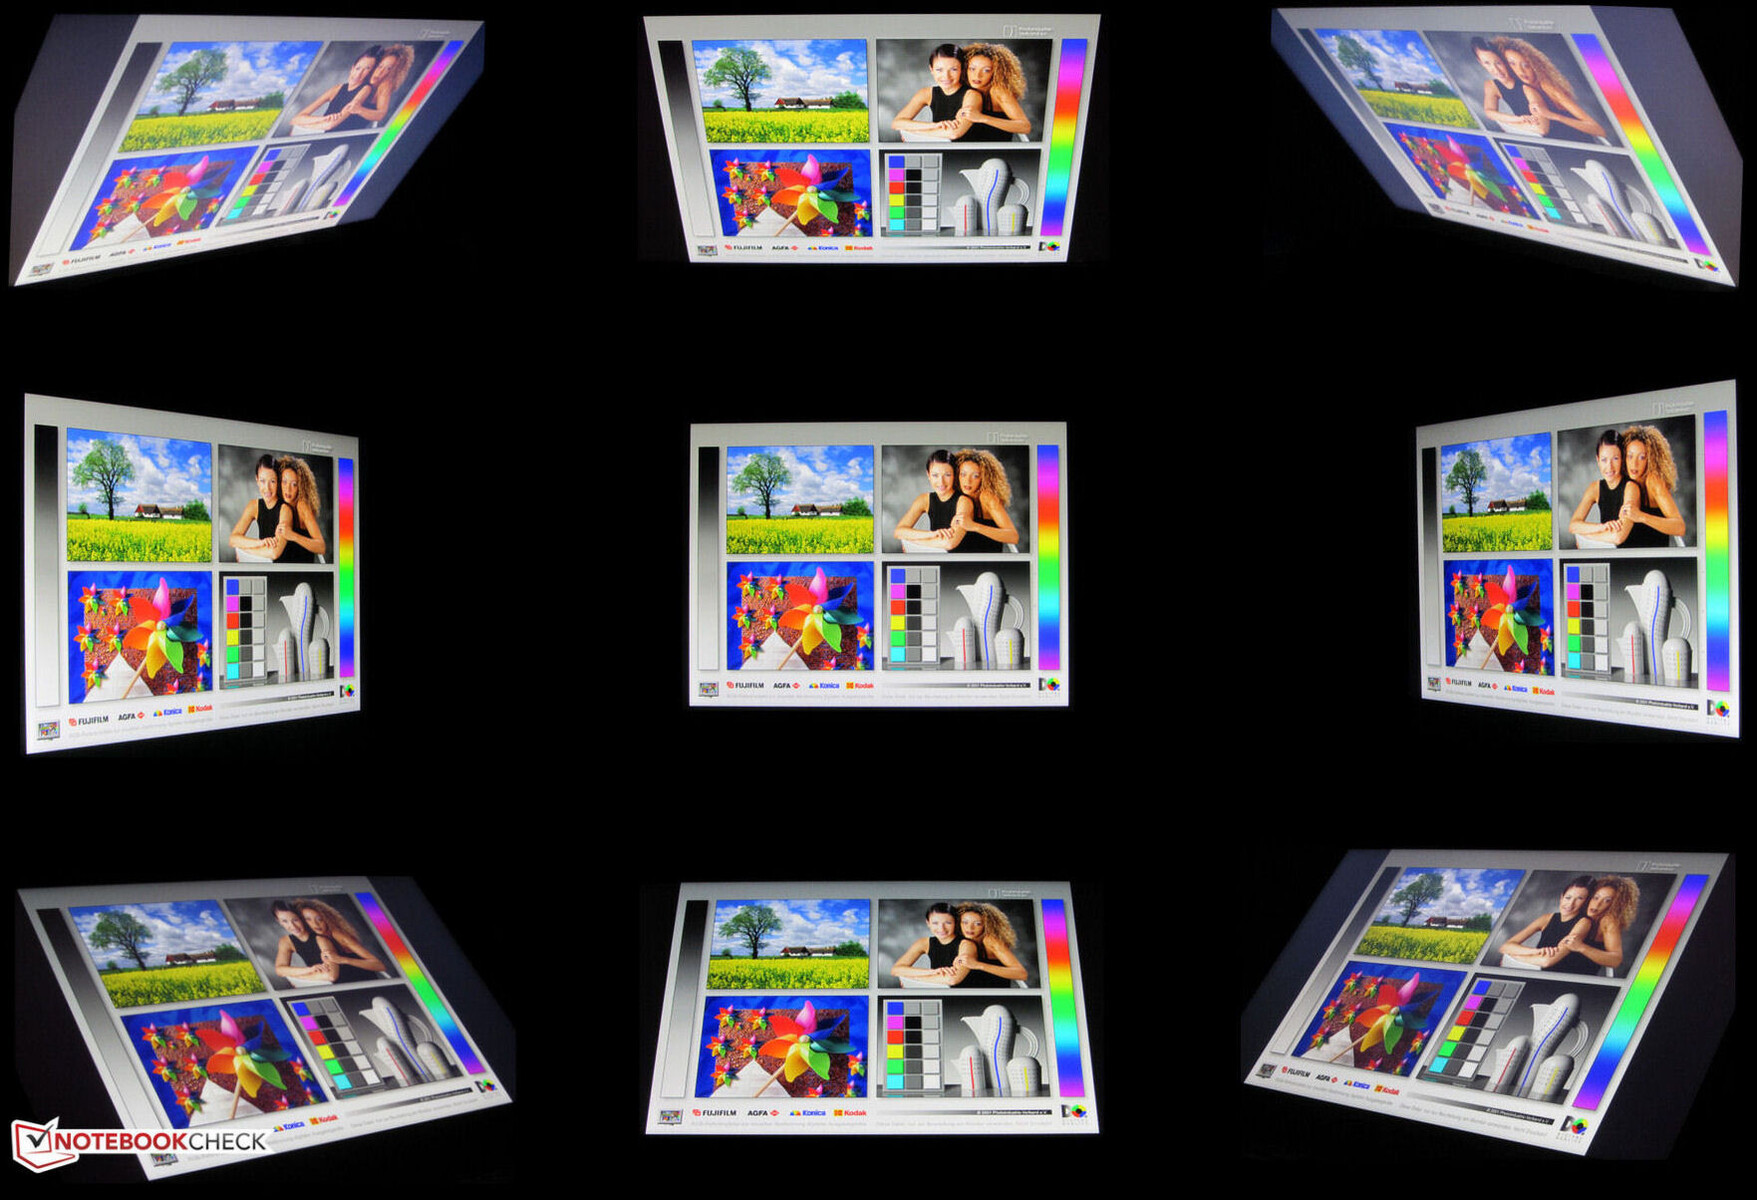
Écran - Un écran QHD avec couverture sRGB
Le panneau réactif de 240 Hz au format 16:9 n'affiche aucun scintillement PWM, quel que soit le réglage de la luminosité. La luminosité et le contraste de l'écran mat de 17,3 pouces (2 560 x 1 440 pixels) atteignent leurs objectifs respectifs (> 300 cd/m² et 1 000:1).
En plus de l'écran QHD de l'appareil examiné, Schenker propose l'Apex 17 avec un écran FHD (1 920 x 1 080 pixels, 144 Hz, IPS).
| |||||||||||||||||||||||||
Homogénéité de la luminosité: 90 %
Valeur mesurée au centre, sur batterie: 403 cd/m²
Contraste: 1089:1 (Valeurs des noirs: 0.37 cd/m²)
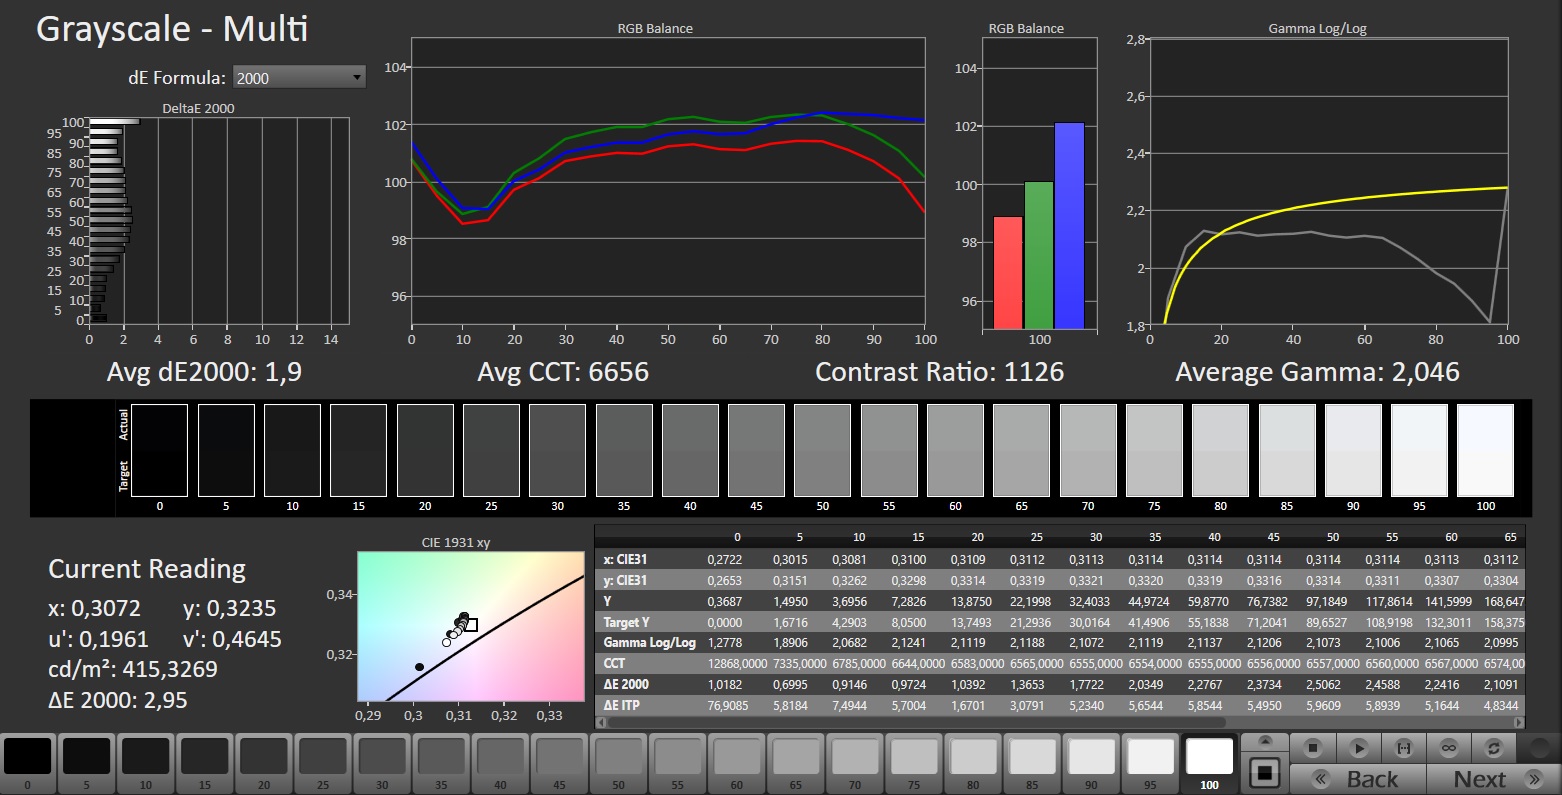
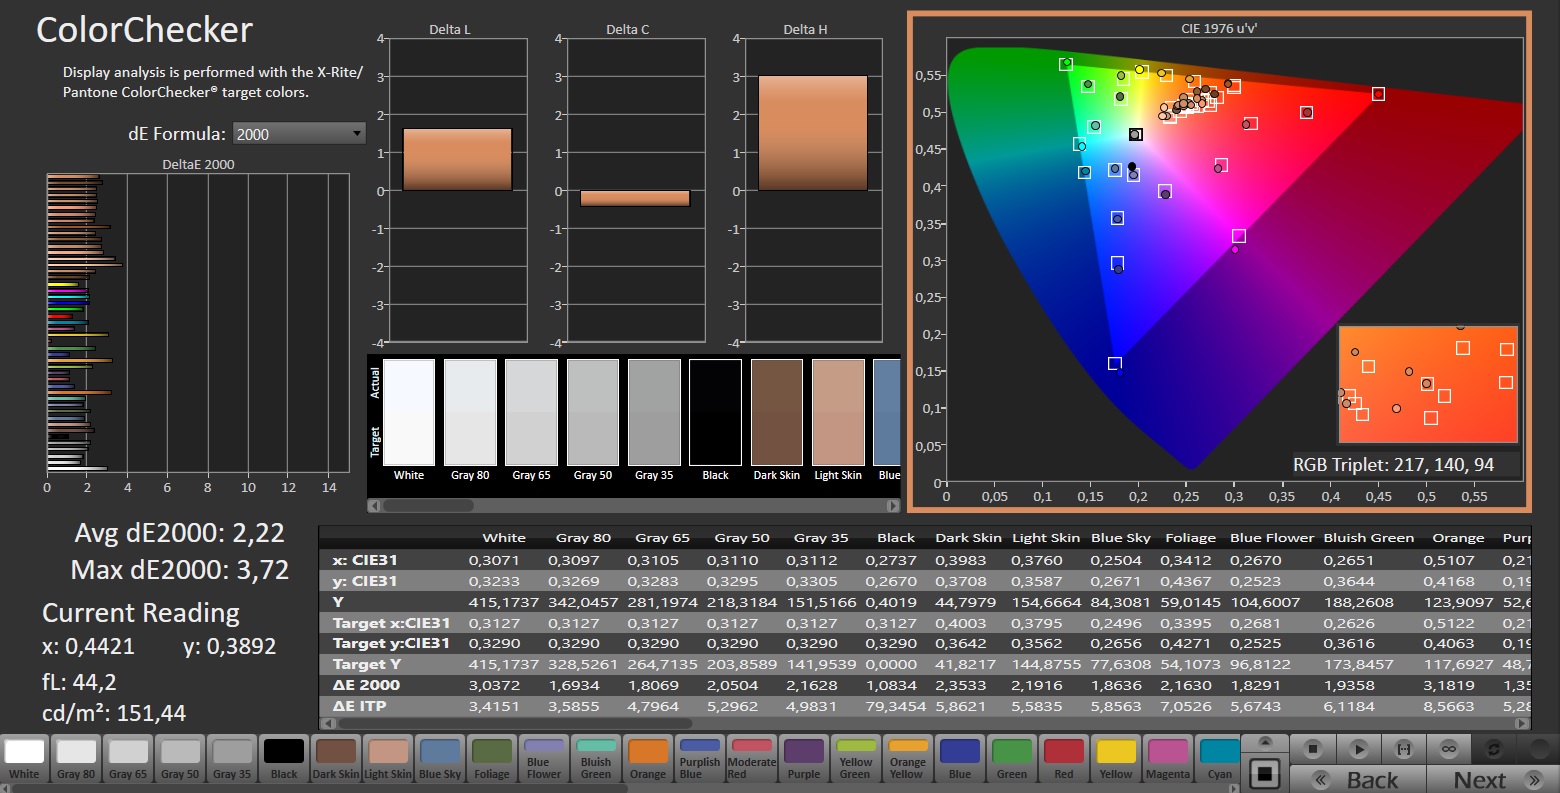
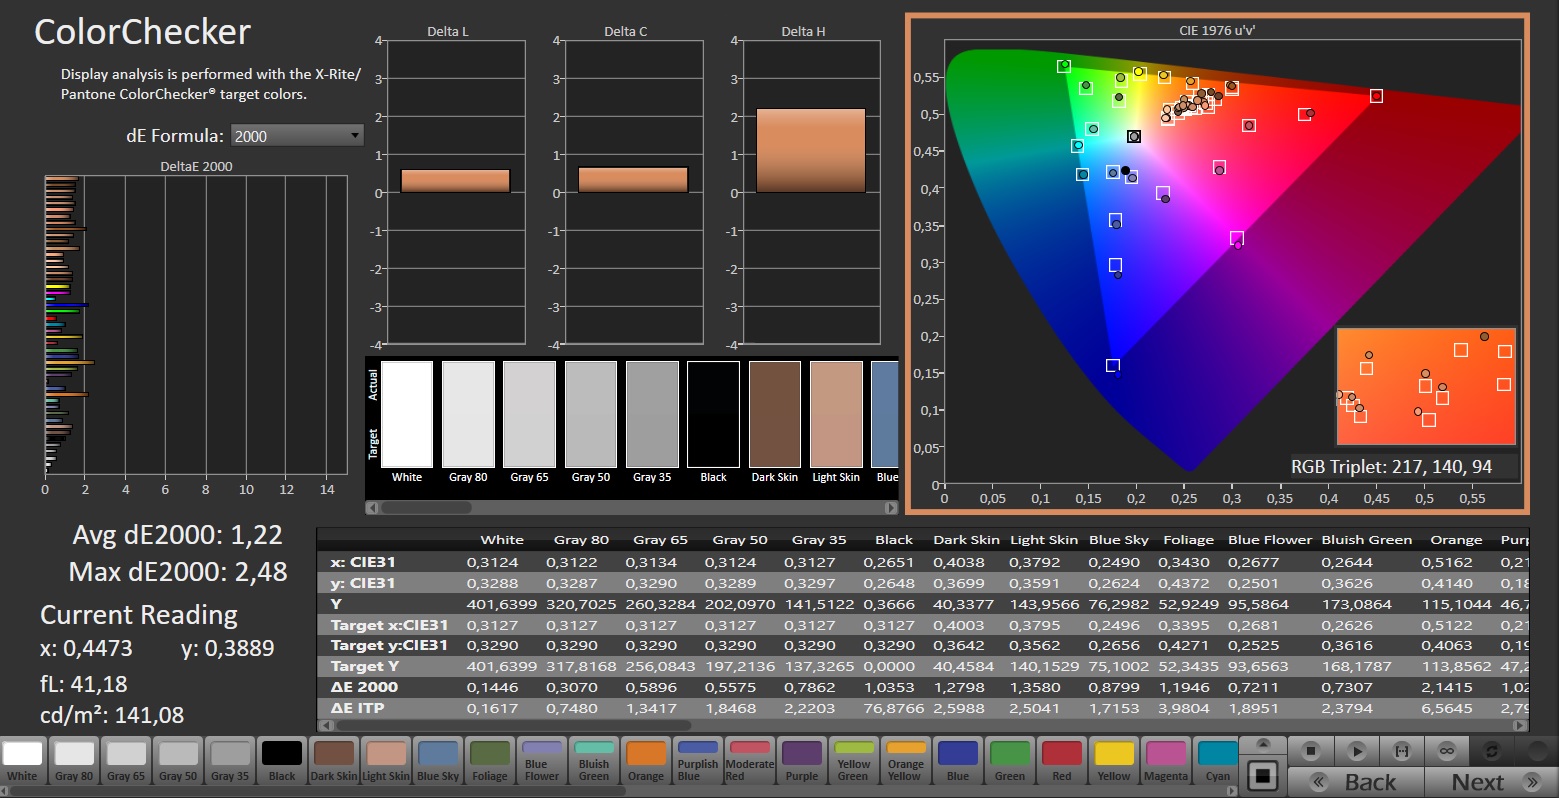
ΔE ColorChecker Calman: 2.22 | ∀{0.5-29.43 Ø4.72}
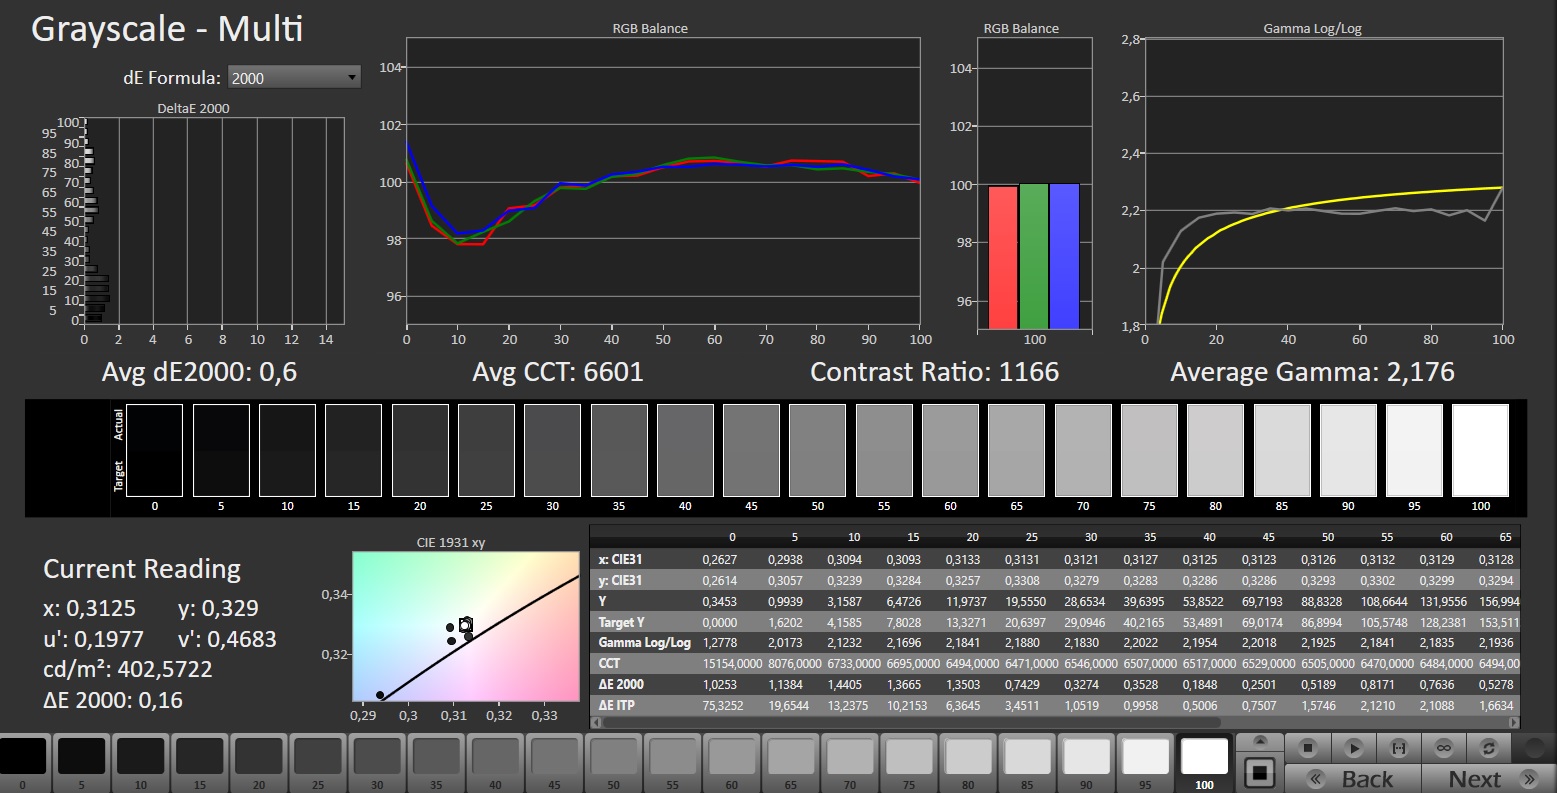
calibrated: 1.22
ΔE Greyscale Calman: 1.9 | ∀{0.09-98 Ø4.97}
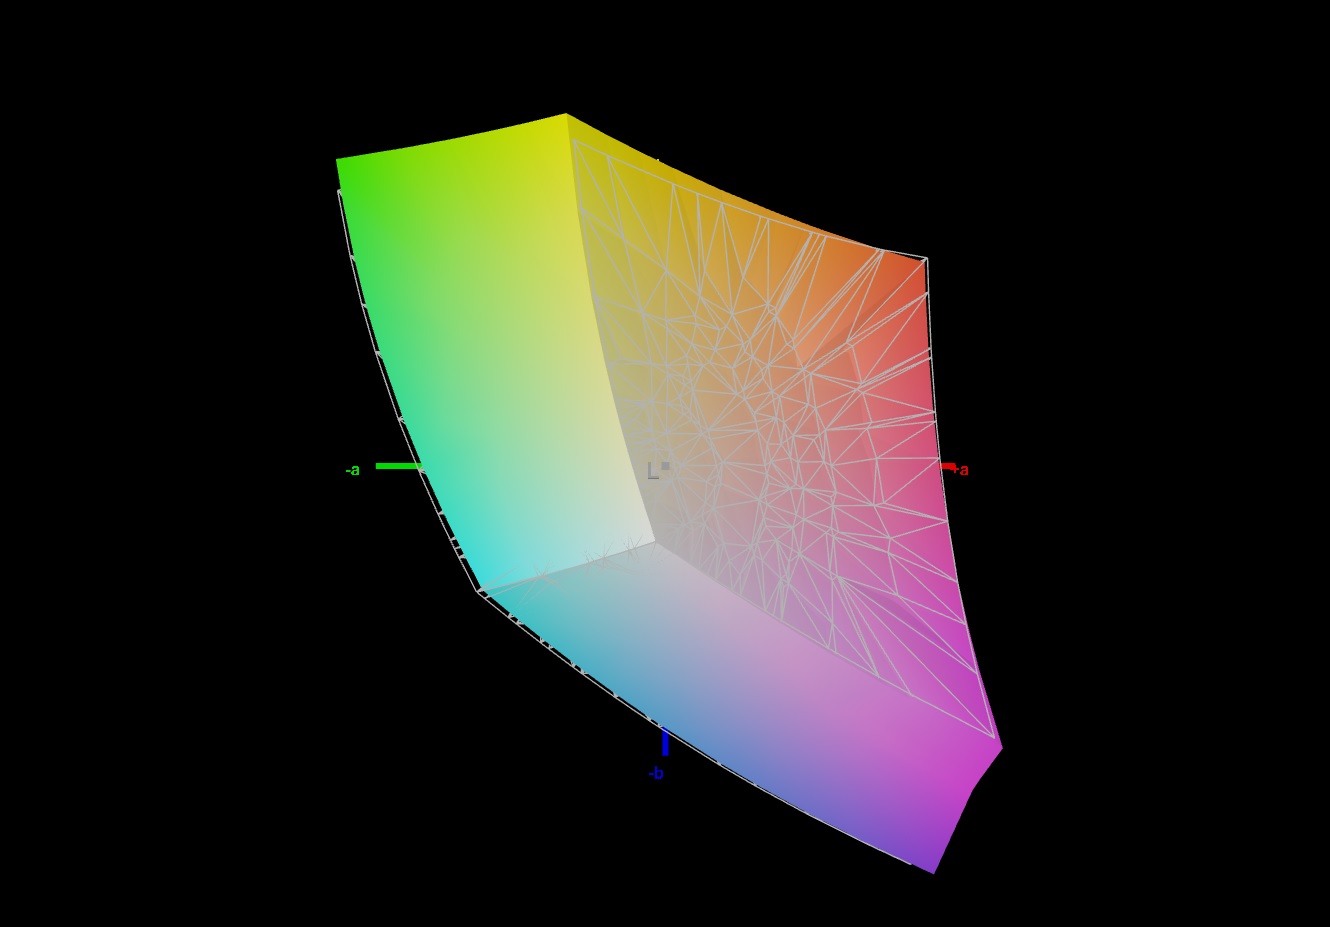
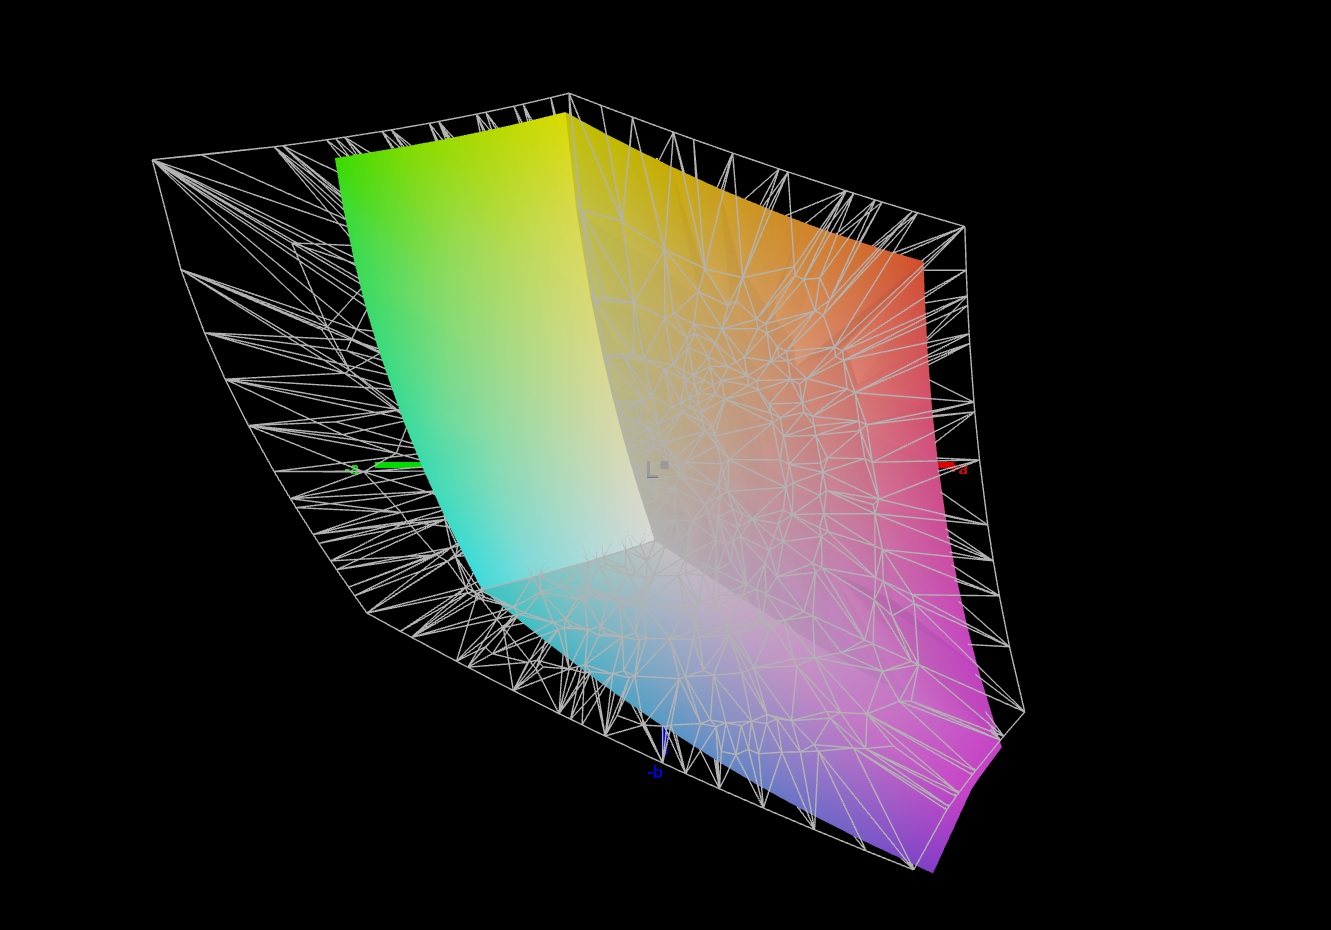
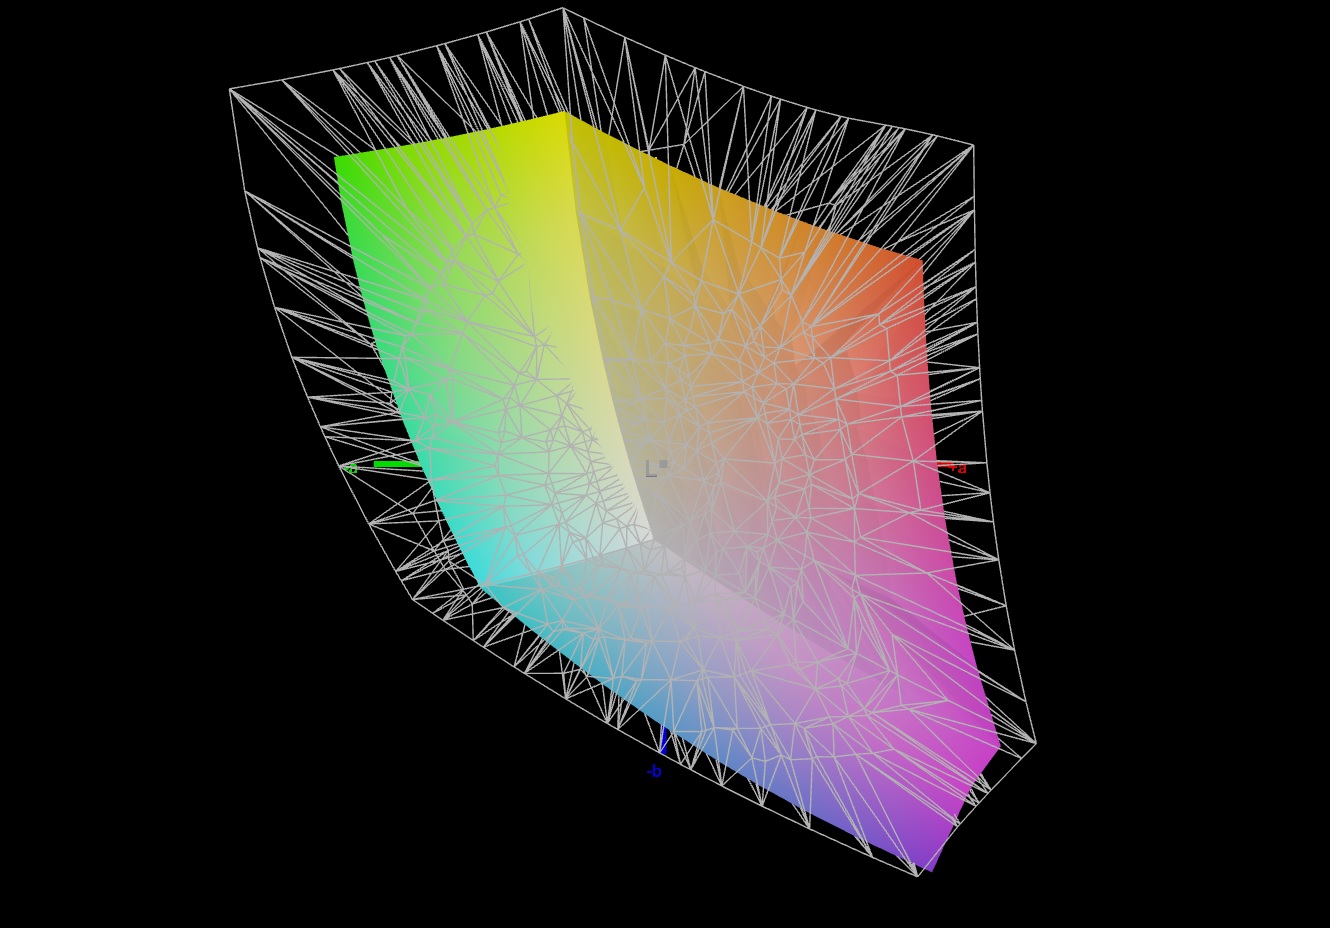
69.5% AdobeRGB 1998 (Argyll 3D)
97.7% sRGB (Argyll 3D)
68.1% Display P3 (Argyll 3D)
Gamma: 2.046
CCT: 6656 K
| Schenker XMG Apex 17 (Late 23) BOE CQ NE173QHM-NZ3, IPS, 2560x1440, 17.3" | Alienware m16 R1 Intel BOE NE16NYB, IPS, 2560x1600, 16" | Lenovo Legion Pro 5 16IRX8 AU Optronics B160QAN03.1, IPS, 2560x1600, 16" | Acer Nitro 17 AN17-51-71ER BOE0B7C NE173QHM-NY6, , 2560x1440, 17.3" | Medion Erazer Defender P40 BOE CQ NE173QHM-NZ3, IPS, 2560x1440, 17.3" | MSI Katana 17 B13VFK B173HAN04.9, IPS LED, 1920x1080, 17.3" | |
|---|---|---|---|---|---|---|
| Display | -0% | 4% | 23% | 0% | -39% | |
| Display P3 Coverage (%) | 68.1 | 67.7 -1% | 71.2 5% | 98.3 44% | 68.3 0% | 40.8 -40% |
| sRGB Coverage (%) | 97.7 | 97.2 -1% | 98.8 1% | 100 2% | 98.1 0% | 61 -38% |
| AdobeRGB 1998 Coverage (%) | 69.5 | 70 1% | 73.3 5% | 85.7 23% | 69.8 0% | 42.2 -39% |
| Response Times | 39% | -20% | -6% | -9% | -187% | |
| Response Time Grey 50% / Grey 80% * (ms) | 13.5 ? | 4 ? 70% | 14.5 ? -7% | 14.8 ? -10% | 14.6 ? -8% | 33 ? -144% |
| Response Time Black / White * (ms) | 7.9 ? | 7.3 ? 8% | 10.4 ? -32% | 8 ? -1% | 8.7 ? -10% | 26 ? -229% |
| PWM Frequency (Hz) | ||||||
| Screen | -12% | 11% | -57% | 11% | -90% | |
| Brightness middle (cd/m²) | 403 | 306 -24% | 405.7 1% | 361 -10% | 364 -10% | 267 -34% |
| Brightness (cd/m²) | 381 | 302 -21% | 368 -3% | 326 -14% | 343 -10% | 256 -33% |
| Brightness Distribution (%) | 90 | 89 -1% | 87 -3% | 87 -3% | 86 -4% | 93 3% |
| Black Level * (cd/m²) | 0.37 | 0.3 19% | 0.38 -3% | 0.6 -62% | 0.28 24% | 0.21 43% |
| Contrast (:1) | 1089 | 1020 -6% | 1068 -2% | 602 -45% | 1300 19% | 1271 17% |
| Colorchecker dE 2000 * | 2.22 | 2.57 -16% | 1.65 26% | 3.83 -73% | 1.67 25% | 4.7 -112% |
| Colorchecker dE 2000 max. * | 3.76 | 4.26 -13% | 4.2 -12% | 5.71 -52% | 2.78 26% | 20.4 -443% |
| Colorchecker dE 2000 calibrated * | 1.22 | 0.85 30% | 0.53 57% | 3.48 -185% | 1.14 7% | 4.5 -269% |
| Greyscale dE 2000 * | 1.9 | 3.3 -74% | 1.2 37% | 3.29 -73% | 1.4 26% | 1.5 21% |
| Gamma | 2.046 108% | 1.997 110% | 2.3 96% | 2.29 96% | 2.091 105% | 2.12 104% |
| CCT | 6656 98% | 6895 94% | 6453 101% | 6679 97% | 6568 99% | 6552 99% |
| Moyenne finale (programmes/paramètres) | 9% /
-2% | -2% /
5% | -13% /
-33% | 1% /
6% | -105% /
-93% |
* ... Moindre est la valeur, meilleures sont les performances
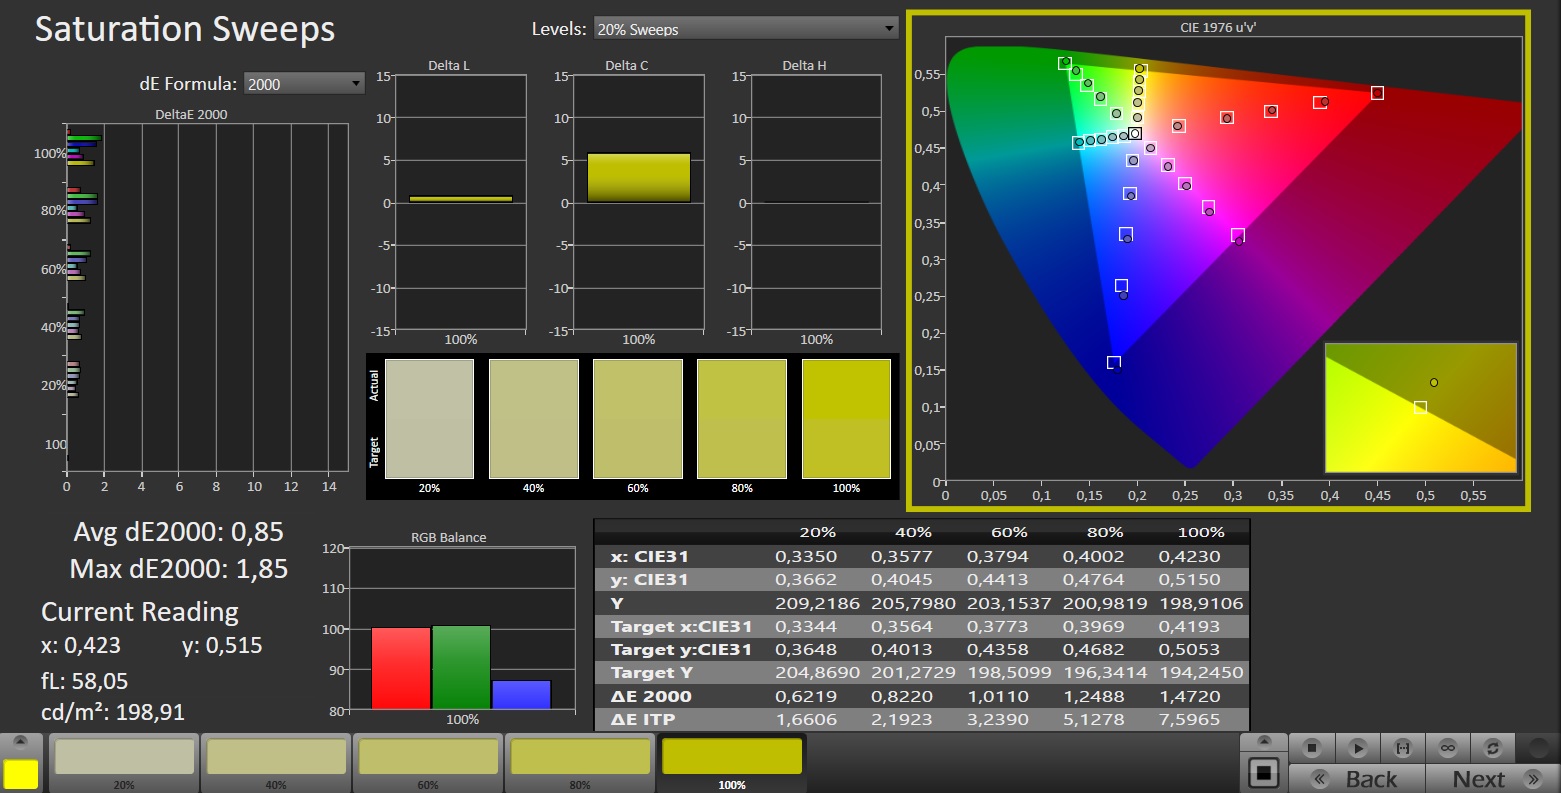
Dès sa sortie de l'emballage, l'écran présente une bonne reproduction des couleurs. Avec un écart d'environ 2,2, la valeur cible (DeltaE < 3) est atteinte. Un étalonnage réduit l'écart à 1,2 et garantit des échelles de gris équilibrées. L'écran couvre presque entièrement l'espace colorimétrique sRGB, mais pas les espaces colorimétriques AdobeRGB et DCI P3. La plupart des écrans des appareils concurrents présentent une image similaire. Seul leNitro 17couvre l'espace colorimétrique P3.

Temps de réponse de l'écran
| ↔ Temps de réponse noir à blanc | ||
|---|---|---|
| 7.9 ms ... hausse ↗ et chute ↘ combinées | ↗ 3 ms hausse | 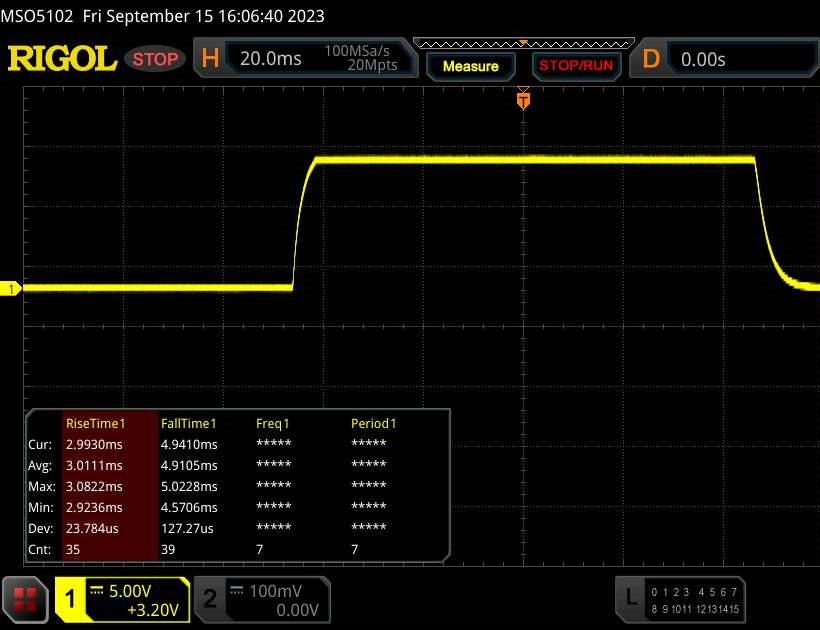 |
| ↘ 4.9 ms chute | ||
| L'écran montre de très faibles temps de réponse, parfait pour le jeu. En comparaison, tous les appareils testés affichent entre 0.1 (minimum) et 240 (maximum) ms. » 22 % des appareils testés affichent de meilleures performances. Cela signifie que les latences relevées sont meilleures que la moyenne (19.8 ms) de tous les appareils testés. | ||
| ↔ Temps de réponse gris 50% à gris 80% | ||
| 13.5 ms ... hausse ↗ et chute ↘ combinées | ↗ 6.4 ms hausse | 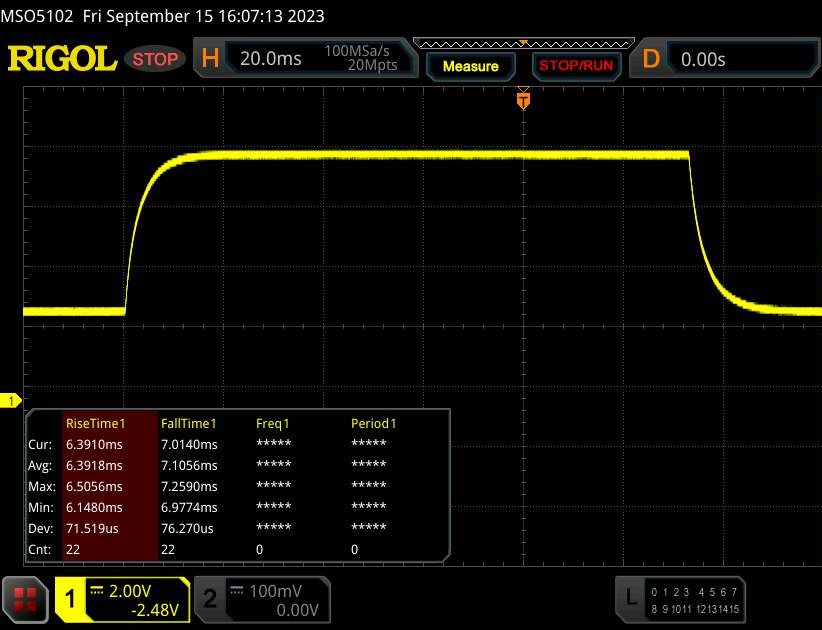 |
| ↘ 7.1 ms chute | ||
| L'écran montre de bons temps de réponse, mais insuffisant pour du jeu compétitif. En comparaison, tous les appareils testés affichent entre 0.165 (minimum) et 636 (maximum) ms. » 27 % des appareils testés affichent de meilleures performances. Cela signifie que les latences relevées sont meilleures que la moyenne (31 ms) de tous les appareils testés. | ||
Scintillement / MLI (Modulation de largeur d'impulsion)
| Scintillement / MLI (Modulation de largeur d'impulsion) non décelé | 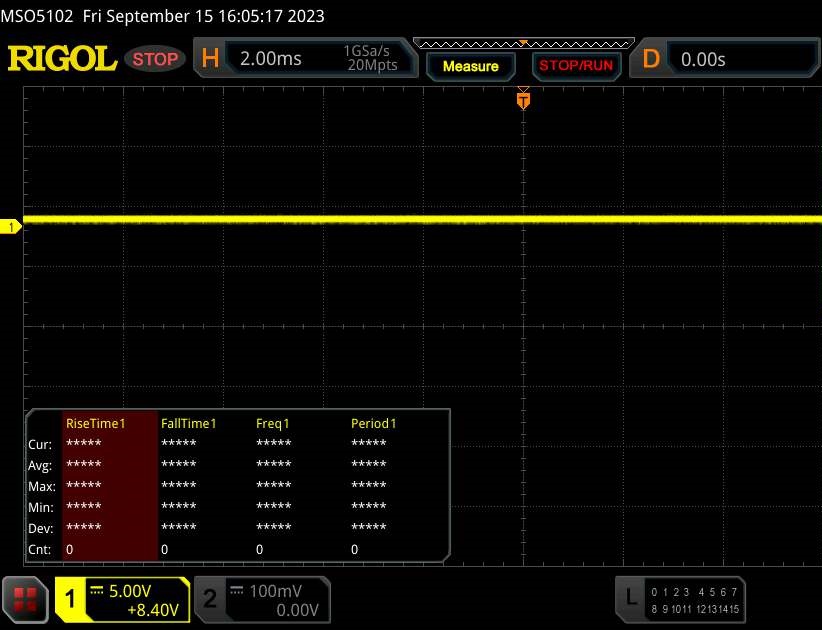 | ||
En comparaison, 52 % des appareils testés n'emploient pas MDI pour assombrir leur écran. Nous avons relevé une moyenne à 7747 (minimum : 5 - maximum : 343500) Hz dans le cas où une MDI était active. | |||
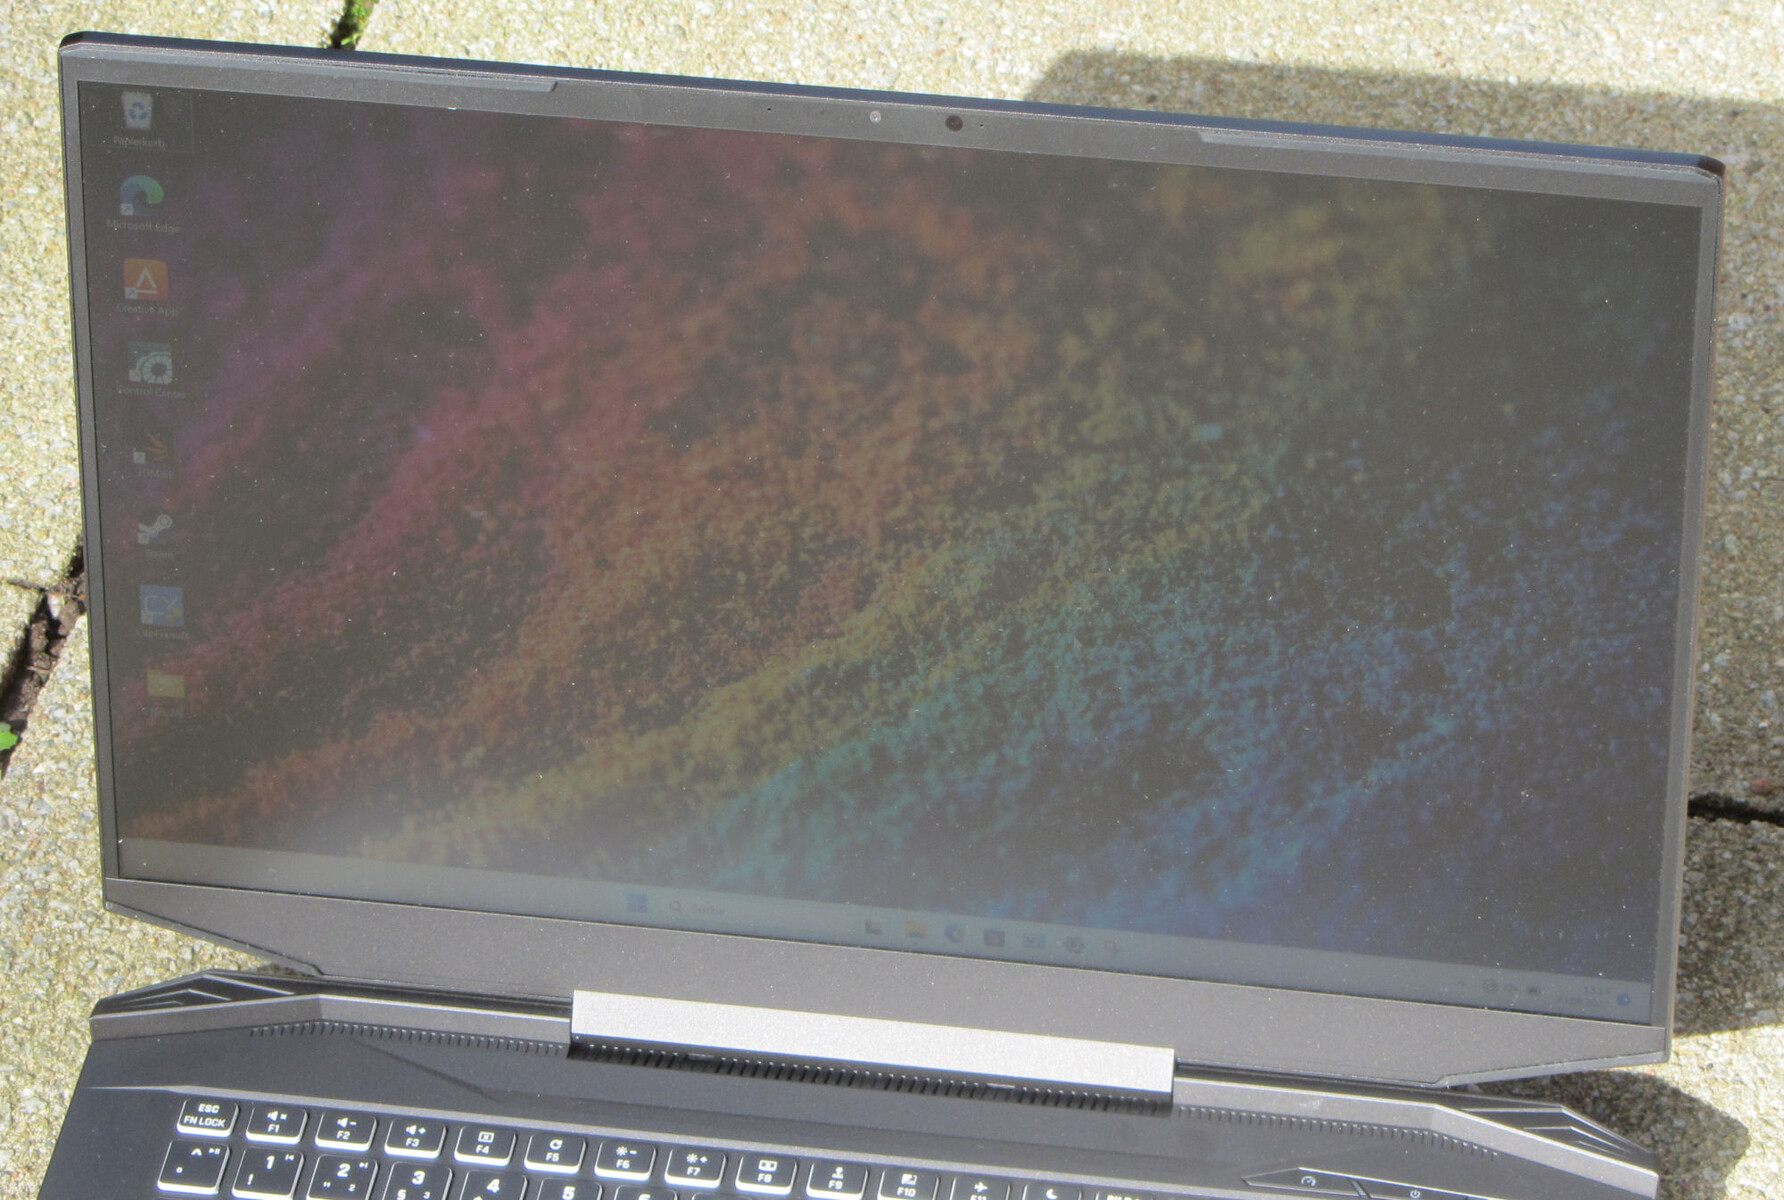
L'écran IPS offre une bonne stabilité de l'angle de vision et est lisible dans toutes les positions. En extérieur, l'écran est lisible tant que la lumière du soleil n'est pas trop forte.
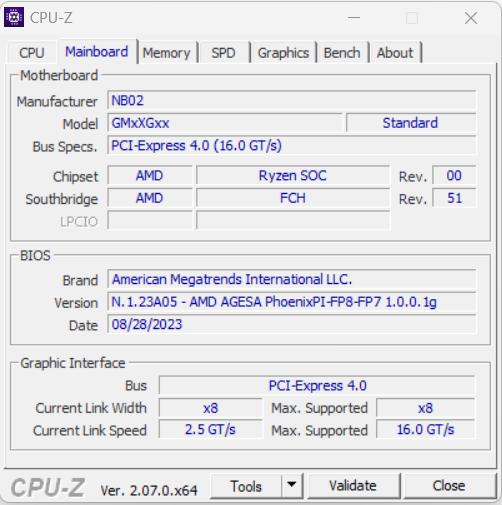
Performance - Phoenix et Ada Lovelace alimentent l'ordinateur portable Schenker
Le Schenker Apex 17 est un ordinateur portable de jeu QHD de milieu de gamme dont la puissance de calcul est fournie par Phoenix et Ada Lovelace. L'ordinateur portable peut être configuré sur mesure et acheté sur Bestware.com. Notre modèle d'essai est disponible au prix de 1 750 euros, avec des prix débutant à environ 1 200 euros.
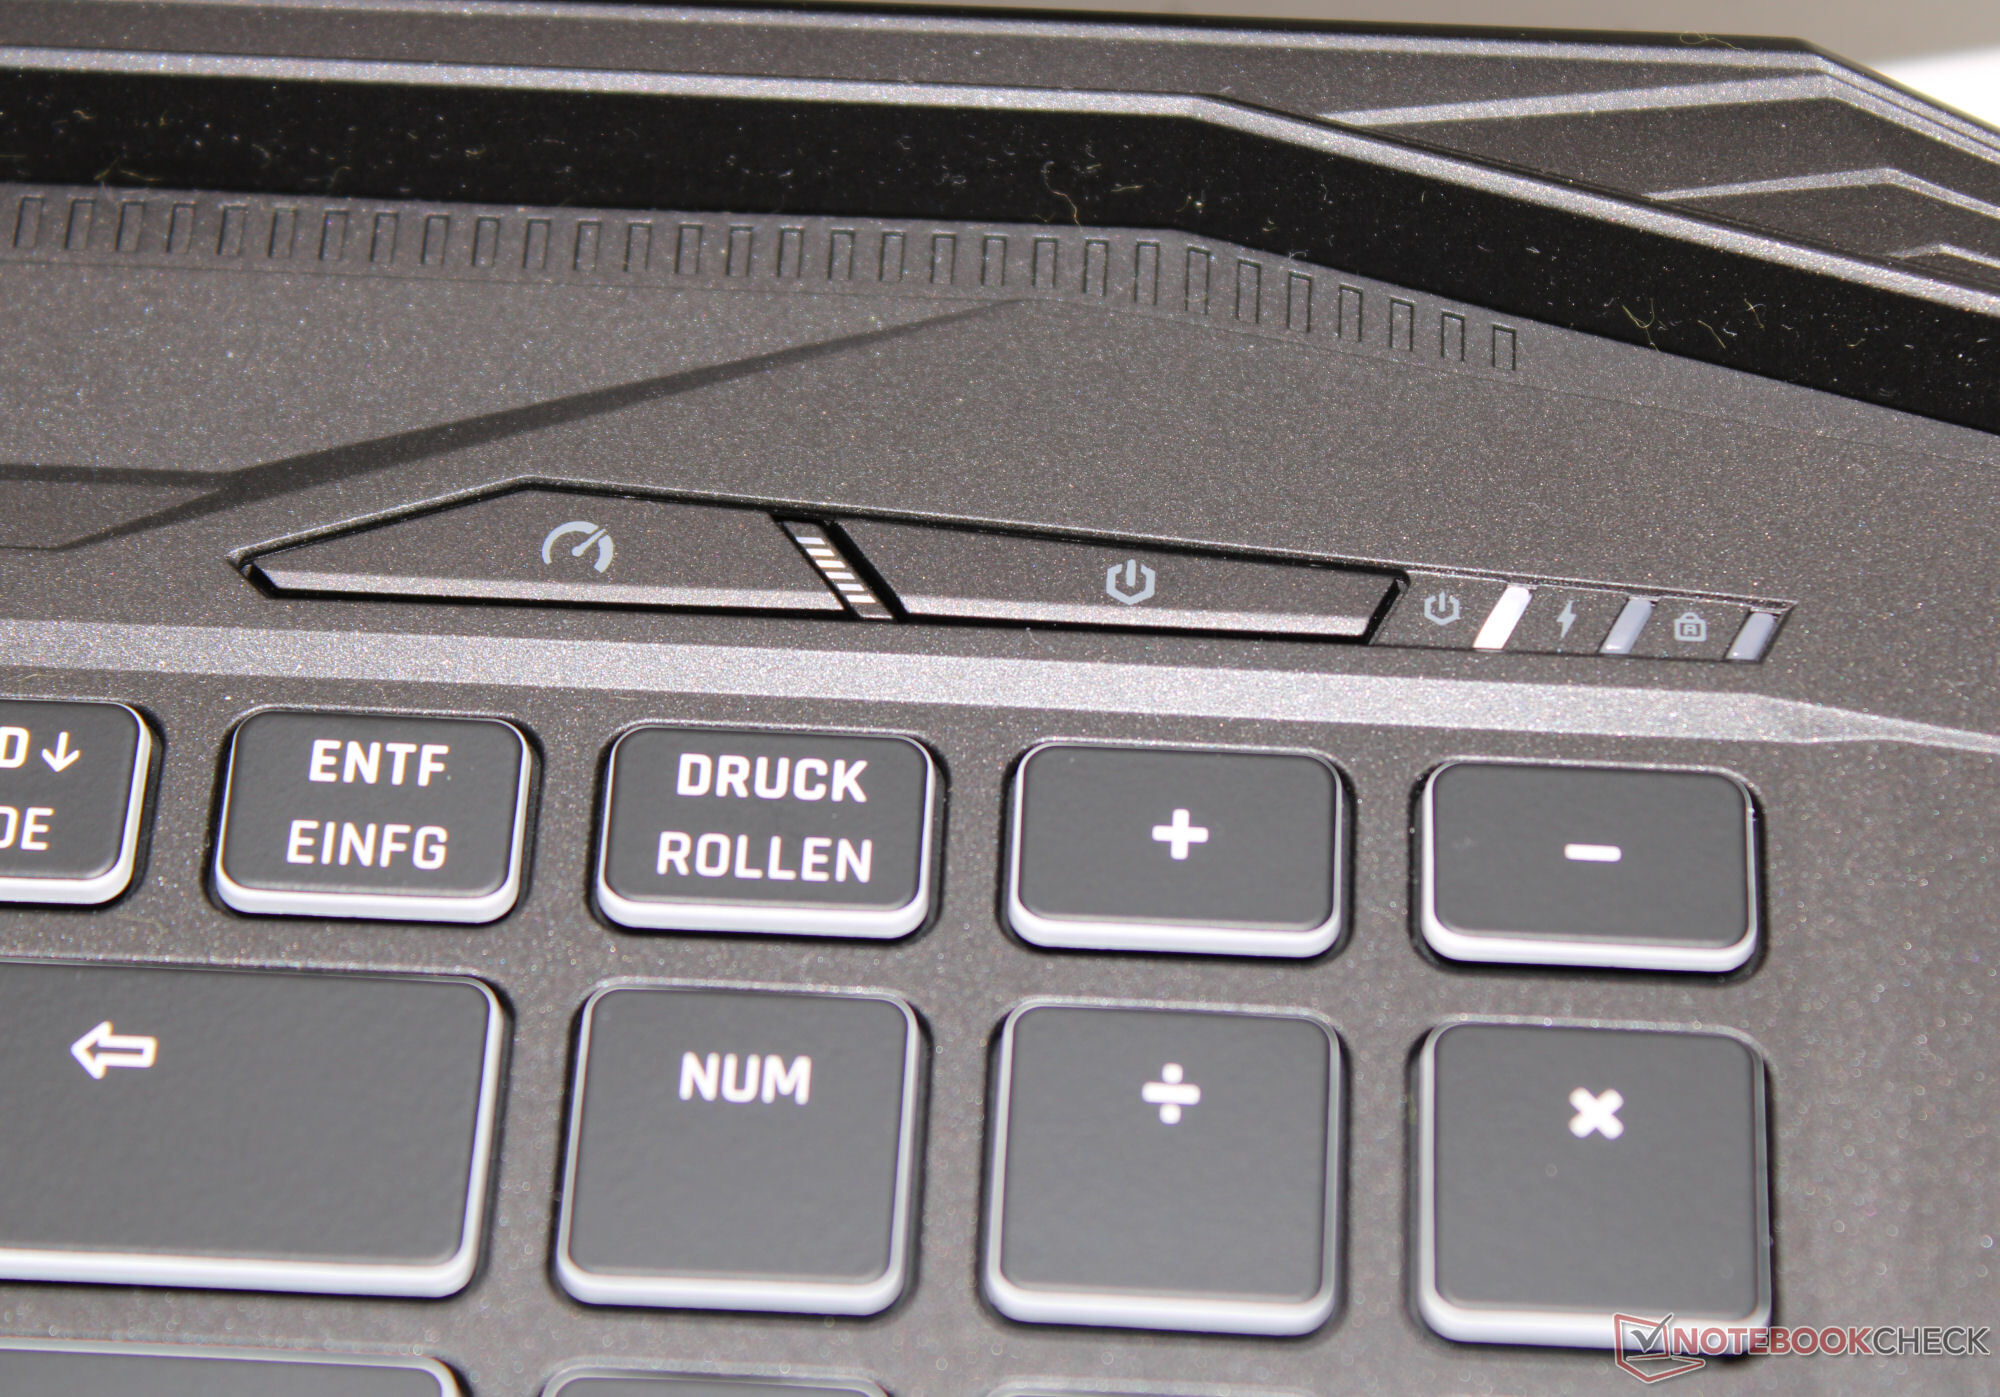
Conditions d'essai
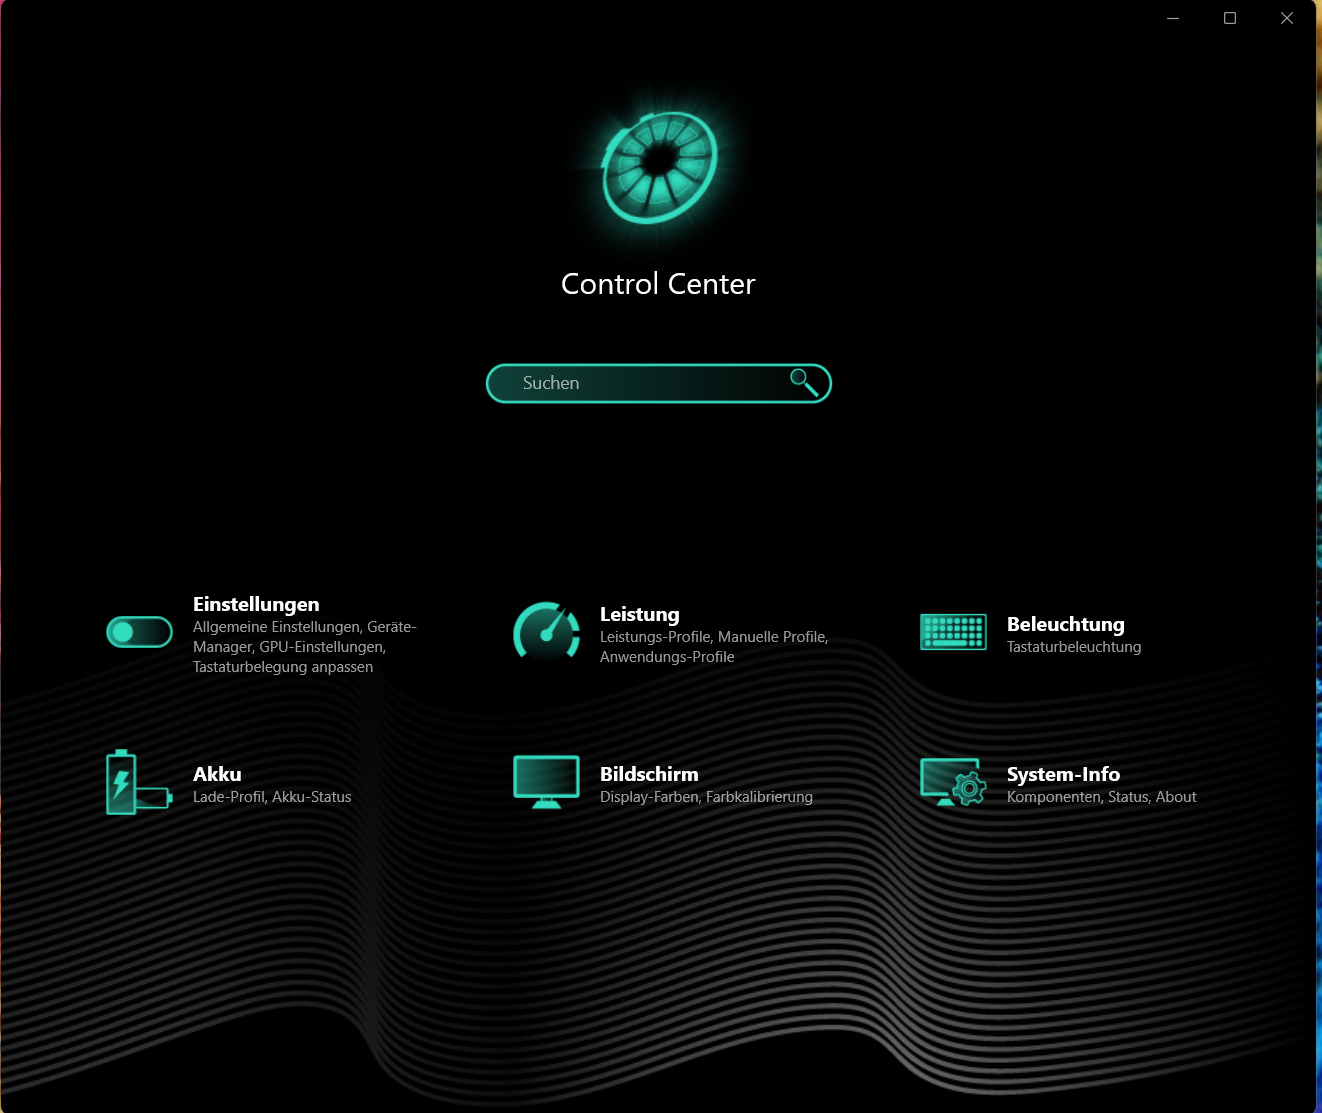
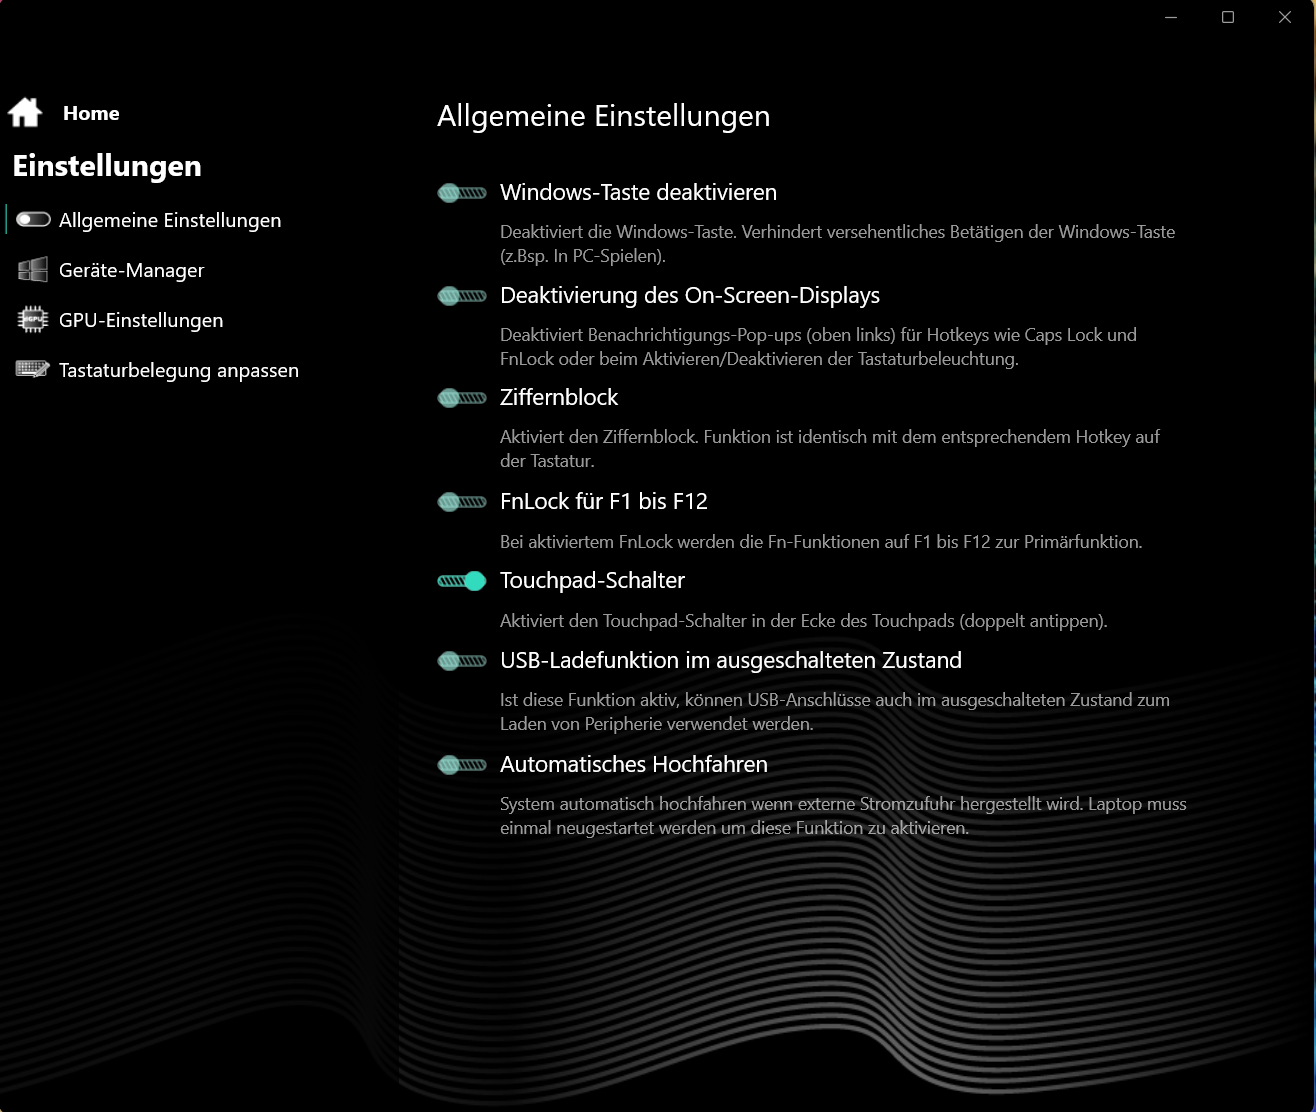
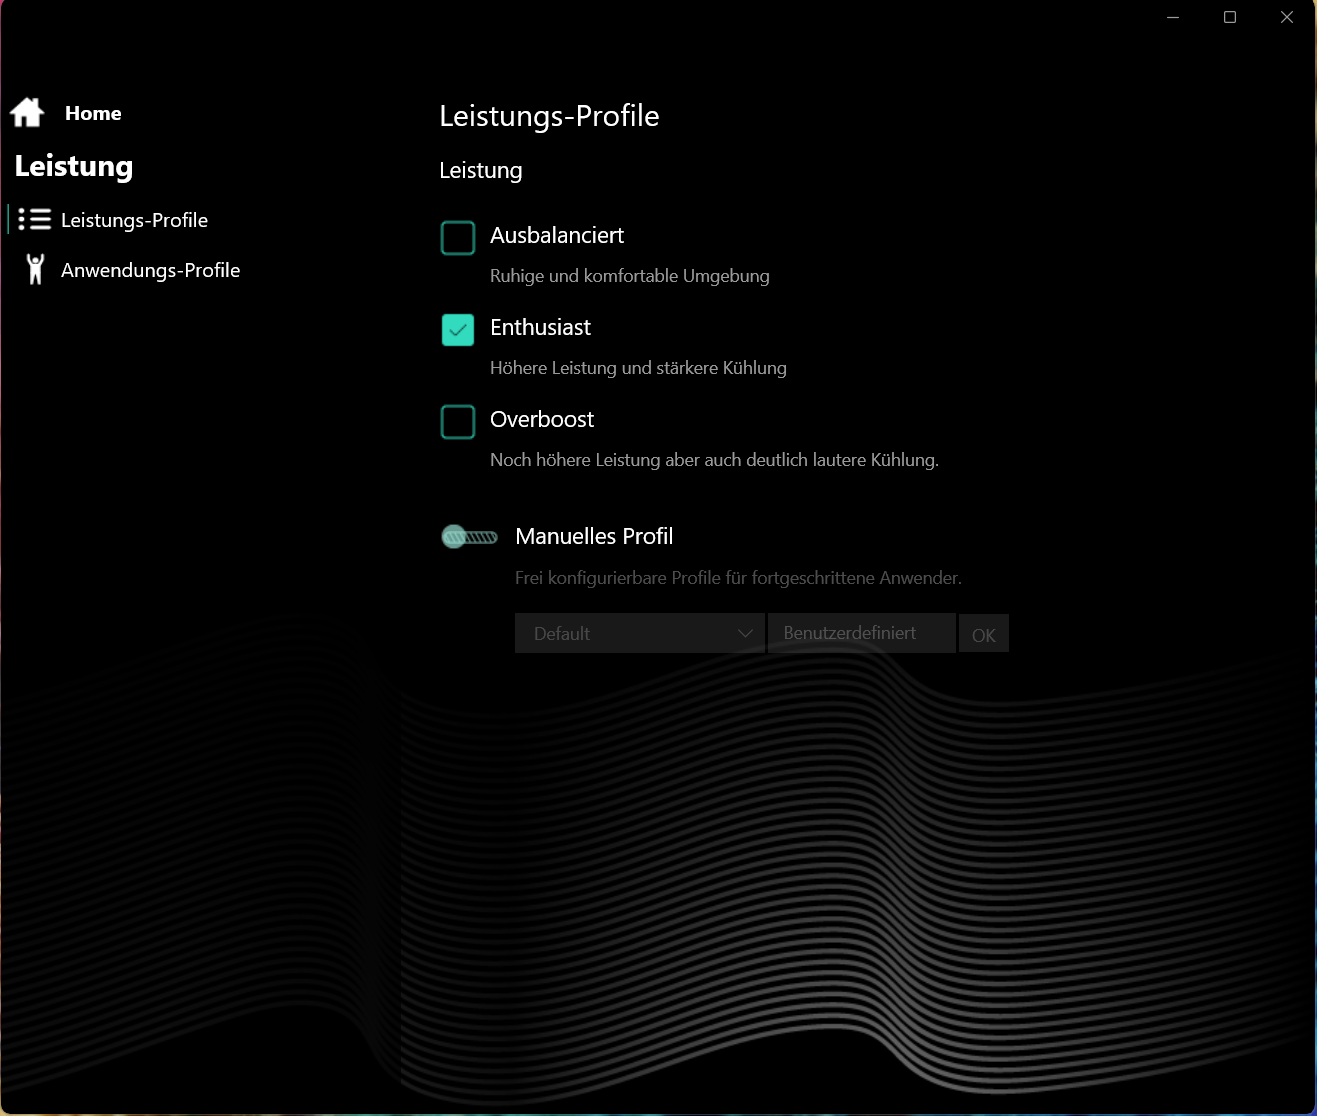
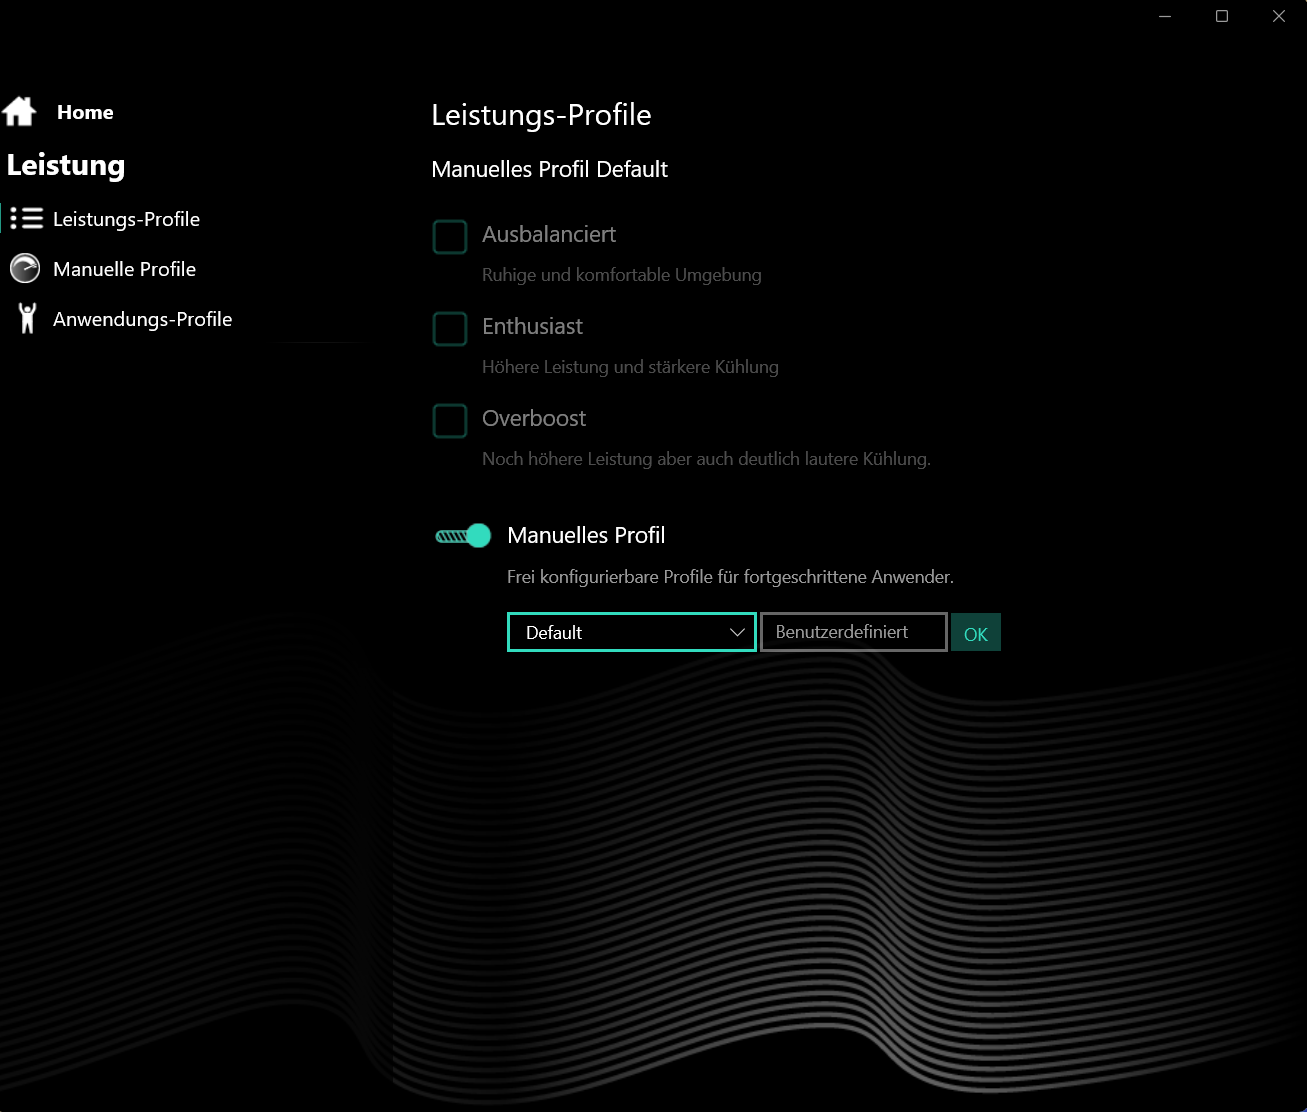
L'Apex offre trois modes de performance spécifiques au fabricant (voir tableau), entre lesquels vous pouvez basculer à l'aide d'une touche distincte (à côté du bouton d'alimentation). Une LED d'état indique le mode actif. Nous avons utilisé les modes "enthusiast" (benchmarks) et "balanced" (tests de batterie). Le mode "Optimus" était actif.
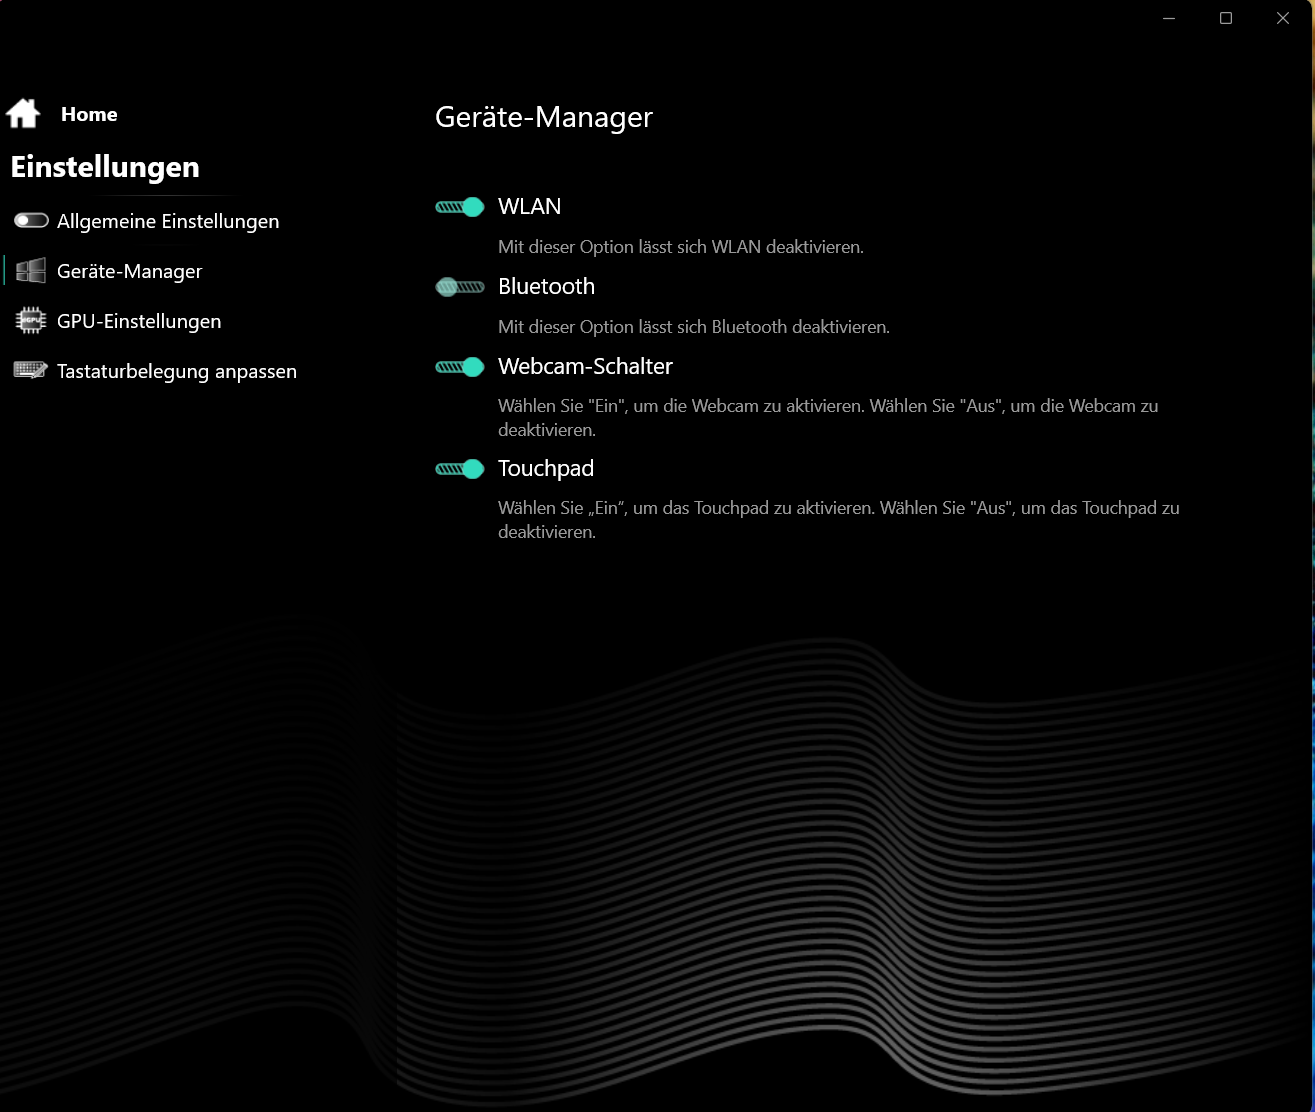
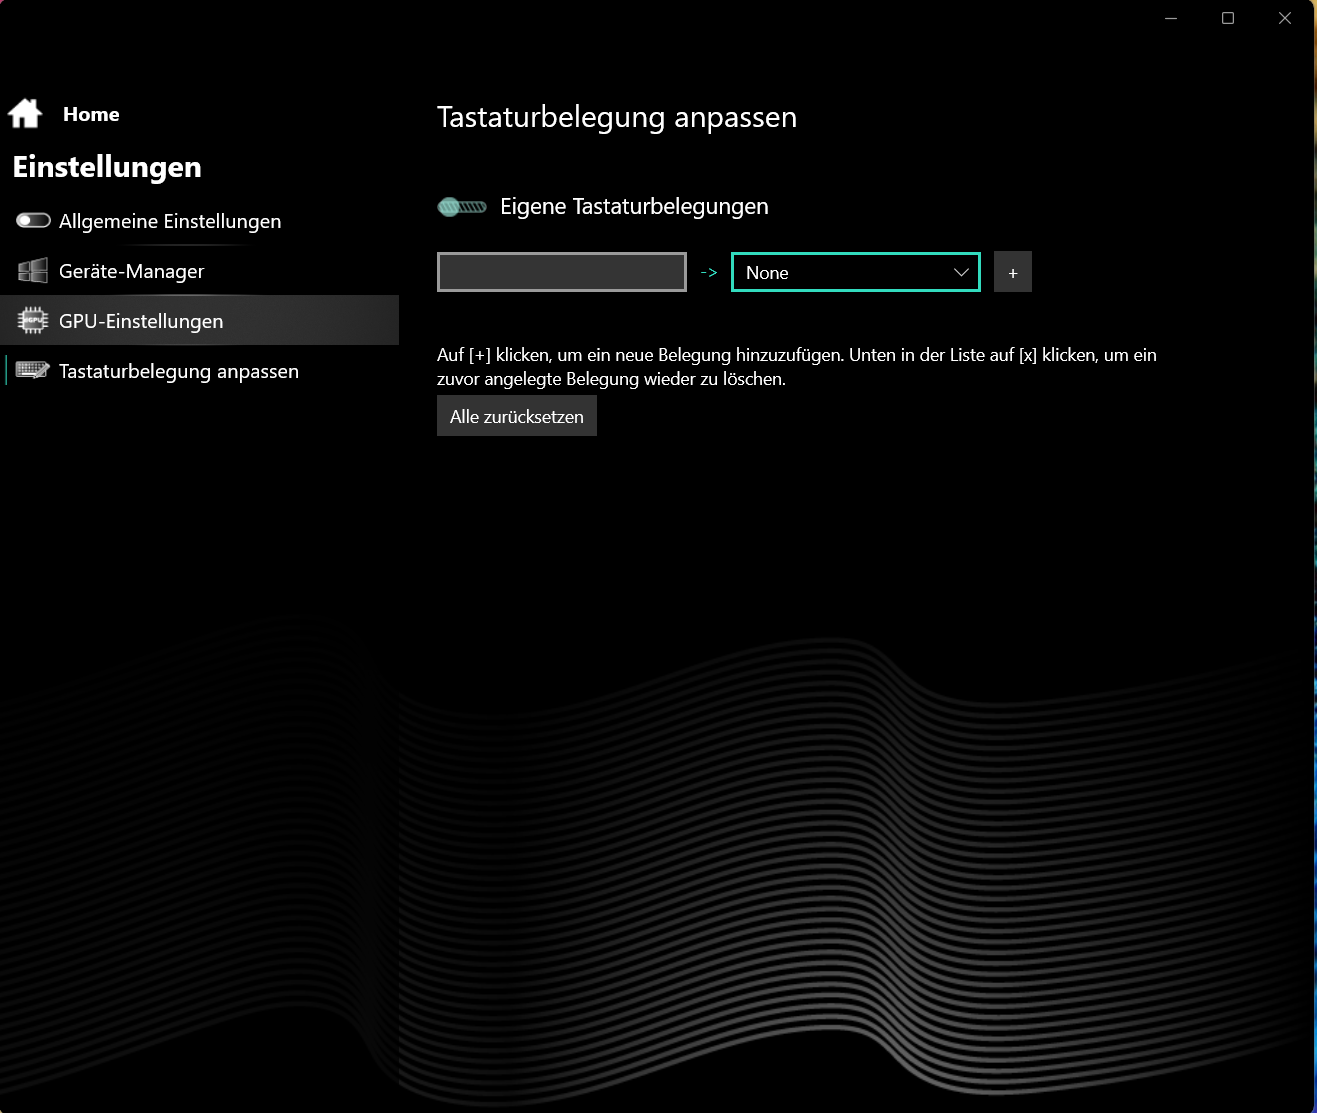
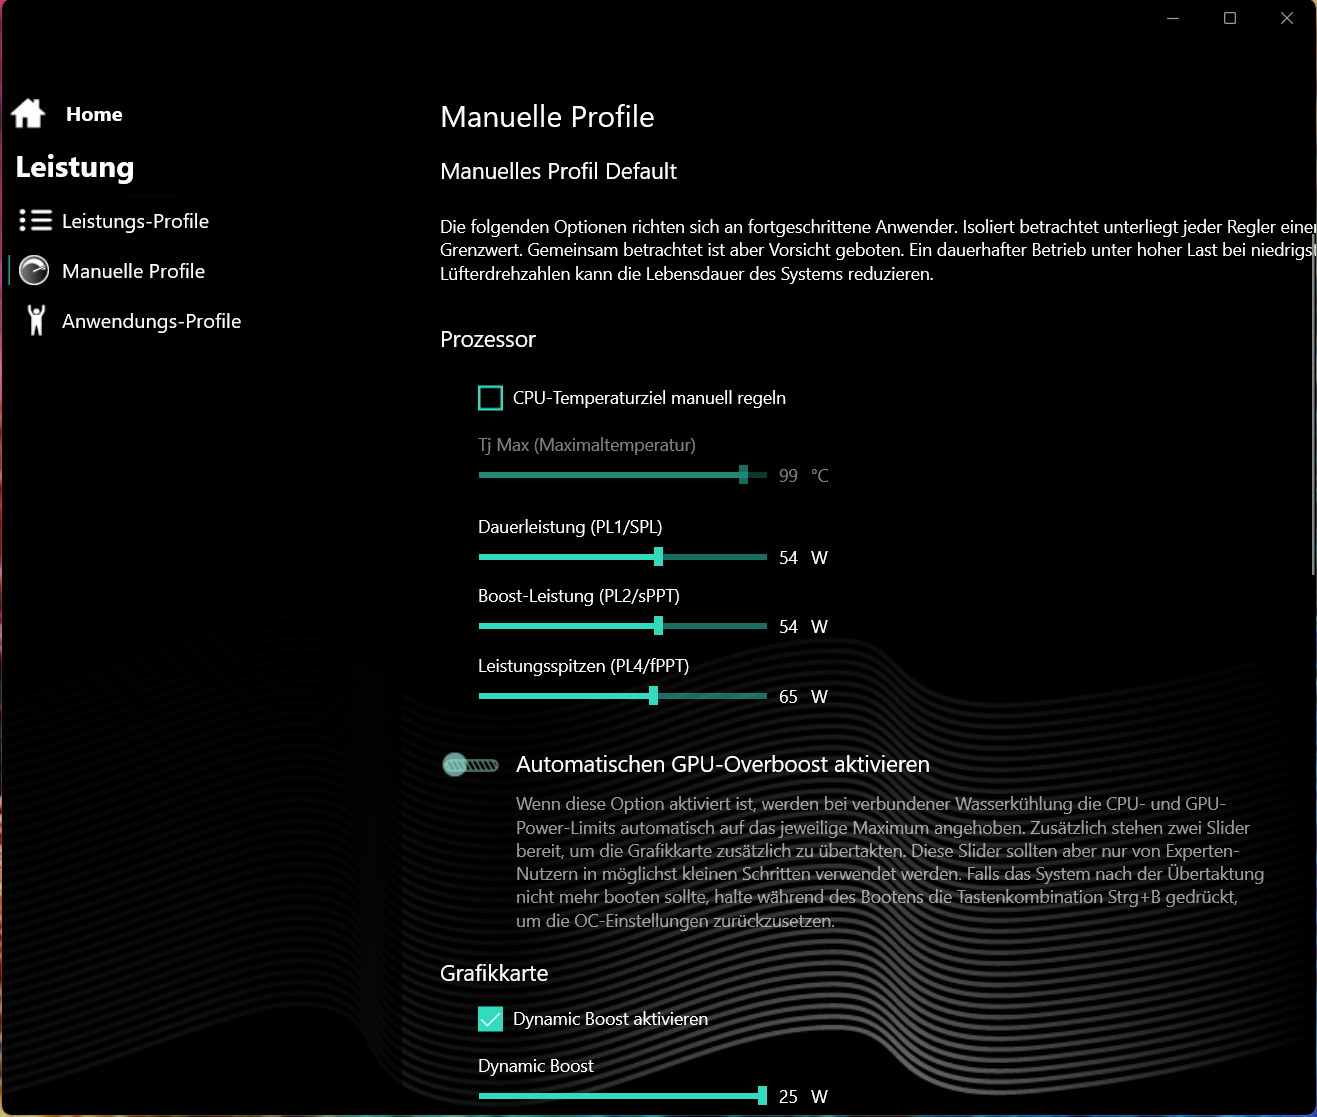
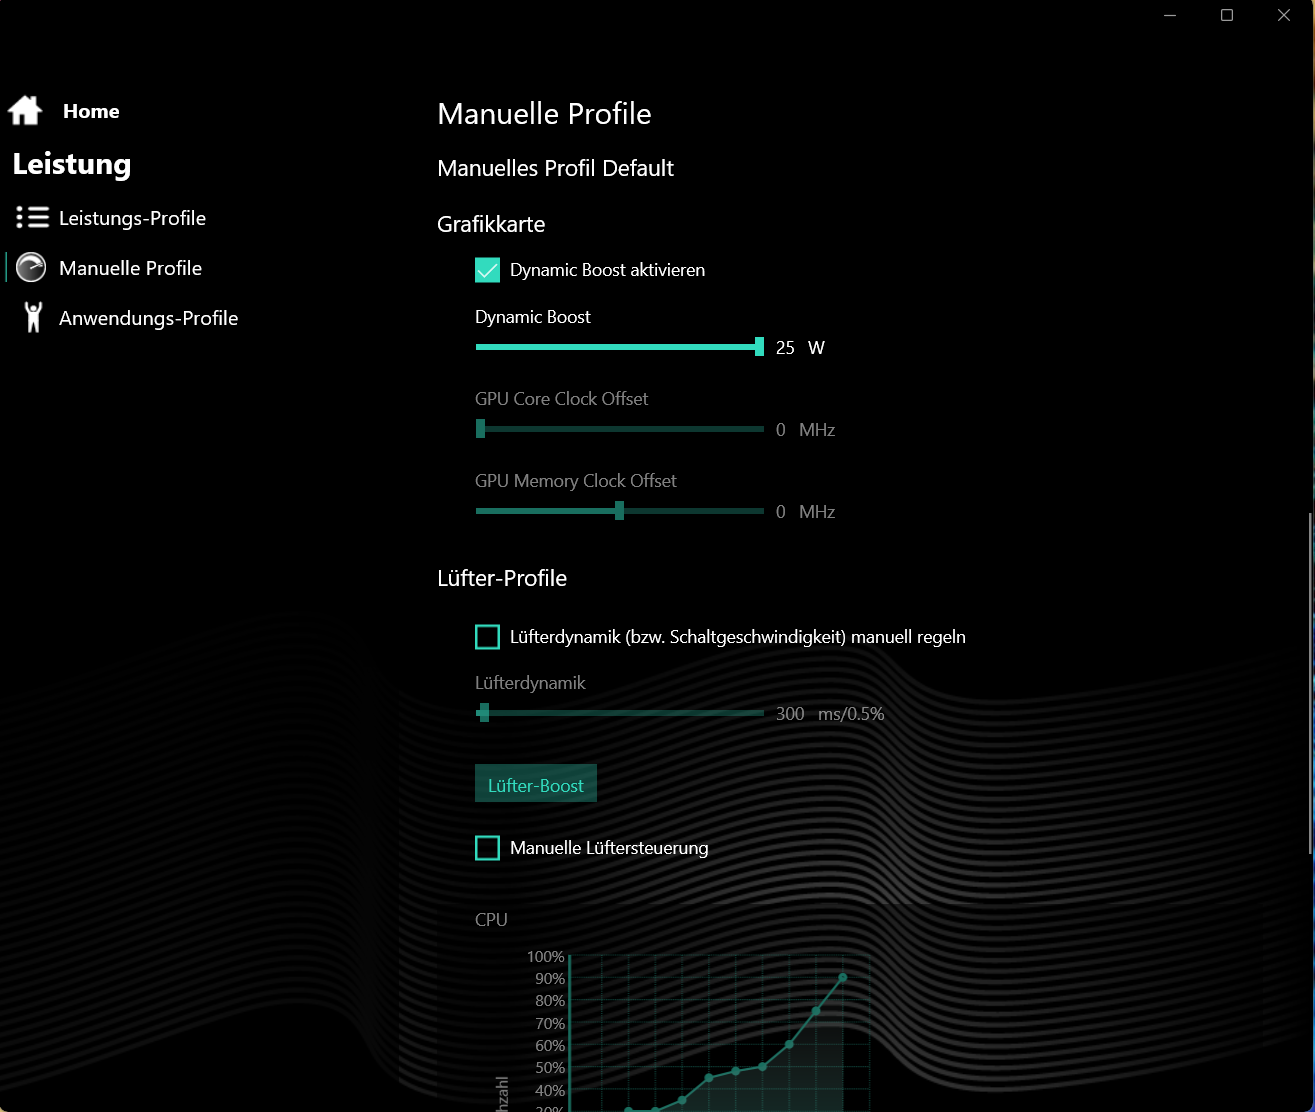
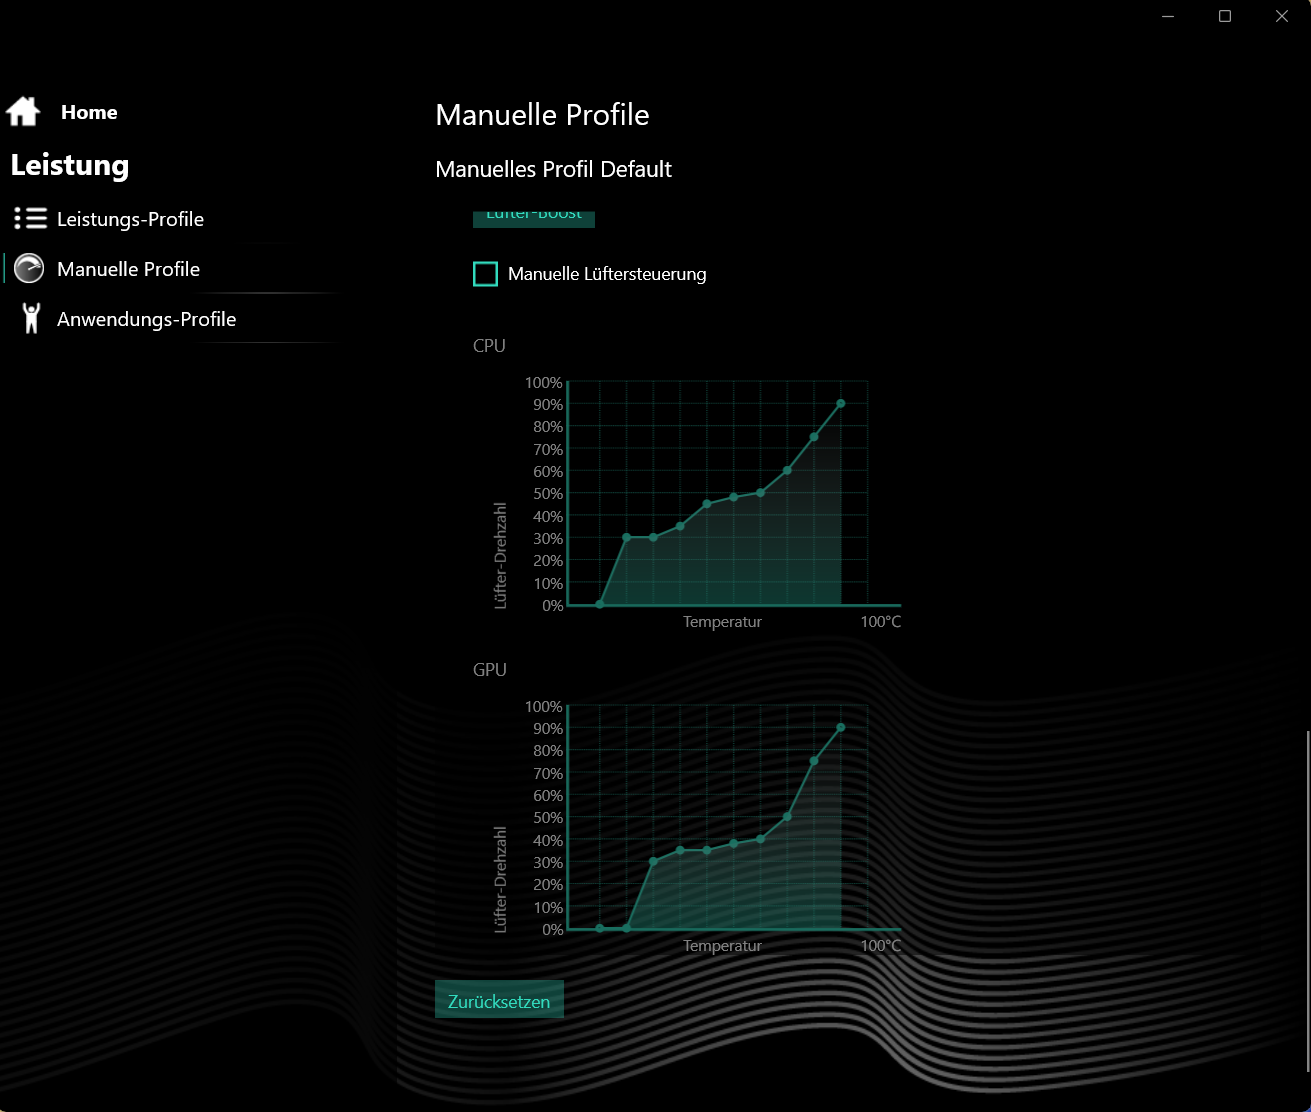
Le centre de contrôle préinstallé permet d'établir des profils individuels : Cela permet d'ajuster, par exemple, les limites de puissance du CPU, le TGP du GPU et/ou le contrôle du ventilateur.
| Enthusiast | Overboost | Balanced | |
|---|---|---|---|
| Limite de puissance 1 (HWInfo) | 54 watts | 80 watts | 35 watts |
| Limite de puissance 2 (HWInfo) | 65 watts | 80 watts | 65 watts |
| Bruit (Witcher 3) | ~50 dB(A) | ~54 dB(A) | ~34 dB(A) |
| Performance (Witcher 3) | ~102 fps | ~105 fps | ~60 fps |
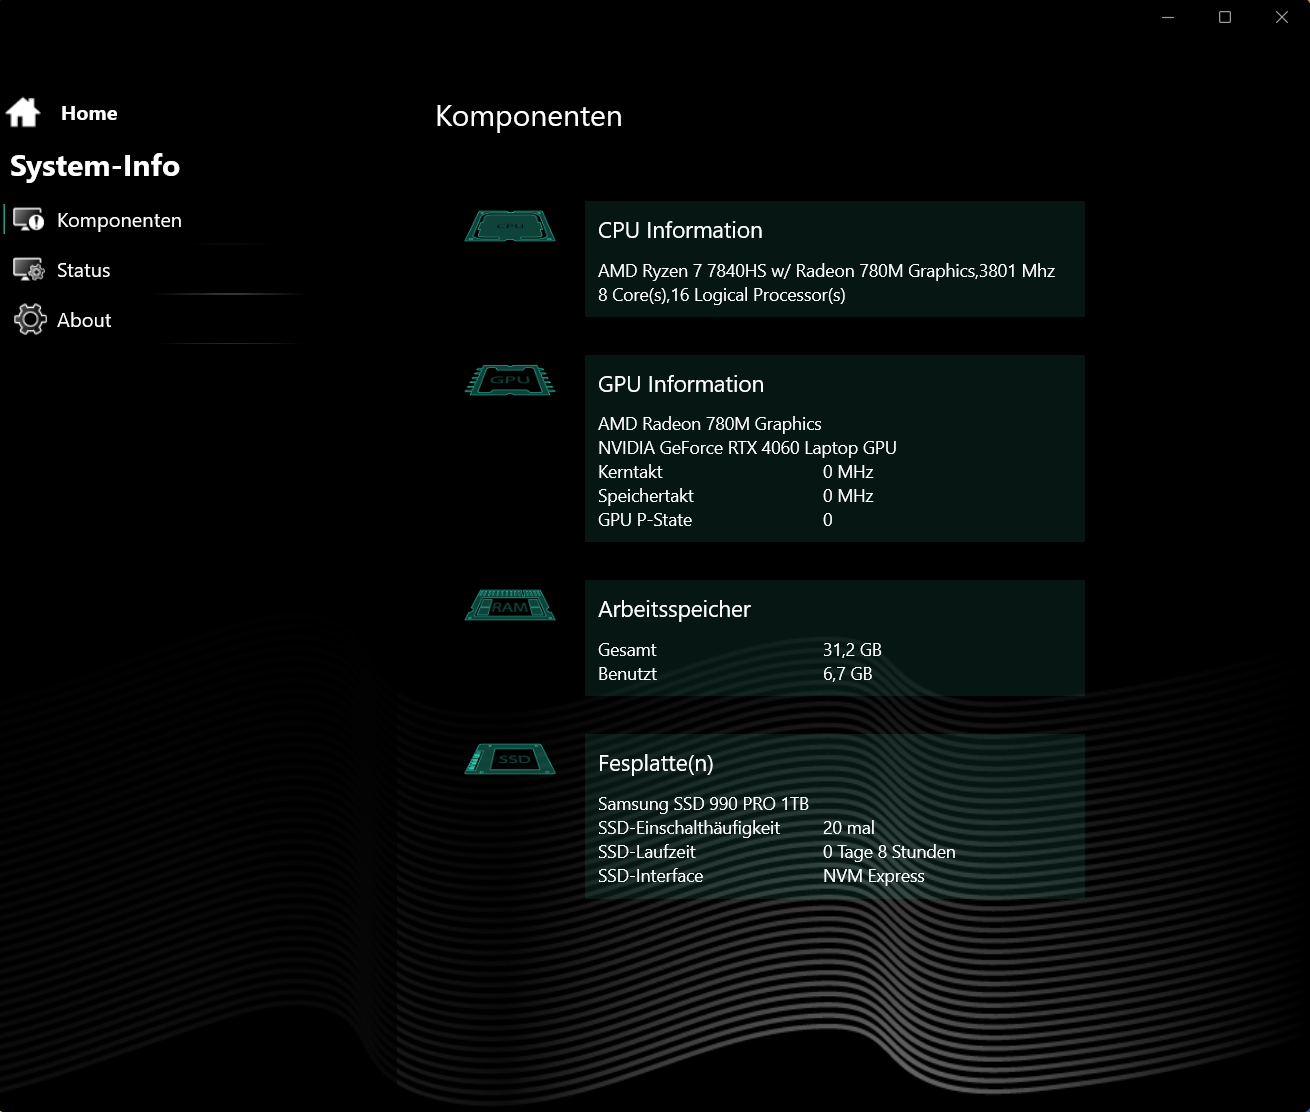
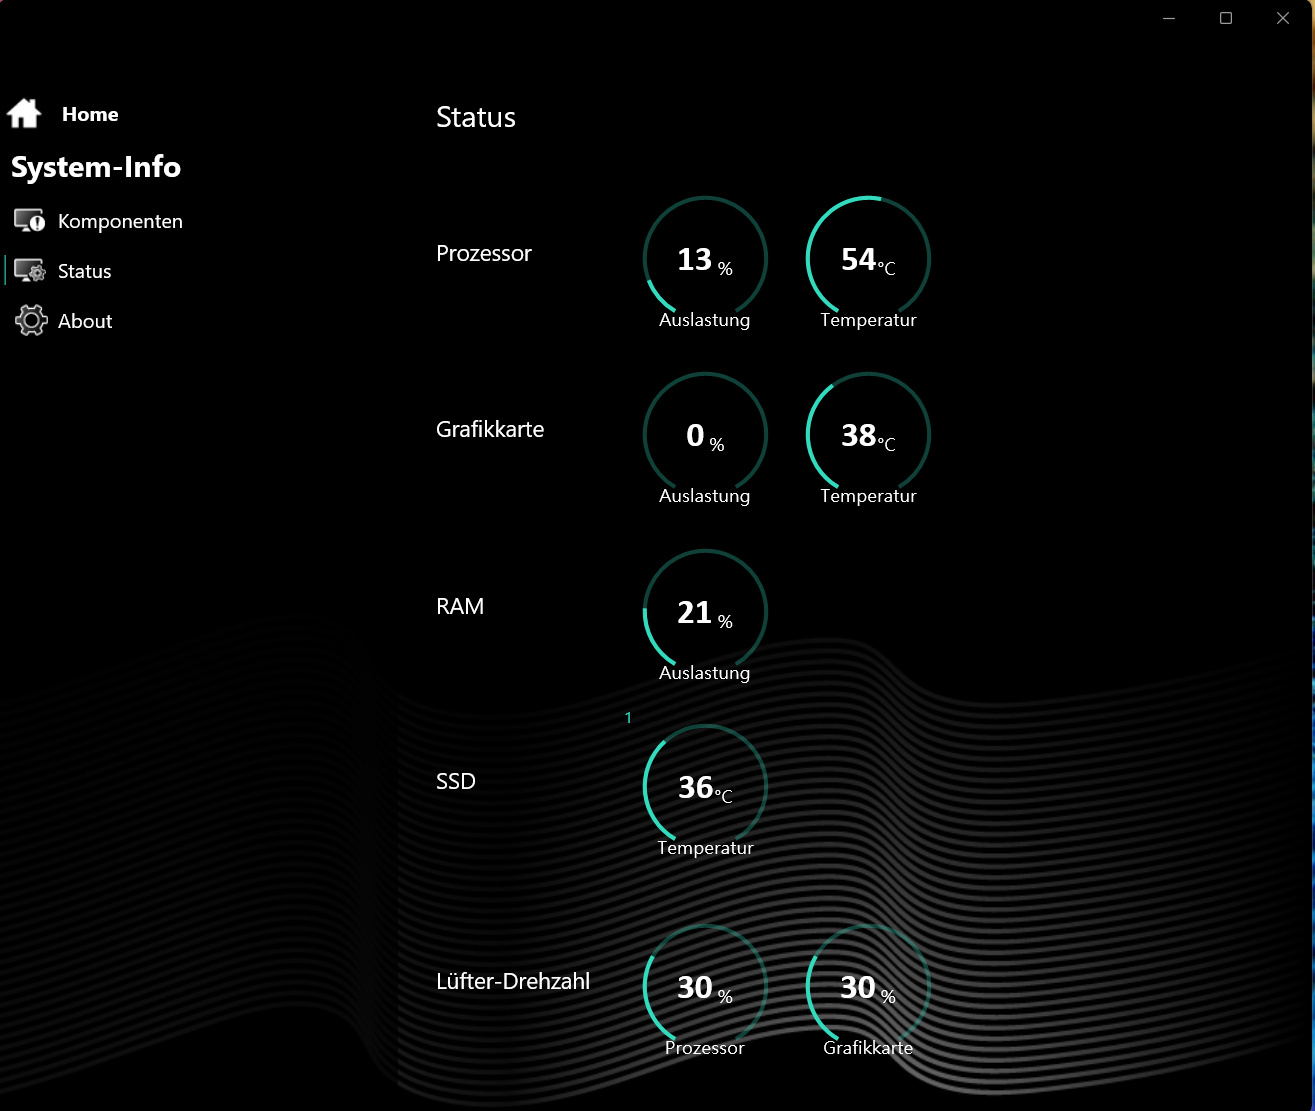
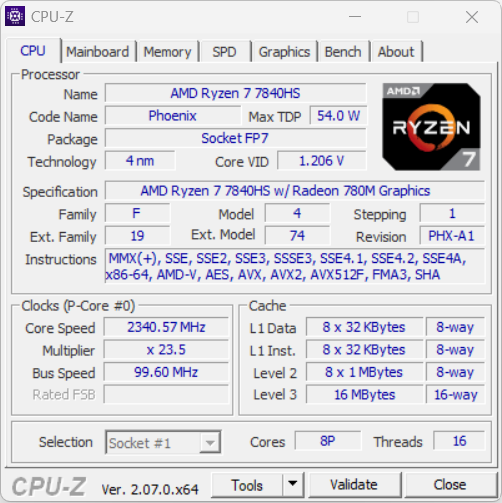
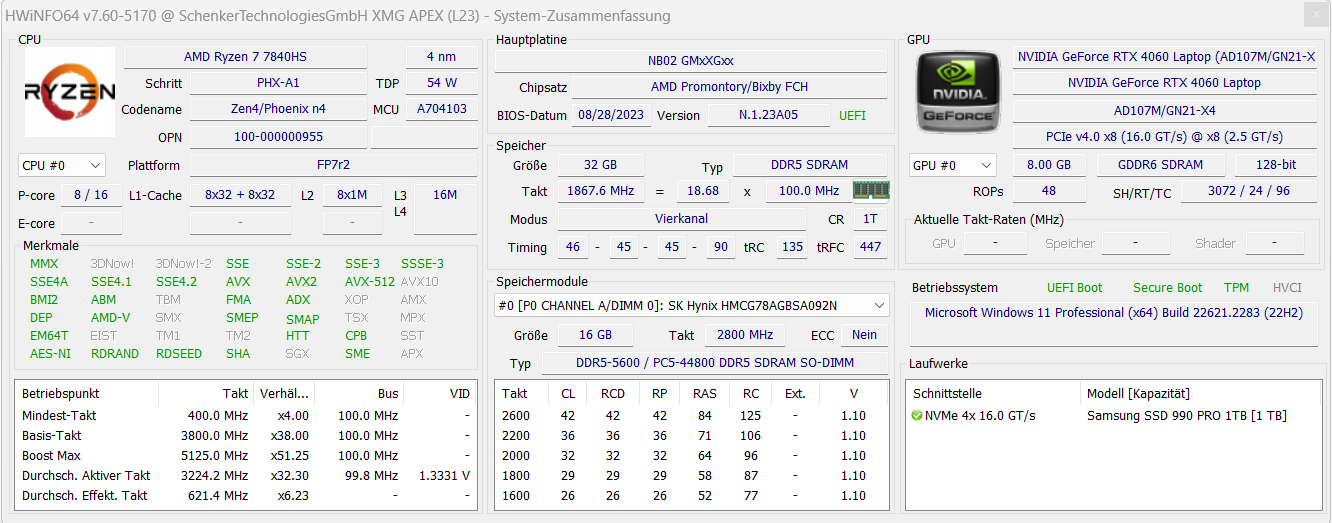
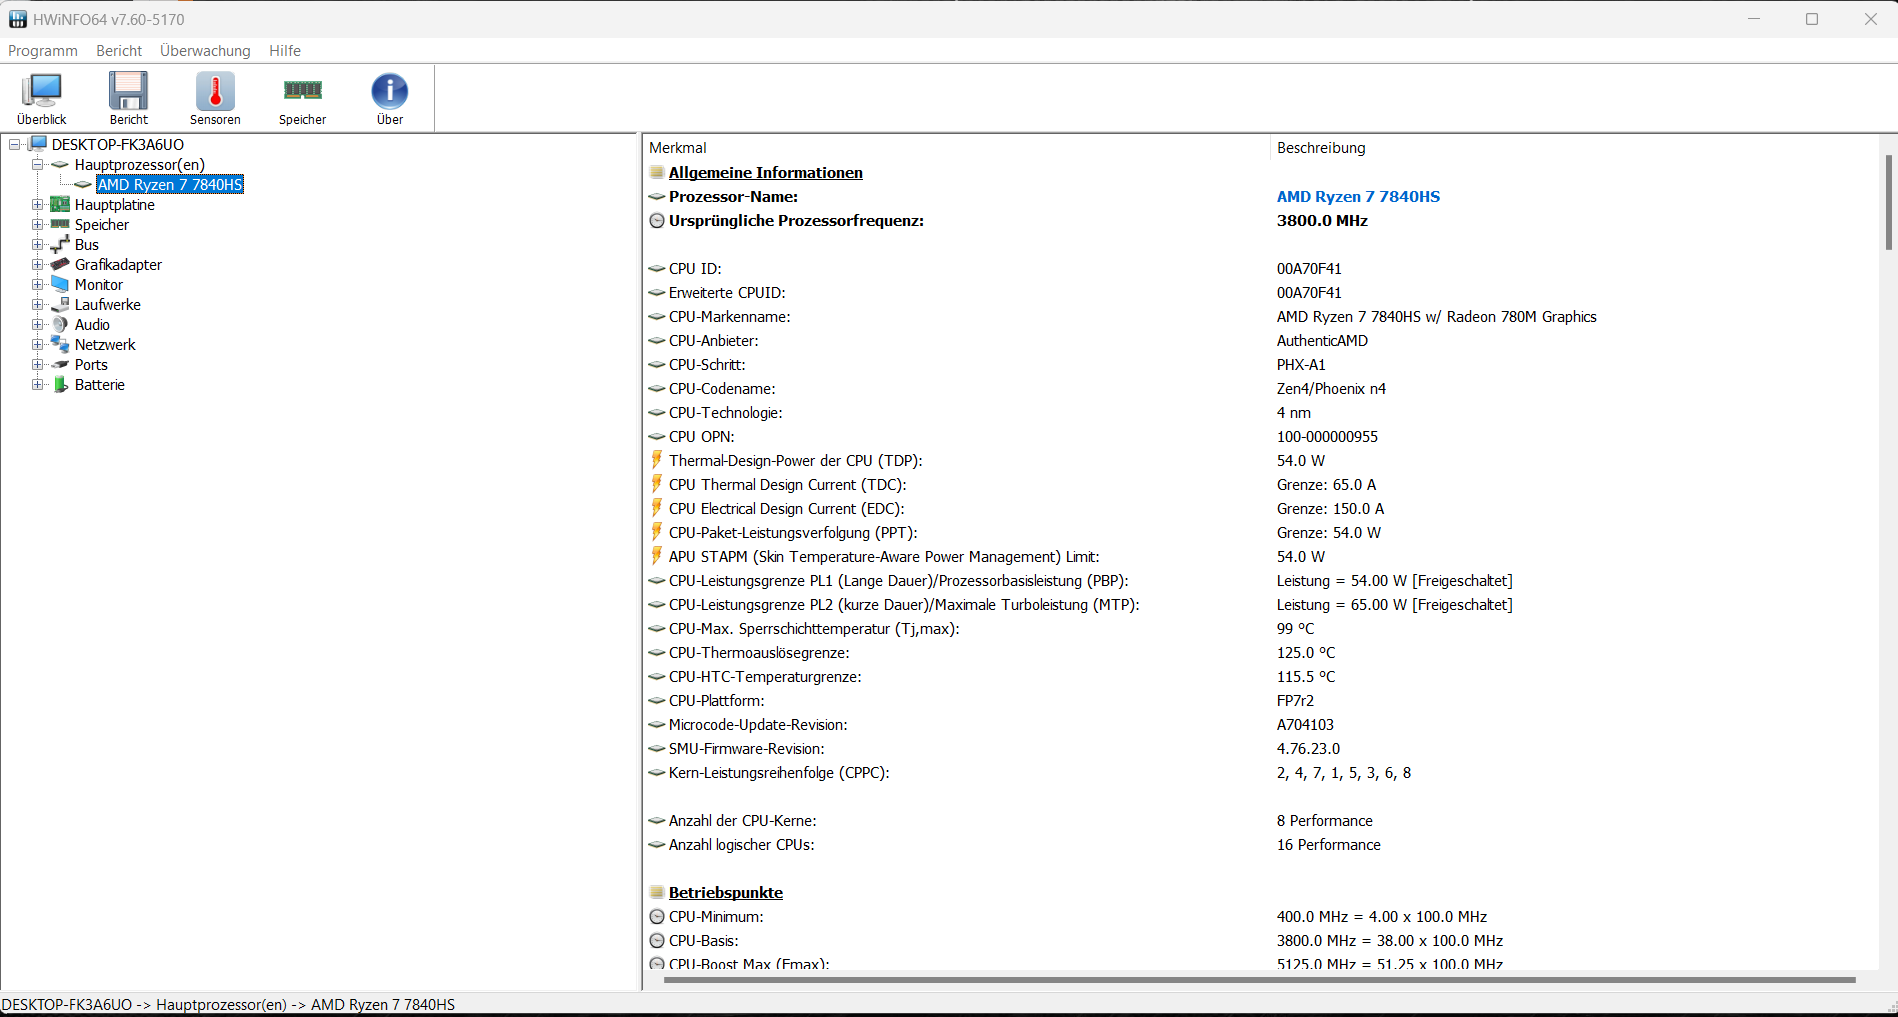
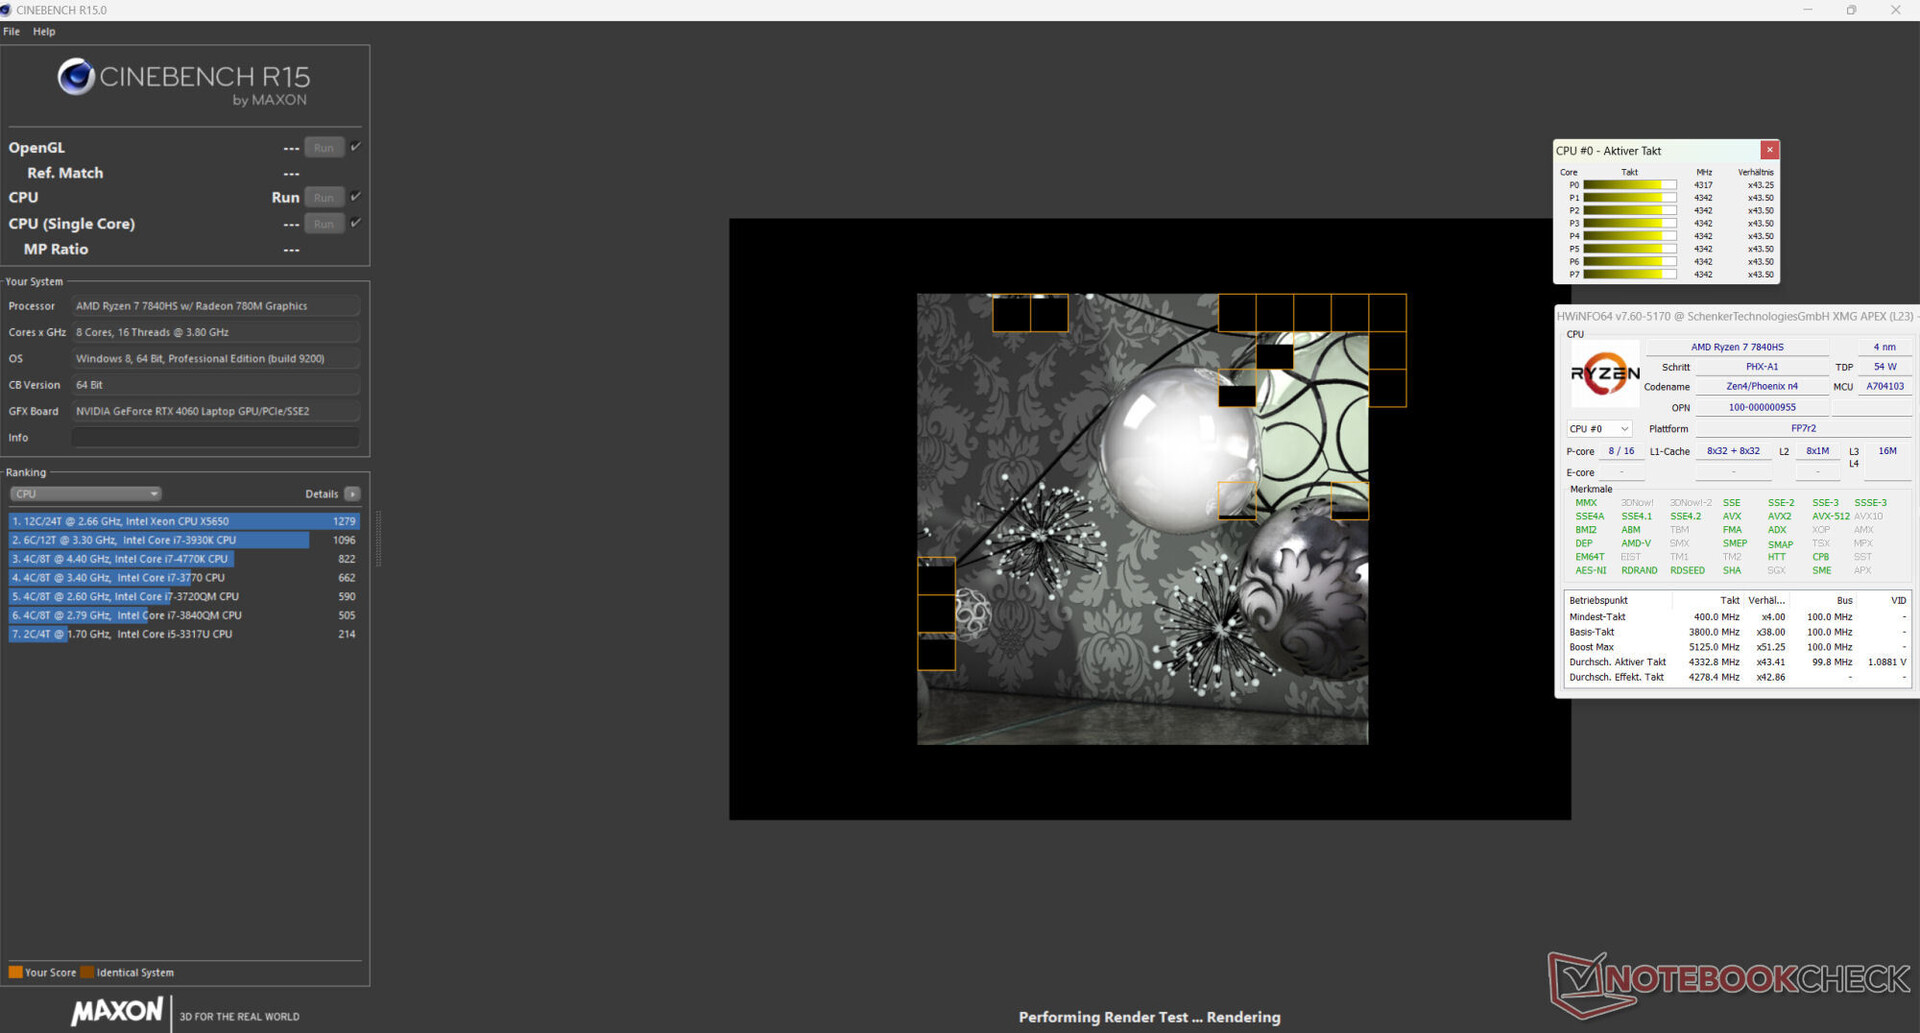
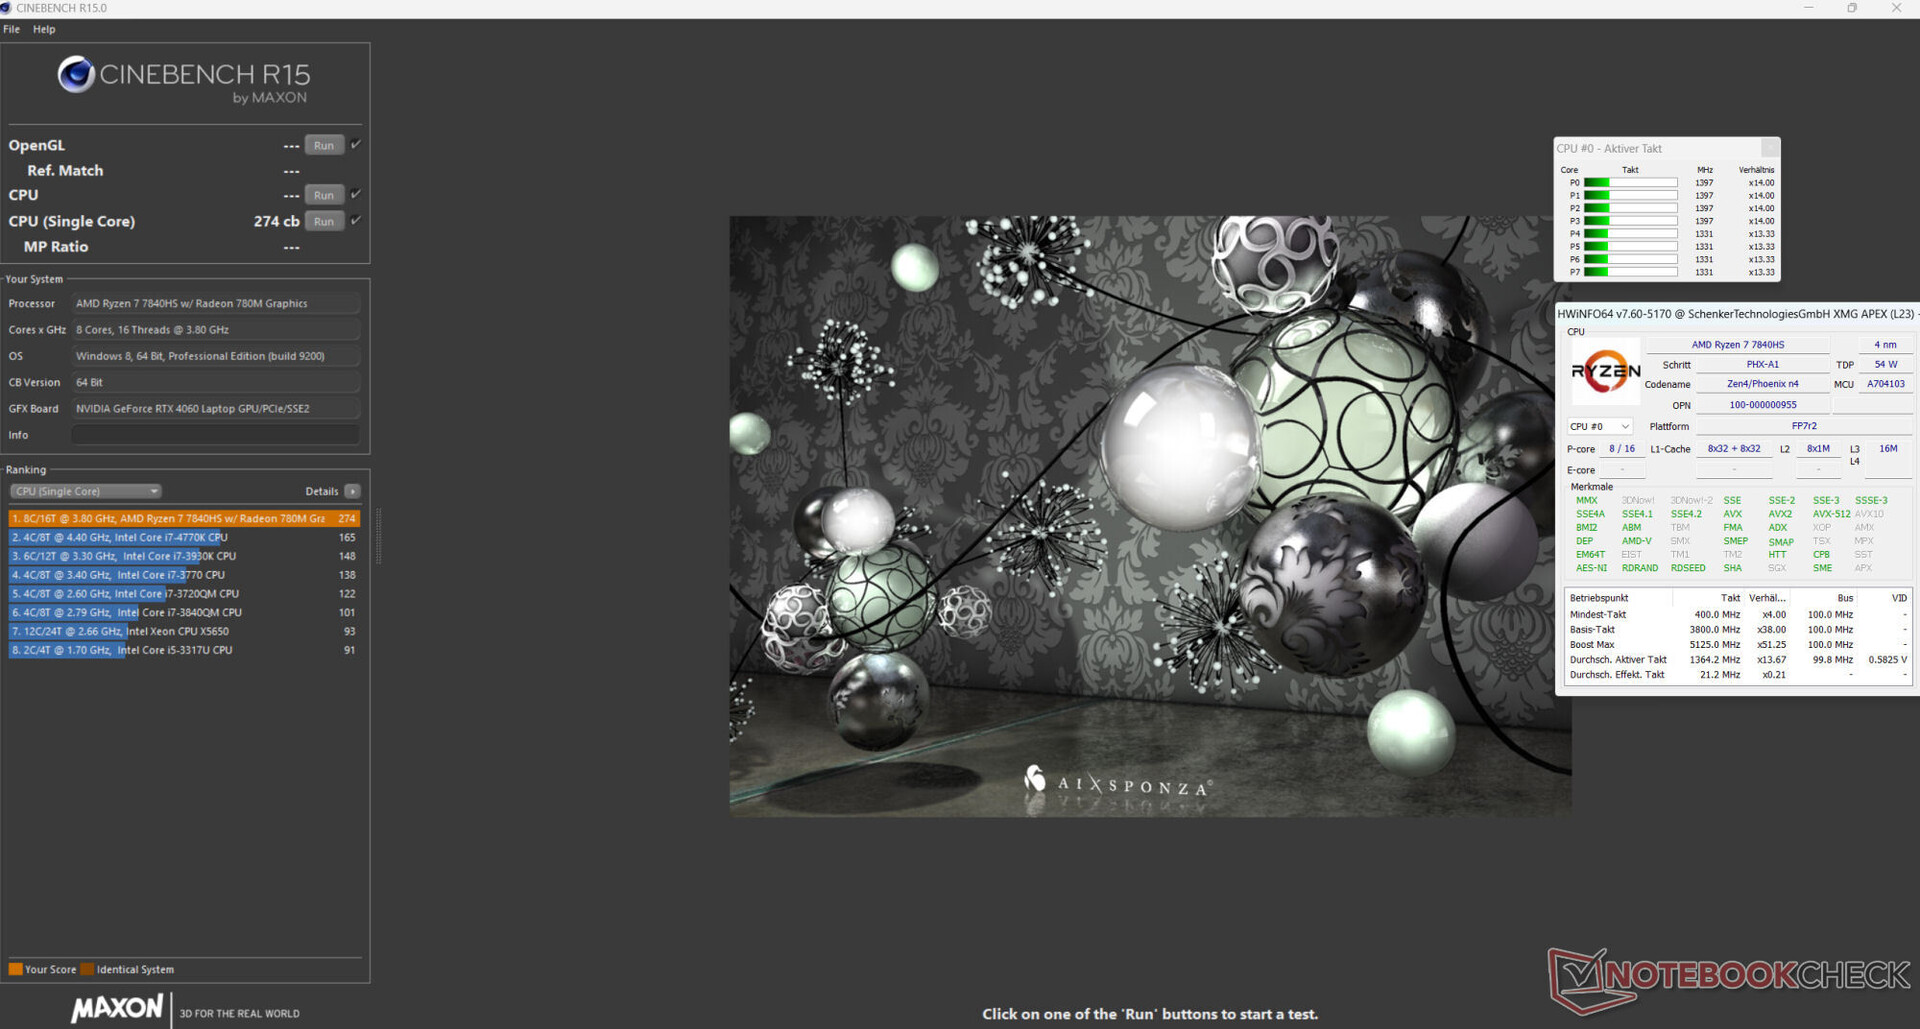
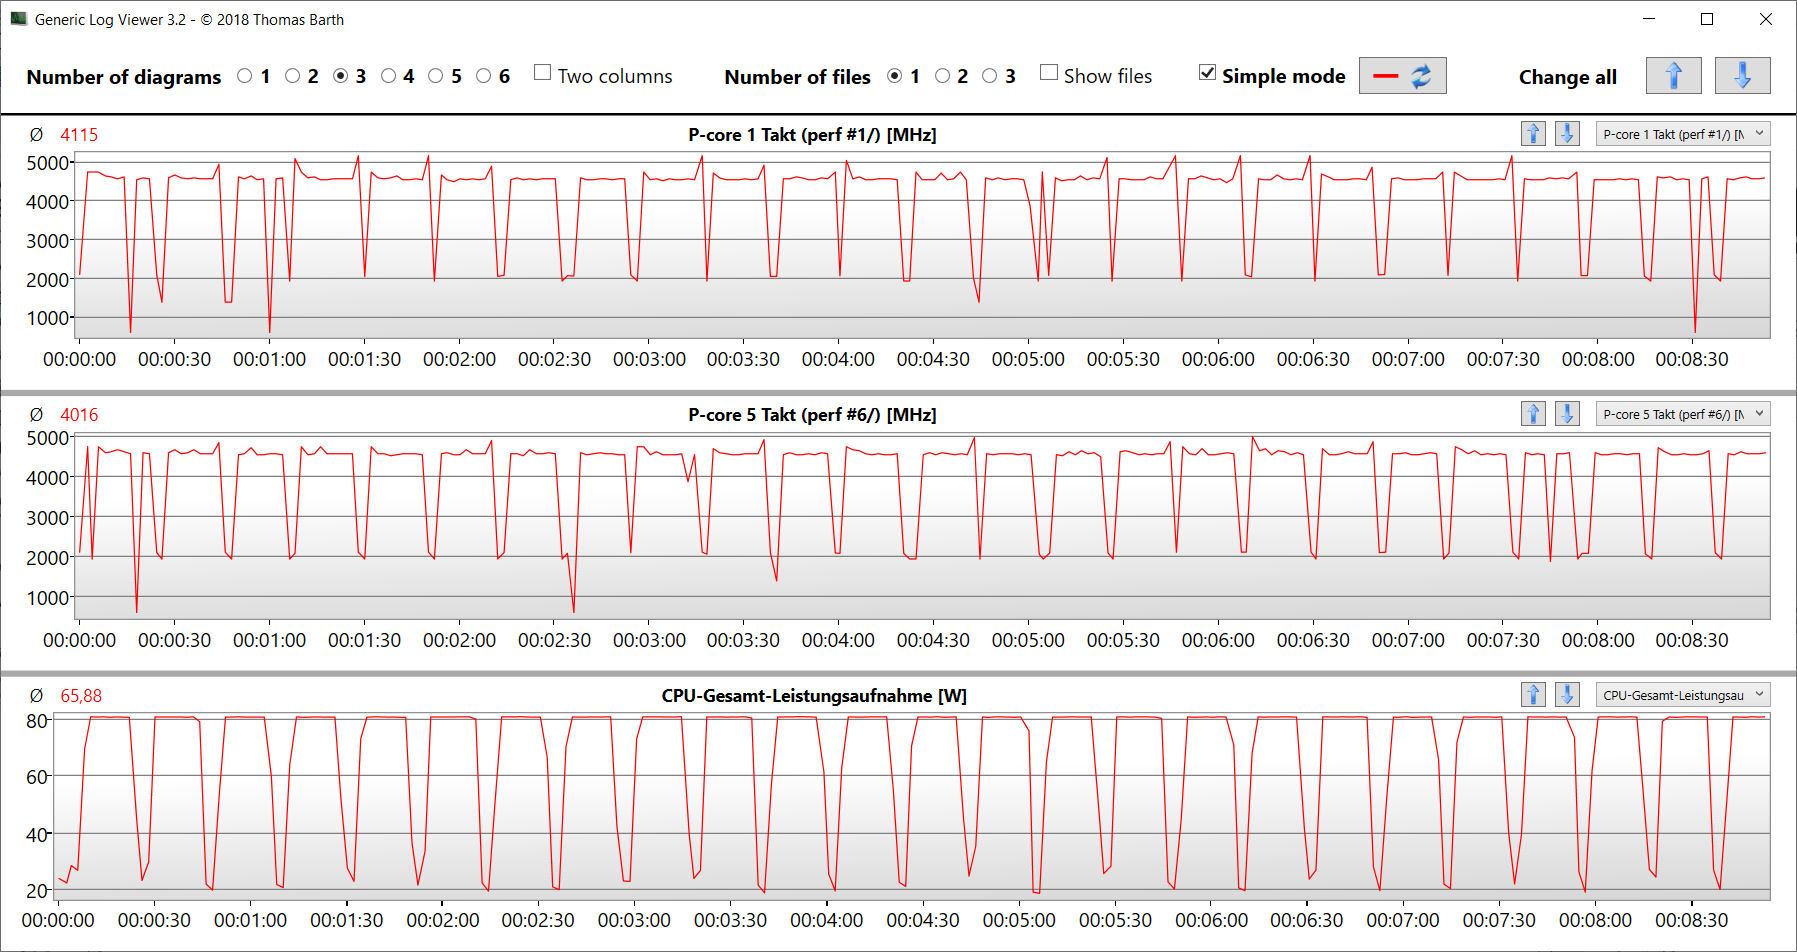
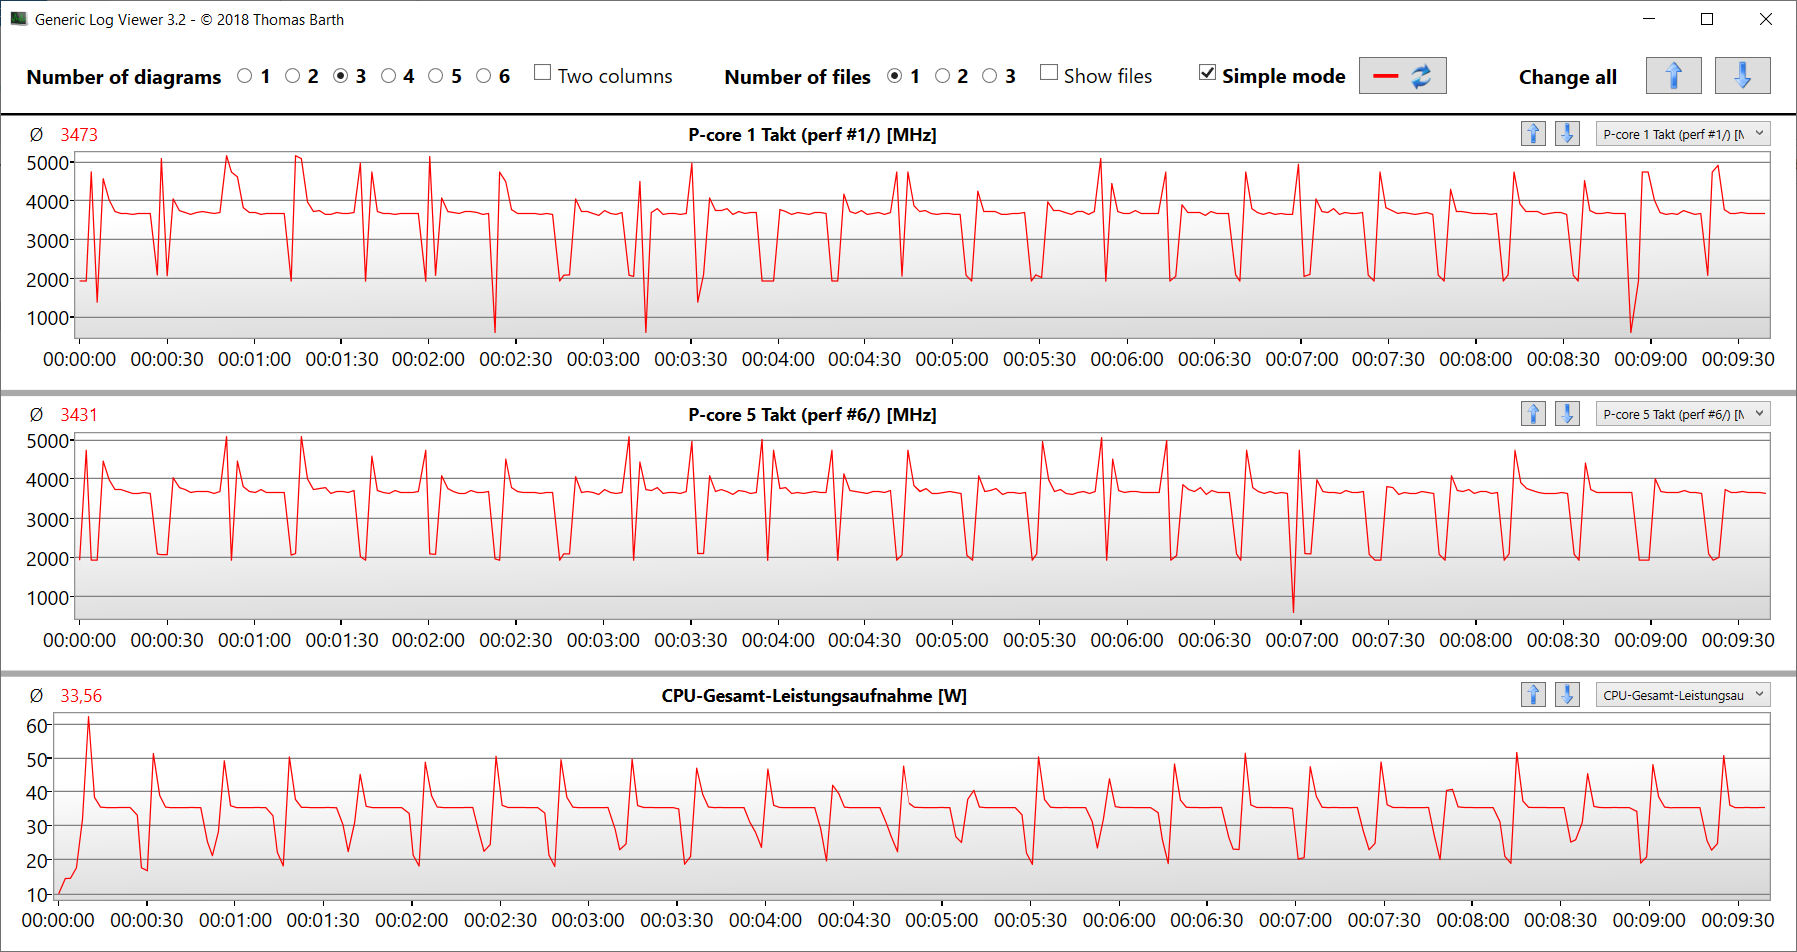
Processeur
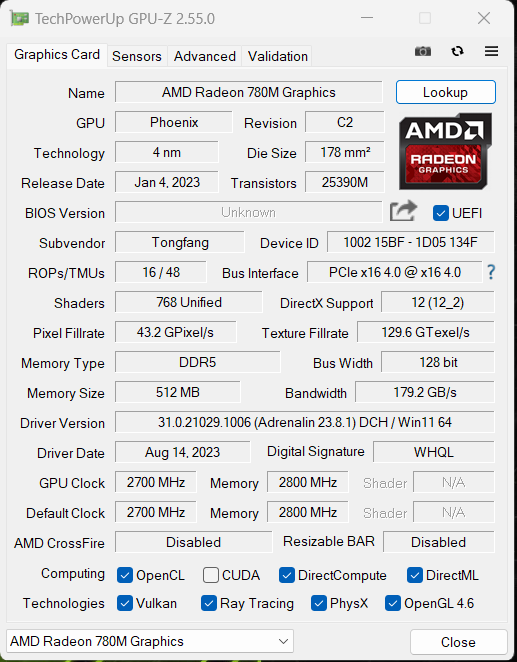
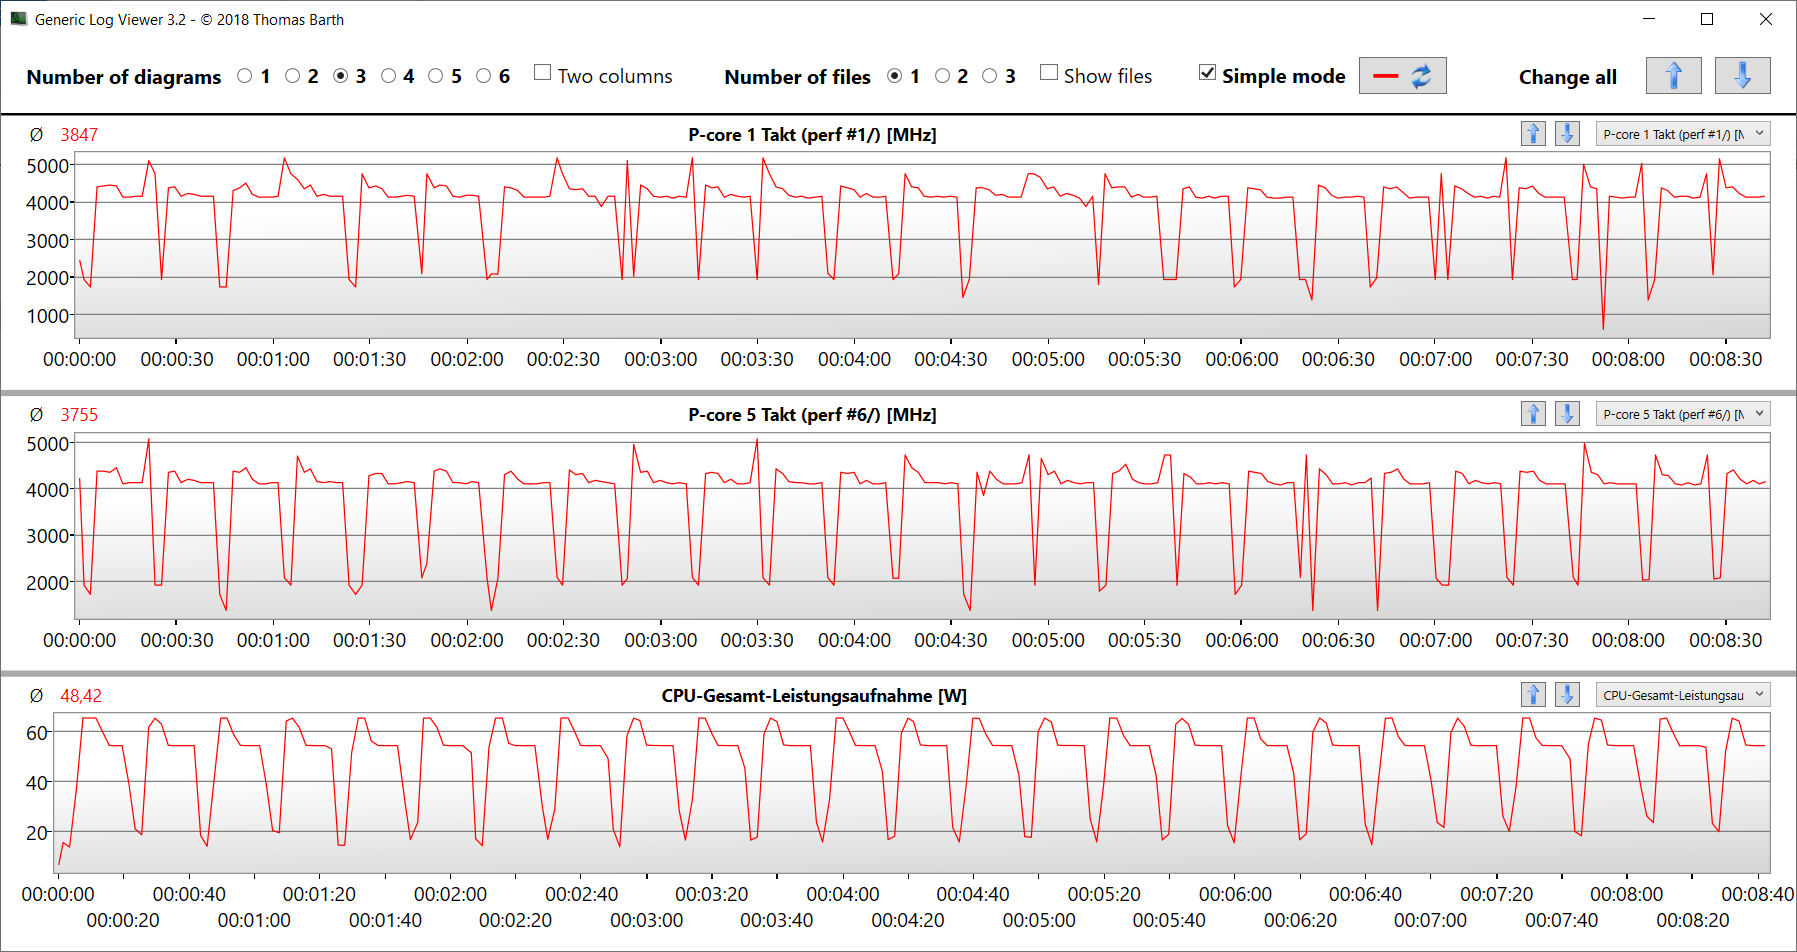
LeRyzen 7 7840HS(Phoenix, Zen 4) offre 8 cœurs de CPU avec un total de 16 threads à une vitesse d'horloge maximale de 5,1 GHz (un cœur). Le processeur reconnaît une charge multithread continue (boucle CB15) avec une vitesse turbo élevée et constante, quel que soit le mode de performance sélectionné.
En fonctionnement sur secteur, les résultats des tests se situent autour de la moyenne du processeur. En mode batterie, les performances les plus pertinentes (216 points) chutent moins que les performances multithread (1 715 points).
Remarque : des informations plus détaillées concernant l'architecture Zen 4 sont disponibles dans l'article d'analyse Test de l'AMD Ryzen 9 7940HS : Zen4 Phoenix semble aussi efficace qu'Apple .
Cinebench R15 Multi Continuous Test
* ... Moindre est la valeur, meilleures sont les performances
AIDA64: FP32 Ray-Trace | FPU Julia | CPU SHA3 | CPU Queen | FPU SinJulia | FPU Mandel | CPU AES | CPU ZLib | FP64 Ray-Trace | CPU PhotoWorxx
| Performance rating | |
| Moyenne de la classe Gaming | |
| Schenker XMG Apex 17 (Late 23) | |
| Moyenne AMD Ryzen 7 7840HS | |
| Alienware m16 R1 Intel | |
| Lenovo Legion Pro 5 16IRX8 | |
| Acer Nitro 17 AN17-51-71ER | |
| Medion Erazer Defender P40 | |
| MSI Katana 17 B13VFK | |
| AIDA64 / FP32 Ray-Trace | |
| Moyenne de la classe Gaming (10227 - 85542, n=103, 2 dernières années) | |
| Moyenne AMD Ryzen 7 7840HS (22845 - 28921, n=21) | |
| Schenker XMG Apex 17 (Late 23) | |
| Lenovo Legion Pro 5 16IRX8 | |
| Alienware m16 R1 Intel | |
| Acer Nitro 17 AN17-51-71ER | |
| Medion Erazer Defender P40 | |
| MSI Katana 17 B13VFK | |
| AIDA64 / FPU Julia | |
| Moyenne de la classe Gaming (51376 - 238426, n=103, 2 dernières années) | |
| Moyenne AMD Ryzen 7 7840HS (97164 - 123167, n=21) | |
| Schenker XMG Apex 17 (Late 23) | |
| Lenovo Legion Pro 5 16IRX8 | |
| Alienware m16 R1 Intel | |
| Acer Nitro 17 AN17-51-71ER | |
| Medion Erazer Defender P40 | |
| MSI Katana 17 B13VFK | |
| AIDA64 / CPU SHA3 | |
| Moyenne de la classe Gaming (2180 - 9817, n=103, 2 dernières années) | |
| Alienware m16 R1 Intel | |
| Moyenne AMD Ryzen 7 7840HS (4293 - 5155, n=21) | |
| Lenovo Legion Pro 5 16IRX8 | |
| Schenker XMG Apex 17 (Late 23) | |
| Acer Nitro 17 AN17-51-71ER | |
| Medion Erazer Defender P40 | |
| MSI Katana 17 B13VFK | |
| AIDA64 / CPU Queen | |
| Moyenne de la classe Gaming (49785 - 173351, n=89, 2 dernières années) | |
| Moyenne AMD Ryzen 7 7840HS (102271 - 125820, n=21) | |
| Schenker XMG Apex 17 (Late 23) | |
| Alienware m16 R1 Intel | |
| Lenovo Legion Pro 5 16IRX8 | |
| Medion Erazer Defender P40 | |
| Acer Nitro 17 AN17-51-71ER | |
| MSI Katana 17 B13VFK | |
| AIDA64 / FPU SinJulia | |
| Moyenne AMD Ryzen 7 7840HS (13767 - 15525, n=21) | |
| Schenker XMG Apex 17 (Late 23) | |
| Moyenne de la classe Gaming (4424 - 33636, n=103, 2 dernières années) | |
| Alienware m16 R1 Intel | |
| Lenovo Legion Pro 5 16IRX8 | |
| Acer Nitro 17 AN17-51-71ER | |
| Medion Erazer Defender P40 | |
| MSI Katana 17 B13VFK | |
| AIDA64 / FPU Mandel | |
| Moyenne de la classe Gaming (25115 - 128721, n=103, 2 dernières années) | |
| Moyenne AMD Ryzen 7 7840HS (52084 - 65812, n=21) | |
| Schenker XMG Apex 17 (Late 23) | |
| Lenovo Legion Pro 5 16IRX8 | |
| Alienware m16 R1 Intel | |
| Acer Nitro 17 AN17-51-71ER | |
| Medion Erazer Defender P40 | |
| MSI Katana 17 B13VFK | |
| AIDA64 / CPU AES | |
| Alienware m16 R1 Intel | |
| Schenker XMG Apex 17 (Late 23) | |
| Acer Nitro 17 AN17-51-71ER | |
| Moyenne AMD Ryzen 7 7840HS (67389 - 177158, n=21) | |
| Moyenne de la classe Gaming (39258 - 247074, n=103, 2 dernières années) | |
| Lenovo Legion Pro 5 16IRX8 | |
| Medion Erazer Defender P40 | |
| MSI Katana 17 B13VFK | |
| AIDA64 / CPU ZLib | |
| Moyenne de la classe Gaming (574 - 2531, n=103, 2 dernières années) | |
| Alienware m16 R1 Intel | |
| Lenovo Legion Pro 5 16IRX8 | |
| Acer Nitro 17 AN17-51-71ER | |
| Moyenne AMD Ryzen 7 7840HS (944 - 1123, n=21) | |
| Schenker XMG Apex 17 (Late 23) | |
| Medion Erazer Defender P40 | |
| MSI Katana 17 B13VFK | |
| AIDA64 / FP64 Ray-Trace | |
| Moyenne de la classe Gaming (5509 - 45446, n=103, 2 dernières années) | |
| Moyenne AMD Ryzen 7 7840HS (12248 - 15599, n=21) | |
| Schenker XMG Apex 17 (Late 23) | |
| Lenovo Legion Pro 5 16IRX8 | |
| Alienware m16 R1 Intel | |
| Acer Nitro 17 AN17-51-71ER | |
| Medion Erazer Defender P40 | |
| MSI Katana 17 B13VFK | |
| AIDA64 / CPU PhotoWorxx | |
| Moyenne de la classe Gaming (12271 - 89891, n=103, 2 dernières années) | |
| Acer Nitro 17 AN17-51-71ER | |
| Moyenne AMD Ryzen 7 7840HS (17615 - 41516, n=21) | |
| Lenovo Legion Pro 5 16IRX8 | |
| Schenker XMG Apex 17 (Late 23) | |
| Medion Erazer Defender P40 | |
| Alienware m16 R1 Intel | |
| MSI Katana 17 B13VFK | |
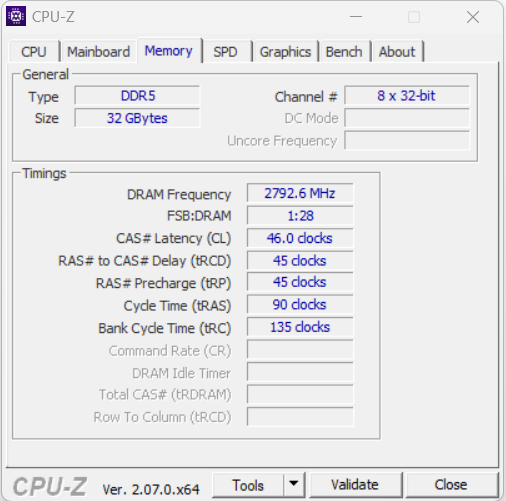
Performance du système
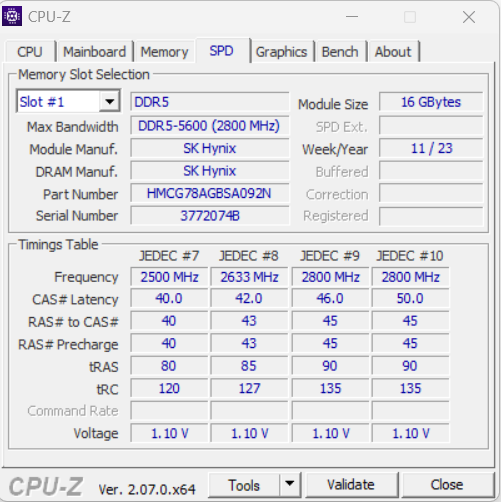
Ce système fluide est conçu pour gérer des scénarios d'utilisation gourmands en performances, tels que le rendu et les jeux - les bons résultats de PC Mark le confirment. Les taux de transfert de la RAM sont normaux pour une RAM DDR5 5600.
CrossMark: Overall | Productivity | Creativity | Responsiveness
| PCMark 10 / Score | |
| Moyenne de la classe Gaming (5828 - 11730, n=92, 2 dernières années) | |
| Schenker XMG Apex 17 (Late 23) | |
| Moyenne AMD Ryzen 7 7840HS, NVIDIA GeForce RTX 4060 Laptop GPU (7502 - 7946, n=4) | |
| Lenovo Legion Pro 5 16IRX8 | |
| Alienware m16 R1 Intel | |
| MSI Katana 17 B13VFK | |
| Acer Nitro 17 AN17-51-71ER | |
| Medion Erazer Defender P40 | |
| PCMark 10 / Essentials | |
| Lenovo Legion Pro 5 16IRX8 | |
| Moyenne AMD Ryzen 7 7840HS, NVIDIA GeForce RTX 4060 Laptop GPU (10441 - 11169, n=4) | |
| MSI Katana 17 B13VFK | |
| Alienware m16 R1 Intel | |
| Schenker XMG Apex 17 (Late 23) | |
| Moyenne de la classe Gaming (8810 - 11935, n=96, 2 dernières années) | |
| Acer Nitro 17 AN17-51-71ER | |
| Medion Erazer Defender P40 | |
| PCMark 10 / Productivity | |
| Moyenne de la classe Gaming (6845 - 21327, n=94, 2 dernières années) | |
| Schenker XMG Apex 17 (Late 23) | |
| Moyenne AMD Ryzen 7 7840HS, NVIDIA GeForce RTX 4060 Laptop GPU (9575 - 10273, n=4) | |
| Medion Erazer Defender P40 | |
| Alienware m16 R1 Intel | |
| MSI Katana 17 B13VFK | |
| Lenovo Legion Pro 5 16IRX8 | |
| Acer Nitro 17 AN17-51-71ER | |
| PCMark 10 / Digital Content Creation | |
| Moyenne de la classe Gaming (7602 - 19954, n=94, 2 dernières années) | |
| Lenovo Legion Pro 5 16IRX8 | |
| Schenker XMG Apex 17 (Late 23) | |
| Moyenne AMD Ryzen 7 7840HS, NVIDIA GeForce RTX 4060 Laptop GPU (11464 - 12418, n=4) | |
| Acer Nitro 17 AN17-51-71ER | |
| Alienware m16 R1 Intel | |
| MSI Katana 17 B13VFK | |
| Medion Erazer Defender P40 | |
| CrossMark / Overall | |
| Alienware m16 R1 Intel | |
| Moyenne de la classe Gaming (1366 - 2409, n=93, 2 dernières années) | |
| MSI Katana 17 B13VFK | |
| Moyenne AMD Ryzen 7 7840HS, NVIDIA GeForce RTX 4060 Laptop GPU (1800 - 1866, n=3) | |
| Schenker XMG Apex 17 (Late 23) | |
| Medion Erazer Defender P40 | |
| Lenovo Legion Pro 5 16IRX8 | |
| Acer Nitro 17 AN17-51-71ER | |
| CrossMark / Productivity | |
| Alienware m16 R1 Intel | |
| Moyenne de la classe Gaming (1386 - 2254, n=93, 2 dernières années) | |
| Moyenne AMD Ryzen 7 7840HS, NVIDIA GeForce RTX 4060 Laptop GPU (1743 - 1821, n=3) | |
| MSI Katana 17 B13VFK | |
| Schenker XMG Apex 17 (Late 23) | |
| Medion Erazer Defender P40 | |
| Lenovo Legion Pro 5 16IRX8 | |
| Acer Nitro 17 AN17-51-71ER | |
| CrossMark / Creativity | |
| Moyenne de la classe Gaming (1343 - 2729, n=93, 2 dernières années) | |
| Alienware m16 R1 Intel | |
| MSI Katana 17 B13VFK | |
| Medion Erazer Defender P40 | |
| Moyenne AMD Ryzen 7 7840HS, NVIDIA GeForce RTX 4060 Laptop GPU (1908 - 1966, n=3) | |
| Schenker XMG Apex 17 (Late 23) | |
| Lenovo Legion Pro 5 16IRX8 | |
| Acer Nitro 17 AN17-51-71ER | |
| CrossMark / Responsiveness | |
| Alienware m16 R1 Intel | |
| MSI Katana 17 B13VFK | |
| Moyenne de la classe Gaming (1226 - 2334, n=93, 2 dernières années) | |
| Schenker XMG Apex 17 (Late 23) | |
| Lenovo Legion Pro 5 16IRX8 | |
| Moyenne AMD Ryzen 7 7840HS, NVIDIA GeForce RTX 4060 Laptop GPU (1522 - 1776, n=3) | |
| Acer Nitro 17 AN17-51-71ER | |
| Medion Erazer Defender P40 | |
| PCMark 10 Score | 7854 points | |
Aide | ||
| AIDA64 / Memory Copy | |
| Moyenne de la classe Gaming (21750 - 129946, n=103, 2 dernières années) | |
| Schenker XMG Apex 17 (Late 23) | |
| Moyenne AMD Ryzen 7 7840HS (30937 - 72158, n=21) | |
| Lenovo Legion Pro 5 16IRX8 | |
| Acer Nitro 17 AN17-51-71ER | |
| Medion Erazer Defender P40 | |
| Alienware m16 R1 Intel | |
| MSI Katana 17 B13VFK | |
| AIDA64 / Memory Read | |
| Moyenne de la classe Gaming (22956 - 118858, n=103, 2 dernières années) | |
| Lenovo Legion Pro 5 16IRX8 | |
| Medion Erazer Defender P40 | |
| Alienware m16 R1 Intel | |
| Acer Nitro 17 AN17-51-71ER | |
| Schenker XMG Apex 17 (Late 23) | |
| MSI Katana 17 B13VFK | |
| Moyenne AMD Ryzen 7 7840HS (30497 - 62147, n=21) | |
| AIDA64 / Memory Write | |
| Schenker XMG Apex 17 (Late 23) | |
| Moyenne AMD Ryzen 7 7840HS (34590 - 93323, n=21) | |
| Moyenne de la classe Gaming (22297 - 135096, n=103, 2 dernières années) | |
| Lenovo Legion Pro 5 16IRX8 | |
| Acer Nitro 17 AN17-51-71ER | |
| Alienware m16 R1 Intel | |
| Medion Erazer Defender P40 | |
| MSI Katana 17 B13VFK | |
| AIDA64 / Memory Latency | |
| Acer Nitro 17 AN17-51-71ER | |
| Moyenne de la classe Gaming (75.3 - 259, n=103, 2 dernières années) | |
| MSI Katana 17 B13VFK | |
| Medion Erazer Defender P40 | |
| Moyenne AMD Ryzen 7 7840HS (85.1 - 112, n=21) | |
| Alienware m16 R1 Intel | |
| Schenker XMG Apex 17 (Late 23) | |
| Lenovo Legion Pro 5 16IRX8 | |
* ... Moindre est la valeur, meilleures sont les performances
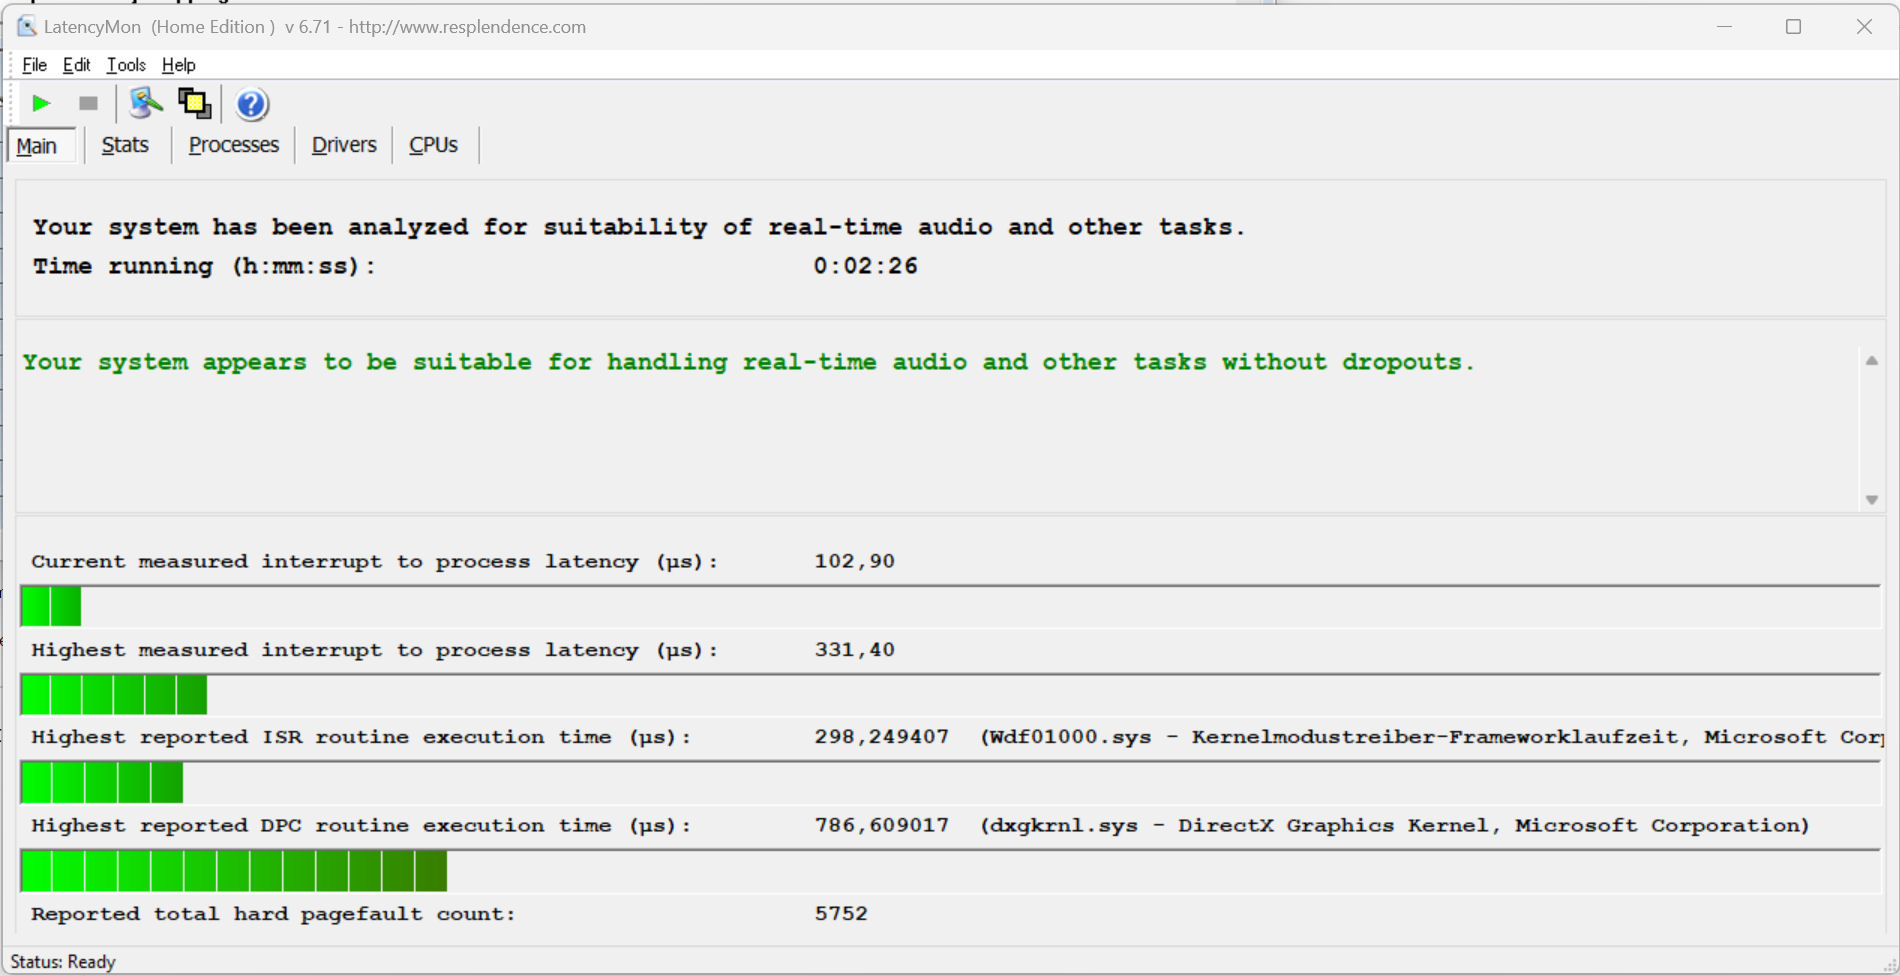
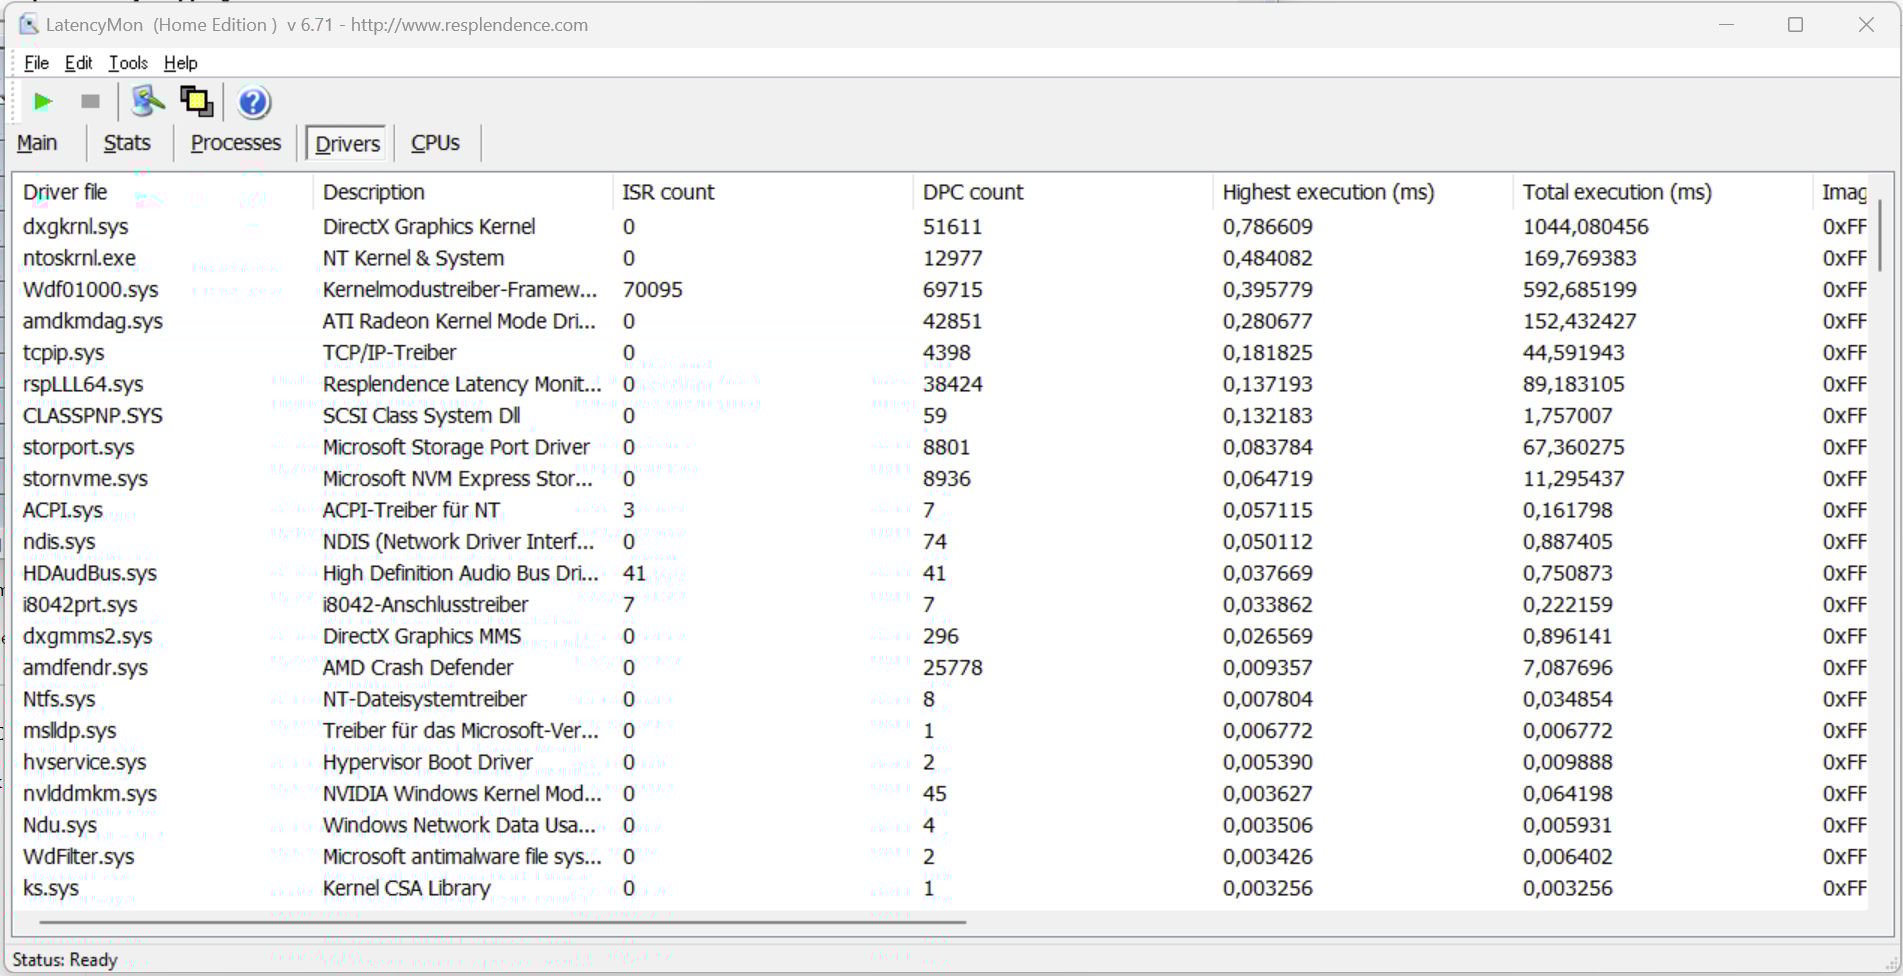
Latences DPC
Le test standardisé Latency Monitor (surf sur internet, lecture vidéo 4k, charge élevée Prime95) n'a révélé aucune anomalie. Le système semble adapté à l'édition vidéo et audio en temps réel. Les futures mises à jour logicielles pourraient améliorer ou détériorer ces performances.
| DPC Latencies / LatencyMon - interrupt to process latency (max), Web, Youtube, Prime95 | |
| Medion Erazer Defender P40 | |
| Alienware m16 R1 Intel | |
| MSI Katana 17 B13VFK | |
| Acer Nitro 17 AN17-51-71ER | |
| Lenovo Legion Pro 5 16IRX8 | |
| Schenker XMG Apex 17 (Late 23) | |
* ... Moindre est la valeur, meilleures sont les performances
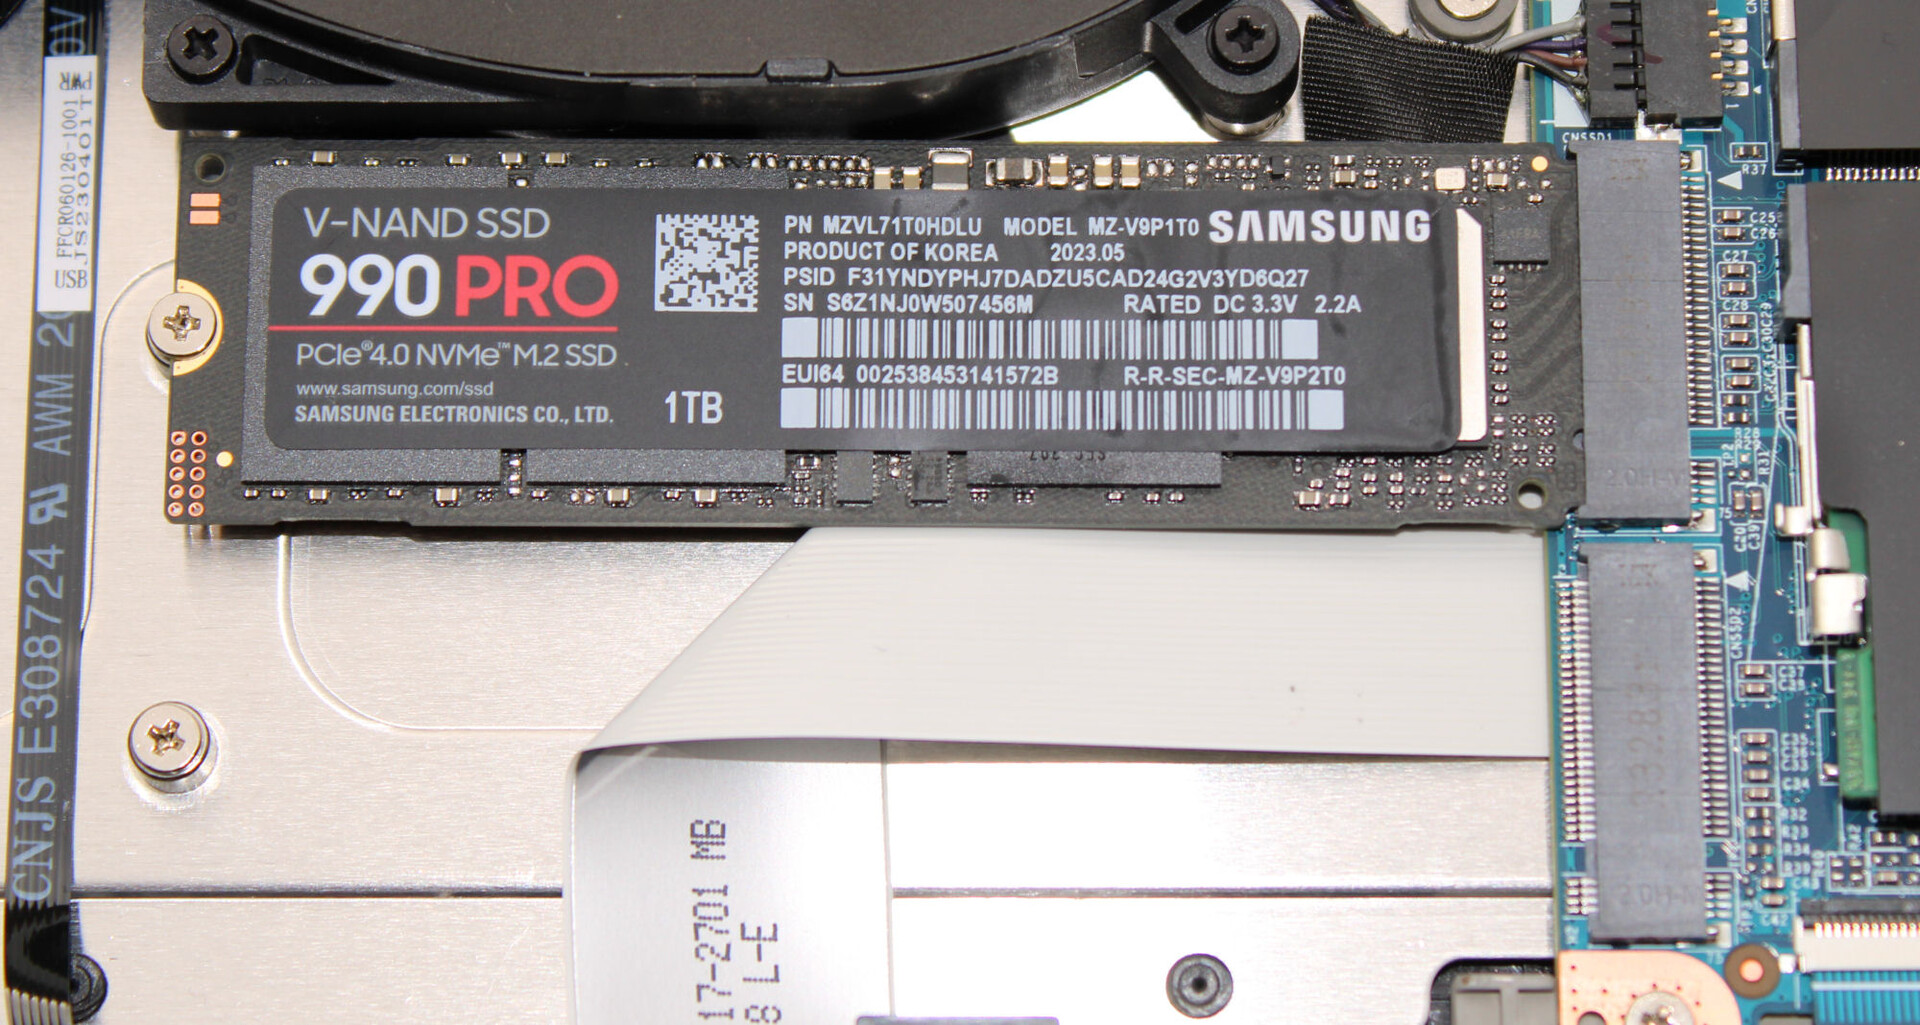
Mémoire de masse
L'Apex peut accueillir un total de deux disques durs PCIe 4 au format M.2 2280. Le RAID-0/1 est pris en charge. L'appareil que nous avons testé est équipé d'un disque SSD Samsung de 1 To (PCIe 4, M.2 2280) qui offre d'excellentes vitesses de transfert. Points positifs : Il n'y a pas eu d'étranglement lié à la température.

* ... Moindre est la valeur, meilleures sont les performances
Continuous Performance Read: DiskSpd Read Loop, Queue Depth 8
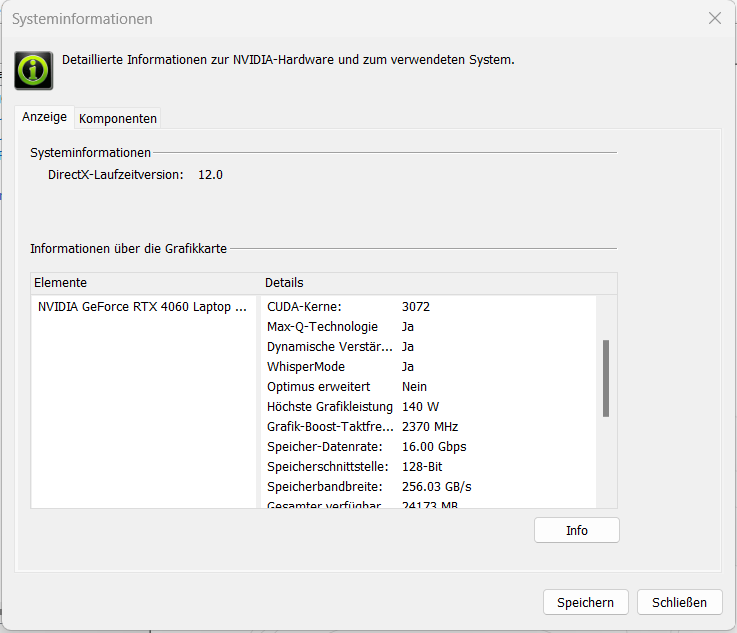
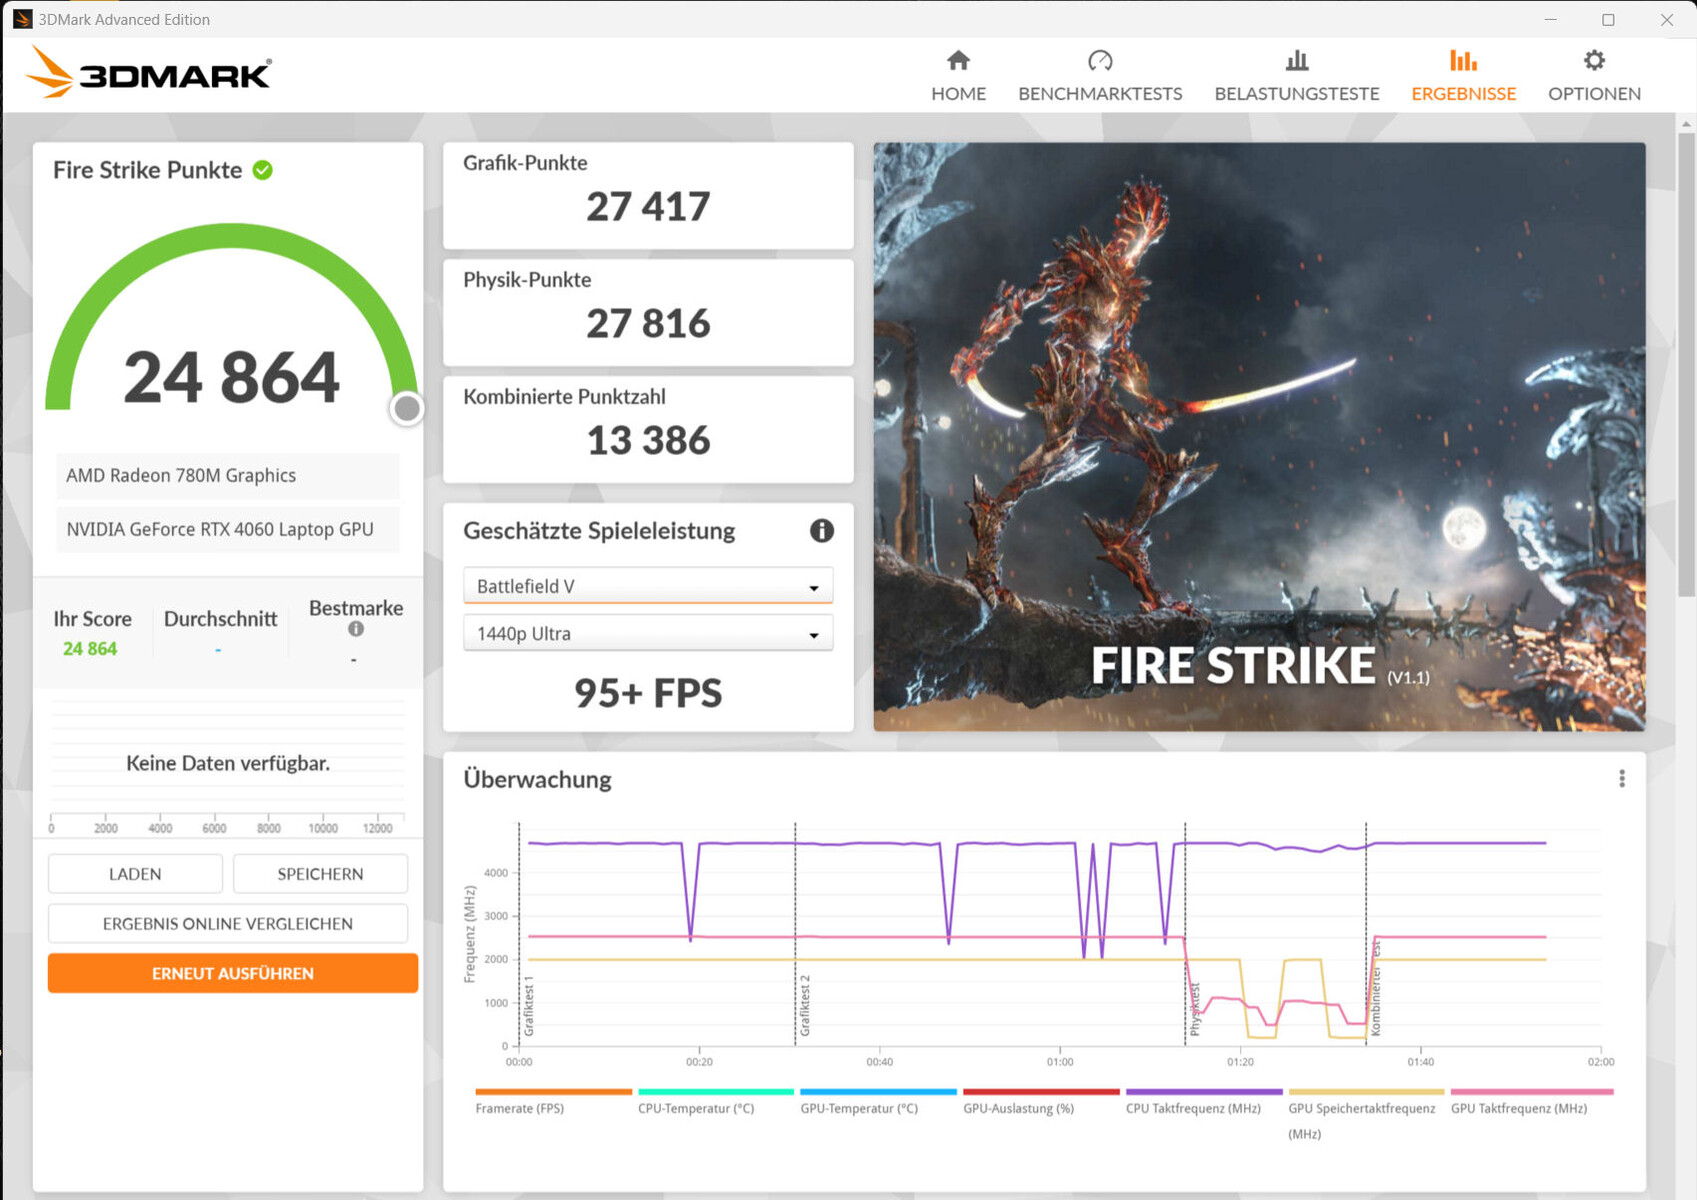
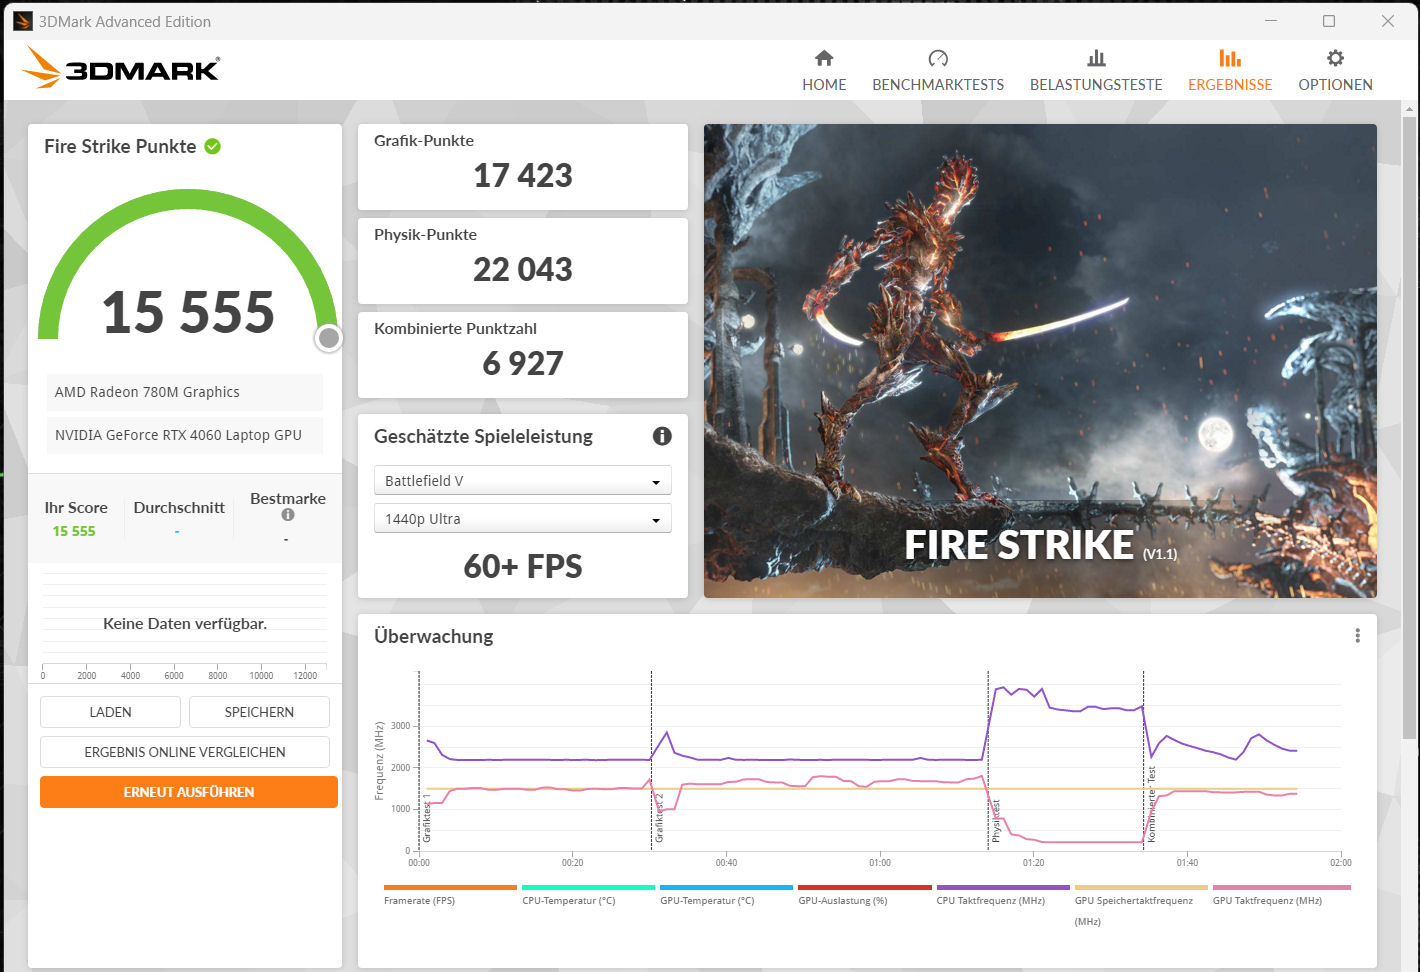
Carte graphique
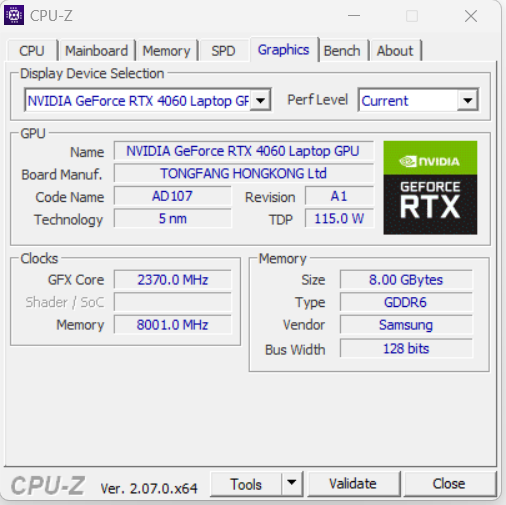
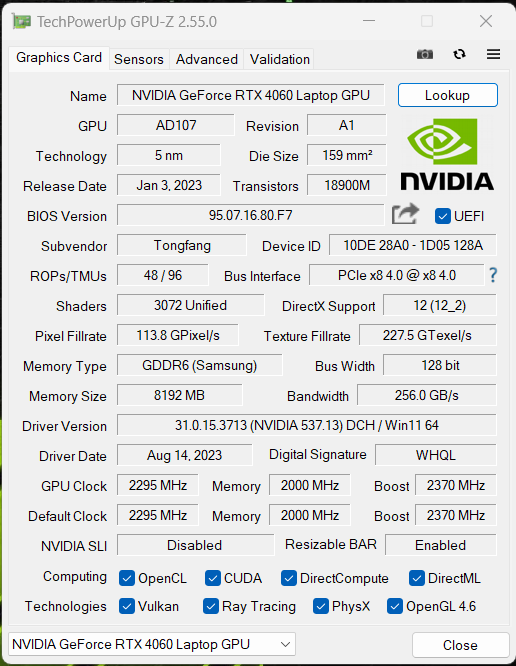
LaGeForce RTX 4060 offre 3 072 shaders, un bus large de 128 bits et une RAM GDDR6 rapide (8 192 Mo). Schenker a fixé le TGP maximum à une valeur de 140 watts (115 watts + 25 watts de boost dynamique) - il n'est pas possible d'aller plus loin. Selon le test Witcher 3, le TGP n'est pas au maximum.
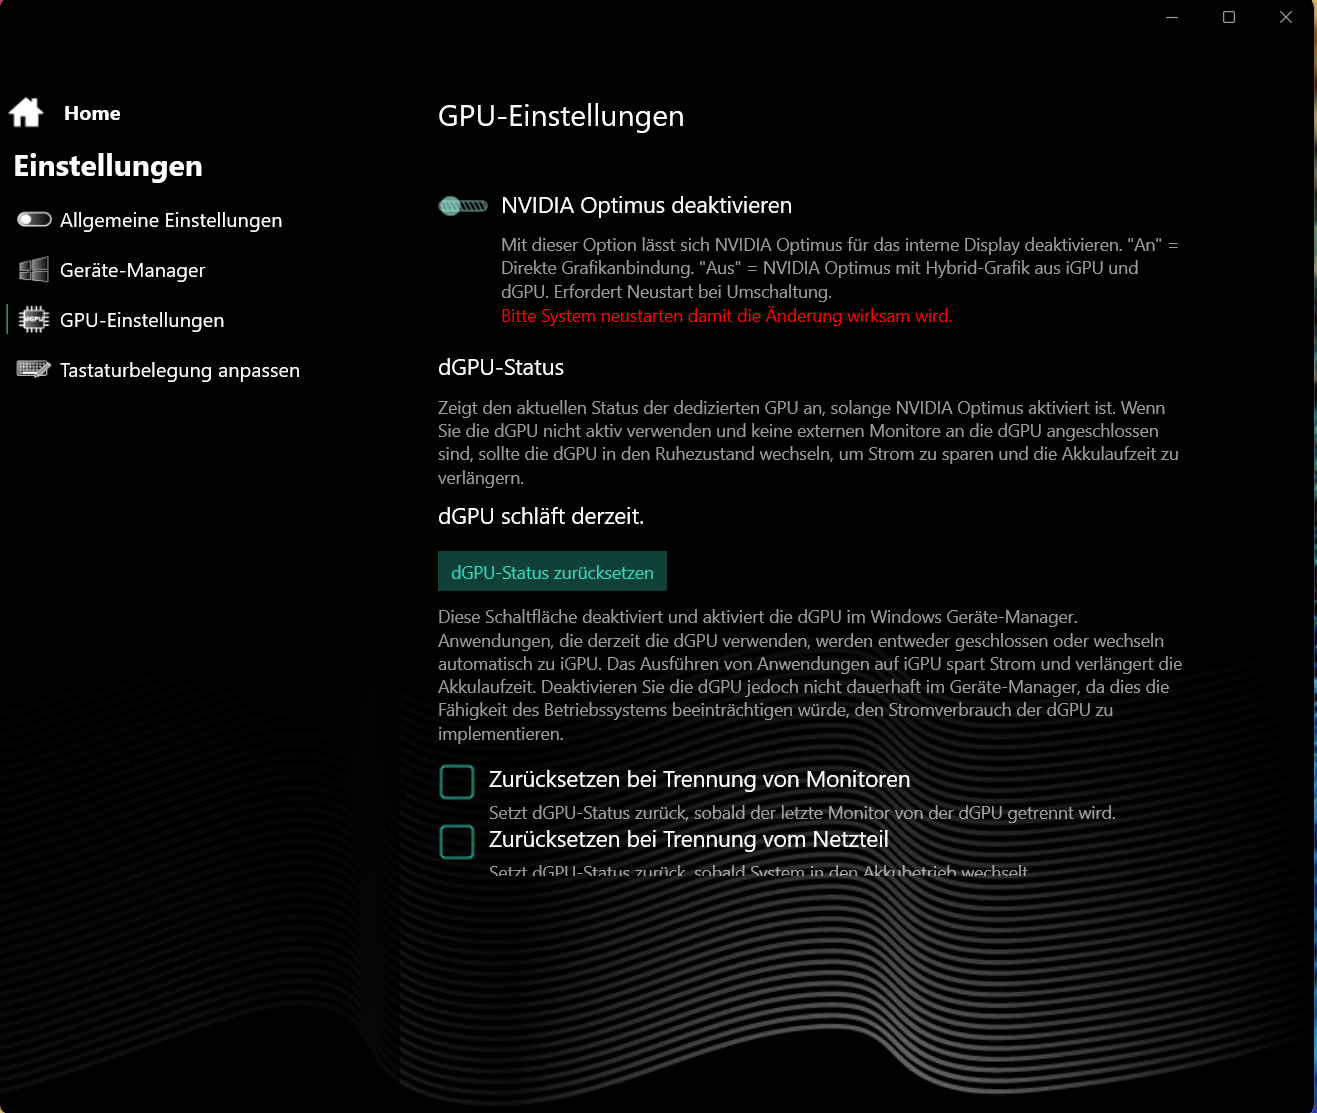
Les résultats du benchmark sont plus élevés que la moyenne de la RTX 4060 précédente. Le mode dGPU n'entraîne aucune augmentation des performances. Le passage entre dGPU et Optimus nécessite un redémarrage - Advanced Optimus n'est pas pris en charge.
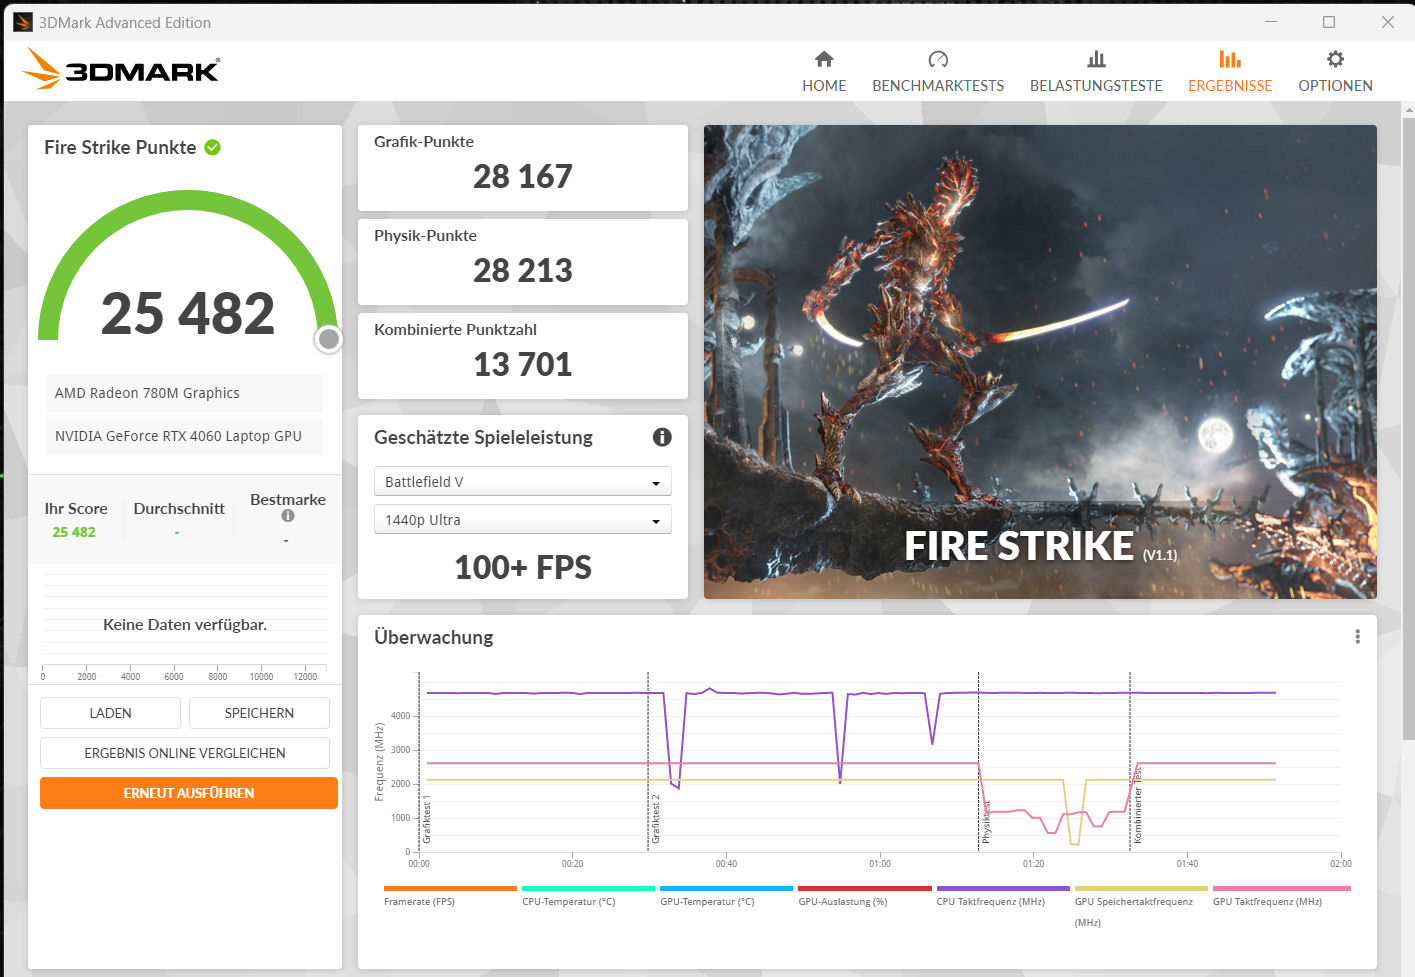
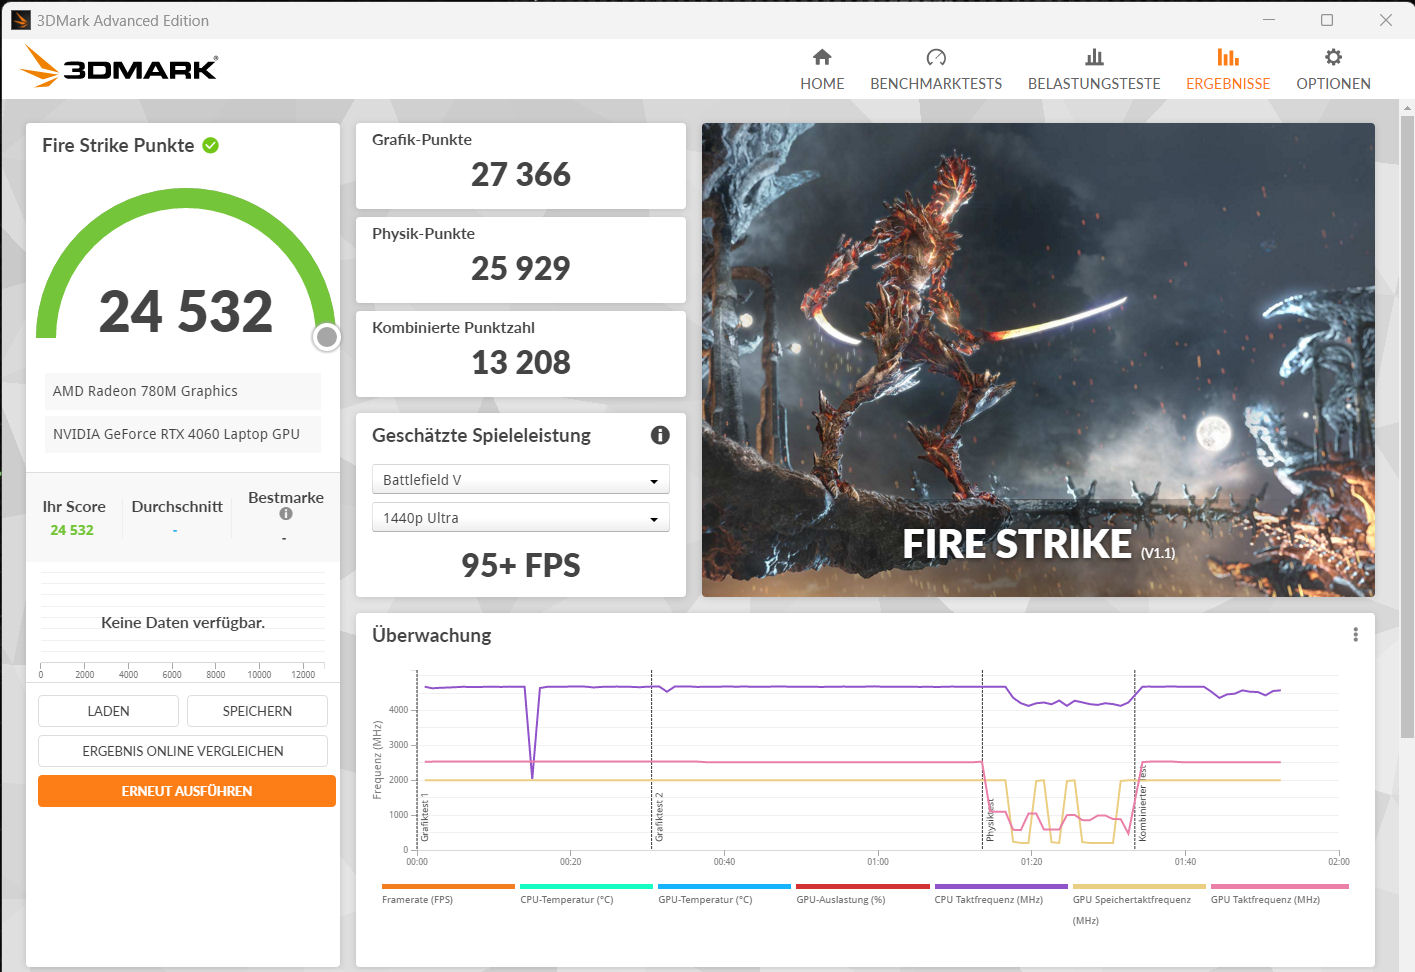
| 3DMark 06 Standard Score | 49011 points | |
| 3DMark 11 Performance | 32639 points | |
| 3DMark Cloud Gate Standard Score | 64881 points | |
| 3DMark Fire Strike Score | 24864 points | |
| 3DMark Time Spy Score | 10640 points | |
Aide | ||
* ... Moindre est la valeur, meilleures sont les performances
Performances de jeu
L'ordinateur Schenker est conçu pour les jeux en QHD avec des paramètres élevés à maximaux. Des résolutions plus élevées peuvent être utilisées avec des paramètres parfois réduits lorsqu'elles sont connectées à un moniteur approprié. Des taux de rafraîchissement typiques de la RTX 4060 peuvent être atteints. En général, le mode dGP n'entraîne pas d'augmentation des performances. Ce n'est que dans le jeu "X Plane 11" qu'une augmentation de 10 à 20 % du taux de rafraîchissement a été enregistrée.
| The Witcher 3 - 1920x1080 Ultra Graphics & Postprocessing (HBAO+) | |
| Moyenne de la classe Gaming (104.7 - 240, n=6, 2 dernières années) | |
| Lenovo Legion Pro 5 16IRX8 | |
| Alienware m16 R1 Intel | |
| Acer Nitro 17 AN17-51-71ER | |
| MSI Katana 17 B13VFK | |
| Schenker XMG Apex 17 (Late 23) | |
| Medion Erazer Defender P40 | |
| Moyenne NVIDIA GeForce RTX 4060 Laptop GPU (77 - 159.7, n=42) | |
| Cyberpunk 2077 1.6 - 1920x1080 Ultra Preset | |
| Lenovo Legion Pro 5 16IRX8 | |
| Alienware m16 R1 Intel | |
| Schenker XMG Apex 17 (Late 23) | |
| Acer Nitro 17 AN17-51-71ER | |
| Moyenne NVIDIA GeForce RTX 4060 Laptop GPU (57.9 - 93.2, n=18) | |
| MSI Katana 17 B13VFK | |
| Ratchet & Clank Rift Apart | |
| 1920x1080 Very High Preset AA:T | |
| Alienware m16 R1 Intel | |
| Schenker XMG Apex 17 (Late 23) | |
| Moyenne NVIDIA GeForce RTX 4060 Laptop GPU (51.6 - 54.8, n=4) | |
| 2560x1440 Very High Preset AA:T | |
| Alienware m16 R1 Intel | |
| Moyenne NVIDIA GeForce RTX 4060 Laptop GPU (45.6 - 46.6, n=3) | |
| Schenker XMG Apex 17 (Late 23) | |
| 1920x1080 Very High Preset + Very High Raytracing AA:T | |
| Alienware m16 R1 Intel | |
| Moyenne NVIDIA GeForce RTX 4060 Laptop GPU (39.1 - 44.5, n=3) | |
| Schenker XMG Apex 17 (Late 23) | |
| Atlas Fallen | |
| 1920x1080 High Preset | |
| Schenker XMG Apex 17 (Late 23) | |
| Alienware m16 R1 Intel | |
| Moyenne NVIDIA GeForce RTX 4060 Laptop GPU (88.8 - 133.3, n=3) | |
| 2560x1440 Very High Preset | |
| Alienware m16 R1 Intel | |
| Schenker XMG Apex 17 (Late 23) | |
| Moyenne NVIDIA GeForce RTX 4060 Laptop GPU (75 - 79.2, n=3) | |
| Immortals of Aveum | |
| 1920x1080 Ultra AF:16x | |
| Alienware m16 R1 Intel | |
| Schenker XMG Apex 17 (Late 23) | |
| Moyenne NVIDIA GeForce RTX 4060 Laptop GPU (33 - 48.9, n=4) | |
| 2560x1440 Ultra AF:16x | |
| Alienware m16 R1 Intel | |
| Schenker XMG Apex 17 (Late 23) | |
| Moyenne NVIDIA GeForce RTX 4060 Laptop GPU (20.5 - 32.8, n=4) | |
| Armored Core 6 | |
| 1920x1080 Maximum Preset | |
| Schenker XMG Apex 17 (Late 23) | |
| Moyenne NVIDIA GeForce RTX 4060 Laptop GPU (95.6 - 100.8, n=3) | |
| Moyenne de la classe Gaming (n=12 dernières années) | |
| 2560x1440 Maximum Preset | |
| Schenker XMG Apex 17 (Late 23) | |
| Moyenne NVIDIA GeForce RTX 4060 Laptop GPU (73.2 - 74.6, n=3) | |
| Moyenne de la classe Gaming (n=12 dernières années) | |
| Starfield | |
| 1920x1080 Ultra Preset | |
| Moyenne NVIDIA GeForce RTX 4060 Laptop GPU (39.7 - 41, n=3) | |
| Schenker XMG Apex 17 (Late 23) | |
| 2560x1440 Ultra Preset | |
| Schenker XMG Apex 17 (Late 23) | |
| Moyenne NVIDIA GeForce RTX 4060 Laptop GPU (32.5 - 32.6, n=2) | |
| Lies of P | |
| 1920x1080 Best Preset | |
| Schenker XMG Apex 17 (Late 23) | |
| Moyenne NVIDIA GeForce RTX 4060 Laptop GPU (106.2 - 126.6, n=3) | |
| 2560x1440 Best Preset | |
| Schenker XMG Apex 17 (Late 23) | |
| Moyenne NVIDIA GeForce RTX 4060 Laptop GPU (83.6 - 85.6, n=2) | |
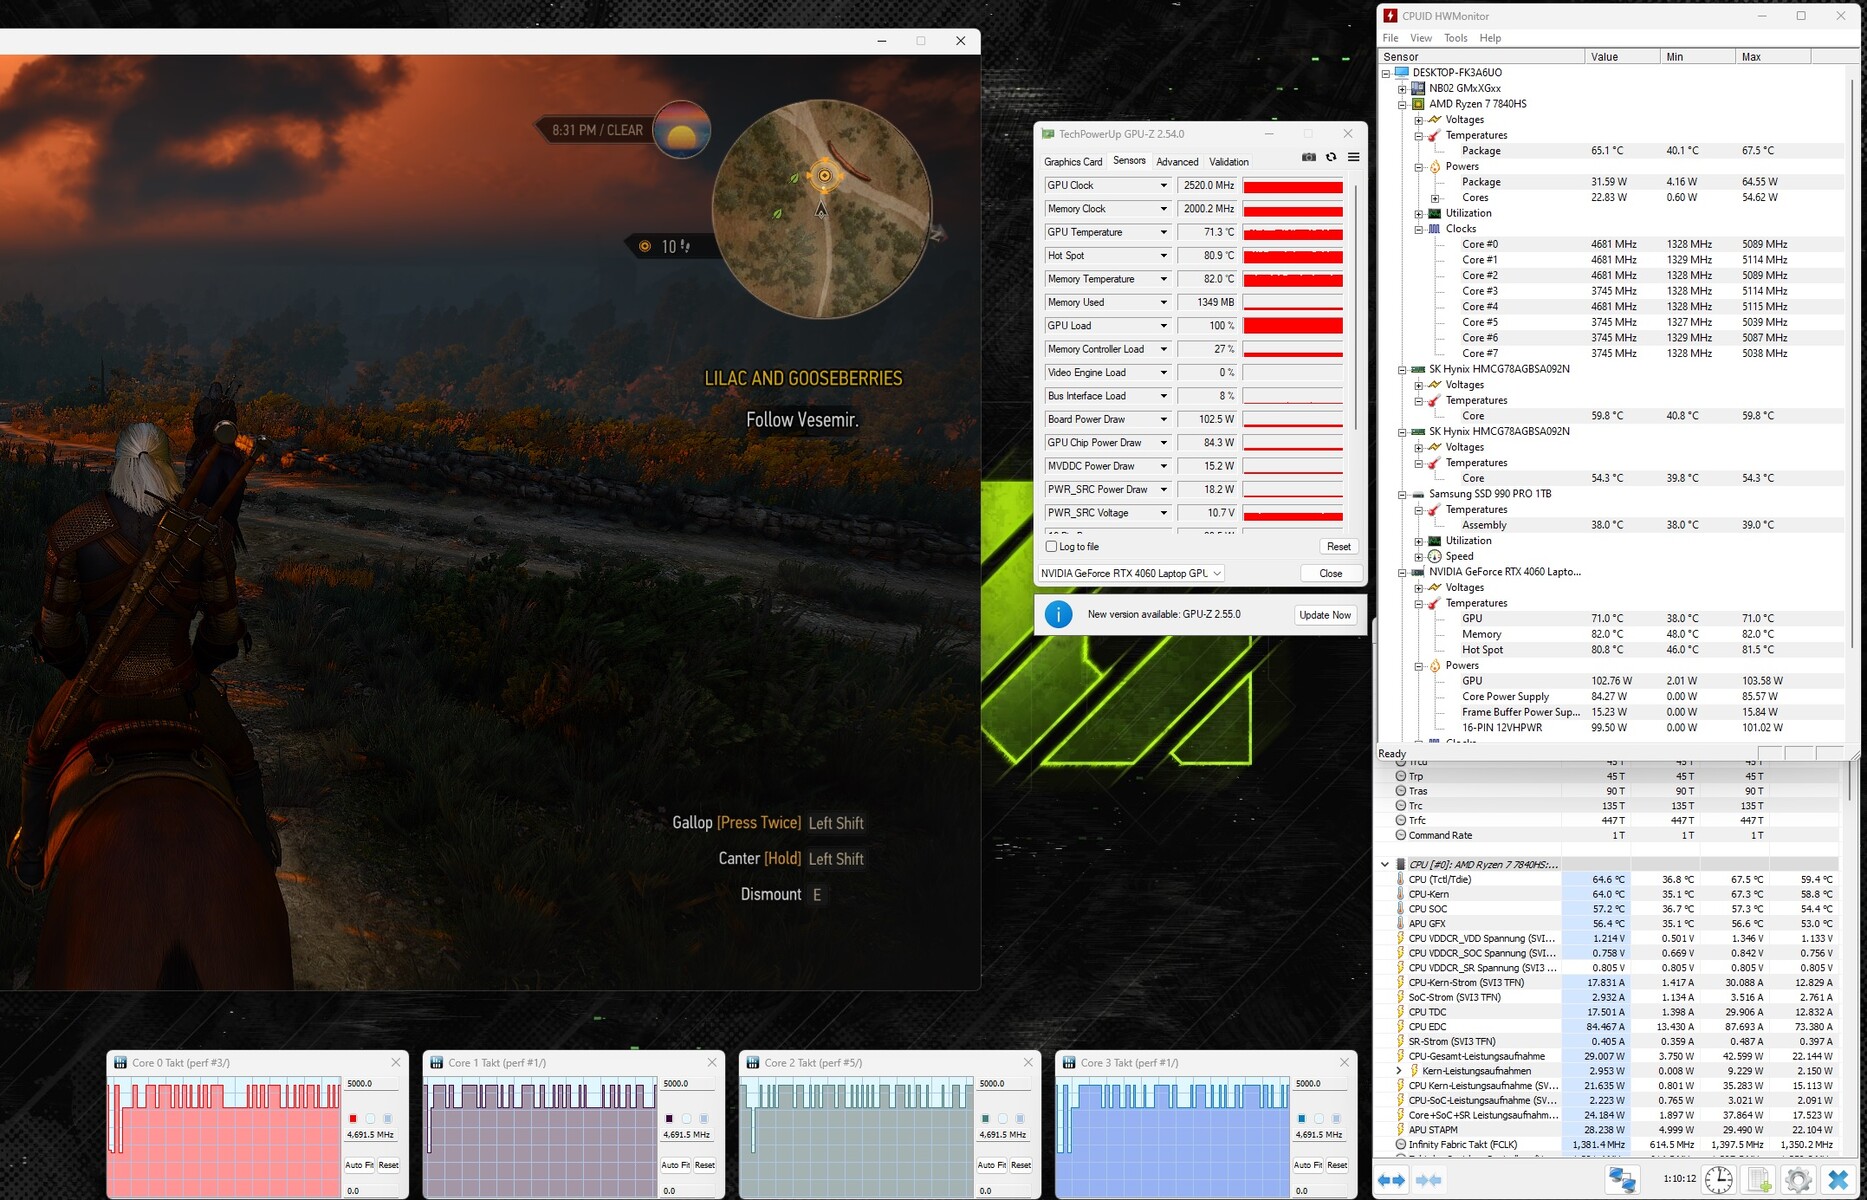
Afin de vérifier si les fréquences d'images restaient globalement constantes sur une période plus longue, nous avons fait tourner le jeu "The Witcher 3" pendant environ 60 minutes en résolution Full HD et avec les paramètres de qualité maximum. Le personnage du jeu n'a pas été déplacé. Nous n'avons pas remarqué de baisse de la fréquence d'images.
Witcher 3 FPS diagram

| Bas | Moyen | Élevé | Ultra | QHD | |
|---|---|---|---|---|---|
| The Witcher 3 (2015) | 401.8 | 316.1 | 198.2 | 103.4 | 76.3 |
| Dota 2 Reborn (2015) | 169.4 | 154.1 | 147.6 | 139.8 | |
| Final Fantasy XV Benchmark (2018) | 223 | 148.4 | 103.4 | 76.8 | |
| X-Plane 11.11 (2018) | 127.3 | 110.9 | 88.2 | ||
| Far Cry 5 (2018) | 163 | 145 | 139 | 130 | 106 |
| Strange Brigade (2018) | 399 | 279 | 221 | 190.1 | 126.9 |
| Gears Tactics (2020) | 320.2 | 255 | 180.5 | 125.9 | 85.8 |
| GRID Legends (2022) | 152.8 | 141.6 | 132.4 | 120.6 | 103.2 |
| Cyberpunk 2077 1.6 (2022) | 129.9 | 101 | 87.5 | 79.8 | 49.1 |
| Spider-Man Miles Morales (2022) | 123.7 | 115.9 | 110.3 | 103.8 | 77.8 |
| F1 23 (2023) | 249 | 244 | 186.2 | 60.1 | 37.8 |
| Ratchet & Clank Rift Apart (2023) | 85.4 | 74.7 | 60.6 | 54.6 | 45.6 |
| Atlas Fallen (2023) | 146 | 143.2 | 133.3 | 112.6 | 79.1 |
| Immortals of Aveum (2023) | 65.7 | 53.1 | 44 | 30.2 | |
| Armored Core 6 (2023) | 111.1 | 108.7 | 109.4 | 100.8 | 74.6 |
| Starfield (2023) | 70.3 | 62.5 | 47.1 | 39.7 | 32.6 |
| The Crew Motorfest (2023) | 60 | 60 | 60 | 60 | 54 |
| Lies of P (2023) | 186.6 | 163.8 | 141.9 | 126.6 | 85.6 |
Émissions - L'ordinateur portable de jeu peut fonctionner silencieusement
Émissions sonores
D'une manière générale, nous estimons que le niveau de bruit de l'Apex est faible à modéré. Dans le cadre d'une utilisation quotidienne (bureau, Internet, banque,...), les ventilateurs tournent souvent lentement ou restent même immobiles. Ils sont également peu bruyants en cas de charge moyenne. Il en va autrement dans le domaine des jeux : Les niveaux de pression sonore peuvent atteindre 54 dB(A) ("overboost"). En mode "enthousiaste", avec 50 dB(A), les niveaux sonores peuvent être qualifiés d'assez faibles. Le mode "balanced" est nettement plus silencieux : un niveau de 34 dB(A) entraîne toutefois une perte significative des performances du GPU.
Les ventilateurs émettent principalement un bruit sonore. Les bruits de fond gênants sont imperceptibles.
Degré de la nuisance sonore
| Au repos |
| 25 / 29 / 33 dB(A) |
| Fortement sollicité |
| 37 / 54 dB(A) |
 | ||
30 dB silencieux 40 dB(A) audible 50 dB(A) bruyant |
||
min: | ||
| Schenker XMG Apex 17 (Late 23) R7 7840HS, GeForce RTX 4060 Laptop GPU | Alienware m16 R1 Intel i7-13700HX, GeForce RTX 4060 Laptop GPU | Lenovo Legion Pro 5 16IRX8 i7-13700HX, GeForce RTX 4060 Laptop GPU | Acer Nitro 17 AN17-51-71ER i7-13700H, GeForce RTX 4060 Laptop GPU | Medion Erazer Defender P40 i7-13700HX, GeForce RTX 4060 Laptop GPU | MSI Katana 17 B13VFK i7-13620H, GeForce RTX 4060 Laptop GPU | |
|---|---|---|---|---|---|---|
| Noise | -2% | 9% | 2% | -10% | -8% | |
| arrêt / environnement * (dB) | 24 | 25 -4% | 23 4% | 24 -0% | 25 -4% | 24.5 -2% |
| Idle Minimum * (dB) | 25 | 25 -0% | 23.1 8% | 24 4% | 26 -4% | 24.5 2% |
| Idle Average * (dB) | 29 | 26 10% | 23.1 20% | 24 17% | 27 7% | 24.5 16% |
| Idle Maximum * (dB) | 33 | 27 18% | 26.6 19% | 32.32 2% | 32 3% | 40 -21% |
| Load Average * (dB) | 37 | 52 -41% | 34.7 6% | 35.18 5% | 53 -43% | 48.3 -31% |
| Witcher 3 ultra * (dB) | 50 | 51 -2% | 47.6 5% | 54.78 -10% | 56 -12% | 56 -12% |
| Load Maximum * (dB) | 54 | 53 2% | 54.8 -1% | 54.78 -1% | 64 -19% | 59.1 -9% |
* ... Moindre est la valeur, meilleures sont les performances
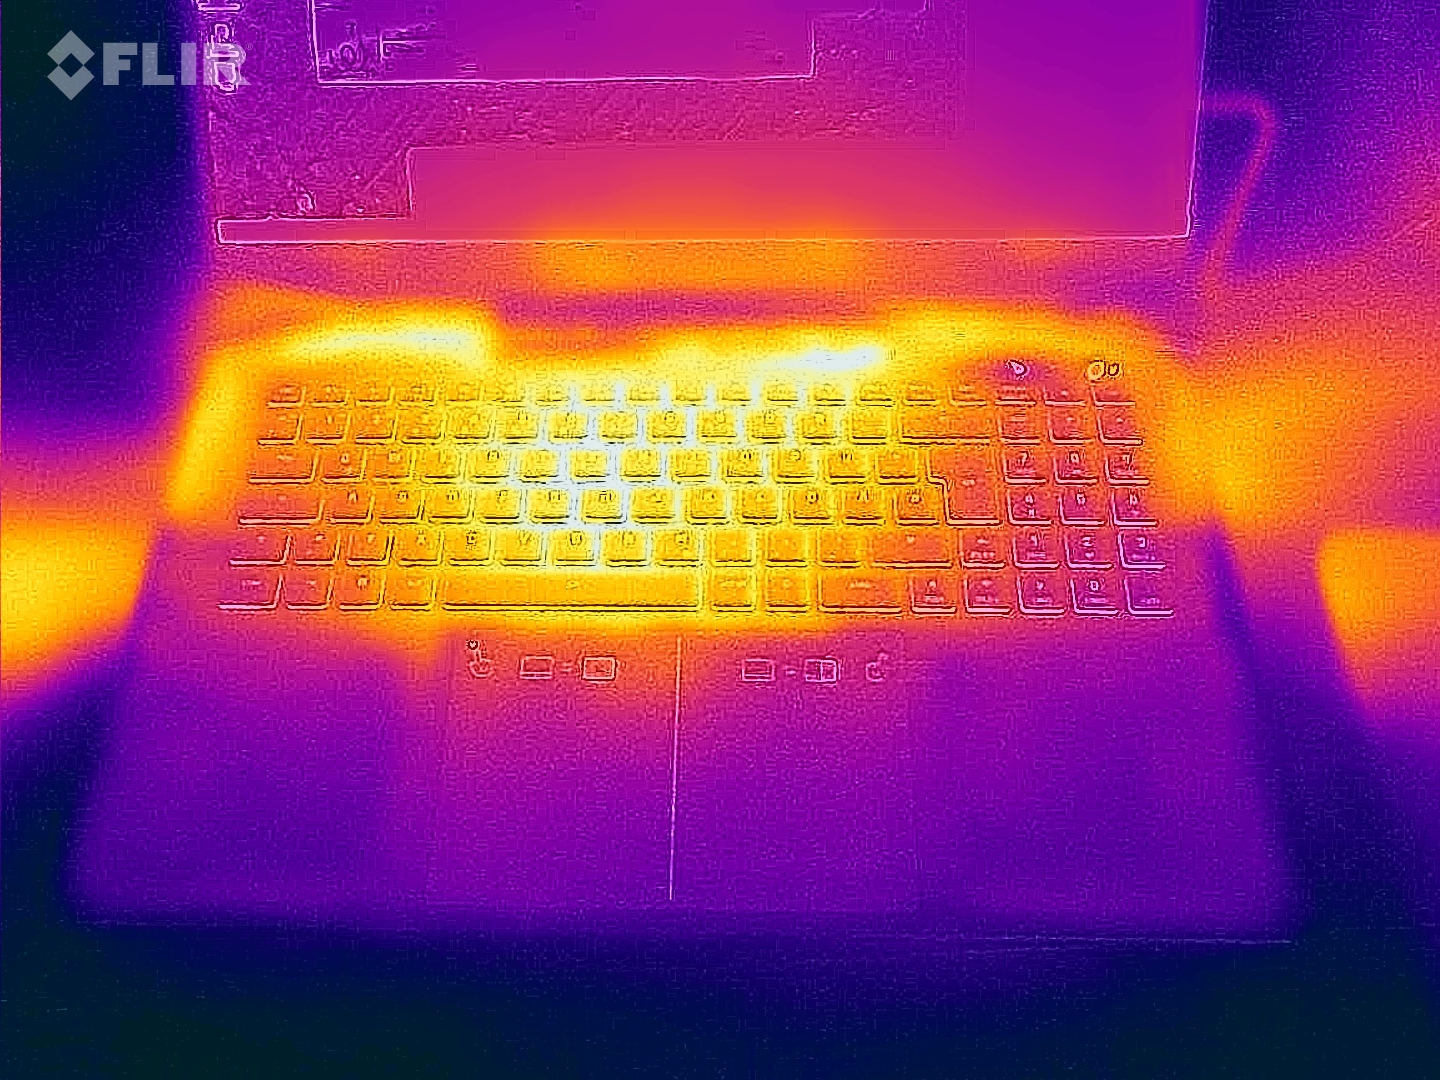
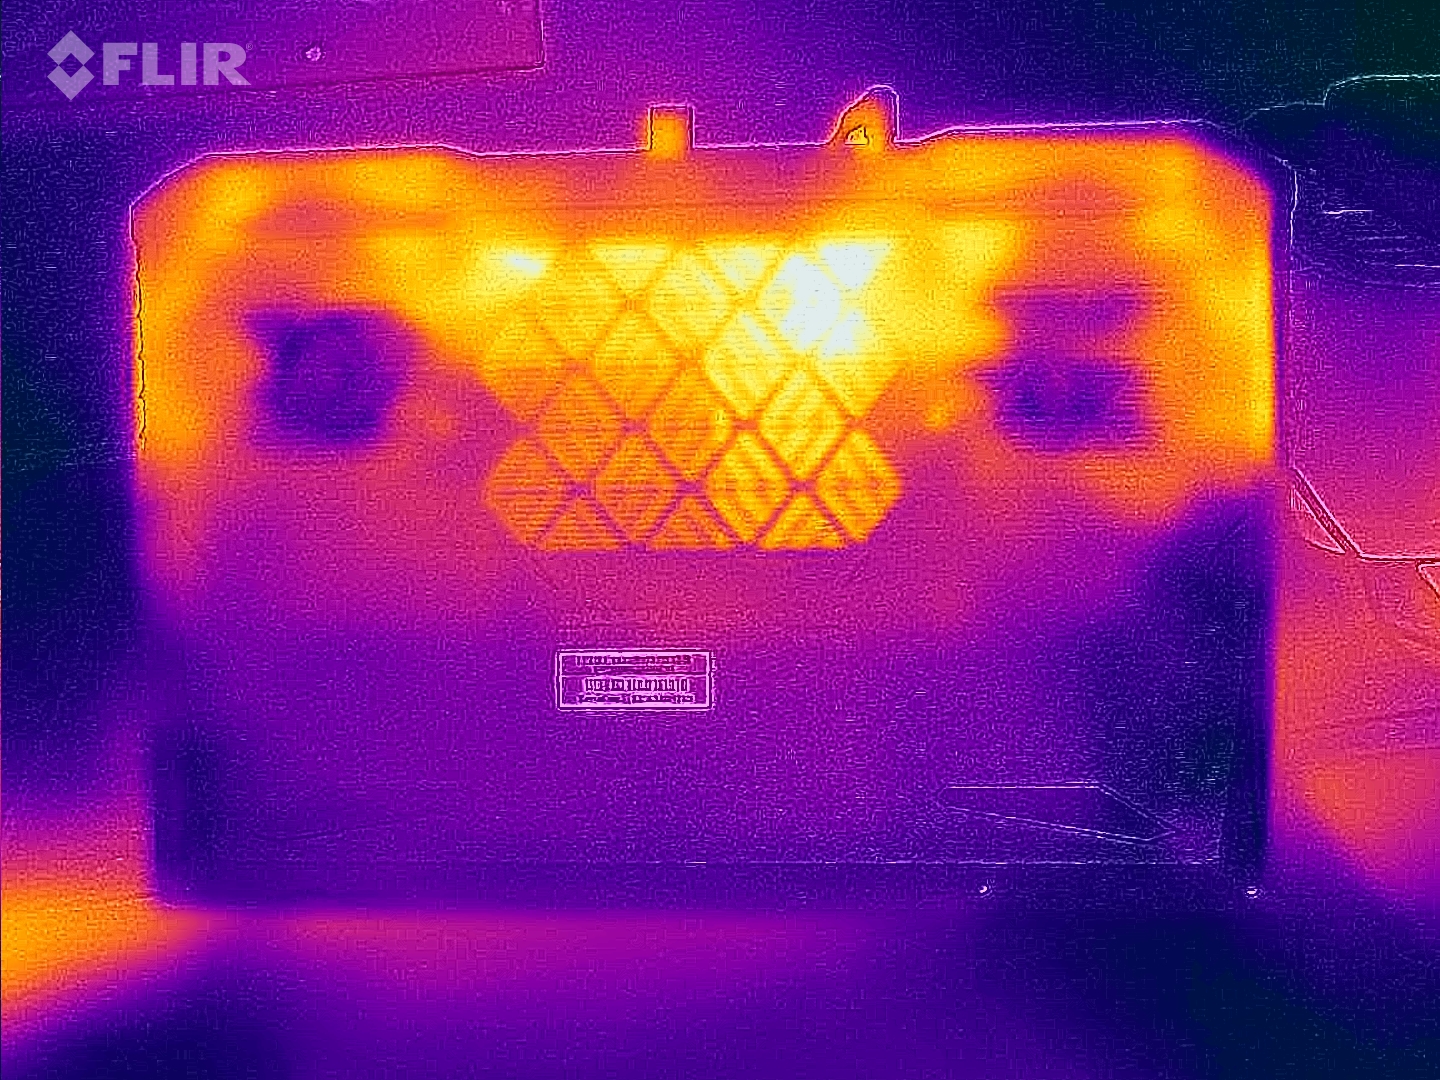
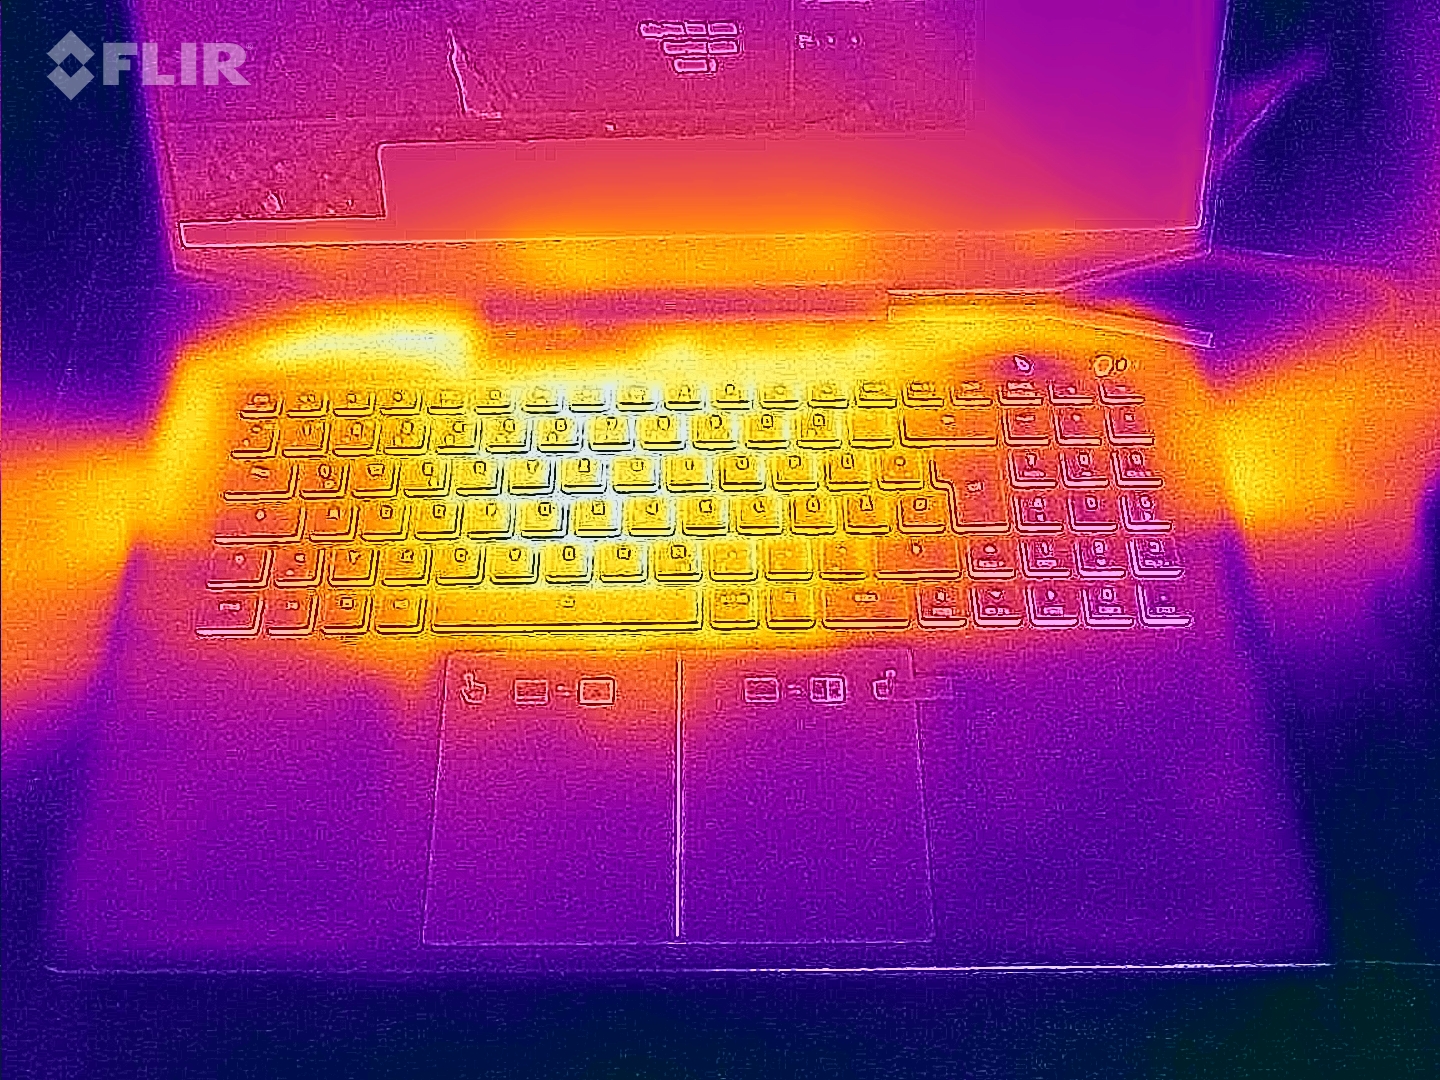
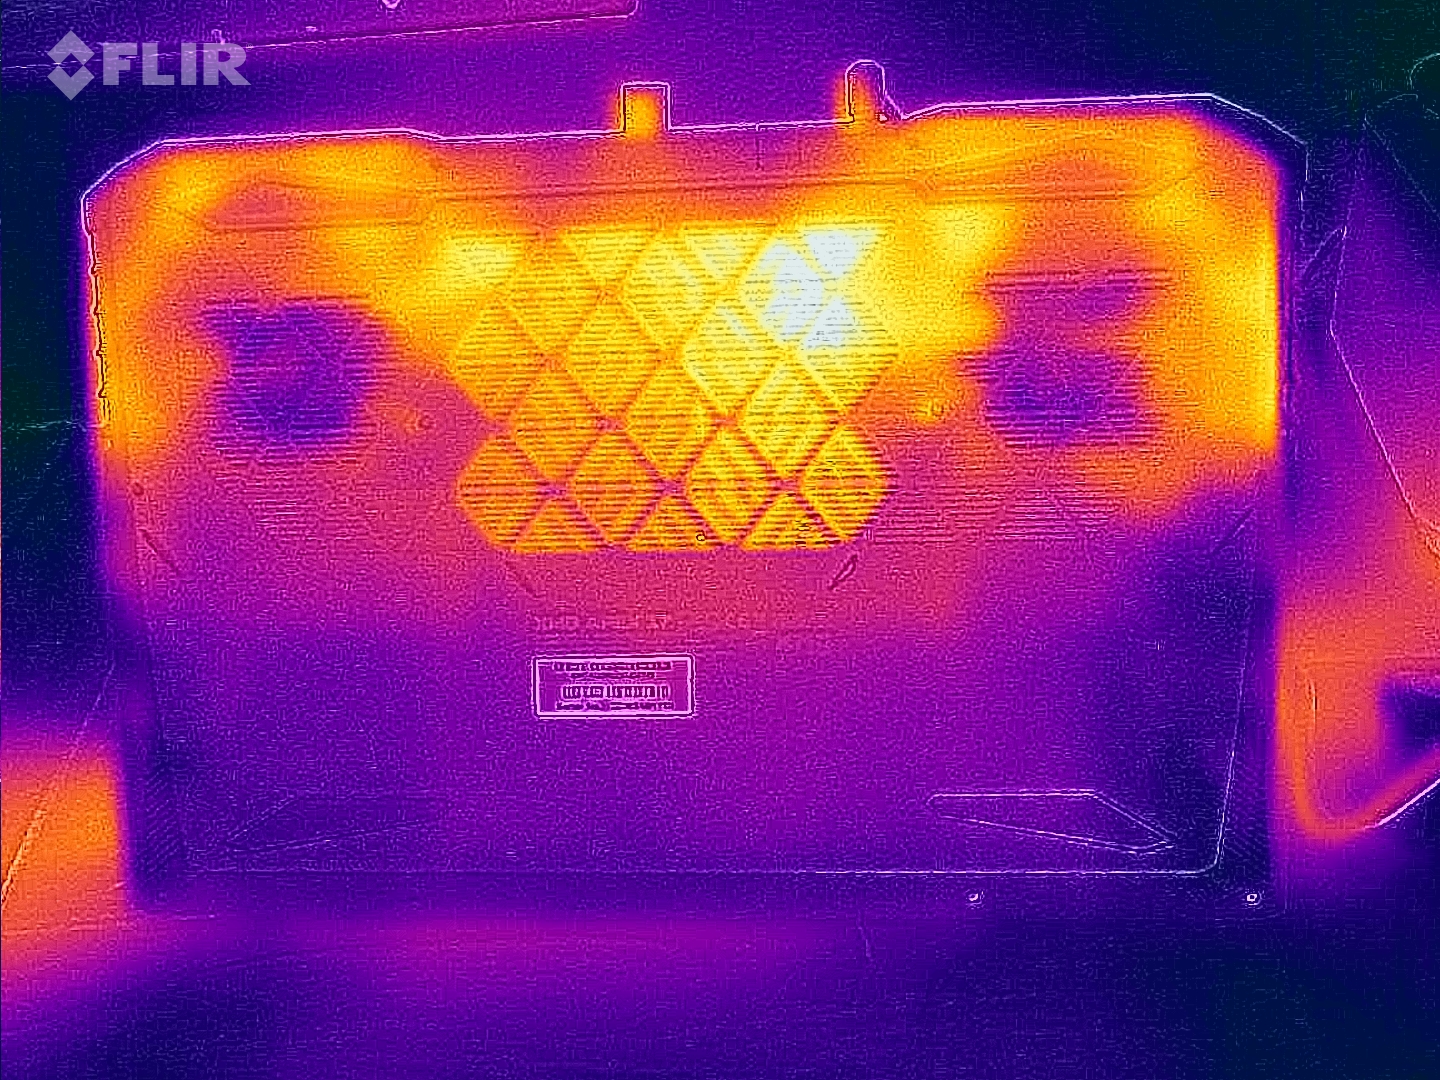
Température
Le test de stress et le test Witcher 3 ont provoqué un réchauffement notable de l'ordinateur portable à certains endroits. Cependant, tout reste dans des dimensions acceptables. En utilisation quotidienne (bureau, internet), les températures du boîtier restent dans la zone verte.
(-) La température maximale du côté supérieur est de 51 °C / 124 F, par rapport à la moyenne de 40.4 °C / 105 F, allant de 21.2 à 68.8 °C pour la classe Gaming.
(-) Le fond chauffe jusqu'à un maximum de 54 °C / 129 F, contre une moyenne de 43.2 °C / 110 F
(+) En utilisation inactive, la température moyenne du côté supérieur est de 30.3 °C / 87 F, par rapport à la moyenne du dispositif de 33.9 °C / 93 F.
(-) En jouant à The Witcher 3, la température moyenne du côté supérieur est de 38.2 °C / 101 F, alors que la moyenne de l'appareil est de 33.9 °C / 93 F.
(+) Les repose-poignets et le pavé tactile sont plus froids que la température de la peau avec un maximum de 31 °C / 87.8 F et sont donc froids au toucher.
(-) La température moyenne de la zone de l'appui-paume de dispositifs similaires était de 28.8 °C / 83.8 F (-2.2 °C / #-4 F).
| Schenker XMG Apex 17 (Late 23) AMD Ryzen 7 7840HS, NVIDIA GeForce RTX 4060 Laptop GPU | Alienware m16 R1 Intel Intel Core i7-13700HX, NVIDIA GeForce RTX 4060 Laptop GPU | Lenovo Legion Pro 5 16IRX8 Intel Core i7-13700HX, NVIDIA GeForce RTX 4060 Laptop GPU | Acer Nitro 17 AN17-51-71ER Intel Core i7-13700H, NVIDIA GeForce RTX 4060 Laptop GPU | Medion Erazer Defender P40 Intel Core i7-13700HX, NVIDIA GeForce RTX 4060 Laptop GPU | MSI Katana 17 B13VFK Intel Core i7-13620H, NVIDIA GeForce RTX 4060 Laptop GPU | |
|---|---|---|---|---|---|---|
| Heat | -5% | 8% | 4% | 16% | 9% | |
| Maximum Upper Side * (°C) | 51 | 49 4% | 42.8 16% | 46 10% | 42 18% | 41.6 18% |
| Maximum Bottom * (°C) | 54 | 48 11% | 50 7% | 51 6% | 45 17% | 43.1 20% |
| Idle Upper Side * (°C) | 33 | 40 -21% | 29.6 10% | 34 -3% | 28 15% | 32 3% |
| Idle Bottom * (°C) | 34 | 39 -15% | 34 -0% | 33 3% | 30 12% | 35.8 -5% |
* ... Moindre est la valeur, meilleures sont les performances
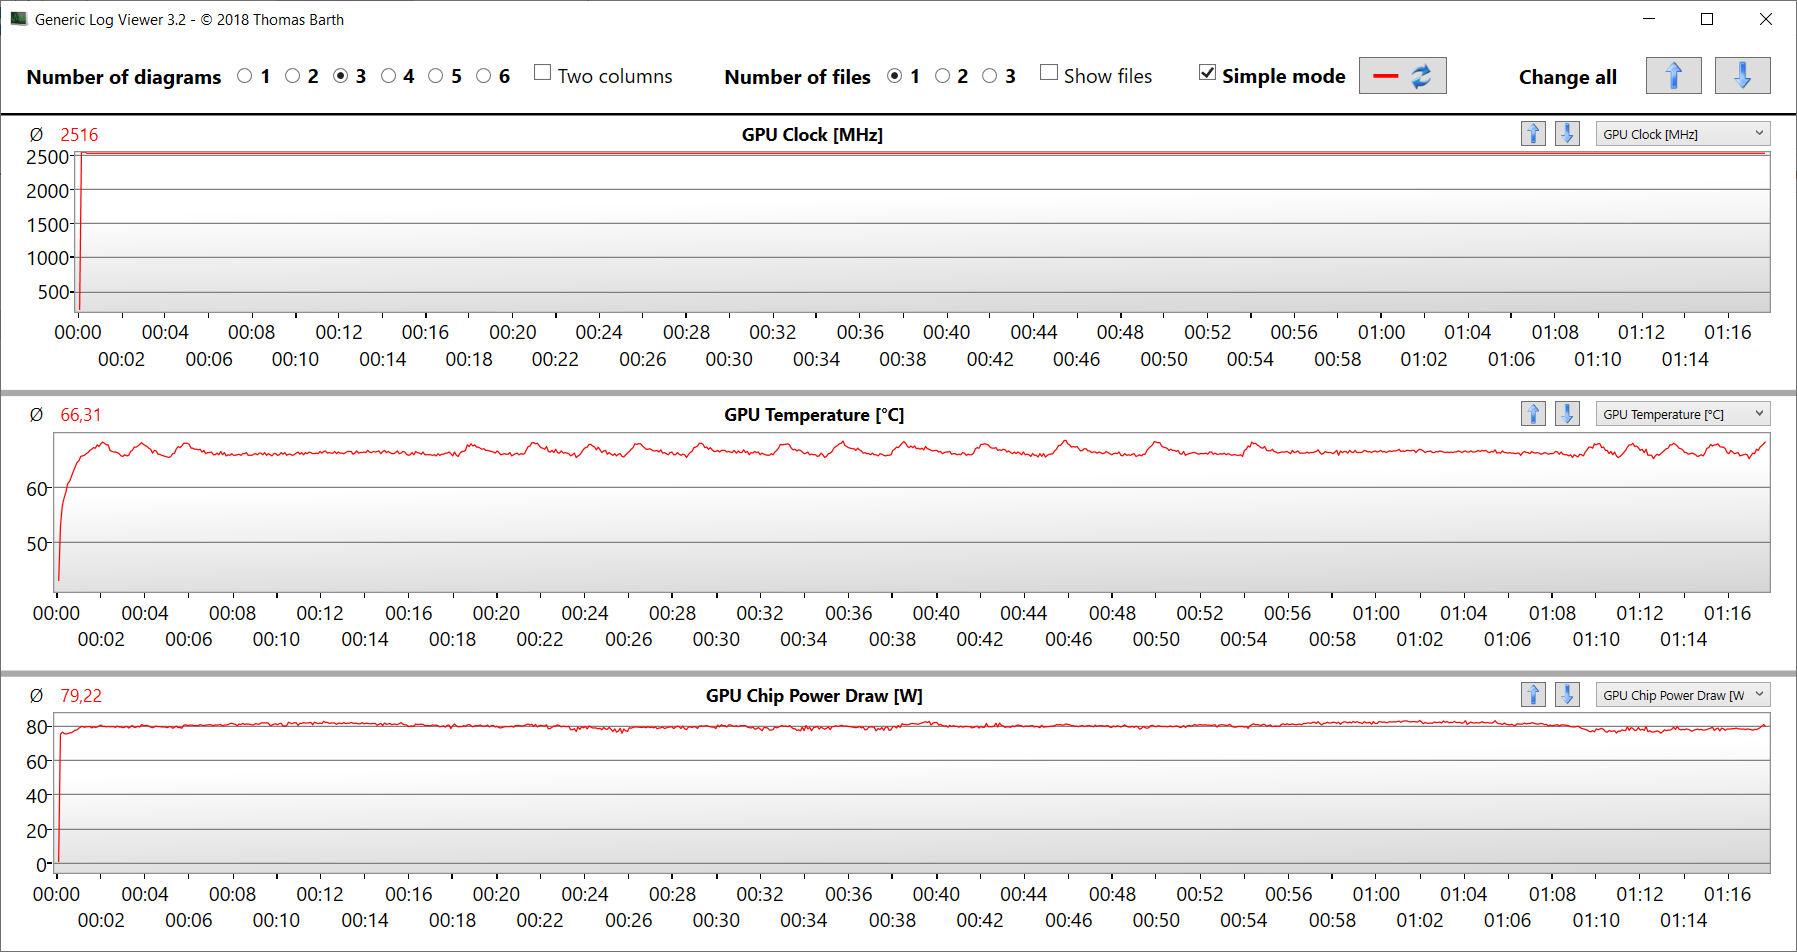
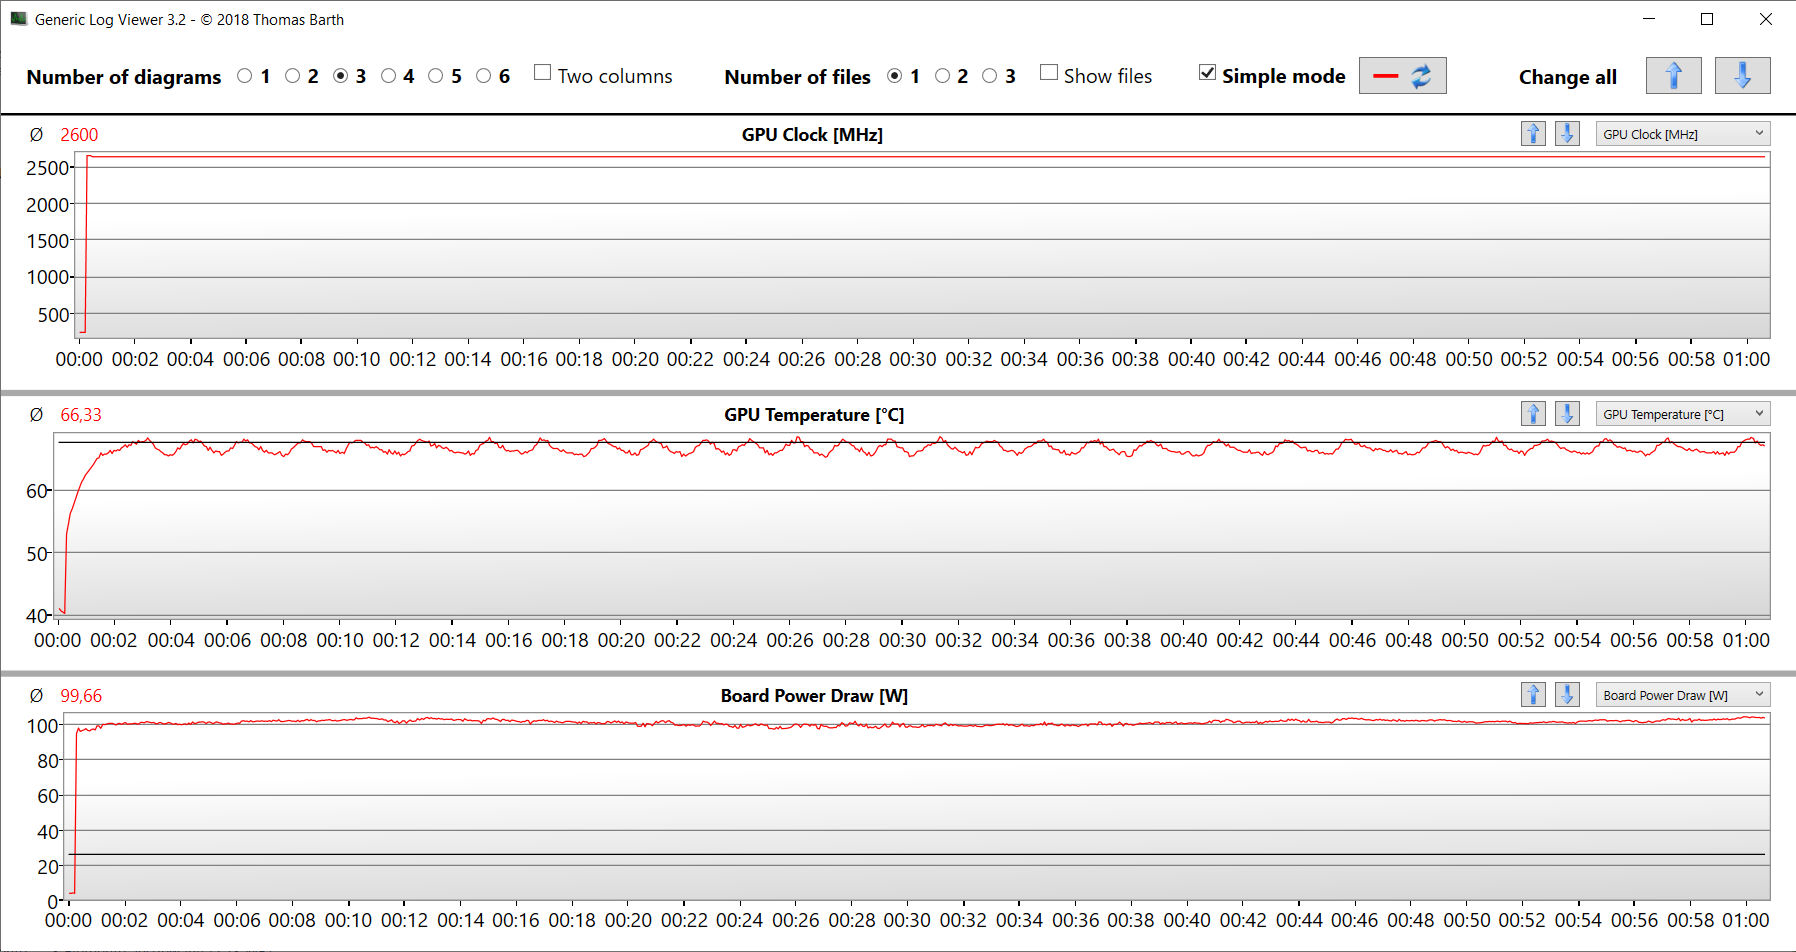
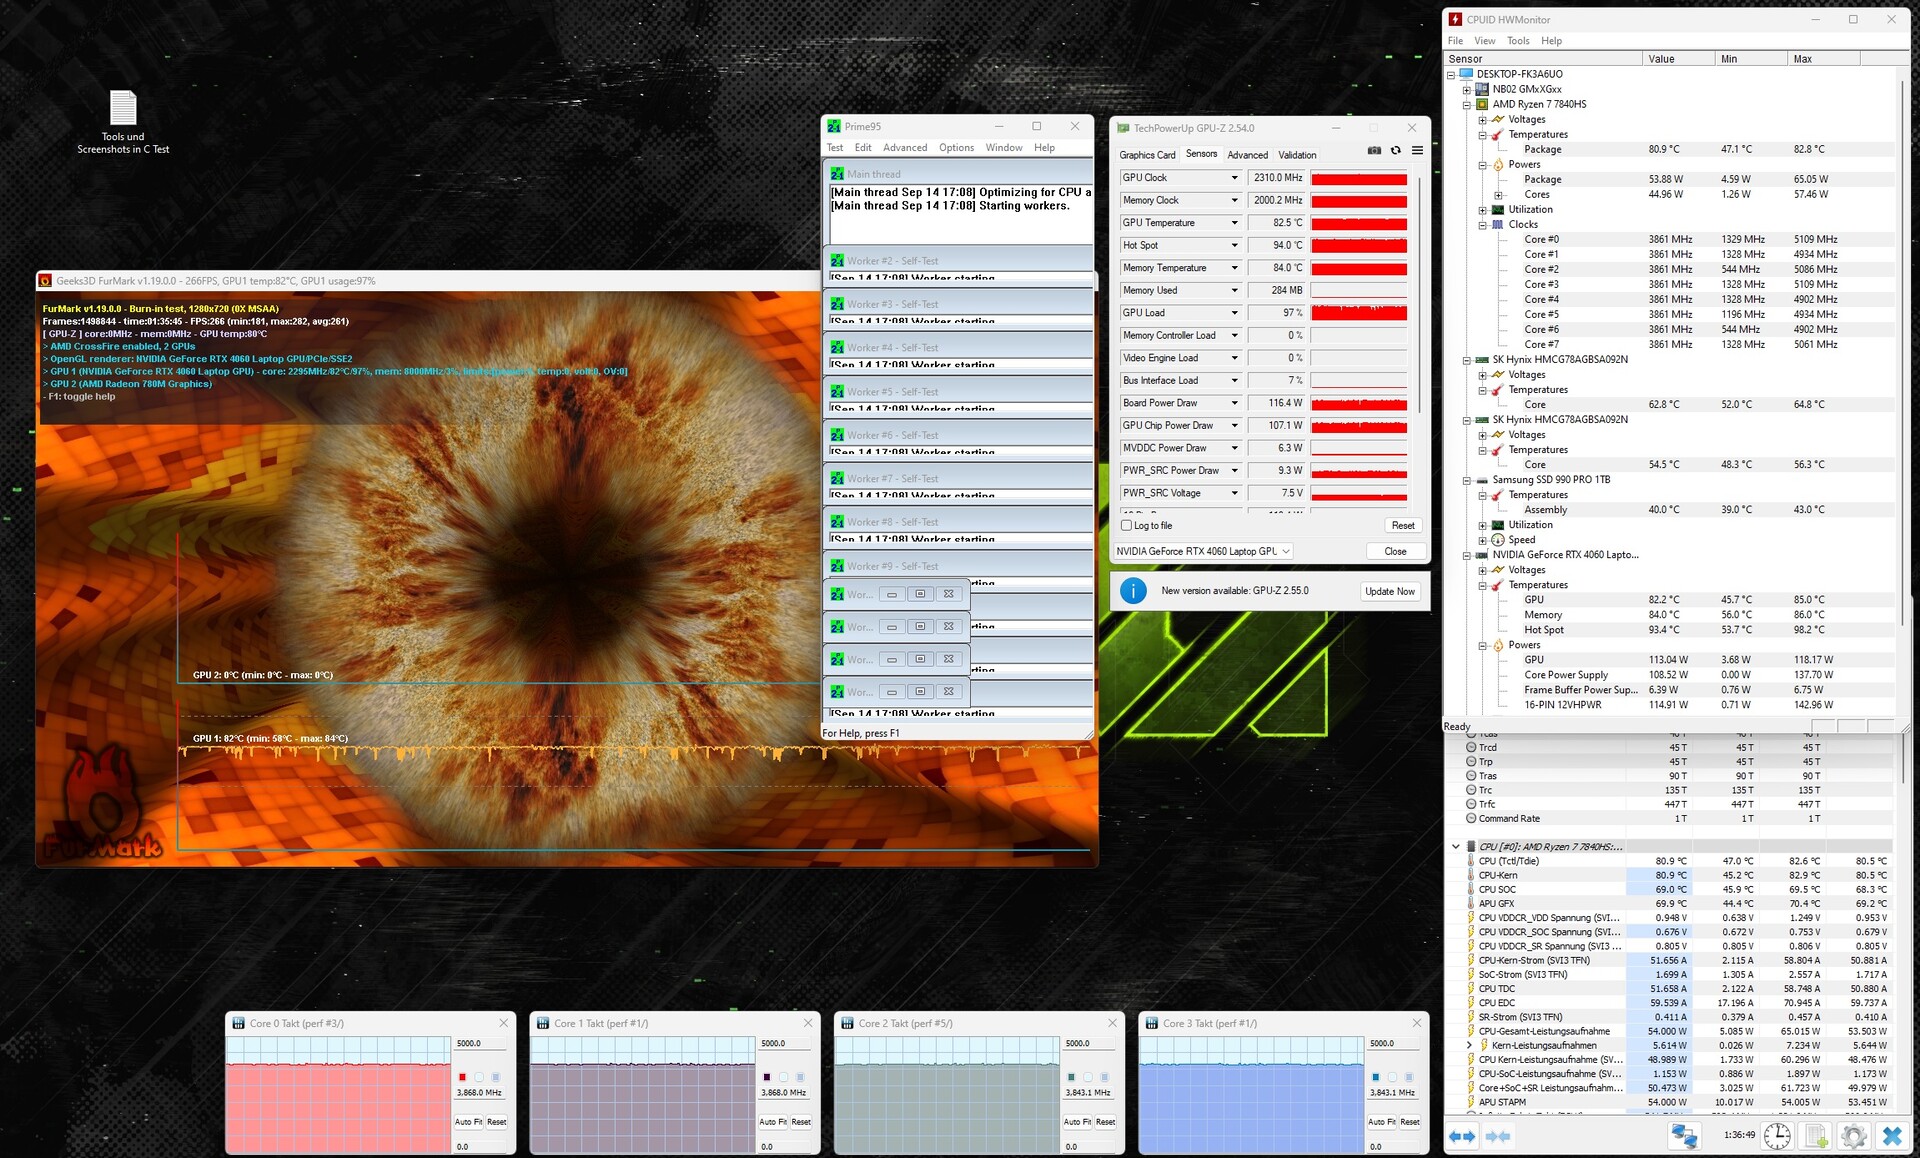
Épreuve d'effort
Le test de stress (Prime95 et Furmark en fonctionnement continu) représente un scénario extrême qui nous permet de vérifier la stabilité du système à pleine charge. Le CPU a fonctionné tout au long du test avec des vitesses d'horloge de 3,8 à 3,9 GHz et les cœurs graphiques ont fonctionné entre 2,2 et 2,4 GHz.
Intervenants
Les haut-parleurs stéréo produisent un son décent mais manquent de basses. Pour une meilleure expérience sonore, nous recommandons l'utilisation d'un casque ou de haut-parleurs externes.
Schenker XMG Apex 17 (Late 23) analyse audio
(±) | le niveau sonore du haut-parleur est moyen mais bon (80# dB)
Basses 100 - 315 Hz
(-) | presque aucune basse - en moyenne 29% plus bas que la médiane
(±) | la linéarité des basses est moyenne (10.4% delta à la fréquence précédente)
Médiums 400 - 2000 Hz
(+) | médiane équilibrée - seulement 2.7% de la médiane
(+) | les médiums sont linéaires (4.7% delta à la fréquence précédente)
Aiguës 2 - 16 kHz
(+) | des sommets équilibrés - à seulement 2.1% de la médiane
(+) | les aigus sont linéaires (4.9% delta à la fréquence précédente)
Globalement 100 - 16 000 Hz
(±) | la linéarité du son global est moyenne (18.3% de différence avec la médiane)
Par rapport à la même classe
» 58% de tous les appareils testés de cette catégorie étaient meilleurs, 9% similaires, 33% pires
» Le meilleur avait un delta de 6%, la moyenne était de 18%, le pire était de 132%.
Par rapport à tous les appareils testés
» 40% de tous les appareils testés étaient meilleurs, 8% similaires, 52% pires
» Le meilleur avait un delta de 4%, la moyenne était de 23%, le pire était de 134%.
Alienware m16 R1 Intel analyse audio
(+) | les haut-parleurs peuvent jouer relativement fort (87# dB)
Basses 100 - 315 Hz
(-) | presque aucune basse - en moyenne 24% plus bas que la médiane
(±) | la linéarité des basses est moyenne (13.5% delta à la fréquence précédente)
Médiums 400 - 2000 Hz
(+) | médiane équilibrée - seulement 1.4% de la médiane
(+) | les médiums sont linéaires (3.3% delta à la fréquence précédente)
Aiguës 2 - 16 kHz
(+) | des sommets équilibrés - à seulement 3.5% de la médiane
(+) | les aigus sont linéaires (4.6% delta à la fréquence précédente)
Globalement 100 - 16 000 Hz
(+) | le son global est linéaire (13.4% différence à la médiane)
Par rapport à la même classe
» 19% de tous les appareils testés de cette catégorie étaient meilleurs, 7% similaires, 74% pires
» Le meilleur avait un delta de 6%, la moyenne était de 18%, le pire était de 132%.
Par rapport à tous les appareils testés
» 14% de tous les appareils testés étaient meilleurs, 4% similaires, 83% pires
» Le meilleur avait un delta de 4%, la moyenne était de 23%, le pire était de 134%.
Gestion de l'énergie - Le Schenker XMG offre une autonomie décente
Consommation électrique
Digne d'éloges : Parmi les appareils de comparaison, l'Apex 17 est l'ordinateur portable le plus économique. Dans l'ensemble, les concurrents ont des besoins en énergie bien plus importants. Le test de stress sous Witcher 3 s'est déroulé avec une consommation d'énergie constante. Le bloc d'alimentation (230 watts) est bien dimensionné.
| Éteint/en veille | |
| Au repos | |
| Fortement sollicité |
|
Légende:
min: | |
| Schenker XMG Apex 17 (Late 23) R7 7840HS, GeForce RTX 4060 Laptop GPU | Alienware m16 R1 Intel i7-13700HX, GeForce RTX 4060 Laptop GPU | Lenovo Legion Pro 5 16IRX8 i7-13700HX, GeForce RTX 4060 Laptop GPU | Acer Nitro 17 AN17-51-71ER i7-13700H, GeForce RTX 4060 Laptop GPU | Medion Erazer Defender P40 i7-13700HX, GeForce RTX 4060 Laptop GPU | MSI Katana 17 B13VFK i7-13620H, GeForce RTX 4060 Laptop GPU | Moyenne NVIDIA GeForce RTX 4060 Laptop GPU | Moyenne de la classe Gaming | |
|---|---|---|---|---|---|---|---|---|
| Power Consumption | -38% | -90% | -8% | -20% | -16% | -28% | -51% | |
| Idle Minimum * (Watt) | 9 | 10 -11% | 24.5 -172% | 8.3 8% | 8 11% | 12.2 -36% | 11.5 ? -28% | 13 ? -44% |
| Idle Average * (Watt) | 12 | 14 -17% | 29.2 -143% | 13.5 -13% | 12 -0% | 14.9 -24% | 16 ? -33% | 18.7 ? -56% |
| Idle Maximum * (Watt) | 14 | 21 -50% | 34.3 -145% | 14.8 -6% | 18 -29% | 15.8 -13% | 20.3 ? -45% | 24.3 ? -74% |
| Load Average * (Watt) | 67 | 119 -78% | 98.7 -47% | 77 -15% | 101 -51% | 85.22 -27% | 92.9 ? -39% | 110.2 ? -64% |
| Witcher 3 ultra * (Watt) | 147.6 | 186.7 -26% | 178.6 -21% | 154 -4% | 180.8 -22% | 151.1 -2% | ||
| Load Maximum * (Watt) | 223 | 323 -45% | 249.6 -12% | 263 -18% | 284 -27% | 212.8 5% | 210 ? 6% | 258 ? -16% |
* ... Moindre est la valeur, meilleures sont les performances
Power consumption Witcher 3 / stress test
Power consumption with an external monitor
Durée de vie de la batterie
Lors du test Wi-Fi (utilisation d'un script pour charger des sites web) et du test vidéo (court métrage de Big Buck Bunny (codage H.264, FHD), l'appareil de 17,3 pouces a atteint des durées d'exécution de 5,06 et 6,51 heures, respectivement. Pendant les tests, les fonctions d'économie d'énergie de l'ordinateur portable ont été désactivées et la luminosité de l'écran a été réglée à environ 150 cd/m². En outre, le test vidéo a été effectué avec les modules radio éteints.
Bien que la capacité de la batterie de l'Apex soit relativement faible, l'autonomie est tout à fait respectable. L'ordinateur laisse dans son sillage certains de ses concurrents dotés d'une batterie plus importante.
| Schenker XMG Apex 17 (Late 23) R7 7840HS, GeForce RTX 4060 Laptop GPU, 62.32 Wh | Alienware m16 R1 Intel i7-13700HX, GeForce RTX 4060 Laptop GPU, 86 Wh | Lenovo Legion Pro 5 16IRX8 i7-13700HX, GeForce RTX 4060 Laptop GPU, 80 Wh | Acer Nitro 17 AN17-51-71ER i7-13700H, GeForce RTX 4060 Laptop GPU, 90 Wh | Medion Erazer Defender P40 i7-13700HX, GeForce RTX 4060 Laptop GPU, 73 Wh | MSI Katana 17 B13VFK i7-13620H, GeForce RTX 4060 Laptop GPU, 53.5 Wh | Moyenne de la classe Gaming | |
|---|---|---|---|---|---|---|---|
| Autonomie de la batterie | -20% | -34% | 31% | -0% | -40% | 18% | |
| Reader / Idle (h) | 7.8 | 6.4 -18% | 6.7 -14% | 8.8 13% | 8.71 ? 12% | ||
| H.264 (h) | 6.9 | 5.6 -19% | 6.9 0% | 5.7 -17% | 8.64 ? 25% | ||
| WiFi v1.3 (h) | 5.1 | 4.8 -6% | 3.4 -33% | 8.2 61% | 6.2 22% | 2.9 -43% | 7.15 ? 40% |
| Load (h) | 1.6 | 1 -37% | 0.7 -56% | 1.3 -19% | 1 -37% | 1.502 ? -6% | |
| Witcher 3 ultra (h) | 2.5 |
Points positifs
Points négatifs
Verdict - Une machine de jeu modeste, de milieu de gamme
Le Das Apex 17 remplit sans difficulté les tâches pour lesquelles il a été conçu (jeux en QHD, rendu, montage vidéo) - LeRyzen 7 7840HSet la GeForce RTX 4060 le permettent. Les deux puces peuvent fonctionner à des vitesses d'horloge élevées et constantes.
Avec le XMG Apex 17 (23 ans), Schenker propose un ordinateur portable QHD de milieu de gamme bien équilibré.
L'ordinateur ne produit pas beaucoup de bruit au quotidien, mais pour les jeux, il est possible de trouver un compromis entre les performances et le bruit en sélectionnant le profil approprié. L'autonomie de la batterie dans la vie réelle est d'environ 5 à 7 heures, ce qui est tout à fait acceptable par rapport à la capacité de la batterie. La batterie ne peut pas être chargée via le port USB-C (USB 3.2 Gen 2).
L'ordinateur portable offre de la place pour deux SSD PCIe 4 (M.2 2280). Le RAID 0/1 est pris en charge. La boutique en ligne de Schenker vous permet de sélectionner le ou les SSD de votre choix. L'appareil testé est équipé d'un SSD PCIe 4 extrêmement rapide (1 To). Dans l'ensemble, l'écran QHD installé (17,3 pouces, 2 560 x 1 440 pixels, sRGB, IPS, 240 Hz) a fait bonne impression. Un écran FHD moins cher est également disponible.
L'ordinateurMedion Erazer Defender P40 serait une alternative avec des performances et des spécifications comparables. Contrairement à l'Apex, le P40 est équipé d'un port Thunderbolt 4.
Notebookcheck.com publiera bientôt un test du modèle jumeau de 15,6 pouces, le XMG Apex 15 (fin 23) dans une variante avec un Ryzen 7 7840HS et un GeForce RTX 4050.
Prix et disponibilité
Une variante similaire à notre modèle d'essai (16 au lieu de 32 Go de RAM) est disponible pour 1 739 euros chez Notebooksbilliger.de. Le site propose également un modèle d'entrée de gamme moins cher avec une RTX 4050 ( GeForce ) pour 1 399 euros. Il est également possible de configurer son propre appareil sur la boutique en ligne de Schenker.
Schenker XMG Apex 17 (Late 23)
- 10/04/2023 v7 (old)
Sascha Mölck
Transparency
La sélection des appareils à examiner est effectuée par notre équipe éditoriale. L'échantillon de test a été prêté à l'auteur par le fabricant ou le détaillant pour les besoins de cet examen. Le prêteur n'a pas eu d'influence sur cette évaluation et le fabricant n'a pas reçu de copie de cette évaluation avant sa publication. Il n'y avait aucune obligation de publier cet article. En tant que média indépendant, Notebookcheck n'est pas soumis à l'autorité des fabricants, des détaillants ou des éditeurs.
Voici comment Notebookcheck teste
Chaque année, Notebookcheck examine de manière indépendante des centaines d'ordinateurs portables et de smartphones en utilisant des procédures standardisées afin de garantir que tous les résultats sont comparables. Nous avons continuellement développé nos méthodes de test depuis environ 20 ans et avons établi des normes industrielles dans le processus. Dans nos laboratoires de test, des équipements de mesure de haute qualité sont utilisés par des techniciens et des rédacteurs expérimentés. Ces tests impliquent un processus de validation en plusieurs étapes. Notre système d'évaluation complexe repose sur des centaines de mesures et de points de référence bien fondés, ce qui garantit l'objectivité.Price comparison

