
Notebookcheck Logo
Teaser

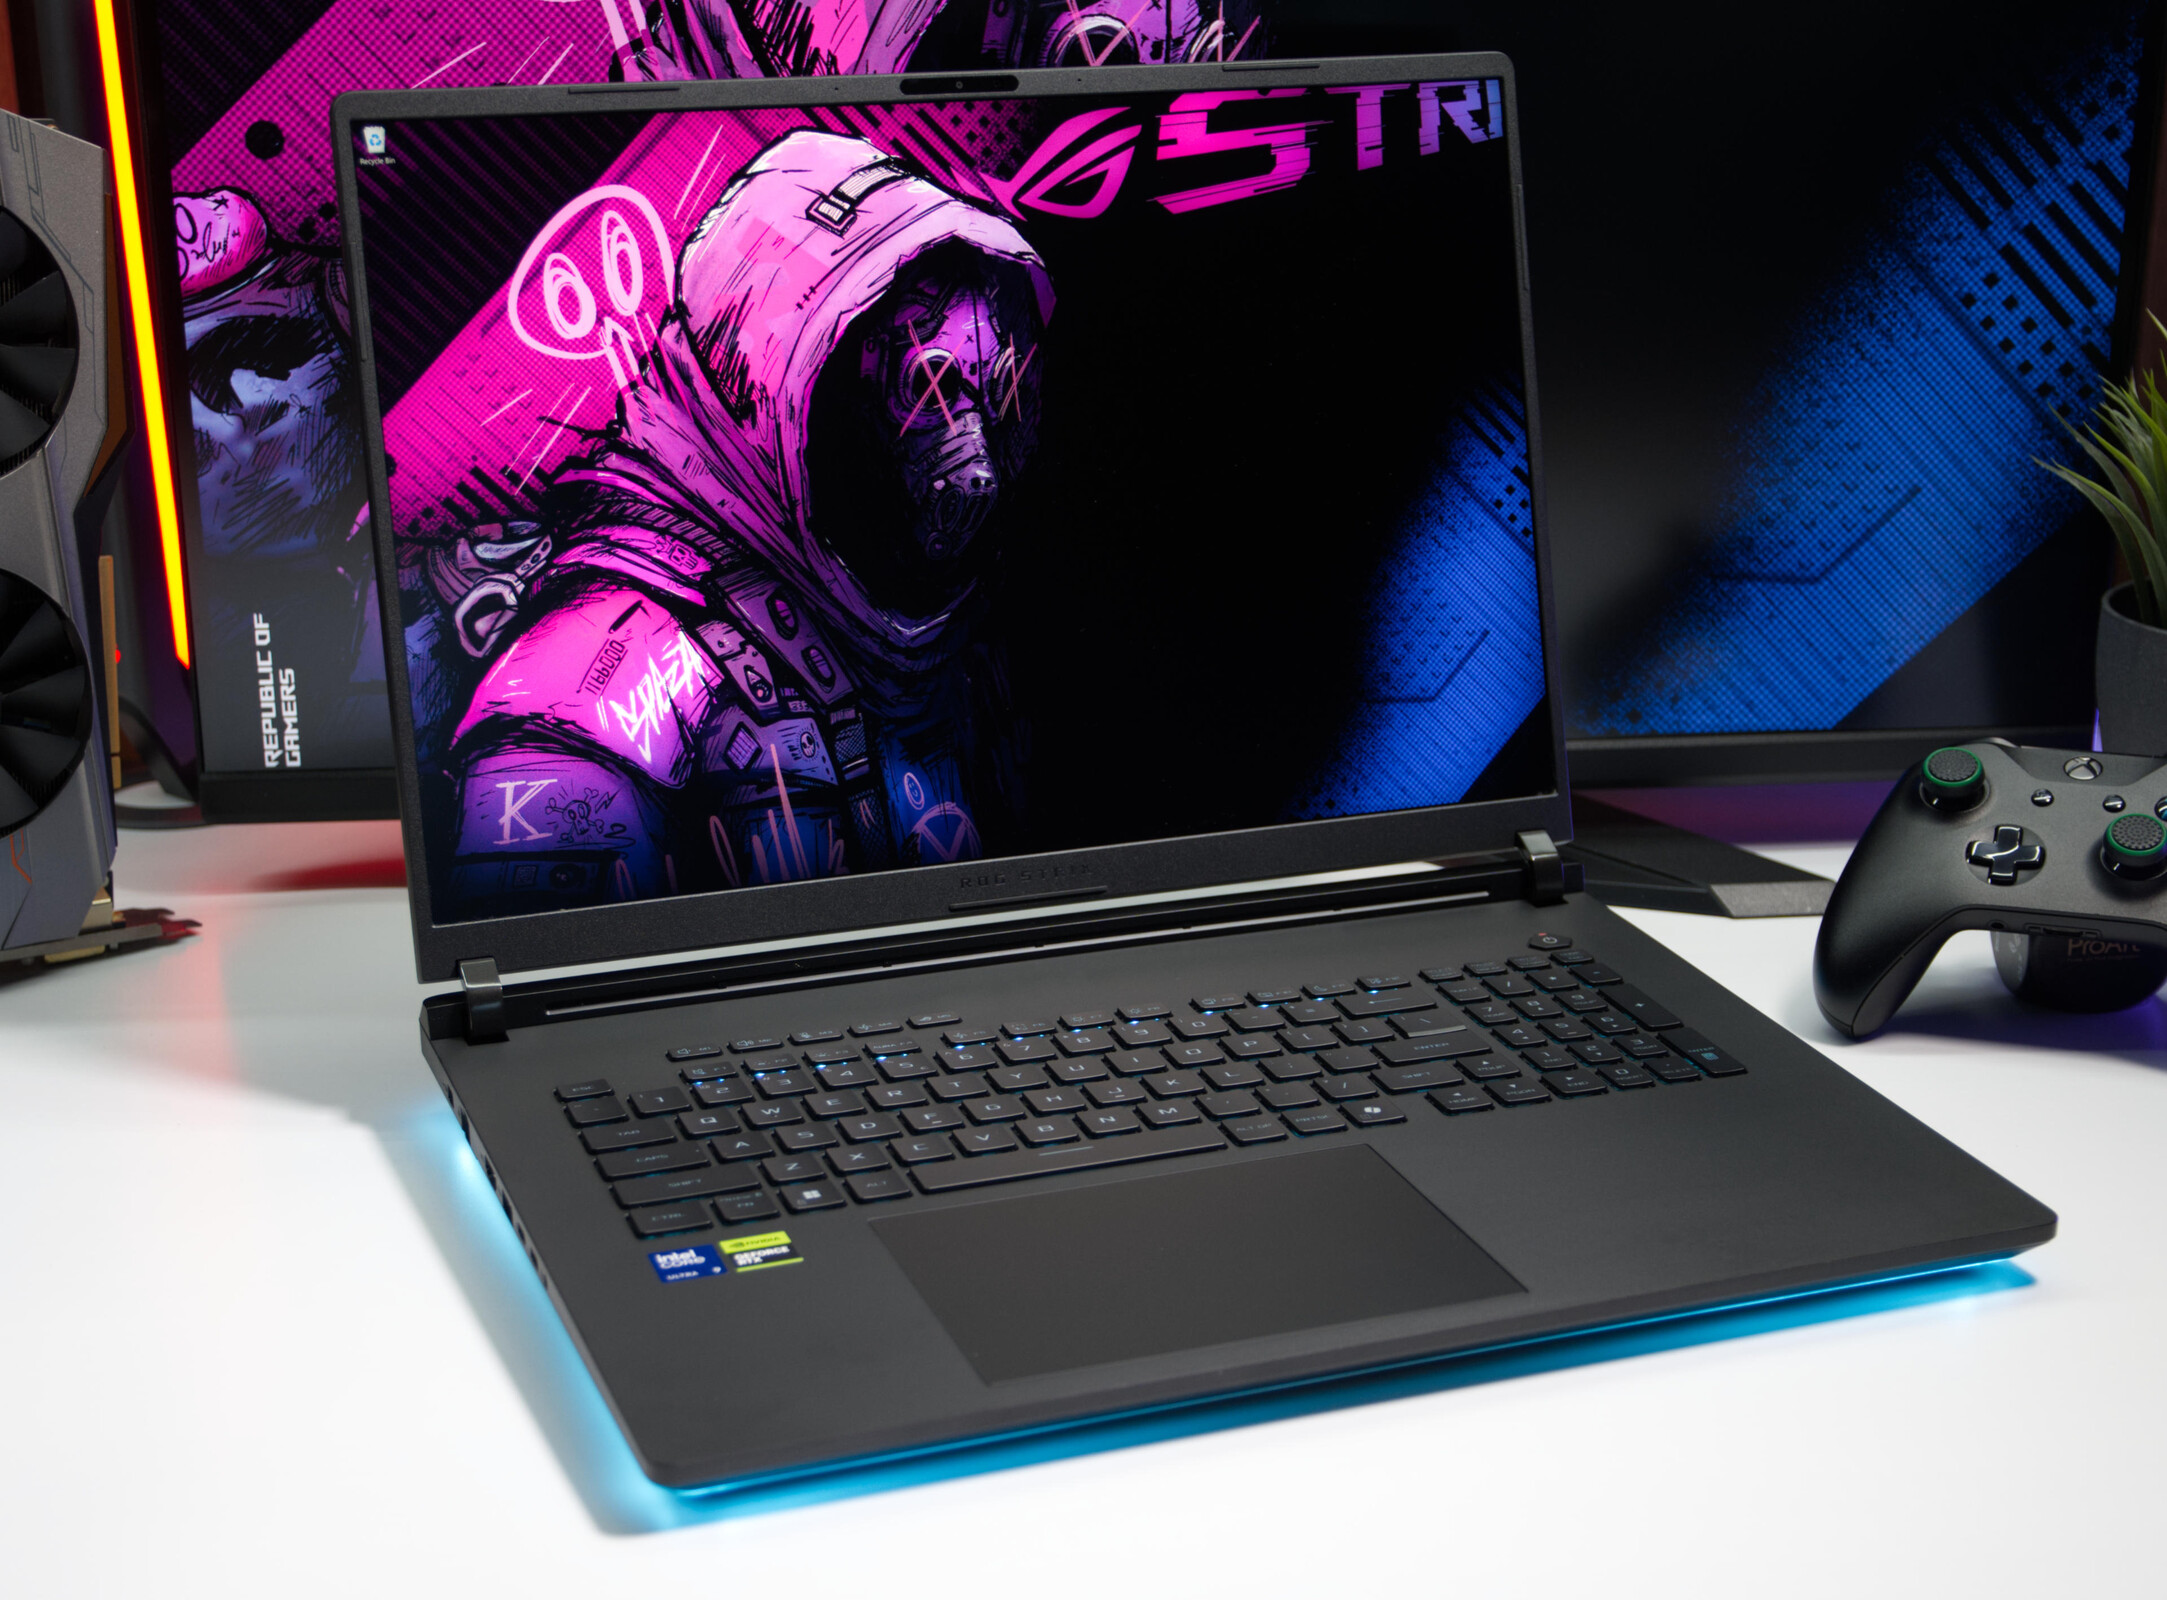
Un monstre du gaming doté d’un écran 4K Mini-LED, d’une carte graphique RTX 5090 et de 128 Go de RAM – Test de l’Asus ROG Strix SCAR 18 G835LXG

Une expérience de jeu haut de gamme avec des performances sans compromis.

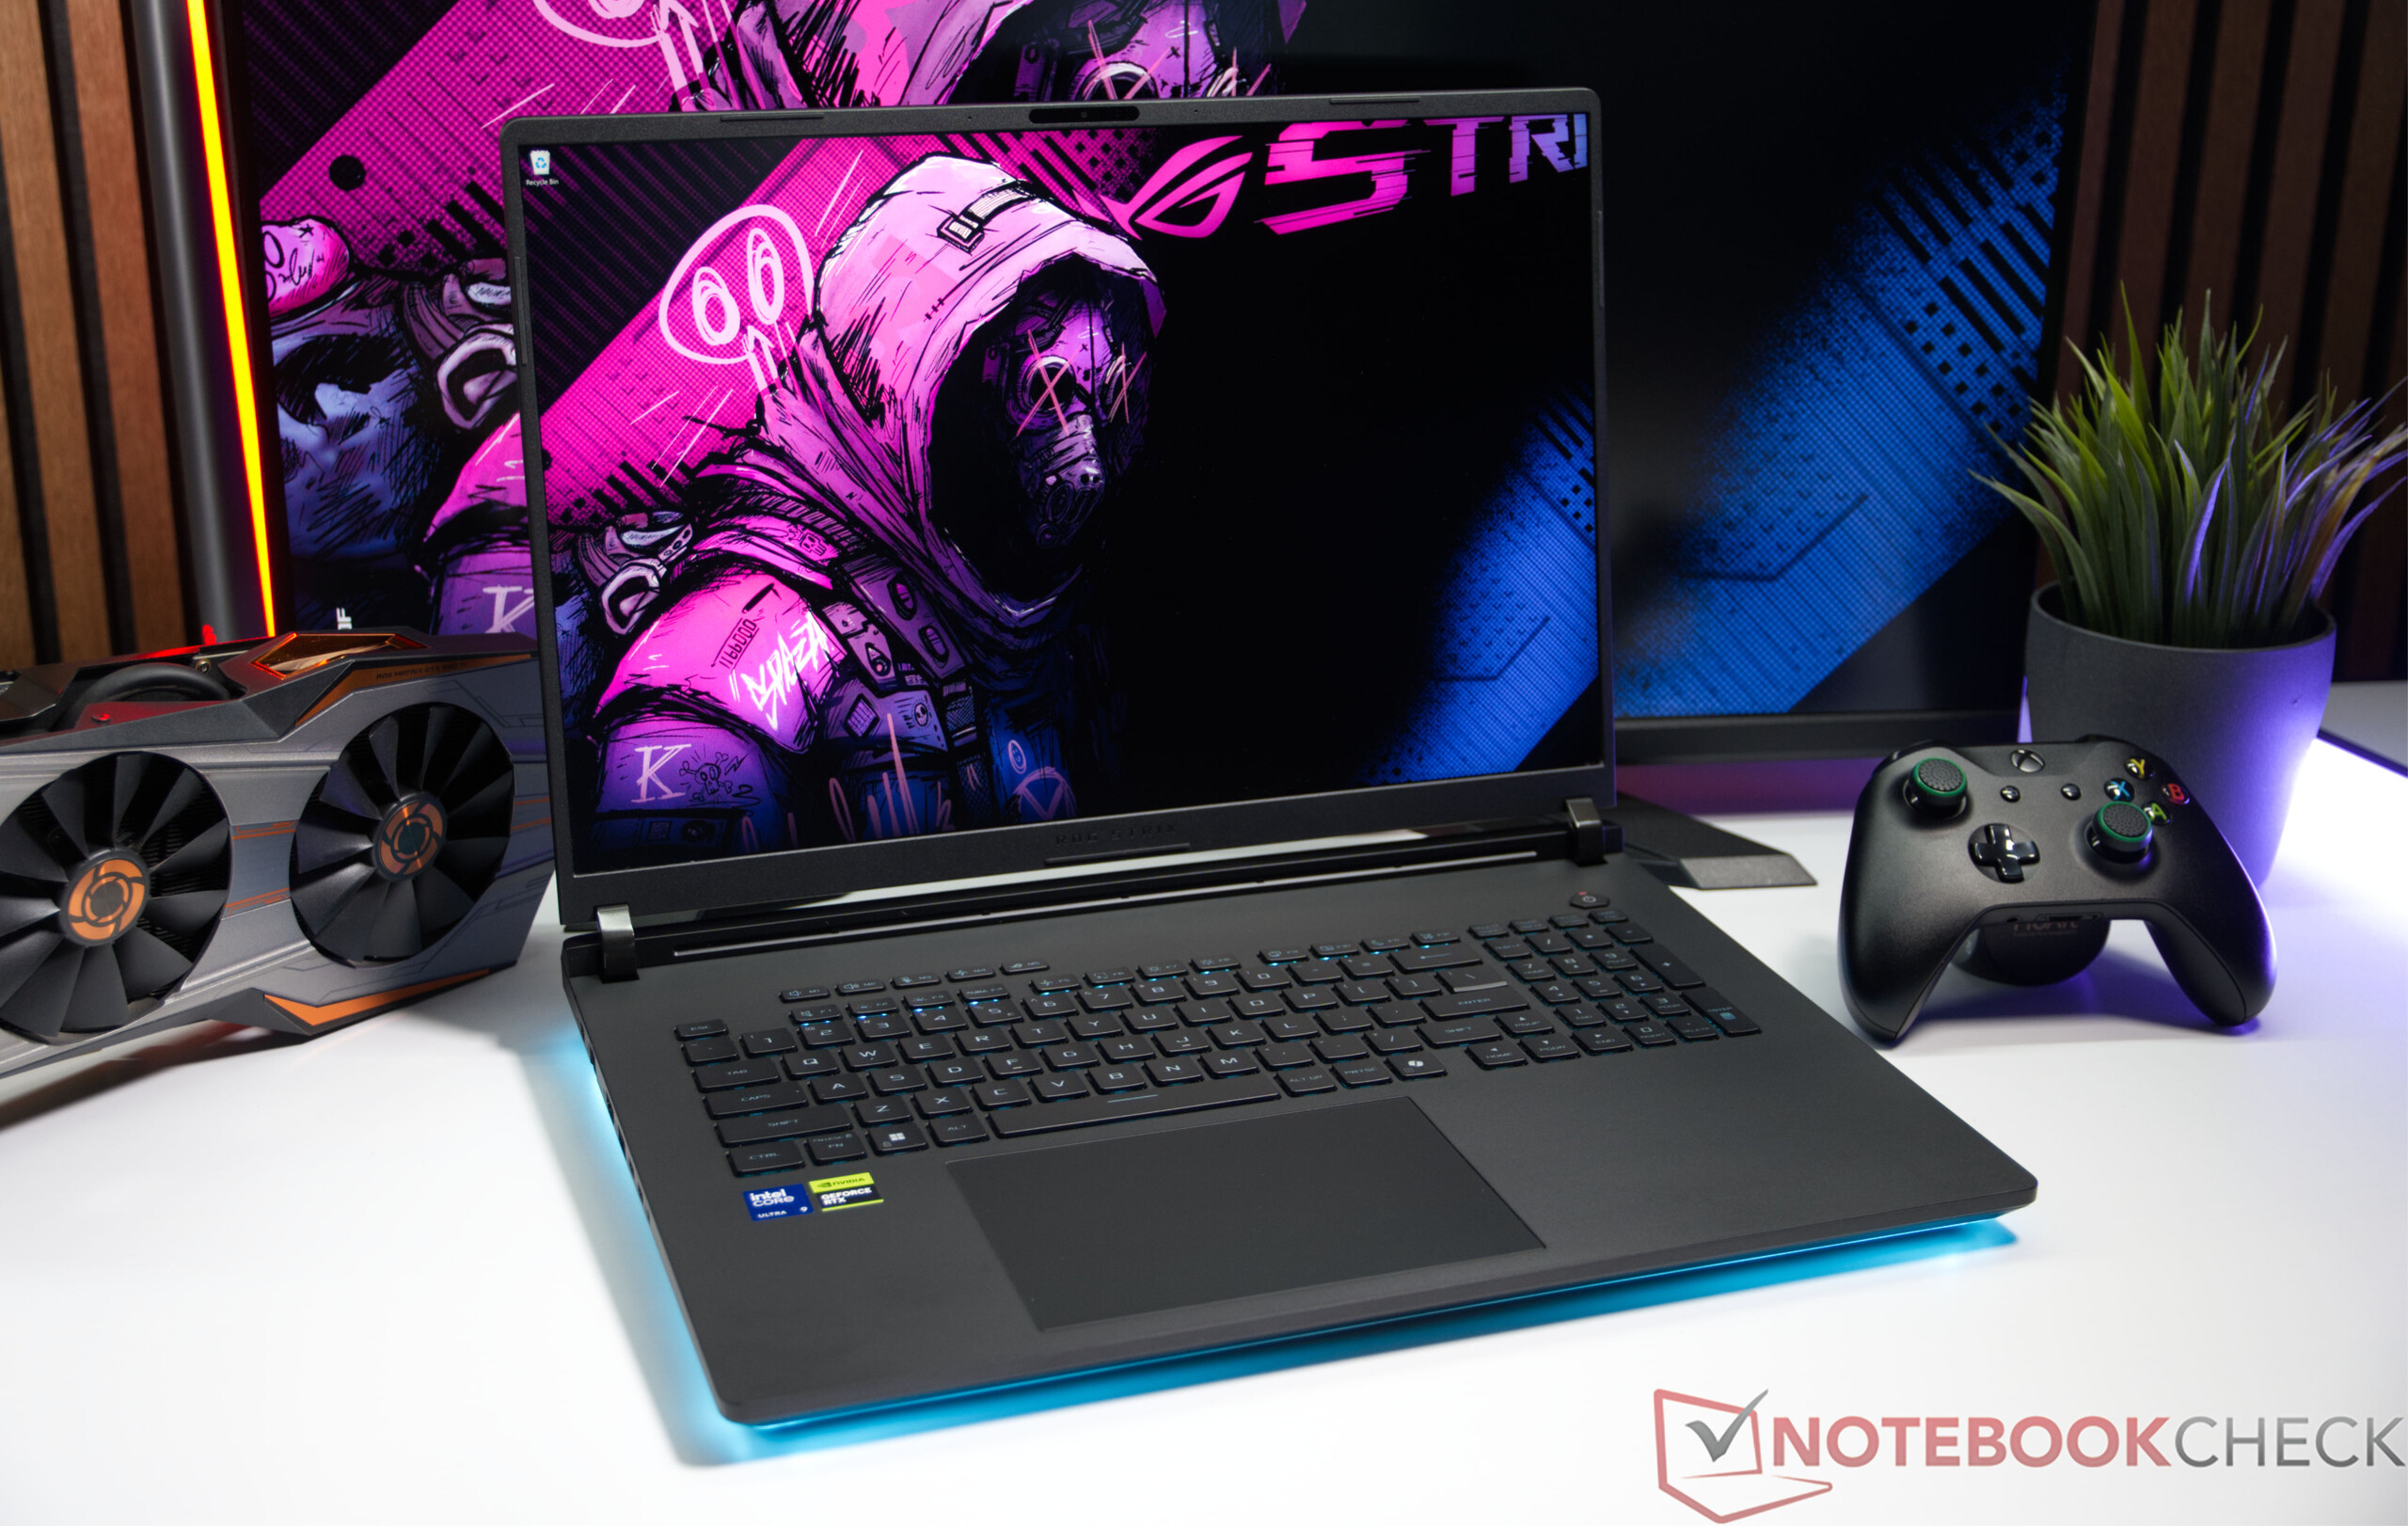
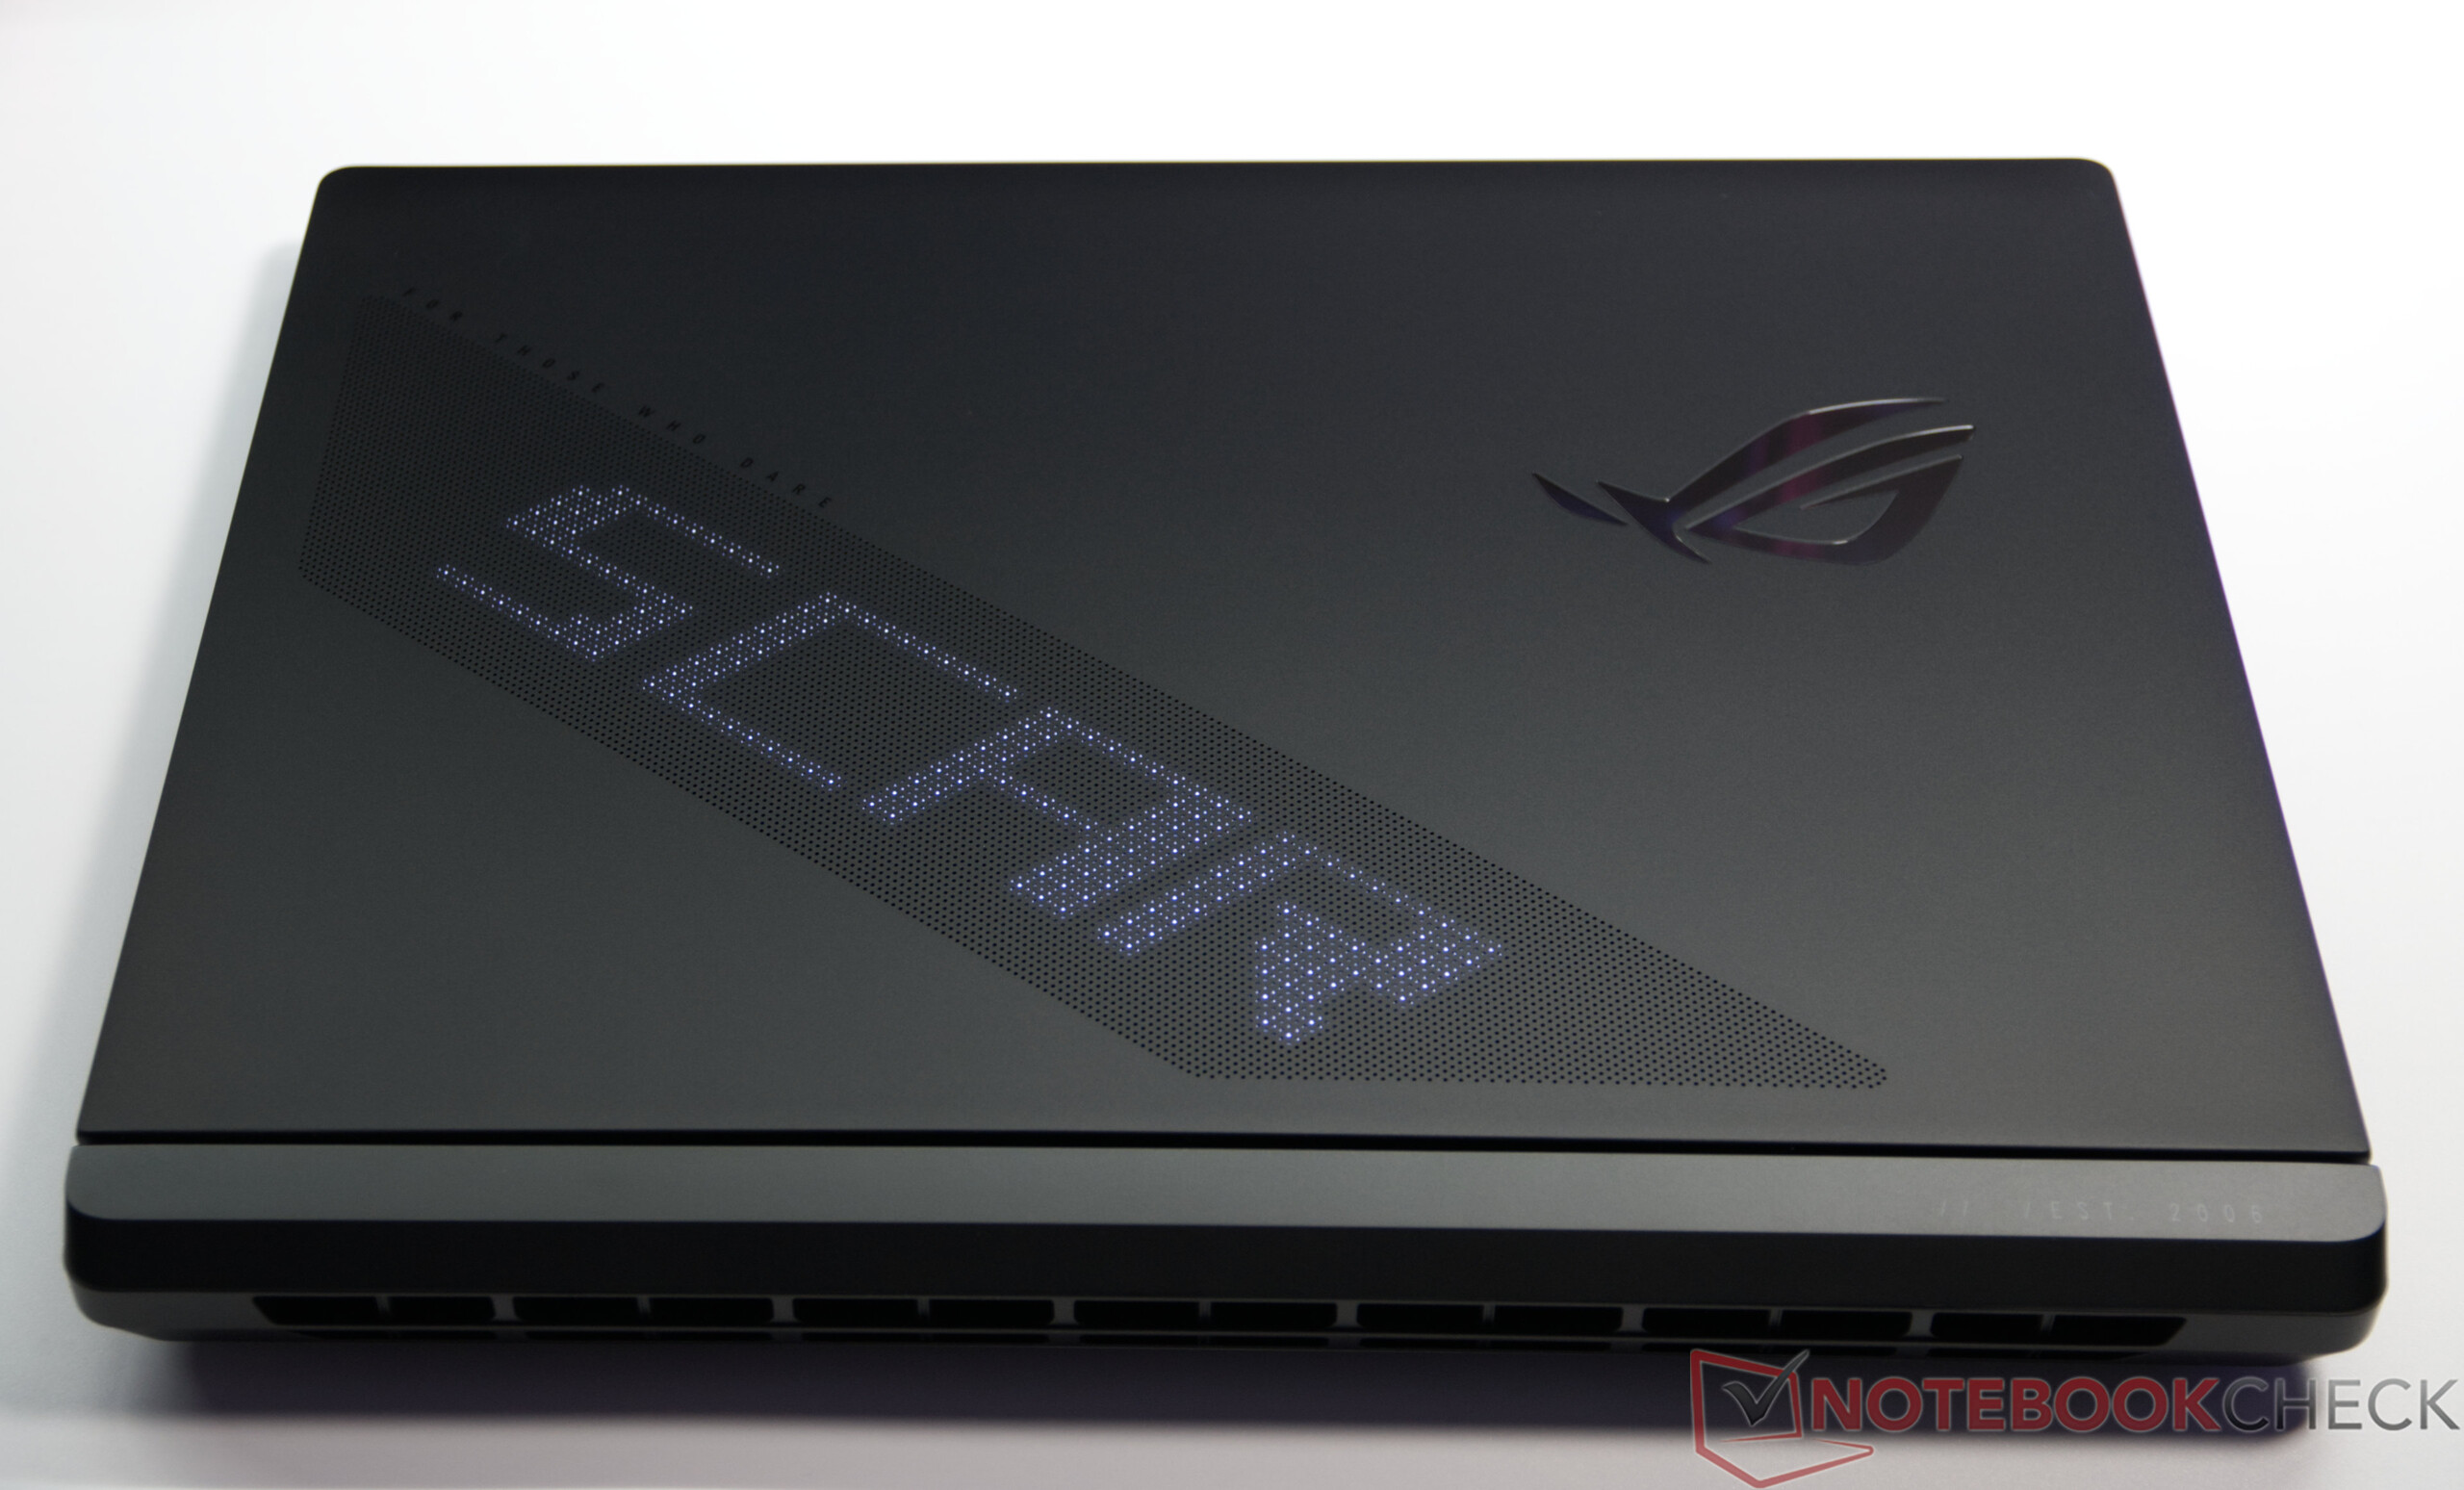
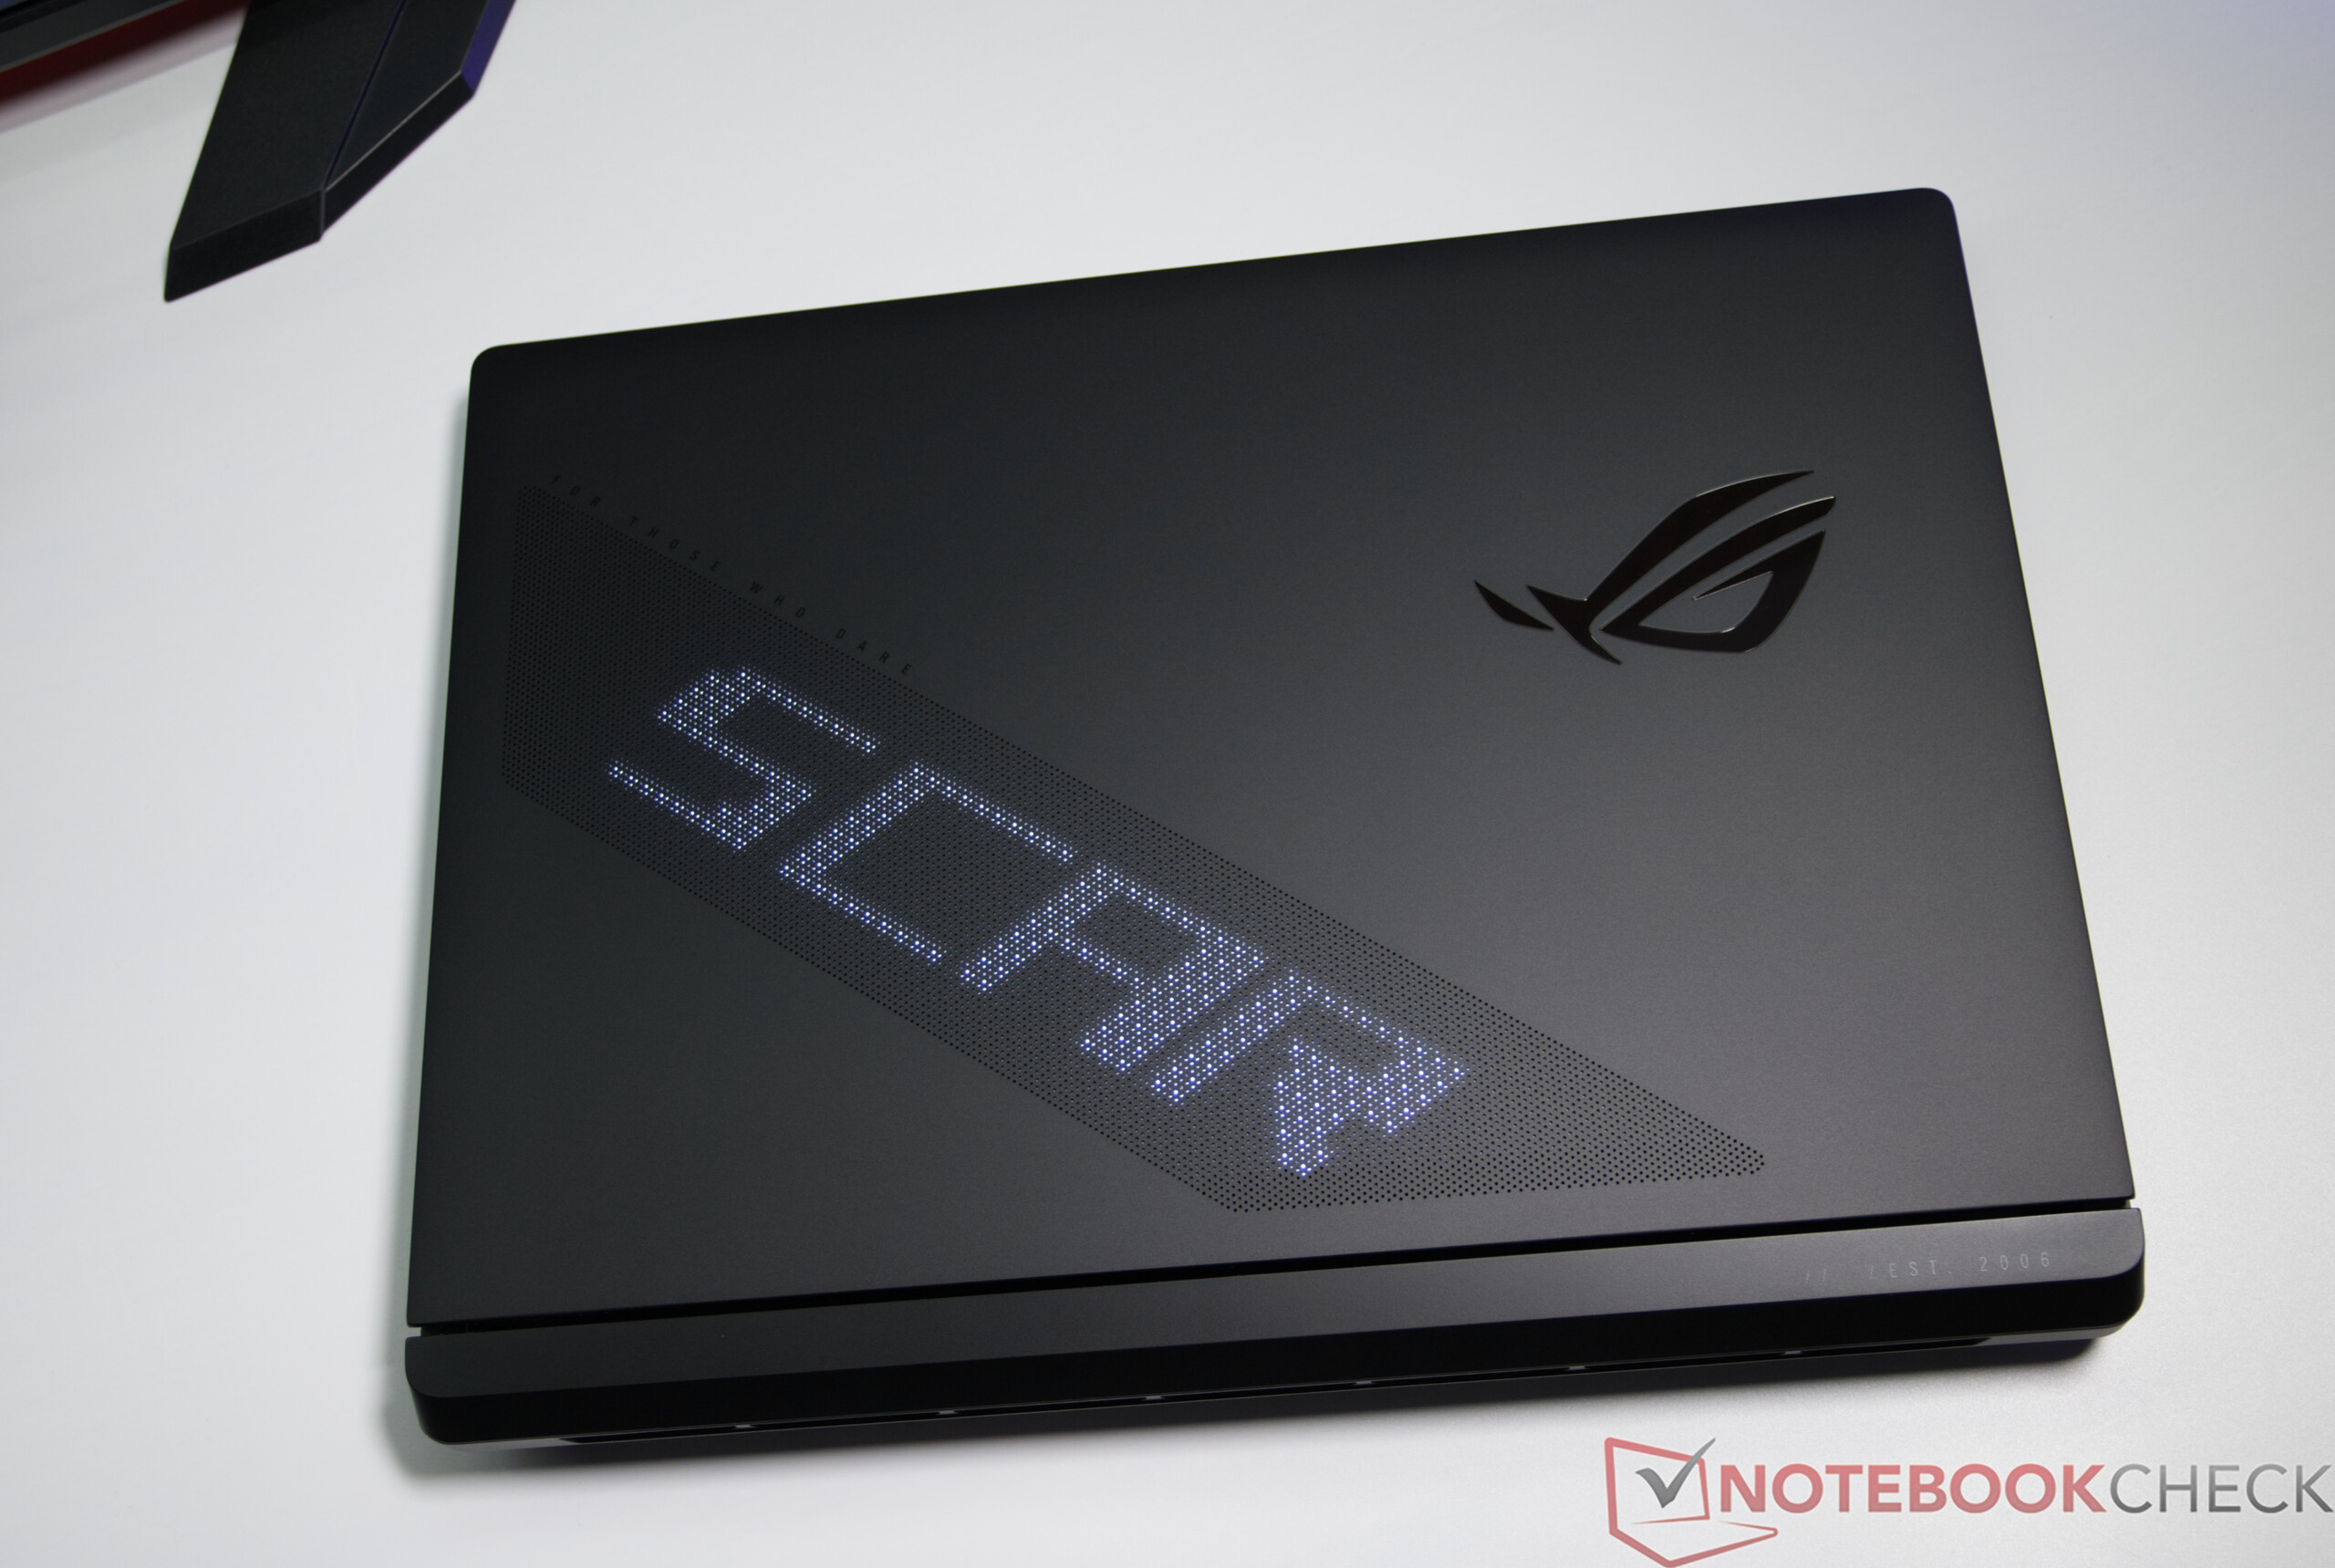
Asus met à jour son ROG Strix SCAR 18 G835LXG en l'équipant d'un processeur Intel Core Ultra 9 290HX, d’un GPU pour ordinateur portable NVIDIA GeForce RTX 5090 et d’un écran Mini-LED 4K de 18 pouces offrant un taux de rafraîchissement de 240 Hz et 2 000 zones de gradation. Il offre également une excellente facilité d’entretien grâce à un accès simplifié aux composants, ainsi que de nombreuses options de personnalisation avec AniME Vision et un éclairage RVB polyvalent.
Sebastian Bade, 👁 Sebastian Bade (traduit par DeepL / Ninh Duy) Publié 🇺🇸 🇩🇪 ...
AI Blackwell RTX 5000 Nvidia Arrow Lake Intel Laptop / Notebook Windows Gaming Wi-Fi 7 Thunderbolt

Verdict : des performances de jeu optimales avec peu de défauts

L'Asus ROG Strix SCAR 18 G835LXG est l'un des ordinateurs portables de jeu les plus puissants actuellement disponibles sur le marché. Équipé d’un processeur Intel Core Ultra 9 290HX, d’une carte graphique NVIDIA GeForce RTX 5090 Laptop avec un TGP de 175 watts et de 128 Go de RAM, l’appareil testé offre d’énormes réserves de performances pour les derniers jeux AAA, la création de contenu professionnel et les tâches d’IA exigeantes. Les performances du processeur et de la carte graphique restent stables, même sous une charge prolongée.

L'écran Mini-LED de 18 pouces, doté d'une résolution 4K, de 2 000 zones de gradation et d'un taux de rafraîchissement de 240 Hz, constitue l'un des principaux atouts de cet ordinateur portable. Il séduit par sa grande netteté, ses excellentes capacités HDR et sa luminosité maximale élevée. Les seules limites concernent le calibrage des couleurs par défaut, qui peut toutefois être considérablement amélioré grâce à un calibrage. De plus, le taux de rafraîchissement de 240 Hz n’est disponible qu’en mode « GPU Ultimate » ; dans tous les autres modes graphiques, le taux de 120 Hz reste possible.

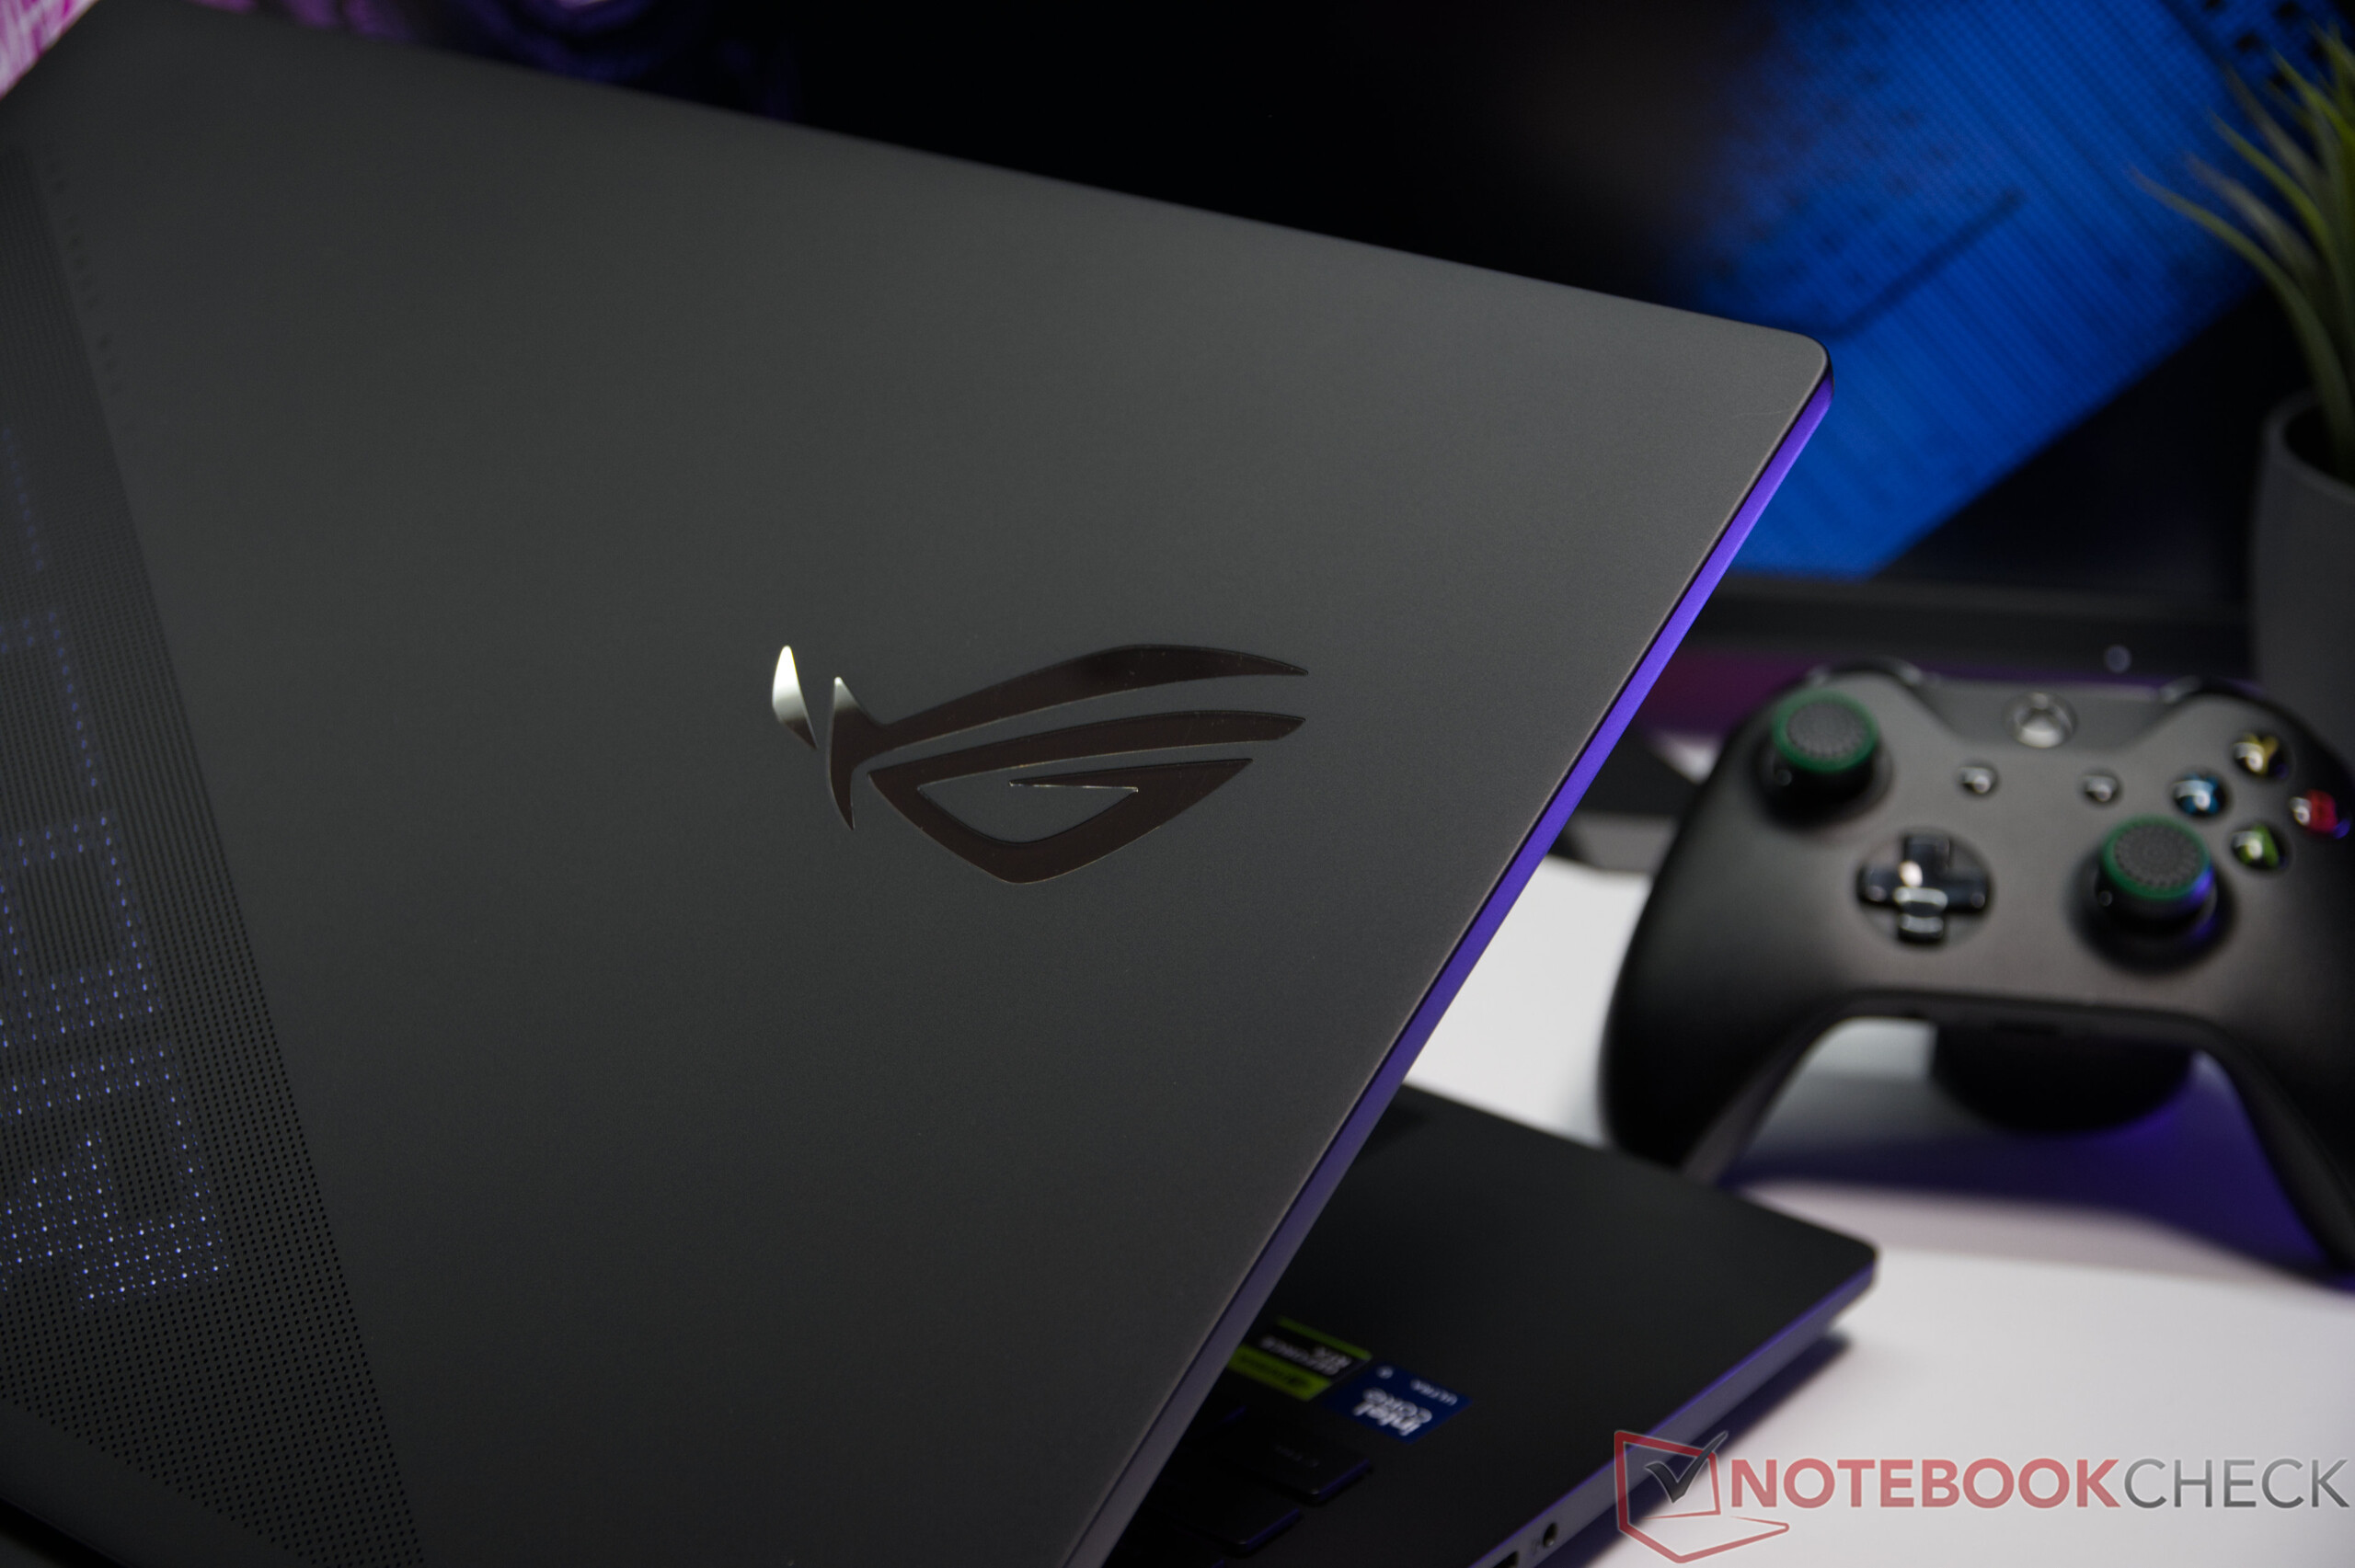
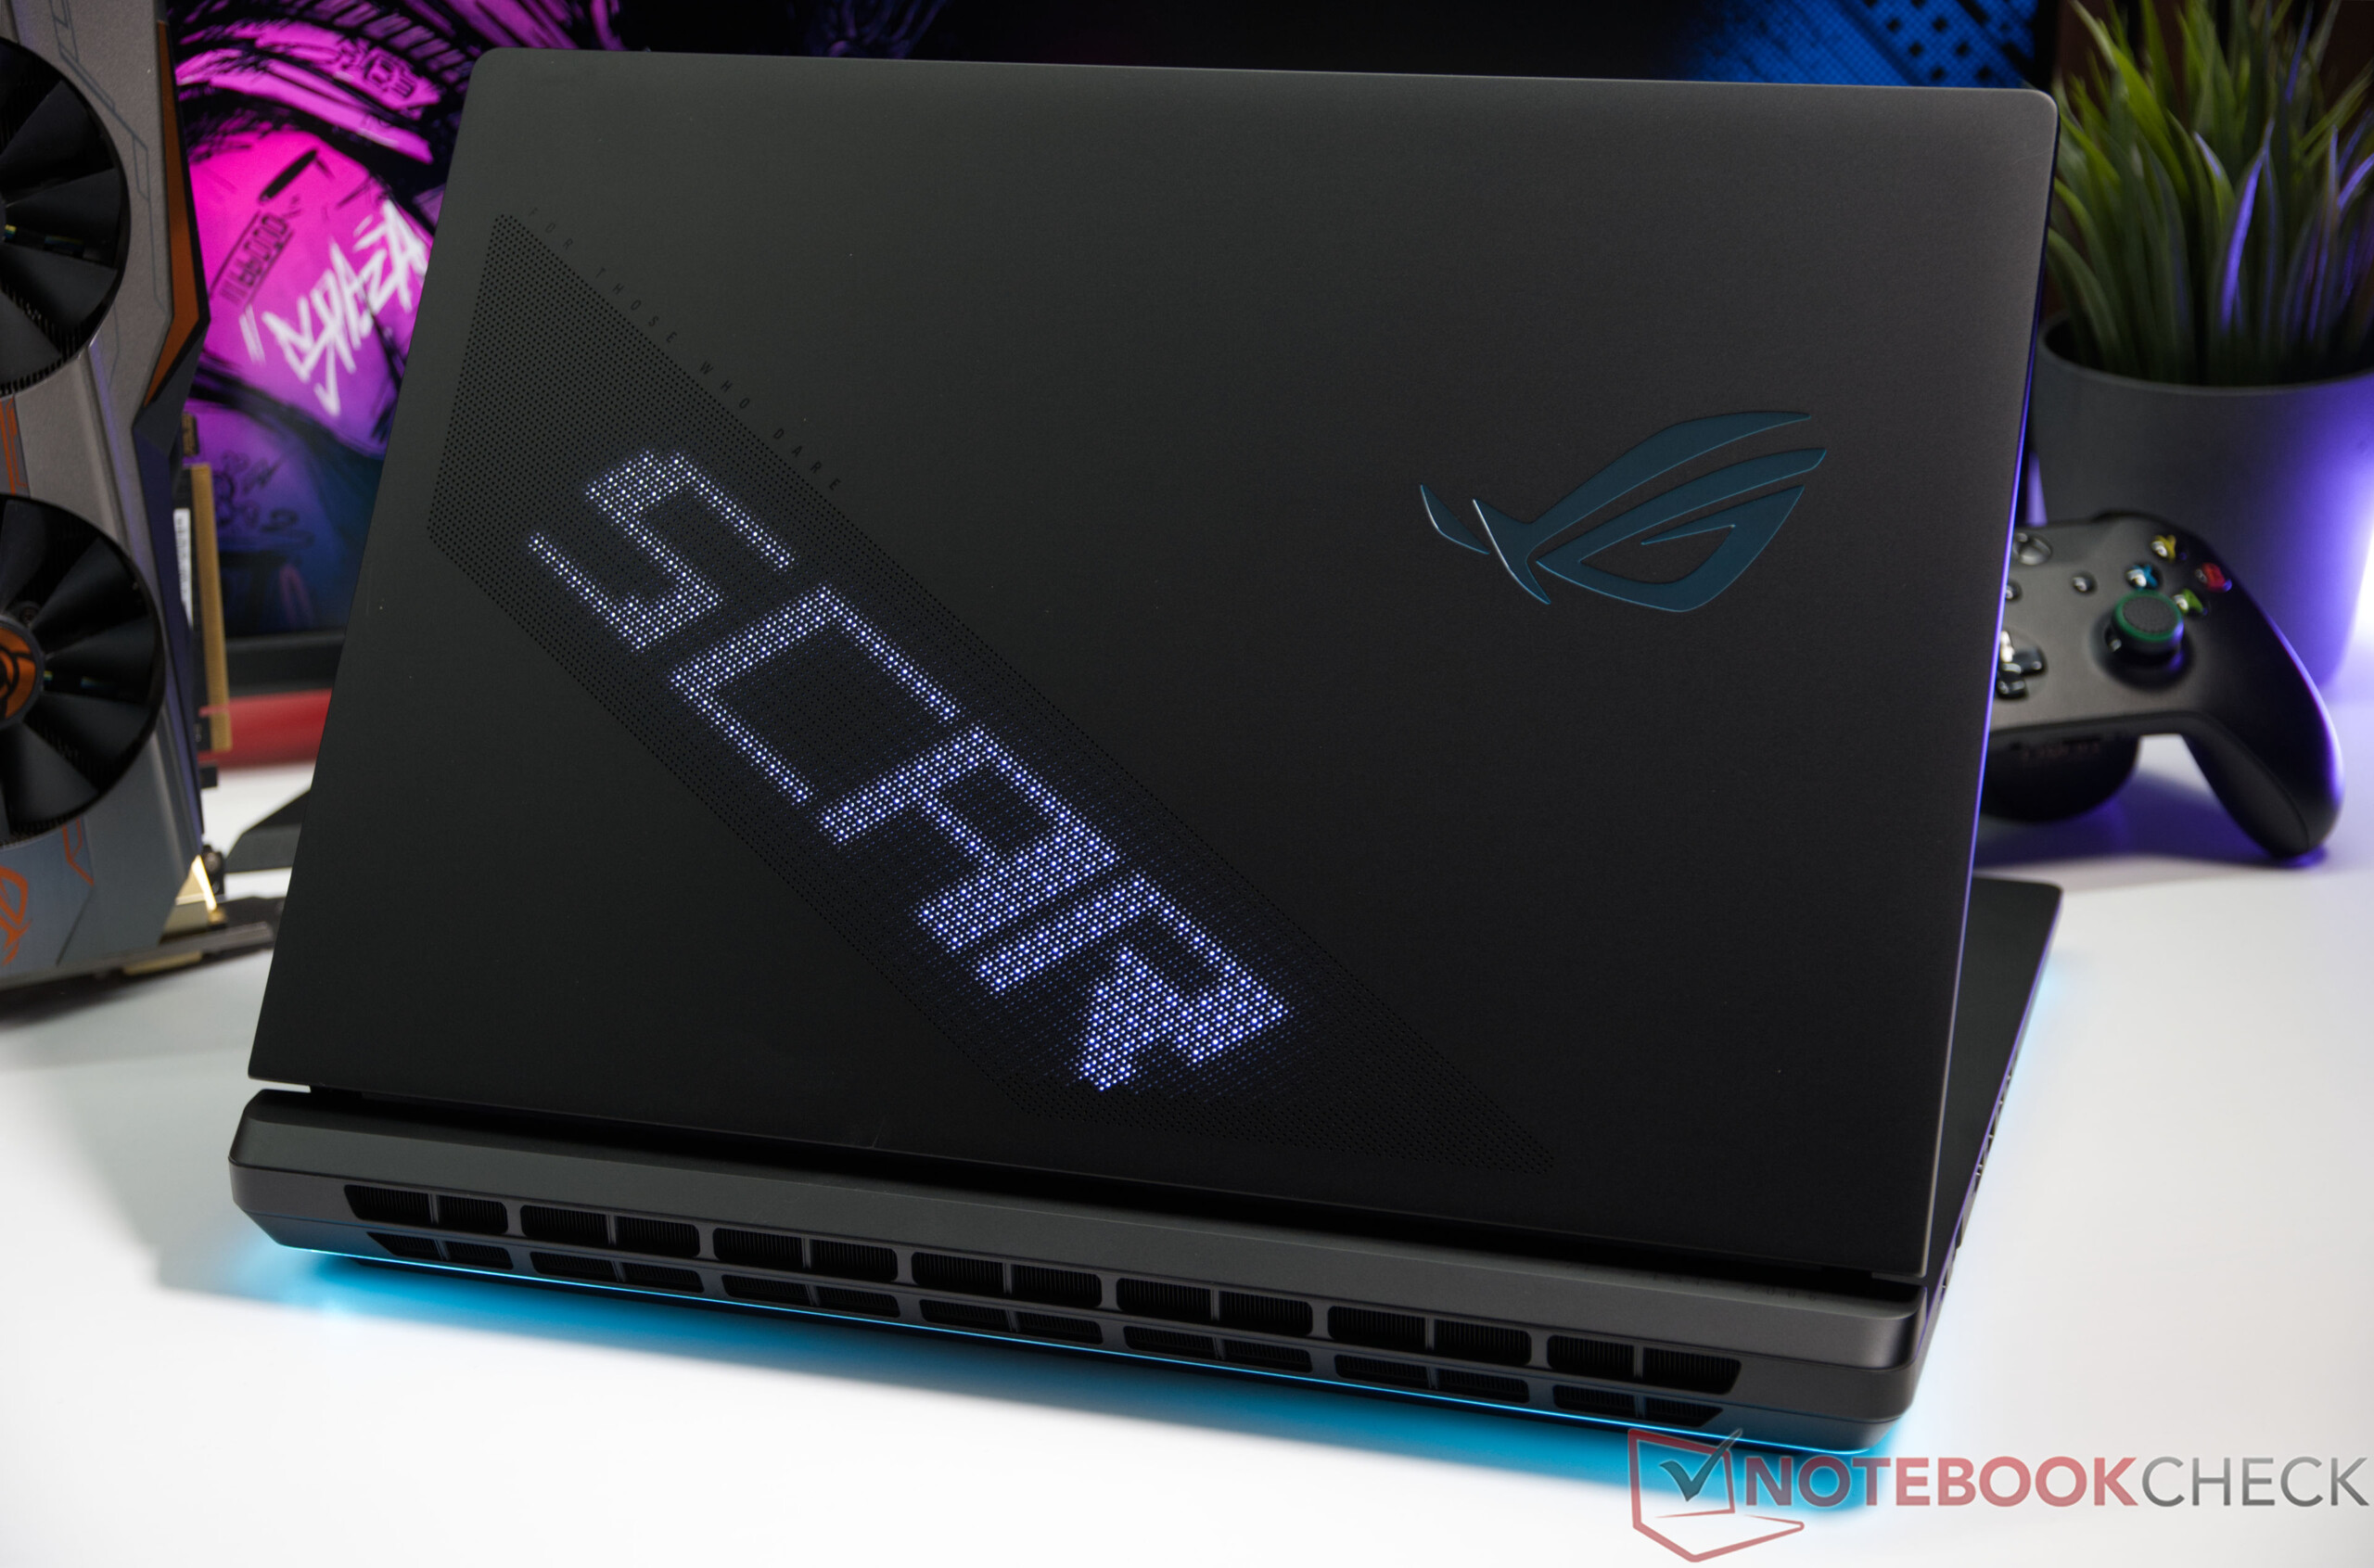
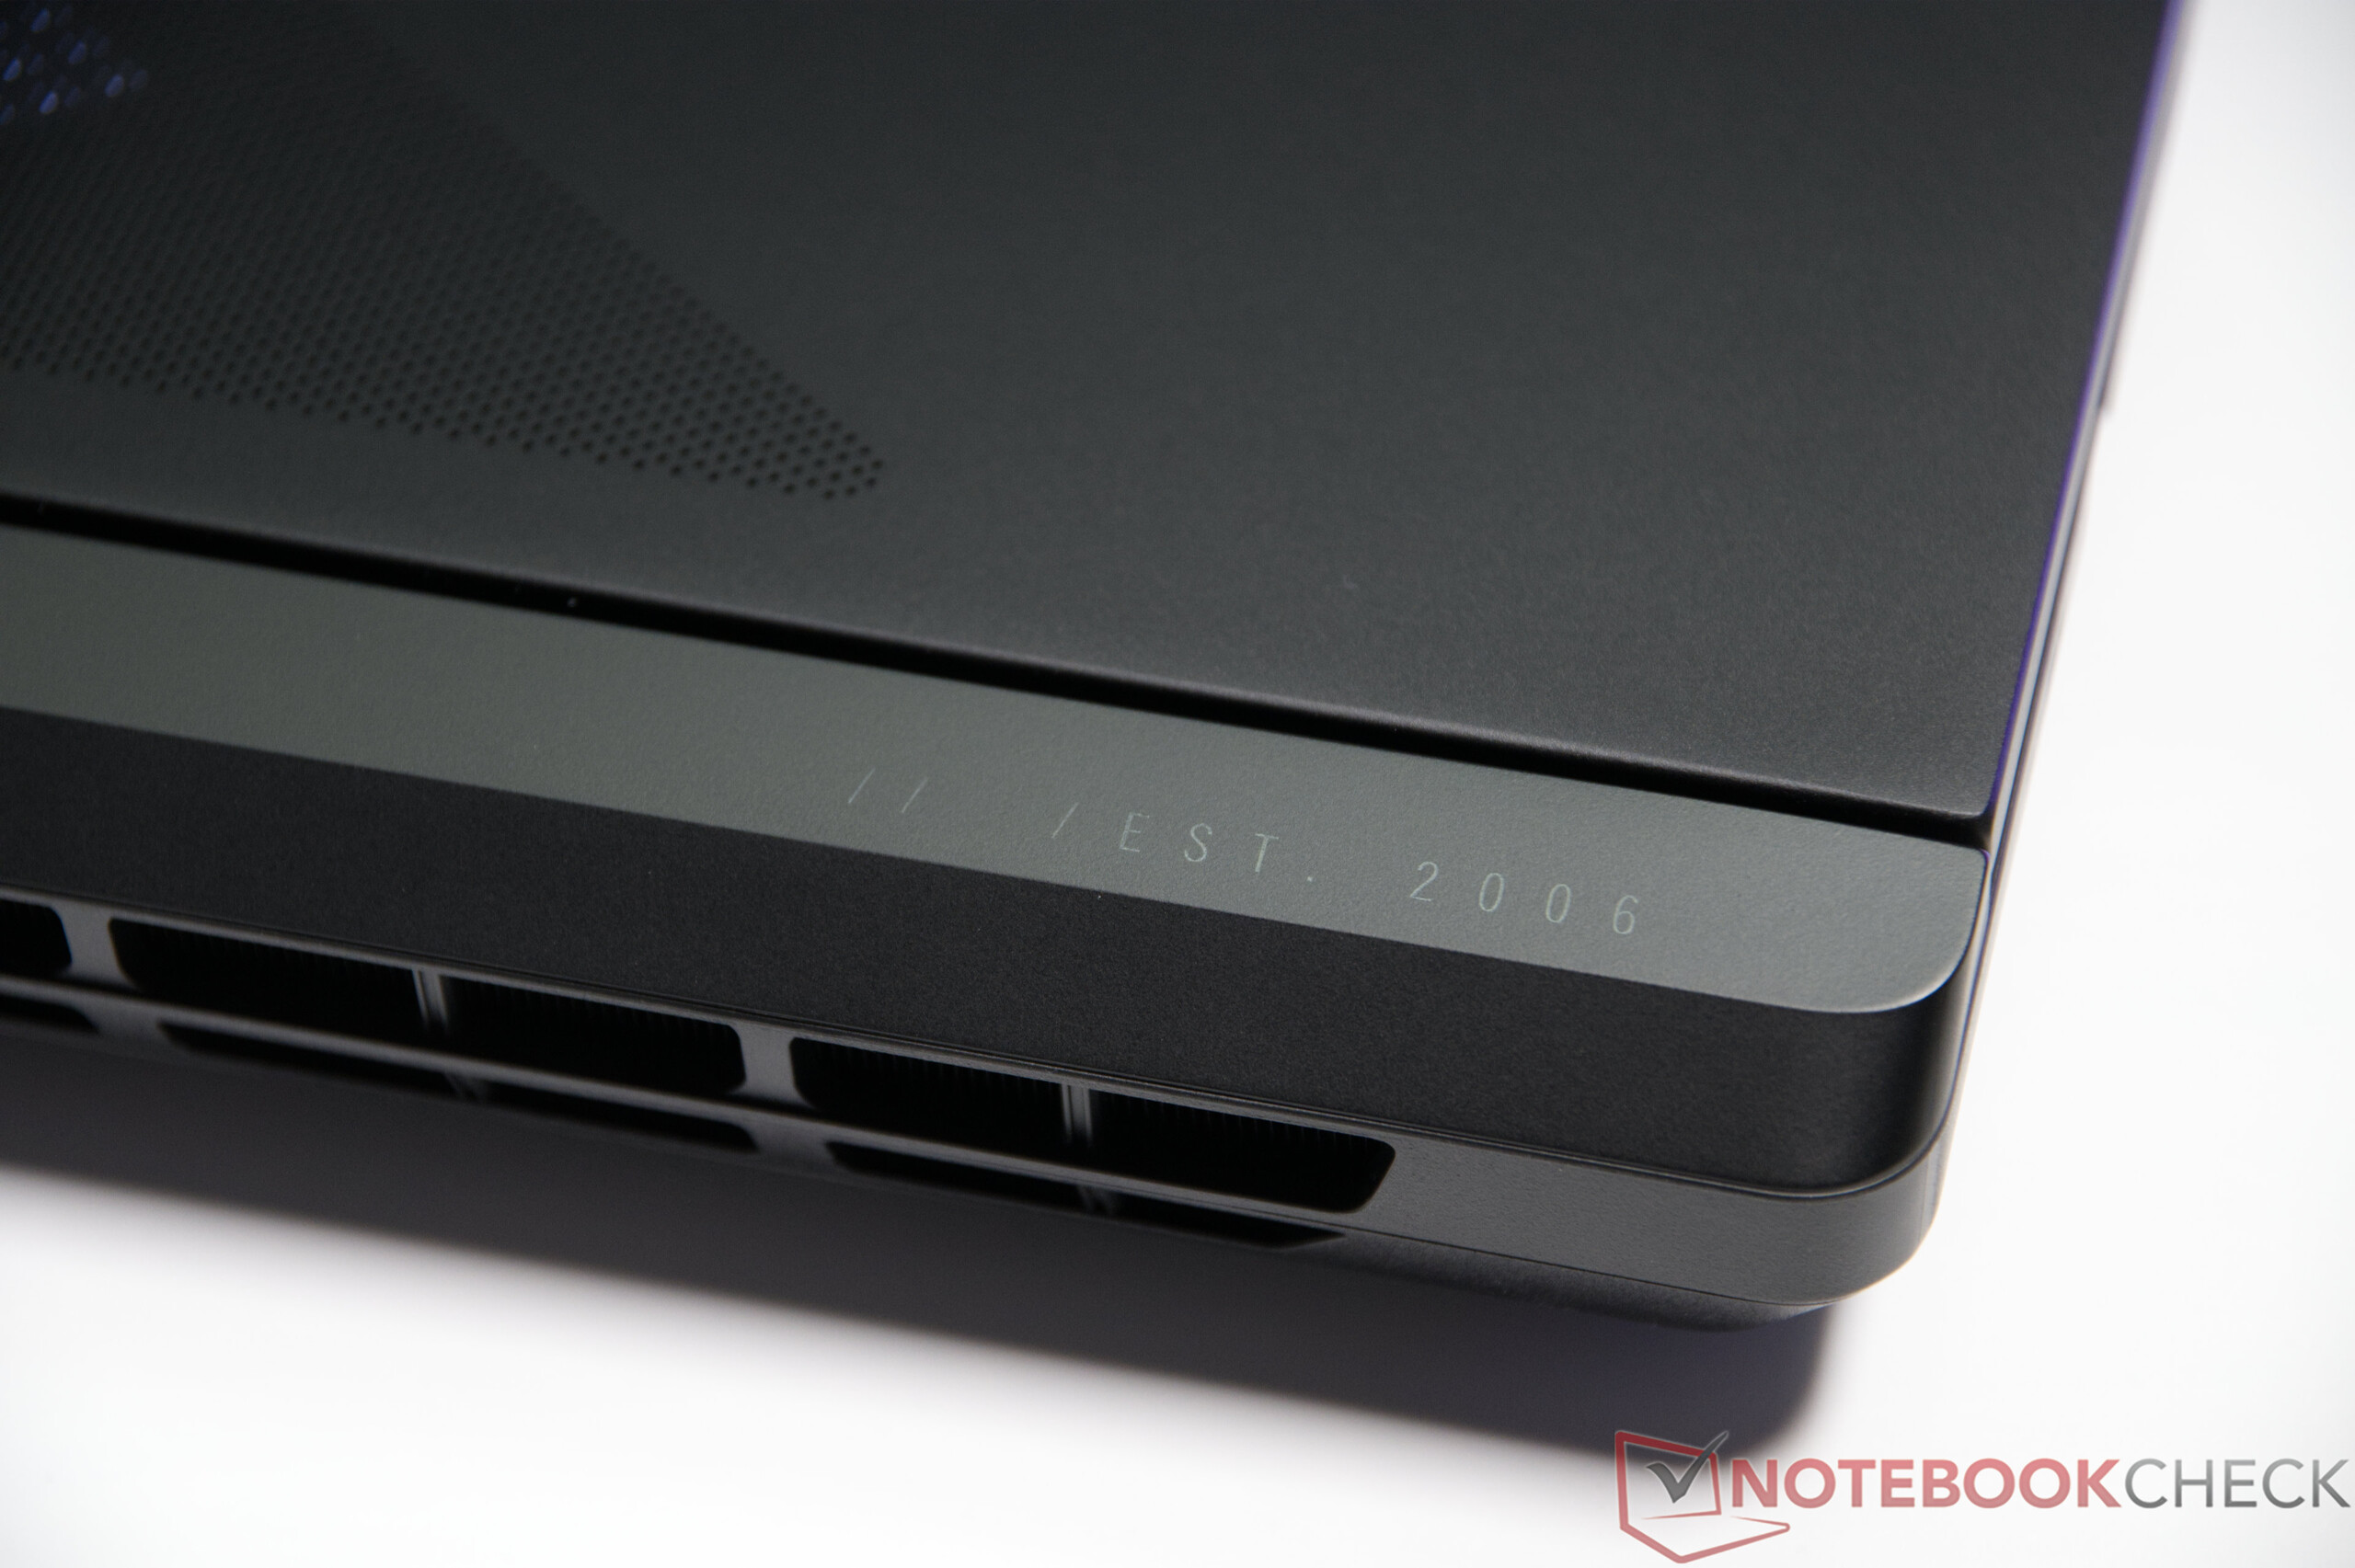
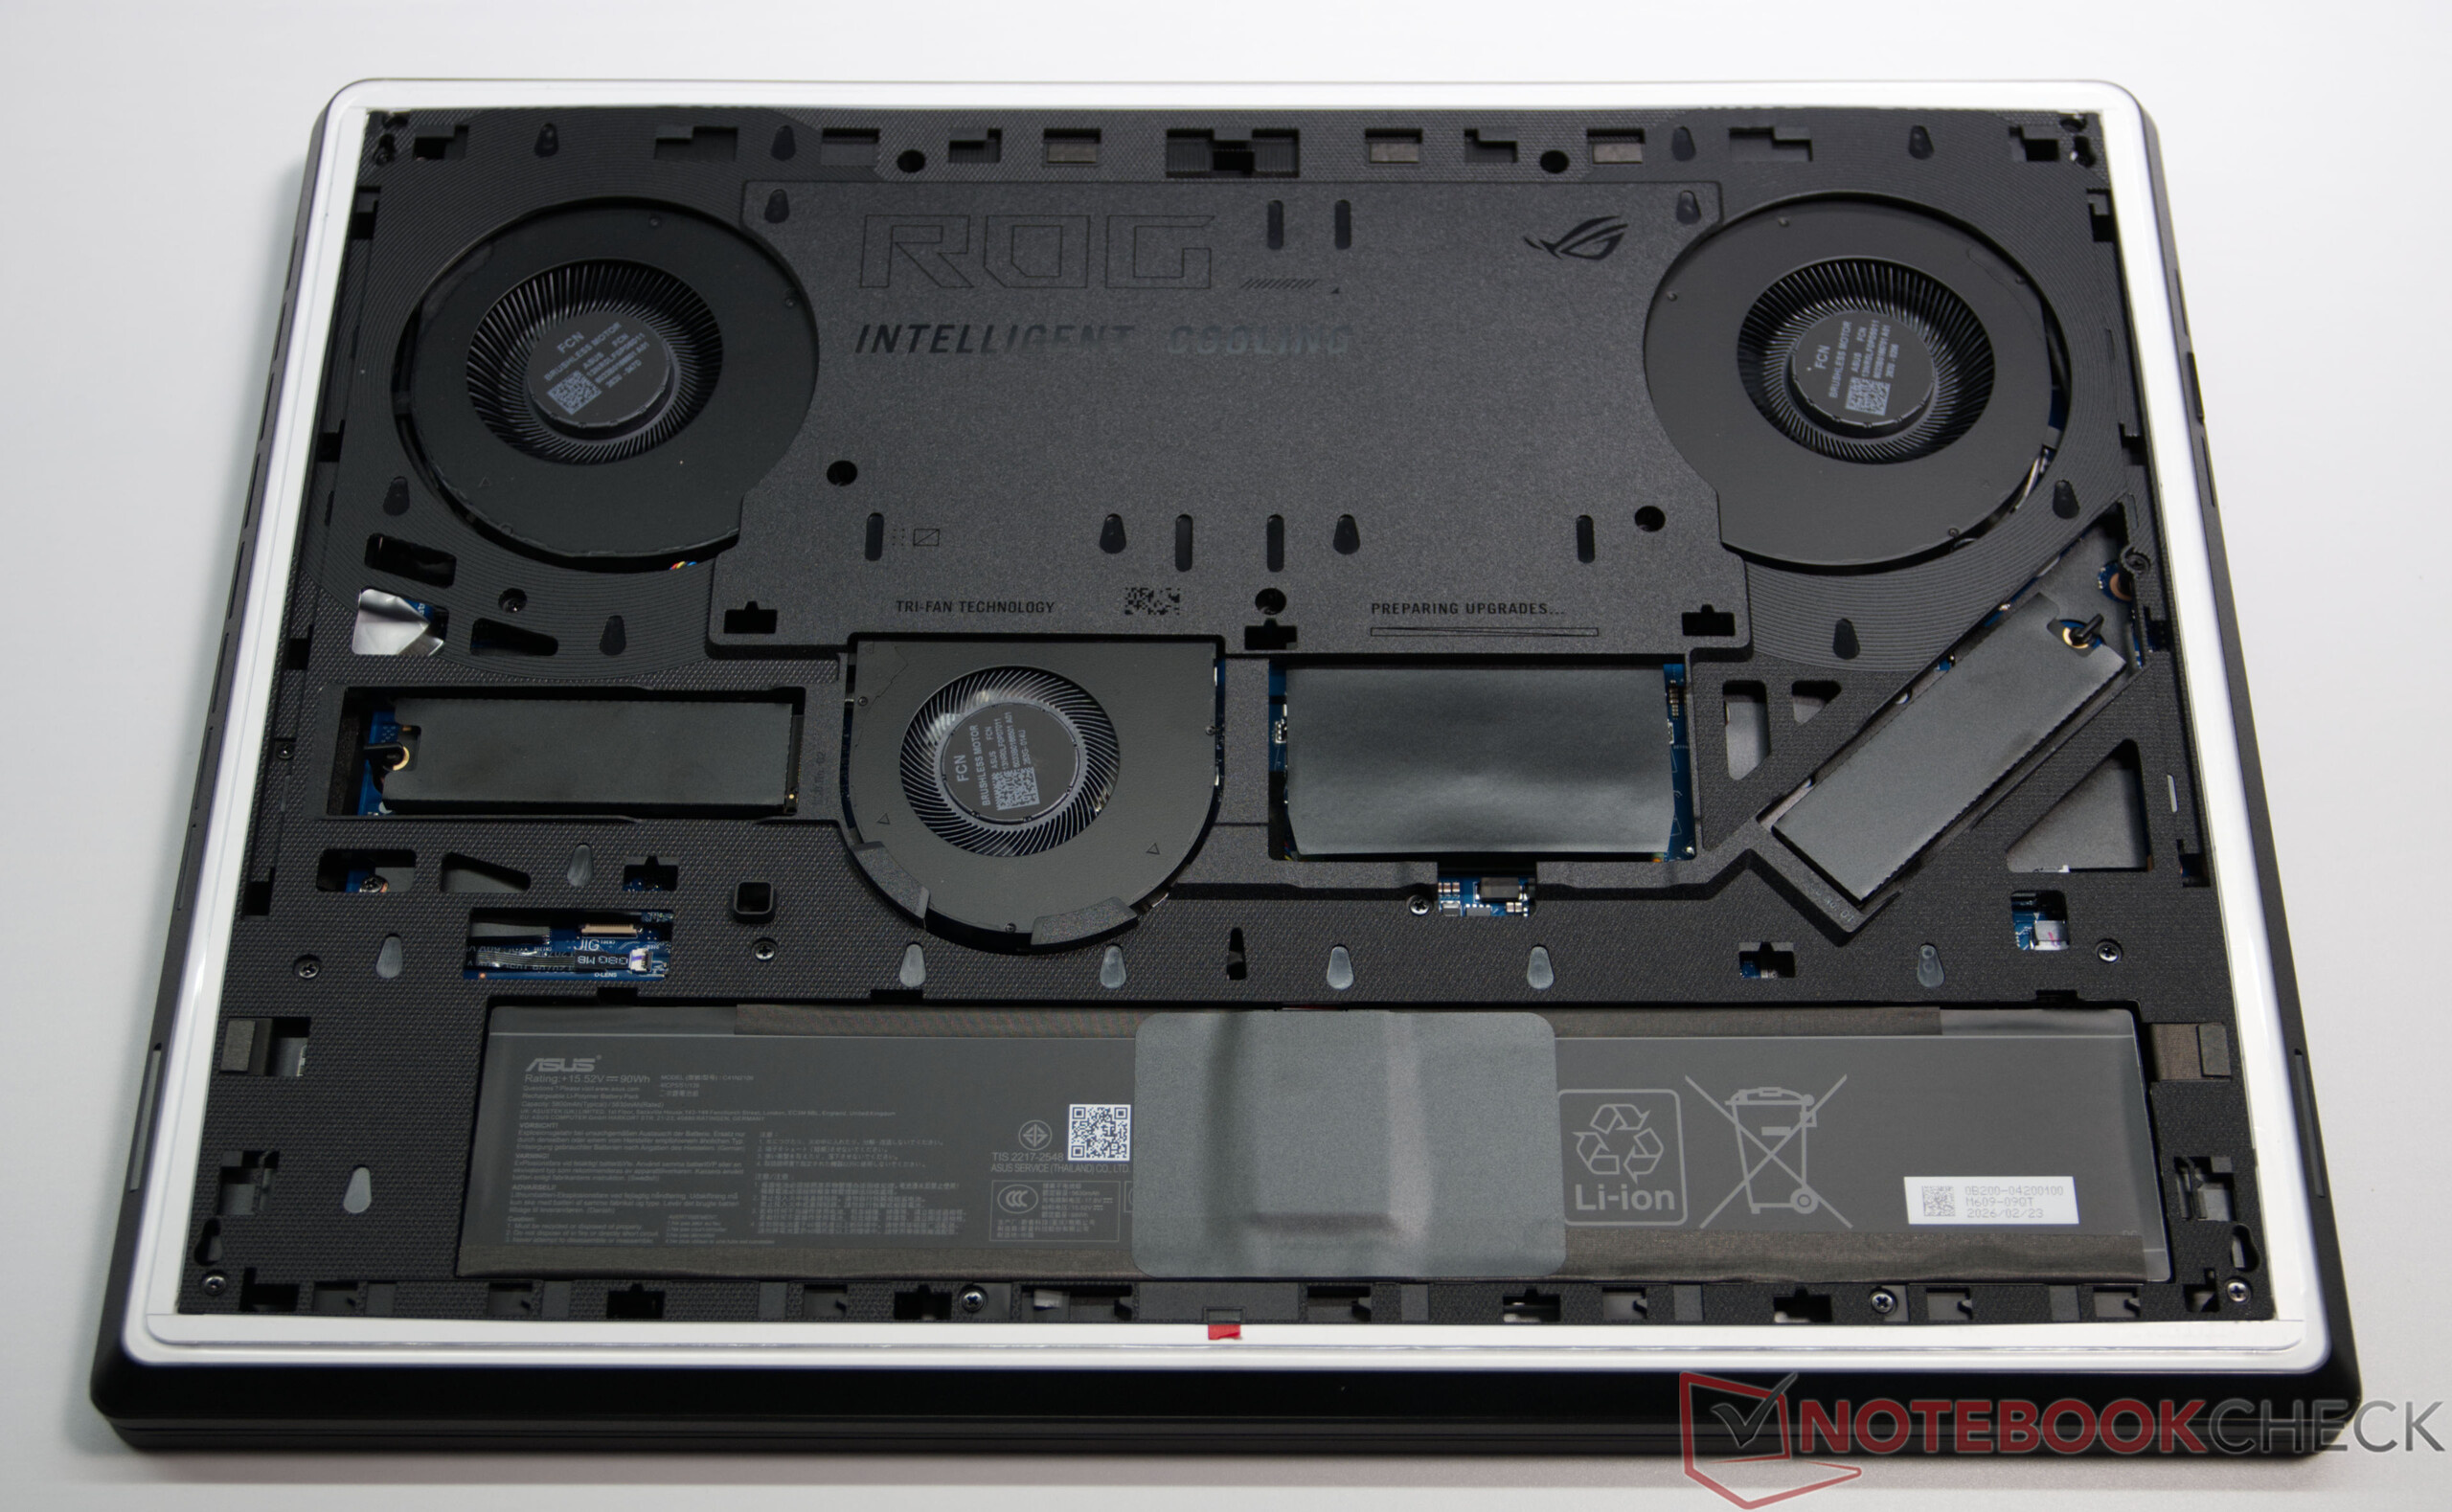
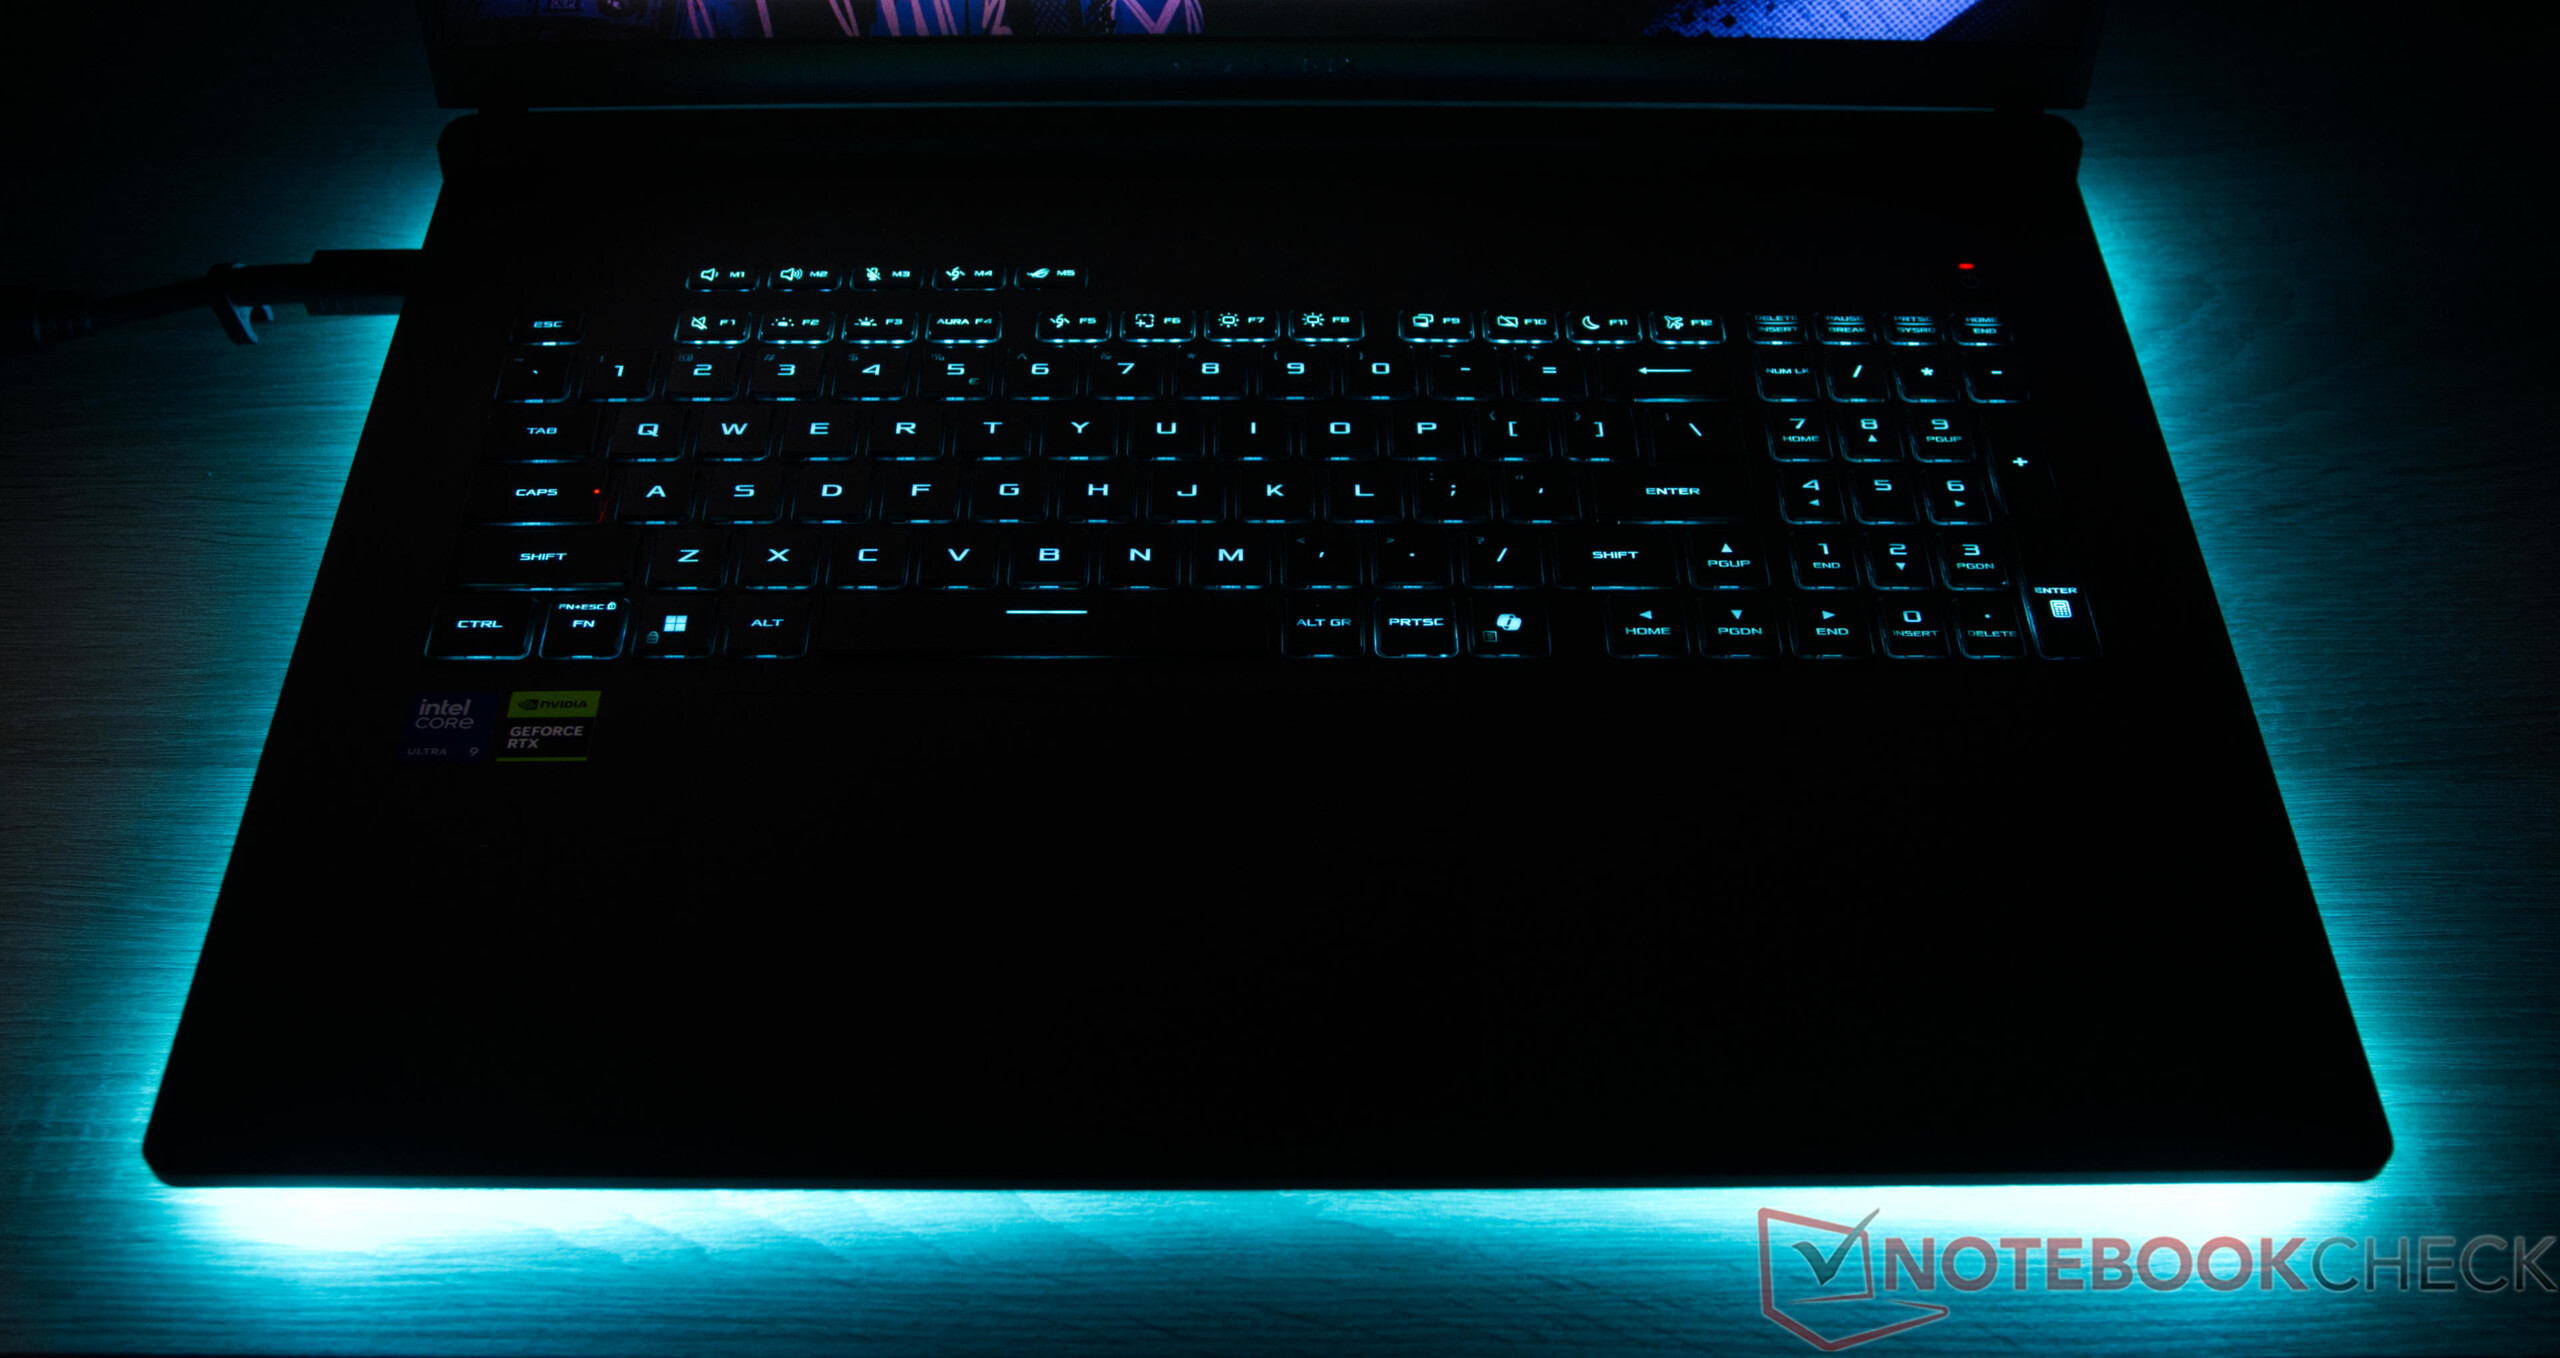
Le boîtier donne également une impression de grande qualité. L’éclairage RVB complet, notamment la fonction AniME Vision, ainsi que la facilité d’entretien, soulignent son caractère haut de gamme. Moins convaincants sont la surface en plastique délicate de la base, qui se couvre rapidement d’empreintes digitales, et le système de refroidissement, clairement audible en charge. À cela s’ajoutent une consommation d’énergie élevée et une autonomie de batterie qui n’est que moyenne pour cette catégorie de performances.

Si vous recherchez un ordinateur portable de remplacement d’un PC de bureau sans compromis, offrant des performances maximales pour les jeux et les applications, l’Asus ROG Strix SCAR 18 G835LXG est l’un des ordinateurs portables de jeu 18 pouces les plus puissants actuellement disponibles. Toutefois, cela s’accompagne d’un prix d’achat très élevé ainsi que d’un niveau sonore et d’une consommation d’énergie importants — des compromis typiques pour cette catégorie de performances.

Points positifs

+ Performances exceptionnelles en matière de jeux et de système
+ Ordinateur portable équipé d’une GeForce RTX 5090 avec un TGP de 175 watts
+ 128 Go de mémoire vive DDR5
+ Un total de 8 To de stockage (2 x 4 To en RAID 0)
+ Excellent écran Mini-LED de 18 pouces
+ Deux ports Thunderbolt 5
+ Options de maintenance et de mise à niveau exceptionnelles
+ Éclairage RGB et AniME Vision polyvalent et configurable
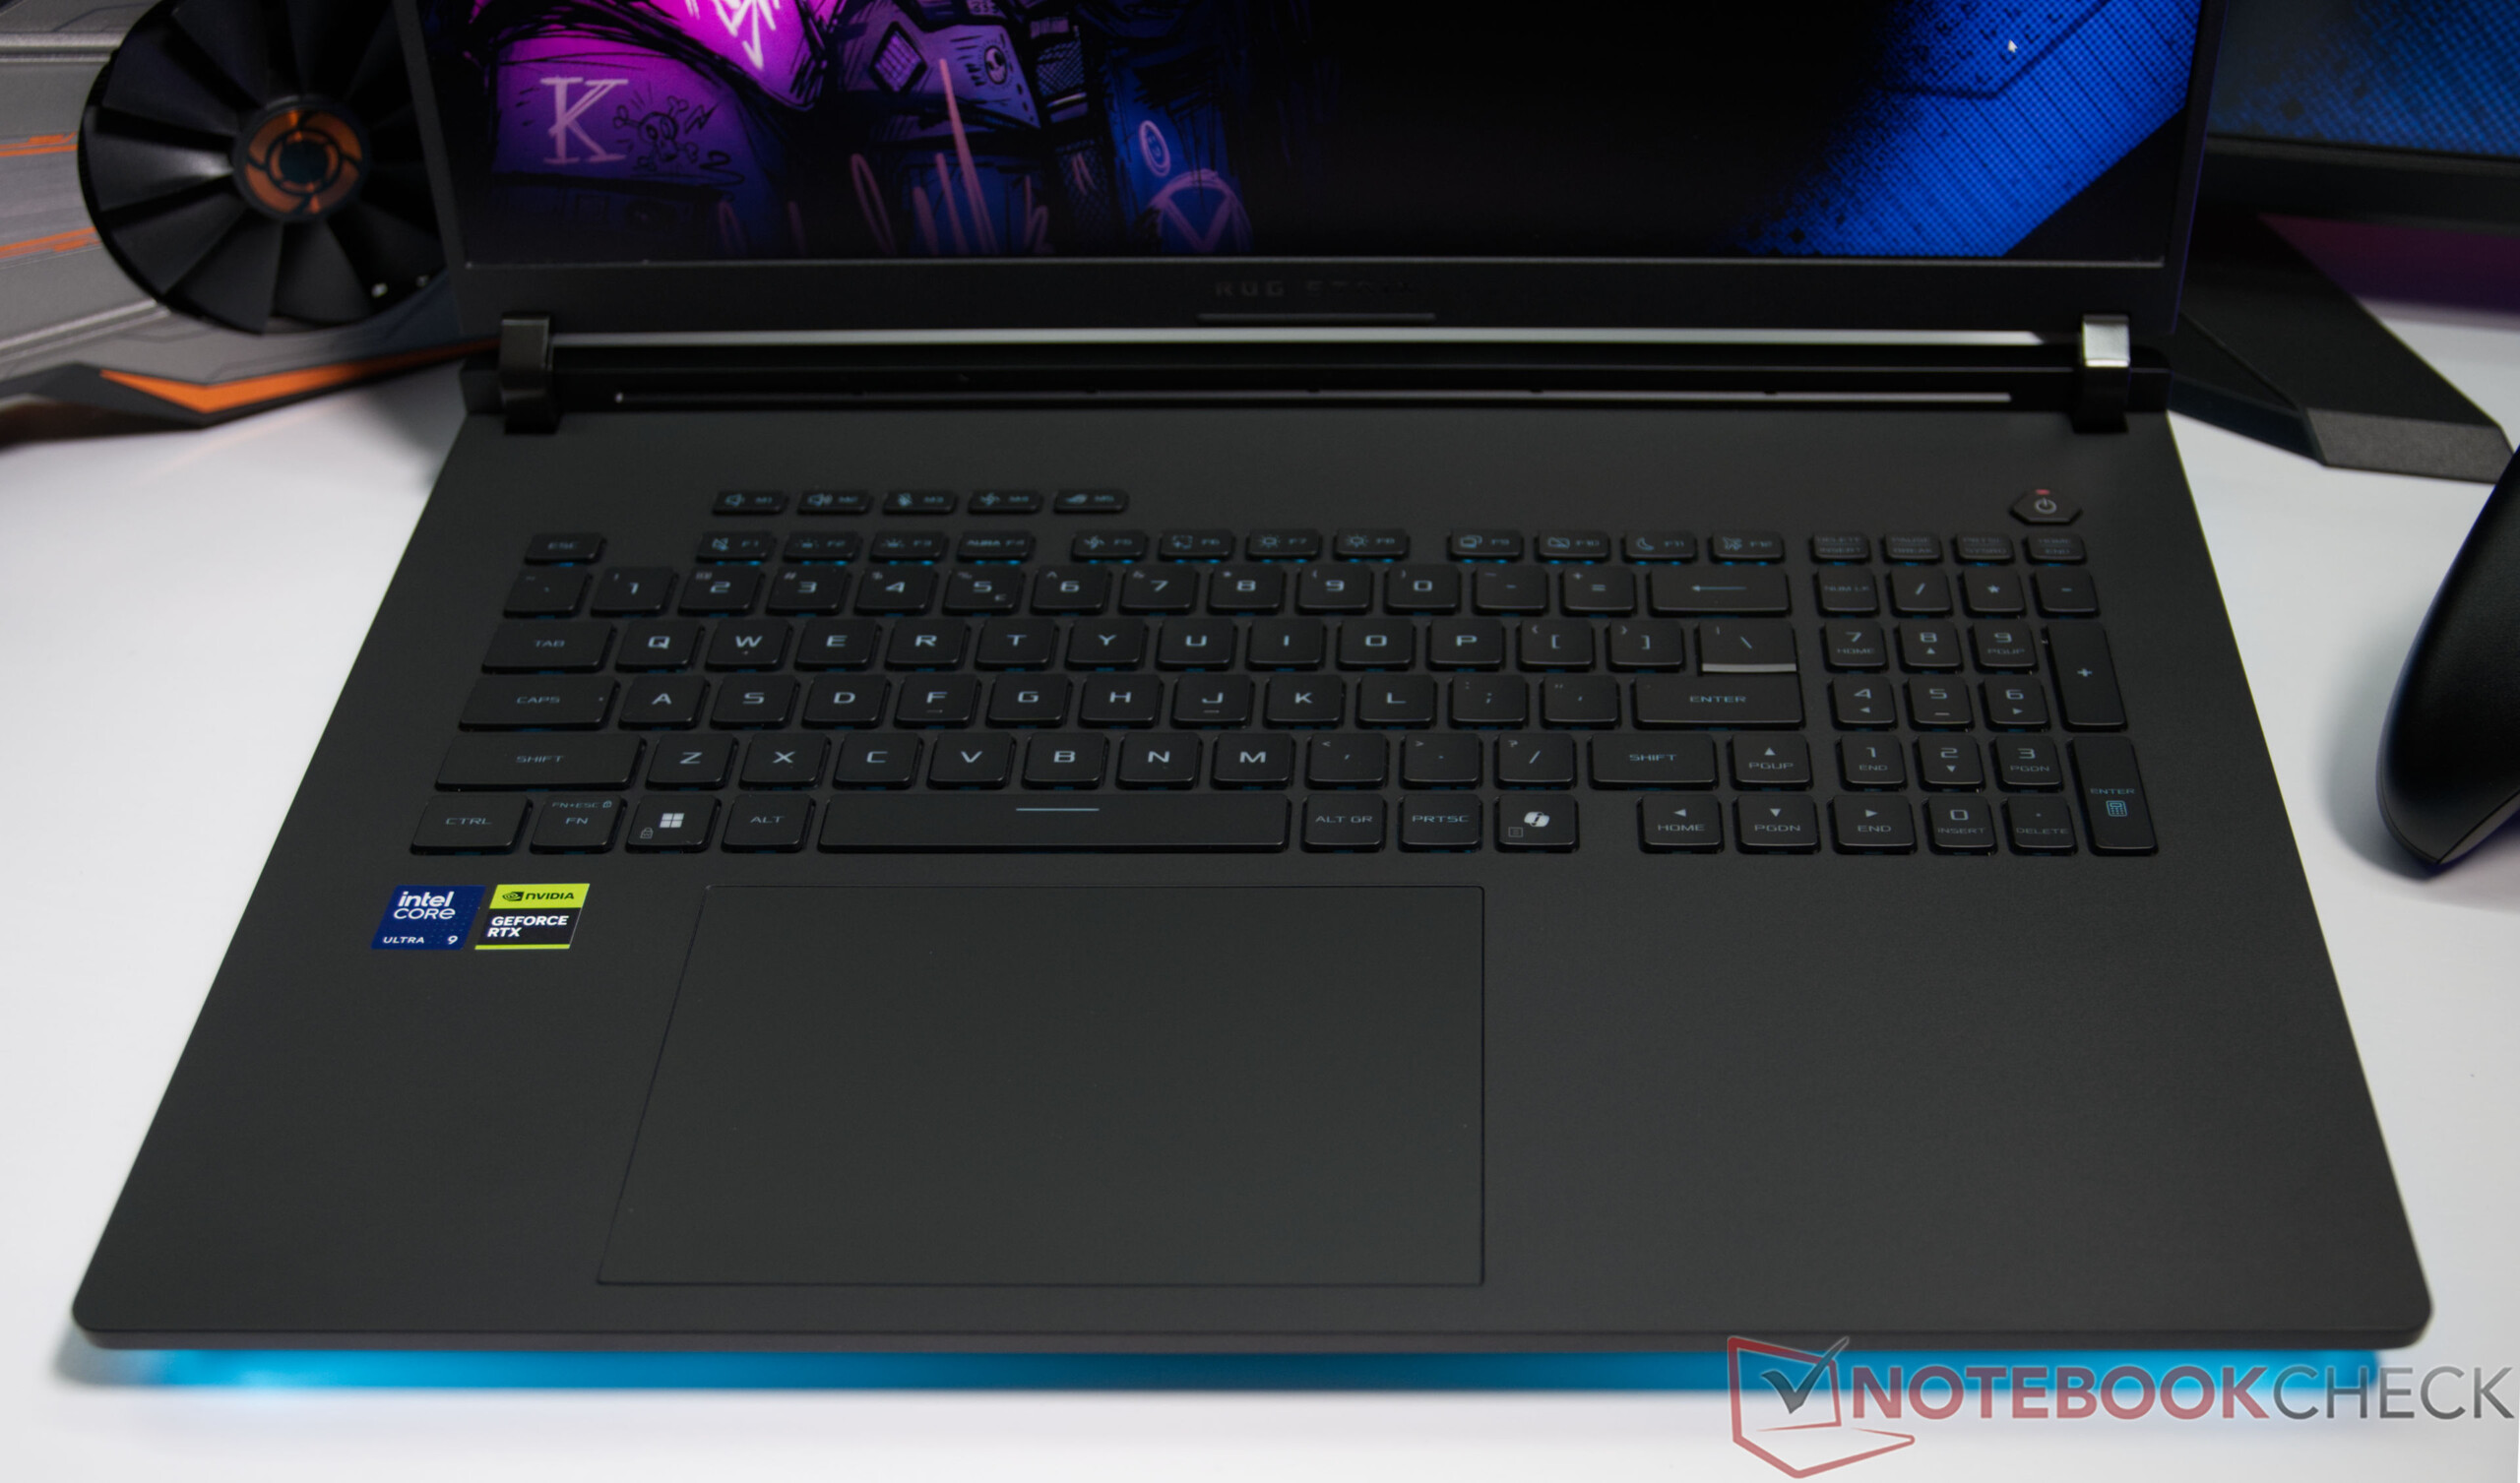
+ Clavier confortable offrant une frappe précise

Points négatifs

- Niveau sonore élevé en charge lors des jeux
- Le boîtier en plastique est très sensible aux traces de doigts
- Consommation électrique élevée en charge
- Aucun port à l'arrière du boîtier

Prix et disponibilité

Le nouvel Asus ROG Strix SCAR 18 devrait être disponible en magasin d'ici peu.

Amazon Logo
  • $7,439.00
    HIDevolution [2026] ASUS ROG Strix Scar 18 G835LXG 18" 4K 240Hz Mini LED, 2.7 GHz Ultra 9-290HX Plus, RTX 5090, 128 GB DDR5 RAM, 4 TB PCIe SSD, Windows 11 Pro
  • $6,284.00
    HIDevolution [2026] ASUS ROG Strix Scar 18 G835LXG 18" 4K 240Hz Mini LED, 2.7 GHz Ultra 9-290HX Plus, RTX 5090, 64 GB DDR5 RAM, 2 TB PCIe SSD, Windows 11 Home
  • $6,019.00
    HIDevolution [2026] ASUS ROG Strix Scar 18 G835LXG 18" 4K 240Hz Mini LED, 2.7 GHz Ultra 9-290HX Plus, RTX 5090, 64 GB DDR5 RAM, 1 TB PCIe SSD, Windows 11 Home

L’Asus ROG Strix SCAR 18 G835LXG est l’ordinateur portable de jeu phare d’Asus, conçu pour les utilisateurs ayant les exigences les plus élevées en matière de performances. Notre modèle de test associe un processeur Intel Core Ultra 9 290HX à une carte graphique pour ordinateur portable Nvidia GeForce RTX 5090 et dispose également de 128 Go de RAM, deux SSD rapides de 4 To en configuration RAID 0, ainsi qu’un écran Mini-LED de 18 pouces avec un taux de rafraîchissement de 240 Hz. Cet ordinateur portable haut de gamme est ainsi tout aussi adapté aux jeux exigeants qu’à la création de contenu professionnel.

Spécifications

Asus ROG Strix Scar 18 G835LXG (Strix Scar 18 Gamme)
Processeur
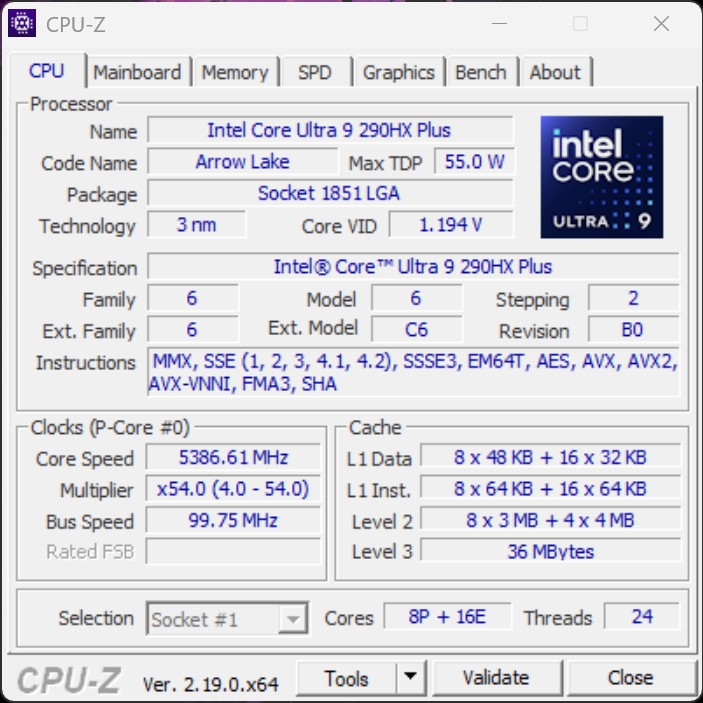
Intel Core Ultra 9 290HX Plus 24c/24t, 8 x 5.5 GHz Intel Lion Cove P-Core, 16 x 4.7 GHz Intel Skymont E-Core, 200 W PL2 / Short Burst, 180 W PL1 / Sustained, Arrow Lake-HX
Carte graphique
NVIDIA GeForce RTX 5090 Laptop - 24 Go VRAM, Processeur: 1597 MHz, RAM: 1750 MHz, 175 W TDP ( y compris 25 W Dynamic Boost), GDDR7, Nvidia 610.62, Advanced Optimus
Mémoire
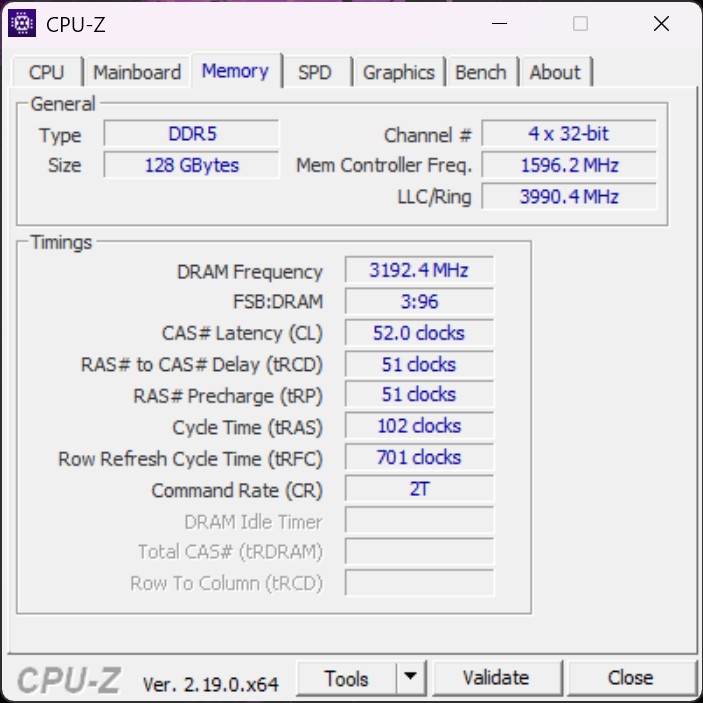
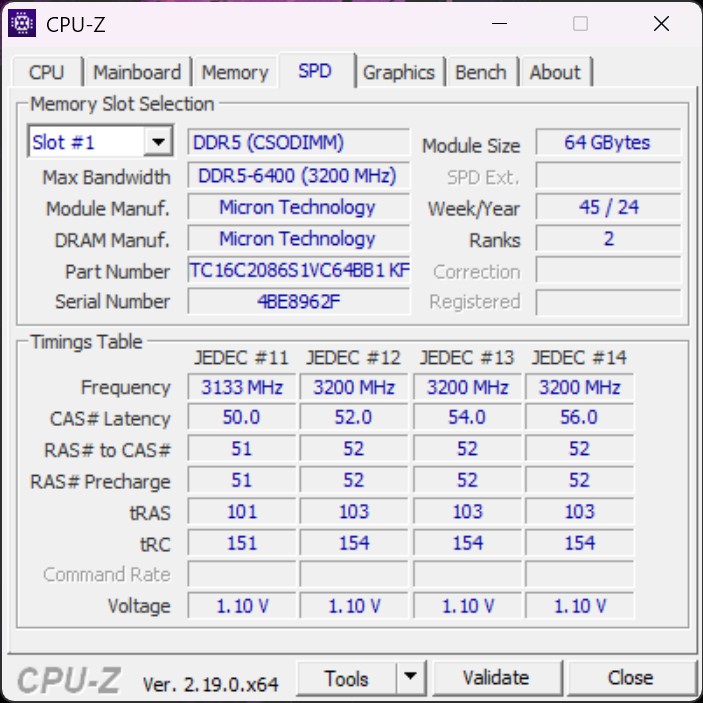
128 Go 
, DDR5-6400, 2x SO-DIMM, Dual-Channel
Écran
18.00 pouces 16:10, 3840 x 2400 pixel 252 PPP, NE180QA1-MM0, Mini LED, brillant: non, HDR, 240 Hz, Adaptive Sync
Carte mère
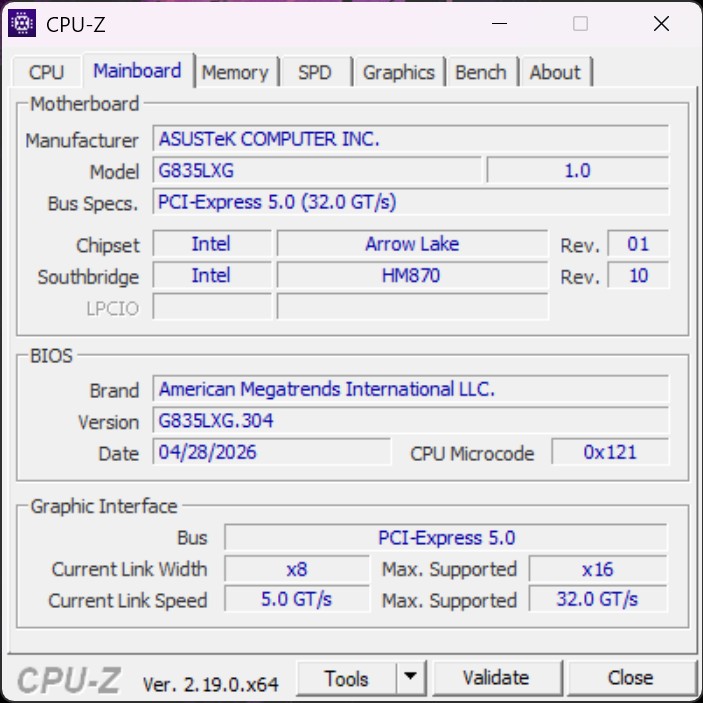
Intel HM870 (Arrow Lake-HX PCH)
Disque dur
2x Samsung PM9E1 MZVLC4T0HBL1 (RAID 0), 8192 Go 
, M.2 PCIe, RAID 0, 7280 Go libres
Carte son
Intel Arrow Lake-S PCH - ACE (Audio Context Engine)
Connexions
3 USB 3.1 Gen2, 2 Thunderbolt 5, USB-C Power Delivery (PD), 1 HDMI, 2 DisplayPort, 1 Port pour Station d'accueil, Connectique audio: 3.5 mm Stereo
Réseau
Realtek RTL8125 2.5GBe Family Ethernet Controller (10/100/1000/2500MBit/s), Intel Wi-Fi 7 BE200 320MHz (a/b/g/n = Wi-Fi 4/ac = Wi-Fi 5/ax = Wi-Fi 6/ Wi-Fi 6E 6 GHz be = Wi-Fi 7), Bluetooth 5.4
Taille
Hauteur x Largeur x Profondeur (en mm): 35 x 399 x 298
Batterie
90 Wh Lithium-Polymère, 4-cell
Système d'exploitation
Microsoft Windows 11 Home
Appareil photo
Webcam: 1080P FHD IR Camera for Windows Hello
Appareil photo primaire: 2 MPix
Fonctionnalités additionnelles
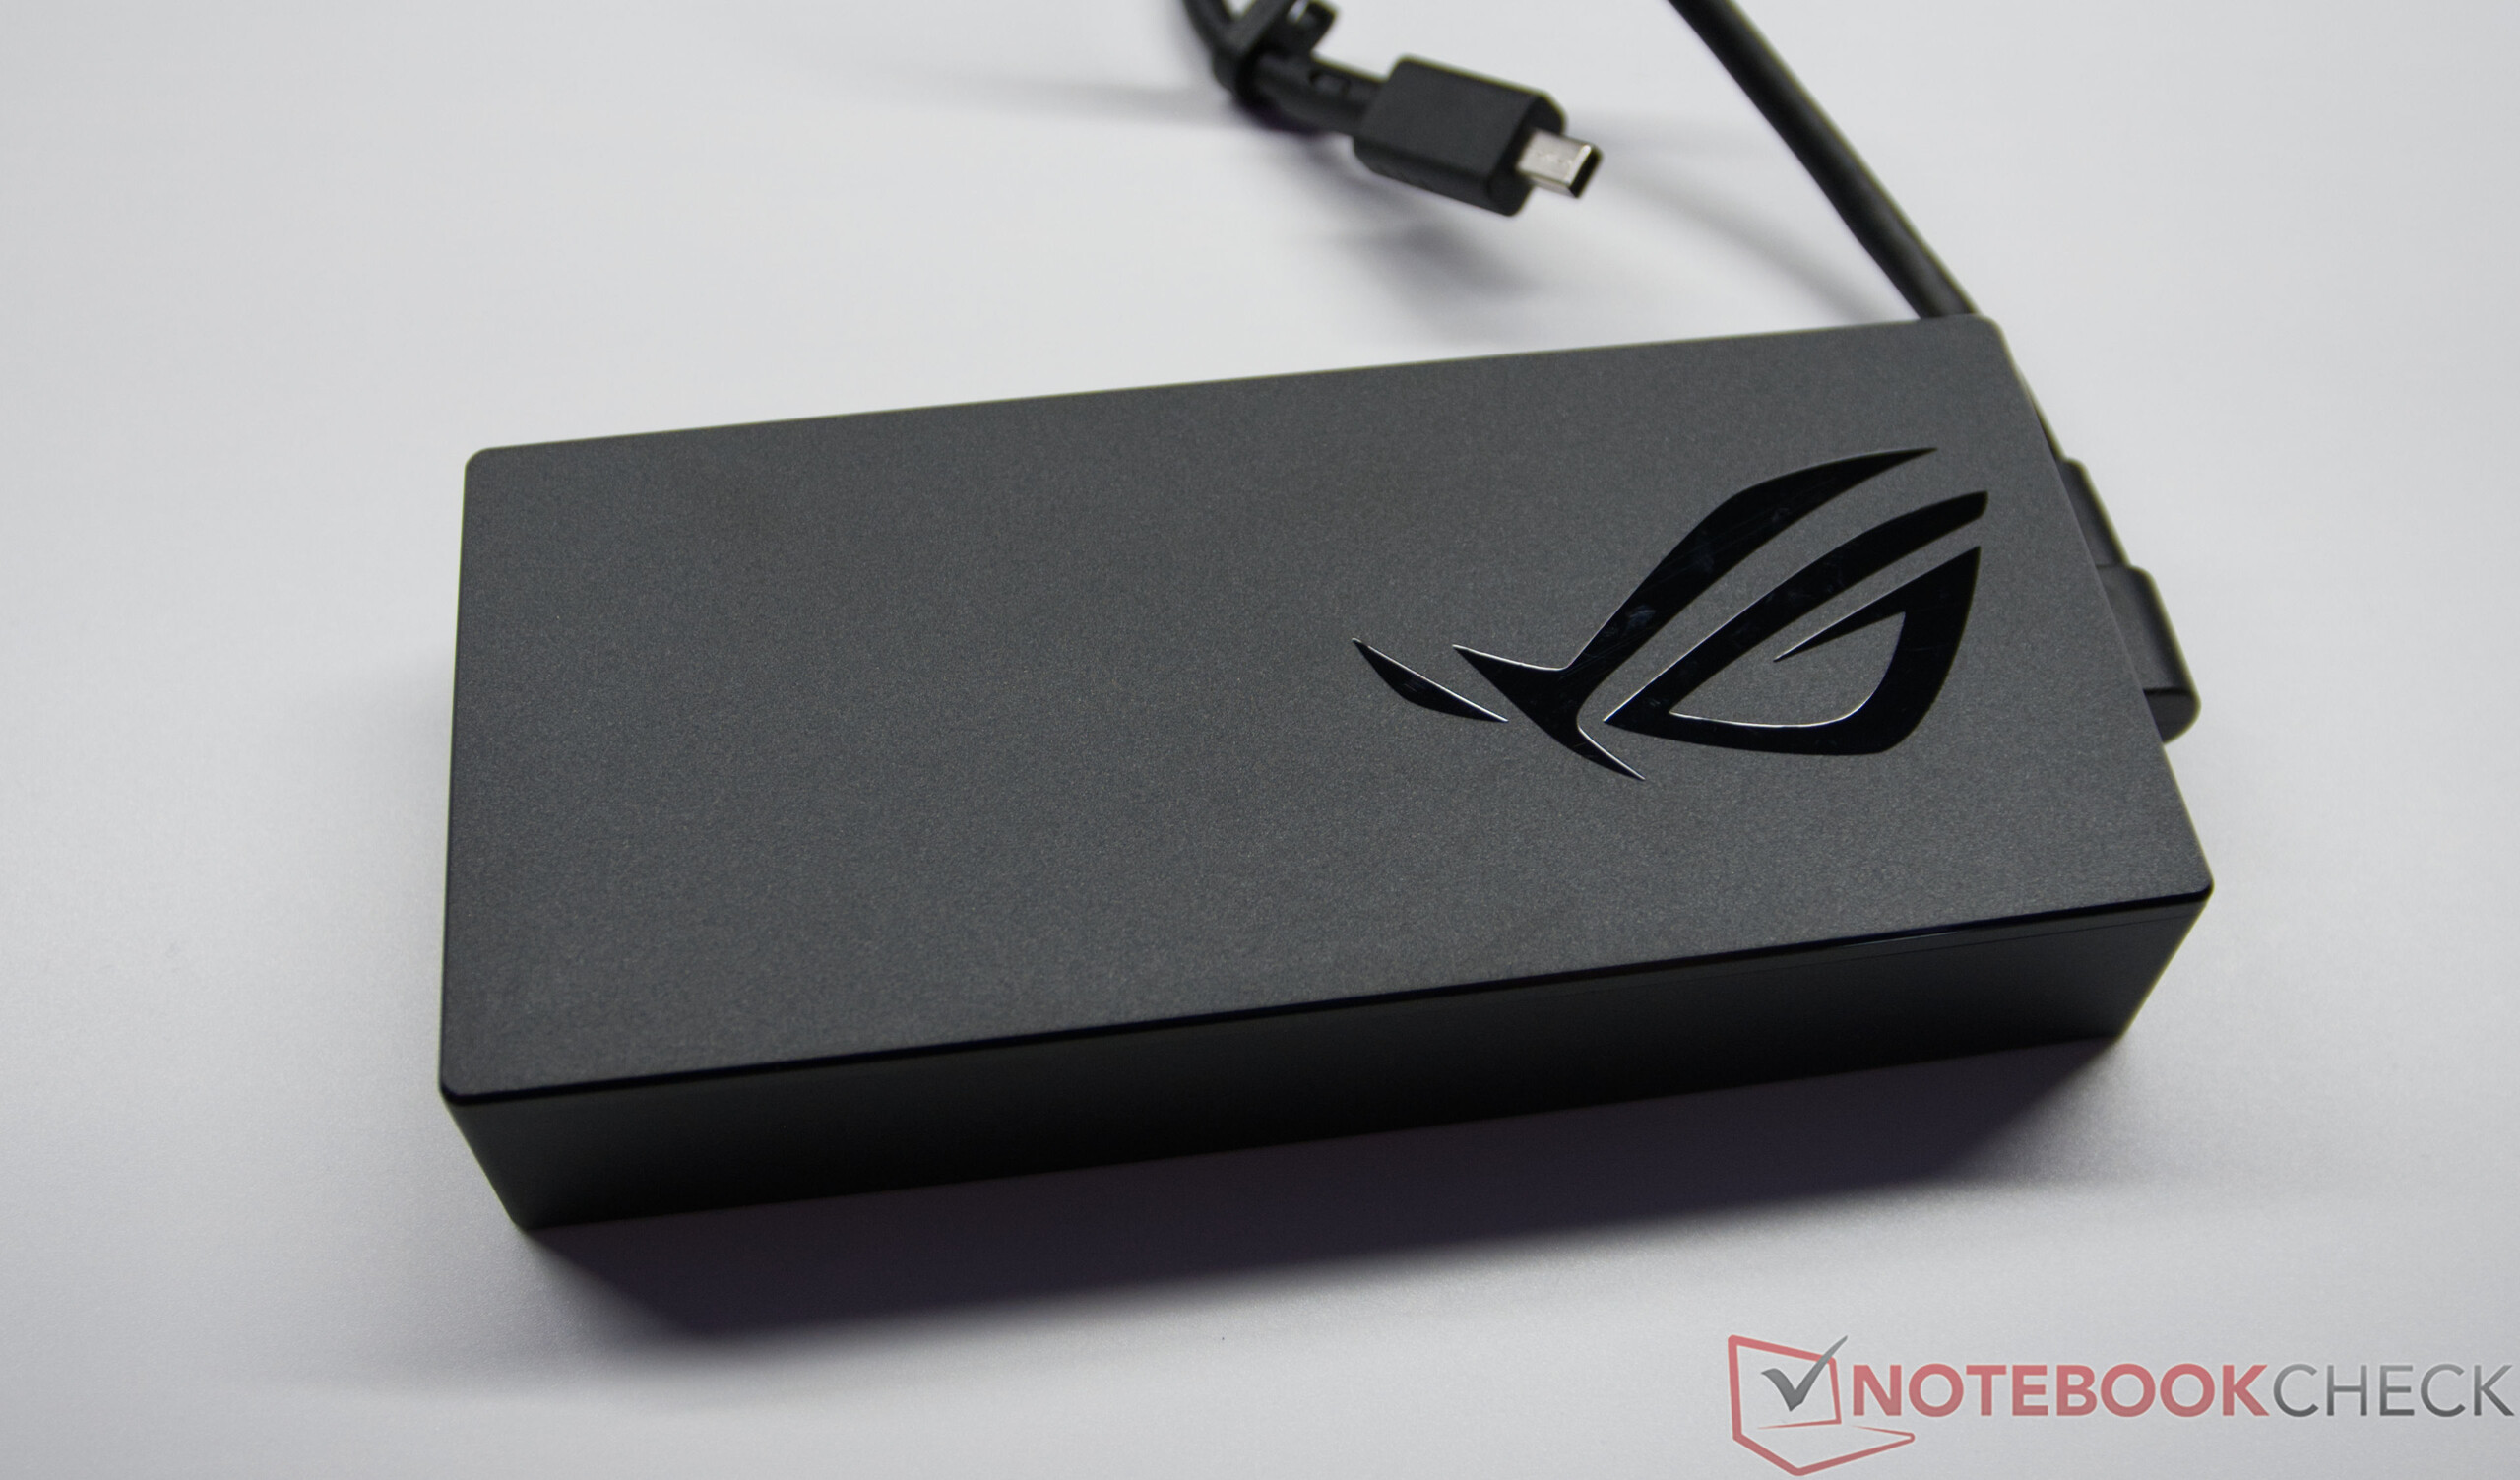
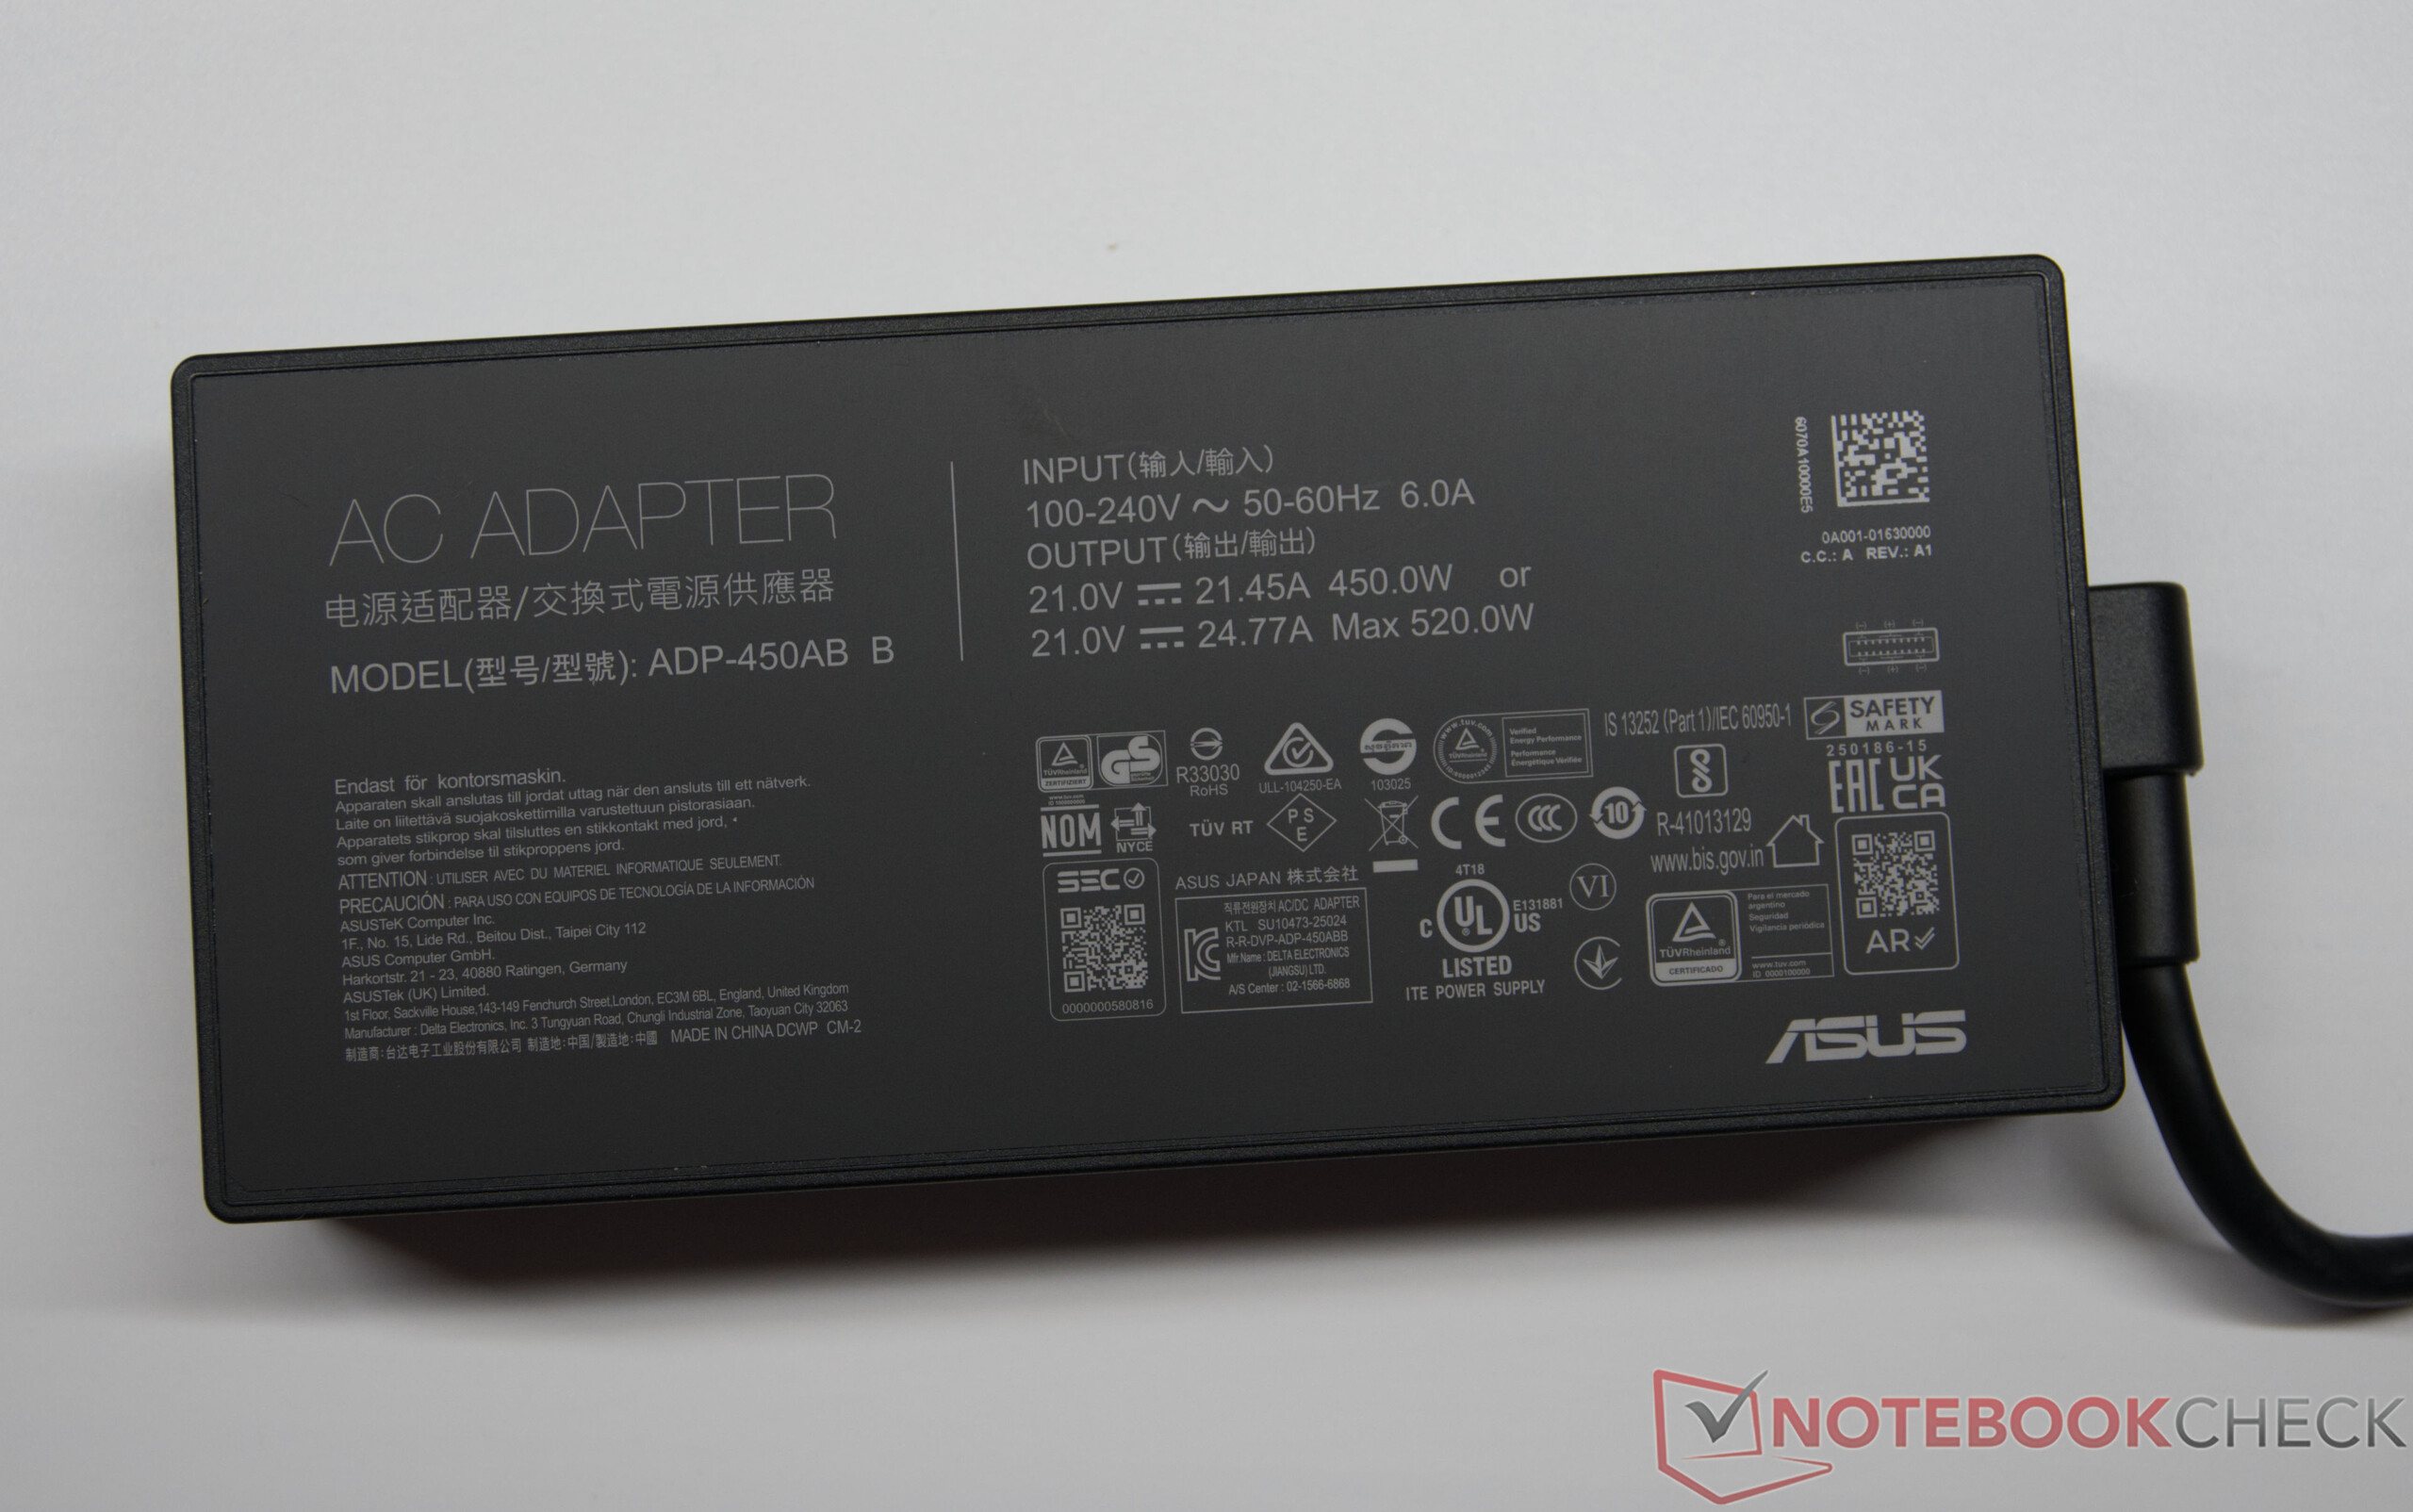
Haut-parleurs: 4-speaker system, Clavier: Chiclet, Rétroéclairage du clavier: oui, 450W PSU, Armoury Crate, 24 Mois Garantie
Poids
3.605 kg, Alimentation: 821 g
Prix
8999 euros
Remarque : le fabricant peut utiliser des composants provenant de différents fournisseurs, notamment des panneaux d'affichage, des lecteurs ou des clés USB ayant des spécifications similaires.


Boîtier, fonctionnalités et périphériques d'entrée

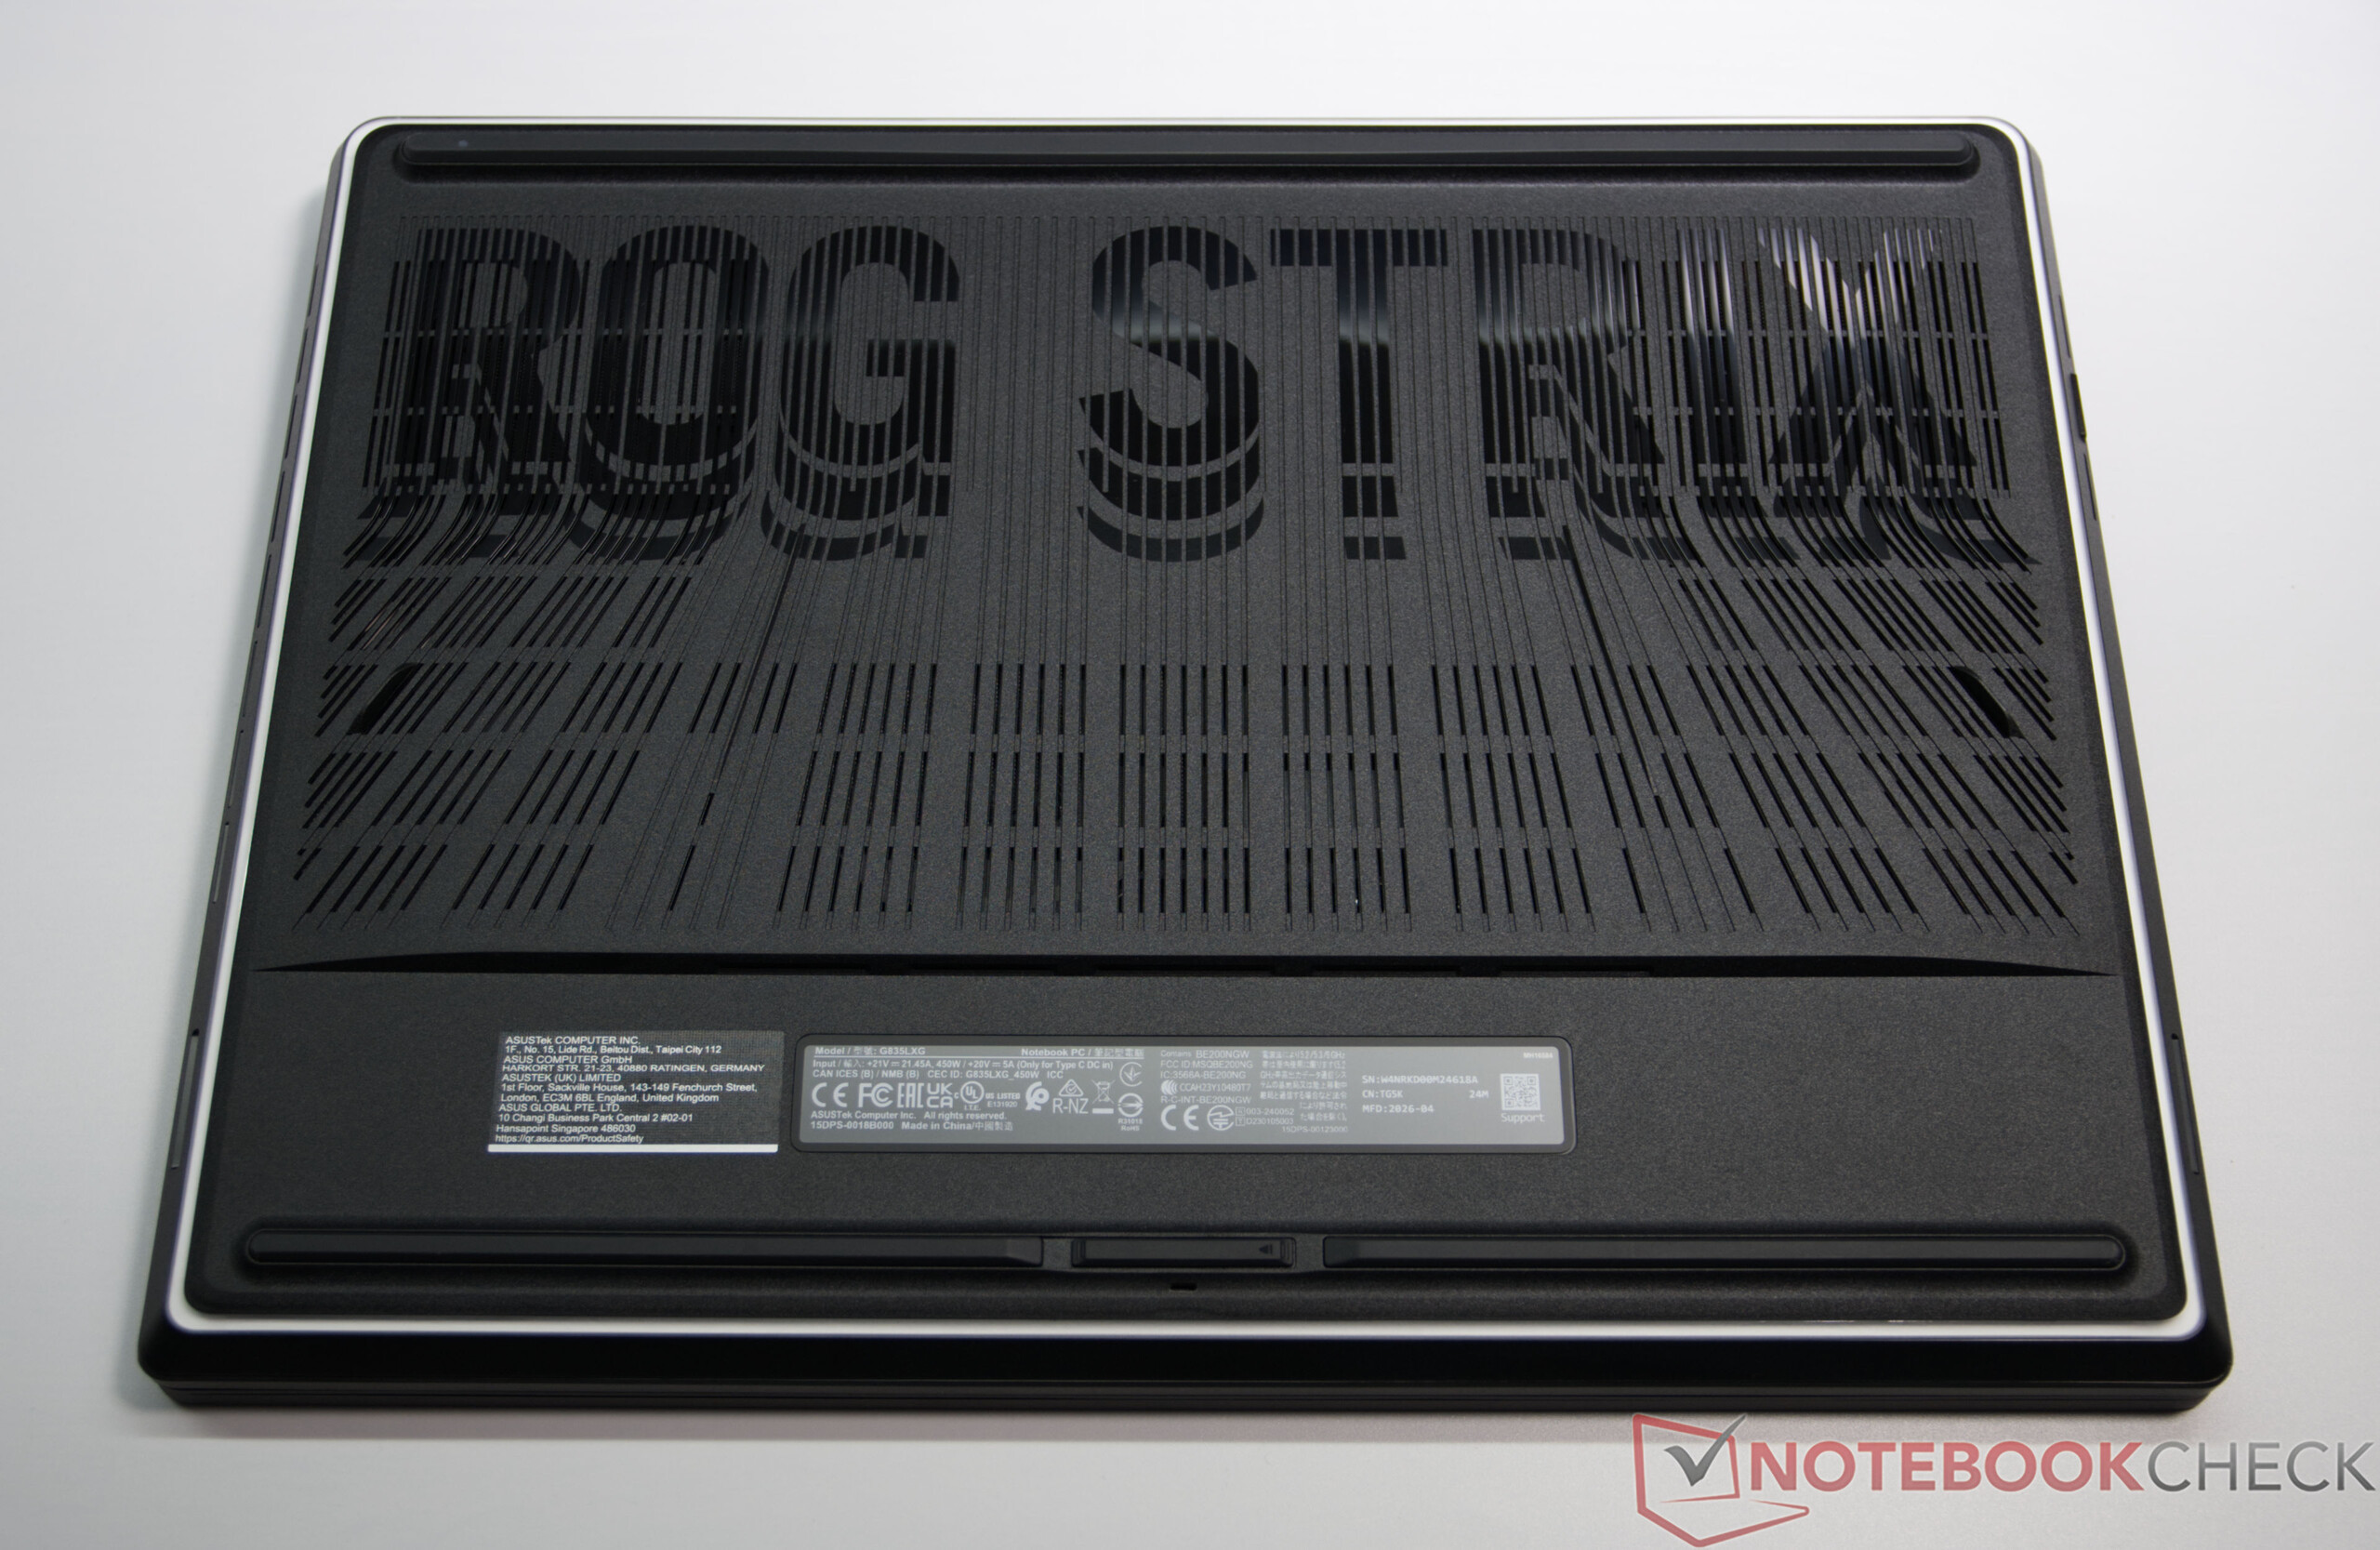
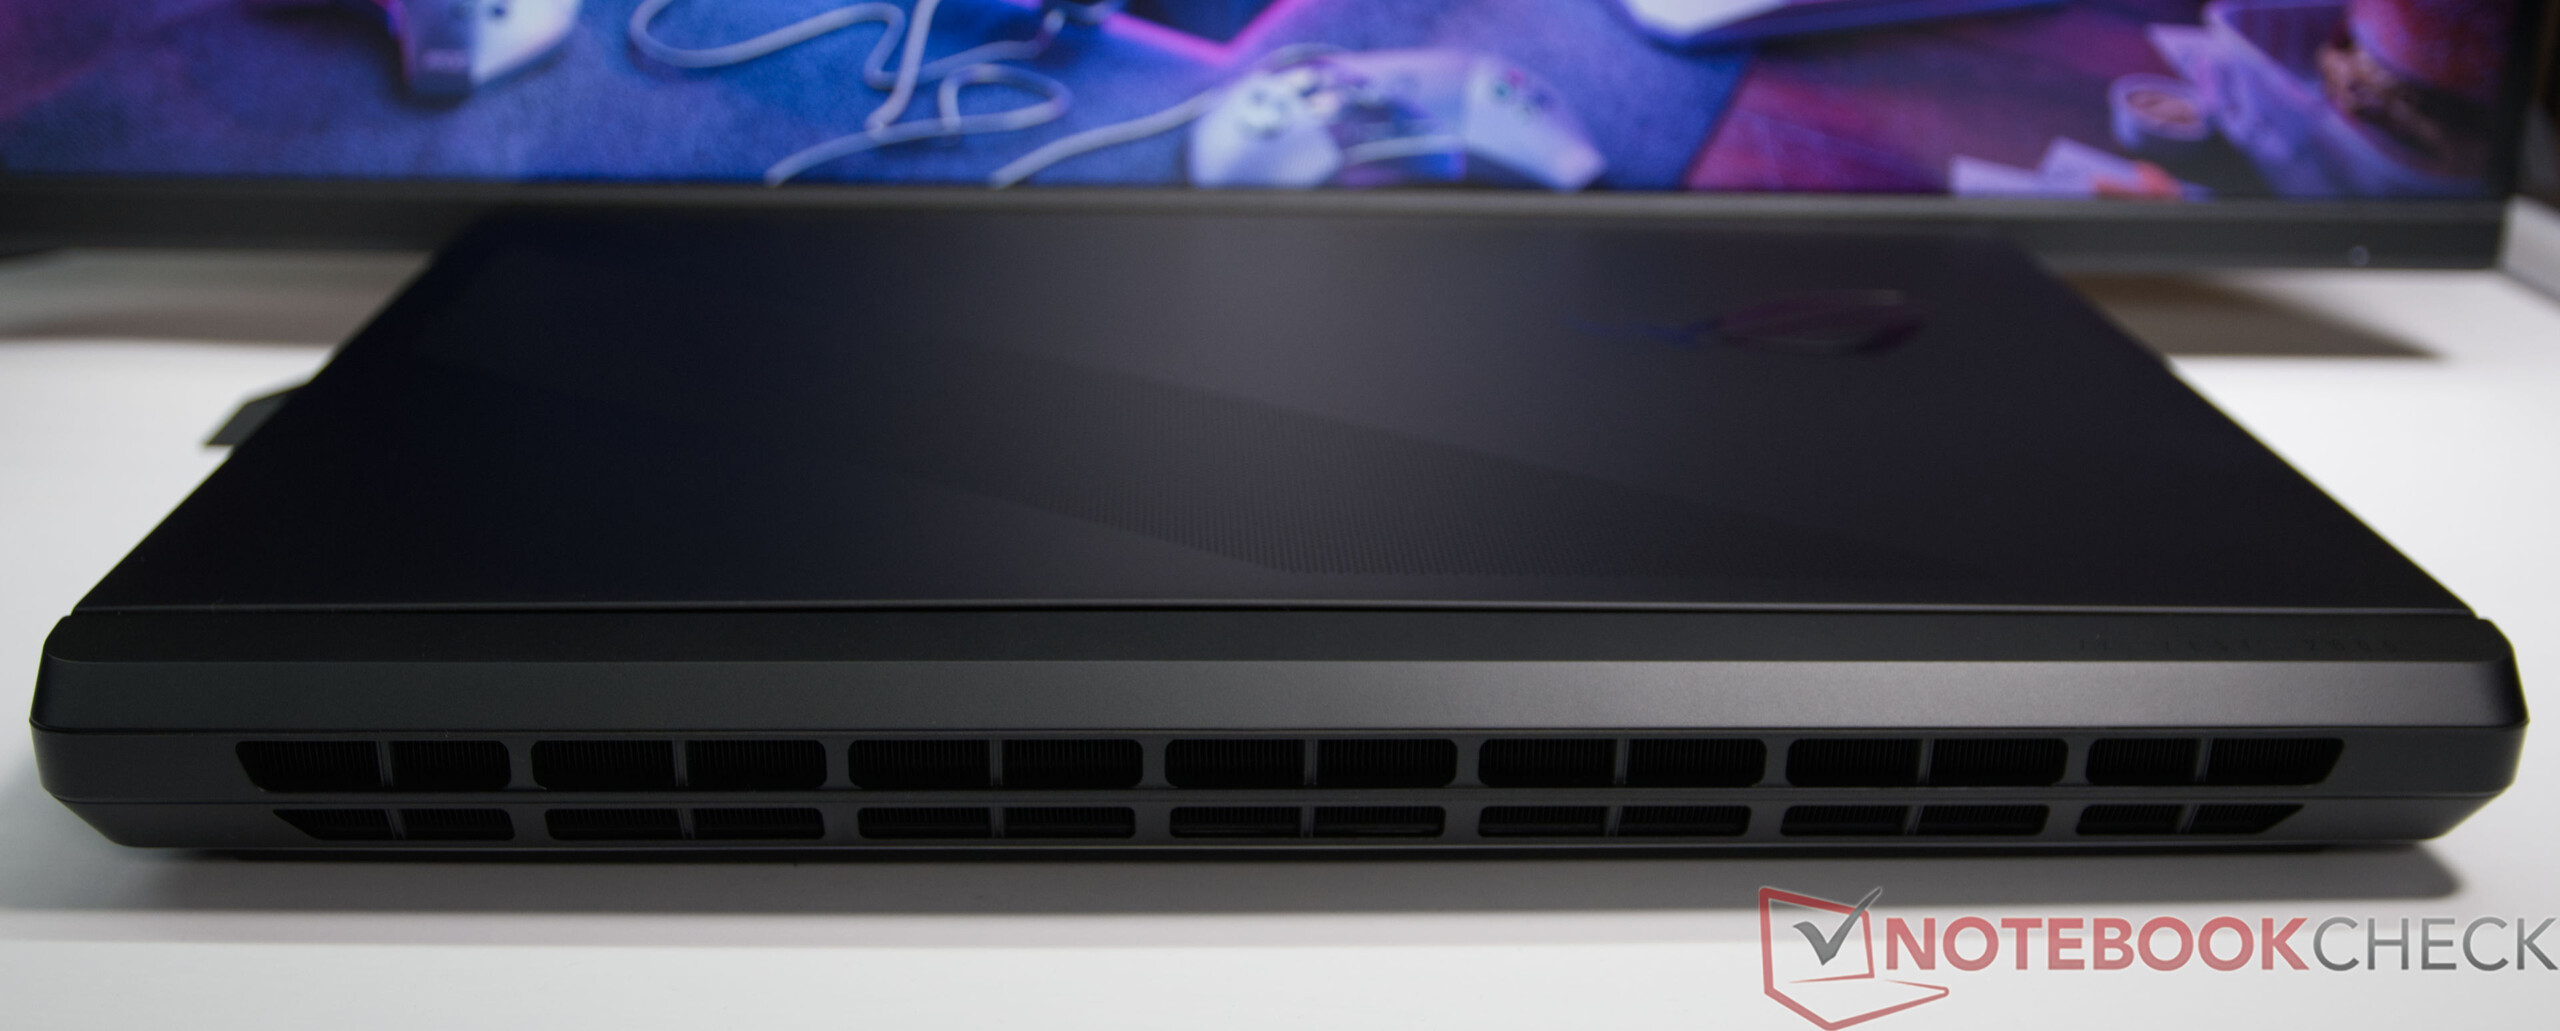
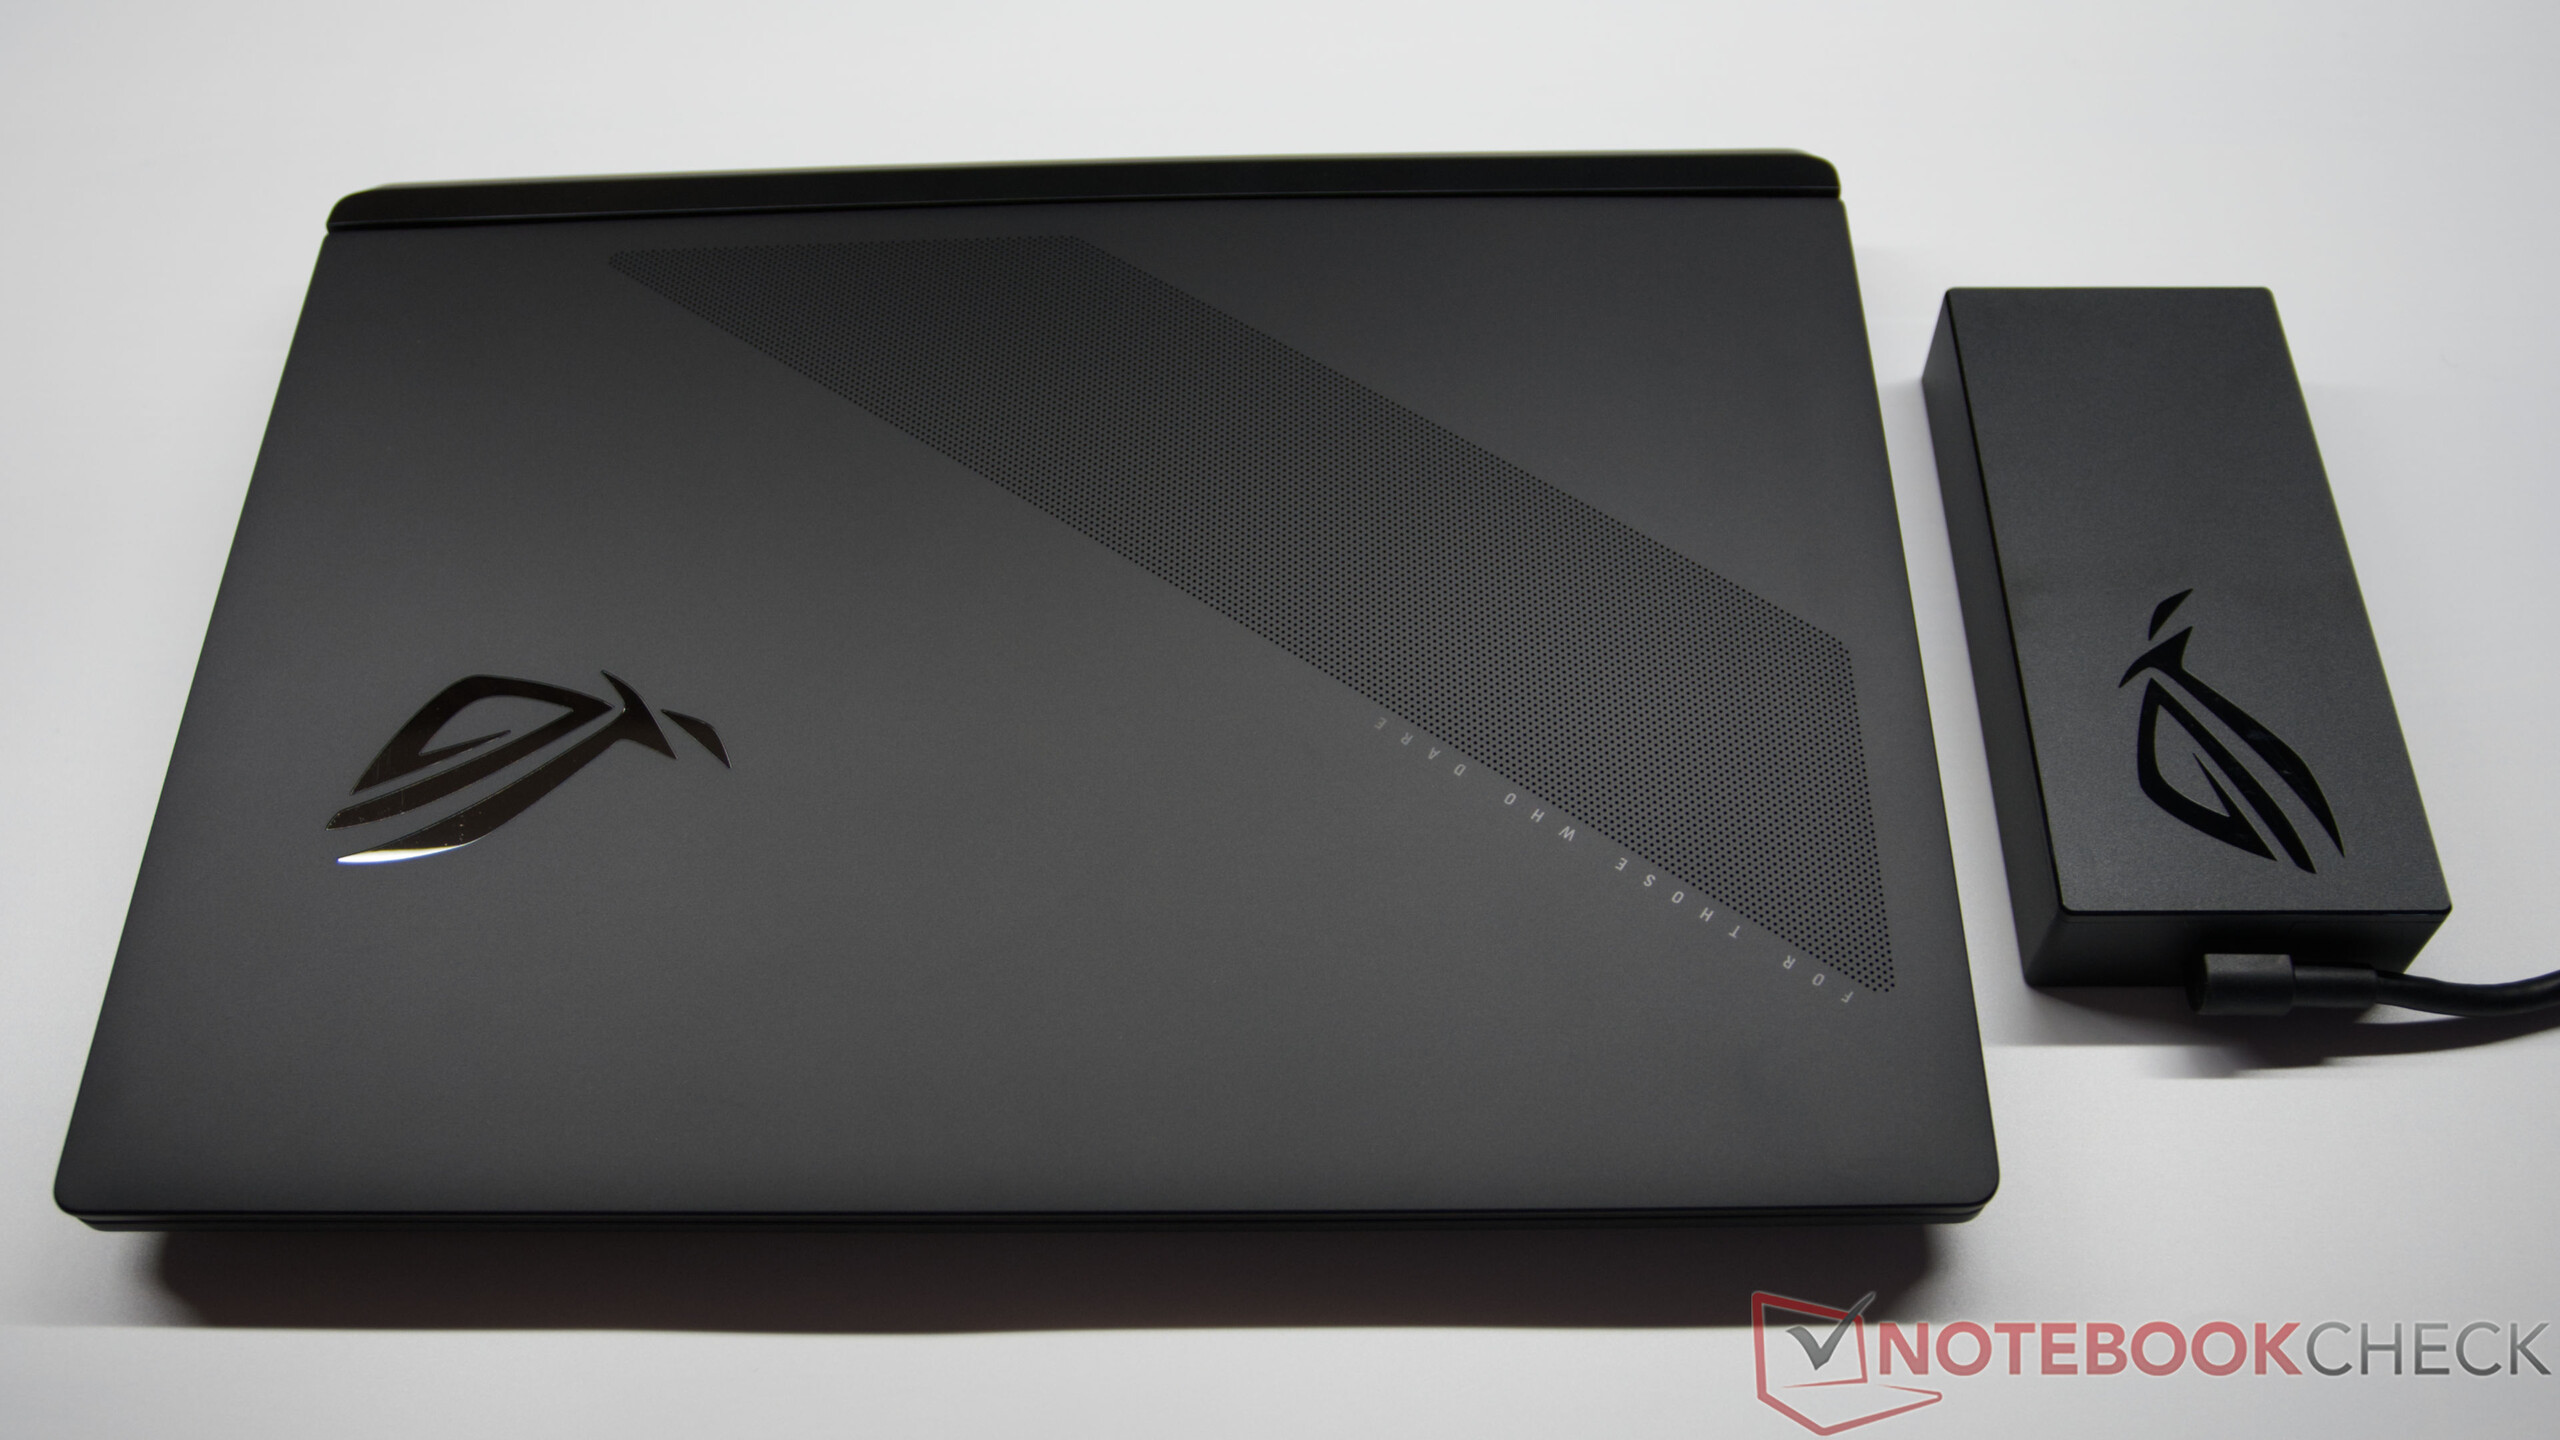
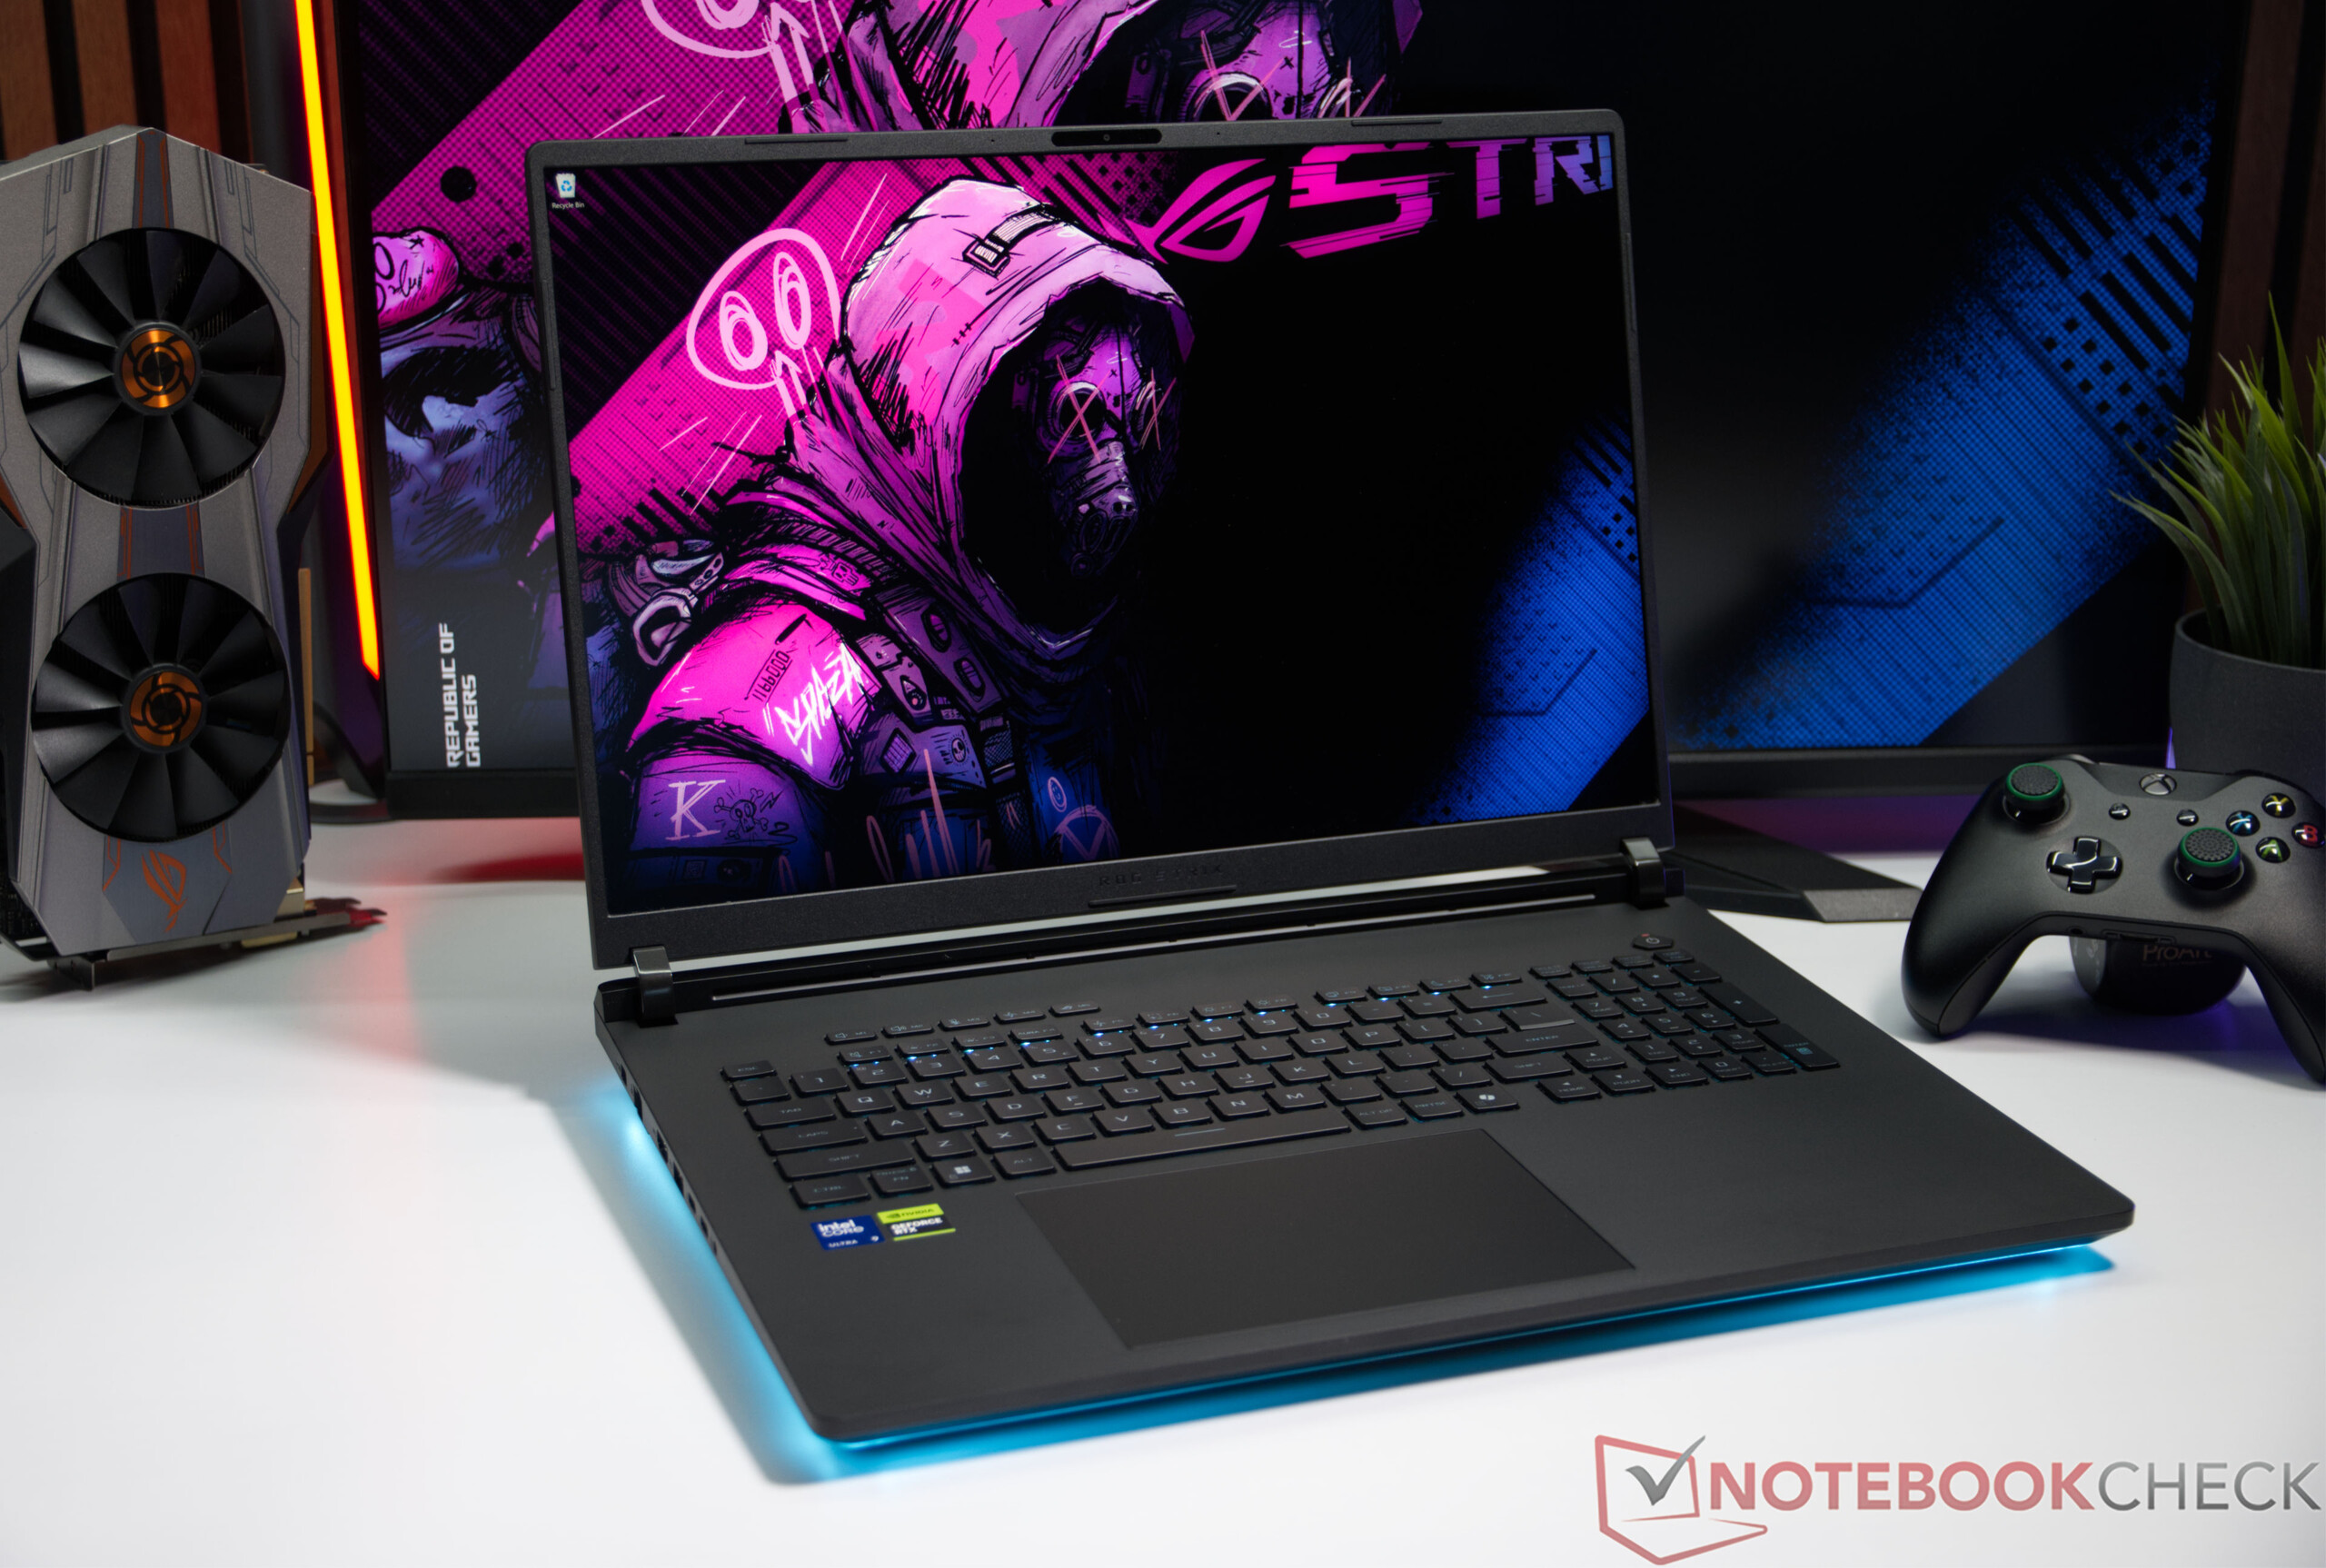
L'Asus ROG Strix SCAR 18 G835LXG reposant sur le même châssis que le ROG Strix SCAR 18 G835LX testé précédemment, la qualité de fabrication et le design restent inchangés. Pour un aperçu détaillé du châssis, des ports et des périphériques d'entrée, veuillez vous reporter à notre test consacré au modèle jumeau.
Comparaison de tailles

410.3 mm 319.9 mm 26.7 mm 4 kg404 mm 307.5 mm 32.1 mm 3.6 kg405 mm 312 mm 29.5 mm 3.3 kg399 mm 298 mm 35 mm 3.6 kg399 mm 298 mm 32 mm 3.3 kg399.9 mm 275.4 mm 21.9 mm 3.1 kg396 mm 278 mm 24.9 mm 3.4 kg297 mm 210 mm 1 mm 5.7 g
À gauche : adaptateur secteur, LAN 2,5G, HDMI 2.1, USB-A 3.2 Gen. 2 (10 Gbit/s), 2 ports Thunderbolt 5 (DisplayPort, alimentation, G-SYNC (débit de données jusqu’à 120 Gbps), prise audio 3,5 mm
Exemple correct : 2 ports USB-A 3.2 Gen. 2 (10 Gbit/s)
Networking
iperf3 transmit Wi-Fi6/7 RT-BE96U
Moyenne Intel Wi-Fi 7 BE200 320MHz
  (3270 - 3587, n=2)
3429 MBit/s +5%
Asus ROG Strix Scar 18 G835LXG
Intel Wi-Fi 7 BE200 320MHz
3270 (3115min - 3471max) MBit/s
Moyenne de la classe Gaming
  (872 - 4473, n=6, 2 dernières années)
2376 MBit/s -27%
iperf3 receive Wi-Fi6/7 RT-BE96U
Moyenne Intel Wi-Fi 7 BE200 320MHz
  (3047 - 3487, n=2)
3267 MBit/s +7%
Asus ROG Strix Scar 18 G835LXG
Intel Wi-Fi 7 BE200 320MHz
3047 (2765min - 3114max) MBit/s
Moyenne de la classe Gaming
  (788 - 3208, n=6, 2 dernières années)
2082 MBit/s -32%
iperf3 receive AXE11000 6GHz
Schenker Key 17 Pro (M24)
Intel Wi-Fi 7 BE200 320MHz
1714 (853min - 1741max) MBit/s
Moyenne de la classe Gaming
  (975 - 1775, n=35, 2 dernières années)
1556 MBit/s
Moyenne Intel Wi-Fi 7 BE200 320MHz
  (725 - 1770, n=29)
1483 MBit/s
MSI Titan 18 HX A14VIG
Intel Killer Wi-Fi 7 BE1750x BE200NGW
1379 (709min - 1426max) MBit/s
Razer Blade 18 2024 RZ09-0509
Intel Wi-Fi 7 BE200 320MHz
1315 (1269min - 1369max) MBit/s
Alienware m18 R2
Intel Killer Wi-Fi 7 BE1750x BE200NGW
1292 (1215min - 1327max) MBit/s
iperf3 transmit AXE11000 6GHz
Schenker Key 17 Pro (M24)
Intel Wi-Fi 7 BE200 320MHz
1634 (812min - 1725max) MBit/s
Moyenne de la classe Gaming
  (723 - 1868, n=36, 2 dernières années)
1449 MBit/s
Moyenne Intel Wi-Fi 7 BE200 320MHz
  (693 - 1653, n=29)
1293 MBit/s
Razer Blade 18 2024 RZ09-0509
Intel Wi-Fi 7 BE200 320MHz
1199 (1057min - 1319max) MBit/s
MSI Titan 18 HX A14VIG
Intel Killer Wi-Fi 7 BE1750x BE200NGW
1096 (900min - 1242max) MBit/s
Alienware m18 R2
Intel Killer Wi-Fi 7 BE1750x BE200NGW
648 (595min - 759max) MBit/s
01002003004005006007008009001000110012001300140015001600170018001900200021002200230024002500260027002800290030003100320033003400Tooltip
Asus ROG Strix Scar 18 G835LXG; iperf3 transmit Wi-Fi6/7 RT-BE96U; iperf 3.1.3: Ø3270 (3115-3471) MBit/s
Asus ROG Strix Scar 18 G835LXG; iperf3 receive Wi-Fi6/7 RT-BE96U; iperf 3.1.3: Ø3046 (2765-3114) MBit/s
ColorChecker
7.7 ∆E
3.5 ∆E
9.6 ∆E
12.7 ∆E
7.5 ∆E
7.8 ∆E
5.1 ∆E
10.1 ∆E
3.8 ∆E
2.6 ∆E
8.5 ∆E
6.4 ∆E
3.1 ∆E
13.4 ∆E
10.5 ∆E
3.1 ∆E
2.6 ∆E
14.3 ∆E
6.7 ∆E
2.4 ∆E
3.1 ∆E
5.2 ∆E
2.1 ∆E
5.9 ∆E
ColorChecker Asus ROG Strix Scar 18 G835LXG: 6.57 ∆E min: 2.09 - max: 14.27 ∆E

Affichage

Structure des sous-pixels
Aucun halo visible
Aucun halo visible

L'écran Mini-LED de 18 pouces de l'Asus ROG Strix SCAR 18 G835LXG offre une résolution de 3 840 x 2 400 pixels au format 16:10 et dispose de 2 000 zones de gradation ainsi que d’un taux de rafraîchissement de 240 Hz. La qualité d’image séduit par sa grande netteté, ses couleurs éclatantes et son rétroéclairage homogène. Grâce à ce taux de rafraîchissement élevé, les mouvements sont rendus avec une extrême fluidité, ce qui constitue un avantage certain pour les jeux vidéo. Le taux de rafraîchissement maximal de 240 Hz n’est disponible qu’en mode « GPU Ultimate », qui peut être activé via Armoury Crate. Dans tous les autres modes GPU, l’écran est limité à 120 Hz.

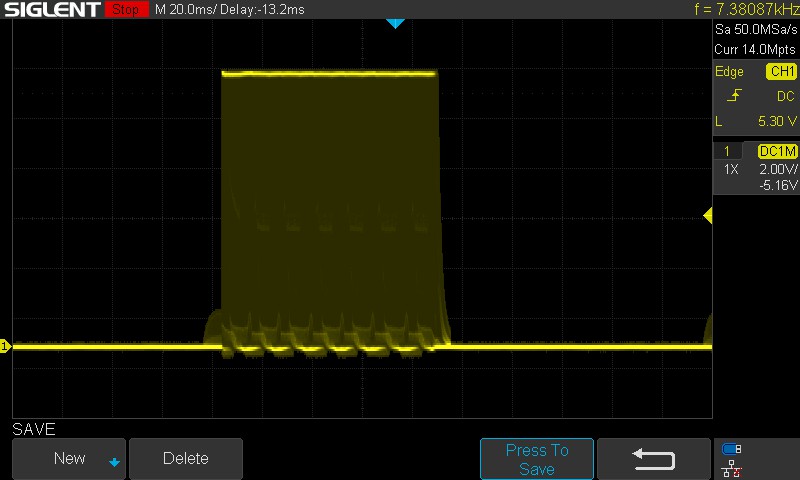
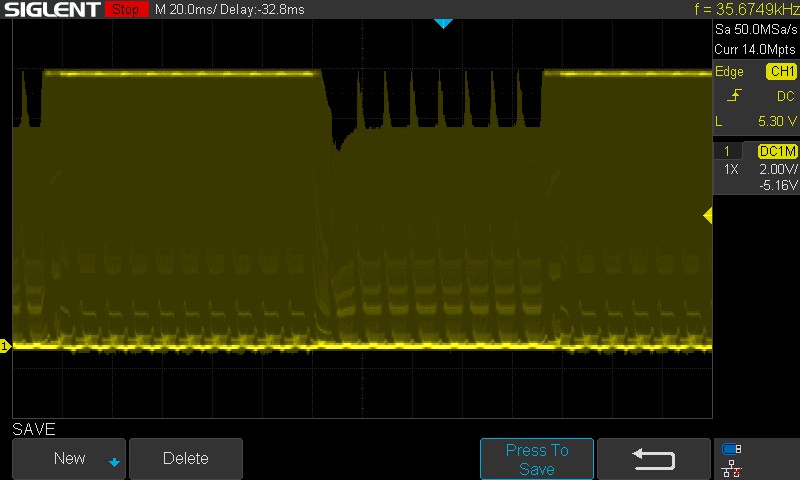
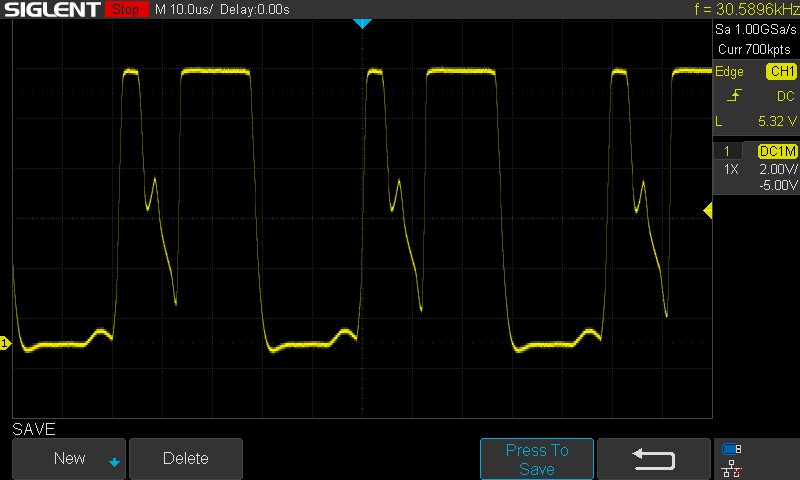
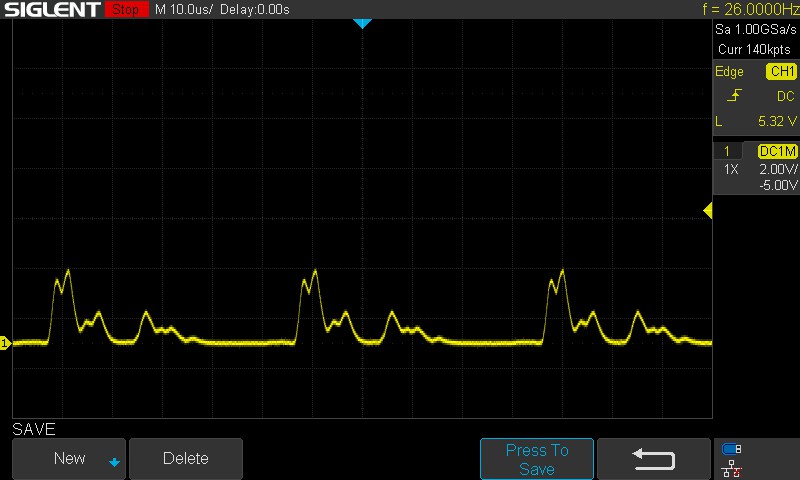
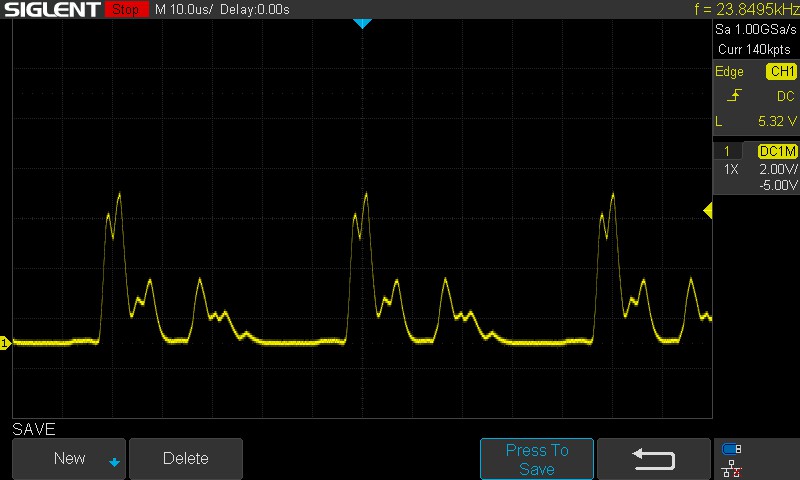
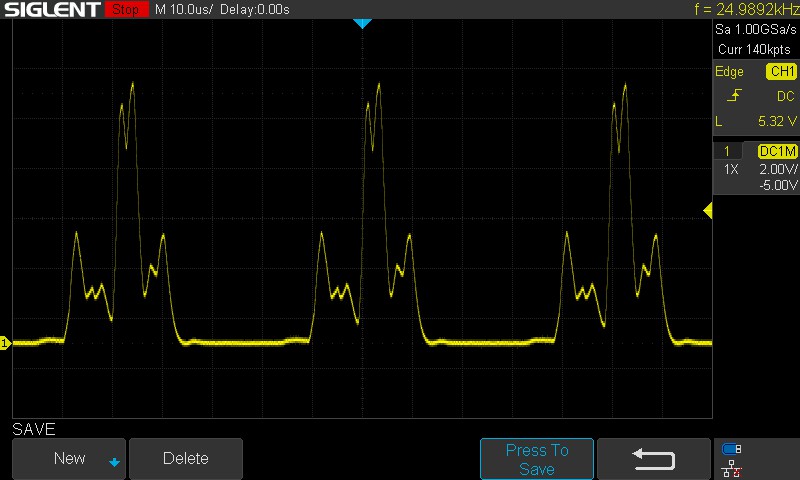
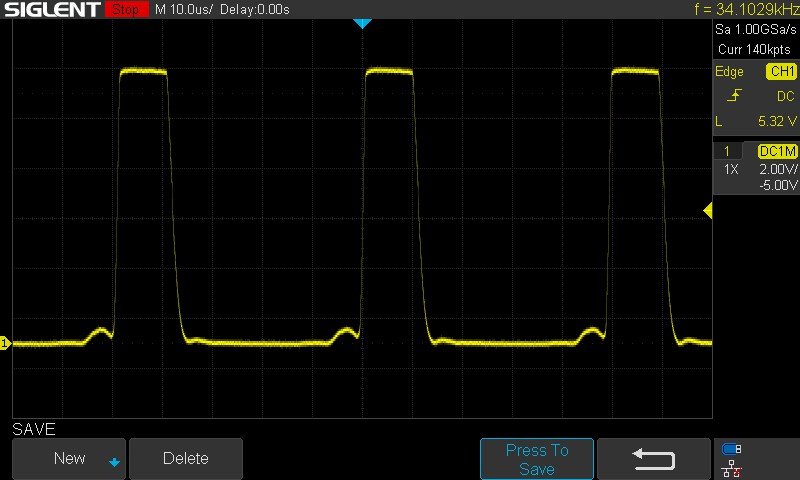
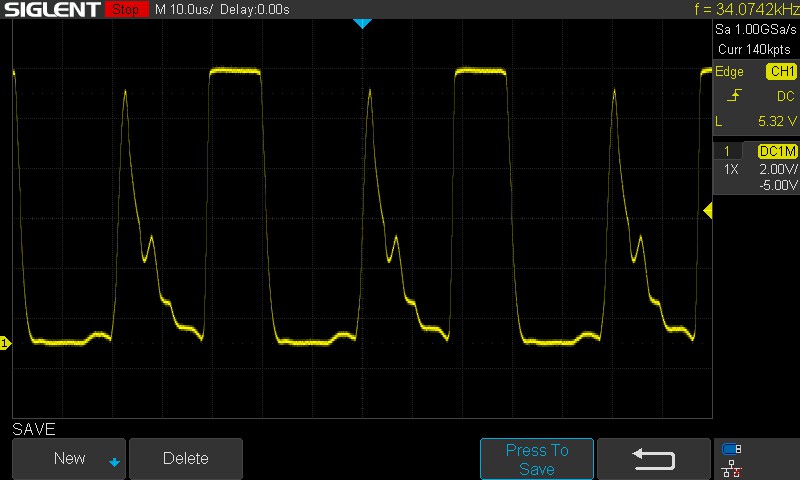
ASUS propose divers profils d’affichage avec ou sans gradation locale, permettant de personnaliser la dalle aussi bien pour les jeux que pour la retouche d’images. En mode HDR, l’écran atteint une luminosité de crête très élevée et bénéficie d’un excellent contraste avec des noirs profonds. Avec une luminosité SDR maximale d’environ 600 cd/m², la dalle reste l’une des plus lumineuses de sa catégorie et est parfaitement adaptée aux environnements clairs. La luminosité maximale est également disponible en fonctionnement sur batterie. Comme c’est généralement le cas pour les dalles Mini-LED, le rétroéclairage utilise la modulation PWM ; toutefois, la fréquence très élevée d’environ 30 kHz ne devrait pas poser de problème dans la pratique, même pour les utilisateurs sensibles.

662
cd/m²
624
cd/m²
595
cd/m²
613
cd/m²
600
cd/m²
581
cd/m²
618
cd/m²
588
cd/m²
559
cd/m²
Homogénéité de la luminosité
NE180QA1-MM0 testé avec X-Rite i1Pro 3
Maximum: 662 cd/m² (Nits) Moyenne: 604.4 cd/m² Minimum: 44.1 cd/m²
Homogénéité de la luminosité: 84 %
Valeur mesurée au centre, sur batterie: 589 cd/m²
Contraste: ∞:1 (Valeurs des noirs: 0 cd/m²)
ΔE ColorChecker Calman: 7.12 | ∀{0.5-29.43 Ø4.71}
calibrated: 4.92
ΔE Greyscale Calman: 7.17 | ∀{0.09-98 Ø4.96}
92.8% AdobeRGB 1998 (Argyll 3D)
99.9% sRGB (Argyll 3D)
99.9% Display P3 (Argyll 3D)
Gamma: 1.77
CCT: 6687 K
Asus ROG Strix Scar 18 G835LXG
NE180QA1-MM0, Mini LED, 3840x2400, 18", 240 Hz
Asus Strix Scar 18 G835LX
N180QDM-NM2, Mini-LED, 2560x1600, 18", 240 Hz
Razer Blade 18 2024 RZ09-0509
BOE NE180QDM-NM1, Mini-LED, 2560x1600, 18", 300 Hz
Alienware m18 R2
BOE NE18NZ1, IPS, 2560x1600, 18", 165 Hz
Acer Predator Helios 18 PH18-72-98MW
B180QAN01.2 (AUO45A8), Mini-LED, 2560x1600, 18", 250 Hz
MSI Titan 18 HX A14VIG
AU Optronics B180ZAN01.0, Mini-LED, 3840x2400, 18", 120 Hz
Schenker Key 17 Pro (M24)
BOE, IPS, 3840x2160, 17.3", 144 Hz
Display
-2%
-2%
-2%
-0%
-3%
-5%
HDR Peak Brightness (cd/m²)
1264
Display P3 Coverage (%)
99.9
99
-1%
99
-1%
97.8
-2%
99.7
0%
98.1
-2%
93.51
-6%
sRGB Coverage (%)
99.9
100
0%
100
0%
99.5
0%
100
0%
99.8
0%
99.86
0%
AdobeRGB 1998 Coverage (%)
92.8
87.2
-6%
86.9
-6%
88.9
-4%
91.6
-1%
86.2
-7%
84.33
-9%
Response Times
-19%
-53%
-11%
-79%
-486%
-38%
Response Time Grey 50% / Grey 80% * (ms)
5.8 ?(2.1, 3.7)
7.4 ?(2.4, 5)
-28%
7.6 ?(3.6, 4)
-31%
5.3 ?(2.2, 3.1)
9%
8 ?(4.9, 3.1)
-38%
8.6 ?(4.2, 4.4)
-48%
11.593 ?(5.307, 6.286)
-100%
Response Time Black / White * (ms)
8 ?(4, 4)
10.4 ?(0.6, 9.8)
-30%
14 ?(6.6, 7.4)
-75%
10.4 ?(4.8, 5.6)
-30%
17.6 ?(15.2, 2.4)
-120%
81.8 ?(76, 5.8)
-923%
6 ?(1.5, 4.5)
25%
PWM Frequency (Hz)
30589
20610 ?(100)
26444 ?(100)
4832 ?(100)
2592 ?(100)
PWM Amplitude * (%)
100
100
-0%
Screen
50%
36%
19%
38%
21%
17%
Brightness middle (cd/m²)
600
764
27%
605.4
1%
271.8
-55%
722
20%
467.5
-22%
548
-9%
Brightness (cd/m²)
604
747
24%
600
-1%
275
-54%
724
20%
459
-24%
505
-16%
Brightness Distribution (%)
84
93
11%
97
15%
78
-7%
93
11%
90
7%
86
2%
Black Level * (cd/m²)
0.1
0.62
0.27
0.04
0.54
Colorchecker dE 2000 *
7.12
1.2
83%
1.53
79%
2.48
65%
3.4
52%
3.77
47%
3.81
46%
Colorchecker dE 2000 max. *
10.42
2.8
73%
4.15
60%
5.59
46%
5.32
49%
6.12
41%
7.9
24%
Colorchecker dE 2000 calibrated *
4.92
0.56
89%
1.6
67%
2.94
40%
2.54
48%
Greyscale dE 2000 *
7.17
1.5
79%
2.6
64%
3.7
48%
3.8
47%
3.2
55%
5.4
25%
Gamma
1.77 124%
2.17 101%
2.22 99%
2.2 100%
2.383 92%
2.43 91%
2.062 107%
CCT
6687 97%
6556 99%
6843 95%
6355 102%
7051 92%
6478 100%
7224 90%
Contrast (:1)
7640
976
1007
18050
1015
Moyenne finale (programmes/paramètres)
10% / 19%
-6% / 10%
2% / 9%
-14% / 9%
-156% / -70%
-9% / 3%

* ... Moindre est la valeur, meilleures sont les performances
Échelle de gris CalMAN (profil : Display P3)
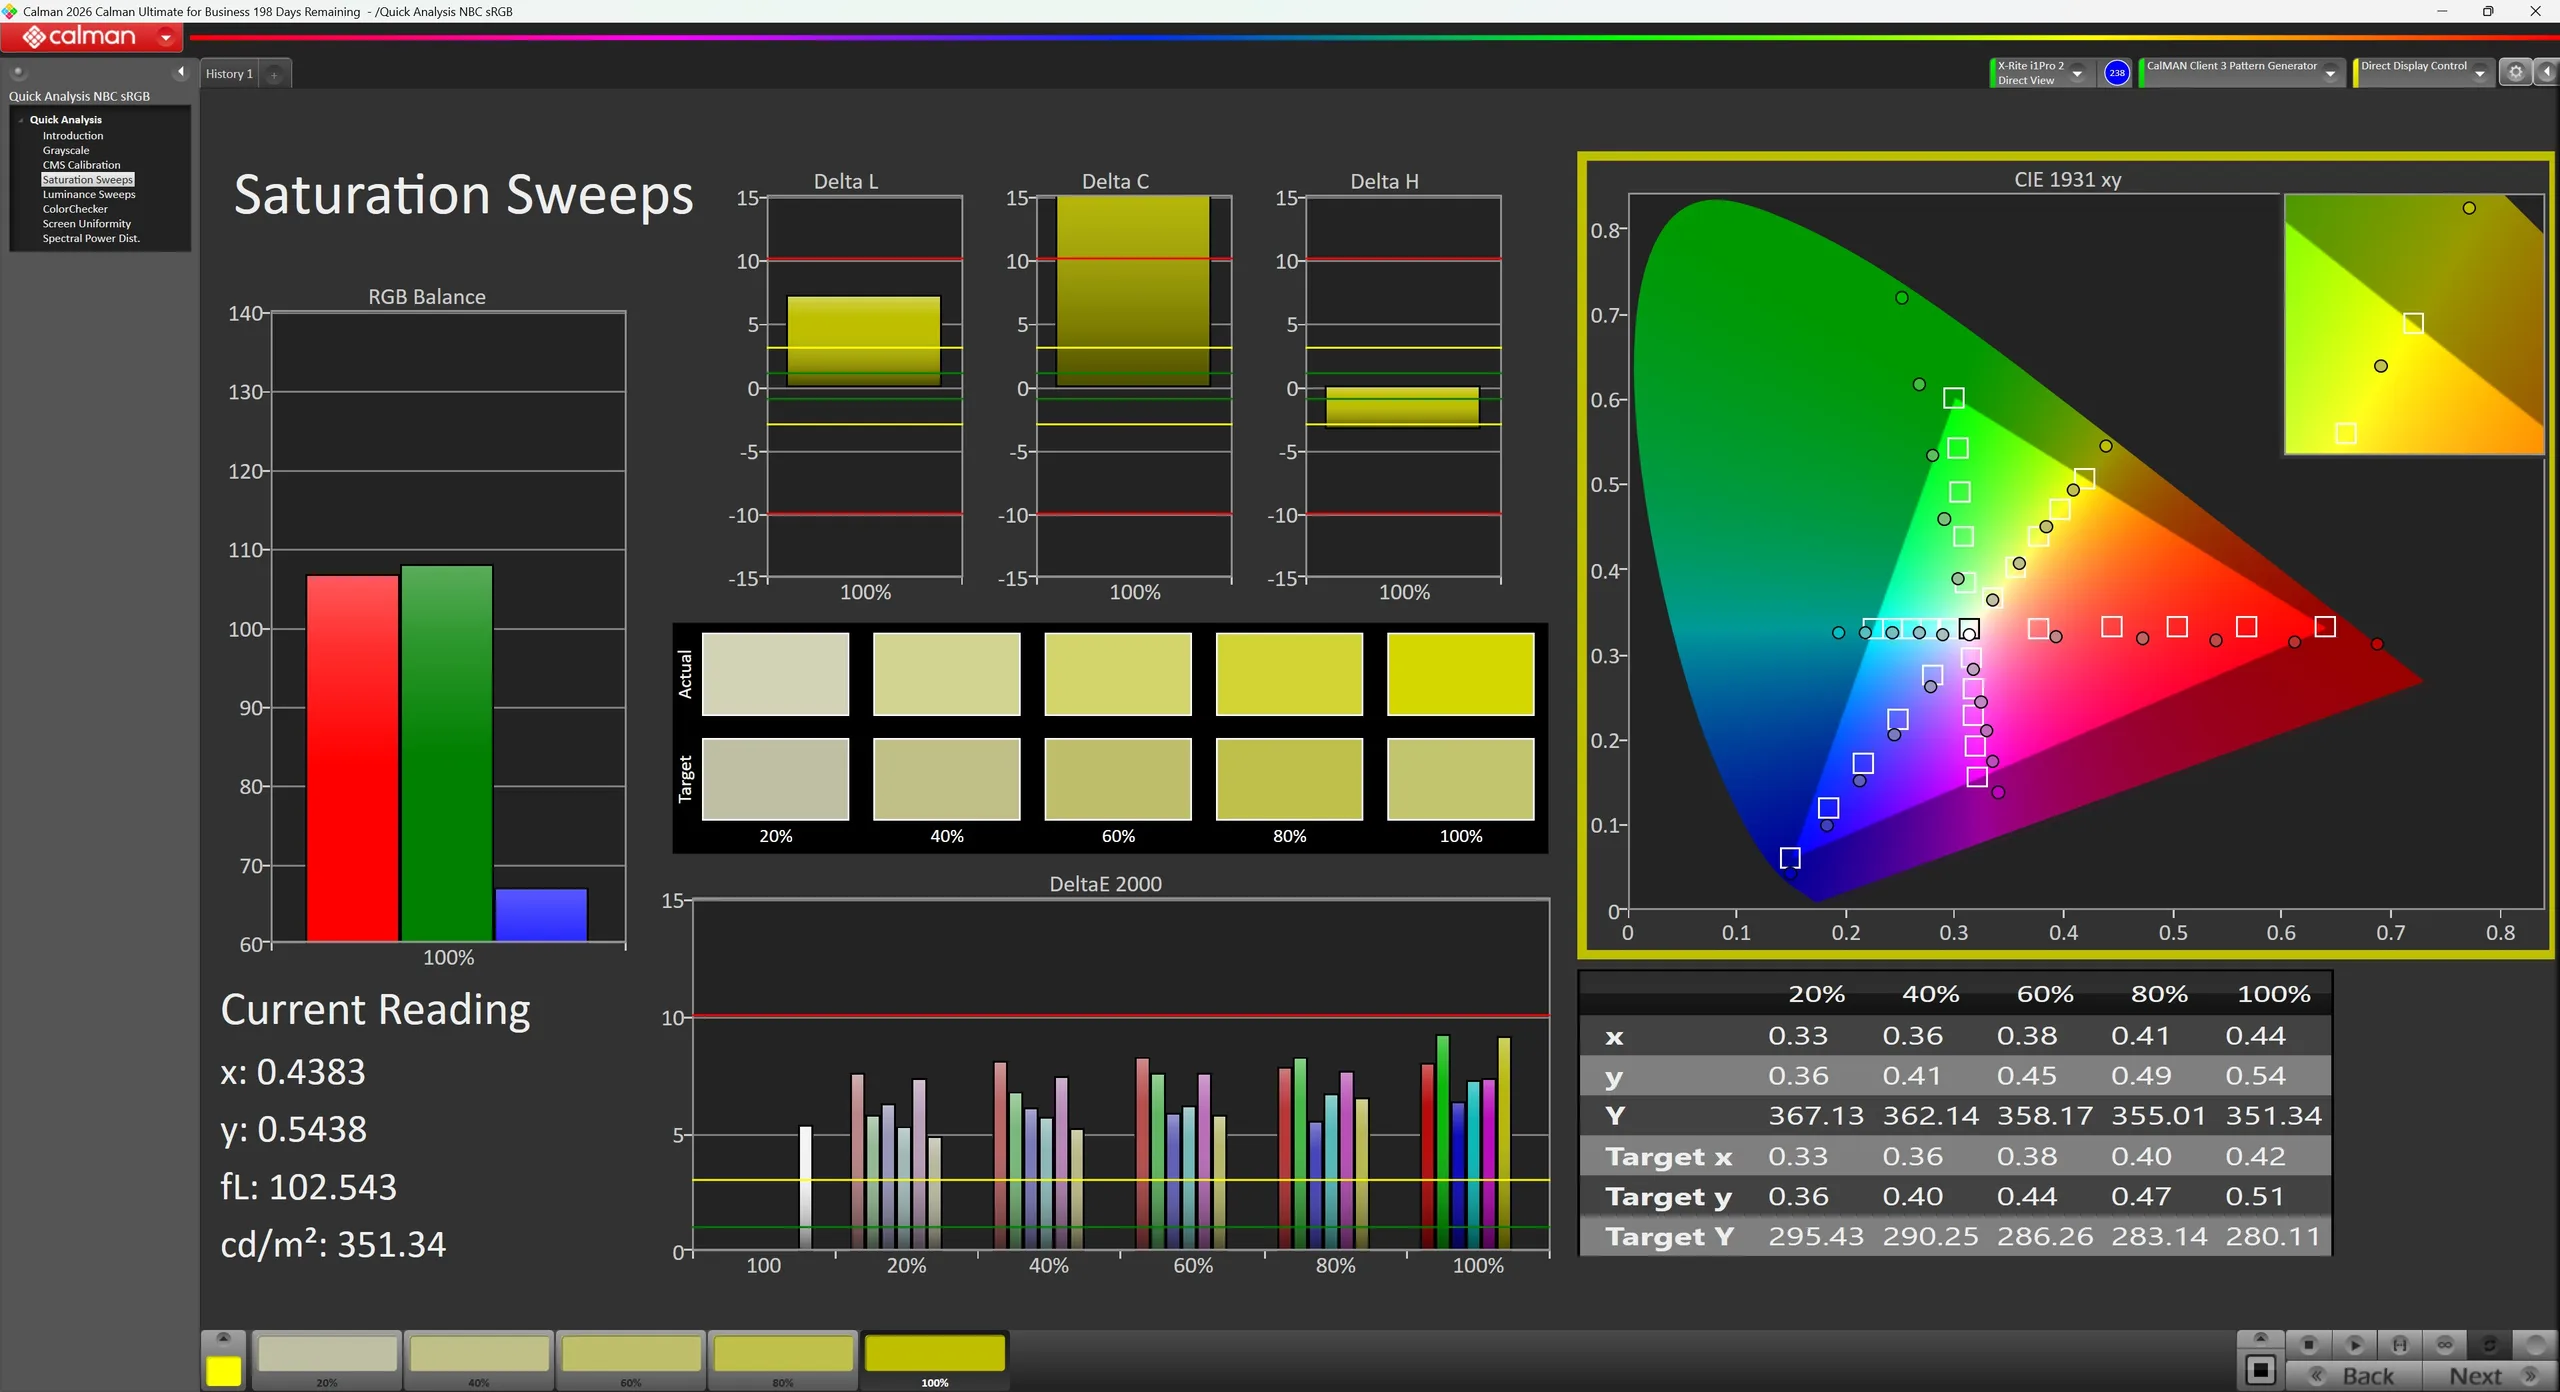
Saturation CalMAN (profil : Display P3)
CalMAN ColorChecker (profil : Display P3)
Échelle de gris CalMAN (profil : Native)
Saturation CalMAN (profil : natif)
CalMAN ColorChecker (profil : natif)

Couverture de l'espace colorimétrique

sRGB
sRGB
AdobeRGB
AdobeRGB
DCI-P3
DCI-P3

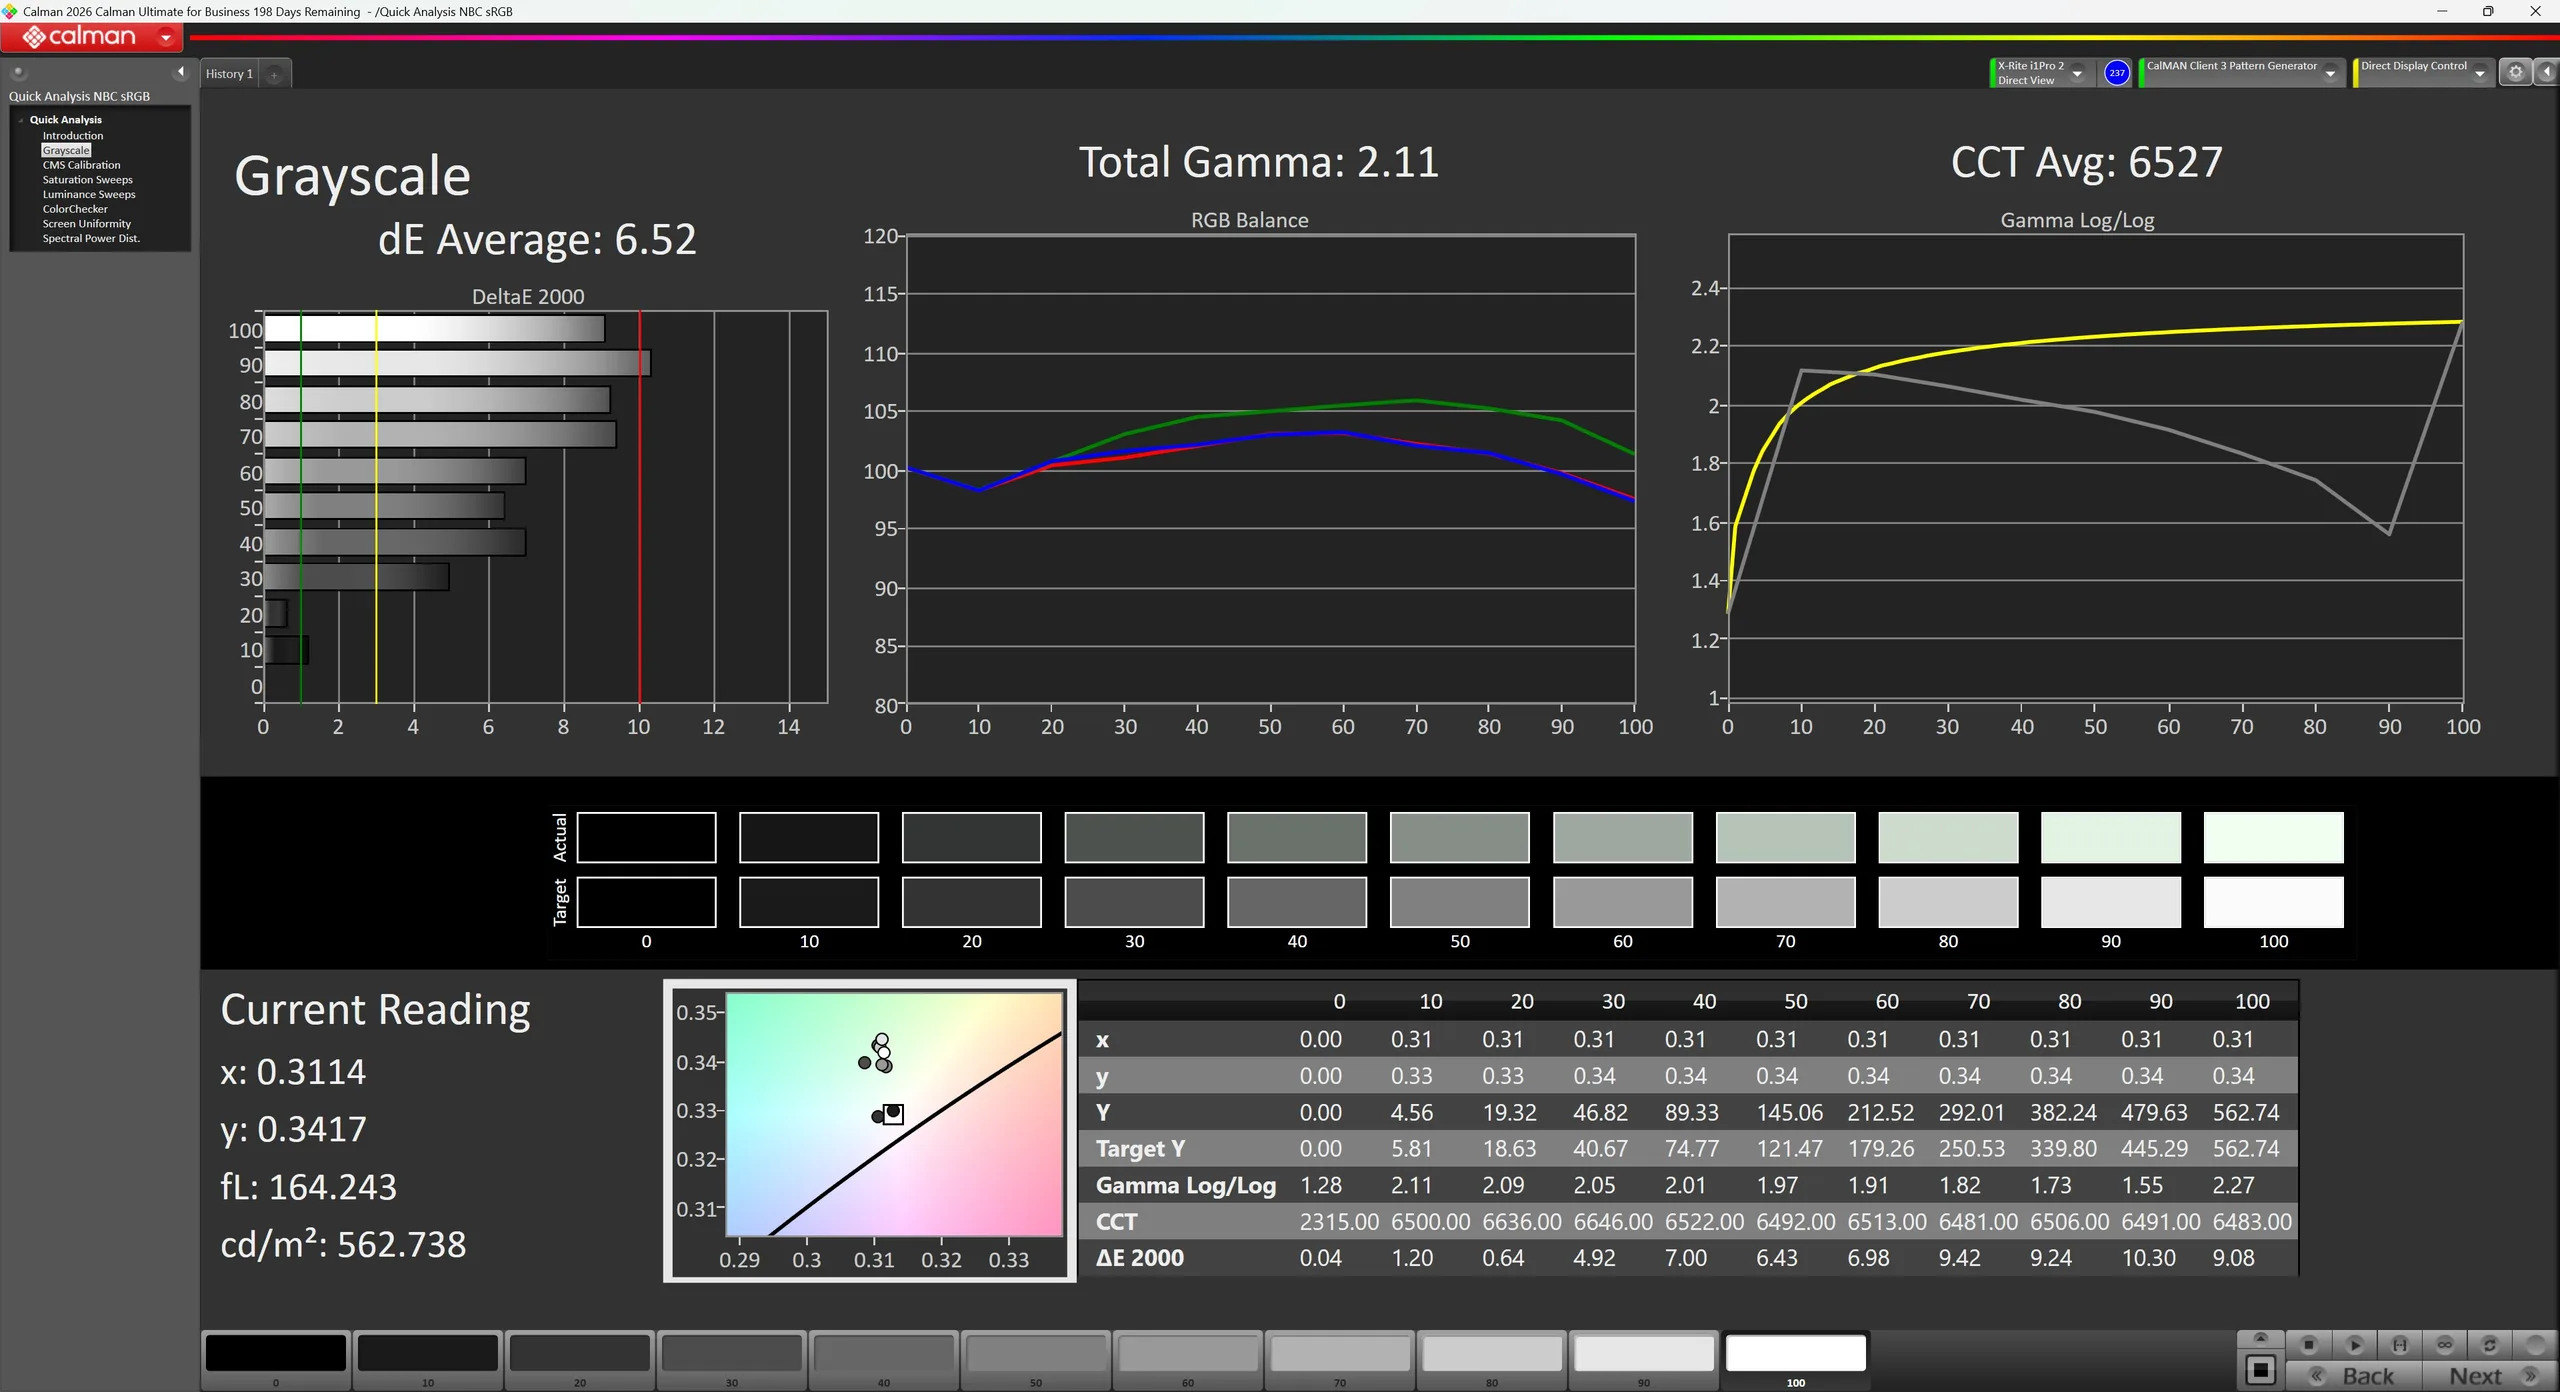
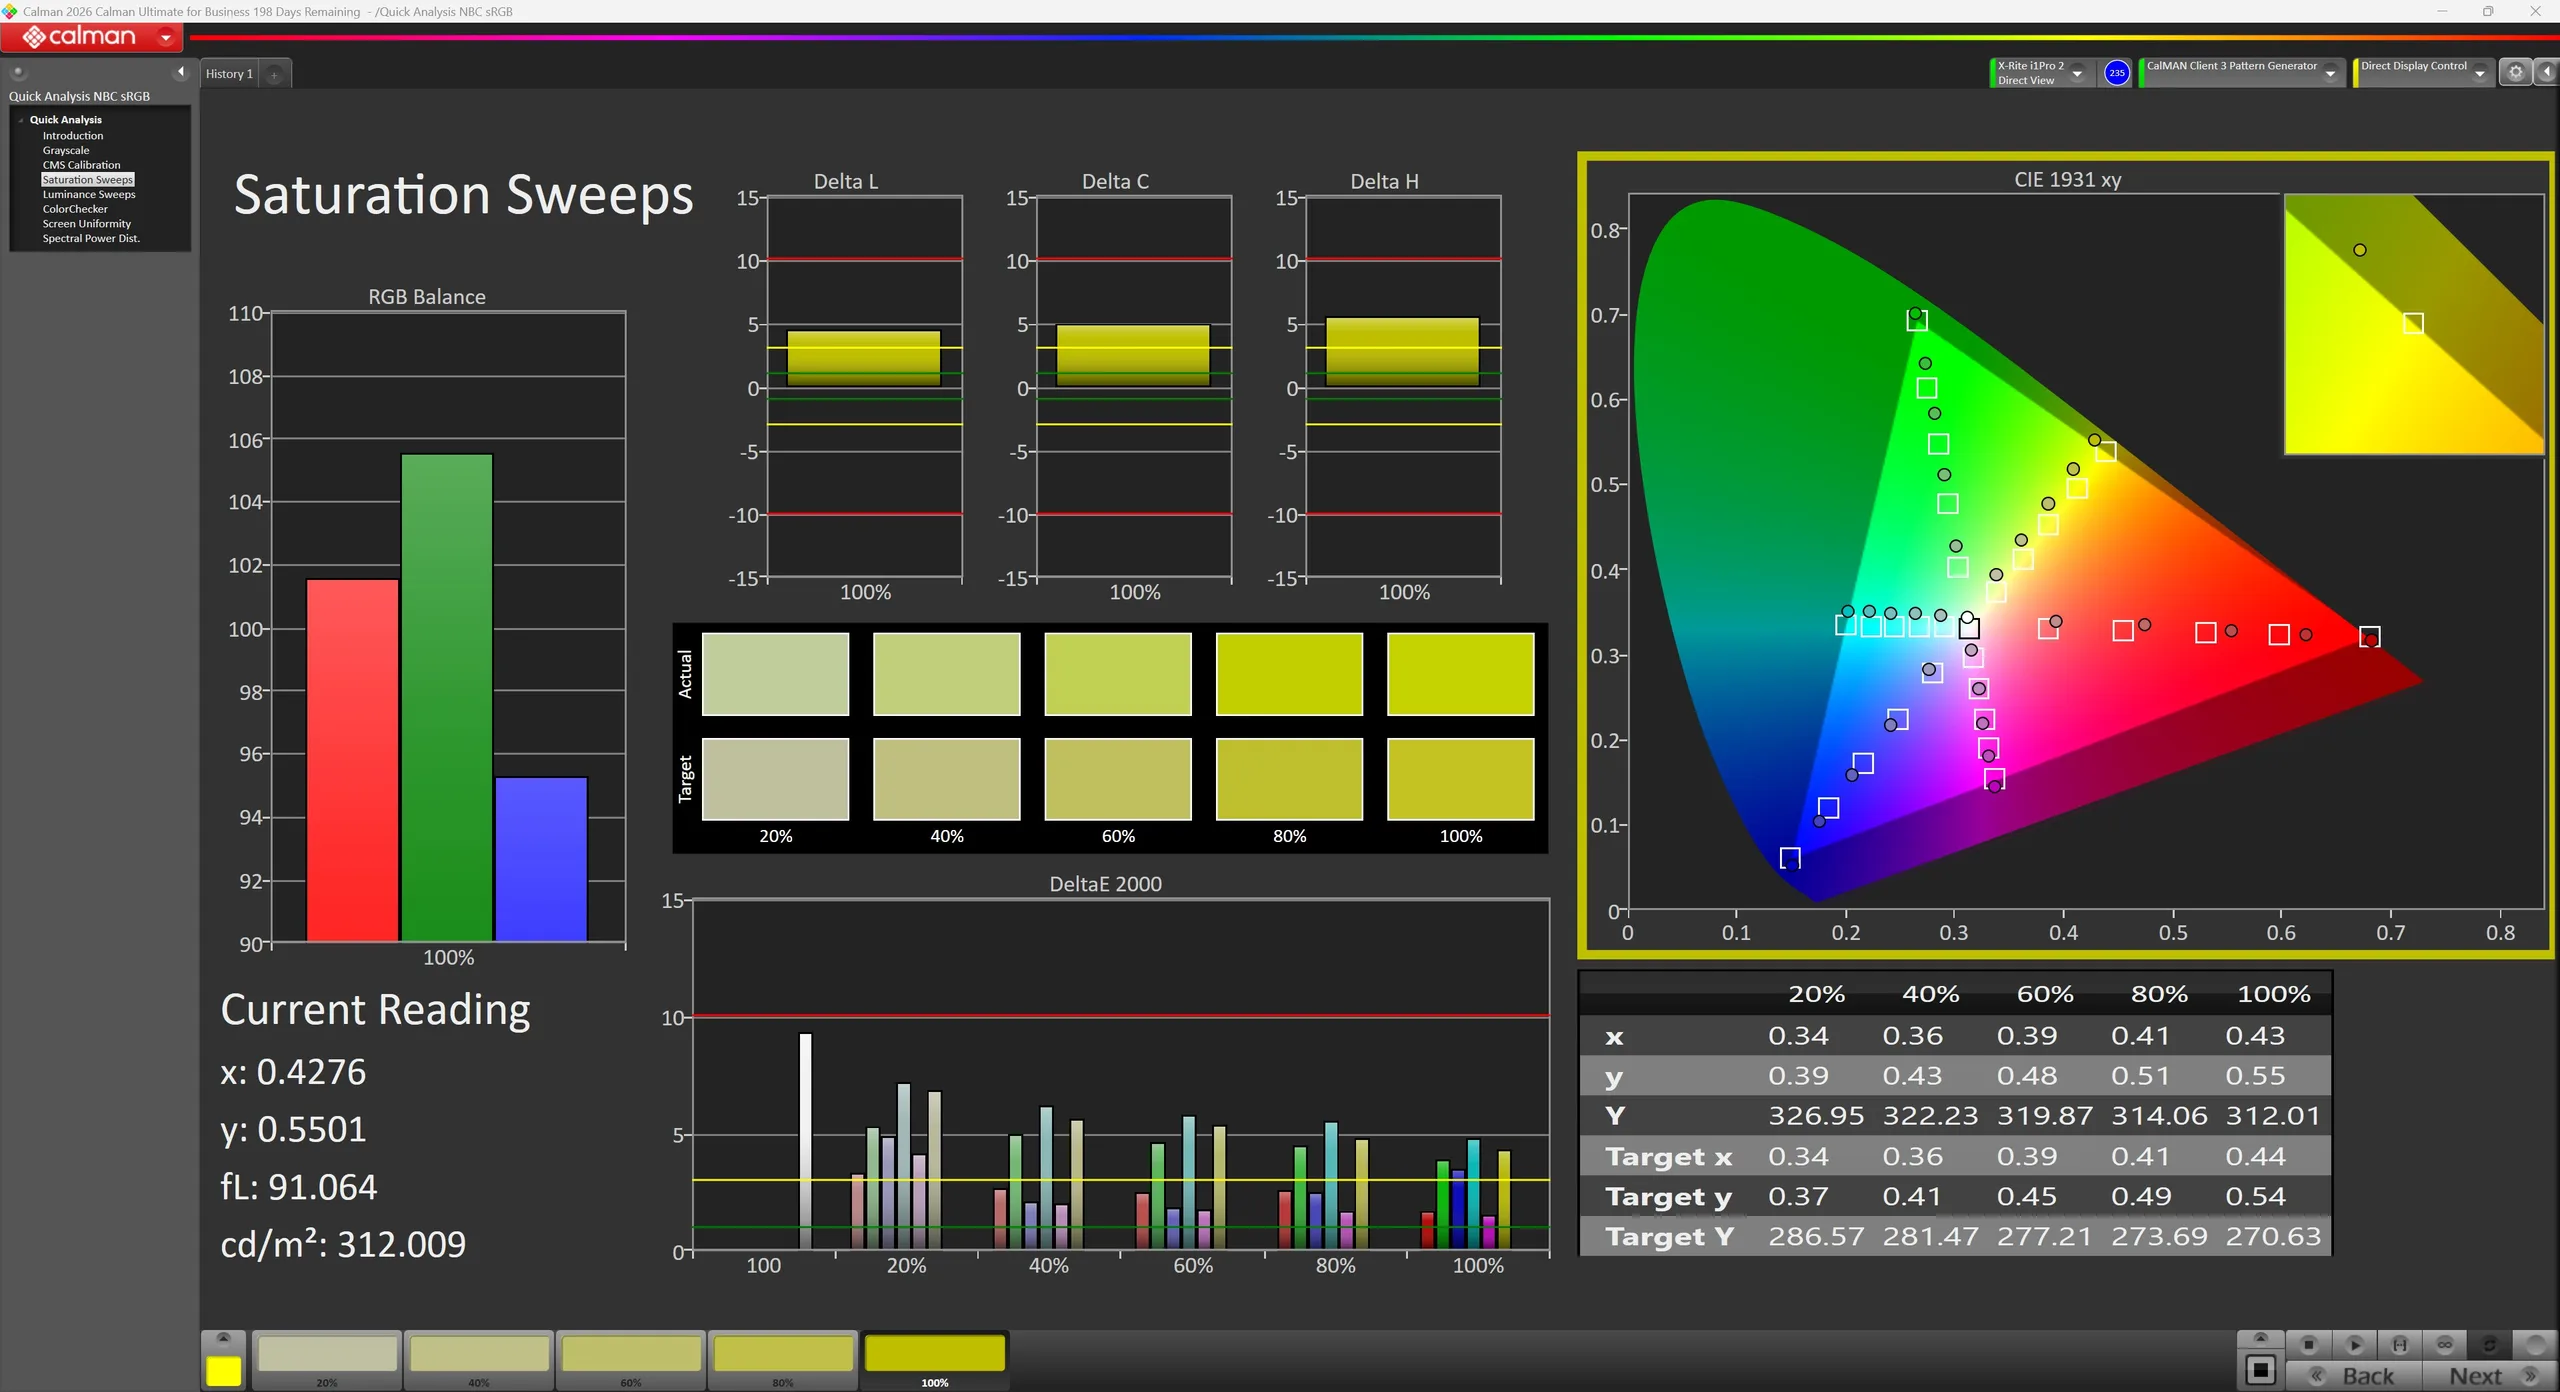
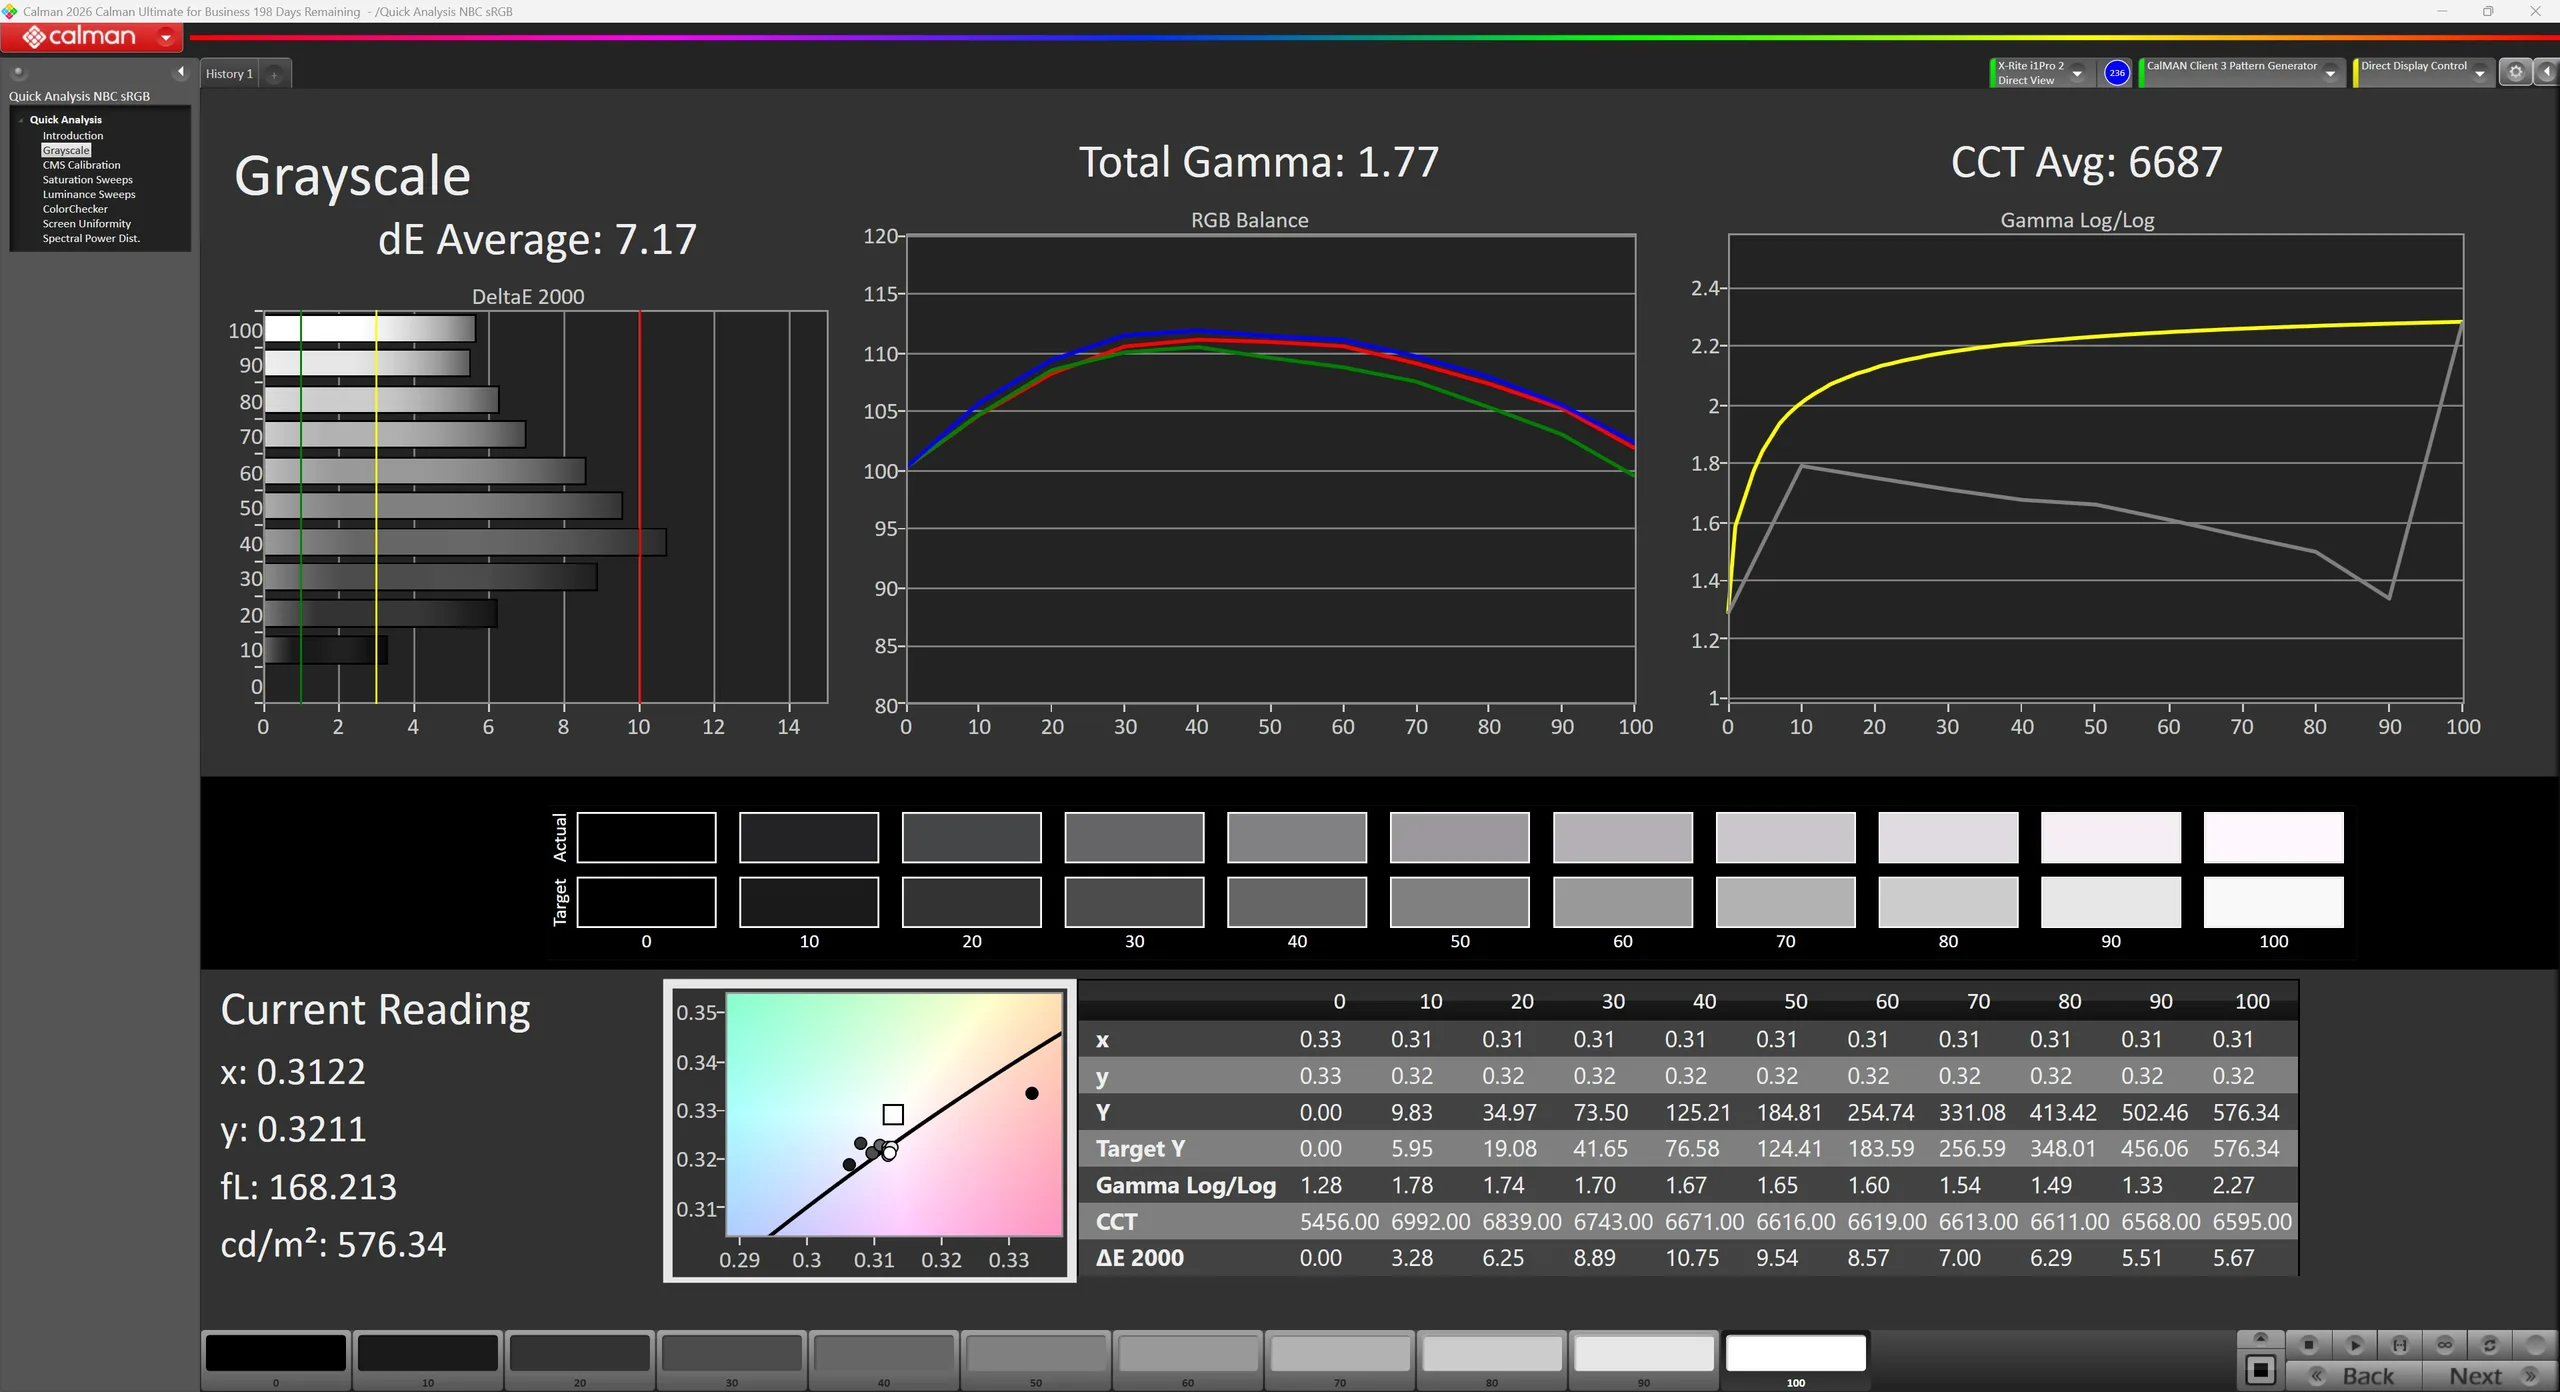
Asus propose également 18 profils de couleurs différents pour le ROG Strix SCAR. Cependant, à la sortie de l'emballage, notre modèle de test présente des écarts de couleurs relativement importants, ce qui signifie que la précision des couleurs n'est pas à la hauteur de ce que l'on attend d'un ordinateur portable haut de gamme. Ce n’est qu’après étalonnage que l’affichage s’améliore considérablement et que les écarts de couleur sont sensiblement réduits, ce qui rend l’écran bien mieux adapté aux applications où la précision des couleurs est essentielle.

Temps de réponse de l'écran

Le temps de réponse d'un écran mesure la rapidité à laquelle l'écran est capable de changer une couleur pour une autre. Un temps de réponse élevé se traduit par une image floutée pour les objets en mouvement. Les joueurs bénéficieront de faibles latences d'affichage en jeu.
       Temps de réponse noir à blanc
8 ms ... hausse ↗ et chute ↘ combinées↗ 4 ms hausse
↘ 4 ms chute
L'écran montre de faibles temps de réponse, un bon écran pour jouer.
En comparaison, tous les appareils testés affichent entre 0.1 (minimum) et 240 (maximum) ms. » 22 % des appareils testés affichent de meilleures performances.
Cela signifie que les latences relevées sont meilleures que la moyenne (19.8 ms) de tous les appareils testés.
       Temps de réponse gris 50% à gris 80%
5.8 ms ... hausse ↗ et chute ↘ combinées↗ 2.1 ms hausse
↘ 3.7 ms chute
L'écran montre de très faibles temps de réponse, parfait pour le jeu.
En comparaison, tous les appareils testés affichent entre 0.165 (minimum) et 636 (maximum) ms. » 19 % des appareils testés affichent de meilleures performances.
Cela signifie que les latences relevées sont meilleures que la moyenne (31 ms) de tous les appareils testés.

Scintillement / MLI (Modulation de largeur d'impulsion)

Afin d'abaisser la luminosité de l'écran, certains ordinateurs portables font varier très rapidement le rétroéclairage entre éteint et allumé. La fréquence à laquelle le rétroéclairage s'éteint et se rallume est normalement fixée à une valeur qui permet de rendre la variation indétectable à l'œil nu? Si la fréquence est trop basse, certaines personnes peuvent être sujettes à une fatigue oculaire, des maux de tête ou même percevoir les variations.
Scintillement / MLI (Modulation de largeur d'impulsion) décelé 30589 Hz
Amplitude: 100 %

Le rétroéclairage de l'écran scintille à la fréquence de 30589 Hz (certainement du fait de l'utilisation d'une MDI - Modulation de largeur d'impulsion) .

La fréquence de rafraîchissement de 30589 Hz est élevée, la grande majorité des utilisateurs ne devrait pas percevoir de scintillements et être sujette à une fatigue oculaire accrue.

En comparaison, 52 % des appareils testés n'emploient pas MDI pour assombrir leur écran. Nous avons relevé une moyenne à 7754 (minimum : 5 - maximum : 343500) Hz dans le cas où une MDI était active.

Scintillement PWM (luminosité à 0 %)
Scintillement PWM (luminosité à 20 %)
Scintillement PWM (luminosité à 40 %)
Scintillement PWM (luminosité à 60 %)
Scintillement PWM (luminosité à 80 %)
Scintillement PWM (luminosité à 100 %)
Sous un ciel nuageux
Au soleil
Au soleil
Au soleil
Au soleil
Stabilité de l'angle de vision

Performances

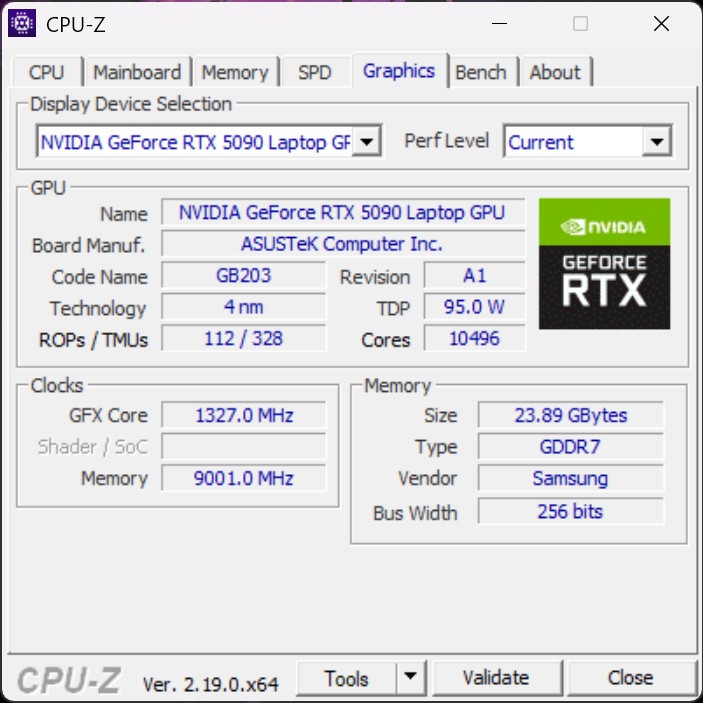
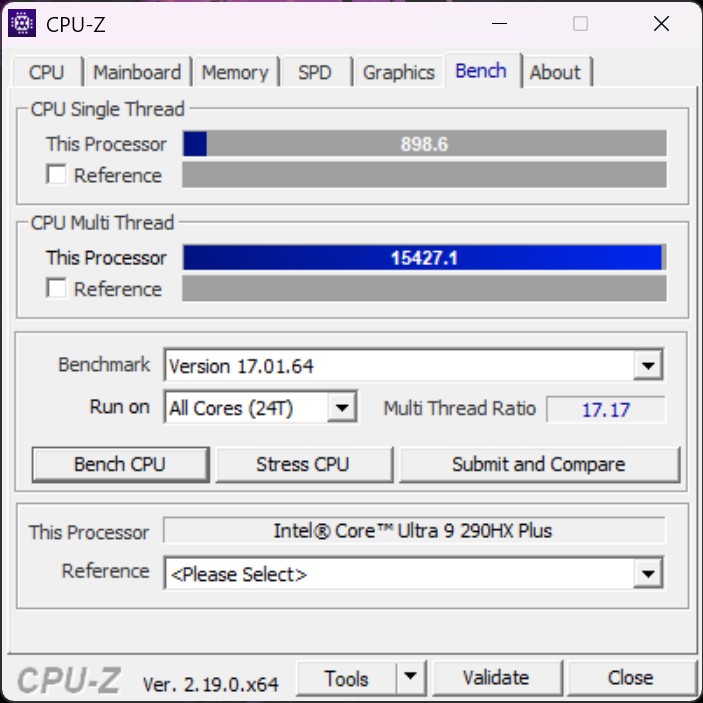
CPU-Z
CPU-Z
CPU-Z
CPU-Z
CPU-Z
CPU-Z
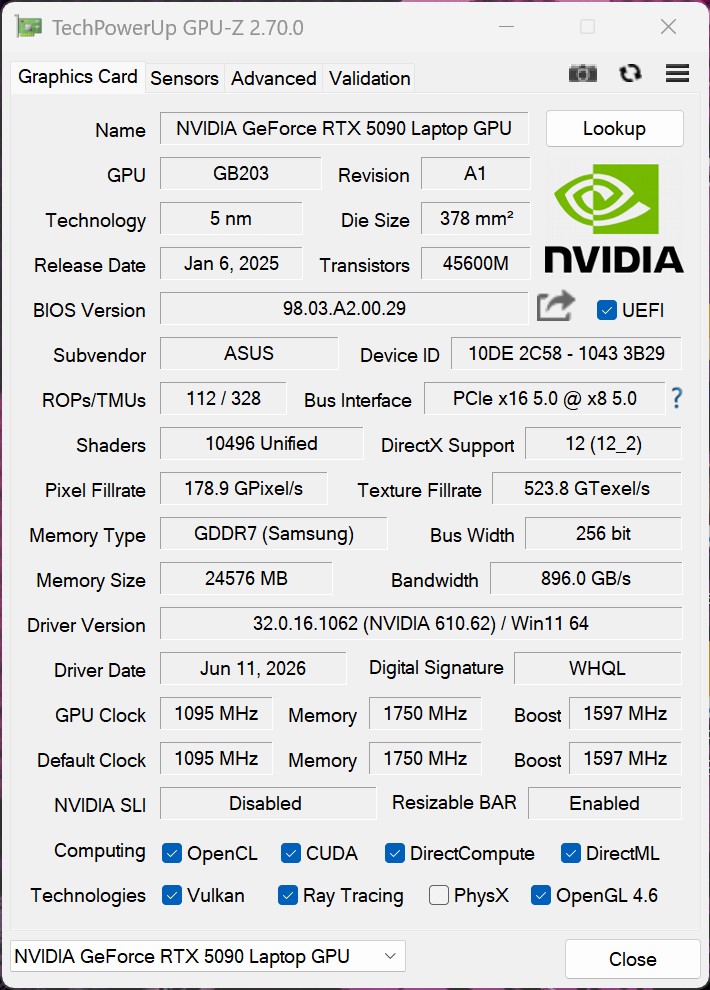
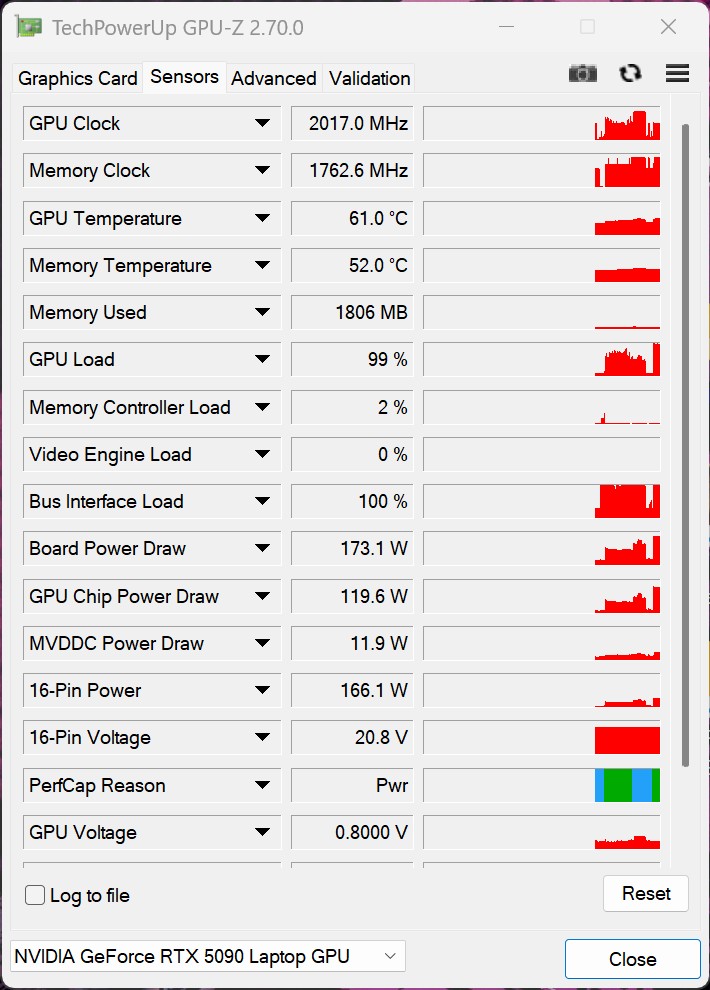
GPU-Z
GPU-Z
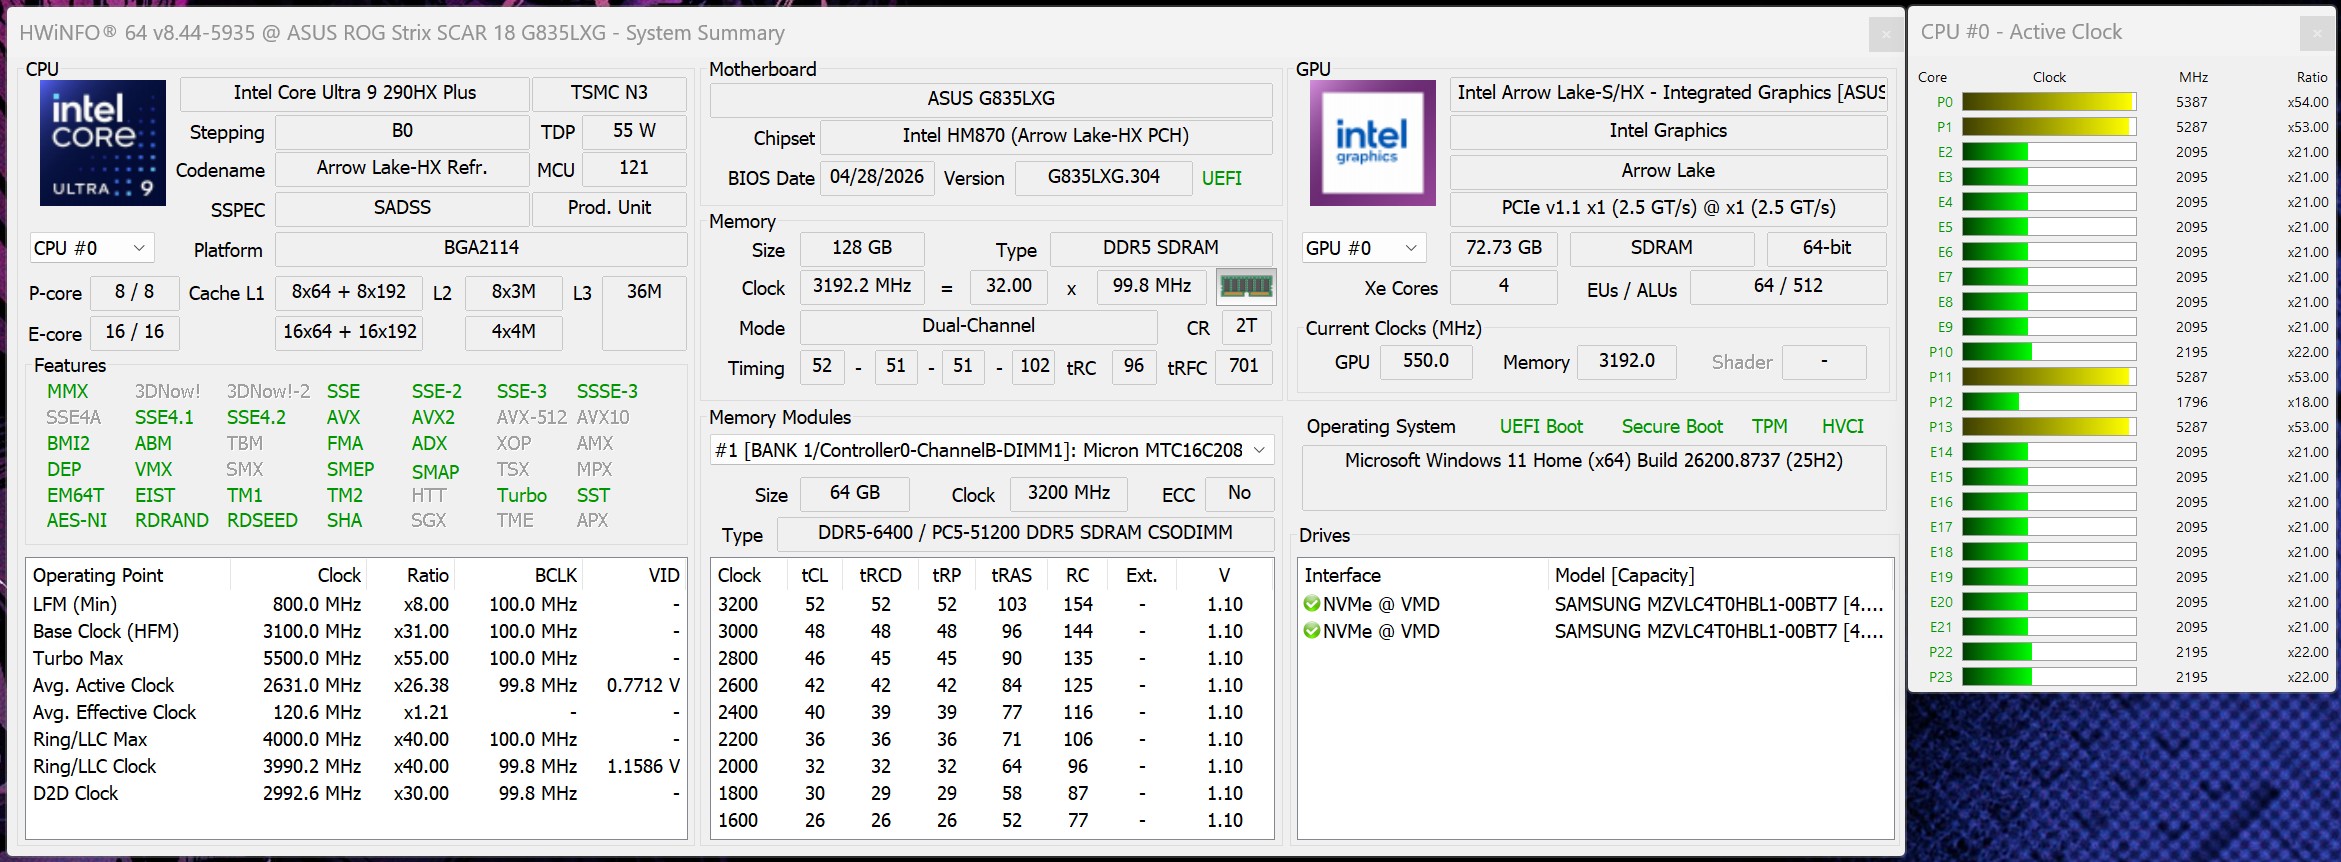
HWiNFO

Conditions d'essai

L'Asus ROG Strix SCAR 18 propose les trois profils d'alimentation habituels : Silencieux, Performance et Turbo. Le mode Turbo, qui libère les performances maximales, a été utilisé pour tous les tests de performance et toutes les mesures. De plus, un mode manuel est disponible, dans lequel il est notamment possible de personnaliser les fréquences d’horloge du GPU et le contrôle des ventilateurs. Toutefois, le mode Turbo n’est pas disponible lorsque l’appareil fonctionne sur batterie.

Profil de consommation TDP du processeur CBR24Multi TGP du GPU TimeSpy Graphics CP2077QHD Bruit maximaldu ventilateur
Silencieux 100/80 watts 1953 points 95 watts 16321 points 80,2 FPS 34,8 dB(A)
Performances 125/100 watts 2133 points 150 watts 23177 points 110,0 FPS 49 dB(A)
Mode Turbo 200/180 watts 2318 points 175 watts 25256 points 118,7 FPS 53,7 dB(A)

Processeur - Core Ultra 9 290HX Plus

L'Intel Core Ultra 9 290HX est l'un des processeurs mobiles les plus rapides de la génération actuelle Arrow Lake-HX ; il est conçu pour les ordinateurs portables de jeu haut de gamme et les stations de travail mobiles. Grâce à ses performances multicœurs élevées, il gère les applications exigeantes telles que le rendu, le montage vidéo ou le développement logiciel avec autant d'aisance que les jeux les plus récents. Lors des tests, le processeur offre des performances élevées et constantes et se classe parmi les meilleurs processeurs pour ordinateurs portables actuellement disponibles. Sur l’Asus ROG Strix SCAR 18, le fabricant propose trois modes de performance prédéfinis avec une puissance de pointe pouvant atteindre 200 watts. Les utilisateurs qui souhaitent régler les paramètres manuellement peuvent même allouer jusqu’à 240 watts au processeur mobile.

Cinebench R15 Multi Loop

0125250375500625750875100011251250137515001625175018752000212522502375250026252750287530003125325033753500362537503875400041254250437545004625475048755000512552505375550056255750587560006125Tooltip
Asus ROG Strix Scar 18 G835LXG Intel Core Ultra 9 290HX Plus: Ø6190 (6119.95-6230.53) Points
Asus Strix Scar 18 G835LX Intel Core Ultra 9 275HX: Ø5942 (5879.76-6059.69) Points
Razer Blade 18 2024 RZ09-0509 Intel Core i9-14900HX: Ø4163 (3956.09-4227.88) Points
Alienware m18 R2 Intel Core i9-14900HX: Ø4743 (4458.81-4807.11) Points
Acer Predator Helios 18 PH18-72-98MW Intel Core i9-14900HX: Ø4064 (3787.52-4673.44) Points
MSI Titan 18 HX A14VIG Intel Core i9-14900HX: Ø4753 (4700.35-4782.4) Points
Schenker Key 17 Pro (M24) Intel Core i9-14900HX: Ø3786 (3488.57-4363) Points
CPU Performance rating: Percent
Cinebench R23: Multi Core | Single Core
Cinebench R20: CPU (Multi Core) | CPU (Single Core)
Cinebench R15: CPU Multi 64Bit | CPU Single 64Bit
Blender: v2.79 BMW27 CPU
7-Zip 18.03: 7z b 4 | 7z b 4 -mmt1
Geekbench 6.7: Multi-Core | Single-Core
Geekbench 5.5: Multi-Core | Single-Core
HWBOT x265 Benchmark v2.2: 4k Preset
LibreOffice : 20 Documents To PDF
R Benchmark 2.5: Overall mean
CPU Performance rating
Asus ROG Strix Scar 18 G835LXG
Intel Core Ultra 9 290HX Plus
86 pt
Asus Strix Scar 18 G835LX
Intel Core Ultra 9 275HX
83.4 pt
Moyenne Intel Core Ultra 9 290HX Plus
 
83.3 pt
Alienware m18 R2
Intel Core i9-14900HX
74.8 pt
MSI Titan 18 HX A14VIG
Intel Core i9-14900HX
71.6 pt
Razer Blade 18 2024 RZ09-0509
Intel Core i9-14900HX
67.9 pt
Schenker Key 17 Pro (M24)
Intel Core i9-14900HX
66.1 pt
Acer Predator Helios 18 PH18-72-98MW
Intel Core i9-14900HX
65.2 pt
Moyenne de la classe Gaming
 
63.4 pt
Cinebench R23 / Multi Core
Asus ROG Strix Scar 18 G835LXG
Intel Core Ultra 9 290HX Plus
42661 Points
Moyenne Intel Core Ultra 9 290HX Plus
  (37038 - 42661, n=5)
39891 Points -6%
Asus Strix Scar 18 G835LX
Intel Core Ultra 9 275HX
39001 Points -9%
MSI Titan 18 HX A14VIG
Intel Core i9-14900HX
32428 (29693.8min - 32428.3max) Points -24%
Alienware m18 R2
Intel Core i9-14900HX
31391 (28656min - 31390.7max) Points -26%
Razer Blade 18 2024 RZ09-0509
Intel Core i9-14900HX
27657 (23328.1min - 27657.5max) Points -35%
Schenker Key 17 Pro (M24)
Intel Core i9-14900HX
27338 Points -36%
Moyenne de la classe Gaming
  (10488 - 42661, n=107, 2 dernières années)
26304 Points -38%
Acer Predator Helios 18 PH18-72-98MW
Intel Core i9-14900HX
26171 Points -39%
Cinebench R23 / Single Core
Asus ROG Strix Scar 18 G835LXG
Intel Core Ultra 9 290HX Plus
2415 Points
Moyenne Intel Core Ultra 9 290HX Plus
  (2319 - 2415, n=5)
2361 Points -2%
Asus Strix Scar 18 G835LX
Intel Core Ultra 9 275HX
2252 Points -7%
Alienware m18 R2
Intel Core i9-14900HX
2235 Points -7%
Acer Predator Helios 18 PH18-72-98MW
Intel Core i9-14900HX
2176 Points -10%
MSI Titan 18 HX A14VIG
Intel Core i9-14900HX
2143 Points -11%
Razer Blade 18 2024 RZ09-0509
Intel Core i9-14900HX
2088 Points -14%
Schenker Key 17 Pro (M24)
Intel Core i9-14900HX
2028 Points -16%
Moyenne de la classe Gaming
  (1166 - 2415, n=107, 2 dernières années)
2015 Points -17%
Cinebench R20 / CPU (Multi Core)
Asus ROG Strix Scar 18 G835LXG
Intel Core Ultra 9 290HX Plus
16433 Points
Asus Strix Scar 18 G835LX
Intel Core Ultra 9 275HX
15517 Points -6%
Moyenne Intel Core Ultra 9 290HX Plus
  (14397 - 16433, n=5)
15445 Points -6%
MSI Titan 18 HX A14VIG
Intel Core i9-14900HX
12103 Points -26%
Alienware m18 R2
Intel Core i9-14900HX
11816 Points -28%
Razer Blade 18 2024 RZ09-0509
Intel Core i9-14900HX
10871 Points -34%
Schenker Key 17 Pro (M24)
Intel Core i9-14900HX
10276 Points -37%
Moyenne de la classe Gaming
  (4029 - 16433, n=106, 2 dernières années)
10226 Points -38%
Acer Predator Helios 18 PH18-72-98MW
Intel Core i9-14900HX
9881 Points -40%
Cinebench R20 / CPU (Single Core)
Asus ROG Strix Scar 18 G835LXG
Intel Core Ultra 9 290HX Plus
913 Points
Moyenne Intel Core Ultra 9 290HX Plus
  (864 - 913, n=5)
891 Points -2%
Asus Strix Scar 18 G835LX
Intel Core Ultra 9 275HX
866 Points -5%
Alienware m18 R2
Intel Core i9-14900HX
853 Points -7%
Acer Predator Helios 18 PH18-72-98MW
Intel Core i9-14900HX
832 Points -9%
MSI Titan 18 HX A14VIG
Intel Core i9-14900HX
823 Points -10%
Razer Blade 18 2024 RZ09-0509
Intel Core i9-14900HX
814 Points -11%
Moyenne de la classe Gaming
  (442 - 913, n=106, 2 dernières années)
780 Points -15%
Schenker Key 17 Pro (M24)
Intel Core i9-14900HX
779 Points -15%
Cinebench R15 / CPU Multi 64Bit
Asus ROG Strix Scar 18 G835LXG
Intel Core Ultra 9 290HX Plus
6330 Points
Asus Strix Scar 18 G835LX
Intel Core Ultra 9 275HX
6060 (5879.76min - 6059.69max) Points -4%
Moyenne Intel Core Ultra 9 290HX Plus
  (5617 - 6330, n=5)
6002 Points -5%
Alienware m18 R2
Intel Core i9-14900HX
4807 (4458.81min - 4807.11max) Points -24%
MSI Titan 18 HX A14VIG
Intel Core i9-14900HX
4782 (4700.35min - 4782.4max) Points -24%
Acer Predator Helios 18 PH18-72-98MW
Intel Core i9-14900HX
4673 (3787.52min - 4673.44max) Points -26%
Schenker Key 17 Pro (M24)
Intel Core i9-14900HX
4363 (3488.57min - 4363max) Points -31%
Razer Blade 18 2024 RZ09-0509
Intel Core i9-14900HX
4228 (3956.09min - 4227.88max) Points -33%
Moyenne de la classe Gaming
  (1578 - 6330, n=105, 2 dernières années)
4079 Points -36%
Cinebench R15 / CPU Single 64Bit
Asus ROG Strix Scar 18 G835LXG
Intel Core Ultra 9 290HX Plus
350 Points
Asus Strix Scar 18 G835LX
Intel Core Ultra 9 275HX
343 Points -2%
Moyenne Intel Core Ultra 9 290HX Plus
  (324 - 350, n=5)
339 Points -3%
Alienware m18 R2
Intel Core i9-14900HX
318 Points -9%
Acer Predator Helios 18 PH18-72-98MW
Intel Core i9-14900HX
312 Points -11%
Razer Blade 18 2024 RZ09-0509
Intel Core i9-14900HX
304 Points -13%
MSI Titan 18 HX A14VIG
Intel Core i9-14900HX
300 Points -14%
Moyenne de la classe Gaming
  (188.8 - 350, n=106, 2 dernières années)
297 Points -15%
Schenker Key 17 Pro (M24)
Intel Core i9-14900HX
288 Points -18%
Blender / v2.79 BMW27 CPU
Moyenne de la classe Gaming
  (79 - 330, n=104, 2 dernières années)
149.9 Seconds * -90%
Acer Predator Helios 18 PH18-72-98MW
Intel Core i9-14900HX
125 Seconds * -58%
Schenker Key 17 Pro (M24)
Intel Core i9-14900HX
121 Seconds * -53%
Razer Blade 18 2024 RZ09-0509
Intel Core i9-14900HX
117 Seconds * -48%
MSI Titan 18 HX A14VIG
Intel Core i9-14900HX
104 Seconds * -32%
Alienware m18 R2
Intel Core i9-14900HX
102 Seconds * -29%
Asus Strix Scar 18 G835LX
Intel Core Ultra 9 275HX
87 Seconds * -10%
Moyenne Intel Core Ultra 9 290HX Plus
  (79 - 94, n=5)
86.2 Seconds * -9%
Asus ROG Strix Scar 18 G835LXG
Intel Core Ultra 9 290HX Plus
79 Seconds *
7-Zip 18.03 / 7z b 4
Asus ROG Strix Scar 18 G835LXG
Intel Core Ultra 9 290HX Plus
131933 MIPS
Asus Strix Scar 18 G835LX
Intel Core Ultra 9 275HX
122818 MIPS -7%
Alienware m18 R2
Intel Core i9-14900HX
122772 MIPS -7%
MSI Titan 18 HX A14VIG
Intel Core i9-14900HX
121266 MIPS -8%
Moyenne Intel Core Ultra 9 290HX Plus
  (103986 - 131933, n=5)
119559 MIPS -9%
Schenker Key 17 Pro (M24)
Intel Core i9-14900HX
109204 MIPS -17%
Razer Blade 18 2024 RZ09-0509
Intel Core i9-14900HX
107527 MIPS -18%
Acer Predator Helios 18 PH18-72-98MW
Intel Core i9-14900HX
106977 MIPS -19%
Moyenne de la classe Gaming
  (33491 - 148086, n=105, 2 dernières années)
90547 MIPS -31%
7-Zip 18.03 / 7z b 4 -mmt1
Asus ROG Strix Scar 18 G835LXG
Intel Core Ultra 9 290HX Plus
7143 MIPS
Alienware m18 R2
Intel Core i9-14900HX
7103 MIPS -1%
Asus Strix Scar 18 G835LX
Intel Core Ultra 9 275HX
7027 MIPS -2%
Schenker Key 17 Pro (M24)
Intel Core i9-14900HX
6858 MIPS -4%
Moyenne Intel Core Ultra 9 290HX Plus
  (6562 - 7143, n=5)
6850 MIPS -4%
MSI Titan 18 HX A14VIG
Intel Core i9-14900HX
6504 MIPS -9%
Razer Blade 18 2024 RZ09-0509
Intel Core i9-14900HX
6497 MIPS -9%
Moyenne de la classe Gaming
  (4199 - 7436, n=105, 2 dernières années)
6417 MIPS -10%
Acer Predator Helios 18 PH18-72-98MW
Intel Core i9-14900HX
6206 MIPS -13%
Geekbench 6.7 / Multi-Core
Asus ROG Strix Scar 18 G835LXG
Intel Core Ultra 9 290HX Plus
22850 Points
Asus Strix Scar 18 G835LX
Intel Core Ultra 9 275HX
21668 Points -5%
Moyenne Intel Core Ultra 9 290HX Plus
  (19855 - 22850, n=6)
21145 Points -7%
Alienware m18 R2
Intel Core i9-14900HX
18233 Points -20%
Acer Predator Helios 18 PH18-72-98MW
Intel Core i9-14900HX
17403 Points -24%
Razer Blade 18 2024 RZ09-0509
Intel Core i9-14900HX
17231 Points -25%
MSI Titan 18 HX A14VIG
Intel Core i9-14900HX
16652 Points -27%
Schenker Key 17 Pro (M24)
Intel Core i9-14900HX
16482 Points -28%
Moyenne de la classe Gaming
  (6625 - 22850, n=106, 2 dernières années)
16010 Points -30%
Geekbench 6.7 / Single-Core
Asus ROG Strix Scar 18 G835LXG
Intel Core Ultra 9 290HX Plus
3228 Points
Moyenne Intel Core Ultra 9 290HX Plus
  (3147 - 3228, n=6)
3186 Points -1%
Asus Strix Scar 18 G835LX
Intel Core Ultra 9 275HX
3158 Points -2%
Alienware m18 R2
Intel Core i9-14900HX
3057 Points -5%
Acer Predator Helios 18 PH18-72-98MW
Intel Core i9-14900HX
2965 Points -8%
Moyenne de la classe Gaming
  (1490 - 3259, n=106, 2 dernières années)
2848 Points -12%
MSI Titan 18 HX A14VIG
Intel Core i9-14900HX
2843 Points -12%
Razer Blade 18 2024 RZ09-0509
Intel Core i9-14900HX
2842 Points -12%
Schenker Key 17 Pro (M24)
Intel Core i9-14900HX
2611 Points -19%
Geekbench 5.5 / Multi-Core
Asus ROG Strix Scar 18 G835LXG
Intel Core Ultra 9 290HX Plus
28263 Points
Asus Strix Scar 18 G835LX
Intel Core Ultra 9 275HX
25855 Points -9%
Moyenne Intel Core Ultra 9 290HX Plus
  (23839 - 28263, n=5)
25396 Points -10%
Alienware m18 R2
Intel Core i9-14900HX
21284 Points -25%
Acer Predator Helios 18 PH18-72-98MW
Intel Core i9-14900HX
20029 Points -29%
Schenker Key 17 Pro (M24)
Intel Core i9-14900HX
19316 Points -32%
Razer Blade 18 2024 RZ09-0509
Intel Core i9-14900HX
19310 Points -32%
MSI Titan 18 HX A14VIG
Intel Core i9-14900HX
19137 Points -32%
Moyenne de la classe Gaming
  (6460 - 28263, n=105, 2 dernières années)
17266 Points -39%
Geekbench 5.5 / Single-Core
Asus ROG Strix Scar 18 G835LXG
Intel Core Ultra 9 290HX Plus
2350 Points
Moyenne Intel Core Ultra 9 290HX Plus
  (2282 - 2357, n=5)
2318 Points -1%
Asus Strix Scar 18 G835LX
Intel Core Ultra 9 275HX
2292 Points -2%
Alienware m18 R2
Intel Core i9-14900HX
2193 Points -7%
MSI Titan 18 HX A14VIG
Intel Core i9-14900HX
2098 Points -11%
Moyenne de la classe Gaming
  (986 - 2474, n=105, 2 dernières années)
2060 Points -12%
Razer Blade 18 2024 RZ09-0509
Intel Core i9-14900HX
2015 Points -14%
Acer Predator Helios 18 PH18-72-98MW
Intel Core i9-14900HX
2009 Points -15%
Schenker Key 17 Pro (M24)
Intel Core i9-14900HX
1924 Points -18%
HWBOT x265 Benchmark v2.2 / 4k Preset
Asus ROG Strix Scar 18 G835LXG
Intel Core Ultra 9 290HX Plus
44.4 fps
Moyenne Intel Core Ultra 9 290HX Plus
  (38.2 - 44.4, n=5)
41.4 fps -7%
Asus Strix Scar 18 G835LX
Intel Core Ultra 9 275HX
41.2 fps -7%
Alienware m18 R2
Intel Core i9-14900HX
32.1 fps -28%
MSI Titan 18 HX A14VIG
Intel Core i9-14900HX
30.9 fps -30%
Acer Predator Helios 18 PH18-72-98MW
Intel Core i9-14900HX
29.5 fps -34%
Moyenne de la classe Gaming
  (11.5 - 44.4, n=105, 2 dernières années)
28.8 fps -35%
Razer Blade 18 2024 RZ09-0509
Intel Core i9-14900HX
27.7 fps -38%
Schenker Key 17 Pro (M24)
Intel Core i9-14900HX
27.1 fps -39%
LibreOffice / 20 Documents To PDF
Acer Predator Helios 18 PH18-72-98MW
Intel Core i9-14900HX
85.1 s * -25%
Asus ROG Strix Scar 18 G835LXG
Intel Core Ultra 9 290HX Plus
68.2 s *
Moyenne de la classe Gaming
  (33.2 - 88.8, n=105, 2 dernières années)
49.7 s * +27%
Razer Blade 18 2024 RZ09-0509
Intel Core i9-14900HX
48.5 s * +29%
Schenker Key 17 Pro (M24)
Intel Core i9-14900HX
46.6 s * +32%
MSI Titan 18 HX A14VIG
Intel Core i9-14900HX
46.2 s * +32%
Moyenne Intel Core Ultra 9 290HX Plus
  (38.9 - 68.2, n=5)
45.5 s * +33%
Alienware m18 R2
Intel Core i9-14900HX
44.8 s * +34%
Asus Strix Scar 18 G835LX
Intel Core Ultra 9 275HX
41.3 s * +39%
R Benchmark 2.5 / Overall mean
Moyenne de la classe Gaming
  (0.3439 - 0.759, n=106, 2 dernières années)
0.4284 sec * -10%
Acer Predator Helios 18 PH18-72-98MW
Intel Core i9-14900HX
0.4225 sec * -8%
Schenker Key 17 Pro (M24)
Intel Core i9-14900HX
0.4143 sec * -6%
Asus Strix Scar 18 G835LX
Intel Core Ultra 9 275HX
0.3943 sec * -1%
Razer Blade 18 2024 RZ09-0509
Intel Core i9-14900HX
0.3937 sec * -1%
MSI Titan 18 HX A14VIG
Intel Core i9-14900HX
0.3919 sec * -1%
Asus ROG Strix Scar 18 G835LXG
Intel Core Ultra 9 290HX Plus
0.3899 sec *
Moyenne Intel Core Ultra 9 290HX Plus
  (0.3788 - 0.3951, n=5)
0.3887 sec * -0%
Alienware m18 R2
Intel Core i9-14900HX
0.3767 sec * +3%

* ... Moindre est la valeur, meilleures sont les performances
Cinebench R10 Rendering Single 32Bit
12575
Cinebench R10 Shading 64Bit
13665 Points
Cinebench R10 Rendering Multiple CPUs 64Bit
165835 Points
Cinebench R10 Rendering Single CPUs 64Bit
19487 Points
Cinebench R10 Shading 32Bit
13696
Cinebench R10 Rendering Multiple CPUs 32Bit
102066
Cinebench R11.5 CPU Single 32Bit
3.66 Points
Cinebench R11.5 CPU Multi 32Bit
67.85 Points
Cinebench R11.5 OpenGL 32Bit
199.32 fps
Cinebench R11.5 CPU Single 64Bit
4.16 Points
Cinebench R11.5 CPU Multi 64Bit
76.69 Points
Cinebench R11.5 OpenGL 64Bit
220.23 fps
Cinebench R15 CPU Single 64Bit
350 Points
Cinebench R15 CPU Multi 64Bit
6330 Points
Cinebench R15 Ref. Match 64Bit
99.6 %
Cinebench R15 OpenGL 64Bit
321.54 fps
Cinebench R20 CPU (Single Core)
913 Points
Cinebench R20 CPU (Multi Core)
16433 Points
Cinebench R23 Multi Core
42661 Points
Cinebench R23 Single Core
2415 Points
Cinebench 2024 CPU Single Core
141 Points
Cinebench 2024 CPU Multi Core
2327 Points
Cinebench 2026 CPU Multi
9542 Points
Cinebench 2026 CPU Single Thread
581 Points
Aide
Performance rating
Asus ROG Strix Scar 18 G835LXG
Intel Core Ultra 9 290HX Plus, GeForce RTX 5090 Laptop
97.5 pt
Moyenne Intel Core Ultra 9 290HX Plus
 
91.7 pt
Asus Strix Scar 18 G835LX -1!
Intel Core Ultra 9 275HX, GeForce RTX 5090 Laptop
90.1 pt
MSI Titan 18 HX A14VIG -1!
Intel Core i9-14900HX, GeForce RTX 4090 Laptop GPU
77.8 pt
Alienware m18 R2 -1!
Intel Core i9-14900HX, GeForce RTX 4090 Laptop GPU
77.4 pt
Moyenne de la classe Gaming
 
71.2 pt
Razer Blade 18 2024 RZ09-0509 -1!
Intel Core i9-14900HX, GeForce RTX 4090 Laptop GPU
69.8 pt
Acer Predator Helios 18 PH18-72-98MW -1!
Intel Core i9-14900HX, GeForce RTX 4090 Laptop GPU
67 pt
Schenker Key 17 Pro (M24) -1!
Intel Core i9-14900HX, GeForce RTX 4090 Laptop GPU
64.8 pt
AIDA64 / FP32 Ray-Trace
Asus ROG Strix Scar 18 G835LXG
Intel Core Ultra 9 290HX Plus, GeForce RTX 5090 Laptop (v6.92.6600)
43239 KRay/s
Asus ROG Strix Scar 18 G835LXG
Intel Core Ultra 9 290HX Plus, GeForce RTX 5090 Laptop (v8.20.8100)
43116 KRay/s 0%
Moyenne Intel Core Ultra 9 290HX Plus
  (34761 - 43239, n=6)
40296 KRay/s -7%
Asus Strix Scar 18 G835LX
Intel Core Ultra 9 275HX, GeForce RTX 5090 Laptop (v6.92.6600)
39458 KRay/s -9%
Moyenne de la classe Gaming
  (10227 - 85542, n=105, 2 dernières années)
32356 KRay/s -25%
MSI Titan 18 HX A14VIG
Intel Core i9-14900HX, GeForce RTX 4090 Laptop GPU (v6.92.6600)
29351 KRay/s -32%
Alienware m18 R2
Intel Core i9-14900HX, GeForce RTX 4090 Laptop GPU (v6.92.6600)
29280 KRay/s -32%
Razer Blade 18 2024 RZ09-0509
Intel Core i9-14900HX, GeForce RTX 4090 Laptop GPU (v6.85.6300)
25098 KRay/s -42%
Acer Predator Helios 18 PH18-72-98MW
Intel Core i9-14900HX, GeForce RTX 4090 Laptop GPU (v6.92.6600)
23862 KRay/s -45%
Schenker Key 17 Pro (M24)
Intel Core i9-14900HX, GeForce RTX 4090 Laptop GPU (v6.92.6600)
21858 KRay/s -49%
AIDA64 / FPU Julia
Asus ROG Strix Scar 18 G835LXG
Intel Core Ultra 9 290HX Plus, GeForce RTX 5090 Laptop (v8.20.8100)
218895 Points
Asus ROG Strix Scar 18 G835LXG
Intel Core Ultra 9 290HX Plus, GeForce RTX 5090 Laptop (v6.92.6600)
217175 Points -1%
Moyenne Intel Core Ultra 9 290HX Plus
  (174665 - 218895, n=6)
204722 Points -6%
Asus Strix Scar 18 G835LX
Intel Core Ultra 9 275HX, GeForce RTX 5090 Laptop (v6.92.6600)
194867 Points -11%
MSI Titan 18 HX A14VIG
Intel Core i9-14900HX, GeForce RTX 4090 Laptop GPU (v6.92.6600)
148888 Points -32%
Alienware m18 R2
Intel Core i9-14900HX, GeForce RTX 4090 Laptop GPU (v6.92.6600)
142791 Points -35%
Moyenne de la classe Gaming
  (51376 - 238426, n=105, 2 dernières années)
140193 Points -36%
Razer Blade 18 2024 RZ09-0509
Intel Core i9-14900HX, GeForce RTX 4090 Laptop GPU (v6.85.6300)
128369 Points -41%
Acer Predator Helios 18 PH18-72-98MW
Intel Core i9-14900HX, GeForce RTX 4090 Laptop GPU (v6.92.6600)
118469 Points -46%
Schenker Key 17 Pro (M24)
Intel Core i9-14900HX, GeForce RTX 4090 Laptop GPU (v6.92.6600)
113270 Points -48%
AIDA64 / CPU SHA3
Asus ROG Strix Scar 18 G835LXG
Intel Core Ultra 9 290HX Plus, GeForce RTX 5090 Laptop (v8.20.8100)
10115 MB/s
Asus ROG Strix Scar 18 G835LXG
Intel Core Ultra 9 290HX Plus, GeForce RTX 5090 Laptop (v6.92.6600)
10055 MB/s -1%
Moyenne Intel Core Ultra 9 290HX Plus
  (8352 - 10115, n=6)
9565 MB/s -5%
Asus Strix Scar 18 G835LX
Intel Core Ultra 9 275HX, GeForce RTX 5090 Laptop (v6.92.6600)
9482 MB/s -6%
MSI Titan 18 HX A14VIG
Intel Core i9-14900HX, GeForce RTX 4090 Laptop GPU (v6.92.6600)
7229 MB/s -29%
Alienware m18 R2
Intel Core i9-14900HX, GeForce RTX 4090 Laptop GPU (v6.92.6600)
7095 MB/s -30%
Moyenne de la classe Gaming
  (2180 - 10115, n=105, 2 dernières années)
6367 MB/s -37%
Razer Blade 18 2024 RZ09-0509
Intel Core i9-14900HX, GeForce RTX 4090 Laptop GPU (v6.85.6300)
6159 MB/s -39%
Acer Predator Helios 18 PH18-72-98MW
Intel Core i9-14900HX, GeForce RTX 4090 Laptop GPU (v6.92.6600)
5804 MB/s -43%
Schenker Key 17 Pro (M24)
Intel Core i9-14900HX, GeForce RTX 4090 Laptop GPU (v6.92.6600)
5598 MB/s -45%
AIDA64 / CPU Queen
MSI Titan 18 HX A14VIG
Intel Core i9-14900HX, GeForce RTX 4090 Laptop GPU (v6.92.6600)
148773 Points +5%
Asus ROG Strix Scar 18 G835LXG
Intel Core Ultra 9 290HX Plus, GeForce RTX 5090 Laptop (v6.92.6600)
141622 Points
Moyenne Intel Core Ultra 9 290HX Plus
  (n=1)
141622 Points 0%
Asus Strix Scar 18 G835LX
Intel Core Ultra 9 275HX, GeForce RTX 5090 Laptop (v6.92.6600)
139608 Points -1%
Alienware m18 R2
Intel Core i9-14900HX, GeForce RTX 4090 Laptop GPU (v6.92.6600)
139323 Points -2%
Acer Predator Helios 18 PH18-72-98MW
Intel Core i9-14900HX, GeForce RTX 4090 Laptop GPU (v6.92.6600)
139146 Points -2%
Schenker Key 17 Pro (M24)
Intel Core i9-14900HX, GeForce RTX 4090 Laptop GPU (v6.92.6600)
138708 Points -2%
Razer Blade 18 2024 RZ09-0509
Intel Core i9-14900HX, GeForce RTX 4090 Laptop GPU (v6.85.6300)
136621 Points -4%
Moyenne de la classe Gaming
  (49785 - 173351, n=90, 2 dernières années)
116544 Points -18%
AIDA64 / FPU SinJulia
MSI Titan 18 HX A14VIG
Intel Core i9-14900HX, GeForce RTX 4090 Laptop GPU (v6.92.6600)
18256 Points +23%
Alienware m18 R2
Intel Core i9-14900HX, GeForce RTX 4090 Laptop GPU (v6.92.6600)
16279 Points +9%
Razer Blade 18 2024 RZ09-0509
Intel Core i9-14900HX, GeForce RTX 4090 Laptop GPU (v6.85.6300)
15500 Points +4%
Acer Predator Helios 18 PH18-72-98MW
Intel Core i9-14900HX, GeForce RTX 4090 Laptop GPU (v6.92.6600)
15099 Points +2%
Asus ROG Strix Scar 18 G835LXG
Intel Core Ultra 9 290HX Plus, GeForce RTX 5090 Laptop (v8.20.8100)
14874 Points
Asus ROG Strix Scar 18 G835LXG
Intel Core Ultra 9 290HX Plus, GeForce RTX 5090 Laptop (v6.92.6600)
14857 Points 0%
Moyenne de la classe Gaming
  (4424 - 33636, n=105, 2 dernières années)
14619 Points -2%
Moyenne Intel Core Ultra 9 290HX Plus
  (13612 - 14874, n=6)
14247 Points -4%
Asus Strix Scar 18 G835LX
Intel Core Ultra 9 275HX, GeForce RTX 5090 Laptop (v6.92.6600)
14112 Points -5%
Schenker Key 17 Pro (M24)
Intel Core i9-14900HX, GeForce RTX 4090 Laptop GPU (v6.92.6600)
13903 Points -7%
AIDA64 / FPU Mandel
Asus ROG Strix Scar 18 G835LXG
Intel Core Ultra 9 290HX Plus, GeForce RTX 5090 Laptop (v6.92.6600)
115371 Points
Asus ROG Strix Scar 18 G835LXG
Intel Core Ultra 9 290HX Plus, GeForce RTX 5090 Laptop (v8.20.8100)
115355 Points 0%
Moyenne Intel Core Ultra 9 290HX Plus
  (91215 - 115371, n=6)
107382 Points -7%
Asus Strix Scar 18 G835LX
Intel Core Ultra 9 275HX, GeForce RTX 5090 Laptop (v6.92.6600)
104057 Points -10%
Moyenne de la classe Gaming
  (25115 - 128721, n=105, 2 dernières années)
73608 Points -36%
Alienware m18 R2
Intel Core i9-14900HX, GeForce RTX 4090 Laptop GPU (v6.92.6600)
72594 Points -37%
MSI Titan 18 HX A14VIG
Intel Core i9-14900HX, GeForce RTX 4090 Laptop GPU (v6.92.6600)
72355 Points -37%
Razer Blade 18 2024 RZ09-0509
Intel Core i9-14900HX, GeForce RTX 4090 Laptop GPU (v6.85.6300)
62867 Points -46%
Acer Predator Helios 18 PH18-72-98MW
Intel Core i9-14900HX, GeForce RTX 4090 Laptop GPU (v6.92.6600)
59005 Points -49%
Schenker Key 17 Pro (M24)
Intel Core i9-14900HX, GeForce RTX 4090 Laptop GPU (v6.92.6600)
54428 Points -53%
AIDA64 / CPU AES
Asus ROG Strix Scar 18 G835LXG
Intel Core Ultra 9 290HX Plus, GeForce RTX 5090 Laptop (v6.92.6600)
143205 MB/s
Asus ROG Strix Scar 18 G835LXG
Intel Core Ultra 9 290HX Plus, GeForce RTX 5090 Laptop (v8.20.8100)
143046 MB/s 0%
MSI Titan 18 HX A14VIG
Intel Core i9-14900HX, GeForce RTX 4090 Laptop GPU (v6.92.6600)
138830 MB/s -3%
Moyenne Intel Core Ultra 9 290HX Plus
  (127585 - 143205, n=6)
136036 MB/s -5%
Asus Strix Scar 18 G835LX
Intel Core Ultra 9 275HX, GeForce RTX 5090 Laptop (v6.92.6600)
134920 MB/s -6%
Alienware m18 R2
Intel Core i9-14900HX, GeForce RTX 4090 Laptop GPU (v6.92.6600)
134675 MB/s -6%
Razer Blade 18 2024 RZ09-0509
Intel Core i9-14900HX, GeForce RTX 4090 Laptop GPU (v6.85.6300)
117887 MB/s -18%
Acer Predator Helios 18 PH18-72-98MW
Intel Core i9-14900HX, GeForce RTX 4090 Laptop GPU (v6.92.6600)
112197 MB/s -22%
Moyenne de la classe Gaming
  (39258 - 247074, n=105, 2 dernières années)
108017 MB/s -25%
Schenker Key 17 Pro (M24)
Intel Core i9-14900HX, GeForce RTX 4090 Laptop GPU (v6.92.6600)
106371 MB/s -26%
AIDA64 / CPU ZLib
Asus ROG Strix Scar 18 G835LXG
Intel Core Ultra 9 290HX Plus, GeForce RTX 5090 Laptop (v6.92.6600)
2340 MB/s
Asus ROG Strix Scar 18 G835LXG
Intel Core Ultra 9 290HX Plus, GeForce RTX 5090 Laptop (v8.20.8100)
2334 MB/s 0%
Asus Strix Scar 18 G835LX
Intel Core Ultra 9 275HX, GeForce RTX 5090 Laptop (v6.92.6600)
2220 MB/s -5%
Moyenne Intel Core Ultra 9 290HX Plus
  (1967 - 2340, n=6)
2202 MB/s -6%
MSI Titan 18 HX A14VIG
Intel Core i9-14900HX, GeForce RTX 4090 Laptop GPU (v6.92.6600)
2149 MB/s -8%
Alienware m18 R2
Intel Core i9-14900HX, GeForce RTX 4090 Laptop GPU (v6.92.6600)
2053 MB/s -12%
Razer Blade 18 2024 RZ09-0509
Intel Core i9-14900HX, GeForce RTX 4090 Laptop GPU (v6.85.6300)
1794 MB/s -23%
Acer Predator Helios 18 PH18-72-98MW
Intel Core i9-14900HX, GeForce RTX 4090 Laptop GPU (v6.92.6600)
1696 MB/s -28%
Schenker Key 17 Pro (M24)
Intel Core i9-14900HX, GeForce RTX 4090 Laptop GPU (v6.92.6600)
1691 MB/s -28%
Moyenne de la classe Gaming
  (574 - 2531, n=105, 2 dernières années)
1569 MB/s -33%
AIDA64 / FP64 Ray-Trace
Asus ROG Strix Scar 18 G835LXG
Intel Core Ultra 9 290HX Plus, GeForce RTX 5090 Laptop (v6.92.6600)
23843 KRay/s
Asus ROG Strix Scar 18 G835LXG
Intel Core Ultra 9 290HX Plus, GeForce RTX 5090 Laptop (v8.20.8100)
23227 KRay/s -3%
Moyenne Intel Core Ultra 9 290HX Plus
  (18611 - 23843, n=6)
21823 KRay/s -8%
Asus Strix Scar 18 G835LX
Intel Core Ultra 9 275HX, GeForce RTX 5090 Laptop (v6.92.6600)
21372 KRay/s -10%
Moyenne de la classe Gaming
  (5509 - 45446, n=105, 2 dernières années)
17303 KRay/s -27%
Alienware m18 R2
Intel Core i9-14900HX, GeForce RTX 4090 Laptop GPU (v6.92.6600)
16128 KRay/s -32%
MSI Titan 18 HX A14VIG
Intel Core i9-14900HX, GeForce RTX 4090 Laptop GPU (v6.92.6600)
16104 KRay/s -32%
Razer Blade 18 2024 RZ09-0509
Intel Core i9-14900HX, GeForce RTX 4090 Laptop GPU (v6.85.6300)
13680 KRay/s -43%
Acer Predator Helios 18 PH18-72-98MW
Intel Core i9-14900HX, GeForce RTX 4090 Laptop GPU (v6.92.6600)
12565 KRay/s -47%
Schenker Key 17 Pro (M24)
Intel Core i9-14900HX, GeForce RTX 4090 Laptop GPU (v6.92.6600)
11838 KRay/s -50%
AIDA64 / CPU PhotoWorxx
Asus ROG Strix Scar 18 G835LXG
Intel Core Ultra 9 290HX Plus, GeForce RTX 5090 Laptop (v8.20.8100)
65272 MPixel/s
Asus ROG Strix Scar 18 G835LXG
Intel Core Ultra 9 290HX Plus, GeForce RTX 5090 Laptop (v6.92.6600)
62686 MPixel/s -4%
Moyenne Intel Core Ultra 9 290HX Plus
  (51134 - 65272, n=6)
56956 MPixel/s -13%
Asus Strix Scar 18 G835LX
Intel Core Ultra 9 275HX, GeForce RTX 5090 Laptop (v6.92.6600)
56601 MPixel/s -13%
Schenker Key 17 Pro (M24)
Intel Core i9-14900HX, GeForce RTX 4090 Laptop GPU (v6.92.6600)
50465 MPixel/s -23%
Alienware m18 R2
Intel Core i9-14900HX, GeForce RTX 4090 Laptop GPU (v6.92.6600)
49716 MPixel/s -24%
Razer Blade 18 2024 RZ09-0509
Intel Core i9-14900HX, GeForce RTX 4090 Laptop GPU (v6.85.6300)
47472 MPixel/s -27%
Acer Predator Helios 18 PH18-72-98MW
Intel Core i9-14900HX, GeForce RTX 4090 Laptop GPU (v6.92.6600)
47343 MPixel/s -27%
Moyenne de la classe Gaming
  (12271 - 89891, n=105, 2 dernières années)
44630 MPixel/s -32%
MSI Titan 18 HX A14VIG
Intel Core i9-14900HX, GeForce RTX 4090 Laptop GPU (v6.92.6600)
33960 MPixel/s -48%
AIDA64 / CPU CheckMate
Asus ROG Strix Scar 18 G835LXG
Intel Core Ultra 9 290HX Plus, GeForce RTX 5090 Laptop (v8.20.8100)
8765 MP/s
Moyenne Intel Core Ultra 9 290HX Plus
  (7624 - 8765, n=5)
8207 MP/s -6%
Moyenne de la classe Gaming
  (2930 - 11788, n=14, 2 dernières années)
6635 MP/s -24%

Performances du système et du stockage

L'Asus ROG Strix SCAR 18 impressionne au quotidien par ses vitesses système très élevées et ses temps de chargement courts. Les applications et les jeux se lancent rapidement, ce qui confère à l'ordinateur portable une réactivité exceptionnelle en permanence. Le changement de mode graphique via Nvidia Advanced Optimus entraîne un bref délai lors du lancement de certains jeux ; cela est dû à des contraintes techniques et n'entraîne aucune autre restriction pendant le fonctionnement.

Performance rating: Percent
PCMark 10: Score | Essentials | Productivity | Digital Content Creation
CrossMark: Overall | Productivity | Creativity | Responsiveness
WebXPRT 3: Overall
WebXPRT 4: Overall
Mozilla Kraken 1.1: Total
Performance rating
Asus ROG Strix Scar 18 G835LXG
GeForce RTX 5090 Laptop, Ultra 9 290HX Plus, 2x Samsung PM9E1 MZVLC4T0HBL1 (RAID 0)
91.6 pt
Moyenne Intel Core Ultra 9 290HX Plus, NVIDIA GeForce RTX 5090 Laptop
 
89.1 pt
Asus Strix Scar 18 G835LX
GeForce RTX 5090 Laptop, Ultra 9 275HX, WD PC SN8000S 2TB
79.4 pt
Alienware m18 R2
GeForce RTX 4090 Laptop GPU, i9-14900HX, SK Hynix PC811 HFS002TEM9X152N
77.2 pt
Razer Blade 18 2024 RZ09-0509 -1!
GeForce RTX 4090 Laptop GPU, i9-14900HX
74.1 pt
MSI Titan 18 HX A14VIG
GeForce RTX 4090 Laptop GPU, i9-14900HX, 2x Samsung PM9A1a MZVL22T0HDLB (RAID 0)
72.3 pt
Moyenne de la classe Gaming
 
72.1 pt
Schenker Key 17 Pro (M24) -4!
GeForce RTX 4090 Laptop GPU, i9-14900HX, Samsung 990 Pro 1 TB
63 pt
Acer Predator Helios 18 PH18-72-98MW -6!
GeForce RTX 4090 Laptop GPU, i9-14900HX, 2x SK Hynix HFS001TEJ9X115N (RAID 0)
56.2 pt
PCMark 10 / Score
Asus ROG Strix Scar 18 G835LXG
GeForce RTX 5090 Laptop, Ultra 9 290HX Plus, 2x Samsung PM9E1 MZVLC4T0HBL1 (RAID 0)
12414 Points
Moyenne Intel Core Ultra 9 290HX Plus, NVIDIA GeForce RTX 5090 Laptop
  (11015 - 12414, n=3)
11720 Points -6%
Alienware m18 R2
GeForce RTX 4090 Laptop GPU, i9-14900HX, SK Hynix PC811 HFS002TEM9X152N
9234 Points -26%
MSI Titan 18 HX A14VIG
GeForce RTX 4090 Laptop GPU, i9-14900HX, 2x Samsung PM9A1a MZVL22T0HDLB (RAID 0)
8968 Points -28%
Razer Blade 18 2024 RZ09-0509
GeForce RTX 4090 Laptop GPU, i9-14900HX
8805 Points -29%
Asus Strix Scar 18 G835LX
GeForce RTX 5090 Laptop, Ultra 9 275HX, WD PC SN8000S 2TB
8623 Points -31%
Moyenne de la classe Gaming
  (5828 - 12414, n=93, 2 dernières années)
8463 Points -32%
Schenker Key 17 Pro (M24)
GeForce RTX 4090 Laptop GPU, i9-14900HX, Samsung 990 Pro 1 TB
8277 Points -33%
Acer Predator Helios 18 PH18-72-98MW
GeForce RTX 4090 Laptop GPU, i9-14900HX, 2x SK Hynix HFS001TEJ9X115N (RAID 0)
8230 Points -34%
PCMark 10 / Essentials
MSI Titan 18 HX A14VIG
GeForce RTX 4090 Laptop GPU, i9-14900HX, 2x Samsung PM9A1a MZVL22T0HDLB (RAID 0)
11628 Points 0%
Asus ROG Strix Scar 18 G835LXG
GeForce RTX 5090 Laptop, Ultra 9 290HX Plus, 2x Samsung PM9E1 MZVLC4T0HBL1 (RAID 0)
11604 Points
Moyenne Intel Core Ultra 9 290HX Plus, NVIDIA GeForce RTX 5090 Laptop
  (11316 - 11604, n=3)
11468 Points -1%
Alienware m18 R2
GeForce RTX 4090 Laptop GPU, i9-14900HX, SK Hynix PC811 HFS002TEM9X152N
11415 Points -2%
Razer Blade 18 2024 RZ09-0509
GeForce RTX 4090 Laptop GPU, i9-14900HX
11378 Points -2%
Acer Predator Helios 18 PH18-72-98MW
GeForce RTX 4090 Laptop GPU, i9-14900HX, 2x SK Hynix HFS001TEJ9X115N (RAID 0)
11032 Points -5%
Asus Strix Scar 18 G835LX
GeForce RTX 5090 Laptop, Ultra 9 275HX, WD PC SN8000S 2TB
10966 Points -5%
Schenker Key 17 Pro (M24)
GeForce RTX 4090 Laptop GPU, i9-14900HX, Samsung 990 Pro 1 TB
10778 Points -7%
Moyenne de la classe Gaming
  (8810 - 11935, n=97, 2 dernières années)
10660 Points -8%
PCMark 10 / Productivity
Asus ROG Strix Scar 18 G835LXG
GeForce RTX 5090 Laptop, Ultra 9 290HX Plus, 2x Samsung PM9E1 MZVLC4T0HBL1 (RAID 0)
25323 Points
Moyenne Intel Core Ultra 9 290HX Plus, NVIDIA GeForce RTX 5090 Laptop
  (16305 - 25323, n=3)
20246 Points -20%
Alienware m18 R2
GeForce RTX 4090 Laptop GPU, i9-14900HX, SK Hynix PC811 HFS002TEM9X152N
11415 Points -55%
Moyenne de la classe Gaming
  (6845 - 25323, n=95, 2 dernières années)
11222 Points -56%
MSI Titan 18 HX A14VIG
GeForce RTX 4090 Laptop GPU, i9-14900HX, 2x Samsung PM9A1a MZVL22T0HDLB (RAID 0)
10225 Points -60%
Razer Blade 18 2024 RZ09-0509
GeForce RTX 4090 Laptop GPU, i9-14900HX
10186 Points -60%
Acer Predator Helios 18 PH18-72-98MW
GeForce RTX 4090 Laptop GPU, i9-14900HX, 2x SK Hynix HFS001TEJ9X115N (RAID 0)
9951 Points -61%
Schenker Key 17 Pro (M24)
GeForce RTX 4090 Laptop GPU, i9-14900HX, Samsung 990 Pro 1 TB
9458 Points -63%
Asus Strix Scar 18 G835LX
GeForce RTX 5090 Laptop, Ultra 9 275HX, WD PC SN8000S 2TB
9444 Points -63%
PCMark 10 / Digital Content Creation
Moyenne Intel Core Ultra 9 290HX Plus, NVIDIA GeForce RTX 5090 Laptop
  (17665 - 19954, n=3)
19092 Points +8%
Asus ROG Strix Scar 18 G835LXG
GeForce RTX 5090 Laptop, Ultra 9 290HX Plus, 2x Samsung PM9E1 MZVLC4T0HBL1 (RAID 0)
17665 Points
Asus Strix Scar 18 G835LX
GeForce RTX 5090 Laptop, Ultra 9 275HX, WD PC SN8000S 2TB
16802 Points -5%
MSI Titan 18 HX A14VIG
GeForce RTX 4090 Laptop GPU, i9-14900HX, 2x Samsung PM9A1a MZVL22T0HDLB (RAID 0)
16462 Points -7%
Alienware m18 R2
GeForce RTX 4090 Laptop GPU, i9-14900HX, SK Hynix PC811 HFS002TEM9X152N
16398 Points -7%
Razer Blade 18 2024 RZ09-0509
GeForce RTX 4090 Laptop GPU, i9-14900HX
15985 Points -10%
Schenker Key 17 Pro (M24)
GeForce RTX 4090 Laptop GPU, i9-14900HX, Samsung 990 Pro 1 TB
15093 Points -15%
Moyenne de la classe Gaming
  (7602 - 19954, n=95, 2 dernières années)
14060 Points -20%
Acer Predator Helios 18 PH18-72-98MW
GeForce RTX 4090 Laptop GPU, i9-14900HX, 2x SK Hynix HFS001TEJ9X115N (RAID 0)
13779 Points -22%
CrossMark / Overall
Asus ROG Strix Scar 18 G835LXG
GeForce RTX 5090 Laptop, Ultra 9 290HX Plus, 2x Samsung PM9E1 MZVLC4T0HBL1 (RAID 0)
2345 Points
Moyenne Intel Core Ultra 9 290HX Plus, NVIDIA GeForce RTX 5090 Laptop
  (2177 - 2401, n=3)
2308 Points -2%
Asus Strix Scar 18 G835LX
GeForce RTX 5090 Laptop, Ultra 9 275HX, WD PC SN8000S 2TB
2221 Points -5%
Alienware m18 R2
GeForce RTX 4090 Laptop GPU, i9-14900HX, SK Hynix PC811 HFS002TEM9X152N
2073 Points -12%
Razer Blade 18 2024 RZ09-0509
GeForce RTX 4090 Laptop GPU, i9-14900HX
2048 Points -13%
Moyenne de la classe Gaming
  (1366 - 2409, n=94, 2 dernières années)
1986 Points -15%
MSI Titan 18 HX A14VIG
GeForce RTX 4090 Laptop GPU, i9-14900HX, 2x Samsung PM9A1a MZVL22T0HDLB (RAID 0)
1877 Points -20%
CrossMark / Productivity
Asus ROG Strix Scar 18 G835LXG
GeForce RTX 5090 Laptop, Ultra 9 290HX Plus, 2x Samsung PM9E1 MZVLC4T0HBL1 (RAID 0)
2110 Points
Moyenne Intel Core Ultra 9 290HX Plus, NVIDIA GeForce RTX 5090 Laptop
  (1994 - 2213, n=3)
2106 Points 0%
Asus Strix Scar 18 G835LX
GeForce RTX 5090 Laptop, Ultra 9 275HX, WD PC SN8000S 2TB
2025 Points -4%
Razer Blade 18 2024 RZ09-0509
GeForce RTX 4090 Laptop GPU, i9-14900HX
1902 Points -10%
Alienware m18 R2
GeForce RTX 4090 Laptop GPU, i9-14900HX, SK Hynix PC811 HFS002TEM9X152N
1881 Points -11%
Moyenne de la classe Gaming
  (1386 - 2254, n=94, 2 dernières années)
1856 Points -12%
MSI Titan 18 HX A14VIG
GeForce RTX 4090 Laptop GPU, i9-14900HX, 2x Samsung PM9A1a MZVL22T0HDLB (RAID 0)
1738 Points -18%
CrossMark / Creativity
Asus ROG Strix Scar 18 G835LXG
GeForce RTX 5090 Laptop, Ultra 9 290HX Plus, 2x Samsung PM9E1 MZVLC4T0HBL1 (RAID 0)
2786 Points
Moyenne Intel Core Ultra 9 290HX Plus, NVIDIA GeForce RTX 5090 Laptop
  (2548 - 2786, n=3)
2665 Points -4%
Asus Strix Scar 18 G835LX
GeForce RTX 5090 Laptop, Ultra 9 275HX, WD PC SN8000S 2TB
2606 Points -6%
Alienware m18 R2
GeForce RTX 4090 Laptop GPU, i9-14900HX, SK Hynix PC811 HFS002TEM9X152N
2393 Points -14%
Razer Blade 18 2024 RZ09-0509
GeForce RTX 4090 Laptop GPU, i9-14900HX
2316 Points -17%
Moyenne de la classe Gaming
  (1343 - 2786, n=94, 2 dernières années)
2241 Points -20%
MSI Titan 18 HX A14VIG
GeForce RTX 4090 Laptop GPU, i9-14900HX, 2x Samsung PM9A1a MZVL22T0HDLB (RAID 0)
2195 Points -21%
CrossMark / Responsiveness
Moyenne Intel Core Ultra 9 290HX Plus, NVIDIA GeForce RTX 5090 Laptop
  (1766 - 2249, n=3)
1979 Points +3%
Asus ROG Strix Scar 18 G835LXG
GeForce RTX 5090 Laptop, Ultra 9 290HX Plus, 2x Samsung PM9E1 MZVLC4T0HBL1 (RAID 0)
1922 Points
Asus Strix Scar 18 G835LX
GeForce RTX 5090 Laptop, Ultra 9 275HX, WD PC SN8000S 2TB
1813 Points -6%
Alienware m18 R2
GeForce RTX 4090 Laptop GPU, i9-14900HX, SK Hynix PC811 HFS002TEM9X152N
1806 Points -6%
Razer Blade 18 2024 RZ09-0509
GeForce RTX 4090 Laptop GPU, i9-14900HX
1765 Points -8%
Moyenne de la classe Gaming
  (1226 - 2334, n=94, 2 dernières années)
1705 Points -11%
MSI Titan 18 HX A14VIG
GeForce RTX 4090 Laptop GPU, i9-14900HX, 2x Samsung PM9A1a MZVL22T0HDLB (RAID 0)
1478 Points -23%
WebXPRT 3 / Overall
Asus ROG Strix Scar 18 G835LXG
GeForce RTX 5090 Laptop, Ultra 9 290HX Plus, 2x Samsung PM9E1 MZVLC4T0HBL1 (RAID 0)
369 Points
Moyenne Intel Core Ultra 9 290HX Plus, NVIDIA GeForce RTX 5090 Laptop
  (354 - 369, n=3)
361 Points -2%
Asus Strix Scar 18 G835LX
GeForce RTX 5090 Laptop, Ultra 9 275HX, WD PC SN8000S 2TB
346 Points -6%
Razer Blade 18 2024 RZ09-0509
GeForce RTX 4090 Laptop GPU, i9-14900HX
339 Points -8%
MSI Titan 18 HX A14VIG
GeForce RTX 4090 Laptop GPU, i9-14900HX, 2x Samsung PM9A1a MZVL22T0HDLB (RAID 0)
327 Points -11%
Alienware m18 R2
GeForce RTX 4090 Laptop GPU, i9-14900HX, SK Hynix PC811 HFS002TEM9X152N
326 Points -12%
Moyenne de la classe Gaming
  (220 - 532, n=98, 2 dernières années)
318 Points -14%
Schenker Key 17 Pro (M24)
GeForce RTX 4090 Laptop GPU, i9-14900HX, Samsung 990 Pro 1 TB
308 Points -17%
WebXPRT 4 / Overall
Asus ROG Strix Scar 18 G835LXG
GeForce RTX 5090 Laptop, Ultra 9 290HX Plus, 2x Samsung PM9E1 MZVLC4T0HBL1 (RAID 0)
336 Points
Asus Strix Scar 18 G835LX
GeForce RTX 5090 Laptop, Ultra 9 275HX, WD PC SN8000S 2TB
335 Points 0%
Moyenne Intel Core Ultra 9 290HX Plus, NVIDIA GeForce RTX 5090 Laptop
  (310 - 336, n=3)
327 Points -3%
Alienware m18 R2
GeForce RTX 4090 Laptop GPU, i9-14900HX, SK Hynix PC811 HFS002TEM9X152N
309 Points -8%
MSI Titan 18 HX A14VIG
GeForce RTX 4090 Laptop GPU, i9-14900HX, 2x Samsung PM9A1a MZVL22T0HDLB (RAID 0)
287 Points -15%
Moyenne de la classe Gaming
  (165 - 354, n=98, 2 dernières années)
285 Points -15%
Schenker Key 17 Pro (M24)
GeForce RTX 4090 Laptop GPU, i9-14900HX, Samsung 990 Pro 1 TB
275 Points -18%
Mozilla Kraken 1.1 / Total
Schenker Key 17 Pro (M24)
GeForce RTX 4090 Laptop GPU, i9-14900HX, Samsung 990 Pro 1 TB
481 ms * -22%
Moyenne de la classe Gaming
  (391 - 590, n=100, 2 dernières années)
459 ms * -17%
MSI Titan 18 HX A14VIG
GeForce RTX 4090 Laptop GPU, i9-14900HX, 2x Samsung PM9A1a MZVL22T0HDLB (RAID 0)
452 ms * -15%
Razer Blade 18 2024 RZ09-0509
GeForce RTX 4090 Laptop GPU, i9-14900HX
449 ms * -14%
Acer Predator Helios 18 PH18-72-98MW
GeForce RTX 4090 Laptop GPU, i9-14900HX, 2x SK Hynix HFS001TEJ9X115N (RAID 0)
441 ms * -12%
Alienware m18 R2
GeForce RTX 4090 Laptop GPU, i9-14900HX, SK Hynix PC811 HFS002TEM9X152N
430 ms * -9%
Asus Strix Scar 18 G835LX
GeForce RTX 5090 Laptop, Ultra 9 275HX, WD PC SN8000S 2TB
409 ms * -4%
Moyenne Intel Core Ultra 9 290HX Plus, NVIDIA GeForce RTX 5090 Laptop
  (393 - 399, n=3)
395 ms * -1%
Asus ROG Strix Scar 18 G835LXG
GeForce RTX 5090 Laptop, Ultra 9 290HX Plus, 2x Samsung PM9E1 MZVLC4T0HBL1 (RAID 0)
393 ms *

* ... Moindre est la valeur, meilleures sont les performances

PCMark 10 Score
12414 points
Aide
AIDA64 / Memory Copy
Asus ROG Strix Scar 18 G835LXG
Intel Core Ultra 9 290HX Plus, GeForce RTX 5090 Laptop (v8.20.8100)
93930 MB/s
Asus ROG Strix Scar 18 G835LXG
Intel Core Ultra 9 290HX Plus, GeForce RTX 5090 Laptop (v6.92.6600)
93592 MB/s 0%
Moyenne Intel Core Ultra 9 290HX Plus
  (76912 - 93930, n=6)
85886 MB/s -9%
Asus Strix Scar 18 G835LX
Intel Core Ultra 9 275HX, GeForce RTX 5090 Laptop (v6.92.6600)
84432 MB/s -10%
Alienware m18 R2
Intel Core i9-14900HX, GeForce RTX 4090 Laptop GPU (v6.92.6600)
79243 MB/s -16%
Schenker Key 17 Pro (M24)
Intel Core i9-14900HX, GeForce RTX 4090 Laptop GPU (v6.92.6600)
78820 MB/s -16%
Acer Predator Helios 18 PH18-72-98MW
Intel Core i9-14900HX, GeForce RTX 4090 Laptop GPU (v6.92.6600)
78016 MB/s -17%
Razer Blade 18 2024 RZ09-0509
Intel Core i9-14900HX, GeForce RTX 4090 Laptop GPU (v6.85.6300)
76268 MB/s -19%
Moyenne de la classe Gaming
  (21750 - 129946, n=105, 2 dernières années)
72521 MB/s -23%
MSI Titan 18 HX A14VIG
Intel Core i9-14900HX, GeForce RTX 4090 Laptop GPU (v6.92.6600)
56992 MB/s -39%
AIDA64 / Memory Read
Asus ROG Strix Scar 18 G835LXG
Intel Core Ultra 9 290HX Plus, GeForce RTX 5090 Laptop (v8.20.8100)
98574 MB/s
Asus ROG Strix Scar 18 G835LXG
Intel Core Ultra 9 290HX Plus, GeForce RTX 5090 Laptop (v6.92.6600)
98471 MB/s 0%
Moyenne Intel Core Ultra 9 290HX Plus
  (84638 - 98574, n=6)
92870 MB/s -6%
Asus Strix Scar 18 G835LX
Intel Core Ultra 9 275HX, GeForce RTX 5090 Laptop (v6.92.6600)
86194 MB/s -13%
Alienware m18 R2
Intel Core i9-14900HX, GeForce RTX 4090 Laptop GPU (v6.92.6600)
85791 MB/s -13%
Schenker Key 17 Pro (M24)
Intel Core i9-14900HX, GeForce RTX 4090 Laptop GPU (v6.92.6600)
85763 MB/s -13%
Acer Predator Helios 18 PH18-72-98MW
Intel Core i9-14900HX, GeForce RTX 4090 Laptop GPU (v6.92.6600)
85323 MB/s -13%
Razer Blade 18 2024 RZ09-0509
Intel Core i9-14900HX, GeForce RTX 4090 Laptop GPU (v6.85.6300)
82992 MB/s -16%
Moyenne de la classe Gaming
  (22956 - 118858, n=105, 2 dernières années)
74162 MB/s -25%
MSI Titan 18 HX A14VIG
Intel Core i9-14900HX, GeForce RTX 4090 Laptop GPU (v6.92.6600)
54443 MB/s -45%
AIDA64 / Memory Write
Asus ROG Strix Scar 18 G835LXG
Intel Core Ultra 9 290HX Plus, GeForce RTX 5090 Laptop (v6.92.6600)
100988 MB/s
Asus ROG Strix Scar 18 G835LXG
Intel Core Ultra 9 290HX Plus, GeForce RTX 5090 Laptop (v8.20.8100)
89856 MB/s -11%
Moyenne Intel Core Ultra 9 290HX Plus
  (76094 - 100988, n=6)
85213 MB/s -16%
Asus Strix Scar 18 G835LX
Intel Core Ultra 9 275HX, GeForce RTX 5090 Laptop (v6.92.6600)
82198 MB/s -19%
Schenker Key 17 Pro (M24)
Intel Core i9-14900HX, GeForce RTX 4090 Laptop GPU (v6.92.6600)
77439 MB/s -23%
Alienware m18 R2
Intel Core i9-14900HX, GeForce RTX 4090 Laptop GPU (v6.92.6600)
77089 MB/s -24%
Moyenne de la classe Gaming
  (22297 - 135096, n=105, 2 dernières années)
76303 MB/s -24%
Acer Predator Helios 18 PH18-72-98MW
Intel Core i9-14900HX, GeForce RTX 4090 Laptop GPU (v6.92.6600)
70089 MB/s -31%
Razer Blade 18 2024 RZ09-0509
Intel Core i9-14900HX, GeForce RTX 4090 Laptop GPU (v6.85.6300)
67801 MB/s -33%
MSI Titan 18 HX A14VIG
Intel Core i9-14900HX, GeForce RTX 4090 Laptop GPU (v6.92.6600)
51387 MB/s -49%
AIDA64 / Memory Latency
Asus Strix Scar 18 G835LX
Intel Core Ultra 9 275HX, GeForce RTX 5090 Laptop (v6.92.6600)
108.9 ns * -4%
Moyenne de la classe Gaming
  (75.3 - 259, n=105, 2 dernières années)
107 ns * -2%
Asus ROG Strix Scar 18 G835LXG
Intel Core Ultra 9 290HX Plus, GeForce RTX 5090 Laptop (v6.92.6600)
105.2 ns *
Asus ROG Strix Scar 18 G835LXG
Intel Core Ultra 9 290HX Plus, GeForce RTX 5090 Laptop (v8.20.8100)
104.8 ns * -0%
MSI Titan 18 HX A14VIG
Intel Core i9-14900HX, GeForce RTX 4090 Laptop GPU (v6.92.6600)
105 ns * -0%
Moyenne Intel Core Ultra 9 290HX Plus
  (100.7 - 108.4, n=6)
105 ns * -0%
Razer Blade 18 2024 RZ09-0509
Intel Core i9-14900HX, GeForce RTX 4090 Laptop GPU (v6.85.6300)
87.6 ns * +17%
Alienware m18 R2
Intel Core i9-14900HX, GeForce RTX 4090 Laptop GPU (v6.92.6600)
86.4 ns * +18%
Schenker Key 17 Pro (M24)
Intel Core i9-14900HX, GeForce RTX 4090 Laptop GPU (v6.92.6600)
84.5 ns * +20%
Acer Predator Helios 18 PH18-72-98MW
Intel Core i9-14900HX, GeForce RTX 4090 Laptop GPU (v6.92.6600)
83 ns * +21%

* ... Moindre est la valeur, meilleures sont les performances
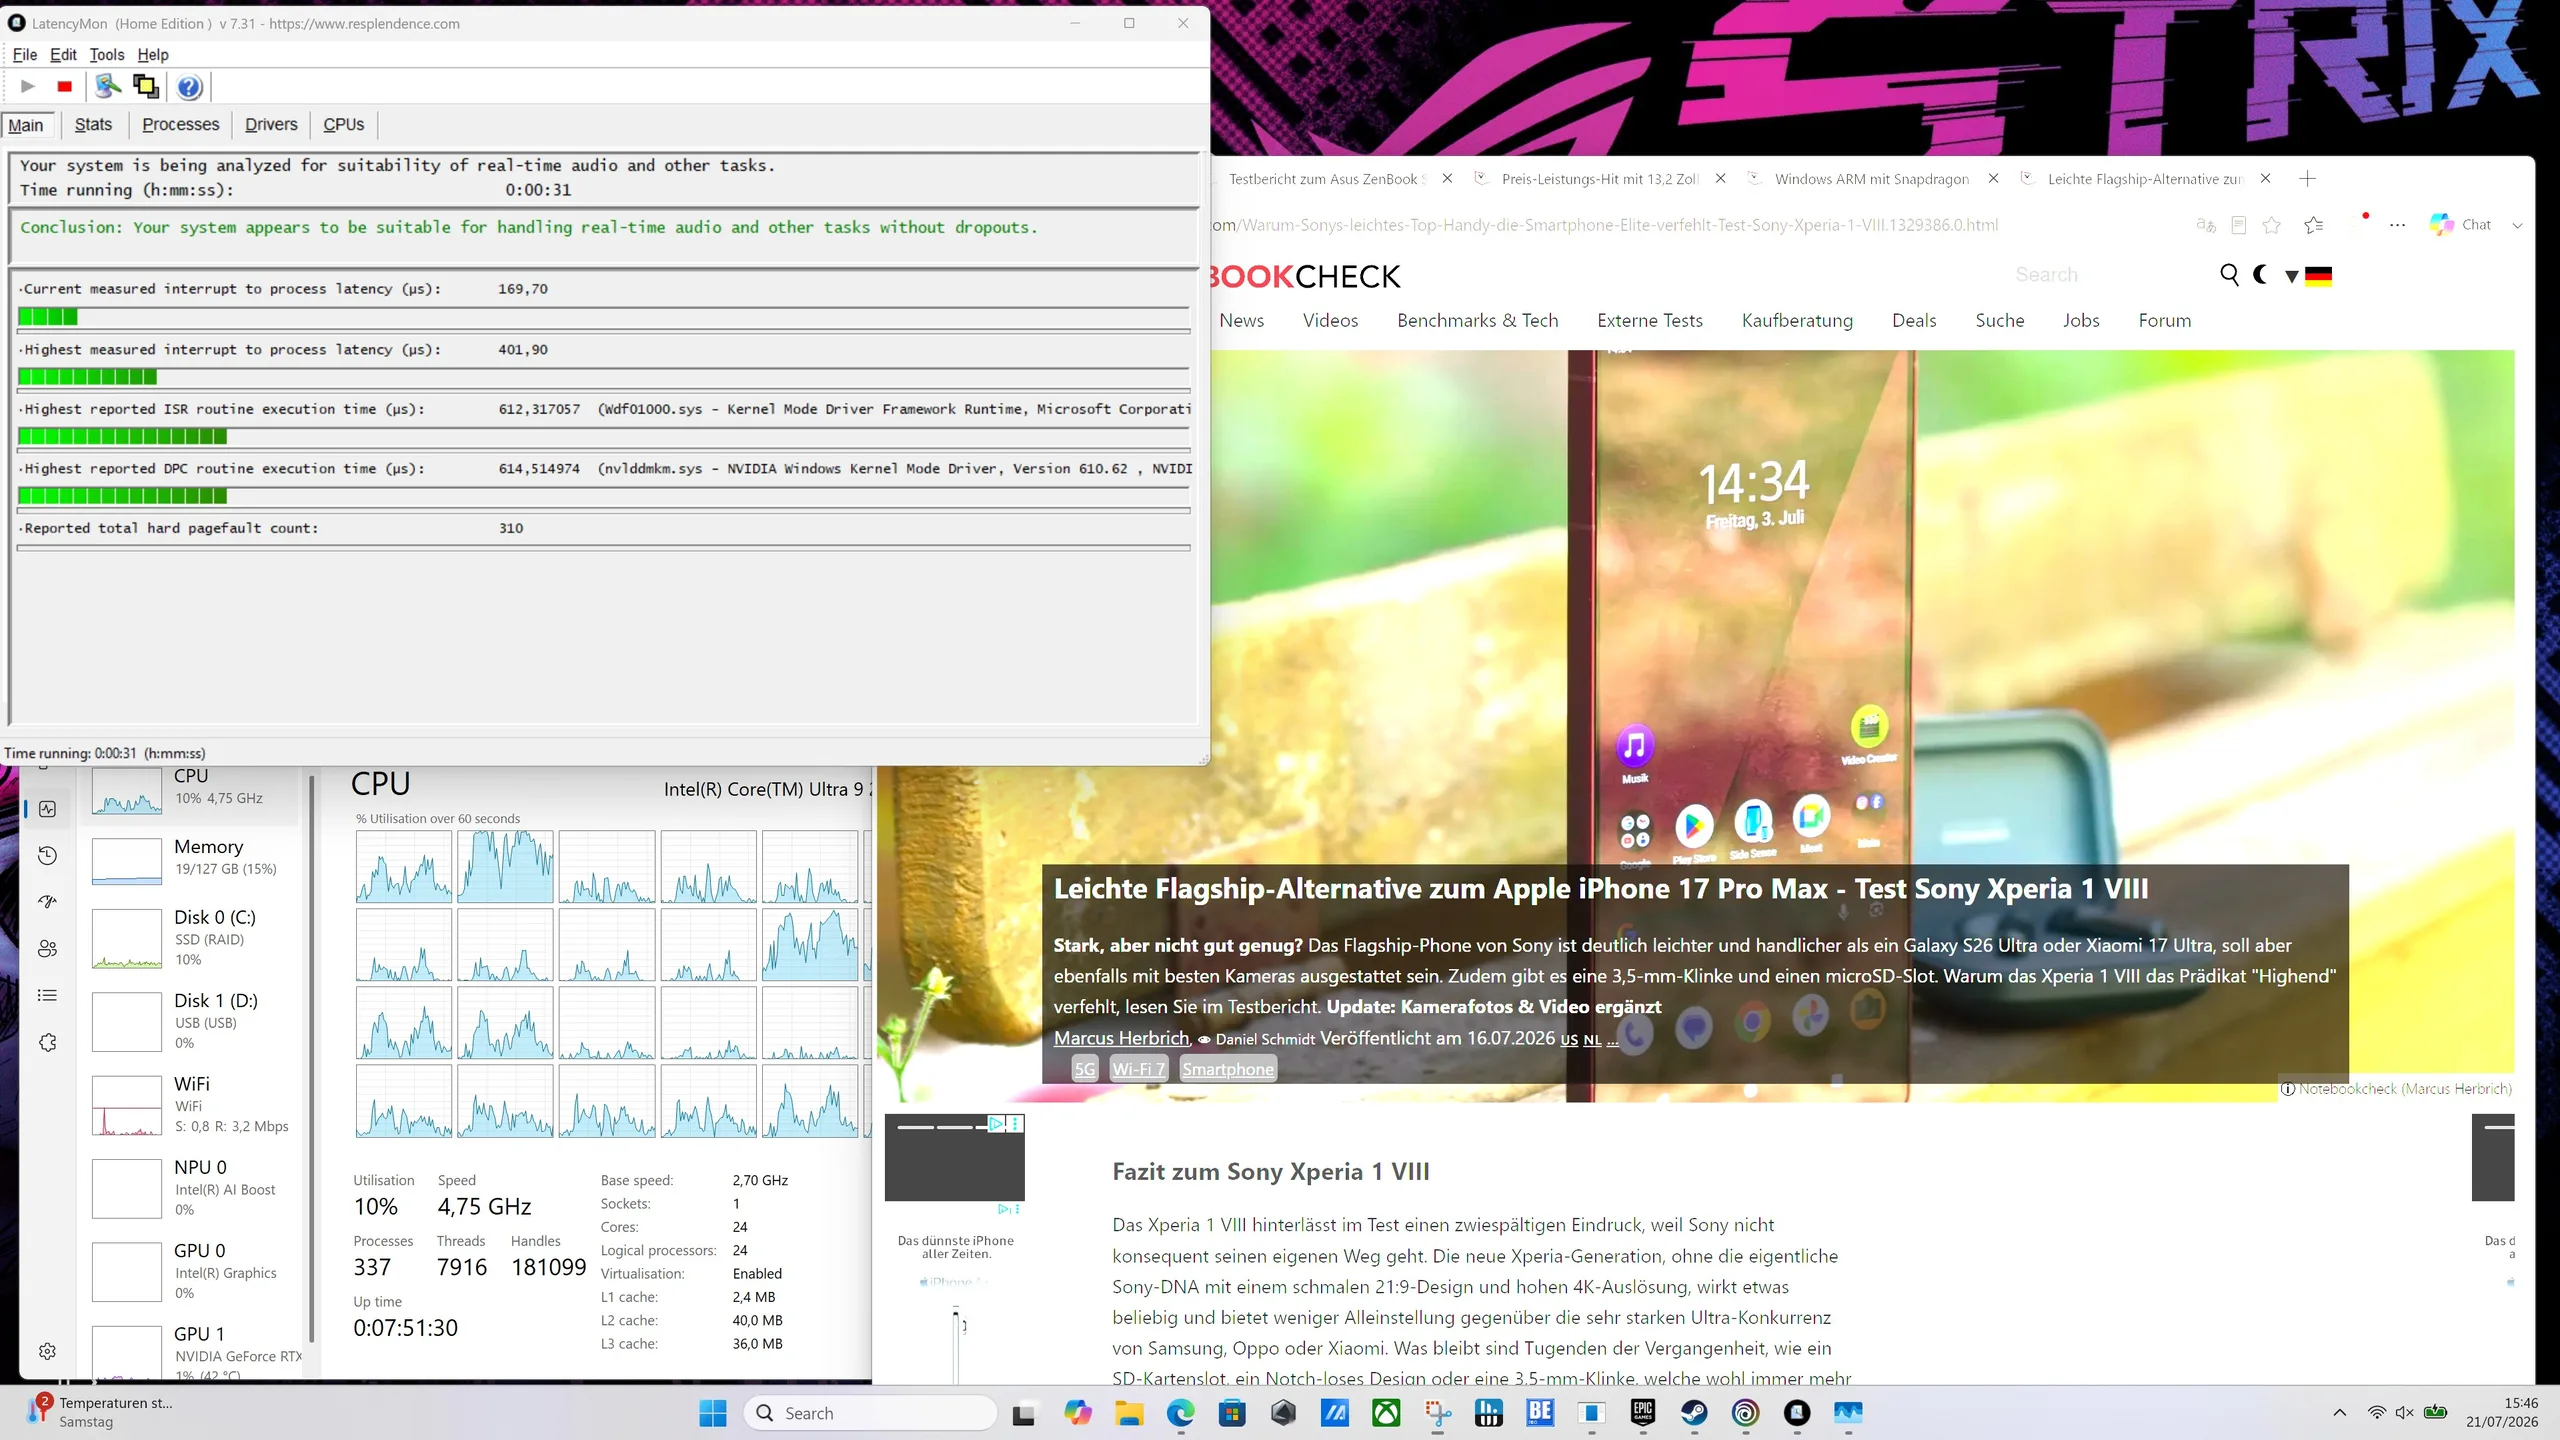
Latences DPC

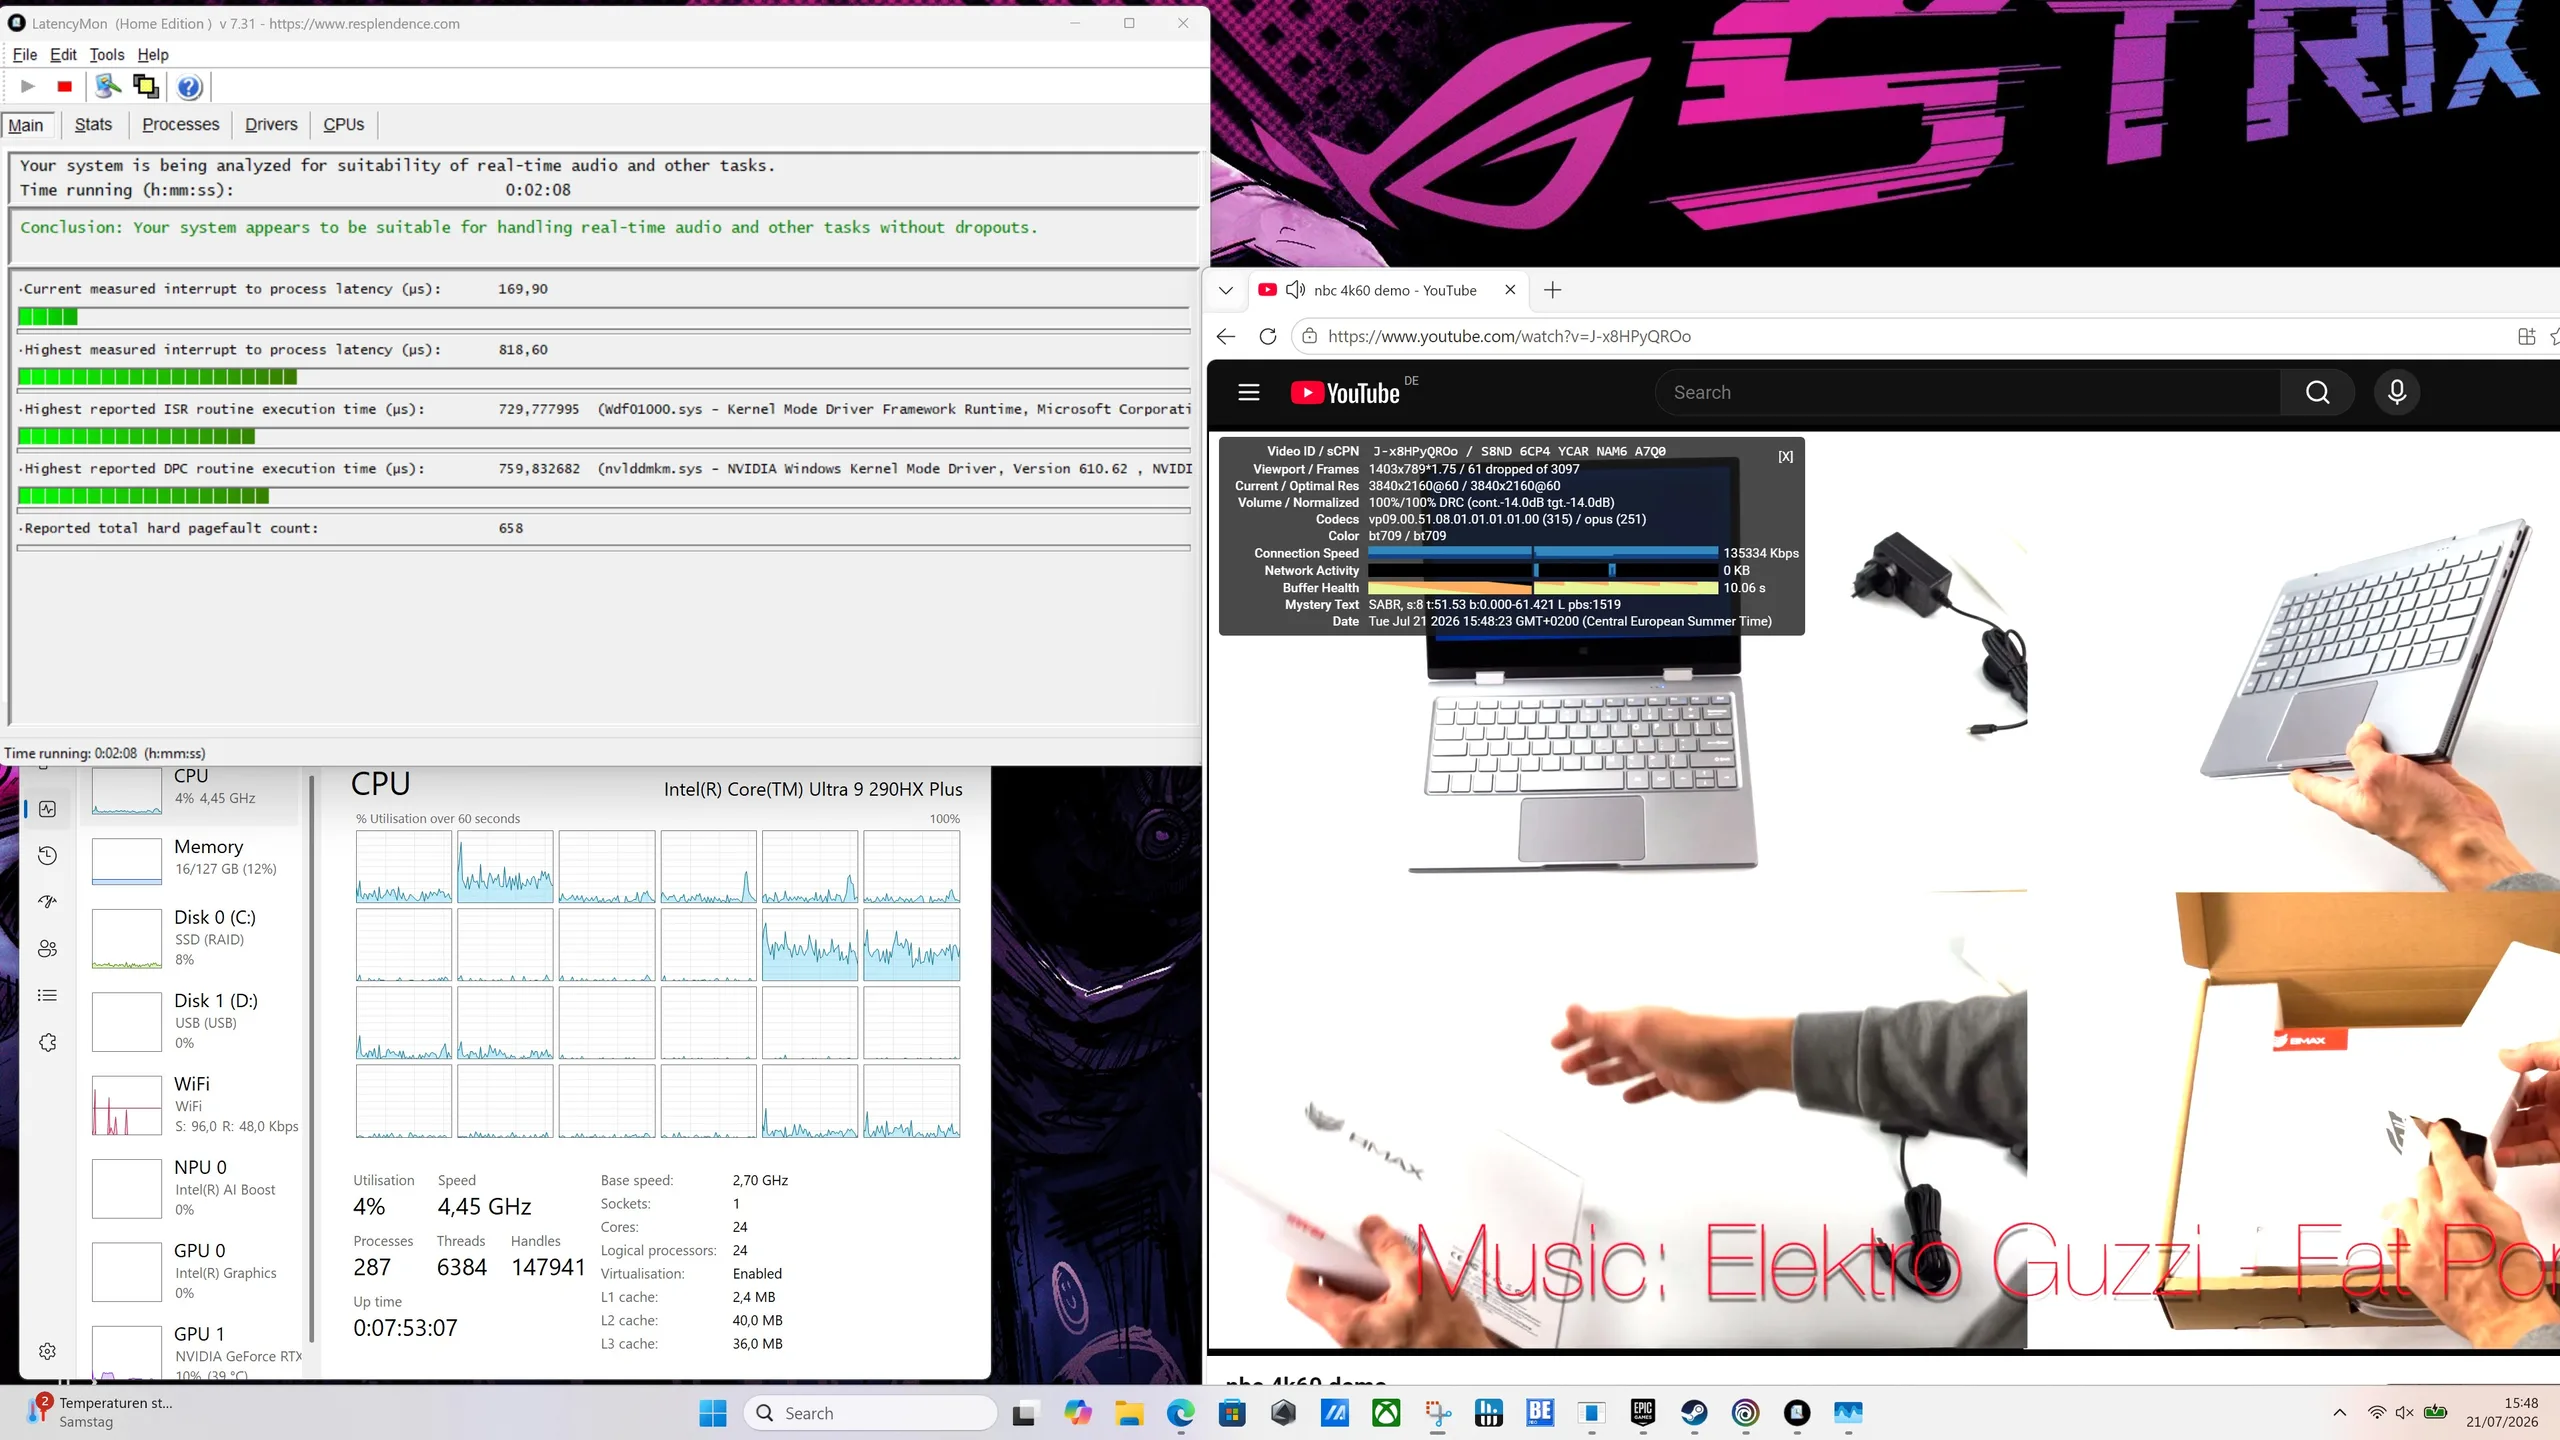
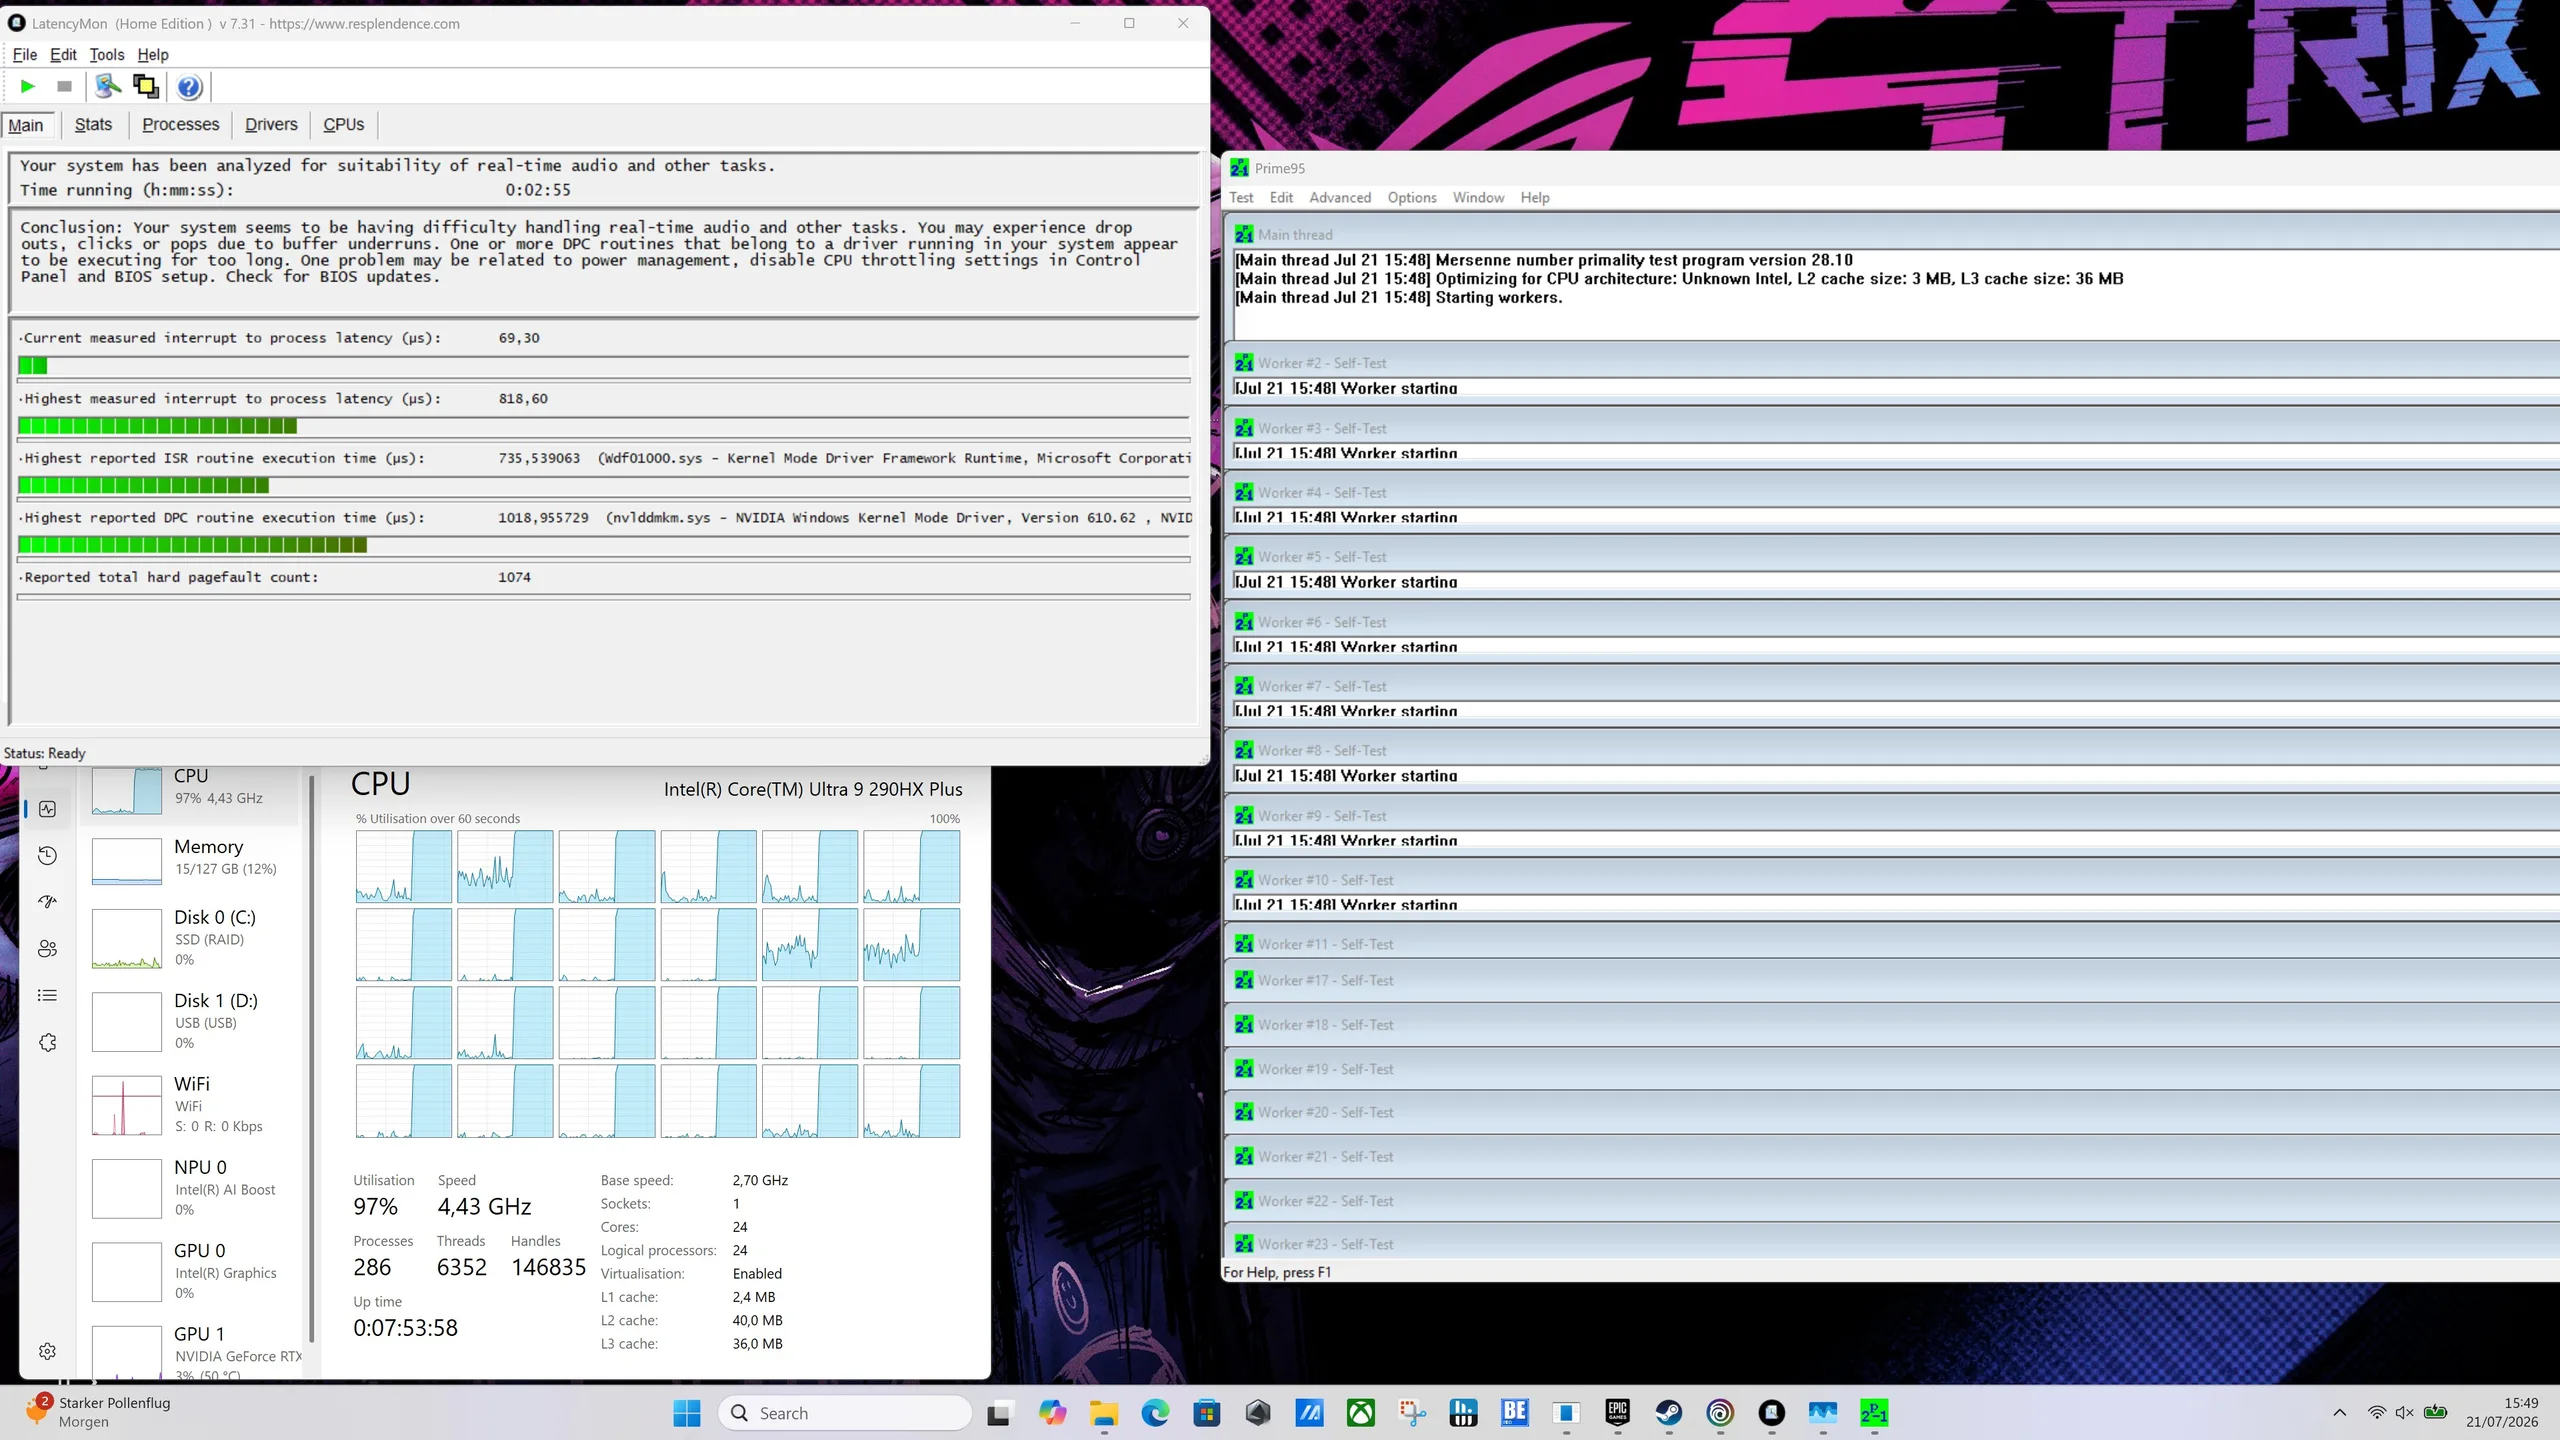
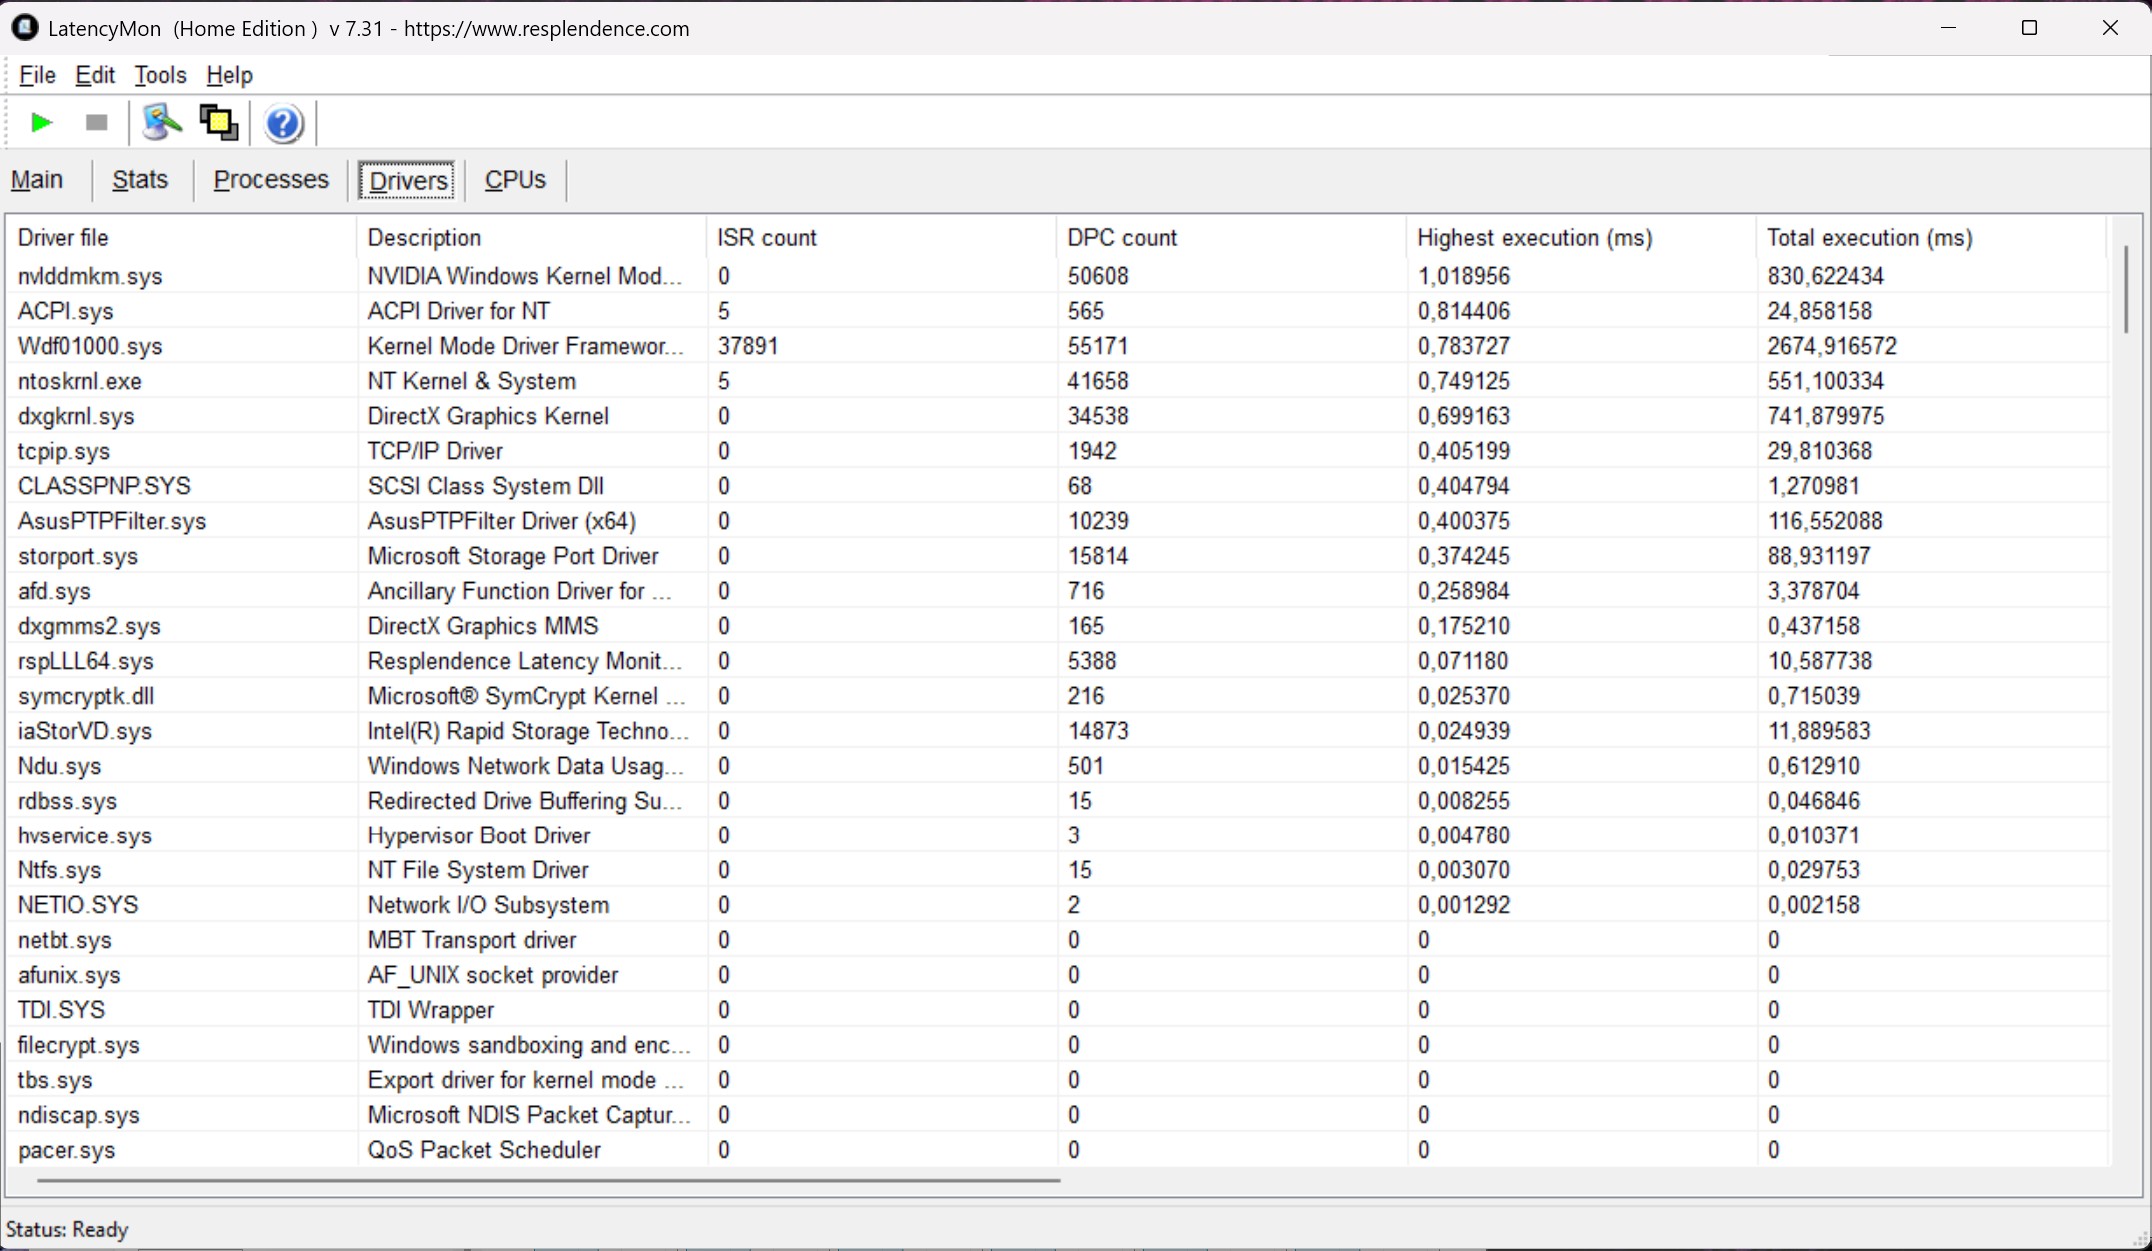
Lors du test standardisé LatencyMon (navigation sur le Web, lecture de vidéos YouTube en 4K et charge du processeur), l’Asus ROG Strix SCAR 18 G835LXG offre de bonnes performances globales. Seul le pilote graphique NVIDIA (nvlddmkm.sys) entraîne une latence accrue lors de la lecture de vidéos.

Latence maximale lors de l'ouverture de plusieurs onglets de navigateur
Latence maximale lors de la lecture de séquences vidéo en 4K
Latence maximale après dix secondes d'exécution de Prime95
Pilotes classés par temps d'exécution le plus long
DPC Latencies / LatencyMon - interrupt to process latency (max), Web, Youtube, Prime95
Acer Predator Helios 18 PH18-72-98MW
GeForce RTX 4090 Laptop GPU, i9-14900HX, 2x SK Hynix HFS001TEJ9X115N (RAID 0)
3388 μs * -233%
Alienware m18 R2
GeForce RTX 4090 Laptop GPU, i9-14900HX, SK Hynix PC811 HFS002TEM9X152N
2815.1 μs * -177%
Moyenne de la classe Gaming
  (410 - 11799, n=93, 2 dernières années)
2500 μs * -146%
MSI Titan 18 HX A14VIG
GeForce RTX 4090 Laptop GPU, i9-14900HX, 2x Samsung PM9A1a MZVL22T0HDLB (RAID 0)
2384.5 μs * -134%
Schenker Key 17 Pro (M24)
GeForce RTX 4090 Laptop GPU, i9-14900HX, Samsung 990 Pro 1 TB
1955.8 μs * -92%
Razer Blade 18 2024 RZ09-0509
GeForce RTX 4090 Laptop GPU, i9-14900HX
1479.7 μs * -45%
Asus ROG Strix Scar 18 G835LXG
GeForce RTX 5090 Laptop, Ultra 9 290HX Plus, 2x Samsung PM9E1 MZVLC4T0HBL1 (RAID 0)
1018 μs *
Asus Strix Scar 18 G835LX
GeForce RTX 5090 Laptop, Ultra 9 275HX, WD PC SN8000S 2TB
810 μs * +20%

* ... Moindre est la valeur, meilleures sont les performances
Périphériques de stockage

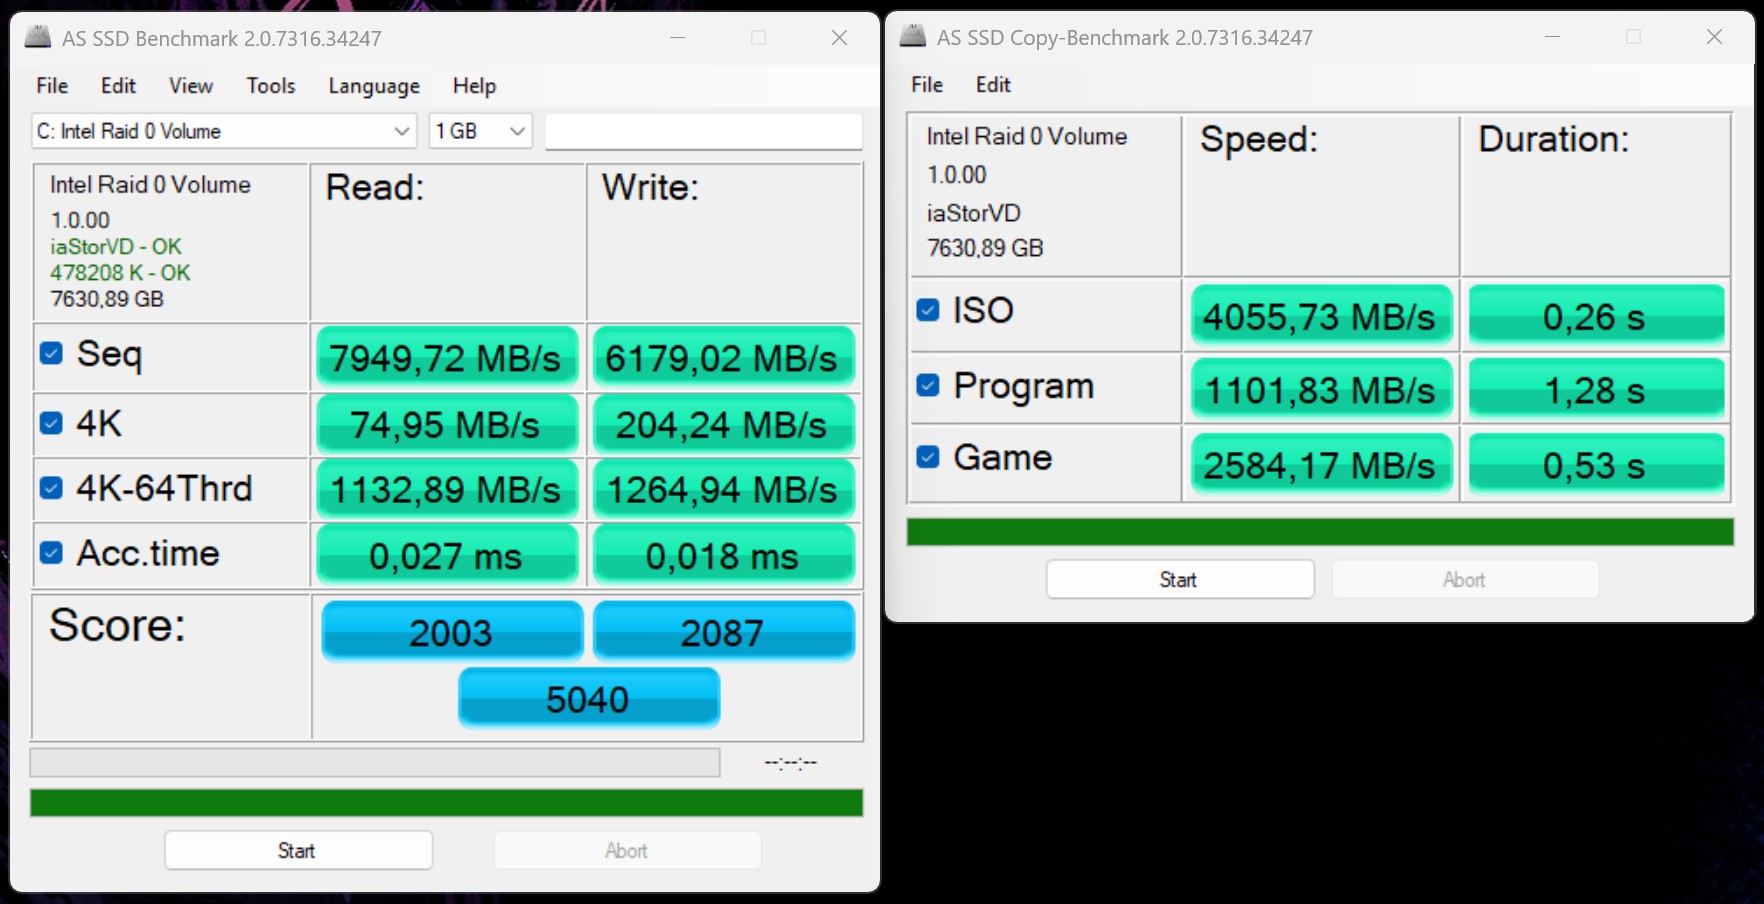
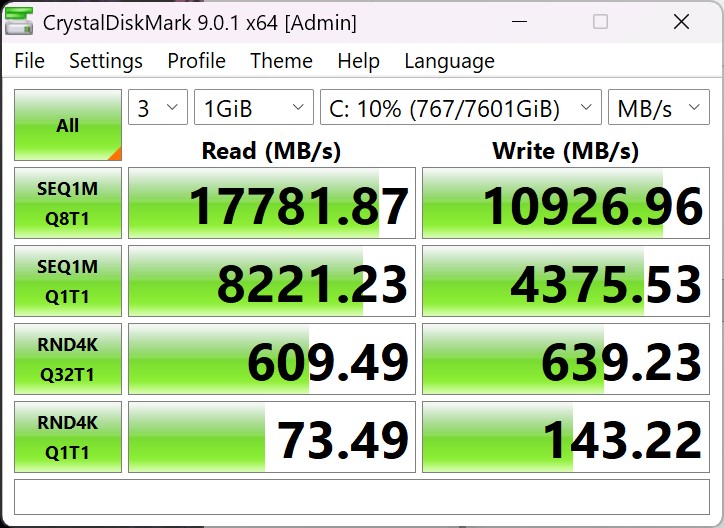
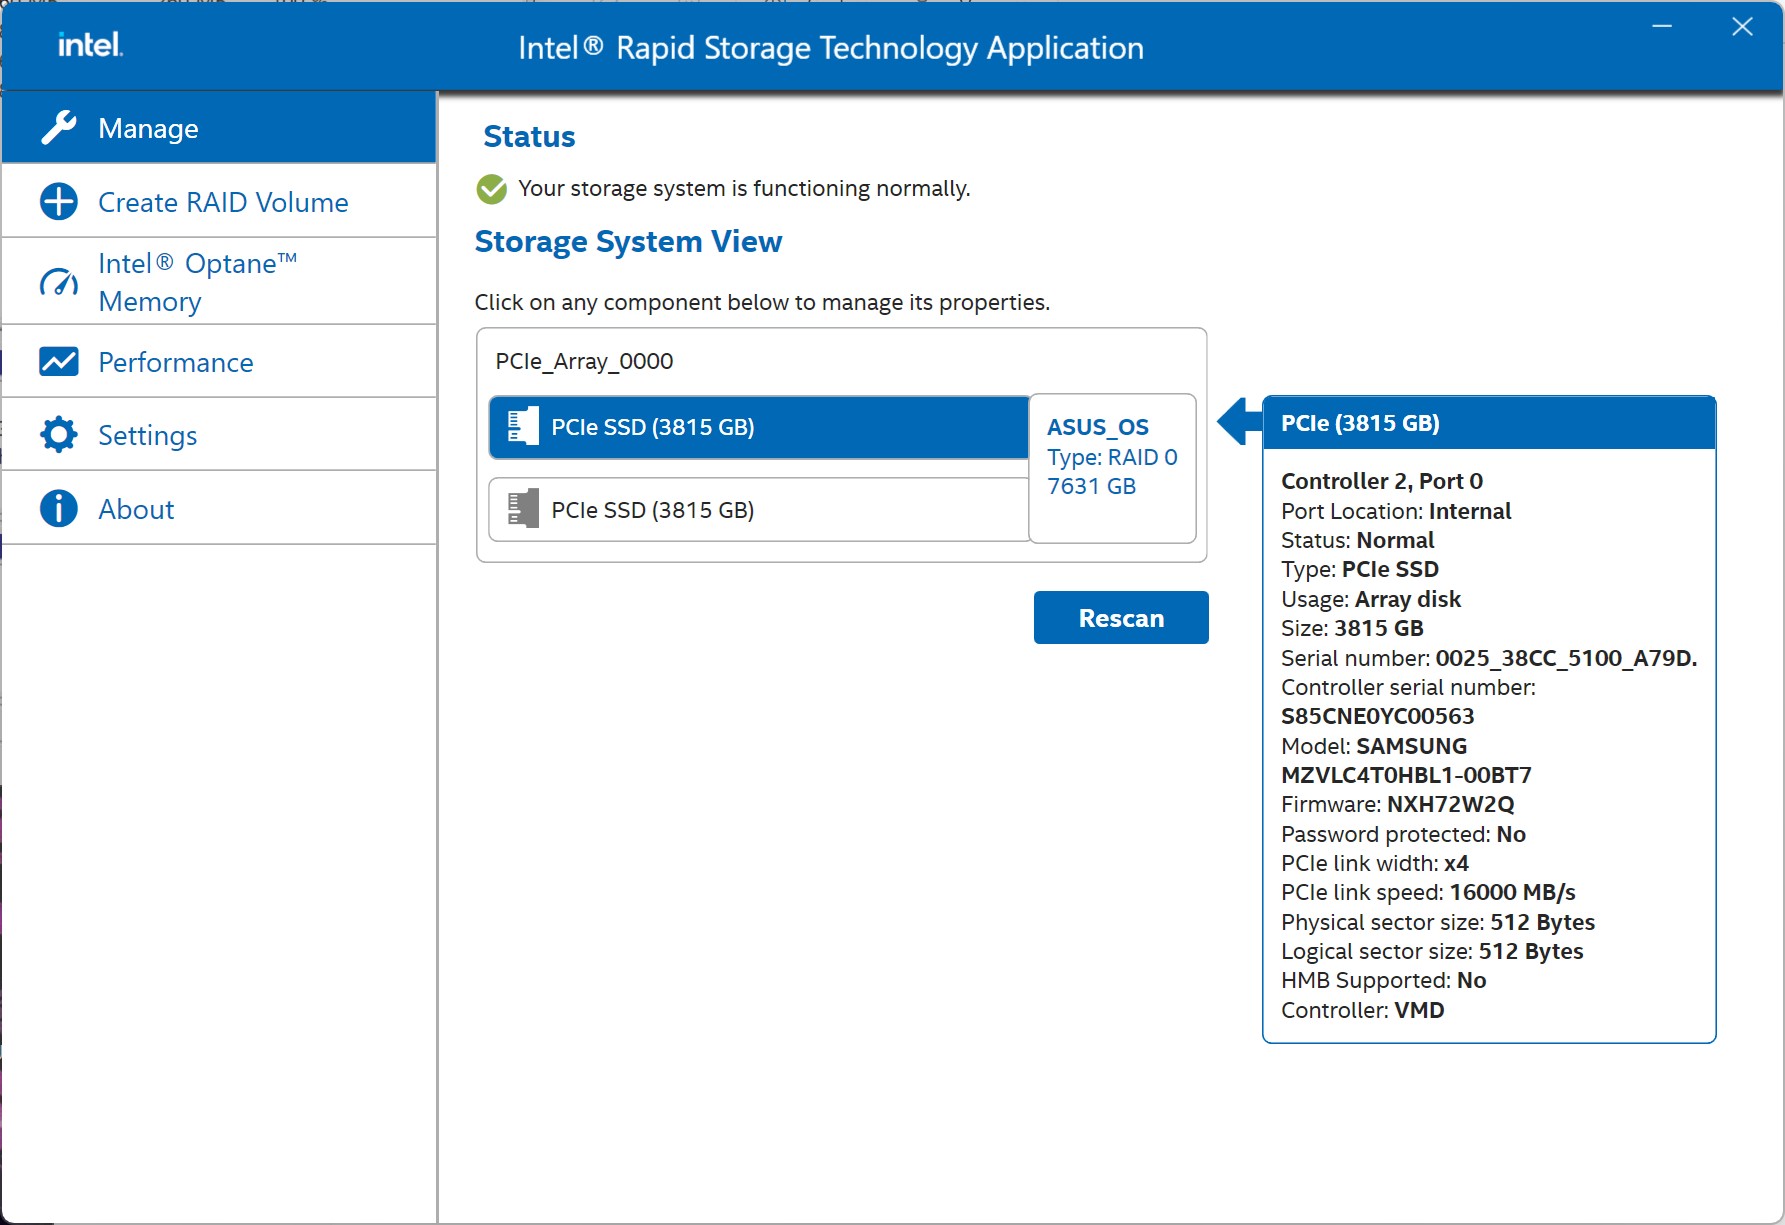
Notre configuration de test est équipée de deux SSD PCIe 5.0 de 4 To (Samsung PM9E1), offrant au total 8 To de stockage de masse à haute vitesse. Ces disques se distinguent par des taux de transfert très élevés et des temps d'accès réduits, ce qui permet un chargement particulièrement rapide des programmes, des jeux et des fichiers volumineux. Sous une charge soutenue, les performances diminuent toutefois au bout d'un certain temps ; il faut donc s'attendre à des baisses de performances perceptibles lors de processus de copie ou d'installation prolongés.

AS SSD
AS SSD
CDM9
CDM9
Configuration du SSD
2x Samsung PM9E1 MZVLC4T0HBL1 (RAID 0)
Sequential Read: 7949MB/s
Sequential Write: 6179MB/s
4K Read: 75MB/s
4K Write: 204MB/s
4K-64 Read: 1133MB/s
4K-64 Write: 1265MB/s
Access Time Read: 0.027ms
Access Time Write: 0.018ms
Copy ISO: 4055.73MB/s
Copy Program: 1101.83MB/s
Copy Game: 2584.17MB/s
Score Read: 2003Points
Score Write: 2087Points
Score Total: 5040Points
Drive Performance rating - Percent
Alienware m18 R2
SK Hynix PC811 HFS002TEM9X152N
78.1 pt
Schenker Key 17 Pro (M24)
Samsung 990 Pro 1 TB
78 pt
Acer Predator Helios 18 PH18-72-98MW
2x SK Hynix HFS001TEJ9X115N (RAID 0)
64.2 pt
Asus ROG Strix Scar 18 G835LXG
2x Samsung PM9E1 MZVLC4T0HBL1 (RAID 0)
63.2 pt
Moyenne 2x Samsung PM9E1 MZVLC4T0HBL1 (RAID 0)
 
63.2 pt
MSI Titan 18 HX A14VIG
2x Samsung PM9A1a MZVL22T0HDLB (RAID 0)
56.8 pt
Moyenne de la classe Gaming
 
54.9 pt
Asus Strix Scar 18 G835LX
WD PC SN8000S 2TB
48.3 pt
Razer Blade 18 2024 RZ09-0509
 
46.1 pt
DiskSpd
seq read
Asus ROG Strix Scar 18 G835LXG
2x Samsung PM9E1 MZVLC4T0HBL1 (RAID 0)
7917 (7533.6min - 7917.48max) MB/s
Moyenne 2x Samsung PM9E1 MZVLC4T0HBL1 (RAID 0)
  (n=1)
7917 MB/s 0%
Acer Predator Helios 18 PH18-72-98MW
2x SK Hynix HFS001TEJ9X115N (RAID 0)
7045 (6975.86min - 7044.54max) MB/s -11%
Alienware m18 R2
SK Hynix PC811 HFS002TEM9X152N
5588 (5540.05min - 5587.65max) MB/s -29%
MSI Titan 18 HX A14VIG
2x Samsung PM9A1a MZVL22T0HDLB (RAID 0)
5424 (5395.57min - 5423.86max) MB/s -31%
Asus Strix Scar 18 G835LX
WD PC SN8000S 2TB
3799 (23.02min - 3799.36max) MB/s -52%
Razer Blade 18 2024 RZ09-0509
 
3560 (3002.28min - 3559.93max) MB/s -55%
Moyenne de la classe Gaming
  (281 - 9494, n=99, 2 dernières années)
3556 MB/s -55%
Schenker Key 17 Pro (M24)
Samsung 990 Pro 1 TB
3142 (3005.43min - 3141.53max) MB/s -60%
seq write
Acer Predator Helios 18 PH18-72-98MW
2x SK Hynix HFS001TEJ9X115N (RAID 0)
8992 (8801.75min - 8992.01max) MB/s +53%
MSI Titan 18 HX A14VIG
2x Samsung PM9A1a MZVL22T0HDLB (RAID 0)
7291 (7191.64min - 7291.38max) MB/s +24%
Asus ROG Strix Scar 18 G835LXG
2x Samsung PM9E1 MZVLC4T0HBL1 (RAID 0)
5867 (5141.17min - 5866.57max) MB/s
Moyenne 2x Samsung PM9E1 MZVLC4T0HBL1 (RAID 0)
  (n=1)
5867 MB/s 0%
Alienware m18 R2
SK Hynix PC811 HFS002TEM9X152N
5153 (5139.7min - 5152.91max) MB/s -12%
Schenker Key 17 Pro (M24)
Samsung 990 Pro 1 TB
4891 (4759.07min - 4890.56max) MB/s -17%
Asus Strix Scar 18 G835LX
WD PC SN8000S 2TB
4437 (4373.88min - 4437.36max) MB/s -24%
Moyenne de la classe Gaming
  (1057 - 9832, n=99, 2 dernières années)
3957 MB/s -33%
Razer Blade 18 2024 RZ09-0509
 
3367 (3255.82min - 3366.95max) MB/s -43%
seq q8 t1 read
Asus ROG Strix Scar 18 G835LXG
2x Samsung PM9E1 MZVLC4T0HBL1 (RAID 0)
17459 (12476.6min - 17459.1max) MB/s
Moyenne 2x Samsung PM9E1 MZVLC4T0HBL1 (RAID 0)
  (n=1)
17459 MB/s 0%
MSI Titan 18 HX A14VIG
2x Samsung PM9A1a MZVL22T0HDLB (RAID 0)
13588 (10727.3min - 13588.3max) MB/s -22%
Asus Strix Scar 18 G835LX
WD PC SN8000S 2TB
12470 (11207.2min - 12469.7max) MB/s -29%
Acer Predator Helios 18 PH18-72-98MW
2x SK Hynix HFS001TEJ9X115N (RAID 0)
11019 (9854.1min - 11018.8max) MB/s -37%
Moyenne de la classe Gaming
  (3772 - 17459, n=99, 2 dernières années)
7552 MB/s -57%
Alienware m18 R2
SK Hynix PC811 HFS002TEM9X152N
7110 (6256.85min - 7110.18max) MB/s -59%
Schenker Key 17 Pro (M24)
Samsung 990 Pro 1 TB
7033 (6025.44min - 7033.01max) MB/s -60%
Razer Blade 18 2024 RZ09-0509
 
6797 (5573.18min - 6797.33max) MB/s -61%
seq q8 t1 write
Acer Predator Helios 18 PH18-72-98MW
2x SK Hynix HFS001TEJ9X115N (RAID 0)
11472 (11391min - 11471.6max) MB/s 0%
Asus ROG Strix Scar 18 G835LXG
2x Samsung PM9E1 MZVLC4T0HBL1 (RAID 0)
11431 (10787.1min - 11430.9max) MB/s
Moyenne 2x Samsung PM9E1 MZVLC4T0HBL1 (RAID 0)
  (n=1)
11431 MB/s 0%
MSI Titan 18 HX A14VIG
2x Samsung PM9A1a MZVL22T0HDLB (RAID 0)
10571 (10519.3min - 10571.3max) MB/s -8%
Asus Strix Scar 18 G835LX
WD PC SN8000S 2TB
8696 (8611.54min - 8696.26max) MB/s -24%
Alienware m18 R2
SK Hynix PC811 HFS002TEM9X152N
6779 (6710.47min - 6778.83max) MB/s -41%
Schenker Key 17 Pro (M24)
Samsung 990 Pro 1 TB
6620 (6576.94min - 6620.29max) MB/s -42%
Moyenne de la classe Gaming
  (1218 - 13519, n=99, 2 dernières années)
5961 MB/s -48%
Razer Blade 18 2024 RZ09-0509
 
4902 (4309.42min - 4901.73max) MB/s -57%
4k q1 t1 read
Schenker Key 17 Pro (M24)
Samsung 990 Pro 1 TB
99 (97.84min - 99.01max) MB/s +21%
Acer Predator Helios 18 PH18-72-98MW
2x SK Hynix HFS001TEJ9X115N (RAID 0)
81.6 (81.02min - 81.62max) MB/s 0%
Asus ROG Strix Scar 18 G835LXG
2x Samsung PM9E1 MZVLC4T0HBL1 (RAID 0)
81.6 (80.95min - 81.61max) MB/s
Moyenne 2x Samsung PM9E1 MZVLC4T0HBL1 (RAID 0)
  (n=1)
81.6 MB/s 0%
Alienware m18 R2
SK Hynix PC811 HFS002TEM9X152N
75.4 (73.49min - 75.43max) MB/s -8%
Moyenne de la classe Gaming
  (32.2 - 111.2, n=99, 2 dernières années)
70.3 MB/s -14%
MSI Titan 18 HX A14VIG
2x Samsung PM9A1a MZVL22T0HDLB (RAID 0)
69.6 (68.6min - 69.57max) MB/s -15%
Asus Strix Scar 18 G835LX
WD PC SN8000S 2TB
63.4 (62.2min - 63.4max) MB/s -22%
Razer Blade 18 2024 RZ09-0509
 
61.8 (61.2min - 61.81max) MB/s -24%
4k q1 t1 write
Schenker Key 17 Pro (M24)
Samsung 990 Pro 1 TB
316 (303.92min - 316.48max) MB/s +61%
Alienware m18 R2
SK Hynix PC811 HFS002TEM9X152N
300 (297.27min - 299.6max) MB/s +53%
Acer Predator Helios 18 PH18-72-98MW
2x SK Hynix HFS001TEJ9X115N (RAID 0)
259 (250.68min - 258.82max) MB/s +32%
Moyenne de la classe Gaming
  (78 - 345, n=99, 2 dernières années)
195.9 MB/s 0%
Asus ROG Strix Scar 18 G835LXG
2x Samsung PM9E1 MZVLC4T0HBL1 (RAID 0)
195.8 (125.81min - 195.77max) MB/s
Moyenne 2x Samsung PM9E1 MZVLC4T0HBL1 (RAID 0)
  (n=1)
195.8 MB/s 0%
Razer Blade 18 2024 RZ09-0509
 
164 (110.95min - 164max) MB/s -16%
MSI Titan 18 HX A14VIG
2x Samsung PM9A1a MZVL22T0HDLB (RAID 0)
152.1 (149.74min - 152.09max) MB/s -22%
Asus Strix Scar 18 G835LX
WD PC SN8000S 2TB
136.4 (134.95min - 136.4max) MB/s -30%
4k q32 t16 read
Alienware m18 R2
SK Hynix PC811 HFS002TEM9X152N
6067 (5596.15min - 6066.73max) MB/s +626%
Schenker Key 17 Pro (M24)
Samsung 990 Pro 1 TB
4926 (4895.9min - 4926.27max) MB/s +489%
Moyenne de la classe Gaming
  (539 - 8067, n=99, 2 dernières années)
2264 MB/s +171%
MSI Titan 18 HX A14VIG
2x Samsung PM9A1a MZVL22T0HDLB (RAID 0)
1623 (1464.8min - 1623.24max) MB/s +94%
Acer Predator Helios 18 PH18-72-98MW
2x SK Hynix HFS001TEJ9X115N (RAID 0)
1385 (1275.7min - 1385.11max) MB/s +66%
Razer Blade 18 2024 RZ09-0509
 
1005 (964.75min - 1004.59max) MB/s +20%
Asus ROG Strix Scar 18 G835LXG
2x Samsung PM9E1 MZVLC4T0HBL1 (RAID 0)
836 (795.8min - 835.68max) MB/s
Moyenne 2x Samsung PM9E1 MZVLC4T0HBL1 (RAID 0)
  (n=1)
836 MB/s 0%
Asus Strix Scar 18 G835LX
WD PC SN8000S 2TB
746 (519.37min - 746.01max) MB/s -11%
4k q32 t16 write
Alienware m18 R2
SK Hynix PC811 HFS002TEM9X152N
4176 (3805.57min - 4175.9max) MB/s +551%
Schenker Key 17 Pro (M24)
Samsung 990 Pro 1 TB
3579 (3433.86min - 3579.4max) MB/s +458%
Moyenne de la classe Gaming
  (227 - 5653, n=99, 2 dernières années)
1832 MB/s +186%
MSI Titan 18 HX A14VIG
2x Samsung PM9A1a MZVL22T0HDLB (RAID 0)
1377 (1306.51min - 1377.05max) MB/s +115%
Acer Predator Helios 18 PH18-72-98MW
2x SK Hynix HFS001TEJ9X115N (RAID 0)
1330 (1184.45min - 1330.4max) MB/s +107%
Asus ROG Strix Scar 18 G835LXG
2x Samsung PM9E1 MZVLC4T0HBL1 (RAID 0)
641 (632.54min - 640.8max) MB/s
Moyenne 2x Samsung PM9E1 MZVLC4T0HBL1 (RAID 0)
  (n=1)
641 MB/s 0%
Razer Blade 18 2024 RZ09-0509
 
442 (336.87min - 441.83max) MB/s -31%
Asus Strix Scar 18 G835LX
WD PC SN8000S 2TB
284 (254.39min - 283.58max) MB/s -56%
AS SSD
Score Total
Alienware m18 R2
SK Hynix PC811 HFS002TEM9X152N
10655 Points +111%
Schenker Key 17 Pro (M24)
Samsung 990 Pro 1 TB
10591 Points +110%
Moyenne de la classe Gaming
  (2912 - 14159, n=97, 2 dernières années)
6872 Points +36%
MSI Titan 18 HX A14VIG
2x Samsung PM9A1a MZVL22T0HDLB (RAID 0)
5369 Points +7%
Acer Predator Helios 18 PH18-72-98MW
2x SK Hynix HFS001TEJ9X115N (RAID 0)
5102 Points +1%
Asus ROG Strix Scar 18 G835LXG
2x Samsung PM9E1 MZVLC4T0HBL1 (RAID 0)
5040 Points
Moyenne 2x Samsung PM9E1 MZVLC4T0HBL1 (RAID 0)
  (n=1)
5040 Points 0%
Razer Blade 18 2024 RZ09-0509
 
4927 Points -2%
Asus Strix Scar 18 G835LX
WD PC SN8000S 2TB
4764 Points -5%
Score Read
Schenker Key 17 Pro (M24)
Samsung 990 Pro 1 TB
3807 Points +90%
Alienware m18 R2
SK Hynix PC811 HFS002TEM9X152N
3753 Points +87%
Moyenne de la classe Gaming
  (953 - 5082, n=97, 2 dernières années)
2248 Points +12%
MSI Titan 18 HX A14VIG
2x Samsung PM9A1a MZVL22T0HDLB (RAID 0)
2194 Points +10%
Acer Predator Helios 18 PH18-72-98MW
2x SK Hynix HFS001TEJ9X115N (RAID 0)
2049 Points +2%
Asus ROG Strix Scar 18 G835LXG
2x Samsung PM9E1 MZVLC4T0HBL1 (RAID 0)
2003 Points
Moyenne 2x Samsung PM9E1 MZVLC4T0HBL1 (RAID 0)
  (n=1)
2003 Points 0%
Razer Blade 18 2024 RZ09-0509
 
1667 Points -17%
Asus Strix Scar 18 G835LX
WD PC SN8000S 2TB
1653 Points -17%
Score Write
Alienware m18 R2
SK Hynix PC811 HFS002TEM9X152N
4993 Points +139%
Schenker Key 17 Pro (M24)
Samsung 990 Pro 1 TB
4852 Points +132%
Moyenne de la classe Gaming
  (1136 - 6457, n=97, 2 dernières années)
3547 Points +70%
Razer Blade 18 2024 RZ09-0509
 
2518 Points +21%
Asus Strix Scar 18 G835LX
WD PC SN8000S 2TB
2267 Points +9%
MSI Titan 18 HX A14VIG
2x Samsung PM9A1a MZVL22T0HDLB (RAID 0)
2092 Points 0%
Asus ROG Strix Scar 18 G835LXG
2x Samsung PM9E1 MZVLC4T0HBL1 (RAID 0)
2087 Points
Moyenne 2x Samsung PM9E1 MZVLC4T0HBL1 (RAID 0)
  (n=1)
2087 Points 0%
Acer Predator Helios 18 PH18-72-98MW
2x SK Hynix HFS001TEJ9X115N (RAID 0)
2038 Points -2%
Seq Read
MSI Titan 18 HX A14VIG
2x Samsung PM9A1a MZVL22T0HDLB (RAID 0)
9576.8 MB/s +20%
Acer Predator Helios 18 PH18-72-98MW
2x SK Hynix HFS001TEJ9X115N (RAID 0)
8496.25 MB/s +7%
Asus ROG Strix Scar 18 G835LXG
2x Samsung PM9E1 MZVLC4T0HBL1 (RAID 0)
7949 MB/s
Moyenne 2x Samsung PM9E1 MZVLC4T0HBL1 (RAID 0)
  (n=1)
7949 MB/s 0%
Alienware m18 R2
SK Hynix PC811 HFS002TEM9X152N
5916.27 MB/s -26%
Asus Strix Scar 18 G835LX
WD PC SN8000S 2TB
5595 MB/s -30%
Moyenne de la classe Gaming
  (2346 - 10091, n=97, 2 dernières années)
5591 MB/s -30%
Razer Blade 18 2024 RZ09-0509
 
5476.6 MB/s -31%
Schenker Key 17 Pro (M24)
Samsung 990 Pro 1 TB
5346 MB/s -33%
Seq Write
MSI Titan 18 HX A14VIG
2x Samsung PM9A1a MZVL22T0HDLB (RAID 0)
8685.54 MB/s +41%
Acer Predator Helios 18 PH18-72-98MW
2x SK Hynix HFS001TEJ9X115N (RAID 0)
7597.23 MB/s +23%
Asus ROG Strix Scar 18 G835LXG
2x Samsung PM9E1 MZVLC4T0HBL1 (RAID 0)
6179 MB/s
Moyenne 2x Samsung PM9E1 MZVLC4T0HBL1 (RAID 0)
  (n=1)
6179 MB/s 0%
Alienware m18 R2
SK Hynix PC811 HFS002TEM9X152N
5929.42 MB/s -4%
Asus Strix Scar 18 G835LX
WD PC SN8000S 2TB
5305 MB/s -14%
Schenker Key 17 Pro (M24)
Samsung 990 Pro 1 TB
5012 MB/s -19%
Moyenne de la classe Gaming
  (114.5 - 10726, n=97, 2 dernières années)
3972 MB/s -36%
Razer Blade 18 2024 RZ09-0509
 
2995.22 MB/s -52%
4K Read
Schenker Key 17 Pro (M24)
Samsung 990 Pro 1 TB
90.9 MB/s +21%
Asus ROG Strix Scar 18 G835LXG
2x Samsung PM9E1 MZVLC4T0HBL1 (RAID 0)
75 MB/s
Moyenne 2x Samsung PM9E1 MZVLC4T0HBL1 (RAID 0)
  (n=1)
75 MB/s 0%
Moyenne de la classe Gaming
  (36.4 - 108.4, n=97, 2 dernières années)
71.1 MB/s -5%
Acer Predator Helios 18 PH18-72-98MW
2x SK Hynix HFS001TEJ9X115N (RAID 0)
69.86 MB/s -7%
Razer Blade 18 2024 RZ09-0509
 
65.49 MB/s -13%
Asus Strix Scar 18 G835LX
WD PC SN8000S 2TB
65.1 MB/s -13%
Alienware m18 R2
SK Hynix PC811 HFS002TEM9X152N
64.97 MB/s -13%
MSI Titan 18 HX A14VIG
2x Samsung PM9A1a MZVL22T0HDLB (RAID 0)
63.69 MB/s -15%
4K Write
Schenker Key 17 Pro (M24)
Samsung 990 Pro 1 TB
260 MB/s +27%
Alienware m18 R2
SK Hynix PC811 HFS002TEM9X152N
238.28 MB/s +17%
Razer Blade 18 2024 RZ09-0509
 
219.58 MB/s +8%
Moyenne de la classe Gaming
  (75.6 - 307, n=97, 2 dernières années)
215 MB/s +5%
Asus ROG Strix Scar 18 G835LXG
2x Samsung PM9E1 MZVLC4T0HBL1 (RAID 0)
204 MB/s
Moyenne 2x Samsung PM9E1 MZVLC4T0HBL1 (RAID 0)
  (n=1)
204 MB/s 0%
Acer Predator Helios 18 PH18-72-98MW
2x SK Hynix HFS001TEJ9X115N (RAID 0)
200.92 MB/s -2%
Asus Strix Scar 18 G835LX
WD PC SN8000S 2TB
189.8 MB/s -7%
MSI Titan 18 HX A14VIG
2x Samsung PM9A1a MZVL22T0HDLB (RAID 0)
134.66 MB/s -34%
4K-64 Read
Schenker Key 17 Pro (M24)
Samsung 990 Pro 1 TB
3182 MB/s +181%
Alienware m18 R2
SK Hynix PC811 HFS002TEM9X152N
3096 MB/s +173%
Moyenne de la classe Gaming
  (517 - 3977, n=97, 2 dernières années)
1618 MB/s +43%
MSI Titan 18 HX A14VIG
2x Samsung PM9A1a MZVL22T0HDLB (RAID 0)
1172.14 MB/s +3%
Asus ROG Strix Scar 18 G835LXG
2x Samsung PM9E1 MZVLC4T0HBL1 (RAID 0)
1133 MB/s
Moyenne 2x Samsung PM9E1 MZVLC4T0HBL1 (RAID 0)
  (n=1)
1133 MB/s 0%
Acer Predator Helios 18 PH18-72-98MW
2x SK Hynix HFS001TEJ9X115N (RAID 0)
1129.76 MB/s 0%
Razer Blade 18 2024 RZ09-0509
 
1053.83 MB/s -7%
Asus Strix Scar 18 G835LX
WD PC SN8000S 2TB
1029 MB/s -9%
4K-64 Write
Alienware m18 R2
SK Hynix PC811 HFS002TEM9X152N
4161.9 MB/s +229%
Schenker Key 17 Pro (M24)
Samsung 990 Pro 1 TB
4090 MB/s +223%
Moyenne de la classe Gaming
  (850 - 5356, n=97, 2 dernières années)
2935 MB/s +132%
Razer Blade 18 2024 RZ09-0509
 
1998.53 MB/s +58%
Asus Strix Scar 18 G835LX
WD PC SN8000S 2TB
1546 MB/s +22%
Asus ROG Strix Scar 18 G835LXG
2x Samsung PM9E1 MZVLC4T0HBL1 (RAID 0)
1265 MB/s
Moyenne 2x Samsung PM9E1 MZVLC4T0HBL1 (RAID 0)
  (n=1)
1265 MB/s 0%
MSI Titan 18 HX A14VIG
2x Samsung PM9A1a MZVL22T0HDLB (RAID 0)
1088.59 MB/s -14%
Acer Predator Helios 18 PH18-72-98MW
2x SK Hynix HFS001TEJ9X115N (RAID 0)
1077.68 MB/s -15%
Access Time Read
Asus Strix Scar 18 G835LX
WD PC SN8000S 2TB
0.067 ms * -148%
Moyenne de la classe Gaming
  (0.017 - 0.623, n=97, 2 dernières années)
0.06364 ms * -136%
Schenker Key 17 Pro (M24)
Samsung 990 Pro 1 TB
0.046 ms * -70%
Acer Predator Helios 18 PH18-72-98MW
2x SK Hynix HFS001TEJ9X115N (RAID 0)
0.044 ms * -63%
MSI Titan 18 HX A14VIG
2x Samsung PM9A1a MZVL22T0HDLB (RAID 0)
0.036 ms * -33%
Alienware m18 R2
SK Hynix PC811 HFS002TEM9X152N
0.029 ms * -7%
Asus ROG Strix Scar 18 G835LXG
2x Samsung PM9E1 MZVLC4T0HBL1 (RAID 0)
0.027 ms *
Moyenne 2x Samsung PM9E1 MZVLC4T0HBL1 (RAID 0)
  (n=1)
0.027 ms * -0%
Razer Blade 18 2024 RZ09-0509
 
0.025 ms * +7%
Access Time Write
MSI Titan 18 HX A14VIG
2x Samsung PM9A1a MZVL22T0HDLB (RAID 0)
0.091 ms * -406%
Razer Blade 18 2024 RZ09-0509
 
0.057 ms * -217%
Alienware m18 R2
SK Hynix PC811 HFS002TEM9X152N
0.055 ms * -206%
Moyenne de la classe Gaming
  (0.012 - 0.277, n=97, 2 dernières années)
0.03794 ms * -111%
Acer Predator Helios 18 PH18-72-98MW
2x SK Hynix HFS001TEJ9X115N (RAID 0)
0.019 ms * -6%
Asus Strix Scar 18 G835LX
WD PC SN8000S 2TB
0.019 ms * -6%
Asus ROG Strix Scar 18 G835LXG
2x Samsung PM9E1 MZVLC4T0HBL1 (RAID 0)
0.018 ms *
Moyenne 2x Samsung PM9E1 MZVLC4T0HBL1 (RAID 0)
  (n=1)
0.018 ms * -0%
Schenker Key 17 Pro (M24)
Samsung 990 Pro 1 TB
0.015 ms * +17%

* ... Moindre est la valeur, meilleures sont les performances

Limitation du disque : boucle de lecture DiskSpd, profondeur de file d'attente 8

035571010651420177521302485284031953550390542604615497053255680603563906745710074557810816585208875923095859940102951065011005113601171512070124251278013135134901384514200145551491015265156201597516330166851704017395Tooltip
Asus ROG Strix Scar 18 G835LXG; diskspd 2.0.17 f: Ø17083 (13259.78-17590.28) MB/s

Performances du GPU et des jeux

L'Asus ROG Strix SCAR 18 est équipé d'un GPU pour ordinateur portable Nvidia GeForce RTX 5090 doté de 24 Go de mémoire vidéo GDDR7. Lors de notre test, le GPU a fonctionné à un TGP maximal de 175 watts (150 watts + 25 watts de Dynamic Boost), ce qui en fait la configuration la plus rapide disponible. Les performances en jeux et dans les applications sont donc très élevées, offrant d’importantes réserves de puissance même pour les titres exigeants à haute résolution.

En mode manuel, les fréquences d’horloge du GPU et de la mémoire peuvent être encore augmentées, ce qui permet un léger gain supplémentaire en termes de performances graphiques. Un autre aspect positif est que les performances de la RTX 5090 Laptop restent stables même sous une charge soutenue et ne présentent aucune baisse significative. En mode batterie, cependant, la puissance disponible est nettement inférieure, ce qui explique pourquoi les performances du GPU baissent sensiblement.

3DMark Performance rating - Percent
Asus ROG Strix Scar 18 G835LXG
NVIDIA GeForce RTX 5090 Laptop, Intel Core Ultra 9 290HX Plus
100 pt
Moyenne NVIDIA GeForce RTX 5090 Laptop
 
91.3 pt
Asus Strix Scar 18 G835LX
NVIDIA GeForce RTX 5090 Laptop, Intel Core Ultra 9 275HX
90.4 pt
MSI Titan 18 HX A14VIG
NVIDIA GeForce RTX 4090 Laptop GPU, Intel Core i9-14900HX
87.4 pt
Alienware m18 R2
NVIDIA GeForce RTX 4090 Laptop GPU, Intel Core i9-14900HX
86 pt
Razer Blade 18 2024 RZ09-0509
NVIDIA GeForce RTX 4090 Laptop GPU, Intel Core i9-14900HX
82.9 pt
Schenker Key 17 Pro (M24)
NVIDIA GeForce RTX 4090 Laptop GPU, Intel Core i9-14900HX
79.2 pt
Acer Predator Helios 18 PH18-72-98MW
NVIDIA GeForce RTX 4090 Laptop GPU, Intel Core i9-14900HX
76.6 pt
Moyenne de la classe Gaming
 
65.8 pt
3DMark 11 - 1280x720 Performance GPU
Asus ROG Strix Scar 18 G835LXG
NVIDIA GeForce RTX 5090 Laptop, Intel Core Ultra 9 290HX Plus
77229 Points
Alienware m18 R2
NVIDIA GeForce RTX 4090 Laptop GPU, Intel Core i9-14900HX
69254 Points -10%
Moyenne NVIDIA GeForce RTX 5090 Laptop
  (26378 - 80022, n=24)
66542 Points -14%
Asus Strix Scar 18 G835LX
NVIDIA GeForce RTX 5090 Laptop, Intel Core Ultra 9 275HX
66337 Points -14%
Razer Blade 18 2024 RZ09-0509
NVIDIA GeForce RTX 4090 Laptop GPU, Intel Core i9-14900HX
64952 Points -16%
MSI Titan 18 HX A14VIG
NVIDIA GeForce RTX 4090 Laptop GPU, Intel Core i9-14900HX
63978 Points -17%
Acer Predator Helios 18 PH18-72-98MW
NVIDIA GeForce RTX 4090 Laptop GPU, Intel Core i9-14900HX
59871 Points -22%
Schenker Key 17 Pro (M24)
NVIDIA GeForce RTX 4090 Laptop GPU, Intel Core i9-14900HX
59715 Points -23%
Moyenne de la classe Gaming
  (21841 - 80022, n=104, 2 dernières années)
50006 Points -35%
3DMark
2560x1440 Time Spy Graphics
Asus ROG Strix Scar 18 G835LXG
NVIDIA GeForce RTX 5090 Laptop, Intel Core Ultra 9 290HX Plus
25562 Points
Asus Strix Scar 18 G835LX
NVIDIA GeForce RTX 5090 Laptop, Intel Core Ultra 9 275HX
24599 Points -4%
Moyenne NVIDIA GeForce RTX 5090 Laptop
  (19216 - 26212, n=27)
23833 Points -7%
Alienware m18 R2
NVIDIA GeForce RTX 4090 Laptop GPU, Intel Core i9-14900HX
22290 Points -13%
MSI Titan 18 HX A14VIG
NVIDIA GeForce RTX 4090 Laptop GPU, Intel Core i9-14900HX
22256 Points -13%
Razer Blade 18 2024 RZ09-0509
NVIDIA GeForce RTX 4090 Laptop GPU, Intel Core i9-14900HX
21246 Points -17%
Schenker Key 17 Pro (M24)
NVIDIA GeForce RTX 4090 Laptop GPU, Intel Core i9-14900HX
19741 Points -23%
Acer Predator Helios 18 PH18-72-98MW
NVIDIA GeForce RTX 4090 Laptop GPU, Intel Core i9-14900HX
18814 Points -26%
Moyenne de la classe Gaming
  (5012 - 26212, n=115, 2 dernières années)
15813 Points -38%
1920x1080 Fire Strike Graphics
Asus ROG Strix Scar 18 G835LXG
NVIDIA GeForce RTX 5090 Laptop, Intel Core Ultra 9 290HX Plus
54821 Points
Moyenne NVIDIA GeForce RTX 5090 Laptop
  (42175 - 62849, n=29)
51817 Points -5%
MSI Titan 18 HX A14VIG
NVIDIA GeForce RTX 4090 Laptop GPU, Intel Core i9-14900HX
50532 Points -8%
Asus Strix Scar 18 G835LX
NVIDIA GeForce RTX 5090 Laptop, Intel Core Ultra 9 275HX
48863 Points -11%
Schenker Key 17 Pro (M24)
NVIDIA GeForce RTX 4090 Laptop GPU, Intel Core i9-14900HX
45600 Points -17%
Razer Blade 18 2024 RZ09-0509
NVIDIA GeForce RTX 4090 Laptop GPU, Intel Core i9-14900HX
44702 Points -18%
Alienware m18 R2
NVIDIA GeForce RTX 4090 Laptop GPU, Intel Core i9-14900HX
44492 Points -19%
Acer Predator Helios 18 PH18-72-98MW
NVIDIA GeForce RTX 4090 Laptop GPU, Intel Core i9-14900HX
43140 Points -21%
Moyenne de la classe Gaming
  (12242 - 62849, n=115, 2 dernières années)
38781 Points -29%
3DMark 06 Standard Score
69318 points
3DMark Vantage P Result
145142 points
3DMark 11 Performance
54427 points
3DMark Ice Storm Standard Score
328157 points
3DMark Cloud Gate Standard Score
79173 points
3DMark Fire Strike Score
42509 points
3DMark Fire Strike Extreme Score
30184 points
3DMark Time Spy Score
24092 points
3DMark Steel Nomad Score
6277 points
Aide
Blender
v3.3 Classroom OPTIX/RTX
Moyenne de la classe Gaming
  (9 - 32, n=106, 2 dernières années)
18.3 Seconds * -31%
Razer Blade 18 2024 RZ09-0509
NVIDIA GeForce RTX 4090 Laptop GPU, Intel Core i9-14900HX
14 Seconds * -0%
Asus ROG Strix Scar 18 G835LXG
NVIDIA GeForce RTX 5090 Laptop, Intel Core Ultra 9 290HX Plus
14 Seconds *
Acer Predator Helios 18 PH18-72-98MW
NVIDIA GeForce RTX 4090 Laptop GPU, Intel Core i9-14900HX
13 Seconds * +7%
Schenker Key 17 Pro (M24)
NVIDIA GeForce RTX 4090 Laptop GPU, Intel Core i9-14900HX
13 Seconds * +7%
Alienware m18 R2
NVIDIA GeForce RTX 4090 Laptop GPU, Intel Core i9-14900HX
12 Seconds * +14%
Moyenne NVIDIA GeForce RTX 5090 Laptop
  (9 - 18, n=23)
11.8 Seconds * +16%
MSI Titan 18 HX A14VIG
NVIDIA GeForce RTX 4090 Laptop GPU, Intel Core i9-14900HX
10 Seconds * +29%
Asus Strix Scar 18 G835LX
NVIDIA GeForce RTX 5090 Laptop, Intel Core Ultra 9 275HX
10 Seconds * +29%
v3.3 Classroom CUDA
Moyenne de la classe Gaming
  (15 - 228, n=106, 2 dernières années)
32.4 Seconds * -91%
Razer Blade 18 2024 RZ09-0509
NVIDIA GeForce RTX 4090 Laptop GPU, Intel Core i9-14900HX
19 Seconds * -12%
MSI Titan 18 HX A14VIG
NVIDIA GeForce RTX 4090 Laptop GPU, Intel Core i9-14900HX
18 Seconds * -6%
Acer Predator Helios 18 PH18-72-98MW
NVIDIA GeForce RTX 4090 Laptop GPU, Intel Core i9-14900HX
18 Seconds * -6%
Alienware m18 R2
NVIDIA GeForce RTX 4090 Laptop GPU, Intel Core i9-14900HX
18 Seconds * -6%
Schenker Key 17 Pro (M24)
NVIDIA GeForce RTX 4090 Laptop GPU, Intel Core i9-14900HX
18 Seconds * -6%
Moyenne NVIDIA GeForce RTX 5090 Laptop
  (15 - 37, n=22)
17.6 Seconds * -4%
Asus ROG Strix Scar 18 G835LXG
NVIDIA GeForce RTX 5090 Laptop, Intel Core Ultra 9 290HX Plus
17 Seconds *
Asus Strix Scar 18 G835LX
NVIDIA GeForce RTX 5090 Laptop, Intel Core Ultra 9 275HX
16 Seconds * +6%
v3.3 Classroom CPU
Moyenne de la classe Gaming
  (122 - 565, n=102, 2 dernières années)
247 Seconds * -96%
Acer Predator Helios 18 PH18-72-98MW
NVIDIA GeForce RTX 4090 Laptop GPU, Intel Core i9-14900HX
225 Seconds * -79%
Schenker Key 17 Pro (M24)
NVIDIA GeForce RTX 4090 Laptop GPU, Intel Core i9-14900HX
218 Seconds * -73%
Razer Blade 18 2024 RZ09-0509
NVIDIA GeForce RTX 4090 Laptop GPU, Intel Core i9-14900HX
207 Seconds * -64%
Alienware m18 R2
NVIDIA GeForce RTX 4090 Laptop GPU, Intel Core i9-14900HX
180 Seconds * -43%
MSI Titan 18 HX A14VIG
NVIDIA GeForce RTX 4090 Laptop GPU, Intel Core i9-14900HX
179 Seconds * -42%
Moyenne NVIDIA GeForce RTX 5090 Laptop
  (123 - 282, n=23)
164.3 Seconds * -30%
Asus Strix Scar 18 G835LX
NVIDIA GeForce RTX 5090 Laptop, Intel Core Ultra 9 275HX
137 Seconds * -9%
Asus ROG Strix Scar 18 G835LXG
NVIDIA GeForce RTX 5090 Laptop, Intel Core Ultra 9 290HX Plus
126 Seconds *

* ... Moindre est la valeur, meilleures sont les performances

Performance rating - Percent
Asus ROG Strix Scar 18 G835LXG
Intel Core Ultra 9 290HX Plus, NVIDIA GeForce RTX 5090 Laptop
98 pt
Asus Strix Scar 18 G835LX
Intel Core Ultra 9 275HX, NVIDIA GeForce RTX 5090 Laptop
91.6 pt
Alienware m18 R2
Intel Core i9-14900HX, NVIDIA GeForce RTX 4090 Laptop GPU
87.8 pt
MSI Titan 18 HX A14VIG
Intel Core i9-14900HX, NVIDIA GeForce RTX 4090 Laptop GPU
86.6 pt
Schenker Key 17 Pro (M24)
Intel Core i9-14900HX, NVIDIA GeForce RTX 4090 Laptop GPU
82.4 pt
Acer Predator Helios 18 PH18-72-98MW -2!
Intel Core i9-14900HX, NVIDIA GeForce RTX 4090 Laptop GPU
78.1 pt
Razer Blade 18 2024 RZ09-0509
Intel Core i9-14900HX, NVIDIA GeForce RTX 4090 Laptop GPU
75.9 pt
Moyenne de la classe Gaming
 
70 pt
Cyberpunk 2077 - 1920x1080 Ultra Preset (FSR off)
Asus ROG Strix Scar 18 G835LXG
Intel Core Ultra 9 290HX Plus, NVIDIA GeForce RTX 5090 Laptop
169.4 (133.9min) fps
Asus Strix Scar 18 G835LX
Intel Core Ultra 9 275HX, NVIDIA GeForce RTX 5090 Laptop
154.9 (126.3min) fps -9%
Alienware m18 R2
Intel Core i9-14900HX, NVIDIA GeForce RTX 4090 Laptop GPU
133.9 (67.5min) fps -21%
MSI Titan 18 HX A14VIG
Intel Core i9-14900HX, NVIDIA GeForce RTX 4090 Laptop GPU
129.8 (26.2min) fps -23%
Schenker Key 17 Pro (M24)
Intel Core i9-14900HX, NVIDIA GeForce RTX 4090 Laptop GPU
113.5 (84.3min) fps -33%
Moyenne de la classe Gaming
  (17.7 - 169.9, n=115, 2 dernières années)
108.4 fps -36%
Razer Blade 18 2024 RZ09-0509
Intel Core i9-14900HX, NVIDIA GeForce RTX 4090 Laptop GPU
101.25 (77.2min) fps -40%
Baldur's Gate 3 - 1920x1080 Ultra Preset AA:T
MSI Titan 18 HX A14VIG
Intel Core i9-14900HX, NVIDIA GeForce RTX 4090 Laptop GPU
207.7 fps 0%
Asus ROG Strix Scar 18 G835LXG
Intel Core Ultra 9 290HX Plus, NVIDIA GeForce RTX 5090 Laptop
207 (90.2min, 154.6P0.1, 186.9P1) fps
Alienware m18 R2
Intel Core i9-14900HX, NVIDIA GeForce RTX 4090 Laptop GPU
202 fps -2%
Asus Strix Scar 18 G835LX
Intel Core Ultra 9 275HX, NVIDIA GeForce RTX 5090 Laptop
193.7 fps -6%
Schenker Key 17 Pro (M24)
Intel Core i9-14900HX, NVIDIA GeForce RTX 4090 Laptop GPU
177 fps -14%
Razer Blade 18 2024 RZ09-0509
Intel Core i9-14900HX, NVIDIA GeForce RTX 4090 Laptop GPU
160.5 (65P0.1, 99.5P1) fps -22%
Moyenne de la classe Gaming
  (59.4 - 246, n=104, 2 dernières années)
139.9 fps -32%
GTA V - 1920x1080 Highest AA:4xMSAA + FX AF:16x
Asus ROG Strix Scar 18 G835LXG
Intel Core Ultra 9 290HX Plus, NVIDIA GeForce RTX 5090 Laptop
173 (3.12min, 125P1) fps
Asus Strix Scar 18 G835LX
Intel Core Ultra 9 275HX, NVIDIA GeForce RTX 5090 Laptop
161.9 (2.78min, 111.1P1) fps -6%
MSI Titan 18 HX A14VIG
Intel Core i9-14900HX, NVIDIA GeForce RTX 4090 Laptop GPU
139.2 (3.73min, 90.9P1) fps -20%
Alienware m18 R2
Intel Core i9-14900HX, NVIDIA GeForce RTX 4090 Laptop GPU
137 (7.81min, 83.3P1) fps -21%
Acer Predator Helios 18 PH18-72-98MW
Intel Core i9-14900HX, NVIDIA GeForce RTX 4090 Laptop GPU
134 (22.7min, 90.9P1) fps -23%
Moyenne de la classe Gaming
  (48.3 - 186.9, n=94, 2 dernières années)
132.3 fps -24%
Razer Blade 18 2024 RZ09-0509
Intel Core i9-14900HX, NVIDIA GeForce RTX 4090 Laptop GPU
129.8 (16.1min, 90.9P1) fps -25%
Schenker Key 17 Pro (M24)
Intel Core i9-14900HX, NVIDIA GeForce RTX 4090 Laptop GPU
126.7 (8.43min, 83.3P1) fps -27%
Final Fantasy XV Benchmark - 1920x1080 High Quality
Asus ROG Strix Scar 18 G835LXG
Intel Core Ultra 9 290HX Plus, NVIDIA GeForce RTX 5090 Laptop
214 fps
Asus Strix Scar 18 G835LX
Intel Core Ultra 9 275HX, NVIDIA GeForce RTX 5090 Laptop
199.3 fps -7%
Alienware m18 R2
Intel Core i9-14900HX, NVIDIA GeForce RTX 4090 Laptop GPU
193.2 fps -10%
MSI Titan 18 HX A14VIG
Intel Core i9-14900HX, NVIDIA GeForce RTX 4090 Laptop GPU
184 fps -14%
Schenker Key 17 Pro (M24)
Intel Core i9-14900HX, NVIDIA GeForce RTX 4090 Laptop GPU
174.6 fps -18%
Acer Predator Helios 18 PH18-72-98MW
Intel Core i9-14900HX, NVIDIA GeForce RTX 4090 Laptop GPU
157.1 fps -27%
Razer Blade 18 2024 RZ09-0509
Intel Core i9-14900HX, NVIDIA GeForce RTX 4090 Laptop GPU
156.9 fps -27%
Moyenne de la classe Gaming
  (41 - 215, n=95, 2 dernières années)
150.1 fps -30%
Strange Brigade - 1920x1080 ultra AA:ultra AF:16
Asus ROG Strix Scar 18 G835LXG
Intel Core Ultra 9 290HX Plus, NVIDIA GeForce RTX 5090 Laptop
458 (143.1min, 329P1) fps
Asus Strix Scar 18 G835LX
Intel Core Ultra 9 275HX, NVIDIA GeForce RTX 5090 Laptop
401 (103.4min, 236P1) fps -12%
MSI Titan 18 HX A14VIG
Intel Core i9-14900HX, NVIDIA GeForce RTX 4090 Laptop GPU
385 (27.2min, 274P1) fps -16%
Alienware m18 R2
Intel Core i9-14900HX, NVIDIA GeForce RTX 4090 Laptop GPU
369 (31.4min, 266P1) fps -19%
Schenker Key 17 Pro (M24)
Intel Core i9-14900HX, NVIDIA GeForce RTX 4090 Laptop GPU
360 (22.5min, 268P1) fps -21%
Razer Blade 18 2024 RZ09-0509
Intel Core i9-14900HX, NVIDIA GeForce RTX 4090 Laptop GPU
325 (49.1min, 213P1) fps -29%
Acer Predator Helios 18 PH18-72-98MW
Intel Core i9-14900HX, NVIDIA GeForce RTX 4090 Laptop GPU
305 (14.5min, 223P1) fps -33%
Moyenne de la classe Gaming
  (76.3 - 458, n=87, 2 dernières années)
288 fps -37%
Dota 2 Reborn - 1920x1080 ultra (3/3) best looking
Asus ROG Strix Scar 18 G835LXG
Intel Core Ultra 9 290HX Plus, NVIDIA GeForce RTX 5090 Laptop
194.7 (163.7min) fps
Asus Strix Scar 18 G835LX
Intel Core Ultra 9 275HX, NVIDIA GeForce RTX 5090 Laptop
186.6 (157.4min) fps -4%
Schenker Key 17 Pro (M24)
Intel Core i9-14900HX, NVIDIA GeForce RTX 4090 Laptop GPU
178.4 (149.2min) fps -8%
Acer Predator Helios 18 PH18-72-98MW
Intel Core i9-14900HX, NVIDIA GeForce RTX 4090 Laptop GPU
178.3 (150.2min) fps -8%
MSI Titan 18 HX A14VIG
Intel Core i9-14900HX, NVIDIA GeForce RTX 4090 Laptop GPU
174.5 (151.1min) fps -10%
Alienware m18 R2
Intel Core i9-14900HX, NVIDIA GeForce RTX 4090 Laptop GPU
171.8 (143.6min) fps -12%
Razer Blade 18 2024 RZ09-0509
Intel Core i9-14900HX, NVIDIA GeForce RTX 4090 Laptop GPU
164 (140min) fps -16%
Moyenne de la classe Gaming
  (84.8 - 248, n=107, 2 dernières années)
153.7 fps -21%
X-Plane 11.11 - 1920x1080 high (fps_test=3)
Alienware m18 R2
Intel Core i9-14900HX, NVIDIA GeForce RTX 4090 Laptop GPU
140.6 fps +15%
Schenker Key 17 Pro (M24)
Intel Core i9-14900HX, NVIDIA GeForce RTX 4090 Laptop GPU
139.7 fps +15%
Razer Blade 18 2024 RZ09-0509
Intel Core i9-14900HX, NVIDIA GeForce RTX 4090 Laptop GPU
127.2 fps +4%
MSI Titan 18 HX A14VIG
Intel Core i9-14900HX, NVIDIA GeForce RTX 4090 Laptop GPU
126.1 fps +4%
Asus ROG Strix Scar 18 G835LXG
Intel Core Ultra 9 290HX Plus, NVIDIA GeForce RTX 5090 Laptop
121.8 fps
Asus Strix Scar 18 G835LX
Intel Core Ultra 9 275HX, NVIDIA GeForce RTX 5090 Laptop
121.7 fps 0%
Acer Predator Helios 18 PH18-72-98MW
Intel Core i9-14900HX, NVIDIA GeForce RTX 4090 Laptop GPU
114.5 fps -6%
Moyenne de la classe Gaming
  (55.5 - 143.5, n=109, 2 dernières années)
98.7 fps -19%
The Witcher 3
1024x768 Low Graphics & Postprocessing
MSI Titan 18 HX A14VIG
Intel Core i9-14900HX, NVIDIA GeForce RTX 4090 Laptop GPU
595.3 (554min) fps +33%
Alienware m18 R2
Intel Core i9-14900HX, NVIDIA GeForce RTX 4090 Laptop GPU
585.5 (526min) fps +31%
Moyenne de la classe Gaming
  (447 - 686, n=2, 2 dernières années)
567 fps +27%
Asus ROG Strix Scar 18 G835LXG
Intel Core Ultra 9 290HX Plus, NVIDIA GeForce RTX 5090 Laptop
447 (29.3min, 93.2P0.1, 271P1) fps
Moyenne NVIDIA GeForce RTX 5090 Laptop
  (n=1)
447 fps 0%
1366x768 Medium Graphics & Postprocessing
Alienware m18 R2
Intel Core i9-14900HX, NVIDIA GeForce RTX 4090 Laptop GPU
525.8 (493min) fps +23%
MSI Titan 18 HX A14VIG
Intel Core i9-14900HX, NVIDIA GeForce RTX 4090 Laptop GPU
506.6 (447min) fps +18%
Moyenne de la classe Gaming
  (428 - 517, n=2, 2 dernières années)
473 fps +11%
Asus ROG Strix Scar 18 G835LXG
Intel Core Ultra 9 290HX Plus, NVIDIA GeForce RTX 5090 Laptop
428 (15.6min, 153P0.1, 268P1) fps
Moyenne NVIDIA GeForce RTX 5090 Laptop
  (n=1)
428 fps 0%
1920x1080 High Graphics & Postprocessing (Nvidia HairWorks Off)
MSI Titan 18 HX A14VIG
Intel Core i9-14900HX, NVIDIA GeForce RTX 4090 Laptop GPU
412.2 (387min) fps +2%
Alienware m18 R2
Intel Core i9-14900HX, NVIDIA GeForce RTX 4090 Laptop GPU
405.6 (374min) fps 0%
Asus ROG Strix Scar 18 G835LXG
Intel Core Ultra 9 290HX Plus, NVIDIA GeForce RTX 5090 Laptop
404 (88.1min, 153.9P0.1, 264P1) fps
Moyenne NVIDIA GeForce RTX 5090 Laptop
  (n=1)
404 fps 0%
Moyenne de la classe Gaming
  (341 - 404, n=2, 2 dernières années)
373 fps -8%
1920x1080 Ultra Graphics & Postprocessing (HBAO+)
Asus ROG Strix Scar 18 G835LXG
Intel Core Ultra 9 290HX Plus, NVIDIA GeForce RTX 5090 Laptop
234 (14.7min, 99.6P0.1, 147.5P1) fps
Moyenne NVIDIA GeForce RTX 5090 Laptop
  (192 - 240, n=5)
222 fps -5%
MSI Titan 18 HX A14VIG
Intel Core i9-14900HX, NVIDIA GeForce RTX 4090 Laptop GPU
211.2 (165min) fps -10%
Alienware m18 R2
Intel Core i9-14900HX, NVIDIA GeForce RTX 4090 Laptop GPU
205.7 (193min) fps -12%
Moyenne de la classe Gaming
  (104.7 - 240, n=7, 2 dernières années)
196.3 fps -16%
Razer Blade 18 2024 RZ09-0509
Intel Core i9-14900HX, NVIDIA GeForce RTX 4090 Laptop GPU
193 (53.6P0.1, 119.7P1) fps -18%
Acer Predator Helios 18 PH18-72-98MW
Intel Core i9-14900HX, NVIDIA GeForce RTX 4090 Laptop GPU
180 fps -23%

Tableau des FPS - 30 min Cyberpunk 2077 1920 x 1080, préréglage « Ultra » (FSR désactivé)
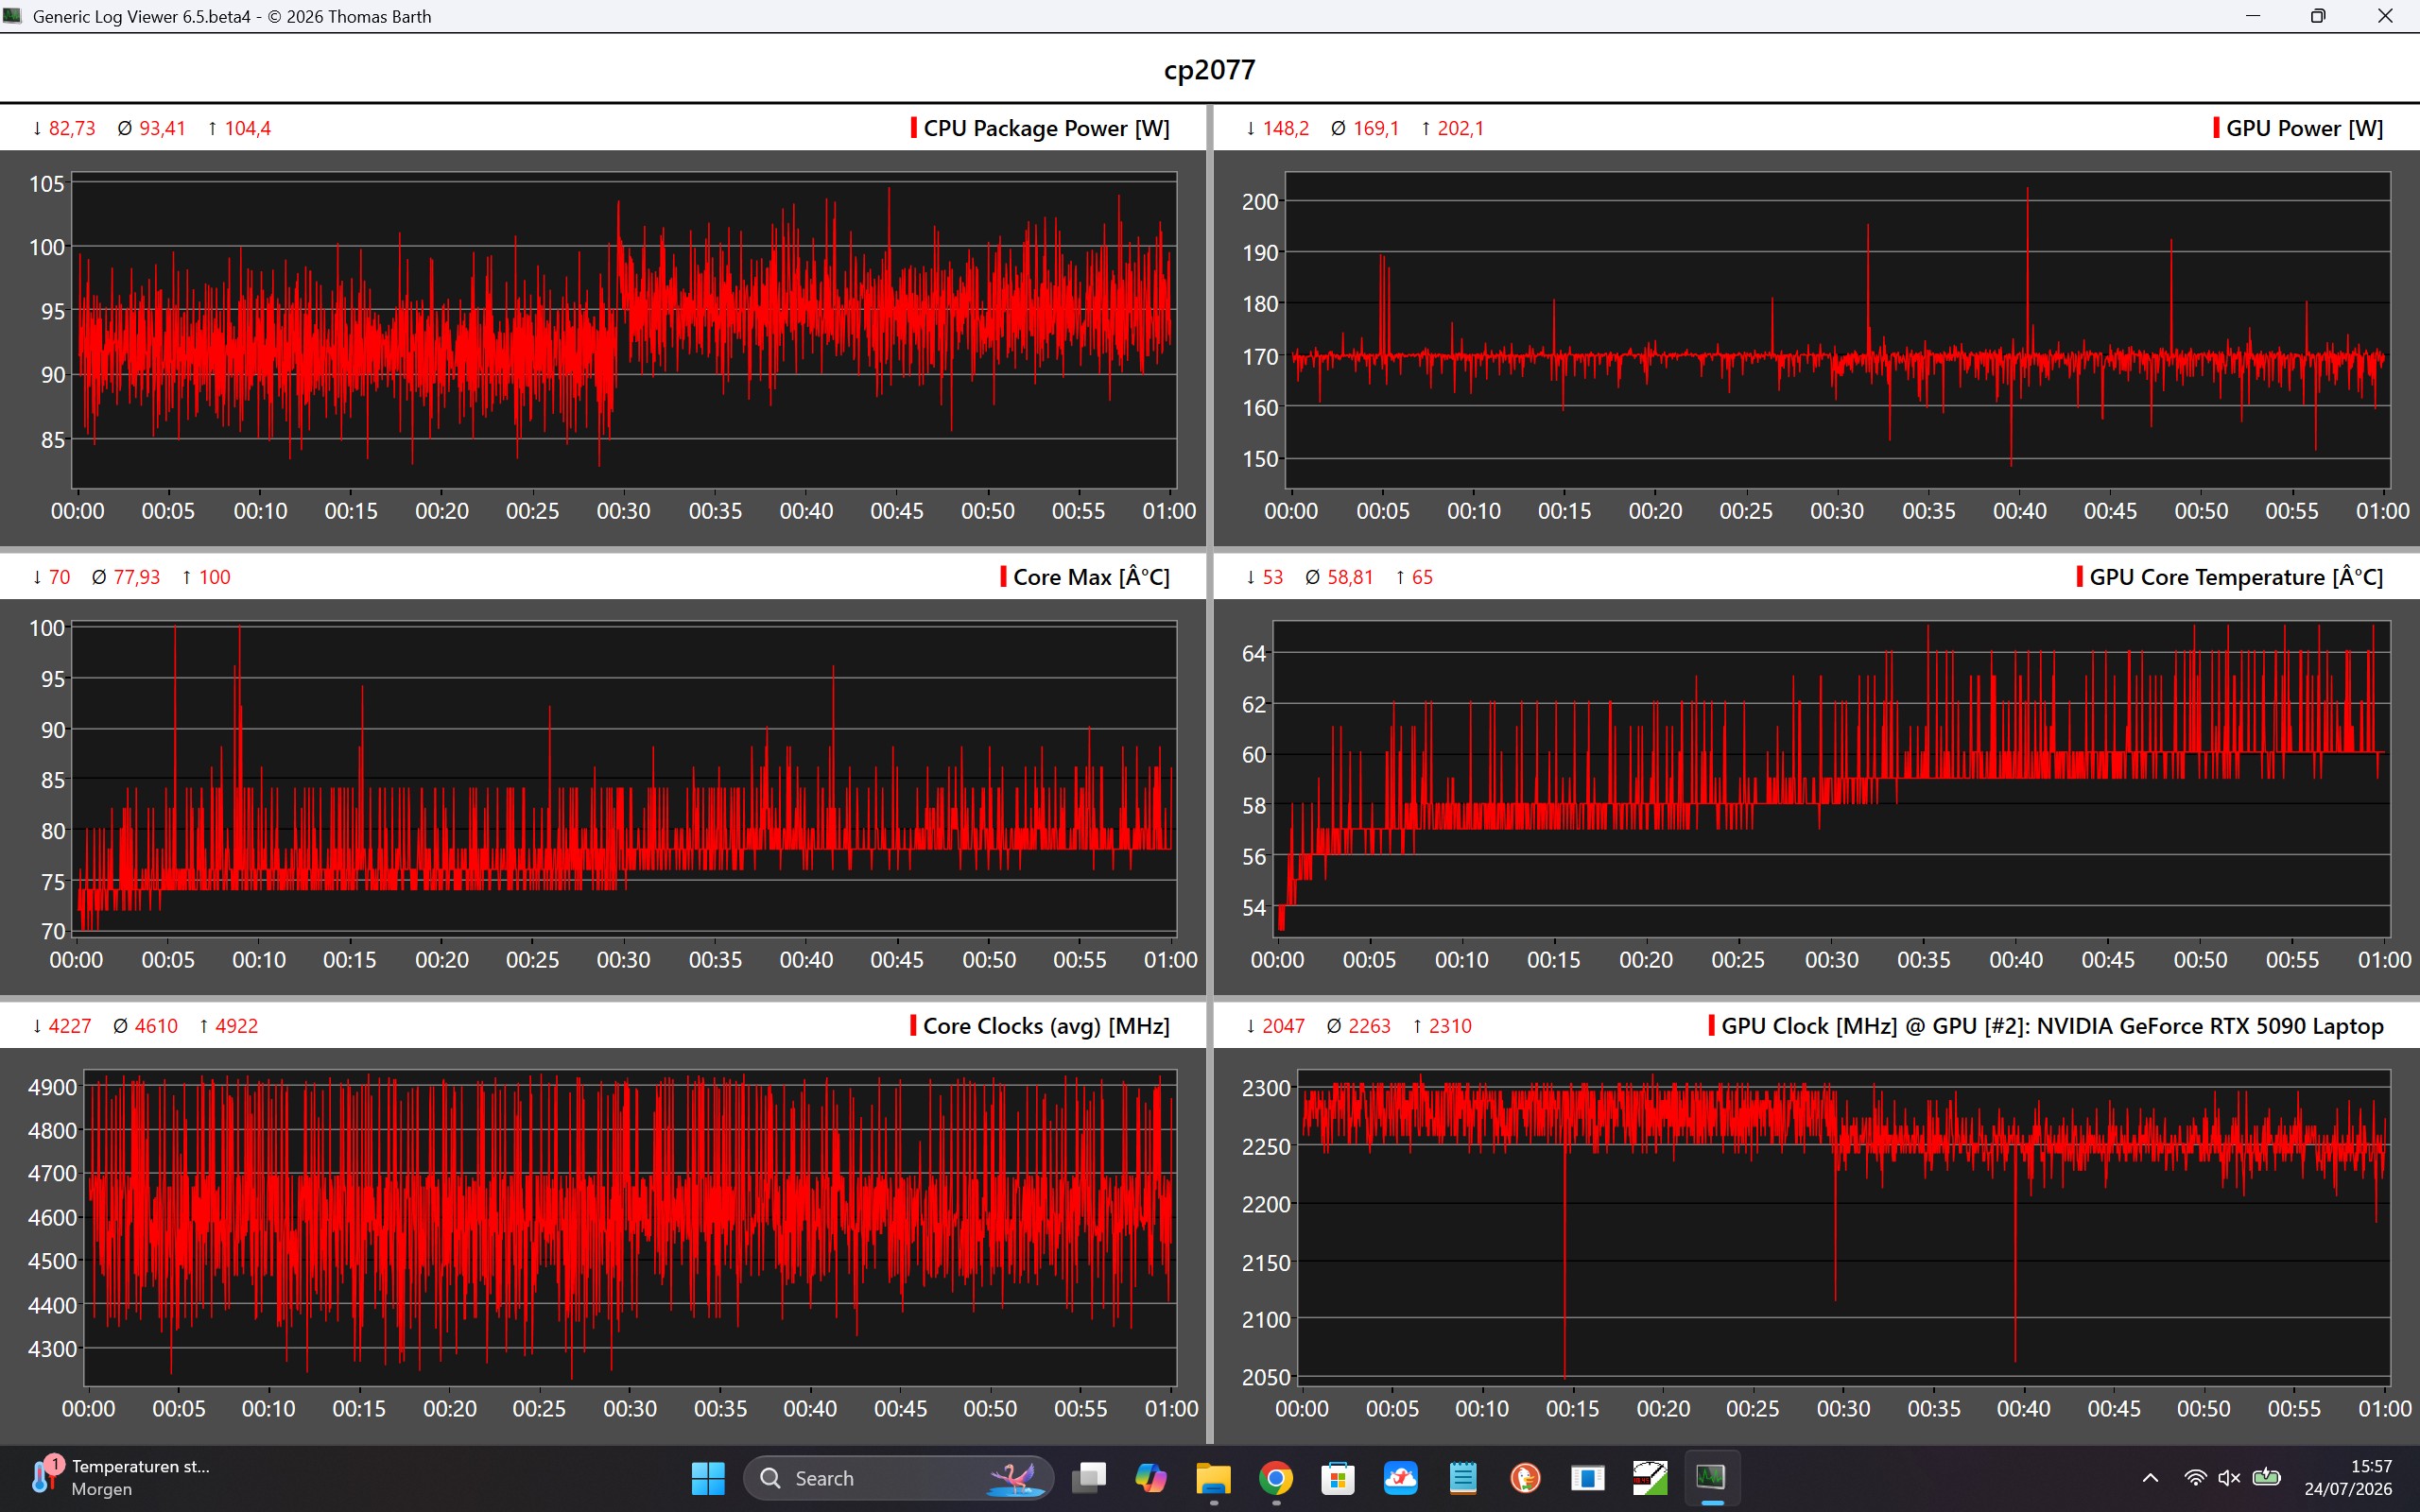
05101520253035404550556065707580859095100105110115120125130135140145150155160165Tooltip
Asus ROG Strix Scar 18 G835LXG Ultra 9 290HX Plus, GeForce RTX 5090 Laptop: Ø163.1 (152.9-166.7) fps
Asus Strix Scar 18 G835LX Ultra 9 275HX, GeForce RTX 5090 Laptop: Ø144.2 (124.3-147.1) fps
Caractéristiques techniques du processeur et de la carte graphique pour Cyberpunk 2077
BasMoyenÉlevéUltraQHD4K
GTA V (2015) 187.7 187.1 186.8 173 173.7 186.6
The Witcher 3 (2015) 447 428 404 234 193.5 170.9
Dota 2 Reborn (2015) 238.8 217.9 207.9 194.7 193.1
Final Fantasy XV Benchmark (2018) 234 231 214 174 107
X-Plane 11.11 (2018) 149.3 150.3 121.8 97.6
Strange Brigade (2018) 654 500 494 458 354 184.5
Baldur's Gate 3 (2023) 229 240 212 207 152.8 87.4
Cyberpunk 2077 (2023) 209 194.8 173.3 169.4 118.7 56.1
Alan Wake 2 (2023) 145.3 143.5 132.7 88.3 46
F1 24 (2024) 363 391 372 163.6 109.4 54.3
Black Myth: Wukong (2024) 182 135 107 65 49 29
Indiana Jones and the Great Circle (2024) 217 183.2 164.5 152.5 122.8 75
Kingdom Come Deliverance 2 (2025) 252 206 177.7 126.8 94.4 54.7
Assassin's Creed Shadows (2025) 113 111 96 75 64 46
F1 25 (2025) 286 266 255 65.3 39.1 18.8
Anno 117: Pax Romana (2025) 191.3 149.4 121.6 69.8 49.5 28.2
Call of Duty Black Ops 7 (2025) 216 208 170 69 47 31
Pragmata (2026) 257 199.9 164.9 125 71.4
007 First Light (2026) 135 128 111.8 108.2 78.6 45.9

Émissions et énergie

Bruit du système

Le niveau sonore de l’Asus ROG Strix SCAR 18 dépend fortement du profil d’alimentation sélectionné. Pour une utilisation quotidienne, le mode « Quiet » est recommandé, car les ventilateurs s’arrêtent souvent en cas de charge légère et l’ordinateur portable fonctionne à un niveau sonore agréablement bas. Même les jeux peu exigeants peuvent être joués avec ce profil, avec un bruit de fond modéré.

En mode Turbo, en revanche, les ventilateurs tournent en continu et atteignent jusqu’à 55,1 dB(A) en cas de charge importante ou pendant les sessions de jeu. Le port d’un casque est donc recommandé pour les sessions de jeu prolongées. Un aspect positif est que les performances de refroidissement restent constantes même à ce niveau sonore élevé. Un léger bruit de fond électronique n’est apparu que lors de quelques benchmarks synthétiques du GPU et n’était pas perceptible en fonctionnement normal ni pendant les sessions de jeu.

Degré de la nuisance sonore

Au repos
30.9 / 31 / 31.1 dB(A)
Fortement sollicité
47.8 / 55.1 dB(A)
  red to green bar
 
 
30 dB
silencieux
40 dB(A)
audible
50 dB(A)
bruyant
 
min: dark, med: mid, max: light   Earthworks M23R (à 15 cm de distance)   bruit ambiant: 25 dB(A)
dB(A) 0102030405060708090Deep BassMiddle BassHigh BassLower RangeMidsHigher MidsLower HighsMid HighsUpper HighsSuper Highs2032.634.834.632.728.344.72529.728.528.624.828.833.43131.926.428.1263035.94022.922.119.92223.532.15022.525.219.919.218.933.36321.219.216.817.915.732.98023.617.515.314.511.431.710022.616.416.315.512.334.212526.516.316.316.111.432.116026.416.717.517.51332.72002817.418.518.110.431.72503018.419.418.31038.531530.819.218.218.89.236.140035.124.624.223.610.142.650032.520.120.420.110.644.363036.322.922.822.81038.180036.621.421.621.910.437.2100036.82120.620.611.939.3125037.520.319.919.61242.5160038.120.720.420.411.942.8200039.220.1202011.938.2250037.518.718.218.212.437.531503516.516.616.313.236.44000341514.91513.838.150003314.714.614.614.134.3630031.215.114.914.914.533.8800026151514.914.732.81000024.815.715.715.61534.51250025.415.11515.114.630.41600025.516.416.516.214.224.7SPL47.831.13130.92551N5.91.41.41.40.68median 32.5median 17.4median 18.2median 18.1median 12median 36.4Delta5.32.32.42.41.83.2hearing rangehide median Fan NoiseAsus ROG Strix Scar 18 G835LXG
Asus ROG Strix Scar 18 G835LXG
Ultra 9 290HX Plus, GeForce RTX 5090 Laptop
Asus Strix Scar 18 G835LX
Ultra 9 275HX, GeForce RTX 5090 Laptop
Razer Blade 18 2024 RZ09-0509
i9-14900HX, GeForce RTX 4090 Laptop GPU
Alienware m18 R2
i9-14900HX, GeForce RTX 4090 Laptop GPU
Acer Predator Helios 18 PH18-72-98MW
i9-14900HX, GeForce RTX 4090 Laptop GPU
MSI Titan 18 HX A14VIG
i9-14900HX, GeForce RTX 4090 Laptop GPU
Schenker Key 17 Pro (M24)
i9-14900HX, GeForce RTX 4090 Laptop GPU
Noise
5%
8%
12%
-5%
10%
9%
arrêt / environnement * (dB)
25
23.3
7%
23.4
6%
23.6
6%
25
-0%
22.8
9%
23.41
6%
Idle Minimum * (dB)
30.9
29.8
4%
23.9
23%
23.8
23%
30
3%
23.8
23%
25.33
18%
Idle Average * (dB)
31
29.8
4%
28.2
9%
26.1
16%
36
-16%
23.8
23%
25.33
18%
Idle Maximum * (dB)
31.1
29.8
4%
29
7%
31.5
-1%
44
-41%
28
10%
25.33
19%
Load Average * (dB)
47.8
42.9
10%
36.8
23%
31.5
34%
48
-0%
38
21%
33.57
30%
Witcher 3 ultra * (dB)
55.2
54.1
2%
52.1
6%
49
11%
57.3
-4%
Cyberpunk 2077 ultra * (dB)
55.1
53.7
3%
61.97
-12%
Load Maximum * (dB)
55.1
53.7
3%
61.1
-11%
56.6
-3%
51
7%
62.8
-14%
62.14
-13%

* ... Moindre est la valeur, meilleures sont les performances

Température

Les températures de surface de l’Asus ROG Strix SCAR 18 restent bien maîtrisées, même en cas de charge intense. Nous n’avons mesuré que des températures allant jusqu’à 45 °C dans certaines zones isolées de la face inférieure. Le clavier, en revanche, ne se réchauffe que légèrement ; ainsi, la zone WASD, en particulier, reste agréablement fraîche même lors de longues sessions de jeu.

Lors du test de résistance, le système de refroidissement donne la priorité à la GeForce RTX 5090 Laptop, dont la TGP se stabilise rapidement à environ 175 watts. Le processeur Intel Core Ultra 9 290HX fonctionne en parallèle à environ 95 watts. Malgré cette consommation élevée, les températures du processeur et de la carte graphique restent à tout moment dans une plage de sécurité.
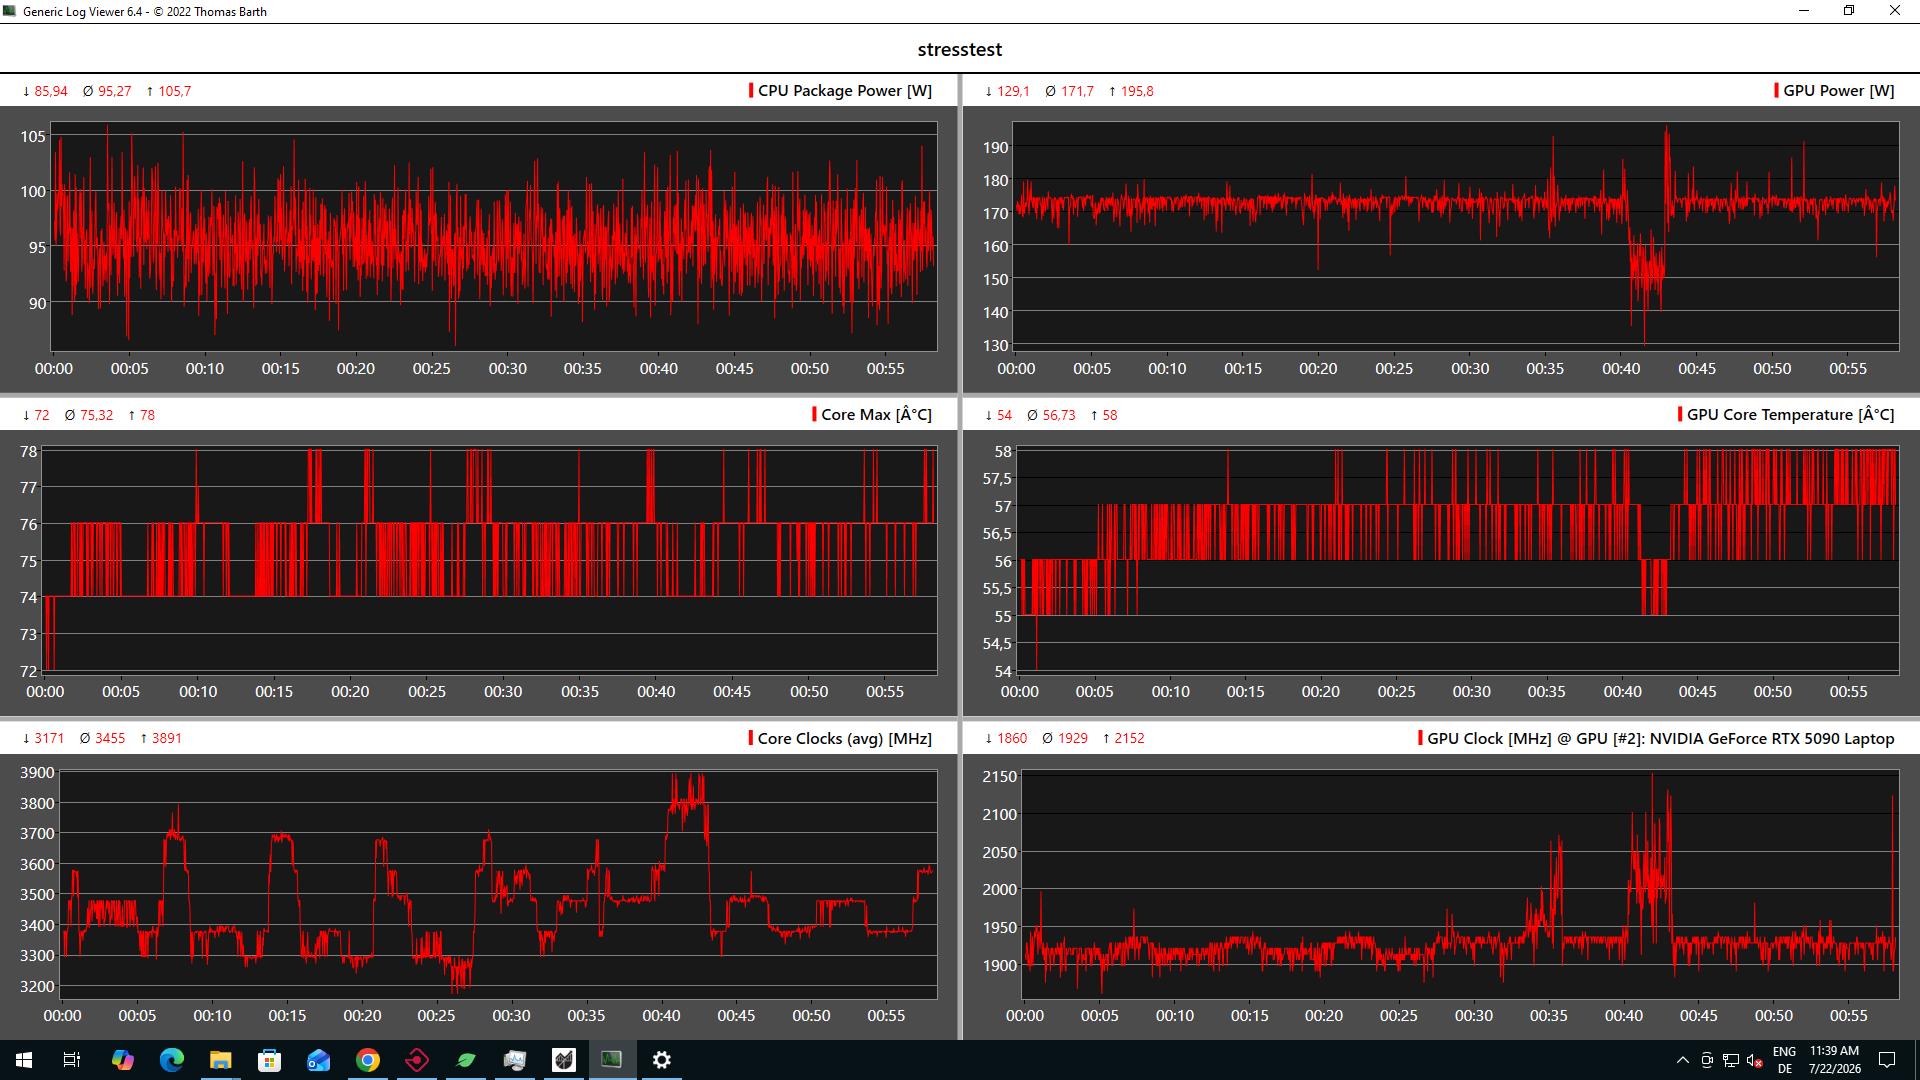
Test de résistance des données CPU/GPU
 34.3 °C37.5 °C32.6 °C 
 29.2 °C34.6 °C27.7 °C 
 26.8 °C28.6 °C27.3 °C 
Maximum: 37.5 °C
Moyenne: 31 °C
25.8 °C40.9 °C28.5 °C
25.7 °C26.1 °C26.4 °C
26.3 °C27.5 °C27.4 °C
Maximum: 40.9 °C
Moyenne: 28.3 °C
Alimentation (valeur maximale)  53.9 °C | Température ambiante de la pièce 22.7 °C | Fluke t3000FC (calibrated)
(+) La température moyenne de la face supérieure sous charge maximale est de 31 °C / 88 F, par rapport à la moyenne de 33.9 °C / 93 F pour les appareils de la classe Gaming.
(+) La température maximale du côté supérieur est de 37.5 °C / 100 F, par rapport à la moyenne de 40.4 °C / 105 F, allant de 21.2 à 68.8 °C pour la classe Gaming.
(±) Le fond chauffe jusqu'à un maximum de 40.9 °C / 106 F, contre une moyenne de 43.2 °C / 110 F
(+) En utilisation inactive, la température moyenne du côté supérieur est de 28 °C / 82 F, par rapport à la moyenne du dispositif de 33.9 °C / 93 F.
(±) 3: The average temperature for the upper side is 32.7 °C / 91 F, compared to the average of 33.9 °C / 93 F for the class Gaming.
(+) Les repose-poignets et le pavé tactile sont plus froids que la température de la peau avec un maximum de 30.7 °C / 87.3 F et sont donc froids au toucher.
(±) La température moyenne de la zone de l'appui-paume de dispositifs similaires était de 28.8 °C / 83.8 F (-1.9 °C / #-3.5 F).
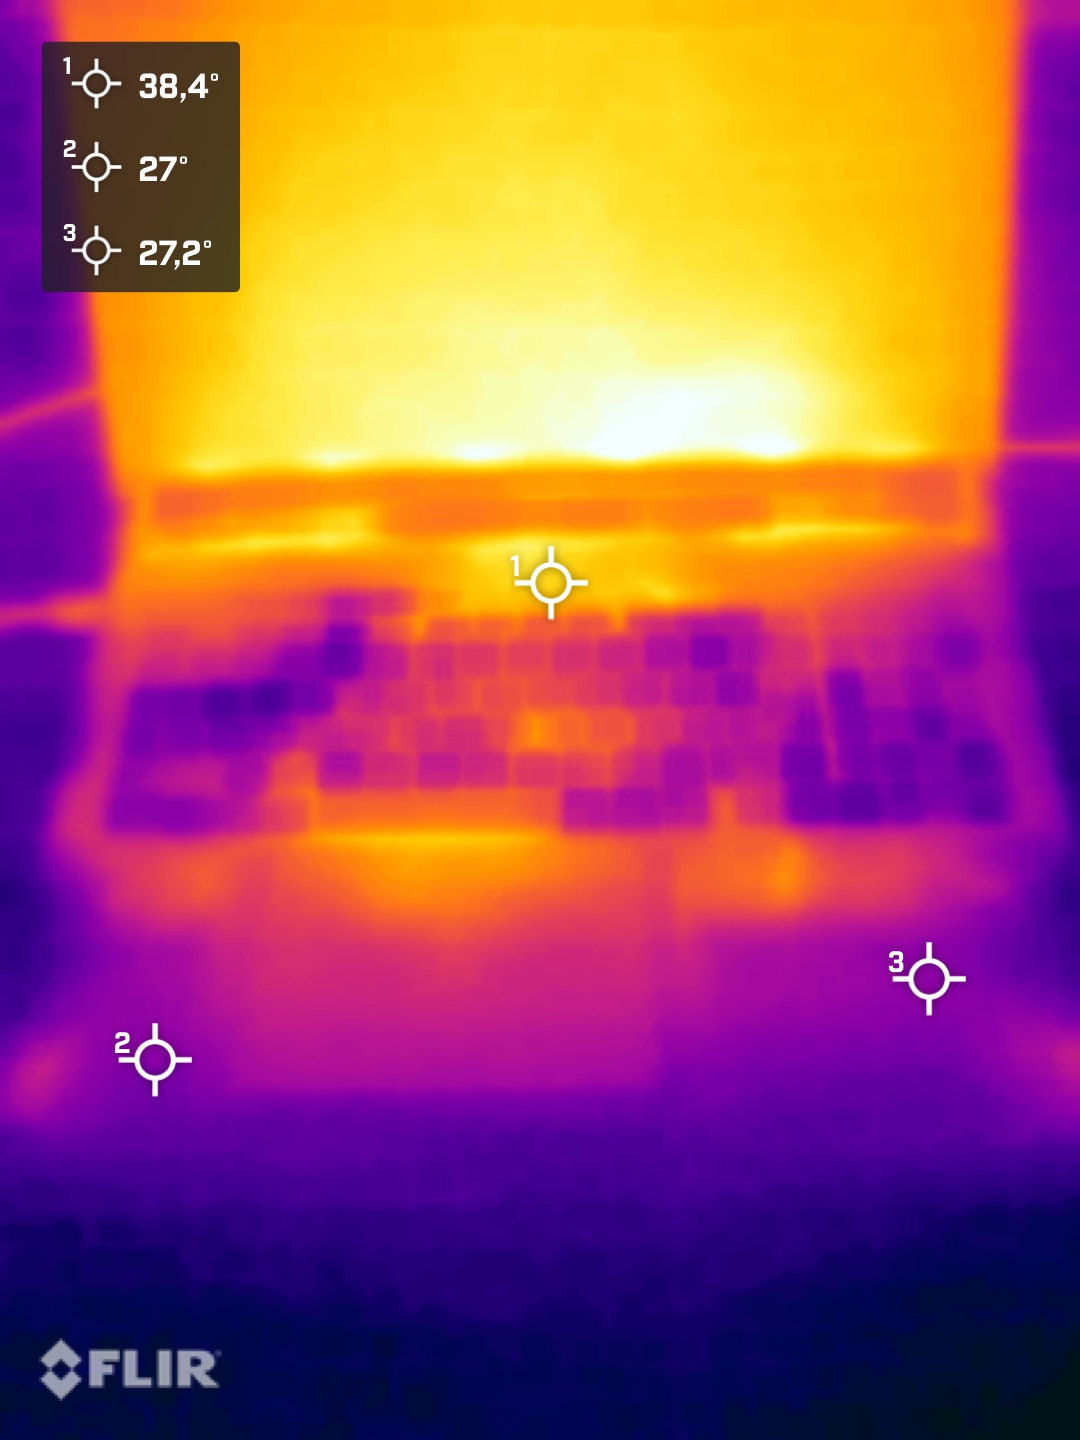
Essai de résistance à la température de surface (face supérieure)
Test de résistance à la température de surface (face inférieure)
Test de résistance d'une alimentation électrique
Asus ROG Strix Scar 18 G835LXG
Ultra 9 290HX Plus, GeForce RTX 5090 Laptop
Asus Strix Scar 18 G835LX
Ultra 9 275HX, GeForce RTX 5090 Laptop
Razer Blade 18 2024 RZ09-0509
i9-14900HX, GeForce RTX 4090 Laptop GPU
Alienware m18 R2
i9-14900HX, GeForce RTX 4090 Laptop GPU
Acer Predator Helios 18 PH18-72-98MW
i9-14900HX, GeForce RTX 4090 Laptop GPU
MSI Titan 18 HX A14VIG
i9-14900HX, GeForce RTX 4090 Laptop GPU
Schenker Key 17 Pro (M24)
i9-14900HX, GeForce RTX 4090 Laptop GPU
Heat
-6%
-14%
-19%
-19%
-6%
-45%
Maximum Upper Side * (°C)
37.5
45.6
-22%
43.2
-15%
41.2
-10%
43
-15%
37.8
-1%
51
-36%
Maximum Bottom * (°C)
40.9
46
-12%
42.6
-4%
34.6
15%
59
-44%
37.6
8%
64
-56%
Idle Upper Side * (°C)
31.1
28.9
7%
36
-16%
42.8
-38%
32
-3%
34.8
-12%
42.3
-36%
Idle Bottom * (°C)
30.2
29.2
3%
36.4
-21%
43.6
-44%
34
-13%
36
-19%
46
-52%

* ... Moindre est la valeur, meilleures sont les performances

Intervenants

L'Asus ROG Strix SCAR 18 est équipé d'un système à quatre haut-parleurs offrant une bonne qualité sonore globale. Les voix sont restituées avec clarté, et la musique ainsi que les films bénéficient également d'un profil sonore bien équilibré. En comparaison directe avec certains concurrents haut de gamme, il existe toutefois des systèmes offrant un son encore plus puissant et des basses plus profondes. Pour les jeux, nous vous recommandons de toute façon d’utiliser un casque, car les ventilateurs sont clairement audibles en cas de forte sollicitation.

dB(A) 0102030405060708090Deep BassMiddle BassHigh BassLower RangeMidsHigher MidsLower HighsMid HighsUpper HighsSuper Highs2028.333.42528.828.63130294023.522.65018.933.56315.722.88011.434.710012.342.812511.446.61601351.620010.455.825010603159.263.440010.165.950010.668.66301073.980010.476.1100011.973.712501275.5160011.974.1200011.967250012.464.6315013.262.6400013.858500014.153.6630014.553.4800014.759.5100001573.41250014.667.91600014.259.9SPL2582.6N0.651.8median 12median 63.4Delta1.89.426.325.821.422.12624.925.127.622.532.523.448.72655.818.860.922.167.2267019.372.317.674.217.774.319.575.31571.711.871.311.27410.574.21072.710.17210.67210.97511.374.811.671.71269.71269.612.371.112.669.61270.111.269.824.784.70.666.6median 12median 71.73.42.2hearing rangehide median Pink NoiseAsus ROG Strix Scar 18 G835LXGApple MacBook Pro 16 2021 M1 Pro
Diagramme de fréquence (les cases peuvent être cochées et décochées pour comparer les appareils)
Asus ROG Strix Scar 18 G835LXG analyse audio

(+) | les haut-parleurs peuvent jouer relativement fort (82.6# dB)
Basses 100 - 315 Hz
(±) | basse réduite - en moyenne 10% inférieure à la médiane
(±) | la linéarité des basses est moyenne (9.3% delta à la fréquence précédente)
Médiums 400 - 2000 Hz
(±) | médiane supérieure - en moyenne 8.5% supérieure à la médiane
(+) | les médiums sont linéaires (6.2% delta à la fréquence précédente)
Aiguës 2 - 16 kHz
(±) | sommets réduits - en moyenne 5.8% plus bas que la médiane
(±) | la linéarité des aigus est moyenne (9.4% delta à la fréquence précédente)
Globalement 100 - 16 000 Hz
(±) | la linéarité du son global est moyenne (16.2% de différence avec la médiane)
Par rapport à la même classe
» 40% de tous les appareils testés de cette catégorie étaient meilleurs, 7% similaires, 53% pires
» Le meilleur avait un delta de 6%, la moyenne était de 18%, le pire était de 132%.
Par rapport à tous les appareils testés
» 26% de tous les appareils testés étaient meilleurs, 6% similaires, 68% pires
» Le meilleur avait un delta de 4%, la moyenne était de 23%, le pire était de 134%.

Apple MacBook Pro 16 2021 M1 Pro analyse audio

(+) | les haut-parleurs peuvent jouer relativement fort (84.7# dB)
Basses 100 - 315 Hz
(+) | bonne basse - seulement 3.8% loin de la médiane
(+) | les basses sont linéaires (5.2% delta à la fréquence précédente)
Médiums 400 - 2000 Hz
(+) | médiane équilibrée - seulement 1.3% de la médiane
(+) | les médiums sont linéaires (2.1% delta à la fréquence précédente)
Aiguës 2 - 16 kHz
(+) | des sommets équilibrés - à seulement 1.9% de la médiane
(+) | les aigus sont linéaires (2.7% delta à la fréquence précédente)
Globalement 100 - 16 000 Hz
(+) | le son global est linéaire (4.6% différence à la médiane)
Par rapport à la même classe
» 0% de tous les appareils testés de cette catégorie étaient meilleurs, 0% similaires, 100% pires
» Le meilleur avait un delta de 5%, la moyenne était de 17%, le pire était de 45%.
Par rapport à tous les appareils testés
» 0% de tous les appareils testés étaient meilleurs, 0% similaires, 100% pires
» Le meilleur avait un delta de 4%, la moyenne était de 23%, le pire était de 134%.

Gestion de l'énergie

L'Asus ROG Strix SCAR 18 ne figure pas parmi les ordinateurs portables de jeu les plus économes en énergie. Même au repos, sa consommation d'énergie reste relativement élevée en raison de son matériel puissant et de son écran Mini-LED très lumineux. À pleine charge, le système atteint brièvement une consommation pouvant aller jusqu’à 354 watts, avant de se stabiliser autour de 230 watts. Le bloc d’alimentation de 450 watts fourni offre donc une marge suffisante. La consommation en veille est inutilement élevée, à 19 watts.

Asus ROG Strix SCAR 18 équipé d'un bloc d'alimentation de 450 watts
Bloc d'alimentation de 450 watts

Consommation électrique et autonomie de la batterie

Naturellement, la batterie de 90 Wh de l’Asus ROG Strix SCAR 18 ne peut compenser que dans une mesure limitée la forte consommation d’énergie du système. Lors d’un test Wi-Fi en conditions réelles, cet ordinateur portable de jeu n’a atteint qu’une autonomie de 4 heures. Certains concurrents offrent de meilleurs résultats à cet égard.

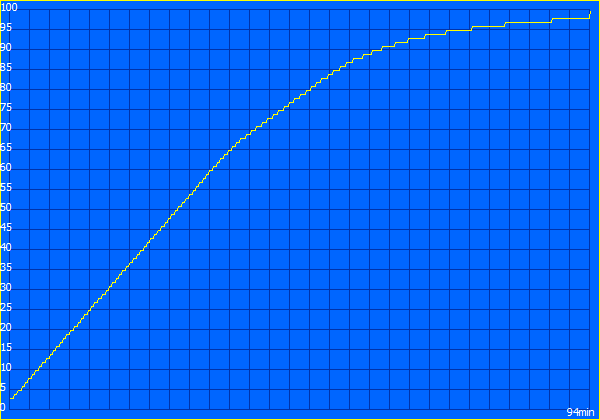
Informations sur la batterie
Processus de facturation
Consommation énergétique
Éteint/en veilledarklight 0.8 / 19.4 Watts
Au reposdarkmidlight 15.5 / 43.2 / 47.6 Watts
Fortement sollicité midlight 163.9 / 354 Watts
 color bar
Légende: min: dark, med: mid, max: light        Metrahit Energy

Consommation électrique : Cyberpunk / Test de résistance

0102030405060708090100110120130140150160170180190200210220230240250260270280290300310320330340350Tooltip
Asus ROG Strix Scar 18 G835LXG; 1280x720 Prime95 28.10 and Furmark 1.25: Ø229 (160.4-354) Watt
Asus ROG Strix Scar 18 G835LXG; Idle 150cd/m2: Ø37.3 (22.4-50.4) Watt
Asus ROG Strix Scar 18 G835LXG; Cyberpunk 2077 FHD ultra no FSR 150cd: Ø254 (249-269) Watt

Consommation électrique avec un écran externe

05101520253035404550556065707580859095100105110115120125130135140145150155160165170175180185190195200205210215220225230235240245Tooltip
Asus ROG Strix Scar 18 G835LXG; Prime95 V2810 Stress (external Monitor): Ø190.3 (177.2-205) Watt
Asus ROG Strix Scar 18 G835LXG; Cinebench R15 Multi (external Monitor): Ø190.3 (189.5-191.1) Watt
Asus ROG Strix Scar 18 G835LXG; Cinebench R23 Single (external Monitor): Ø73.8 (69.2-99.1) Watt
Asus ROG Strix Scar 18 G835LXG; Cinebench R23 Multi (external Monitor): Ø189 (187.4-190.8) Watt
Asus ROG Strix Scar 18 G835LXG; 1280x720 FurMark 1.19 GPU Stress Test (external Monitor): Ø209 (192.1-223) Watt
Asus ROG Strix Scar 18 G835LXG; Idle 1min (external Monitor): Ø33.4 (17.6-51.5) Watt
Asus ROG Strix Scar 18 G835LXG; Cyberpunk 2077 FHD ultra no FSR (external Monitor): Ø241 (237-249) Watt
Autonomie
Au repos (module WiFi éteint, luminosité au minimum)
2h 58min
WiFi Websurfing
4h 00min
WiFi Websurfing max. Brightness
2h 16min
En lecture de Big Buck Bunny encodé en H.264 1080p
2h 08min
Fortement sollicité (luminosité au maximum)
1h 31min
Asus ROG Strix Scar 18 G835LXG
Ultra 9 290HX Plus, GeForce RTX 5090 Laptop, 90 Wh
Asus Strix Scar 18 G835LX
Ultra 9 275HX, GeForce RTX 5090 Laptop, 90 Wh
Razer Blade 18 2024 RZ09-0509
i9-14900HX, GeForce RTX 4090 Laptop GPU, 91.7 Wh
Alienware m18 R2
i9-14900HX, GeForce RTX 4090 Laptop GPU, 97 Wh
Acer Predator Helios 18 PH18-72-98MW
i9-14900HX, GeForce RTX 4090 Laptop GPU, 90 Wh
MSI Titan 18 HX A14VIG
i9-14900HX, GeForce RTX 4090 Laptop GPU, 99.9 Wh
Schenker Key 17 Pro (M24)
i9-14900HX, GeForce RTX 4090 Laptop GPU, 99 Wh
Moyenne de la classe Gaming
 
Autonomie de la batterie
65%
32%
20%
-24%
27%
-21%
138%
Reader / Idle (h)
3
6.6
120%
5.9
97%
H.264 (h)
2.1
5.8
176%
WiFi v1.3 (h)
4
5.5
38%
4.4
10%
4.8
20%
3.2
-20%
4.2
5%
3.4
-15%
Load (h)
1.5
1.2
-20%
1
-33%
1.1
-27%
1.2
-20%
1.1
-27%
Cyberpunk 2077 ultra 150cd (h)
0.7
1.1

Note globale de Notebookcheck

Asus ROG Strix Scar 18 G835LXG - 07/24/2026 v8
Sebastian Bade

Châssis
85 / 98 → 86%
Clavier
91%
Dispositif de pointage
86%
Connectivité
75 / 80 → 94%
Poids
53 / 10-68 → 73%
Autonomie
55 / 95 → 58%
Écran
87%
Performances en jeu
96%
Performances dans les applications
97%
Workstation
81%
Chauffe
93 / 95 → 97%
Nuisance sonore
59 / 90 → 65%
Audio
78%
Appareil photo
33 / 75 → 43%
Moyenne
59%
87%
Gaming - Moyenne compensée
CO2 Emissions
No Data
Materials
0%
Packaging
50%
Power Use
41.8%
Repairability
40%
Software Updates
22.3%
Recycle Logo Total Sustainability Score: 25.7%

Comparaison des alternatives possibles

Image
Modèle
Prix
Poids
Épaisseur
Écran
1.
87.4%
Asus ROG Strix Scar 18 G835LXG
Intel Core Ultra 9 290HX Plus ⎘
NVIDIA GeForce RTX 5090 Laptop ⎘
128 Go Mémoire, 8192 Go SSD
Amazon:
1. $7,439.00
HIDevolution [2026] ASUS ROG...
2. $6,284.00
HIDevolution [2026] ASUS ROG...
3. $6,019.00
HIDevolution [2026] ASUS ROG...
Prix de liste: 8999€
3.6 kg35 mm18.00"
3840x2400
252 PPI
Mini LED
2.
88%
Asus Strix Scar 18 G835LX
Intel Core Ultra 9 275HX ⎘
NVIDIA GeForce RTX 5090 Laptop ⎘
64 Go Mémoire, 2048 Go SSD
Amazon: Prix de liste: 5799€3.3 kg32 mm18.00"
2560x1600
168 PPI
Mini-LED
3.
90.5% v7 (old)
Razer Blade 18 2024 RZ09-0509
Intel Core i9-14900HX ⎘
NVIDIA GeForce RTX 4090 Laptop GPU ⎘
32 Go Mémoire
Amazon: Prix de liste: 4500 USD3.1 kg21.9 mm18.00"
2560x1600
168 PPI
Mini-LED
4.
89.5% v7 (old)
Alienware m18 R2
Alienware m18 R2
Intel Core i9-14900HX ⎘
NVIDIA GeForce RTX 4090 Laptop GPU ⎘
32 Go Mémoire, 2048 Go SSD
Amazon:
1. $3,499.99
Dell Alienware m18 R2 Gaming...
2. $2,799.00
Alienware M18 Gaming Laptop ...
3. $3,699.00
Dell Alienware 18 Area-51 Ga...
Prix de liste: 3300 USD
4 kg26.7 mm18.00"
2560x1600
168 PPI
IPS
5.
87.1% v7 (old)
Acer Predator Helios 18 PH18-72-98MW
Intel Core i9-14900HX ⎘
NVIDIA GeForce RTX 4090 Laptop GPU ⎘
32 Go Mémoire, 2048 Go SSD
Amazon:
1. $23.99
HSSDTECH DC in Power Jack Ch...
2. $84.99
330W Charger for Acer Predat...
3. $899.99
Acer Predator Helios 300 PH3...
3.3 kg29.5 mm18.00"
2560x1600
168 PPI
Mini-LED
6.
88.8% v7 (old)
MSI Titan 18 HX A14VIG
Intel Core i9-14900HX ⎘
NVIDIA GeForce RTX 4090 Laptop GPU ⎘
128 Go Mémoire, 4096 Go SSD
Amazon:
1. $6,699.99
msi Titan 18 HX AI 18" 240Hz...
2. $5,699.99
msi Titan 18 HX AI 18" 120Hz...
3. $2,699.99
msi Vector A18 HX 18” 240H...
Prix de liste: 5000 USD
3.6 kg32.1 mm18.00"
3840x2400
252 PPI
Mini-LED
7.
85.1%
Schenker Key 17 Pro (M24)
Intel Core i9-14900HX ⎘
NVIDIA GeForce RTX 4090 Laptop GPU ⎘
32 Go Mémoire, 1024 Go SSD
Amazon:
Prix de liste: 4273€
3.4 kg24.9 mm17.30"
3840x2160
255 PPI
IPS

Transparency

La sélection des appareils à examiner est effectuée par notre équipe éditoriale. L'échantillon de test a été prêté à l'auteur par le fabricant ou le détaillant pour les besoins de cet examen. Le prêteur n'a pas eu d'influence sur cette évaluation et le fabricant n'a pas reçu de copie de cette évaluation avant sa publication. Il n'y avait aucune obligation de publier cet article. En tant que média indépendant, Notebookcheck n'est pas soumis à l'autorité des fabricants, des détaillants ou des éditeurs.

Voici comment Notebookcheck teste

Chaque année, Notebookcheck examine de manière indépendante des centaines d'ordinateurs portables et de smartphones en utilisant des procédures standardisées afin de garantir que tous les résultats sont comparables. Nous avons continuellement développé nos méthodes de test depuis environ 20 ans et avons établi des normes industrielles dans le processus. Dans nos laboratoires de test, des équipements de mesure de haute qualité sont utilisés par des techniciens et des rédacteurs expérimentés. Ces tests impliquent un processus de validation en plusieurs étapes. Notre système d'évaluation complexe repose sur des centaines de mesures et de points de référence bien fondés, ce qui garantit l'objectivité.
Google LogoAdd as a preferred source on Google
Mail Logo
> Revues et rapports de ordinateurs portatifs et smartphones, ordiphones > Critiques > Un monstre du gaming doté d’un écran 4K Mini-LED, d’une carte graphique RTX 5090 et de 128 Go de RAM – Test de l’Asus ROG Strix SCAR 18 G835LXG
Sebastian Bade, 2026-07-26 (Update: 2026-07-26)