Notebookcheck Logo

Intel Core Ultra 9 290HX Plus

Intel Ultra 9 290HX Plus

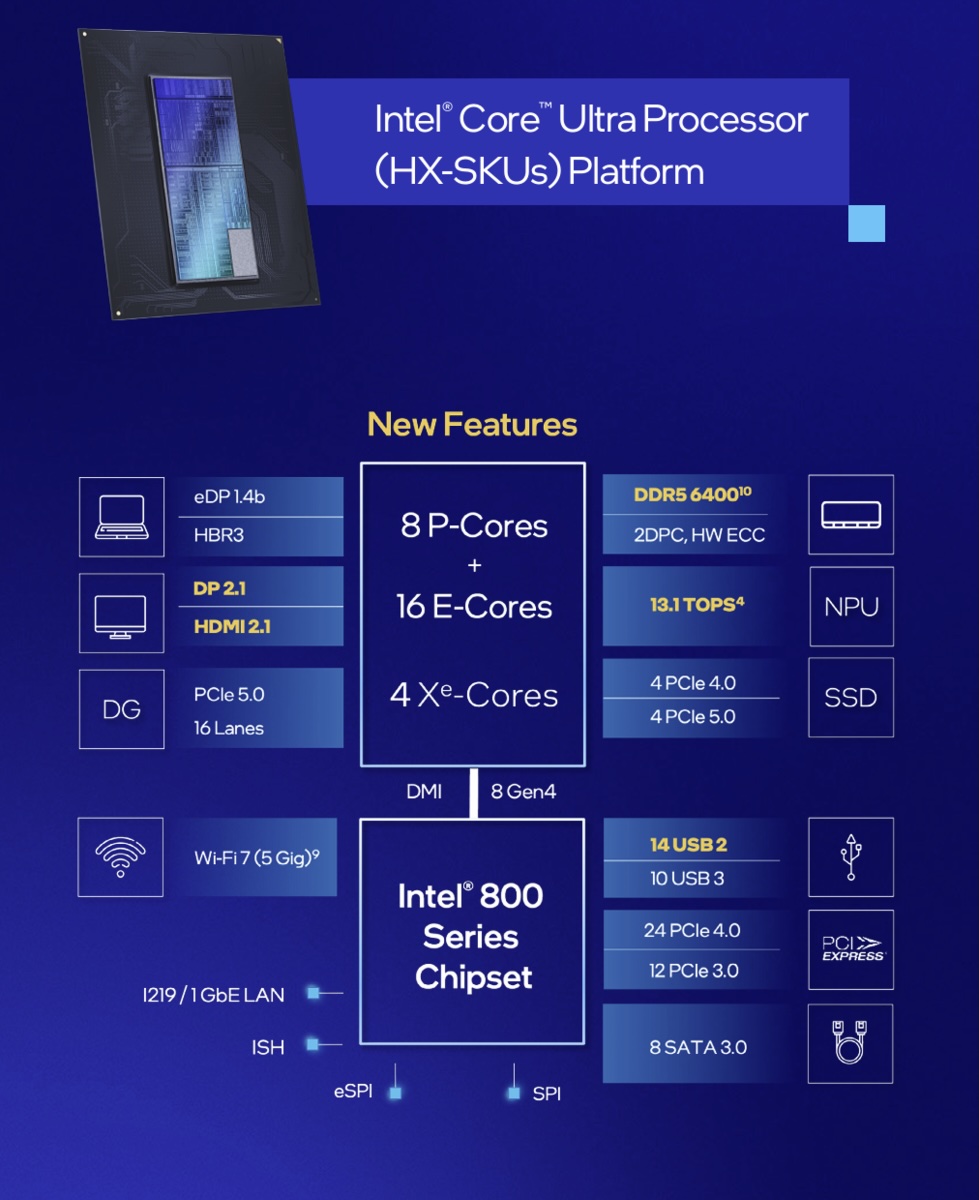
L'Intel Core Ultra 9 285HX est un CPU mobile haut de gamme pour les ordinateurs portables de jeu, basé sur l'architecture Arrow Lake. Il offre 24 cœurs composés de 8 cœurs de performance rapides cadencés jusqu'à 5,5 GHz et de 16 cœurs d'efficacité plus petits cadencés jusqu'à 4,6 GHz. Le CPU a accès à 40 Mo de cache L2 et 36 Mo de cache L3 et est spécifié avec un TDP de 55 watts.

Le SoC intègre un petit NPU dédié appelé AI Boost avec 13 TOPS (Int8) et supporte en option vPro Enterprise. Le contrôleur de mémoire intégré supporte jusqu'à 192 Go de DDR5-6400 (double canal, ECC en option). Le GPU intégré (iGPU) est une petite carte graphique appelée Intel Graphics qui offre quatre cœurs Xe à 300 - 2000 MHz.

Performance - haut de gamme

Les performances de l'Ultra 9 285HX devraient être légèrement inférieures à celles de son homologue Core Ultra 9 285K de bureau (cadence plus élevée jusqu'à 5,7 GHz et TDP plus élevé avec 125 watts). Grâce à l'amélioration de l'IPC des cœurs (en particulier les cœurs efficaces), le CPU devrait se positionner devant les anciens Raptor Lake Core i9-14900HX (8 + 16 cœurs, max 5,8 / 4,1 GHz). Cela rend le CPU parfaitement adapté aux tâches très exigeantes telles que le jeu haut de gamme et la création de contenu.

Fabrication - TSMC et Foveros

Les puces Arrow Lake-HX sont basées sur les puces Arrow Lake-S de bureau et sont composées de plusieurs chipsets. La partie CPU est fabriquée par TSMC selon le processus moderne N3B (3nm), le GPU provient également de TSMC selon le processus N5P. Le SoC et la partie E/S sont fabriqués selon le processus TSMC N6. La partie de base est fabriquée par Intel en 22nm et porte les puces individuelles grâce à Foveros 3D Packaging.

Nom de codeArrow Lake-HX
GammeIntel Arrow Lake

Gamme: Arrow Lake Arrow Lake-HX

Intel Core Ultra 9 290HX Plus « 1.8 - 5.5 GHz24 / 24 cores36 MB L3
Intel Core Ultra 9 285HX2.1 - 5.5 GHz24 / 24 cores36 MB L3
Intel Core Ultra 9 275HX2.1 - 5.4 GHz24 / 24 cores36 MB L3
Intel Core Ultra 7 270HX Plus1.8 - 5.3 GHz20 / 20 cores36 MB L3
Intel Core Ultra 7 265HX2.3 - 5.3 GHz20 / 20 cores36 MB L3
Intel Core Ultra 7 255HX2.3 - 5.2 GHz20 / 20 cores36 MB L3
Intel Core Ultra 7 251HX2.5 - 5.1 GHz18 / 18 cores30 MB L3
Intel Core Ultra 5 235HX2.6 - 5.1 GHz14 / 14 cores26 MB L3
Intel Core Ultra 5 245HX2.6 - 5.1 GHz14 / 14 cores26 MB L3
Intel Core 7 245HX2.6 - 5.1 GHz14 / 14 cores26 MB L3
Fréquence1800 - 5500 MHz
Cache de Niveau 2 (L2)40 MB
Cache de Niveau 3 (L3)36 MB
Nombres de cœurs/threads simultanés supportés24 / 24
8 x 5.5 GHz Intel Lion Cove P-Core
16 x 4.7 GHz Intel Skymont E-Core
Consommation énergétique maximale (TDP)55 Watt(s)
TDP Turbo PL2160 Watt(s)
Lithographie (procédé de fabrication)3 nm
Carte graphiqueIntel Graphics 4-Core iGPU (Meteor / Arrow Lake) (300 - 2000 MHz)
NPU / AI13 TOPS INT8
Chip AI36 TOPS INT8
64 BitPrend en charge les instructions 64 Bit
Architecturex86
Date de présentation03/17/2026
Lien redirigeant vers une page externe du produitwww.intel.com

Benchmarks

Performance Rating - CB R15 + R20 + 7-Zip + X265 + Blender + 3DM11 CPU
48.3 pt (81%)
2.26 -95%
...
44.9 -7%
45.5 -6%
46.1 -5%
46.3 -4%
46.3 -4%
46.4 -4%
46.8 -3%
47.5 -2%
48 -1%
Intel Core Ultra 9 290HX Plus
48.3
AMD Ryzen 9 9955HX3D
48.9 1%
AMD Ryzen 9 9955HX
49.1 2%
max:
59.6 23%
0%
100%
Restrict / Search: Model: Max. age: years
Cinebench 2026 - Cinebench 2026 CPU Single Thread
min: 562     moyenne: 565     médian: 565 (76%)     maximum: 568 Points
Cinebench 2026 - Cinebench 2026 CPU Multi
min: 7964     moyenne: 8381     médian: 8381 (82%)     maximum: 8798 Points
Cinebench 2024 - Cinebench 2024 CPU Single Core
min: 135.9     moyenne: 136.6     médian: 136.6 (1%)     maximum: 137.3 Points
Cinebench 2024 - Cinebench 2024 CPU Multi Core
min: 1954     moyenne: 2075     médian: 2074.5 (39%)     maximum: 2195 Points
Cinebench R23 - Cinebench R23 Multi Core
min: 37038     moyenne: 38276     médian: 38276 (36%)     maximum: 39514 Points
202 -99%
...
30428 -21%
31781 -17%
32782 -14%
33078 -14%
34474 -10%
35061 -8%
35766 -7%
36908 -4%
AMD Ryzen 9 9955HX
37800 -1%
Intel Core Ultra 9 290HX Plus
38276
AMD Ryzen 9 9955HX3D
39065 2%
max:
107681 181%
0%
100%
Restrict / Search: Model: Max. age: years
Cinebench R23 - Cinebench R23 Single Core
min: 2319     moyenne: 2325     médian: 2324.5 (95%)     maximum: 2330 Points
74.4 -97%
...
2154 -7%
AMD Ryzen 9 9955HX3D
2172 -7%
2180 -6%
2188 -6%
2194 -6%
2202 -5%
2209 -5%
2213 -5%
2270 -2%
Intel Core Ultra 9 290HX Plus
2325
Apple M5 10-Core
2459 6%
0%
100%
Restrict / Search: Model: Max. age: years
Cinebench R20 - Cinebench R20 CPU (Single Core)
min: 864     moyenne: 871     médian: 871 (94%)     maximum: 878 Points
Cinebench R20 - Cinebench R20 CPU (Multi Core)
min: 14397     moyenne: 14848     médian: 14848 (36%)     maximum: 15299 Points
Cinebench R15 - Cinebench R15 CPU Multi 64 Bit
min: 5617     moyenne: 5769     médian: 5768.5 (36%)     maximum: 5920 Points
32.5 -99%
...
4724 -18%
4807 -17%
4851 -16%
5247 -9%
5334 -8%
5363 -7%
5554 -4%
5600 -3%
5708 -1%
Intel Core Ultra 9 290HX Plus
5769
AMD Ryzen 9 9955HX
5877 2%
AMD Ryzen 9 9955HX3D
6043 5%
max:
15842 175%
0%
100%
Restrict / Search: Model: Max. age: years
012024036048060072084096010801200132014401560168018001920204021602280240025202640276028803000312032403360348036003720384039604080420043204440456046804800492050405160528054005520564057605880Tooltip
Cinebench R15 - Cinebench R15 CPU Single 64 Bit
min: 324     moyenne: 332     médian: 332 (92%)     maximum: 340 Points
19 -94%
...
307 -8%
308 -7%
311 -6%
311.3 -6%
315.9 -5%
324 -2%
326 -2%
AMD Ryzen 9 9955HX3D
327 -2%
331.3 0%
Intel Core Ultra 9 290HX Plus
332
AMD Ryzen 9 9955HX
334.6 1%
...
332 0%
max:
Intel Core Ultra 9 285K
357.8 8%
0%
100%
Restrict / Search: Model: Max. age: years
7-Zip 18.03 - 7-Zip 18.03 Multi Thread 4 runs
min: 103986     moyenne: 110390     médian: 110390 (63%)     maximum: 116793 MIPS
7-Zip 18.03 - 7-Zip 18.03 Single Thread 4 runs
min: 6562     moyenne: 6624     médian: 6623.5 (75%)     maximum: 6685 MIPS
HWBOT x265 Benchmark v2.2 - HWBOT x265 4k Preset
min: 38.2     moyenne: 39.6     médian: 39.6 (70%)     maximum: 40.9 fps
0510152025303540Tooltip
Blender - Blender 3.3 Classroom CPU *
min: 137     moyenne: 146     médian: 146 (2%)     maximum: 155 Seconds
Blender - Blender 2.79 BMW27 CPU *
min: 88     moyenne: 91     médian: 91 (1%)     maximum: 94 Seconds
R Benchmark 2.5 - R Benchmark 2.5 *
min: 0.391     moyenne: 0.4     médian: 0.4 (8%)     maximum: 0.3951 sec
3DMark 11 - 3DM11 Performance Physics
min: 22894     moyenne: 25538     médian: 25537.5 (63%)     maximum: 28181 Points
3DMark - 3DMark Cloud Gate Physics
min: 25337     moyenne: 25729     médian: 25729 (65%)     maximum: 26121 Points
3DMark - 3DMark Fire Strike Standard Physics
min: 46054     moyenne: 48533     médian: 48533 (87%)     maximum: 51012 Points
3DMark - 3DMark Time Spy CPU
min: 17318     moyenne: 17426     médian: 17426 (73%)     maximum: 17534 Points
Geekbench 6.6 - Geekbench 6.6 Single-Core
min: 3147     moyenne: 3172     médian: 3170 (73%)     maximum: 3198 points
Geekbench 6.6 - Geekbench 6.6 Multi-Core
min: 19855     moyenne: 20785     médian: 20920 (71%)     maximum: 21581 points
533 -97%
...
18378 -12%
18766 -10%
AMD Ryzen 9 9955HX
18887 -9%
19106 -8%
19359 -7%
19741 -5%
AMD Ryzen 9 9955HX3D
20200 -3%
20487 -1%
20546 -1%
Intel Core Ultra 9 290HX Plus
20785
21254 2%
22527 8%
23166 11%
23204 12%
23384 13%
25760 24%
Apple M5 Pro 15-Core
25892 25%
Apple M5 Pro 18-Core
28436 37%
Apple M5 Max
29226 41%
0%
100%
Restrict / Search: Model: Max. age: years
Geekbench 5.5 - Geekbench 5.1 - 5.5 64 Bit Single-Core
min: 2282     moyenne: 2297     médian: 2296.5 (77%)     maximum: 2311 points
Geekbench 5.5 - Geekbench 5.1 - 5.5 64 Bit Multi-Core
min: 23839     moyenne: 24141     médian: 24141 (43%)     maximum: 24443 points
Mozilla Kraken 1.1 - Kraken 1.1 Total Score *
min: 391     moyenne: 392.5     médian: 392.5 (0%)     maximum: 394 ms
WebXPRT 4 - WebXPRT 4 Score
min: 345     moyenne: 349.5     médian: 349.5 (87%)     maximum: 354 Points
WebXPRT 3 - WebXPRT 3 Score
min: 375     moyenne: 378     médian: 378 (63%)     maximum: 381 Points
CrossMark - CrossMark Overall
min: 2390     moyenne: 2400     médian: 2399.5 (84%)     maximum: 2409 Points
Power Consumption - Prime95 Power Consumption - external Monitor *
min: 170.3     moyenne: 209.2     médian: 209.2 (36%)     maximum: 248 Watt
0102030405060708090100110120130140150160170180190200210220230240250260Tooltip
Power Consumption - Cinebench R15 Multi Power Consumption - external Monitor *
min: 218     moyenne: 233     médian: 233 (43%)     maximum: 248 Watt
05101520253035404550556065707580859095100105110115120125130135140145150155160165170175180185190195200205210215220225230235240245250Tooltip
Power Consumption - Idle Power Consumption - external Monitor *
min: 6.94     moyenne: 15.6     médian: 15.6 (10%)     maximum: 24.3 Watt
0510152025303540Tooltip
Power Consumption - Idle Power Consumption 150cd 1min *
min: 6.52     moyenne: 15.4     médian: 15.4 (11%)     maximum: 24.2 Watt
0510152025303540Tooltip
Power Consumption - Power Efficiency - Cinebench R15 Multi external Monitor
25.8 Points per Watt (19%)
- Amplitude des valeurs obtenues dans le benchmark avec cette carte graphique


red legend - Valeur moyenne obtenue dans le benchmark avec cette carte graphique

* Plus les chiffres sont petits, plus les performances sont élevées

Amazon Logo
  • $3,709.00
    HIDevolution [2025] EVOC High Performance Systems X5802A (X580WNS-G) 18" QHD+ 240Hz, 2.7 GHz Ultra 9-290HX Plus, RTX 5080, 32 GB DDR5 RAM, 1 TB PCIe SSD, Windows 11 Pro
  • $5,999.00
    Eluktronics HYDROC 16 G2R RTX 5090 Gaming Laptop: Intel Core Ultra 9 290HX Plus, 16" QHD 300Hz Mini LED 1000-Nit HDR, WiFi 7, Win 11 Pro, 2026 Flagship Mobile Workstation Notebook (96, GB, 4, TB)
  • $1,399.00
    Dell 16 Plus Touchscreen Laptop Computer, Intel Core Ultra 9 288V, Copilot+ PC with on-Device AI, 32GB LPDDR5X RAM, 1TB PCIe SSD, WiFi 7, Backlit Keyboard, Windows 11 Home
  • $4,774.00
    HIDevolution [2025] EVOC High Performance Systems X5802A (X580WNS-G) 18" QHD+ 240Hz, 2.7 GHz Ultra 9-290HX Plus, RTX 5080, 96 GB DDR5 RAM, 2 TB PCIe SSD, Windows 11 Pro
  • $6,199.00
    HIDevolution [2025] EVOC High Performance Systems X5802B (X580WNS-G) 18" UHD+ 200Hz, 2.7 GHz Ultra 9-290HX Plus, RTX 5080, 128 GB DDR5 RAM, 8 TB PCIe SSD, Windows 11 Pro

v1.35
log 24. 23:17:34

#0 ran 0s before starting gpusingle class +0s ... 0s

#1 no ids found in url (should be separated by "_") +0s ... 0s

#2 not redirecting to Ajax server +0s ... 0s

#3 did not recreate cache, as it is less than 5 days old! Created at Fri, 22 May 2026 05:29:17 +0200 +0.002s ... 0.003s

#4 no comparison url found in template nbc.compare_page_2 needed +0.02s ... 0.023s

#5 no comparison url found in template nbc.compare_page_2 needed +0s ... 0.023s

#6 no comparison url found in template nbc.compare_page_2 needed +0s ... 0.023s

#7 no comparison url found in template nbc.compare_page_2 needed +0s ... 0.023s

#8 no comparison url found in template nbc.compare_page_2 needed +0s ... 0.024s

#9 no comparison url found in template nbc.compare_page_2 needed +0s ... 0.024s

#10 no comparison url found in template nbc.compare_page_2 needed +0s ... 0.024s

#11 no comparison url found in template nbc.compare_page_2 needed +0s ... 0.024s

#12 no comparison url found in template nbc.compare_page_2 needed +0s ... 0.025s

#13 composed specs +0.001s ... 0.026s

#14 did output specs +0s ... 0.026s

#15 getting avg benchmarks for device 20456 +0.031s ... 0.056s

#16 got single benchmarks 20456 +0.011s ... 0.067s

#17 got avg benchmarks for devices +0s ... 0.067s

#18 min, max, avg, median took s +1.379s ... 1.446s

#19 no comparison url found in template nbc.compare_page_2 needed +0.295s ... 1.741s

#20 return log +0s ... 1.741s

Critiques du Intel Core Ultra 9 290HX Plus processeur

Test de l'Alienware 16X Aurora 2026 : de nouvelles fonctionnalités pour un prix plus élevé

Test de l'Alienware 16X Aurora 2026 : de nouvelles fonctionnalités pour un prix plus élevé

Le 16X Aurora peut maintenant être configuré avec des caractéristiques plus sophistiquées comme l'OLED et la GeForce RTX 5070 Ti. Cependant, préparez-vous à payer plus de 3 000 $ pour cet ordinateur portable de jeu de milieu de gamme.
Intel Core Ultra 9 290HX Plus, NVIDIA GeForce RTX 5070 Ti Laptop, 16", 2.6 kg
Test de l'Alienware 16 Area-51 : nouveau Core Ultra 9 290HX Plus, la puissance à tout prix

Test de l'Alienware 16 Area-51 : nouveau Core Ultra 9 290HX Plus, la puissance à tout prix

Intel Arrow Lake-H monte d'un cran avec un SKU encore plus puissant cette année pour remplacer le Core Ultra 9 275HX. Toutefois, l'augmentation des performances de la même architecture sous-jacente a des conséquences.
Intel Core Ultra 9 290HX Plus, NVIDIA GeForce RTX 5080 Laptop, 16", 3.3 kg

Alienware 16X Aurora Core Ultra 9 290HX Plus: NVIDIA GeForce RTX 5070 Ti Laptop, 16.00", 2.6 kg
   » Pourquoi jouer en mode équilibré plutôt qu'en mode performance est intéressant sur l'Alienware 16X Aurora

   » 2026 L'Alienware 16X Aurora est si cher qu'il rivalise désormais avec la série Area-51 en termes de prix

   » L'Alienware 16X Aurora est enfin livré avec la GeForce RTX 5070 Ti, mais les configurations peuvent être frustrantes

Alienware 16 Area-51 Core Ultra 9 290HX Plus: NVIDIA GeForce RTX 5080 Laptop, 16.00", 3.3 kg
   » Le mode Overdrive de l'Alienware 16, très bruyant, n'est pas nécessaire pour les jeux

   » Le Core Ultra 9 290HX Plus est l'un des processeurs mobiles les plus chauds, avec plus de 100 °C sous charge

   » Le nouvel Alienware 16 équipé d'un Core Ultra 9 290HX Plus est incroyablement rapide, mais il n'est pas sans conséquences

   » La nouvelle option OLED est exactement ce dont l'Alienware 16 avait besoin s'il n'y avait pas un gros problème

Google LogoAdd as a preferred source on Google
Mail Logo

» Comparaison des processeurs pour ordinateur portable
Comparaison de tout les processeurs mobiles


» Processeurs mobiles - liste des benchmarks
Liste des benchmarks de l'intégralité des processeurs pour portables


Les autres processeurs de la gamme Arrow Lake

» Intel Core Ultra 7 270K Plus
   24x
» Intel Core Ultra 9 285K
   24x 3.2 GHz - 5.7 GHz
» Intel Core Ultra 7 265KF
   20x 3.3 GHz - 5.5 GHz
» Intel Core Ultra 7 265K
   20x 3.3 GHz - 5.5 GHz
» Intel Core Ultra 9 290HX Plus
   24x 1.8 GHz - 5.5 GHz
» Intel Core Ultra 9 285
   24x 1.9 GHz - 5.6 GHz
» Intel Core Ultra 9 285HX
   24x 2.1 GHz - 5.5 GHz
» Intel Core Ultra 9 275HX
   24x 2.1 GHz - 5.4 GHz
» Intel Core Ultra 5 250K Plus
   18x 4.2 GHz - 5.3 GHz
» Intel Core Ultra 7 270HX Plus
   20x 1.8 GHz - 5.3 GHz
» Intel Core Ultra 7 265HX
   20x 2.3 GHz - 5.3 GHz
» Intel Core Ultra 7 255HX
   20x 2.3 GHz - 5.2 GHz
» Intel Core Ultra 5 245KF
   14x 3.6 GHz - 5.2 GHz
» Intel Core Ultra 5 245K
   14x 4.2 GHz - 5.2 GHz
» Intel Core Ultra 5 245
   14x 3 GHz - 5.1 GHz
» Intel Core Ultra 5 235
   14x 3.4 GHz - 5 GHz
» Intel Core Ultra 9 285H
   16x 4.5 GHz - 5.4 GHz
» Intel Core Ultra 7 251HX
   18x 2.5 GHz - 5.1 GHz
» Intel Core Ultra 7 265H
   16x 4.5 GHz - 5.3 GHz
» Intel Core Ultra 7 255H
   16x 4.4 GHz - 5.1 GHz
» Intel Core Ultra 5 235HX
   14x 2.6 GHz - 5.1 GHz
» Intel Core Ultra 5 225F
   10x 3.3 GHz - 4.9 GHz
» Intel Core Ultra 5 245HX
   14x 2.6 GHz - 5.1 GHz
» Intel Core 7 245HX
   14x 2.6 GHz - 5.1 GHz
» Intel Core Ultra 5 225H
   14x 4.3 GHz - 4.9 GHz
» Intel Core Ultra 5 225
   10x 3.3 GHz - 4.9 GHz
» Intel Core Ultra 5 235H
   14x 4.4 GHz - 5.1 GHz
» Intel Core Ultra 7 265U
   12x 2.4 GHz - 5.3 GHz
» Intel Core Ultra 7 255U
   12x 3.8 GHz - 4.8 GHz
» Intel Core Ultra 5 225U
   12x 2.4 GHz - 4.8 GHz
» Intel Core Ultra 5 235U
   12x 2.4 GHz - 4.9 GHz

Processeurs similaires

+ Intel Core Ultra 7 255U
   1.7 GHz - 5.2 GHz
+ AMD Ryzen 9 9955HX3D
   16x 2.5 GHz - 5.4 GHz
+ Apple M5 Pro 15-Core
   15x 3.05 GHz - 4.61 GHz
+ Apple M4 Max 14-Core
   14x 2.59 GHz - 4.51 GHz
» Intel Core Ultra 9 290HX Plus
   24x 1.8 GHz - 5.5 GHz
- AMD Ryzen 9 9955HX
   16x 2.5 GHz - 5.4 GHz
- Intel Core Ultra 9 285HX
   24x 2.1 GHz - 5.5 GHz
- Intel Core Ultra 9 275HX
   24x 2.1 GHz - 5.4 GHz
- Apple M4 Pro 14-Core
   14x 2.59 GHz - 4.51 GHz
Klaus Hinum (Update: 2026-03-17)