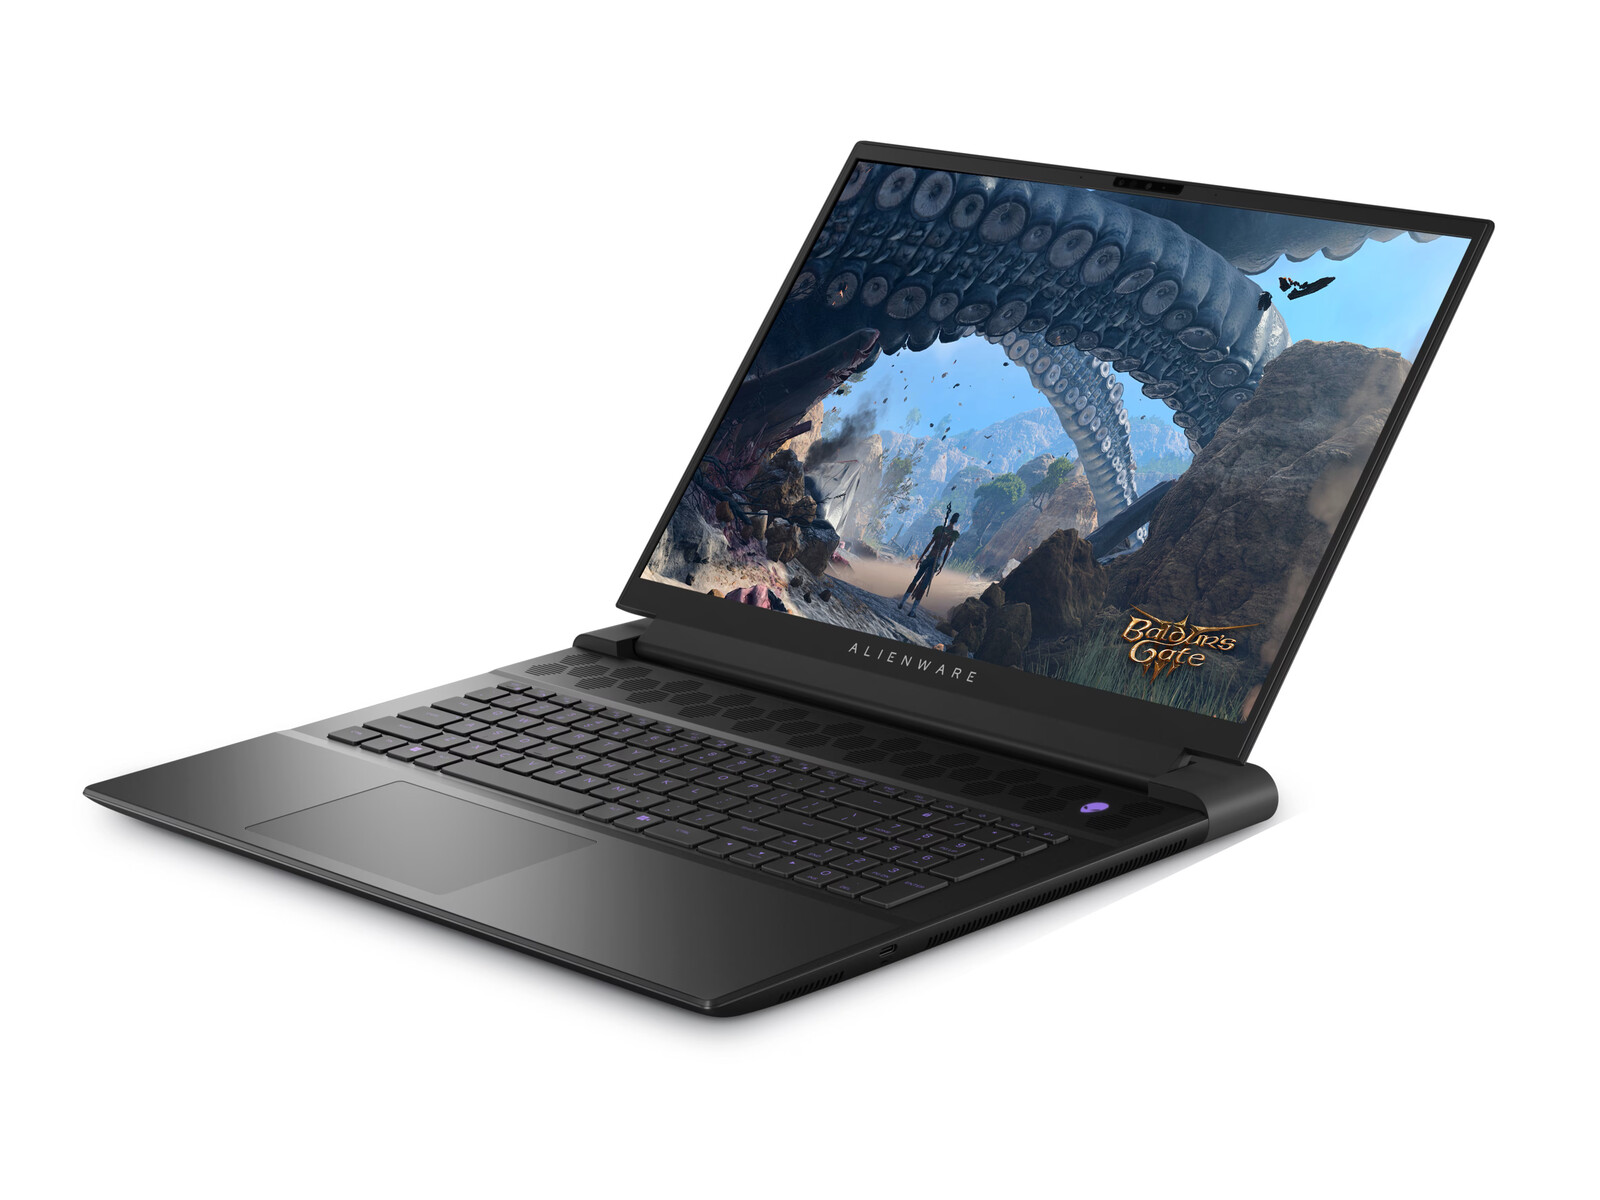
Test de l'Alienware m18 R2 : passer du Core i9-13980HX au Core i9-14900HX

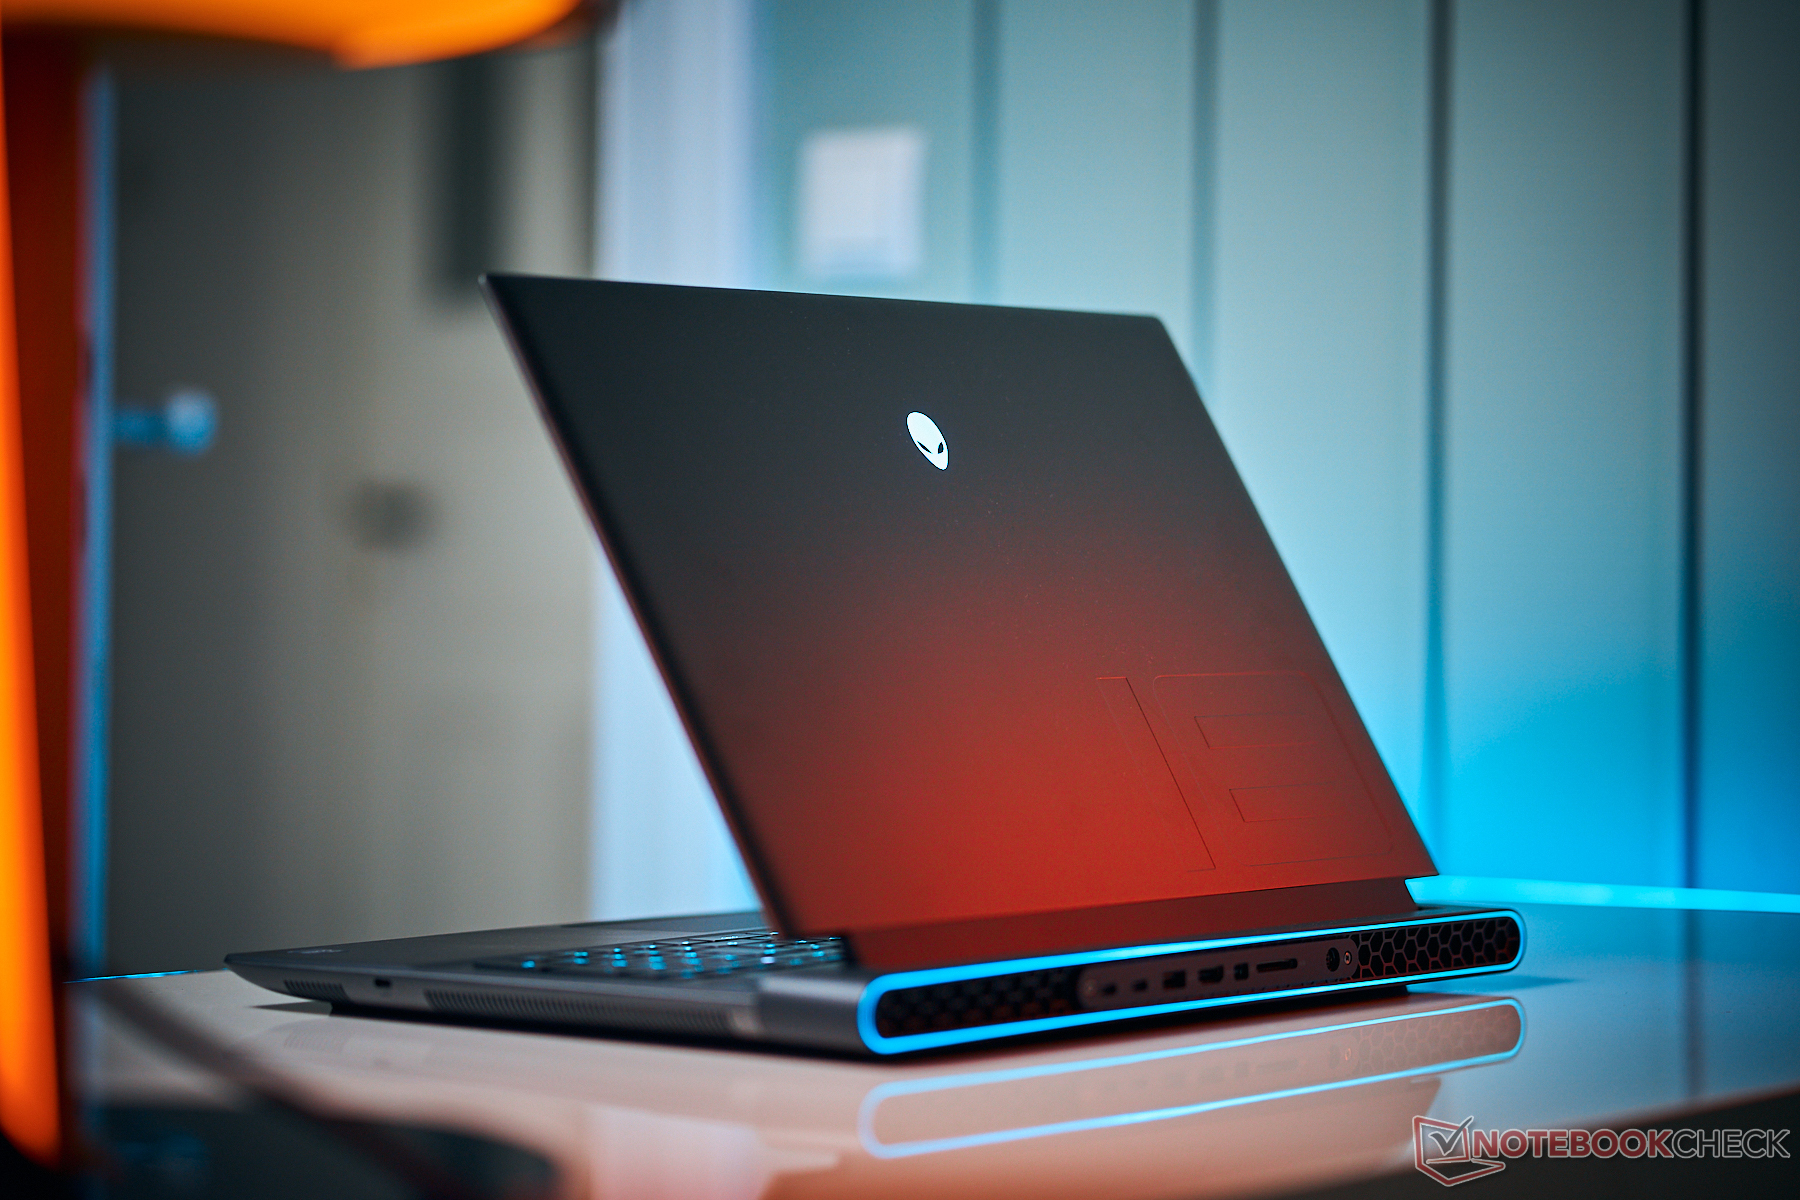
Dell a rafraîchi sa série Alienware m18 cette année avec le nouveau m18 R2. Contrairement au passage du m16 R1 au m16 R2le m18 R2 utilise le même design de châssis que son prédécesseur mais avec de nouveaux CPU Raptor Lake-HX Core ix-14000HX pour remplacer les anciens Core ix-13000HX. Presque tout le reste reste inchangé et nous vous recommandons donc de consulter nos revues existantes sur le m18 R1 et m18 R1 AMD pour en savoir plus sur les caractéristiques physiques du m18 r2.
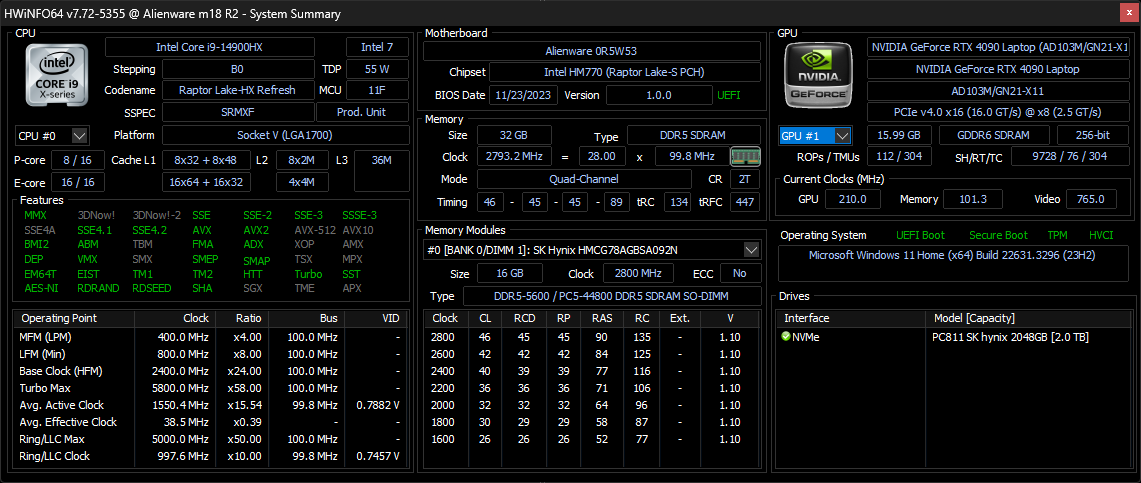
Notre modèle est la configuration la plus haut de gamme avec le processeur Core i9-14900HX, le GPU RTX 4090 de 175 W GeForce, l'écran IPS 1600p 165 Hz et le clavier mécanique CherryMX ultra low-profile pour un prix d'environ 3200 $. D'autres UGS peuvent inclure le Core i7-14650HX, la RTX 4060, un écran 1200p 480 Hz et un clavier à membrane standard à partir d'un peu moins de 2000 $.
Plus d'avis sur Alienware :
Comparaison avec les concurrents potentiels
Note | Date | Modèle | Poids | Épaisseur | Taille | Résolution | Prix |
|---|---|---|---|---|---|---|---|
| 89.5 % v7 (old) | 03/24 | Alienware m18 R2 i9-14900HX, GeForce RTX 4090 Laptop GPU | 4 kg | 26.7 mm | 18.00" | 2560x1600 | |
| 89.2 % v7 (old) | 11/23 | Alienware m18 R1 AMD R9 7945HX, Radeon RX 7900M | 3.9 kg | 26.7 mm | 18.00" | 1920x1200 | |
| 90.7 % v7 (old) | 04/23 | Alienware m18 R1 i9-13980HX, GeForce RTX 4090 Laptop GPU | 3.9 kg | 26.7 mm | 18.00" | 1920x1200 | |
| 88.8 % v7 (old) | 01/24 | MSI Titan 18 HX A14VIG i9-14900HX, GeForce RTX 4090 Laptop GPU | 3.6 kg | 32.1 mm | 18.00" | 3840x2400 | |
| 87.4 % v7 (old) | 03/23 | Asus ROG Strix G18 G814JI i7-13650HX, GeForce RTX 4070 Laptop GPU | 3 kg | 31 mm | 18.00" | 2560x1600 | |
| 88.3 % v7 (old) | 10/23 | Acer Predator Helios 18 N23Q2 i9-13900HX, GeForce RTX 4080 Laptop GPU | 3.2 kg | 29.15 mm | 18.00" | 2560x1600 |
Case - Toujours aussi grand avec une platine thermique arrière
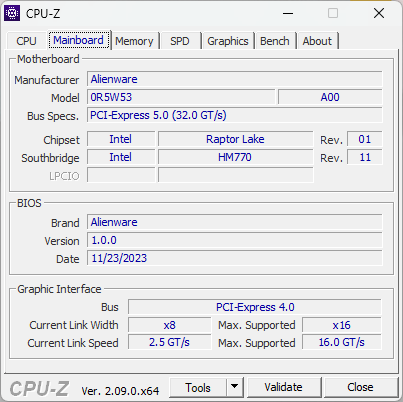
Cette année, le port RJ-45 est passé du Killer E3000 au Killer E5000 pour un débit deux fois plus élevé (2,5 Gbps contre 5 Gbps). Pour le reste, le design extérieur reste le même qu'auparavant.
Lecteur de carte SD
| SD Card Reader | |
| average JPG Copy Test (av. of 3 runs) | |
| Alienware m18 R1 (Angelibird AV Pro V60) | |
| Alienware m18 R2 (Toshiba Exceria Pro SDXC 64 GB UHS-II) | |
| Alienware m18 R1 AMD (Toshiba Exceria Pro SDXC 64 GB UHS-II) | |
| MSI Titan 18 HX A14VIG (Toshiba Exceria Pro SDXC 64 GB UHS-II) | |
| Acer Predator Helios 18 N23Q2 | |
| maximum AS SSD Seq Read Test (1GB) | |
| Alienware m18 R1 AMD (Toshiba Exceria Pro SDXC 64 GB UHS-II) | |
| Alienware m18 R2 (Toshiba Exceria Pro SDXC 64 GB UHS-II) | |
| Alienware m18 R1 (Angelibird AV Pro V60) | |
| MSI Titan 18 HX A14VIG (Toshiba Exceria Pro SDXC 64 GB UHS-II) | |
| Acer Predator Helios 18 N23Q2 | |
Communication
| Networking | |
| iperf3 transmit AXE11000 | |
| Asus ROG Strix G18 G814JI | |
| Alienware m18 R1 AMD | |
| Alienware m18 R1 | |
| MSI Titan 18 HX A14VIG | |
| Acer Predator Helios 18 N23Q2 | |
| Alienware m18 R2 | |
| iperf3 receive AXE11000 | |
| Asus ROG Strix G18 G814JI | |
| Alienware m18 R1 AMD | |
| Alienware m18 R2 | |
| Alienware m18 R1 | |
| MSI Titan 18 HX A14VIG | |
| Acer Predator Helios 18 N23Q2 | |
| iperf3 transmit AXE11000 6GHz | |
| Alienware m18 R1 AMD | |
| Acer Predator Helios 18 N23Q2 | |
| Alienware m18 R1 | |
| MSI Titan 18 HX A14VIG | |
| Alienware m18 R2 | |
| iperf3 receive AXE11000 6GHz | |
| Alienware m18 R1 AMD | |
| Acer Predator Helios 18 N23Q2 | |
| MSI Titan 18 HX A14VIG | |
| Alienware m18 R1 | |
| Alienware m18 R2 | |
Webcam


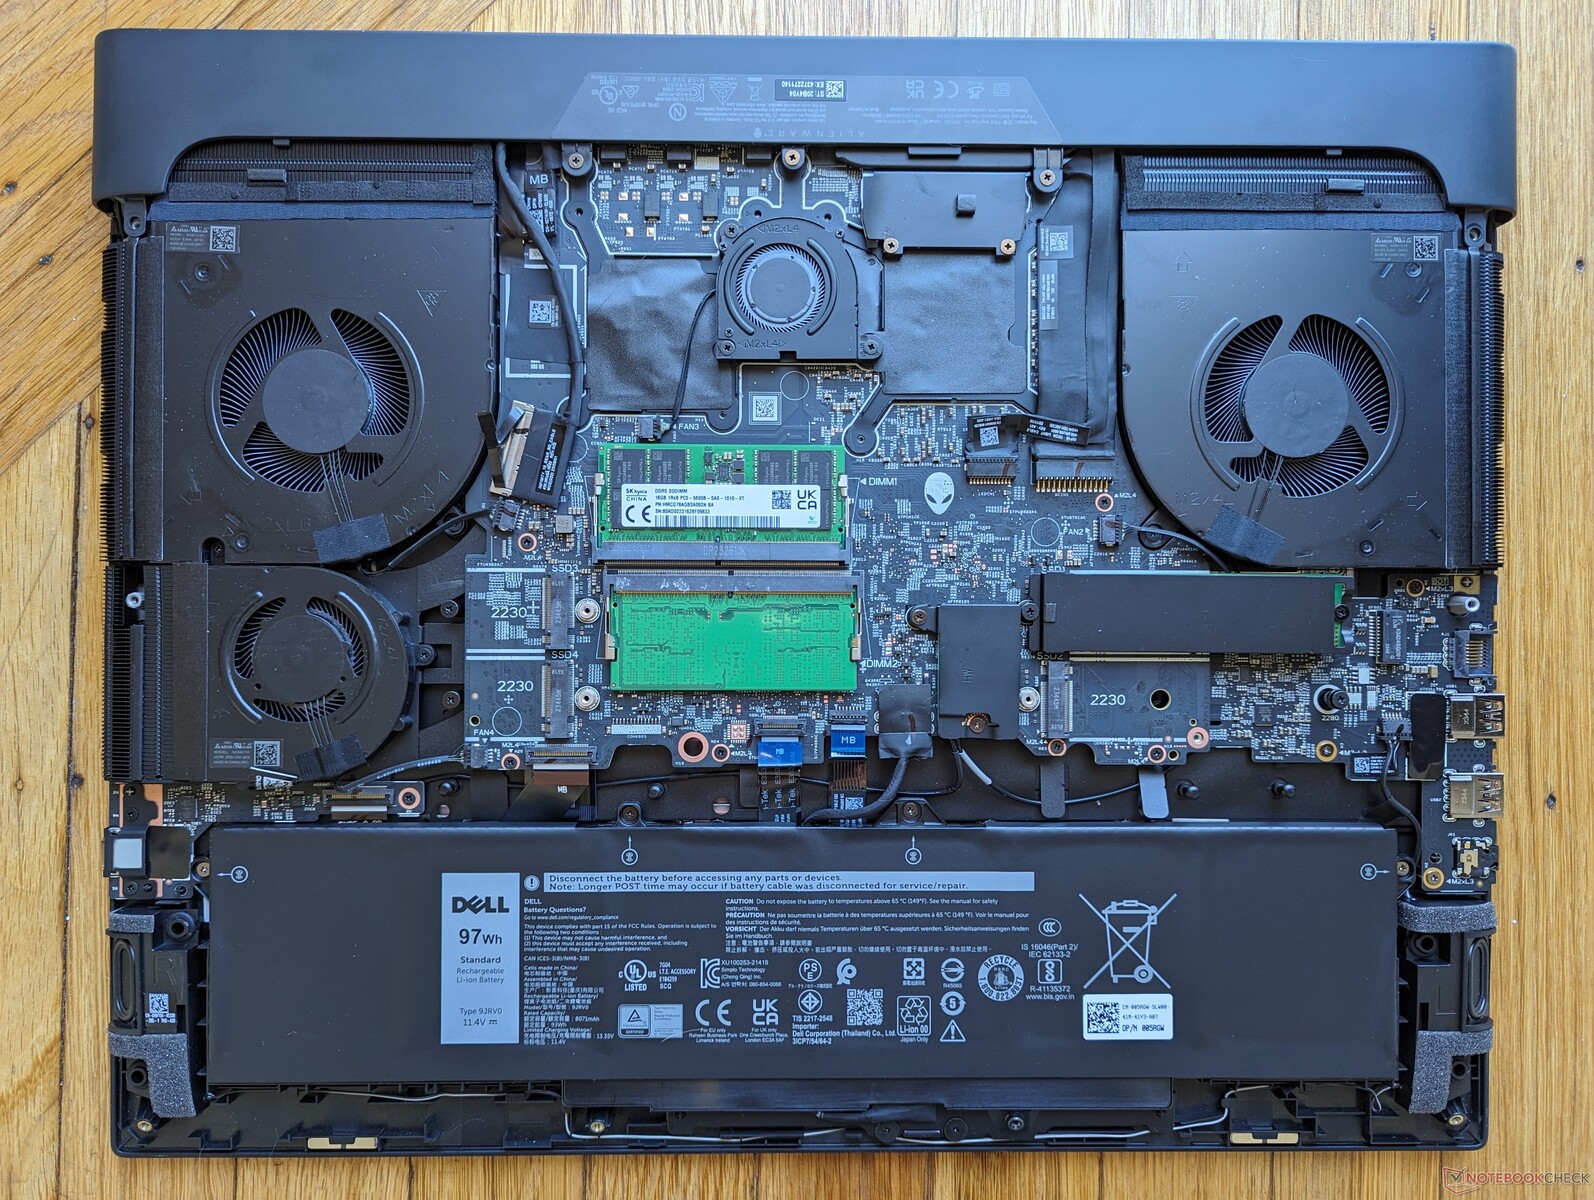
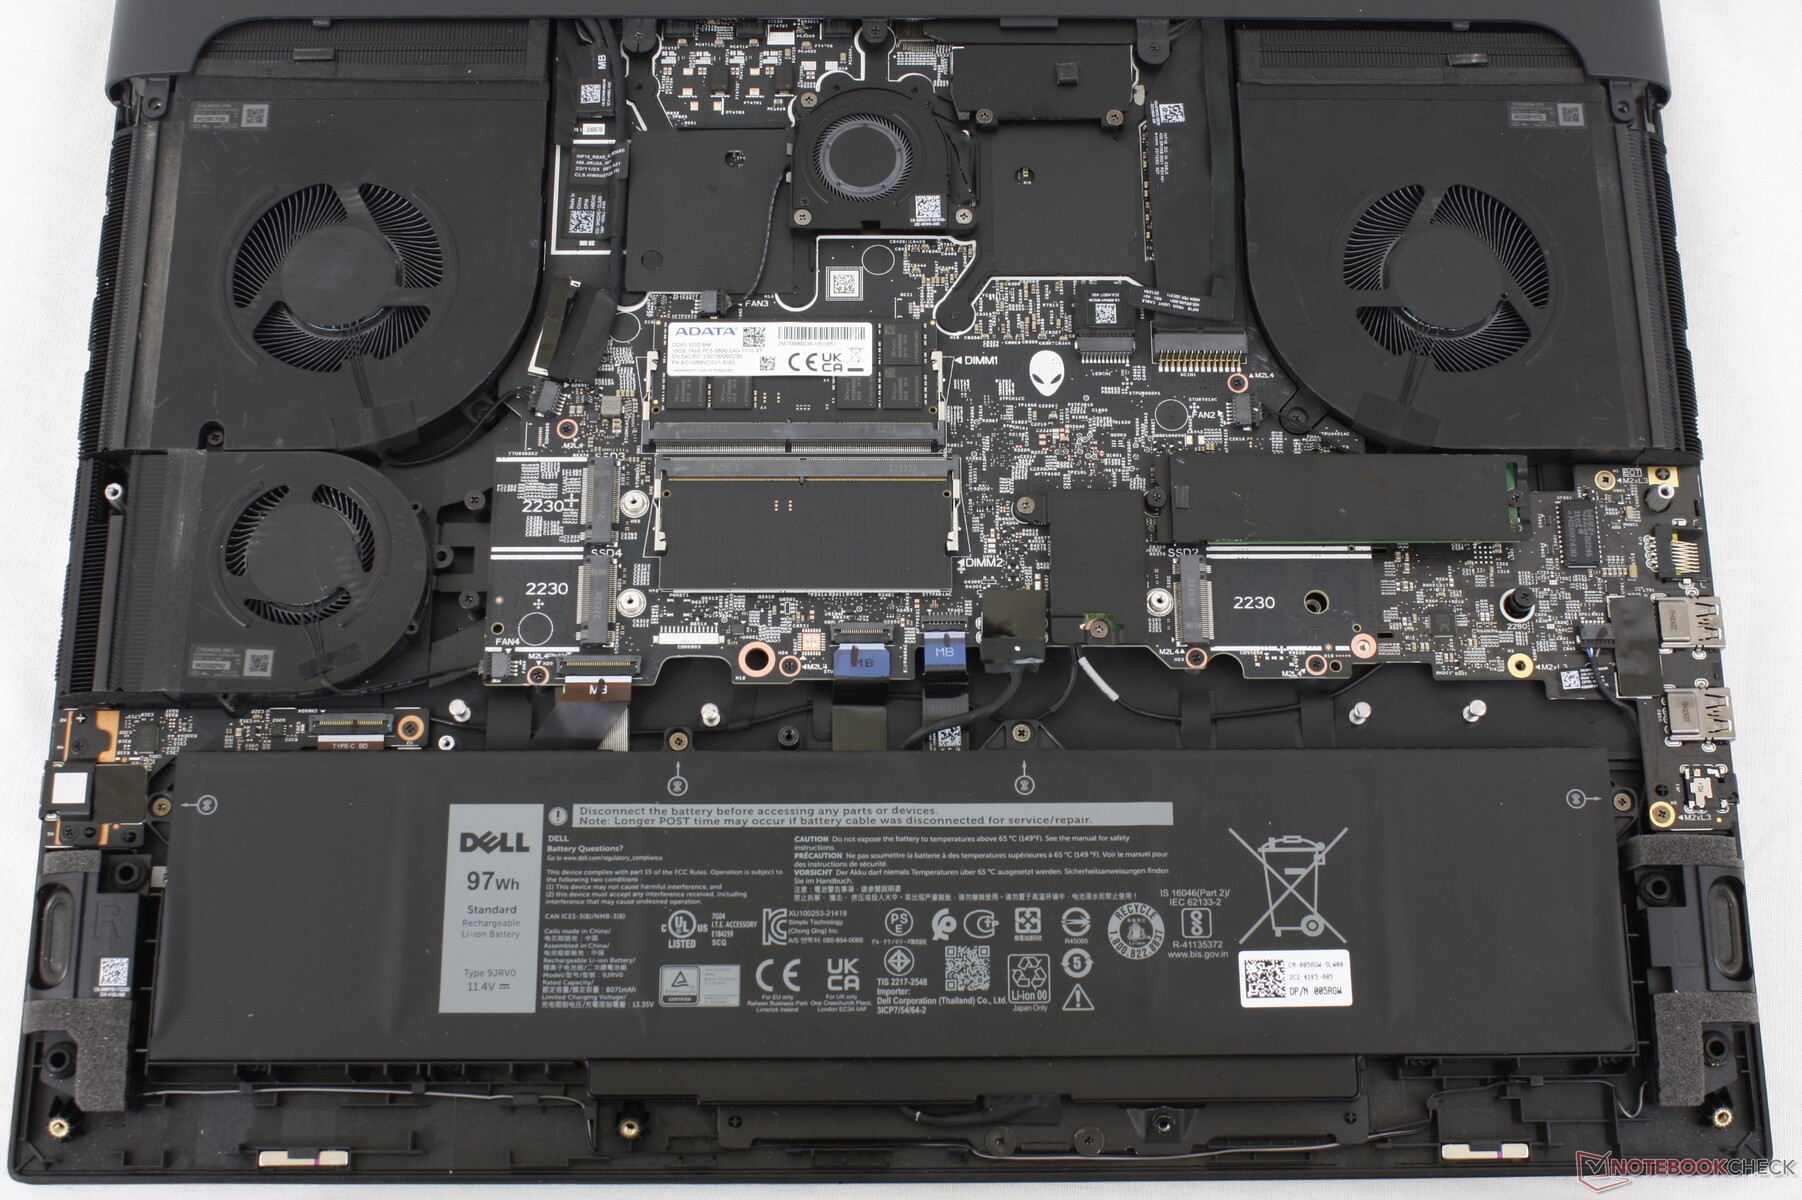
Maintenance
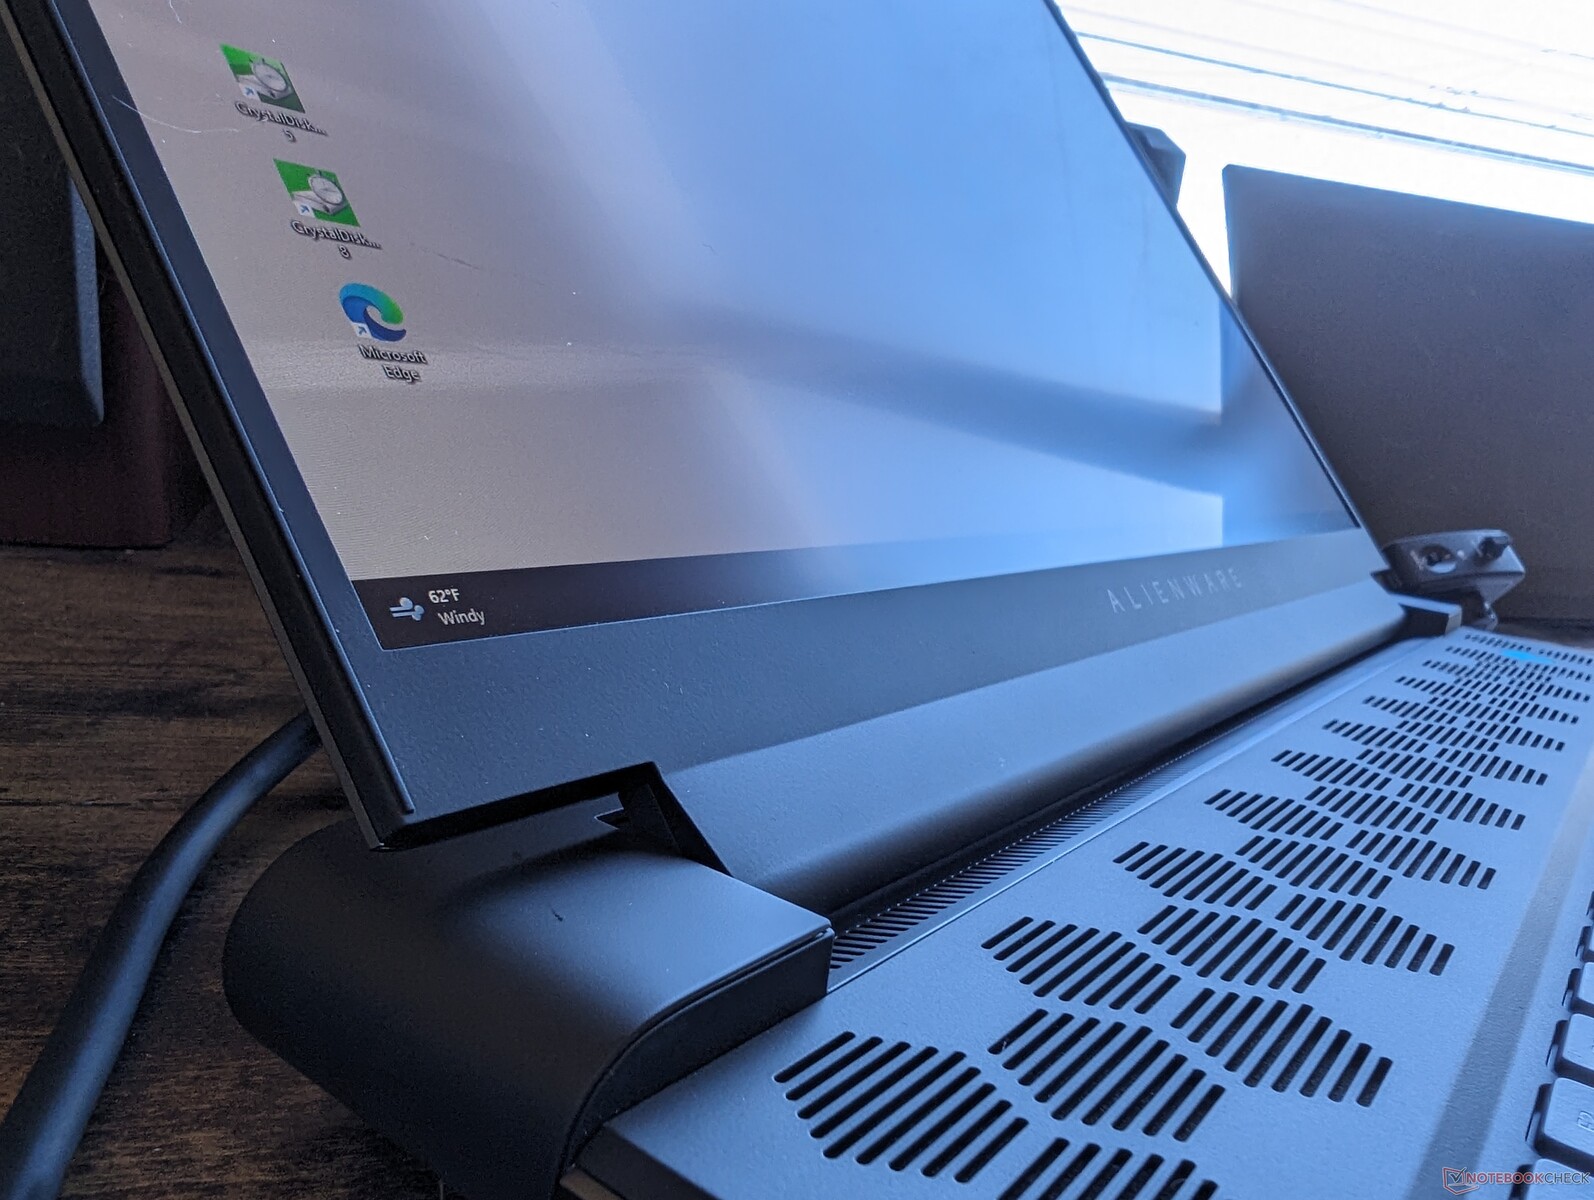
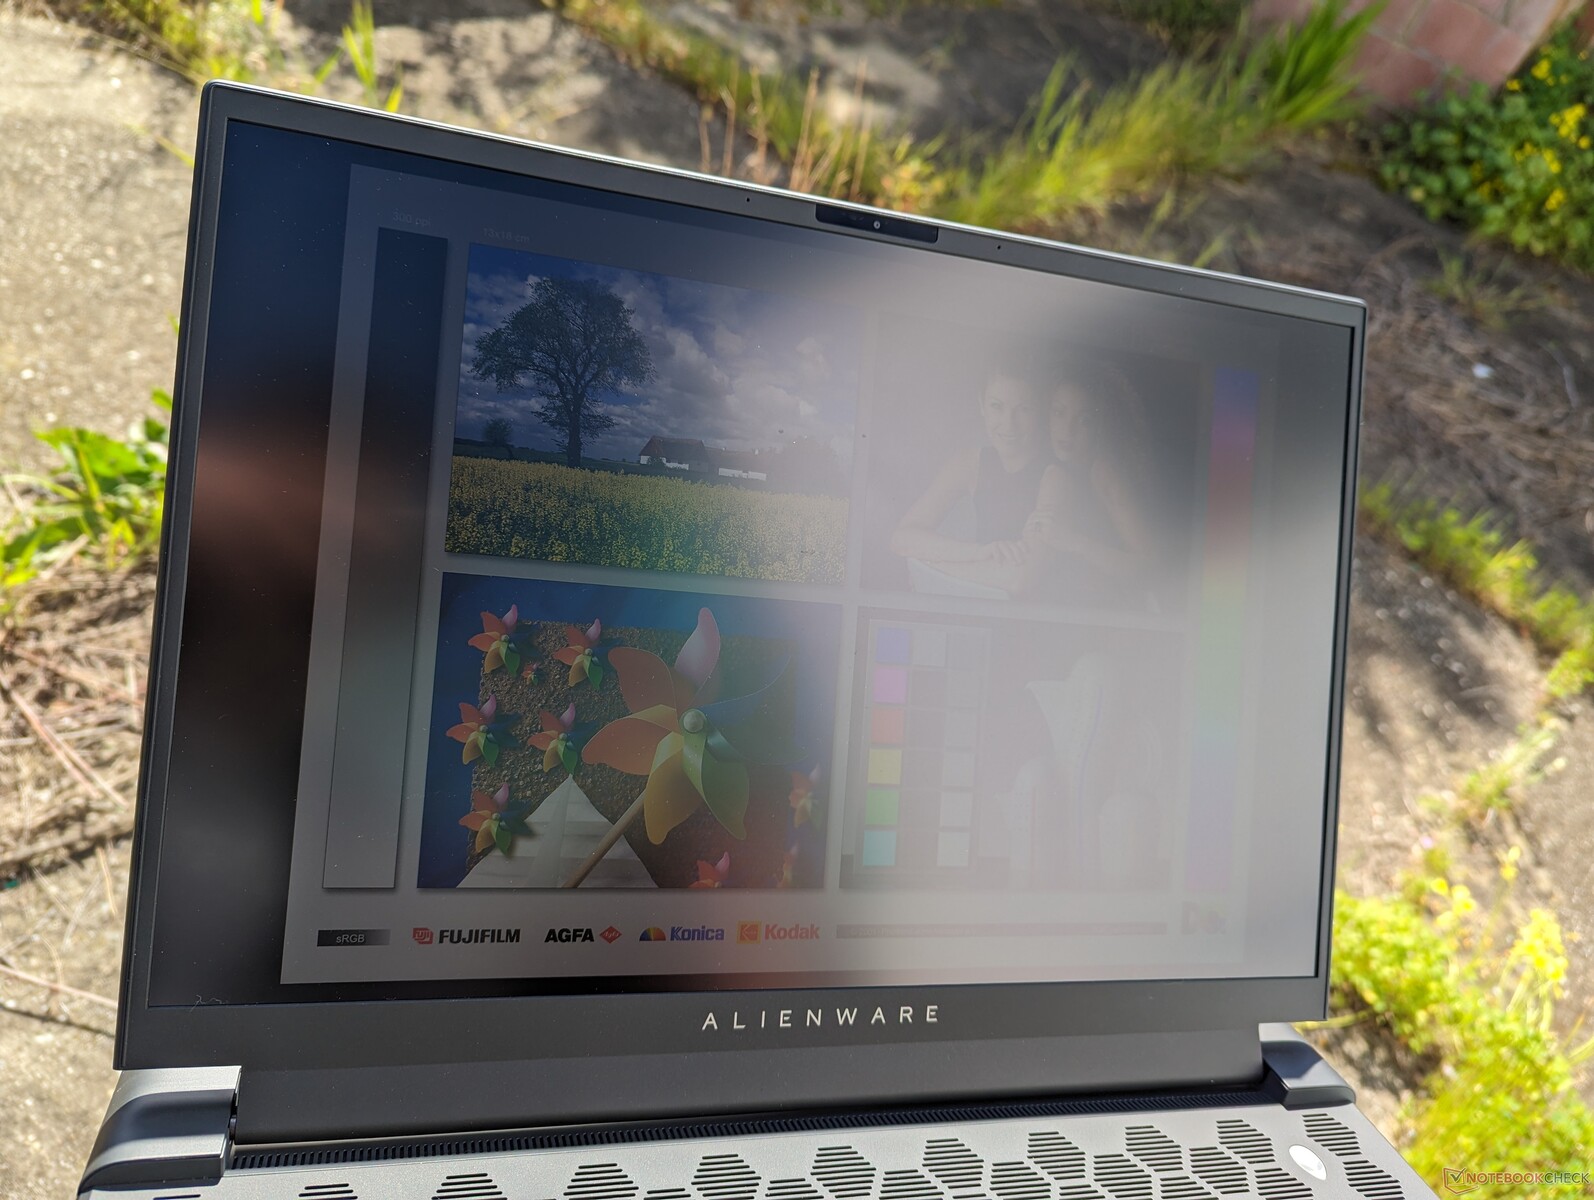
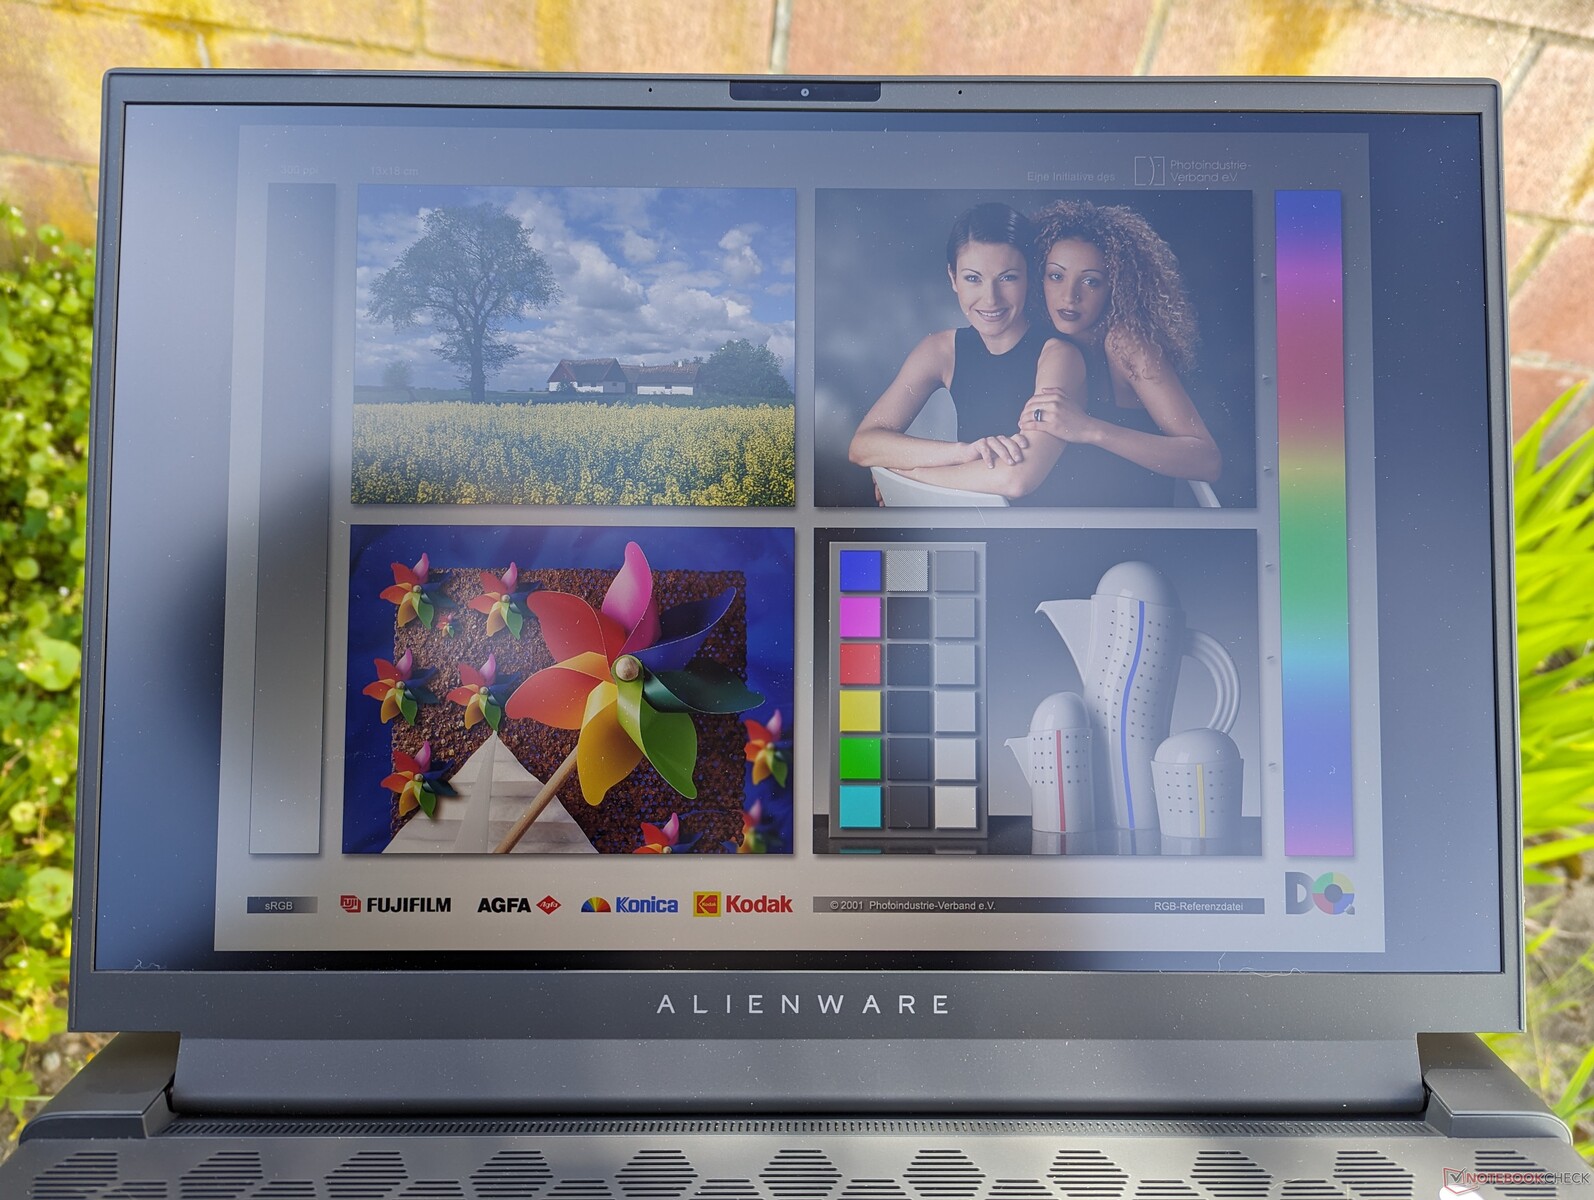
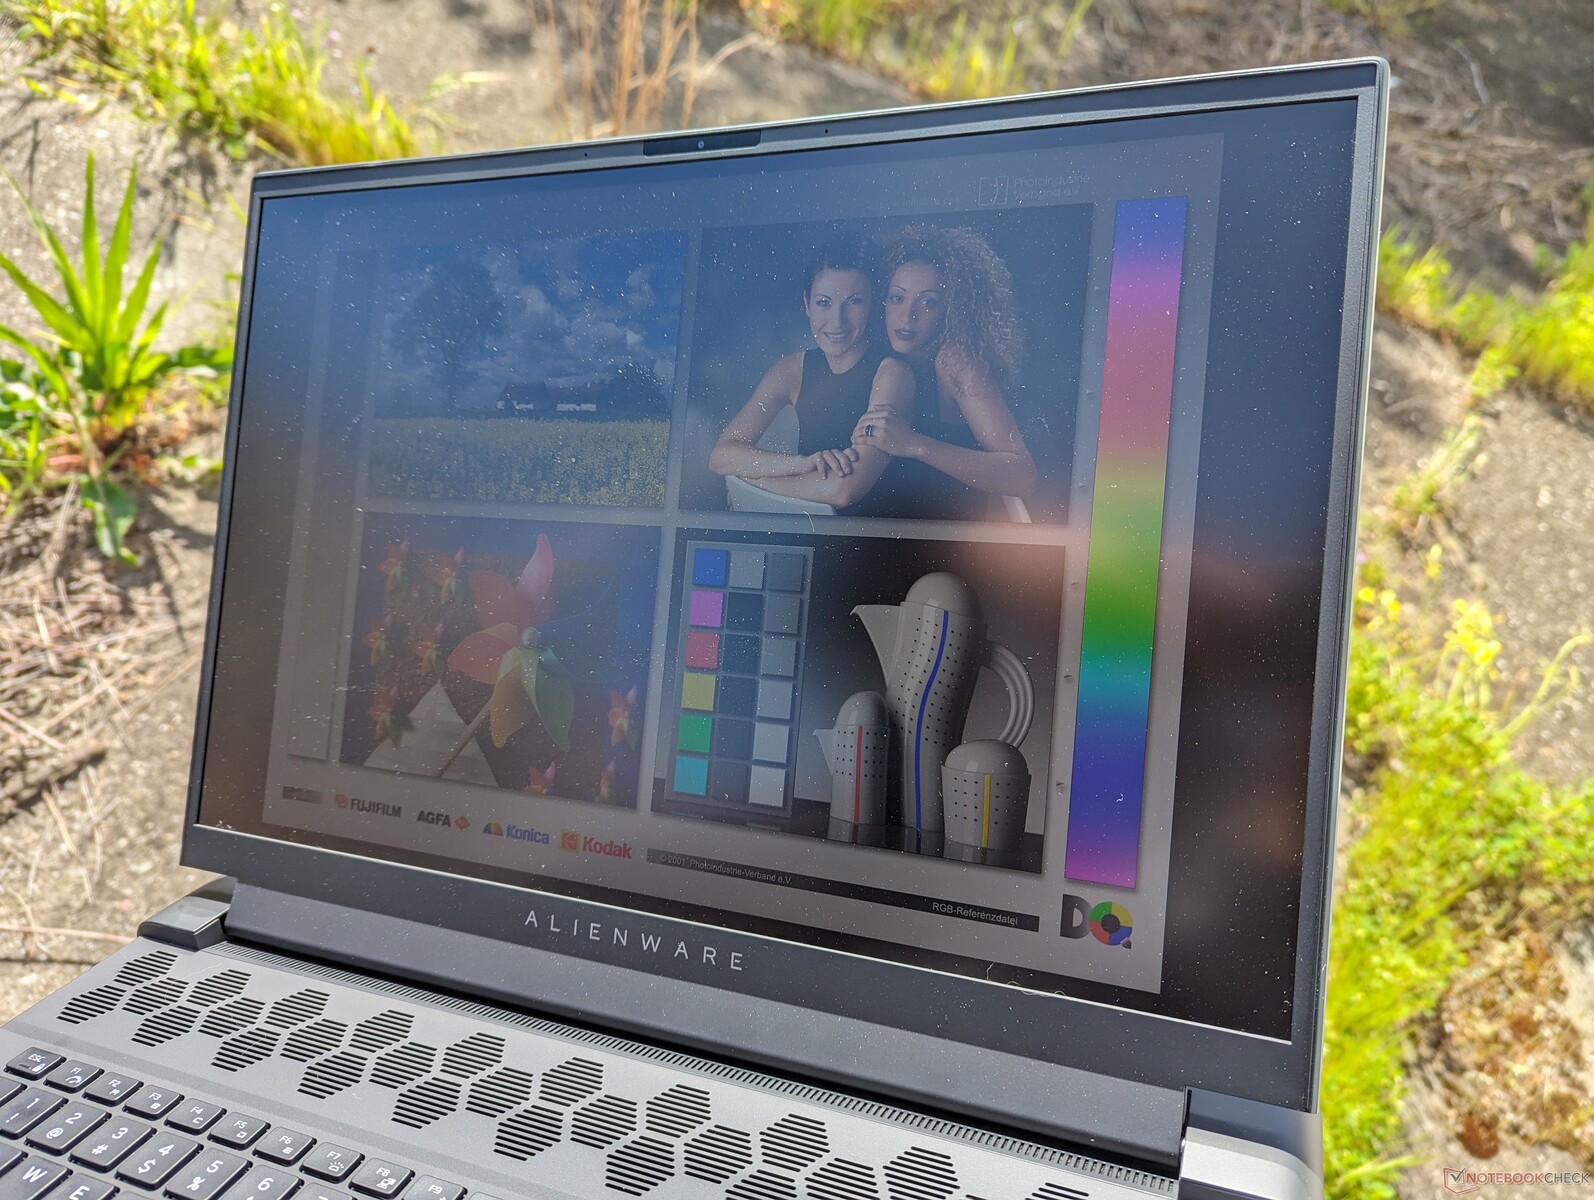
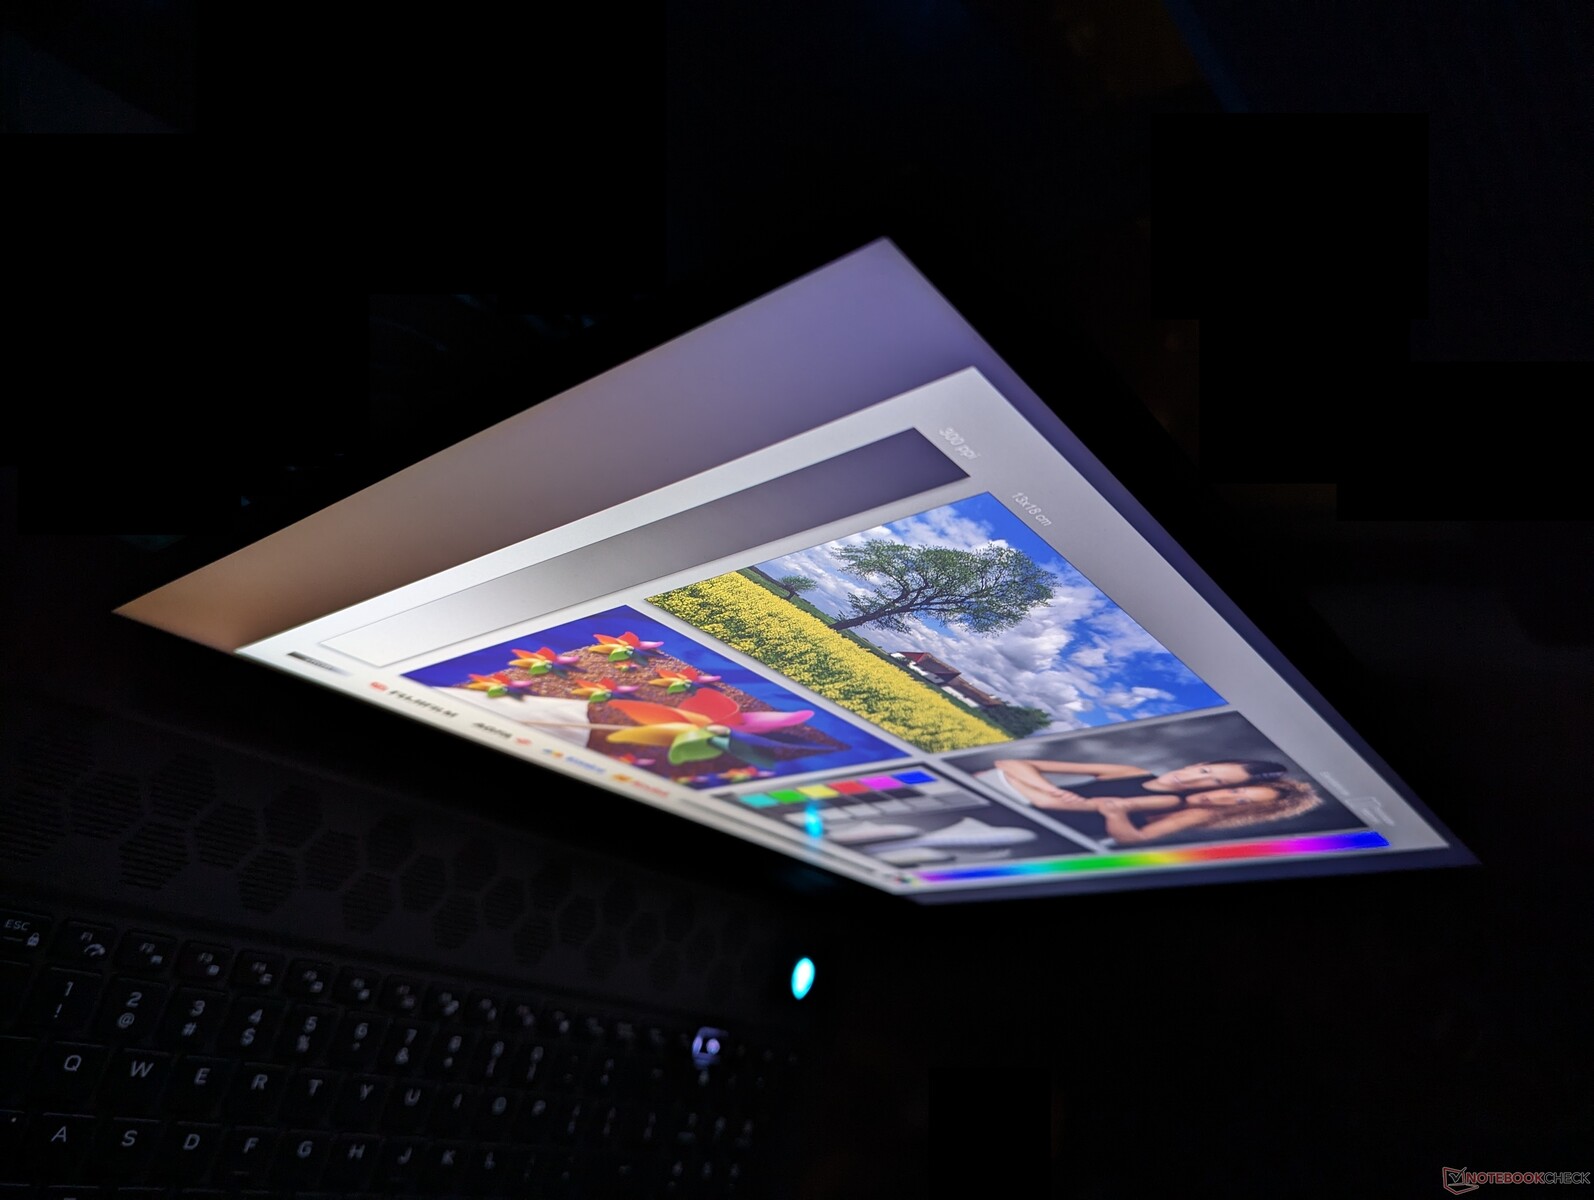
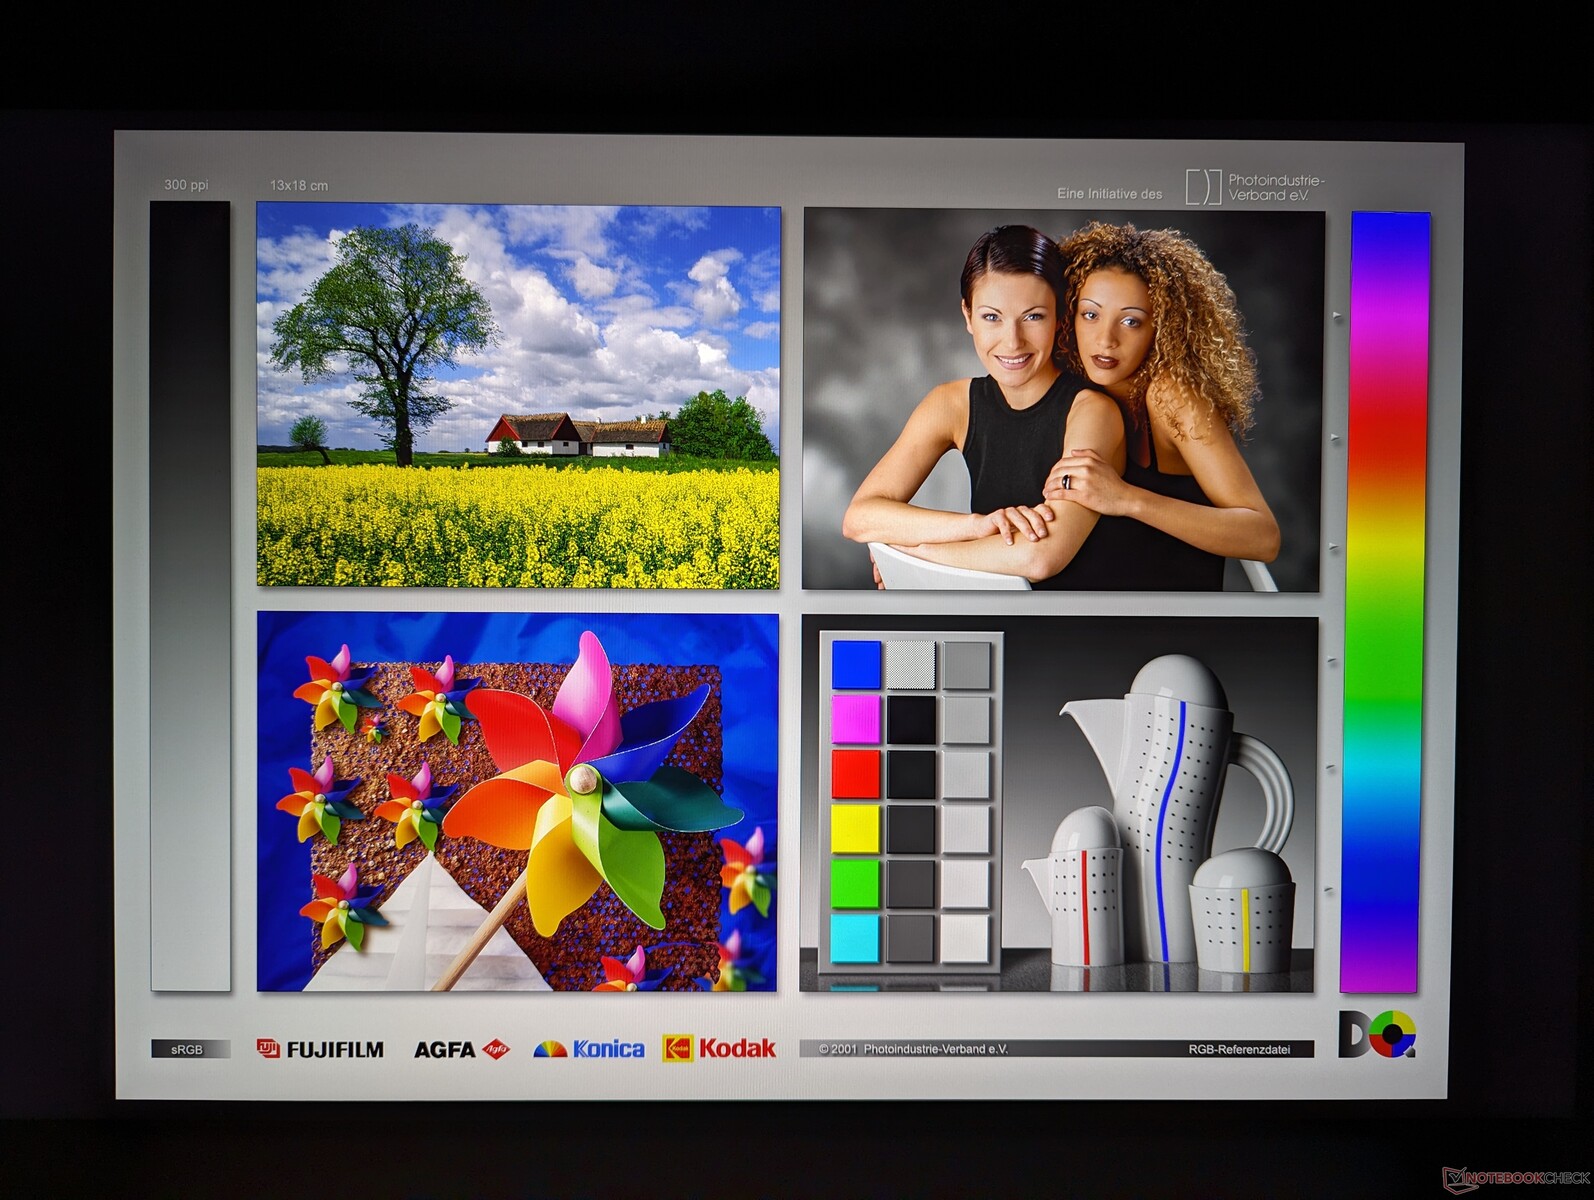
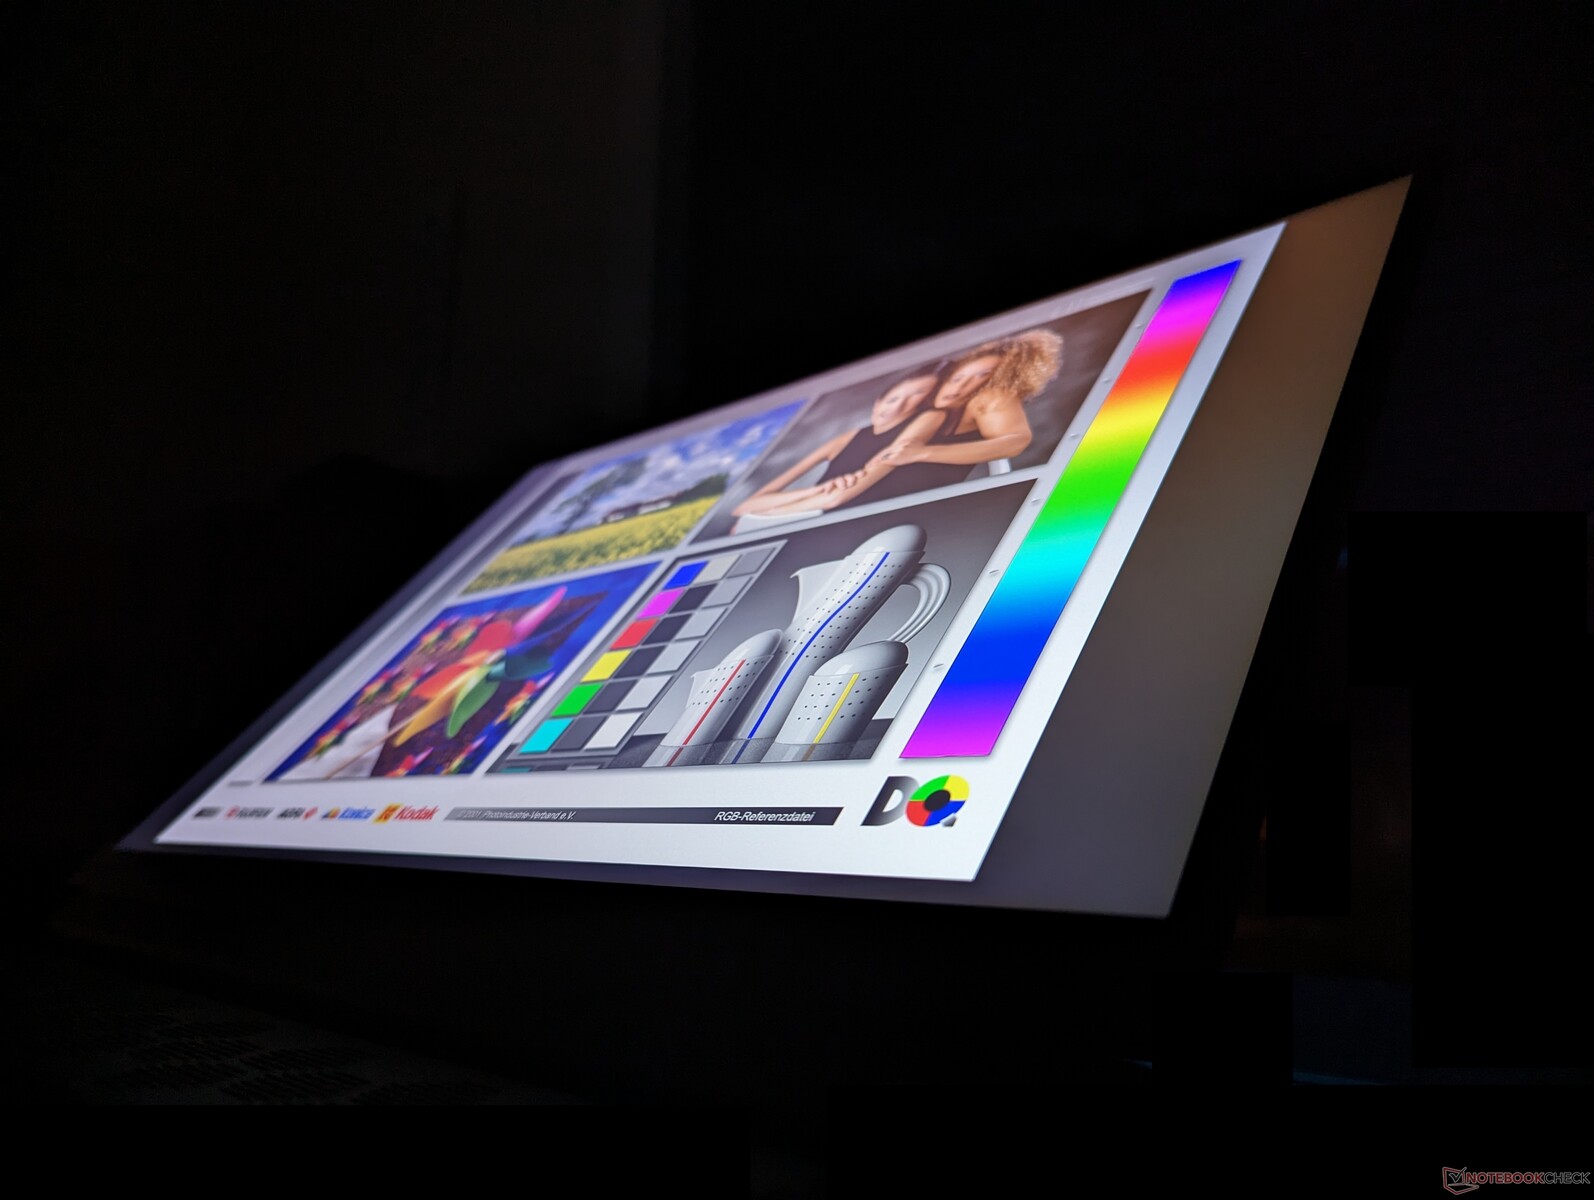
Affichage - 1200p ou 1600p ?
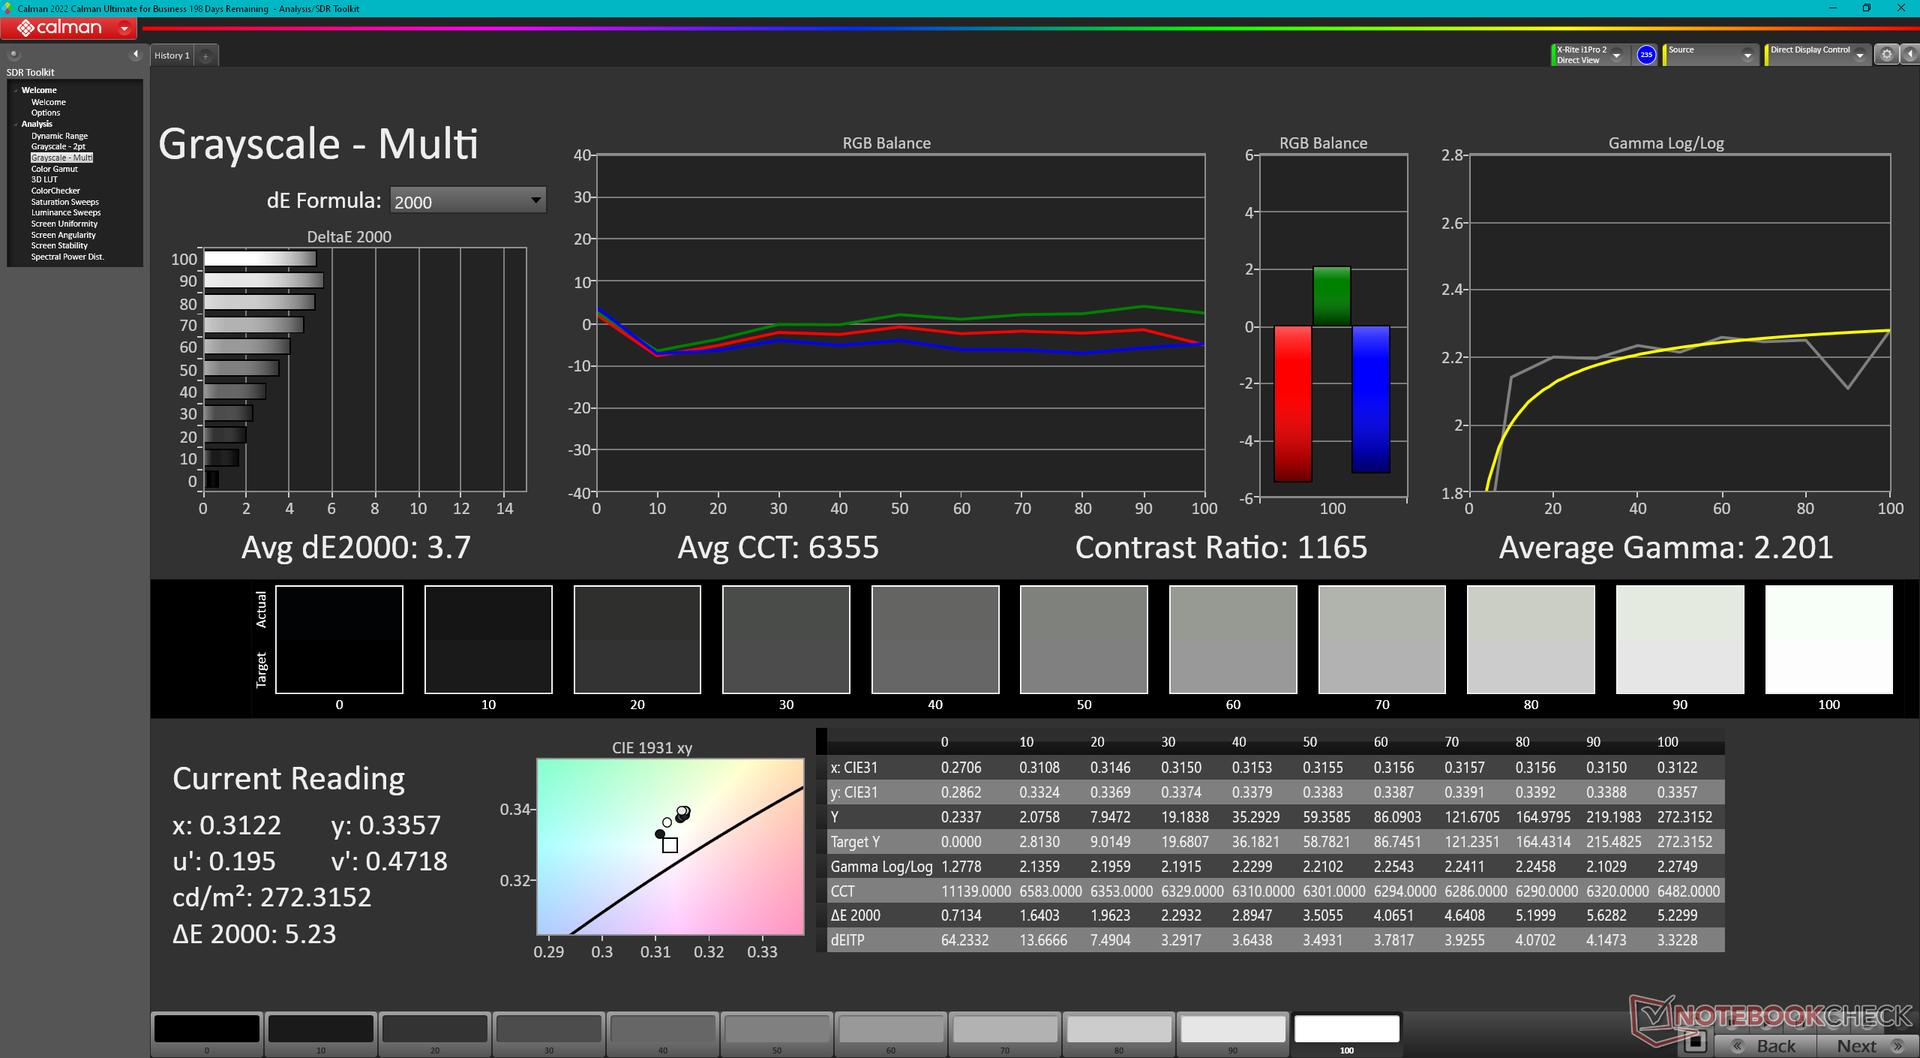
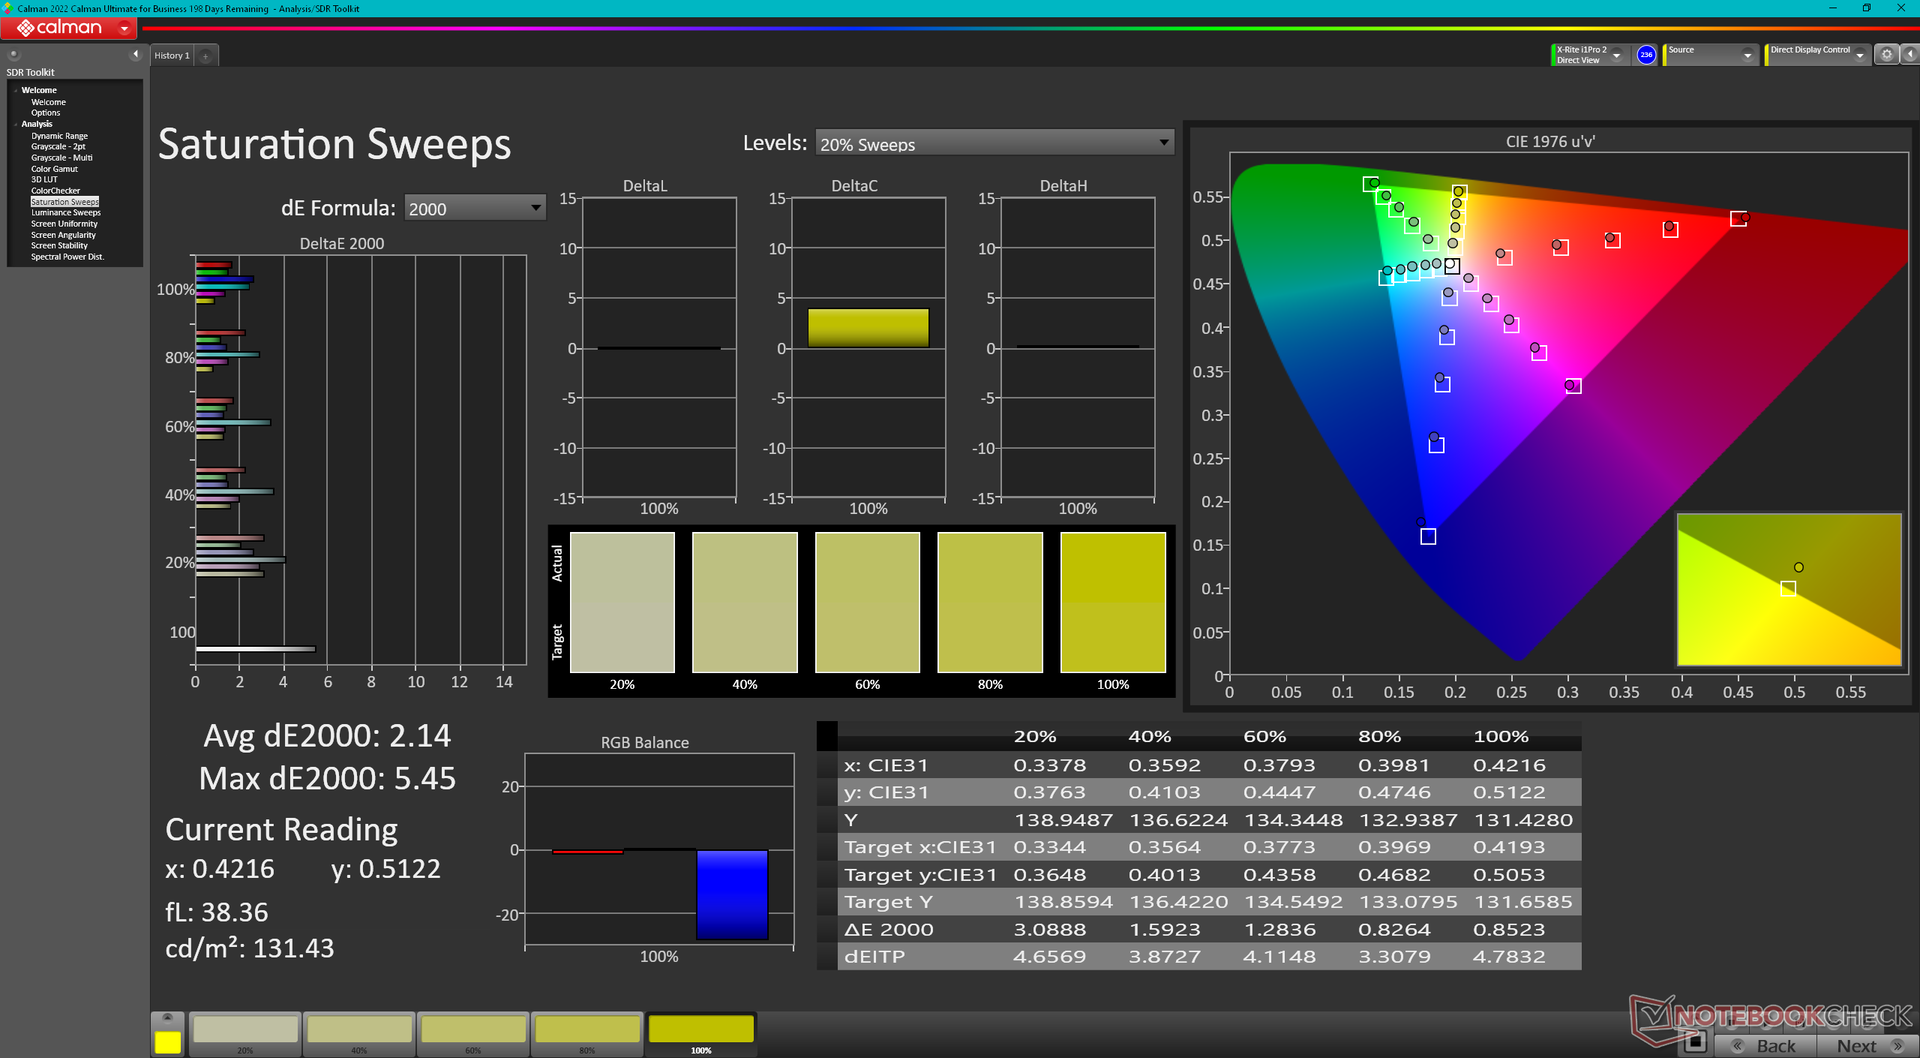
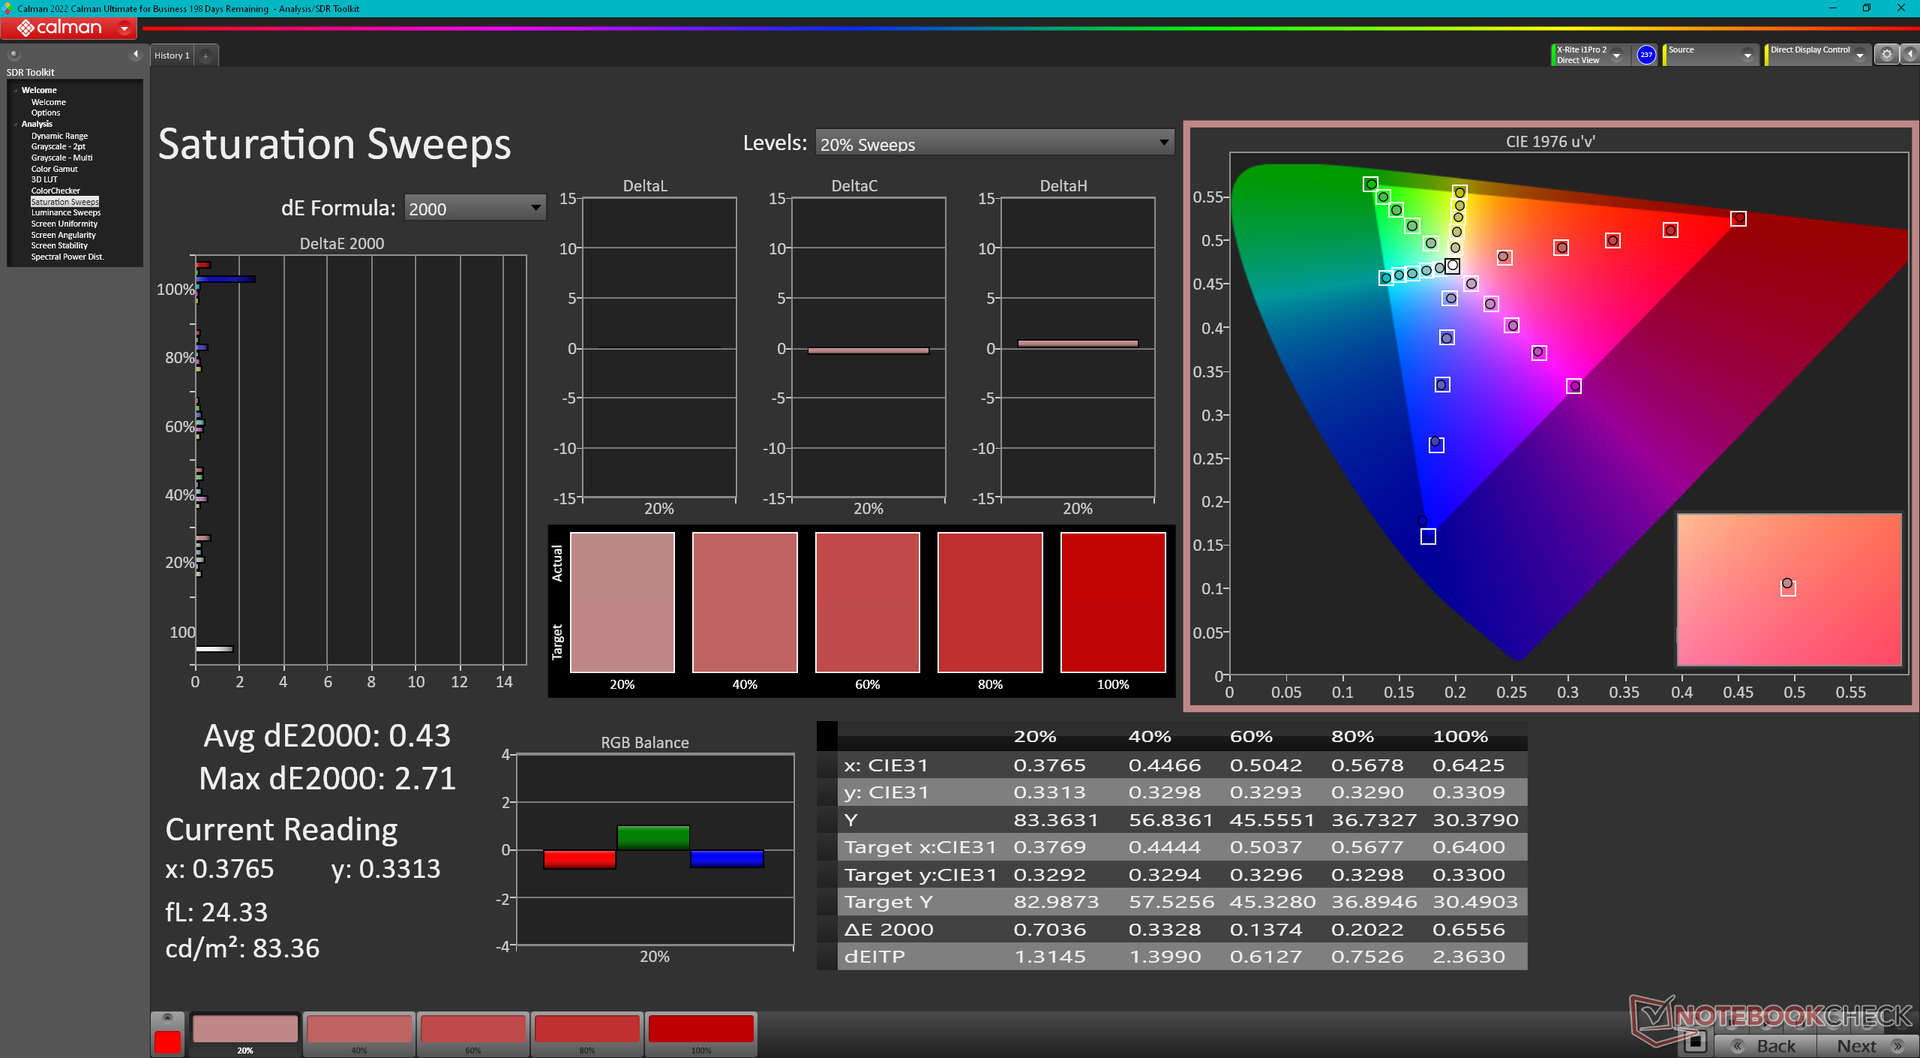
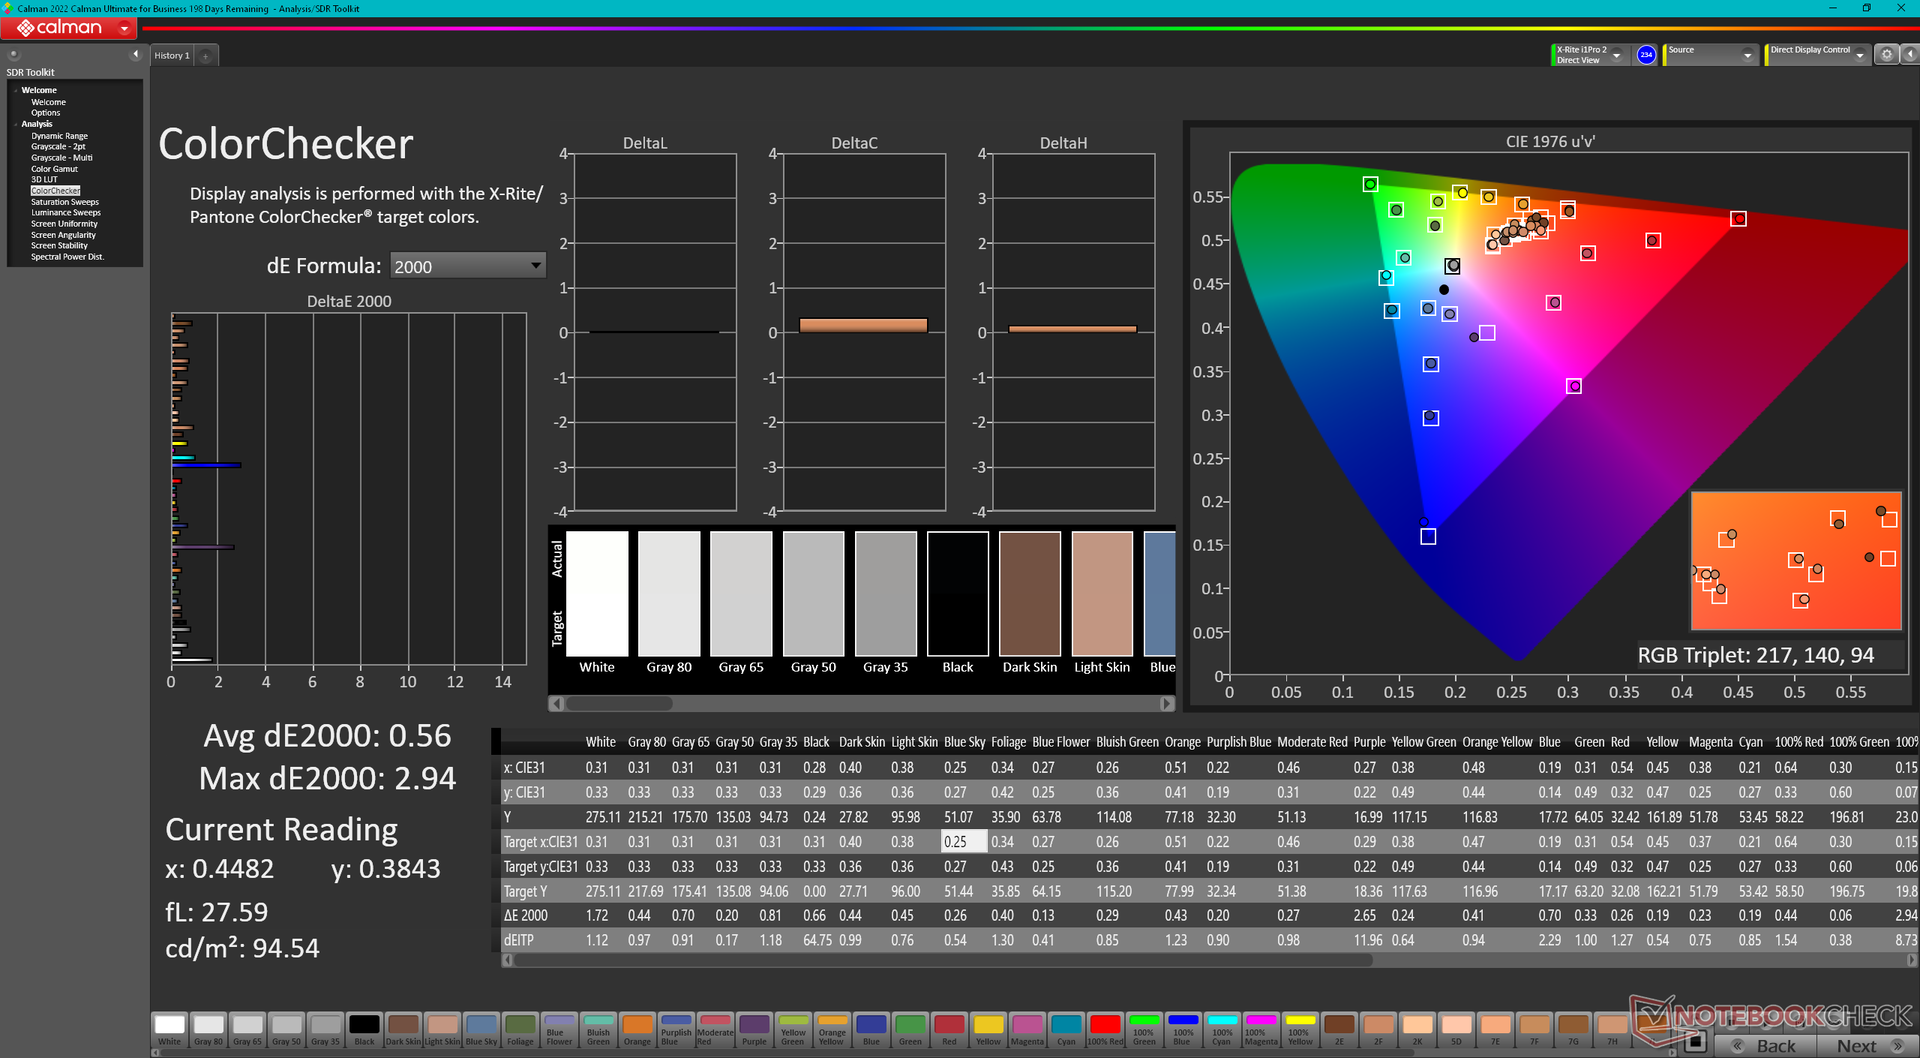
Il est intéressant de noter que le nom de l'écran de notre configuration m18 R2 est le même que celui de notre configuration m18 R1, même si les résolutions natives (1600p vs. 1200p) et les taux de rafraîchissement (165 Hz vs. 480 Hz) sont différents. Les deux écrans offrent des couleurs P3 similaires, des temps de réponse rapides et des taux de contraste décents de ~1000:1.
Après avoir vu les deux écrans, nous recommandons l'option 1600p car la résolution 1200p sur un écran de 18 pouces n'est pas très nette, tandis que le taux de rafraîchissement de 480 Hz n'offre que des avantages marginaux par rapport à 165 Hz pour la grande majorité des cas d'utilisation.
La résolution dynamique de Windows n'est pas prise en charge et le taux de rafraîchissement est donc fixé à 165 Hz ou 60 Hz par le système d'exploitation. Cependant, G-Sync est toujours pris en charge lorsque vous exécutez des jeux en mode dGPU. Le HDR n'est pas pris en charge car le rétroéclairage n'est pas assez lumineux pour répondre aux exigences du HDR. En fait, notre écran 1600p est même légèrement moins lumineux en moyenne que la configuration 1200p.
| |||||||||||||||||||||||||
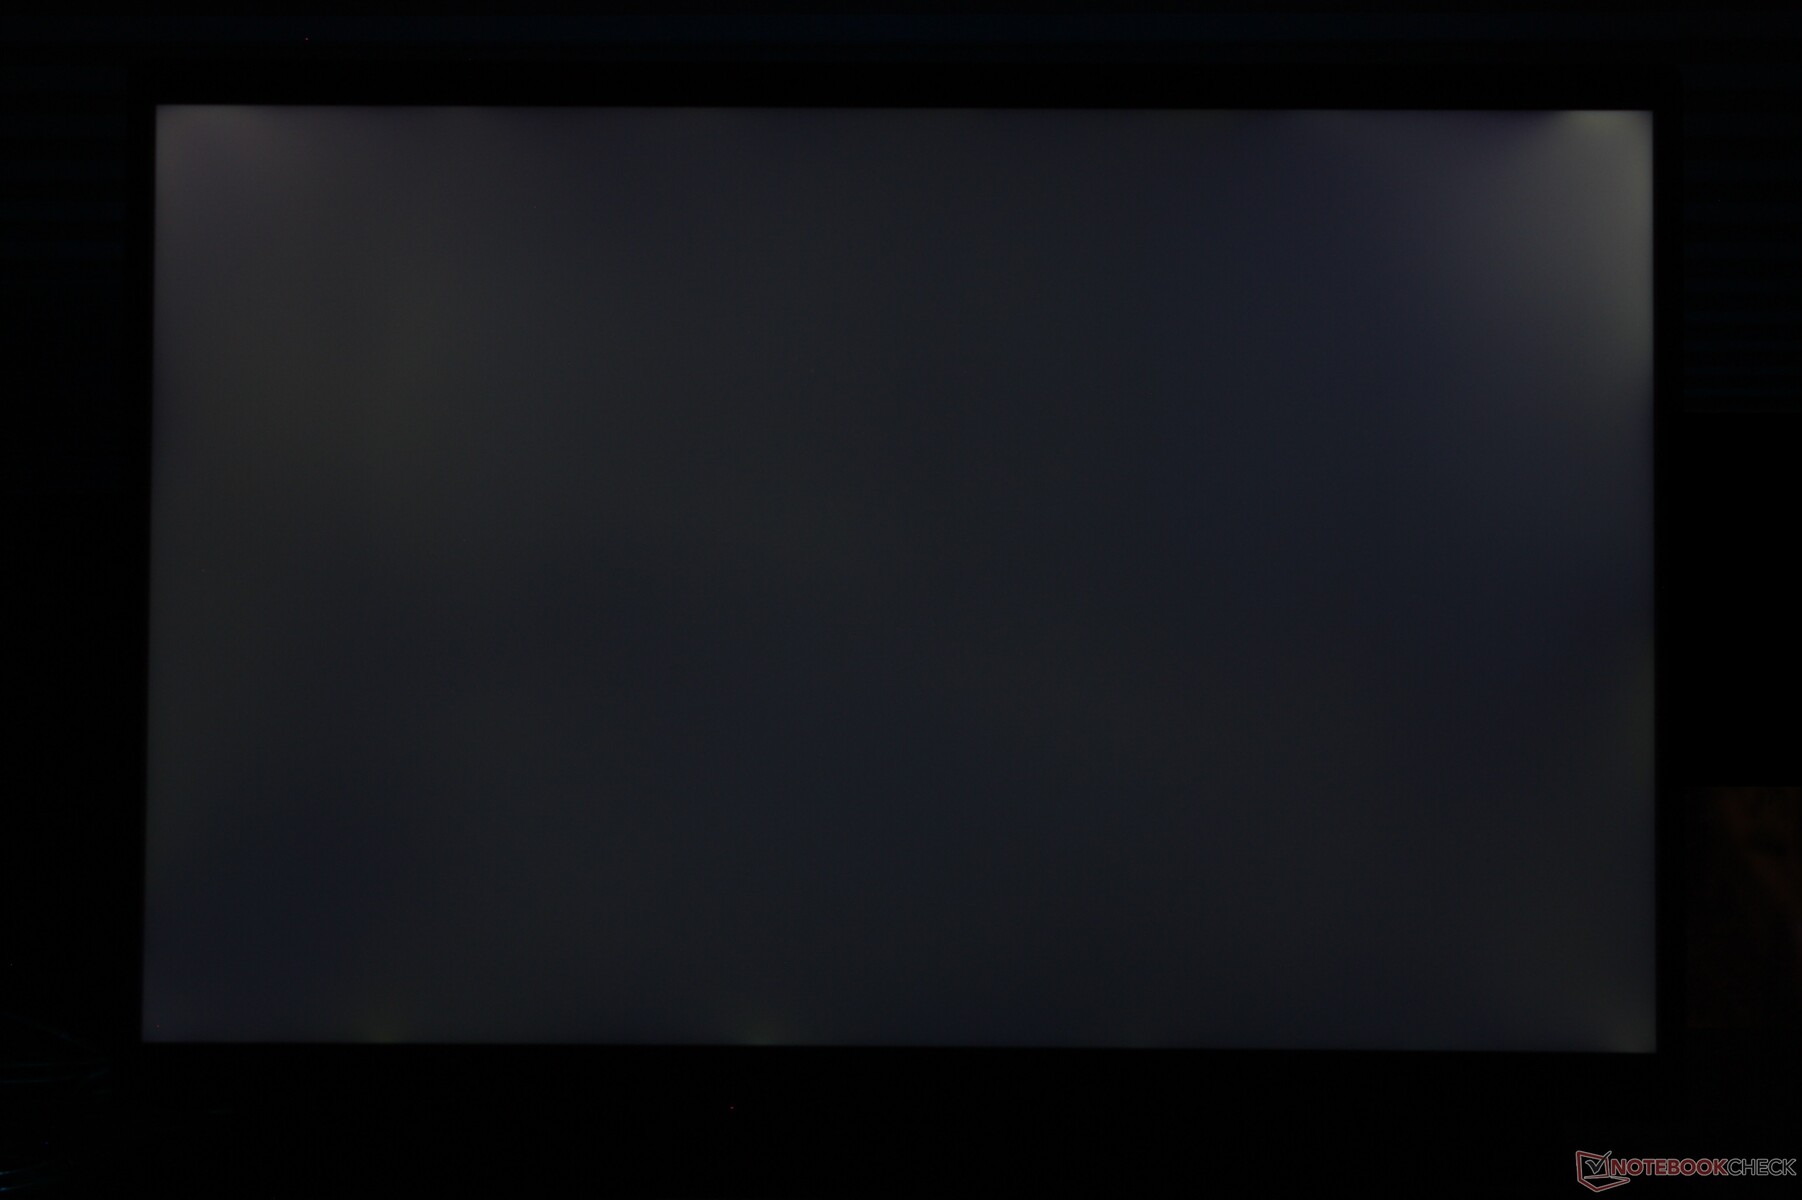
Homogénéité de la luminosité: 78 %
Valeur mesurée au centre, sur batterie: 271.8 cd/m²
Contraste: 1007:1 (Valeurs des noirs: 0.27 cd/m²)
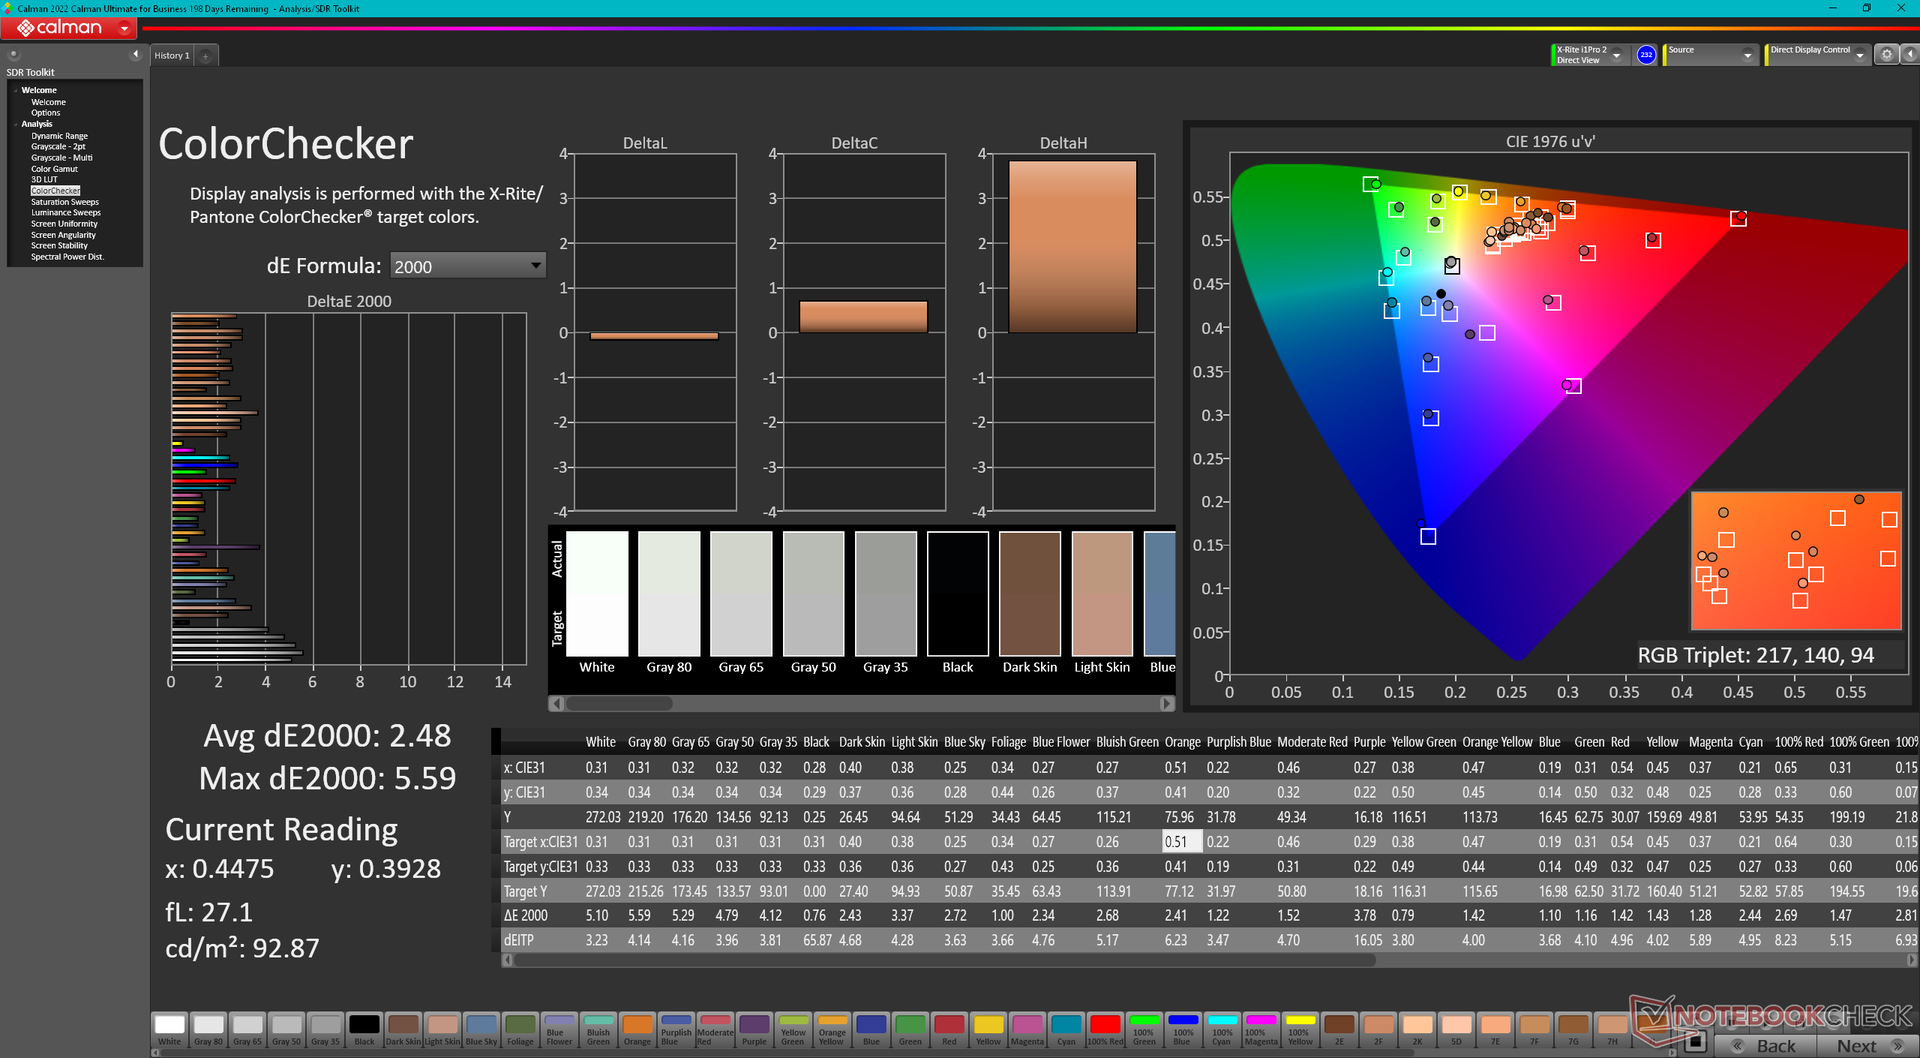
ΔE ColorChecker Calman: 2.48 | ∀{0.5-29.43 Ø4.71}
calibrated: 0.56
ΔE Greyscale Calman: 3.7 | ∀{0.09-98 Ø4.96}
88.9% AdobeRGB 1998 (Argyll 3D)
99.5% sRGB (Argyll 3D)
97.8% Display P3 (Argyll 3D)
Gamma: 2.2
CCT: 6355 K
| Alienware m18 R2 BOE NE18NZ1, IPS, 2560x1600, 18" | Alienware m18 R1 AMD BOE NE18NZ1, IPS, 1920x1200, 18" | Alienware m18 R1 Chi Mei 180JME, IPS, 1920x1200, 18" | MSI Titan 18 HX A14VIG AU Optronics B180ZAN01.0, Mini-LED, 3840x2400, 18" | Asus ROG Strix G18 G814JI NE180QDM-NZ2 (BOE0B35), IPS, 2560x1600, 18" | Acer Predator Helios 18 N23Q2 AUO45A8 (B180QAN01.2), IPS, 2560x1600, 18" | |
|---|---|---|---|---|---|---|
| Display | 0% | 1% | -1% | -1% | 2% | |
| Display P3 Coverage (%) | 97.8 | 98.5 1% | 97.7 0% | 98.1 0% | 98.1 0% | 99.8 2% |
| sRGB Coverage (%) | 99.5 | 99.7 0% | 100 1% | 99.8 0% | 99.9 0% | 100 1% |
| AdobeRGB 1998 Coverage (%) | 88.9 | 88.7 0% | 89.8 1% | 86.2 -3% | 85.6 -4% | 91.8 3% |
| Response Times | 28% | 24% | -375% | 4% | -57% | |
| Response Time Grey 50% / Grey 80% * (ms) | 5.3 ? | 2.8 ? 47% | 3 ? 43% | 8.6 ? -62% | 5.6 ? -6% | 7.6 ? -43% |
| Response Time Black / White * (ms) | 10.4 ? | 9.6 ? 8% | 9.9 ? 5% | 81.8 ? -687% | 9 ? 13% | 17.8 ? -71% |
| PWM Frequency (Hz) | 2592 ? | 2509 | ||||
| Screen | 29% | 24% | -45% | 9% | -28% | |
| Brightness middle (cd/m²) | 271.8 | 319.6 18% | 372.8 37% | 467.5 72% | 471 73% | 360 32% |
| Brightness (cd/m²) | 275 | 304 11% | 367 33% | 459 67% | 422 53% | 355 29% |
| Brightness Distribution (%) | 78 | 87 12% | 97 24% | 90 15% | 83 6% | 92 18% |
| Black Level * (cd/m²) | 0.27 | 0.25 7% | 0.32 -19% | 0.47 -74% | 0.21 22% | |
| Contrast (:1) | 1007 | 1278 27% | 1165 16% | 1002 0% | 1714 70% | |
| Colorchecker dE 2000 * | 2.48 | 1.22 51% | 1.92 23% | 3.77 -52% | 2.05 17% | 3.82 -54% |
| Colorchecker dE 2000 max. * | 5.59 | 3.1 45% | 3.65 35% | 6.12 -9% | 4.15 26% | 7.38 -32% |
| Colorchecker dE 2000 calibrated * | 0.56 | 0.47 16% | 0.51 9% | 2.94 -425% | 0.8 -43% | 2.24 -300% |
| Greyscale dE 2000 * | 3.7 | 0.8 78% | 1.5 59% | 3.2 14% | 2.8 24% | 5.06 -37% |
| Gamma | 2.2 100% | 2.23 99% | 2.34 94% | 2.43 91% | 2.204 100% | 2.52 87% |
| CCT | 6355 102% | 6471 100% | 6607 98% | 6478 100% | 7122 91% | 5657 115% |
| Moyenne finale (programmes/paramètres) | 19% /
23% | 16% /
19% | -140% /
-89% | 4% /
6% | -28% /
-26% |
* ... Moindre est la valeur, meilleures sont les performances
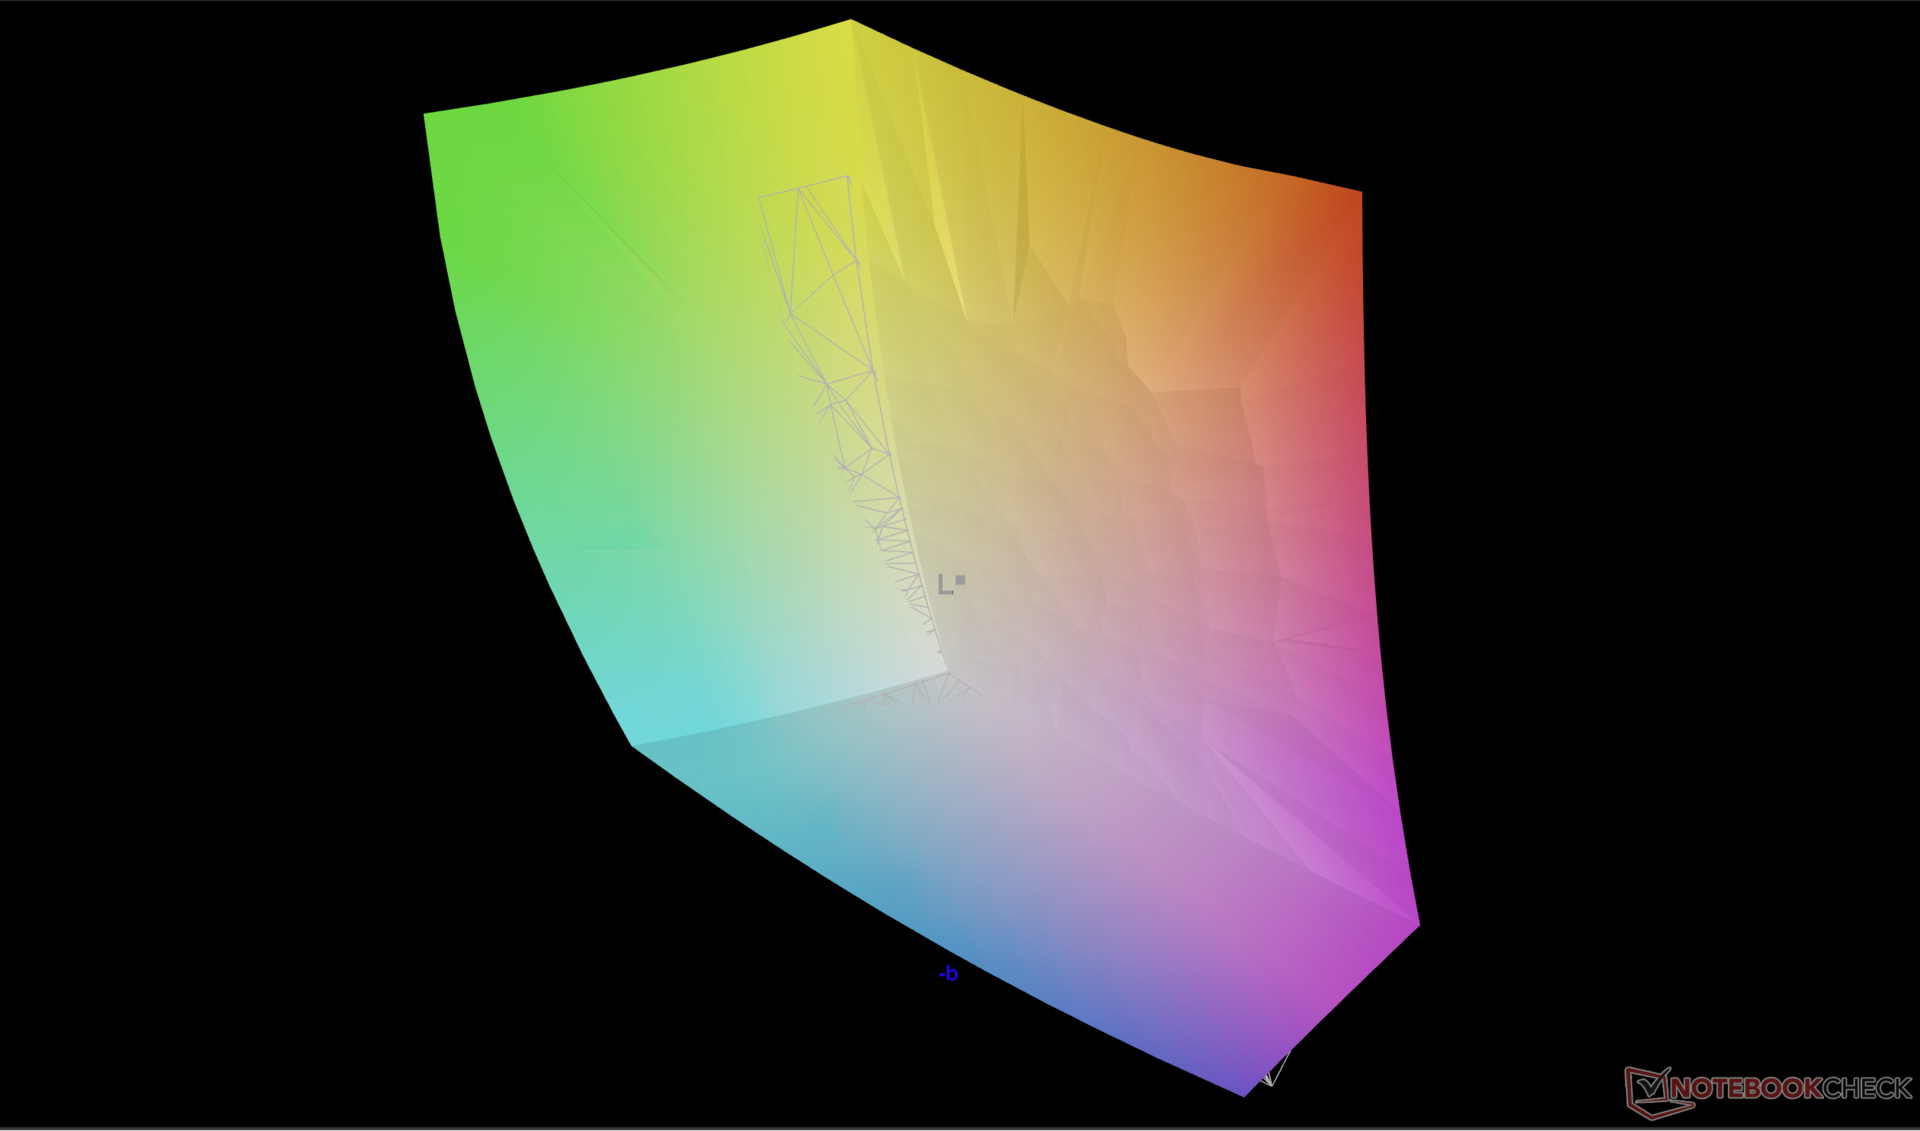
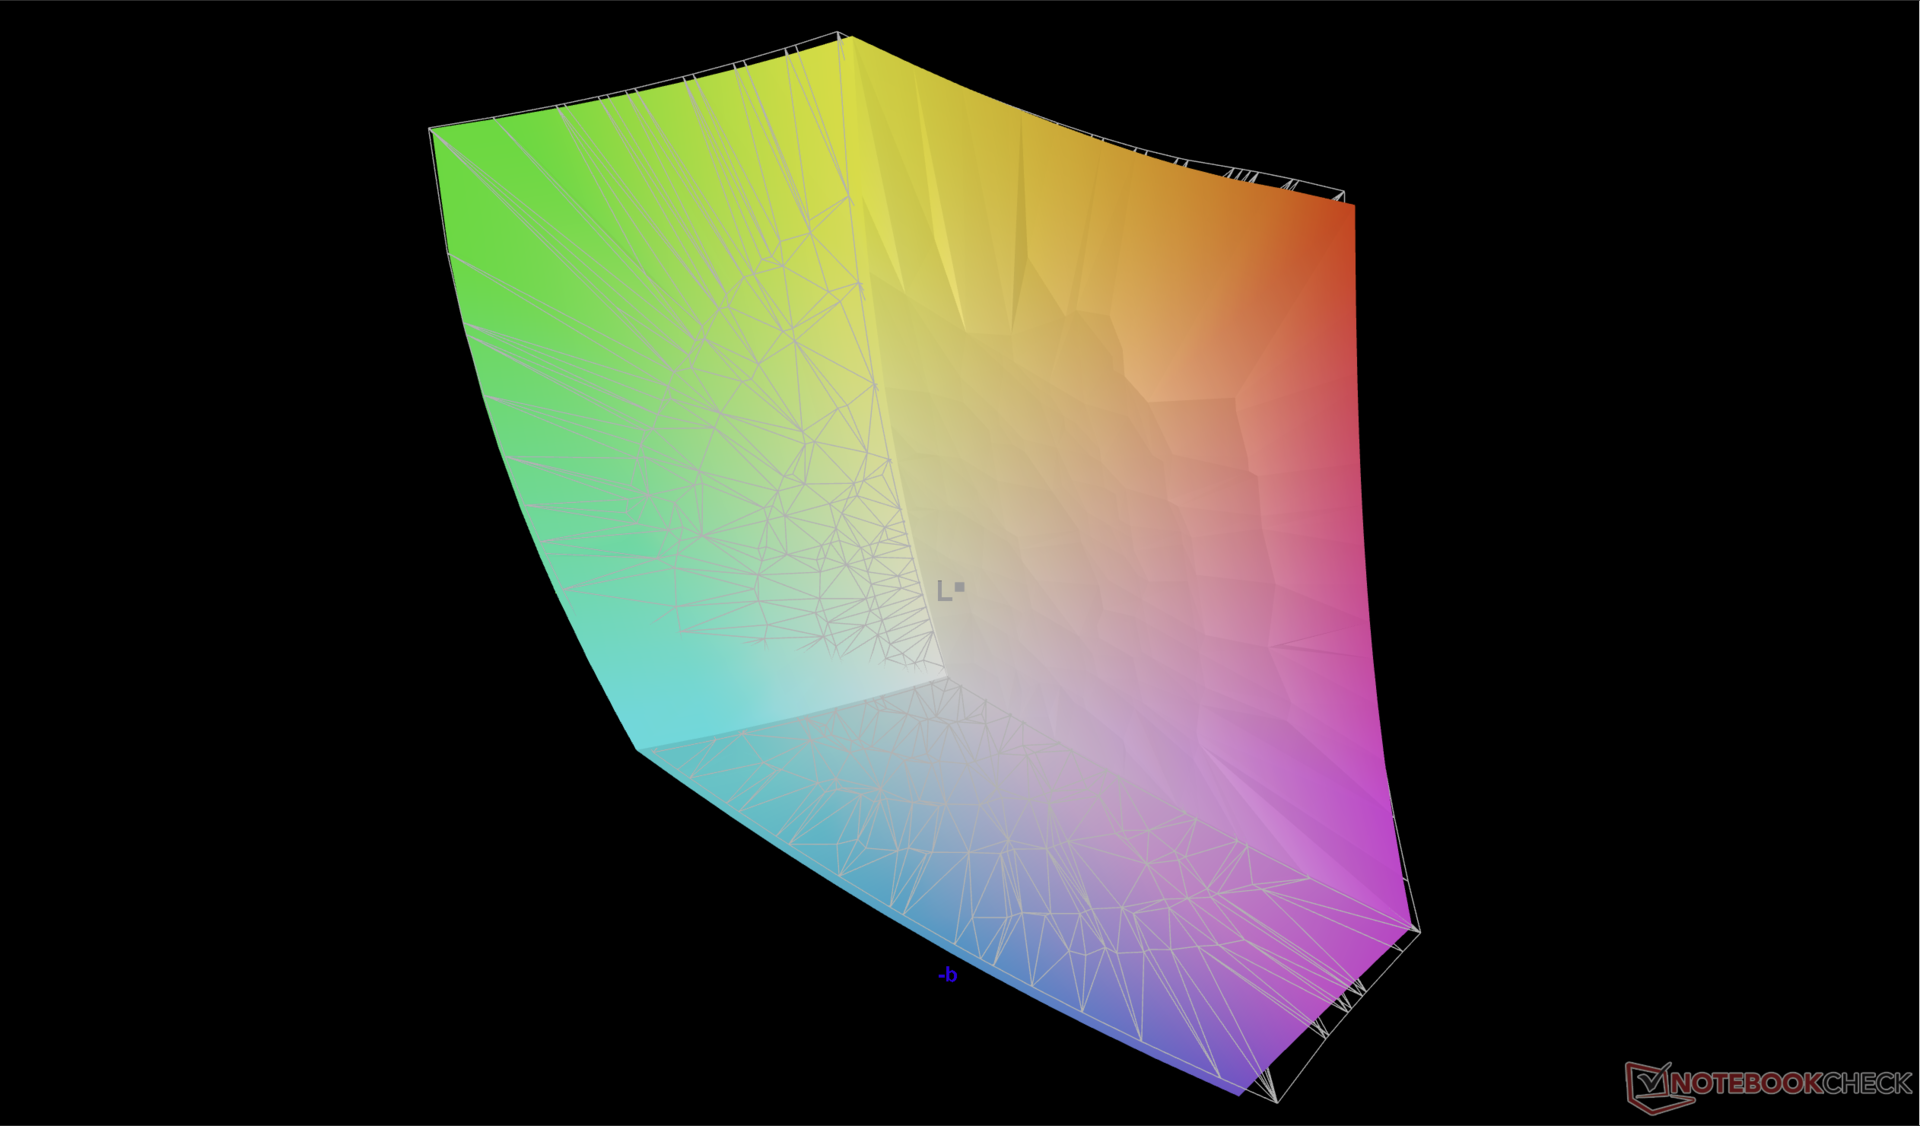
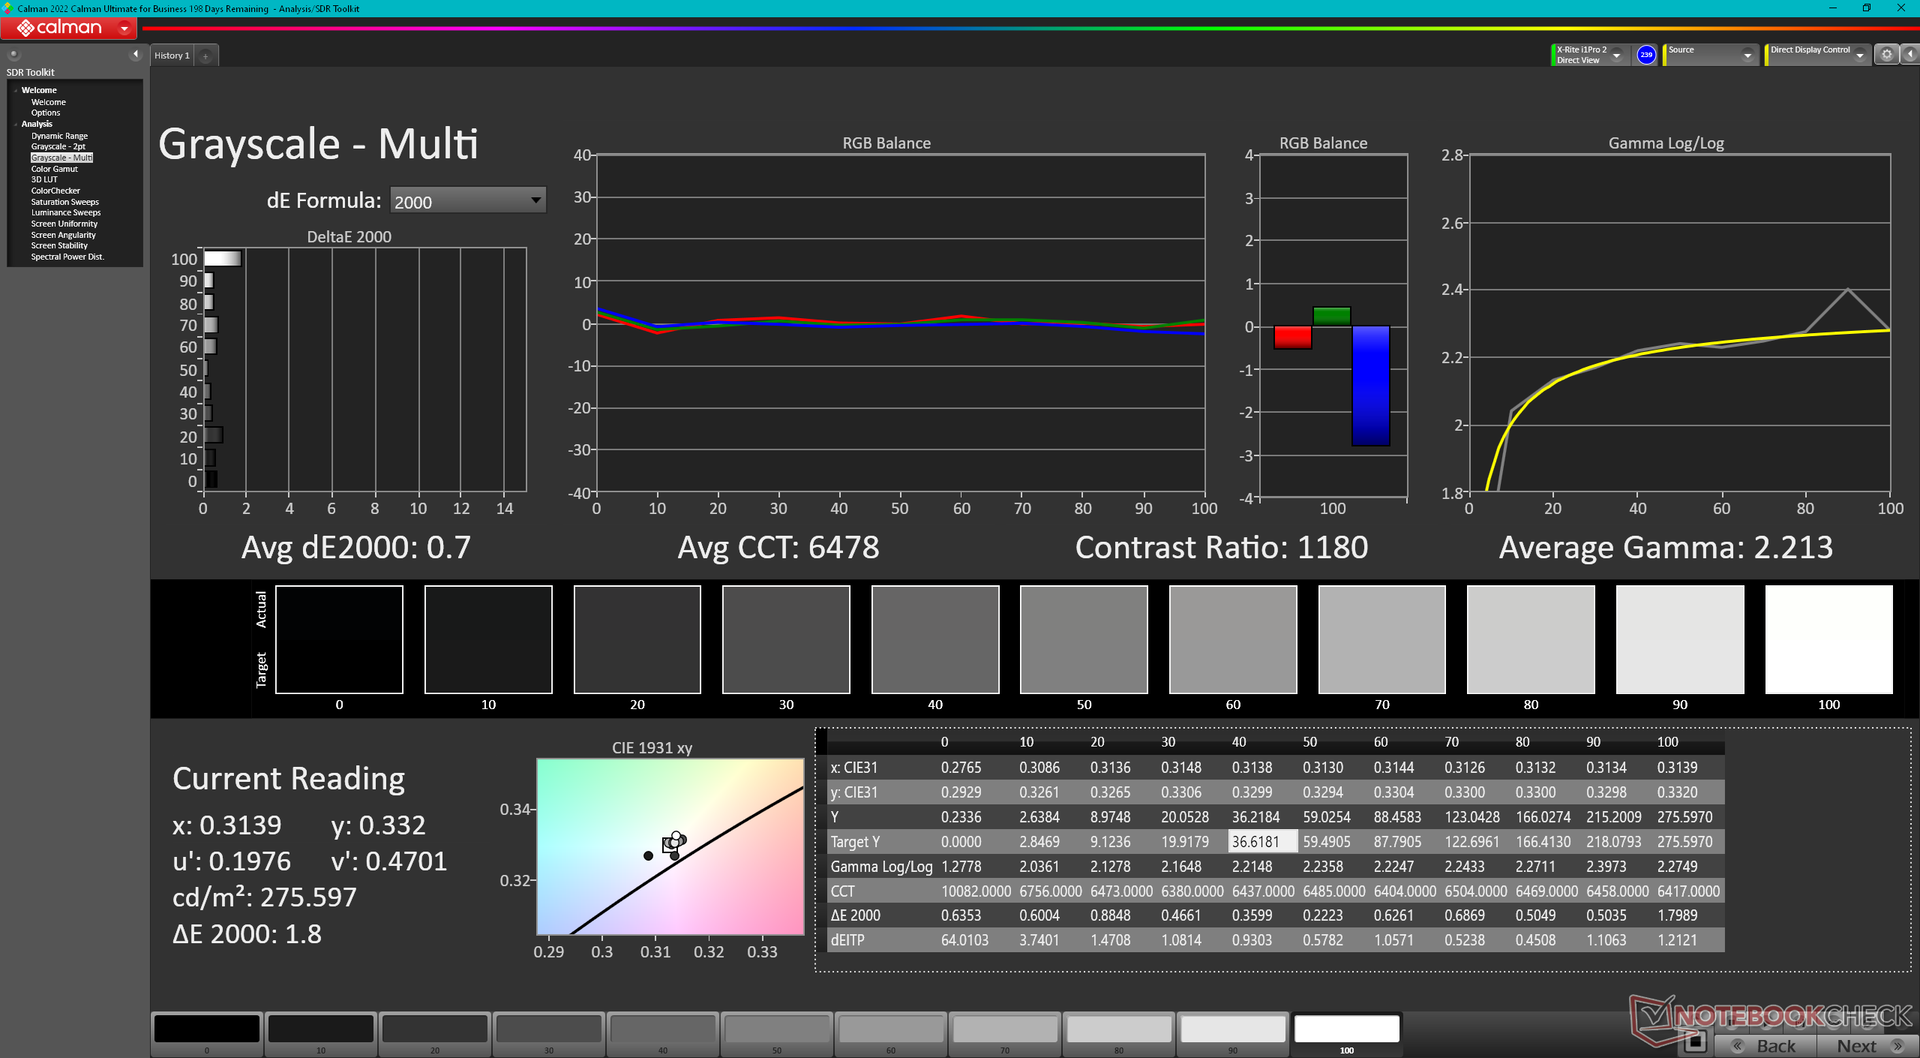
Les niveaux de gris et les couleurs sont assez précis dès la sortie de la boîte, même si l'écran n'est pas pré-calibré. L'étalonnage de l'écran par nos soins permettrait d'améliorer les valeurs deltaE moyennes à <1 afin de mieux exploiter toutes les couleurs du P3. Notre profil ICM calibré peut être téléchargé gratuitement ci-dessus.
Temps de réponse de l'écran
| ↔ Temps de réponse noir à blanc | ||
|---|---|---|
| 10.4 ms ... hausse ↗ et chute ↘ combinées | ↗ 4.8 ms hausse | 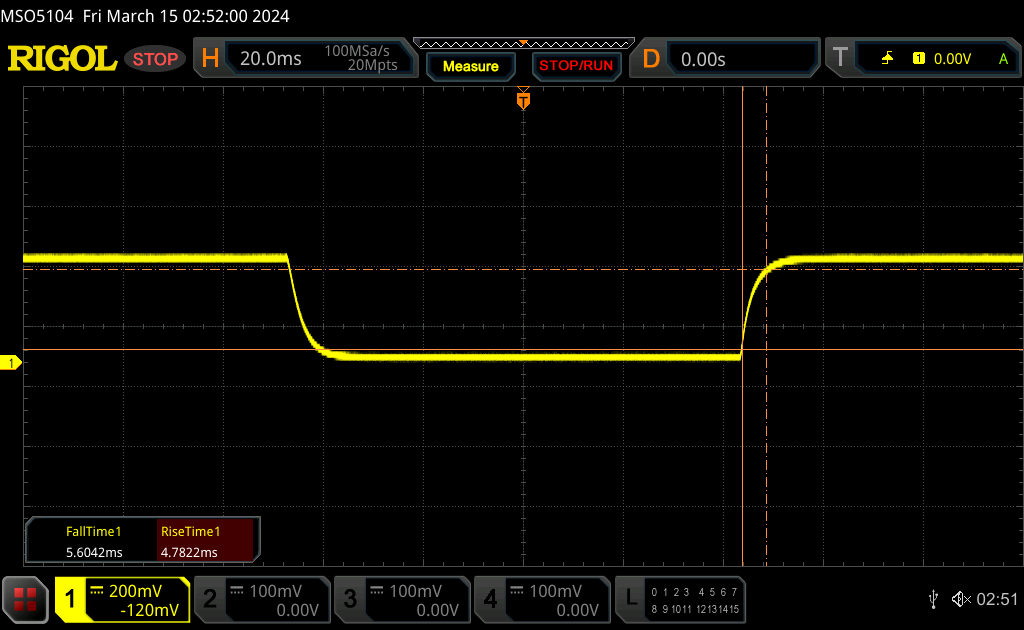 |
| ↘ 5.6 ms chute | ||
| L'écran montre de bons temps de réponse, mais insuffisant pour du jeu compétitif. En comparaison, tous les appareils testés affichent entre 0.1 (minimum) et 240 (maximum) ms. » 28 % des appareils testés affichent de meilleures performances. Cela signifie que les latences relevées sont meilleures que la moyenne (19.8 ms) de tous les appareils testés. | ||
| ↔ Temps de réponse gris 50% à gris 80% | ||
| 5.3 ms ... hausse ↗ et chute ↘ combinées | ↗ 2.2 ms hausse | 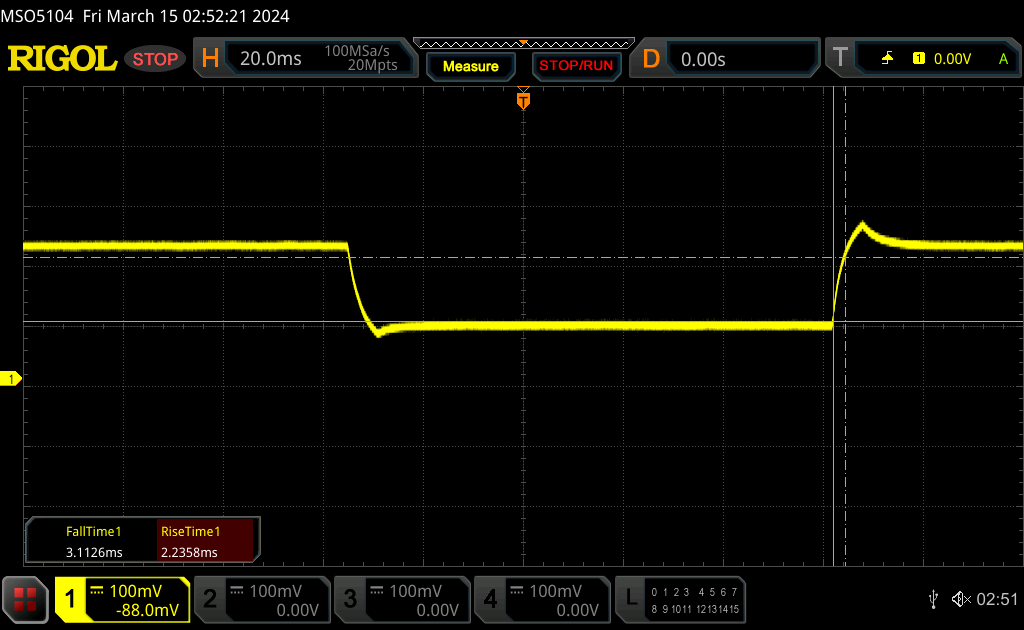 |
| ↘ 3.1 ms chute | ||
| L'écran montre de très faibles temps de réponse, parfait pour le jeu. En comparaison, tous les appareils testés affichent entre 0.165 (minimum) et 636 (maximum) ms. » 18 % des appareils testés affichent de meilleures performances. Cela signifie que les latences relevées sont meilleures que la moyenne (31 ms) de tous les appareils testés. | ||
Scintillement / MLI (Modulation de largeur d'impulsion)
| Scintillement / MLI (Modulation de largeur d'impulsion) non décelé |  | ||
En comparaison, 52 % des appareils testés n'emploient pas MDI pour assombrir leur écran. Nous avons relevé une moyenne à 7757 (minimum : 5 - maximum : 343500) Hz dans le cas où une MDI était active. | |||
Performance - Raptor Lake-HX Refresh
Conditions d'essai
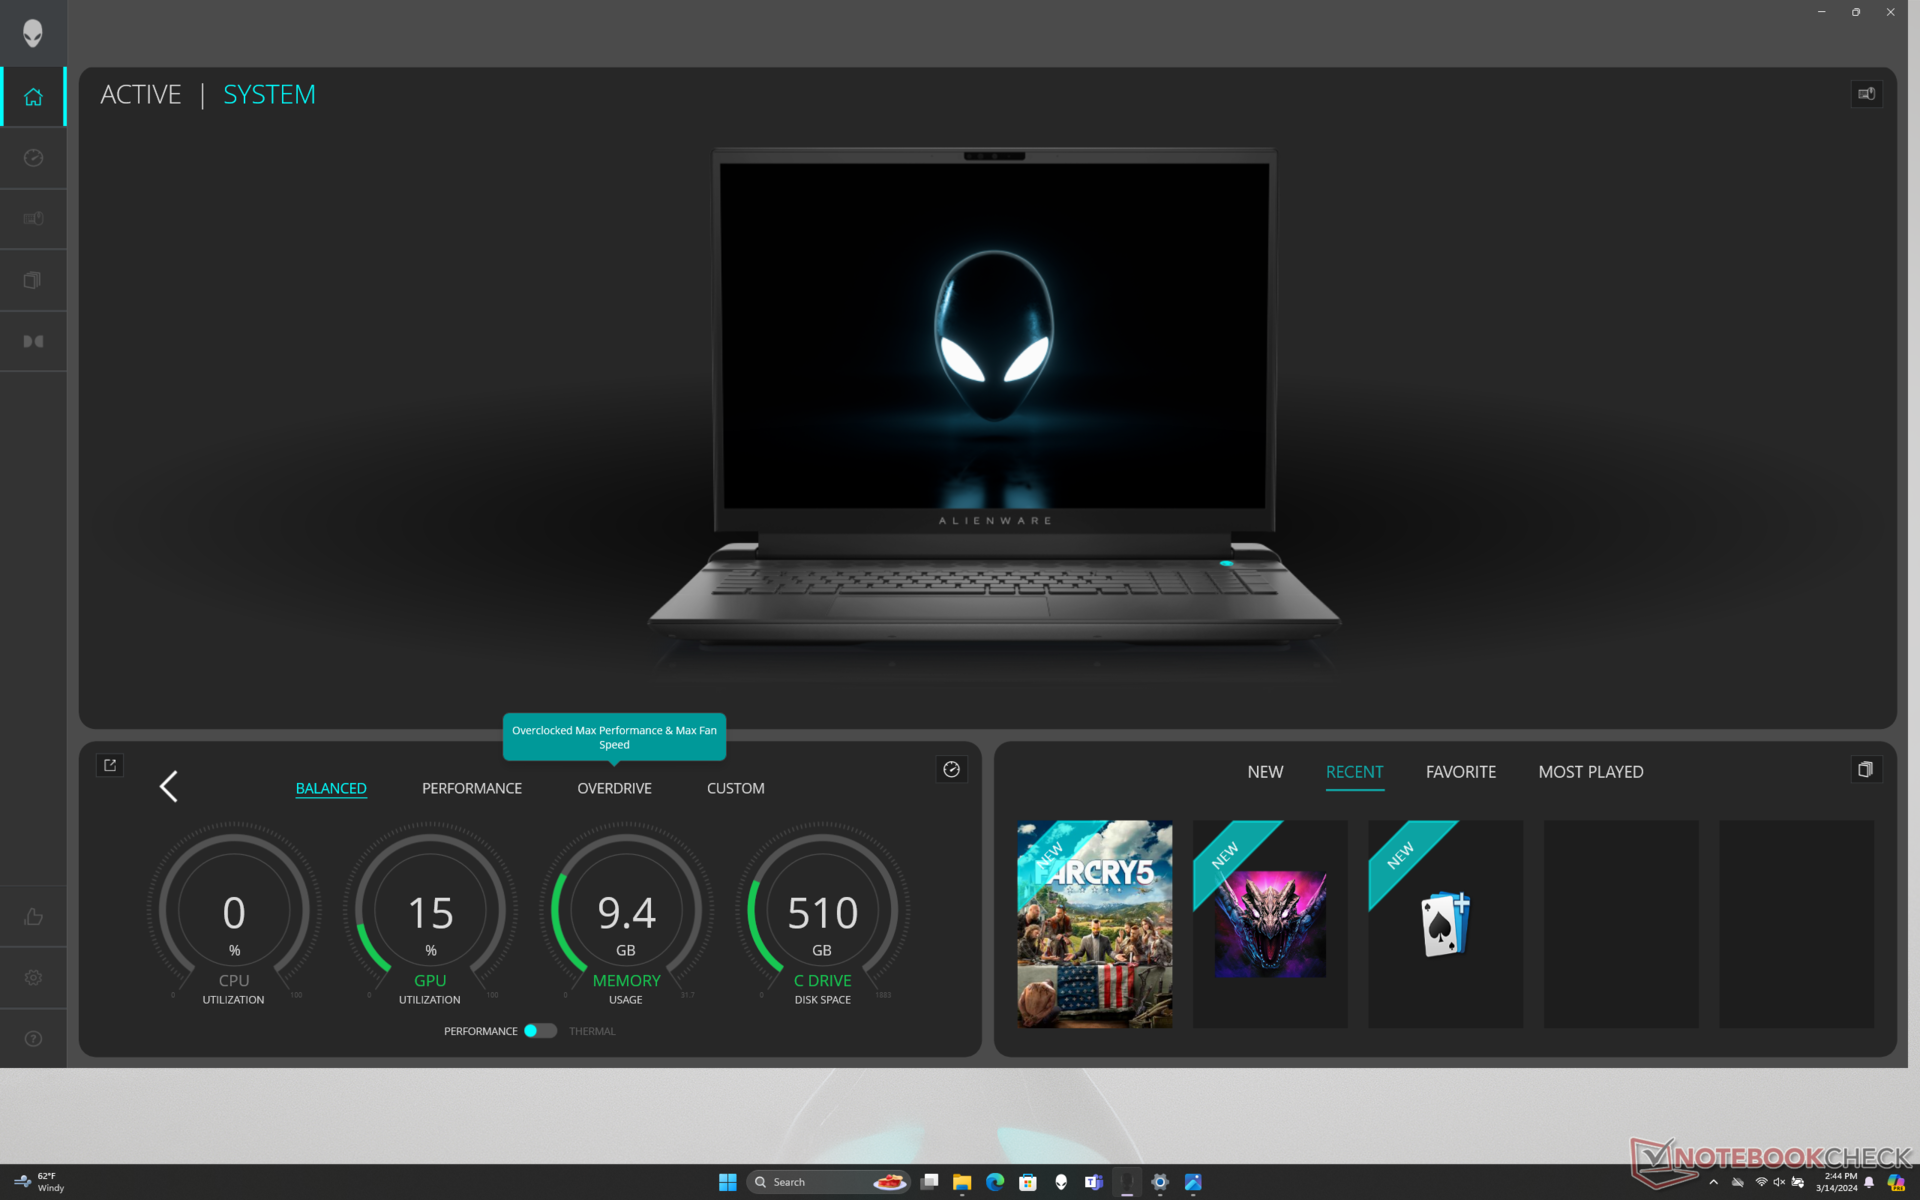
Nous avons réglé Alienware Command Center sur le mode Overdrive et Windows sur le mode Performance avant d'effectuer les tests de référence ci-dessous. Nous avons également réglé le système en mode dGPU via le panneau de configuration Nvidia. Advanced Optimus et MUX sont pris en charge, ce qui signifie qu'aucun redémarrage n'est nécessaire pour passer de l'iGPU au dGPU.
Il est intéressant de noter que nous avons rencontré quelques bugs sur notre unité, tous liés au mode Veille. Le système n'entrait parfois pas correctement en mode Veille lorsque l'on fermait le couvercle et il devenait alors très chaud sans raison. Si cela se produit lors d'un voyage, la batterie peut s'épuiser sans avertissement. En outre, l'écran se fige parfois pendant quelques secondes lorsqu'il sort du mode Veille. Nous pensons qu'il s'agit d'un problème lié au MUX ou à la commutation automatique du GPU.
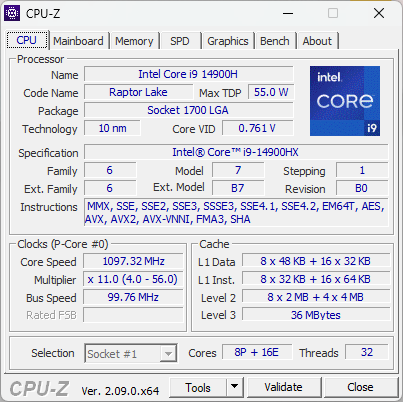
Processeur
Le Core i9-14900HX est une version remaniée du Core i9-13900HX et les différences de performances entre les deux sont au mieux mineures. En fait, le Core i9-13980HX du m18 R1 de l'année dernière surpassait régulièrement notre i9-14900HX de quelques points de pourcentage dans les charges de travail multithread.
Le passage au Core i7-14700HX ou au Core i7-14650HX devrait réduire les performances du processeur d'environ 25 à 30 % et 30 à 35 %, respectivement. Ces processeurs moins performants sont également des rebrands des anciens Core i7-13700HX et Core i7-14750HX.
Cinebench R15 Multi Loop
Cinebench R23: Multi Core | Single Core
Cinebench R20: CPU (Multi Core) | CPU (Single Core)
Cinebench R15: CPU Multi 64Bit | CPU Single 64Bit
Blender: v2.79 BMW27 CPU
7-Zip 18.03: 7z b 4 | 7z b 4 -mmt1
Geekbench 6.7: Multi-Core | Single-Core
Geekbench 5.5: Multi-Core | Single-Core
HWBOT x265 Benchmark v2.2: 4k Preset
LibreOffice : 20 Documents To PDF
R Benchmark 2.5: Overall mean
| CPU Performance rating | |
| Alienware m18 R1 AMD | |
| Alienware m18 R2 | |
| Alienware m18 R1 -2! | |
| MSI Titan 18 HX A14VIG | |
| Acer Predator Helios 18 N23Q2 | |
| Moyenne Intel Core i9-14900HX | |
| Razer Blade 18 RTX 4070 -2! | |
| Asus TUF Gaming A17 FA707XI-NS94 | |
| Asus ROG Strix G18 G814JI -2! | |
| Schenker XMG Apex 17 (Late 23) | |
| Acer Nitro 17 AN17-51-71ER -2! | |
| Acer Nitro 17 AN17-41-R9LN | |
| Geekbench 6.7 / Multi-Core | |
| Alienware m18 R2 | |
| Acer Predator Helios 18 N23Q2 | |
| Moyenne Intel Core i9-14900HX (13158 - 19665, n=37) | |
| MSI Titan 18 HX A14VIG | |
| Alienware m18 R1 AMD | |
| Schenker XMG Apex 17 (Late 23) | |
| Asus TUF Gaming A17 FA707XI-NS94 | |
| Acer Nitro 17 AN17-41-R9LN | |
| Geekbench 6.7 / Single-Core | |
| Alienware m18 R2 | |
| Moyenne Intel Core i9-14900HX (2419 - 3129, n=37) | |
| Acer Predator Helios 18 N23Q2 | |
| Alienware m18 R1 AMD | |
| MSI Titan 18 HX A14VIG | |
| Asus TUF Gaming A17 FA707XI-NS94 | |
| Schenker XMG Apex 17 (Late 23) | |
| Acer Nitro 17 AN17-41-R9LN | |
* ... Moindre est la valeur, meilleures sont les performances
AIDA64: FP32 Ray-Trace | FPU Julia | CPU SHA3 | CPU Queen | FPU SinJulia | FPU Mandel | CPU AES | CPU ZLib | FP64 Ray-Trace | CPU PhotoWorxx
| Performance rating | |
| Alienware m18 R1 AMD | |
| Acer Predator Helios 18 N23Q2 | |
| Alienware m18 R1 | |
| Alienware m18 R2 | |
| MSI Titan 18 HX A14VIG | |
| Moyenne Intel Core i9-14900HX | |
| Asus ROG Strix G18 G814JI | |
| AIDA64 / FP32 Ray-Trace | |
| Alienware m18 R1 AMD | |
| Alienware m18 R1 | |
| MSI Titan 18 HX A14VIG | |
| Alienware m18 R2 | |
| Acer Predator Helios 18 N23Q2 | |
| Moyenne Intel Core i9-14900HX (13098 - 33474, n=36) | |
| Asus ROG Strix G18 G814JI | |
| AIDA64 / FPU Julia | |
| Alienware m18 R1 AMD | |
| MSI Titan 18 HX A14VIG | |
| Alienware m18 R1 | |
| Alienware m18 R2 | |
| Acer Predator Helios 18 N23Q2 | |
| Moyenne Intel Core i9-14900HX (67573 - 166040, n=36) | |
| Asus ROG Strix G18 G814JI | |
| AIDA64 / CPU SHA3 | |
| Alienware m18 R1 AMD | |
| MSI Titan 18 HX A14VIG | |
| Alienware m18 R1 | |
| Alienware m18 R2 | |
| Acer Predator Helios 18 N23Q2 | |
| Moyenne Intel Core i9-14900HX (3589 - 7979, n=36) | |
| Asus ROG Strix G18 G814JI | |
| AIDA64 / CPU Queen | |
| Alienware m18 R1 AMD | |
| MSI Titan 18 HX A14VIG | |
| Alienware m18 R1 | |
| Alienware m18 R2 | |
| Moyenne Intel Core i9-14900HX (118405 - 148966, n=36) | |
| Acer Predator Helios 18 N23Q2 | |
| Asus ROG Strix G18 G814JI | |
| AIDA64 / FPU SinJulia | |
| Alienware m18 R1 AMD | |
| MSI Titan 18 HX A14VIG | |
| Alienware m18 R1 | |
| Alienware m18 R2 | |
| Acer Predator Helios 18 N23Q2 | |
| Moyenne Intel Core i9-14900HX (10475 - 18517, n=36) | |
| Asus ROG Strix G18 G814JI | |
| AIDA64 / FPU Mandel | |
| Alienware m18 R1 AMD | |
| Alienware m18 R1 | |
| Alienware m18 R2 | |
| MSI Titan 18 HX A14VIG | |
| Acer Predator Helios 18 N23Q2 | |
| Moyenne Intel Core i9-14900HX (32543 - 83662, n=36) | |
| Asus ROG Strix G18 G814JI | |
| AIDA64 / CPU AES | |
| Acer Predator Helios 18 N23Q2 | |
| Alienware m18 R1 AMD | |
| Moyenne Intel Core i9-14900HX (86964 - 241777, n=36) | |
| MSI Titan 18 HX A14VIG | |
| Alienware m18 R1 | |
| Alienware m18 R2 | |
| Asus ROG Strix G18 G814JI | |
| AIDA64 / CPU ZLib | |
| Alienware m18 R1 AMD | |
| MSI Titan 18 HX A14VIG | |
| Alienware m18 R2 | |
| Alienware m18 R1 | |
| Acer Predator Helios 18 N23Q2 | |
| Moyenne Intel Core i9-14900HX (1054 - 2292, n=36) | |
| Asus ROG Strix G18 G814JI | |
| AIDA64 / FP64 Ray-Trace | |
| Alienware m18 R1 AMD | |
| Alienware m18 R1 | |
| Alienware m18 R2 | |
| MSI Titan 18 HX A14VIG | |
| Acer Predator Helios 18 N23Q2 | |
| Moyenne Intel Core i9-14900HX (6809 - 18349, n=36) | |
| Asus ROG Strix G18 G814JI | |
| AIDA64 / CPU PhotoWorxx | |
| Alienware m18 R1 | |
| Acer Predator Helios 18 N23Q2 | |
| Alienware m18 R2 | |
| Moyenne Intel Core i9-14900HX (23903 - 54702, n=36) | |
| Asus ROG Strix G18 G814JI | |
| Alienware m18 R1 AMD | |
| MSI Titan 18 HX A14VIG | |
Test de stress
La température du cœur lors de l'exécution du stress Prime95 se stabilise à 100°C, similaire à ce que nous avons observé sur le m18 R1 de l'année dernière, malgré le passage à un processeur plus récent. Les fréquences d'horloge semblent fluctuer plus fréquemment sur le i9-14900HX, cependant, ce qui peut expliquer ses performances légèrement plus lentes que celles du i9-13980HX, comme mentionné ci-dessus.
Les fréquences d'horloge du GPU et la consommation d'énergie de la carte ne changent pratiquement pas lorsque l'on passe des modes Balanced, Performance et Overdrive, ce qui correspond aux résultats de notre test Fire Strike dans la section Performances du GPU ci-dessous. Ce comportement est différent de celui de la plupart des autres ordinateurs portables de jeu où l'écart de performance est plus important entre les modes Équilibré et Performance.
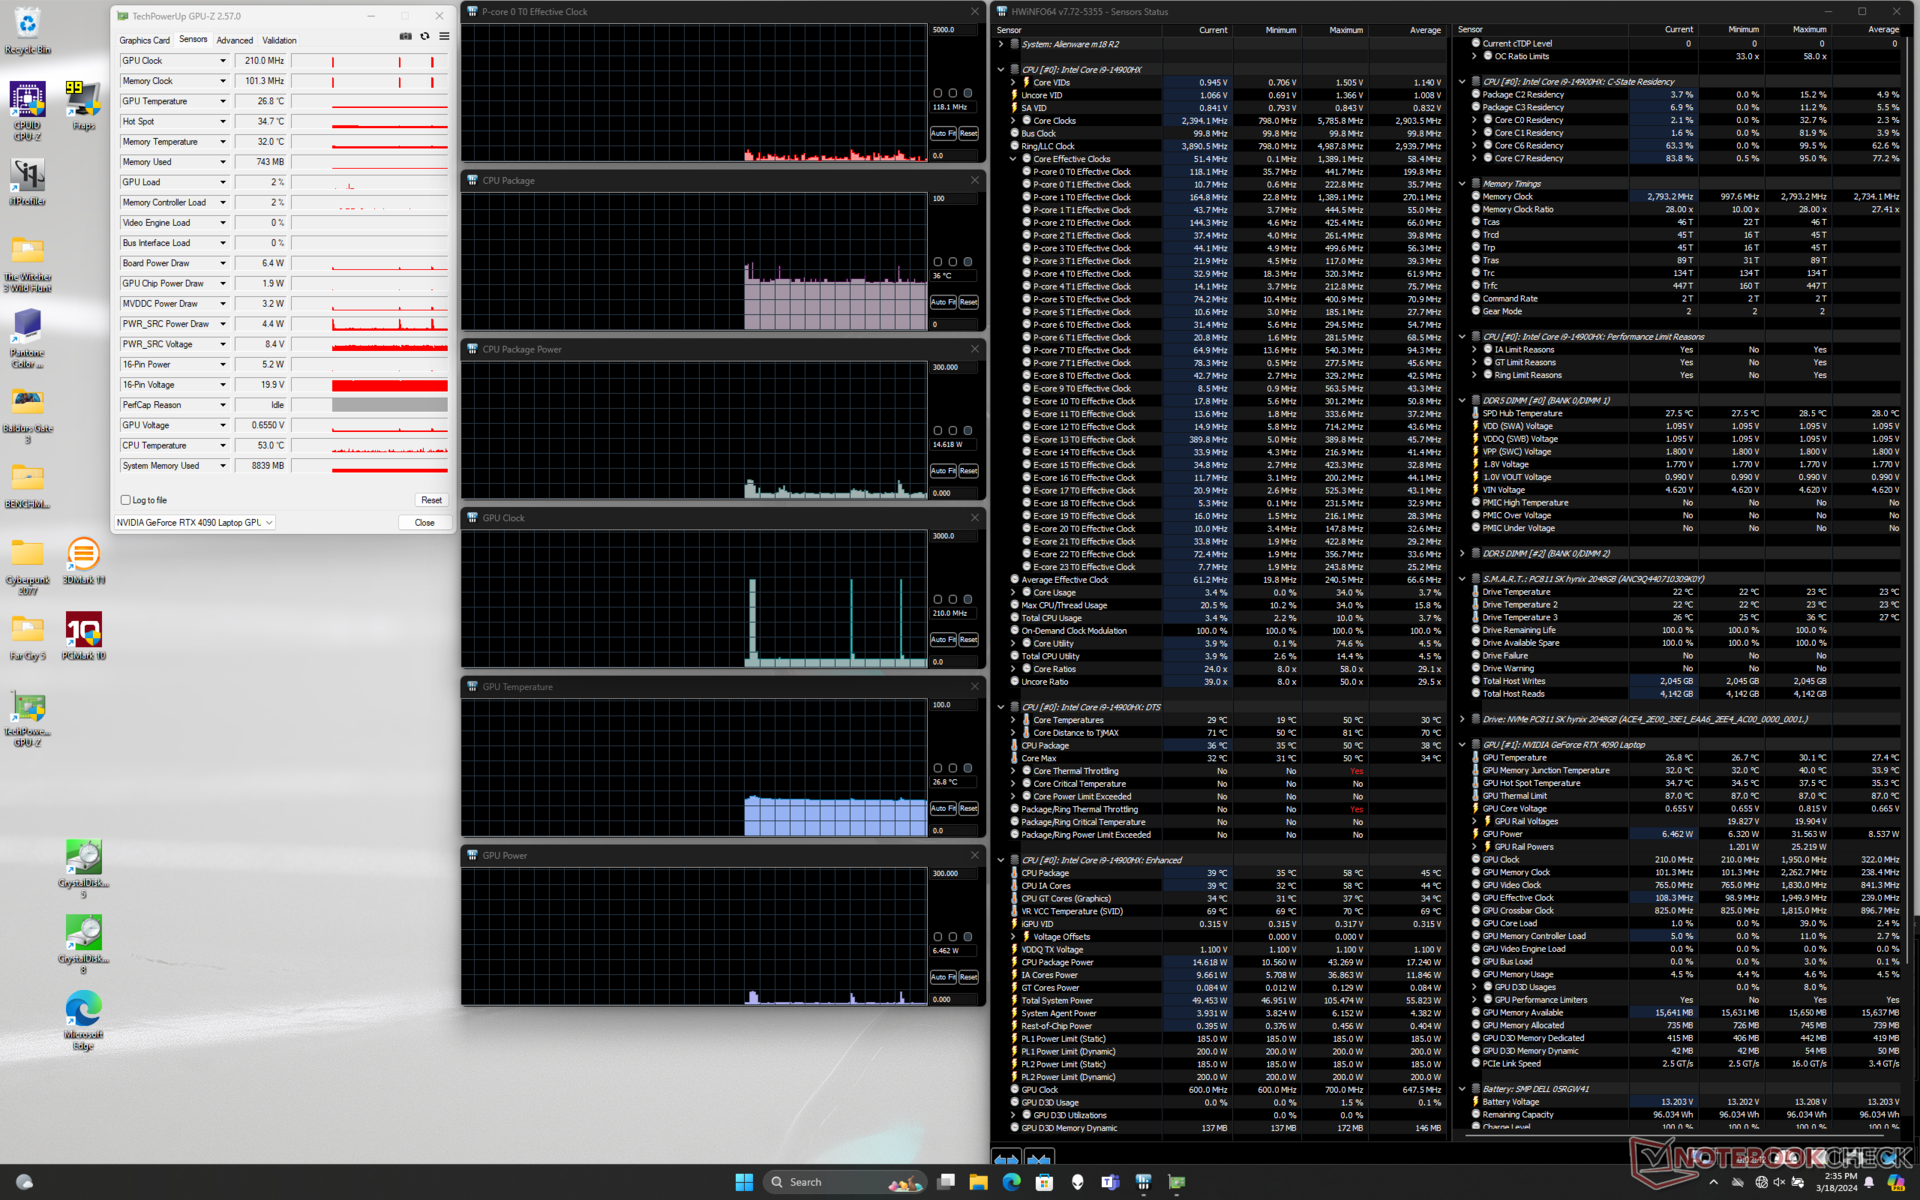
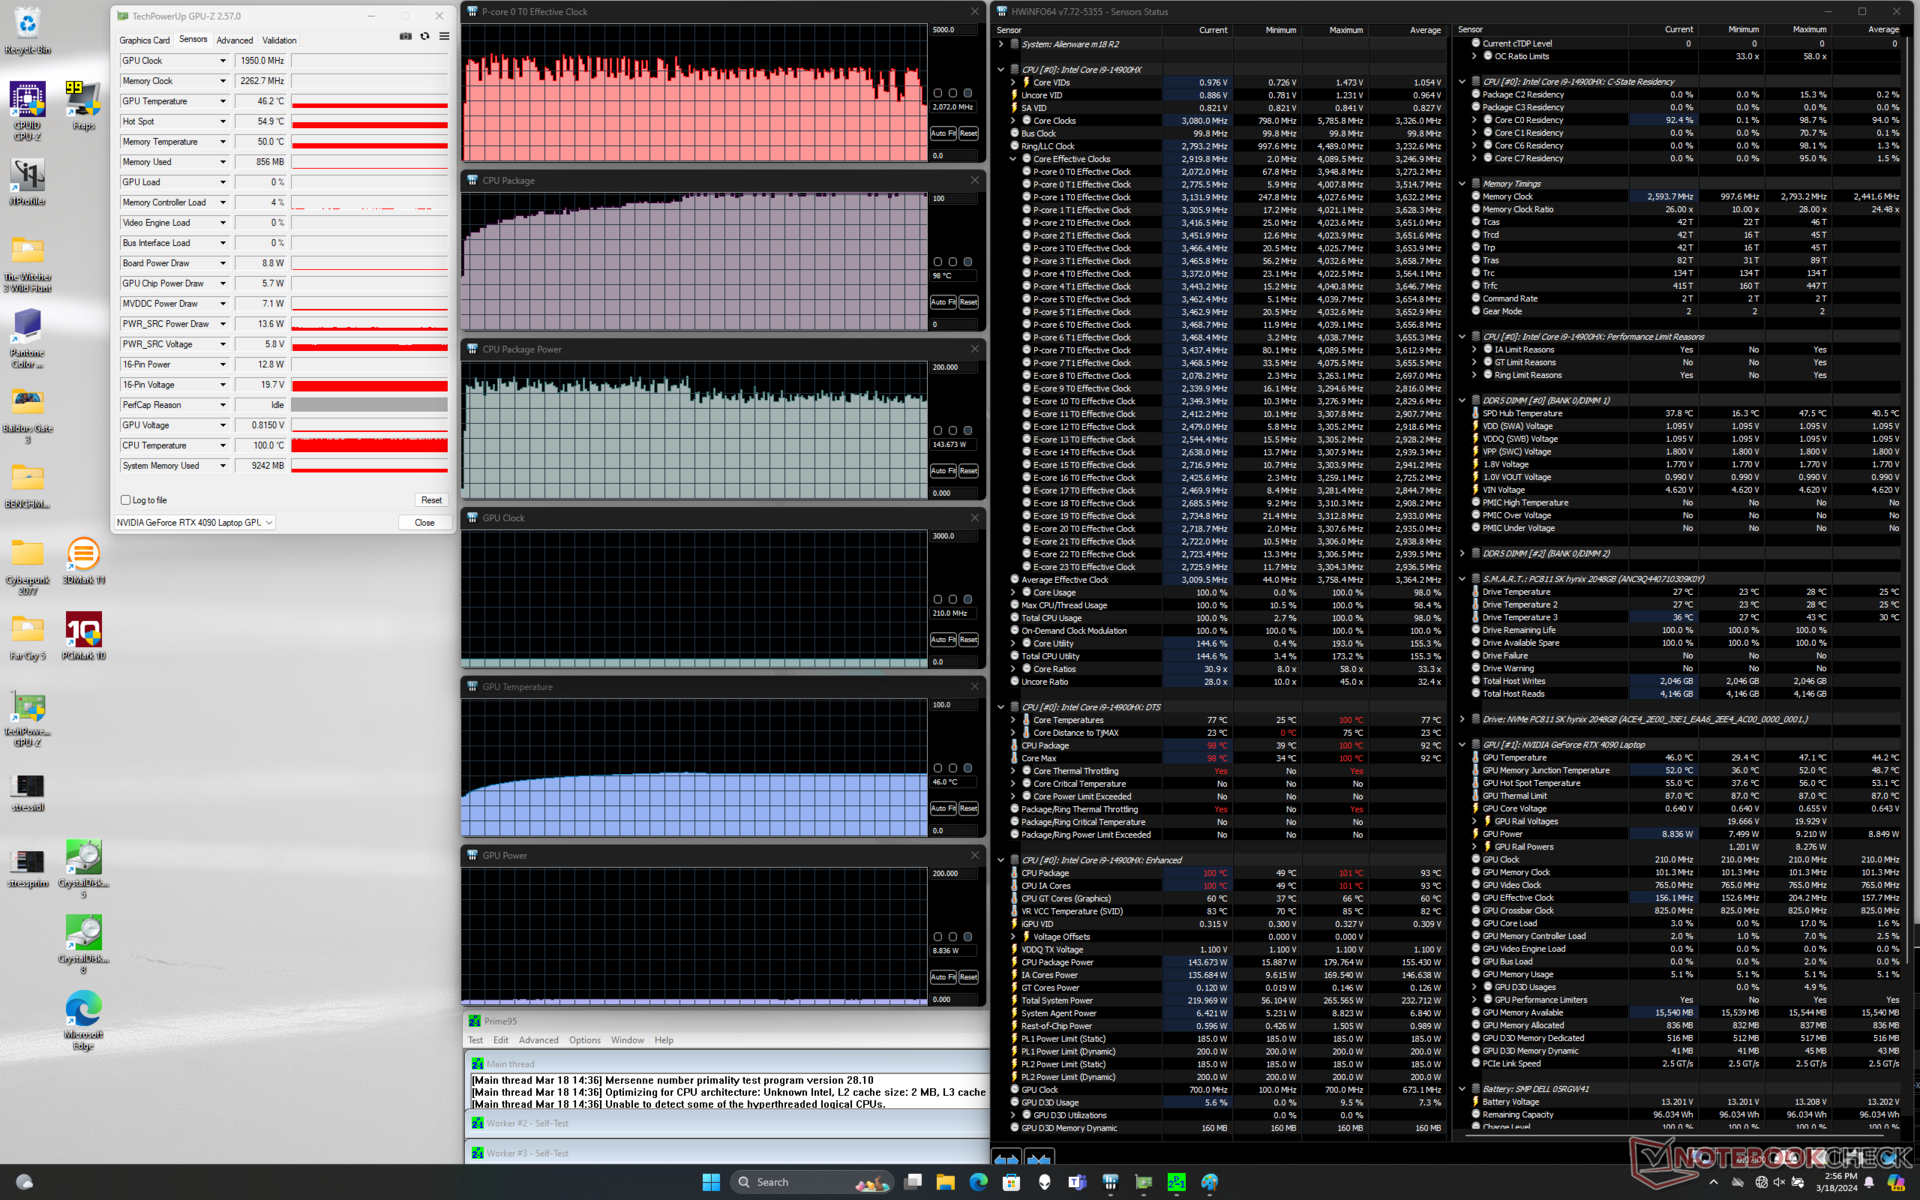
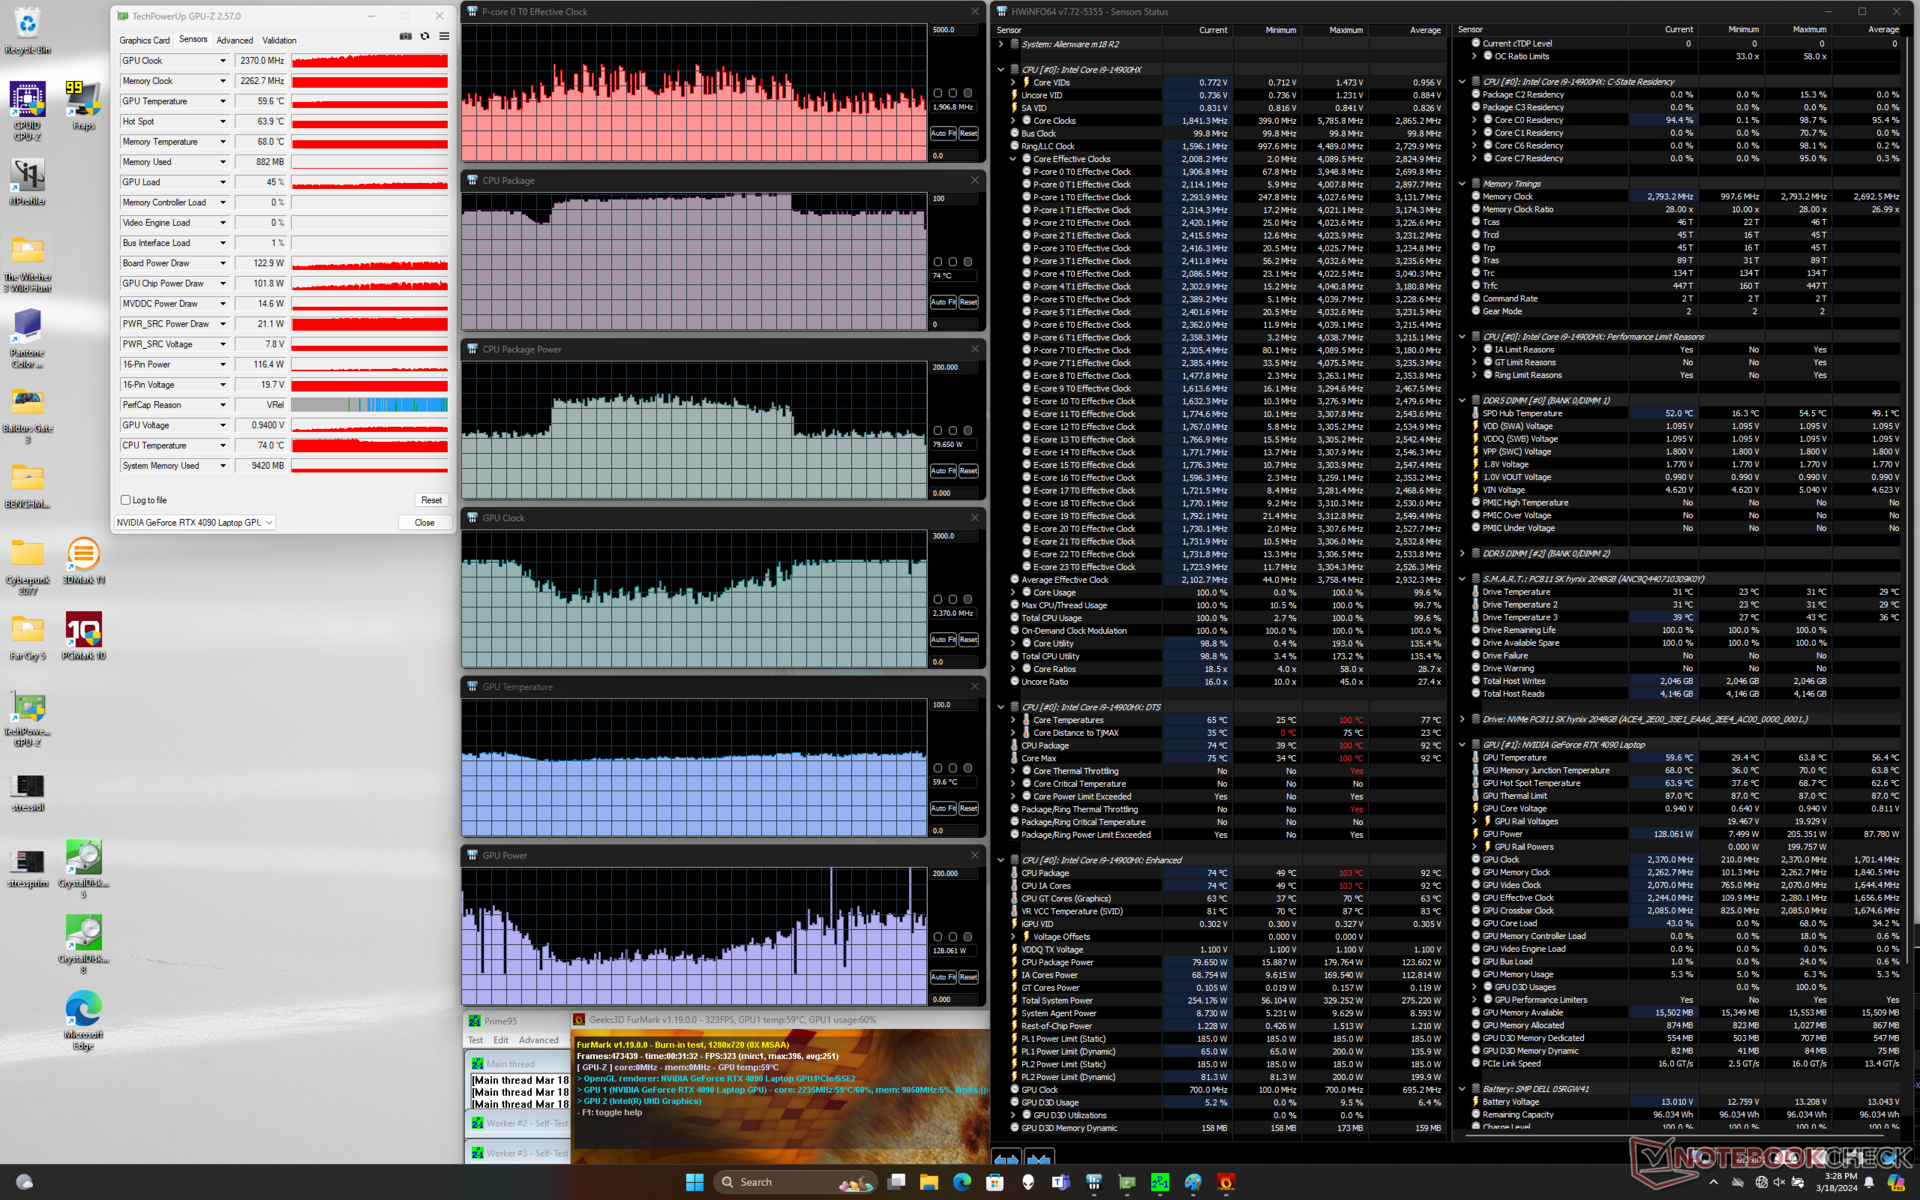
| Horloge du CPU (GHz) | Horloge du GPU (MHz) | Température moyenne du CPU (°C) | Température moyenne du GPU (°C) | |
| Système en veille | -- | -- | 36 | 27 |
| Prime95 Stress | 2.1 - 3.3 | -- | 99 | 46 |
| Prime95 + FurMark Stress | 1.7 - 3.7 | 1350 - 2370 | 74 - 100 | 54 - 61 |
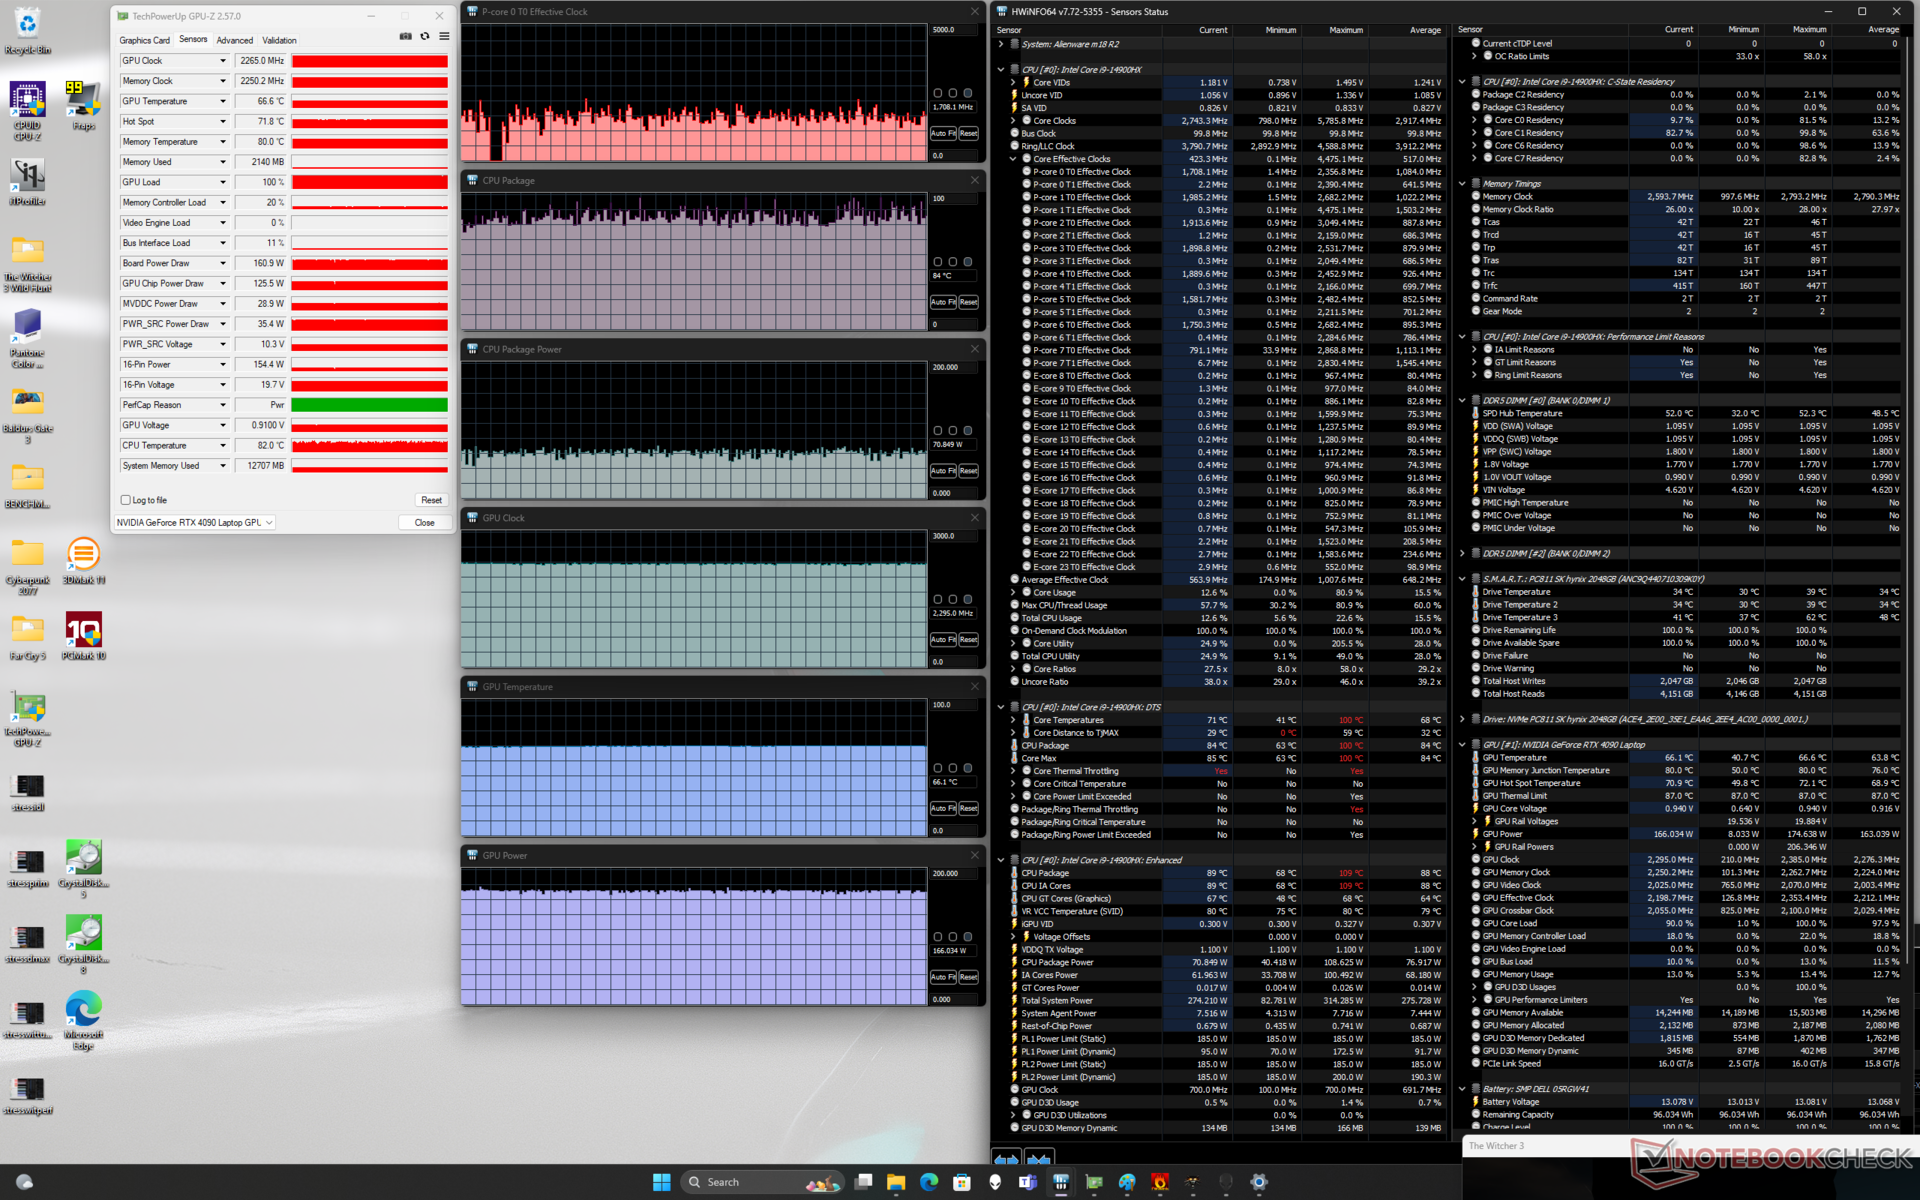
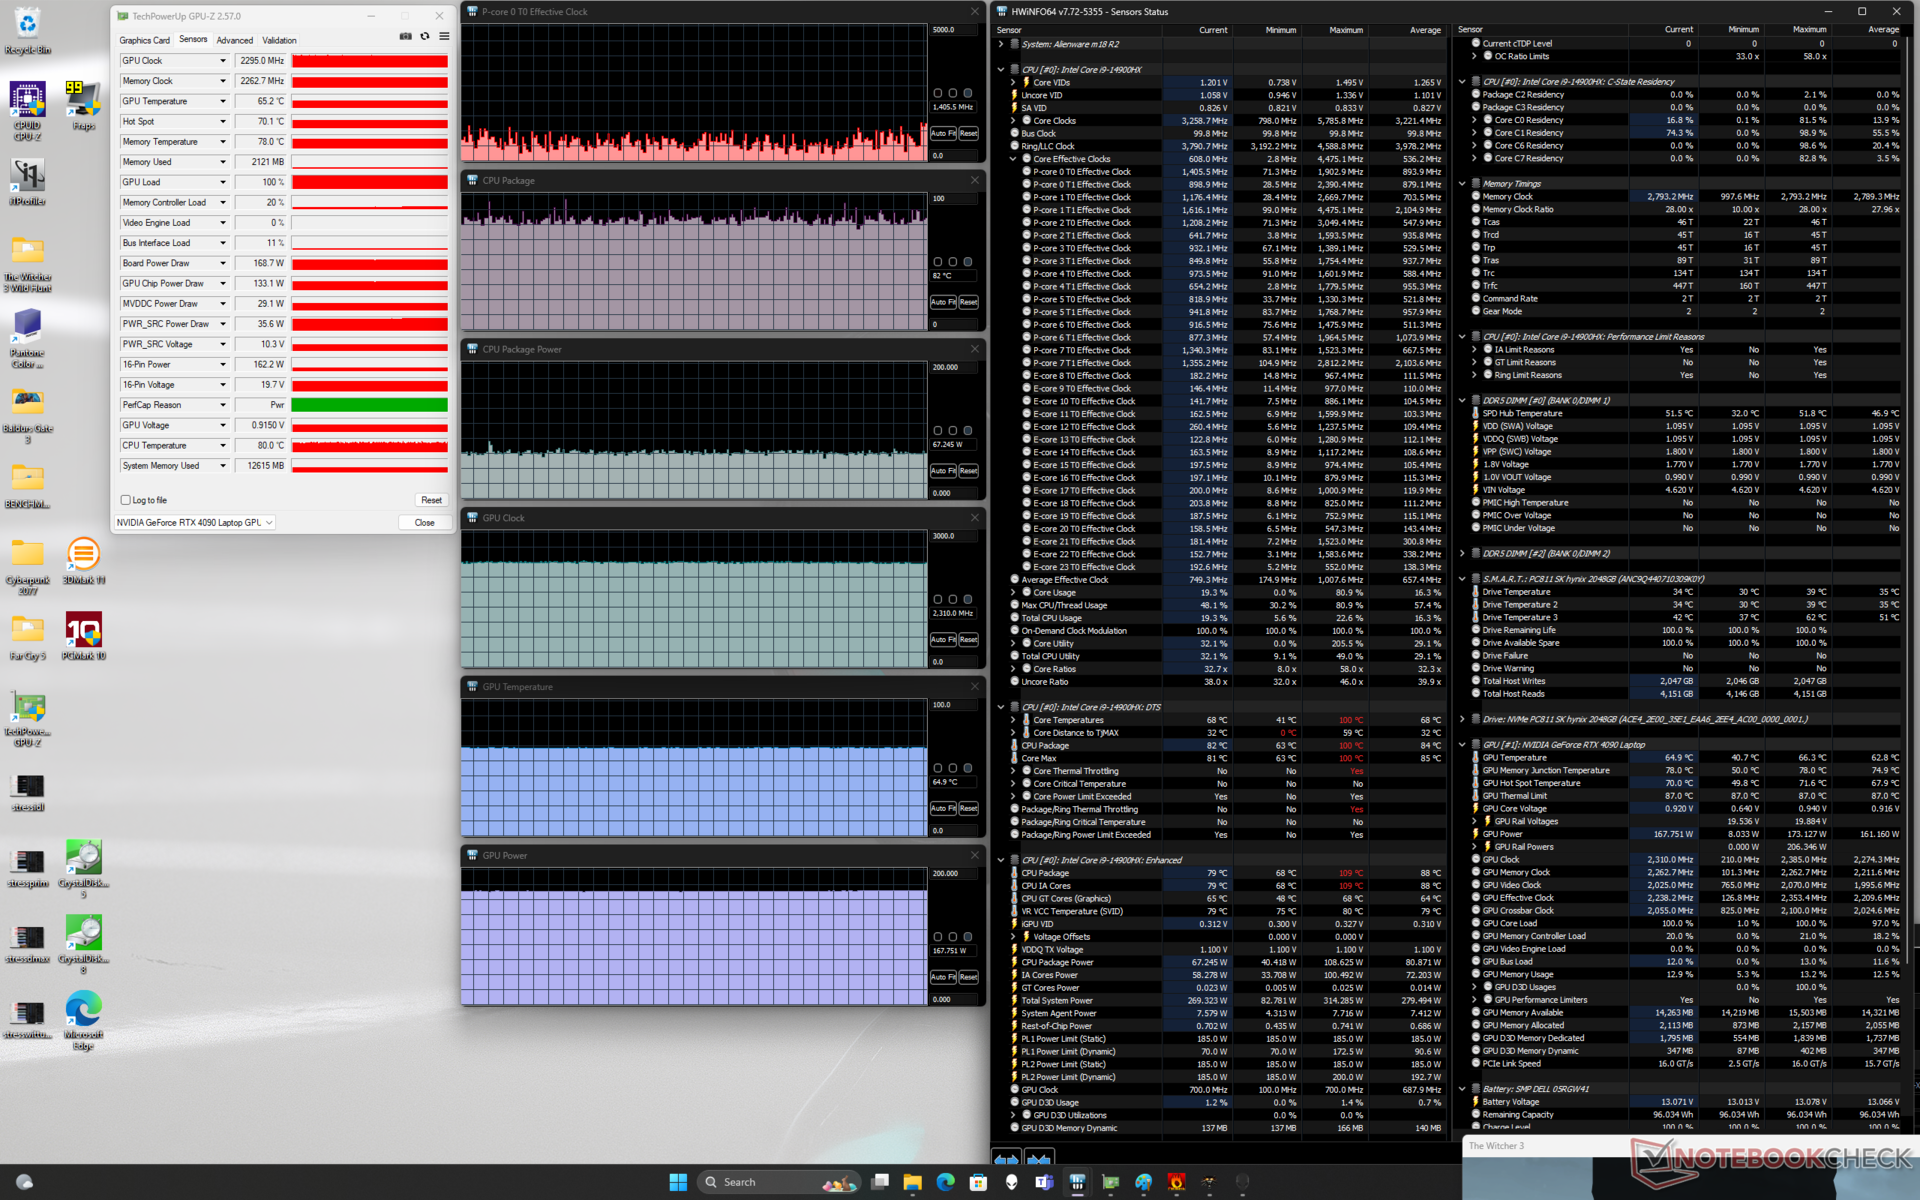
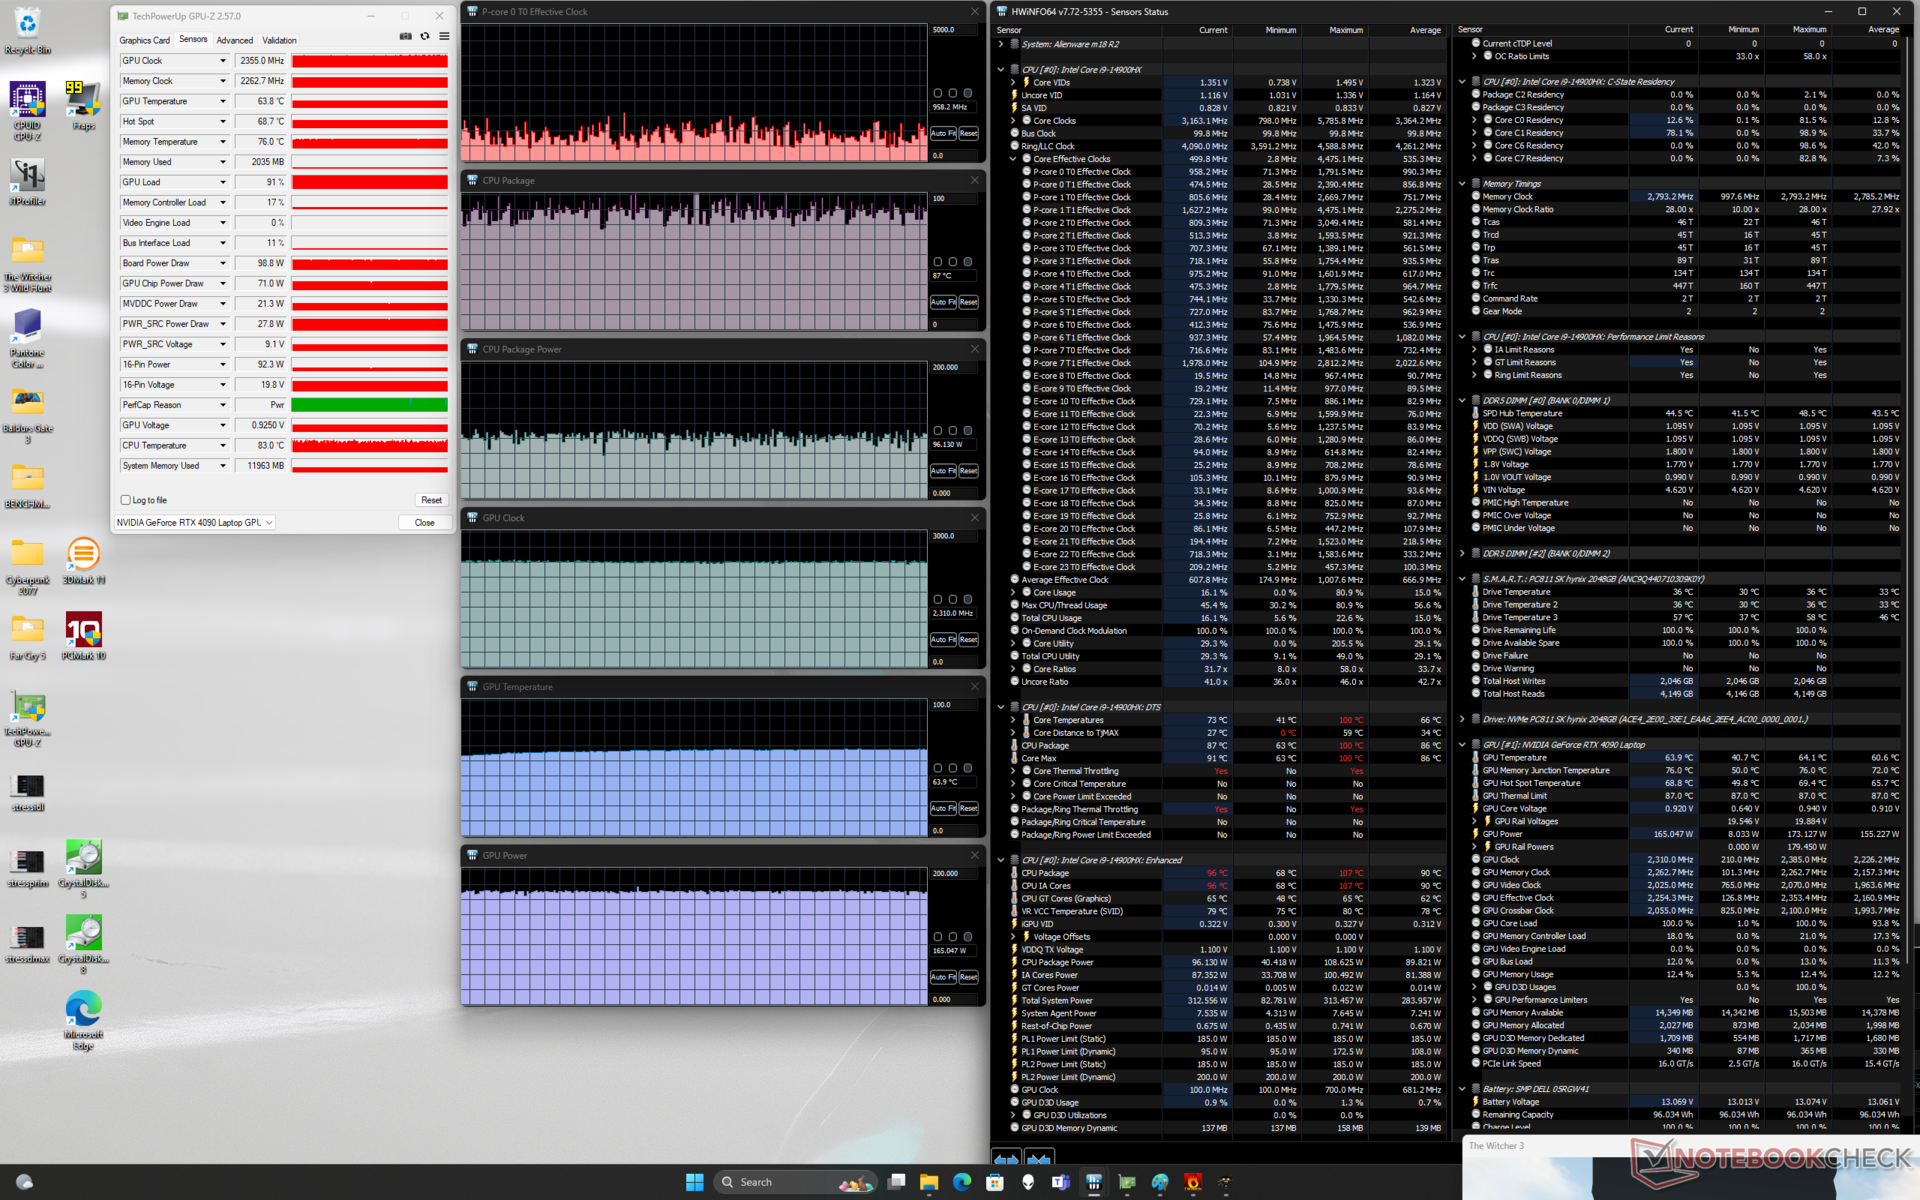
| Witcher 3 Stress(mode équilibré) | ~1.7 | 2295 | ~84 | 66 |
| Witcher 3 Stress (mode Performance) | ~1.4 | 2310 | ~82 | 65 |
| Witcher 3 Stress (mode Overdrive) | ~1.0 | 2310 | ~87 | 64 |
Performance du système
CrossMark: Overall | Productivity | Creativity | Responsiveness
WebXPRT 3: Overall
WebXPRT 4: Overall
Mozilla Kraken 1.1: Total
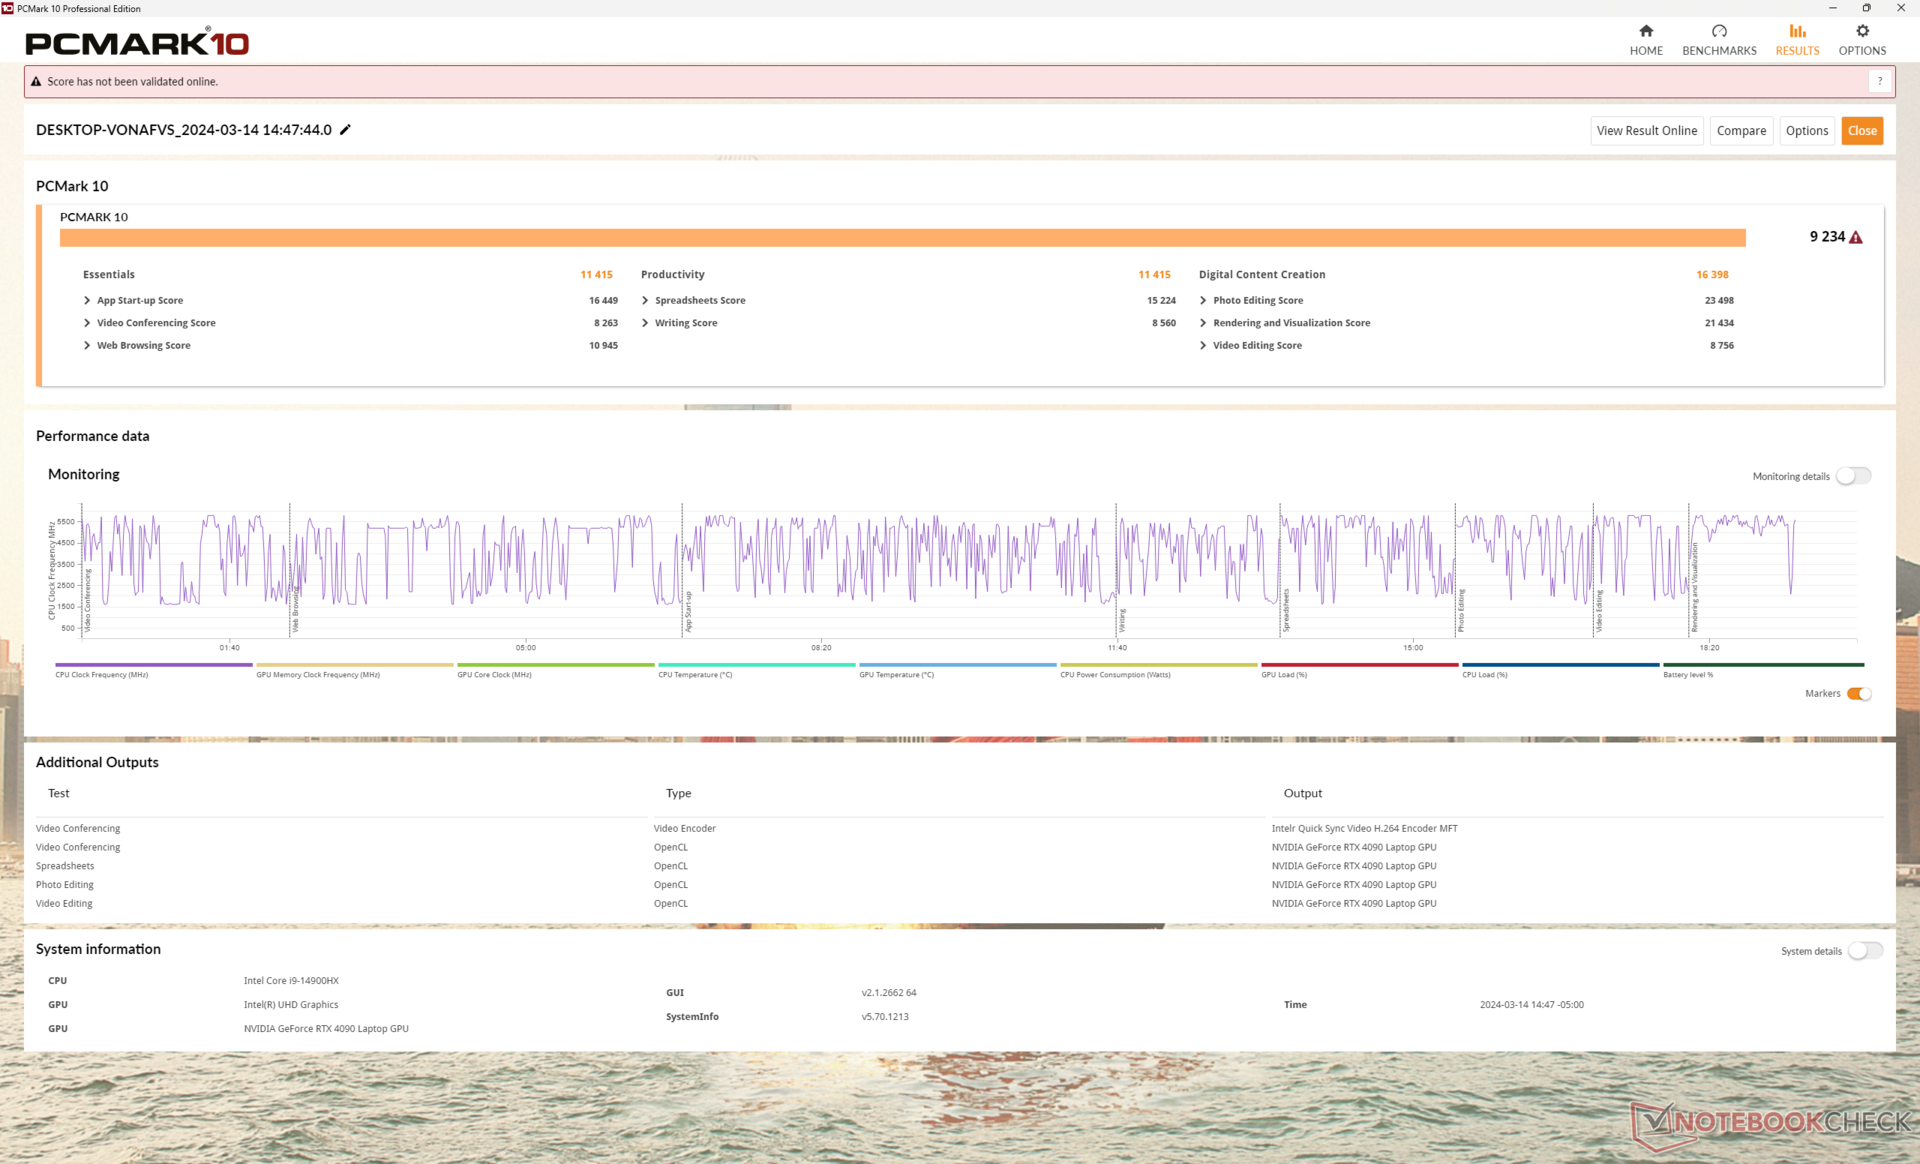
| PCMark 10 / Score | |
| Alienware m18 R1 AMD | |
| Alienware m18 R2 | |
| MSI Titan 18 HX A14VIG | |
| Alienware m18 R1 | |
| Moyenne Intel Core i9-14900HX, NVIDIA GeForce RTX 4090 Laptop GPU (8230 - 9234, n=13) | |
| Acer Predator Helios 18 N23Q2 | |
| Asus ROG Strix G18 G814JI | |
| PCMark 10 / Essentials | |
| Alienware m18 R1 AMD | |
| MSI Titan 18 HX A14VIG | |
| Alienware m18 R2 | |
| Alienware m18 R1 | |
| Moyenne Intel Core i9-14900HX, NVIDIA GeForce RTX 4090 Laptop GPU (10778 - 11628, n=13) | |
| Acer Predator Helios 18 N23Q2 | |
| Asus ROG Strix G18 G814JI | |
| PCMark 10 / Productivity | |
| Alienware m18 R2 | |
| Alienware m18 R1 AMD | |
| Moyenne Intel Core i9-14900HX, NVIDIA GeForce RTX 4090 Laptop GPU (9458 - 11759, n=13) | |
| Acer Predator Helios 18 N23Q2 | |
| MSI Titan 18 HX A14VIG | |
| Alienware m18 R1 | |
| Asus ROG Strix G18 G814JI | |
| PCMark 10 / Digital Content Creation | |
| Alienware m18 R1 AMD | |
| MSI Titan 18 HX A14VIG | |
| Alienware m18 R2 | |
| Alienware m18 R1 | |
| Moyenne Intel Core i9-14900HX, NVIDIA GeForce RTX 4090 Laptop GPU (13219 - 16462, n=13) | |
| Acer Predator Helios 18 N23Q2 | |
| Asus ROG Strix G18 G814JI | |
| CrossMark / Overall | |
| Acer Predator Helios 18 N23Q2 | |
| Alienware m18 R1 | |
| Moyenne Intel Core i9-14900HX, NVIDIA GeForce RTX 4090 Laptop GPU (1877 - 2344, n=10) | |
| Alienware m18 R2 | |
| Alienware m18 R1 AMD | |
| MSI Titan 18 HX A14VIG | |
| CrossMark / Productivity | |
| Acer Predator Helios 18 N23Q2 | |
| Alienware m18 R1 | |
| Moyenne Intel Core i9-14900HX, NVIDIA GeForce RTX 4090 Laptop GPU (1738 - 2162, n=10) | |
| Alienware m18 R2 | |
| Alienware m18 R1 AMD | |
| MSI Titan 18 HX A14VIG | |
| CrossMark / Creativity | |
| Alienware m18 R1 | |
| Acer Predator Helios 18 N23Q2 | |
| Alienware m18 R2 | |
| Moyenne Intel Core i9-14900HX, NVIDIA GeForce RTX 4090 Laptop GPU (2195 - 2660, n=10) | |
| Alienware m18 R1 AMD | |
| MSI Titan 18 HX A14VIG | |
| CrossMark / Responsiveness | |
| Acer Predator Helios 18 N23Q2 | |
| Alienware m18 R1 | |
| Moyenne Intel Core i9-14900HX, NVIDIA GeForce RTX 4090 Laptop GPU (1478 - 2327, n=10) | |
| Alienware m18 R2 | |
| Alienware m18 R1 AMD | |
| MSI Titan 18 HX A14VIG | |
| WebXPRT 3 / Overall | |
| Alienware m18 R1 AMD | |
| Alienware m18 R1 | |
| MSI Titan 18 HX A14VIG | |
| Alienware m18 R2 | |
| Moyenne Intel Core i9-14900HX, NVIDIA GeForce RTX 4090 Laptop GPU (279 - 339, n=10) | |
| Acer Predator Helios 18 N23Q2 | |
| Asus ROG Strix G18 G814JI | |
| Asus ROG Strix G18 G814JI | |
| WebXPRT 4 / Overall | |
| Alienware m18 R2 | |
| Alienware m18 R1 | |
| Alienware m18 R1 AMD | |
| Moyenne Intel Core i9-14900HX, NVIDIA GeForce RTX 4090 Laptop GPU (246 - 309, n=8) | |
| MSI Titan 18 HX A14VIG | |
| Asus ROG Strix G18 G814JI | |
| Asus ROG Strix G18 G814JI | |
| Mozilla Kraken 1.1 / Total | |
| Asus ROG Strix G18 G814JI | |
| Asus ROG Strix G18 G814JI | |
| Alienware m18 R1 AMD | |
| Alienware m18 R1 | |
| Acer Predator Helios 18 N23Q2 | |
| Moyenne Intel Core i9-14900HX, NVIDIA GeForce RTX 4090 Laptop GPU (428 - 535, n=11) | |
| MSI Titan 18 HX A14VIG | |
| Alienware m18 R2 | |
* ... Moindre est la valeur, meilleures sont les performances
| PCMark 10 Score | 9234 points | |
Aide | ||
| AIDA64 / Memory Copy | |
| Alienware m18 R1 | |
| Alienware m18 R2 | |
| Acer Predator Helios 18 N23Q2 | |
| Moyenne Intel Core i9-14900HX (38028 - 83392, n=36) | |
| Asus ROG Strix G18 G814JI | |
| MSI Titan 18 HX A14VIG | |
| Alienware m18 R1 AMD | |
| AIDA64 / Memory Read | |
| Alienware m18 R1 | |
| Acer Predator Helios 18 N23Q2 | |
| Alienware m18 R2 | |
| Moyenne Intel Core i9-14900HX (43306 - 87568, n=36) | |
| Asus ROG Strix G18 G814JI | |
| Alienware m18 R1 AMD | |
| MSI Titan 18 HX A14VIG | |
| AIDA64 / Memory Write | |
| Alienware m18 R1 | |
| Alienware m18 R2 | |
| Acer Predator Helios 18 N23Q2 | |
| Moyenne Intel Core i9-14900HX (37146 - 80589, n=36) | |
| Alienware m18 R1 AMD | |
| Asus ROG Strix G18 G814JI | |
| MSI Titan 18 HX A14VIG | |
| AIDA64 / Memory Latency | |
| MSI Titan 18 HX A14VIG | |
| Alienware m18 R1 AMD | |
| Alienware m18 R2 | |
| Moyenne Intel Core i9-14900HX (76.1 - 105, n=36) | |
| Asus ROG Strix G18 G814JI | |
| Acer Predator Helios 18 N23Q2 | |
| Alienware m18 R1 | |
* ... Moindre est la valeur, meilleures sont les performances
Latence DPC
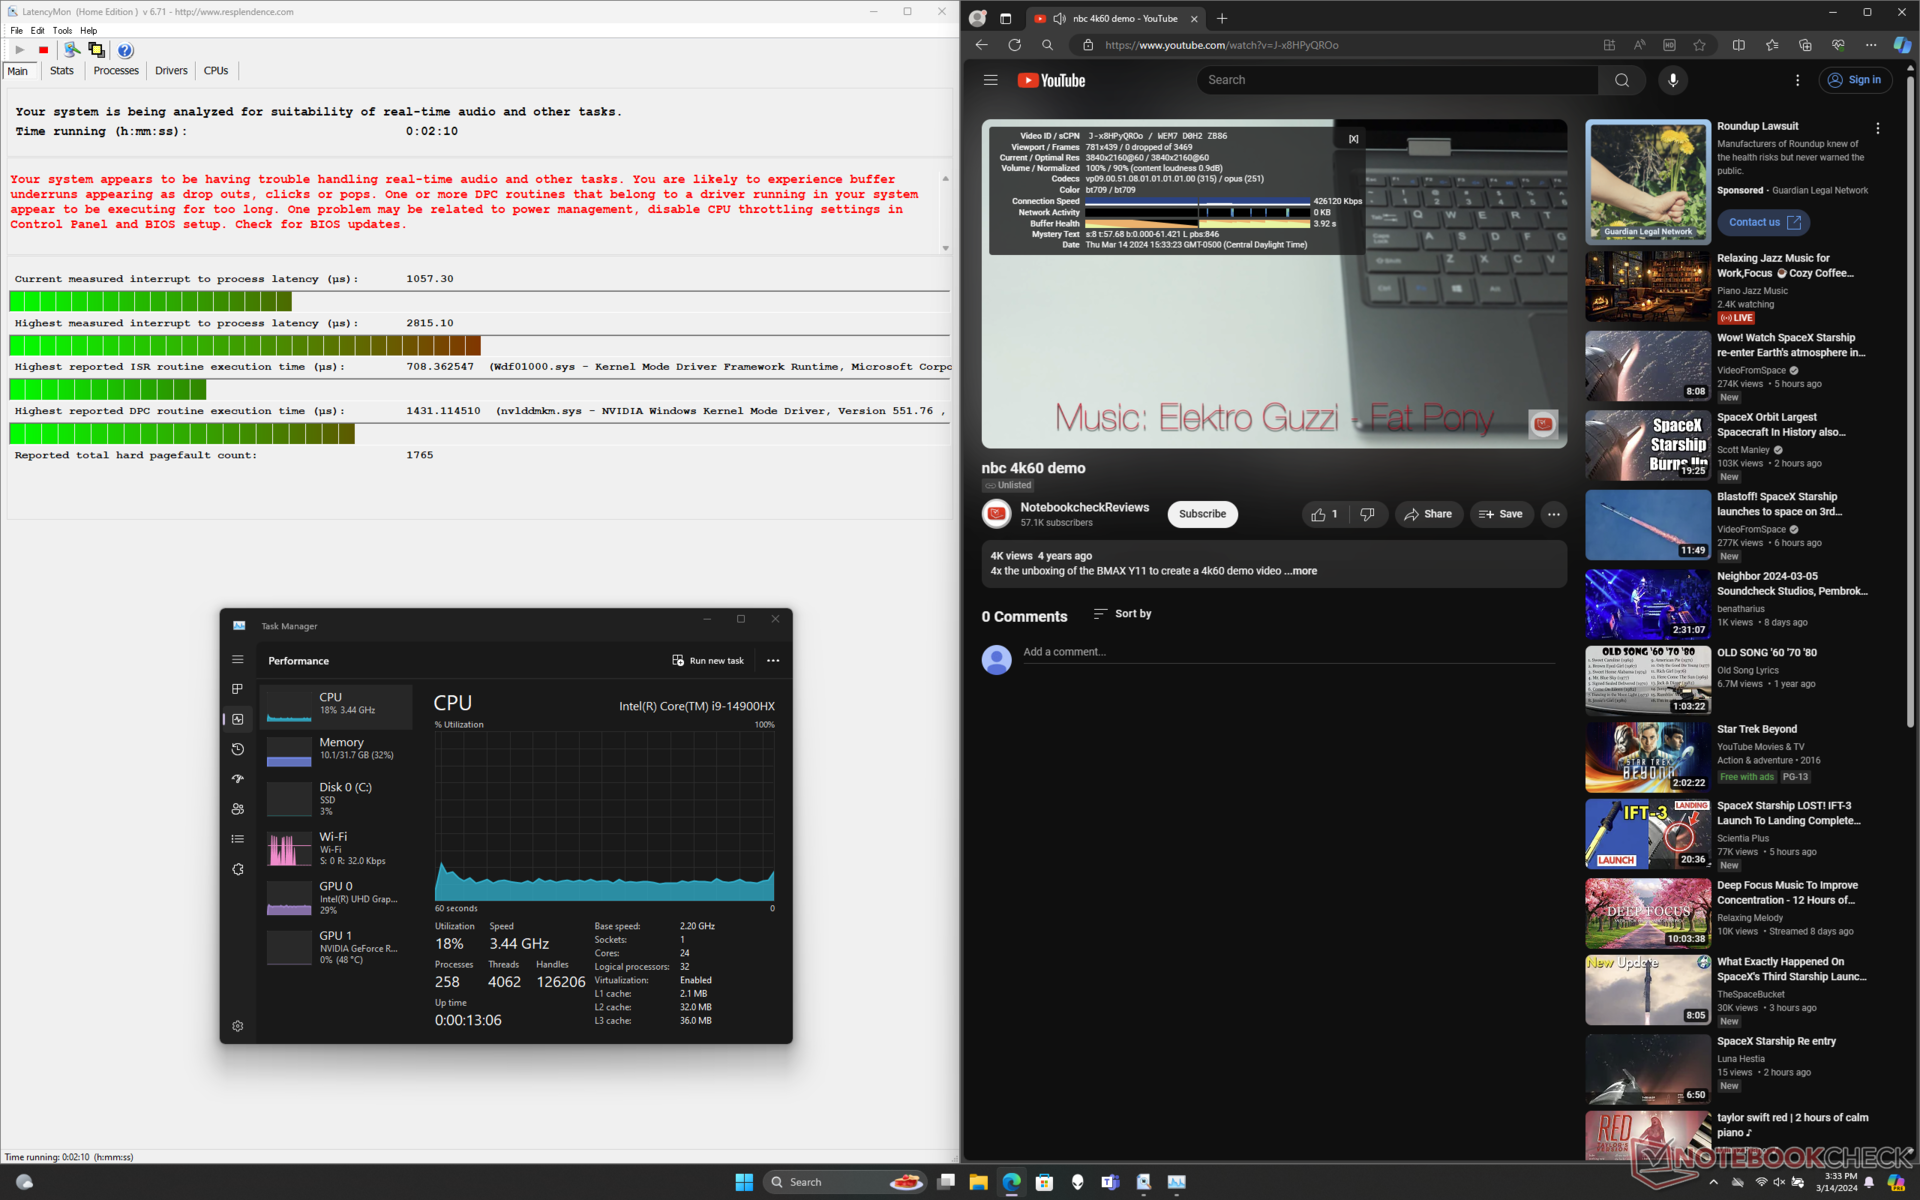
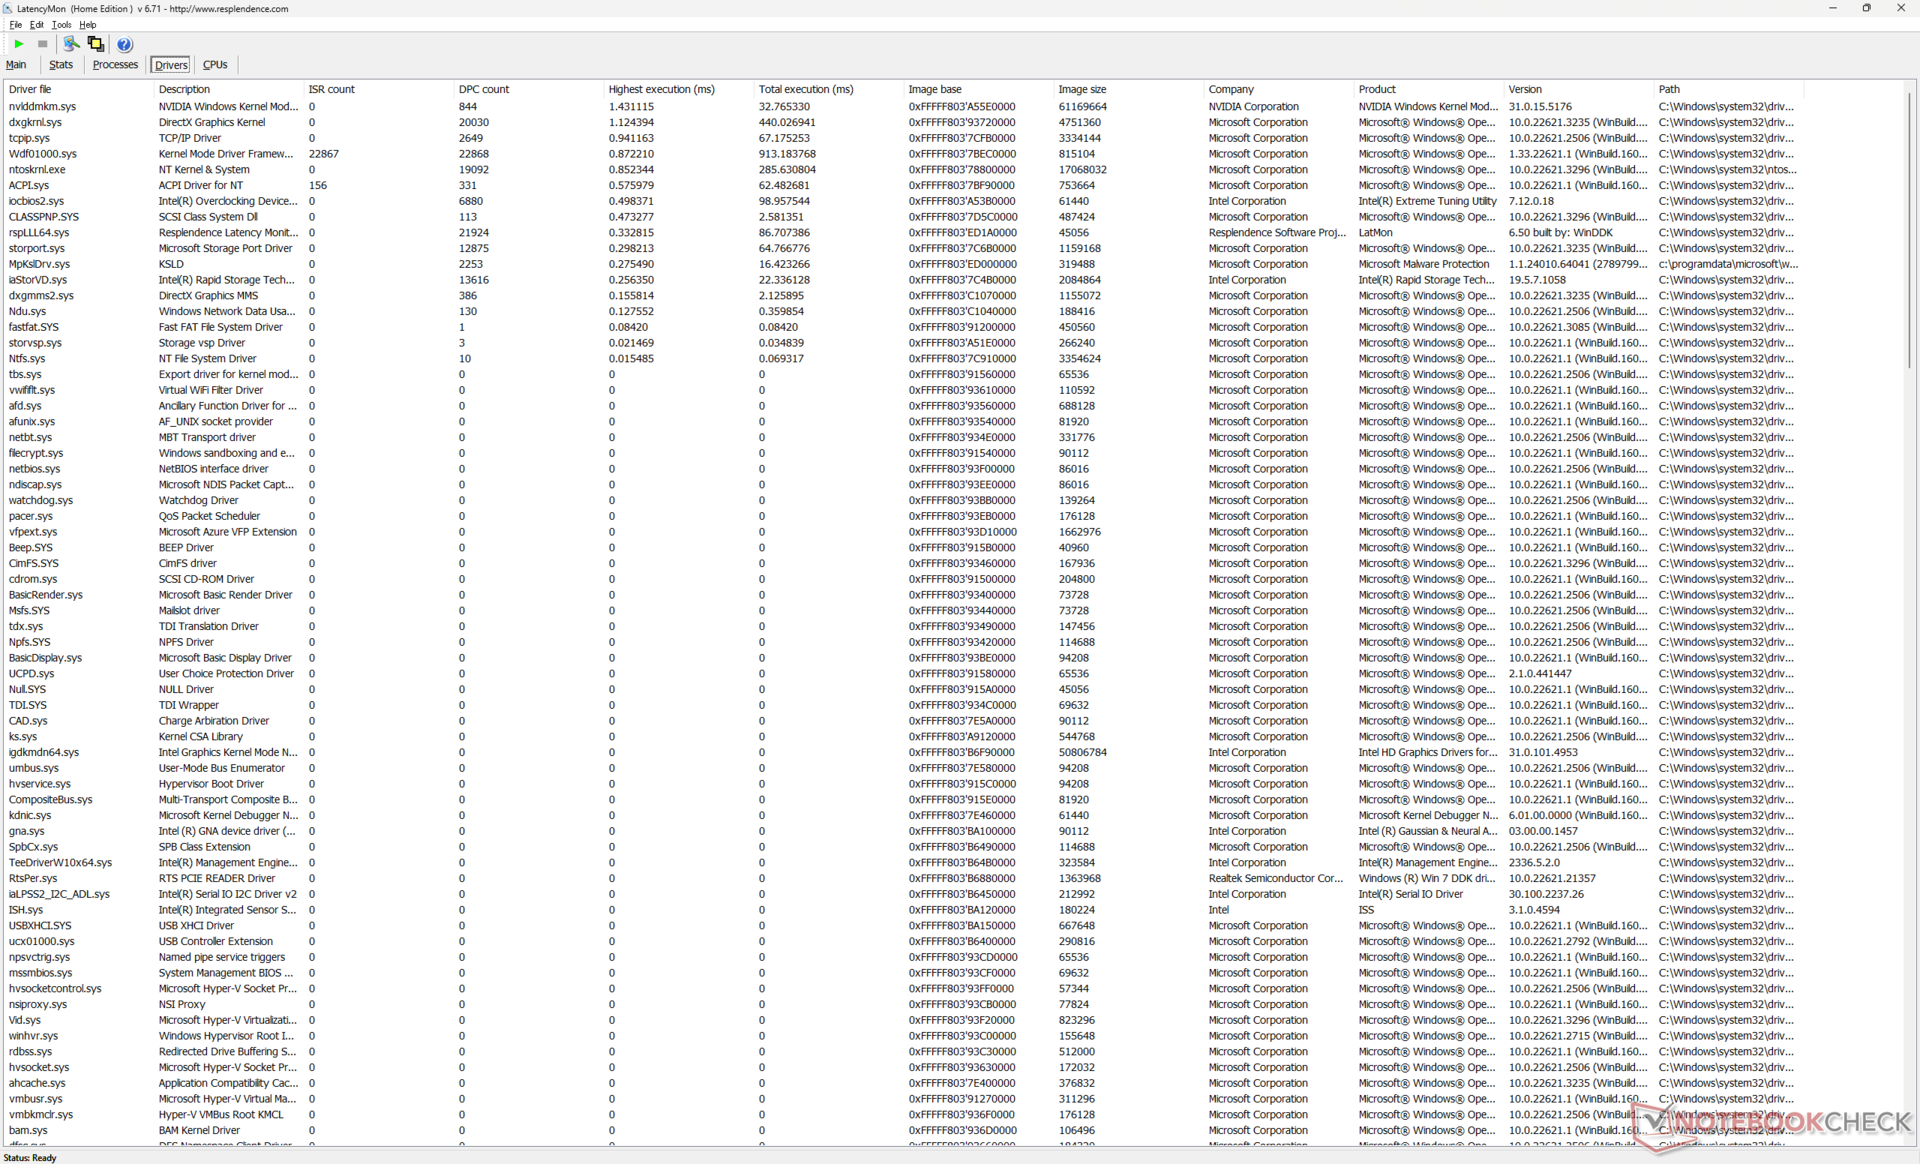
| DPC Latencies / LatencyMon - interrupt to process latency (max), Web, Youtube, Prime95 | |
| Acer Predator Helios 18 N23Q2 | |
| Alienware m18 R2 | |
| Alienware m18 R1 | |
| MSI Titan 18 HX A14VIG | |
| Alienware m18 R1 AMD | |
| Asus ROG Strix G18 G814JI | |
* ... Moindre est la valeur, meilleures sont les performances
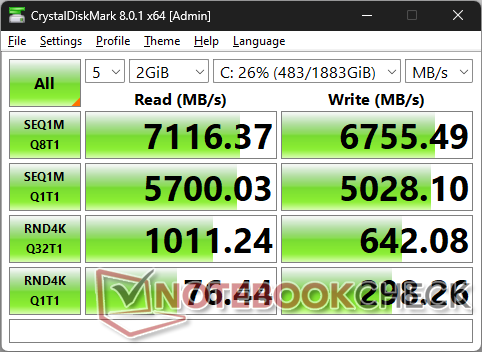
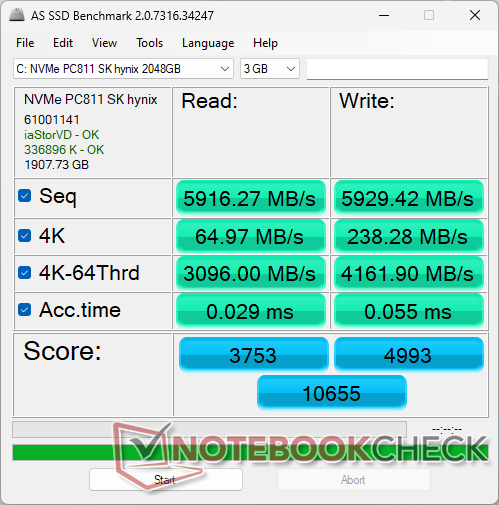
Dispositifs de stockage
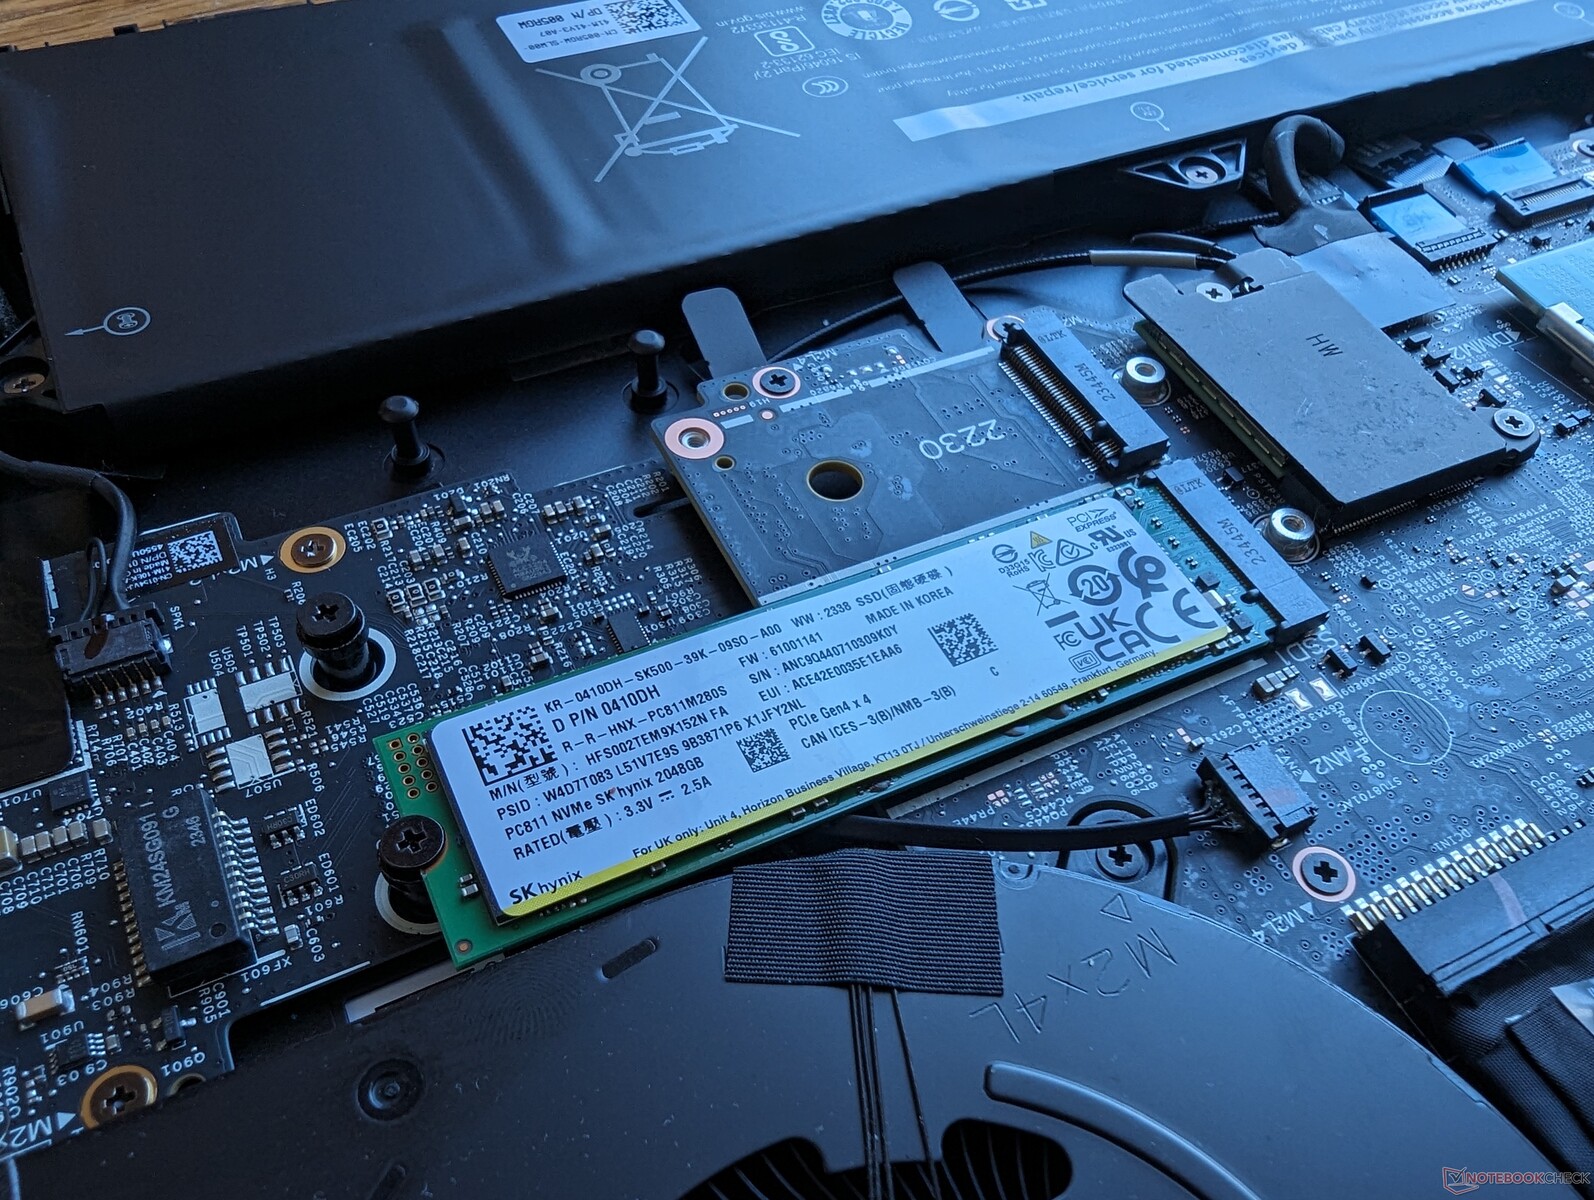
L'Alienware est l'un des premiers à être livré avec le disque dur de 2 To SK Hynix PC811 PCIe4 x4 NVMe SSD. Par rapport à la série PC801, la série PC811 intègre une flash NAND 8D au lieu d'une NAND 4D pour une capacité de stockage globalement plus dense et une efficacité énergétique améliorée. Le disque est capable de soutenir des taux de transfert maximum de ~7100 MB/s lorsqu'il est sollicité, ce qui est essentiellement le plafond de performance pour les SSD PCIe4 x4 singuliers.
Dell peut configurer deux disques de 4 To pour un total de 8 To de stockage.

| Drive Performance rating - Percent | |
| Alienware m18 R2 | |
| Alienware m18 R1 | |
| Acer Predator Helios 18 N23Q2 | |
| MSI Titan 18 HX A14VIG | |
| Alienware m18 R1 AMD | |
| Asus ROG Strix G18 G814JI | |
* ... Moindre est la valeur, meilleures sont les performances
Disk Throttling: DiskSpd Read Loop, Queue Depth 8
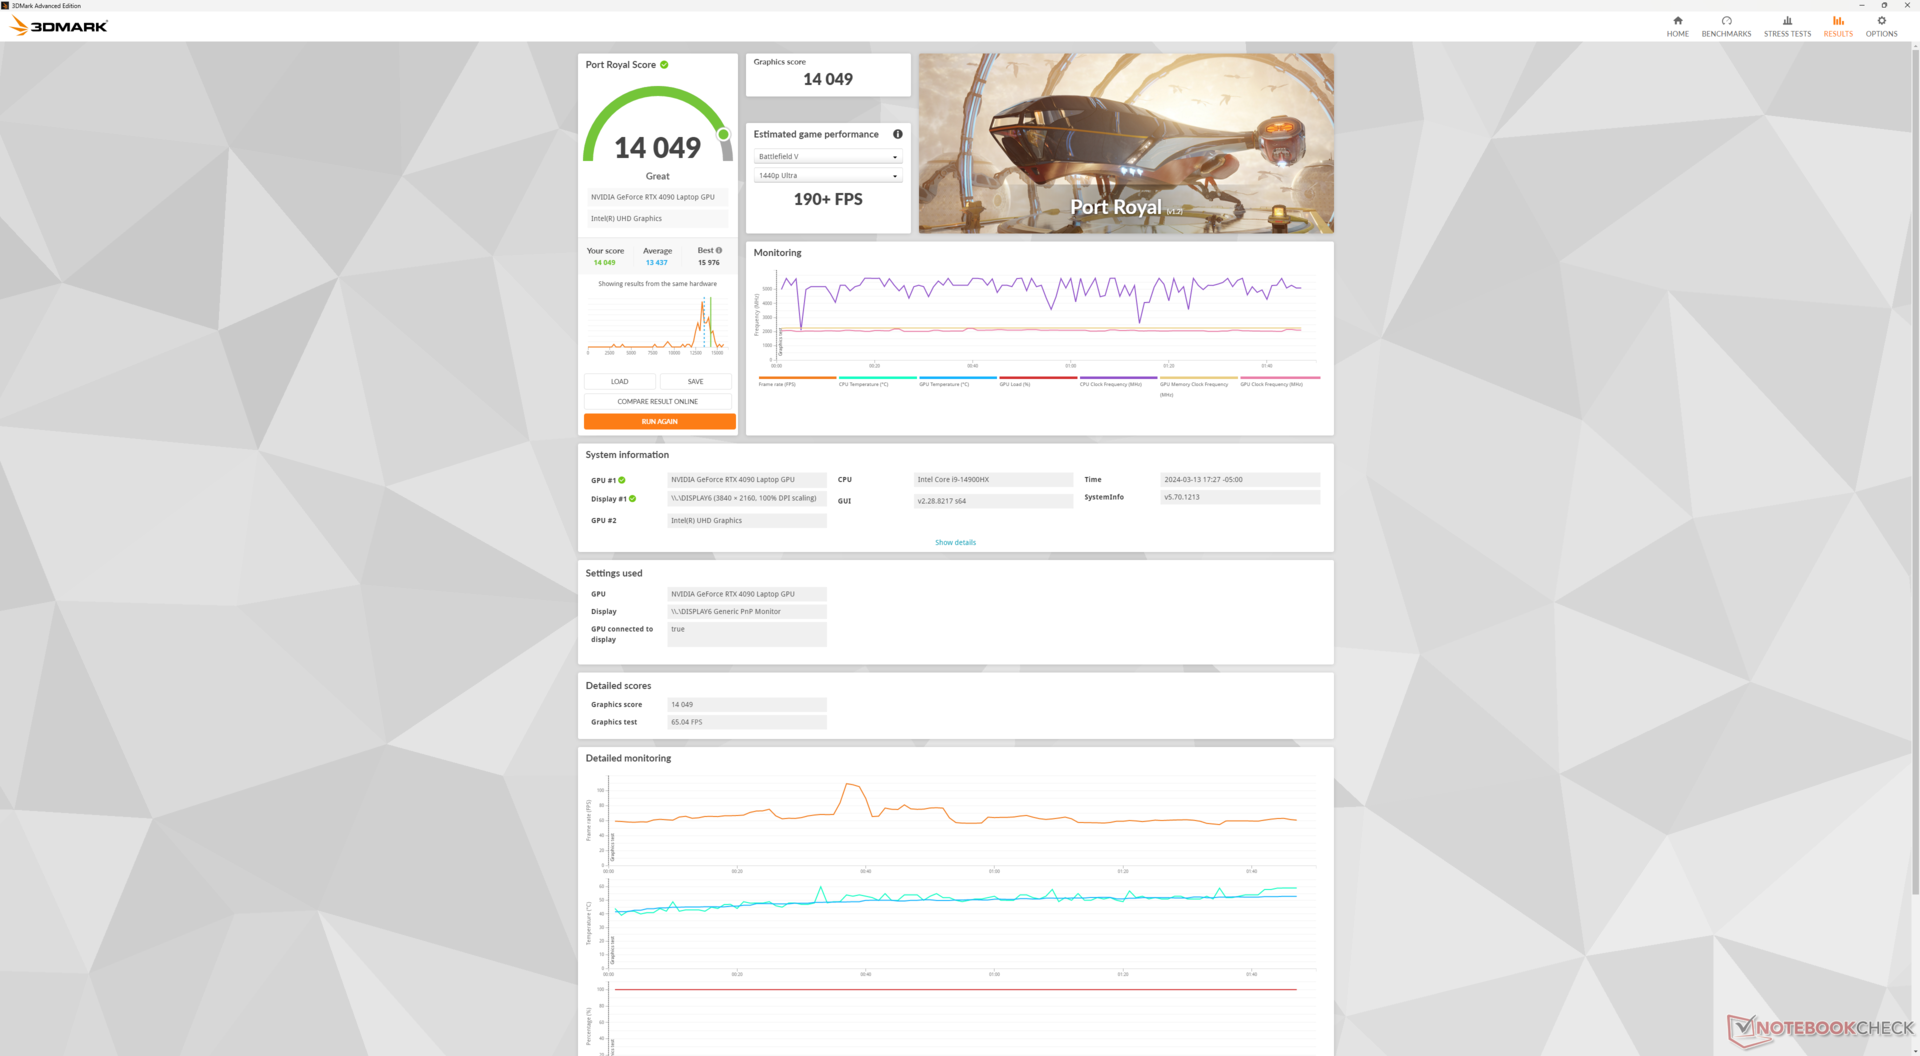
Performance du GPU - 175 W TGP Graphics
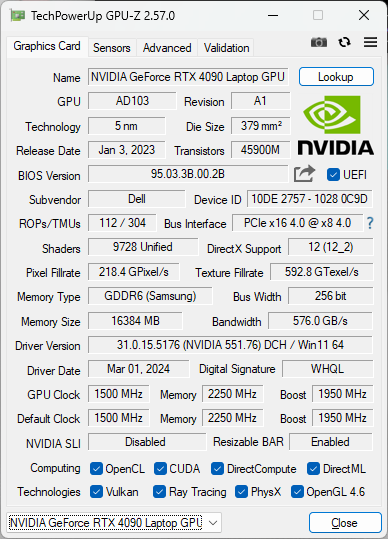
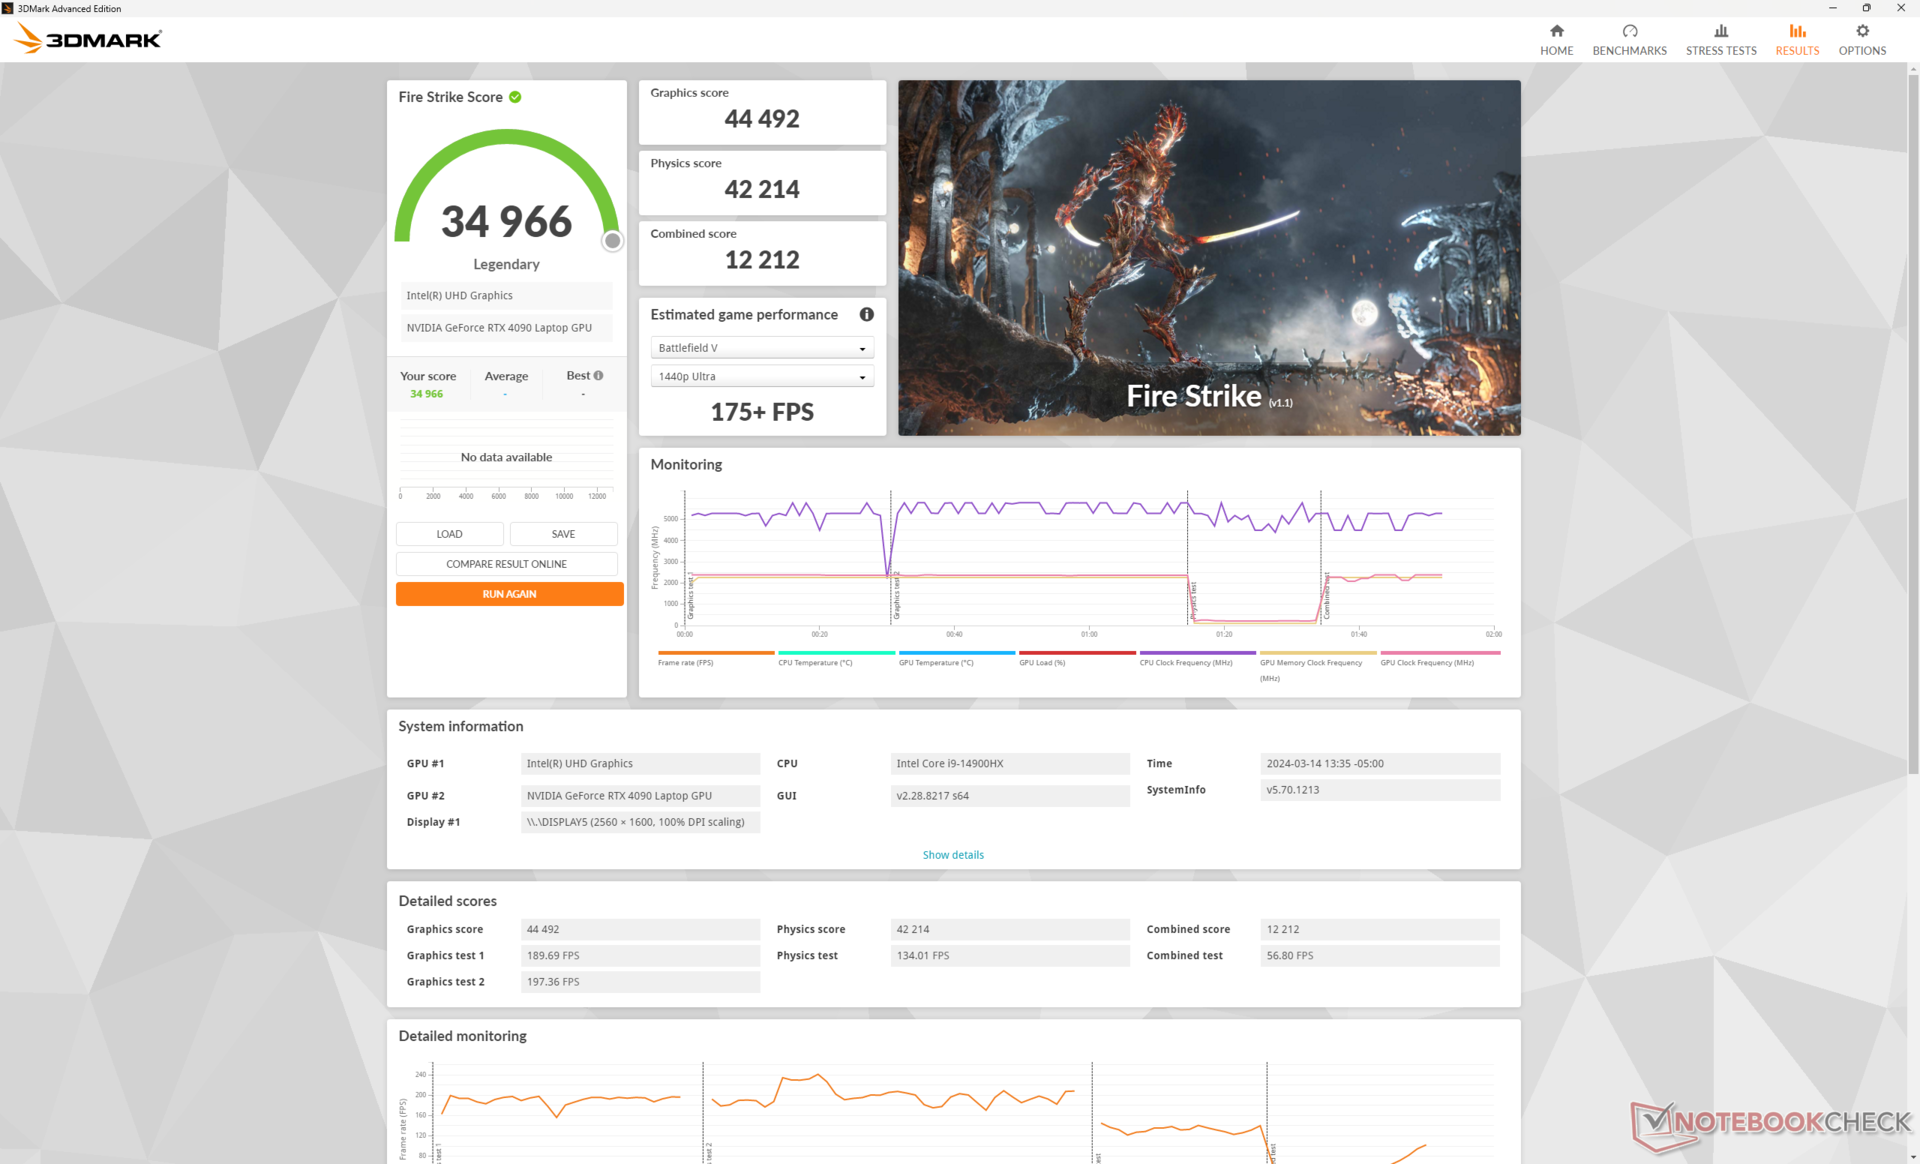
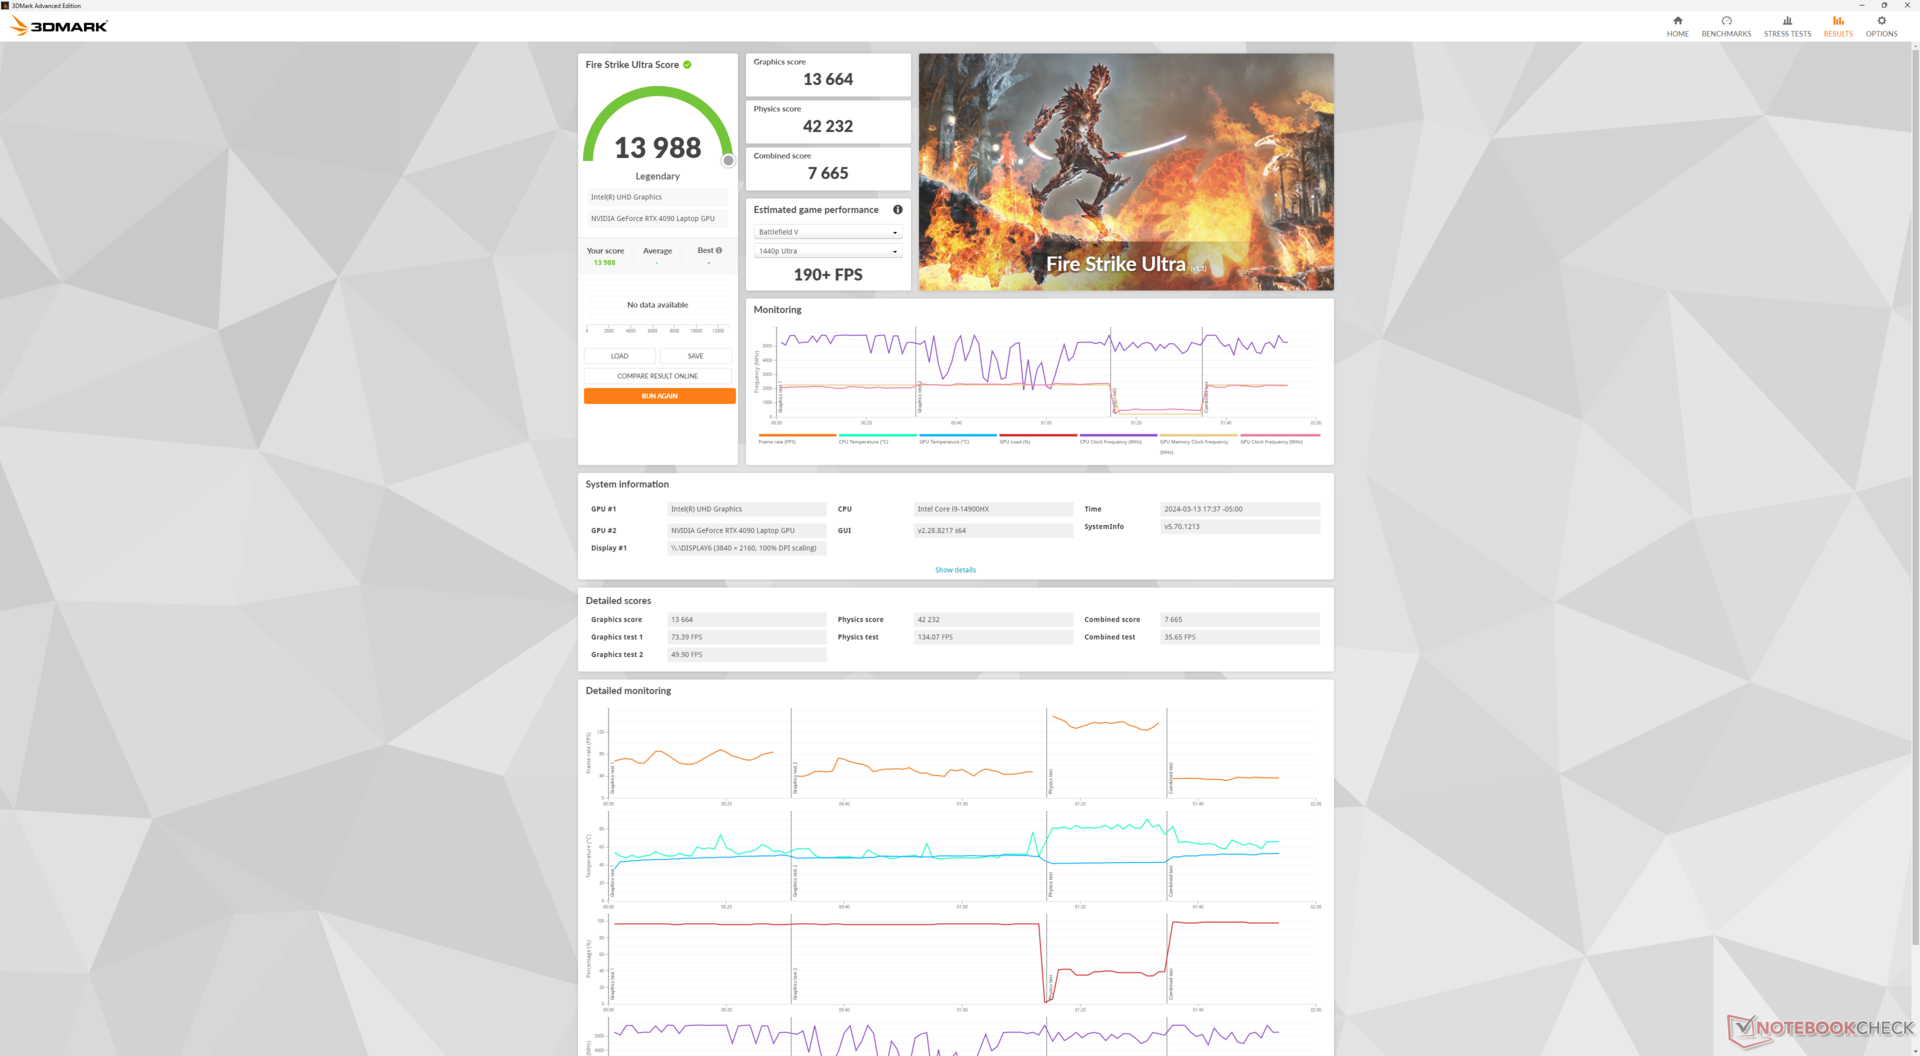
Le 175 W GeForce RTX 4090 est de retour cette année sans changement majeur pour les mêmes performances de jeu que le m18 R1 de l'année dernière. Plus important encore, il n'y a pas de différences majeures entre les profils Overdrive, Performance et Balanced, comme le montre notre tableau de résultats Fire Strike ci-dessous.
| Profil de puissance | Score graphique | Score physique | Score combiné |
| Mode Overdrive | 13664 | 42232 | 7665 |
| Mode Performance | 13579 (-0%) | 42217 (-0%) | 7541 (-2%) |
| Mode équilibré | 13449 (-1%) | 40978 (-3%) | 7592 (-1%) |
| Puissance de la batterie | 5116 (-63%) | 22857 (-46%) | 2102 (-73%) |
En descendant à la RTX 40804070 ou 4060 devrait réduire les performances graphiques d'environ 5 à 10 %, 30 à 35 % et 45 à 55 %, respectivement. C'est donc entre la RTX 4080 et la RTX 4070 que la baisse des performances est la plus importante.
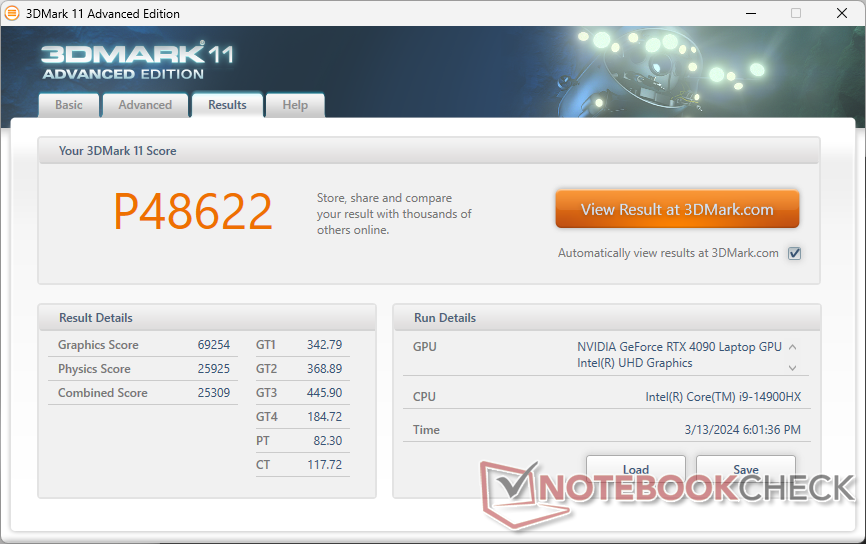
| 3DMark 11 Performance | 48622 points | |
| 3DMark Fire Strike Score | 34966 points | |
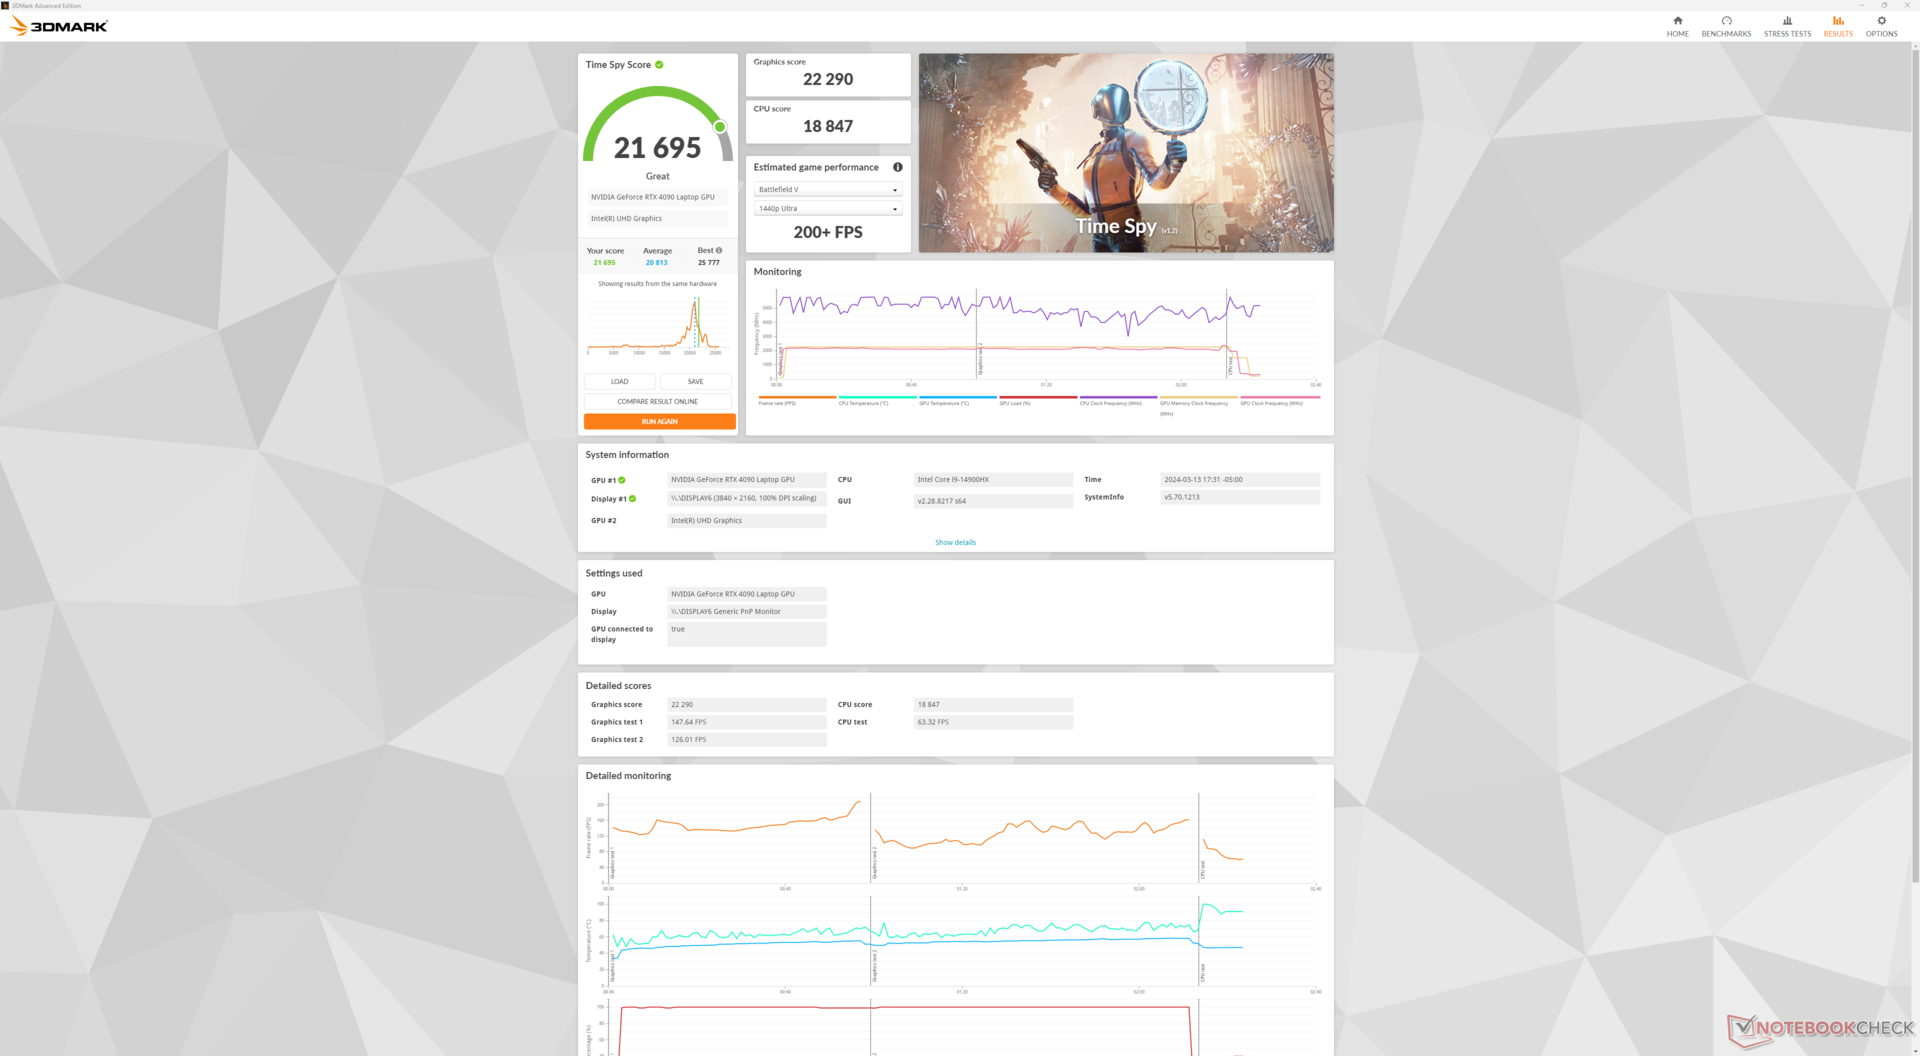
| 3DMark Time Spy Score | 21695 points | |
Aide | ||
* ... Moindre est la valeur, meilleures sont les performances
Performances des jeux
Les performances de jeu restent les mêmes que sur le m18 R1 malgré le changement de CPU. La RTX 4090 s'associe très bien avec l'écran 1600p lorsque l'on vise des taux de rafraîchissement supérieurs à 60 FPS.
| Performance rating - Percent | |
| Alienware m18 R1 | |
| Alienware m18 R2 | |
| MSI Titan 18 HX A14VIG | |
| Acer Predator Helios 18 N23Q2 | |
| Alienware m18 R1 AMD | |
| Asus ROG Strix G18 G814JI | |
| The Witcher 3 - 1920x1080 Ultra Graphics & Postprocessing (HBAO+) | |
| Alienware m18 R1 | |
| MSI Titan 18 HX A14VIG | |
| Alienware m18 R2 | |
| Acer Predator Helios 18 N23Q2 | |
| Alienware m18 R1 AMD | |
| Asus ROG Strix G18 G814JI | |
| GTA V - 1920x1080 Highest AA:4xMSAA + FX AF:16x | |
| Acer Predator Helios 18 N23Q2 | |
| Alienware m18 R1 | |
| MSI Titan 18 HX A14VIG | |
| Alienware m18 R2 | |
| Asus ROG Strix G18 G814JI | |
| Alienware m18 R1 AMD | |
| Final Fantasy XV Benchmark - 1920x1080 High Quality | |
| Alienware m18 R1 | |
| Alienware m18 R2 | |
| MSI Titan 18 HX A14VIG | |
| Acer Predator Helios 18 N23Q2 | |
| Alienware m18 R1 AMD | |
| Asus ROG Strix G18 G814JI | |
| Strange Brigade - 1920x1080 ultra AA:ultra AF:16 | |
| MSI Titan 18 HX A14VIG | |
| Alienware m18 R1 | |
| Alienware m18 R2 | |
| Alienware m18 R1 AMD | |
| Acer Predator Helios 18 N23Q2 | |
| Asus ROG Strix G18 G814JI | |
| Dota 2 Reborn - 1920x1080 ultra (3/3) best looking | |
| Alienware m18 R1 | |
| Acer Predator Helios 18 N23Q2 | |
| MSI Titan 18 HX A14VIG | |
| Alienware m18 R2 | |
| Asus ROG Strix G18 G814JI | |
| Alienware m18 R1 AMD | |
| X-Plane 11.11 - 1920x1080 high (fps_test=3) | |
| Alienware m18 R1 | |
| Alienware m18 R2 | |
| Acer Predator Helios 18 N23Q2 | |
| MSI Titan 18 HX A14VIG | |
| Asus ROG Strix G18 G814JI | |
| Alienware m18 R1 AMD | |
Witcher 3 FPS Chart
| Bas | Moyen | Élevé | Ultra | QHD DLSS | QHD | 4K DLSS | 4K | |
|---|---|---|---|---|---|---|---|---|
| GTA V (2015) | 185.2 | 181.6 | 179.6 | 137 | 134.7 | 174.9 | ||
| The Witcher 3 (2015) | 585.5 | 525.8 | 405.6 | 205.7 | 157.7 | |||
| Dota 2 Reborn (2015) | 217 | 190.1 | 181.5 | 171.8 | 160.8 | |||
| Final Fantasy XV Benchmark (2018) | 229 | 199.2 | 193.2 | 160.1 | 93.8 | |||
| X-Plane 11.11 (2018) | 201 | 180.1 | 140.6 | 120.4 | ||||
| Far Cry 5 (2018) | 181 | 171 | 160 | 154 | 112 | |||
| Strange Brigade (2018) | 471 | 387 | 383 | 369 | 309 | 160.2 | ||
| Tiny Tina's Wonderlands (2022) | 348.6 | 285.3 | 227.2 | 187.5 | 132.8 | 71.2 | ||
| F1 22 (2022) | 305 | 295 | 276 | 135.1 | 91.4 | 45.4 | ||
| Baldur's Gate 3 (2023) | 246.9 | 222.5 | 206.7 | 202 | 151.6 | 81.7 | ||
| Cyberpunk 2077 (2023) | 149.3 | 148.7 | 142.9 | 133.9 | 94.1 | 43.4 | ||
| Assassin's Creed Mirage (2023) | 230 | 215 | 205 | 160 | 135 | 110 | 81 | |
| Alan Wake 2 (2023) | 124.6 | 121.4 | 116.9 | 83.1 | 62.3 | 45.2 | ||
| Call of Duty Modern Warfare 3 2023 (2023) | 276 | 255 | 220 | 205 | 160 | 113 | 106 | |
| Avatar Frontiers of Pandora (2023) | 162 | 150 | 131 | 103 | 70 | 63 | 36 | |
| Black Myth: Wukong (2024) | 55 | 62 | 42 | 25 | ||||
| Indiana Jones and the Great Circle (2024) | 121.1 | 95.6 | 60.9 | |||||
| Monster Hunter Wilds (2025) | 78.54 | 76.96 | 66.98 | 42.01 | ||||
| Assassin's Creed Shadows (2025) | 100 | 90 | 77 | 57 | 59 | 50 |
Émissions
Bruit du système
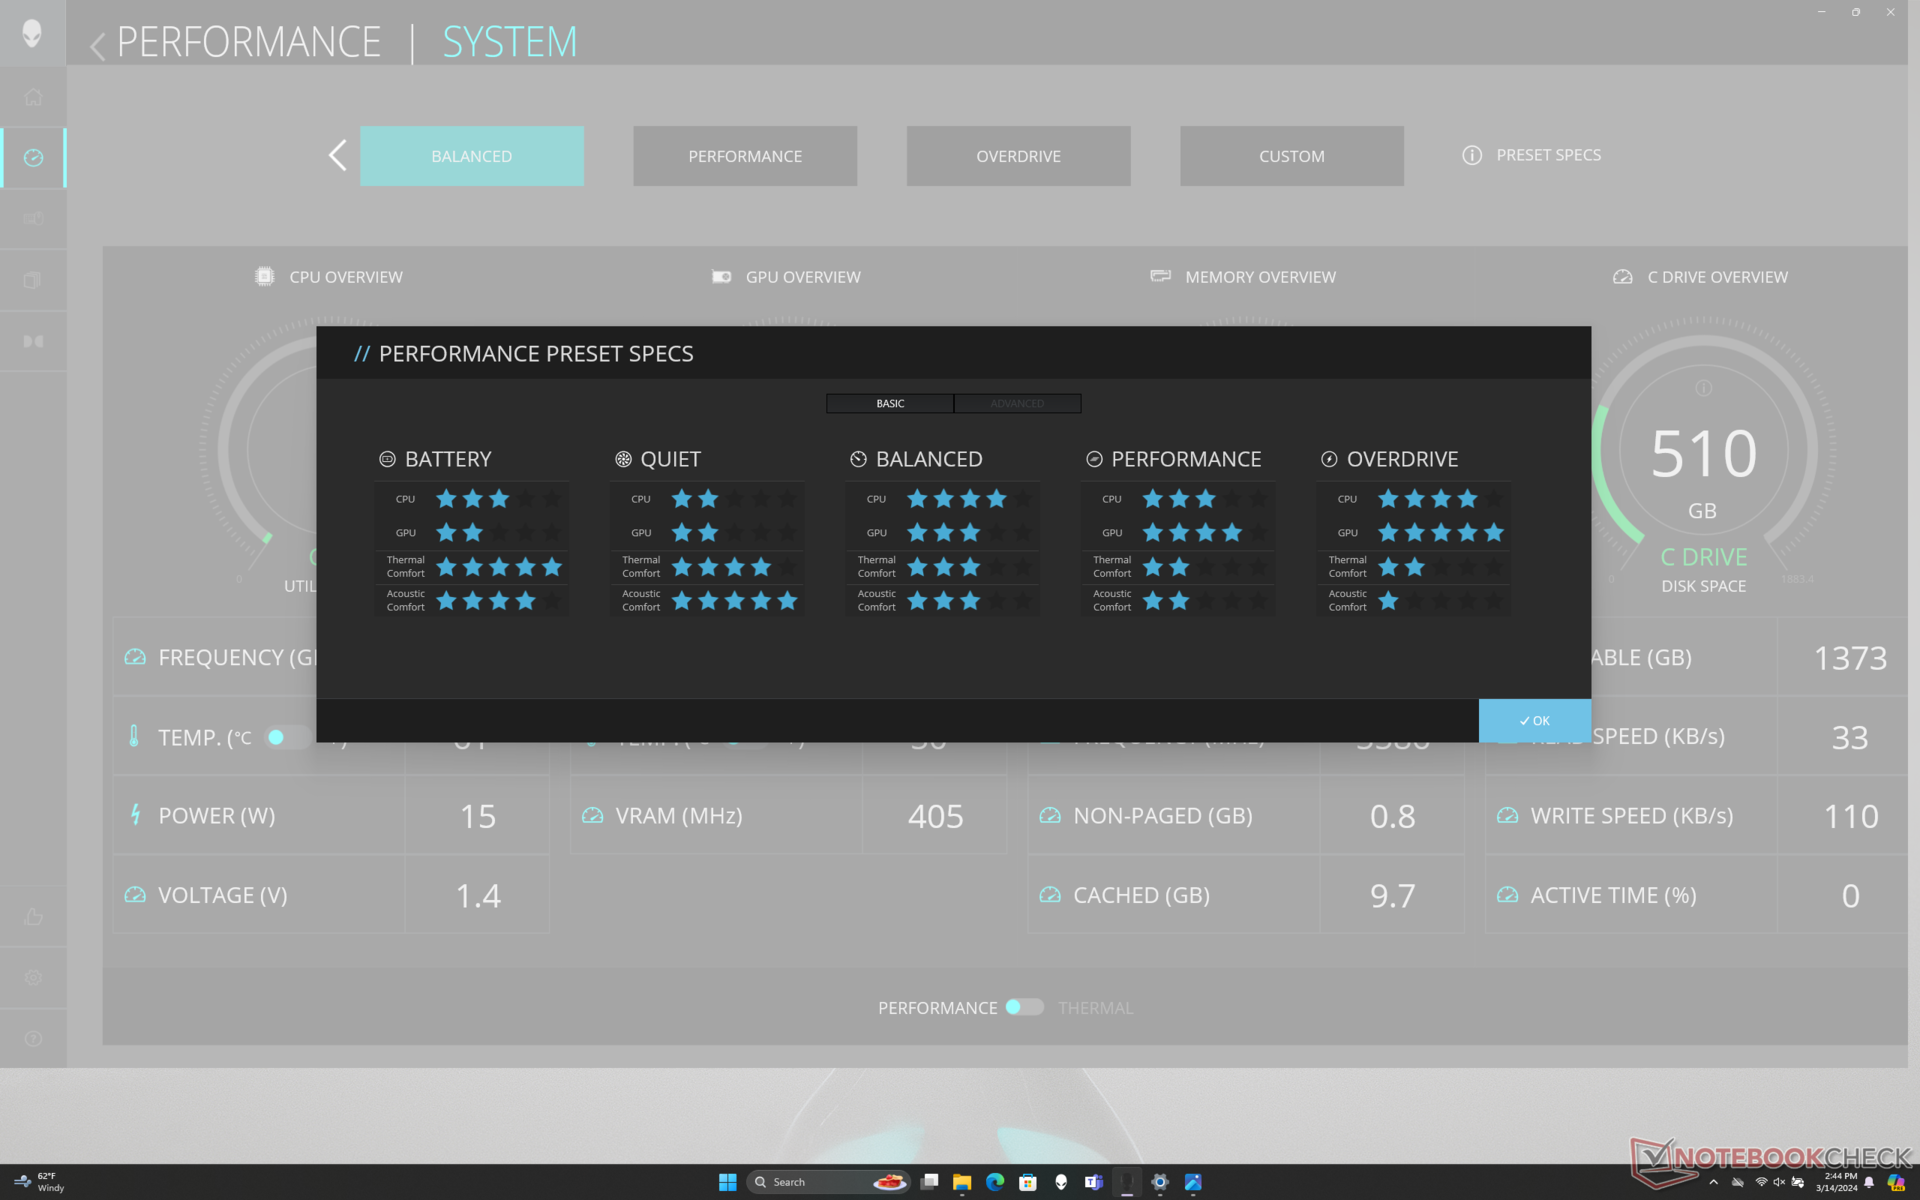
Il n'y a pas de changement majeur dans le comportement du bruit du ventilateur. La chose la plus importante à garder à l'esprit est que le bruit du ventilateur est légèrement plus fort en modes Performance et Overdrive qu'en mode Équilibré, même si les performances globales sont généralement les mêmes dans les trois modes. Cela signifie que vous pouvez jouer en mode équilibré ou performance pour une expérience plus silencieuse sans avoir à sacrifier des performances de jeu significatives. Le mode Overdrive devrait plutôt être réservé à des fins d'overclocking.
Degré de la nuisance sonore
| Au repos |
| 23.8 / 26.1 / 31.5 dB(A) |
| Fortement sollicité |
| 31.5 / 56.6 dB(A) |
 | ||
30 dB silencieux 40 dB(A) audible 50 dB(A) bruyant |
||
min: | ||
| Alienware m18 R2 GeForce RTX 4090 Laptop GPU, i9-14900HX, SK Hynix PC811 HFS002TEM9X152N | Alienware m18 R1 AMD Radeon RX 7900M, R9 7945HX, Kioxia XG8 KXG80ZNV1T02 | Alienware m18 R1 GeForce RTX 4090 Laptop GPU, i9-13980HX, SK hynix PC801 HFS001TEJ9X101N | MSI Titan 18 HX A14VIG GeForce RTX 4090 Laptop GPU, i9-14900HX, 2x Samsung PM9A1a MZVL22T0HDLB (RAID 0) | Asus ROG Strix G18 G814JI GeForce RTX 4070 Laptop GPU, i7-13650HX, Micron 2400 MTFDKBA1T0QFM | Acer Predator Helios 18 N23Q2 GeForce RTX 4080 Laptop GPU, i9-13900HX, Samsung PM9A1 MZVL22T0HBLB | |
|---|---|---|---|---|---|---|
| Noise | 1% | 5% | -3% | -1% | -3% | |
| arrêt / environnement * (dB) | 23.6 | 22.4 5% | 22.8 3% | 22.8 3% | 25 -6% | 23 3% |
| Idle Minimum * (dB) | 23.8 | 23 3% | 23 3% | 23.8 -0% | 26 -9% | 23 3% |
| Idle Average * (dB) | 26.1 | 23.4 10% | 23 12% | 23.8 9% | 28 -7% | 23 12% |
| Idle Maximum * (dB) | 31.5 | 33.5 -6% | 23 27% | 28 11% | 29 8% | 23 27% |
| Load Average * (dB) | 31.5 | 33.5 -6% | 35.6 -13% | 38 -21% | 41 -30% | 45.26 -44% |
| Witcher 3 ultra * (dB) | 52.1 | 53.6 -3% | 51.3 2% | 57.3 -10% | 44 16% | 59.82 -15% |
| Load Maximum * (dB) | 56.6 | 53.6 5% | 56.7 -0% | 62.8 -11% | 46 19% | 59.94 -6% |
* ... Moindre est la valeur, meilleures sont les performances
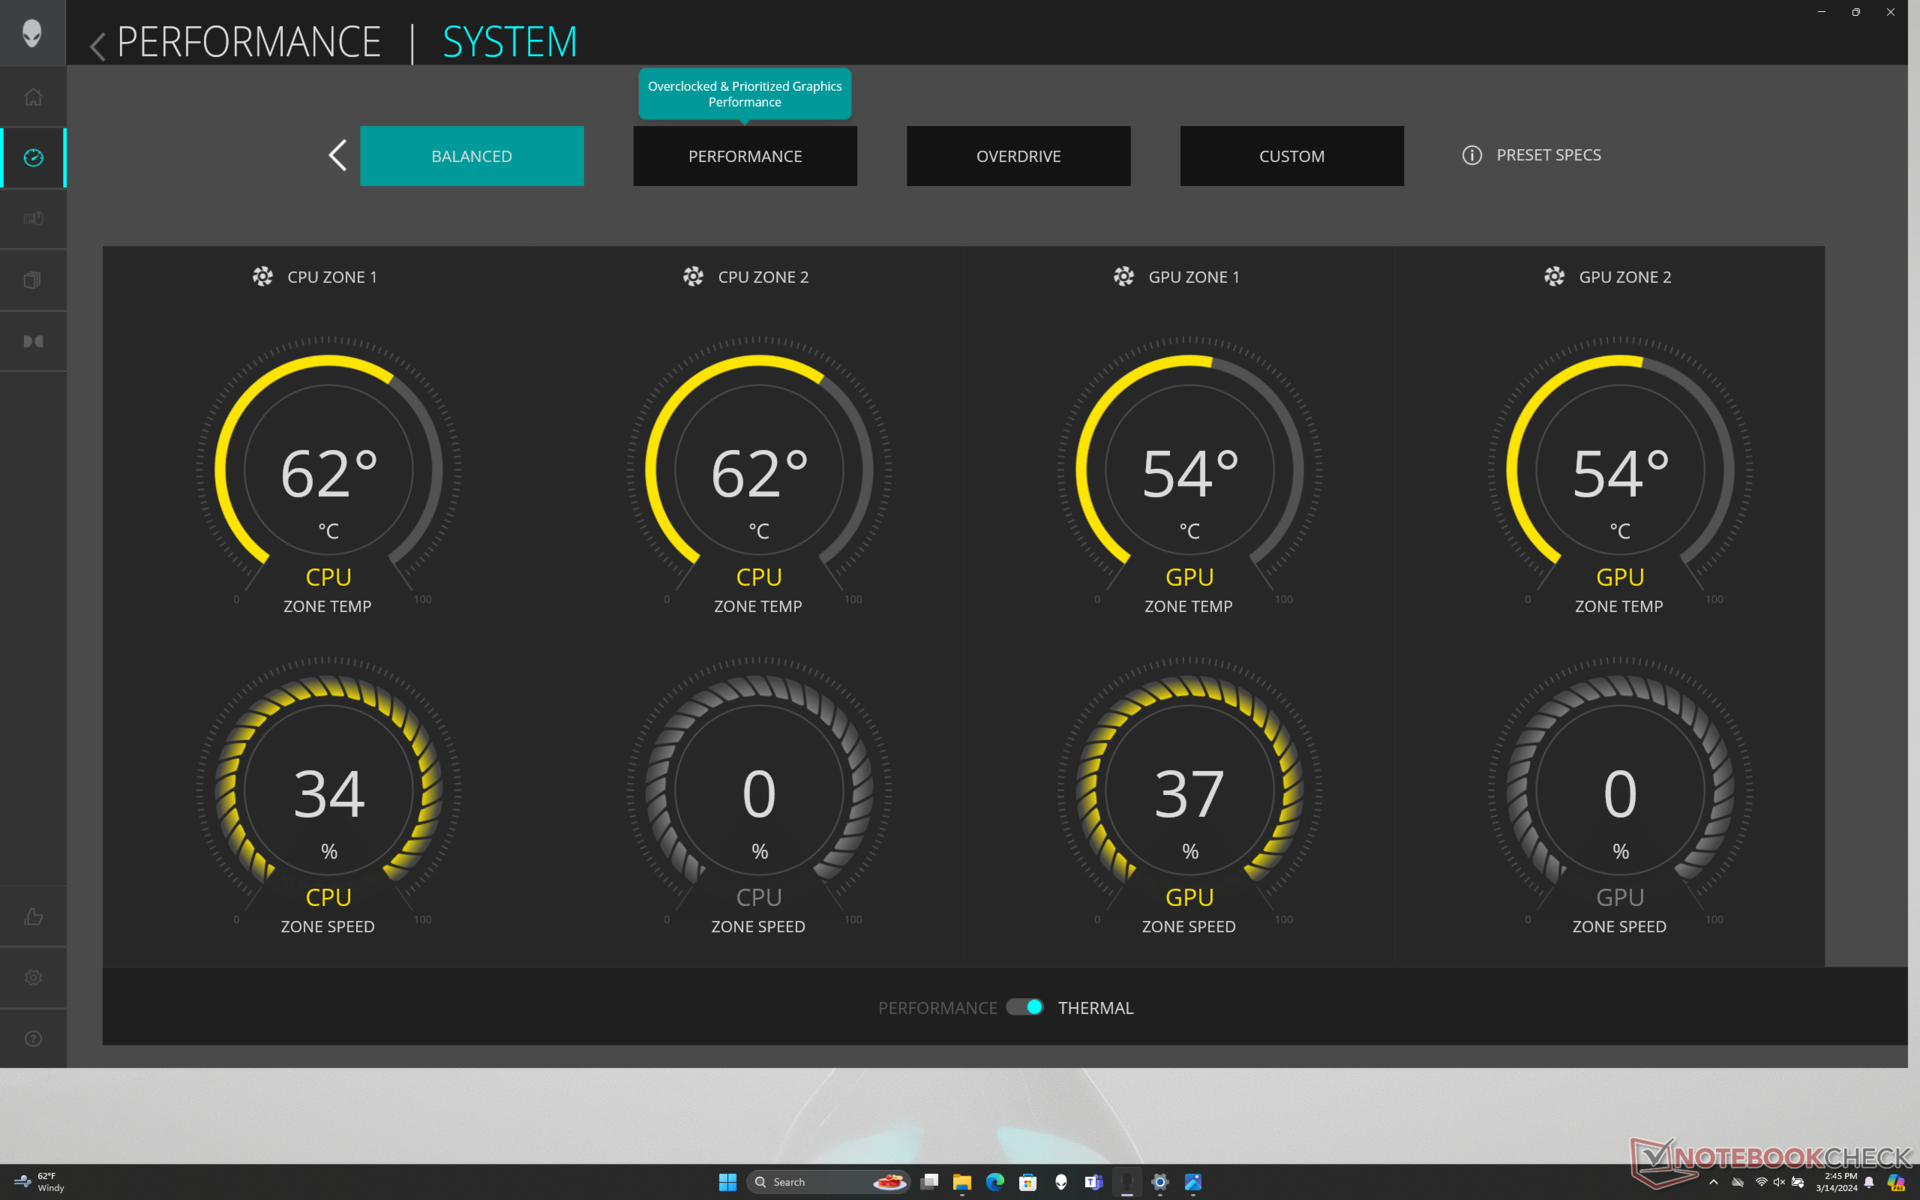
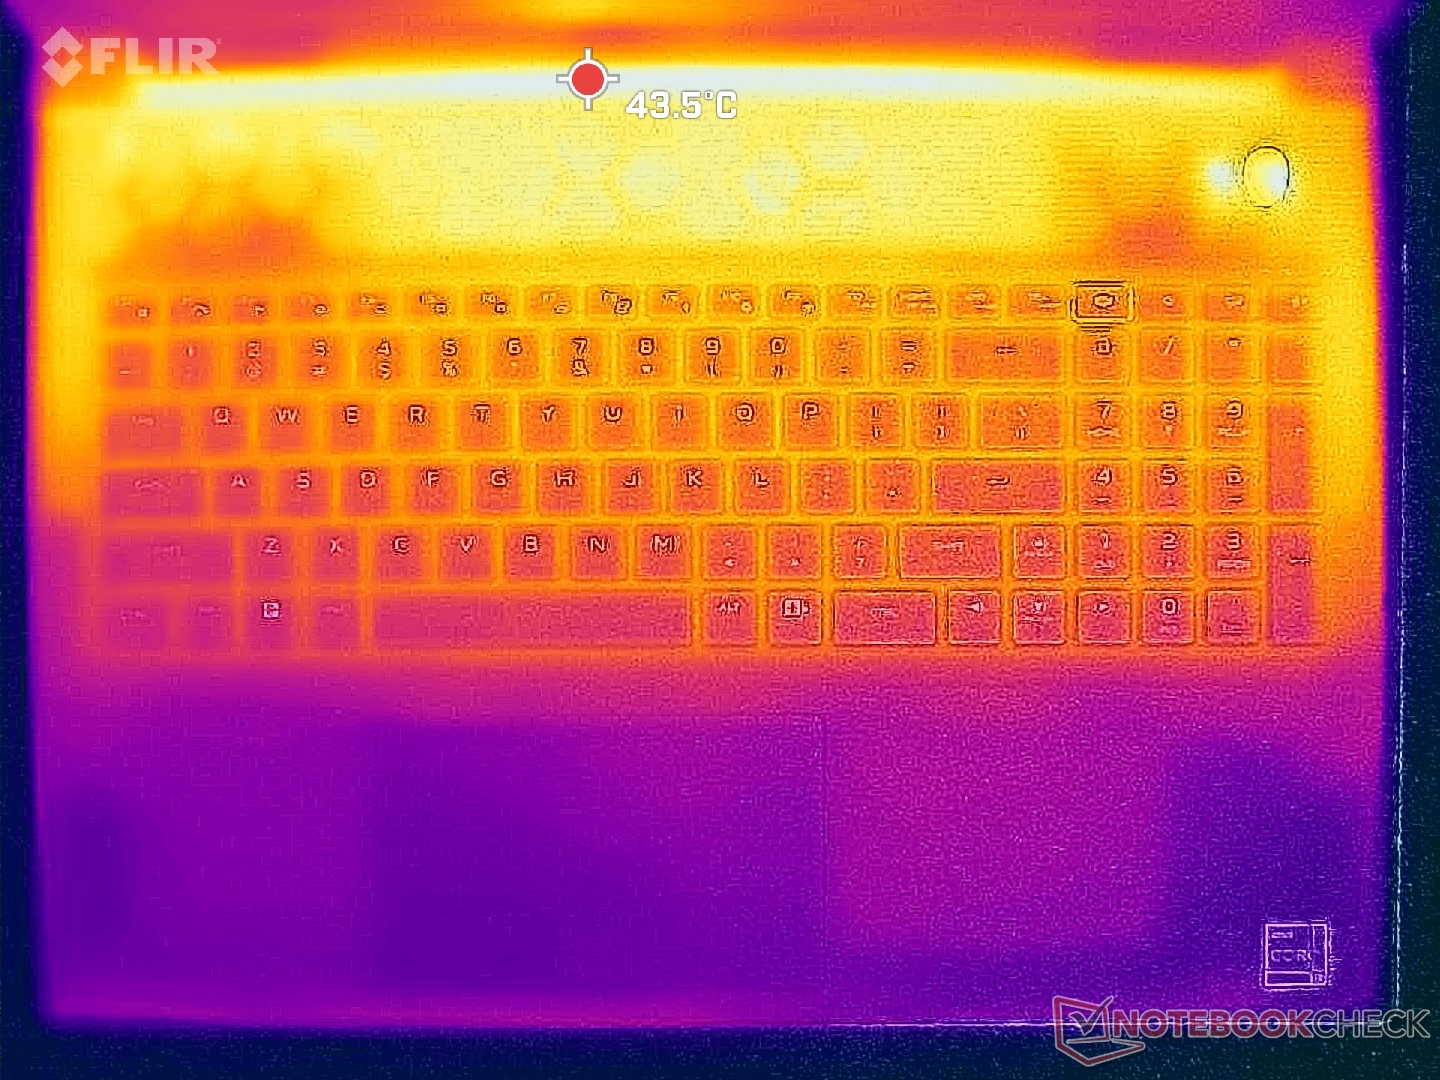
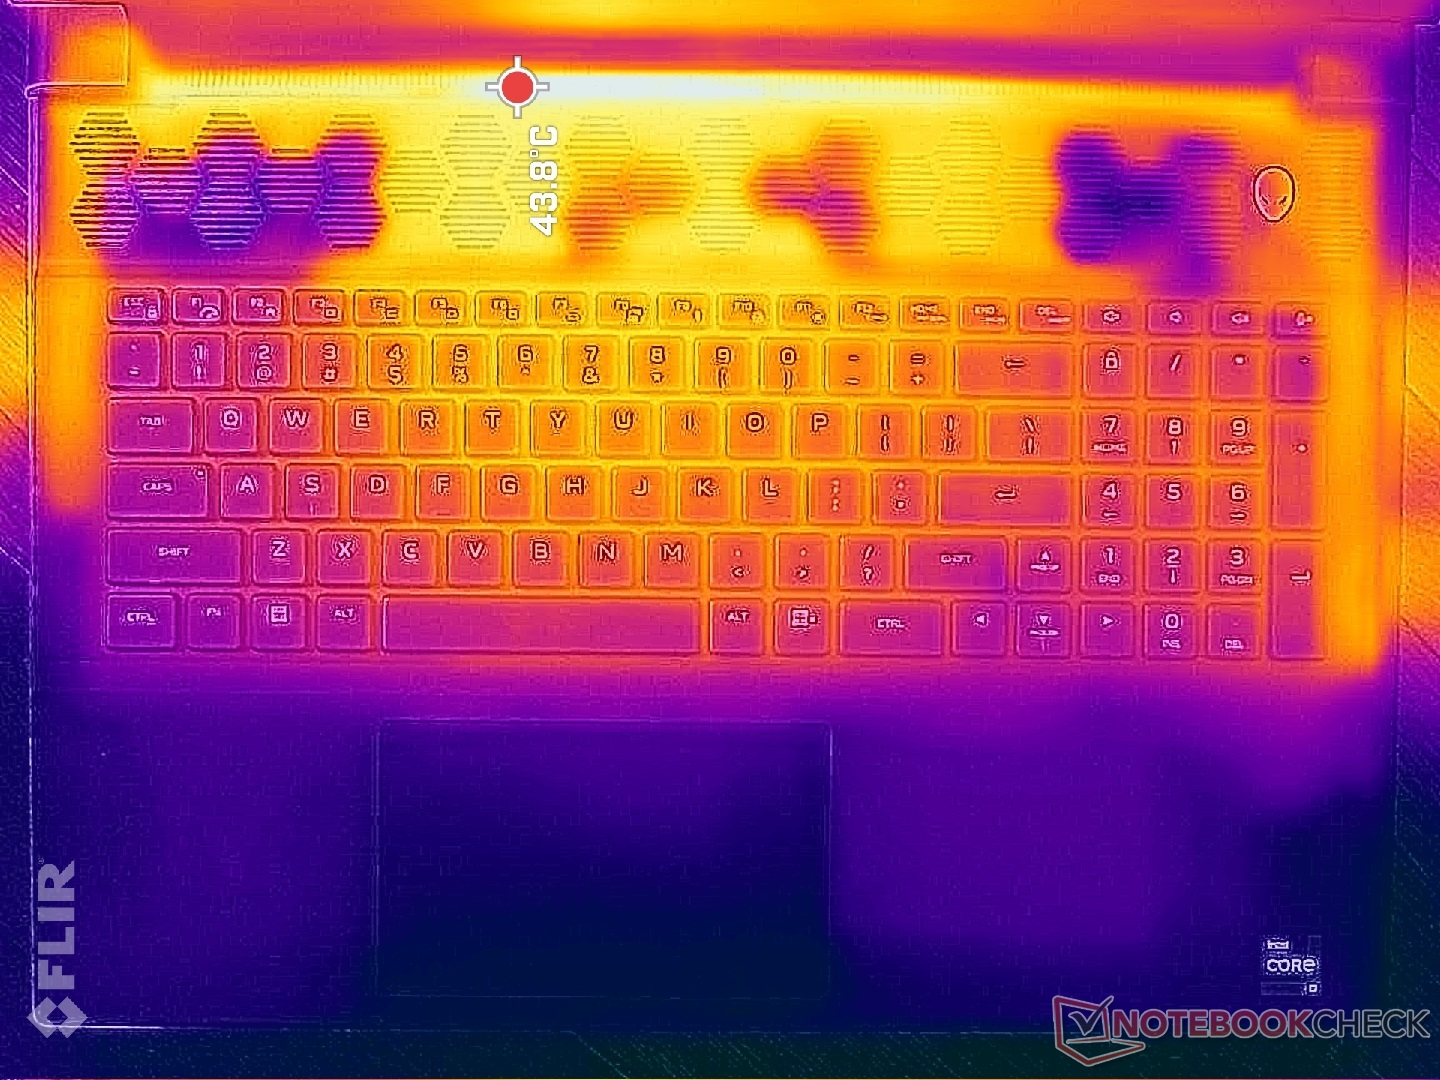
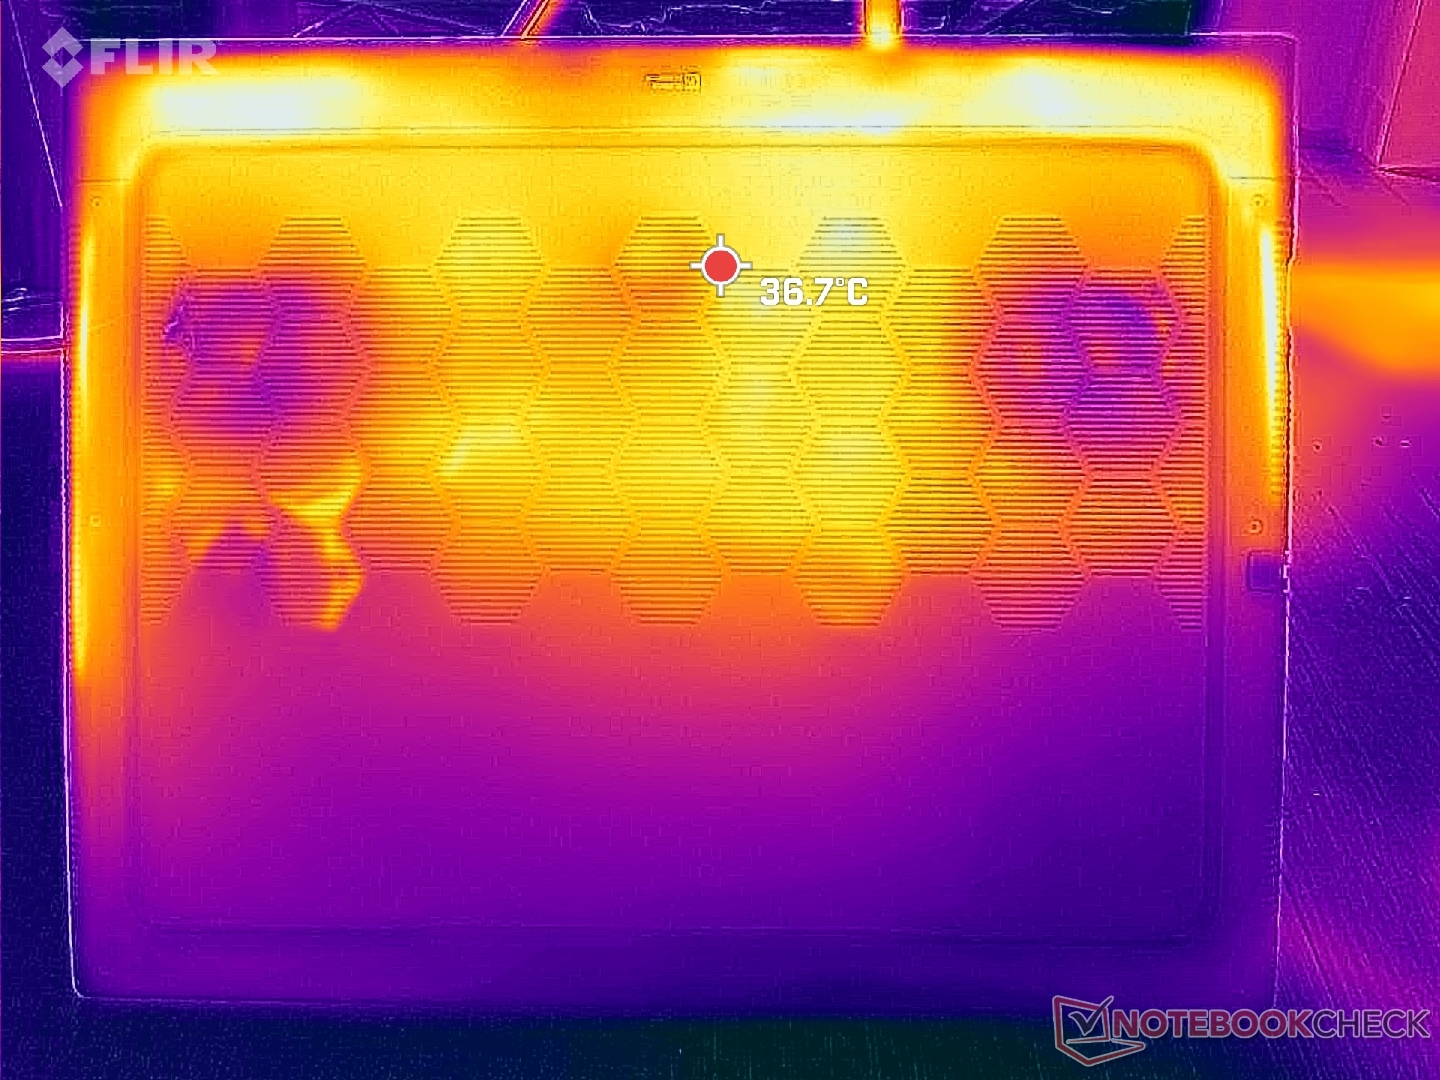
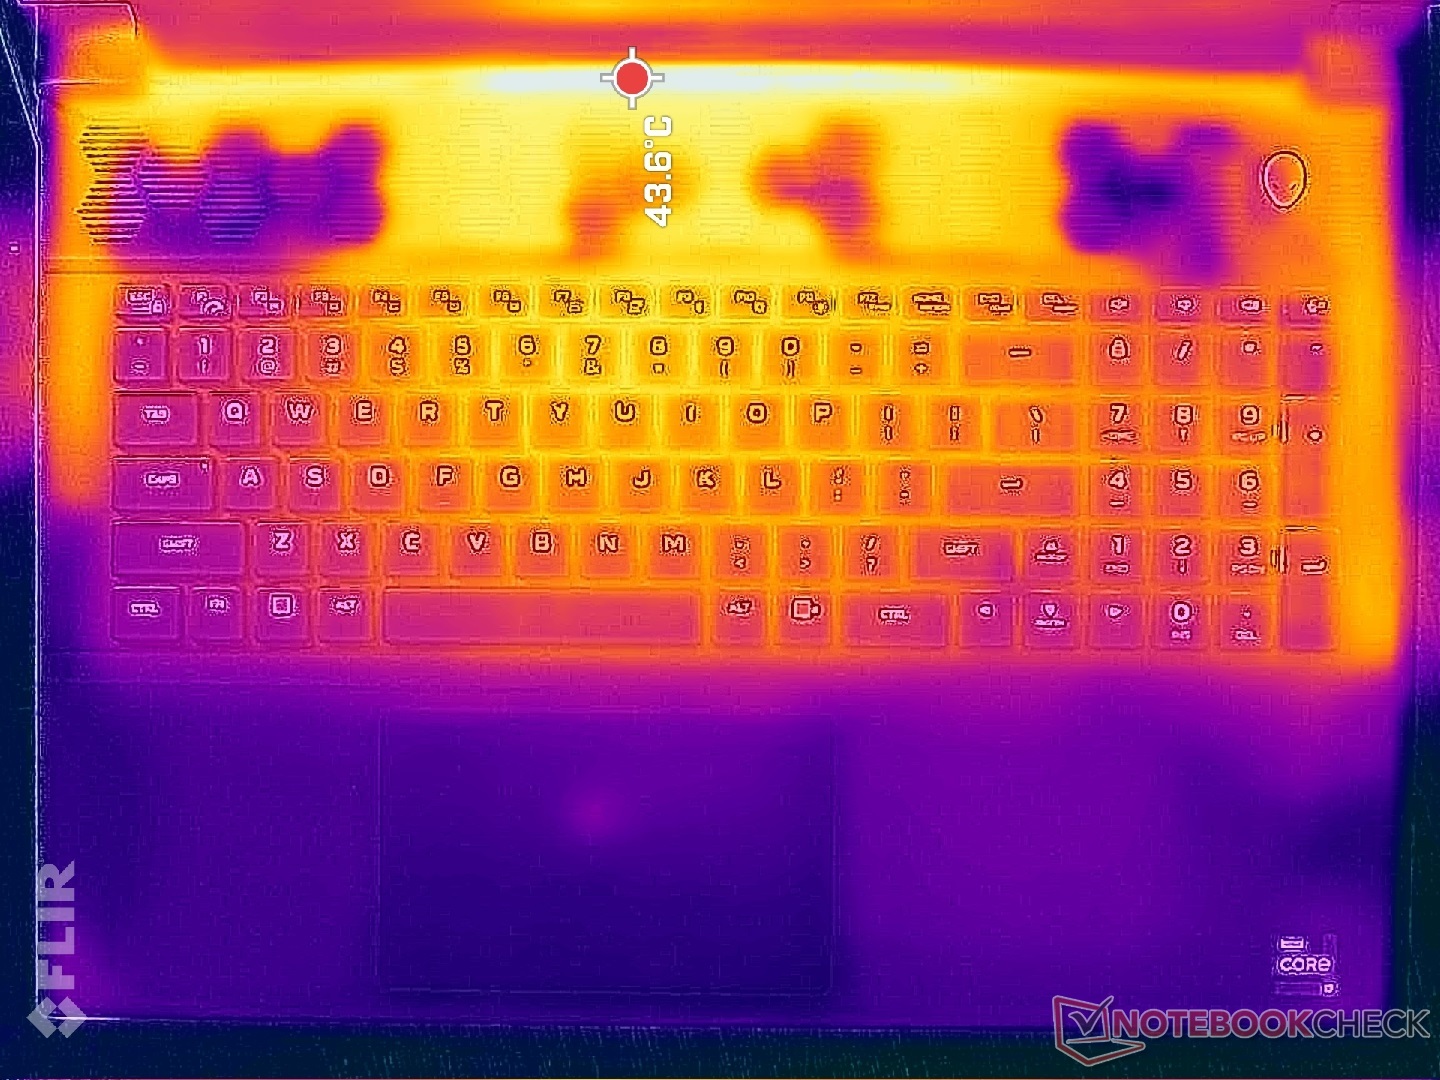
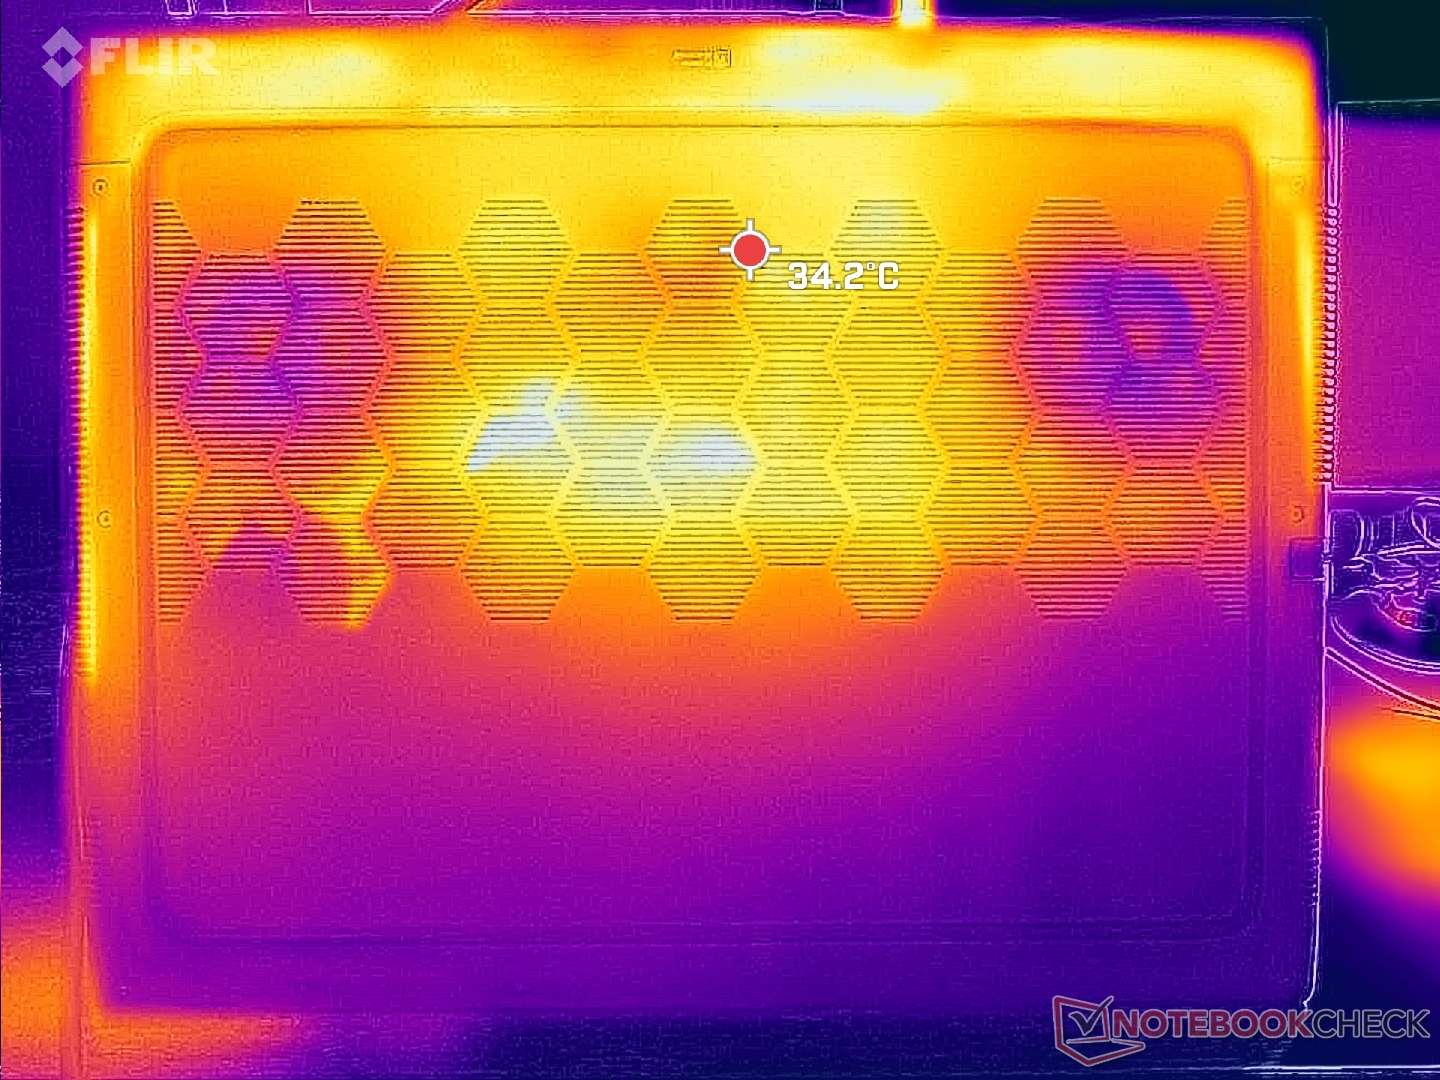
Température
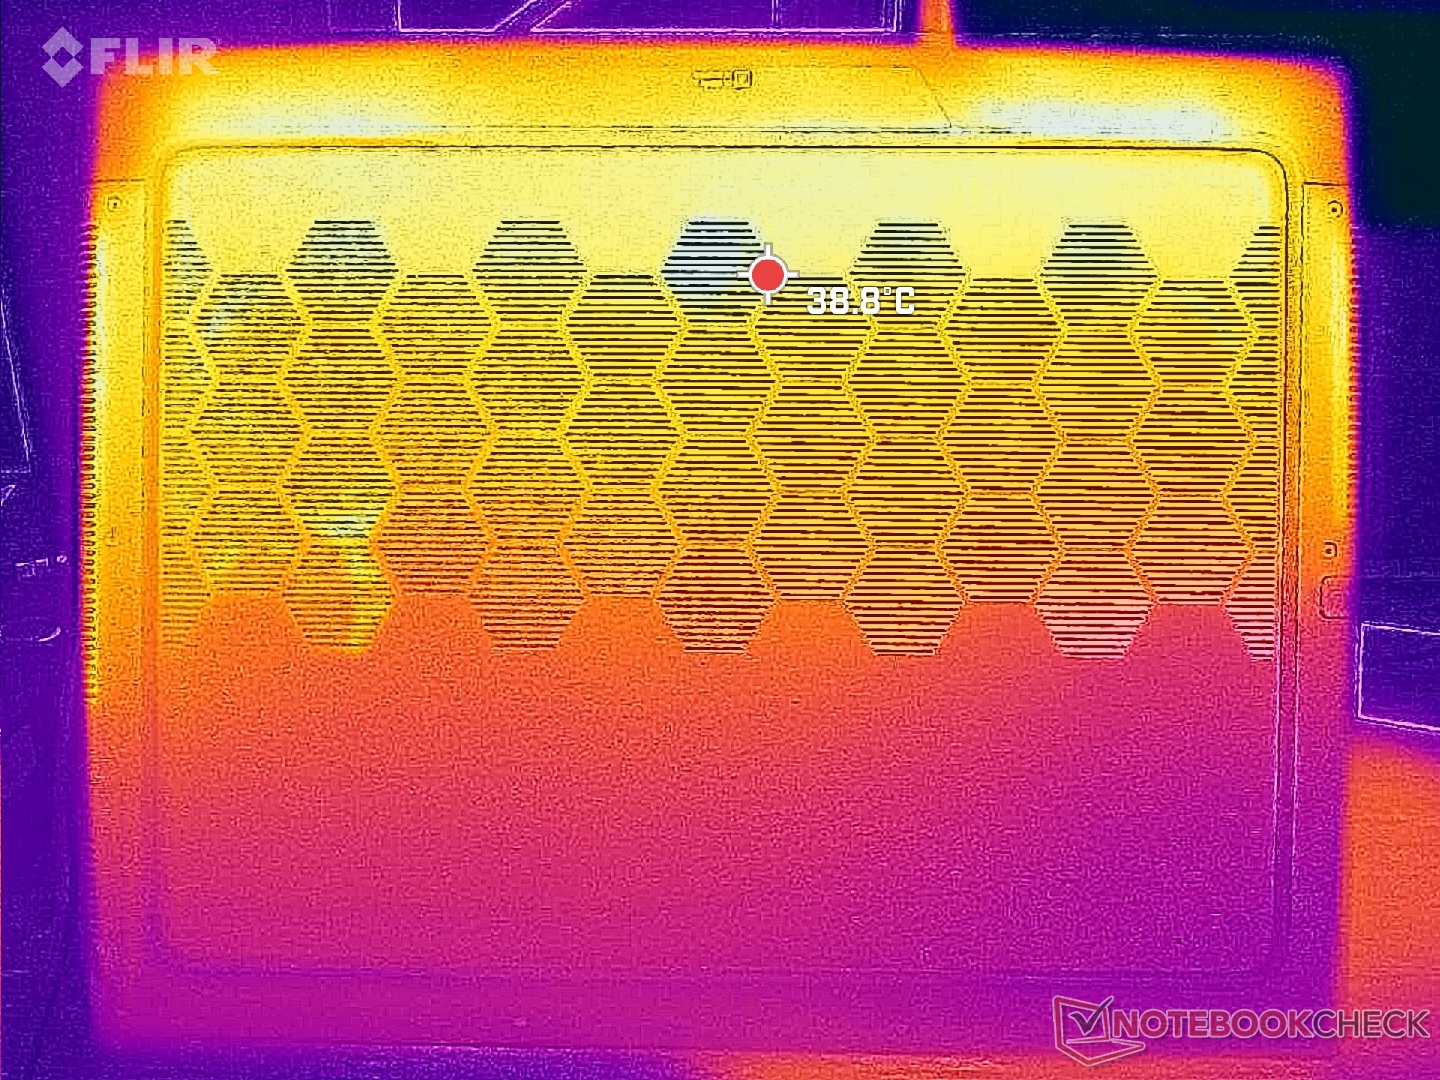
Les températures moyennes de surface sont généralement plus fraîches que celles que nous avons observées sur les modèles Asus ROG Strix G18. Les points chauds sont relégués à l'arrière du châssis afin de minimiser le contact avec la peau.
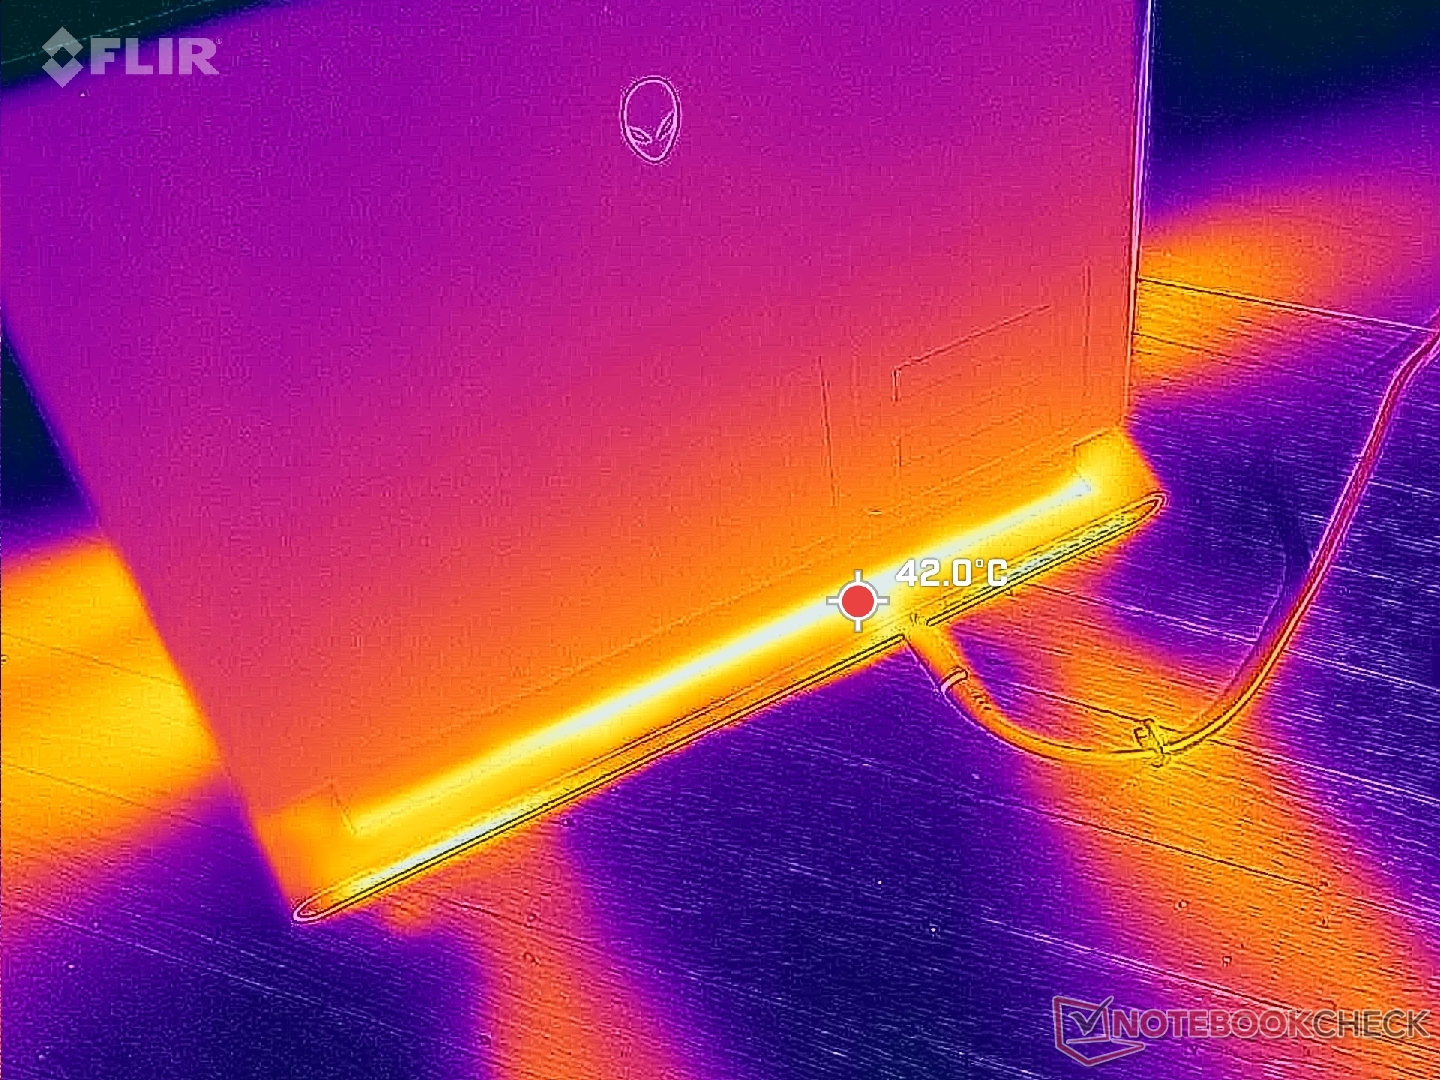
(±) La température maximale du côté supérieur est de 41.2 °C / 106 F, par rapport à la moyenne de 40.4 °C / 105 F, allant de 21.2 à 68.8 °C pour la classe Gaming.
(+) Le fond chauffe jusqu'à un maximum de 34.6 °C / 94 F, contre une moyenne de 43.2 °C / 110 F
(±) En utilisation inactive, la température moyenne du côté supérieur est de 34.9 °C / 95 F, par rapport à la moyenne du dispositif de 33.9 °C / 93 F.
(±) En jouant à The Witcher 3, la température moyenne du côté supérieur est de 32 °C / 90 F, alors que la moyenne de l'appareil est de 33.9 °C / 93 F.
(+) Les repose-poignets et le pavé tactile sont plus froids que la température de la peau avec un maximum de 28.2 °C / 82.8 F et sont donc froids au toucher.
(±) La température moyenne de la zone de l'appui-paume de dispositifs similaires était de 28.8 °C / 83.8 F (+0.6 °C / #1 F).
| Alienware m18 R2 Intel Core i9-14900HX, NVIDIA GeForce RTX 4090 Laptop GPU | Alienware m18 R1 AMD AMD Ryzen 9 7945HX, AMD Radeon RX 7900M | Alienware m18 R1 Intel Core i9-13980HX, NVIDIA GeForce RTX 4090 Laptop GPU | MSI Titan 18 HX A14VIG Intel Core i9-14900HX, NVIDIA GeForce RTX 4090 Laptop GPU | Asus ROG Strix G18 G814JI Intel Core i7-13650HX, NVIDIA GeForce RTX 4070 Laptop GPU | Acer Predator Helios 18 N23Q2 Intel Core i9-13900HX, NVIDIA GeForce RTX 4080 Laptop GPU | |
|---|---|---|---|---|---|---|
| Heat | 13% | 17% | 9% | 5% | -4% | |
| Maximum Upper Side * (°C) | 41.2 | 40.2 2% | 39 5% | 37.8 8% | 45 -9% | 35 15% |
| Maximum Bottom * (°C) | 34.6 | 37.4 -8% | 36.4 -5% | 37.6 -9% | 47 -36% | 56 -62% |
| Idle Upper Side * (°C) | 42.8 | 31.6 26% | 29.2 32% | 34.8 19% | 28 35% | 34 21% |
| Idle Bottom * (°C) | 43.6 | 30.6 30% | 27.8 36% | 36 17% | 31 29% | 39 11% |
* ... Moindre est la valeur, meilleures sont les performances
Intervenants
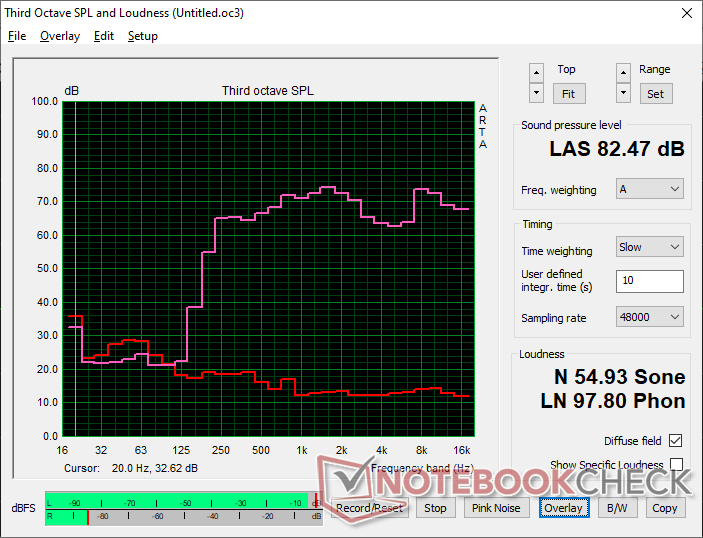
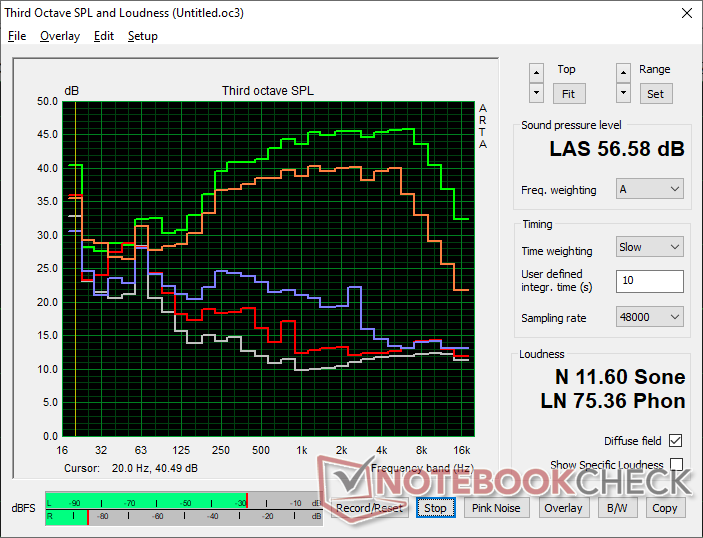
Alienware m18 R2 analyse audio
(+) | les haut-parleurs peuvent jouer relativement fort (82.5# dB)
Basses 100 - 315 Hz
(-) | presque aucune basse - en moyenne 22.1% plus bas que la médiane
(±) | la linéarité des basses est moyenne (14% delta à la fréquence précédente)
Médiums 400 - 2000 Hz
(+) | médiane équilibrée - seulement 4.1% de la médiane
(+) | les médiums sont linéaires (3.3% delta à la fréquence précédente)
Aiguës 2 - 16 kHz
(+) | des sommets équilibrés - à seulement 4% de la médiane
(+) | les aigus sont linéaires (6.1% delta à la fréquence précédente)
Globalement 100 - 16 000 Hz
(±) | la linéarité du son global est moyenne (17% de différence avec la médiane)
Par rapport à la même classe
» 45% de tous les appareils testés de cette catégorie étaient meilleurs, 12% similaires, 43% pires
» Le meilleur avait un delta de 6%, la moyenne était de 18%, le pire était de 132%.
Par rapport à tous les appareils testés
» 31% de tous les appareils testés étaient meilleurs, 8% similaires, 61% pires
» Le meilleur avait un delta de 4%, la moyenne était de 23%, le pire était de 134%.
Apple MacBook Pro 16 2021 M1 Pro analyse audio
(+) | les haut-parleurs peuvent jouer relativement fort (84.7# dB)
Basses 100 - 315 Hz
(+) | bonne basse - seulement 3.8% loin de la médiane
(+) | les basses sont linéaires (5.2% delta à la fréquence précédente)
Médiums 400 - 2000 Hz
(+) | médiane équilibrée - seulement 1.3% de la médiane
(+) | les médiums sont linéaires (2.1% delta à la fréquence précédente)
Aiguës 2 - 16 kHz
(+) | des sommets équilibrés - à seulement 1.9% de la médiane
(+) | les aigus sont linéaires (2.7% delta à la fréquence précédente)
Globalement 100 - 16 000 Hz
(+) | le son global est linéaire (4.6% différence à la médiane)
Par rapport à la même classe
» 0% de tous les appareils testés de cette catégorie étaient meilleurs, 0% similaires, 100% pires
» Le meilleur avait un delta de 5%, la moyenne était de 17%, le pire était de 45%.
Par rapport à tous les appareils testés
» 0% de tous les appareils testés étaient meilleurs, 0% similaires, 100% pires
» Le meilleur avait un delta de 4%, la moyenne était de 23%, le pire était de 134%.
Gestion de l'énergie
Consommation électrique
La course à pied Witcher 3 pour représenter des charges de jeu typiques, la consommation moyenne serait de 328 W, ce qui est légèrement supérieur à ce que nous avons enregistré sur la version Intel du m18 R1 de l'année dernière. En tant que tel, il n'y a pas de gains majeurs en termes de performance par watt puisque le matériel sous-jacent n'a pas changé.
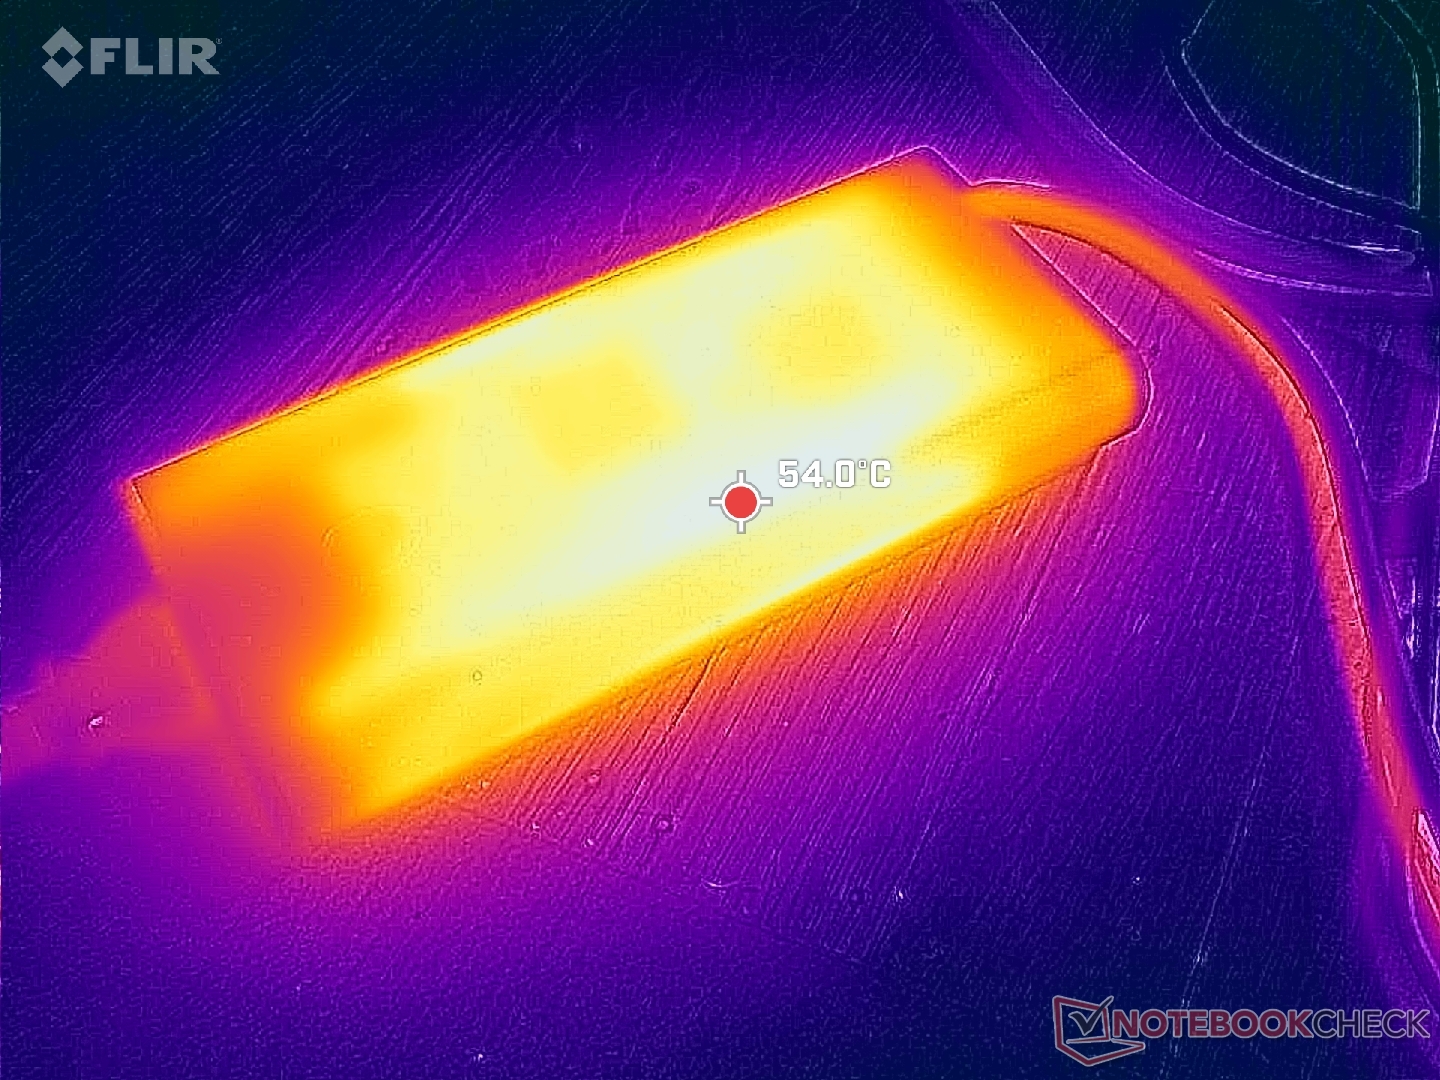
La nouveauté de cette année est l'adaptateur secteur de 360 W de plus grande capacité, alors que le m18 R1 est livré avec un adaptateur de 330 W. L'adaptateur plus récent est également plus petit. Le nouvel adaptateur est également plus petit (~18,9 x 8,6 x 2,6 cm contre ~19,5 x 9,8 x 4 cm) en raison du passage à la technologie GaN. L'adaptateur de plus grande capacité réduit les risques d'étranglement tout en permettant une charge plus rapide en cas d'utilisation simultanée de charges exigeantes.
(Note de la rédaction: cette section sera mise à jour lorsque les réparations de notre multimètre Metrahit Energy seront terminées. Nous vous prions de nous excuser pour la gêne occasionnée)
| Éteint/en veille | |
| Au repos | |
| Fortement sollicité |
|
Légende:
min: | |
| Alienware m18 R2 i9-14900HX, GeForce RTX 4090 Laptop GPU, SK Hynix PC811 HFS002TEM9X152N, IPS, 2560x1600, 18" | Alienware m18 R1 AMD R9 7945HX, Radeon RX 7900M, Kioxia XG8 KXG80ZNV1T02, IPS, 1920x1200, 18" | Alienware m18 R1 i9-13980HX, GeForce RTX 4090 Laptop GPU, SK hynix PC801 HFS001TEJ9X101N, IPS, 1920x1200, 18" | MSI Titan 18 HX A14VIG i9-14900HX, GeForce RTX 4090 Laptop GPU, 2x Samsung PM9A1a MZVL22T0HDLB (RAID 0), Mini-LED, 3840x2400, 18" | Asus ROG Strix G18 G814JI i7-13650HX, GeForce RTX 4070 Laptop GPU, Micron 2400 MTFDKBA1T0QFM, IPS, 2560x1600, 18" | Acer Predator Helios 18 N23Q2 i9-13900HX, GeForce RTX 4080 Laptop GPU, Samsung PM9A1 MZVL22T0HBLB, IPS, 2560x1600, 18" | |
|---|---|---|---|---|---|---|
| Power Consumption | -72% | -21% | -9% | 36% | 13% | |
| Idle Minimum * (Watt) | 10.6 | 30.3 -186% | 21.6 -104% | 13.2 -25% | 8 25% | 16 -51% |
| Idle Average * (Watt) | 20.9 | 55.6 -166% | 25.2 -21% | 25.4 -22% | 15 28% | 19 9% |
| Idle Maximum * (Watt) | 40 | 101.1 -153% | 56.7 -42% | 53.5 -34% | 26 35% | 21.3 47% |
| Load Average * (Watt) | 201.1 | 160.3 20% | 164.1 18% | 151.4 25% | 102 49% | 124 38% |
| Witcher 3 ultra * (Watt) | 358 | 216 40% | 311 13% | 336 6% | 178.6 50% | 289 19% |
| Load Maximum * (Watt) | 378.9 | 332.1 12% | 338.9 11% | 395.2 -4% | 267 30% | 319 16% |
* ... Moindre est la valeur, meilleures sont les performances
Power Consumption Witcher 3 / Stresstest
Power Consumption external Monitor
Autonomie de la batterie
Les durées d'utilisation restent à peu près les mêmes qu'auparavant, si ce n'est qu'elles sont légèrement plus longues, d'environ une demi-heure. Cela contraste avec notre configuration m18 R1 AMD qui a présenté des problèmes d'épuisement de la batterie pendant les tests.
Le chargement via l'USB-C n'est toujours pas possible.
| Alienware m18 R2 i9-14900HX, GeForce RTX 4090 Laptop GPU, 97 Wh | Alienware m18 R1 AMD R9 7945HX, Radeon RX 7900M, 97 Wh | Alienware m18 R1 i9-13980HX, GeForce RTX 4090 Laptop GPU, 97 Wh | MSI Titan 18 HX A14VIG i9-14900HX, GeForce RTX 4090 Laptop GPU, 99.9 Wh | Asus ROG Strix G18 G814JI i7-13650HX, GeForce RTX 4070 Laptop GPU, 90 Wh | Acer Predator Helios 18 N23Q2 i9-13900HX, GeForce RTX 4080 Laptop GPU, 90 Wh | |
|---|---|---|---|---|---|---|
| Autonomie de la batterie | -71% | -10% | -12% | 69% | -8% | |
| WiFi v1.3 (h) | 4.8 | 1.4 -71% | 4.3 -10% | 4.2 -12% | 8.1 69% | 4.4 -8% |
| Reader / Idle (h) | 4.5 | 5.6 | 5.9 | 11.7 | ||
| Load (h) | 0.7 | 0.7 | 1.2 | 1.2 | 1.7 | |
| H.264 (h) | 4.8 |
Points positifs
Points négatifs
Verdict - Plus qu'un Alienware m18 R1.1
Les ordinateurs portables de jeu sont dans une position difficile cette année. Les CPU Raptor Lake-HX refresh ont des performances presque identiques à celles de leurs homologues 2023, tandis que rien de nouveau n'a été annoncé pour supplanter la RTX 4090, vieille d'un an. Par conséquent, les nouveaux ordinateurs portables de jeu comme l'Alienware m18 R2 sont plus ou moins coincés en utilisant les mêmes pièces que les modèles de l'année dernière. Les utilisateurs de l'Alienware m18 R2 doivent donc s'attendre à ce que les performances soient du même ordre que celles de l Alienware m18 R1.
L'Alienware m18 R2 est un pas en avant par rapport à l'Alienware m18 R1. C'est toujours l'un des ordinateurs portables de jeu les plus rapides, mais les améliorations d'une année sur l'autre sont au mieux marginales.
Il y a quelques améliorations mineures comme le port RJ-45 plus rapide, l'adaptateur secteur plus petit et les options SSD plus récentes, mais l'expérience utilisateur est essentiellement la même. Nous vous recommandons de considérer le m18 R1 avant le m18 R2, d'autant plus que le m18 R1 est désormais moins cher.
Prix et disponibilité
Dell livre maintenant l'Alienware m18 R2 à partir de 1900 USD pour la configuration de base Core i7-14650HX, GeForce RTX 4060, et écran 1600p165 jusqu'à plus de 3200 USD pour la configuration Core i9-14900HX, RTX 4090, et écran 1200p480.
Alienware m18 R2
- 03/22/2024 v7 (old)
Allen Ngo
Transparency
La sélection des appareils à examiner est effectuée par notre équipe éditoriale. L'échantillon de test a été prêté à l'auteur par le fabricant ou le détaillant pour les besoins de cet examen. Le prêteur n'a pas eu d'influence sur cette évaluation et le fabricant n'a pas reçu de copie de cette évaluation avant sa publication. Il n'y avait aucune obligation de publier cet article. En tant que média indépendant, Notebookcheck n'est pas soumis à l'autorité des fabricants, des détaillants ou des éditeurs.
Voici comment Notebookcheck teste
Chaque année, Notebookcheck examine de manière indépendante des centaines d'ordinateurs portables et de smartphones en utilisant des procédures standardisées afin de garantir que tous les résultats sont comparables. Nous avons continuellement développé nos méthodes de test depuis environ 20 ans et avons établi des normes industrielles dans le processus. Dans nos laboratoires de test, des équipements de mesure de haute qualité sont utilisés par des techniciens et des rédacteurs expérimentés. Ces tests impliquent un processus de validation en plusieurs étapes. Notre système d'évaluation complexe repose sur des centaines de mesures et de points de référence bien fondés, ce qui garantit l'objectivité.Price comparison

