Notebookcheck Logo

NVIDIA GeForce RTX 5090 Laptop

NVIDIA GeForce RTX 5090 Laptop

La Nvidia GeForce RTX 5090 Laptop est une carte graphique mobile de la famille Blackwell pour ordinateurs portables, présentée au CES 2025 et commercialisée en avril 2025.

Architecture

La GeForce RTX 5090 Mobile utilise la puce GB203 et emploie 10 496 shaders/CUDA cores, soit le maximum de 10 752 que la puce supporte. La RTX 5090 Laptop est donc plus proche de la variante de bureau RTX 5080 (même puce) que la RTX 5090 de bureau avec 20 760 cœurs et des fréquences d'horloge plus élevées.

Blackwell propose une nouveauté : la prise en charge de la génération de trames multiples (MFG) avec DLSS4, grâce à la 5e génération de cœurs Tensor.

Performances

Comme le montrent nos tests, les gains de performance par rapport à un ordinateur portable 175W RTX 4090 Laptop Sont à peine perceptibles dans les tests 3DMark. Néanmoins, lorsqu'il s'agit de performances de jeu globales, la carte est 2 à 19% plus rapide que le précédent fleuron mobile. La variante pour ordinateur portable la plus rapide que nous avons testée n'est que 5 % derrière la RTX 5080 pour ordinateur de bureau. Cela signifie que la 5090L est généralement capable d'afficher tous les détails en 4k avec fluidité (voir ci-dessous). De plus, avec la génération multi-frame (MFG) mentionnée, vous pouvez obtenir des taux de trame impressionnants, mais gardez à l'esprit la latence.

Consommation électrique

La puce GB203 est fabriquée par TSMC dans le processus 4N (custom 4NP 5nm). Le TGP maximum de la carte peut atteindre 175 watts (150 watts + 25 watts Dynamic Boost).

GeForce RTX 5000 Laptop GPU Gamme

GeForce RTX 5090 Laptop 10496 @ 0.99 - 1.52 GHz256 Bit @ 28000 MHz
GeForce RTX 5080 Laptop 8192 @ 0.98 - 2.29 GHz256 Bit @ 28000 MHz
GeForce RTX 5070 Ti Laptop 5888 @ 0.85 - 2.22 GHz192 Bit @ 32000 MHz
GeForce RTX 5070 Laptop 4608 @ 0.91 - 2.35 GHz128 Bit @ 32000 MHz
GeForce RTX 5060 Laptop 3328 @ 0.95 - 1.46 GHz128 Bit @ 24000 MHz
GeForce RTX 5050 Laptop 2560 @ 1.02 - 2.66 GHz128 Bit @ 14000 MHz
Nom de codeGN22-X11
ArchitectureBlackwell
Pipelines10496 - unifiés
TMUs328
ROPs112
Raytracing Cores82
Tensor / AI Cores328
Fréquence du noyau interne990 - 1515 (Boost) MHz
Theoretical Performance31.8 TFLOPS FP16, 31.8 TFLOPS FP32
AI GPU1824 TOPS INT8
CacheL1: 10.3 Mo, L2: 64 Mo
Fréquence de la mémoire28000 effective = 1750 MHz
Largeur du bus mémoire256 Bit
Type de mémoireGDDR7
Quantité maximale possible de mémoire embarquée24 GB
Mémoire partagéenon
Memory Bandwidth896 GB/s
APIDirectX 12_2, OpenGL 4.6, OpenCL 3.0, Vulkan 1.4
Consommation d'énergie150 Watt(s) (95 - 150 Watt(s) TGP)
technologie5 nm
PCIe5
Displays4 Displays (max.), HDMI 2.1b, DisplayPort 2.1b
Dimension de l'ordinateur portablede grandes dimensions (en remplacement d'un ordinateur de bureau)
Date de présentation02.01.2025
PredecessorGeForce RTX 4090 Laptop GPU

Benchmarks

Performance Rating - 3DMark 11 + Fire Strike + Time Spy
19 pt (57%)
Restrict / Search: Model: Max. age: years
3DMark - 3DMark Speed Way Score
min: 6041     moyenne: 6368     médian: 6404 (44%)     maximum: 6643 Points
3DMark - 3DMark Steel Nomad
min: 4791     moyenne: 5905     médian: 6038 (42%)     maximum: 6329 Points
3DMark - 3DMark Steel Nomad Light
min: 18624     moyenne: 24478     médian: 25981 (59%)     maximum: 27244 Points
3DMark - 3DMark Wild Life Unlimited
153090 Points (77%)
3DMark - 3DMark Wild Life Extreme Unlimited
min: 34972     moyenne: 44673     médian: 46751 (54%)     maximum: 49864 Points
3DMark - 3DMark Solar Bay
min: 113929     moyenne: 114416     médian: 114416 (52%)     maximum: 114903 Points
3DMark - 3DMark Fire Strike Standard Score
min: 31954     moyenne: 39753     médian: 39162 (59%)     maximum: 49845 Points
3DMark - 3DMark Fire Strike Standard Graphics
min: 42175     moyenne: 51762     médian: 50860 (47%)     maximum: 62849 Points
3DMark - 3DMark Ice Storm Graphics
min: 532587     moyenne: 581908     médian: 595425 (66%)     maximum: 617713 Points
3DMark - 3DMark Time Spy Score
min: 16828     moyenne: 21671     médian: 22220.5 (59%)     maximum: 24013 Points
3DMark - 3DMark Time Spy Graphics
min: 19216     moyenne: 23746     médian: 24521 (50%)     maximum: 25984 Points
107.5 -100%
...
NVIDIA GeForce RTX 5070 Laptop
13282 -44%
15184 -36%
16308 -31%
16838 -29%
17764 -25%
19434 -18%
20950 -12%
21099 -11%
Nvidia RTX PRO 5000 Blackwell Generation Laptop
23742 0%
NVIDIA GeForce RTX 5090 Laptop
23746
...
Nvidia RTX PRO 5000 Blackwell Generation Laptop
23742 0%
max:
NVIDIA GeForce RTX 5090
46337 95%
0%
100%
Restrict / Search: Model: Max. age: years
3DMark - 3DMark Ice Storm Unlimited Graphics
min: 836363     moyenne: 849431     médian: 849431 (86%)     maximum: 862499 Points
3DMark - 3DMark Ice Storm Extreme Graphics
min: 582157     moyenne: 588672     médian: 588672 (69%)     maximum: 595187 Points
3DMark - 3DMark Cloud Gate Score
min: 69384     moyenne: 74028     médian: 73245.5 (69%)     maximum: 80657 Points
3DMark - 3DMark Cloud Gate Graphics
min: 133460     moyenne: 144547     médian: 141976 (35%)     maximum: 163068 Points
3DMark - 3DMark Night Raid
min: 85147     moyenne: 88899     médian: 88898.5 (84%)     maximum: 92650 Points
3DMark - 3DMark Night Raid Graphics Score
min: 189862     moyenne: 196526     médian: 196526 (76%)     maximum: 203190 Points
3DMark 11 - 3DM11 Performance Score
min: 38921     moyenne: 48635     médian: 49088 (59%)     maximum: 54833 Points
3DMark 11 - 3DM11 Performance GPU
min: 48548     moyenne: 67438     médian: 69860 (53%)     maximum: 80022 Points
171.8 -100%
...
44536 -34%
46877 -30%
51979 -23%
54921 -19%
56687 -16%
56791 -16%
59943 -11%
62210 -8%
65041 -4%
NVIDIA GeForce RTX 5090 Laptop
67438
Nvidia RTX PRO 5000 Blackwell Generation Laptop
68846 2%
max:
NVIDIA GeForce RTX 5090
129772 92%
0%
100%
Restrict / Search: Model: Max. age: years
3DMark Vantage
3DM Vant. Perf. total +
3DMark Vantage - 3DM Vant. Perf. total
min: 111238     moyenne: 121938     médian: 121938 (35%)     maximum: 132638 Points
3DM Vant. Perf. GPU no PhysX +
3DMark Vantage - 3DM Vant. Perf. GPU no PhysX
min: 131334     moyenne: 133963     médian: 133962 (73%)     maximum: 136591 Points
Restrict / Search: Model: Max. age: years
3DMark 06 3DMark 06 - Standard 1280x1024 +
3DMark 06
min: 64778     moyenne: 65248     médian: 65248 (85%)     maximum: 65718 Points
Unigine Valley 1.0 - Unigine Valley 1.0 DX
min: 231     moyenne: 249.7     médian: 249.7 (76%)     maximum: 268.3 fps
Blender - Blender 3.3 Classroom CUDA *
min: 15     moyenne: 17.8     médian: 16 (2%)     maximum: 37 Seconds
Blender - Blender 3.3 Classroom OPTIX *
min: 9     moyenne: 11.9     médian: 11.2 (4%)     maximum: 18 Seconds
SPECviewperf 2020 specvp2020 solidworks-05 1080p +
SPECviewperf 2020 - specvp2020 solidworks-05 1080p
542 fps (100%)
specvp2020 snx-04 1080p +
SPECviewperf 2020 - specvp2020 snx-04 1080p
35.9 fps (4%)
specvp2020 medical-03 1080p +
SPECviewperf 2020 - specvp2020 medical-03 1080p
60.6 fps (17%)
specvp2020 maya-06 1080p +
SPECviewperf 2020 - specvp2020 maya-06 1080p
640 fps (69%)
specvp2020 energy-03 1080p +
SPECviewperf 2020 - specvp2020 energy-03 1080p
77.7 fps (13%)
specvp2020 creo-03 1080p +
SPECviewperf 2020 - specvp2020 creo-03 1080p
122.2 fps (42%)
specvp2020 catia-06 1080p +
SPECviewperf 2020 - specvp2020 catia-06 1080p
108.4 fps (53%)
specvp2020 3dsmax-07 1080p +
SPECviewperf 2020 - specvp2020 3dsmax-07 1080p
207.3 fps (55%)
specvp2020 snx-04 4k +
SPECviewperf 2020 - specvp2020 snx-04 4k
33.3 fps (3%)
specvp2020 medical-03 4k +
SPECviewperf 2020 - specvp2020 medical-03 4k
27.4 fps (18%)
specvp2020 maya-06 4k +
SPECviewperf 2020 - specvp2020 maya-06 4k
422 fps (61%)
specvp2020 energy-03 4k +
SPECviewperf 2020 - specvp2020 energy-03 4k
56.4 fps (12%)
specvp2020 creo-03 4k +
SPECviewperf 2020 - specvp2020 creo-03 4k
105 fps (47%)
specvp2020 catia-06 4k +
SPECviewperf 2020 - specvp2020 catia-06 4k
65.2 fps (43%)
specvp2020 3dsmax-07 4k +
SPECviewperf 2020 - specvp2020 3dsmax-07 4k
160 fps (54%)
Cinebench R10 Cinebench R10 Shading (32bit) +
Cinebench R10 - Cinebench R10 Shading (32bit)
min: 22892     moyenne: 23907     médian: 23907 (17%)     maximum: 24922 points
Cinebench R11.5 Cinebench R11.5 OpenGL 64 Bit +
Cinebench R11.5 - Cinebench R11.5 OpenGL 64 Bit
min: 232.51     moyenne: 235.6     médian: 235.6 (78%)     maximum: 238.7 fps
Cinebench R15
Cinebench R15 OpenGL 64 Bit +
Cinebench R15 - Cinebench R15 OpenGL 64 Bit
min: 121.3     moyenne: 277.6     médian: 288 (17%)     maximum: 346 fps
Cinebench R15 OpenGL Ref. Match 64 Bit +
Cinebench R15 - Cinebench R15 OpenGL Ref. Match 64 Bit
min: 97.8     moyenne: 99.5     médian: 99.6 (100%)     maximum: 99.6 %
GFXBench - GFXBench 5.0 4K Aztec Ruins High Tier Offscreen
min: 242.8     moyenne: 254.8     médian: 254.8 (96%)     maximum: 266.7 fps
GFXBench - GFXBench 5.0 Aztec Ruins High Tier Offscreen
min: 466     moyenne: 512     médian: 511.5 (92%)     maximum: 557 fps
Restrict / Search: Model: Max. age: years
GFXBench - GFXBench 5.0 Aztec Ruins Normal Tier Offscreen
min: 1067     moyenne: 1094     médian: 1094.5 (81%)     maximum: 1121.9 fps
GFXBench - GFXBench Car Chase Offscreen
min: 975     moyenne: 1017     médian: 1016.6 (96%)     maximum: 1058.2 fps
GFXBench 3.1 - GFXBench Manhattan ES 3.1 Offscreen
1112 fps (24%)
GFXBench 3.0 - GFXBench 3.0 Manhattan Offscreen
1154 fps (48%)
GFXBench (DX / GLBenchmark) 2.7
GFXBench T-Rex HD Offscreen C24Z16 +
GFXBench (DX / GLBenchmark) 2.7 - GFXBench T-Rex HD Offscreen C24Z16
4193 fps (33%)
Basemark GPU 1.2 - Basemark GPU 1.2 Vulkan Official Medium Offscreen 1080
min: 104.6     moyenne: 481.9     médian: 315 (8%)     maximum: 2756 fps
Basemark GPU 1.2 - Basemark GPU 1.2 Vulkan Official High Offscreen 2160
3.6 fps (1%)
Geekbench 6.5 - Geekbench 6.5 GPU OpenCL
min: 181670     moyenne: 219590     médian: 228998 (60%)     maximum: 253130 points
Geekbench 6.5 - Geekbench 6.5 GPU Vulkan
min: 7393     moyenne: 113098     médian: 112426 (28%)     maximum: 231659 points
LuxMark v2.0 64Bit - LuxMark v2.0 Room GPU
min: 9883     moyenne: 14086     médian: 10445 (38%)     maximum: 21929 Samples/s
LuxMark v2.0 64Bit - LuxMark v2.0 Sala GPU
min: 10315     moyenne: 18254     médian: 21079 (37%)     maximum: 23367 Samples/s
ComputeMark v2.1 - ComputeMark v2.1 Result
min: 48753     moyenne: 55060     médian: 58198 (48%)     maximum: 58228 points
Power Consumption - Furmark Stress Test Power Consumption - external Monitor *
min: 155.5     moyenne: 222.1     médian: 225.5 (30%)     maximum: 250 Watt
020406080100120140160180200220240260280300Tooltip
Power Consumption - The Witcher 3 Power Consumption - external Monitor *
min: 200     moyenne: 240.5     médian: 240.5 (34%)     maximum: 281 Watt
0153045607590105120135150165180195210225240255270285Tooltip
Power Consumption - Power Efficiency - Witcher 3 ultra external Monitor
min: 0.778     moyenne: 0.9     médian: 0.9 (72%)     maximum: 0.96 fps per Watt
Power Consumption - Cyberpunk 2077 Power Consumption 150cd *
min: 164.5     moyenne: 282.7     médian: 295 (82%)     maximum: 348 Watt
020406080100120140160180200220240260280300320340Tooltip
Power Consumption - Cyberpunk 2077 Power Consumption - external Monitor *
min: 160.4     moyenne: 278.4     médian: 290.5 (37%)     maximum: 343 Watt
020406080100120140160180200220240260280300320340Tooltip
Power Consumption - Power Efficiency - Cyberpunk 2077 ultra
min: 0.4423     moyenne: 0.5     médian: 0.5 (2%)     maximum: 0.686 fps per Watt
- Amplitude des valeurs obtenues dans le benchmark avec cette carte graphique
red legend - Valeur moyenne obtenue dans le benchmark avec cette carte graphique
* Plus les chiffres sont petits, plus les performances sont élevées

Benchmarks de jeux

Les benchmarks qui suivent sont tirés de tests effectués dans nos critiques des ordinateurs portables. Les performances dépendent du type et de la quantité de mémoire graphique embaquée, mais aussi de sa fréquence, du processeur, des paramètres système, des pilotes et du système d'exploitation. Les résultats ne sont donc pas représentatifs de tous les appareils intégrant cette carte graphique. Pour plus de détails sur les résultats, cliquez sur le nombre d'images par seconde.

Battlefield 6

Battlefield 6

2025
Bas 1920x1080
181.4  fps    + Comparer + 📈 Graph
Moyen 1920x1080
169.4  fps    + Comparer + 📈 Graph
Élevé 1920x1080
159.9  fps    + Comparer + 📈 Graph
Ultra 1920x1080
145.8 159.4 ~ 153 fps    + Comparer + 📈 Graph
QHD 2560x1440
108.5 109.3 ~ 109 fps    + Comparer + 📈 Graph
4K 3840x2160
59.4 59.7 ~ 60 fps    + Comparer + 📈 Graph
4K DLSS 3840x2160
82.5 83.6 ~ 83 fps    + Comparer + 📈 Graph
QHD DLSS 2560x1440
136.7 143.4 ~ 140 fps    + Comparer + 📈 Graph
» Jouable avec tous les ordinateurs portables testés avec les détails paramétrés sur Ultra.
Borderlands 4

Borderlands 4

2025
Bas 1920x1080
98.4  fps    + Comparer + 📈 Graph
Moyen 1920x1080
82  fps    + Comparer + 📈 Graph
Élevé 1920x1080
68.7 76.6 ~ 73 fps    + Comparer + 📈 Graph
Ultra 1920x1080
48.5 54 ~ 51 fps    + Comparer + 📈 Graph
QHD 2560x1440
32.8 37.1 ~ 35 fps    + Comparer + 📈 Graph
4K 3840x2160
18.6 20.2 ~ 19 fps    + Comparer + 📈 Graph
4K DLSS 3840x2160
107.1 117.5 ~ 112 fps    + Comparer + 📈 Graph
QHD DLSS 2560x1440
54.9  fps    + Comparer + 📈 Graph
» Jouable avec tous les ordinateurs portables testés avec les détails paramétrés sur Ultra.
F1 25

F1 25

2025
Bas 1920x1080
188.1 221 240 279 317 322 ~ 261 fps    + Comparer
Moyen 1920x1080
176.8 207 226 256 268 279 308 ~ 246 fps    + Comparer
Élevé 1920x1080
168.3 200 217 241 252 280 291 ~ 236 fps    + Comparer
Ultra 1920x1080
49.4 49.7 57 58.6 58.8 59.8 62.3 ~ 57 fps    + Comparer
QHD 2560x1440
30.2 30.9 34 35.8 36.1 36.8 37.5 ~ 34 fps    + Comparer
4K 3840x2160
13.2 14.1 16 16.7 17.8 ~ 16 fps    + Comparer
4K DLSS 3840x2160
25.4 26.7 32.2 34.1 ~ 30 fps    + Comparer
QHD DLSS 2560x1440
53 53.2 61 64 67.5 ~ 60 fps    + Comparer
» Jouable avec tous les ordinateurs portables testés avec les détails paramétrés sur Ultra.
Additional Benchmarks
Ultra High Preset 16xAF TAA 1920x1080
111.6
114
116.9
117.9
91.4
91.4
Bas 1920x1080
133.5  fps    + Comparer
Moyen 1920x1080
117.3 124.3 ~ 121 fps    + Comparer + 📈 Graph
Élevé 1920x1080
108.4 113.9 133.2 ~ 119 fps    + Comparer + 📈 Graph
Ultra 1920x1080
105.3 111.3 128.9 ~ 115 fps    + Comparer + 📈 Graph
QHD 2560x1440
77 82.1 92.2 ~ 84 fps    + Comparer + 📈 Graph
4K 3840x2160
43.3 52.2 ~ 48 fps    + Comparer + 📈 Graph
4K DLSS 3840x2160
63 75.6 ~ 69 fps    + Comparer + 📈 Graph
QHD DLSS 2560x1440
102.3 107.3 ~ 105 fps    + Comparer + 📈 Graph
» Jouable avec tous les ordinateurs portables testés avec les détails paramétrés sur Ultra.
Moyen 1920x1080
118.4  fps    + Comparer + 📈 Graph
Élevé 1920x1080
104.2 111.8 ~ 108 fps    + Comparer + 📈 Graph
Ultra 1920x1080
57.5 61.9 ~ 60 fps    + Comparer + 📈 Graph
QHD 2560x1440
41.7 45.9 ~ 44 fps    + Comparer + 📈 Graph
4K 3840x2160
27.3  fps    + Comparer + 📈 Graph
4K DLSS 3840x2160
41.6  fps    + Comparer + 📈 Graph
QHD DLSS 2560x1440
59.7  fps    + Comparer + 📈 Graph
» Jouable avec tous les ordinateurs portables testés avec les détails paramétrés sur Ultra.
Bas 1920x1080
107 112 115 126 ~ 115 fps    + Comparer
Moyen 1920x1080
101 104 109 115 ~ 107 fps    + Comparer
Élevé 1920x1080
88 90 95 97 ~ 93 fps    + Comparer
Ultra 1920x1080
44 62 63 64 65 69 70 70 72 74 75 75 76 ~ 68 fps    + Comparer
QHD 2560x1440
37 50 51 54 55 55 56 57 59 59 59 61 63 64 ~ 56 fps    + Comparer
4K 3840x2160
35 36 39 40 40 41 41 42 44 46 46 ~ 41 fps    + Comparer
4K DLSS 3840x2160
47 53 53 53 55 59 61 ~ 54 fps    + Comparer
QHD DLSS 2560x1440
45 62 64 65 65 69 76 ~ 64 fps    + Comparer
» Jouable avec tous les ordinateurs portables testés avec les détails paramétrés sur Ultra.
Additional Benchmarks
Ultra High + GI + DLSS Quality + FG 2560x1440
87
106
97
105
108
Ultra High + GI + DLSS Quality + FG 3840x2160
66
78
74
81
84
Moyen 1920x1080
206 231 ~ 219 fps    + Comparer + 📈 Graph
Élevé 1920x1080
203 225 ~ 214 fps    + Comparer + 📈 Graph
QHD 2560x1440
171.3 184.9 ~ 178 fps    + Comparer + 📈 Graph
» Jouable avec tous les ordinateurs portables testés avec les détails paramétrés sur Élevé.
Ultra 1920x1080
66.4 68.1 80.8 87.6 88.2 88.3 88.9 89 94.6 95.3 ~ 85 fps    + Comparer
QHD 2560x1440
54 65.6 70.3 72 73.3 73.8 74.7 75 76.4 80.5 ~ 72 fps    + Comparer
4K 3840x2160
33.4 44.1 46 46.3 46.8 46.9 47.5 47.7 48.5 50.8 ~ 46 fps    + Comparer
4K DLSS 3840x2160
57.6 61.2 64 64.5 69.2 ~ 63 fps    + Comparer
QHD DLSS 2560x1440
63.9 68.6 79 85 86.4 92.8 ~ 79 fps    + Comparer
» Jouable avec tous les ordinateurs portables testés avec les détails paramétrés sur Ultra.
Moyen 1920x1080
184.3 195.8 ~ 190 fps    + Comparer + 📈 Graph
Élevé 1920x1080
151.7 165.7 ~ 159 fps    + Comparer + 📈 Graph
Ultra 1920x1080
108 118.5 130.3 ~ 119 fps    + Comparer + 📈 Graph
QHD 2560x1440
82.6 86 97.2 ~ 89 fps    + Comparer + 📈 Graph
4K 3840x2160
56.2  fps    + Comparer + 📈 Graph
4K DLSS 3840x2160
70.2  fps    + Comparer + 📈 Graph
QHD DLSS 2560x1440
98.7 114.5 115.5 ~ 110 fps    + Comparer + 📈 Graph
» Jouable avec tous les ordinateurs portables testés avec les détails paramétrés sur Ultra.
Bas 1920x1080
187.5 192.6 203 ~ 194 fps    + Comparer
Élevé 1920x1080
138.2 142.6 151.9 ~ 144 fps    + Comparer
Ultra 1920x1080
87.7 119.6 121.9 127.9 128.6 130.6 132 133.4 133.9 135.2 140.3 142.3 152.6 ~ 130 fps    + Comparer + 📈 Graph
QHD 2560x1440
66.1 97.3 99.1 101.3 102 102.2 102.6 105 105.9 106 107.1 112.6 112.9 115.9 121.9 ~ 104 fps    + Comparer + 📈 Graph
4K 3840x2160
48.2 62.3 63.5 65 65.6 66.4 66.6 66.6 68.6 70.8 72.3 73 ~ 66 fps    + Comparer + 📈 Graph
QHD DLSS 2560x1440
76.2 113.9 118 120.6 122.4 133.7 141.4 ~ 118 fps    + Comparer + 📈 Graph
» Jouable avec tous les ordinateurs portables testés avec les détails paramétrés sur Ultra.
Additional Benchmarks
Very Ultra Preset + Full Path Tracing + Quality DLSS + Frame Generation 2560x1440
72.9
180
80.2
82
84.2
91.5
83.1
Very Ultra Preset + Full Path Tracing + Quality DLSS + Frame Generation 3840x2160
109
51.9
51
51.8
56.2
51.7
Stalker 2

Stalker 2

2024
Moyen 1920x1080
100 106.1 ~ 103 fps    + Comparer + 📈 Graph
Élevé 1920x1080
88.1 92.6 167.8 ~ 116 fps    + Comparer + 📈 Graph
Ultra 1920x1080
76.3 81.8 147.6 ~ 102 fps    + Comparer + 📈 Graph
QHD 2560x1440
59.8 65.4 110.7 ~ 79 fps    + Comparer + 📈 Graph
4K 3840x2160
65.4  fps    + Comparer + 📈 Graph
4K DLSS 3840x2160
92.7  fps    + Comparer + 📈 Graph
QHD DLSS 2560x1440
124.9 134.6 ~ 130 fps    + Comparer + 📈 Graph
» Jouable avec tous les ordinateurs portables testés avec les détails paramétrés sur Ultra.
Bas 1920x1080
201 205 215 229 ~ 213 fps    + Comparer
Moyen 1920x1080
186 194 200 209 ~ 197 fps    + Comparer
Élevé 1920x1080
135 157 165 169 ~ 157 fps    + Comparer
Ultra 1920x1080
128 147 147 151 161 162 162 174 ~ 154 fps    + Comparer
QHD 2560x1440
92 116 117 123 127 131 136 151 ~ 124 fps    + Comparer
4K 3840x2160
60 71 79 82 90 101 ~ 81 fps    + Comparer
4K DLSS 3840x2160
81  fps    + Comparer
QHD DLSS 2560x1440
131  fps    + Comparer
» Jouable avec tous les ordinateurs portables testés avec les détails paramétrés sur Ultra.
Moyen 1920x1080
109.9 110.6 ~ 110 fps    + Comparer + 📈 Graph
Élevé 1920x1080
96.9 102.4 116.6 ~ 105 fps    + Comparer + 📈 Graph
Ultra 1920x1080
87.5 93.9 104 ~ 95 fps    + Comparer + 📈 Graph
QHD 2560x1440
65.6 69.5 76.6 ~ 71 fps    + Comparer + 📈 Graph
4K 3840x2160
45.4  fps    + Comparer + 📈 Graph
4K DLSS 3840x2160
63.2  fps    + Comparer + 📈 Graph
QHD DLSS 2560x1440
79.7 86.3 ~ 83 fps    + Comparer + 📈 Graph
» Jouable avec tous les ordinateurs portables testés avec les détails paramétrés sur Ultra.
Moyen 1920x1080
102.8 104.1 ~ 103 fps    + Comparer + 📈 Graph
Élevé 1920x1080
102.1 103.1 108.5 ~ 105 fps    + Comparer + 📈 Graph
Ultra 1920x1080
100.8 101.4 108 ~ 103 fps    + Comparer + 📈 Graph
QHD 2560x1440
97.2 98.6 107.4 ~ 101 fps    + Comparer + 📈 Graph
4K 3840x2160
69.6  fps    + Comparer + 📈 Graph
4K DLSS 3840x2160
94.7  fps    + Comparer + 📈 Graph
QHD DLSS 2560x1440
97.5 100.8 ~ 99 fps    + Comparer + 📈 Graph
» Jouable avec tous les ordinateurs portables testés avec les détails paramétrés sur Ultra.
Moyen 1920x1080 cinem.
79.3 91.1 ~ 85 fps    + Comparer + 📈 Graph
Élevé 1920x1080 cinem.
72.7 82.9 ~ 78 fps    + Comparer + 📈 Graph
Ultra 1920x1080 cinem.
62.8 70 71.6 ~ 68 fps    + Comparer + 📈 Graph
QHD 2560x1440 cinem.
43.7 54 61 ~ 53 fps    + Comparer + 📈 Graph
4K 3840x2160 cinem.
24.6  fps    + Comparer + 📈 Graph
4K DLSS 3840x2160 cinem.
40.4  fps    + Comparer + 📈 Graph
QHD DLSS 2560x1440 cinem.
66.5 70.8 70.9 ~ 69 fps    + Comparer + 📈 Graph
» Jouable avec tous les ordinateurs portables testés avec les détails paramétrés sur Ultra.
Additional Benchmarks
ultra, RT ultra, DLSS, FG RR 2560x1440 cinem.
87.9
ultra, RT ultra, DLSS, FG RR 3840x2160 cinem.
53.4
ultra, RT ultra, DLSS, FG 4x, RR 3840x2160 cinem.
97.2
Élevé 1920x1080
109  fps    + Comparer
Ultra 1920x1080
57 63 63 65 74 ~ 64 fps    + Comparer
QHD 2560x1440
44 47 48 48 50 ~ 47 fps    + Comparer
4K 3840x2160
27 28 29 30 33 ~ 29 fps    + Comparer
4K DLSS 3840x2160
46 49 52 ~ 49 fps    + Comparer
QHD DLSS 2560x1440
64 67 69 70 73 ~ 69 fps    + Comparer
QHD FSR 2560x1440
49  fps    + Comparer
» Jouable avec tous les ordinateurs portables testés avec les détails paramétrés sur Ultra.
Additional Benchmarks
cinematic RT: Very High DLSS 68 FG 3840x2160
45
44
47
45
cinematic RT: Very High DLSS 68 FG 2560x1440
76
82
82
85
79
F1 24

F1 24

2024
Bas 1920x1080
236 240 301 343 361 421 ~ 317 fps    + Comparer
Moyen 1920x1080
236 260 299 335 342 369 399 ~ 320 fps    + Comparer
Élevé 1920x1080
207 236 240 252 275 281 305 324 341 357 357 ~ 289 fps    + Comparer
Ultra 1920x1080
107.5 107.7 123.3 129 133 139 144.2 144.9 148 152 152.2 154.2 154.9 155.4 156.3 157.8 158.3 ~ 142 fps    + Comparer
QHD 2560x1440
72.5 75.4 84.6 90 94.9 95 97.8 100 101 101.2 103.3 103.6 104 104.3 105 105.5 106.4 106.9 ~ 97 fps    + Comparer
4K 3840x2160
39.3 39.5 48.8 49 50 50.5 51.3 52 52 52.2 52.3 53.6 54.2 ~ 50 fps    + Comparer
4K DLSS 3840x2160
66 66.8 80.5 80.8 82 87.9 89.2 90.2 90.6 90.9 ~ 82 fps    + Comparer
4K FSR 3840x2160
77.7  fps    + Comparer
QHD DLSS 2560x1440
105.5 108.1 124.7 126 130.7 139.1 141 141.8 151 155.9 156.3 159.3 ~ 137 fps    + Comparer
QHD FSR 2560x1440
156.1  fps    + Comparer
» Jouable avec tous les ordinateurs portables testés avec les détails paramétrés sur Ultra.
Additional Benchmarks
Ultra Low Preset TAA 1280x720
257
Moyen 1920x1080
96.8  fps    + Comparer + 📈 Graph
Élevé 1920x1080
76.6 86.1 ~ 81 fps    + Comparer + 📈 Graph
QHD 2560x1440
56.2 63.1 ~ 60 fps    + Comparer + 📈 Graph
4K 3840x2160
37.5  fps    + Comparer + 📈 Graph
4K DLSS 3840x2160
61.8  fps    + Comparer + 📈 Graph
QHD DLSS 2560x1440
81.9  fps    + Comparer + 📈 Graph
» Jouable avec tous les ordinateurs portables testés avec les détails paramétrés sur Élevé.
Moyen 1920x1080
119.6  fps    + Comparer + 📈 Graph
Élevé 1920x1080
115.1 115.1 ~ 115 fps    + Comparer + 📈 Graph
Ultra 1920x1080
104.2 108.1 ~ 106 fps    + Comparer + 📈 Graph
QHD 2560x1440
84.9 100.3 ~ 93 fps    + Comparer + 📈 Graph
4K 3840x2160
62  fps    + Comparer + 📈 Graph
4K DLSS 3840x2160
94.4  fps    + Comparer + 📈 Graph
QHD DLSS 2560x1440
105.2  fps    + Comparer + 📈 Graph
» Jouable avec tous les ordinateurs portables testés avec les détails paramétrés sur Ultra.
Moyen 1920x1080
160.3  fps    + Comparer + 📈 Graph
Élevé 1920x1080
121.6 140.7 ~ 131 fps    + Comparer + 📈 Graph
Ultra 1920x1080
120.3 140.3 ~ 130 fps    + Comparer + 📈 Graph
QHD 2560x1440
95 100.9 ~ 98 fps    + Comparer + 📈 Graph
4K 3840x2160
59.5  fps    + Comparer + 📈 Graph
4K DLSS 3840x2160
81  fps    + Comparer + 📈 Graph
QHD DLSS 2560x1440
116.6  fps    + Comparer + 📈 Graph
» Jouable avec tous les ordinateurs portables testés avec les détails paramétrés sur Ultra.
Élevé 1920x1080
99.3  fps    + Comparer + 📈 Graph
QHD 2560x1440
93.4  fps    + Comparer + 📈 Graph
» Jouable avec tous les ordinateurs portables testés avec les détails paramétrés sur Élevé.
Moyen 1920x1080
157.7  fps    + Comparer + 📈 Graph
Élevé 1920x1080
157.3  fps    + Comparer + 📈 Graph
Ultra 1920x1080
153.8  fps    + Comparer + 📈 Graph
QHD 2560x1440
140.1  fps    + Comparer + 📈 Graph
» Jouable avec tous les ordinateurs portables testés avec les détails paramétrés sur Ultra.
Moyen 1920x1080
358  fps    + Comparer + 📈 Graph
Élevé 1920x1080
358  fps    + Comparer + 📈 Graph
Ultra 1920x1080
357  fps    + Comparer + 📈 Graph
QHD 2560x1440
357  fps    + Comparer + 📈 Graph
» Jouable avec tous les ordinateurs portables testés avec les détails paramétrés sur Ultra.
Bas 1920x1080
123.4 130.5 135.7 145.4 ~ 134 fps    + Comparer
Moyen 1920x1080
119.6 129.6 137.7 138.6 ~ 131 fps    + Comparer
Élevé 1920x1080
83 95 95.2 116.1 116.4 120.6 124.7 125.2 127.2 127.7 129.7 129.8 133.2 ~ 117 fps    + Comparer + 📈 Graph
QHD 2560x1440
57.6 76.7 81.1 82.4 82.9 83.4 84.5 88.1 88.3 88.4 88.5 88.5 88.8 91.4 93.1 ~ 84 fps    + Comparer + 📈 Graph
4K 3840x2160
33.4 43 43.1 45.9 46 46.2 46.8 47.1 47.7 49.3 49.6 49.9 ~ 46 fps    + Comparer + 📈 Graph
4K DLSS 3840x2160
69.7 75.4 ~ 73 fps    + Comparer
» Jouable avec tous les ordinateurs portables testés avec les détails paramétrés sur Élevé.
Additional Benchmarks
High Preset + High Ray Tracing 1920x1080
70.9
72
High Preset + High Ray Tracing 3840x2160
21.8
22.5
High Preset + Ultra Ray Tracing 3840x2160
19.7
20
20.8
High Preset + Ultra Ray Tracing + Quality DLSS 3840x2160
38.7
38.2
39.4
41.9
High Preset + Ultra Ray Tracing + Quality DLSS + FG 2x 3840x2160
66.7
65.8
71.1
72.3
High Preset + Ultra Ray Tracing + Quality DLSS + FG 4x 3840x2160
116.3
120.6
125.7
126.6
Moyen 1920x1080
390  fps    + Comparer + 📈 Graph
Élevé 1920x1080
327  fps    + Comparer + 📈 Graph
Ultra 1920x1080
275  fps    + Comparer + 📈 Graph
QHD 2560x1440
224  fps    + Comparer + 📈 Graph
» Jouable avec tous les ordinateurs portables testés avec les détails paramétrés sur Ultra.
Bas 1920x1080
125.8 132.4 154.7 164.2 164.7 173.7 178.7 186 191.2 194.9 208 226 ~ 175 fps    + Comparer
Moyen 1920x1080
115.4 127.9 146.4 154.5 163.5 171.6 177.3 181.6 185 187.9 188.1 191 202 208 ~ 171 fps    + Comparer
Élevé 1920x1080
117.8 120.3 124.5 147 155.1 161.5 166.4 166.8 168.9 170.2 171.9 174.5 177.1 179.1 180 185 ~ 160 fps    + Comparer
Ultra 1920x1080
91.4 105.3 112.3 112.3 137.5 144 151.9 152.5 153.6 154.8 154.9 155.8 157 157.5 158.5 163.4 164 166.5 167.3 169.9 ~ 147 fps    + Comparer
QHD 2560x1440
83.2 84.9 90.8 98.6 104.8 106.8 107.7 108.3 109.7 109.7 110.6 110.8 111.1 111.2 111.3 111.4 115.6 116.6 118.9 120.5 121.8 122.8 ~ 109 fps    + Comparer
4K 3840x2160
39.6 43.2 50.7 52.1 52.3 52.7 52.8 52.9 53.1 53.1 53.5 54.2 54.7 55 55.1 ~ 52 fps    + Comparer
4K DLSS 3840x2160
72.2 73.8 76.9 79.5 80.2 80.6 82.6 ~ 78 fps    + Comparer
4K FSR 3840x2160
46.2 46.4 ~ 46 fps    + Comparer
QHD DLSS 2560x1440
94.1 100.7 104.6 118.4 119 125.3 125.5 126.2 127.3 128.1 132.4 135.2 136.6 ~ 121 fps    + Comparer
» Jouable avec tous les ordinateurs portables testés avec les détails paramétrés sur Ultra.
Additional Benchmarks
Low Preset (FSR off) 1280x720
173.2
177.8
Ray Tracing Ultra Preset (DLSS off) 1920x1080
80.6
81.7
84.9
Ultra Preset (FSR2 on) 1920x1080
153.8
156.9
Ray Tracing Ultra Preset (DLSS off, no Path Tracing) 3840x2160
23.4
25.7
25
25
25.8
26.1
26
30min Start Ultra Preset (FSR off) 1920x1080
107.9
143.5
144.2
110
135
151.4
144.4
172.1
137.1
148.8
154
146
152.4
152.6
154.3
157
148.6
106.5
165.1
Ray Tracing Overdrive Preset (no DLSS, no FG) 3840x2160
13.9
13.6
13
13
13.8
13.6
11.1
13.9
Ray Tracing Overdrive Preset + DLSS 4 Transformer Quality (no FG) 3840x2160
26.1
28.9
28.1
28.9
28.2
29.7
29.5
22.6
30
Ray Tracing Overdrive Preset + DLSS 4 Transformer Quality + Frame Generation (M)FG 2x 3840x2160
46.2
50.4
50.4
52
50
47.4
50.8
41
53.2
Ray Tracing Overdrive Preset + DLSS 4 Transformer Quality + Frame Generation MFG 4x 3840x2160
83.7
90.1
90
96.3
93.5
86.3
93.7
73.9
97.8
Bas 1920x1080
180 225.3 250 250 260.8 274 333.4 ~ 253 fps    + Comparer
Moyen 1920x1080
175 199 205.2 217 218.2 224 229.6 244 260.7 ~ 219 fps    + Comparer + 📈 Graph
Élevé 1920x1080
163.5 188.6 196.7 197 198.5 202 203.7 209 213.5 227.4 ~ 200 fps    + Comparer + 📈 Graph
Ultra 1920x1080
118.8 143.1 158.7 162 186.3 193.3 193.7 194 196.2 199.2 200 201 202 209 213 218.8 220.4 225.3 236.5 ~ 193 fps    + Comparer + 📈 Graph
QHD 2560x1440
103.1 114.2 121 138.8 139.6 141.7 145.6 146 149.5 150.5 151 151 153.8 155.3 156.4 156.9 158.3 158.4 161.5 174.8 ~ 146 fps    + Comparer + 📈 Graph
4K 3840x2160
62.2 68.1 79.1 81.7 82.8 84.1 84.3 84.6 85.3 85.3 87.8 88.5 89.8 94 ~ 83 fps    + Comparer + 📈 Graph
4K DLSS 3840x2160
124.2 124.9 125.4 129 129 133.1 135.5 149.3 ~ 131 fps    + Comparer + 📈 Graph
QHD DLSS 2560x1440
192 237.3 ~ 215 fps    + Comparer
» Jouable avec tous les ordinateurs portables testés avec les détails paramétrés sur Ultra.
Additional Benchmarks
Low Preset SMAA 1280x720
269
Ultra 1920x1080
108.3  fps    + Comparer + 📈 Graph
QHD 2560x1440
96.8  fps    + Comparer + 📈 Graph
4K 3840x2160
59.5  fps    + Comparer + 📈 Graph
» Jouable avec tous les ordinateurs portables testés avec les détails paramétrés sur Ultra.
Strange Brigade

Strange Brigade

2018
Bas 1280x720
380 404 480 511 553 563 601 617 632 643 652 ~ 549 fps    + Comparer
Moyen 1920x1080
321 341 381 398 426 431 475 478 479 482 509 526 ~ 437 fps    + Comparer
Élevé 1920x1080
321 322 334 397 415 418 425 450 457 473 479 485 499 ~ 421 fps    + Comparer
Ultra 1920x1080
303 308 319 368 375 382 401 408 418 434 437 443 453 453.1 456 464 ~ 401 fps    + Comparer
QHD 2560x1440
240 266 287 290 303 308 315 319 330 333 336 339 342.9 343 345 350 ~ 315 fps    + Comparer
4K 3840x2160
151.4 153.9 164.2 168 174.6 177.5 179.3 179.6 182.2 182.2 185.5 187.2 ~ 174 fps    + Comparer
» Jouable avec tous les ordinateurs portables testés avec les détails paramétrés sur Ultra.
Bas 1280x720
106.8 108.9 109.4 122.9 140.4 148.8 149.2 153.2 153.7 158 160 161.3 161.6 163.4 172.3 181.1 ~ 147 fps    + Comparer
Moyen 1920x1080
99.7 103.6 111.8 128.6 133 136.1 139.2 141.5 143.3 143.6 143.9 148.3 152.6 155.6 158.1 159.9 ~ 137 fps    + Comparer
Élevé 1920x1080
79.9 85.2 91.4 99.7 110 112.6 113.2 114.2 115.9 117.6 118.7 119.5 120.9 121.4 121.7 122.1 122.9 129.8 133.6 ~ 113 fps    + Comparer
4K 3840x2160
67 71.3 77.2 89.9 93.6 94.8 95.6 97.1 100 100.2 102.4 104.3 ~ 91 fps    + Comparer
» Jouable avec tous les ordinateurs portables testés avec les détails paramétrés sur Élevé.
Bas 1280x720
174.7 196.1 218 226 232 233 233 234 234 234 235 ~ 223 fps    + Comparer
Moyen 1920x1080
167.8 173.6 184.5 217 226 226 230 230 231 232 233 233 234 236 ~ 218 fps    + Comparer
Élevé 1920x1080
144.4 147.4 154.4 181.9 192.6 194.6 199.3 201 201 203 203 205 208 209 210 212 212 215 ~ 194 fps    + Comparer
QHD 2560x1440
123.4 129.9 139.5 157 160.5 160.7 161.8 162.4 166.4 169.7 170.7 172.2 173.5 176.5 176.7 177.2 179.5 181 183.6 184.3 ~ 165 fps    + Comparer
4K 3840x2160
83.4 96.8 99 101.3 102.9 103.9 104.2 104.7 106.4 109.1 109.2 109.4 111.8 ~ 103 fps    + Comparer
» Jouable avec tous les ordinateurs portables testés avec les détails paramétrés sur Élevé.
Bas 1280x720
169.2 170.5 173.9 200 215 216 217 223 223 225 229 234 234 240 251 313 ~ 221 fps    + Comparer
Moyen 1366x768
150.7 152.7 154.4 175 184.1 186.6 189.4 193.8 195.2 196.6 204 207 207 210 214 288 ~ 194 fps    + Comparer
Élevé 1920x1080
143.3 143.3 151.3 168.9 177.5 178.9 179.2 187.5 188.3 190.2 193 197.3 198.3 200 201 208 275 ~ 187 fps    + Comparer
Ultra 1920x1080
132.4 137.1 141.9 154.7 161 166.4 167.2 170.3 171 171.5 175.5 176.4 184.7 184.8 185.6 186.1 186.6 248 ~ 172 fps    + Comparer
4K 3840x2160
131.2 133 151.6 152.6 165.2 165.3 168.6 174 176.8 178.5 179.9 180.1 ~ 163 fps    + Comparer
» Jouable avec tous les ordinateurs portables testés avec les détails paramétrés sur Ultra.
Ultra 1920x1080
192 218.5 224 240 ~ 219 fps    + Comparer + 📈 Graph
QHD 2560x1440
151 185 199.1 ~ 178 fps    + Comparer + 📈 Graph
4K 3840x2160
114 129 169.8 ~ 138 fps    + Comparer + 📈 Graph
» Jouable avec tous les ordinateurs portables testés avec les détails paramétrés sur Ultra.
Additional Benchmarks
Ultra Graphics & Postprocessing (HBAO+) 3840x2160
112.4
GTA V

GTA V

2015
Bas 1024x768
182 185.2 ~ 184 fps    + Comparer
Moyen 1366x768
178 184.5 186.7 187.5 ~ 184 fps    + Comparer
Élevé 1920x1080
180.4 180.5 182.5 184.3 185.3 ~ 183 fps    + Comparer
Ultra 1920x1080
120.5 121.6 136.6 140.9 142.4 145.6 161.9 162.4 162.8 164.1 166.1 166.2 183.9 186.9 ~ 154 fps    + Comparer
QHD 2560x1440
96.9 119.8 121.4 129.7 133.4 146.8 156.8 158 160.1 163.1 164.3 164.5 165.6 183.9 ~ 147 fps    + Comparer
4K 3840x2160
150.7 163.8 173.2 176.1 179.5 179.9 ~ 171 fps    + Comparer
» Jouable avec tous les ordinateurs portables testés avec les détails paramétrés sur Ultra.
Additional Benchmarks
Highest Settings possible 16xAF 4xMSAA + FXAA 3840x2160
84.4
110.3
110.6
114.7
116.7
104.2
105.4
90.1
Normal/Off 4xAF 1920x1080
183
184.8
Lowest Settings possible 1920x1080
179.4
186.5
BasMoyenÉlevéUltraQHD4K
Battlefield 6181.4169.4159.915310960
Borderlands 498.48273513519
F1 25261246236573416
Doom: The Dark Ages133.51211191158448
The Elder Scrolls IV Oblivion Remastered118.4108604427.3
Assassin's Creed Shadows11510793685641
Civilization 7219214178
Monster Hunter Wilds857246
Kingdom Come Deliverance 21901591198956.2
Indiana Jones and the Great Circle19414413010466
Stalker 21031161027965.4
Call of Duty Black Ops 621319715715412481
Until Dawn110105957145.4
Space Marine 210310510310169.6
Star Wars Outlaws8578685324.6
Black Myth: Wukong109644729
F1 243173202891429750
Senua's Saga Hellblade 296.8816037.5
Ghost of Tsushima119.61151069362
Horizon Forbidden West160.31311309859.5
Dragon's Dogma 299.393.4
Helldivers 2157.7157.3153.8140.1
Prince of Persia The Lost Crown358358357357
Alan Wake 21341311178446
Counter-Strike 2390327275224
Cyberpunk 2077 2.2 Phantom Liberty17517116014710952
Baldur's Gate 325321920019314683
Hogwarts Legacy108.396.859.5
Strange Brigade549437421401315174
X-Plane 11.1114713711391
Final Fantasy XV Benchmark223218194165103
Dota 2 Reborn221194187172163
The Witcher 3219178138
GTA V184184183154147171
BasMoyenÉlevéUltraQHD4K
< 30 fps
< 60 fps
< 120 fps
≥ 120 fps


2
14


9
19


14
17

2
12
14

6
16
10
5
11
9
4

Pour plus de jeux susceptibles d'être fluides avec cette carte graphique et obtenir une liste exhaustive de tous les jeux et cartes graphiques testés, consultez notre liste des jeux.

v1.34
log 27. 10:34:30

#0 ran 0s before starting gpusingle class +0s ... 0s

#1 no ids found in url (should be separated by "_") +0s ... 0s

#2 not redirecting to Ajax server +0s ... 0s

#3 did not recreate cache, as it is less than 5 days old! Created at Sat, 25 Oct 2025 05:35:13 +0200 +0.001s ... 0.001s

#4 no comparison url found in template nbc.compare_page_1 needed +0.033s ... 0.034s

#5 no comparison url found in template nbc.compare_page_1 needed +0s ... 0.034s

#6 no comparison url found in template nbc.compare_page_1 needed +0s ... 0.034s

#7 no comparison url found in template nbc.compare_page_1 needed +0s ... 0.034s

#8 no comparison url found in template nbc.compare_page_1 needed +0s ... 0.035s

#9 composed specs +0.001s ... 0.036s

#10 did output specs +0s ... 0.036s

#11 start showIntegratedCPUs +0s ... 0.036s

#12 getting avg benchmarks for device 12928 +0.026s ... 0.062s

#13 got single benchmarks 12928 +0.061s ... 0.122s

#14 got avg benchmarks for devices +0s ... 0.122s

#15 min, max, avg, median took s +1.167s ... 1.29s

#16 before gaming benchmark output +0s ... 1.29s

#17 Got 1450 rows for game benchmarks. +0.829s ... 2.119s

#18 composed SQL query for gamebenchmarks +0s ... 2.119s

#19 got data and put it in $dataArray +0.025s ... 2.144s

#20 benchmarks composed for output. +0.32s ... 2.464s

#21 no comparison url found in template nbc.compare_page_1 needed +0.003s ... 2.467s

#22 return log +0s ... 2.467s

Testés dans les ordinateurs portables : NVIDIA GeForce RTX 5090 Laptop carte graphique

Asus ProArt P16 5090 - Tandem OLED et RTX 5090 face au MacBook Pro 16 Apple

Asus ProArt P16 5090 - Tandem OLED et RTX 5090 face au MacBook Pro 16 Apple

Asus poursuit sa marche vers l'amélioration, et son ProArt P16 est désormais disponible avec un panneau OLED tandem extrêmement lumineux et la carte mobile GeFo...
AMD Ryzen AI 9 HX 370 | NVIDIA GeForce RTX 5090 Laptop | 16.00" | 2 kg
Le Lenovo Legion 9 18 avec RTX 5090 en test

Test du Lenovo Legion 9 18 RTX 5090 : le PC portable de jeu le plus puissant du marché

Lenovo a conquis sans peine le segment des ordinateurs portables de jeu de 18 pouces avec le Legion 9 18. Après avoir récemment testé la version RTX 5080, nous ...
Intel Core Ultra 9 275HX | NVIDIA GeForce RTX 5090 Laptop | 18.00" | 3.5 kg
Boîte Aorus RTX 5090 AI

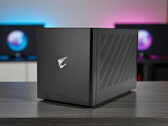
Test du Gigabyte Aorus RTX 5090 AI Box : GPU externe Nvidia GeForce RTX 5090 via Thunderbolt 5

Avec l'AORUS RTX 5090 AI Box, Gigabyte présente une solution GPU externe basée sur la carte graphique grand public la plus rapide actuellement disponible. Il es...
Intel Core Ultra 9 275HX | NVIDIA GeForce RTX 5090 Laptop | 18.00"
Test du Schenker Key 18 Pro E25 : station de travail haut de gamme avec RTX 5090 et 256 Go de RAM

Test du Schenker Key 18 Pro E25 : station de travail haut de gamme avec RTX 5090 et 256 Go de RAM

Avec le Key 18 Pro, Schenker propose une station de travail mobile destinée aux passionnés et pouvant être configurée de manière extensive. Nous avons testé le ...
Intel Core Ultra 9 275HX | NVIDIA GeForce RTX 5090 Laptop | 18.00" | 4.1 kg
Test du Razer Blade 18 2025 RTX 5090 : joueur extrêmement rapide et plutôt silencieux

Test du Razer Blade 18 2025 RTX 5090 : joueur extrêmement rapide et plutôt silencieux

Le nouveau Blade 18 2025 de Razer vise à offrir des performances de jeu maximales grâce au GPU mobile GeForce RTX 5090 et à un écran bimode qui prend en charge ...
Intel Core Ultra 9 275HX | NVIDIA GeForce RTX 5090 Laptop | 18.00" | 3.2 kg

Alienware 18 Area-51: Intel Core Ultra 9 275HX, 18.00", 4.2 kg
  Critique » Test de l'Alienware 18 Area-51 : les performances avant tout

MSI Titan 18 HX AI A2XWJG: Intel Core Ultra 9 285HX, 18.00", 3.6 kg
  Critique » Test du MSI Titan 18 HX AI A2XWJG : la puissance des Core Ultra 9 285HX et RTX 5090 175 watts

Aorus MASTER 16 AM6H: Intel Core Ultra 9 275HX, 16.00", 2.5 kg
  Critique » Test du Gigabyte Aorus Master 16 : RTX 5090 et OLED 240 Hz face aux ROG et autres Legion

Schenker XMG Neo 16 A25 5090: AMD Ryzen 9 9955HX3D, 16.00", 2.9 kg
  Critique » Test du XMG Neo 16 A25 : Ryzen 9 9955HX3D et RTX 5090 pour des performances de jeu maximales

Medion Erazer Beast 16 X1 Ultimate: Intel Core Ultra 9 275HX, 16.00", 2.8 kg
  Critique » Test du Medion Erazer Beast 16 X1 : RTX 5090 gamer avec refroidissement par eau en option

Tuxedo Stellaris 16 Gen7 Engineering Sample: AMD Ryzen 9 9955HX3D
  Critique » Ryzen 9955HX3D contre Intel Core Ultra 275HX : AMD leader du jeu avec sa gamme Fire HX3D

Schenker XMG Neo 16 E25 RTX 5090 Laptop: Intel Core Ultra 9 275HX, 16.00", 2.9 kg
  Critique » Test du XMG Neo 16 E25 RTX 5090 : le plus puissant des PC portables de jeu encore meilleur grâce à la mini LED 300 Hz

Asus ROG Strix Scar 16 2025: Intel Core Ultra 9 275HX, 16.00", 2.8 kg
  Critique » Test de l'Asus ROG Strix SCAR 16 2025 : RTX 5090 et mini LED dans un PC portable de jeu

HP Omen Max 16 ah000: Intel Core Ultra 9 275HX, 16.00", 2.8 kg
  Critique » Test du HP Omen Max 16 : ultra rapide mais un peu trop chaud

Aorus Master 18 AM8H: Intel Core Ultra 9 275HX, 18.00", 3.4 kg
  Critique » Test de l'Aorus Master 18 : la RTX 5090 fait des ravages dans ce PC portable de jeu

Asus ROG Zephyrus G16 GU605CX: Intel Core Ultra 9 285H, 16.00", 1.9 kg
  Critique » Asus ROG Zephyrus G16 contre Razer Blade 16 : PC portables de jeu les plus fins avec RTX 5090

Razer Blade 16 2025 RTX 5090: AMD Ryzen AI 9 HX 370, 16.00", 2.1 kg
  Critique » Asus ROG Zephyrus G16 contre Razer Blade 16 : PC portables de jeu les plus fins avec RTX 5090

Asus Strix Scar 18 G835LX: Intel Core Ultra 9 275HX, 18.00", 3.3 kg
  Critique » AMD Ryzen 9 9955HX face à Intel Core Ultra 9 275HX : bataille pour le CPU de jeu le plus puissant

Schenker Neo 16 A25 5090 Engineering Sample: AMD Ryzen 9 9955HX
  Critique » AMD Ryzen 9 9955HX face à Intel Core Ultra 9 275HX : bataille pour le CPU de jeu le plus puissant

Asus ROG Zephyrus G16 GU605CX: Intel Core Ultra 9 285H, 16.00", 1.9 kg
  Critique » Test de l'Asus ROG Zephyrus G16 2025 : PC portable de jeu fin avec RTX 5090 et 64 Go de RAM

Asus Strix Scar 18 G835LX: Intel Core Ultra 9 275HX, 18.00", 3.3 kg
  Critique » Test de l'Asus Strix SCAR 18 G835LX : gamer de 18 pouces avec mini LED et une RTX 5090

Schenker Neo 16 A25 5090 Engineering Sample: AMD Ryzen 9 9955HX
  Critique » Test du XMG Neo 16 2025 : le PC portable de jeu le plus rapide avec AMD, RTX 5000 et Mini-LED 300 Hz

Razer Blade 16 2025 RTX 5090: AMD Ryzen AI 9 HX 370, 16.00", 2.1 kg
  Critique » Test du Razer Blade 16 2025 : le PC portable de jeu encore plus fin et désormais avec une GeForce RTX 5090

  Critique » Test de la Nvidia GeForce RTX 5090 : plus puissante, mais il y a plus à venir

MSI Stealth 18 HX AI A2XWJG: Intel Core Ultra 9 275HX, 18.00", 2.9 kg
  Autres tests » MSI Stealth 18 HX AI A2XWJG

MSI Raider A18 HX A9WJG: AMD Ryzen 9 9955HX3D, 18.00", 3.6 kg
  Autres tests » MSI Raider A18 HX A9WJG

Acer Predator Helios 16 AI PH16-73: Intel Core Ultra 9 275HX, 16.00", 2.7 kg
  Autres tests » Acer Predator Helios 16 AI PH16-73

Lenovo Legion 9 18IAX10: Intel Core Ultra 9 275HX, 18.00", 3.5 kg
  Autres tests » Lenovo Legion 9 18IAX10

Acer Predator Helios 18 AI PH18-73: Intel Core Ultra 9 275HX, 18.00", 3.2 kg
  Autres tests » Acer Predator Helios 18 AI PH18-73

Razer Blade 18 2025 RTX 5090 Laptop: Intel Core Ultra 9 275HX, 18.00", 3.2 kg
  Autres tests » Razer Blade 18 2025 RTX 5090 Laptop

Medion Erazer Beast 16 X1 Ultimate: Intel Core Ultra 9 275HX, 16.00", 2.8 kg
  Autres tests » Medion Erazer Beast 16 X1 Ultimate

Lenovo Legion Pro 7 16IAX10H, RTX 5090: Intel Core Ultra 9 275HX, 16.00", 2.3 kg
  Autres tests » Lenovo Legion Pro 7 16IAX10H, RTX 5090

HP Omen Max 16 ah000: Intel Core Ultra 9 275HX, 16.00", 2.8 kg
  Autres tests » HP Omen Max 16 ah000

Asus ROG Zephyrus G16 GU605CX: Intel Core Ultra 9 285H, 16.00", 1.9 kg
  Autres tests » Asus ROG Zephyrus G16 GU605CX

Asus ROG Strix Scar 16 2025: Intel Core Ultra 9 275HX, 16.00", 2.8 kg
  Autres tests » Asus ROG Strix Scar 16 2025

Alienware 18 Area-51: Intel Core Ultra 9 275HX, 18.00", 4.2 kg
  Autres tests » Alienware 18 Area-51

Asus Strix Scar 18 G835LX: Intel Core Ultra 9 275HX, 18.00", 3.3 kg
  Autres tests » Asus Strix Scar 18 G835LX

MSI Titan 18 HX AI A2XWJG: Intel Core Ultra 9 285HX, 18.00", 3.6 kg
  Autres tests » MSI Titan 18 HX AI A2XWJG

Aorus MASTER 16 AM6H: Intel Core Ultra 9 275HX, 16.00", 2.5 kg
  Autres tests » Aorus MASTER 16 AM6H

Aorus Master 18 AM8H: Intel Core Ultra 9 275HX, 18.00", 3.4 kg
  Autres tests » Aorus Master 18 AM8H

Razer Blade 16 2025 RTX 5090: AMD Ryzen AI 9 HX 370, 16.00", 2.1 kg
  Autres tests » Razer Blade 16 2025 RTX 5090

Asus ROG Xbox Ally X: AMD Ryzen Z2 Extreme
   » Les fuites de l'offre Asus ROG Xbox Ally X suggèrent que Microsoft n'a pas une grande confiance dans la console portable

Asus ProArt P16 RTX 5090: AMD Ryzen AI 9 HX 370, 16.00", 2 kg
   » Asus ProArt P16 Preview - Maintenant avec RTX 5090 Laptop et Lumina Pro OLED

Schenker XMG Neo 16 E25 RTX 5090 Laptop: Intel Core Ultra 9 275HX, 16.00", 2.9 kg
   » Les modèles NEO 16 et PRO 16 de XMG ne bénéficient finalement pas de la prise en charge de G-Sync et Advanced Optimus

Schenker Key 18 Pro M25 RTX 5090: Intel Core Ultra 9 275HX, 18.00", 4.1 kg
   » La station de travail mobile Key 18 Pro de Schenker offre des caractéristiques haut de gamme et d'excellentes possibilités de maintenance

Razer Blade 18 2025 RTX 5090 Laptop: Intel Core Ultra 9 275HX, 18.00", 3.2 kg
   » Avez-vous vraiment besoin de 440 Hz ? Pourquoi le nouvel écran bi-mode du Razer Blade 18 est une régression pour de nombreux utilisateurs

   » Le nouveau Blade 18 de Razer est 1 kg plus léger que l'Alienware 18, mais tout aussi rapide et même un peu plus silencieux

Alienware 18 Area-51: Intel Core Ultra 9 275HX, 18.00", 4.2 kg
   » L'Alienware 18 Area-51 manque d'une caractéristique clé par rapport à la MSI Titan 18 HX

   » L'Alienware 18 Area-51 surpasse presque tous les autres ordinateurs portables de jeu et nous avons les tests de référence pour le prouver

Aorus MASTER 16 AM6H: Intel Core Ultra 9 275HX, 16.00", 2.5 kg
   » Comparaison des ordinateurs portables RTX 5090 : Où se situe le Gigabyte Aorus Master 16 ?

Schenker XMG Neo 16 A25 5090: AMD Ryzen 9 9955HX3D, 16.00", 2.9 kg
   » Intel est battu - Le Ryzen 9 9955HX3D d'AMD avec 3D V-Cache est le meilleur choix pour les jeux

Schenker XMG Neo 16 E25 RTX 5090 Laptop: Intel Core Ultra 9 275HX, 16.00", 2.9 kg
   » XMG Neo 16 E25 : Toujours l'un des meilleurs ordinateurs portables pour le jeu, mais l'Advanced Optimus/G-Sync fait défaut

Asus Strix Scar 18 G835LX: Intel Core Ultra 9 275HX, 18.00", 3.3 kg
   » Asus ROG Strix Scar 18 (2025) avec RTX 5090, écran mini-LED et Thunderbolt 5 disponible en précommande

Please share our article, every link counts!
Mail Logo

Rang 1

Rang 2

GeForce RTX 2080 Super Mobile
RTX PRO 2000 Blackwell Generation Laptop *
M1 Max 32-Core GPU *
GeForce RTX 2070 Super Mobile
M1 Max 24-Core GPU *
Radeon 8050S *
Radeon RX 5700M *
M1 Pro 16-Core GPU *
Radeon PRO W6600M *
GeForce RTX 2070 Super Max-Q
M1 Pro 14-Core GPU *
RTX PRO 1000 Blackwell Generation Laptop *
GeForce GTX 1070 Mobile
RTX PRO 500 Blackwell Generation Laptop *
Radeon 8040S *
Arc B 12 Xe3 Panther Lake iGPU

Rang 3

Arc 140T *
Arc 130T *
Radeon RX 580X (Laptop) *
Radeon RX 580 (Laptop)
X2-90 *
X2-85 *
Radeon Pro 5300M
Radeon RX 5300M
Adreno 840 *
Radeon RX 570X (Laptop) *
Radeon RX 570 (Laptop) *
Radeon RX 470 (Laptop) *
GeForce GTX 1050 Ti Mobile
Radeon 680M
Quadro P2000 Max-Q
Radeon R9 M395X
GeForce GTX 1050 Ti Max-Q *
Radeon R9 M485X
GeForce GTX 1050 Max-Q *
Radeon 660M
Radeon RX 560X (Laptop)
Radeon RX 560 (Laptop)
Radeon Pro 560X
Radeon Pro 560
Radeon Pro 460
Quadro P620 *
Radeon RX 550X (Laptop)
Radeon Pro 555X
Radeon Pro 555
Radeon Pro 455
Quadro P600
Graphics 3-Core iGPU (Arrow Lake) *
Radeon RX 540X *
Radeon Pro WX 2100 *
Graphics 2-Core iGPU (Arrow Lake) *
Radeon Pro 450
Radeon 630
Radeon 540X *
Quadro P520
Quadro P500 *
Iris Plus Graphics G7 (Ice Lake 64 EU) *
Vega 10 *
Iris Pro Graphics 580
Vega 9
UHD Graphics Xe G4 48EUs *
UHD Graphics 32EUs
UHD Graphics Xe 32EUs (Tiger Lake-H) *
UHD Graphics 750
UHD Graphics 730
Vega 7
Vega 8
Iris Plus Graphics G4 (Ice Lake 48 EU)
FirePro W4190M
Radeon R7 M445
UHD Graphics 24EUs (Alder Lake-N) *
Radeon R7 M460 *
Radeon R7 M340
Radeon 610M *
UHD Graphics G1 (Ice Lake 32 EU)
UHD Graphics Xe 16EUs (Tiger Lake-H) *
Adreno 690 *
Adreno 685 *
Adreno 680 *

Rang 4

* Position approximative de la carte graphique

Klaus Hinum, 2025-07-29 (Update: 2025-07-29)