 Deutsch
 English
 Español
 Français
 Italiano
 Nederlands
 Polski
 Português
 Русский
 Türkçe
 Svenska
 Chinese
 Magyar
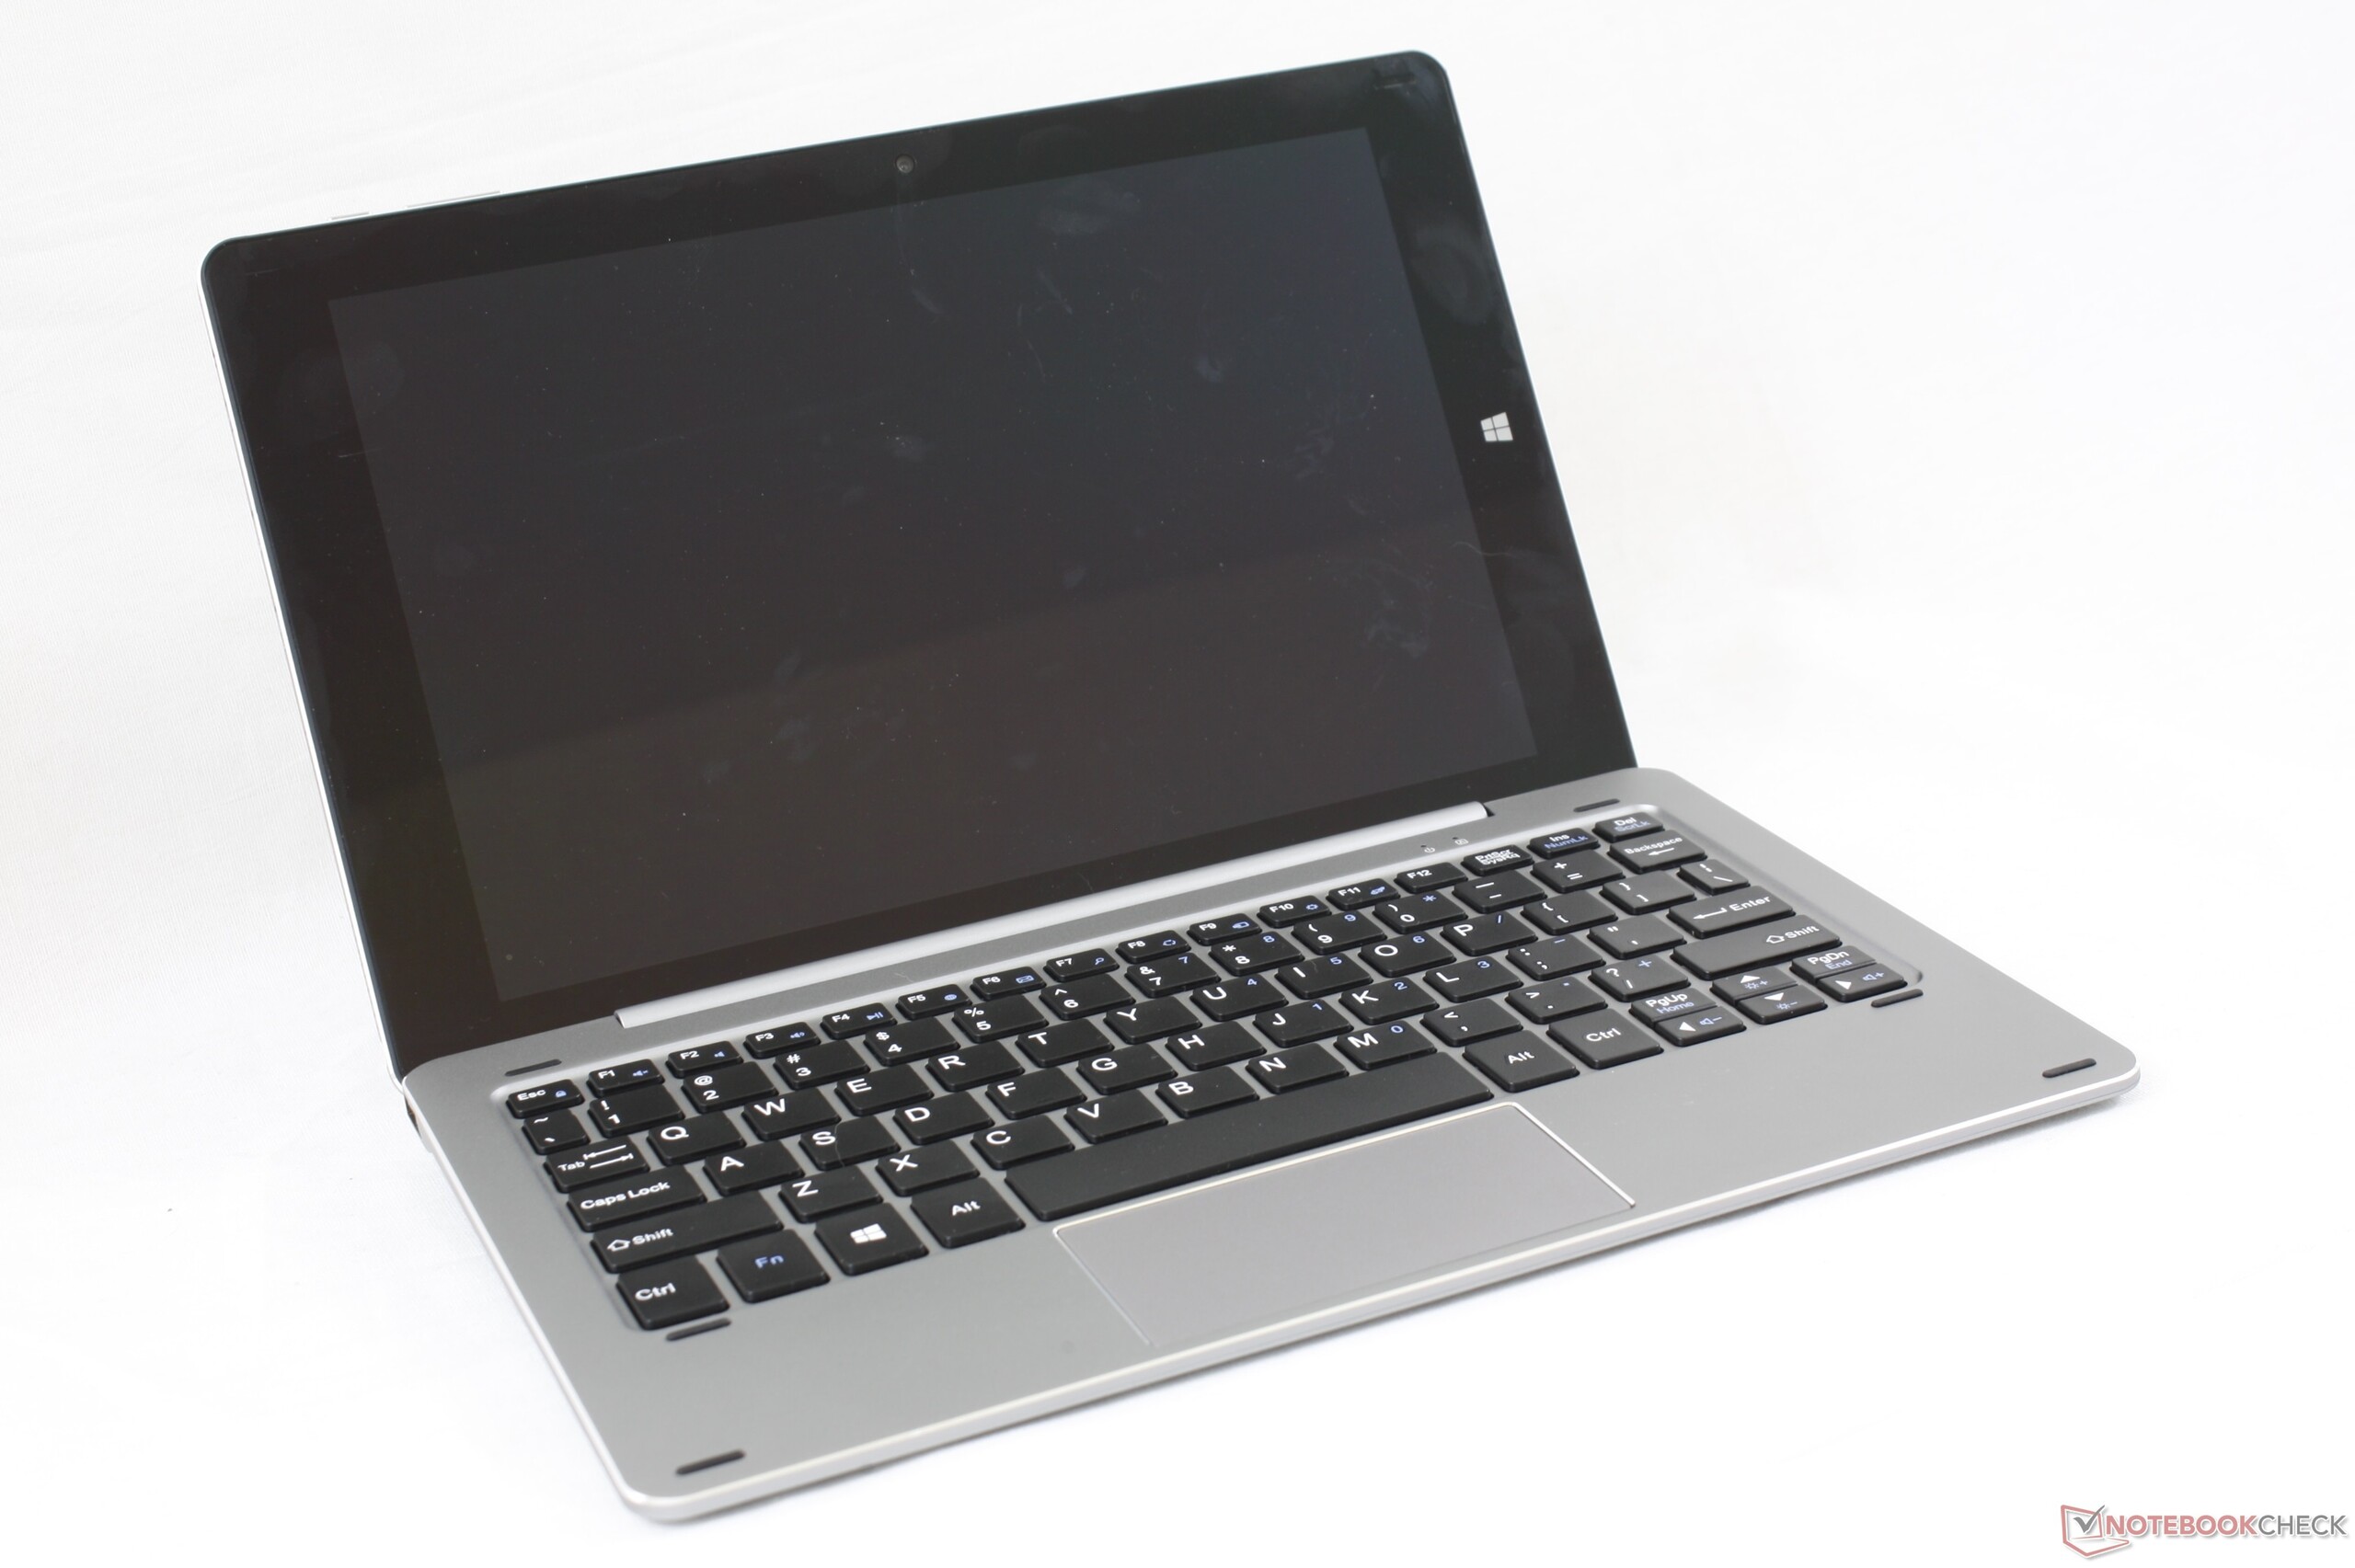
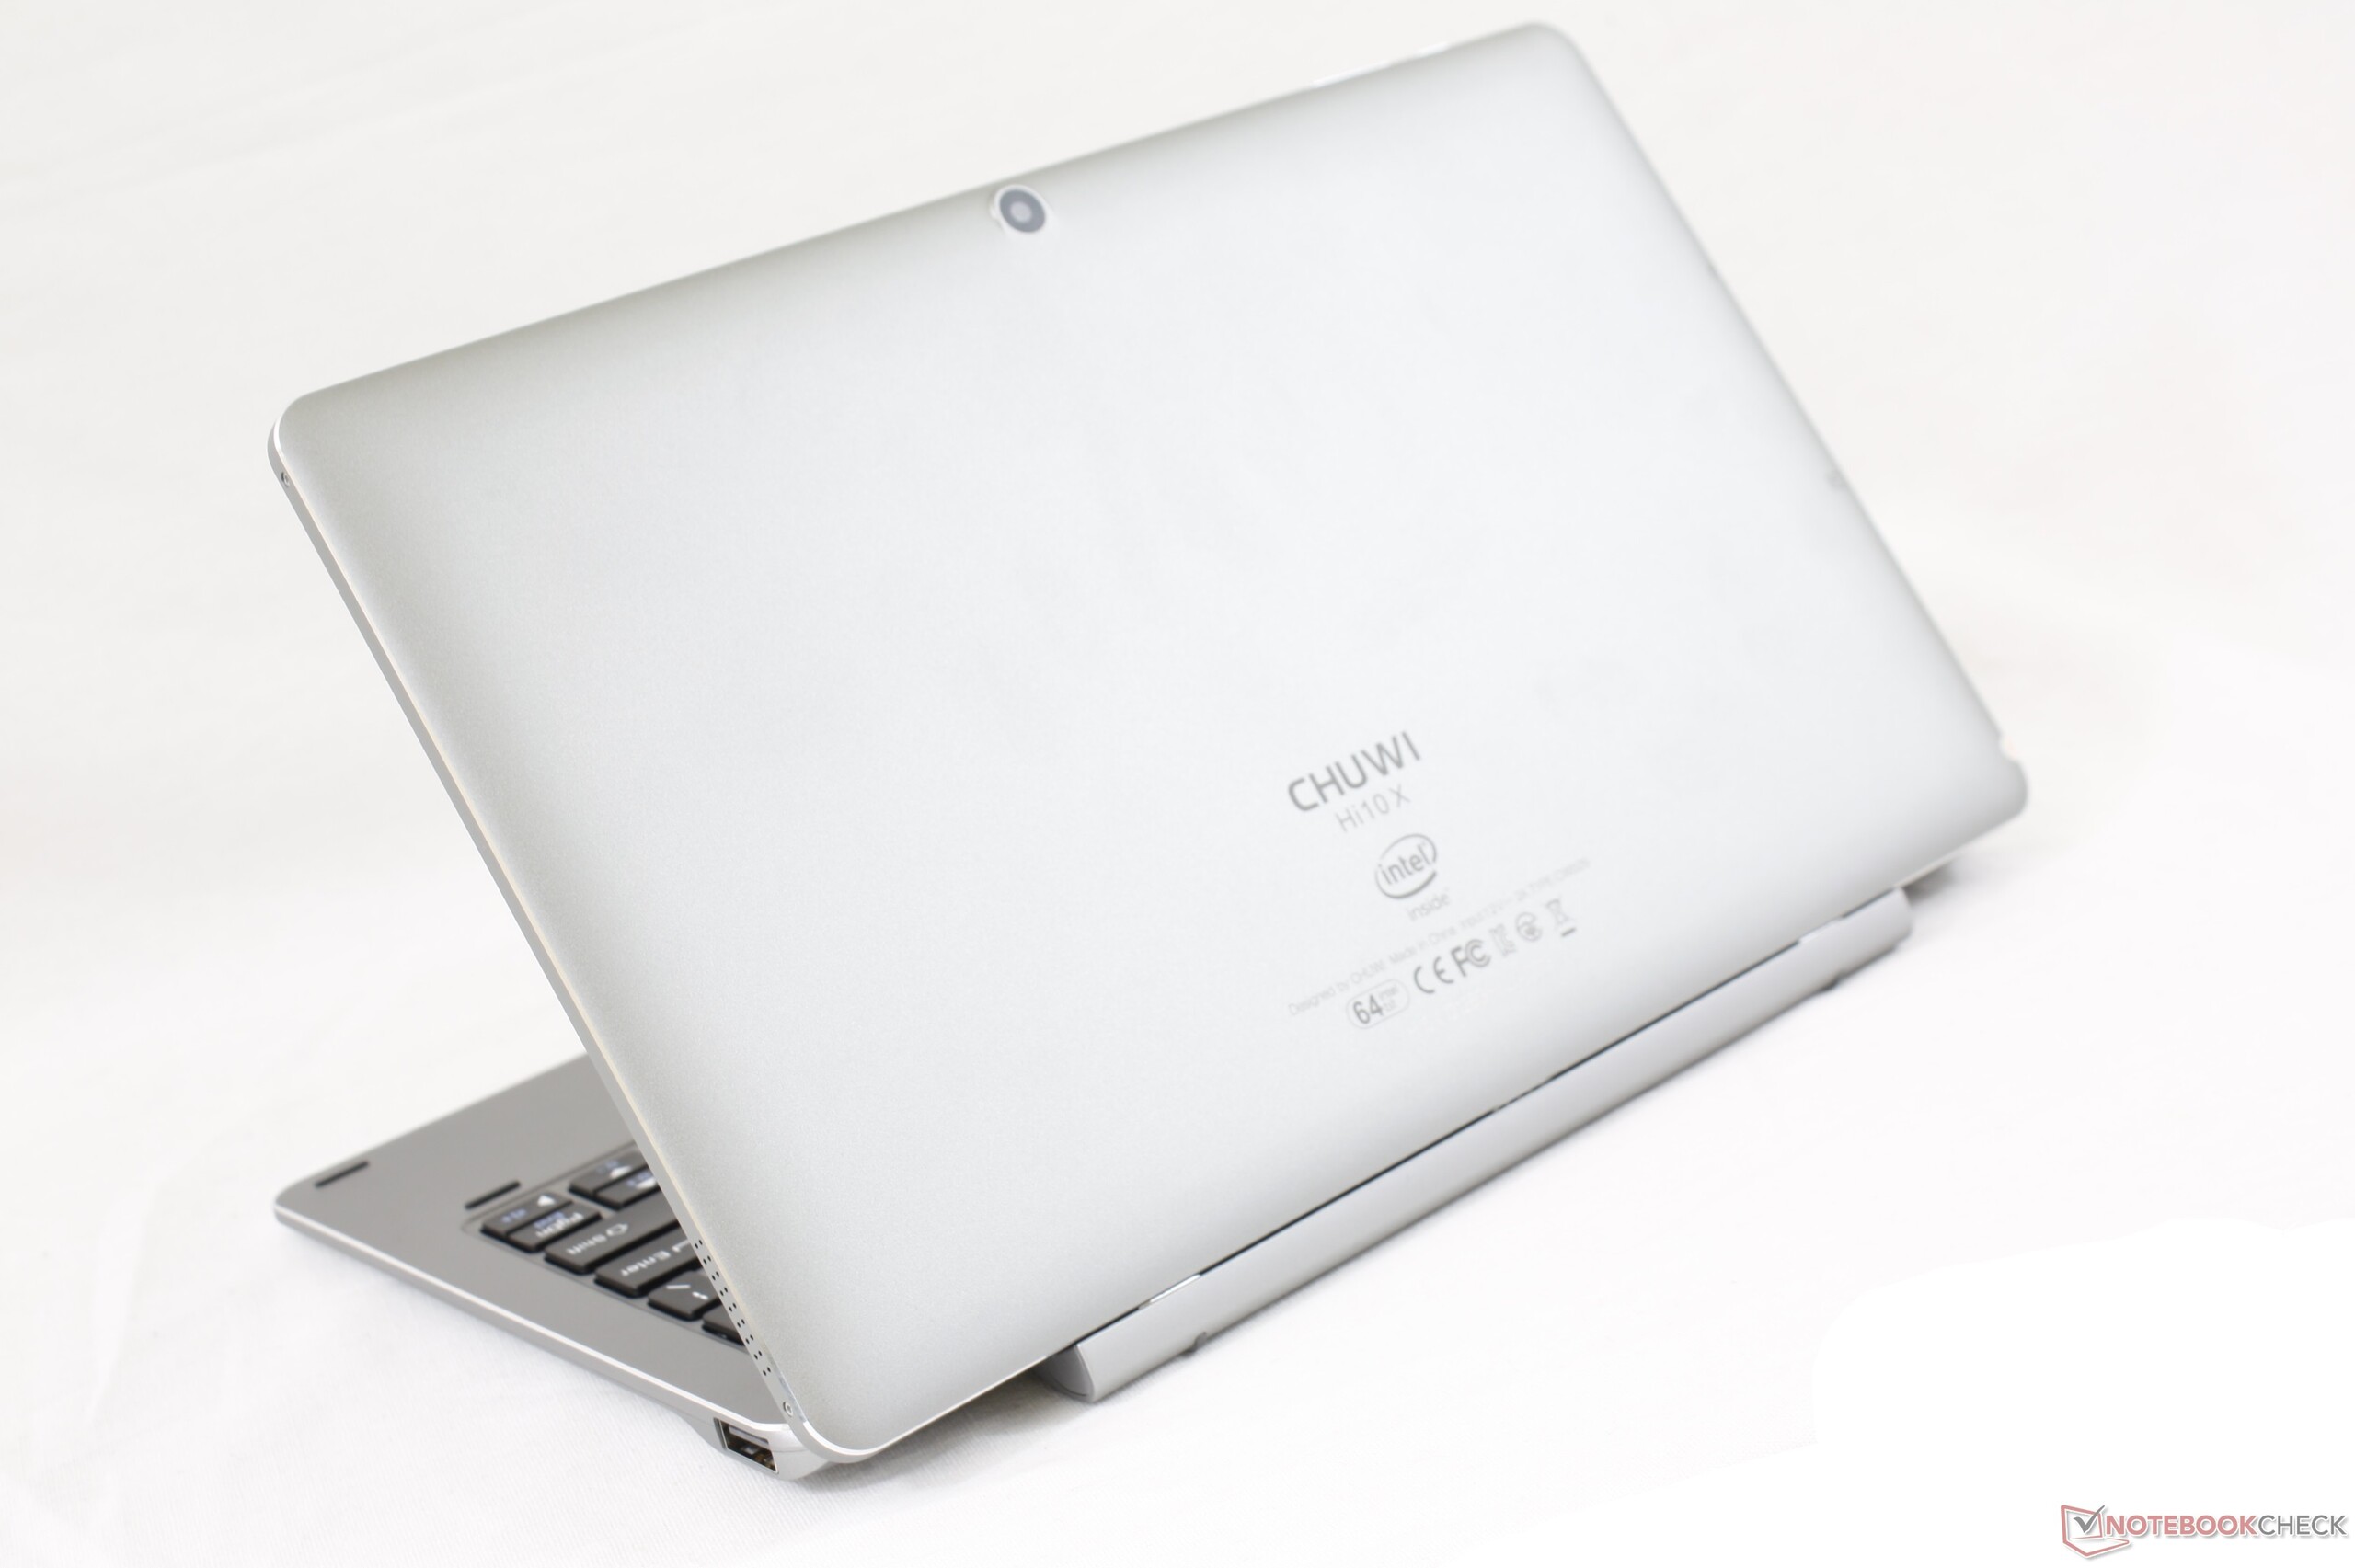
Test du Chuwi Hi10 X (N4100, UHD 600, FHD) : châssis en métal pour moins de 250 €
Note | Date | Modèle | Poids | Épaisseur | Taille | Résolution | Meilleur prix |
|---|---|---|---|---|---|---|---|
| 69.1 % | 06/20 | Chuwi Hi10 X Celeron N4100, UHD Graphics 600 | 600 g | 8.8 mm | 10.10" | 1920x1200 | |
| 83.3 % | 10/18 | Microsoft Surface Go MHN-00003 Pentium 4415Y, UHD Graphics 615 | 523 g | 8.3 mm | 10.00" | 1800x1200 | |
| 80.4 % | 02/18 | Lenovo IdeaPad Miix 320-10ICR Pro LTE Z8350, HD Graphics 400 (Braswell) | 1 kg | 17.5 mm | 10.10" | 1920x1200 | |
| 77.3 % | 12/18 | HP x2 210 G2 Z8350, HD Graphics 400 (Braswell) | 1.2 kg | 23.5 mm | 10.10" | 1280x800 | |
| 67.7 % | 05/20 | Jumper EZbook X3 Celeron N3350, HD Graphics 500 | 1.3 kg | 18 mm | 13.30" | 1920x1080 |
| SD Card Reader | |
| average JPG Copy Test (av. of 3 runs) | |
| Microsoft Surface Go MHN-00003 (Toshiba Exceria Pro M501) | |
| HP x2 210 G2 (Toshiba Exceria Pro M501 microSDXC 64GB) | |
| Jumper EZbook X3 | |
| Chuwi Hi10 X (Toshiba Exceria Pro M501 64 GB UHS-II) | |
| Acer TravelMate Spin B1 B118-G2-RN-P7ED (Toshiba Exceria Pro SDXC 64 GB UHS-II) | |
| Dell Latitude 3400 (Toshiba Exceria Pro SDXC 64 GB UHS-II) | |
| LincPlus P1 | |
| maximum AS SSD Seq Read Test (1GB) | |
| Microsoft Surface Go MHN-00003 (Toshiba Exceria Pro M501) | |
| HP x2 210 G2 (Toshiba Exceria Pro M501 microSDXC 64GB) | |
| Dell Latitude 3400 (Toshiba Exceria Pro SDXC 64 GB UHS-II) | |
| Acer TravelMate Spin B1 B118-G2-RN-P7ED (Toshiba Exceria Pro SDXC 64 GB UHS-II) | |
| Jumper EZbook X3 | |
| LincPlus P1 | |
| Chuwi Hi10 X (Toshiba Exceria Pro M501 64 GB UHS-II) | |
| Networking | |
| iperf3 transmit AX12 | |
| HP x2 210 G2 | |
| Microsoft Surface Go MHN-00003 | |
| Chuwi Hi10 X | |
| Lenovo IdeaPad Miix 320-10ICR Pro LTE | |
| iperf3 receive AX12 | |
| Microsoft Surface Go MHN-00003 | |
| HP x2 210 G2 | |
| Chuwi Hi10 X | |
| Lenovo IdeaPad Miix 320-10ICR Pro LTE | |


| |||||||||||||||||||||||||
Homogénéité de la luminosité: 93 %
Valeur mesurée au centre, sur batterie: 256.3 cd/m²
Contraste: 625:1 (Valeurs des noirs: 0.41 cd/m²)
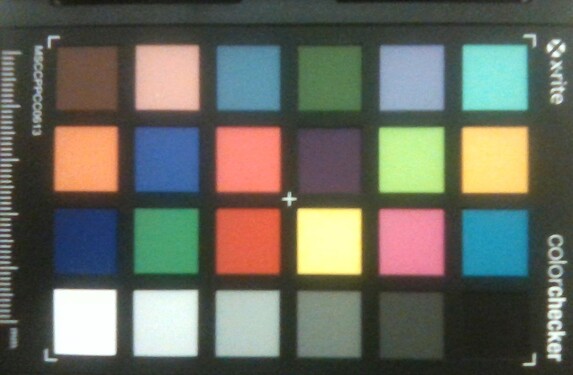
ΔE Color 10.04 | 0.5-29.43 Ø5, calibrated: 2.17
ΔE Greyscale 10.4 | 0.57-98 Ø5.3
96.7% sRGB (Argyll 1.6.3 3D)
63% AdobeRGB 1998 (Argyll 1.6.3 3D)
68.9% AdobeRGB 1998 (Argyll 2.2.0 3D)
96.8% sRGB (Argyll 2.2.0 3D)
67.9% Display P3 (Argyll 2.2.0 3D)
Gamma: 2.23
| Chuwi Hi10 X AU Optronics AUO17D8, IPS, 10.10, 1920x1200 | Amazon Fire HD 10 2019 IPS, 10.10, 1920x1200 | Samsung Galaxy Tab A 10.1 2019 TFT-LCD, 10.10, 1920x1200 | Chuwi HiPad IPS, 10.10, 1920x1200 | Microsoft Surface Go MHN-00003 Sharp SHP14A6, IPS, 10.00, 1800x1200 | Lenovo IdeaPad Miix 320-10ICR Pro LTE YF102, MS_9003, IPS, 10.10, 1920x1200 | |
|---|---|---|---|---|---|---|
| Display | -1% | -18% | ||||
| Display P3 Coverage | 67.9 | 66.5 -2% | 54.2 -20% | |||
| sRGB Coverage | 96.8 | 97.5 1% | 81.4 -16% | |||
| AdobeRGB 1998 Coverage | 68.9 | 67.5 -2% | 56 -19% | |||
| Response Times | -34% | -52% | -39% | -25% | -2% | |
| Response Time Grey 50% / Grey 80% * | 30.4 ? | 49.6 ? -63% | 52.8 ? -74% | 33.2 ? -9% | 44 ? -45% | 32 ? -5% |
| Response Time Black / White * | 24.4 ? | 25.6 ? -5% | 31.6 ? -30% | 41.2 ? -69% | 25.6 ? -5% | 24 ? 2% |
| PWM Frequency | 1020 ? | 19000 ? | ||||
| Screen | 38% | 39% | 36% | 55% | 12% | |
| Brightness middle | 256.3 | 449 75% | 401 56% | 408.7 59% | 456 78% | 251 -2% |
| Brightness | 255 | 425 67% | 396 55% | 396 55% | 426 67% | 244 -4% |
| Brightness Distribution | 93 | 89 -4% | 86 -8% | 85 -9% | 88 -5% | 79 -15% |
| Black Level * | 0.41 | 0.6 -46% | 0.5 -22% | 0.51 -24% | 0.31 24% | 0.33 20% |
| Contrast | 625 | 748 20% | 802 28% | 801 28% | 1471 135% | 761 22% |
| Colorchecker dE 2000 * | 10.04 | 3.1 69% | 2.9 71% | 4.13 59% | 1.3 87% | 5.34 47% |
| Colorchecker dE 2000 max. * | 17.49 | 6.4 63% | 5.8 67% | 7.34 58% | 3 83% | 9.91 43% |
| Colorchecker dE 2000 calibrated * | 2.17 | 1.1 49% | ||||
| Greyscale dE 2000 * | 10.4 | 3.8 63% | 4.1 61% | 4.4 58% | 1.4 87% | 6.04 42% |
| Gamma | 2.23 99% | 2.09 105% | 2.36 93% | 2.24 98% | 2.24 98% | 3.23 68% |
| CCT | 10211 64% | 7202 90% | 7263 89% | 7389 88% | 6687 97% | 7491 87% |
| Color Space (Percent of AdobeRGB 1998) | 63 | 62.3 -1% | 51 -19% | |||
| Color Space (Percent of sRGB) | 96.7 | 96.8 0% | 81 -16% | |||
| Moyenne finale (programmes/paramètres) | 2% /
24% | -7% /
20% | -2% /
21% | 10% /
34% | -3% /
4% |
* ... Moindre est la valeur, meilleures sont les performances
Temps de réponse de l'écran
| ↔ Temps de réponse noir à blanc | ||
|---|---|---|
| 24.4 ms ... hausse ↗ et chute ↘ combinées | ↗ 12.4 ms hausse | 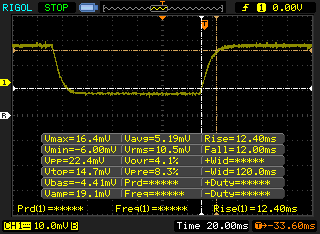 |
| ↘ 12 ms chute | ||
| L'écran montre de bons temps de réponse, mais insuffisant pour du jeu compétitif. En comparaison, tous les appareils testés affichent entre 0.1 (minimum) et 240 (maximum) ms. » 52 % des appareils testés affichent de meilleures performances. Cela signifie que les latences relevées sont moins bonnes que la moyenne (21.5 ms) de tous les appareils testés. | ||
| ↔ Temps de réponse gris 50% à gris 80% | ||
| 30.4 ms ... hausse ↗ et chute ↘ combinées | ↗ 18.8 ms hausse | 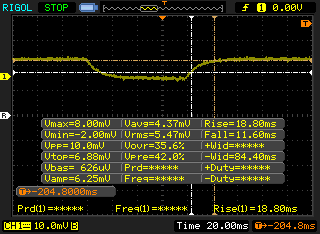 |
| ↘ 11.6 ms chute | ||
| L'écran souffre de latences très élevées, à éviter pour le jeu. En comparaison, tous les appareils testés affichent entre 0.2 (minimum) et 636 (maximum) ms. » 35 % des appareils testés affichent de meilleures performances. Cela signifie que les latences relevées sont similaires à la moyenne (33.7 ms) de tous les appareils testés. | ||
Scintillement / MLI (Modulation de largeur d'impulsion)
| Scintillement / MLI (Modulation de largeur d'impulsion) non décelé | 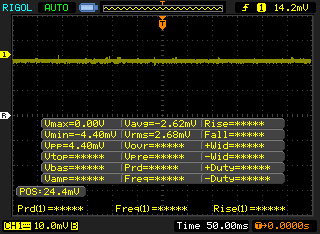 | ||
En comparaison, 53 % des appareils testés n'emploient pas MDI pour assombrir leur écran. Nous avons relevé une moyenne à 17853 (minimum : 5 - maximum : 3846000) Hz dans le cas où une MDI était active. | |||
Cinebench R20: CPU (Single Core) | CPU (Multi Core)
Blender: v2.79 BMW27 CPU
7-Zip 18.03: 7z b 4 -mmt1 | 7z b 4
Geekbench 5.5: Single-Core | Multi-Core
HWBOT x265 Benchmark v2.2: 4k Preset
LibreOffice : 20 Documents To PDF
R Benchmark 2.5: Overall mean
| Cinebench R15 / CPU Multi 64Bit | |
| Dell XPS 13 7390 2-in-1 Core i3 | |
| Dell Latitude 3400 | |
| Acer TravelMate Spin B1 B118-G2-RN-P7ED | |
| Moyenne Intel Celeron N4100 (161 - 254, n=12) | |
| Dell Venue 11 Pro 7140 | |
| Chuwi Hi10 X | |
| Microsoft Surface Go MHN-00003 | |
| Lhmzniy A9 15.6 | |
| LincPlus P1 | |
| HP x2 210 G2 | |
| Lenovo IdeaPad Miix 320-10ICR Pro LTE | |
| Jumper EZbook X3 | |
| Cinebench R15 / CPU Single 64Bit | |
| Dell XPS 13 7390 2-in-1 Core i3 | |
| Dell Latitude 3400 | |
| Dell Venue 11 Pro 7140 | |
| Acer TravelMate Spin B1 B118-G2-RN-P7ED | |
| LincPlus P1 | |
| Chuwi Hi10 X | |
| Moyenne Intel Celeron N4100 (62 - 71, n=12) | |
| Microsoft Surface Go MHN-00003 | |
| Jumper EZbook X3 | |
| Lenovo IdeaPad Miix 320-10ICR Pro LTE | |
| HP x2 210 G2 | |
| Cinebench R20 / CPU (Single Core) | |
| Dell XPS 13 7390 2-in-1 Core i3 | |
| Dell Latitude 3400 | |
| LincPlus P1 | |
| Chuwi Hi10 X | |
| Moyenne Intel Celeron N4100 (151 - 155, n=7) | |
| Jumper EZbook X3 | |
| Cinebench R20 / CPU (Multi Core) | |
| Dell XPS 13 7390 2-in-1 Core i3 | |
| Dell Latitude 3400 | |
| Moyenne Intel Celeron N4100 (368 - 560, n=7) | |
| Chuwi Hi10 X | |
| LincPlus P1 | |
| Jumper EZbook X3 | |
| Lhmzniy A9 15.6 | |
| Blender / v2.79 BMW27 CPU | |
| Jumper EZbook X3 | |
| LincPlus P1 | |
| Chuwi Hi10 X | |
| Moyenne Intel Celeron N4100 (2437 - 3527, n=7) | |
| Dell XPS 13 7390 2-in-1 Core i3 | |
| 7-Zip 18.03 / 7z b 4 -mmt1 | |
| Dell XPS 13 7390 2-in-1 Core i3 | |
| LincPlus P1 | |
| Moyenne Intel Celeron N4100 (2125 - 2459, n=7) | |
| Chuwi Hi10 X | |
| Jumper EZbook X3 | |
| 7-Zip 18.03 / 7z b 4 | |
| Dell XPS 13 7390 2-in-1 Core i3 | |
| Moyenne Intel Celeron N4100 (5620 - 7835, n=7) | |
| Chuwi Hi10 X | |
| LincPlus P1 | |
| Jumper EZbook X3 | |
| Geekbench 5.5 / Single-Core | |
| LincPlus P1 | |
| Lhmzniy A9 15.6 | |
| Chuwi Hi10 X | |
| Moyenne Intel Celeron N4100 (378 - 414, n=7) | |
| Jumper EZbook X3 | |
| Geekbench 5.5 / Multi-Core | |
| Moyenne Intel Celeron N4100 (1082 - 1419, n=7) | |
| Chuwi Hi10 X | |
| Lhmzniy A9 15.6 | |
| LincPlus P1 | |
| Jumper EZbook X3 | |
| HWBOT x265 Benchmark v2.2 / 4k Preset | |
| Dell XPS 13 7390 2-in-1 Core i3 | |
| Moyenne Intel Celeron N4100 (0.974 - 1.5, n=6) | |
| Microsoft Surface Go MHN-00003 | |
| Chuwi Hi10 X | |
| LincPlus P1 | |
| Jumper EZbook X3 | |
| LibreOffice / 20 Documents To PDF | |
| Jumper EZbook X3 | |
| Moyenne Intel Celeron N4100 (155 - 178, n=5) | |
| Chuwi Hi10 X | |
| LincPlus P1 | |
| R Benchmark 2.5 / Overall mean | |
| Jumper EZbook X3 | |
| Moyenne Intel Celeron N4100 (1.75 - 1.786, n=5) | |
| Chuwi Hi10 X | |
| LincPlus P1 | |
* ... Moindre est la valeur, meilleures sont les performances
| PCMark 8 Home Score Accelerated v2 | 1670 points | |
| PCMark 8 Work Score Accelerated v2 | 2738 points | |
| PCMark 10 Score | 1527 points | |
Aide | ||
| DPC Latencies / LatencyMon - interrupt to process latency (max), Web, Youtube, Prime95 | |
| Chuwi Hi10 X | |
* ... Moindre est la valeur, meilleures sont les performances
| Chuwi Hi10 X SanDisk DF4128 | Microsoft Surface Go MHN-00003 64 GB eMMC Flash | Lenovo IdeaPad Miix 320-10ICR Pro LTE SanDisk DF4128 | HP x2 210 G2 64 GB eMMC Flash | Dell Venue 11 Pro 7140 Sandisk X110 M.2 SD6SP1M-128G | |
|---|---|---|---|---|---|
| AS SSD | 83% | -22% | 382% | ||
| Seq Read | 258.5 | 289.8 12% | 127.5 -51% | 405.4 57% | |
| Seq Write | 120.8 | 126.7 5% | 41.75 -65% | 134.7 12% | |
| 4K Read | 5.94 | 18.29 208% | 5.51 -7% | 19.3 225% | |
| 4K Write | 12.4 | 35.07 183% | 7.42 -40% | 33.22 168% | |
| 4K-64 Read | 25.96 | 40.27 55% | 28.99 12% | 242 832% | |
| 4K-64 Write | 10.16 | 44.48 338% | 12.91 27% | 152.5 1401% | |
| Access Time Read * | 0.597 | 0.151 75% | 0.454 24% | 0.16 73% | |
| Access Time Write * | 1.105 | 0.233 79% | 0.896 19% | 0.104 91% | |
| Score Read | 58 | 88 52% | 47 -19% | 302 421% | |
| Score Write | 35 | 92 163% | 28 -20% | 199 469% | |
| Score Total | 117 | 225 92% | 94 -20% | 648 454% | |
| Copy ISO MB/s | 130.2 | 99.1 -24% | 57.2 -56% | ||
| Copy Program MB/s | 88.3 | 44.34 -50% | 36.15 -59% | ||
| Copy Game MB/s | 103.8 | 76.5 -26% | 51.4 -50% | ||
| CrystalDiskMark 5.2 / 6 | 77% | 17% | |||
| Write 4K | 12.85 | 26.91 109% | 18.11 41% | ||
| Read 4K | 10.02 | 19.72 97% | 15.77 57% | ||
| Write Seq | 120.8 | 126.2 4% | 62.5 -48% | ||
| Read Seq | 259.7 | 268 3% | 121.8 -53% | ||
| Write 4K Q32T1 | 15.17 | 62.9 315% | 31.72 109% | ||
| Read 4K Q32T1 | 33.09 | 39.82 20% | 48.64 47% | ||
| Write Seq Q32T1 | 108.8 | 131.3 21% | 95.6 -12% | ||
| Read Seq Q32T1 | 180.1 | 259.3 44% | 166.5 -8% | ||
| Moyenne finale (programmes/paramètres) | 80% /
81% | -22% /
-22% | 17% /
17% | 382% /
382% |
* ... Moindre est la valeur, meilleures sont les performances

| 3DMark 11 | |
| 1280x720 Performance GPU | |
| Dell XPS 13 7390 2-in-1 Core i3 | |
| Dell Latitude 3400 | |
| Microsoft Surface Go MHN-00003 | |
| Dell Venue 11 Pro 7140 | |
| Acer TravelMate Spin B1 B118-G2-RN-P7ED | |
| Moyenne Intel UHD Graphics 600 (410 - 854, n=27) | |
| Chuwi Hi10 X | |
| HP x2 210 G2 | |
| Lenovo IdeaPad Miix 320-10ICR Pro LTE | |
| 1280x720 Performance Combined | |
| Dell XPS 13 7390 2-in-1 Core i3 | |
| Dell Latitude 3400 | |
| Microsoft Surface Go MHN-00003 | |
| Dell Venue 11 Pro 7140 | |
| Acer TravelMate Spin B1 B118-G2-RN-P7ED | |
| Moyenne Intel UHD Graphics 600 (362 - 983, n=27) | |
| HP x2 210 G2 | |
| Chuwi Hi10 X | |
| Lenovo IdeaPad Miix 320-10ICR Pro LTE | |
| 3DMark | |
| 1280x720 Cloud Gate Standard Graphics | |
| Dell XPS 13 7390 2-in-1 Core i3 | |
| Dell Latitude 3400 | |
| Microsoft Surface Go MHN-00003 | |
| Dell Venue 11 Pro 7140 | |
| Acer TravelMate Spin B1 B118-G2-RN-P7ED | |
| Moyenne Intel UHD Graphics 600 (2346 - 4958, n=20) | |
| Chuwi Hi10 X | |
| HP x2 210 G2 | |
| 1920x1080 Fire Strike Graphics | |
| Dell XPS 13 7390 2-in-1 Core i3 | |
| Dell Latitude 3400 | |
| Microsoft Surface Go MHN-00003 | |
| Dell Venue 11 Pro 7140 | |
| Acer TravelMate Spin B1 B118-G2-RN-P7ED | |
| Moyenne Intel UHD Graphics 600 (307 - 637, n=21) | |
| LincPlus P1 | |
| Jumper EZbook X3 | |
| Chuwi Hi10 X | |
| HP x2 210 G2 | |
| 1920x1080 Ice Storm Extreme Graphics | |
| Dell XPS 13 7390 2-in-1 Core i3 | |
| Microsoft Surface Go MHN-00003 | |
| Dell Latitude 3400 | |
| Moyenne Intel UHD Graphics 600 (8277 - 19919, n=12) | |
| 2560x1440 Time Spy Graphics | |
| Dell Latitude 3400 | |
| Moyenne Intel UHD Graphics 600 (85 - 124, n=12) | |
| Chuwi Hi10 X | |
| 3DMark 11 Performance | 519 points | |
| 3DMark Ice Storm Standard Score | 14062 points | |
| 3DMark Cloud Gate Standard Score | 2346 points | |
| 3DMark Fire Strike Score | 327 points | |
| 3DMark Time Spy Score | 107 points | |
Aide | ||
| Bas | Moyen | Élevé | Ultra | |
| Dota 2 Reborn (2015) | 19.1 | 12.4 | 5.9 | 5.7 |
| X-Plane 11.11 (2018) | 3.94 | 3.48 | 3.18 |
(±) La température maximale du côté supérieur est de 41.8 °C / 107 F, par rapport à la moyenne de 35.3 °C / 96 F, allant de 19.6 à 55.7 °C pour la classe Convertible.
(±) Le fond chauffe jusqu'à un maximum de 42.8 °C / 109 F, contre une moyenne de 36.7 °C / 98 F
(+) En utilisation inactive, la température moyenne du côté supérieur est de 28.6 °C / 83 F, par rapport à la moyenne du dispositif de 30.2 °C / 86 F.
(±) Les repose-poignets et le pavé tactile peuvent devenir très chauds au toucher, avec un maximum de 39 °C / 102.2# F.
(-) La température moyenne de la zone de l'appui-paume de dispositifs similaires était de 28.1 °C / 82.6 F (-10.9 °C / #-19.6 F).
Chuwi Hi10 X analyse audio
(-) | haut-parleurs pas très forts (71 dB)
Bass 100 - 315 Hz
(±) | basse réduite - en moyenne 14.4% inférieure à la médiane
(+) | les basses sont linéaires (5.2% delta à la fréquence précédente)
Mids 400 - 2000 Hz
(±) | médiane supérieure - en moyenne 6.2% supérieure à la médiane
(±) | la linéarité des médiums est moyenne (14.8% delta à la fréquence précédente)
Aiguës 2 - 16 kHz
(±) | sommets plus élevés - en moyenne 7.3% plus élevés que la médiane
(-) | les aigus ne sont pas linéaires (21.2% delta à la fréquence précédente)
Overall 100 - 16.000 Hz
(-) | le son global n'est pas linéaire (44.6% de différence à la médiane)
Par rapport à la même classe
» 98% de tous les appareils testés de cette catégorie étaient meilleurs, 1% similaires, 1% pires
» Le meilleur avait un delta de 6%, la moyenne était de 21%, le pire était de 57%.
Par rapport à tous les appareils testés
» 95% de tous les appareils testés étaient meilleurs, 0% similaires, 5% pires
» Le meilleur avait un delta de 4%, la moyenne était de 25%, le pire était de 134%.
Apple MacBook 12 (Early 2016) 1.1 GHz analyse audio
(+) | les haut-parleurs peuvent jouer relativement fort (83.6# dB)
Bass 100 - 315 Hz
(±) | basse réduite - en moyenne 11.3% inférieure à la médiane
(±) | la linéarité des basses est moyenne (14.2% delta à la fréquence précédente)
Mids 400 - 2000 Hz
(+) | médiane équilibrée - seulement 2.4% de la médiane
(+) | les médiums sont linéaires (5.5% delta à la fréquence précédente)
Aiguës 2 - 16 kHz
(+) | des sommets équilibrés - à seulement 2% de la médiane
(+) | les aigus sont linéaires (4.5% delta à la fréquence précédente)
Overall 100 - 16.000 Hz
(+) | le son global est linéaire (10.2% différence à la médiane)
Par rapport à la même classe
» 5% de tous les appareils testés de cette catégorie étaient meilleurs, 2% similaires, 93% pires
» Le meilleur avait un delta de 5%, la moyenne était de 19%, le pire était de 53%.
Par rapport à tous les appareils testés
» 3% de tous les appareils testés étaient meilleurs, 1% similaires, 96% pires
» Le meilleur avait un delta de 4%, la moyenne était de 25%, le pire était de 134%.
| Éteint/en veille | |
| Au repos | |
| Fortement sollicité |
|
| Chuwi Hi10 X Celeron N4100, UHD Graphics 600, SanDisk DF4128, IPS, 1920x1200, 10.10 | Microsoft Surface Go MHN-00003 Pentium 4415Y, UHD Graphics 615, 64 GB eMMC Flash, IPS, 1800x1200, 10.00 | Lenovo IdeaPad Miix 320-10ICR Pro LTE Z8350, HD Graphics 400 (Braswell), SanDisk DF4128, IPS, 1920x1200, 10.10 | HP x2 210 G2 Z8350, HD Graphics 400 (Braswell), 64 GB eMMC Flash, IPS, 1280x800, 10.10 | Dell Venue 11 Pro 7140 5Y10a, HD Graphics 5300, Sandisk X110 M.2 SD6SP1M-128G, IPS, 1920x1080, 10.80 | |
|---|---|---|---|---|---|
| Power Consumption | -10% | 17% | 24% | -1% | |
| Idle Minimum * | 3.7 | 2.88 22% | 3 19% | 2.9 22% | 2 46% |
| Idle Average * | 6.3 | 4.8 24% | 5.3 16% | 4.8 24% | 5.9 6% |
| Idle Maximum * | 6.7 | 7.5 -12% | 6.4 4% | 5.2 22% | 6.2 7% |
| Load Average * | 14 | 16.9 -21% | 10.9 22% | 10.4 26% | 19.1 -36% |
| Load Maximum * | 14.5 | 23.8 -64% | 11 24% | 10.9 25% | 18.2 -26% |
* ... Moindre est la valeur, meilleures sont les performances
| Chuwi Hi10 X Celeron N4100, UHD Graphics 600, 24 Wh | Microsoft Surface Go MHN-00003 Pentium 4415Y, UHD Graphics 615, 28 Wh | Lenovo IdeaPad Miix 320-10ICR Pro LTE Z8350, HD Graphics 400 (Braswell), 33.3 Wh | HP x2 210 G2 Z8350, HD Graphics 400 (Braswell), 32.5 Wh | Dell Venue 11 Pro 7140 5Y10a, HD Graphics 5300, 38 Wh | Lenovo Yoga Smart Tab YT-X705F SD 439, Adreno 505, 27 Wh | |
|---|---|---|---|---|---|---|
| Autonomie de la batterie | 33% | 37% | 64% | 137% | ||
| WiFi v1.3 | 336 | 448 33% | 461 37% | 551 64% | 795 137% | |
| Reader / Idle | 771 | 777 | 2083 | |||
| Load | 180 | 244 | 288 | |||
| WiFi | 562 |
Points positifs
Points négatifs
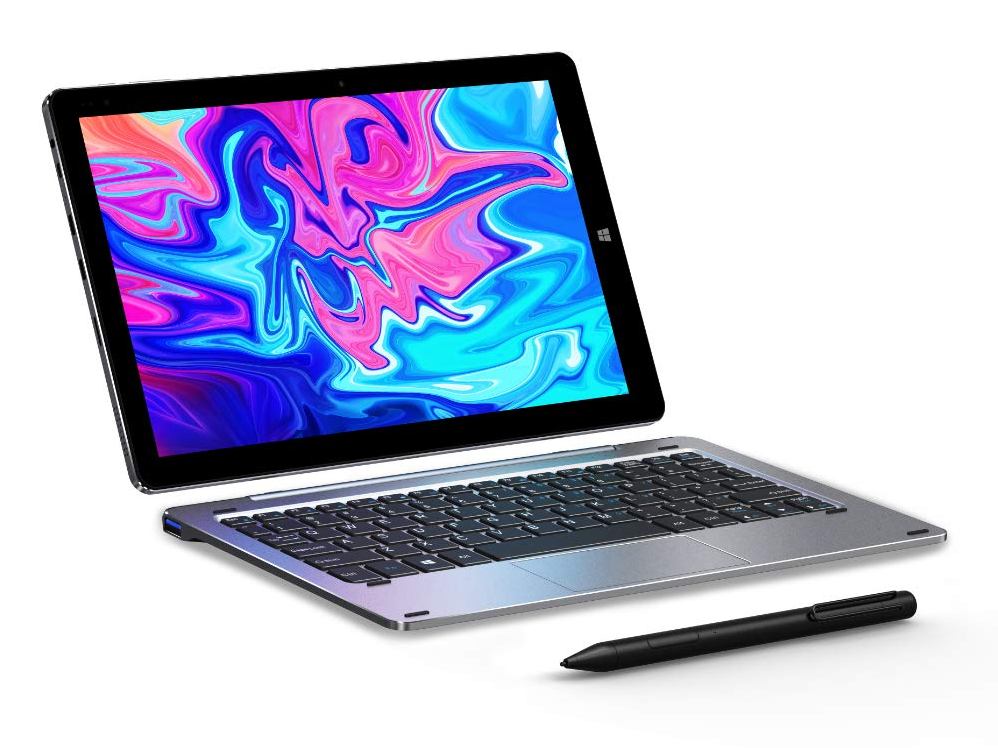
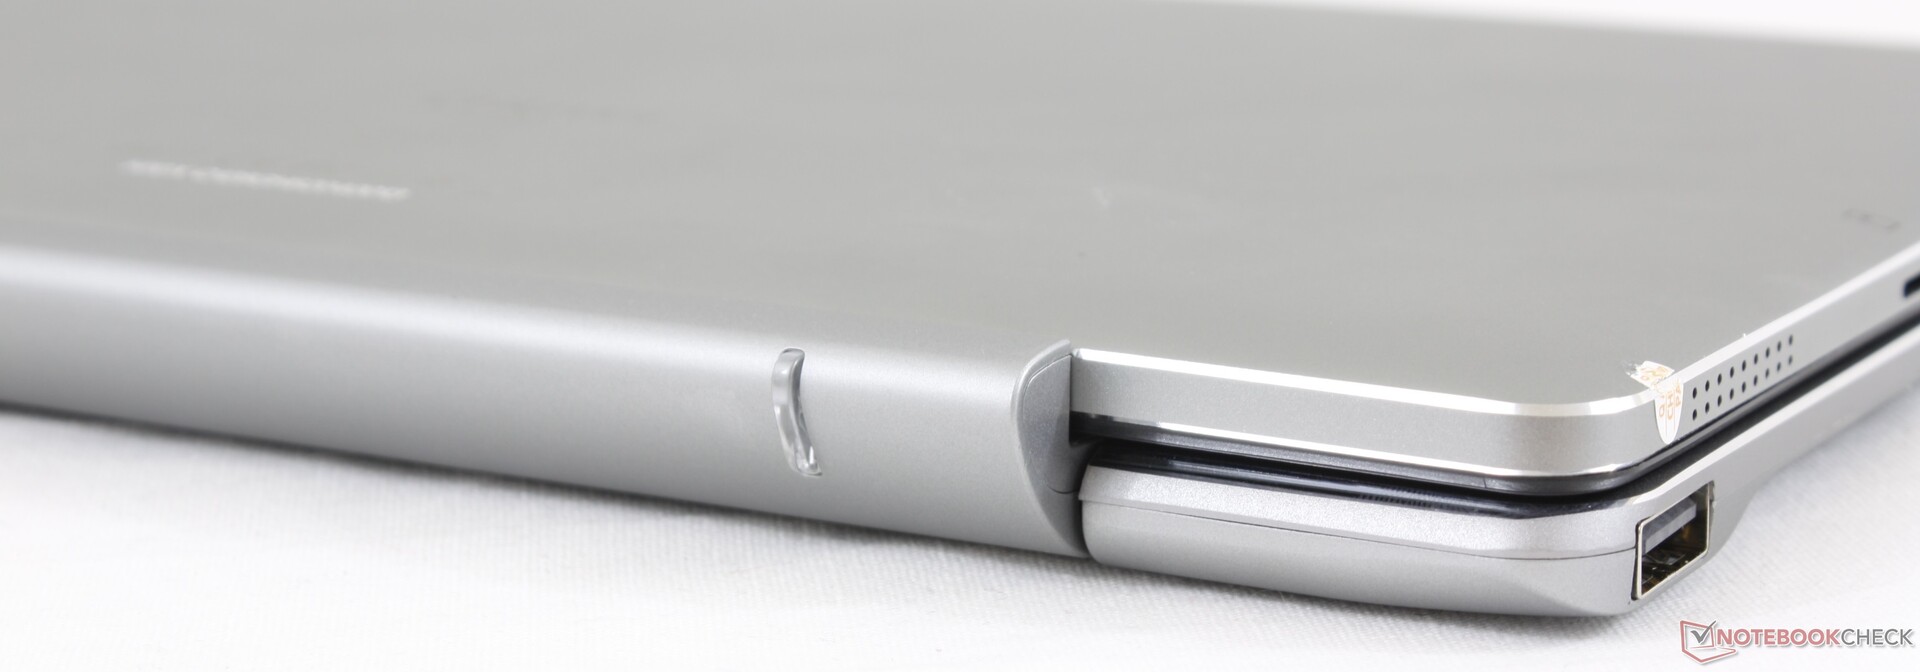
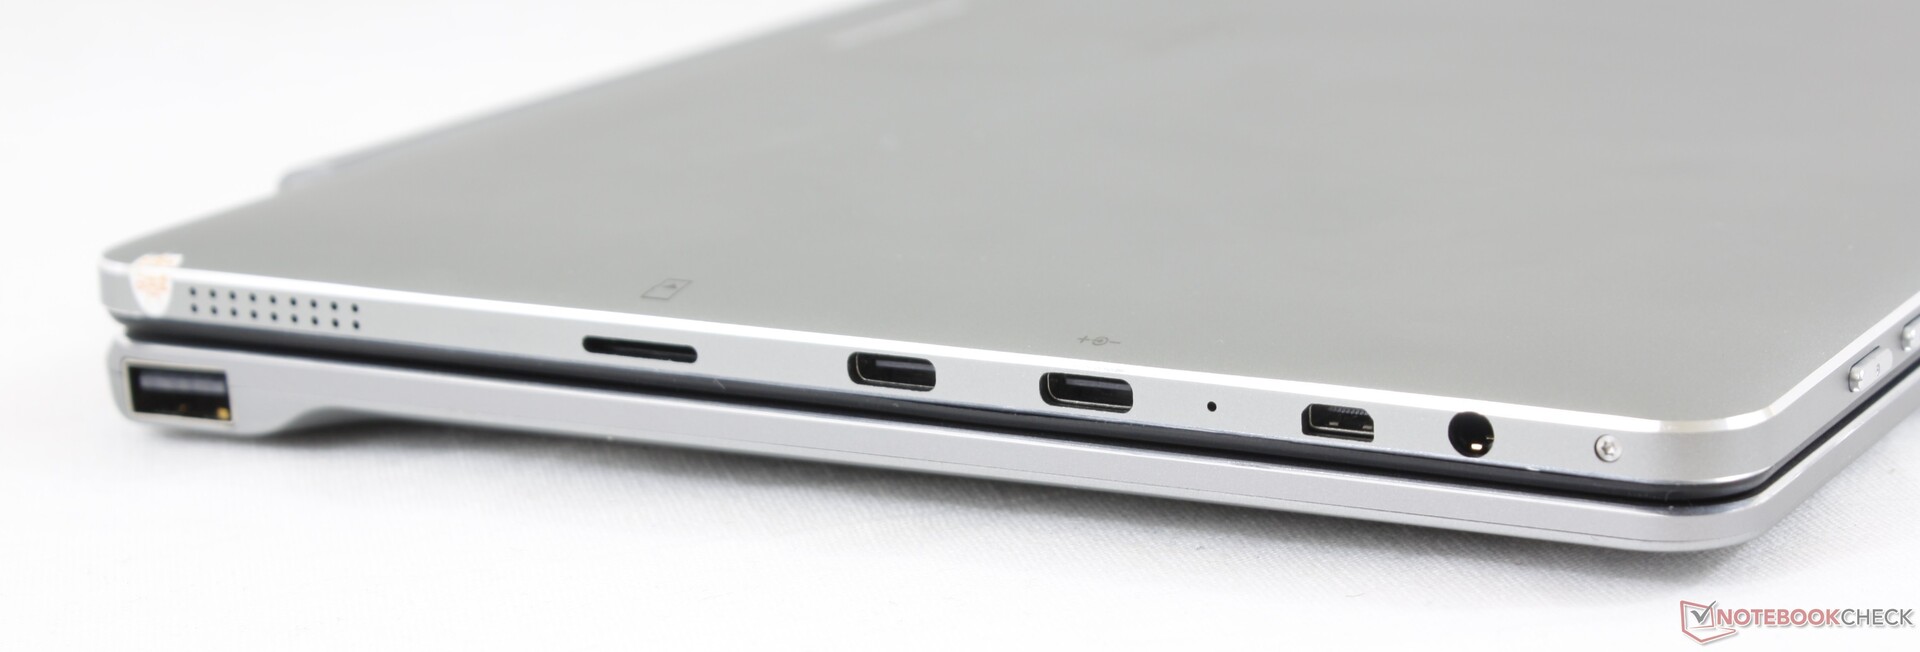
Le Chuwi Hi10 X possède une poignée de qualité. Le châssis robuste et le clavier laissent une bonne impression, vu le prix, et le nombre de port est appréciable. Malheureusement cela ne suffit pas à compenser le clickpad peu fiable, le jeu dans les charnières, l'écran trop peu lumineux, ou l'expérience Windows ralentie. Essayer d'utiliser la tablette à l'extérieur ou même à l'intérieur mais sans souris peut être vraiment frustrant. Nous avons plus là une tablette Windows de secours qu'une tablette pour un peu de navigation et de streaming vidéo, vu que toute autre activité la ralentira démesurément.
Nous avons là une tablette Windows passable pour de faibles sollicitations ou pour servir de centre multimédia à seule fin de streaming vidéo. Pour le reste, le clickpad est aux abonnés absents, et l'écran est trop sombre pour l'extérieur.
L’intégralité de cette critique est disponible en anglais en suivant ce lien.
Chuwi Hi10 X
-
05/05/2020 v7
Allen Ngo
Pricecompare
