Intel Celeron N4100
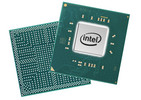
L'Intel Pentium N4100 est un SoC quadricœur avant tout destiné aux ordinateurs portables bon marché, et annoncé fin 2017. Il monte entre 1,1 et 2,4 GHz (en monocœur, 2,3 GHz en multicœur) et il est basé sur la plateforme Gemini Lake. Similaire à son prédécesseur Apollo Lake, la puce est fabriquée grâce à un procédé 14 nm avec FinFET, mais possède des cœurs physiques légèrement améliorés, le double de cache L2, une nouvelle génération de sorties vidéo (Gen 10), et un puce Wifi partiellement intégrée. En plus des quatre cœurs physiques, la puce inclut également un GPU DirectX 12 ainsi qu'un contrôleur mémoire DDR4 / LPPDR4 (double canal, jusqu'à 2 400 MHz). Le SoC n'est pas remplaçable, étant directement soudé sur la carte-mère.
L'architecture du processeur a été légèrement retravaillée, et s'appelle maintenant Goldmont Plus. Elle possède un cache amélioré de niveau 2 (jusqu'à 4 Mo). Cela signifie que les performances par MHz devraient être un peu meilleures, mais sans se rapprocher des cœurs physiques de type Kaby Lake Y.
Les performances du Celeron N4100 sont légèrement meilleures que celles de l'ancien Celeron N3450, grâce à l'architecture CPU légèrement retravaillée et à la fréquence de boost légèrement augmentée de 200 MHz, et devraient atteindre le niveau de l'ancien Pentium N4200 (1,1 - 2,5 GHz, 2 MB L2, Apollo Lake). Par rapport aux processeurs Core Y plus chers, les performances mono thread en particulier sont bien plus faibles avec les processeurs Gemini Lake. Toujours est-il que les performances devraient suffire pour de la bureautique et du multitâche légers.
La UHD Graphics 600 (Gemini Lake) est basée sur l'architecture d'Intel de 9e génération, qui supporte DirectX 12 et qui est également utilisée pour les puces graphiques Kaby Lake, Skylake et Apollo Lake (comme la HD Graphics 520). Avec 12 unités de calcul et une fréquence qui monte à 700 MHz, les performances devraient être à peu près du niveau de l'ancienne HD Graphics 500 (Apollo Lake).
La puce inclut également un moteur vidéo avec compatibilité matérielle pour la lecture du VP9 et du H.265 (profondeur de couleur de 8 bits).
Comme avec le prédécesseur, Intel indique une enveloppe thermique de 6 W (avec Scenario Design Power de 4,8 W). La puce peut donc être en théorie refroidie passivement, mais elle peut également nécessiter un ventilateur.
Gamme Intel Gemini Lake Nom de code Gemini Lake Gamme: Gemini Lake Gemini Lake Fréquence 1100 - 2400 MHz Cache de Niveau 2 (L2) 4 MB Nombres de cœurs/threads simultanés supportés 4 / 4 Consommation énergétique maximale (TDP) 6 Watt(s) Lithographie (procédé de fabrication) 14 nm Socket FCBGA1090 Fonctionnalités Intel UHD Graphics 605 (18 EUs, 200 - 700 MHz), Quick Sync, AES-NI, max. 8 GB Dual-Channel DDR4/LPDDR4-2400 Carte graphique Intel UHD Graphics 600 (200 - 700 MHz)64 Bit Prend en charge les instructions 64 Bit Architecture x86 Prix de départ $107 U.S. Date de présentation 12/11/2017 Lien redirigeant vers une page externe du produit Intel Gemini Lake Celeron N4100
Benchmarks Performance Rating - CB R15 + R20 + 7-Zip + X265 + Blender + 3DM11 CPU
20.5 pt (21%)
...
Intel Celeron N3350 -31%
Intel Atom x7-E3950 -25%
Intel Celeron J4115 7%
...
Cinebench R23 - Cinebench R23 CPU (Multi Core)
min: 955 moyenne: 961 médian: 960.5 (4%) maximum: 966 Points
Intel Celeron N3350 -66%
Intel Atom x7-Z8750 -36%
Intel Core i7-2860QM 181%
...
Cinebench R23 - Cinebench R23 CPU (Single Core)
min: 382 moyenne: 387 médian: 386.5 (23%) maximum: 391 Points
Intel Atom x7-Z8750 -46%
Intel Celeron N3350 -35%
Intel Core i7-2860QM 79%
AMD Ryzen 5 1400 115%
...
Cinebench R20 - Cinebench R20 CPU (Single Core)
min: 151 moyenne: 153 médian: 152 (24%) maximum: 155 Points
...
AMD A6-9220e -52%
Intel Atom x7-Z8750 -49%
Intel Atom x7-E3950 -39%
Intel Celeron N3350 -32%
Intel Celeron J3355 -31%
Intel Celeron J4115 3%
...
Cinebench R20 - Cinebench R20 CPU (Multi Core)
min: 368 moyenne: 440 médian: 391 (4%) maximum: 560 Points
...
AMD A9-9425 -35%
Intel Celeron J4115 24%
...
AMD Ryzen Threadripper 2970WX 2173%
Cinebench R15 - Cinebench R15 CPU Multi 64 Bit
min: 161 moyenne: 206 médian: 198 (4%) maximum: 254 Points
...
AMD PRO A8-9600B -1%
...
AMD Ryzen Threadripper 2970WX 2024%
0 10 20 30 40 50 60 70 80 90 100 110 120 130 140 150 160 170 180 190 200 210 220 230 240 250 260 Tooltip Zotac ZBOX EDGE CI341 : Ø238 (236.41-244.84)
Cinebench R15 - Cinebench R15 CPU Single 64 Bit
min: 62 moyenne: 68.1 médian: 68.6 (25%) maximum: 71 Points
...
AMD A6-9220 1%
Intel Celeron J4115 4%
AMD PRO A8-9600B 4%
...
Cinebench R11.5 - Cinebench R11.5 CPU Multi 64 Bit
min: 2.13 moyenne: 2.4 médian: 2.2 (4%) maximum: 2.9 Points
...
AMD PRO A8-9600B 0%
Intel Core i5-2415M 1%
...
Cinebench R11.5 - Cinebench R11.5 CPU Single 64 Bit
min: 0.8 moyenne: 0.8 médian: 0.8 (26%) maximum: 0.83 Points
...
AMD A6-9220 -2%
AMD A10-9620P -1%
Intel Celeron J4115 1%
AMD PRO A8-9600B 2%
...
Cinebench R10 - Cinebench R10 Rend. Single (32bit)
min: 1664 moyenne: 1951 médian: 2013 (18%) maximum: 2049 points
...
AMD Phenom II X3 N850 -1%
AMD Athlon 64 X2 (Desktop) 4600+ -1%
AMD Athlon II P360 0%
AMD Athlon II N330 2%
...
Cinebench R10 - Cinebench R10 Rend. Multi (32bit)
min: 4915 moyenne: 5999 médian: 5904 (10%) maximum: 7123 points
...
Intel Core i3-350M -3%
Intel Core 2 Duo (Desktop) E6850 -3%
AMD A8-3510MX 3%
...
Cinebench R10 - Cinebench R10 Rend. Multi (64bit)
10929 Points (10%)
...
...
Cinebench R10 - Cinebench R10 Rend. Single (64bit)
3337 Points (25%)
...
Intel Core i3-370M -1%
AMD Phenom II X2 N660 -1%
AMD A8-3850 1%
Intel Core 2 Extreme (Desktop) X6800 2%
AMD A9-9420 2%
Intel Core i3-380M 3%
...
wPrime 2.10 - wPrime 2.0 1024m *
min: 591.026 moyenne: 724 médian: 789.6 (9%) maximum: 790.4 s
AMD Ryzen Threadripper 2970WX -95%
...
AMD A8-3520M -3%
AMD Phenom II X4 P960 -3%
AMD A9-9420 -2%
...
VIA C3-M C3-M-1200 1069%
wPrime 2.10 - wPrime 2.0 32m *
min: 18.97 moyenne: 20.3 médian: 19.4 (4%) maximum: 22.5 s
...
Intel Core i3-380M -1%
Intel Core i3-7100U 0%
AMD A9-9420 5%
Intel Core i3-370M 7%
...
min: 1093 moyenne: 1148 médian: 1139 (7%) maximum: 1212 points
...
AMD E2-7110 -5%
Intel Core 2 Duo (Desktop) E6600 2%
AMD A6-7310 2%
...
7-Zip 18.03 - 7-Zip 18.03 Multli Thread 4 runs
min: 5620 moyenne: 6674 médian: 6608 (5%) maximum: 7835 MIPS
...
Intel Atom x5-E8000 -34%
Intel Atom x7-E3950 -32%
AMD Ryzen Embedded R1505G 4%
Intel Celeron J4115 14%
...
7-Zip 18.03 - 7-Zip 18.03 Single Thread 4 runs
min: 2125 moyenne: 2209 médian: 2158 (14%) maximum: 2459 MIPS
...
Intel Atom x7-E3950 -34%
Intel Celeron N3350 -22%
Intel Celeron J3355 -17%
Intel Celeron J4115 0%
AMD Ryzen Embedded R1505G 13%
AMD Phenom II X4 905e 14%
...
X264 HD Benchmark 4.0 - x264 Pass 2
min: 11.8 moyenne: 13.3 médian: 11.8 (5%) maximum: 16.3 fps
Intel Pentium 4 2.4 GHz -86%
...
AMD PRO A8-9600B 0%
...
X264 HD Benchmark 4.0 - x264 Pass 1
min: 57.65 moyenne: 64.5 médian: 58.2 (17%) maximum: 77.7 fps
...
...
HWBOT x265 Benchmark v2.2 - HWBOT x265 4k Preset
min: 0.974 moyenne: 1.2 médian: 1.2 (4%) maximum: 1.5 fps
...
Intel Celeron J3355 -42%
Intel Atom x7-E3950 -19%
Intel Celeron J4115 17%
...
0 10 Tooltip Zotac ZBOX EDGE CI341 : Ø1.5 (0.29-2.69)
TrueCrypt - TrueCrypt Serpent
min: 0.156 moyenne: 0.2 médian: 0.2 (7%) maximum: 0.162 GB/s
...
AMD A6-7310 4%
...
TrueCrypt - TrueCrypt Twofish
min: 0.222 moyenne: 0.2 médian: 0.2 (6%) maximum: 0.236 GB/s
...
AMD A8-7410 -1%
AMD A9-9425 0%
...
AMD Ryzen 9 3950X 1463%
TrueCrypt - TrueCrypt AES
1.7 GB/s (6%)
...
Intel Core i7-2640M -6%
Intel Core i3-7130U 0%
...
Blender 2.79 - Blender 2.79 BMW27 CPU *
min: 2437 moyenne: 3032 médian: 3176 (22%) maximum: 3527 Seconds
Intel Core i5-1038NG7 -100%
...
AMD Phenom II X4 905e -20%
Intel Celeron J4115 -17%
Intel Atom x7-E3950 51%
...
R Benchmark 2.5 - R Benchmark 2.5 *
min: 1.75 moyenne: 1.8 médian: 1.8 (38%) maximum: 1.786 sec
...
Intel Celeron J4115 -2%
Intel Core i9-9900T 7%
Intel Celeron N3350 32%
Intel Atom x7-Z8750 56%
...
3DMark 06 - CPU - 3DMark 06 - CPU
min: 2748 moyenne: 2985 médian: 2805 (16%) maximum: 3580 Points
...
Intel Core i5-2415M -3%
AMD PRO A8-9600B -2%
AMD A8-7410 -2%
AMD Phenom II X4 N950 0%
AMD Phenom II X4 N970 2%
...
Super Pi mod 1.5 XS 1M - Super Pi mod 1.5 XS 1M *
min: 27.415 moyenne: 28.3 médian: 28.5 (6%) maximum: 28.94 s
...
AMD A6-7310 -2%
Intel Core Duo T2600 -1%
Intel Celeron N3350 3%
...
VIA C3-M C3-M-1200 1536%
Super Pi mod 1.5 XS 2M - Super Pi mod 1.5 XS 2M *
min: 61.86 moyenne: 63.1 médian: 62.6 (3%) maximum: 64.8 s
...
Intel Core i3-2365M -2%
Intel Celeron J4115 0%
Intel Core 2 Duo T7200 1%
AMD A6-7310 1%
AMD Phenom II X4 905e 1%
Intel Celeron N3350 2%
...
Super Pi Mod 1.5 XS 32M - Super Pi mod 1.5 XS 32M *
min: 1381.31 moyenne: 1462 médian: 1474 (7%) maximum: 1532 s
...
Intel Core i3-2365M -3%
AMD A6-7310 -2%
Intel Core 2 Duo T7600 0%
Intel Celeron J4115 1%
Intel Core 2 Duo T7300 2%
...
VIA C3-M C3-M-1200 1440%
3DMark 11 - 3DM11 Performance Physics
min: 2009 moyenne: 2338 médian: 2213 (9%) maximum: 2919 Points
...
AMD A8-3520M -1%
AMD A6-3420M 1%
AMD A6-3410MX 2%
AMD A10-9620P 3%
...
3DMark - 3DMark Ice Storm Physics
min: 12964 moyenne: 20919 médian: 19160 (12%) maximum: 31380 Points
Samsung Hummingbird S5PC110 / Exynos 3110 -97%
...
AMD E2-7110 -3%
AMD PRO A8-9600B 2%
AMD A4-7210 3%
...
3DMark - 3DMark Ice Storm Extreme Physics
min: 12613 moyenne: 20195 médian: 19086 (20%) maximum: 29271 Points
...
AMD A9-9420 -10%
Intel Core i3-7100U -4%
...
3DMark - 3DMark Ice Storm Unlimited Physics
min: 19890 moyenne: 24471 médian: 23934 (25%) maximum: 32203 Points
Qualcomm Snapdragon S4 Play MSM8625Q -88%
...
AMD A4-7210 -1%
AMD PRO A8-9600B 1%
Apple A11 Bionic 3%
...
3DMark - 3DMark Cloud Gate Physics
min: 1591 moyenne: 1967 médian: 1818 (5%) maximum: 2555 Points
...
AMD A4-7210 -3%
...
3DMark - 3DMark Fire Strike Standard Physics
min: 2146 moyenne: 2954 médian: 2910 (7%) maximum: 3799 Points
...
AMD A8-7410 2%
...
3DMark - 3DMark Time Spy CPU
min: 611 moyenne: 711 médian: 706 (5%) maximum: 841 Points
AMD A6-9220 -11%
Intel Atom x7-E3950 -6%
AMD A9-9425 -1%
Intel Celeron J4115 50%
...
Geekbench 3 - Geekbench 3 32 Bit Multi-Core
min: 4998 moyenne: 5042 médian: 5041.5 (9%) maximum: 5085 points
Samsung Hummingbird S5PC110 / Exynos 3110 -95%
...
Intel Core i3-7020U -4%
Intel Core i3-7100U 2%
...
Geekbench 3 - Geekbench 3 32 Bit Single-Core
min: 1623 moyenne: 1629 médian: 1629 (33%) maximum: 1635 points
Samsung Hummingbird S5PC110 / Exynos 3110 -85%
...
AMD A6-9220 10%
...
Geekbench 3 - Geekbench 3 64 Bit Multi-Core
5490 points (9%)
...
Apple A9X -3%
...
Geekbench 3 - Geekbench 3 64 Bit Single-Core
1762 points (36%)
...
AMD E2-9000 -13%
HiSilicon Kirin 960s 0%
AMD A6-9220 8%
...
Geekbench 4.0 - Geekbench 4.0 64 Bit Single-Core
min: 1813 moyenne: 1825 médian: 1825 (28%) maximum: 1837 points
...
Qualcomm Snapdragon 821 MSM8996 Pro -8%
HiSilicon Kirin 960s -7%
Samsung Exynos 8890 Octa 2%
AMD A6-9220 3%
HiSilicon Kirin 960 6%
...
Geekbench 4.0 - Geekbench 4.0 64 Bit Multi-Core
min: 5056 moyenne: 5123 médian: 5122.5 (12%) maximum: 5189 points
...
Samsung Exynos 8890 Octa 5%
...
AMD Ryzen 9 3900 701%
Geekbench 4.1 - 4.4 - Geekbench 4.1 - 4.4 64 Bit Single-Core
min: 1731 moyenne: 1779 médian: 1795 (24%) maximum: 1799 points
...
HiSilicon Kirin 960s -8%
Mediatek Helio X25 MTK6797T 1%
Samsung Exynos 8890 Octa 2%
Qualcomm Snapdragon 821 MSM8996 Pro 3%
HiSilicon Kirin 960 5%
...
Geekbench 4.1 - 4.4 - Geekbench 4.1 - 4.4 64 Bit Multi-Core
min: 4713 moyenne: 5188 médian: 5259 (8%) maximum: 5404 points
...
Qualcomm Snapdragon 460 -4%
Apple A9X 2%
Samsung Exynos 8890 Octa 3%
...
Geekbench 5.0 - Geekbench 5.0 64 Bit Single-Core
min: 377 moyenne: 401 médian: 408 (24%) maximum: 409 points
...
AMD Ryzen Embedded R1505G 54%
...
Geekbench 5.0 - Geekbench 5.0 64 Bit Multi-Core
min: 1078 moyenne: 1238 médian: 1232 (7%) maximum: 1409 points
...
Qualcomm Snapdragon 626 -11%
...
Geekbench 5.3 - Geekbench 5.1 - 5.3 64 Bit Single-Core
min: 378 moyenne: 403 médian: 405 (22%) maximum: 414 points
...
Intel Celeron J4115 -1%
Intel Celeron 3867U 8%
...
Intel Core i7-11700K 349%
Geekbench 5.3 - Geekbench 5.1 - 5.3 64 Bit Multi-Core
min: 1082 moyenne: 1267 médian: 1271 (8%) maximum: 1419 points
...
Mediatek Helio P60T -27%
Qualcomm Snapdragon 460 -8%
...
Mozilla Kraken 1.1 - Kraken 1.1 Total Score *
min: 2561 moyenne: 3127 médian: 3214.3 (5%) maximum: 3865 ms
...
AMD E2-9000 2%
HiSilicon Kirin 960 3%
...
Qualcomm Snapdragon S1 MSM7227A 1802%
Sunspider - Sunspider 1.0 Total Score *
233 ms (3%)
...
Apple A9 -4%
...
Octane V2 - Octane V2 Total Score
min: 10309 moyenne: 11163 médian: 11328 (18%) maximum: 11852 Points
...
Mediatek MT8173C -6%
AMD E2-9000 -5%
AMD A6-7310 -4%
HiSilicon Kirin 960 -3%
...
Apple M1 457%
PCMark for Android - PCM f. Android Work Score 2.0
7616 Points (50%)
...
Mediatek Helio P60 -4%
...
Power Consumption - Prime95 Power Consumption - external Monitor *
min: 6.4 moyenne: 11.3 médian: 11.3 (3%) maximum: 16.1 Watt
Intel Atom x7-E3950 12%
Intel Celeron J4115 25%
...
AMD Ryzen Threadripper 2970WX 3201%
Power Consumption - Cinebench R15 Multi Power Consumption - external Monitor *
6.7 Watt (2%)
Intel Atom x7-E3950 51%
Intel Celeron J4115 82%
...
AMD Ryzen Threadripper 2970WX 5542%
- Amplitude des valeurs obtenues dans le benchmark avec cette carte graphique
- Valeur moyenne obtenue dans le benchmark avec cette carte graphique
* Smaller numbers mean a higher performance
v1.16
log 22. 06:03:35
#0 no ids found in url (should be separated by "_") +0s ... 0s
#1 not redirecting to Ajax server +0s ... 0s
#2 did not recreate cache, as it is less than 5 days old! Created at Thu, 21 Jan 2021 11:08:23 +0100 +0.001s ... 0.001s
#3 no comparison url found in template nbc.compare_page_2 needed +0.006s ... 0.007s
#4 no comparison url found in template nbc.compare_page_2 needed +0s ... 0.007s
#5 no comparison url found in template nbc.compare_page_2 needed +0s ... 0.007s
#6 no comparison url found in template nbc.compare_page_2 needed +0s ... 0.007s
#7 no comparison url found in template nbc.compare_page_2 needed +0s ... 0.007s
#8 no comparison url found in template nbc.compare_page_2 needed +0s ... 0.007s
#9 composed specs +0s ... 0.007s
#10 did output specs +0s ... 0.007s
#11 getting avg benchmarks for device 9424 +0.005s ... 0.012s
#12 got single benchmarks 9424 +0.021s ... 0.033s
#13 got avg benchmarks for devices +0s ... 0.033s
#14 min, max, avg, median took s +0.53s ... 0.564s
#15 no comparison url found in template nbc.compare_page_2 needed +0.001s ... 0.565s
#16 return log +0s ... 0.565s
Critiques du Intel Gemini Lake Celeron N4100 processeur
Acer Chromebook 11 CB311-9HT-C783 (Intel UHD Graphics 600, 11.60")
» Acer Chromebook 11 CB311-9HT-C783 - Autres tests
Acer Chromebook Spin 11 CP311-2H-C7BG (Intel UHD Graphics 600, 11.60")
» Acer Chromebook Spin 11 CP311-2H-C7BG - Autres tests
BMAX MaxBook Y11 H1M6 (Intel UHD Graphics 600, 11.60")
» Test du BMAX MaxBook Y11 H1M6 (N4100, UHD 600, FHD) : convertible à petit prix - Critique
Chuwi GBox CWI560 (Intel UHD Graphics 600, ")
» Courte critique du Mini PC Chuwi GBox CWI560 (Celeron N4100) - Critique
Chuwi Hi10 X (Intel UHD Graphics 600, 10.10")
» Test du Chuwi Hi10 X (N4100, UHD 600, FHD) : châssis en métal pour moins de 250 € - Critique
Chuwi LapBook Pro (Intel UHD Graphics 600, 14.00")
» Courte critique du Chuwi LapBook Pro (N4100, UHD 600, FHD) : PC abordable avec autonomie et espace colorimétrique à la hauteur - Critique
Chuwi LapBook SE (Intel UHD Graphics 600, 13.30")
» Courte critique du PC portable Chuwi LapBook SE (N4100, UHD600, FHD) - Critique » Chuwi LapBook SE - Autres tests
Chuwi MiniBook CWI526 (Intel UHD Graphics 600, 8.00")
» Courte critique du Chuwi MiniBook (N4100, UHD 600, 1200p) : Chuwi au top - Critique » Chuwi MiniBook CWI526 - Autres tests
Chuwi SurBook SE (Intel UHD Graphics 600, 10.10")
» Chuwi SurBook SE - Autres tests
Chuwi UBook CWI509 (Intel UHD Graphics 600, 11.60")
» Test du Chuwi UBook CWI509 (Celeron N4100, UHD 600, FHD) : un ersatz de Surface Go - Critique
Jumper EZBook X1 (Intel UHD Graphics 600, 11.60")
» Jumper EZBook X1 - Autres tests
Jumper EZbook X3 Air (Intel UHD Graphics 600, 13.30")
» Jumper EZbook X3 Air - Autres tests
Jumper EZBook X4 (Intel UHD Graphics 600, 14.00")
» Jumper EZBook X4 - Autres tests
Jumper Tech Ez Book X3 Air (Intel UHD Graphics 600, 13.30")
» Test du Jumper Tech EZbook X3 Air (Celeron N4100, UHD 600, FHD) : design réussi et petit prix - Critique
Lenovo IdeaPad 330-15IGM (Intel UHD Graphics 600, 15.60")
» Courte critique du PC portable Lenovo IdeaPad 330-15IGM (Celeron N4100) - Critique
Lenovo IdeaPad 330-15IGM-81D1003TUS (Intel UHD Graphics 600, 15.60")
» Lenovo IdeaPad 330-15IGM-81D1003TUS - Autres tests
Lenovo Tablet 10-20L3000KGE (Intel UHD Graphics 600, 10.10")
» Courte critique de la tablette Lenovo Tablet 10 (Celeron N4100, eMMC, LTE, WUXGA) - Critique » Lenovo Tablet 10-20L3000KGE - Autres tests
Lenovo Tablet 10-20L3000RGE (Intel UHD Graphics 600, 10.10")
» Lenovo Tablet 10-20L3000RGE - Autres tests
Teclast F5 (Intel UHD Graphics 600, 11.60")
» Teclast F5 - Autres tests
Les autres processeurs de la gamme Gemini Lake » Intel Celeron J4115 4x 1.8 GHz - 2.5 GHz
Processeurs similaires + AMD A8-3550MX 4x 2 GHz - 2.7 GHz
+ Intel Celeron J4115 4x 1.8 GHz - 2.5 GHz
- AMD Phenom II X2 N660 2x 3 GHz
- Intel Core i3-350M 2x 2.26 GHz
Please share our article, every link counts!
Klaus Hinum (Update: 2018-10-29)