Verdict - Apex 16 Max avec des performances de jeu complètes et peu de compromis
Avec ses composants rapides, l'Apex 16 Max se concentre entièrement sur les performances de jeu et fournit des résultats convaincants. Combiné à l'écran Mini-LED, le jeu HDR en particulier est très amusant. Cependant, l'écran lumineux consomme beaucoup d'énergie et nuit à l'autonomie de la batterie. Si vous avez besoin d'une plus grande autonomie, optez plutôt pour l'écran IPS.
Pour maintenir le prix d'entrée de gamme bas, XMG fait quelques compromis (pas d'USB-C 4.0, pas de Wi-Fi 7, pas d'Advanced Optimus, et une base en plastique). Honnêtement, rien de tout cela n'est un réel problème dans le jeu de tous les jours, et nous accepterions volontiers ces compromis en échange d'une RTX 5070 Ti avec 12 Go de VRAM. Dans l'ensemble, il s'agit d'un très bon ordinateur portable de jeu à un prix raisonnable.
Points positifs
Points négatifs
Prix et disponibilité
Le XMG Apex 16 Max peut être configuré chez Bestware à partir de 2 099 € (environ 2 461 $).
Note du traducteur : Les ordinateurs portables XMG ne sont pas officiellement disponibles en Amérique du Nord.
Table des matières
- Verdict - Apex 16 Max avec des performances de jeu complètes et peu de compromis
- Spécifications
- Mallette et équipement
- Périphériques d'entrée - Clavier avec illumination d'une seule touche
- Écran - Mini LED avec 1 000 cd/m²
- Performance
- Émissions et énergie
- Notebookcheck note globale
- Comparaison des alternatives possibles
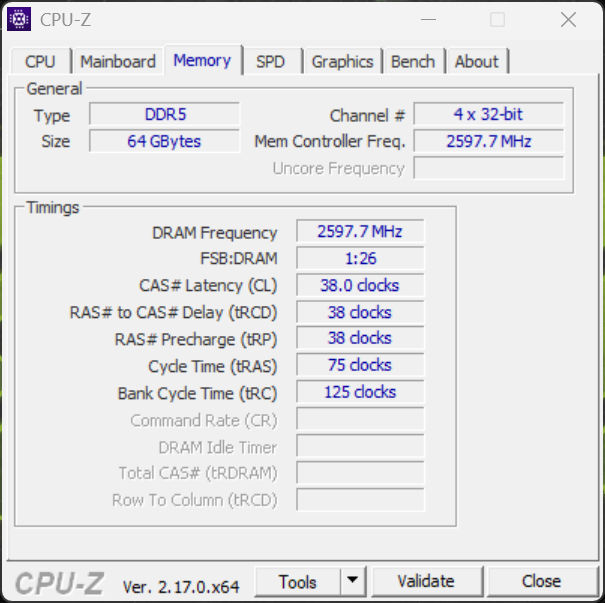
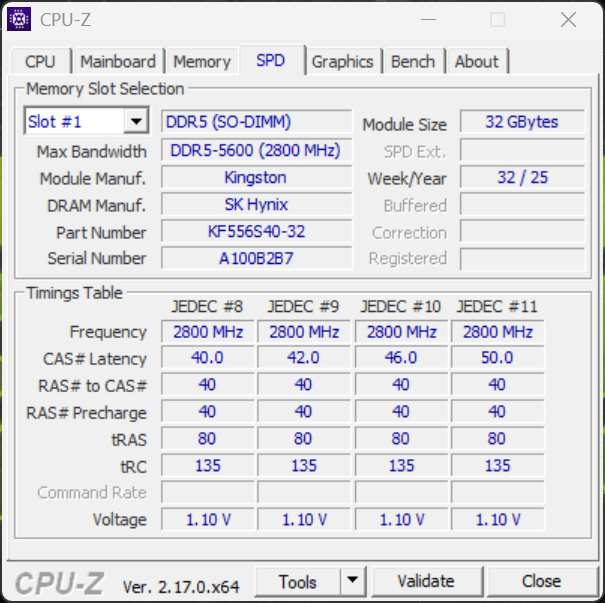
Avec l'Apex 16 Max, XMG propose un ordinateur portable de jeu puissant qui devrait séduire les acheteurs les plus sensibles au prix. Le prix de départ avec écran IPS et RTX 5070 Ti est actuellement d'environ 2 090 €, tandis que notre appareil de test coûte environ 2 800 €, principalement en raison de la configuration mémoire généreuse (64 Go de RAM, 2 TB SSD) et du mini panneau LED.
Avec l'Apex 16 Max, XMG propose un ordinateur portable de jeu puissant destiné aux acheteurs les plus soucieux de leur budget. Le prix de départ avec l'écran IPS et la RTX 5070 Ti est actuellement d'environ 2 090 €, tandis que notre modèle d'essai coûte environ 2 800 € (environ 3 x 283 $) - principalement en raison de la configuration mémoire généreuse (64 Go de RAM, 2 TB SSD) et de l'écran Mini-LED.
Spécifications
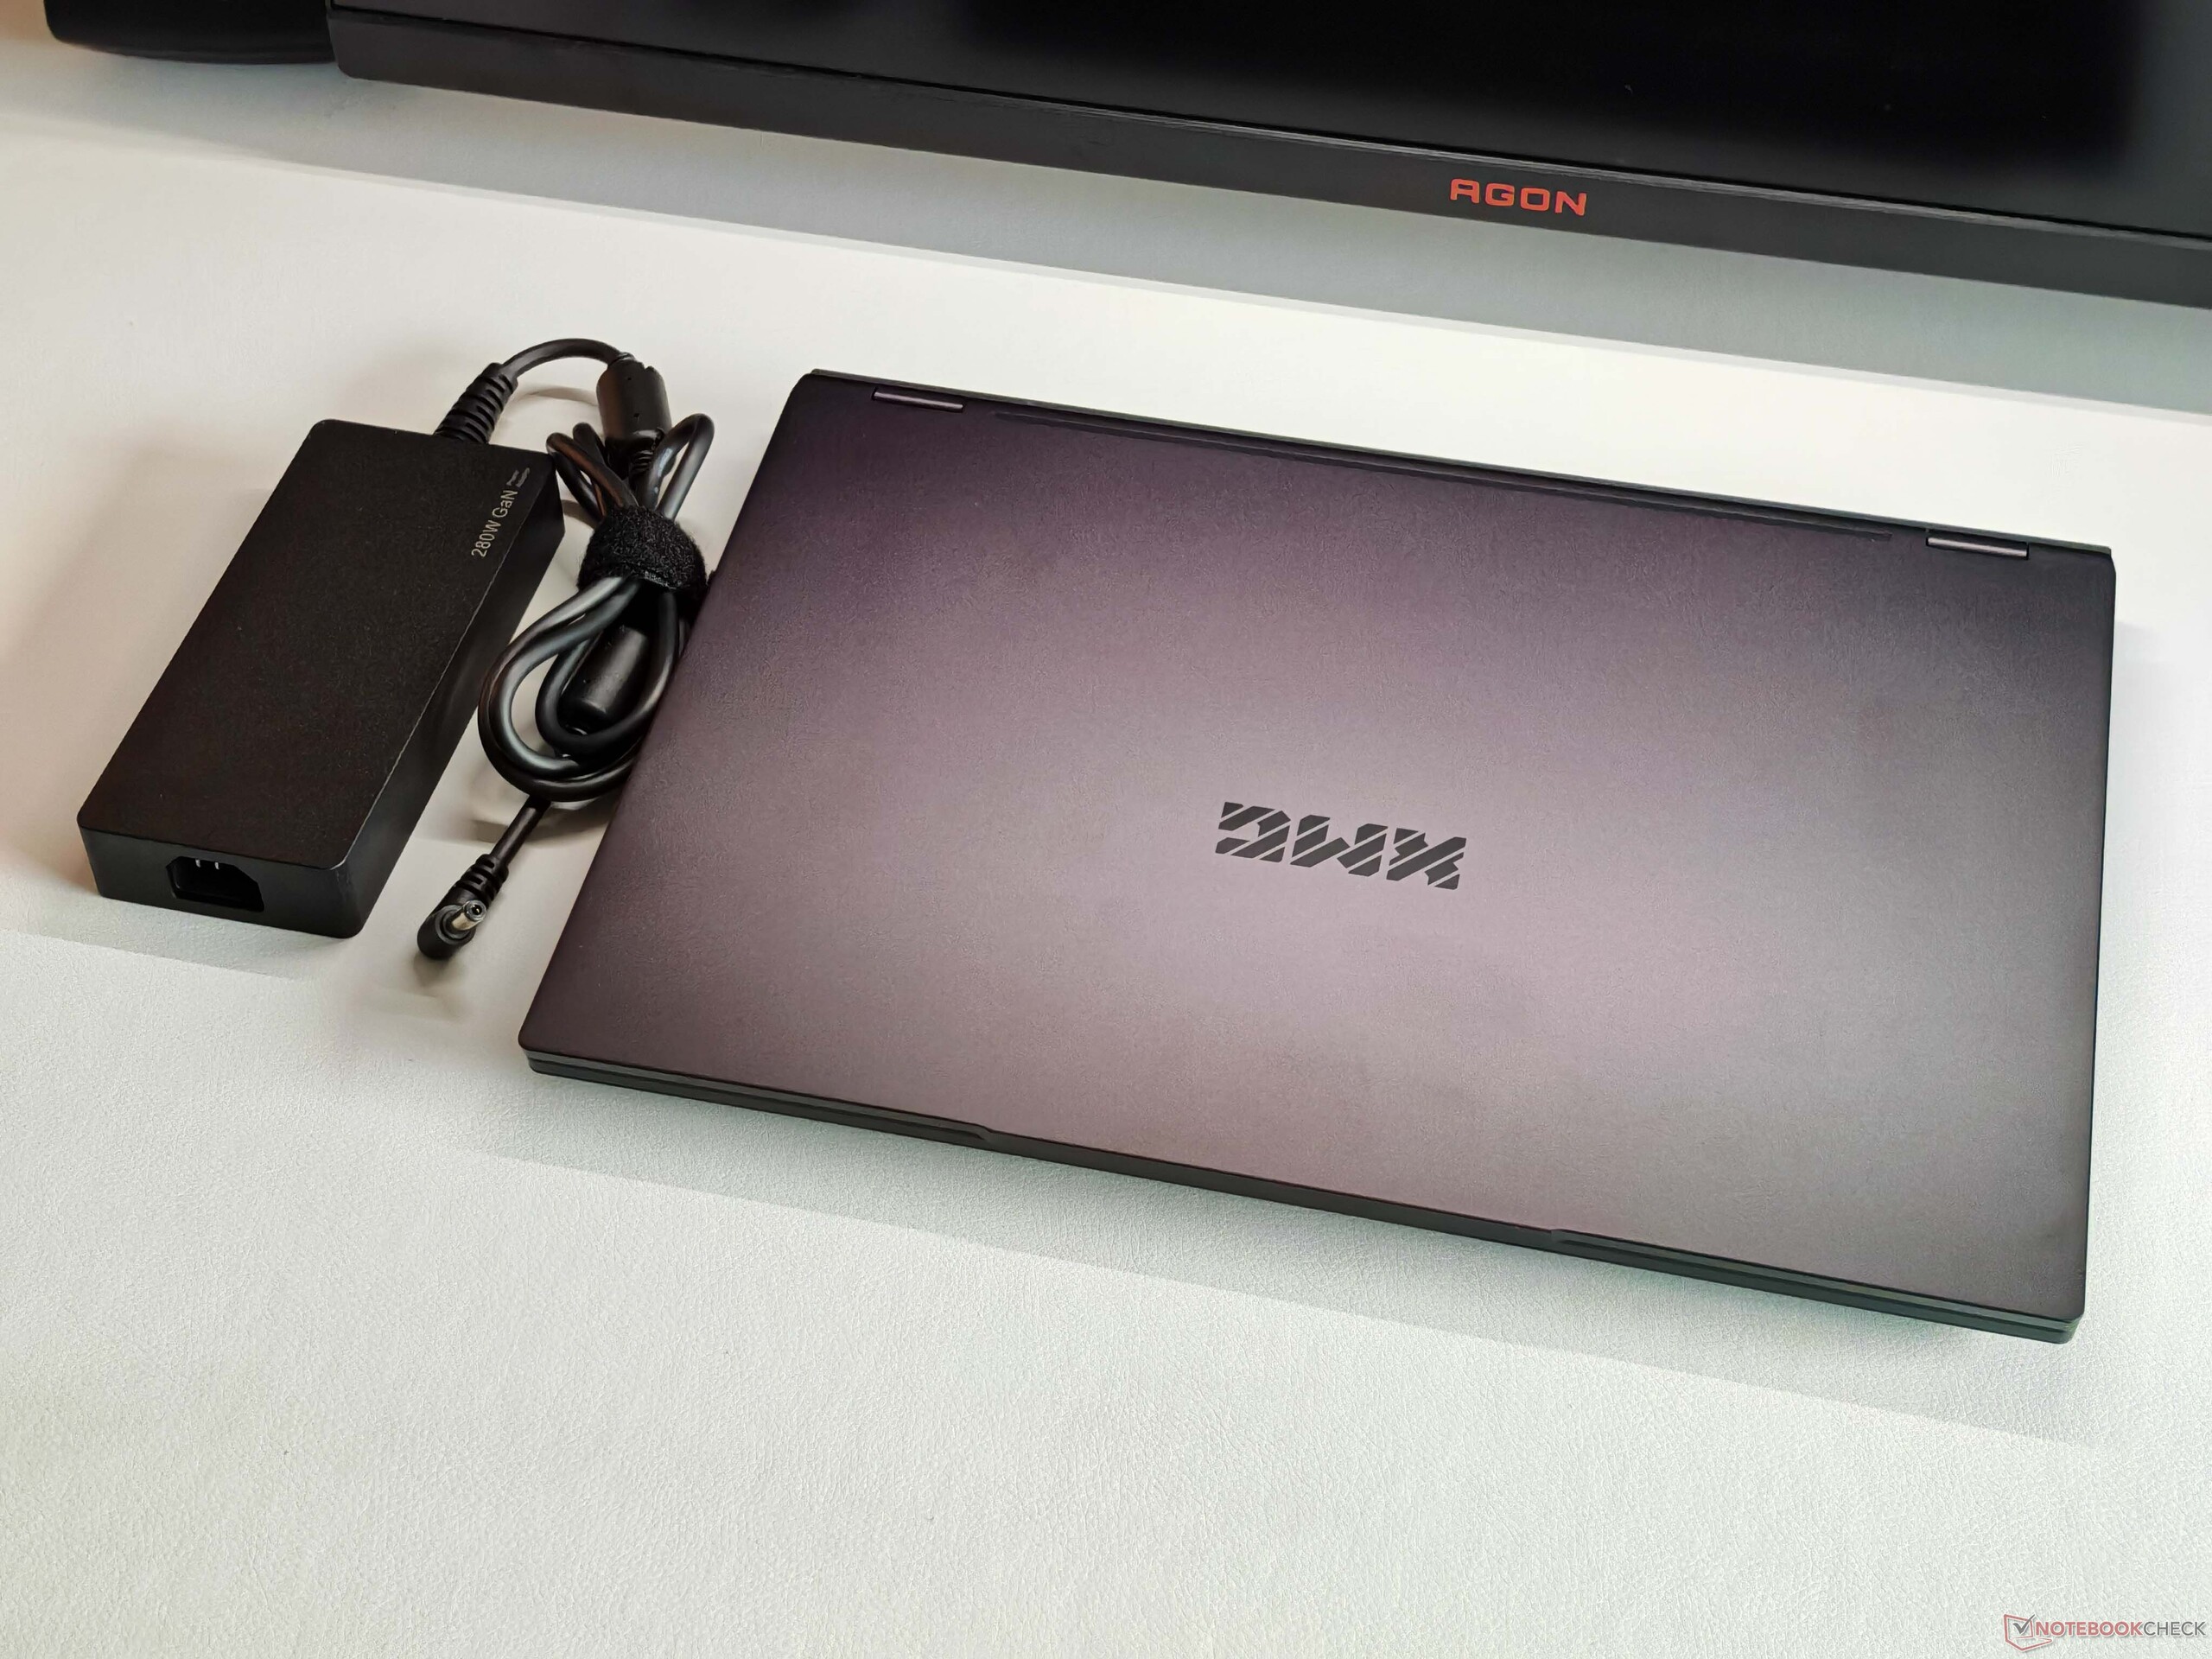
Mallette et équipement
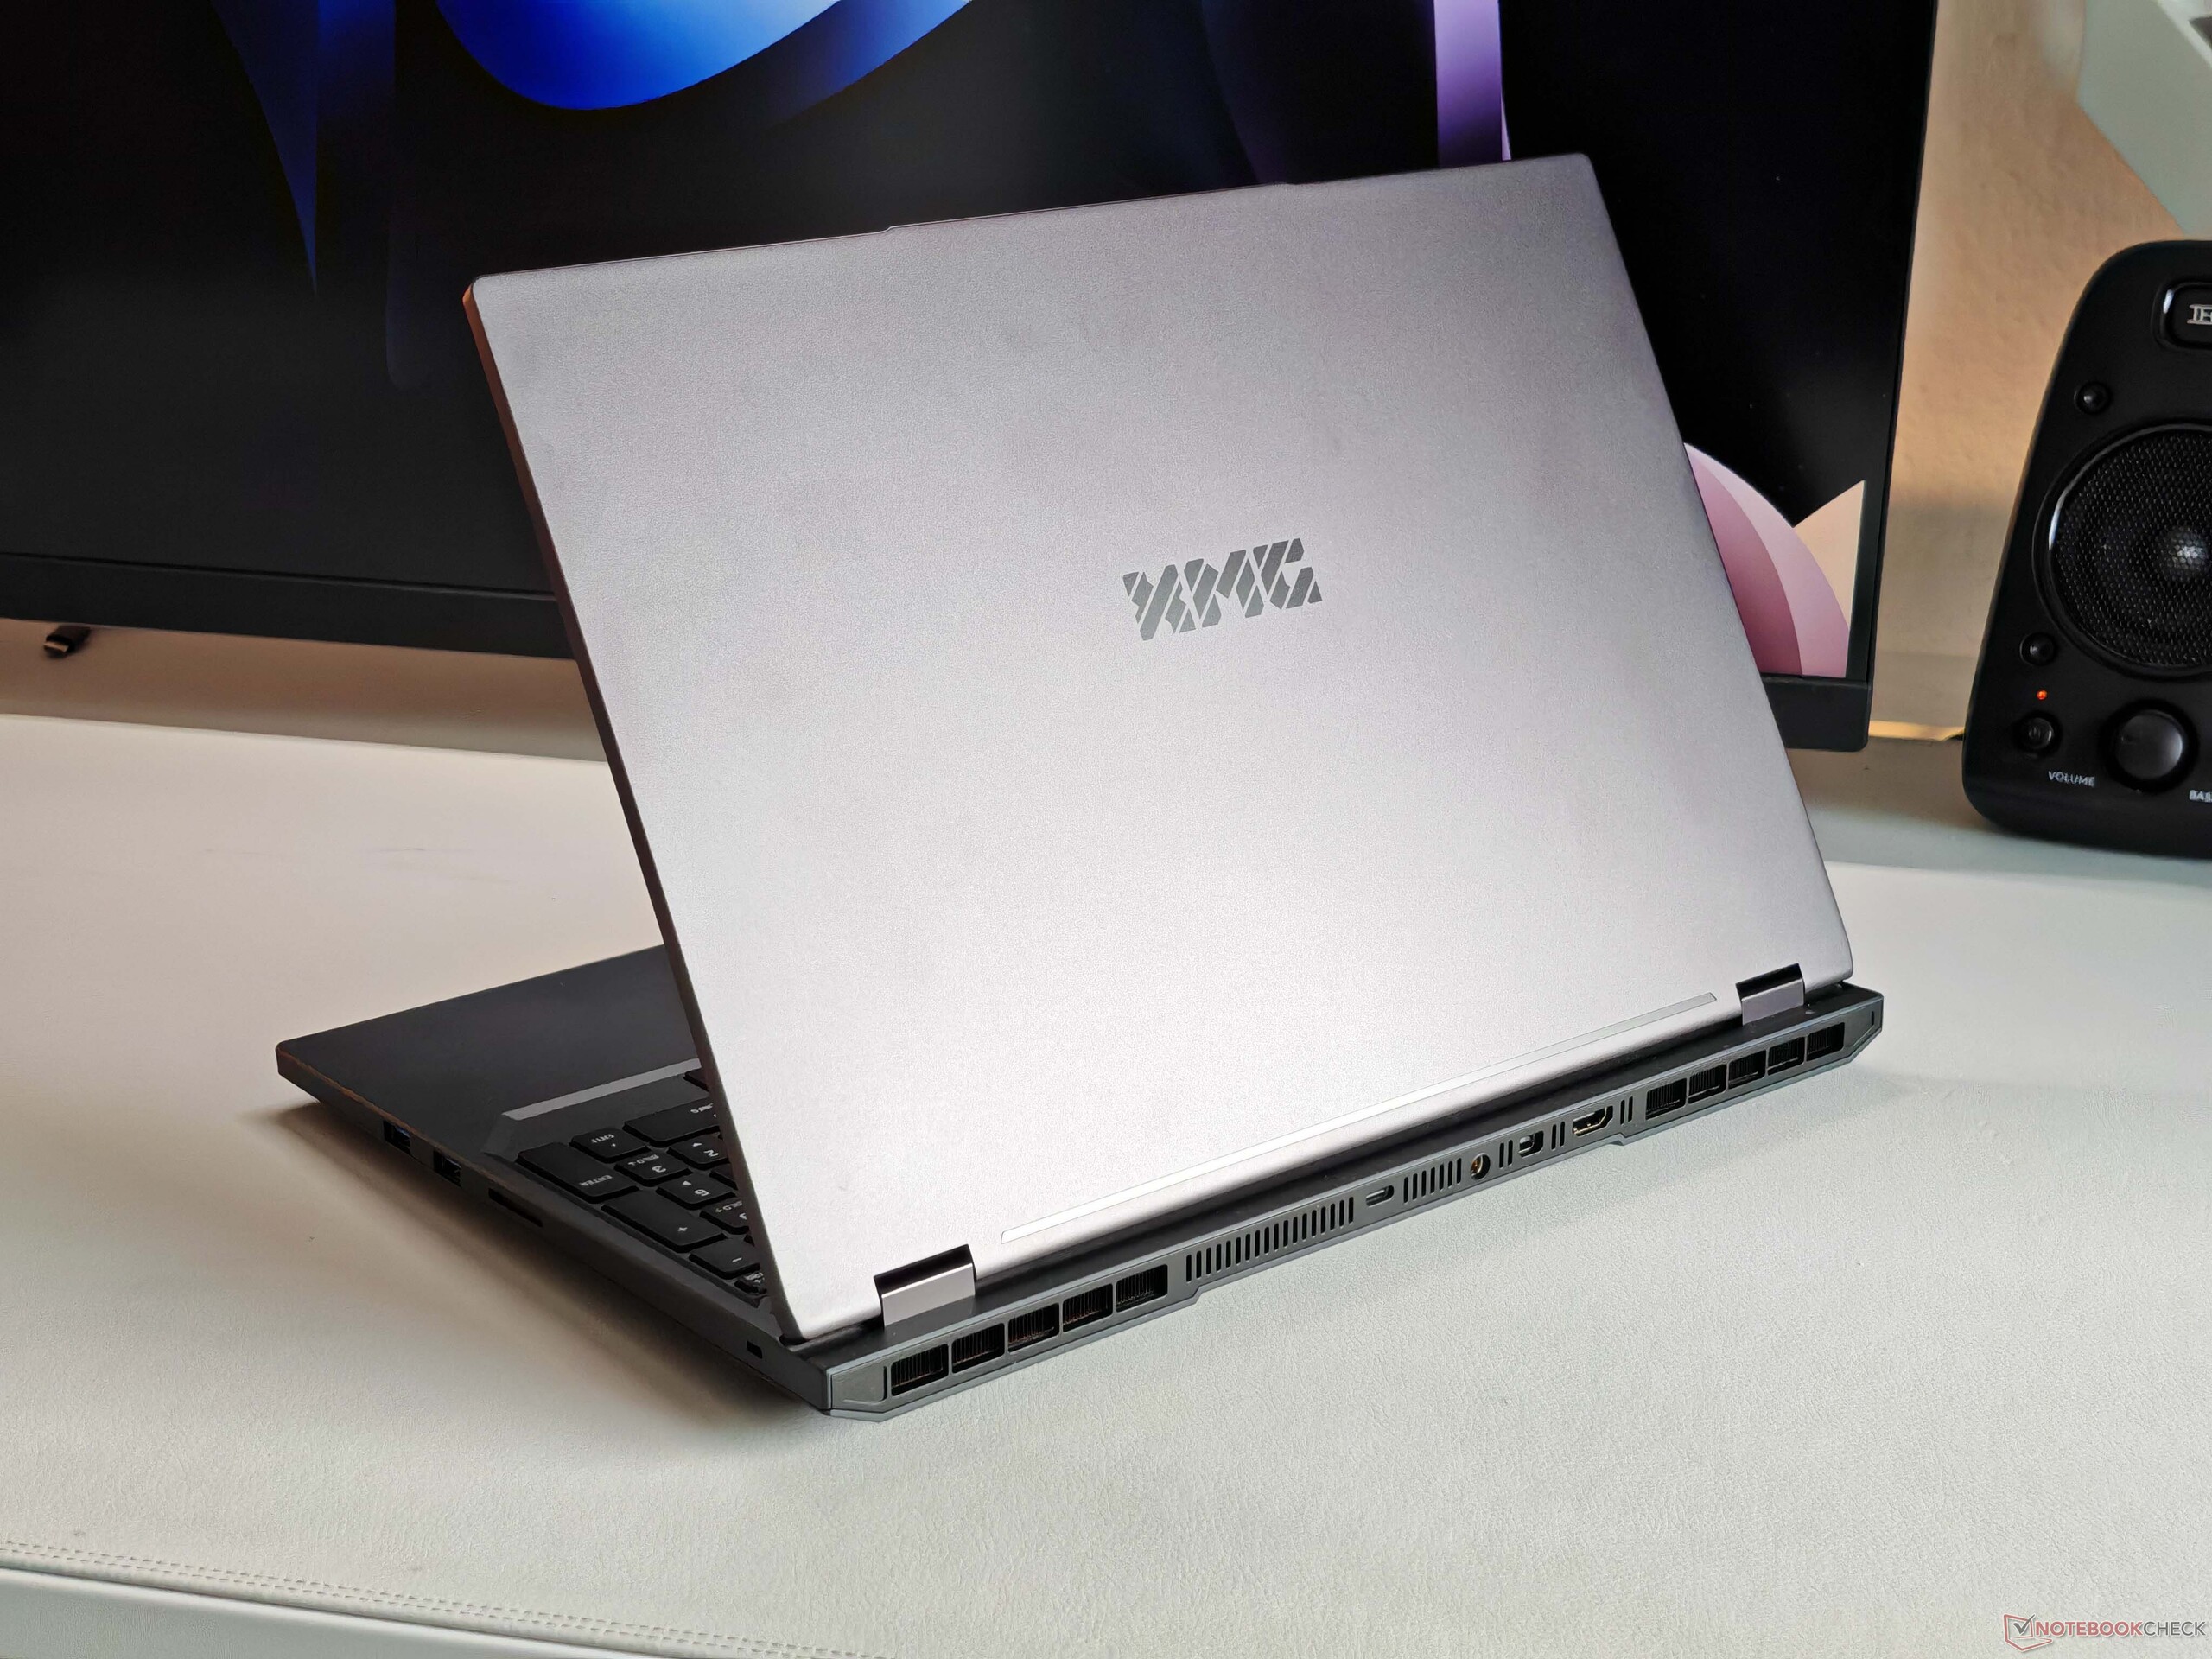
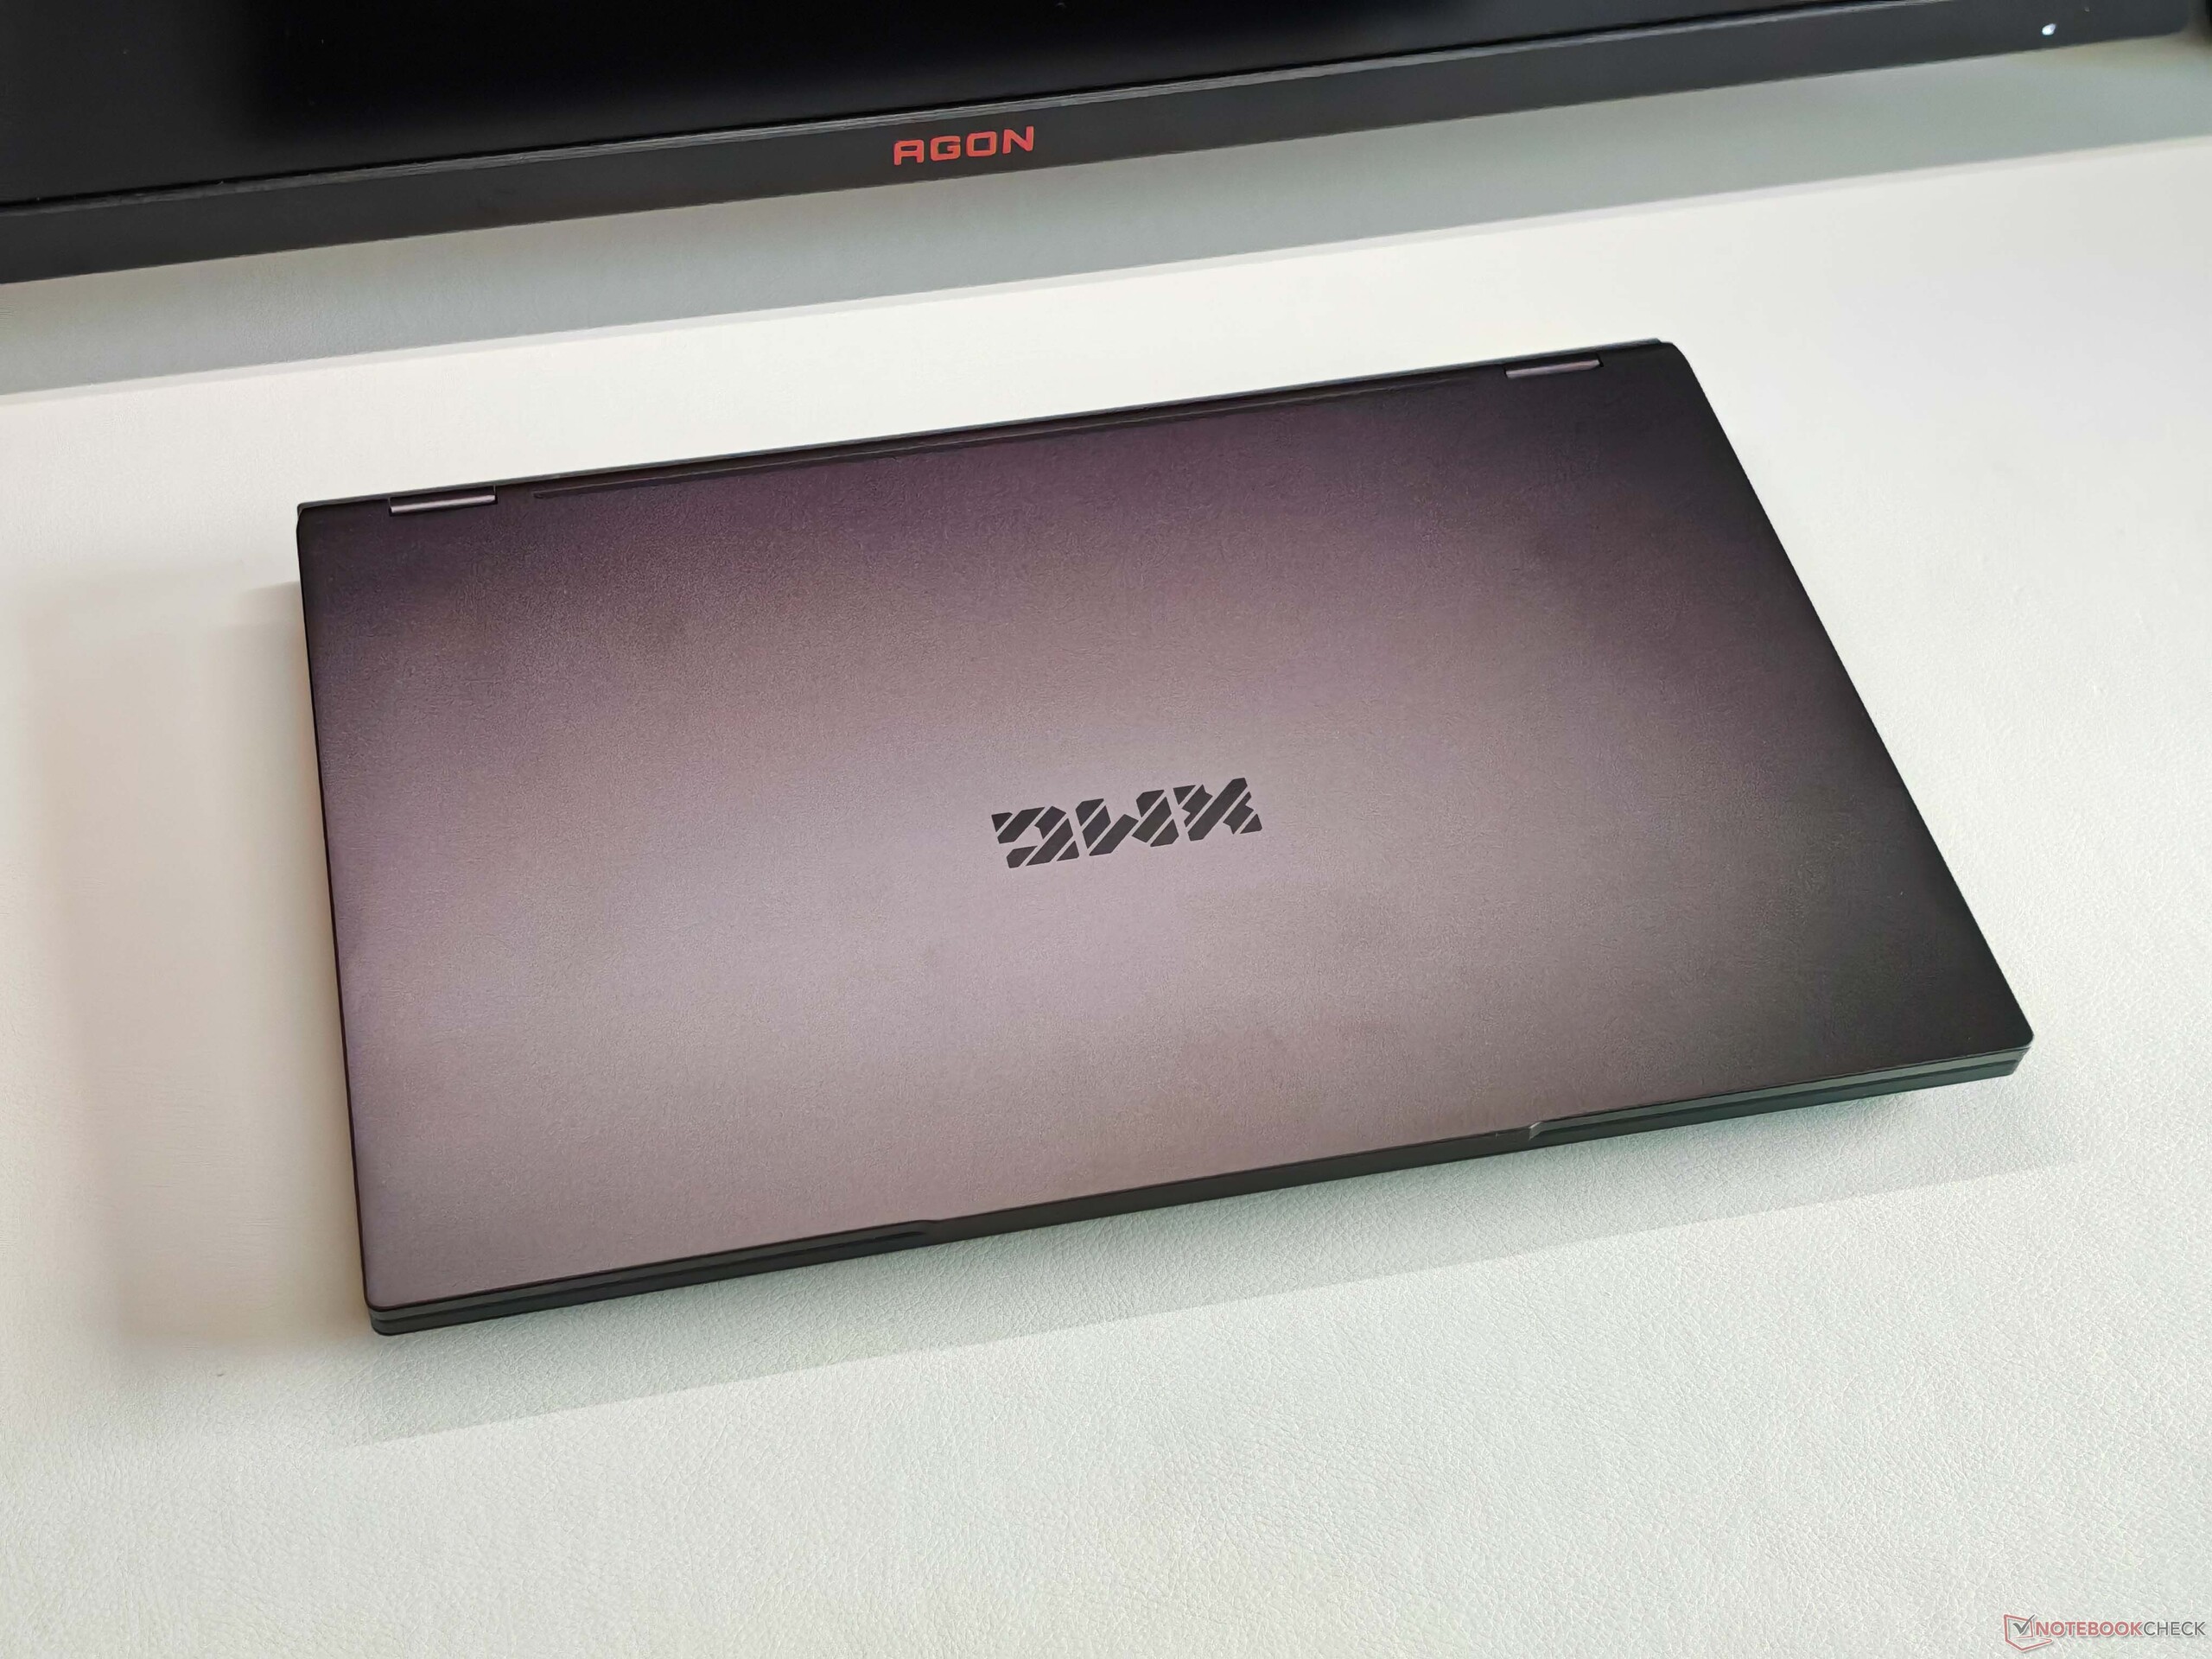
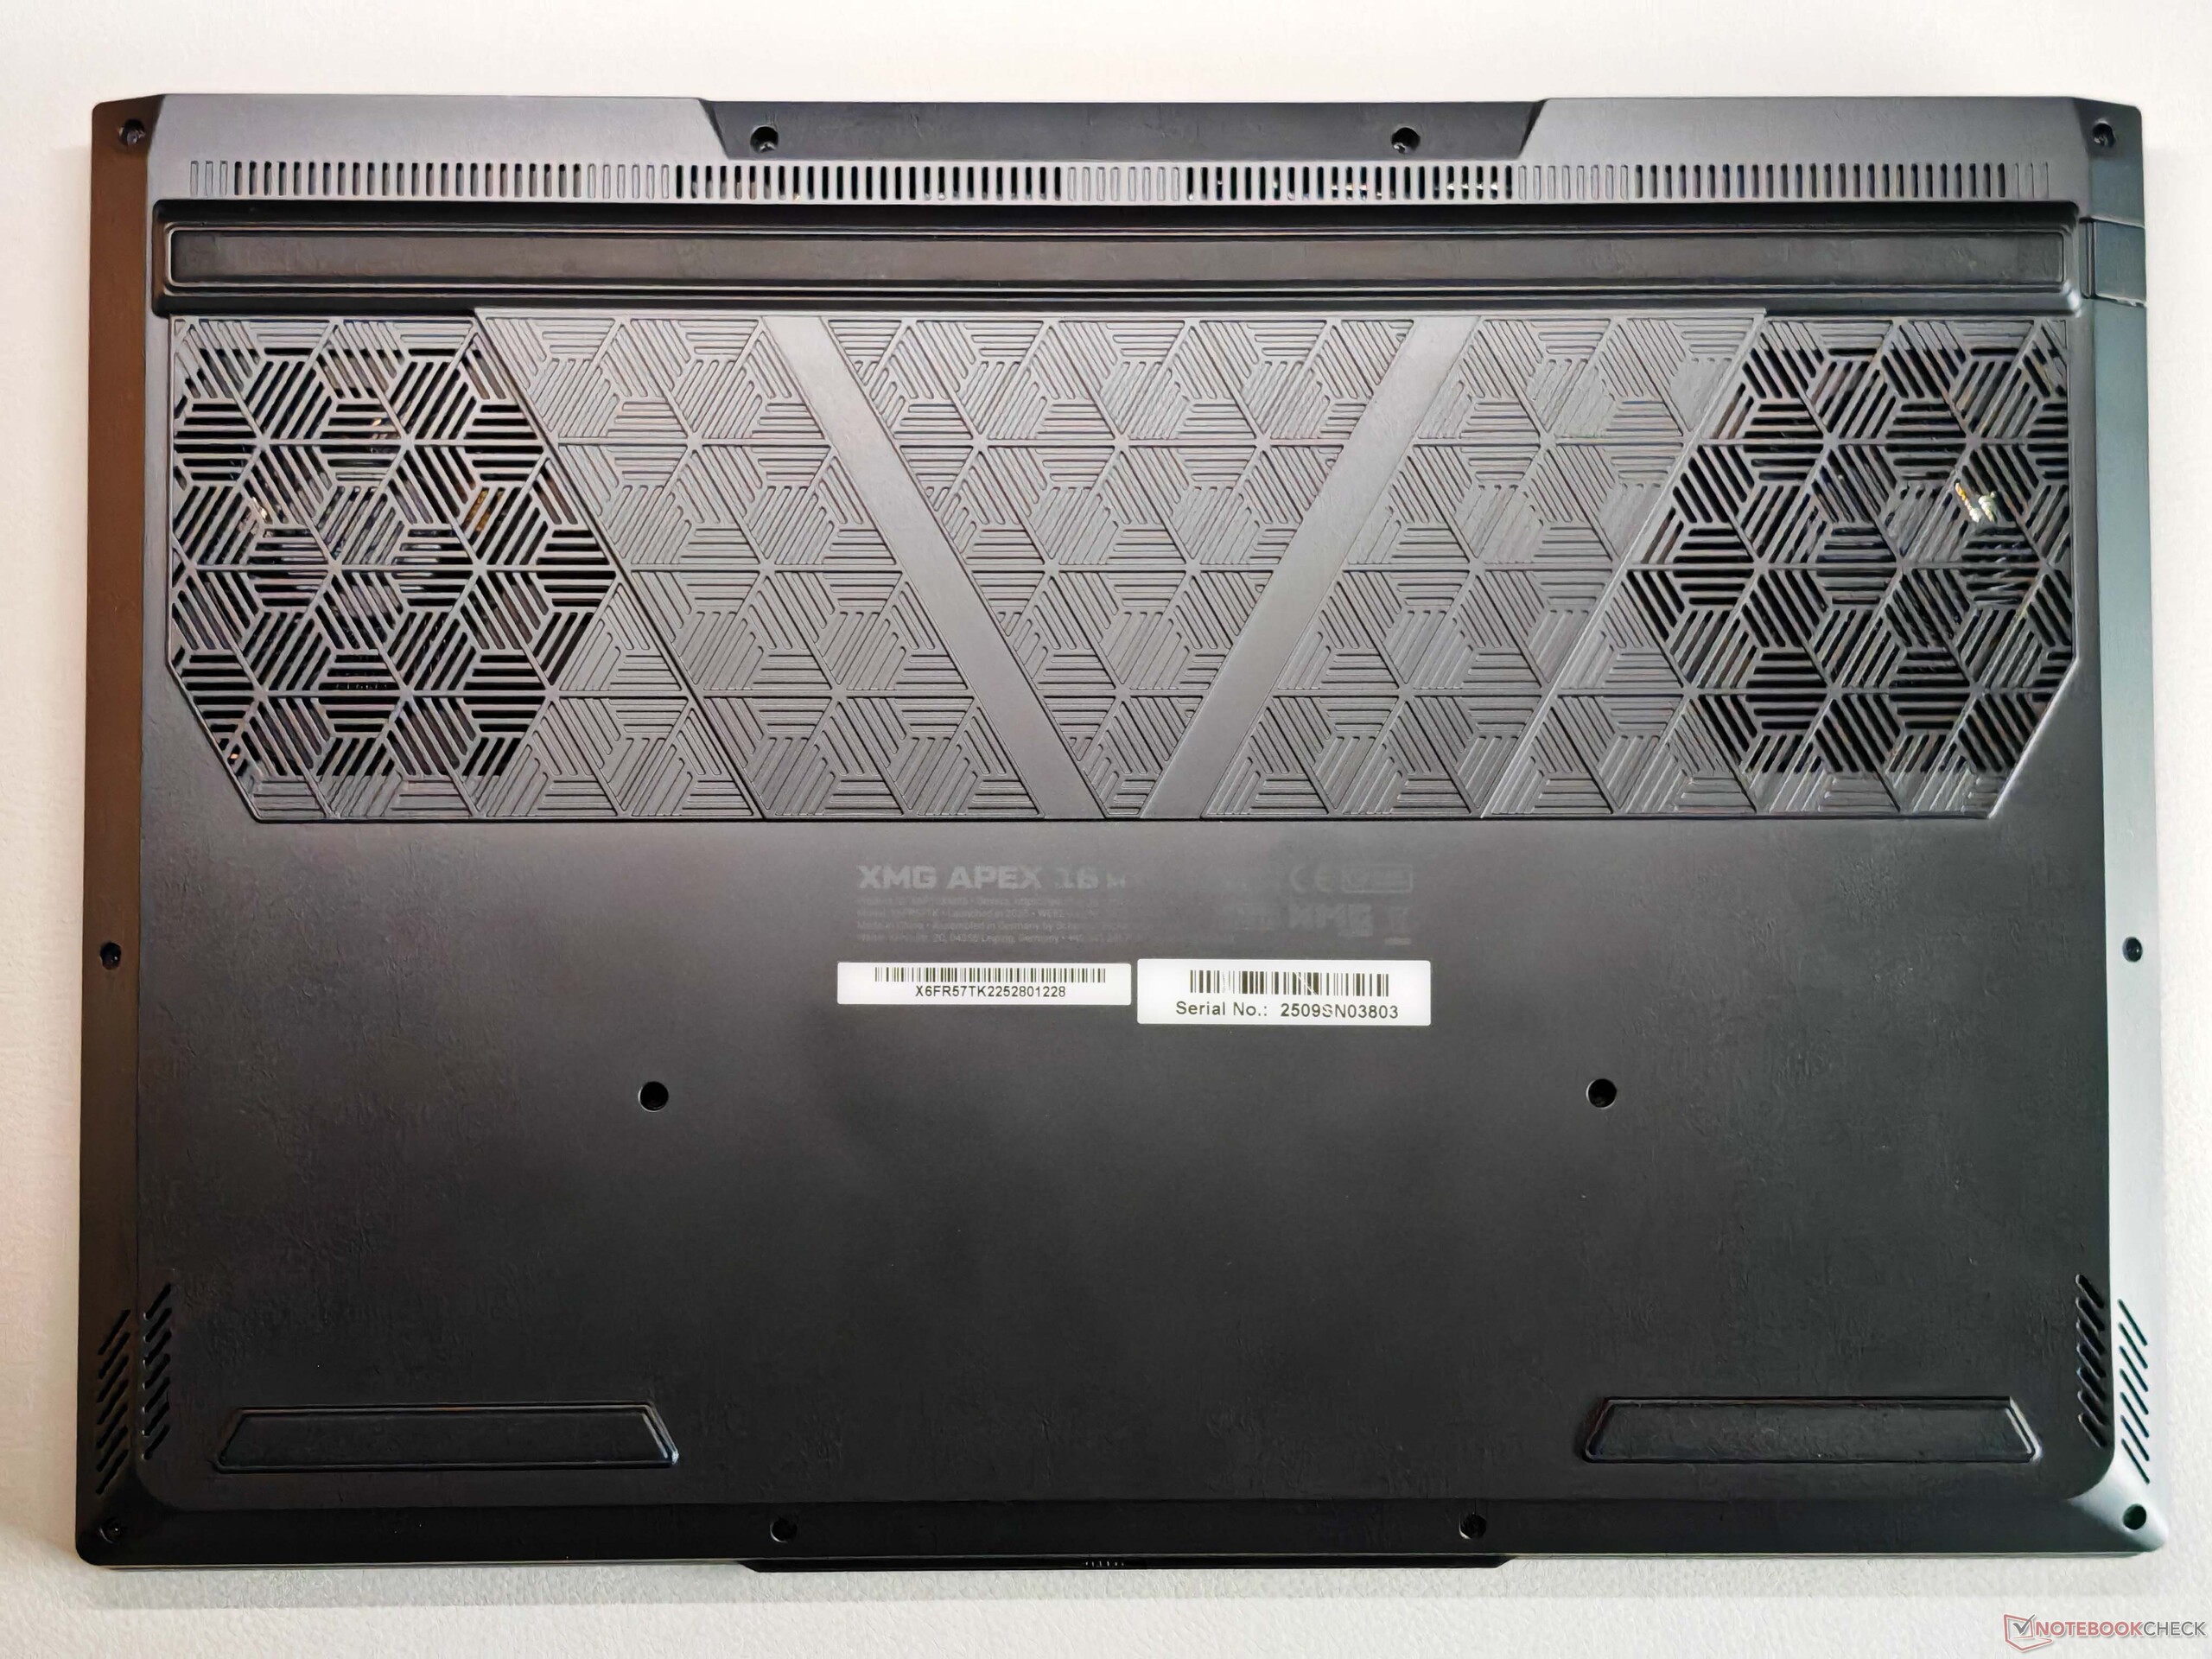
Nous connaissons déjà ce châssis sous une forme très similaire à l'actuel XMG Pro 16. Dans l'ensemble, le design est sobre et il n'y a pas d'éléments lumineux sur le châssis. Pour maintenir le prix le plus bas possible, seul le couvercle de l'écran est en aluminium, tandis que le boîtier inférieur est en plastique. Malgré cela, la stabilité générale est très bonne et les charnières (jusqu'à 180 degrés) ne permettent qu'une légère oscillation.
Les options de maintenance sont nombreuses (2× RAM, 2× SSD), et il y a beaucoup de ports disponibles - bien qu'il n'y ait pas d'USB 4.0. En plus du Wi-Fi 6E, l'ordinateur portable offre également une connexion Gigabit Ethernet et un lecteur de cartes de taille normale. La webcam 1080p (avec obturateur et infrarouge) remplit son rôle.


| SD Card Reader | |
| average JPG Copy Test (av. of 3 runs) | |
| Medion Erazer Major 16 X1 MD62736 (AV PRO microSD 128 GB V60) | |
| Schenker XMG Pro 16 (E25) (Angelbird AV Pro V60) | |
| Moyenne de la classe Gaming (20.9 - 210, n=60, 2 dernières années) | |
| MSI Vector 16 HX AI A2XWHG (AV PRO microSD 128 GB V60) | |
| Acer Predator Helios Neo 16S AI PHN16S-71-94L9 (AV PRO microSD 128 GB V60) | |
| Schenker XMG APEX 16 MAX (Angelbird AV Pro V60) | |
| maximum AS SSD Seq Read Test (1GB) | |
| Schenker XMG Pro 16 (E25) (Angelbird AV Pro V60) | |
| Medion Erazer Major 16 X1 MD62736 (AV PRO microSD 128 GB V60) | |
| Moyenne de la classe Gaming (25.5 - 261, n=57, 2 dernières années) | |
| MSI Vector 16 HX AI A2XWHG (AV PRO microSD 128 GB V60) | |
| Schenker XMG APEX 16 MAX (Angelbird AV Pro V60) | |
| Acer Predator Helios Neo 16S AI PHN16S-71-94L9 (AV PRO microSD 128 GB V60) | |
| Networking | |
| Schenker XMG APEX 16 MAX | |
| iperf3 transmit AXE11000 | |
| iperf3 receive AXE11000 | |
| Acer Predator Helios Neo 16S AI PHN16S-71-94L9 | |
| iperf3 transmit AXE11000 | |
| iperf3 receive AXE11000 | |
| Chuwi Gamebook, R9 9955HX | |
| iperf3 transmit AXE11000 | |
| iperf3 receive AXE11000 | |
| iperf3 transmit AXE11000 6GHz | |
| iperf3 receive AXE11000 6GHz | |
| Medion Erazer Major 16 X1 MD62736 | |
| iperf3 transmit AXE11000 | |
| iperf3 receive AXE11000 | |
| Lenovo Legion 5 Pro 16IAX10H | |
| iperf3 transmit AXE11000 | |
| iperf3 receive AXE11000 | |
| MSI Vector 16 HX AI A2XWHG | |
| iperf3 transmit AXE11000 | |
| iperf3 receive AXE11000 | |
| Schenker XMG Pro 16 (E25) | |
| iperf3 transmit AXE11000 | |
| iperf3 receive AXE11000 | |


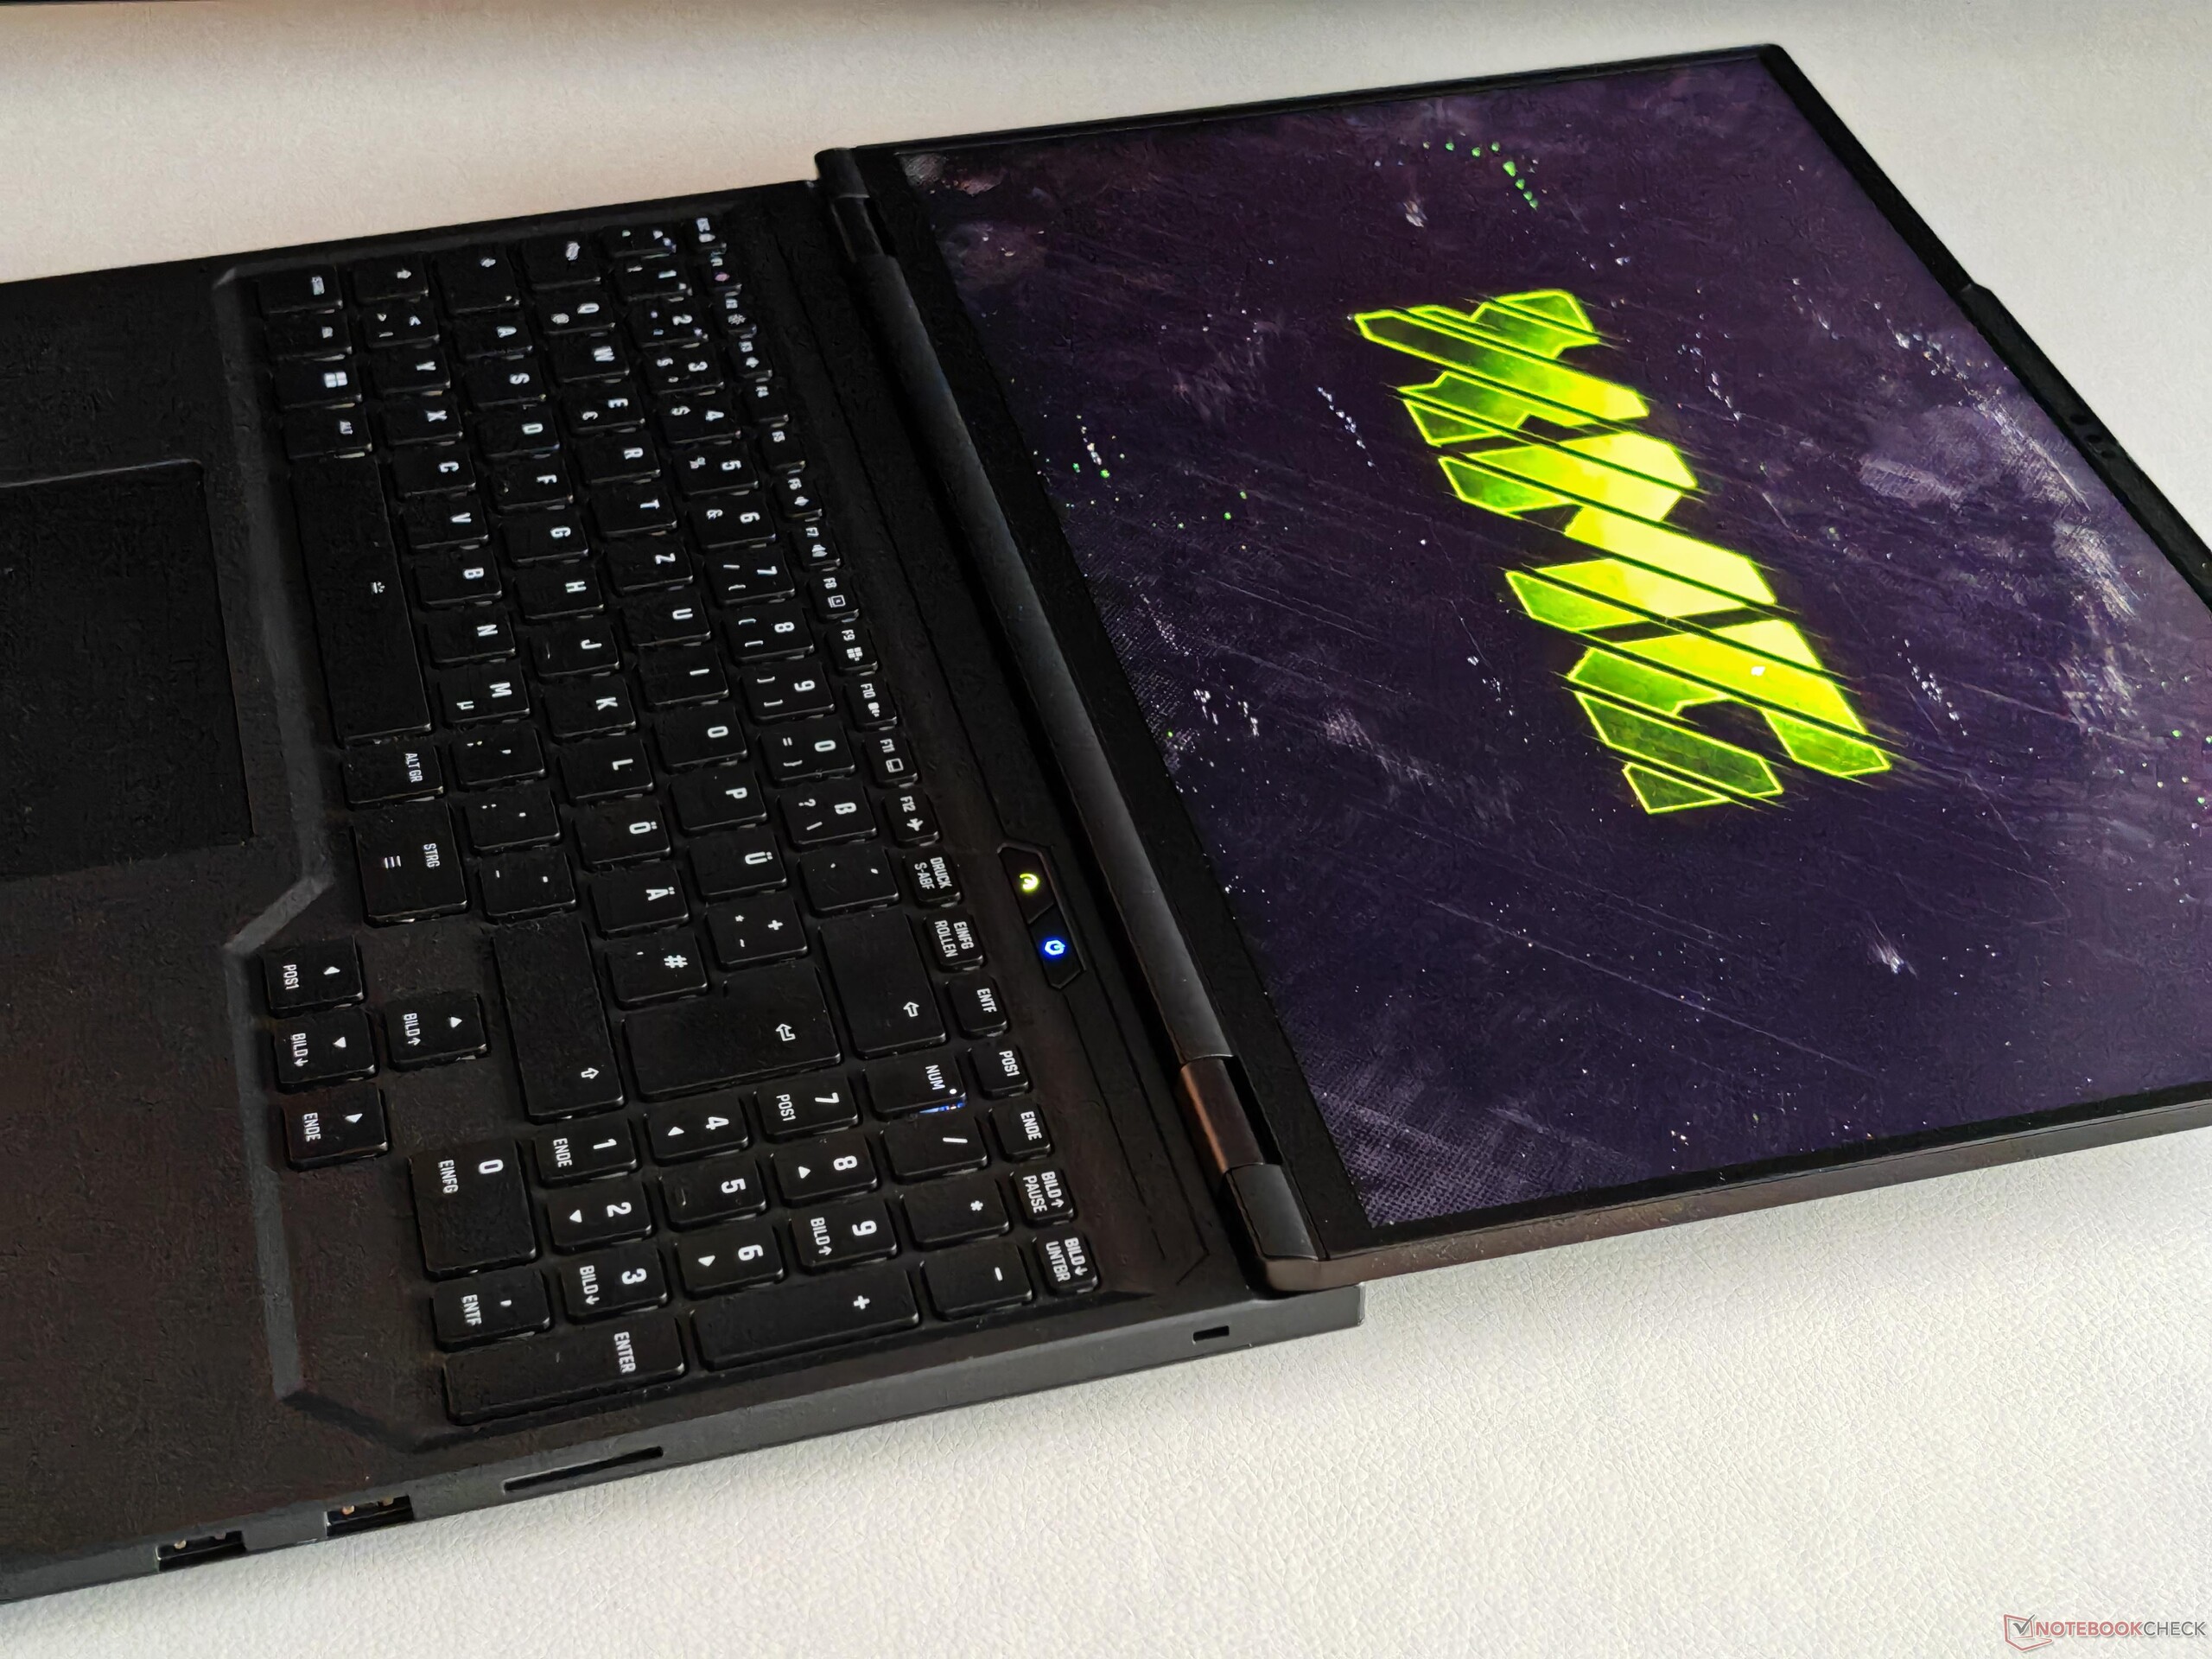
Périphériques d'entrée - Clavier avec illumination d'une seule touche
Nous connaissons déjà ce clavier avec son rétroéclairage par touche sur d'autres modèles XMG, et il ne déçoit pas non plus sur l'Apex 16 Max. La course des touches est suffisamment longue, le retour d'information est précis et il y a un pavé numérique dédié. Le clickpad fonctionne également bien, bien que les clics mécaniques dans la zone inférieure soient un peu bruyants.


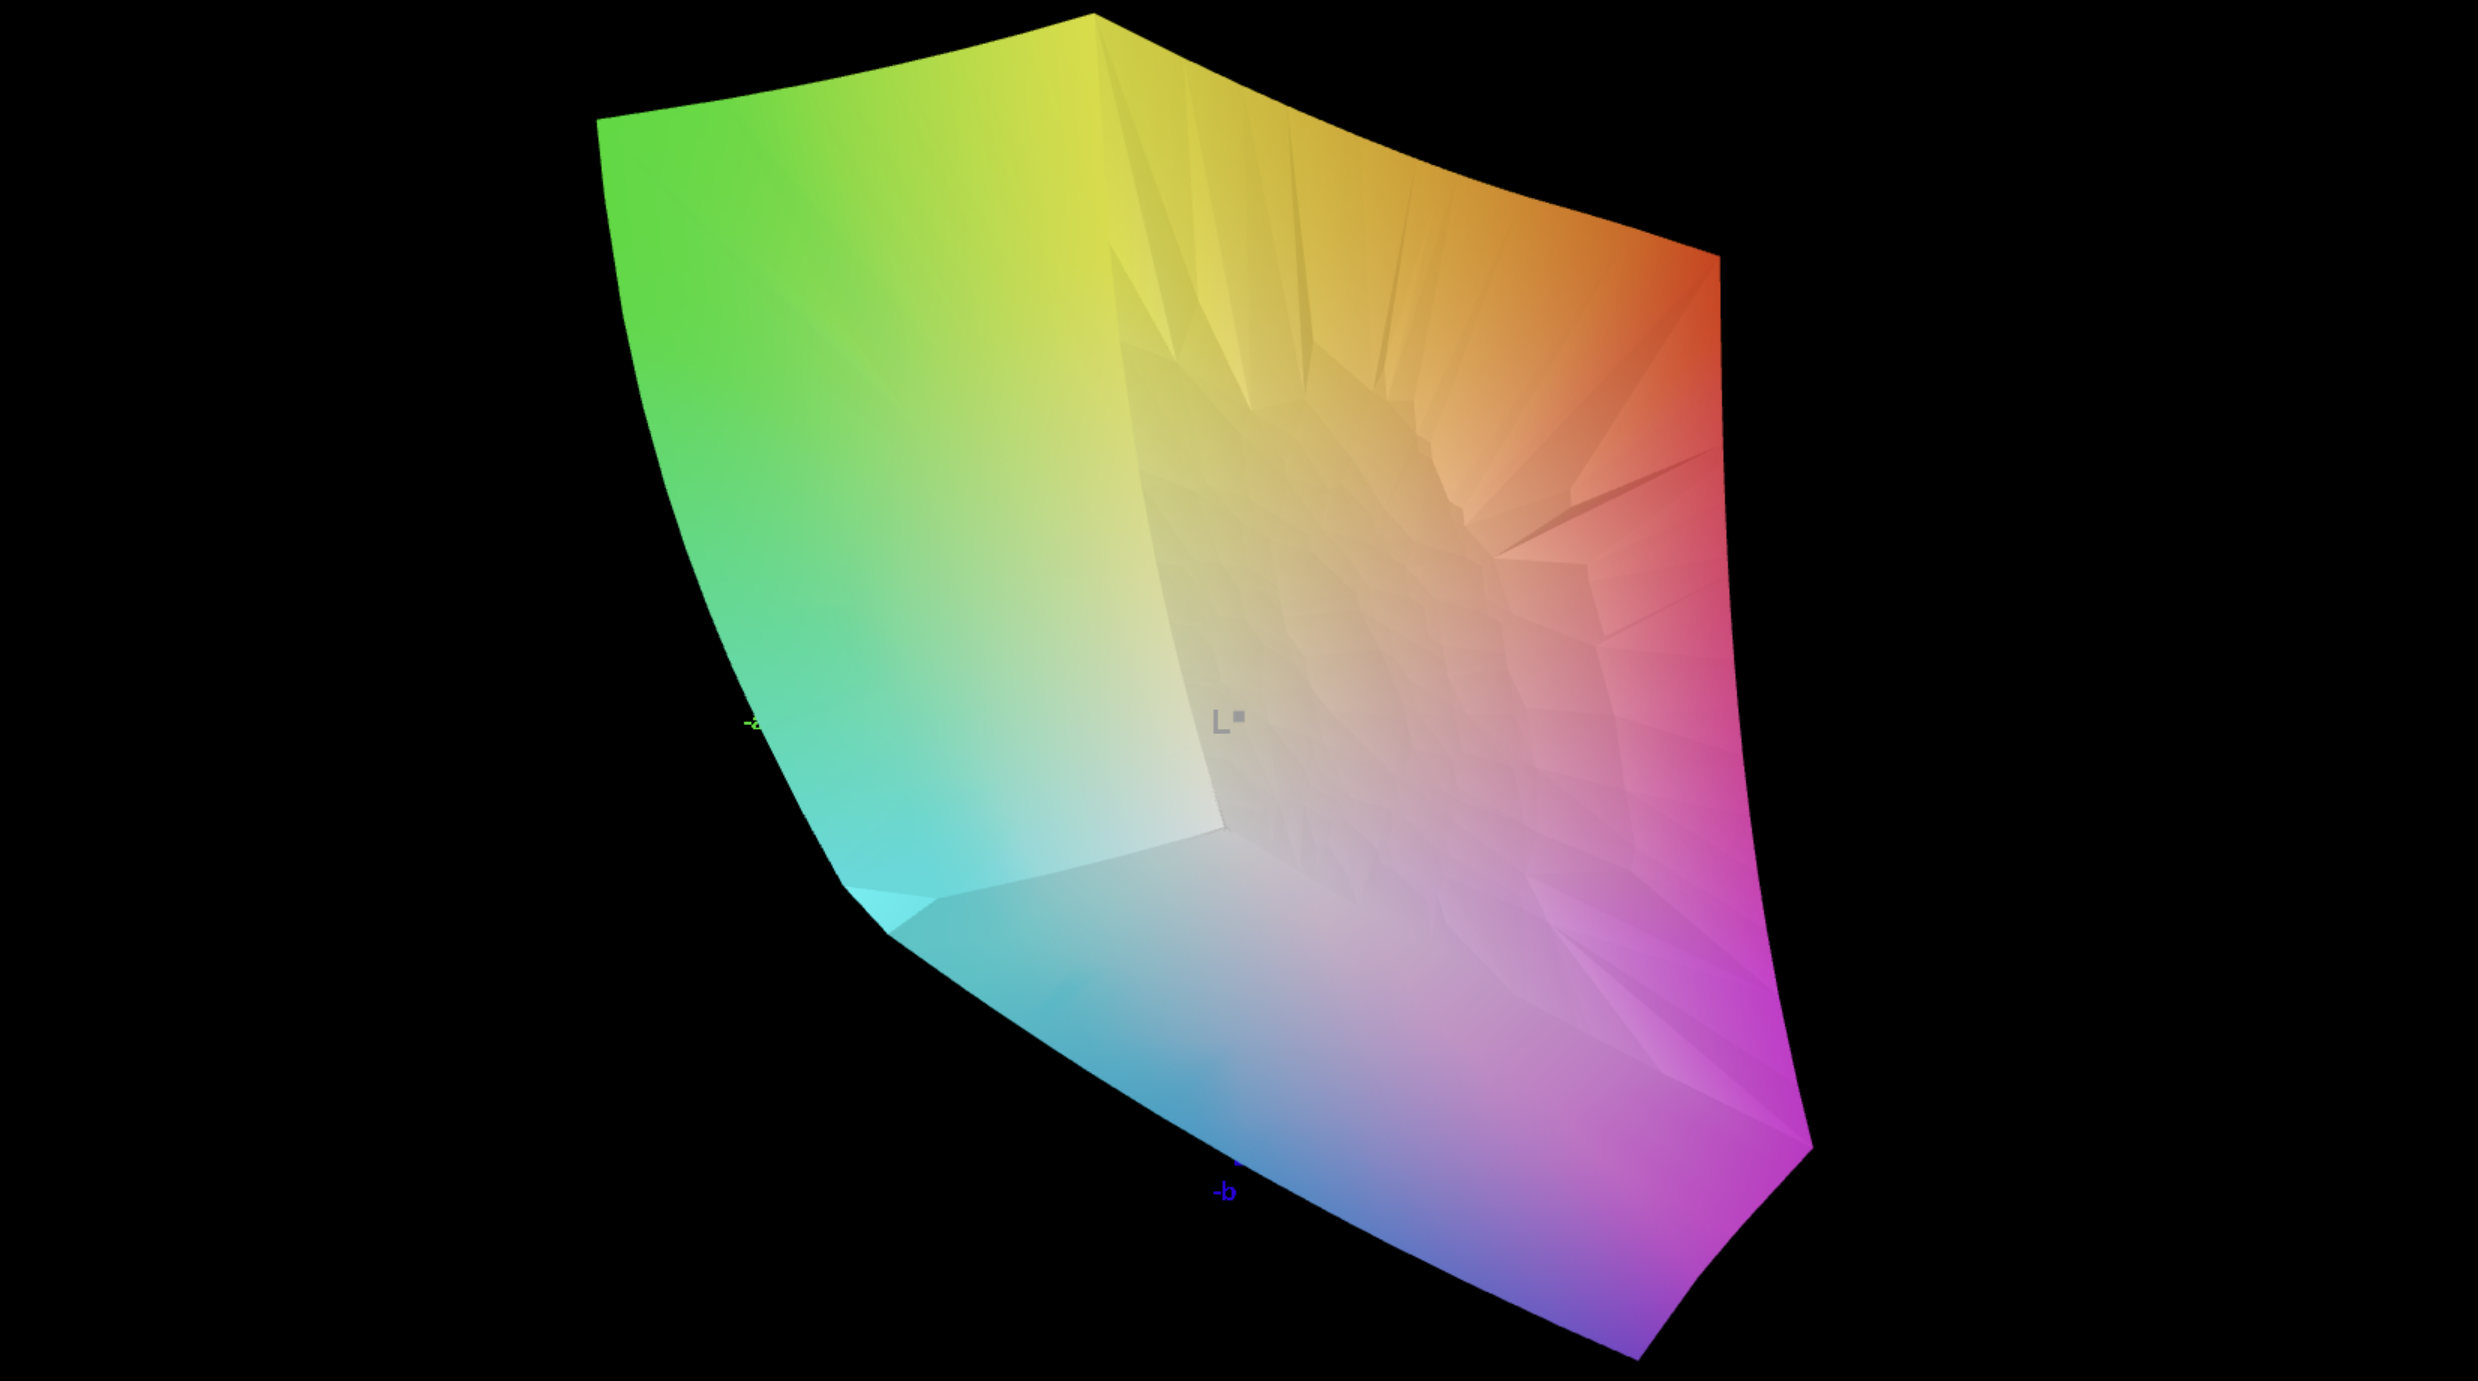
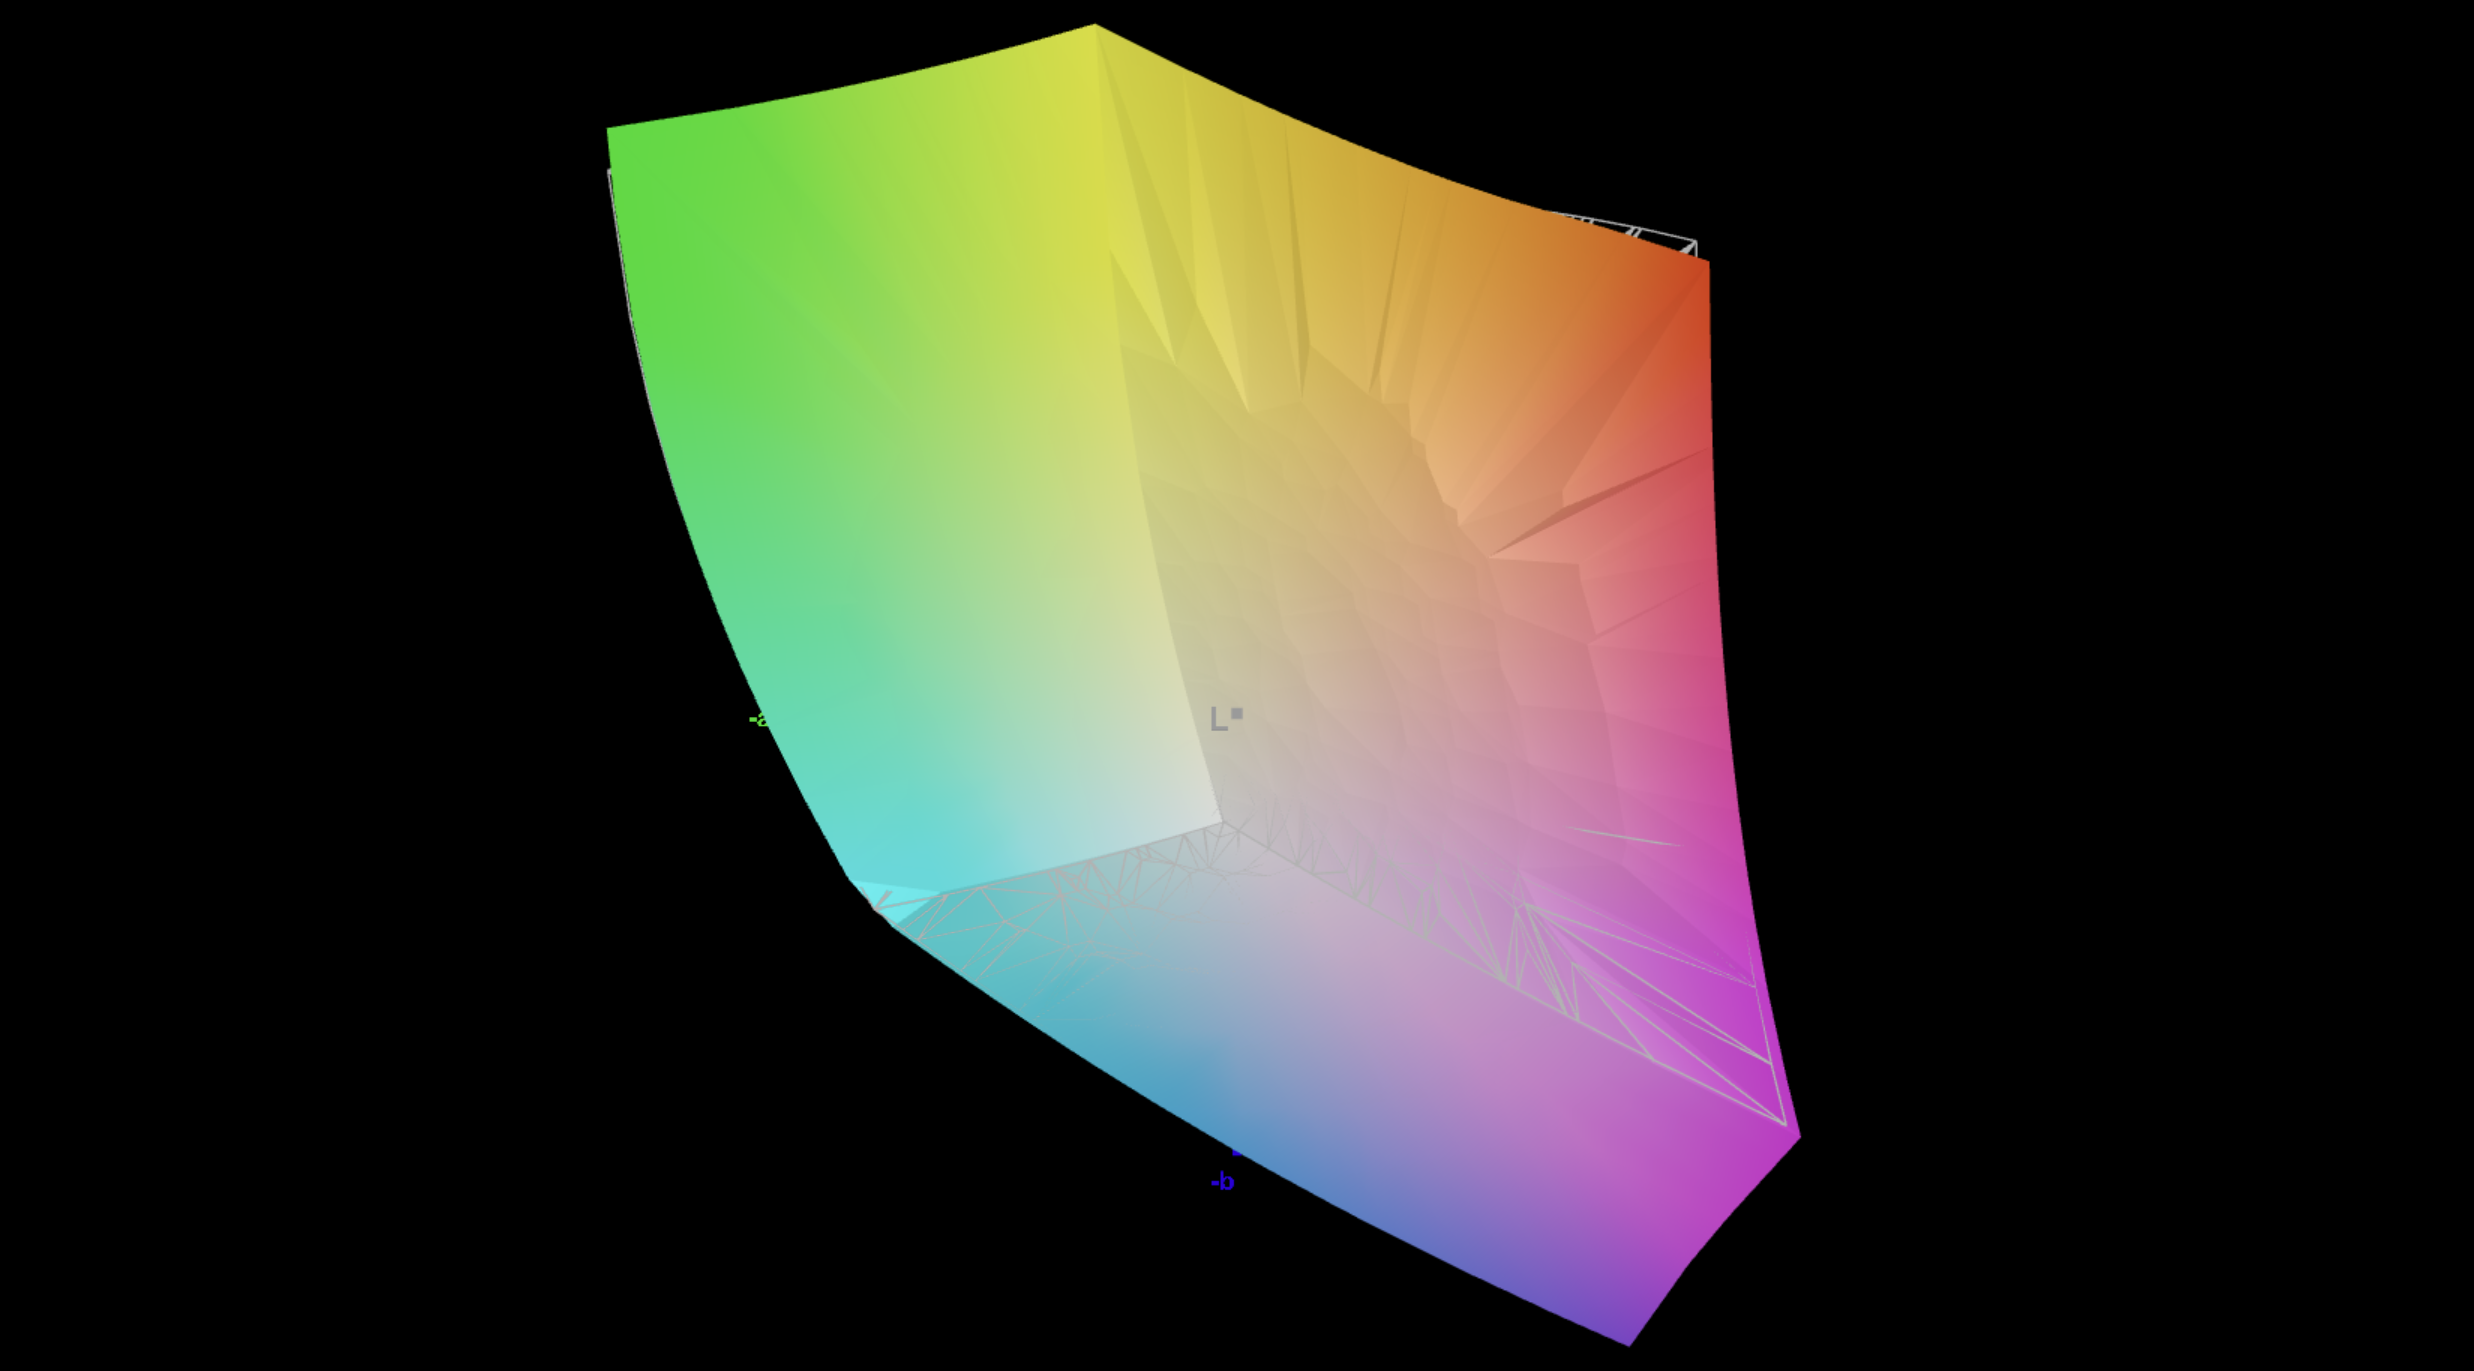
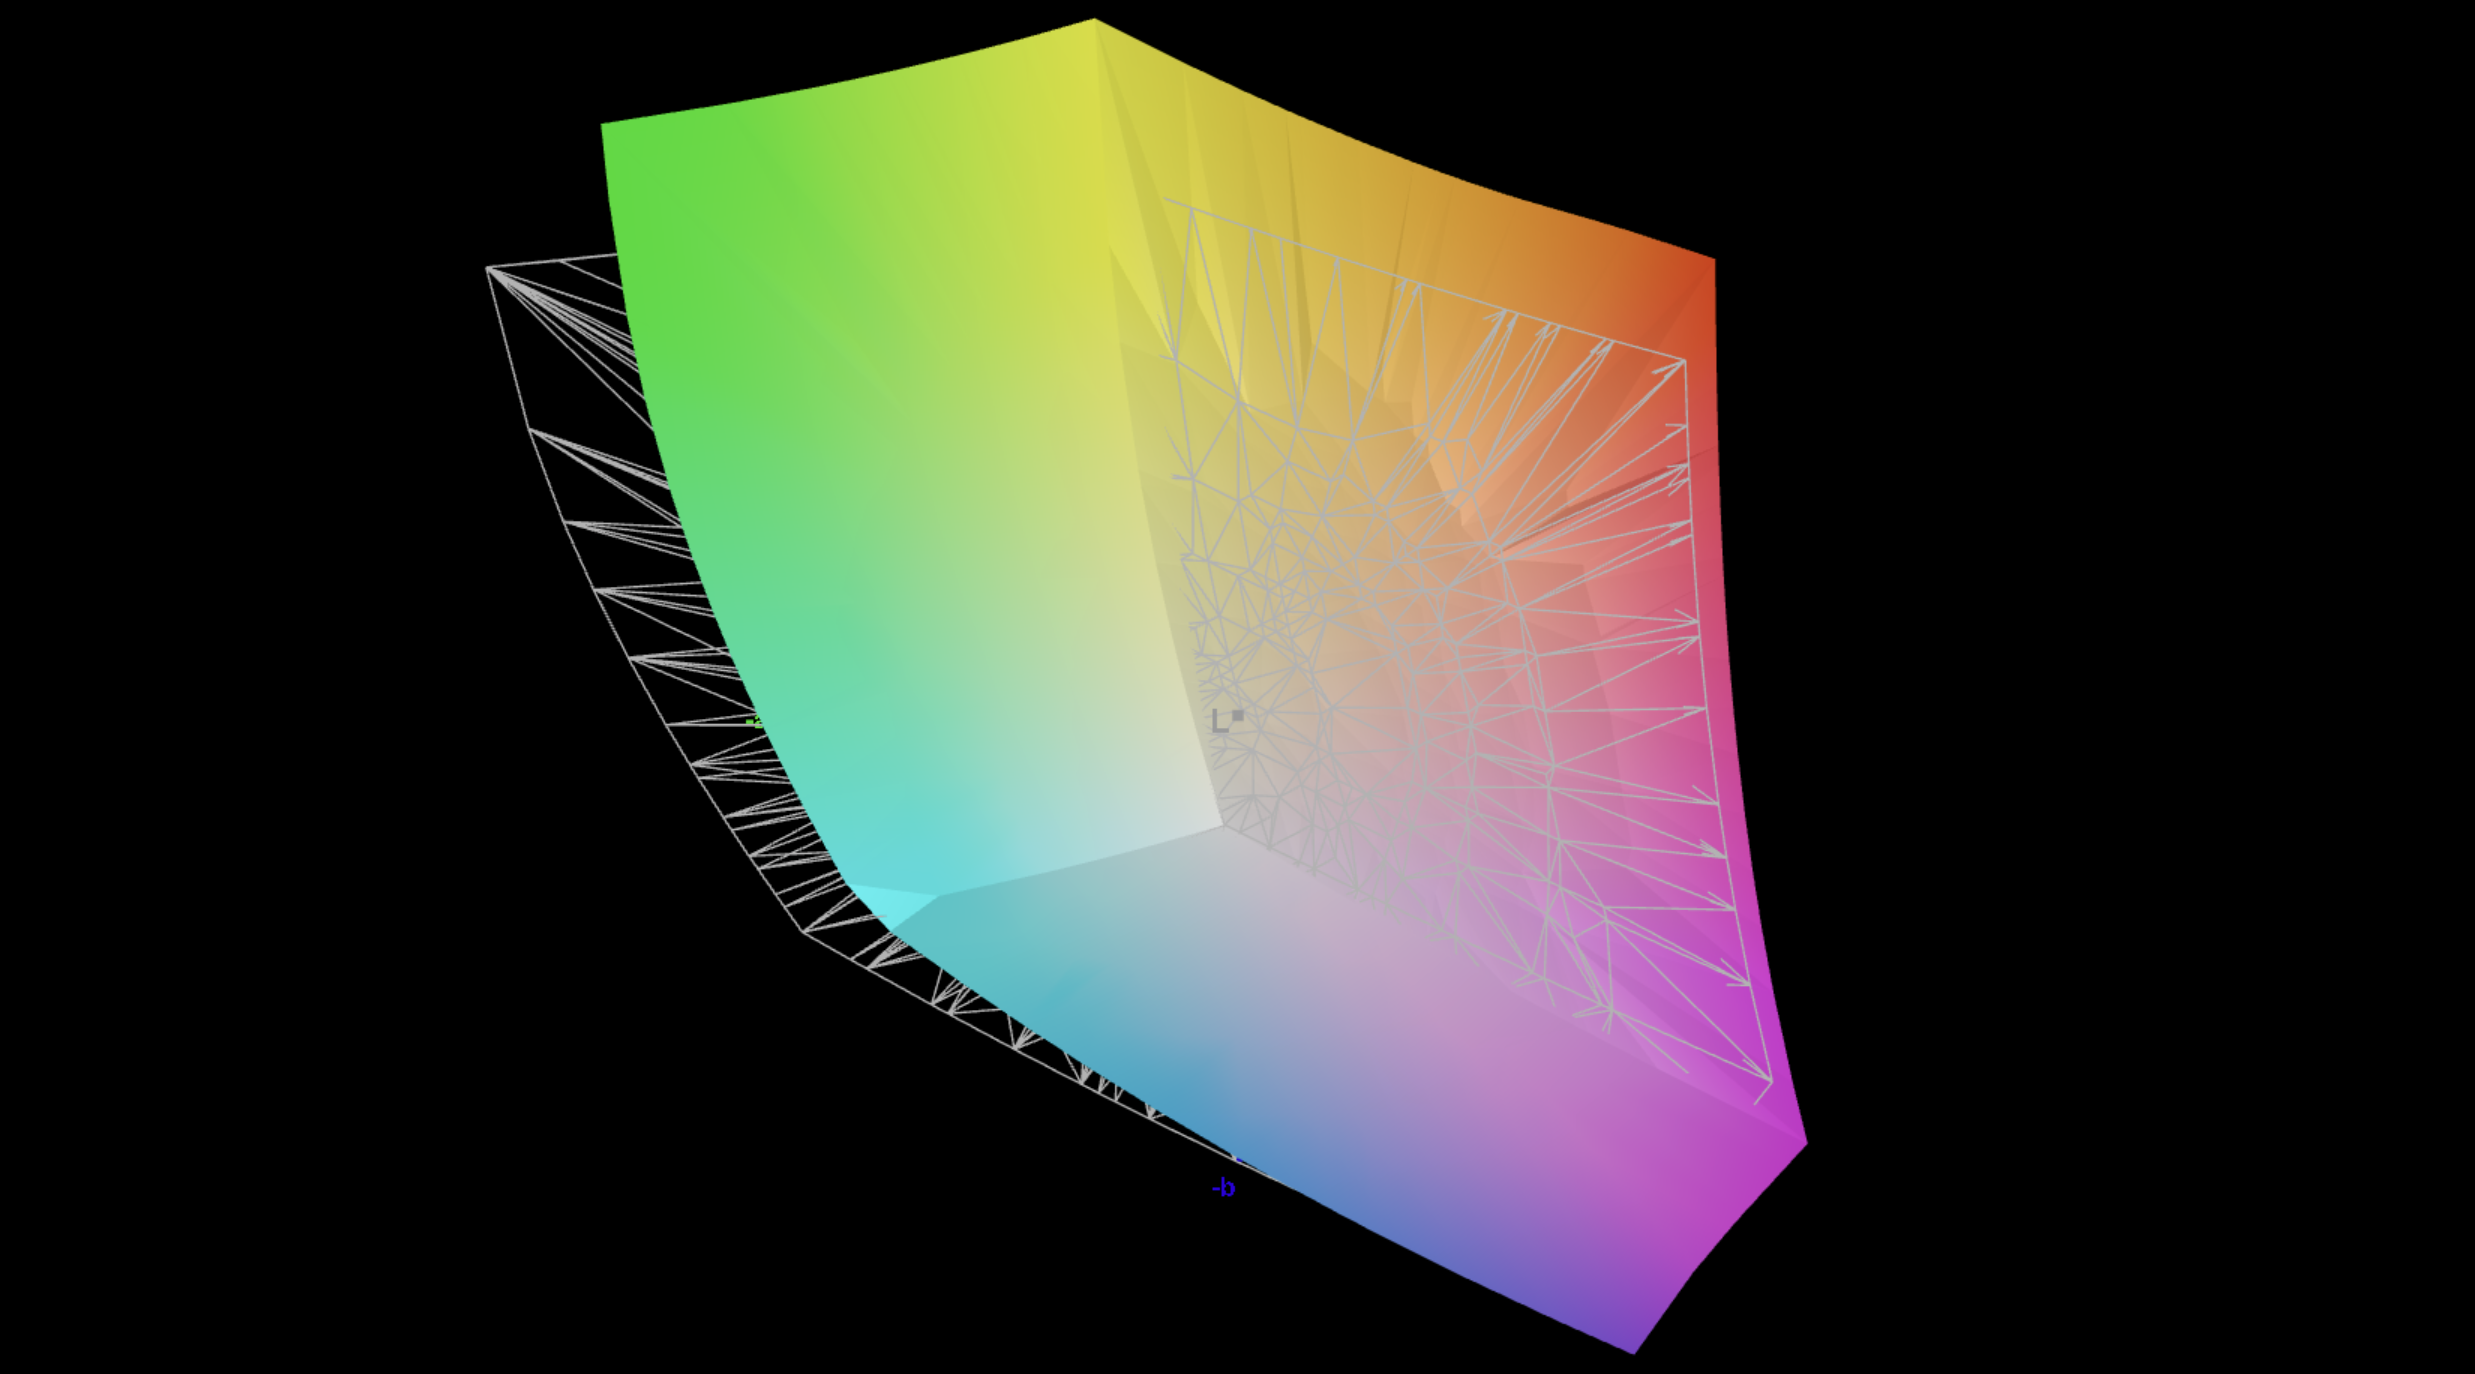
Écran - Mini LED avec 1 000 cd/m²
Notre appareil de test est équipé de l'écran Mini-LED mat (2 560 × 1 600 pixels, 16:10, 300 Hz) que nous connaissons déjà pour le XMG Neo 16. La qualité d'image est excellente et, surtout en termes de luminosité (jusqu'à 752 cd/m² en SDR et 974 cd/m² en HDR), elle surpasse nettement la dalle IPS standard. La gradation locale peut être désactivée, ce qui est utile pour des tâches telles que l'édition de photos.
Cependant, les profils de couleurs inclus (pour P3 et sRGB) ne sont pas optimaux, bien que la précision des couleurs s'améliore légèrement à des niveaux de luminosité plus faibles. Notre propre étalonnage montre qu'il y a encore des progrès à faire. Les temps de réponse sont difficiles à mesurer en raison du scintillement PWM constant (bien qu'à un niveau très élevé de 20 kHz), mais dans l'ensemble, il s'agit d'un panneau de type IPS rapide, et nous n'avons rencontré aucun problème pendant les jeux.


| |||||||||||||||||||||||||
Homogénéité de la luminosité: 93 %
Valeur mesurée au centre, sur batterie: 742 cd/m²
Contraste: 74200:1 (Valeurs des noirs: 0.01 cd/m²)
ΔE ColorChecker Calman: 3 | ∀{0.5-29.43 Ø4.75}
calibrated: 1.2
ΔE Greyscale Calman: 3.6 | ∀{0.09-98 Ø5}
87.9% AdobeRGB 1998 (Argyll 3D)
100% sRGB (Argyll 3D)
99.7% Display P3 (Argyll 3D)
Gamma: 2.43
CCT: 6559 K
| Schenker XMG APEX 16 MAX NE160QDM-NM9, Mini-LED, 2560x1600, 16", 300 Hz | Acer Predator Helios Neo 16S AI PHN16S-71-94L9 Samsung ATNA60DL03-0, OLED, 2560x1600, 16", 240 Hz | Chuwi Gamebook, R9 9955HX BOE0D55, IPS, 2560x1600, 16", 300 Hz | Medion Erazer Major 16 X1 MD62736 NE160QDM-NZL (BOE0D55), IPS, 2560x1600, 16", 300 Hz | Lenovo Legion 5 Pro 16IAX10H ATNA60HS01-0 (Samsung SDC420A), OLED, 2560x1600, 16", 165 Hz | MSI Vector 16 HX AI A2XWHG B160QAN02.3 (AUO7DB2), IPS, 2560x1600, 16", 240 Hz | Schenker XMG Pro 16 (E25) NE160QDM-NZL, IPS, 2560x1600, 16", 300 Hz | |
|---|---|---|---|---|---|---|---|
| Display | 3% | -16% | -14% | 2% | -2% | -13% | |
| Display P3 Coverage (%) | 99.7 | 99.9 0% | 72.5 -27% | 73.2 -27% | 99.9 0% | 96.6 -3% | 74.7 -25% |
| sRGB Coverage (%) | 100 | 100 0% | 97.9 -2% | 99.8 0% | 100 0% | 99.8 0% | 99.8 0% |
| AdobeRGB 1998 Coverage (%) | 87.9 | 96.5 10% | 72.5 -18% | 73.9 -16% | 94.1 7% | 84.4 -4% | 75.4 -14% |
| Response Times | 77% | 39% | 52% | 85% | 65% | 49% | |
| Response Time Grey 50% / Grey 80% * (ms) | 17.4 ? | 0.2 ? 99% | 12.4 ? 29% | 10 ? 43% | 2 ? 89% | 4.3 ? 75% | 10.5 ? 40% |
| Response Time Black / White * (ms) | 13 ? | 0.25 ? 98% | 6.8 ? 48% | 5.2 ? 60% | 1.4 ? 89% | 6 ? 54% | 5.4 ? 58% |
| PWM Frequency (Hz) | 20253 ? | 960 | 1300 | ||||
| PWM Amplitude * (%) | 75 | 50 33% | 16.7 78% | ||||
| Screen | -42% | -557% | -553% | -18% | -485% | -587% | |
| Brightness middle (cd/m²) | 742 | 390 -47% | 576 -22% | 577 -22% | 518 -30% | 473 -36% | 538 -27% |
| Brightness (cd/m²) | 733 | 394 -46% | 545 -26% | 539 -26% | 522 -29% | 426 -42% | 508 -31% |
| Brightness Distribution (%) | 93 | 98 5% | 88 -5% | 85 -9% | 97 4% | 85 -9% | 88 -5% |
| Black Level * (cd/m²) | 0.01 | 0.04 -300% | 0.5 -4900% | 0.5 -4900% | 0.42 -4100% | 0.47 -4600% | |
| Contrast (:1) | 74200 | 9750 -87% | 1152 -98% | 1154 -98% | 1126 -98% | 1145 -98% | |
| Colorchecker dE 2000 * | 3 | 1.61 46% | 2.04 32% | 2.12 29% | 2.49 17% | 3.47 -16% | 1.9 37% |
| Colorchecker dE 2000 max. * | 4.3 | 3.49 19% | 3.56 17% | 3.32 23% | 5.25 -22% | 7.24 -68% | 4 7% |
| Colorchecker dE 2000 calibrated * | 1.2 | 1.59 -33% | 1.85 -54% | 1.33 -11% | 2.15 -79% | 1.36 -13% | |
| Greyscale dE 2000 * | 3.6 | 1.2 67% | 2.09 42% | 2.2 39% | 3.02 16% | 3.1 14% | 2.7 25% |
| Gamma | 2.43 91% | 2.235 98% | 2.3 96% | 2.123 104% | 2.37 93% | 2.486 88% | 2.24 98% |
| CCT | 6559 99% | 6580 99% | 6492 100% | 6457 101% | 6426 101% | 6832 95% | 7027 93% |
| Moyenne finale (programmes/paramètres) | 13% /
-9% | -178% /
-356% | -172% /
-351% | 23% /
11% | -141% /
-303% | -184% /
-356% |
* ... Moindre est la valeur, meilleures sont les performances


Temps de réponse de l'écran
| ↔ Temps de réponse noir à blanc | ||
|---|---|---|
| 13 ms ... hausse ↗ et chute ↘ combinées | ↗ 4.6 ms hausse | 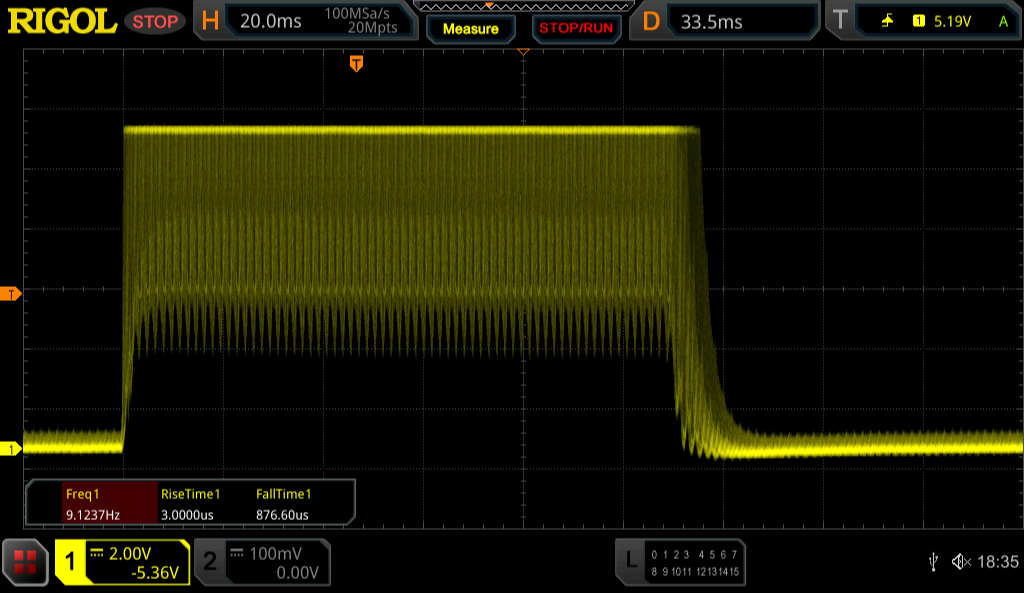 |
| ↘ 8.4 ms chute | ||
| L'écran montre de bons temps de réponse, mais insuffisant pour du jeu compétitif. En comparaison, tous les appareils testés affichent entre 0.1 (minimum) et 240 (maximum) ms. » 33 % des appareils testés affichent de meilleures performances. Cela signifie que les latences relevées sont meilleures que la moyenne (20 ms) de tous les appareils testés. | ||
| ↔ Temps de réponse gris 50% à gris 80% | ||
| 17.4 ms ... hausse ↗ et chute ↘ combinées | ↗ 8.4 ms hausse | 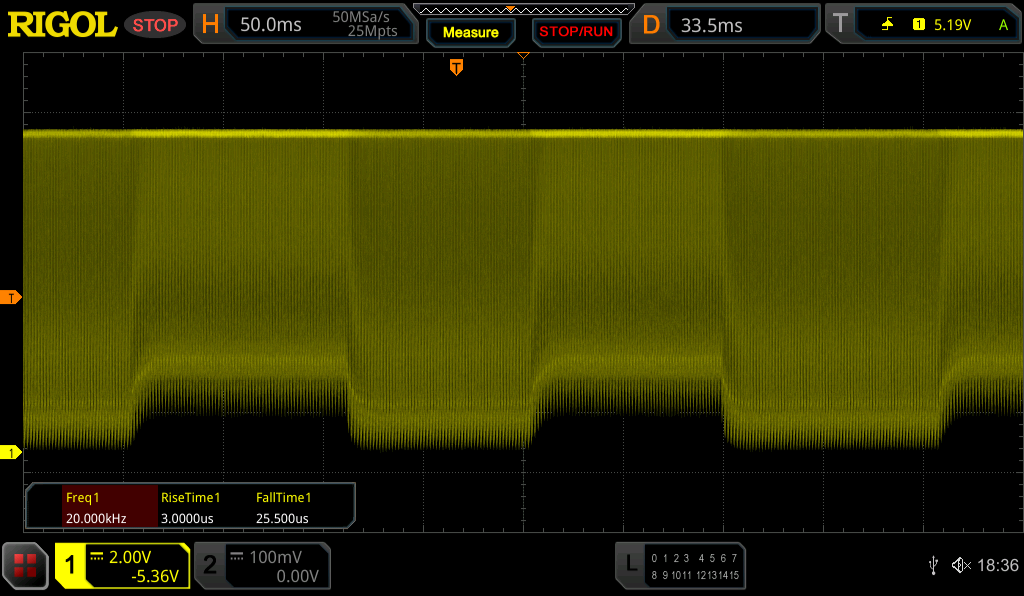 |
| ↘ 9 ms chute | ||
| L'écran montre de bons temps de réponse, mais insuffisant pour du jeu compétitif. En comparaison, tous les appareils testés affichent entre 0.165 (minimum) et 636 (maximum) ms. » 31 % des appareils testés affichent de meilleures performances. Cela signifie que les latences relevées sont meilleures que la moyenne (31.3 ms) de tous les appareils testés. | ||
Scintillement / MLI (Modulation de largeur d'impulsion)
| Scintillement / MLI (Modulation de largeur d'impulsion) décelé | 20253 Hz Amplitude: 75 % | ≤ 100 Niveau de luminosité | 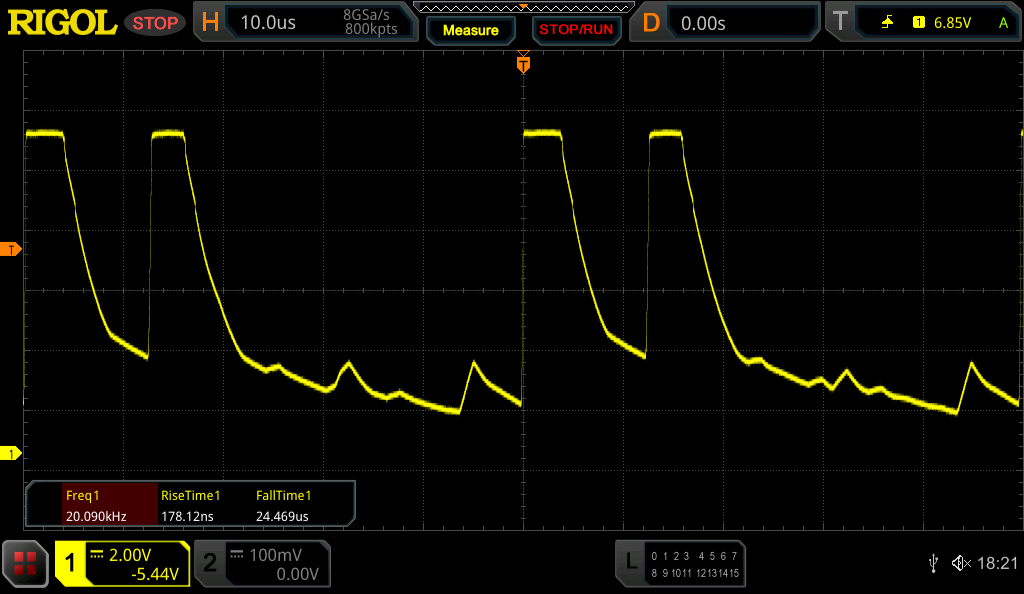 |
Le rétroéclairage de l'écran scintille à la fréquence de 20253 Hz (certainement du fait de l'utilisation d'une MDI - Modulation de largeur d'impulsion) à un niveau de luminosité inférieur ou égal à 100 % . Aucun scintillement ne devrait être perceptible au-dessus de cette valeur. La fréquence de rafraîchissement de 20253 Hz est élevée, la grande majorité des utilisateurs ne devrait pas percevoir de scintillements et être sujette à une fatigue oculaire accrue. En comparaison, 53 % des appareils testés n'emploient pas MDI pour assombrir leur écran. Nous avons relevé une moyenne à 7952 (minimum : 5 - maximum : 343500) Hz dans le cas où une MDI était active. | |||


Performance
Conditions d'essai
Nous avons effectué les tests suivants enmode Overboost (Normal). En cas de fonctionnement sur batterie, le mode Enthusiast est le réglage le plus élevé disponible.
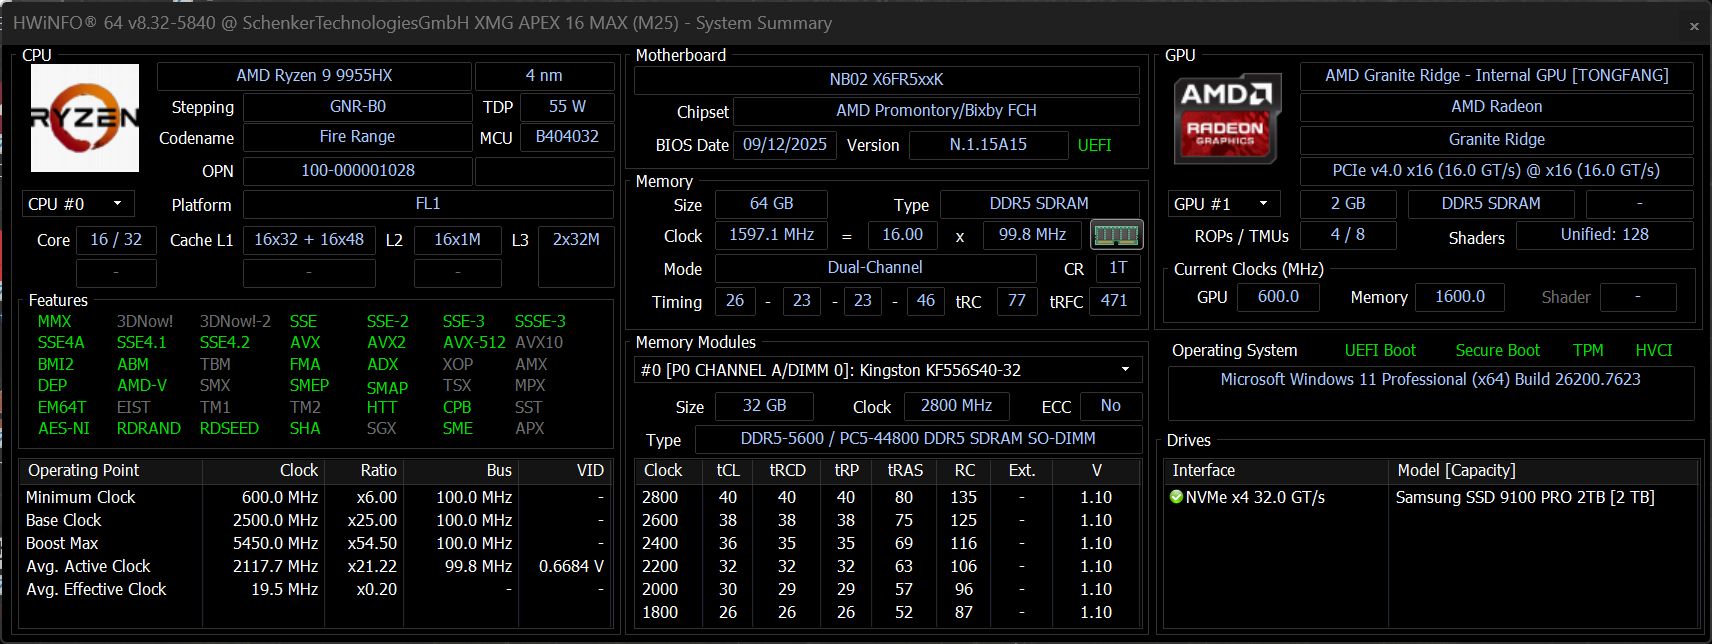
Processeur
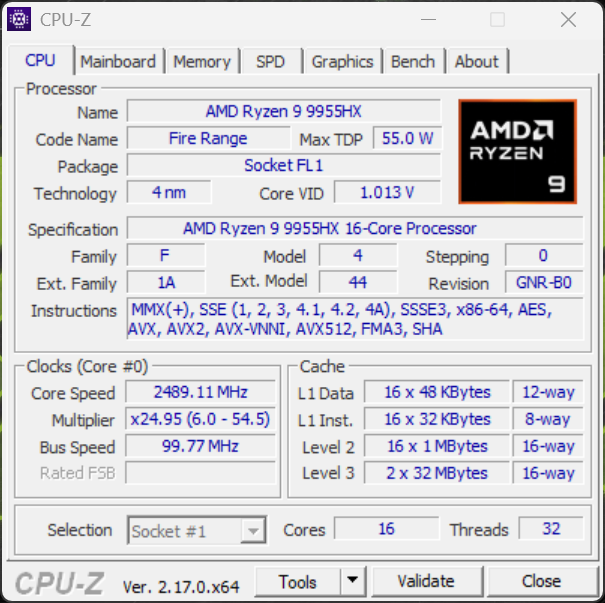
Le AMD Ryzen 9 9955HX (Zen 5) est un processeur mobile très rapide qui peut consommer jusqu'à 135/130 watts, ce qui lui permet d'offrir des performances très régulières. Dans nos benchmarks, par exemple, il peut même surpasser l'Intel Core Ultra 9 275HX Intel Core Ultra 9 275HXbien que la puce Intel consomme plus d'énergie. En revanche, sur batterie (35 watts), les performances multicœur sont nettement réduites (-55 %).
Test d'endurance multiple Cinebench R15
Cinebench R23: Multi Core | Single Core
Cinebench R20: CPU (Multi Core) | CPU (Single Core)
Cinebench R15: CPU Multi 64Bit | CPU Single 64Bit
Blender: v2.79 BMW27 CPU
7-Zip 18.03: 7z b 4 | 7z b 4 -mmt1
Geekbench 6.6: Multi-Core | Single-Core
Geekbench 5.5: Multi-Core | Single-Core
HWBOT x265 Benchmark v2.2: 4k Preset
LibreOffice : 20 Documents To PDF
R Benchmark 2.5: Overall mean
| CPU Performance rating | |
| Moyenne AMD Ryzen 9 9955HX | |
| Schenker XMG APEX 16 MAX | |
| Chuwi Gamebook, R9 9955HX | |
| Lenovo Legion 5 Pro 16IAX10H | |
| Schenker XMG Pro 16 (E25) | |
| Acer Predator Helios Neo 16S AI PHN16S-71-94L9 | |
| Medion Erazer Major 16 X1 MD62736 | |
| MSI Vector 16 HX AI A2XWHG | |
| Moyenne de la classe Gaming | |
| Cinebench R23 / Multi Core | |
| Moyenne AMD Ryzen 9 9955HX (35960 - 39690, n=9) | |
| Lenovo Legion 5 Pro 16IAX10H | |
| Schenker XMG Pro 16 (E25) | |
| Chuwi Gamebook, R9 9955HX | |
| Schenker XMG APEX 16 MAX | |
| Medion Erazer Major 16 X1 MD62736 | |
| Acer Predator Helios Neo 16S AI PHN16S-71-94L9 | |
| MSI Vector 16 HX AI A2XWHG | |
| Moyenne de la classe Gaming (10488 - 40970, n=125, 2 dernières années) | |
| Cinebench R23 / Single Core | |
| Acer Predator Helios Neo 16S AI PHN16S-71-94L9 | |
| Lenovo Legion 5 Pro 16IAX10H | |
| Schenker XMG Pro 16 (E25) | |
| Chuwi Gamebook, R9 9955HX | |
| Schenker XMG APEX 16 MAX | |
| MSI Vector 16 HX AI A2XWHG | |
| Moyenne AMD Ryzen 9 9955HX (1828 - 2183, n=9) | |
| Medion Erazer Major 16 X1 MD62736 | |
| Moyenne de la classe Gaming (1166 - 2267, n=125, 2 dernières années) | |
| Cinebench R20 / CPU (Multi Core) | |
| Lenovo Legion 5 Pro 16IAX10H | |
| Moyenne AMD Ryzen 9 9955HX (13963 - 15524, n=9) | |
| Schenker XMG Pro 16 (E25) | |
| Chuwi Gamebook, R9 9955HX | |
| Schenker XMG APEX 16 MAX | |
| Acer Predator Helios Neo 16S AI PHN16S-71-94L9 | |
| Medion Erazer Major 16 X1 MD62736 | |
| MSI Vector 16 HX AI A2XWHG | |
| Moyenne de la classe Gaming (4029 - 16108, n=124, 2 dernières années) | |
| Cinebench R20 / CPU (Single Core) | |
| Acer Predator Helios Neo 16S AI PHN16S-71-94L9 | |
| Lenovo Legion 5 Pro 16IAX10H | |
| Schenker XMG Pro 16 (E25) | |
| Schenker XMG APEX 16 MAX | |
| Chuwi Gamebook, R9 9955HX | |
| Moyenne AMD Ryzen 9 9955HX (819 - 856, n=9) | |
| MSI Vector 16 HX AI A2XWHG | |
| Medion Erazer Major 16 X1 MD62736 | |
| Moyenne de la classe Gaming (442 - 870, n=124, 2 dernières années) | |
| Cinebench R15 / CPU Multi 64Bit | |
| Lenovo Legion 5 Pro 16IAX10H | |
| Moyenne AMD Ryzen 9 9955HX (5624 - 6103, n=9) | |
| Chuwi Gamebook, R9 9955HX | |
| Schenker XMG APEX 16 MAX | |
| Schenker XMG Pro 16 (E25) | |
| Medion Erazer Major 16 X1 MD62736 | |
| Acer Predator Helios Neo 16S AI PHN16S-71-94L9 | |
| MSI Vector 16 HX AI A2XWHG | |
| Moyenne de la classe Gaming (1578 - 6271, n=125, 2 dernières années) | |
| Cinebench R15 / CPU Single 64Bit | |
| Chuwi Gamebook, R9 9955HX | |
| Schenker XMG APEX 16 MAX | |
| Schenker XMG Pro 16 (E25) | |
| Acer Predator Helios Neo 16S AI PHN16S-71-94L9 | |
| Moyenne AMD Ryzen 9 9955HX (320 - 338, n=9) | |
| Lenovo Legion 5 Pro 16IAX10H | |
| MSI Vector 16 HX AI A2XWHG | |
| Medion Erazer Major 16 X1 MD62736 | |
| Moyenne de la classe Gaming (188.8 - 343, n=124, 2 dernières années) | |
| Blender / v2.79 BMW27 CPU | |
| Moyenne de la classe Gaming (80 - 330, n=121, 2 dernières années) | |
| MSI Vector 16 HX AI A2XWHG | |
| Acer Predator Helios Neo 16S AI PHN16S-71-94L9 | |
| Medion Erazer Major 16 X1 MD62736 | |
| Lenovo Legion 5 Pro 16IAX10H | |
| Schenker XMG Pro 16 (E25) | |
| Chuwi Gamebook, R9 9955HX | |
| Schenker XMG APEX 16 MAX | |
| Moyenne AMD Ryzen 9 9955HX (80 - 91, n=9) | |
| 7-Zip 18.03 / 7z b 4 | |
| Schenker XMG APEX 16 MAX | |
| Moyenne AMD Ryzen 9 9955HX (132435 - 144064, n=9) | |
| Chuwi Gamebook, R9 9955HX | |
| Schenker XMG Pro 16 (E25) | |
| Lenovo Legion 5 Pro 16IAX10H | |
| Acer Predator Helios Neo 16S AI PHN16S-71-94L9 | |
| Medion Erazer Major 16 X1 MD62736 | |
| Moyenne de la classe Gaming (33491 - 148086, n=122, 2 dernières années) | |
| MSI Vector 16 HX AI A2XWHG | |
| 7-Zip 18.03 / 7z b 4 -mmt1 | |
| Schenker XMG APEX 16 MAX | |
| Moyenne AMD Ryzen 9 9955HX (7061 - 7462, n=9) | |
| Chuwi Gamebook, R9 9955HX | |
| Schenker XMG Pro 16 (E25) | |
| Acer Predator Helios Neo 16S AI PHN16S-71-94L9 | |
| Lenovo Legion 5 Pro 16IAX10H | |
| Medion Erazer Major 16 X1 MD62736 | |
| MSI Vector 16 HX AI A2XWHG | |
| Moyenne de la classe Gaming (4199 - 7508, n=122, 2 dernières années) | |
| Geekbench 6.6 / Multi-Core | |
| Schenker XMG Pro 16 (E25) | |
| Lenovo Legion 5 Pro 16IAX10H | |
| Schenker XMG APEX 16 MAX | |
| Acer Predator Helios Neo 16S AI PHN16S-71-94L9 | |
| Chuwi Gamebook, R9 9955HX | |
| Moyenne AMD Ryzen 9 9955HX (16313 - 19725, n=9) | |
| Medion Erazer Major 16 X1 MD62736 | |
| MSI Vector 16 HX AI A2XWHG | |
| Moyenne de la classe Gaming (6625 - 22104, n=123, 2 dernières années) | |
| Geekbench 6.6 / Single-Core | |
| Schenker XMG APEX 16 MAX | |
| Moyenne AMD Ryzen 9 9955HX (3156 - 3259, n=9) | |
| Chuwi Gamebook, R9 9955HX | |
| Acer Predator Helios Neo 16S AI PHN16S-71-94L9 | |
| Schenker XMG Pro 16 (E25) | |
| Lenovo Legion 5 Pro 16IAX10H | |
| Medion Erazer Major 16 X1 MD62736 | |
| MSI Vector 16 HX AI A2XWHG | |
| Moyenne de la classe Gaming (1490 - 3259, n=123, 2 dernières années) | |
| Geekbench 5.5 / Multi-Core | |
| Schenker XMG Pro 16 (E25) | |
| Schenker XMG APEX 16 MAX | |
| Lenovo Legion 5 Pro 16IAX10H | |
| Acer Predator Helios Neo 16S AI PHN16S-71-94L9 | |
| Moyenne AMD Ryzen 9 9955HX (20576 - 22716, n=9) | |
| Chuwi Gamebook, R9 9955HX | |
| Medion Erazer Major 16 X1 MD62736 | |
| MSI Vector 16 HX AI A2XWHG | |
| Moyenne de la classe Gaming (6460 - 27010, n=122, 2 dernières années) | |
| Geekbench 5.5 / Single-Core | |
| Schenker XMG APEX 16 MAX | |
| Moyenne AMD Ryzen 9 9955HX (2307 - 2474, n=9) | |
| Chuwi Gamebook, R9 9955HX | |
| Schenker XMG Pro 16 (E25) | |
| Lenovo Legion 5 Pro 16IAX10H | |
| Acer Predator Helios Neo 16S AI PHN16S-71-94L9 | |
| MSI Vector 16 HX AI A2XWHG | |
| Medion Erazer Major 16 X1 MD62736 | |
| Moyenne de la classe Gaming (986 - 2474, n=122, 2 dernières années) | |
| HWBOT x265 Benchmark v2.2 / 4k Preset | |
| Moyenne AMD Ryzen 9 9955HX (38.9 - 43, n=9) | |
| Chuwi Gamebook, R9 9955HX | |
| Schenker XMG APEX 16 MAX | |
| Schenker XMG Pro 16 (E25) | |
| Lenovo Legion 5 Pro 16IAX10H | |
| Medion Erazer Major 16 X1 MD62736 | |
| Acer Predator Helios Neo 16S AI PHN16S-71-94L9 | |
| MSI Vector 16 HX AI A2XWHG | |
| Moyenne de la classe Gaming (11.5 - 44.3, n=122, 2 dernières années) | |
| LibreOffice / 20 Documents To PDF | |
| Schenker XMG Pro 16 (E25) | |
| Moyenne de la classe Gaming (19 - 88.8, n=122, 2 dernières années) | |
| Schenker XMG APEX 16 MAX | |
| Moyenne AMD Ryzen 9 9955HX (42.2 - 52.4, n=9) | |
| Chuwi Gamebook, R9 9955HX | |
| Acer Predator Helios Neo 16S AI PHN16S-71-94L9 | |
| Medion Erazer Major 16 X1 MD62736 | |
| MSI Vector 16 HX AI A2XWHG | |
| Lenovo Legion 5 Pro 16IAX10H | |
| R Benchmark 2.5 / Overall mean | |
| Moyenne de la classe Gaming (0.3439 - 0.759, n=123, 2 dernières années) | |
| MSI Vector 16 HX AI A2XWHG | |
| Medion Erazer Major 16 X1 MD62736 | |
| Lenovo Legion 5 Pro 16IAX10H | |
| Schenker XMG Pro 16 (E25) | |
| Acer Predator Helios Neo 16S AI PHN16S-71-94L9 | |
| Chuwi Gamebook, R9 9955HX | |
| Moyenne AMD Ryzen 9 9955HX (0.3439 - 0.3737, n=9) | |
| Schenker XMG APEX 16 MAX | |
* ... Moindre est la valeur, meilleures sont les performances
AIDA64: FP32 Ray-Trace | FPU Julia | CPU SHA3 | CPU Queen | FPU SinJulia | FPU Mandel | CPU AES | CPU ZLib | FP64 Ray-Trace | CPU PhotoWorxx
| Performance rating | |
| Schenker XMG APEX 16 MAX | |
| Moyenne AMD Ryzen 9 9955HX | |
| Chuwi Gamebook, R9 9955HX | |
| Lenovo Legion 5 Pro 16IAX10H | |
| Schenker XMG Pro 16 (E25) | |
| Medion Erazer Major 16 X1 MD62736 | |
| Acer Predator Helios Neo 16S AI PHN16S-71-94L9 | |
| Moyenne de la classe Gaming | |
| MSI Vector 16 HX AI A2XWHG | |
| AIDA64 / FP32 Ray-Trace | |
| Schenker XMG APEX 16 MAX | |
| Chuwi Gamebook, R9 9955HX | |
| Moyenne AMD Ryzen 9 9955HX (66596 - 85542, n=9) | |
| Lenovo Legion 5 Pro 16IAX10H | |
| Schenker XMG Pro 16 (E25) | |
| Medion Erazer Major 16 X1 MD62736 | |
| Moyenne de la classe Gaming (10227 - 85542, n=122, 2 dernières années) | |
| Acer Predator Helios Neo 16S AI PHN16S-71-94L9 | |
| MSI Vector 16 HX AI A2XWHG | |
| AIDA64 / FPU Julia | |
| Schenker XMG APEX 16 MAX | |
| Moyenne AMD Ryzen 9 9955HX (191535 - 232031, n=9) | |
| Chuwi Gamebook, R9 9955HX | |
| Lenovo Legion 5 Pro 16IAX10H | |
| Schenker XMG Pro 16 (E25) | |
| Medion Erazer Major 16 X1 MD62736 | |
| Acer Predator Helios Neo 16S AI PHN16S-71-94L9 | |
| MSI Vector 16 HX AI A2XWHG | |
| Moyenne de la classe Gaming (51376 - 238426, n=122, 2 dernières années) | |
| AIDA64 / CPU SHA3 | |
| Schenker XMG APEX 16 MAX | |
| Moyenne AMD Ryzen 9 9955HX (8489 - 9780, n=9) | |
| Chuwi Gamebook, R9 9955HX | |
| Schenker XMG Pro 16 (E25) | |
| Lenovo Legion 5 Pro 16IAX10H | |
| Medion Erazer Major 16 X1 MD62736 | |
| Acer Predator Helios Neo 16S AI PHN16S-71-94L9 | |
| MSI Vector 16 HX AI A2XWHG | |
| Moyenne de la classe Gaming (2180 - 9817, n=122, 2 dernières années) | |
| AIDA64 / CPU Queen | |
| Moyenne AMD Ryzen 9 9955HX (153027 - 164154, n=9) | |
| Schenker XMG APEX 16 MAX | |
| Chuwi Gamebook, R9 9955HX | |
| Lenovo Legion 5 Pro 16IAX10H | |
| Schenker XMG Pro 16 (E25) | |
| Medion Erazer Major 16 X1 MD62736 | |
| Acer Predator Helios Neo 16S AI PHN16S-71-94L9 | |
| Moyenne de la classe Gaming (49785 - 173351, n=120, 2 dernières années) | |
| MSI Vector 16 HX AI A2XWHG | |
| AIDA64 / FPU SinJulia | |
| Schenker XMG APEX 16 MAX | |
| Moyenne AMD Ryzen 9 9955HX (29876 - 32647, n=9) | |
| Chuwi Gamebook, R9 9955HX | |
| Moyenne de la classe Gaming (4424 - 33636, n=122, 2 dernières années) | |
| Schenker XMG Pro 16 (E25) | |
| Lenovo Legion 5 Pro 16IAX10H | |
| Medion Erazer Major 16 X1 MD62736 | |
| Acer Predator Helios Neo 16S AI PHN16S-71-94L9 | |
| MSI Vector 16 HX AI A2XWHG | |
| AIDA64 / FPU Mandel | |
| Schenker XMG APEX 16 MAX | |
| Moyenne AMD Ryzen 9 9955HX (101131 - 128721, n=9) | |
| Chuwi Gamebook, R9 9955HX | |
| Schenker XMG Pro 16 (E25) | |
| Lenovo Legion 5 Pro 16IAX10H | |
| Medion Erazer Major 16 X1 MD62736 | |
| Acer Predator Helios Neo 16S AI PHN16S-71-94L9 | |
| MSI Vector 16 HX AI A2XWHG | |
| Moyenne de la classe Gaming (25115 - 128721, n=122, 2 dernières années) | |
| AIDA64 / CPU AES | |
| Schenker XMG APEX 16 MAX | |
| Moyenne AMD Ryzen 9 9955HX (146979 - 218385, n=9) | |
| Chuwi Gamebook, R9 9955HX | |
| Lenovo Legion 5 Pro 16IAX10H | |
| Schenker XMG Pro 16 (E25) | |
| Medion Erazer Major 16 X1 MD62736 | |
| Moyenne de la classe Gaming (39258 - 247074, n=122, 2 dernières années) | |
| Acer Predator Helios Neo 16S AI PHN16S-71-94L9 | |
| MSI Vector 16 HX AI A2XWHG | |
| AIDA64 / CPU ZLib | |
| Moyenne AMD Ryzen 9 9955HX (2186 - 2531, n=9) | |
| Schenker XMG APEX 16 MAX | |
| Chuwi Gamebook, R9 9955HX | |
| Lenovo Legion 5 Pro 16IAX10H | |
| Schenker XMG Pro 16 (E25) | |
| Medion Erazer Major 16 X1 MD62736 | |
| Acer Predator Helios Neo 16S AI PHN16S-71-94L9 | |
| Moyenne de la classe Gaming (574 - 2531, n=122, 2 dernières années) | |
| MSI Vector 16 HX AI A2XWHG | |
| AIDA64 / FP64 Ray-Trace | |
| Schenker XMG APEX 16 MAX | |
| Chuwi Gamebook, R9 9955HX | |
| Moyenne AMD Ryzen 9 9955HX (35252 - 45446, n=9) | |
| Lenovo Legion 5 Pro 16IAX10H | |
| Schenker XMG Pro 16 (E25) | |
| Medion Erazer Major 16 X1 MD62736 | |
| Moyenne de la classe Gaming (5509 - 45446, n=122, 2 dernières années) | |
| Acer Predator Helios Neo 16S AI PHN16S-71-94L9 | |
| MSI Vector 16 HX AI A2XWHG | |
| AIDA64 / CPU PhotoWorxx | |
| Acer Predator Helios Neo 16S AI PHN16S-71-94L9 | |
| Schenker XMG Pro 16 (E25) | |
| Medion Erazer Major 16 X1 MD62736 | |
| Lenovo Legion 5 Pro 16IAX10H | |
| Moyenne de la classe Gaming (12271 - 62916, n=122, 2 dernières années) | |
| Schenker XMG APEX 16 MAX | |
| Chuwi Gamebook, R9 9955HX | |
| Moyenne AMD Ryzen 9 9955HX (35974 - 42495, n=9) | |
| MSI Vector 16 HX AI A2XWHG | |
Performance du système
Sans surprise, les performances du système sont excellentes et les résultats des tests de référence sont également très bons.
PCMark 10: Score | Essentials | Productivity | Digital Content Creation
CrossMark: Overall | Productivity | Creativity | Responsiveness
WebXPRT 3: Overall
WebXPRT 4: Overall
Mozilla Kraken 1.1: Total
| Performance rating | |
| Lenovo Legion 5 Pro 16IAX10H | |
| Moyenne AMD Ryzen 9 9955HX, NVIDIA GeForce RTX 5070 Ti Laptop | |
| Chuwi Gamebook, R9 9955HX | |
| Schenker XMG APEX 16 MAX | |
| Schenker XMG Pro 16 (E25) | |
| Acer Predator Helios Neo 16S AI PHN16S-71-94L9 | |
| Medion Erazer Major 16 X1 MD62736 | |
| Moyenne de la classe Gaming | |
| MSI Vector 16 HX AI A2XWHG | |
| PCMark 10 / Score | |
| Schenker XMG APEX 16 MAX | |
| Moyenne AMD Ryzen 9 9955HX, NVIDIA GeForce RTX 5070 Ti Laptop (9208 - 10060, n=3) | |
| Chuwi Gamebook, R9 9955HX | |
| Schenker XMG Pro 16 (E25) | |
| Acer Predator Helios Neo 16S AI PHN16S-71-94L9 | |
| Lenovo Legion 5 Pro 16IAX10H | |
| Moyenne de la classe Gaming (5828 - 10060, n=104, 2 dernières années) | |
| Medion Erazer Major 16 X1 MD62736 | |
| MSI Vector 16 HX AI A2XWHG | |
| PCMark 10 / Essentials | |
| Schenker XMG APEX 16 MAX | |
| Moyenne AMD Ryzen 9 9955HX, NVIDIA GeForce RTX 5070 Ti Laptop (11178 - 11719, n=3) | |
| Schenker XMG Pro 16 (E25) | |
| Chuwi Gamebook, R9 9955HX | |
| Acer Predator Helios Neo 16S AI PHN16S-71-94L9 | |
| Medion Erazer Major 16 X1 MD62736 | |
| Lenovo Legion 5 Pro 16IAX10H | |
| MSI Vector 16 HX AI A2XWHG | |
| Moyenne de la classe Gaming (8810 - 12600, n=108, 2 dernières années) | |
| PCMark 10 / Productivity | |
| Schenker XMG APEX 16 MAX | |
| Moyenne AMD Ryzen 9 9955HX, NVIDIA GeForce RTX 5070 Ti Laptop (10734 - 16314, n=3) | |
| Chuwi Gamebook, R9 9955HX | |
| Moyenne de la classe Gaming (6662 - 16716, n=106, 2 dernières années) | |
| Acer Predator Helios Neo 16S AI PHN16S-71-94L9 | |
| Lenovo Legion 5 Pro 16IAX10H | |
| Schenker XMG Pro 16 (E25) | |
| MSI Vector 16 HX AI A2XWHG | |
| Medion Erazer Major 16 X1 MD62736 | |
| PCMark 10 / Digital Content Creation | |
| Chuwi Gamebook, R9 9955HX | |
| Moyenne AMD Ryzen 9 9955HX, NVIDIA GeForce RTX 5070 Ti Laptop (14454 - 18192, n=3) | |
| Schenker XMG Pro 16 (E25) | |
| Lenovo Legion 5 Pro 16IAX10H | |
| Acer Predator Helios Neo 16S AI PHN16S-71-94L9 | |
| Schenker XMG APEX 16 MAX | |
| Moyenne de la classe Gaming (7602 - 19351, n=106, 2 dernières années) | |
| Medion Erazer Major 16 X1 MD62736 | |
| MSI Vector 16 HX AI A2XWHG | |
| CrossMark / Overall | |
| Chuwi Gamebook, R9 9955HX | |
| Schenker XMG Pro 16 (E25) | |
| Lenovo Legion 5 Pro 16IAX10H | |
| Moyenne AMD Ryzen 9 9955HX, NVIDIA GeForce RTX 5070 Ti Laptop (2111 - 2215, n=3) | |
| Acer Predator Helios Neo 16S AI PHN16S-71-94L9 | |
| Schenker XMG APEX 16 MAX | |
| Medion Erazer Major 16 X1 MD62736 | |
| Moyenne de la classe Gaming (1366 - 2344, n=106, 2 dernières années) | |
| MSI Vector 16 HX AI A2XWHG | |
| CrossMark / Productivity | |
| Lenovo Legion 5 Pro 16IAX10H | |
| Schenker XMG Pro 16 (E25) | |
| Chuwi Gamebook, R9 9955HX | |
| Acer Predator Helios Neo 16S AI PHN16S-71-94L9 | |
| Medion Erazer Major 16 X1 MD62736 | |
| Moyenne AMD Ryzen 9 9955HX, NVIDIA GeForce RTX 5070 Ti Laptop (1882 - 1999, n=3) | |
| Schenker XMG APEX 16 MAX | |
| Moyenne de la classe Gaming (1386 - 2211, n=106, 2 dernières années) | |
| MSI Vector 16 HX AI A2XWHG | |
| CrossMark / Creativity | |
| Moyenne AMD Ryzen 9 9955HX, NVIDIA GeForce RTX 5070 Ti Laptop (2592 - 2660, n=3) | |
| Chuwi Gamebook, R9 9955HX | |
| Schenker XMG APEX 16 MAX | |
| Schenker XMG Pro 16 (E25) | |
| Lenovo Legion 5 Pro 16IAX10H | |
| Acer Predator Helios Neo 16S AI PHN16S-71-94L9 | |
| Medion Erazer Major 16 X1 MD62736 | |
| MSI Vector 16 HX AI A2XWHG | |
| Moyenne de la classe Gaming (1343 - 2729, n=106, 2 dernières années) | |
| CrossMark / Responsiveness | |
| Chuwi Gamebook, R9 9955HX | |
| Lenovo Legion 5 Pro 16IAX10H | |
| Schenker XMG Pro 16 (E25) | |
| Acer Predator Helios Neo 16S AI PHN16S-71-94L9 | |
| Medion Erazer Major 16 X1 MD62736 | |
| Moyenne AMD Ryzen 9 9955HX, NVIDIA GeForce RTX 5070 Ti Laptop (1608 - 1854, n=3) | |
| Moyenne de la classe Gaming (1226 - 2330, n=106, 2 dernières années) | |
| Schenker XMG APEX 16 MAX | |
| MSI Vector 16 HX AI A2XWHG | |
| WebXPRT 3 / Overall | |
| Lenovo Legion 5 Pro 16IAX10H | |
| Schenker XMG Pro 16 (E25) | |
| Moyenne AMD Ryzen 9 9955HX, NVIDIA GeForce RTX 5070 Ti Laptop (328 - 361, n=3) | |
| Chuwi Gamebook, R9 9955HX | |
| Acer Predator Helios Neo 16S AI PHN16S-71-94L9 | |
| Schenker XMG APEX 16 MAX | |
| Medion Erazer Major 16 X1 MD62736 | |
| MSI Vector 16 HX AI A2XWHG | |
| Moyenne de la classe Gaming (237 - 532, n=109, 2 dernières années) | |
| WebXPRT 4 / Overall | |
| Schenker XMG Pro 16 (E25) | |
| Lenovo Legion 5 Pro 16IAX10H | |
| Medion Erazer Major 16 X1 MD62736 | |
| Acer Predator Helios Neo 16S AI PHN16S-71-94L9 | |
| MSI Vector 16 HX AI A2XWHG | |
| Moyenne AMD Ryzen 9 9955HX, NVIDIA GeForce RTX 5070 Ti Laptop (282 - 322, n=3) | |
| Chuwi Gamebook, R9 9955HX | |
| Schenker XMG APEX 16 MAX | |
| Moyenne de la classe Gaming (176.4 - 345, n=108, 2 dernières années) | |
| Mozilla Kraken 1.1 / Total | |
| Moyenne de la classe Gaming (397 - 594, n=115, 2 dernières années) | |
| Schenker XMG APEX 16 MAX | |
| MSI Vector 16 HX AI A2XWHG | |
| Medion Erazer Major 16 X1 MD62736 | |
| Moyenne AMD Ryzen 9 9955HX, NVIDIA GeForce RTX 5070 Ti Laptop (403 - 440, n=3) | |
| Lenovo Legion 5 Pro 16IAX10H | |
| Acer Predator Helios Neo 16S AI PHN16S-71-94L9 | |
| Schenker XMG Pro 16 (E25) | |
| Chuwi Gamebook, R9 9955HX | |
* ... Moindre est la valeur, meilleures sont les performances
| PCMark 10 Score | 10060 points | |
Aide | ||
| AIDA64 / Memory Copy | |
| Acer Predator Helios Neo 16S AI PHN16S-71-94L9 | |
| Schenker XMG Pro 16 (E25) | |
| Lenovo Legion 5 Pro 16IAX10H | |
| Medion Erazer Major 16 X1 MD62736 | |
| Moyenne de la classe Gaming (21750 - 108104, n=122, 2 dernières années) | |
| MSI Vector 16 HX AI A2XWHG | |
| Schenker XMG APEX 16 MAX | |
| Chuwi Gamebook, R9 9955HX | |
| Moyenne AMD Ryzen 9 9955HX (53598 - 62777, n=9) | |
| AIDA64 / Memory Read | |
| Schenker XMG Pro 16 (E25) | |
| Acer Predator Helios Neo 16S AI PHN16S-71-94L9 | |
| Lenovo Legion 5 Pro 16IAX10H | |
| Medion Erazer Major 16 X1 MD62736 | |
| MSI Vector 16 HX AI A2XWHG | |
| Moyenne de la classe Gaming (22956 - 104349, n=122, 2 dernières années) | |
| Schenker XMG APEX 16 MAX | |
| Moyenne AMD Ryzen 9 9955HX (63953 - 67256, n=9) | |
| Chuwi Gamebook, R9 9955HX | |
| AIDA64 / Memory Write | |
| Medion Erazer Major 16 X1 MD62736 | |
| Acer Predator Helios Neo 16S AI PHN16S-71-94L9 | |
| Schenker XMG Pro 16 (E25) | |
| Lenovo Legion 5 Pro 16IAX10H | |
| Moyenne de la classe Gaming (22297 - 133486, n=122, 2 dernières années) | |
| Schenker XMG APEX 16 MAX | |
| Moyenne AMD Ryzen 9 9955HX (65421 - 72060, n=9) | |
| Chuwi Gamebook, R9 9955HX | |
| MSI Vector 16 HX AI A2XWHG | |
| AIDA64 / Memory Latency | |
| Lenovo Legion 5 Pro 16IAX10H | |
| Acer Predator Helios Neo 16S AI PHN16S-71-94L9 | |
| Medion Erazer Major 16 X1 MD62736 | |
| MSI Vector 16 HX AI A2XWHG | |
| Schenker XMG Pro 16 (E25) | |
| Moyenne de la classe Gaming (75.3 - 259, n=122, 2 dernières années) | |
| Chuwi Gamebook, R9 9955HX | |
| Moyenne AMD Ryzen 9 9955HX (92.1 - 103.5, n=9) | |
| Schenker XMG APEX 16 MAX | |
* ... Moindre est la valeur, meilleures sont les performances
Latences DPC
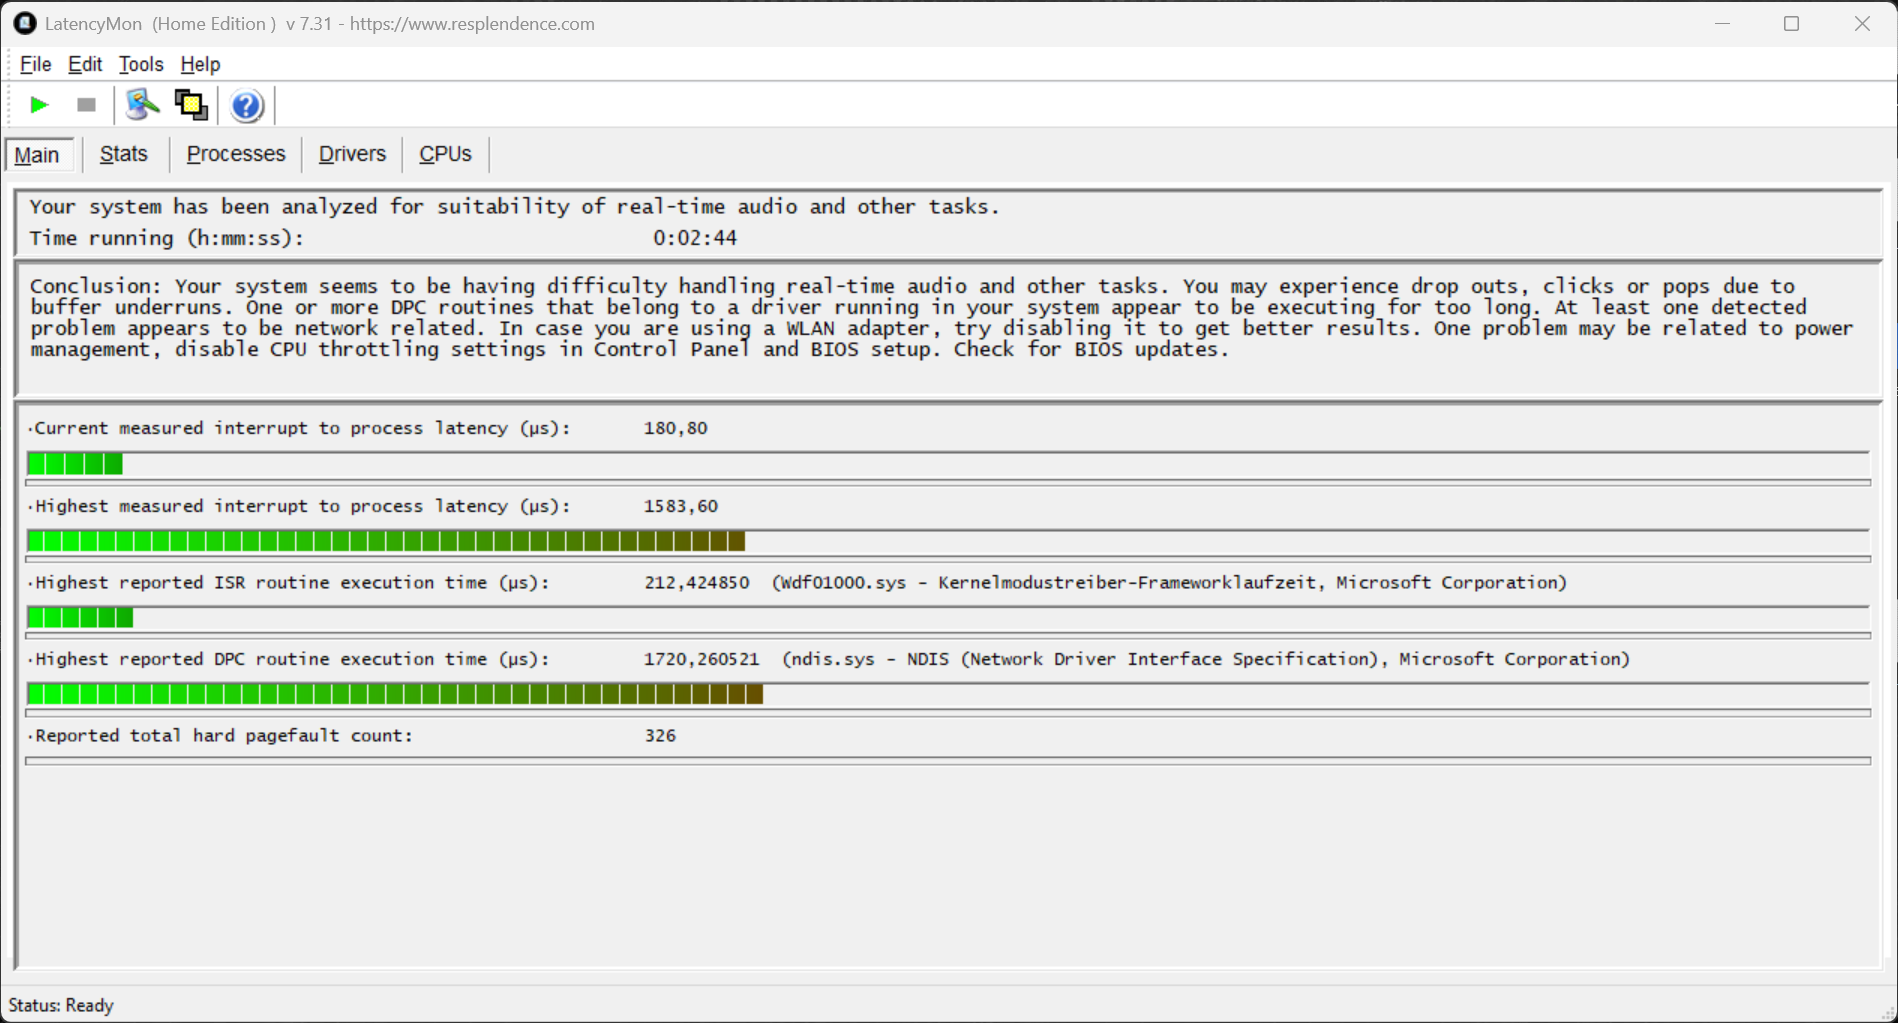
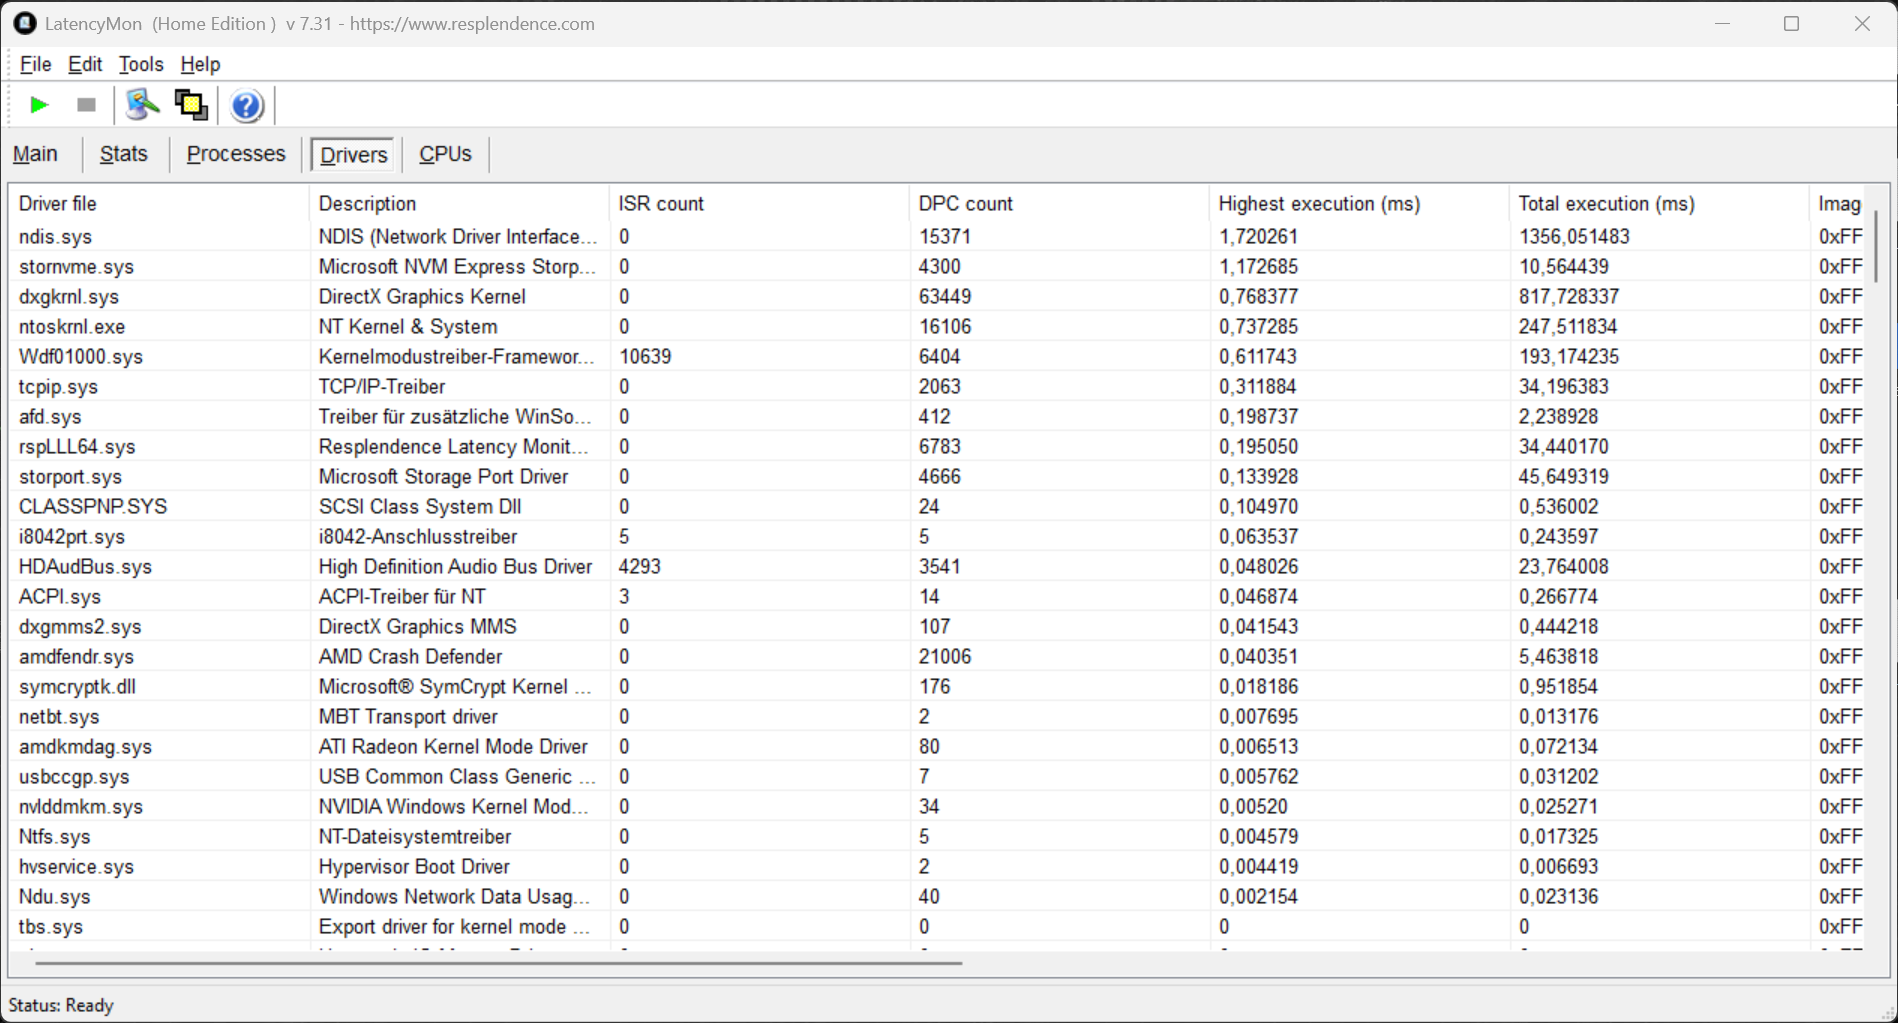
| DPC Latencies / LatencyMon - interrupt to process latency (max), Web, Youtube, Prime95 | |
| Chuwi Gamebook, R9 9955HX | |
| MSI Vector 16 HX AI A2XWHG | |
| Medion Erazer Major 16 X1 MD62736 | |
| Acer Predator Helios Neo 16S AI PHN16S-71-94L9 | |
| Schenker XMG Pro 16 (E25) | |
| Schenker XMG APEX 16 MAX | |
| Lenovo Legion 5 Pro 16IAX10H | |
* ... Moindre est la valeur, meilleures sont les performances
Stockage
L'Apex 16 Max supporte déjà le PCIe 5.0 et un Samsung 9100 Pro correspondant (2 TB, 1,73 TB utilisable) est installé dans le système de test. Les performances sont très bonnes et restent stables. Le deuxième emplacement M.2 2280 est connecté via PCIe 4.0.

* ... Moindre est la valeur, meilleures sont les performances
Performances en lecture continue : Boucle de lecture DiskSpd, profondeur de la file d'attente 8
Performance du GPU
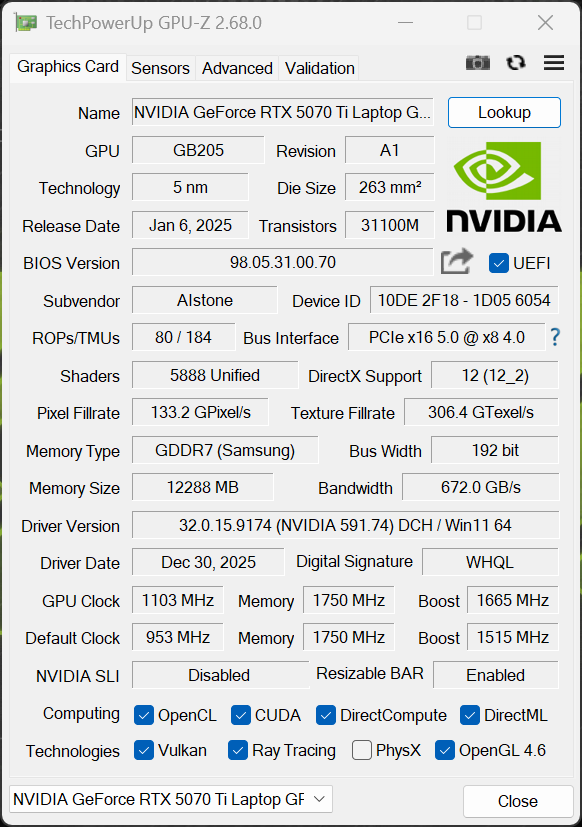
XMG utilise la version la plus rapide de 140 watts de la carte mobile GeForce RTX 5070 Ti avec 12 Go de VRAM. La commutation graphique est gérée par Optimus, mais un commutateur MUX est inclus. Les performances graphiques globales sont très bonnes et restent parfaitement stables, même en cas de charge prolongée. Sur batterie (40 watts), les performances sont inférieures d'environ 60 %.
| 3DMark 11 Performance | 45731 points | |
| 3DMark Fire Strike Score | 39568 points | |
| 3DMark Time Spy Score | 17095 points | |
| 3DMark Steel Nomad Score | 3953 points | |
| 3DMark Steel Nomad Light Score | 18188 points | |
Aide | ||
| Blender / v3.3 Classroom OPTIX/RTX | |
| Moyenne de la classe Gaming (9 - 32, n=122, 2 dernières années) | |
| Acer Predator Helios Neo 16S AI PHN16S-71-94L9 | |
| MSI Vector 16 HX AI A2XWHG | |
| Medion Erazer Major 16 X1 MD62736 | |
| Schenker XMG APEX 16 MAX | |
| Moyenne NVIDIA GeForce RTX 5070 Ti Laptop (13 - 19, n=12) | |
| Lenovo Legion 5 Pro 16IAX10H | |
| Schenker XMG Pro 16 (E25) | |
| Chuwi Gamebook, R9 9955HX | |
| Blender / v3.3 Classroom CUDA | |
| Moyenne de la classe Gaming (15 - 228, n=122, 2 dernières années) | |
| Acer Predator Helios Neo 16S AI PHN16S-71-94L9 | |
| Schenker XMG APEX 16 MAX | |
| Moyenne NVIDIA GeForce RTX 5070 Ti Laptop (24 - 33, n=12) | |
| Schenker XMG Pro 16 (E25) | |
| Medion Erazer Major 16 X1 MD62736 | |
| MSI Vector 16 HX AI A2XWHG | |
| Lenovo Legion 5 Pro 16IAX10H | |
| Chuwi Gamebook, R9 9955HX | |
| Blender / v3.3 Classroom CPU | |
| Moyenne de la classe Gaming (122 - 565, n=119, 2 dernières années) | |
| MSI Vector 16 HX AI A2XWHG | |
| Moyenne NVIDIA GeForce RTX 5070 Ti Laptop (122 - 361, n=12) | |
| Acer Predator Helios Neo 16S AI PHN16S-71-94L9 | |
| Medion Erazer Major 16 X1 MD62736 | |
| Lenovo Legion 5 Pro 16IAX10H | |
| Schenker XMG Pro 16 (E25) | |
| Chuwi Gamebook, R9 9955HX | |
| Schenker XMG APEX 16 MAX | |
* ... Moindre est la valeur, meilleures sont les performances
Performances des jeux
Les performances de jeu sont très bonnes, et tous les jeux modernes fonctionnent sans problème avec les paramètres de détail les plus élevés et la résolution native. Seul le ray tracing nécessite parfois un DLSS ou une génération d'images. Les performances restent également très stables lors de sessions de jeu prolongées.
| Strange Brigade - 1920x1080 ultra AA:ultra AF:16 | |
| Lenovo Legion 5 Pro 16IAX10H | |
| Schenker XMG APEX 16 MAX | |
| Chuwi Gamebook, R9 9955HX | |
| Moyenne de la classe Gaming (76.3 - 456, n=106, 2 dernières années) | |
| Schenker XMG Pro 16 (E25) | |
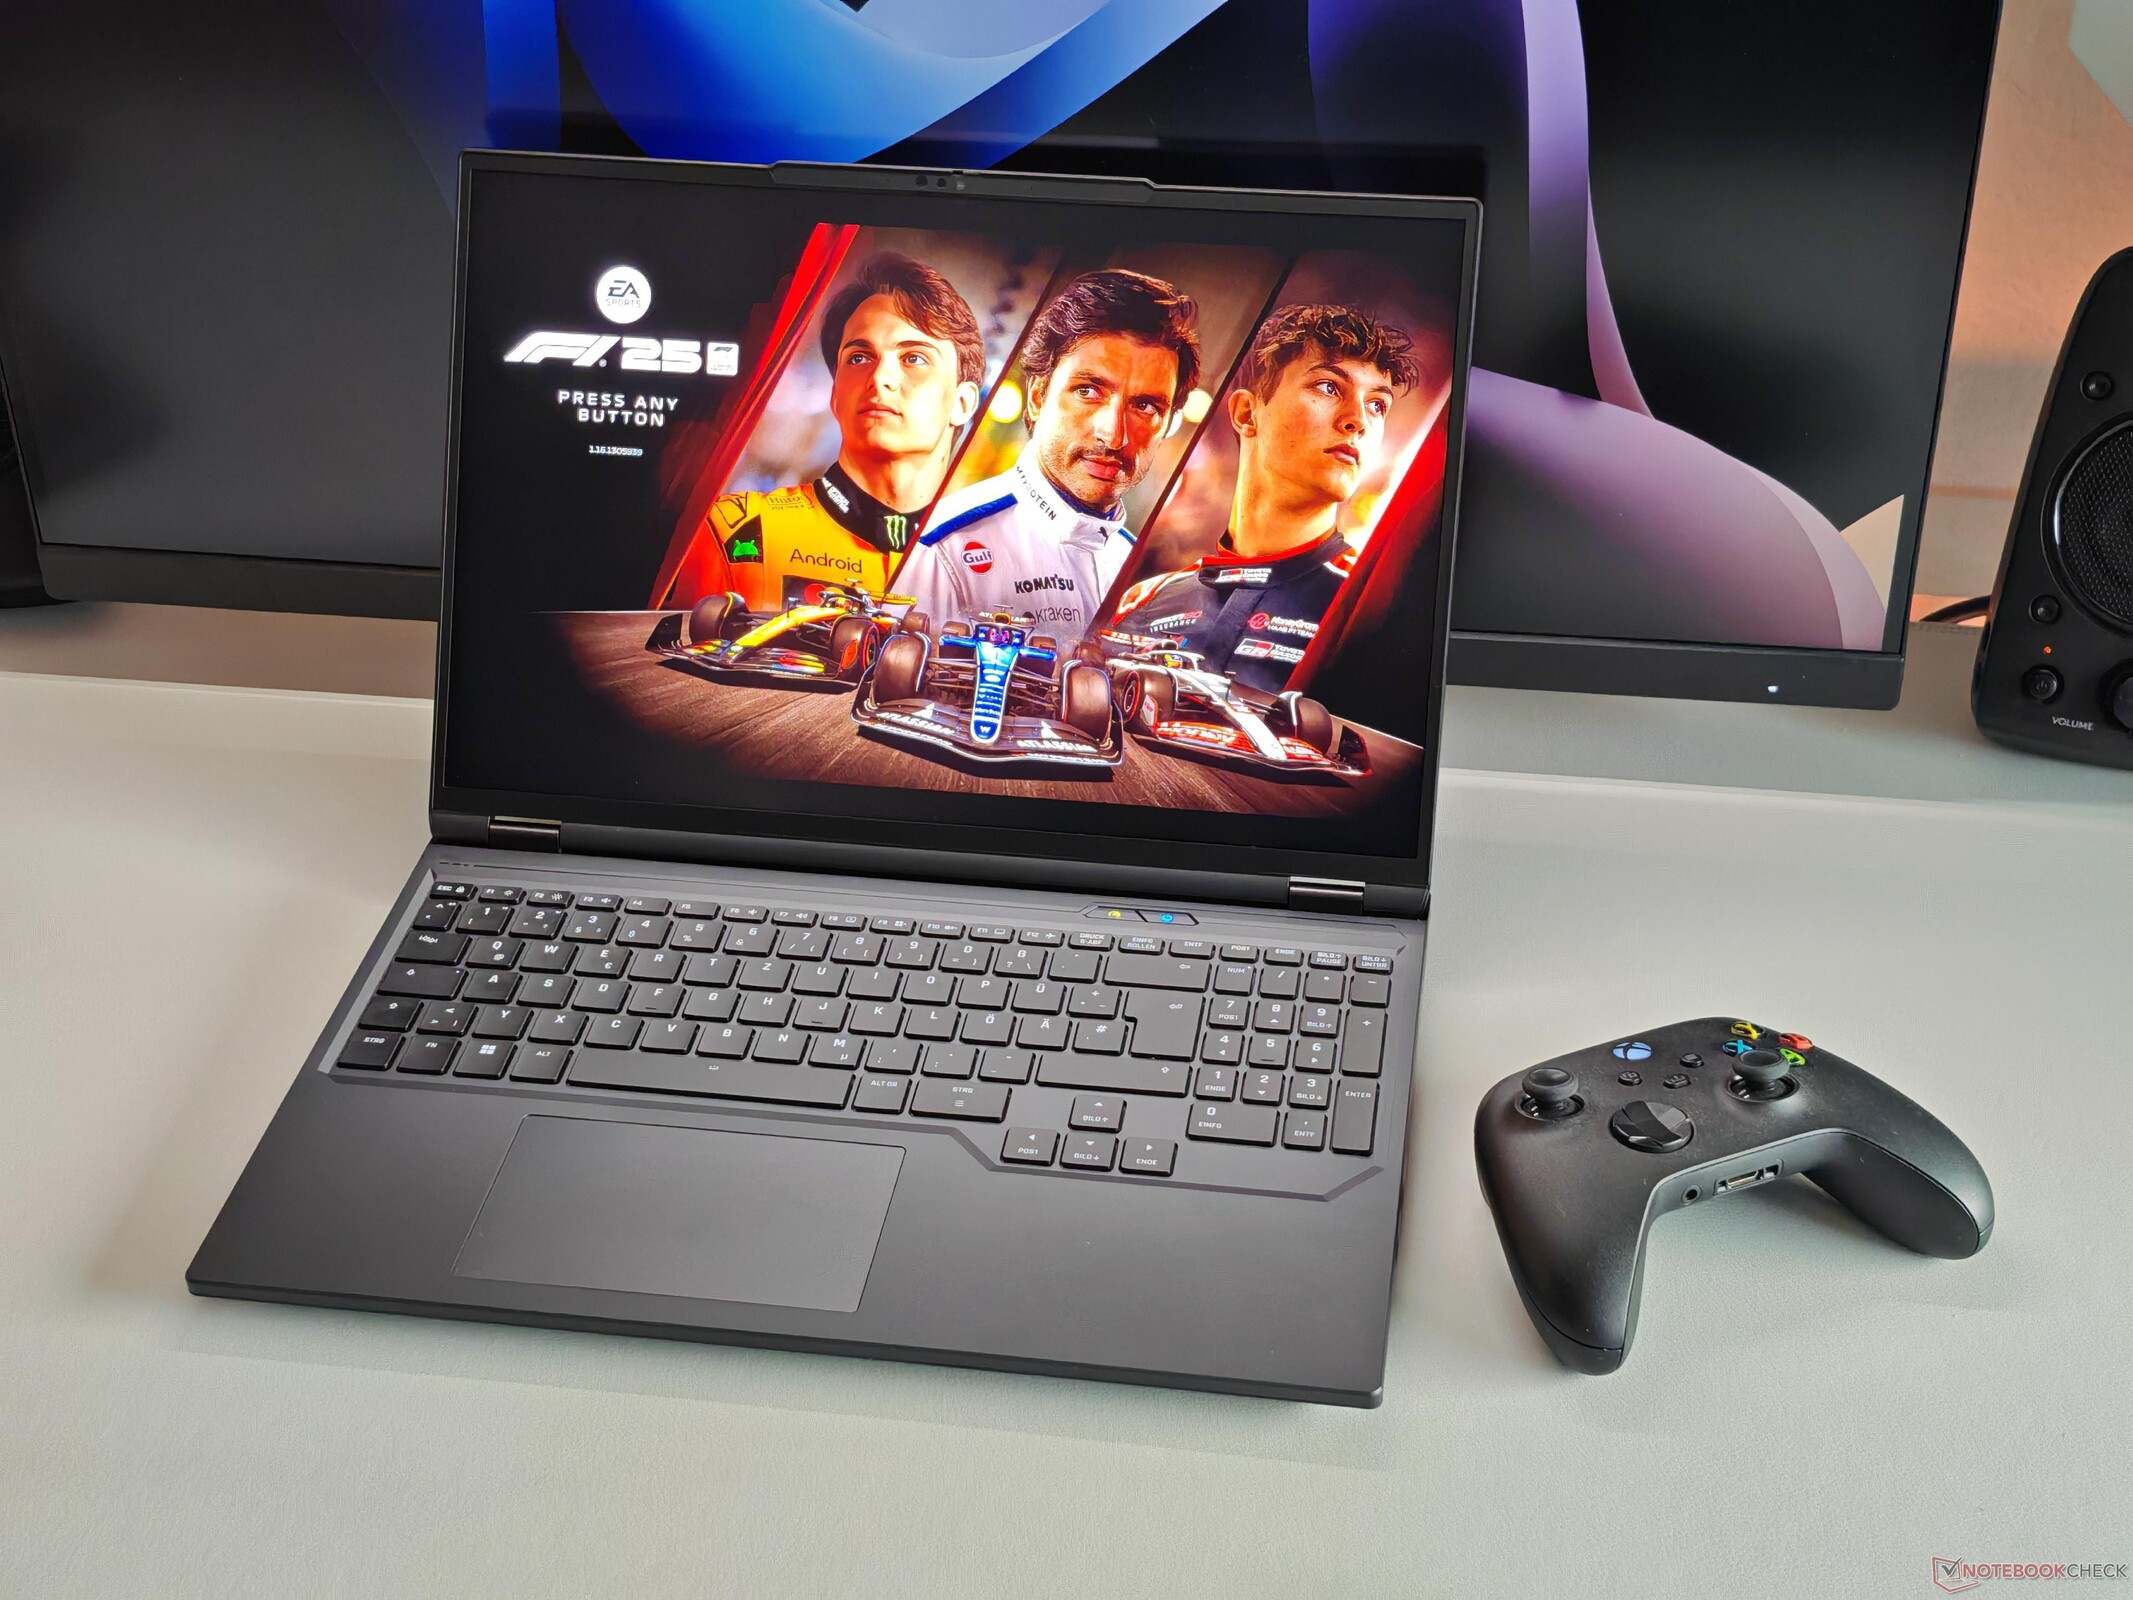
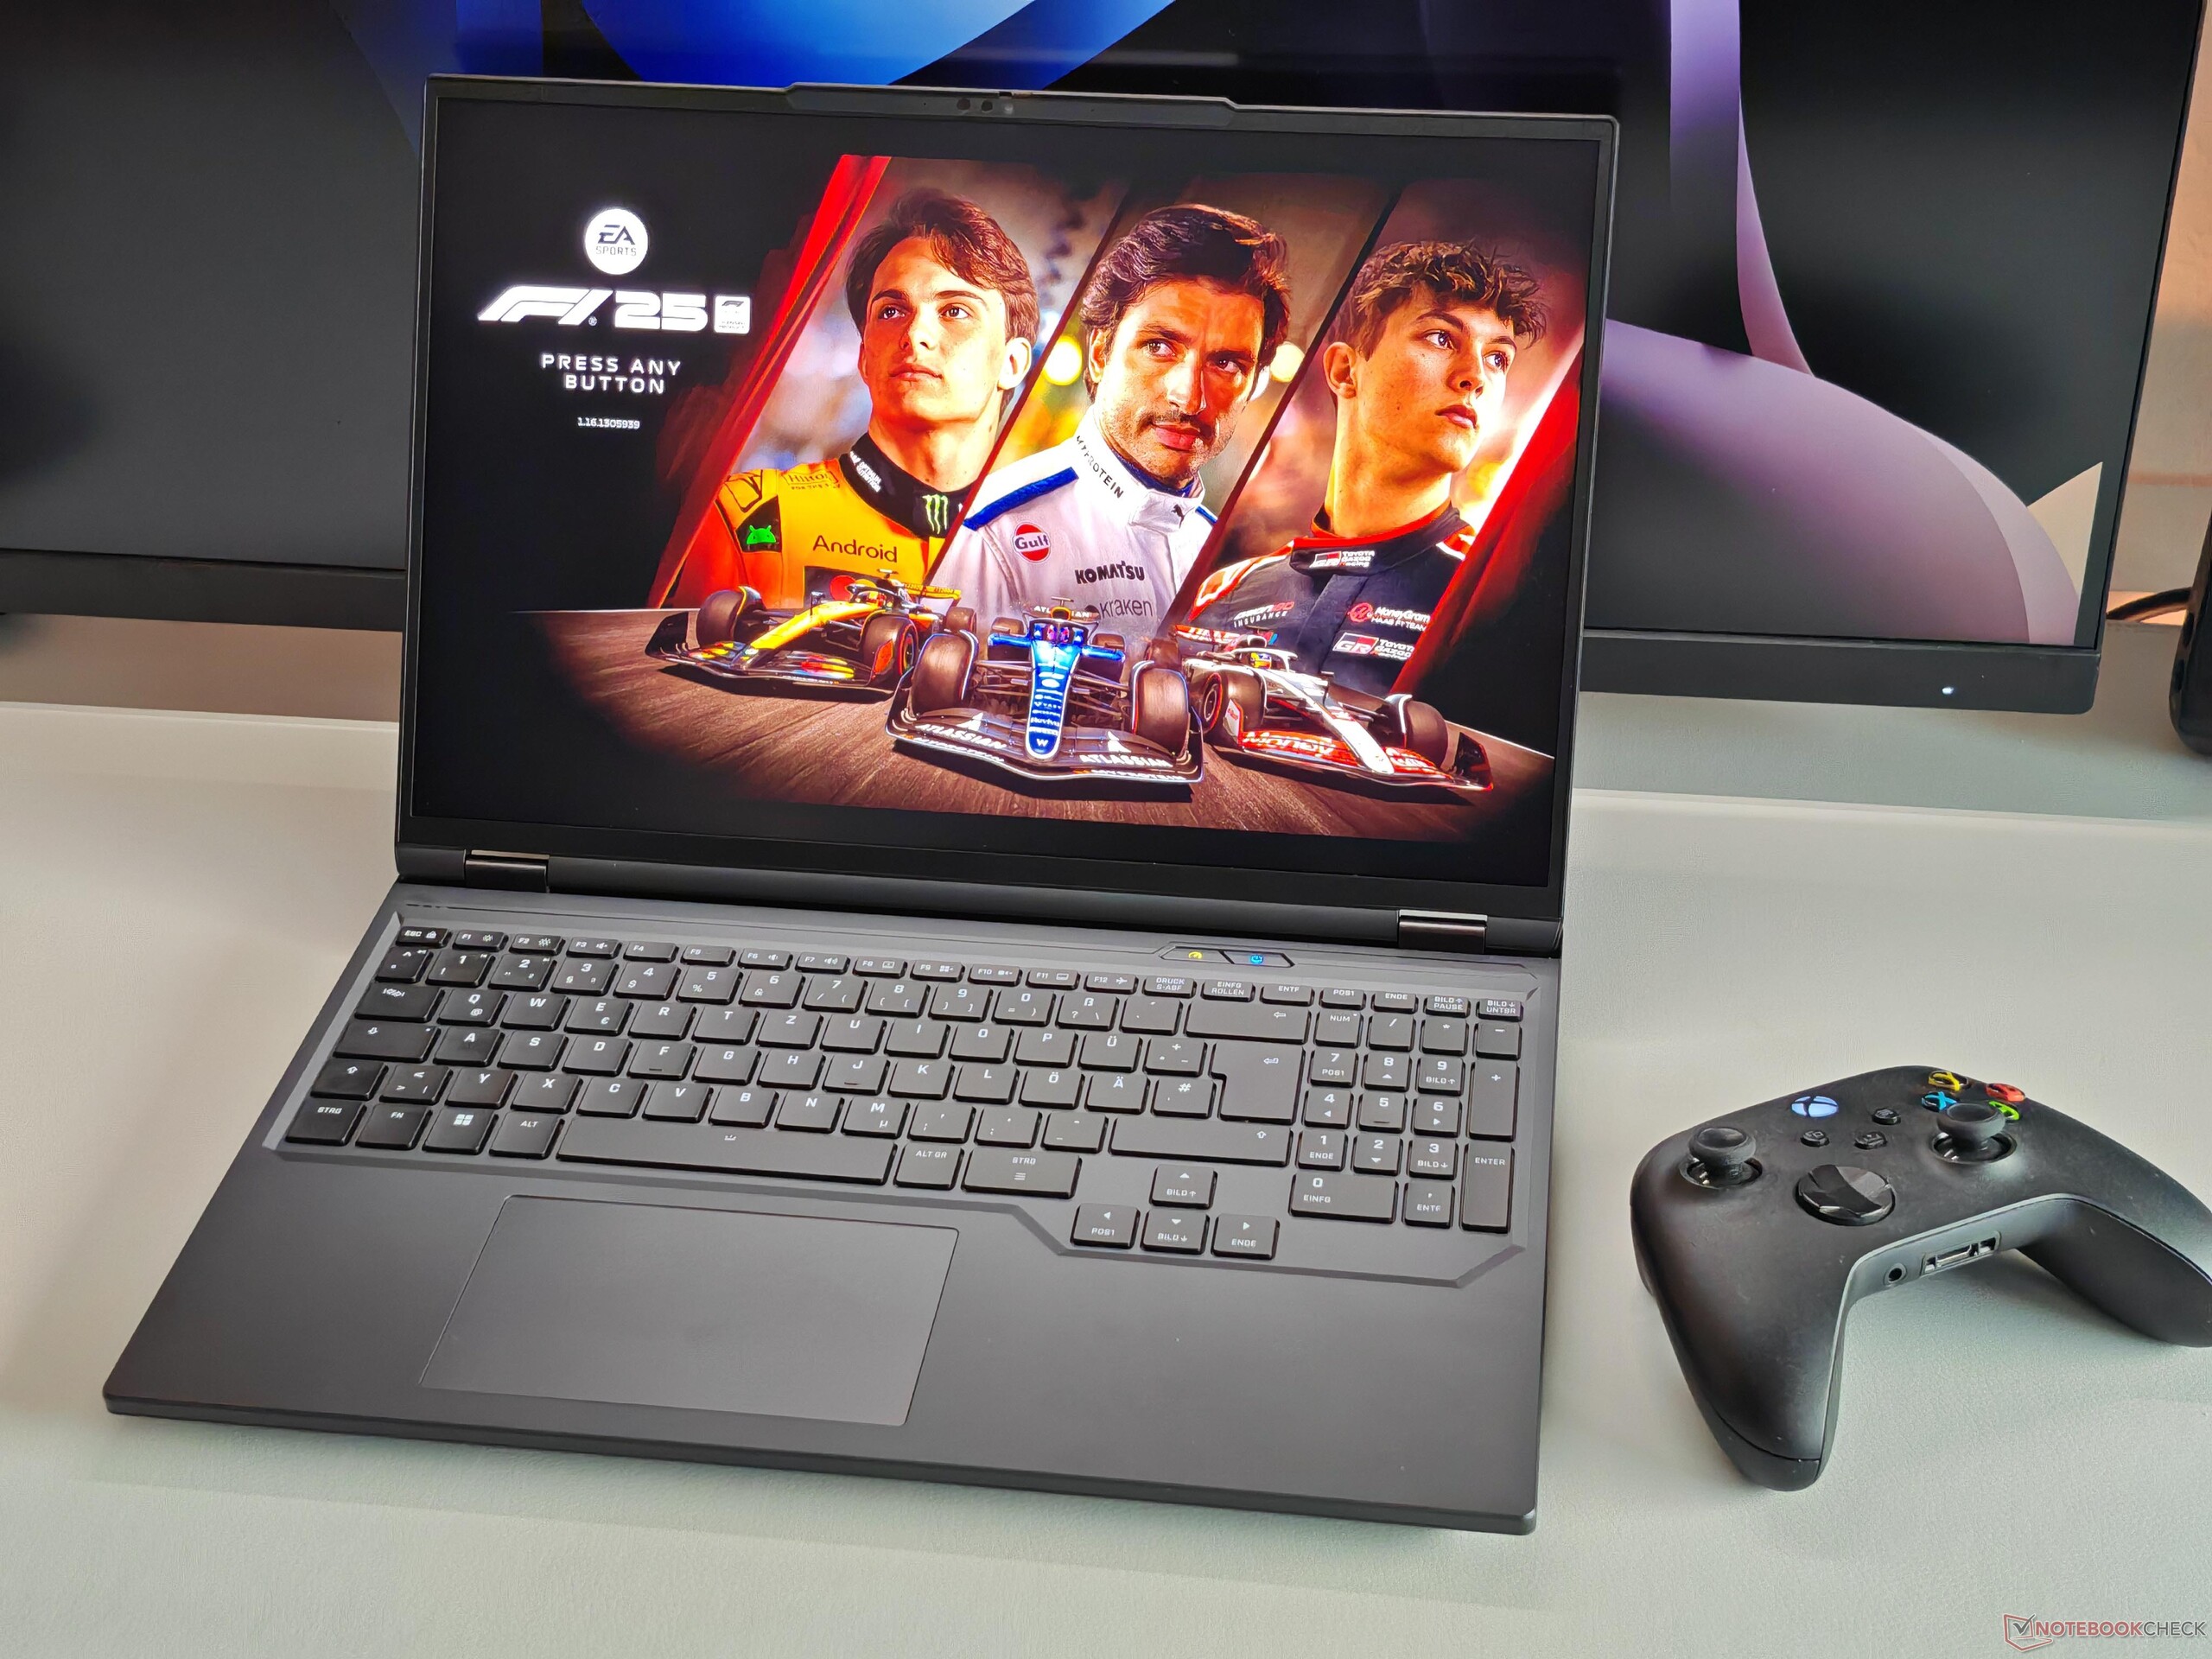
| F1 24 | |
| 2560x1440 Ultra High Preset AA:T AF:16x | |
| Schenker XMG APEX 16 MAX | |
| Schenker XMG Pro 16 (E25) | |
| Moyenne de la classe Gaming (29.8 - 106.9, n=57, 2 dernières années) | |
| Chuwi Gamebook, R9 9955HX | |
| Moyenne NVIDIA GeForce RTX 5070 Ti Laptop (53.2 - 72.1, n=8) | |
| 2560x1440 Ultra High Preset + Quality DLSS AF:16x | |
| Schenker XMG APEX 16 MAX | |
| Chuwi Gamebook, R9 9955HX | |
| Moyenne de la classe Gaming (14.3 - 159.3, n=45, 2 dernières années) | |
| Moyenne NVIDIA GeForce RTX 5070 Ti Laptop (78.1 - 115.8, n=7) | |
| F1 25 | |
| 2560x1440 Ultra Max Preset AA:T AF:16x | |
| Schenker XMG APEX 16 MAX | |
| Chuwi Gamebook, R9 9955HX | |
| Moyenne NVIDIA GeForce RTX 5070 Ti Laptop (18 - 26, n=6) | |
| Moyenne de la classe Gaming (5 - 37.5, n=21, 2 dernières années) | |
| Lenovo Legion 5 Pro 16IAX10H | |
| 2560x1440 Ultra Max Preset + DLSS Quality AA:DLSS AF:16x | |
| Schenker XMG APEX 16 MAX | |
| Chuwi Gamebook, R9 9955HX | |
| Moyenne NVIDIA GeForce RTX 5070 Ti Laptop (32 - 48.1, n=6) | |
| Moyenne de la classe Gaming (9 - 67.5, n=19, 2 dernières années) | |
| Lenovo Legion 5 Pro 16IAX10H | |

Cyberpunk 2077 ultra FPS chart
| Bas | Moyen | Élevé | Ultra | QHD DLSS | QHD | |
|---|---|---|---|---|---|---|
| GTA V (2015) | 166.3 | 157.3 | ||||
| Dota 2 Reborn (2015) | 259 | 240 | 209 | 188.4 | ||
| Final Fantasy XV Benchmark (2018) | 232 | 211 | 158.2 | 121.8 | ||
| X-Plane 11.11 (2018) | 155.8 | 123.9 | 105.6 | |||
| Strange Brigade (2018) | 579 | 468 | 387 | 340 | 236 | |
| Baldur's Gate 3 (2023) | 221 | 178.7 | 157.5 | 155.6 | 110.5 | |
| Cyberpunk 2077 (2023) | 183.7 | 164.6 | 140.6 | 128 | 96.1 | 82.9 |
| F1 24 (2024) | 315 | 270 | 110.6 | 112.4 | 72 | |
| F1 25 (2025) | 249 | 231 | 218 | 42.9 | 48.1 | 26 |
| Call of Duty Black Ops 7 (2025) | 239 | 188 | 151 | 60 | 39 |
Émissions et énergie
Émissions sonores

Le bruit des ventilateurs dépend en grande partie du mode de performance sélectionné. Le mode équilibré est le plus approprié pour une utilisation quotidienne, car les ventilateurs sont inactifs ou ne produisent qu'un faible bruit. En mode Overboost Normal, cependant, l'ordinateur portable devient très bruyant pendant les jeux à 51 dB(A)(Overboost Extreme: 55 dB(A), Enthusiast: 47.9 dB(A), Balanced: 43.3 dB(A), Battery : 35.8 dB(A)). Nous n'avons remarqué aucun bruit de bobine sur notre unité de test.
Degré de la nuisance sonore
| Au repos |
| 25.9 / 26.5 / 26.5 dB(A) |
| Fortement sollicité |
| 42.1 / 51 dB(A) |
 | ||
30 dB silencieux 40 dB(A) audible 50 dB(A) bruyant |
||
min: | ||
| Schenker XMG APEX 16 MAX R9 9955HX, GeForce RTX 5070 Ti Laptop | Acer Predator Helios Neo 16S AI PHN16S-71-94L9 Ultra 9 275HX, GeForce RTX 5070 Ti Laptop | Chuwi Gamebook, R9 9955HX R9 9955HX, GeForce RTX 5070 Ti Laptop | Medion Erazer Major 16 X1 MD62736 Ultra 7 255HX, GeForce RTX 5070 Ti Laptop | Lenovo Legion 5 Pro 16IAX10H Ultra 9 275HX, GeForce RTX 5070 Ti Laptop | MSI Vector 16 HX AI A2XWHG Ultra 7 255HX, GeForce RTX 5070 Ti Laptop | Schenker XMG Pro 16 (E25) Ultra 9 275HX, GeForce RTX 5070 Ti Laptop | |
|---|---|---|---|---|---|---|---|
| Noise | -9% | -3% | -7% | -7% | -13% | 1% | |
| arrêt / environnement * (dB) | 25.9 | 24 7% | 25 3% | 25 3% | 24 7% | 25 3% | 23.3 10% |
| Idle Minimum * (dB) | 25.9 | 24 7% | 26.3 -2% | 26 -0% | 24 7% | 33 -27% | 25 3% |
| Idle Average * (dB) | 26.5 | 30 -13% | 26.5 -0% | 27 -2% | 24 9% | 34 -28% | 25 6% |
| Idle Maximum * (dB) | 26.5 | 35 -32% | 27.3 -3% | 30 -13% | 30.9 -17% | 38 -43% | 25 6% |
| Load Average * (dB) | 42.1 | 53 -26% | 50.4 -20% | 53 -26% | 55.9 -33% | 46 -9% | 45.5 -8% |
| Cyberpunk 2077 ultra * (dB) | 51 | 52 -2% | 50.3 1% | 54 -6% | 56.72 -11% | 47 8% | 53.3 -5% |
| Load Maximum * (dB) | 51 | 54 -6% | 50.4 1% | 54 -6% | 56.72 -11% | 49 4% | 53.3 -5% |
| Witcher 3 ultra * (dB) | 50.4 |
* ... Moindre est la valeur, meilleures sont les performances
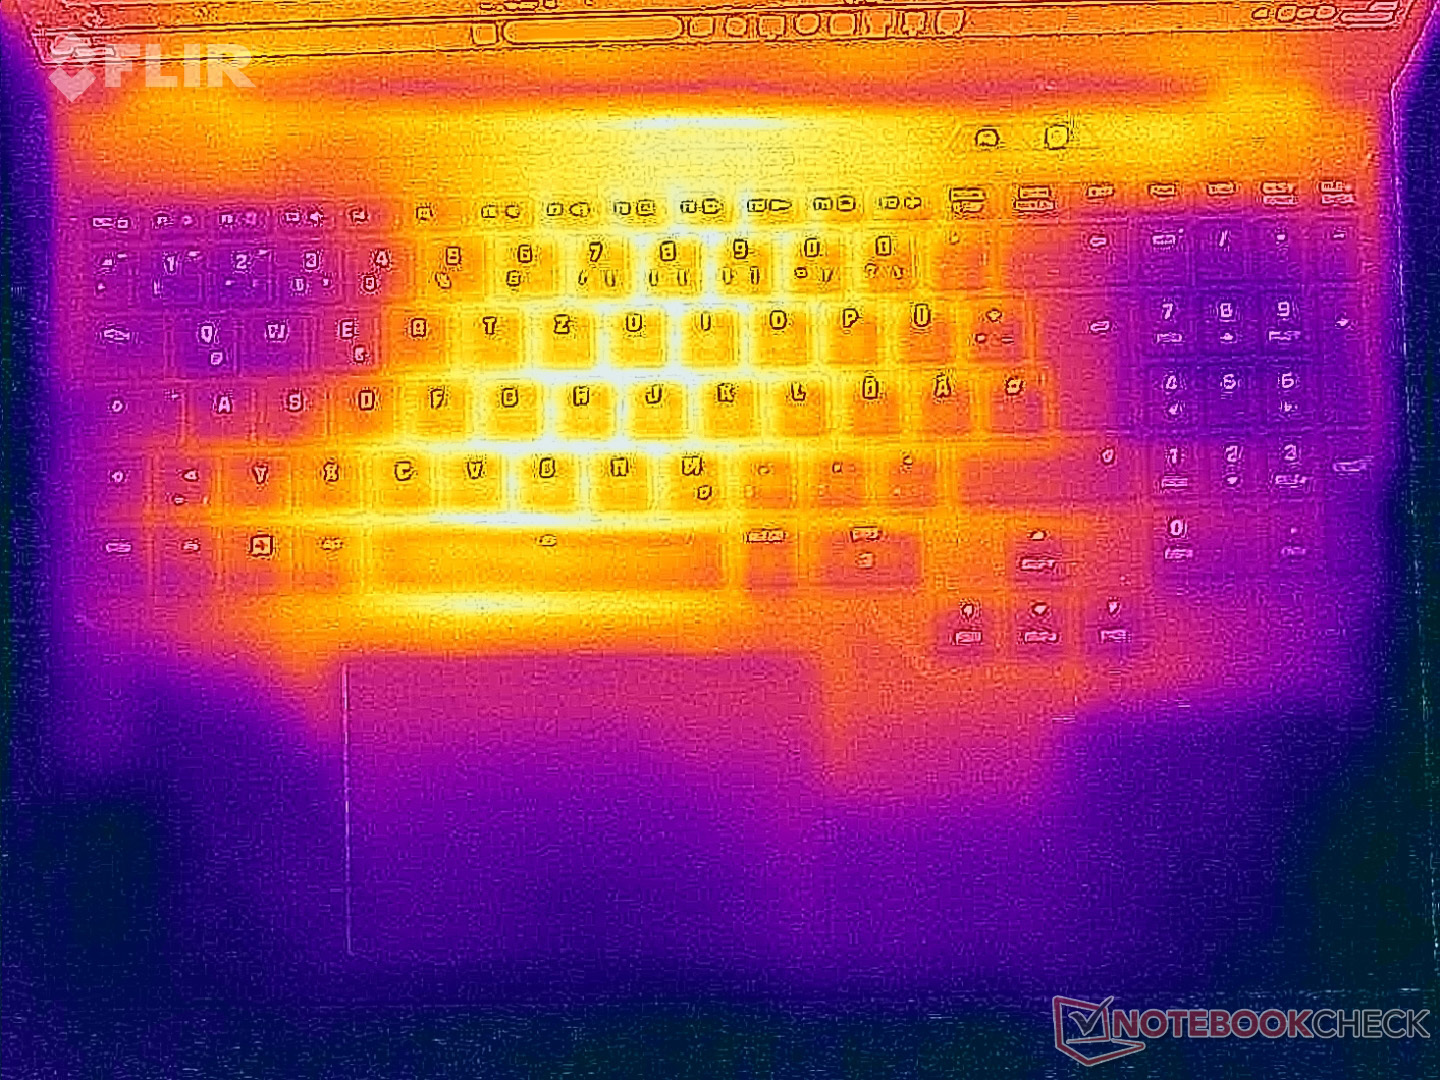
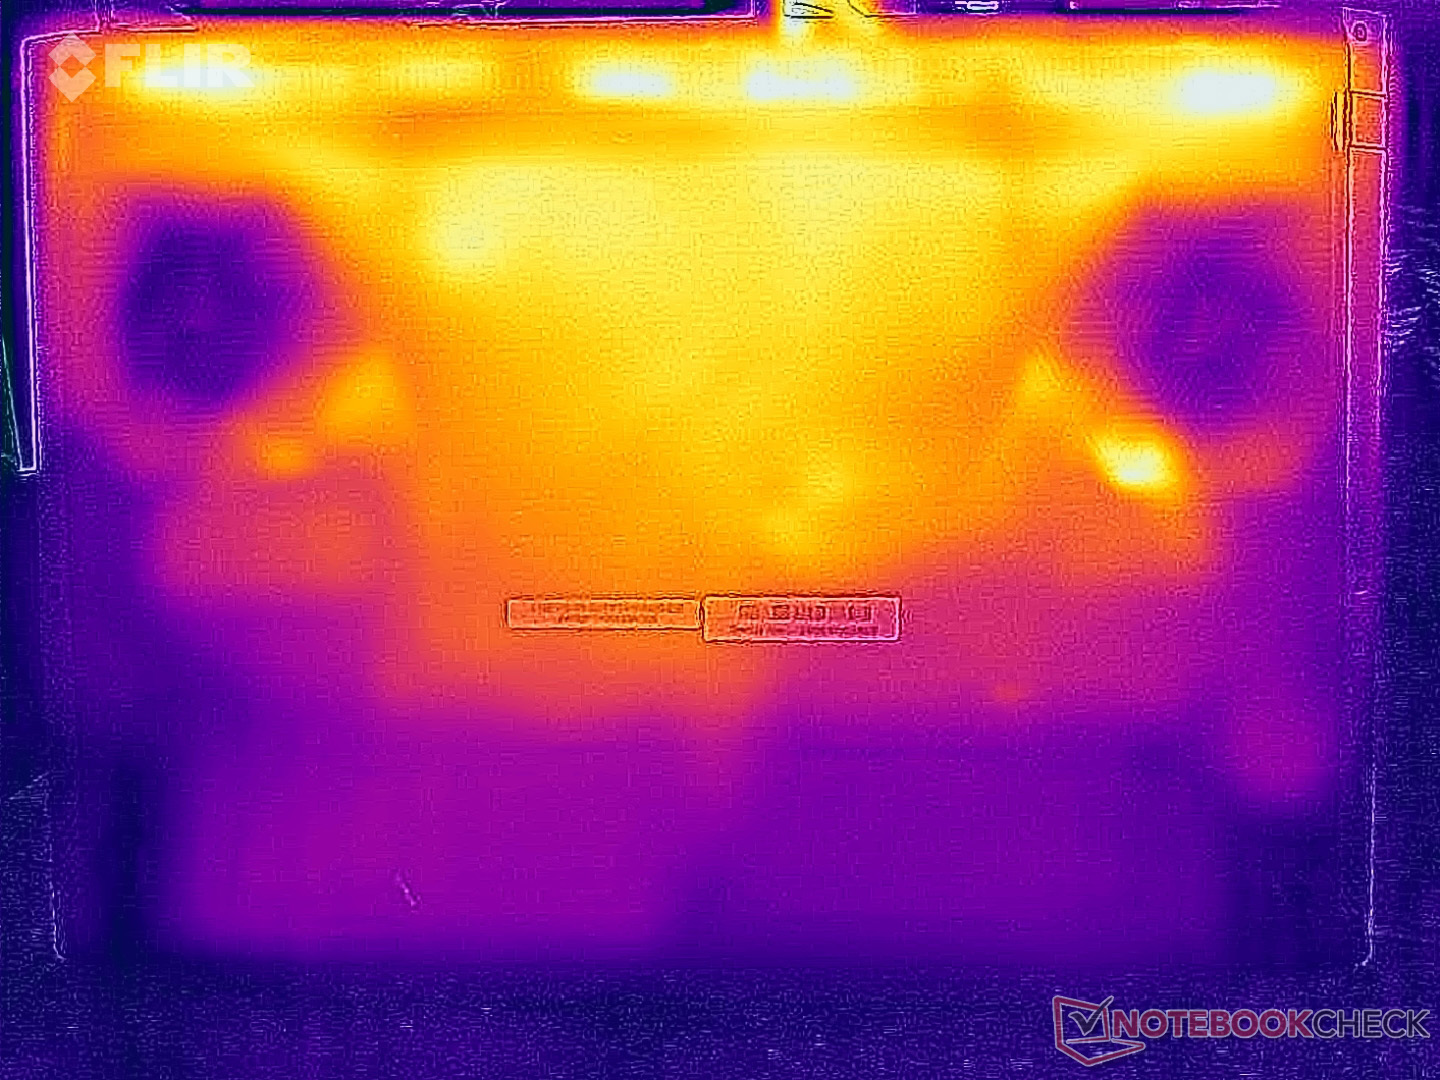
Température
Les températures de surface ne posent généralement pas de problème. Bien que nous ayons mesuré jusqu'à 46 °C sur le dessus et le dessous en cas de charge élevée, cela n'entraîne pas de réelles limitations. Dans le test de stress, le GPU est prioritaire (140 watts à 80 °C), tandis que le CPU se contente de 45 watts (70 °C).

(-) La température maximale du côté supérieur est de 46.5 °C / 116 F, par rapport à la moyenne de 40.4 °C / 105 F, allant de 21.2 à 68.8 °C pour la classe Gaming.
(-) Le fond chauffe jusqu'à un maximum de 46.4 °C / 116 F, contre une moyenne de 43.3 °C / 110 F
(+) En utilisation inactive, la température moyenne du côté supérieur est de 30.1 °C / 86 F, par rapport à la moyenne du dispositif de 33.9 °C / 93 F.
(-) 3: The average temperature for the upper side is 40 °C / 104 F, compared to the average of 33.9 °C / 93 F for the class Gaming.
(+) Les repose-poignets et le pavé tactile atteignent la température maximale de la peau (35.4 °C / 95.7 F) et ne sont donc pas chauds.
(-) La température moyenne de la zone de l'appui-paume de dispositifs similaires était de 28.8 °C / 83.8 F (-6.6 °C / #-11.9 F).
| Schenker XMG APEX 16 MAX R9 9955HX, GeForce RTX 5070 Ti Laptop | Acer Predator Helios Neo 16S AI PHN16S-71-94L9 Ultra 9 275HX, GeForce RTX 5070 Ti Laptop | Chuwi Gamebook, R9 9955HX R9 9955HX, GeForce RTX 5070 Ti Laptop | Medion Erazer Major 16 X1 MD62736 Ultra 7 255HX, GeForce RTX 5070 Ti Laptop | Lenovo Legion 5 Pro 16IAX10H Ultra 9 275HX, GeForce RTX 5070 Ti Laptop | MSI Vector 16 HX AI A2XWHG Ultra 7 255HX, GeForce RTX 5070 Ti Laptop | Schenker XMG Pro 16 (E25) Ultra 9 275HX, GeForce RTX 5070 Ti Laptop | |
|---|---|---|---|---|---|---|---|
| Heat | 2% | -5% | -9% | -14% | -4% | -167% | |
| Maximum Upper Side * (°C) | 46.5 | 47 -1% | 51.8 -11% | 49 -5% | 48 -3% | 53 -14% | 43.2 7% |
| Maximum Bottom * (°C) | 46.4 | 55 -19% | 46.6 -0% | 50 -8% | 50 -8% | 52 -12% | 46 1% |
| Idle Upper Side * (°C) | 32.1 | 28 13% | 34.9 -9% | 36 -12% | 38 -18% | 33 -3% | 27.7 14% |
| Idle Bottom * (°C) | 33.5 | 29 13% | 33.4 -0% | 37 -10% | 42 -25% | 29 13% | 264 -688% |
* ... Moindre est la valeur, meilleures sont les performances
Intervenants
Schenker XMG APEX 16 MAX analyse audio
(±) | le niveau sonore du haut-parleur est moyen mais bon (78.3# dB)
Basses 100 - 315 Hz
(-) | presque aucune basse - en moyenne 16.7% plus bas que la médiane
(±) | la linéarité des basses est moyenne (10.3% delta à la fréquence précédente)
Médiums 400 - 2000 Hz
(±) | médiane supérieure - en moyenne 5.6% supérieure à la médiane
(+) | les médiums sont linéaires (4.2% delta à la fréquence précédente)
Aiguës 2 - 16 kHz
(+) | des sommets équilibrés - à seulement 2.2% de la médiane
(+) | les aigus sont linéaires (6.2% delta à la fréquence précédente)
Globalement 100 - 16 000 Hz
(±) | la linéarité du son global est moyenne (16.8% de différence avec la médiane)
Par rapport à la même classe
» 43% de tous les appareils testés de cette catégorie étaient meilleurs, 11% similaires, 46% pires
» Le meilleur avait un delta de 6%, la moyenne était de 18%, le pire était de 132%.
Par rapport à tous les appareils testés
» 29% de tous les appareils testés étaient meilleurs, 8% similaires, 63% pires
» Le meilleur avait un delta de 4%, la moyenne était de 24%, le pire était de 134%.
Acer Predator Helios Neo 16S AI PHN16S-71-94L9 analyse audio
(+) | les haut-parleurs peuvent jouer relativement fort (86# dB)
Basses 100 - 315 Hz
(-) | presque aucune basse - en moyenne 24.8% plus bas que la médiane
(±) | la linéarité des basses est moyenne (12.6% delta à la fréquence précédente)
Médiums 400 - 2000 Hz
(±) | médiane supérieure - en moyenne 5.9% supérieure à la médiane
(+) | les médiums sont linéaires (6.4% delta à la fréquence précédente)
Aiguës 2 - 16 kHz
(+) | des sommets équilibrés - à seulement 2.8% de la médiane
(+) | les aigus sont linéaires (5.9% delta à la fréquence précédente)
Globalement 100 - 16 000 Hz
(±) | la linéarité du son global est moyenne (17.3% de différence avec la médiane)
Par rapport à la même classe
» 47% de tous les appareils testés de cette catégorie étaient meilleurs, 12% similaires, 41% pires
» Le meilleur avait un delta de 6%, la moyenne était de 18%, le pire était de 132%.
Par rapport à tous les appareils testés
» 32% de tous les appareils testés étaient meilleurs, 8% similaires, 60% pires
» Le meilleur avait un delta de 4%, la moyenne était de 24%, le pire était de 134%.
Chuwi Gamebook, R9 9955HX analyse audio
(±) | le niveau sonore du haut-parleur est moyen mais bon (75.7# dB)
Basses 100 - 315 Hz
(-) | presque aucune basse - en moyenne 18.7% plus bas que la médiane
(±) | la linéarité des basses est moyenne (10.3% delta à la fréquence précédente)
Médiums 400 - 2000 Hz
(±) | médiane supérieure - en moyenne 7.2% supérieure à la médiane
(±) | la linéarité des médiums est moyenne (9.9% delta à la fréquence précédente)
Aiguës 2 - 16 kHz
(+) | des sommets équilibrés - à seulement 3.2% de la médiane
(±) | la linéarité des aigus est moyenne (8.1% delta à la fréquence précédente)
Globalement 100 - 16 000 Hz
(±) | la linéarité du son global est moyenne (21.2% de différence avec la médiane)
Par rapport à la même classe
» 76% de tous les appareils testés de cette catégorie étaient meilleurs, 4% similaires, 20% pires
» Le meilleur avait un delta de 6%, la moyenne était de 18%, le pire était de 132%.
Par rapport à tous les appareils testés
» 59% de tous les appareils testés étaient meilleurs, 7% similaires, 34% pires
» Le meilleur avait un delta de 4%, la moyenne était de 24%, le pire était de 134%.
Medion Erazer Major 16 X1 MD62736 analyse audio
(+) | les haut-parleurs peuvent jouer relativement fort (82# dB)
Basses 100 - 315 Hz
(-) | presque aucune basse - en moyenne 19.4% plus bas que la médiane
(±) | la linéarité des basses est moyenne (13.5% delta à la fréquence précédente)
Médiums 400 - 2000 Hz
(±) | médiane supérieure - en moyenne 8.4% supérieure à la médiane
(±) | la linéarité des médiums est moyenne (9.1% delta à la fréquence précédente)
Aiguës 2 - 16 kHz
(+) | des sommets équilibrés - à seulement 4.2% de la médiane
(+) | les aigus sont linéaires (6.4% delta à la fréquence précédente)
Globalement 100 - 16 000 Hz
(±) | la linéarité du son global est moyenne (20.8% de différence avec la médiane)
Par rapport à la même classe
» 75% de tous les appareils testés de cette catégorie étaient meilleurs, 4% similaires, 21% pires
» Le meilleur avait un delta de 6%, la moyenne était de 18%, le pire était de 132%.
Par rapport à tous les appareils testés
» 56% de tous les appareils testés étaient meilleurs, 8% similaires, 36% pires
» Le meilleur avait un delta de 4%, la moyenne était de 24%, le pire était de 134%.
Lenovo Legion 5 Pro 16IAX10H analyse audio
(±) | le niveau sonore du haut-parleur est moyen mais bon (78.2# dB)
Basses 100 - 315 Hz
(-) | presque aucune basse - en moyenne 21.1% plus bas que la médiane
(±) | la linéarité des basses est moyenne (8% delta à la fréquence précédente)
Médiums 400 - 2000 Hz
(±) | médiane supérieure - en moyenne 6.3% supérieure à la médiane
(+) | les médiums sont linéaires (6.5% delta à la fréquence précédente)
Aiguës 2 - 16 kHz
(+) | des sommets équilibrés - à seulement 1.6% de la médiane
(+) | les aigus sont linéaires (4.9% delta à la fréquence précédente)
Globalement 100 - 16 000 Hz
(±) | la linéarité du son global est moyenne (18.3% de différence avec la médiane)
Par rapport à la même classe
» 57% de tous les appareils testés de cette catégorie étaient meilleurs, 9% similaires, 34% pires
» Le meilleur avait un delta de 6%, la moyenne était de 18%, le pire était de 132%.
Par rapport à tous les appareils testés
» 40% de tous les appareils testés étaient meilleurs, 8% similaires, 53% pires
» Le meilleur avait un delta de 4%, la moyenne était de 24%, le pire était de 134%.
MSI Vector 16 HX AI A2XWHG analyse audio
(+) | les haut-parleurs peuvent jouer relativement fort (86# dB)
Basses 100 - 315 Hz
(±) | basse réduite - en moyenne 12.3% inférieure à la médiane
(±) | la linéarité des basses est moyenne (8.5% delta à la fréquence précédente)
Médiums 400 - 2000 Hz
(±) | médiane supérieure - en moyenne 9.9% supérieure à la médiane
(+) | les médiums sont linéaires (6.8% delta à la fréquence précédente)
Aiguës 2 - 16 kHz
(+) | des sommets équilibrés - à seulement 1.8% de la médiane
(+) | les aigus sont linéaires (2.9% delta à la fréquence précédente)
Globalement 100 - 16 000 Hz
(±) | la linéarité du son global est moyenne (15.8% de différence avec la médiane)
Par rapport à la même classe
» 36% de tous les appareils testés de cette catégorie étaient meilleurs, 7% similaires, 57% pires
» Le meilleur avait un delta de 6%, la moyenne était de 18%, le pire était de 132%.
Par rapport à tous les appareils testés
» 24% de tous les appareils testés étaient meilleurs, 5% similaires, 71% pires
» Le meilleur avait un delta de 4%, la moyenne était de 24%, le pire était de 134%.
Schenker XMG Pro 16 (E25) analyse audio
(±) | le niveau sonore du haut-parleur est moyen mais bon (79.2# dB)
Basses 100 - 315 Hz
(±) | basse réduite - en moyenne 14.2% inférieure à la médiane
(±) | la linéarité des basses est moyenne (10.6% delta à la fréquence précédente)
Médiums 400 - 2000 Hz
(±) | médiane supérieure - en moyenne 8.2% supérieure à la médiane
(±) | la linéarité des médiums est moyenne (9.9% delta à la fréquence précédente)
Aiguës 2 - 16 kHz
(+) | des sommets équilibrés - à seulement 3.8% de la médiane
(+) | les aigus sont linéaires (5.9% delta à la fréquence précédente)
Globalement 100 - 16 000 Hz
(±) | la linéarité du son global est moyenne (18.5% de différence avec la médiane)
Par rapport à la même classe
» 60% de tous les appareils testés de cette catégorie étaient meilleurs, 8% similaires, 32% pires
» Le meilleur avait un delta de 6%, la moyenne était de 18%, le pire était de 132%.
Par rapport à tous les appareils testés
» 41% de tous les appareils testés étaient meilleurs, 8% similaires, 51% pires
» Le meilleur avait un delta de 4%, la moyenne était de 24%, le pire était de 134%.
Consommation d'énergie
La luminosité du panneau Mini-LED est particulièrement remarquable en termes de consommation d'énergie au repos. Au début du test de stress, nous avons brièvement mesuré jusqu'à 320 watts, avant que la consommation ne se stabilise à 242 watts. L'adaptateur de 280 watts est donc bien dimensionné. En revanche, la consommation en veille de plus de 3 watts est trop élevée.
| Éteint/en veille | |
| Au repos | |
| Fortement sollicité |
|
Légende:
min: | |
| Schenker XMG APEX 16 MAX R9 9955HX, GeForce RTX 5070 Ti Laptop, Samsung 9100 Pro 2 TB, Mini-LED, 2560x1600, 16" | Acer Predator Helios Neo 16S AI PHN16S-71-94L9 Ultra 9 275HX, GeForce RTX 5070 Ti Laptop, Micron 3500 1TB MTFDKBA1T0TGD, OLED, 2560x1600, 16" | Chuwi Gamebook, R9 9955HX R9 9955HX, GeForce RTX 5070 Ti Laptop, YMTC PC41Q-1TB-B, IPS, 2560x1600, 16" | Medion Erazer Major 16 X1 MD62736 Ultra 7 255HX, GeForce RTX 5070 Ti Laptop, Phison E31 2 TB, IPS, 2560x1600, 16" | Lenovo Legion 5 Pro 16IAX10H Ultra 9 275HX, GeForce RTX 5070 Ti Laptop, Western Digital PC SN8000S SDEPNRK-1T00, OLED, 2560x1600, 16" | MSI Vector 16 HX AI A2XWHG Ultra 7 255HX, GeForce RTX 5070 Ti Laptop, Micron 2400 MTFDKBA512QFM, IPS, 2560x1600, 16" | Schenker XMG Pro 16 (E25) Ultra 9 275HX, GeForce RTX 5070 Ti Laptop, Samsung 9100 Pro 1 TB, IPS, 2560x1600, 16" | Moyenne NVIDIA GeForce RTX 5070 Ti Laptop | Moyenne de la classe Gaming | |
|---|---|---|---|---|---|---|---|---|---|
| Power Consumption | 41% | 6% | 8% | 7% | 16% | 16% | 12% | 21% | |
| Idle Minimum * (Watt) | 15.4 | 3.9 75% | 16.4 -6% | 17.8 -16% | 14 9% | 7.1 54% | 11.7 24% | 14.1 ? 8% | 13.5 ? 12% |
| Idle Average * (Watt) | 29.9 | 11 63% | 21.2 29% | 20.7 31% | 14.3 52% | 15.9 47% | 16.6 44% | 22.8 ? 24% | 19.3 ? 35% |
| Idle Maximum * (Watt) | 30.1 | 16.9 44% | 28.3 6% | 23.4 22% | 20.1 33% | 29.5 2% | 17.1 43% | 26.4 ? 12% | 24.7 ? 18% |
| Load Average * (Watt) | 136.4 | 123 10% | 145.6 -7% | 110 19% | 177 -30% | 124 9% | 122.4 10% | 129.9 ? 5% | 108.6 ? 20% |
| Cyberpunk 2077 ultra * (Watt) | 231 | 152.7 34% | 221 4% | 233 -1% | 255 -10% | 222 4% | 245 -6% | ||
| Cyberpunk 2077 ultra external monitor * (Watt) | 226 | 144.9 36% | 218 4% | 232 -3% | 255 -13% | 217 4% | 241 -7% | ||
| Load Maximum * (Watt) | 315 | 229 27% | 284 10% | 297 6% | 294 7% | 336 -7% | 291.5 7% | 283 ? 10% | 254 ? 19% |
* ... Moindre est la valeur, meilleures sont les performances
consommation d'énergie Cyberpunk / Stress test
consommation d'énergie avec moniteur externe
Durée de vie de la batterie
Malgré la grande batterie de 99 Wh, la consommation d'énergie élevée se traduit par des durées d'utilisation courtes. Lors du test Wi-Fi à 150 cd/m², nous avons mesuré une autonomie d'un peu moins de 5 heures, qui tombe à un peu moins de 3 heures à pleine luminosité.
| Schenker XMG APEX 16 MAX R9 9955HX, GeForce RTX 5070 Ti Laptop, 99.8 Wh | Acer Predator Helios Neo 16S AI PHN16S-71-94L9 Ultra 9 275HX, GeForce RTX 5070 Ti Laptop, 76 Wh | Chuwi Gamebook, R9 9955HX R9 9955HX, GeForce RTX 5070 Ti Laptop, 77 Wh | Medion Erazer Major 16 X1 MD62736 Ultra 7 255HX, GeForce RTX 5070 Ti Laptop, 80 Wh | Lenovo Legion 5 Pro 16IAX10H Ultra 9 275HX, GeForce RTX 5070 Ti Laptop, 80 Wh | MSI Vector 16 HX AI A2XWHG Ultra 7 255HX, GeForce RTX 5070 Ti Laptop, 90 Wh | Schenker XMG Pro 16 (E25) Ultra 9 275HX, GeForce RTX 5070 Ti Laptop, 99.8 Wh | Moyenne de la classe Gaming | |
|---|---|---|---|---|---|---|---|---|
| Battery Runtime | 2% | 0% | 29% | -4% | 43% | 100% | 59% | |
| WiFi Websurfing (h) | 4.9 | 5 2% | 4.9 0% | 6.3 29% | 4.9 0% | 7 43% | 9.1 86% | 6.8 ? 39% |
| WiFi Websurfing max. Brightness (h) | 2.9 | 2.7 -7% | 6.2 114% | 5.16 ? 78% |
Notebookcheck note globale
Schenker XMG APEX 16 MAX
- 01/16/2026 v8
Andreas Osthoff
 Total Sustainability Score:
 Comparaison des alternatives possibles
Image | Modèle | Prix | Poids | Épaisseur | Écran |
|---|---|---|---|---|---|
1. 87.8%  | Schenker XMG APEX 16 MAX AMD Ryzen 9 9955HX ⎘ NVIDIA GeForce RTX 5070 Ti Laptop ⎘ 64 Go Mémoire, 2048 Go SSD | Amazon: Prix de liste: 2815€ | 2.7 kg | 26 mm | 16.00" 2560x1600 189 PPI Mini-LED |
2. 82%  | Acer Predator Helios Neo 16S AI PHN16S-71-94L9 Intel Core Ultra 9 275HX ⎘ NVIDIA GeForce RTX 5070 Ti Laptop ⎘ 32 Go Mémoire, 1024 Go SSD | Amazon: Prix de liste: 2400 EUR | 2.2 kg | 19.9 mm | 16.00" 2560x1600 189 PPI OLED |
3. 84.9%  | Chuwi Gamebook, R9 9955HX AMD Ryzen 9 9955HX ⎘ NVIDIA GeForce RTX 5070 Ti Laptop ⎘ 32 Go Mémoire, 1024 Go SSD | Amazon: 1. $379.89 CHUWI MiniBook X 2-in-1 Lapt... 2. $378.99 CHUWI 2-in-1 Touchscreen Lap... 3. $278.99 CHUWI 2 in 1 Laptop 10.1", I... Prix de liste: 2300 EUR | 2.5 kg | 21.4 mm | 16.00" 2560x1600 189 PPI IPS |
4. 85.2%  | Medion Erazer Major 16 X1 MD62736 Intel Core Ultra 7 255HX ⎘ NVIDIA GeForce RTX 5070 Ti Laptop ⎘ 32 Go Mémoire, SSD | Amazon: Prix de liste: 2600 EUR | 2.5 kg | 22.7 mm | 16.00" 2560x1600 189 PPI IPS |
5. 84.5% 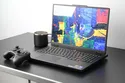 | Lenovo Legion 5 Pro 16IAX10H Intel Core Ultra 9 275HX ⎘ NVIDIA GeForce RTX 5070 Ti Laptop ⎘ 32 Go Mémoire, 1024 Go SSD | Amazon: 1. $1,549.00 Lenovo Legion 5 Pro Gaming A... 2. $99.99 Lenovo Slim 245W AC Adapter ... 3. $1,699.99 Lenovo Legion 5 Pro 5i Gen 1... Prix de liste: 2500 Euro | 2.4 kg | 25.95 mm | 16.00" 2560x1600 189 PPI OLED |
6. 84%  | MSI Vector 16 HX AI A2XWHG Intel Core Ultra 7 255HX ⎘ NVIDIA GeForce RTX 5070 Ti Laptop ⎘ 16 Go Mémoire, 512 Go SSD | Amazon: Prix de liste: 2000 EUR | 2.6 kg | 28.6 mm | 16.00" 2560x1600 189 PPI IPS |
7. 87.4%  | Schenker XMG Pro 16 (E25) Intel Core Ultra 9 275HX ⎘ NVIDIA GeForce RTX 5070 Ti Laptop ⎘ 32 Go Mémoire, 1024 Go SSD | Amazon: 1. atFoliX Plastic Glass Protec... 2. atFoliX Screen Protection Fi... 3. atFoliX Screen Protector com... Prix de liste: 2480€ | 2.5 kg | 26.5 mm | 16.00" 2560x1600 189 PPI IPS |
Transparency
La sélection des appareils à examiner est effectuée par notre équipe éditoriale. L'échantillon de test a été prêté à l'auteur par le fabricant ou le détaillant pour les besoins de cet examen. Le prêteur n'a pas eu d'influence sur cette évaluation et le fabricant n'a pas reçu de copie de cette évaluation avant sa publication. Il n'y avait aucune obligation de publier cet article. En tant que média indépendant, Notebookcheck n'est pas soumis à l'autorité des fabricants, des détaillants ou des éditeurs.
Voici comment Notebookcheck teste
Chaque année, Notebookcheck examine de manière indépendante des centaines d'ordinateurs portables et de smartphones en utilisant des procédures standardisées afin de garantir que tous les résultats sont comparables. Nous avons continuellement développé nos méthodes de test depuis environ 20 ans et avons établi des normes industrielles dans le processus. Dans nos laboratoires de test, des équipements de mesure de haute qualité sont utilisés par des techniciens et des rédacteurs expérimentés. Ces tests impliquent un processus de validation en plusieurs étapes. Notre système d'évaluation complexe repose sur des centaines de mesures et de points de référence bien fondés, ce qui garantit l'objectivité.