Courte critique du MSI GF75 Thin 9SC (i7-9750H, GTX 1650, FHD) : un PC portable à la prestation mitigéé

| Networking | |
| iperf3 transmit AX12 | |
| MSI GP75 Leopard 9SD | |
| MSI GF75 Thin 9SC | |
| MSI GF72VR 7RF | |
| Asus TUF FX705DT-AU068T | |
| iperf3 receive AX12 | |
| MSI GP75 Leopard 9SD | |
| MSI GF72VR 7RF | |
| MSI GF75 Thin 9SC | |
| Asus TUF FX705DT-AU068T | |
| |||||||||||||||||||||||||
Homogénéité de la luminosité: 91 %
Valeur mesurée au centre, sur batterie: 344.7 cd/m²
Contraste: 1149:1 (Valeurs des noirs: 0.3 cd/m²)
ΔE ColorChecker Calman: 3.08 | ∀{0.5-29.43 Ø4.71}
calibrated: 2.94
ΔE Greyscale Calman: 3.8 | ∀{0.09-98 Ø4.96}
89.6% sRGB (Argyll 1.6.3 3D)
58% AdobeRGB 1998 (Argyll 1.6.3 3D)
64% AdobeRGB 1998 (Argyll 3D)
90% sRGB (Argyll 3D)
62.5% Display P3 (Argyll 3D)
Gamma: 2.17
CCT: 7284 K
| MSI GF75 Thin 9SC AU Optronics B173HAN04.2, IPS, 17.3", 1920x1080 | MSI GF72VR 7RF Chi Mei CMN1747, TN LED, 17.3", 1920x1080 | Asus TUF FX705DT-AU068T AU Optronics B173HAN04.2, IPS, 17.3", 1920x1080 | MSI GP75 Leopard 9SD Chi Mei N173HCE-G33 (CMN175C), IPS, 17.3", 1920x1080 | Lenovo Legion Y740-17ICH AU Optronics B173HAN03.2, IPS, 17.3", 1920x1080 | HP Omen 17t-3AW55AV_1 AU Optronics AUO309D, IPS, 17.3", 1920x1080 | |
|---|---|---|---|---|---|---|
| Display | 30% | -0% | 3% | 1% | 3% | |
| Display P3 Coverage (%) | 62.5 | 90.8 45% | 62.3 0% | 63.4 1% | 64 2% | 65.4 5% |
| sRGB Coverage (%) | 90 | 99.8 11% | 89.1 -1% | 94.9 5% | 90.4 0% | 90 0% |
| AdobeRGB 1998 Coverage (%) | 64 | 85.6 34% | 63.7 0% | 65.1 2% | 64.8 1% | 65.8 3% |
| Response Times | 44% | -10% | 74% | 56% | 58% | |
| Response Time Grey 50% / Grey 80% * (ms) | 34 ? | 24.4 ? 28% | 41 ? -21% | 8 ? 76% | 15.6 ? 54% | 17.6 ? 48% |
| Response Time Black / White * (ms) | 30.4 ? | 12.6 ? 59% | 30 ? 1% | 8.8 ? 71% | 12.8 ? 58% | 10 ? 67% |
| PWM Frequency (Hz) | 25000 ? | 25510 ? | ||||
| Screen | -37% | -1% | 10% | -24% | -5% | |
| Brightness middle (cd/m²) | 344.7 | 329.2 -4% | 316 -8% | 420 22% | 299.1 -13% | 343.6 0% |
| Brightness (cd/m²) | 332 | 318 -4% | 294 -11% | 393 18% | 273 -18% | 320 -4% |
| Brightness Distribution (%) | 91 | 92 1% | 84 -8% | 91 0% | 81 -11% | 87 -4% |
| Black Level * (cd/m²) | 0.3 | 0.4 -33% | 0.32 -7% | 0.32 -7% | 0.27 10% | 0.34 -13% |
| Contrast (:1) | 1149 | 823 -28% | 988 -14% | 1313 14% | 1108 -4% | 1011 -12% |
| Colorchecker dE 2000 * | 3.08 | 6.4 -108% | 3.39 -10% | 3.04 1% | 5.07 -65% | 3.74 -21% |
| Colorchecker dE 2000 max. * | 6.32 | 11.7 -85% | 5.56 12% | 7.22 -14% | 10.55 -67% | 5.33 16% |
| Colorchecker dE 2000 calibrated * | 2.94 | 2.14 27% | 0.89 70% | 3.31 -13% | 3.49 -19% | |
| Greyscale dE 2000 * | 3.8 | 9.2 -142% | 3.17 17% | 3.91 -3% | 6.8 -79% | 3.7 3% |
| Gamma | 2.17 101% | 2.18 101% | 2.39 92% | 2.26 97% | 2.46 89% | 2.36 93% |
| CCT | 7284 89% | 10484 62% | 7098 92% | 7138 91% | 7805 83% | 6388 102% |
| Color Space (Percent of AdobeRGB 1998) (%) | 58 | 76 31% | 51 -12% | 60 3% | 58.5 1% | 58 0% |
| Color Space (Percent of sRGB) (%) | 89.6 | 92 3% | 89 -1% | 95 6% | 89.9 0% | 90 0% |
| Moyenne finale (programmes/paramètres) | 12% /
-13% | -4% /
-2% | 29% /
17% | 11% /
-9% | 19% /
4% |
* ... Moindre est la valeur, meilleures sont les performances
Temps de réponse de l'écran
| ↔ Temps de réponse noir à blanc | ||
|---|---|---|
| 30.4 ms ... hausse ↗ et chute ↘ combinées | ↗ 18 ms hausse | 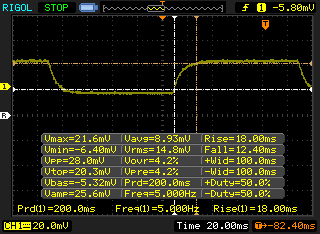 |
| ↘ 12.4 ms chute | ||
| L'écran souffre de latences très élevées, à éviter pour le jeu. En comparaison, tous les appareils testés affichent entre 0.1 (minimum) et 240 (maximum) ms. » 82 % des appareils testés affichent de meilleures performances. Cela signifie que les latences relevées sont moins bonnes que la moyenne (19.8 ms) de tous les appareils testés. | ||
| ↔ Temps de réponse gris 50% à gris 80% | ||
| 34 ms ... hausse ↗ et chute ↘ combinées | ↗ 17.6 ms hausse | 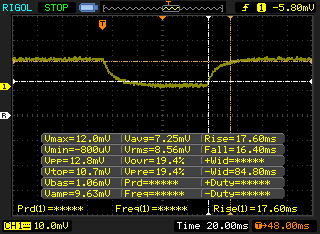 |
| ↘ 16.4 ms chute | ||
| L'écran souffre de latences très élevées, à éviter pour le jeu. En comparaison, tous les appareils testés affichent entre 0.165 (minimum) et 636 (maximum) ms. » 47 % des appareils testés affichent de meilleures performances. Cela signifie que les latences relevées sont moins bonnes que la moyenne (30.9 ms) de tous les appareils testés. | ||
Scintillement / MLI (Modulation de largeur d'impulsion)
| Scintillement / MLI (Modulation de largeur d'impulsion) non décelé | 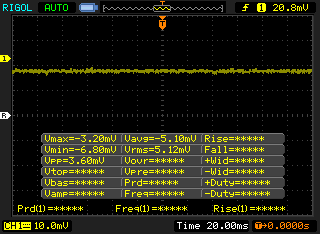 | ||
En comparaison, 52 % des appareils testés n'emploient pas MDI pour assombrir leur écran. Nous avons relevé une moyenne à 7741 (minimum : 5 - maximum : 343500) Hz dans le cas où une MDI était active. | |||
| PCMark 8 | |
| Home Score Accelerated v2 | |
| Lenovo Legion Y740-17ICH | |
| Asus TUF FX705DT-AU068T | |
| MSI GF75 Thin 9SC | |
| MSI GF72VR 7RF | |
| MSI GF75 8RD-001 | |
| MSI GP75 Leopard 9SD | |
| Work Score Accelerated v2 | |
| Lenovo Legion Y740-17ICH | |
| MSI GP75 Leopard 9SD | |
| MSI GF75 Thin 9SC | |
| MSI GF75 8RD-001 | |
| MSI GF72VR 7RF | |
| Asus TUF FX705DT-AU068T | |
| PCMark 8 Home Score Accelerated v2 | 4116 points | |
| PCMark 8 Work Score Accelerated v2 | 5417 points | |
| PCMark 10 Score | 5249 points | |
Aide | ||
| MSI GF75 Thin 9SC Crucial P1 SSD CT1000P1SSD8 | MSI GF72VR 7RF Samsung PM961 MZVLW256HEHP | Asus TUF FX705DT-AU068T WDC PC SN520 SDAPNUW-256G | MSI GP75 Leopard 9SD Kingston RBUSNS8154P3256GJ1 | Lenovo Legion Y740-17ICH Samsung SSD PM981 MZVLB256HAHQ | |
|---|---|---|---|---|---|
| AS SSD | 19% | -28% | -65% | 9% | |
| Seq Read (MB/s) | 1079 | 2337 117% | 1546 43% | 748 -31% | 1153 7% |
| Seq Write (MB/s) | 1566 | 897 -43% | 1182 -25% | 219 -86% | 1328 -15% |
| 4K Read (MB/s) | 48.68 | 48.49 0% | 36.54 -25% | 25.7 -47% | 35.05 -28% |
| 4K Write (MB/s) | 106.7 | 126.1 18% | 109.2 2% | 82.4 -23% | 96 -10% |
| 4K-64 Read (MB/s) | 656 | 1122 71% | 612 -7% | 259.3 -60% | 727 11% |
| 4K-64 Write (MB/s) | 751 | 359.7 -52% | 436.6 -42% | 190.2 -75% | 1212 61% |
| Access Time Read * (ms) | 0.044 | 0.053 -20% | 0.113 -157% | 0.159 -261% | 0.063 -43% |
| Access Time Write * (ms) | 0.131 | 0.03 77% | 0.034 74% | 0.058 56% | 0.04 69% |
| Score Read (Points) | 812 | 1405 73% | 803 -1% | 360 -56% | 878 8% |
| Score Write (Points) | 1014 | 575 -43% | 664 -35% | 294 -71% | 1441 42% |
| Score Total (Points) | 2281 | 2635 16% | 1869 -18% | 821 -64% | 2784 22% |
| Copy ISO MB/s (MB/s) | 1414 | 698 -51% | 1487 5% | ||
| Copy Program MB/s (MB/s) | 531 | 114.1 -79% | 608 15% | ||
| Copy Game MB/s (MB/s) | 1483 | 379.6 -74% | 1162 -22% |
* ... Moindre est la valeur, meilleures sont les performances

| 3DMark 11 Performance | 12993 points | |
| 3DMark Cloud Gate Standard Score | 30331 points | |
| 3DMark Fire Strike Score | 8367 points | |
| 3DMark Fire Strike Extreme Score | 4064 points | |
| 3DMark Time Spy Score | 3731 points | |
Aide | ||
| Shadow of the Tomb Raider - 1920x1080 Highest Preset AA:T | |
| MSI GE75 9SG | |
| Asus G752VS | |
| Asus ROG Zephyrus G15 GA502DU | |
| MSI GF75 Thin 9SC | |
| Moyenne NVIDIA GeForce GTX 1650 Mobile (34 - 47, n=15) | |
| Asus Zephyrus S GX531GM | |
| Asus TUF FX505DT-EB73 | |
| Asus G752VY | |
| Asus TUF FX705GE-EW096T | |
| Bas | Moyen | Élevé | Ultra | |
|---|---|---|---|---|
| BioShock Infinite (2013) | 319.5 | 251 | 221.6 | 90.4 |
| The Witcher 3 (2015) | 209.1 | 126 | 67.6 | 37.7 |
| Shadow of the Tomb Raider (2018) | 128 | 59 | 51 | 45 |
| MSI GF75 Thin 9SC GeForce GTX 1650 Mobile, i7-9750H, Crucial P1 SSD CT1000P1SSD8 | MSI GF72VR 7RF GeForce GTX 1060 Mobile, i7-7700HQ, Samsung PM961 MZVLW256HEHP | MSI GP75 Leopard 9SD GeForce GTX 1660 Ti Mobile, i7-9750H, Kingston RBUSNS8154P3256GJ1 | Lenovo Legion Y740-17ICH GeForce RTX 2080 Max-Q, i7-8750H, Samsung SSD PM981 MZVLB256HAHQ | HP Omen 17t-3AW55AV_1 GeForce GTX 1070 Mobile, i7-8750H, Samsung SSD PM981 MZVLB512HAJQ | Asus TUF FX505DT-EB73 GeForce GTX 1650 Mobile, R7 3750H, Intel SSD 660p SSDPEKNW512G8 | |
|---|---|---|---|---|---|---|
| Noise | -2% | -13% | 3% | -2% | 0% | |
| arrêt / environnement * (dB) | 28.2 | 28.1 -0% | 29 -3% | 28.3 -0% | 27.8 1% | 28.2 -0% |
| Idle Minimum * (dB) | 33.6 | 31.4 7% | 29 14% | 31.5 6% | 31.1 7% | 28.2 16% |
| Idle Average * (dB) | 33.6 | 31.4 7% | 34 -1% | 31.6 6% | 31.1 7% | 28.2 16% |
| Idle Maximum * (dB) | 33.8 | 32.6 4% | 37 -9% | 31.6 7% | 35 -4% | 31.4 7% |
| Load Average * (dB) | 37.2 | 39.4 -6% | 53 -42% | 32.3 13% | 42 -13% | 39.8 -7% |
| Witcher 3 ultra * (dB) | 40.6 | 45.3 -12% | 51 -26% | 43 -6% | 44.5 -10% | 47 -16% |
| Load Maximum * (dB) | 44.4 | 52 -17% | 55 -24% | 45.5 -2% | 46.5 -5% | 50.2 -13% |
* ... Moindre est la valeur, meilleures sont les performances
Degré de la nuisance sonore
| Au repos |
| 33.6 / 33.6 / 33.8 dB(A) |
| Fortement sollicité |
| 37.2 / 44.4 dB(A) |
 | ||
30 dB silencieux 40 dB(A) audible 50 dB(A) bruyant |
||
min: | ||
(-) La température maximale du côté supérieur est de 47.8 °C / 118 F, par rapport à la moyenne de 40.4 °C / 105 F, allant de 21.2 à 68.8 °C pour la classe Gaming.
(-) Le fond chauffe jusqu'à un maximum de 57 °C / 135 F, contre une moyenne de 43.2 °C / 110 F
(+) En utilisation inactive, la température moyenne du côté supérieur est de 27.7 °C / 82 F, par rapport à la moyenne du dispositif de 33.9 °C / 93 F.
(±) En jouant à The Witcher 3, la température moyenne du côté supérieur est de 35.9 °C / 97 F, alors que la moyenne de l'appareil est de 33.9 °C / 93 F.
(+) Les repose-poignets et le pavé tactile sont plus froids que la température de la peau avec un maximum de 31.2 °C / 88.2 F et sont donc froids au toucher.
(-) La température moyenne de la zone de l'appui-paume de dispositifs similaires était de 28.8 °C / 83.8 F (-2.4 °C / #-4.4 F).
MSI GF75 Thin 9SC analyse audio
(+) | les haut-parleurs peuvent jouer relativement fort (85# dB)
Analysis not possible as minimum curve is missing or too high
Apple MacBook 12 (Early 2016) 1.1 GHz analyse audio
(+) | les haut-parleurs peuvent jouer relativement fort (83.6# dB)
Basses 100 - 315 Hz
(±) | basse réduite - en moyenne 11.3% inférieure à la médiane
(±) | la linéarité des basses est moyenne (14.2% delta à la fréquence précédente)
Médiums 400 - 2000 Hz
(+) | médiane équilibrée - seulement 2.4% de la médiane
(+) | les médiums sont linéaires (5.5% delta à la fréquence précédente)
Aiguës 2 - 16 kHz
(+) | des sommets équilibrés - à seulement 2% de la médiane
(+) | les aigus sont linéaires (4.5% delta à la fréquence précédente)
Globalement 100 - 16 000 Hz
(+) | le son global est linéaire (10.2% différence à la médiane)
Par rapport à la même classe
» 7% de tous les appareils testés de cette catégorie étaient meilleurs, 2% similaires, 90% pires
» Le meilleur avait un delta de 5%, la moyenne était de 18%, le pire était de 53%.
Par rapport à tous les appareils testés
» 5% de tous les appareils testés étaient meilleurs, 1% similaires, 94% pires
» Le meilleur avait un delta de 4%, la moyenne était de 23%, le pire était de 134%.
| Éteint/en veille | |
| Au repos | |
| Fortement sollicité |
|
Légende:
min: | |
| MSI GF75 Thin 9SC i7-9750H, GeForce GTX 1650 Mobile, Crucial P1 SSD CT1000P1SSD8, IPS, 1920x1080, 17.3" | MSI GF72VR 7RF i7-7700HQ, GeForce GTX 1060 Mobile, Samsung PM961 MZVLW256HEHP, TN LED, 1920x1080, 17.3" | MSI GP75 Leopard 9SD i7-9750H, GeForce GTX 1660 Ti Mobile, Kingston RBUSNS8154P3256GJ1, IPS, 1920x1080, 17.3" | HP Omen 17t-3AW55AV_1 i7-8750H, GeForce GTX 1070 Mobile, Samsung SSD PM981 MZVLB512HAJQ, IPS, 1920x1080, 17.3" | Asus TUF FX505DT-EB73 R7 3750H, GeForce GTX 1650 Mobile, Intel SSD 660p SSDPEKNW512G8, IPS, 1920x1080, 15.6" | MSI GF75 8RD-001 i7-8750H, GeForce GTX 1050 Ti Max-Q, Kingston RBUSNS8154P3256GJ1, IPS, 1920x1080, 17.3" | |
|---|---|---|---|---|---|---|
| Power Consumption | -39% | -24% | -67% | 20% | 15% | |
| Idle Minimum * (Watt) | 6.1 | 15.7 -157% | 10 -64% | 17.8 -192% | 7 -15% | 6.5 -7% |
| Idle Average * (Watt) | 11.2 | 21.4 -91% | 15 -34% | 24.7 -121% | 9.9 12% | 11.9 -6% |
| Idle Maximum * (Watt) | 24.5 | 21.9 11% | 22 10% | 29.6 -21% | 12 51% | 13.1 47% |
| Load Average * (Watt) | 94.7 | 83.9 11% | 92 3% | 110 -16% | 68.4 28% | 86 9% |
| Witcher 3 ultra * (Watt) | 105.8 | 130.2 -23% | 153 -45% | 167.8 -59% | 94.9 10% | |
| Load Maximum * (Watt) | 192.2 | 159.6 17% | 216 -12% | 178.6 7% | 130.9 32% | 131 32% |
* ... Moindre est la valeur, meilleures sont les performances
| MSI GF75 Thin 9SC i7-9750H, GeForce GTX 1650 Mobile, 51 Wh | MSI GF72VR 7RF i7-7700HQ, GeForce GTX 1060 Mobile, 43 Wh | Asus TUF FX705DT-AU068T R5 3550H, GeForce GTX 1650 Mobile, 64 Wh | MSI GP75 Leopard 9SD i7-9750H, GeForce GTX 1660 Ti Mobile, 51 Wh | Lenovo Legion Y740-17ICH i7-8750H, GeForce RTX 2080 Max-Q, 76 Wh | HP Omen 17t-3AW55AV_1 i7-8750H, GeForce GTX 1070 Mobile, 86 Wh | |
|---|---|---|---|---|---|---|
| Autonomie de la batterie | -49% | 66% | -32% | -32% | -11% | |
| WiFi v1.3 (h) | 4.7 | 2.4 -49% | 7.8 66% | 3.2 -32% | 3.2 -32% | 4.2 -11% |
| Reader / Idle (h) | 3.4 | 13.6 | 4.8 | 4.5 | ||
| Load (h) | 0.7 | 2.1 | 0.6 | 1.6 |
Points positifs
Points négatifs
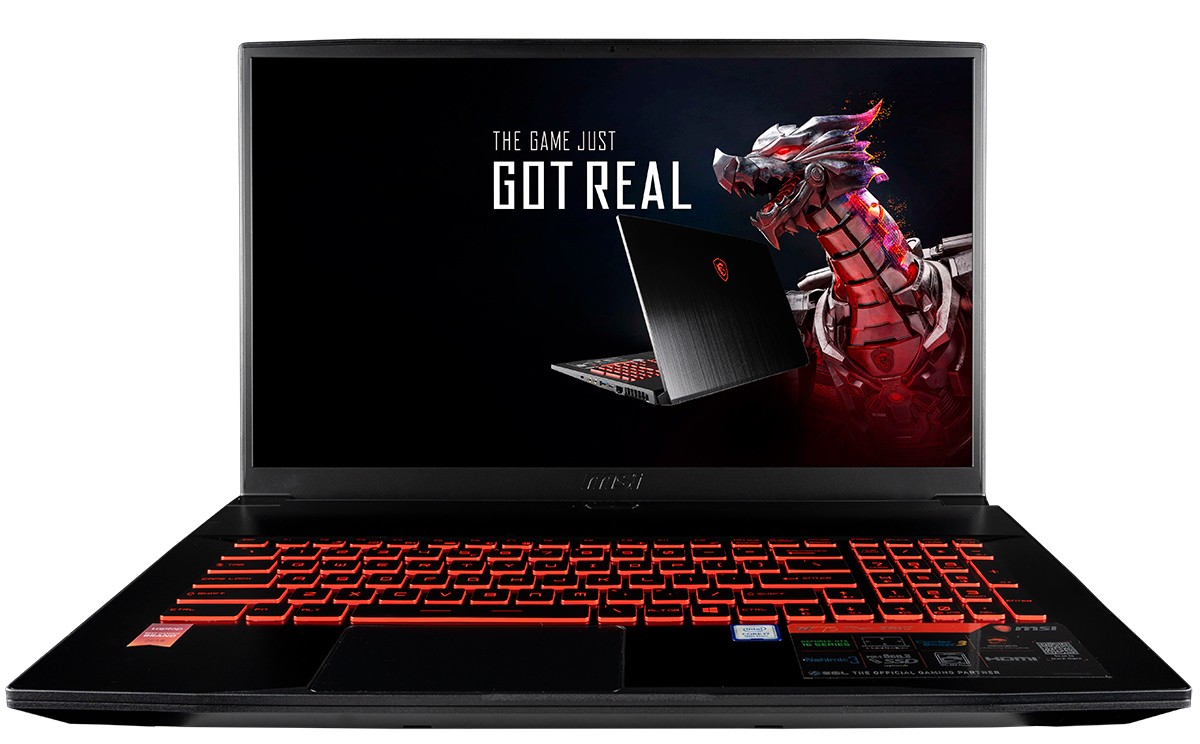

Difficile de recommander un portable de jeu avec un Core i7-9750H quand les gains de performances sur un Core i7-8750H sont presque négligeables. C’est dommage que MSI ne propose pas le GF75 avec un Core i7-8750H et une GTX 1650, parce que les performances de jeu auraient été pour ainsi dire les mêmes, mais pour un prix inférieur.
À propos du prix, les 1 200 $ de base sont un peu élevés pour un portable de jeu bon marché. Le MSI GL73 8SD, par exemple, est équipé d’un Core i7-8750H et d’une carte graphique GTX 1660 Ti plus rapide, pour moins de 1 100 $. Ce surcoût du GF75 est dû à ses bordures d’écran étroites, à sa légèreté et à sa compacité, et non à ses performances brutes. Si vous avez l’intention de voyager fréquemment, et pouvez tirer profit d’un écran de 17,3 pouces relativement léger avec des capacités de jeu correctes, alors le MSI GF75 pourrait faire l’affaire. Mais pour ceux intéressés par le meilleur rapport performances / prix devraient regarder ailleurs, des portables avec la GTX 1660 Ti plus puissante pouvant être trouvés à peu près au même prix – tels le HP Pavilion Gaming 17 ou l’Alienware m17 de base.
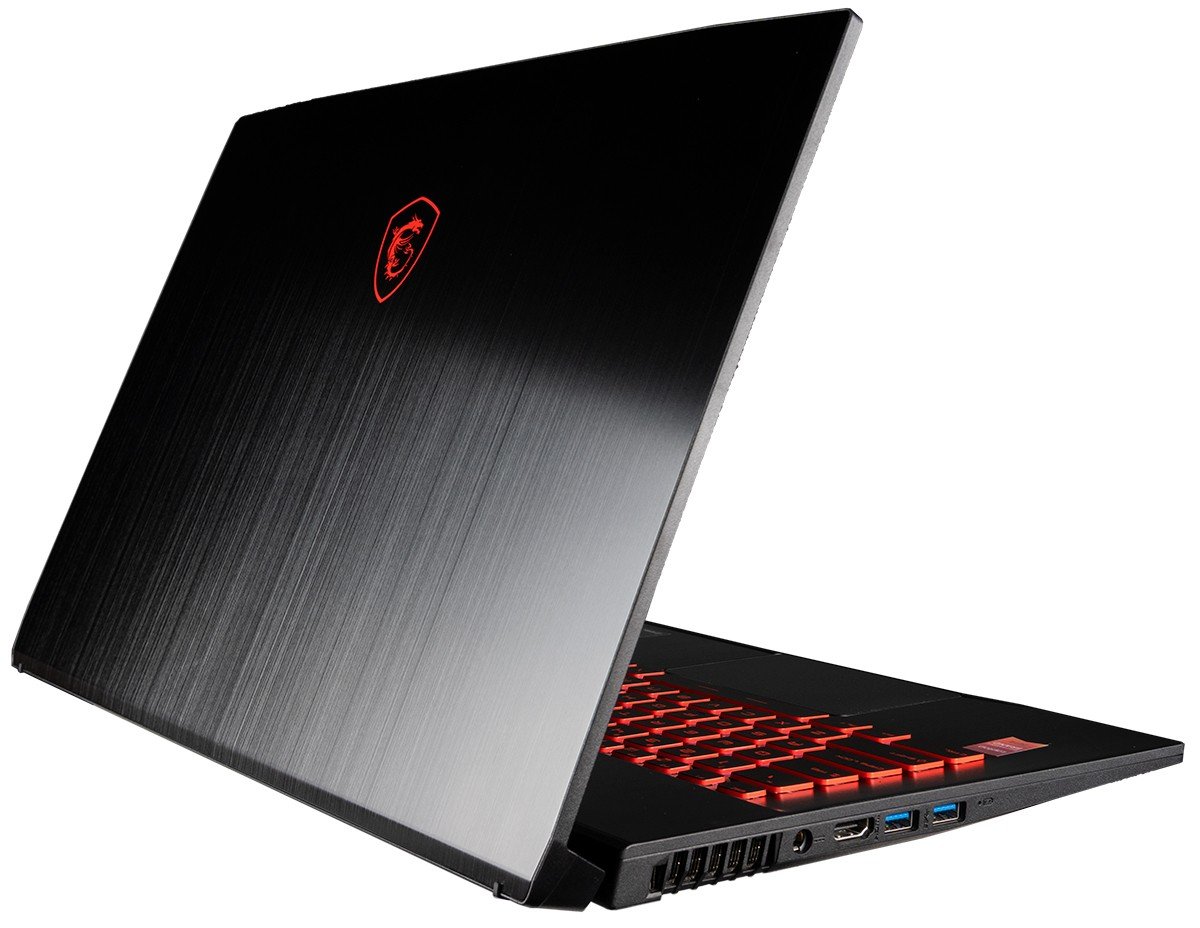
Le MSI GF75 est l’un des portables de jeu de 17,3 pouces les plus légers actuellement disponibles, surtout à ce niveau de prix. Il faudra laisser de côtés les performances et certaines fonctionnalités, pour en faire un hybride joueur / nomade, plutôt qu’un pur portable de jeu.
L’intégralité de cette critique est disponible en anglais en suivant ce lien.
MSI GF75 Thin 9SC
- 10/26/2019 v7 (old)
Allen Ngo
Price comparison
