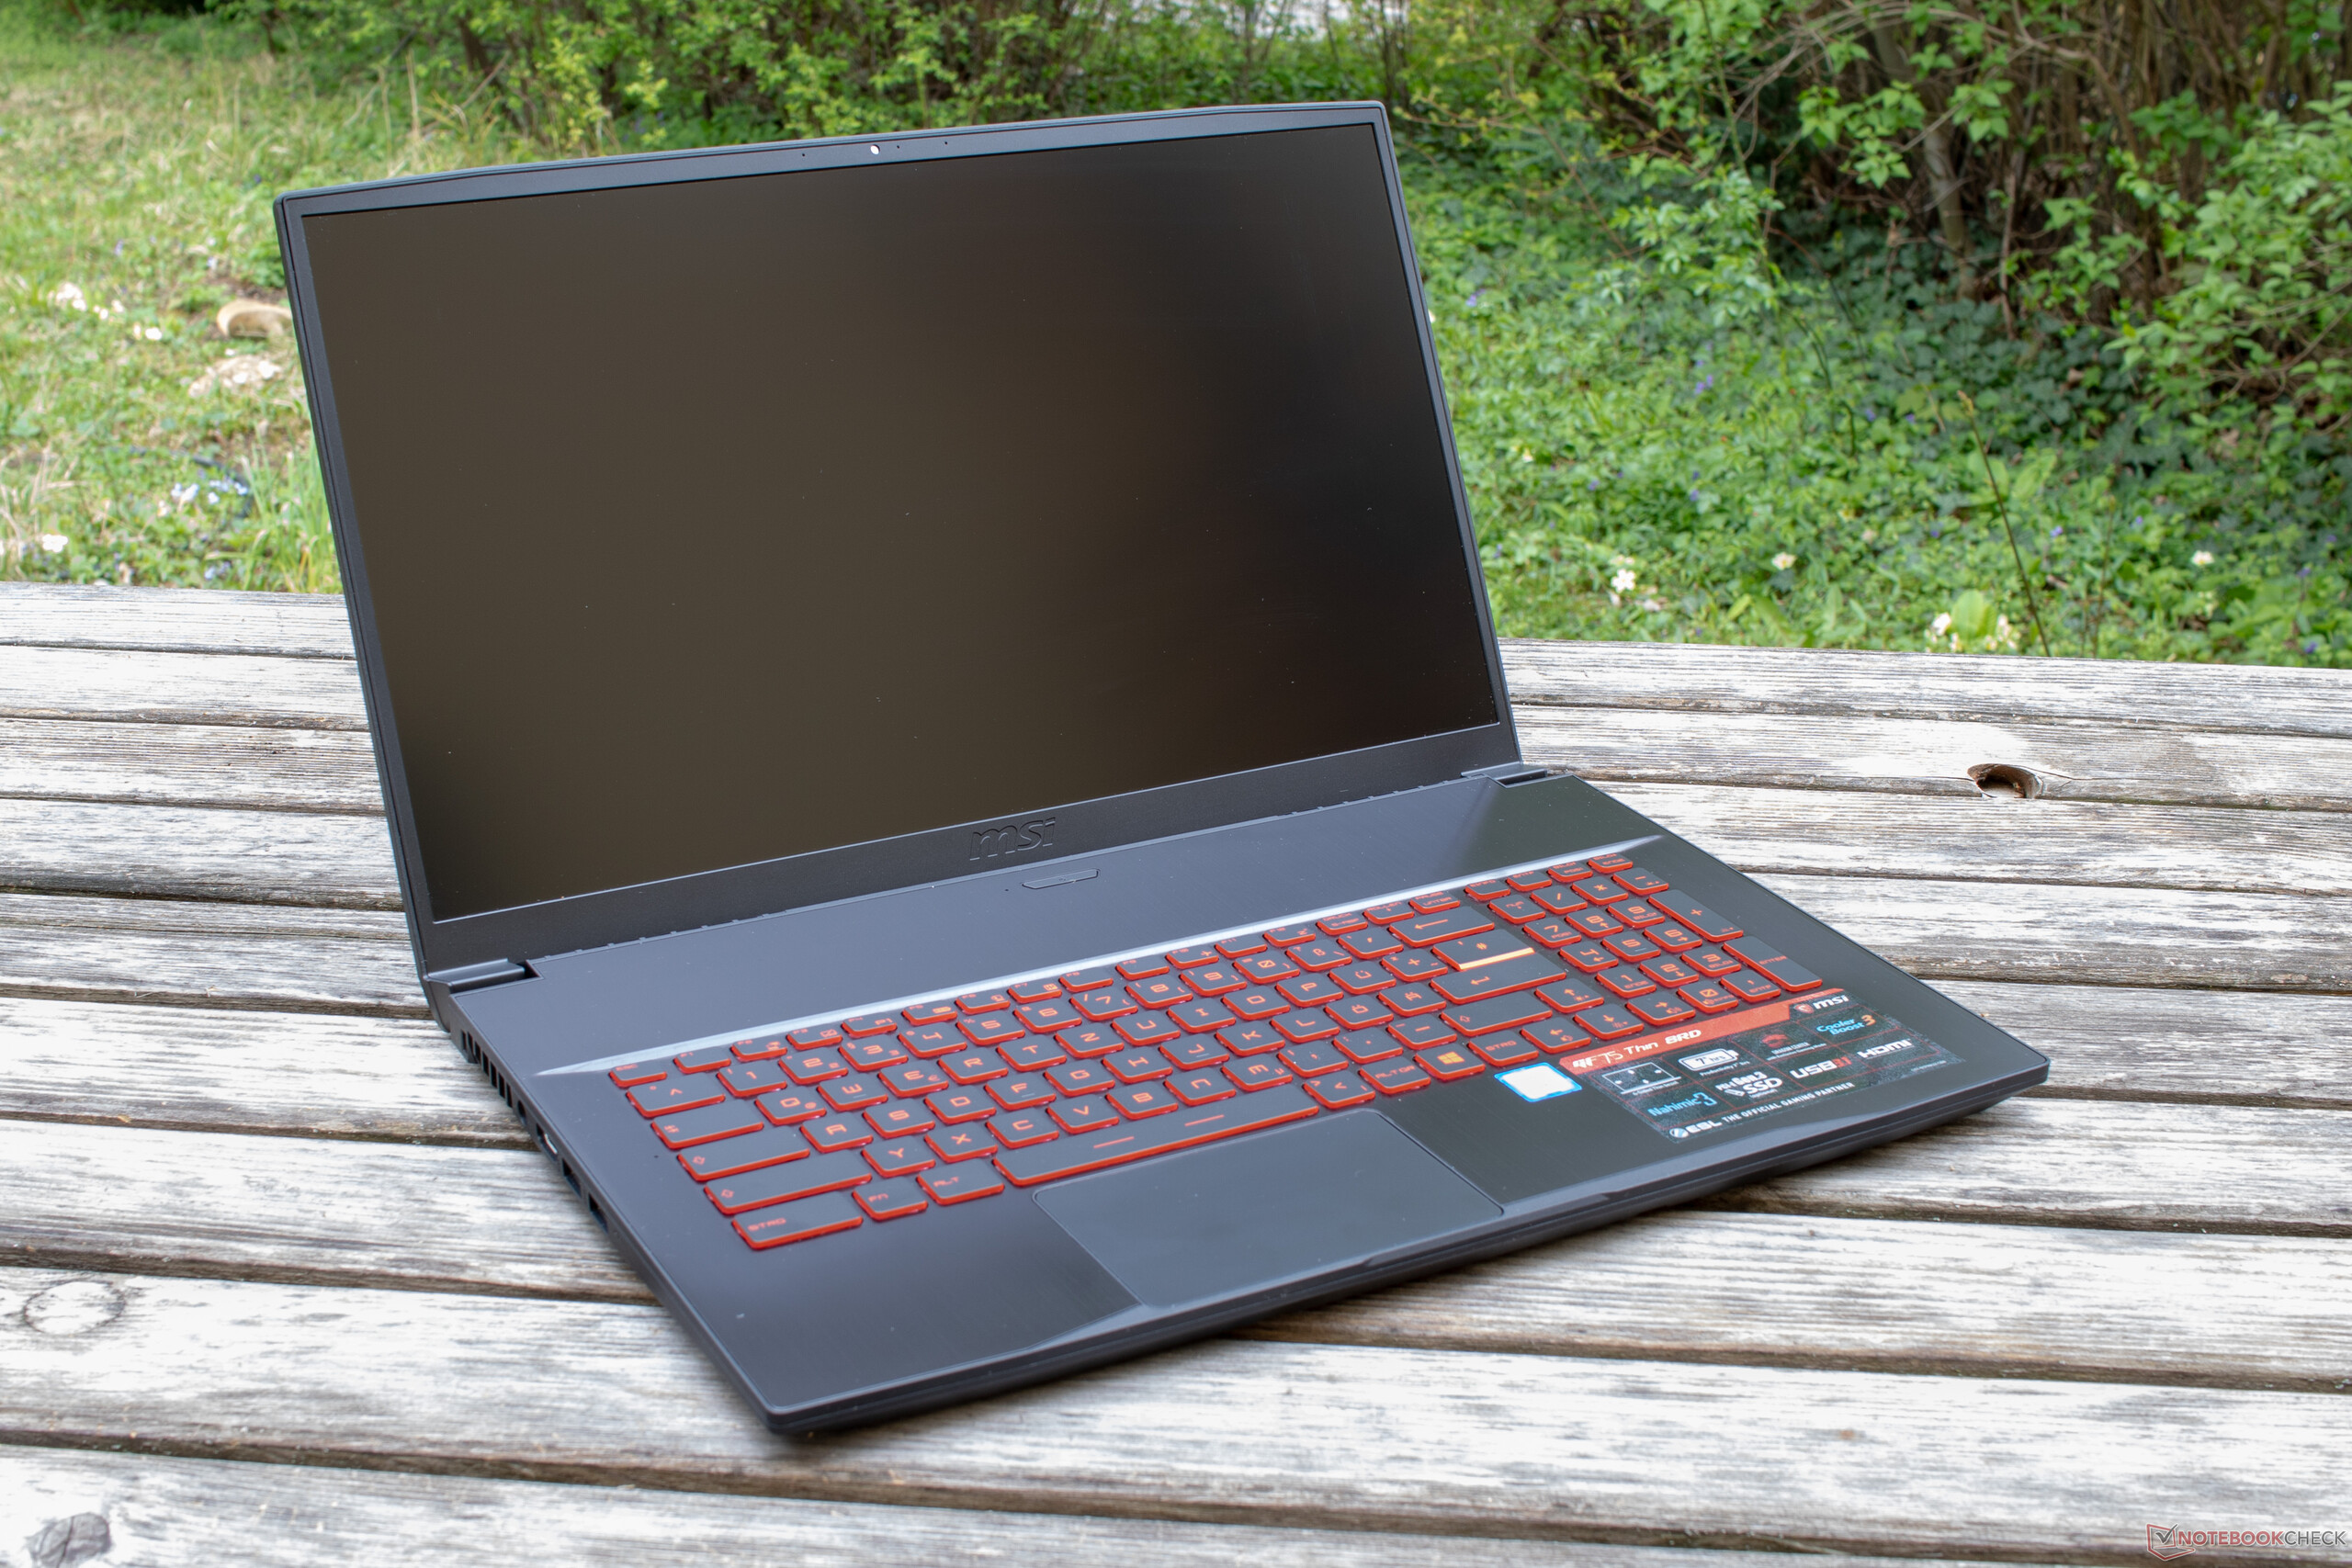
Courte critique du PC portable de jeu MSI GF75 Thin 3RD (i7-8750H, GTX 1050Ti Max-Q, FHD)

| Networking | |
| iperf3 transmit AX12 | |
| HP Pavilion Gaming 15-cx0003ng | |
| Asus TUF FX705GE-EW096T | |
| Medion Erazer P6705-MD61131 | |
| Acer Aspire 7 A715-72G-704Q | |
| Lenovo Legion Y730-17ICH, i7-8750H | |
| MSI GF75 8RD-001 | |
| iperf3 receive AX12 | |
| Medion Erazer P6705-MD61131 | |
| Asus TUF FX705GE-EW096T | |
| Lenovo Legion Y730-17ICH, i7-8750H | |
| HP Pavilion Gaming 15-cx0003ng | |
| Acer Aspire 7 A715-72G-704Q | |
| MSI GF75 8RD-001 | |
| |||||||||||||||||||||||||
Homogénéité de la luminosité: 89 %
Valeur mesurée au centre, sur batterie: 356 cd/m²
Contraste: 1319:1 (Valeurs des noirs: 0.27 cd/m²)
ΔE ColorChecker Calman: 2.73 | ∀{0.5-29.43 Ø4.73}
calibrated: 2.14
ΔE Greyscale Calman: 2.38 | ∀{0.09-98 Ø4.97}
90% sRGB (Argyll 1.6.3 3D)
59% AdobeRGB 1998 (Argyll 1.6.3 3D)
65.2% AdobeRGB 1998 (Argyll 3D)
90.1% sRGB (Argyll 3D)
64% Display P3 (Argyll 3D)
Gamma: 2.48
CCT: 6643 K
| MSI GF75 8RD-001 B173HAN04.2, , 1920x1080, 17.3" | Asus TUF FX705GE-EW096T AU Optronics B173HAN04.2, , 1920x1080, 17.3" | Lenovo Legion Y730-17ICH, i7-8750H LP173WF4-SPF6, , 1920x1080, 17.3" | Medion Erazer P6705-MD61131 AU Optronics B156HTN03.8 (AUO38ED), , 1920x1080, 15.6" | HP Pavilion Gaming 15-cx0003ng BOE07A1, , 1920x1080, 15.6" | Acer Aspire 7 A715-72G-704Q LG Philips LP156WFC-SPP1, , 1920x1080, 15.6" | |
|---|---|---|---|---|---|---|
| Display | -3% | -2% | -41% | -36% | -38% | |
| Display P3 Coverage (%) | 64 | 63.1 -1% | 66.4 4% | 36.4 -43% | 39.72 -38% | 38.34 -40% |
| sRGB Coverage (%) | 90.1 | 86.8 -4% | 84.9 -6% | 54.8 -39% | 59.3 -34% | 57.5 -36% |
| AdobeRGB 1998 Coverage (%) | 65.2 | 63.5 -3% | 62.1 -5% | 37.61 -42% | 41.04 -37% | 39.65 -39% |
| Response Times | -2% | 9% | 13% | -18% | 11% | |
| Response Time Grey 50% / Grey 80% * (ms) | 38 ? | 39 ? -3% | 36.8 ? 3% | 44.8 ? -18% | 47 ? -24% | 35 ? 8% |
| Response Time Black / White * (ms) | 28 ? | 28 ? -0% | 24 ? 14% | 16 ? 43% | 31 ? -11% | 24 ? 14% |
| PWM Frequency (Hz) | 208 ? | |||||
| Screen | -9% | -47% | -124% | -36% | -55% | |
| Brightness middle (cd/m²) | 356 | 299 -16% | 328.7 -8% | 200 -44% | 241 -32% | 280 -21% |
| Brightness (cd/m²) | 332 | 291 -12% | 318 -4% | 186 -44% | 236 -29% | 248 -25% |
| Brightness Distribution (%) | 89 | 90 1% | 91 2% | 85 -4% | 75 -16% | 81 -9% |
| Black Level * (cd/m²) | 0.27 | 0.28 -4% | 0.51 -89% | 0.43 -59% | 0.15 44% | 0.56 -107% |
| Contrast (:1) | 1319 | 1068 -19% | 645 -51% | 465 -65% | 1607 22% | 500 -62% |
| Colorchecker dE 2000 * | 2.73 | 3.02 -11% | 4.91 -80% | 11.39 -317% | 4.85 -78% | 4.75 -74% |
| Colorchecker dE 2000 max. * | 4.7 | 5.27 -12% | 10.15 -116% | 19.36 -312% | 8.82 -88% | 8.04 -71% |
| Colorchecker dE 2000 calibrated * | 2.14 | 2.76 -29% | 4.27 -100% | 3.05 -43% | 4.93 -130% | |
| Greyscale dE 2000 * | 2.38 | 2.18 8% | 3.9 -64% | 11.73 -393% | 5.15 -116% | 3.21 -35% |
| Gamma | 2.48 89% | 2.48 89% | 2.13 103% | 1.97 112% | 2.49 88% | 2.59 85% |
| CCT | 6643 98% | 6392 102% | 6911 94% | 12614 52% | 7042 92% | 6601 98% |
| Color Space (Percent of AdobeRGB 1998) (%) | 59 | 57 -3% | 55.6 -6% | 35 -41% | 38 -36% | 36 -39% |
| Color Space (Percent of sRGB) (%) | 90 | 87 -3% | 84.7 -6% | 55 -39% | 59 -34% | 57 -37% |
| Moyenne finale (programmes/paramètres) | -5% /
-7% | -13% /
-32% | -51% /
-91% | -30% /
-34% | -27% /
-44% |
* ... Moindre est la valeur, meilleures sont les performances
Temps de réponse de l'écran
| ↔ Temps de réponse noir à blanc | ||
|---|---|---|
| 28 ms ... hausse ↗ et chute ↘ combinées | ↗ 16 ms hausse | 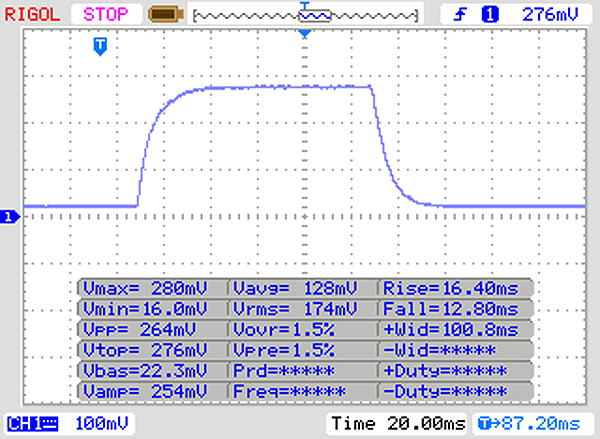 |
| ↘ 12 ms chute | ||
| L'écran souffre de latences relativement élevées, insuffisant pour le jeu. En comparaison, tous les appareils testés affichent entre 0.1 (minimum) et 240 (maximum) ms. » 71 % des appareils testés affichent de meilleures performances. Cela signifie que les latences relevées sont moins bonnes que la moyenne (19.9 ms) de tous les appareils testés. | ||
| ↔ Temps de réponse gris 50% à gris 80% | ||
| 38 ms ... hausse ↗ et chute ↘ combinées | ↗ 18 ms hausse | 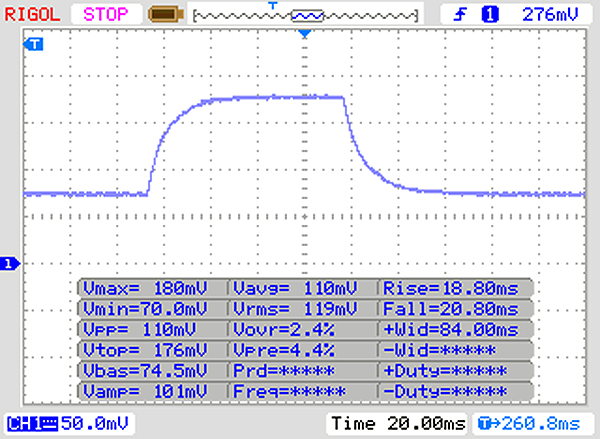 |
| ↘ 20 ms chute | ||
| L'écran souffre de latences très élevées, à éviter pour le jeu. En comparaison, tous les appareils testés affichent entre 0.165 (minimum) et 636 (maximum) ms. » 55 % des appareils testés affichent de meilleures performances. Cela signifie que les latences relevées sont moins bonnes que la moyenne (31.1 ms) de tous les appareils testés. | ||
Scintillement / MLI (Modulation de largeur d'impulsion)
| Scintillement / MLI (Modulation de largeur d'impulsion) non décelé |  | ||
En comparaison, 52 % des appareils testés n'emploient pas MDI pour assombrir leur écran. Nous avons relevé une moyenne à 7798 (minimum : 5 - maximum : 343500) Hz dans le cas où une MDI était active. | |||
| PCMark 8 | |
| Home Score Accelerated v2 | |
| Moyenne de la classe Gaming (n=12 dernières années) | |
| HP Pavilion Gaming 15-cx0003ng | |
| MSI GL73 8RD-418US | |
| Asus TUF FX705GE-EW096T | |
| Lenovo Legion Y730-17ICH, i7-8750H | |
| Acer Aspire 7 A715-72G-704Q | |
| Medion Erazer P6705-MD61131 | |
| MSI GF75 8RD-001 | |
| MSI GF63 8RC | |
| Moyenne Intel Core i7-8750H, NVIDIA GeForce GTX 1050 Ti Max-Q (3494 - 3969, n=4) | |
| Work Score Accelerated v2 | |
| Asus TUF FX705GE-EW096T | |
| MSI GL73 8RD-418US | |
| Medion Erazer P6705-MD61131 | |
| Lenovo Legion Y730-17ICH, i7-8750H | |
| MSI GF75 8RD-001 | |
| Acer Aspire 7 A715-72G-704Q | |
| HP Pavilion Gaming 15-cx0003ng | |
| MSI GF63 8RC | |
| Moyenne Intel Core i7-8750H, NVIDIA GeForce GTX 1050 Ti Max-Q (4316 - 5317, n=4) | |
| Moyenne de la classe Gaming (n=12 dernières années) | |
| PCMark 8 Home Score Accelerated v2 | 3969 points | |
| PCMark 8 Work Score Accelerated v2 | 5317 points | |
| PCMark 10 Score | 4437 points | |
Aide | ||
| MSI GF75 8RD-001 Kingston RBUSNS8154P3256GJ1 | Asus TUF FX705GE-EW096T SK hynix BC501 HFM128GDJTNG-831 | Lenovo Legion Y730-17ICH, i7-8750H Toshiba KBG30ZMT128G | Medion Erazer P6705-MD61131 Samsung SSD PM981 MZVLB256HAHQ | HP Pavilion Gaming 15-cx0003ng Intel Optane 16 GB MEMPEK1J016GAH + HGST HTS721010A9E630 1 TB HDD | Acer Aspire 7 A715-72G-704Q Intel SSD 760p SSDPEKKW256G8 | Moyenne Kingston RBUSNS8154P3256GJ1 | |
|---|---|---|---|---|---|---|---|
| CrystalDiskMark 5.2 / 6 | -13% | -39% | 62% | -7% | 37% | 47% | |
| Write 4K (MB/s) | 72.1 | 90.3 25% | 71.4 -1% | 107 48% | 59.2 -18% | 103.4 43% | 141.1 ? 96% |
| Read 4K (MB/s) | 28.12 | 37.03 32% | 29.98 7% | 39.91 42% | 91.3 225% | 56 99% | 82.4 ? 193% |
| Write Seq (MB/s) | 746 | 320.3 -57% | 129.6 -83% | 1439 93% | 158.3 -79% | 808 8% | 722 ? -3% |
| Read Seq (MB/s) | 834 | 1012 21% | 843 1% | 2011 141% | 880 6% | 1939 132% | 974 ? 17% |
| Write 4K Q32T1 (MB/s) | 313.7 | 196.8 -37% | 88.9 -72% | 282.1 -10% | 161.8 -48% | 281.3 -10% | 418 ? 33% |
| Read 4K Q32T1 (MB/s) | 348.7 | 271.5 -22% | 196.4 -44% | 326.6 -6% | 286.5 -18% | 326.5 -6% | 571 ? 64% |
| Write Seq Q32T1 (MB/s) | 854 | 268.8 -69% | 130.5 -85% | 1441 69% | 159.8 -81% | 474.1 -44% | 717 ? -16% |
| Read Seq Q32T1 (MB/s) | 1587 | 1595 1% | 1037 -35% | 3516 122% | 929 -41% | 2735 72% | 1413 ? -11% |
| AS SSD | -56% | -147% | 12% | -1524% | 4% | -11% | |
| Seq Read (MB/s) | 1416 | 878 -38% | 979 -31% | 2724 92% | 854 -40% | 2493 76% | 1195 ? -16% |
| Seq Write (MB/s) | 798 | 336.8 -58% | 125.4 -84% | 1365 71% | 147 -82% | 1241 56% | 668 ? -16% |
| 4K Read (MB/s) | 38.92 | 23.76 -39% | 19.73 -49% | 46.14 19% | 105.1 170% | 41.22 6% | 33.6 ? -14% |
| 4K Write (MB/s) | 100.1 | 92 -8% | 38.73 -61% | 102.6 2% | 59.5 -41% | 112.4 12% | 82.6 ? -17% |
| 4K-64 Read (MB/s) | 726 | 248.9 -66% | 168.6 -77% | 567 -22% | 42.09 -94% | 522 -28% | 667 ? -8% |
| 4K-64 Write (MB/s) | 584 | 112.5 -81% | 31.38 -95% | 459.8 -21% | 137.3 -76% | 470.7 -19% | 561 ? -4% |
| Access Time Read * (ms) | 0.072 | 0.141 -96% | 0.519 -621% | 0.08 -11% | 14.99 -20719% | 0.058 19% | 0.117 ? -63% |
| Access Time Write * (ms) | 0.044 | 0.054 -23% | 0.324 -636% | 0.037 16% | 0.043 2% | 0.099 -125% | 0.05571 ? -27% |
| Score Read (Points) | 907 | 360 -60% | 286 -68% | 886 -2% | 233 -74% | 812 -10% | 820 ? -10% |
| Score Write (Points) | 764 | 238 -69% | 86 -89% | 699 -9% | 211 -72% | 707 -7% | 710 ? -7% |
| Score Total (Points) | 2112 | 764 -64% | 479 -77% | 1983 -6% | 577 -73% | 1883 -11% | 1931 ? -9% |
| Copy ISO MB/s (MB/s) | 608 | 224.1 -63% | 272.7 -55% | 110.1 -82% | 968 59% | 773 ? 27% | |
| Copy Program MB/s (MB/s) | 350.7 | 111.9 -68% | 182.9 -48% | 94.1 -73% | 319.4 -9% | 375 ? 7% | |
| Copy Game MB/s (MB/s) | 478.7 | 229.2 -52% | 134.6 -72% | 81.7 -83% | 648 35% | 509 ? 6% | |
| Moyenne finale (programmes/paramètres) | -35% /
-41% | -93% /
-108% | 37% /
33% | -766% /
-972% | 21% /
16% | 18% /
10% |
* ... Moindre est la valeur, meilleures sont les performances

| 3DMark 11 Performance | 9171 points | |
| 3DMark Cloud Gate Standard Score | 28253 points | |
| 3DMark Fire Strike Score | 6714 points | |
Aide | ||
| The Witcher 3 | |
| 1920x1080 High Graphics & Postprocessing (Nvidia HairWorks Off) | |
| Moyenne de la classe Gaming (181 - 341, n=3, 2 dernières années) | |
| Schenker XMG Neo 17 | |
| Gigabyte Aero 15-Y9 | |
| MSI GF75 8RD-001 | |
| Lenovo Legion Y730-17ICH, i7-8750H | |
| Acer Aspire 7 A715-72G-704Q | |
| Moyenne NVIDIA GeForce GTX 1050 Ti Max-Q (42.6 - 60, n=6) | |
| Asus TUF FX705GE-EW096T | |
| HP Spectre x360 15-df0126ng | |
| Medion Erazer P6705-MD61131 | |
| HP Pavilion Gaming 15-cx0003ng | |
| Acer Aspire 5 A515-52G-723L | |
| 1920x1080 Ultra Graphics & Postprocessing (HBAO+) | |
| Moyenne de la classe Gaming (95 - 240, n=8, 2 dernières années) | |
| MSI GS75 8SG Stealth | |
| Schenker XMG Neo 17 | |
| Gigabyte Aero 15-Y9 | |
| MSI GF75 8RD-001 | |
| Acer Aspire 7 A715-72G-704Q | |
| Moyenne NVIDIA GeForce GTX 1050 Ti Max-Q (23.5 - 43, n=7) | |
| Lenovo Legion Y730-17ICH, i7-8750H | |
| Asus TUF FX705GE-EW096T | |
| HP Spectre x360 15-df0126ng | |
| Medion Erazer P6705-MD61131 | |
| HP Pavilion Gaming 15-cx0003ng | |
| Acer Aspire 5 A515-52G-723L | |
| Far Cry New Dawn | |
| 1920x1080 High Preset | |
| MSI GS75 8SG Stealth | |
| Schenker XMG Neo 17 | |
| Gigabyte Aero 15-Y9 | |
| MSI GF75 8RD-001 | |
| Moyenne NVIDIA GeForce GTX 1050 Ti Max-Q (43 - 46, n=2) | |
| HP Spectre x360 15-df0126ng | |
| MSI GE72 7RE | |
| Acer Aspire 5 A515-52G-723L | |
| 1920x1080 Ultra Preset | |
| MSI GS75 8SG Stealth | |
| Schenker XMG Neo 17 | |
| Gigabyte Aero 15-Y9 | |
| MSI GF75 8RD-001 | |
| Moyenne NVIDIA GeForce GTX 1050 Ti Max-Q (40 - 43, n=2) | |
| HP Spectre x360 15-df0126ng | |
| MSI GE72 7RE | |
| Acer Aspire 5 A515-52G-723L | |
| 2560x1440 Ultra Preset | |
| Schenker XMG Neo 17 | |
| MSI GF75 8RD-001 | |
| Moyenne NVIDIA GeForce GTX 1050 Ti Max-Q (n=1) | |
| MSI GE72 7RE | |
| 3840x2160 Ultra Preset | |
| Schenker XMG Neo 17 | |
| Gigabyte Aero 15-Y9 | |
| MSI GF75 8RD-001 | |
| Moyenne NVIDIA GeForce GTX 1050 Ti Max-Q (14 - 15, n=2) | |
| HP Spectre x360 15-df0126ng | |
| MSI GE72 7RE | |
| Metro Exodus | |
| 1920x1080 Medium Quality AF:4x | |
| Schenker XMG Neo 17 | |
| Gigabyte Aero 15-Y9 | |
| HP Spectre x360 15-df0126ng | |
| Moyenne NVIDIA GeForce GTX 1050 Ti Max-Q (31.4 - 49.8, n=2) | |
| MSI GF75 8RD-001 | |
| MSI GE72 7RE | |
| Acer Aspire 5 A515-52G-723L | |
| Lenovo V145-15AST | |
| 1920x1080 High Quality AF:16x | |
| MSI GS75 8SG Stealth | |
| Schenker XMG Neo 17 | |
| Gigabyte Aero 15-Y9 | |
| HP Spectre x360 15-df0126ng | |
| Moyenne NVIDIA GeForce GTX 1050 Ti Max-Q (23.5 - 36.5, n=2) | |
| MSI GF75 8RD-001 | |
| MSI GE72 7RE | |
| Acer Aspire 5 A515-52G-723L | |
| 1920x1080 Ultra Quality AF:16x | |
| Schenker XMG Neo 17 | |
| MSI GS75 8SG Stealth | |
| Gigabyte Aero 15-Y9 | |
| HP Spectre x360 15-df0126ng | |
| Moyenne NVIDIA GeForce GTX 1050 Ti Max-Q (19.3 - 28.3, n=2) | |
| MSI GF75 8RD-001 | |
| MSI GE72 7RE | |
| Acer Aspire 5 A515-52G-723L | |
| Bas | Moyen | Élevé | Ultra | QHD | 4K | |
|---|---|---|---|---|---|---|
| The Witcher 3 (2015) | 145 | 99 | 60 | 43 | ||
| Final Fantasy XV Benchmark (2018) | 75.1 | 37.7 | 25 | |||
| Far Cry New Dawn (2019) | 89 | 50 | 46 | 43 | 29 | 15 |
| Metro Exodus (2019) | 60.4 | 31.4 | 23.5 | 19.3 |
Degré de la nuisance sonore
| Au repos |
| 32 / 32 / 32.1 dB(A) |
| Fortement sollicité |
| 33.6 / 40.6 dB(A) |
 | ||
30 dB silencieux 40 dB(A) audible 50 dB(A) bruyant |
||
min: | ||
(±) La température maximale du côté supérieur est de 44.2 °C / 112 F, par rapport à la moyenne de 40.4 °C / 105 F, allant de 21.2 à 68.8 °C pour la classe Gaming.
(+) Le fond chauffe jusqu'à un maximum de 39.1 °C / 102 F, contre une moyenne de 43.2 °C / 110 F
(+) En utilisation inactive, la température moyenne du côté supérieur est de 23.3 °C / 74 F, par rapport à la moyenne du dispositif de 33.9 °C / 93 F.
(+) Les repose-poignets et le pavé tactile sont plus froids que la température de la peau avec un maximum de 26.8 °C / 80.2 F et sont donc froids au toucher.
(±) La température moyenne de la zone de l'appui-paume de dispositifs similaires était de 28.8 °C / 83.8 F (+2 °C / #3.6 F).
MSI GF75 8RD-001 analyse audio
(-) | haut-parleurs pas très forts (66.8 dB)
Basses 100 - 315 Hz
(-) | presque aucune basse - en moyenne 17.3% plus bas que la médiane
(±) | la linéarité des basses est moyenne (13.5% delta à la fréquence précédente)
Médiums 400 - 2000 Hz
(±) | médiane supérieure - en moyenne 6.9% supérieure à la médiane
(-) | les médiums ne sont pas linéaires (16.5% delta à la fréquence précédente)
Aiguës 2 - 16 kHz
(+) | des sommets équilibrés - à seulement 3.8% de la médiane
(±) | la linéarité des aigus est moyenne (9.8% delta à la fréquence précédente)
Globalement 100 - 16 000 Hz
(-) | le son global n'est pas linéaire (31.4% de différence à la médiane)
Par rapport à la même classe
» 97% de tous les appareils testés de cette catégorie étaient meilleurs, 1% similaires, 2% pires
» Le meilleur avait un delta de 6%, la moyenne était de 18%, le pire était de 132%.
Par rapport à tous les appareils testés
» 90% de tous les appareils testés étaient meilleurs, 2% similaires, 8% pires
» Le meilleur avait un delta de 4%, la moyenne était de 24%, le pire était de 134%.
Apple MacBook 12 (Early 2016) 1.1 GHz analyse audio
(+) | les haut-parleurs peuvent jouer relativement fort (83.6# dB)
Basses 100 - 315 Hz
(±) | basse réduite - en moyenne 11.3% inférieure à la médiane
(±) | la linéarité des basses est moyenne (14.2% delta à la fréquence précédente)
Médiums 400 - 2000 Hz
(+) | médiane équilibrée - seulement 2.4% de la médiane
(+) | les médiums sont linéaires (5.5% delta à la fréquence précédente)
Aiguës 2 - 16 kHz
(+) | des sommets équilibrés - à seulement 2% de la médiane
(+) | les aigus sont linéaires (4.5% delta à la fréquence précédente)
Globalement 100 - 16 000 Hz
(+) | le son global est linéaire (10.2% différence à la médiane)
Par rapport à la même classe
» 7% de tous les appareils testés de cette catégorie étaient meilleurs, 2% similaires, 91% pires
» Le meilleur avait un delta de 5%, la moyenne était de 18%, le pire était de 53%.
Par rapport à tous les appareils testés
» 5% de tous les appareils testés étaient meilleurs, 1% similaires, 94% pires
» Le meilleur avait un delta de 4%, la moyenne était de 24%, le pire était de 134%.
| Éteint/en veille | |
| Au repos | |
| Fortement sollicité |
|
Légende:
min: | |
| MSI GF75 8RD-001 i7-8750H, GeForce GTX 1050 Ti Max-Q, Kingston RBUSNS8154P3256GJ1, IPS, 1920x1080, 17.3" | Asus TUF FX705GE-EW096T i7-8750H, GeForce GTX 1050 Ti Mobile, SK hynix BC501 HFM128GDJTNG-831, IPS, 1920x1080, 17.3" | Lenovo Legion Y730-17ICH, i7-8750H i7-8750H, GeForce GTX 1050 Ti Mobile, Toshiba KBG30ZMT128G, IPS, 1920x1080, 17.3" | Medion Erazer P6705-MD61131 i7-8750H, GeForce GTX 1050 Ti Mobile, Samsung SSD PM981 MZVLB256HAHQ, TN, 1920x1080, 15.6" | HP Pavilion Gaming 15-cx0003ng i7-8750H, GeForce GTX 1050 Ti Mobile, Intel Optane 16 GB MEMPEK1J016GAH + HGST HTS721010A9E630 1 TB HDD, IPS, 1920x1080, 15.6" | Acer Aspire 7 A715-72G-704Q i7-8750H, GeForce GTX 1050 Ti Mobile, Intel SSD 760p SSDPEKKW256G8, IPS, 1920x1080, 15.6" | Moyenne NVIDIA GeForce GTX 1050 Ti Max-Q | Moyenne de la classe Gaming | |
|---|---|---|---|---|---|---|---|---|
| Power Consumption | 15% | 4% | 18% | 7% | 23% | 4% | -74% | |
| Idle Minimum * (Watt) | 6.5 | 3.8 42% | 6.3 3% | 4 38% | 5.5 15% | 3.9 40% | 5.8 ? 11% | 13.3 ? -105% |
| Idle Average * (Watt) | 11.9 | 9 24% | 11 8% | 7 41% | 8.5 29% | 6.6 45% | 11.2 ? 6% | 19 ? -60% |
| Idle Maximum * (Watt) | 13.1 | 11.2 15% | 11.5 12% | 11 16% | 11.9 9% | 8.5 35% | 13.5 ? -3% | 24.5 ? -87% |
| Load Average * (Watt) | 86 | 101 -17% | 89.8 -4% | 72 16% | 94 -9% | 89 -3% | 86.9 ? -1% | 108.1 ? -26% |
| Load Maximum * (Watt) | 131 | 119.7 9% | 130.7 -0% | 158 -21% | 144 -10% | 134 -2% | 122.4 ? 7% | 254 ? -94% |
| Witcher 3 ultra * (Watt) | 102 | 79 | 86 |
* ... Moindre est la valeur, meilleures sont les performances
| MSI GF75 8RD-001 i7-8750H, GeForce GTX 1050 Ti Max-Q, 51 Wh | Lenovo ThinkPad X1 Extreme-20MF000XGE i7-8750H, GeForce GTX 1050 Ti Max-Q, 80 Wh | HP Spectre x360 15-df0126ng i7-8750H, GeForce GTX 1050 Ti Max-Q, 84 Wh | Acer Aspire 7 A715-72G-704Q i7-8750H, GeForce GTX 1050 Ti Mobile, 48.9 Wh | Asus Zephyrus S GX531GX i7-8750H, GeForce RTX 2080 Max-Q, 50 Wh | Medion Erazer P6705-MD61131 i7-8750H, GeForce GTX 1050 Ti Mobile, 62 Wh | Moyenne de la classe Gaming | |
|---|---|---|---|---|---|---|---|
| Autonomie de la batterie | 71% | 130% | 54% | -36% | 70% | 66% | |
| Reader / Idle (h) | 6.3 | 11.5 83% | 18.8 198% | 12.3 95% | 8.9 41% | 8.71 ? 38% | |
| H.264 (h) | 3.4 | 6.2 82% | 7.7 126% | 6 76% | 8.26 ? 143% | ||
| WiFi v1.3 (h) | 4.7 | 6.4 36% | 8.8 87% | 6.4 36% | 3 -36% | 6.7 43% | 7.01 ? 49% |
| Load (h) | 1.1 | 2 82% | 2.3 109% | 1.2 9% | 2.5 127% | 1.47 ? 34% | |
| Witcher 3 ultra (h) | 1.1 |
Points positifs
Points négatifs
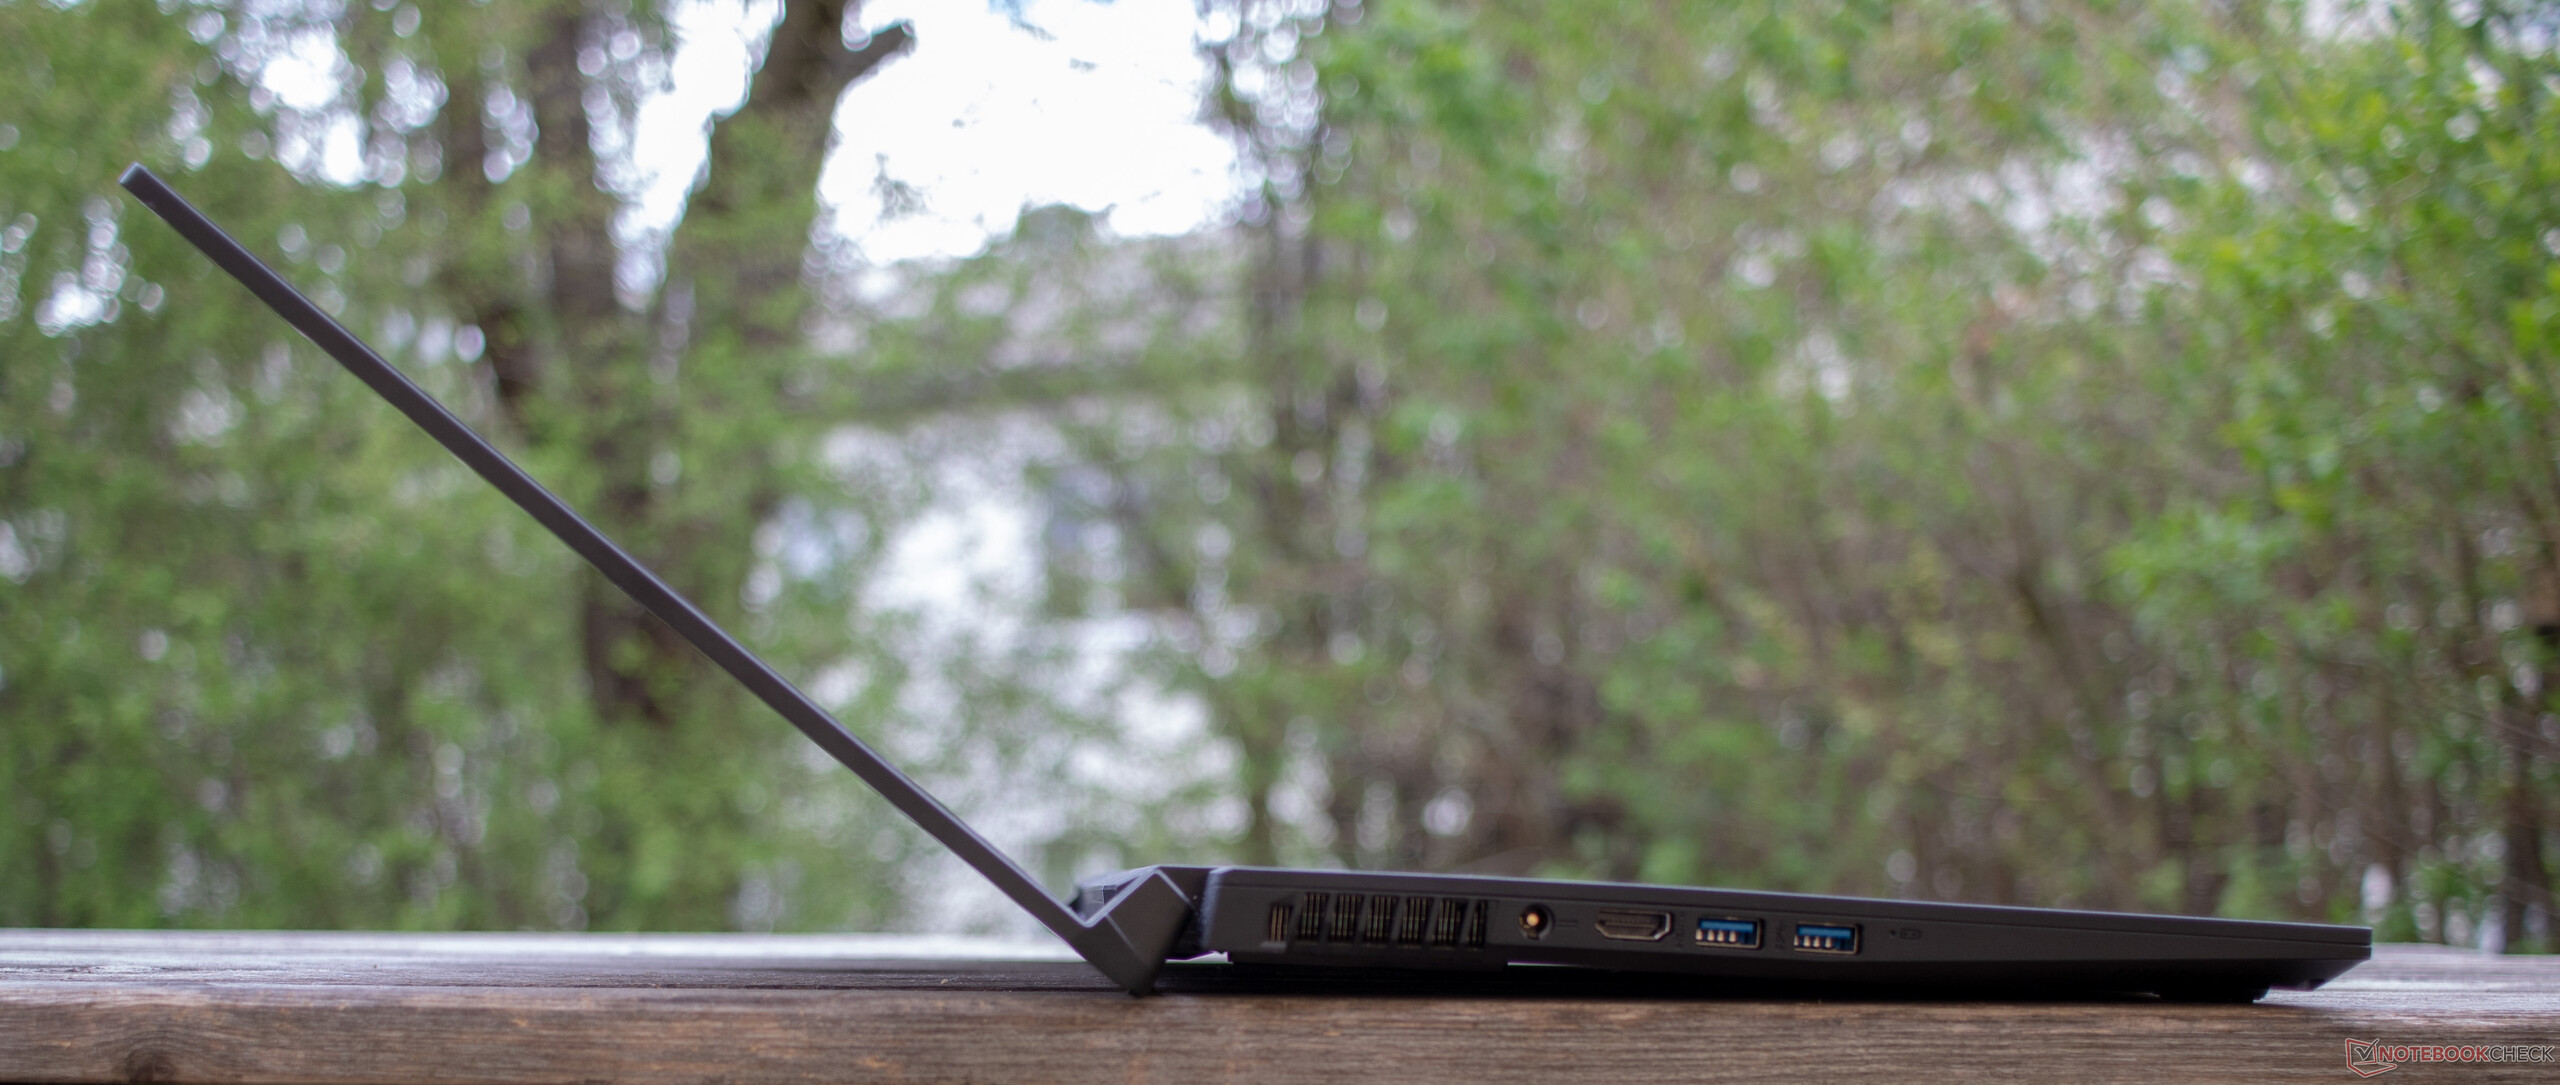
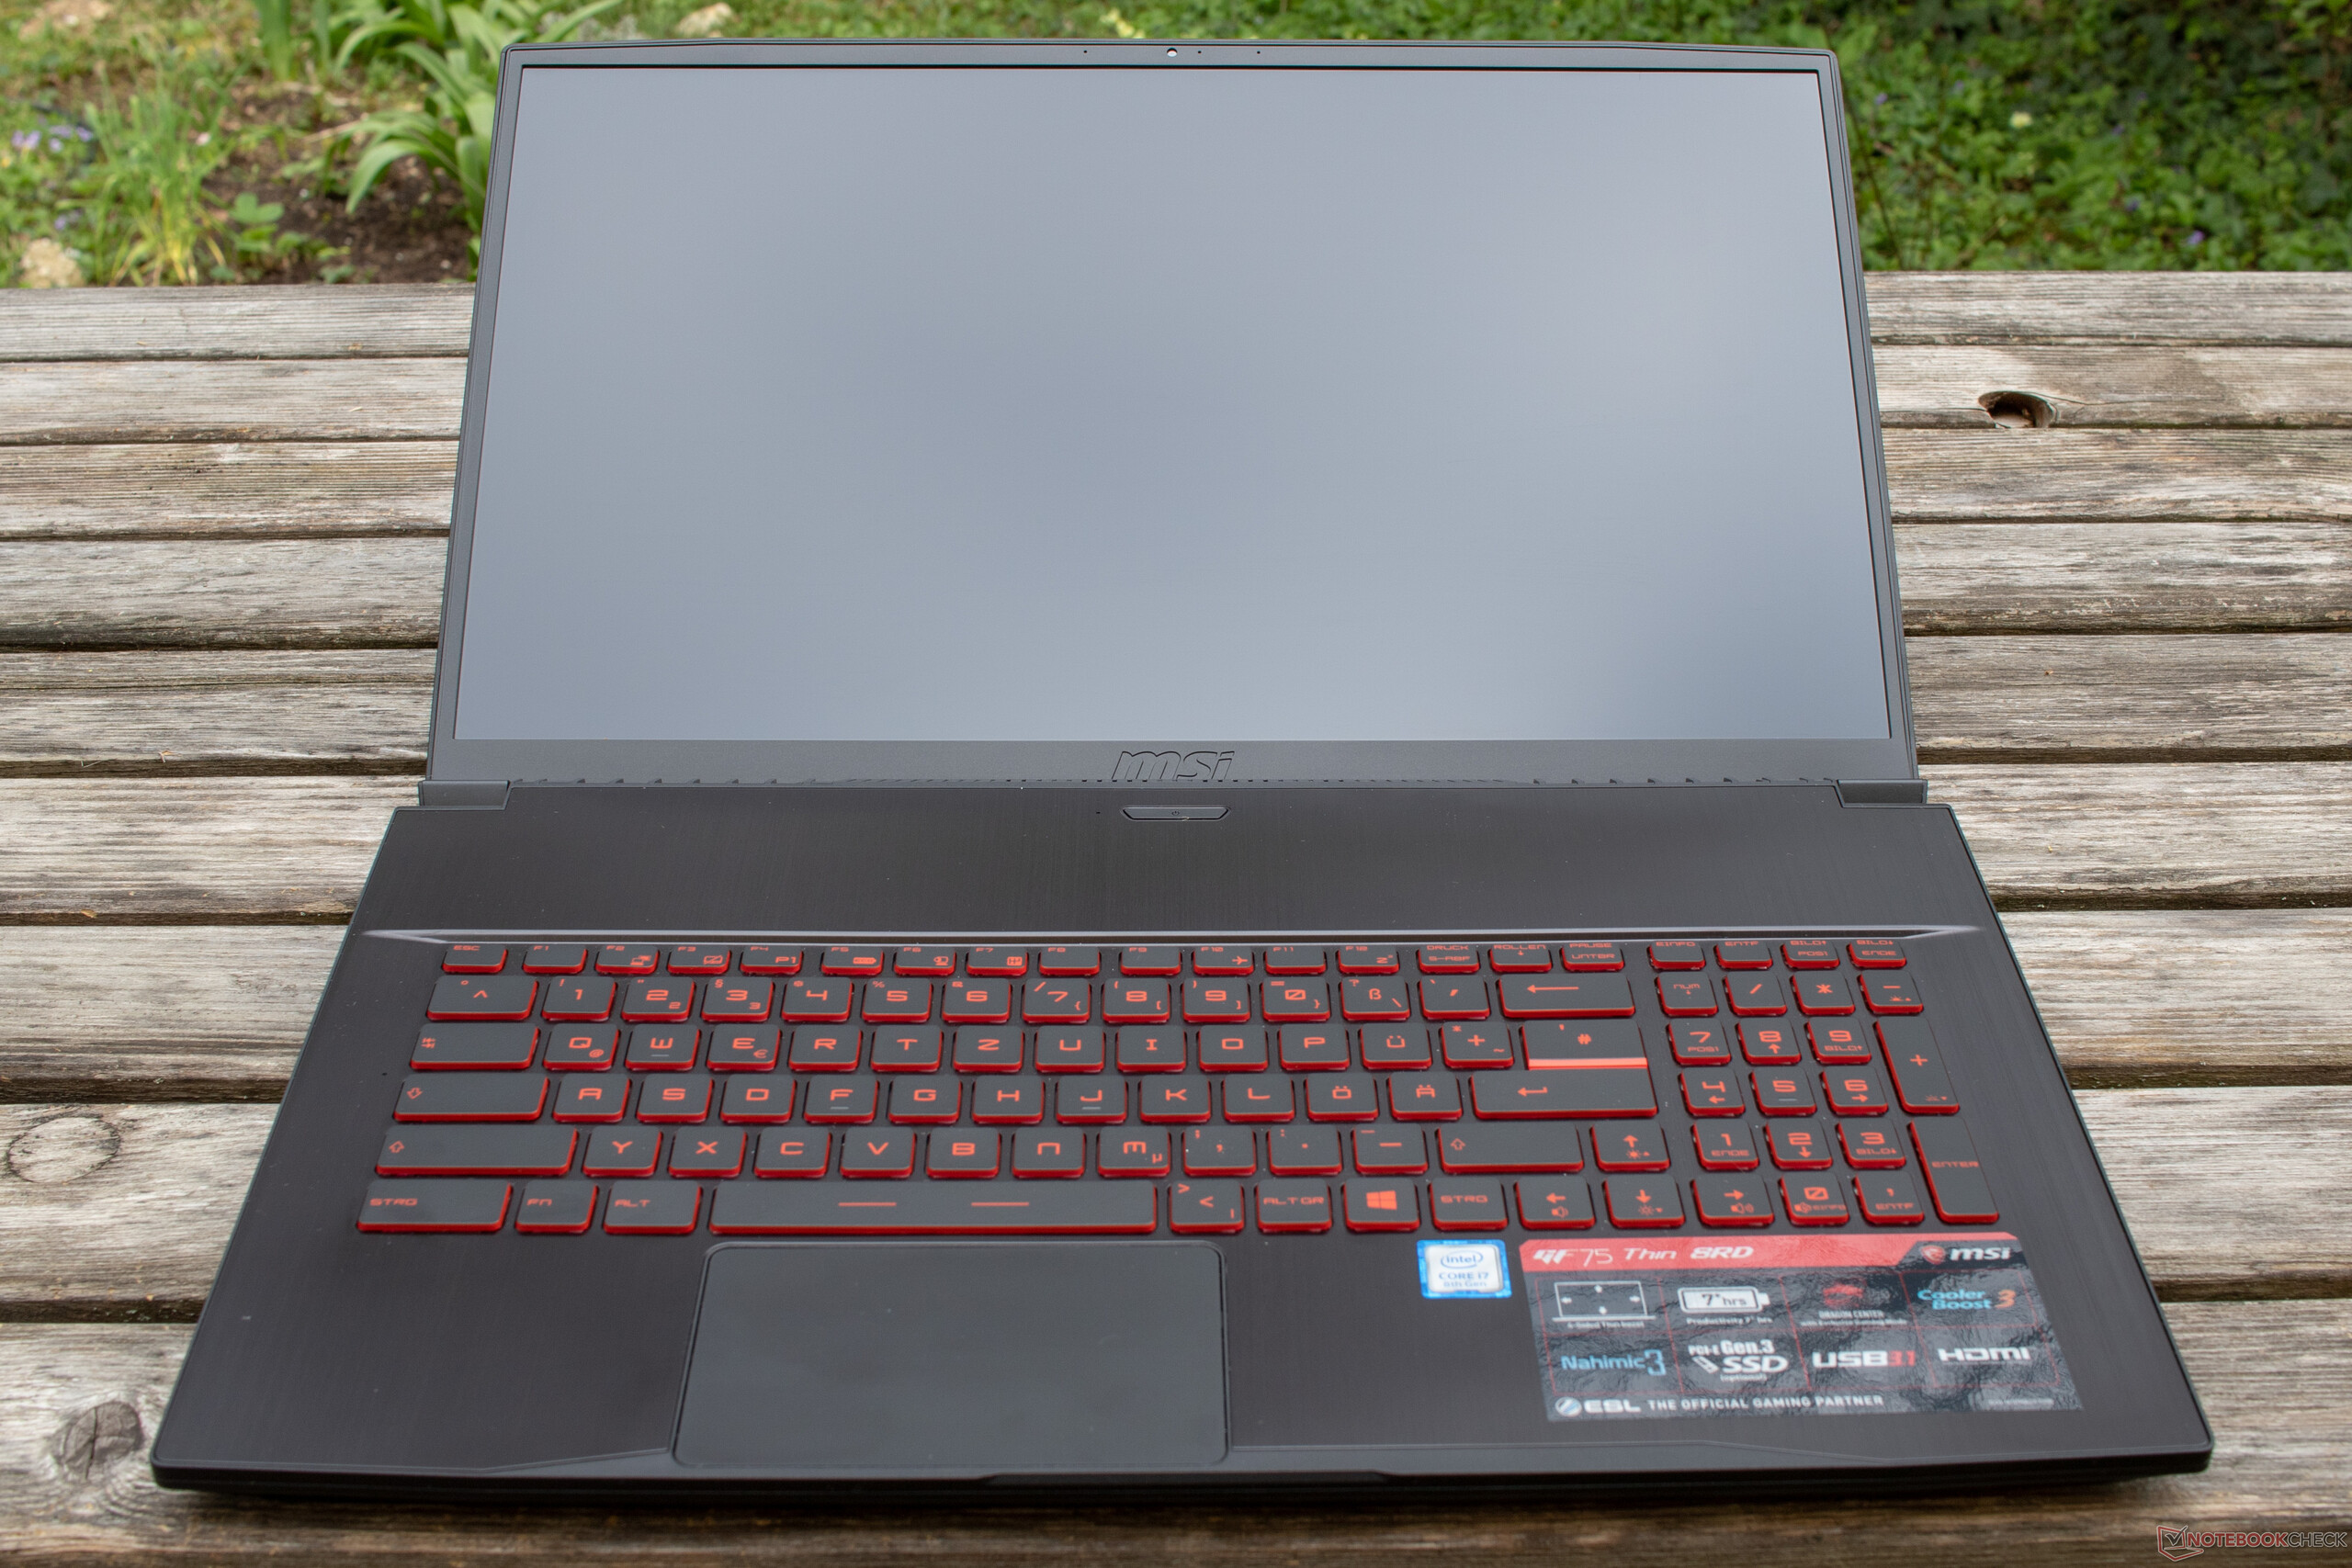
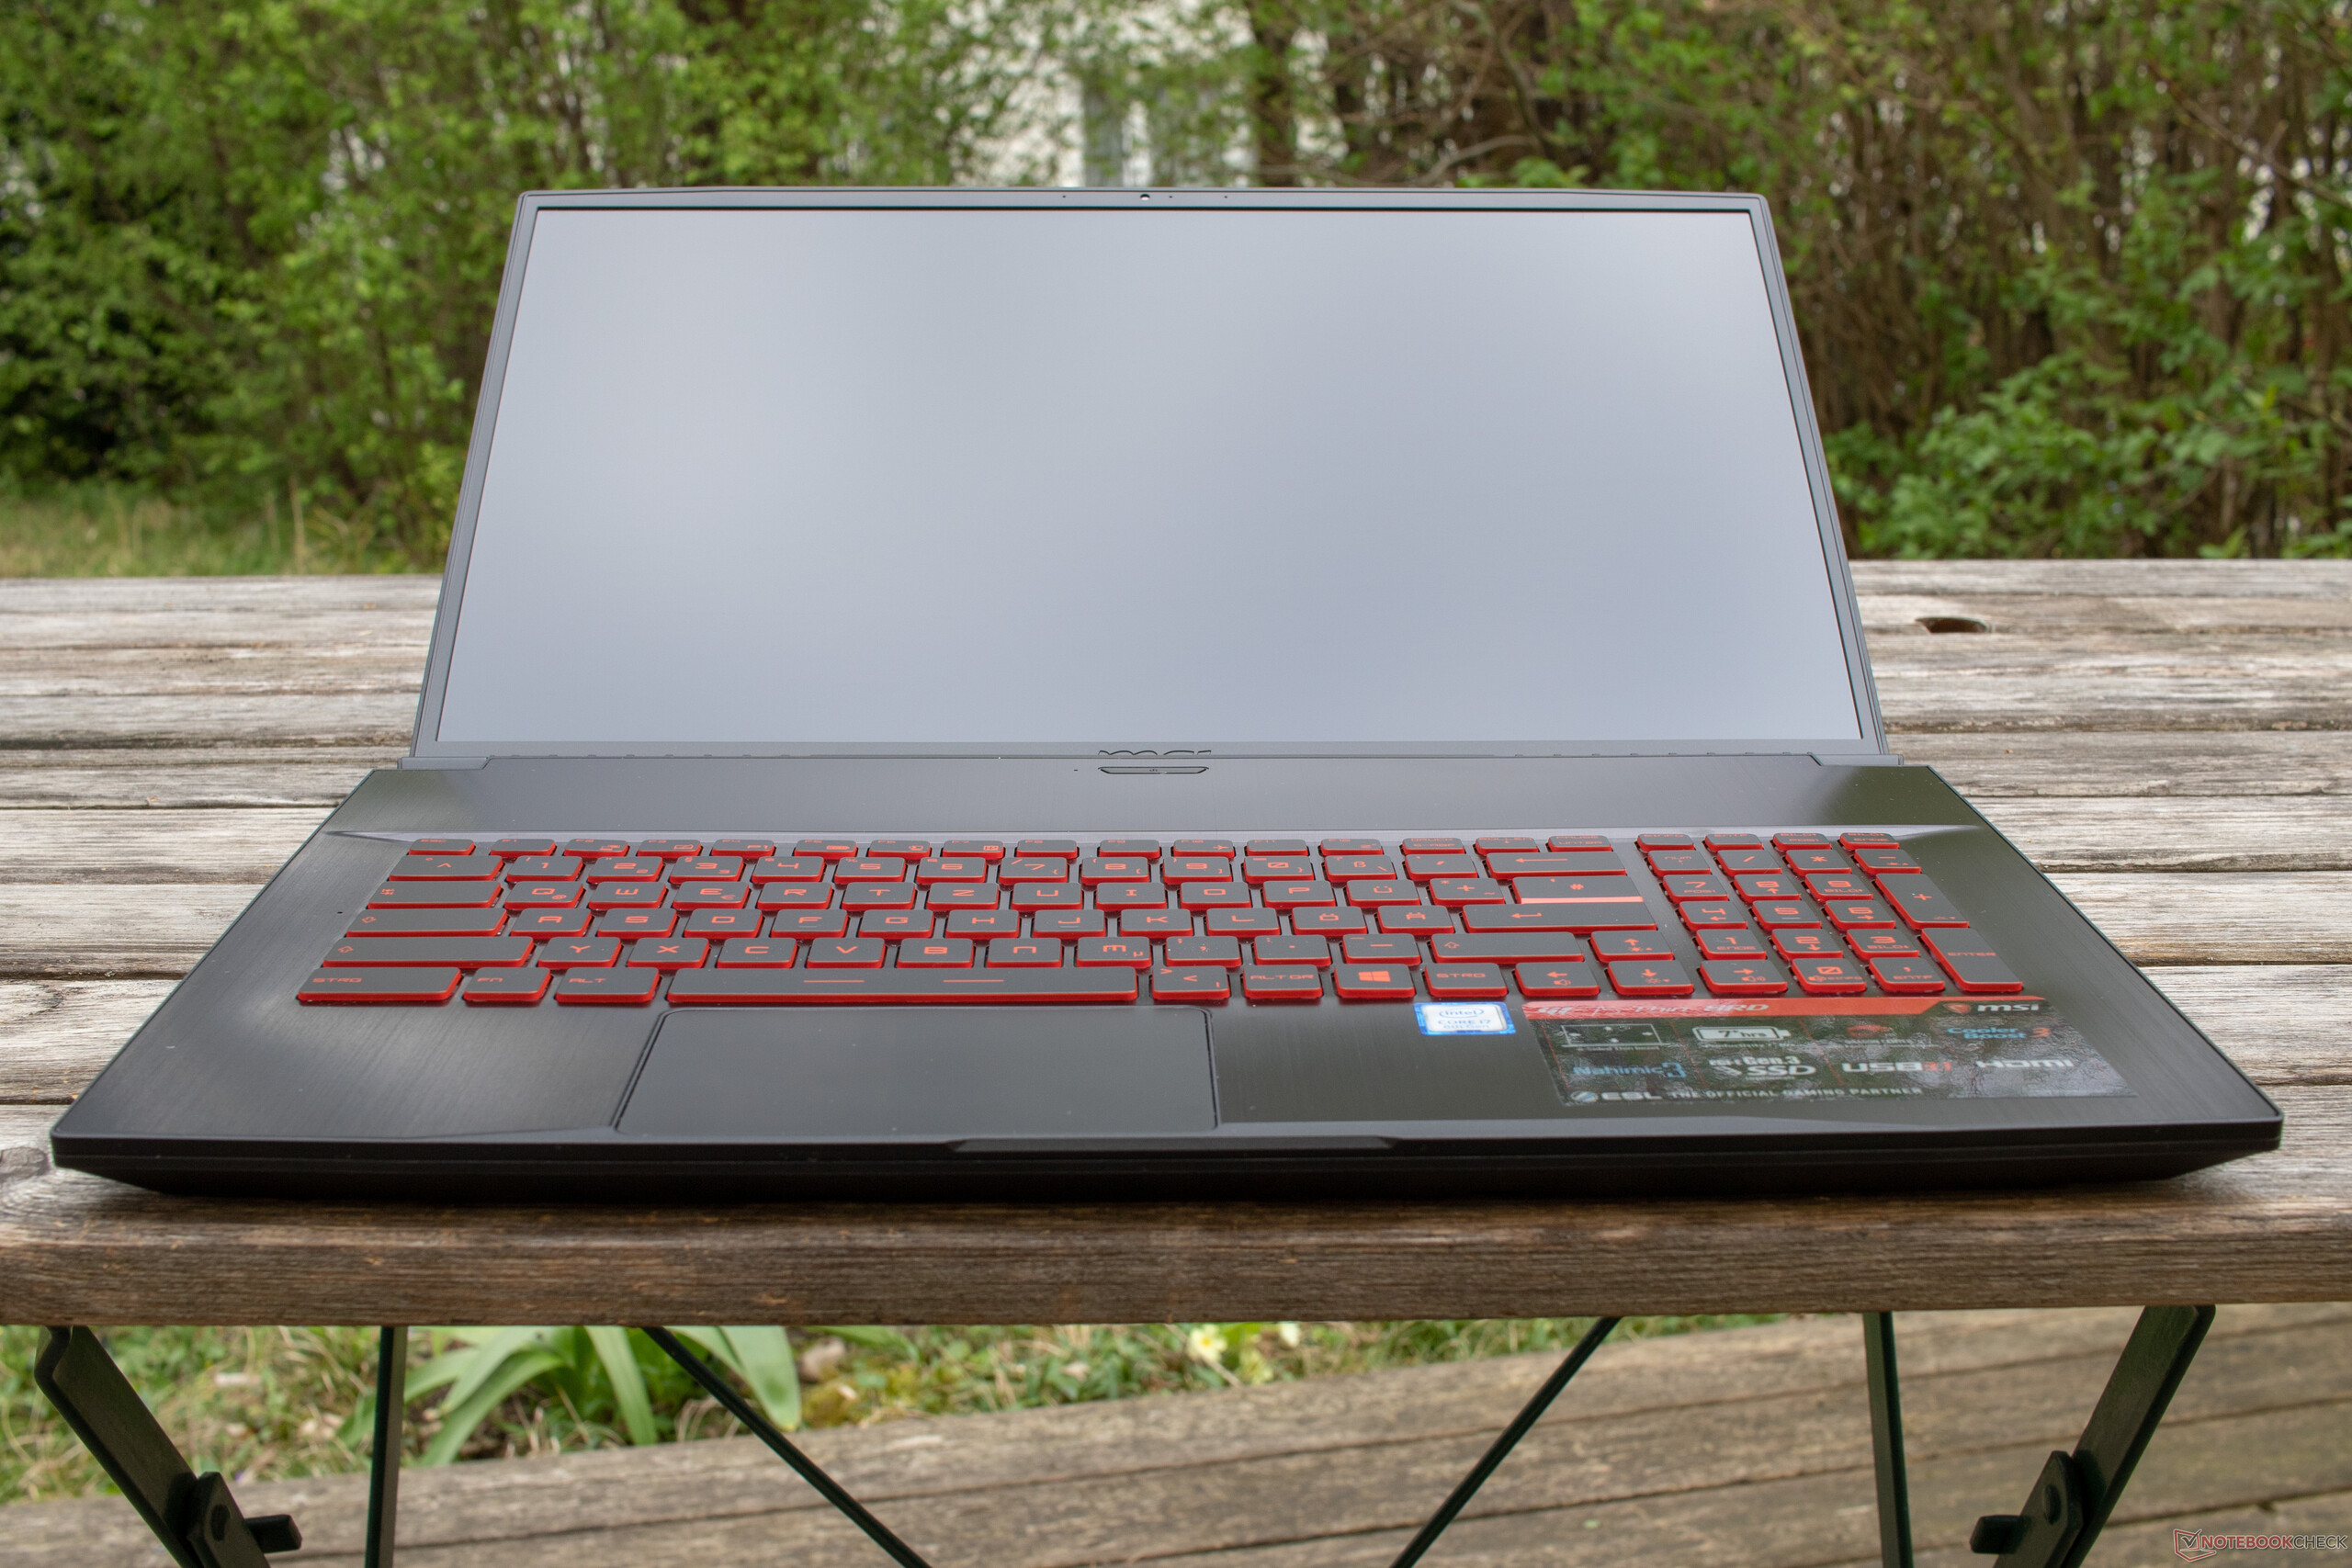
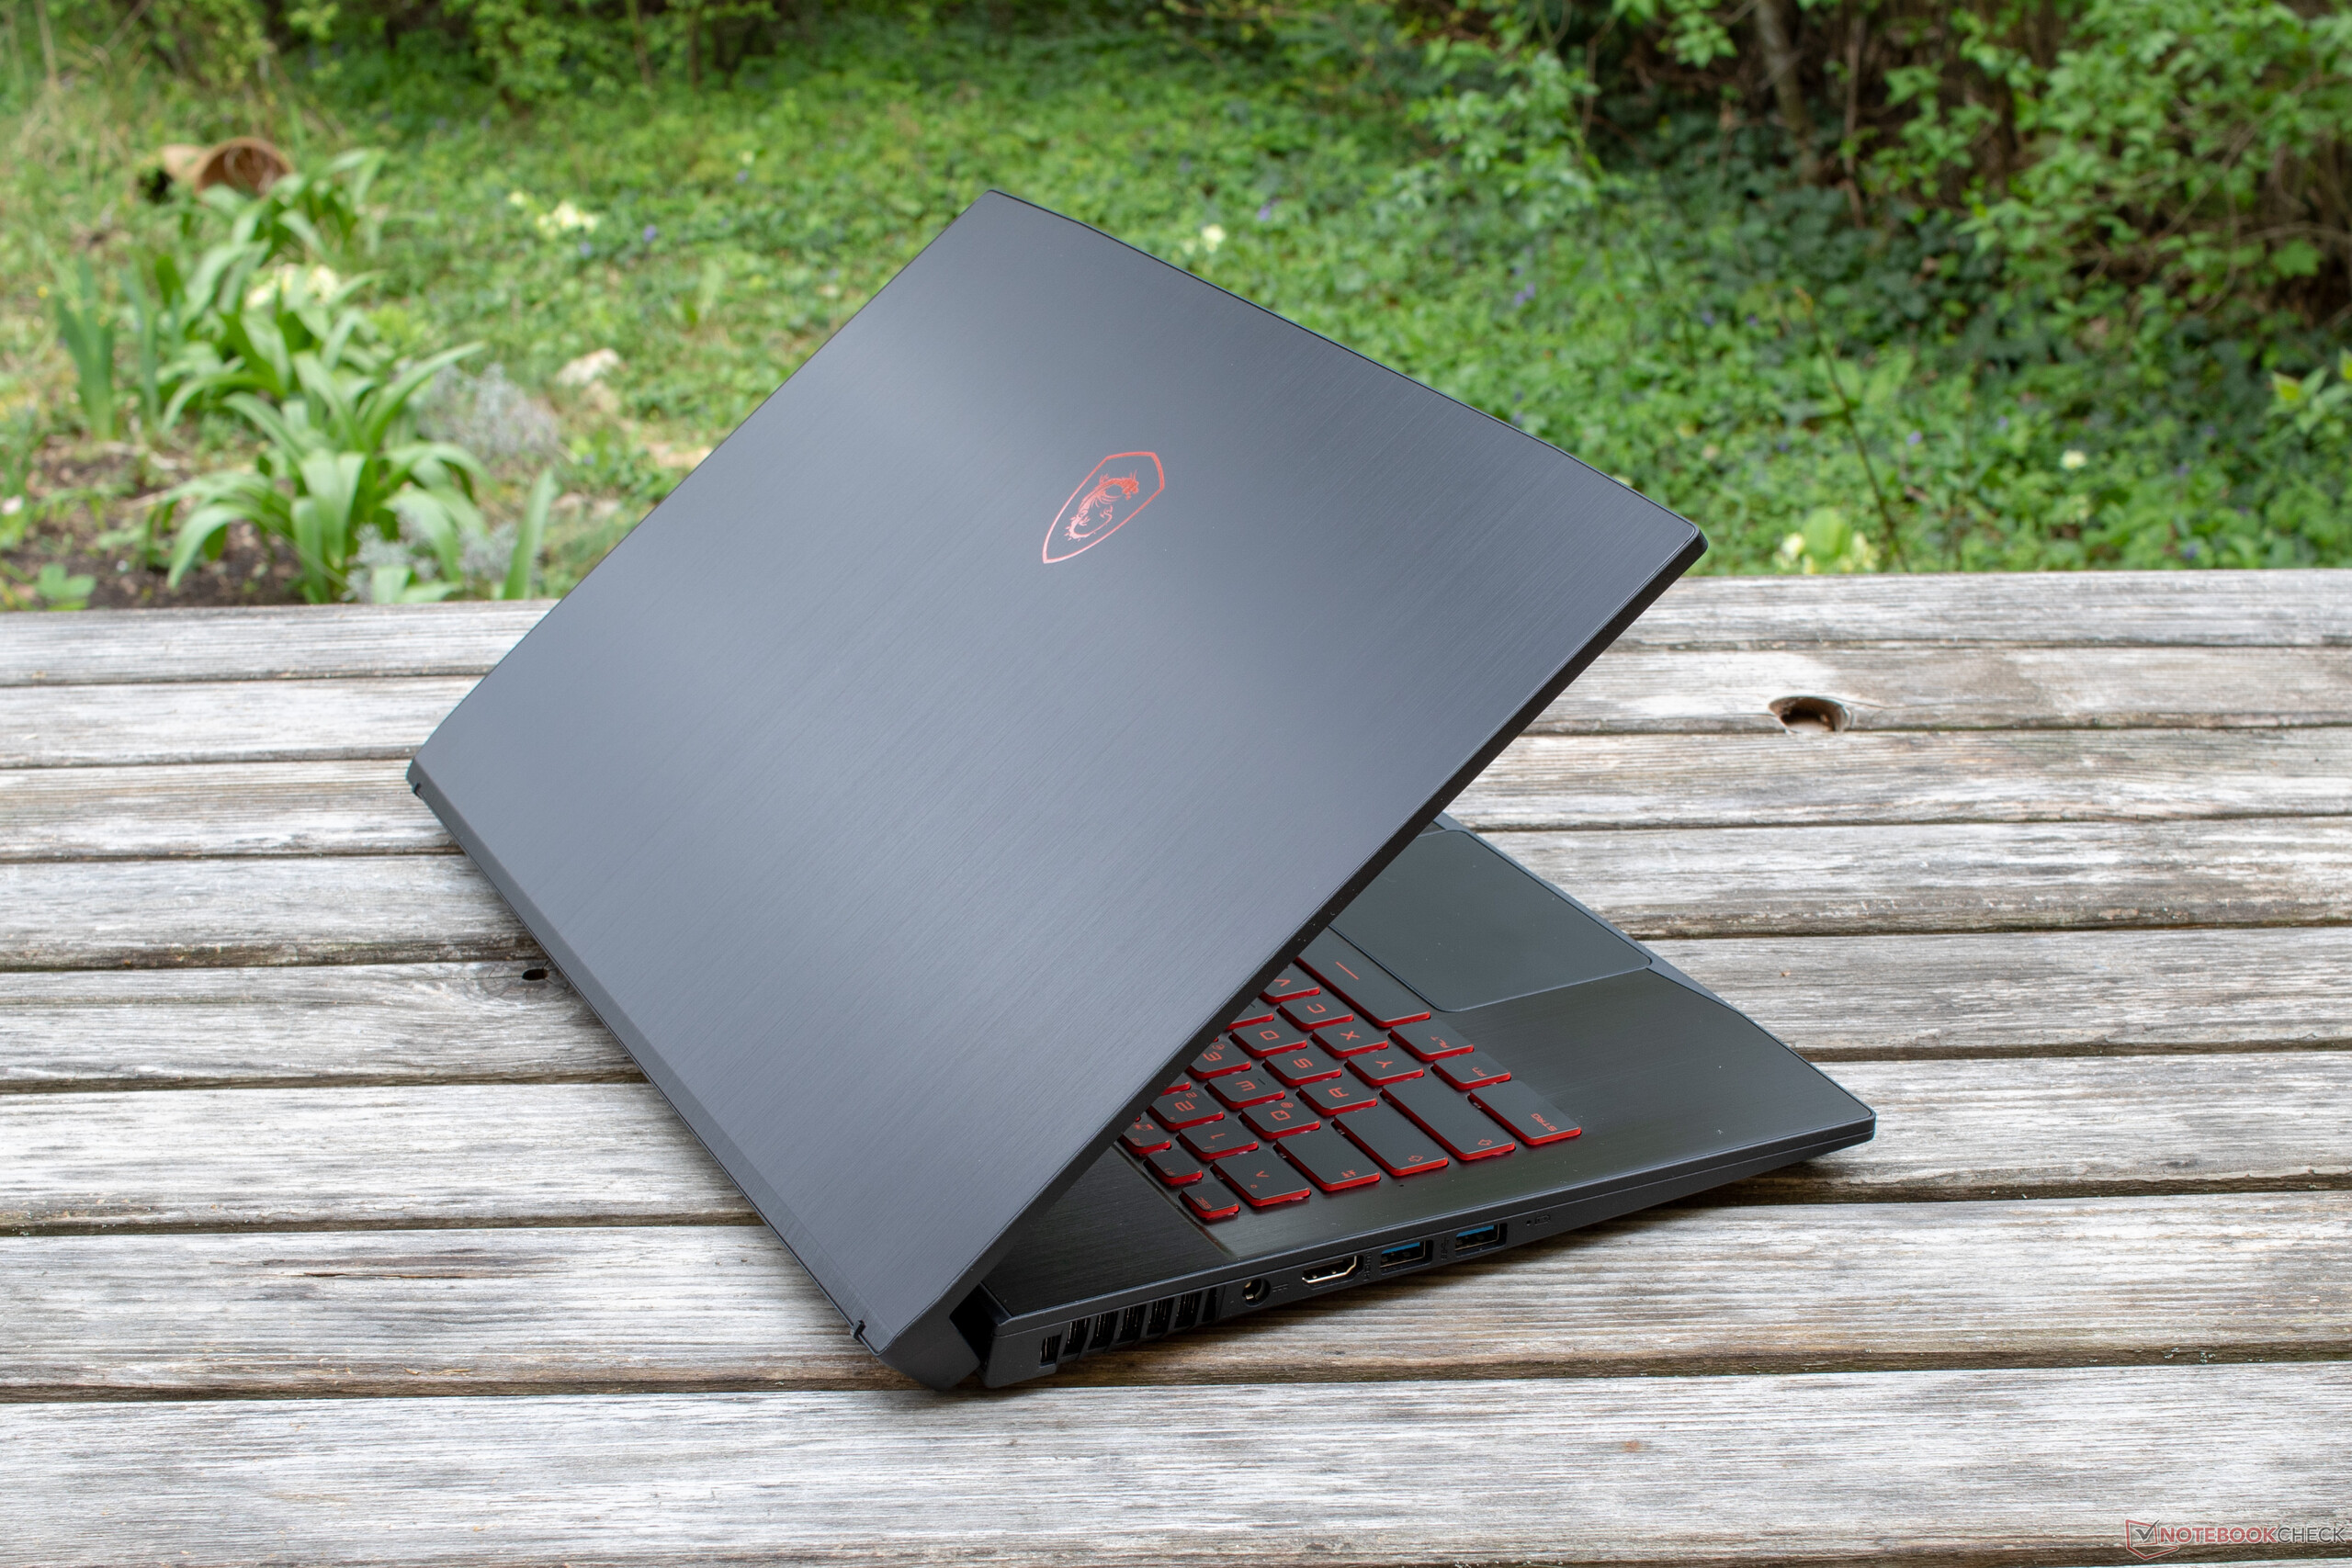
MSI a essayé de se concentrer sur l’essentiel, et a réussi à faire du GF75 une machine honnête. Il est assez puissant pour être considéré comme un portable de jeu, tout en proposant un châssis fin et léger. Même si la GeForce GTX 1050 Ti Max-Q économe en énergie avec une fréquence légèrement réduite ne parviendra pas à afficher les jeux actuels à des détails élevés, elle devrait permettre de jouer à la plupart des titres à des réglages moyens.
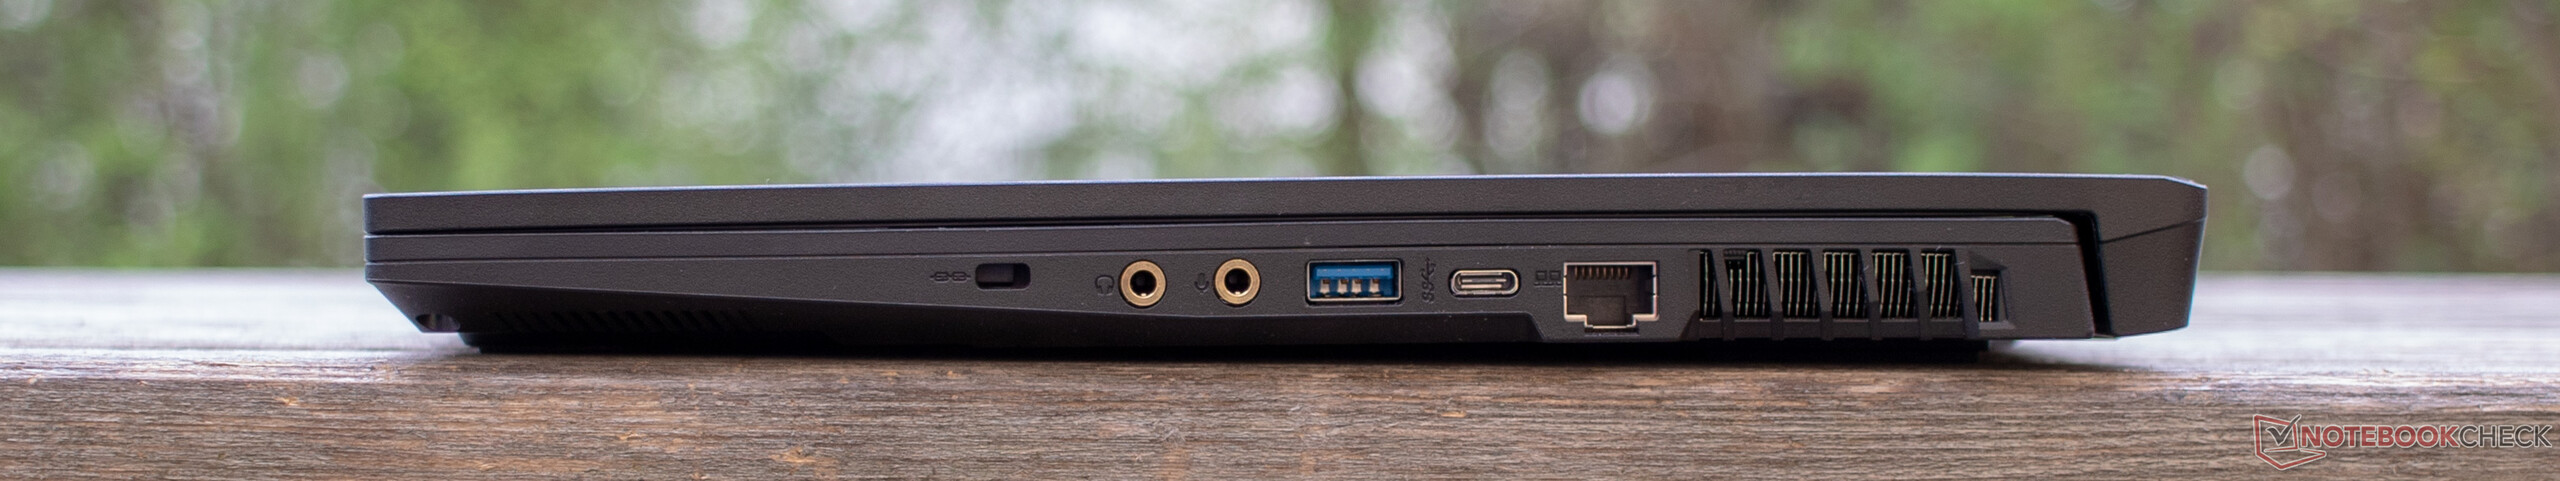
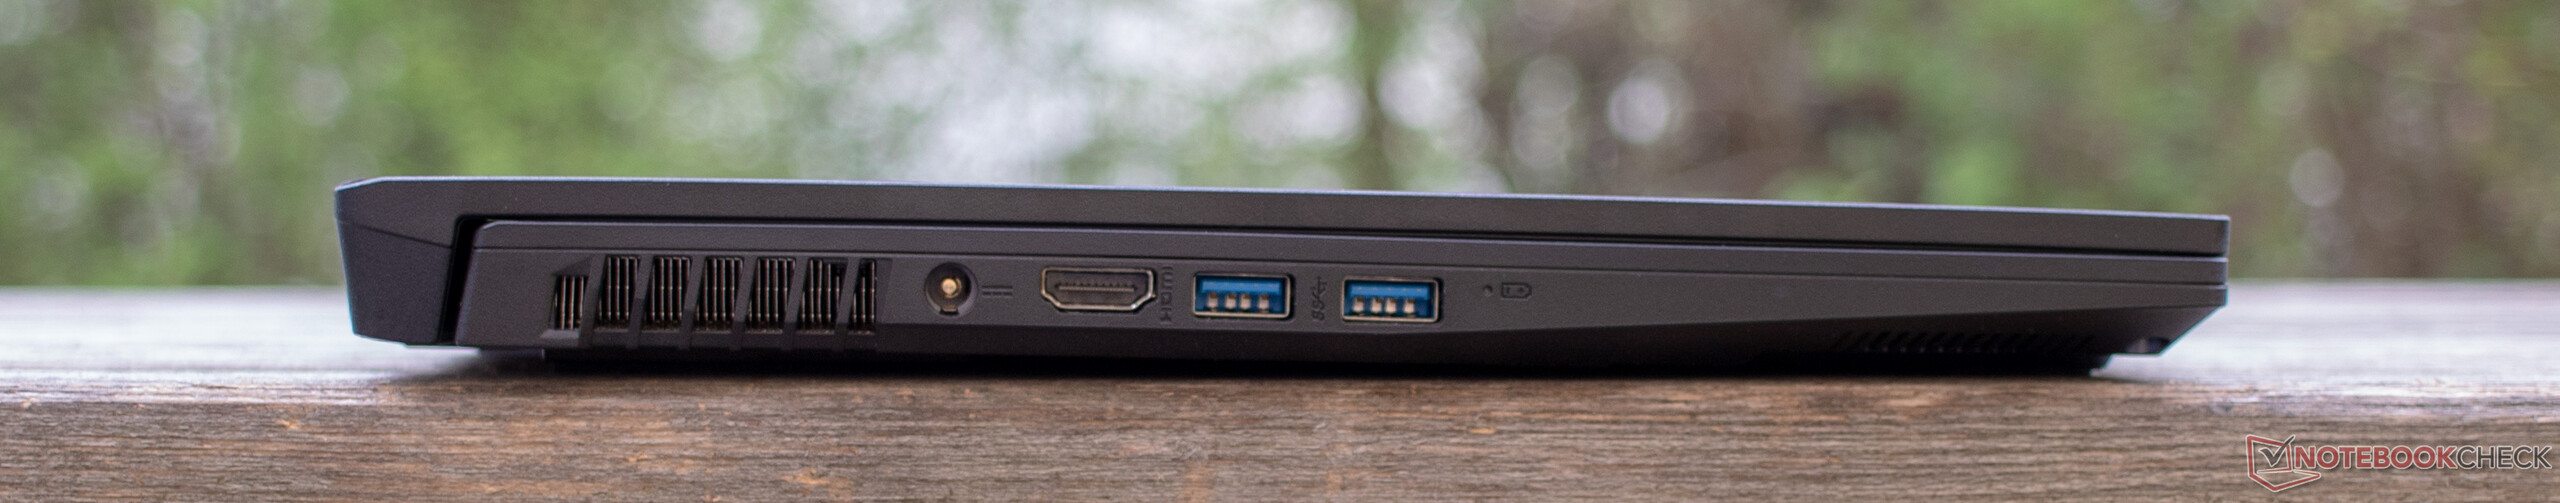
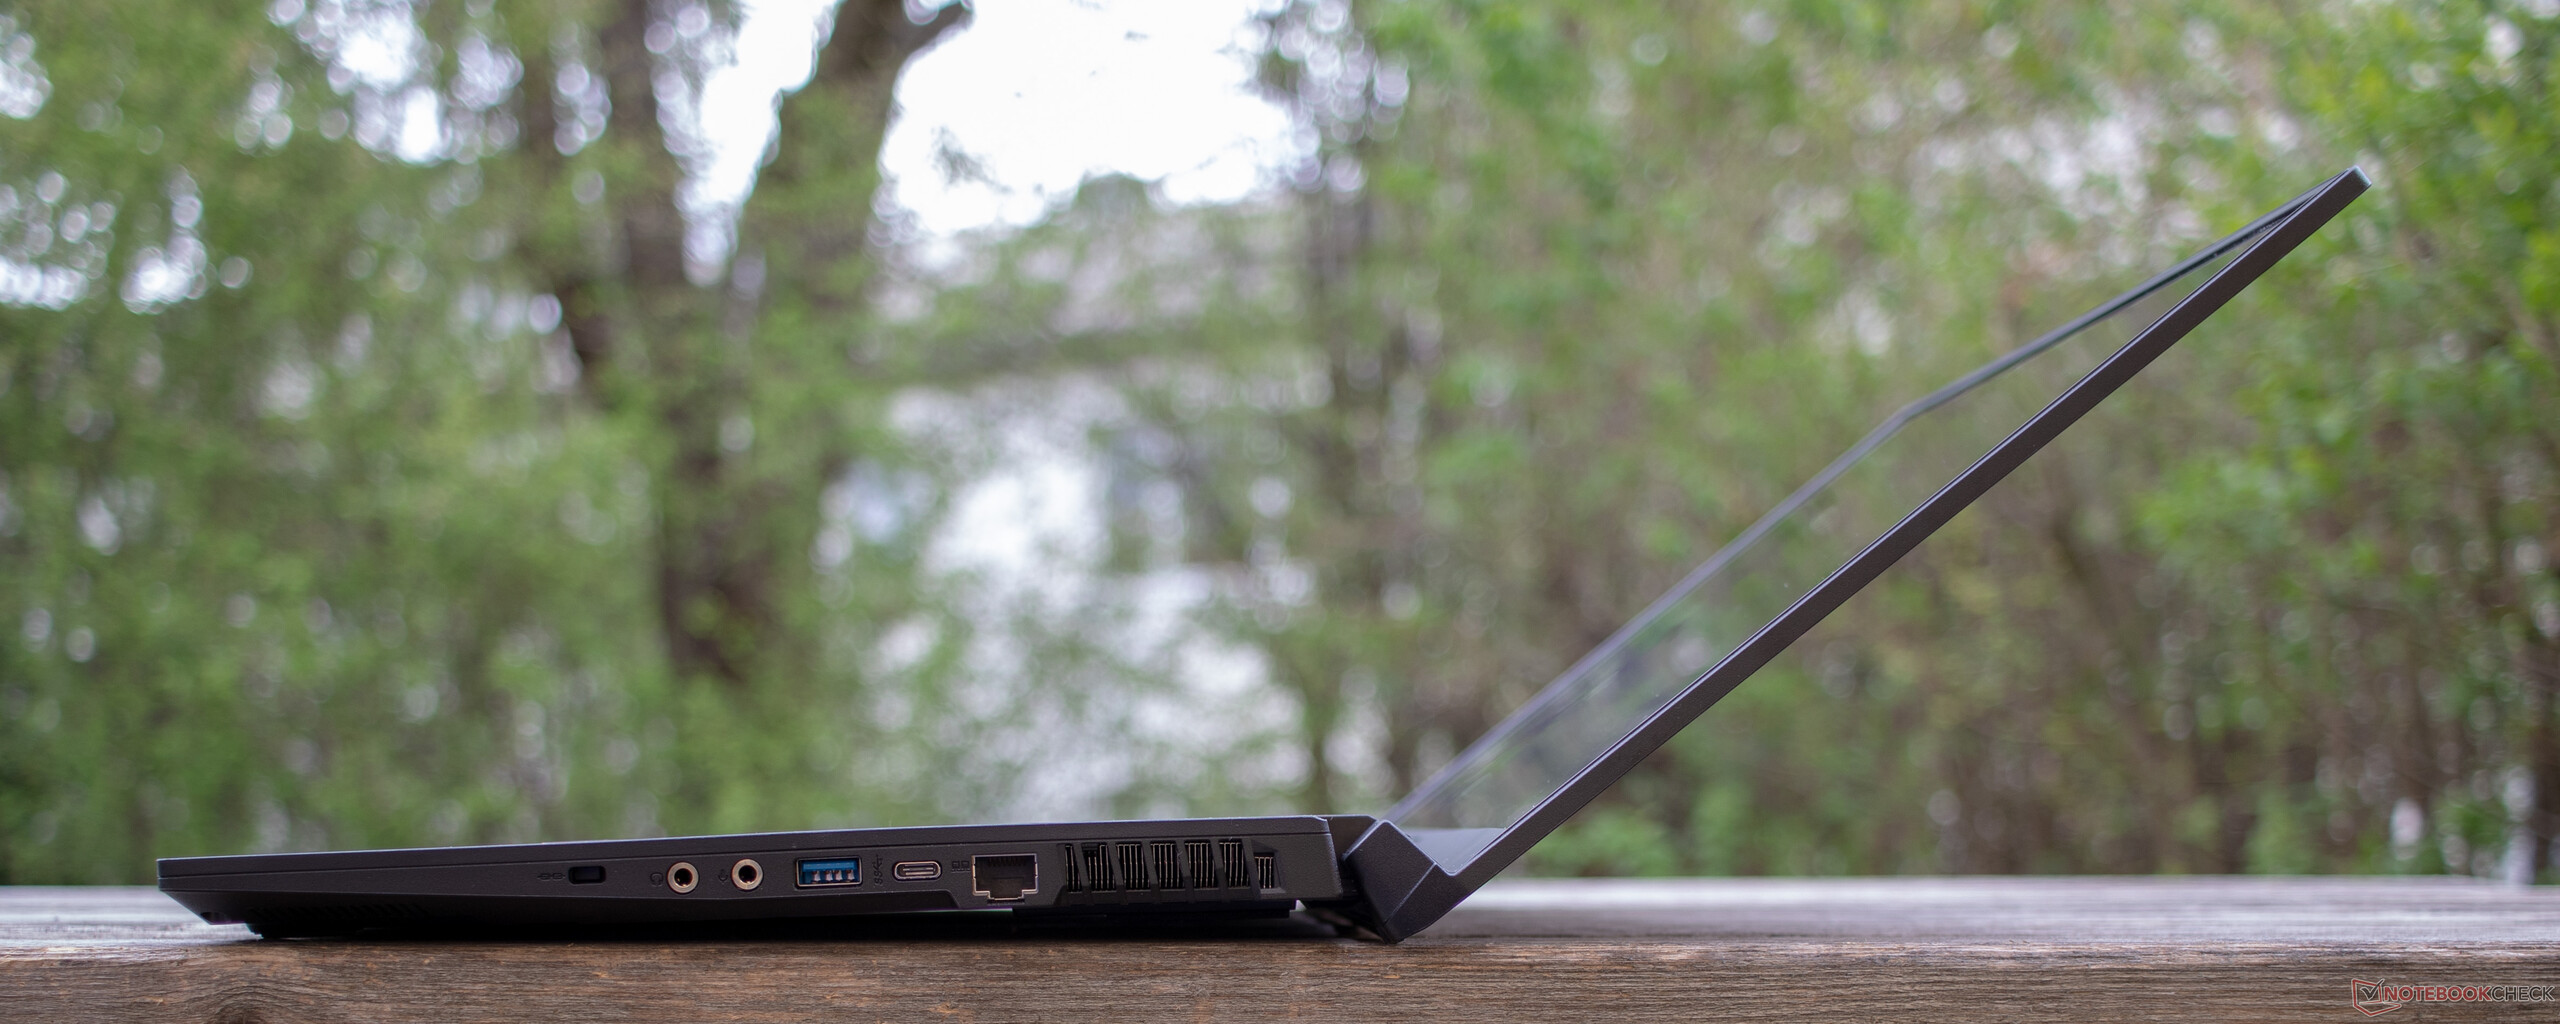
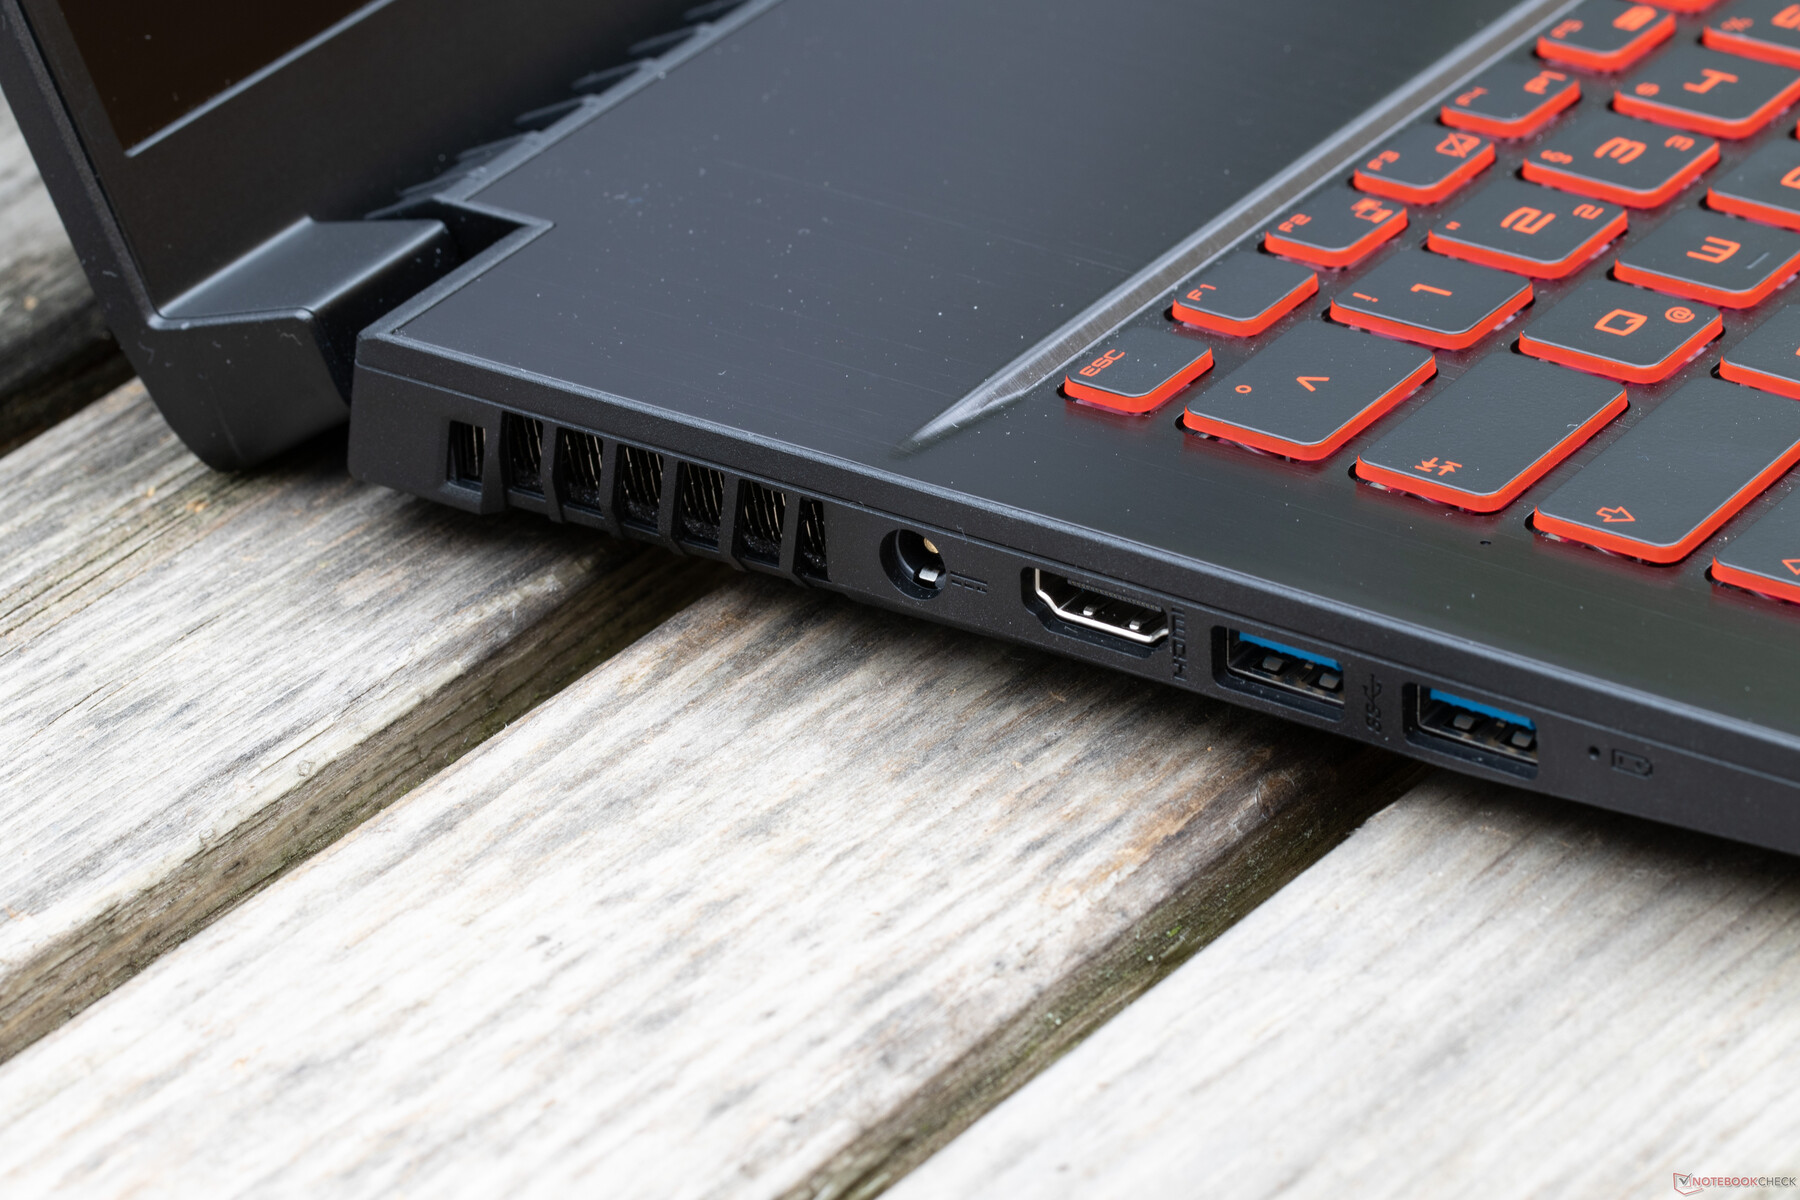
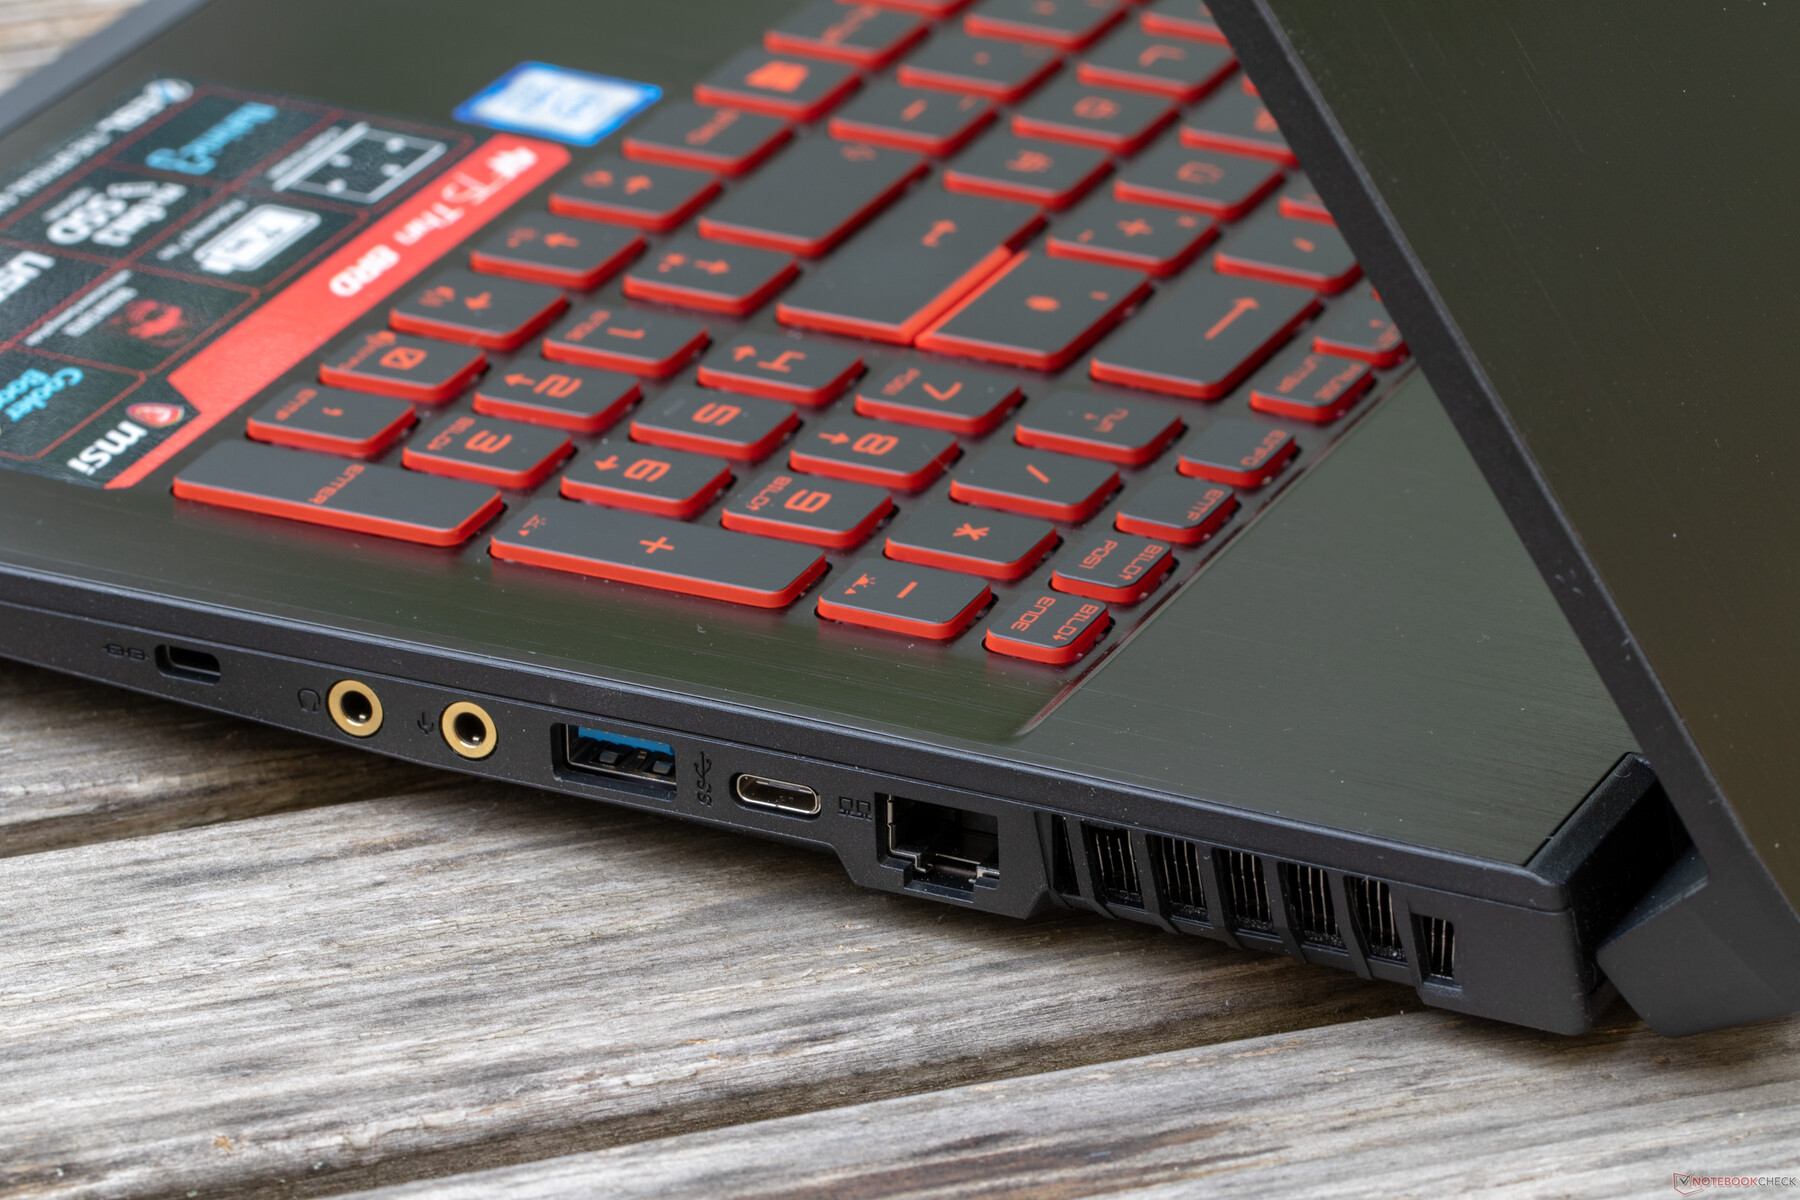
En revanche, MSI a choisi de réduire au minimum la sélection des ports, certainement pour atteindre ses objectifs de finesse, mais aussi pour garder le prix sous un certain palier.
Ceux qui peuvent supporter de travailler sans Thunderbolt ni DisplayPort, et qui n'ont pas besoin de lecteur de carte SD ni de fonctionnalités de sécurité comme un lecteur d’empreintes digitales, pourront être parfaitement convaincus par ce portable abordable qui inclut une GTX 1050 Max-Q.
L’écran IPS est très bon, et affronte la concurrence avec sérénité. Les résultats Cinebench ne sont pas aussi bons. Nous avons l’impression que le fabricant a été trop soucieux de maîtriser le bruit. Le ventilateur est très silencieux, et aurait pu tourner plus vite. La batterie pourrait également profiter d’une hausse de sa capacité. Alors que l’autonomie est suffisante pour un portable de jeu de 17 pouces toujours branché, les choses se compliqueront en déplacements.
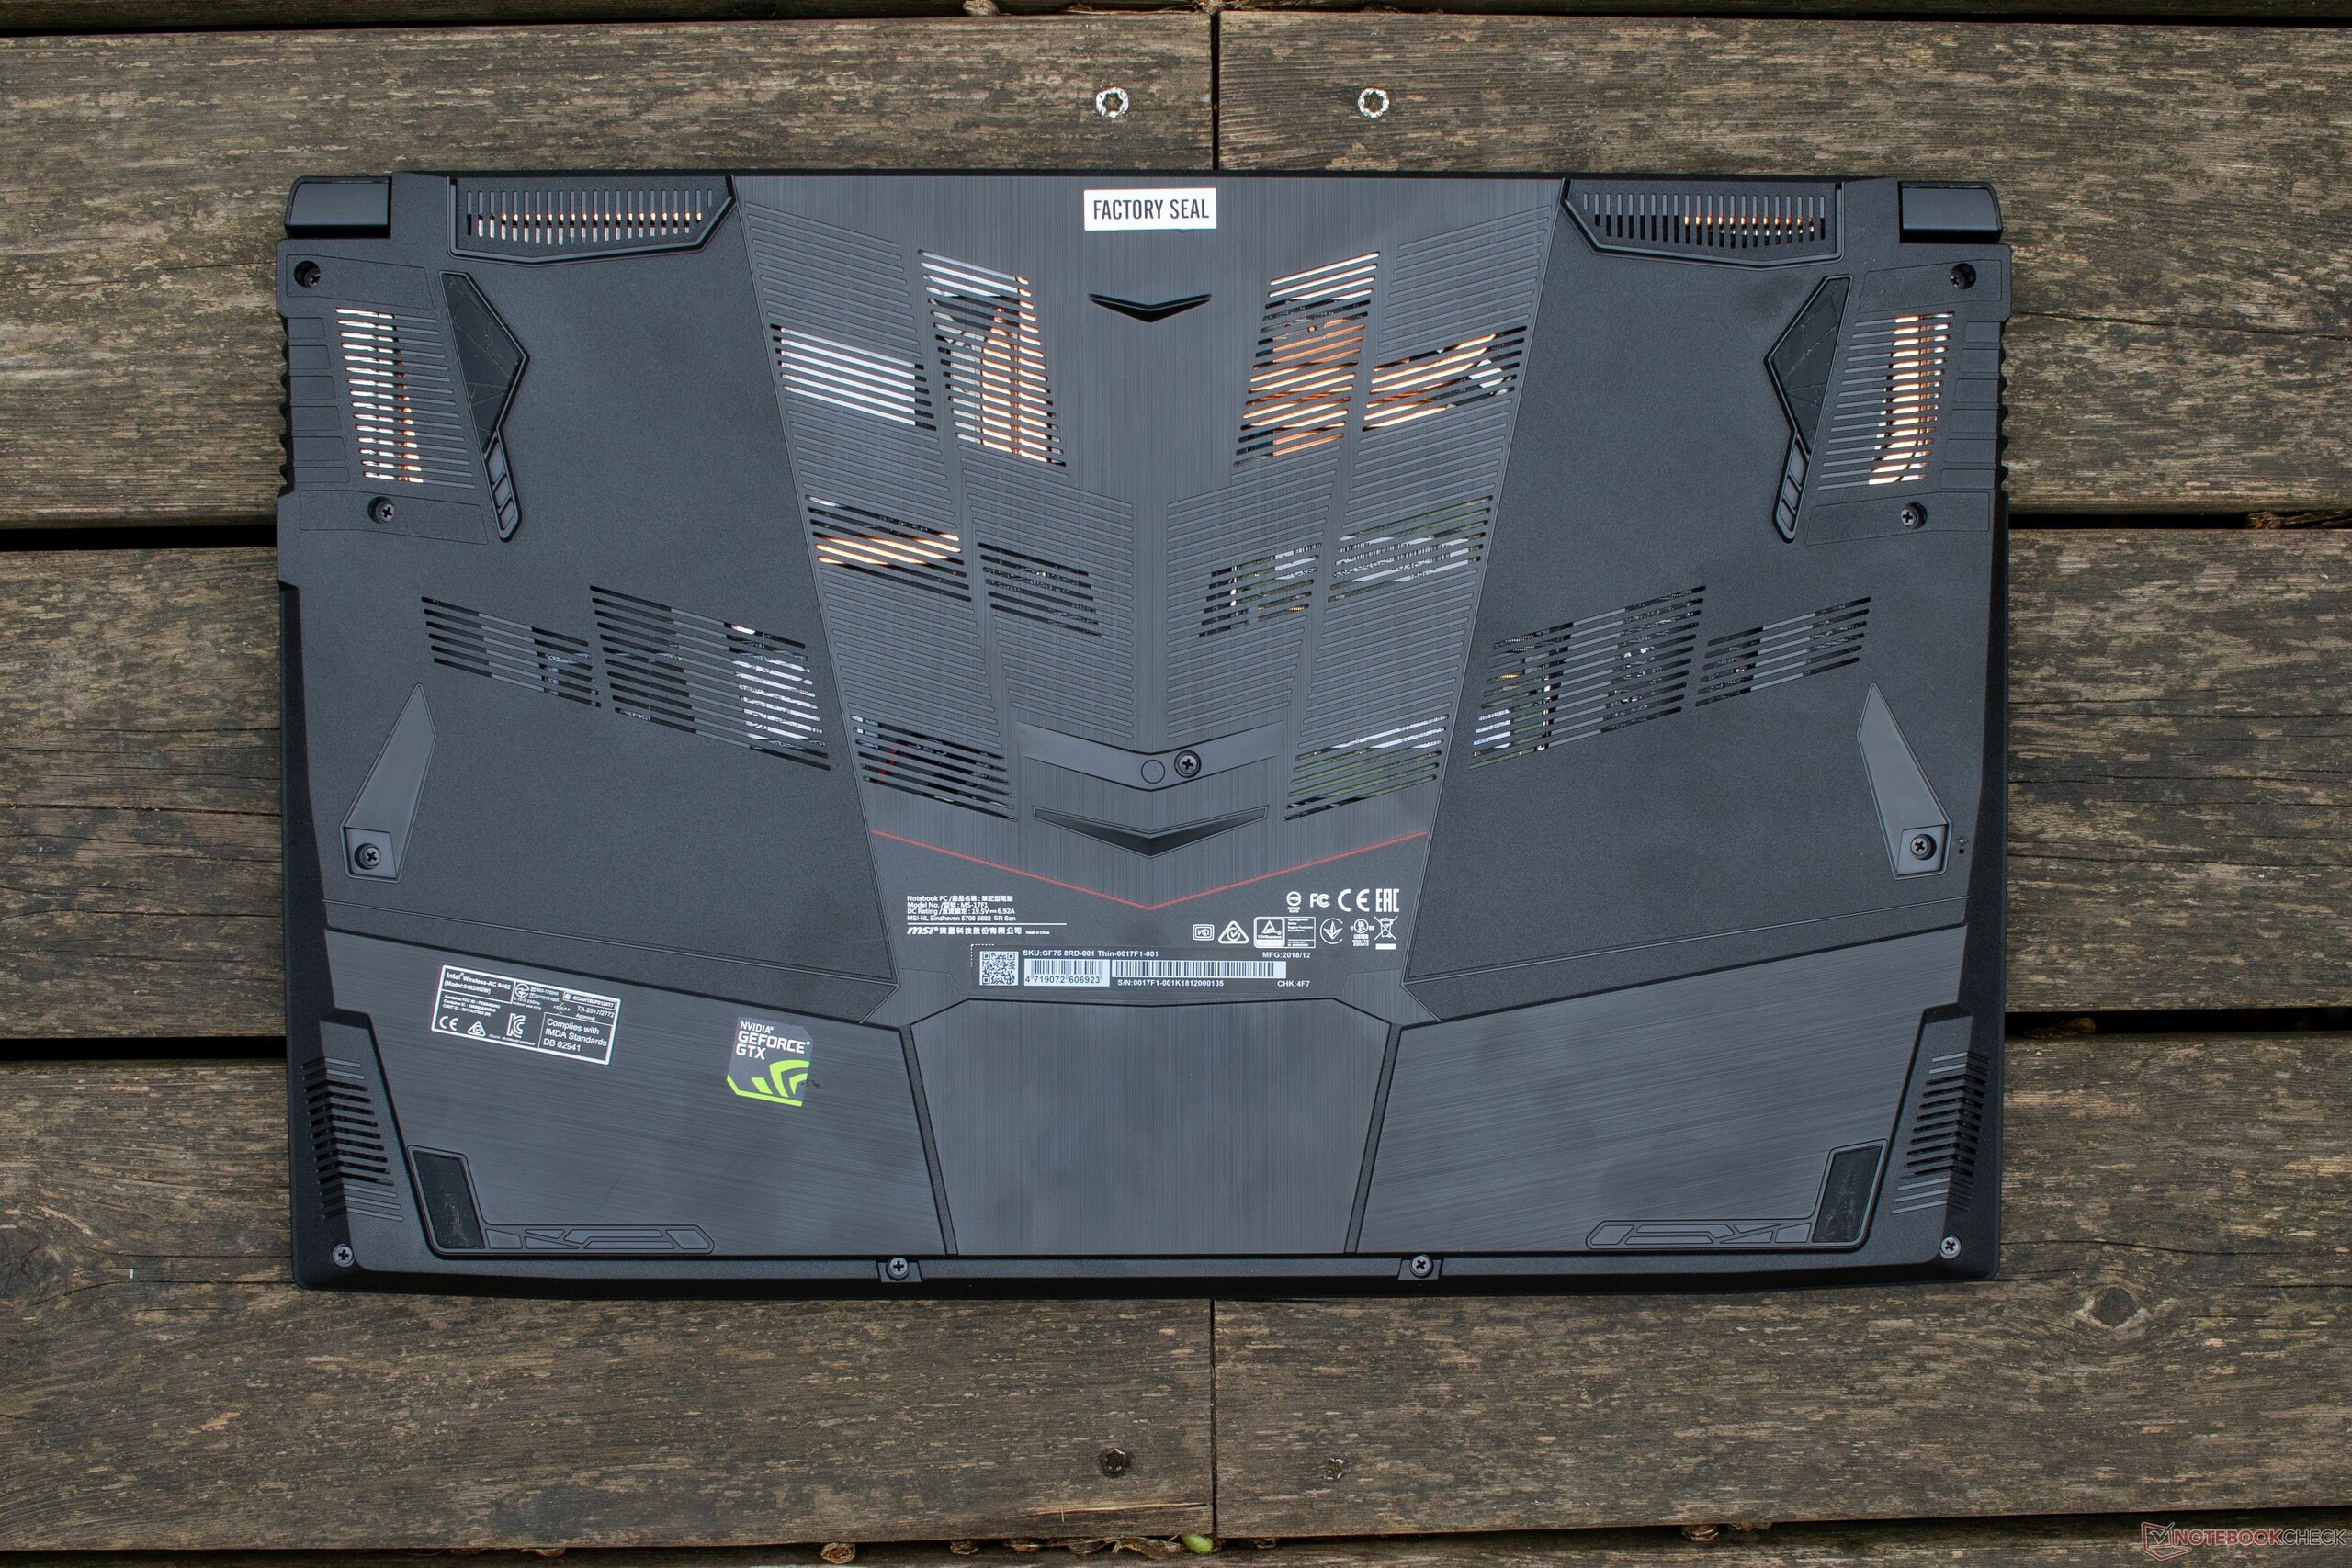
Ainsi, nous pouvons dire que les joueurs du milieu de gamme jouant aux jeux actuels devraient être satisfaits du ratio prix / performances du MSI GF75 Thin. Et son aspect est très réussi. Il faudra cependant accepter des petits défauts comme une coque inférieure bon marché en plastique. Mais en les acceptant, on aura un appareil assez réactif et performant.
L’intégralité de cette critique est disponible en anglais en suivant ce lien.
MSI GF75 8RD-001
- 04/30/2019 v7 (old)
Daniel Puschina
Price comparison
