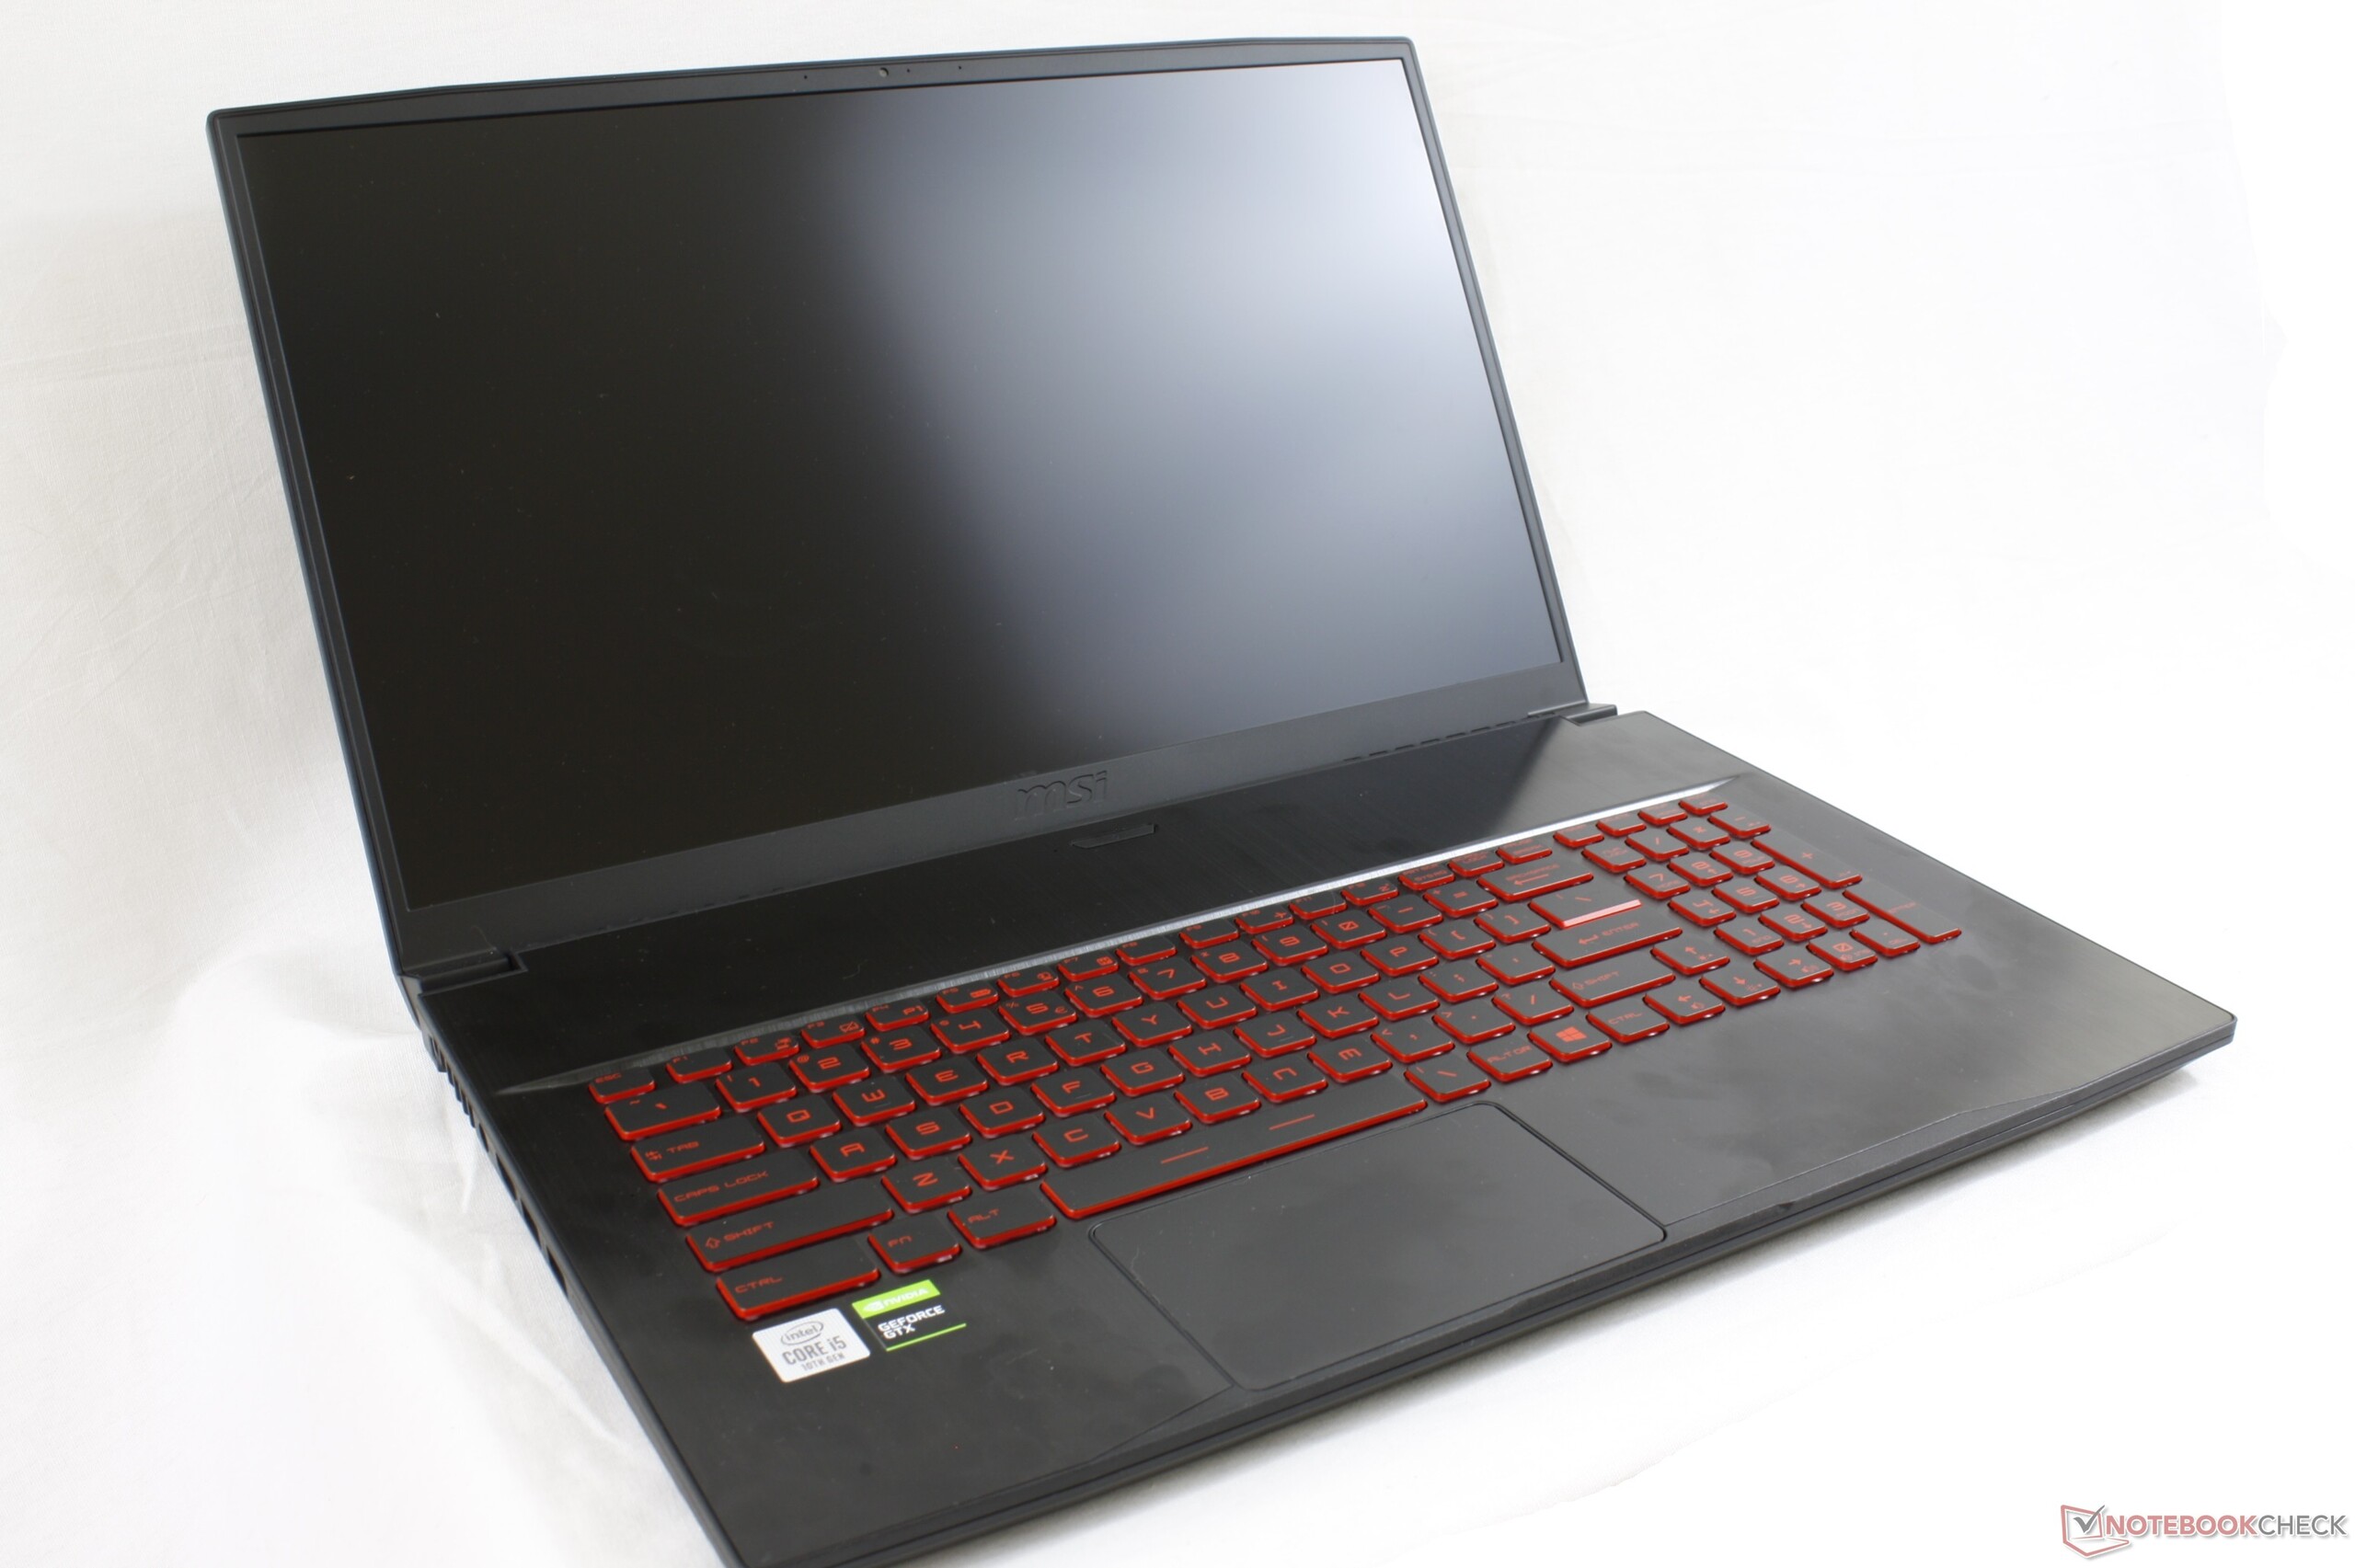
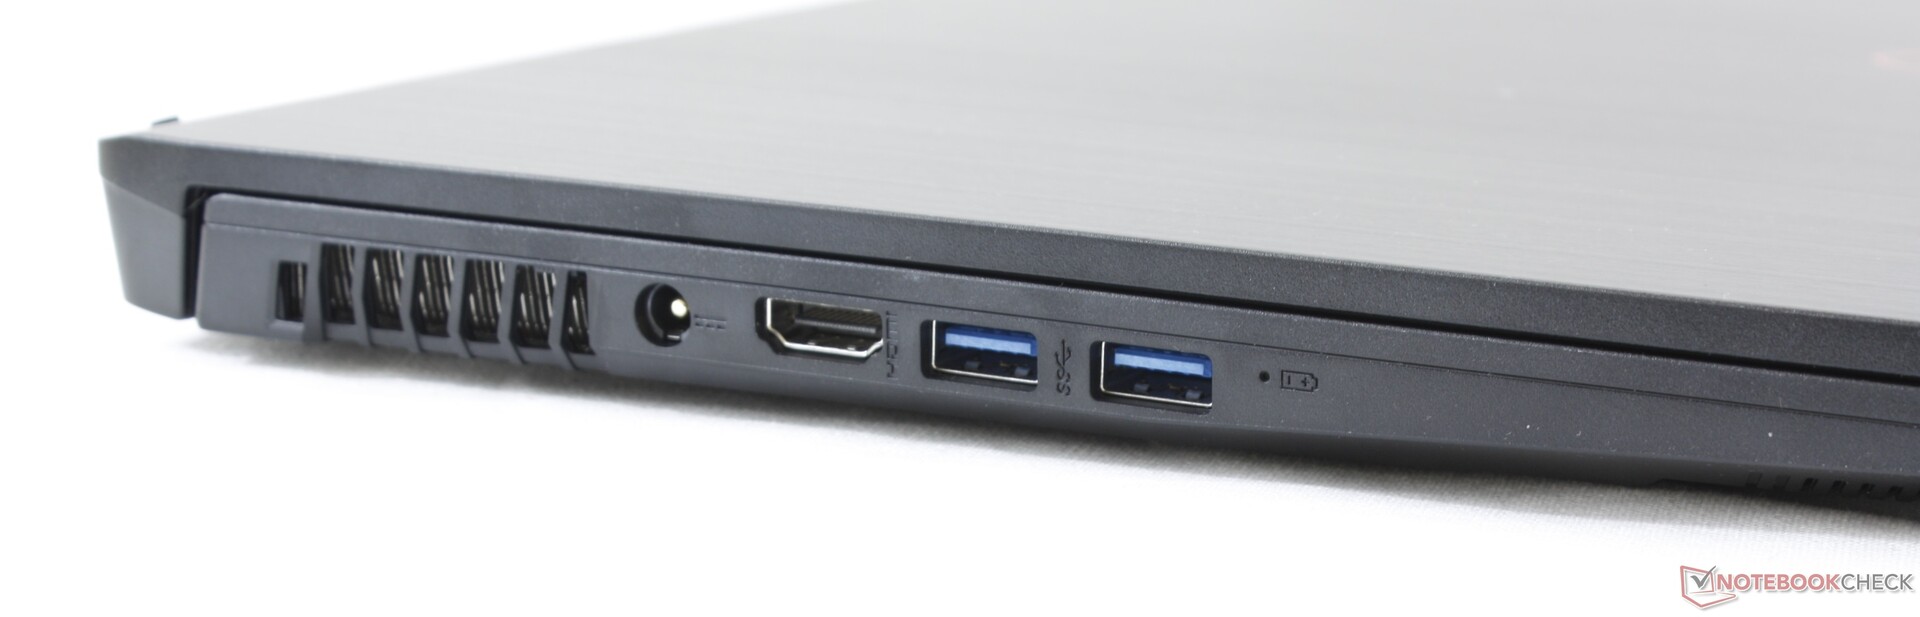
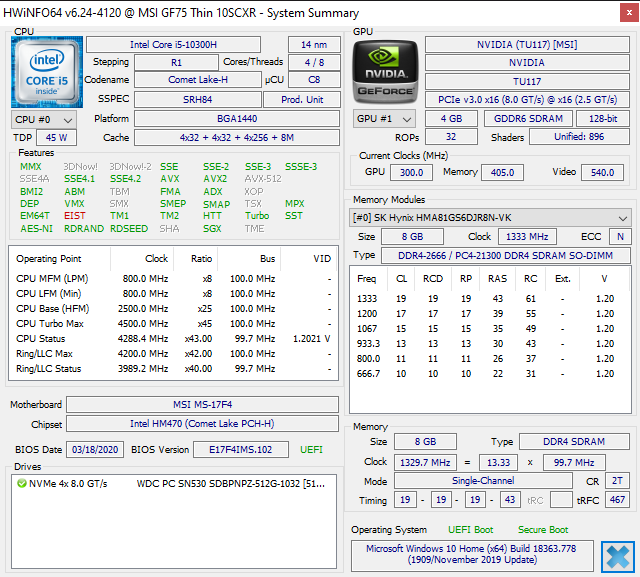
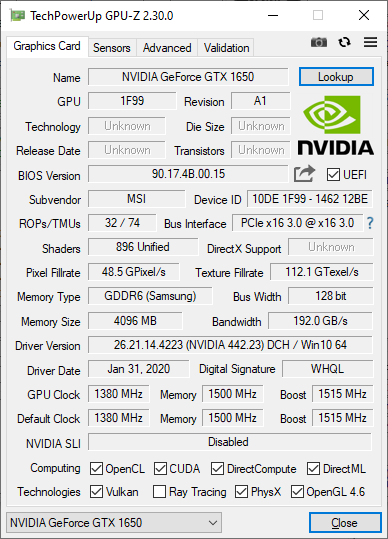
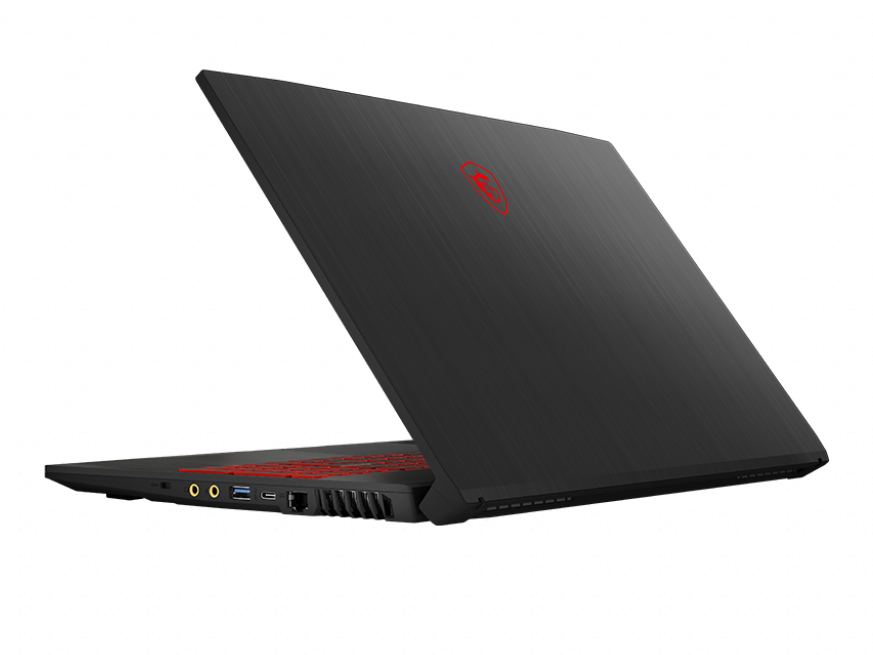
Test du MSI GF75 Thin 10SCXR (i5-10300H, GTX 1650, FHD, 120 Hz) : les débuts de l'i5 Comet Lake H
Note | Date | Modèle | Poids | Épaisseur | Taille | Résolution | Prix |
|---|---|---|---|---|---|---|---|
| 78.5 % v7 (old) | 05/20 | MSI GF75 Thin 10SCXR i5-10300H, GeForce GTX 1650 Mobile | 2.2 kg | 23.1 mm | 17.30" | 1920x1080 | |
| 84.3 % v6 (old) | 08/19 | Acer Aspire Nitro 5 AN517-51-7887 i7-9750H, GeForce GTX 1660 Ti Mobile | 2.8 kg | 26.9 mm | 17.30" | 1920x1080 | |
| 85.1 % v6 (old) | 06/19 | MSI GP75 Leopard 9SD i7-9750H, GeForce GTX 1660 Ti Mobile | 2.6 kg | 29 mm | 17.30" | 1920x1080 | |
| 77.9 % v7 (old) | 09/19 | Lenovo Ideapad L340-17IRH 81LL001YGE i5-9300H, GeForce GTX 1650 Mobile | 2.5 kg | 25.3 mm | 17.30" | 1920x1080 | |
| 81.6 % v7 (old) | 08/19 | HP Pavilion Gaming 17-cd0085cl i7-9750H, GeForce GTX 1660 Ti Max-Q | 2.8 kg | 25 mm | 17.30" | 1920x1080 |
| Networking | |
| iperf3 transmit AX12 | |
| Asus Zephyrus G14 GA401IV | |
| Lenovo ThinkPad X1 Carbon G7 20R1-000YUS | |
| MSI GF75 Thin 10SCXR | |
| LG Gram 14T90N | |
| iperf3 receive AX12 | |
| MSI GF75 Thin 10SCXR | |
| Asus Zephyrus G14 GA401IV | |
| Lenovo ThinkPad X1 Carbon G7 20R1-000YUS | |
| LG Gram 14T90N | |


| |||||||||||||||||||||||||
Homogénéité de la luminosité: 92 %
Valeur mesurée au centre, sur batterie: 251.2 cd/m²
Contraste: 739:1 (Valeurs des noirs: 0.34 cd/m²)
ΔE ColorChecker Calman: 4.5 | ∀{0.5-29.43 Ø4.73}
calibrated: 3.91
ΔE Greyscale Calman: 4 | ∀{0.09-98 Ø4.97}
58.1% sRGB (Argyll 1.6.3 3D)
37.3% AdobeRGB 1998 (Argyll 1.6.3 3D)
40.77% AdobeRGB 1998 (Argyll 3D)
58.4% sRGB (Argyll 3D)
39.46% Display P3 (Argyll 3D)
Gamma: 2.25
CCT: 5882 K
| MSI GF75 Thin 10SCXR AU Optronics B173HAN04.7, IPS, 17.3", 1920x1080 | Acer Aspire Nitro 5 AN517-51-7887 LP173WF5-SPB3, IPS, 17.3", 1920x1080 | Asus ROG Strix G GL731GU-RB74 AU Optronics B173HAN04.0, IPS, 17.3", 1920x1080 | Lenovo Ideapad L340-17IRH 81LL001YGE Chi Mei N173HCE-E31, IPS, 17.3", 1920x1080 | MSI GP75 Leopard 9SD Chi Mei N173HCE-G33 (CMN175C), IPS, 17.3", 1920x1080 | HP Pavilion Gaming 17-cd0085cl BOE0825, IPS, 17.3", 1920x1080 | MSI GF75 Thin 9SC AU Optronics B173HAN04.2, IPS, 17.3", 1920x1080 | |
|---|---|---|---|---|---|---|---|
| Display | 58% | 55% | 63% | 61% | 57% | 56% | |
| Display P3 Coverage (%) | 39.46 | 62.7 59% | 61.9 57% | 66.3 68% | 63.4 61% | 63.3 60% | 62.5 58% |
| sRGB Coverage (%) | 58.4 | 92.5 58% | 89.4 53% | 92.7 59% | 94.9 63% | 90.2 54% | 90 54% |
| AdobeRGB 1998 Coverage (%) | 40.77 | 63.5 56% | 63.3 55% | 66.6 63% | 65.1 60% | 64.3 58% | 64 57% |
| Response Times | -4% | 70% | 10% | 72% | 17% | -8% | |
| Response Time Grey 50% / Grey 80% * (ms) | 34 ? | 37 ? -9% | 6.4 ? 81% | 32 ? 6% | 8 ? 76% | 31.6 ? 7% | 34 ? -0% |
| Response Time Black / White * (ms) | 26.4 ? | 26 ? 2% | 11.2 ? 58% | 23 ? 13% | 8.8 ? 67% | 19.6 ? 26% | 30.4 ? -15% |
| PWM Frequency (Hz) | 250 ? | 25510 ? | |||||
| Screen | 26% | 27% | 38% | 47% | 24% | 34% | |
| Brightness middle (cd/m²) | 251.2 | 407 62% | 294.3 17% | 318 27% | 420 67% | 299.6 19% | 344.7 37% |
| Brightness (cd/m²) | 242 | 364 50% | 289 19% | 292 21% | 393 62% | 285 18% | 332 37% |
| Brightness Distribution (%) | 92 | 84 -9% | 89 -3% | 85 -8% | 91 -1% | 86 -7% | 91 -1% |
| Black Level * (cd/m²) | 0.34 | 0.3 12% | 0.3 12% | 0.21 38% | 0.32 6% | 0.33 3% | 0.3 12% |
| Contrast (:1) | 739 | 1357 84% | 981 33% | 1514 105% | 1313 78% | 908 23% | 1149 55% |
| Colorchecker dE 2000 * | 4.5 | 4.55 -1% | 3.95 12% | 4.04 10% | 3.04 32% | 3.68 18% | 3.08 32% |
| Colorchecker dE 2000 max. * | 20 | 12.44 38% | 6.49 68% | 6.59 67% | 7.22 64% | 8.05 60% | 6.32 68% |
| Colorchecker dE 2000 calibrated * | 3.91 | 3.08 21% | 2.06 47% | 0.89 77% | 3.15 19% | 2.94 25% | |
| Greyscale dE 2000 * | 4 | 7.61 -90% | 3.7 7% | 4.21 -5% | 3.91 2% | 3.8 5% | 3.8 5% |
| Gamma | 2.25 98% | 2.51 88% | 2.07 106% | 2.5 88% | 2.26 97% | 2.12 104% | 2.17 101% |
| CCT | 5882 111% | 7212 90% | 7155 91% | 7189 90% | 7138 91% | 7240 90% | 7284 89% |
| Color Space (Percent of AdobeRGB 1998) (%) | 37.3 | 59 58% | 57.7 55% | 60 61% | 60 61% | 58.1 56% | 58 55% |
| Color Space (Percent of sRGB) (%) | 58.1 | 92 58% | 89 53% | 93 60% | 95 64% | 89.8 55% | 89.6 54% |
| Moyenne finale (programmes/paramètres) | 27% /
29% | 51% /
37% | 37% /
40% | 60% /
52% | 33% /
30% | 27% /
33% |
* ... Moindre est la valeur, meilleures sont les performances
Temps de réponse de l'écran
| ↔ Temps de réponse noir à blanc | ||
|---|---|---|
| 26.4 ms ... hausse ↗ et chute ↘ combinées | ↗ 15.6 ms hausse | 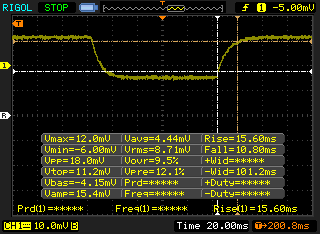 |
| ↘ 10.8 ms chute | ||
| L'écran souffre de latences relativement élevées, insuffisant pour le jeu. En comparaison, tous les appareils testés affichent entre 0.1 (minimum) et 240 (maximum) ms. » 66 % des appareils testés affichent de meilleures performances. Cela signifie que les latences relevées sont moins bonnes que la moyenne (19.9 ms) de tous les appareils testés. | ||
| ↔ Temps de réponse gris 50% à gris 80% | ||
| 34 ms ... hausse ↗ et chute ↘ combinées | ↗ 18 ms hausse | 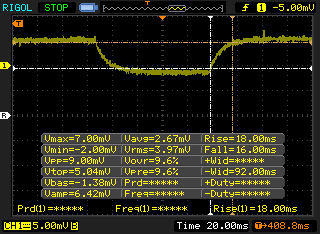 |
| ↘ 16 ms chute | ||
| L'écran souffre de latences très élevées, à éviter pour le jeu. En comparaison, tous les appareils testés affichent entre 0.165 (minimum) et 636 (maximum) ms. » 47 % des appareils testés affichent de meilleures performances. Cela signifie que les latences relevées sont similaires à la moyenne (31.1 ms) de tous les appareils testés. | ||
Scintillement / MLI (Modulation de largeur d'impulsion)
| Scintillement / MLI (Modulation de largeur d'impulsion) non décelé | 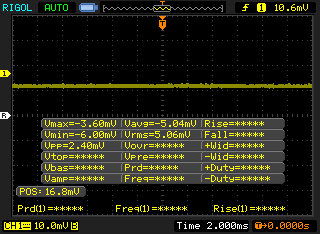 | ||
En comparaison, 52 % des appareils testés n'emploient pas MDI pour assombrir leur écran. Nous avons relevé une moyenne à 7801 (minimum : 5 - maximum : 343500) Hz dans le cas où une MDI était active. | |||
| wPrime 2.10 - 1024m | |
| MSI GF75 Thin 10SCXR | |
| Asus ROG Zephyrus G15 GA502DU | |
| Asus Zephyrus G14 GA401IV | |
* ... Moindre est la valeur, meilleures sont les performances
| PCMark 8 Home Score Accelerated v2 | 3797 points | |
| PCMark 8 Work Score Accelerated v2 | 5276 points | |
| PCMark 10 Score | 5301 points | |
Aide | ||
| DPC Latencies / LatencyMon - interrupt to process latency (max), Web, Youtube, Prime95 | |
| MSI GF75 Thin 10SCXR | |
* ... Moindre est la valeur, meilleures sont les performances
| MSI GF75 Thin 10SCXR WDC PC SN530 SDBPNPZ-512G | Acer Aspire Nitro 5 AN517-51-7887 WDC PC SN520 SDAPNUW-512G | MSI GF75 Thin 9SC Crucial P1 SSD CT1000P1SSD8 | MSI GP75 Leopard 9SD Kingston RBUSNS8154P3256GJ1 | Asus ROG Strix G GL731GU-RB74 Intel SSD 660p SSDPEKNW512G8 | |
|---|---|---|---|---|---|
| AS SSD | 42% | 30% | -45% | 22% | |
| Seq Read (MB/s) | 1007 | 1578 57% | 1079 7% | 748 -26% | 1319 31% |
| Seq Write (MB/s) | 1755 | 1381 -21% | 1566 -11% | 219 -88% | 930 -47% |
| 4K Read (MB/s) | 39.88 | 44.79 12% | 48.68 22% | 25.7 -36% | 49.43 24% |
| 4K Write (MB/s) | 111.6 | 108.7 -3% | 106.7 -4% | 82.4 -26% | 104.3 -7% |
| 4K-64 Read (MB/s) | 751 | 1045 39% | 656 -13% | 259.3 -65% | 321.9 -57% |
| 4K-64 Write (MB/s) | 402.6 | 1121 178% | 751 87% | 190.2 -53% | 774 92% |
| Access Time Read * (ms) | 0.084 | 0.083 1% | 0.044 48% | 0.159 -89% | 0.055 35% |
| Access Time Write * (ms) | 0.151 | 0.034 77% | 0.131 13% | 0.058 62% | 0.138 9% |
| Score Read (Points) | 892 | 1248 40% | 812 -9% | 360 -60% | 503 -44% |
| Score Write (Points) | 690 | 1368 98% | 1014 47% | 294 -57% | 971 41% |
| Score Total (Points) | 2085 | 3252 56% | 2281 9% | 821 -61% | 1731 -17% |
| Copy ISO MB/s (MB/s) | 1828 | 1254 -31% | 1414 -23% | 1707 -7% | |
| Copy Program MB/s (MB/s) | 307.2 | 443.8 44% | 531 73% | 852 177% | |
| Copy Game MB/s (MB/s) | 532 | 722 36% | 1483 179% | 930 75% | |
| CrystalDiskMark 5.2 / 6 | -15% | 7% | -41% | -6% | |
| Write 4K (MB/s) | 140.7 | 104.6 -26% | 133 -5% | 105.8 -25% | 127.6 -9% |
| Read 4K (MB/s) | 43.18 | 39.76 -8% | 55.6 29% | 27.89 -35% | 56 30% |
| Write Seq (MB/s) | 1829 | 1268 -31% | 1623 -11% | 270.8 -85% | 986 -46% |
| Read Seq (MB/s) | 1095 | 1414 29% | 1386 27% | 879 -20% | 1605 47% |
| Write 4K Q32T1 (MB/s) | 431.7 | 287.9 -33% | 501 16% | 273.3 -37% | 451.5 5% |
| Read 4K Q32T1 (MB/s) | 527 | 381.1 -28% | 584 11% | 361.2 -31% | 343.3 -35% |
| Write Seq Q32T1 (MB/s) | 1831 | 1319 -28% | 1696 -7% | 253 -86% | 983 -46% |
| Read Seq Q32T1 (MB/s) | 1708 | 1735 2% | 1572 -8% | 1505 -12% | 1810 6% |
| Write 4K Q8T8 (MB/s) | 768 | ||||
| Read 4K Q8T8 (MB/s) | 1090 | ||||
| Moyenne finale (programmes/paramètres) | 14% /
21% | 19% /
22% | -43% /
-44% | 8% /
12% |
* ... Moindre est la valeur, meilleures sont les performances

| 3DMark 06 Standard Score | 34955 points | |
| 3DMark 11 Performance | 11727 points | |
| 3DMark Ice Storm Standard Score | 77860 points | |
| 3DMark Cloud Gate Standard Score | 25707 points | |
| 3DMark Fire Strike Score | 8581 points | |
| 3DMark Time Spy Score | 3554 points | |
Aide | ||
| The Witcher 3 | |
| 1024x768 Low Graphics & Postprocessing | |
| HP Omen 15-dc0015ng | |
| MSI GF75 Thin 9SC | |
| HP Pavilion Gaming 15-ec0017ng | |
| Dell G3 3590 | |
| MSI GF75 Thin 10SCXR | |
| Moyenne NVIDIA GeForce GTX 1650 Mobile (127 - 209, n=22) | |
| MSI Alpha 15 A3DDK | |
| HP Pavilion Gaming 15-ec0002ng | |
| 1920x1080 Ultra Graphics & Postprocessing (HBAO+) | |
| HP Omen 15-dc0015ng | |
| HP Pavilion Gaming 15-ec0017ng | |
| MSI Alpha 15 A3DDK | |
| MSI GF75 Thin 9SC | |
| MSI GF75 Thin 10SCXR | |
| Asus TUF FX705GM | |
| Dell G3 3590 | |
| Moyenne NVIDIA GeForce GTX 1650 Mobile (29.9 - 40.3, n=31) | |
| HP Pavilion Gaming 15-ec0002ng | |
| Rocket League | |
| 1280x720 Performance | |
| MSI GF75 Thin 10SCXR | |
| HP Pavilion Gaming 15-ec0017ng | |
| Dell G3 3590 | |
| Moyenne NVIDIA GeForce GTX 1650 Mobile (214 - 249, n=5) | |
| 1920x1080 Performance | |
| MSI GF75 Thin 10SCXR | |
| Moyenne NVIDIA GeForce GTX 1650 Mobile (189.8 - 228, n=3) | |
| 1920x1080 Quality AA:Medium FX | |
| HP Pavilion Gaming 15-ec0017ng | |
| MSI GF75 Thin 10SCXR | |
| Moyenne NVIDIA GeForce GTX 1650 Mobile (152.5 - 229, n=6) | |
| Dell G3 3590 | |
| 1920x1080 High Quality AA:High FX | |
| MSI Alpha 15 A3DDK | |
| HP Pavilion Gaming 15-ec0017ng | |
| MSI GF75 Thin 10SCXR | |
| Dell G3 3590 | |
| Moyenne NVIDIA GeForce GTX 1650 Mobile (96.4 - 162.2, n=6) | |
| Bas | Moyen | Élevé | Ultra | |
|---|---|---|---|---|
| BioShock Infinite (2013) | 241.5 | 212.7 | 200.1 | 93.6 |
| The Witcher 3 (2015) | 169.4 | 116.6 | 70.4 | 37.7 |
| Dota 2 Reborn (2015) | 117 | 104 | 93.7 | 87.5 |
| Rocket League (2017) | 248.4 | 198.5 | 162.2 | |
| X-Plane 11.11 (2018) | 75.7 | 65.1 | 57.4 | |
| Shadow of the Tomb Raider (2018) | 88 | 60 | 51 | 44 |
| MSI GF75 Thin 10SCXR GeForce GTX 1650 Mobile, i5-10300H, WDC PC SN530 SDBPNPZ-512G | Acer Aspire Nitro 5 AN517-51-7887 GeForce GTX 1660 Ti Mobile, i7-9750H, WDC PC SN520 SDAPNUW-512G | MSI GF75 Thin 9SC GeForce GTX 1650 Mobile, i7-9750H, Crucial P1 SSD CT1000P1SSD8 | MSI GP75 Leopard 9SD GeForce GTX 1660 Ti Mobile, i7-9750H, Kingston RBUSNS8154P3256GJ1 | Asus ROG Strix G GL731GU-RB74 GeForce GTX 1660 Ti Mobile, i7-9750H, Intel SSD 660p SSDPEKNW512G8 | Lenovo Ideapad L340-17IRH 81LL001YGE GeForce GTX 1650 Mobile, i5-9300H, WDC PC SN520 SDAPMUW-512 | |
|---|---|---|---|---|---|---|
| Noise | -3% | -1% | -14% | -11% | 2% | |
| arrêt / environnement * (dB) | 28.4 | 30 -6% | 28.2 1% | 29 -2% | 28.2 1% | 30 -6% |
| Idle Minimum * (dB) | 33 | 30.2 8% | 33.6 -2% | 29 12% | 31.8 4% | 30 9% |
| Idle Average * (dB) | 33 | 30.2 8% | 33.6 -2% | 34 -3% | 32 3% | 30 9% |
| Idle Maximum * (dB) | 33.1 | 31 6% | 33.8 -2% | 37 -12% | 40.6 -23% | 30.4 8% |
| Load Average * (dB) | 37.7 | 43.4 -15% | 37.2 1% | 53 -41% | 48 -27% | 40.9 -8% |
| Witcher 3 ultra * (dB) | 39.2 | 48.5 -24% | 40.6 -4% | 51 -30% | 48 -22% | 43.8 -12% |
| Load Maximum * (dB) | 46 | 45.5 1% | 44.4 3% | 55 -20% | 51.5 -12% | 40.9 11% |
* ... Moindre est la valeur, meilleures sont les performances
Degré de la nuisance sonore
| Au repos |
| 33 / 33 / 33.1 dB(A) |
| Fortement sollicité |
| 37.7 / 46 dB(A) |
 | ||
30 dB silencieux 40 dB(A) audible 50 dB(A) bruyant |
||
min: | ||
(±) La température maximale du côté supérieur est de 42 °C / 108 F, par rapport à la moyenne de 40.4 °C / 105 F, allant de 21.2 à 68.8 °C pour la classe Gaming.
(-) Le fond chauffe jusqu'à un maximum de 53.4 °C / 128 F, contre une moyenne de 43.2 °C / 110 F
(+) En utilisation inactive, la température moyenne du côté supérieur est de 31.5 °C / 89 F, par rapport à la moyenne du dispositif de 33.9 °C / 93 F.
(+) En jouant à The Witcher 3, la température moyenne du côté supérieur est de 31.3 °C / 88 F, alors que la moyenne de l'appareil est de 33.9 °C / 93 F.
(+) Les repose-poignets et le pavé tactile sont plus froids que la température de la peau avec un maximum de 29 °C / 84.2 F et sont donc froids au toucher.
(±) La température moyenne de la zone de l'appui-paume de dispositifs similaires était de 28.8 °C / 83.8 F (-0.2 °C / #-0.4 F).
MSI GF75 Thin 10SCXR analyse audio
(+) | les haut-parleurs peuvent jouer relativement fort (83.6# dB)
Basses 100 - 315 Hz
(-) | presque aucune basse - en moyenne 18.5% plus bas que la médiane
(±) | la linéarité des basses est moyenne (14.2% delta à la fréquence précédente)
Médiums 400 - 2000 Hz
(+) | médiane équilibrée - seulement 2.2% de la médiane
(±) | la linéarité des médiums est moyenne (7.7% delta à la fréquence précédente)
Aiguës 2 - 16 kHz
(+) | des sommets équilibrés - à seulement 3.4% de la médiane
(±) | la linéarité des aigus est moyenne (9.4% delta à la fréquence précédente)
Globalement 100 - 16 000 Hz
(±) | la linéarité du son global est moyenne (18.2% de différence avec la médiane)
Par rapport à la même classe
» 57% de tous les appareils testés de cette catégorie étaient meilleurs, 8% similaires, 35% pires
» Le meilleur avait un delta de 6%, la moyenne était de 18%, le pire était de 132%.
Par rapport à tous les appareils testés
» 39% de tous les appareils testés étaient meilleurs, 8% similaires, 53% pires
» Le meilleur avait un delta de 4%, la moyenne était de 24%, le pire était de 134%.
Apple MacBook 12 (Early 2016) 1.1 GHz analyse audio
(+) | les haut-parleurs peuvent jouer relativement fort (83.6# dB)
Basses 100 - 315 Hz
(±) | basse réduite - en moyenne 11.3% inférieure à la médiane
(±) | la linéarité des basses est moyenne (14.2% delta à la fréquence précédente)
Médiums 400 - 2000 Hz
(+) | médiane équilibrée - seulement 2.4% de la médiane
(+) | les médiums sont linéaires (5.5% delta à la fréquence précédente)
Aiguës 2 - 16 kHz
(+) | des sommets équilibrés - à seulement 2% de la médiane
(+) | les aigus sont linéaires (4.5% delta à la fréquence précédente)
Globalement 100 - 16 000 Hz
(+) | le son global est linéaire (10.2% différence à la médiane)
Par rapport à la même classe
» 7% de tous les appareils testés de cette catégorie étaient meilleurs, 2% similaires, 91% pires
» Le meilleur avait un delta de 5%, la moyenne était de 18%, le pire était de 53%.
Par rapport à tous les appareils testés
» 5% de tous les appareils testés étaient meilleurs, 1% similaires, 94% pires
» Le meilleur avait un delta de 4%, la moyenne était de 24%, le pire était de 134%.
| Éteint/en veille | |
| Au repos | |
| Fortement sollicité |
|
Légende:
min: | |
| MSI GF75 Thin 10SCXR i5-10300H, GeForce GTX 1650 Mobile, WDC PC SN530 SDBPNPZ-512G, IPS, 1920x1080, 17.3" | Acer Aspire Nitro 5 AN517-51-7887 i7-9750H, GeForce GTX 1660 Ti Mobile, WDC PC SN520 SDAPNUW-512G, IPS, 1920x1080, 17.3" | MSI GF75 Thin 9SC i7-9750H, GeForce GTX 1650 Mobile, Crucial P1 SSD CT1000P1SSD8, IPS, 1920x1080, 17.3" | MSI GP75 Leopard 9SD i7-9750H, GeForce GTX 1660 Ti Mobile, Kingston RBUSNS8154P3256GJ1, IPS, 1920x1080, 17.3" | Asus ROG Strix G GL731GU-RB74 i7-9750H, GeForce GTX 1660 Ti Mobile, Intel SSD 660p SSDPEKNW512G8, IPS, 1920x1080, 17.3" | Lenovo Ideapad L340-17IRH 81LL001YGE i5-9300H, GeForce GTX 1650 Mobile, WDC PC SN520 SDAPMUW-512, IPS, 1920x1080, 17.3" | HP Pavilion Gaming 17-cd0085cl i7-9750H, GeForce GTX 1660 Ti Max-Q, Samsung SSD PM981 MZVLB256HAHQ, IPS, 1920x1080, 17.3" | |
|---|---|---|---|---|---|---|---|
| Power Consumption | 18% | 2% | -15% | -41% | 34% | 17% | |
| Idle Minimum * (Watt) | 13 | 3.9 70% | 6.1 53% | 10 23% | 13.6 -5% | 3.4 74% | 5.4 58% |
| Idle Average * (Watt) | 15.7 | 8.9 43% | 11.2 29% | 15 4% | 26.2 -67% | 7.7 51% | 9.2 41% |
| Idle Maximum * (Watt) | 21 | 12.2 42% | 24.5 -17% | 22 -5% | 35 -67% | 9.6 54% | 13 38% |
| Load Average * (Watt) | 87 | 83 5% | 94.7 -9% | 92 -6% | 113.6 -31% | 75 14% | 85.9 1% |
| Witcher 3 ultra * (Watt) | 96.4 | 130 -35% | 105.8 -10% | 153 -59% | 134.1 -39% | 92 5% | 107.9 -12% |
| Load Maximum * (Watt) | 145.8 | 168 -15% | 192.2 -32% | 216 -48% | 200.2 -37% | 135 7% | 182.2 -25% |
* ... Moindre est la valeur, meilleures sont les performances
| MSI GF75 Thin 10SCXR i5-10300H, GeForce GTX 1650 Mobile, 51 Wh | Acer Aspire Nitro 5 AN517-51-7887 i7-9750H, GeForce GTX 1660 Ti Mobile, 57 Wh | MSI GF75 Thin 9SC i7-9750H, GeForce GTX 1650 Mobile, 51 Wh | MSI GP75 Leopard 9SD i7-9750H, GeForce GTX 1660 Ti Mobile, 51 Wh | Asus ROG Strix G GL731GU-RB74 i7-9750H, GeForce GTX 1660 Ti Mobile, 66 Wh | Lenovo Ideapad L340-17IRH 81LL001YGE i5-9300H, GeForce GTX 1650 Mobile, 45 Wh | |
|---|---|---|---|---|---|---|
| Autonomie de la batterie | 54% | 0% | -38% | 20% | 32% | |
| Reader / Idle (h) | 7.7 | 13.4 74% | 4.8 -38% | 8.6 12% | ||
| WiFi v1.3 (h) | 4.7 | 6.2 32% | 4.7 0% | 3.2 -32% | 4.9 4% | 6.2 32% |
| Load (h) | 1.1 | 1.7 55% | 0.6 -45% | 1.6 45% |
Points positifs
Points négatifs
Le mieux en ce qui concerne le MSI GF75 10SCXR de 2020 est que le modèle de 2019 est maintenant moins cher… Le Core i5-9300H de l’an dernier est juste un tout petit peu moins performant que le Core i5-10300H, si bien qu’aucun gain de performances sera visible en jeu. C’est une bonne nouvelle pour ceux qui mettent à jour leur appareil depuis un ancien portable de jeu, parce qu’ils pourront économiser de l’argent en prenant un Core i5 de 9e génération plutôt qu’un i5 de la 10e, sans sacrifier les performances.
Concernant l’appareil en lui-même, ses principales qualités sont un poids et une taille réduits, et des ventilateurs plutôt peu bruyants pour un portable de jeu de 17,3 pouces. Il n’est peut-être pas aussi fin que le GS75, mais il est difficile de le critiquer vu son prix et le taux de rafraîchissement de 120 Hz. Nous recommandons de prendre une version à 16 Go de RAM plutôt qu’à 8 avec le modèle de 2019, et de vérifier avec le service client qu’un changement simple de RAM et de disque dur est possible, sans avoir à briser de sceau de garantie. Pensez à avoir une souris, pour ne pas avoir à utiliser le clickpad mou.
Une évolution réduite des performances : il vaut mieux choisir la version Core i5 de 9e génération du PC portable de jeu, plutôt que la 10e, afin de profiter d’un meilleur rapport performances - prix.
L’intégralité de cette critique est disponible en anglais en suivant ce lien.
MSI GF75 Thin 10SCXR
- 04/24/2020 v7 (old)
Allen Ngo
Price comparison
