Verdict - L'ordinateur portable le plus fin et le plus professionnel de MSI à ce jour
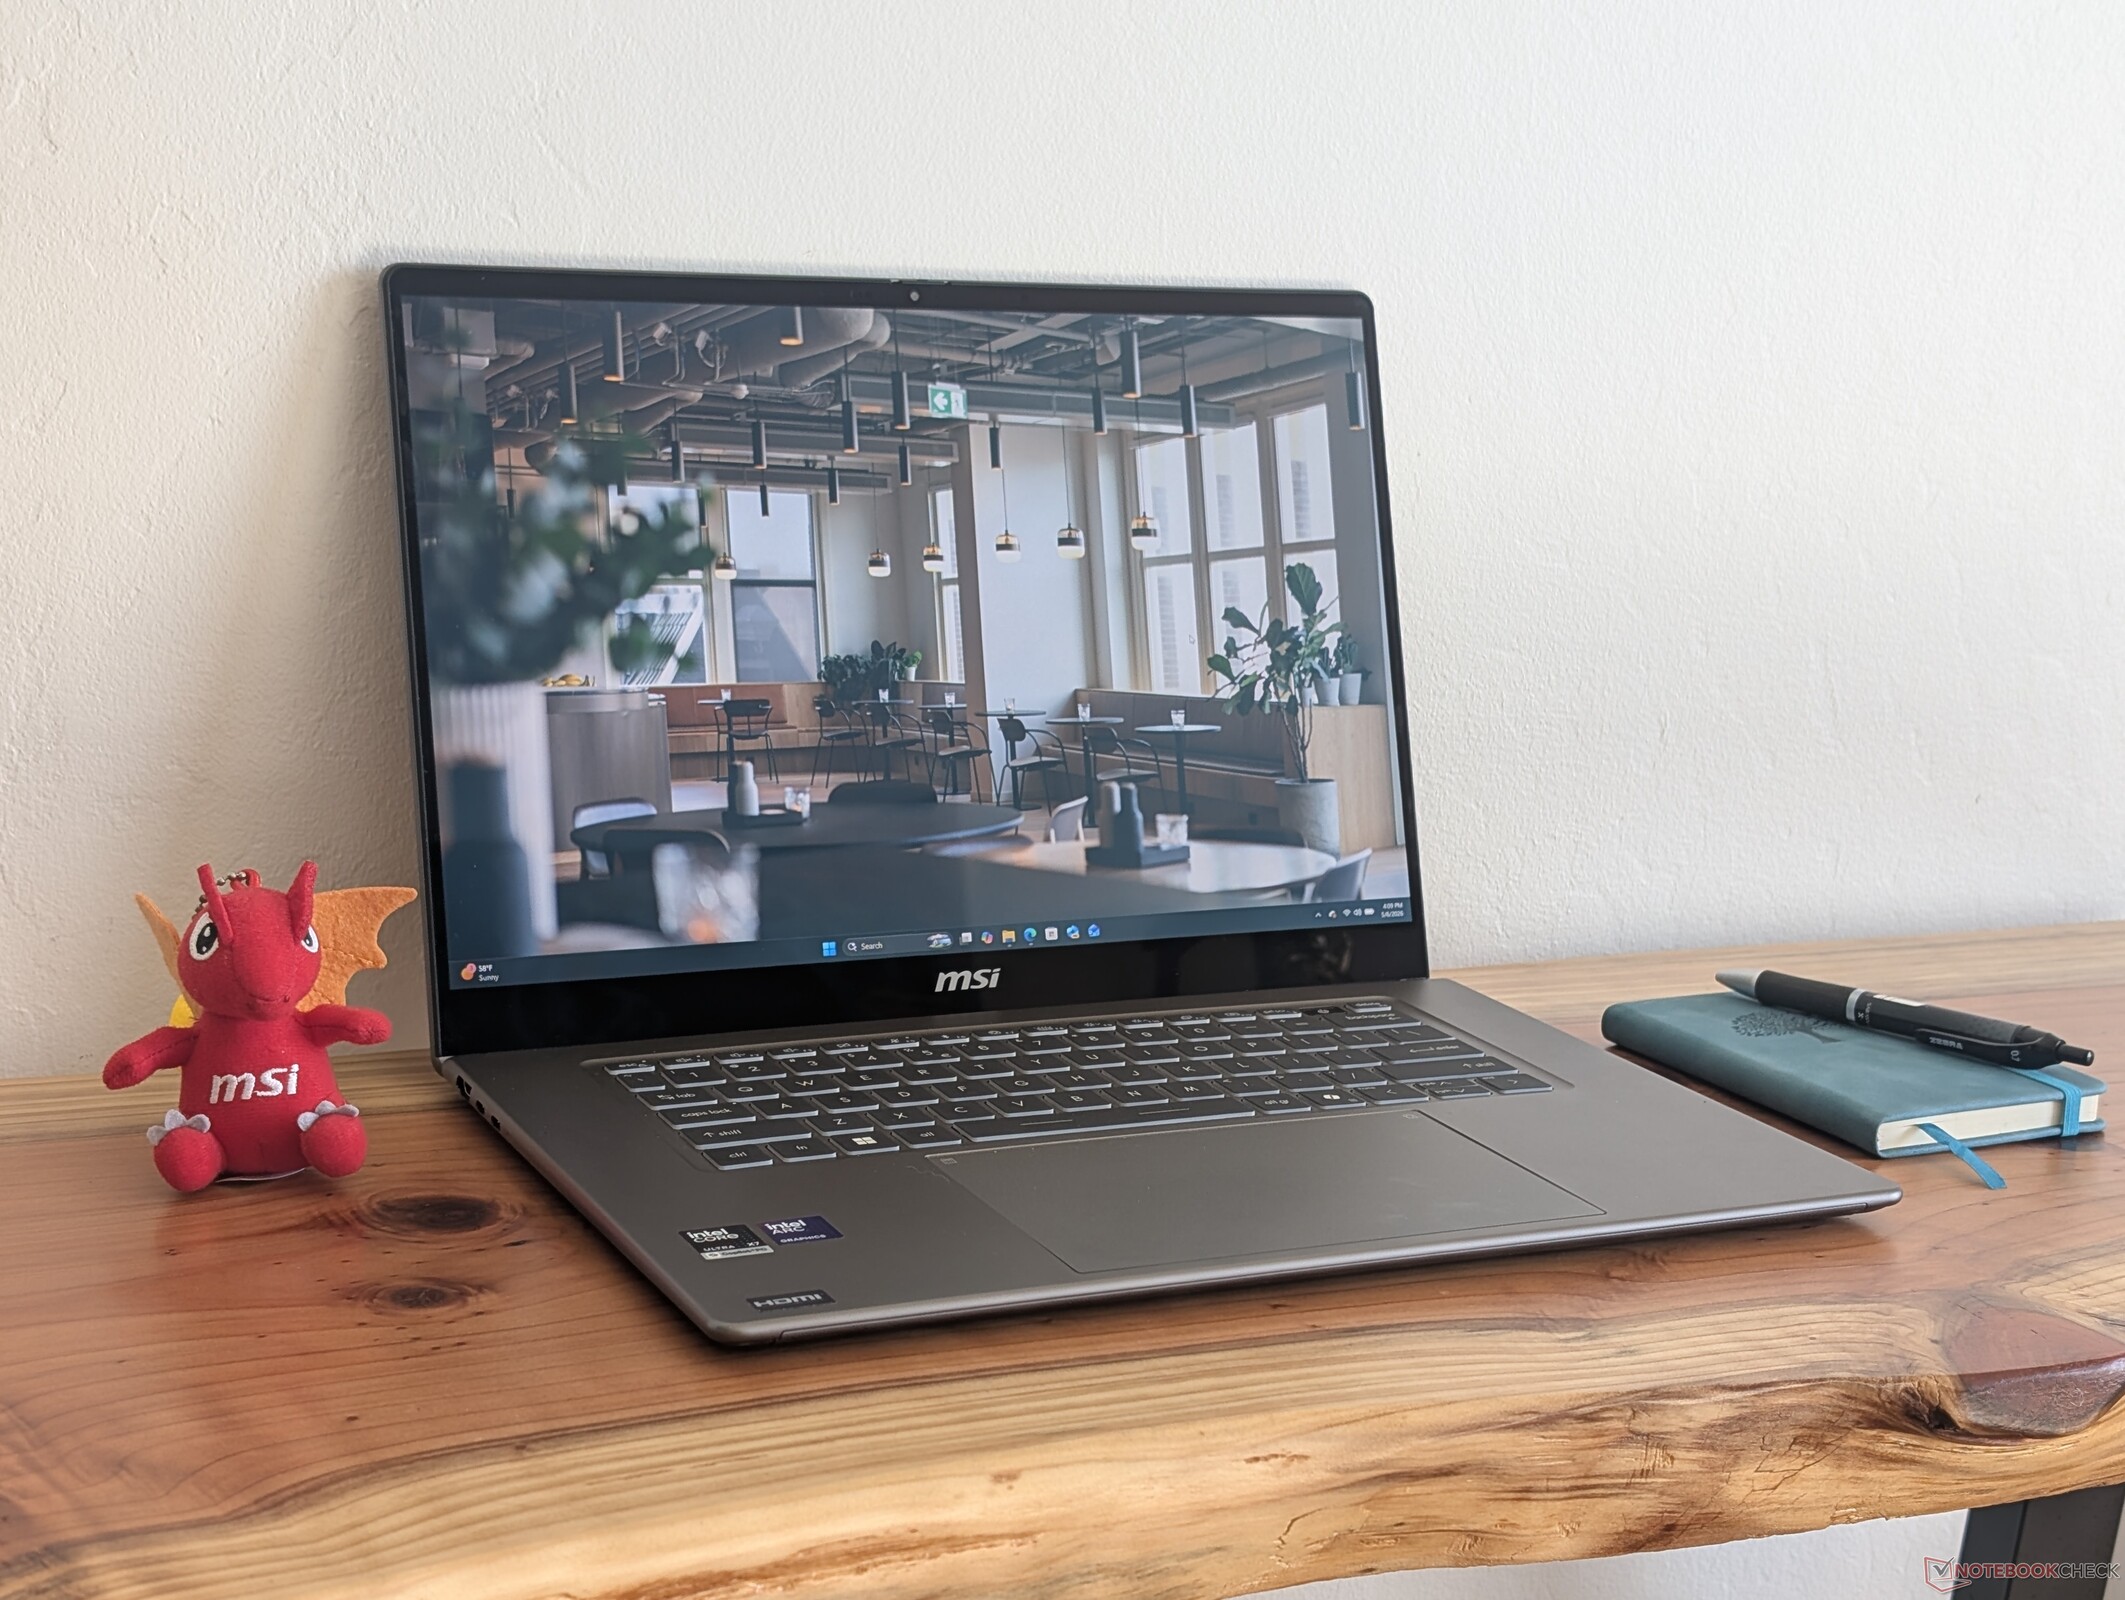
À l'instar de la transformation du dell 16 Premium 2025 au 2026 XPS 162026, la Prestige 16 2026 est une machine plus mince, plus élégante et plus efficace que la prestige 16 2025. Cela est dû en grande partie au passage à Intel Panther Lake X7 qui offre des gains significatifs en termes de performances par watt par rapport à la génération précédente. Les performances du GPU en particulier sont impressionnantes étant donné que le MSI est plus mince que la plupart des autres ordinateurs portables de 16 pouces avec des options de processeur similaires.
Outre le processeur, MSI a introduit des changements significatifs cette année, allant des ports à l'écran. La plupart de ces changements sont des avancées, notamment la dalle OLED 120 Hz et l'esthétique plus professionnelle, mais les ports supprimés et la batterie plus petite sont des points négatifs. La température du cœur est plus élevée que celle des concurrents, tandis que l'adaptateur secteur USB-C de 65 W freine à la fois les performances Turbo Boost et les taux de charge dans certaines conditions.
Les utilisateurs qui n'ont pas peur d'un système un peu plus épais et plus lourd trouveront dans le XPS 16 une alternative solide, car il offre un écran tactile et une webcam d'une résolution encore plus élevée, mais avec moins d'options de port et une autonomie de batterie plus faible. Quant à l'Asus Zenbook S16, équipé d'un processeur AMD, il s'agit d'une alternative intéressante Asus Zenbook S16 alimenté par AMD, est encore plus léger et plus petit, avec des performances de CPU et des options de panneau similaires, mais ses ventilateurs sont plus bruyants et ses performances graphiques sont moins bonnes. Un modèle peut être meilleur que l'autre en fonction de vos besoins spécifiques.
Points positifs
Points négatifs
Prix et disponibilité
Le modèle Prestige 16 AI+ C3MTG de MSI n'est pas encore disponible à l'heure où nous publions. Cependant, le Prestige 16 Flip AI+ C3MTG est désormais disponible à partir de 2150 $.
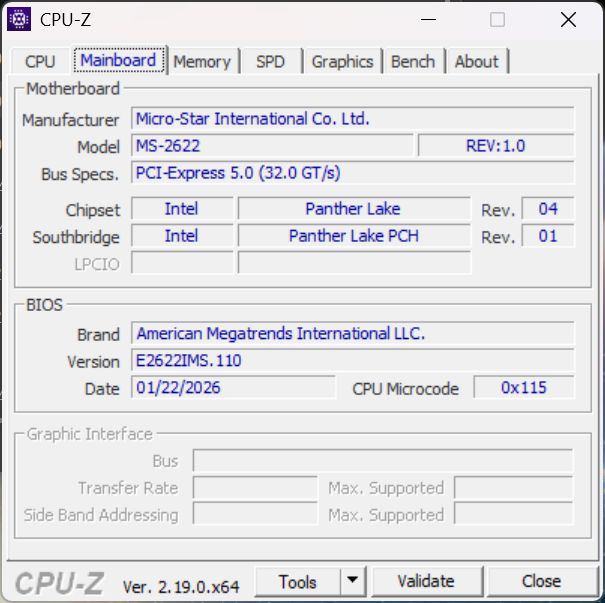
La Prestige 16 AI+ C3MG à clapet a été dévoilé au CES 2026 aux côtés d'une multitude d'autres modèles Prestige, tous équipés de CPU Intel Panther Lake. Cette dernière Prestige 16 a été entièrement redessinée par rapport au modèle de l'année dernière équipé de processeurs Arrow Lake, pour une expérience utilisateur rafraîchie.
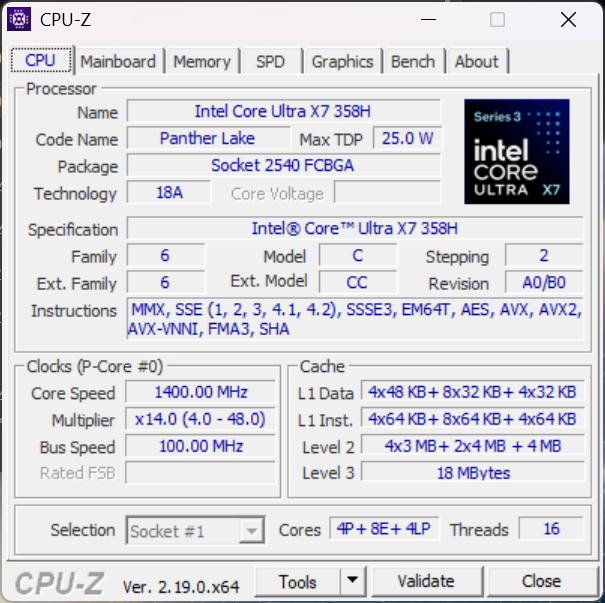
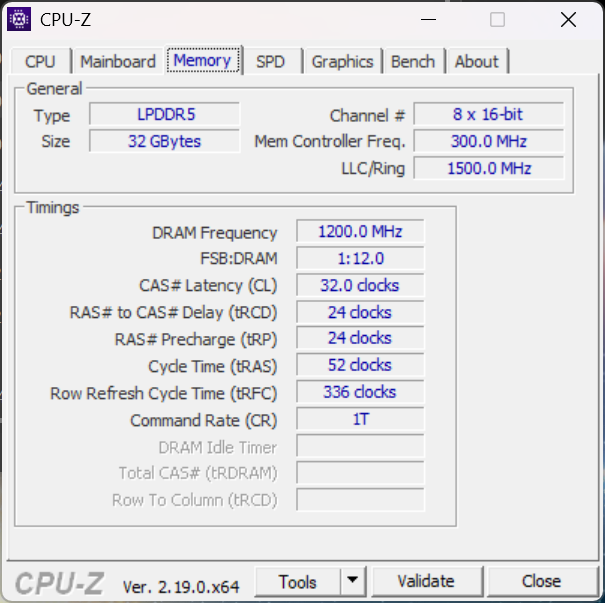
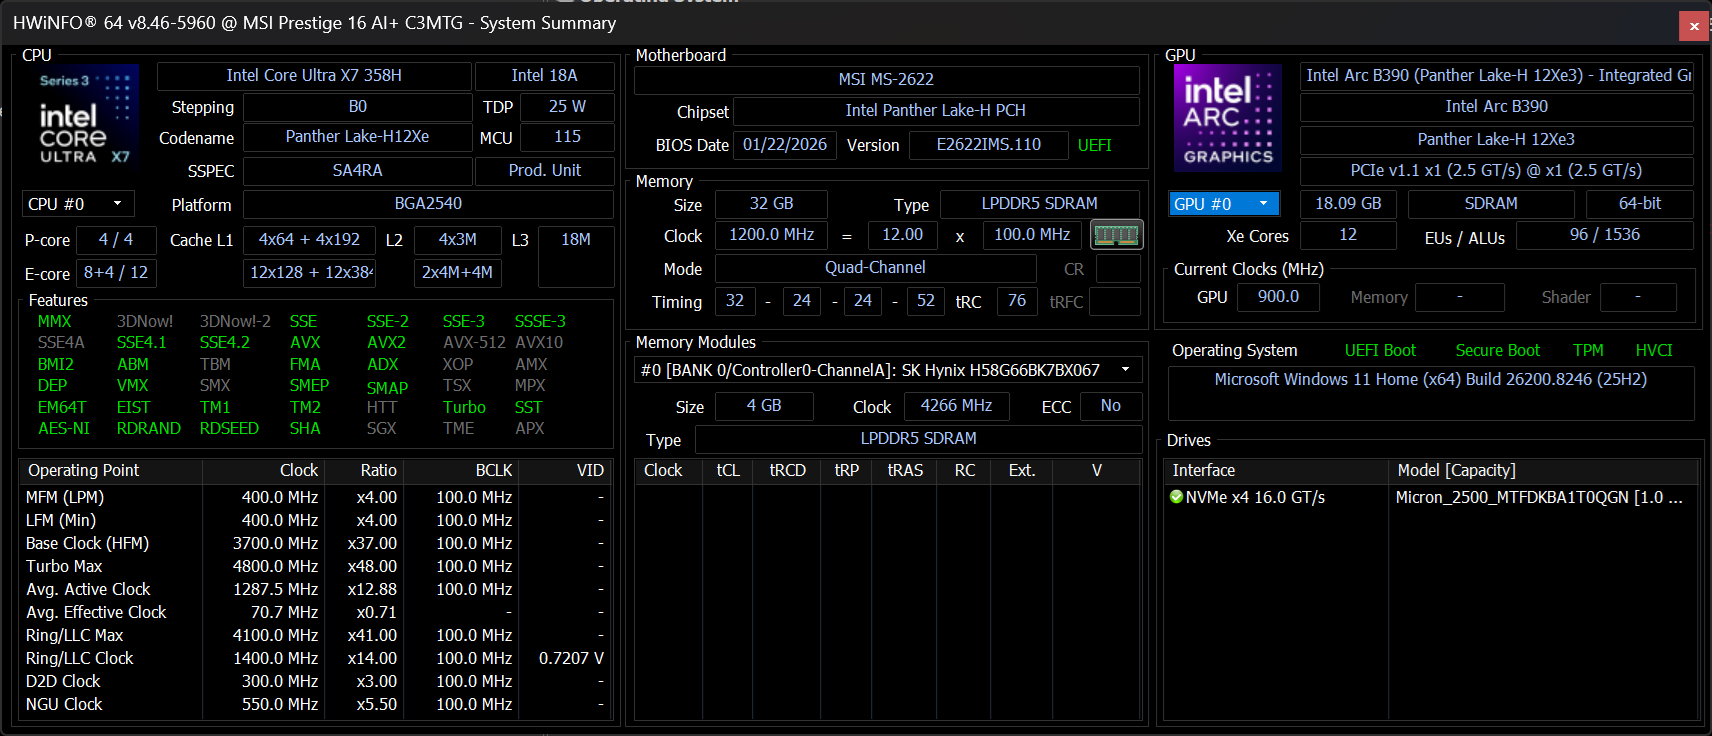
Notre unité de test est configurée avec le CPU Core Ultra X7 358H, 32 Go de RAM et un écran tactile OLED 1800p pour environ 2100 $. D'autres modèles peuvent être livrés avec le Core Ultra X9 388H, mais l'écran OLED 1800p et le GPU Arc B390 restent inchangés.
Parmi les modèles concurrents, on trouve d'autres ordinateurs portables haut de gamme destinés aux consommateurs, comme le Dell XPS 16, Lenovo Pro 9i 16 Auralenovo Pro 9i 16 Aura Asus ZenBook S16 de la série ZenBook S16. Une version convertible avec des charnières à 360 degrés est également disponible sous le nom de Prestige 16 Flip AI+ C3MG.
Plus d'avis sur MSI :
Spécifications
Cas
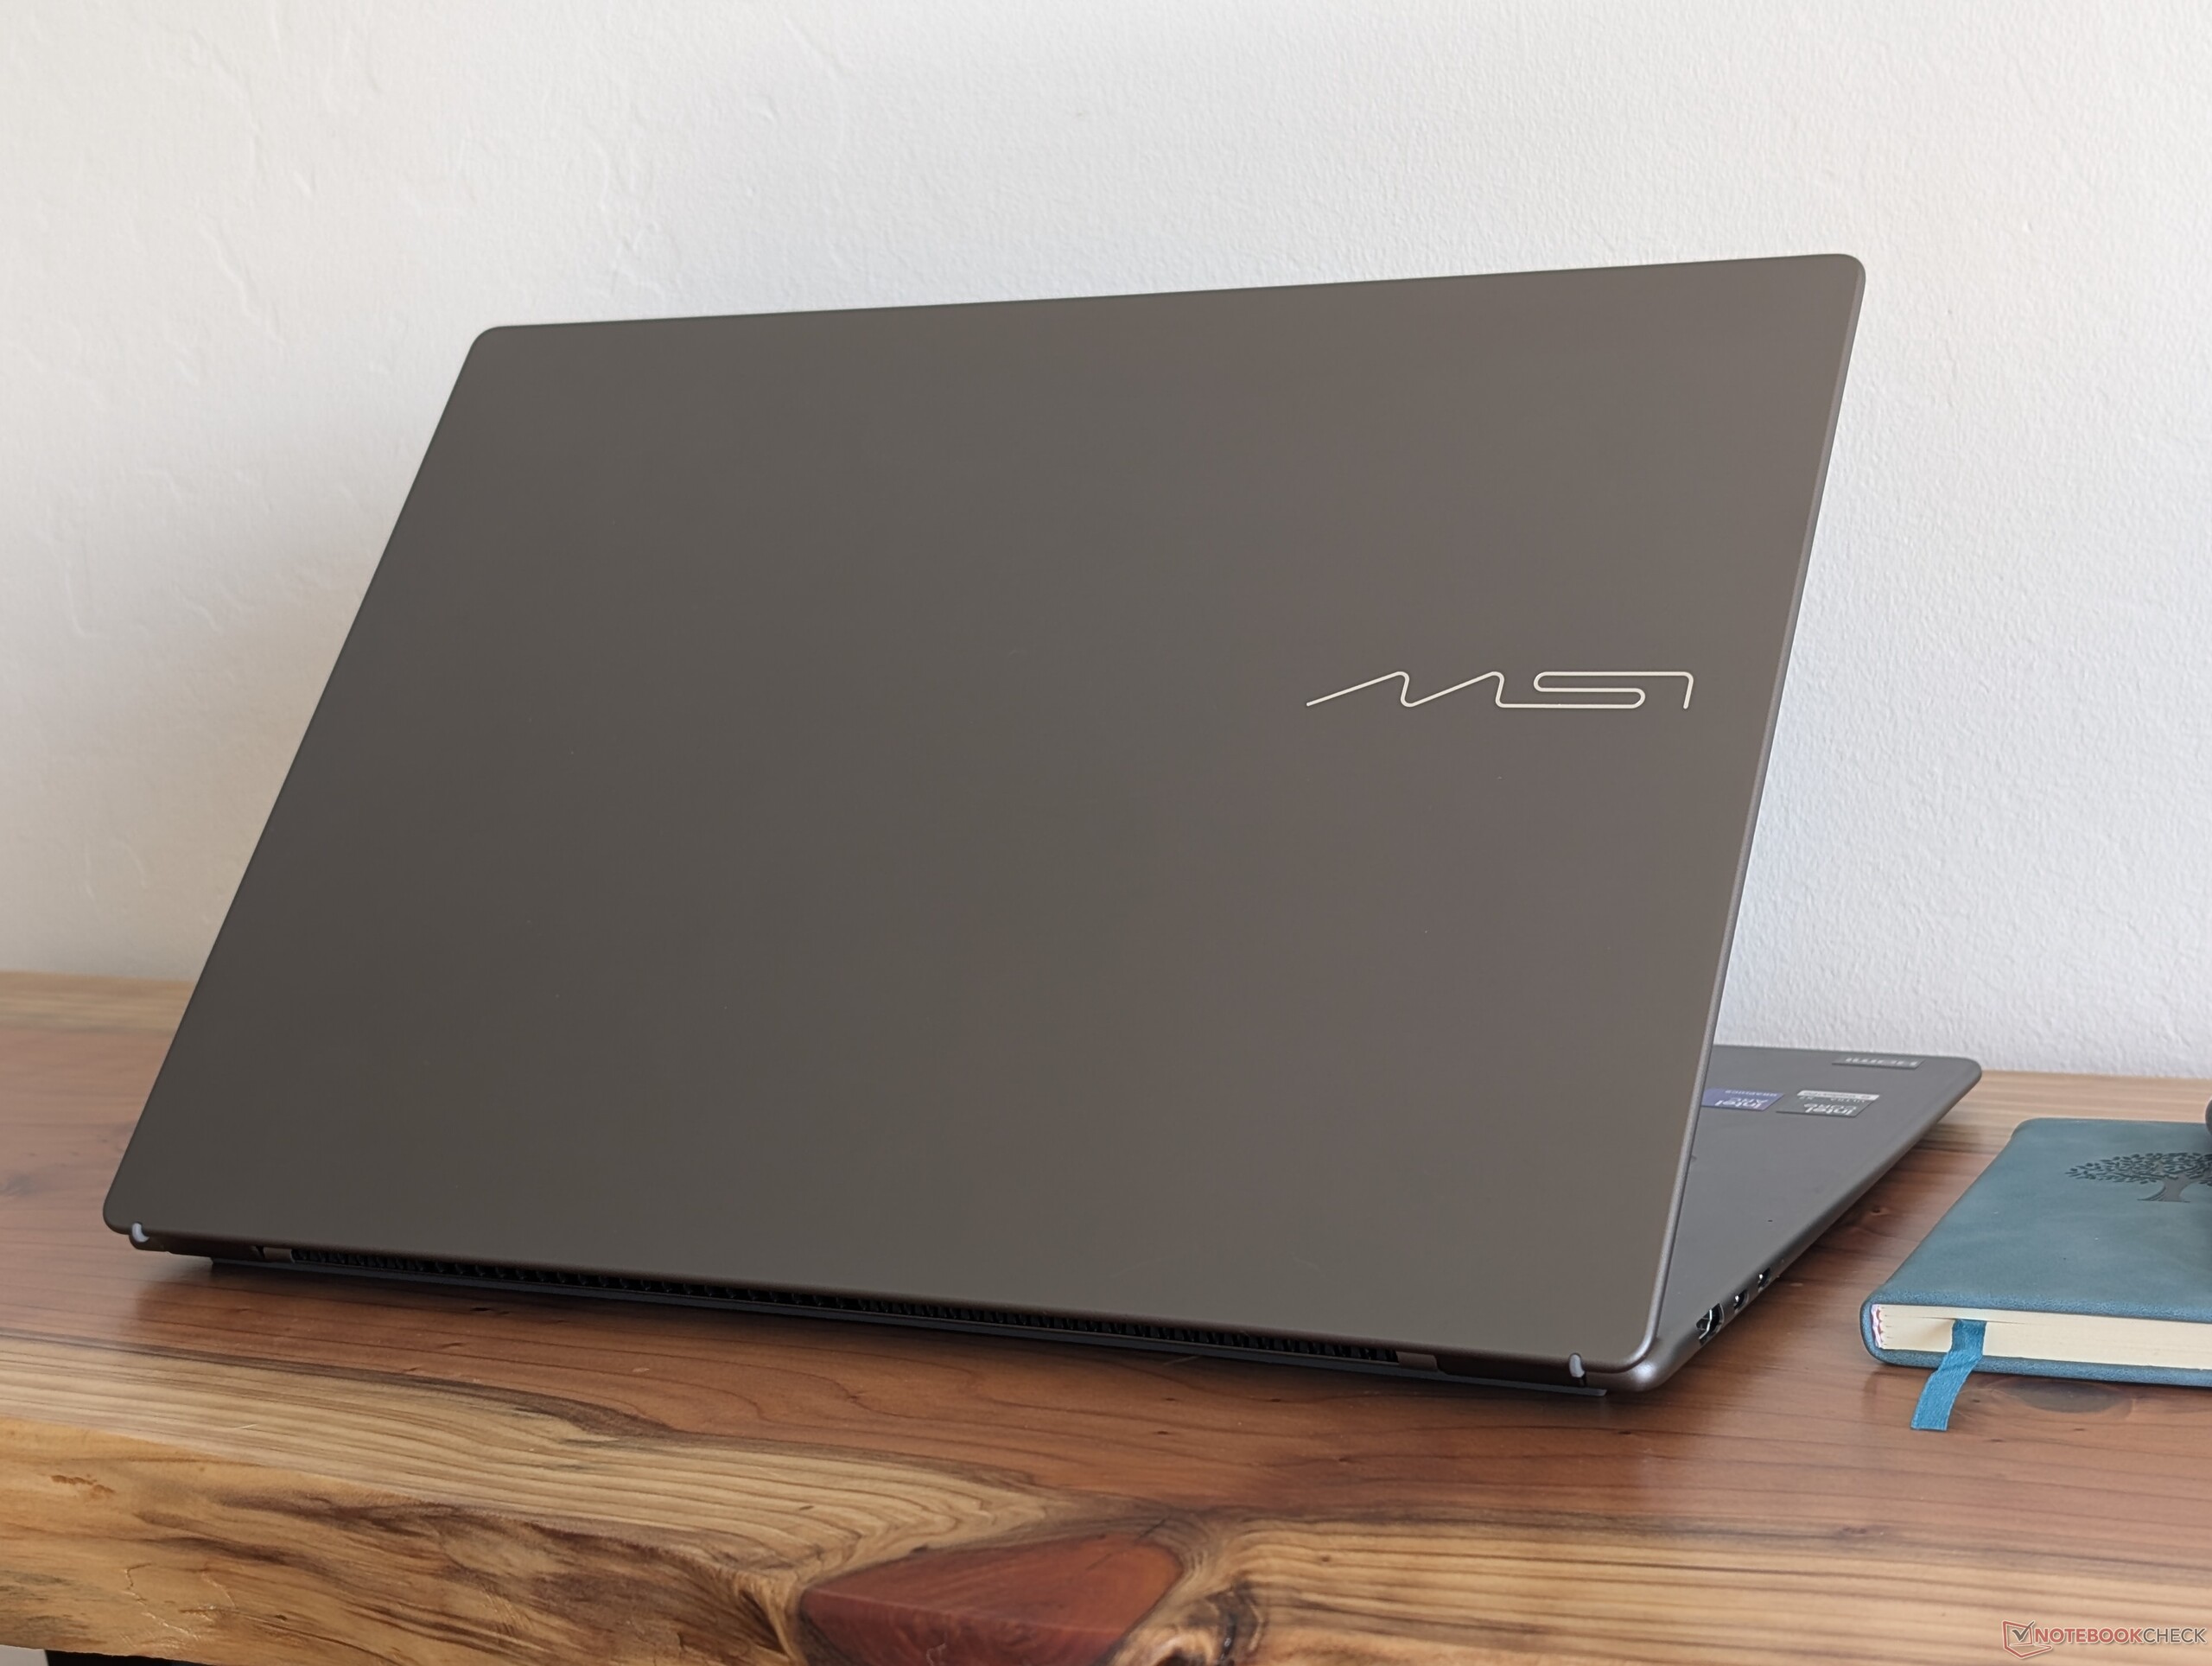
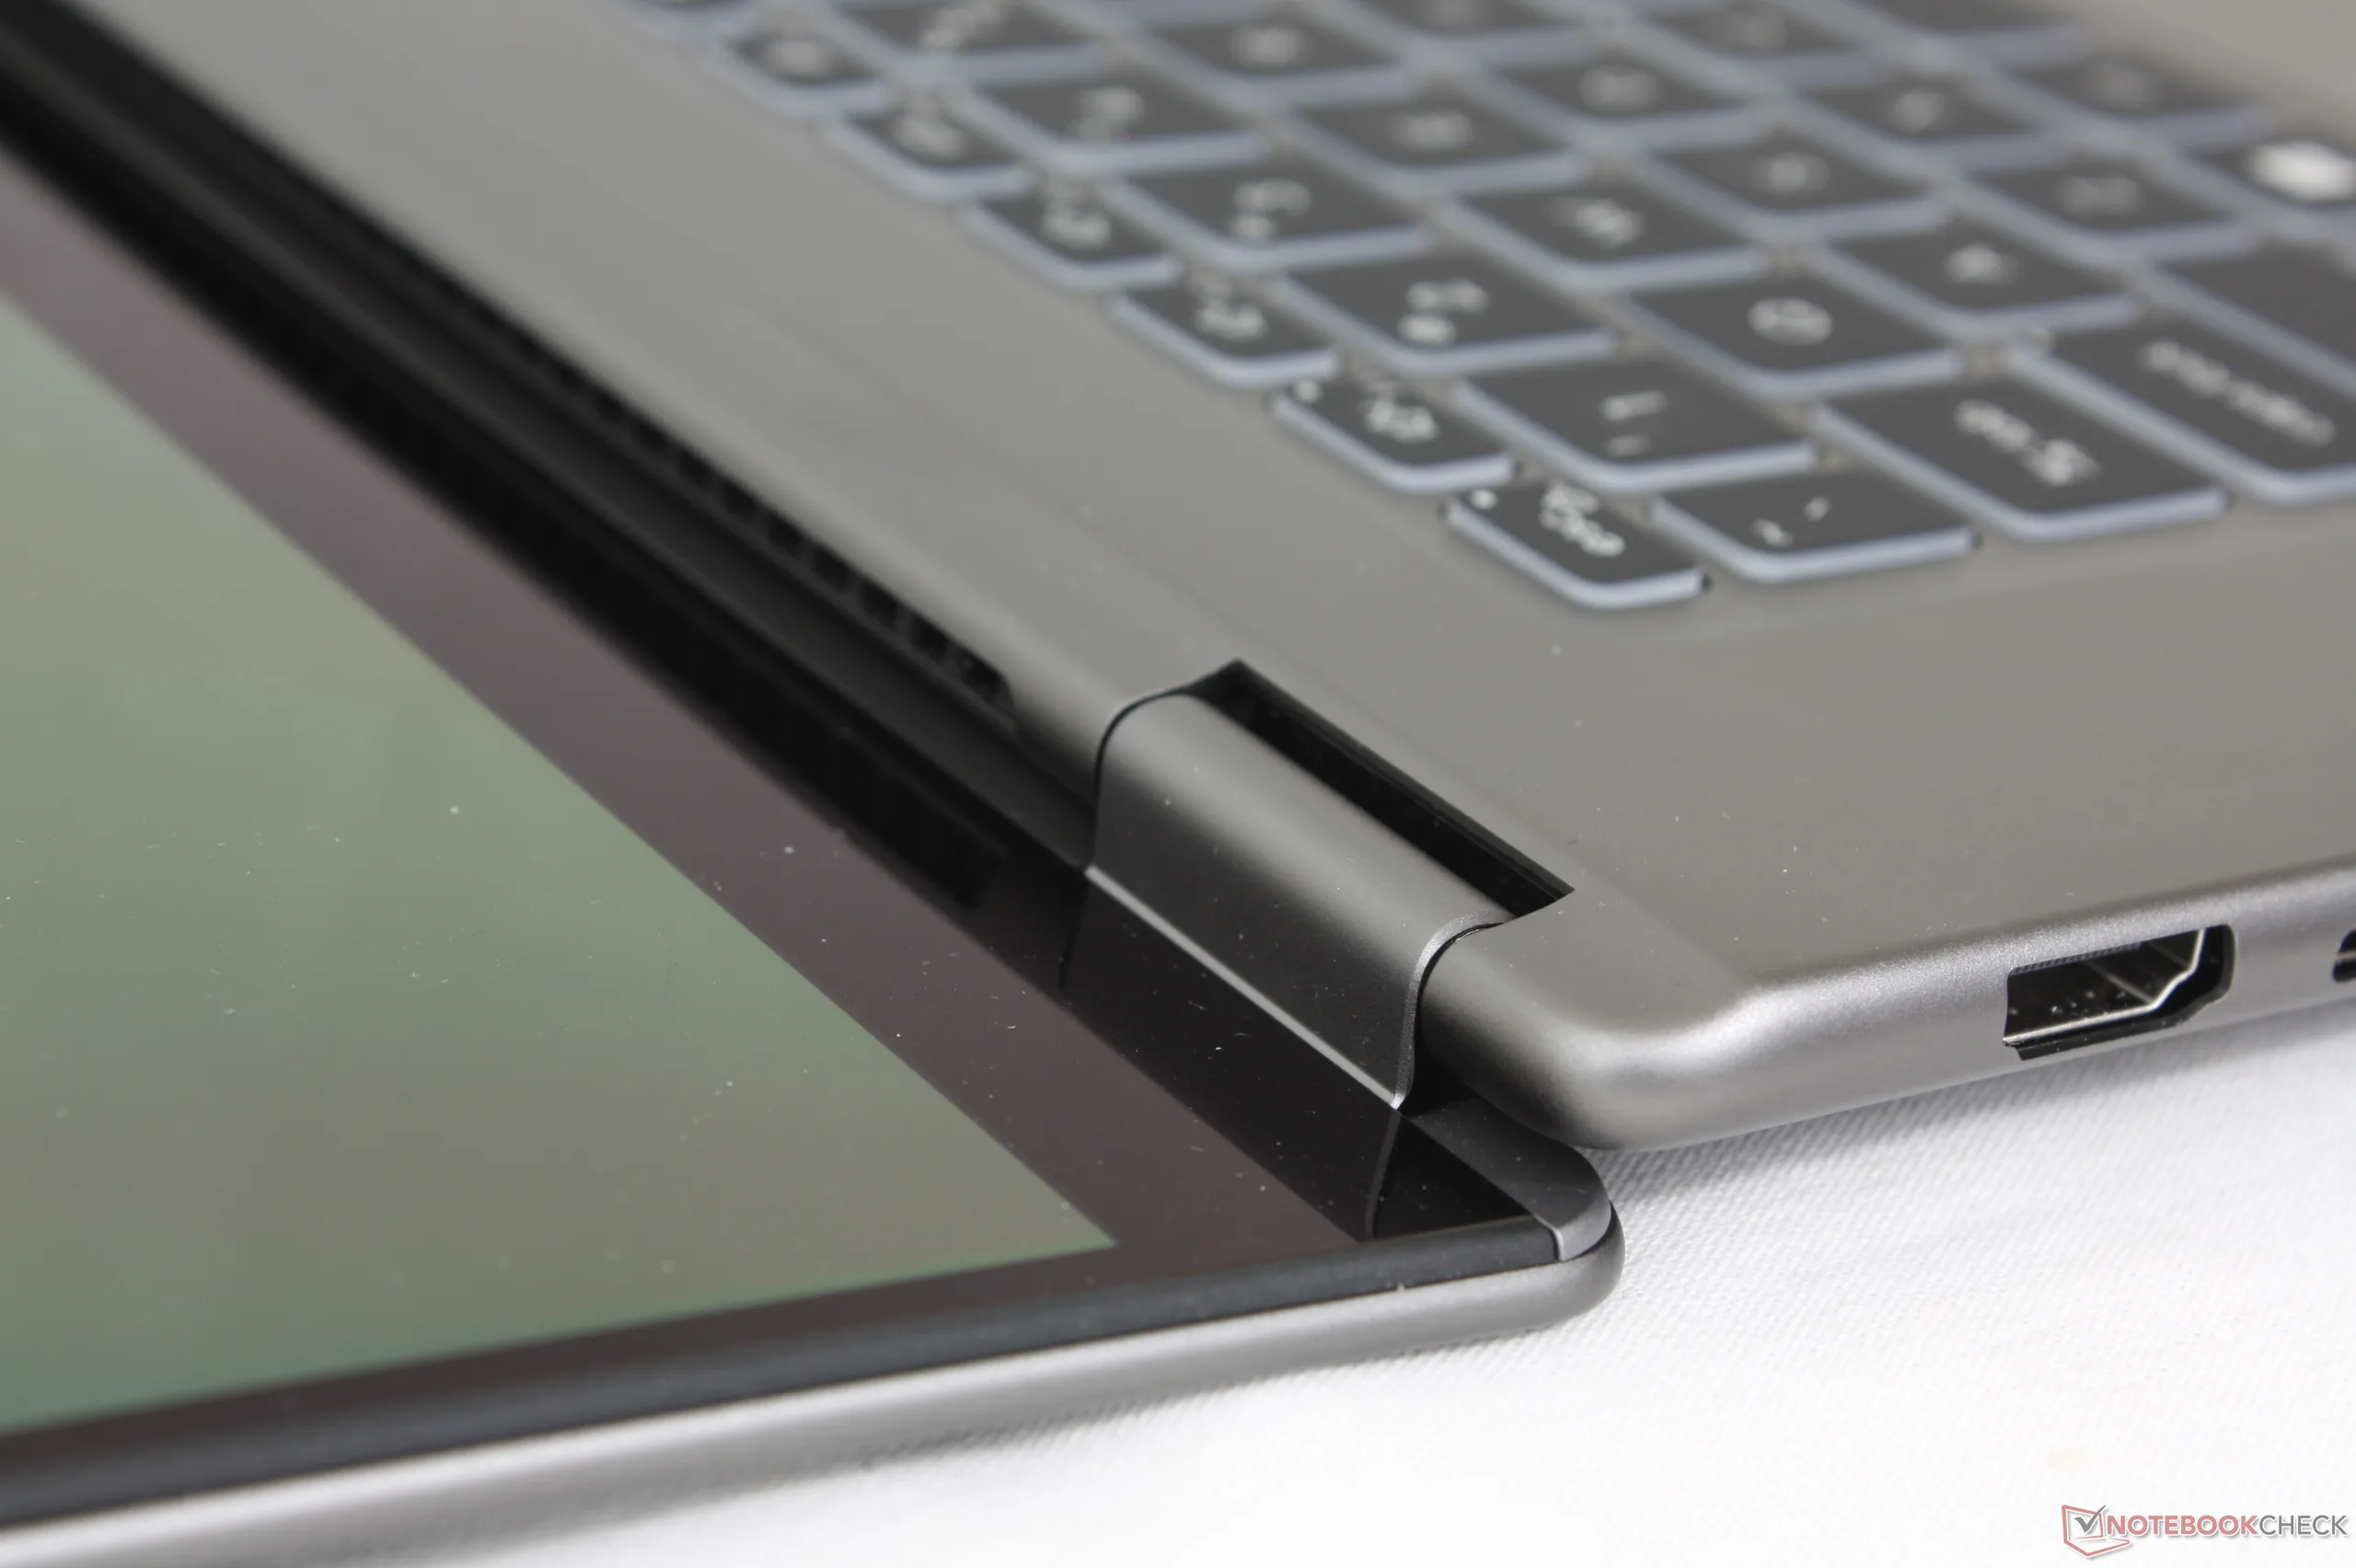
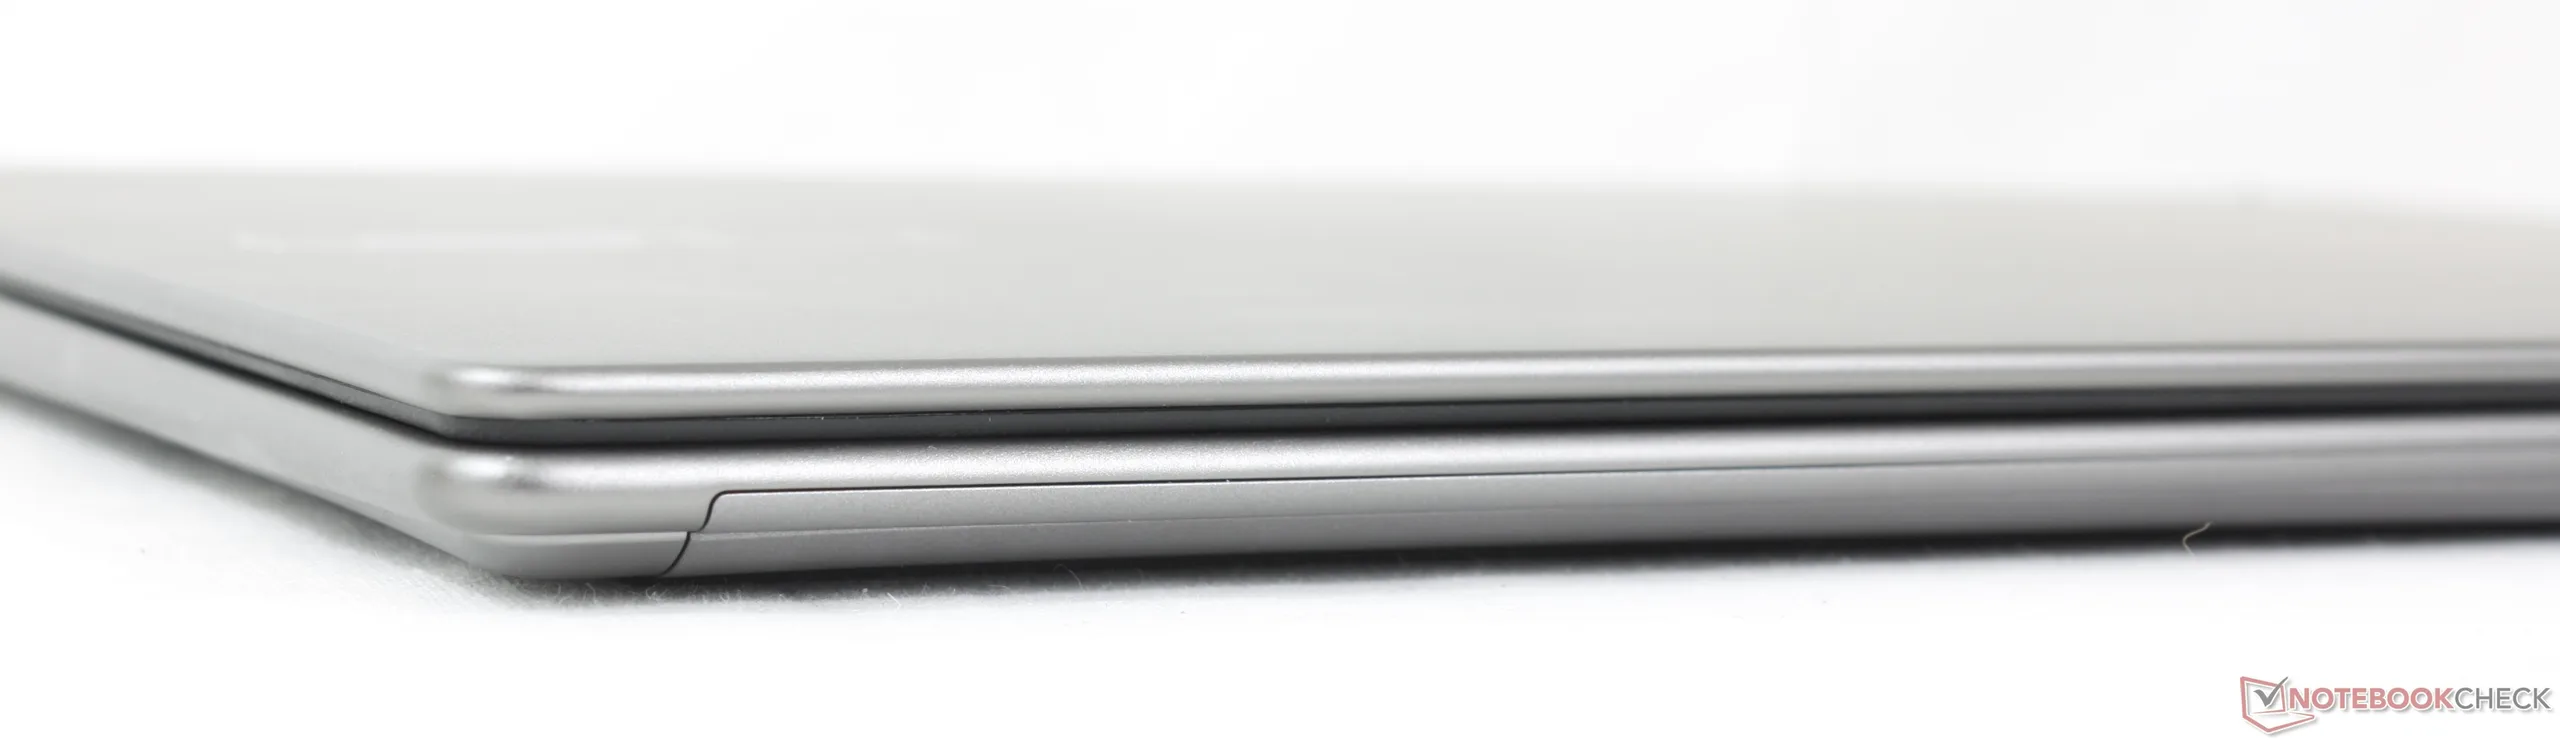
Le châssis en alliage d'aluminium est désormais plus fin et présente moins d'angles et de lignes superficielles pour une impression plus professionnelle. En effet, comparé au modèle sortant, le 2026 Prestige 16 est sans doute plus classe sans pour autant paraître trop ennuyeux ou trop minimaliste.
La rigidité du châssis est forte, même si la flexion est légèrement supérieure à celle du XPS 16 ou du Lenovo Pro 9i 16 Aura, qui sont plus épais.
MSI introduit également cette année un nouveau logo sur le couvercle extérieur à partir de la gamme 2026 Prestige. Selon le fabricant, cette gravure au laser fantaisiste pourrait apparaître sur d'autres modèles haut de gamme dans un avenir proche, afin de mieux les distinguer des solutions MSI axées sur les jeux.
Le système est sensiblement plus fin que le design de l'année dernière, mais son poids n'a pratiquement pas changé, ce qui lui confère une sensation de densité. Il se situe confortablement entre le XPS 16 et le ZenBook S16 en termes de poids, tout en étant légèrement plus grand que les deux en termes d'encombrement.
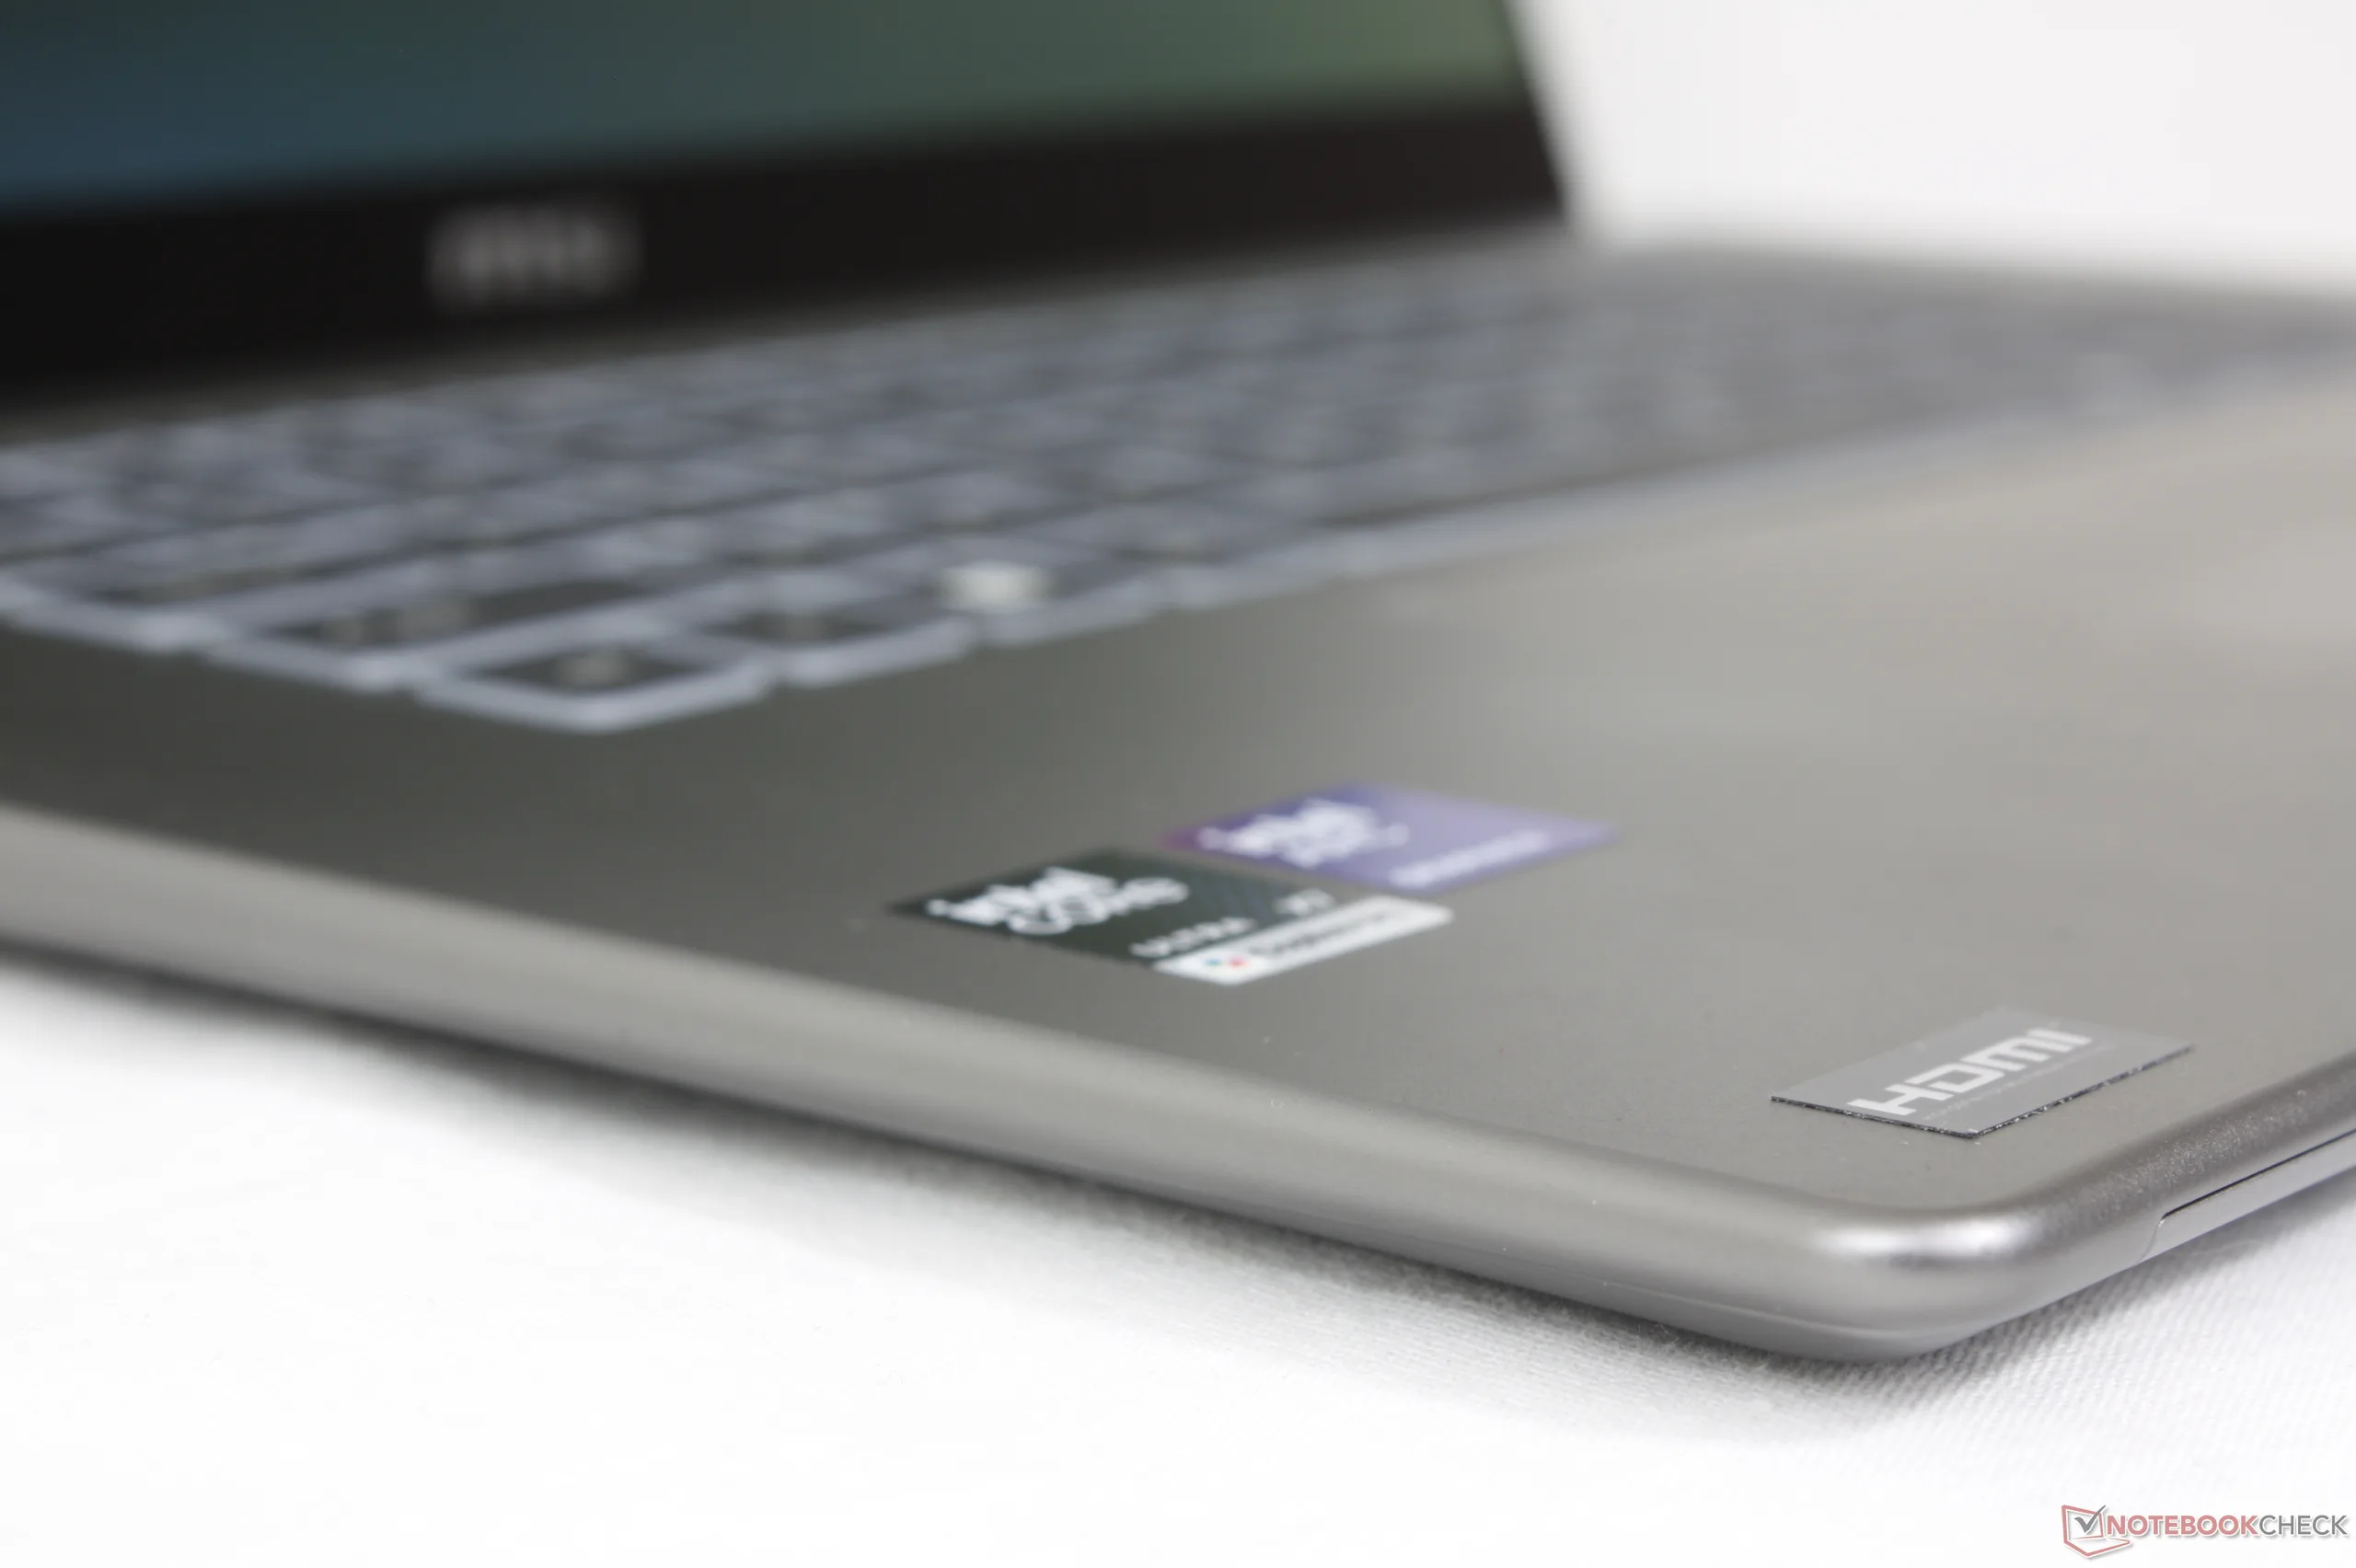
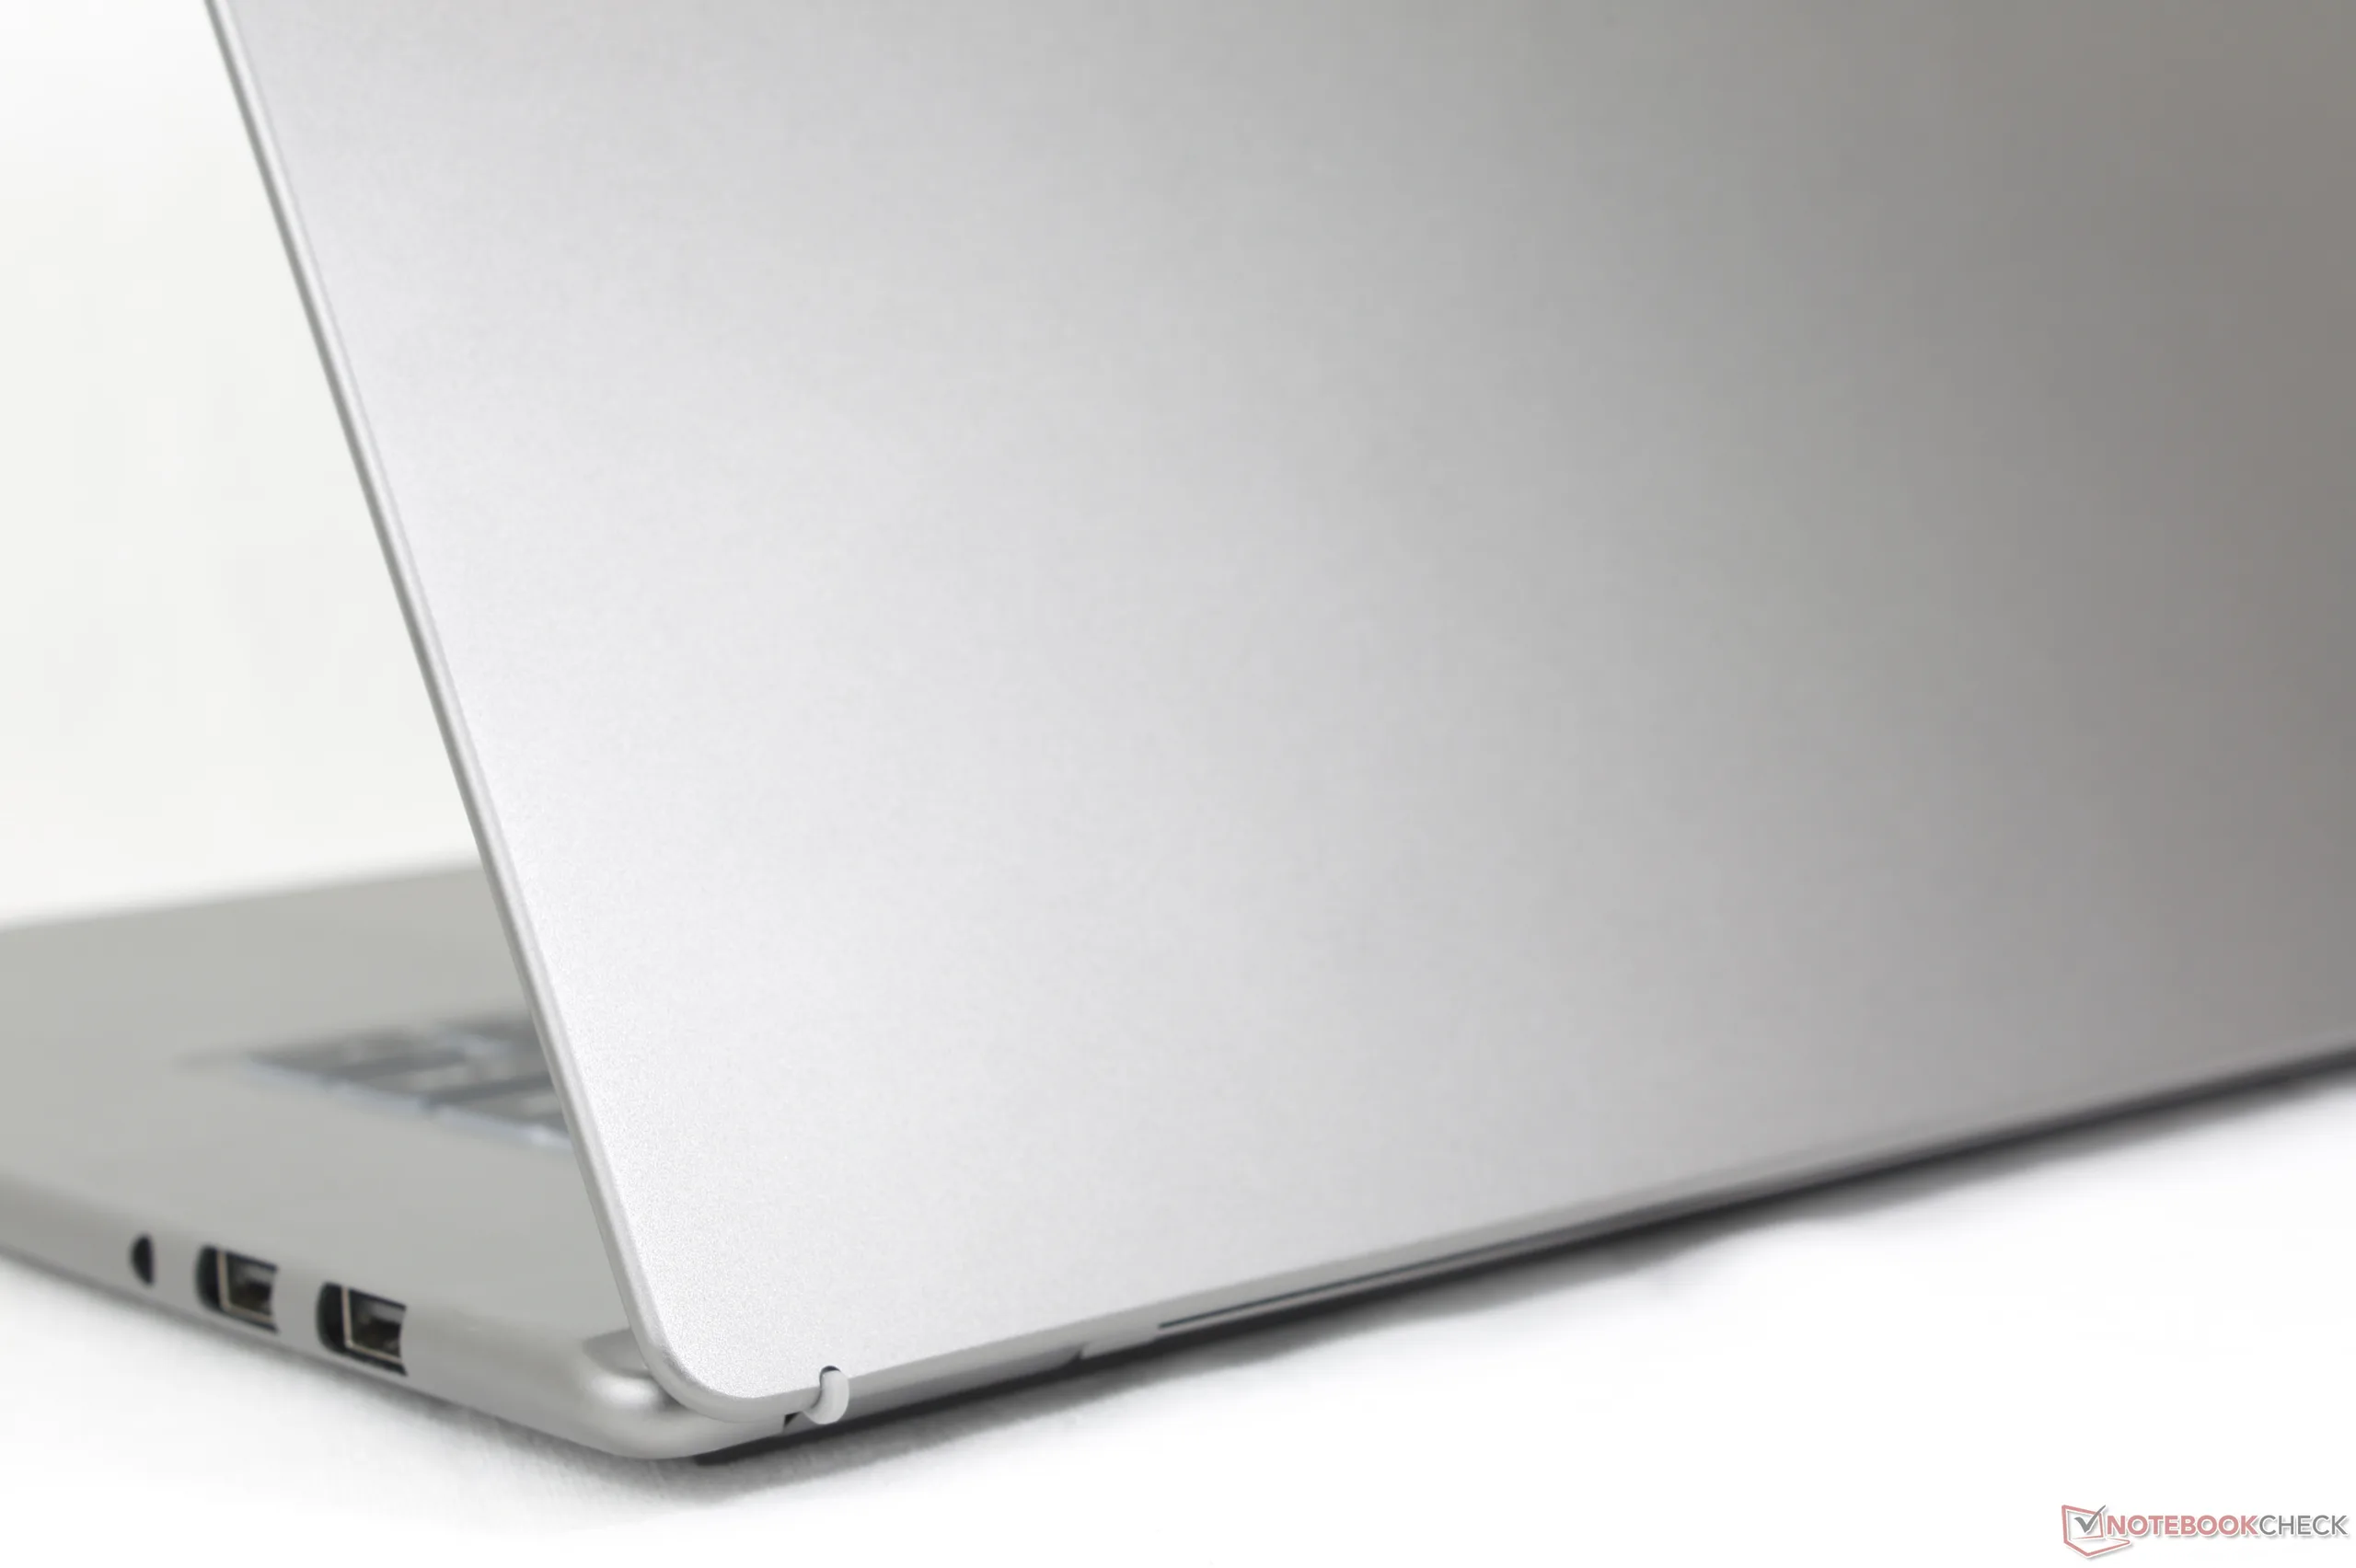
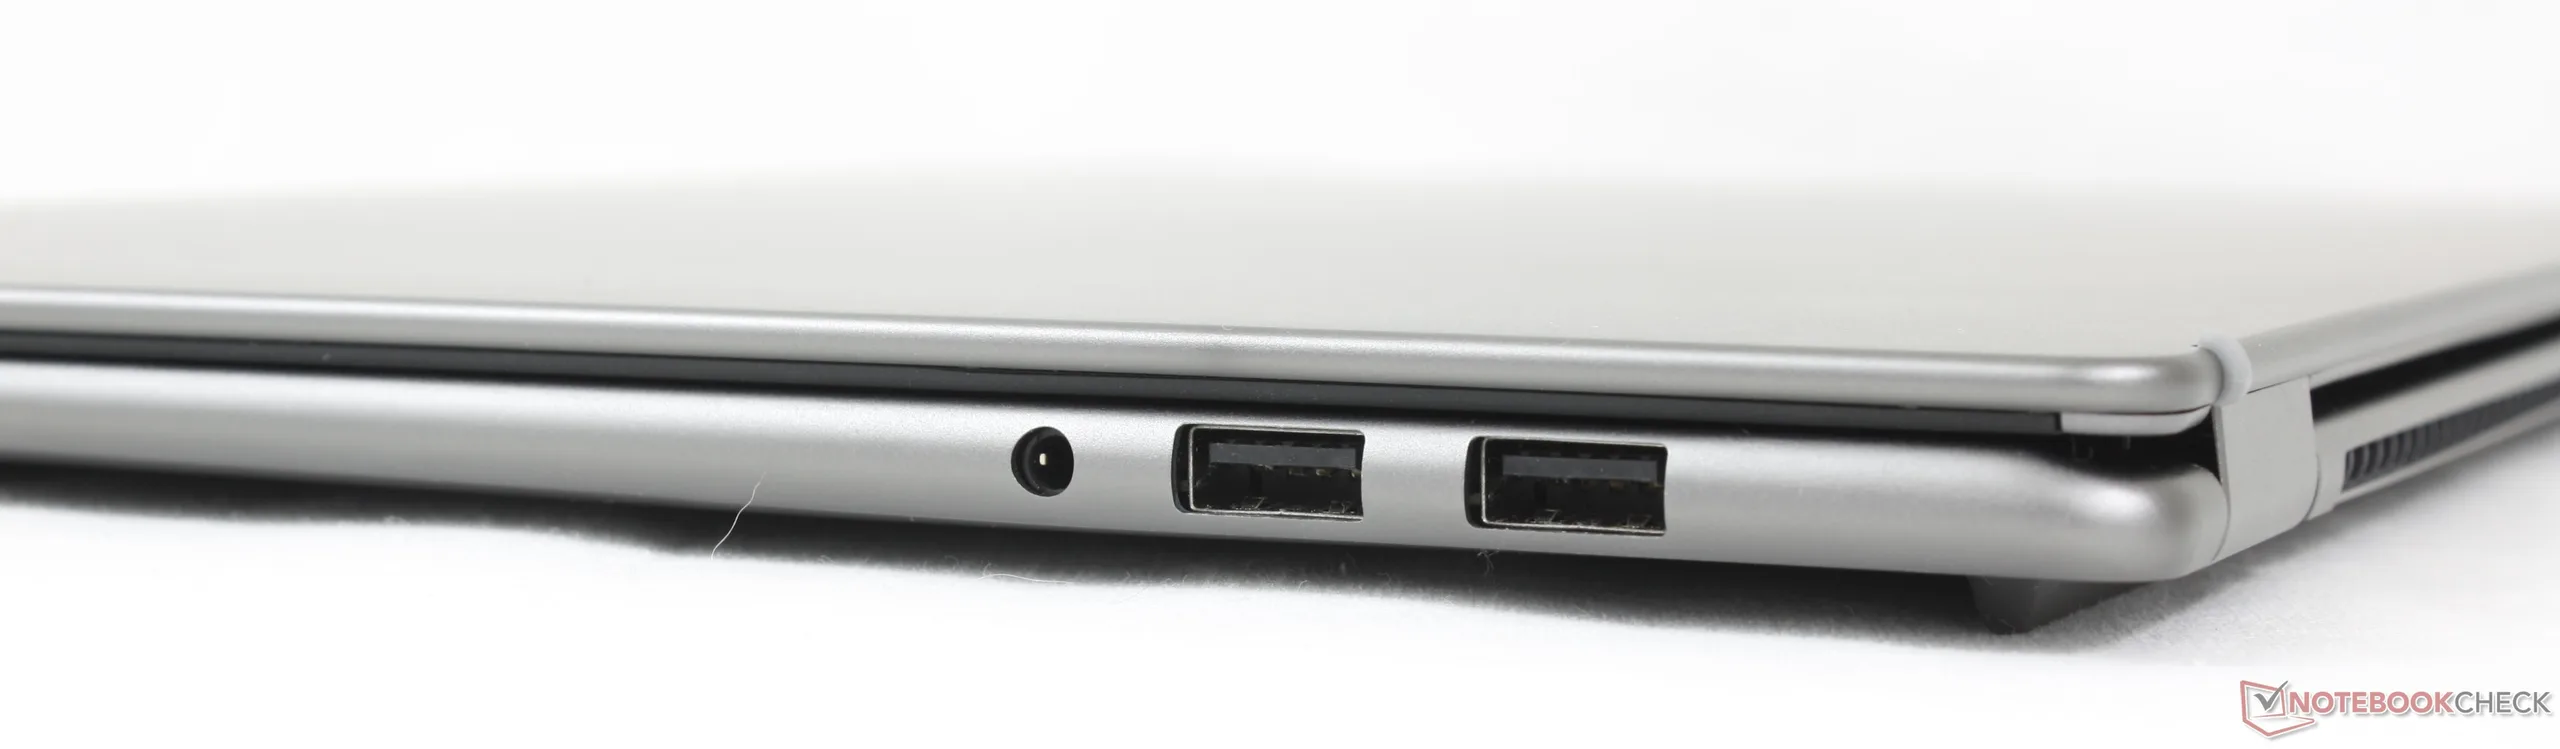
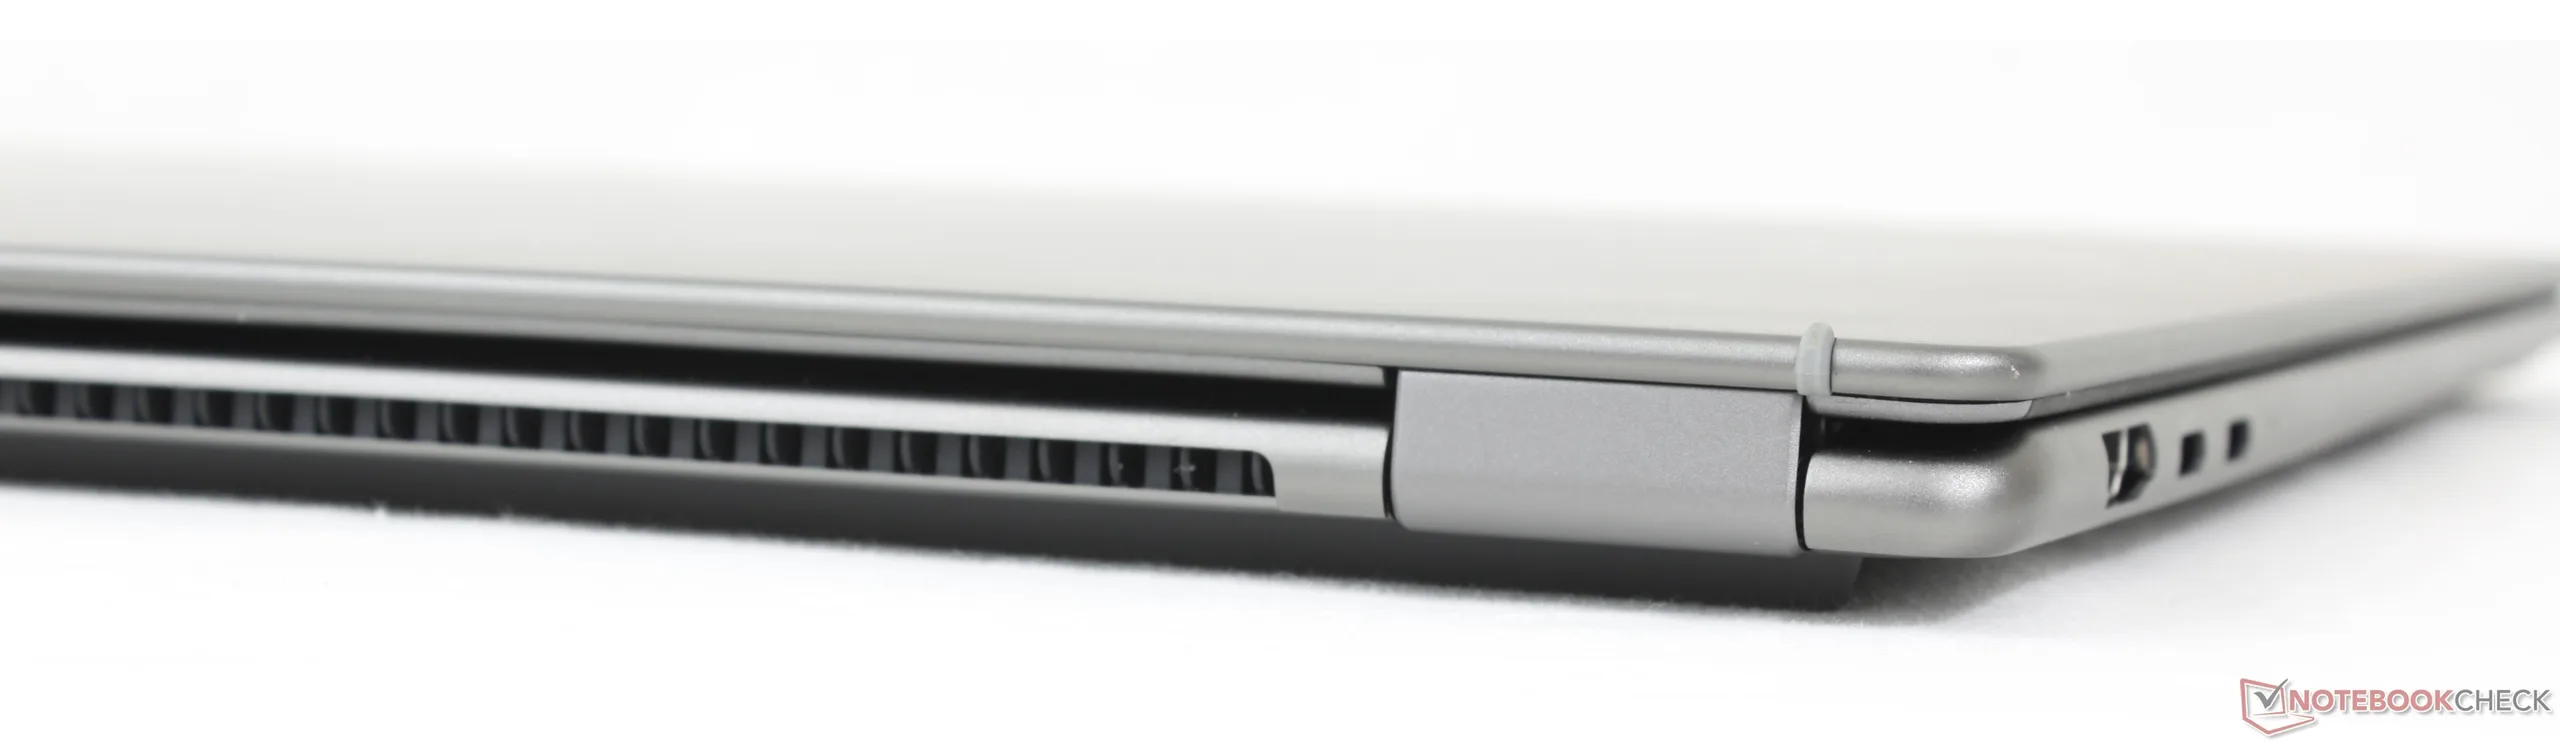
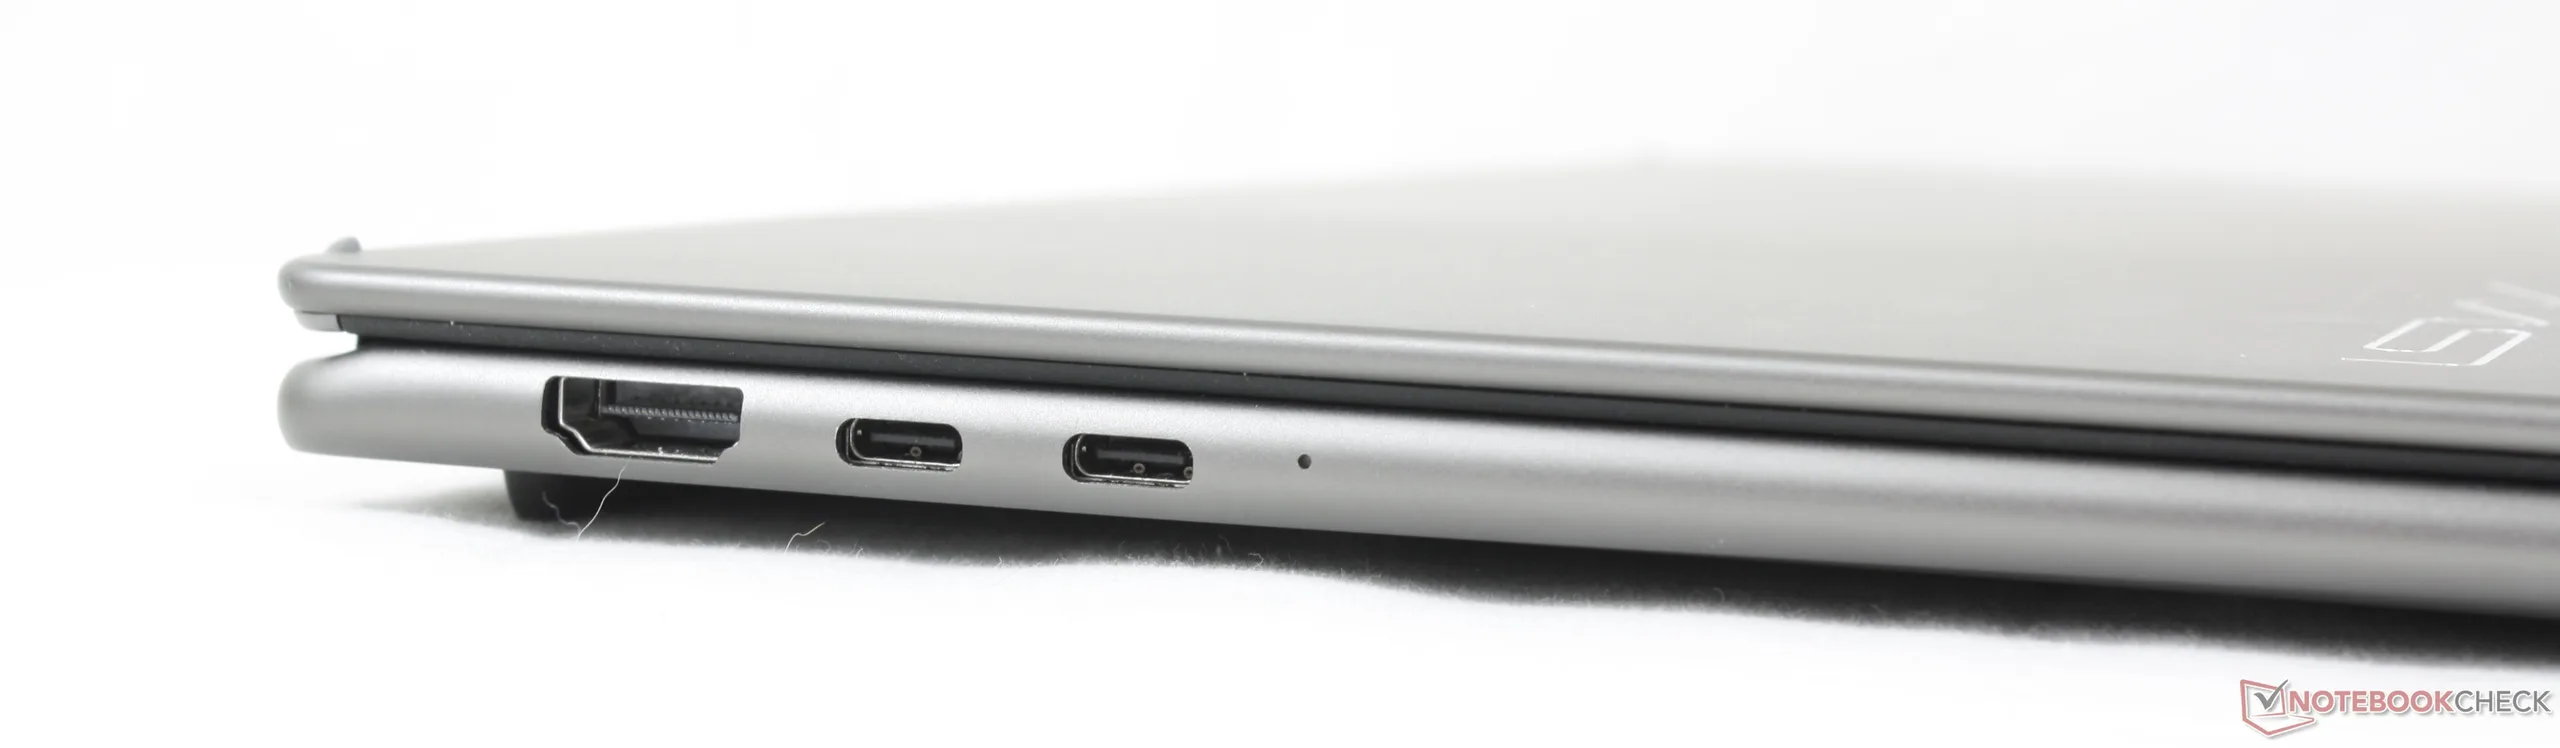
Connectivité
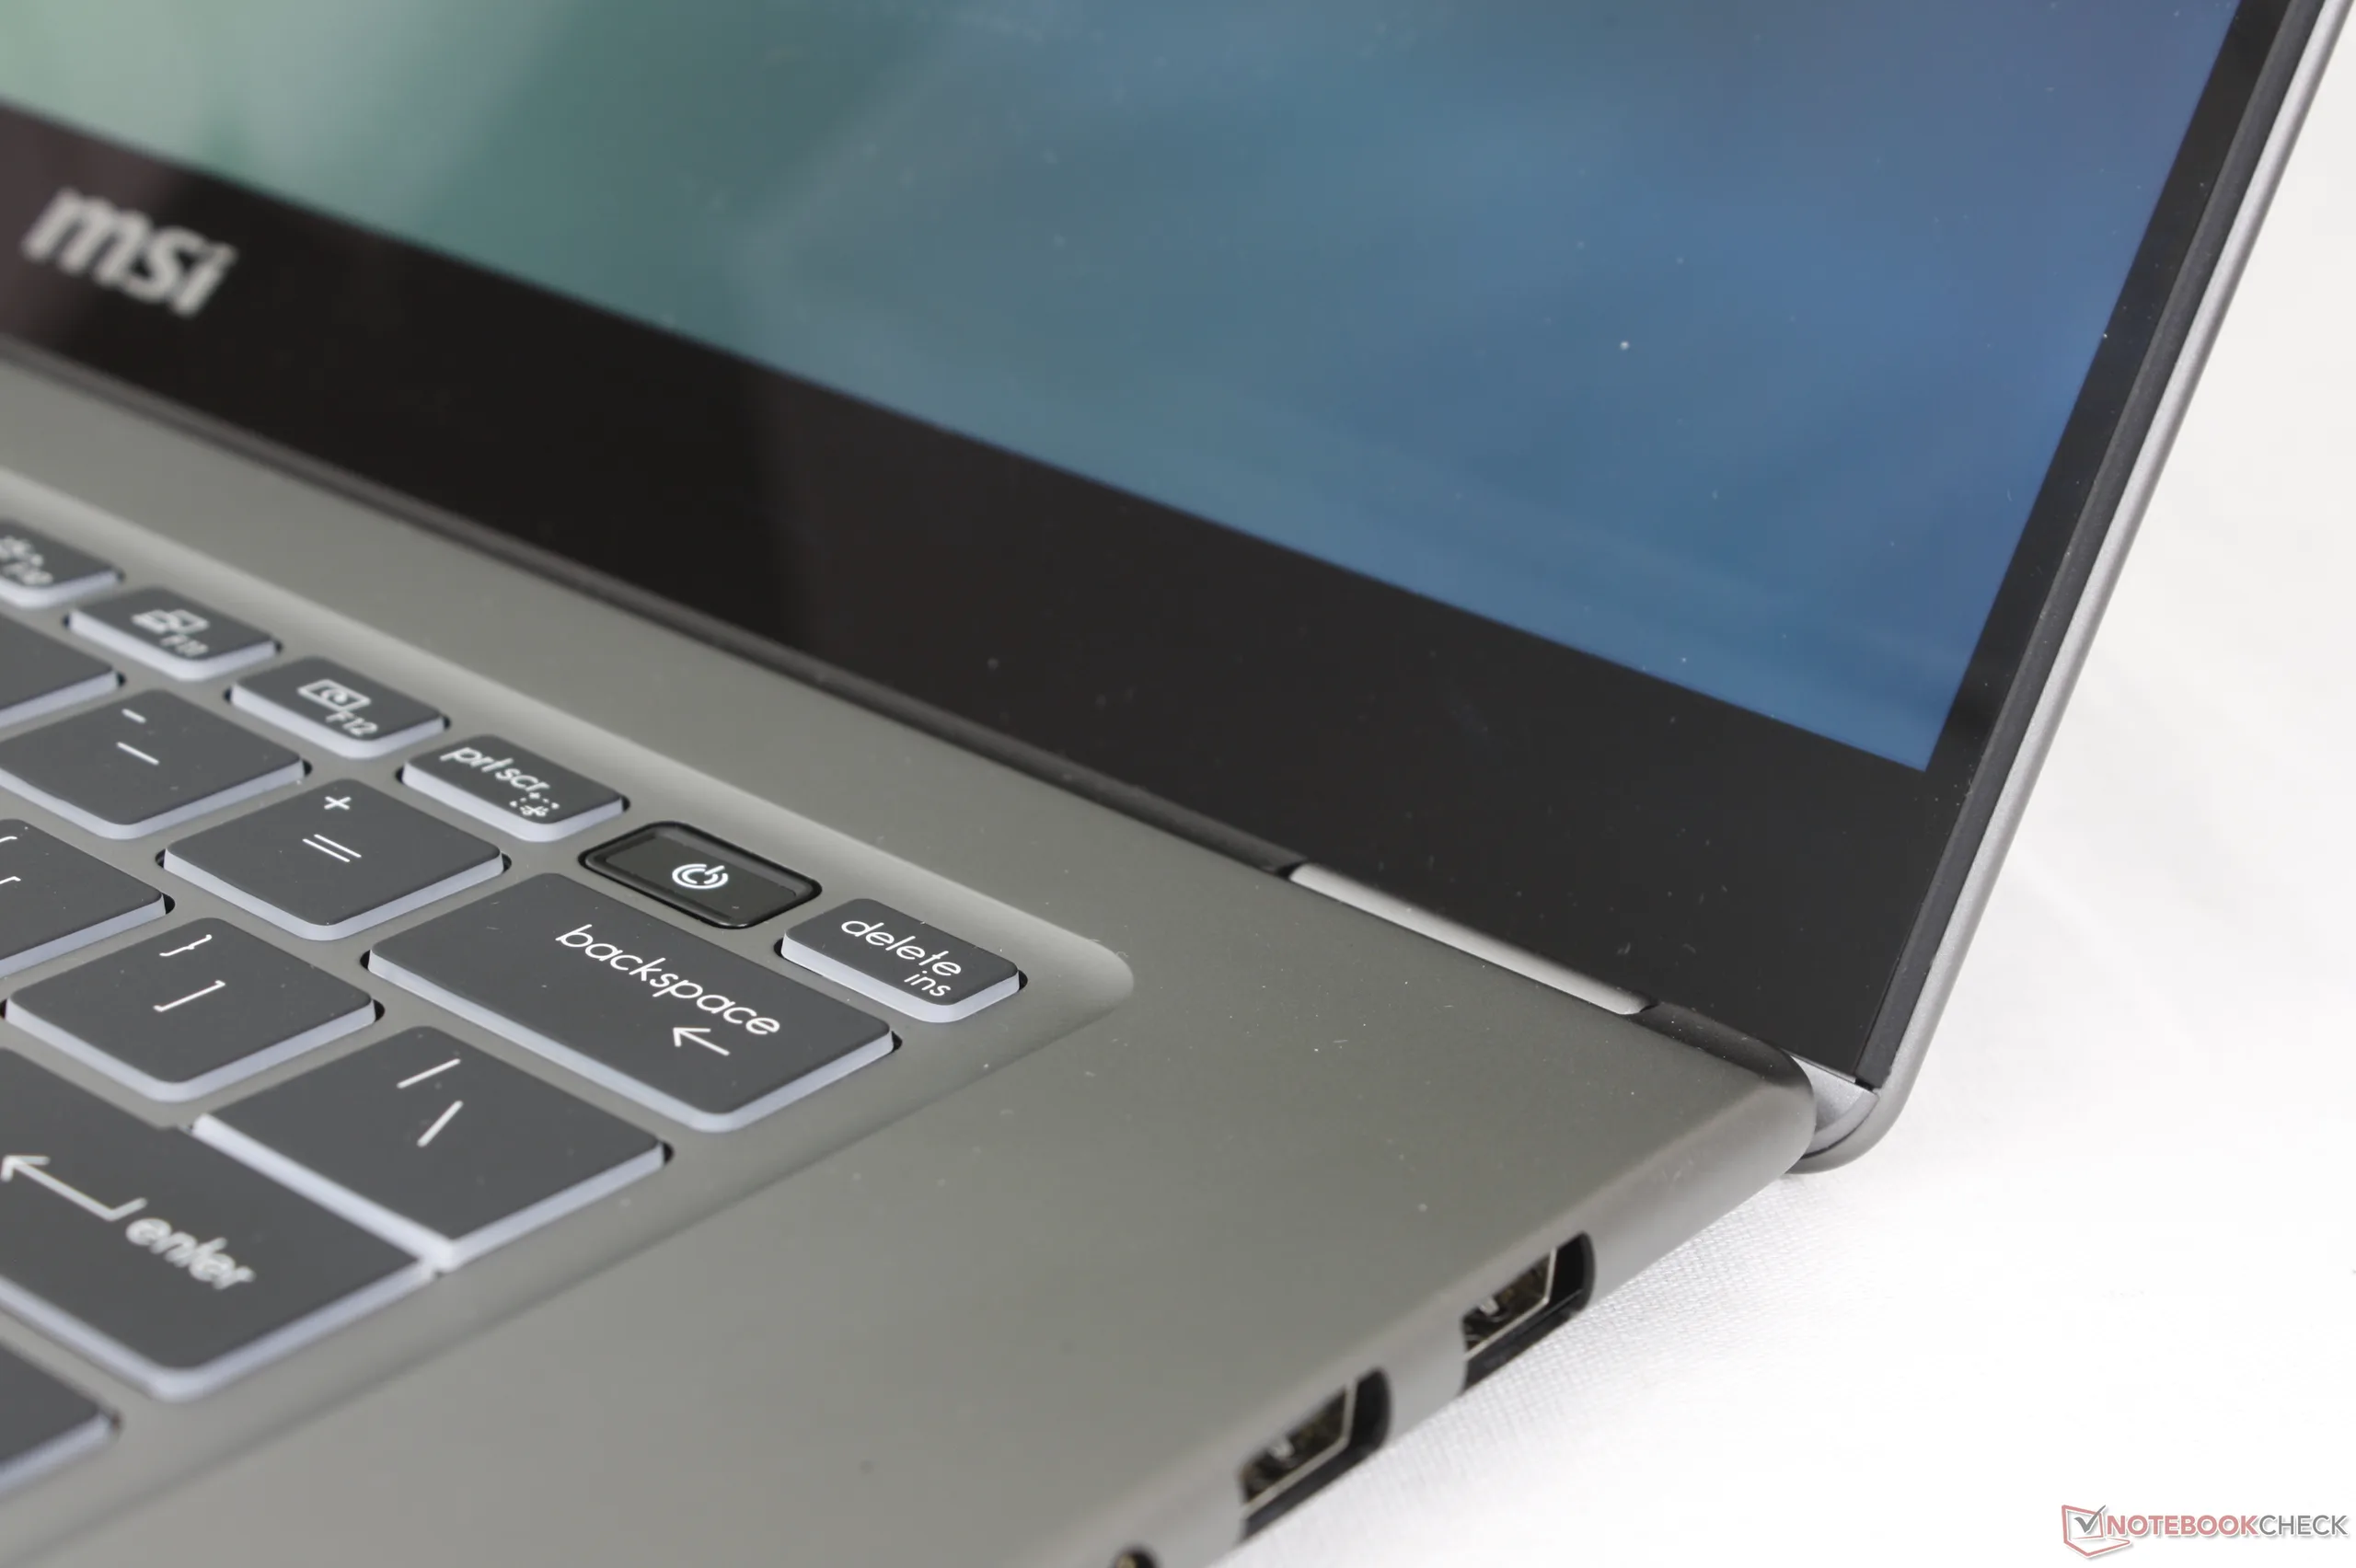
Les options de port ont changé par rapport au modèle 2025. MSI a supprimé le port RJ-45, le lecteur de carte SD et le verrou Kensington, tout en ajoutant un second port USB-A. Les changements sont mitigés en fonction des préférences de l'utilisateur.
Le positionnement des ports aurait également pu être amélioré puisque la charge USB-C est limitée au seul côté gauche du système.
Communication
Webcam
La webcam de 2 mégapixels est équipée en standard d'un obturateur à infrarouge et d'un obturateur physique.


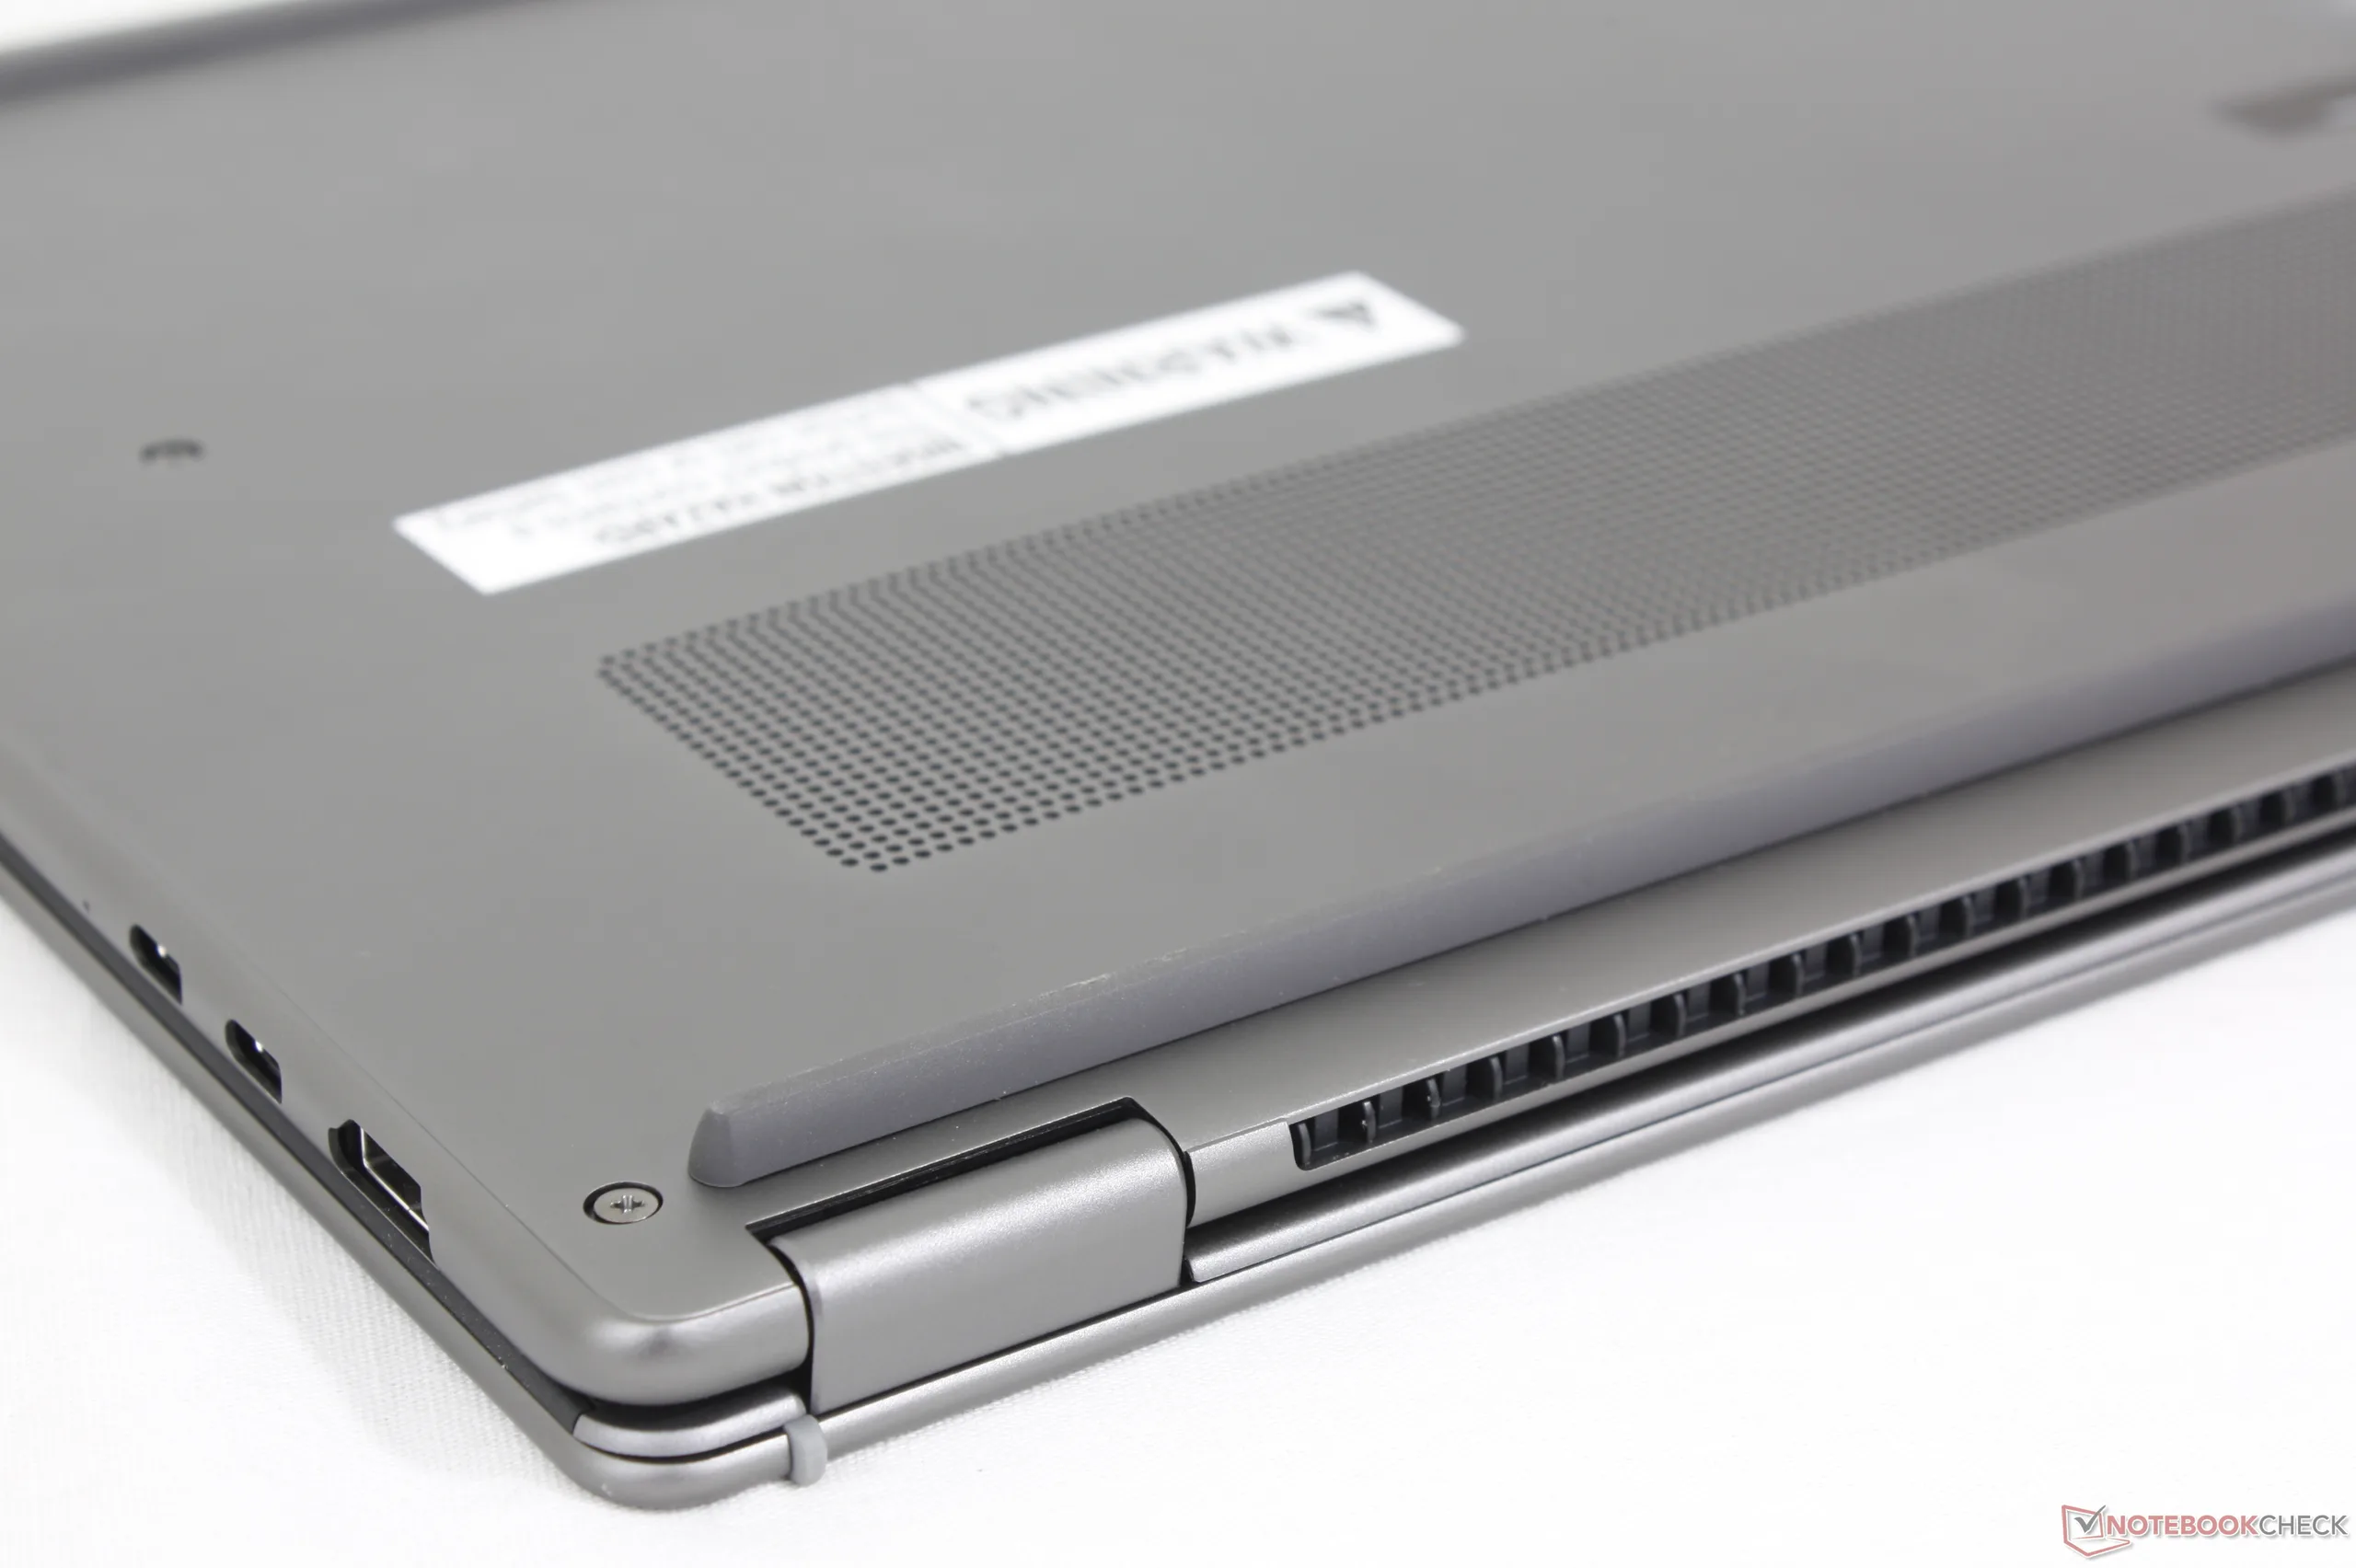
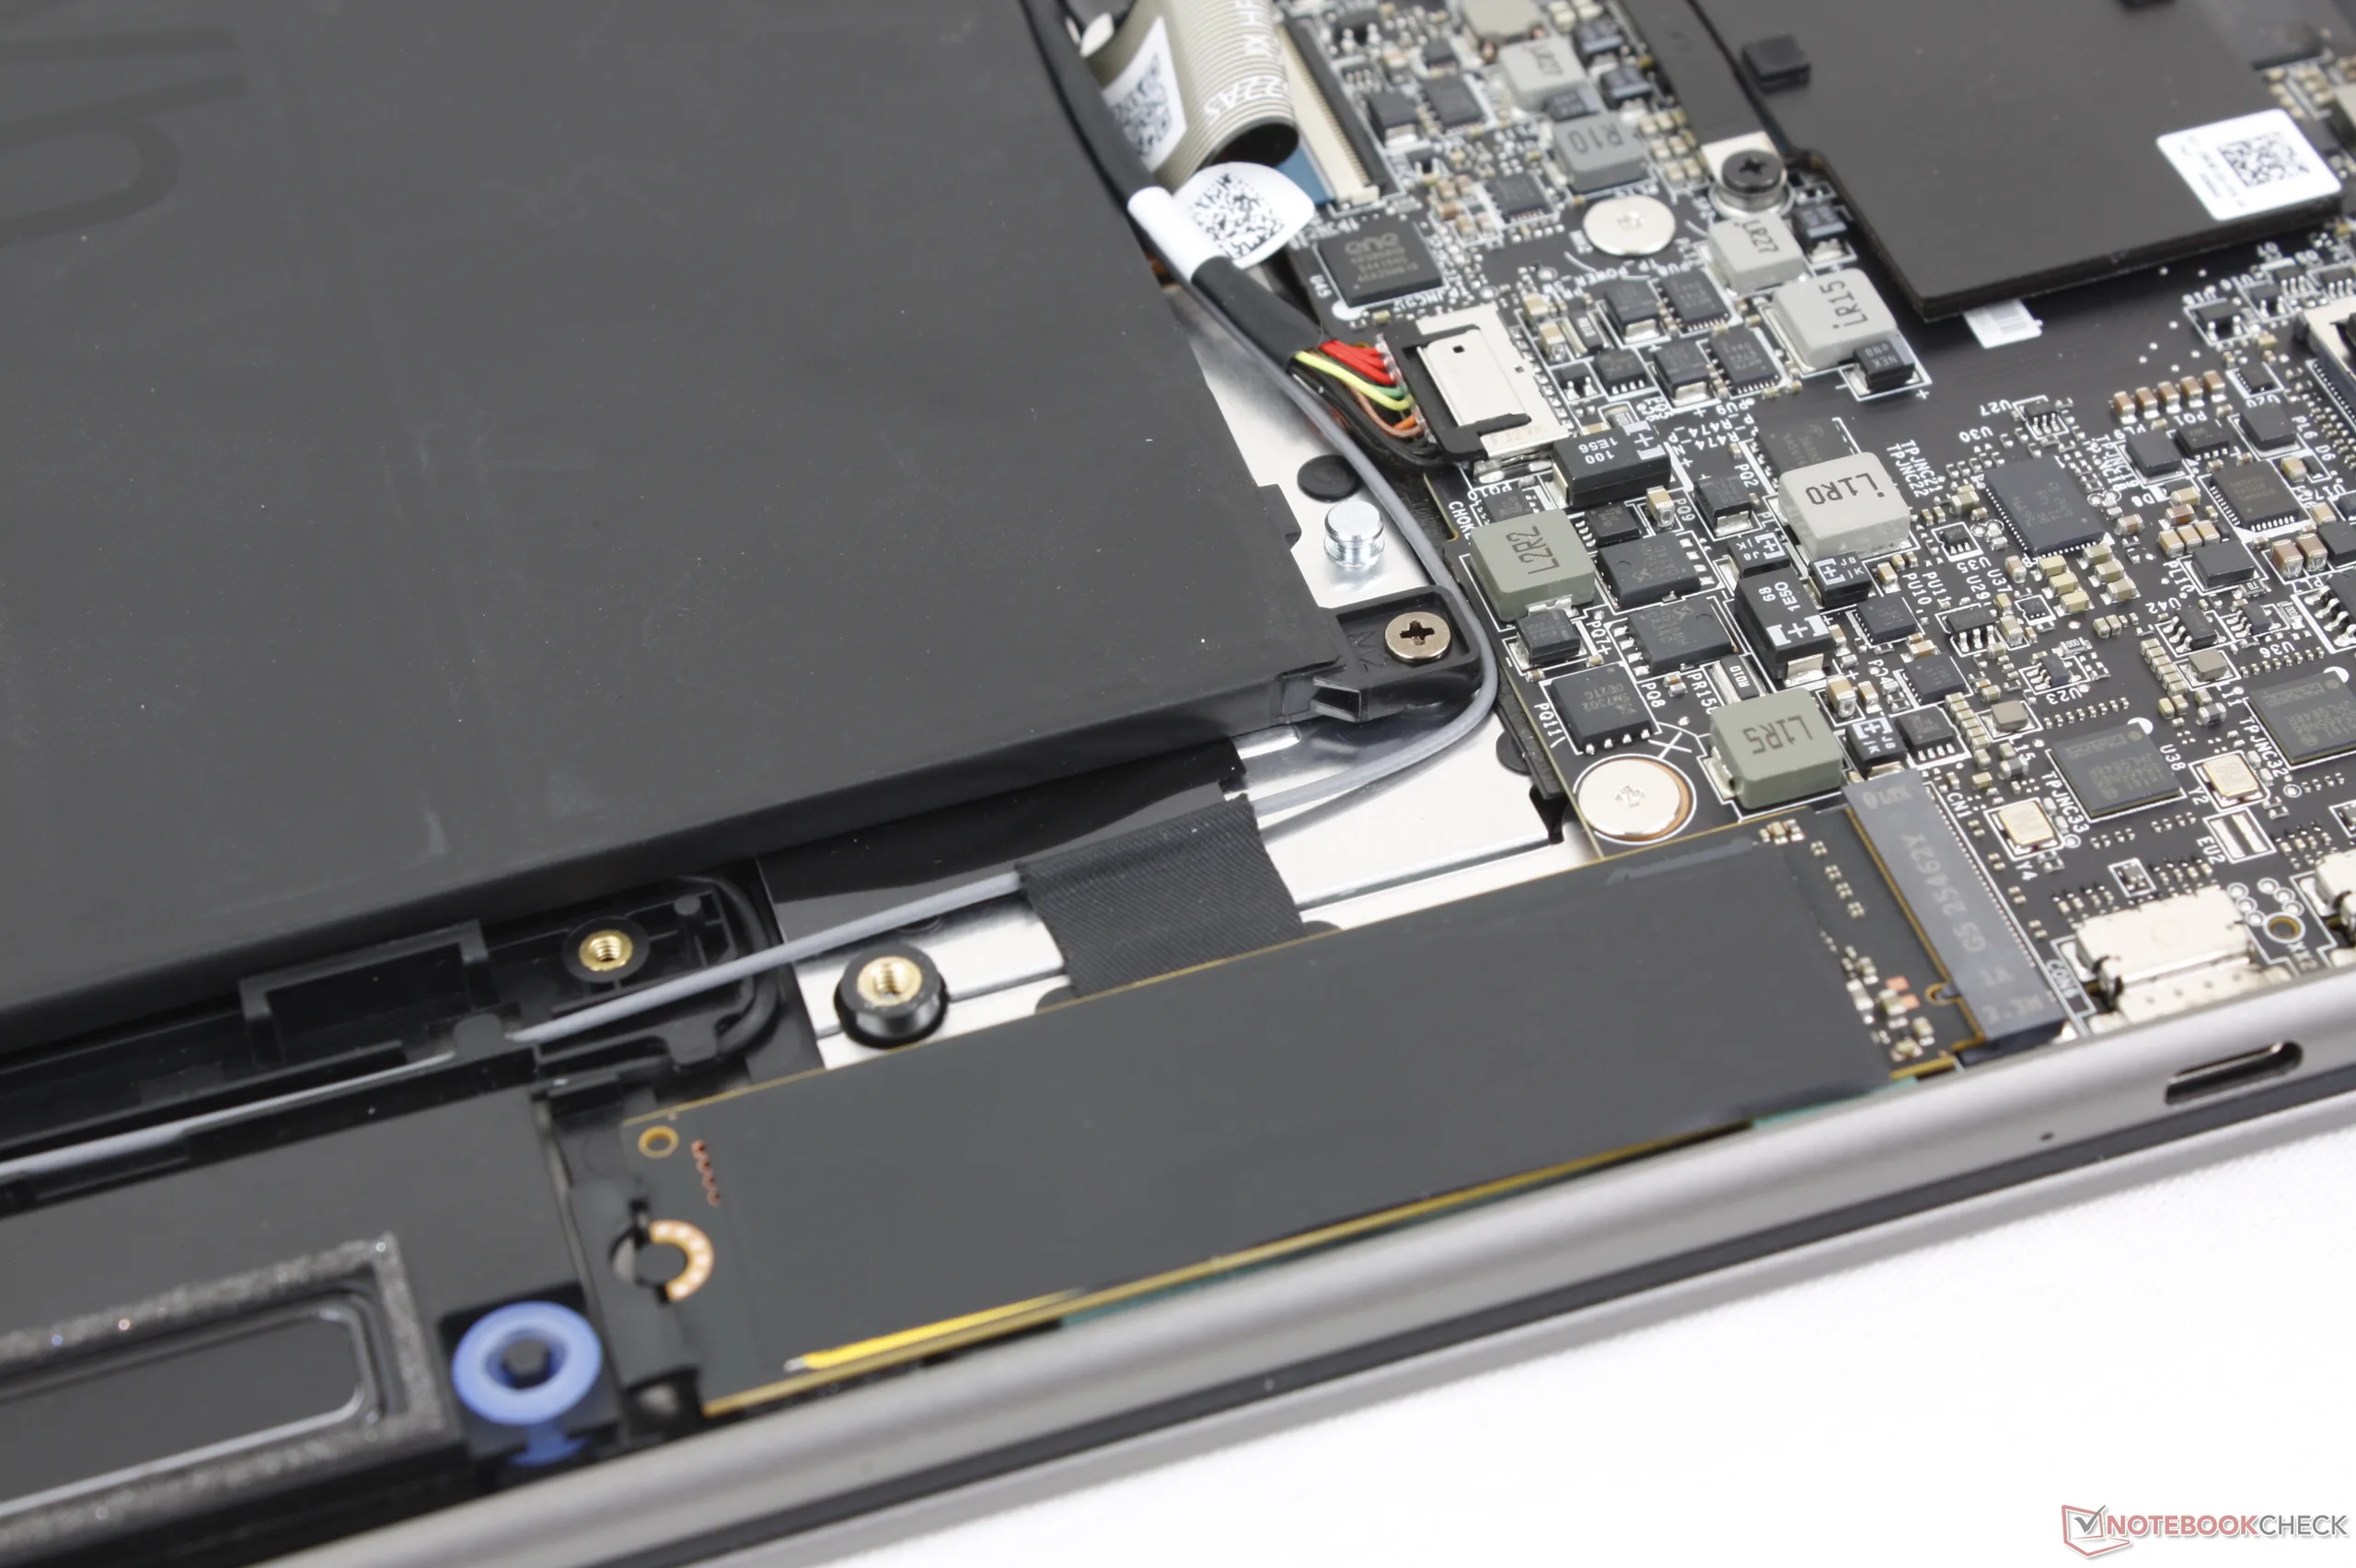
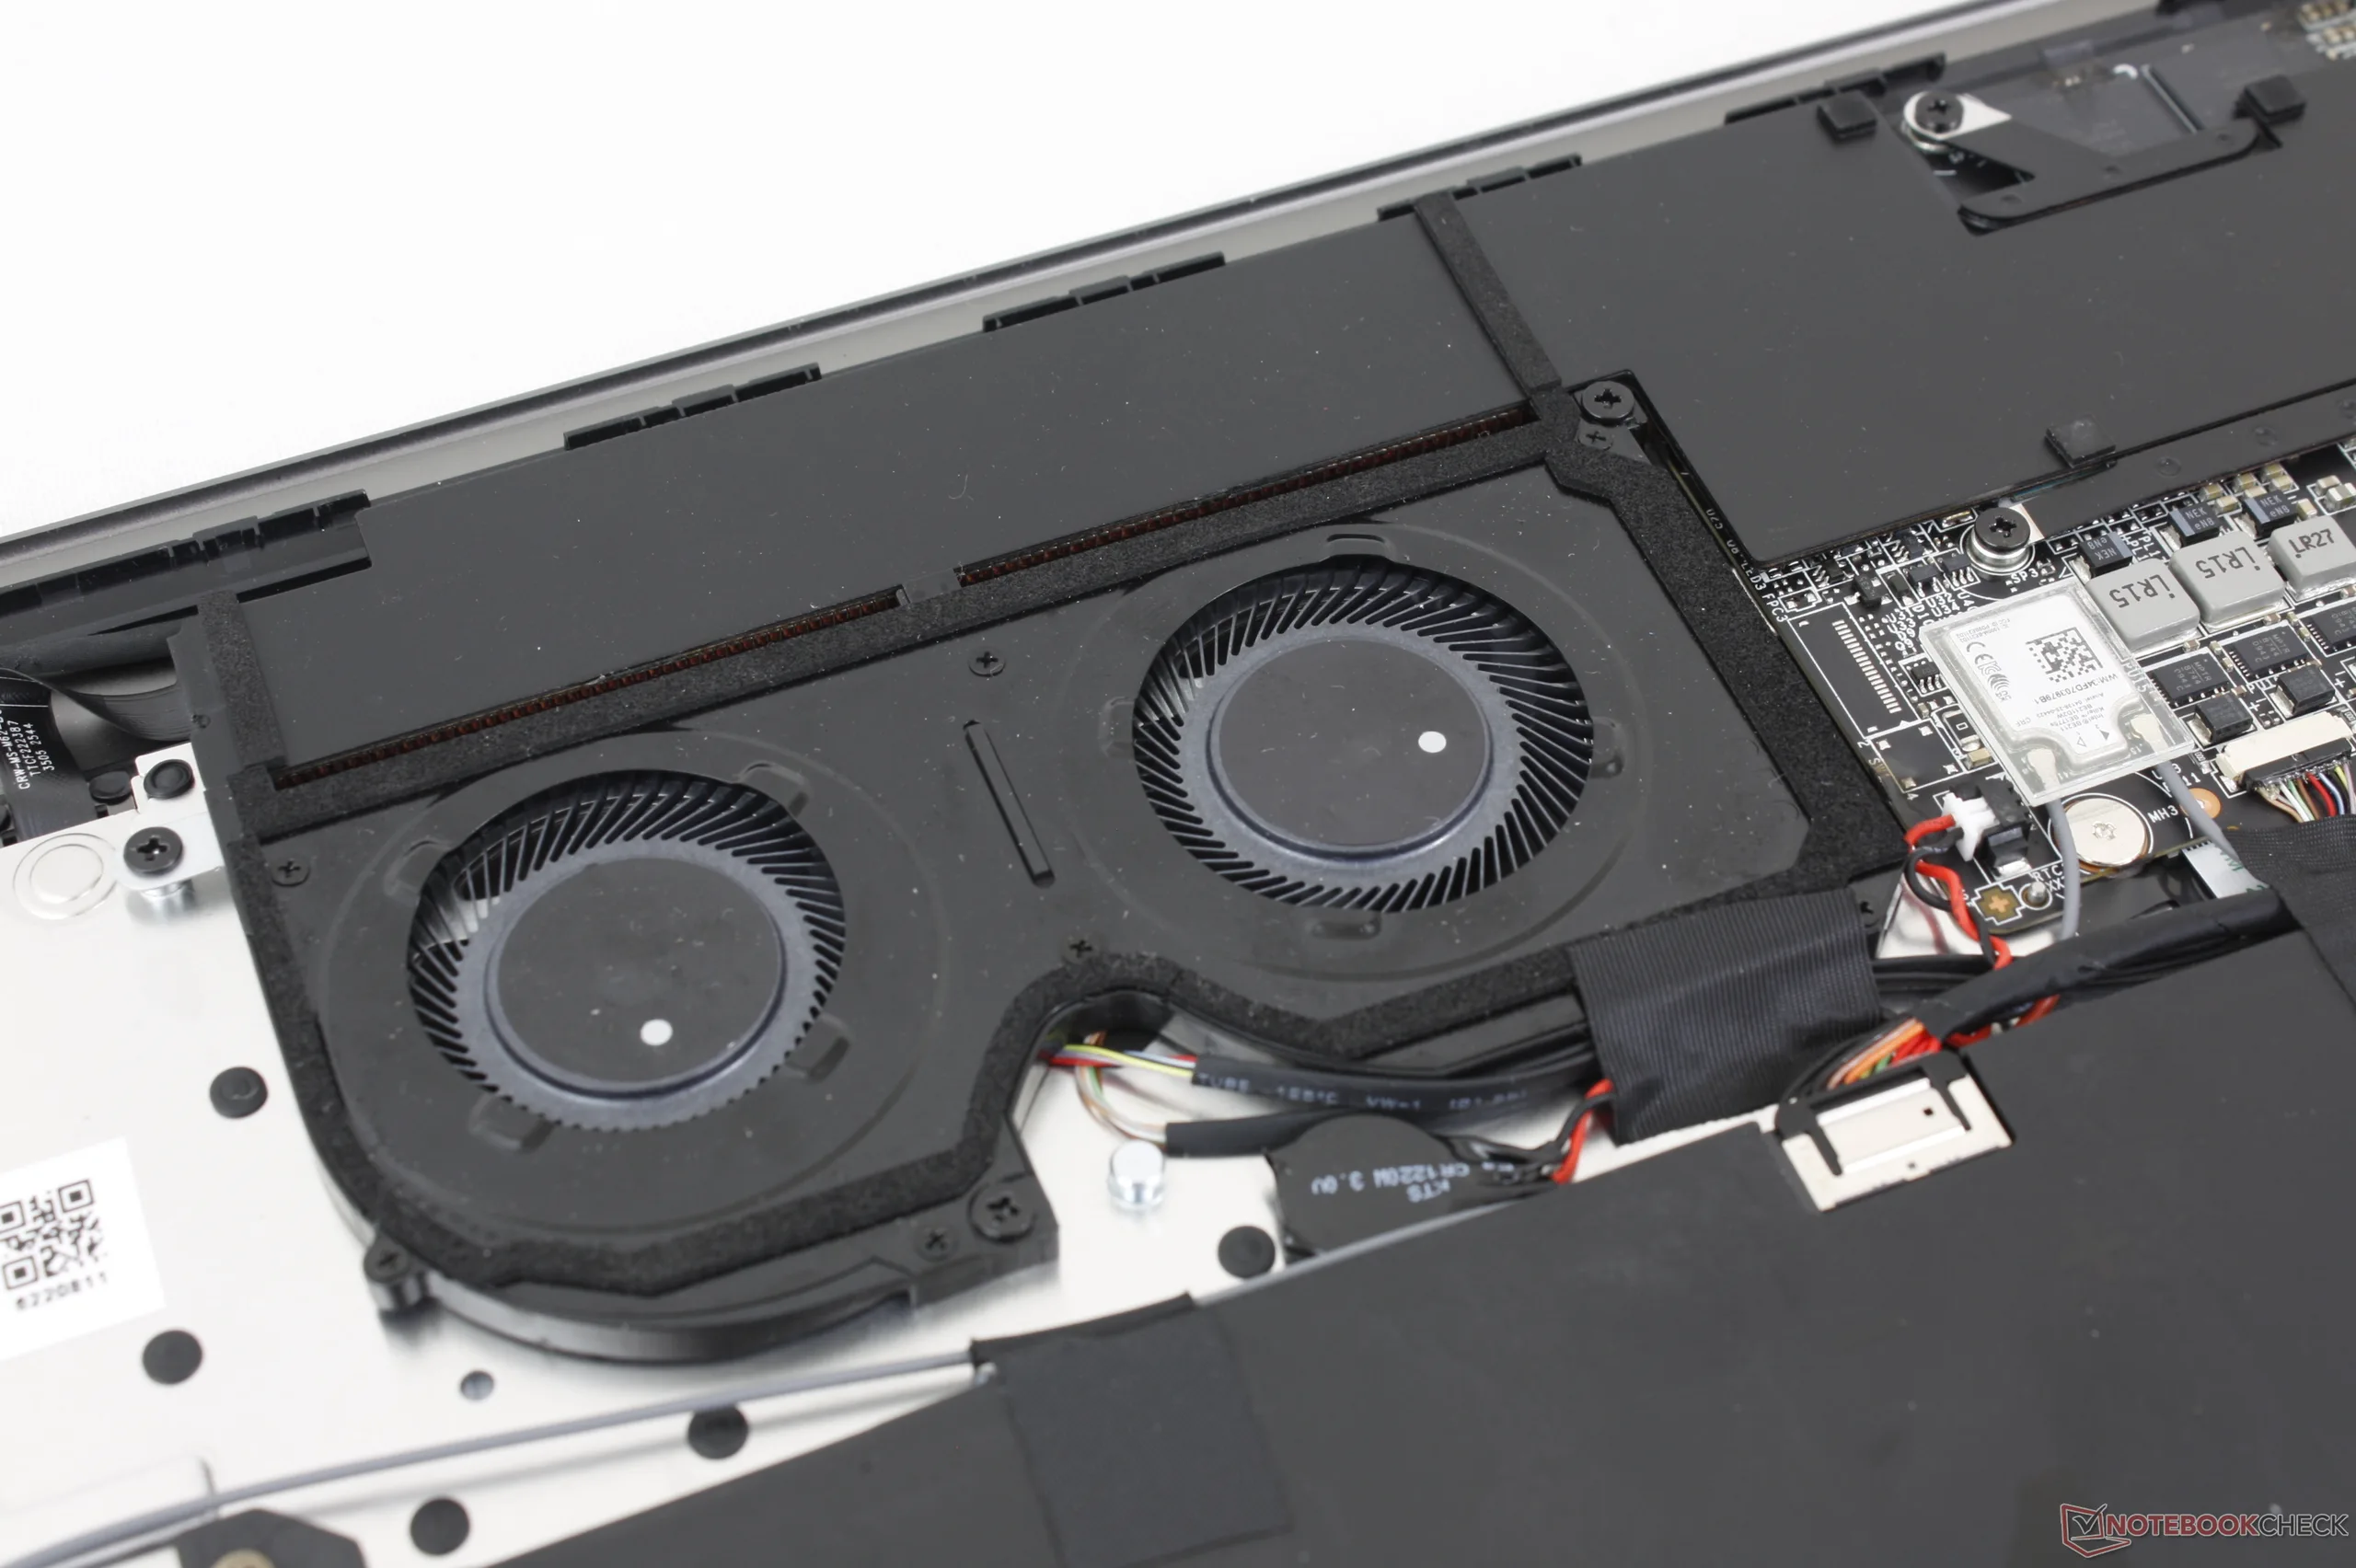
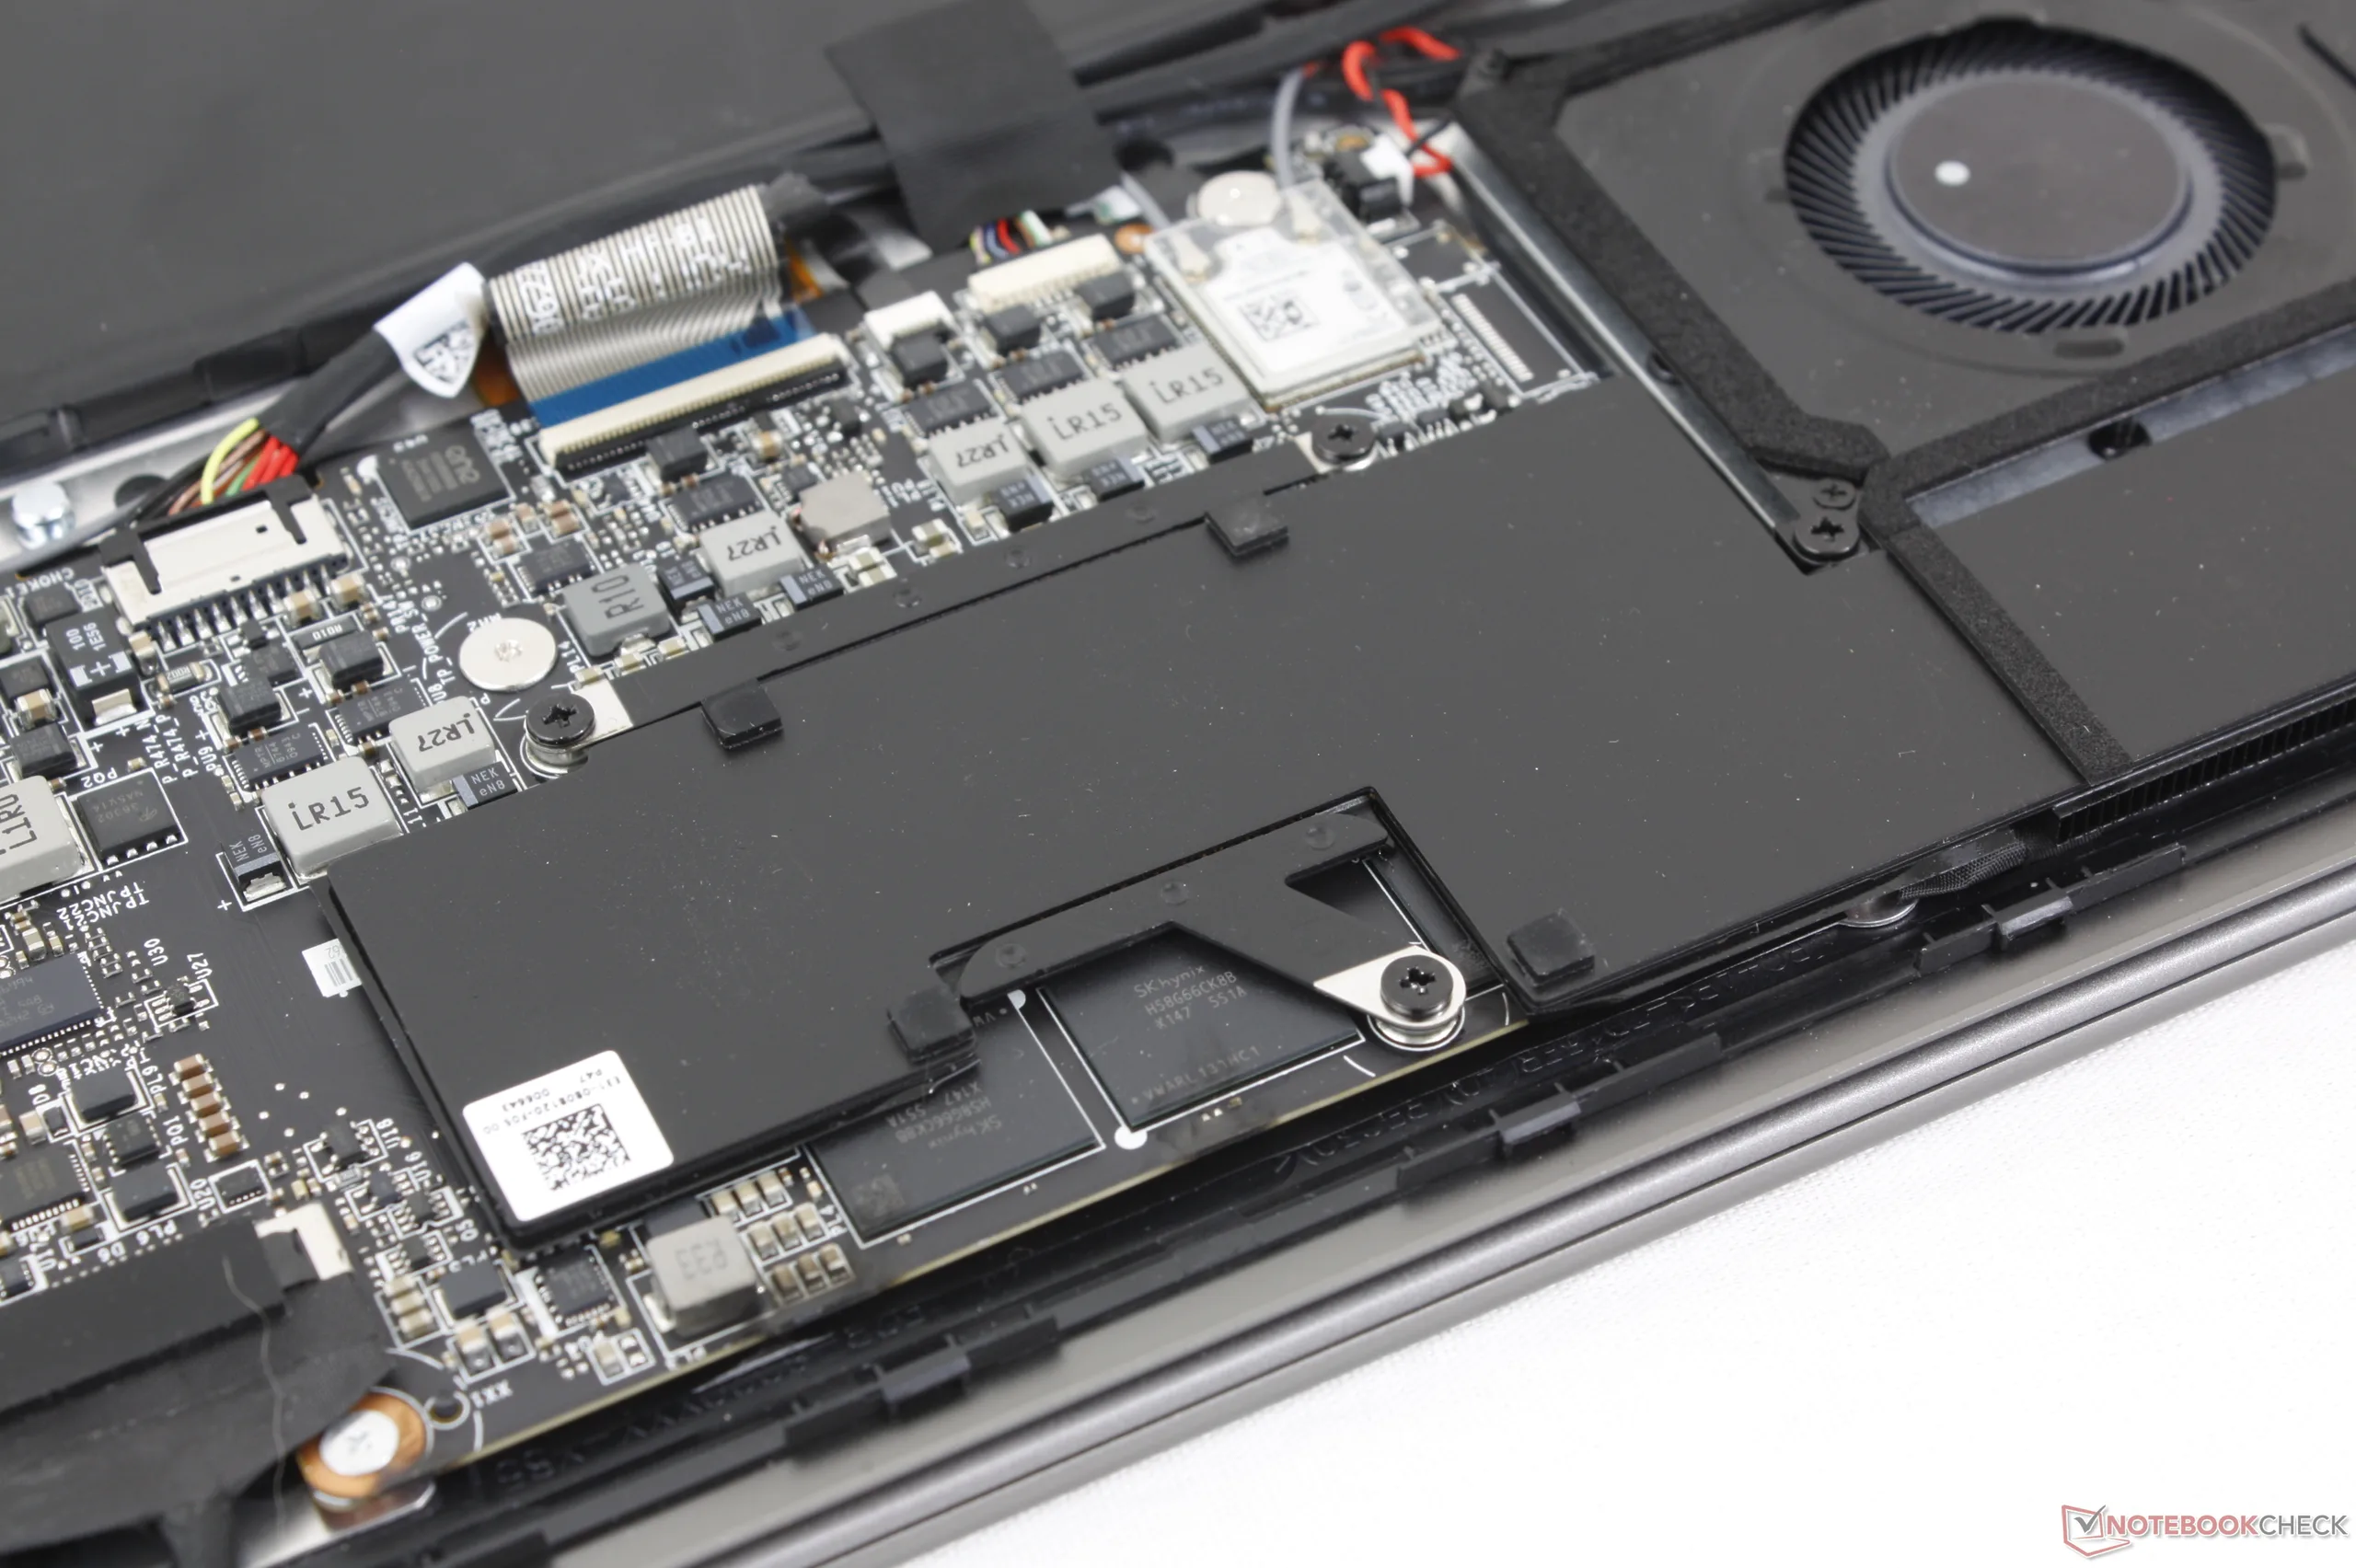
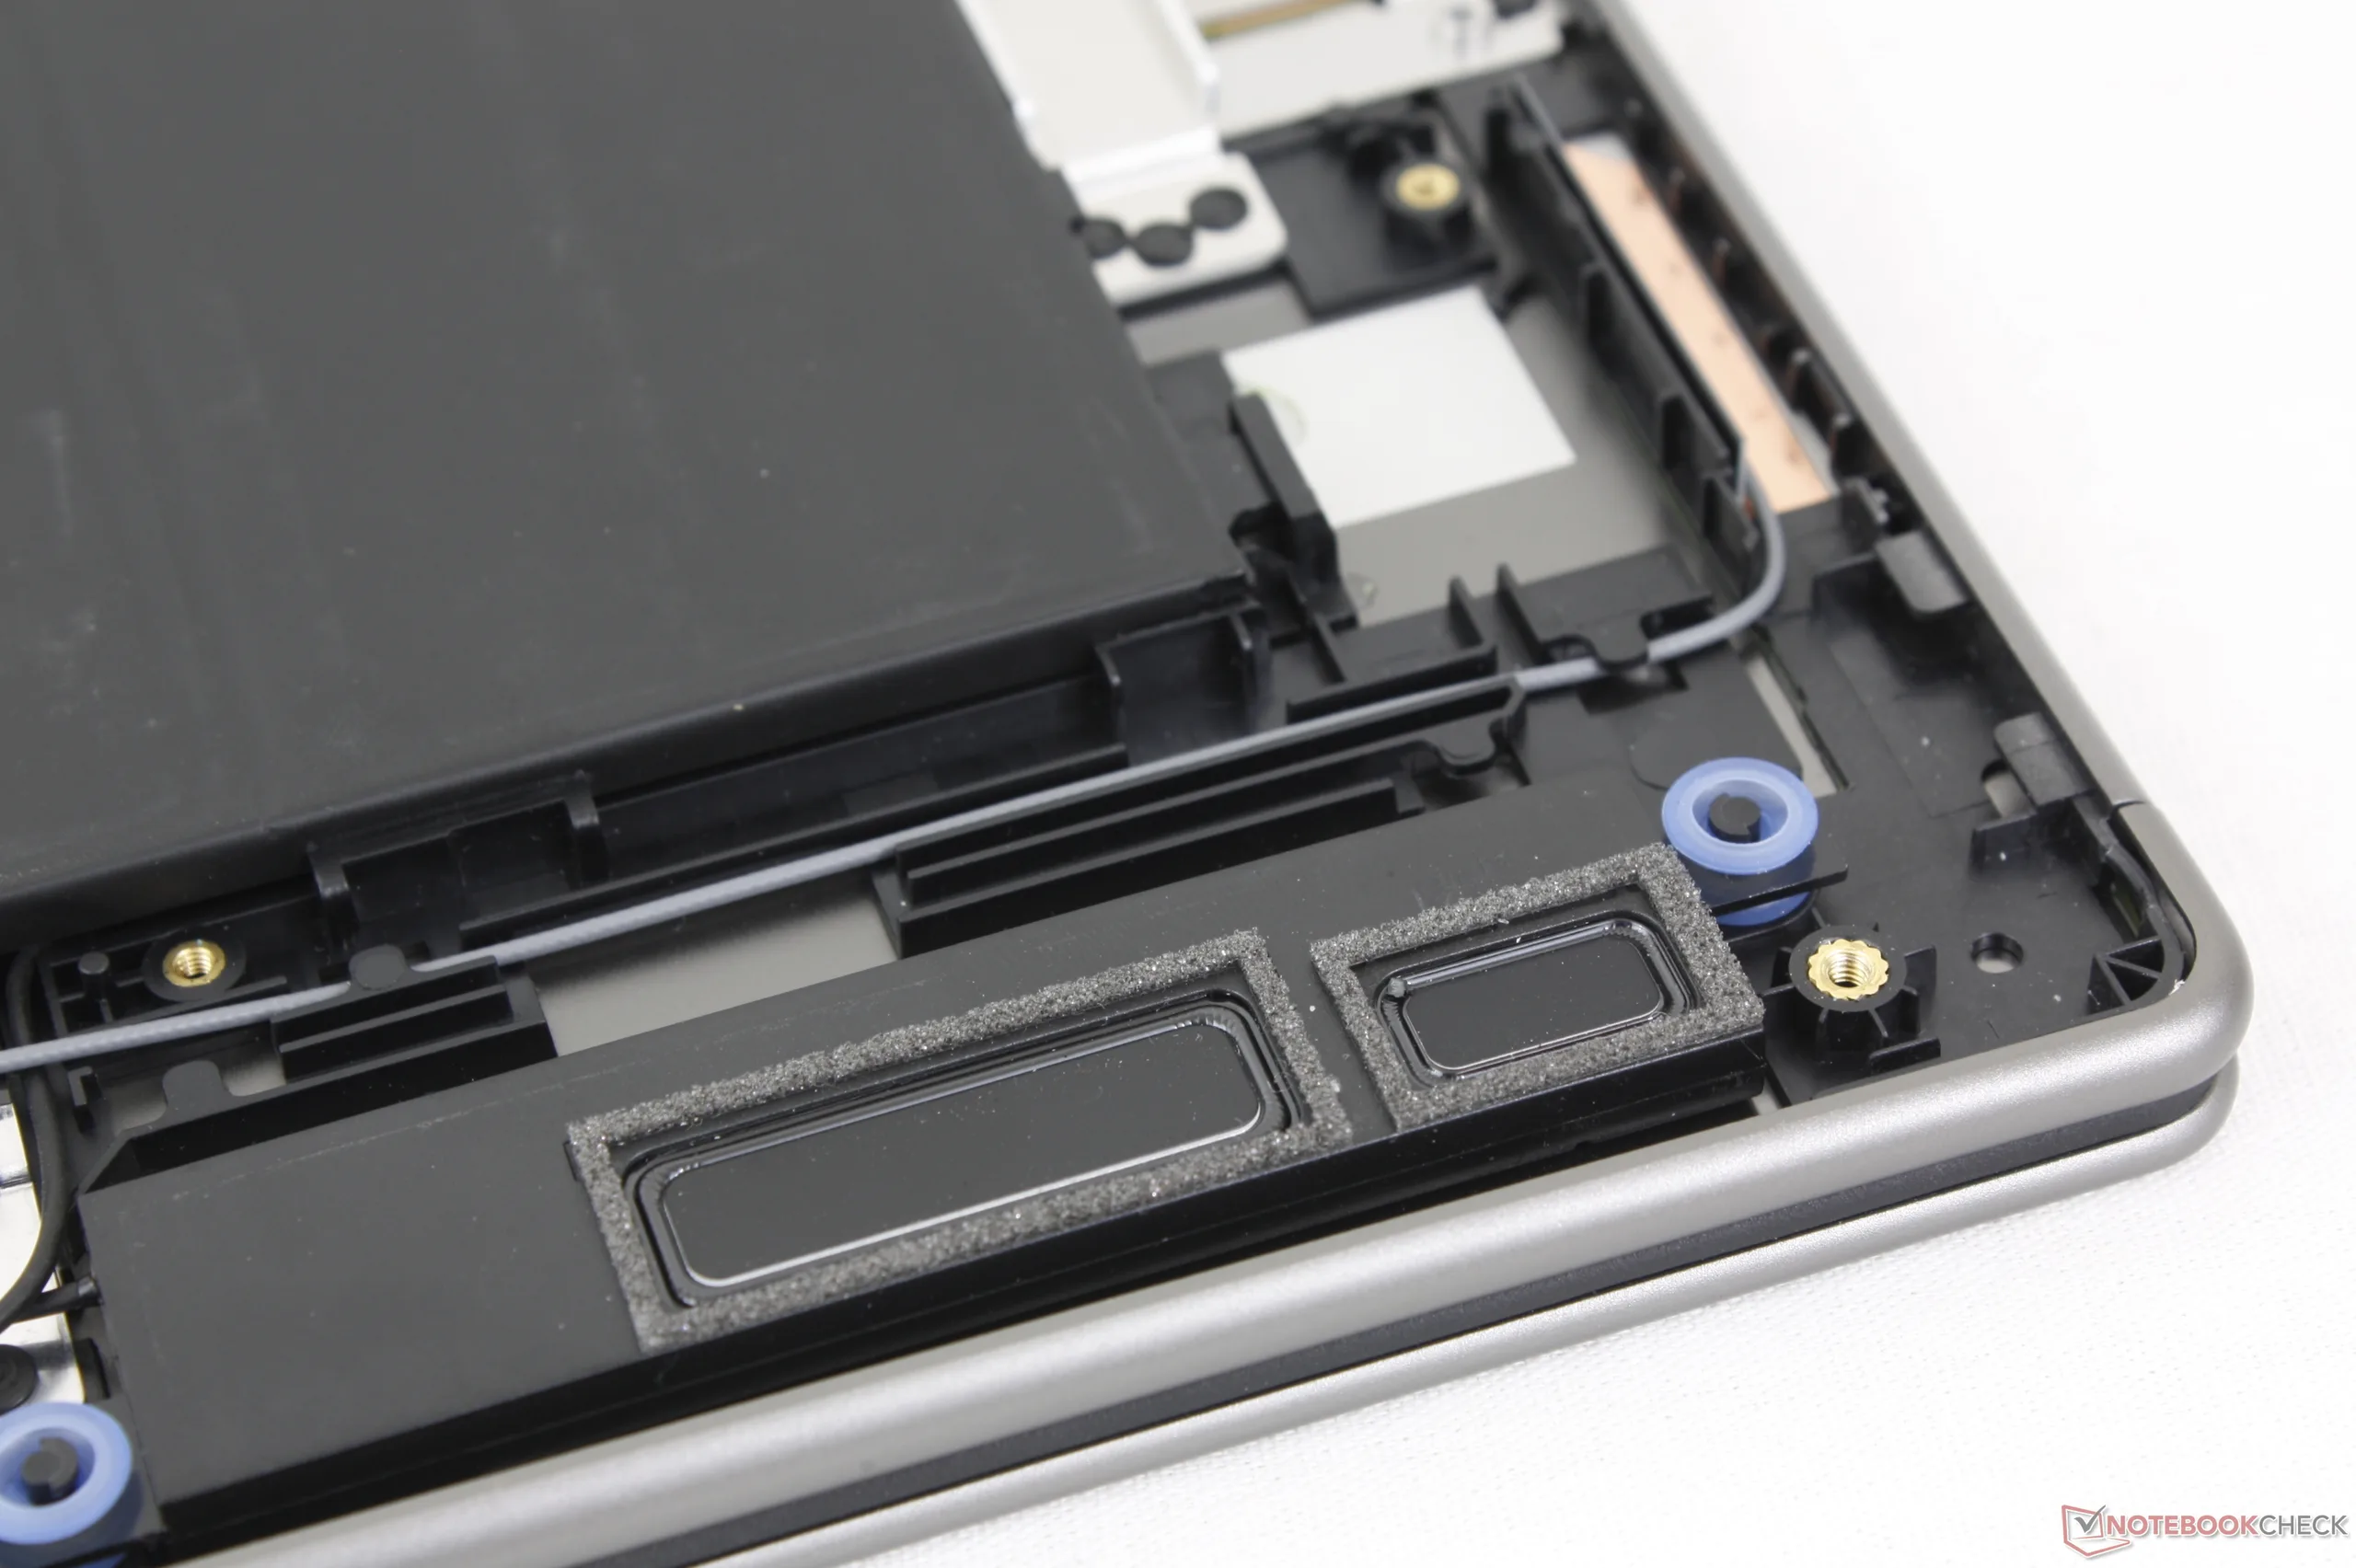
Maintenance
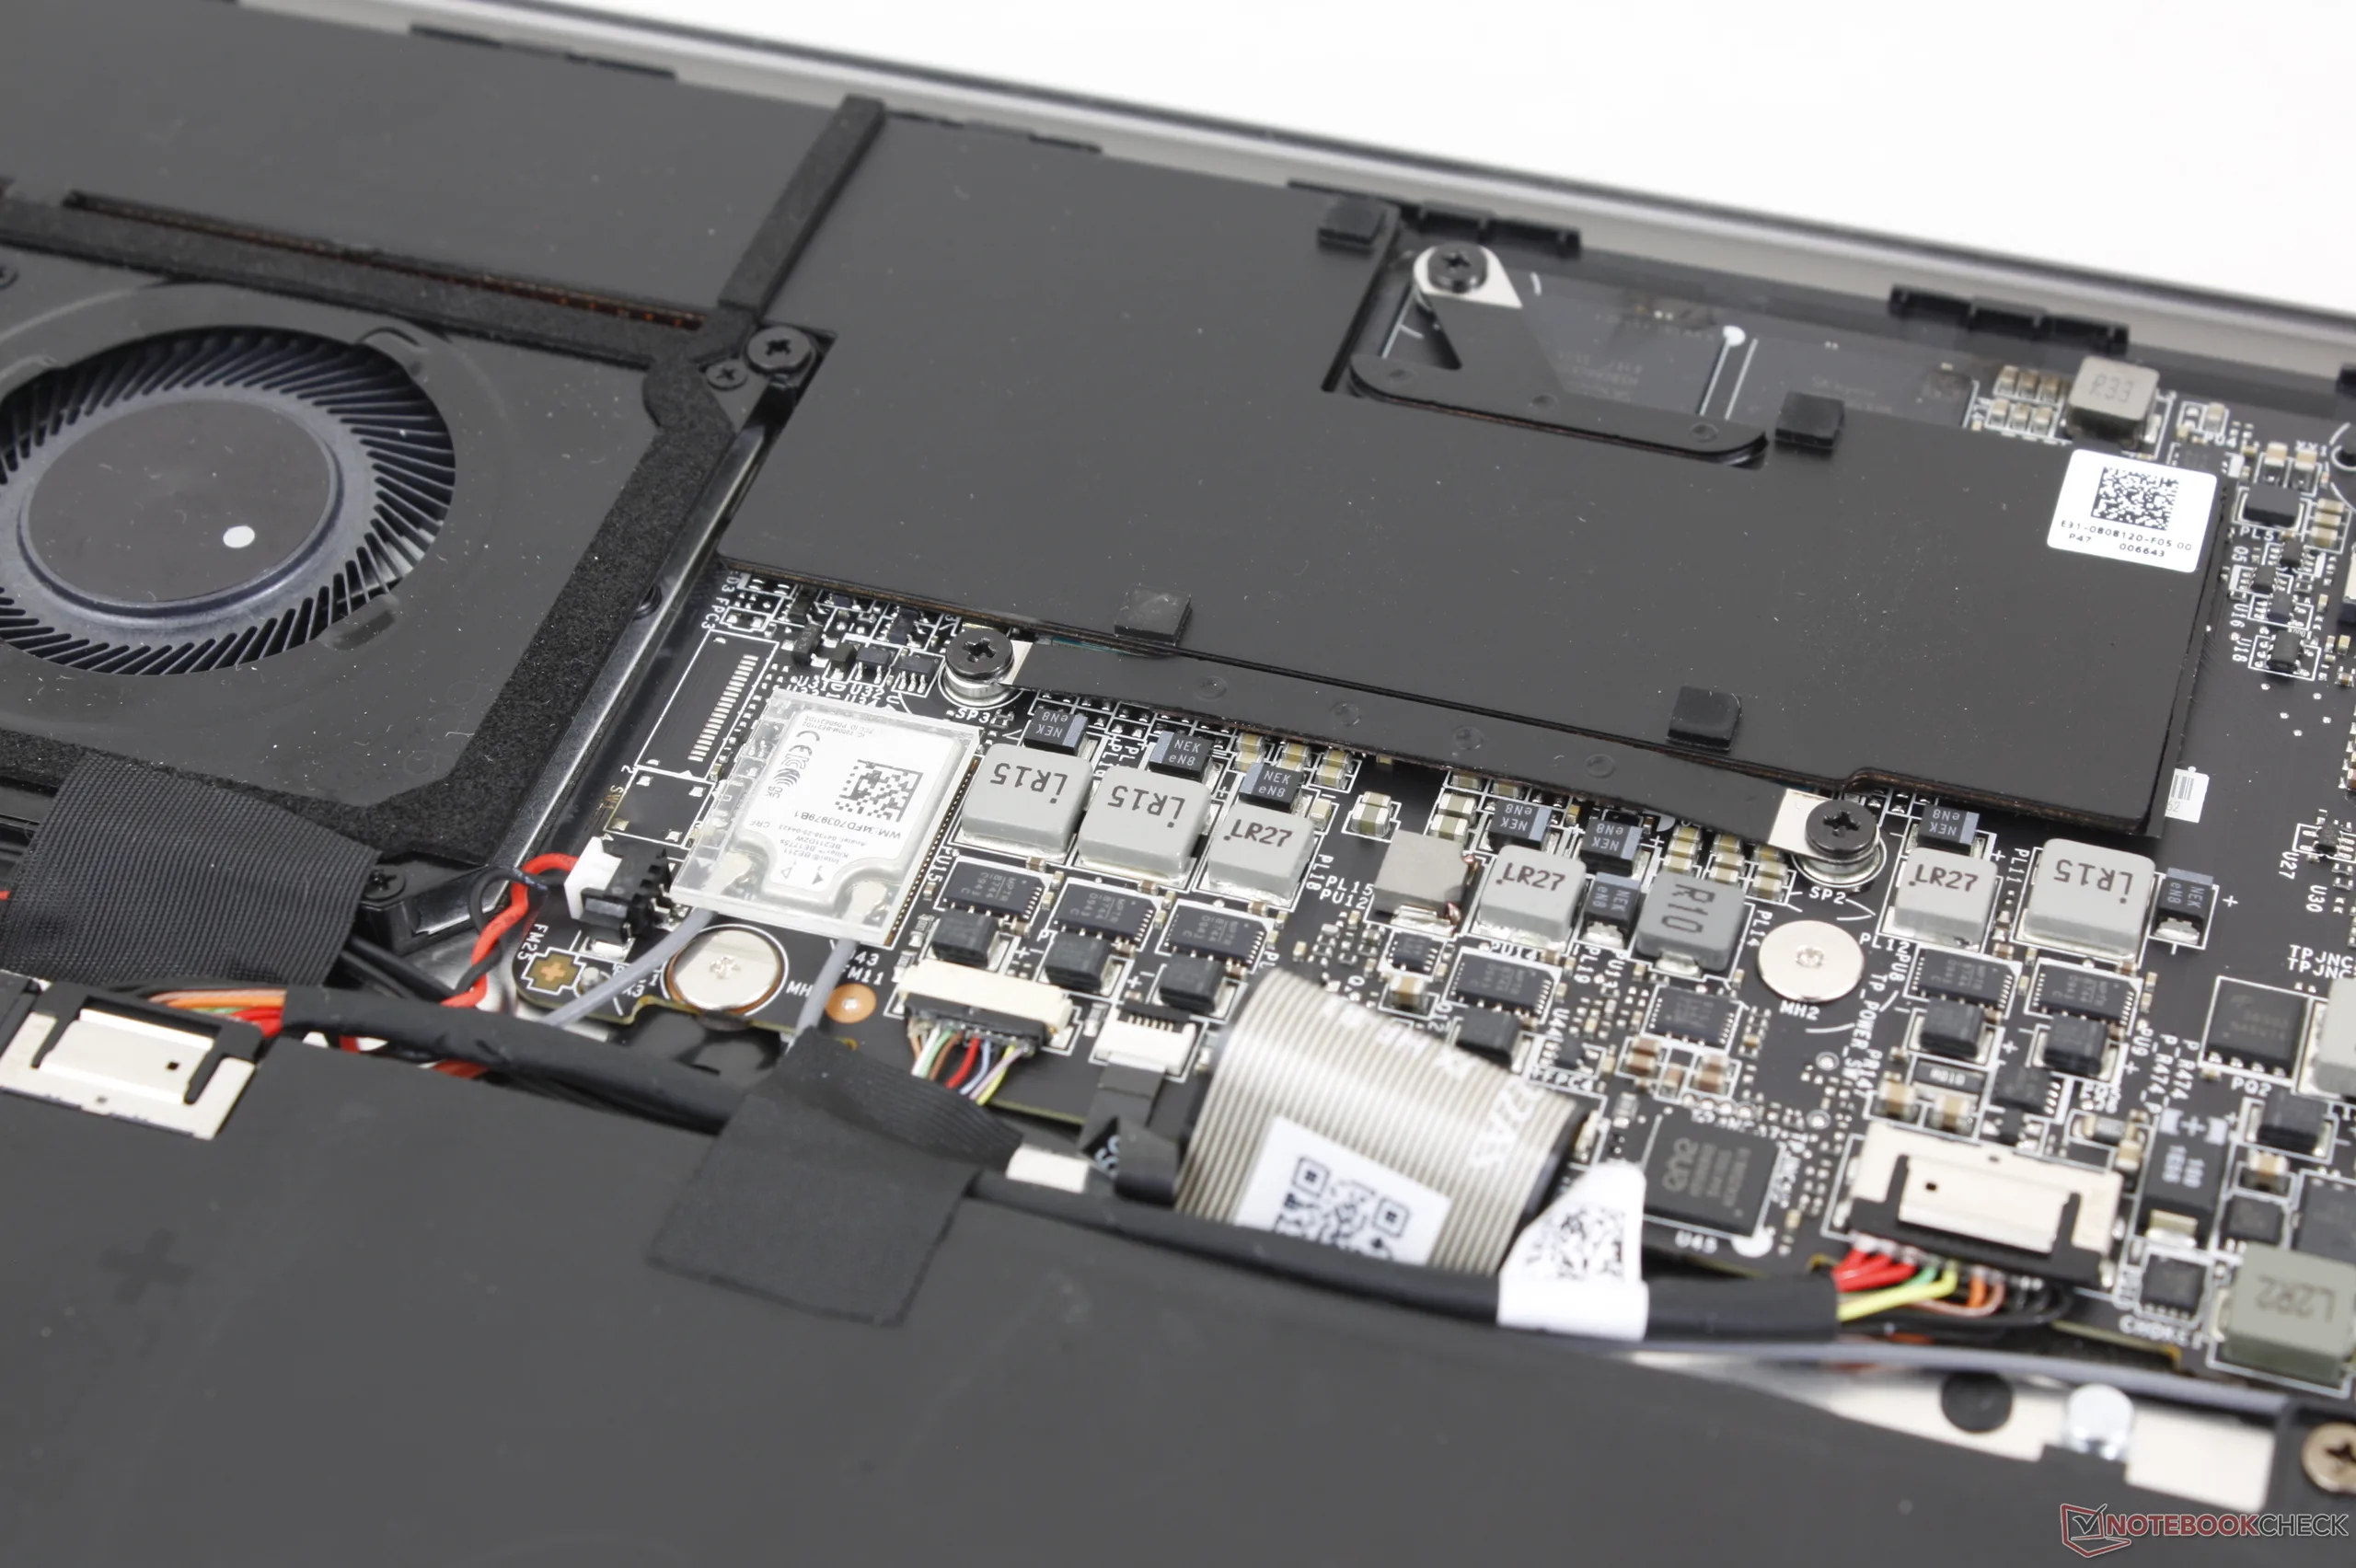
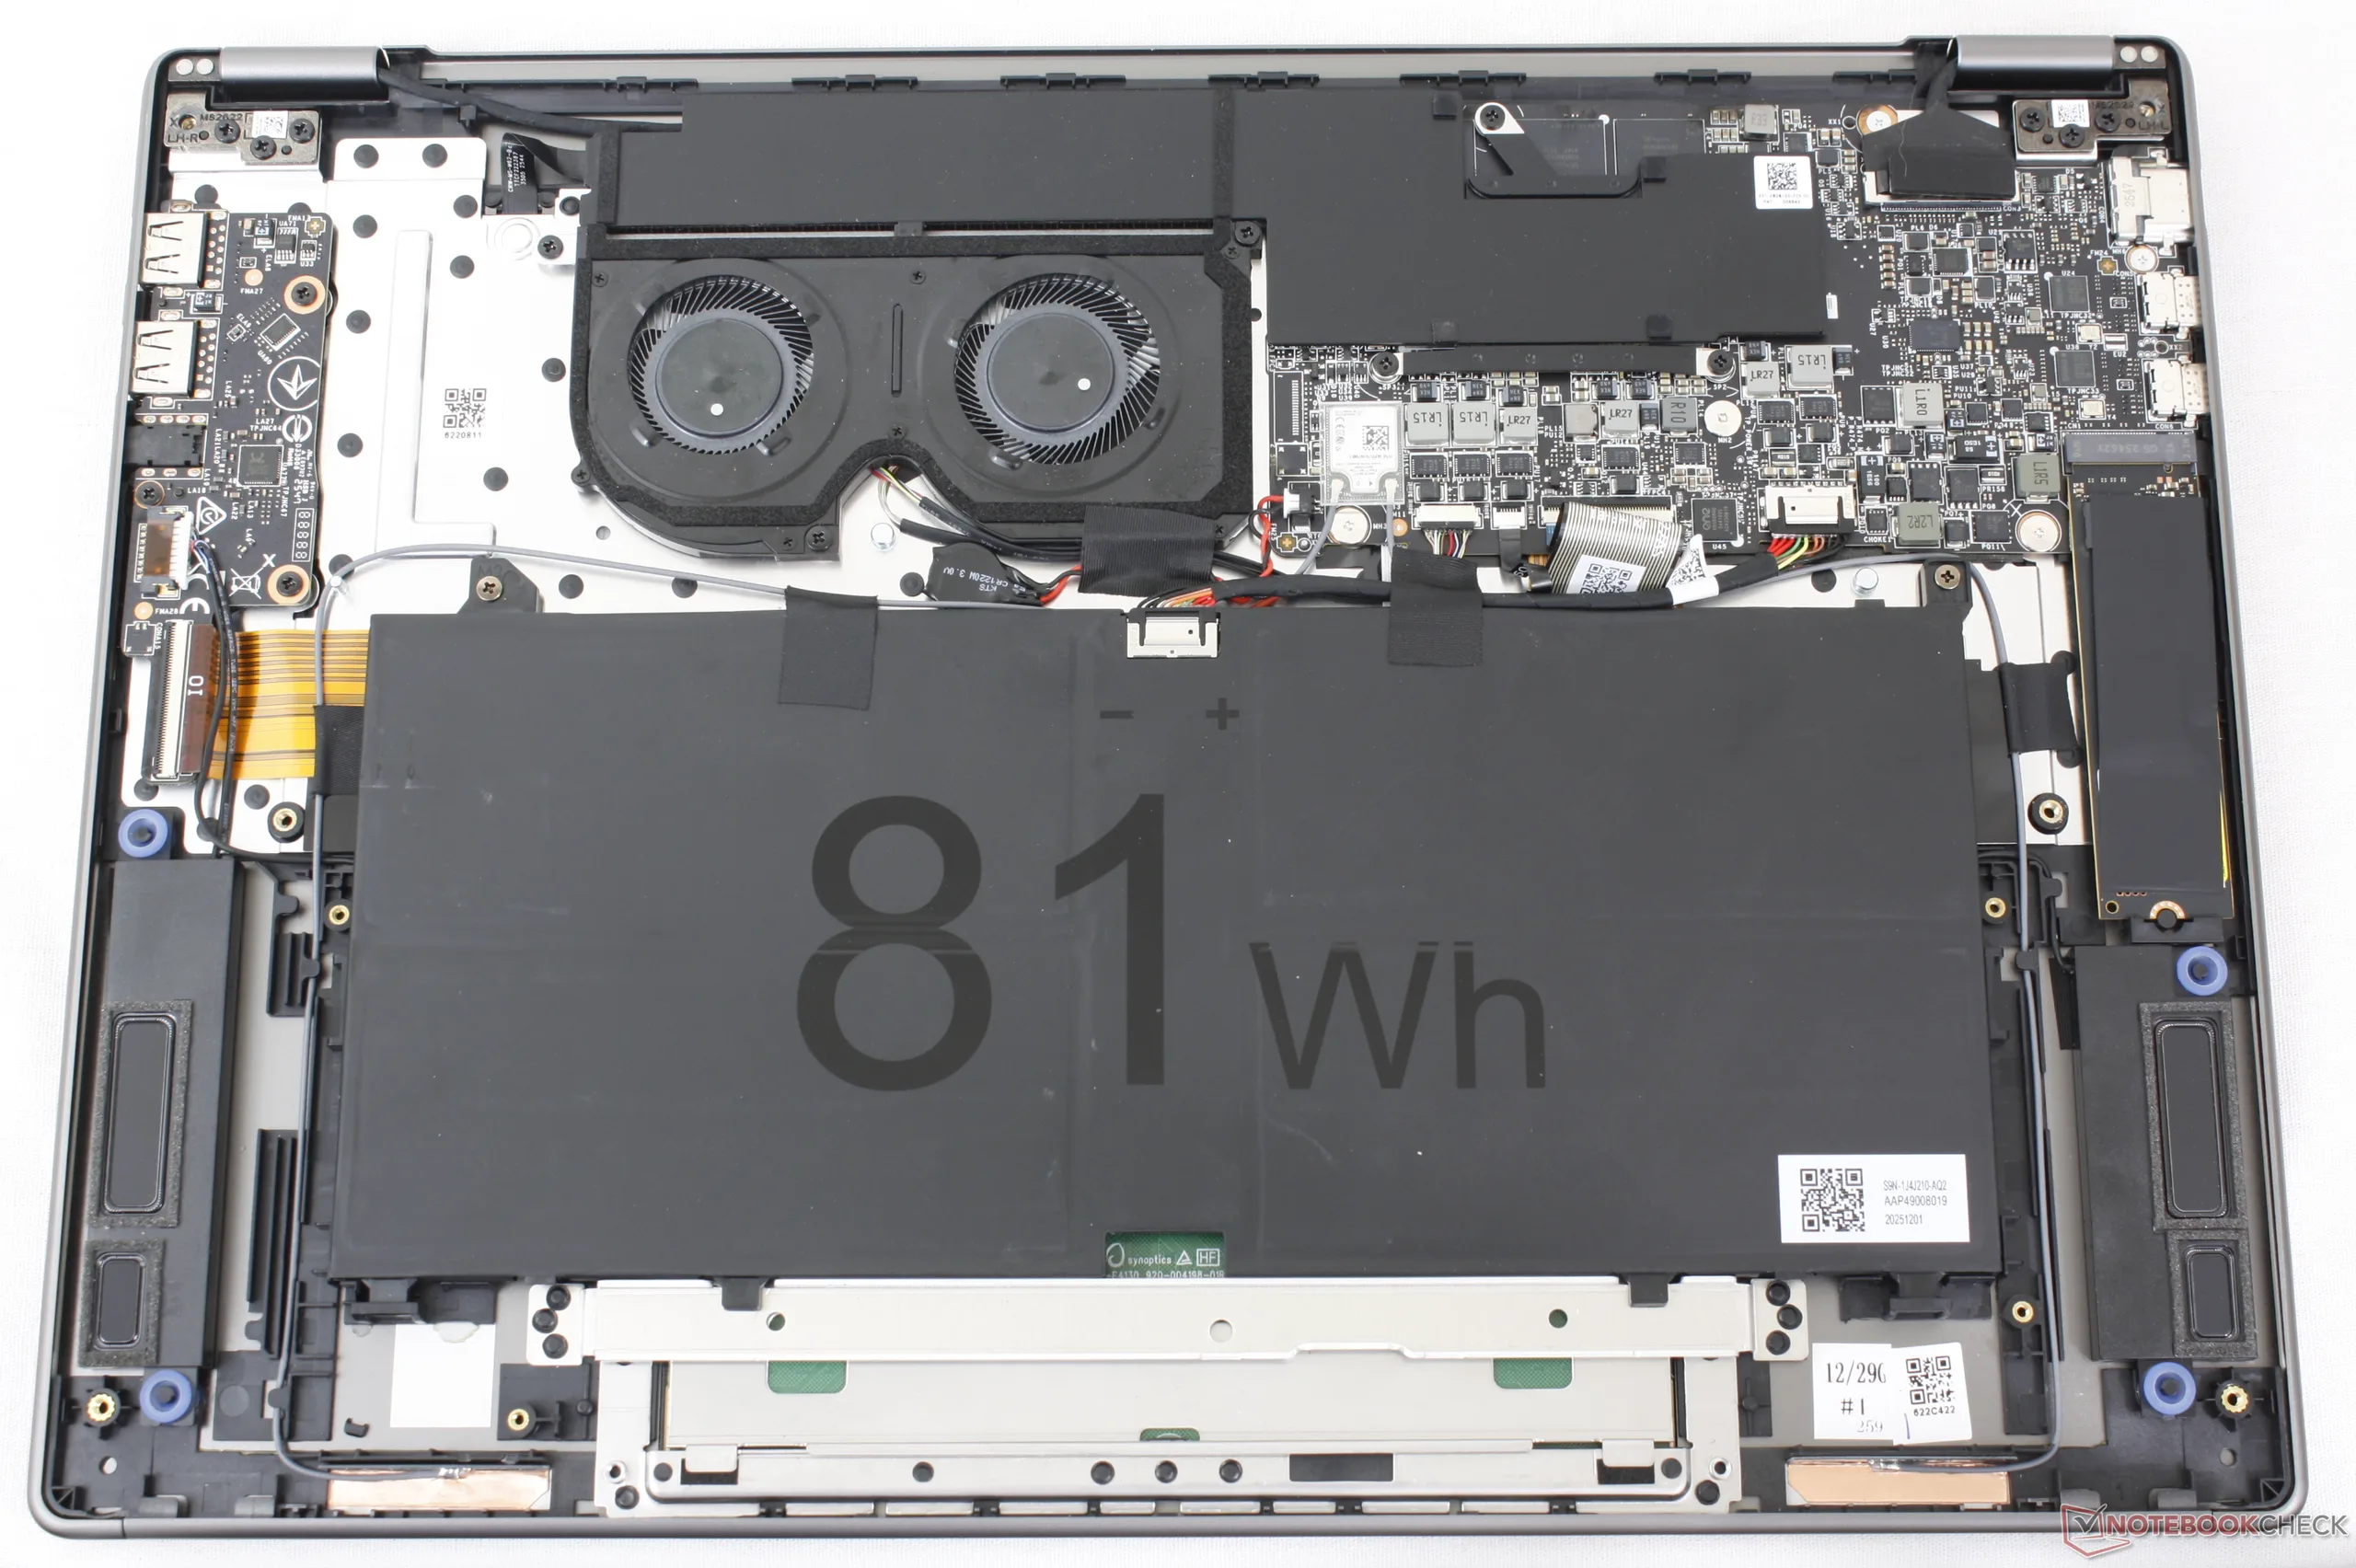
Le panneau inférieur est facilement démontable à l'aide d'un tournevis Phillips et d'une lame tranchante. La carte mère a été complètement revue par rapport au modèle 2025, comme le montre le schéma ci-dessous. Notamment, le modèle ne supporte plus qu'un SSD M.2 au lieu de deux, tandis que la capacité de la batterie a été réduite, probablement pour gagner du poids.

Durabilité
L'utilisation de matériaux recyclés au cours de la fabrication n'est pas explicitement mentionnée par le fabricant. En revanche, l'emballage est certifié FSC et se compose à la fois de papier et de plastique.
Accessoires et garantie
La boîte ne contient pas d'autres éléments que l'adaptateur secteur et la documentation. La garantie limitée habituelle d'un an du fabricant s'applique si l'appareil est acheté aux États-Unis.
Périphériques d'entrée
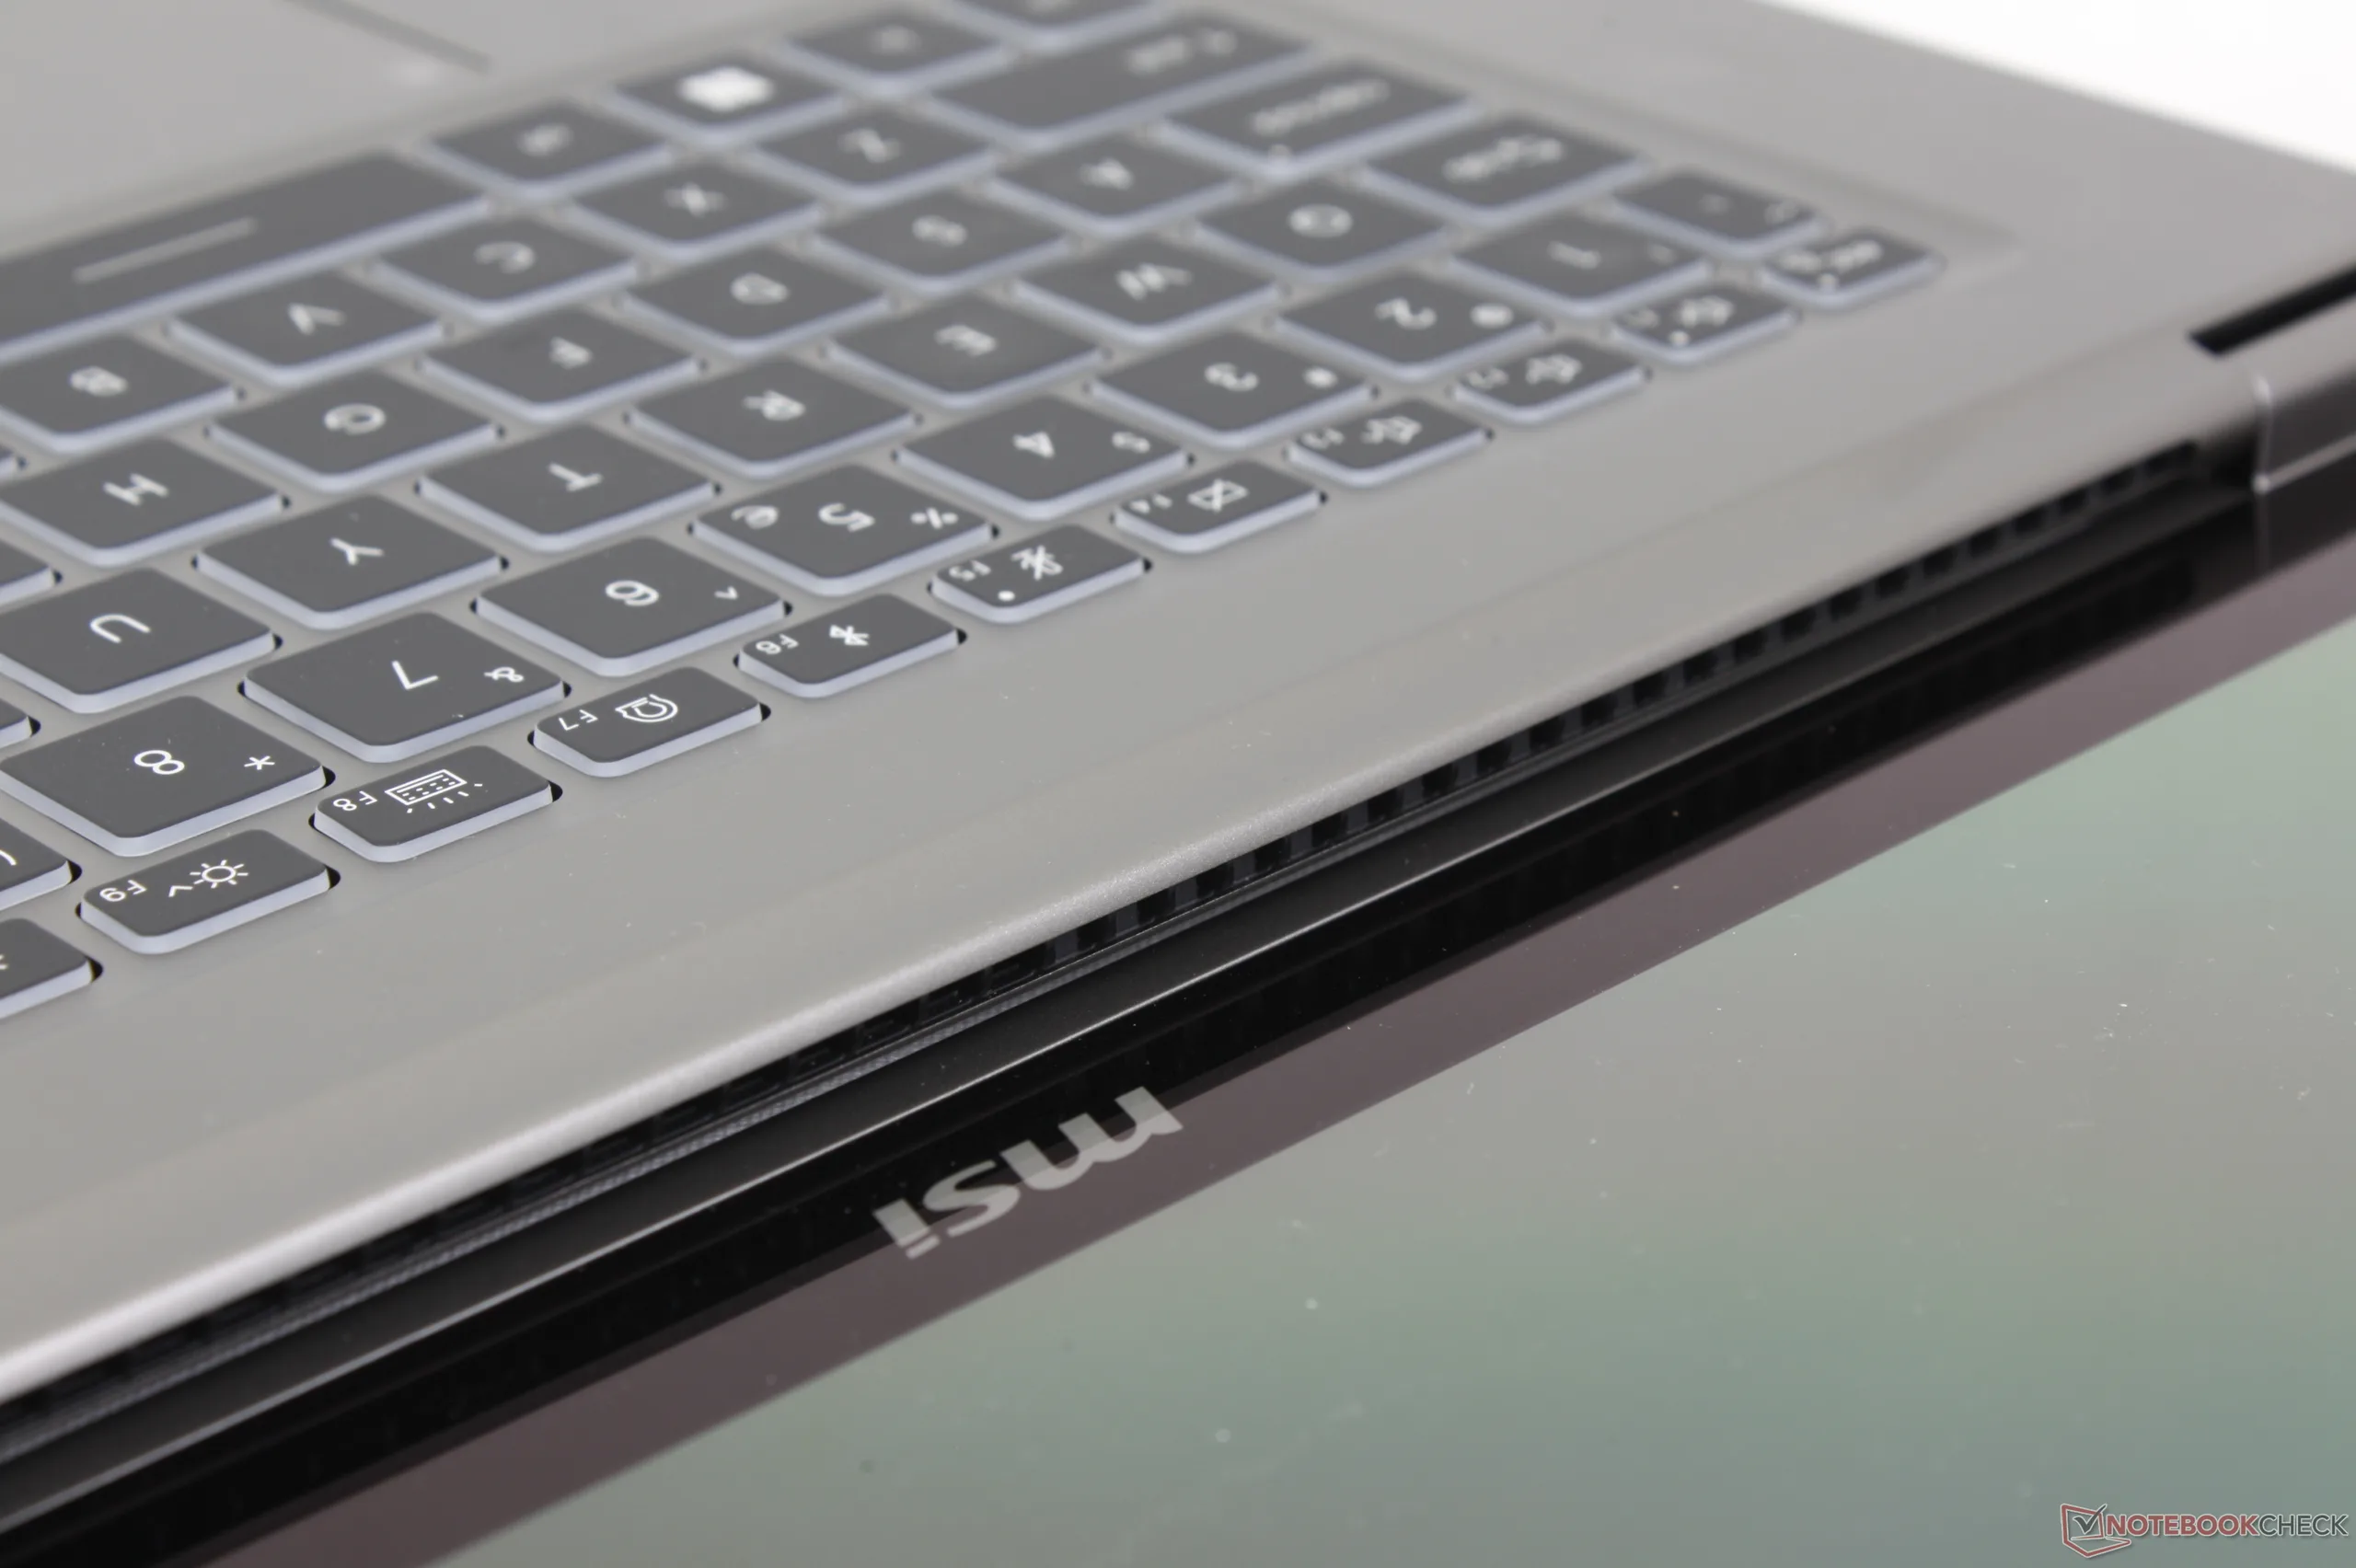
Clavier
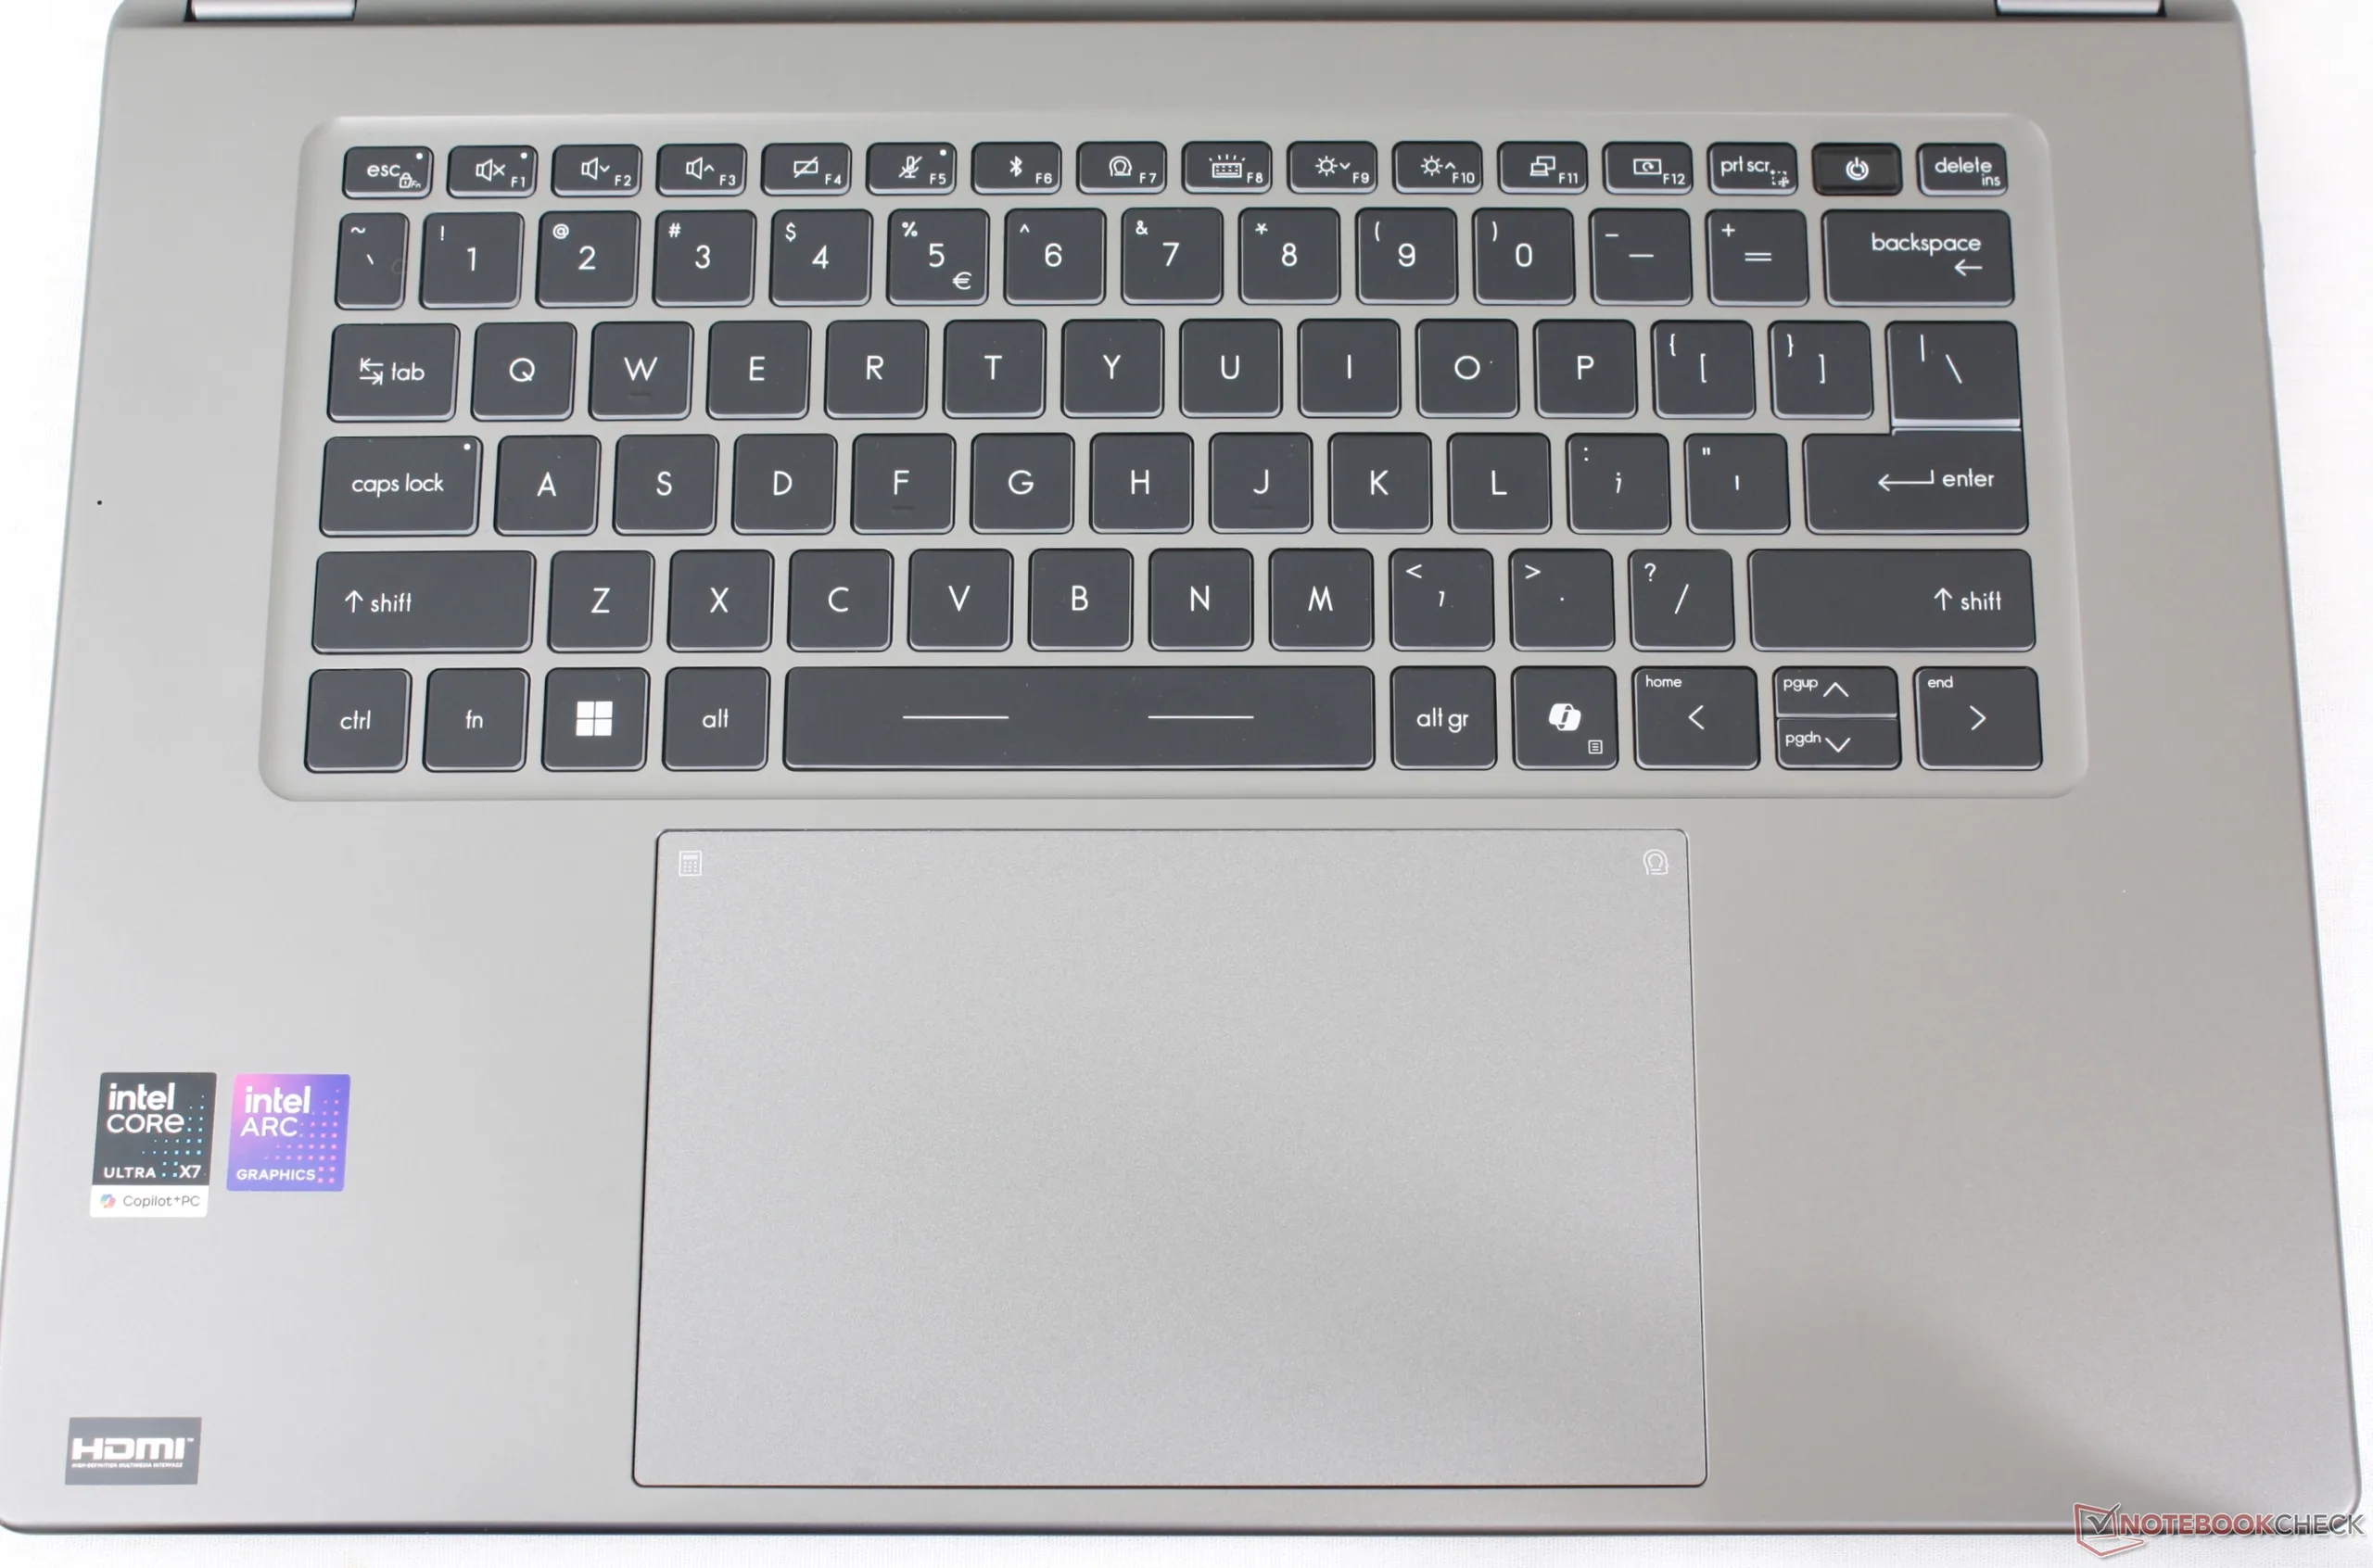
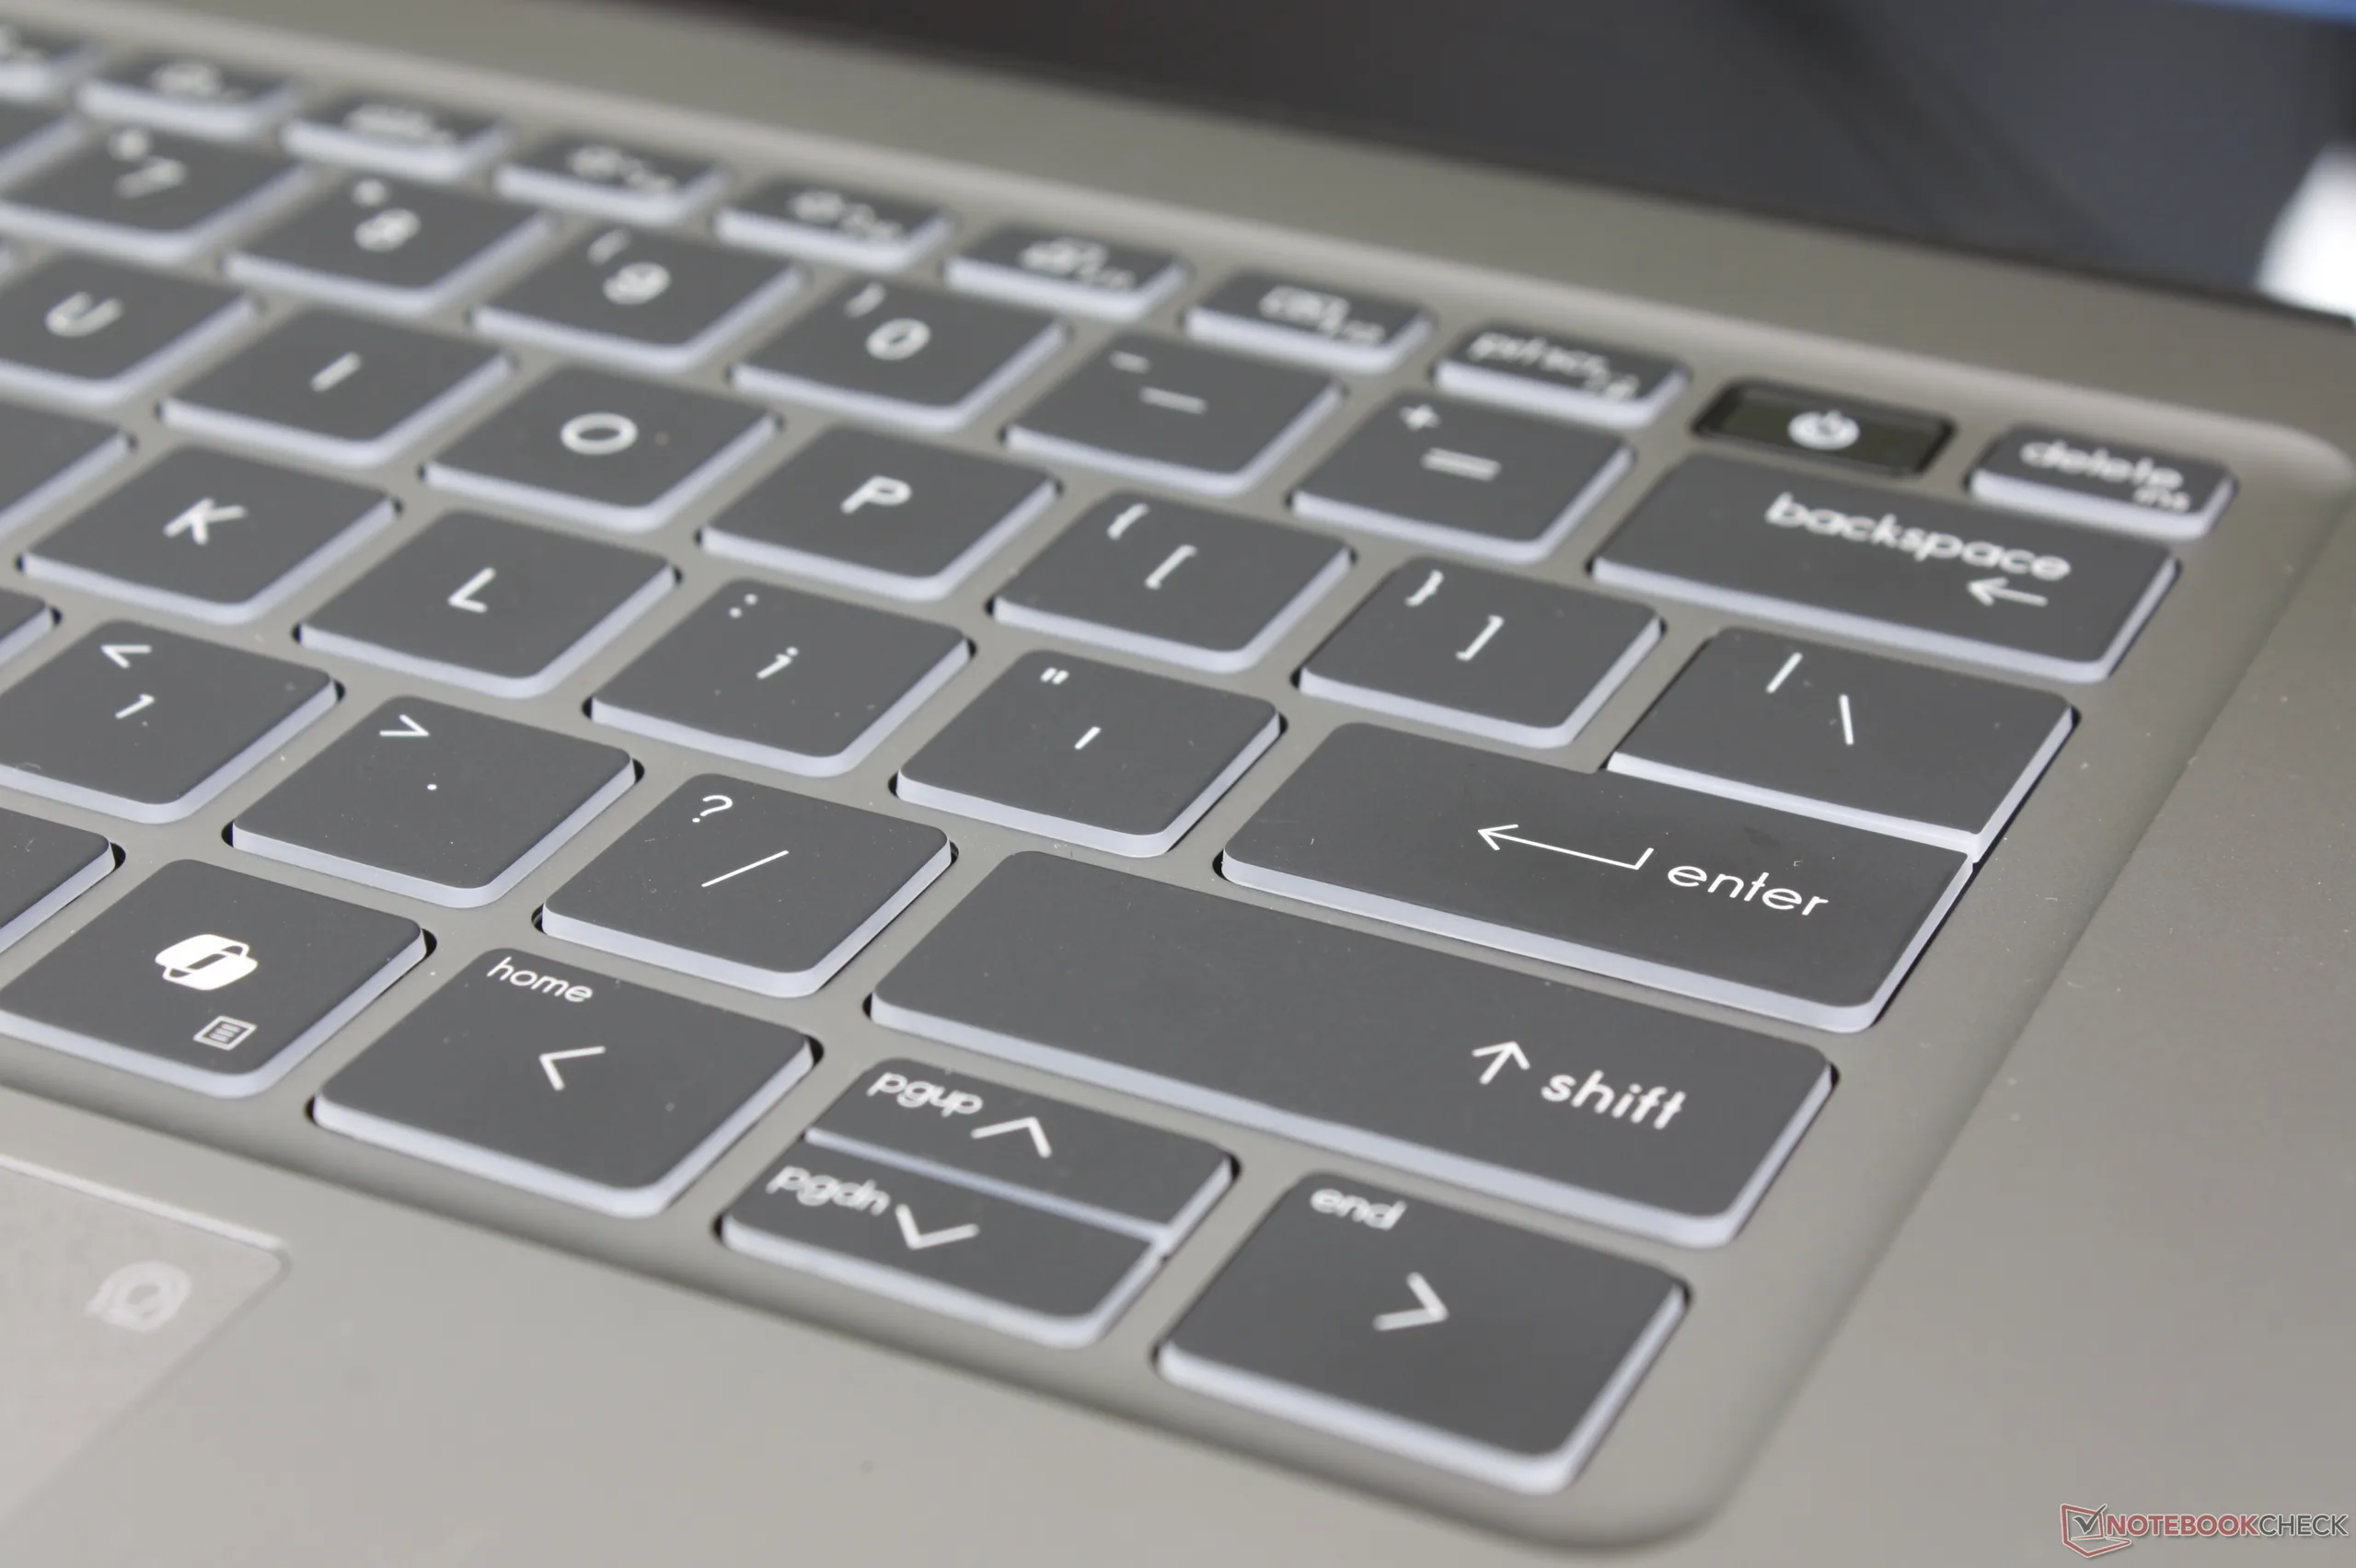
Le pavé numérique a disparu, pour le meilleur et pour le pire. Pour le reste, la frappe semble plus légère et moins profonde que sur les ordinateurs portables de bureau classiques de la série Thinkpad T ou EliteBook. En tapant sur l'ordinateur beaucoup moins cher Venture 16beaucoup moins cher, la sensation de frappe est à peu près la même que sur la gamme Prestige de premier plan. Alors que MSI a réussi le design général du nouveau châssis Prestige, son clavier n'a pas été à la hauteur.
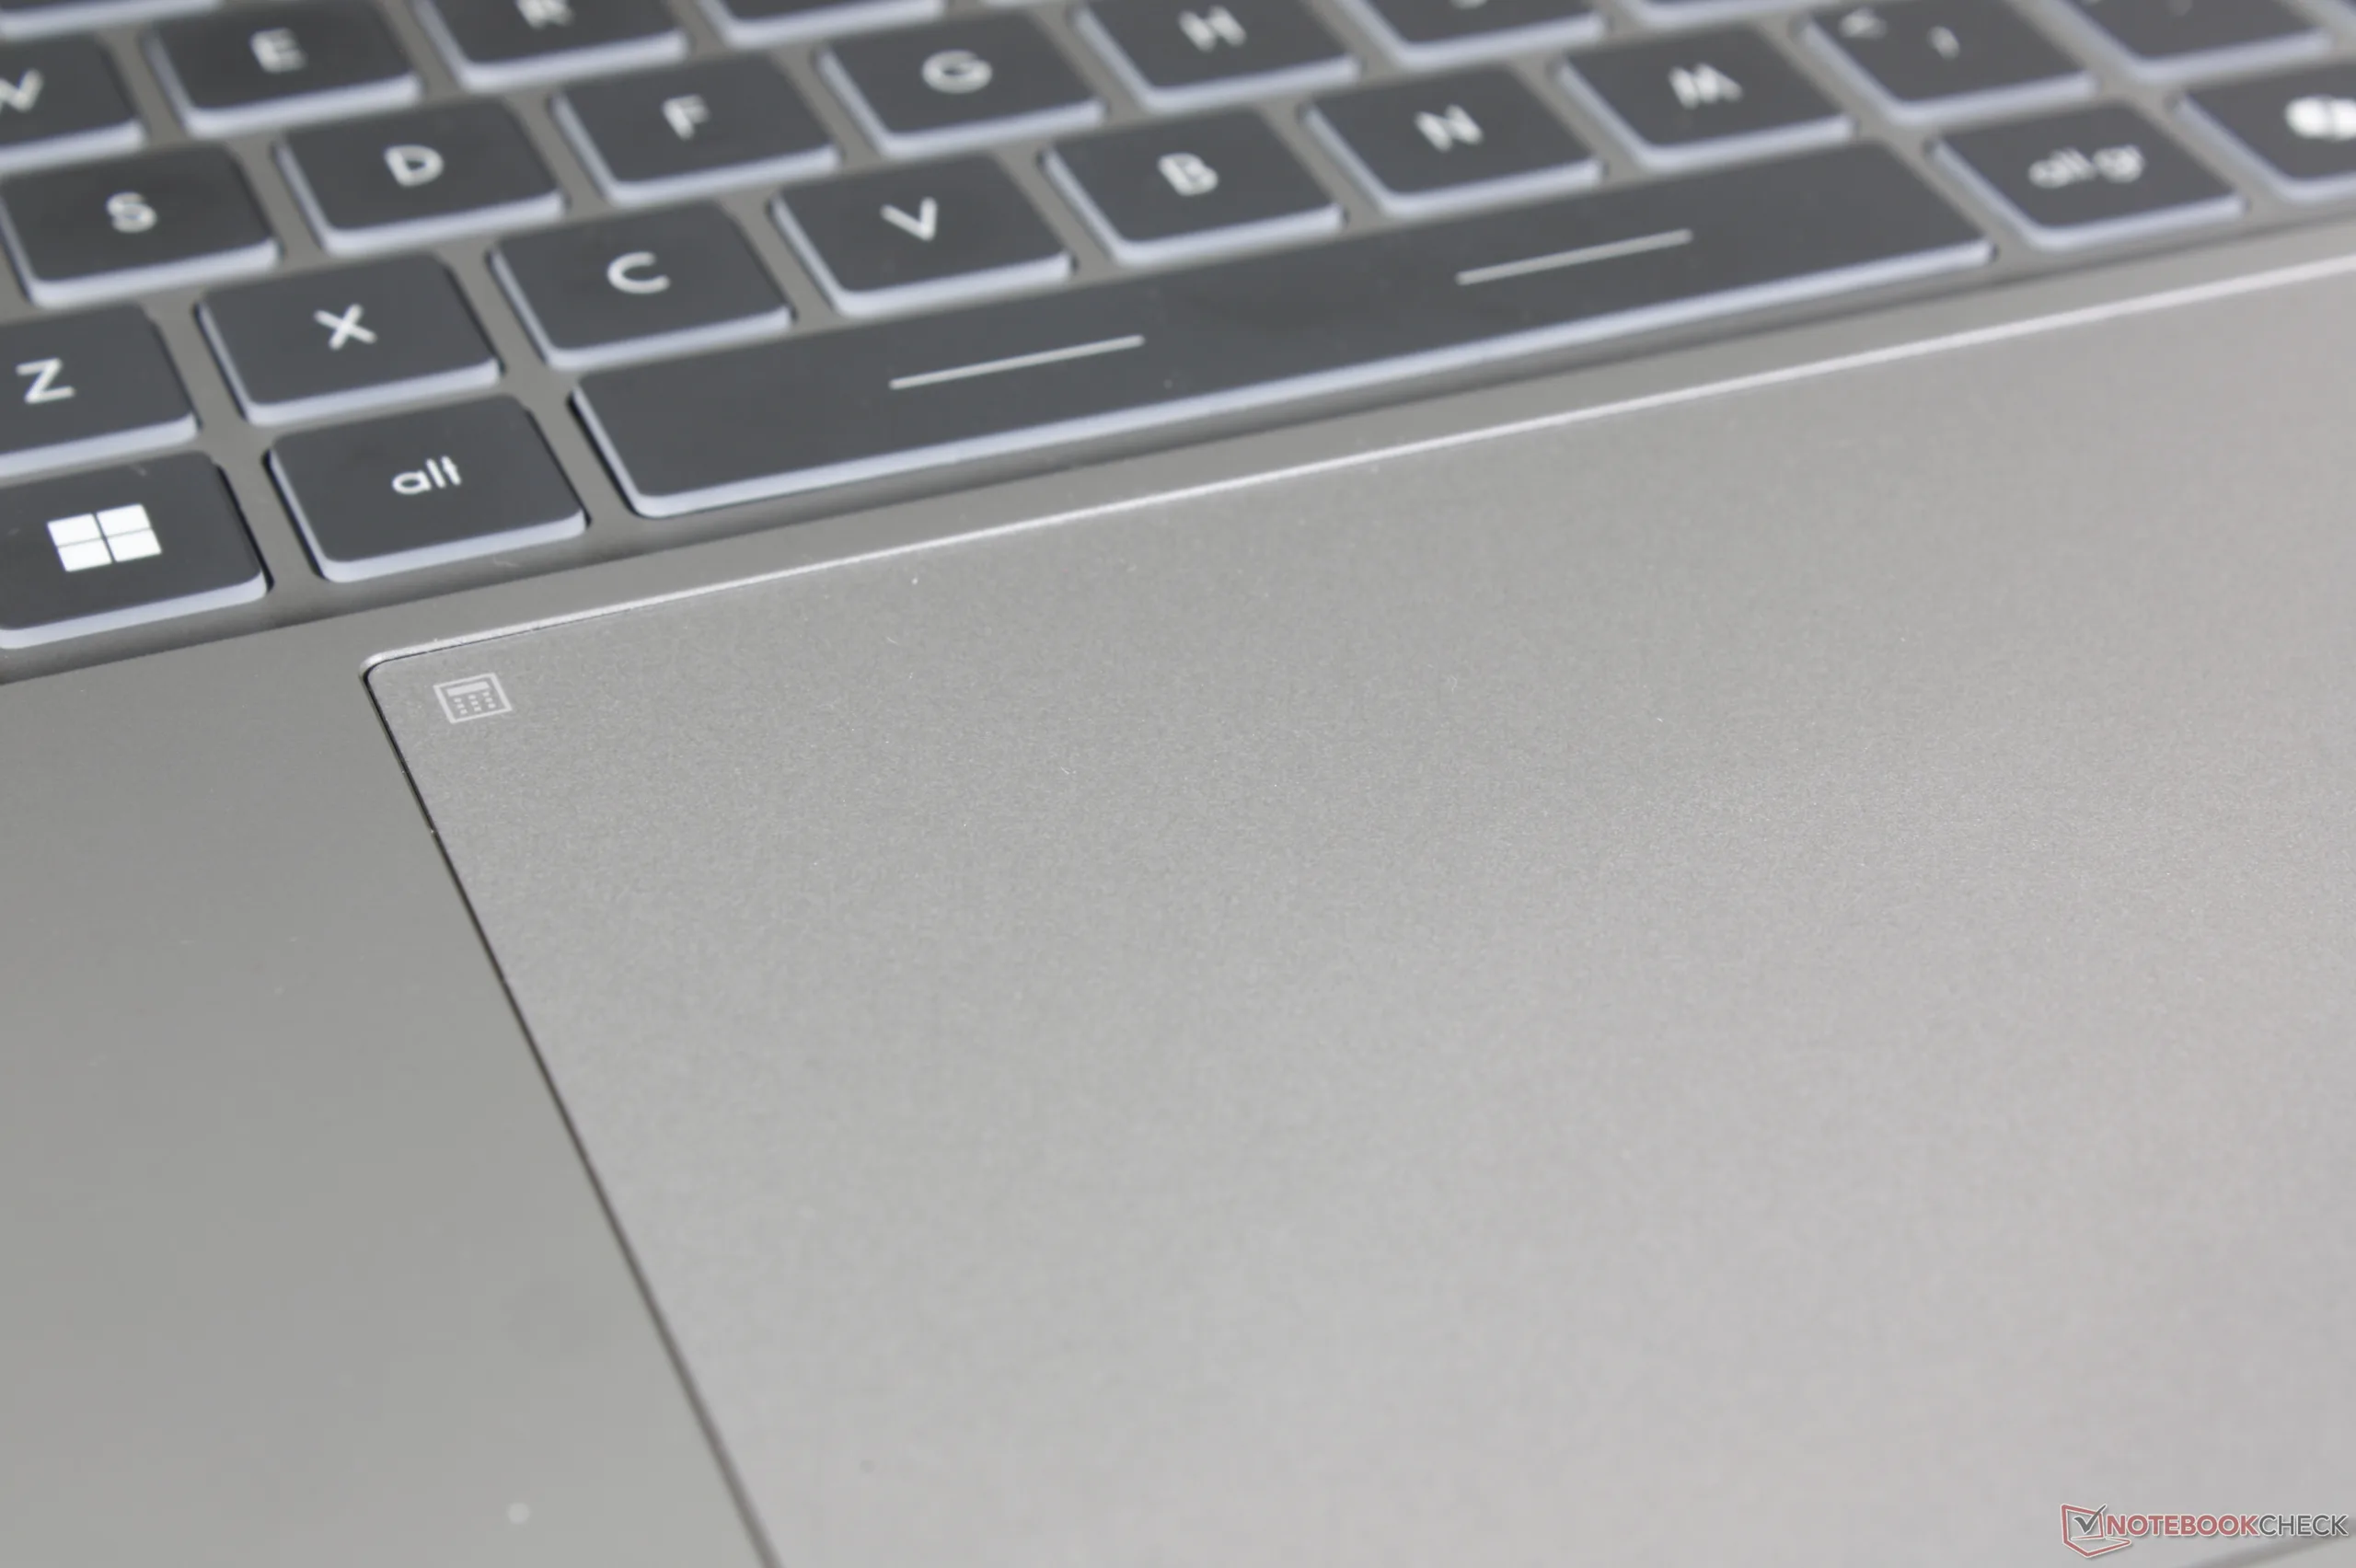
Pavé tactile
Le pavé tactile est encore plus grand qu'auparavant, passant de 15 x 9 cm à 16 x 10 cm sur le modèle le plus récent. La traction est douce et précise quelle que soit la vitesse de glissement, mais le retour d'information lors du clic reste relativement faible. En outre, le clic n'est confortable que dans les deux coins inférieurs, où la surface du pavé tactile s'enfonce beaucoup plus facilement.

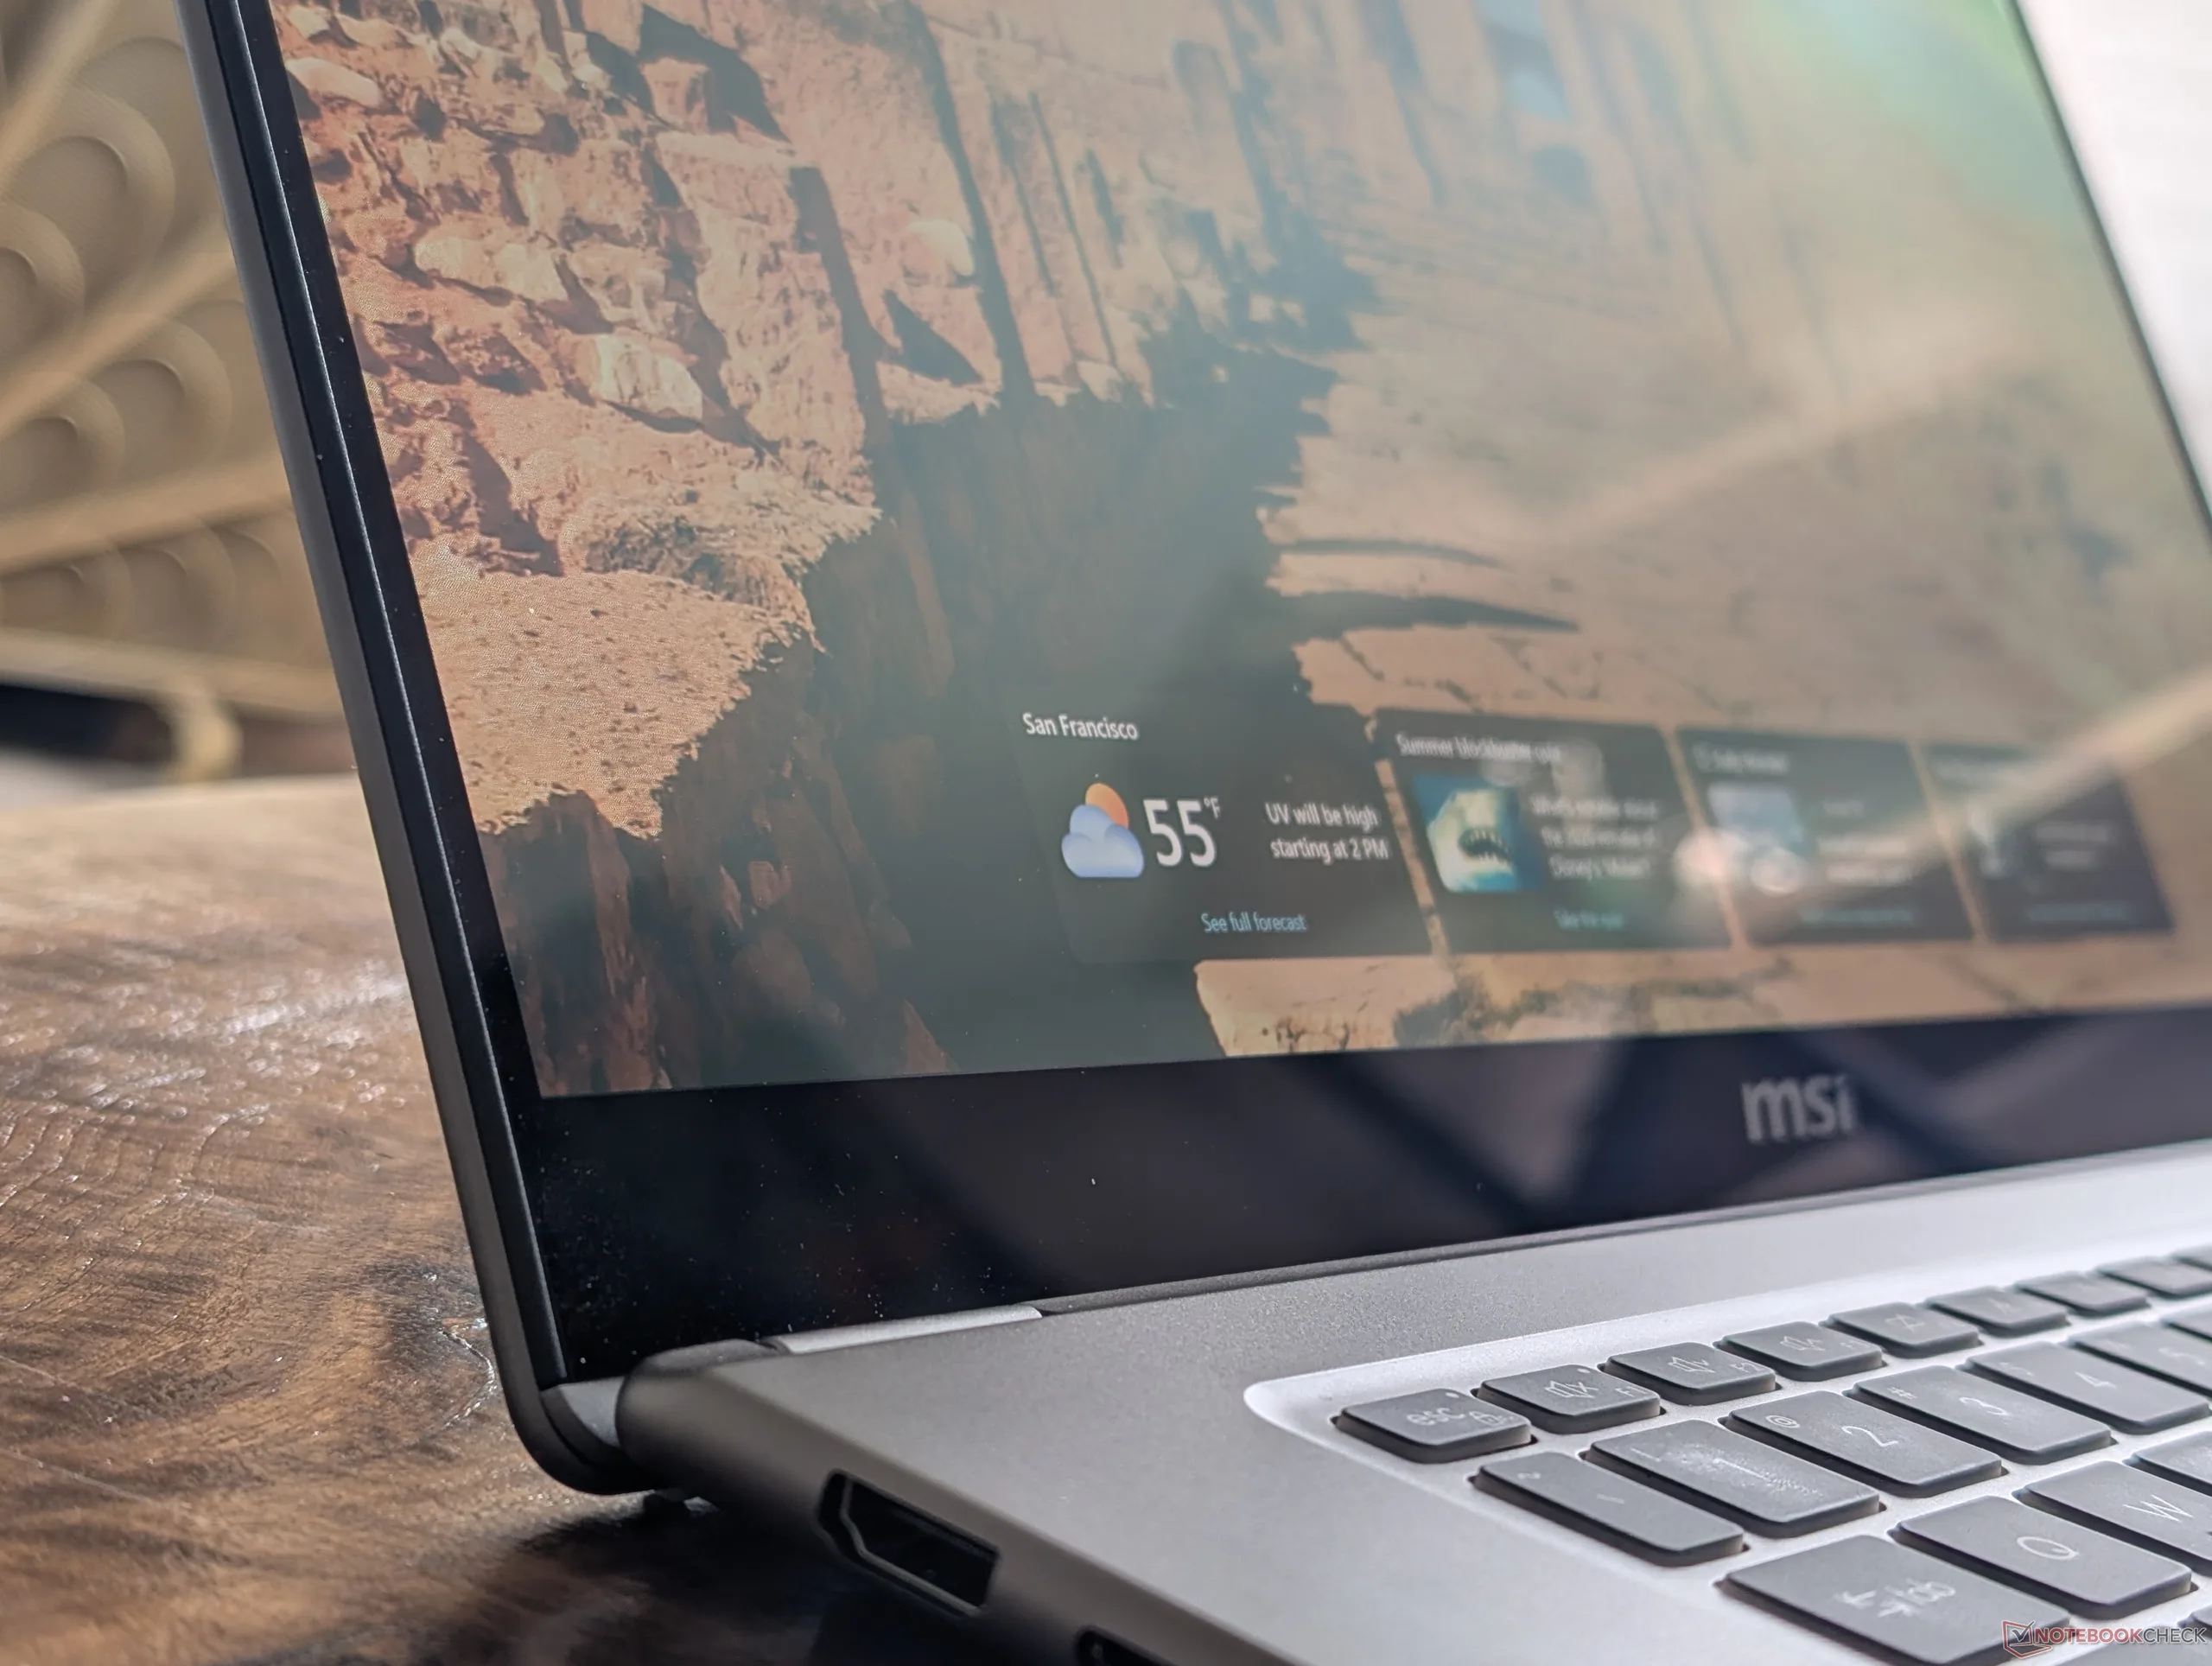
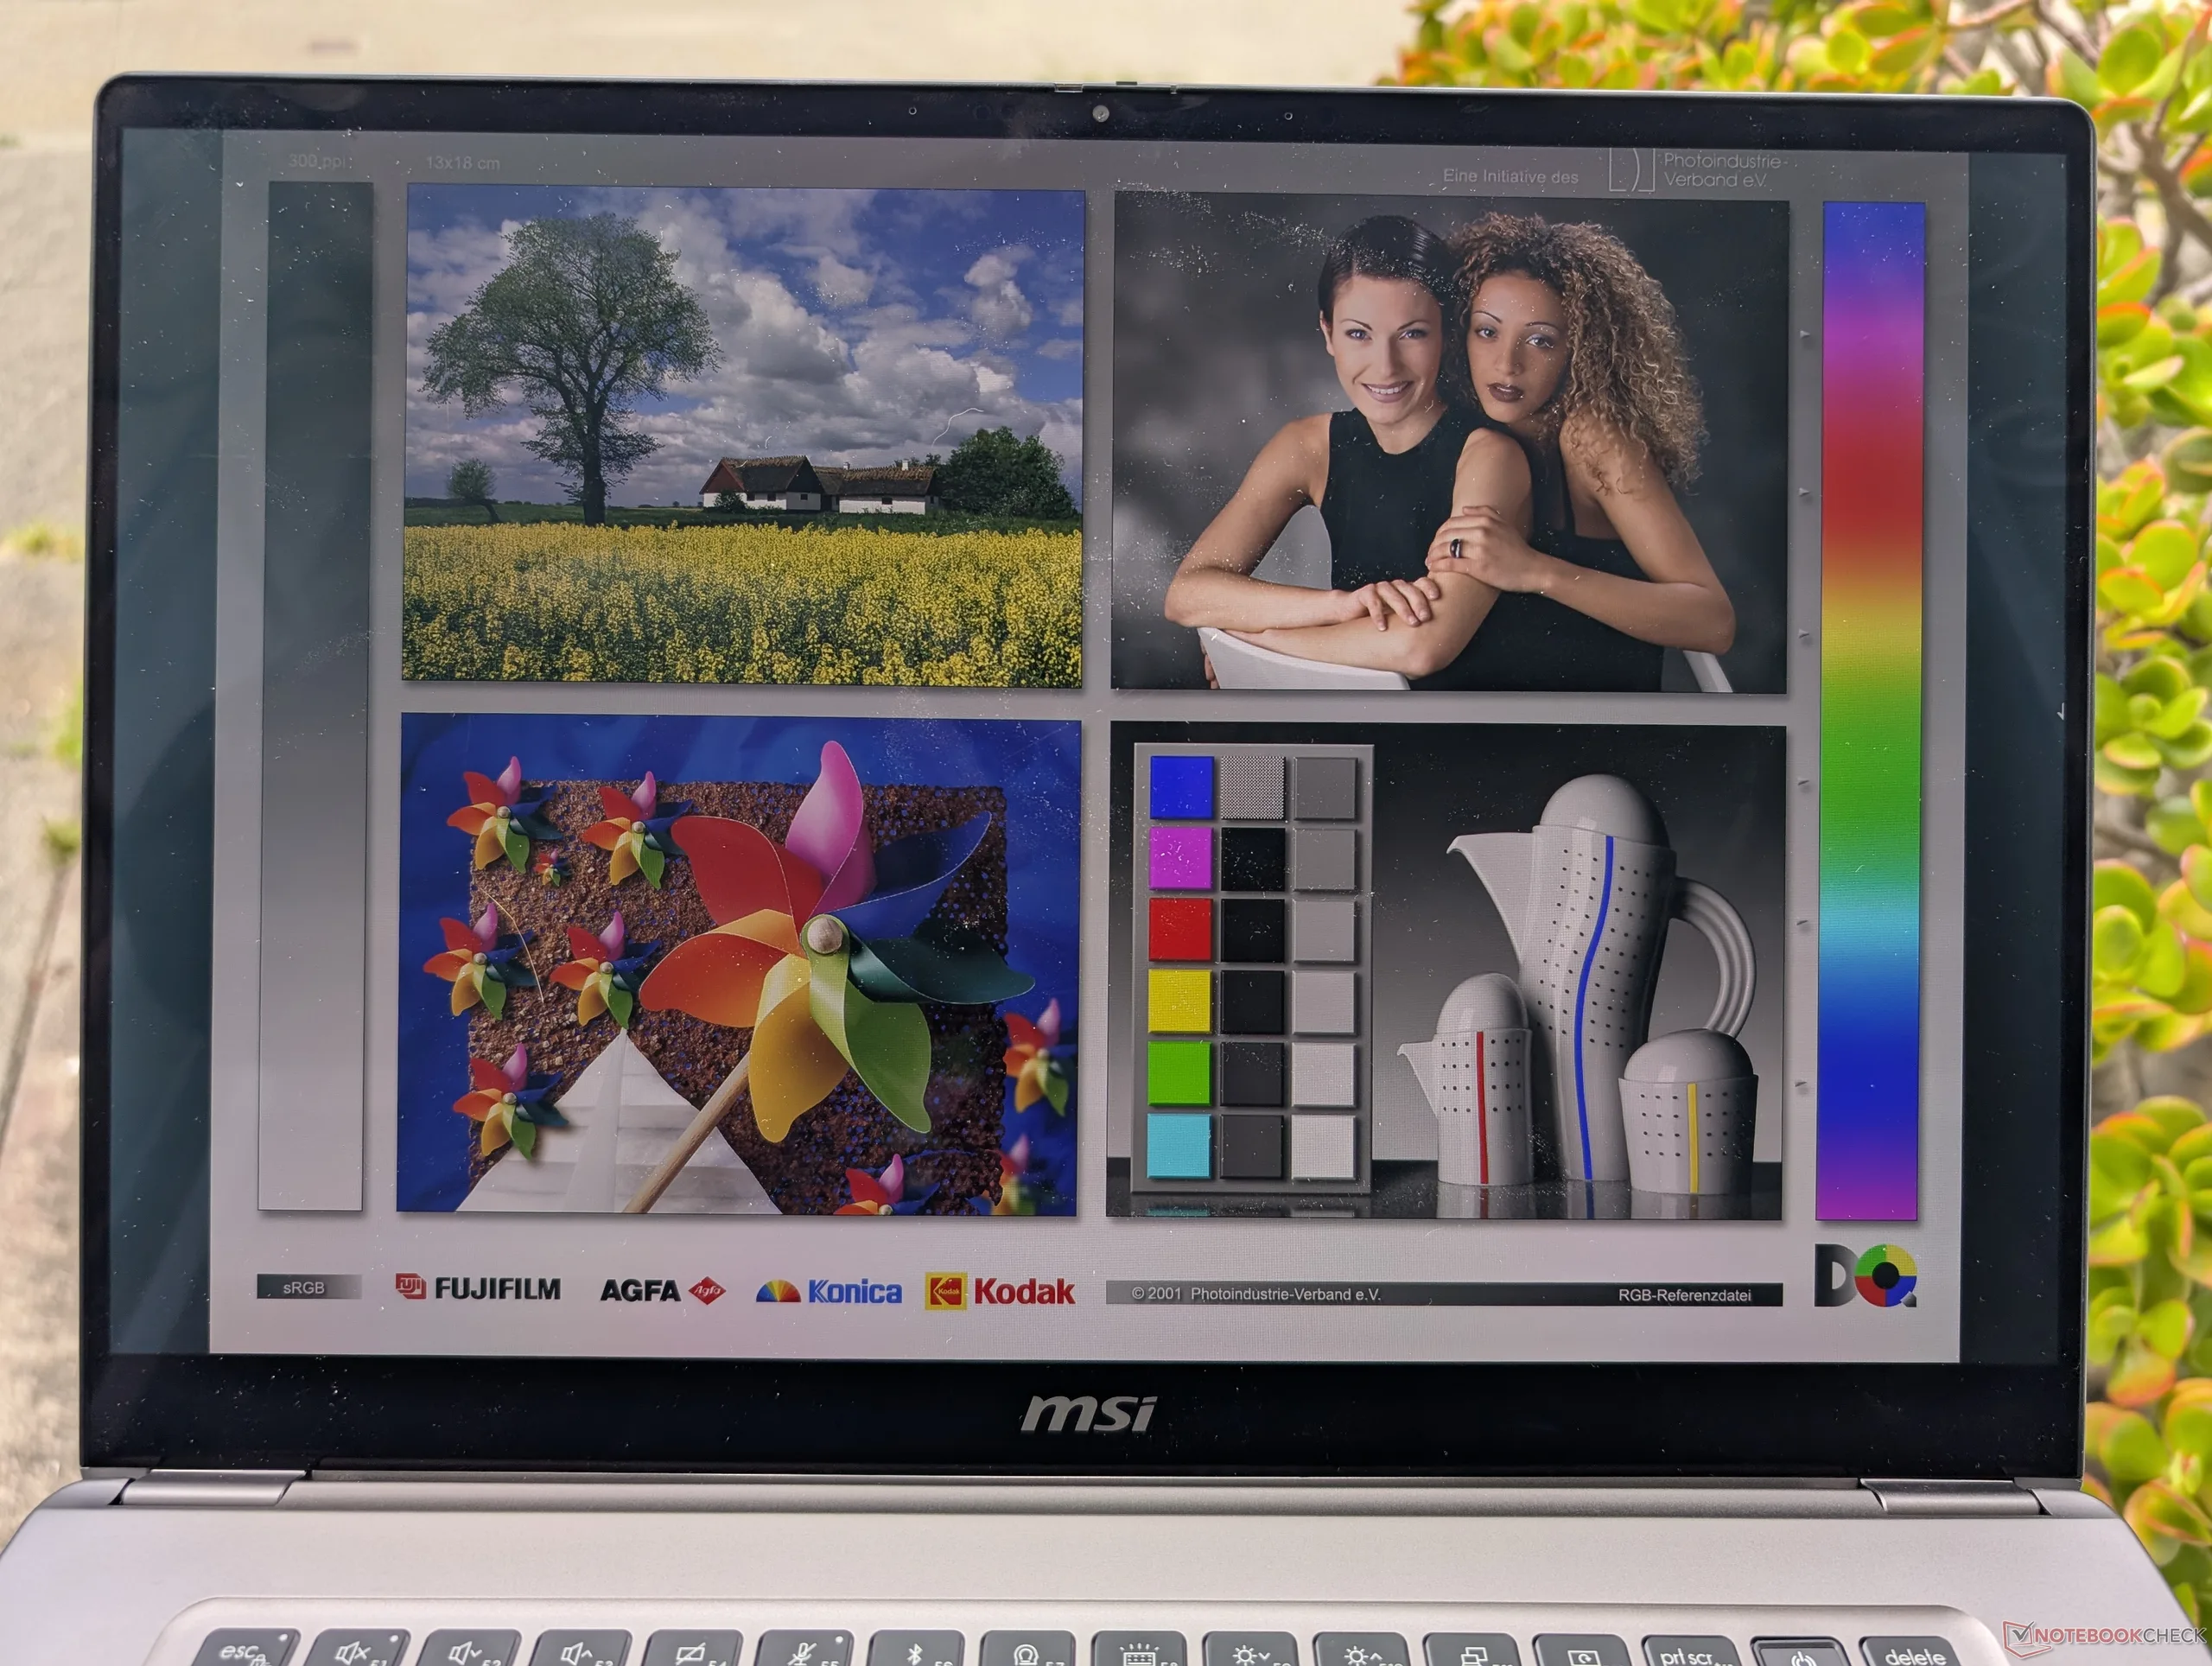
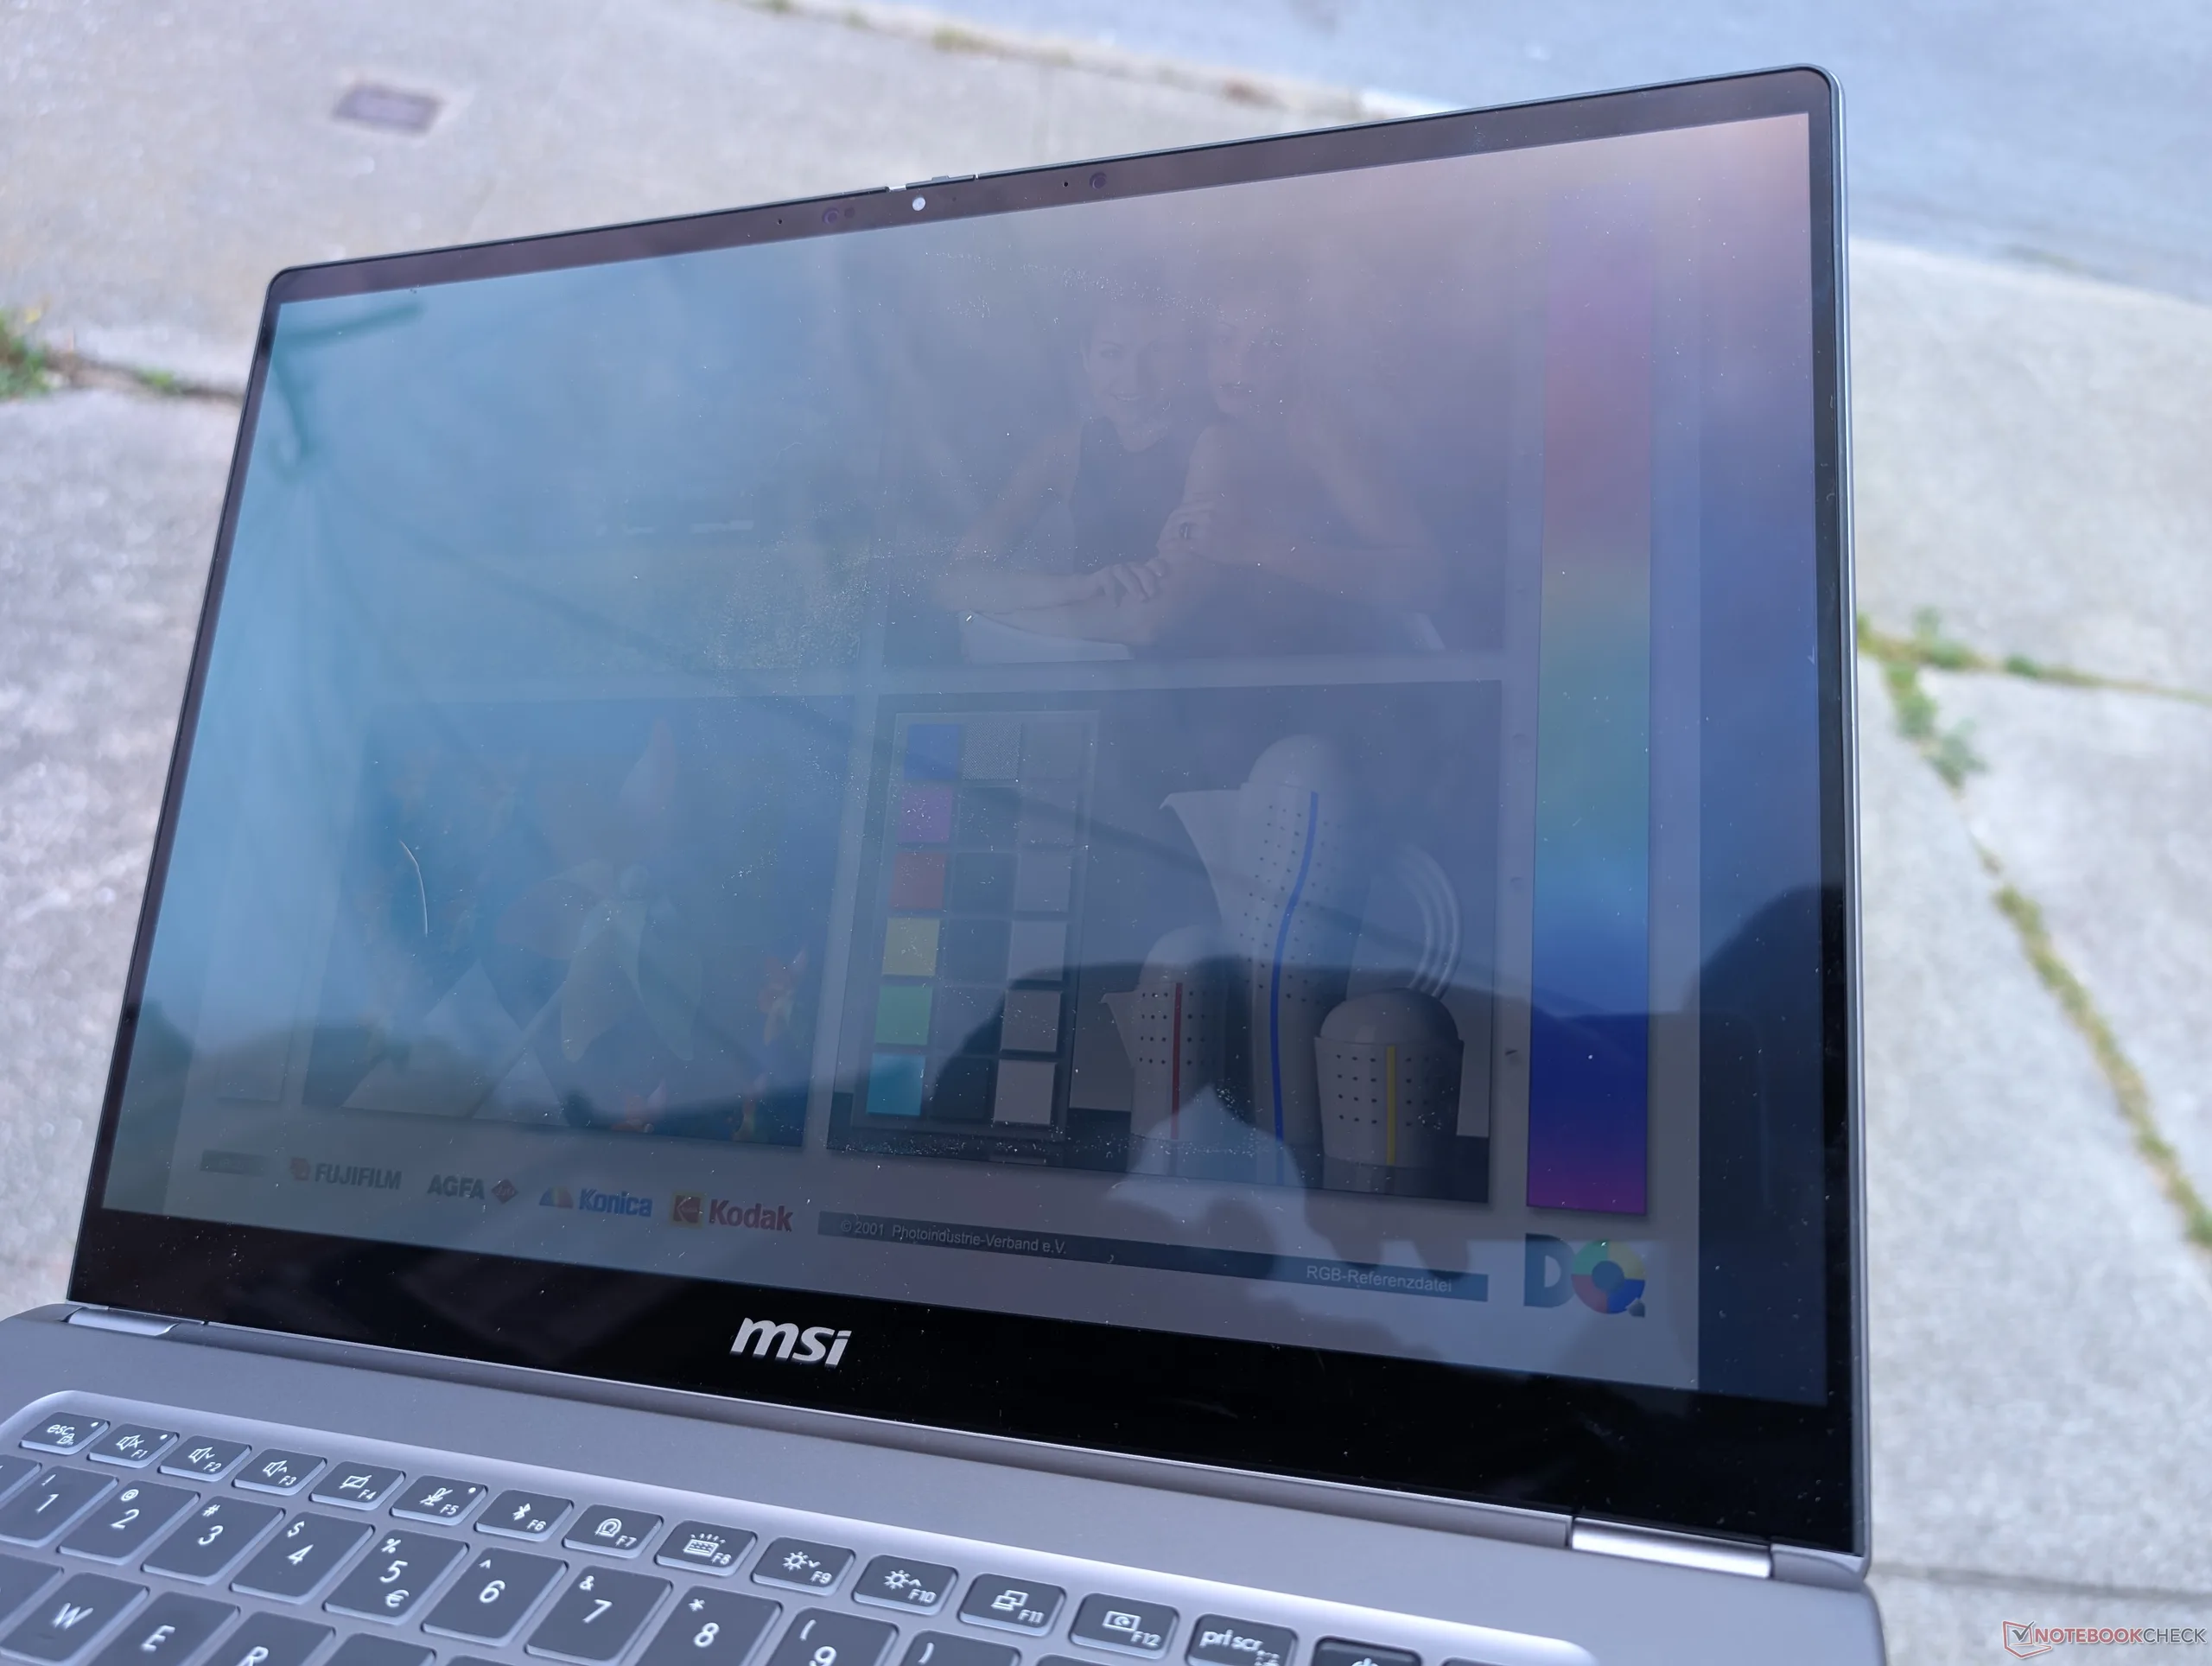
Affichage
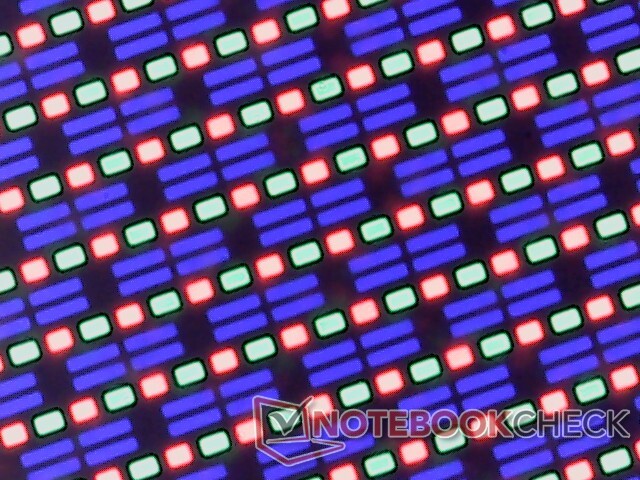
Le panneau OLED ATNA60CL11-0 de Samsung est très similaire au panneau ATNA60CL10-0 que l'on trouve sur le ZenBook S16. Le taux de rafraîchissement de 120 Hz et la résolution native de 1800p sont une amélioration par rapport à la dalle IPS du modèle de l'année dernière. En fait, il n'y a plus d'options IPS à proprement parler, ce qui place la série Prestige 16 dans la catégorie des ordinateurs haut de gamme.
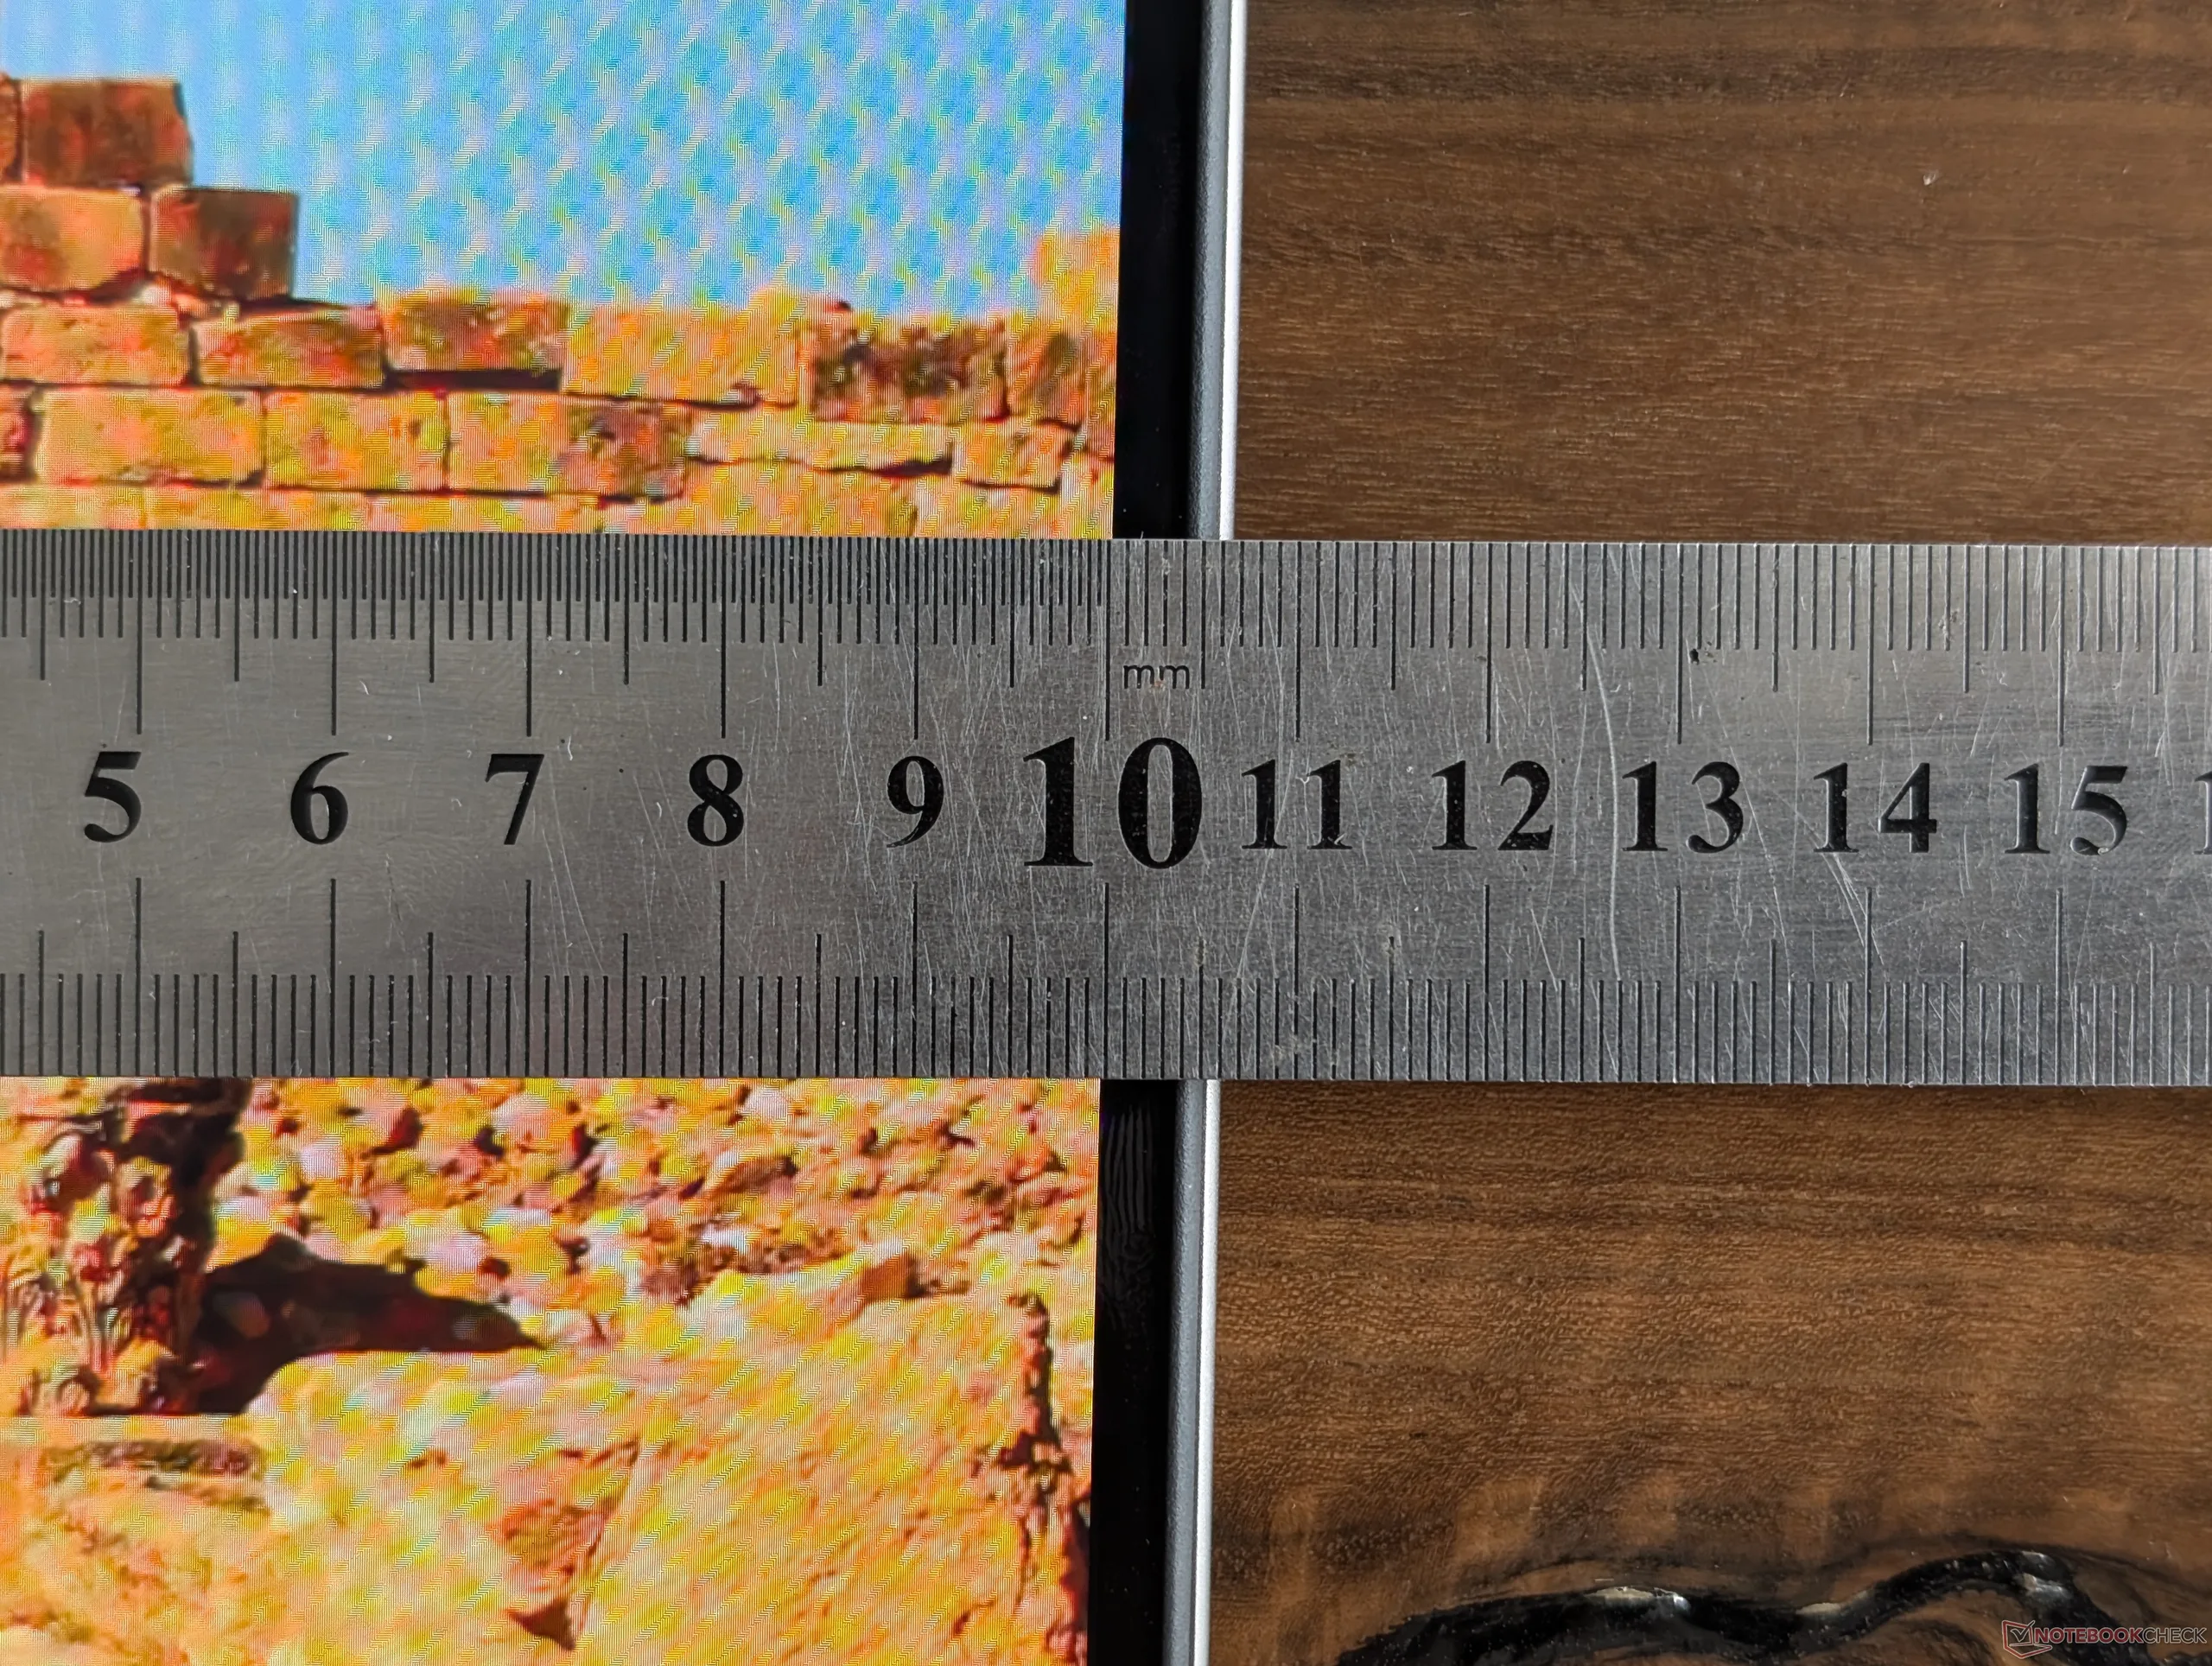
La luminosité, tout en restant excellente, est plus faible que celle de l'écran IPS de la Prestige 16 2025. Nos tests montrent une luminosité maximale de seulement 383 nits et 422 nits en mode SDR et HDR, respectivement, contre 471 nits sur le modèle de l'année dernière. Certaines configurations supportent DisplayHDR1000 pour des maximums plus lumineux si vous les trouvez disponibles, mais notre unité de test n'est pas l'une d'entre elles.
| |||||||||||||||||||||||||
Homogénéité de la luminosité: 98 %
Valeur mesurée au centre, sur batterie: 375 cd/m²
Contraste: ∞:1 (Valeurs des noirs: 0 cd/m²)
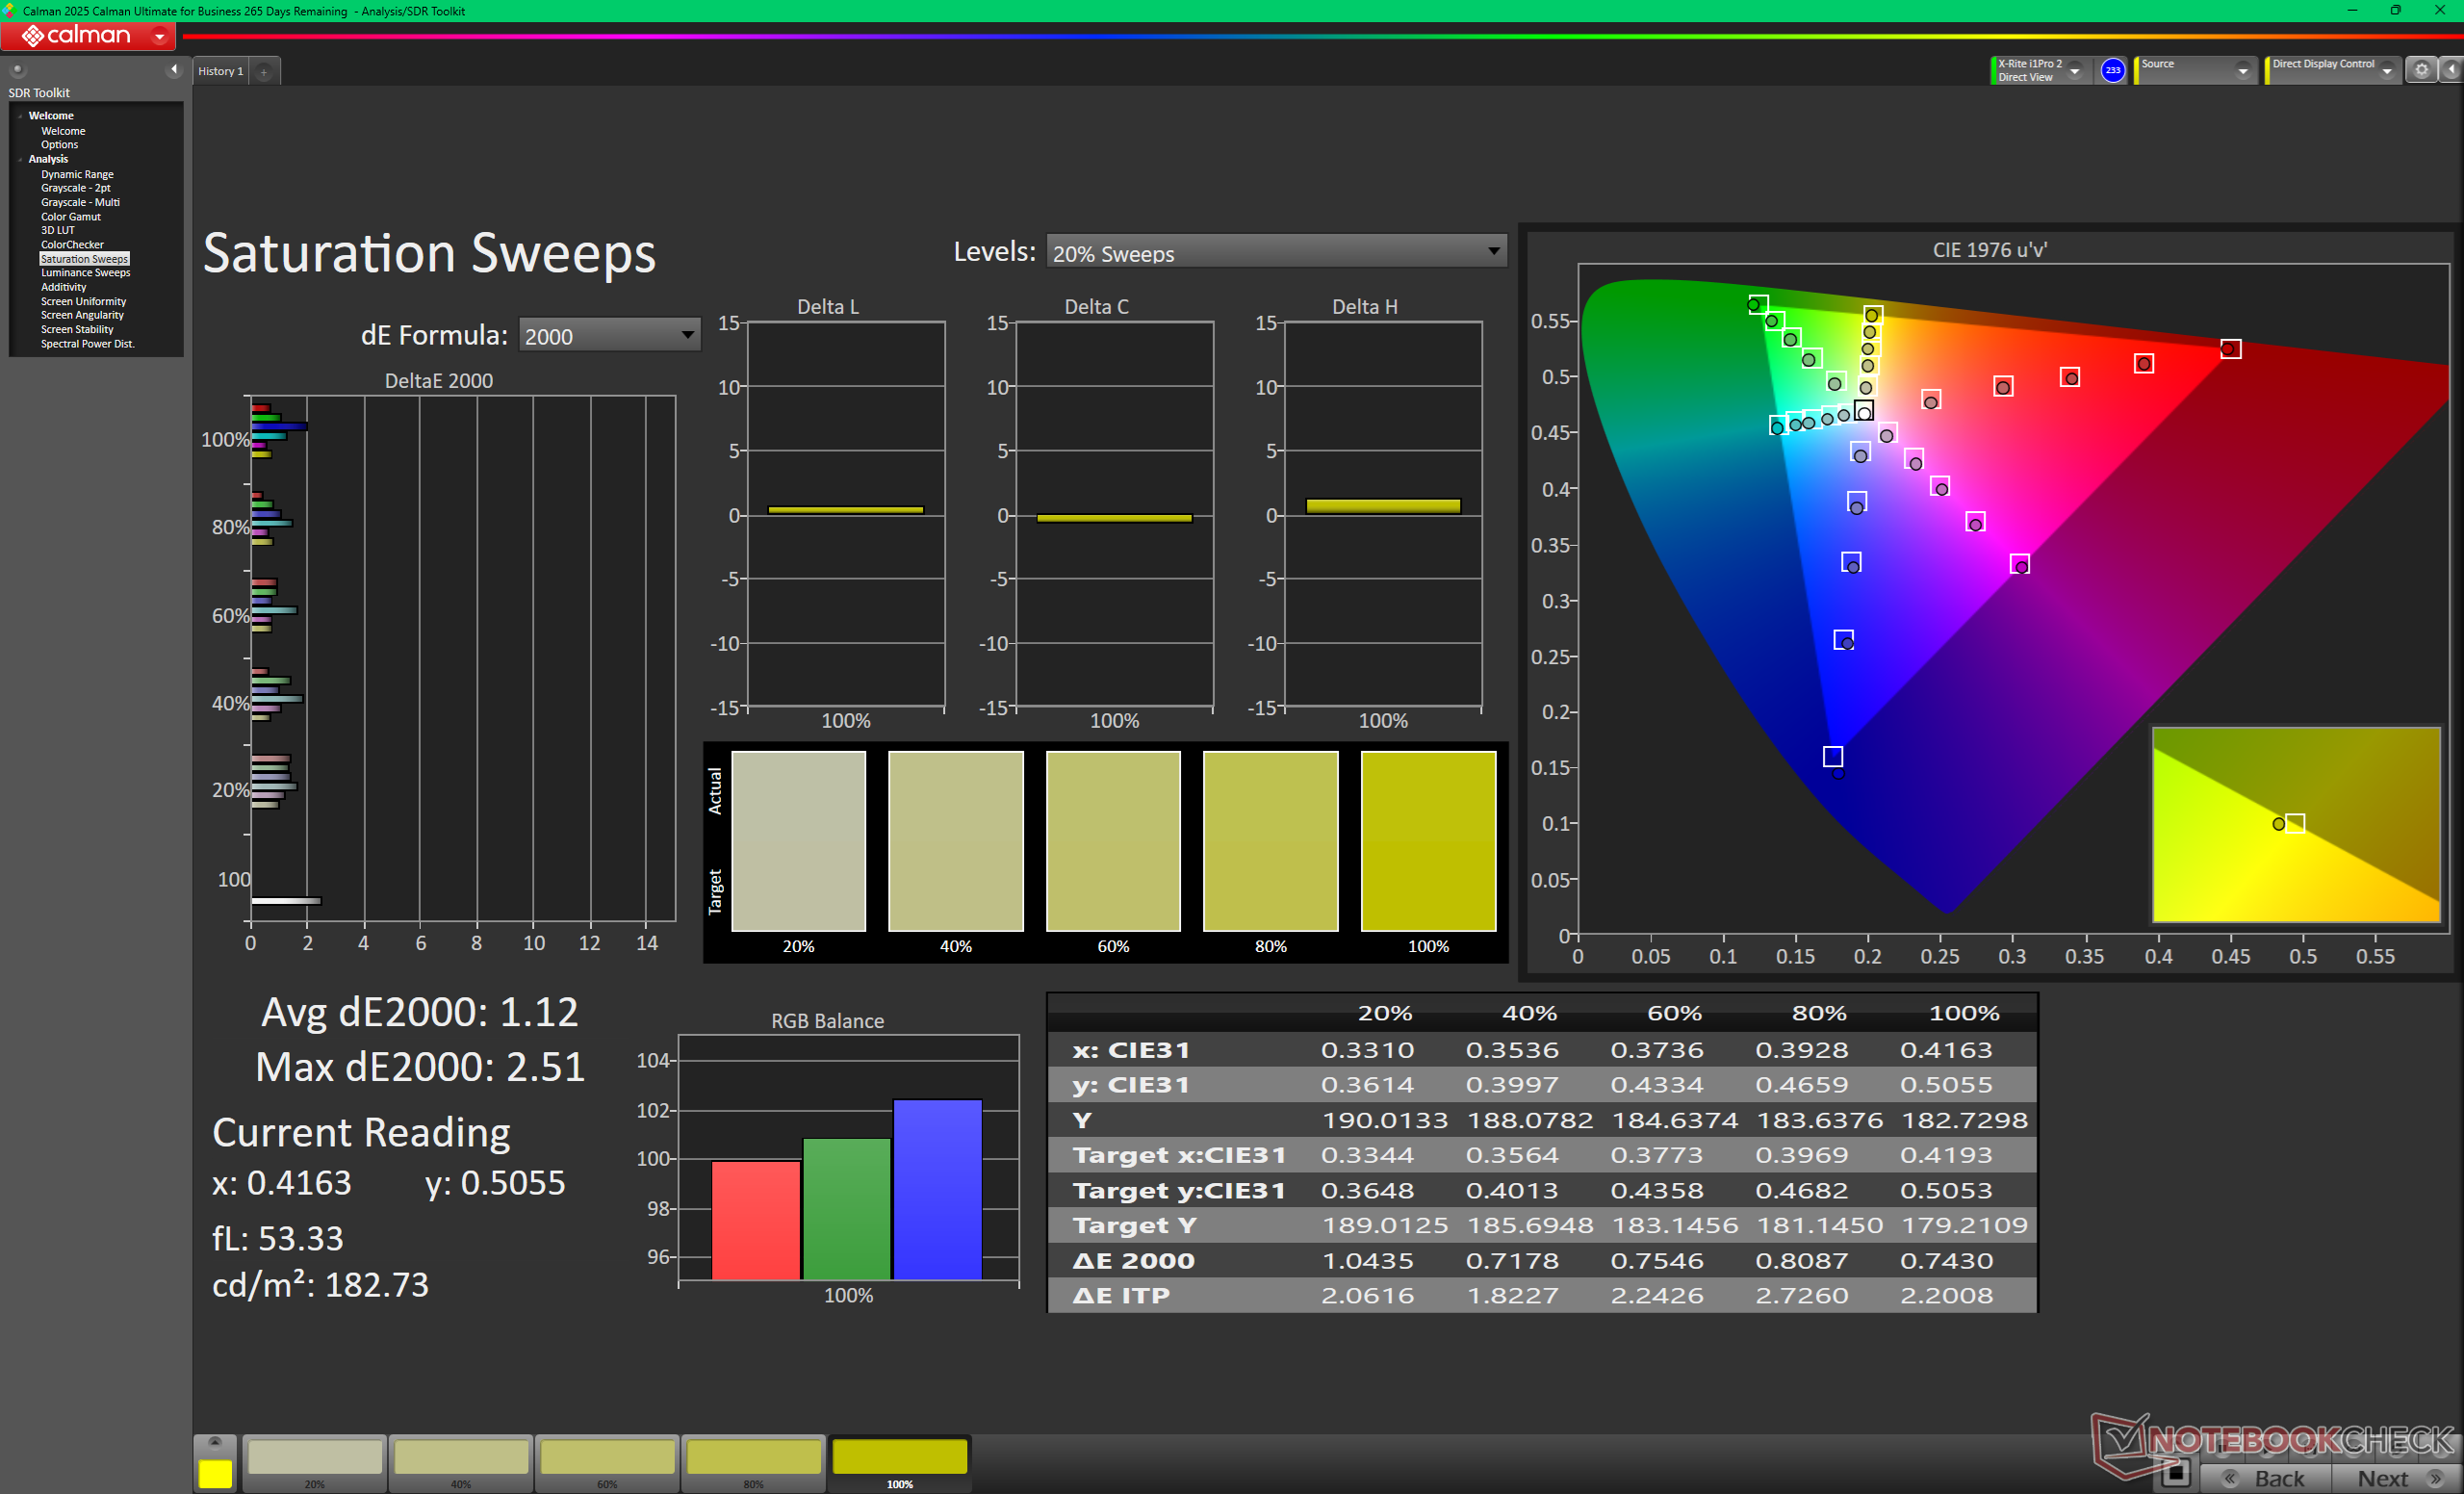
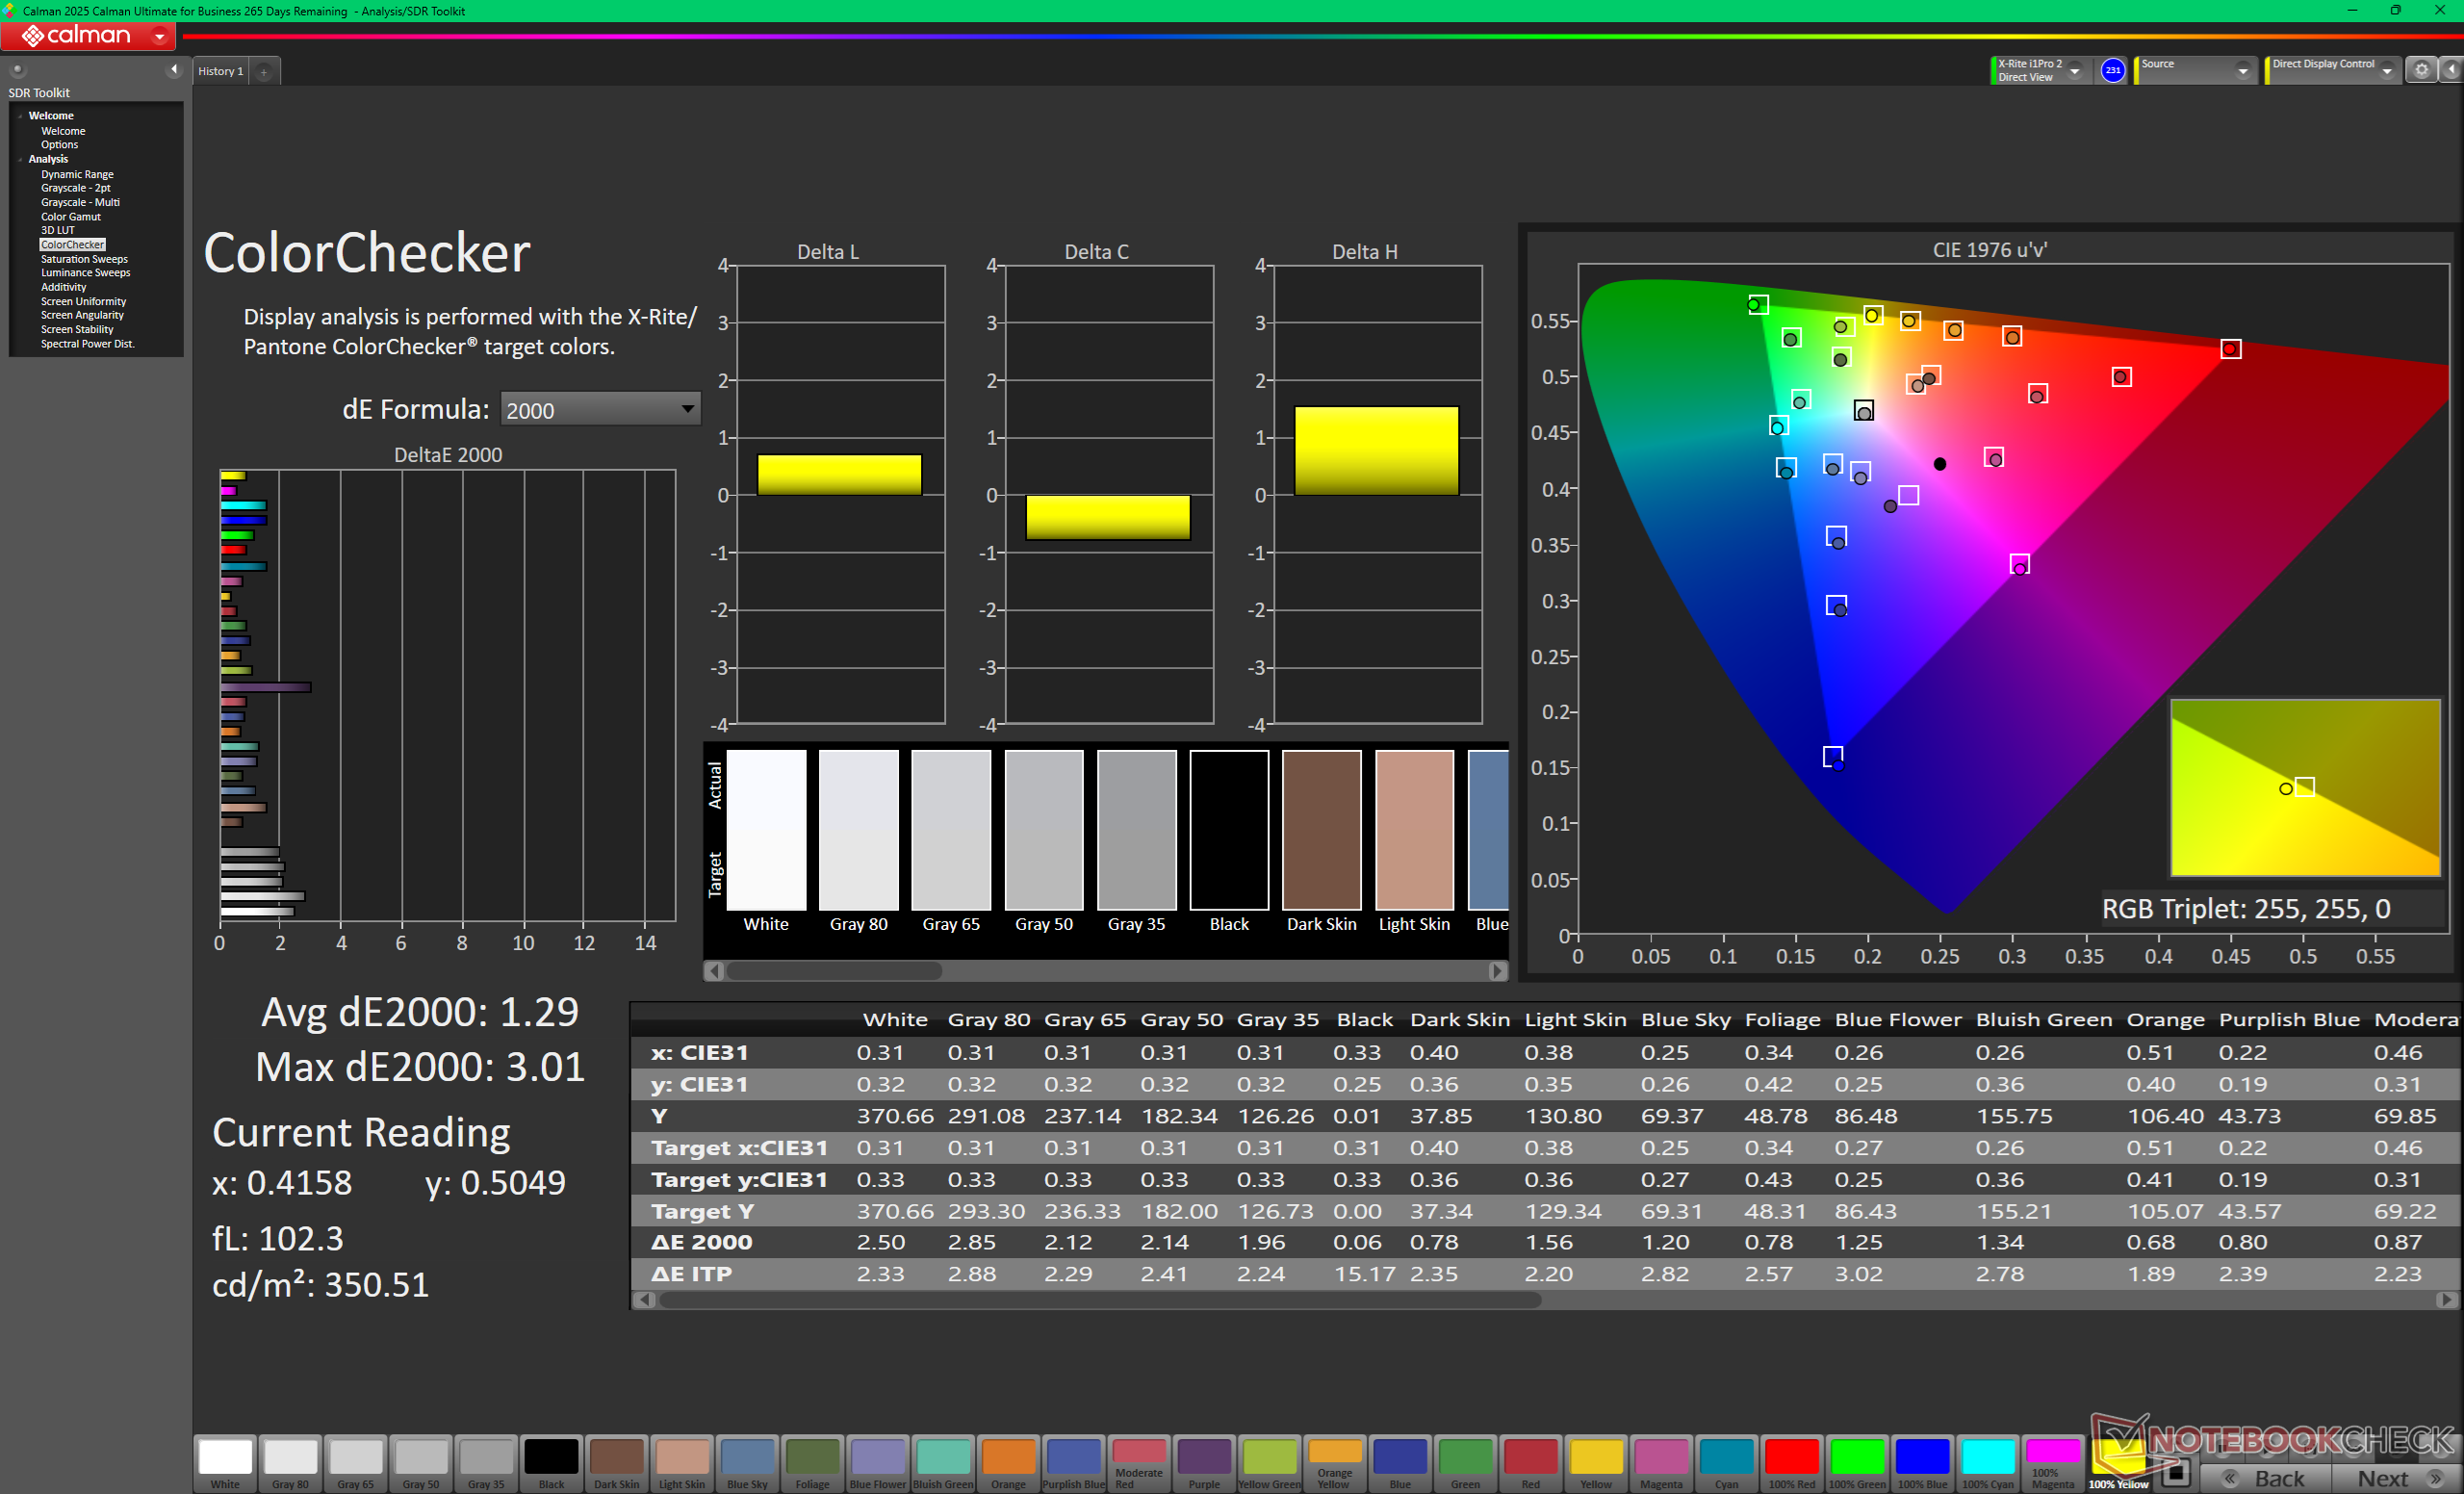
ΔE ColorChecker Calman: 1.29 | ∀{0.5-29.43 Ø4.74}
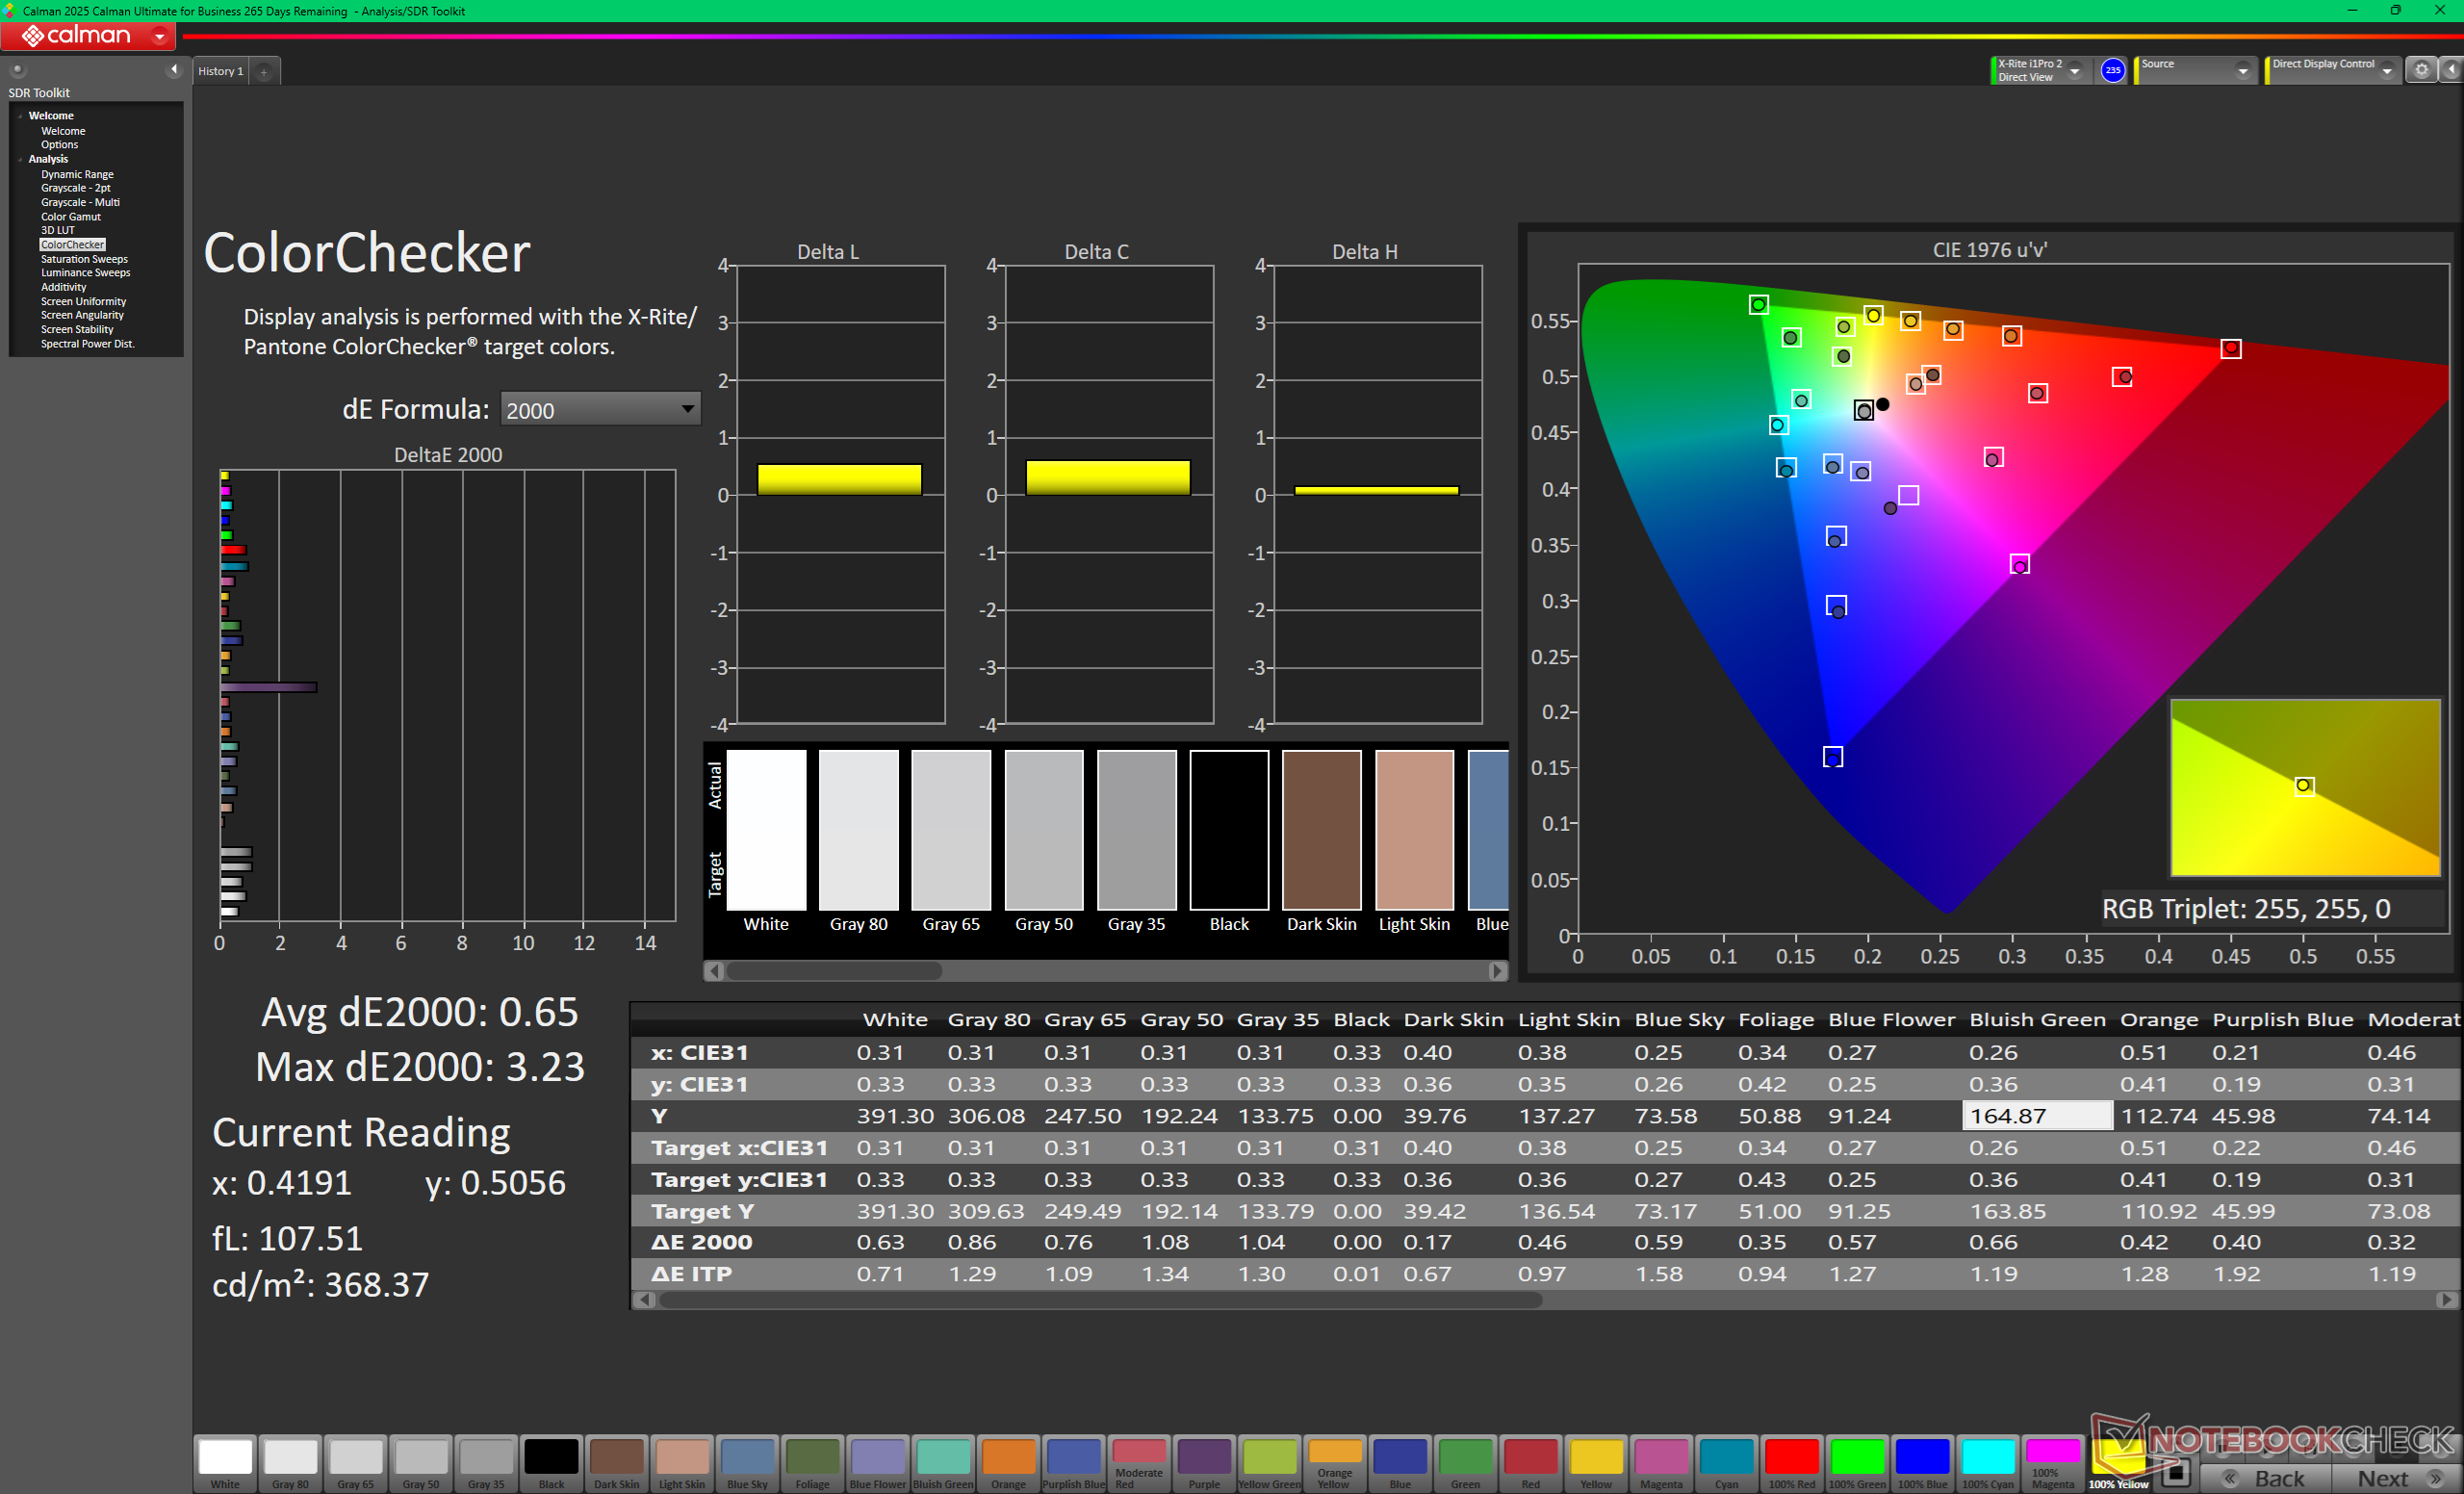
calibrated: 0.65
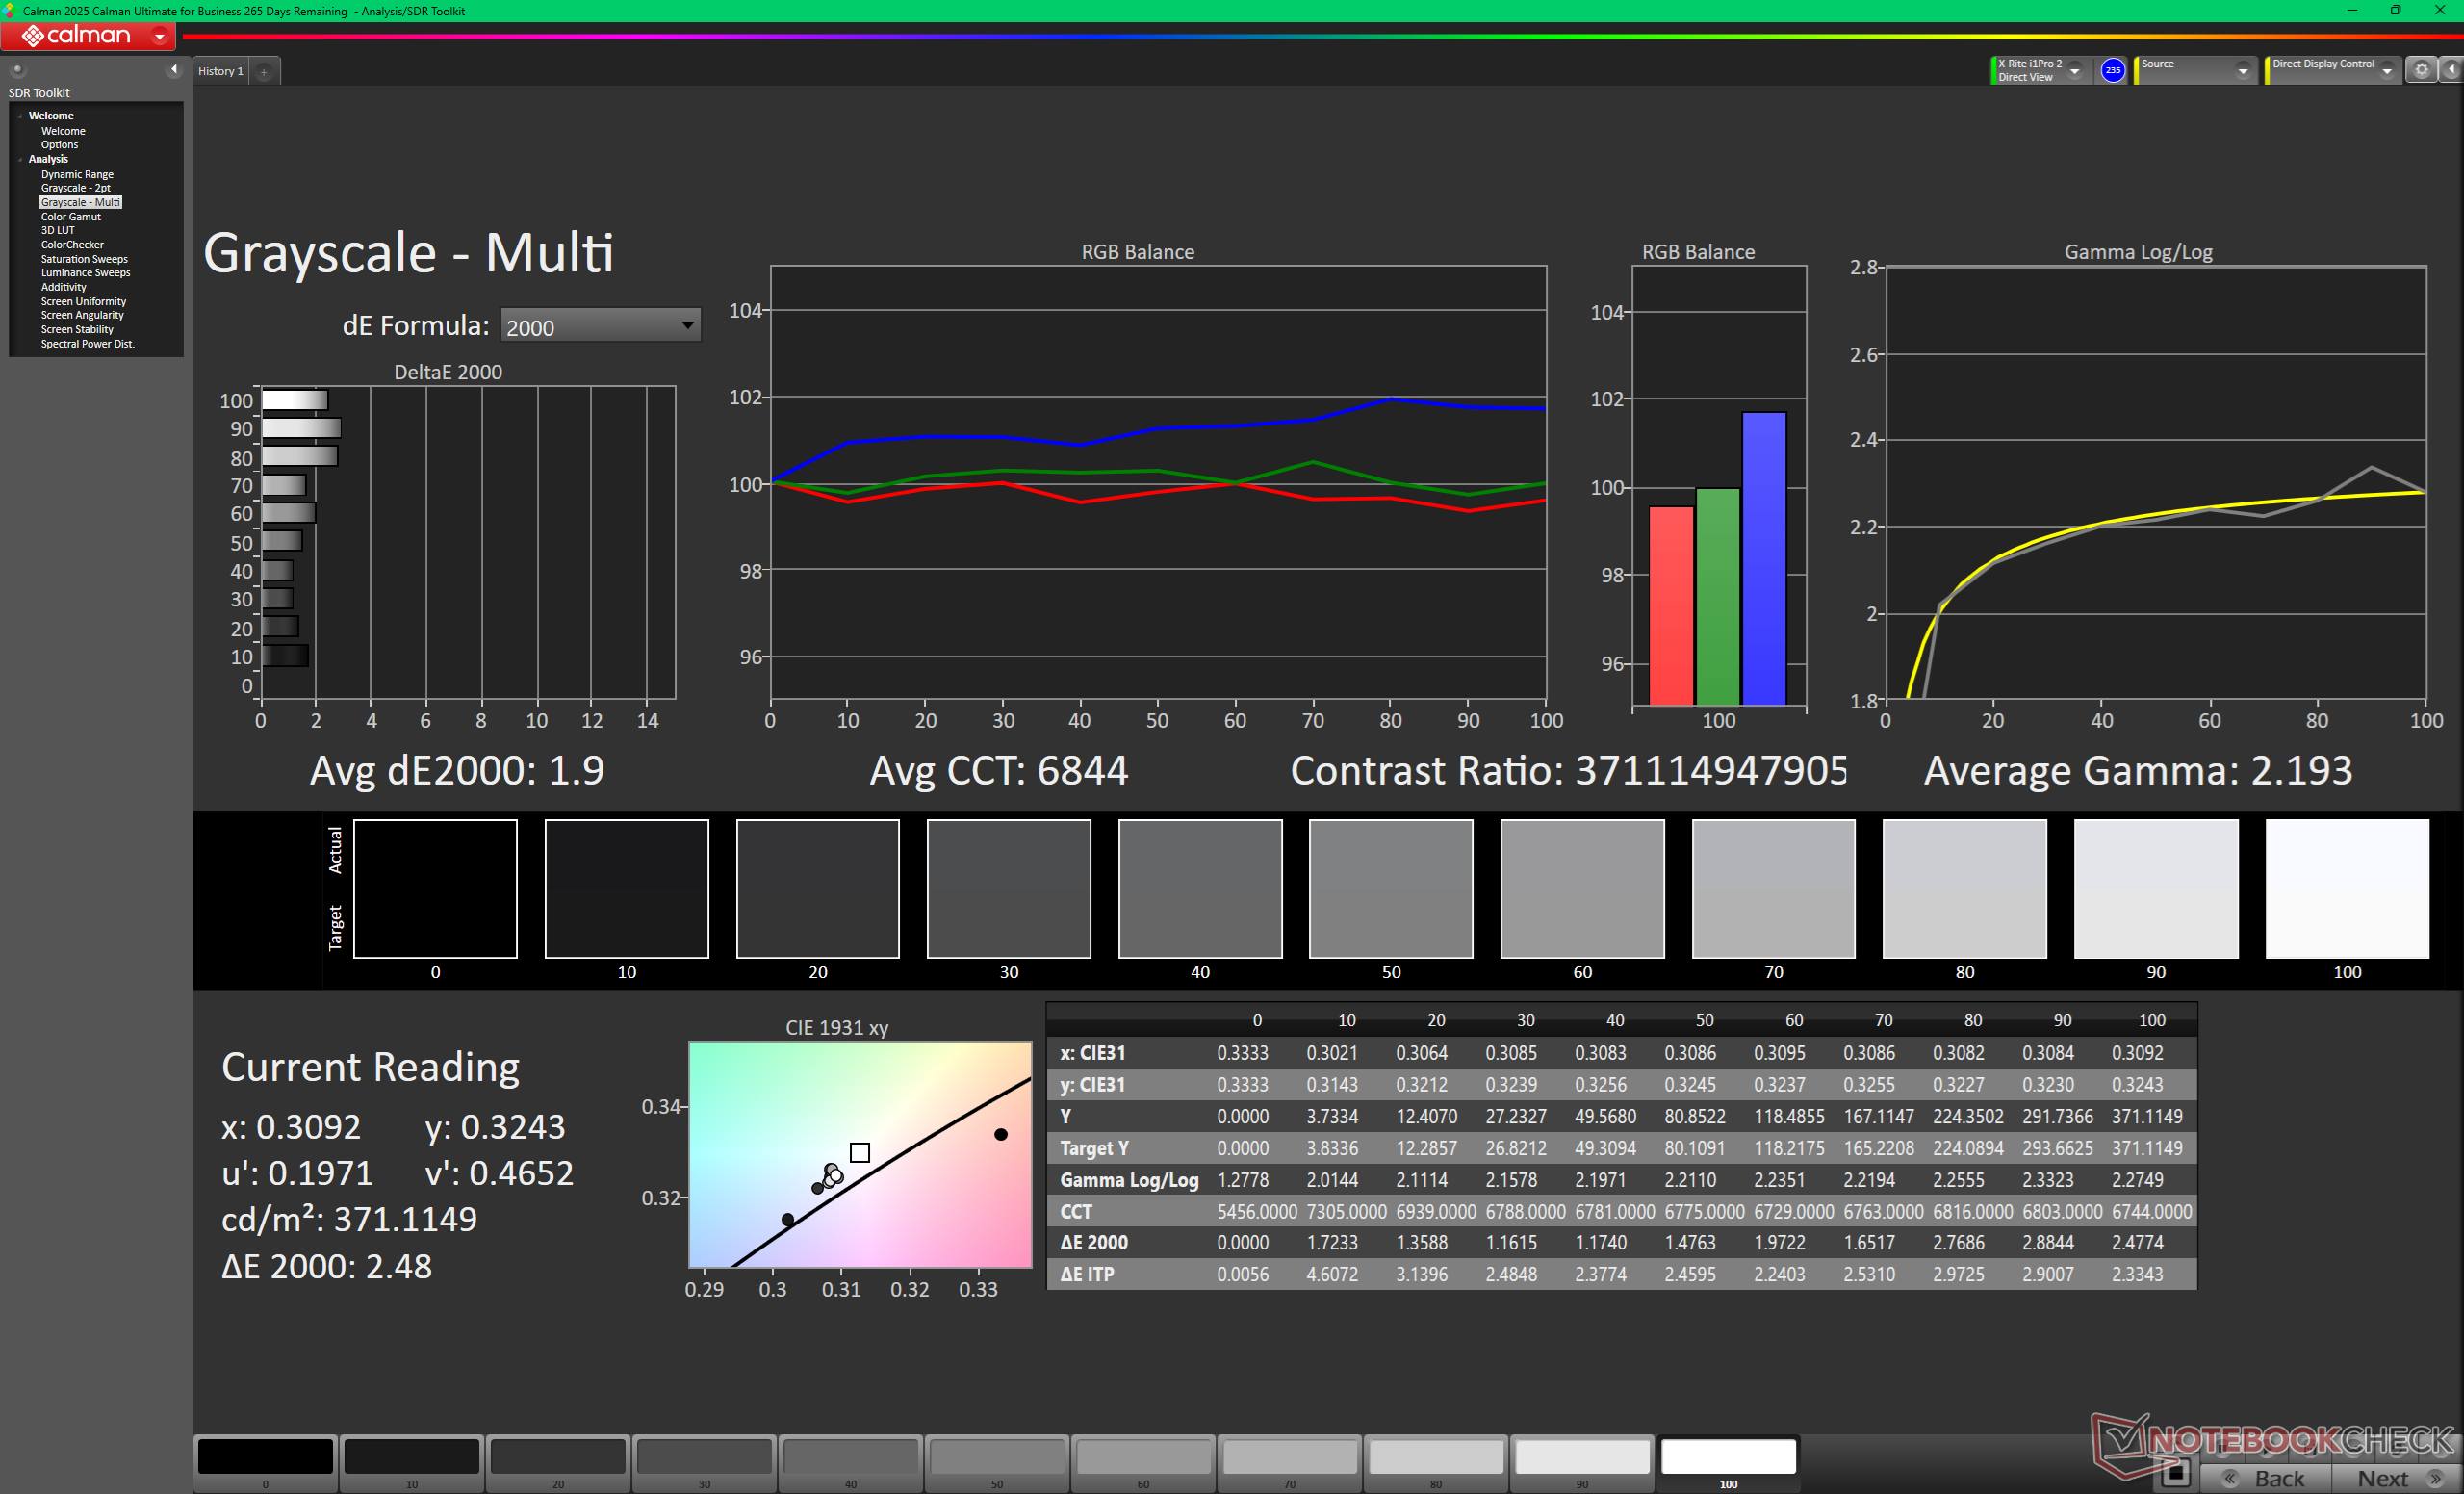
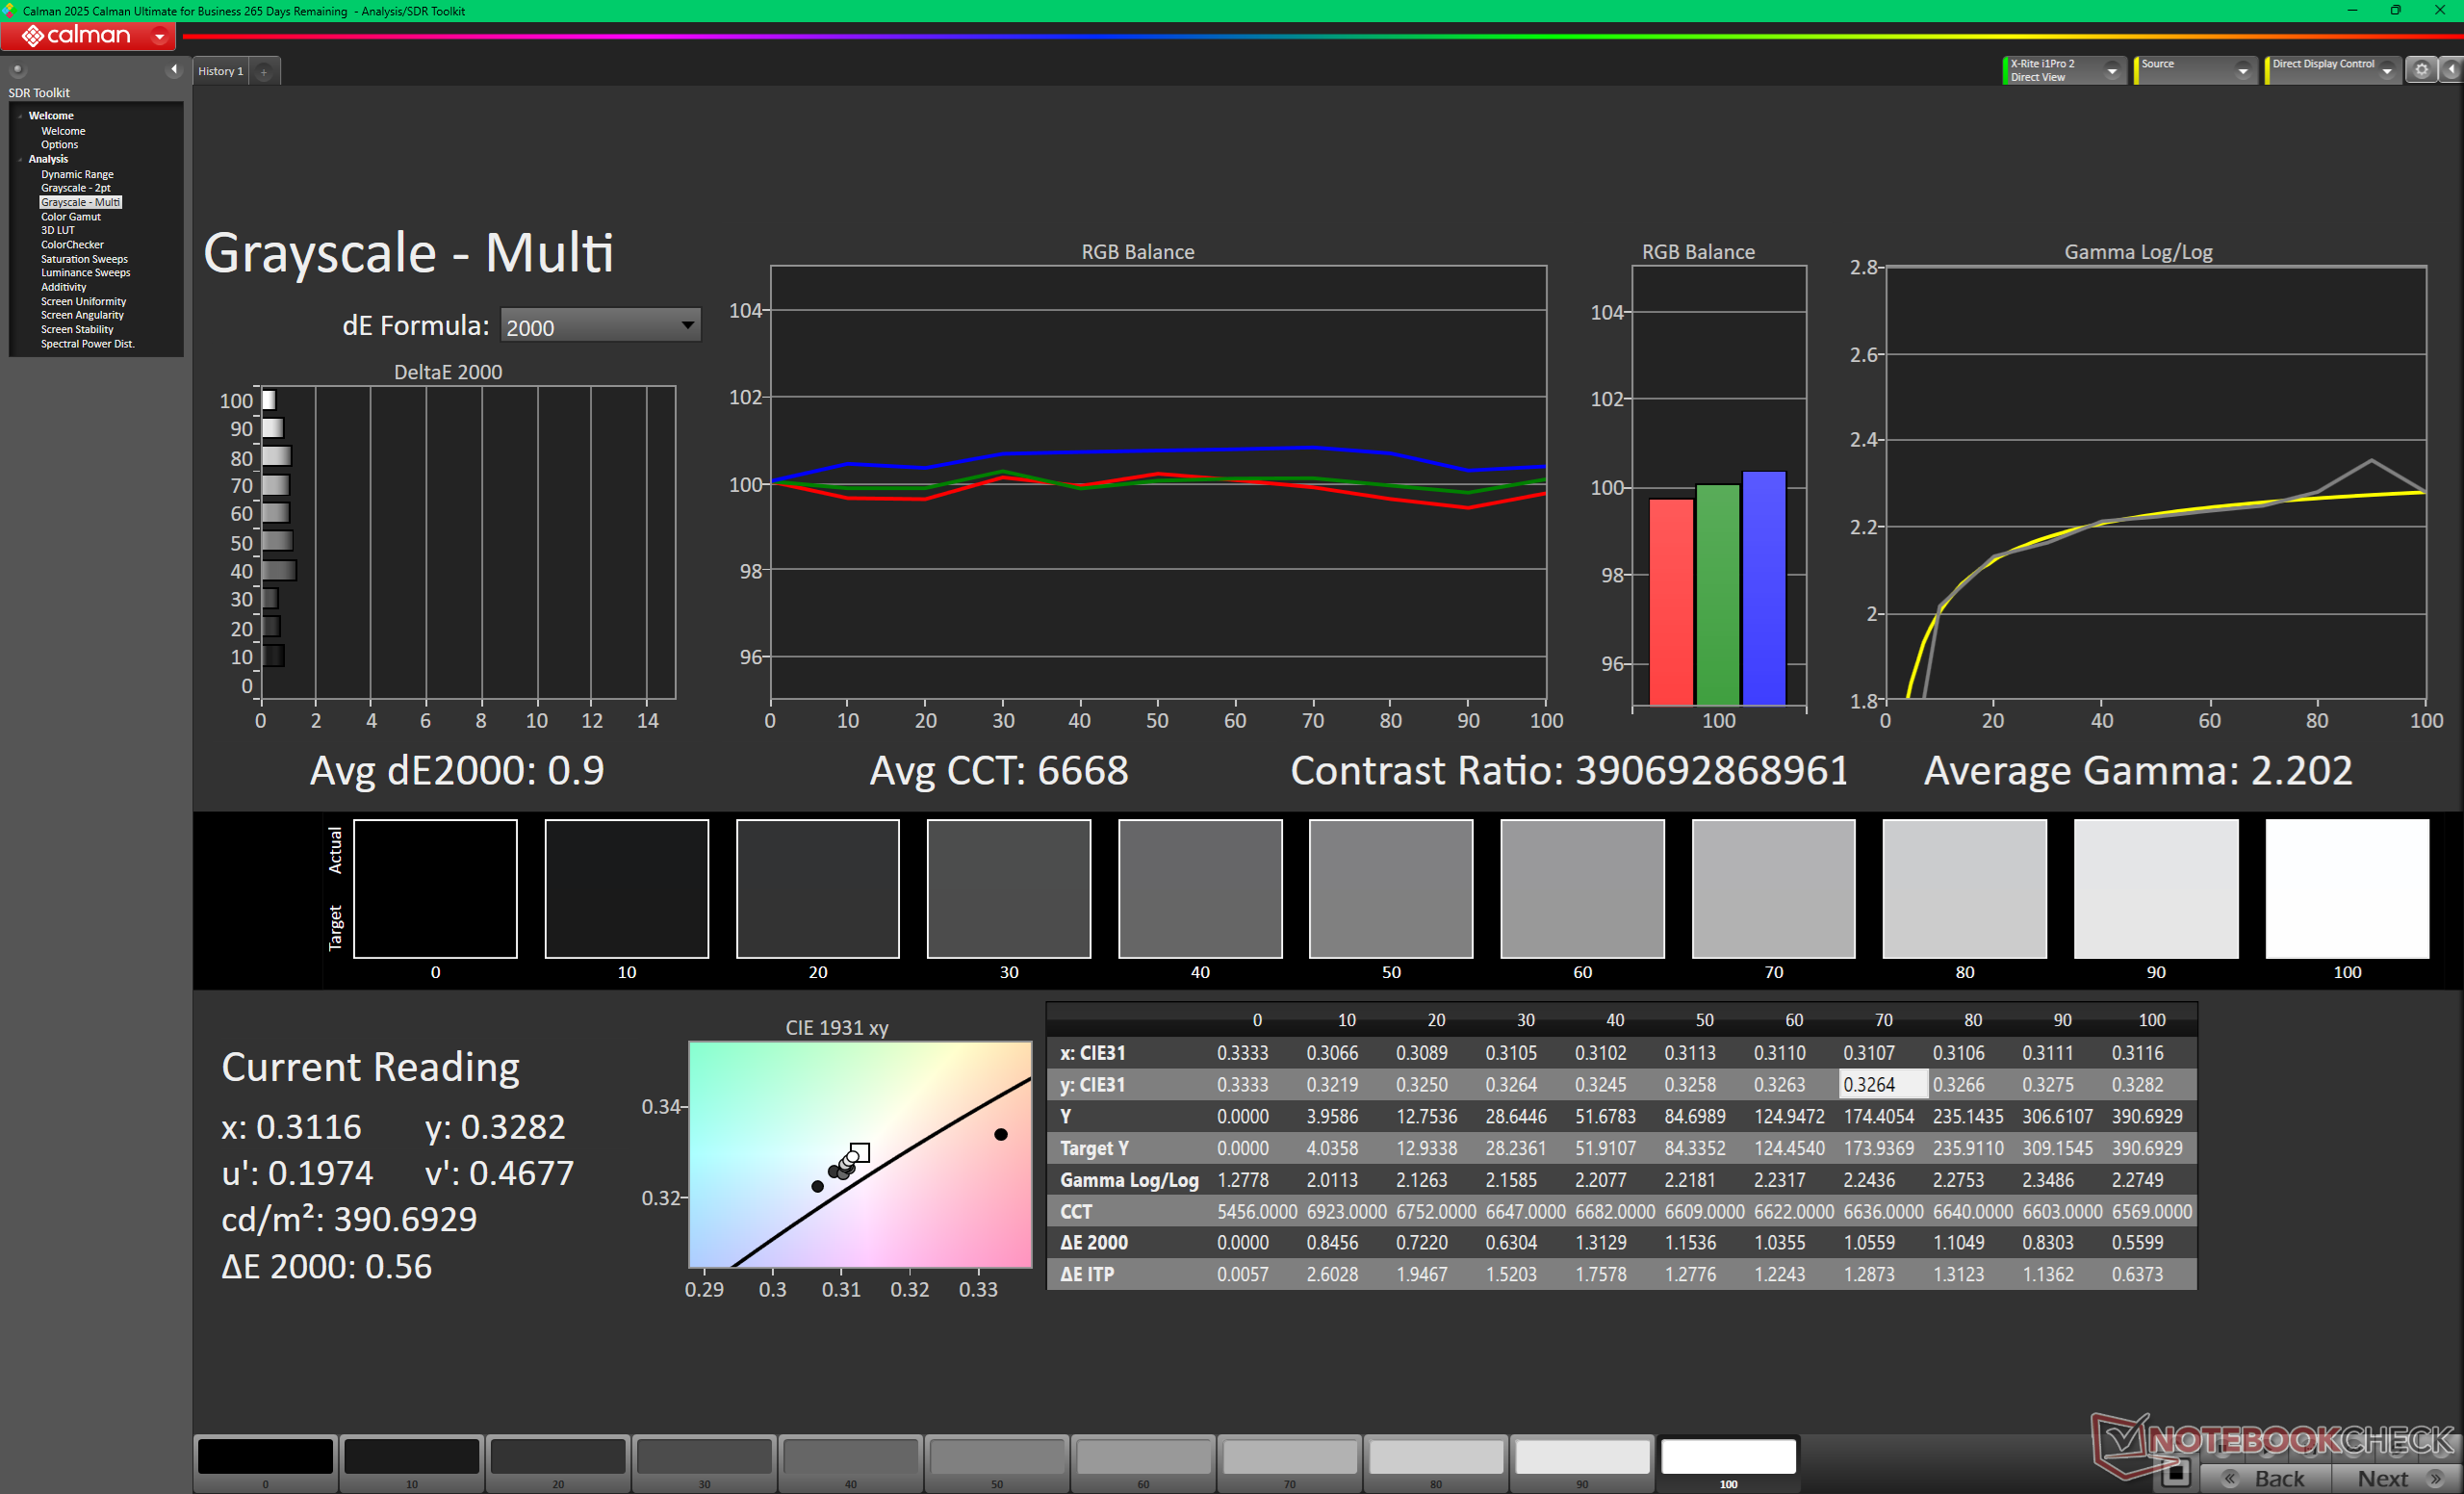
ΔE Greyscale Calman: 1.9 | ∀{0.09-98 Ø4.98}
98% AdobeRGB 1998 (Argyll 3D)
100% sRGB (Argyll 3D)
99.8% Display P3 (Argyll 3D)
Gamma: 2.19
CCT: 6844 K
| MSI Prestige 16 AI C3MTG Samsung ATNA60CL11-0, OLED, 2880x1800, 16", 120 Hz | MSI Prestige 16 AI Evo B2HMG B160QAN03_R, IPS, 2560x1600, 16", 60 Hz | Dell XPS 16 Core Ultra X7 358H LG Philips 160WV1, OLED, 3200x2000, 16", 120 Hz | Asus ZenBook S16 UM5606GA ATNA60HR07-0, OLED, 2880x1800, 16", 120 Hz | Lenovo ThinkBook 16 G7+ AMD LEN160-3.2K, IPS, 3200x2000, 16", 165 Hz | HP Envy x360 2-in-1 16-ad0097nr Samsung SDC41A6, OLED, 2880x1800, 16", 120 Hz | |
|---|---|---|---|---|---|---|
| Display | -6% | -1% | -1% | -5% | -1% | |
| Display P3 Coverage (%) | 99.8 | 96.4 -3% | 99.5 0% | 99.8 0% | 96.3 -4% | 99.6 0% |
| sRGB Coverage (%) | 100 | 99.7 0% | 100 0% | 100 0% | 100 0% | 100 0% |
| AdobeRGB 1998 Coverage (%) | 98 | 84.3 -14% | 96.5 -2% | 94 -4% | 86.9 -11% | 96.5 -2% |
| Response Times | -4924% | -21% | -80% | -1241% | -8% | |
| Response Time Grey 50% / Grey 80% * (ms) | 0.71 ? | 51.5 ? -7154% | 0.65 ? 8% | 1.27 ? -79% | 13.9 ? -1858% | 0.8 ? -13% |
| Response Time Black / White * (ms) | 0.87 ? | 24.3 ? -2693% | 0.87 ? -0% | 0.43 ? 51% | 6.3 ? -624% | 0.89 ? -2% |
| PWM Frequency (Hz) | 460.46 ? | 240.2 ? | 960 ? | 491.8 ? | ||
| PWM Amplitude * (%) | 18 | 31 -72% | 56 -211% | |||
| Screen | -153% | -50% | 12% | -9% | -48% | |
| Brightness middle (cd/m²) | 375 | 471 26% | 395.4 5% | 465 24% | 422 13% | 399.4 7% |
| Brightness (cd/m²) | 380 | 455 20% | 392 3% | 466 23% | 403 6% | 405 7% |
| Brightness Distribution (%) | 98 | 92 -6% | 95 -3% | 99 1% | 93 -5% | 98 0% |
| Black Level * (cd/m²) | 0.2 | 0.3 | ||||
| Colorchecker dE 2000 * | 1.29 | 5.8 -350% | 3.69 -186% | 1 22% | 1.7 -32% | 4.05 -214% |
| Colorchecker dE 2000 max. * | 3.01 | 10.8 -259% | 7.94 -164% | 3 -0% | 3.4 -13% | 6.69 -122% |
| Colorchecker dE 2000 calibrated * | 0.65 | 1.9 -192% | 0.68 -5% | 0.7 -8% | 1.02 -57% | |
| Greyscale dE 2000 * | 1.9 | 7.8 -311% | 1.9 -0% | 1.9 -0% | 2.4 -26% | 1.1 42% |
| Gamma | 2.19 100% | 2.07 106% | 2.28 96% | 2.19 100% | 2.19 100% | 2.27 97% |
| CCT | 6844 95% | 7262 90% | 6274 104% | 6458 101% | 6989 93% | 6419 101% |
| Contrast (:1) | 2355 | 1407 | ||||
| Moyenne finale (programmes/paramètres) | -1694% /
-911% | -24% /
-32% | -23% /
-14% | -418% /
-214% | -19% /
-30% |
* ... Moindre est la valeur, meilleures sont les performances
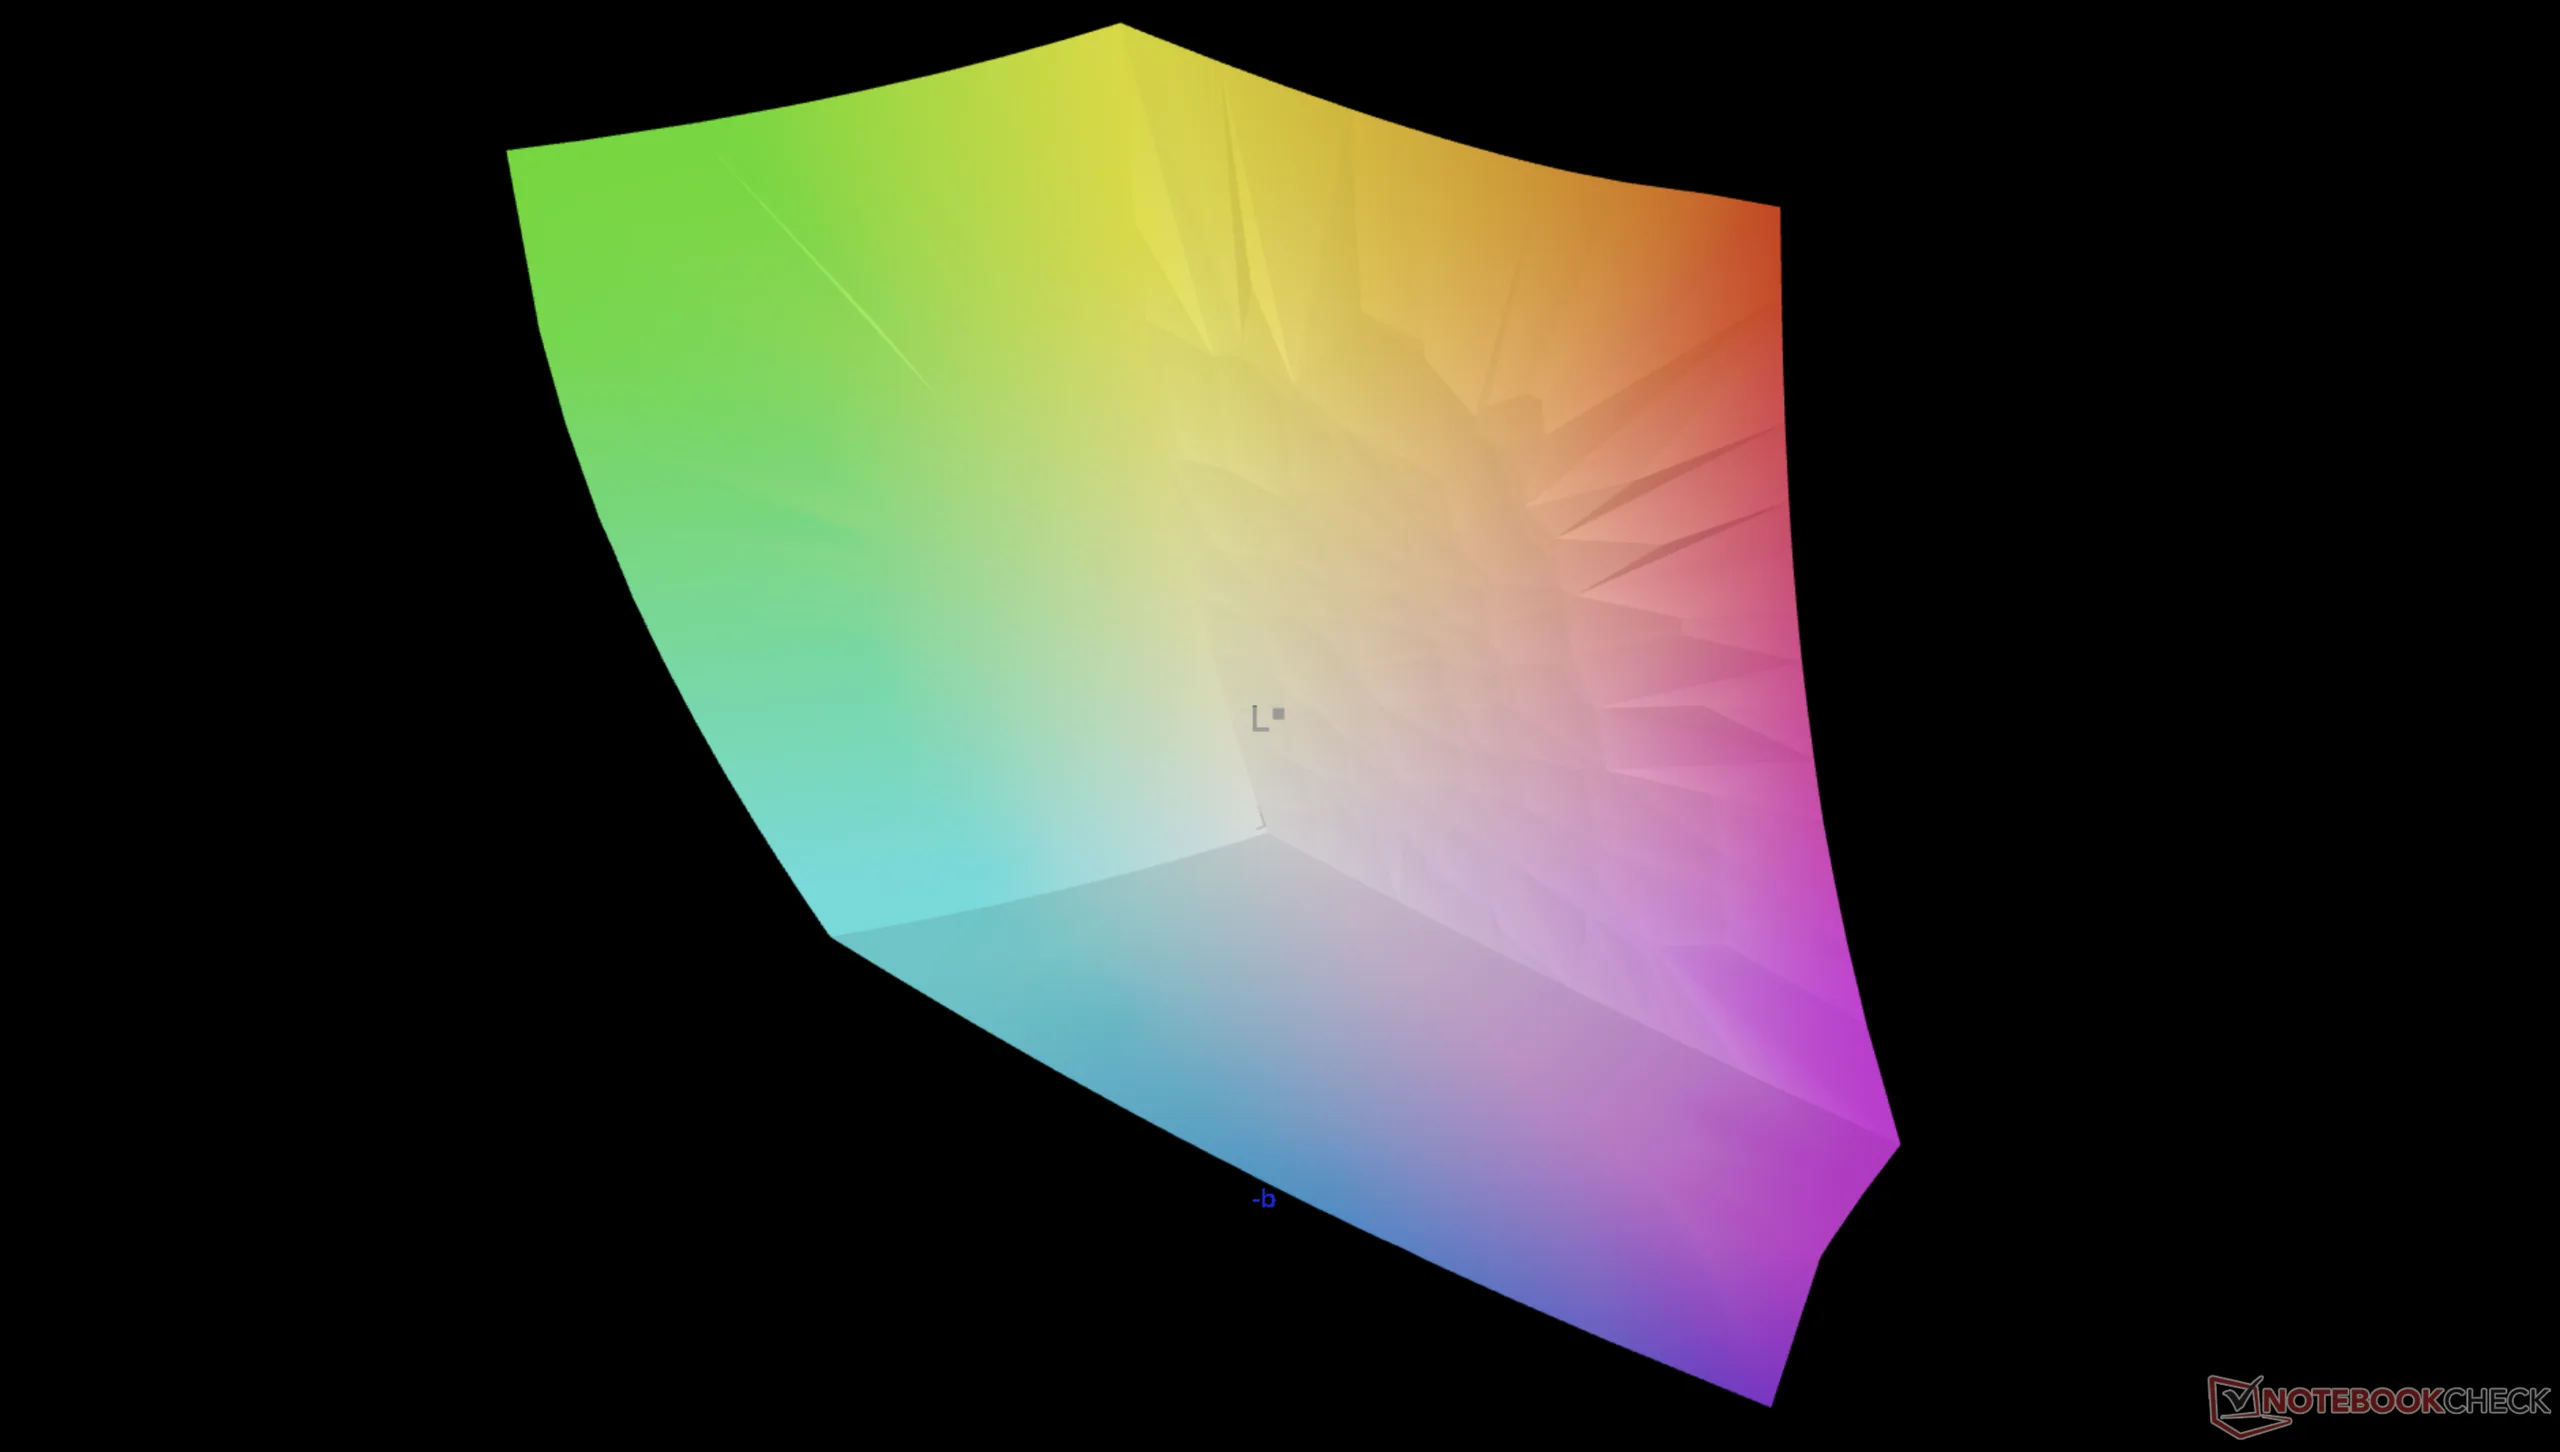
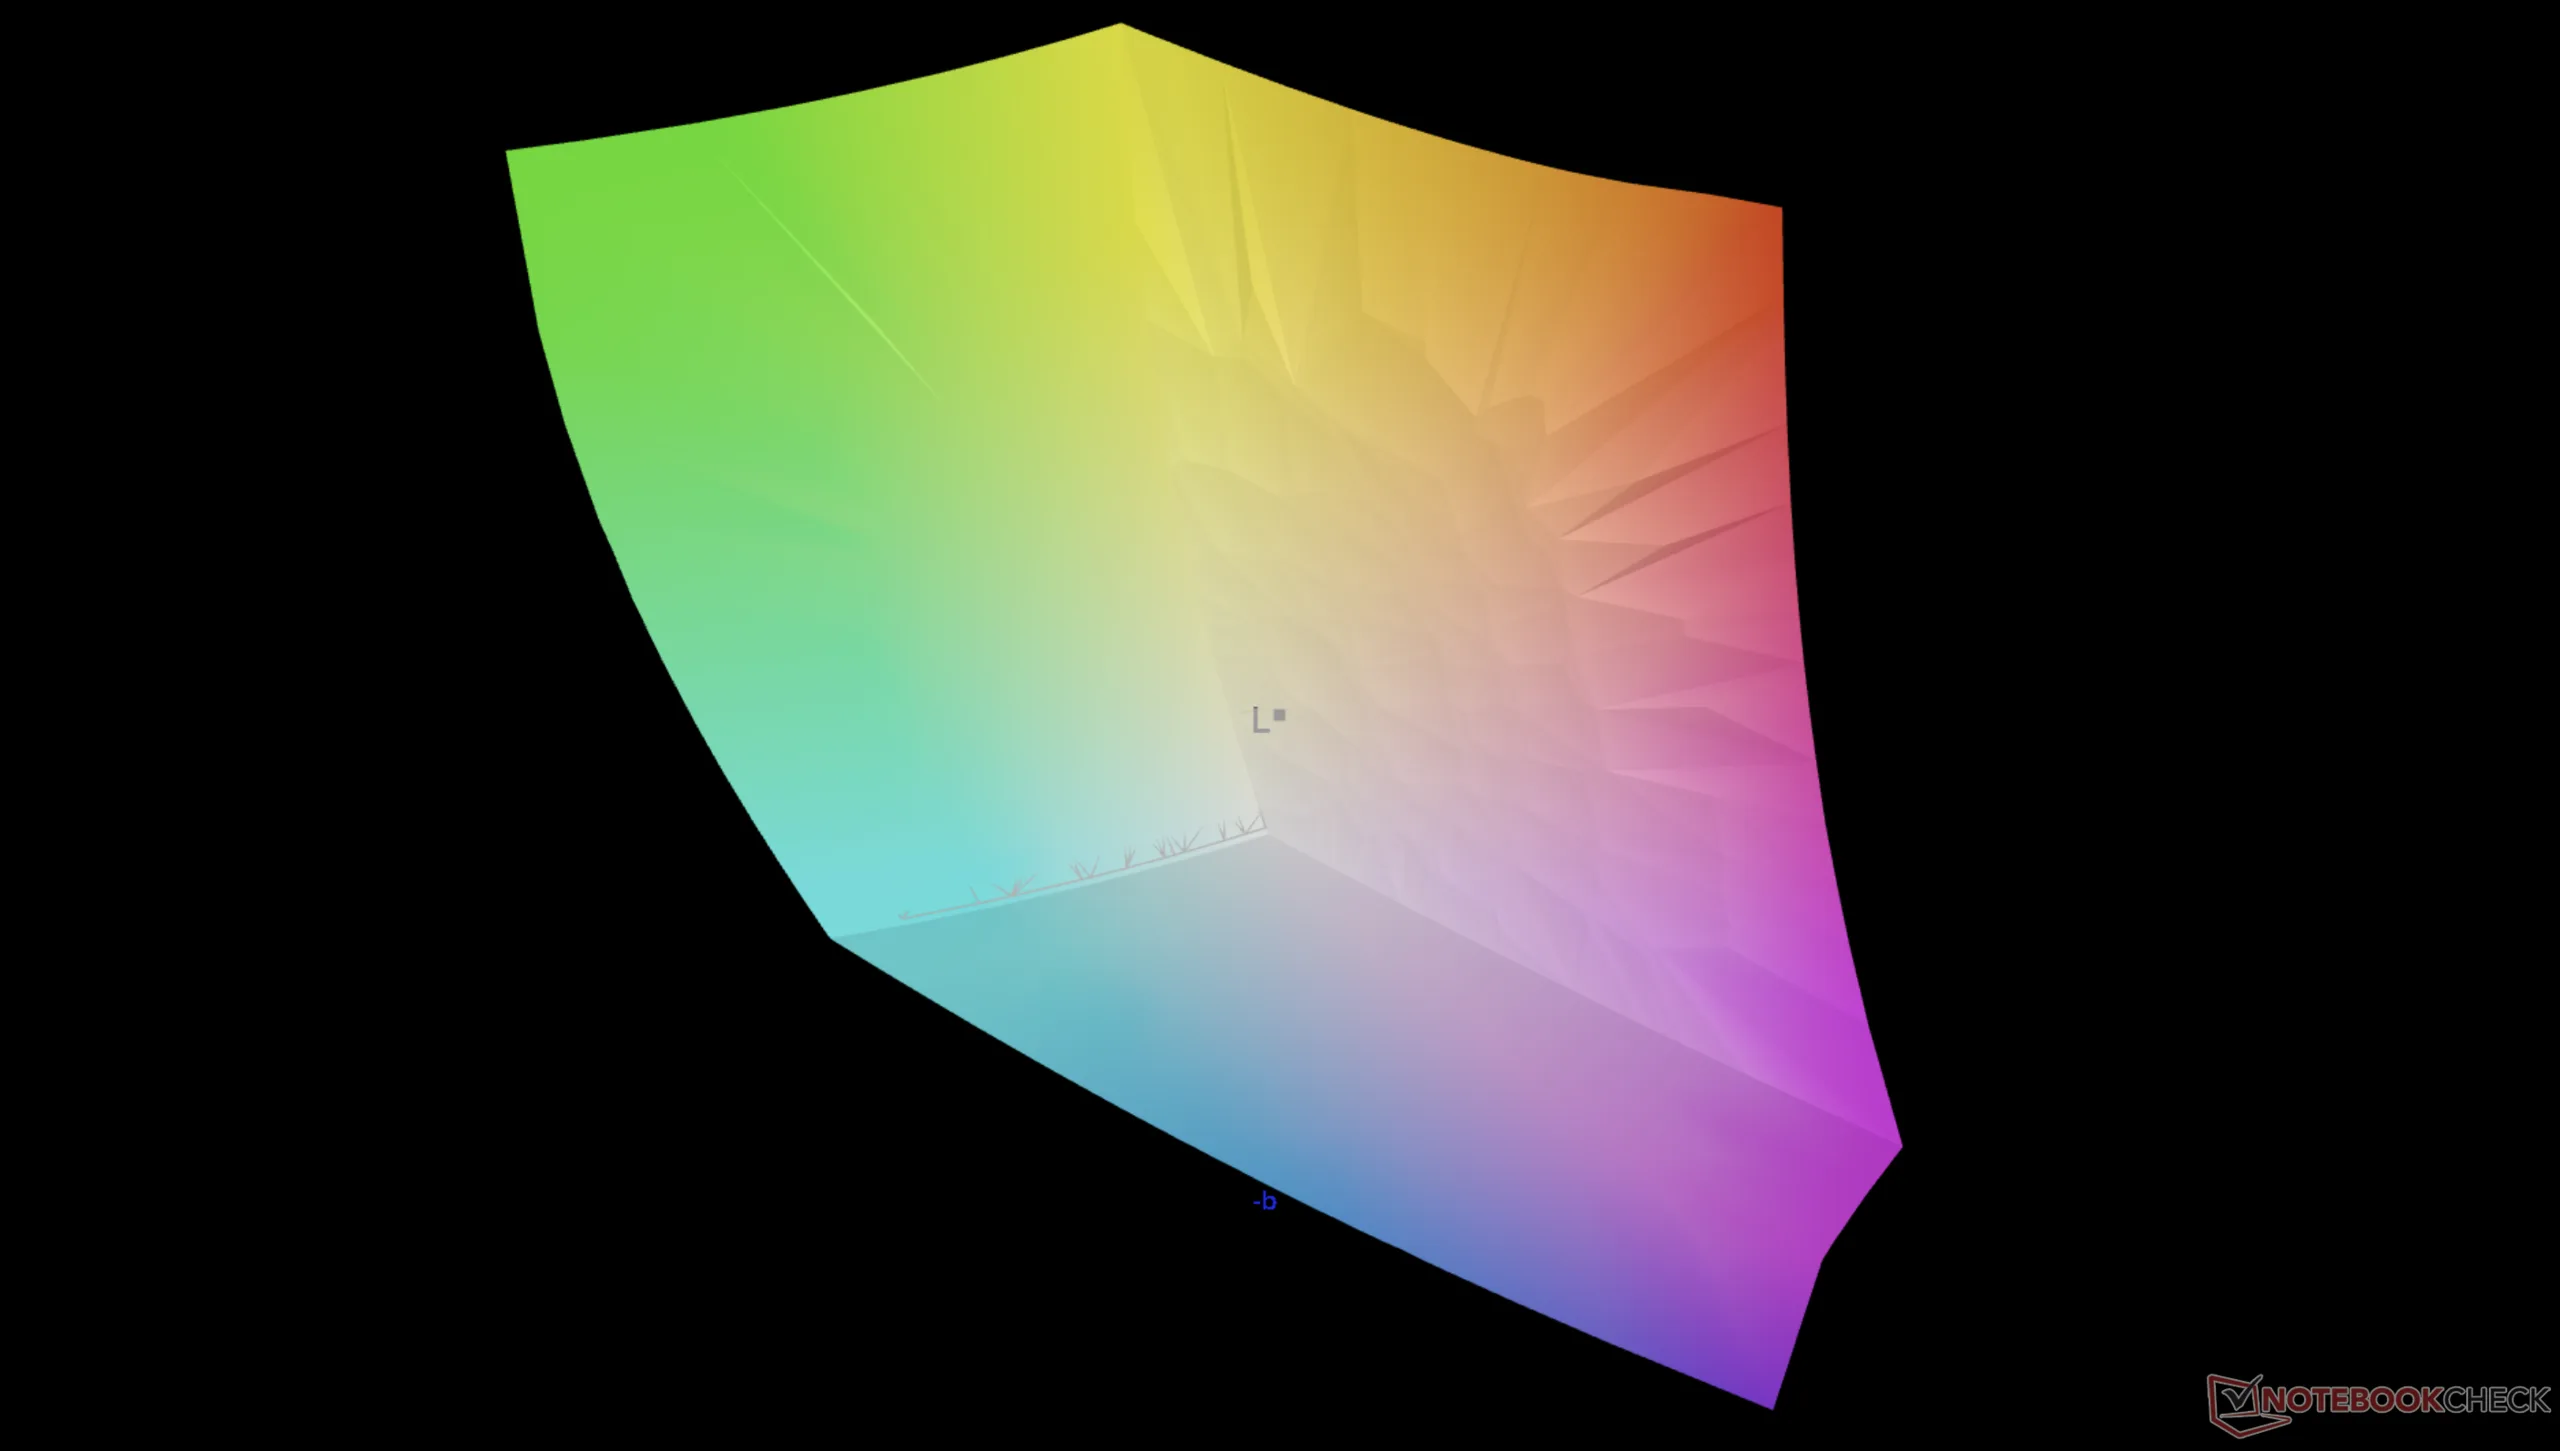
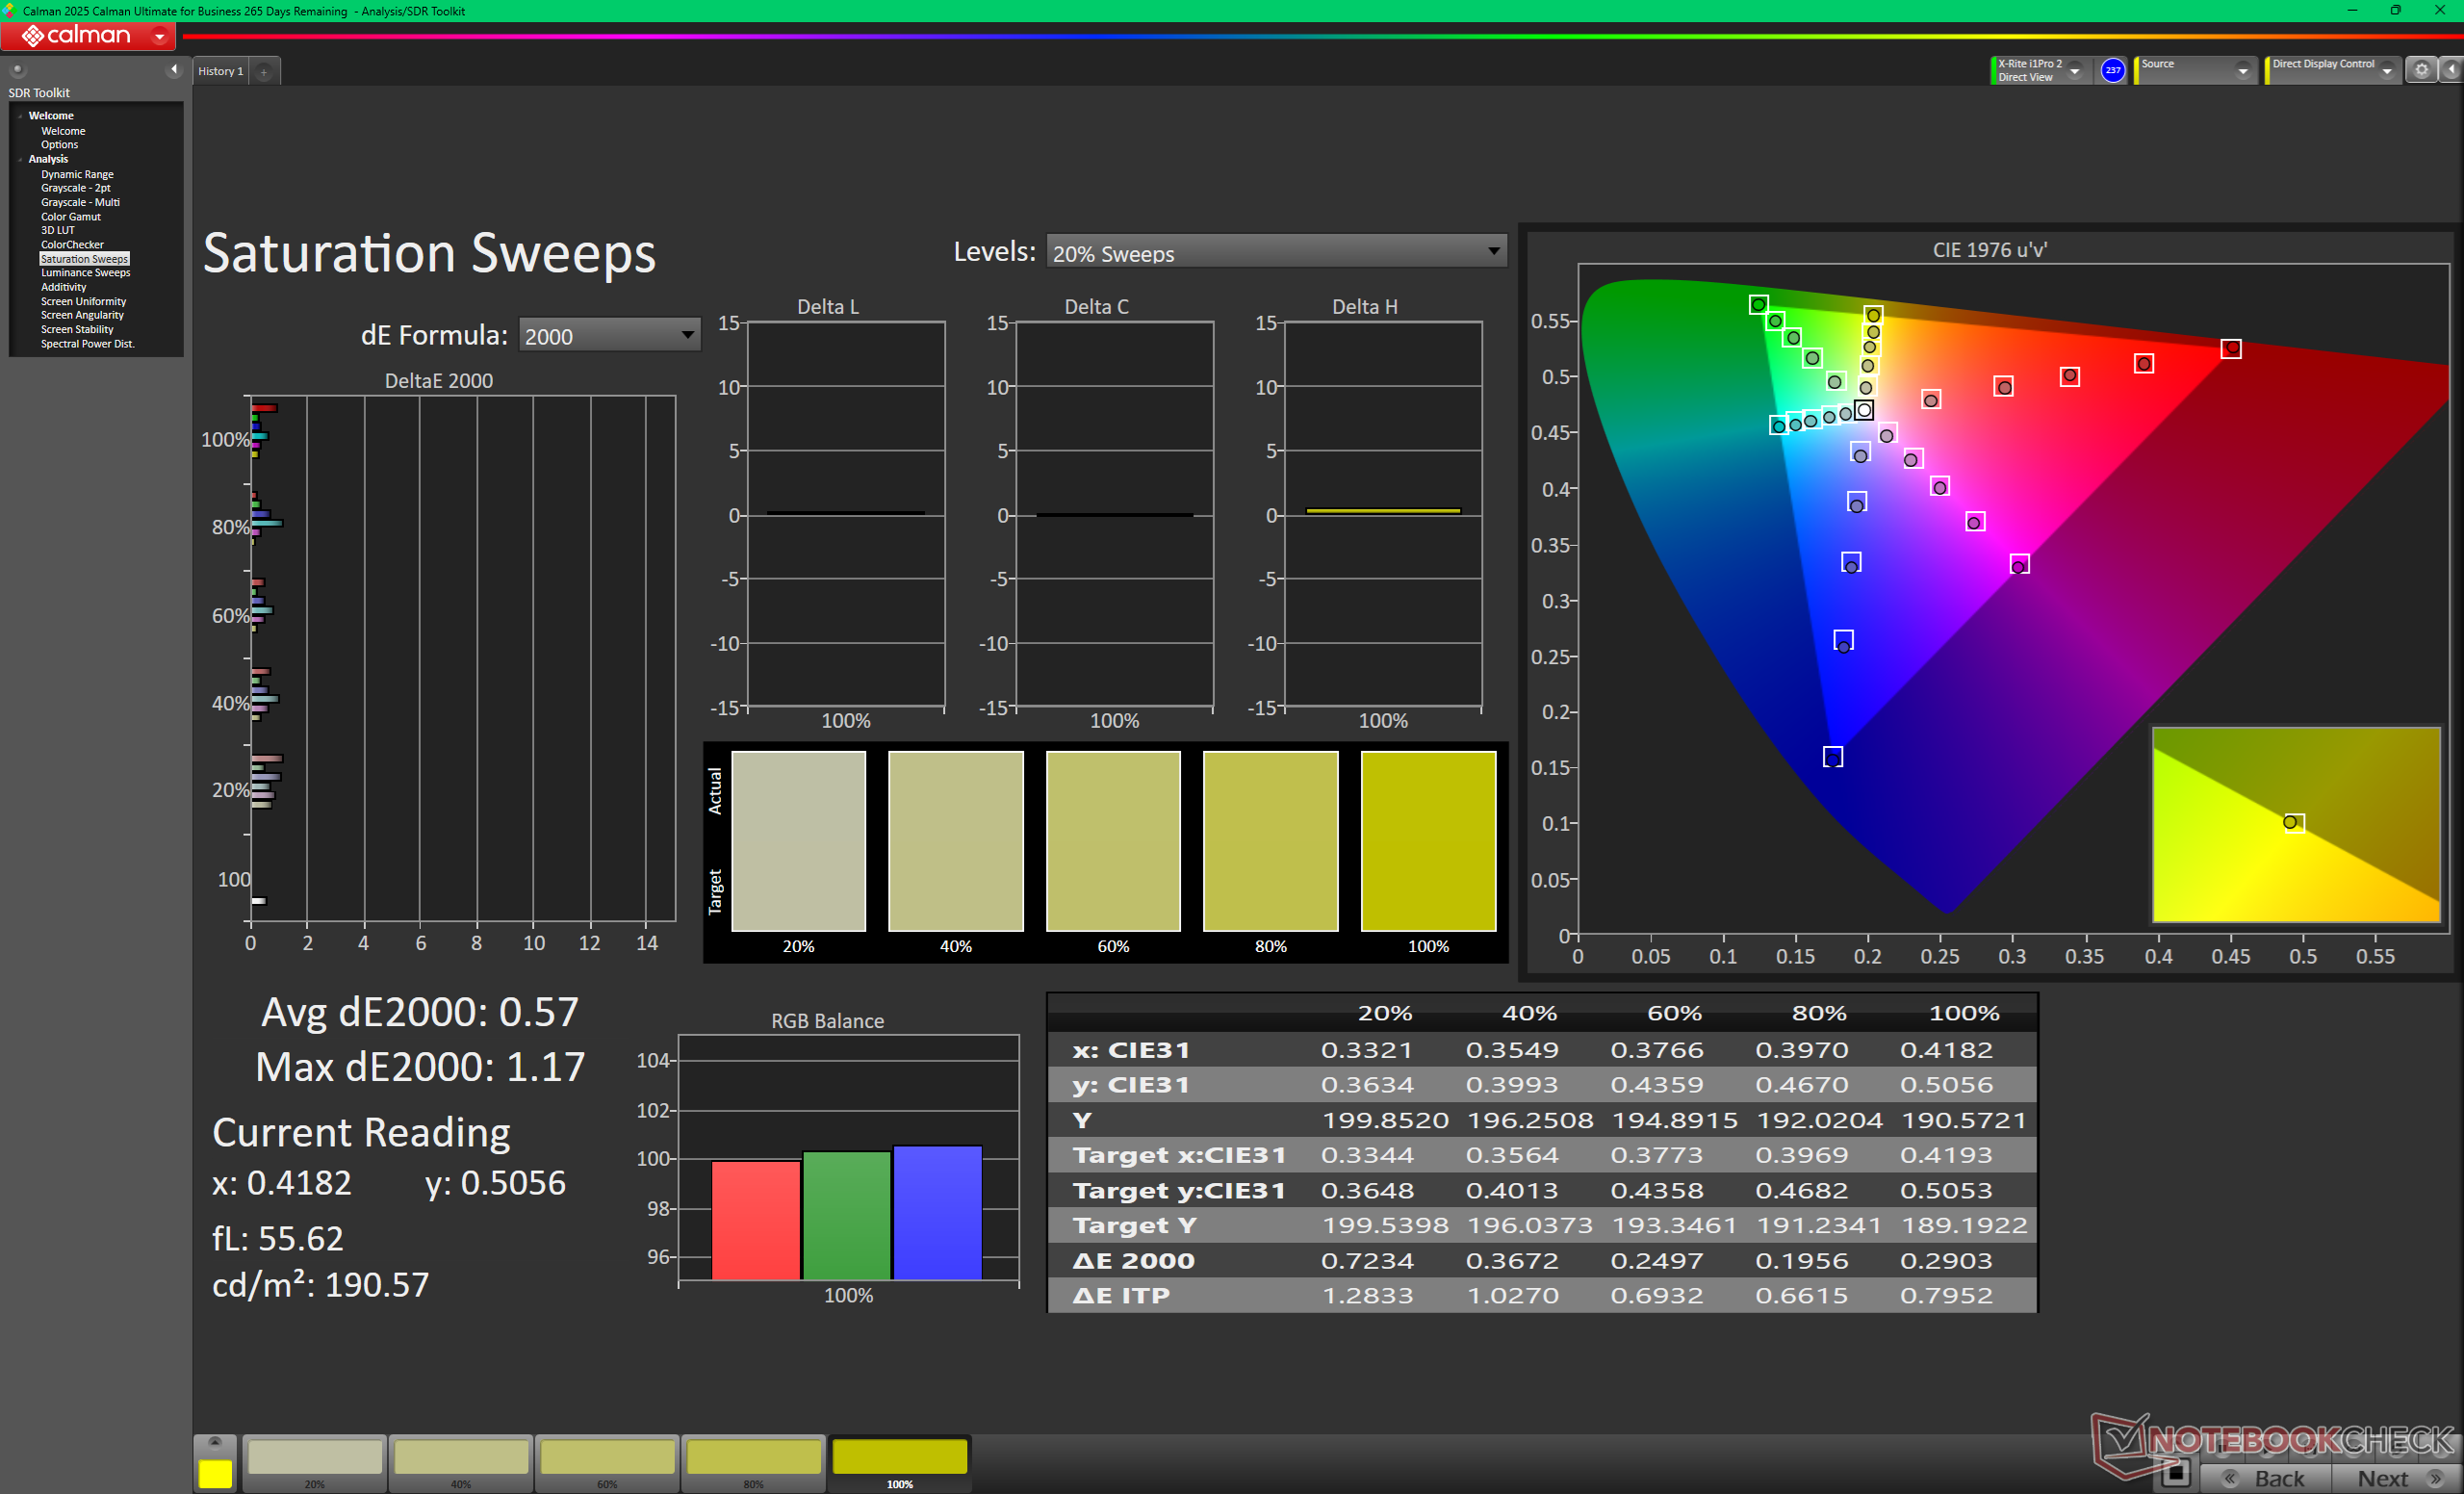
Le système est préréglé et précalibré sur sRGB, même si l'écran OLED prend en charge toutes les couleurs P3. Les valeurs moyennes d'échelle de gris et de couleur deltaE sont déjà très précises, à seulement 1,9 et 1,29, respectivement, avant tout effort d'étalonnage.
Temps de réponse de l'écran
| ↔ Temps de réponse noir à blanc | ||
|---|---|---|
| 0.87 ms ... hausse ↗ et chute ↘ combinées | ↗ 0.41 ms hausse | 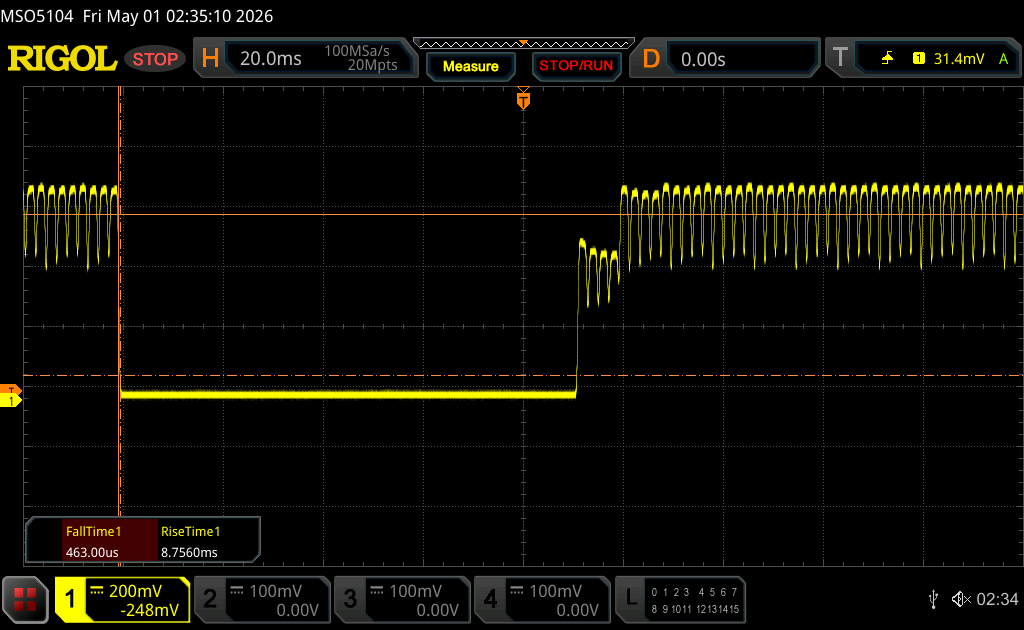 |
| ↘ 0.46 ms chute | ||
| L'écran montre de très faibles temps de réponse, parfait pour le jeu. En comparaison, tous les appareils testés affichent entre 0.1 (minimum) et 240 (maximum) ms. » 3 % des appareils testés affichent de meilleures performances. Cela signifie que les latences relevées sont meilleures que la moyenne (19.9 ms) de tous les appareils testés. | ||
| ↔ Temps de réponse gris 50% à gris 80% | ||
| 0.71 ms ... hausse ↗ et chute ↘ combinées | ↗ 0.38 ms hausse | 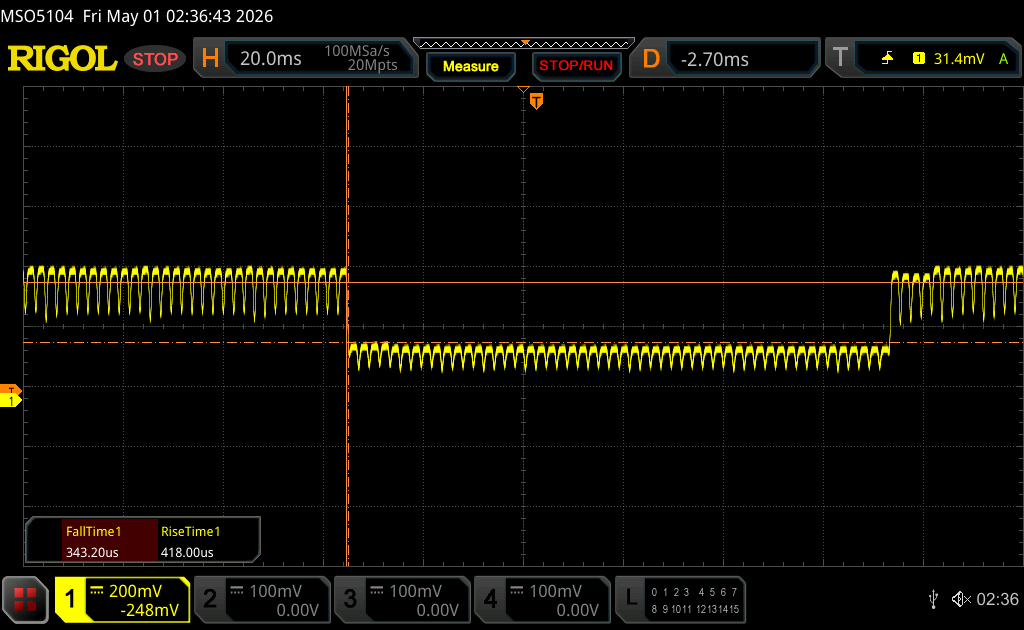 |
| ↘ 0.33 ms chute | ||
| L'écran montre de très faibles temps de réponse, parfait pour le jeu. En comparaison, tous les appareils testés affichent entre 0.165 (minimum) et 636 (maximum) ms. » 2 % des appareils testés affichent de meilleures performances. Cela signifie que les latences relevées sont meilleures que la moyenne (31.2 ms) de tous les appareils testés. | ||
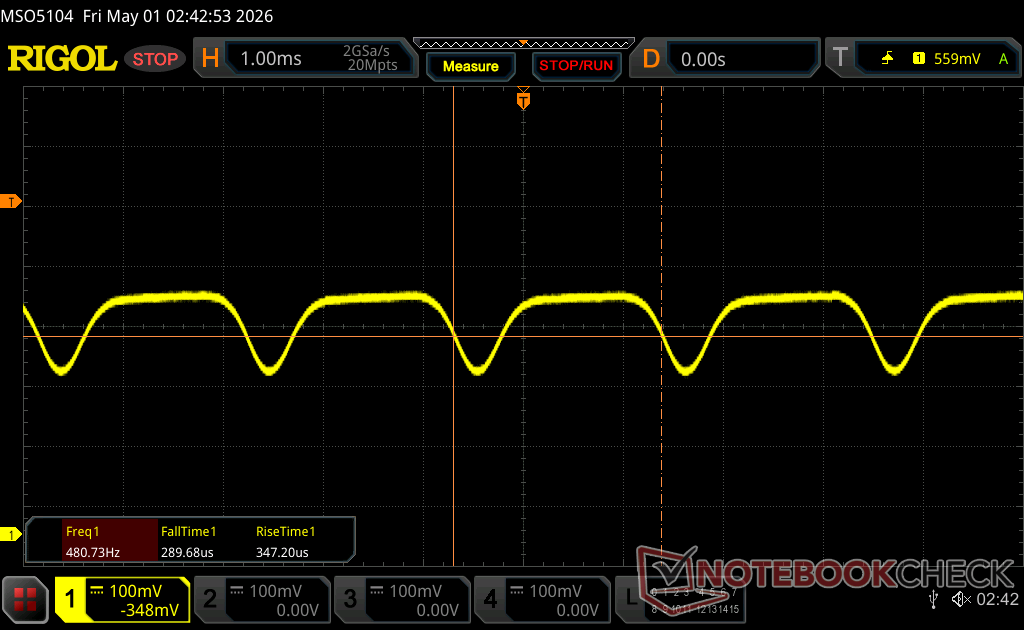
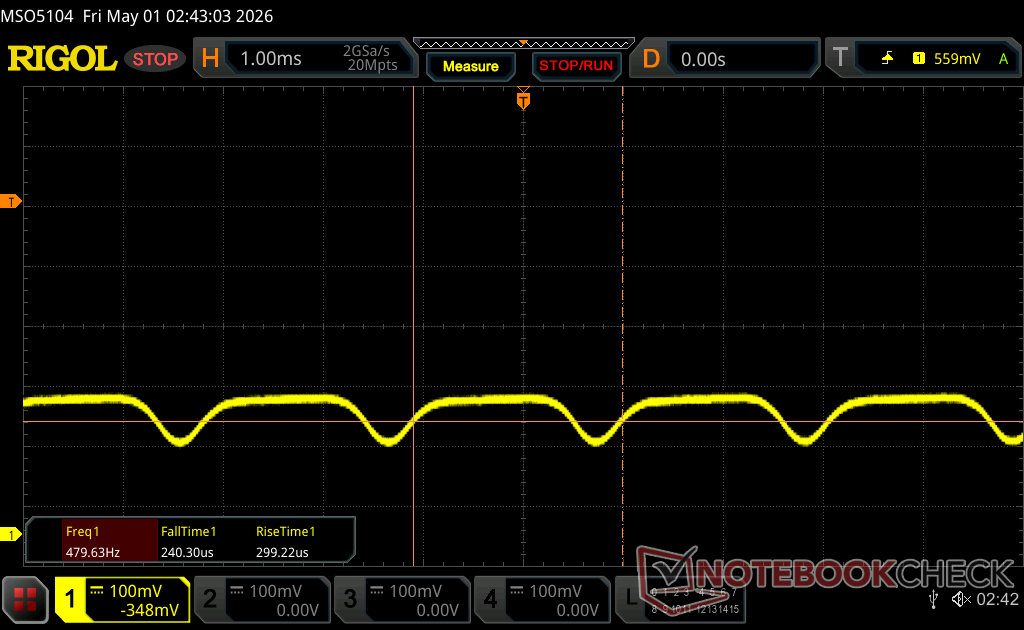
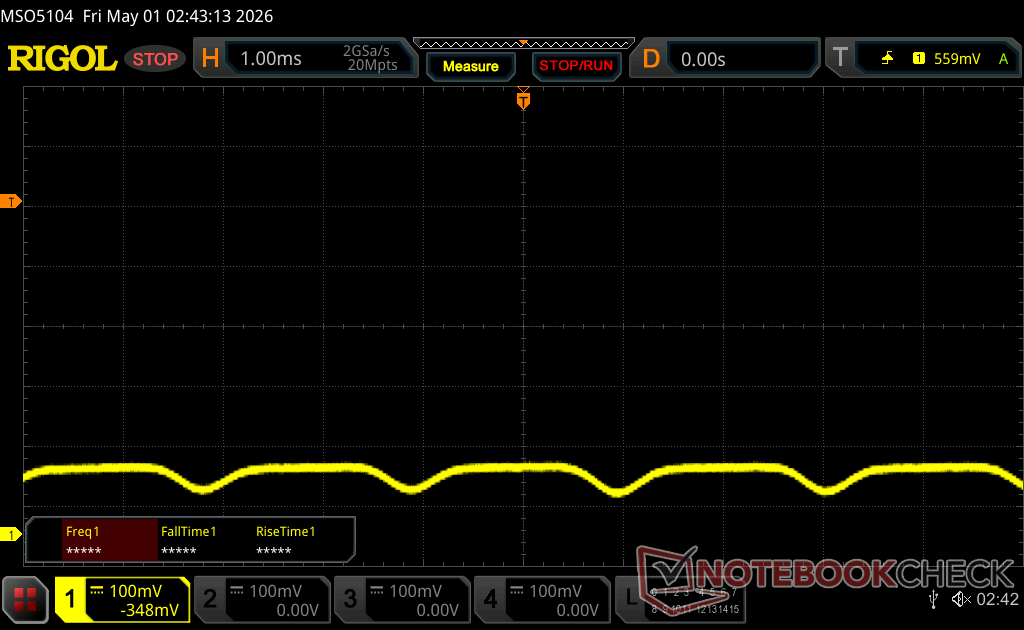
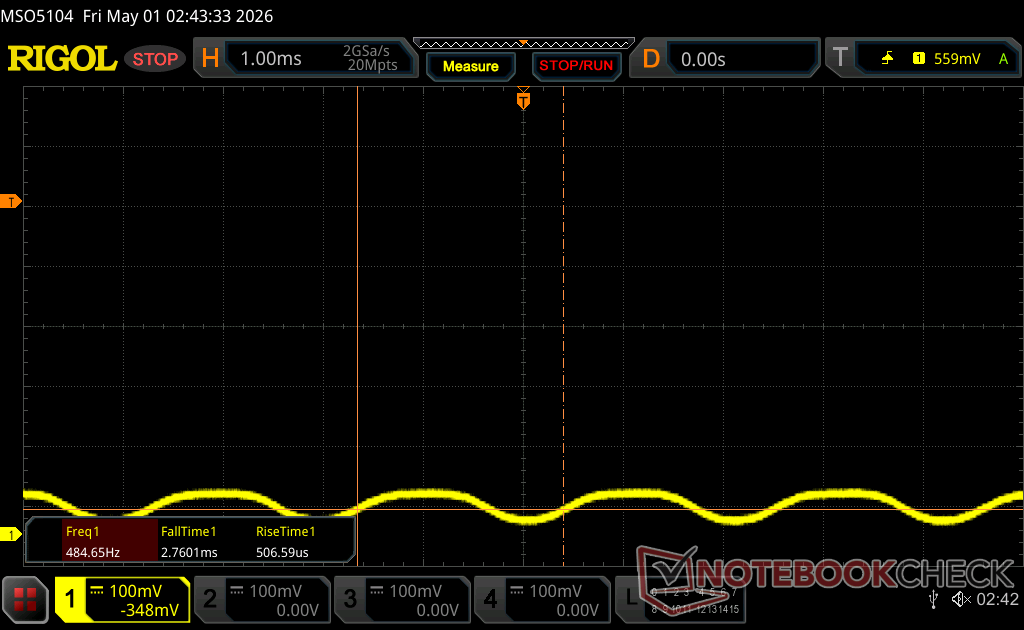
Scintillement / MLI (Modulation de largeur d'impulsion)
| Scintillement / MLI (Modulation de largeur d'impulsion) décelé | 460.46 Hz Amplitude: 18 % | ≤ 100 Niveau de luminosité | 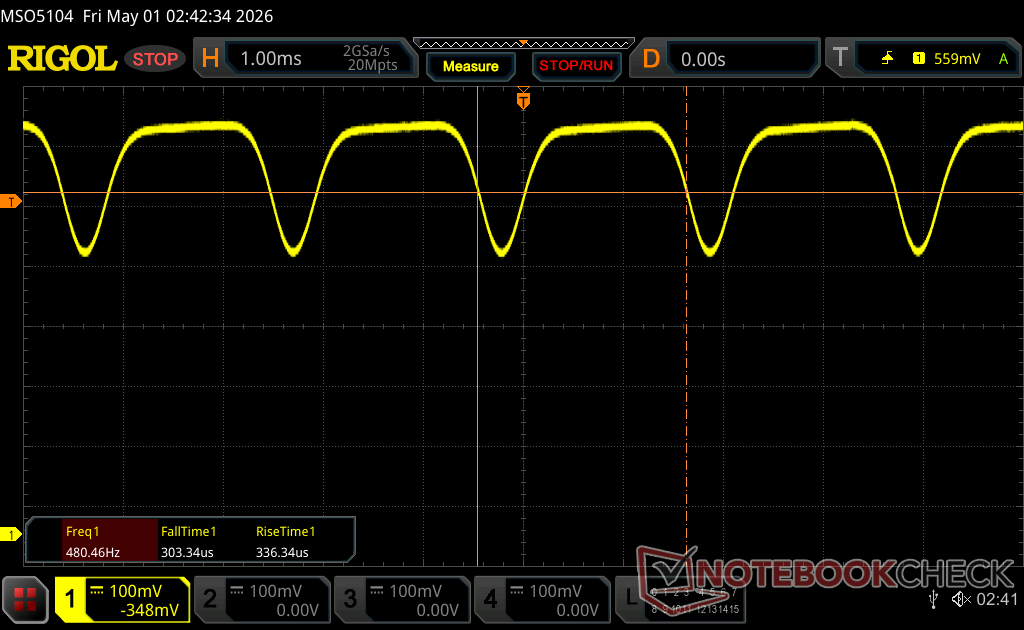 |
Le rétroéclairage de l'écran scintille à la fréquence de 460.46 Hz (certainement du fait de l'utilisation d'une MDI - Modulation de largeur d'impulsion) à un niveau de luminosité inférieur ou égal à 100 % . Aucun scintillement ne devrait être perceptible au-dessus de cette valeur. La fréquence de rafraîchissement de 460.46 Hz est relativement élevée, la grande majorité des utilisateurs ne devrait pas percevLa fréquence de rafraîchissement de 460.46 Hz est relativement élevée, la grande majorité des utilisateurs ne devrait pas percevoir de scintillements et être sujette à une fatigue oculaire accrue.oir de scintillements et être sujette à une fatigue oculaire accrue. Néanmoins certaines personnes pourront toujours percevoir un scintillement. En comparaison, 52 % des appareils testés n'emploient pas MDI pour assombrir leur écran. Nous avons relevé une moyenne à 7873 (minimum : 5 - maximum : 343500) Hz dans le cas où une MDI était active. | |||


Performance
Conditions d'essai
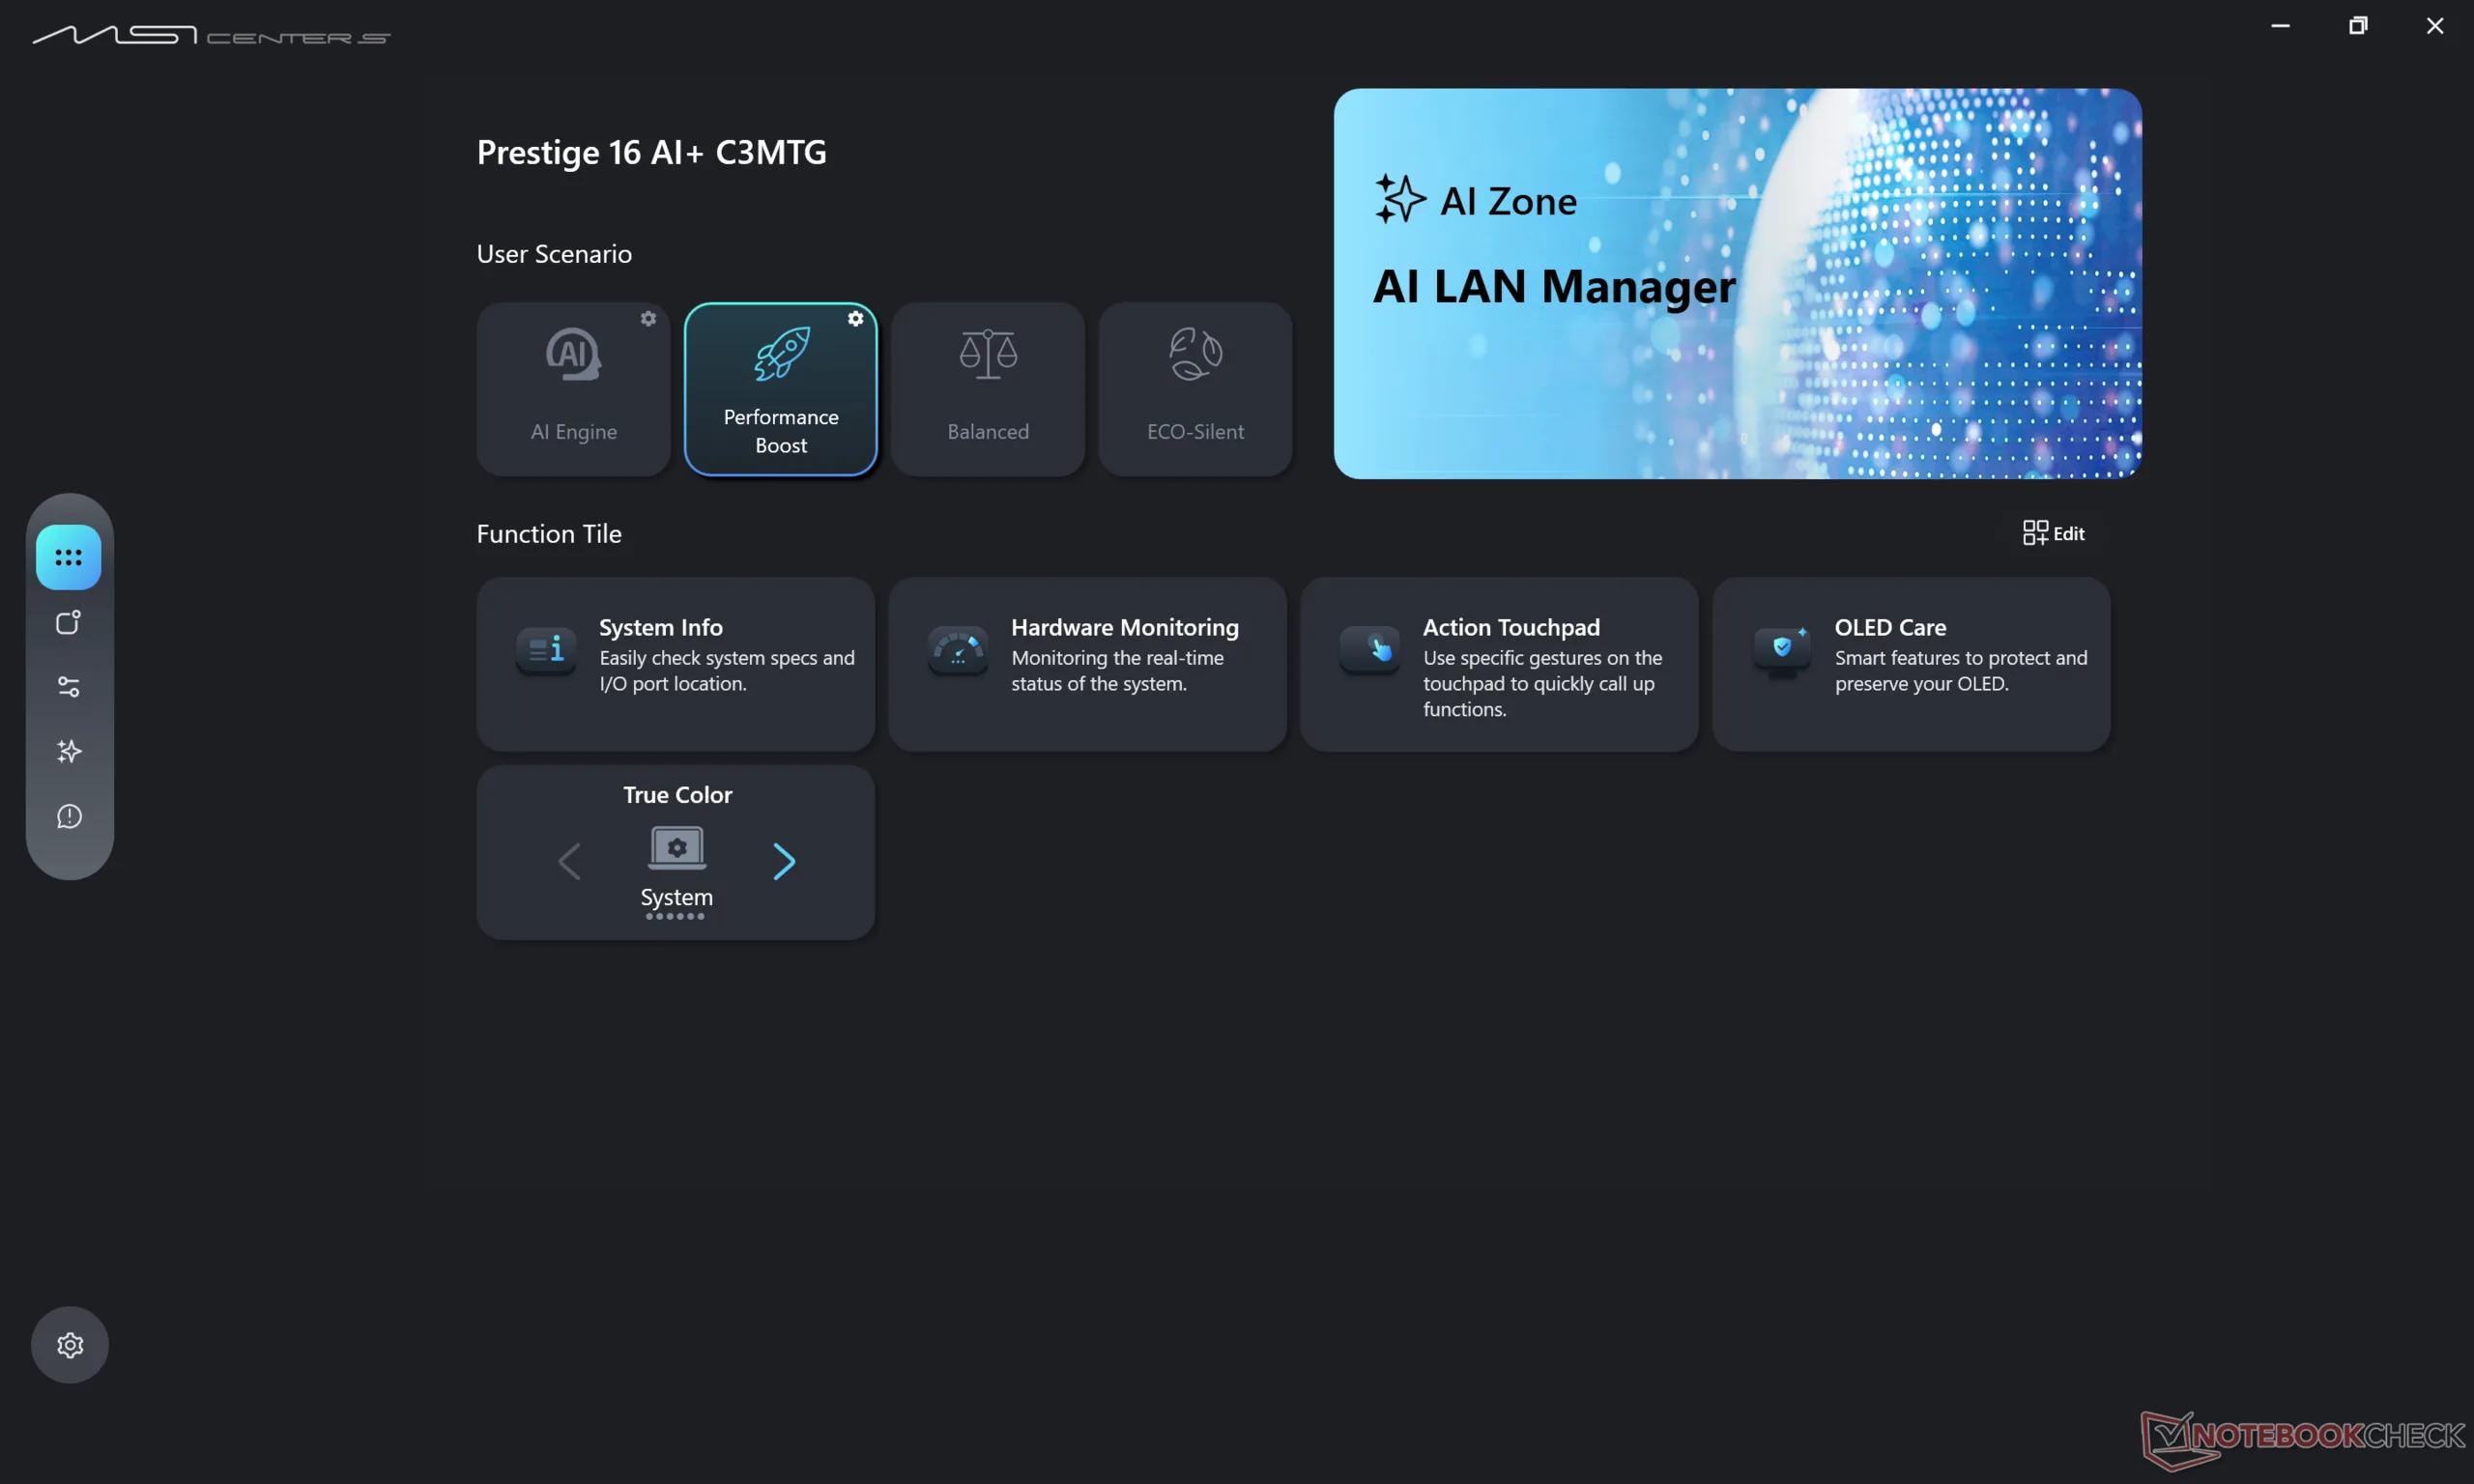
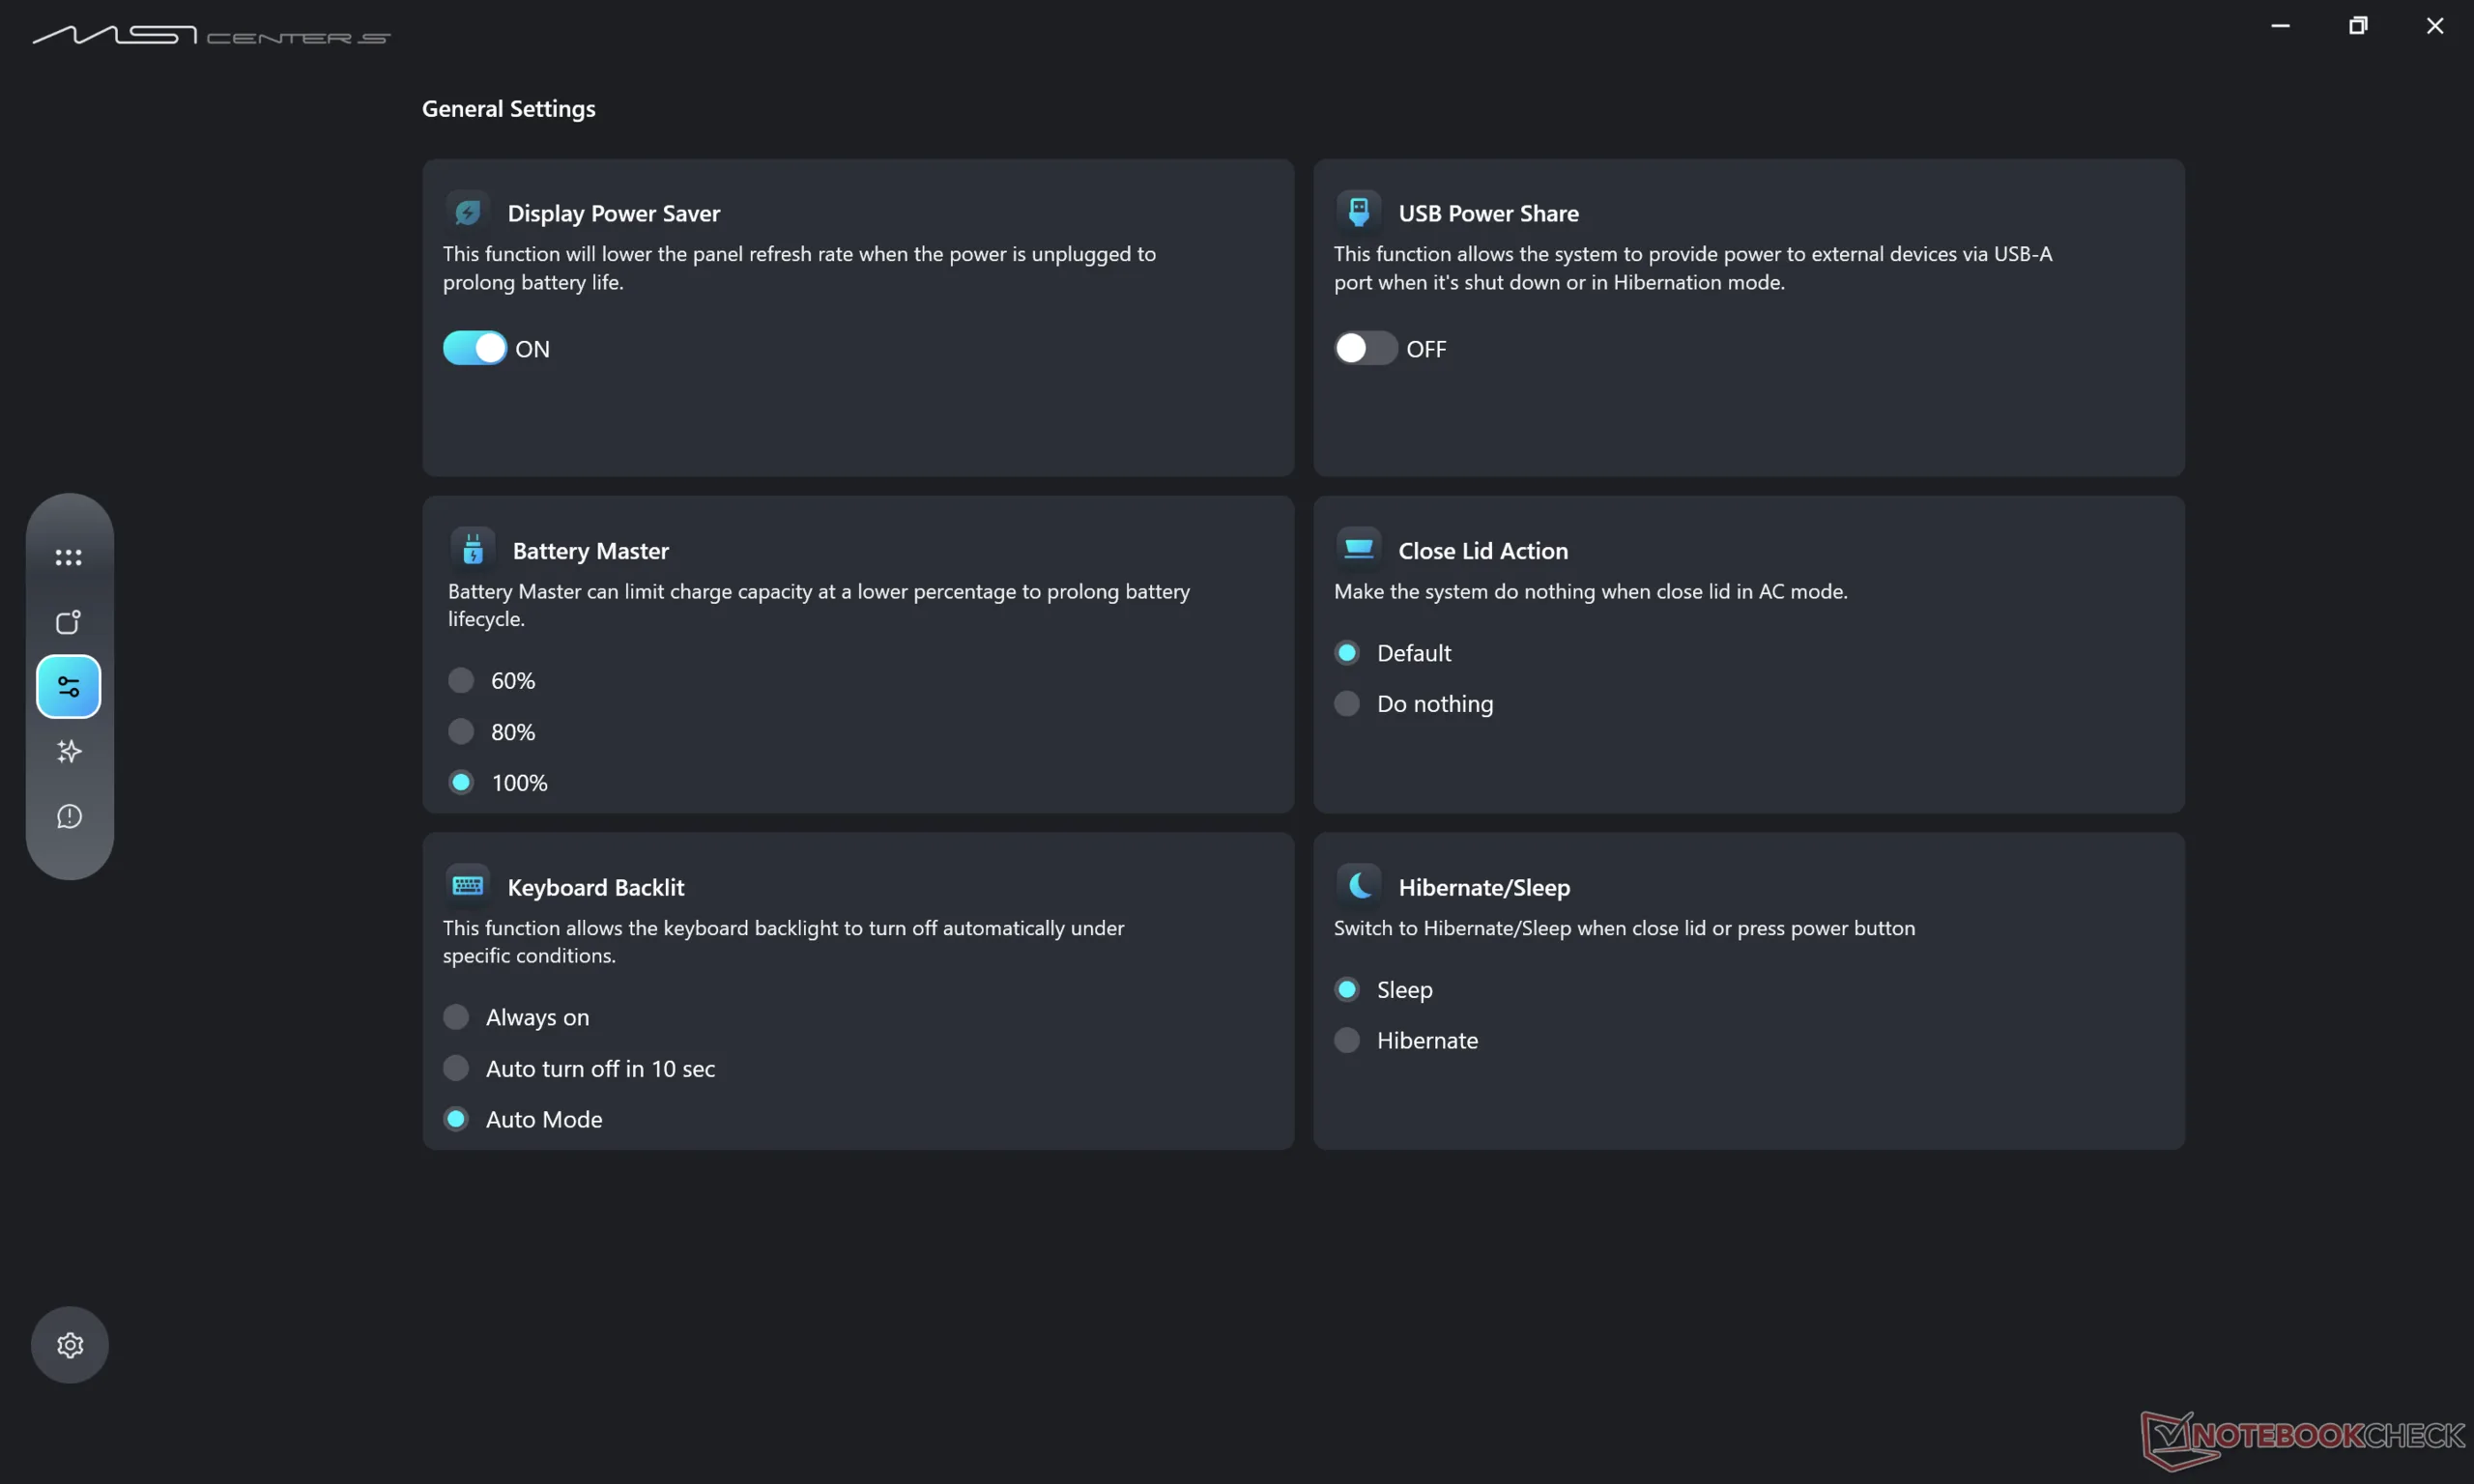
Nous avons réglé MSI Center S et Windows sur le mode Performance avant d'effectuer les tests ci-dessous.
Processeur
Le Core Ultra X7 358H offre des performances plus régulières que le Core Ultra 9 285H dans le 2025 Prestige 16. Alors que ce dernier peut être jusqu'à 10 % plus rapide lorsque Turbo Boost est le plus efficace, l'inverse est vrai une fois que Turbo Boost s'est calmé. Vous pouvez le constater en exécutant CineBench R15 xT en boucle : la Prestige 16 2025 est la machine la plus rapide pendant la première minute environ, avant que la Prestige 16 2026 ne la rattrape par la suite.
En passant au Core Ultra X9 388H devrait augmenter les performances multithread jusqu'à 10 %, d'après notre expérience avec l'Asus ZenBook Duo UX8407AA.
Cinebench R15 Multi Loop
Cinebench R23: Multi Core | Single Core
Cinebench R20: CPU (Multi Core) | CPU (Single Core)
Cinebench R15: CPU Multi 64Bit | CPU Single 64Bit
Blender: v2.79 BMW27 CPU
7-Zip 18.03: 7z b 4 | 7z b 4 -mmt1
Geekbench 6.6: Multi-Core | Single-Core
Geekbench 5.5: Multi-Core | Single-Core
HWBOT x265 Benchmark v2.2: 4k Preset
LibreOffice : 20 Documents To PDF
R Benchmark 2.5: Overall mean
* ... Moindre est la valeur, meilleures sont les performances
AIDA64: FP32 Ray-Trace | FPU Julia | CPU SHA3 | CPU Queen | FPU SinJulia | FPU Mandel | CPU AES | CPU ZLib | FP64 Ray-Trace | CPU PhotoWorxx | CPU CheckMate
| Performance rating | |
| Asus ZenBook S16 UM5606GA -1! | |
| Lenovo ThinkBook 16 G7+ AMD -1! | |
| Dell XPS 16 Core Ultra X7 358H -1! | |
| HP Envy x360 2-in-1 16-ad0097nr -1! | |
| MSI Prestige 16 AI C3MTG -1! | |
| MSI Prestige 16 AI Evo B2HMG -1! | |
| Moyenne Intel Core Ultra X7 358H | |
| AIDA64 / FP32 Ray-Trace | |
| Lenovo ThinkBook 16 G7+ AMD (v6.92.6600) | |
| Asus ZenBook S16 UM5606GA (v6.92.6600) | |
| HP Envy x360 2-in-1 16-ad0097nr (v6.92.6600) | |
| MSI Prestige 16 AI Evo B2HMG (v6.92.6600) | |
| MSI Prestige 16 AI C3MTG (v8.20.8100) | |
| Dell XPS 16 Core Ultra X7 358H (v8.20.8100) | |
| Moyenne Intel Core Ultra X7 358H (12221 - 17932, n=7) | |
| AIDA64 / FPU Julia | |
| Lenovo ThinkBook 16 G7+ AMD (v6.92.6600) | |
| Asus ZenBook S16 UM5606GA (v6.92.6600) | |
| MSI Prestige 16 AI Evo B2HMG (v6.92.6600) | |
| HP Envy x360 2-in-1 16-ad0097nr (v6.92.6600) | |
| MSI Prestige 16 AI C3MTG (v8.20.8100) | |
| Dell XPS 16 Core Ultra X7 358H (v8.20.8100) | |
| Moyenne Intel Core Ultra X7 358H (29930 - 95525, n=7) | |
| AIDA64 / CPU SHA3 | |
| Lenovo ThinkBook 16 G7+ AMD (v6.92.6600) | |
| Asus ZenBook S16 UM5606GA (v6.92.6600) | |
| Moyenne Intel Core Ultra X7 358H (3910 - 4911, n=7) | |
| MSI Prestige 16 AI Evo B2HMG (v6.92.6600) | |
| Dell XPS 16 Core Ultra X7 358H (v8.20.8100) | |
| MSI Prestige 16 AI C3MTG (v8.20.8100) | |
| HP Envy x360 2-in-1 16-ad0097nr (v6.92.6600) | |
| AIDA64 / CPU Queen | |
| HP Envy x360 2-in-1 16-ad0097nr (v6.92.6600) | |
| Asus ZenBook S16 UM5606GA (v6.92.6600) | |
| Lenovo ThinkBook 16 G7+ AMD (v6.92.6600) | |
| MSI Prestige 16 AI Evo B2HMG (v6.92.6600) | |
| Moyenne Intel Core Ultra X7 358H (63425 - 63827, n=2) | |
| AIDA64 / FPU SinJulia | |
| Lenovo ThinkBook 16 G7+ AMD (v6.92.6600) | |
| Asus ZenBook S16 UM5606GA (v6.92.6600) | |
| HP Envy x360 2-in-1 16-ad0097nr (v6.92.6600) | |
| MSI Prestige 16 AI Evo B2HMG (v6.92.6600) | |
| Dell XPS 16 Core Ultra X7 358H (v8.20.8100) | |
| MSI Prestige 16 AI C3MTG (v8.20.8100) | |
| Moyenne Intel Core Ultra X7 358H (4735 - 7038, n=7) | |
| AIDA64 / FPU Mandel | |
| Lenovo ThinkBook 16 G7+ AMD (v6.92.6600) | |
| Asus ZenBook S16 UM5606GA (v6.92.6600) | |
| MSI Prestige 16 AI Evo B2HMG (v6.92.6600) | |
| HP Envy x360 2-in-1 16-ad0097nr (v6.92.6600) | |
| Dell XPS 16 Core Ultra X7 358H (v8.20.8100) | |
| MSI Prestige 16 AI C3MTG (v8.20.8100) | |
| Moyenne Intel Core Ultra X7 358H (14716 - 50734, n=7) | |
| AIDA64 / CPU AES | |
| Asus ZenBook S16 UM5606GA (v6.92.6600) | |
| HP Envy x360 2-in-1 16-ad0097nr (v6.92.6600) | |
| Lenovo ThinkBook 16 G7+ AMD (v6.92.6600) | |
| MSI Prestige 16 AI Evo B2HMG (v6.92.6600) | |
| MSI Prestige 16 AI C3MTG (v8.20.8100) | |
| Dell XPS 16 Core Ultra X7 358H (v8.20.8100) | |
| Moyenne Intel Core Ultra X7 358H (5127 - 67510, n=7) | |
| AIDA64 / CPU ZLib | |
| Lenovo ThinkBook 16 G7+ AMD (v6.92.6600) | |
| Asus ZenBook S16 UM5606GA (v6.92.6600) | |
| Moyenne Intel Core Ultra X7 358H (932 - 1179, n=7) | |
| MSI Prestige 16 AI Evo B2HMG (v6.92.6600) | |
| MSI Prestige 16 AI C3MTG (v8.20.8100) | |
| Dell XPS 16 Core Ultra X7 358H (v8.20.8100) | |
| HP Envy x360 2-in-1 16-ad0097nr (v6.92.6600) | |
| AIDA64 / FP64 Ray-Trace | |
| Lenovo ThinkBook 16 G7+ AMD (v6.92.6600) | |
| Asus ZenBook S16 UM5606GA (v6.92.6600) | |
| HP Envy x360 2-in-1 16-ad0097nr (v6.92.6600) | |
| MSI Prestige 16 AI Evo B2HMG (v6.92.6600) | |
| MSI Prestige 16 AI C3MTG (v8.20.8100) | |
| Dell XPS 16 Core Ultra X7 358H (v8.20.8100) | |
| Moyenne Intel Core Ultra X7 358H (6506 - 9447, n=7) | |
| AIDA64 / CPU PhotoWorxx | |
| Dell XPS 16 Core Ultra X7 358H (v8.20.8100) | |
| MSI Prestige 16 AI C3MTG (v8.20.8100) | |
| Moyenne Intel Core Ultra X7 358H (30538 - 88154, n=7) | |
| MSI Prestige 16 AI Evo B2HMG (v6.92.6600) | |
| Asus ZenBook S16 UM5606GA (v6.92.6600) | |
| Lenovo ThinkBook 16 G7+ AMD (v6.92.6600) | |
| HP Envy x360 2-in-1 16-ad0097nr (v6.92.6600) | |
| AIDA64 / CPU CheckMate | |
| Moyenne Intel Core Ultra X7 358H (4261 - 4475, n=6) | |
| Dell XPS 16 Core Ultra X7 358H (v8.20.8100) | |
| MSI Prestige 16 AI C3MTG (v8.20.8100) | |
Performance du système
PCMark 10: Score | Essentials | Productivity | Digital Content Creation
CrossMark: Overall | Productivity | Creativity | Responsiveness
WebXPRT 3: Overall
WebXPRT 4: Overall
Mozilla Kraken 1.1: Total
Geekbench AI: Quantized GPU 1.7 | Half Precision GPU 1.7 | Single Precision GPU 1.7
| Performance rating | |
| Dell XPS 16 Core Ultra X7 358H | |
| MSI Prestige 16 AI C3MTG | |
| Moyenne Intel Core Ultra X7 358H, Intel Arc B390 12 Xe3 Panther Lake iGPU | |
| MSI Prestige 16 AI Evo B2HMG -3! | |
| Asus ZenBook S16 UM5606GA -3! | |
| Lenovo ThinkBook 16 G7+ AMD -3! | |
| HP Envy x360 2-in-1 16-ad0097nr -3! | |
| PCMark 10 / Score | |
| Dell XPS 16 Core Ultra X7 358H | |
| MSI Prestige 16 AI C3MTG | |
| Moyenne Intel Core Ultra X7 358H, Intel Arc B390 12 Xe3 Panther Lake iGPU (8834 - 9880, n=8) | |
| Asus ZenBook S16 UM5606GA | |
| MSI Prestige 16 AI Evo B2HMG | |
| Lenovo ThinkBook 16 G7+ AMD | |
| HP Envy x360 2-in-1 16-ad0097nr | |
| PCMark 10 / Essentials | |
| MSI Prestige 16 AI Evo B2HMG | |
| Dell XPS 16 Core Ultra X7 358H | |
| Moyenne Intel Core Ultra X7 358H, Intel Arc B390 12 Xe3 Panther Lake iGPU (10282 - 11263, n=7) | |
| MSI Prestige 16 AI C3MTG | |
| Lenovo ThinkBook 16 G7+ AMD | |
| HP Envy x360 2-in-1 16-ad0097nr | |
| Asus ZenBook S16 UM5606GA | |
| PCMark 10 / Productivity | |
| MSI Prestige 16 AI C3MTG | |
| Dell XPS 16 Core Ultra X7 358H | |
| Asus ZenBook S16 UM5606GA | |
| Moyenne Intel Core Ultra X7 358H, Intel Arc B390 12 Xe3 Panther Lake iGPU (13908 - 16780, n=7) | |
| Lenovo ThinkBook 16 G7+ AMD | |
| HP Envy x360 2-in-1 16-ad0097nr | |
| MSI Prestige 16 AI Evo B2HMG | |
| PCMark 10 / Digital Content Creation | |
| Dell XPS 16 Core Ultra X7 358H | |
| Moyenne Intel Core Ultra X7 358H, Intel Arc B390 12 Xe3 Panther Lake iGPU (13082 - 13893, n=7) | |
| MSI Prestige 16 AI C3MTG | |
| MSI Prestige 16 AI Evo B2HMG | |
| Lenovo ThinkBook 16 G7+ AMD | |
| Asus ZenBook S16 UM5606GA | |
| HP Envy x360 2-in-1 16-ad0097nr | |
| CrossMark / Overall | |
| MSI Prestige 16 AI Evo B2HMG | |
| Dell XPS 16 Core Ultra X7 358H | |
| MSI Prestige 16 AI C3MTG | |
| Moyenne Intel Core Ultra X7 358H, Intel Arc B390 12 Xe3 Panther Lake iGPU (1884 - 2114, n=7) | |
| Lenovo ThinkBook 16 G7+ AMD | |
| Asus ZenBook S16 UM5606GA | |
| HP Envy x360 2-in-1 16-ad0097nr | |
| CrossMark / Productivity | |
| MSI Prestige 16 AI Evo B2HMG | |
| Dell XPS 16 Core Ultra X7 358H | |
| MSI Prestige 16 AI C3MTG | |
| Moyenne Intel Core Ultra X7 358H, Intel Arc B390 12 Xe3 Panther Lake iGPU (1678 - 1898, n=7) | |
| Asus ZenBook S16 UM5606GA | |
| HP Envy x360 2-in-1 16-ad0097nr | |
| Lenovo ThinkBook 16 G7+ AMD | |
| CrossMark / Creativity | |
| Dell XPS 16 Core Ultra X7 358H | |
| MSI Prestige 16 AI C3MTG | |
| Moyenne Intel Core Ultra X7 358H, Intel Arc B390 12 Xe3 Panther Lake iGPU (2241 - 2529, n=7) | |
| MSI Prestige 16 AI Evo B2HMG | |
| Lenovo ThinkBook 16 G7+ AMD | |
| Asus ZenBook S16 UM5606GA | |
| HP Envy x360 2-in-1 16-ad0097nr | |
| CrossMark / Responsiveness | |
| MSI Prestige 16 AI Evo B2HMG | |
| Dell XPS 16 Core Ultra X7 358H | |
| Moyenne Intel Core Ultra X7 358H, Intel Arc B390 12 Xe3 Panther Lake iGPU (1560 - 1707, n=7) | |
| MSI Prestige 16 AI C3MTG | |
| HP Envy x360 2-in-1 16-ad0097nr | |
| Lenovo ThinkBook 16 G7+ AMD | |
| Asus ZenBook S16 UM5606GA | |
| WebXPRT 3 / Overall | |
| MSI Prestige 16 AI Evo B2HMG | |
| MSI Prestige 16 AI C3MTG | |
| Lenovo ThinkBook 16 G7+ AMD | |
| Moyenne Intel Core Ultra X7 358H, Intel Arc B390 12 Xe3 Panther Lake iGPU (293 - 338, n=7) | |
| Dell XPS 16 Core Ultra X7 358H | |
| HP Envy x360 2-in-1 16-ad0097nr | |
| Asus ZenBook S16 UM5606GA | |
| WebXPRT 4 / Overall | |
| MSI Prestige 16 AI Evo B2HMG | |
| MSI Prestige 16 AI C3MTG | |
| Dell XPS 16 Core Ultra X7 358H | |
| Moyenne Intel Core Ultra X7 358H, Intel Arc B390 12 Xe3 Panther Lake iGPU (278 - 305, n=7) | |
| Lenovo ThinkBook 16 G7+ AMD | |
| HP Envy x360 2-in-1 16-ad0097nr | |
| Asus ZenBook S16 UM5606GA | |
| Mozilla Kraken 1.1 / Total | |
| HP Envy x360 2-in-1 16-ad0097nr | |
| Asus ZenBook S16 UM5606GA | |
| MSI Prestige 16 AI C3MTG | |
| Moyenne Intel Core Ultra X7 358H, Intel Arc B390 12 Xe3 Panther Lake iGPU (445 - 460, n=7) | |
| Dell XPS 16 Core Ultra X7 358H | |
| Lenovo ThinkBook 16 G7+ AMD | |
| MSI Prestige 16 AI Evo B2HMG | |
| Geekbench AI / Quantized GPU 1.7 | |
| Dell XPS 16 Core Ultra X7 358H | |
| MSI Prestige 16 AI C3MTG | |
| Moyenne Intel Core Ultra X7 358H, Intel Arc B390 12 Xe3 Panther Lake iGPU (6908 - 8011, n=6) | |
| Geekbench AI / Half Precision GPU 1.7 | |
| MSI Prestige 16 AI C3MTG | |
| Dell XPS 16 Core Ultra X7 358H | |
| Moyenne Intel Core Ultra X7 358H, Intel Arc B390 12 Xe3 Panther Lake iGPU (16188 - 21963, n=6) | |
| Geekbench AI / Single Precision GPU 1.7 | |
| MSI Prestige 16 AI C3MTG | |
| Dell XPS 16 Core Ultra X7 358H | |
| Moyenne Intel Core Ultra X7 358H, Intel Arc B390 12 Xe3 Panther Lake iGPU (9783 - 12255, n=6) | |
* ... Moindre est la valeur, meilleures sont les performances
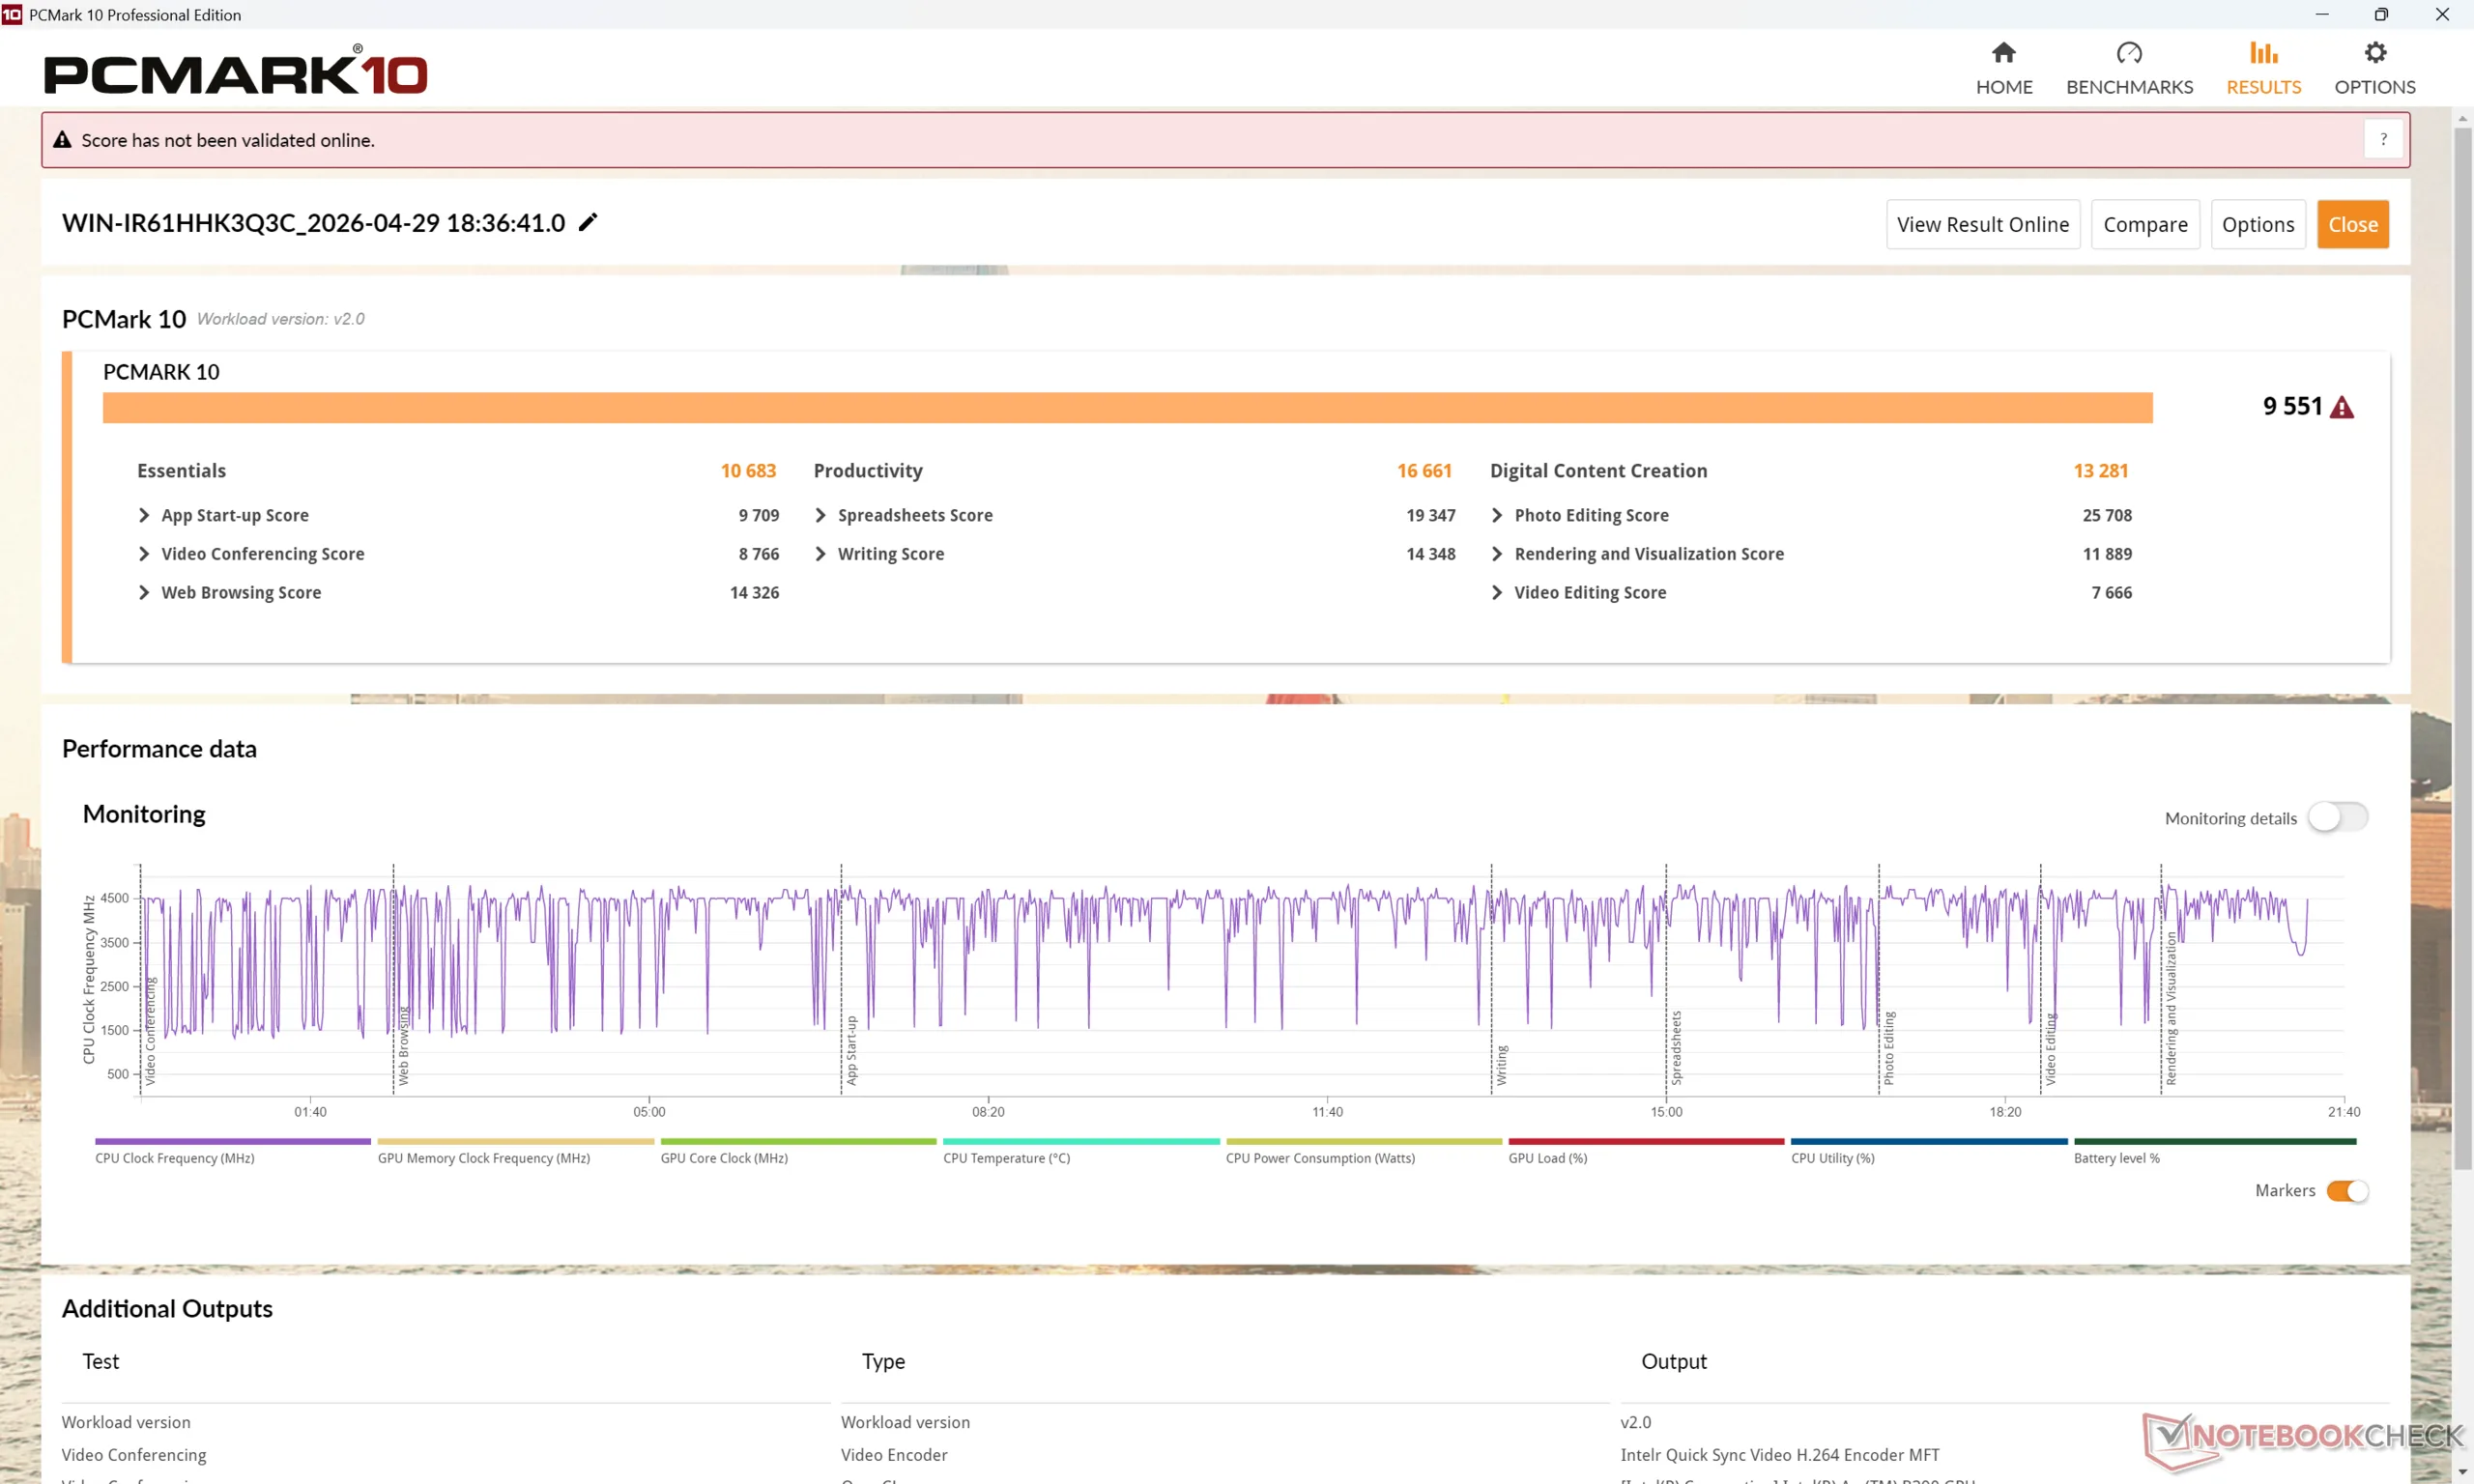
| PCMark 10 Score | 9551 points | |
Aide | ||
| AIDA64 / Memory Copy | |
| Dell XPS 16 Core Ultra X7 358H | |
| MSI Prestige 16 AI C3MTG | |
| Moyenne Intel Core Ultra X7 358H (102745 - 132135, n=6) | |
| MSI Prestige 16 AI Evo B2HMG | |
| Asus ZenBook S16 UM5606GA | |
| Lenovo ThinkBook 16 G7+ AMD | |
| HP Envy x360 2-in-1 16-ad0097nr | |
| AIDA64 / Memory Read | |
| Dell XPS 16 Core Ultra X7 358H | |
| Moyenne Intel Core Ultra X7 358H (97755 - 118888, n=7) | |
| MSI Prestige 16 AI C3MTG | |
| Asus ZenBook S16 UM5606GA | |
| Lenovo ThinkBook 16 G7+ AMD | |
| MSI Prestige 16 AI Evo B2HMG | |
| HP Envy x360 2-in-1 16-ad0097nr | |
| AIDA64 / Memory Write | |
| Dell XPS 16 Core Ultra X7 358H | |
| Moyenne Intel Core Ultra X7 358H (105984 - 134998, n=7) | |
| MSI Prestige 16 AI C3MTG | |
| Asus ZenBook S16 UM5606GA | |
| Lenovo ThinkBook 16 G7+ AMD | |
| HP Envy x360 2-in-1 16-ad0097nr | |
| MSI Prestige 16 AI Evo B2HMG | |
| AIDA64 / Memory Latency | |
| MSI Prestige 16 AI Evo B2HMG | |
| HP Envy x360 2-in-1 16-ad0097nr | |
| Lenovo ThinkBook 16 G7+ AMD | |
| Asus ZenBook S16 UM5606GA | |
| MSI Prestige 16 AI C3MTG | |
| Dell XPS 16 Core Ultra X7 358H | |
| Moyenne Intel Core Ultra X7 358H (84.6 - 101.9, n=7) | |
* ... Moindre est la valeur, meilleures sont les performances
Latence DPC
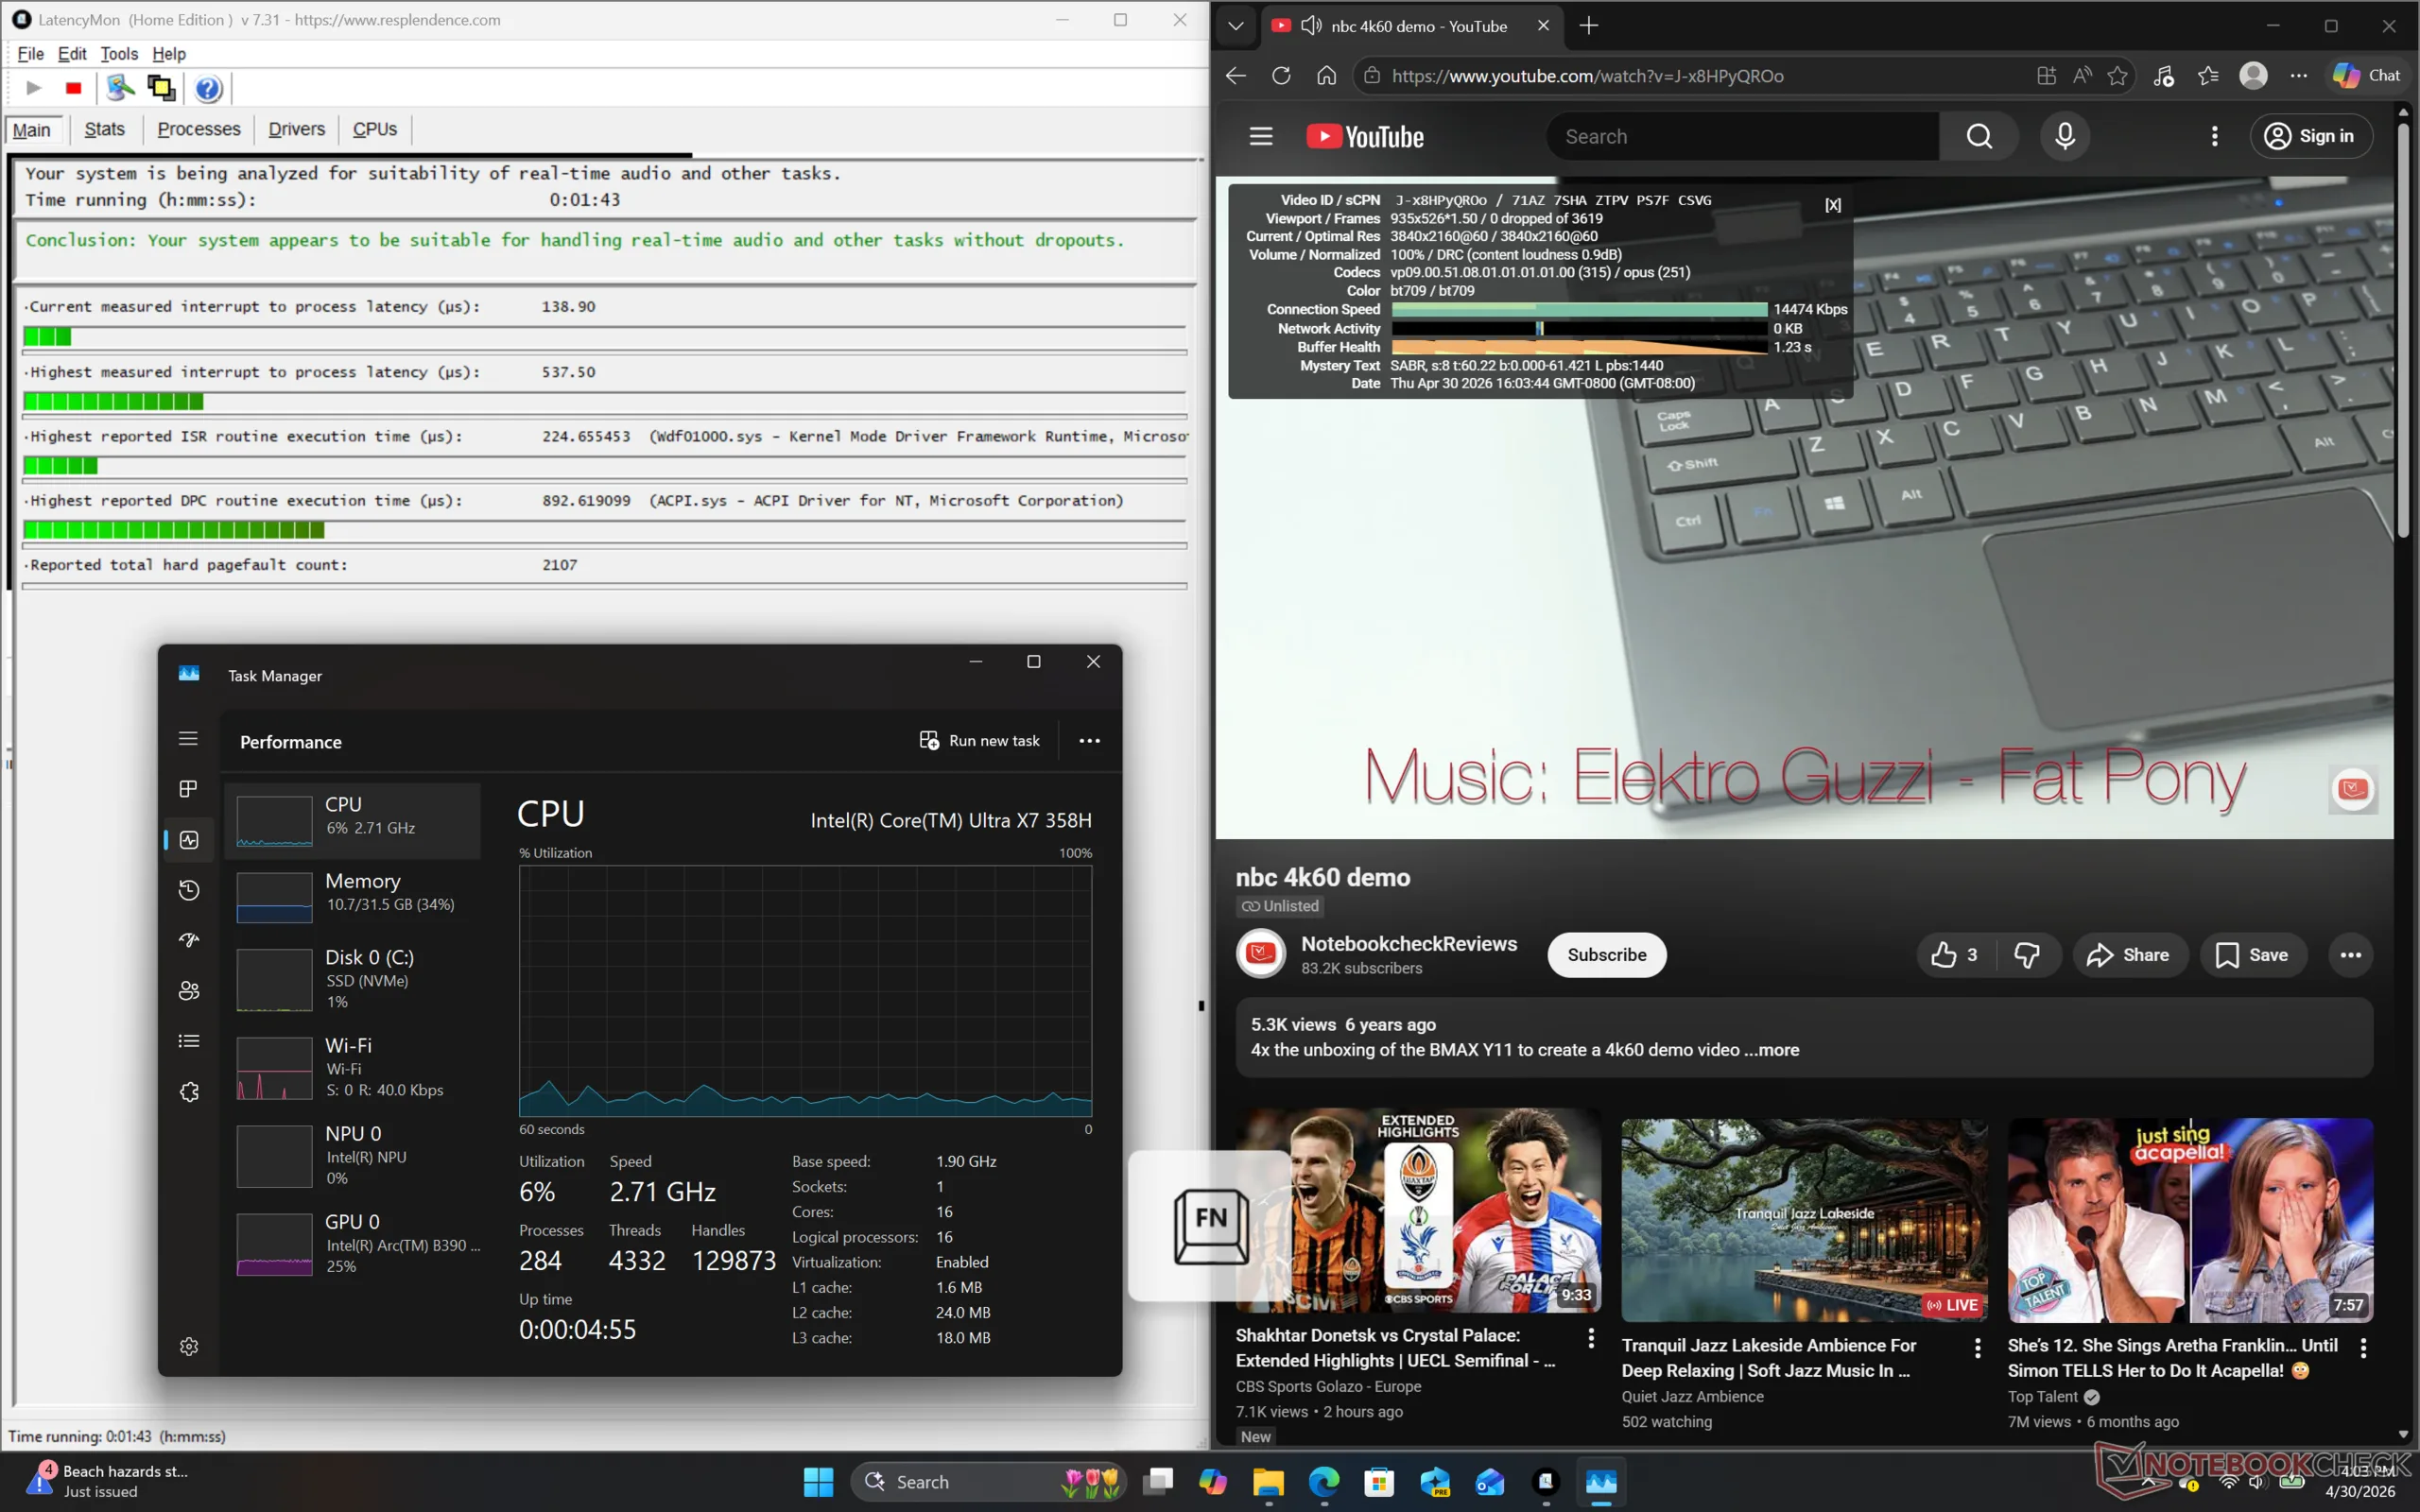
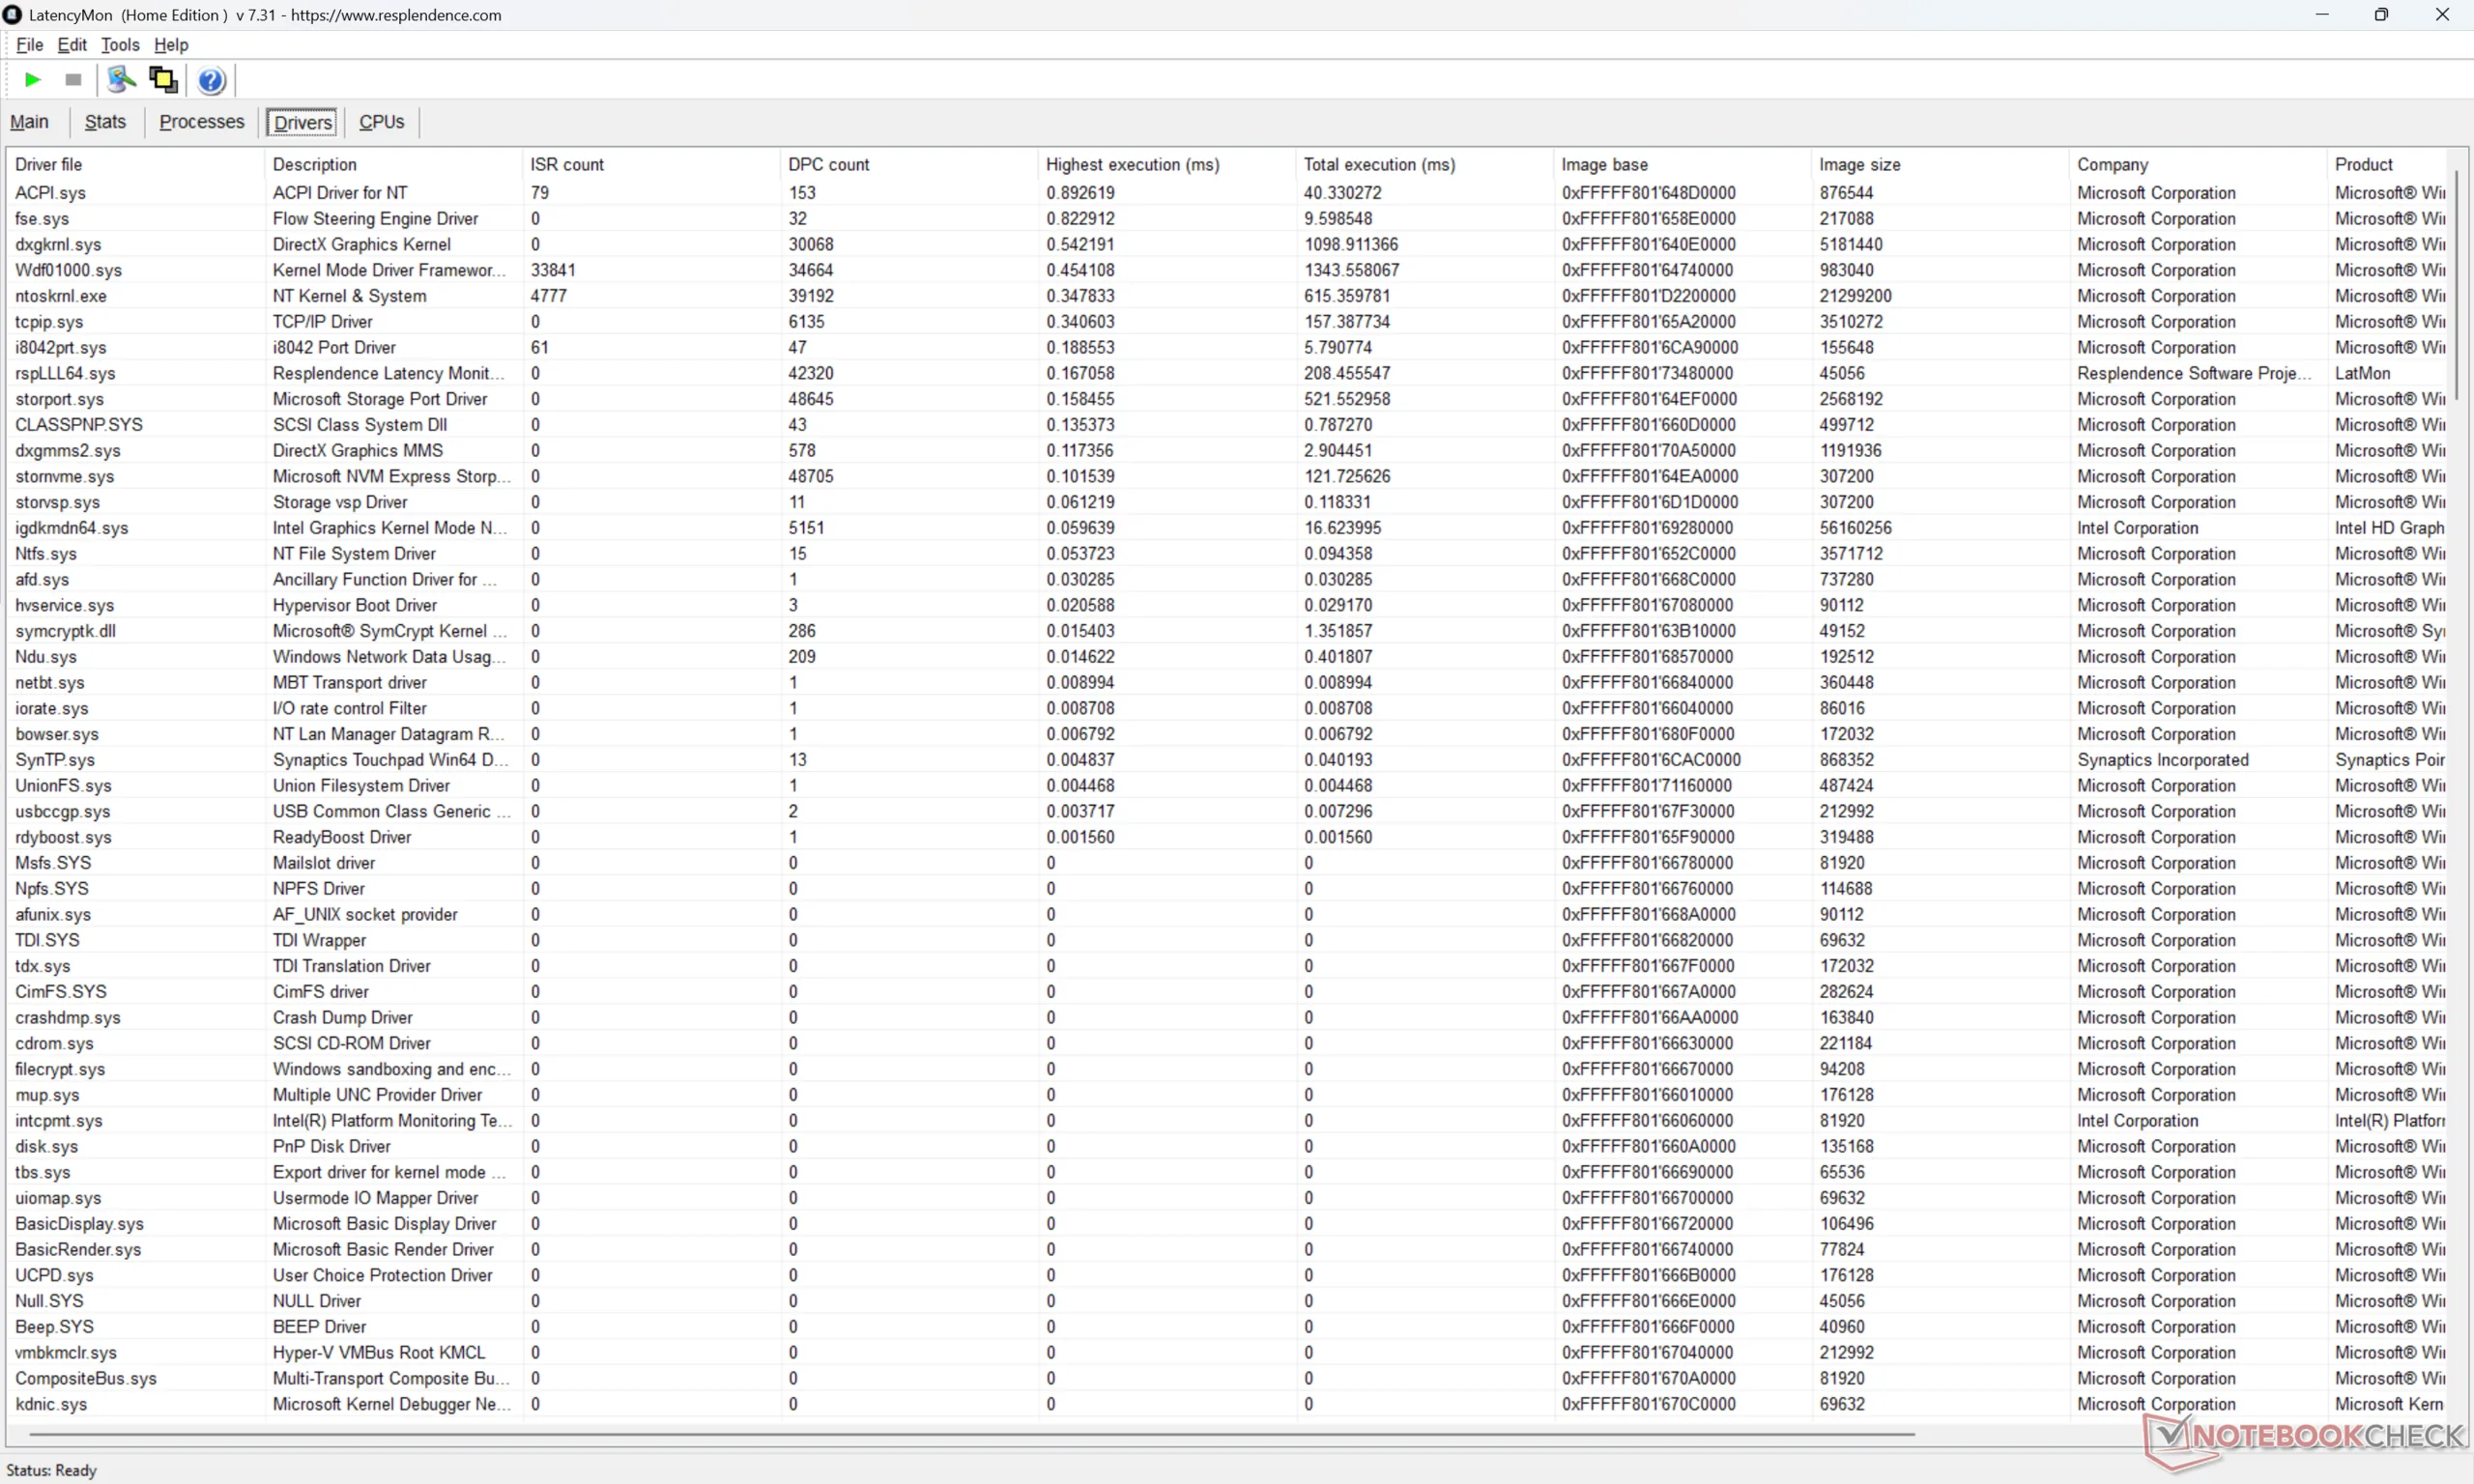
| DPC Latencies / LatencyMon - interrupt to process latency (max), Web, Youtube, Prime95 | |
| MSI Prestige 16 AI Evo B2HMG | |
| HP Envy x360 2-in-1 16-ad0097nr | |
| Lenovo ThinkBook 16 G7+ AMD | |
| Asus ZenBook S16 UM5606GA | |
| MSI Prestige 16 AI C3MTG | |
| Dell XPS 16 Core Ultra X7 358H | |
* ... Moindre est la valeur, meilleures sont les performances
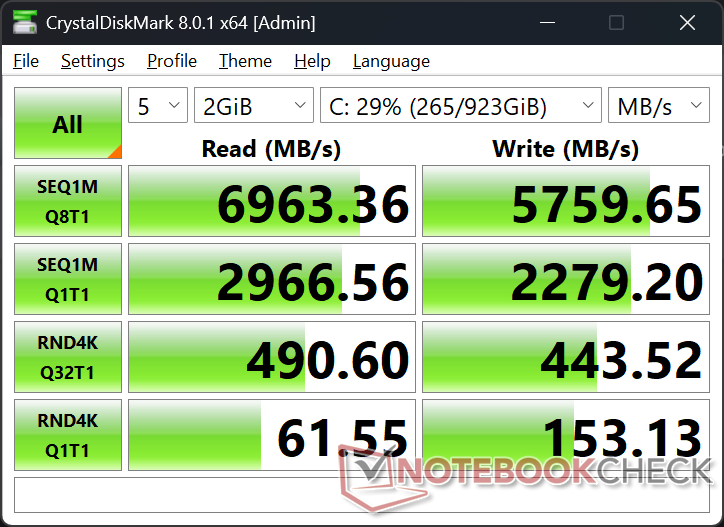
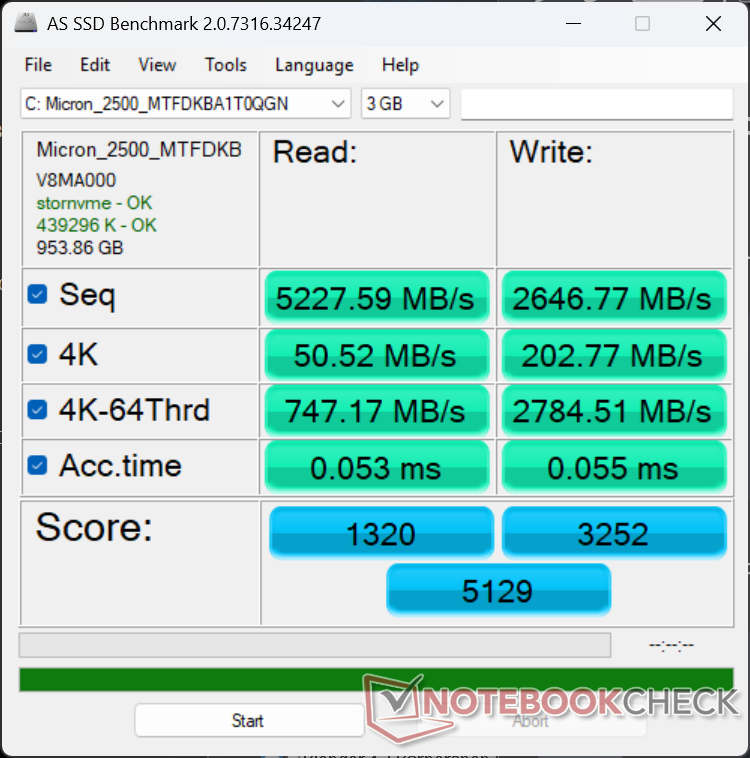
Dispositifs de stockage
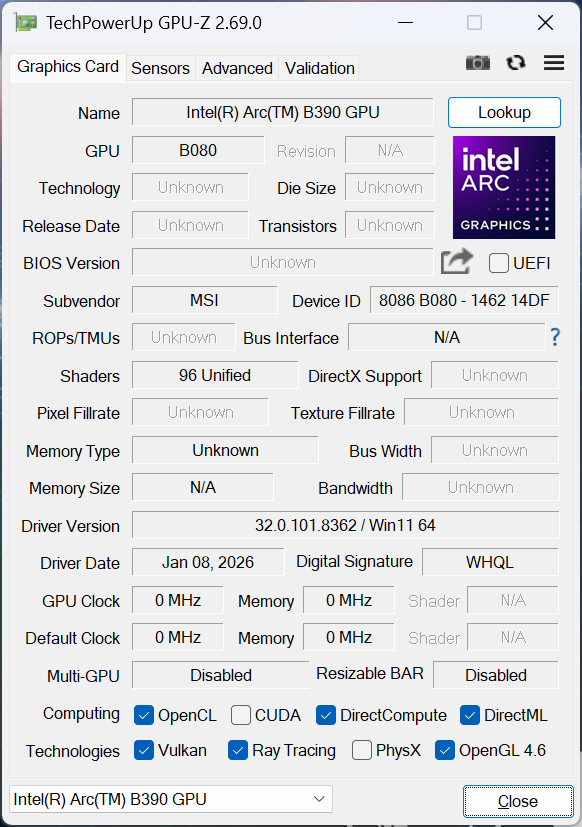
Notre unité de test est livrée avec le même disque de 1 To Micron 2500 PCIe4 x4 NVMe SSD que le modèle de l'année dernière pour des niveaux de performance similaires et aucun comportement d'étranglement notable. Il n'y a plus de support pour les SSD M.2 secondaires, ce qui semble être une tendance avec les nouveaux ordinateurs portables de 16 pouces comme le XPS 16 ou le Zenbook S16 d'Asus Asus Zenbook S16.

* ... Moindre est la valeur, meilleures sont les performances
Throttoir de disque : Boucle de lecture DiskSpd, profondeur de la file d'attente 8
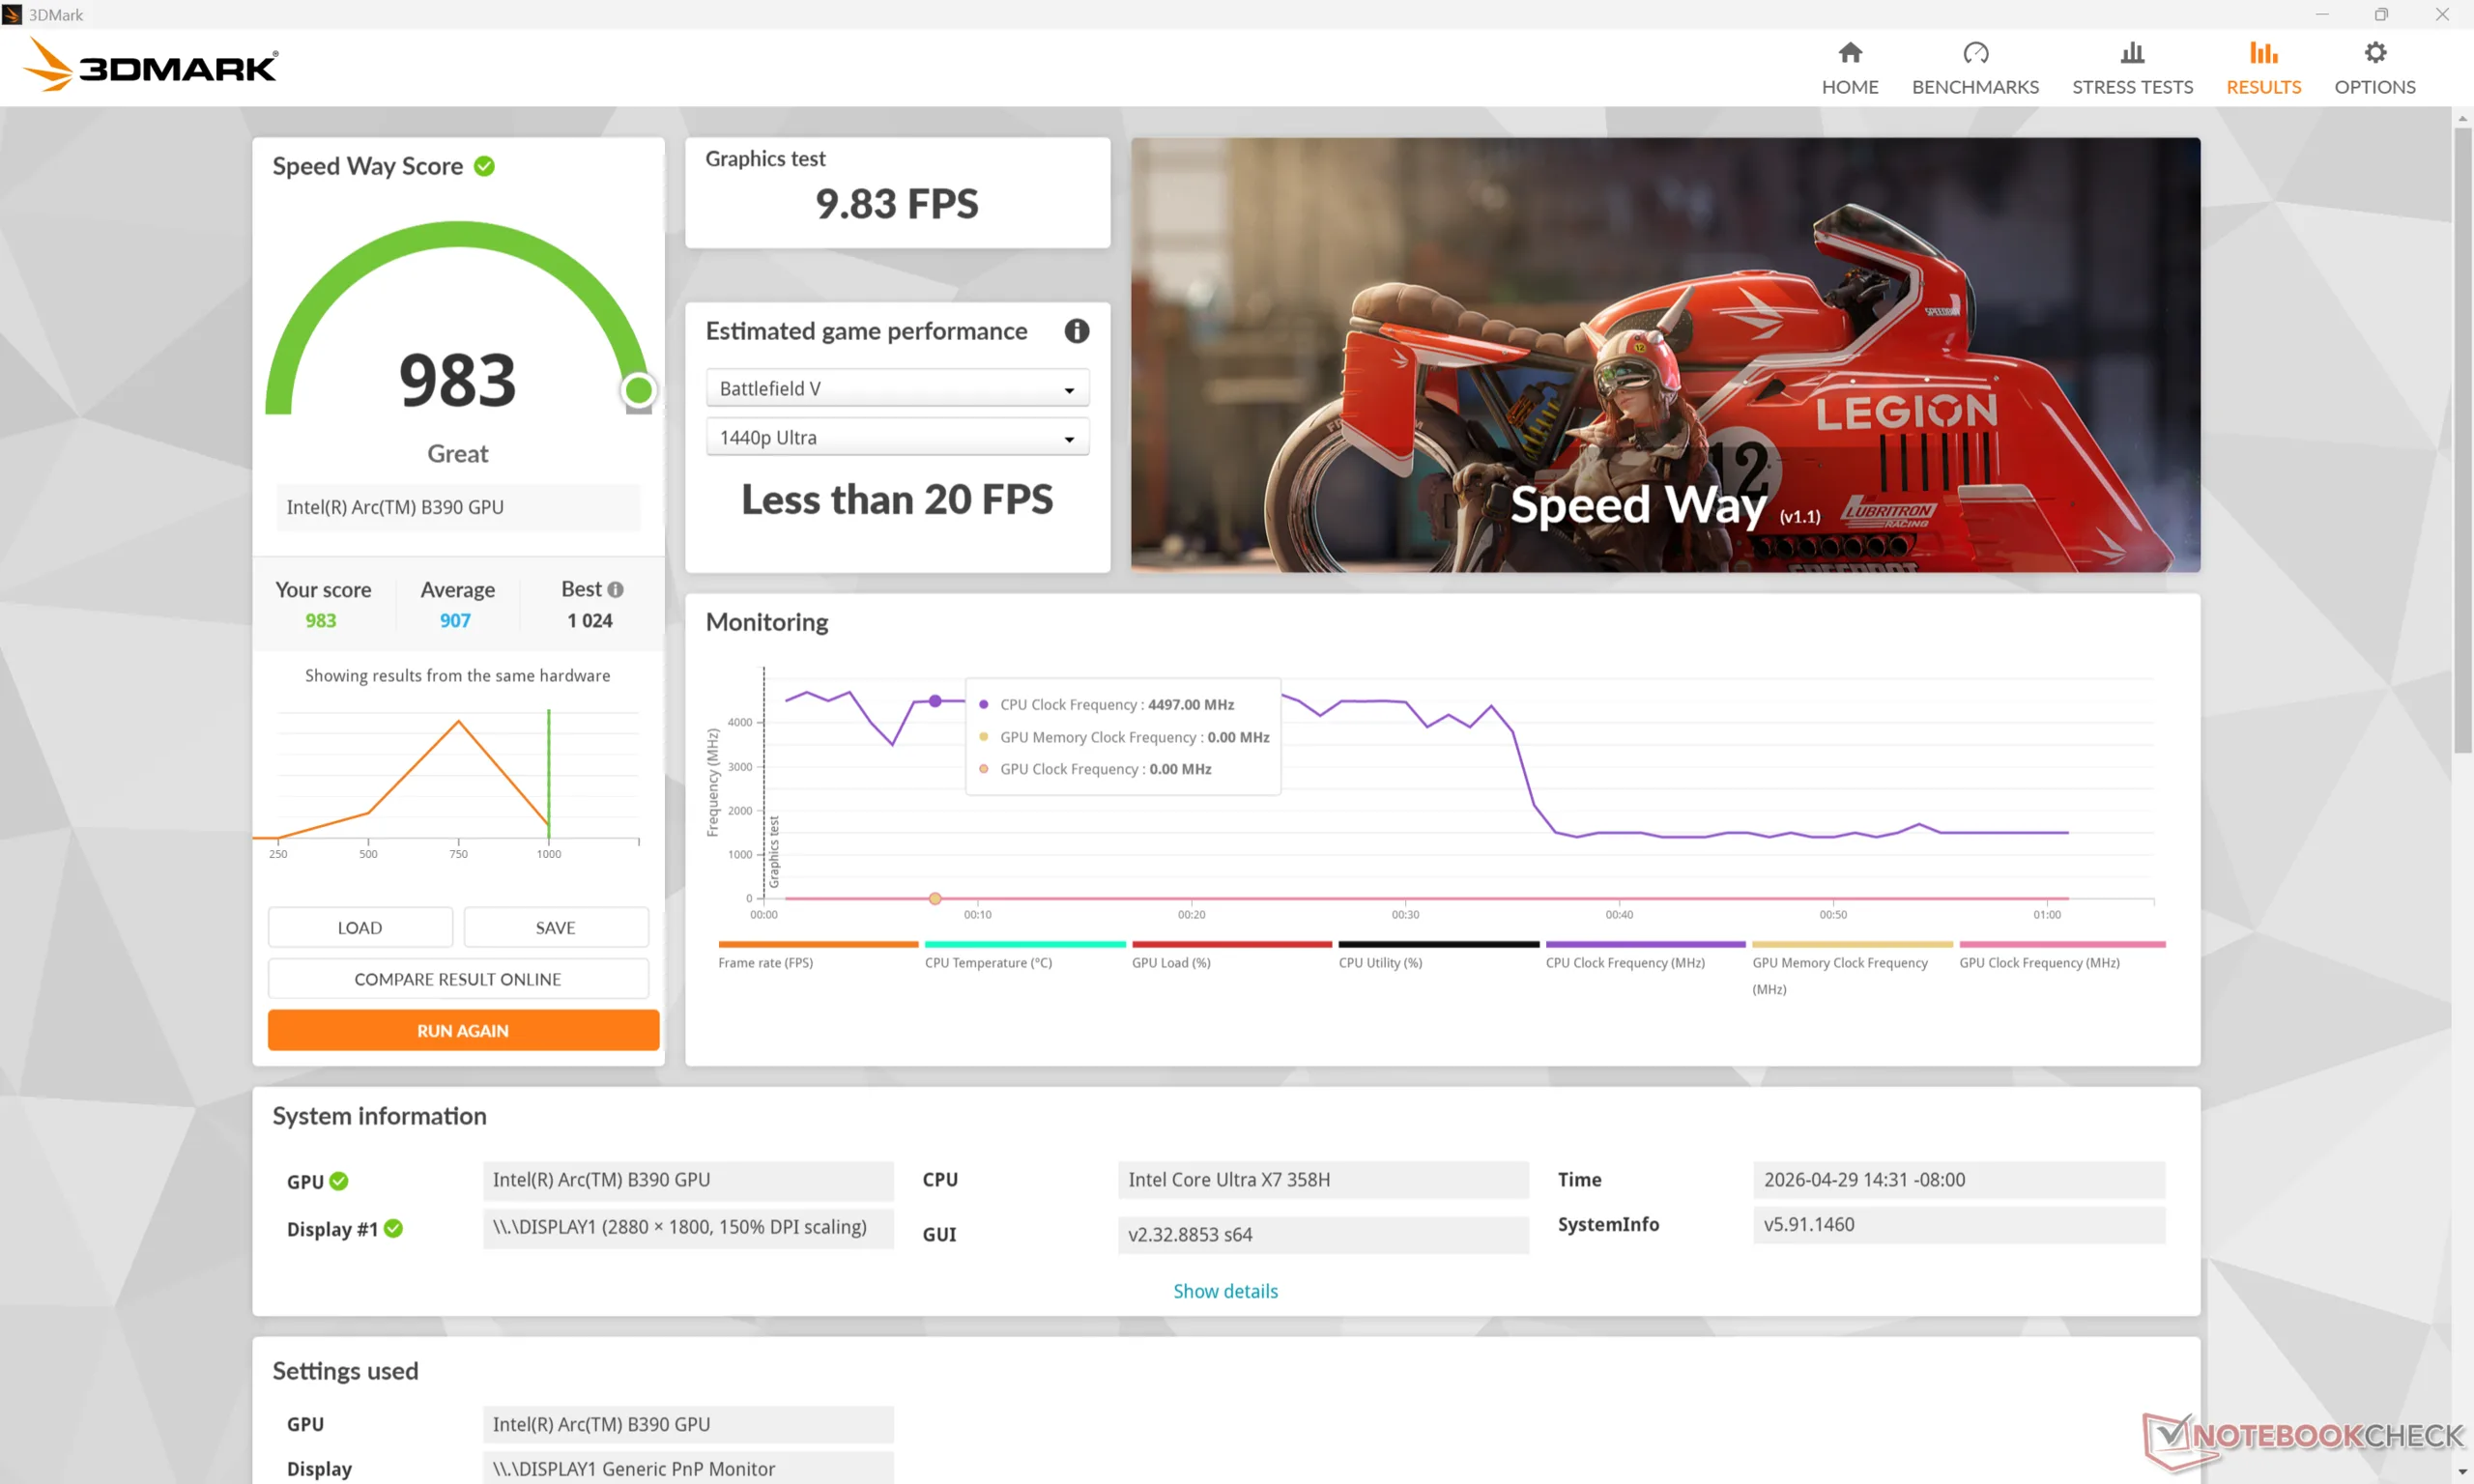
Performance du GPU
Les performances graphiques sont à la hauteur de nos espérances par rapport à d'autres PC de la même catégorie Arc B390 Si ce n'est qu'elle est légèrement plus lente de quelques points de pourcentage. L'Arc B390 est nettement plus rapide que l Arc 140T de la Prestige 16 de l'année dernière, de 50 à 80 %, et c'est l'une des principales raisons de passer à Panther Lake.
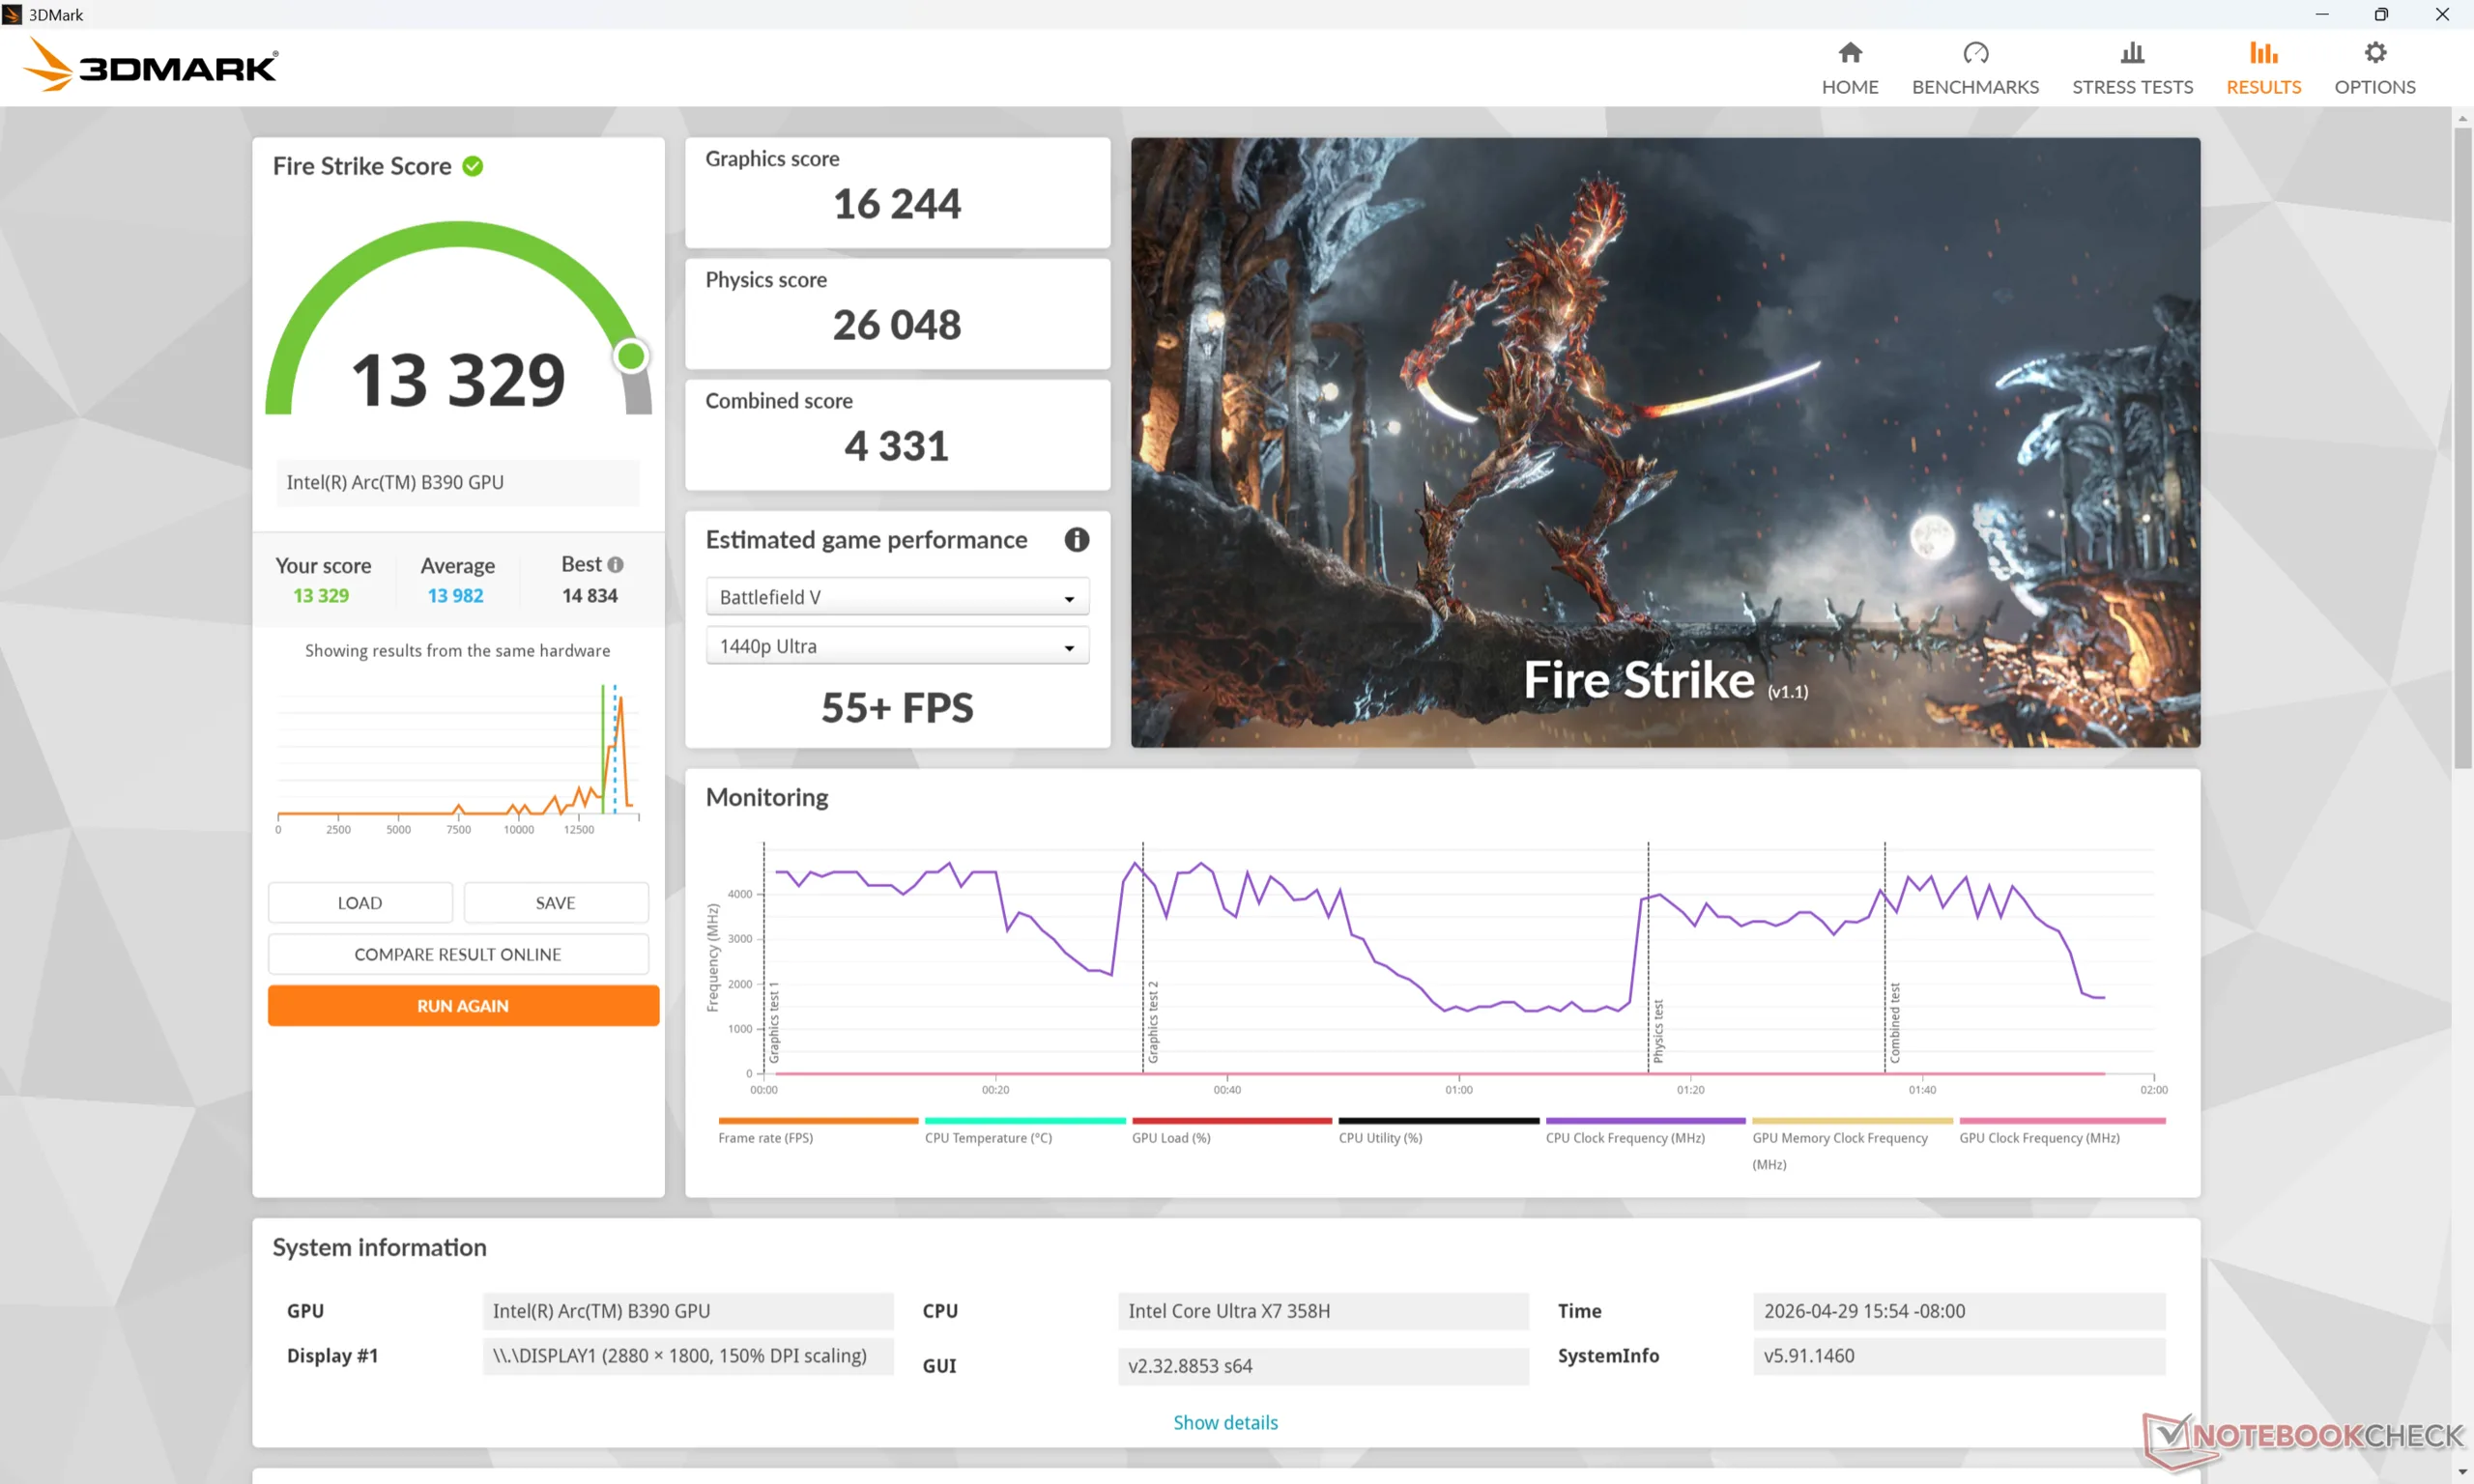
L'utilisation du mode Balanced au lieu du mode Performance aurait un impact plus important que prévu sur les performances, jusqu'à 25 %, comme le montre notre tableau de résultats Fire Strike ci-dessous. Cela affecterait ensuite le bruit du ventilateur et les performances de jeu, comme le montrent les sections ci-dessous.
| Profil de puissance | Score graphique | Score physique | Score combiné |
| Mode Performance | 16244 | 26048 | 4331 |
| Mode équilibré | 15684 (-3%) | 19912 (-24%) | 4476 (-0%) |
| Alimentation par batterie | 16481 (-0%) | 20729 (-20%) | 4794 (-0%) |
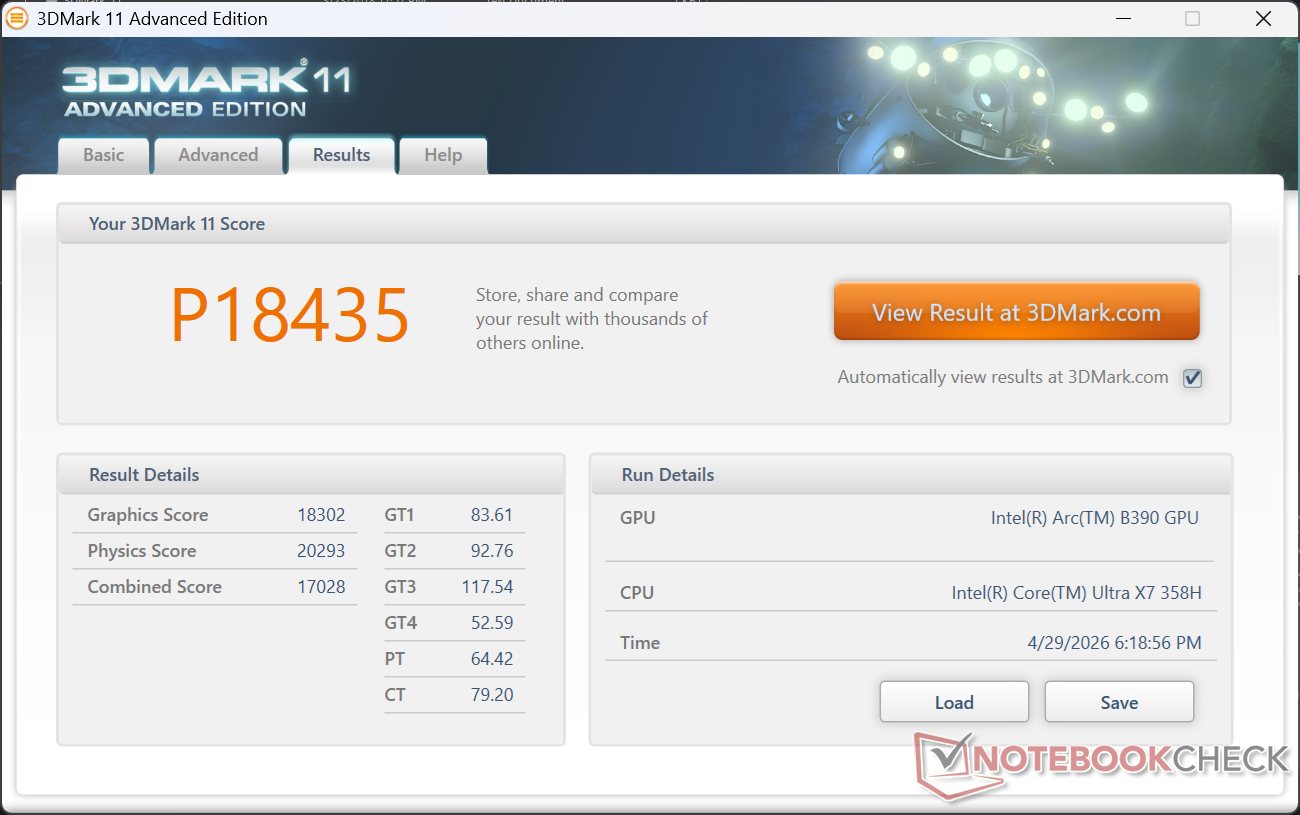
| 3DMark 11 Performance | 18435 points | |
| 3DMark Cloud Gate Standard Score | 35193 points | |
| 3DMark Fire Strike Score | 13329 points | |
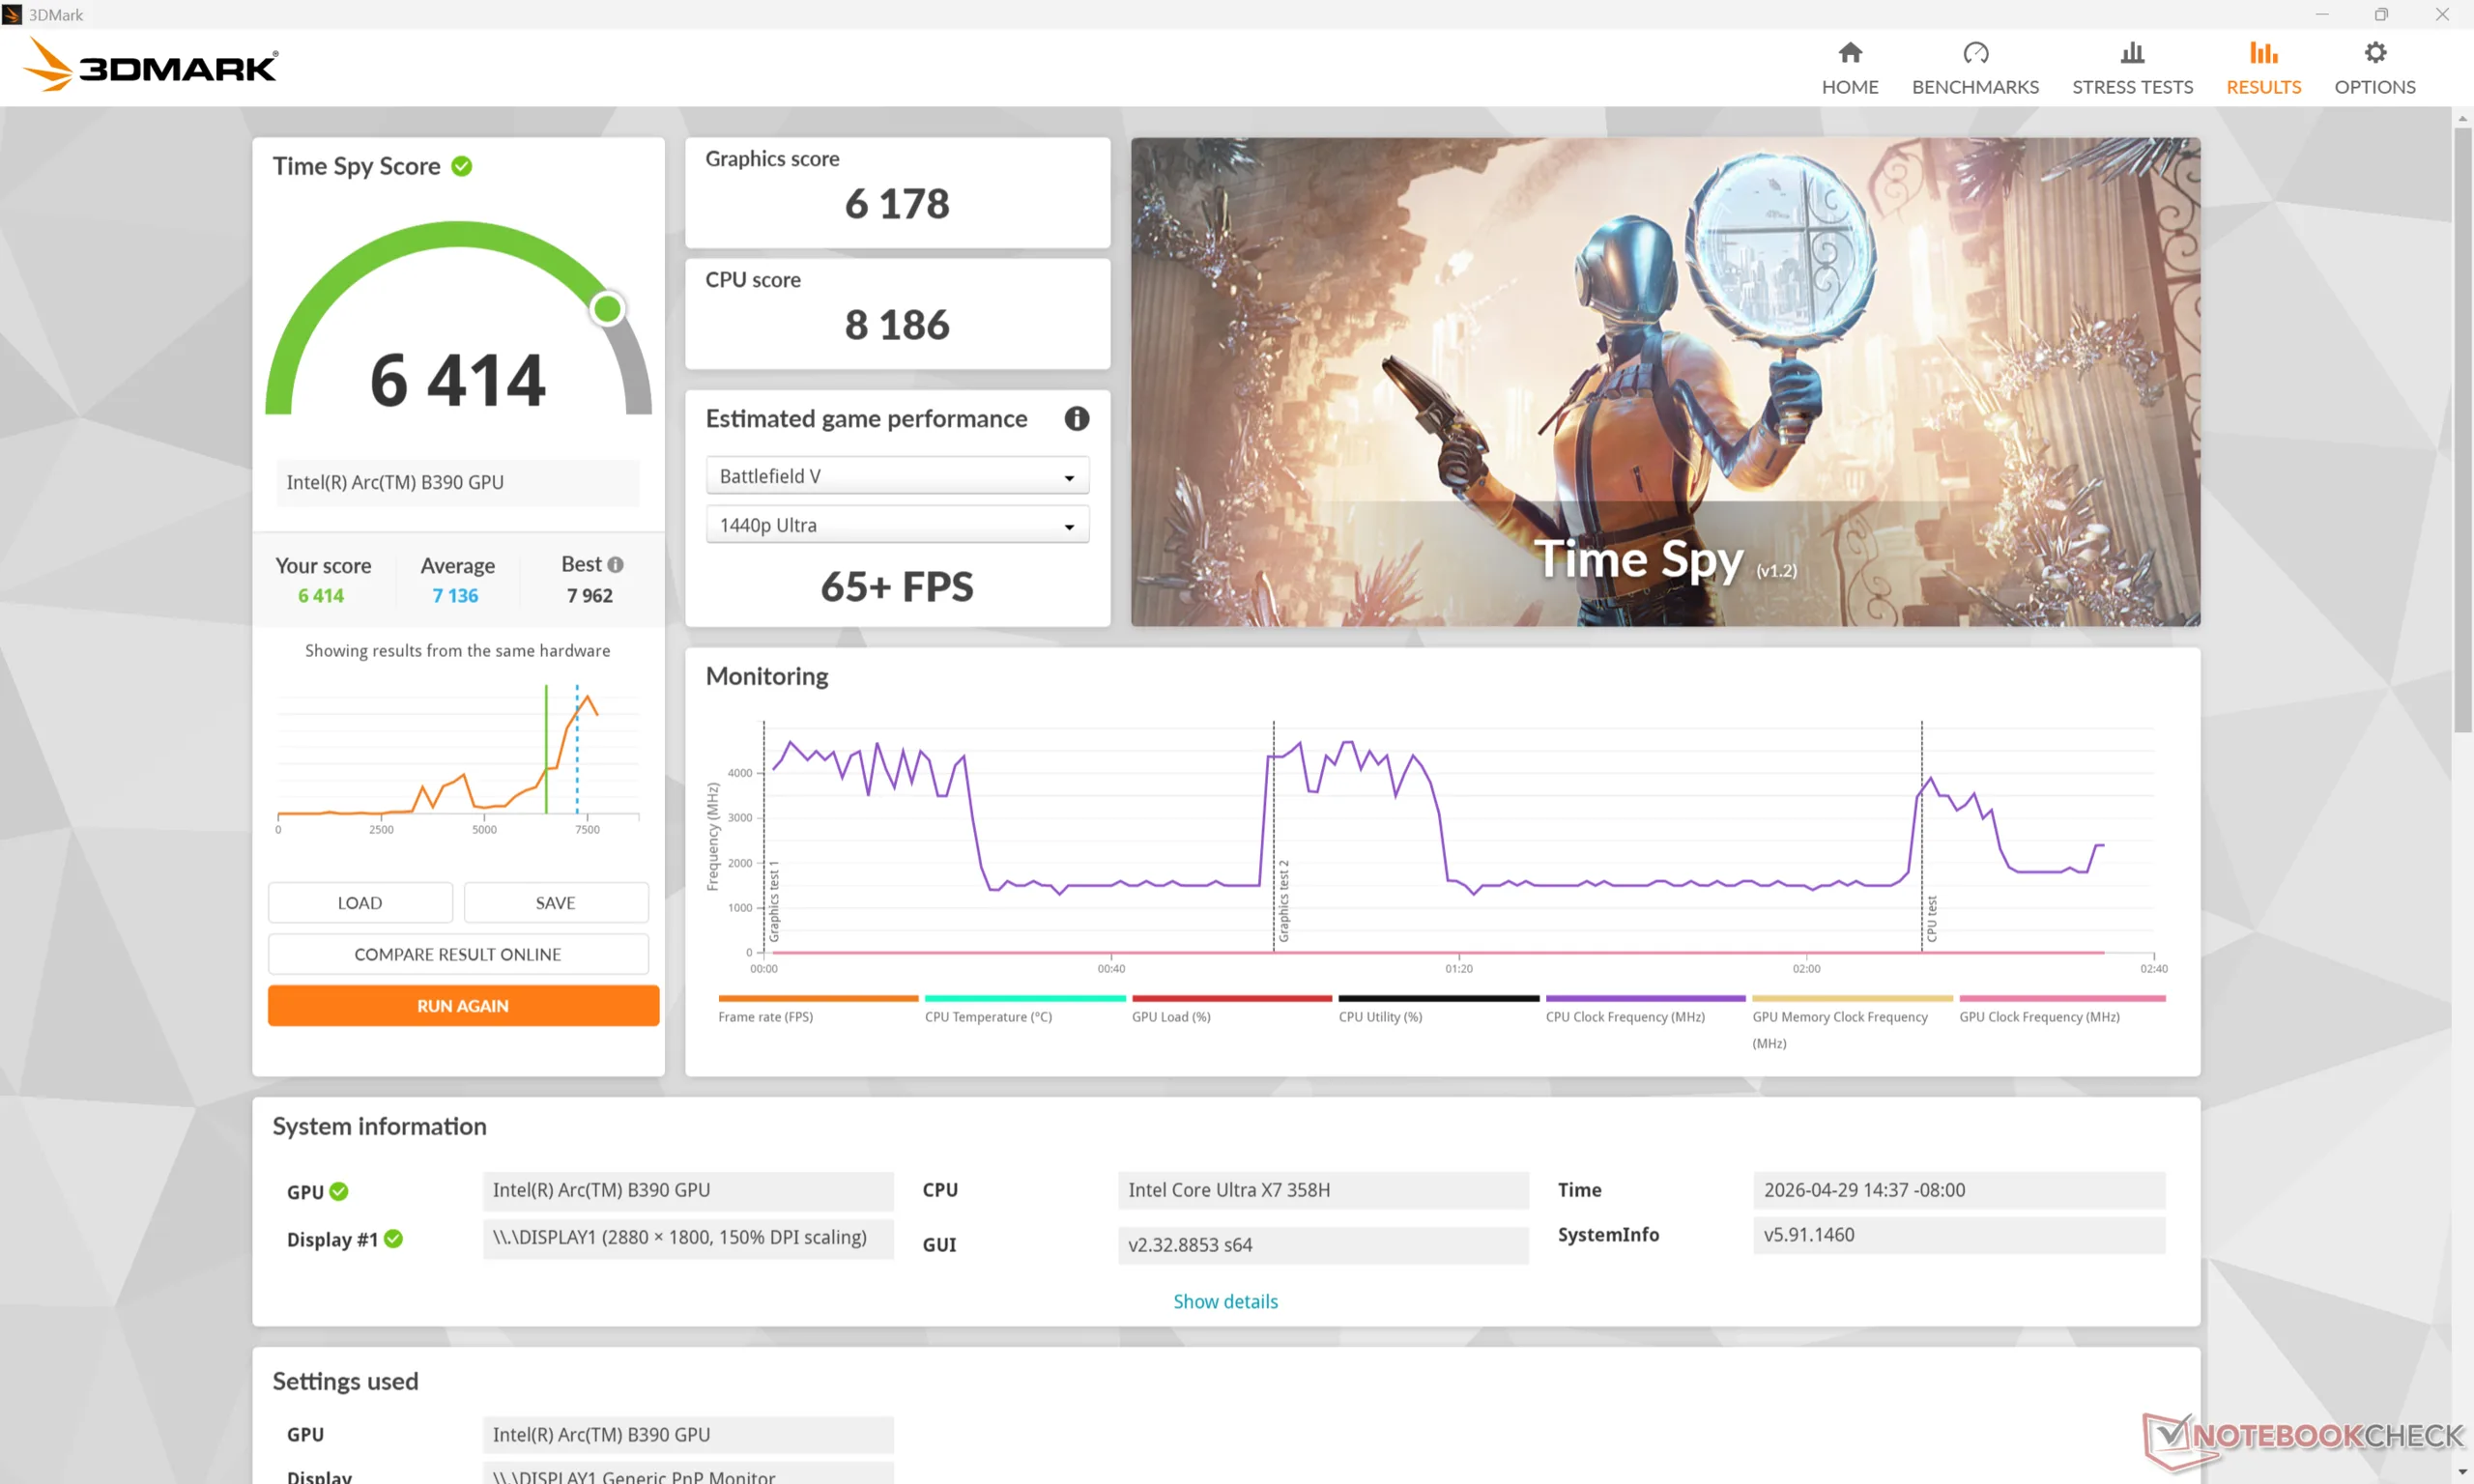
| 3DMark Time Spy Score | 6414 points | |
Aide | ||
* ... Moindre est la valeur, meilleures sont les performances
Performances des jeux
Bien qu'il ne s'agisse pas d'une machine de jeu à proprement parler, les ordinateurs portables équipés de l'Arc B390 sont tout à fait capables de faire tourner les titres les plus exigeants avec des paramètres 1080p et des taux de rafraîchissement décents. Cyberpunk 2077, par exemple, affiche une moyenne de 45 FPS avec des paramètres 1080p Ultra avant d'appliquer tout upscaling XeSS.
G-Sync n'est pas pris en charge sur l'écran interne.
| Performance rating - Percent | |
| MSI Prestige 16 AI C3MTG | |
| Dell XPS 16 Core Ultra X7 358H | |
| Lenovo ThinkBook 16 G7+ AMD | |
| Asus ZenBook S16 UM5606GA | |
| MSI Prestige 16 AI Evo B2HMG | |
| HP Envy x360 2-in-1 16-ad0097nr -1! | |
| Cyberpunk 2077 - 1920x1080 Ultra Preset (FSR off) | |
| Dell XPS 16 Core Ultra X7 358H | |
| MSI Prestige 16 AI C3MTG | |
| MSI Prestige 16 AI Evo B2HMG | |
| Lenovo ThinkBook 16 G7+ AMD | |
| Asus ZenBook S16 UM5606GA | |
| HP Envy x360 2-in-1 16-ad0097nr | |
| Baldur's Gate 3 - 1920x1080 Ultra Preset AA:T | |
| Dell XPS 16 Core Ultra X7 358H | |
| MSI Prestige 16 AI C3MTG | |
| Lenovo ThinkBook 16 G7+ AMD | |
| Asus ZenBook S16 UM5606GA | |
| MSI Prestige 16 AI Evo B2HMG | |
| HP Envy x360 2-in-1 16-ad0097nr | |
| GTA V - 1920x1080 Highest AA:4xMSAA + FX AF:16x | |
| Dell XPS 16 Core Ultra X7 358H | |
| MSI Prestige 16 AI C3MTG | |
| Lenovo ThinkBook 16 G7+ AMD | |
| Asus ZenBook S16 UM5606GA | |
| MSI Prestige 16 AI Evo B2HMG | |
| Final Fantasy XV Benchmark - 1920x1080 High Quality | |
| Dell XPS 16 Core Ultra X7 358H | |
| MSI Prestige 16 AI C3MTG | |
| Lenovo ThinkBook 16 G7+ AMD | |
| MSI Prestige 16 AI Evo B2HMG | |
| Asus ZenBook S16 UM5606GA | |
| HP Envy x360 2-in-1 16-ad0097nr | |
| Strange Brigade - 1920x1080 ultra AA:ultra AF:16 | |
| Dell XPS 16 Core Ultra X7 358H | |
| MSI Prestige 16 AI C3MTG | |
| MSI Prestige 16 AI Evo B2HMG | |
| Lenovo ThinkBook 16 G7+ AMD | |
| Asus ZenBook S16 UM5606GA | |
| HP Envy x360 2-in-1 16-ad0097nr | |
| Dota 2 Reborn - 1920x1080 ultra (3/3) best looking | |
| MSI Prestige 16 AI C3MTG | |
| Dell XPS 16 Core Ultra X7 358H | |
| Lenovo ThinkBook 16 G7+ AMD | |
| Asus ZenBook S16 UM5606GA | |
| MSI Prestige 16 AI Evo B2HMG | |
| HP Envy x360 2-in-1 16-ad0097nr | |
| X-Plane 11.11 - 1920x1080 high (fps_test=3) | |
| Lenovo ThinkBook 16 G7+ AMD | |
| Asus ZenBook S16 UM5606GA | |
| MSI Prestige 16 AI C3MTG | |
| Dell XPS 16 Core Ultra X7 358H | |
| MSI Prestige 16 AI Evo B2HMG | |
| HP Envy x360 2-in-1 16-ad0097nr | |
Cyberpunk 2077 ultra FPS Chart
| Bas | Moyen | Élevé | Ultra | |
|---|---|---|---|---|
| GTA V (2015) | 174.7 | 164.7 | 97.9 | 43 |
| Dota 2 Reborn (2015) | 122.1 | 98.4 | 104.3 | 111.8 |
| Final Fantasy XV Benchmark (2018) | 124.3 | 73.9 | 53.4 | |
| X-Plane 11.11 (2018) | 61.7 | 52.4 | 44.5 | |
| Strange Brigade (2018) | 304 | 118.7 | 98.5 | 88.5 |
| Baldur's Gate 3 (2023) | 69.4 | 58.5 | 52.6 | 51.7 |
| Cyberpunk 2077 (2023) | 77.2 | 62.3 | 53.8 | 44.8 |
| F1 24 (2024) | 144.9 | 135.3 | 104.3 | 37.4 |
Émissions
Bruit du système
La solution de refroidissement est beaucoup plus petite que celle du XPS 16, ce qui contribue aux différences notables de température entre les deux modèles. Si les ventilateurs du MSI peuvent rester plus longtemps silencieux avant de devoir monter en puissance, ils plafonnent néanmoins à des valeurs maximales similaires au bout d'un certain temps. Le bruit du ventilateur lors de l'exécution de Cyberpunk 2077 en mode Performance, par exemple, se stabilise à 41 dB(A) contre 42 dB(A) sur le Dell.
Notez que le bruit du ventilateur diminue de manière significative si vous jouez en mode équilibré au lieu du mode performance. Dans ce cas, les ventilateurs plafonnent à moins de 30 dB(A), ce qui peut justifier le déficit de performance de 20 % mentionné ci-dessus, en fonction des préférences de l'utilisateur.
Degré de la nuisance sonore
| Au repos |
| 23.3 / 23.3 / 25.9 dB(A) |
| Fortement sollicité |
| 30.1 / 44.7 dB(A) |
 | ||
30 dB silencieux 40 dB(A) audible 50 dB(A) bruyant |
||
min: | ||
| MSI Prestige 16 AI C3MTG Ultra X7 358H, Arc B390 Panther Lake iGPU | MSI Prestige 16 AI Evo B2HMG Ultra 9 285H, Arc 140T | Dell XPS 16 Core Ultra X7 358H Ultra X7 358H, Arc B390 Panther Lake iGPU | Asus ZenBook S16 UM5606GA Ryzen AI 9 465, Radeon 880M | Lenovo ThinkBook 16 G7+ AMD Ryzen AI 9 365, Radeon 880M | HP Envy x360 2-in-1 16-ad0097nr R7 8840HS, Radeon 780M | |
|---|---|---|---|---|---|---|
| Noise | -4% | -4% | -15% | -3% | 6% | |
| arrêt / environnement * (dB) | 23.1 | 23.6 -2% | 23.3 -1% | 24.9 -8% | 24.5 -6% | 22.9 1% |
| Idle Minimum * (dB) | 23.3 | 23.6 -1% | 23.4 -0% | 24.9 -7% | 24.5 -5% | 23 1% |
| Idle Average * (dB) | 23.3 | 23.6 -1% | 23.4 -0% | 24.9 -7% | 24.5 -5% | 23 1% |
| Idle Maximum * (dB) | 25.9 | 26.2 -1% | 25.8 -0% | 24.9 4% | 25.9 -0% | 23 11% |
| Load Average * (dB) | 30.1 | 37.1 -23% | 38 -26% | 45.7 -52% | 36.2 -20% | 23.8 21% |
| Cyberpunk 2077 ultra * (dB) | 40.8 | 42.1 -3% | 38.1 7% | 49 -20% | 40.1 2% | |
| Load Maximum * (dB) | 44.7 | 42.1 6% | 48.6 -9% | 50.4 -13% | 40.1 10% | 43.8 2% |
| Witcher 3 ultra * (dB) | 43.8 |
* ... Moindre est la valeur, meilleures sont les performances
Température
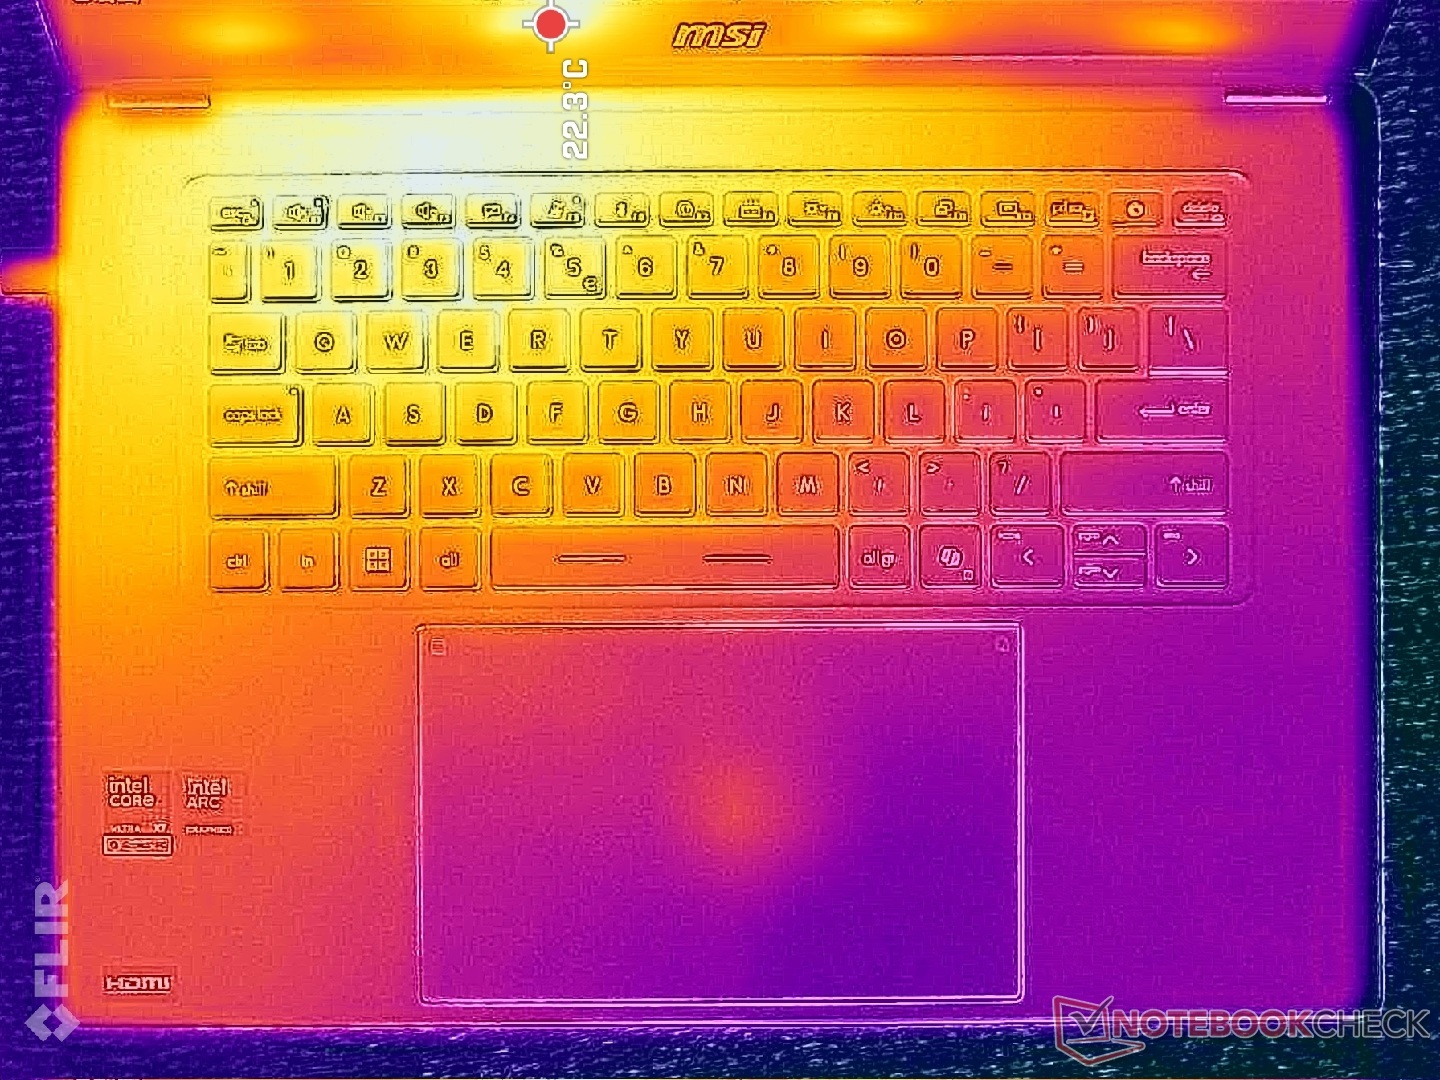
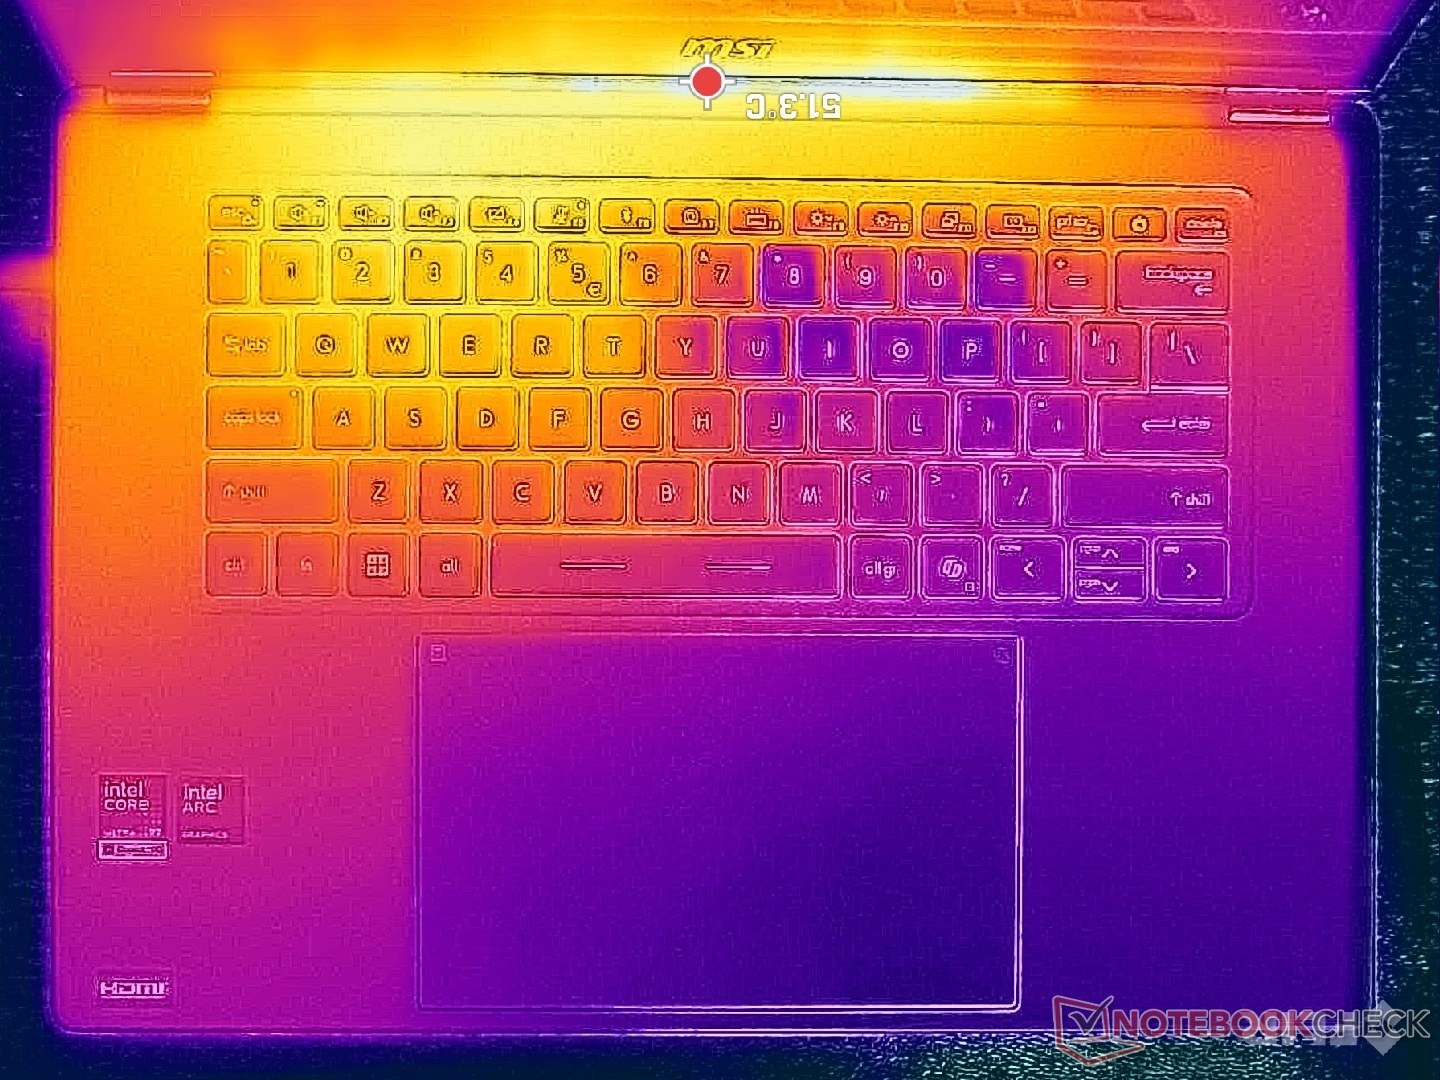
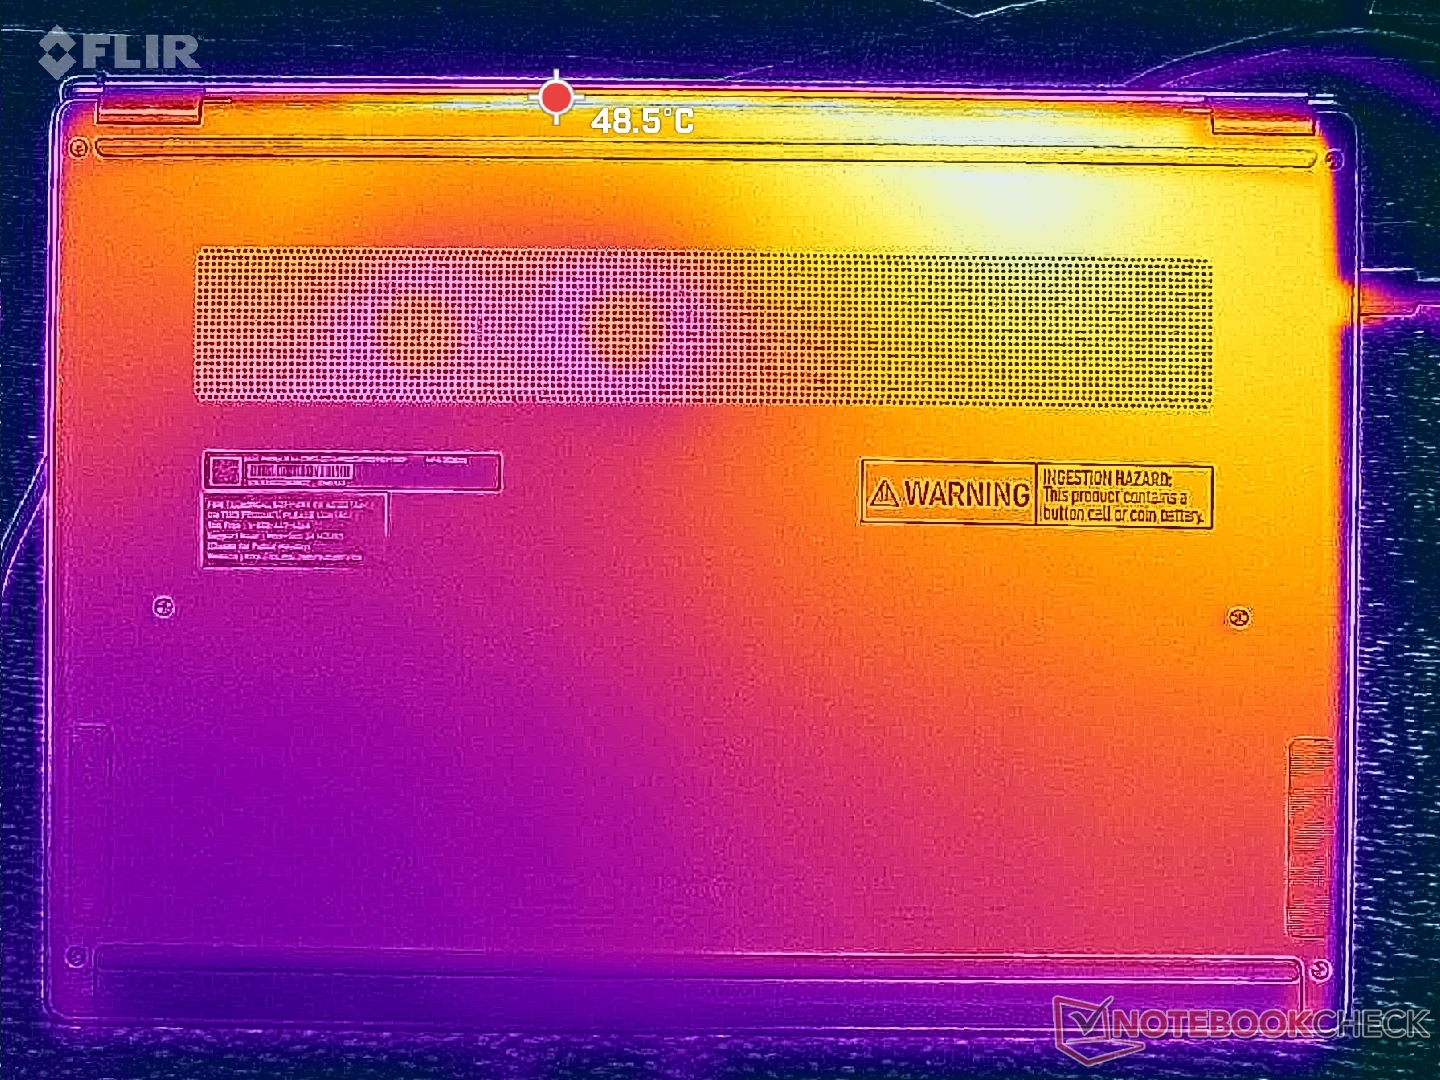
Les températures de surface se sont améliorées par rapport à la génération précédente. Alors que la Prestige 16 de 2025 atteignait des températures de 47°C à 52°C, le nouveau modèle atteint des températures de 40°C à 47°C. Les points chauds se situent près du coin arrière du châssis, où le contact avec la peau est minimisé.
Malgré cela, les températures de surface sont toujours plus élevées que sur les modèles concurrents XPS 16 où les points chauds n'atteignent que 41°C quel que soit le côté, pour une moyenne plus froide.
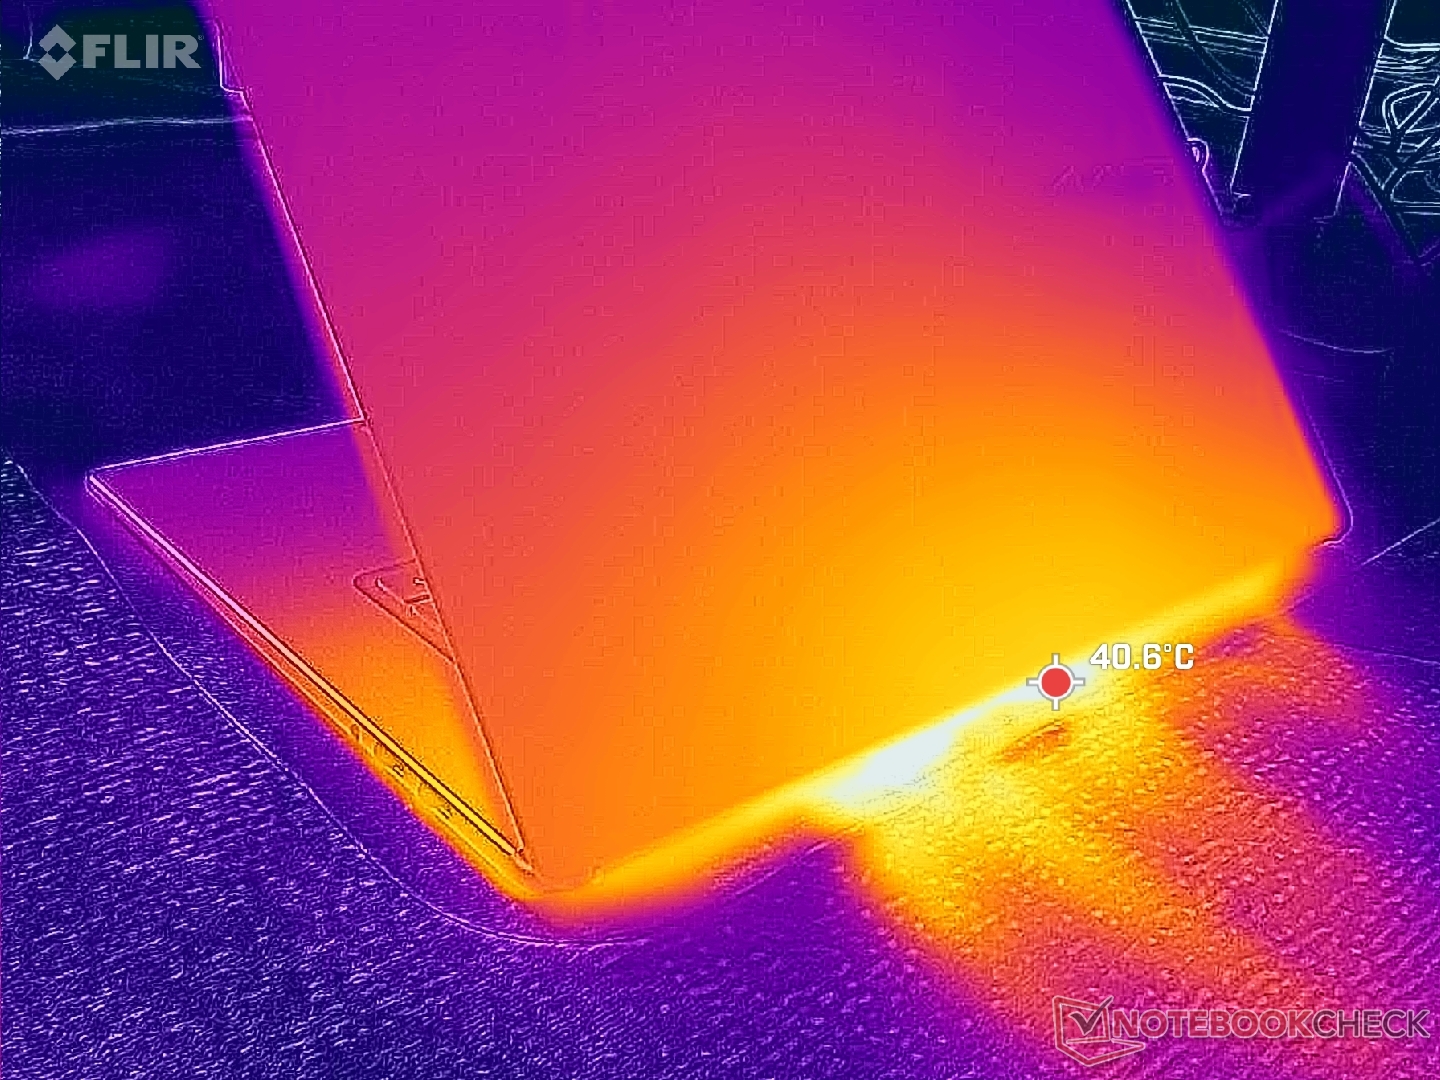
(-) La température maximale du côté supérieur est de 47 °C / 117 F, par rapport à la moyenne de 36.8 °C / 98 F, allant de 21 à 71 °C pour la classe Multimedia.
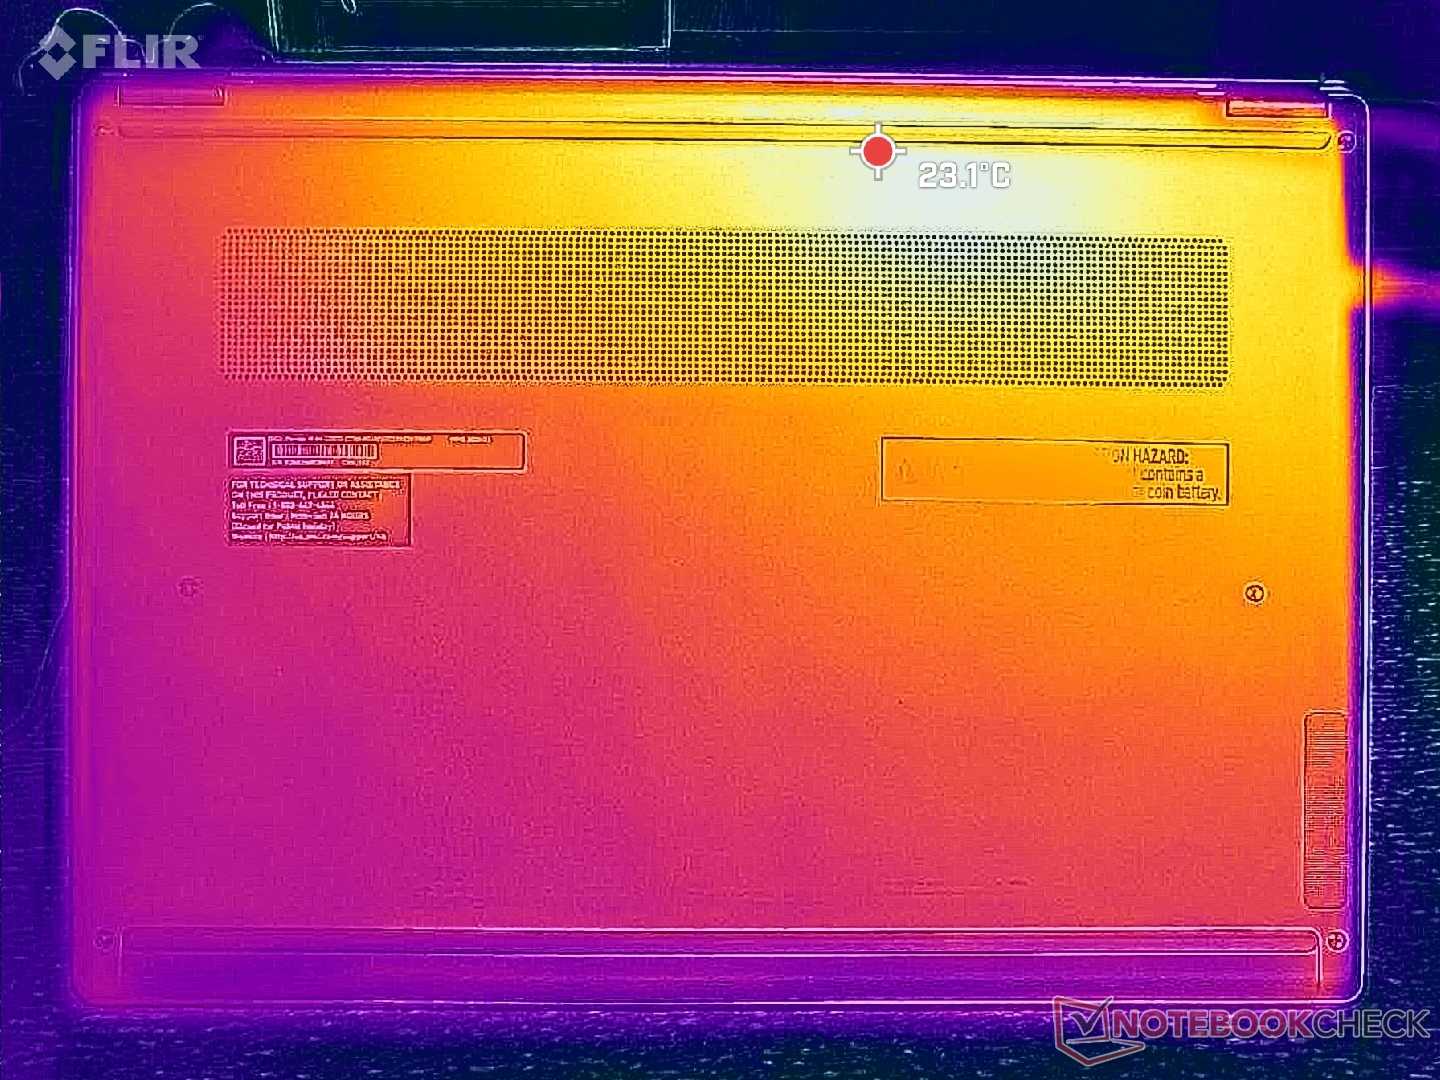
(±) Le fond chauffe jusqu'à un maximum de 40 °C / 104 F, contre une moyenne de 39.1 °C / 102 F
(+) En utilisation inactive, la température moyenne du côté supérieur est de 24.8 °C / 77 F, par rapport à la moyenne du dispositif de 31.3 °C / 88 F.
(+) Les repose-poignets et le pavé tactile sont plus froids que la température de la peau avec un maximum de 30.4 °C / 86.7 F et sont donc froids au toucher.
(±) La température moyenne de la zone de l'appui-paume de dispositifs similaires était de 28.7 °C / 83.7 F (-1.7 °C / #-3 F).
| MSI Prestige 16 AI C3MTG Ultra X7 358H, Arc B390 Panther Lake iGPU | MSI Prestige 16 AI Evo B2HMG Ultra 9 285H, Arc 140T | Dell XPS 16 Core Ultra X7 358H Ultra X7 358H, Arc B390 Panther Lake iGPU | Asus ZenBook S16 UM5606GA Ryzen AI 9 465, Radeon 880M | Lenovo ThinkBook 16 G7+ AMD Ryzen AI 9 365, Radeon 880M | HP Envy x360 2-in-1 16-ad0097nr R7 8840HS, Radeon 780M | |
|---|---|---|---|---|---|---|
| Heat | -5% | 11% | -1% | 9% | -3% | |
| Maximum Upper Side * (°C) | 47 | 48.1 -2% | 40.6 14% | 43.4 8% | 38.2 19% | 42.6 9% |
| Maximum Bottom * (°C) | 40 | 51.6 -29% | 39.8 1% | 46.2 -16% | 37.9 5% | 47.8 -19% |
| Idle Upper Side * (°C) | 27.4 | 25.9 5% | 23.2 15% | 26.5 3% | 25.4 7% | 27.4 -0% |
| Idle Bottom * (°C) | 27.4 | 25.2 8% | 23.8 13% | 27 1% | 25.7 6% | 27.8 -1% |
* ... Moindre est la valeur, meilleures sont les performances
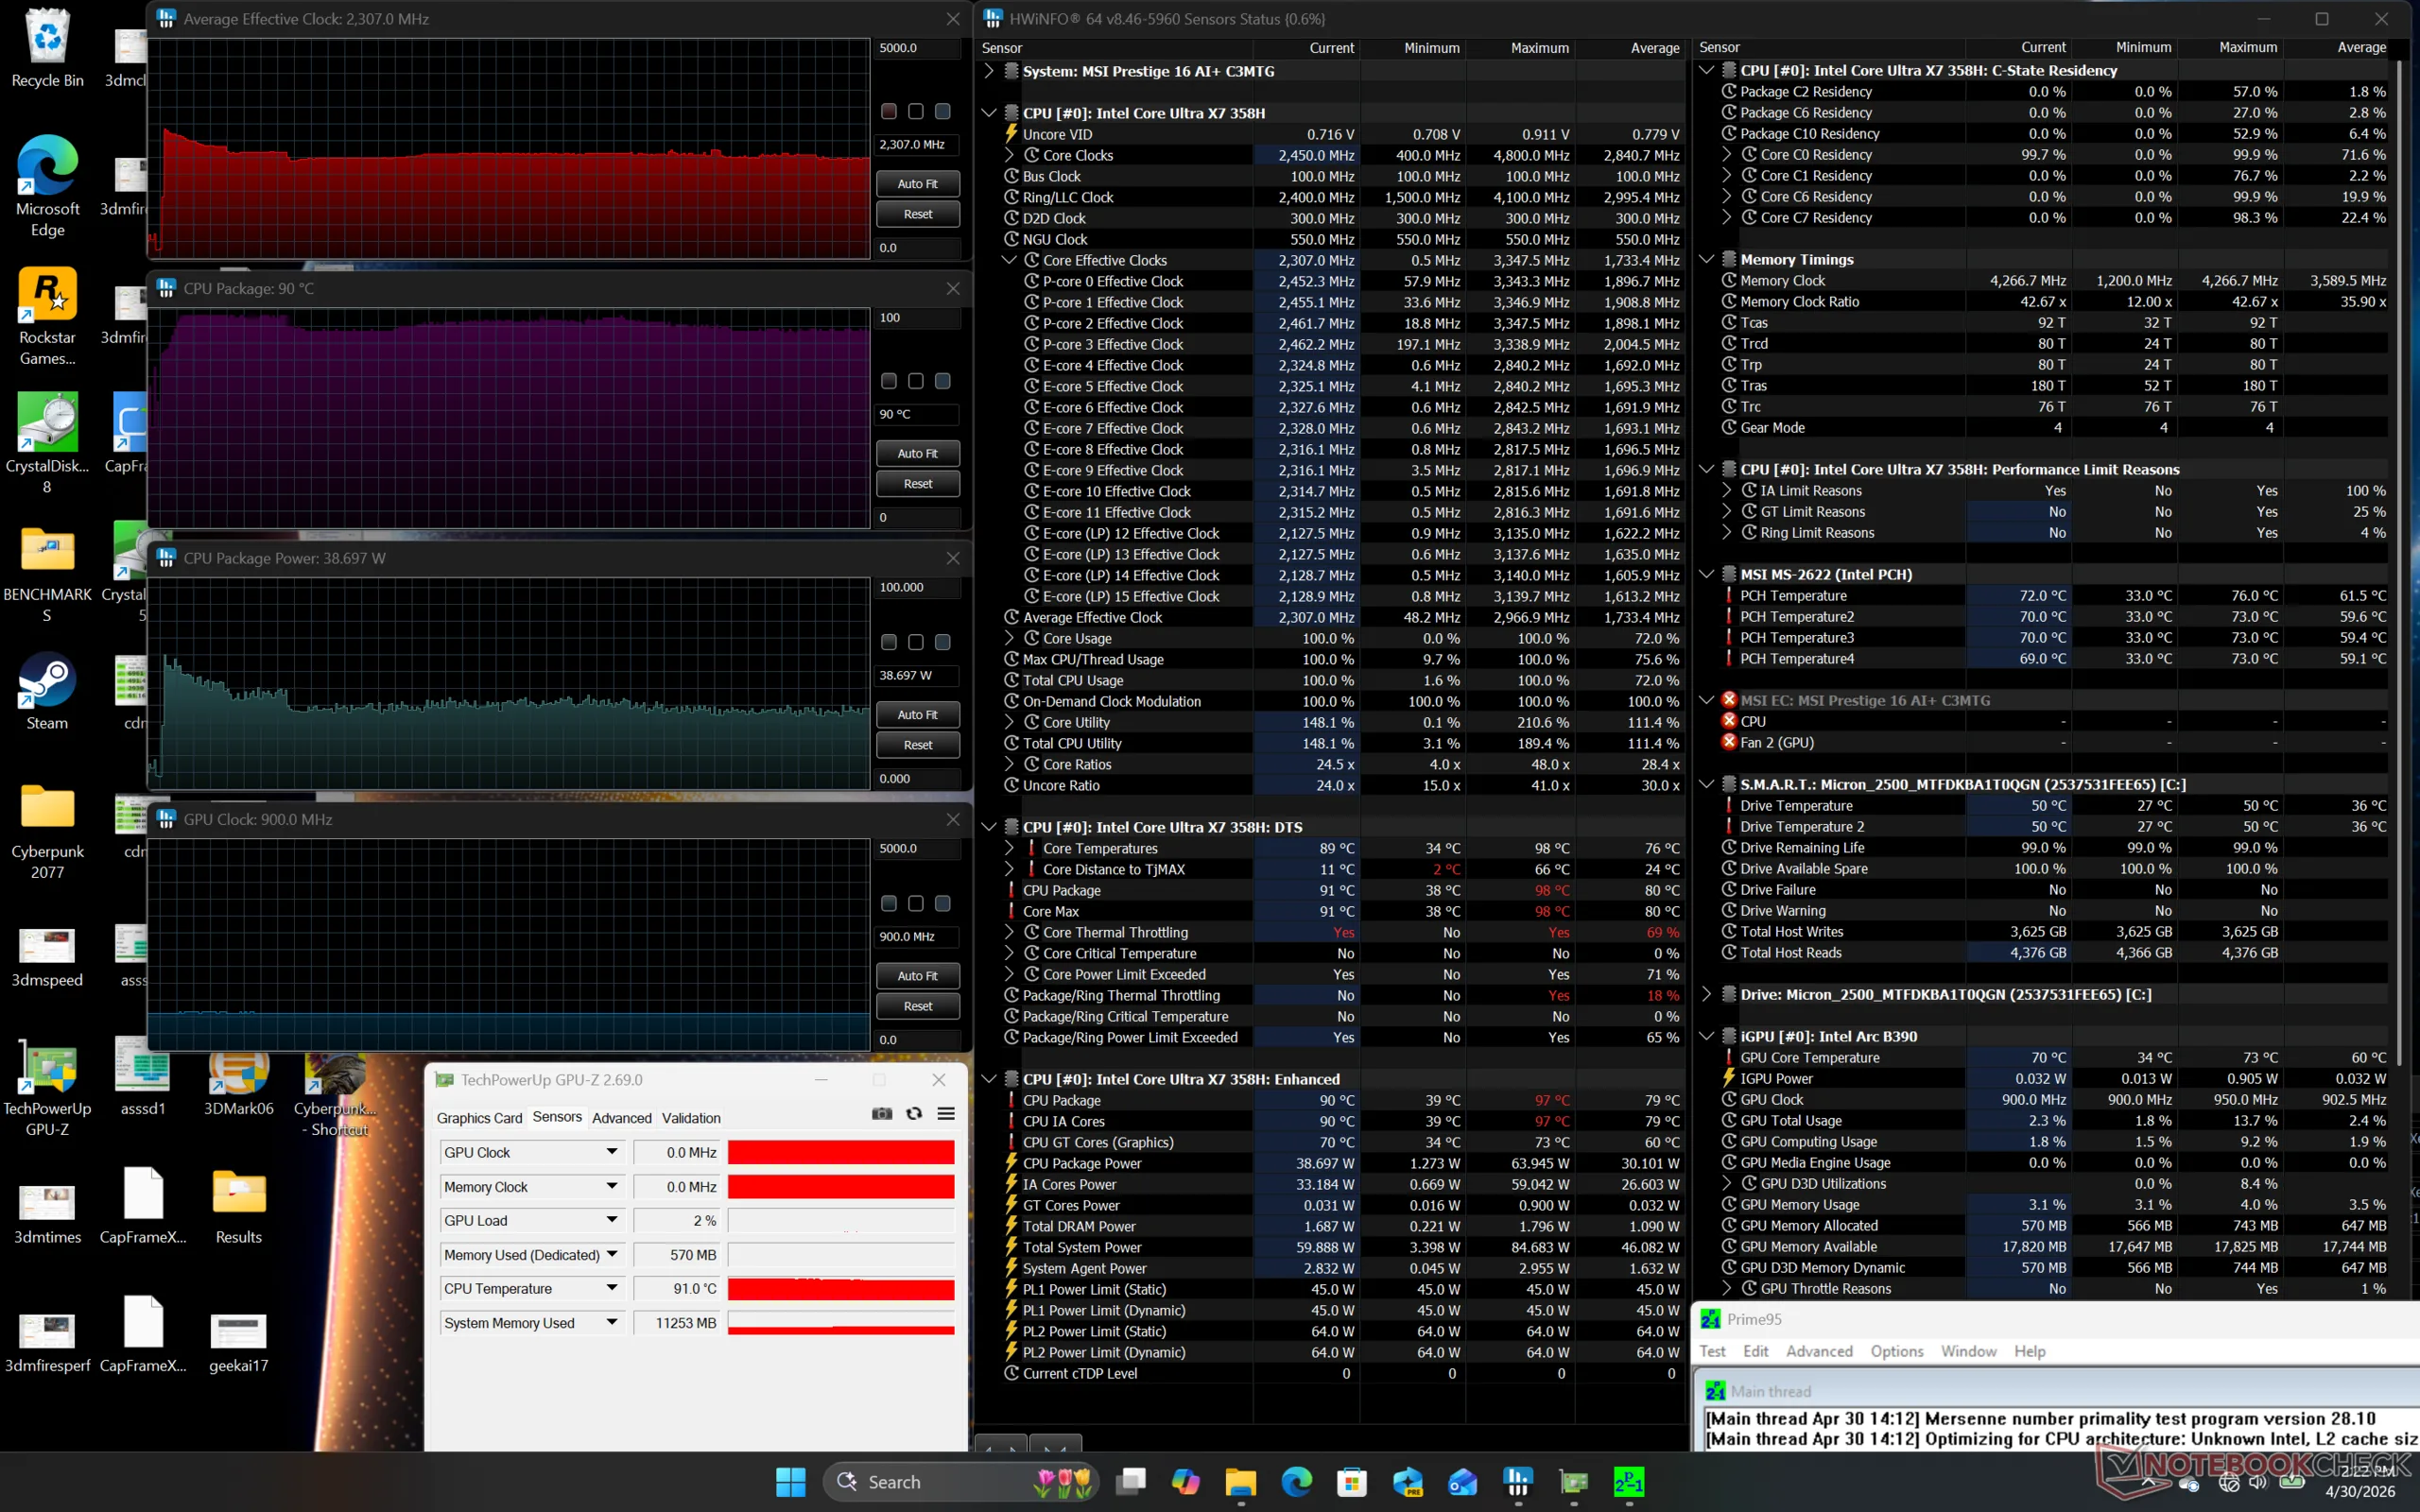
Test de stress
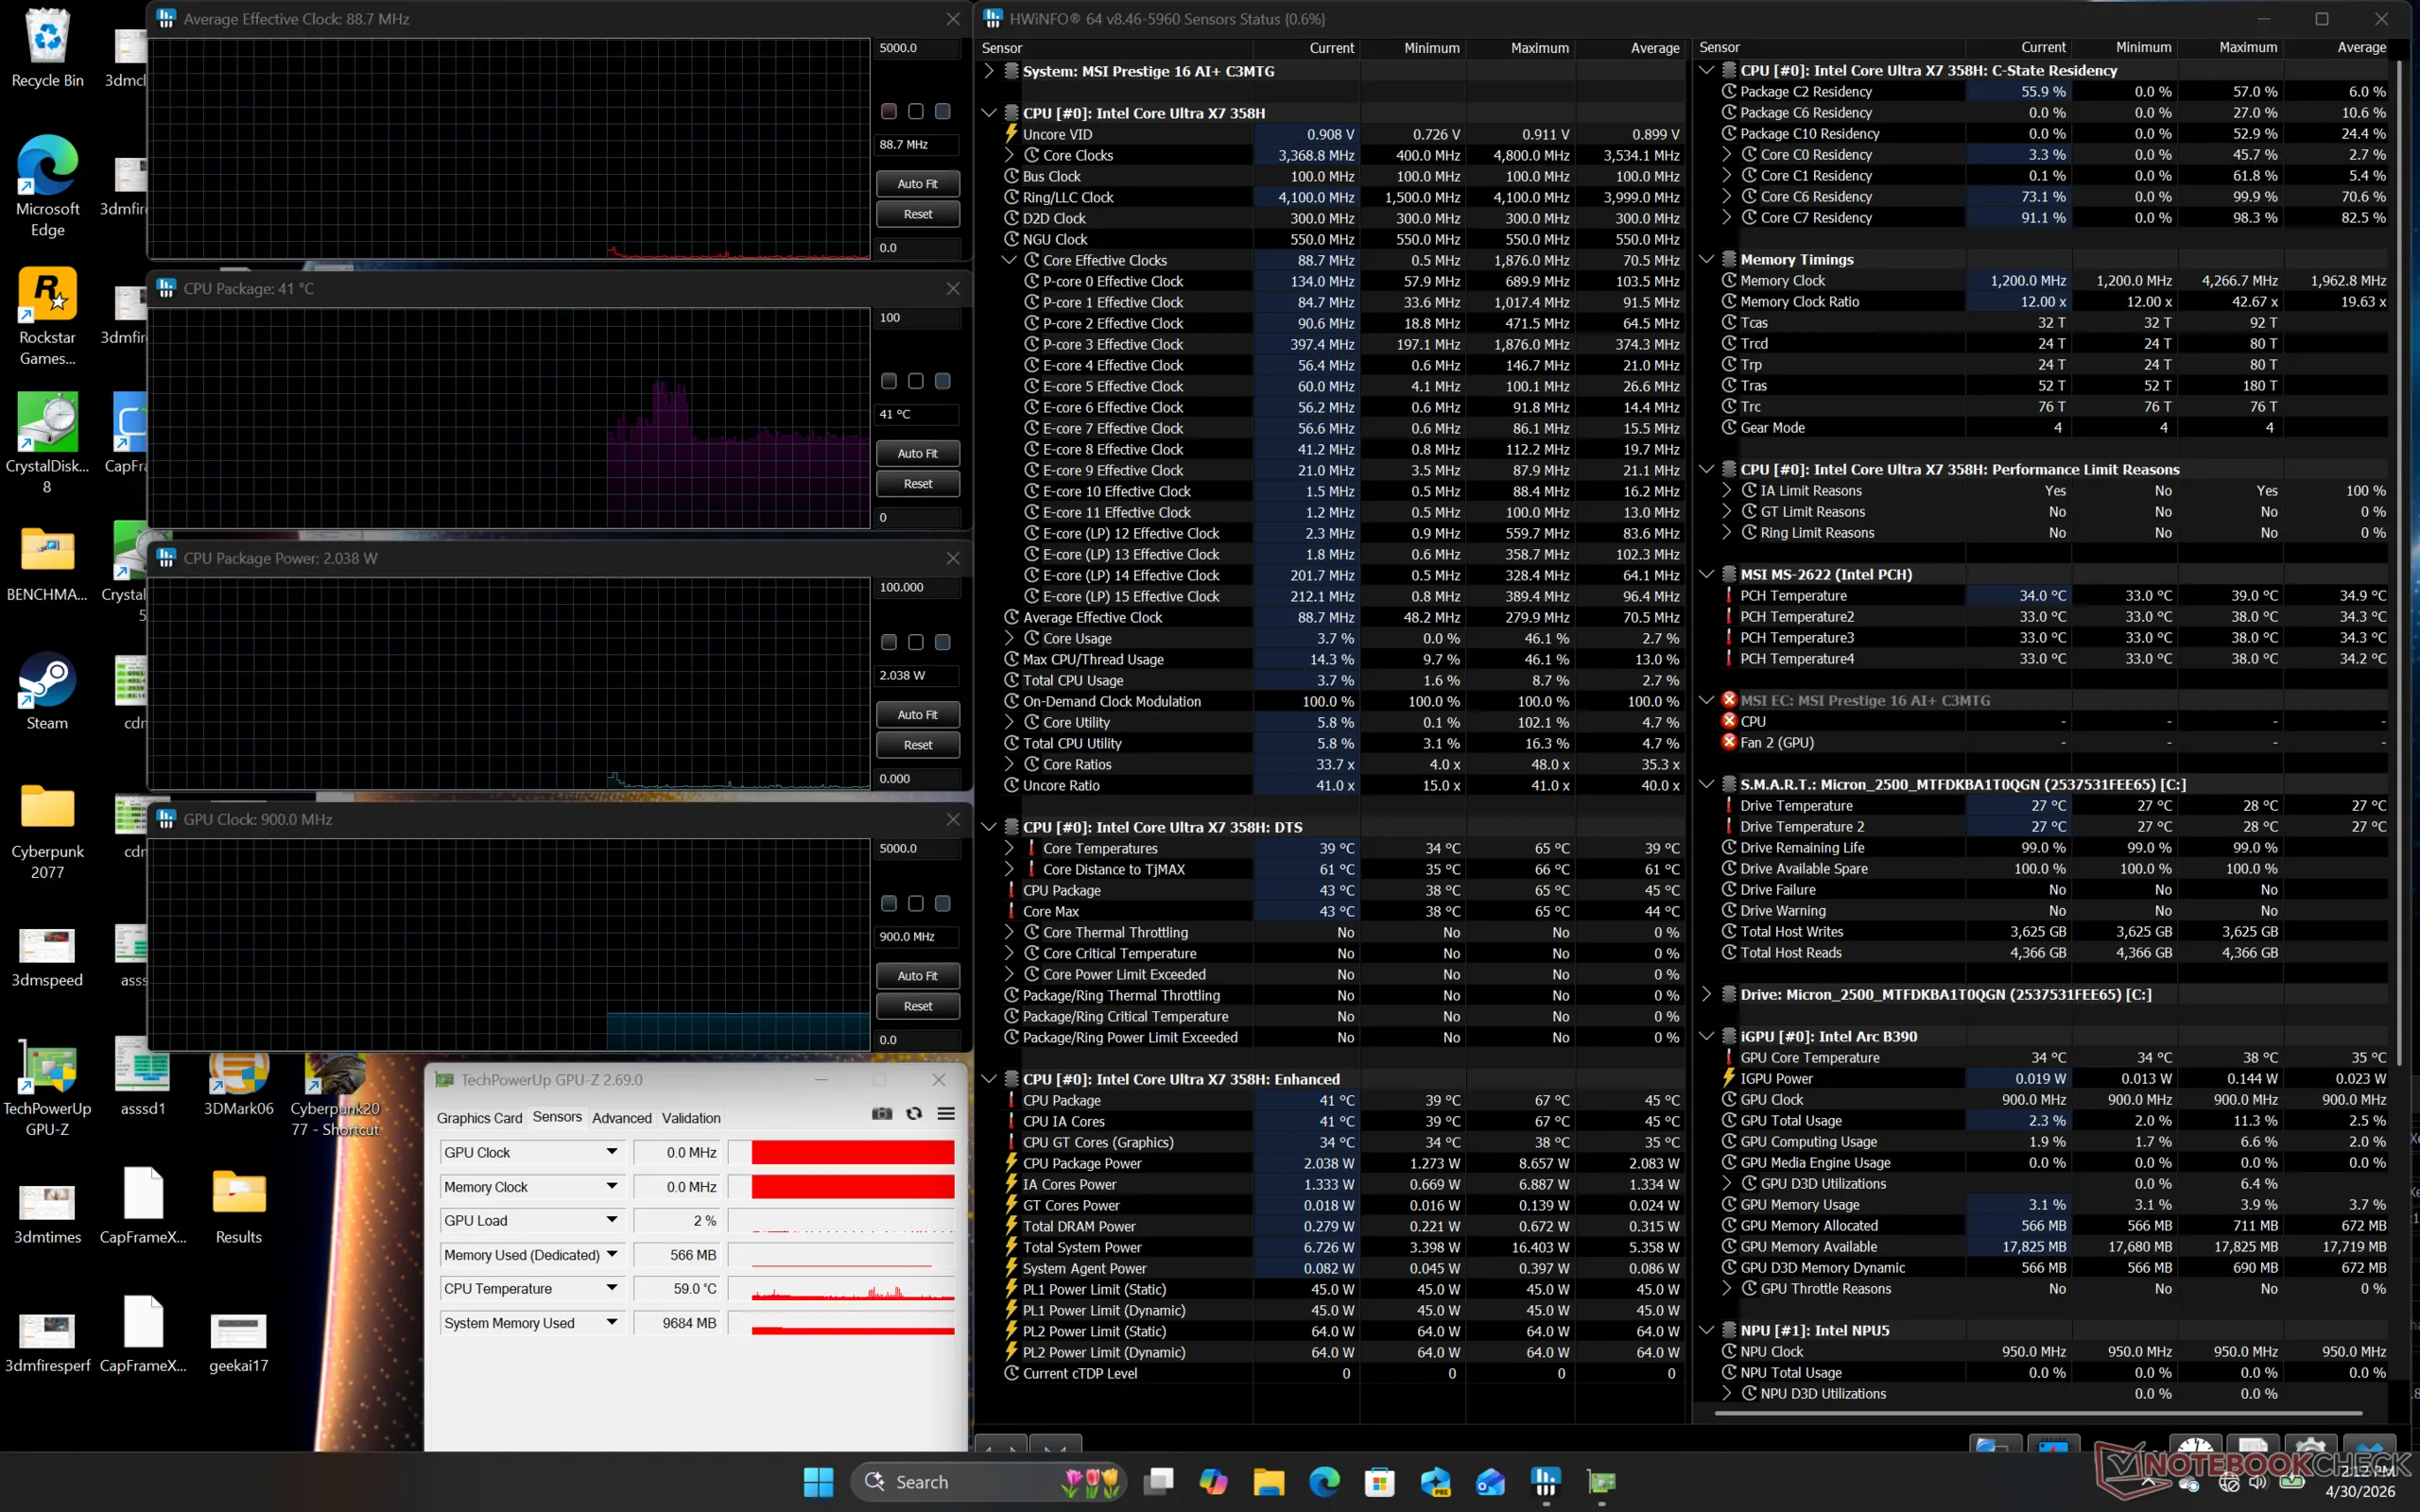
Lors de l'exécution du stress Prime95, le CPU passe à 3 GHz, 64 W et 97 C avant de redescendre rapidement à 2,3 GHz et 39 W afin de maintenir une température stable de 90 C. Les résultats sont plus chauds que ceux que nous avons enregistrés sur le XPS 16 avec exactement le même CPU où la température du cœur se stabilise à seulement 78 C en comparaison.
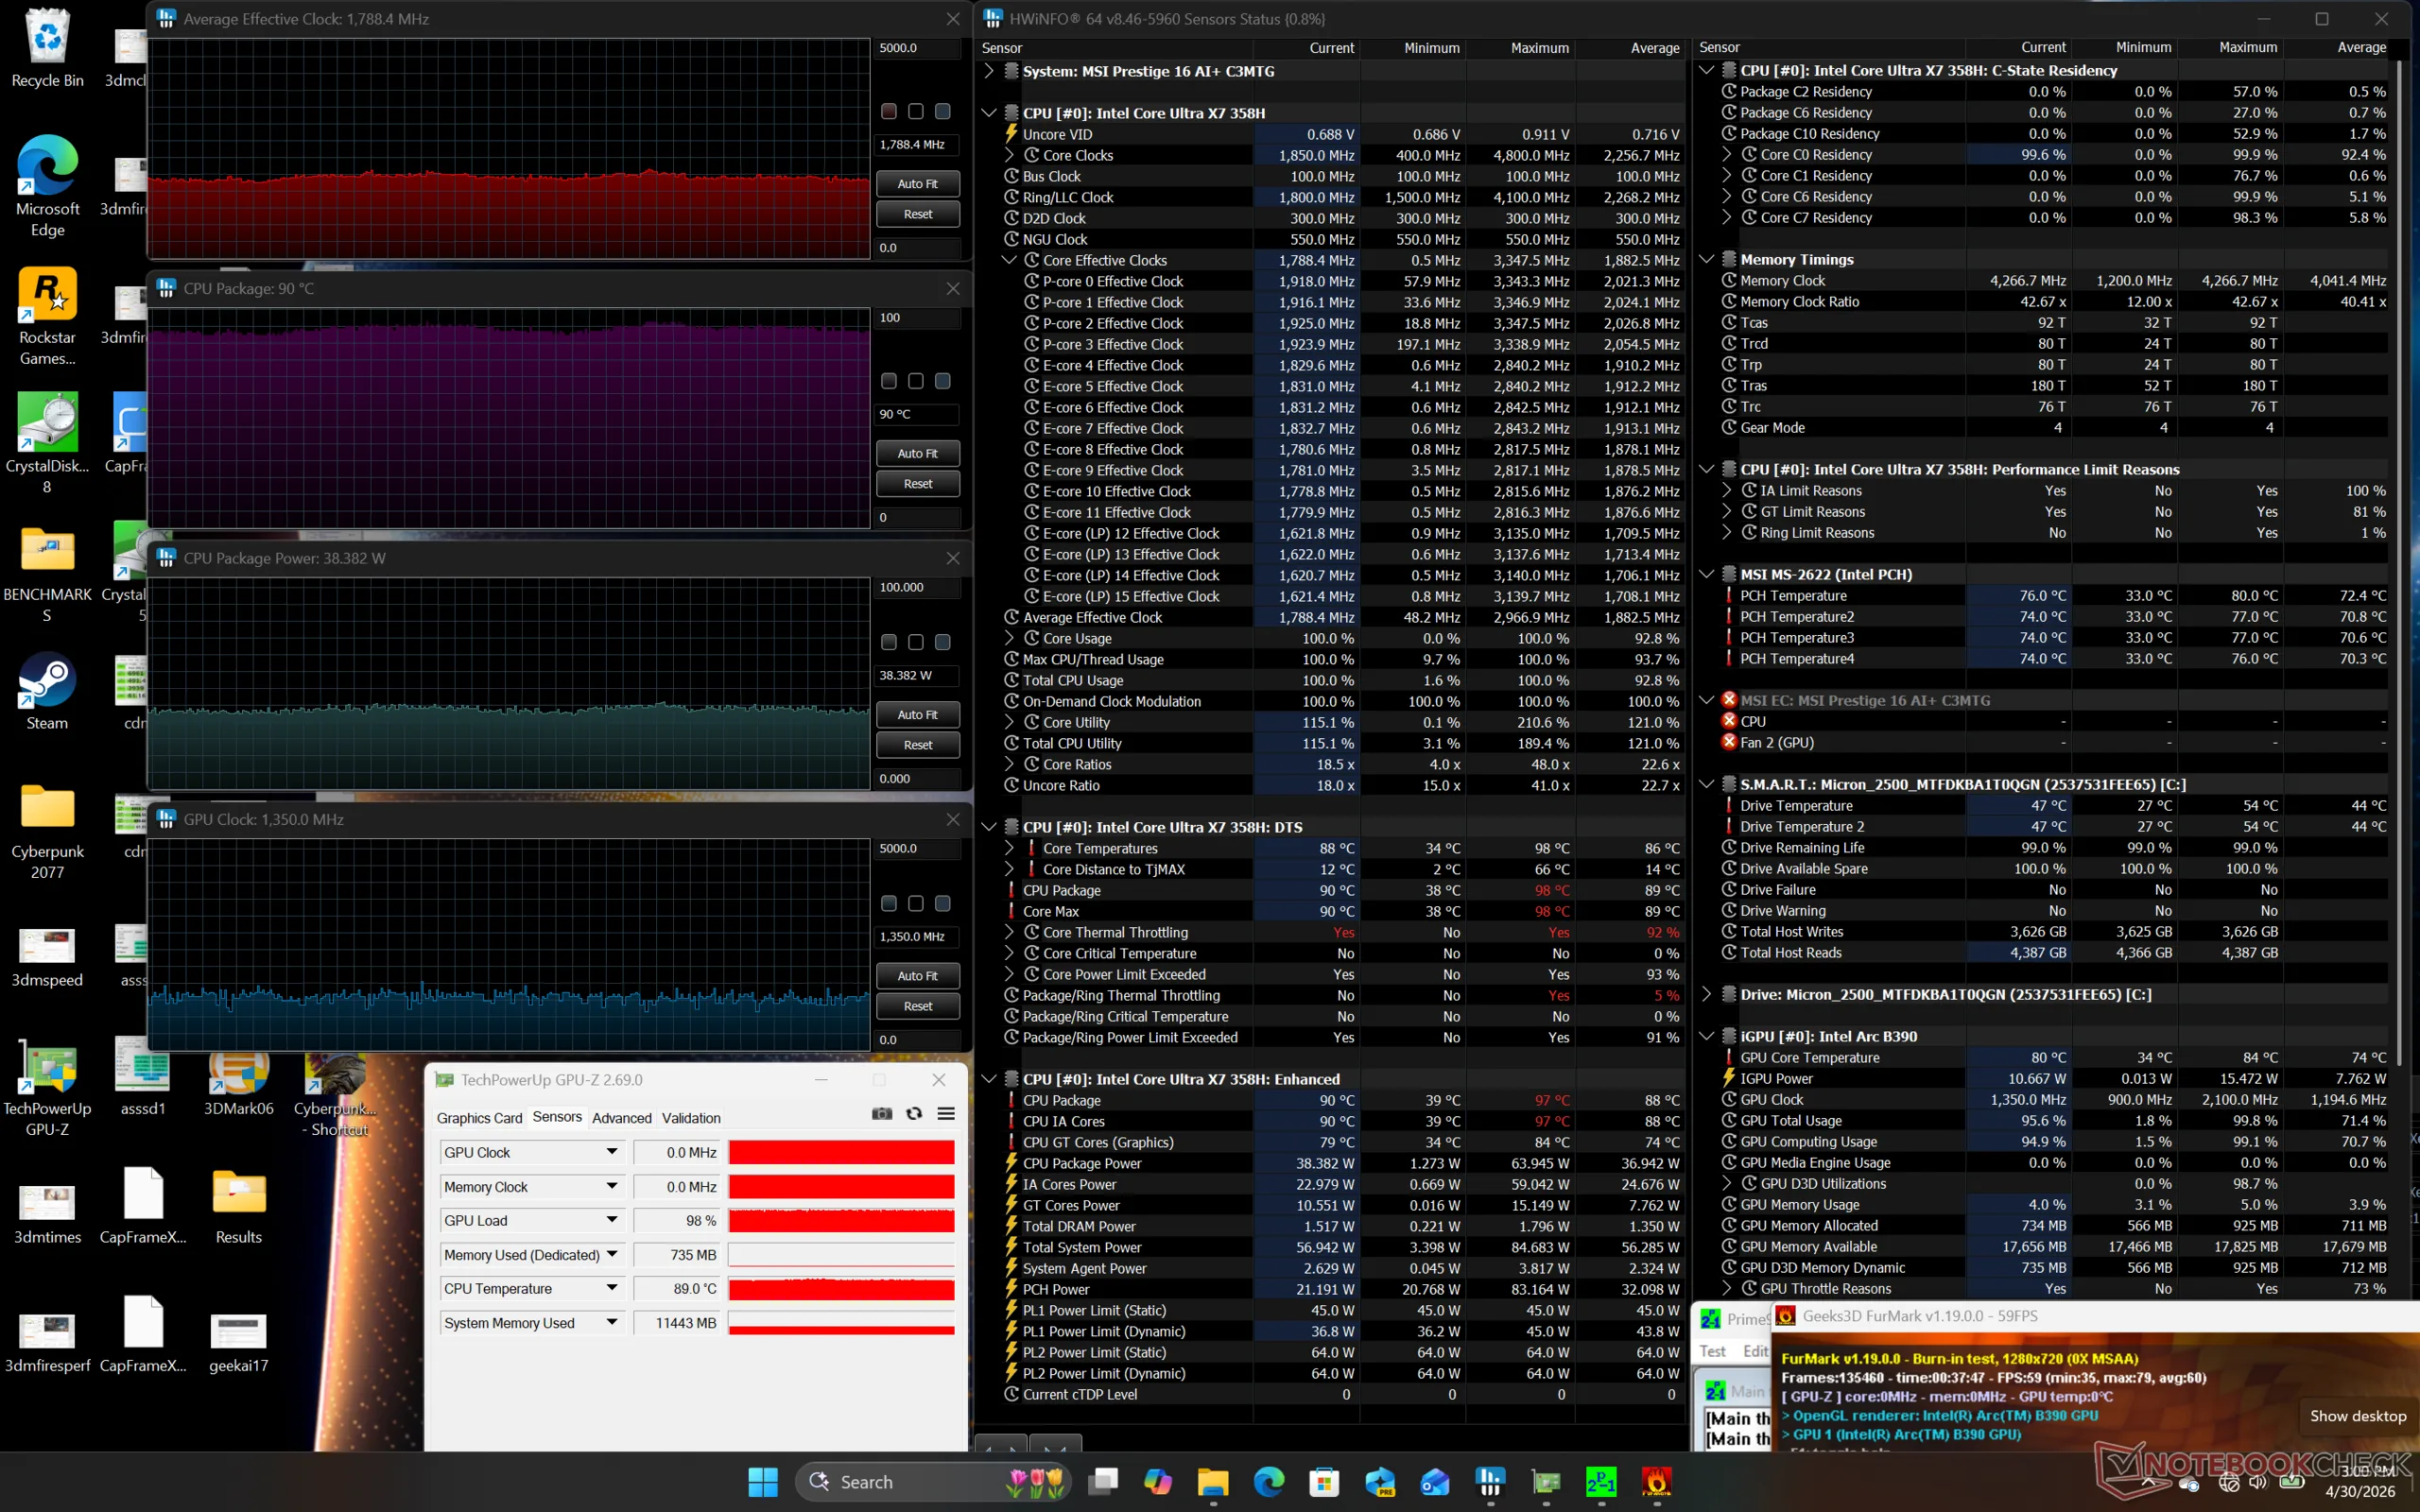
En exécutant Cyberpunk 2077 en mode Performance pour représenter le stress du jeu, le GPU se stabilise à 2500 MHz, 38 W et 86 C, ce qui est encore une fois beaucoup plus chaud que le Dell susmentionné de plus de 20 C. En réglant le système en mode Équilibré, le GPU passe de 1220 MHz à 1850 MHz et de 16 W à 26 W, ce qui correspond à la fois aux performances graphiques plus lentes mentionnées ci-dessus et au bruit du ventilateur plus silencieux.
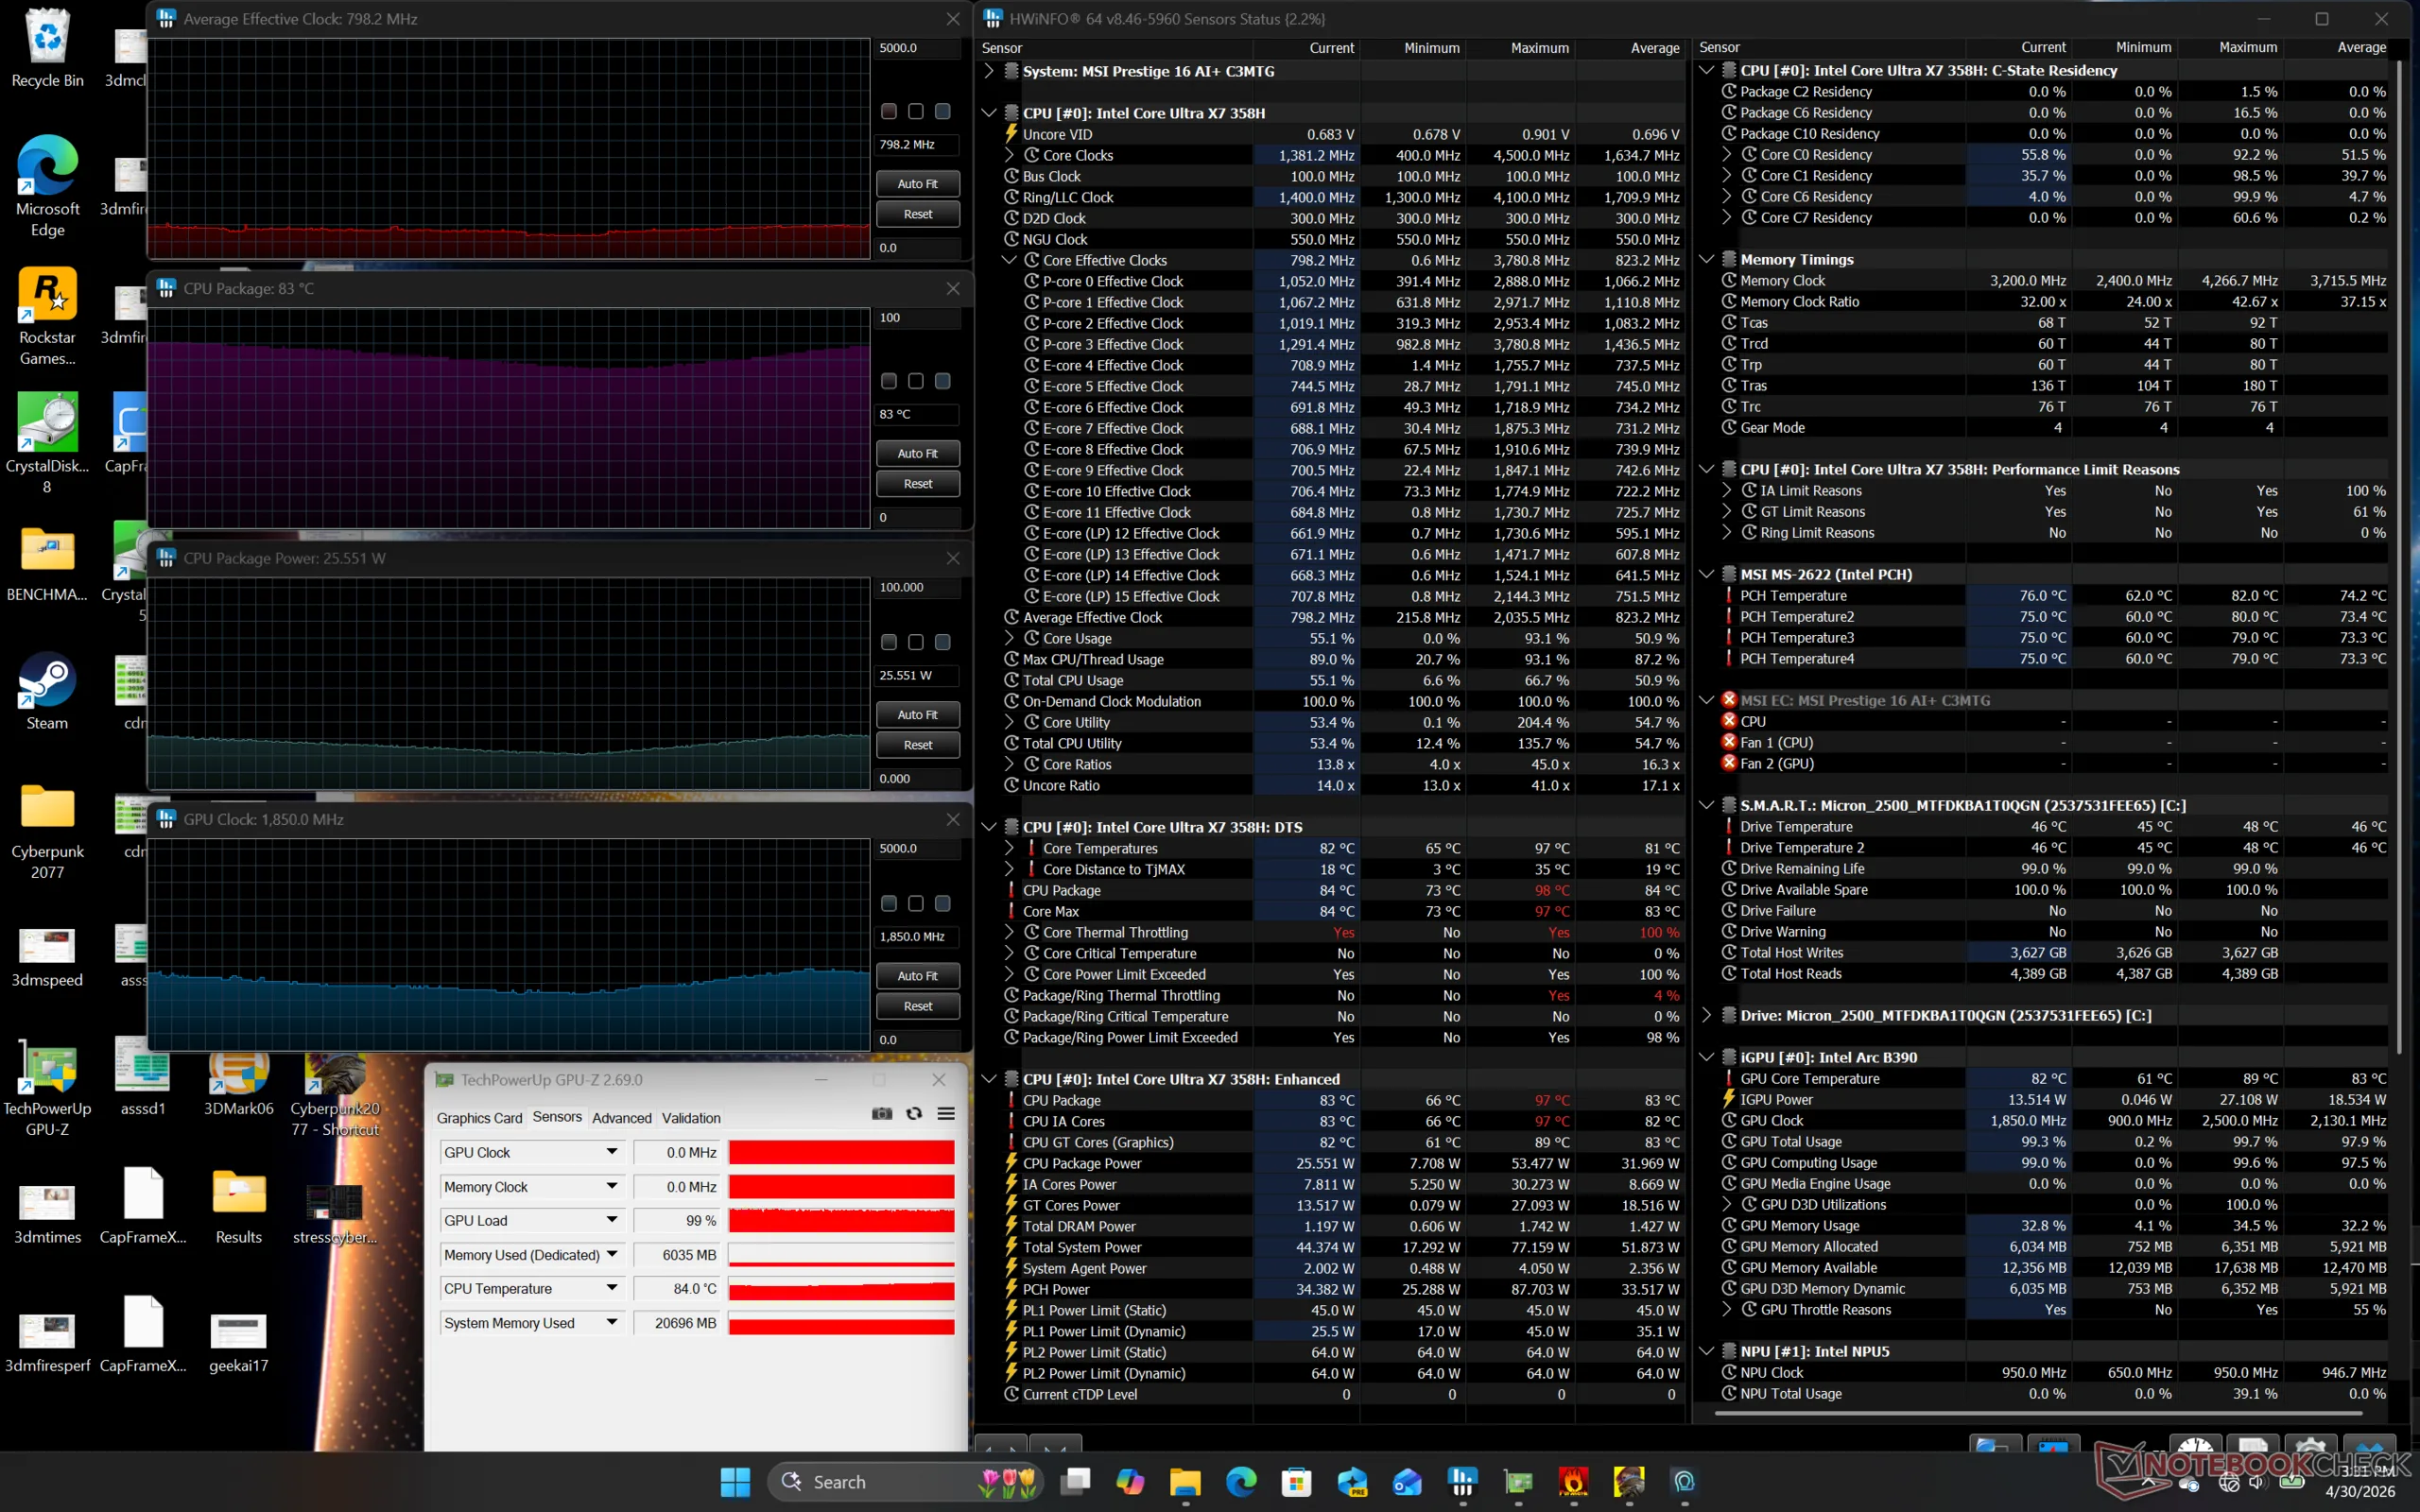
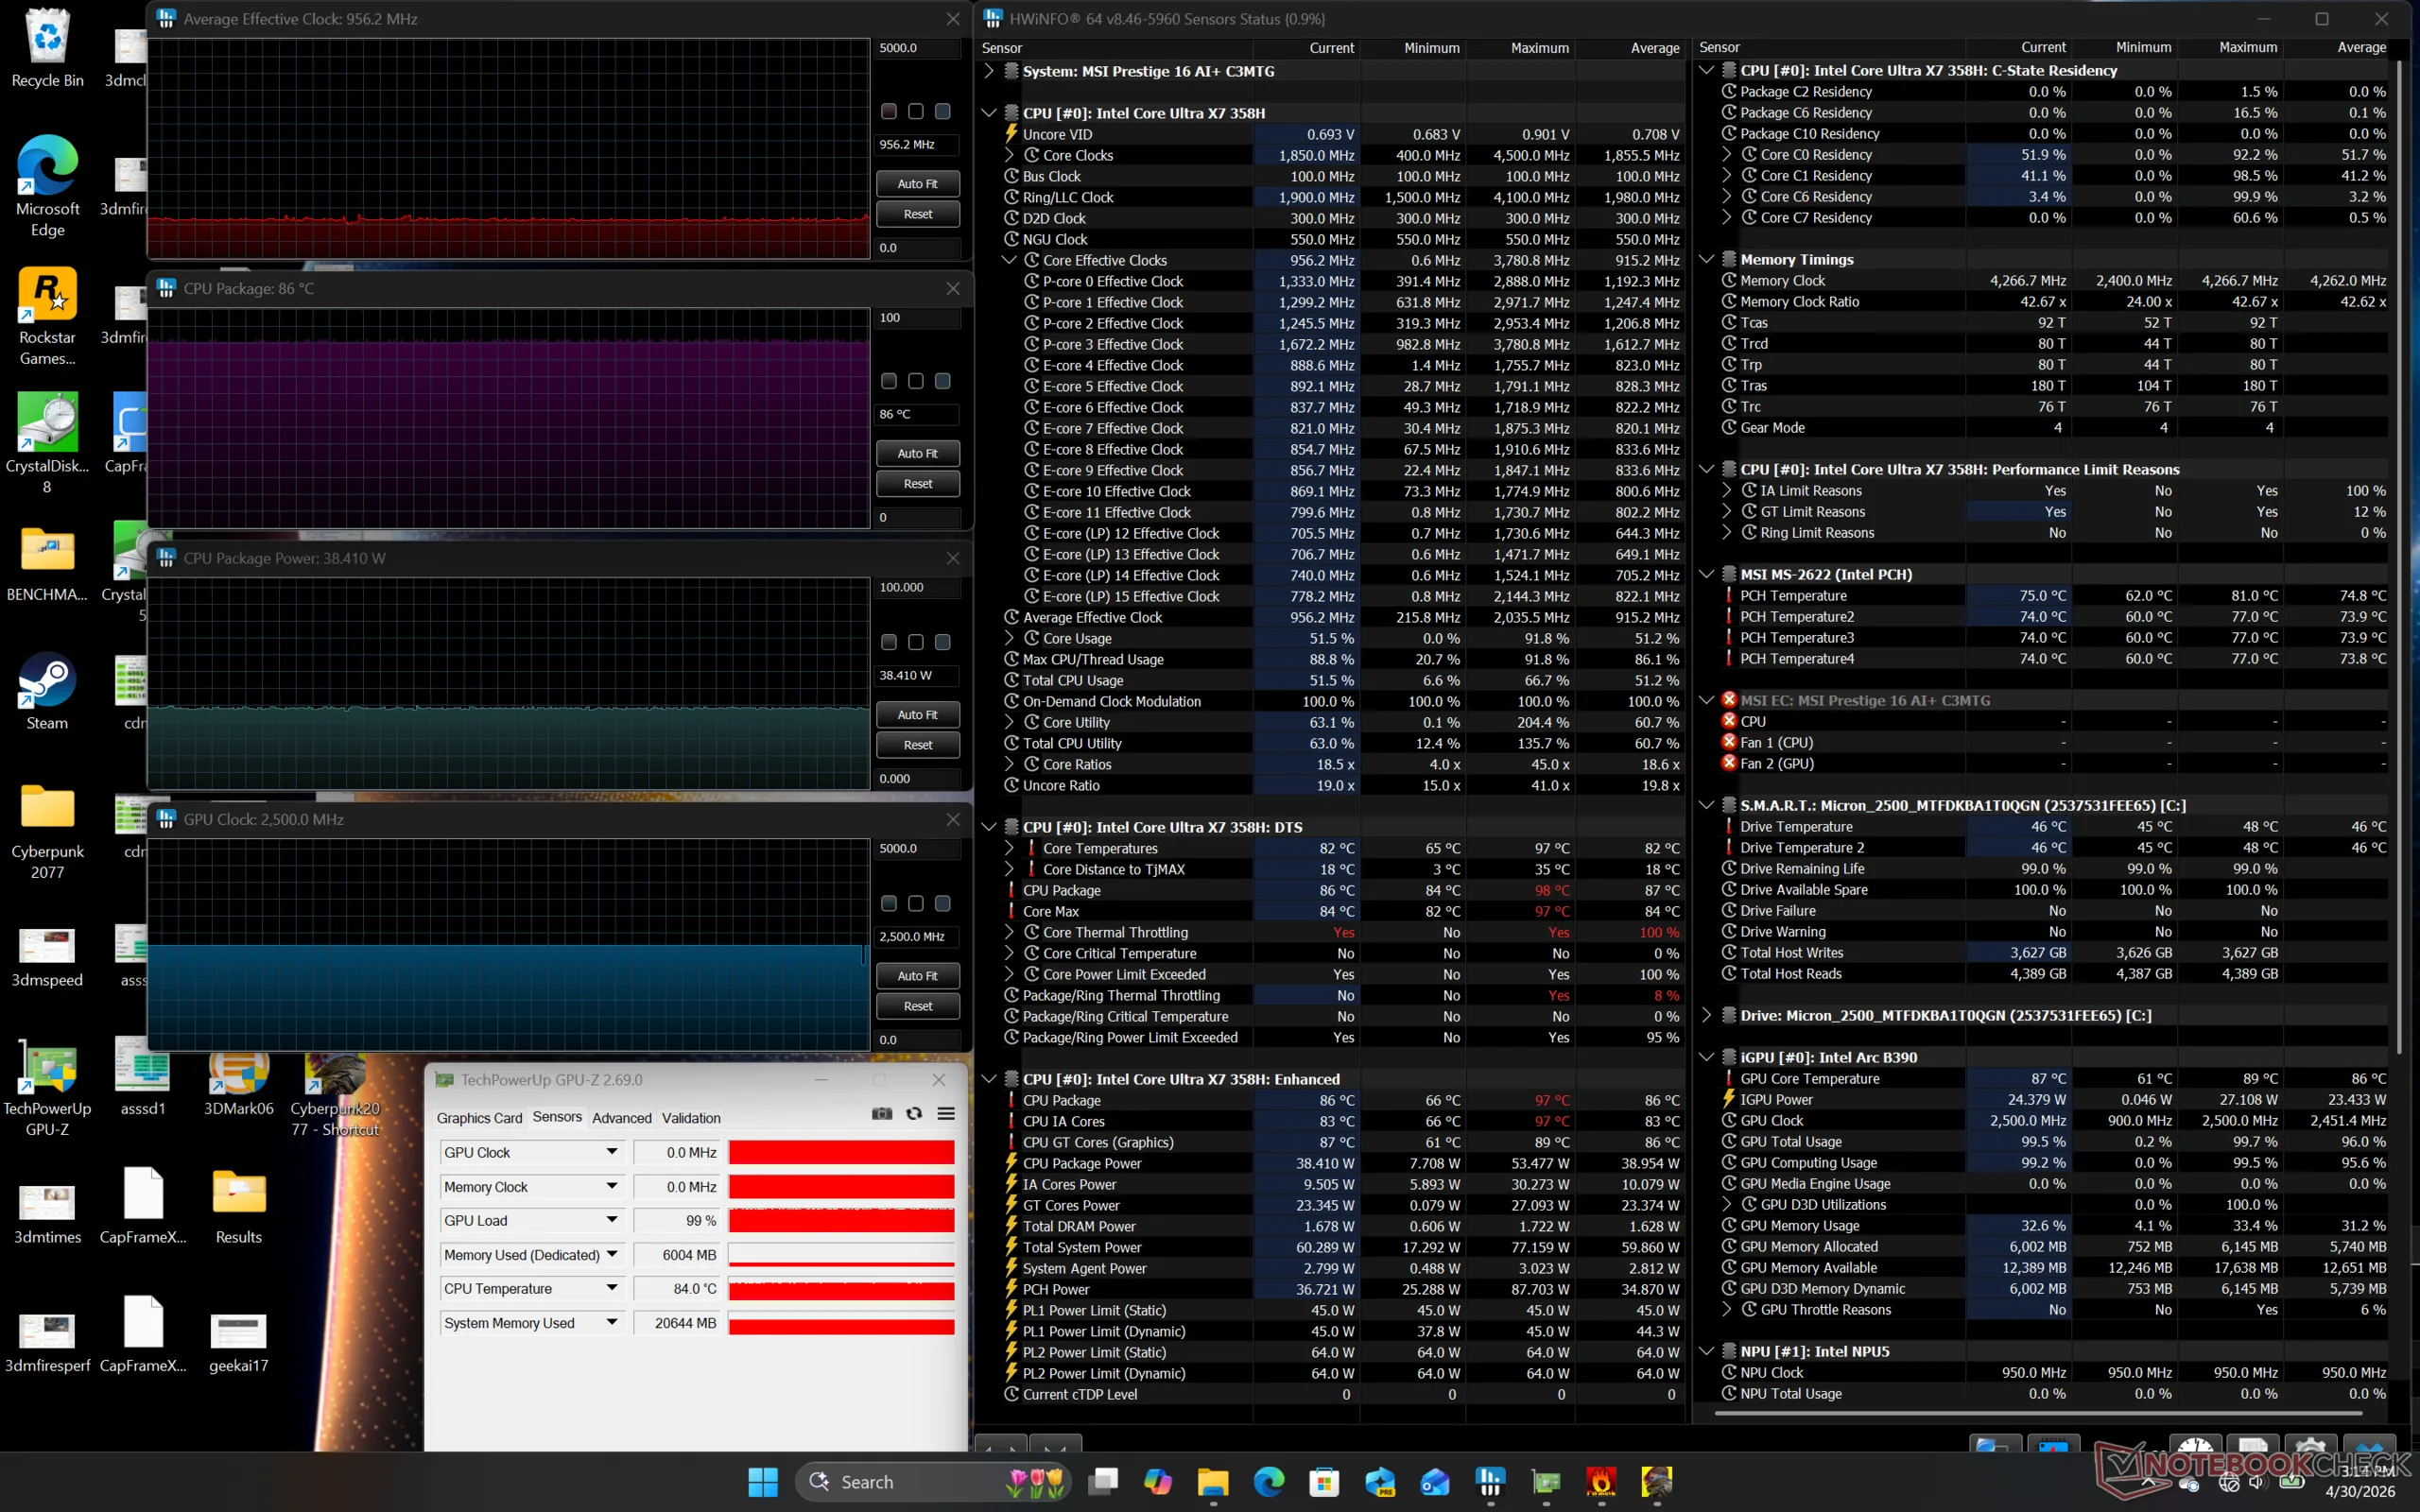
| Horloge moyenne du CPU (GHz) | Horloge du GPU (MHz) | Température moyenne du CPU (°C) | |
| Système au repos | -- | 900 | 41 |
| Prime95 Stress | 2.3 | -- | 90 |
| Prime95 + FurMark Stress | 1.8 | ~1350 | 90 |
| Cyberpunk 2077 Stress (mode équilibré) | 0.8 | 1220 - 1850 | 83 |
| Cyberpunk 2077 Stress (mode Performance) | 1.0 | 2500 | 86 |
Intervenants
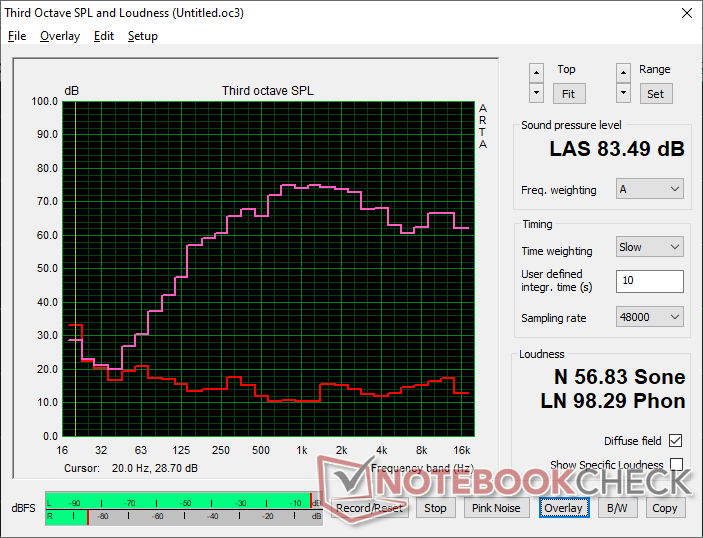
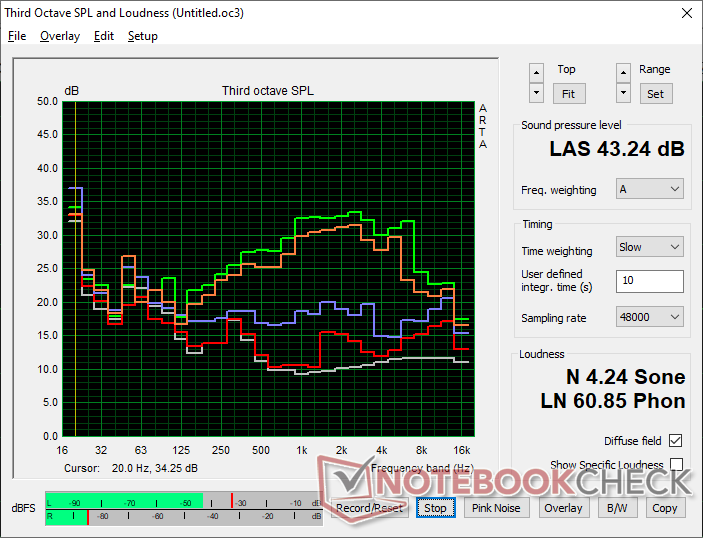
MSI Prestige 16 AI C3MTG analyse audio
(+) | les haut-parleurs peuvent jouer relativement fort (83.5# dB)
Basses 100 - 315 Hz
(±) | basse réduite - en moyenne 11.2% inférieure à la médiane
(±) | la linéarité des basses est moyenne (9% delta à la fréquence précédente)
Médiums 400 - 2000 Hz
(±) | médiane supérieure - en moyenne 5.9% supérieure à la médiane
(+) | les médiums sont linéaires (4% delta à la fréquence précédente)
Aiguës 2 - 16 kHz
(+) | des sommets équilibrés - à seulement 3.3% de la médiane
(+) | les aigus sont linéaires (5.4% delta à la fréquence précédente)
Globalement 100 - 16 000 Hz
(+) | le son global est linéaire (12.8% différence à la médiane)
Par rapport à la même classe
» 24% de tous les appareils testés de cette catégorie étaient meilleurs, 5% similaires, 71% pires
» Le meilleur avait un delta de 5%, la moyenne était de 17%, le pire était de 45%.
Par rapport à tous les appareils testés
» 12% de tous les appareils testés étaient meilleurs, 3% similaires, 86% pires
» Le meilleur avait un delta de 4%, la moyenne était de 24%, le pire était de 134%.
Apple MacBook Pro 16 2021 M1 Pro analyse audio
(+) | les haut-parleurs peuvent jouer relativement fort (84.7# dB)
Basses 100 - 315 Hz
(+) | bonne basse - seulement 3.8% loin de la médiane
(+) | les basses sont linéaires (5.2% delta à la fréquence précédente)
Médiums 400 - 2000 Hz
(+) | médiane équilibrée - seulement 1.3% de la médiane
(+) | les médiums sont linéaires (2.1% delta à la fréquence précédente)
Aiguës 2 - 16 kHz
(+) | des sommets équilibrés - à seulement 1.9% de la médiane
(+) | les aigus sont linéaires (2.7% delta à la fréquence précédente)
Globalement 100 - 16 000 Hz
(+) | le son global est linéaire (4.6% différence à la médiane)
Par rapport à la même classe
» 0% de tous les appareils testés de cette catégorie étaient meilleurs, 0% similaires, 100% pires
» Le meilleur avait un delta de 5%, la moyenne était de 17%, le pire était de 45%.
Par rapport à tous les appareils testés
» 0% de tous les appareils testés étaient meilleurs, 0% similaires, 100% pires
» Le meilleur avait un delta de 4%, la moyenne était de 24%, le pire était de 134%.
Gestion de l'énergie
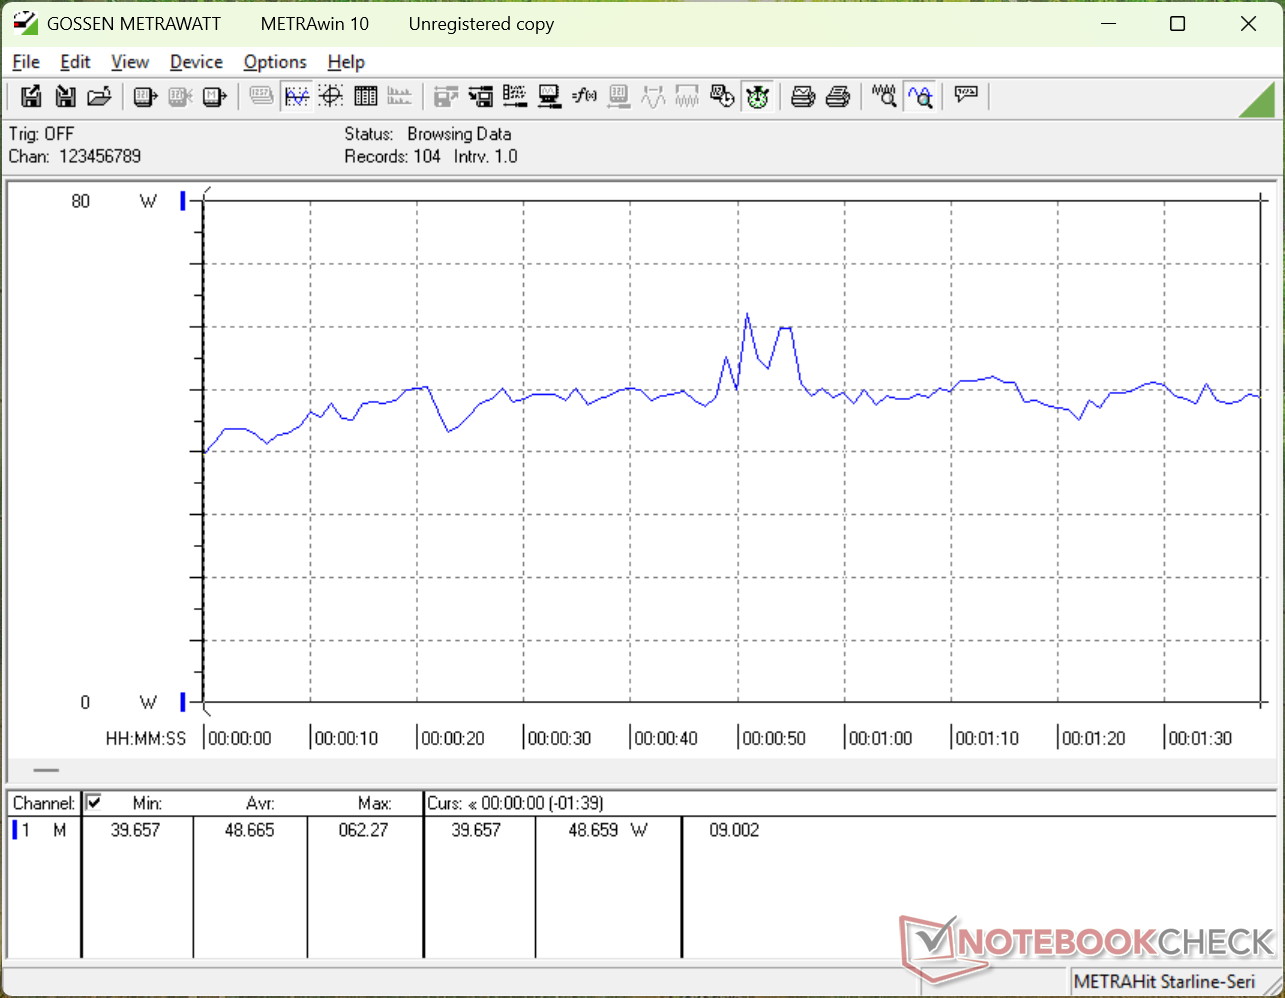
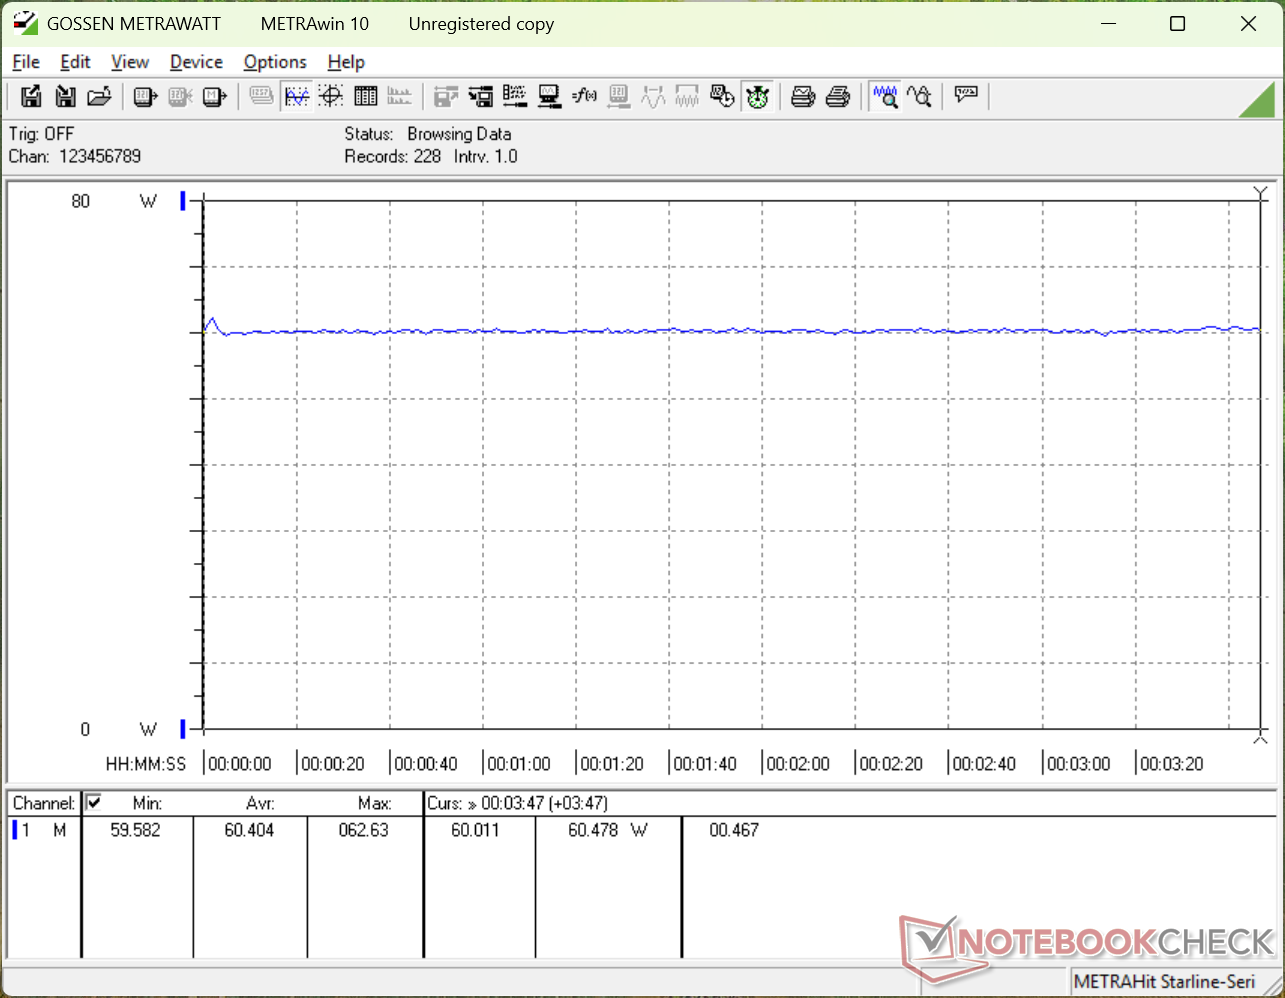
Consommation électrique
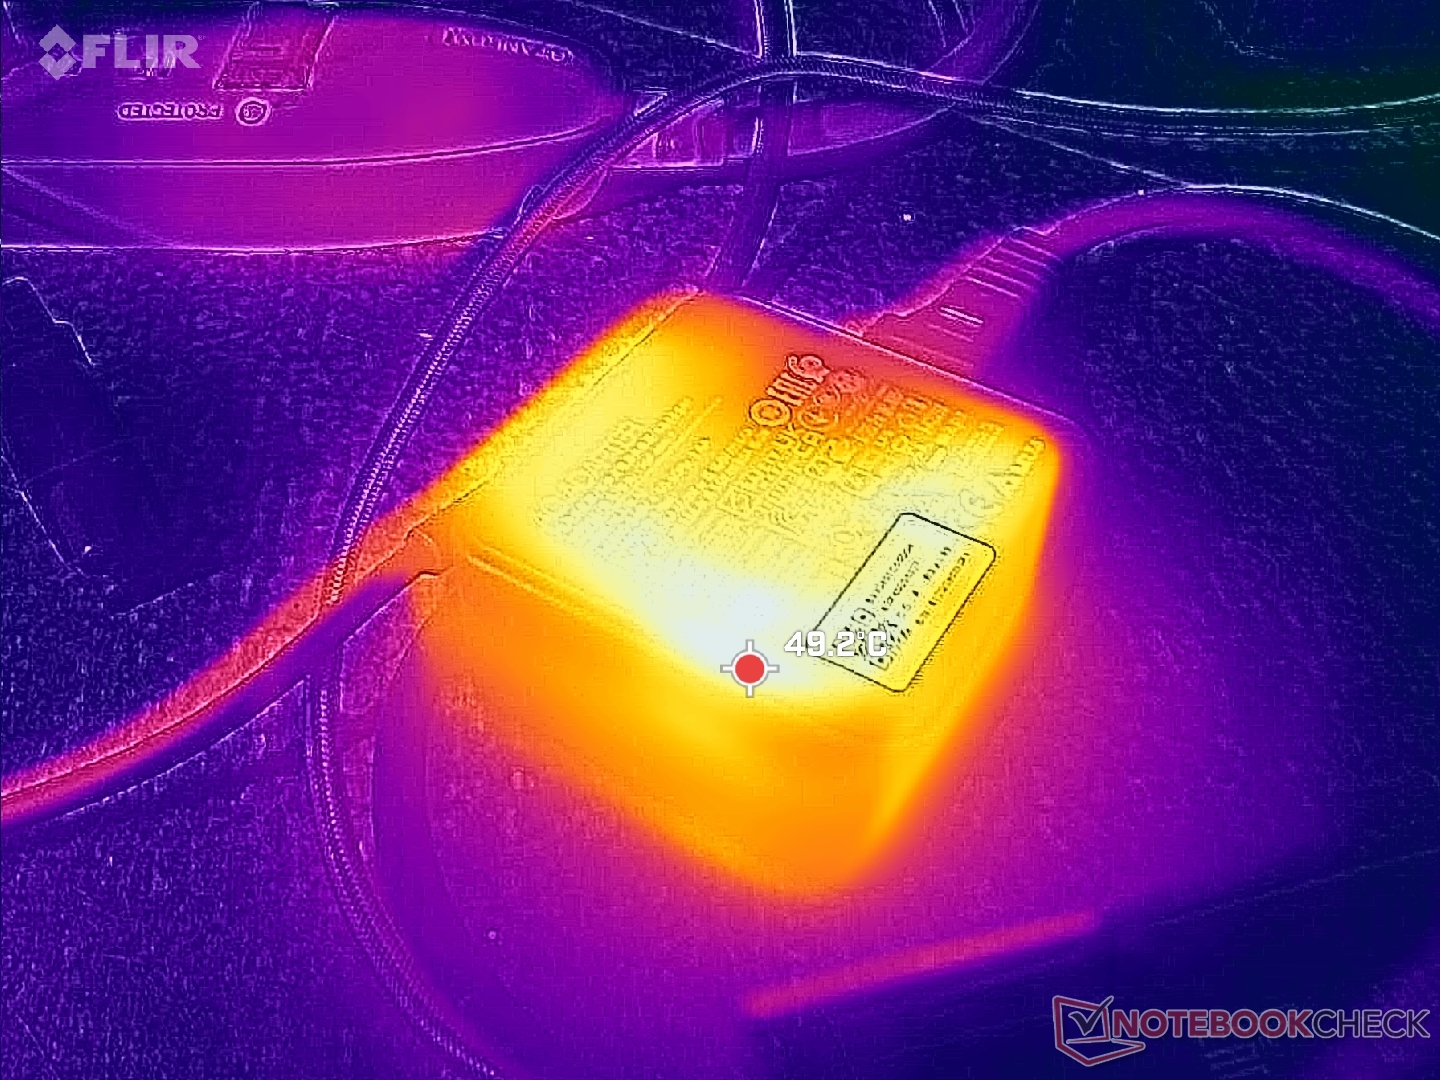
Le modèle est livré avec un adaptateur secteur USB-C plus petit de 65 W (~6,5 x 6,5 x 3,0 cm) au lieu de l'adaptateur de 100 W qui était livré avec le modèle 2025. Malgré cela, la consommation globale entre les deux modèles est assez similaire, comme le montrent les graphiques ci-dessous. Les performances par watt ont considérablement augmenté en ce qui concerne les graphiques, puisque la nouvelle Prestige 16 est jusqu'à 80 % plus rapide tout en consommant pratiquement la même quantité d'énergie.
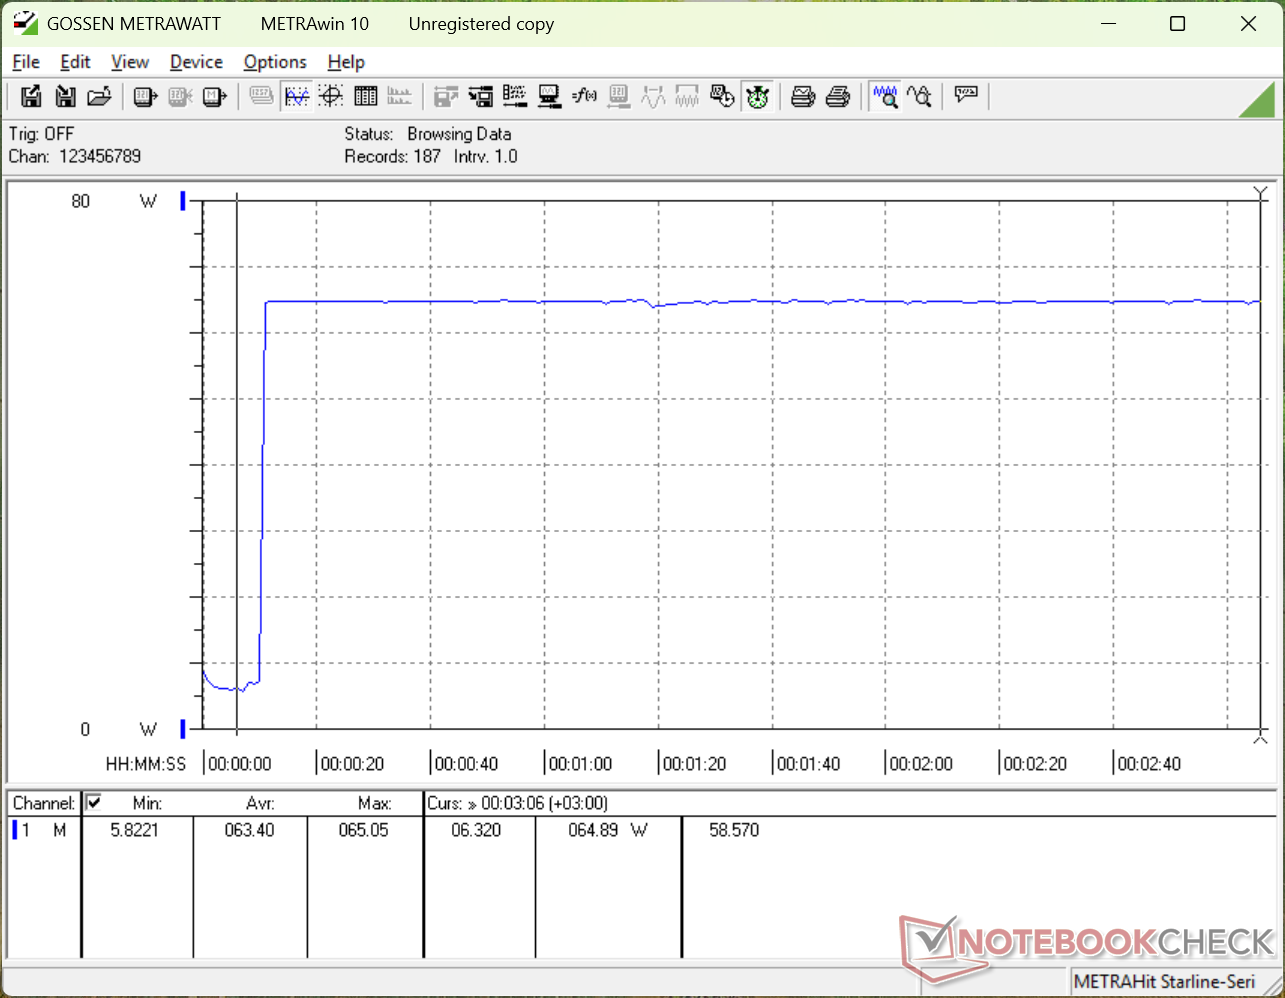
Une conséquence de l'adaptateur CA plus petit de 65 W est la performance inférieure de Turbo Boost. Lors de l'exécution du stress Prime95, par exemple, la Prestige 16 2025 pouvait consommer temporairement jusqu'à 103 W, contre seulement 66 W pour notre Prestige 16 2026. Le modèle le plus ancien pourrait donc légèrement surpasser le modèle le plus récent en termes de performances brutes du processeur pendant la première minute environ du test de stress, lorsque le Turbo Boost est le plus efficace.
Gardez à l'esprit que les taux de charge ralentissent considérablement si vous utilisez simultanément des charges exigeantes, car l'adaptateur secteur de 65 W est sans doute sous-puissant ; Cyberpunk 2077 consomme déjà plus de 60 W à lui seul.
| Éteint/en veille | |
| Au repos | |
| Fortement sollicité |
|
Légende:
min: | |
| MSI Prestige 16 AI C3MTG Ultra X7 358H, Arc B390 Panther Lake iGPU, Micron 2500 1TB MTFDKBA1T0QGN, OLED, 2880x1800, 16" | MSI Prestige 16 AI Evo B2HMG Ultra 9 285H, Arc 140T, Micron 2500 1TB MTFDKBA1T0QGN, IPS, 2560x1600, 16" | Dell XPS 16 Core Ultra X7 358H Ultra X7 358H, Arc B390 Panther Lake iGPU, , OLED, 3200x2000, 16" | Asus ZenBook S16 UM5606GA Ryzen AI 9 465, Radeon 880M, SanDisk PC SN5100S, OLED, 2880x1800, 16" | Lenovo ThinkBook 16 G7+ AMD Ryzen AI 9 365, Radeon 880M, Samsung PM9C1a MZAL81T0HDLB, IPS, 3200x2000, 16" | HP Envy x360 2-in-1 16-ad0097nr R7 8840HS, Radeon 780M, KIOXIA BG5 KBG50ZNV1T02, OLED, 2880x1800, 16" | |
|---|---|---|---|---|---|---|
| Power Consumption | -22% | -0% | -2% | -55% | -10% | |
| Idle Minimum * (Watt) | 3.3 | 4.4 -33% | 4 -21% | 3.7 -12% | 6.4 -94% | 5 -52% |
| Idle Average * (Watt) | 7.4 | 9.2 -24% | 4.4 41% | 7.4 -0% | 14.1 -91% | 6.2 16% |
| Idle Maximum * (Watt) | 13 | 9.5 27% | 10.2 22% | 9.5 27% | 14.3 -10% | 14.7 -13% |
| Load Average * (Watt) | 48.7 | 66.9 -37% | 44.2 9% | 57.9 -19% | 83.4 -71% | 49.9 -2% |
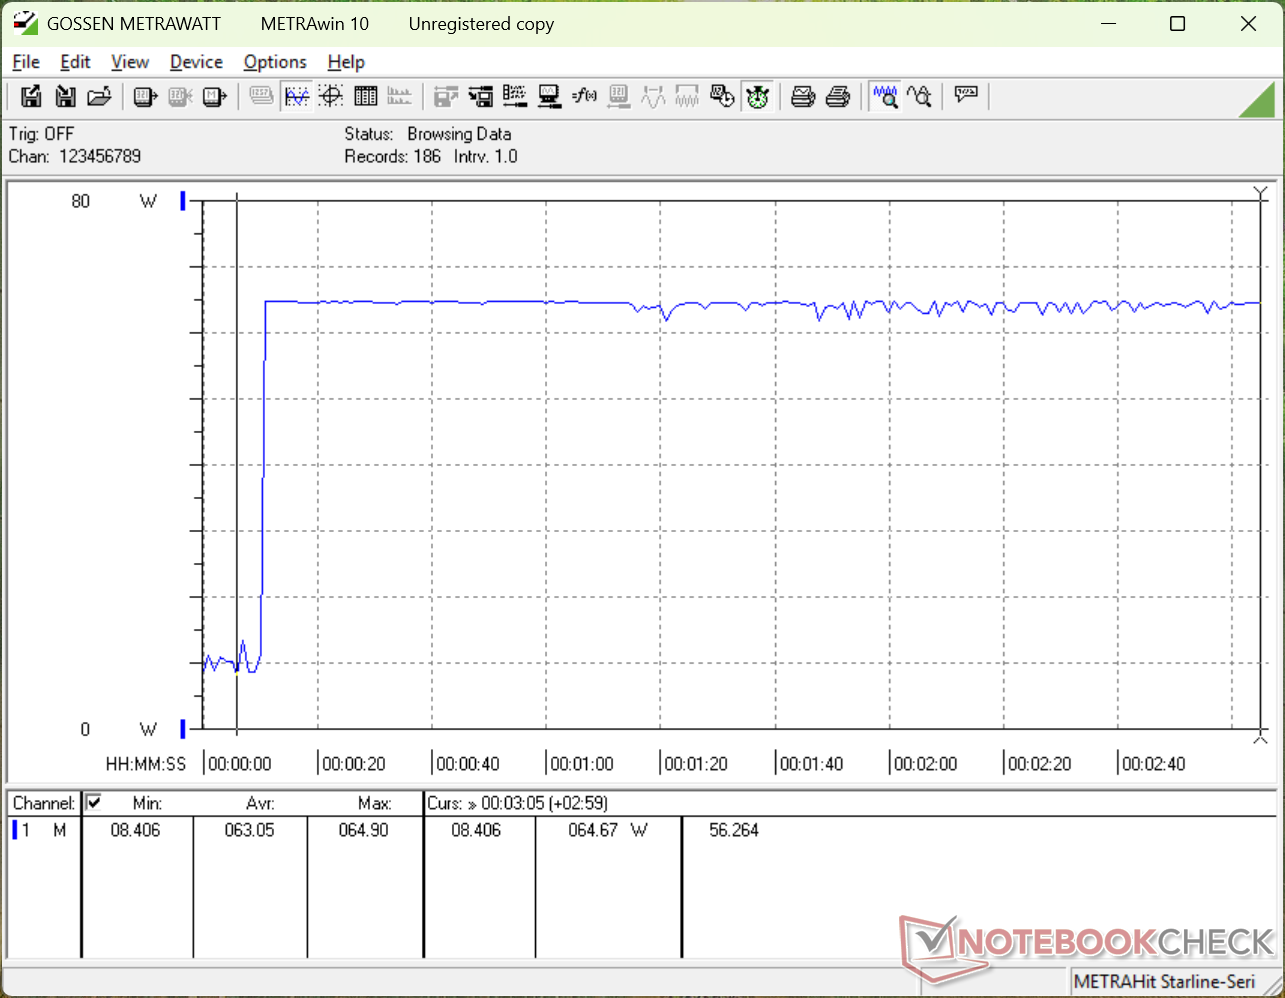
| Cyberpunk 2077 ultra * (Watt) | 60.4 | 68.8 -14% | 62.6 -4% | 58.5 3% | 79.8 -32% | |
| Cyberpunk 2077 ultra external monitor * (Watt) | 60.4 | 67.4 -12% | 62.4 -3% | 57 6% | 77.5 -28% | |
| Load Maximum * (Watt) | 64.8 | 102.9 -59% | 94.6 -46% | 76.9 -19% | 102.9 -59% | 65 -0% |
| Witcher 3 ultra * (Watt) | 54.5 |
* ... Moindre est la valeur, meilleures sont les performances
Consommation électrique Cyberpunk / Stress Test
Consommation électrique du moniteur externe
Autonomie de la batterie
Les durées d'utilisation sont plus courtes cette année, en partie à cause d'une batterie plus petite (99 Wh contre 81 Wh) et du passage de l'IPS à l'OLED. Cependant, l'impact est légèrement compensé par les gains d'efficacité réalisés ailleurs sur le système. Nous avons pu enregistrer une durée d'utilisation WLAN de près de 13 heures, soit 3 à 4 heures de moins que le modèle 2025.
| MSI Prestige 16 AI C3MTG Ultra X7 358H, Arc B390 Panther Lake iGPU, 81 Wh | MSI Prestige 16 AI Evo B2HMG Ultra 9 285H, Arc 140T, 99.9 Wh | Dell XPS 16 Core Ultra X7 358H Ultra X7 358H, Arc B390 Panther Lake iGPU, 70 Wh | Asus ZenBook S16 UM5606GA Ryzen AI 9 465, Radeon 880M, 83 Wh | Lenovo ThinkBook 16 G7+ AMD Ryzen AI 9 365, Radeon 880M, 85 Wh | HP Envy x360 2-in-1 16-ad0097nr R7 8840HS, Radeon 780M, 68 Wh | |
|---|---|---|---|---|---|---|
| Autonomie de la batterie | 31% | -18% | 4% | -14% | -39% | |
| WiFi v1.3 (h) | 12.6 | 16.5 31% | 10.3 -18% | 13.1 4% | 10.8 -14% | 7.7 -39% |
| H.264 (h) | 20.8 | 13.9 | ||||
| Load (h) | 2.4 | 1.9 | ||||
| Reader / Idle (h) | 15.6 |
Notebookcheck Rating
Le MSI Prestige 16 2026 est l'un des ordinateurs portables prosumers les plus fins disponibles avec Intel Panther Lake, mais la concurrence est féroce en ce qui concerne la résolution de la webcam, les options d'affichage et les ports intégrés.
MSI Prestige 16 AI C3MTG
- 05/07/2026 v8
Allen Ngo
 Total Sustainability Score:
 Comparaison avec des concurrents potentiels
Image | Modèle | Prix | Poids | Épaisseur | Écran |
|---|---|---|---|---|---|
1. 86.4%  | MSI Prestige 16 AI C3MTG Intel Core Ultra X7 358H ⎘ Intel Arc B390 12 Xe3 Panther Lake iGPU ⎘ 32 Go Mémoire, 1024 Go SSD | Amazon: Prix de liste: 2100 USD | 1.6 kg | 13.9 mm | 16.00" 2880x1800 212 PPI OLED |
2. 82.8%  | MSI Prestige 16 AI Evo B2HMG Intel Core Ultra 9 285H ⎘ Intel Arc Graphics 140T ⎘ 32 Go Mémoire, 1024 Go SSD | Amazon: 1. $1,484.99 MSI Prestige 16 AI+ Evo 16" ... 2. $1,595.00 MSI Prestige 16 AI Evo Lapto... 3. $2,197.99 MSI Prestige 16 AI Evo 16" N... | 1.6 kg | 18.95 mm | 16.00" 2560x1600 189 PPI IPS |
3. 87.2%  | Dell XPS 16 Core Ultra X7 358H Intel Core Ultra X7 358H ⎘ Intel Arc B390 12 Xe3 Panther Lake iGPU ⎘ 32 Go Mémoire | Amazon: 1. $2,699.99 Dell XPS 16 9640 Laptop | In... 2. $2,999.00 Dell Premium 16 (Previously ... 3. $1,295.00 Dell 16 Plus Laptop 16" WUXG... Prix de liste: 2350 USD | 1.7 kg | 14.62 mm | 16.00" 3200x2000 236 PPI OLED |
4. 86.6%  | Asus ZenBook S16 UM5606GA AMD Ryzen AI 9 465 ⎘ AMD Radeon 880M ⎘ 32 Go Mémoire, 1024 Go SSD | Amazon: 1. $1,299.99 ASUS Zenbook S 16 Touchscree... 2. $1,299.99 ASUS Zenbook S 16 AI Laptop ... 3. $1,229.99 ASUS Zenbook S 16 Laptop, AM... Prix de liste: 1799€ | 1.5 kg | 12.9 mm | 16.00" 2880x1800 212 PPI OLED |
5. 86.6%  | Lenovo ThinkBook 16 G7+ AMD AMD Ryzen AI 9 365 ⎘ AMD Radeon 880M ⎘ 32 Go Mémoire, 1024 Go SSD | Prix de liste: 1399€ | 1.9 kg | 16.9 mm | 16.00" 3200x2000 236 PPI IPS |
6. 87.2% v7 (old)  | HP Envy x360 2-in-1 16-ad0097nr AMD Ryzen 7 8840HS ⎘ AMD Radeon 780M ⎘ 16 Go Mémoire, 1024 Go SSD | Prix de liste: 1300 USD | 1.8 kg | 18.3 mm | 16.00" 2880x1800 212 PPI OLED |
Transparency
La sélection des appareils à examiner est effectuée par notre équipe éditoriale. L'échantillon de test a été prêté à l'auteur par le fabricant ou le détaillant pour les besoins de cet examen. Le prêteur n'a pas eu d'influence sur cette évaluation et le fabricant n'a pas reçu de copie de cette évaluation avant sa publication. Il n'y avait aucune obligation de publier cet article. En tant que média indépendant, Notebookcheck n'est pas soumis à l'autorité des fabricants, des détaillants ou des éditeurs.
Voici comment Notebookcheck teste
Chaque année, Notebookcheck examine de manière indépendante des centaines d'ordinateurs portables et de smartphones en utilisant des procédures standardisées afin de garantir que tous les résultats sont comparables. Nous avons continuellement développé nos méthodes de test depuis environ 20 ans et avons établi des normes industrielles dans le processus. Dans nos laboratoires de test, des équipements de mesure de haute qualité sont utilisés par des techniciens et des rédacteurs expérimentés. Ces tests impliquent un processus de validation en plusieurs étapes. Notre système d'évaluation complexe repose sur des centaines de mesures et de points de référence bien fondés, ce qui garantit l'objectivité.
