Verdict
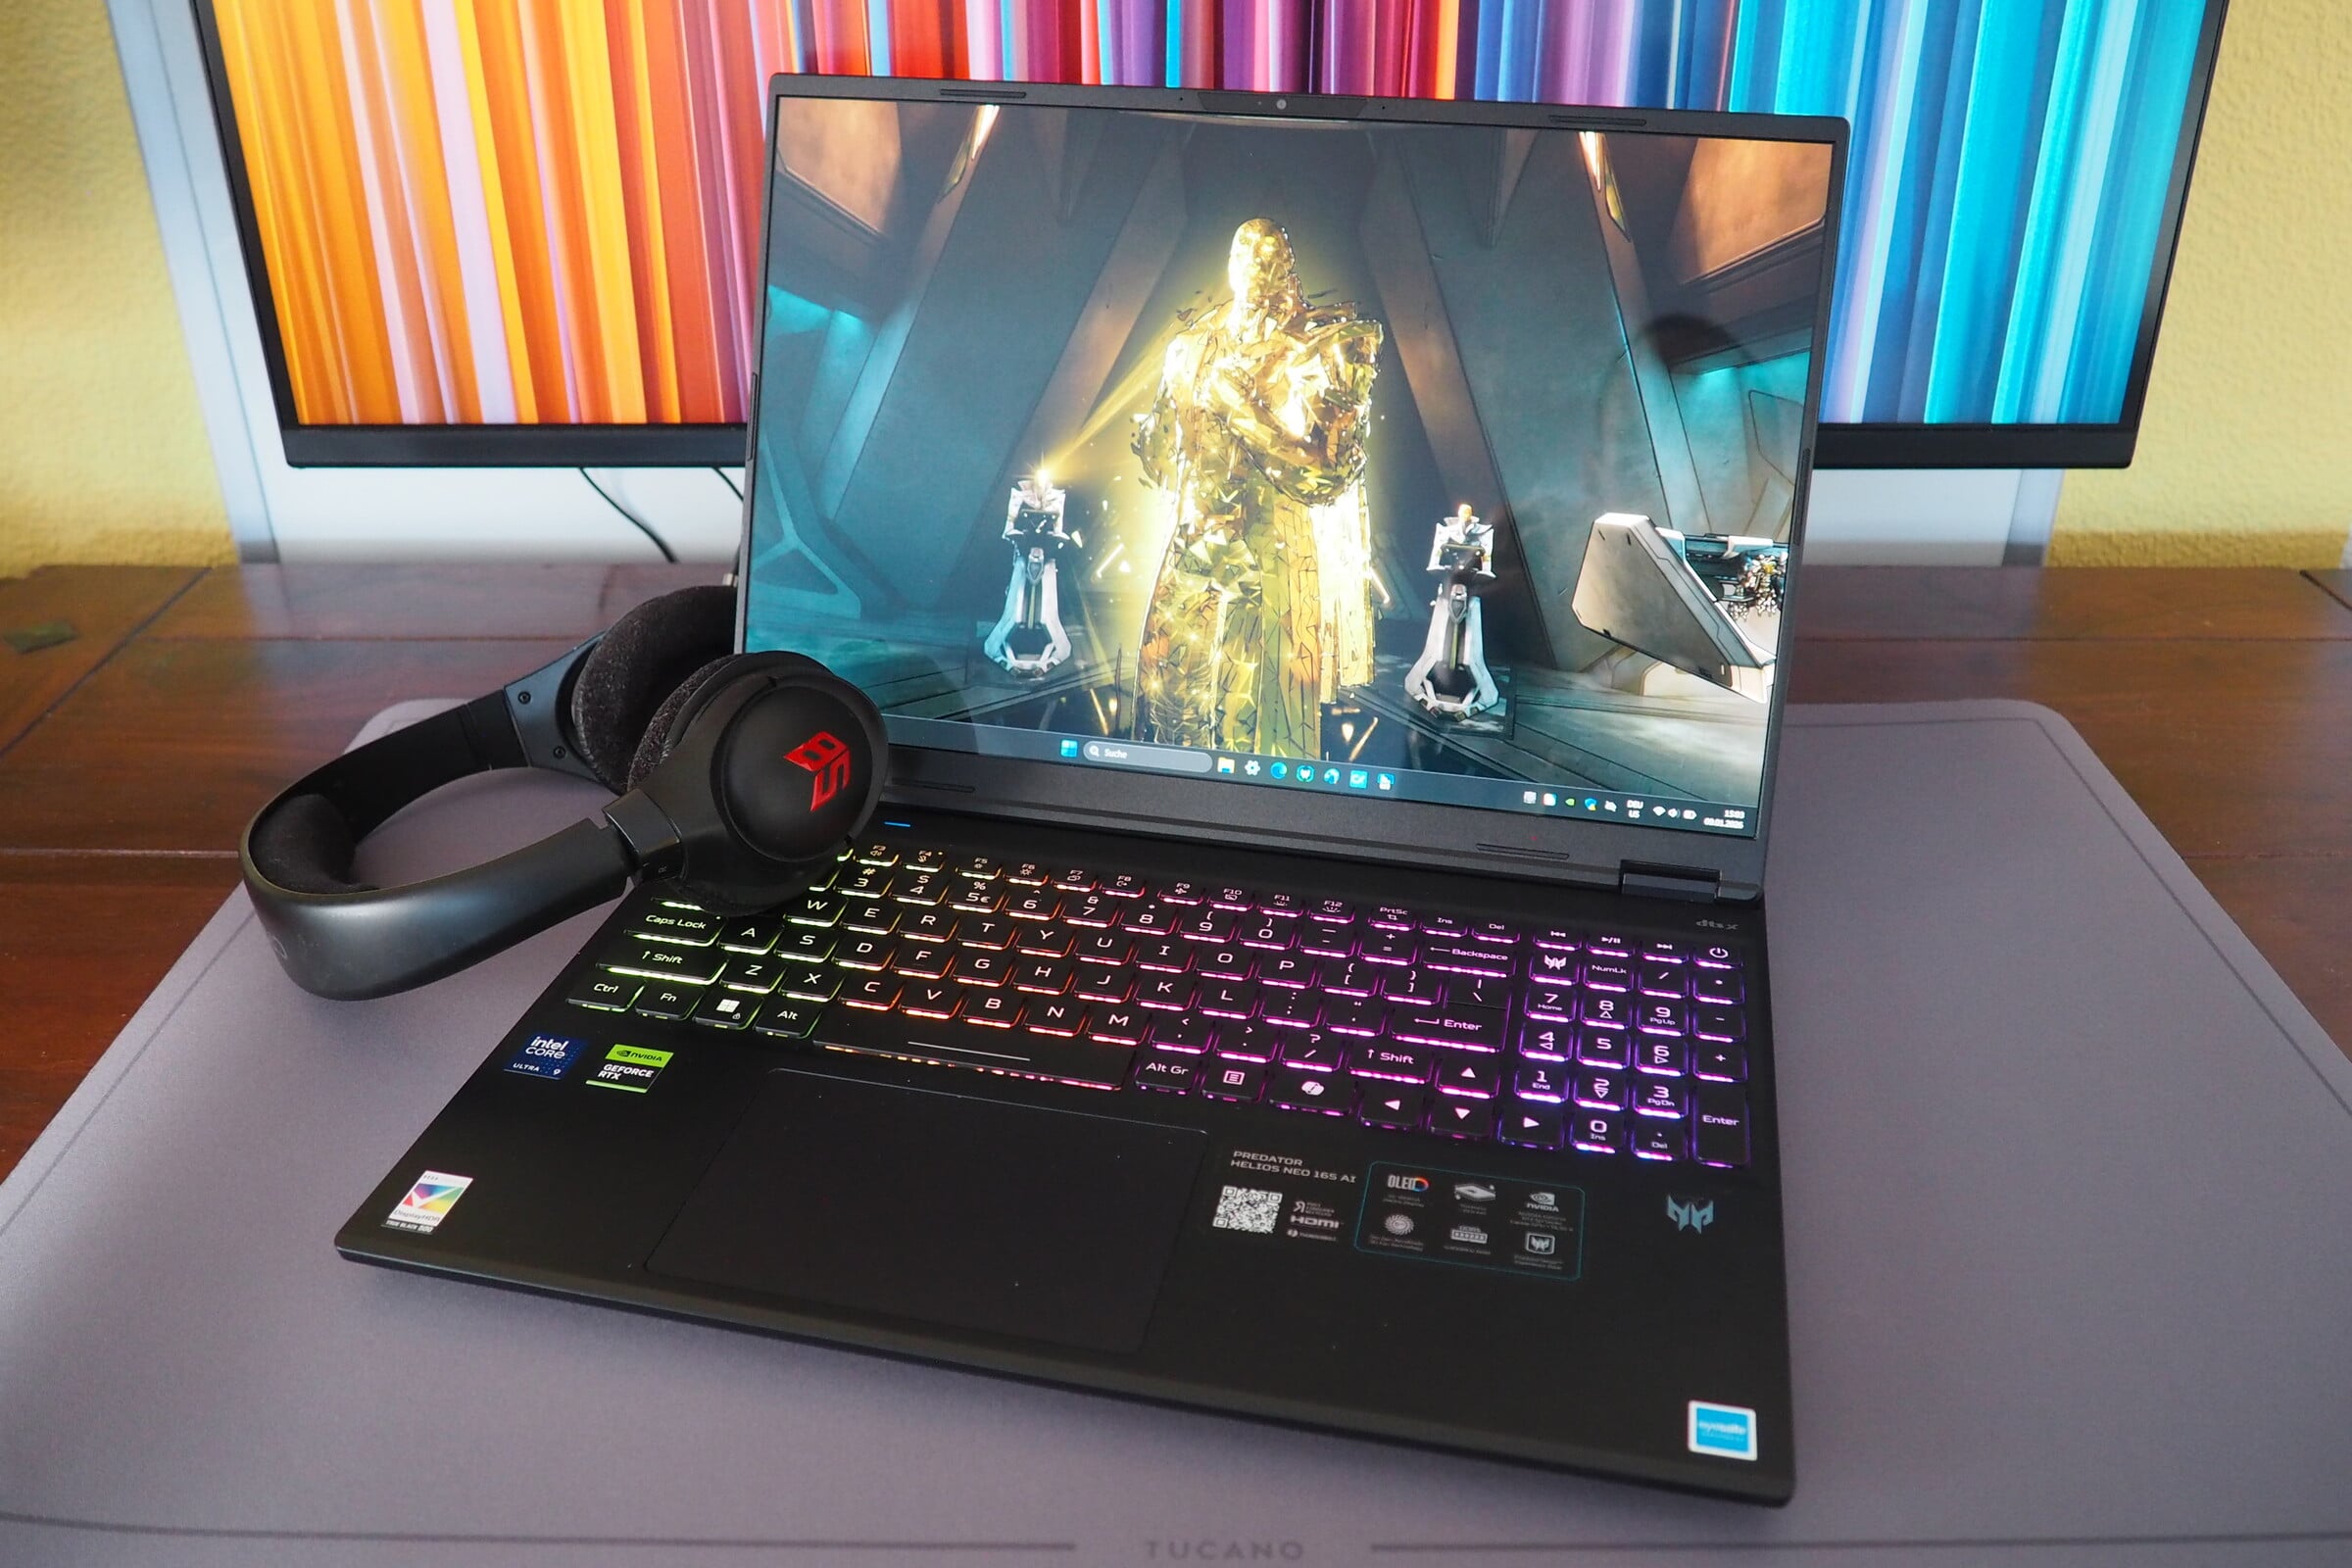
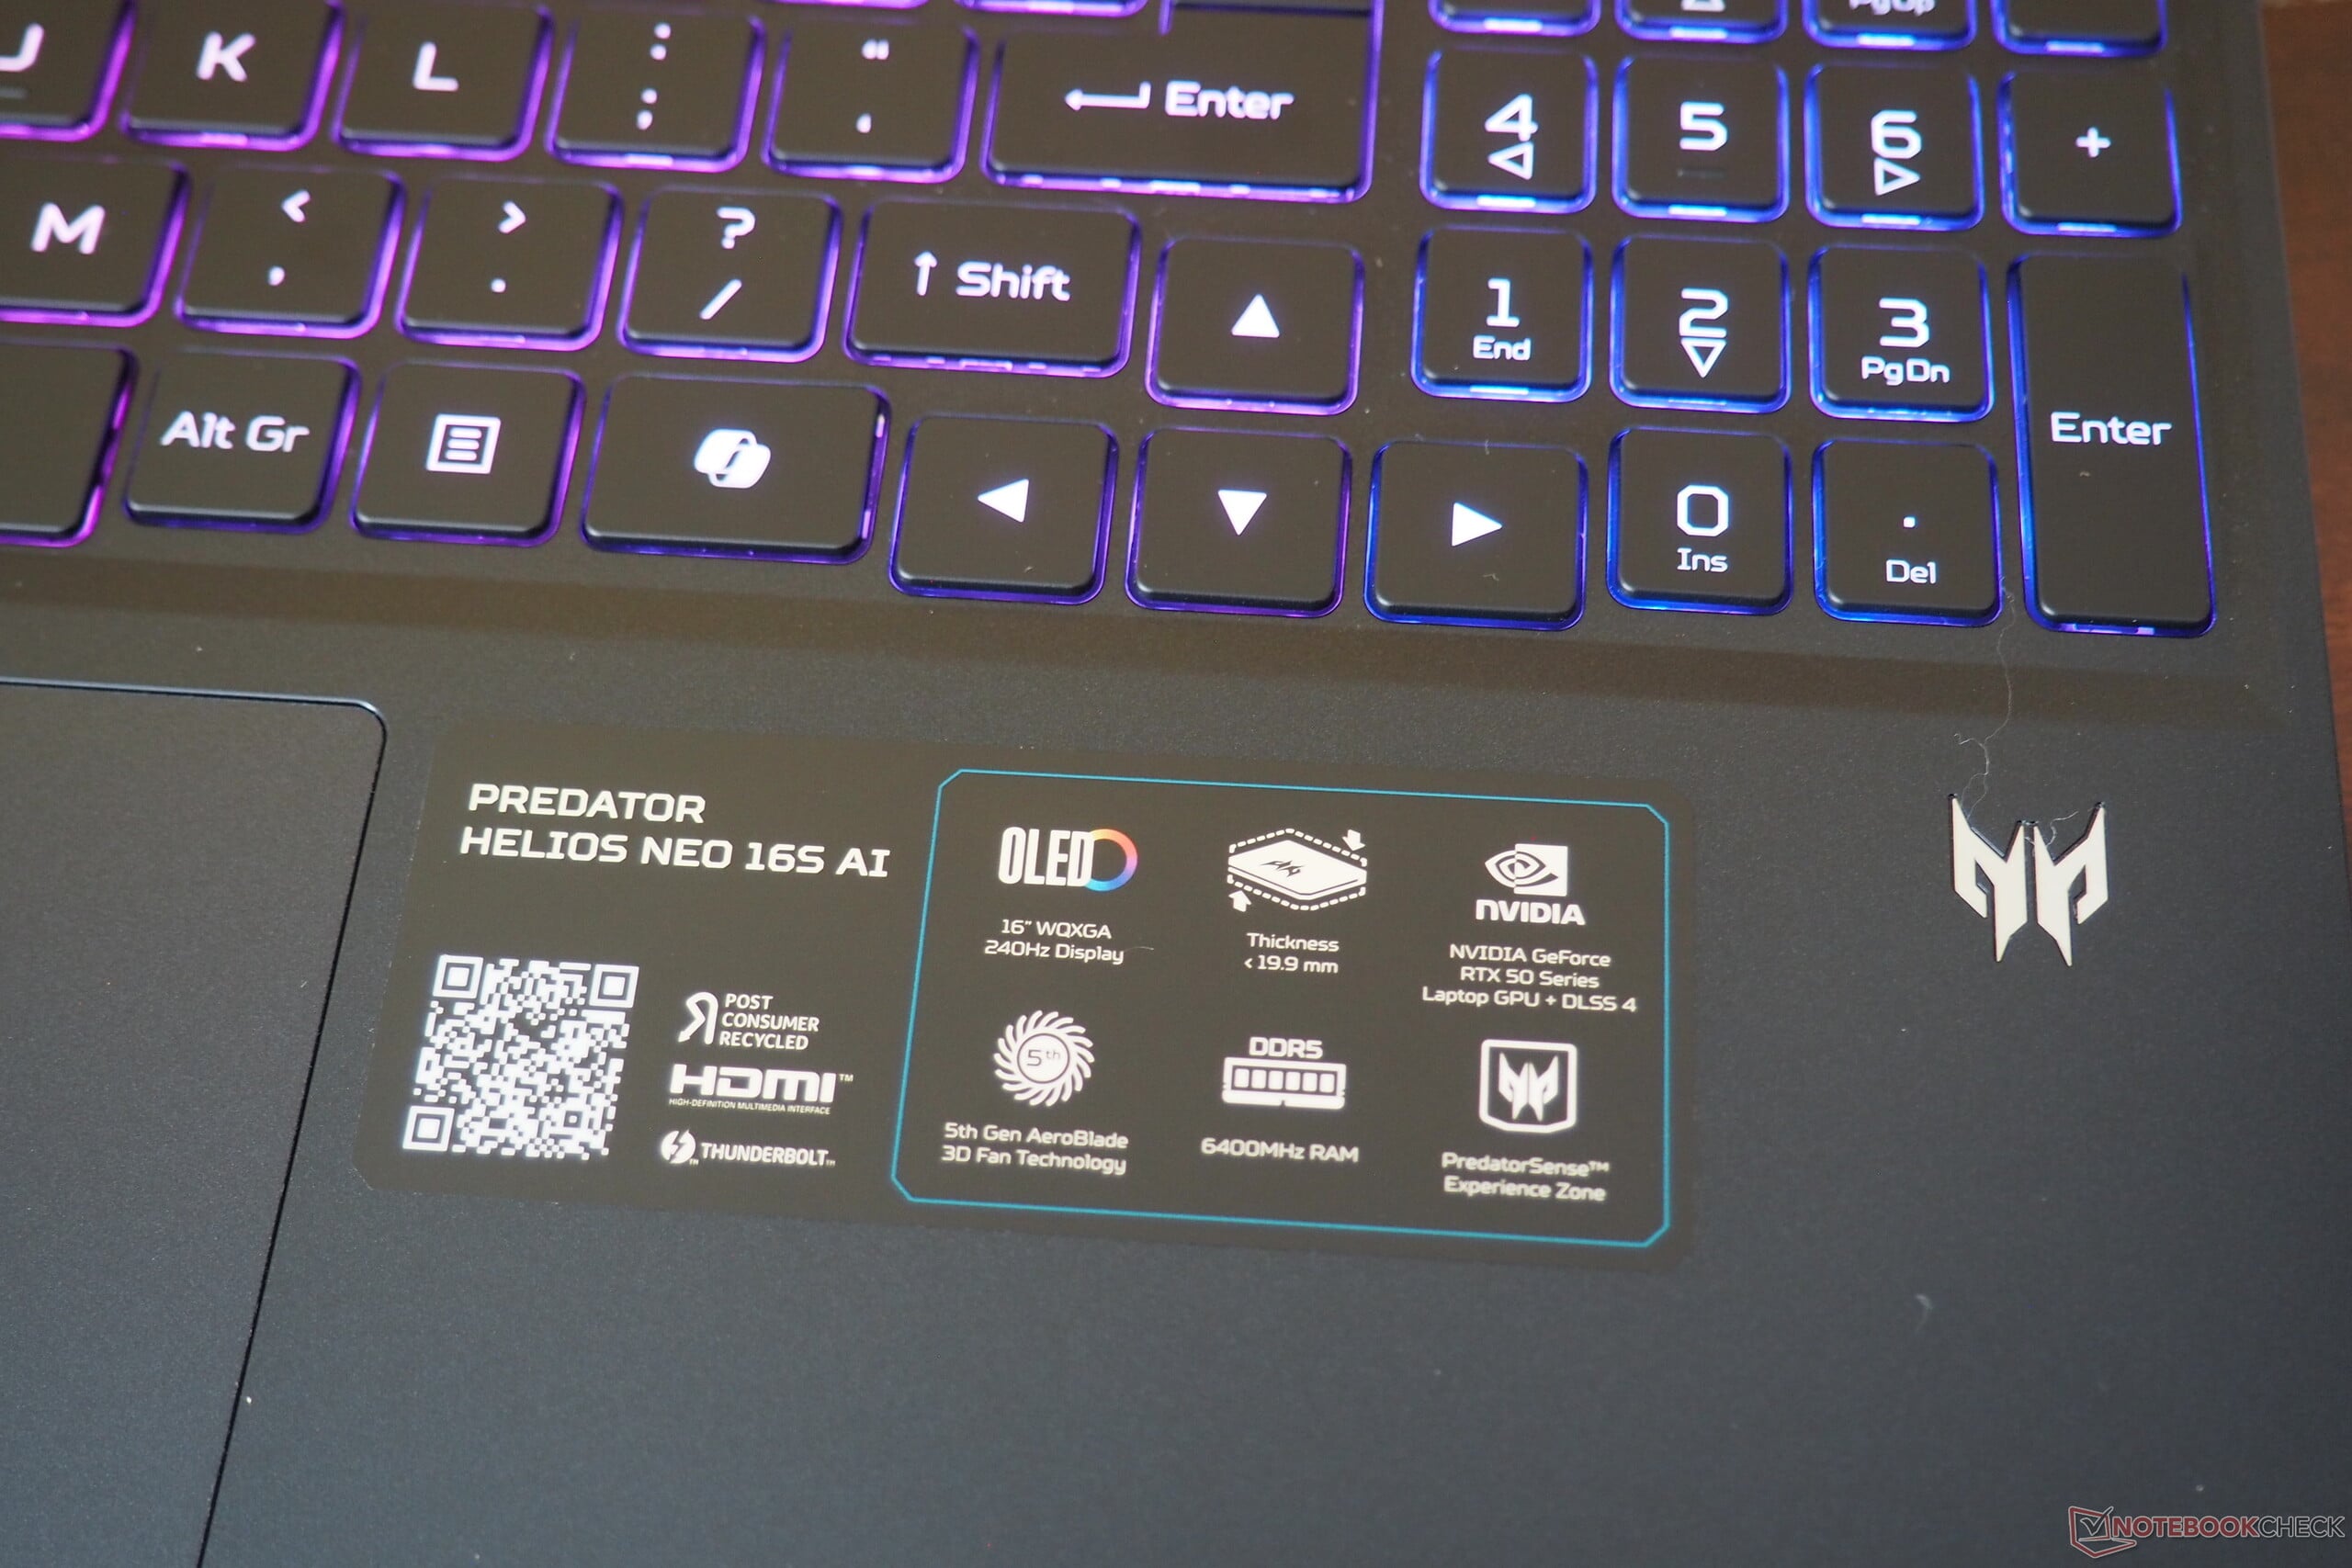
Avec une hauteur d'un peu moins de 2 cm, le Predator Helios Neo 16S AI est l'un des représentants les plus minces parmi les ordinateurs portables de jeu. Bien que ce portable de 16 pouces soit doté d'un écran OLED coloré, d'une large gamme de connectivité, y compris Thunderbolt 4, et de deux emplacements pour la RAM et le SSD, d'autres aspects ne sont pas tout à fait optimaux. Enfin, l'autonomie de la batterie et les performances pourraient être améliorées (le SSD a tendance à fluctuer au fil du temps).
Nous verrons au fil de l'article comment le 16 pouces se comporte face à des concurrents directs tels que le MSI Vector 16 HX AI, le Lenovo Legion 5 Pro 16 et surtout l'Asus ROG Zephyrus G16 (bien que ce dernier soit plus cher). Un ordinateur portable équipé d'une RTX 5070 ou d'une RTX 5080 est également inclus dans les tableaux de comparaison pour un meilleur classement.
Points positifs
Points négatifs
Prix et disponibilité
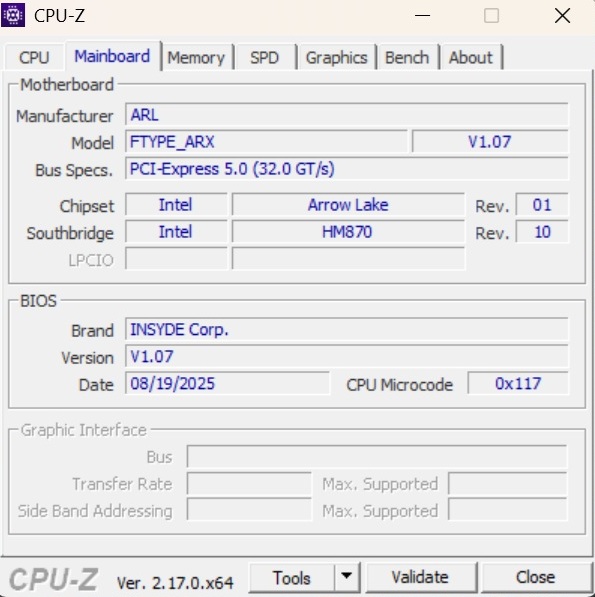
L'Acer Predator Helios Neo 16S AI avec Core Ultra 9 275HX, ordinateur portable RTX 5070 Ti et 32 Go de RAM est disponible à partir d'environ 2 400 euros (environ 2 700 $ US) sur différents sites de vente en ligne (par exemple, galaxus.de).
Spécifications
Cas
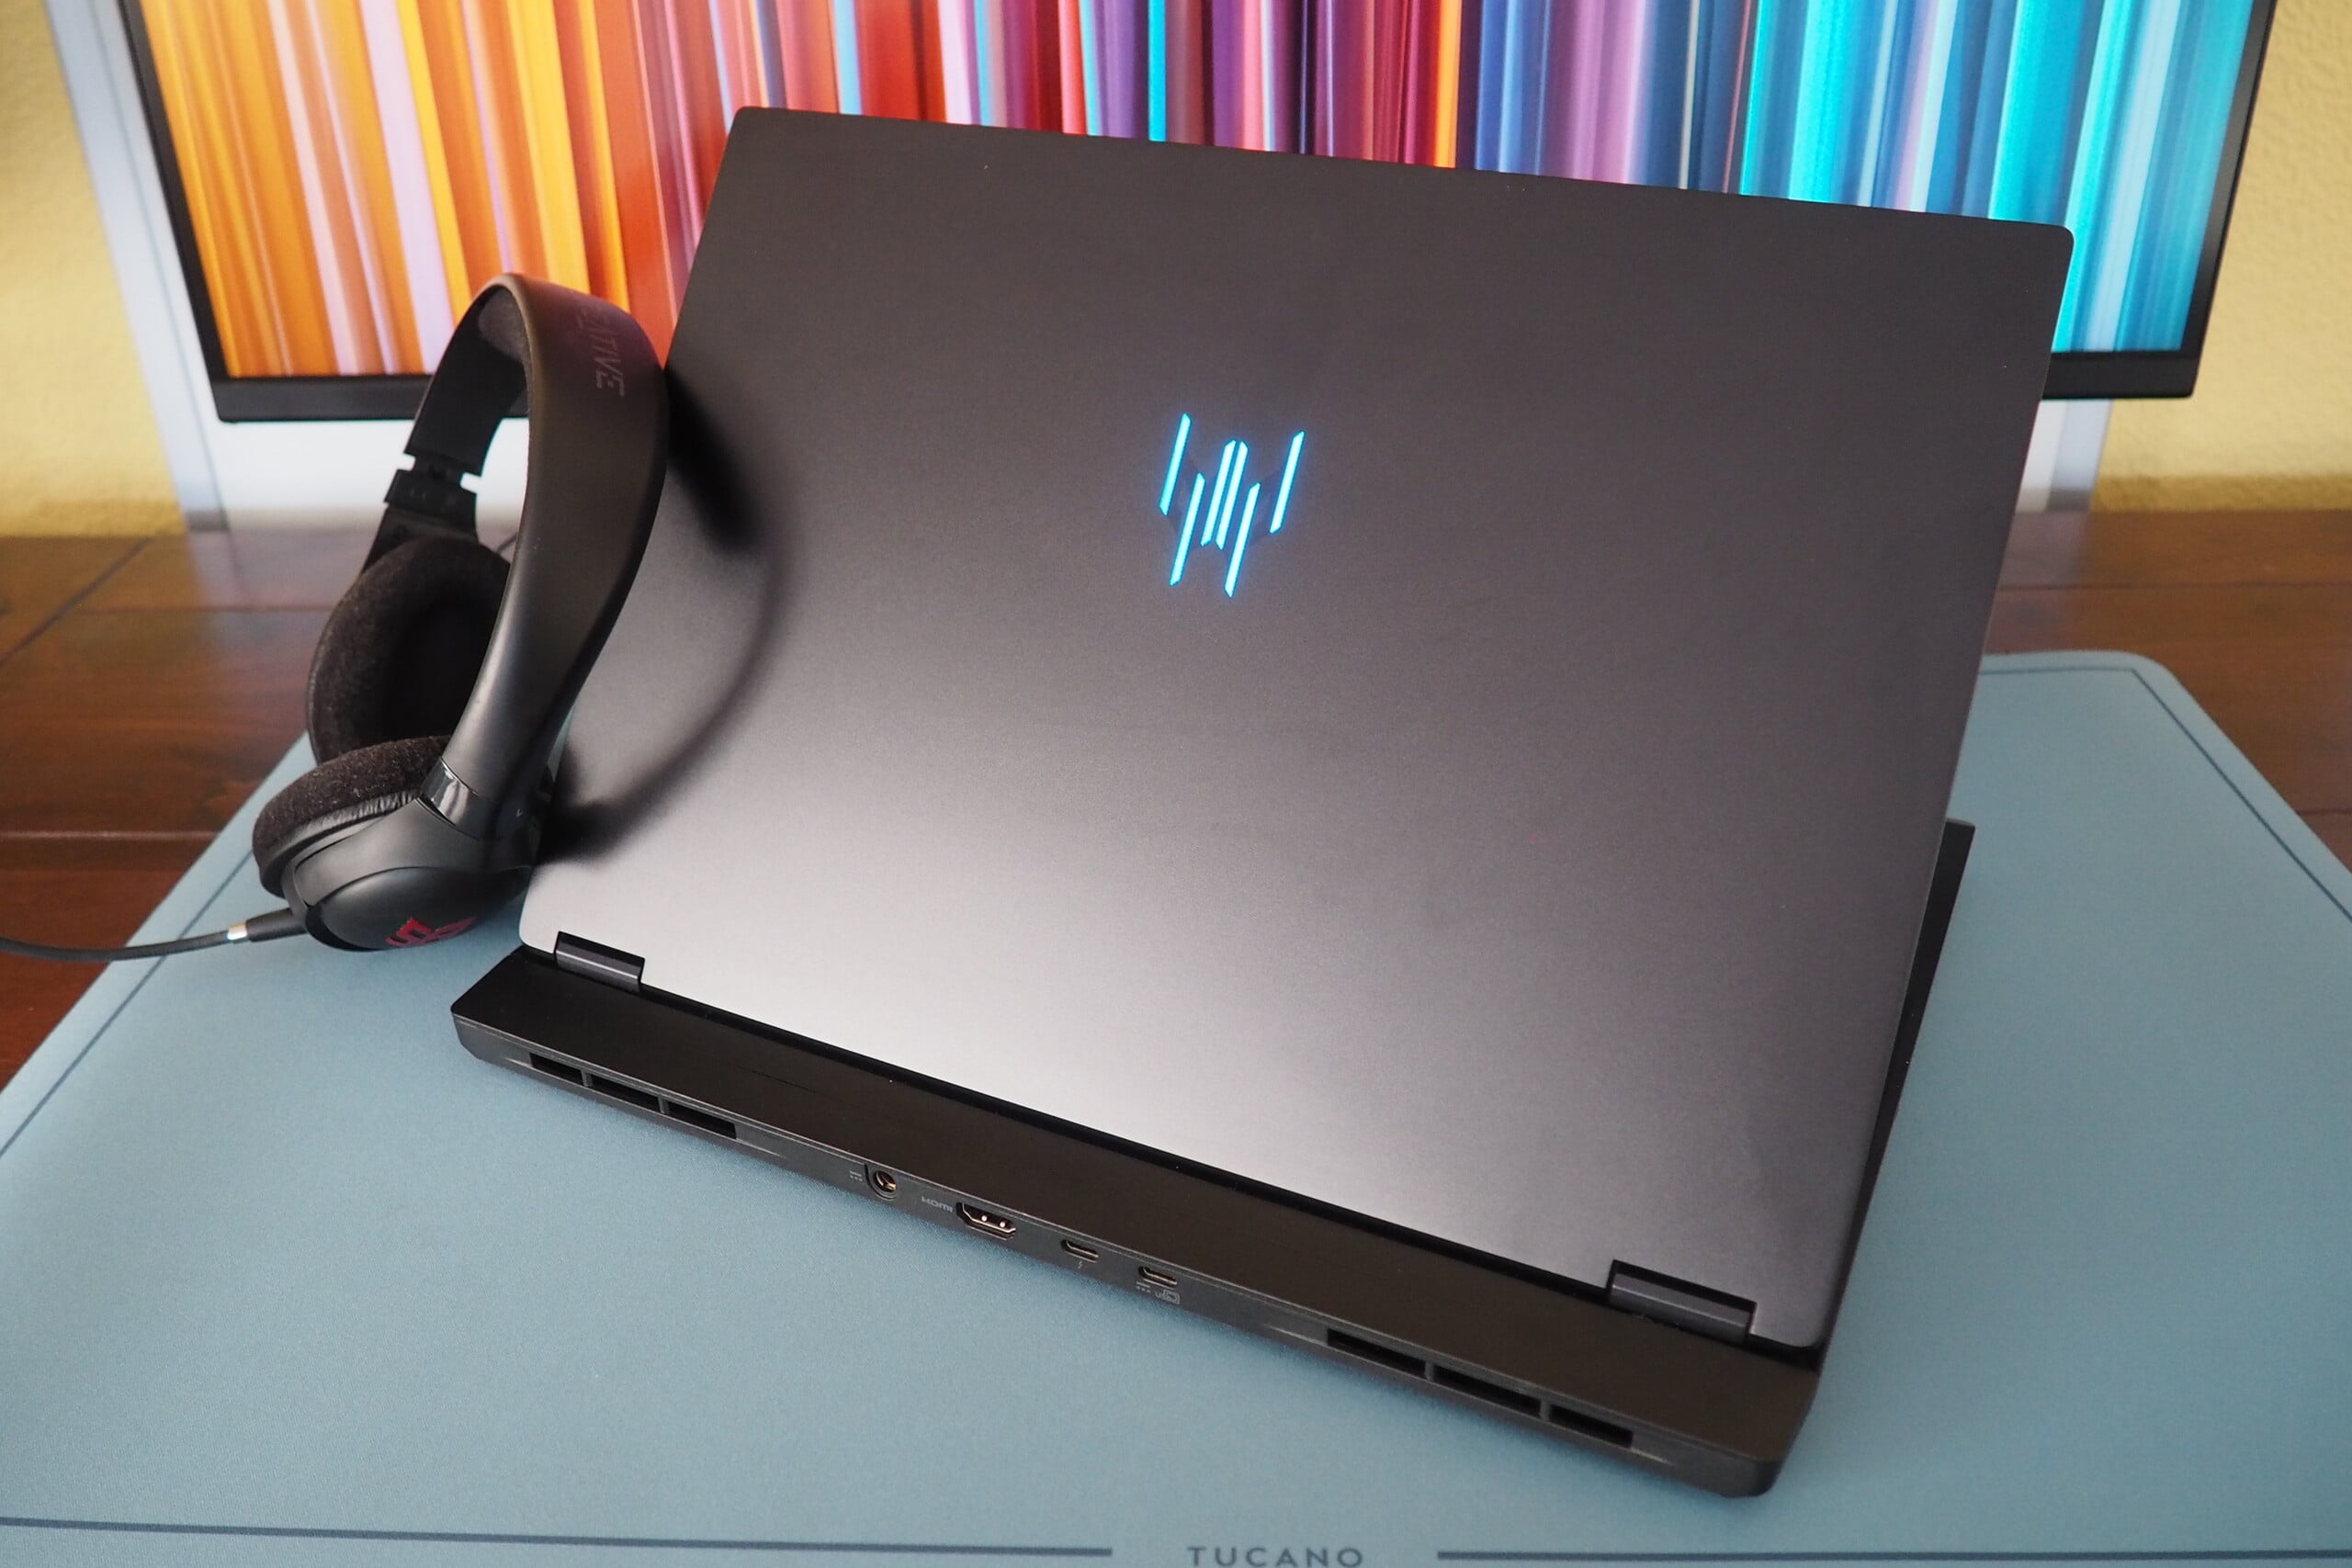
L'appareil de 16 pouces n'est ni bon marché ni particulièrement élégant. Alors que le couvercle est en métal, l'unité de base est en plastique. Comme d'habitude, les surfaces sombres sont sujettes aux traces de doigts, et l'angle d'ouverture maximal est de 145°. Le poids de 2,2 kg correspond à peu près à celui de la concurrence, qui va de 1,9 à 2,6 kg.
Equipement
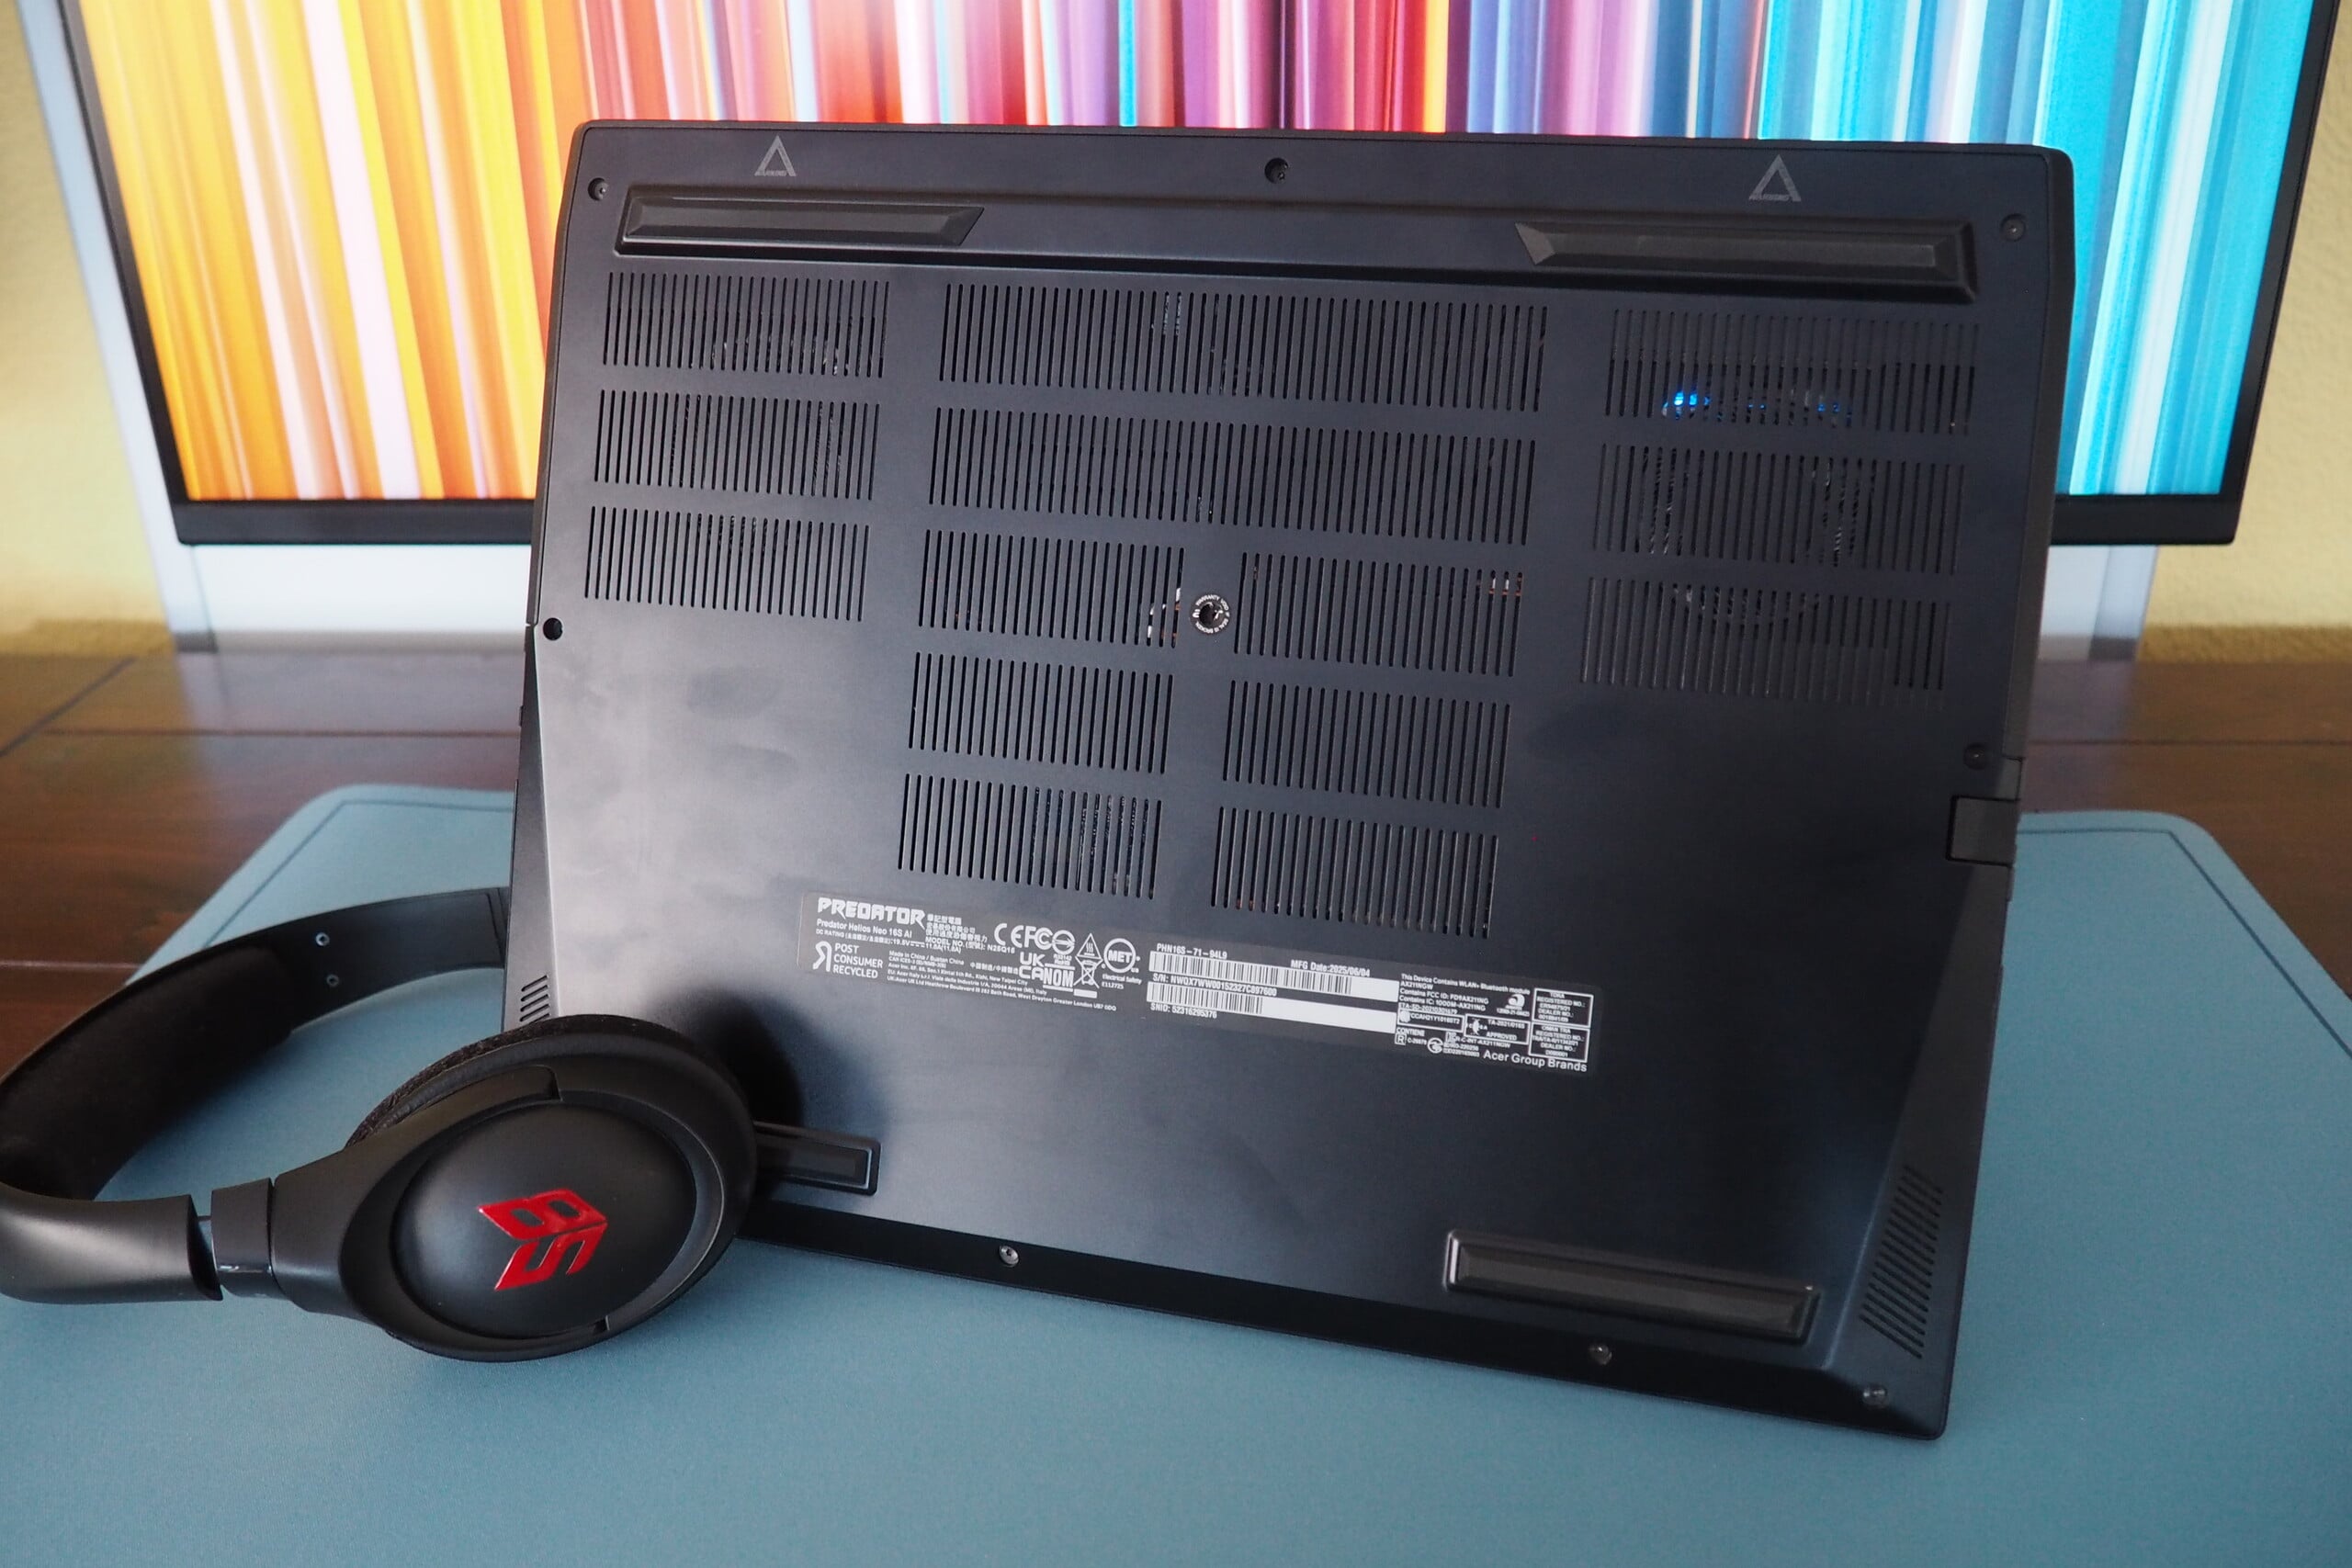
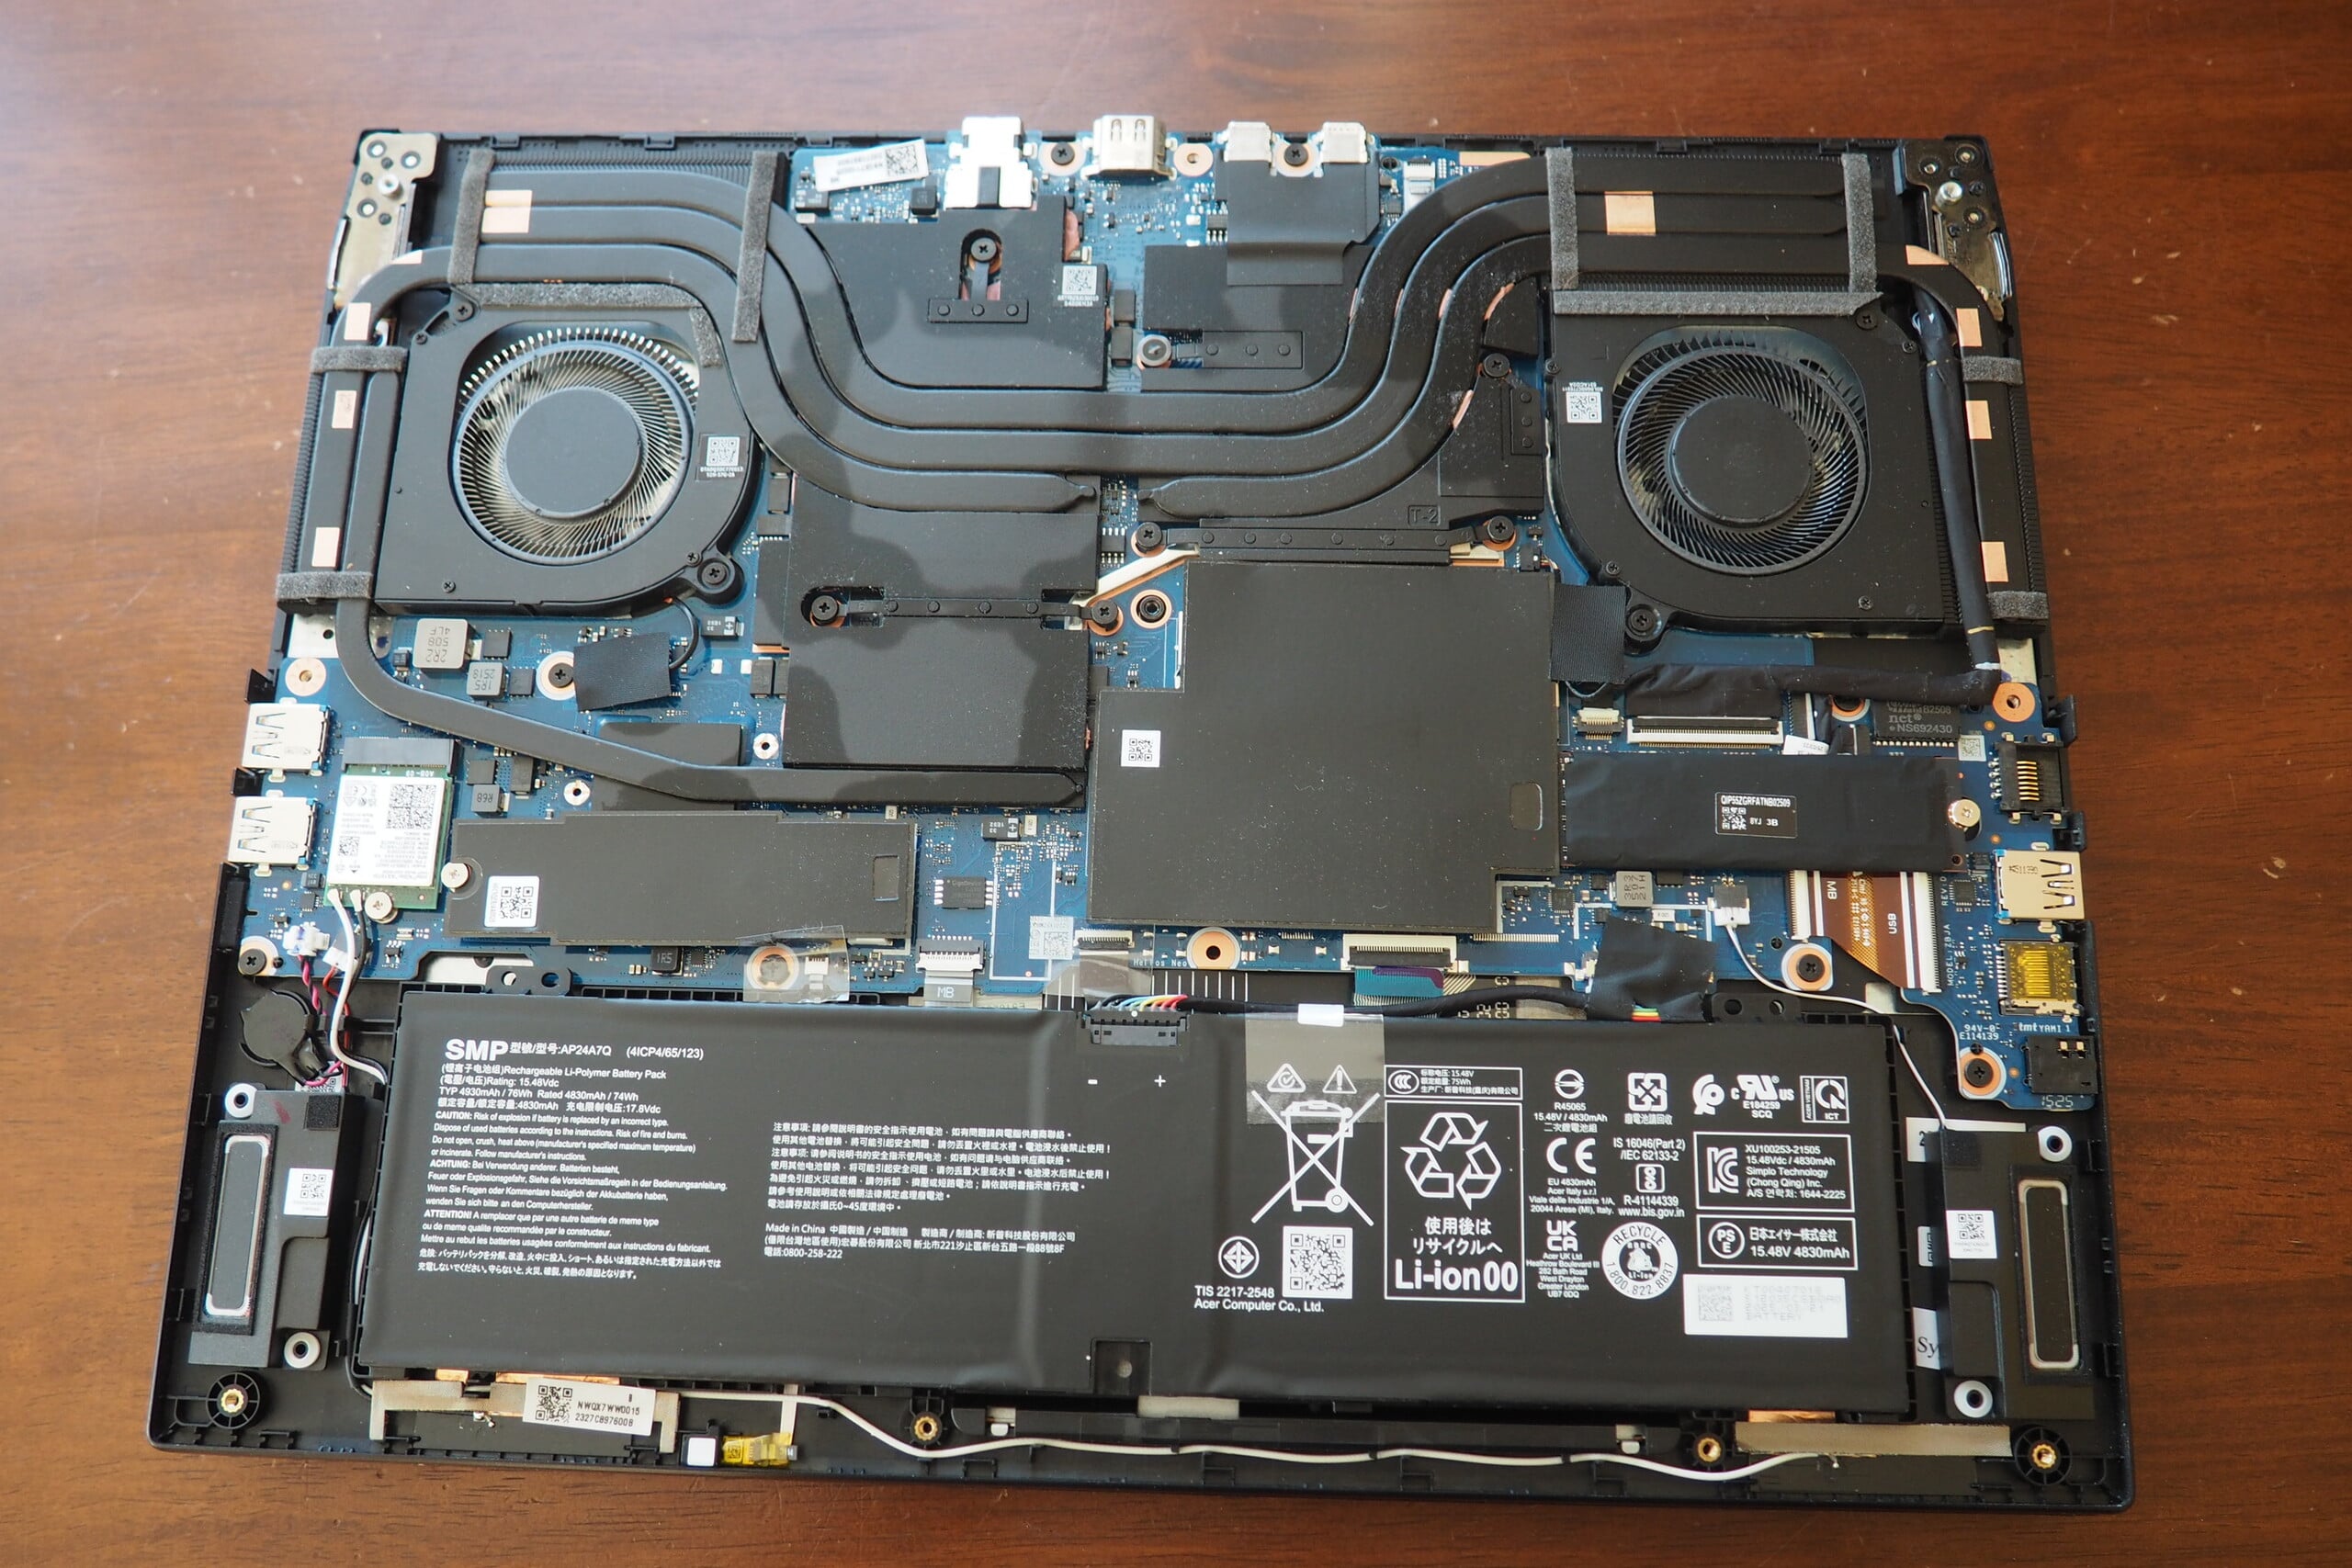
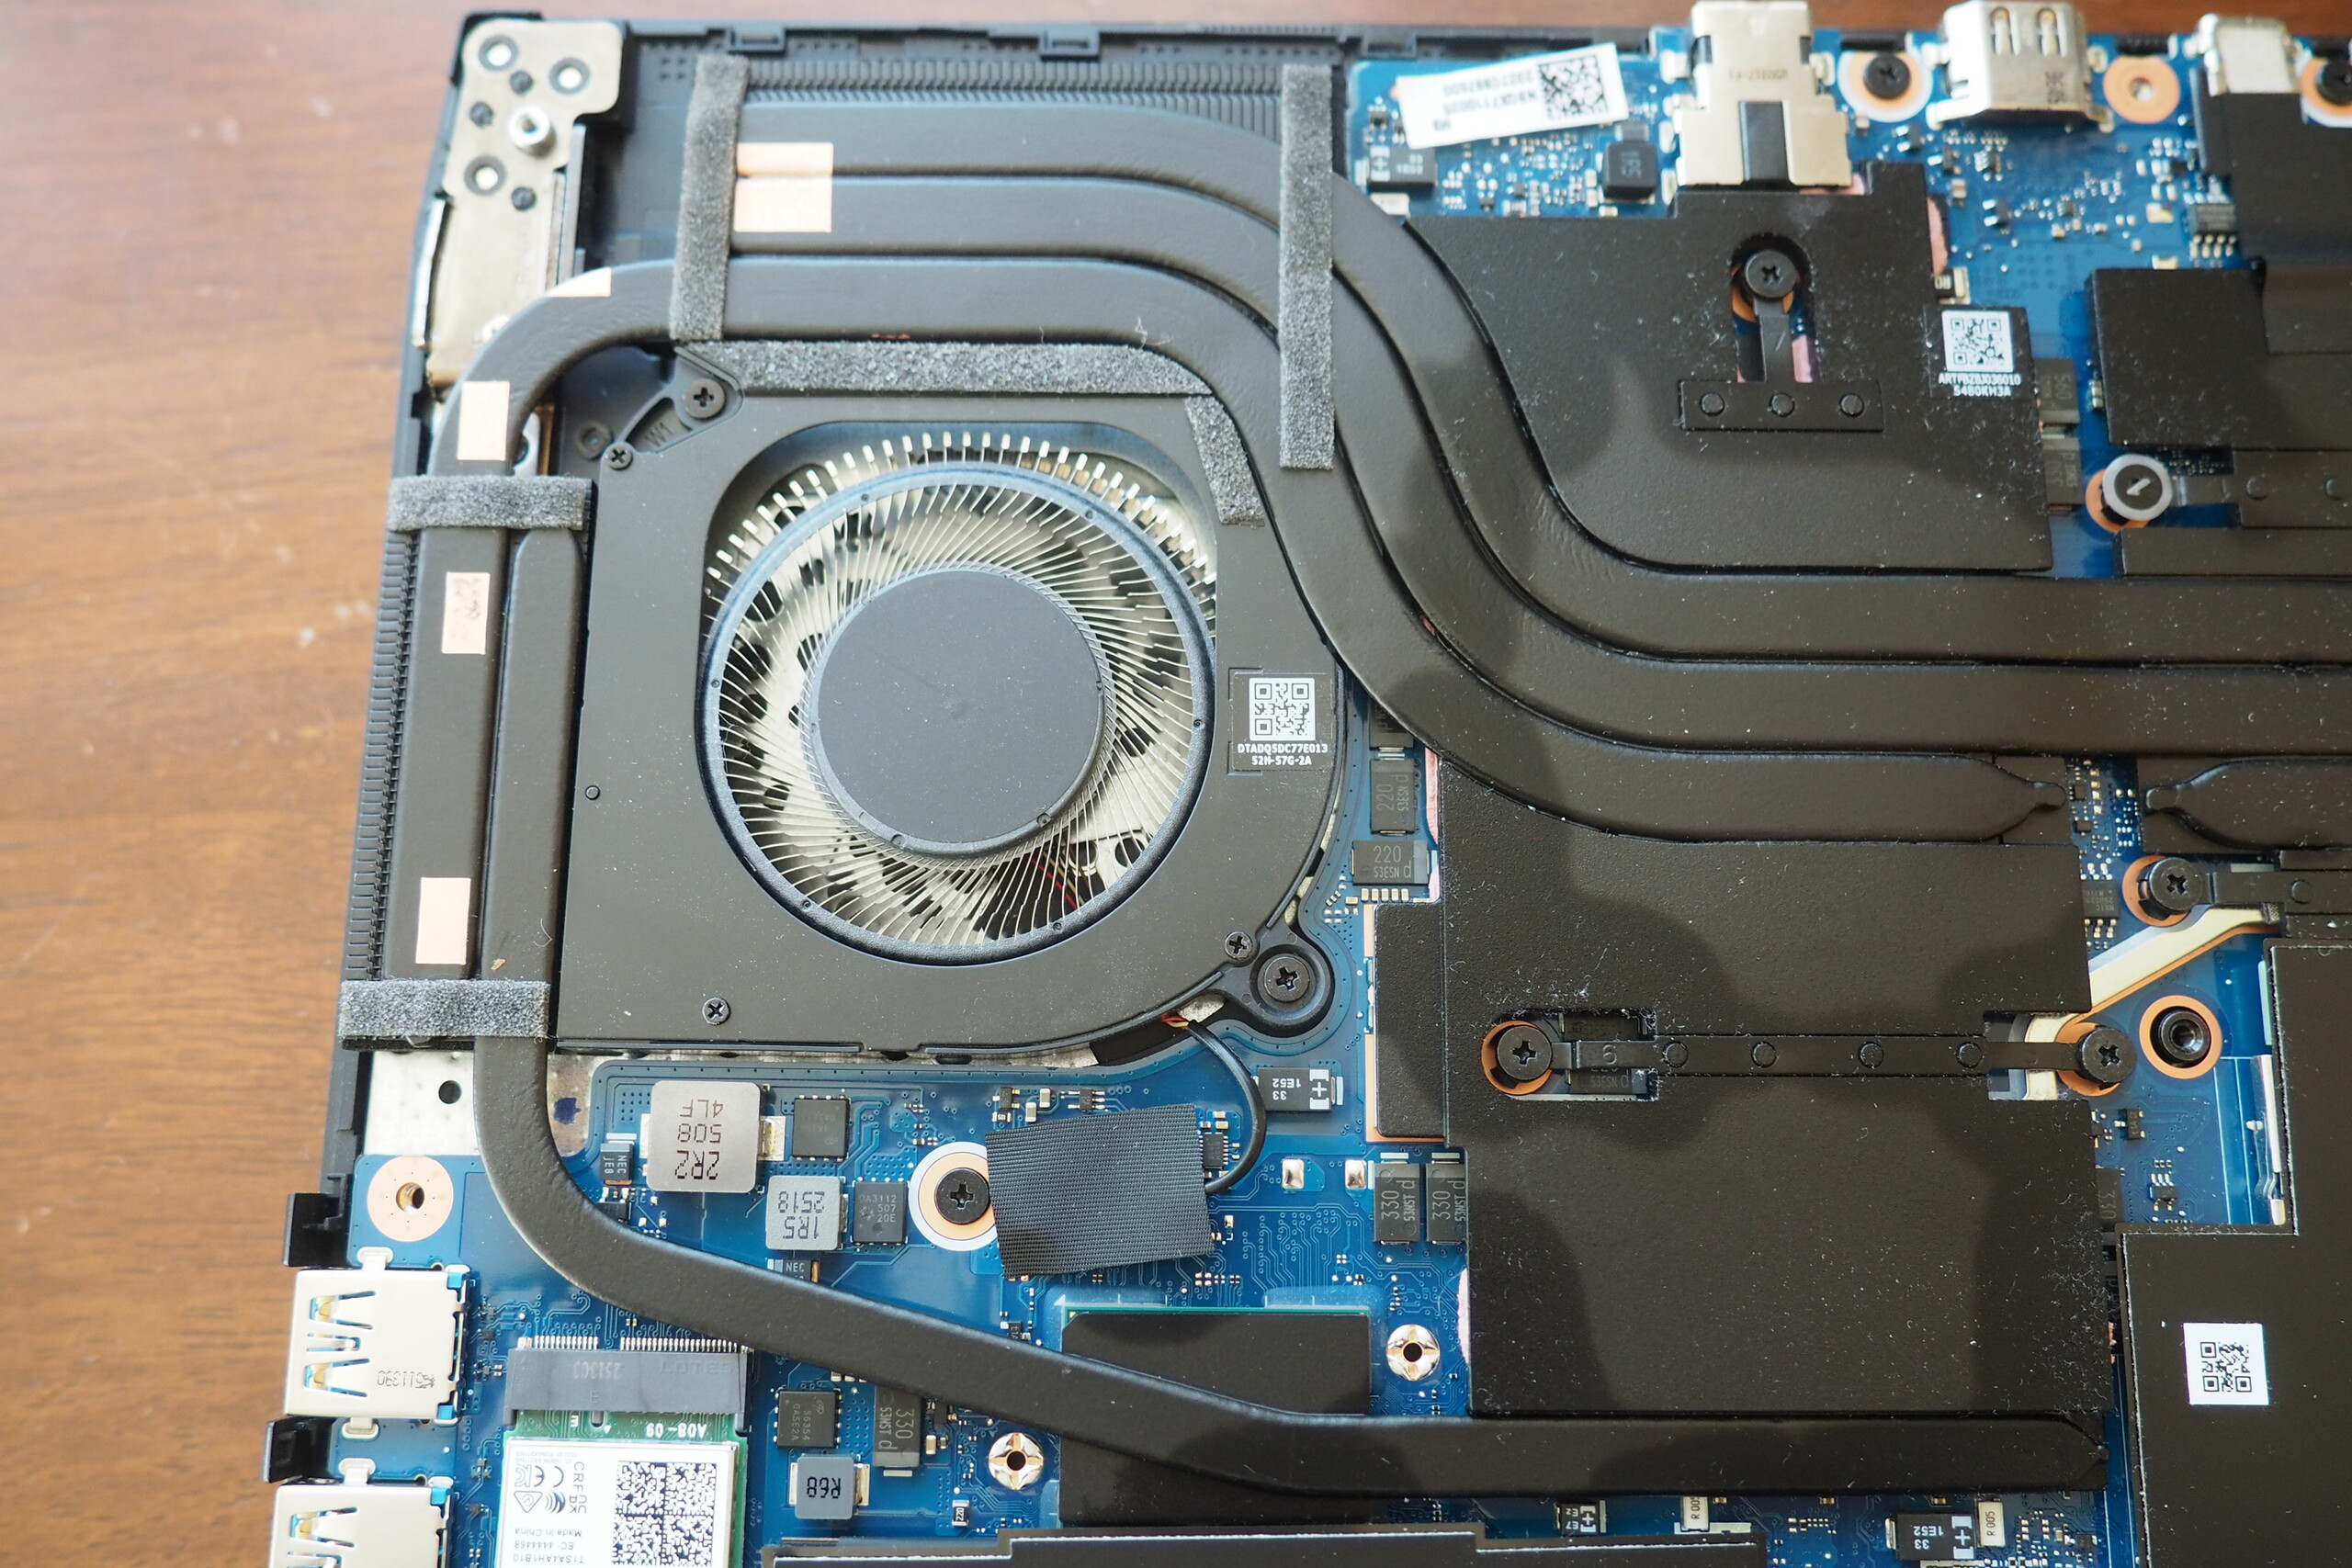
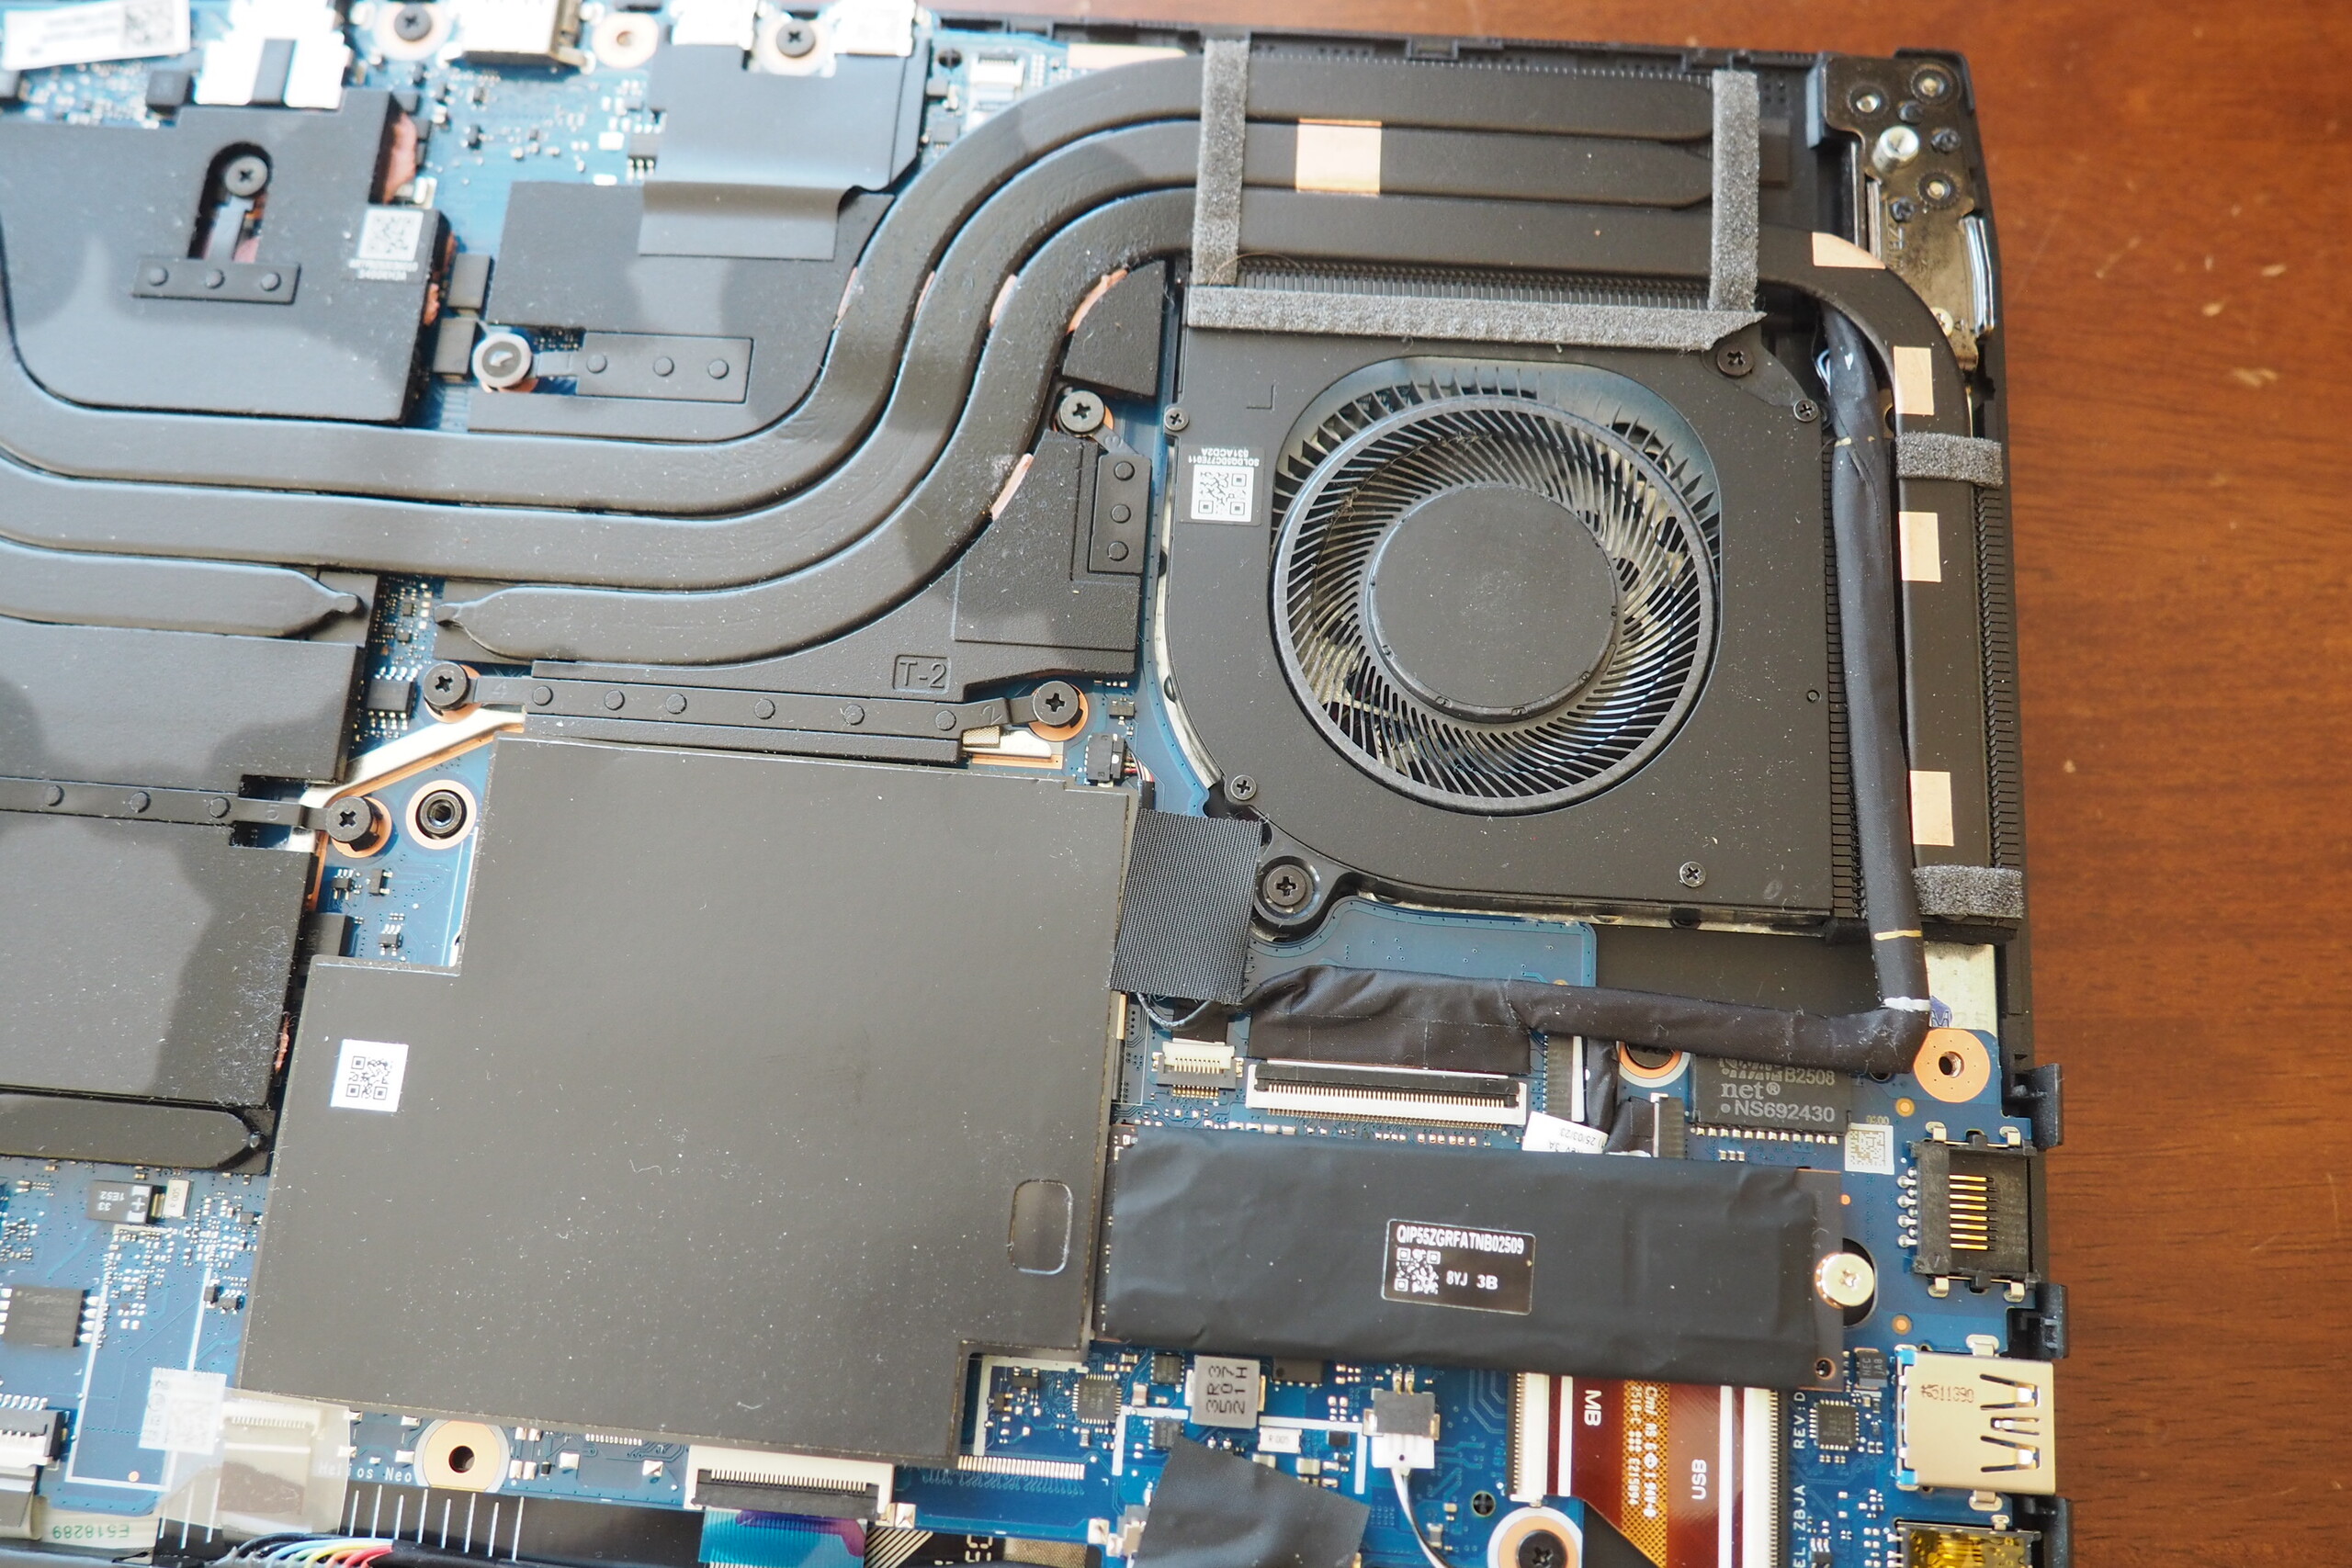
Le Neo 16S AI offre un total de cinq ports USB, dont les deux ports Type-C prennent en charge Thunderbolt 4. Il y a également une sortie HDMI, un port LAN, une prise audio et un lecteur de cartes à vitesse moyenne. La vitesse du module Wi-Fi 6E varie entre décente (envoi) et très bonne (réception). La qualité de la webcam Full HD s'avère légèrement supérieure à la moyenne en termes de netteté de l'image et de précision des couleurs. La plaque de base peut être retirée après avoir desserré 10 vis Torx (une vis est couverte par un sceau de garantie).


Lecteur de carte SD
| SD Card Reader | |
| average JPG Copy Test (av. of 3 runs) | |
| Razer Blade 16 RTX 5080 (Toshiba Exceria Pro SDXC 64 GB UHS-II) | |
| Moyenne de la classe Gaming (20 - 210, n=62, 2 dernières années) | |
| MSI Vector 16 HX AI A2XWHG (AV PRO microSD 128 GB V60) | |
| Acer Predator Helios Neo 16S AI PHN16S-71-94L9 (AV PRO microSD 128 GB V60) | |
| Schenker XMG FUSION 16 (M25) (Angelbird AV Pro V60) | |
| maximum AS SSD Seq Read Test (1GB) | |
| Razer Blade 16 RTX 5080 (Toshiba Exceria Pro SDXC 64 GB UHS-II) | |
| Moyenne de la classe Gaming (25.5 - 261, n=59, 2 dernières années) | |
| MSI Vector 16 HX AI A2XWHG (AV PRO microSD 128 GB V60) | |
| Schenker XMG FUSION 16 (M25) (Angelbird AV Pro V60) | |
| Acer Predator Helios Neo 16S AI PHN16S-71-94L9 (AV PRO microSD 128 GB V60) | |
Communication
Webcam


Maintenance
Dispositifs d'entrée
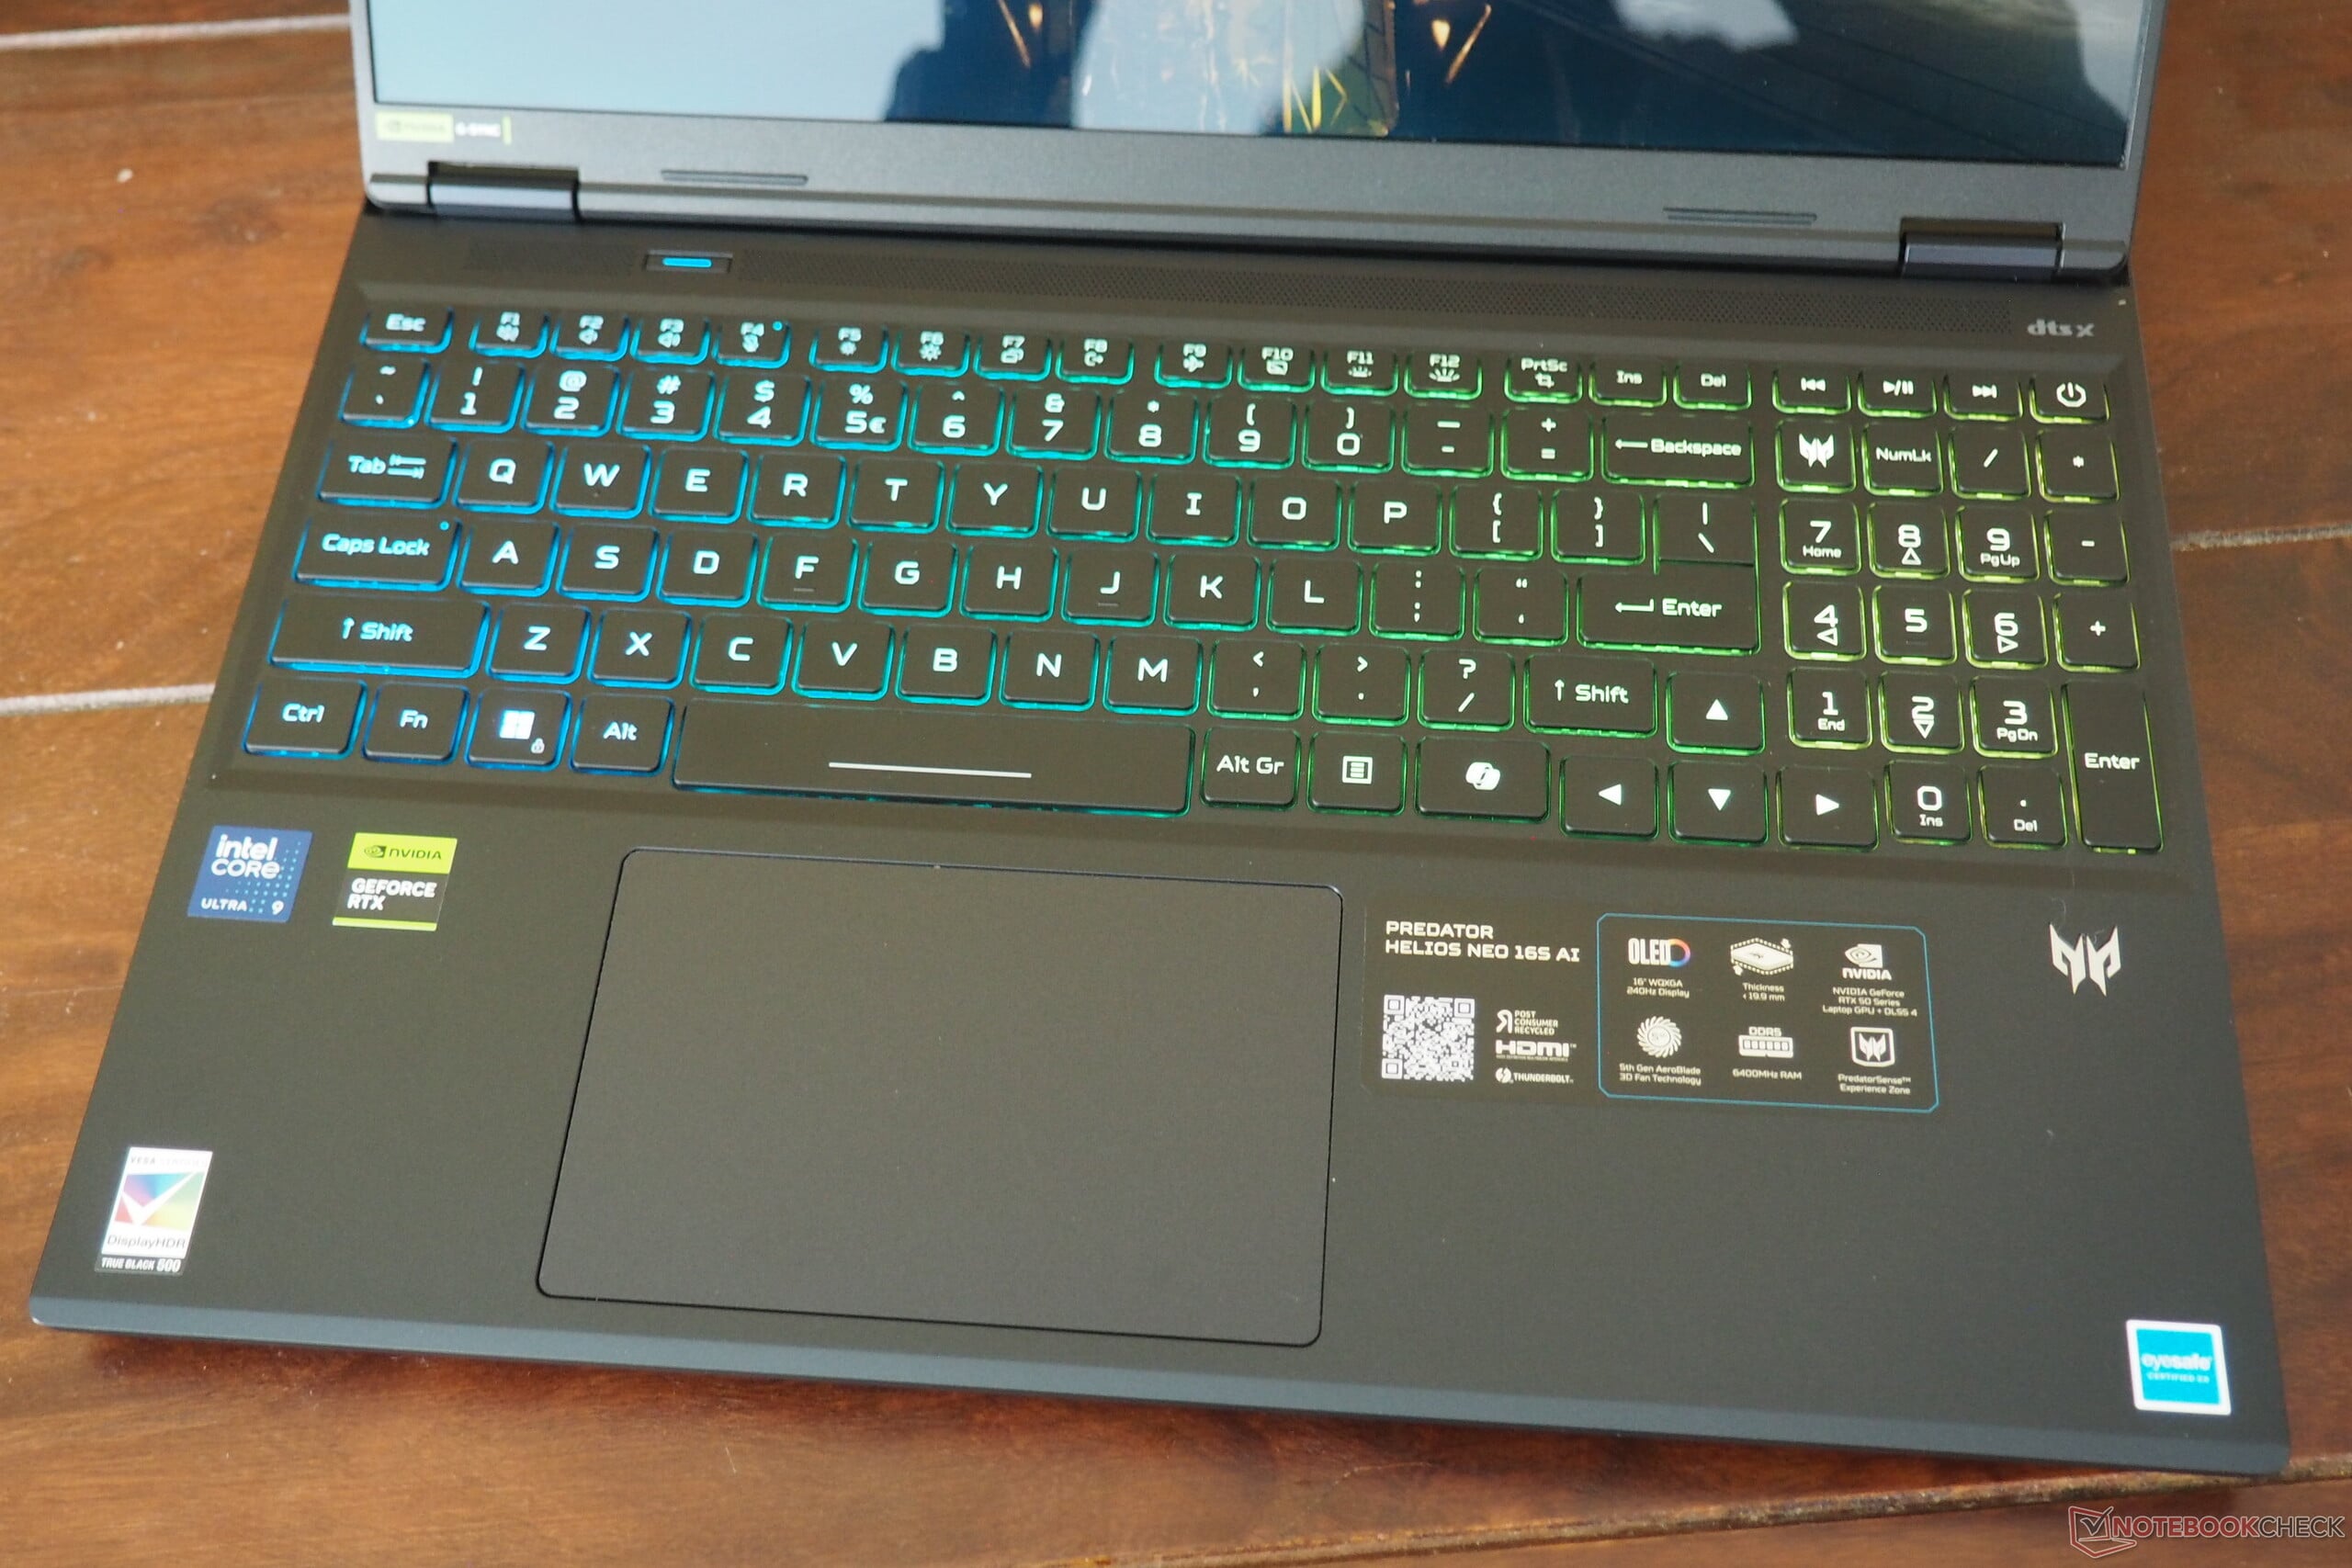
Les périphériques d'entrée sont raisonnablement bons sans être de premier ordre. Le clavier impressionne par son éclairage RGB stylisé et le retour d'information des touches. Nous avons apprécié la disposition des touches (les flèches directionnelles sont de taille normale, par exemple), mais nous aurions aimé avoir un bouton d'alimentation séparé. Le pavé tactile, d'une surface de 12,6 x 8,3 cm, offre une bonne précision et des propriétés de glissement acceptables. Comme sur beaucoup d'ordinateurs portables, les zones de clics claquent un peu, mais elles sont utilisables.

Affichage
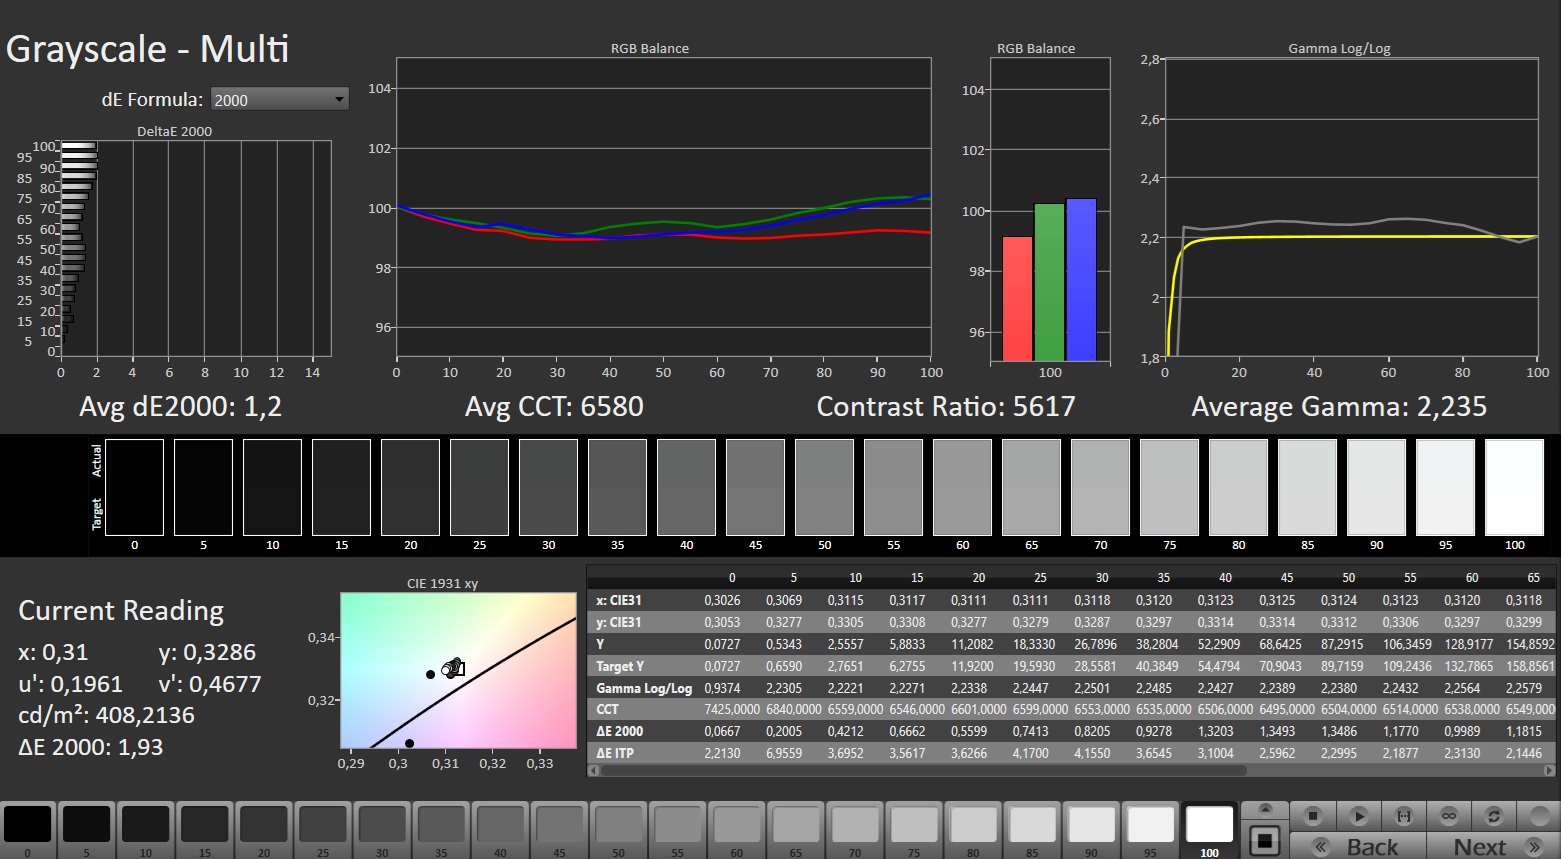
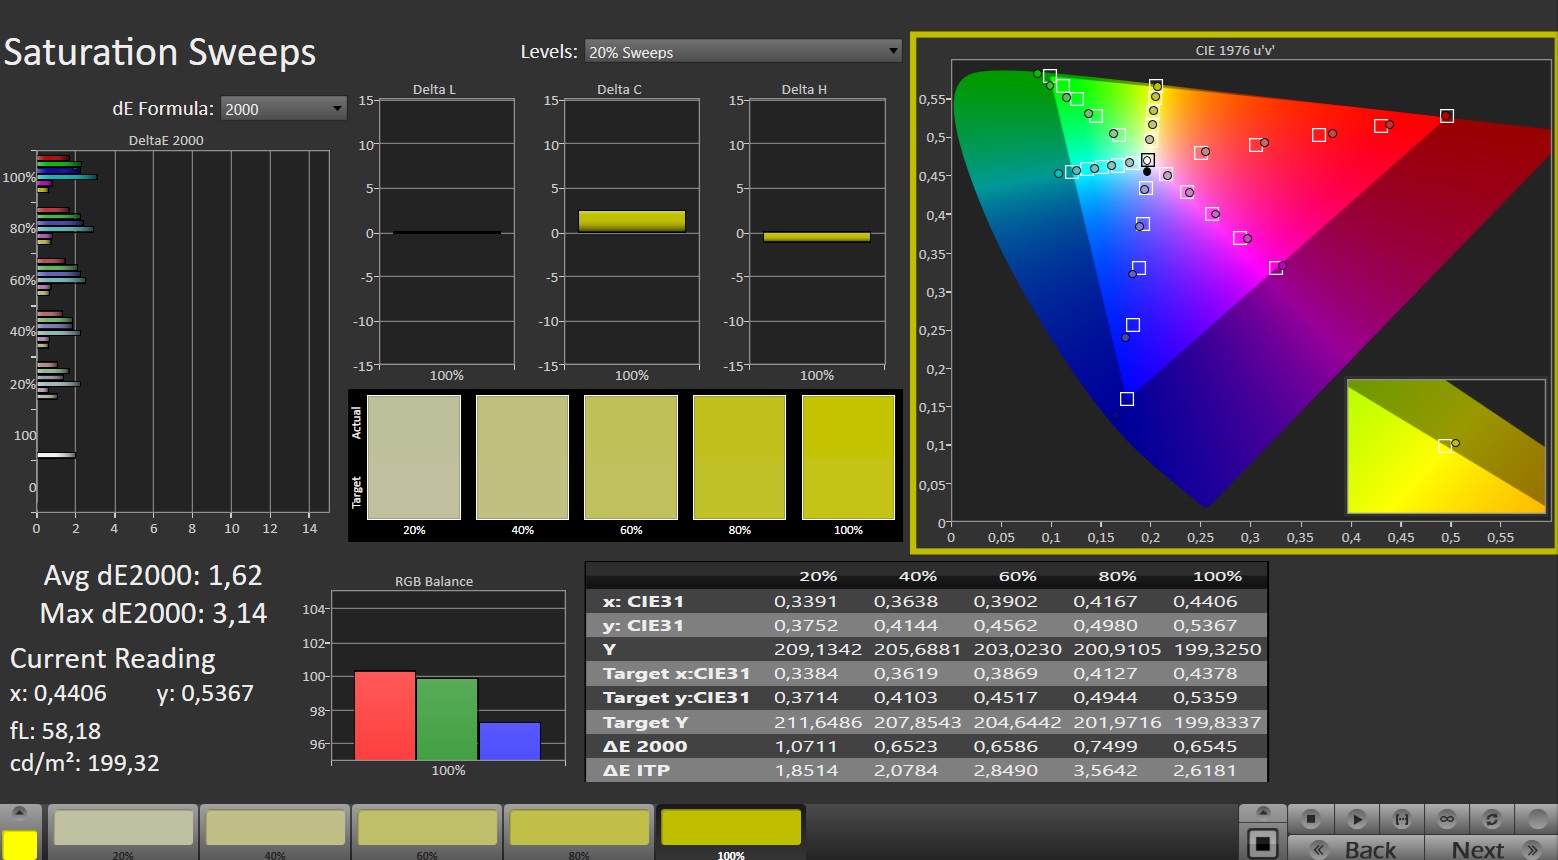
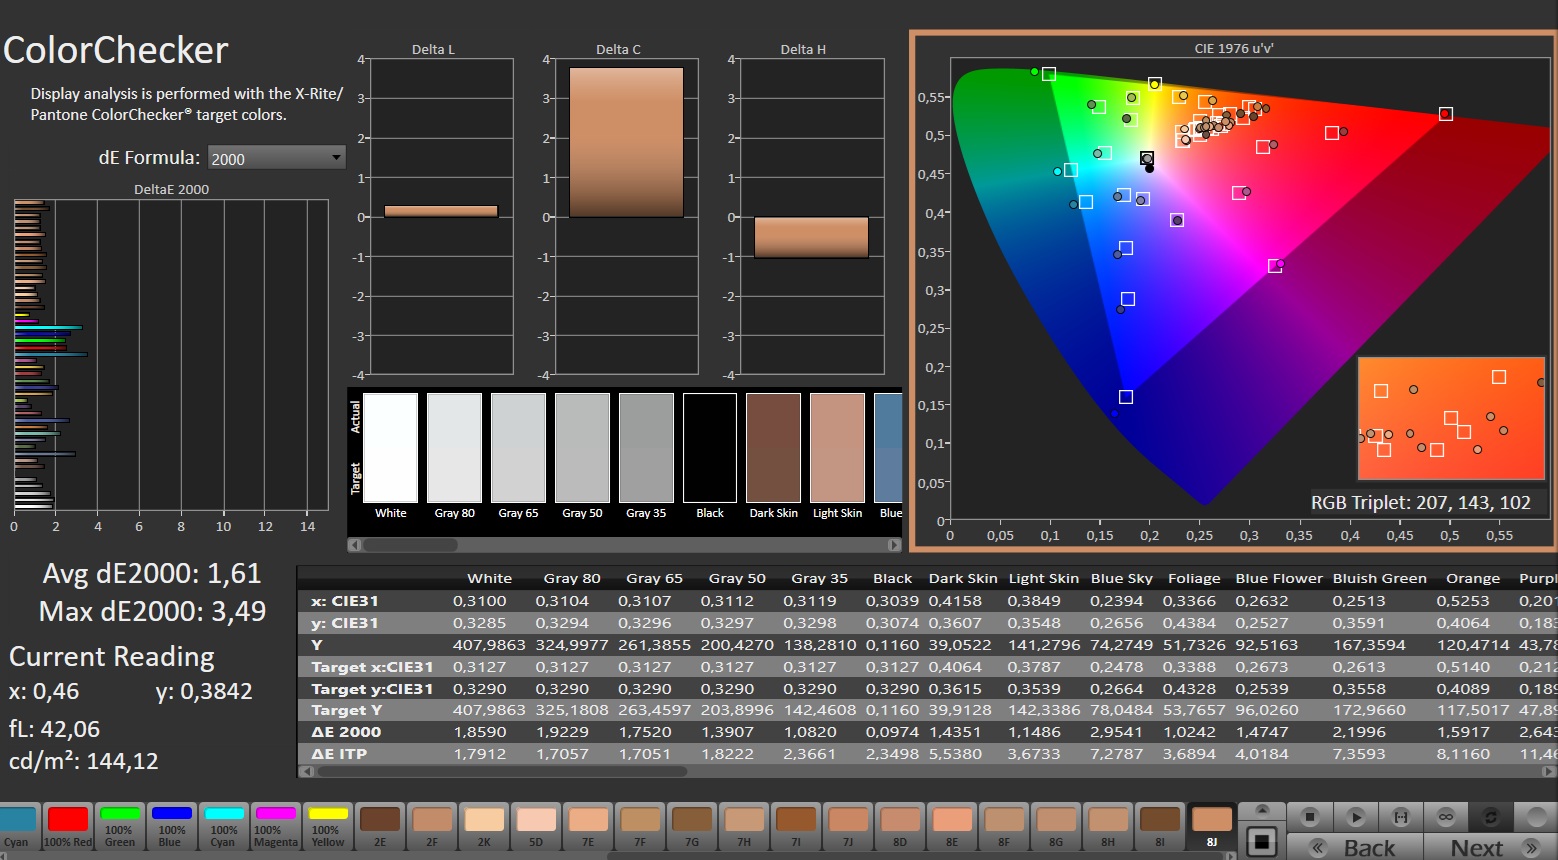
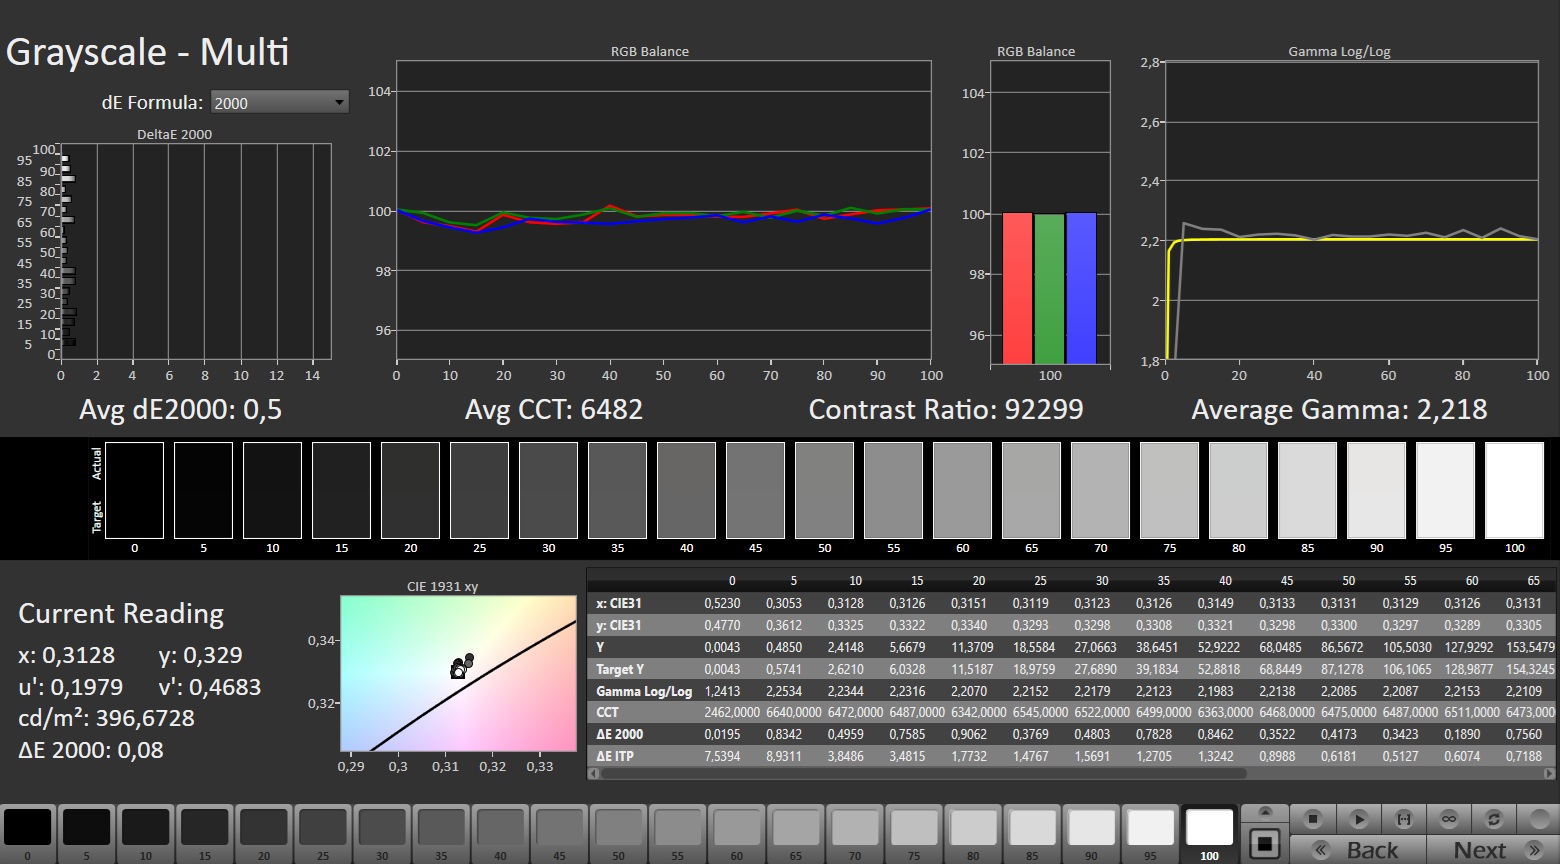
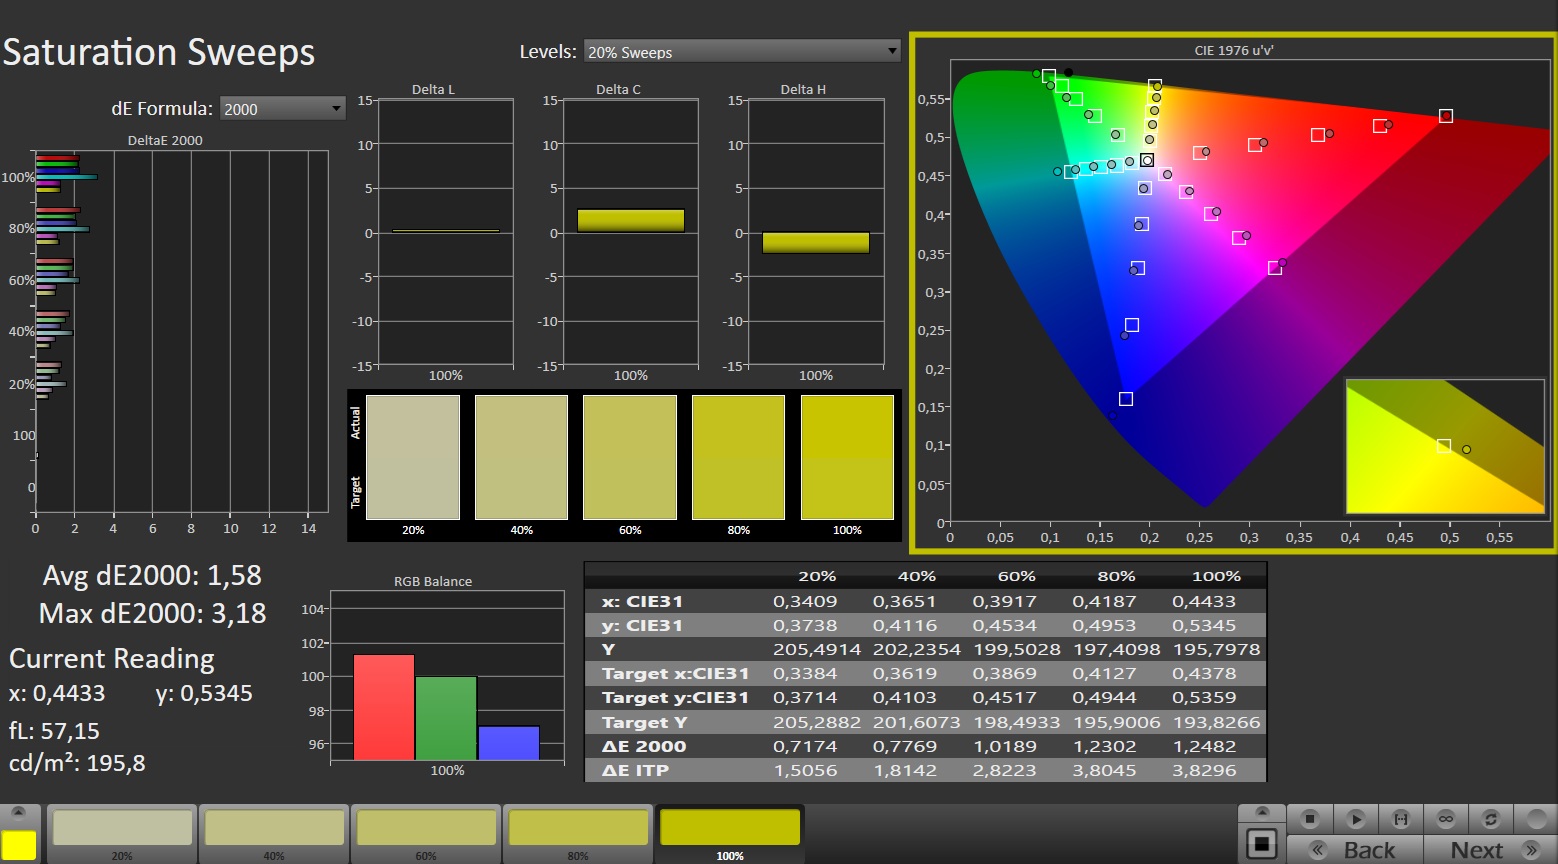
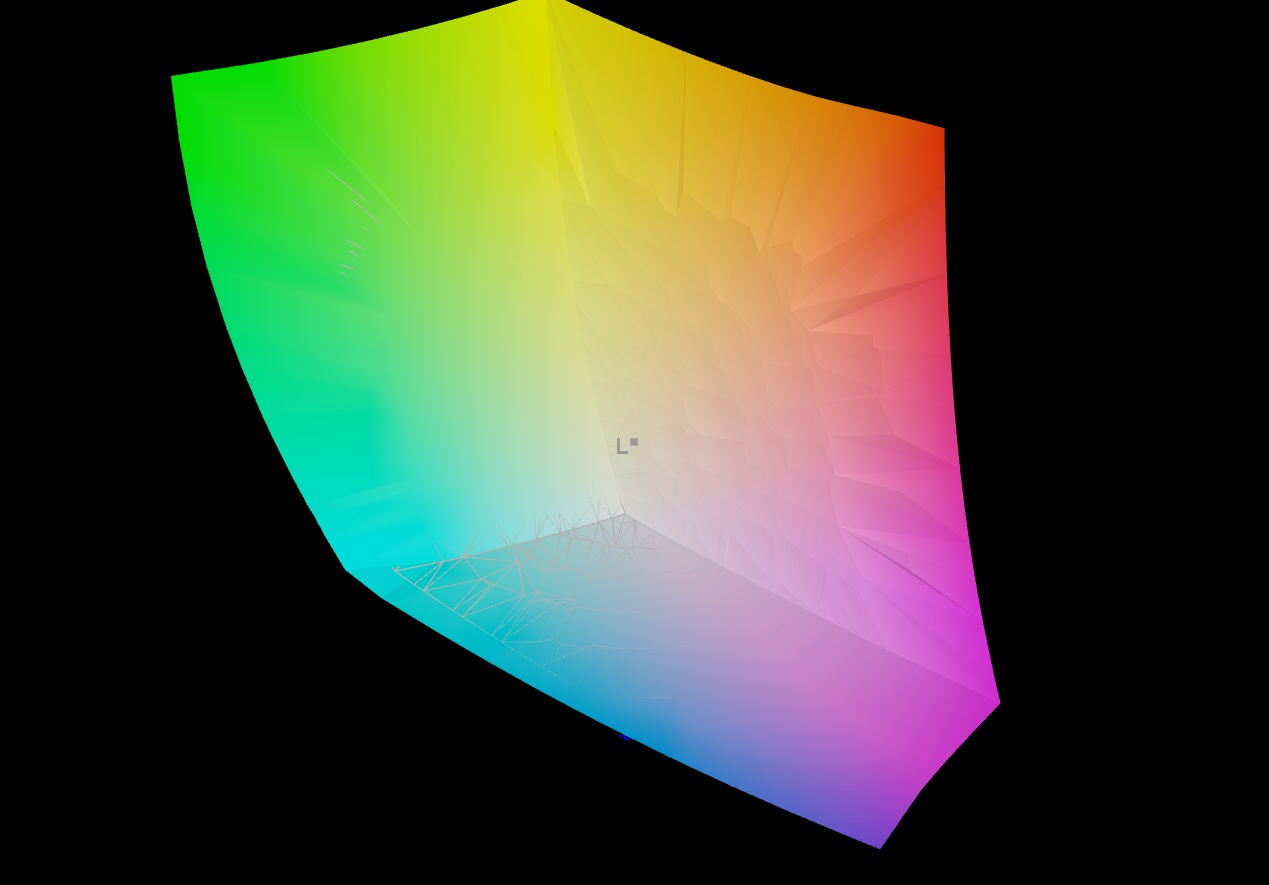
Le panneau OLED intégré présente les avantages et les inconvénients habituels. Bien que l'utilisation en extérieur soit plutôt difficile en raison de la surface très réfléchissante et que chaque niveau de luminosité doive faire face à un scintillement de l'image (bien que la fréquence soit assez élevée), le temps de réponse, le niveau de noir, le contraste et la reproduction des couleurs, entre autres, sont impressionnants. Outre l'espace sRGB, les espaces DCI-P3 et AdobeRGB sont également presque entièrement couverts. Il n'y a rien à redire non plus sur la fidélité des couleurs et les angles de vue. Acer a opté pour une résolution de 2 560 x 1 600 pixels. L'écran est également spécifié à 240 Hz.
| |||||||||||||||||||||||||
Homogénéité de la luminosité: 98 %
Valeur mesurée au centre, sur batterie: 390 cd/m²
Contraste: 9750:1 (Valeurs des noirs: 0.04 cd/m²)
ΔE ColorChecker Calman: 1.61 | ∀{0.5-29.43 Ø4.76}
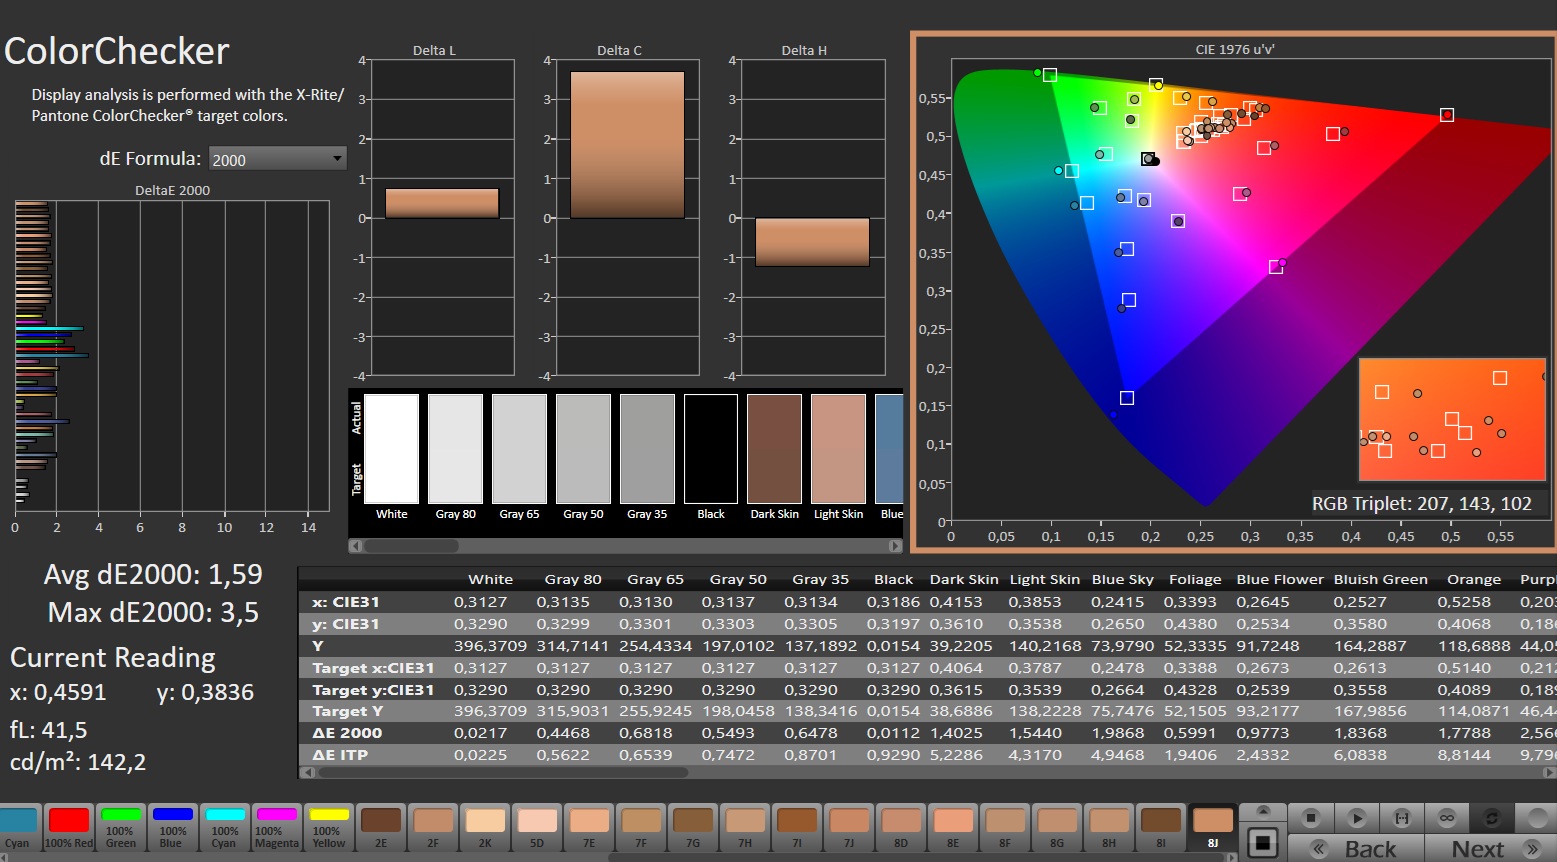
calibrated: 1.59
ΔE Greyscale Calman: 1.2 | ∀{0.09-98 Ø5}
96.5% AdobeRGB 1998 (Argyll 3D)
100% sRGB (Argyll 3D)
99.9% Display P3 (Argyll 3D)
Gamma: 2.235
CCT: 6580 K
| Acer Predator Helios Neo 16S AI PHN16S-71-94L9 Samsung ATNA60DL03-0, OLED, 2560x1600, 16", 240 Hz | Schenker XMG FUSION 16 (M25) ATNA60CL10_0, OLED, 2880x1800, 16", 120 Hz | MSI Vector 16 HX AI A2XWHG B160QAN02.3 (AUO7DB2), IPS, 2560x1600, 16", 240 Hz | Lenovo Legion 5 Pro 16IAX10H ATNA60HS01-0 (Samsung SDC420A), OLED, 2560x1600, 16", 165 Hz | Razer Blade 16 RTX 5080 ATNA60DL04-0, OLED, 2560x1600, 16", 240 Hz | |
|---|---|---|---|---|---|
| Display | -1% | -5% | -1% | 0% | |
| Display P3 Coverage (%) | 99.9 | 99.9 0% | 96.6 -3% | 99.9 0% | 99.3 -1% |
| sRGB Coverage (%) | 100 | 100 0% | 99.8 0% | 100 0% | 100 0% |
| AdobeRGB 1998 Coverage (%) | 96.5 | 93.3 -3% | 84.4 -13% | 94.1 -2% | 97.8 1% |
| Response Times | -88% | -2175% | -431% | -31% | |
| Response Time Grey 50% / Grey 80% * (ms) | 0.2 ? | 0.56 ? -180% | 4.3 ? -2050% | 2 ? -900% | 0.29 ? -45% |
| Response Time Black / White * (ms) | 0.25 ? | 0.58 ? -132% | 6 ? -2300% | 1.4 ? -460% | 0.4 ? -60% |
| PWM Frequency (Hz) | 960 | 480 ? | 1300 | 960 ? | |
| PWM Amplitude * (%) | 50 | 26 48% | 16.7 67% | 44 12% | |
| Screen | -40% | -154% | -33% | 13% | |
| Brightness middle (cd/m²) | 390 | 434 11% | 473 21% | 518 33% | 394.4 1% |
| Brightness (cd/m²) | 394 | 433 10% | 426 8% | 522 32% | 401 2% |
| Brightness Distribution (%) | 98 | 99 1% | 85 -13% | 97 -1% | 97 -1% |
| Black Level * (cd/m²) | 0.04 | 0.42 -950% | |||
| Contrast (:1) | 9750 | 1126 -88% | |||
| Colorchecker dE 2000 * | 1.61 | 3 -86% | 3.47 -116% | 2.49 -55% | 0.82 49% |
| Colorchecker dE 2000 max. * | 3.49 | 5.1 -46% | 7.24 -107% | 5.25 -50% | 2.82 19% |
| Colorchecker dE 2000 calibrated * | 1.59 | 1.4 12% | 1.36 14% | 2.15 -35% | |
| Greyscale dE 2000 * | 1.2 | 3.4 -183% | 3.1 -158% | 3.02 -152% | 1.1 8% |
| Gamma | 2.235 98% | 2.47 89% | 2.486 88% | 2.37 93% | 2.2 100% |
| CCT | 6580 99% | 6452 101% | 6832 95% | 6426 101% | 6424 101% |
| Moyenne finale (programmes/paramètres) | -43% /
-42% | -778% /
-411% | -155% /
-117% | -6% /
-1% |
* ... Moindre est la valeur, meilleures sont les performances


Temps de réponse de l'écran
| ↔ Temps de réponse noir à blanc | ||
|---|---|---|
| 0.25 ms ... hausse ↗ et chute ↘ combinées | ↗ 0.13 ms hausse | 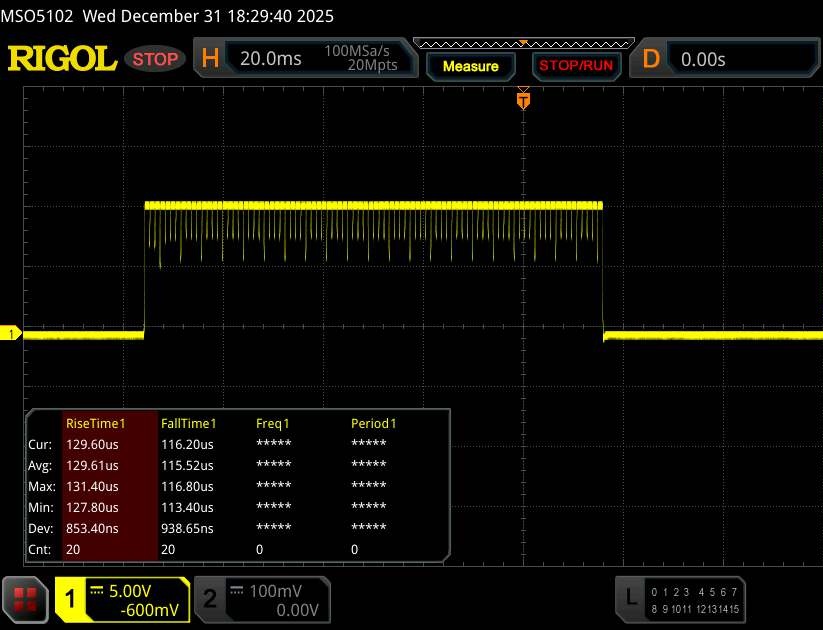 |
| ↘ 0.12 ms chute | ||
| L'écran montre de très faibles temps de réponse, parfait pour le jeu. En comparaison, tous les appareils testés affichent entre 0.1 (minimum) et 240 (maximum) ms. » 0 % des appareils testés affichent de meilleures performances. Cela signifie que les latences relevées sont meilleures que la moyenne (20.1 ms) de tous les appareils testés. | ||
| ↔ Temps de réponse gris 50% à gris 80% | ||
| 0.2 ms ... hausse ↗ et chute ↘ combinées | ↗ 0.1 ms hausse | 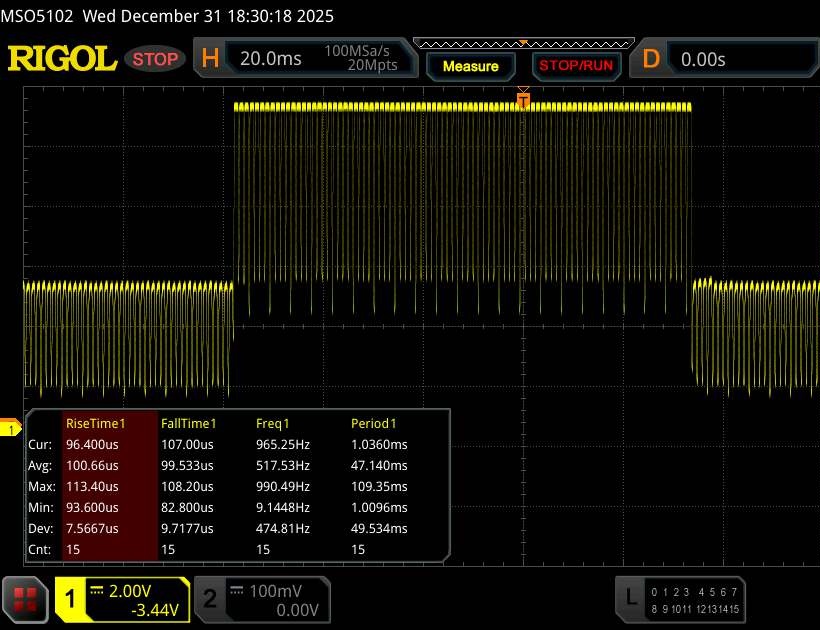 |
| ↘ 0.1 ms chute | ||
| L'écran montre de très faibles temps de réponse, parfait pour le jeu. En comparaison, tous les appareils testés affichent entre 0.165 (minimum) et 636 (maximum) ms. » 0 % des appareils testés affichent de meilleures performances. Cela signifie que les latences relevées sont meilleures que la moyenne (31.4 ms) de tous les appareils testés. | ||
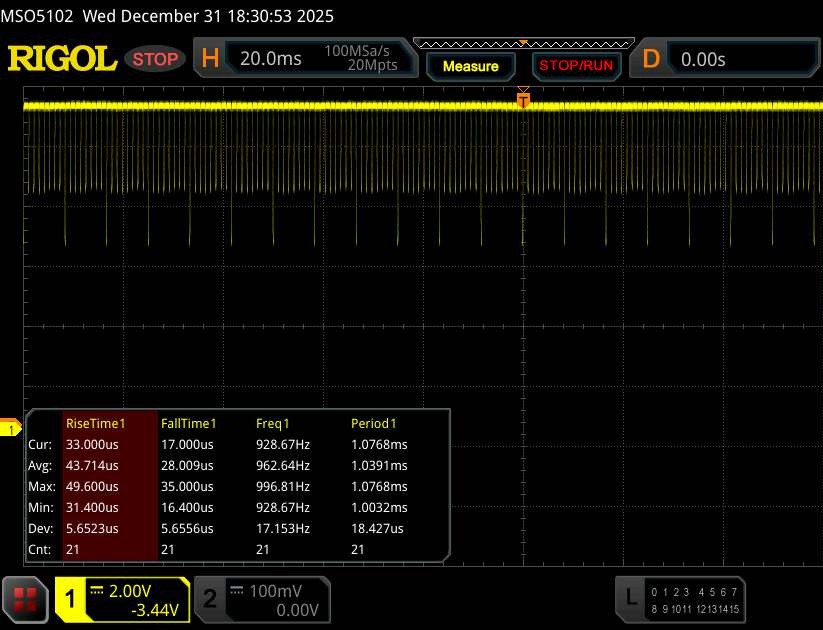
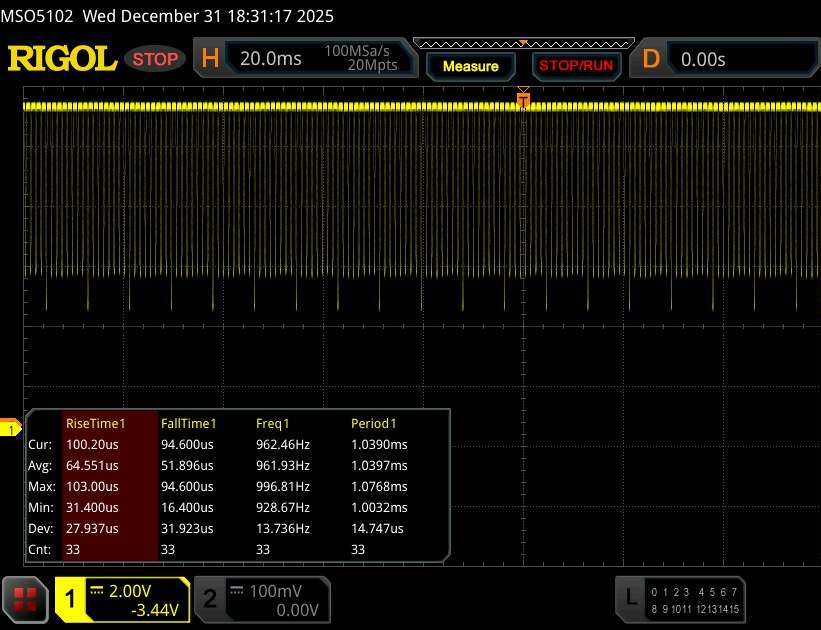
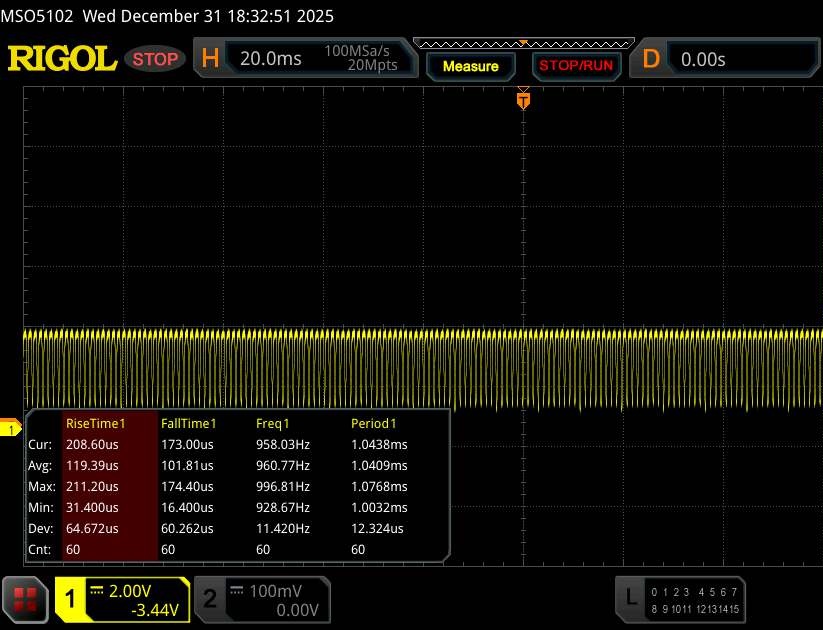
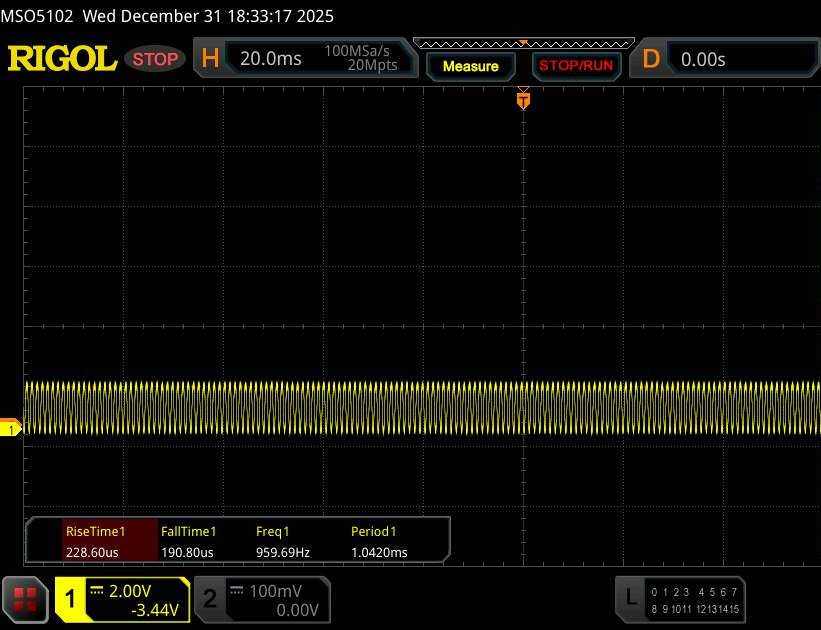
Scintillement / MLI (Modulation de largeur d'impulsion)
| Scintillement / MLI (Modulation de largeur d'impulsion) décelé | 960 Hz Amplitude: 50 % | 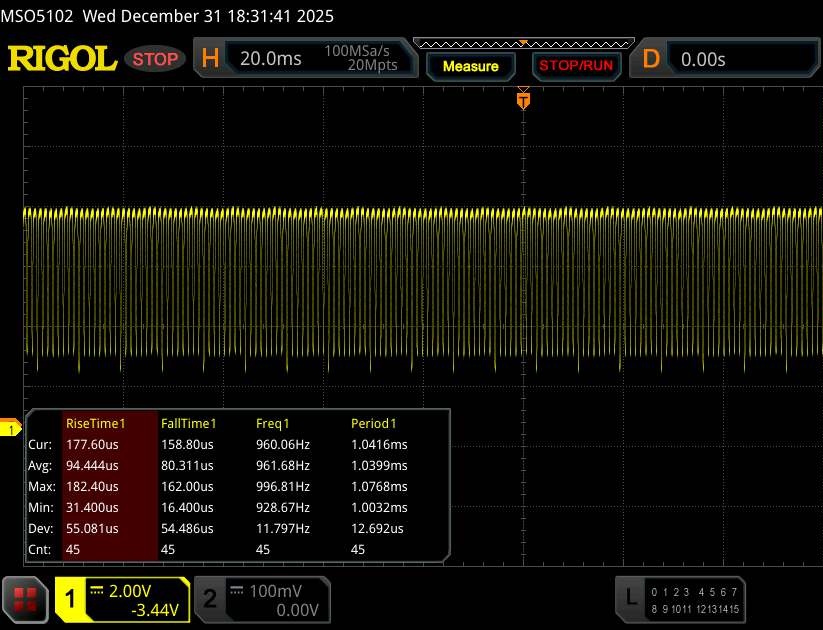 | |
Le rétroéclairage de l'écran scintille à la fréquence de 960 Hz (certainement du fait de l'utilisation d'une MDI - Modulation de largeur d'impulsion) . La fréquence de rafraîchissement de 960 Hz est élevée, la grande majorité des utilisateurs ne devrait pas percevoir de scintillements et être sujette à une fatigue oculaire accrue. En comparaison, 53 % des appareils testés n'emploient pas MDI pour assombrir leur écran. Nous avons relevé une moyenne à 7999 (minimum : 5 - maximum : 343500) Hz dans le cas où une MDI était active. | |||
Performance
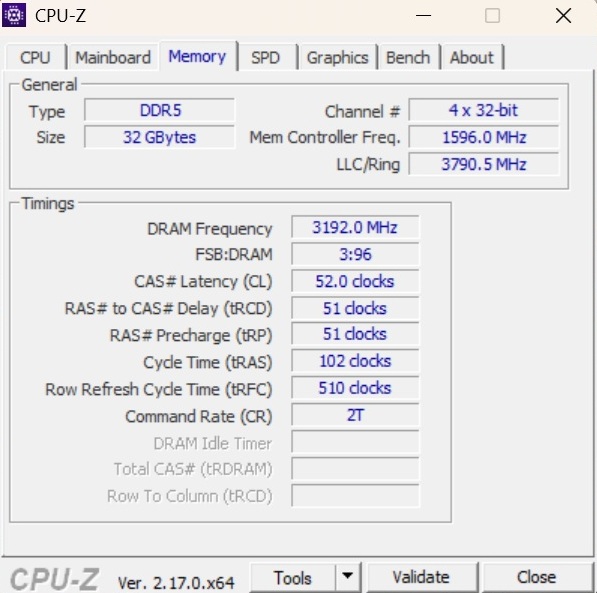
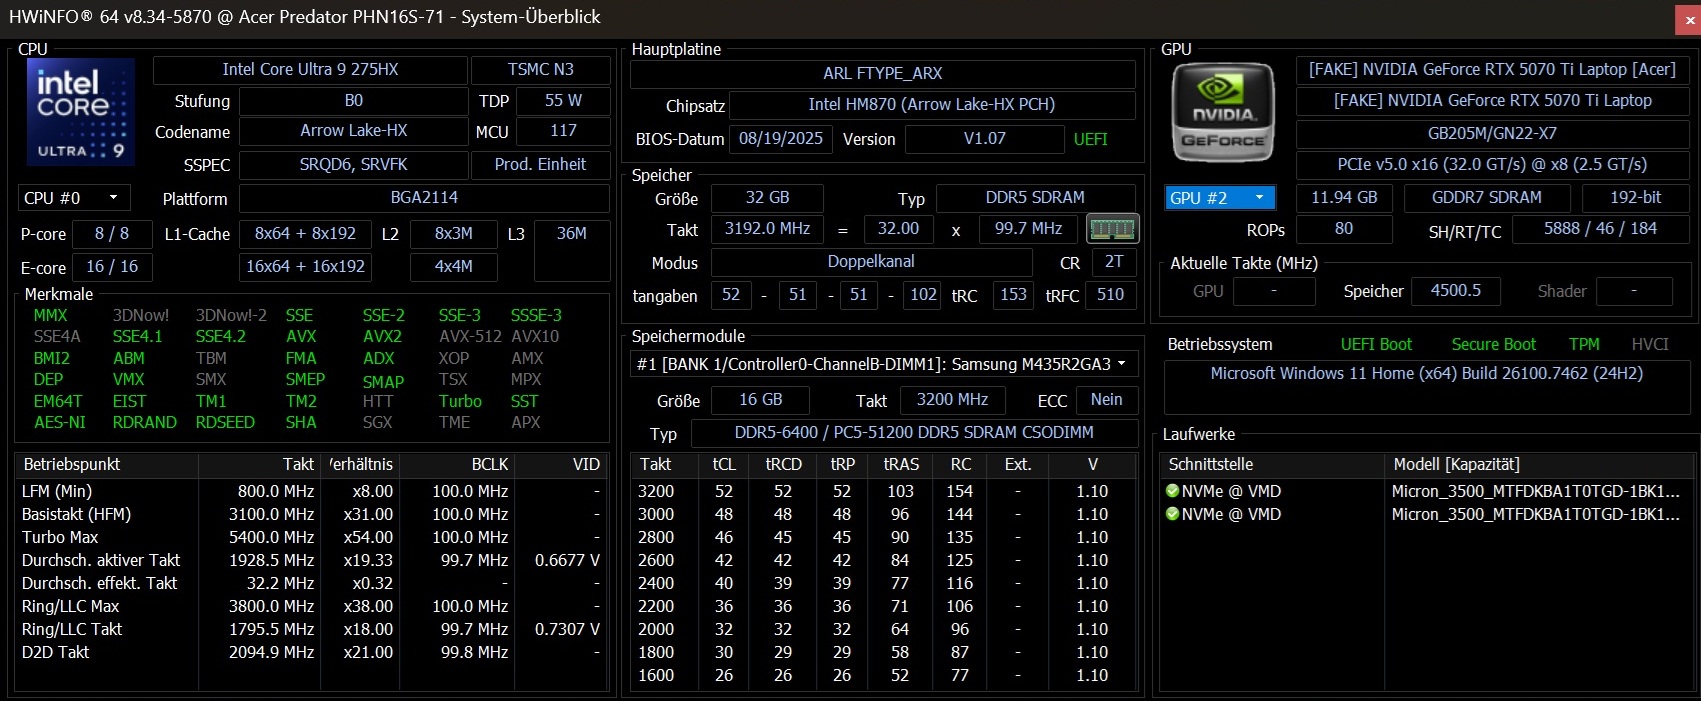
Le Predator Helios Neo 16S AI est disponible à partir d'environ 1 700 euros, bien que la version la moins chère soit "seulement" équipée des éléments suivants Core Ultra 7 255HX, GeForce RTX 5060 et de 16 Go de RAM. Notre échantillon de test, quant à lui, dispose de 32 Go de RAM (2x 16 Go DDR-6400) et de deux disques durs de 1 To.


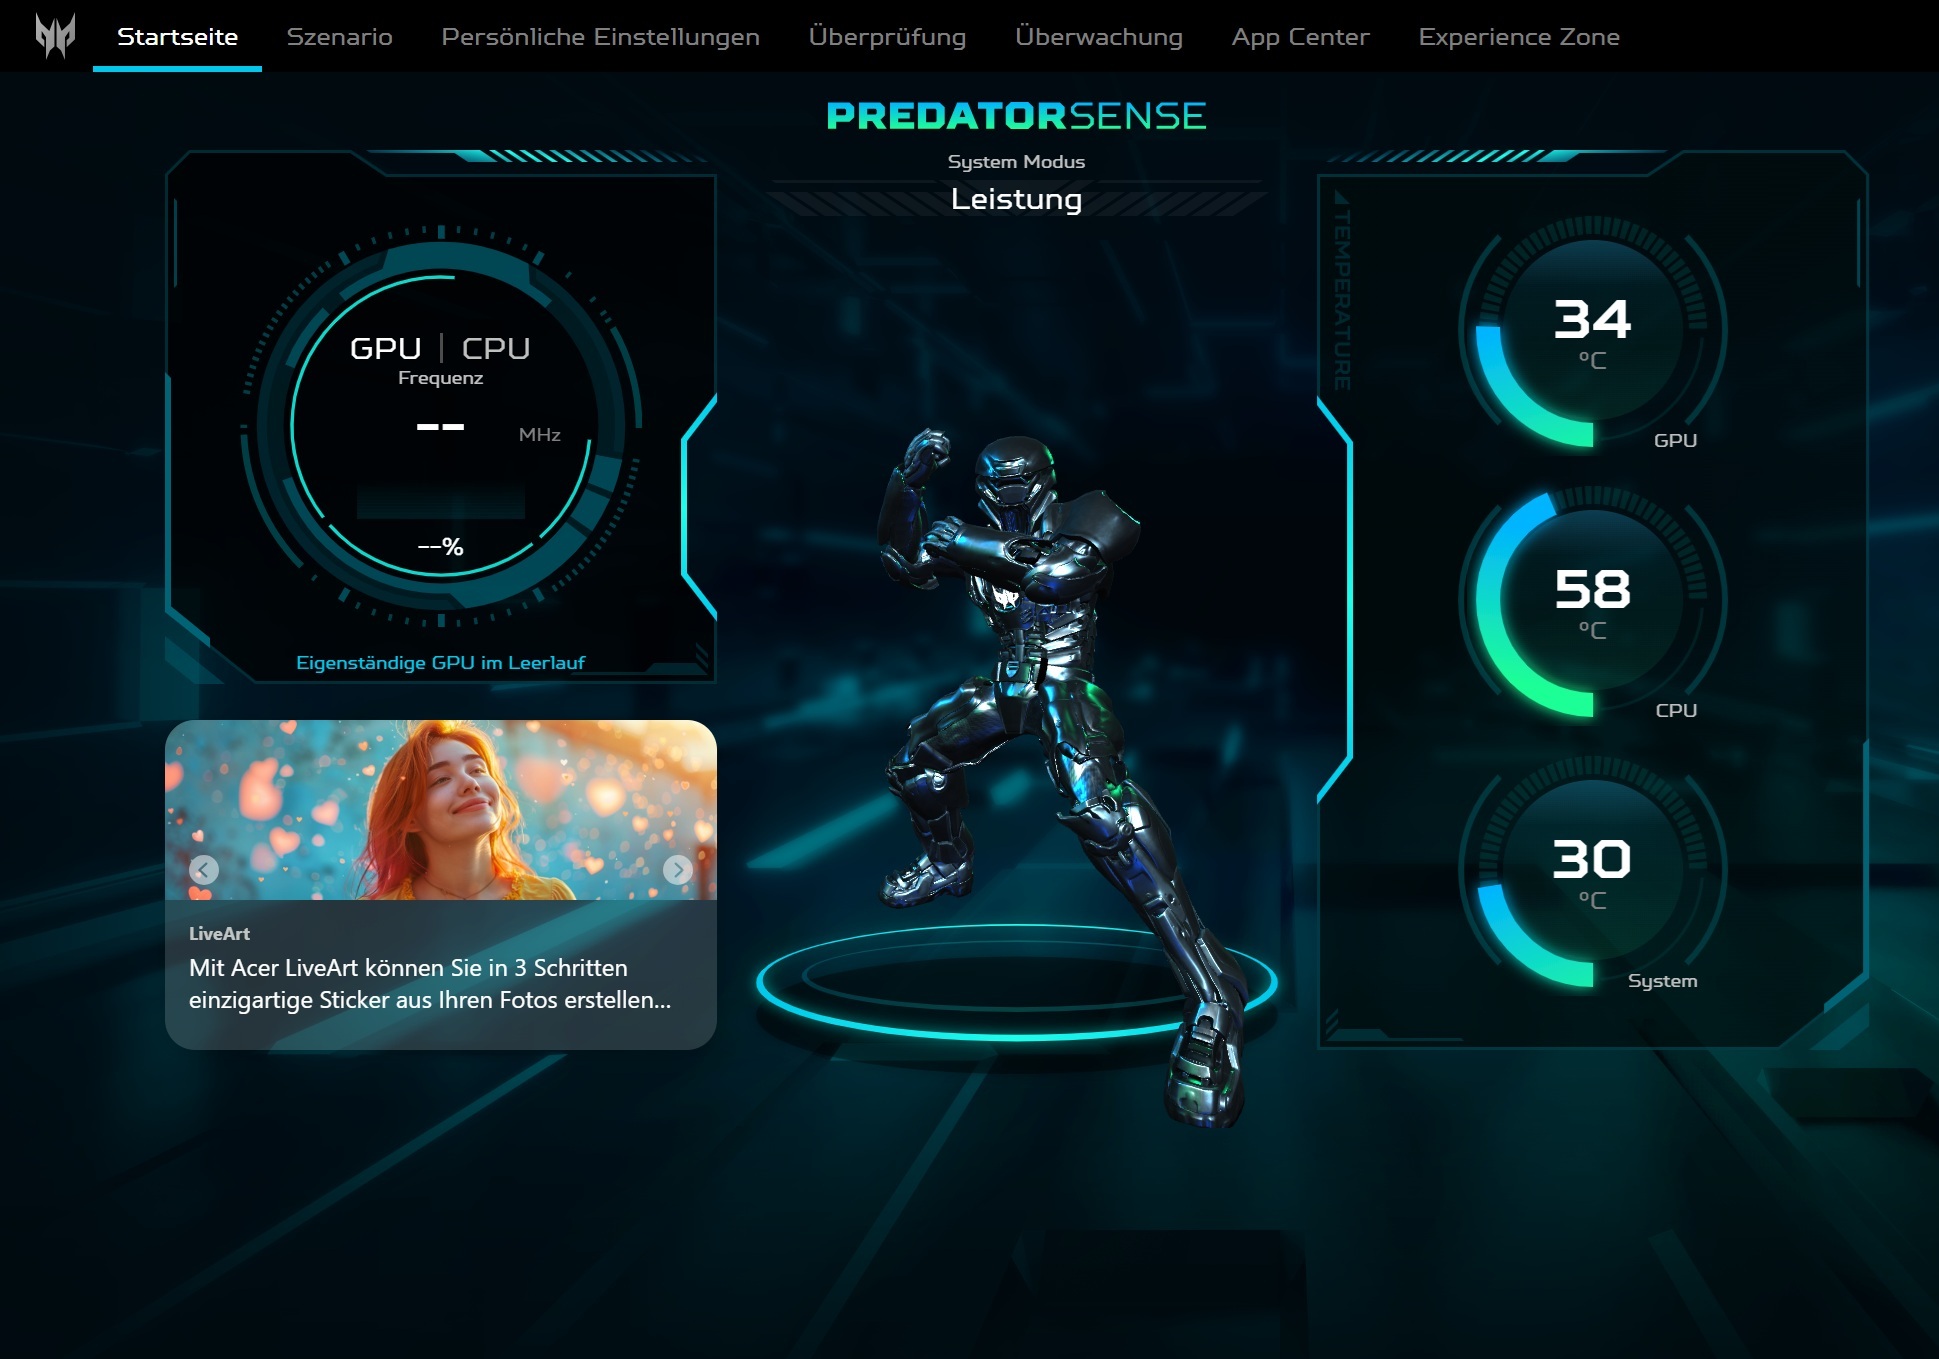
Conditions d'essai
Dans le logiciel PredatorSense préinstallé, vous pouvez choisir entre quatre modes de fonctionnement, qui diffèrent à la fois en termes de bruit et de puissance du CPU ou du GPU. À l'exception du test de la batterie, toutes nos mesures ont été effectuées en mode Performance.

| Mode | Silencieux | Équilibré | Performance | Turbo |
| Cyberpunk 2077 Bruit | 38 dB(A) | 45 dB(A) | 52 dB(A) | 57 dB(A) |
| Taux de rafraîchissement de Cyberpunk 2077 (FHD/Ultra) | 85.8 fps | 91.3 fps | 100.8 fps | 109.7 fps |
| Consommation du GPU | ~60 W | ~70 W | ~90 W | ~100 W |
| CPU PL1 | 55 W | 65 W | 75 W | 85 W |
| CPU PL2 | 140 W | 140 W | 140 W | 140 W |
Processeur
Le Core Ultra 9 275HX est actuellement l'un des processeurs les plus populaires pour les ordinateurs portables haut de gamme. Le modèle 3 nm se compose de 8 cœurs de performance et de 16 cœurs d'efficacité, qui ne peuvent toutefois pas développer leurs performances dans notre parcours de référence aussi bien que, par exemple, le Legion 5 Pro 16, d'autant plus que la vitesse diminue légèrement après quelques exécutions (voir Cinebench loop) et tend ensuite à se stabiliser au niveau du Core Ultra 7 255HX. Les Ryzen AI 9 365 du Razer Blade 16 est clairement battu.
Cinebench R15 Multi loop
* ... Moindre est la valeur, meilleures sont les performances
AIDA64: FP32 Ray-Trace | FPU Julia | CPU SHA3 | CPU Queen | FPU SinJulia | FPU Mandel | CPU AES | CPU ZLib | FP64 Ray-Trace | CPU PhotoWorxx
| Performance rating | |
| Lenovo Legion 5 Pro 16IAX10H | |
| Moyenne Intel Core Ultra 9 275HX | |
| Schenker XMG FUSION 16 (M25) | |
| Acer Predator Helios Neo 16S AI PHN16S-71-94L9 | |
| Moyenne de la classe Gaming | |
| Razer Blade 16 RTX 5080 | |
| MSI Vector 16 HX AI A2XWHG | |
| AIDA64 / FP32 Ray-Trace | |
| Moyenne Intel Core Ultra 9 275HX (28039 - 39895, n=30) | |
| Lenovo Legion 5 Pro 16IAX10H | |
| Schenker XMG FUSION 16 (M25) | |
| Razer Blade 16 RTX 5080 | |
| Moyenne de la classe Gaming (10227 - 85542, n=128, 2 dernières années) | |
| Acer Predator Helios Neo 16S AI PHN16S-71-94L9 | |
| MSI Vector 16 HX AI A2XWHG | |
| AIDA64 / FPU Julia | |
| Lenovo Legion 5 Pro 16IAX10H | |
| Moyenne Intel Core Ultra 9 275HX (140254 - 200744, n=30) | |
| Schenker XMG FUSION 16 (M25) | |
| Acer Predator Helios Neo 16S AI PHN16S-71-94L9 | |
| MSI Vector 16 HX AI A2XWHG | |
| Moyenne de la classe Gaming (51376 - 238426, n=128, 2 dernières années) | |
| Razer Blade 16 RTX 5080 | |
| AIDA64 / CPU SHA3 | |
| Moyenne Intel Core Ultra 9 275HX (6710 - 9817, n=30) | |
| Lenovo Legion 5 Pro 16IAX10H | |
| Schenker XMG FUSION 16 (M25) | |
| Acer Predator Helios Neo 16S AI PHN16S-71-94L9 | |
| MSI Vector 16 HX AI A2XWHG | |
| Moyenne de la classe Gaming (2180 - 9817, n=128, 2 dernières années) | |
| Razer Blade 16 RTX 5080 | |
| AIDA64 / CPU Queen | |
| Lenovo Legion 5 Pro 16IAX10H | |
| Moyenne Intel Core Ultra 9 275HX (113887 - 140937, n=30) | |
| Schenker XMG FUSION 16 (M25) | |
| Acer Predator Helios Neo 16S AI PHN16S-71-94L9 | |
| Moyenne de la classe Gaming (49785 - 173351, n=128, 2 dernières années) | |
| MSI Vector 16 HX AI A2XWHG | |
| Razer Blade 16 RTX 5080 | |
| AIDA64 / FPU SinJulia | |
| Razer Blade 16 RTX 5080 | |
| Moyenne de la classe Gaming (4424 - 33636, n=128, 2 dernières années) | |
| Lenovo Legion 5 Pro 16IAX10H | |
| Moyenne Intel Core Ultra 9 275HX (11172 - 14425, n=30) | |
| Schenker XMG FUSION 16 (M25) | |
| Acer Predator Helios Neo 16S AI PHN16S-71-94L9 | |
| MSI Vector 16 HX AI A2XWHG | |
| AIDA64 / FPU Mandel | |
| Moyenne Intel Core Ultra 9 275HX (72596 - 104508, n=30) | |
| Lenovo Legion 5 Pro 16IAX10H | |
| Schenker XMG FUSION 16 (M25) | |
| Acer Predator Helios Neo 16S AI PHN16S-71-94L9 | |
| MSI Vector 16 HX AI A2XWHG | |
| Moyenne de la classe Gaming (25115 - 128721, n=128, 2 dernières années) | |
| Razer Blade 16 RTX 5080 | |
| AIDA64 / CPU AES | |
| Lenovo Legion 5 Pro 16IAX10H | |
| Moyenne Intel Core Ultra 9 275HX (105608 - 247074, n=30) | |
| Schenker XMG FUSION 16 (M25) | |
| Moyenne de la classe Gaming (39258 - 247074, n=128, 2 dernières années) | |
| Acer Predator Helios Neo 16S AI PHN16S-71-94L9 | |
| MSI Vector 16 HX AI A2XWHG | |
| Razer Blade 16 RTX 5080 | |
| AIDA64 / CPU ZLib | |
| Lenovo Legion 5 Pro 16IAX10H | |
| Moyenne Intel Core Ultra 9 275HX (1582 - 2263, n=30) | |
| Schenker XMG FUSION 16 (M25) | |
| Acer Predator Helios Neo 16S AI PHN16S-71-94L9 | |
| Moyenne de la classe Gaming (574 - 2531, n=128, 2 dernières années) | |
| MSI Vector 16 HX AI A2XWHG | |
| Razer Blade 16 RTX 5080 | |
| AIDA64 / FP64 Ray-Trace | |
| Moyenne Intel Core Ultra 9 275HX (14847 - 21854, n=30) | |
| Lenovo Legion 5 Pro 16IAX10H | |
| Schenker XMG FUSION 16 (M25) | |
| Razer Blade 16 RTX 5080 | |
| Moyenne de la classe Gaming (5509 - 45446, n=128, 2 dernières années) | |
| Acer Predator Helios Neo 16S AI PHN16S-71-94L9 | |
| MSI Vector 16 HX AI A2XWHG | |
| AIDA64 / CPU PhotoWorxx | |
| Acer Predator Helios Neo 16S AI PHN16S-71-94L9 | |
| Razer Blade 16 RTX 5080 | |
| Schenker XMG FUSION 16 (M25) | |
| Moyenne Intel Core Ultra 9 275HX (37482 - 62916, n=30) | |
| Lenovo Legion 5 Pro 16IAX10H | |
| Moyenne de la classe Gaming (10805 - 62916, n=128, 2 dernières années) | |
| MSI Vector 16 HX AI A2XWHG | |
Performance du système
En ce qui concerne les performances du système, l'ordinateur portable Acer se situe dans la moyenne des appareils de comparaison. D'un point de vue subjectif, le système agit et réagit agréablement et rapidement.
PCMark 10: Score | Essentials | Productivity | Digital Content Creation
CrossMark: Overall | Productivity | Creativity | Responsiveness
WebXPRT 3: Overall
WebXPRT 4: Overall
Mozilla Kraken 1.1: Total
| Performance rating | |
| Lenovo Legion 5 Pro 16IAX10H | |
| Schenker XMG FUSION 16 (M25) | |
| Moyenne Intel Core Ultra 9 275HX, NVIDIA GeForce RTX 5070 Ti Laptop | |
| Acer Predator Helios Neo 16S AI PHN16S-71-94L9 | |
| Moyenne de la classe Gaming | |
| MSI Vector 16 HX AI A2XWHG | |
| Razer Blade 16 RTX 5080 -4! | |
| PCMark 10 / Score | |
| Schenker XMG FUSION 16 (M25) | |
| Razer Blade 16 RTX 5080 | |
| Moyenne Intel Core Ultra 9 275HX, NVIDIA GeForce RTX 5070 Ti Laptop (8297 - 8550, n=3) | |
| Acer Predator Helios Neo 16S AI PHN16S-71-94L9 | |
| Lenovo Legion 5 Pro 16IAX10H | |
| Moyenne de la classe Gaming (5828 - 10060, n=110, 2 dernières années) | |
| MSI Vector 16 HX AI A2XWHG | |
| PCMark 10 / Essentials | |
| Moyenne Intel Core Ultra 9 275HX, NVIDIA GeForce RTX 5070 Ti Laptop (10738 - 11290, n=3) | |
| Acer Predator Helios Neo 16S AI PHN16S-71-94L9 | |
| Razer Blade 16 RTX 5080 | |
| Lenovo Legion 5 Pro 16IAX10H | |
| MSI Vector 16 HX AI A2XWHG | |
| Moyenne de la classe Gaming (8810 - 12600, n=114, 2 dernières années) | |
| Schenker XMG FUSION 16 (M25) | |
| PCMark 10 / Productivity | |
| Schenker XMG FUSION 16 (M25) | |
| Moyenne de la classe Gaming (6662 - 16716, n=112, 2 dernières années) | |
| Razer Blade 16 RTX 5080 | |
| Acer Predator Helios Neo 16S AI PHN16S-71-94L9 | |
| Lenovo Legion 5 Pro 16IAX10H | |
| Moyenne Intel Core Ultra 9 275HX, NVIDIA GeForce RTX 5070 Ti Laptop (9591 - 9771, n=3) | |
| MSI Vector 16 HX AI A2XWHG | |
| PCMark 10 / Digital Content Creation | |
| Razer Blade 16 RTX 5080 | |
| Moyenne Intel Core Ultra 9 275HX, NVIDIA GeForce RTX 5070 Ti Laptop (14812 - 15662, n=3) | |
| Lenovo Legion 5 Pro 16IAX10H | |
| Acer Predator Helios Neo 16S AI PHN16S-71-94L9 | |
| Schenker XMG FUSION 16 (M25) | |
| Moyenne de la classe Gaming (7505 - 19351, n=112, 2 dernières années) | |
| MSI Vector 16 HX AI A2XWHG | |
| CrossMark / Overall | |
| Lenovo Legion 5 Pro 16IAX10H | |
| Moyenne Intel Core Ultra 9 275HX, NVIDIA GeForce RTX 5070 Ti Laptop (2116 - 2193, n=3) | |
| Acer Predator Helios Neo 16S AI PHN16S-71-94L9 | |
| Schenker XMG FUSION 16 (M25) | |
| Moyenne de la classe Gaming (1247 - 2344, n=110, 2 dernières années) | |
| MSI Vector 16 HX AI A2XWHG | |
| CrossMark / Productivity | |
| Lenovo Legion 5 Pro 16IAX10H | |
| Moyenne Intel Core Ultra 9 275HX, NVIDIA GeForce RTX 5070 Ti Laptop (1967 - 2038, n=3) | |
| Acer Predator Helios Neo 16S AI PHN16S-71-94L9 | |
| Schenker XMG FUSION 16 (M25) | |
| Moyenne de la classe Gaming (1299 - 2211, n=110, 2 dernières années) | |
| MSI Vector 16 HX AI A2XWHG | |
| CrossMark / Creativity | |
| Moyenne Intel Core Ultra 9 275HX, NVIDIA GeForce RTX 5070 Ti Laptop (2430 - 2531, n=3) | |
| Lenovo Legion 5 Pro 16IAX10H | |
| Schenker XMG FUSION 16 (M25) | |
| Acer Predator Helios Neo 16S AI PHN16S-71-94L9 | |
| MSI Vector 16 HX AI A2XWHG | |
| Moyenne de la classe Gaming (1275 - 2729, n=110, 2 dernières années) | |
| CrossMark / Responsiveness | |
| Lenovo Legion 5 Pro 16IAX10H | |
| Moyenne Intel Core Ultra 9 275HX, NVIDIA GeForce RTX 5070 Ti Laptop (1740 - 1844, n=3) | |
| Schenker XMG FUSION 16 (M25) | |
| Acer Predator Helios Neo 16S AI PHN16S-71-94L9 | |
| Moyenne de la classe Gaming (1030 - 2330, n=110, 2 dernières années) | |
| MSI Vector 16 HX AI A2XWHG | |
| WebXPRT 3 / Overall | |
| Lenovo Legion 5 Pro 16IAX10H | |
| Moyenne Intel Core Ultra 9 275HX, NVIDIA GeForce RTX 5070 Ti Laptop (328 - 532, n=3) | |
| Schenker XMG FUSION 16 (M25) | |
| Razer Blade 16 RTX 5080 | |
| Acer Predator Helios Neo 16S AI PHN16S-71-94L9 | |
| MSI Vector 16 HX AI A2XWHG | |
| Moyenne de la classe Gaming (237 - 532, n=113, 2 dernières années) | |
| WebXPRT 4 / Overall | |
| Lenovo Legion 5 Pro 16IAX10H | |
| Moyenne Intel Core Ultra 9 275HX, NVIDIA GeForce RTX 5070 Ti Laptop (306 - 341, n=3) | |
| Acer Predator Helios Neo 16S AI PHN16S-71-94L9 | |
| MSI Vector 16 HX AI A2XWHG | |
| Schenker XMG FUSION 16 (M25) | |
| Moyenne de la classe Gaming (176.4 - 345, n=111, 2 dernières années) | |
| Razer Blade 16 RTX 5080 | |
| Mozilla Kraken 1.1 / Total | |
| Moyenne de la classe Gaming (397 - 674, n=120, 2 dernières années) | |
| Razer Blade 16 RTX 5080 | |
| Schenker XMG FUSION 16 (M25) | |
| MSI Vector 16 HX AI A2XWHG | |
| Lenovo Legion 5 Pro 16IAX10H | |
| Moyenne Intel Core Ultra 9 275HX, NVIDIA GeForce RTX 5070 Ti Laptop (405 - 414, n=3) | |
| Acer Predator Helios Neo 16S AI PHN16S-71-94L9 | |
* ... Moindre est la valeur, meilleures sont les performances
| PCMark 10 Score | 8332 points | |
Aide | ||
| AIDA64 / Memory Copy | |
| Razer Blade 16 RTX 5080 | |
| Acer Predator Helios Neo 16S AI PHN16S-71-94L9 | |
| Schenker XMG FUSION 16 (M25) | |
| Moyenne Intel Core Ultra 9 275HX (56003 - 94460, n=30) | |
| Lenovo Legion 5 Pro 16IAX10H | |
| Moyenne de la classe Gaming (21750 - 108104, n=128, 2 dernières années) | |
| MSI Vector 16 HX AI A2XWHG | |
| AIDA64 / Memory Read | |
| Razer Blade 16 RTX 5080 | |
| Acer Predator Helios Neo 16S AI PHN16S-71-94L9 | |
| Schenker XMG FUSION 16 (M25) | |
| Lenovo Legion 5 Pro 16IAX10H | |
| Moyenne Intel Core Ultra 9 275HX (55795 - 97151, n=30) | |
| MSI Vector 16 HX AI A2XWHG | |
| Moyenne de la classe Gaming (22956 - 104349, n=128, 2 dernières années) | |
| AIDA64 / Memory Write | |
| Acer Predator Helios Neo 16S AI PHN16S-71-94L9 | |
| Razer Blade 16 RTX 5080 | |
| Schenker XMG FUSION 16 (M25) | |
| Moyenne Intel Core Ultra 9 275HX (55663 - 116129, n=30) | |
| Lenovo Legion 5 Pro 16IAX10H | |
| Moyenne de la classe Gaming (22297 - 133486, n=128, 2 dernières années) | |
| MSI Vector 16 HX AI A2XWHG | |
| AIDA64 / Memory Latency | |
| Moyenne Intel Core Ultra 9 275HX (105.8 - 161.6, n=30) | |
| Lenovo Legion 5 Pro 16IAX10H | |
| Schenker XMG FUSION 16 (M25) | |
| Acer Predator Helios Neo 16S AI PHN16S-71-94L9 | |
| MSI Vector 16 HX AI A2XWHG | |
| Razer Blade 16 RTX 5080 | |
| Moyenne de la classe Gaming (75.3 - 259, n=128, 2 dernières années) | |
* ... Moindre est la valeur, meilleures sont les performances
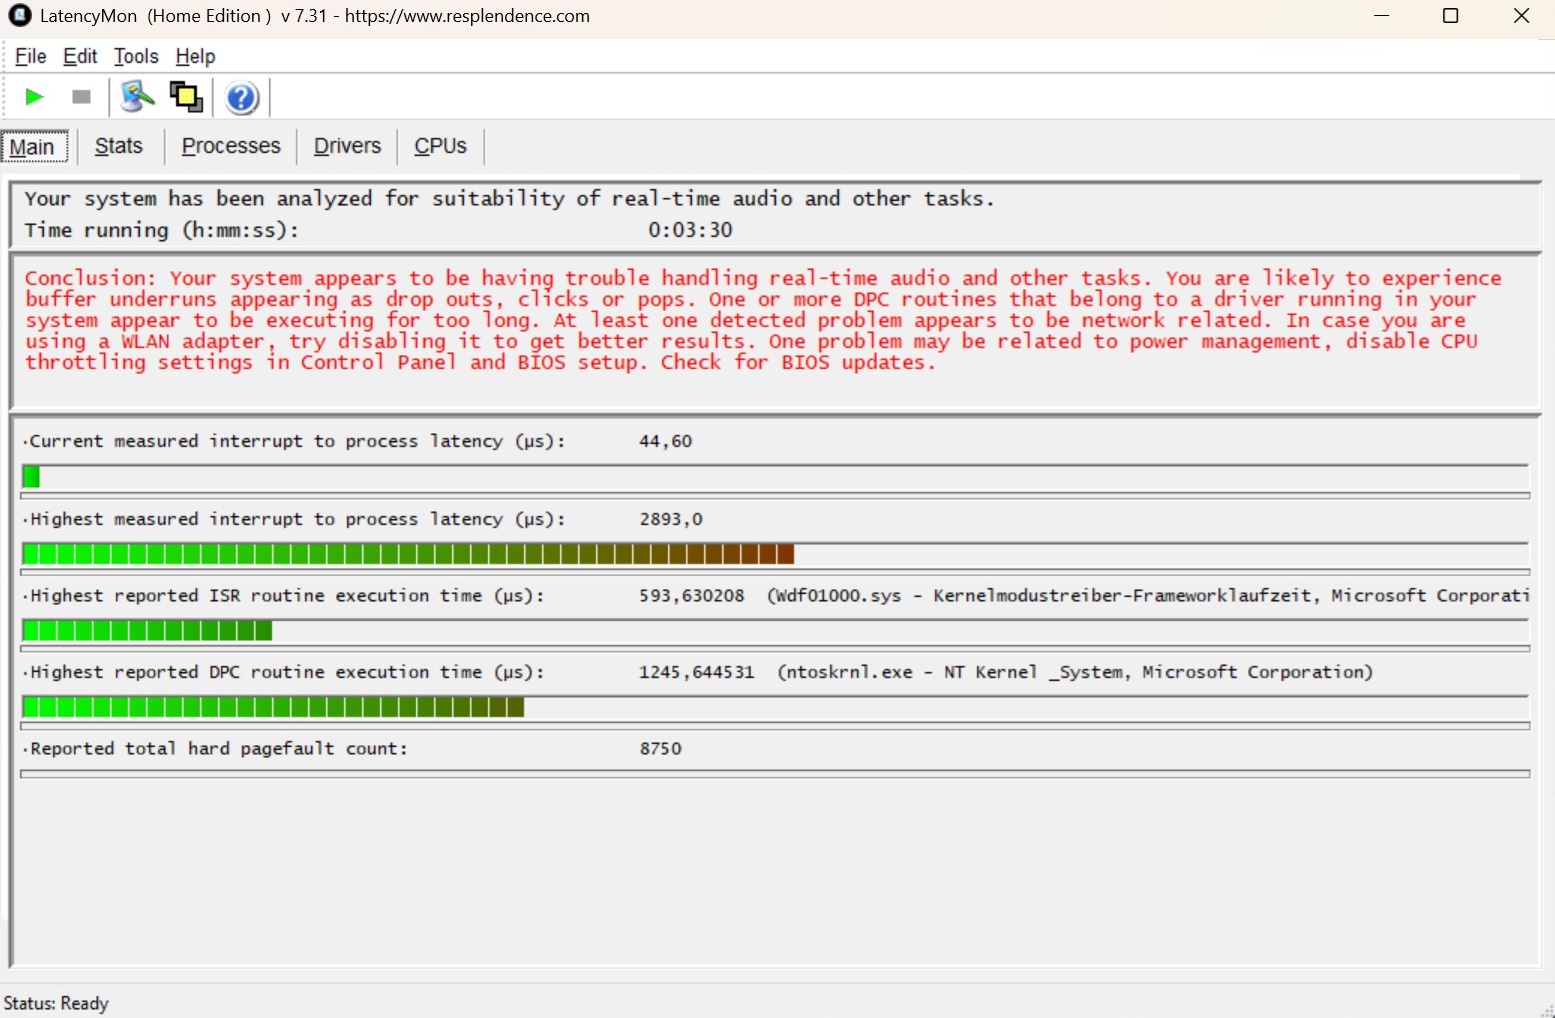
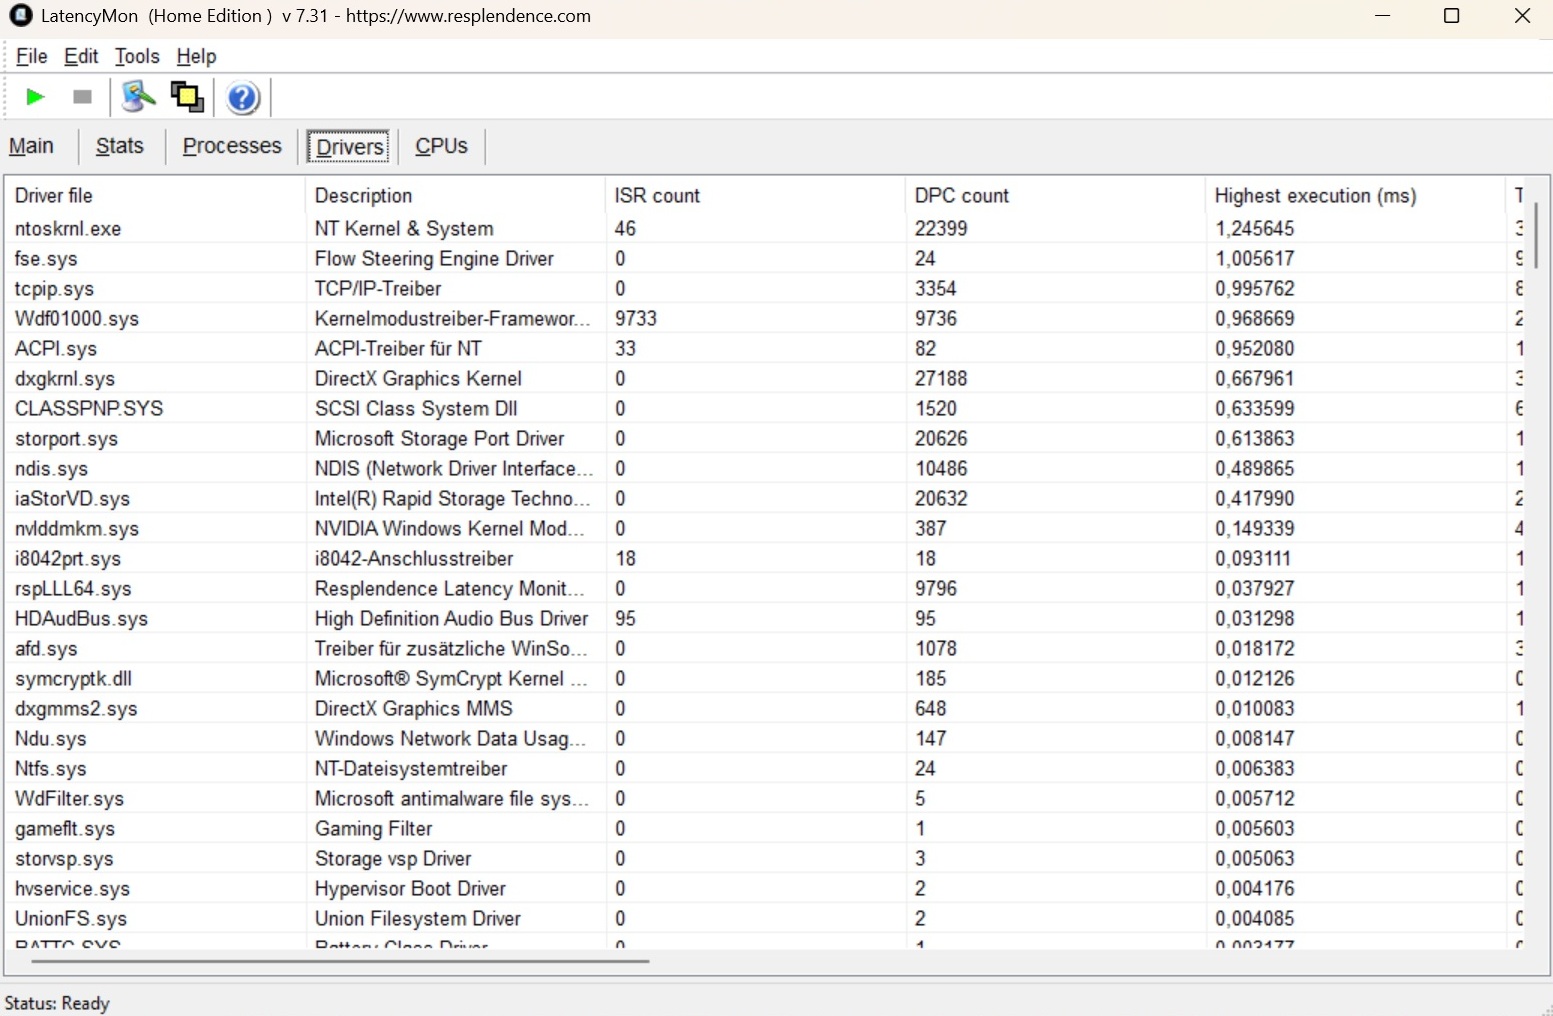
Latences DPC
Malheureusement, comme pour beaucoup d'ordinateurs portables, les latences ne sont pas parfaites, de sorte que des problèmes tels que des blocages courts peuvent survenir dans certains scénarios d'application.
| DPC Latencies / LatencyMon - interrupt to process latency (max), Web, Youtube, Prime95 | |
| MSI Vector 16 HX AI A2XWHG | |
| Acer Predator Helios Neo 16S AI PHN16S-71-94L9 | |
| Razer Blade 16 RTX 5080 | |
| Lenovo Legion 5 Pro 16IAX10H | |
| Schenker XMG FUSION 16 (M25) | |
* ... Moindre est la valeur, meilleures sont les performances
Dispositifs de stockage
Acer a choisi un disque M.2 à vitesse moyenne pour le stockage de masse. Comme pour le processeur, les performances ne sont pas constantes après une utilisation prolongée, mais les baisses sont souvent limitées.

* ... Moindre est la valeur, meilleures sont les performances
Performances en lecture continue : Boucle de lecture DiskSpd, profondeur de la file d'attente 8
Performance du GPU
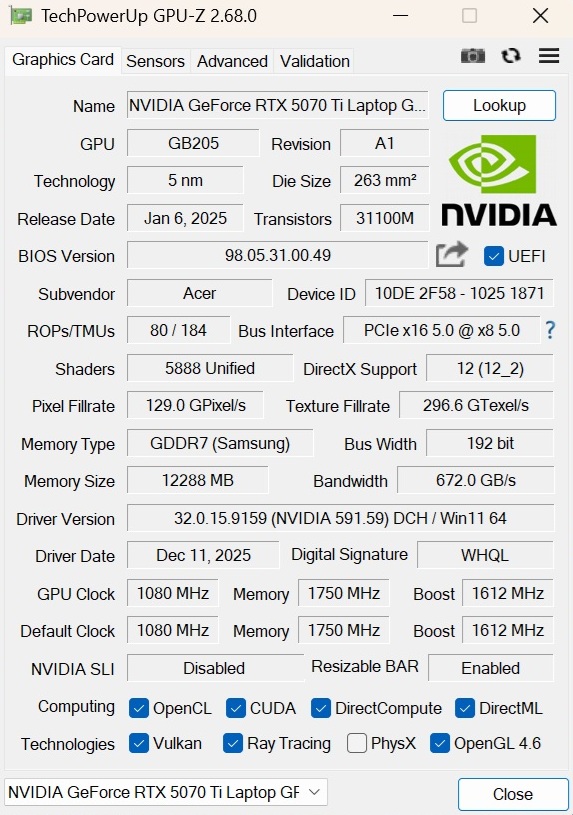
Avec la GeForce RTX 5070 Tinvidia comble le fossé entre le milieu de gamme et la classe supérieure. Le modèle Blackwell contient 5 888 unités de shaders et dispose de 12 Go de VRAM GDDR7, ce qui est désormais indispensable dans certains jeux (du moins à des résolutions et des paramètres plus élevés). Dans les benchmarks GPU, la Neo 16S AI n'obtient pas de résultats spectaculaires et se situe à un peu moins de 10 % en dessous de la moyenne déterminée précédemment pour cette carte graphique. L'une des raisons en est le TGP (théoriquement jusqu'à 115 watts), qui n'est souvent pas pleinement utilisé, même en mode Turbo.
| 3DMark 11 Performance | 40569 points | |
| 3DMark Cloud Gate Standard Score | 65305 points | |
| 3DMark Fire Strike Score | 30864 points | |
| 3DMark Time Spy Score | 14888 points | |
Aide | ||
* ... Moindre est la valeur, meilleures sont les performances
Performances des jeux
Si vous renoncez aux fonctions modernes telles que l'upscaling, la RTX 5070 Ti atteint ses limites dans la plage QHD (2 560x1 600 ou 2 560x1 440 pixels), du moins avec les jeux les plus exigeants. En plus de Borderlands 4 et The Outer Worlds 2, Anno 117 et Black Ops 7 ne fonctionnent pas non plus de manière totalement fluide avec un maximum de détails. DLSS y remédie en faisant passer le taux de rafraîchissement du dernier jeu Call of Duty de 31 à 48 FPS. Si l'on tient compte de la quadruple génération d'images, on atteint même 131 FPS, bien que les chiffres sur papier ne correspondent pas nécessairement à 1:1 avec le déroulement subjectif du jeu.
| Bas | Moyen | Élevé | Ultra | QHD | |
|---|---|---|---|---|---|
| GTA V (2015) | 186.6 | 182.8 | 147 | ||
| Dota 2 Reborn (2015) | 199.9 | 192.5 | 176.4 | ||
| X-Plane 11.11 (2018) | 135.3 | 109.4 | |||
| Baldur's Gate 3 (2023) | 147.9 | 129.8 | 122.8 | ||
| Cyberpunk 2077 (2023) | 127.3 | 112 | 100.8 | ||
| Borderlands 4 (2025) | 54.7 | 51.8 | 31.1 | 22.4 | |
| The Outer Worlds 2 (2025) | 100.5 | 82.3 | 49.9 | 33.4 | |
| ARC Raiders (2025) | 142.3 | 114.5 | 79.8 | 58 | |
| Anno 117: Pax Romana (2025) | 107.4 | 78.3 | 41.7 | 29.3 | |
| Call of Duty Black Ops 7 (2025) | 138 | 123 | 47 | 31 |
| Call of Duty Black Ops 7 | |
| 1920x1080 Extreme Preset + Raytracing | |
| Moyenne NVIDIA GeForce RTX 5070 Ti Laptop (47 - 60, n=3) | |
| Acer Predator Helios Neo 16S AI PHN16S-71-94L9 | |
| Schenker XMG FUSION 16 (M25) | |
| Moyenne de la classe Gaming (24 - 60, n=9, 2 dernières années) | |
| 2560x1440 Extreme Preset + Raytracing | |
| Moyenne NVIDIA GeForce RTX 5070 Ti Laptop (31 - 39, n=3) | |
| Acer Predator Helios Neo 16S AI PHN16S-71-94L9 | |
| Moyenne de la classe Gaming (18 - 39, n=5, 2 dernières années) | |
| Schenker XMG FUSION 16 (M25) | |
| ARC Raiders | |
| 1920x1080 Epic Preset + Epic Raytracing AA:TSR | |
| Acer Predator Helios Neo 16S AI PHN16S-71-94L9 | |
| Moyenne NVIDIA GeForce RTX 5070 Ti Laptop (n=1) | |
| Moyenne de la classe Gaming (43.5 - 79.8, n=8, 2 dernières années) | |
| 2560x1440 Epic Preset + Epic Raytracing AA:TSR | |
| Acer Predator Helios Neo 16S AI PHN16S-71-94L9 | |
| Moyenne NVIDIA GeForce RTX 5070 Ti Laptop (n=1) | |
| Moyenne de la classe Gaming (47.8 - 58, n=2, 2 dernières années) | |
| The Outer Worlds 2 | |
| 1920x1080 Very High Preset AA:T | |
| Acer Predator Helios Neo 16S AI PHN16S-71-94L9 | |
| Moyenne NVIDIA GeForce RTX 5070 Ti Laptop (n=1) | |
| Moyenne de la classe Gaming (26.4 - 49.9, n=8, 2 dernières années) | |
| 2560x1440 Very High Preset AA:T | |
| Acer Predator Helios Neo 16S AI PHN16S-71-94L9 | |
| Moyenne NVIDIA GeForce RTX 5070 Ti Laptop (n=1) | |
| Moyenne de la classe Gaming (21.5 - 33.4, n=3, 2 dernières années) | |
| Borderlands 4 | |
| 1920x1080 Badass Preset AA:FX | |
| Acer Predator Helios Neo 16S AI PHN16S-71-94L9 | |
| Moyenne NVIDIA GeForce RTX 5070 Ti Laptop (n=1) | |
| Moyenne de la classe Gaming (16 - 54, n=10, 2 dernières années) | |
| 2560x1440 Badass Preset AA:FX | |
| Moyenne de la classe Gaming (11.5 - 37.1, n=3, 2 dernières années) | |
| Acer Predator Helios Neo 16S AI PHN16S-71-94L9 | |
| Moyenne NVIDIA GeForce RTX 5070 Ti Laptop (n=1) | |
Cyberpunk 2077 Ultra FPS chart
Émissions
Émissions sonores
Si le moteur de 16 pouces est plutôt discret au ralenti - à l'exception de phases de montée en régime temporaires - il peut devenir assez bruyant sous charge. Dans Cyberpunk 2077par exemple, notre appareil émet un son clairement audible de 52 dB(A) (en mode équilibré, il n'est que de 45 dB), qui n'est surpassé que par le Legion 5 Pro dans le champ de test.
Degré de la nuisance sonore
| Au repos |
| 24 / 30 / 35 dB(A) |
| Fortement sollicité |
| 53 / 54 dB(A) |
 | ||
30 dB silencieux 40 dB(A) audible 50 dB(A) bruyant |
||
min: | ||
| Acer Predator Helios Neo 16S AI PHN16S-71-94L9 Ultra 9 275HX, GeForce RTX 5070 Ti Laptop | Schenker XMG FUSION 16 (M25) Ultra 9 275HX, GeForce RTX 5070 Laptop | MSI Vector 16 HX AI A2XWHG Ultra 7 255HX, GeForce RTX 5070 Ti Laptop | Lenovo Legion 5 Pro 16IAX10H Ultra 9 275HX, GeForce RTX 5070 Ti Laptop | Razer Blade 16 RTX 5080 Ryzen AI 9 365, GeForce RTX 5080 Laptop | |
|---|---|---|---|---|---|
| Noise | 8% | -5% | 2% | 11% | |
| arrêt / environnement * (dB) | 24 | 25.7 -7% | 25 -4% | 24 -0% | 23 4% |
| Idle Minimum * (dB) | 24 | 25.7 -7% | 33 -38% | 24 -0% | 23.1 4% |
| Idle Average * (dB) | 30 | 25.7 14% | 34 -13% | 24 20% | 23.1 23% |
| Idle Maximum * (dB) | 35 | 28 20% | 38 -9% | 30.9 12% | 29.2 17% |
| Load Average * (dB) | 53 | 38.9 27% | 46 13% | 55.9 -5% | 43 19% |
| Cyberpunk 2077 ultra * (dB) | 52 | 49.7 4% | 47 10% | 56.72 -9% | 50.1 4% |
| Load Maximum * (dB) | 54 | 49.7 8% | 49 9% | 56.72 -5% | 52.4 3% |
* ... Moindre est la valeur, meilleures sont les performances
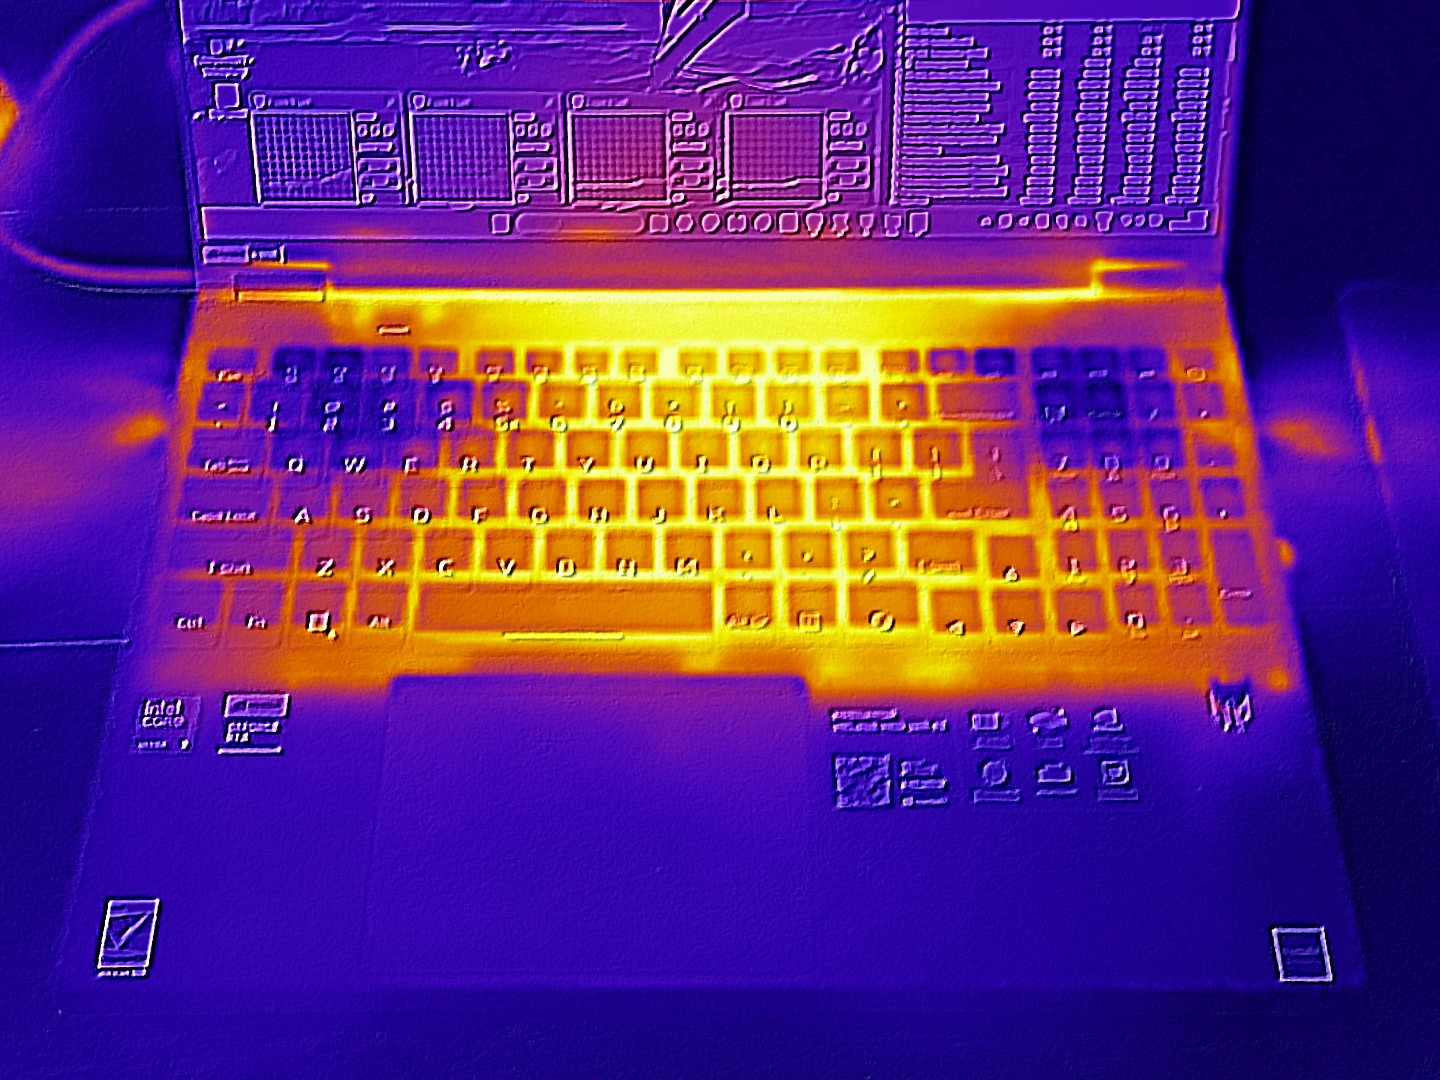
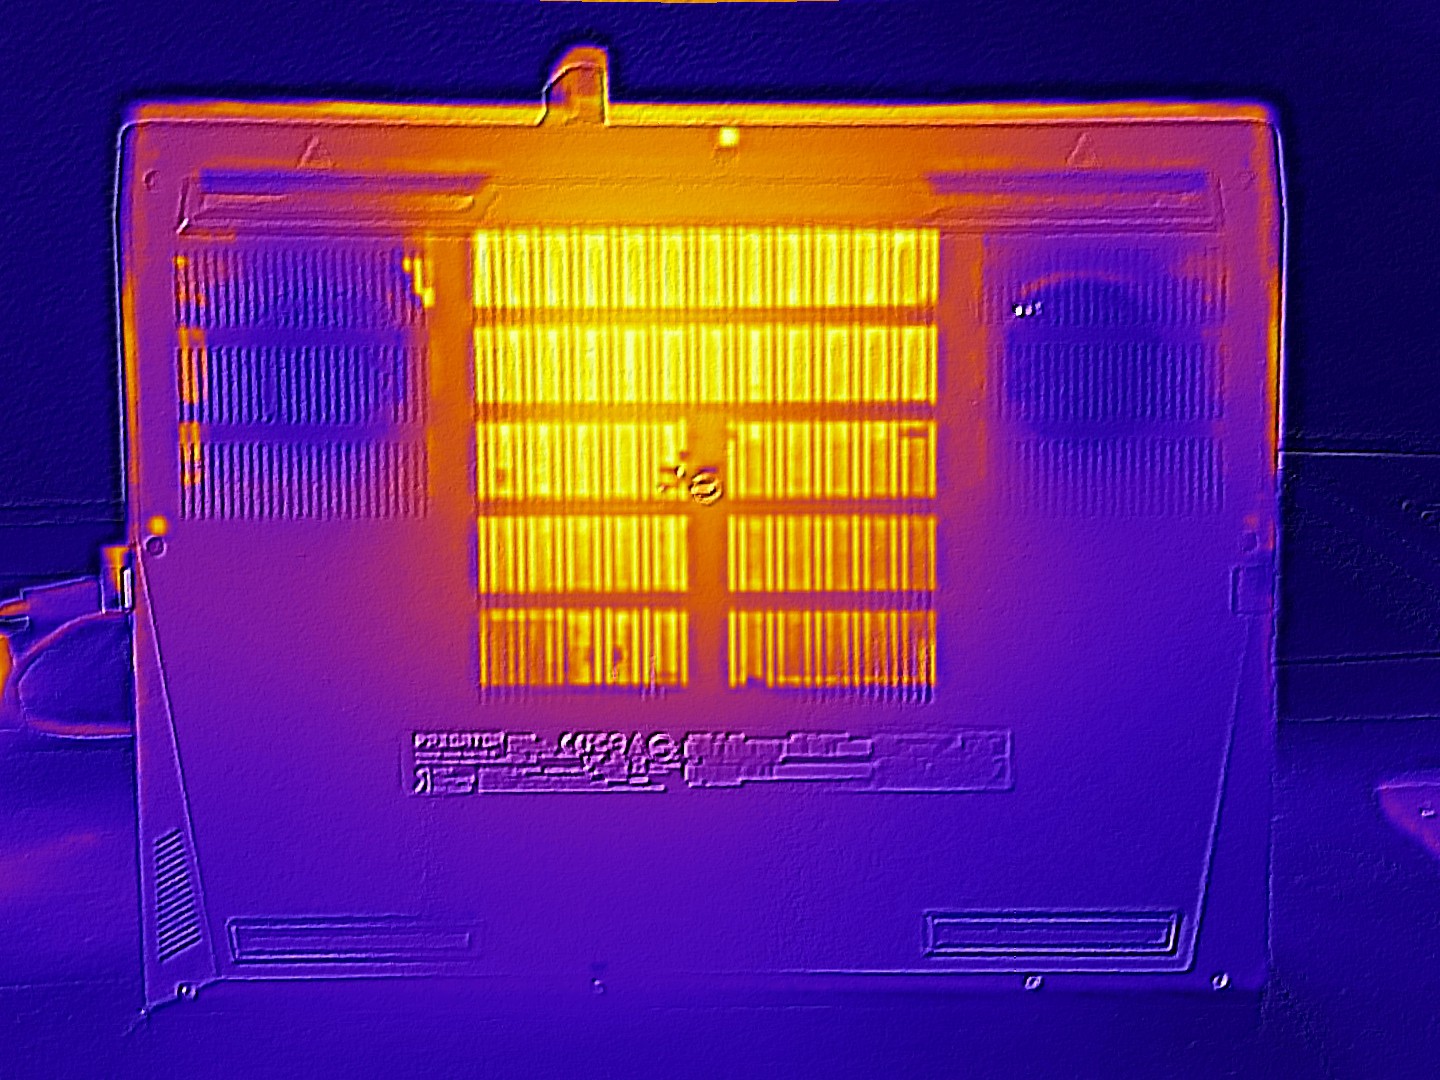
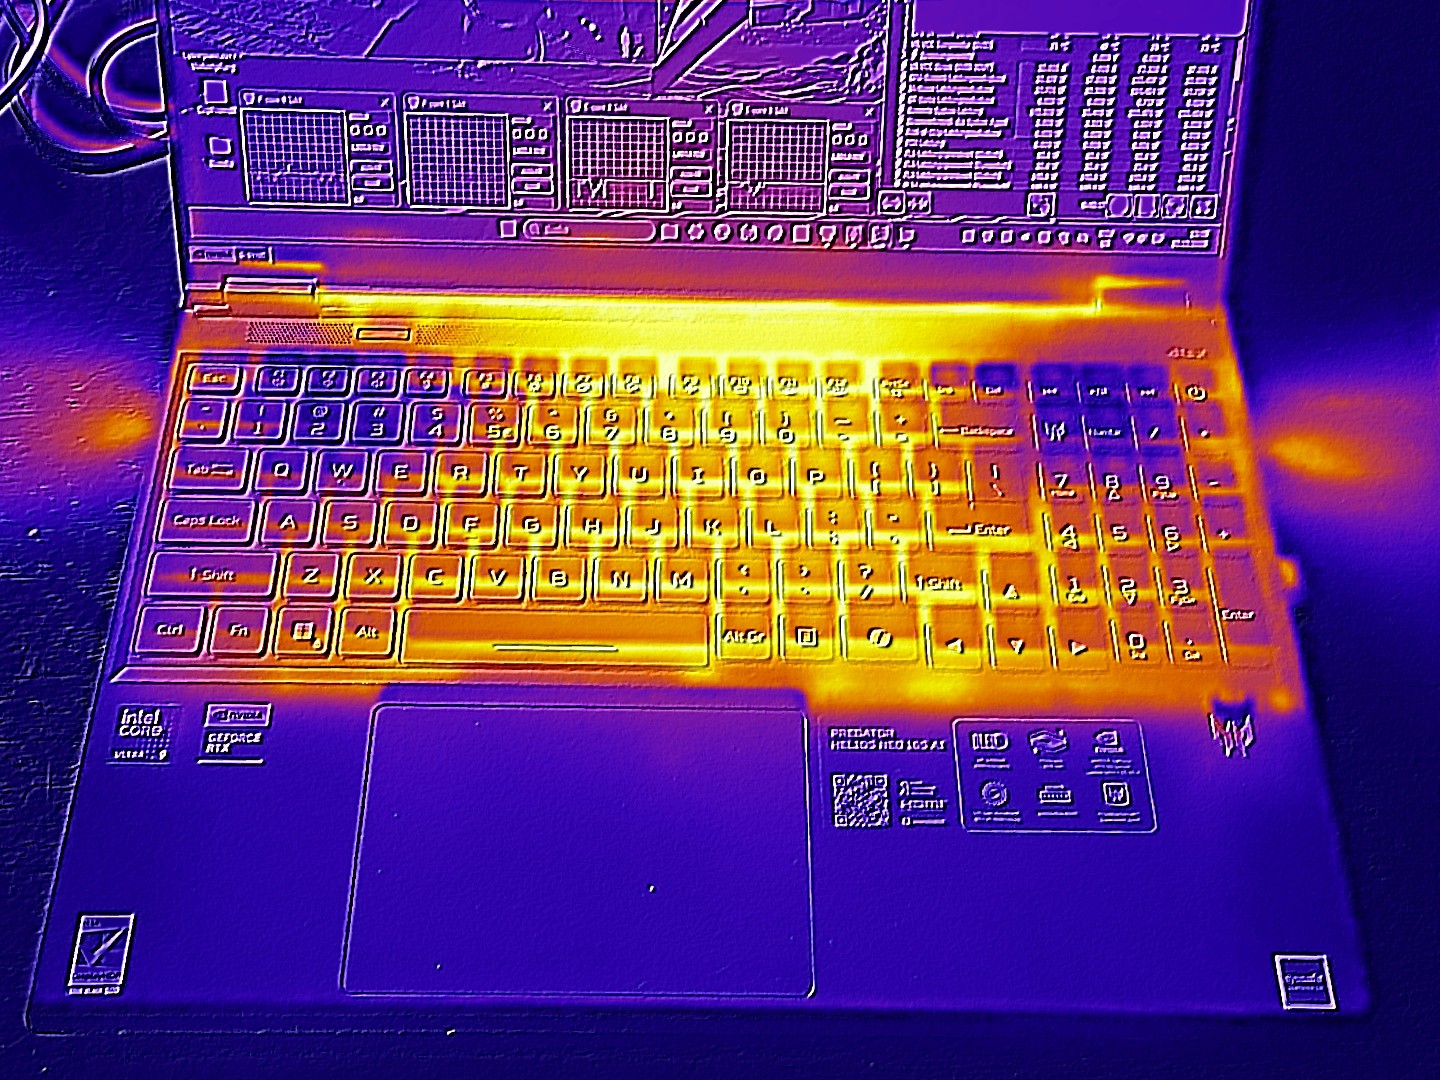
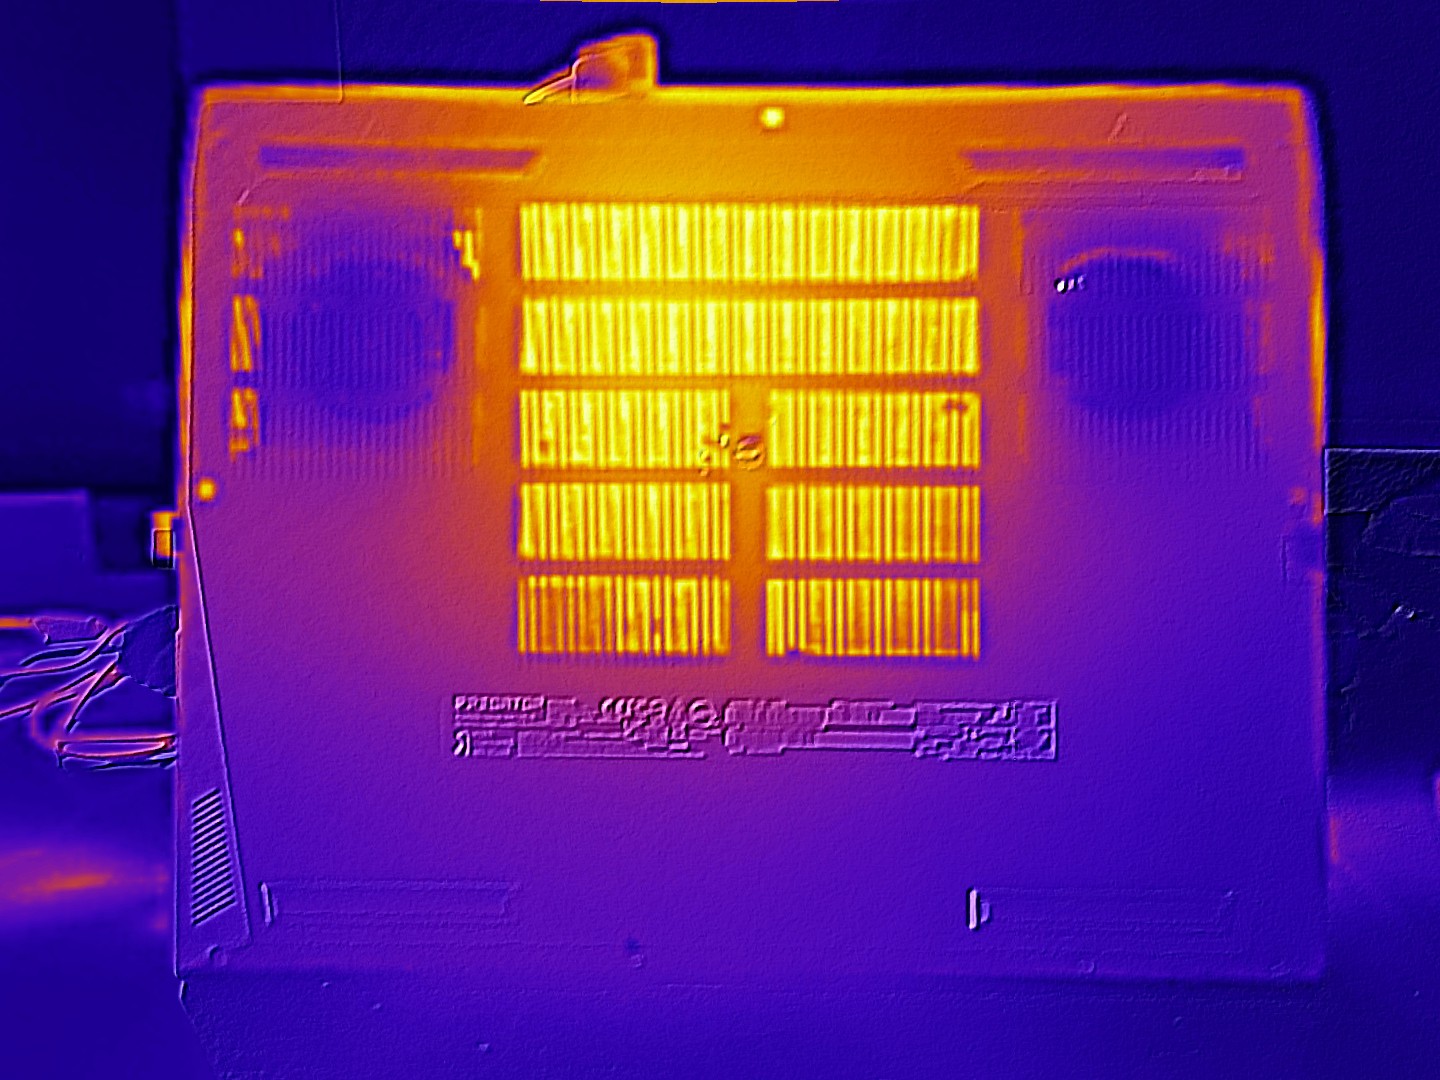
Température
La conclusion concernant l'évolution de la température est similaire. Tant que l'ordinateur portable tourne au ralenti, les surfaces restent agréablement fraîches et se maintiennent en dessous de 30 °C. En mode 3D, la partie inférieure du boîtier atteint des températures beaucoup plus élevées : un maximum de 55 °C plaide contre les sessions de jeu sur les genoux. La température du haut est plus modérée, avec un maximum de 47 °C.
(-) La température maximale du côté supérieur est de 47 °C / 117 F, par rapport à la moyenne de 40.4 °C / 105 F, allant de 21.2 à 68.8 °C pour la classe Gaming.
(-) Le fond chauffe jusqu'à un maximum de 55 °C / 131 F, contre une moyenne de 43.3 °C / 110 F
(+) En utilisation inactive, la température moyenne du côté supérieur est de 26 °C / 79 F, par rapport à la moyenne du dispositif de 33.9 °C / 93 F.
(-) 3: The average temperature for the upper side is 40.1 °C / 104 F, compared to the average of 33.9 °C / 93 F for the class Gaming.
(+) Les repose-poignets et le pavé tactile sont plus froids que la température de la peau avec un maximum de 31 °C / 87.8 F et sont donc froids au toucher.
(-) La température moyenne de la zone de l'appui-paume de dispositifs similaires était de 28.8 °C / 83.8 F (-2.2 °C / #-4 F).
| Acer Predator Helios Neo 16S AI PHN16S-71-94L9 Ultra 9 275HX, GeForce RTX 5070 Ti Laptop | Schenker XMG FUSION 16 (M25) Ultra 9 275HX, GeForce RTX 5070 Laptop | MSI Vector 16 HX AI A2XWHG Ultra 7 255HX, GeForce RTX 5070 Ti Laptop | Lenovo Legion 5 Pro 16IAX10H Ultra 9 275HX, GeForce RTX 5070 Ti Laptop | Razer Blade 16 RTX 5080 Ryzen AI 9 365, GeForce RTX 5080 Laptop | |
|---|---|---|---|---|---|
| Heat | 8% | -7% | -19% | -13% | |
| Maximum Upper Side * (°C) | 47 | 43.2 8% | 53 -13% | 48 -2% | 50.6 -8% |
| Maximum Bottom * (°C) | 55 | 48 13% | 52 5% | 50 9% | 48.6 12% |
| Idle Upper Side * (°C) | 28 | 26.6 5% | 33 -18% | 38 -36% | 35.2 -26% |
| Idle Bottom * (°C) | 29 | 27.6 5% | 29 -0% | 42 -45% | 37 -28% |
* ... Moindre est la valeur, meilleures sont les performances
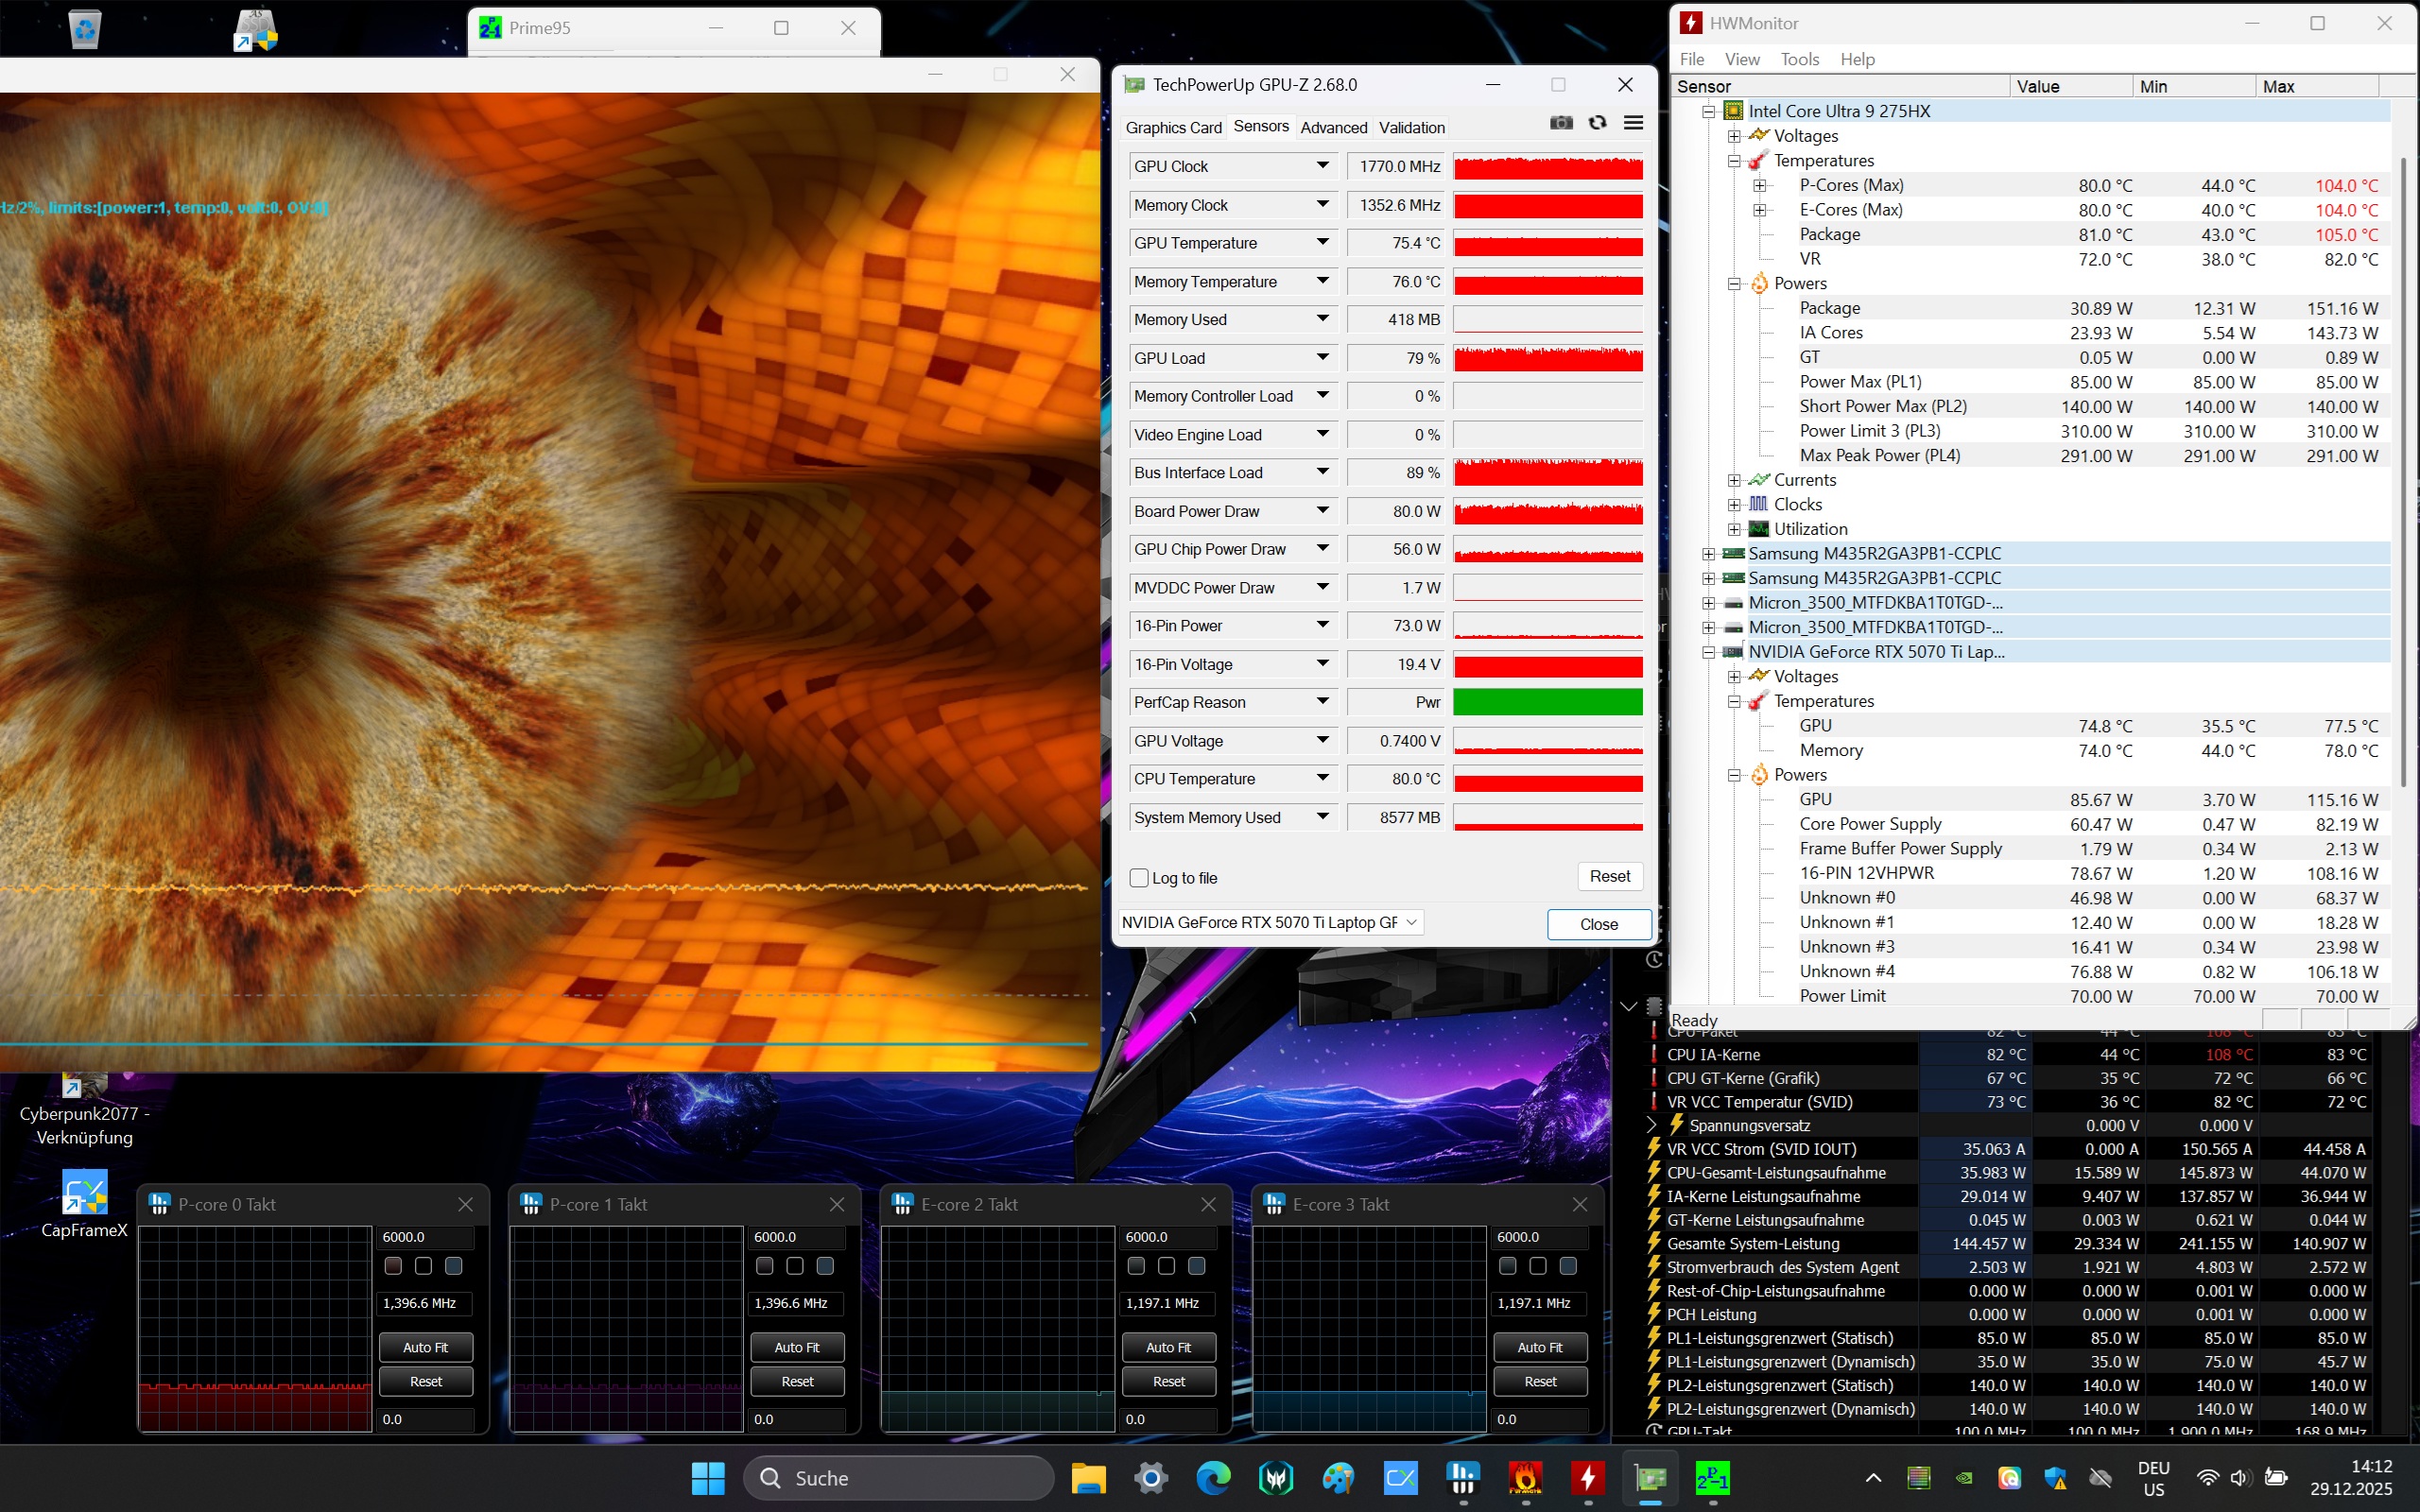
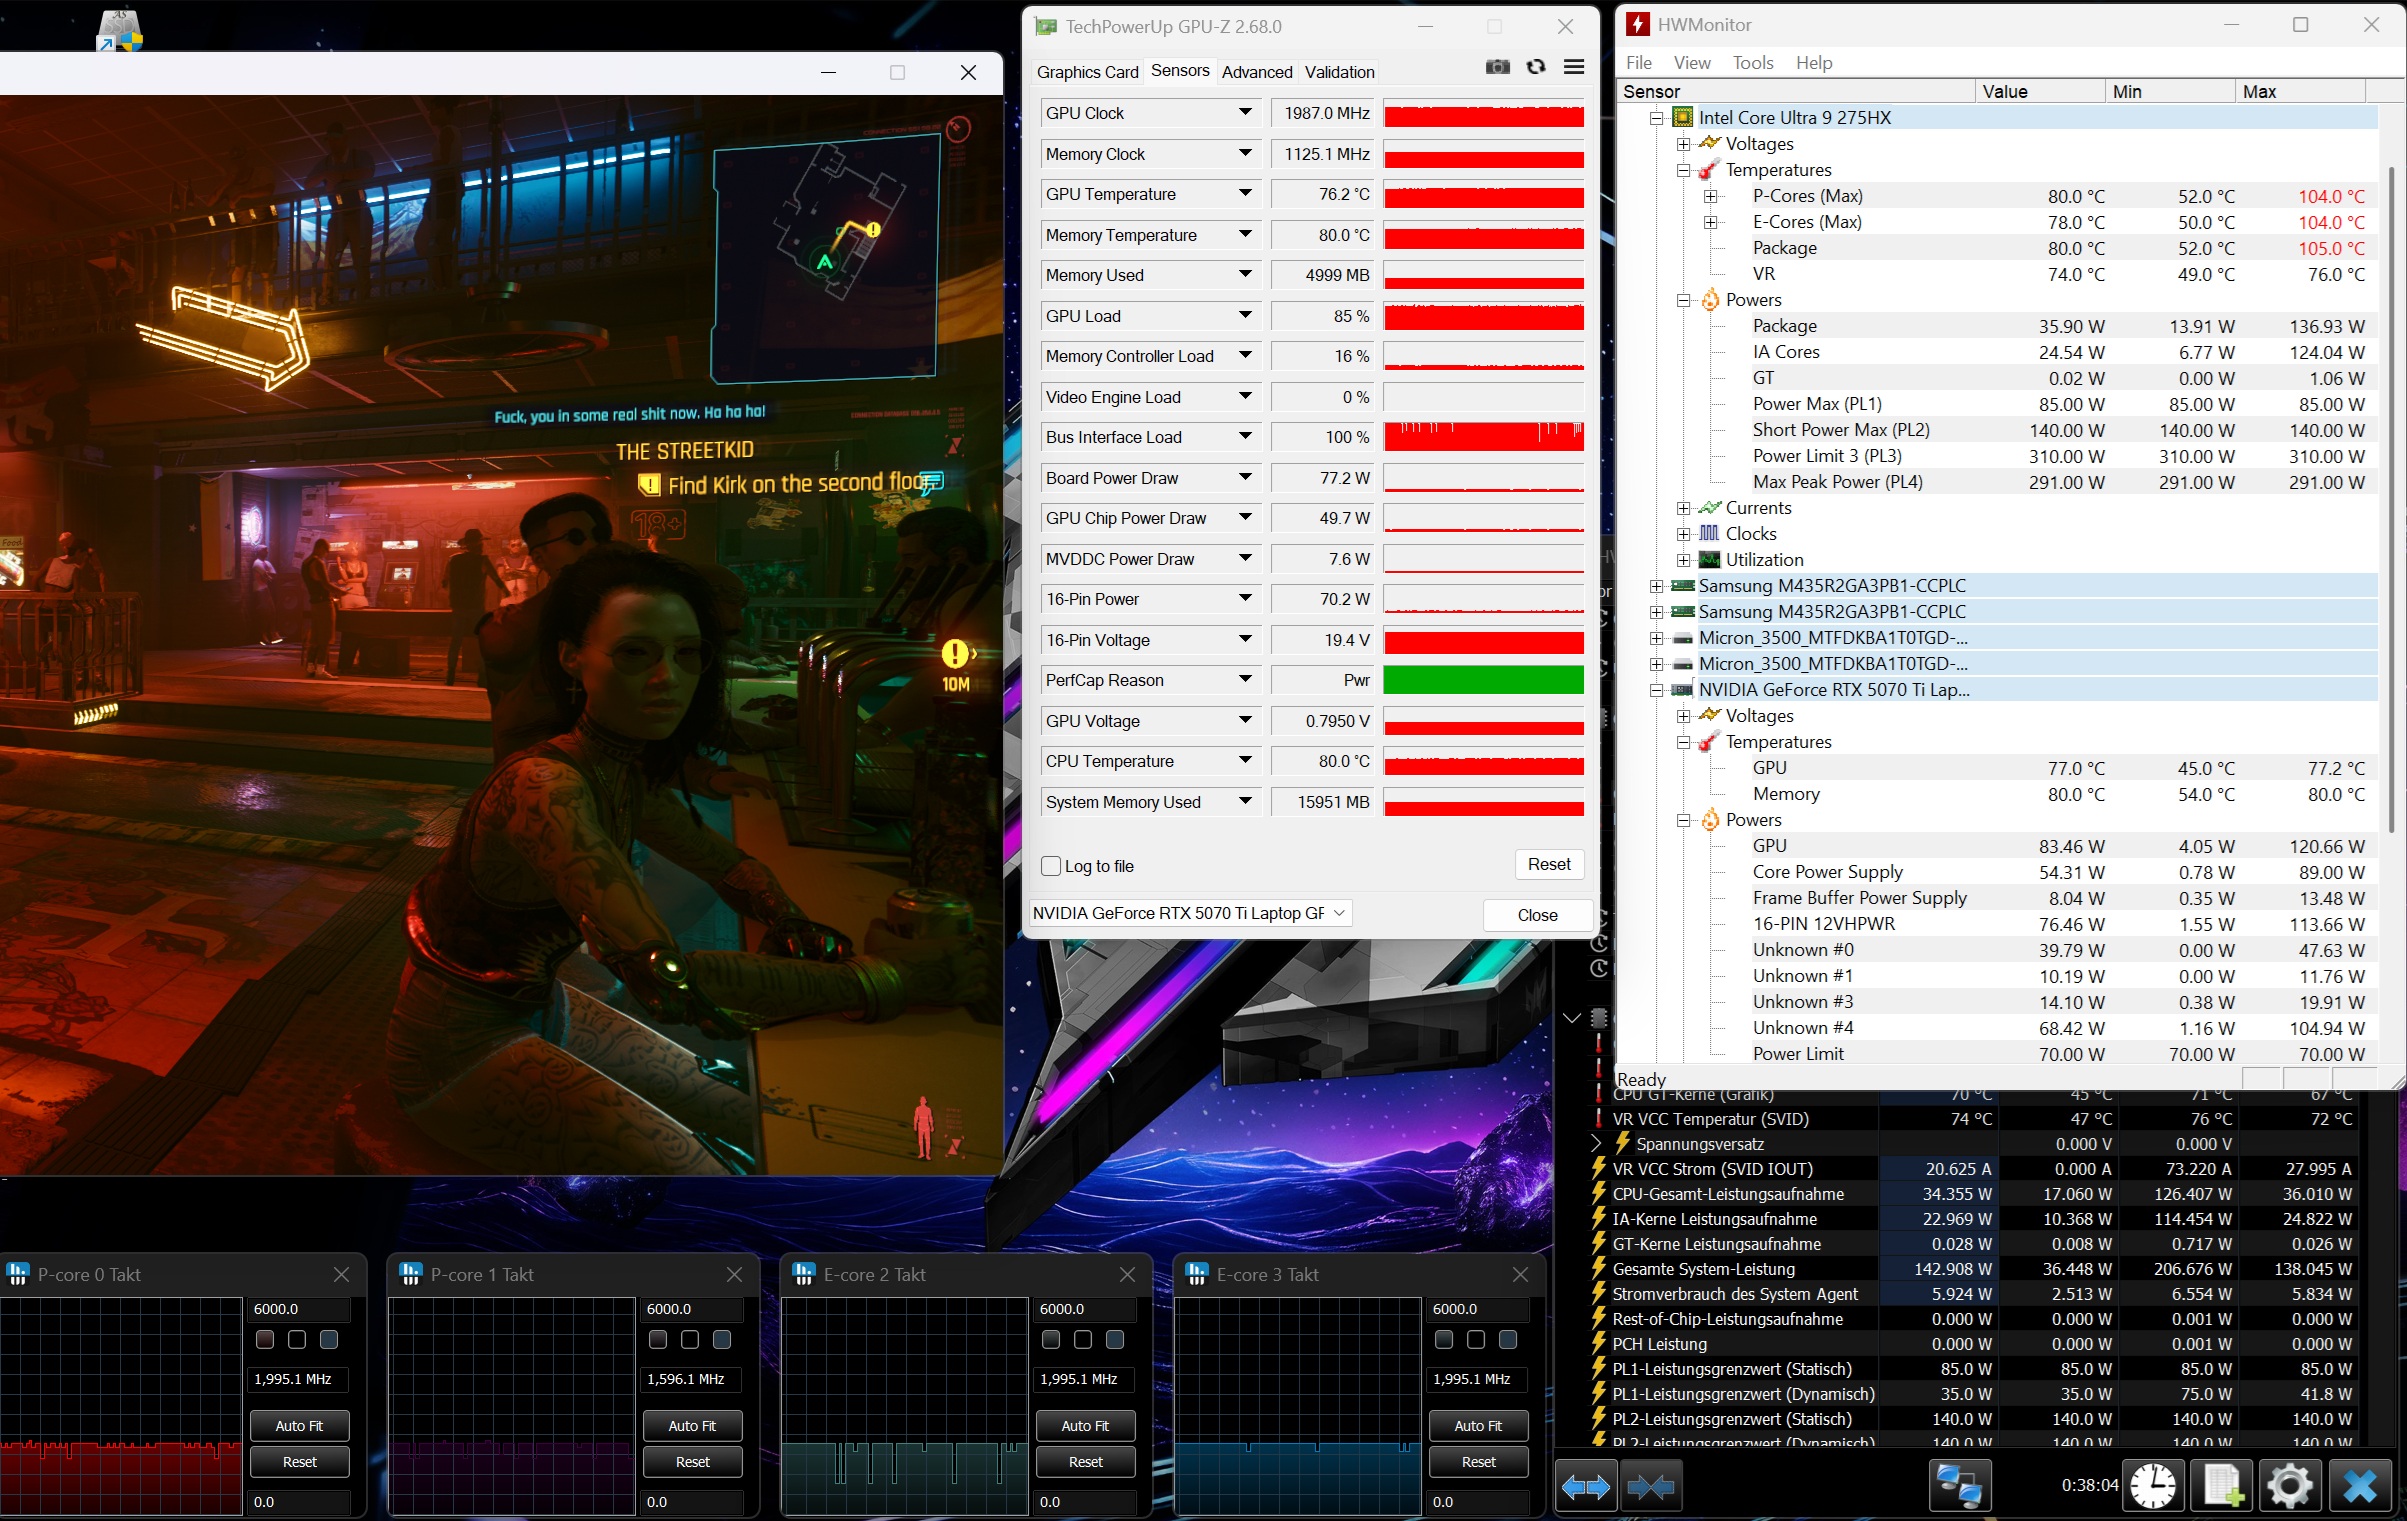
Épreuve d'effort
Lors du test de stress avec les outils Furmark et Prime95, le processeur en particulier a transpiré à grosses gouttes. Après avoir brièvement dépassé les 100 °C, la température s'est stabilisée à un niveau acceptable de 80 °C. Le GPU s'est quant à lui stabilisé autour de 75 °C.
Intervenants
La qualité sonore se situe dans la moyenne des appareils testés. Si le volume maximal est tout à fait convaincant, les basses pourraient, comme souvent, être encore plus puissantes.
Acer Predator Helios Neo 16S AI PHN16S-71-94L9 analyse audio
(+) | les haut-parleurs peuvent jouer relativement fort (86# dB)
Basses 100 - 315 Hz
(-) | presque aucune basse - en moyenne 24.8% plus bas que la médiane
(±) | la linéarité des basses est moyenne (12.6% delta à la fréquence précédente)
Médiums 400 - 2000 Hz
(±) | médiane supérieure - en moyenne 5.9% supérieure à la médiane
(+) | les médiums sont linéaires (6.4% delta à la fréquence précédente)
Aiguës 2 - 16 kHz
(+) | des sommets équilibrés - à seulement 2.8% de la médiane
(+) | les aigus sont linéaires (5.9% delta à la fréquence précédente)
Globalement 100 - 16 000 Hz
(±) | la linéarité du son global est moyenne (17.3% de différence avec la médiane)
Par rapport à la même classe
» 47% de tous les appareils testés de cette catégorie étaient meilleurs, 12% similaires, 41% pires
» Le meilleur avait un delta de 6%, la moyenne était de 18%, le pire était de 132%.
Par rapport à tous les appareils testés
» 32% de tous les appareils testés étaient meilleurs, 8% similaires, 60% pires
» Le meilleur avait un delta de 4%, la moyenne était de 24%, le pire était de 134%.
Lenovo Legion 5 Pro 16IAX10H analyse audio
(±) | le niveau sonore du haut-parleur est moyen mais bon (78.2# dB)
Basses 100 - 315 Hz
(-) | presque aucune basse - en moyenne 21.1% plus bas que la médiane
(±) | la linéarité des basses est moyenne (8% delta à la fréquence précédente)
Médiums 400 - 2000 Hz
(±) | médiane supérieure - en moyenne 6.3% supérieure à la médiane
(+) | les médiums sont linéaires (6.5% delta à la fréquence précédente)
Aiguës 2 - 16 kHz
(+) | des sommets équilibrés - à seulement 1.6% de la médiane
(+) | les aigus sont linéaires (4.9% delta à la fréquence précédente)
Globalement 100 - 16 000 Hz
(±) | la linéarité du son global est moyenne (18.3% de différence avec la médiane)
Par rapport à la même classe
» 57% de tous les appareils testés de cette catégorie étaient meilleurs, 9% similaires, 34% pires
» Le meilleur avait un delta de 6%, la moyenne était de 18%, le pire était de 132%.
Par rapport à tous les appareils testés
» 39% de tous les appareils testés étaient meilleurs, 8% similaires, 53% pires
» Le meilleur avait un delta de 4%, la moyenne était de 24%, le pire était de 134%.
Gestion de l'énergie
Consommation électrique
Le TGP et le TDP étant maintenus dans les limites, les besoins en énergie sont inférieurs à ceux d'autres appareils de cette classe de performance, aussi bien en mode veille qu'en charge. Cela explique également le niveau relativement bas du bloc d'alimentation de 230 watts.
| Éteint/en veille | |
| Au repos | |
| Fortement sollicité |
|
Légende:
min: | |
| Acer Predator Helios Neo 16S AI PHN16S-71-94L9 Ultra 9 275HX, GeForce RTX 5070 Ti Laptop | Schenker XMG FUSION 16 (M25) Ultra 9 275HX, GeForce RTX 5070 Laptop | MSI Vector 16 HX AI A2XWHG Ultra 7 255HX, GeForce RTX 5070 Ti Laptop | Lenovo Legion 5 Pro 16IAX10H Ultra 9 275HX, GeForce RTX 5070 Ti Laptop | Razer Blade 16 RTX 5080 Ryzen AI 9 365, GeForce RTX 5080 Laptop | Moyenne de la classe Gaming | |
|---|---|---|---|---|---|---|
| Power Consumption | -54% | -49% | -75% | -24% | -75% | |
| Idle Minimum * (Watt) | 3.9 | 15.3 -292% | 7.1 -82% | 14 -259% | 7 -79% | 13.6 ? -249% |
| Idle Average * (Watt) | 11 | 16.8 -53% | 15.9 -45% | 14.3 -30% | 15 -36% | 19.3 ? -75% |
| Idle Maximum * (Watt) | 16.9 | 17.3 -2% | 29.5 -75% | 20.1 -19% | 15.4 9% | 25.1 ? -49% |
| Load Average * (Watt) | 123 | 94.7 23% | 124 -1% | 177 -44% | 108.5 12% | 110.3 ? 10% |
| Cyberpunk 2077 ultra * (Watt) | 152.7 | 185.3 -21% | 222 -45% | 255 -67% | 195.2 -28% | |
| Cyberpunk 2077 ultra external monitor * (Watt) | 144.9 | 180.9 -25% | 217 -50% | 255 -76% | 194.8 -34% | |
| Load Maximum * (Watt) | 229 | 242.7 -6% | 336 -47% | 294 -28% | 254.1 -11% | 257 ? -12% |
* ... Moindre est la valeur, meilleures sont les performances
Consommation électrique Cyberpunk / Stress test
Consommation électrique avec moniteur externe
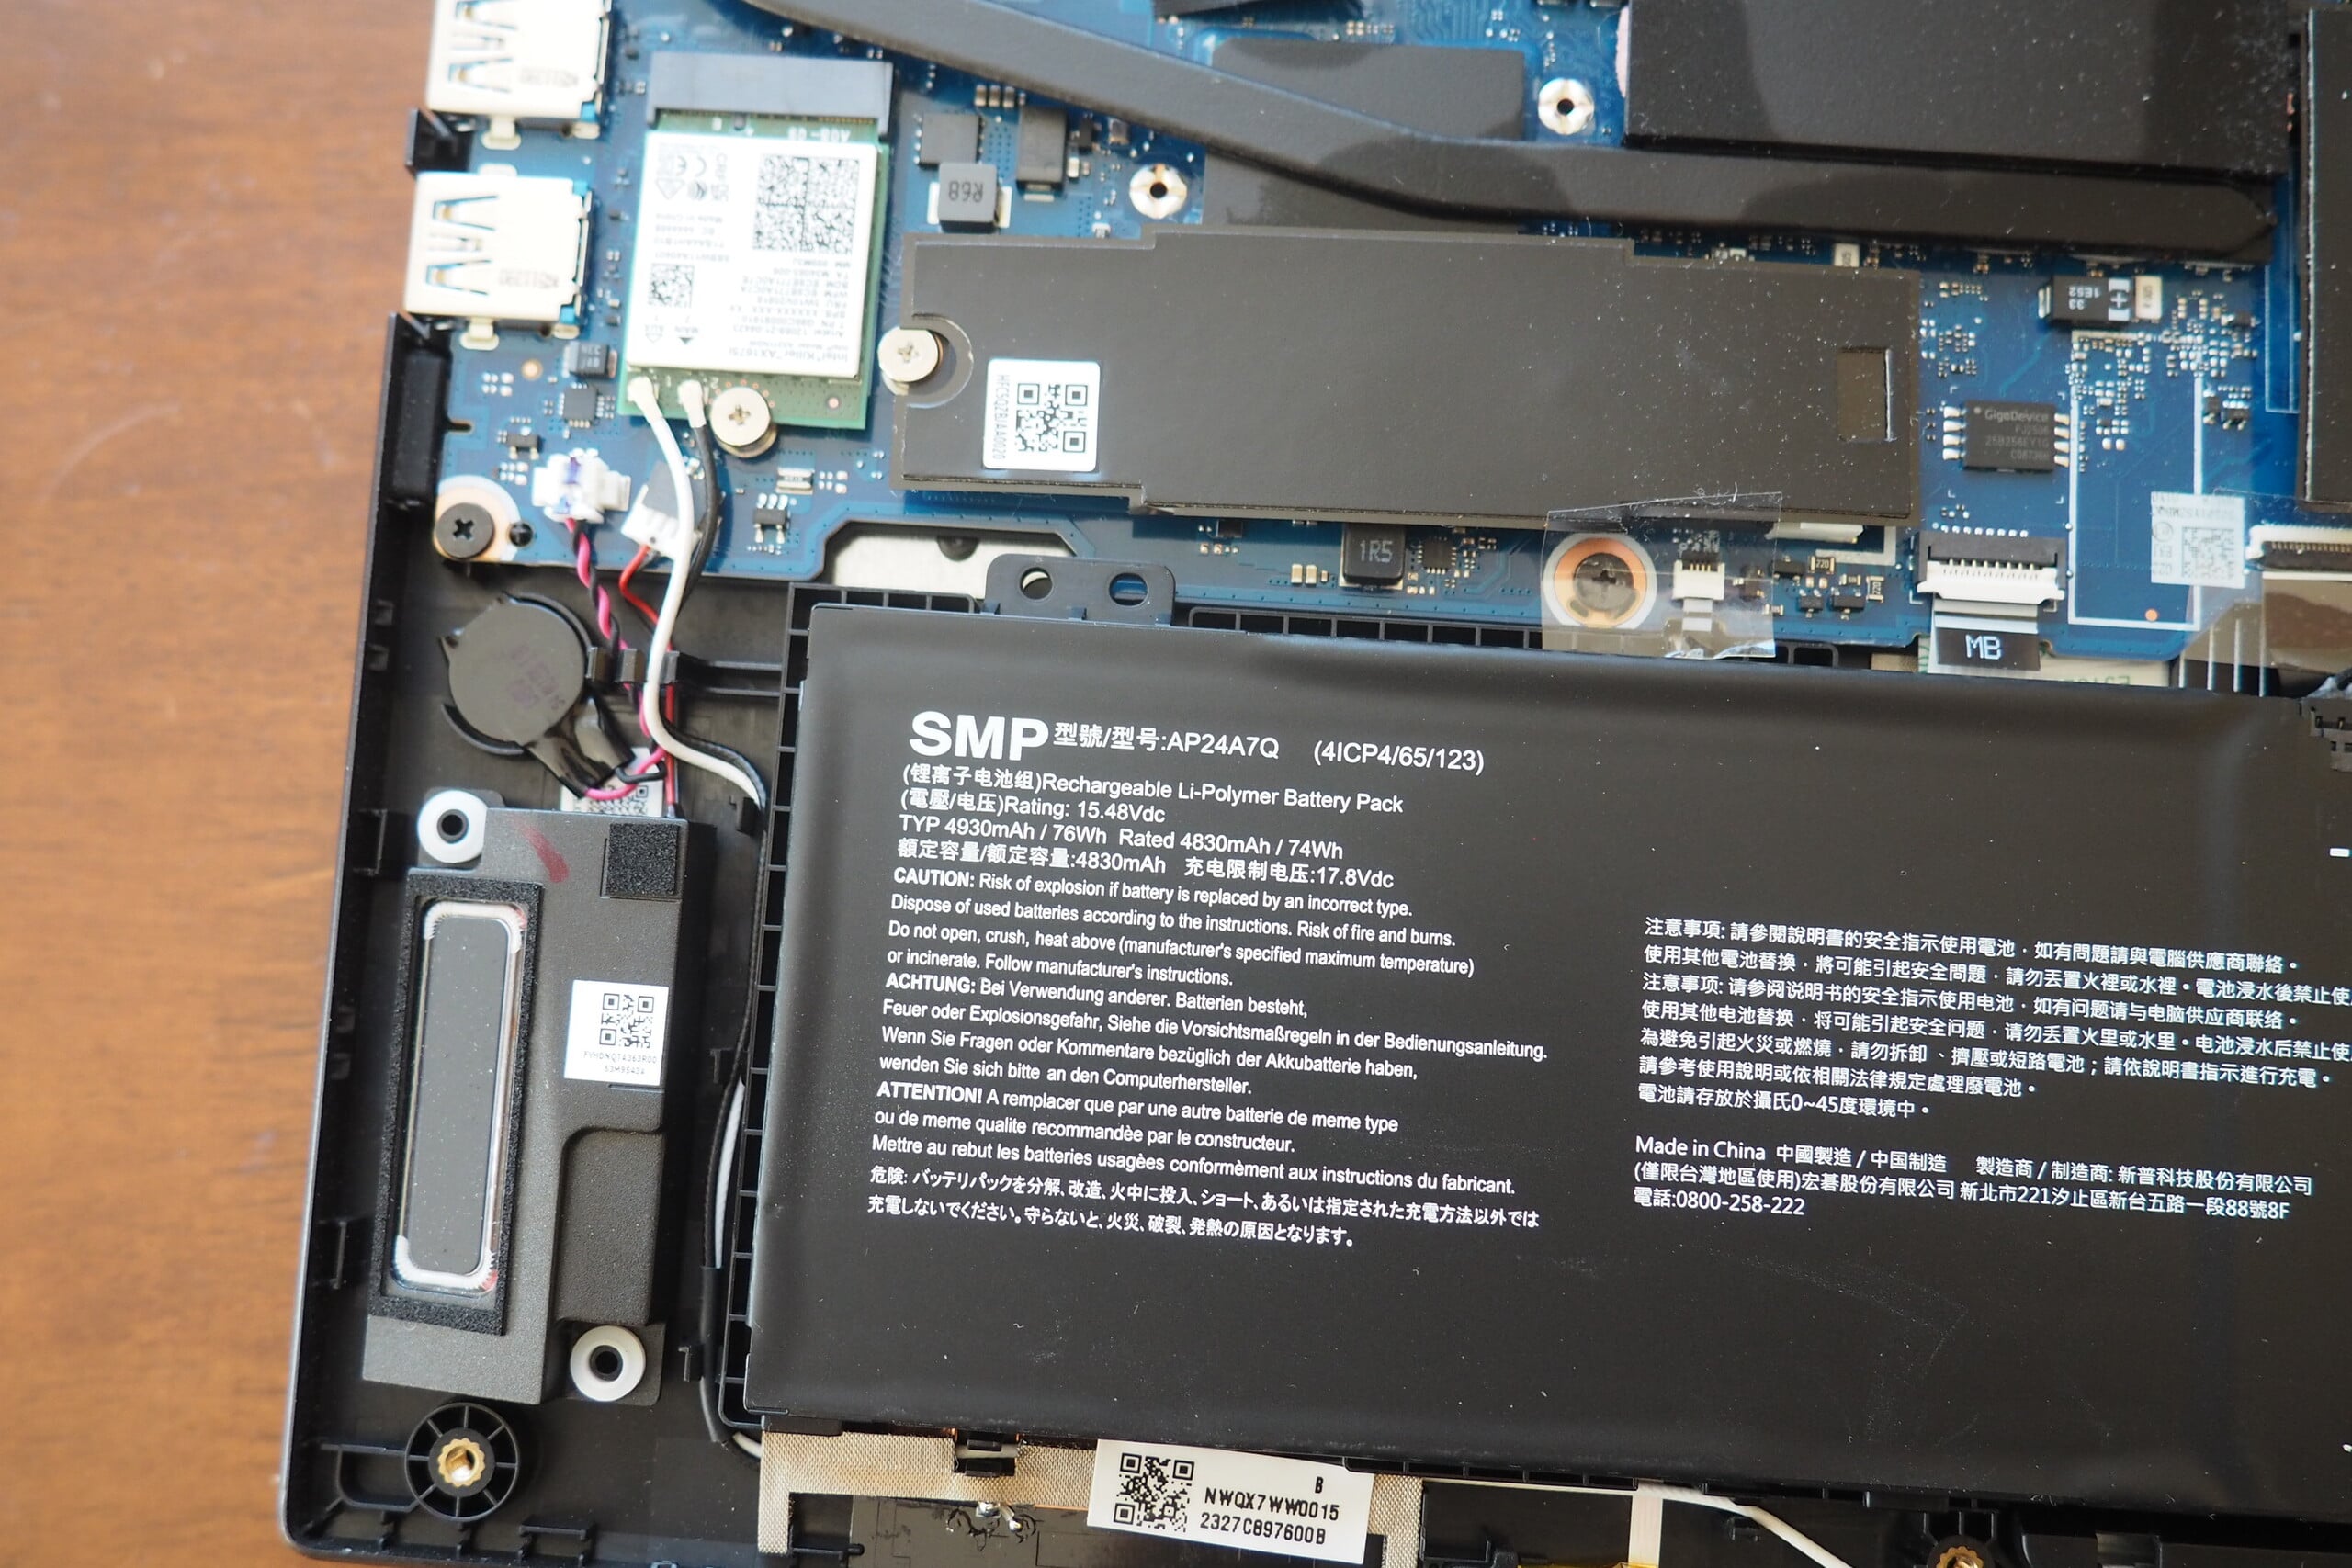
Durée de vie de la batterie
Malgré la consommation d'énergie modérée, les durées d'utilisation sont plutôt faibles (Acer doit encore travailler sur les mécanismes d'économie d'énergie en mode batterie). L'autonomie d'environ 5 heures lors de notre test WLAN (luminosité réduite à 150 cd/m²) est à peine inférieure à celle du Legion 5 Pro 16 sur le terrain de test. Les autres concurrents obtiennent des résultats nettement meilleurs, de 7 à 10 heures.
| Acer Predator Helios Neo 16S AI PHN16S-71-94L9 Ultra 9 275HX, GeForce RTX 5070 Ti Laptop, 76 Wh | Schenker XMG FUSION 16 (M25) Ultra 9 275HX, GeForce RTX 5070 Laptop, 99.8 Wh | MSI Vector 16 HX AI A2XWHG Ultra 7 255HX, GeForce RTX 5070 Ti Laptop, 90 Wh | Lenovo Legion 5 Pro 16IAX10H Ultra 9 275HX, GeForce RTX 5070 Ti Laptop, 80 Wh | Razer Blade 16 RTX 5080 Ryzen AI 9 365, GeForce RTX 5080 Laptop, 90 Wh | Moyenne de la classe Gaming | |
|---|---|---|---|---|---|---|
| Autonomie de la batterie | 106% | 40% | -2% | 60% | 34% | |
| WiFi v1.3 (h) | 5 | 10.3 106% | 7 40% | 4.9 -2% | 8 60% | 6.7 ? 34% |
| H.264 (h) | 4.8 | 7.93 ? | ||||
| Load (h) | 1.7 | 1.502 ? |
Notebookcheck note globale
Le Predator Helios Neo 16S AI ne sort pas du lot en termes de qualité ou de performances. Néanmoins, les acheteurs obtiennent un bon ordinateur portable de jeu haut de gamme.
Acer Predator Helios Neo 16S AI PHN16S-71-94L9
- 01/05/2026 v8
Florian Glaser
 Total Sustainability Score:
 Comparaison des alternatives possibles
Image | Modèle | Prix | Poids | Épaisseur | Écran |
|---|---|---|---|---|---|
1. 82%  | Acer Predator Helios Neo 16S AI PHN16S-71-94L9 Intel Core Ultra 9 275HX ⎘ NVIDIA GeForce RTX 5070 Ti Laptop ⎘ 32 Go Mémoire, 1024 Go SSD | Amazon: Prix de liste: 2400 EUR | 2.2 kg | 19.9 mm | 16.00" 2560x1600 189 PPI OLED |
2. 87.5%  | Schenker XMG FUSION 16 (M25) Intel Core Ultra 9 275HX ⎘ NVIDIA GeForce RTX 5070 Laptop ⎘ 64 Go Mémoire, 2048 Go SSD | Amazon: 1. $165.66 Schenker XMG P406 Laptop Key... Prix de liste: 2700€ | 2.1 kg | 23 mm | 16.00" 2880x1800 212 PPI OLED |
3. 84%  | MSI Vector 16 HX AI A2XWHG Intel Core Ultra 7 255HX ⎘ NVIDIA GeForce RTX 5070 Ti Laptop ⎘ 16 Go Mémoire, 512 Go SSD | Prix de liste: 2000 EUR | 2.6 kg | 28.6 mm | 16.00" 2560x1600 189 PPI IPS |
4. 84.5%  | Lenovo Legion 5 Pro 16IAX10H Intel Core Ultra 9 275HX ⎘ NVIDIA GeForce RTX 5070 Ti Laptop ⎘ 32 Go Mémoire, 1024 Go SSD | Prix de liste: 2500 Euro | 2.4 kg | 25.95 mm | 16.00" 2560x1600 189 PPI OLED |
5. 89.9%  | Asus ROG Zephyrus G16 2025 5070 Ti Intel Core Ultra 9 285H ⎘ NVIDIA GeForce RTX 5070 Ti Laptop ⎘ 32 Go Mémoire, 1024 Go SSD | Prix de liste: 3399€ | 1.9 kg | 17.4 mm | 16.00" 2560x1600 189 PPI |
6. 87.2%  | Razer Blade 16 RTX 5080 AMD Ryzen AI 9 365 ⎘ NVIDIA GeForce RTX 5080 Laptop ⎘ 32 Go Mémoire, 1024 Go SSD | Prix de liste: 3500 USD | 2.1 kg | 17.4 mm | 16.00" 2560x1600 189 PPI OLED |
Transparency
La sélection des appareils à examiner est effectuée par notre équipe éditoriale. L'échantillon de test a été prêté à l'auteur par le fabricant ou le détaillant pour les besoins de cet examen. Le prêteur n'a pas eu d'influence sur cette évaluation et le fabricant n'a pas reçu de copie de cette évaluation avant sa publication. Il n'y avait aucune obligation de publier cet article. En tant que média indépendant, Notebookcheck n'est pas soumis à l'autorité des fabricants, des détaillants ou des éditeurs.
Voici comment Notebookcheck teste
Chaque année, Notebookcheck examine de manière indépendante des centaines d'ordinateurs portables et de smartphones en utilisant des procédures standardisées afin de garantir que tous les résultats sont comparables. Nous avons continuellement développé nos méthodes de test depuis environ 20 ans et avons établi des normes industrielles dans le processus. Dans nos laboratoires de test, des équipements de mesure de haute qualité sont utilisés par des techniciens et des rédacteurs expérimentés. Ces tests impliquent un processus de validation en plusieurs étapes. Notre système d'évaluation complexe repose sur des centaines de mesures et de points de référence bien fondés, ce qui garantit l'objectivité.