
Notebookcheck Logo
Teaser

Intel surpasse nettement Snapdragon - Test du Microsoft Surface Laptop 15 Gen 8

Core Ultra X contre Snapdragon X2.

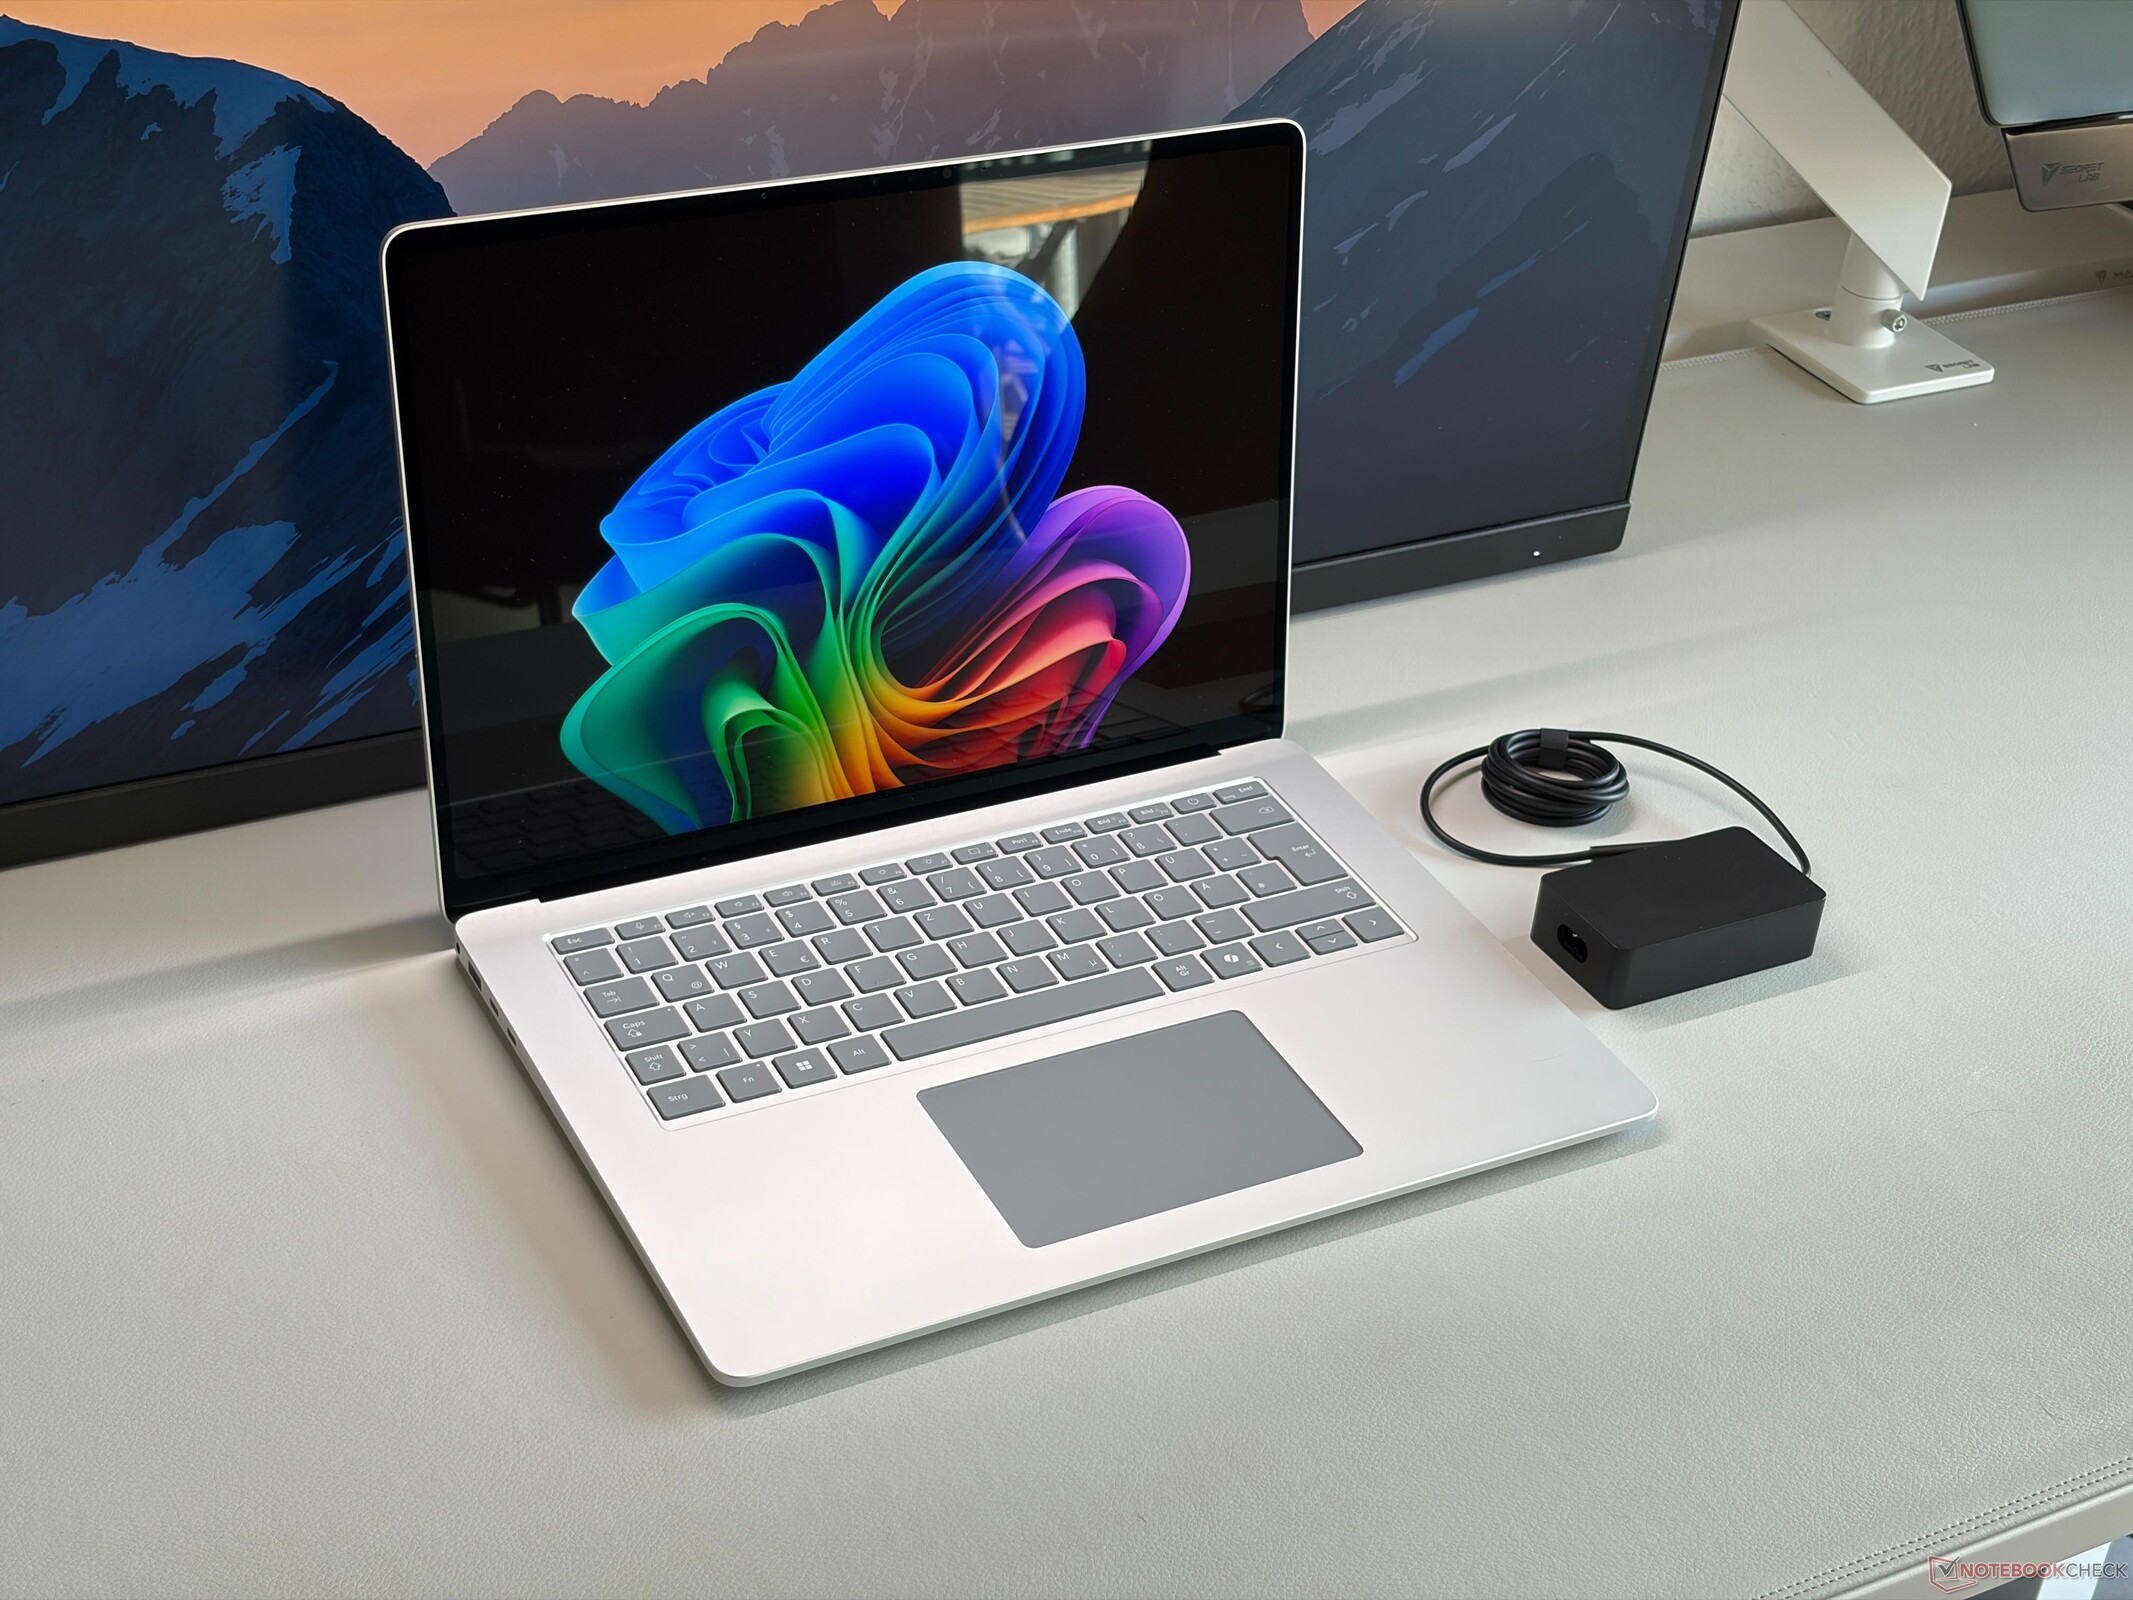
L’actuel Surface Laptop 15 for Business de Microsoft est disponible avec les puissants processeurs Core Ultra X d’Intel, qui intègrent également le rapide iGPU Arc B390. Le résultat est le meilleur ordinateur portable sous Windows que vous puissiez actuellement acheter, et il est également supérieur aux modèles Snapdragon destinés aux particuliers.
Andreas Osthoff, 👁 Andreas Osthoff (traduit par DeepL / Ninh Duy) Publié 🇺🇸 🇳🇱 ...
Arc Business Laptop / Notebook MS Surface Microsoft Panther Lake Thunderbolt Touchscreen Wi-Fi 7 Windows

Verdict - Le Surface Laptop 15 est meilleur avec Intel

Le Surface Laptop 15 Gen 8 est un bon ordinateur portable multimédia et la version Intel offre de meilleures performances graphiques, une meilleure compatibilité avec les applications et les jeux ainsi qu’une connectivité Thunderbolt 4. Les performances brutes du processeur sont probablement meilleures sur la variante Snapdragon, mais la version Intel, avec son iGPU supérieur, constitue indéniablement un meilleur choix global pour la majorité des utilisateurs. L’approche de Microsoft consistant à proposer des modèles Snapdragon aux particuliers est, selon nous, une erreur, et nous pensons que les utilisateurs devraient pouvoir choisir à des prix compétitifs, ce qui n’est généralement pas le cas avec les modèles professionnels (même si les particuliers peuvent également les acheter).

Nous apprécions la qualité de fabrication haut de gamme, le clavier confortable, les bons haut-parleurs et la qualité de la webcam. C’est aussi l’un des rares appareils haut de gamme dotés d’un écran tactile IPS. Celui-ci offre une bonne qualité d’image avec des couleurs fidèles, un taux de rafraîchissement de 120 Hz et aucun scintillement PWM, ce qui est appréciable si vous êtes sensible au scintillement des écrans OLED. L’autonomie de la variante Intel est également très bonne (Microsoft annonce d’ailleurs une autonomie légèrement inférieure pour le modèle Snapdragon).

Cela ne signifie pas que le Surface Laptop 15 est l’appareil parfait, car il présente indéniablement des problèmes. Les performances de refroidissement avec un seul ventilateur ne sont pas excellentes et les performances soutenues en pâtissent un peu. Cela suffisait pour l’ancien processeur Lunar Lake, mais ne permet pas d’exploiter tout le potentiel de la puce rapide Panther Lake. L’adaptateur secteur de 65W est également insuffisant en charge, du moins pendant quelques minutes avant que les performances ne soient réduites. Nous aimerions aussi des SSD M.2-2280 standard, puisqu’il y a beaucoup d’espace libre à l’intérieur du châssis. Le port Surface Connect est assez grand et nous préférerions un autre port USB-C et peut-être un lecteur de cartes SD standard plutôt qu’un lecteur microSD. Les prix des mises à niveau de la RAM et du stockage sont également astronomiques.

Dans l’ensemble, le Surface Laptop 15 Gen 8 est un bon ordinateur portable multimédia et la version Intel est le meilleur choix pour la plupart des utilisateurs, mais des concurrents comme le Lenovo ThinkPad X9-15p offrent des prestations globalement meilleures. Nous espérons que Microsoft mettra l’appareil à jour l’année prochaine et corrigera certains des problèmes mentionnés, sans se concentrer uniquement sur le prochain Surface Laptop Ultra équipé de RTX Spark.

Points positifs

+ boîtier de haute qualité et robuste
+ bonnes performances système
+ bonne autonomie
+ lecteur de cartes microSD-Express rapide
+ périphériques de saisie confortables
+ excellents profils colorimétriques d’usine
+ très silencieux au quotidien
+ bonnes possibilités de maintenance/accessibilité

Points négatifs

- La RAM ne peut pas être mise à niveau
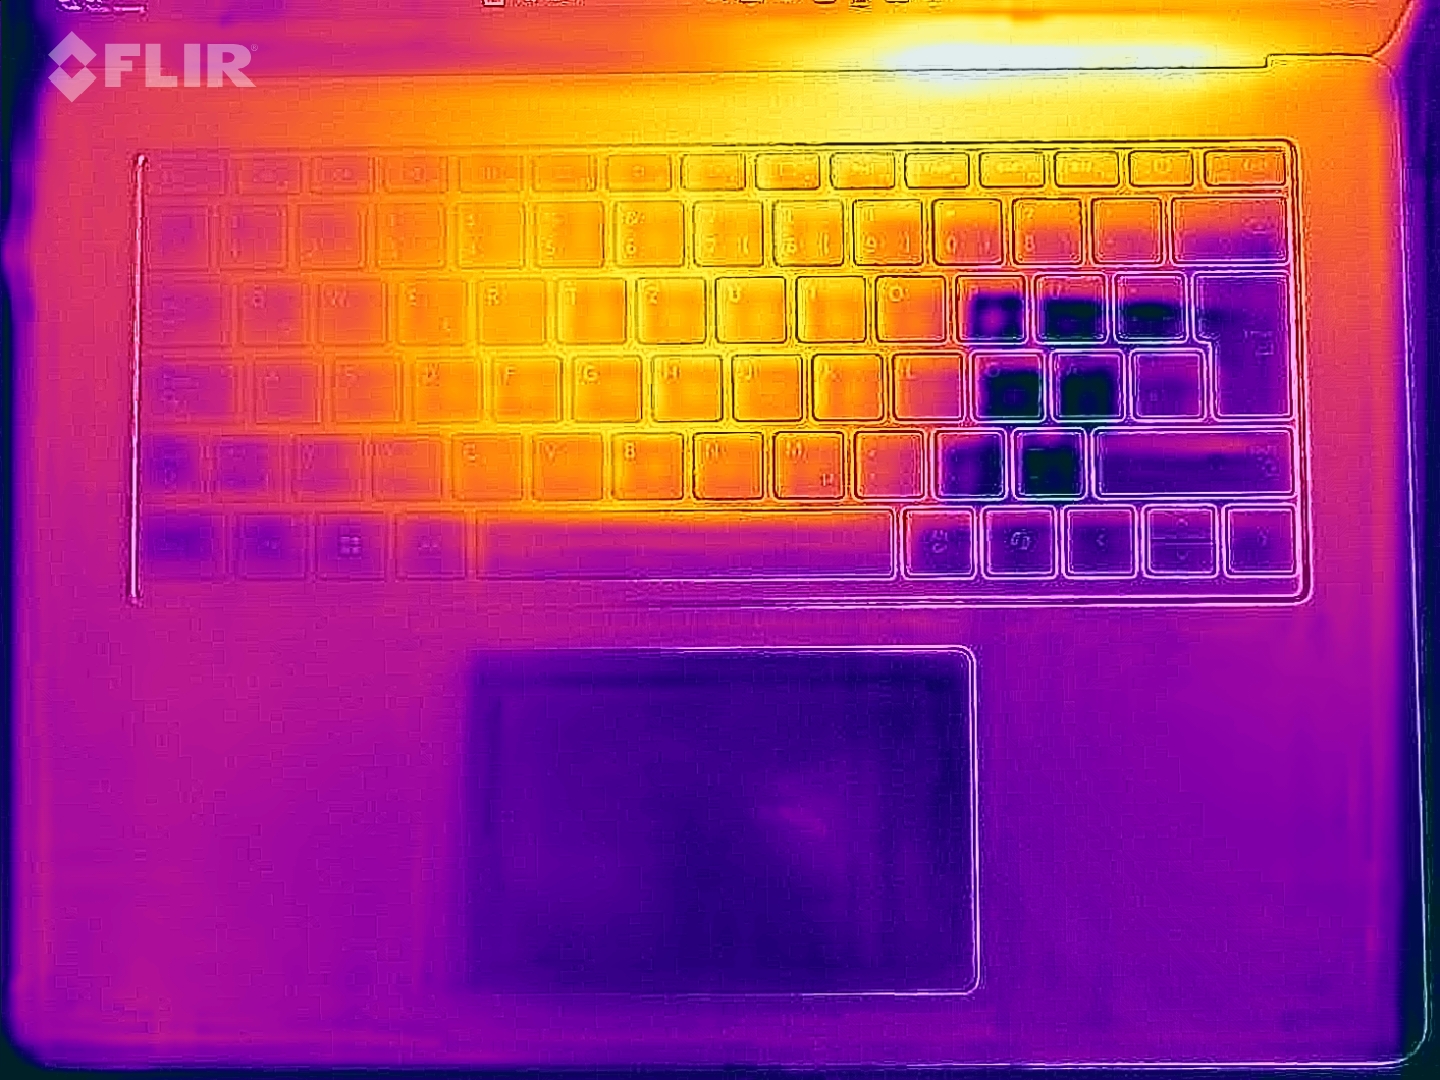
- le clavier chauffe sensiblement sous charge
- sifflement des bobines
- bloc d'alimentation insuffisant
- mises à niveau coûteuses
- pas de module WWAN
- garantie d'un an seulement

Prix et disponibilité

Vous pouvez commander le Surface Laptop 8 15 for Business avec le processeur Core Ultra X directement auprès de Microsoft à partir de 2749,99 $.

Amazon Logo
  • $238.94
    Microsoft Surface Laptop 3 15" Touch-Screen - CORE I5 1035G7 - 8GB Memory - 128GB Solid State Drive Platinum (Renewed)
  • $483.98
    Microsoft Surface Laptop 5 13.5" Touchscreen Notebook - 2256 x 1504 - Intel Core i7 12th Gen i7-1265U - Intel Evo Platform - 16 GB Total RAM - 512 GB SSD (Platinum) (Renewed)
  • $685.00
    Microsoft Surface Laptop 4 15” Touch-Screen – Intel Core i7 - 32GB - 1TB Solid State Drive - Matte Black

Spécifications

Microsoft Surface Laptop 15 Gen 8 (Surface Laptop Gamme)
Processeur
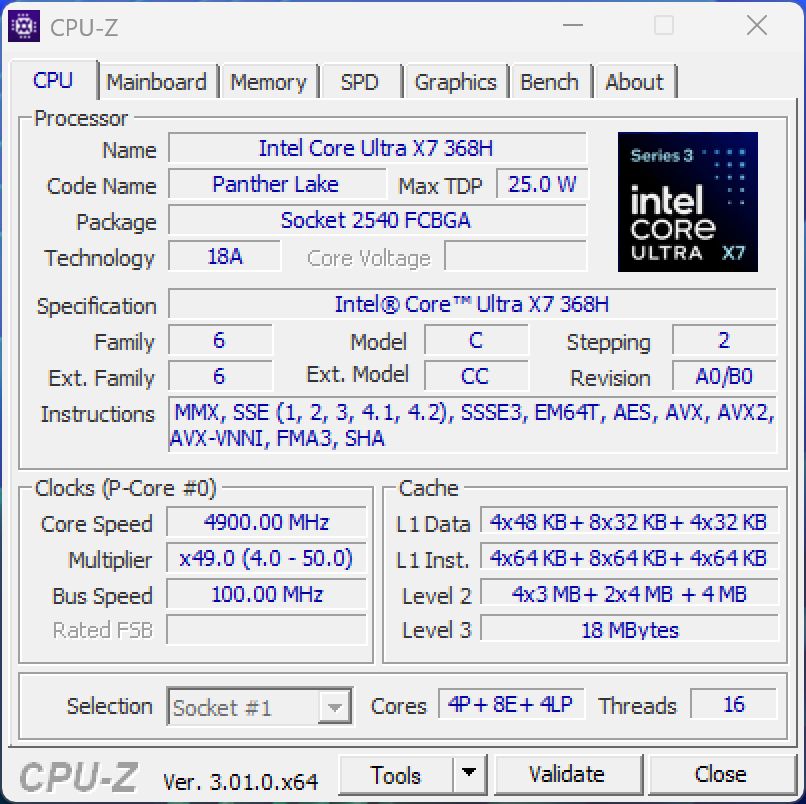
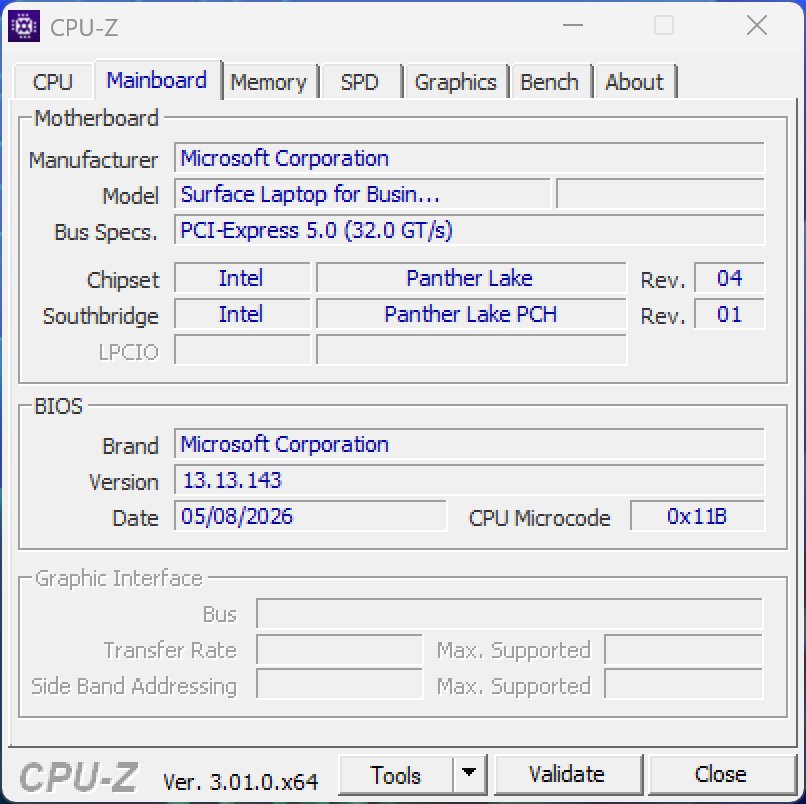
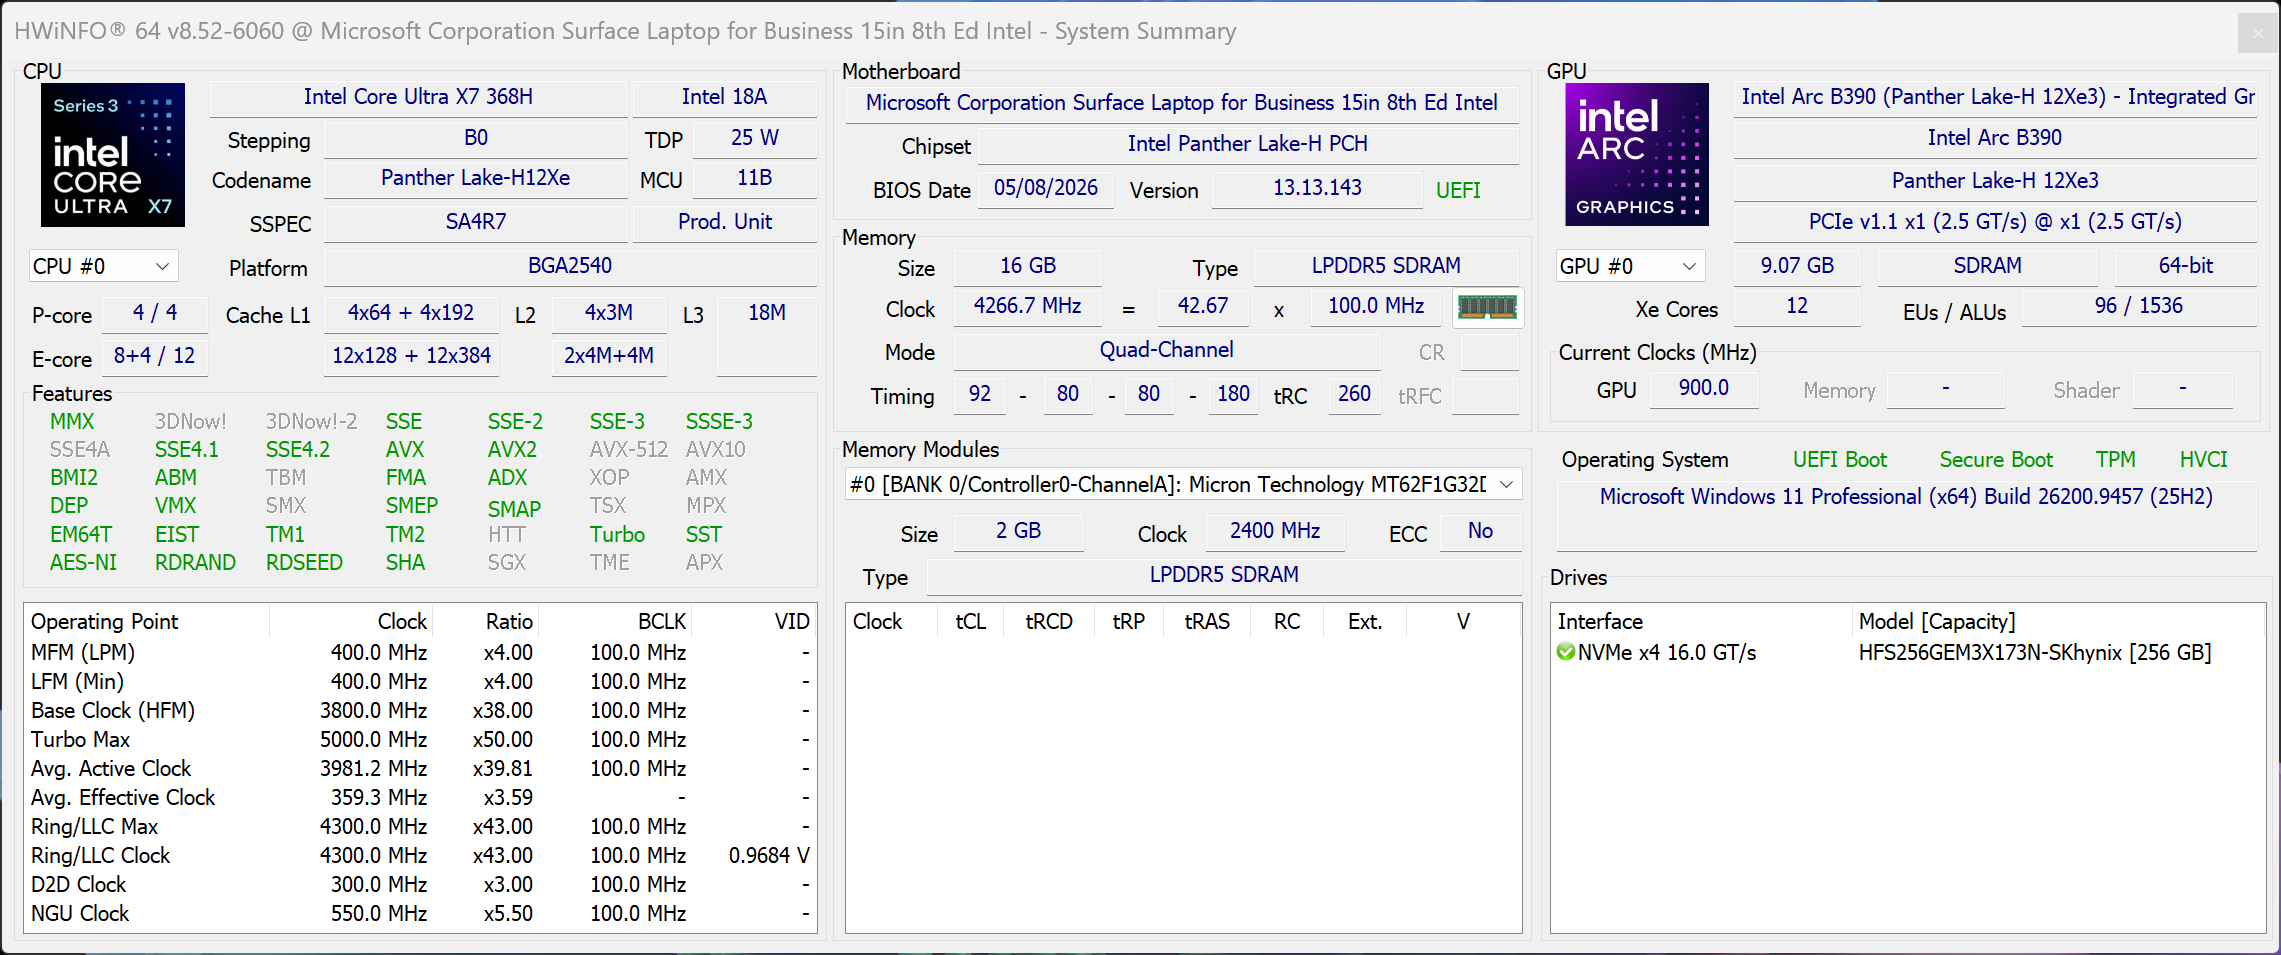
Intel Core Ultra X7 368H 16c/16t, 4 x 4.9 GHz Intel Cougar Cove P-Core, 8 x 4.0 GHz Intel Darkmont E-Core, 4 x 3.6 GHz Intel Darkmont E-Core, 65 W PL2 / Short Burst, 35 W PL1 / Sustained, Panther Lake
Carte graphique
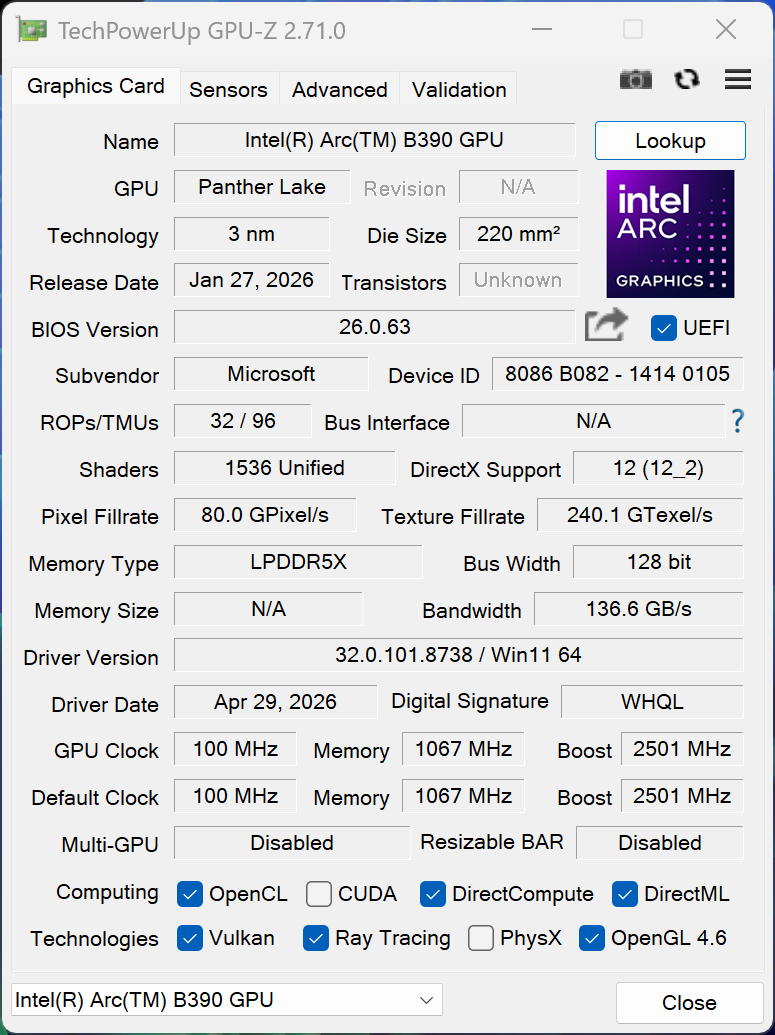
Intel Arc B390 12 Xe3 Panther Lake iGPU, Processeur: 2500 MHz, RAM: 800 MHz, 32.0.101.8738
Mémoire
16 Go 
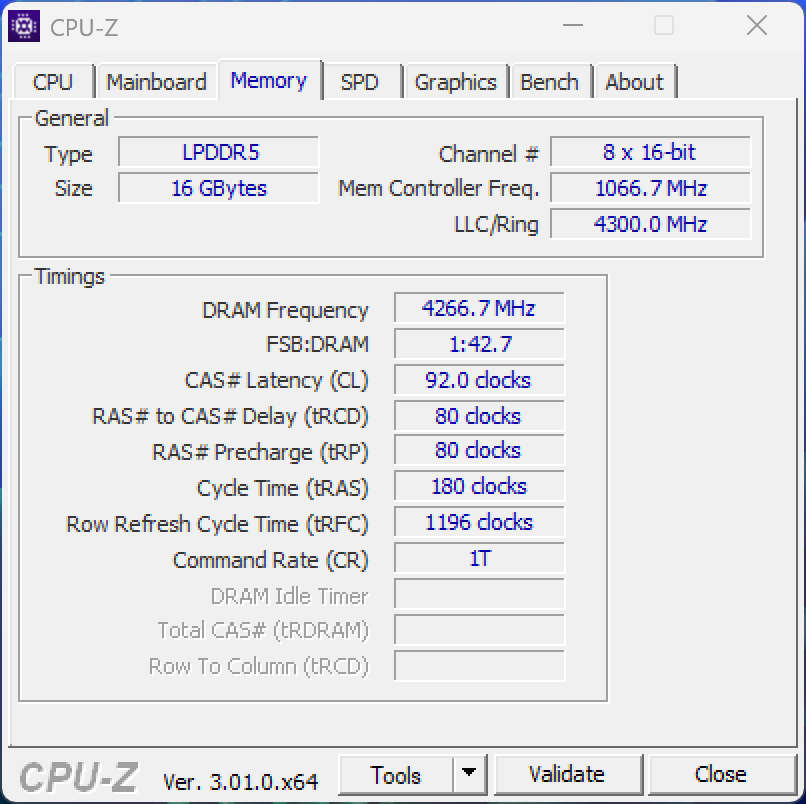
, LPDDR5x-8533, Dual-Channel, onboard
Écran
15.00 pouces 3:2, 3270 x 2180 pixel 262 PPP, capacitive, LP150UD2-SPA1, IPS, brillant: oui, 120 Hz
Carte mère
Intel Panther Lake-H PCH
Disque dur
SK hynix PVC10 HFS256GEM4X182N, 256 Go 
, 188 Go libres
Carte son
Intel Panther Lake-H PCH - High Definition Audio - AVS (Audio, Voice, Speech)
Connexions
1 USB 3.0 / 3.1 Gen1, 2 Thunderbolt 4, USB-C Power Delivery (PD), 2 DisplayPort, 1 Port pour Station d'accueil, Connectique audio: 3.5 mm stereo, Lecteur de cartes mémoires: microSD Express, Capteur de luminosité
Réseau
Intel BE201 320MHz (a/b/g/h/n = Wi-Fi 4/ac = Wi-Fi 5/ax = Wi-Fi 6/ Wi-Fi 6E 6 GHz be = Wi-Fi 7), Bluetooth 5.4
Taille
Hauteur x Largeur x Profondeur (en mm): 18.3 x 329 x 239
Batterie
66 Wh Lithium-Polymère
Système d'exploitation
Microsoft Windows 11 Home
Appareil photo
Webcam: IR
Appareil photo primaire: 2 MPix
Fonctionnalités additionnelles
Haut-parleurs: Stereo, Clavier: Chiclet, 65W PSU, 12 Mois Garantie
Poids
1.651 kg, Alimentation: 255 g
Prix
2400 euros
Remarque : le fabricant peut utiliser des composants provenant de différents fournisseurs, notamment des panneaux d'affichage, des lecteurs ou des clés USB ayant des spécifications similaires.


Boîtier, connectivité et périphériques d’entrée

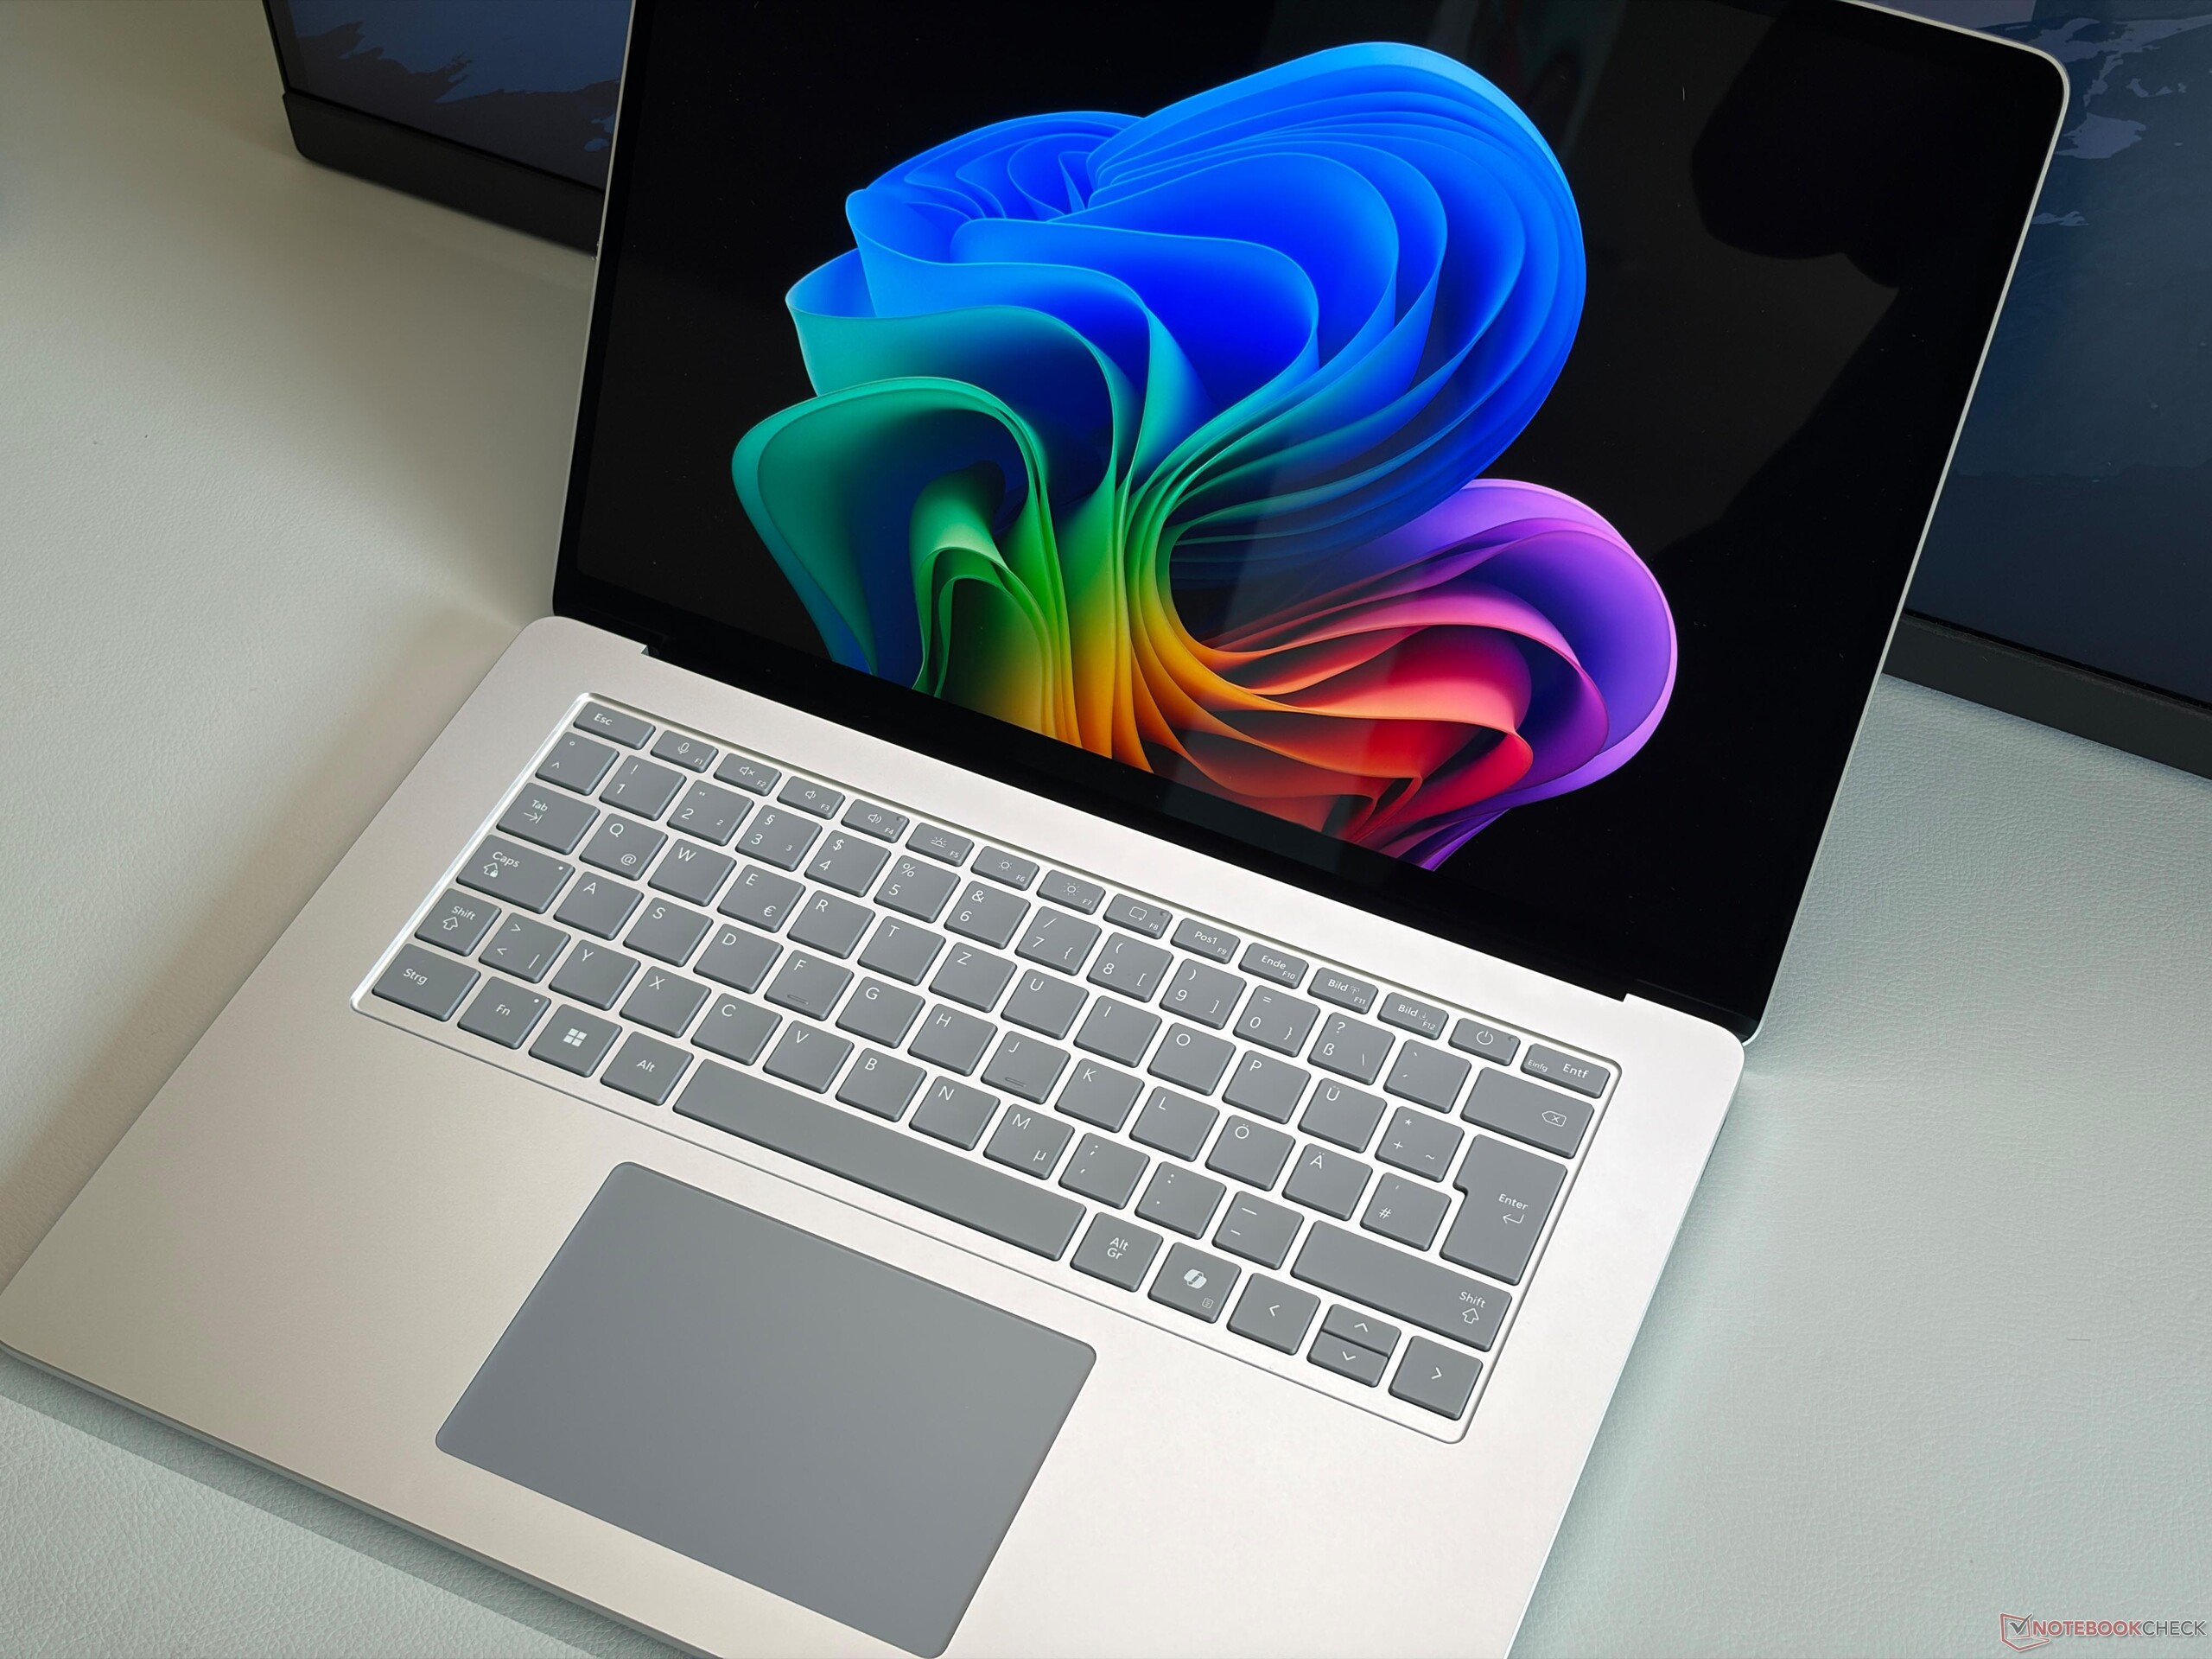
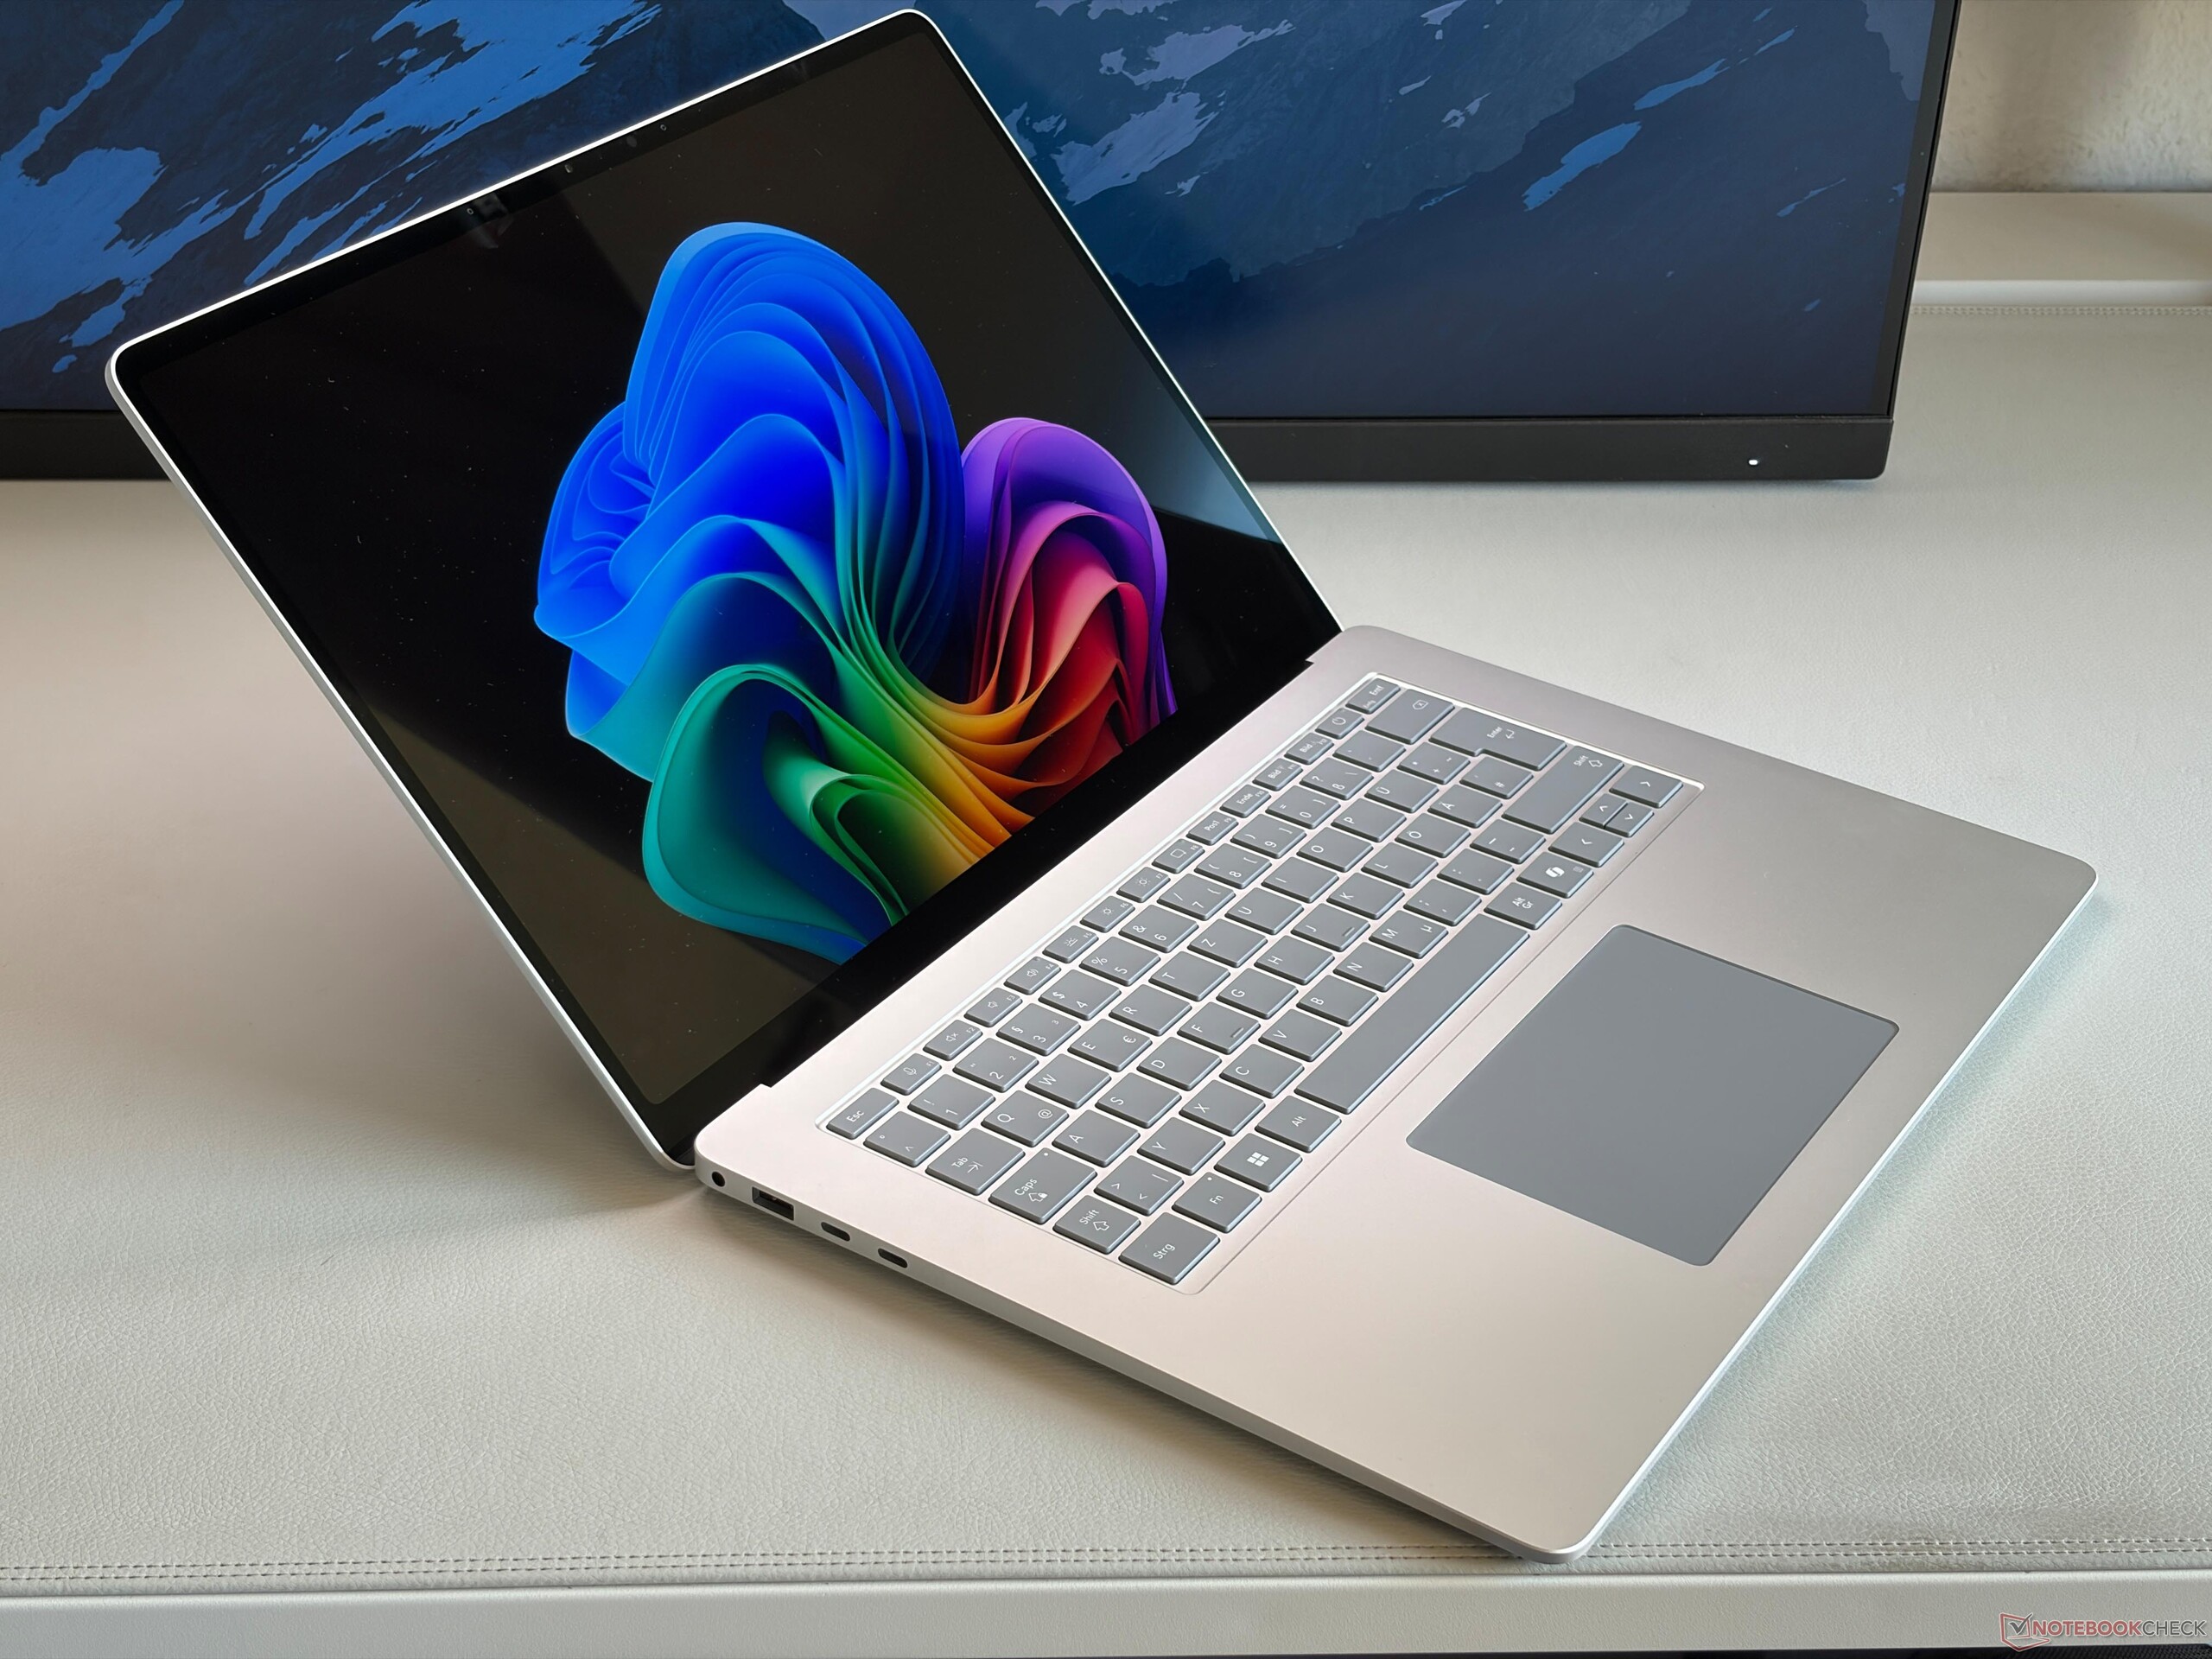
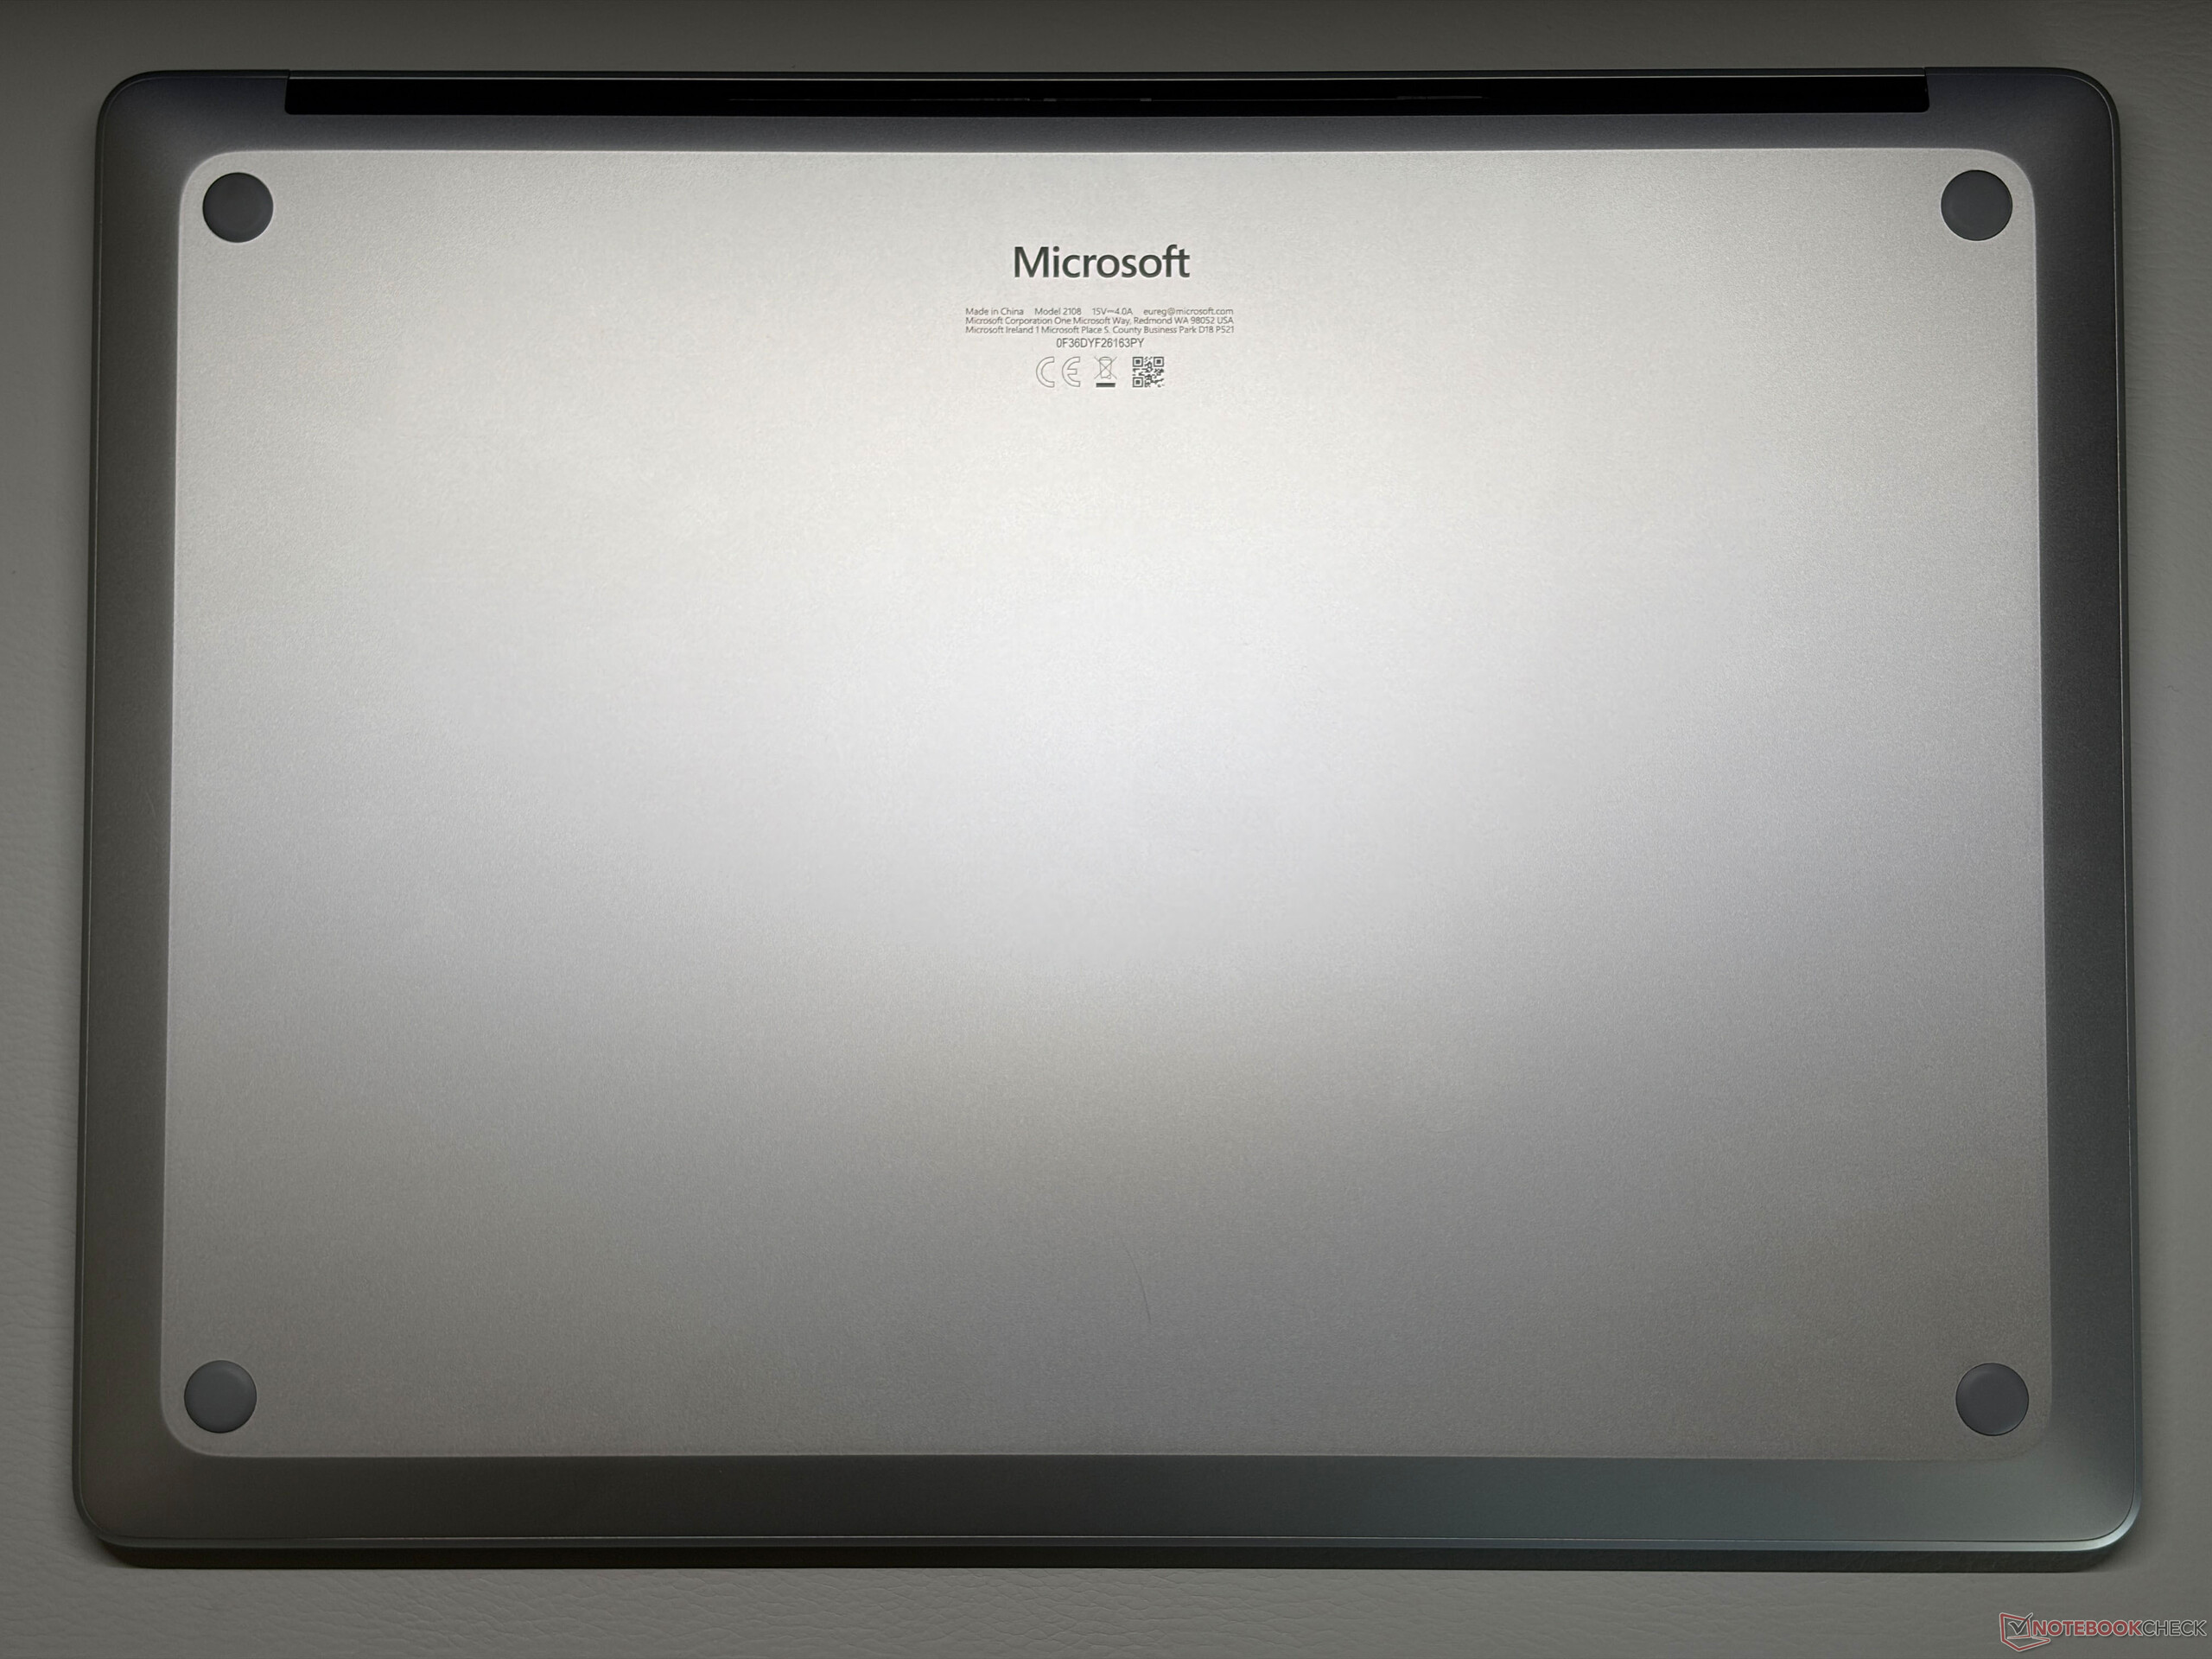
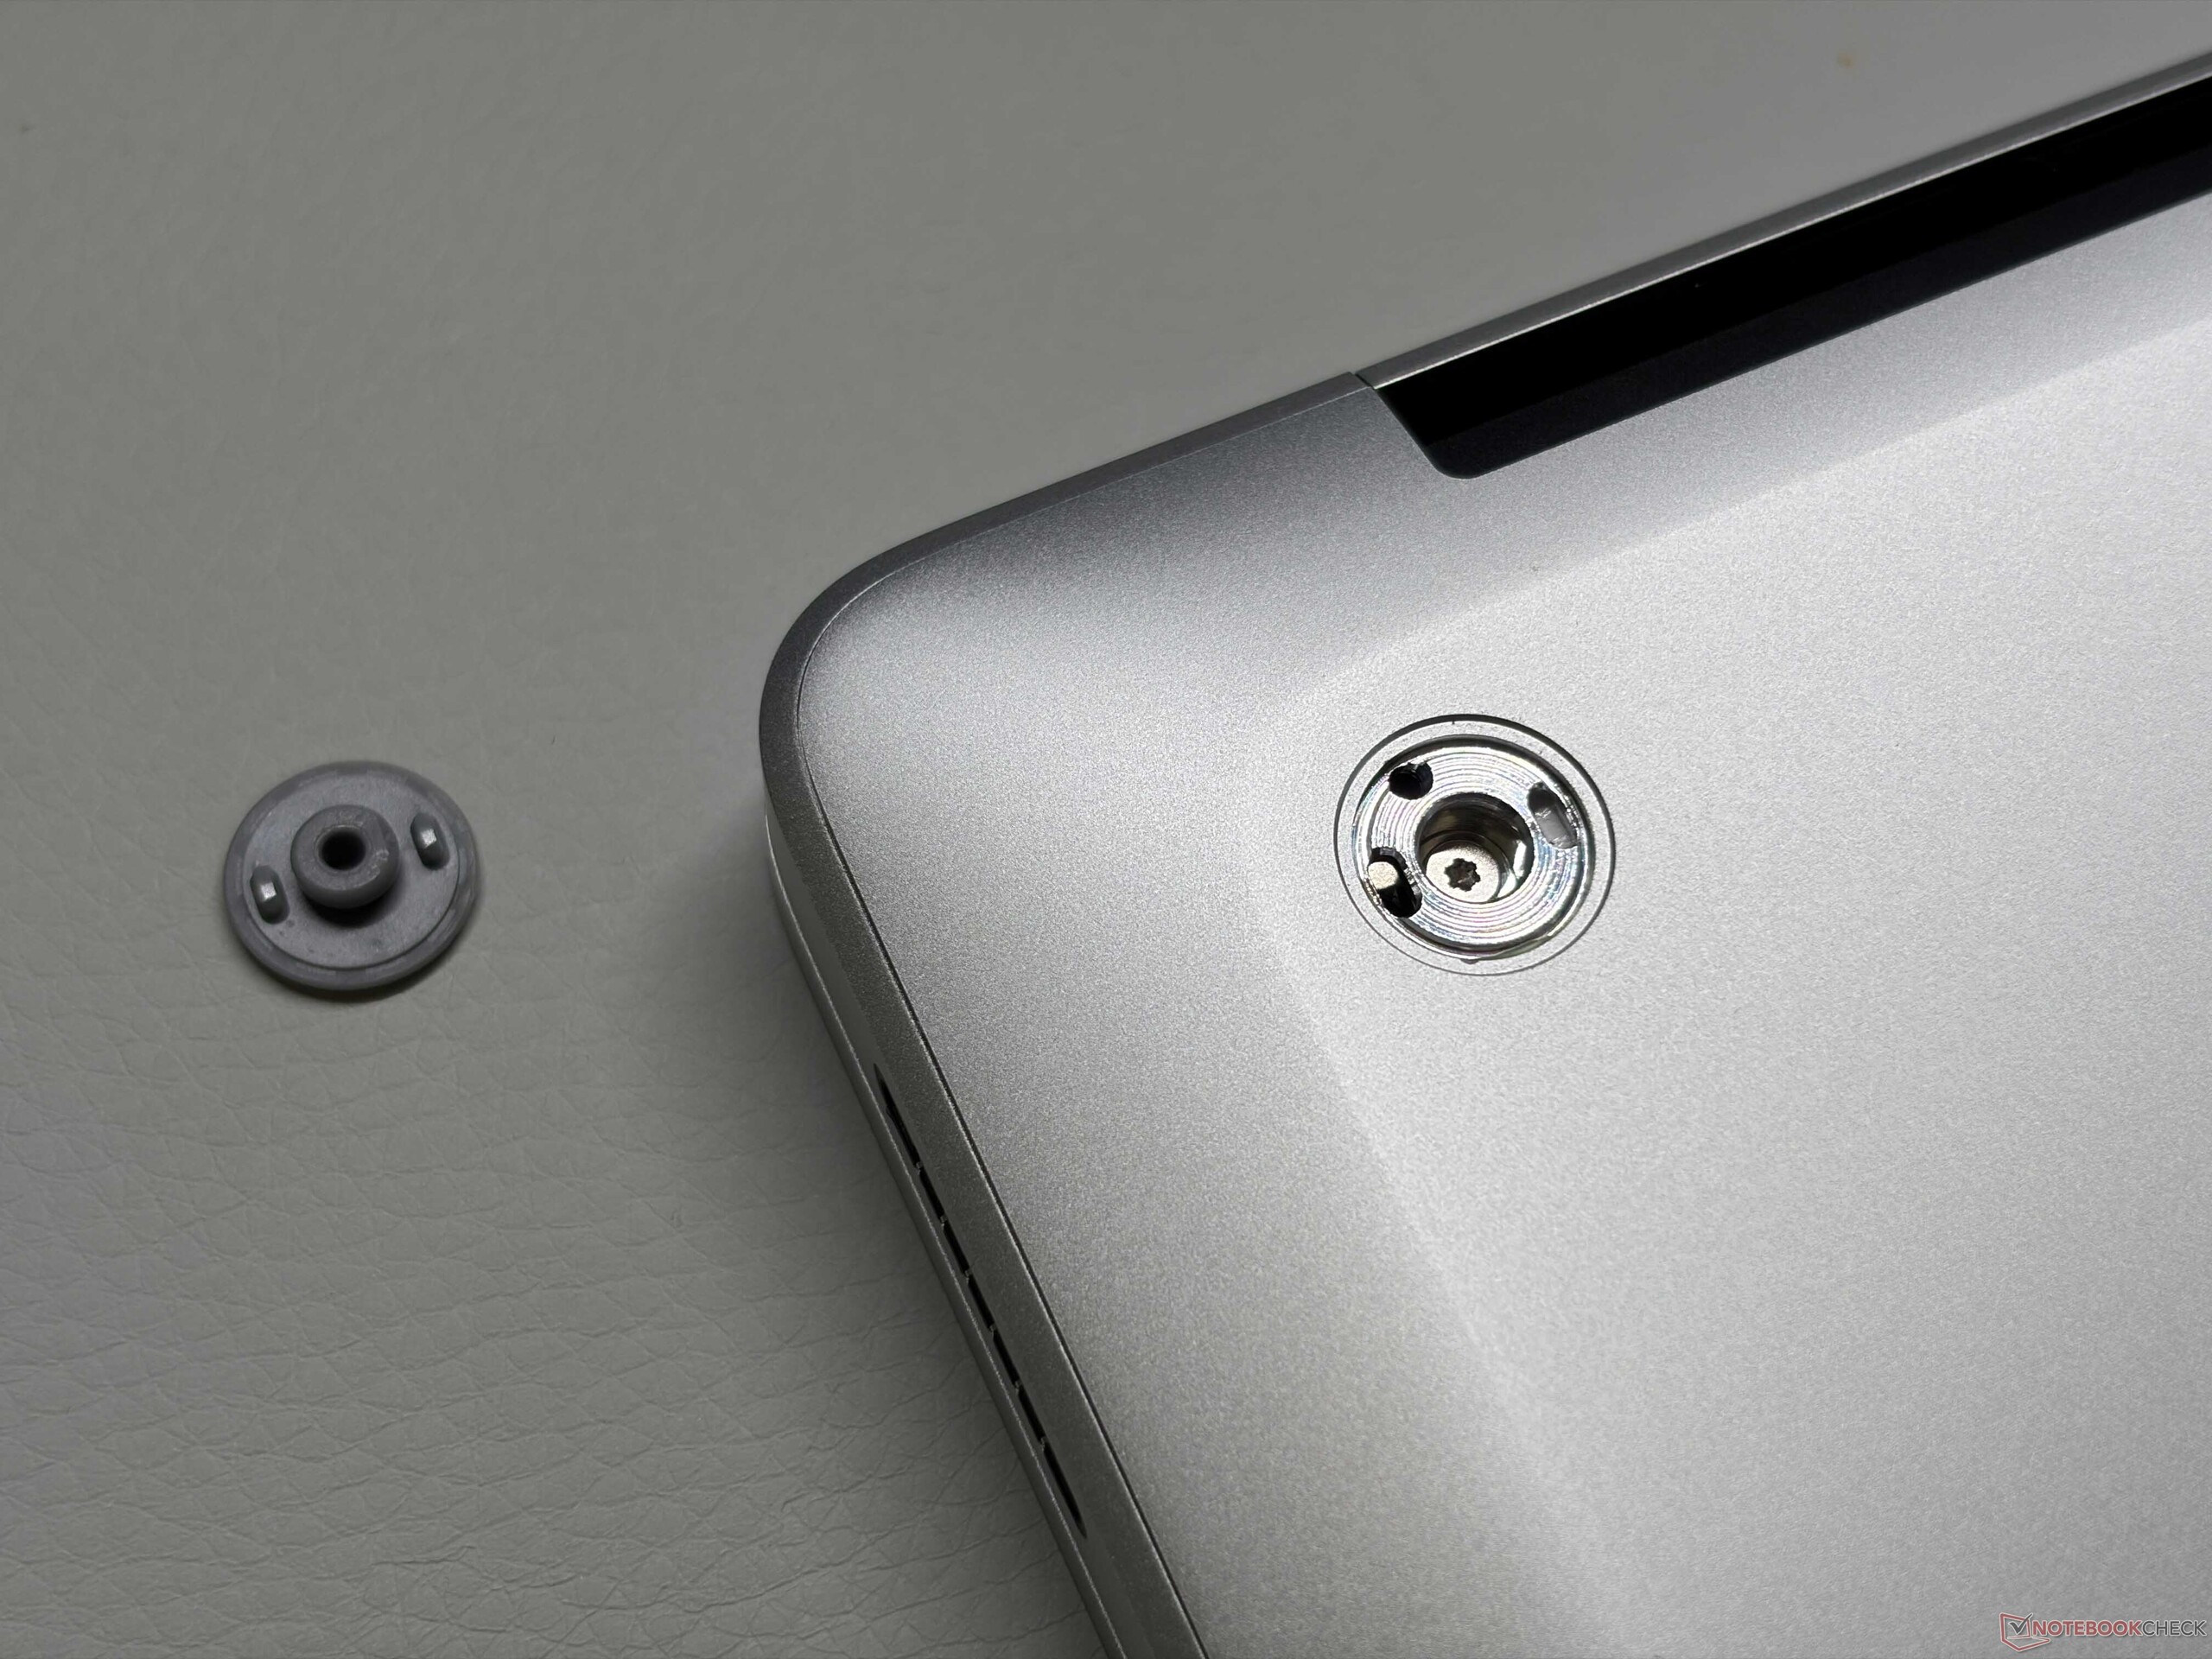
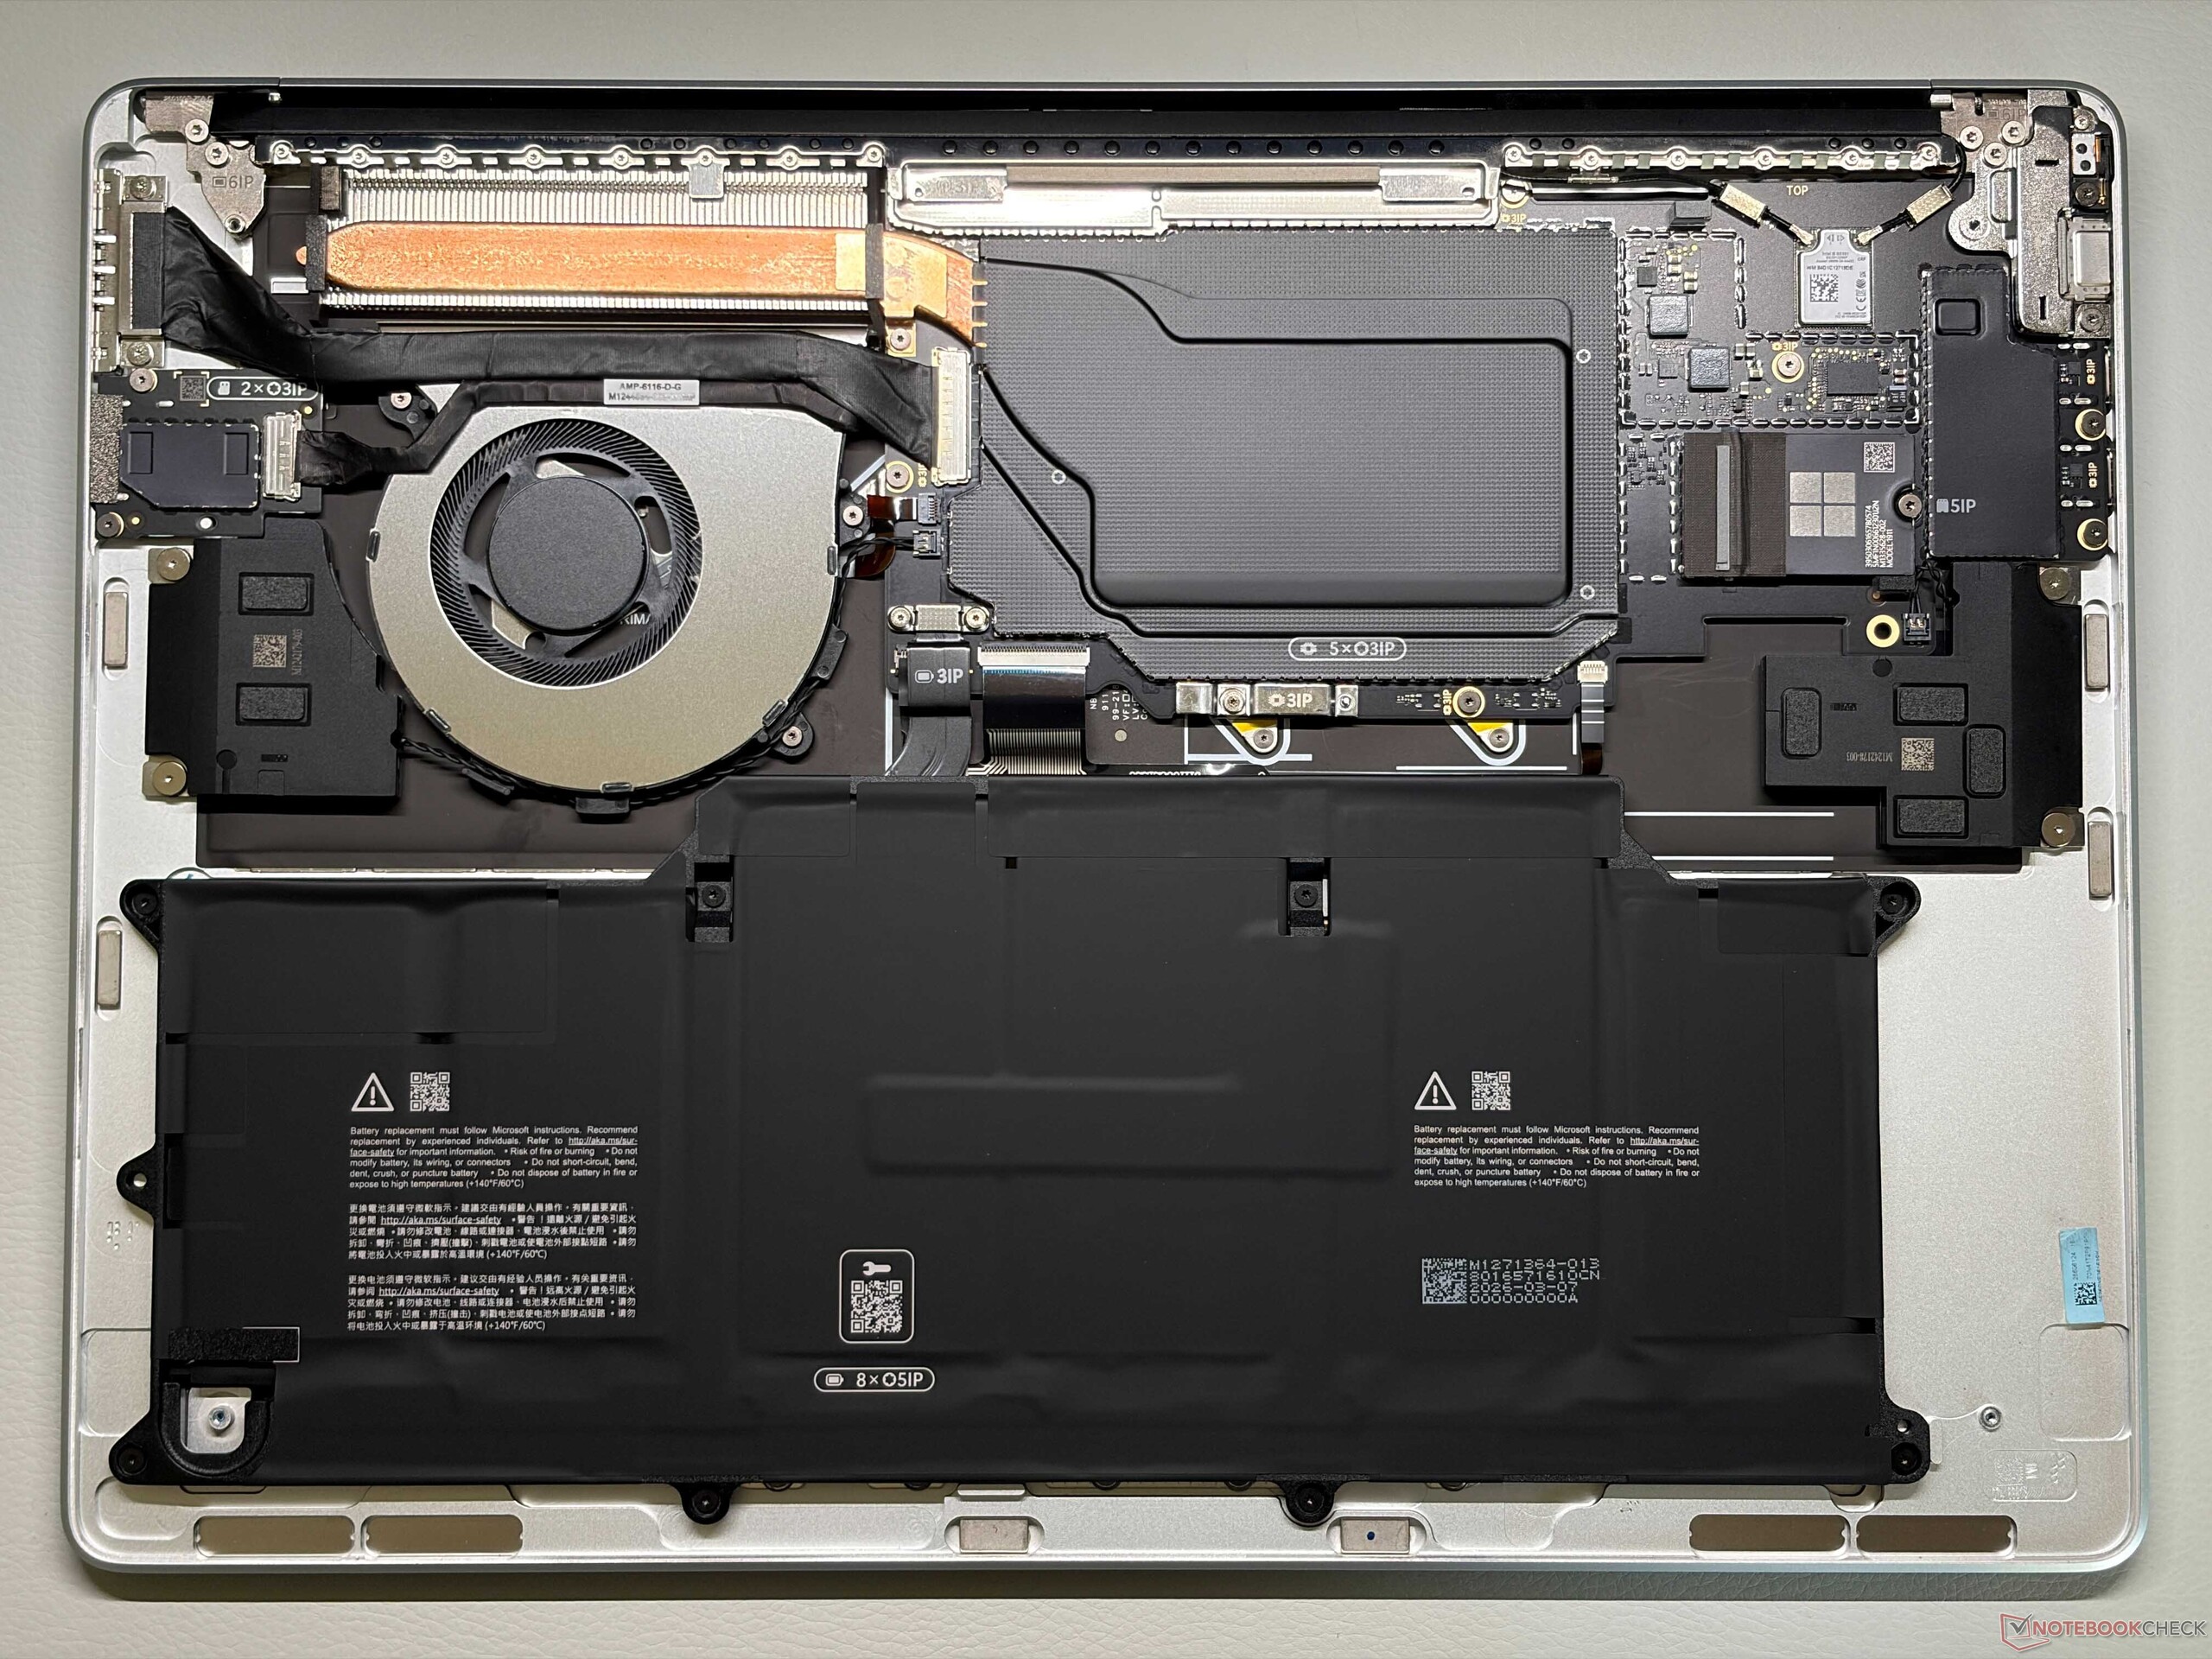
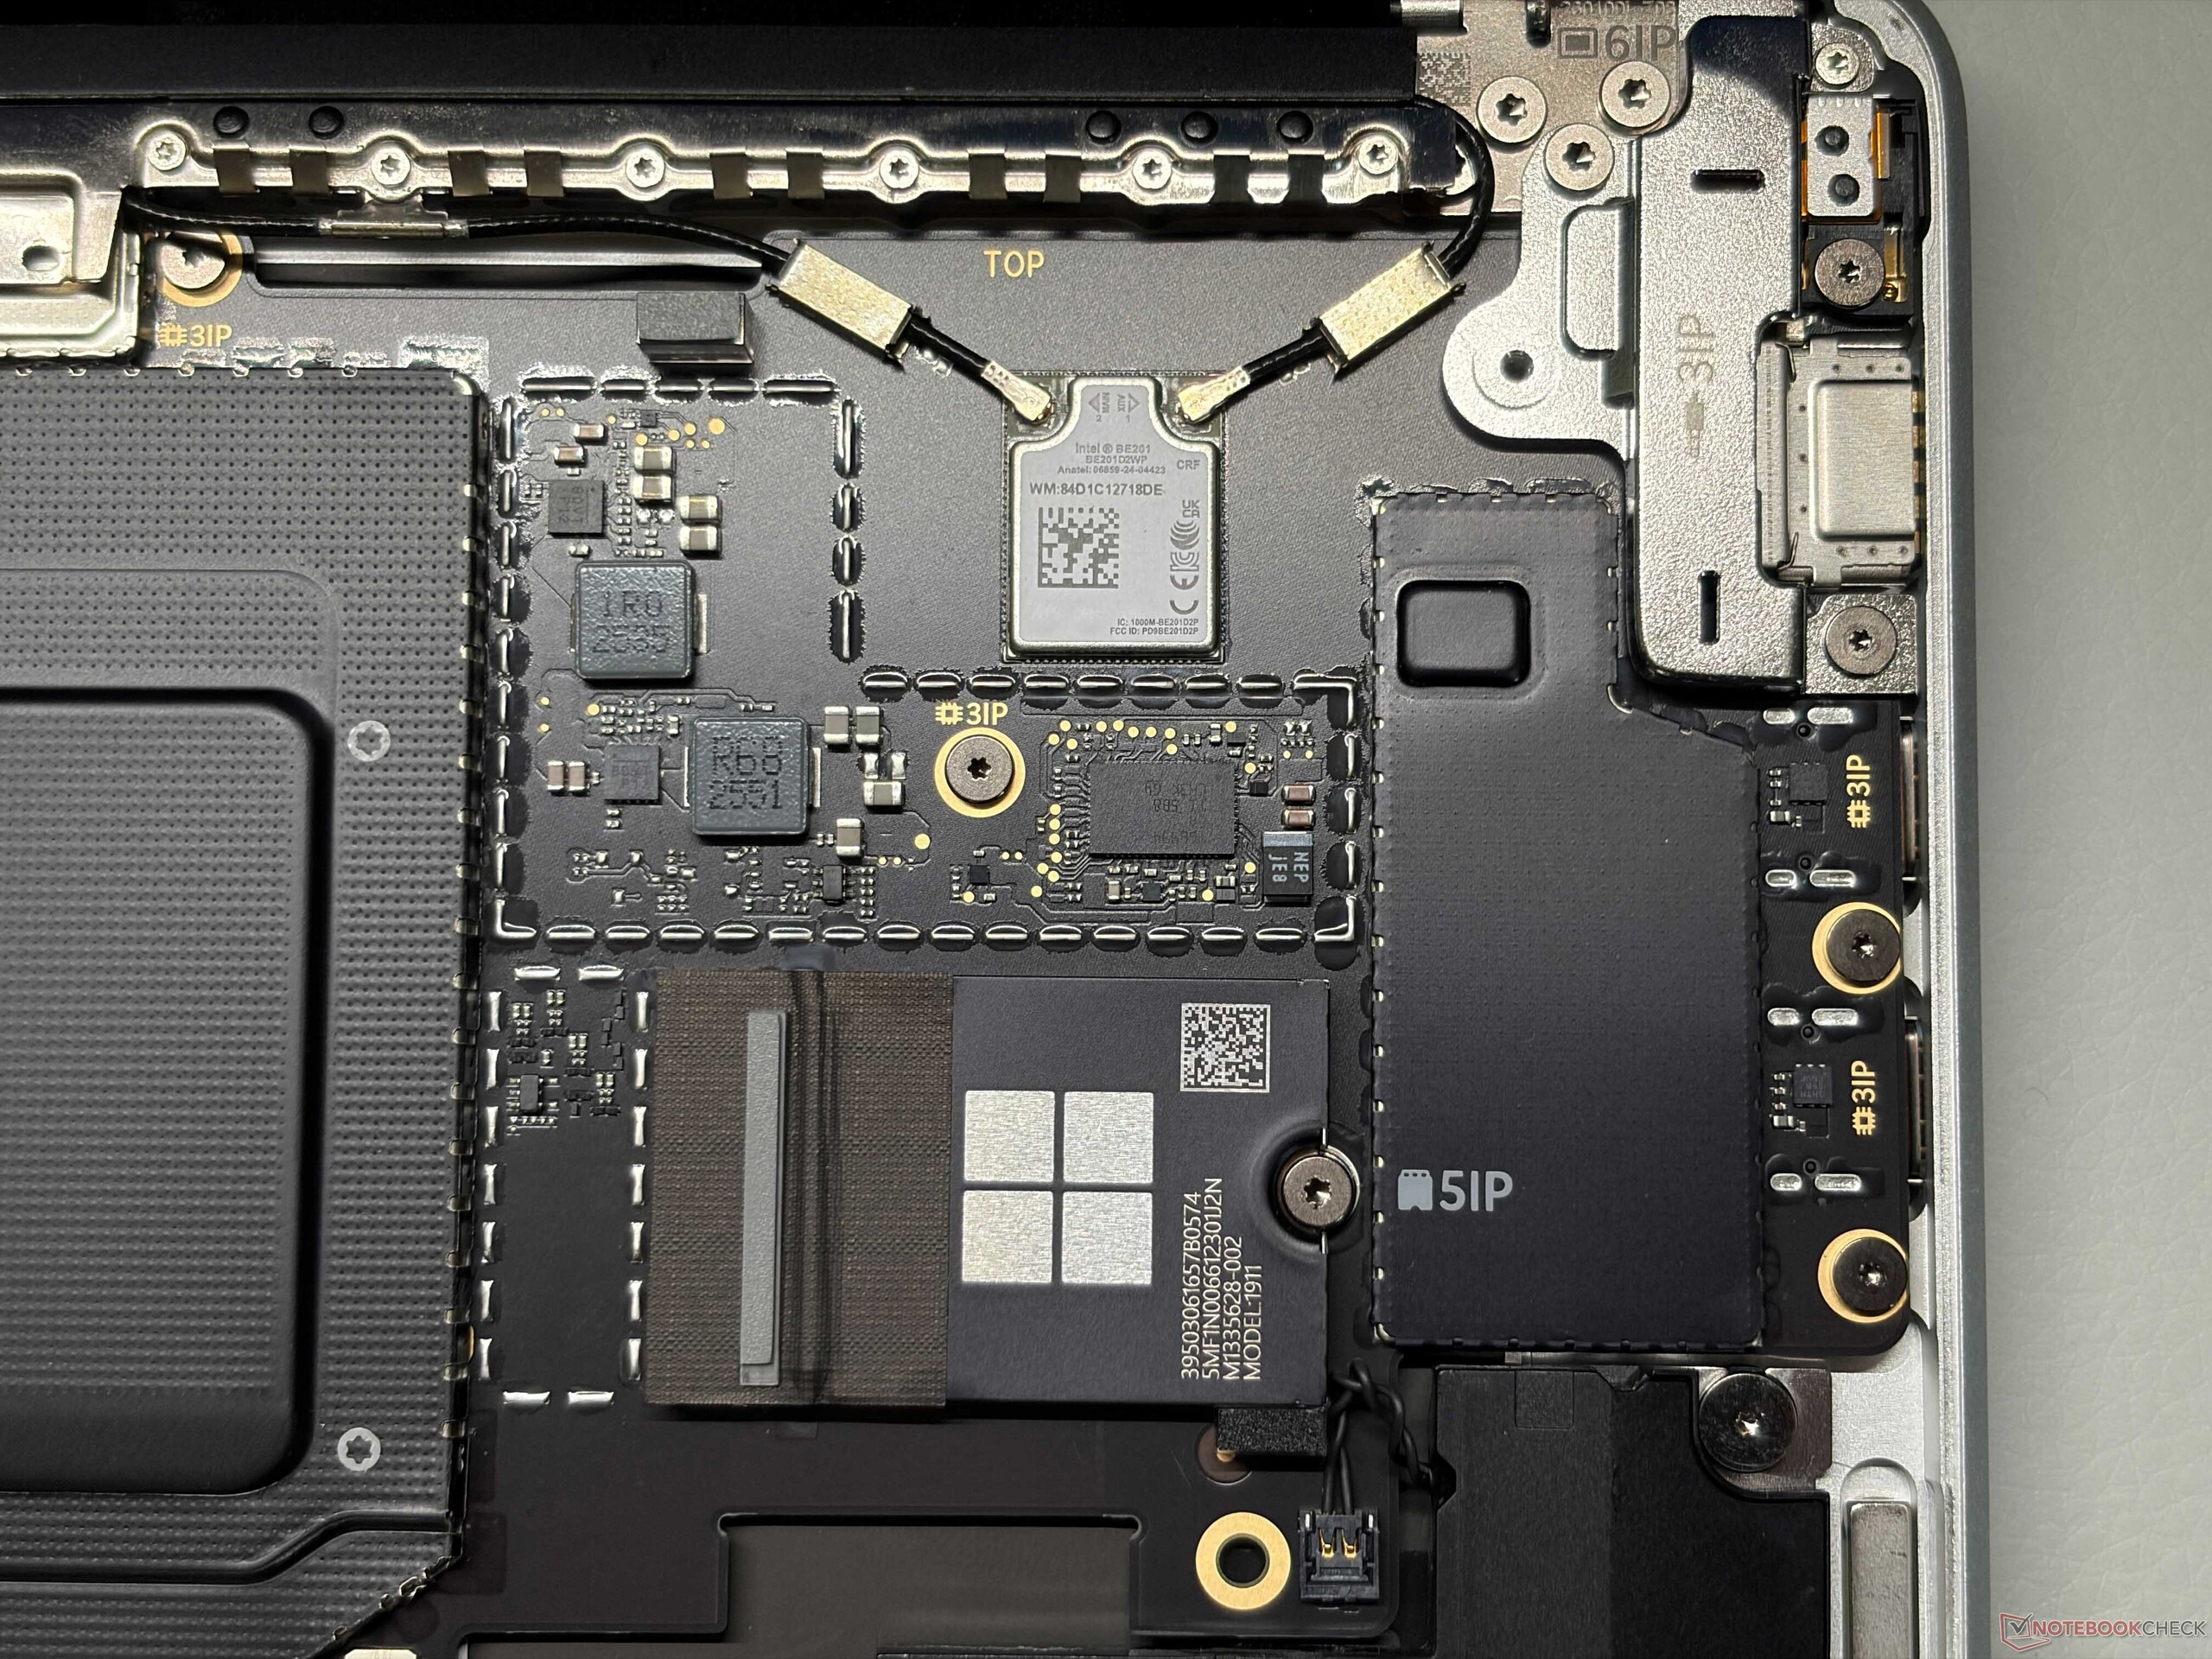
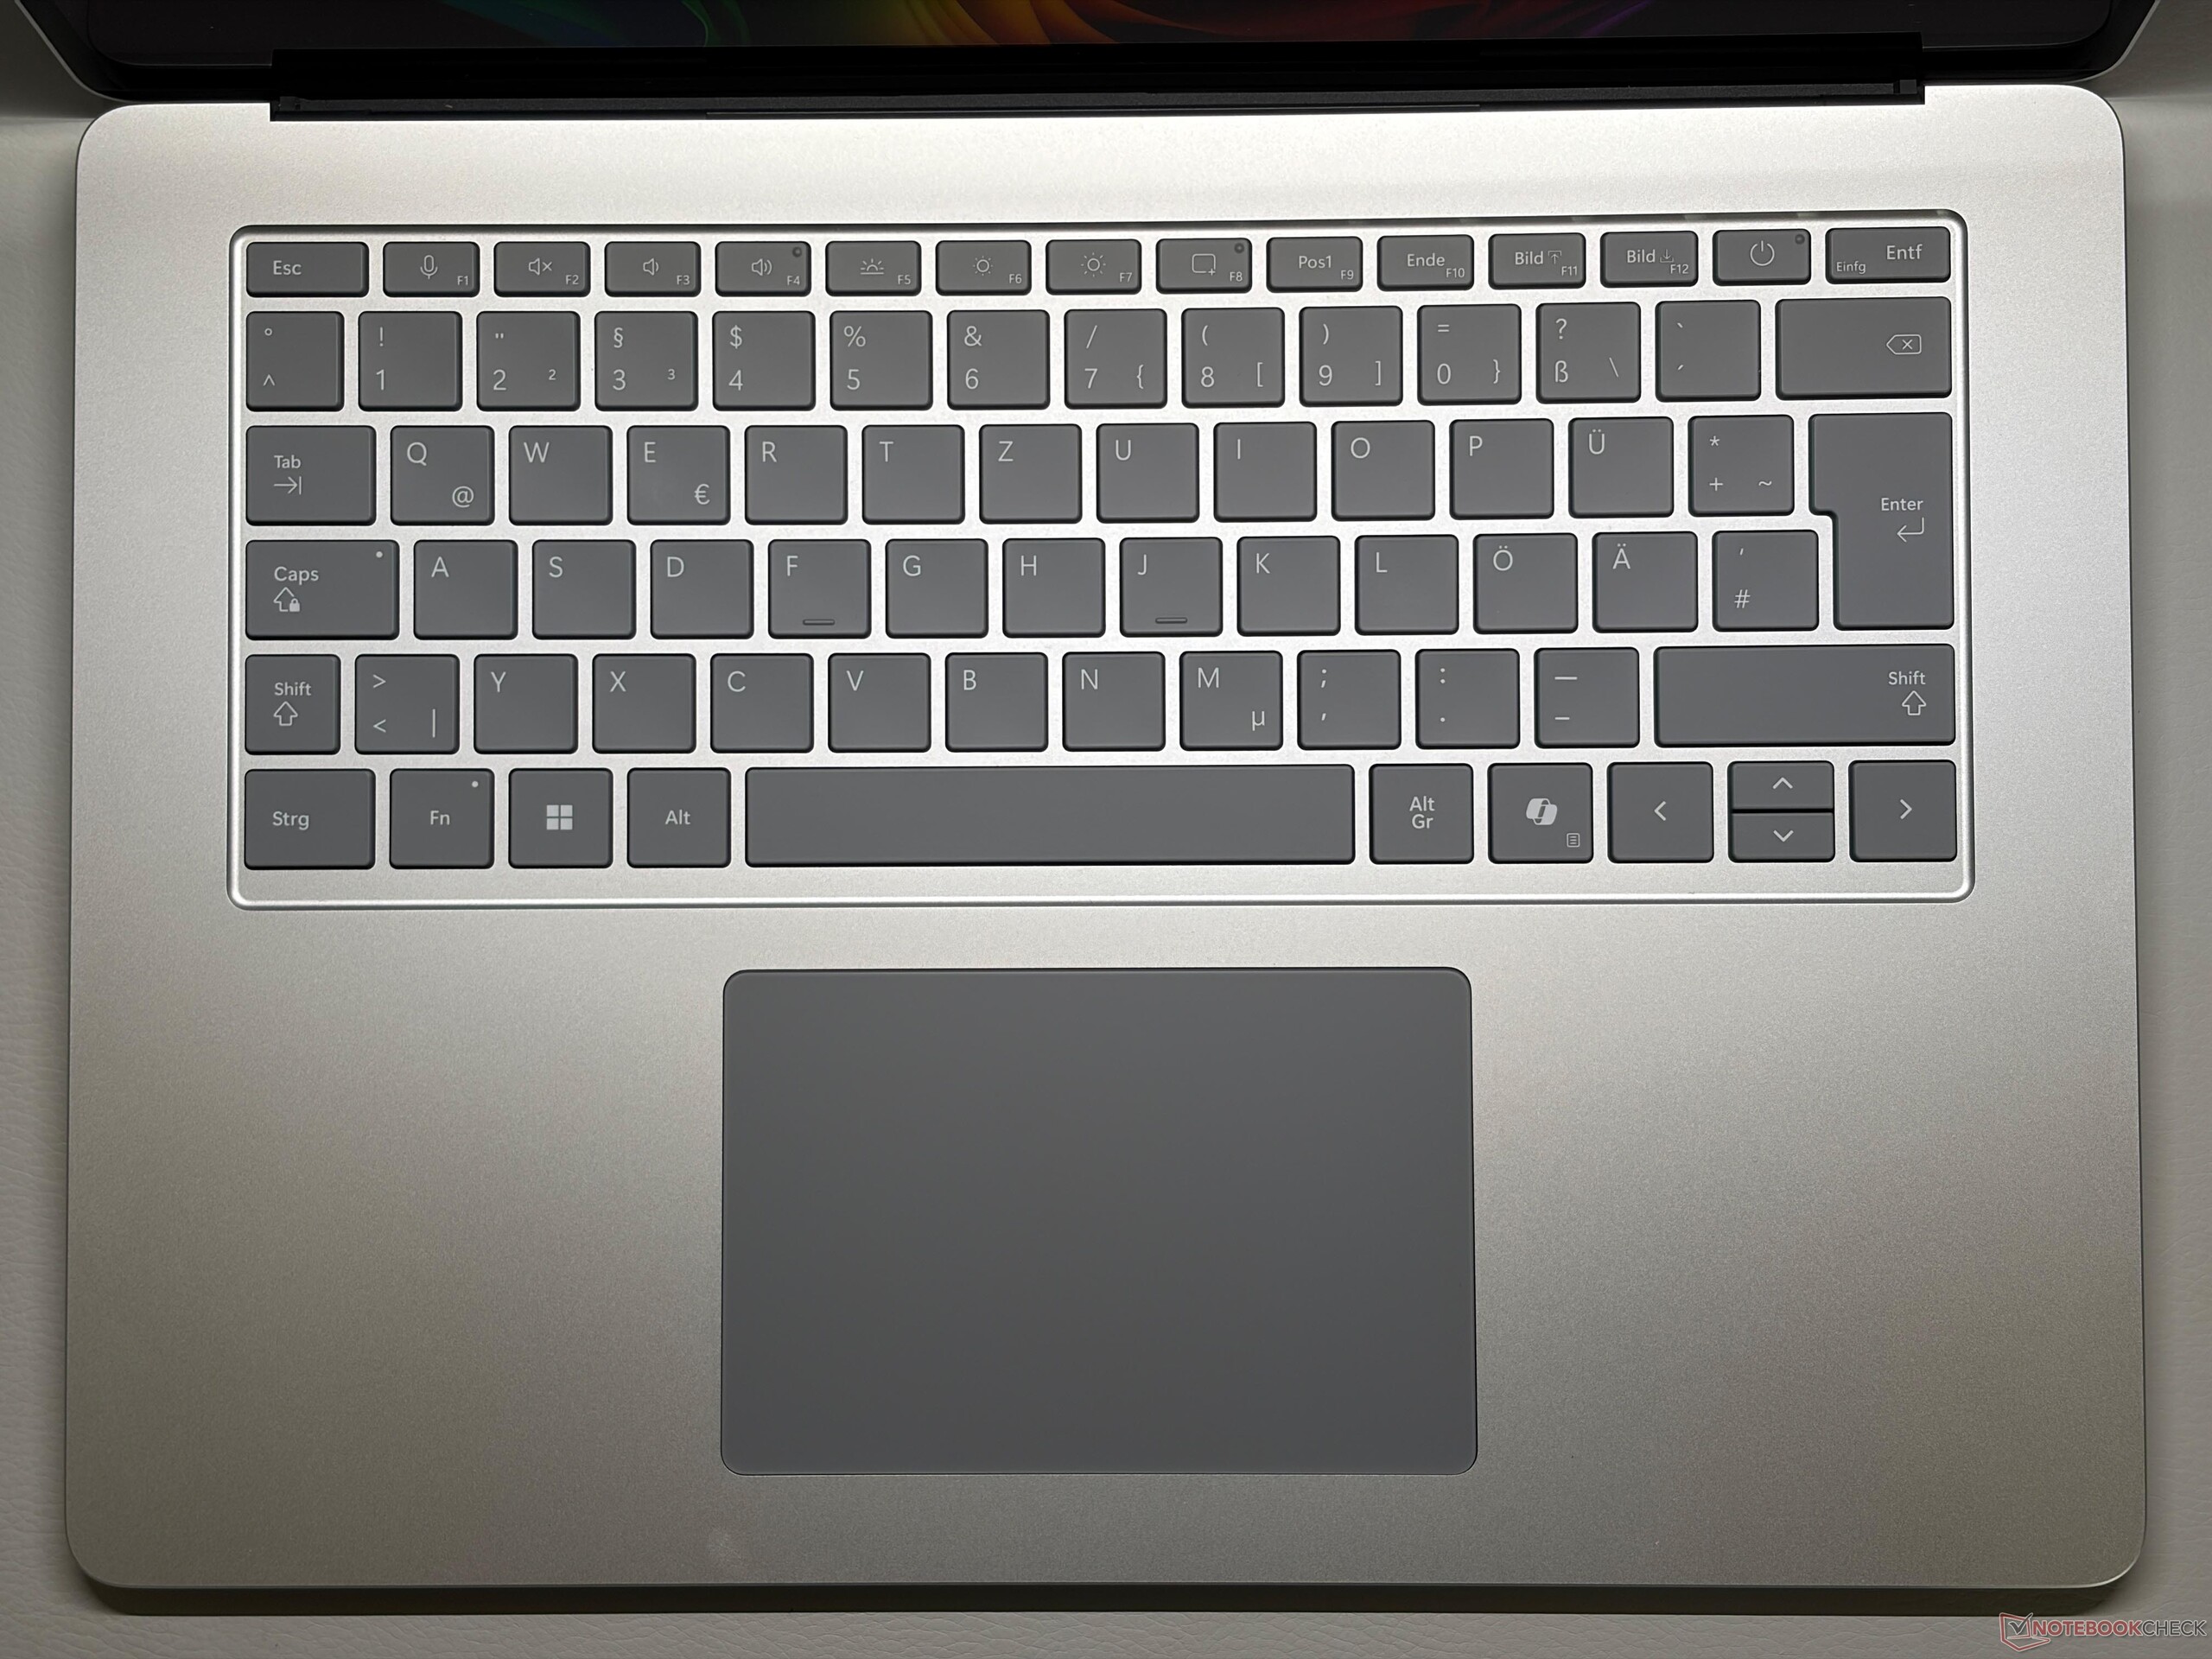
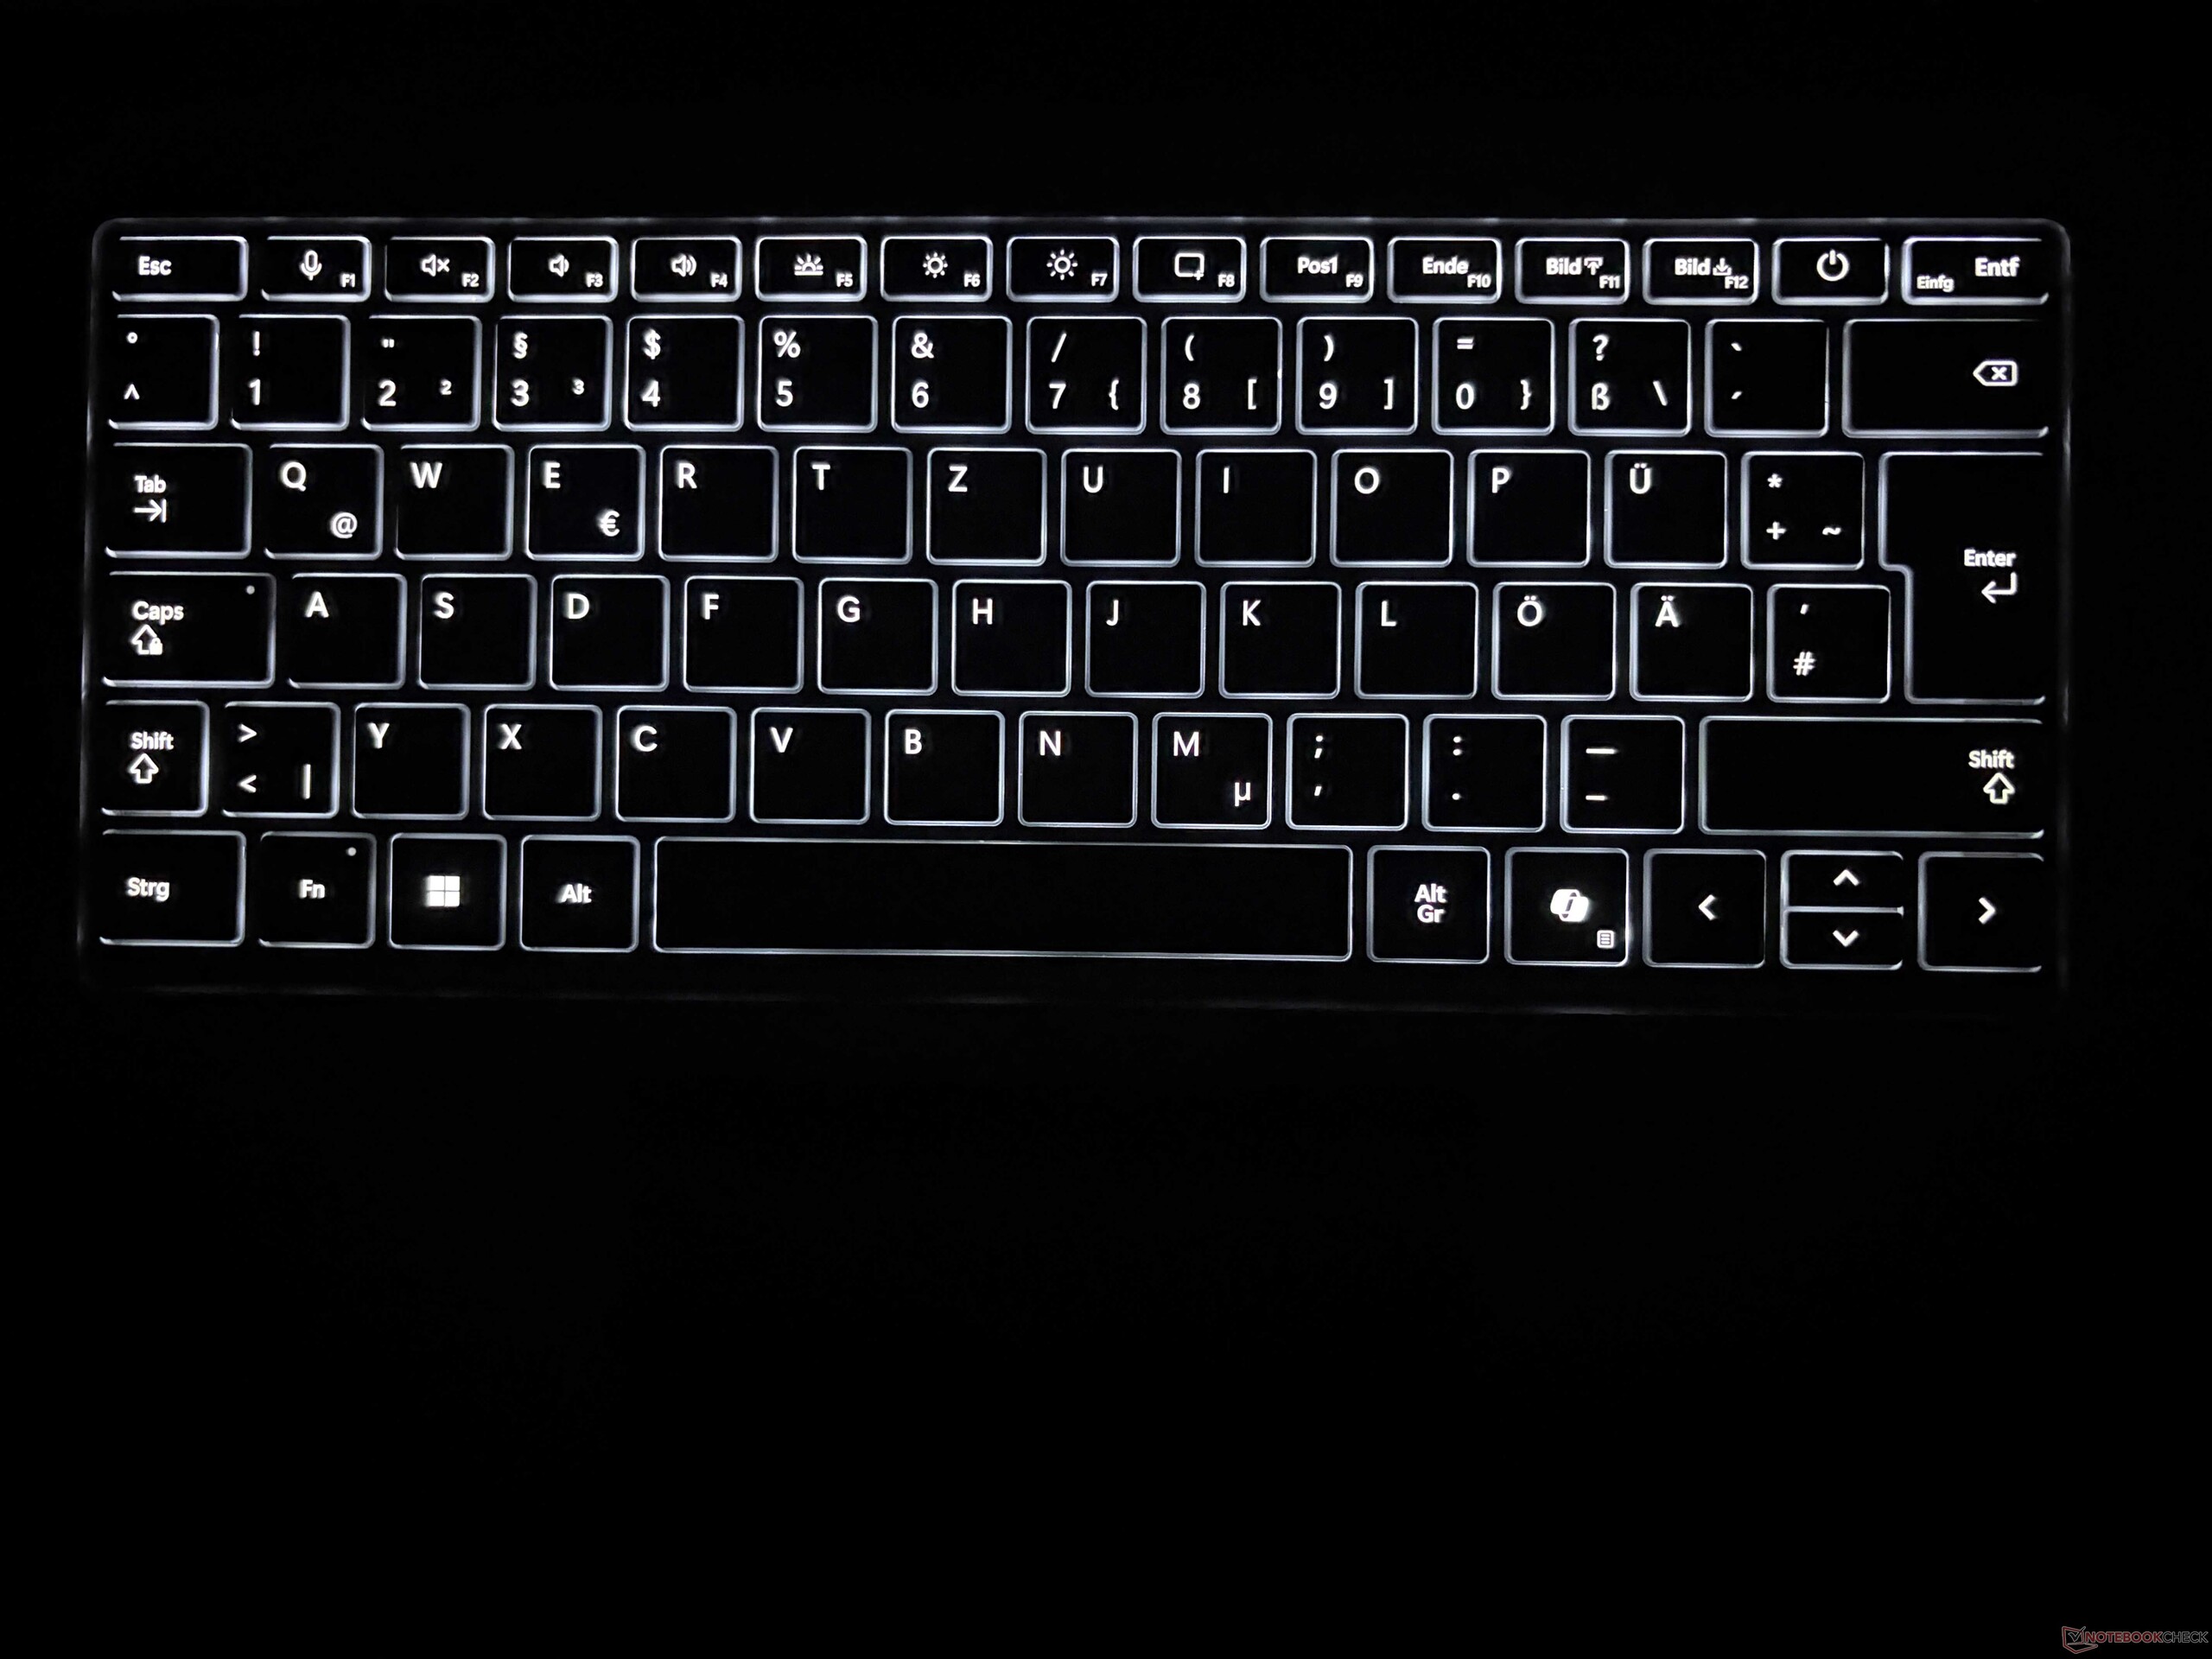
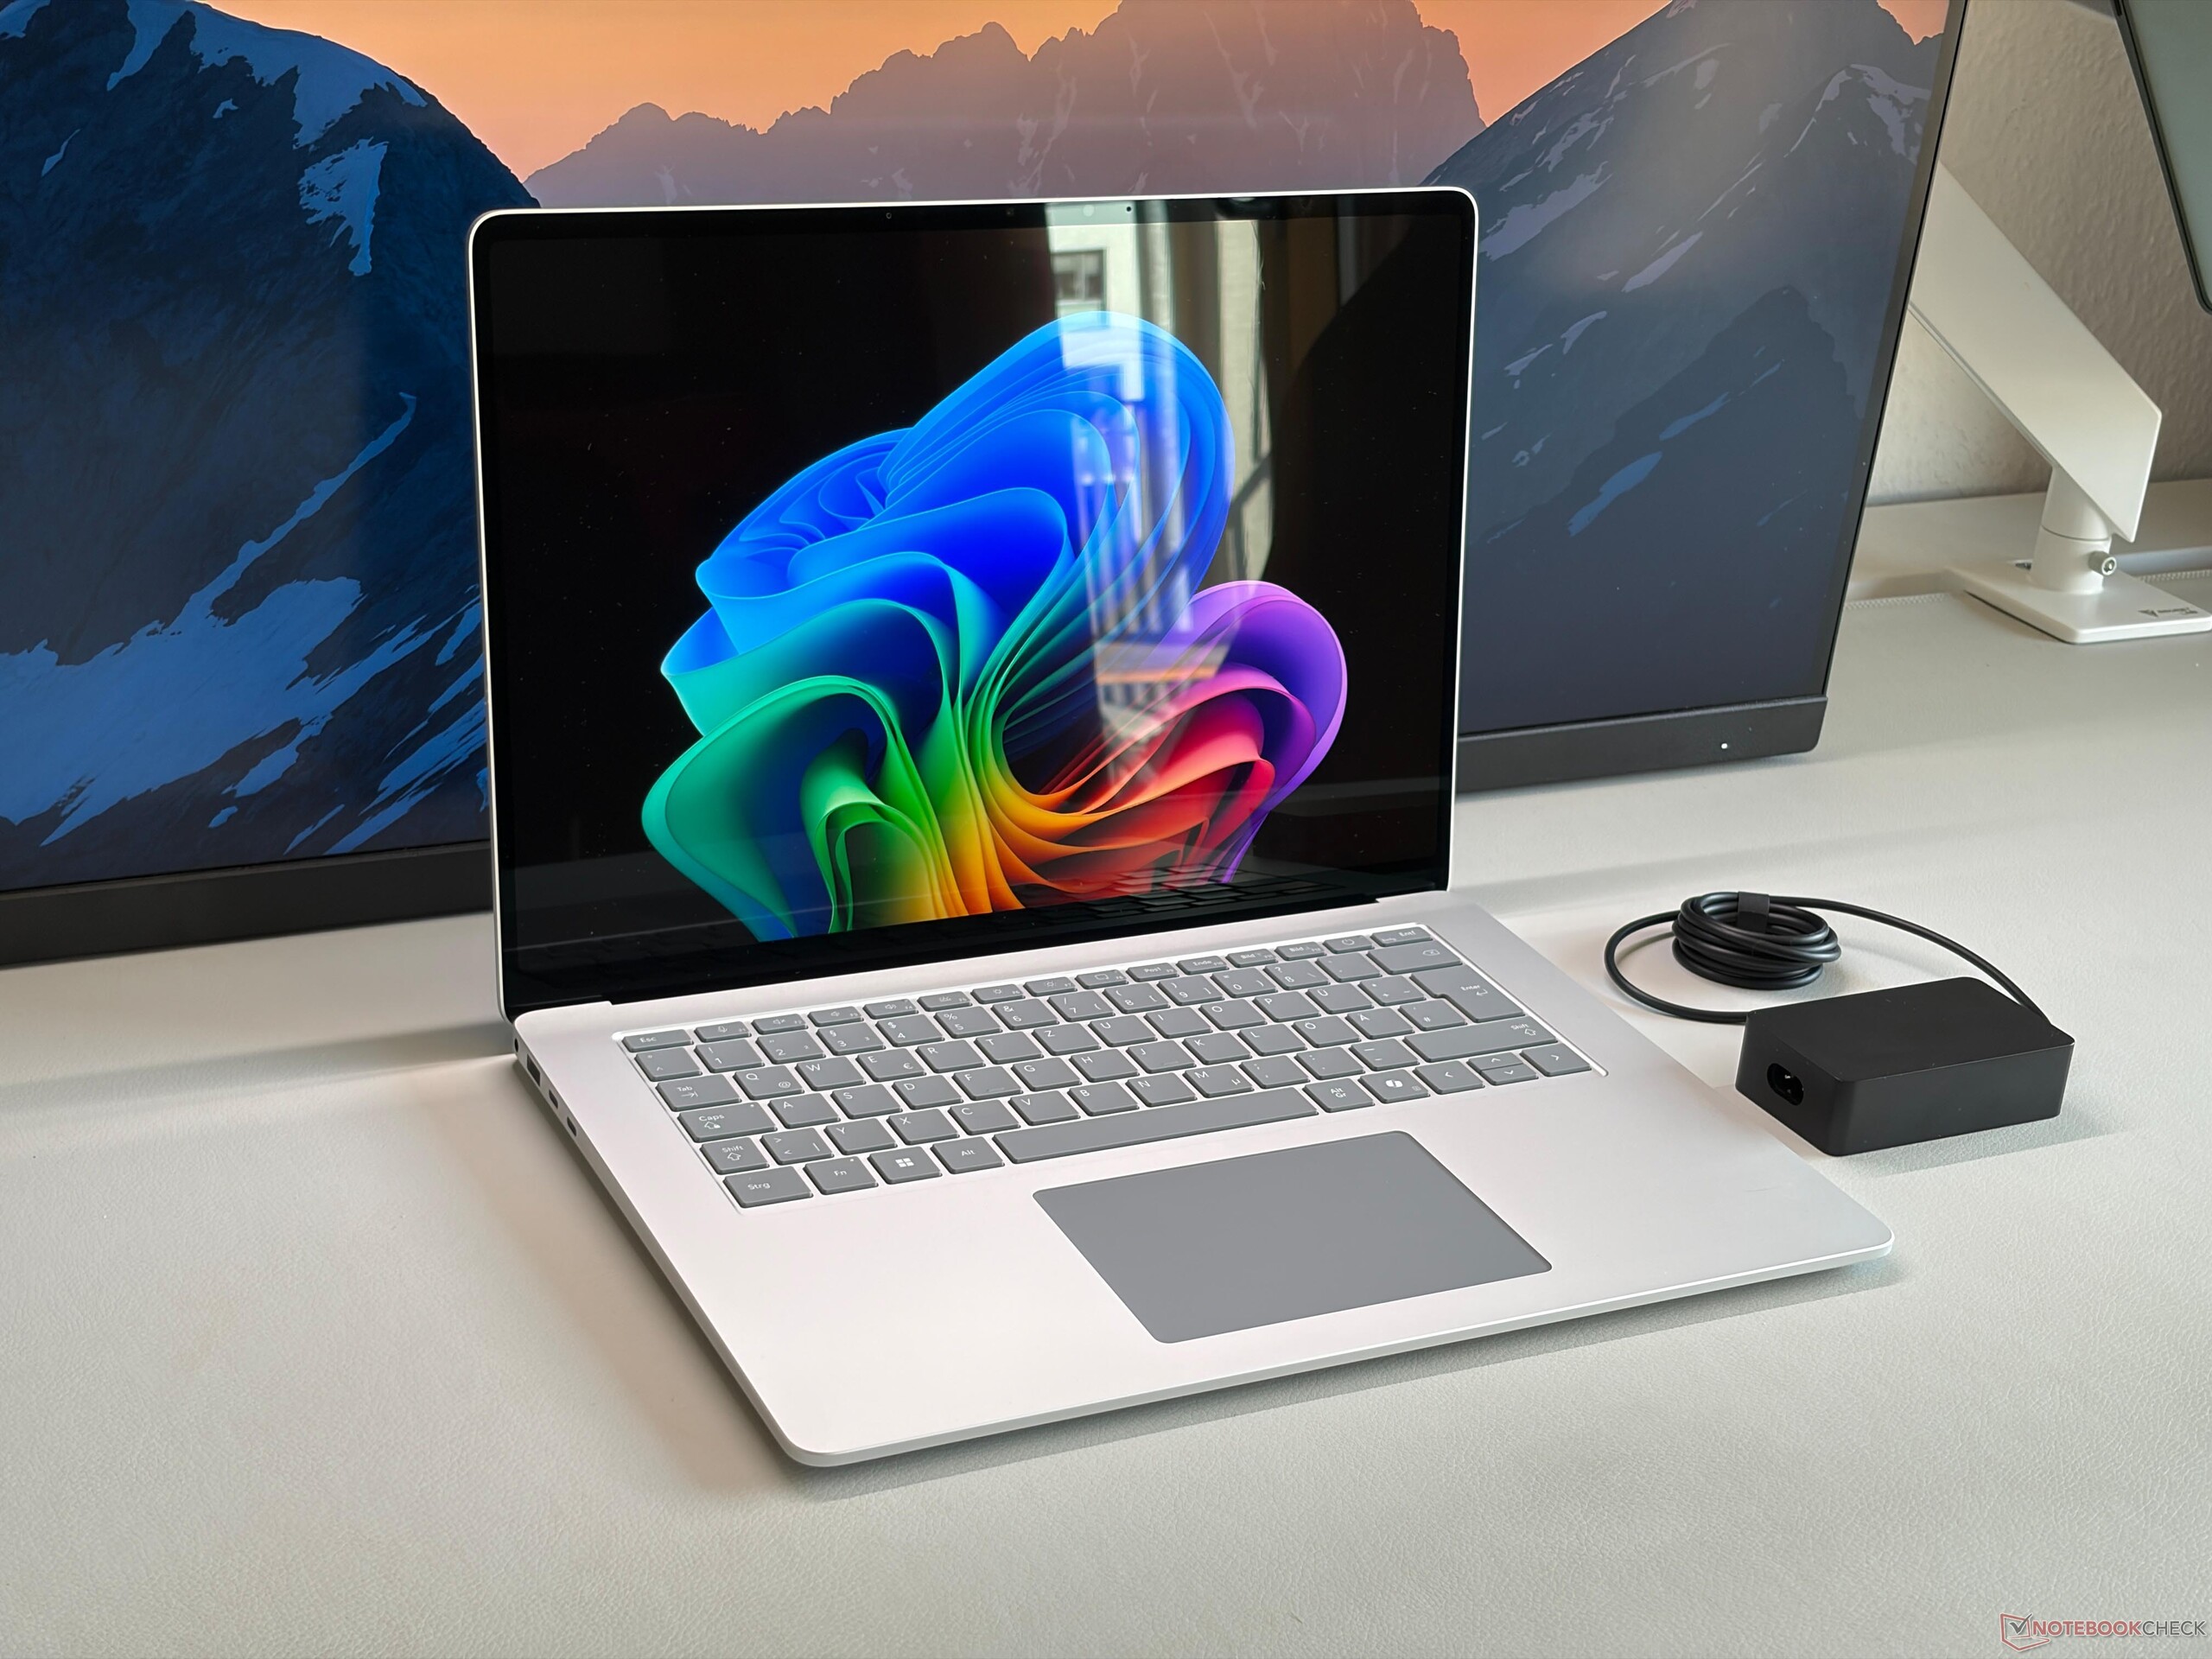
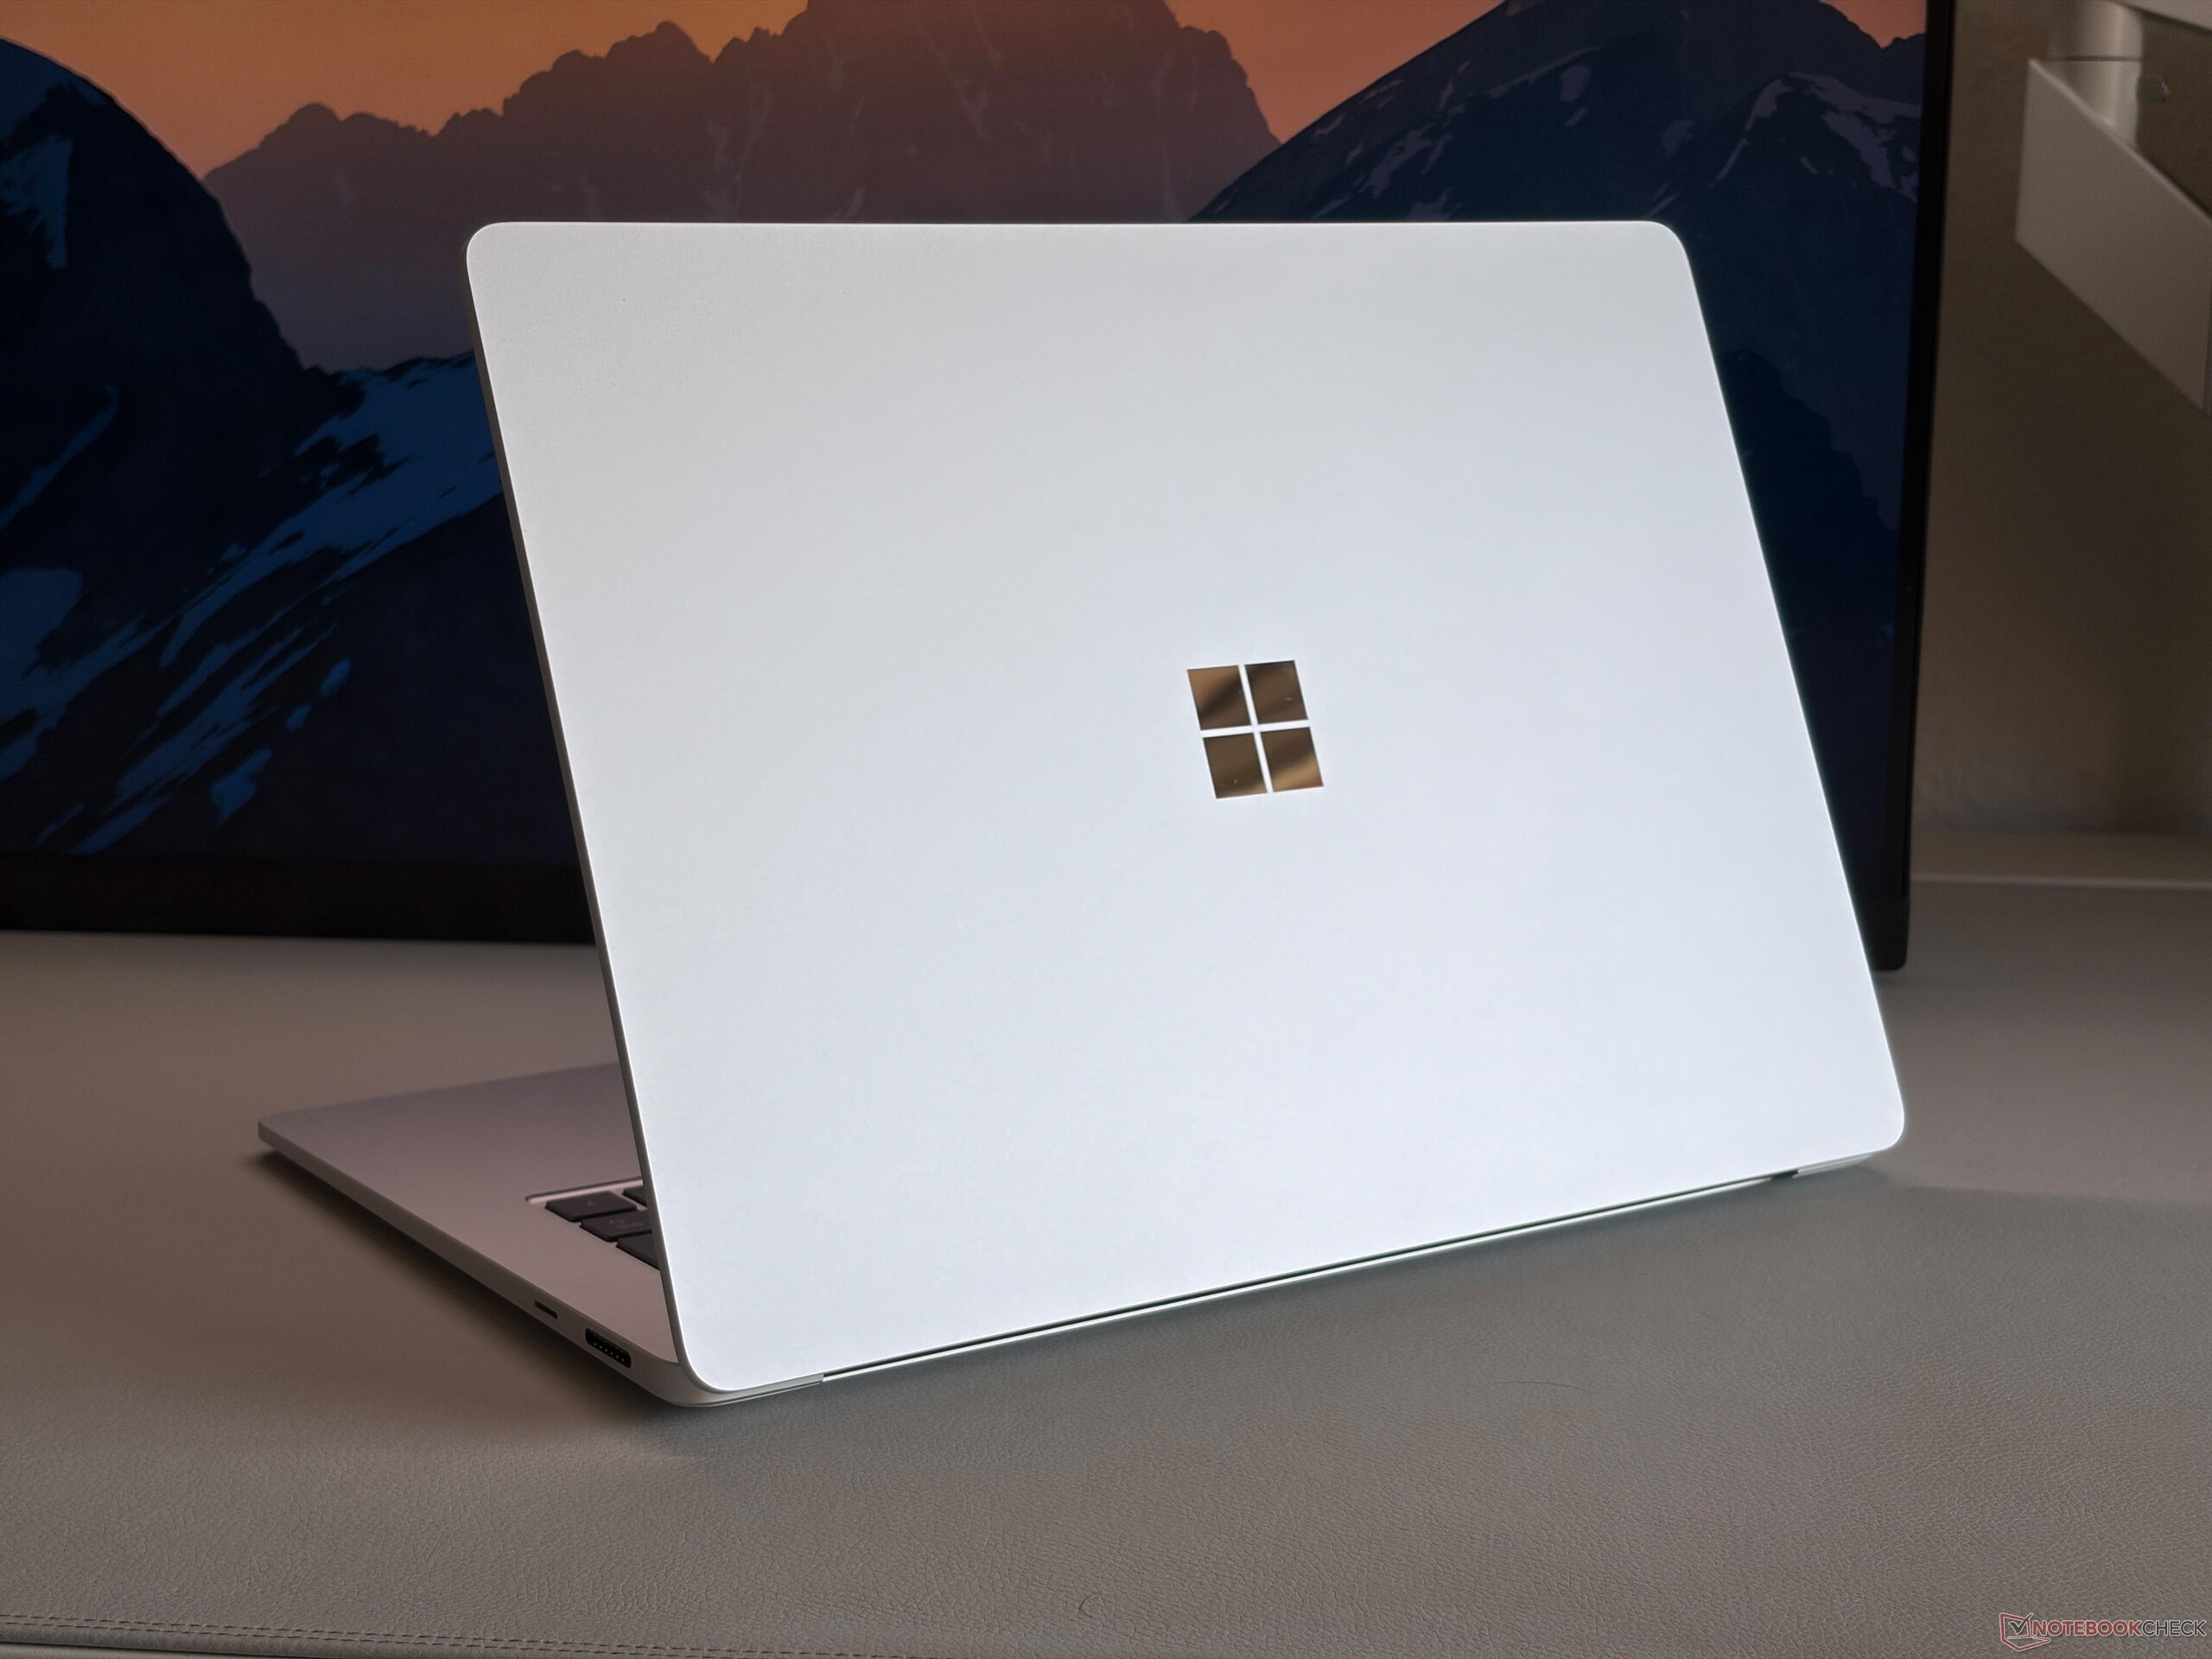
Microsoft n’a pas modifié le châssis du Surface Laptop 15 : vous bénéficiez donc toujours d’un châssis en aluminium haut de gamme offrant une excellente stabilité et une très bonne qualité de fabrication. La frappe est très confortable et le pavé tactile haptique fonctionne très bien, même s’il pourrait être un peu plus grand. L’écran est également très stable, mais les charnières pourraient être un peu plus fermes. Notre exemplaire de test argenté ne laisse pas apparaître de traces de doigts. Les composants internes sont faciles d’accès et vous pouvez remplacer le SSD M.2-2242, mais on remarque aussi beaucoup d’espace inutilisé, qui pourrait accueillir des ports supplémentaires, un SSD M.2-2280 standard ou un ventilateur de refroidissement supplémentaire.

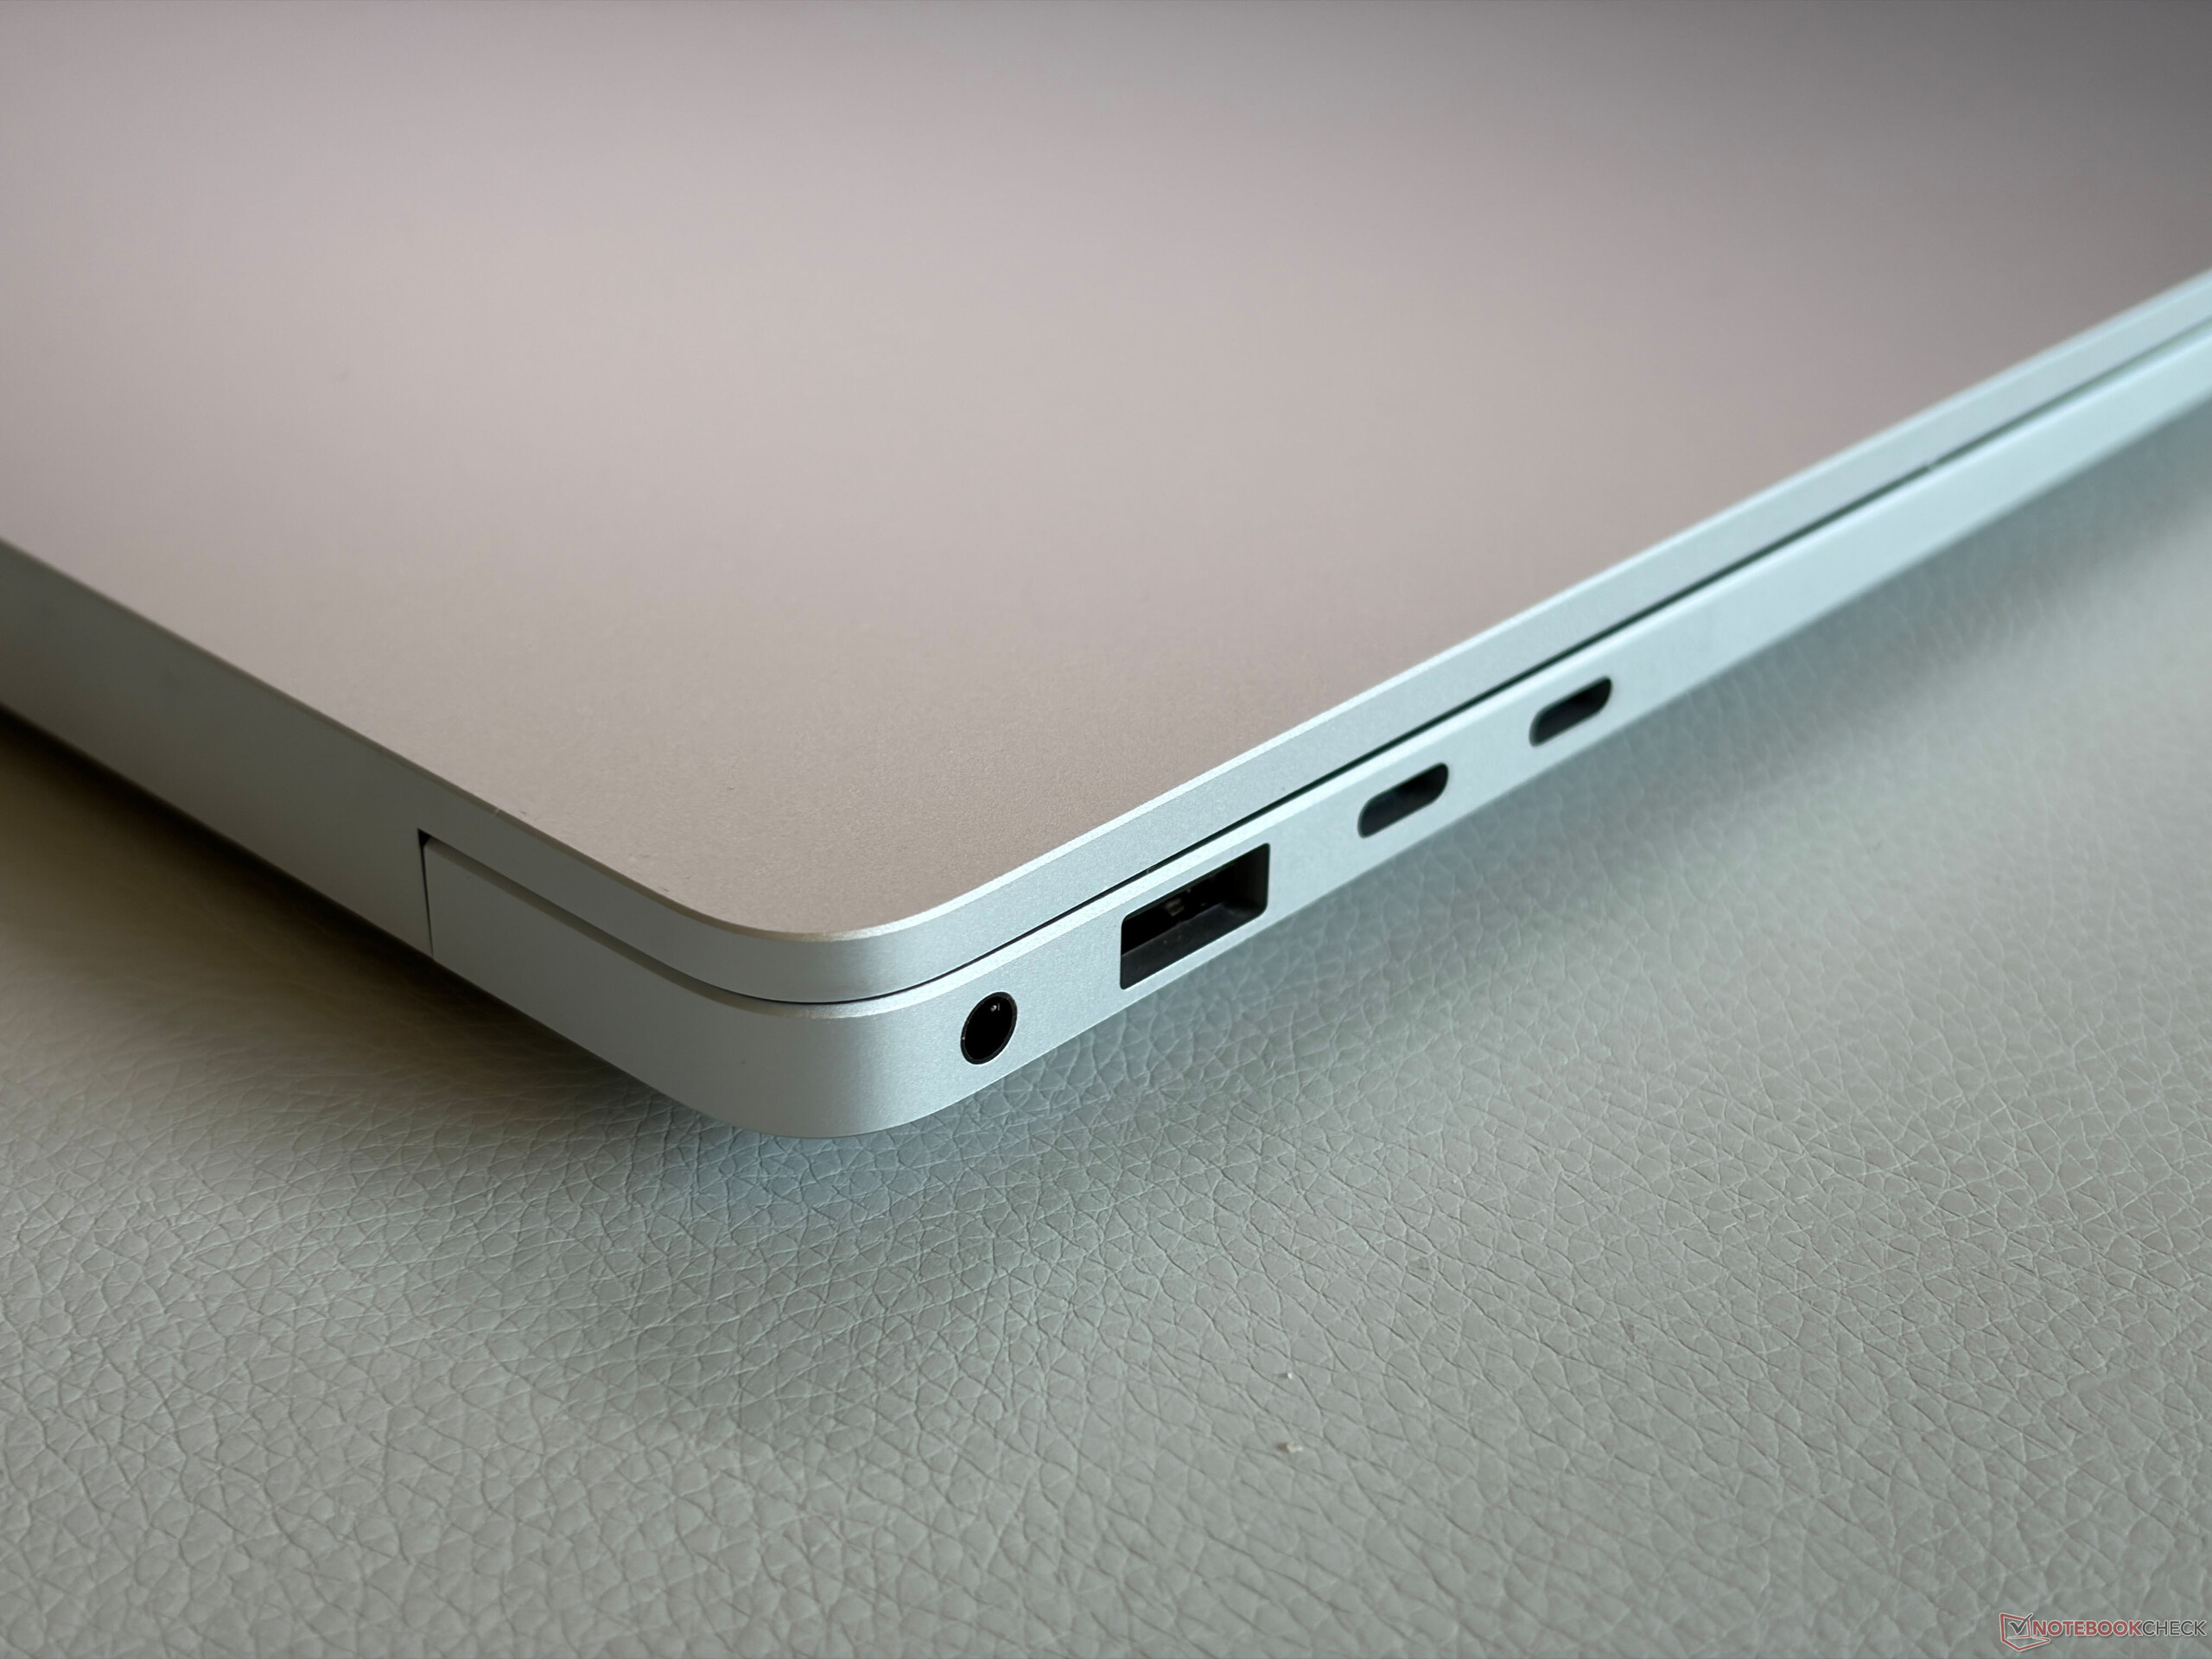
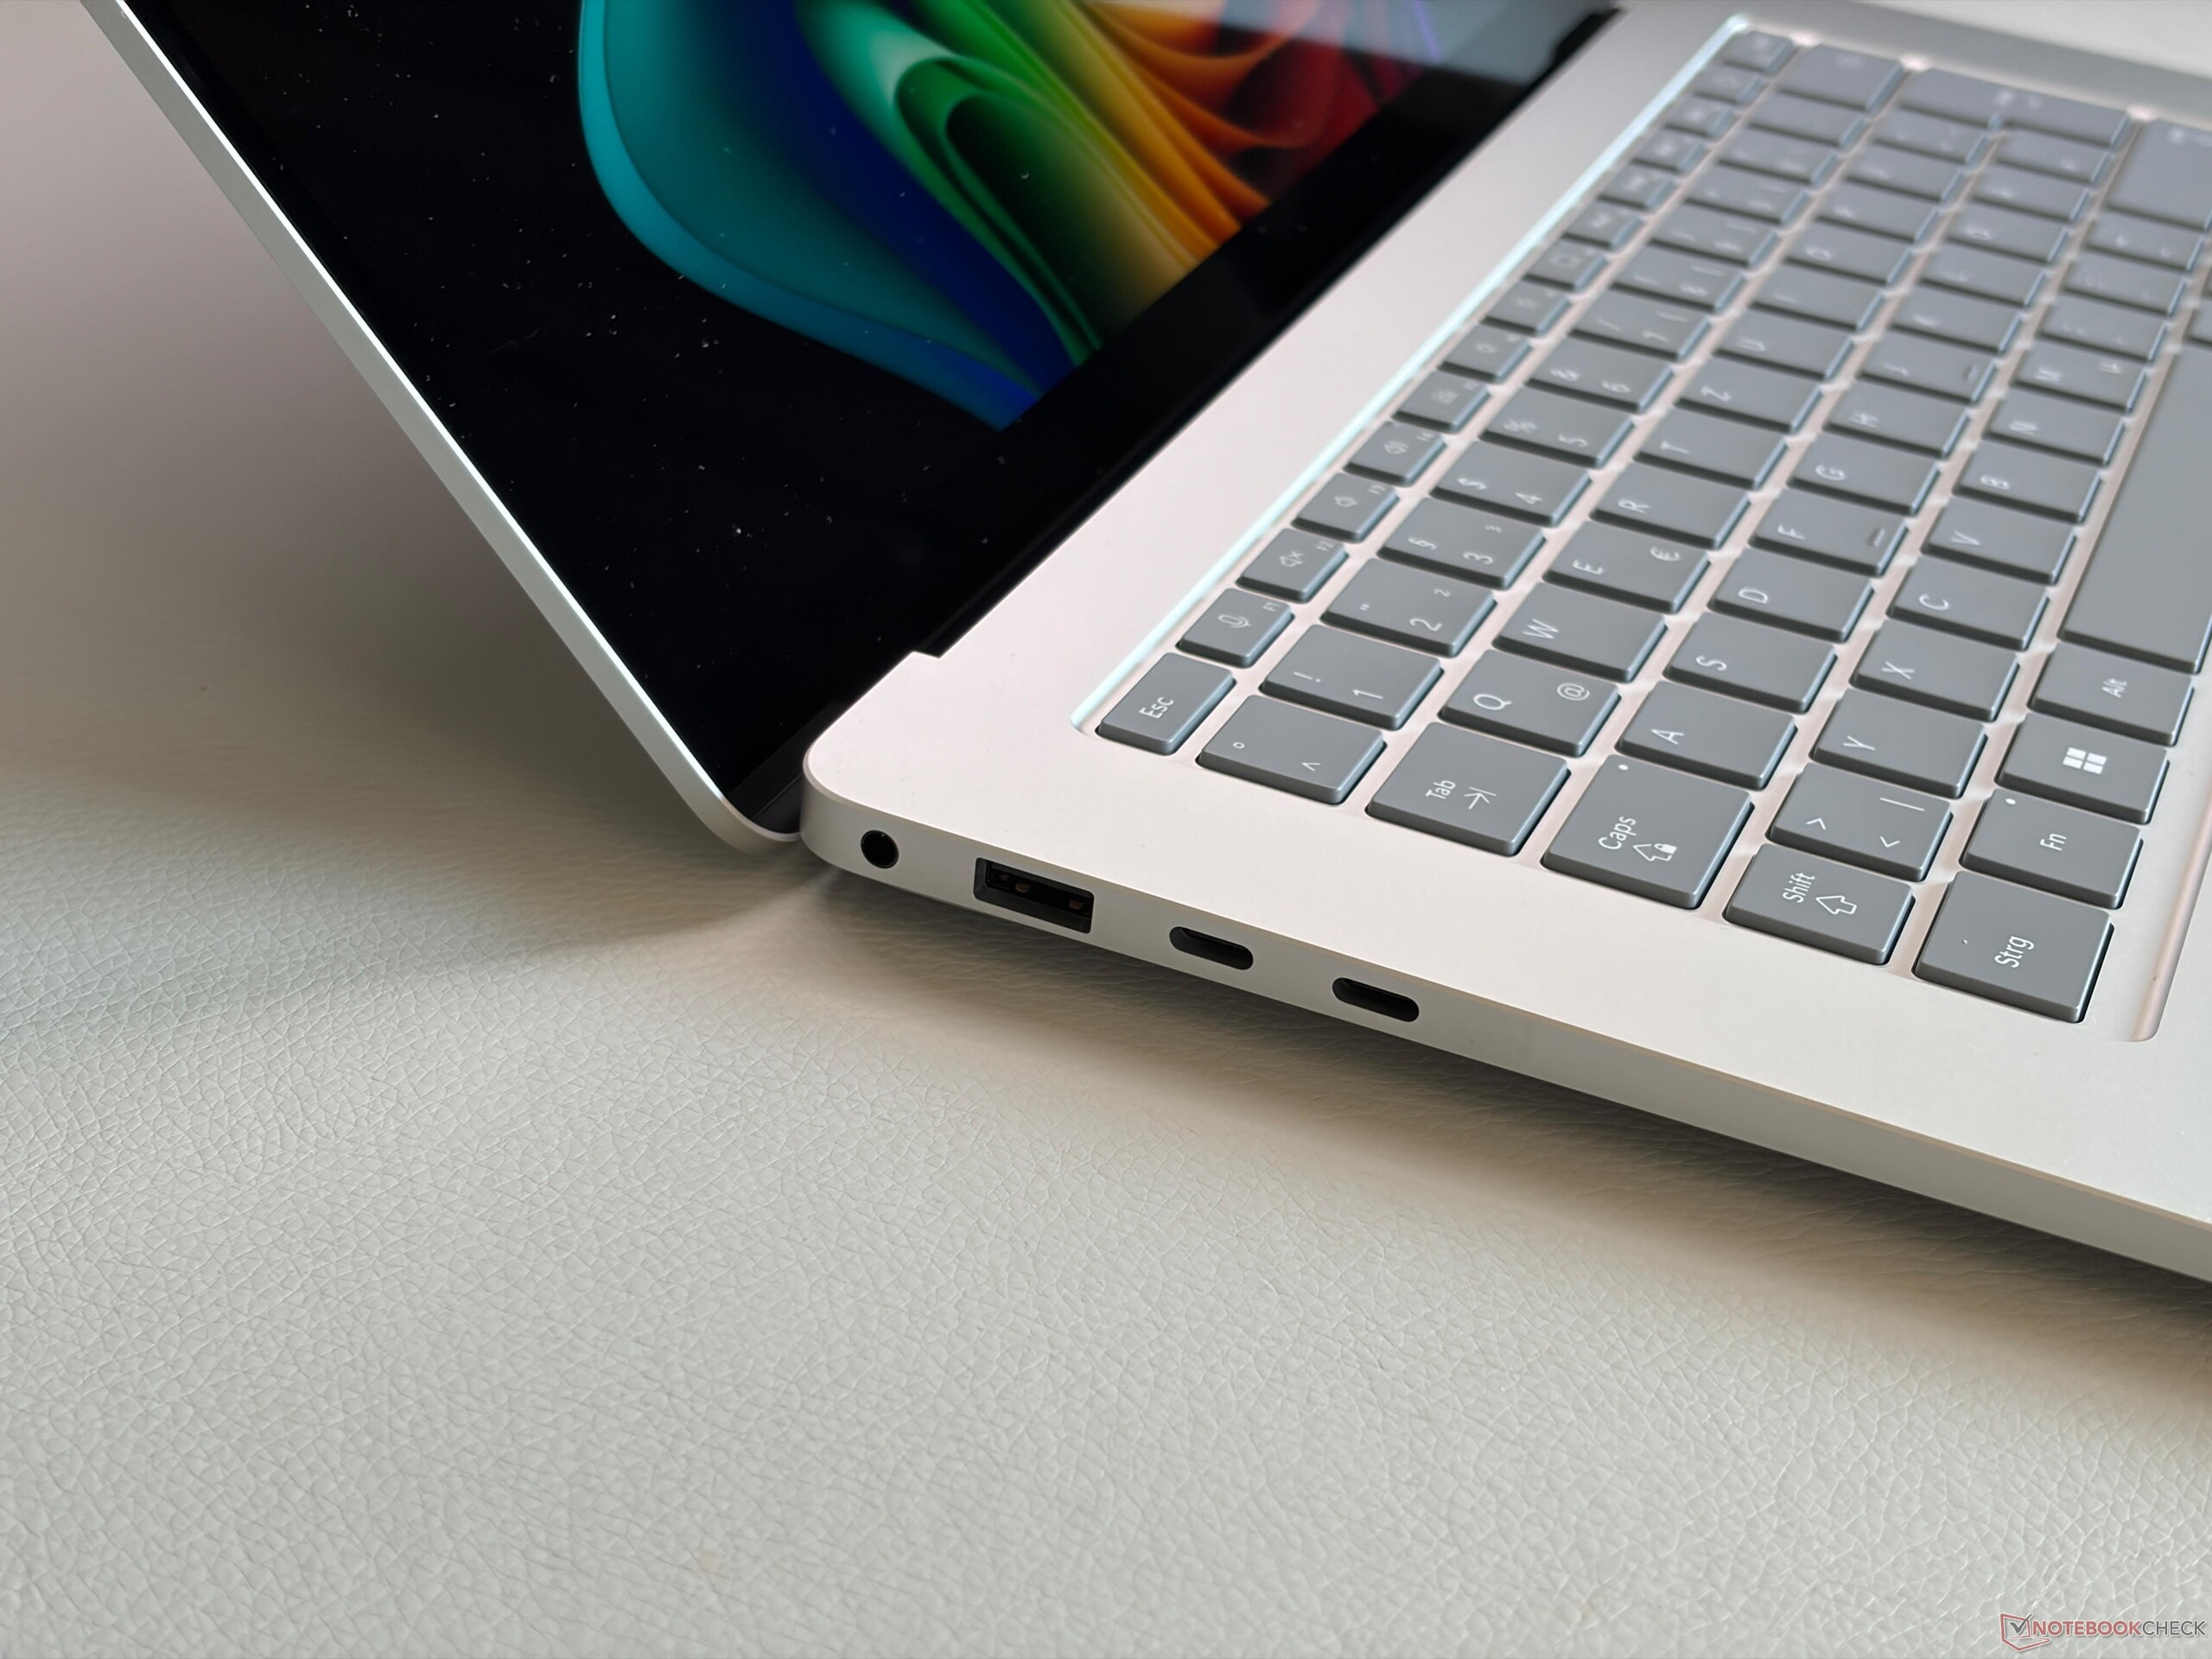
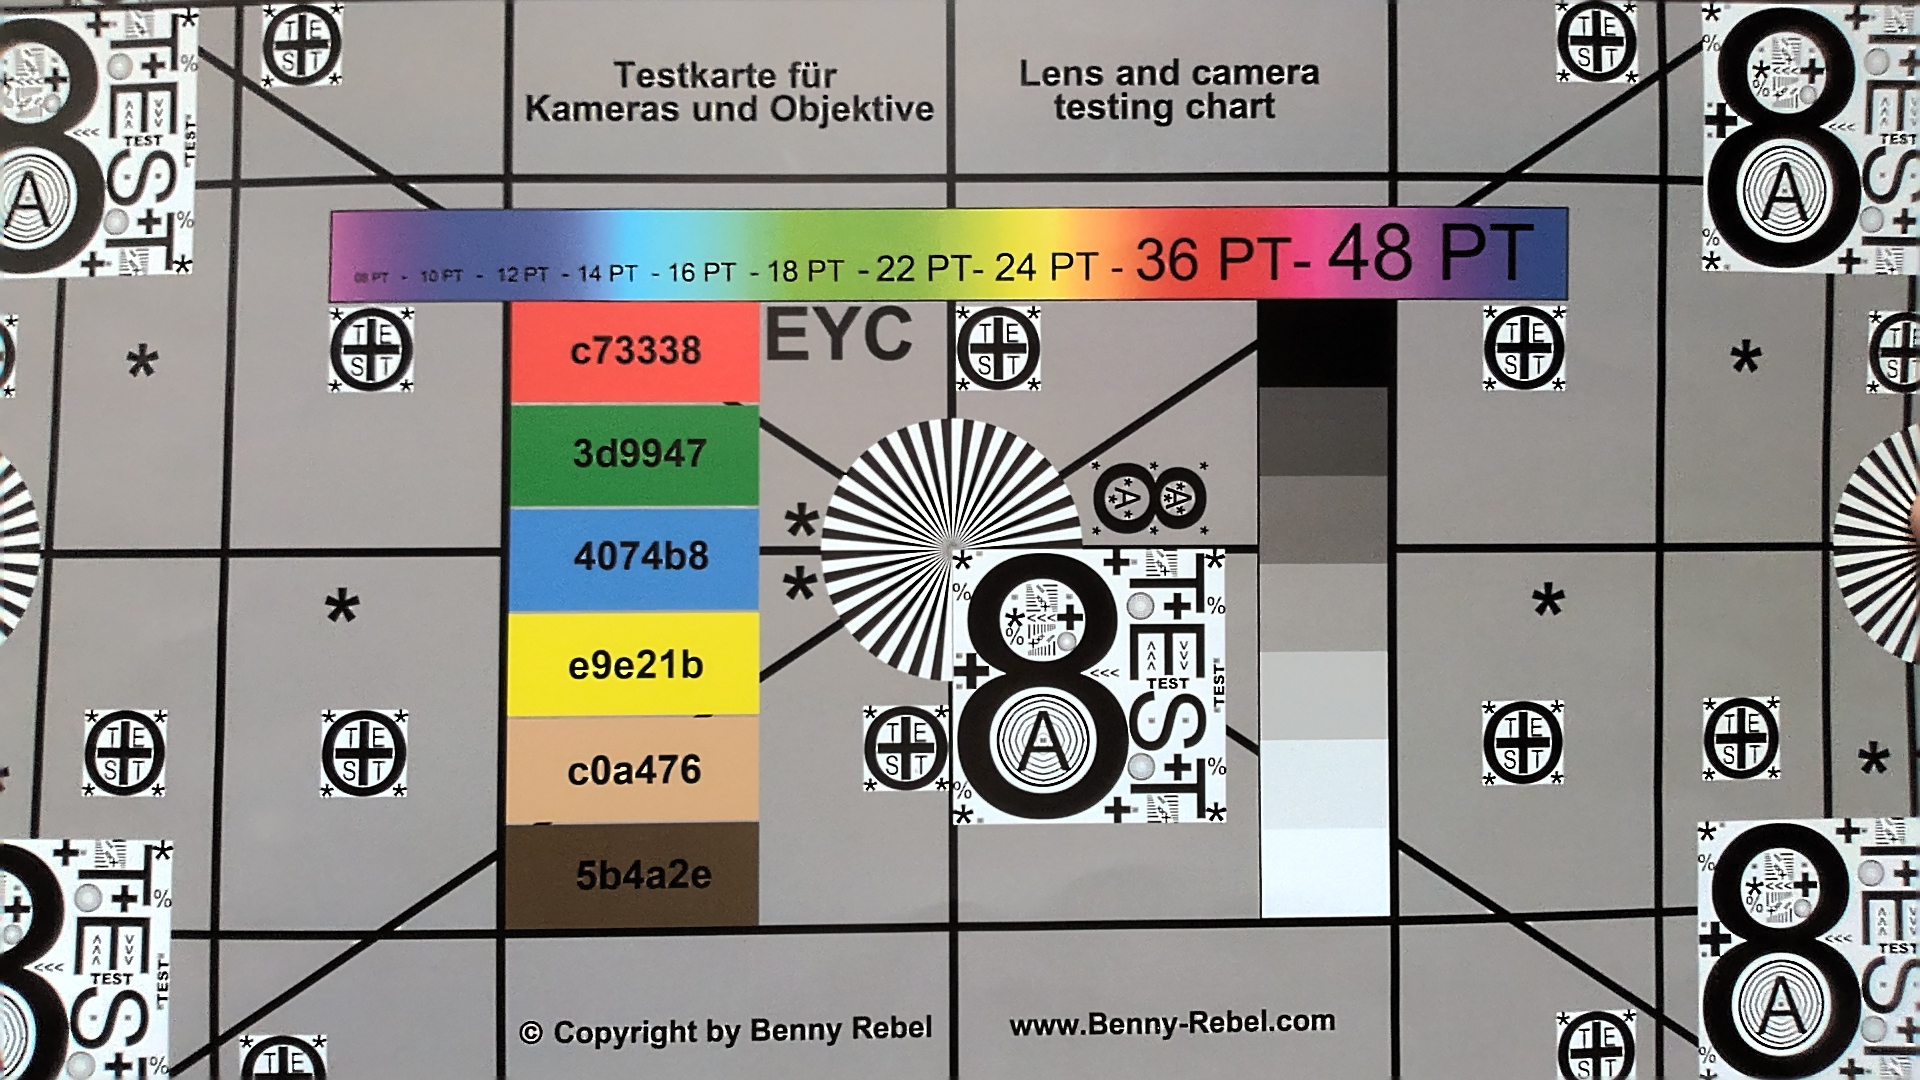
Le modèle Intel propose deux ports Thunderbolt 4 (contre uniquement de l’USB 4 pour le modèle Snapdragon) et peut même être équipé d’un lecteur de carte à puce. Le port Surface Connect situé sur le côté droit est un peu dépassé à notre avis et il est également assez encombrant ; nous aurions préféré un port USB-C supplémentaire et peut-être un lecteur de carte SD standard. Le lecteur microSD reste très rapide (débits de transfert allant jusqu’à 834 Mo/s) grâce à la prise en charge de SD-Express, et la qualité de la caméra est très bonne. Le module Wi-Fi 7 assure des débits de transfert stables.
Comparaison des tailles

❌
353.5 mm 242.4 mm 16.5 mm 1.2 kg352.58 mm 237.47 mm 14.62 mm 1.7 kg339.5 mm 228.5 mm 18 mm 1.5 kg340.4 mm 237.6 mm 11.5 mm 1.5 kg329 mm 239 mm 18.3 mm 1.7 kg329 mm 239 mm 18.3 mm 1.7 kg297 mm 210 mm 1 mm 5.7 g
À gauche : audio 3,5 mm, USB-A 3.2 Gen 1 (5 Gbit/s), 2x USB-C 4.0 avec Thunderbolt 4 (40 Gbit/s, DisplayPort ALT Mode 2.1, Power Delivery 3.0)
À droite : lecteur de carte microSD-Express, port Surface Connect
SD Card Reader
average JPG Copy Test (av. of 3 runs)
Microsoft Surface Laptop 15 Gen 8
Intel Core Ultra X7 368H (SanDisk microSD Express 256 GB)
567 MB/s
Asus Zenbook A16 UX3607
Qualcomm Snapdragon X2 Elite Extreme X2E-94-100 (Angelbird AV Pro V60)
211 MB/s -63%
Moyenne de la classe Multimedia
  (22.3 - 567, n=34, 2 dernières années)
140.2 MB/s -75%
Microsoft Surface Laptop 7 15 Lunar Lake
Intel Core Ultra 7 268V (Angelbird AV Pro V60)
86.2 MB/s -85%
Lenovo ThinkPad X9-15p Gen 1
Intel Core Ultra X7 358H
22.3 MB/s -96%
maximum AS SSD Seq Read Test (1GB)
Microsoft Surface Laptop 15 Gen 8
Intel Core Ultra X7 368H (SanDisk microSD Express 256 GB)
833.8 MB/s
Asus Zenbook A16 UX3607
Qualcomm Snapdragon X2 Elite Extreme X2E-94-100 (Angelbird AV Pro V60)
246.4 MB/s -70%
Moyenne de la classe Multimedia
  (37.3 - 1455, n=33, 2 dernières années)
218 MB/s -74%
Lenovo ThinkPad X9-15p Gen 1
Intel Core Ultra X7 358H
91.9 MB/s -89%
Microsoft Surface Laptop 7 15 Lunar Lake
Intel Core Ultra 7 268V (Angelbird AV Pro V60)
88.5 MB/s -89%
Networking
Microsoft Surface Laptop 15 Gen 8
Intel BE201 320MHz
iperf3 transmit Wi-Fi6/7 RT-BE96U
2440 (min: 2250) MBit/s ∼67%
iperf3 receive Wi-Fi6/7 RT-BE96U
2038 (min: 1980) MBit/s ∼71%
Lenovo ThinkPad X9-15p Gen 1
Intel Wi-Fi 7 BE211 320MHz
iperf3 transmit Wi-Fi6/7 RT-BE96U
3618 (min: 2749) MBit/s ∼100%
iperf3 receive Wi-Fi6/7 RT-BE96U
2878 (min: 2594) MBit/s ∼100%
Dell XPS 16 Core Ultra X7 358H
Intel Wi-Fi 7 BE211 320MHz
iperf3 receive AXE11000 6GHz
1735 (min: 1715) MBit/s ∼100%
iperf3 transmit AXE11000 6GHz
1619 (min: 1525) MBit/s ∼100%
iperf3 receive AXE11000
852 (min: 701) MBit/s ∼47%
iperf3 transmit AXE11000
875 (min: 459) MBit/s ∼49%
Apple MacBook Air 15 M5
Wi-Fi 7
iperf3 receive AXE11000
1827 (min: 1707) MBit/s ∼100%
iperf3 transmit AXE11000
1794 (min: 1717) MBit/s ∼100%
Microsoft Surface Laptop 7 15 Lunar Lake
Intel BE201 320MHz
iperf3 receive AXE11000
1562 (min: 1469) MBit/s ∼85%
iperf3 transmit AXE11000
1640 (min: 1449) MBit/s ∼91%
01002003004005006007008009001000110012001300140015001600170018001900200021002200230024002500Tooltip
Microsoft Surface Laptop 15 Gen 8; iperf3 transmit Wi-Fi6/7 RT-BE96U; iperf 3.1.3: Ø2440 (2250-2581) MBit/s
Microsoft Surface Laptop 15 Gen 8; iperf3 receive Wi-Fi6/7 RT-BE96U; iperf 3.1.3: Ø2038 (1980-2077) MBit/s
ColorChecker
10.8 ∆E
10.6 ∆E
14.9 ∆E
12.7 ∆E
10.3 ∆E
10.4 ∆E
9.7 ∆E
17.1 ∆E
13.9 ∆E
7.8 ∆E
11.8 ∆E
6.6 ∆E
9.7 ∆E
13.2 ∆E
18.6 ∆E
4.4 ∆E
12.9 ∆E
15.9 ∆E
5 ∆E
4.9 ∆E
8.6 ∆E
9.4 ∆E
4.3 ∆E
4.2 ∆E
ColorChecker Microsoft Surface Laptop 15 Gen 8: 10.32 ∆E min: 4.22 - max: 18.55 ∆E

Écran - écran tactile IPS avec une résolution supérieure

Matrice de sous-pixels
Seulement de légères fuites de rétroéclairage

Microsoft a mis à jour l’écran tactile IPS brillant. Le format reste de 3:2, mais la définition est plus élevée, à 3270 x 2180 pixels. L’impression visuelle subjective est très bonne, avec des images nettes et des couleurs riches, mais la profondeur des noirs ne peut évidemment pas rivaliser avec celle des concurrents OLED. La dalle prend en charge une fréquence de 120 Hz, mais nous remarquons toujours des effets de rémanence dus à des temps de réponse lents. Il n’y a pas de scintillement PWM et les fuites de rétroéclairage ne posent pas non plus de problème. L’écran est très brillant, ce qui constitue un véritable défi en extérieur et dans les environnements lumineux. La luminosité et les couleurs peuvent toutes deux être ajustées automatiquement.

Notre analyse avec le logiciel professionnel CalMAN révèle des couleurs fidèles dès la sortie de la boîte (profils précis pour sRGB et P3) et un rapport de contraste supérieur à celui annoncé, à ~1800:1, mais la luminosité maximale est inférieure à celle du modèle de l’année dernière. Nous mesurons jusqu’à 537 nits et 520 en moyenne. Le HDR est pris en charge, mais la luminosité n’est pas augmentée.

530
cd/m²
516
cd/m²
505
cd/m²
533
cd/m²
537
cd/m²
505
cd/m²
534
cd/m²
525
cd/m²
498
cd/m²
Homogénéité de la luminosité
LP150UD2-SPA1 testé avec X-Rite i1Pro 3
Maximum: 537 cd/m² (Nits) Moyenne: 520.3 cd/m² Minimum: 1.7 cd/m²
Homogénéité de la luminosité: 93 %
Valeur mesurée au centre, sur batterie: 537 cd/m²
Contraste: 1852:1 (Valeurs des noirs: 0.29 cd/m²)
ΔE ColorChecker Calman: 1 | ∀{0.5-29.43 Ø4.69}
ΔE Greyscale Calman: 1.6 | ∀{0.09-98 Ø4.94}
86.3% AdobeRGB 1998 (Argyll 3D)
100% sRGB (Argyll 3D)
97.9% Display P3 (Argyll 3D)
Gamma: 2.2
CCT: 6804 K
Microsoft Surface Laptop 15 Gen 8
LP150UD2-SPA1, IPS, 3270x2180, 15", 120 Hz
Lenovo ThinkPad X9-15p Gen 1
ATNA53JB03-0, OLED, 2880x1800, 15.3", 120 Hz
Asus Zenbook A16 UX3607
ATNA60HR07-0, OLED, 2880x1800, 16", 120 Hz
Dell XPS 16 Core Ultra X7 358H
LG Philips 160WV1, OLED, 3200x2000, 16", 120 Hz
Apple MacBook Air 15 M5
IPS, 2880x1864, 15.3", 60 Hz
Microsoft Surface Laptop 7 15 Lunar Lake
LQ150P1JX61, IPS, 2496x1664, 15", 120 Hz
Display
3%
2%
5%
-1%
0%
HDR Peak Brightness (cd/m²)
518
Display P3 Coverage (%)
97.9
99.1
1%
99.8
2%
99.5
2%
97.5
0%
98.1
0%
sRGB Coverage (%)
100
100
0%
100
0%
100
0%
98.3
-2%
100
0%
AdobeRGB 1998 Coverage (%)
86.3
94.3
9%
89
3%
96.5
12%
86.3
0%
87.2
1%
Response Times
96%
97%
98%
34%
30%
Response Time Grey 50% / Grey 80% * (ms)
45.7
1.1 ?(0.5, 0.6)
98%
2 ?(1, 1)
96%
0.65 ?(0.36, 0.29)
99%
26.9 ?(13.4, 13.5)
41%
33.4 ?(12.5, 20.9)
27%
Response Time Black / White * (ms)
21.5
1.4 ?(0.7, 0.7)
93%
0.48 ?(0.23, 0.25)
98%
0.87 ?(0.43, 0.44)
96%
15.9 ?(4.9, 11)
26%
14.7 ?(5.5, 9.2)
32%
PWM Frequency (Hz)
1194 ?(100)
960 ?(100)
240.2 ?(100)
PWM Amplitude * (%)
35
56
31
Screen
-112%
152%
-95%
-46%
18%
Brightness middle (cd/m²)
537
489
-9%
493
-8%
395.4
-26%
538
0%
599
12%
Brightness (cd/m²)
520
492
-5%
495
-5%
392
-25%
521
0%
590
13%
Brightness Distribution (%)
93
98
5%
98
5%
95
2%
90
-3%
93
0%
Black Level * (cd/m²)
0.29
0.02
93%
0.44
-52%
0.4
-38%
Contrast (:1)
1852
24650
1231%
1223
-34%
1498
-19%
Colorchecker dE 2000 *
1
4.6
-360%
1.1
-10%
3.69
-269%
2.1
-110%
0.5
50%
Colorchecker dE 2000 max. *
2.4
8.2
-242%
3.9
-63%
7.94
-231%
4.1
-71%
0.9
62%
Greyscale dE 2000 *
1.6
2.6
-63%
2.1
-31%
1.9
-19%
3.1
-94%
0.6
63%
Gamma
2.2 100%
2.18 101%
2.15 102%
2.28 96%
2.19 100%
2.16 102%
CCT
6804 96%
6334 103%
6544 99%
6274 104%
7075 92%
6543 99%
Colorchecker dE 2000 calibrated *
5
0.68
0.7
Moyenne finale (programmes/paramètres)
-4% / -43%
84% / 109%
3% / -33%
-4% / -23%
16% / 16%

* ... Moindre est la valeur, meilleures sont les performances

Échelle de gris CalMAN
CalMAN Colorchecker
CalMAN Colorchecker
vs. sRGB
vs. sRGB
vs. P3
vs. P3
vs. AdobeRGB
vs. AdobeRGB

Temps de réponse de l'écran

ℹ
Le temps de réponse d'un écran mesure la rapidité à laquelle l'écran est capable de changer une couleur pour une autre. Un temps de réponse élevé se traduit par une image floutée pour les objets en mouvement. Les joueurs bénéficieront de faibles latences d'affichage en jeu.
   ↔    Temps de réponse noir à blanc
21.5 ms ... hausse ↗ et chute ↘ combinées↗ ms hausse
↘ ms chute
L'écran montre de bons temps de réponse, mais insuffisant pour du jeu compétitif.
En comparaison, tous les appareils testés affichent entre 0.1 (minimum) et 240 (maximum) ms. » 48 % des appareils testés affichent de meilleures performances.
Cela signifie que les latences relevées sont similaires à la moyenne (19.7 ms) de tous les appareils testés.
   ↔    Temps de réponse gris 50% à gris 80%
45.7 ms ... hausse ↗ et chute ↘ combinées↗ ms hausse
↘ ms chute
L'écran souffre de latences très élevées, à éviter pour le jeu.
En comparaison, tous les appareils testés affichent entre 0.13 (minimum) et 636 (maximum) ms. » 79 % des appareils testés affichent de meilleures performances.
Cela signifie que les latences relevées sont moins bonnes que la moyenne (30.7 ms) de tous les appareils testés.

Scintillement / MLI (Modulation de largeur d'impulsion)

ℹ
Afin d'abaisser la luminosité de l'écran, certains ordinateurs portables font varier très rapidement le rétroéclairage entre éteint et allumé. La fréquence à laquelle le rétroéclairage s'éteint et se rallume est normalement fixée à une valeur qui permet de rendre la variation indétectable à l'œil nu? Si la fréquence est trop basse, certaines personnes peuvent être sujettes à une fatigue oculaire, des maux de tête ou même percevoir les variations.
Scintillement / MLI (Modulation de largeur d'impulsion) non décelé

En comparaison, 52 % des appareils testés n'emploient pas MDI pour assombrir leur écran. Nous avons relevé une moyenne à 7611 (minimum : 5 - maximum : 343500) Hz dans le cas où une MDI était active.

Au soleil
Au soleil
À l’extérieur (journée lumineuse, sans lumière directe du soleil)
Angles de vision
Angles de vision

Performances - Intel Core Ultra X7

Conditions de test

Nous avons utilisé le mode Meilleures performances pour nos benchmarks et nos mesures.

Performances du processeur

L’Intel Core Ultra X7 368H est l’un des processeurs mobiles Panther Lake les plus rapides et il peut consommer 65/35 watts. Ce n’est pas idéal pour un ordinateur portable de 15 pouces et les performances multicœurs pourraient être un peu meilleures. Cependant, Panther Lake met davantage l’accent sur l’efficacité énergétique que sur les performances multicœurs brutes. Les performances sont très similaires à celles du Dell XPS 16 avec des limites de puissance comparables. Le modèle Snapdragon utilise des processeurs Snapdragon X2 Plus ou X2 Elite (X2E-78-100), qui devraient offrir des performances CPU multicœurs légèrement supérieures. 

CPU Performance rating: Percent
Cinebench 2024: CPU Multi Core | CPU Single Core
Geekbench 6.7: Multi-Core | Single-Core
CPU Performance rating
Asus Zenbook A16 UX3607
Qualcomm Snapdragon X2 Elite Extreme X2E-94-100
91.8 pt
Apple MacBook Air 15 M5
Apple M5 10-Core
82 pt
Lenovo ThinkPad X9-15p Gen 1 -2!
Intel Core Ultra X7 358H
70.9 pt
Microsoft Surface Pro 13 OLED
Qualcomm Snapdragon X2 Elite X2E-78-100
67.9 pt
Moyenne de la classe Multimedia
 
67.1 pt
Microsoft Surface Laptop 15 Gen 8
Intel Core Ultra X7 368H
65.6 pt
Dell XPS 16 Core Ultra X7 358H
Intel Core Ultra X7 358H
65.3 pt
Moyenne Intel Core Ultra X7 368H
 
65 pt
Microsoft Surface Laptop 8 13.8
Qualcomm Snapdragon X2 Plus X2P-64-100
63.8 pt
Microsoft Surface Laptop 7 15 Lunar Lake
Intel Core Ultra 7 268V
53.3 pt
Cinebench 2024 / CPU Multi Core
Asus Zenbook A16 UX3607
Qualcomm Snapdragon X2 Elite Extreme X2E-94-100
1761 Points +83%
Moyenne de la classe Multimedia
  (327 - 2490, n=61, 2 dernières années)
1120 Points +17%
Microsoft Surface Pro 13 OLED
Qualcomm Snapdragon X2 Elite X2E-78-100
1078 Points +12%
Moyenne Intel Core Ultra X7 368H
  (960 - 1104, n=2)
1032 Points +8%
Dell XPS 16 Core Ultra X7 358H
Intel Core Ultra X7 358H
1004 Points +5%
Apple MacBook Air 15 M5
Apple M5 10-Core
962 Points 0%
Microsoft Surface Laptop 15 Gen 8
Intel Core Ultra X7 368H
960 Points
Microsoft Surface Laptop 8 13.8
Qualcomm Snapdragon X2 Plus X2P-64-100
854 Points -11%
Microsoft Surface Laptop 7 15 Lunar Lake
Intel Core Ultra 7 268V
600 Points -37%
Cinebench 2024 / CPU Single Core
Apple MacBook Air 15 M5
Apple M5 10-Core
199 Points +57%
Asus Zenbook A16 UX3607
Qualcomm Snapdragon X2 Elite Extreme X2E-94-100
151 Points +19%
Microsoft Surface Laptop 8 13.8
Qualcomm Snapdragon X2 Plus X2P-64-100
134 Points +5%
Microsoft Surface Pro 13 OLED
Qualcomm Snapdragon X2 Elite X2E-78-100
133 Points +5%
Moyenne de la classe Multimedia
  (72.5 - 201, n=55, 2 dernières années)
130.6 Points +3%
Moyenne Intel Core Ultra X7 368H
  (127.1 - 128.8, n=2)
128 Points +1%
Microsoft Surface Laptop 15 Gen 8
Intel Core Ultra X7 368H
127.1 Points
Dell XPS 16 Core Ultra X7 358H
Intel Core Ultra X7 358H
123.7 Points -3%
Microsoft Surface Laptop 7 15 Lunar Lake
Intel Core Ultra 7 268V
123.3 Points -3%
Geekbench 6.7 / Multi-Core
Asus Zenbook A16 UX3607
Qualcomm Snapdragon X2 Elite Extreme X2E-94-100
23204 Points +37%
Apple MacBook Air 15 M5
Apple M5 10-Core
16995 Points 0%
Dell XPS 16 Core Ultra X7 358H
Intel Core Ultra X7 358H
16943 Points 0%
Microsoft Surface Laptop 15 Gen 8
Intel Core Ultra X7 368H
16943 Points
Lenovo ThinkPad X9-15p Gen 1
Intel Core Ultra X7 358H
16876 Points 0%
Moyenne de la classe Multimedia
  (4983 - 30057, n=61, 2 dernières années)
15748 Points -7%
Moyenne Intel Core Ultra X7 368H
  (12050 - 17352, n=4)
15438 Points -9%
Microsoft Surface Pro 13 OLED
Qualcomm Snapdragon X2 Elite X2E-78-100
15102 Points -11%
Microsoft Surface Laptop 8 13.8
Qualcomm Snapdragon X2 Plus X2P-64-100
14277 Points -16%
Microsoft Surface Laptop 7 15 Lunar Lake
Intel Core Ultra 7 268V
11279 Points -33%
Geekbench 6.7 / Single-Core
Apple MacBook Air 15 M5
Apple M5 10-Core
4195 Points +41%
Asus Zenbook A16 UX3607
Qualcomm Snapdragon X2 Elite Extreme X2E-94-100
3826 Points +28%
Microsoft Surface Pro 13 OLED
Qualcomm Snapdragon X2 Elite X2E-78-100
3287 Points +10%
Microsoft Surface Laptop 8 13.8
Qualcomm Snapdragon X2 Plus X2P-64-100
3265 Points +10%
Moyenne de la classe Multimedia
  (1591 - 4336, n=61, 2 dernières années)
2990 Points 0%
Microsoft Surface Laptop 15 Gen 8
Intel Core Ultra X7 368H
2980 Points
Moyenne Intel Core Ultra X7 368H
  (2924 - 2983, n=3)
2962 Points -1%
Dell XPS 16 Core Ultra X7 358H
Intel Core Ultra X7 358H
2903 Points -3%
Lenovo ThinkPad X9-15p Gen 1
Intel Core Ultra X7 358H
2901 Points -3%
Microsoft Surface Laptop 7 15 Lunar Lake
Intel Core Ultra 7 268V
2871 Points -4%

Cinebench R15 en boucle multi-cœur

075150225300375450525600675750825900975105011251200127513501425150015751650172518001875195020252100217522502325240024752550262527002775285029253000307531503225330033753450352536003675Tooltip
Microsoft Surface Laptop 15 Gen 8 Intel Core Ultra X7 368H: Ø2462 (2121.79-3156.32) Points
Lenovo ThinkPad X9-15p Gen 1 Intel Core Ultra X7 358H: Ø2913 (2846.57-3015.45) Points
Asus Zenbook A16 UX3607 Qualcomm Snapdragon X2 Elite Extreme X2E-94-100: Ø3638 (3524.54-3682.9) Points
Dell XPS 16 Core Ultra X7 358H Intel Core Ultra X7 358H: Ø2543 (2491.75-2985.52) Points
Microsoft Surface Laptop 7 15 Lunar Lake Intel Core Ultra 7 268V: Ø1469 (1435.9-1615.7) Points
CPU Performance rating: Percent
Cinebench R23: Multi Core | Single Core
Cinebench R20: CPU (Multi Core) | CPU (Single Core)
Cinebench R15: CPU Multi 64Bit | CPU Single 64Bit
Blender: v2.79 BMW27 CPU
7-Zip 18.03: 7z b 4 | 7z b 4 -mmt1
HWBOT x265 Benchmark v2.2: 4k Preset
LibreOffice : 20 Documents To PDF
R Benchmark 2.5: Overall mean
CPU Performance rating
Lenovo ThinkPad X9-15p Gen 1
Intel Core Ultra X7 358H
77.9 pt
Moyenne Intel Core Ultra X7 368H
 
76.2 pt
Microsoft Surface Laptop 15 Gen 8
Intel Core Ultra X7 368H
75.8 pt
Dell XPS 16 Core Ultra X7 358H
Intel Core Ultra X7 358H
75.2 pt
Moyenne de la classe Multimedia
 
69.1 pt
Asus Zenbook A16 UX3607 -1!
Qualcomm Snapdragon X2 Elite Extreme X2E-94-100
68.9 pt
Microsoft Surface Laptop 7 15 Lunar Lake
Intel Core Ultra 7 268V
53.1 pt
Cinebench R23 / Multi Core
Lenovo ThinkPad X9-15p Gen 1
Intel Core Ultra X7 358H
19360 Points +14%
Asus Zenbook A16 UX3607
Qualcomm Snapdragon X2 Elite Extreme X2E-94-100
19037 Points +12%
Dell XPS 16 Core Ultra X7 358H
Intel Core Ultra X7 358H
17884 (15984.6min - 17883.7max) Points +5%
Moyenne Intel Core Ultra X7 368H
  (17052 - 17350, n=2)
17201 Points +1%
Microsoft Surface Laptop 15 Gen 8
Intel Core Ultra X7 368H
17052 Points
Moyenne de la classe Multimedia
  (4861 - 33362, n=60, 2 dernières années)
17050 Points 0%
Microsoft Surface Laptop 7 15 Lunar Lake
Intel Core Ultra 7 268V
10535 Points -38%
Cinebench R23 / Single Core
Moyenne Intel Core Ultra X7 368H
  (2140 - 2169, n=2)
2155 Points +1%
Microsoft Surface Laptop 15 Gen 8
Intel Core Ultra X7 368H
2140 Points
Dell XPS 16 Core Ultra X7 358H
Intel Core Ultra X7 358H
2087 Points -2%
Lenovo ThinkPad X9-15p Gen 1
Intel Core Ultra X7 358H
2080 Points -3%
Moyenne de la classe Multimedia
  (1237 - 2459, n=59, 2 dernières années)
1982 Points -7%
Microsoft Surface Laptop 7 15 Lunar Lake
Intel Core Ultra 7 268V
1910 Points -11%
Asus Zenbook A16 UX3607
Qualcomm Snapdragon X2 Elite Extreme X2E-94-100
1622 Points -24%
Cinebench R20 / CPU (Multi Core)
Lenovo ThinkPad X9-15p Gen 1
Intel Core Ultra X7 358H
7531 Points +13%
Moyenne Intel Core Ultra X7 368H
  (6681 - 7938, n=2)
7310 Points +9%
Asus Zenbook A16 UX3607
Qualcomm Snapdragon X2 Elite Extreme X2E-94-100
7298 Points +9%
Dell XPS 16 Core Ultra X7 358H
Intel Core Ultra X7 358H
7195 Points +8%
Microsoft Surface Laptop 15 Gen 8
Intel Core Ultra X7 368H
6681 Points
Moyenne de la classe Multimedia
  (1887 - 12912, n=51, 2 dernières années)
6585 Points -1%
Microsoft Surface Laptop 7 15 Lunar Lake
Intel Core Ultra 7 268V
4129 Points -38%
Cinebench R20 / CPU (Single Core)
Moyenne Intel Core Ultra X7 368H
  (809 - 820, n=2)
815 Points +1%
Microsoft Surface Laptop 15 Gen 8
Intel Core Ultra X7 368H
809 Points
Lenovo ThinkPad X9-15p Gen 1
Intel Core Ultra X7 358H
785 Points -3%
Dell XPS 16 Core Ultra X7 358H
Intel Core Ultra X7 358H
780 Points -4%
Moyenne de la classe Multimedia
  (482 - 833, n=51, 2 dernières années)
744 Points -8%
Microsoft Surface Laptop 7 15 Lunar Lake
Intel Core Ultra 7 268V
736 Points -9%
Asus Zenbook A16 UX3607
Qualcomm Snapdragon X2 Elite Extreme X2E-94-100
620 Points -23%
Cinebench R15 / CPU Multi 64Bit
Asus Zenbook A16 UX3607
Qualcomm Snapdragon X2 Elite Extreme X2E-94-100
3683 (3524.54min - 3682.9max) Points +17%
Microsoft Surface Laptop 15 Gen 8
Intel Core Ultra X7 368H
3156 (2121.79min - 3156.32max) Points
Moyenne Intel Core Ultra X7 368H
  (2976 - 3156, n=2)
3066 Points -3%
Lenovo ThinkPad X9-15p Gen 1
Intel Core Ultra X7 358H
3015 (2846.57min - 3015.45max) Points -4%
Dell XPS 16 Core Ultra X7 358H
Intel Core Ultra X7 358H
2986 (2491.75min - 2985.52max) Points -5%
Moyenne de la classe Multimedia
  (856 - 5224, n=56, 2 dernières années)
2713 Points -14%
Microsoft Surface Laptop 7 15 Lunar Lake
Intel Core Ultra 7 268V
1616 (1435.9min - 1615.7max) Points -49%
Cinebench R15 / CPU Single 64Bit
Moyenne Intel Core Ultra X7 368H
  (308 - 323, n=2)
316 Points +3%
Microsoft Surface Laptop 15 Gen 8
Intel Core Ultra X7 368H
308 Points
Dell XPS 16 Core Ultra X7 358H
Intel Core Ultra X7 358H
304 Points -1%
Asus Zenbook A16 UX3607
Qualcomm Snapdragon X2 Elite Extreme X2E-94-100
303 Points -2%
Lenovo ThinkPad X9-15p Gen 1
Intel Core Ultra X7 358H
299 Points -3%
Microsoft Surface Laptop 7 15 Lunar Lake
Intel Core Ultra 7 268V
287 Points -7%
Moyenne de la classe Multimedia
  (184.8 - 326, n=53, 2 dernières années)
285 Points -7%
Blender / v2.79 BMW27 CPU
Microsoft Surface Laptop 7 15 Lunar Lake
Intel Core Ultra 7 268V
337 Seconds * -66%
Moyenne de la classe Multimedia
  (100 - 557, n=52, 2 dernières années)
239 Seconds * -18%
Microsoft Surface Laptop 15 Gen 8
Intel Core Ultra X7 368H
203 Seconds *
Dell XPS 16 Core Ultra X7 358H
Intel Core Ultra X7 358H
196 Seconds * +3%
Moyenne Intel Core Ultra X7 368H
  (179 - 203, n=2)
191 Seconds * +6%
Lenovo ThinkPad X9-15p Gen 1
Intel Core Ultra X7 358H
175 Seconds * +14%
Asus Zenbook A16 UX3607
Qualcomm Snapdragon X2 Elite Extreme X2E-94-100
172 Seconds * +15%
7-Zip 18.03 / 7z b 4
Lenovo ThinkPad X9-15p Gen 1
Intel Core Ultra X7 358H
68930 MIPS +11%
Dell XPS 16 Core Ultra X7 358H
Intel Core Ultra X7 358H
64852 MIPS +4%
Moyenne Intel Core Ultra X7 368H
  (62173 - 63679, n=2)
62926 MIPS +1%
Microsoft Surface Laptop 15 Gen 8
Intel Core Ultra X7 368H
62173 MIPS
Moyenne de la classe Multimedia
  (26062 - 130368, n=49, 2 dernières années)
58487 MIPS -6%
Microsoft Surface Laptop 7 15 Lunar Lake
Intel Core Ultra 7 268V
35687 MIPS -43%
7-Zip 18.03 / 7z b 4 -mmt1
Microsoft Surface Laptop 15 Gen 8
Intel Core Ultra X7 368H
6637 MIPS
Moyenne Intel Core Ultra X7 368H
  (6434 - 6637, n=2)
6536 MIPS -2%
Lenovo ThinkPad X9-15p Gen 1
Intel Core Ultra X7 358H
6449 MIPS -3%
Dell XPS 16 Core Ultra X7 358H
Intel Core Ultra X7 358H
6441 MIPS -3%
Asus Zenbook A16 UX3607
Qualcomm Snapdragon X2 Elite Extreme X2E-94-100
6247 MIPS -6%
Microsoft Surface Laptop 7 15 Lunar Lake
Intel Core Ultra 7 268V
6021 MIPS -9%
Moyenne de la classe Multimedia
  (4526 - 7337, n=50, 2 dernières années)
5944 MIPS -10%
HWBOT x265 Benchmark v2.2 / 4k Preset
Lenovo ThinkPad X9-15p Gen 1
Intel Core Ultra X7 358H
22.1 fps +18%
Dell XPS 16 Core Ultra X7 358H
Intel Core Ultra X7 358H
21 fps +12%
Moyenne de la classe Multimedia
  (6.08 - 36.1, n=50, 2 dernières années)
19.3 fps +3%
Microsoft Surface Laptop 15 Gen 8
Intel Core Ultra X7 368H
18.7 fps
Moyenne Intel Core Ultra X7 368H
  (14.1 - 18.7, n=2)
16.4 fps -12%
Asus Zenbook A16 UX3607
Qualcomm Snapdragon X2 Elite Extreme X2E-94-100
13.6 fps -27%
Microsoft Surface Laptop 7 15 Lunar Lake
Intel Core Ultra 7 268V
12.9 fps -31%
LibreOffice / 20 Documents To PDF
Dell XPS 16 Core Ultra X7 358H
Intel Core Ultra X7 358H
49.5 s * -22%
Microsoft Surface Laptop 7 15 Lunar Lake
Intel Core Ultra 7 268V
48 s * -19%
Moyenne de la classe Multimedia
  (23.9 - 72.5, n=51, 2 dernières années)
47.9 s * -18%
Lenovo ThinkPad X9-15p Gen 1
Intel Core Ultra X7 358H
47.6 s * -18%
Asus Zenbook A16 UX3607
Qualcomm Snapdragon X2 Elite Extreme X2E-94-100
44.2 s * -9%
Microsoft Surface Laptop 15 Gen 8
Intel Core Ultra X7 368H
40.5 s *
Moyenne Intel Core Ultra X7 368H
  (39.1 - 40.5, n=2)
39.8 s * +2%
R Benchmark 2.5 / Overall mean
Asus Zenbook A16 UX3607
Qualcomm Snapdragon X2 Elite Extreme X2E-94-100
0.507 sec * -22%
Microsoft Surface Laptop 7 15 Lunar Lake
Intel Core Ultra 7 268V
0.4565 sec * -10%
Moyenne de la classe Multimedia
  (0.3903 - 0.609, n=50, 2 dernières années)
0.4464 sec * -8%
Lenovo ThinkPad X9-15p Gen 1
Intel Core Ultra X7 358H
0.4236 sec * -2%
Dell XPS 16 Core Ultra X7 358H
Intel Core Ultra X7 358H
0.4216 sec * -2%
Microsoft Surface Laptop 15 Gen 8
Intel Core Ultra X7 368H
0.4144 sec *
Moyenne Intel Core Ultra X7 368H
  (0.4137 - 0.4144, n=2)
0.4141 sec * -0%

* ... Moindre est la valeur, meilleures sont les performances

Cinebench R15 CPU Multi 64Bit
3156 Points
Cinebench R15 OpenGL 64Bit
253 fps
Cinebench R15 Ref. Match 64Bit
97.8 %
Cinebench R15 CPU Single 64Bit
308 Points
Cinebench R20 CPU (Multi Core)
6681 Points
Cinebench R20 CPU (Single Core)
809 Points
Cinebench R23 Single Core
2140 Points
Cinebench R23 Multi Core
17052 Points
Cinebench 2024 CPU Single Core
127.1 Points
Cinebench 2024 CPU Multi Core
960 Points
Aide
Performance rating
Lenovo ThinkPad X9-15p Gen 1 -1!
Intel Core Ultra X7 358H, Arc B390 Panther Lake iGPU
91.4 pt
Moyenne Intel Core Ultra X7 368H -1!
 
84.2 pt
Moyenne de la classe Multimedia
 
83.6 pt
Dell XPS 16 Core Ultra X7 358H -1!
Intel Core Ultra X7 358H, Arc B390 Panther Lake iGPU
82.6 pt
Microsoft Surface Laptop 15 Gen 8 -1!
Intel Core Ultra X7 368H, Arc B390 Panther Lake iGPU
79.2 pt
Asus Zenbook A16 UX3607 -1!
Qualcomm Snapdragon X2 Elite Extreme X2E-94-100, X2-90
70 pt
Microsoft Surface Laptop 7 15 Lunar Lake -1!
Intel Core Ultra 7 268V, Arc 140V
55 pt
AIDA64 / FP32 Ray-Trace
Lenovo ThinkPad X9-15p Gen 1
Intel Core Ultra X7 358H, Arc B390 Panther Lake iGPU (v8.20.8100)
18710 KRay/s +21%
Moyenne de la classe Multimedia
  (2214 - 50388, n=48, 2 dernières années)
18202 KRay/s +18%
Moyenne Intel Core Ultra X7 368H
  (15419 - 17245, n=2)
16332 KRay/s +6%
Dell XPS 16 Core Ultra X7 358H
Intel Core Ultra X7 358H, Arc B390 Panther Lake iGPU (v8.20.8100)
15681 KRay/s +2%
Microsoft Surface Laptop 15 Gen 8
Intel Core Ultra X7 368H, Arc B390 Panther Lake iGPU (v8.20.8100)
15419 KRay/s
Asus Zenbook A16 UX3607
Qualcomm Snapdragon X2 Elite Extreme X2E-94-100, X2-90 (v8.20.8100)
12578 KRay/s -18%
Microsoft Surface Laptop 7 15 Lunar Lake
Intel Core Ultra 7 268V, Arc 140V (v6.92.6600)
11547 KRay/s -25%
AIDA64 / FPU Julia
Lenovo ThinkPad X9-15p Gen 1
Intel Core Ultra X7 358H, Arc B390 Panther Lake iGPU (v8.20.8100)
96559 Points +15%
Moyenne Intel Core Ultra X7 368H
  (84167 - 90689, n=2)
87428 Points +4%
Moyenne de la classe Multimedia
  (12867 - 201874, n=48, 2 dernières années)
85899 Points +2%
Microsoft Surface Laptop 15 Gen 8
Intel Core Ultra X7 368H, Arc B390 Panther Lake iGPU (v8.20.8100)
84167 Points
Dell XPS 16 Core Ultra X7 358H
Intel Core Ultra X7 358H, Arc B390 Panther Lake iGPU (v8.20.8100)
83114 Points -1%
Microsoft Surface Laptop 7 15 Lunar Lake
Intel Core Ultra 7 268V, Arc 140V (v6.92.6600)
56299 Points -33%
Asus Zenbook A16 UX3607
Qualcomm Snapdragon X2 Elite Extreme X2E-94-100, X2-90 (v8.20.8100)
49008 Points -42%
AIDA64 / CPU SHA3
Asus Zenbook A16 UX3607
Qualcomm Snapdragon X2 Elite Extreme X2E-94-100, X2-90 (v8.20.8100)
5433 MB/s +34%
Lenovo ThinkPad X9-15p Gen 1
Intel Core Ultra X7 358H, Arc B390 Panther Lake iGPU (v8.20.8100)
4955 MB/s +22%
Moyenne Intel Core Ultra X7 368H
  (4052 - 4537, n=2)
4295 MB/s +6%
Dell XPS 16 Core Ultra X7 358H
Intel Core Ultra X7 358H, Arc B390 Panther Lake iGPU (v8.20.8100)
4200 MB/s +4%
Microsoft Surface Laptop 15 Gen 8
Intel Core Ultra X7 368H, Arc B390 Panther Lake iGPU (v8.20.8100)
4052 MB/s
Moyenne de la classe Multimedia
  (626 - 8623, n=48, 2 dernières années)
3988 MB/s -2%
Microsoft Surface Laptop 7 15 Lunar Lake
Intel Core Ultra 7 268V, Arc 140V (v6.92.6600)
2538 MB/s -37%
AIDA64 / CPU Queen
Moyenne de la classe Multimedia
  (13483 - 181505, n=31, 2 dernières années)
70972 Points
Microsoft Surface Laptop 7 15 Lunar Lake
Intel Core Ultra 7 268V, Arc 140V (v6.92.6600)
49645 Points
AIDA64 / FPU SinJulia
Moyenne de la classe Multimedia
  (886 - 28794, n=48, 2 dernières années)
8498 Points +26%
Moyenne Intel Core Ultra X7 368H
  (6765 - 7511, n=2)
7138 Points +6%
Lenovo ThinkPad X9-15p Gen 1
Intel Core Ultra X7 358H, Arc B390 Panther Lake iGPU (v8.20.8100)
7033 Points +4%
Dell XPS 16 Core Ultra X7 358H
Intel Core Ultra X7 358H, Arc B390 Panther Lake iGPU (v8.20.8100)
6892 Points +2%
Microsoft Surface Laptop 15 Gen 8
Intel Core Ultra X7 368H, Arc B390 Panther Lake iGPU (v8.20.8100)
6765 Points
Microsoft Surface Laptop 7 15 Lunar Lake
Intel Core Ultra 7 268V, Arc 140V (v6.92.6600)
4426 Points -35%
Asus Zenbook A16 UX3607
Qualcomm Snapdragon X2 Elite Extreme X2E-94-100, X2-90 (v8.20.8100)
4199 Points -38%
AIDA64 / FPU Mandel
Lenovo ThinkPad X9-15p Gen 1
Intel Core Ultra X7 358H, Arc B390 Panther Lake iGPU (v8.20.8100)
50766 Points +13%
Moyenne Intel Core Ultra X7 368H
  (44784 - 48562, n=2)
46673 Points +4%
Moyenne de la classe Multimedia
  (6395 - 105740, n=48, 2 dernières années)
45242 Points +1%
Microsoft Surface Laptop 15 Gen 8
Intel Core Ultra X7 368H, Arc B390 Panther Lake iGPU (v8.20.8100)
44784 Points
Dell XPS 16 Core Ultra X7 358H
Intel Core Ultra X7 358H, Arc B390 Panther Lake iGPU (v8.20.8100)
44733 Points 0%
Microsoft Surface Laptop 7 15 Lunar Lake
Intel Core Ultra 7 268V, Arc 140V (v6.92.6600)
29637 Points -34%
Asus Zenbook A16 UX3607
Qualcomm Snapdragon X2 Elite Extreme X2E-94-100, X2-90 (v8.20.8100)
26387 Points -41%
AIDA64 / CPU AES
Asus Zenbook A16 UX3607
Qualcomm Snapdragon X2 Elite Extreme X2E-94-100, X2-90 (v8.20.8100)
110260 MB/s +88%
Lenovo ThinkPad X9-15p Gen 1
Intel Core Ultra X7 358H, Arc B390 Panther Lake iGPU (v8.20.8100)
68737 MB/s +17%
Moyenne de la classe Multimedia
  (8171 - 126790, n=48, 2 dernières années)
64193 MB/s +10%
Moyenne Intel Core Ultra X7 368H
  (58572 - 68180, n=2)
63376 MB/s +8%
Dell XPS 16 Core Ultra X7 358H
Intel Core Ultra X7 358H, Arc B390 Panther Lake iGPU (v8.20.8100)
61102 MB/s +4%
Microsoft Surface Laptop 15 Gen 8
Intel Core Ultra X7 368H, Arc B390 Panther Lake iGPU (v8.20.8100)
58572 MB/s
Microsoft Surface Laptop 7 15 Lunar Lake
Intel Core Ultra 7 268V, Arc 140V (v6.92.6600)
38706 MB/s -34%
AIDA64 / CPU ZLib
Asus Zenbook A16 UX3607
Qualcomm Snapdragon X2 Elite Extreme X2E-94-100, X2-90 (v8.20.8100)
1337 MB/s +67%
Lenovo ThinkPad X9-15p Gen 1
Intel Core Ultra X7 358H, Arc B390 Panther Lake iGPU (v8.20.8100)
1111 MB/s +38%
Dell XPS 16 Core Ultra X7 358H
Intel Core Ultra X7 358H, Arc B390 Panther Lake iGPU (v8.20.8100)
991 MB/s +23%
Moyenne de la classe Multimedia
  (143.8 - 2022, n=48, 2 dernières années)
982 MB/s +22%
Moyenne Intel Core Ultra X7 368H
  (803 - 1130, n=2)
967 MB/s +20%
Microsoft Surface Laptop 15 Gen 8
Intel Core Ultra X7 368H, Arc B390 Panther Lake iGPU (v8.20.8100)
803 MB/s
Microsoft Surface Laptop 7 15 Lunar Lake
Intel Core Ultra 7 268V, Arc 140V (v6.92.6600)
583 MB/s -27%
AIDA64 / FP64 Ray-Trace
Moyenne de la classe Multimedia
  (1014 - 26875, n=48, 2 dernières années)
9692 KRay/s +19%
Lenovo ThinkPad X9-15p Gen 1
Intel Core Ultra X7 358H, Arc B390 Panther Lake iGPU (v8.20.8100)
9612 KRay/s +18%
Moyenne Intel Core Ultra X7 368H
  (8151 - 9131, n=2)
8641 KRay/s +6%
Dell XPS 16 Core Ultra X7 358H
Intel Core Ultra X7 358H, Arc B390 Panther Lake iGPU (v8.20.8100)
8285 KRay/s +2%
Microsoft Surface Laptop 15 Gen 8
Intel Core Ultra X7 368H, Arc B390 Panther Lake iGPU (v8.20.8100)
8151 KRay/s
Asus Zenbook A16 UX3607
Qualcomm Snapdragon X2 Elite Extreme X2E-94-100, X2-90 (v8.20.8100)
6811 KRay/s -16%
Microsoft Surface Laptop 7 15 Lunar Lake
Intel Core Ultra 7 268V, Arc 140V (v6.92.6600)
6214 KRay/s -24%
AIDA64 / CPU PhotoWorxx
Lenovo ThinkPad X9-15p Gen 1
Intel Core Ultra X7 358H, Arc B390 Panther Lake iGPU (v8.20.8100)
88533 MPixel/s +17%
Dell XPS 16 Core Ultra X7 358H
Intel Core Ultra X7 358H, Arc B390 Panther Lake iGPU (v8.20.8100)
88154 MPixel/s +16%
Moyenne Intel Core Ultra X7 368H
  (75761 - 84065, n=2)
79913 MPixel/s +5%
Microsoft Surface Laptop 15 Gen 8
Intel Core Ultra X7 368H, Arc B390 Panther Lake iGPU (v8.20.8100)
75761 MPixel/s
Asus Zenbook A16 UX3607
Qualcomm Snapdragon X2 Elite Extreme X2E-94-100, X2-90 (v8.20.8100)
66951 MPixel/s -12%
Microsoft Surface Laptop 7 15 Lunar Lake
Intel Core Ultra 7 268V, Arc 140V (v6.92.6600)
53540 MPixel/s -29%
Moyenne de la classe Multimedia
  (8187 - 88533, n=48, 2 dernières années)
53006 MPixel/s -30%
AIDA64 / CPU CheckMate
Moyenne Intel Core Ultra X7 368H
  (4328 - 4613, n=2)
4471 MP/s +3%
Microsoft Surface Laptop 15 Gen 8
Intel Core Ultra X7 368H, Arc B390 Panther Lake iGPU (v8.20.8100)
4328 MP/s
Lenovo ThinkPad X9-15p Gen 1
Intel Core Ultra X7 358H, Arc B390 Panther Lake iGPU (v8.20.8100)
4279 MP/s -1%
Dell XPS 16 Core Ultra X7 358H
Intel Core Ultra X7 358H, Arc B390 Panther Lake iGPU (v8.20.8100)
4269 MP/s -1%
Moyenne de la classe Multimedia
  (569 - 4742, n=20, 2 dernières années)
3548 MP/s -18%
Asus Zenbook A16 UX3607
Qualcomm Snapdragon X2 Elite Extreme X2E-94-100, X2-90 (v8.20.8100)
1570 MP/s -64%

Système et périphériques de stockage

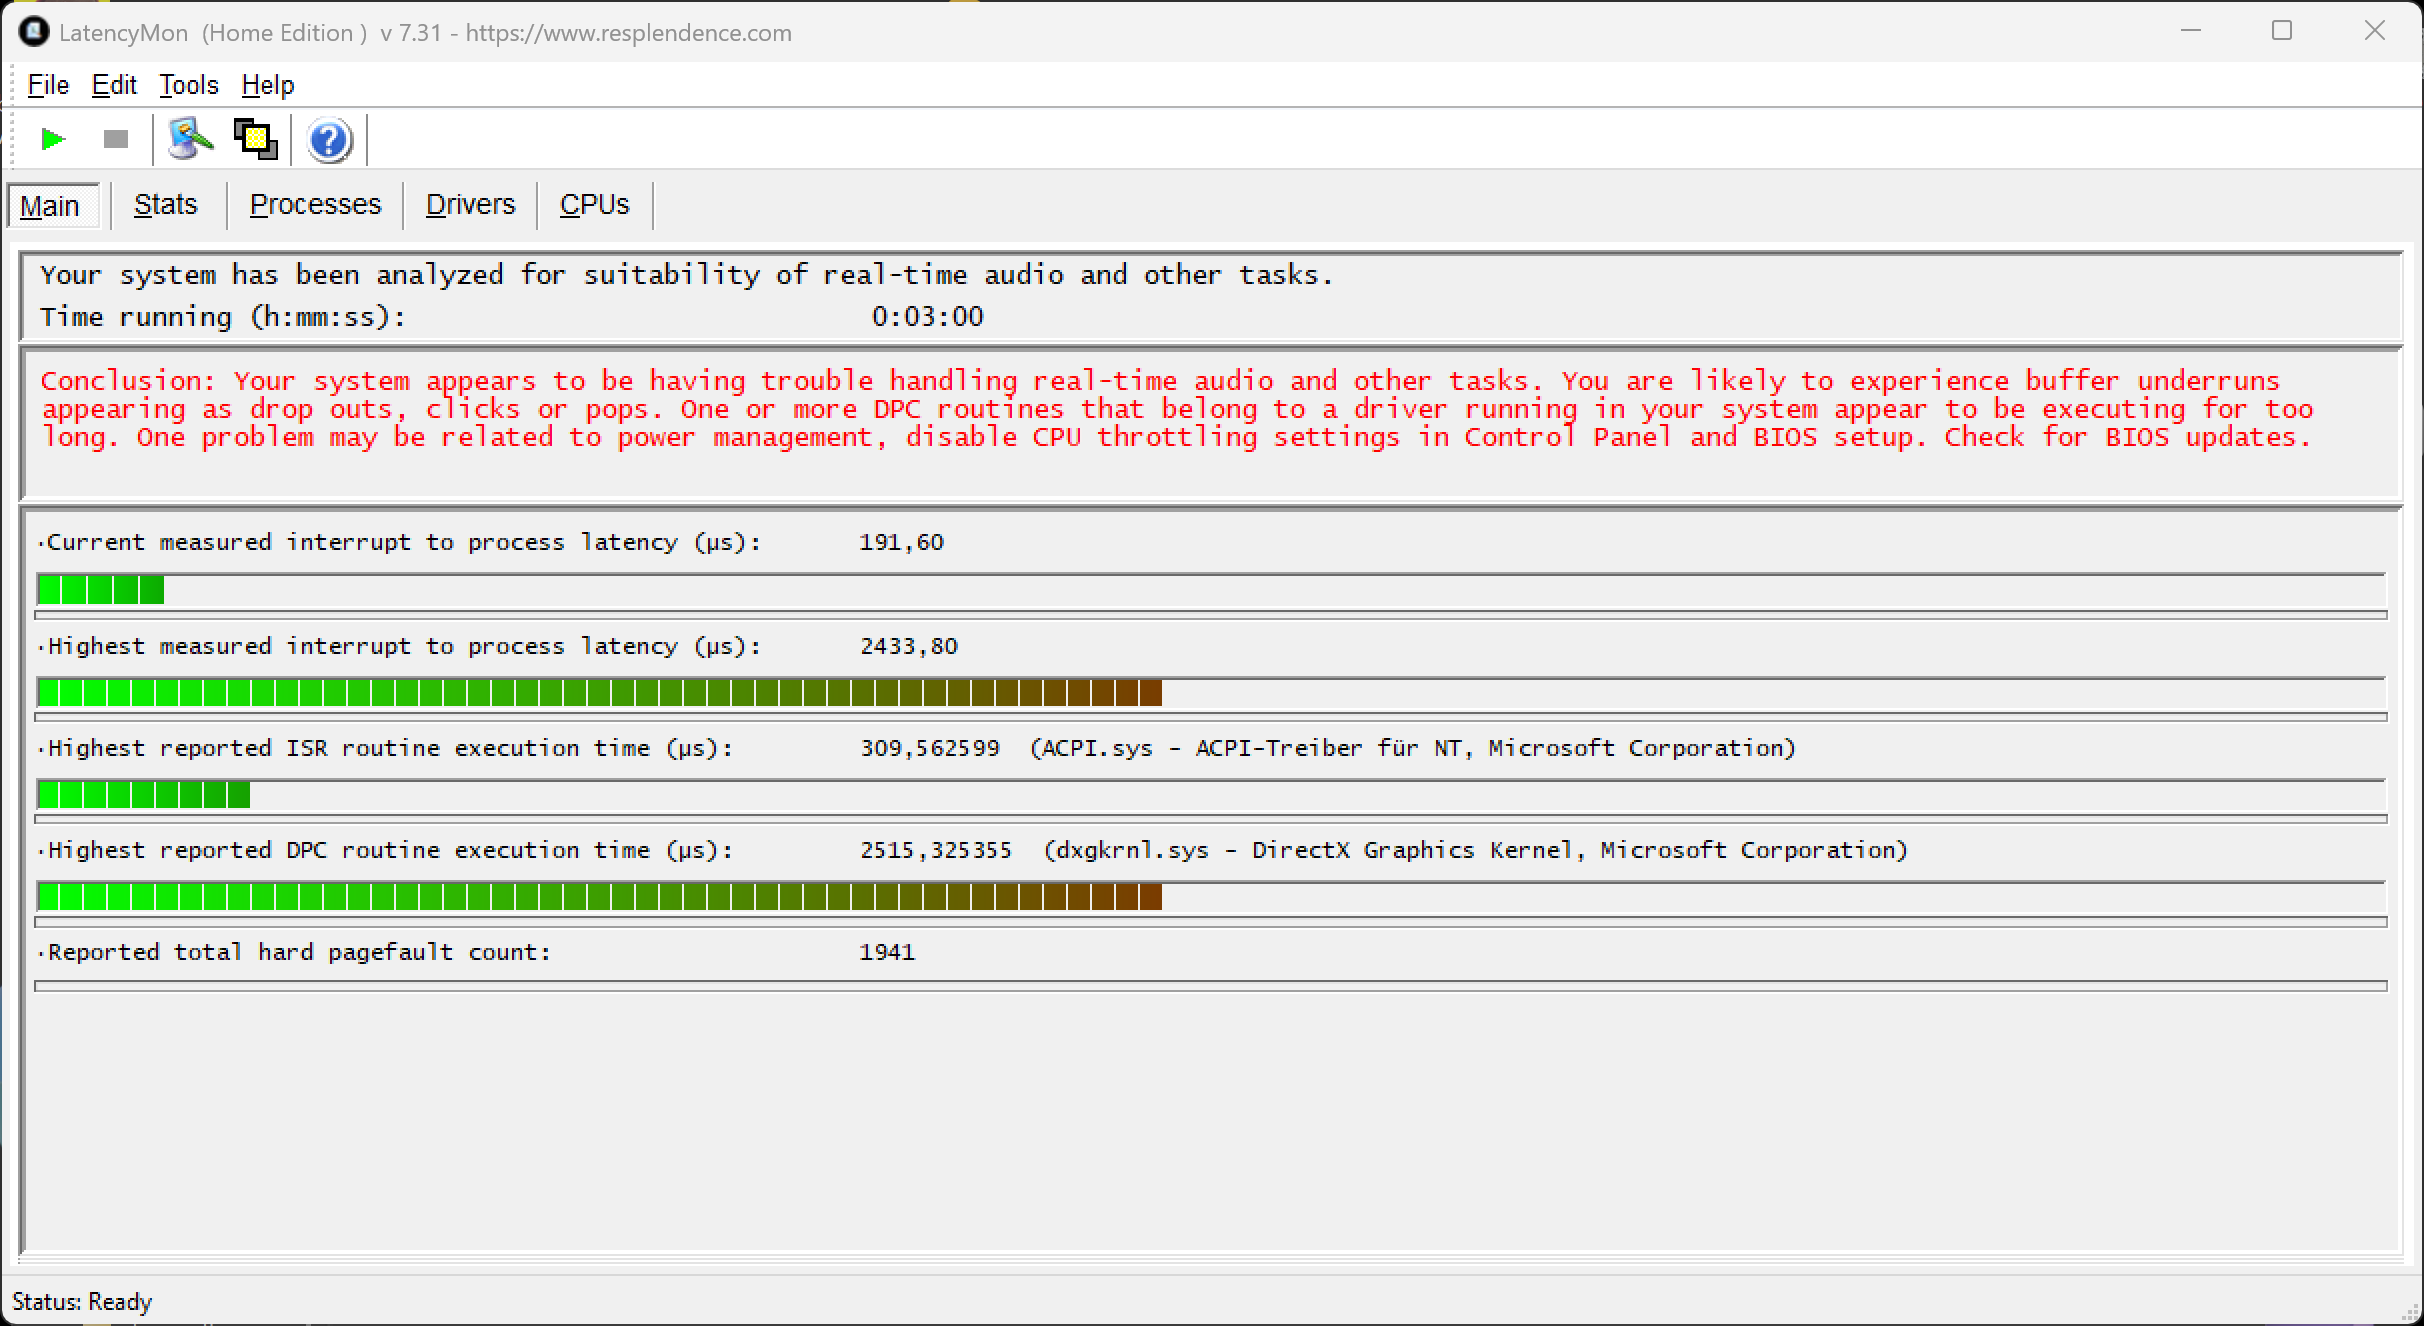
Les performances globales du système sont excellentes et nous n'avons pas non plus constaté de problèmes de stabilité. Il n'y a évidemment aucun problème de compatibilité avec la version Intel, ce qui constitue un avantage par rapport à la version Snapdragon. Notre exemplaire de test ne dispose que de 16 Go de RAM, mais nous n'avons rencontré aucun problème et, si vous restez modéré en matière de multitâche, cette version moins chère devrait convenir. 32 Go seraient évidemment préférables (vous pouvez configurer jusqu'à 64 Go), mais les suppléments sont élevés. Notre test de latence a révélé quelques problèmes pour les applications audio en temps réel. Les performances du SSD (PCIe 4.0) sont bonnes et stables.

Performance rating: Percent
PCMark 10: Score | Essentials | Productivity | Digital Content Creation
CrossMark: Overall | Productivity | Creativity | Responsiveness
WebXPRT 3: Overall
WebXPRT 4: Overall
Mozilla Kraken 1.1: Total
Performance rating
Apple MacBook Air 15 M5 -4!
M5 10-Core GPU, M5 10-Core, Apple SSD AP2048Z
91.1 pt
Asus Zenbook A16 UX3607 -4!
X2-90, X2E-94-100, Samsung PM9C1b MZVL81T0HFLB-00BTW
83.5 pt
Microsoft Surface Laptop 15 Gen 8
Arc B390 Panther Lake iGPU, Ultra X7 368H, SK hynix PVC10 HFS256GEM4X182N
83.3 pt
Moyenne Intel Core Ultra X7 368H, Intel Arc B390 12 Xe3 Panther Lake iGPU
 
83.1 pt
Lenovo ThinkPad X9-15p Gen 1
Arc B390 Panther Lake iGPU, Ultra X7 358H, Samsung PM9E1 1 TB MZVLC1T0HFLU
80.6 pt
Dell XPS 16 Core Ultra X7 358H
Arc B390 Panther Lake iGPU, Ultra X7 358H
80 pt
Moyenne de la classe Multimedia
 
72.5 pt
Microsoft Surface Laptop 7 15 Lunar Lake
Arc 140V, Core Ultra 7 268V, Samsung PM9C1a MZ9L81T0HDLB
64.9 pt
PCMark 10 / Score
Moyenne Intel Core Ultra X7 368H, Intel Arc B390 12 Xe3 Panther Lake iGPU
  (9923 - 10456, n=2)
10190 Points +3%
Microsoft Surface Laptop 15 Gen 8
Arc B390 Panther Lake iGPU, Ultra X7 368H, SK hynix PVC10 HFS256GEM4X182N
9923 Points
Dell XPS 16 Core Ultra X7 358H
Arc B390 Panther Lake iGPU, Ultra X7 358H
9717 Points -2%
Lenovo ThinkPad X9-15p Gen 1
Arc B390 Panther Lake iGPU, Ultra X7 358H, Samsung PM9E1 1 TB MZVLC1T0HFLU
9303 Points -6%
Moyenne de la classe Multimedia
  (4325 - 10386, n=48, 2 dernières années)
8022 Points -19%
Microsoft Surface Laptop 7 15 Lunar Lake
Arc 140V, Core Ultra 7 268V, Samsung PM9C1a MZ9L81T0HDLB
7236 Points -27%
PCMark 10 / Essentials
Moyenne Intel Core Ultra X7 368H, Intel Arc B390 12 Xe3 Panther Lake iGPU
  (11288 - 11715, n=2)
11502 Points +2%
Microsoft Surface Laptop 15 Gen 8
Arc B390 Panther Lake iGPU, Ultra X7 368H, SK hynix PVC10 HFS256GEM4X182N
11288 Points
Dell XPS 16 Core Ultra X7 358H
Arc B390 Panther Lake iGPU, Ultra X7 358H
11122 Points -1%
Lenovo ThinkPad X9-15p Gen 1
Arc B390 Panther Lake iGPU, Ultra X7 358H, Samsung PM9E1 1 TB MZVLC1T0HFLU
10762 Points -5%
Microsoft Surface Laptop 7 15 Lunar Lake
Arc 140V, Core Ultra 7 268V, Samsung PM9C1a MZ9L81T0HDLB
10701 Points -5%
Moyenne de la classe Multimedia
  (8025 - 11664, n=47, 2 dernières années)
10507 Points -7%
PCMark 10 / Productivity
Moyenne Intel Core Ultra X7 368H, Intel Arc B390 12 Xe3 Panther Lake iGPU
  (17463 - 18738, n=2)
18101 Points +4%
Microsoft Surface Laptop 15 Gen 8
Arc B390 Panther Lake iGPU, Ultra X7 368H, SK hynix PVC10 HFS256GEM4X182N
17463 Points
Dell XPS 16 Core Ultra X7 358H
Arc B390 Panther Lake iGPU, Ultra X7 358H
16422 Points -6%
Lenovo ThinkPad X9-15p Gen 1
Arc B390 Panther Lake iGPU, Ultra X7 358H, Samsung PM9E1 1 TB MZVLC1T0HFLU
14870 Points -15%
Moyenne de la classe Multimedia
  (7323 - 18233, n=47, 2 dernières années)
12568 Points -28%
Microsoft Surface Laptop 7 15 Lunar Lake
Arc 140V, Core Ultra 7 268V, Samsung PM9C1a MZ9L81T0HDLB
9217 Points -47%
PCMark 10 / Digital Content Creation
Moyenne Intel Core Ultra X7 368H, Intel Arc B390 12 Xe3 Panther Lake iGPU
  (13454 - 14129, n=2)
13792 Points +3%
Lenovo ThinkPad X9-15p Gen 1
Arc B390 Panther Lake iGPU, Ultra X7 358H, Samsung PM9E1 1 TB MZVLC1T0HFLU
13652 Points +1%
Dell XPS 16 Core Ultra X7 358H
Arc B390 Panther Lake iGPU, Ultra X7 358H
13633 Points +1%
Microsoft Surface Laptop 15 Gen 8
Arc B390 Panther Lake iGPU, Ultra X7 368H, SK hynix PVC10 HFS256GEM4X182N
13454 Points
Moyenne de la classe Multimedia
  (3738 - 16240, n=47, 2 dernières années)
10853 Points -19%
Microsoft Surface Laptop 7 15 Lunar Lake
Arc 140V, Core Ultra 7 268V, Samsung PM9C1a MZ9L81T0HDLB
10427 Points -22%
CrossMark / Overall
Apple MacBook Air 15 M5
M5 10-Core GPU, M5 10-Core, Apple SSD AP2048Z
2356 Points +8%
Lenovo ThinkPad X9-15p Gen 1
Arc B390 Panther Lake iGPU, Ultra X7 358H, Samsung PM9E1 1 TB MZVLC1T0HFLU
2182 Points 0%
Microsoft Surface Laptop 15 Gen 8
Arc B390 Panther Lake iGPU, Ultra X7 368H, SK hynix PVC10 HFS256GEM4X182N
2182 Points
Dell XPS 16 Core Ultra X7 358H
Arc B390 Panther Lake iGPU, Ultra X7 358H
2114 Points -3%
Moyenne Intel Core Ultra X7 368H, Intel Arc B390 12 Xe3 Panther Lake iGPU
  (2032 - 2182, n=2)
2107 Points -3%
Asus Zenbook A16 UX3607
X2-90, X2E-94-100, Samsung PM9C1b MZVL81T0HFLB-00BTW
1978 Points -9%
Moyenne de la classe Multimedia
  (866 - 3231, n=56, 2 dernières années)
1949 Points -11%
Microsoft Surface Laptop 7 15 Lunar Lake
Arc 140V, Core Ultra 7 268V, Samsung PM9C1a MZ9L81T0HDLB
1738 Points -20%
CrossMark / Productivity
Apple MacBook Air 15 M5
M5 10-Core GPU, M5 10-Core, Apple SSD AP2048Z
2277 Points +14%
Microsoft Surface Laptop 15 Gen 8
Arc B390 Panther Lake iGPU, Ultra X7 368H, SK hynix PVC10 HFS256GEM4X182N
1995 Points
Lenovo ThinkPad X9-15p Gen 1
Arc B390 Panther Lake iGPU, Ultra X7 358H, Samsung PM9E1 1 TB MZVLC1T0HFLU
1960 Points -2%
Moyenne Intel Core Ultra X7 368H, Intel Arc B390 12 Xe3 Panther Lake iGPU
  (1916 - 1995, n=2)
1956 Points -2%
Dell XPS 16 Core Ultra X7 358H
Arc B390 Panther Lake iGPU, Ultra X7 358H
1898 Points -5%
Moyenne de la classe Multimedia
  (931 - 2677, n=56, 2 dernières années)
1817 Points -9%
Asus Zenbook A16 UX3607
X2-90, X2E-94-100, Samsung PM9C1b MZVL81T0HFLB-00BTW
1732 Points -13%
Microsoft Surface Laptop 7 15 Lunar Lake
Arc 140V, Core Ultra 7 268V, Samsung PM9C1a MZ9L81T0HDLB
1680 Points -16%
CrossMark / Creativity
Apple MacBook Air 15 M5
M5 10-Core GPU, M5 10-Core, Apple SSD AP2048Z
2743 Points +8%
Lenovo ThinkPad X9-15p Gen 1
Arc B390 Panther Lake iGPU, Ultra X7 358H, Samsung PM9E1 1 TB MZVLC1T0HFLU
2563 Points +1%
Microsoft Surface Laptop 15 Gen 8
Arc B390 Panther Lake iGPU, Ultra X7 368H, SK hynix PVC10 HFS256GEM4X182N
2530 Points
Dell XPS 16 Core Ultra X7 358H
Arc B390 Panther Lake iGPU, Ultra X7 358H
2529 Points 0%
Moyenne Intel Core Ultra X7 368H, Intel Arc B390 12 Xe3 Panther Lake iGPU
  (2241 - 2530, n=2)
2386 Points -6%
Asus Zenbook A16 UX3607
X2-90, X2E-94-100, Samsung PM9C1b MZVL81T0HFLB-00BTW
2327 Points -8%
Moyenne de la classe Multimedia
  (907 - 4522, n=56, 2 dernières années)
2261 Points -11%
Microsoft Surface Laptop 7 15 Lunar Lake
Arc 140V, Core Ultra 7 268V, Samsung PM9C1a MZ9L81T0HDLB
1976 Points -22%
CrossMark / Responsiveness
Lenovo ThinkPad X9-15p Gen 1
Arc B390 Panther Lake iGPU, Ultra X7 358H, Samsung PM9E1 1 TB MZVLC1T0HFLU
1855 Points +1%
Microsoft Surface Laptop 15 Gen 8
Arc B390 Panther Lake iGPU, Ultra X7 368H, SK hynix PVC10 HFS256GEM4X182N
1832 Points
Moyenne Intel Core Ultra X7 368H, Intel Arc B390 12 Xe3 Panther Lake iGPU
  (1808 - 1832, n=2)
1820 Points -1%
Asus Zenbook A16 UX3607
X2-90, X2E-94-100, Samsung PM9C1b MZVL81T0HFLB-00BTW
1811 Points -1%
Dell XPS 16 Core Ultra X7 358H
Arc B390 Panther Lake iGPU, Ultra X7 358H
1706 Points -7%
Apple MacBook Air 15 M5
M5 10-Core GPU, M5 10-Core, Apple SSD AP2048Z
1657 Points -10%
Moyenne de la classe Multimedia
  (605 - 2073, n=56, 2 dernières années)
1568 Points -14%
Microsoft Surface Laptop 7 15 Lunar Lake
Arc 140V, Core Ultra 7 268V, Samsung PM9C1a MZ9L81T0HDLB
1311 Points -28%
WebXPRT 3 / Overall
Apple MacBook Air 15 M5
M5 10-Core GPU, M5 10-Core, Apple SSD AP2048Z
530 Points +57%
Asus Zenbook A16 UX3607
X2-90, X2E-94-100, Samsung PM9C1b MZVL81T0HFLB-00BTW
514 Points +52%
Lenovo ThinkPad X9-15p Gen 1
Arc B390 Panther Lake iGPU, Ultra X7 358H, Samsung PM9E1 1 TB MZVLC1T0HFLU
350 Points +4%
Moyenne de la classe Multimedia
  (197.4 - 622, n=59, 2 dernières années)
346 Points +2%
Moyenne Intel Core Ultra X7 368H, Intel Arc B390 12 Xe3 Panther Lake iGPU
  (338 - 342, n=2)
340 Points +1%
Microsoft Surface Laptop 15 Gen 8
Arc B390 Panther Lake iGPU, Ultra X7 368H, SK hynix PVC10 HFS256GEM4X182N
338 Points
Microsoft Surface Laptop 7 15 Lunar Lake
Arc 140V, Core Ultra 7 268V, Samsung PM9C1a MZ9L81T0HDLB
310 Points -8%
Dell XPS 16 Core Ultra X7 358H
Arc B390 Panther Lake iGPU, Ultra X7 358H
304 Points -10%
WebXPRT 4 / Overall
Asus Zenbook A16 UX3607
X2-90, X2E-94-100, Samsung PM9C1b MZVL81T0HFLB-00BTW
383 Points +22%
Apple MacBook Air 15 M5
M5 10-Core GPU, M5 10-Core, Apple SSD AP2048Z
378 Points +20%
Microsoft Surface Laptop 15 Gen 8
Arc B390 Panther Lake iGPU, Ultra X7 368H, SK hynix PVC10 HFS256GEM4X182N
314 Points
Moyenne Intel Core Ultra X7 368H, Intel Arc B390 12 Xe3 Panther Lake iGPU
  (304 - 314, n=2)
309 Points -2%
Lenovo ThinkPad X9-15p Gen 1
Arc B390 Panther Lake iGPU, Ultra X7 358H, Samsung PM9E1 1 TB MZVLC1T0HFLU
307 Points -2%
Dell XPS 16 Core Ultra X7 358H
Arc B390 Panther Lake iGPU, Ultra X7 358H
300 Points -4%
Moyenne de la classe Multimedia
  (167.3 - 415, n=59, 2 dernières années)
295 Points -6%
Microsoft Surface Laptop 7 15 Lunar Lake
Arc 140V, Core Ultra 7 268V, Samsung PM9C1a MZ9L81T0HDLB
287 Points -9%
Mozilla Kraken 1.1 / Total
Microsoft Surface Laptop 7 15 Lunar Lake
Arc 140V, Core Ultra 7 268V, Samsung PM9C1a MZ9L81T0HDLB
475 ms * -11%
Lenovo ThinkPad X9-15p Gen 1
Arc B390 Panther Lake iGPU, Ultra X7 358H, Samsung PM9E1 1 TB MZVLC1T0HFLU
465 ms * -8%
Dell XPS 16 Core Ultra X7 358H
Arc B390 Panther Lake iGPU, Ultra X7 358H
450 ms * -5%
Moyenne de la classe Multimedia
  (228 - 835, n=60, 2 dernières années)
440 ms * -3%
Moyenne Intel Core Ultra X7 368H, Intel Arc B390 12 Xe3 Panther Lake iGPU
  (429 - 437, n=2)
433 ms * -1%
Microsoft Surface Laptop 15 Gen 8
Arc B390 Panther Lake iGPU, Ultra X7 368H, SK hynix PVC10 HFS256GEM4X182N
429 ms *
Asus Zenbook A16 UX3607
X2-90, X2E-94-100, Samsung PM9C1b MZVL81T0HFLB-00BTW
261.4 ms * +39%
Apple MacBook Air 15 M5
M5 10-Core GPU, M5 10-Core, Apple SSD AP2048Z
238.6 ms * +44%

* ... Moindre est la valeur, meilleures sont les performances

PCMark 10 Score
9923 points
Aide
AIDA64 / Memory Copy
Dell XPS 16 Core Ultra X7 358H
Intel Core Ultra X7 358H, Arc B390 Panther Lake iGPU
132135 MB/s +20%
Lenovo ThinkPad X9-15p Gen 1
Intel Core Ultra X7 358H, Arc B390 Panther Lake iGPU
129389 MB/s +18%
Moyenne Intel Core Ultra X7 368H
  (109931 - 114339, n=2)
112135 MB/s +2%
Microsoft Surface Laptop 15 Gen 8
Intel Core Ultra X7 368H, Arc B390 Panther Lake iGPU
109931 MB/s
Microsoft Surface Laptop 7 15 Lunar Lake
Intel Core Ultra 7 268V, Arc 140V
107108 MB/s -3%
Asus Zenbook A16 UX3607
Qualcomm Snapdragon X2 Elite Extreme X2E-94-100, X2-90
104879 MB/s -5%
Moyenne de la classe Multimedia
  (11299 - 132135, n=48, 2 dernières années)
85254 MB/s -22%
AIDA64 / Memory Read
Asus Zenbook A16 UX3607
Qualcomm Snapdragon X2 Elite Extreme X2E-94-100, X2-90
174586 MB/s +55%
Lenovo ThinkPad X9-15p Gen 1
Intel Core Ultra X7 358H, Arc B390 Panther Lake iGPU
120727 MB/s +7%
Dell XPS 16 Core Ultra X7 358H
Intel Core Ultra X7 358H, Arc B390 Panther Lake iGPU
118888 MB/s +6%
Microsoft Surface Laptop 15 Gen 8
Intel Core Ultra X7 368H, Arc B390 Panther Lake iGPU
112338 MB/s
Moyenne Intel Core Ultra X7 368H
  (106702 - 112338, n=2)
109520 MB/s -3%
Microsoft Surface Laptop 7 15 Lunar Lake
Intel Core Ultra 7 268V, Arc 140V
88341 MB/s -21%
Moyenne de la classe Multimedia
  (11624 - 174586, n=48, 2 dernières années)
81379 MB/s -28%
AIDA64 / Memory Write
Dell XPS 16 Core Ultra X7 358H
Intel Core Ultra X7 358H, Arc B390 Panther Lake iGPU
134998 MB/s +12%
Lenovo ThinkPad X9-15p Gen 1
Intel Core Ultra X7 358H, Arc B390 Panther Lake iGPU
134848 MB/s +12%
Moyenne Intel Core Ultra X7 368H
  (120698 - 120732, n=2)
120715 MB/s 0%
Microsoft Surface Laptop 15 Gen 8
Intel Core Ultra X7 368H, Arc B390 Panther Lake iGPU
120698 MB/s
Microsoft Surface Laptop 7 15 Lunar Lake
Intel Core Ultra 7 268V, Arc 140V
117888 MB/s -2%
Moyenne de la classe Multimedia
  (11755 - 134998, n=48, 2 dernières années)
86357 MB/s -28%
Asus Zenbook A16 UX3607
Qualcomm Snapdragon X2 Elite Extreme X2E-94-100, X2-90
73995 MB/s -39%
AIDA64 / Memory Latency
Moyenne de la classe Multimedia
  (84.1 - 535, n=47, 2 dernières années)
127.5 ns * -43%
Microsoft Surface Laptop 7 15 Lunar Lake
Intel Core Ultra 7 268V, Arc 140V
97.4 ns * -10%
Moyenne Intel Core Ultra X7 368H
  (88.9 - 90.3, n=2)
89.6 ns * -1%
Microsoft Surface Laptop 15 Gen 8
Intel Core Ultra X7 368H, Arc B390 Panther Lake iGPU
88.9 ns *
Dell XPS 16 Core Ultra X7 358H
Intel Core Ultra X7 358H, Arc B390 Panther Lake iGPU
84.6 ns * +5%
Lenovo ThinkPad X9-15p Gen 1
Intel Core Ultra X7 358H, Arc B390 Panther Lake iGPU
84.1 ns * +5%

* ... Moindre est la valeur, meilleures sont les performances

LatencyMon - Présentation
LatencyMon - Pilotes
DPC Latencies / LatencyMon - interrupt to process latency (max), Web, Youtube, Prime95
Lenovo ThinkPad X9-15p Gen 1
Arc B390 Panther Lake iGPU, Ultra X7 358H, Samsung PM9E1 1 TB MZVLC1T0HFLU
3844.3 μs * -58%
Microsoft Surface Laptop 15 Gen 8
Arc B390 Panther Lake iGPU, Ultra X7 368H, SK hynix PVC10 HFS256GEM4X182N
2433.8 μs *
Moyenne de la classe Multimedia
  (327 - 7067, n=46, 2 dernières années)
1815 μs * +25%
Microsoft Surface Laptop 7 15 Lunar Lake
Arc 140V, Core Ultra 7 268V, Samsung PM9C1a MZ9L81T0HDLB
891.9 μs * +63%
Dell XPS 16 Core Ultra X7 358H
Arc B390 Panther Lake iGPU, Ultra X7 358H
513.7 μs * +79%

* ... Moindre est la valeur, meilleures sont les performances

SK hynix PVC10 HFS256GEM4X182N
CDM 5/6 Read Seq Q32T1: 5688 MB/s
CDM 5/6 Write Seq Q32T1: 2845 MB/s
CDM 5/6 Read 4K Q32T1: 602 MB/s
CDM 5/6 Write 4K Q32T1: 766 MB/s
CDM 5/6 Read 4K: 81.8 MB/s
CDM 5/6 Write 4K: 151.3 MB/s
CDM 6 Write 4K Q8T8: 2141 MB/s
CDM 6 Read 4K Q8T8: 1777 MB/s
Drive Performance rating - Percent
Lenovo ThinkPad X9-15p Gen 1
Samsung PM9E1 1 TB MZVLC1T0HFLU
93.3 pt
Asus Zenbook A16 UX3607
Samsung PM9C1b MZVL81T0HFLB-00BTW
54.4 pt
Microsoft Surface Laptop 15 Gen 8
SK hynix PVC10 HFS256GEM4X182N
51.3 pt
Moyenne de la classe Multimedia
 
47.5 pt
Dell XPS 16 Core Ultra X7 358H
 
43.4 pt
Microsoft Surface Laptop 7 15 Lunar Lake
Samsung PM9C1a MZ9L81T0HDLB
42.9 pt
Moyenne SK hynix PVC10 HFS256GEM4X182N
 
41.3 pt
DiskSpd
seq read
Lenovo ThinkPad X9-15p Gen 1
Samsung PM9E1 1 TB MZVLC1T0HFLU
7663 (7579.05min - 7663.4max) MB/s +241%
Dell XPS 16 Core Ultra X7 358H
 
3600 (3100.64min - 3600.18max) MB/s +60%
Asus Zenbook A16 UX3607
Samsung PM9C1b MZVL81T0HFLB-00BTW
3256 (3194.8min - 3255.62max) MB/s +45%
Moyenne de la classe Multimedia
  (453 - 7811, n=51, 2 dernières années)
3140 MB/s +40%
Moyenne SK hynix PVC10 HFS256GEM4X182N
  (2249 - 3278, n=2)
2764 MB/s +23%
Microsoft Surface Laptop 7 15 Lunar Lake
Samsung PM9C1a MZ9L81T0HDLB
2302 (2064.86min - 2301.62max) MB/s +2%
Microsoft Surface Laptop 15 Gen 8
SK hynix PVC10 HFS256GEM4X182N
2249 (2210.19min - 2248.78max) MB/s
seq write
Lenovo ThinkPad X9-15p Gen 1
Samsung PM9E1 1 TB MZVLC1T0HFLU
9312 (3040.03min - 9311.98max) MB/s +433%
Asus Zenbook A16 UX3607
Samsung PM9C1b MZVL81T0HFLB-00BTW
3644 (3588.65min - 3643.8max) MB/s +109%
Moyenne de la classe Multimedia
  (384 - 9952, n=51, 2 dernières années)
3319 MB/s +90%
Dell XPS 16 Core Ultra X7 358H
 
2599 (796.92min - 2599.25max) MB/s +49%
Moyenne SK hynix PVC10 HFS256GEM4X182N
  (1747 - 2155, n=2)
1951 MB/s +12%
Microsoft Surface Laptop 15 Gen 8
SK hynix PVC10 HFS256GEM4X182N
1747 (1666.63min - 1747.42max) MB/s
Microsoft Surface Laptop 7 15 Lunar Lake
Samsung PM9C1a MZ9L81T0HDLB
1718 (1595.51min - 1717.99max) MB/s -2%
seq q8 t1 read
Lenovo ThinkPad X9-15p Gen 1
Samsung PM9E1 1 TB MZVLC1T0HFLU
14162 (13273.2min - 14161.6max) MB/s +133%
Dell XPS 16 Core Ultra X7 358H
 
7039 (5536.1min - 7039.48max) MB/s +16%
Asus Zenbook A16 UX3607
Samsung PM9C1b MZVL81T0HFLB-00BTW
6940 (5727.82min - 6940.07max) MB/s +14%
Microsoft Surface Laptop 7 15 Lunar Lake
Samsung PM9C1a MZ9L81T0HDLB
6158 (5002.91min - 6158.13max) MB/s +1%
Moyenne de la classe Multimedia
  (467 - 14162, n=51, 2 dernières années)
6122 MB/s +1%
Microsoft Surface Laptop 15 Gen 8
SK hynix PVC10 HFS256GEM4X182N
6074 (4968.99min - 6073.77max) MB/s
Moyenne SK hynix PVC10 HFS256GEM4X182N
  (5911 - 6074, n=2)
5993 MB/s -1%
seq q8 t1 write
Lenovo ThinkPad X9-15p Gen 1
Samsung PM9E1 1 TB MZVLC1T0HFLU
13512 (13475.9min - 13511.8max) MB/s +305%
Dell XPS 16 Core Ultra X7 358H
 
6101 (5938.22min - 6101.03max) MB/s +83%
Moyenne de la classe Multimedia
  (247 - 13512, n=51, 2 dernières années)
5102 MB/s +53%
Asus Zenbook A16 UX3607
Samsung PM9C1b MZVL81T0HFLB-00BTW
4986 (4743.29min - 4986.07max) MB/s +50%
Microsoft Surface Laptop 7 15 Lunar Lake
Samsung PM9C1a MZ9L81T0HDLB
4651 (3142.37min - 4651.2max) MB/s +40%
Microsoft Surface Laptop 15 Gen 8
SK hynix PVC10 HFS256GEM4X182N
3333 (2050.9min - 3333.21max) MB/s
Moyenne SK hynix PVC10 HFS256GEM4X182N
  (3041 - 3333, n=2)
3187 MB/s -4%
4k q1 t1 read
Lenovo ThinkPad X9-15p Gen 1
Samsung PM9E1 1 TB MZVLC1T0HFLU
85.1 (79.62min - 85.09max) MB/s +35%
Asus Zenbook A16 UX3607
Samsung PM9C1b MZVL81T0HFLB-00BTW
81.4 (73.37min - 81.4max) MB/s +29%
Moyenne SK hynix PVC10 HFS256GEM4X182N
  (63 - 68, n=2)
65.5 MB/s +4%
Moyenne de la classe Multimedia
  (18.8 - 94.1, n=51, 2 dernières années)
64.4 MB/s +2%
Microsoft Surface Laptop 15 Gen 8
SK hynix PVC10 HFS256GEM4X182N
63 (62.83min - 63max) MB/s
Dell XPS 16 Core Ultra X7 358H
 
59.1 (53.74min - 59.08max) MB/s -6%
Microsoft Surface Laptop 7 15 Lunar Lake
Samsung PM9C1a MZ9L81T0HDLB
55 (51.05min - 55.02max) MB/s -13%
4k q1 t1 write
Asus Zenbook A16 UX3607
Samsung PM9C1b MZVL81T0HFLB-00BTW
249 (236.18min - 248.88max) MB/s +33%
Lenovo ThinkPad X9-15p Gen 1
Samsung PM9E1 1 TB MZVLC1T0HFLU
206 (194.33min - 205.81max) MB/s +10%
Microsoft Surface Laptop 15 Gen 8
SK hynix PVC10 HFS256GEM4X182N
186.6 (149.98min - 186.58max) MB/s
Moyenne de la classe Multimedia
  (40.3 - 278, n=51, 2 dernières années)
161.6 MB/s -13%
Moyenne SK hynix PVC10 HFS256GEM4X182N
  (115.1 - 186.6, n=2)
150.9 MB/s -19%
Dell XPS 16 Core Ultra X7 358H
 
145.5 (139.46min - 145.49max) MB/s -22%
Microsoft Surface Laptop 7 15 Lunar Lake
Samsung PM9C1a MZ9L81T0HDLB
113.9 (108.41min - 113.89max) MB/s -39%
4k q32 t16 read
Lenovo ThinkPad X9-15p Gen 1
Samsung PM9E1 1 TB MZVLC1T0HFLU
5278 (5224.04min - 5277.98max) MB/s +116%
Microsoft Surface Laptop 15 Gen 8
SK hynix PVC10 HFS256GEM4X182N
2446 (2400.1min - 2445.99max) MB/s
Moyenne SK hynix PVC10 HFS256GEM4X182N
  (1450 - 2446, n=2)
1948 MB/s -20%
Moyenne de la classe Multimedia
  (190.3 - 6121, n=51, 2 dernières années)
1626 MB/s -34%
Microsoft Surface Laptop 7 15 Lunar Lake
Samsung PM9C1a MZ9L81T0HDLB
1546 (1446.52min - 1545.71max) MB/s -37%
Asus Zenbook A16 UX3607
Samsung PM9C1b MZVL81T0HFLB-00BTW
1184 (1174.4min - 1183.69max) MB/s -52%
Dell XPS 16 Core Ultra X7 358H
 
652 (602.16min - 651.54max) MB/s -73%
4k q32 t16 write
Lenovo ThinkPad X9-15p Gen 1
Samsung PM9E1 1 TB MZVLC1T0HFLU
3134 (3116.91min - 3133.98max) MB/s +30%
Microsoft Surface Laptop 15 Gen 8
SK hynix PVC10 HFS256GEM4X182N
2414 (735.3min - 2413.9max) MB/s
Moyenne SK hynix PVC10 HFS256GEM4X182N
  (635 - 2414, n=2)
1525 MB/s -37%
Microsoft Surface Laptop 7 15 Lunar Lake
Samsung PM9C1a MZ9L81T0HDLB
1244 (771.44min - 1244.07max) MB/s -48%
Moyenne de la classe Multimedia
  (154.9 - 4447, n=51, 2 dernières années)
1148 MB/s -52%
Asus Zenbook A16 UX3607
Samsung PM9C1b MZVL81T0HFLB-00BTW
805 (790.83min - 804.52max) MB/s -67%
Dell XPS 16 Core Ultra X7 358H
 
447 (308.53min - 447.08max) MB/s -81%
AS SSD
Score Total
Lenovo ThinkPad X9-15p Gen 1
Samsung PM9E1 1 TB MZVLC1T0HFLU
11377 Points +108%
Microsoft Surface Laptop 15 Gen 8
SK hynix PVC10 HFS256GEM4X182N
5467 Points
Moyenne de la classe Multimedia
  (482 - 11377, n=49, 2 dernières années)
5379 Points -2%
Dell XPS 16 Core Ultra X7 358H
 
5309 Points -3%
Asus Zenbook A16 UX3607
Samsung PM9C1b MZVL81T0HFLB-00BTW
5124 Points -6%
Moyenne SK hynix PVC10 HFS256GEM4X182N
  (2859 - 5467, n=2)
4163 Points -24%
Microsoft Surface Laptop 7 15 Lunar Lake
Samsung PM9C1a MZ9L81T0HDLB
3869 Points -29%
Score Read
Lenovo ThinkPad X9-15p Gen 1
Samsung PM9E1 1 TB MZVLC1T0HFLU
4351 Points +99%
Microsoft Surface Laptop 15 Gen 8
SK hynix PVC10 HFS256GEM4X182N
2182 Points
Moyenne SK hynix PVC10 HFS256GEM4X182N
  (1628 - 2182, n=2)
1905 Points -13%
Moyenne de la classe Multimedia
  (192 - 4351, n=49, 2 dernières années)
1761 Points -19%
Microsoft Surface Laptop 7 15 Lunar Lake
Samsung PM9C1a MZ9L81T0HDLB
1470 Points -33%
Dell XPS 16 Core Ultra X7 358H
 
1423 Points -35%
Asus Zenbook A16 UX3607
Samsung PM9C1b MZVL81T0HFLB-00BTW
1188 Points -46%
Score Write
Lenovo ThinkPad X9-15p Gen 1
Samsung PM9E1 1 TB MZVLC1T0HFLU
4851 Points +113%
Asus Zenbook A16 UX3607
Samsung PM9C1b MZVL81T0HFLB-00BTW
3402 Points +49%
Dell XPS 16 Core Ultra X7 358H
 
3277 Points +44%
Moyenne de la classe Multimedia
  (191 - 4851, n=49, 2 dernières années)
2777 Points +22%
Microsoft Surface Laptop 15 Gen 8
SK hynix PVC10 HFS256GEM4X182N
2278 Points
Microsoft Surface Laptop 7 15 Lunar Lake
Samsung PM9C1a MZ9L81T0HDLB
1716 Points -25%
Moyenne SK hynix PVC10 HFS256GEM4X182N
  (506 - 2278, n=2)
1392 Points -39%
Seq Read
Lenovo ThinkPad X9-15p Gen 1
Samsung PM9E1 1 TB MZVLC1T0HFLU
10401 MB/s +120%
Asus Zenbook A16 UX3607
Samsung PM9C1b MZVL81T0HFLB-00BTW
5391 MB/s +14%
Dell XPS 16 Core Ultra X7 358H
 
5083.41 MB/s +7%
Moyenne de la classe Multimedia
  (484 - 10494, n=49, 2 dernières années)
4775 MB/s +1%
Microsoft Surface Laptop 15 Gen 8
SK hynix PVC10 HFS256GEM4X182N
4734 MB/s
Microsoft Surface Laptop 7 15 Lunar Lake
Samsung PM9C1a MZ9L81T0HDLB
4668 MB/s -1%
Moyenne SK hynix PVC10 HFS256GEM4X182N
  (3681 - 4734, n=2)
4208 MB/s -11%
Seq Write
Lenovo ThinkPad X9-15p Gen 1
Samsung PM9E1 1 TB MZVLC1T0HFLU
9596 MB/s +329%
Asus Zenbook A16 UX3607
Samsung PM9C1b MZVL81T0HFLB-00BTW
3527 MB/s +58%
Moyenne de la classe Multimedia
  (344 - 9596, n=49, 2 dernières années)
3353 MB/s +50%
Microsoft Surface Laptop 7 15 Lunar Lake
Samsung PM9C1a MZ9L81T0HDLB
3049 MB/s +36%
Dell XPS 16 Core Ultra X7 358H
 
2509.02 MB/s +12%
Microsoft Surface Laptop 15 Gen 8
SK hynix PVC10 HFS256GEM4X182N
2239 MB/s
Moyenne SK hynix PVC10 HFS256GEM4X182N
  (1427 - 2239, n=2)
1833 MB/s -18%
4K Read
Microsoft Surface Laptop 15 Gen 8
SK hynix PVC10 HFS256GEM4X182N
80.7 MB/s
Lenovo ThinkPad X9-15p Gen 1
Samsung PM9E1 1 TB MZVLC1T0HFLU
78.9 MB/s -2%
Asus Zenbook A16 UX3607
Samsung PM9C1b MZVL81T0HFLB-00BTW
65.7 MB/s -19%
Moyenne SK hynix PVC10 HFS256GEM4X182N
  (47.2 - 80.7, n=2)
64 MB/s -21%
Moyenne de la classe Multimedia
  (17.5 - 89.9, n=49, 2 dernières années)
63.4 MB/s -21%
Microsoft Surface Laptop 7 15 Lunar Lake
Samsung PM9C1a MZ9L81T0HDLB
57.6 MB/s -29%
Dell XPS 16 Core Ultra X7 358H
 
52.53 MB/s -35%
4K Write
Asus Zenbook A16 UX3607
Samsung PM9C1b MZVL81T0HFLB-00BTW
225 MB/s +50%
Lenovo ThinkPad X9-15p Gen 1
Samsung PM9E1 1 TB MZVLC1T0HFLU
181.3 MB/s +20%
Moyenne de la classe Multimedia
  (43.1 - 265, n=49, 2 dernières années)
181 MB/s +20%
Microsoft Surface Laptop 15 Gen 8
SK hynix PVC10 HFS256GEM4X182N
150.5 MB/s
Moyenne SK hynix PVC10 HFS256GEM4X182N
  (110.8 - 150.5, n=2)
130.7 MB/s -13%
Microsoft Surface Laptop 7 15 Lunar Lake
Samsung PM9C1a MZ9L81T0HDLB
130.6 MB/s -13%
Dell XPS 16 Core Ultra X7 358H
 
125.58 MB/s -17%
4K-64 Read
Lenovo ThinkPad X9-15p Gen 1
Samsung PM9E1 1 TB MZVLC1T0HFLU
3232 MB/s +99%
Microsoft Surface Laptop 15 Gen 8
SK hynix PVC10 HFS256GEM4X182N
1628 MB/s
Moyenne SK hynix PVC10 HFS256GEM4X182N
  (1213 - 1628, n=2)
1421 MB/s -13%
Moyenne de la classe Multimedia
  (125.7 - 3394, n=49, 2 dernières années)
1220 MB/s -25%
Microsoft Surface Laptop 7 15 Lunar Lake
Samsung PM9C1a MZ9L81T0HDLB
945 MB/s -42%
Dell XPS 16 Core Ultra X7 358H
 
862.49 MB/s -47%
Asus Zenbook A16 UX3607
Samsung PM9C1b MZVL81T0HFLB-00BTW
583 MB/s -64%
4K-64 Write
Lenovo ThinkPad X9-15p Gen 1
Samsung PM9E1 1 TB MZVLC1T0HFLU
3710 MB/s +95%
Dell XPS 16 Core Ultra X7 358H
 
2900.39 MB/s +52%
Asus Zenbook A16 UX3607
Samsung PM9C1b MZVL81T0HFLB-00BTW
2825 MB/s +48%
Moyenne de la classe Multimedia
  (75.2 - 4042, n=49, 2 dernières années)
2261 MB/s +19%
Microsoft Surface Laptop 15 Gen 8
SK hynix PVC10 HFS256GEM4X182N
1903 MB/s
Microsoft Surface Laptop 7 15 Lunar Lake
Samsung PM9C1a MZ9L81T0HDLB
1281 MB/s -33%
Moyenne SK hynix PVC10 HFS256GEM4X182N
  (252 - 1903, n=2)
1078 MB/s -43%
Access Time Read
Moyenne SK hynix PVC10 HFS256GEM4X182N
  (0.087 - 0.162, n=2)
0.1245 ms * -43%
Microsoft Surface Laptop 15 Gen 8
SK hynix PVC10 HFS256GEM4X182N
0.087 ms *
Lenovo ThinkPad X9-15p Gen 1
Samsung PM9E1 1 TB MZVLC1T0HFLU
0.077 ms * +11%
Asus Zenbook A16 UX3607
Samsung PM9C1b MZVL81T0HFLB-00BTW
0.075 ms * +14%
Moyenne de la classe Multimedia
  (0.018 - 0.168, n=49, 2 dernières années)
0.06484 ms * +25%
Dell XPS 16 Core Ultra X7 358H
 
0.059 ms * +32%
Microsoft Surface Laptop 7 15 Lunar Lake
Samsung PM9C1a MZ9L81T0HDLB
0.034 ms * +61%
Access Time Write
Dell XPS 16 Core Ultra X7 358H
 
0.082 ms * -273%
Moyenne de la classe Multimedia
  (0.015 - 0.754, n=49, 2 dernières années)
0.0771 ms * -250%
Moyenne SK hynix PVC10 HFS256GEM4X182N
  (0.022 - 0.045, n=2)
0.0335 ms * -52%
Microsoft Surface Laptop 7 15 Lunar Lake
Samsung PM9C1a MZ9L81T0HDLB
0.03 ms * -36%
Microsoft Surface Laptop 15 Gen 8
SK hynix PVC10 HFS256GEM4X182N
0.022 ms *
Lenovo ThinkPad X9-15p Gen 1
Samsung PM9E1 1 TB MZVLC1T0HFLU
0.021 ms * +5%
Asus Zenbook A16 UX3607
Samsung PM9C1b MZVL81T0HFLB-00BTW
0.019 ms * +14%

* ... Moindre est la valeur, meilleures sont les performances
Limitation du débit du disque : boucle de lecture DiskSpd, profondeur de file d’attente 8

0285570855114014251710199522802565285031353420370539904275456048455130541557005985627065556840712574107695798082658550883591209405969099751026010545108301111511400116851197012255125401282513110133951368013965Tooltip
Microsoft Surface Laptop 15 Gen 8 SK hynix PVC10 HFS256GEM4X182N; diskspd 2.0.17 f: Ø6131 (5502.51-6156.25) MB/s
Lenovo ThinkPad X9-15p Gen 1 Samsung PM9E1 1 TB MZVLC1T0HFLU; diskspd 2.0.17 f: Ø8537 (5788.93-14160.38) MB/s
Asus Zenbook A16 UX3607 Samsung PM9C1b MZVL81T0HFLB-00BTW; diskspd 2.0.17 f: Ø6739 (2925.13-6893.49) MB/s
Dell XPS 16 Core Ultra X7 358H  ; diskspd 2.0.17 f: Ø7017 (6000.16-7049.37) MB/s
Microsoft Surface Laptop 7 15 Lunar Lake Samsung PM9C1a MZ9L81T0HDLB; diskspd 2.0.17 f: Ø6146 (4937.32-6171.08) MB/s

Performances du GPU et en jeu

Le point fort du processeur Core Ultra X est le puissant iGPU Arc B390, qui est bien plus rapide que l’Adreno X2-85 des modèles Snapdragon. Cependant, le Surface Laptop ne peut pas exploiter tout son potentiel en raison de la baisse à 35 watts lors de charges de travail prolongées, ce qui entraîne une baisse des performances d’environ 20 % après quelques minutes, également clairement perceptible dans notre test de jeu sur Cyberpunk. Ce n’est pas idéal, mais l’Arc B390 reste le meilleur choix pour un ordinateur portable multimédia et ne présente pas non plus de problèmes de compatibilité avec les jeux. 

3DMark Performance rating - Percent
Lenovo ThinkPad X9-15p Gen 1 -2!
Intel Arc B390 12 Xe3 Panther Lake iGPU, Intel Core Ultra X7 358H
98.5 pt
Dell XPS 16 Core Ultra X7 358H -2!
Intel Arc B390 12 Xe3 Panther Lake iGPU, Intel Core Ultra X7 358H
95.4 pt
Moyenne de la classe Multimedia
 
94.8 pt
Moyenne Intel Arc B390 12 Xe3 Panther Lake iGPU
 
85.4 pt
Microsoft Surface Laptop 15 Gen 8
Intel Arc B390 12 Xe3 Panther Lake iGPU, Intel Core Ultra X7 368H
83.5 pt
Asus Zenbook A16 UX3607
Qualcomm Adreno X2-90, Qualcomm Snapdragon X2 Elite Extreme X2E-94-100
64.5 pt
Apple MacBook Air 15 M5 -3!
Apple M5 10-Core GPU, Apple M5 10-Core
57.2 pt
Microsoft Surface Laptop 7 15 Lunar Lake
Intel Arc Graphics 140V, Intel Core Ultra 7 268V
54.7 pt
Microsoft Surface Pro 13 OLED
Qualcomm Adreno X2-85, Qualcomm Snapdragon X2 Elite X2E-78-100
40 pt
Microsoft Surface Laptop 8 13.8
Qualcomm SD X2 Adreno X2-45, Qualcomm Snapdragon X2 Plus X2P-64-100
34.8 pt
3DMark 11 - 1280x720 Performance GPU
Moyenne de la classe Multimedia
  (3749 - 60002, n=49, 2 dernières années)
19892 Points +3%
Microsoft Surface Laptop 15 Gen 8
Intel Arc B390 12 Xe3 Panther Lake iGPU, Intel Core Ultra X7 368H
19256 Points
Lenovo ThinkPad X9-15p Gen 1
Intel Arc B390 12 Xe3 Panther Lake iGPU, Intel Core Ultra X7 358H
18972 Points -1%
Moyenne Intel Arc B390 12 Xe3 Panther Lake iGPU
  (14637 - 19804, n=16)
18495 Points -4%
Dell XPS 16 Core Ultra X7 358H
Intel Arc B390 12 Xe3 Panther Lake iGPU, Intel Core Ultra X7 358H
18308 Points -5%
Asus Zenbook A16 UX3607
Qualcomm Adreno X2-90, Qualcomm Snapdragon X2 Elite Extreme X2E-94-100
13847 Points -28%
Microsoft Surface Laptop 7 15 Lunar Lake
Intel Arc Graphics 140V, Intel Core Ultra 7 268V
12772 Points -34%
Microsoft Surface Pro 13 OLED
Qualcomm Adreno X2-85, Qualcomm Snapdragon X2 Elite X2E-78-100
8565 Points -56%
Microsoft Surface Laptop 8 13.8
Qualcomm SD X2 Adreno X2-45, Qualcomm Snapdragon X2 Plus X2P-64-100
7647 Points -60%
3DMark
1920x1080 Fire Strike Graphics
Lenovo ThinkPad X9-15p Gen 1
Intel Arc B390 12 Xe3 Panther Lake iGPU, Intel Core Ultra X7 358H
17351 Points +3%
Dell XPS 16 Core Ultra X7 358H
Intel Arc B390 12 Xe3 Panther Lake iGPU, Intel Core Ultra X7 358H
17018 Points +1%
Microsoft Surface Laptop 15 Gen 8
Intel Arc B390 12 Xe3 Panther Lake iGPU, Intel Core Ultra X7 368H
16839 Points
Moyenne Intel Arc B390 12 Xe3 Panther Lake iGPU
  (13410 - 18327, n=16)
16743 Points -1%
Moyenne de la classe Multimedia
  (2328 - 48907, n=53, 2 dernières années)
15695 Points -7%
Asus Zenbook A16 UX3607
Qualcomm Adreno X2-90, Qualcomm Snapdragon X2 Elite Extreme X2E-94-100
11834 Points -30%
Microsoft Surface Laptop 7 15 Lunar Lake
Intel Arc Graphics 140V, Intel Core Ultra 7 268V
10476 Points -38%
Microsoft Surface Pro 13 OLED
Qualcomm Adreno X2-85, Qualcomm Snapdragon X2 Elite X2E-78-100
7617 Points -55%
Microsoft Surface Laptop 8 13.8
Qualcomm SD X2 Adreno X2-45, Qualcomm Snapdragon X2 Plus X2P-64-100
6626 Points -61%
2560x1440 Time Spy Graphics
Lenovo ThinkPad X9-15p Gen 1
Intel Arc B390 12 Xe3 Panther Lake iGPU, Intel Core Ultra X7 358H
7257 Points +13%
Dell XPS 16 Core Ultra X7 358H
Intel Arc B390 12 Xe3 Panther Lake iGPU, Intel Core Ultra X7 358H
6972 Points +9%
Moyenne Intel Arc B390 12 Xe3 Panther Lake iGPU
  (4567 - 7257, n=23)
6497 Points +1%
Microsoft Surface Laptop 15 Gen 8
Intel Arc B390 12 Xe3 Panther Lake iGPU, Intel Core Ultra X7 368H
6407 Points
Moyenne de la classe Multimedia
  (696 - 19403, n=53, 2 dernières années)
6065 Points -5%
Microsoft Surface Laptop 7 15 Lunar Lake
Intel Arc Graphics 140V, Intel Core Ultra 7 268V
4415 Points -31%
Asus Zenbook A16 UX3607
Qualcomm Adreno X2-90, Qualcomm Snapdragon X2 Elite Extreme X2E-94-100
4064 Points -37%
Microsoft Surface Pro 13 OLED
Qualcomm Adreno X2-85, Qualcomm Snapdragon X2 Elite X2E-78-100
2605 Points -59%
Microsoft Surface Laptop 8 13.8
Qualcomm SD X2 Adreno X2-45, Qualcomm Snapdragon X2 Plus X2P-64-100
2262 Points -65%
Steel Nomad Score
Moyenne de la classe Multimedia
  (342 - 4959, n=39, 2 dernières années)
2011 Points +55%
Moyenne Intel Arc B390 12 Xe3 Panther Lake iGPU
  (1301 - 1667, n=11)
1539 Points +18%
Microsoft Surface Laptop 15 Gen 8
Intel Arc B390 12 Xe3 Panther Lake iGPU, Intel Core Ultra X7 368H
1301 Points
Asus Zenbook A16 UX3607
Qualcomm Adreno X2-90, Qualcomm Snapdragon X2 Elite Extreme X2E-94-100
1264 Points -3%
Apple MacBook Air 15 M5
Apple M5 10-Core GPU, Apple M5 10-Core
1070 Points -18%
Microsoft Surface Laptop 7 15 Lunar Lake
Intel Arc Graphics 140V, Intel Core Ultra 7 268V
910 Points -30%
Microsoft Surface Pro 13 OLED
Qualcomm Adreno X2-85, Qualcomm Snapdragon X2 Elite X2E-78-100
711 Points -45%
Microsoft Surface Laptop 8 13.8
Qualcomm SD X2 Adreno X2-45, Qualcomm Snapdragon X2 Plus X2P-64-100
622 Points -52%
Steel Nomad Light Score
Moyenne de la classe Multimedia
  (2001 - 21012, n=38, 2 dernières années)
8315 Points +41%
Moyenne Intel Arc B390 12 Xe3 Panther Lake iGPU
  (5562 - 6338, n=8)
5927 Points +1%
Microsoft Surface Laptop 15 Gen 8
Intel Arc B390 12 Xe3 Panther Lake iGPU, Intel Core Ultra X7 368H
5878 Points
Asus Zenbook A16 UX3607
Qualcomm Adreno X2-90, Qualcomm Snapdragon X2 Elite Extreme X2E-94-100
5492 Points -7%
Apple MacBook Air 15 M5
Apple M5 10-Core GPU, Apple M5 10-Core
5084 Points -14%
Microsoft Surface Laptop 7 15 Lunar Lake
Intel Arc Graphics 140V, Intel Core Ultra 7 268V
3555 Points -40%
Microsoft Surface Pro 13 OLED
Qualcomm Adreno X2-85, Qualcomm Snapdragon X2 Elite X2E-78-100
3464 Points -41%
Microsoft Surface Laptop 8 13.8
Qualcomm SD X2 Adreno X2-45, Qualcomm Snapdragon X2 Plus X2P-64-100
2935 Points -50%
3DMark 11 Performance
18531 points
3DMark Fire Strike Score
13306 points
3DMark Time Spy Score
6854 points
3DMark Steel Nomad Score
1301 points
3DMark Steel Nomad Light Score
5878 points
Aide
Blender / v3.3 Classroom CPU
Microsoft Surface Laptop 7 15 Lunar Lake
Intel Arc Graphics 140V, Intel Core Ultra 7 268V
555 Seconds * -62%
Moyenne de la classe Multimedia
  (133 - 1042, n=57, 2 dernières années)
372 Seconds * -8%
Apple MacBook Air 15 M5
Apple M5 10-Core GPU, Apple M5 10-Core
344 Seconds * -0%
Microsoft Surface Laptop 15 Gen 8
Intel Arc B390 12 Xe3 Panther Lake iGPU, Intel Core Ultra X7 368H
343 Seconds *
Dell XPS 16 Core Ultra X7 358H
Intel Arc B390 12 Xe3 Panther Lake iGPU, Intel Core Ultra X7 358H
328 Seconds * +4%
Moyenne Intel Arc B390 12 Xe3 Panther Lake iGPU
  (282 - 409, n=16)
327 Seconds * +5%
Asus Zenbook A16 UX3607
Qualcomm Adreno X2-90, Qualcomm Snapdragon X2 Elite Extreme X2E-94-100
320 Seconds * +7%
Lenovo ThinkPad X9-15p Gen 1
Intel Arc B390 12 Xe3 Panther Lake iGPU, Intel Core Ultra X7 358H
288 Seconds * +16%
Blender / v3.3 Classroom METAL
Apple MacBook Air 15 M5
Apple M5 10-Core GPU, Apple M5 10-Core
76.3 Seconds *
Moyenne de la classe Multimedia
  (17.8 - 68, n=6, 2 dernières années)
37.2 Seconds *
Blender / v3.3 Classroom oneAPI/Intel
Moyenne de la classe Multimedia
  (105 - 492, n=17, 2 dernières années)
249 Seconds *
Moyenne Intel Arc B390 12 Xe3 Panther Lake iGPU
  (105 - 254, n=6)
131.5 Seconds *
Dell XPS 16 Core Ultra X7 358H
Intel Arc B390 12 Xe3 Panther Lake iGPU, Intel Core Ultra X7 358H
105 Seconds *

* ... Moindre est la valeur, meilleures sont les performances
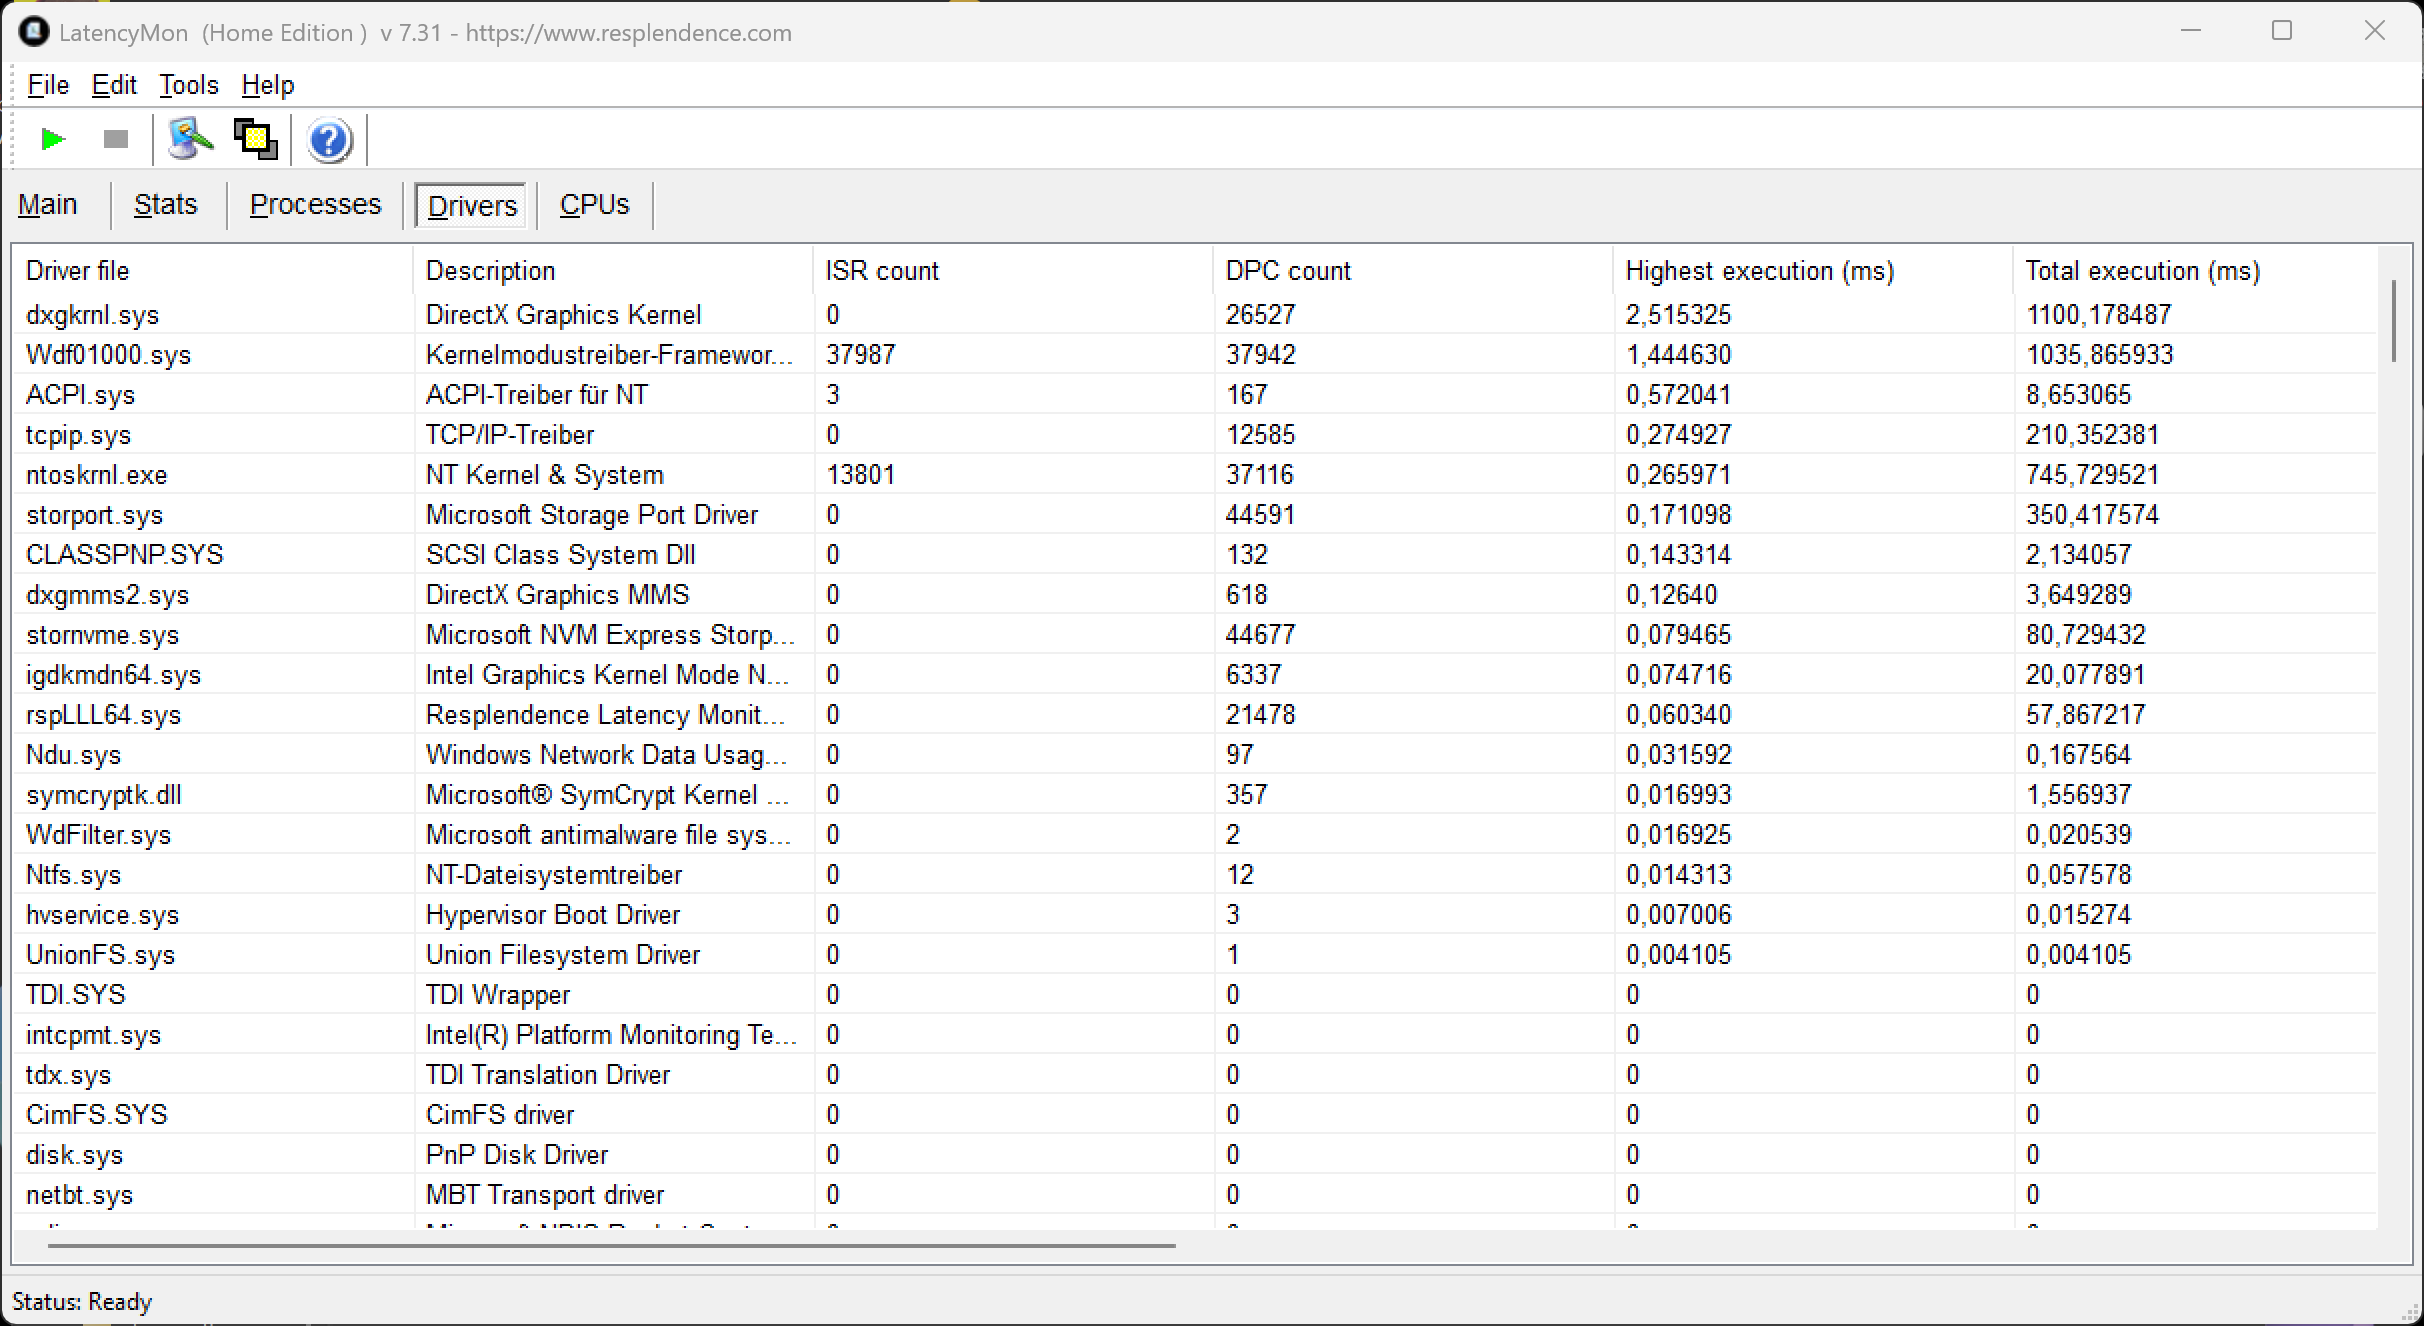
Performance rating - Percent
Moyenne de la classe Multimedia
 
95 pt
Lenovo ThinkPad X9-15p Gen 1 -1!
Intel Core Ultra X7 358H, Intel Arc B390 12 Xe3 Panther Lake iGPU
93 pt
Dell XPS 16 Core Ultra X7 358H
Intel Core Ultra X7 358H, Intel Arc B390 12 Xe3 Panther Lake iGPU
88.9 pt
Microsoft Surface Laptop 15 Gen 8
Intel Core Ultra X7 368H, Intel Arc B390 12 Xe3 Panther Lake iGPU
79.3 pt
Asus Zenbook A16 UX3607
Qualcomm Snapdragon X2 Elite Extreme X2E-94-100, Qualcomm Adreno X2-90
73.1 pt
Microsoft Surface Laptop 7 15 Lunar Lake
Intel Core Ultra 7 268V, Intel Arc Graphics 140V
60.5 pt
Apple MacBook Air 15 M5 -5!
Apple M5 10-Core, Apple M5 10-Core GPU
58.3 pt
Cyberpunk 2077 - 1920x1080 Ultra Preset (FSR off)
Lenovo ThinkPad X9-15p Gen 1
Intel Core Ultra X7 358H, Intel Arc B390 12 Xe3 Panther Lake iGPU
50.4 (41.6min, 39.8P1) fps +19%
Dell XPS 16 Core Ultra X7 358H
Intel Core Ultra X7 358H, Intel Arc B390 12 Xe3 Panther Lake iGPU
48.7 (40min, 37.6P1) fps +15%
Moyenne de la classe Multimedia
  (6.41 - 112.3, n=64, 2 dernières années)
45.3 fps +7%
Microsoft Surface Laptop 15 Gen 8
Intel Core Ultra X7 368H, Intel Arc B390 12 Xe3 Panther Lake iGPU
42.3 (33.3min) fps
Asus Zenbook A16 UX3607
Qualcomm Snapdragon X2 Elite Extreme X2E-94-100, Qualcomm Adreno X2-90
38.2 (30.9min) fps -10%
Microsoft Surface Laptop 7 15 Lunar Lake
Intel Core Ultra 7 268V, Intel Arc Graphics 140V
29.6 (25min) fps -30%
Apple MacBook Air 15 M5
Apple M5 10-Core, Apple M5 10-Core GPU
23.3 fps -45%
Baldur's Gate 3 - 1920x1080 Ultra Preset AA:T
Moyenne de la classe Multimedia
  (7.8 - 158.7, n=61, 2 dernières années)
56 fps +20%
Dell XPS 16 Core Ultra X7 358H
Intel Core Ultra X7 358H, Intel Arc B390 12 Xe3 Panther Lake iGPU
54.3 (48.6min, 49.6P0.1, 51P1) fps +17%
Lenovo ThinkPad X9-15p Gen 1
Intel Core Ultra X7 358H, Intel Arc B390 12 Xe3 Panther Lake iGPU
50.1 (29.6min, 29.8P0.1, 29.9P1) fps +8%
Microsoft Surface Laptop 15 Gen 8
Intel Core Ultra X7 368H, Intel Arc B390 12 Xe3 Panther Lake iGPU
46.6 (42.1min, 42.2P0.1, 43.4P1) fps
Asus Zenbook A16 UX3607
Qualcomm Snapdragon X2 Elite Extreme X2E-94-100, Qualcomm Adreno X2-90
42.5 (28.7min, 29.8P0.1, 39.3P1) fps -9%
Apple MacBook Air 15 M5
Apple M5 10-Core, Apple M5 10-Core GPU
39.4 fps -15%
Microsoft Surface Laptop 7 15 Lunar Lake
Intel Core Ultra 7 268V, Intel Arc Graphics 140V
27.4 fps -41%
GTA V - 1920x1080 Highest AA:4xMSAA + FX AF:16x
Moyenne de la classe Multimedia
  (7.92 - 141.6, n=48, 2 dernières années)
55 fps +66%
Lenovo ThinkPad X9-15p Gen 1
Intel Core Ultra X7 358H, Intel Arc B390 12 Xe3 Panther Lake iGPU
46.2 (9.48min, 35.7P1) fps +39%
Dell XPS 16 Core Ultra X7 358H
Intel Core Ultra X7 358H, Intel Arc B390 12 Xe3 Panther Lake iGPU
45.2 (6.18min, 34.5P1) fps +36%
Asus Zenbook A16 UX3607
Qualcomm Snapdragon X2 Elite Extreme X2E-94-100, Qualcomm Adreno X2-90
41.1 (4.34min, 23.8P1) fps +24%
Microsoft Surface Laptop 15 Gen 8
Intel Core Ultra X7 368H, Intel Arc B390 12 Xe3 Panther Lake iGPU
33.2 (4.78min, 24.4P1) fps
Microsoft Surface Laptop 7 15 Lunar Lake
Intel Core Ultra 7 268V, Intel Arc Graphics 140V
25.3 (11.4min, 14.5P1) fps -24%
Final Fantasy XV Benchmark - 1920x1080 High Quality
Lenovo ThinkPad X9-15p Gen 1
Intel Core Ultra X7 358H, Intel Arc B390 12 Xe3 Panther Lake iGPU
57.9 fps +16%
Dell XPS 16 Core Ultra X7 358H
Intel Core Ultra X7 358H, Intel Arc B390 12 Xe3 Panther Lake iGPU
56.2 fps +12%
Moyenne de la classe Multimedia
  (7.61 - 144.4, n=51, 2 dernières années)
55.6 fps +11%
Microsoft Surface Laptop 15 Gen 8
Intel Core Ultra X7 368H, Intel Arc B390 12 Xe3 Panther Lake iGPU
50 fps
Microsoft Surface Laptop 7 15 Lunar Lake
Intel Core Ultra 7 268V, Intel Arc Graphics 140V
36.4 fps -27%
Asus Zenbook A16 UX3607
Qualcomm Snapdragon X2 Elite Extreme X2E-94-100, Qualcomm Adreno X2-90
34.5 fps -31%
Strange Brigade - 1920x1080 ultra AA:ultra AF:16
Moyenne de la classe Multimedia
  (13.3 - 303, n=50, 2 dernières années)
100.4 fps +13%
Dell XPS 16 Core Ultra X7 358H
Intel Core Ultra X7 358H, Intel Arc B390 12 Xe3 Panther Lake iGPU
90.6 (24.7min, 39.3P1) fps +2%
Microsoft Surface Laptop 15 Gen 8
Intel Core Ultra X7 368H, Intel Arc B390 12 Xe3 Panther Lake iGPU
89.2 (28.1min, 39.2P1) fps
Asus Zenbook A16 UX3607
Qualcomm Snapdragon X2 Elite Extreme X2E-94-100, Qualcomm Adreno X2-90
81.7 (17min, 25.1P1) fps -8%
Microsoft Surface Laptop 7 15 Lunar Lake
Intel Core Ultra 7 268V, Intel Arc Graphics 140V
61.7 (41.5min, 46.9P1) fps -31%
Dota 2 Reborn - 1920x1080 ultra (3/3) best looking
Lenovo ThinkPad X9-15p Gen 1
Intel Core Ultra X7 358H, Intel Arc B390 12 Xe3 Panther Lake iGPU
117.2 (87.1min) fps +47%
Dell XPS 16 Core Ultra X7 358H
Intel Core Ultra X7 358H, Intel Arc B390 12 Xe3 Panther Lake iGPU
96.9 (57min) fps +21%
Moyenne de la classe Multimedia
  (30.3 - 170.9, n=52, 2 dernières années)
92.8 fps +16%
Microsoft Surface Laptop 7 15 Lunar Lake
Intel Core Ultra 7 268V, Intel Arc Graphics 140V
82.4 (50.6min) fps +3%
Microsoft Surface Laptop 15 Gen 8
Intel Core Ultra X7 368H, Intel Arc B390 12 Xe3 Panther Lake iGPU
80 (48.4min) fps
Asus Zenbook A16 UX3607
Qualcomm Snapdragon X2 Elite Extreme X2E-94-100, Qualcomm Adreno X2-90
70.7 (51.1min) fps -12%
X-Plane 11.11 - 1920x1080 high (fps_test=3)
Moyenne de la classe Multimedia
  (16.9 - 103, n=50, 2 dernières années)
50.6 fps +19%
Lenovo ThinkPad X9-15p Gen 1
Intel Core Ultra X7 358H, Intel Arc B390 12 Xe3 Panther Lake iGPU
42.8 fps +1%
Asus Zenbook A16 UX3607
Qualcomm Snapdragon X2 Elite Extreme X2E-94-100, Qualcomm Adreno X2-90
42.6 fps 0%
Microsoft Surface Laptop 15 Gen 8
Intel Core Ultra X7 368H, Intel Arc B390 12 Xe3 Panther Lake iGPU
42.4 fps
Dell XPS 16 Core Ultra X7 358H
Intel Core Ultra X7 358H, Intel Arc B390 12 Xe3 Panther Lake iGPU
38.8 fps -8%
Microsoft Surface Laptop 7 15 Lunar Lake
Intel Core Ultra 7 268V, Intel Arc Graphics 140V
37.9 fps -11%

Graphique des FPS de Cyberpunk 2077 en ultra

051015202530354045Tooltip
Microsoft Surface Laptop 15 Gen 8 Ultra X7 368H, Arc B390 Panther Lake iGPU: Ø34.9 (28.4-37.5) fps
Lenovo ThinkPad X9-15p Gen 1 Ultra X7 358H, Arc B390 Panther Lake iGPU: Ø44.9 (42.5-46.2) fps
Asus Zenbook A16 UX3607 X2E-94-100, X2-90: Ø32.7 (31.5-33.5) fps
Dell XPS 16 Core Ultra X7 358H Ultra X7 358H, Arc B390 Panther Lake iGPU: Ø46 (42.5-47) fps
Microsoft Surface Laptop 7 15 Lunar Lake Core Ultra 7 268V, Arc 140V: Ø26.8 (25-28) fps
BasMoyenÉlevéUltra
GTA V (2015) 176.4 170.4 87.7 33.2
Dota 2 Reborn (2015) 127 85.6 86.9 80
Final Fantasy XV Benchmark (2018) 116.7 68.7 50
X-Plane 11.11 (2018) 61.8 50.2 42.4
Strange Brigade (2018) 307 120.8 101.7 89.2
Baldur's Gate 3 (2023) 71.6 54.3 47.7 46.6
Cyberpunk 2077 (2023) 67.9 60.4 50 42.3
F1 24 (2024) 111.5 109.1 82 28.5

Émissions & consommation d’énergie

Bruit du système

Unité de refroidissement

Le Surface Laptop 15 est un ordinateur portable généralement très silencieux, mais le système de refroidissement doté d'un seul ventilateur peine à gérer le TDP élevé de 65 watts sur de courtes durées, si bien que le ventilateur devient assez rapidement audible sous des charges de travail plus importantes. En jeu et pendant notre test de résistance, nous mesurons jusqu'à 41.3 dB(A) et environ 36-37 dB(A) dans les deux modes de fonctionnement moins performants. La sollicitation du GPU a également provoqué un léger sifflement des bobines sur notre système de test.

Degré de la nuisance sonore

Au repos
24.9 / 24.9 / 24.9 dB(A)
Fortement sollicité
32.2 / 41.3 dB(A)
  red to green bar
 
 
30 dB
silencieux
40 dB(A)
audible
50 dB(A)
bruyant
 
min: dark, med: mid, max: light   Earthworks M23R, Arta (à 15 cm de distance)   bruit ambiant: 24.9 dB(A)
dB(A) 0102030405060708090Deep BassMiddle BassHigh BassLower RangeMidsHigher MidsLower HighsMid HighsUpper HighsSuper Highs2042.340.438.242.72533.333.93533.93138.940.440.136.14040.841.439.639.55039.139.237.339.16335.735.832.532.18031.430.826.925.110028.632.927.324.612525.130.120.822.316025.527.52220.820026.228.524.121.225026.130.624.321.831528.42518.319.14003121.514.416.350031.422.312.614.163030.522.612.413.880028211112.1100027.319.810.912.8125029.319.910.712.616003320.710.412.2200032.62110.111.8250031.520.610.411.8315028.514.910.812.1400025.313.911.212.3500024.71811.512.4630023.816.911.812.6800027.713.711.612.61000018.213.211.612.41250015.313.311.412.21600013.212.410.611.5SPL41.332.224.925.5N3.81.70.70.7median 27.7median 20.7median 11.6median 12.6Delta2.66.13.32.9hearing rangehide median Fan NoiseMicrosoft Surface Laptop 15 Gen 8
Microsoft Surface Laptop 15 Gen 8
Ultra X7 368H, Arc B390 Panther Lake iGPU
Lenovo ThinkPad X9-15p Gen 1
Ultra X7 358H, Arc B390 Panther Lake iGPU
Asus Zenbook A16 UX3607
X2E-94-100, X2-90
Dell XPS 16 Core Ultra X7 358H
Ultra X7 358H, Arc B390 Panther Lake iGPU
Apple MacBook Air 15 M5
M5 10-Core, M5 10-Core GPU
Microsoft Surface Laptop 7 15 Lunar Lake
Core Ultra 7 268V, Arc 140V
Noise
3%
-5%
-2%
3%
arrêt / environnement * (dB)
24.9
22.9
8%
24.9
-0%
23.3
6%
23.9
4%
Idle Minimum * (dB)
24.9
22.9
8%
24.9
-0%
23.4
6%
23.9
4%
Idle Average * (dB)
24.9
22.9
8%
24.9
-0%
23.4
6%
23.9
4%
Idle Maximum * (dB)
24.9
22.9
8%
24.9
-0%
25.8
-4%
23.9
4%
Load Average * (dB)
32.2
31.4
2%
27.9
13%
38
-18%
31.8
1%
Cyberpunk 2077 ultra * (dB)
41.3
43.8
-6%
51.1
-24%
38.1
8%
38
8%
Load Maximum * (dB)
41.3
43.7
-6%
51.1
-24%
48.6
-18%
41.9
-1%

* ... Moindre est la valeur, meilleures sont les performances

Température

Les surfaces en aluminium peuvent devenir assez chaudes sous forte charge, et cela se ressent nettement lors de la frappe. Le panneau inférieur reste sensiblement plus frais, et vous pouvez poser l’appareil sur vos genoux sans problème. Lors de notre test de stress, le CPU se stabilise rapidement à 28 watts (~79 °C).

Test de stress des données CPU/iGPU
40.7 °C44.2 °C43 °C
40.2 °C41.5 °C35.6 °C
31.7 °C29.2 °C30.7 °C
Maximum: 44.2 °C
Moyenne: 37.4 °C
39.9 °C41 °C39.4 °C
37.2 °C38.2 °C37.2 °C
31.7 °C32.5 °C32 °C
Maximum: 40.3 °C
Moyenne: 36.3 °C
Alimentation (valeur maximale)  42.4 °C | Température ambiante de la pièce 21 °C | Fluke t3000FC (calibrated), Voltcraft IR-900
(±) La température moyenne de la face supérieure sous charge maximale est de 37.4 °C / 99 F, par rapport à la moyenne de 31.3 °C / 88 F pour les appareils de la classe Multimedia.
(±) La température maximale du côté supérieur est de 44.2 °C / 112 F, par rapport à la moyenne de 36.8 °C / 98 F, allant de 21 à 71 °C pour la classe Multimedia.
(±) Le fond chauffe jusqu'à un maximum de 40.3 °C / 105 F, contre une moyenne de 39.1 °C / 102 F
(+) En utilisation inactive, la température moyenne du côté supérieur est de 25.4 °C / 78 F, par rapport à la moyenne du dispositif de 31.3 °C / 88 F.
(±) 3: The average temperature for the upper side is 37.1 °C / 99 F, compared to the average of 31.3 °C / 88 F for the class Multimedia.
(+) Les repose-poignets et le pavé tactile sont plus froids que la température de la peau avec un maximum de 31.7 °C / 89.1 F et sont donc froids au toucher.
(-) La température moyenne de la zone de l'appui-paume de dispositifs similaires était de 28.7 °C / 83.7 F (-3 °C / #-5.4 F).
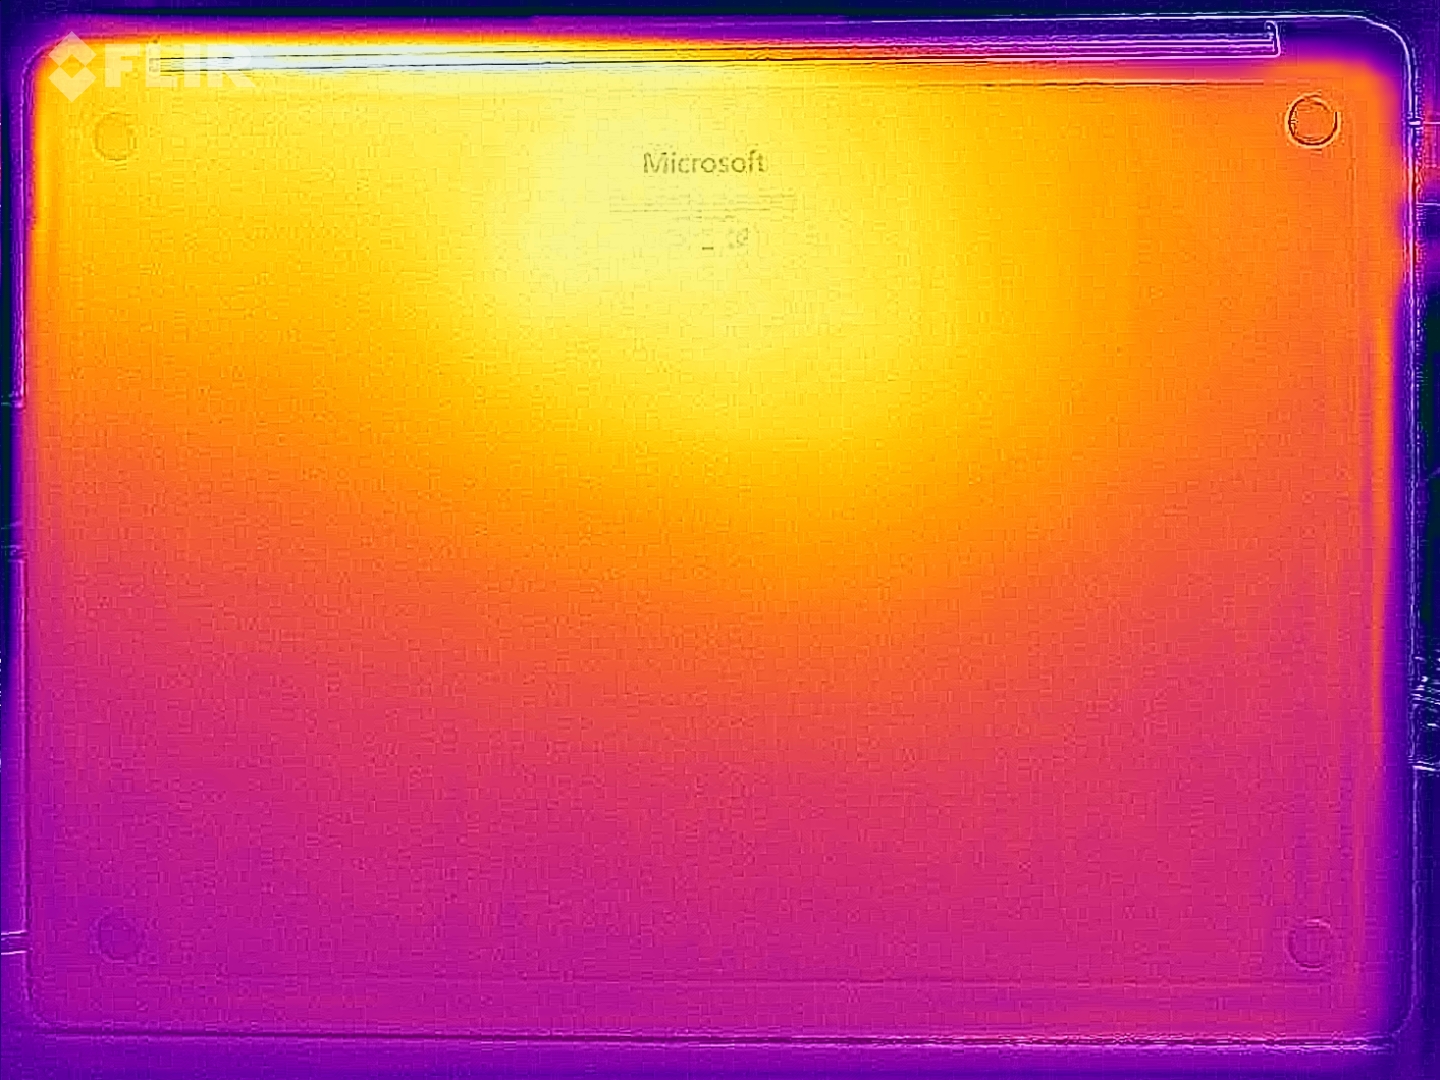
Test de résistance thermique (en haut)
Test de résistance de la carte thermique (en bas)
Microsoft Surface Laptop 15 Gen 8
Ultra X7 368H, Arc B390 Panther Lake iGPU
Lenovo ThinkPad X9-15p Gen 1
Ultra X7 358H, Arc B390 Panther Lake iGPU
Asus Zenbook A16 UX3607
X2E-94-100, X2-90
Dell XPS 16 Core Ultra X7 358H
Ultra X7 358H, Arc B390 Panther Lake iGPU
Apple MacBook Air 15 M5
M5 10-Core, M5 10-Core GPU
Microsoft Surface Laptop 7 15 Lunar Lake
Core Ultra 7 268V, Arc 140V
Heat
-9%
-2%
7%
2%
3%
Maximum Upper Side * (°C)
44.2
43.3
2%
43.2
2%
40.6
8%
44.1
-0%
45.7
-3%
Maximum Bottom * (°C)
40.3
38.6
4%
43.3
-7%
39.8
1%
43.1
-7%
42.9
-6%
Idle Upper Side * (°C)
26
32.6
-25%
26.7
-3%
23.2
11%
24
8%
23.6
9%
Idle Bottom * (°C)
25.8
30.4
-18%
26
-1%
23.8
8%
23.9
7%
23.1
10%

* ... Moindre est la valeur, meilleures sont les performances

Haut-parleurs

Le système audio est toujours très bon, même si ceux des concurrents sont légèrement supérieurs.

dB(A) 0102030405060708090Deep BassMiddle BassHigh BassLower RangeMidsHigher MidsLower HighsMid HighsUpper HighsSuper Highs2038.242.4253533.43140.140.54039.642.15037.339.66332.534.68026.937.110027.34212520.847.51602251.320024.158.125024.360.531518.364.740014.463.150012.665.963012.464.68001168.4100010.971.6125010.770.8160010.471.1200010.170250010.468.3315010.871.7400011.267500011.565.1630011.866.2800011.665.31000011.662.11250011.4621600010.661.8SPL24.980.8N0.750.4median 11.6median 65.1Delta3.34.332.233.127.830.126.326.32829.135.135.621.822.81941.718.454.715.761.618.464.914.470.320.167.112.468.91371.31369.512.373.31275.411.971.312.367.712.467.911.762.812.461.312.360.512.760.612.660.112.664.714.566.412.465.812.370.11270.225.180.30.651.3median 12.4median 67.10.74.337.338.429.33024.725.526.131.42729.526.136.121.545.418.953.61860.116.76219.268.721.570.415.473.313.269.410.469.51173.19.978.510.574.610.874.710.574.410.672.811.972.512.871.913.669.41465.314.466.11468.713.26013.458.413.25524.984.50.665median 13.2median 69.435.134.430.125.621.323.921.219.421.428.424.821.432.619.852.916.560.314.161.514.464.614.464.11468.914.274.212.473.710.977.910.373.110.274.49.475.29.675.41073.41070.510.8731172.611.473.312.369.412.167.712.766.112.772.712.672.812.472.323.485.10.570median 12.3median 72.71.82.744.343.434.933.735.236.733.532.227.330.334.739.425.149.92254.918.260.918.159.720.466.322.268.41770.414.568.413.368.613.370.412.268.11267.911.773.211.773.911.571.31270.212.36912.373.612.775.112.775.912.876.612.973.612.870.212.759.625.284.80.766.8median 12.8median 70.223.240.442.830.834.230.432.534.935.728.63326.533.92139.318.84418.650.916.350.71857.918.761.215.564.912.562.711.366.411.467.210.769.910.168.710.368.810.670.210.969.711.365.311.46611.964.412.263.912.159.912.158.612.260.712.261.811.859.123.978.80.545.3median 12.1median 63.92.14.1hearing rangehide median Pink NoiseMicrosoft Surface Laptop 15 Gen 8Lenovo ThinkPad X9-15p Gen 1Asus Zenbook A16 UX3607Dell XPS 16 Core Ultra X7 358HApple MacBook Air 15 M5Microsoft Surface Laptop 7 15 Lunar Lake
Diagramme de fréquence (les cases peuvent être cochées et décochées pour comparer les appareils)
Microsoft Surface Laptop 15 Gen 8 analyse audio

(±) | le niveau sonore du haut-parleur est moyen mais bon (80.8# dB)
Basses 100 - 315 Hz
(±) | basse réduite - en moyenne 11.1% inférieure à la médiane
(±) | la linéarité des basses est moyenne (8.6% delta à la fréquence précédente)
Médiums 400 - 2000 Hz
(+) | médiane équilibrée - seulement 3.7% de la médiane
(+) | les médiums sont linéaires (3.5% delta à la fréquence précédente)
Aiguës 2 - 16 kHz
(+) | des sommets équilibrés - à seulement 2.3% de la médiane
(+) | les aigus sont linéaires (4.5% delta à la fréquence précédente)
Globalement 100 - 16 000 Hz
(+) | le son global est linéaire (11.1% différence à la médiane)
Par rapport à la même classe
» 17% de tous les appareils testés de cette catégorie étaient meilleurs, 3% similaires, 80% pires
» Le meilleur avait un delta de 5%, la moyenne était de 17%, le pire était de 45%.
Par rapport à tous les appareils testés
» 7% de tous les appareils testés étaient meilleurs, 2% similaires, 91% pires
» Le meilleur avait un delta de 4%, la moyenne était de 23%, le pire était de 136%.

Lenovo ThinkPad X9-15p Gen 1 analyse audio

(±) | le niveau sonore du haut-parleur est moyen mais bon (80.3# dB)
Basses 100 - 315 Hz
(+) | bonne basse - seulement 4.2% loin de la médiane
(±) | la linéarité des basses est moyenne (10.2% delta à la fréquence précédente)
Médiums 400 - 2000 Hz
(+) | médiane équilibrée - seulement 3.9% de la médiane
(+) | les médiums sont linéaires (5.2% delta à la fréquence précédente)
Aiguës 2 - 16 kHz
(+) | des sommets équilibrés - à seulement 4.3% de la médiane
(+) | les aigus sont linéaires (2.6% delta à la fréquence précédente)
Globalement 100 - 16 000 Hz
(+) | le son global est linéaire (8.9% différence à la médiane)
Par rapport à la même classe
» 11% de tous les appareils testés de cette catégorie étaient meilleurs, 2% similaires, 87% pires
» Le meilleur avait un delta de 5%, la moyenne était de 17%, le pire était de 45%.
Par rapport à tous les appareils testés
» 3% de tous les appareils testés étaient meilleurs, 1% similaires, 96% pires
» Le meilleur avait un delta de 4%, la moyenne était de 23%, le pire était de 136%.

Asus Zenbook A16 UX3607 analyse audio

(+) | les haut-parleurs peuvent jouer relativement fort (84.5# dB)
Basses 100 - 315 Hz
(±) | basse réduite - en moyenne 6.4% inférieure à la médiane
(±) | la linéarité des basses est moyenne (8.3% delta à la fréquence précédente)
Médiums 400 - 2000 Hz
(+) | médiane équilibrée - seulement 3.9% de la médiane
(+) | les médiums sont linéaires (4.2% delta à la fréquence précédente)
Aiguës 2 - 16 kHz
(+) | des sommets équilibrés - à seulement 3.3% de la médiane
(+) | les aigus sont linéaires (5% delta à la fréquence précédente)
Globalement 100 - 16 000 Hz
(+) | le son global est linéaire (9.8% différence à la médiane)
Par rapport à la même classe
» 14% de tous les appareils testés de cette catégorie étaient meilleurs, 2% similaires, 84% pires
» Le meilleur avait un delta de 5%, la moyenne était de 17%, le pire était de 45%.
Par rapport à tous les appareils testés
» 4% de tous les appareils testés étaient meilleurs, 1% similaires, 95% pires
» Le meilleur avait un delta de 4%, la moyenne était de 23%, le pire était de 136%.

Dell XPS 16 Core Ultra X7 358H analyse audio

(+) | les haut-parleurs peuvent jouer relativement fort (85.1# dB)
Basses 100 - 315 Hz
(±) | basse réduite - en moyenne 7.6% inférieure à la médiane
(+) | les basses sont linéaires (6.1% delta à la fréquence précédente)
Médiums 400 - 2000 Hz
(+) | médiane équilibrée - seulement 2.1% de la médiane
(+) | les médiums sont linéaires (3.4% delta à la fréquence précédente)
Aiguës 2 - 16 kHz
(+) | des sommets équilibrés - à seulement 2.3% de la médiane
(+) | les aigus sont linéaires (4.1% delta à la fréquence précédente)
Globalement 100 - 16 000 Hz
(+) | le son global est linéaire (6.2% différence à la médiane)
Par rapport à la même classe
» 4% de tous les appareils testés de cette catégorie étaient meilleurs, 0% similaires, 96% pires
» Le meilleur avait un delta de 5%, la moyenne était de 17%, le pire était de 45%.
Par rapport à tous les appareils testés
» 0% de tous les appareils testés étaient meilleurs, 0% similaires, 99% pires
» Le meilleur avait un delta de 4%, la moyenne était de 23%, le pire était de 136%.

Apple MacBook Air 15 M5 analyse audio

(+) | les haut-parleurs peuvent jouer relativement fort (84.8# dB)
Basses 100 - 315 Hz
(±) | basse réduite - en moyenne 6.8% inférieure à la médiane
(+) | les basses sont linéaires (6.6% delta à la fréquence précédente)
Médiums 400 - 2000 Hz
(+) | médiane équilibrée - seulement 2% de la médiane
(+) | les médiums sont linéaires (3.3% delta à la fréquence précédente)
Aiguës 2 - 16 kHz
(+) | des sommets équilibrés - à seulement 3.6% de la médiane
(+) | les aigus sont linéaires (3.2% delta à la fréquence précédente)
Globalement 100 - 16 000 Hz
(+) | le son global est linéaire (7.7% différence à la médiane)
Par rapport à la même classe
» 2% de tous les appareils testés de cette catégorie étaient meilleurs, 0% similaires, 98% pires
» Le meilleur avait un delta de 5%, la moyenne était de 18%, le pire était de 53%.
Par rapport à tous les appareils testés
» 1% de tous les appareils testés étaient meilleurs, 0% similaires, 98% pires
» Le meilleur avait un delta de 4%, la moyenne était de 23%, le pire était de 136%.

Microsoft Surface Laptop 7 15 Lunar Lake analyse audio

(±) | le niveau sonore du haut-parleur est moyen mais bon (78.8# dB)
Basses 100 - 315 Hz
(±) | basse réduite - en moyenne 9.3% inférieure à la médiane
(±) | la linéarité des basses est moyenne (8.4% delta à la fréquence précédente)
Médiums 400 - 2000 Hz
(+) | médiane équilibrée - seulement 4.4% de la médiane
(+) | les médiums sont linéaires (3% delta à la fréquence précédente)
Aiguës 2 - 16 kHz
(+) | des sommets équilibrés - à seulement 2.4% de la médiane
(+) | les aigus sont linéaires (4.1% delta à la fréquence précédente)
Globalement 100 - 16 000 Hz
(+) | le son global est linéaire (11.4% différence à la médiane)
Par rapport à la même classe
» 4% de tous les appareils testés de cette catégorie étaient meilleurs, 2% similaires, 95% pires
» Le meilleur avait un delta de 7%, la moyenne était de 21%, le pire était de 53%.
Par rapport à tous les appareils testés
» 8% de tous les appareils testés étaient meilleurs, 2% similaires, 90% pires
» Le meilleur avait un delta de 4%, la moyenne était de 23%, le pire était de 136%.

Consommation électrique et autonomie de la batterie

L’alimentation de 65 W est insuffisante.

La configuration Panther Lake est plus économe en énergie au repos que l'ancien modèle Lunar Lake, malgré l'écran mis à jour. L'autonomie dans notre test Wi-Fi est toutefois un peu plus courte, ce qui s'explique par le TDP à court terme plus élevé. Les résultats restent néanmoins très bons, avec près de 16 heures dans notre test Wi-Fi à 150 nits et 8,5 heures à la luminosité maximale. L'adaptateur secteur de 65 W est cependant insuffisant, ce qui n'est guère surprenant compte tenu du TDP à court terme de 65 watts. Cela signifie que la batterie doit être sollicitée lors des pics de charge. Nous avons également essayé un adaptateur secteur de 140 W, mais l'appareil n'accepte tout simplement pas davantage de puissance.

Consommation énergétique
Éteint/en veilledarklight 0.28 / 0.38 Watts
Au reposdarkmidlight 2 / 7.6 / 8.1 Watts
Fortement sollicité midlight 54.4 / 62.6 Watts
 color bar
Légende: min: dark, med: mid, max: light        Metrahit Energy

Consommation électrique Cyberpunk / Test de charge

051015202530354045505560Tooltip
Microsoft Surface Laptop 15 Gen 8; 1280x720 Prime95 28.10 and Furmark 1.25: Ø51.8 (46.4-62.3) Watt
Microsoft Surface Laptop 15 Gen 8; Idle 150cd/m2: Ø4.01 (3.89-4.61) Watt
Microsoft Surface Laptop 15 Gen 8; Cyberpunk 2077 FHD ultra no FSR 150cd: Ø51.1 (47.7-57.2) Watt

Consommation électrique du moniteur externe

051015202530354045505560Tooltip
Microsoft Surface Laptop 15 Gen 8; Prime95 V2810 Stress (external Monitor): Ø54.6 (38.9-62.5) Watt
Microsoft Surface Laptop 15 Gen 8; Cinebench R23 Single (external Monitor): Ø25.1 (23.8-34.4) Watt
Microsoft Surface Laptop 15 Gen 8; Cinebench R23 Multi (external Monitor): Ø57.3 (53.5-62.6) Watt
Microsoft Surface Laptop 15 Gen 8; 1280x720 FurMark 1.19 GPU Stress Test (external Monitor): Ø56.4 (50.3-61.2) Watt
Microsoft Surface Laptop 15 Gen 8; Idle 1min (external Monitor): Ø6.93 (6.67-7.61) Watt
Microsoft Surface Laptop 15 Gen 8; Cyberpunk 2077 FHD ultra no FSR (external Monitor): Ø51.8 (50.9-55.1) Watt
Autonomie
WiFi Websurfing
15h 46min
WiFi Websurfing max. Brightness
8h 35min
Battery Runtime
WiFi Websurfing
Lenovo ThinkPad X9-15p Gen 1
Ultra X7 358H, Arc B390 Panther Lake iGPU, 88 Wh (Edge 150, 60 Hz)
18.3 h +16%
Microsoft Surface Laptop 7 15 Lunar Lake
Core Ultra 7 268V, Arc 140V, 64 Wh
17.7 h +12%
Apple MacBook Air 15 M5
M5 10-Core, M5 10-Core GPU, 66.5 Wh
17.2 h +9%
Microsoft Surface Laptop 15 Gen 8
Ultra X7 368H, Arc B390 Panther Lake iGPU, 66 Wh
15.8 h
Asus Zenbook A16 UX3607
X2E-94-100, X2-90, 70 Wh
13 h -18%
Moyenne de la classe Multimedia
  (4.37 - 26.6, n=59, 2 dernières années)
13 h -18%
Dell XPS 16 Core Ultra X7 358H
Ultra X7 358H, Arc B390 Panther Lake iGPU, 70 Wh
10.3 h -35%
WiFi Websurfing max. Brightness
Lenovo ThinkPad X9-15p Gen 1
Ultra X7 358H, Arc B390 Panther Lake iGPU, 88 Wh (Edge 150, 30 - 120 Hz VRR)
9.6 h +12%
Lenovo ThinkPad X9-15p Gen 1
Ultra X7 358H, Arc B390 Panther Lake iGPU, 88 Wh (Edge 150, 60 Hz)
9.2 h +7%
Microsoft Surface Laptop 7 15 Lunar Lake
Core Ultra 7 268V, Arc 140V, 64 Wh
8.8 h +2%
Microsoft Surface Laptop 15 Gen 8
Ultra X7 368H, Arc B390 Panther Lake iGPU, 66 Wh
8.6 h
Moyenne de la classe Multimedia
  (3.53 - 11.6, n=30, 2 dernières années)
7.28 h -15%
Apple MacBook Air 15 M5
M5 10-Core, M5 10-Core GPU, 66.5 Wh
6.7 h -22%
Asus Zenbook A16 UX3607
X2E-94-100, X2-90, 70 Wh
6.4 h -26%

Évaluation Notebookcheck

Microsoft Surface Laptop 15 Gen 8 - 10/05/2026 v8
Andreas Osthoff

Châssis
84 / 98 → 86%
Clavier
85%
Dispositif de pointage
94%
Connectivité
75 / 80 → 93%
Poids
67 / 20-74 → 87%
Autonomie
90 / 95 → 95%
Écran
84%
Performances en jeu
58 / 88 → 65%
Performances dans les applications
89 / 92 → 96%
AI Performance
90%
Chauffe
91%
Nuisance sonore
77 / 95 → 81%
Audio
87%
Appareil photo
40 / 75 → 53%
Moyenne
75%
85%
Multimedia - Moyenne compensée
CO2 Emissions
77.1%
Materials
50%
Packaging
100%
Power Use
88.7%
Repairability
60%
Software Updates
22.3%
Recycle Logo Total Sustainability Score: 66.4%

Comparaison des concurrents potentiels

Image
Modèle
Prix
Poids
Épaisseur
Écran
1.
85.3%
Microsoft Surface Laptop 15 Gen 8
Intel Core Ultra X7 368H ⎘
Intel Arc B390 12 Xe3 Panther Lake iGPU ⎘
16 Go Mémoire, 256 Go SSD
Amazon:
1. $238.94
Microsoft Surface Laptop 3 1...
2. $483.98
Microsoft Surface Laptop 5 1...
3. $685.00
Microsoft Surface Laptop 4 1...
Prix de liste: 2400€
1.7 kg18.3 mm15.00"
3270x2180
262 PPI
IPS
2.
89.9%
Lenovo ThinkPad X9-15p Gen 1
Intel Core Ultra X7 358H ⎘
Intel Arc B390 12 Xe3 Panther Lake iGPU ⎘
32 Go Mémoire, 1024 Go SSD
Prix de liste: 2500 Euro1.5 kg18 mm15.30"
2880x1800
222 PPI
OLED
3.
87.5%
Asus Zenbook A16 UX3607
Qualcomm Snapdragon X2 Elite Extreme X2E-94-100 ⎘
Qualcomm Adreno X2-90 ⎘
48 Go Mémoire, 1000 Go SSD
Amazon:
1. $2,299.99
ASUS Zenbook A16 AI Laptop, ...
2. $2,299.99
ASUS Zenbook A16 16" Laptop,...
3. $2,059.99
ASUS Zenbook A16 AI Laptop, ...
1.2 kg16.5 mm16.00"
2880x1800
212 PPI
OLED
4.
87.2%
Dell XPS 16 Core Ultra X7 358H
Intel Core Ultra X7 358H ⎘
Intel Arc B390 12 Xe3 Panther Lake iGPU ⎘
32 Go Mémoire
Amazon:
1. $1,977.99
Dell Premium 16 (Previously ...
2. $2,599.00
Dell Premium 16 (XPS 16 2025...
3. $3,624.48
Dell 16 Premium (XPS 16 2025...
Prix de liste: 2350 USD
1.7 kg14.62 mm16.00"
3200x2000
236 PPI
OLED
5.
91.6%
Apple MacBook Air 15 M5
Apple M5 10-Core ⎘
Apple M5 10-Core GPU ⎘
32 Go Mémoire, 2048 Go SSD
1.5 kg11.5 mm15.30"
2880x1864
224 PPI
IPS
6.
87.4%
Microsoft Surface Laptop 7 15 Lunar Lake
Intel Core Ultra 7 268V ⎘
Intel Arc Graphics 140V ⎘
32 Go Mémoire, 1024 Go SSD
Prix de liste: 2760€1.7 kg18.3 mm15.00"
2496x1664
200 PPI
IPS

Transparency

La sélection des appareils à examiner est effectuée par notre équipe éditoriale. L'échantillon de test a été prêté à l'auteur par le fabricant ou le détaillant pour les besoins de cet examen. Le prêteur n'a pas eu d'influence sur cette évaluation et le fabricant n'a pas reçu de copie de cette évaluation avant sa publication. Il n'y avait aucune obligation de publier cet article. En tant que média indépendant, Notebookcheck n'est pas soumis à l'autorité des fabricants, des détaillants ou des éditeurs.

Voici comment Notebookcheck teste

Chaque année, Notebookcheck examine de manière indépendante des centaines d'ordinateurs portables et de smartphones en utilisant des procédures standardisées afin de garantir que tous les résultats sont comparables. Nous avons continuellement développé nos méthodes de test depuis environ 20 ans et avons établi des normes industrielles dans le processus. Dans nos laboratoires de test, des équipements de mesure de haute qualité sont utilisés par des techniciens et des rédacteurs expérimentés. Ces tests impliquent un processus de validation en plusieurs étapes. Notre système d'évaluation complexe repose sur des centaines de mesures et de points de référence bien fondés, ce qui garantit l'objectivité.
Google LogoAdd as a preferred source on Google
Mail Logo
> Revues et rapports de ordinateurs portatifs et smartphones, ordiphones > Critiques > Intel surpasse nettement Snapdragon - Test du Microsoft Surface Laptop 15 Gen 8
Andreas Osthoff, 2026-10- 6 (Update: 2026-10- 6)