Notebookcheck Logo
Lenovo Yoga Pro 9i G10 Aura Edition en revue

Revue du Lenovo Yoga Pro 9i 16IAH G10 Aura Edition : L'ordinateur portable multimédia impressionne avec son OLED de 1 100 nits

La RTX 5060 correspond à l'ordinateur portable multimédia.

Le Lenovo Yoga Pro 9i Aura Edition est un ordinateur portable multimédia de haute qualité qui impressionne même dans sa version de base grâce à ses bonnes performances et à l'un des meilleurs écrans OLED du marché. Des périphériques de saisie confortables et un excellent système audio complètent l'expérience.
Andreas Osthoff, 👁 Andreas Osthoff (traduit par DeepL / Ninh Duy) Publié 🇺🇸 🇩🇪
Laptop / Notebook Intel Arrow Lake Geforce

Verdict : Un excellent ordinateur portable multimédia, même dans sa version de base

Le nouveau Lenovo Yoga Pro 9i 16IAH G10 Aura Edition est une fois de plus un très bon ordinateur portable multimédia et un ensemble bien équilibré.

Les performances sont excellentes pour un ordinateur portable multimédia et la RTX 5060 fait également bonne figure. La commutation GPU Optimus avancée est également disponible.

Nous testerons bientôt si le supplément pour la mise à niveau du GPU de l'ordinateur portable RTX 5070 en vaut la peine.

Download your licensed rating image as SVG / PNG

Le nouveau panneau OLED tandem, d'une luminosité de 1 600 nits, a été l'objet de toutes les attentions avant le lancement, mais le panneau OLED 2,8K normal, d'une fréquence de 120 Hz et d'une luminosité de 1 100 nits, offre lui aussi une qualité d'image exceptionnelle et figure déjà parmi les meilleurs écrans actuellement disponibles. Lenovo fournit également des profils calibrés pour sRGB et P3.

Les deux ventilateurs sont très bruyants en mode Performance, c'est pourquoi nous vous recommandons d'essayer le mode Auto. Le mode Auto n'affecte pas radicalement les performances de jeu, mais il offre l'avantage de ventilateurs nettement plus silencieux.

Points positifs

+ boîtier en aluminium robuste et de haute qualité
+ grand écran OLED avec 120 Hz
+ profils de couleurs précis pour sRGB et P3
+ très bonnes performances du système
+ ordinateur portable RTX 5060 rapide
+ Thunderbolt 4/Wi-Fi 7 & Advanced Optimus
+ 2 emplacements SSD
+ très bon système audio
+ bons périphériques d'entrée

Points négatifs

- rAM soudée
- Scintillement du PWM/fortes réflexions sur l'écran
- ventilateur bruyant en mode d'alimentation
- pas de capteur de luminosité/température de couleur

Prix et disponibilité

La version Campus du Lenovo Yoga Pro 9 16 peut être commandée sur Campuspoint au prix de 1 939 €. L'appareil coûte actuellement 2 209 € dans la boutique en ligne DE de Lenovo.

Aux États-Unis, le Lenovo Yoga Pro 9i 16IAH Aura Edition est disponible avec un Core Ultra 9 285H et un GPU RTX 5060 pour ordinateur portable au prix de 2 299,99 $ sur la boutique américaine de Lenovo

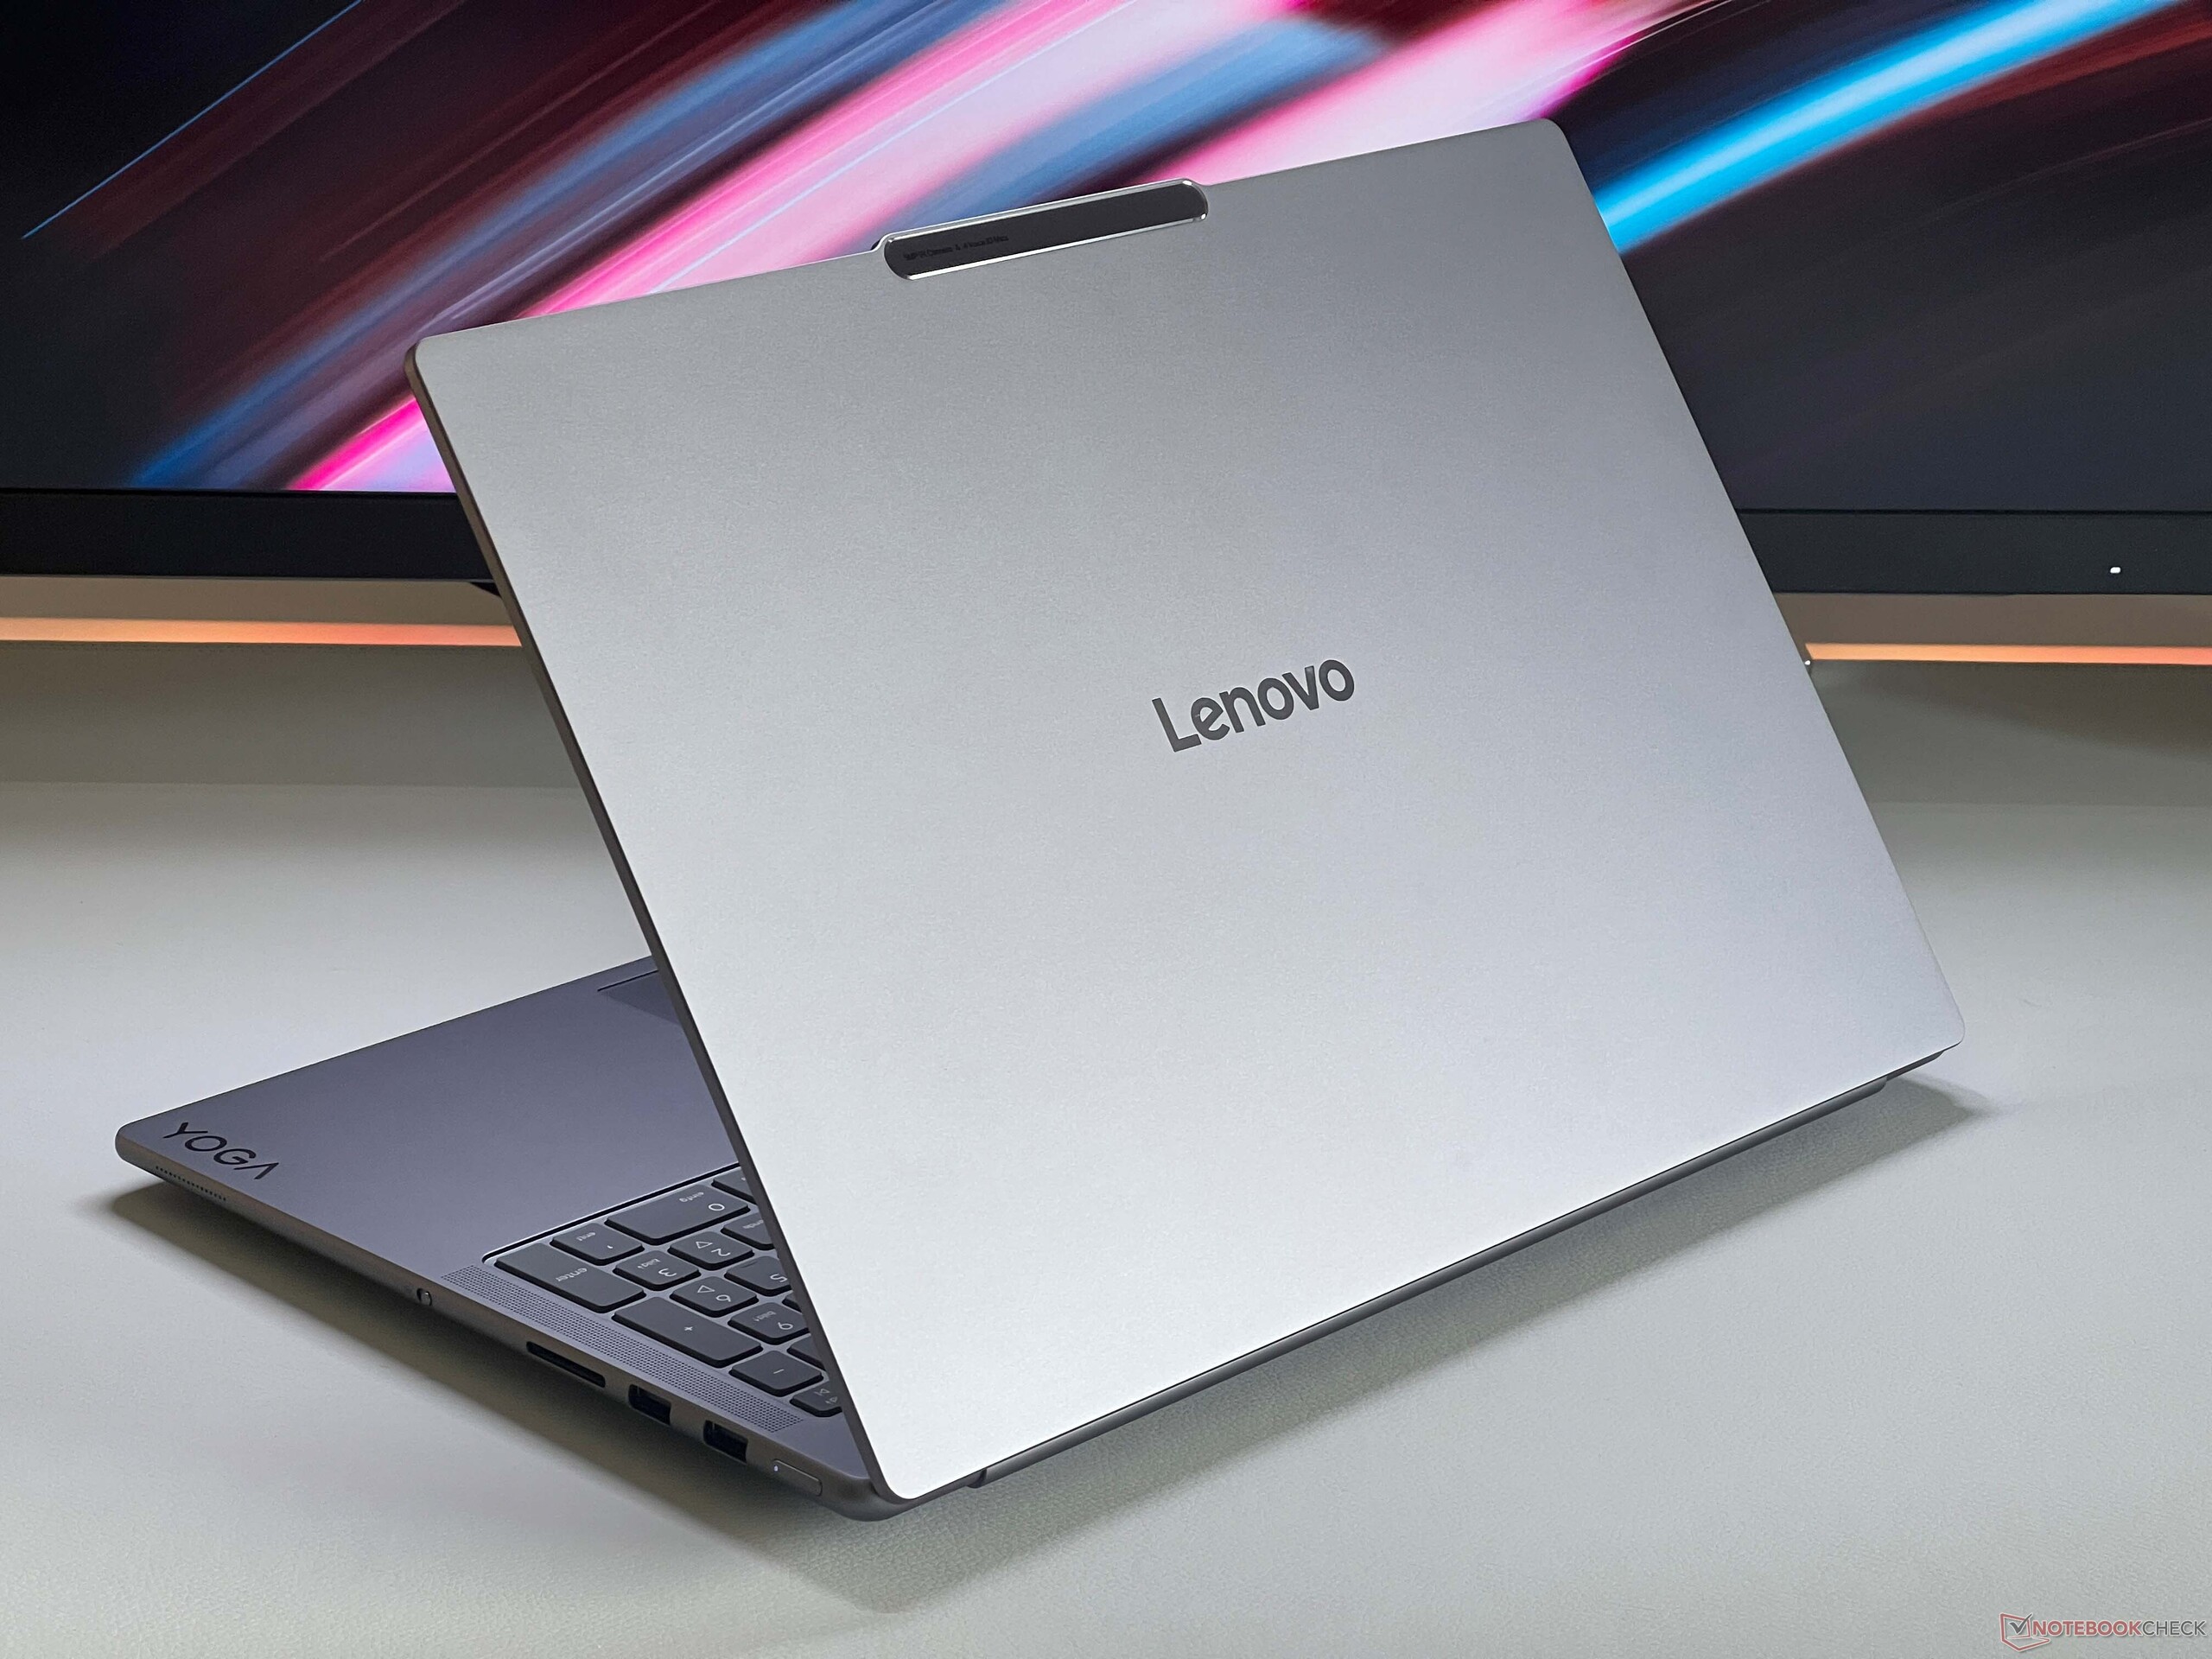
Lenovo a relancé son ordinateur portable multimédia haut de gamme Yoga Pro 9i G10 Aura Edition avec, outre un châssis redessiné, de nouveaux écrans OLED, des processeurs Intel Arrow Lake et des options de GPU Nvidia GeForce RTX 5000 Laptop.

Nous avons testé le modèle de base avec le Core Ultra 7 255H, un écran OLED 2,8K avec 120 Hz et une luminosité maximale de 1 100 cd/m², 32 Go de RAM, 1 TB SSD, et le GPU GeForce RTX 5060 Laptop. Cette configuration est disponible au prix de 2 199 € (ou 1 939 € pour la version Campus).

Le modèle haut de gamme avec le Core Ultra 9 285H, 64 Go de RAM, le GPU RTX 5070 Laptop et un panneau OLED tandem avec une luminosité allant jusqu'à 1 600 cd/m² et une couverture Adobe RGB complète vous coûtera 3 129 € (2 899 € pour la version Campus).

Spécifications

Lenovo Yoga Pro 9 16IAH G10 RTX 5060 (Yoga Pro 9 16 Gamme)
Processeur
Intel Core Ultra 7 255H 16 x 4.4 - 5.1 GHz, 115 W PL2 / Short Burst, 80 W PL1 / Sustained, Arrow Lake-H
Carte graphique
Nvidia GeForce RTX 5060 Laptop - 8 Go VRAM, Processeur: 2647 MHz, RAM: 1500 MHz, GDDR7, 576.88, Advanced Optimus
Mémoire
32 Go 
, LPDDR5x-8400, Dual-Channel, onboard
Écran
16.00 pouces 16:10, 2880 x 1800 pixel 212 PPP, ATNA60HR04-0, OLED, brillant: oui, HDR, 120 Hz
Carte mère
Intel Arrow Lake-H PCH
Disque dur
WD PC SN7100S SDFPMSL-1T00-1101, 1024 Go 
, 884 Go libres
Carte son
Intel Arrow Lake-U/H PCH - cAVS (Audio, Voice, Speech)
Connexions
2 USB 3.0 / 3.1 Gen1, 2 USB 4.0 40 Gbps, 2 Thunderbolt, USB-C Power Delivery (PD), 1 HDMI, 1 Port pour Station d'accueil, Connectique audio: 3.5 mm Stereo, Lecteur de cartes mémoires: SDXC
Réseau
Intel BE201 320MHz (a/b/g/h/n = Wi-Fi 4/ac = Wi-Fi 5/ax = Wi-Fi 6/ Wi-Fi 6E 6 GHz be = Wi-Fi 7), Bluetooth 5.4
Taille
Hauteur x Largeur x Profondeur (en mm): 17.9 x 362.7 x 253.7
Batterie
84 Wh, 5285 mAh Lithium-Ion
Système d'exploitation
Microsoft Windows 11 Home
Appareil photo
Webcam: 5 MP with eShutter / IR
Appareil photo primaire: 5 MPix
Fonctionnalités additionnelles
Haut-parleurs: 6 speakers (4x 2W woofers, 2x 2W tweeters), Clavier: Chiclet, Rétroéclairage du clavier: oui, 170W PSU, 24 Mois Garantie
Poids
1.929 kg, Alimentation: 542 g
Prix
2199 euros
Remarque : le fabricant peut utiliser des composants provenant de différents fournisseurs, notamment des panneaux d'affichage, des lecteurs ou des clés USB ayant des spécifications similaires.


Châssis et équipement : Nouveau design, construction en aluminium haut de gamme

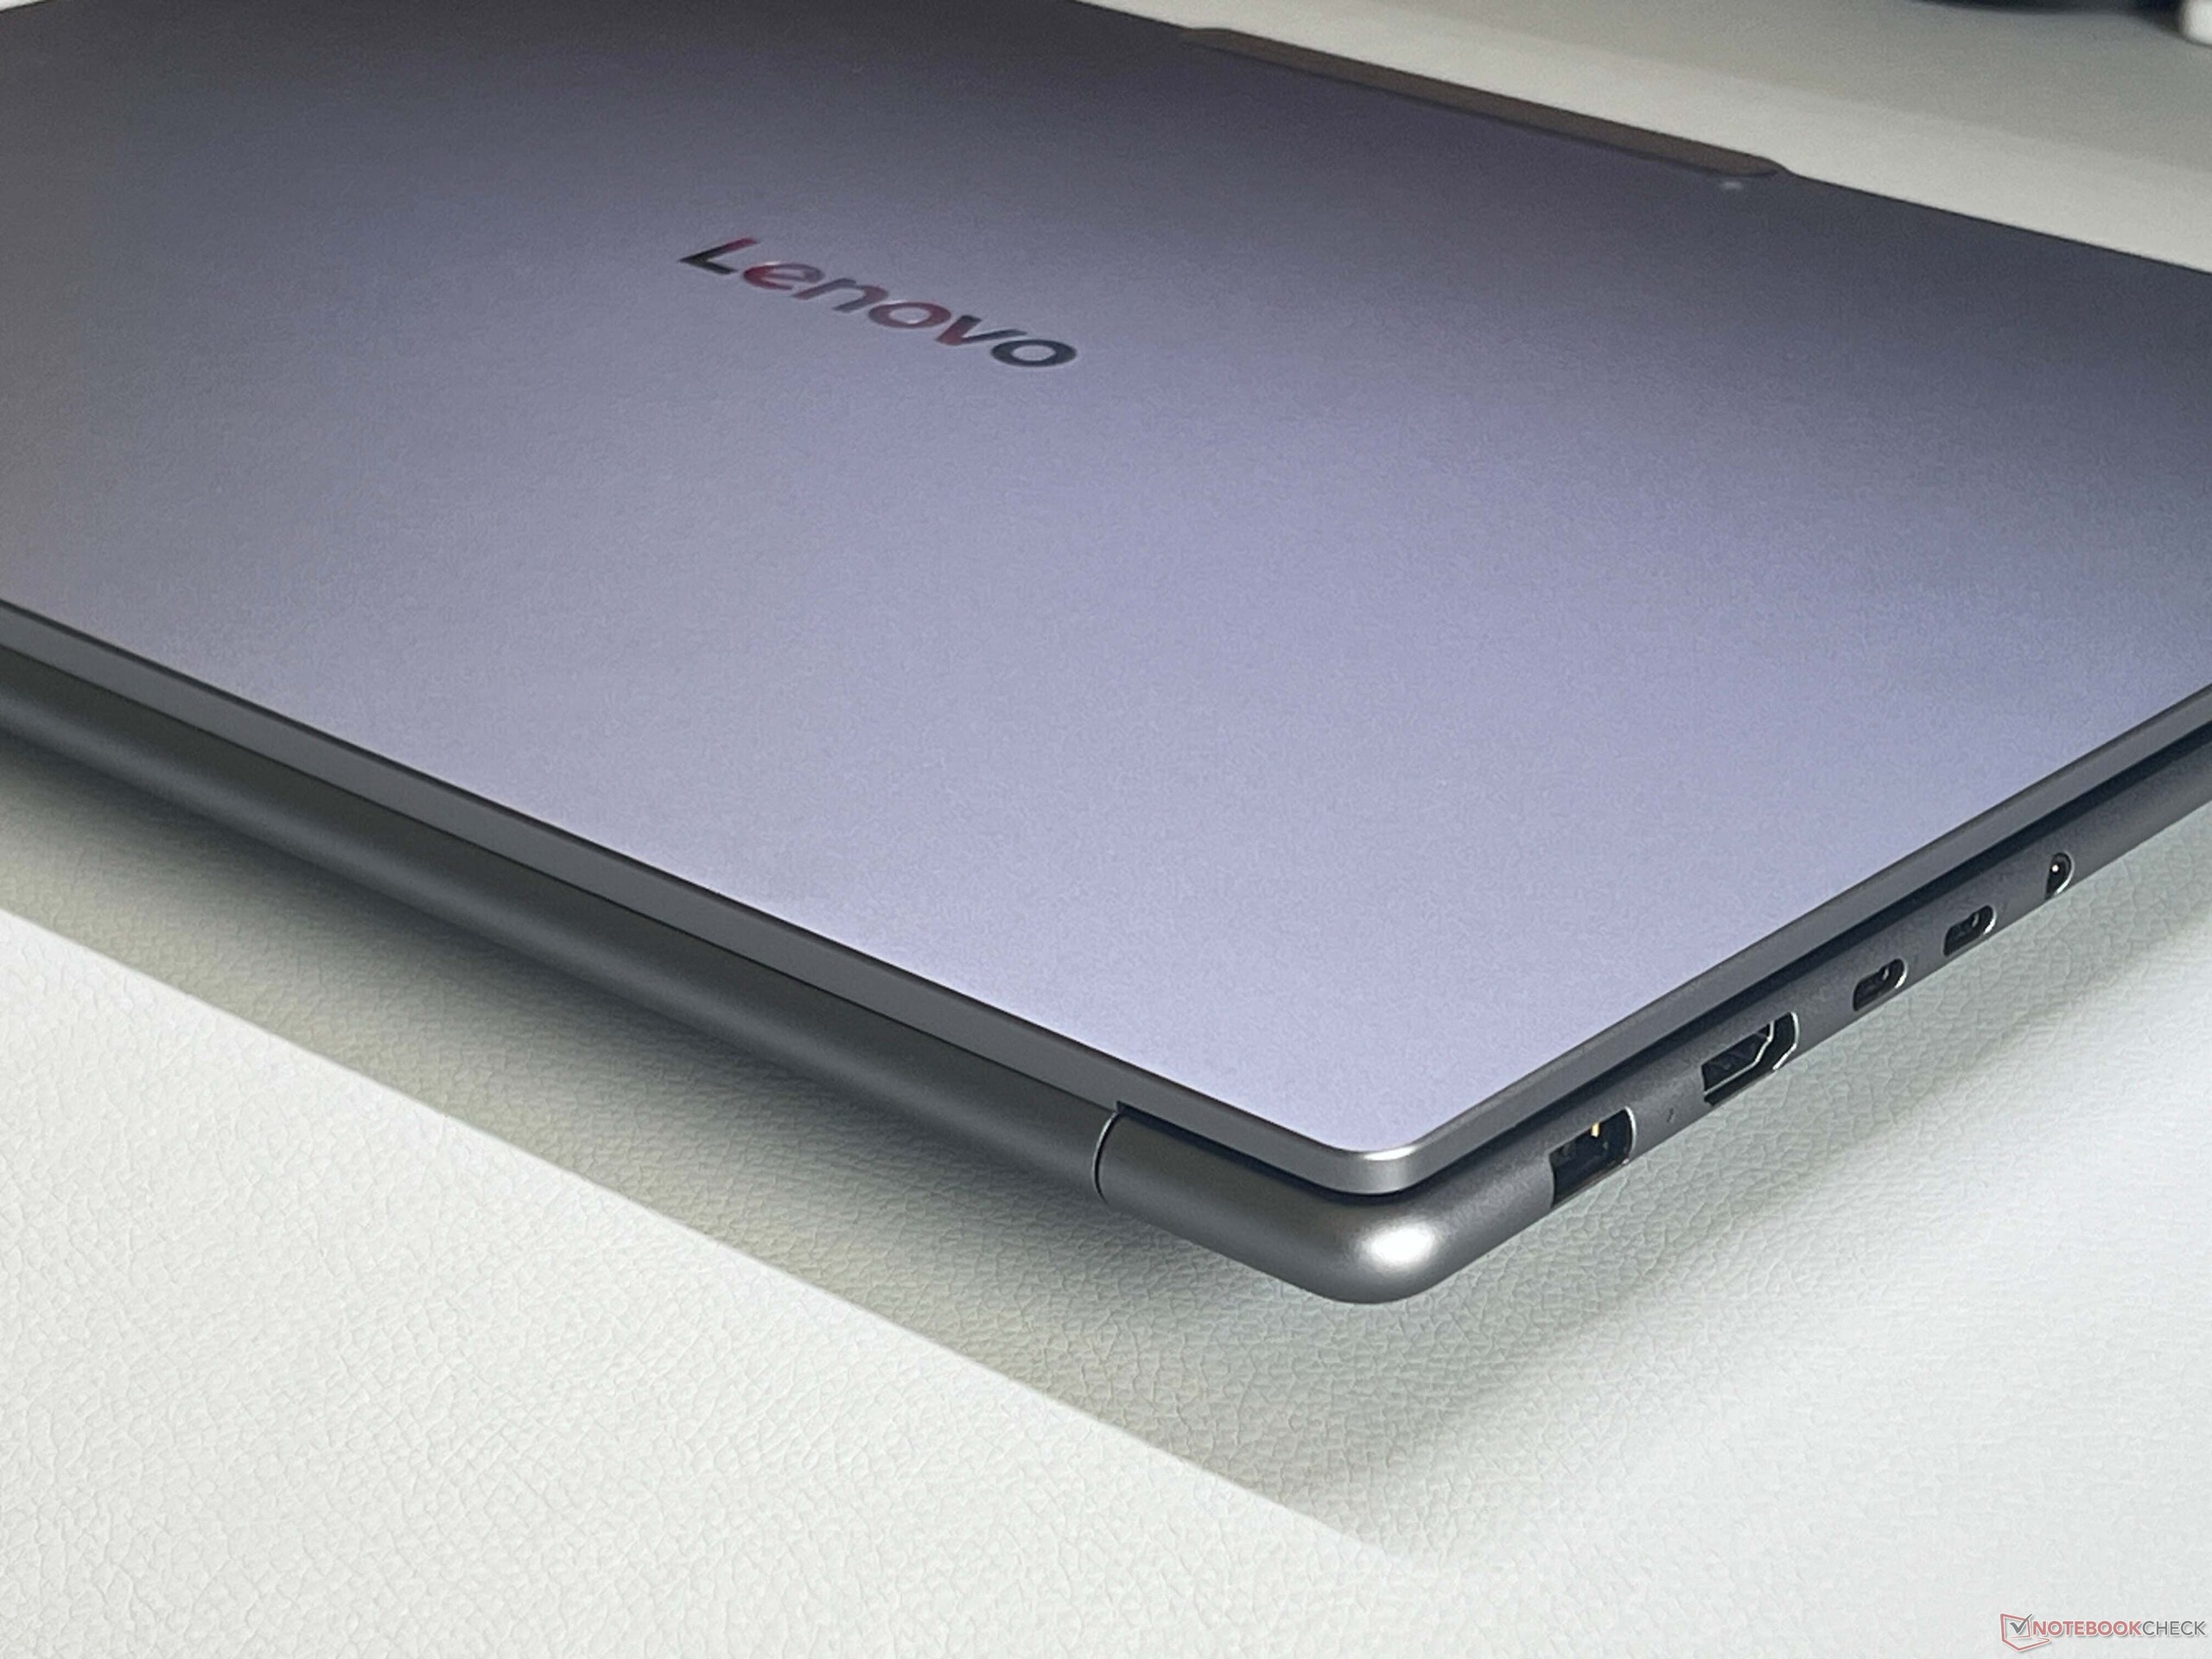
Le châssis en aluminium du Yoga Pro 9i G10 Aura Edition n'a subi que des modifications minimes, mais Lenovo a supprimé la plaque de base grinçante qui équipait le Yoga Pro 9i G9, le prédécesseur du Yoga Pro 9i G10 Yoga Pro 9i G9 prédécesseur. La stabilité, la finition et le toucher sont à la hauteur du prix élevé cette fois-ci, et l'ordinateur portable ressemble désormais indubitablement à un appareil haut de gamme. Le Yoga est disponible en gris ou en turquoise et les surfaces de notre modèle gris ne sont pas particulièrement sensibles à la saleté.

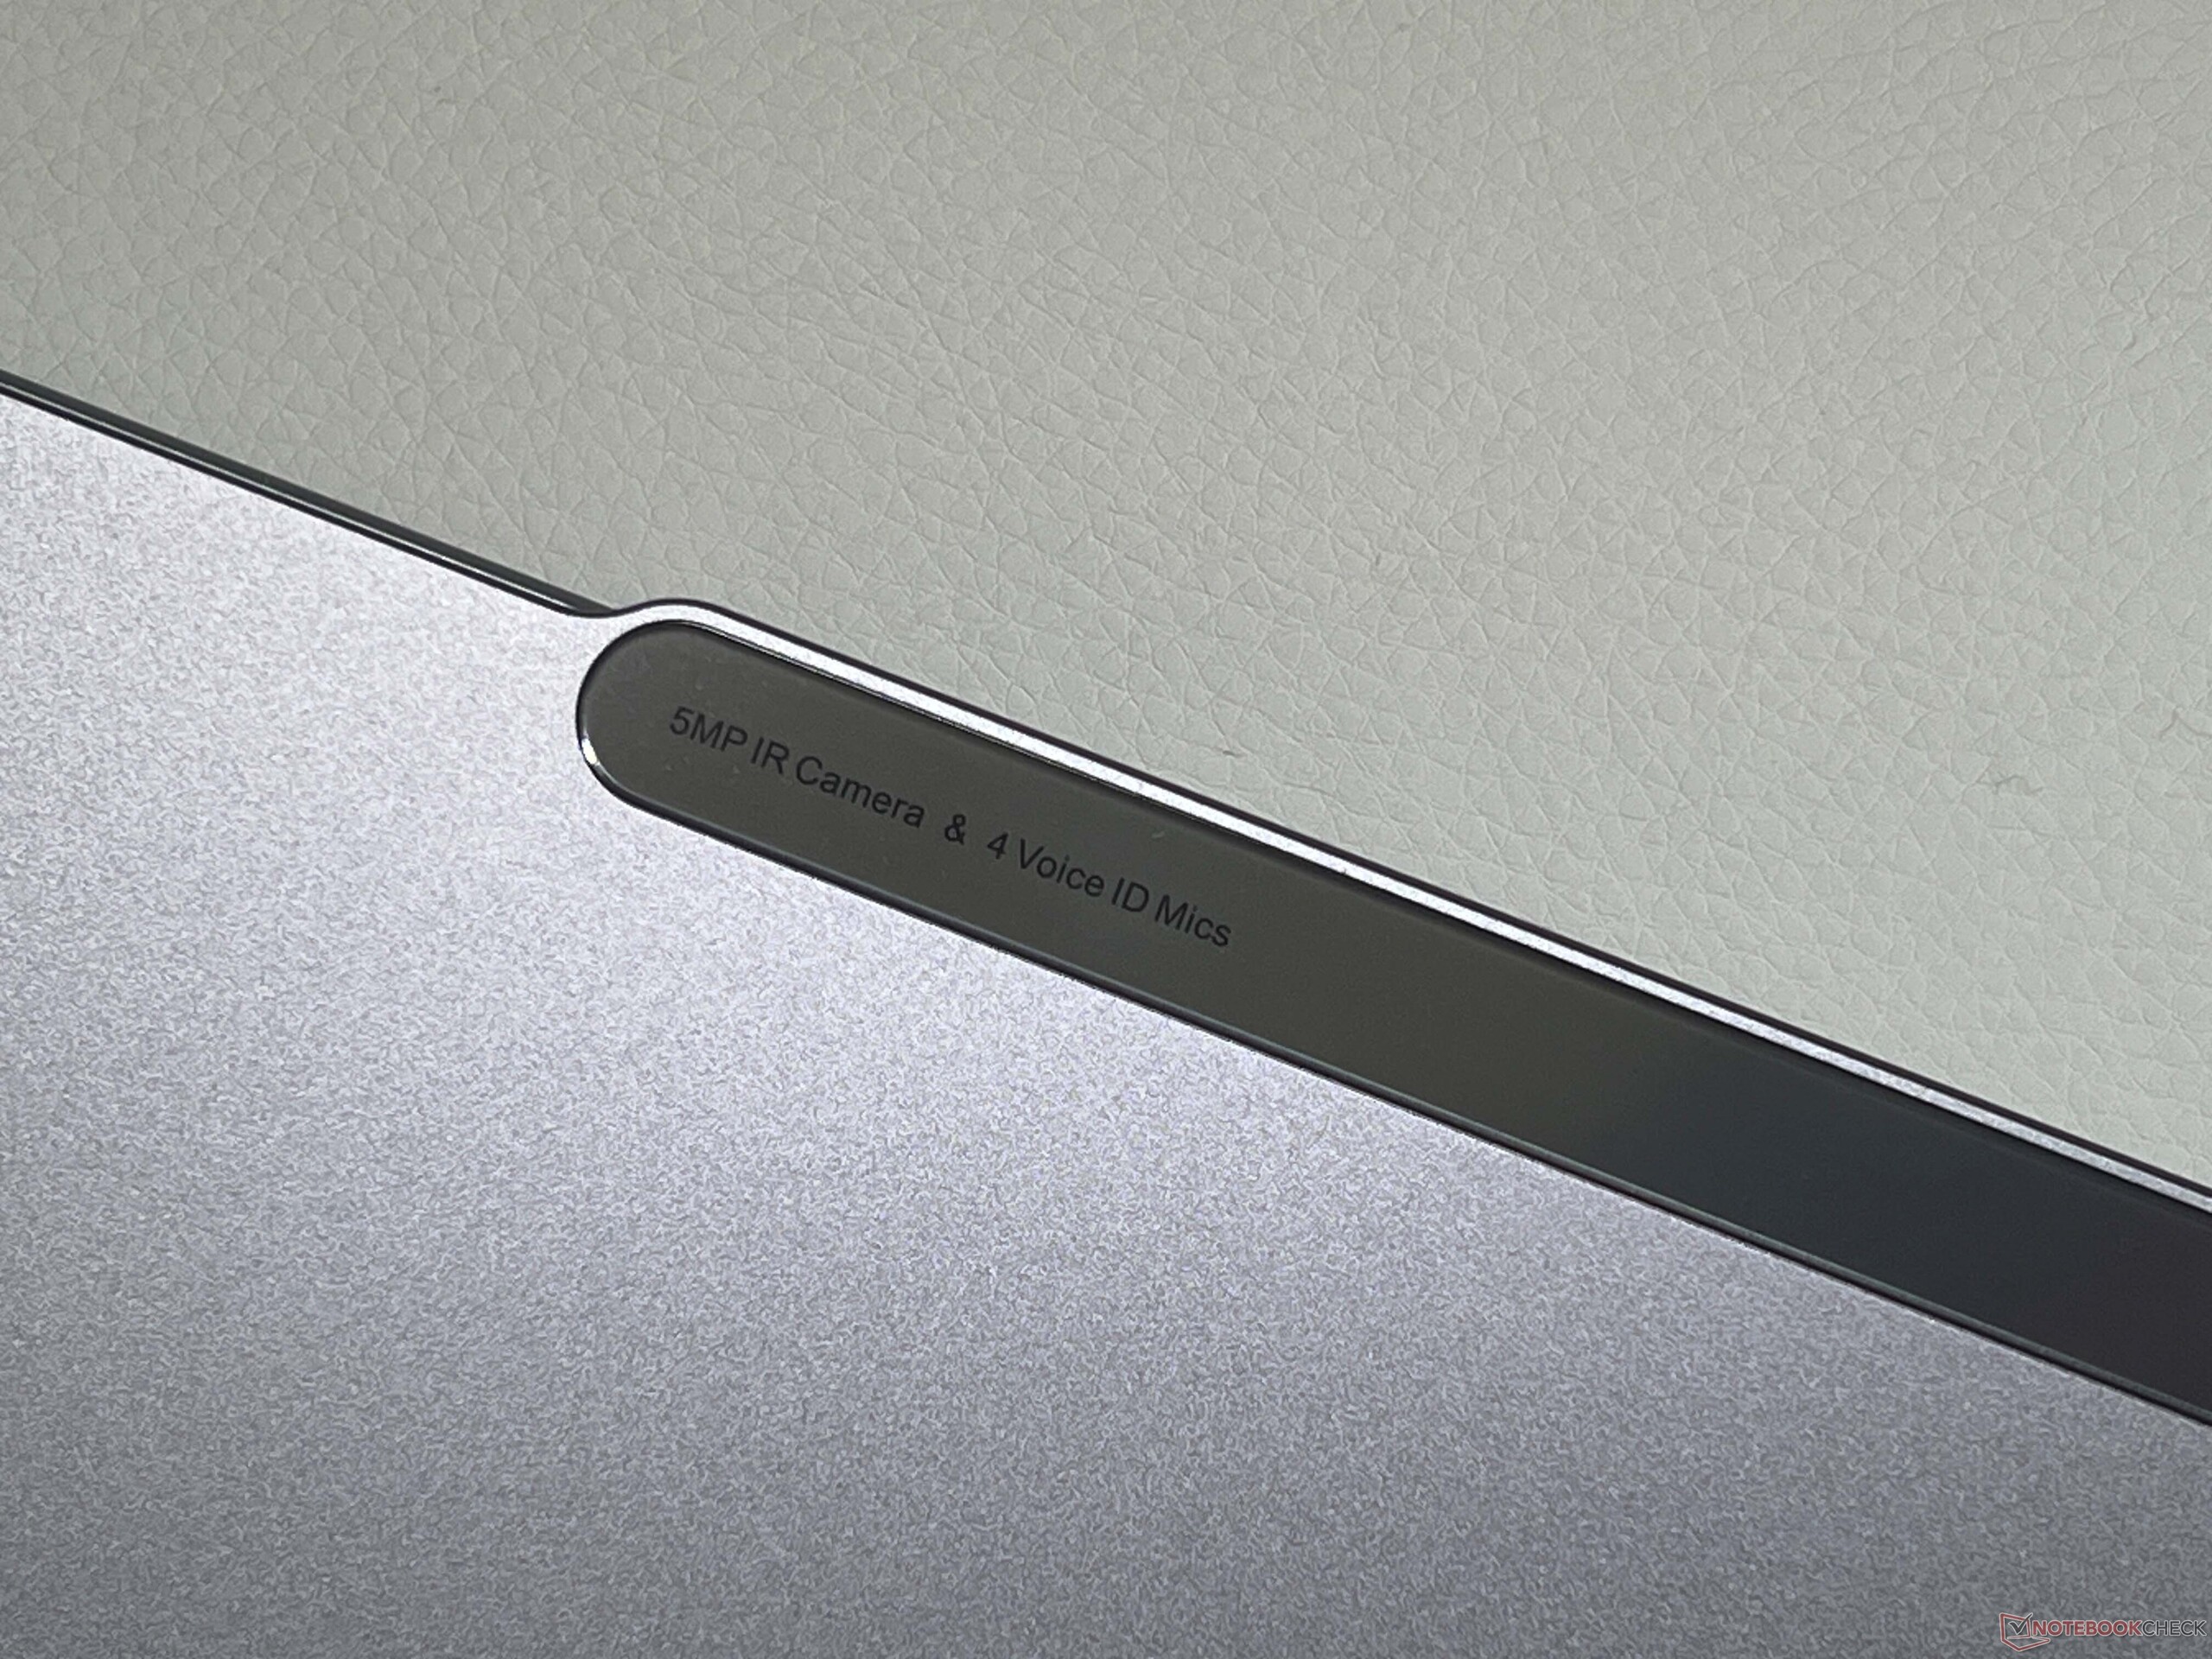
Cependant, le boîtier de l'appareil photo n'est toujours pas très beau. Les charnières sont bien ajustées et ne permettent qu'un basculement minimal (angle d'ouverture maximal de 180°). Le capot inférieur peut être facilement retiré, mais les options de maintenance se limitent aux disques SSD (une combinaison de facteurs de forme M.2 2242 et M.2 2280), aux ventilateurs et à la batterie. La RAM et le module WLAN sont soudés.

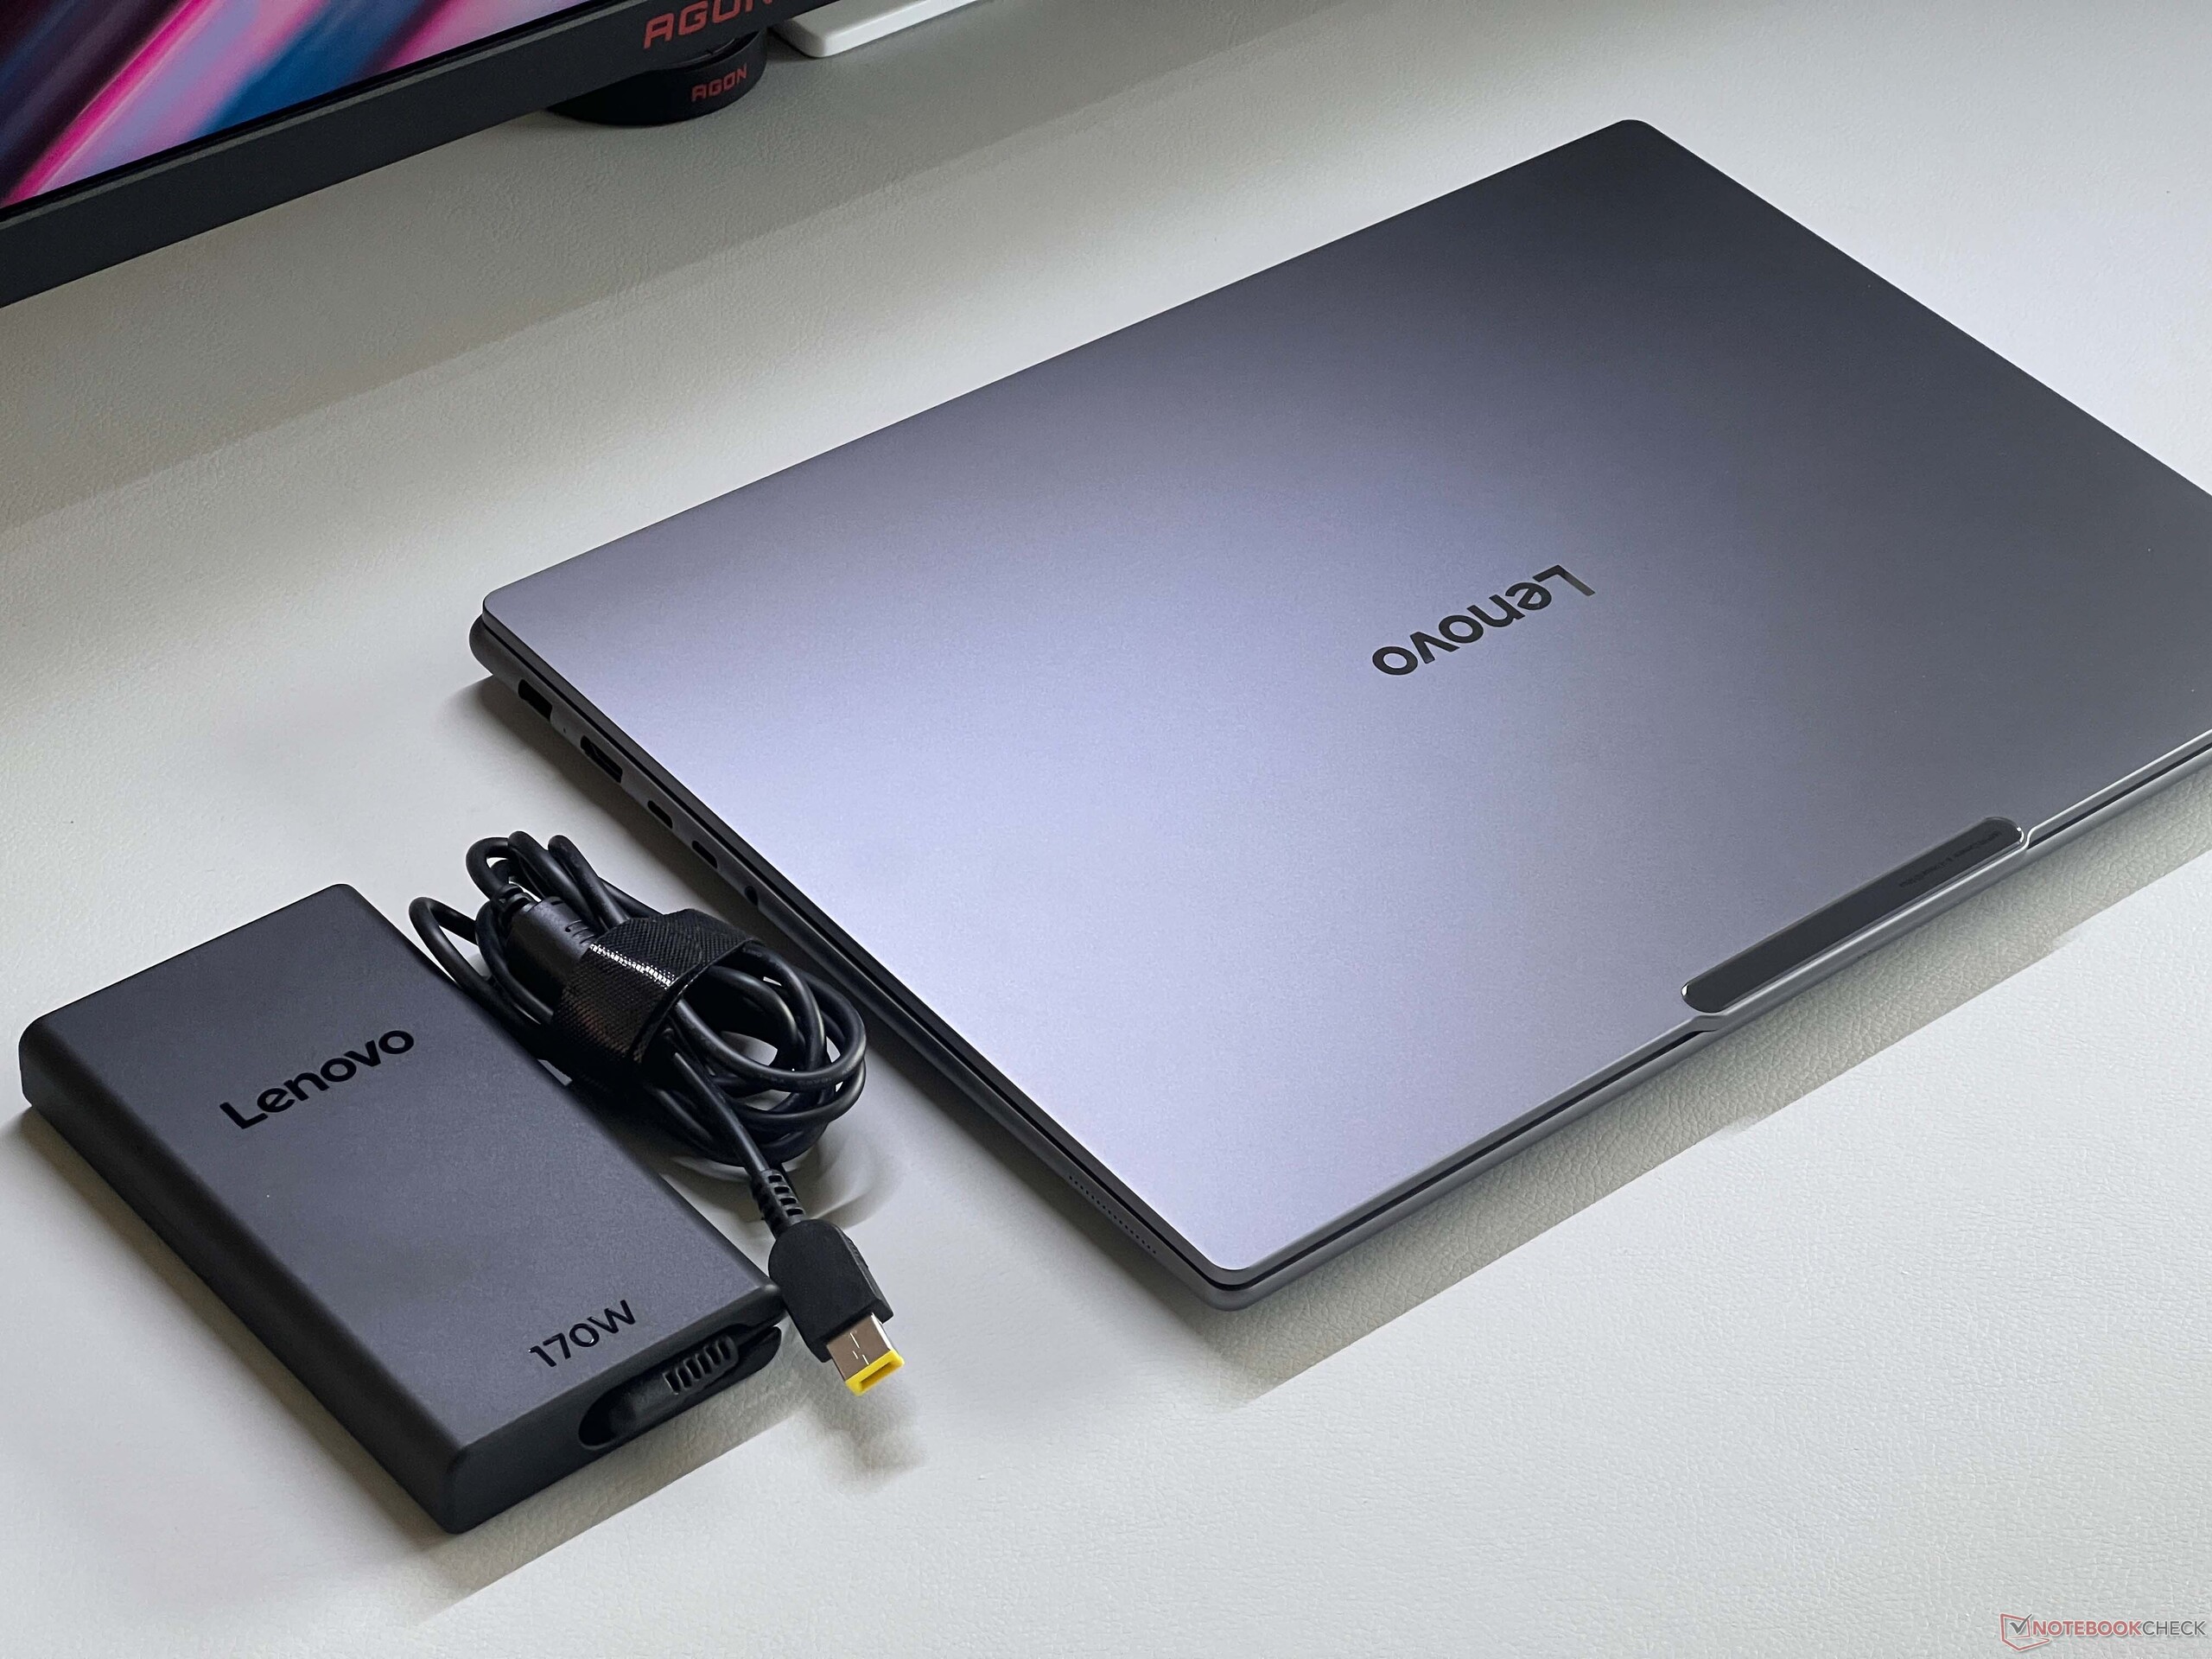
Les ports ont été revus cette fois-ci, et deux ports Thunderbolt 4 sont disponibles, mais Lenovo a renoncé au Thunderbolt 5. Le module Wi-Fi 7 atteint de bons taux de transfert, et le lecteur de carte SD atteint également des taux de transfert raisonnables.

La webcam de 5 MP prend des photos décentes et est équipée d'un eShutter, d'un capteur IR et prend en charge Windows Studio Effects. Cela dit, le Yoga Pro 9i Gen 10 n'est pas un ordinateur portable Copilot+.

Lenovo Yoga Pro 9i 16IAH G10 Aura Edition
Lenovo Yoga Pro 9i 16IAH G10 Aura Edition avec la brique d'alimentation de 170 W
Lenovo Yoga Pro 9i 16IAH G10 Aura Edition : Boîtier de l'appareil photo
Lenovo Yoga Pro 9i 16IAH G10 Aura Edition
Lenovo Yoga Pro 9i 16IAH G10 Aura Edition : Panneau inférieur
Lenovo Yoga Pro 9i 16IAH G10 Aura Edition : Intérieur
Lenovo Yoga Pro 9i 16IAH G10 Aura Edition : Emplacement de rechange pour SSD M.2 2280 NVMe
Lenovo Yoga Pro 9i 16IAH G10 Aura Edition : Disque système M.2 2242

Comparaison des tailles

362.72 mm 253.69 mm 18.3 mm 2.1 kg362.7 mm 253.7 mm 17.9 mm 1.9 kg354.6 mm 258.2 mm 23.1 mm 2.2 kg358.18 mm 240 mm 18.7 mm 2.3 kg354.9 mm 246.9 mm 17.3 mm 1.8 kg355 mm 250 mm 17 mm 1.8 kg297 mm 210 mm 1 mm 5.7 g
À gauche : entrée DC, sortie HDMI 2.1, 2x Thunderbolt 4, prise audio combo 3,5 mm
Droite : Lecteur de carte SD, 2x USB 3.1 Gen1 Type-A
SD Card Reader
average JPG Copy Test (av. of 3 runs)
Dell XPS 16 9640
Intel Core Ultra 7 155H (Angelbird AV Pro V60)
148 MB/s +79%
Asus ProArt P16 H7606WI
AMD Ryzen AI 9 HX 370 (Angelbird AV Pro V60)
127 MB/s +54%
Moyenne de la classe Multimedia
  (19.3 - 198, n=44, 2 dernières années)
101.7 MB/s +23%
Lenovo Yoga Pro 9 16IAH G10 RTX 5060
Intel Core Ultra 7 255H (Angelbird AV Pro V60)
82.7 MB/s
Samsung Galaxy Book4 Ultra
Intel Core Ultra 7 155H (Angelbird AV Pro V60)
78.8 MB/s -5%
Lenovo Yoga Pro 9 16IMH9
Intel Core Ultra 9 185H (Angelbird AV Pro V60)
78.3 MB/s -5%
Lenovo ThinkBook 16p G5 IRX 21N50011GE
Intel Core i9-14900HX (AV Pro V60)
52.6 MB/s -36%
maximum AS SSD Seq Read Test (1GB)
Asus ProArt P16 H7606WI
AMD Ryzen AI 9 HX 370 (Angelbird AV Pro V60)
254.4 MB/s +186%
Dell XPS 16 9640
Intel Core Ultra 7 155H (Angelbird AV Pro V60)
204.3 MB/s +130%
Moyenne de la classe Multimedia
  (27.4 - 262, n=44, 2 dernières années)
143.4 MB/s +61%
Lenovo ThinkBook 16p G5 IRX 21N50011GE
Intel Core i9-14900HX (AV Pro V60)
90.5 MB/s +2%
Lenovo Yoga Pro 9 16IMH9
Intel Core Ultra 9 185H (Angelbird AV Pro V60)
89.9 MB/s +1%
Lenovo Yoga Pro 9 16IAH G10 RTX 5060
Intel Core Ultra 7 255H (Angelbird AV Pro V60)
88.9 MB/s
Samsung Galaxy Book4 Ultra
Intel Core Ultra 7 155H (Angelbird AV Pro V60)
87.2 MB/s -2%
Networking
Lenovo Yoga Pro 9 16IAH G10 RTX 5060
Intel BE201 320MHz
iperf3 transmit AXE11000
1666 (min: 1551) MBit/s ∼93%
iperf3 receive AXE11000
1631 (min: 1577) MBit/s ∼95%
Lenovo ThinkBook 16p G5 IRX 21N50011GE
Intel Wi-Fi 6E AX211
iperf3 transmit AXE11000
1234 (min: 634) MBit/s ∼69%
iperf3 receive AXE11000
1689 (min: 1495) MBit/s ∼98%
iperf3 transmit AXE11000 6GHz
1202 (min: 633) MBit/s ∼100%
iperf3 receive AXE11000 6GHz
1707 (min: 1630) MBit/s ∼100%
Asus ProArt P16 H7606WI
Mediatek Wi-Fi 7 MT7925 Wireless LAN Card
iperf3 transmit AXE11000
1788 (min: 1649) MBit/s ∼100%
iperf3 receive AXE11000
1699 (min: 1607) MBit/s ∼99%
Lenovo Yoga Pro 9 16IMH9
Intel Wi-Fi 6E AX211
iperf3 transmit AXE11000
1650 (min: 1445) MBit/s ∼92%
iperf3 receive AXE11000
1654 (min: 1568) MBit/s ∼96%
Dell XPS 16 9640
Intel Wi-Fi 7 BE200 320MHz
iperf3 transmit AXE11000
1580 (min: 1483) MBit/s ∼88%
iperf3 receive AXE11000
1591 (min: 1476) MBit/s ∼93%
Samsung Galaxy Book4 Ultra
Intel Wi-Fi 6E AX211
iperf3 transmit AXE11000
1625 (min: 1476) MBit/s ∼91%
iperf3 receive AXE11000
1715 (min: 1675) MBit/s ∼100%
050100150200250300350400450500550600650700750800850900950100010501100115012001250130013501400145015001550160016501700Tooltip
Lenovo Yoga Pro 9 16IAH G10 RTX 5060; iperf3 transmit AXE11000: Ø1666 (1551-1712)
Lenovo Yoga Pro 9 16IAH G10 RTX 5060; iperf3 receive AXE11000: Ø1631 (1577-1652)
ColorChecker
6.4 ∆E
8.9 ∆E
13.9 ∆E
14.2 ∆E
11.1 ∆E
8.9 ∆E
6.5 ∆E
14.2 ∆E
8.2 ∆E
7.9 ∆E
8.8 ∆E
9.6 ∆E
7.5 ∆E
14.9 ∆E
7.8 ∆E
6.4 ∆E
7.9 ∆E
19.8 ∆E
2.4 ∆E
4.4 ∆E
8.8 ∆E
8.6 ∆E
6.2 ∆E
5.7 ∆E
ColorChecker Lenovo Yoga Pro 9 16IAH G10 RTX 5060: 9.13 ∆E min: 2.42 - max: 19.8 ∆E

Durabilité

Le Yoga Pro 9i offre diverses certifications environnementales telles que Energy Star 9.0 et EPEAT Gold, mais Lenovo ne fournit pas d'informations précises sur l'empreinteCO2 ou l'utilisation de matériaux recyclés. Un manuel d'entretien est disponible et l'emballage est entièrement recyclable.

Périphériques d'entrée : Course confortable des touches de 1,5 mm

Rien n'a changé au niveau des périphériques de saisie : le clavier avec une course de touche de 1,5 mm et un éclairage à deux niveaux (également contrôlé par un capteur) offre toujours une expérience de frappe confortable.

Le grand ClickPad de 15 cm x 9,5 cm impressionne par ses bonnes propriétés de glissement et ses clics mécaniques silencieux et de haute qualité.

Clavier et ClickPad
Clavier et ClickPad
Éclairage du clavier dans l'obscurité

Écran : oLED 120 Hz avec 1 100 nits

Matrice sous-pixel
Matrice sous-pixel

Lenovo propose deux panneaux OLED différents. Notre Yoga Pro 9i de base est équipé d'un panneau 2,8K (2 880 x 1 600, 16:10) avec un taux de rafraîchissement de 120 Hz et une couverture DisplayP3, qui offre une excellente qualité d'image subjective.

Les couleurs sont éclatantes, le contenu est net et les contrastes sont élevés. Les temps de réponse sont également très rapides, mais il y a un scintillement PWM. La fréquence est toutefois très élevée (1,2 kHz). La surface brillante entraîne des reflets gênants, en particulier à l'extérieur. Lenovo n'a pas installé de capteur de luminosité ou de température de couleur.

Le panneau OLED impressionne également dans notre analyse avec le logiciel professionnel Calman Ultimate de Portrait Displays. Nous avons mesuré une luminosité maximale de 474 cd/m² en mode SDR, et le rapport de contraste est extrêmement élevé. En mode HDR, nous avons noté un maximum de 1.090 cd/m² nits, et même avec une image presque entièrement blanche, c'est encore une luminosité de 660 cd/m².

Les profils de couleur fournis en usine pour P3 et sRGB sont déjà parfaitement calibrés et grâce à la couverture complète de l'espace colorimétrique, les flux de travail d'édition d'images sensibles aux couleurs sont possibles sans aucun problème. Nous n'avons pas été en mesure d'améliorer davantage l'affichage avec notre propre étalonnage.

477
cd/m²
476
cd/m²
478
cd/m²
471
cd/m²
475
cd/m²
478
cd/m²
464
cd/m²
470
cd/m²
479
cd/m²
Homogénéité de la luminosité
ATNA60HR04-0 testé avec X-Rite i1Pro 3
Maximum: 479 cd/m² (Nits) Moyenne: 474.2 cd/m² Minimum: 4.4 cd/m²
Homogénéité de la luminosité: 97 %
Valeur mesurée au centre, sur batterie: 475 cd/m²
Contraste: ∞:1 (Valeurs des noirs: 0 cd/m²)
ΔE ColorChecker Calman: 1 | ∀{0.5-29.43 Ø4.83}
ΔE Greyscale Calman: 1.3 | ∀{0.09-98 Ø5.1}
89.6% AdobeRGB 1998 (Argyll 3D)
100% sRGB (Argyll 3D)
99% Display P3 (Argyll 3D)
Gamma: 2.24
Lenovo Yoga Pro 9 16IAH G10 RTX 5060
ATNA60HR04-0, OLED, 2880x1800, 16", 120 Hz
Lenovo ThinkBook 16p G5 IRX 21N50011GE
MNG007ZA1-2 , IPS LCD, 3200x2000, 16", 165 Hz
Asus ProArt P16 H7606WI
ATNA60YV02-0, OLED, 3840x2400, 16", 60 Hz
Lenovo Yoga Pro 9 16IMH9
LEN160-3.2K, Mini-LED, 3200x2000, 16", 165 Hz
Dell XPS 16 9640
SDC4196, OLED, 3840x2400, 16.3", 90 Hz
Samsung Galaxy Book4 Ultra
ATNA60CL07-0, OLED, 2880x1800, 16", 120 Hz
Display
-3%
4%
-2%
-1%
-0%
Display P3 Coverage
99
94.4
-5%
99.9
1%
97
-2%
98.3
-1%
98.6
0%
sRGB Coverage
100
99.9
0%
100
0%
99.9
0%
100
0%
99.9
0%
AdobeRGB 1998 Coverage
89.6
86
-4%
99.1
11%
86.6
-3%
87.8
-2%
88.5
-1%
Response Times
-1534%
-67%
-2679%
-29%
-1%
Response Time Grey 50% / Grey 80% *
1.47 ?(0.71, 0.76)
15.5 ?(7, 8.5)
-954%
1.58 ?(0.84, 0.74)
-7%
22.2 ?(9.6, 12.6)
-1410%
0.82 ?(0.43, 0.39)
44%
0.54 ?(0.29, 0.25)
63%
Response Time Black / White *
0.42 ?(0.23, 0.19)
9.3 ?(5.5, 3.8)
-2114%
1.25 ?(0.67, 0.58)
-198%
17 ?(8.2, 8.8)
-3948%
0.85 ?(0.46, 0.39)
-102%
0.69 ?(0.39, 0.3)
-64%
PWM Frequency
1200 ?(90)
240 ?(52, 93)
4840 ?(100)
360 ?(90)
240 ?(100)
PWM Amplitude *
37
36
3%
Screen
-93%
-15%
-43%
-38%
-29%
Brightness middle
475
448
-6%
355
-25%
651
37%
366
-23%
390
-18%
Brightness
474
426
-10%
360
-24%
673
42%
367
-23%
393
-17%
Brightness Distribution
97
84
-13%
98
1%
93
-4%
96
-1%
98
1%
Black Level *
0.4
0.22
Colorchecker dE 2000 *
1
3.3
-230%
1.2
-20%
1.9
-90%
1.3
-30%
1.4
-40%
Colorchecker dE 2000 max. *
2
5.4
-170%
2.6
-30%
4.2
-110%
3.6
-80%
2.7
-35%
Greyscale dE 2000 *
1.3
3
-131%
1.2
8%
3
-131%
2.2
-69%
2.1
-62%
Gamma
2.24 98%
2.27 97%
2.14 103%
2.18 101%
2.14 103%
2.27 97%
CCT
6672 97%
7110 91%
6526 100%
6738 96%
6680 97%
6431 101%
Contrast
1120
2959
Colorchecker dE 2000 calibrated *
2.7
0.6
1
Moyenne finale (programmes/paramètres)
-543% / -331%
-26% / -23%
-908% / -511%
-23% / -26%
-10% / -16%

* ... Moindre est la valeur, meilleures sont les performances

Niveaux de gris Calman (profil : P3, espace couleur cible : P3)
Balayages de saturation Calman (profil : P3, espace colorimétrique cible : P3)
Calman ColorChecker (Profil : P3, Espace colorimétrique cible : P3)
Niveaux de gris Calman (Profil : sRGB, Espace couleur cible : sRGB)
Balayages de saturation de Calman (Profil : sRGB, Espace couleur cible : sRGB)
Calman ColorChecker (Profil : sRGB, Espace couleur cible : sRGB)
vs. sRGB
vs. sRGB
vs. P3
vs. P3
vs. AdobeRGB
vs. AdobeRGB

Temps de réponse de l'écran

Le temps de réponse d'un écran mesure la rapidité à laquelle l'écran est capable de changer une couleur pour une autre. Un temps de réponse élevé se traduit par une image floutée pour les objets en mouvement. Les joueurs bénéficieront de faibles latences d'affichage en jeu.
       Temps de réponse noir à blanc
0.42 ms ... hausse ↗ et chute ↘ combinées↗ 0.23 ms hausse
↘ 0.19 ms chute
L'écran montre de très faibles temps de réponse, parfait pour le jeu.
En comparaison, tous les appareils testés affichent entre 0.1 (minimum) et 240 (maximum) ms. » 0 % des appareils testés affichent de meilleures performances.
Cela signifie que les latences relevées sont meilleures que la moyenne (20.5 ms) de tous les appareils testés.
       Temps de réponse gris 50% à gris 80%
1.47 ms ... hausse ↗ et chute ↘ combinées↗ 0.71 ms hausse
↘ 0.76 ms chute
L'écran montre de très faibles temps de réponse, parfait pour le jeu.
En comparaison, tous les appareils testés affichent entre 0.165 (minimum) et 636 (maximum) ms. » 5 % des appareils testés affichent de meilleures performances.
Cela signifie que les latences relevées sont meilleures que la moyenne (32.1 ms) de tous les appareils testés.

Scintillement / MLI (Modulation de largeur d'impulsion)

Afin d'abaisser la luminosité de l'écran, certains ordinateurs portables font varier très rapidement le rétroéclairage entre éteint et allumé. La fréquence à laquelle le rétroéclairage s'éteint et se rallume est normalement fixée à une valeur qui permet de rendre la variation indétectable à l'œil nu? Si la fréquence est trop basse, certaines personnes peuvent être sujettes à une fatigue oculaire, des maux de tête ou même percevoir les variations.
Scintillement / MLI (Modulation de largeur d'impulsion) décelé 1200 Hz
Amplitude: 37 %
≤ 90 Niveau de luminosité

Le rétroéclairage de l'écran scintille à la fréquence de 1200 Hz (certainement du fait de l'utilisation d'une MDI - Modulation de largeur d'impulsion) à un niveau de luminosité inférieur ou égal à 90 % . Aucun scintillement ne devrait être perceptible au-dessus de cette valeur.

La fréquence de rafraîchissement de 1200 Hz est élevée, la grande majorité des utilisateurs ne devrait pas percevoir de scintillements et être sujette à une fatigue oculaire accrue.

En comparaison, 53 % des appareils testés n'emploient pas MDI pour assombrir leur écran. Nous avons relevé une moyenne à 8342 (minimum : 5 - maximum : 343500) Hz dans le cas où une MDI était active.

Scintillement PWM (0 % de luminosité)
Scintillement PWM (20 % de luminosité)
Scintillement PWM (40 % de luminosité)
Scintillement PWM (60 % de luminosité)
Scintillement PWM (luminosité de 80 %)
Scintillement PWM (100 % de luminosité)
Visionnage en plein air sous le soleil
Visualisation en extérieur (journée lumineuse, pas de lumière directe du soleil)
Angles de vision stables

Performance : Ordinateur portable Arrow Lake-H et RTX 5060


Conditions d'essai

Comme d'habitude, Lenovo propose différents profils énergétiques qui sont également liés aux paramètres Windows. Nous avons effectué tous les tests en mode Performance.

Profil énergétique CPU TDP CB24 Multi GPU TGP Time Spy Graphics Cyberpunk 2077 QHD Ultra Max. Volume du ventilateur
Mode économie de batterie 40 W 796 points 28 W 2,622 points 11.7 fps 31.6 dB(A)
Auto 80/65 W 1 107 points 75 W 10 603 points 53,5 fps 44,5 dB(A)
Puissance 115/80 W 1 197 points 100 W 11 675 points 54,1 fps 52,7 dB(A)
batterie 80 W 1.191 points 65 W 9.818 points 45.5 fps 44.5 dB(A)

Processeur : Core Ultra 7 255H

Le Intel Core Ultra 7 255H offre un total de 16 cœurs, et ses 6 cœurs de performance atteignent jusqu'à 5,1 GHz. Le processeur peut brièvement consommer plus de 100 W, avant de se stabiliser à 80 W.

Dans l'ensemble, les performances du processeur sont très bonnes et comparables à celles des processeurs AMD Ryzen AI 9 HX 370 dans l'Asus ProArt P16 Asus ProArt P16. L'avantage par rapport à l'ancien Core Ultra 9 185H de son prédécesseur est de 10 %.

Cinebench R15 Multi loop

0240480720960120014401680192021602400264028803120336036003840408043204560Tooltip
Lenovo Yoga Pro 9 16IAH G10 RTX 5060 Intel Core Ultra 7 255H: Ø3250 (3208.21-3444.42)
Lenovo ThinkBook 16p G5 IRX 21N50011GE Intel Core i9-14900HX: Ø4637 (4531.04-4774.41)
Asus ProArt P16 H7606WI AMD Ryzen AI 9 HX 370: Ø3476 (3466.5-3497.73)
Lenovo Yoga Pro 9 16IMH9 Intel Core Ultra 9 185H: Ø2931 (2869.44-3004.58)
Dell XPS 16 9640 Intel Core Ultra 7 155H: Ø2707 (2643.06-2817.5)
Samsung Galaxy Book4 Ultra Intel Core Ultra 7 155H: Ø2195 (2134.59-2575.83)
CPU Performance Rating: Percent
Cinebench R23: Multi Core | Single Core
Cinebench R20: CPU (Multi Core) | CPU (Single Core)
Cinebench R15: CPU Multi 64Bit | CPU Single 64Bit
Blender: v2.79 BMW27 CPU
7-Zip 18.03: 7z b 4 | 7z b 4 -mmt1
Geekbench 6.4: Multi-Core | Single-Core
Geekbench 5.5: Multi-Core | Single-Core
HWBOT x265 Benchmark v2.2: 4k Preset
LibreOffice : 20 Documents To PDF
R Benchmark 2.5: Overall mean
CPU Performance Rating
Lenovo ThinkBook 16p G5 IRX 21N50011GE
Intel Core i9-14900HX
87.7 pt
Lenovo Yoga Pro 9 16IAH G10 RTX 5060
Intel Core Ultra 7 255H
72.3 pt
Asus ProArt P16 H7606WI
AMD Ryzen AI 9 HX 370
72 pt
Lenovo Yoga Pro 9 16IMH9
Intel Core Ultra 9 185H
66 pt
Moyenne Intel Core Ultra 7 255H
 
65.6 pt
Dell XPS 16 9640
Intel Core Ultra 7 155H
60.7 pt
Samsung Galaxy Book4 Ultra
Intel Core Ultra 7 155H
56.8 pt
Moyenne de la classe Multimedia
 
55.7 pt
Cinebench R23 / Multi Core
Lenovo ThinkBook 16p G5 IRX 21N50011GE
Intel Core i9-14900HX
30416 Points +35%
Asus ProArt P16 H7606WI
AMD Ryzen AI 9 HX 370
23750 Points +5%
Lenovo Yoga Pro 9 16IAH G10 RTX 5060
Intel Core Ultra 7 255H
22578 Points
Lenovo Yoga Pro 9 16IMH9
Intel Core Ultra 9 185H
19851 Points -12%
Dell XPS 16 9640
Intel Core Ultra 7 155H
18433 Points -18%
Moyenne Intel Core Ultra 7 255H
  (16435 - 22578, n=9)
18319 Points -19%
Samsung Galaxy Book4 Ultra
Intel Core Ultra 7 155H
15698 Points -30%
Moyenne de la classe Multimedia
  (4861 - 30783, n=81, 2 dernières années)
15587 Points -31%
Cinebench R23 / Single Core
Lenovo ThinkBook 16p G5 IRX 21N50011GE
Intel Core i9-14900HX
2245 Points +9%
Moyenne Intel Core Ultra 7 255H
  (2047 - 2152, n=9)
2091 Points +2%
Lenovo Yoga Pro 9 16IAH G10 RTX 5060
Intel Core Ultra 7 255H
2054 Points
Asus ProArt P16 H7606WI
AMD Ryzen AI 9 HX 370
2044 Points 0%
Lenovo Yoga Pro 9 16IMH9
Intel Core Ultra 9 185H
1906 Points -7%
Moyenne de la classe Multimedia
  (1128 - 2290, n=73, 2 dernières années)
1824 Points -11%
Dell XPS 16 9640
Intel Core Ultra 7 155H
1791 Points -13%
Samsung Galaxy Book4 Ultra
Intel Core Ultra 7 155H
1789 Points -13%
Cinebench R20 / CPU (Multi Core)
Lenovo ThinkBook 16p G5 IRX 21N50011GE
Intel Core i9-14900HX
11517 Points +30%
Asus ProArt P16 H7606WI
AMD Ryzen AI 9 HX 370
9246 Points +4%
Lenovo Yoga Pro 9 16IAH G10 RTX 5060
Intel Core Ultra 7 255H
8860 Points
Lenovo Yoga Pro 9 16IMH9
Intel Core Ultra 9 185H
7651 Points -14%
Moyenne Intel Core Ultra 7 255H
  (6414 - 8860, n=8)
7230 Points -18%
Dell XPS 16 9640
Intel Core Ultra 7 155H
7146 Points -19%
Samsung Galaxy Book4 Ultra
Intel Core Ultra 7 155H
6085 Points -31%
Moyenne de la classe Multimedia
  (1887 - 11924, n=65, 2 dernières années)
5769 Points -35%
Cinebench R20 / CPU (Single Core)
Lenovo ThinkBook 16p G5 IRX 21N50011GE
Intel Core i9-14900HX
853 Points +8%
Asus ProArt P16 H7606WI
AMD Ryzen AI 9 HX 370
804 Points +2%
Moyenne Intel Core Ultra 7 255H
  (786 - 826, n=8)
804 Points +2%
Lenovo Yoga Pro 9 16IAH G10 RTX 5060
Intel Core Ultra 7 255H
787 Points
Lenovo Yoga Pro 9 16IMH9
Intel Core Ultra 9 185H
735 Points -7%
Samsung Galaxy Book4 Ultra
Intel Core Ultra 7 155H
693 Points -12%
Dell XPS 16 9640
Intel Core Ultra 7 155H
672 Points -15%
Moyenne de la classe Multimedia
  (420 - 853, n=65, 2 dernières années)
672 Points -15%
Cinebench R15 / CPU Multi 64Bit
Lenovo ThinkBook 16p G5 IRX 21N50011GE
Intel Core i9-14900HX
4774 (4531.04min - 4774.41max) Points +39%
Asus ProArt P16 H7606WI
AMD Ryzen AI 9 HX 370
3498 (3466.5min - 3497.73max) Points +2%
Lenovo Yoga Pro 9 16IAH G10 RTX 5060
Intel Core Ultra 7 255H
3444 (3208.21min - 3444.42max) Points
Lenovo Yoga Pro 9 16IMH9
Intel Core Ultra 9 185H
3005 (2869.44min - 3004.58max) Points -13%
Moyenne Intel Core Ultra 7 255H
  (2414 - 3444, n=8)
2875 Points -17%
Dell XPS 16 9640
Intel Core Ultra 7 155H
2818 (2643.06min - 2817.5max) Points -18%
Samsung Galaxy Book4 Ultra
Intel Core Ultra 7 155H
2576 (2134.59min - 2575.83max) Points -25%
Moyenne de la classe Multimedia
  (856 - 5224, n=72, 2 dernières années)
2455 Points -29%
Cinebench R15 / CPU Single 64Bit
Lenovo ThinkBook 16p G5 IRX 21N50011GE
Intel Core i9-14900HX
323 Points +5%
Asus ProArt P16 H7606WI
AMD Ryzen AI 9 HX 370
310 Points 0%
Lenovo Yoga Pro 9 16IAH G10 RTX 5060
Intel Core Ultra 7 255H
309 Points
Moyenne Intel Core Ultra 7 255H
  (258 - 322, n=8)
306 Points -1%
Lenovo Yoga Pro 9 16IMH9
Intel Core Ultra 9 185H
280 Points -9%
Moyenne de la classe Multimedia
  (99.6 - 323, n=67, 2 dernières années)
263 Points -15%
Dell XPS 16 9640
Intel Core Ultra 7 155H
260 Points -16%
Samsung Galaxy Book4 Ultra
Intel Core Ultra 7 155H
259 Points -16%
Blender / v2.79 BMW27 CPU
Moyenne de la classe Multimedia
  (100 - 557, n=66, 2 dernières années)
261 Seconds * -66%
Samsung Galaxy Book4 Ultra
Intel Core Ultra 7 155H
220 Seconds * -40%
Moyenne Intel Core Ultra 7 255H
  (157 - 242, n=8)
202 Seconds * -29%
Dell XPS 16 9640
Intel Core Ultra 7 155H
179 Seconds * -14%
Lenovo Yoga Pro 9 16IMH9
Intel Core Ultra 9 185H
163 Seconds * -4%
Lenovo Yoga Pro 9 16IAH G10 RTX 5060
Intel Core Ultra 7 255H
157 Seconds *
Asus ProArt P16 H7606WI
AMD Ryzen AI 9 HX 370
140 Seconds * +11%
Lenovo ThinkBook 16p G5 IRX 21N50011GE
Intel Core i9-14900HX
107 Seconds * +32%
7-Zip 18.03 / 7z b 4
Lenovo ThinkBook 16p G5 IRX 21N50011GE
Intel Core i9-14900HX
121228 MIPS +77%
Asus ProArt P16 H7606WI
AMD Ryzen AI 9 HX 370
83354 MIPS +21%
Lenovo Yoga Pro 9 16IMH9
Intel Core Ultra 9 185H
76331 MIPS +11%
Dell XPS 16 9640
Intel Core Ultra 7 155H
70074 MIPS +2%
Lenovo Yoga Pro 9 16IAH G10 RTX 5060
Intel Core Ultra 7 255H
68627 MIPS
Samsung Galaxy Book4 Ultra
Intel Core Ultra 7 155H
62513 MIPS -9%
Moyenne de la classe Multimedia
  (29095 - 130368, n=60, 2 dernières années)
58796 MIPS -14%
Moyenne Intel Core Ultra 7 255H
  (47892 - 68627, n=9)
58417 MIPS -15%
7-Zip 18.03 / 7z b 4 -mmt1
Lenovo ThinkBook 16p G5 IRX 21N50011GE
Intel Core i9-14900HX
7545 MIPS +27%
Asus ProArt P16 H7606WI
AMD Ryzen AI 9 HX 370
6179 MIPS +4%
Lenovo Yoga Pro 9 16IAH G10 RTX 5060
Intel Core Ultra 7 255H
5919 MIPS
Moyenne Intel Core Ultra 7 255H
  (4589 - 6385, n=9)
5900 MIPS 0%
Lenovo Yoga Pro 9 16IMH9
Intel Core Ultra 9 185H
5781 MIPS -2%
Moyenne de la classe Multimedia
  (3666 - 7545, n=60, 2 dernières années)
5724 MIPS -3%
Samsung Galaxy Book4 Ultra
Intel Core Ultra 7 155H
5540 MIPS -6%
Dell XPS 16 9640
Intel Core Ultra 7 155H
5474 MIPS -8%
Geekbench 6.4 / Multi-Core
Lenovo ThinkBook 16p G5 IRX 21N50011GE
Intel Core i9-14900HX
18083 Points +5%
Lenovo Yoga Pro 9 16IAH G10 RTX 5060
Intel Core Ultra 7 255H
17174 Points
Asus ProArt P16 H7606WI
AMD Ryzen AI 9 HX 370
15367 Points -11%
Moyenne Intel Core Ultra 7 255H
  (12250 - 17489, n=9)
15301 Points -11%
Lenovo Yoga Pro 9 16IMH9
Intel Core Ultra 9 185H
14031 Points -18%
Dell XPS 16 9640
Intel Core Ultra 7 155H
13656 Points -20%
Moyenne de la classe Multimedia
  (4983 - 25760, n=77, 2 dernières années)
13511 Points -21%
Samsung Galaxy Book4 Ultra
Intel Core Ultra 7 155H
12517 Points -27%
Geekbench 6.4 / Single-Core
Lenovo ThinkBook 16p G5 IRX 21N50011GE
Intel Core i9-14900HX
3094 Points +8%
Moyenne Intel Core Ultra 7 255H
  (2858 - 2925, n=9)
2892 Points +1%
Asus ProArt P16 H7606WI
AMD Ryzen AI 9 HX 370
2877 Points 0%
Lenovo Yoga Pro 9 16IAH G10 RTX 5060
Intel Core Ultra 7 255H
2867 Points
Moyenne de la classe Multimedia
  (1534 - 3927, n=73, 2 dernières années)
2702 Points -6%
Lenovo Yoga Pro 9 16IMH9
Intel Core Ultra 9 185H
2570 Points -10%
Samsung Galaxy Book4 Ultra
Intel Core Ultra 7 155H
2436 Points -15%
Dell XPS 16 9640
Intel Core Ultra 7 155H
2418 Points -16%
Geekbench 5.5 / Multi-Core
Lenovo ThinkBook 16p G5 IRX 21N50011GE
Intel Core i9-14900HX
20422 Points +23%
Lenovo Yoga Pro 9 16IAH G10 RTX 5060
Intel Core Ultra 7 255H
16669 Points
Asus ProArt P16 H7606WI
AMD Ryzen AI 9 HX 370
15012 Points -10%
Moyenne Intel Core Ultra 7 255H
  (12673 - 17218, n=8)
14804 Points -11%
Lenovo Yoga Pro 9 16IMH9
Intel Core Ultra 9 185H
13936 Points -16%
Dell XPS 16 9640
Intel Core Ultra 7 155H
13556 Points -19%
Samsung Galaxy Book4 Ultra
Intel Core Ultra 7 155H
12463 Points -25%
Moyenne de la classe Multimedia
  (4652 - 23059, n=64, 2 dernières années)
12233 Points -27%
Geekbench 5.5 / Single-Core
Lenovo ThinkBook 16p G5 IRX 21N50011GE
Intel Core i9-14900HX
2207 Points +11%
Moyenne Intel Core Ultra 7 255H
  (1980 - 2121, n=8)
2084 Points +5%
Asus ProArt P16 H7606WI
AMD Ryzen AI 9 HX 370
2066 Points +4%
Lenovo Yoga Pro 9 16IAH G10 RTX 5060
Intel Core Ultra 7 255H
1980 Points
Lenovo Yoga Pro 9 16IMH9
Intel Core Ultra 9 185H
1902 Points -4%
Moyenne de la classe Multimedia
  (891 - 2555, n=64, 2 dernières années)
1884 Points -5%
Samsung Galaxy Book4 Ultra
Intel Core Ultra 7 155H
1824 Points -8%
Dell XPS 16 9640
Intel Core Ultra 7 155H
1775 Points -10%
HWBOT x265 Benchmark v2.2 / 4k Preset
Lenovo ThinkBook 16p G5 IRX 21N50011GE
Intel Core i9-14900HX
30.4 fps +18%
Lenovo Yoga Pro 9 16IAH G10 RTX 5060
Intel Core Ultra 7 255H
25.8 fps
Asus ProArt P16 H7606WI
AMD Ryzen AI 9 HX 370
24.6 fps -5%
Lenovo Yoga Pro 9 16IMH9
Intel Core Ultra 9 185H
22.7 fps -12%
Moyenne Intel Core Ultra 7 255H
  (16.2 - 25.8, n=8)
21 fps -19%
Dell XPS 16 9640
Intel Core Ultra 7 155H
20.8 fps -19%
Samsung Galaxy Book4 Ultra
Intel Core Ultra 7 155H
17.1 fps -34%
Moyenne de la classe Multimedia
  (5.26 - 34.3, n=60, 2 dernières années)
16.7 fps -35%
LibreOffice / 20 Documents To PDF
Asus ProArt P16 H7606WI
AMD Ryzen AI 9 HX 370
56.1 s * -36%
Moyenne de la classe Multimedia
  (23.9 - 146.7, n=61, 2 dernières années)
50.1 s * -21%
Moyenne Intel Core Ultra 7 255H
  (41.3 - 61.6, n=8)
48.9 s * -18%
Samsung Galaxy Book4 Ultra
Intel Core Ultra 7 155H
46.6 s * -13%
Lenovo ThinkBook 16p G5 IRX 21N50011GE
Intel Core i9-14900HX
45.4 s * -10%
Dell XPS 16 9640
Intel Core Ultra 7 155H
44.8 s * -8%
Lenovo Yoga Pro 9 16IAH G10 RTX 5060
Intel Core Ultra 7 255H
41.3 s *
Lenovo Yoga Pro 9 16IMH9
Intel Core Ultra 9 185H
39.7 s * +4%
R Benchmark 2.5 / Overall mean
Dell XPS 16 9640
Intel Core Ultra 7 155H
0.4828 sec * -10%
Moyenne de la classe Multimedia
  (0.3604 - 0.947, n=60, 2 dernières années)
0.4815 sec * -10%
Samsung Galaxy Book4 Ultra
Intel Core Ultra 7 155H
0.4682 sec * -7%
Lenovo Yoga Pro 9 16IMH9
Intel Core Ultra 9 185H
0.4457 sec * -2%
Moyenne Intel Core Ultra 7 255H
  (0.4233 - 0.515, n=8)
0.4438 sec * -1%
Lenovo Yoga Pro 9 16IAH G10 RTX 5060
Intel Core Ultra 7 255H
0.4375 sec *
Asus ProArt P16 H7606WI
AMD Ryzen AI 9 HX 370
0.4041 sec * +8%
Lenovo ThinkBook 16p G5 IRX 21N50011GE
Intel Core i9-14900HX
0.3604 sec * +18%

* ... Moindre est la valeur, meilleures sont les performances

Cinebench R15 CPU Multi 64Bit
3444 Points
Cinebench R15 OpenGL 64Bit
265 fps
Cinebench R15 Ref. Match 64Bit
99.6 %
Cinebench R15 CPU Single 64Bit
309 Points
Cinebench R20 CPU (Multi Core)
8860 Points
Cinebench R20 CPU (Single Core)
787 Points
Cinebench R23 Single Core
2054 Points
Cinebench R23 Multi Core
22578 Points
Cinebench 2024 CPU Single Core
125.1 Points
Cinebench 2024 CPU Multi Core
1197 Points
Aide
Performance Rating
Lenovo ThinkBook 16p G5 IRX 21N50011GE
Intel Core i9-14900HX, NVIDIA GeForce RTX 4060 Laptop GPU
92.5 pt
Asus ProArt P16 H7606WI -2!
AMD Ryzen AI 9 HX 370, NVIDIA GeForce RTX 4070 Laptop GPU
83.7 pt
Lenovo Yoga Pro 9 16IAH G10 RTX 5060
Intel Core Ultra 7 255H, GeForce RTX 5060 Laptop
74 pt
Lenovo Yoga Pro 9 16IMH9
Intel Core Ultra 9 185H, NVIDIA GeForce RTX 4070 Laptop GPU
66.3 pt
Dell XPS 16 9640
Intel Core Ultra 7 155H, NVIDIA GeForce RTX 4070 Laptop GPU
61.9 pt
Moyenne Intel Core Ultra 7 255H
 
60.3 pt
Moyenne de la classe Multimedia
 
54.2 pt
Samsung Galaxy Book4 Ultra
Intel Core Ultra 7 155H, NVIDIA GeForce RTX 4050 Laptop GPU
52.5 pt
AIDA64 / FP32 Ray-Trace
Lenovo ThinkBook 16p G5 IRX 21N50011GE
Intel Core i9-14900HX, NVIDIA GeForce RTX 4060 Laptop GPU
27083 KRay/s +9%
Lenovo Yoga Pro 9 16IAH G10 RTX 5060
Intel Core Ultra 7 255H, GeForce RTX 5060 Laptop
24741 KRay/s
Moyenne Intel Core Ultra 7 255H
  (14508 - 24741, n=7)
18959 KRay/s -23%
Lenovo Yoga Pro 9 16IMH9
Intel Core Ultra 9 185H, NVIDIA GeForce RTX 4070 Laptop GPU
18446 KRay/s -25%
Dell XPS 16 9640
Intel Core Ultra 7 155H, NVIDIA GeForce RTX 4070 Laptop GPU
17015 KRay/s -31%
Moyenne de la classe Multimedia
  (5121 - 50388, n=59, 2 dernières années)
15809 KRay/s -36%
Samsung Galaxy Book4 Ultra
Intel Core Ultra 7 155H, NVIDIA GeForce RTX 4050 Laptop GPU
13541 KRay/s -45%
AIDA64 / FPU Julia
Asus ProArt P16 H7606WI
AMD Ryzen AI 9 HX 370, NVIDIA GeForce RTX 4070 Laptop GPU
147248 Points +24%
Lenovo ThinkBook 16p G5 IRX 21N50011GE
Intel Core i9-14900HX, NVIDIA GeForce RTX 4060 Laptop GPU
136606 Points +15%
Lenovo Yoga Pro 9 16IAH G10 RTX 5060
Intel Core Ultra 7 255H, GeForce RTX 5060 Laptop
118886 Points
Lenovo Yoga Pro 9 16IMH9
Intel Core Ultra 9 185H, NVIDIA GeForce RTX 4070 Laptop GPU
95213 Points -20%
Moyenne Intel Core Ultra 7 255H
  (72225 - 118886, n=7)
90438 Points -24%
Dell XPS 16 9640
Intel Core Ultra 7 155H, NVIDIA GeForce RTX 4070 Laptop GPU
88083 Points -26%
Moyenne de la classe Multimedia
  (14528 - 201874, n=60, 2 dernières années)
75535 Points -36%
Samsung Galaxy Book4 Ultra
Intel Core Ultra 7 155H, NVIDIA GeForce RTX 4050 Laptop GPU
71791 Points -40%
AIDA64 / CPU SHA3
Lenovo ThinkBook 16p G5 IRX 21N50011GE
Intel Core i9-14900HX, NVIDIA GeForce RTX 4060 Laptop GPU
6698 MB/s +21%
Asus ProArt P16 H7606WI
AMD Ryzen AI 9 HX 370, NVIDIA GeForce RTX 4070 Laptop GPU
5843 MB/s +5%
Lenovo Yoga Pro 9 16IAH G10 RTX 5060
Intel Core Ultra 7 255H, GeForce RTX 5060 Laptop
5548 MB/s
Moyenne Intel Core Ultra 7 255H
  (3445 - 5548, n=7)
4356 MB/s -21%
Lenovo Yoga Pro 9 16IMH9
Intel Core Ultra 9 185H, NVIDIA GeForce RTX 4070 Laptop GPU
4278 MB/s -23%
Dell XPS 16 9640
Intel Core Ultra 7 155H, NVIDIA GeForce RTX 4070 Laptop GPU
4134 MB/s -25%
Moyenne de la classe Multimedia
  (1188 - 8623, n=60, 2 dernières années)
3537 MB/s -36%
Samsung Galaxy Book4 Ultra
Intel Core Ultra 7 155H, NVIDIA GeForce RTX 4050 Laptop GPU
3251 MB/s -41%
AIDA64 / CPU Queen
Lenovo ThinkBook 16p G5 IRX 21N50011GE
Intel Core i9-14900HX, NVIDIA GeForce RTX 4060 Laptop GPU
141074 Points +113%
Asus ProArt P16 H7606WI
AMD Ryzen AI 9 HX 370, NVIDIA GeForce RTX 4070 Laptop GPU
94661 Points +43%
Lenovo Yoga Pro 9 16IMH9
Intel Core Ultra 9 185H, NVIDIA GeForce RTX 4070 Laptop GPU
94395 Points +42%
Dell XPS 16 9640
Intel Core Ultra 7 155H, NVIDIA GeForce RTX 4070 Laptop GPU
89747 Points +35%
Moyenne de la classe Multimedia
  (21547 - 181505, n=60, 2 dernières années)
84602 Points +27%
Samsung Galaxy Book4 Ultra
Intel Core Ultra 7 155H, NVIDIA GeForce RTX 4050 Laptop GPU
84280 Points +27%
Lenovo Yoga Pro 9 16IAH G10 RTX 5060
Intel Core Ultra 7 255H, GeForce RTX 5060 Laptop
66364 Points
Moyenne Intel Core Ultra 7 255H
  (59810 - 68308, n=7)
63636 Points -4%
AIDA64 / FPU SinJulia
Asus ProArt P16 H7606WI
AMD Ryzen AI 9 HX 370, NVIDIA GeForce RTX 4070 Laptop GPU
19021 Points +113%
Lenovo ThinkBook 16p G5 IRX 21N50011GE
Intel Core i9-14900HX, NVIDIA GeForce RTX 4060 Laptop GPU
16233 Points +82%
Lenovo Yoga Pro 9 16IMH9
Intel Core Ultra 9 185H, NVIDIA GeForce RTX 4070 Laptop GPU
11392 Points +28%
Dell XPS 16 9640
Intel Core Ultra 7 155H, NVIDIA GeForce RTX 4070 Laptop GPU
10607 Points +19%
Samsung Galaxy Book4 Ultra
Intel Core Ultra 7 155H, NVIDIA GeForce RTX 4050 Laptop GPU
9696 Points +9%
Moyenne de la classe Multimedia
  (1240 - 28794, n=60, 2 dernières années)
9621 Points +8%
Lenovo Yoga Pro 9 16IAH G10 RTX 5060
Intel Core Ultra 7 255H, GeForce RTX 5060 Laptop
8931 Points
Moyenne Intel Core Ultra 7 255H
  (6995 - 8931, n=7)
7779 Points -13%
AIDA64 / FPU Mandel
Lenovo ThinkBook 16p G5 IRX 21N50011GE
Intel Core i9-14900HX, NVIDIA GeForce RTX 4060 Laptop GPU
67326 Points +6%
Lenovo Yoga Pro 9 16IAH G10 RTX 5060
Intel Core Ultra 7 255H, GeForce RTX 5060 Laptop
63347 Points
Moyenne Intel Core Ultra 7 255H
  (37743 - 63347, n=7)
47650 Points -25%
Lenovo Yoga Pro 9 16IMH9
Intel Core Ultra 9 185H, NVIDIA GeForce RTX 4070 Laptop GPU
47315 Points -25%
Dell XPS 16 9640
Intel Core Ultra 7 155H, NVIDIA GeForce RTX 4070 Laptop GPU
43496 Points -31%
Moyenne de la classe Multimedia
  (9903 - 105740, n=59, 2 dernières années)
37601 Points -41%
Samsung Galaxy Book4 Ultra
Intel Core Ultra 7 155H, NVIDIA GeForce RTX 4050 Laptop GPU
34862 Points -45%
AIDA64 / CPU AES
Lenovo ThinkBook 16p G5 IRX 21N50011GE
Intel Core i9-14900HX, NVIDIA GeForce RTX 4060 Laptop GPU
126540 MB/s +52%
Lenovo Yoga Pro 9 16IMH9
Intel Core Ultra 9 185H, NVIDIA GeForce RTX 4070 Laptop GPU
94250 MB/s +13%
Dell XPS 16 9640
Intel Core Ultra 7 155H, NVIDIA GeForce RTX 4070 Laptop GPU
84332 MB/s +1%
Lenovo Yoga Pro 9 16IAH G10 RTX 5060
Intel Core Ultra 7 255H, GeForce RTX 5060 Laptop
83398 MB/s
Asus ProArt P16 H7606WI
AMD Ryzen AI 9 HX 370, NVIDIA GeForce RTX 4070 Laptop GPU
81929 MB/s -2%
Moyenne de la classe Multimedia
  (26066 - 169946, n=60, 2 dernières années)
72338 MB/s -13%
Moyenne Intel Core Ultra 7 255H
  (58402 - 83398, n=7)
69519 MB/s -17%
Samsung Galaxy Book4 Ultra
Intel Core Ultra 7 155H, NVIDIA GeForce RTX 4050 Laptop GPU
68288 MB/s -18%
AIDA64 / CPU ZLib
Lenovo ThinkBook 16p G5 IRX 21N50011GE
Intel Core i9-14900HX, NVIDIA GeForce RTX 4060 Laptop GPU
1973 MB/s +50%
Asus ProArt P16 H7606WI
AMD Ryzen AI 9 HX 370, NVIDIA GeForce RTX 4070 Laptop GPU
1520 MB/s +16%
Lenovo Yoga Pro 9 16IAH G10 RTX 5060
Intel Core Ultra 7 255H, GeForce RTX 5060 Laptop
1316 MB/s
Lenovo Yoga Pro 9 16IMH9
Intel Core Ultra 9 185H, NVIDIA GeForce RTX 4070 Laptop GPU
1297 MB/s -1%
Dell XPS 16 9640
Intel Core Ultra 7 155H, NVIDIA GeForce RTX 4070 Laptop GPU
1208 MB/s -8%
Moyenne Intel Core Ultra 7 255H
  (822 - 1316, n=7)
1069 MB/s -19%
Samsung Galaxy Book4 Ultra
Intel Core Ultra 7 155H, NVIDIA GeForce RTX 4050 Laptop GPU
968 MB/s -26%
Moyenne de la classe Multimedia
  (440 - 2022, n=60, 2 dernières années)
950 MB/s -28%
AIDA64 / FP64 Ray-Trace
Asus ProArt P16 H7606WI
AMD Ryzen AI 9 HX 370, NVIDIA GeForce RTX 4070 Laptop GPU
20608 KRay/s +56%
Lenovo ThinkBook 16p G5 IRX 21N50011GE
Intel Core i9-14900HX, NVIDIA GeForce RTX 4060 Laptop GPU
14794 KRay/s +12%
Lenovo Yoga Pro 9 16IAH G10 RTX 5060
Intel Core Ultra 7 255H, GeForce RTX 5060 Laptop
13231 KRay/s
Moyenne Intel Core Ultra 7 255H
  (7685 - 13231, n=7)
10332 KRay/s -22%
Lenovo Yoga Pro 9 16IMH9
Intel Core Ultra 9 185H, NVIDIA GeForce RTX 4070 Laptop GPU
9768 KRay/s -26%
Dell XPS 16 9640
Intel Core Ultra 7 155H, NVIDIA GeForce RTX 4070 Laptop GPU
8899 KRay/s -33%
Moyenne de la classe Multimedia
  (2759 - 26875, n=60, 2 dernières années)
8639 KRay/s -35%
Samsung Galaxy Book4 Ultra
Intel Core Ultra 7 155H, NVIDIA GeForce RTX 4050 Laptop GPU
7087 KRay/s -46%
AIDA64 / CPU PhotoWorxx
Lenovo Yoga Pro 9 16IAH G10 RTX 5060
Intel Core Ultra 7 255H, GeForce RTX 5060 Laptop
65787 MPixel/s
Moyenne Intel Core Ultra 7 255H
  (50511 - 65787, n=7)
59493 MPixel/s -10%
Lenovo Yoga Pro 9 16IMH9
Intel Core Ultra 9 185H, NVIDIA GeForce RTX 4070 Laptop GPU
53918 MPixel/s -18%
Dell XPS 16 9640
Intel Core Ultra 7 155H, NVIDIA GeForce RTX 4070 Laptop GPU
52123 MPixel/s -21%
Samsung Galaxy Book4 Ultra
Intel Core Ultra 7 155H, NVIDIA GeForce RTX 4050 Laptop GPU
50926 MPixel/s -23%
Lenovo ThinkBook 16p G5 IRX 21N50011GE
Intel Core i9-14900HX, NVIDIA GeForce RTX 4060 Laptop GPU
49218 MPixel/s -25%
Asus ProArt P16 H7606WI
AMD Ryzen AI 9 HX 370, NVIDIA GeForce RTX 4070 Laptop GPU
48273 MPixel/s -27%
Moyenne de la classe Multimedia
  (12860 - 65787, n=60, 2 dernières années)
43428 MPixel/s -34%

Performance du système

Le Yoga Pro 9i G10 Aura Edition est un ordinateur portable rapide qui traite toutes les entrées sans délai et ne montre aucun problème dans les benchmarks.

Il y a un bref accrochage lorsque le dGPU est activé (par exemple lors du démarrage d'un jeu) en raison de la commutation Advanced Optimus GPU, mais c'est normal.

Performance Rating: Percent
PCMark 10: Score | Essentials | Productivity | Digital Content Creation
CrossMark: Overall | Productivity | Creativity | Responsiveness
WebXPRT 3: Overall
WebXPRT 4: Overall
Mozilla Kraken 1.1: Total
Performance Rating
Lenovo ThinkBook 16p G5 IRX 21N50011GE
NVIDIA GeForce RTX 4060 Laptop GPU, i9-14900HX, SK Hynix HFS001TEJ9X115N
92.1 pt
Lenovo Yoga Pro 9 16IAH G10 RTX 5060
GeForce RTX 5060 Laptop, Ultra 7 255H, WD PC SN7100S SDFPMSL-1T00-1101
85.2 pt
Moyenne Intel Core Ultra 7 255H, Nvidia GeForce RTX 5060 Laptop
 
85.2 pt
Dell XPS 16 9640 -1!
NVIDIA GeForce RTX 4070 Laptop GPU, Ultra 7 155H, Kioxia XG8 KXG80ZNV1T02
84.7 pt
Asus ProArt P16 H7606WI
NVIDIA GeForce RTX 4070 Laptop GPU, Ryzen AI 9 HX 370, Micron 2400 MTFDKBA1T0QFM
78.9 pt
Lenovo Yoga Pro 9 16IMH9
NVIDIA GeForce RTX 4070 Laptop GPU, Ultra 9 185H, SK Hynix HFS001TEJ9X115N
76.8 pt
Moyenne de la classe Multimedia
 
75.9 pt
Samsung Galaxy Book4 Ultra
NVIDIA GeForce RTX 4050 Laptop GPU, Ultra 7 155H, Samsung PM9A1 MZVL2512HCJQ
75.8 pt
PCMark 10 / Score
Lenovo ThinkBook 16p G5 IRX 21N50011GE
NVIDIA GeForce RTX 4060 Laptop GPU, i9-14900HX, SK Hynix HFS001TEJ9X115N
8322 Points +8%
Asus ProArt P16 H7606WI
NVIDIA GeForce RTX 4070 Laptop GPU, Ryzen AI 9 HX 370, Micron 2400 MTFDKBA1T0QFM
7752 Points 0%
Lenovo Yoga Pro 9 16IAH G10 RTX 5060
GeForce RTX 5060 Laptop, Ultra 7 255H, WD PC SN7100S SDFPMSL-1T00-1101
7740 Points
Moyenne Intel Core Ultra 7 255H, Nvidia GeForce RTX 5060 Laptop
  (n=1)
7740 Points 0%
Lenovo Yoga Pro 9 16IMH9
NVIDIA GeForce RTX 4070 Laptop GPU, Ultra 9 185H, SK Hynix HFS001TEJ9X115N
7547 Points -2%
Dell XPS 16 9640
NVIDIA GeForce RTX 4070 Laptop GPU, Ultra 7 155H, Kioxia XG8 KXG80ZNV1T02
7084 Points -8%
Samsung Galaxy Book4 Ultra
NVIDIA GeForce RTX 4050 Laptop GPU, Ultra 7 155H, Samsung PM9A1 MZVL2512HCJQ
6973 Points -10%
Moyenne de la classe Multimedia
  (4325 - 8670, n=56, 2 dernières années)
6846 Points -12%
PCMark 10 / Essentials
Lenovo ThinkBook 16p G5 IRX 21N50011GE
NVIDIA GeForce RTX 4060 Laptop GPU, i9-14900HX, SK Hynix HFS001TEJ9X115N
11413 Points +8%
Lenovo Yoga Pro 9 16IMH9
NVIDIA GeForce RTX 4070 Laptop GPU, Ultra 9 185H, SK Hynix HFS001TEJ9X115N
11133 Points +5%
Lenovo Yoga Pro 9 16IAH G10 RTX 5060
GeForce RTX 5060 Laptop, Ultra 7 255H, WD PC SN7100S SDFPMSL-1T00-1101
10555 Points
Moyenne Intel Core Ultra 7 255H, Nvidia GeForce RTX 5060 Laptop
  (n=1)
10555 Points 0%
Moyenne de la classe Multimedia
  (8025 - 12420, n=56, 2 dernières années)
10477 Points -1%
Samsung Galaxy Book4 Ultra
NVIDIA GeForce RTX 4050 Laptop GPU, Ultra 7 155H, Samsung PM9A1 MZVL2512HCJQ
10446 Points -1%
Dell XPS 16 9640
NVIDIA GeForce RTX 4070 Laptop GPU, Ultra 7 155H, Kioxia XG8 KXG80ZNV1T02
10393 Points -2%
Asus ProArt P16 H7606WI
NVIDIA GeForce RTX 4070 Laptop GPU, Ryzen AI 9 HX 370, Micron 2400 MTFDKBA1T0QFM
10009 Points -5%
PCMark 10 / Productivity
Lenovo ThinkBook 16p G5 IRX 21N50011GE
NVIDIA GeForce RTX 4060 Laptop GPU, i9-14900HX, SK Hynix HFS001TEJ9X115N
10558 Points +14%
Asus ProArt P16 H7606WI
NVIDIA GeForce RTX 4070 Laptop GPU, Ryzen AI 9 HX 370, Micron 2400 MTFDKBA1T0QFM
9891 Points +7%
Lenovo Yoga Pro 9 16IAH G10 RTX 5060
GeForce RTX 5060 Laptop, Ultra 7 255H, WD PC SN7100S SDFPMSL-1T00-1101
9264 Points
Moyenne Intel Core Ultra 7 255H, Nvidia GeForce RTX 5060 Laptop
  (n=1)
9264 Points 0%
Dell XPS 16 9640
NVIDIA GeForce RTX 4070 Laptop GPU, Ultra 7 155H, Kioxia XG8 KXG80ZNV1T02
9192 Points -1%
Samsung Galaxy Book4 Ultra
NVIDIA GeForce RTX 4050 Laptop GPU, Ultra 7 155H, Samsung PM9A1 MZVL2512HCJQ
9152 Points -1%
Lenovo Yoga Pro 9 16IMH9
NVIDIA GeForce RTX 4070 Laptop GPU, Ultra 9 185H, SK Hynix HFS001TEJ9X115N
9067 Points -2%
Moyenne de la classe Multimedia
  (6763 - 10615, n=56, 2 dernières années)
8916 Points -4%
PCMark 10 / Digital Content Creation
Lenovo ThinkBook 16p G5 IRX 21N50011GE
NVIDIA GeForce RTX 4060 Laptop GPU, i9-14900HX, SK Hynix HFS001TEJ9X115N
12979 Points +1%
Lenovo Yoga Pro 9 16IAH G10 RTX 5060
GeForce RTX 5060 Laptop, Ultra 7 255H, WD PC SN7100S SDFPMSL-1T00-1101
12872 Points
Moyenne Intel Core Ultra 7 255H, Nvidia GeForce RTX 5060 Laptop
  (n=1)
12872 Points 0%
Asus ProArt P16 H7606WI
NVIDIA GeForce RTX 4070 Laptop GPU, Ryzen AI 9 HX 370, Micron 2400 MTFDKBA1T0QFM
12771 Points -1%
Lenovo Yoga Pro 9 16IMH9
NVIDIA GeForce RTX 4070 Laptop GPU, Ultra 9 185H, SK Hynix HFS001TEJ9X115N
11554 Points -10%
Dell XPS 16 9640
NVIDIA GeForce RTX 4070 Laptop GPU, Ultra 7 155H, Kioxia XG8 KXG80ZNV1T02
10100 Points -22%
Samsung Galaxy Book4 Ultra
NVIDIA GeForce RTX 4050 Laptop GPU, Ultra 7 155H, Samsung PM9A1 MZVL2512HCJQ
9624 Points -25%
Moyenne de la classe Multimedia
  (3651 - 15187, n=56, 2 dernières années)
9500 Points -26%
CrossMark / Overall
Lenovo ThinkBook 16p G5 IRX 21N50011GE
NVIDIA GeForce RTX 4060 Laptop GPU, i9-14900HX, SK Hynix HFS001TEJ9X115N
2184 Points +6%
Lenovo Yoga Pro 9 16IAH G10 RTX 5060
GeForce RTX 5060 Laptop, Ultra 7 255H, WD PC SN7100S SDFPMSL-1T00-1101
2058 Points
Moyenne Intel Core Ultra 7 255H, Nvidia GeForce RTX 5060 Laptop
  (n=1)
2058 Points 0%
Dell XPS 16 9640
NVIDIA GeForce RTX 4070 Laptop GPU, Ultra 7 155H, Kioxia XG8 KXG80ZNV1T02
1848 Points -10%
Asus ProArt P16 H7606WI
NVIDIA GeForce RTX 4070 Laptop GPU, Ryzen AI 9 HX 370, Micron 2400 MTFDKBA1T0QFM
1794 Points -13%
Moyenne de la classe Multimedia
  (866 - 2255, n=66, 2 dernières années)
1746 Points -15%
Samsung Galaxy Book4 Ultra
NVIDIA GeForce RTX 4050 Laptop GPU, Ultra 7 155H, Samsung PM9A1 MZVL2512HCJQ
1740 Points -15%
Lenovo Yoga Pro 9 16IMH9
NVIDIA GeForce RTX 4070 Laptop GPU, Ultra 9 185H, SK Hynix HFS001TEJ9X115N
1719 Points -16%
CrossMark / Productivity
Lenovo ThinkBook 16p G5 IRX 21N50011GE
NVIDIA GeForce RTX 4060 Laptop GPU, i9-14900HX, SK Hynix HFS001TEJ9X115N
2040 Points +7%
Lenovo Yoga Pro 9 16IAH G10 RTX 5060
GeForce RTX 5060 Laptop, Ultra 7 255H, WD PC SN7100S SDFPMSL-1T00-1101
1899 Points
Moyenne Intel Core Ultra 7 255H, Nvidia GeForce RTX 5060 Laptop
  (n=1)
1899 Points 0%
Dell XPS 16 9640
NVIDIA GeForce RTX 4070 Laptop GPU, Ultra 7 155H, Kioxia XG8 KXG80ZNV1T02
1750 Points -8%
Samsung Galaxy Book4 Ultra
NVIDIA GeForce RTX 4050 Laptop GPU, Ultra 7 155H, Samsung PM9A1 MZVL2512HCJQ
1659 Points -13%
Moyenne de la classe Multimedia
  (913 - 2050, n=66, 2 dernières années)
1651 Points -13%
Lenovo Yoga Pro 9 16IMH9
NVIDIA GeForce RTX 4070 Laptop GPU, Ultra 9 185H, SK Hynix HFS001TEJ9X115N
1611 Points -15%
Asus ProArt P16 H7606WI
NVIDIA GeForce RTX 4070 Laptop GPU, Ryzen AI 9 HX 370, Micron 2400 MTFDKBA1T0QFM
1611 Points -15%
CrossMark / Creativity
Lenovo ThinkBook 16p G5 IRX 21N50011GE
NVIDIA GeForce RTX 4060 Laptop GPU, i9-14900HX, SK Hynix HFS001TEJ9X115N
2472 Points +2%
Lenovo Yoga Pro 9 16IAH G10 RTX 5060
GeForce RTX 5060 Laptop, Ultra 7 255H, WD PC SN7100S SDFPMSL-1T00-1101
2413 Points
Moyenne Intel Core Ultra 7 255H, Nvidia GeForce RTX 5060 Laptop
  (n=1)
2413 Points 0%
Asus ProArt P16 H7606WI
NVIDIA GeForce RTX 4070 Laptop GPU, Ryzen AI 9 HX 370, Micron 2400 MTFDKBA1T0QFM
2270 Points -6%
Dell XPS 16 9640
NVIDIA GeForce RTX 4070 Laptop GPU, Ultra 7 155H, Kioxia XG8 KXG80ZNV1T02
2014 Points -17%
Lenovo Yoga Pro 9 16IMH9
NVIDIA GeForce RTX 4070 Laptop GPU, Ultra 9 185H, SK Hynix HFS001TEJ9X115N
1993 Points -17%
Moyenne de la classe Multimedia
  (907 - 2795, n=66, 2 dernières années)
1976 Points -18%
Samsung Galaxy Book4 Ultra
NVIDIA GeForce RTX 4050 Laptop GPU, Ultra 7 155H, Samsung PM9A1 MZVL2512HCJQ
1930 Points -20%
CrossMark / Responsiveness
Lenovo ThinkBook 16p G5 IRX 21N50011GE
NVIDIA GeForce RTX 4060 Laptop GPU, i9-14900HX, SK Hynix HFS001TEJ9X115N
1849 Points +14%
Dell XPS 16 9640
NVIDIA GeForce RTX 4070 Laptop GPU, Ultra 7 155H, Kioxia XG8 KXG80ZNV1T02
1683 Points +4%
Lenovo Yoga Pro 9 16IAH G10 RTX 5060
GeForce RTX 5060 Laptop, Ultra 7 255H, WD PC SN7100S SDFPMSL-1T00-1101
1624 Points
Moyenne Intel Core Ultra 7 255H, Nvidia GeForce RTX 5060 Laptop
  (n=1)
1624 Points 0%
Samsung Galaxy Book4 Ultra
NVIDIA GeForce RTX 4050 Laptop GPU, Ultra 7 155H, Samsung PM9A1 MZVL2512HCJQ
1467 Points -10%
Moyenne de la classe Multimedia
  (605 - 2094, n=66, 2 dernières années)
1438 Points -11%
Lenovo Yoga Pro 9 16IMH9
NVIDIA GeForce RTX 4070 Laptop GPU, Ultra 9 185H, SK Hynix HFS001TEJ9X115N
1338 Points -18%
Asus ProArt P16 H7606WI
NVIDIA GeForce RTX 4070 Laptop GPU, Ryzen AI 9 HX 370, Micron 2400 MTFDKBA1T0QFM
1225 Points -25%
WebXPRT 3 / Overall
Lenovo ThinkBook 16p G5 IRX 21N50011GE
NVIDIA GeForce RTX 4060 Laptop GPU, i9-14900HX, SK Hynix HFS001TEJ9X115N
339 Points +9%
Moyenne de la classe Multimedia
  (136.4 - 545, n=68, 2 dernières années)
326 Points +4%
Lenovo Yoga Pro 9 16IAH G10 RTX 5060
GeForce RTX 5060 Laptop, Ultra 7 255H, WD PC SN7100S SDFPMSL-1T00-1101
312 Points
Moyenne Intel Core Ultra 7 255H, Nvidia GeForce RTX 5060 Laptop
  (n=1)
312 Points 0%
Asus ProArt P16 H7606WI
NVIDIA GeForce RTX 4070 Laptop GPU, Ryzen AI 9 HX 370, Micron 2400 MTFDKBA1T0QFM
298 Points -4%
Lenovo Yoga Pro 9 16IMH9
NVIDIA GeForce RTX 4070 Laptop GPU, Ultra 9 185H, SK Hynix HFS001TEJ9X115N
295 Points -5%
Dell XPS 16 9640
NVIDIA GeForce RTX 4070 Laptop GPU, Ultra 7 155H, Kioxia XG8 KXG80ZNV1T02
283 Points -9%
Samsung Galaxy Book4 Ultra
NVIDIA GeForce RTX 4050 Laptop GPU, Ultra 7 155H, Samsung PM9A1 MZVL2512HCJQ
281 Points -10%
WebXPRT 4 / Overall
Lenovo ThinkBook 16p G5 IRX 21N50011GE
NVIDIA GeForce RTX 4060 Laptop GPU, i9-14900HX, SK Hynix HFS001TEJ9X115N
319 Points +9%
Lenovo Yoga Pro 9 16IAH G10 RTX 5060
GeForce RTX 5060 Laptop, Ultra 7 255H, WD PC SN7100S SDFPMSL-1T00-1101
293 Points
Moyenne Intel Core Ultra 7 255H, Nvidia GeForce RTX 5060 Laptop
  (n=1)
293 Points 0%
Moyenne de la classe Multimedia
  (167.3 - 353, n=61, 2 dernières années)
274 Points -6%
Lenovo Yoga Pro 9 16IMH9
NVIDIA GeForce RTX 4070 Laptop GPU, Ultra 9 185H, SK Hynix HFS001TEJ9X115N
268 Points -9%
Samsung Galaxy Book4 Ultra
NVIDIA GeForce RTX 4050 Laptop GPU, Ultra 7 155H, Samsung PM9A1 MZVL2512HCJQ
258 Points -12%
Dell XPS 16 9640
NVIDIA GeForce RTX 4070 Laptop GPU, Ultra 7 155H, Kioxia XG8 KXG80ZNV1T02
254 Points -13%
Asus ProArt P16 H7606WI
NVIDIA GeForce RTX 4070 Laptop GPU, Ryzen AI 9 HX 370, Micron 2400 MTFDKBA1T0QFM
244 Points -17%
Mozilla Kraken 1.1 / Total
Lenovo Yoga Pro 9 16IMH9
NVIDIA GeForce RTX 4070 Laptop GPU, Ultra 9 185H, SK Hynix HFS001TEJ9X115N
494 ms * -9%
Moyenne de la classe Multimedia
  (254 - 835, n=73, 2 dernières années)
482 ms * -6%
Lenovo Yoga Pro 9 16IAH G10 RTX 5060
GeForce RTX 5060 Laptop, Ultra 7 255H, WD PC SN7100S SDFPMSL-1T00-1101
453 ms *
Moyenne Intel Core Ultra 7 255H, Nvidia GeForce RTX 5060 Laptop
  (n=1)
453 ms * -0%
Asus ProArt P16 H7606WI
NVIDIA GeForce RTX 4070 Laptop GPU, Ryzen AI 9 HX 370, Micron 2400 MTFDKBA1T0QFM
439 ms * +3%
Lenovo ThinkBook 16p G5 IRX 21N50011GE
NVIDIA GeForce RTX 4060 Laptop GPU, i9-14900HX, SK Hynix HFS001TEJ9X115N
430 ms * +5%
Samsung Galaxy Book4 Ultra
NVIDIA GeForce RTX 4050 Laptop GPU, Ultra 7 155H, Samsung PM9A1 MZVL2512HCJQ
416.4 ms * +8%

* ... Moindre est la valeur, meilleures sont les performances

PCMark 10 Score
7740 points
Aide
AIDA64 / Memory Copy
Lenovo Yoga Pro 9 16IAH G10 RTX 5060
Intel Core Ultra 7 255H, GeForce RTX 5060 Laptop
108302 MB/s
Moyenne Intel Core Ultra 7 255H
  (76316 - 108302, n=7)
94885 MB/s -12%
Lenovo Yoga Pro 9 16IMH9
Intel Core Ultra 9 185H, NVIDIA GeForce RTX 4070 Laptop GPU
94254 MB/s -13%
Dell XPS 16 9640
Intel Core Ultra 7 155H, NVIDIA GeForce RTX 4070 Laptop GPU
92745 MB/s -14%
Samsung Galaxy Book4 Ultra
Intel Core Ultra 7 155H, NVIDIA GeForce RTX 4050 Laptop GPU
90918 MB/s -16%
Asus ProArt P16 H7606WI
AMD Ryzen AI 9 HX 370, NVIDIA GeForce RTX 4070 Laptop GPU
89675 MB/s -17%
Lenovo ThinkBook 16p G5 IRX 21N50011GE
Intel Core i9-14900HX, NVIDIA GeForce RTX 4060 Laptop GPU
78805 MB/s -27%
Moyenne de la classe Multimedia
  (21158 - 108302, n=60, 2 dernières années)
75398 MB/s -30%
AIDA64 / Memory Read
Asus ProArt P16 H7606WI
AMD Ryzen AI 9 HX 370, NVIDIA GeForce RTX 4070 Laptop GPU
100415 MB/s +17%
Samsung Galaxy Book4 Ultra
Intel Core Ultra 7 155H, NVIDIA GeForce RTX 4050 Laptop GPU
89474 MB/s +4%
Lenovo Yoga Pro 9 16IMH9
Intel Core Ultra 9 185H, NVIDIA GeForce RTX 4070 Laptop GPU
87768 MB/s +2%
Lenovo ThinkBook 16p G5 IRX 21N50011GE
Intel Core i9-14900HX, NVIDIA GeForce RTX 4060 Laptop GPU
87568 MB/s +2%
Lenovo Yoga Pro 9 16IAH G10 RTX 5060
Intel Core Ultra 7 255H, GeForce RTX 5060 Laptop
85971 MB/s
Dell XPS 16 9640
Intel Core Ultra 7 155H, NVIDIA GeForce RTX 4070 Laptop GPU
83887 MB/s -2%
Moyenne Intel Core Ultra 7 255H
  (78333 - 90552, n=7)
83471 MB/s -3%
Moyenne de la classe Multimedia
  (24312 - 125604, n=60, 2 dernières années)
76634 MB/s -11%
AIDA64 / Memory Write
Asus ProArt P16 H7606WI
AMD Ryzen AI 9 HX 370, NVIDIA GeForce RTX 4070 Laptop GPU
100176 MB/s +21%
Lenovo Yoga Pro 9 16IAH G10 RTX 5060
Intel Core Ultra 7 255H, GeForce RTX 5060 Laptop
82641 MB/s
Lenovo ThinkBook 16p G5 IRX 21N50011GE
Intel Core i9-14900HX, NVIDIA GeForce RTX 4060 Laptop GPU
77637 MB/s -6%
Moyenne Intel Core Ultra 7 255H
  (61787 - 82641, n=7)
77576 MB/s -6%
Samsung Galaxy Book4 Ultra
Intel Core Ultra 7 155H, NVIDIA GeForce RTX 4050 Laptop GPU
75813 MB/s -8%
Lenovo Yoga Pro 9 16IMH9
Intel Core Ultra 9 185H, NVIDIA GeForce RTX 4070 Laptop GPU
75773 MB/s -8%
Moyenne de la classe Multimedia
  (24382 - 117933, n=60, 2 dernières années)
74422 MB/s -10%
Dell XPS 16 9640
Intel Core Ultra 7 155H, NVIDIA GeForce RTX 4070 Laptop GPU
73377 MB/s -11%
AIDA64 / Memory Latency
Samsung Galaxy Book4 Ultra
Intel Core Ultra 7 155H, NVIDIA GeForce RTX 4050 Laptop GPU
141.4 ns * -6%
Dell XPS 16 9640
Intel Core Ultra 7 155H, NVIDIA GeForce RTX 4070 Laptop GPU
136.6 ns * -3%
Lenovo Yoga Pro 9 16IAH G10 RTX 5060
Intel Core Ultra 7 255H, GeForce RTX 5060 Laptop
132.8 ns *
Lenovo Yoga Pro 9 16IMH9
Intel Core Ultra 9 185H, NVIDIA GeForce RTX 4070 Laptop GPU
129.6 ns * +2%
Moyenne Intel Core Ultra 7 255H
  (110.1 - 147.2, n=7)
129.6 ns * +2%
Moyenne de la classe Multimedia
  (7 - 346, n=60, 2 dernières années)
113.6 ns * +14%
Asus ProArt P16 H7606WI
AMD Ryzen AI 9 HX 370, NVIDIA GeForce RTX 4070 Laptop GPU
113.2 ns * +15%
Lenovo ThinkBook 16p G5 IRX 21N50011GE
Intel Core i9-14900HX, NVIDIA GeForce RTX 4060 Laptop GPU
78.1 ns * +41%

* ... Moindre est la valeur, meilleures sont les performances

Latence DPC

Lors de notre test standardisé de mesure de la latence, qui comprend la navigation sur Internet, la lecture YouTube en 4K et Prime95, le Yoga Pro 9i avec la version actuelle du BIOS ne montre aucune restriction lors de l'utilisation d'applications audio en temps réel.

LatencyMon : Vue d'ensemble
LatencyMon : Conducteurs
DPC Latencies / LatencyMon - interrupt to process latency (max), Web, Youtube, Prime95
Dell XPS 16 9640
NVIDIA GeForce RTX 4070 Laptop GPU, Ultra 7 155H, Kioxia XG8 KXG80ZNV1T02
903.7 μs * -127%
Samsung Galaxy Book4 Ultra
NVIDIA GeForce RTX 4050 Laptop GPU, Ultra 7 155H, Samsung PM9A1 MZVL2512HCJQ
596.3 μs * -50%
Lenovo ThinkBook 16p G5 IRX 21N50011GE
NVIDIA GeForce RTX 4060 Laptop GPU, i9-14900HX, SK Hynix HFS001TEJ9X115N
515.7 μs * -29%
Lenovo Yoga Pro 9 16IMH9
NVIDIA GeForce RTX 4070 Laptop GPU, Ultra 9 185H, SK Hynix HFS001TEJ9X115N
464.1 μs * -16%
Lenovo Yoga Pro 9 16IAH G10 RTX 5060
GeForce RTX 5060 Laptop, Ultra 7 255H, WD PC SN7100S SDFPMSL-1T00-1101
398.4 μs *

* ... Moindre est la valeur, meilleures sont les performances

Dispositifs de stockage

Le Yoga Pro 9i dispose de deux emplacements M.2 (PCIe 4.0 x4), l'emplacement M.2-2242 le plus petit étant occupé en usine.

Dans notre cas, la version 1 TB du WD PC SN7100 est installée avec 884 GB d'espace libre disponible. Le disque atteint des taux de transfert bons et stables.

Un emplacement M.2-2280 est également disponible pour l'extension du stockage.

WD PC SN7100S SDFPMSL-1T00-1101
CDM 5/6 Read Seq Q32T1: 6824 MB/s
CDM 5/6 Write Seq Q32T1: 5704 MB/s
CDM 5/6 Read 4K Q32T1: 797 MB/s
CDM 5/6 Write 4K Q32T1: 502 MB/s
CDM 5/6 Read 4K: 83.6 MB/s
CDM 5/6 Write 4K: 135.7 MB/s
CDM 6 Write 4K Q8T8: 436 MB/s
CDM 6 Read 4K Q8T8: 1110 MB/s
Drive Performance Rating - Percent
Dell XPS 16 9640
Kioxia XG8 KXG80ZNV1T02
87.8 pt
Samsung Galaxy Book4 Ultra
Samsung PM9A1 MZVL2512HCJQ
78.5 pt
Lenovo ThinkBook 16p G5 IRX 21N50011GE
SK Hynix HFS001TEJ9X115N
71.5 pt
Lenovo Yoga Pro 9 16IMH9
SK Hynix HFS001TEJ9X115N
65.8 pt
Lenovo Yoga Pro 9 16IAH G10 RTX 5060
WD PC SN7100S SDFPMSL-1T00-1101
65.7 pt
Moyenne WD PC SN7100S SDFPMSL-1T00-1101
 
65.7 pt
Moyenne de la classe Multimedia
 
57.4 pt
Asus ProArt P16 H7606WI
Micron 2400 MTFDKBA1T0QFM
41.9 pt
DiskSpd
seq read
Dell XPS 16 9640
Kioxia XG8 KXG80ZNV1T02
4156 (4146.28min - 4156.42max) MB/s +20%
Samsung Galaxy Book4 Ultra
Samsung PM9A1 MZVL2512HCJQ
3712 (3688.85min - 3711.75max) MB/s +7%
Lenovo Yoga Pro 9 16IAH G10 RTX 5060
WD PC SN7100S SDFPMSL-1T00-1101
3458 (3051.96min - 3457.58max) MB/s
Moyenne WD PC SN7100S SDFPMSL-1T00-1101
  (n=1)
3458 MB/s 0%
Moyenne de la classe Multimedia
  (453 - 4432, n=60, 2 dernières années)
2925 MB/s -15%
Lenovo ThinkBook 16p G5 IRX 21N50011GE
SK Hynix HFS001TEJ9X115N
2829 (2751.67min - 2828.64max) MB/s -18%
Lenovo Yoga Pro 9 16IMH9
SK Hynix HFS001TEJ9X115N
2757 (2720.02min - 2757.13max) MB/s -20%
Asus ProArt P16 H7606WI
Micron 2400 MTFDKBA1T0QFM
2119 (2090.65min - 2119.22max) MB/s -39%
seq write
Dell XPS 16 9640
Kioxia XG8 KXG80ZNV1T02
4833 (4624.01min - 4832.66max) MB/s +40%
Samsung Galaxy Book4 Ultra
Samsung PM9A1 MZVL2512HCJQ
4152 (3343.49min - 4151.61max) MB/s +21%
Lenovo Yoga Pro 9 16IMH9
SK Hynix HFS001TEJ9X115N
3474 (3404.52min - 3474.32max) MB/s +1%
Lenovo Yoga Pro 9 16IAH G10 RTX 5060
WD PC SN7100S SDFPMSL-1T00-1101
3445 (3064.1min - 3445.23max) MB/s
Moyenne WD PC SN7100S SDFPMSL-1T00-1101
  (n=1)
3445 MB/s 0%
Lenovo ThinkBook 16p G5 IRX 21N50011GE
SK Hynix HFS001TEJ9X115N
3314 (3155.17min - 3313.5max) MB/s -4%
Moyenne de la classe Multimedia
  (384 - 5711, n=60, 2 dernières années)
3126 MB/s -9%
Asus ProArt P16 H7606WI
Micron 2400 MTFDKBA1T0QFM
2138 (1936.3min - 2137.63max) MB/s -38%
seq q8 t1 read
Dell XPS 16 9640
Kioxia XG8 KXG80ZNV1T02
6985 (6183.66min - 6984.69max) MB/s +2%
Lenovo Yoga Pro 9 16IAH G10 RTX 5060
WD PC SN7100S SDFPMSL-1T00-1101
6830 (6007.86min - 6830.19max) MB/s
Moyenne WD PC SN7100S SDFPMSL-1T00-1101
  (n=1)
6830 MB/s 0%
Lenovo ThinkBook 16p G5 IRX 21N50011GE
SK Hynix HFS001TEJ9X115N
6654 (5666.92min - 6653.94max) MB/s -3%
Lenovo Yoga Pro 9 16IMH9
SK Hynix HFS001TEJ9X115N
6257 (5307.47min - 6256.78max) MB/s -8%
Samsung Galaxy Book4 Ultra
Samsung PM9A1 MZVL2512HCJQ
5759 (4945.05min - 5758.78max) MB/s -16%
Moyenne de la classe Multimedia
  (467 - 7126, n=60, 2 dernières années)
5304 MB/s -22%
Asus ProArt P16 H7606WI
Micron 2400 MTFDKBA1T0QFM
4785 (3105.25min - 4784.86max) MB/s -30%
seq q8 t1 write
Lenovo ThinkBook 16p G5 IRX 21N50011GE
SK Hynix HFS001TEJ9X115N
6132 (6078.18min - 6132.28max) MB/s +17%
Lenovo Yoga Pro 9 16IMH9
SK Hynix HFS001TEJ9X115N
6040 (5907.05min - 6040.01max) MB/s +15%
Dell XPS 16 9640
Kioxia XG8 KXG80ZNV1T02
5426 (5242.67min - 5425.96max) MB/s +3%
Lenovo Yoga Pro 9 16IAH G10 RTX 5060
WD PC SN7100S SDFPMSL-1T00-1101
5251 (5066.44min - 5251.46max) MB/s
Moyenne WD PC SN7100S SDFPMSL-1T00-1101
  (n=1)
5251 MB/s 0%
Samsung Galaxy Book4 Ultra
Samsung PM9A1 MZVL2512HCJQ
5032 (4977.28min - 5031.91max) MB/s -4%
Moyenne de la classe Multimedia
  (247 - 6898, n=60, 2 dernières années)
4113 MB/s -22%
Asus ProArt P16 H7606WI
Micron 2400 MTFDKBA1T0QFM
3109 (2917.35min - 3109.45max) MB/s -41%
4k q1 t1 read
Samsung Galaxy Book4 Ultra
Samsung PM9A1 MZVL2512HCJQ
78.3 (76.54min - 78.34max) MB/s +10%
Lenovo ThinkBook 16p G5 IRX 21N50011GE
SK Hynix HFS001TEJ9X115N
71.9 (70.89min - 71.85max) MB/s +1%
Lenovo Yoga Pro 9 16IAH G10 RTX 5060
WD PC SN7100S SDFPMSL-1T00-1101
71.5 (69.31min - 71.46max) MB/s
Moyenne WD PC SN7100S SDFPMSL-1T00-1101
  (n=1)
71.5 MB/s 0%
Dell XPS 16 9640
Kioxia XG8 KXG80ZNV1T02
67.3 (66.55min - 67.32max) MB/s -6%
Lenovo Yoga Pro 9 16IMH9
SK Hynix HFS001TEJ9X115N
63.7 (63.29min - 63.65max) MB/s -11%
Moyenne de la classe Multimedia
  (14.6 - 97.7, n=60, 2 dernières années)
61.8 MB/s -14%
Asus ProArt P16 H7606WI
Micron 2400 MTFDKBA1T0QFM
39.9 (39.46min - 39.9max) MB/s -44%
4k q1 t1 write
Dell XPS 16 9640
Kioxia XG8 KXG80ZNV1T02
214 (212.24min - 213.72max) MB/s +85%
Lenovo ThinkBook 16p G5 IRX 21N50011GE
SK Hynix HFS001TEJ9X115N
180.5 (170.74min - 180.48max) MB/s +56%
Moyenne de la classe Multimedia
  (44.4 - 378, n=60, 2 dernières années)
164.4 MB/s +42%
Samsung Galaxy Book4 Ultra
Samsung PM9A1 MZVL2512HCJQ
164.2 (156.89min - 164.15max) MB/s +42%
Lenovo Yoga Pro 9 16IMH9
SK Hynix HFS001TEJ9X115N
139.8 (135.84min - 139.76max) MB/s +21%
Lenovo Yoga Pro 9 16IAH G10 RTX 5060
WD PC SN7100S SDFPMSL-1T00-1101
115.5 (92.73min - 115.5max) MB/s
Moyenne WD PC SN7100S SDFPMSL-1T00-1101
  (n=1)
115.5 MB/s 0%
Asus ProArt P16 H7606WI
Micron 2400 MTFDKBA1T0QFM
75.9 (71.09min - 75.93max) MB/s -34%
4k q32 t16 read
Dell XPS 16 9640
Kioxia XG8 KXG80ZNV1T02
3811 (3808.17min - 3810.83max) MB/s +282%
Samsung Galaxy Book4 Ultra
Samsung PM9A1 MZVL2512HCJQ
2181 (2156.61min - 2181.46max) MB/s +119%
Moyenne de la classe Multimedia
  (190.3 - 4881, n=60, 2 dernières années)
1329 MB/s +33%
Lenovo Yoga Pro 9 16IAH G10 RTX 5060
WD PC SN7100S SDFPMSL-1T00-1101
998 (955.63min - 998.16max) MB/s
Moyenne WD PC SN7100S SDFPMSL-1T00-1101
  (n=1)
998 MB/s 0%
Lenovo ThinkBook 16p G5 IRX 21N50011GE
SK Hynix HFS001TEJ9X115N
960 (943.33min - 959.54max) MB/s -4%
Lenovo Yoga Pro 9 16IMH9
SK Hynix HFS001TEJ9X115N
859 (816.31min - 859.16max) MB/s -14%
Asus ProArt P16 H7606WI
Micron 2400 MTFDKBA1T0QFM
548 (543.4min - 547.55max) MB/s -45%
4k q32 t16 write
Samsung Galaxy Book4 Ultra
Samsung PM9A1 MZVL2512HCJQ
3101 (2756.05min - 3100.73max) MB/s +714%
Dell XPS 16 9640
Kioxia XG8 KXG80ZNV1T02
2682 (2675.9min - 2682.13max) MB/s +604%
Moyenne de la classe Multimedia
  (164.6 - 4074, n=60, 2 dernières années)
988 MB/s +159%
Lenovo ThinkBook 16p G5 IRX 21N50011GE
SK Hynix HFS001TEJ9X115N
555 (512.35min - 555.1max) MB/s +46%
Lenovo Yoga Pro 9 16IMH9
SK Hynix HFS001TEJ9X115N
439 (405.1min - 438.82max) MB/s +15%
Lenovo Yoga Pro 9 16IAH G10 RTX 5060
WD PC SN7100S SDFPMSL-1T00-1101
381 (338.71min - 381.35max) MB/s
Moyenne WD PC SN7100S SDFPMSL-1T00-1101
  (n=1)
381 MB/s 0%
Asus ProArt P16 H7606WI
Micron 2400 MTFDKBA1T0QFM
231 (200.24min - 231.41max) MB/s -39%
AS SSD
Score Total
Dell XPS 16 9640
Kioxia XG8 KXG80ZNV1T02
8212 Points +55%
Samsung Galaxy Book4 Ultra
Samsung PM9A1 MZVL2512HCJQ
7043 Points +33%
Lenovo ThinkBook 16p G5 IRX 21N50011GE
SK Hynix HFS001TEJ9X115N
6810 Points +28%
Lenovo Yoga Pro 9 16IAH G10 RTX 5060
WD PC SN7100S SDFPMSL-1T00-1101
5300 Points
Moyenne WD PC SN7100S SDFPMSL-1T00-1101
  (n=1)
5300 Points 0%
Lenovo Yoga Pro 9 16IMH9
SK Hynix HFS001TEJ9X115N
5214 Points -2%
Moyenne de la classe Multimedia
  (482 - 9972, n=57, 2 dernières années)
4798 Points -9%
Asus ProArt P16 H7606WI
Micron 2400 MTFDKBA1T0QFM
3843 Points -27%
Score Read
Dell XPS 16 9640
Kioxia XG8 KXG80ZNV1T02
3310 Points +114%
Samsung Galaxy Book4 Ultra
Samsung PM9A1 MZVL2512HCJQ
2413 Points +56%
Lenovo ThinkBook 16p G5 IRX 21N50011GE
SK Hynix HFS001TEJ9X115N
1585 Points +3%
Lenovo Yoga Pro 9 16IAH G10 RTX 5060
WD PC SN7100S SDFPMSL-1T00-1101
1544 Points
Moyenne WD PC SN7100S SDFPMSL-1T00-1101
  (n=1)
1544 Points 0%
Moyenne de la classe Multimedia
  (192 - 3501, n=57, 2 dernières années)
1536 Points -1%
Lenovo Yoga Pro 9 16IMH9
SK Hynix HFS001TEJ9X115N
1397 Points -10%
Asus ProArt P16 H7606WI
Micron 2400 MTFDKBA1T0QFM
962 Points -38%
Score Write
Lenovo ThinkBook 16p G5 IRX 21N50011GE
SK Hynix HFS001TEJ9X115N
4521 Points +49%
Samsung Galaxy Book4 Ultra
Samsung PM9A1 MZVL2512HCJQ
3462 Points +14%
Dell XPS 16 9640
Kioxia XG8 KXG80ZNV1T02
3244 Points +7%
Lenovo Yoga Pro 9 16IMH9
SK Hynix HFS001TEJ9X115N
3190 Points +5%
Lenovo Yoga Pro 9 16IAH G10 RTX 5060
WD PC SN7100S SDFPMSL-1T00-1101
3025 Points
Moyenne WD PC SN7100S SDFPMSL-1T00-1101
  (n=1)
3025 Points 0%
Moyenne de la classe Multimedia
  (191 - 4684, n=57, 2 dernières années)
2534 Points -16%
Asus ProArt P16 H7606WI
Micron 2400 MTFDKBA1T0QFM
2455 Points -19%
Seq Read
Dell XPS 16 9640
Kioxia XG8 KXG80ZNV1T02
5730 MB/s +10%
Lenovo Yoga Pro 9 16IMH9
SK Hynix HFS001TEJ9X115N
5399 MB/s +4%
Samsung Galaxy Book4 Ultra
Samsung PM9A1 MZVL2512HCJQ
5351 MB/s +3%
Lenovo ThinkBook 16p G5 IRX 21N50011GE
SK Hynix HFS001TEJ9X115N
5320 MB/s +2%
Lenovo Yoga Pro 9 16IAH G10 RTX 5060
WD PC SN7100S SDFPMSL-1T00-1101
5213 MB/s
Moyenne WD PC SN7100S SDFPMSL-1T00-1101
  (n=1)
5213 MB/s 0%
Moyenne de la classe Multimedia
  (484 - 5730, n=57, 2 dernières années)
4229 MB/s -19%
Asus ProArt P16 H7606WI
Micron 2400 MTFDKBA1T0QFM
3776 MB/s -28%
Seq Write
Dell XPS 16 9640
Kioxia XG8 KXG80ZNV1T02
5175 MB/s +41%
Samsung Galaxy Book4 Ultra
Samsung PM9A1 MZVL2512HCJQ
3925 MB/s +7%
Lenovo Yoga Pro 9 16IAH G10 RTX 5060
WD PC SN7100S SDFPMSL-1T00-1101
3676 MB/s
Moyenne WD PC SN7100S SDFPMSL-1T00-1101
  (n=1)
3676 MB/s 0%
Lenovo Yoga Pro 9 16IMH9
SK Hynix HFS001TEJ9X115N
3314 MB/s -10%
Lenovo ThinkBook 16p G5 IRX 21N50011GE
SK Hynix HFS001TEJ9X115N
2924 MB/s -20%
Moyenne de la classe Multimedia
  (344 - 5651, n=57, 2 dernières années)
2832 MB/s -23%
Asus ProArt P16 H7606WI
Micron 2400 MTFDKBA1T0QFM
2397 MB/s -35%
4K Read
Lenovo Yoga Pro 9 16IAH G10 RTX 5060
WD PC SN7100S SDFPMSL-1T00-1101
69.2 MB/s
Moyenne WD PC SN7100S SDFPMSL-1T00-1101
  (n=1)
69.2 MB/s 0%
Samsung Galaxy Book4 Ultra
Samsung PM9A1 MZVL2512HCJQ
65.3 MB/s -6%
Lenovo Yoga Pro 9 16IMH9
SK Hynix HFS001TEJ9X115N
64.2 MB/s -7%
Dell XPS 16 9640
Kioxia XG8 KXG80ZNV1T02
63.3 MB/s -9%
Lenovo ThinkBook 16p G5 IRX 21N50011GE
SK Hynix HFS001TEJ9X115N
63.1 MB/s -9%
Moyenne de la classe Multimedia
  (17.5 - 97.4, n=57, 2 dernières années)
60 MB/s -13%
Asus ProArt P16 H7606WI
Micron 2400 MTFDKBA1T0QFM
28.7 MB/s -59%
4K Write
Lenovo ThinkBook 16p G5 IRX 21N50011GE
SK Hynix HFS001TEJ9X115N
260 MB/s +54%
Dell XPS 16 9640
Kioxia XG8 KXG80ZNV1T02
191.9 MB/s +14%
Moyenne de la classe Multimedia
  (43.1 - 328, n=57, 2 dernières années)
189 MB/s +12%
Lenovo Yoga Pro 9 16IMH9
SK Hynix HFS001TEJ9X115N
183.8 MB/s +9%
Asus ProArt P16 H7606WI
Micron 2400 MTFDKBA1T0QFM
178 MB/s +5%
Lenovo Yoga Pro 9 16IAH G10 RTX 5060
WD PC SN7100S SDFPMSL-1T00-1101
168.8 MB/s
Moyenne WD PC SN7100S SDFPMSL-1T00-1101
  (n=1)
168.8 MB/s 0%
Samsung Galaxy Book4 Ultra
Samsung PM9A1 MZVL2512HCJQ
153.2 MB/s -9%
4K-64 Read
Dell XPS 16 9640
Kioxia XG8 KXG80ZNV1T02
2673 MB/s +180%
Samsung Galaxy Book4 Ultra
Samsung PM9A1 MZVL2512HCJQ
1813 MB/s +90%
Moyenne de la classe Multimedia
  (125.7 - 2989, n=57, 2 dernières années)
1053 MB/s +10%
Lenovo ThinkBook 16p G5 IRX 21N50011GE
SK Hynix HFS001TEJ9X115N
989 MB/s +4%
Lenovo Yoga Pro 9 16IAH G10 RTX 5060
WD PC SN7100S SDFPMSL-1T00-1101
954 MB/s
Moyenne WD PC SN7100S SDFPMSL-1T00-1101
  (n=1)
954 MB/s 0%
Lenovo Yoga Pro 9 16IMH9
SK Hynix HFS001TEJ9X115N
793 MB/s -17%
Asus ProArt P16 H7606WI
Micron 2400 MTFDKBA1T0QFM
555 MB/s -42%
4K-64 Write
Lenovo ThinkBook 16p G5 IRX 21N50011GE
SK Hynix HFS001TEJ9X115N
3969 MB/s +59%
Samsung Galaxy Book4 Ultra
Samsung PM9A1 MZVL2512HCJQ
2916 MB/s +17%
Lenovo Yoga Pro 9 16IMH9
SK Hynix HFS001TEJ9X115N
2675 MB/s +7%
Dell XPS 16 9640
Kioxia XG8 KXG80ZNV1T02
2535 MB/s +2%
Lenovo Yoga Pro 9 16IAH G10 RTX 5060
WD PC SN7100S SDFPMSL-1T00-1101
2489 MB/s
Moyenne WD PC SN7100S SDFPMSL-1T00-1101
  (n=1)
2489 MB/s 0%
Moyenne de la classe Multimedia
  (75.2 - 3975, n=57, 2 dernières années)
2062 MB/s -17%
Asus ProArt P16 H7606WI
Micron 2400 MTFDKBA1T0QFM
2038 MB/s -18%
Access Time Read
Moyenne de la classe Multimedia
  (0.019 - 0.168, n=57, 2 dernières années)
0.05356 ms * -85%
Lenovo ThinkBook 16p G5 IRX 21N50011GE
SK Hynix HFS001TEJ9X115N
0.047 ms * -62%
Dell XPS 16 9640
Kioxia XG8 KXG80ZNV1T02
0.042 ms * -45%
Samsung Galaxy Book4 Ultra
Samsung PM9A1 MZVL2512HCJQ
0.033 ms * -14%
Lenovo Yoga Pro 9 16IAH G10 RTX 5060
WD PC SN7100S SDFPMSL-1T00-1101
0.029 ms *
Moyenne WD PC SN7100S SDFPMSL-1T00-1101
  (n=1)
0.029 ms * -0%
Asus ProArt P16 H7606WI
Micron 2400 MTFDKBA1T0QFM
0.027 ms * +7%
Lenovo Yoga Pro 9 16IMH9
SK Hynix HFS001TEJ9X115N
0.021 ms * +28%
Access Time Write
Asus ProArt P16 H7606WI
Micron 2400 MTFDKBA1T0QFM
0.137 ms * -328%
Moyenne de la classe Multimedia
  (0.014 - 0.754, n=57, 2 dernières années)
0.06844 ms * -114%
Lenovo Yoga Pro 9 16IAH G10 RTX 5060
WD PC SN7100S SDFPMSL-1T00-1101
0.032 ms *
Moyenne WD PC SN7100S SDFPMSL-1T00-1101
  (n=1)
0.032 ms * -0%
Samsung Galaxy Book4 Ultra
Samsung PM9A1 MZVL2512HCJQ
0.027 ms * +16%
Dell XPS 16 9640
Kioxia XG8 KXG80ZNV1T02
0.021 ms * +34%
Lenovo Yoga Pro 9 16IMH9
SK Hynix HFS001TEJ9X115N
0.02 ms * +37%
Lenovo ThinkBook 16p G5 IRX 21N50011GE
SK Hynix HFS001TEJ9X115N
0.017 ms * +47%

* ... Moindre est la valeur, meilleures sont les performances

Disk throttling: DiskSpd Read Loop, Queue Depth 8

03306609901320165019802310264029703300363039604290462049505280561059406270Tooltip
Lenovo Yoga Pro 9 16IAH G10 RTX 5060; diskspd 2.0.17 f: Ø6468 (5697.47-6502.01)

Performance du GPU

Notre Yoga Pro 9i 16 G10 est équipé du nouvel ordinateur portable GeForce RTX 5060 Laptopqui est la version 100 W (85 W + 15 W Dynamic Boost) avec Advaced Optimus. Les performances du GPU sont très bonnes, même si le Yoga ne peut pas utiliser tout le potentiel de la RTX 5060 Laptop.

Dans les tests synthétiques, le portable RTX 5060 est aussi légèrement plus lent que l'ancien portable RTX 4070 Laptop des appareils de comparaison. Les performances de jeu sont bonnes dans l'ensemble, et de nombreux titres tournent sans problème, même en résolution QHD. Le GPU reste complètement stable sous une charge constante.

3DMark Performance Rating - Percent
Asus ProArt P16 H7606WI
NVIDIA GeForce RTX 4070 Laptop GPU, AMD Ryzen AI 9 HX 370
97.8 pt
Lenovo Yoga Pro 9 16IMH9
NVIDIA GeForce RTX 4070 Laptop GPU, Intel Core Ultra 9 185H
97.5 pt
Moyenne Nvidia GeForce RTX 5060 Laptop
 
97.4 pt
Lenovo Yoga Pro 9 16IAH G10 RTX 5060
Nvidia GeForce RTX 5060 Laptop, Intel Core Ultra 7 255H
94.2 pt
Lenovo ThinkBook 16p G5 IRX 21N50011GE
NVIDIA GeForce RTX 4060 Laptop GPU, Intel Core i9-14900HX
85.5 pt
Dell XPS 16 9640
NVIDIA GeForce RTX 4070 Laptop GPU, Intel Core Ultra 7 155H
77.8 pt
Samsung Galaxy Book4 Ultra
NVIDIA GeForce RTX 4050 Laptop GPU, Intel Core Ultra 7 155H
51.5 pt
Moyenne de la classe Multimedia
 
43.9 pt
3DMark 11 - 1280x720 Performance GPU
Asus ProArt P16 H7606WI
NVIDIA GeForce RTX 4070 Laptop GPU, AMD Ryzen AI 9 HX 370
42821 Points +9%
Moyenne Nvidia GeForce RTX 5060 Laptop
  (39428 - 41490, n=3)
40753 Points +3%
Lenovo Yoga Pro 9 16IMH9
NVIDIA GeForce RTX 4070 Laptop GPU, Intel Core Ultra 9 185H
40646 Points +3%
Lenovo Yoga Pro 9 16IAH G10 RTX 5060
Nvidia GeForce RTX 5060 Laptop, Intel Core Ultra 7 255H
39428 Points
Lenovo ThinkBook 16p G5 IRX 21N50011GE
NVIDIA GeForce RTX 4060 Laptop GPU, Intel Core i9-14900HX
36747 Points -7%
Dell XPS 16 9640
NVIDIA GeForce RTX 4070 Laptop GPU, Intel Core Ultra 7 155H
33251 Points -16%
Samsung Galaxy Book4 Ultra
NVIDIA GeForce RTX 4050 Laptop GPU, Intel Core Ultra 7 155H
22216 Points -44%
Moyenne de la classe Multimedia
  (3765 - 45564, n=59, 2 dernières années)
19142 Points -51%
3DMark
1920x1080 Fire Strike Graphics
Moyenne Nvidia GeForce RTX 5060 Laptop
  (29011 - 33193, n=5)
31641 Points +6%
Lenovo Yoga Pro 9 16IMH9
NVIDIA GeForce RTX 4070 Laptop GPU, Intel Core Ultra 9 185H
30874 Points +3%
Asus ProArt P16 H7606WI
NVIDIA GeForce RTX 4070 Laptop GPU, AMD Ryzen AI 9 HX 370
30137 Points +1%
Lenovo Yoga Pro 9 16IAH G10 RTX 5060
Nvidia GeForce RTX 5060 Laptop, Intel Core Ultra 7 255H
29985 Points
Lenovo ThinkBook 16p G5 IRX 21N50011GE
NVIDIA GeForce RTX 4060 Laptop GPU, Intel Core i9-14900HX
26395 Points -12%
Dell XPS 16 9640
NVIDIA GeForce RTX 4070 Laptop GPU, Intel Core Ultra 7 155H
24235 Points -19%
Samsung Galaxy Book4 Ultra
NVIDIA GeForce RTX 4050 Laptop GPU, Intel Core Ultra 7 155H
16735 Points -44%
Moyenne de la classe Multimedia
  (2328 - 34440, n=62, 2 dernières années)
13795 Points -54%
2560x1440 Time Spy Graphics
Lenovo Yoga Pro 9 16IMH9
NVIDIA GeForce RTX 4070 Laptop GPU, Intel Core Ultra 9 185H
12181 Points +4%
Asus ProArt P16 H7606WI
NVIDIA GeForce RTX 4070 Laptop GPU, AMD Ryzen AI 9 HX 370
11941 Points +2%
Moyenne Nvidia GeForce RTX 5060 Laptop
  (10847 - 12306, n=5)
11837 Points +1%
Lenovo Yoga Pro 9 16IAH G10 RTX 5060
Nvidia GeForce RTX 5060 Laptop, Intel Core Ultra 7 255H
11675 Points
Lenovo ThinkBook 16p G5 IRX 21N50011GE
NVIDIA GeForce RTX 4060 Laptop GPU, Intel Core i9-14900HX
10625 Points -9%
Dell XPS 16 9640
NVIDIA GeForce RTX 4070 Laptop GPU, Intel Core Ultra 7 155H
9638 Points -17%
Samsung Galaxy Book4 Ultra
NVIDIA GeForce RTX 4050 Laptop GPU, Intel Core Ultra 7 155H
6073 Points -48%
Moyenne de la classe Multimedia
  (696 - 13010, n=63, 2 dernières années)
5294 Points -55%
3DMark 11 Performance
33967 points
3DMark Fire Strike Score
27364 points
3DMark Time Spy Score
11946 points
3DMark Steel Nomad Score
2575 points
3DMark Steel Nomad Light Score
11681 points
Aide
Blender / v3.3 Classroom OPTIX/RTX
Moyenne de la classe Multimedia
  (19 - 105, n=28, 2 dernières années)
41.4 Seconds * -88%
Samsung Galaxy Book4 Ultra
NVIDIA GeForce RTX 4050 Laptop GPU, Intel Core Ultra 7 155H
32 Seconds * -45%
Lenovo ThinkBook 16p G5 IRX 21N50011GE
NVIDIA GeForce RTX 4060 Laptop GPU, Intel Core i9-14900HX
23 Seconds * -5%
Asus ProArt P16 H7606WI
NVIDIA GeForce RTX 4070 Laptop GPU, AMD Ryzen AI 9 HX 370
22 Seconds * -0%
Lenovo Yoga Pro 9 16IAH G10 RTX 5060
Nvidia GeForce RTX 5060 Laptop, Intel Core Ultra 7 255H
22 Seconds *
Moyenne Nvidia GeForce RTX 5060 Laptop
  (21 - 22, n=3)
21.3 Seconds * +3%
Dell XPS 16 9640
NVIDIA GeForce RTX 4070 Laptop GPU, Intel Core Ultra 7 155H
21 Seconds * +5%
Lenovo Yoga Pro 9 16IMH9
NVIDIA GeForce RTX 4070 Laptop GPU, Intel Core Ultra 9 185H
19 Seconds * +14%
Blender / v3.3 Classroom CUDA
Moyenne de la classe Multimedia
  (32 - 164, n=27, 2 dernières années)
66.1 Seconds * -65%
Samsung Galaxy Book4 Ultra
NVIDIA GeForce RTX 4050 Laptop GPU, Intel Core Ultra 7 155H
56 Seconds * -40%
Lenovo ThinkBook 16p G5 IRX 21N50011GE
NVIDIA GeForce RTX 4060 Laptop GPU, Intel Core i9-14900HX
44 Seconds * -10%
Lenovo Yoga Pro 9 16IAH G10 RTX 5060
Nvidia GeForce RTX 5060 Laptop, Intel Core Ultra 7 255H
40 Seconds *
Moyenne Nvidia GeForce RTX 5060 Laptop
  (38 - 40, n=3)
38.7 Seconds * +3%
Dell XPS 16 9640
NVIDIA GeForce RTX 4070 Laptop GPU, Intel Core Ultra 7 155H
36 Seconds * +10%
Asus ProArt P16 H7606WI
NVIDIA GeForce RTX 4070 Laptop GPU, AMD Ryzen AI 9 HX 370
34 Seconds * +15%
Lenovo Yoga Pro 9 16IMH9
NVIDIA GeForce RTX 4070 Laptop GPU, Intel Core Ultra 9 185H
32 Seconds * +20%
Blender / v3.3 Classroom CPU
Moyenne de la classe Multimedia
  (160 - 1042, n=66, 2 dernières années)
433 Seconds * -69%
Samsung Galaxy Book4 Ultra
NVIDIA GeForce RTX 4050 Laptop GPU, Intel Core Ultra 7 155H
380 Seconds * -48%
Dell XPS 16 9640
NVIDIA GeForce RTX 4070 Laptop GPU, Intel Core Ultra 7 155H
306 Seconds * -20%
Moyenne Nvidia GeForce RTX 5060 Laptop
  (256 - 328, n=3)
291 Seconds * -14%
Lenovo Yoga Pro 9 16IMH9
NVIDIA GeForce RTX 4070 Laptop GPU, Intel Core Ultra 9 185H
285 Seconds * -11%
Lenovo Yoga Pro 9 16IAH G10 RTX 5060
Nvidia GeForce RTX 5060 Laptop, Intel Core Ultra 7 255H
256 Seconds *
Asus ProArt P16 H7606WI
NVIDIA GeForce RTX 4070 Laptop GPU, AMD Ryzen AI 9 HX 370
214 Seconds * +16%
Lenovo ThinkBook 16p G5 IRX 21N50011GE
NVIDIA GeForce RTX 4060 Laptop GPU, Intel Core i9-14900HX
189 Seconds * +26%

* ... Moindre est la valeur, meilleures sont les performances

Performance Rating - Percent
Lenovo ThinkBook 16p G5 IRX 21N50011GE -1!
Intel Core i9-14900HX, NVIDIA GeForce RTX 4060 Laptop GPU
92.9 pt
Lenovo Yoga Pro 9 16IMH9
Intel Core Ultra 9 185H, NVIDIA GeForce RTX 4070 Laptop GPU
87.6 pt
Lenovo Yoga Pro 9 16IAH G10 RTX 5060
Intel Core Ultra 7 255H, Nvidia GeForce RTX 5060 Laptop
87.3 pt
Asus ProArt P16 H7606WI
AMD Ryzen AI 9 HX 370, NVIDIA GeForce RTX 4070 Laptop GPU
81.8 pt
Dell XPS 16 9640
Intel Core Ultra 7 155H, NVIDIA GeForce RTX 4070 Laptop GPU
71.8 pt
Samsung Galaxy Book4 Ultra -1!
Intel Core Ultra 7 155H, NVIDIA GeForce RTX 4050 Laptop GPU
54.4 pt
Moyenne de la classe Multimedia
 
41.8 pt
Cyberpunk 2077 2.2 Phantom Liberty - 1920x1080 Ultra Preset (FSR off)
Lenovo Yoga Pro 9 16IAH G10 RTX 5060
Intel Core Ultra 7 255H, Nvidia GeForce RTX 5060 Laptop
83.2 (68.7min) fps
Asus ProArt P16 H7606WI
AMD Ryzen AI 9 HX 370, NVIDIA GeForce RTX 4070 Laptop GPU
80.7 (65.3min) fps -3%
Lenovo Yoga Pro 9 16IMH9
Intel Core Ultra 9 185H, NVIDIA GeForce RTX 4070 Laptop GPU
76.9 (18min) fps -8%
Lenovo ThinkBook 16p G5 IRX 21N50011GE
Intel Core i9-14900HX, NVIDIA GeForce RTX 4060 Laptop GPU
75.3 (62.2min) fps -9%
Dell XPS 16 9640
Intel Core Ultra 7 155H, NVIDIA GeForce RTX 4070 Laptop GPU
64.3 (53.3min) fps -23%
Samsung Galaxy Book4 Ultra
Intel Core Ultra 7 155H, NVIDIA GeForce RTX 4050 Laptop GPU
39.4 (32.4min) fps -53%
Moyenne de la classe Multimedia
  (6.41 - 97.8, n=65, 2 dernières années)
35.8 fps -57%
Baldur's Gate 3 - 1920x1080 Ultra Preset AA:T
Lenovo Yoga Pro 9 16IMH9
Intel Core Ultra 9 185H, NVIDIA GeForce RTX 4070 Laptop GPU
117.7 fps +50%
Lenovo ThinkBook 16p G5 IRX 21N50011GE
Intel Core i9-14900HX, NVIDIA GeForce RTX 4060 Laptop GPU
96 (76.5min, 79P0.1, 82.3P1) fps +22%
Dell XPS 16 9640
Intel Core Ultra 7 155H, NVIDIA GeForce RTX 4070 Laptop GPU
91.8 fps +17%
Asus ProArt P16 H7606WI
AMD Ryzen AI 9 HX 370, NVIDIA GeForce RTX 4070 Laptop GPU
82.5 fps +5%
Lenovo Yoga Pro 9 16IAH G10 RTX 5060
Intel Core Ultra 7 255H, Nvidia GeForce RTX 5060 Laptop
78.7 fps
Moyenne de la classe Multimedia
  (7.8 - 127.3, n=54, 2 dernières années)
46 fps -42%
GTA V - 1920x1080 Highest Settings possible AA:4xMSAA + FX AF:16x
Lenovo Yoga Pro 9 16IAH G10 RTX 5060
Intel Core Ultra 7 255H, Nvidia GeForce RTX 5060 Laptop
128.5 (6.92min, 90.9P1) fps
Lenovo ThinkBook 16p G5 IRX 21N50011GE
Intel Core i9-14900HX, NVIDIA GeForce RTX 4060 Laptop GPU
126.3 (8.35min, 83.3P1) fps -2%
Asus ProArt P16 H7606WI
AMD Ryzen AI 9 HX 370, NVIDIA GeForce RTX 4070 Laptop GPU
111.2 (9.03min, 76.9P1) fps -13%
Lenovo Yoga Pro 9 16IMH9
Intel Core Ultra 9 185H, NVIDIA GeForce RTX 4070 Laptop GPU
110.9 (3.51min, 71.4P1) fps -14%
Dell XPS 16 9640
Intel Core Ultra 7 155H, NVIDIA GeForce RTX 4070 Laptop GPU
103.6 (5.17min, 71.4P1) fps -19%
Samsung Galaxy Book4 Ultra
Intel Core Ultra 7 155H, NVIDIA GeForce RTX 4050 Laptop GPU
67.6 (4.78min, 43.5P1) fps -47%
Moyenne de la classe Multimedia
  (9.38 - 141.6, n=60, 2 dernières années)
50.8 fps -60%
Final Fantasy XV Benchmark - 1920x1080 High Quality
Lenovo Yoga Pro 9 16IAH G10 RTX 5060
Intel Core Ultra 7 255H, Nvidia GeForce RTX 5060 Laptop
121.1 fps
Lenovo Yoga Pro 9 16IMH9
Intel Core Ultra 9 185H, NVIDIA GeForce RTX 4070 Laptop GPU
115.7 fps -4%
Asus ProArt P16 H7606WI
AMD Ryzen AI 9 HX 370, NVIDIA GeForce RTX 4070 Laptop GPU
115.3 fps -5%
Lenovo ThinkBook 16p G5 IRX 21N50011GE
Intel Core i9-14900HX, NVIDIA GeForce RTX 4060 Laptop GPU
105.5 fps -13%
Dell XPS 16 9640
Intel Core Ultra 7 155H, NVIDIA GeForce RTX 4070 Laptop GPU
93.1 fps -23%
Samsung Galaxy Book4 Ultra
Intel Core Ultra 7 155H, NVIDIA GeForce RTX 4050 Laptop GPU
56.7 fps -53%
Moyenne de la classe Multimedia
  (7.61 - 132, n=63, 2 dernières années)
48.8 fps -60%
Strange Brigade - 1920x1080 ultra AA:ultra AF:16
Lenovo Yoga Pro 9 16IAH G10 RTX 5060
Intel Core Ultra 7 255H, Nvidia GeForce RTX 5060 Laptop
219 (87.6min, 159.6P1) fps
Lenovo Yoga Pro 9 16IMH9
Intel Core Ultra 9 185H, NVIDIA GeForce RTX 4070 Laptop GPU
213 fps -3%
Asus ProArt P16 H7606WI
AMD Ryzen AI 9 HX 370, NVIDIA GeForce RTX 4070 Laptop GPU
206 (86.5min, 156P1) fps -6%
Dell XPS 16 9640
Intel Core Ultra 7 155H, NVIDIA GeForce RTX 4070 Laptop GPU
175 fps -20%
Samsung Galaxy Book4 Ultra
Intel Core Ultra 7 155H, NVIDIA GeForce RTX 4050 Laptop GPU
113 fps -48%
Moyenne de la classe Multimedia
  (13.3 - 247, n=64, 2 dernières années)
85.4 fps -61%
Dota 2 Reborn - 1920x1080 ultra (3/3) best looking
Lenovo ThinkBook 16p G5 IRX 21N50011GE
Intel Core i9-14900HX, NVIDIA GeForce RTX 4060 Laptop GPU
179.9 (153.5min) fps +26%
Lenovo Yoga Pro 9 16IAH G10 RTX 5060
Intel Core Ultra 7 255H, Nvidia GeForce RTX 5060 Laptop
142.3 (123.4min) fps
Asus ProArt P16 H7606WI
AMD Ryzen AI 9 HX 370, NVIDIA GeForce RTX 4070 Laptop GPU
141.6 (119.2min) fps 0%
Lenovo Yoga Pro 9 16IMH9
Intel Core Ultra 9 185H, NVIDIA GeForce RTX 4070 Laptop GPU
139 (119.7min) fps -2%
Samsung Galaxy Book4 Ultra
Intel Core Ultra 7 155H, NVIDIA GeForce RTX 4050 Laptop GPU
126.8 (108.1min) fps -11%
Dell XPS 16 9640
Intel Core Ultra 7 155H, NVIDIA GeForce RTX 4070 Laptop GPU
89.7 (83.8min) fps -37%
Moyenne de la classe Multimedia
  (29 - 179.9, n=64, 2 dernières années)
89.2 fps -37%
X-Plane 11.11 - 1920x1080 high (fps_test=3)
Lenovo ThinkBook 16p G5 IRX 21N50011GE
Intel Core i9-14900HX, NVIDIA GeForce RTX 4060 Laptop GPU
141.1 fps +54%
Lenovo Yoga Pro 9 16IAH G10 RTX 5060
Intel Core Ultra 7 255H, Nvidia GeForce RTX 5060 Laptop
91.9 fps
Lenovo Yoga Pro 9 16IMH9
Intel Core Ultra 9 185H, NVIDIA GeForce RTX 4070 Laptop GPU
90.5 fps -2%
Dell XPS 16 9640
Intel Core Ultra 7 155H, NVIDIA GeForce RTX 4070 Laptop GPU
84.7 fps -8%
Dell XPS 16 9640
Intel Core Ultra 7 155H, NVIDIA GeForce RTX 4070 Laptop GPU
84.4 fps -8%
Samsung Galaxy Book4 Ultra
Intel Core Ultra 7 155H, NVIDIA GeForce RTX 4050 Laptop GPU
81.5 fps -11%
Asus ProArt P16 H7606WI
AMD Ryzen AI 9 HX 370, NVIDIA GeForce RTX 4070 Laptop GPU
72.3 fps -21%
Moyenne de la classe Multimedia
  (16.9 - 141.1, n=59, 2 dernières années)
59.1 fps -36%
Cyberpunk 2077 2.2 Phantom Liberty - 2560x1440 Ultra Preset (FSR off)
Moyenne Nvidia GeForce RTX 5060 Laptop
  (54.1 - 57.9, n=4)
55.7 fps +3%
Lenovo Yoga Pro 9 16IAH G10 RTX 5060
Intel Core Ultra 7 255H, Nvidia GeForce RTX 5060 Laptop
54.1 (46.3min) fps
Asus ProArt P16 H7606WI
AMD Ryzen AI 9 HX 370, NVIDIA GeForce RTX 4070 Laptop GPU
49.4 (41.1min) fps -9%
Lenovo Yoga Pro 9 16IMH9
Intel Core Ultra 9 185H, NVIDIA GeForce RTX 4070 Laptop GPU
47.8 (31.2min) fps -12%
Lenovo ThinkBook 16p G5 IRX 21N50011GE
Intel Core i9-14900HX, NVIDIA GeForce RTX 4060 Laptop GPU
46.7 (39.5min) fps -14%
Dell XPS 16 9640
Intel Core Ultra 7 155H, NVIDIA GeForce RTX 4070 Laptop GPU
39.6 (32.7min) fps -27%
Moyenne de la classe Multimedia
  (9.21 - 64.6, n=23, 2 dernières années)
36.7 fps -32%
Samsung Galaxy Book4 Ultra
Intel Core Ultra 7 155H, NVIDIA GeForce RTX 4050 Laptop GPU
23.3 (19.7min) fps -57%
Baldur's Gate 3 - 2560x1440 Ultra Preset AA:T
Lenovo Yoga Pro 9 16IMH9
Intel Core Ultra 9 185H, NVIDIA GeForce RTX 4070 Laptop GPU
79.8 fps +37%
Moyenne Nvidia GeForce RTX 5060 Laptop
  (58.4 - 76.7, n=4)
69.8 fps +20%
Lenovo ThinkBook 16p G5 IRX 21N50011GE
Intel Core i9-14900HX, NVIDIA GeForce RTX 4060 Laptop GPU
65.8 (34.6min, 48.3P0.1, 56.8P1) fps +13%
Dell XPS 16 9640
Intel Core Ultra 7 155H, NVIDIA GeForce RTX 4070 Laptop GPU
63.8 fps +9%
Asus ProArt P16 H7606WI
AMD Ryzen AI 9 HX 370, NVIDIA GeForce RTX 4070 Laptop GPU
59.9 fps +3%
Lenovo Yoga Pro 9 16IAH G10 RTX 5060
Intel Core Ultra 7 255H, Nvidia GeForce RTX 5060 Laptop
58.4 fps
Moyenne de la classe Multimedia
  (10.4 - 88.4, n=19, 2 dernières années)
52.4 fps -10%
F1 24 - 2560x1440 Ultra High Preset AA:T AF:16x
Lenovo Yoga Pro 9 16IAH G10 RTX 5060
Intel Core Ultra 7 255H, Nvidia GeForce RTX 5060 Laptop
42.6 (34min, 34P1) fps
Moyenne Nvidia GeForce RTX 5060 Laptop
  (39 - 44.5, n=3)
42 fps -1%
Lenovo ThinkBook 16p G5 IRX 21N50011GE
Intel Core i9-14900HX, NVIDIA GeForce RTX 4060 Laptop GPU
38.2 (31min, 30P1) fps -10%
Moyenne de la classe Multimedia
  (6.75 - 51.1, n=5, 2 dernières années)
32.6 fps -23%
GTA V - 2560x1440 Highest Settings possible AA:4xMSAA + FX AF:16x
Lenovo Yoga Pro 9 16IAH G10 RTX 5060
Intel Core Ultra 7 255H, Nvidia GeForce RTX 5060 Laptop
107 (4.99min, 71.4P1) fps
Moyenne Nvidia GeForce RTX 5060 Laptop
  (100.9 - 107, n=3)
104.8 fps -2%
Lenovo ThinkBook 16p G5 IRX 21N50011GE
Intel Core i9-14900HX, NVIDIA GeForce RTX 4060 Laptop GPU
90.8 (6.53min, 58.8P1) fps -15%
Lenovo Yoga Pro 9 16IMH9
Intel Core Ultra 9 185H, NVIDIA GeForce RTX 4070 Laptop GPU
90.4 (4.07min, 58.8P1) fps -16%
Asus ProArt P16 H7606WI
AMD Ryzen AI 9 HX 370, NVIDIA GeForce RTX 4070 Laptop GPU
86.6 (5.76min, 55.6P1) fps -19%
Dell XPS 16 9640
Intel Core Ultra 7 155H, NVIDIA GeForce RTX 4070 Laptop GPU
81.3 (0.1645min, 52.6P1) fps -24%
Moyenne de la classe Multimedia
  (9.23 - 109.9, n=22, 2 dernières années)
69.9 fps -35%
Samsung Galaxy Book4 Ultra
Intel Core Ultra 7 155H, NVIDIA GeForce RTX 4050 Laptop GPU
48.1 (9.07min, 34.5P1) fps -55%
Final Fantasy XV Benchmark - 2560x1440 High Quality
Lenovo Yoga Pro 9 16IAH G10 RTX 5060
Intel Core Ultra 7 255H, Nvidia GeForce RTX 5060 Laptop
89.8 fps
Moyenne Nvidia GeForce RTX 5060 Laptop
  (87 - 92.2, n=3)
89.7 fps 0%
Lenovo Yoga Pro 9 16IMH9
Intel Core Ultra 9 185H, NVIDIA GeForce RTX 4070 Laptop GPU
85.6 fps -5%
Asus ProArt P16 H7606WI
AMD Ryzen AI 9 HX 370, NVIDIA GeForce RTX 4070 Laptop GPU
85.3 fps -5%
Lenovo ThinkBook 16p G5 IRX 21N50011GE
Intel Core i9-14900HX, NVIDIA GeForce RTX 4060 Laptop GPU
75.6 fps -16%
Dell XPS 16 9640
Intel Core Ultra 7 155H, NVIDIA GeForce RTX 4070 Laptop GPU
70 fps -22%
Moyenne de la classe Multimedia
  (13.4 - 100.5, n=28, 2 dernières années)
54.5 fps -39%
Samsung Galaxy Book4 Ultra
Intel Core Ultra 7 155H, NVIDIA GeForce RTX 4050 Laptop GPU
40.7 fps -55%
Assassin's Creed Shadows - 2560x1440 Ultra High
Moyenne de la classe Multimedia
  (29 - 31, n=2, 2 dernières années)
30 fps +3%
Lenovo Yoga Pro 9 16IAH G10 RTX 5060
Intel Core Ultra 7 255H, Nvidia GeForce RTX 5060 Laptop
29 fps
Moyenne Nvidia GeForce RTX 5060 Laptop
  (25 - 29, n=3)
27.3 fps -6%

Cyberpunk 2077 1080p Ultra fps chart

051015202530354045505560657075Tooltip
Lenovo Yoga Pro 9 16IAH G10 RTX 5060 Ultra 7 255H, GeForce RTX 5060 Laptop: Ø77.5 (74.7-78.2)
Données CPU/GPU Cyberpunk 2077 Ultra
BasMoyenÉlevéUltraQHD DLSSQHD
GTA V (2015) 177.3 128.5 107
Dota 2 Reborn (2015) 172.8 156.4 150.9 142.3
Final Fantasy XV Benchmark (2018) 221 164.6 121.1 89.8
X-Plane 11.11 (2018) 122.6 108.3 91.9
Strange Brigade (2018) 515 319 253 219 152
Baldur's Gate 3 (2023) 151.1 121.3 106.7 78.7 58.4
Cyberpunk 2077 2.2 Phantom Liberty (2023) 133.6 110.6 92.5 83.2 63.9 54.1
F1 24 (2024) 255 254 206 68.6 66.5 42.6
Assassin's Creed Shadows (2025) 57 53 46 35 29
F1 25 (2025) 210 190.4 152.7 18 21.9 11.7

Émissions et énergie : Thermique modérée et bonne efficacité énergétique

Émissions sonores

Système de refroidissement

Les deux ventilateurs démarrent assez rapidement en mode Performance, nous vous recommandons donc d'opter pour l'un des modes de puissance inférieure pour les tâches simples.

Il vaut également la peine d'essayer le mode Auto pour les jeux, car les ventilateurs restent nettement plus silencieux (45 contre 50-52 dB(A)) et les performances de jeu restent très bonnes.

Aucun autre bruit électronique n'a été émis par l'appareil testé.

Degré de la nuisance sonore

Au repos
25.2 / 25.2 / 26.9 dB(A)
Fortement sollicité
44.5 / 52.7 dB(A)
  red to green bar
 
 
30 dB
silencieux
40 dB(A)
audible
50 dB(A)
bruyant
 
min: dark, med: mid, max: light   Earthworks M23R, Arta (à 15 cm de distance)   bruit ambiant: 25.2 dB(A)
dB(A) 0102030405060708090Deep BassMiddle BassHigh BassLower RangeMidsHigher MidsLower HighsMid HighsUpper HighsSuper Highs2043.943.24144.237.6472539.736.229.333.730.6373142.741.135.238.935.845.34042.344.236.342.838.641.45039.241.540.840.840.1426333.536.333.941.632.334.28030.933.224.124.923.627.31002829.925.525.720.827.312529.529.825.620.61825.216029.228.924.519.817.424.620032.229.926.521.419.32525032.831.426.624.621.626.231533.932.527.918.517.622.240035.133.929.516.41421.650035.633.829.516.31219.863038.23630.915.41121.280039.737.231.81410.421.1100039.336.431.813.510.820.6125040.637.833.513.511.921.7160039.837.532.812.811.320.3200039.436.732.112.711.419.2250039.637.131.712.611.518.5315039.937.431.812.712.118400041.539.233.312.712.419.2500042.640.235.512.912.717630044.942.935.513.112.715800042.538.629.91312.913.41000039.134.825.212.912.813.11250034.229.720.612.612.712.81600028.424.116.512.412.312.6SPL52.750.244.526.925.231.6N8.87.44.90.90.61.6median 39.1median 36median 29.9median 13.5median 12.7median 20.3Delta3.83.83.53.32.63hearing rangehide median Fan NoiseLenovo Yoga Pro 9 16IAH G10 RTX 5060
Lenovo Yoga Pro 9 16IAH G10 RTX 5060
GeForce RTX 5060 Laptop, Ultra 7 255H, WD PC SN7100S SDFPMSL-1T00-1101
Lenovo ThinkBook 16p G5 IRX 21N50011GE
NVIDIA GeForce RTX 4060 Laptop GPU, i9-14900HX, SK Hynix HFS001TEJ9X115N
Asus ProArt P16 H7606WI
NVIDIA GeForce RTX 4070 Laptop GPU, Ryzen AI 9 HX 370, Micron 2400 MTFDKBA1T0QFM
Lenovo Yoga Pro 9 16IMH9
NVIDIA GeForce RTX 4070 Laptop GPU, Ultra 9 185H, SK Hynix HFS001TEJ9X115N
Dell XPS 16 9640
NVIDIA GeForce RTX 4070 Laptop GPU, Ultra 7 155H, Kioxia XG8 KXG80ZNV1T02
Samsung Galaxy Book4 Ultra
NVIDIA GeForce RTX 4050 Laptop GPU, Ultra 7 155H, Samsung PM9A1 MZVL2512HCJQ
Noise
-3%
-4%
1%
4%
10%
arrêt / environnement *
25.2
25
1%
24.4
3%
24.3
4%
24.5
3%
24.2
4%
Idle Minimum *
25.2
25
1%
24.4
3%
24.3
4%
24.5
3%
24.2
4%
Idle Average *
25.2
25
1%
27.7
-10%
24.3
4%
24.5
3%
24.2
4%
Idle Maximum *
26.9
25
7%
32.3
-20%
25.8
4%
27.5
-2%
24.2
10%
Load Average *
44.5
47.9
-8%
42.2
5%
48.1
-8%
39.6
11%
37.9
15%
Cyberpunk 2077 ultra *
50.2
57.3
-14%
53.2
-6%
Load Maximum *
52.7
57.4
-9%
53.2
-1%
53.9
-2%
49.7
6%
41.7
21%
Witcher 3 ultra *
49.7
49.7
41.7

* ... Moindre est la valeur, meilleures sont les performances

Température

Lenovo a bien maîtrisé les températures de surface. Le châssis chauffe à peine en cas de faible charge et il n'y a pas de points chauds critiques, même lors du test de stress.

Sur la face inférieure, les températures atteignent 47 °C au milieu, mais vous ne touchez pas le boîtier ici de toute façon.

Pendant le test de stress, le GPU fonctionne à 85 W (77 °C) et le CPU à 45 W (78 °C).

Test de stress des données CPU/GPU
 39.9 °C42.9 °C40.5 °C 
 36.9 °C41.6 °C37.8 °C 
 28.8 °C32.4 °C32.1 °C 
Maximum: 42.9 °C
Moyenne: 37 °C
42.8 °C47.4 °C44.1 °C
37.6 °C46.6 °C34.7 °C
30.2 °C31.2 °C31.3 °C
Maximum: 47.4 °C
Moyenne: 38.4 °C
Alimentation (valeur maximale)  45.4 °C | Température ambiante de la pièce 21.8 °C | Fluke t3000FC (calibrated), Voltcraft IR-900
(±) La température moyenne de la face supérieure sous charge maximale est de 37 °C / 99 F, par rapport à la moyenne de 31.3 °C / 88 F pour les appareils de la classe Multimedia.
(±) La température maximale du côté supérieur est de 42.9 °C / 109 F, par rapport à la moyenne de 36.9 °C / 98 F, allant de 21.1 à 71 °C pour la classe Multimedia.
(-) Le fond chauffe jusqu'à un maximum de 47.4 °C / 117 F, contre une moyenne de 39.2 °C / 103 F
(+) En utilisation inactive, la température moyenne du côté supérieur est de 27.1 °C / 81 F, par rapport à la moyenne du dispositif de 31.3 °C / 88 F.
(±) 3: The average temperature for the upper side is 36 °C / 97 F, compared to the average of 31.3 °C / 88 F for the class Multimedia.
(+) Les repose-poignets et le pavé tactile atteignent la température maximale de la peau (32.4 °C / 90.3 F) et ne sont donc pas chauds.
(-) La température moyenne de la zone de l'appui-paume de dispositifs similaires était de 28.7 °C / 83.7 F (-3.7 °C / #-6.6 F).
Test de résistance aux températures de surface (face supérieure)
Essai de résistance aux températures de surface (face inférieure)
Lenovo Yoga Pro 9 16IAH G10 RTX 5060
Intel Core Ultra 7 255H, Nvidia GeForce RTX 5060 Laptop
Lenovo ThinkBook 16p G5 IRX 21N50011GE
Intel Core i9-14900HX, NVIDIA GeForce RTX 4060 Laptop GPU
Asus ProArt P16 H7606WI
AMD Ryzen AI 9 HX 370, NVIDIA GeForce RTX 4070 Laptop GPU
Lenovo Yoga Pro 9 16IMH9
Intel Core Ultra 9 185H, NVIDIA GeForce RTX 4070 Laptop GPU
Dell XPS 16 9640
Intel Core Ultra 7 155H, NVIDIA GeForce RTX 4070 Laptop GPU
Samsung Galaxy Book4 Ultra
Intel Core Ultra 7 155H, NVIDIA GeForce RTX 4050 Laptop GPU
Heat
9%
-6%
4%
9%
14%
Maximum Upper Side *
42.9
41.1
4%
46.9
-9%
41.7
3%
39.4
8%
38.5
10%
Maximum Bottom *
47.4
40.8
14%
50.9
-7%
46.3
2%
36.9
22%
41.2
13%
Idle Upper Side *
27.6
26
6%
28.9
-5%
26.2
5%
28.2
-2%
23.5
15%
Idle Bottom *
29
26
10%
30
-3%
27.2
6%
27.4
6%
24.1
17%

* ... Moindre est la valeur, meilleures sont les performances

Haut-parleur

Le système audio à 6 haut-parleurs (4x woofers et 2x tweeters) continue d'offrir une très bonne qualité sonore et est l'un des meilleurs sur le marché.

dB(A) 0102030405060708090Deep BassMiddle BassHigh BassLower RangeMidsHigher MidsLower HighsMid HighsUpper HighsSuper Highs2037.639.12530.6313135.833.84038.636.25040.139.56332.3378023.647.210020.856.81251861.416017.464.120019.370.725021.670.431517.674.44001470.85001271.66301172.580010.474.1100010.869.8125011.971.6160011.371.6200011.472250011.570.8315012.170.5400012.468500012.765.4630012.764.7800012.961.31000012.8641250012.765.31600012.363SPL25.282.3N0.659.2median 12.7median 70.4Delta2.63.627.428.429.727.527.92128.826.323.721.719.321.91939.516.35219.55514.353.511.359.211.660.710.46812.767.313.364.410.770.810.272.510.167.910.664.912.268.811.763.611.965.312.464.113.466.512.764.512.666136412.663.613.564.51558.624.378.90.547.9median 12.6median 64.51.43.335.641.331.233.642.933.838.540.426.435.225.539.728.148.120.960.820.265.217.961.719.46820.368.616.568.91471.111.771.711.174.410.974.410.571.910.77110.7691168.711.466.511.768.112.167.312.26412.563.612.365.212.460.812.259.411.65124.481.40.655.7median 12.2median 682.9439.64532.536.629.23333.534.832.537.82839.22339.423.347.322.253.123.554.421.760.821.864.517.47014.176.712.175.913.474.910.77410.274.310.172.510.47210.670.310.868.711.270.211.869.311.969.712.16712.166.712.266.312.367.911.462.524.583.40.662.1median 12.1median 69.33.34.540.241.229.532.52831.33134.628.231.125.629.319.329.519.439.918.94917.751.517.559.919.962.7156812.769.511.368.311.17110.975.610.57310.873.910.873.810.97611.473.611.869.112.369.612.565.512.670.312.674.512.876.313.276.613.267.424.2850.665.4median 12.6median 69.625.6hearing rangehide median Pink NoiseLenovo Yoga Pro 9 16IAH G10 RTX 5060Lenovo ThinkBook 16p G5 IRX 21N50011GEAsus ProArt P16 H7606WIDell XPS 16 9640Samsung Galaxy Book4 Ultra
Diagramme de fréquence (les cases peuvent être cochées et décochées pour comparer les appareils)
Lenovo Yoga Pro 9 16IAH G10 RTX 5060 analyse audio

(+) | les haut-parleurs peuvent jouer relativement fort (82.3# dB)
Basses 100 - 315 Hz
(±) | basse réduite - en moyenne 5.5% inférieure à la médiane
(±) | la linéarité des basses est moyenne (8% delta à la fréquence précédente)
Médiums 400 - 2000 Hz
(+) | médiane équilibrée - seulement 1.5% de la médiane
(+) | les médiums sont linéaires (2.9% delta à la fréquence précédente)
Aiguës 2 - 16 kHz
(+) | des sommets équilibrés - à seulement 4.2% de la médiane
(+) | les aigus sont linéaires (3.3% delta à la fréquence précédente)
Globalement 100 - 16 000 Hz
(+) | le son global est linéaire (7.6% différence à la médiane)
Par rapport à la même classe
» 5% de tous les appareils testés de cette catégorie étaient meilleurs, 1% similaires, 94% pires
» Le meilleur avait un delta de 5%, la moyenne était de 18%, le pire était de 45%.
Par rapport à tous les appareils testés
» 1% de tous les appareils testés étaient meilleurs, 0% similaires, 99% pires
» Le meilleur avait un delta de 4%, la moyenne était de 24%, le pire était de 134%.

Lenovo ThinkBook 16p G5 IRX 21N50011GE analyse audio

(±) | le niveau sonore du haut-parleur est moyen mais bon (78.9# dB)
Basses 100 - 315 Hz
(±) | basse réduite - en moyenne 7.6% inférieure à la médiane
(±) | la linéarité des basses est moyenne (10.1% delta à la fréquence précédente)
Médiums 400 - 2000 Hz
(+) | médiane équilibrée - seulement 3.3% de la médiane
(+) | les médiums sont linéaires (6.8% delta à la fréquence précédente)
Aiguës 2 - 16 kHz
(+) | des sommets équilibrés - à seulement 0.9% de la médiane
(+) | les aigus sont linéaires (3.1% delta à la fréquence précédente)
Globalement 100 - 16 000 Hz
(+) | le son global est linéaire (8.8% différence à la médiane)
Par rapport à la même classe
» 8% de tous les appareils testés de cette catégorie étaient meilleurs, 2% similaires, 90% pires
» Le meilleur avait un delta de 5%, la moyenne était de 18%, le pire était de 45%.
Par rapport à tous les appareils testés
» 2% de tous les appareils testés étaient meilleurs, 1% similaires, 97% pires
» Le meilleur avait un delta de 4%, la moyenne était de 24%, le pire était de 134%.

Asus ProArt P16 H7606WI analyse audio

(±) | le niveau sonore du haut-parleur est moyen mais bon (81.4# dB)
Basses 100 - 315 Hz
(+) | bonne basse - seulement 3% loin de la médiane
(±) | la linéarité des basses est moyenne (8.3% delta à la fréquence précédente)
Médiums 400 - 2000 Hz
(+) | médiane équilibrée - seulement 3.5% de la médiane
(+) | les médiums sont linéaires (2.5% delta à la fréquence précédente)
Aiguës 2 - 16 kHz
(+) | des sommets équilibrés - à seulement 3% de la médiane
(+) | les aigus sont linéaires (3.6% delta à la fréquence précédente)
Globalement 100 - 16 000 Hz
(+) | le son global est linéaire (8.5% différence à la médiane)
Par rapport à la même classe
» 7% de tous les appareils testés de cette catégorie étaient meilleurs, 2% similaires, 91% pires
» Le meilleur avait un delta de 5%, la moyenne était de 18%, le pire était de 45%.
Par rapport à tous les appareils testés
» 2% de tous les appareils testés étaient meilleurs, 1% similaires, 98% pires
» Le meilleur avait un delta de 4%, la moyenne était de 24%, le pire était de 134%.

Dell XPS 16 9640 analyse audio

(+) | les haut-parleurs peuvent jouer relativement fort (83.4# dB)
Basses 100 - 315 Hz
(±) | basse réduite - en moyenne 11.2% inférieure à la médiane
(±) | la linéarité des basses est moyenne (8.9% delta à la fréquence précédente)
Médiums 400 - 2000 Hz
(+) | médiane équilibrée - seulement 4.5% de la médiane
(+) | les médiums sont linéaires (3% delta à la fréquence précédente)
Aiguës 2 - 16 kHz
(+) | des sommets équilibrés - à seulement 1.4% de la médiane
(+) | les aigus sont linéaires (2% delta à la fréquence précédente)
Globalement 100 - 16 000 Hz
(+) | le son global est linéaire (10% différence à la médiane)
Par rapport à la même classe
» 10% de tous les appareils testés de cette catégorie étaient meilleurs, 2% similaires, 88% pires
» Le meilleur avait un delta de 5%, la moyenne était de 18%, le pire était de 45%.
Par rapport à tous les appareils testés
» 4% de tous les appareils testés étaient meilleurs, 1% similaires, 95% pires
» Le meilleur avait un delta de 4%, la moyenne était de 24%, le pire était de 134%.

Samsung Galaxy Book4 Ultra analyse audio

(+) | les haut-parleurs peuvent jouer relativement fort (85# dB)
Basses 100 - 315 Hz
(±) | basse réduite - en moyenne 14.4% inférieure à la médiane
(±) | la linéarité des basses est moyenne (11.3% delta à la fréquence précédente)
Médiums 400 - 2000 Hz
(+) | médiane équilibrée - seulement 3.4% de la médiane
(+) | les médiums sont linéaires (3.4% delta à la fréquence précédente)
Aiguës 2 - 16 kHz
(+) | des sommets équilibrés - à seulement 3% de la médiane
(+) | les aigus sont linéaires (5.6% delta à la fréquence précédente)
Globalement 100 - 16 000 Hz
(+) | le son global est linéaire (11.5% différence à la médiane)
Par rapport à la même classe
» 14% de tous les appareils testés de cette catégorie étaient meilleurs, 4% similaires, 82% pires
» Le meilleur avait un delta de 5%, la moyenne était de 18%, le pire était de 45%.
Par rapport à tous les appareils testés
» 7% de tous les appareils testés étaient meilleurs, 2% similaires, 91% pires
» Le meilleur avait un delta de 4%, la moyenne était de 24%, le pire était de 134%.

Consommation d'énergie

bloc d'alimentation 170 W

Nos mesures de consommation ne révèlent aucune surprise. Le Yoga Pro 9i est très efficace en mode veille avec une consommation maximale de 11 W.

Nous mesurons brièvement 176 W lors du test de stress, qui se stabilise ensuite rapidement autour de 165 W.

L'alimentation fournie de 170 W est donc tout juste suffisante et un module de 200 W aurait été un meilleur choix.

Consommation énergétique
Éteint/en veilledarklight 0.06 / 0.37 Watts
Au reposdarkmidlight 4.9 / 10.9 / 11.3 Watts
Fortement sollicité midlight 88.7 / 175.5 Watts
 color bar
Légende: min: dark, med: mid, max: light        Metrahit Energy
Lenovo Yoga Pro 9 16IAH G10 RTX 5060
GeForce RTX 5060 Laptop, Ultra 7 255H, WD PC SN7100S SDFPMSL-1T00-1101
Lenovo ThinkBook 16p G5 IRX 21N50011GE
NVIDIA GeForce RTX 4060 Laptop GPU, i9-14900HX, SK Hynix HFS001TEJ9X115N
Asus ProArt P16 H7606WI
NVIDIA GeForce RTX 4070 Laptop GPU, Ryzen AI 9 HX 370, Micron 2400 MTFDKBA1T0QFM
Lenovo Yoga Pro 9 16IMH9
NVIDIA GeForce RTX 4070 Laptop GPU, Ultra 9 185H, SK Hynix HFS001TEJ9X115N
Dell XPS 16 9640
NVIDIA GeForce RTX 4070 Laptop GPU, Ultra 7 155H, Kioxia XG8 KXG80ZNV1T02
Samsung Galaxy Book4 Ultra
NVIDIA GeForce RTX 4050 Laptop GPU, Ultra 7 155H, Samsung PM9A1 MZVL2512HCJQ
Power Consumption
-68%
-9%
-63%
-2%
21%
Idle Minimum *
4.9
11.6
-137%
8
-63%
10.3
-110%
7.7
-57%
4.8
2%
Idle Average *
10.9
18.5
-70%
9.9
9%
21.9
-101%
10.3
6%
7.5
31%
Idle Maximum *
11.3
19.9
-76%
11.6
-3%
22.4
-98%
10.6
6%
7.9
30%
Load Average *
88.7
126.3
-42%
76.9
13%
96.9
-9%
76.5
14%
79.3
11%
Cyberpunk 2077 ultra *
157.1
233
-48%
157.7
-0%
Cyberpunk 2077 ultra external monitor *
155.7
237
-52%
156.6
-1%
Load Maximum *
175.5
270.4
-54%
212.6
-21%
173.8
1%
138.5
21%
125
29%
Witcher 3 ultra *
159.6
126.4
79.2

* ... Moindre est la valeur, meilleures sont les performances

Power consumption: Cyberpunk 2077 / Stress test

0102030405060708090100110120130140150160170Tooltip
Lenovo Yoga Pro 9 16IAH G10 RTX 5060; 1280x720 Prime95 28.10 and Furmark 1.25: Ø165.7 (158.2-175.5)
Lenovo Yoga Pro 9 16IAH G10 RTX 5060; Idle 150cd/m2: Ø8.54 (5.55-9.85)
Lenovo Yoga Pro 9 16IAH G10 RTX 5060; Cyberpunk 2077 FHD ultra no FSR 150cd: Ø157.1 (151.8-163.2)

Power consumption: External monitor

0102030405060708090100110120130140150160170Tooltip
Lenovo Yoga Pro 9 16IAH G10 RTX 5060; Prime95 V2810 Stress (external Monitor): Ø131.1 (120.9-171.9)
Lenovo Yoga Pro 9 16IAH G10 RTX 5060; Cinebench R15 Multi (external Monitor): Ø168 (165.4-170.3)
Lenovo Yoga Pro 9 16IAH G10 RTX 5060; Cinebench R23 Single (external Monitor): Ø40.4 (37.6-55.2)
Lenovo Yoga Pro 9 16IAH G10 RTX 5060; Cinebench R23 Multi (external Monitor): Ø162 (122.8-171.2)
Lenovo Yoga Pro 9 16IAH G10 RTX 5060; 1280x720 FurMark 1.19 GPU Stress Test (external Monitor): Ø138.8 (133.1-141.9)
Lenovo Yoga Pro 9 16IAH G10 RTX 5060; Idle 1min (external Monitor): Ø6.37 (3.95-8.83)
Lenovo Yoga Pro 9 16IAH G10 RTX 5060; Cyberpunk 2077 FHD ultra no FSR (external Monitor): Ø155.7 (147.6-161.7)

Durée de vie de la batterie

La batterie de 84 Wh permet une autonomie décente, et nous constatons une amélioration par rapport à l'ancien Yoga Pro 9.

Lors du test WLAN avec une luminosité de 150 cd/m² (61 %) et un taux de rafraîchissement de 60 Hz, le Yoga Pro 9i atteint presque 10 heures d'autonomie et peut tenir un peu moins de 7,5 heures avec une luminosité SDR maximale.

Informations sur la batterie
Processus de chargement
Autonomie
WiFi Websurfing
9h 54min
WiFi Websurfing max. Brightness
7h 22min
Battery Runtime
WiFi Websurfing
Moyenne de la classe Multimedia
  (262 - 1204, n=68, 2 dernières années)
690 min +16%
Samsung Galaxy Book4 Ultra
Ultra 7 155H, NVIDIA GeForce RTX 4050 Laptop GPU, 76 Wh
656 min +10%
Dell XPS 16 9640
Ultra 7 155H, NVIDIA GeForce RTX 4070 Laptop GPU, 99.5 Wh
629 min +6%
Lenovo Yoga Pro 9 16IAH G10 RTX 5060
Ultra 7 255H, GeForce RTX 5060 Laptop, 84 Wh
594 min
Lenovo Yoga Pro 9 16IMH9
Ultra 9 185H, NVIDIA GeForce RTX 4070 Laptop GPU, 84 Wh
526 min -11%
Asus ProArt P16 H7606WI
Ryzen AI 9 HX 370, NVIDIA GeForce RTX 4070 Laptop GPU, 90 Wh
499 min -16%
Lenovo ThinkBook 16p G5 IRX 21N50011GE
i9-14900HX, NVIDIA GeForce RTX 4060 Laptop GPU, 80 Wh
344 min -42%
WiFi Websurfing max. Brightness
Dell XPS 16 9640
Ultra 7 155H, NVIDIA GeForce RTX 4070 Laptop GPU, 99.5 Wh
493 min +12%
Lenovo Yoga Pro 9 16IAH G10 RTX 5060
Ultra 7 255H, GeForce RTX 5060 Laptop, 84 Wh
442 min
Samsung Galaxy Book4 Ultra
Ultra 7 155H, NVIDIA GeForce RTX 4050 Laptop GPU, 76 Wh
426 min -4%
Moyenne de la classe Multimedia
  (212 - 698, n=40, 2 dernières années)
426 min -4%
Asus ProArt P16 H7606WI
Ryzen AI 9 HX 370, NVIDIA GeForce RTX 4070 Laptop GPU, 90 Wh
383 min -13%
Lenovo ThinkBook 16p G5 IRX 21N50011GE
i9-14900HX, NVIDIA GeForce RTX 4060 Laptop GPU, 80 Wh
285 min -36%
Lenovo Yoga Pro 9 16IMH9
Ultra 9 185H, NVIDIA GeForce RTX 4070 Laptop GPU, 84 Wh
270 min -39%

Les impressions générales de Notebookcheck sur le Lenovo Yoga Pro 9i G10 Aura Edition

Le Lenovo Yoga Pro 9i 16IAH G10 Aura Edition impressionne par ses performances adéquates et son écran OLED vibrant, ce qui en fait un choix convaincant pour un ordinateur portable multimédia autour de la barre des 2 000 €.

Lenovo Yoga Pro 9 16IAH G10 RTX 5060 - 07/18/2025 v8
Andreas Osthoff

Châssis
88 / 98 → 90%
Clavier
89%
Dispositif de pointage
91%
Connectivité
69 / 80 → 87%
Poids
64 / 20-74 → 81%
Autonomie
88 / 95 → 92%
Écran
86%
Performances en jeu
85 / 88 → 97%
Performances dans les applications
89 / 92 → 97%
Chauffe
87%
Nuisance sonore
76 / 95 → 80%
Audio
91%
Appareil photo
54 / 75 → 72%
Moyenne
68%
89%
Multimedia - Moyenne compensée
CO2 Emissions
No Data
Materials
0%
Packaging
100%
Power Use
88.8%
Repairability
50%
Software Updates
22.3%
Recycle Logo Total Sustainability Score: 43.5%

Comparaison des concurrents potentiels

Benchmark Comparison Plugin: ERROR, Layout "57" not supported!

Transparency

La sélection des appareils à examiner est effectuée par notre équipe éditoriale. L'échantillon de test a été prêté à l'auteur par le fabricant ou le détaillant pour les besoins de cet examen. Le prêteur n'a pas eu d'influence sur cette évaluation et le fabricant n'a pas reçu de copie de cette évaluation avant sa publication. Il n'y avait aucune obligation de publier cet article. Nous n'acceptons jamais de compensation ou de paiement en échange de nos commentaires. En tant que média indépendant, Notebookcheck n'est pas soumis à l'autorité des fabricants, des détaillants ou des éditeurs.

Voici comment Notebookcheck teste

Chaque année, Notebookcheck examine de manière indépendante des centaines d'ordinateurs portables et de smartphones en utilisant des procédures standardisées afin de garantir que tous les résultats sont comparables. Nous avons continuellement développé nos méthodes de test depuis environ 20 ans et avons établi des normes industrielles dans le processus. Dans nos laboratoires de test, des équipements de mesure de haute qualité sont utilisés par des techniciens et des rédacteurs expérimentés. Ces tests impliquent un processus de validation en plusieurs étapes. Notre système d'évaluation complexe repose sur des centaines de mesures et de points de référence bien fondés, ce qui garantit l'objectivité.
Please share our article, every link counts!
Mail Logo
> Revues et rapports de ordinateurs portatifs et smartphones, ordiphones > Critiques > Revue du Lenovo Yoga Pro 9i 16IAH G10 Aura Edition : L'ordinateur portable multimédia impressionne avec son OLED de 1 100 nits
Andreas Osthoff, 2025-07-23 (Update: 2025-07-23)