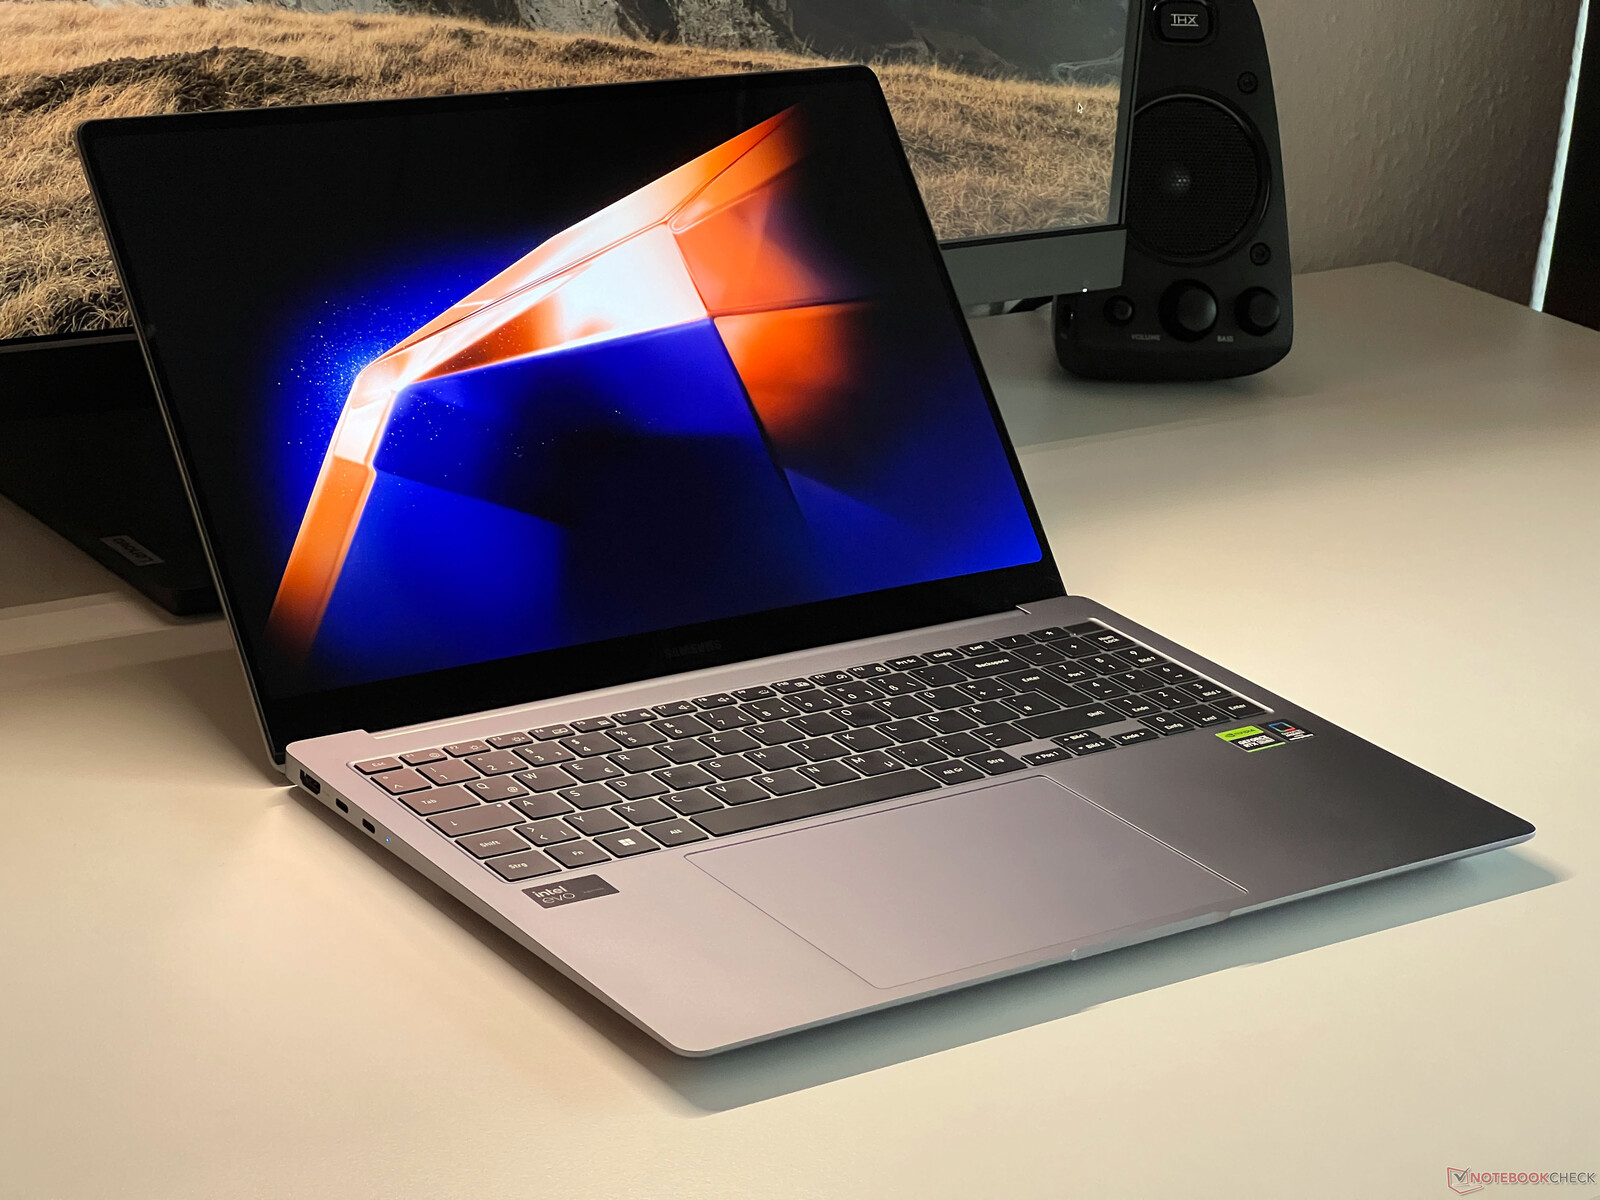
Test du Samsung Galaxy Book4 Ultra : PC portable multimédia avec OLED 120 Hz et RTX 4050
Samsung met à jour sa série Galaxy Book à sa quatrième génération et avec le Galaxy Book 4 Ultra, Samsung souhaite concurrencer directement le MacBook Pro 16 de Apple. Par rapport au modèle de l'année précédente, peu de choses ont changé, seul le Core i7-13700H ayant été remplacé par la puce Meteor Lake Core Ultra 7 155H.
Rien n'a changé non plus en ce qui concerne le prix, le modèle de base avec son Core Ultra 7 155H et GeForce RTX 4050 coûtant 2 399 $. Ce prix reste très ambitieux, surtout si l'on tient compte des maigres spécifications de stockage (16 Go de RAM, 512 Go de SSD). Pour 2 999 $, vous pouvez obtenir la variante supérieure avec le Core Ultra 9 185Hle PC portable GeForce Ordinateur portable RTX 4070 ainsi que plus de mémoire et de stockage (32 Go de RAM, 1 To de SSD).
Comparaison avec les concurrents potentiels
Note | Date | Modèle | Poids | Épaisseur | Taille | Résolution | Prix |
|---|---|---|---|---|---|---|---|
| 90.4 % v7 (old) | 03/24 | Samsung Galaxy Book4 Ultra Ultra 7 155H, GeForce RTX 4050 Laptop GPU | 1.8 kg | 17 mm | 16.00" | 2880x1800 | |
| 88.6 % v7 (old) | 12/23 | Lenovo ThinkPad Z16 Gen 2 R9 PRO 7940HS, Radeon RX 6550M | 1.8 kg | 15.8 mm | 16.00" | 3840x2400 | |
| 93.7 % v7 (old) | 11/23 | Apple MacBook Pro 16 2023 M3 Pro Apple M3 Pro 12-Core, M3 Pro 18-Core GPU | 2.1 kg | 16.9 mm | 16.20" | 3456x2234 | |
| 88 % v7 (old) | 08/23 | Lenovo Slim Pro 9i 16IRP8 i9-13905H, GeForce RTX 4050 Laptop GPU | 2.2 kg | 18.2 mm | 16.00" | 3200x2000 | |
| 91.1 % v7 (old) | 03/24 | HP Spectre x360 16 RTX 4050 Ultra 7 155H, GeForce RTX 4050 Laptop GPU | 2 kg | 19.8 mm | 16.00" | 2880x1800 | |
| 88.6 % v7 (old) | 07/23 | Schenker VISION 16 Pro (M23) i7-13700H, GeForce RTX 4070 Laptop GPU | 1.6 kg | 17.1 mm | 16.00" | 2560x1600 | |
| 89.4 % v7 (old) | 04/23 | Samsung Galaxy Book3 Ultra 16 i7-13700H, GeForce RTX 4050 Laptop GPU | 1.8 kg | 16.5 mm | 16.00" | 2880x1800 |
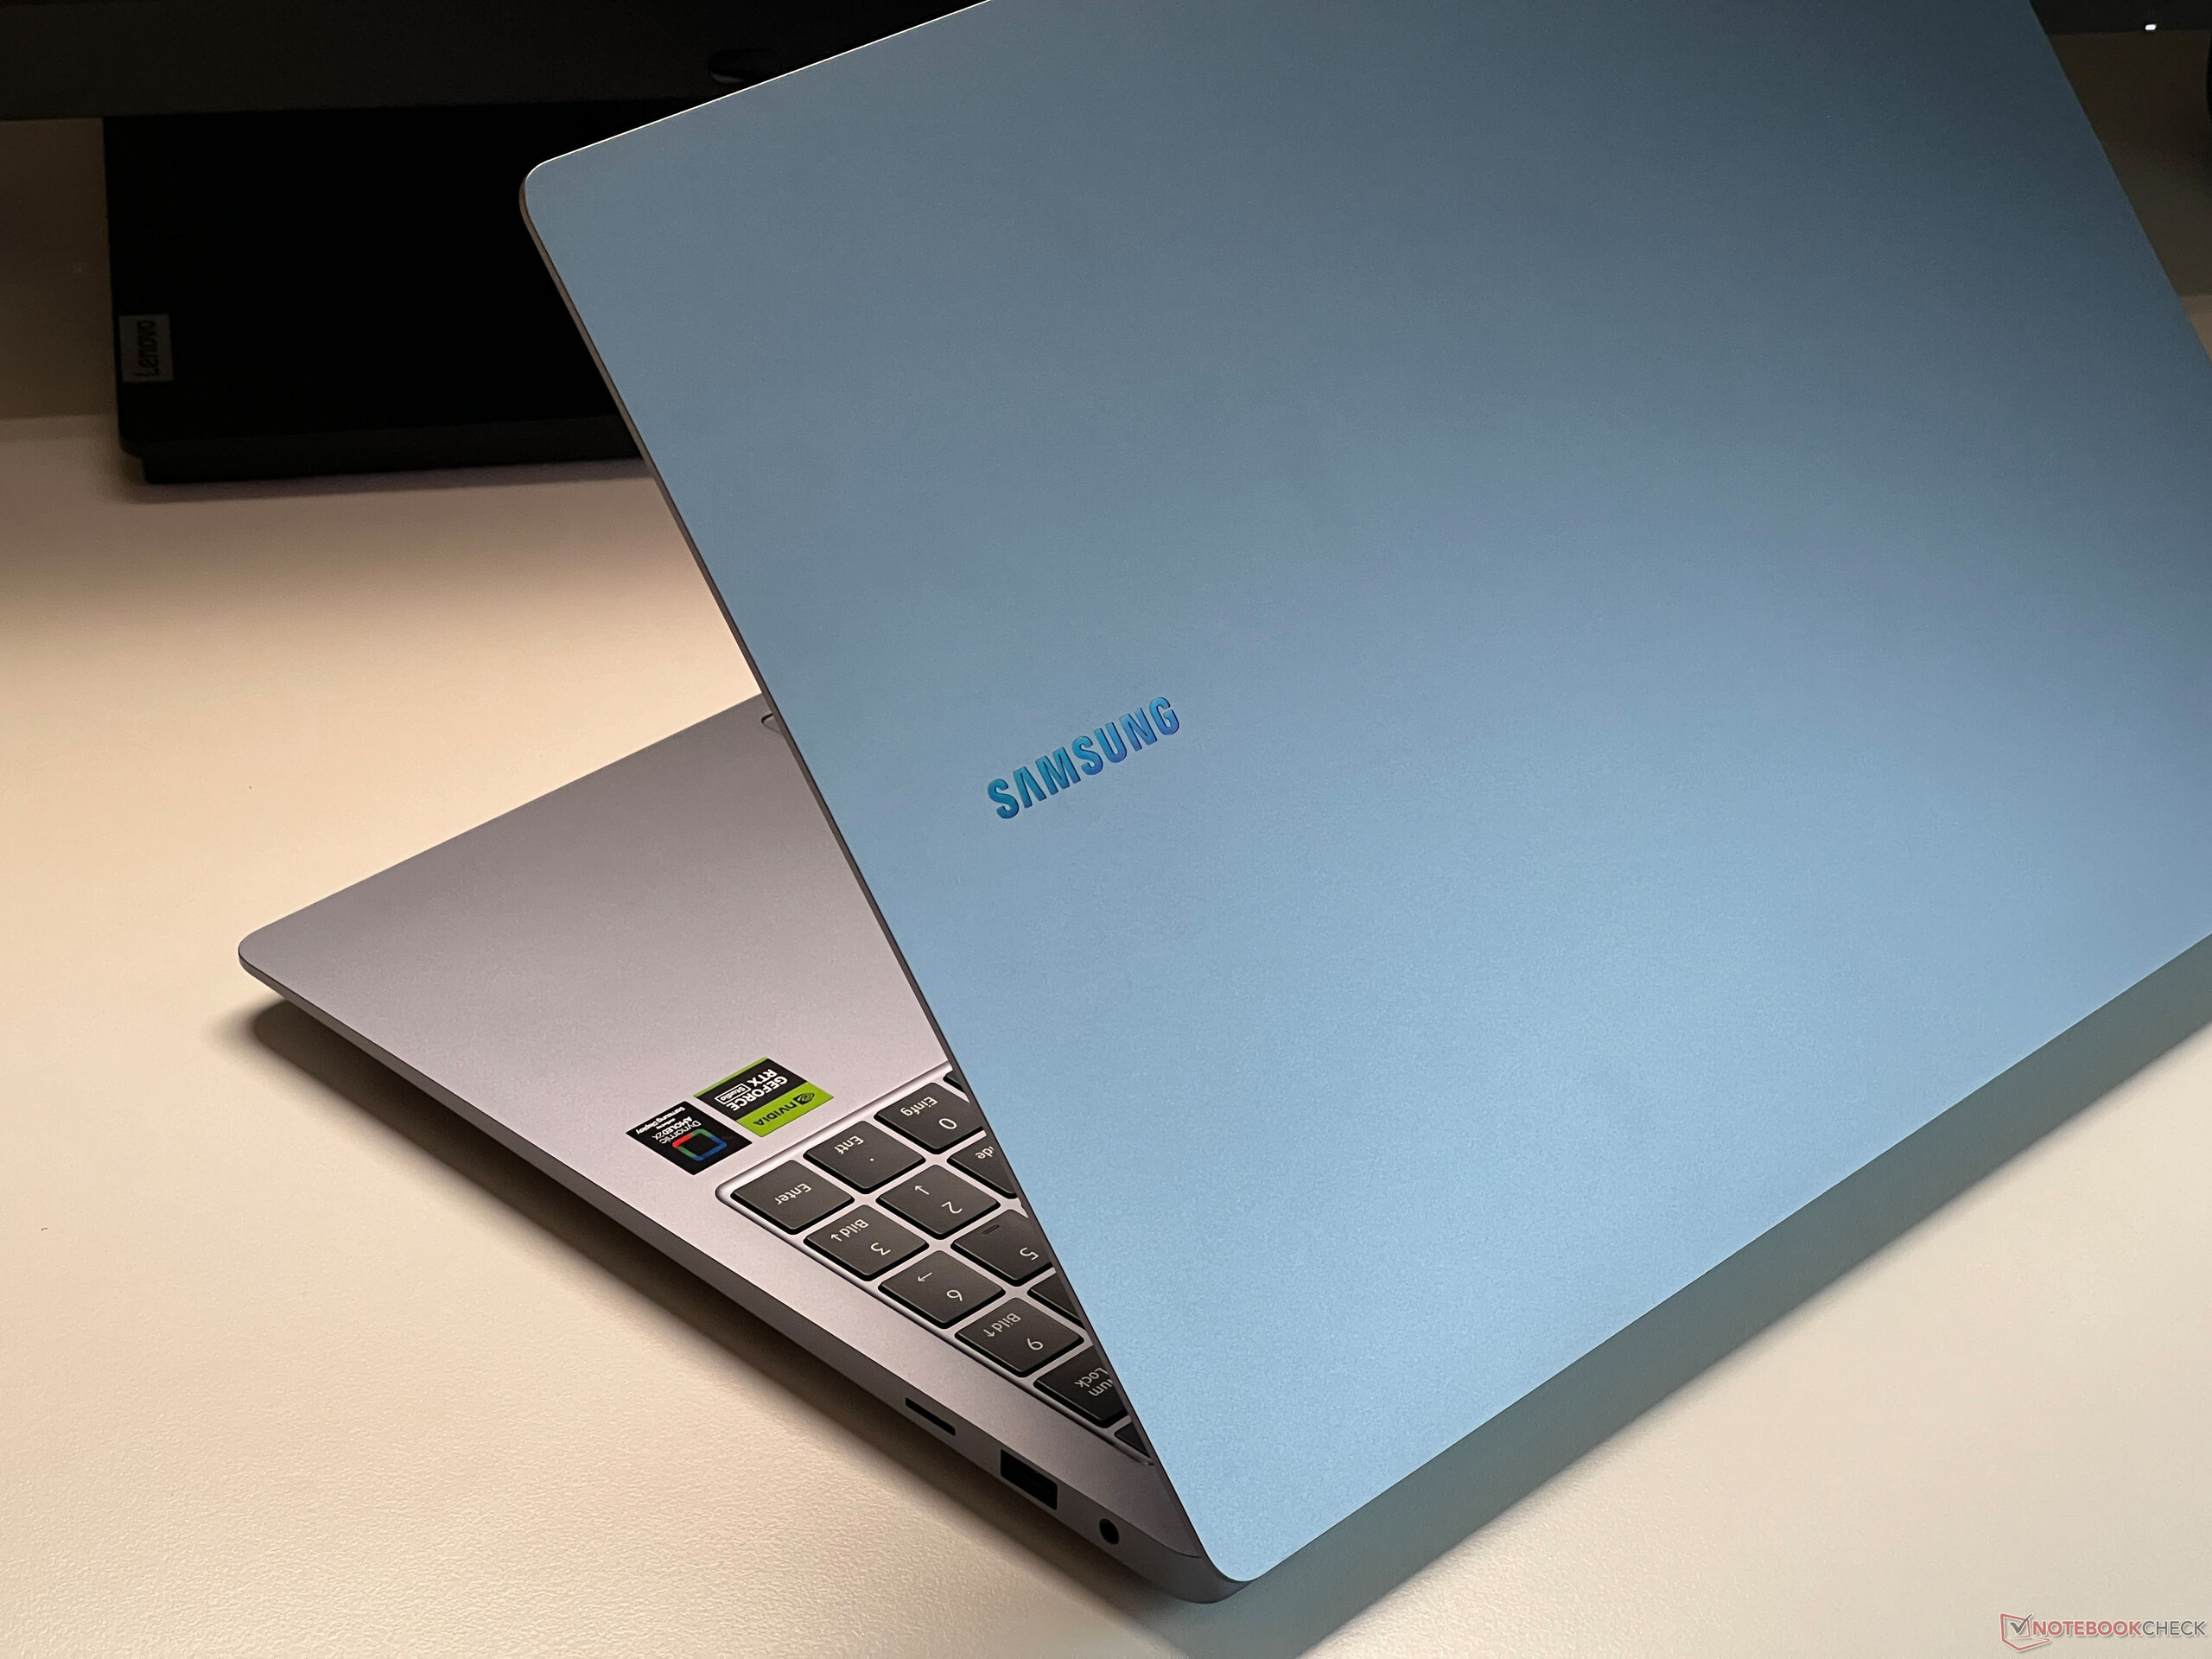
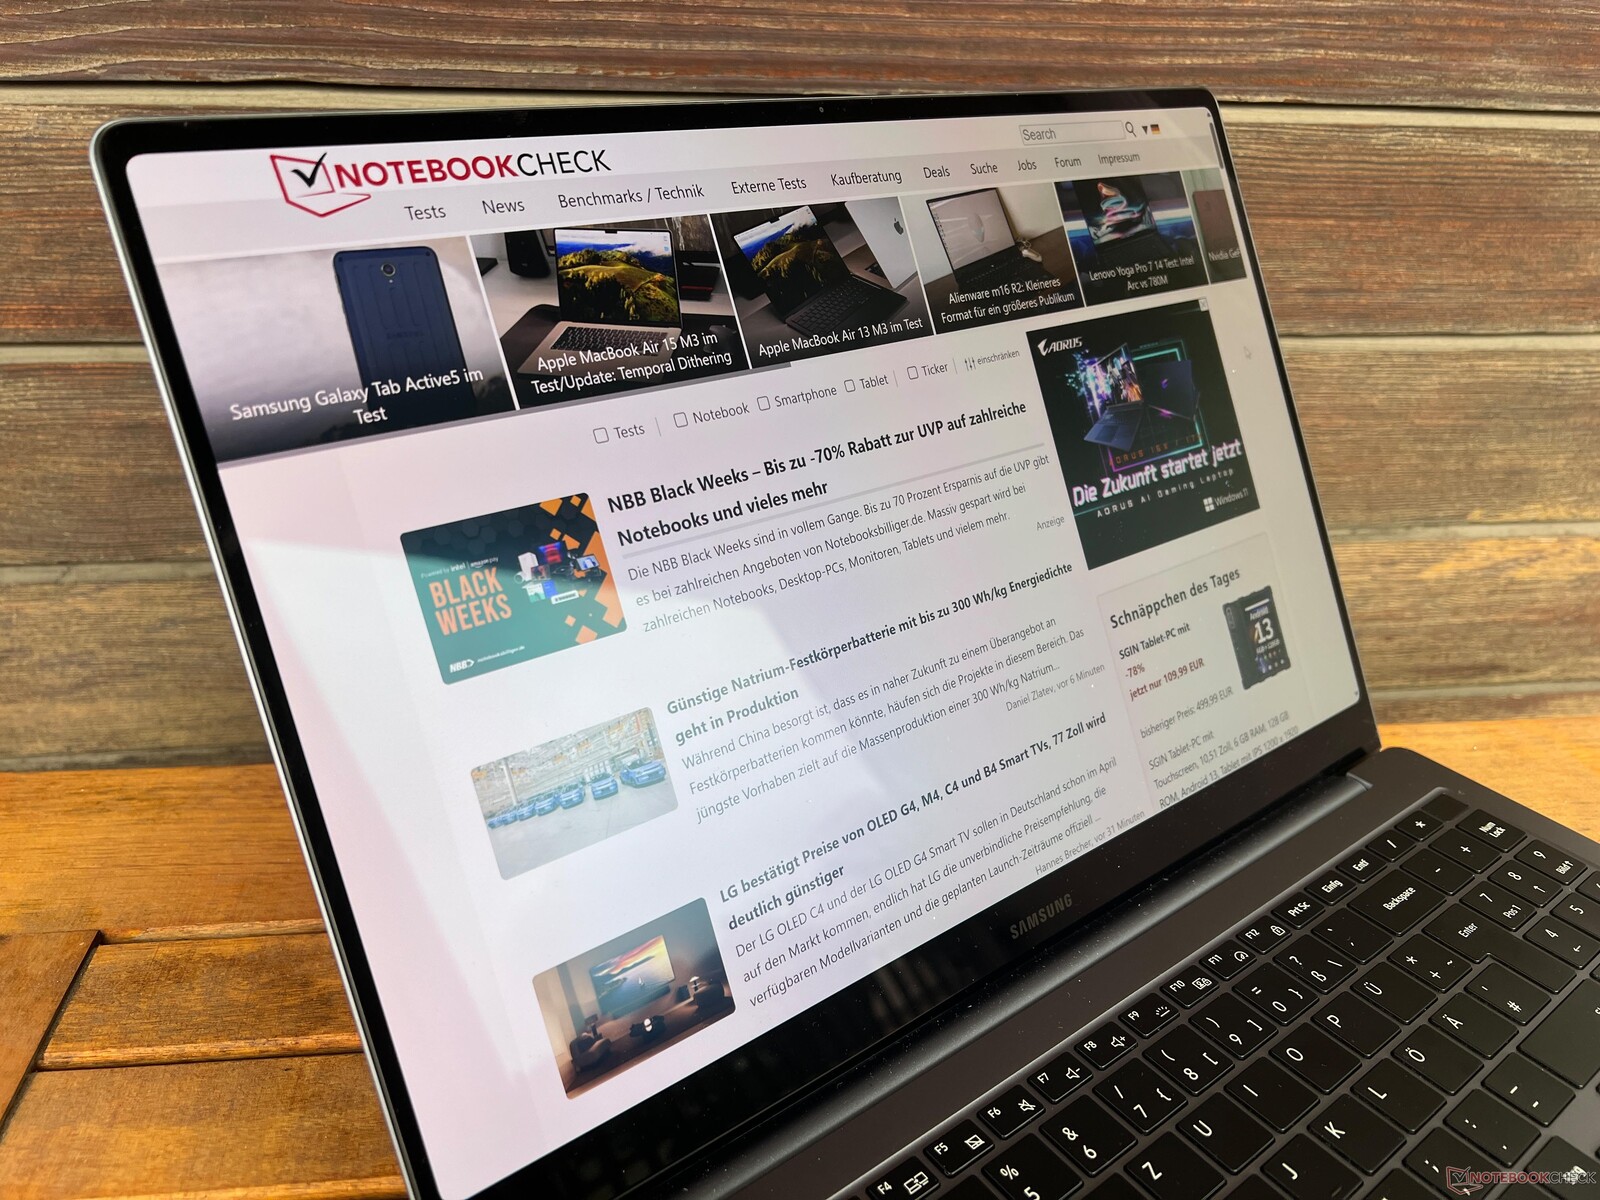
Étui - Le Galaxy Book est livré avec un étui métallique
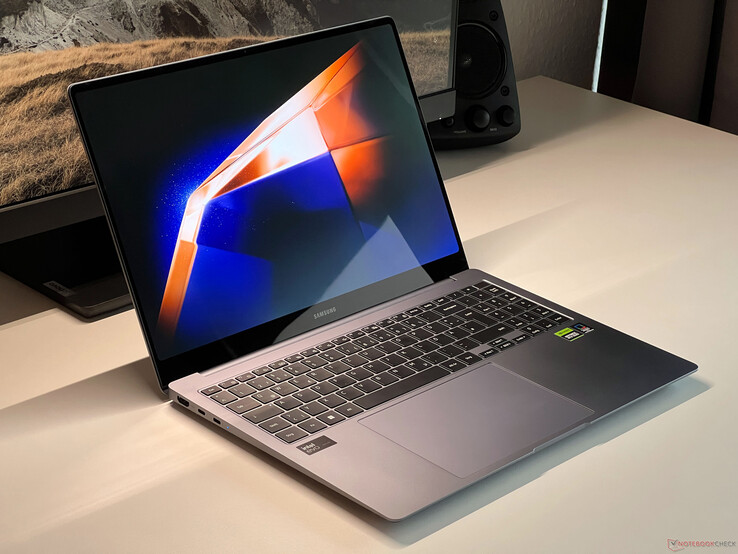
La conception du boîtier est inchangée par rapport à l'ancien modèle l'ancien modèle. Le boîtier en aluminium gris foncé (Moonstone Gray) est très haut de gamme et les surfaces offrent non seulement un retour d'information agréable, mais sont également insensibles aux traces de doigts et peuvent être facilement nettoyées. Cependant, l'épaisseur du cadre inférieur de l'écran est perceptible (1,7 cm) et gâche quelque peu l'aspect général.
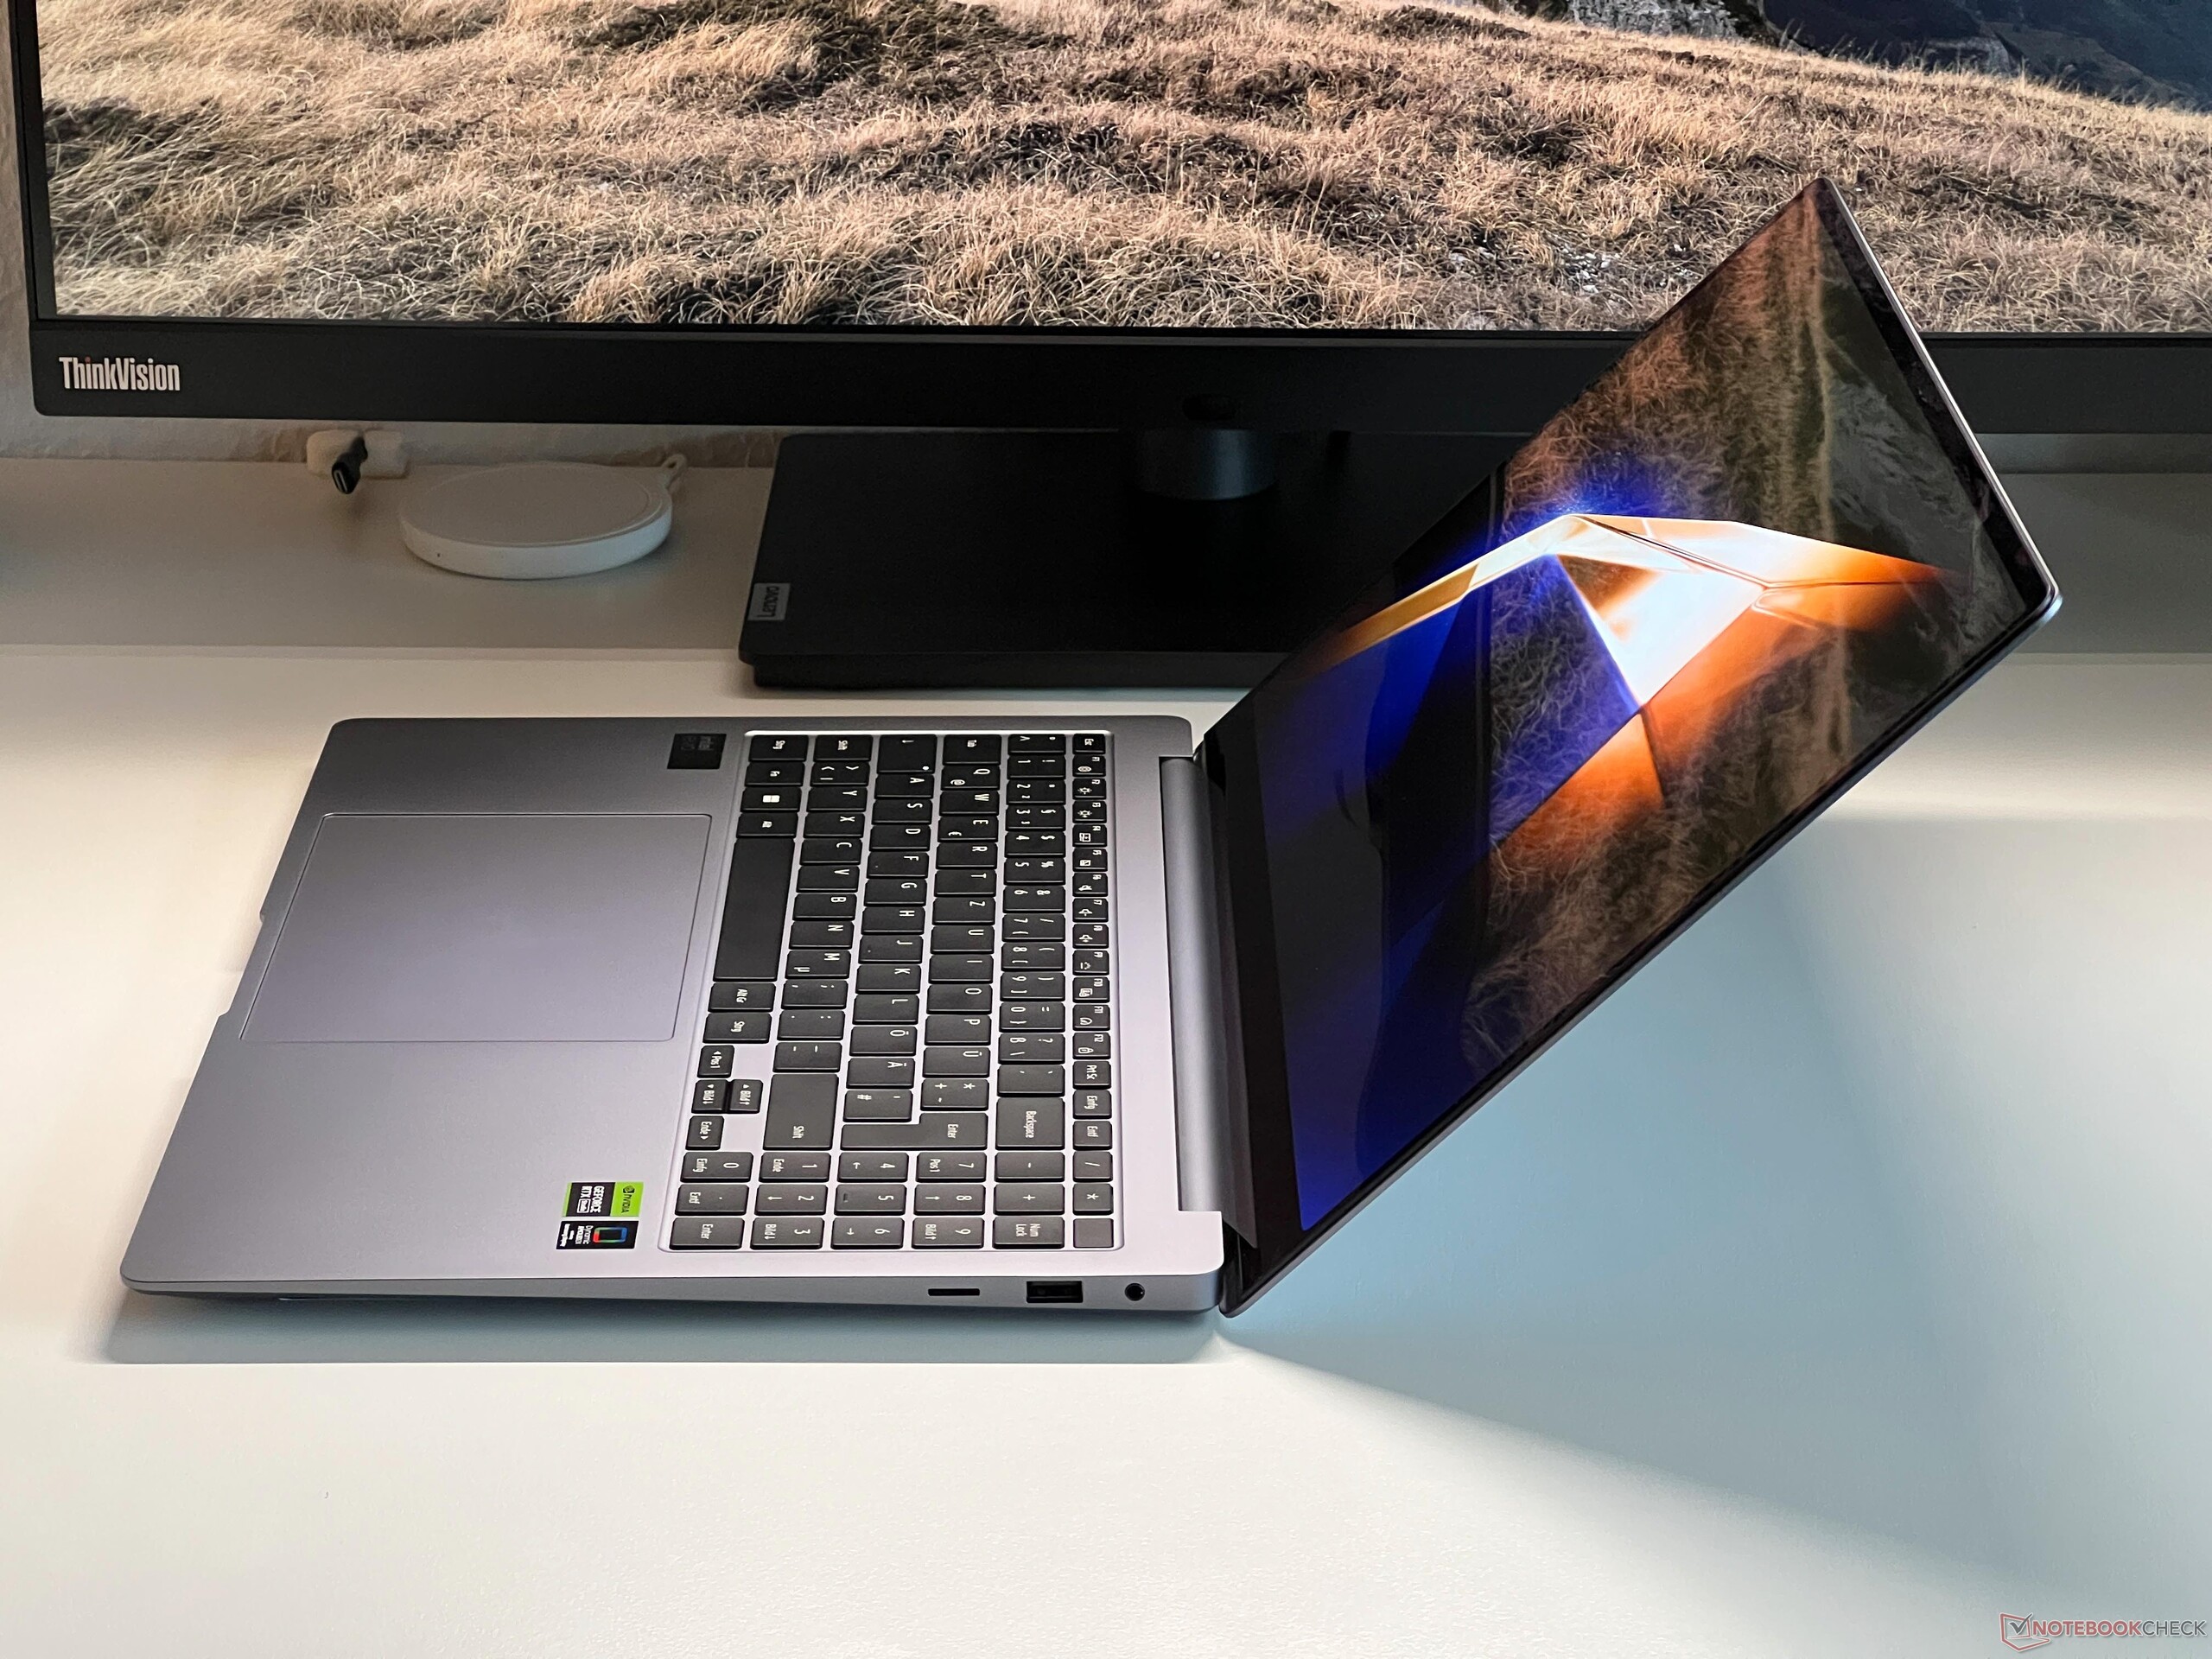
Le Galaxy Book4 Ultra fait bonne impression en termes de qualité de construction et de stabilité. La zone du clavier ne cède que légèrement et l'ensemble de l'unité de base résiste à la torsion. De plus, il n'y a aucun bruit de craquement à signaler. Le couvercle de l'écran lui-même est nettement plus fin et également très stable. Les charnières sont bien réglées et parviennent à éviter toute oscillation, et le couvercle peut être ouvert confortablement d'une seule main. L'angle d'ouverture maximal est de 135 degrés.
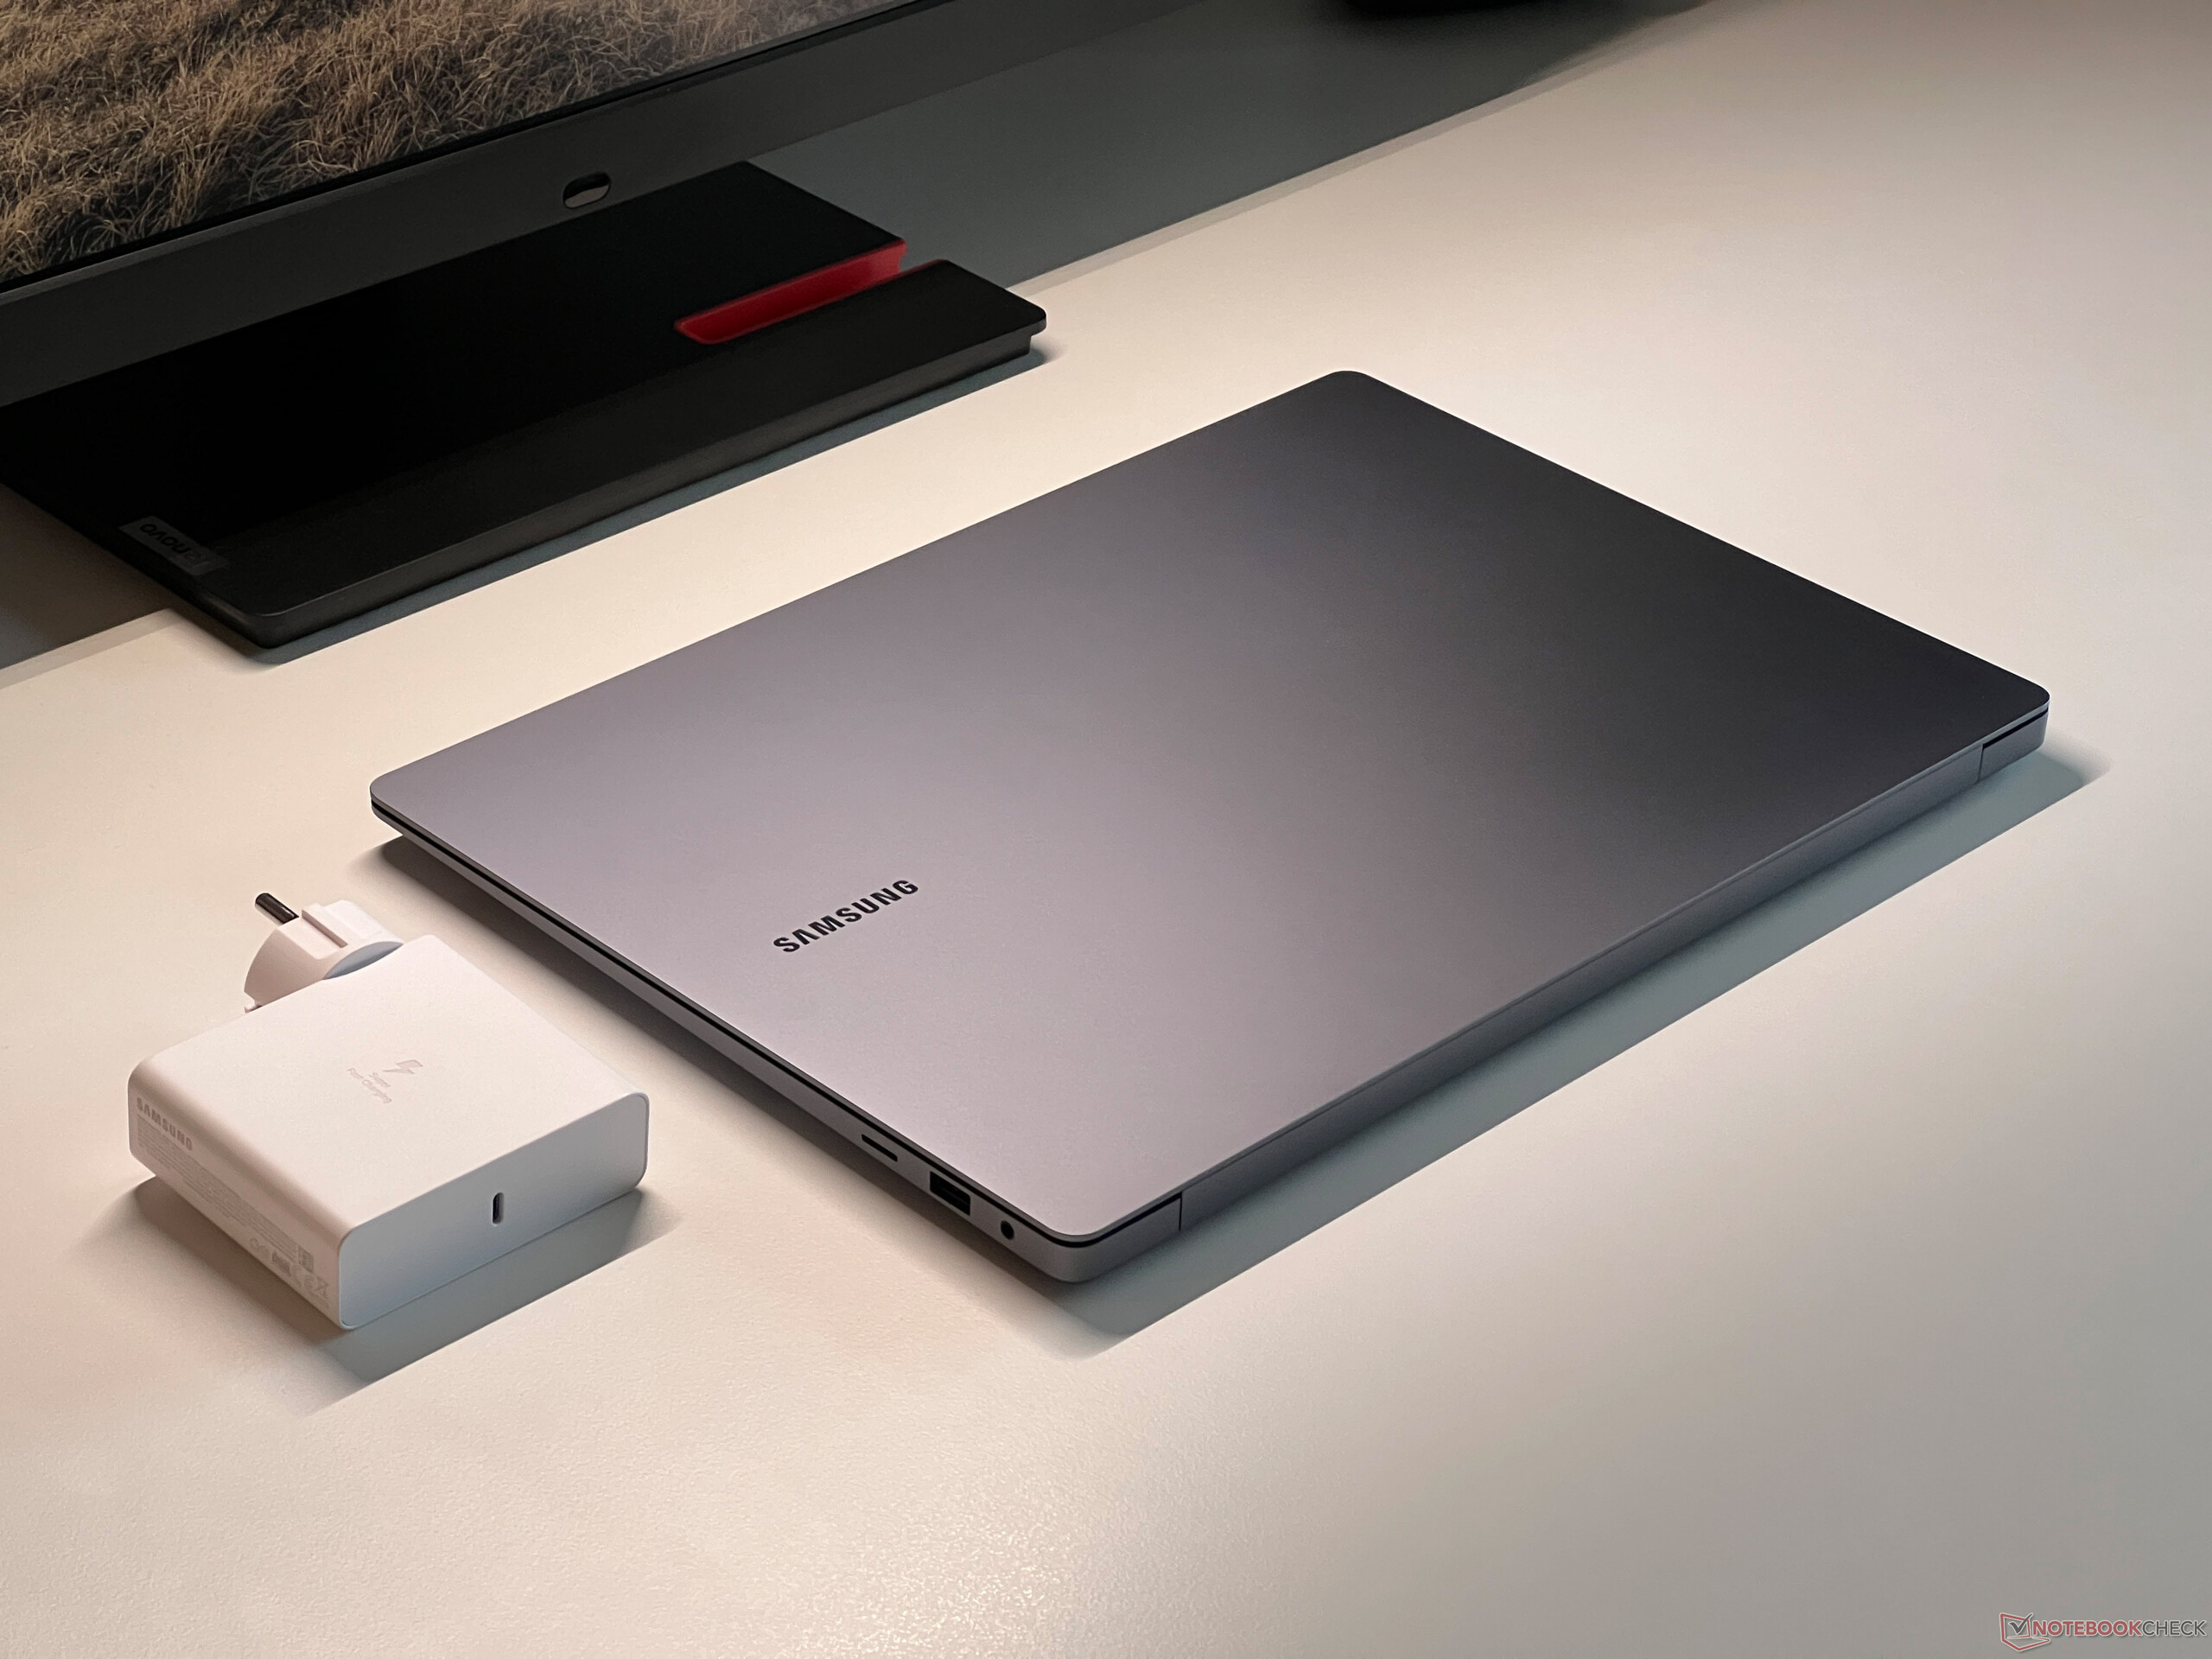
Le cadre épais de l'écran se remarque également au niveau de l'épaisseur de l'appareil, le Book4 Ultra prenant le plus de place par rapport à ses pairs. Avec une hauteur de 16,5 mm et un poids de 1,82 kg, l'appareil examiné se situe au milieu du peloton. Le bloc d'alimentation de 140 watts fourni apporte 351 grammes supplémentaires sur la balance.
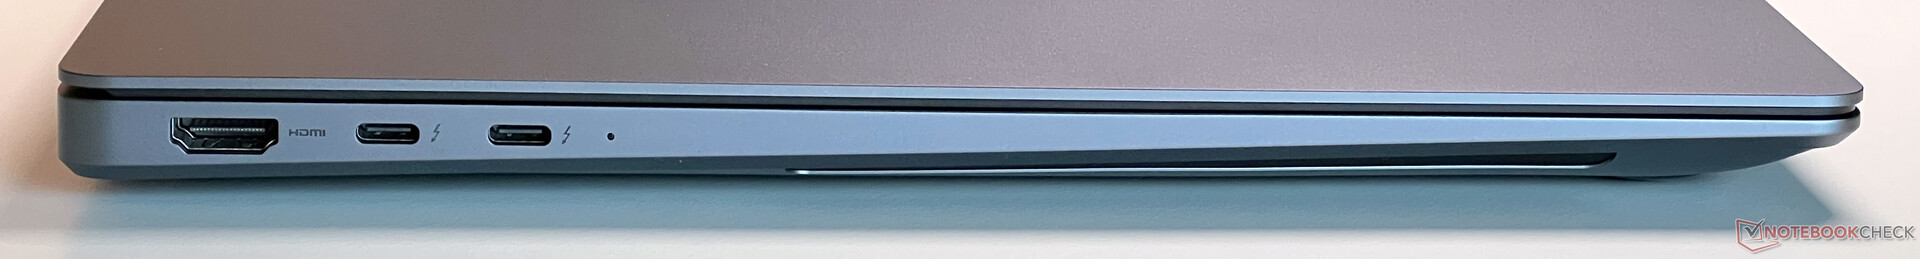
Caractéristiques - Thunderbolt 4 et HDMI 2.1
En plus des interfaces USB-C modernes qui incluent Thunderbolt 4, le Galaxy Book4 Ultra offre également un port USB-A ordinaire ainsi que HDMI 2.1. Cependant, l'une des interfaces USB peut également être utilisée pour le bloc d'alimentation. L'emplacement des ports sur les deux faces arrière de l'appareil n'est pas à critiquer. Le connecteur HDMI est relié directement au GPU Nvidia, mais pas les deux ports USB-C. Lors de l'utilisation d'un moniteur externe, le dGPU ne fonctionne pas toujours automatiquement de manière simultanée.
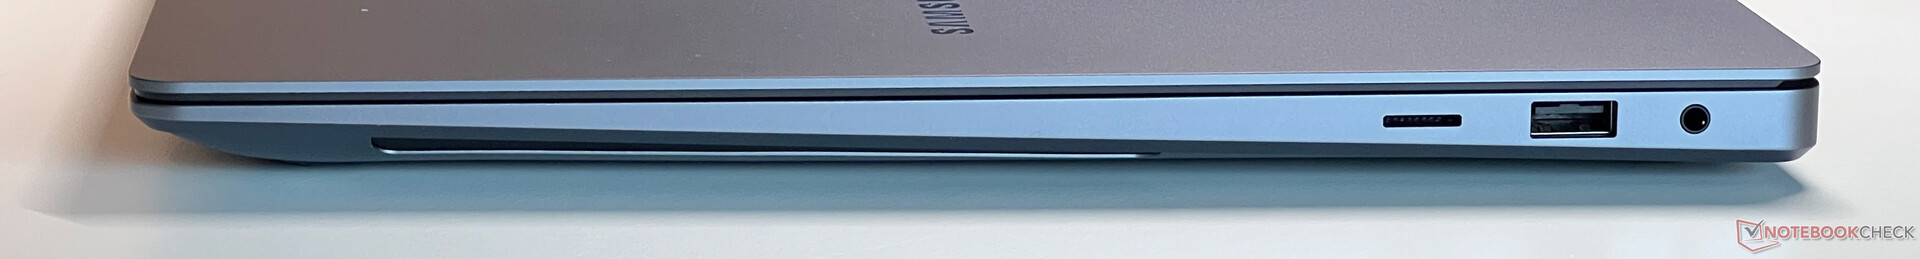
Lecteur de carte SD
Lors de notre test, le lecteur de carte microSD situé à droite a atteint des vitesses moyennes de 80 à 90 Mo/s avec notre carte de référence, l'Angelbird AV Pro V60. Cependant, le lecteur lui-même est problématique (mécanisme à ressort) car le point de connexion se trouve très profondément à l'intérieur du boîtier, ce qui rend difficile l'installation ou le retrait de la carte sans l'aide d'un outil.
| SD Card Reader | |
| average JPG Copy Test (av. of 3 runs) | |
| Lenovo ThinkPad Z16 Gen 2 (Toshiba Exceria Pro SDXC 64 GB UHS-II) | |
| Moyenne de la classe Multimedia (23 - 531, n=40, 2 dernières années) | |
| Samsung Galaxy Book4 Ultra (Angelbird AV Pro V60) | |
| Lenovo Slim Pro 9i 16IRP8 (PNY EliteX-Pro60 V60 256 GB) | |
| Samsung Galaxy Book3 Ultra 16 (AV PRO microSD 128 GB V60) | |
| Schenker VISION 16 Pro (M23) (Angelbird AV Pro V60) | |
| maximum AS SSD Seq Read Test (1GB) | |
| Lenovo ThinkPad Z16 Gen 2 (Toshiba Exceria Pro SDXC 64 GB UHS-II) | |
| Moyenne de la classe Multimedia (37.3 - 1455, n=39, 2 dernières années) | |
| Samsung Galaxy Book4 Ultra (Angelbird AV Pro V60) | |
| Lenovo Slim Pro 9i 16IRP8 (PNY EliteX-Pro60 V60 256 GB) | |
| Samsung Galaxy Book3 Ultra 16 (AV PRO microSD 128 GB V60) | |
| Schenker VISION 16 Pro (M23) (Angelbird AV Pro V60) | |
Communication
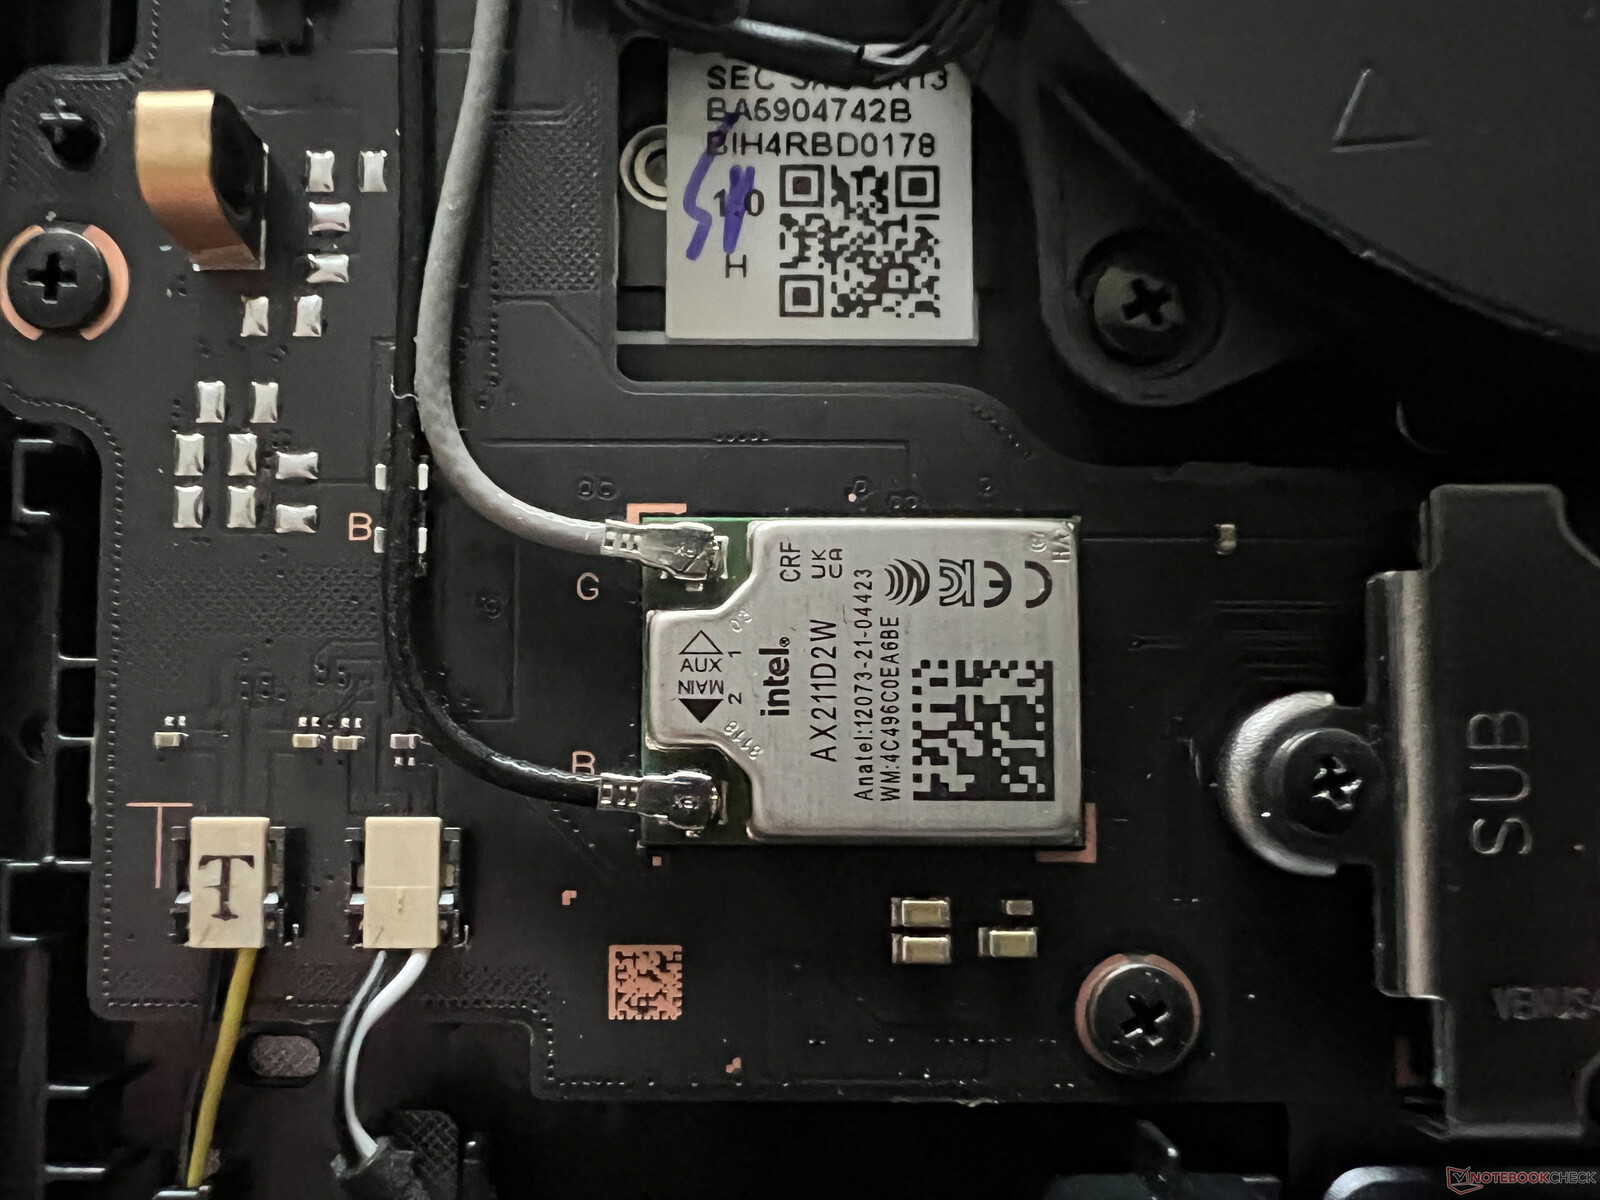
Samsung utilise le module Intel AX211 bien connu qui prend en charge la norme Wi-Fi 6E dans les réseaux de 6 GHz ainsi que Bluetooth 5.3. En tandem avec notre routeur de référence Asus, les vitesses de transfert sont très bonnes et stables. Malgré cela, le nouveau Galaxy Book4 Ultra ne prend pas en charge le Wi-Fi 7.
| Networking | |
| Samsung Galaxy Book4 Ultra | |
| iperf3 transmit AXE11000 | |
| iperf3 receive AXE11000 | |
| Lenovo ThinkPad Z16 Gen 2 | |
| iperf3 transmit AXE11000 | |
| iperf3 receive AXE11000 | |
| iperf3 transmit AXE11000 6GHz | |
| iperf3 receive AXE11000 6GHz | |
| Lenovo Slim Pro 9i 16IRP8 | |
| iperf3 transmit AXE11000 | |
| iperf3 receive AXE11000 | |
| iperf3 transmit AXE11000 6GHz | |
| iperf3 receive AXE11000 6GHz | |
| Schenker VISION 16 Pro (M23) | |
| iperf3 transmit AXE11000 | |
| iperf3 receive AXE11000 | |
| Samsung Galaxy Book3 Ultra 16 | |
| iperf3 transmit AXE11000 | |
| iperf3 receive AXE11000 | |
| Apple MacBook Pro 16 2023 M3 Max | |
| iperf3 transmit AXE11000 | |
| iperf3 receive AXE11000 | |
| HP Spectre x360 16 RTX 4050 | |
| iperf3 transmit AXE11000 | |
| iperf3 receive AXE11000 | |
| iperf3 transmit AXE11000 6GHz | |
| iperf3 receive AXE11000 6GHz | |
Webcam
En ce qui concerne la webcam 1080p, il n'y a pas de changement et la qualité reste moyenne. L'appareil est dépourvu d'un obturateur mécanique et d'un module IR pour la reconnaissance faciale. Grâce au nouveau NPU de la puce Meteor Lake, Studio Effects (flou d'arrière-plan, contact visuel, suivi de la tête) pour la webcam est pris en charge directement par le système d'exploitation, quelle que soit l'application utilisée.


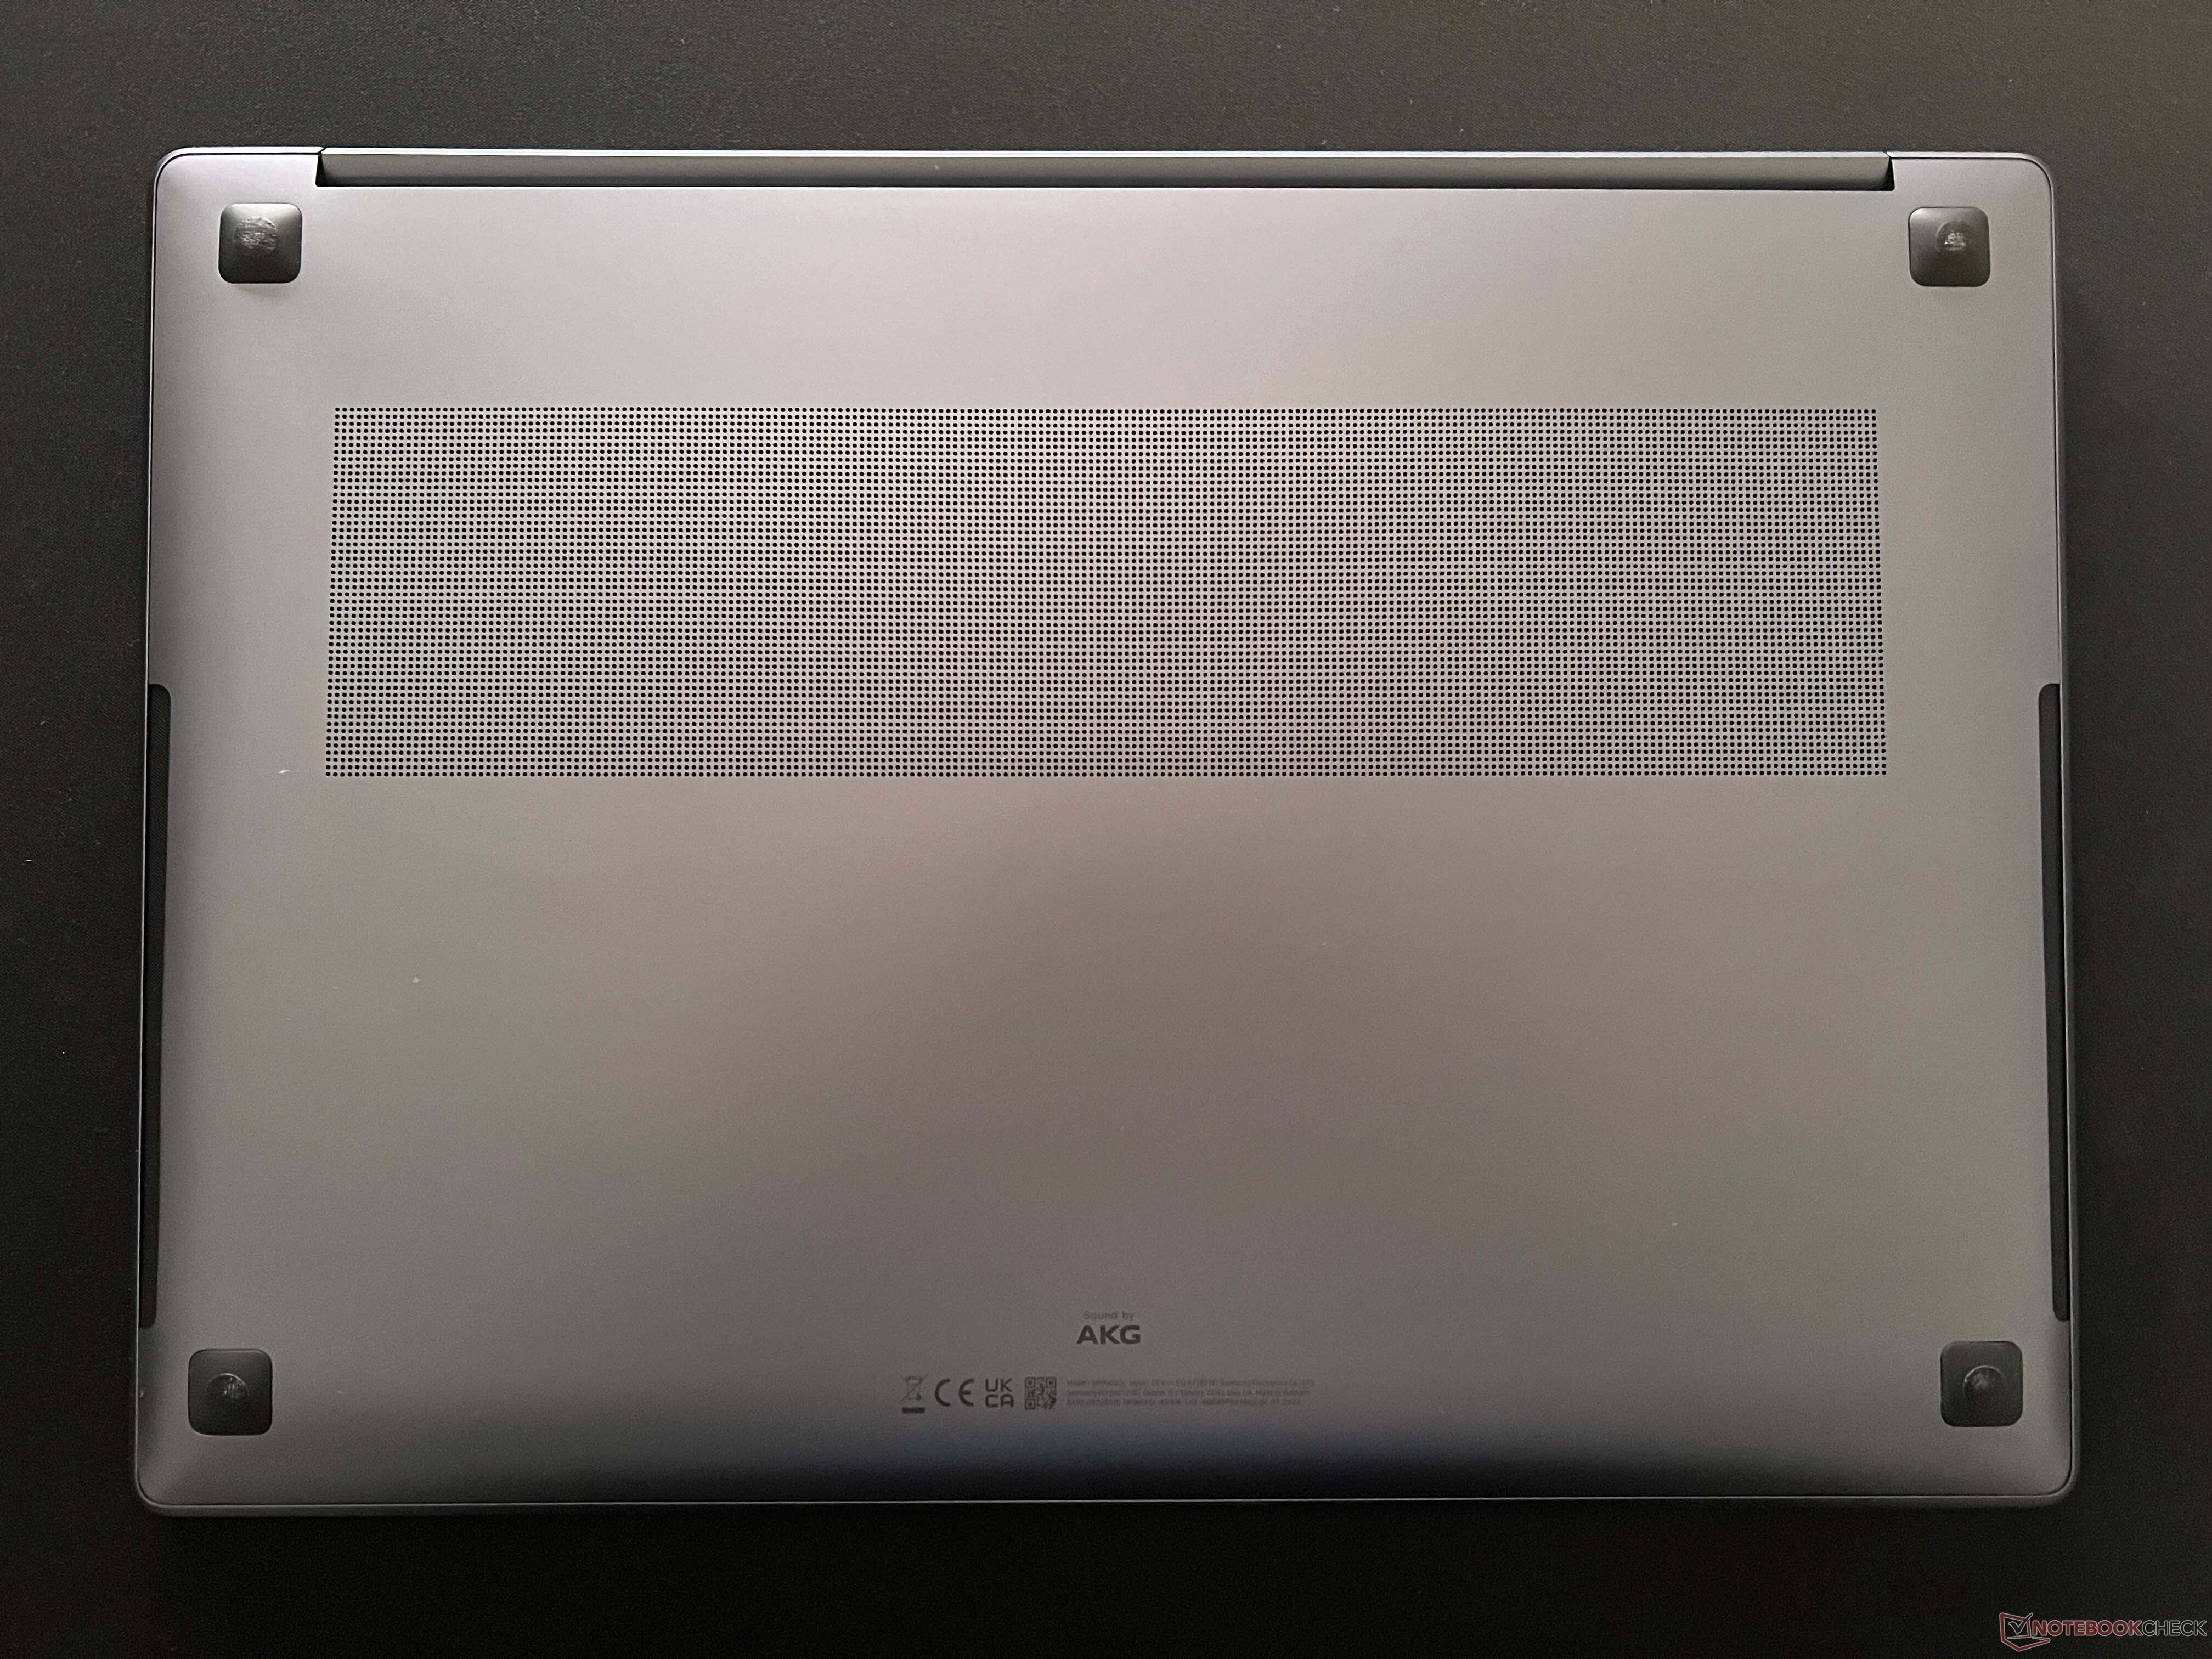
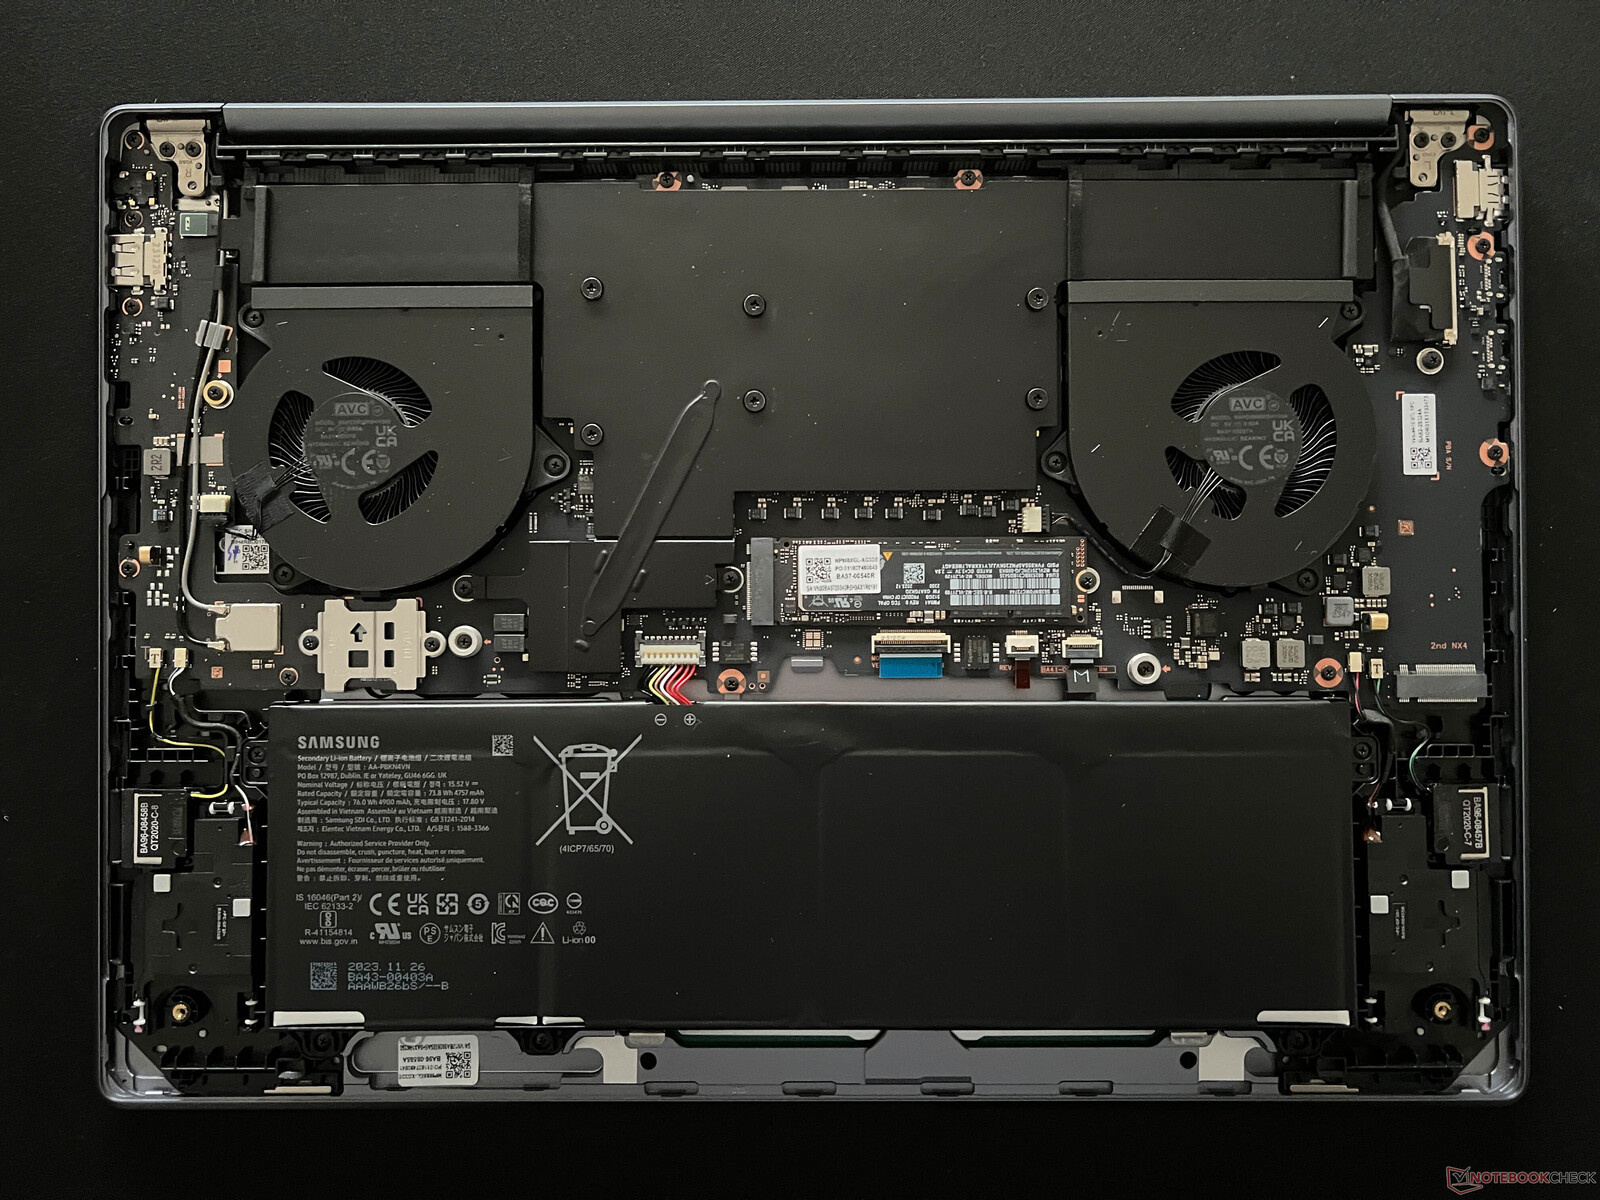
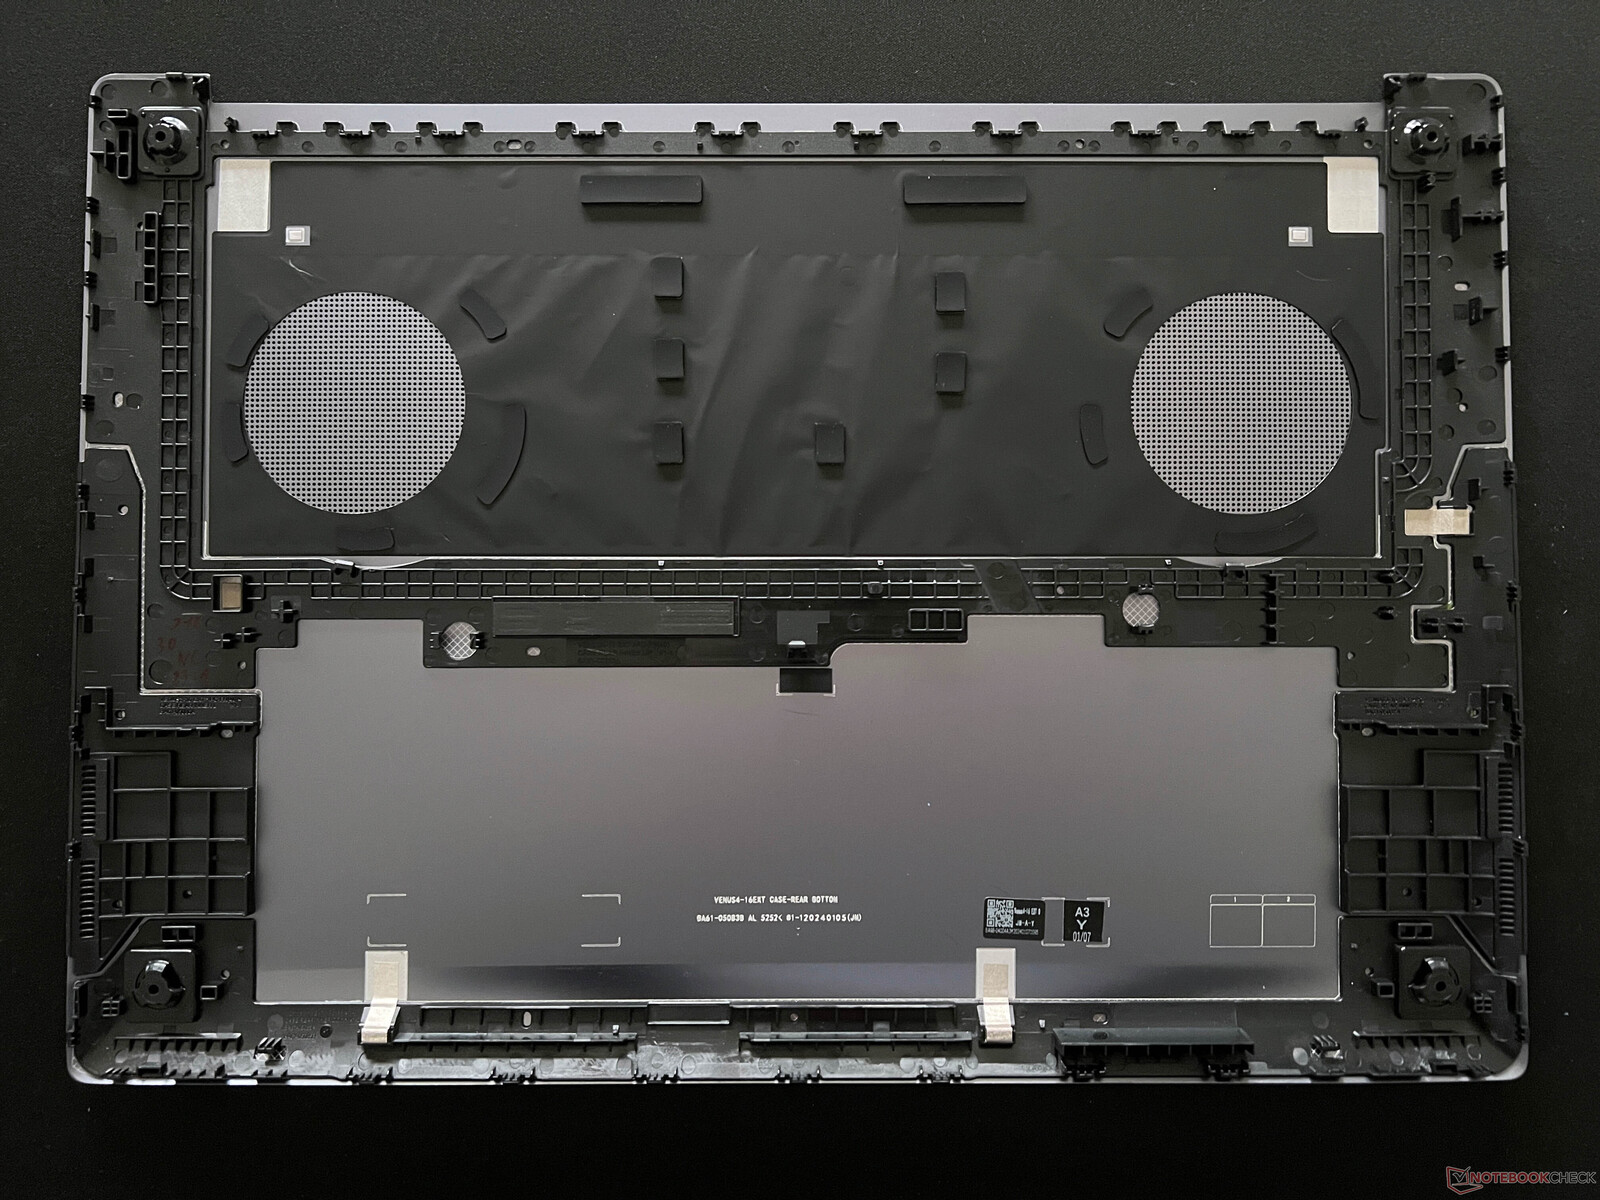
Maintenance
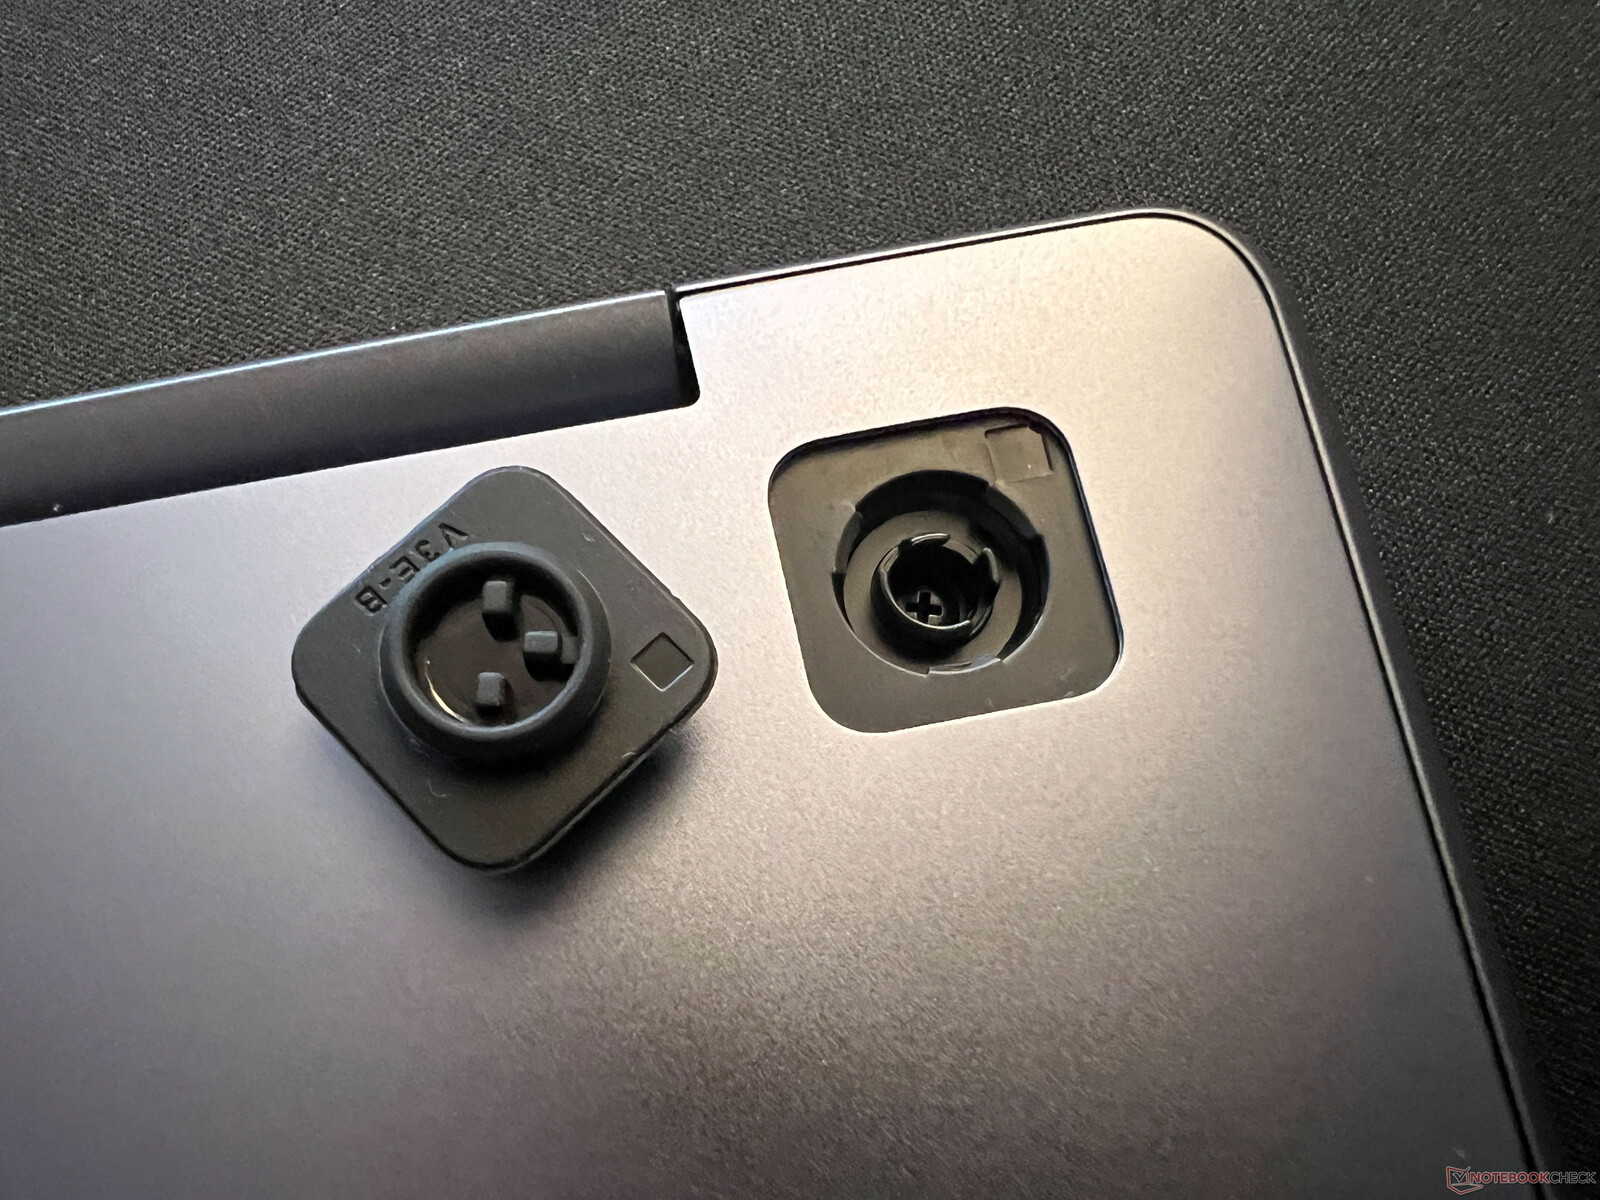
Sur la base de l'appareil, quatre vis sont cachées sous les pieds en caoutchouc. Cependant, même sans les vis, le couvercle de la base est très solidement fixé grâce à des clips de fixation supplémentaires situés au milieu de l'appareil. À l'intérieur de l'appareil, vous êtes confronté aux deux ventilateurs et à la grande chambre à vapeur. Il y a deux emplacements pour les SSD M.2 2280 et bien que la batterie vissée puisse être remplacée, tous les autres composants sont soudés.
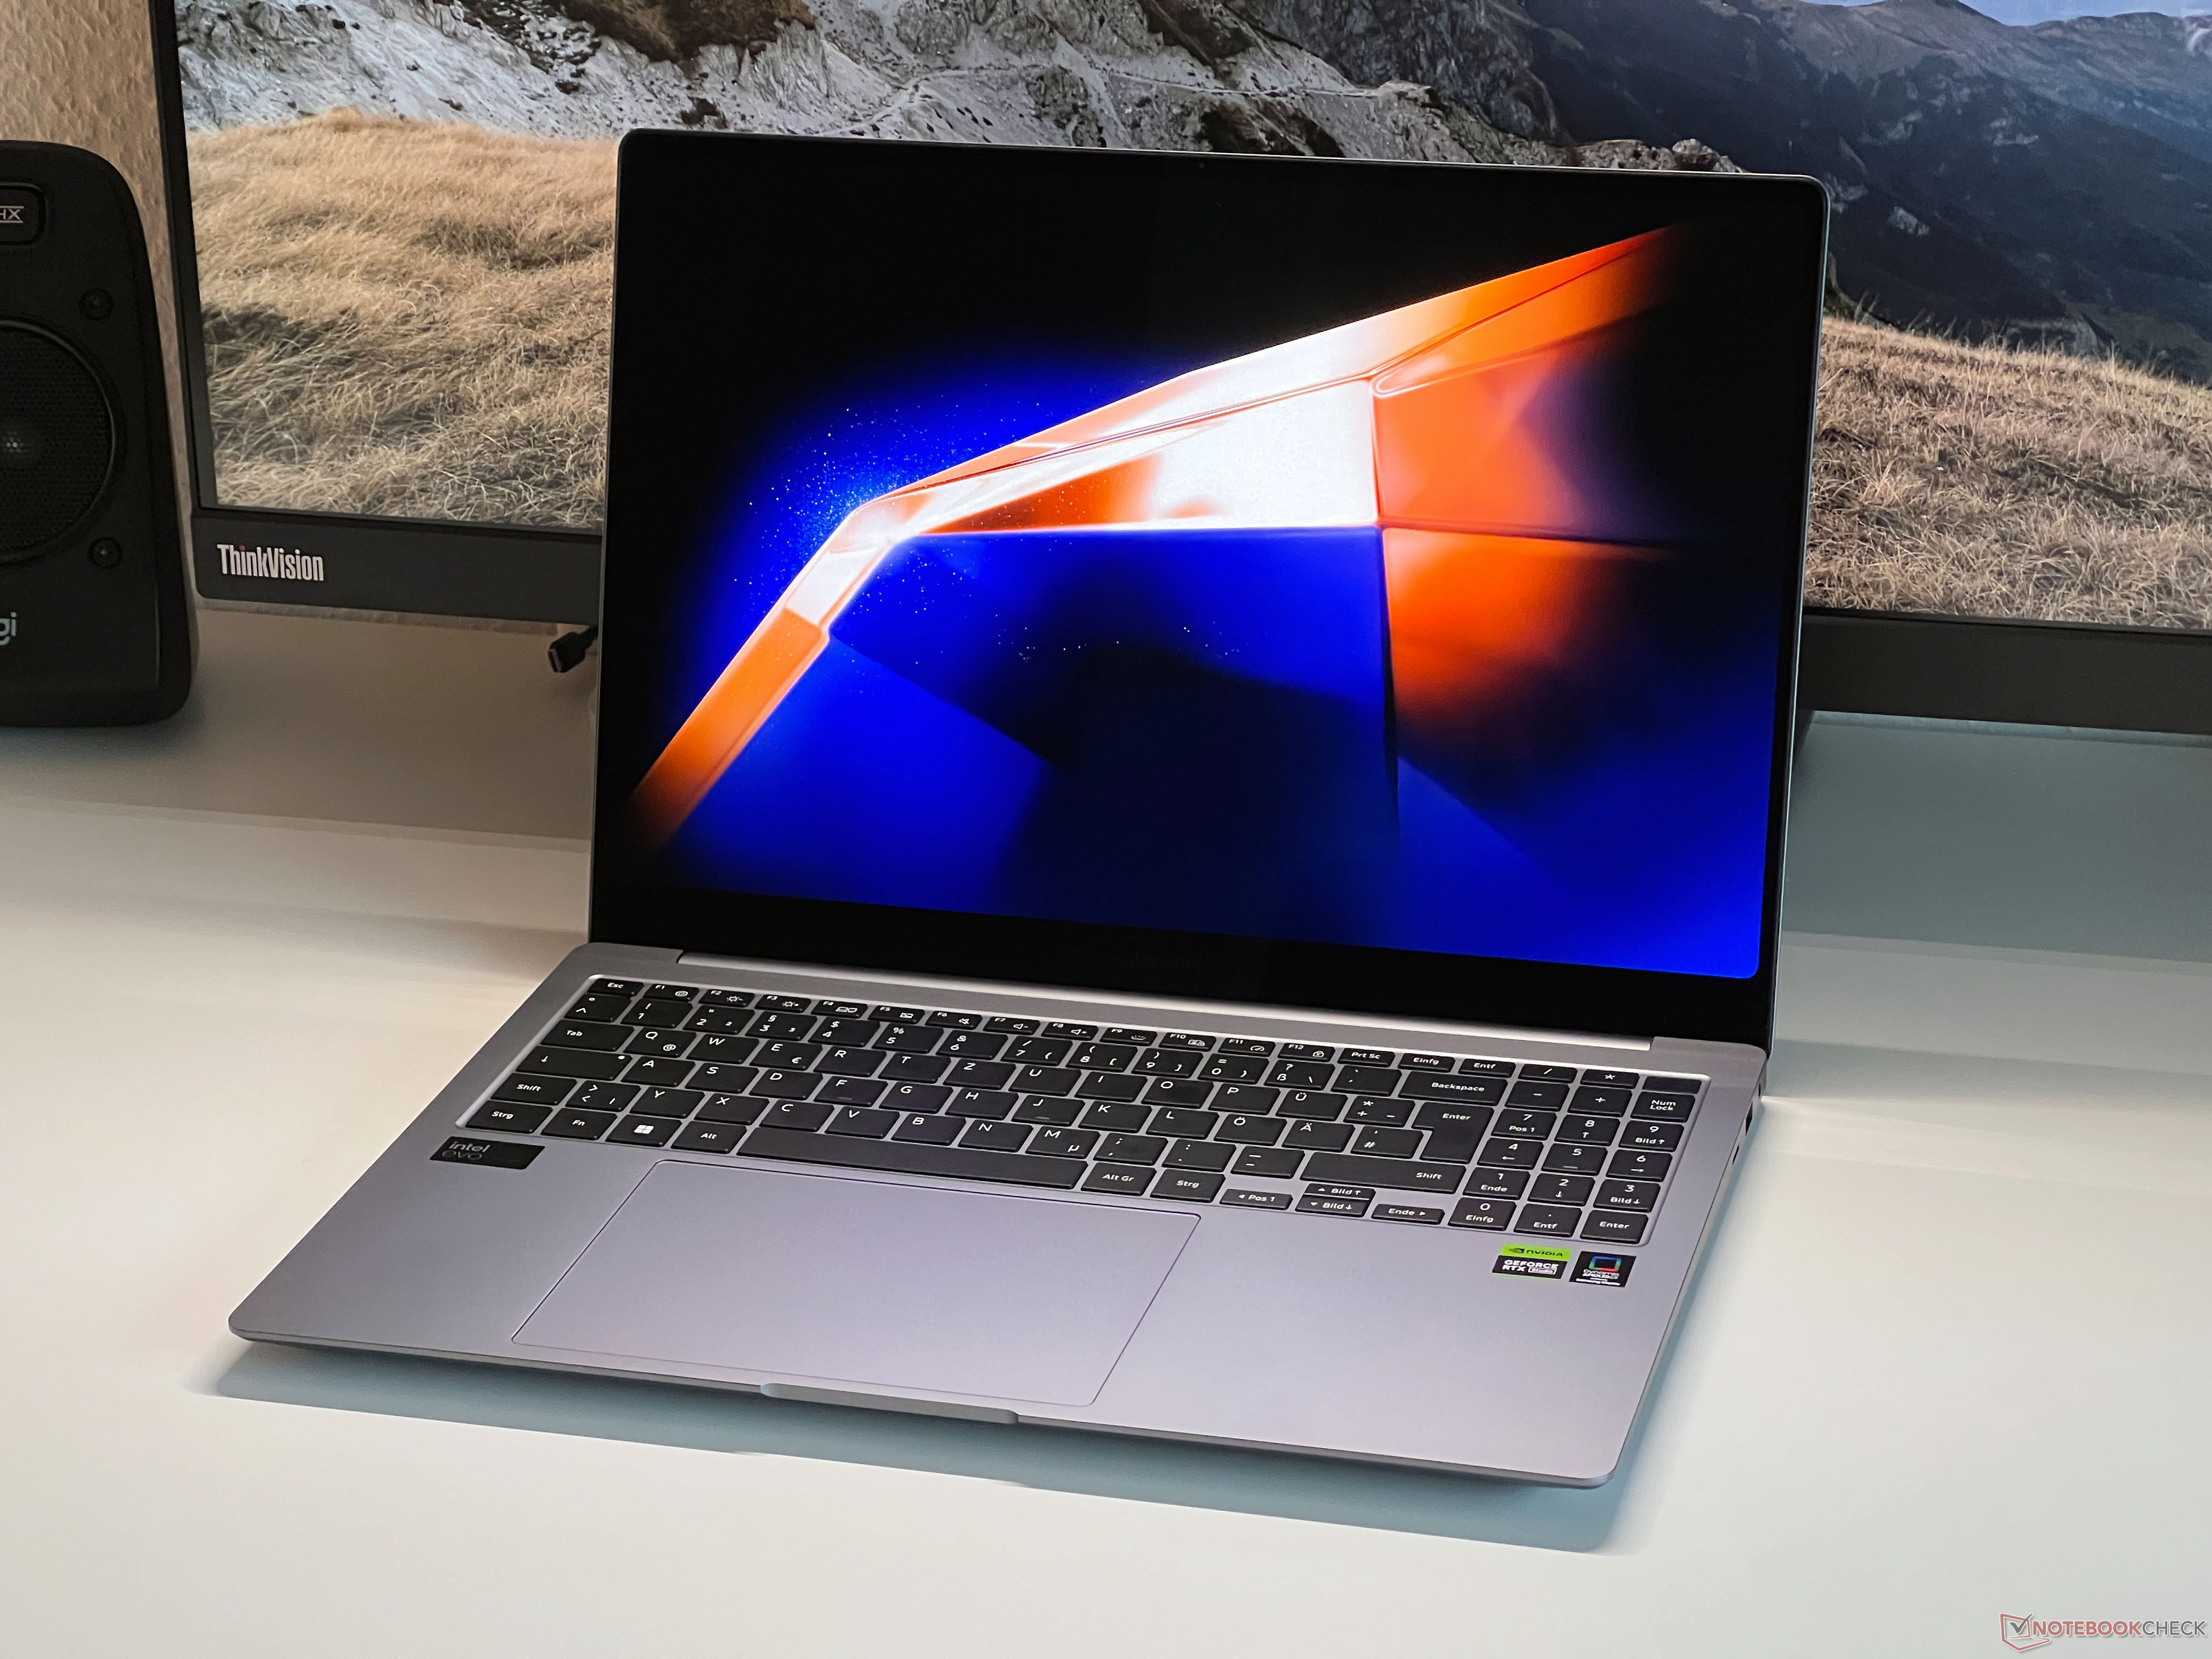
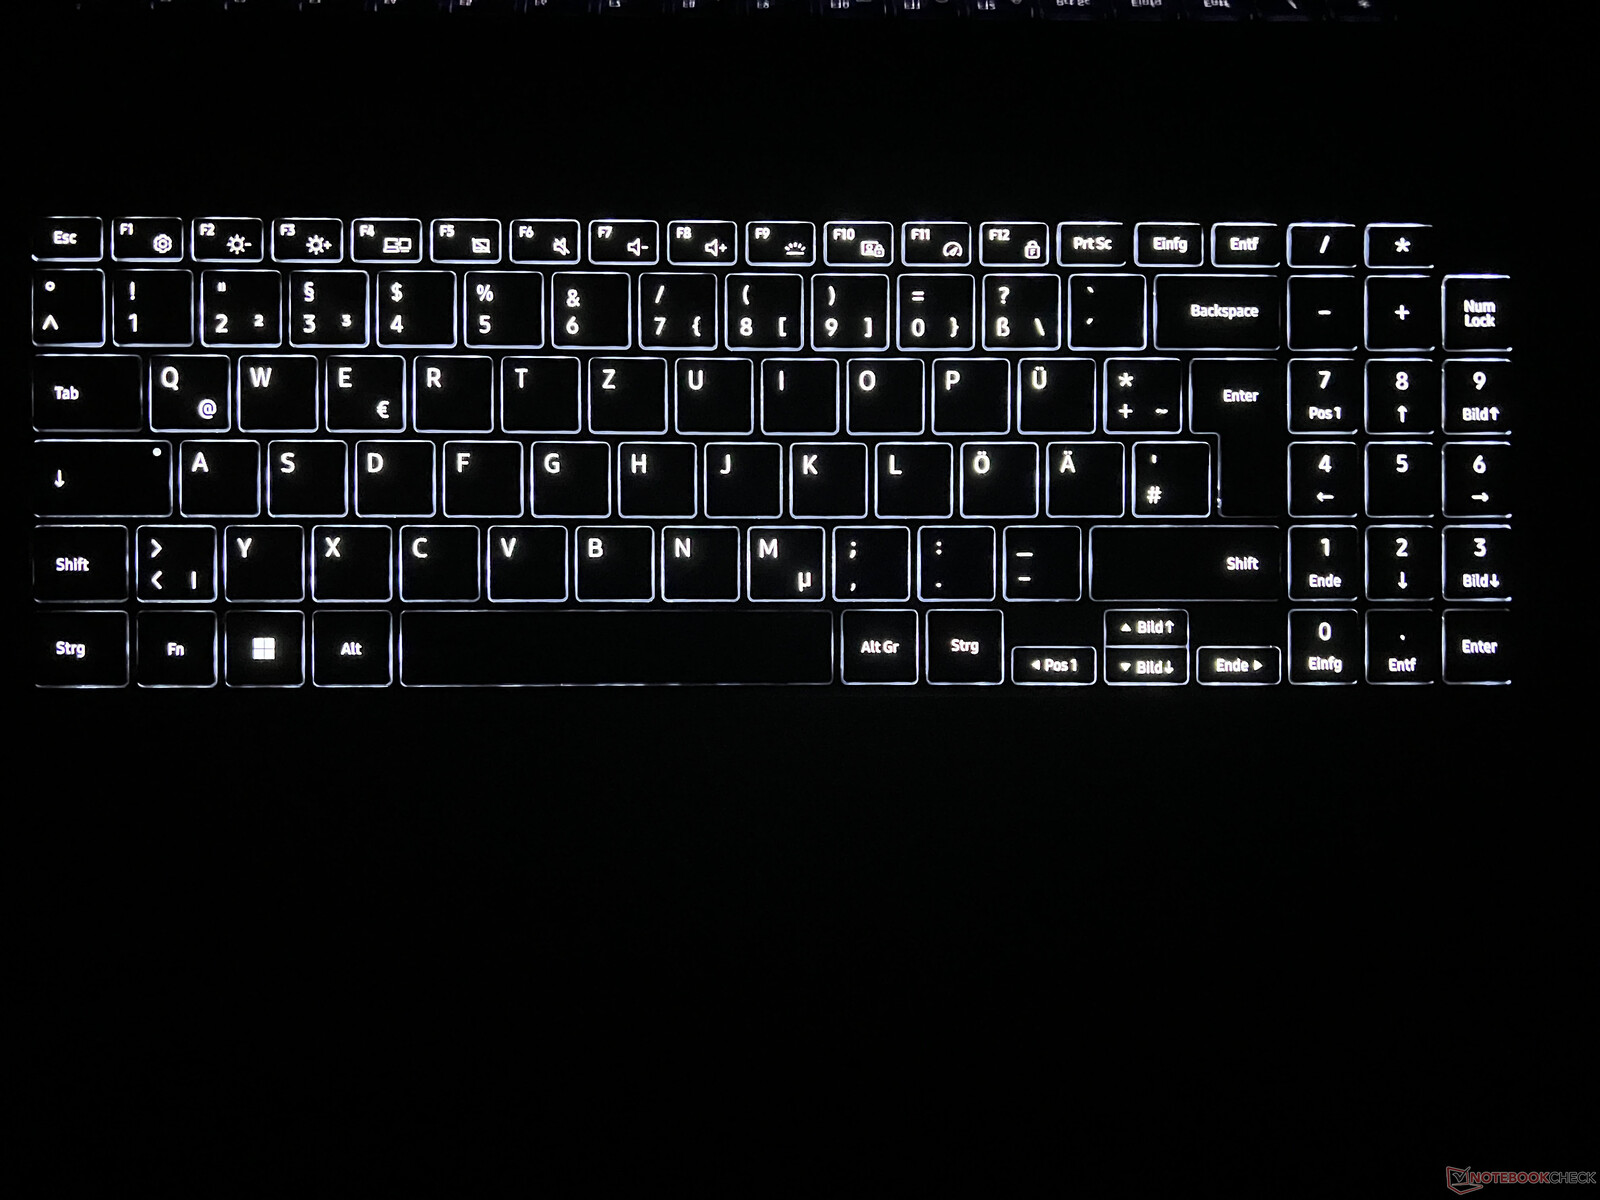
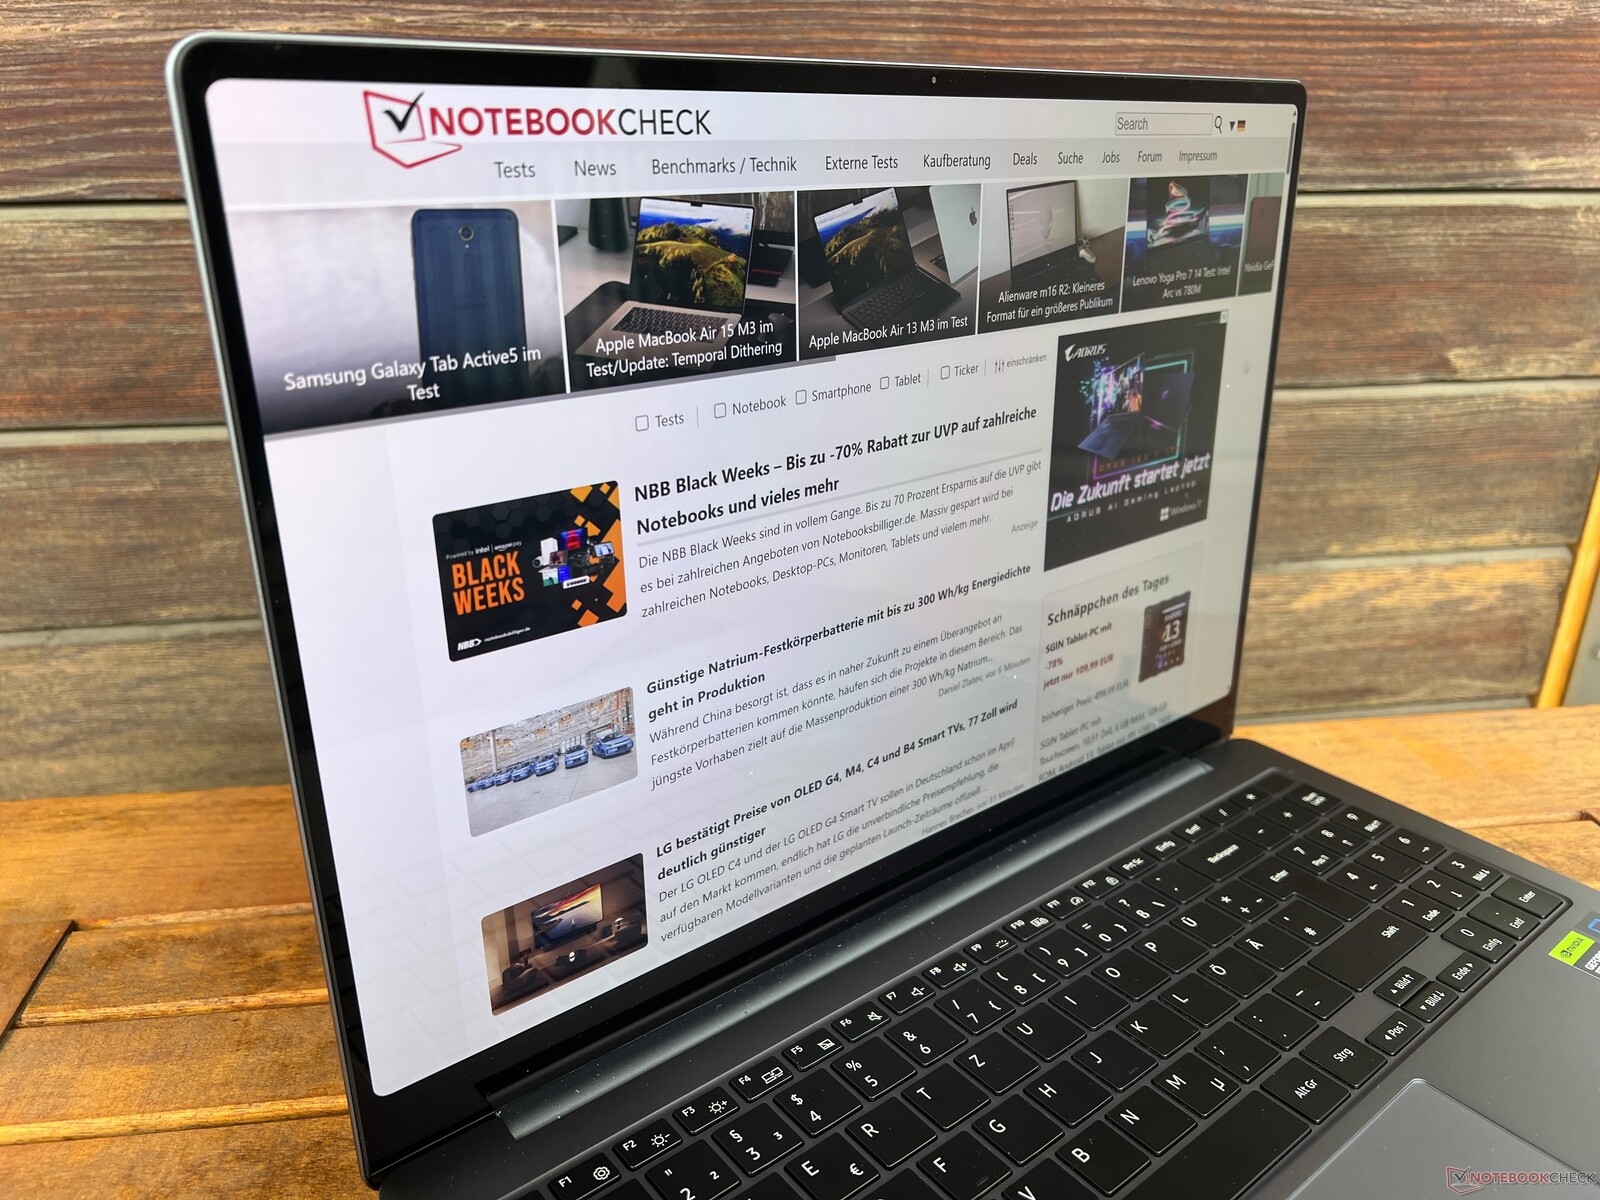
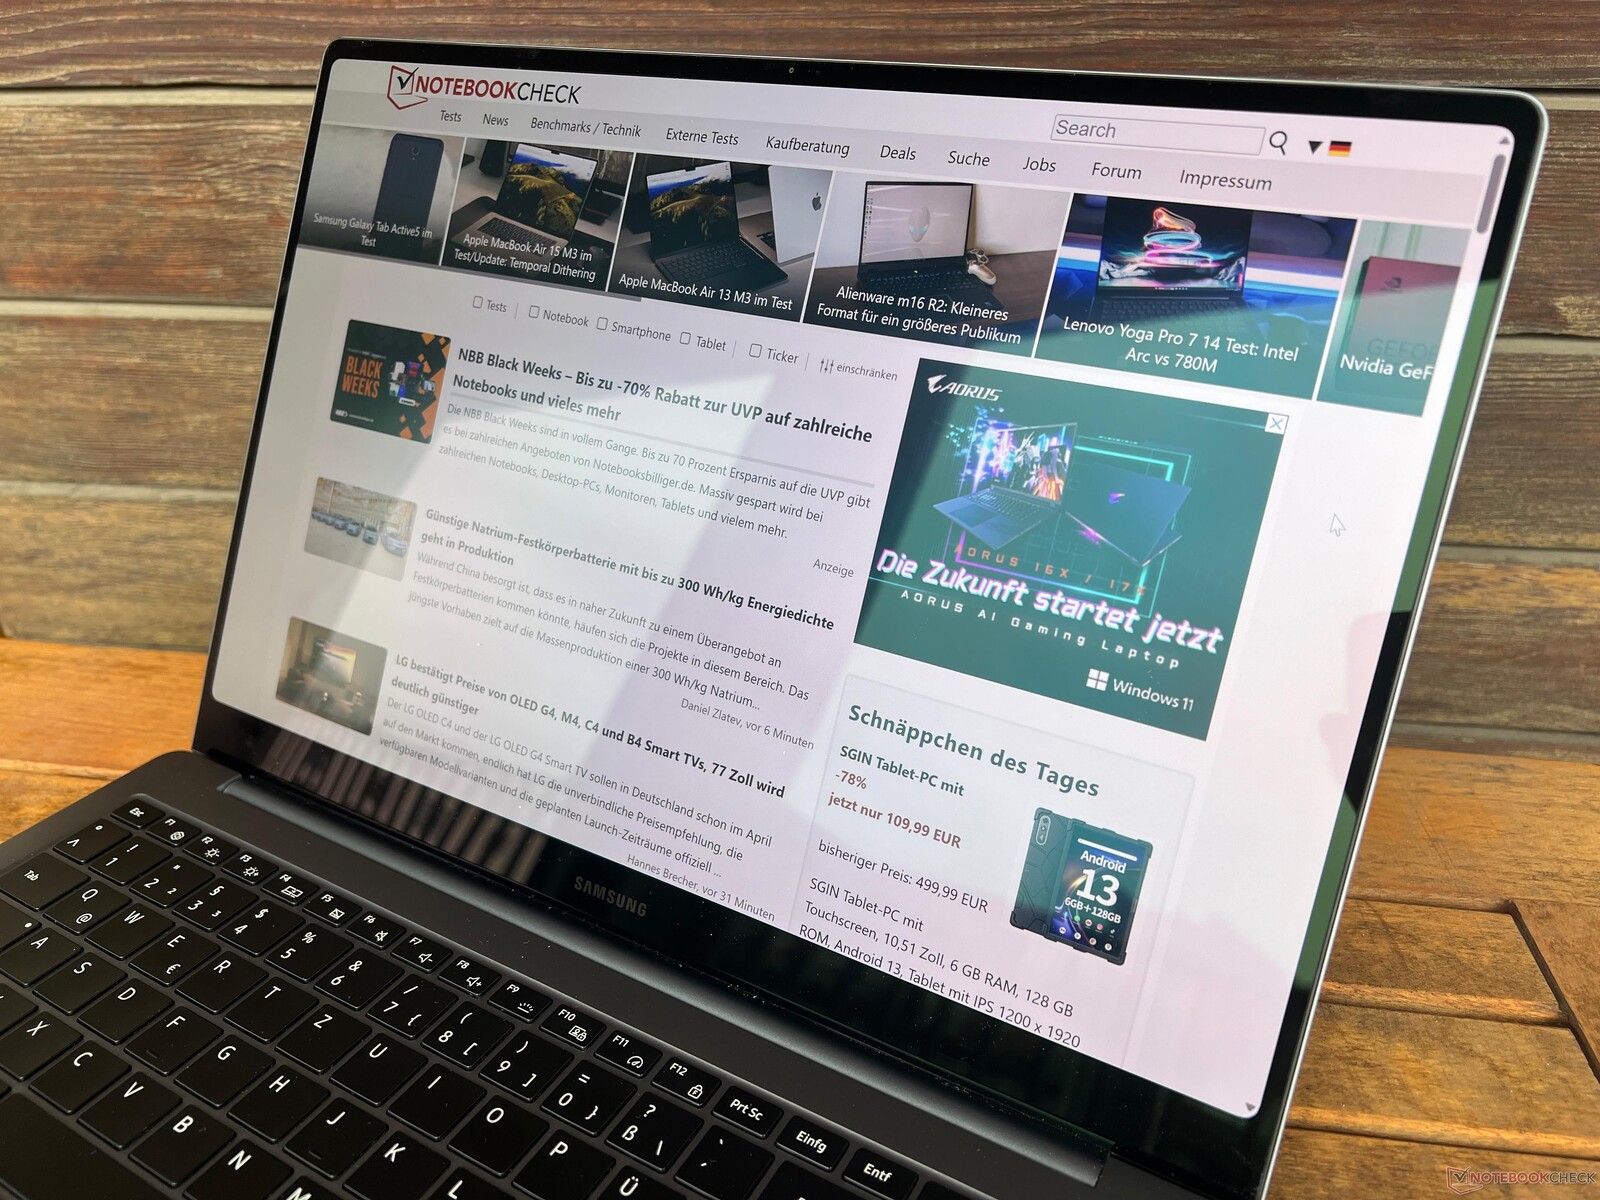
Dispositifs d'entrée - Énorme pavé tactile, clavier moyen
Samsung a équipé le Galaxy Book4 Ultra d'un clavier et d'un pavé numérique. L'expérience de frappe souffre légèrement d'une course des touches trop faible ainsi que d'un bruit de frappe audible et, en comparaison directe avec le Galaxy Book4 Pro, les frappes ne sont pas aussi précises. Dans ce domaine, l'ordinateur portable de Samsung est également à la traîne par rapport à la concurrence. Les personnes qui tapent beaucoup devraient essayer le clavier au préalable. Le bouton d'alimentation situé en haut à droite sert également de capteur d'empreintes digitales. Le rétroéclairage blanc offre trois niveaux d'intensité et peut être activé automatiquement.
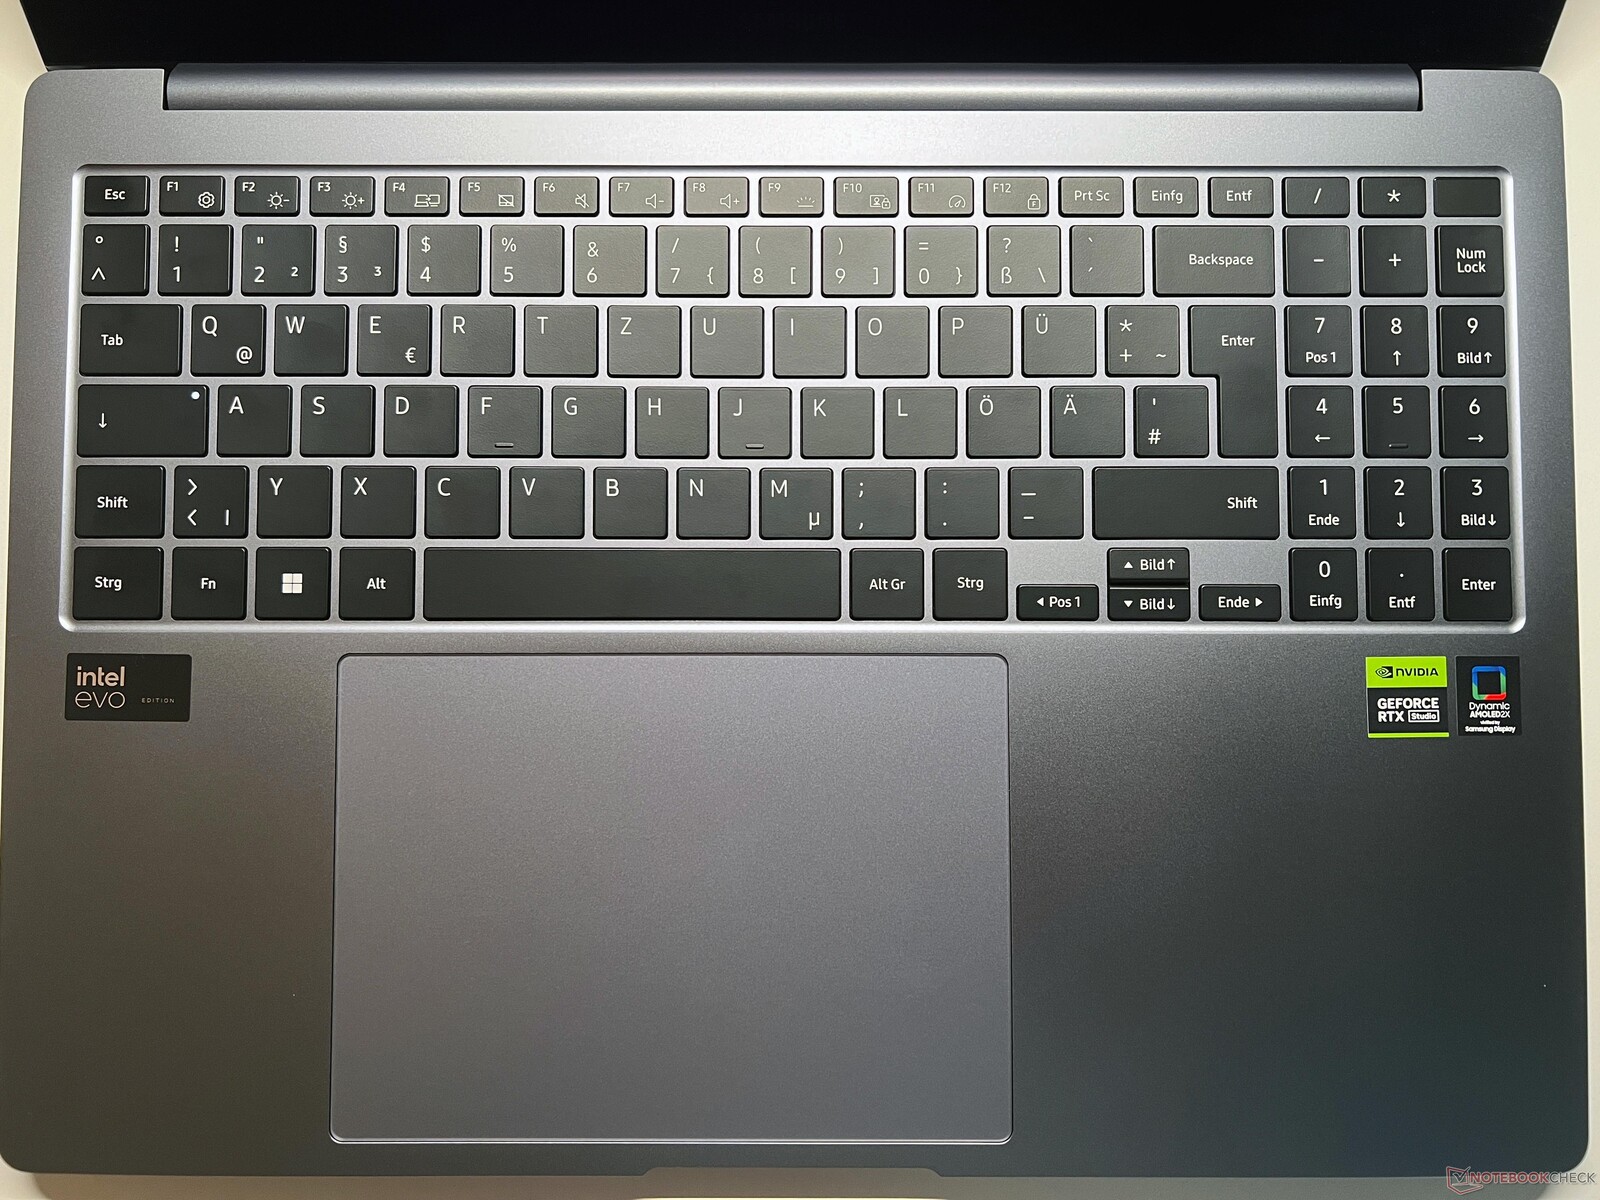
Les gestes de glissement effectués sur l'énorme pavé tactile (15,1 x 10,8 cm) sont très bons, même s'il est situé un peu à gauche du centre. Lorsqu'il s'agit de taper, la boule de la main gauche est presque toujours sur le pavé tactile, mais cela ne s'est pas avéré être un problème pendant les tests. La partie inférieure du pavé peut être cliquée, mais cela se fait au prix d'un bruit relativement fort et bon marché.
Affichage - AMOLED 120 Hz
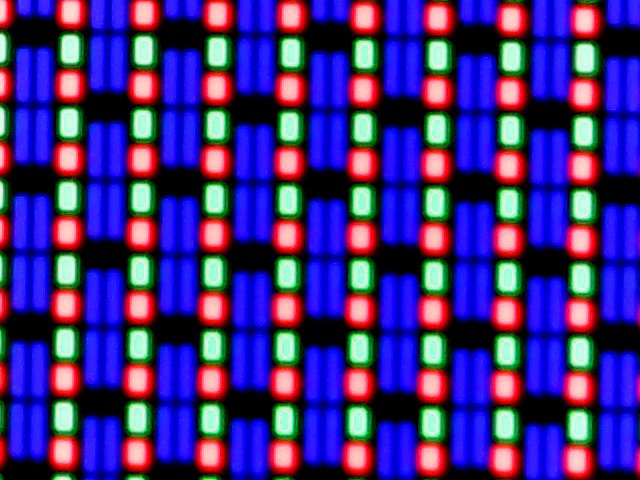
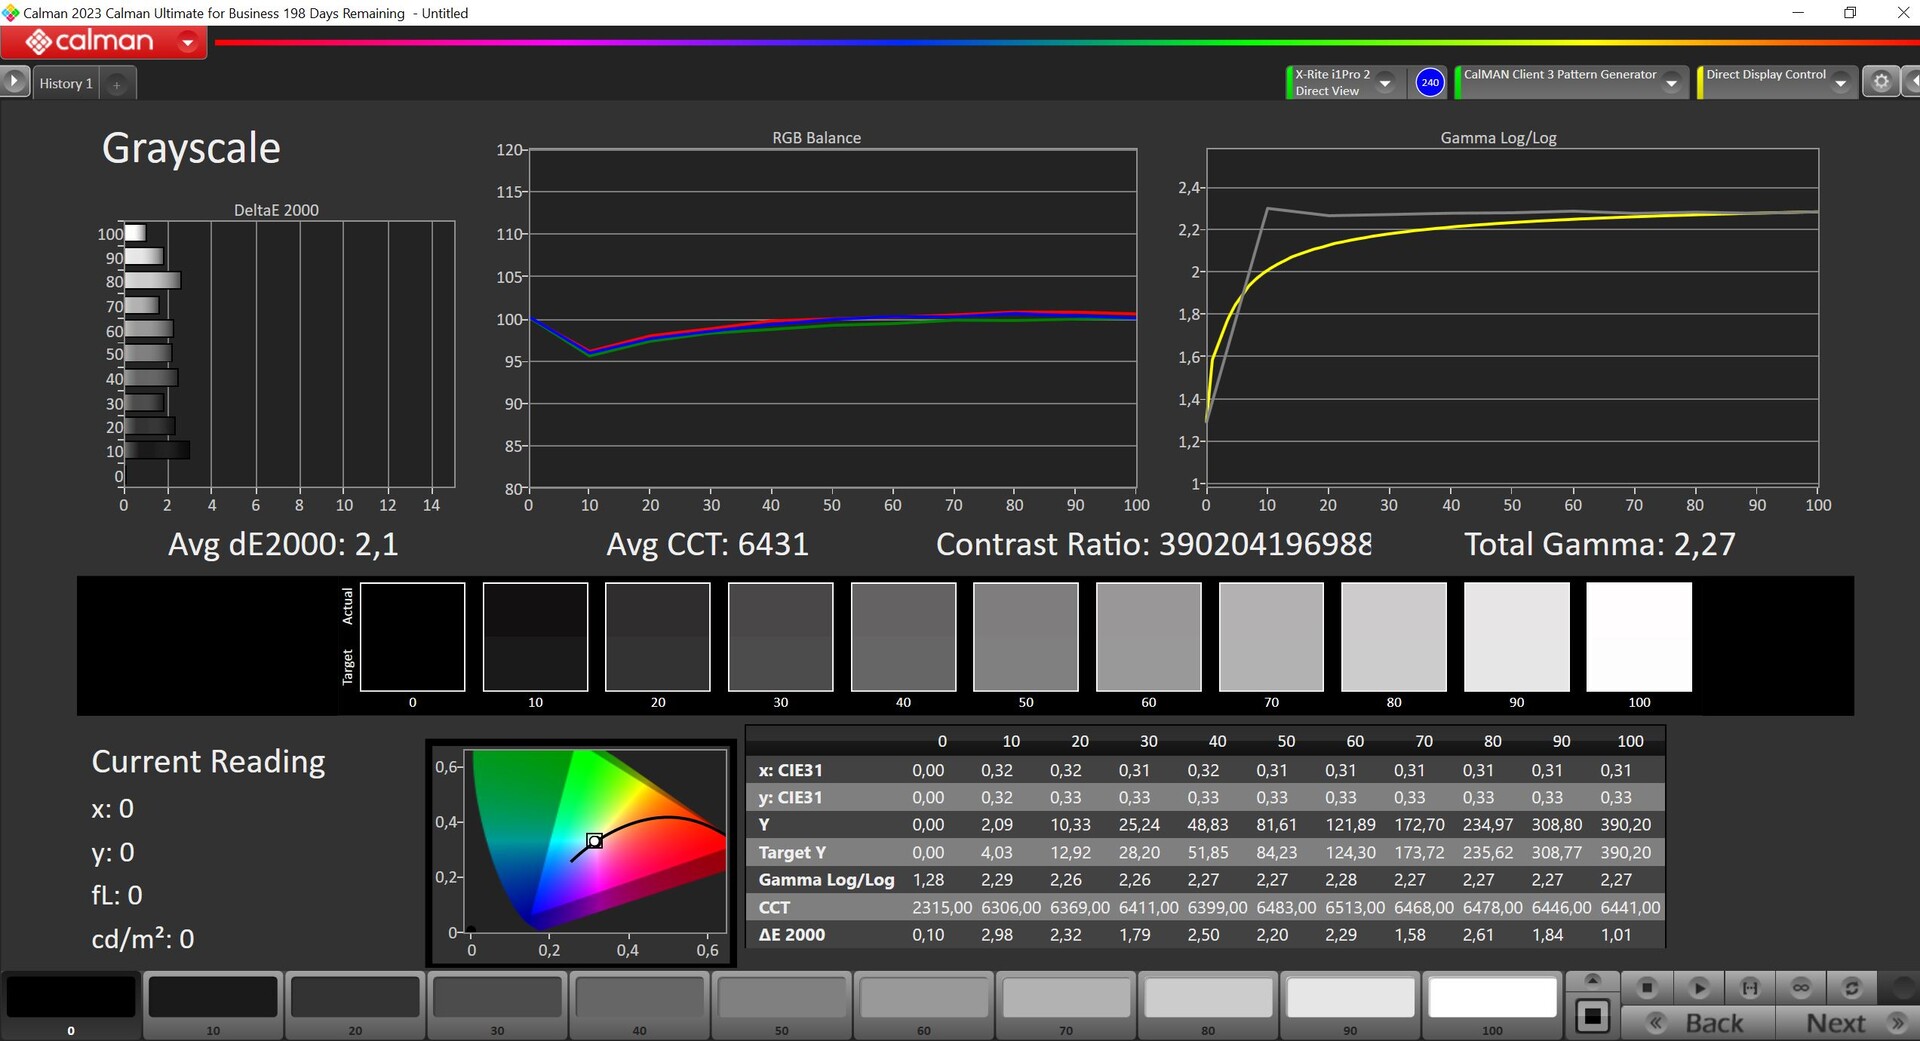
Samsung ne vend que le Galaxy Book4 Ultra avec un écran tactile OLED de 16 pouces (2 880 x 1 800 pixels, 16:10). La qualité subjective de l'image impressionne par ses couleurs vives et ses noirs profonds. Les temps de réponse sont extrêmement rapides et les contenus HDR sont pris en charge. En outre, les mouvements sont très fluides grâce au taux de rafraîchissement de 120 Hz. Comme pour tous les appareils Windows, le mode HDR peut être activé manuellement, mais la gestion des couleurs n'est plus disponible. La luminosité et la température des couleurs peuvent être réglées automatiquement via le capteur.
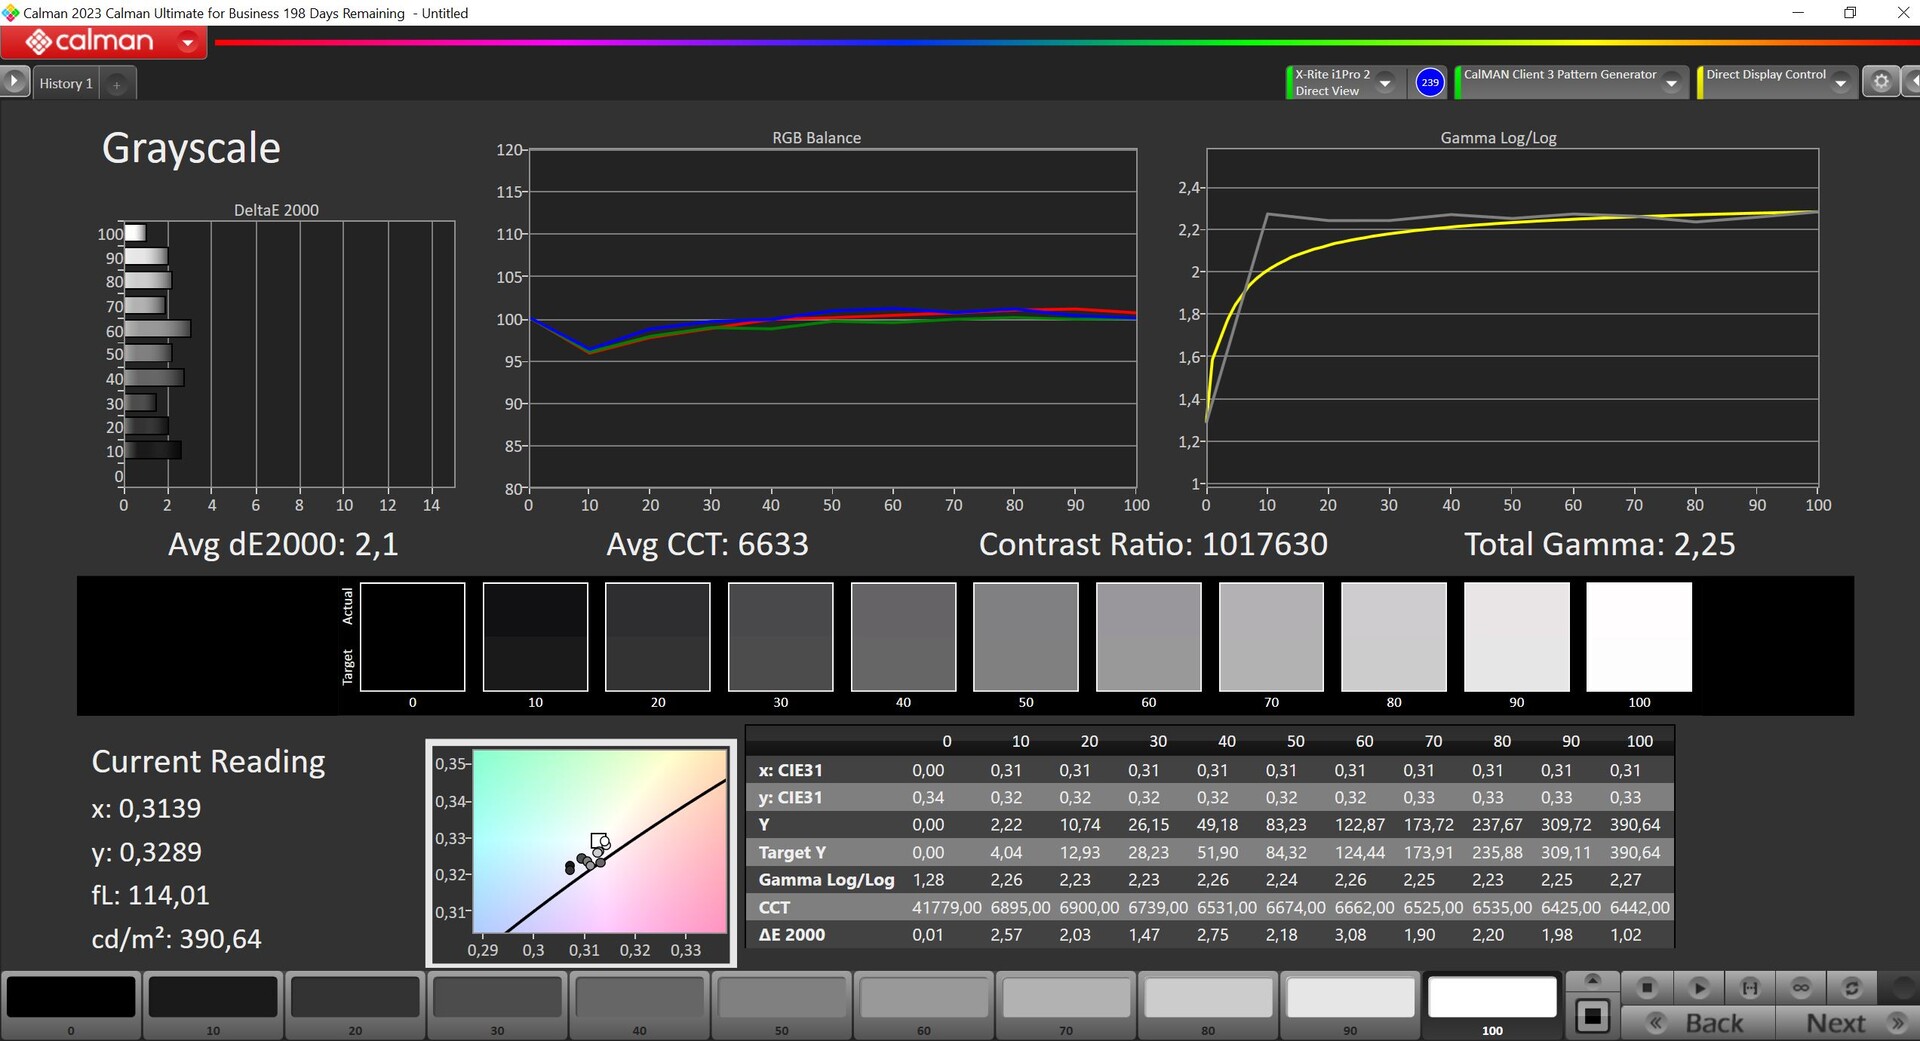
La luminosité maximale en mode SDR se situe à une moyenne de 393 cd/m² et la valeur noire est de 0 cd/m², ce qui conduit à un rapport de contraste très élevé. Nous avons mesuré une luminosité HDR de 564 cd/m² pour les sections d'image ou 540 cd/m² avec une image presque entièrement blanche. Cela signifie que les capacités HDR sont nettement plus limitées que celles des mini dalles LED et, associé à une meilleure gestion de macOS, le MacBook Pro 16 est nettement supérieur dans le domaine du HDR.
| |||||||||||||||||||||||||
Homogénéité de la luminosité: 98 %
Valeur mesurée au centre, sur batterie: 389 cd/m²
Contraste: ∞:1 (Valeurs des noirs: 0 cd/m²)
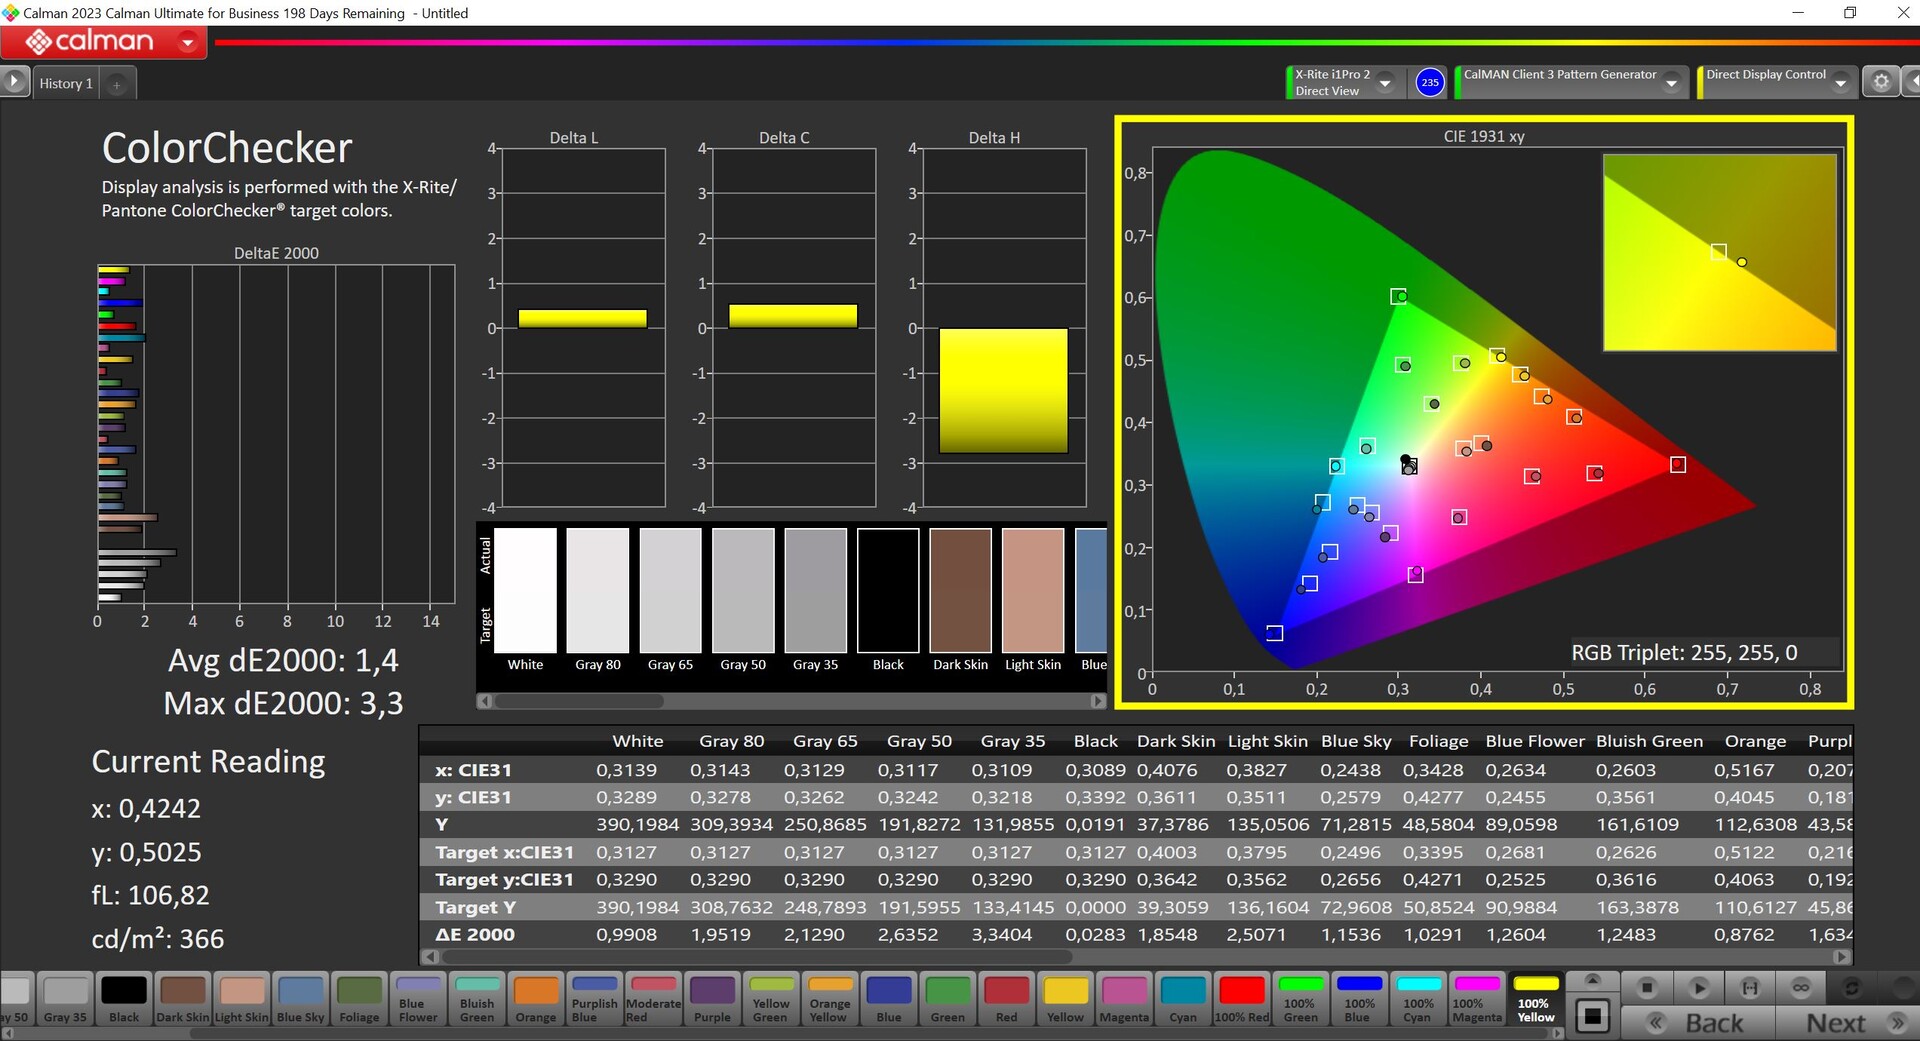
ΔE ColorChecker Calman: 1.4 | ∀{0.5-29.43 Ø4.71}
ΔE Greyscale Calman: 2.1 | ∀{0.09-98 Ø4.96}
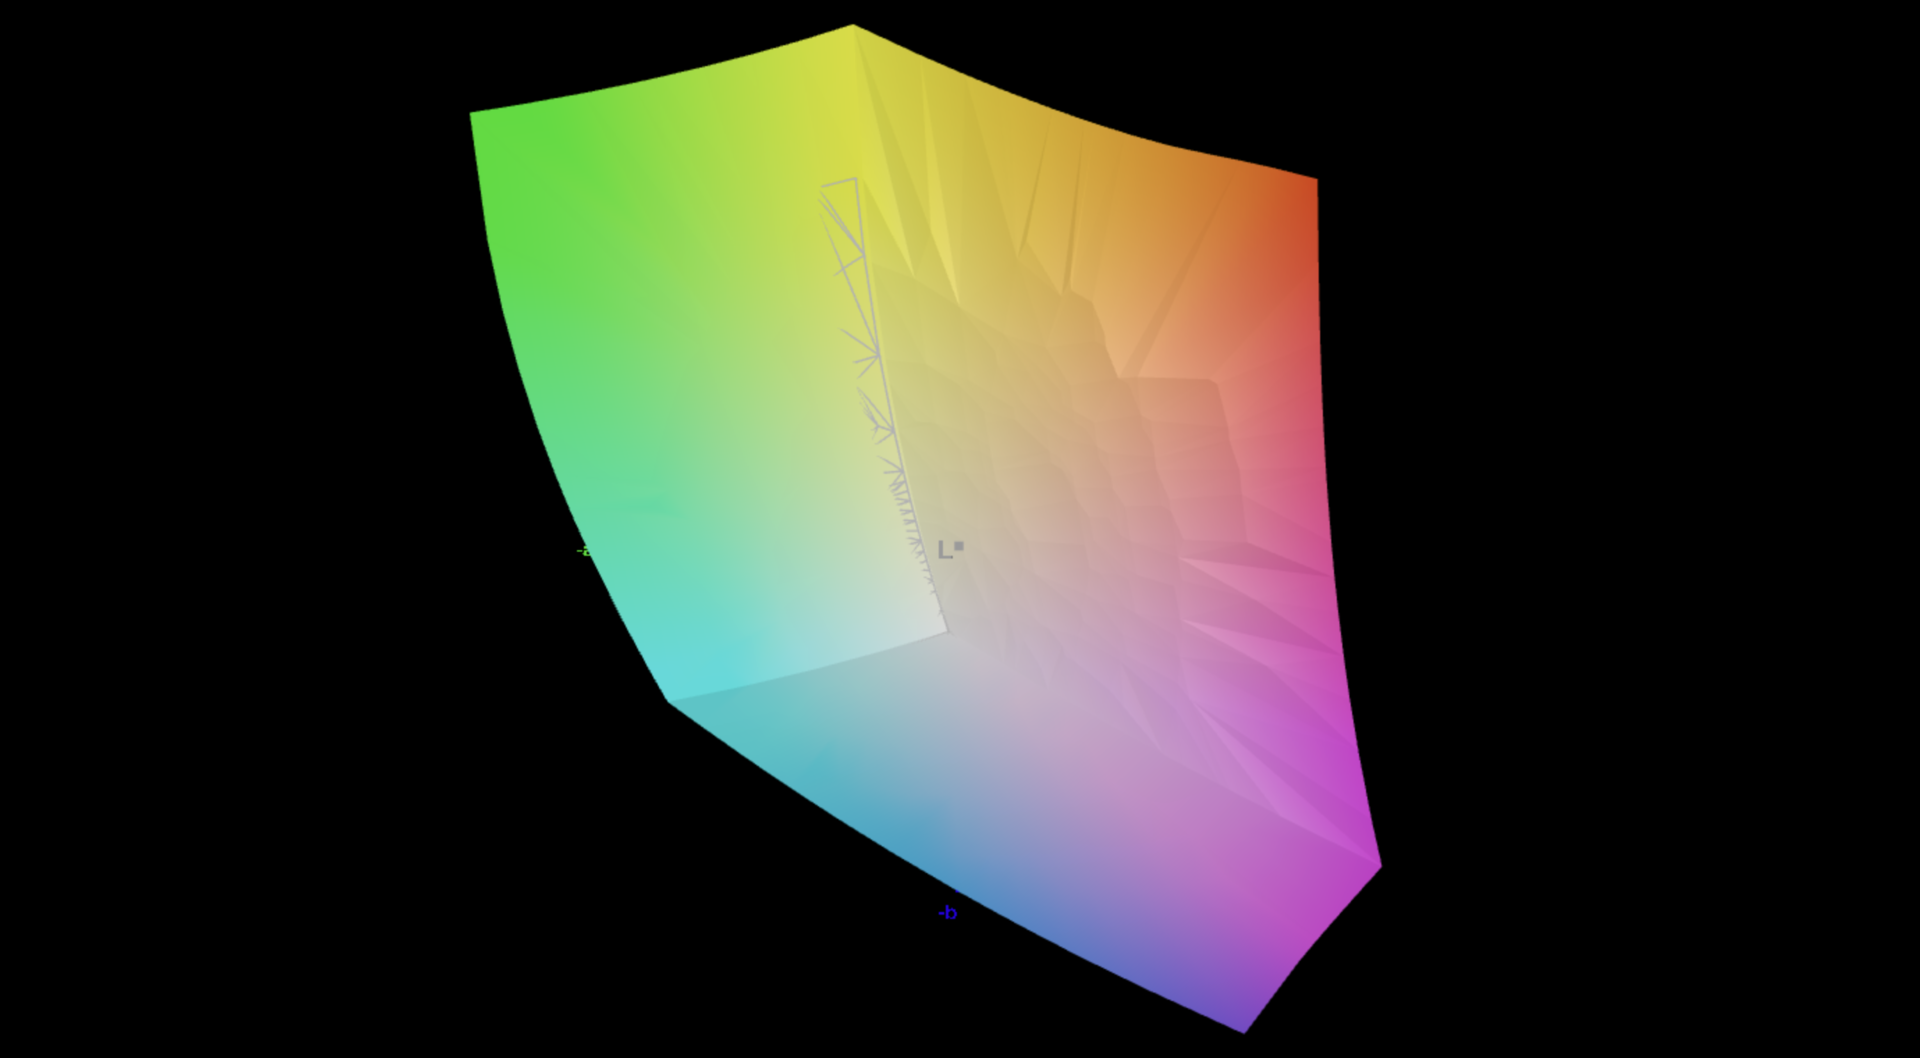
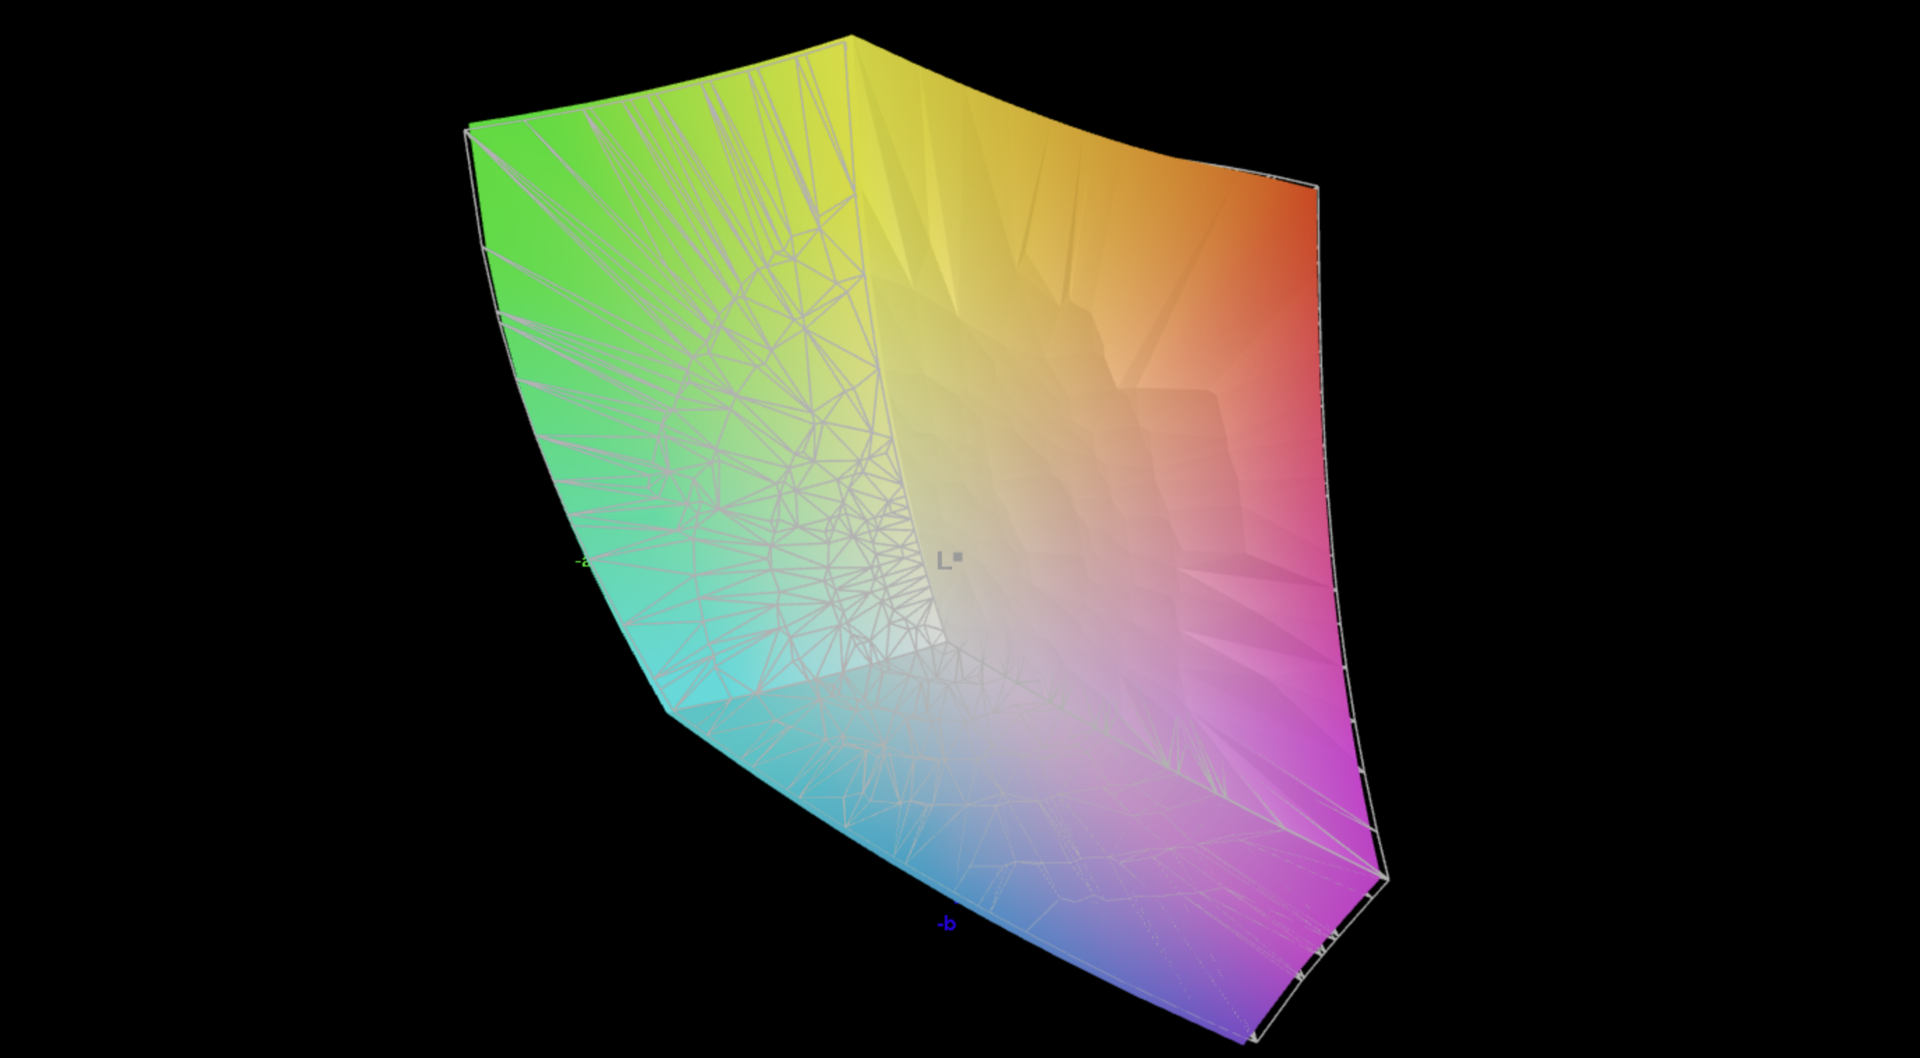
88.5% AdobeRGB 1998 (Argyll 3D)
99.9% sRGB (Argyll 3D)
98.6% Display P3 (Argyll 3D)
Gamma: 2.27
CCT: 6431 K
| Samsung Galaxy Book4 Ultra ATNA60CL07-0, OLED, 2880x1800, 16" | Lenovo ThinkPad Z16 Gen 2 Samsung ATNA60YV04-0, OLED, 3840x2400, 16" | Lenovo Slim Pro 9i 16IRP8 LEN160-3.2K, Mini-LED, 3200x2000, 16" | Schenker VISION 16 Pro (M23) NE160QDM-NZ1, IPS, 2560x1600, 16" | Samsung Galaxy Book3 Ultra 16 Samsung ATNA60CL03-0, AMOLED, 2880x1800, 16" | Apple MacBook Pro 16 2023 M3 Max Mini-LED, 3456x2234, 16" | HP Spectre x360 16 RTX 4050 Samsung SDC41A6, OLED, 2880x1800, 16" | |
|---|---|---|---|---|---|---|---|
| Display | 3% | -3% | -17% | 3% | 1% | 3% | |
| Display P3 Coverage (%) | 98.6 | 99.7 1% | 95.1 -4% | 68.8 -30% | 99.9 1% | 99.2 1% | 99.6 1% |
| sRGB Coverage (%) | 99.9 | 100 0% | 99.9 0% | 98.8 -1% | 100 0% | 100 0% | |
| AdobeRGB 1998 Coverage (%) | 88.5 | 96.7 9% | 84.6 -4% | 70 -21% | 96.3 9% | 96.7 9% | |
| Response Times | -209% | -1863% | -1756% | 8% | -9254% | -35% | |
| Response Time Grey 50% / Grey 80% * (ms) | 0.54 ? | 1.86 ? -244% | 14 ? -2493% | 13.7 ? -2437% | 0.49 ? 9% | 66.9 ? -12289% | 0.78 ? -44% |
| Response Time Black / White * (ms) | 0.69 ? | 1.89 ? -174% | 9.2 ? -1233% | 8.1 ? -1074% | 0.65 ? 6% | 43.6 ? -6219% | 0.86 ? -25% |
| PWM Frequency (Hz) | 240 ? | 60 ? | 5784 ? | 240 ? | 14877 | 480 ? | |
| Screen | -4% | -117% | -77% | -25% | 22% | -16% | |
| Brightness middle (cd/m²) | 390 | 390.1 0% | 627.4 61% | 384 -2% | 400 3% | 630 62% | 385.2 -1% |
| Brightness (cd/m²) | 393 | 393 0% | 618 57% | 371 -6% | 399 2% | 604 54% | 387 -2% |
| Brightness Distribution (%) | 98 | 97 -1% | 95 -3% | 88 -10% | 93 -5% | 94 -4% | 99 1% |
| Black Level * (cd/m²) | 0.19 | 0.3 | 0.03 | ||||
| Colorchecker dE 2000 * | 1.4 | 1.41 -1% | 5.84 -317% | 3.4 -143% | 2.3 -64% | 1.2 14% | 1.73 -24% |
| Colorchecker dE 2000 max. * | 2.7 | 3.43 -27% | 10.22 -279% | 9.2 -241% | 4.15 -54% | 2.8 -4% | 3.95 -46% |
| Greyscale dE 2000 * | 2.1 | 2 5% | 6.7 -219% | 3.4 -62% | 2.7 -29% | 1.9 10% | 2.6 -24% |
| Gamma | 2.27 97% | 2.22 99% | 2.77 79% | 2.16 102% | 2.266 97% | 2.29 96% | 2.17 101% |
| CCT | 6431 101% | 6324 103% | 5795 112% | 7462 87% | 7047 92% | 6812 95% | 6133 106% |
| Contrast (:1) | 3302 | 1280 | 13333 | ||||
| Colorchecker dE 2000 calibrated * | 4.45 | 1.3 | 1.66 | ||||
| Moyenne finale (programmes/paramètres) | -70% /
-39% | -661% /
-403% | -617% /
-366% | -5% /
-11% | -3077% /
-2042% | -16% /
-14% |
* ... Moindre est la valeur, meilleures sont les performances
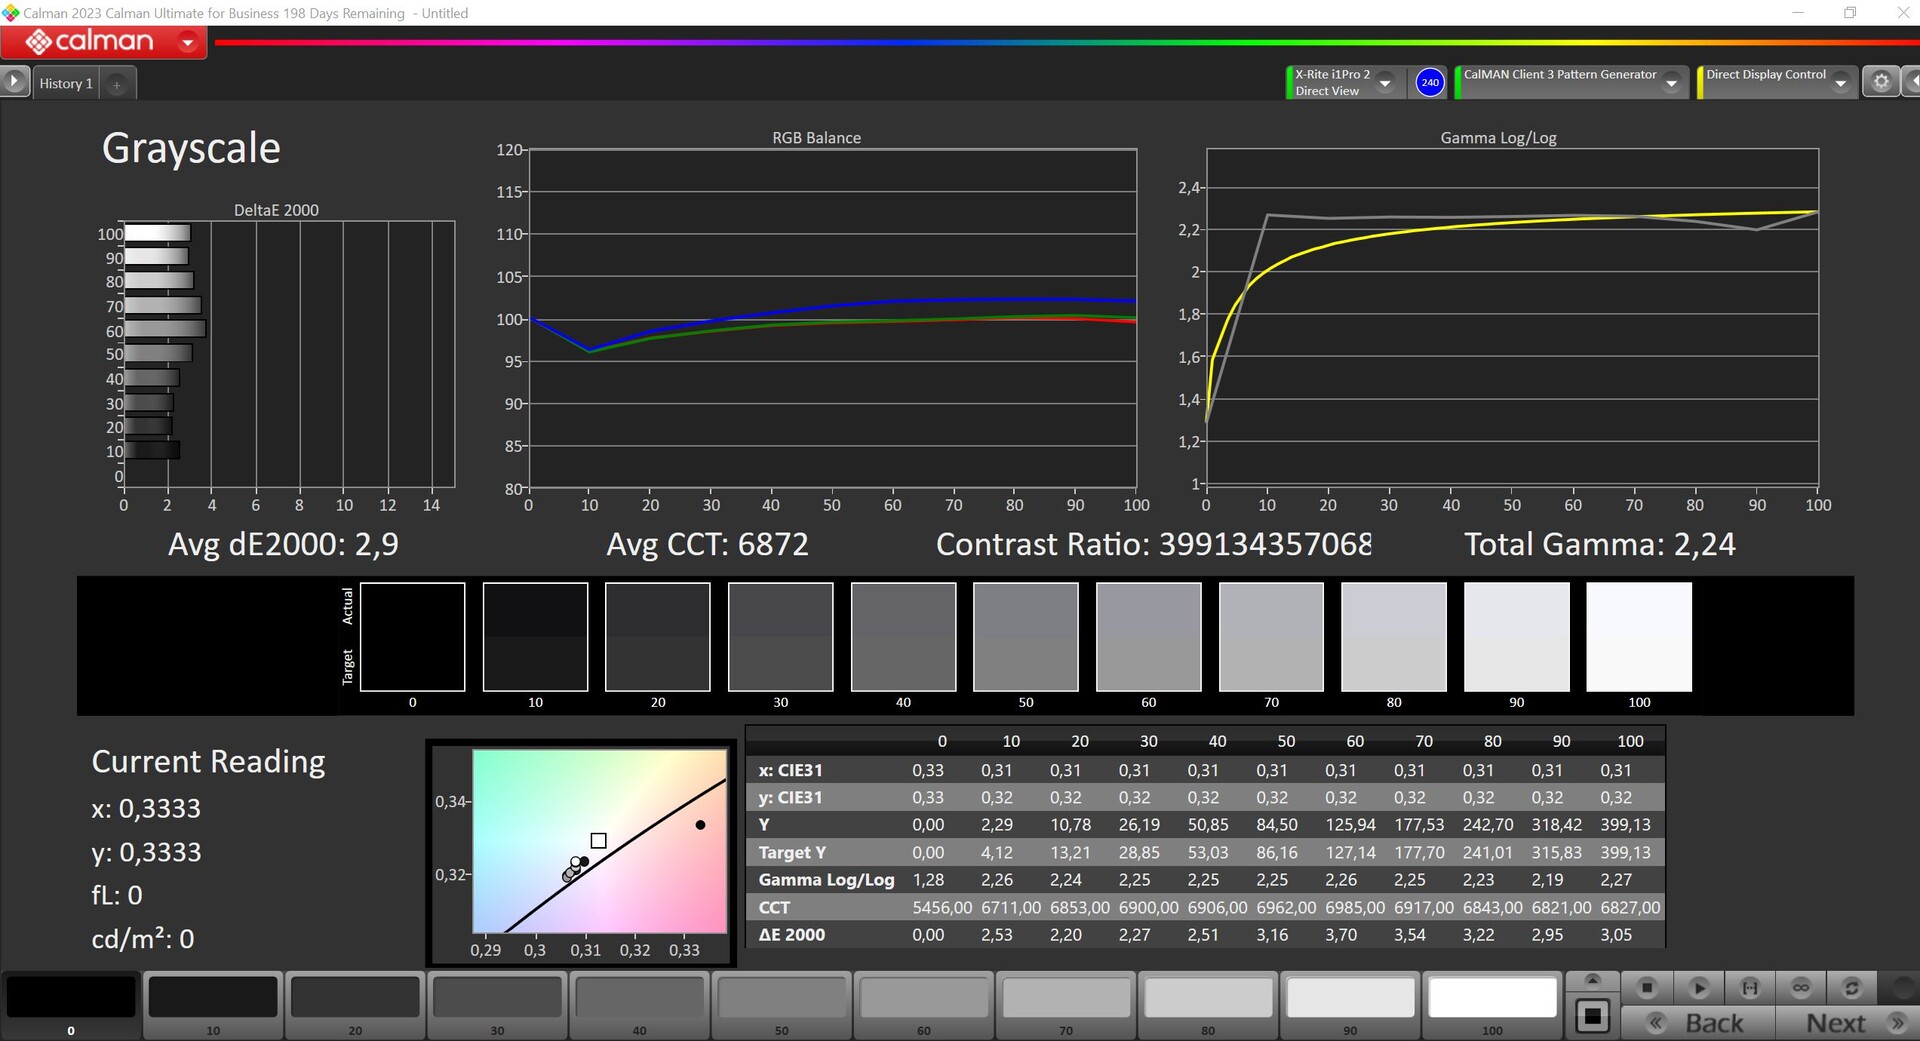

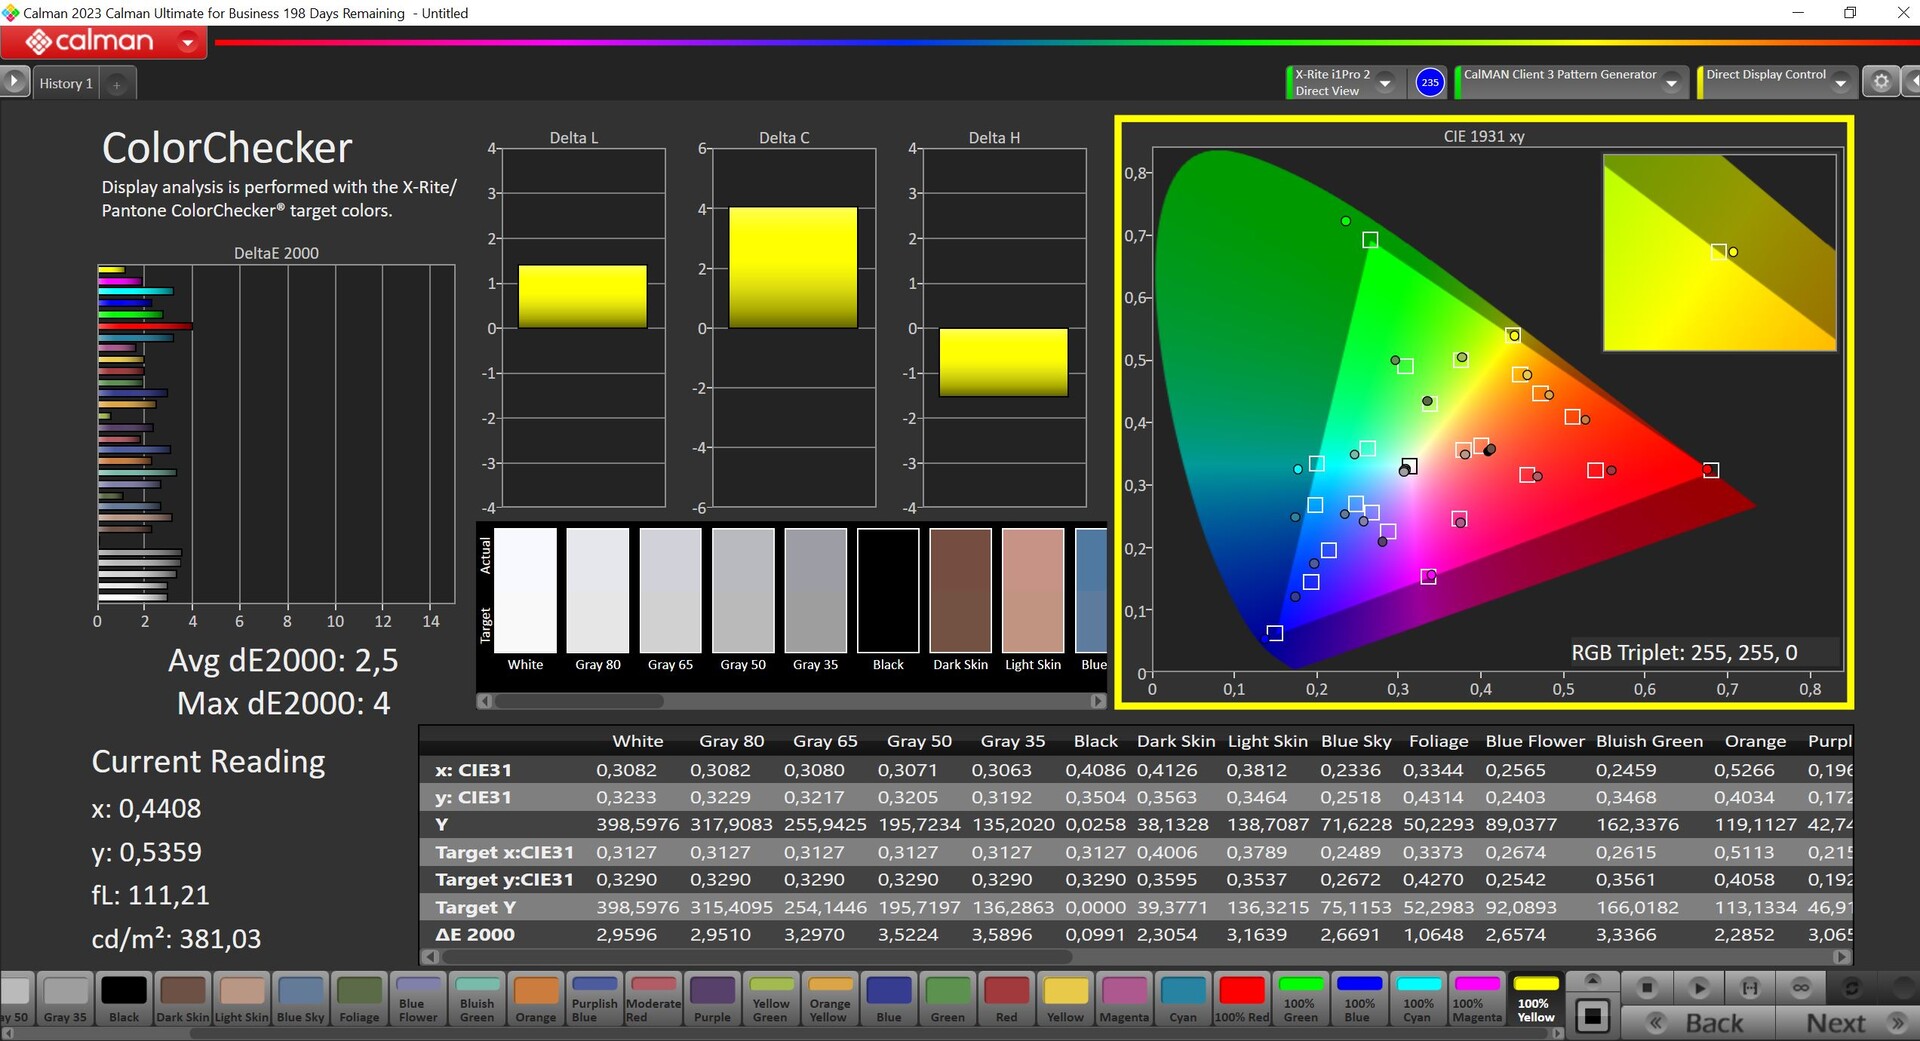
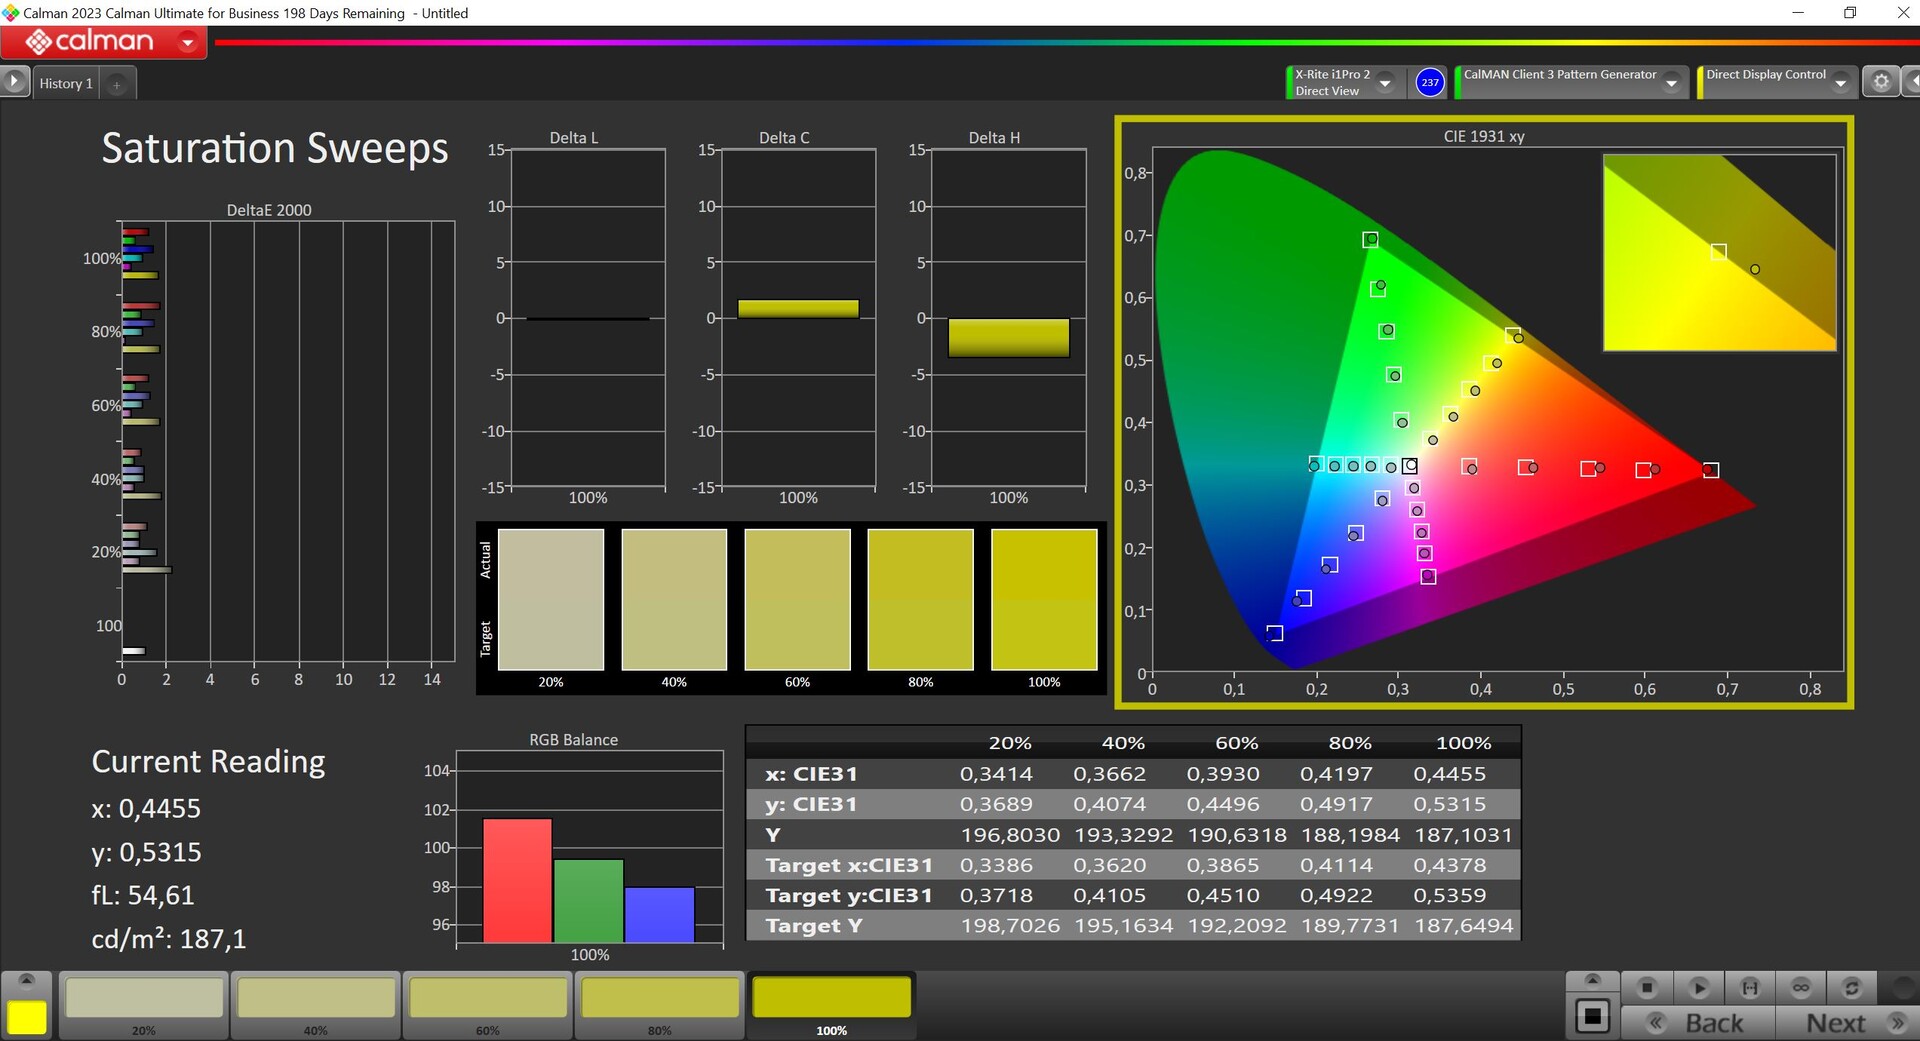
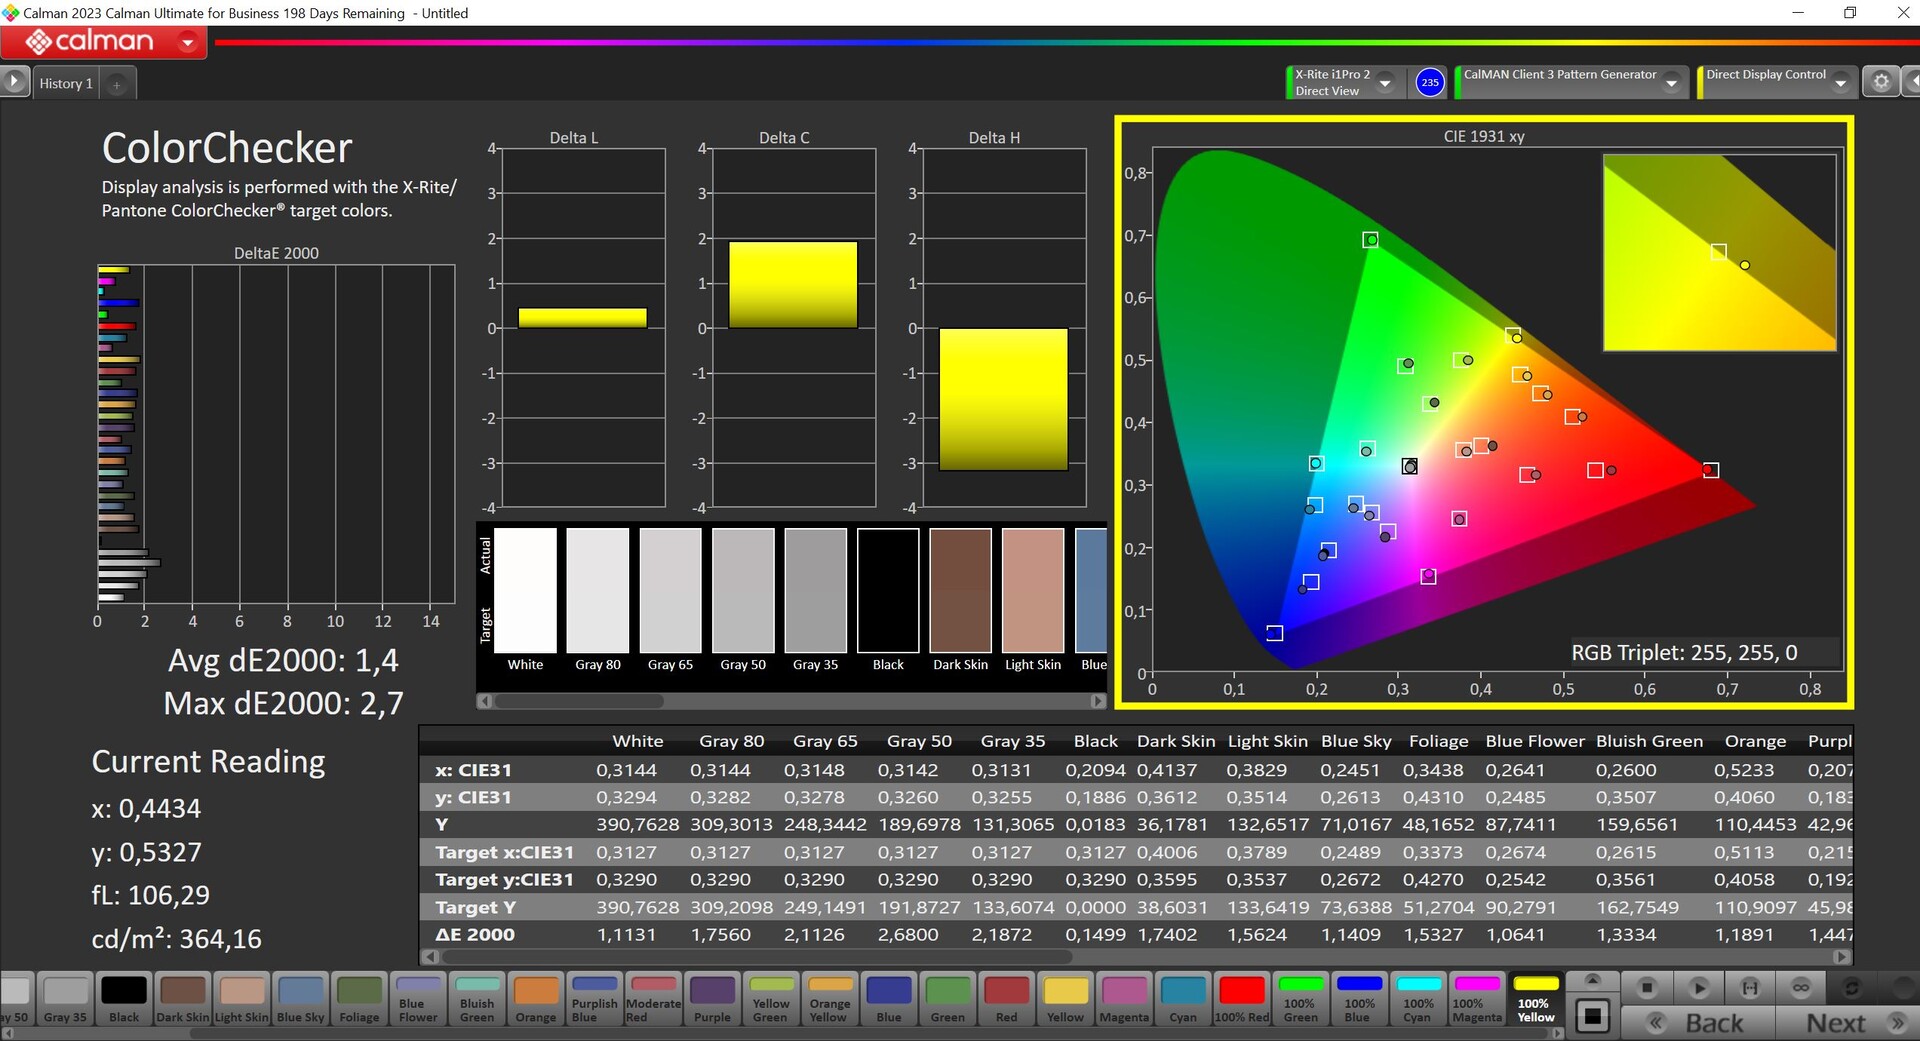
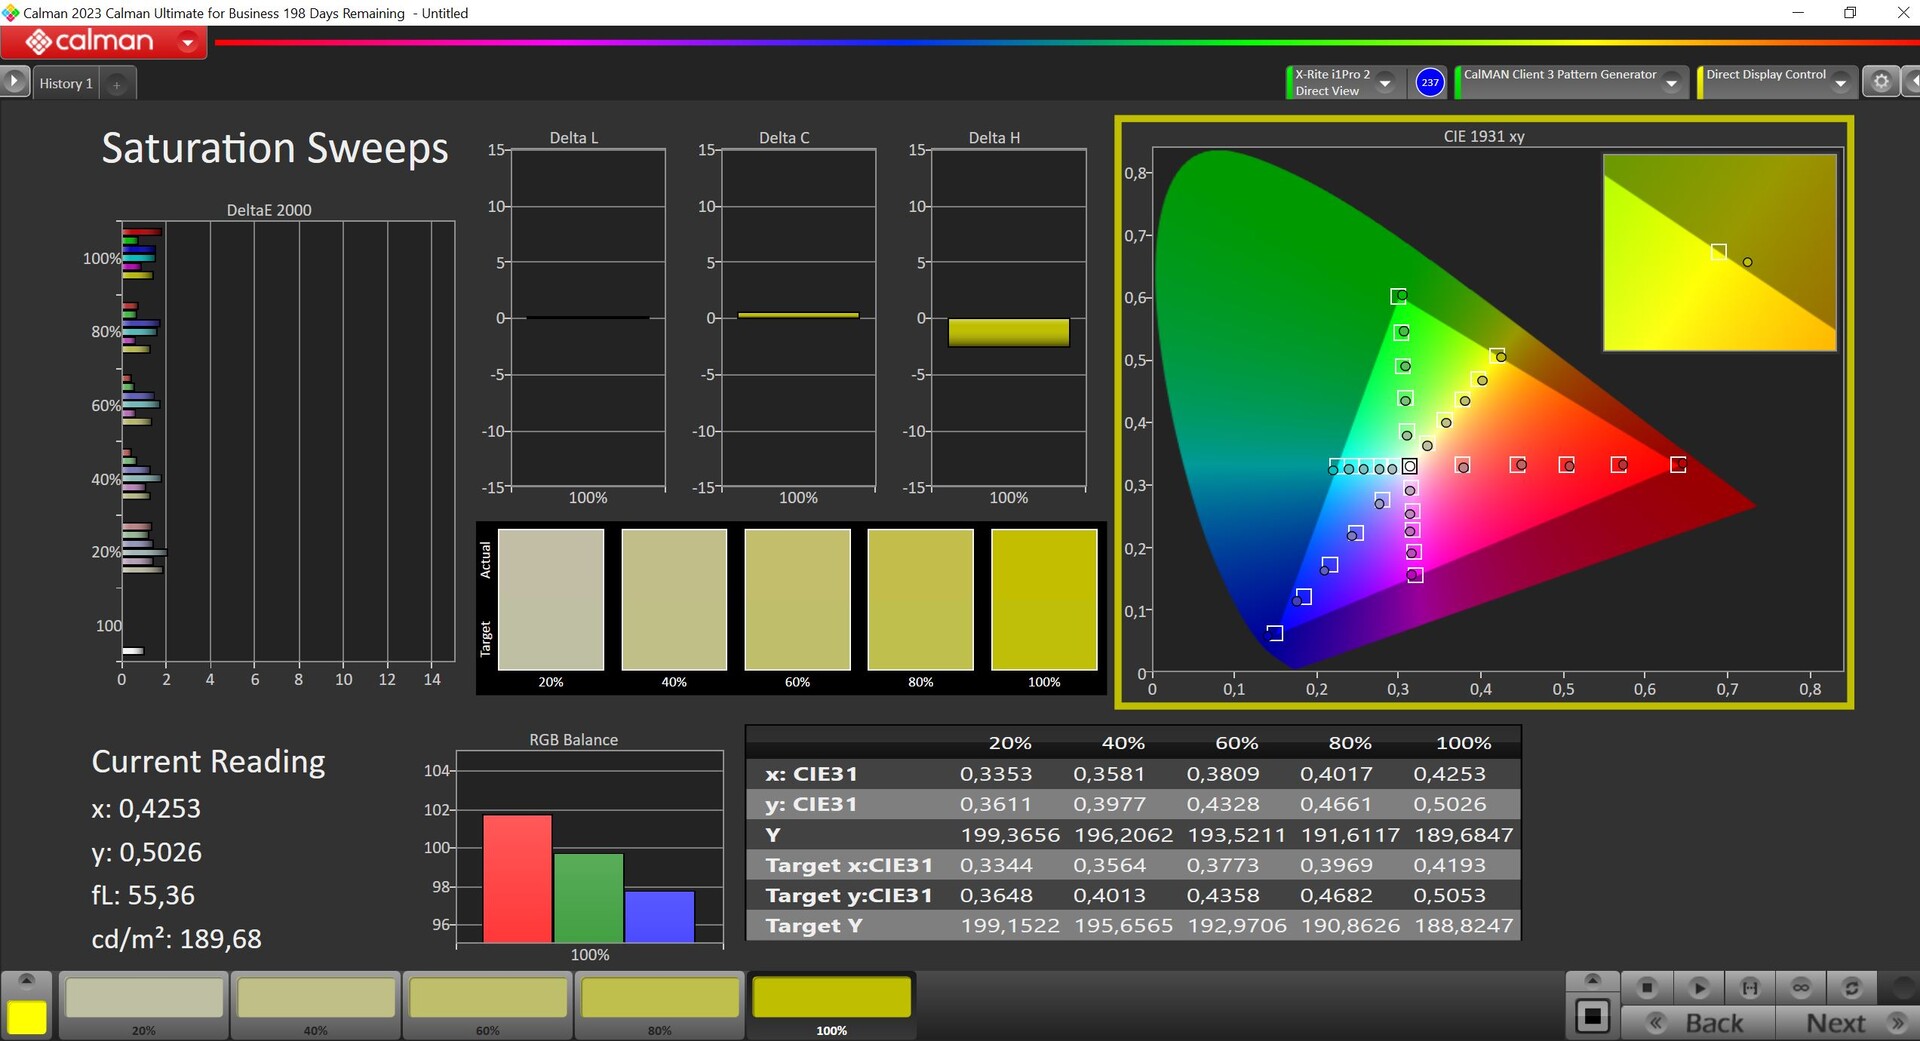
Dans l'application des paramètres de Samsung, il existe différents profils de couleurs, le profil actif standard étant "Vivid". Comme d'habitude, les couleurs sont un peu sursaturées, ce qui rend les images plus éclatantes. Cependant, il existe également le mode P3 qui offre des couleurs plus précises et c'est celui que nous avons utilisé pour nos mesures. En utilisant notre propre étalonnage, nous n'avons pas été en mesure d'améliorer cette performance. Le panneau couvre entièrement les espaces colorimétriques sRGB et P3 et tous ceux qui aiment éditer des images seront satisfaits du mode sRGB, tout aussi précis.

Temps de réponse de l'écran
| ↔ Temps de réponse noir à blanc | ||
|---|---|---|
| 0.69 ms ... hausse ↗ et chute ↘ combinées | ↗ 0.39 ms hausse | 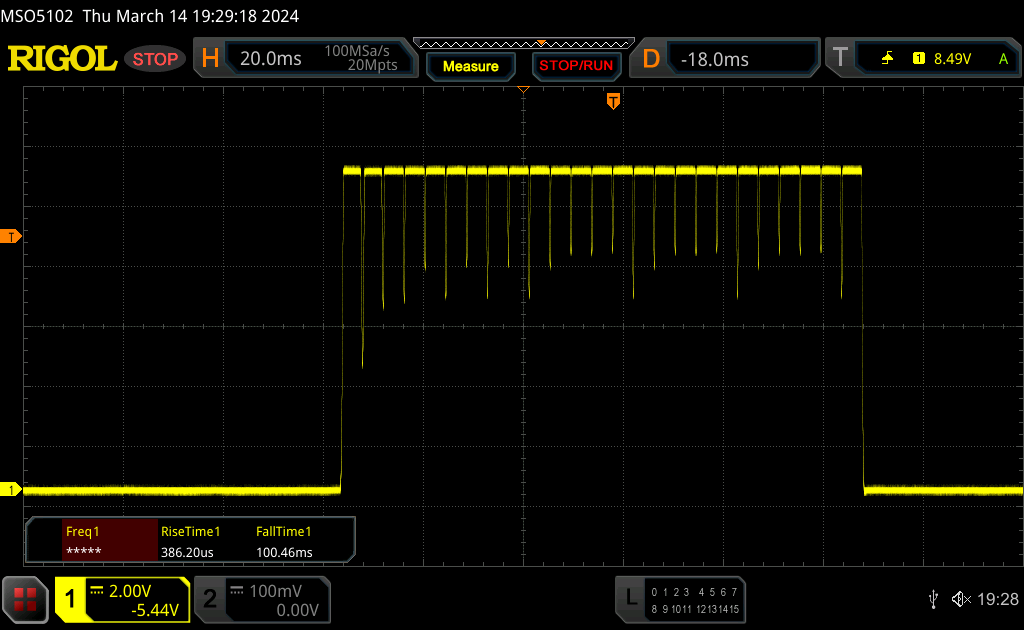 |
| ↘ 0.3 ms chute | ||
| L'écran montre de très faibles temps de réponse, parfait pour le jeu. En comparaison, tous les appareils testés affichent entre 0.1 (minimum) et 240 (maximum) ms. » 2 % des appareils testés affichent de meilleures performances. Cela signifie que les latences relevées sont meilleures que la moyenne (19.8 ms) de tous les appareils testés. | ||
| ↔ Temps de réponse gris 50% à gris 80% | ||
| 0.54 ms ... hausse ↗ et chute ↘ combinées | ↗ 0.29 ms hausse | 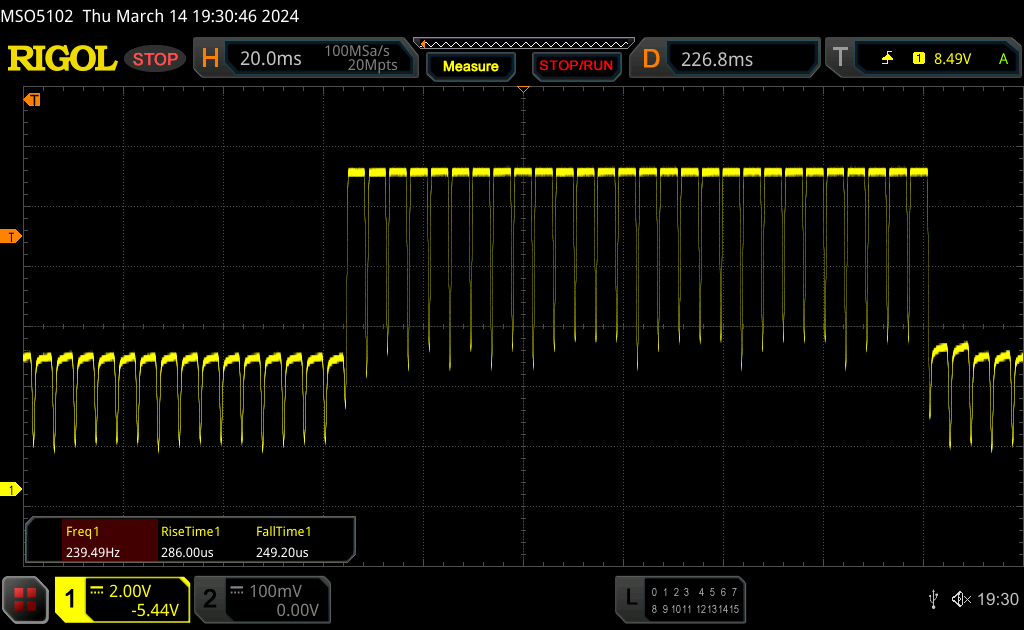 |
| ↘ 0.25 ms chute | ||
| L'écran montre de très faibles temps de réponse, parfait pour le jeu. En comparaison, tous les appareils testés affichent entre 0.165 (minimum) et 636 (maximum) ms. » 1 % des appareils testés affichent de meilleures performances. Cela signifie que les latences relevées sont meilleures que la moyenne (31 ms) de tous les appareils testés. | ||
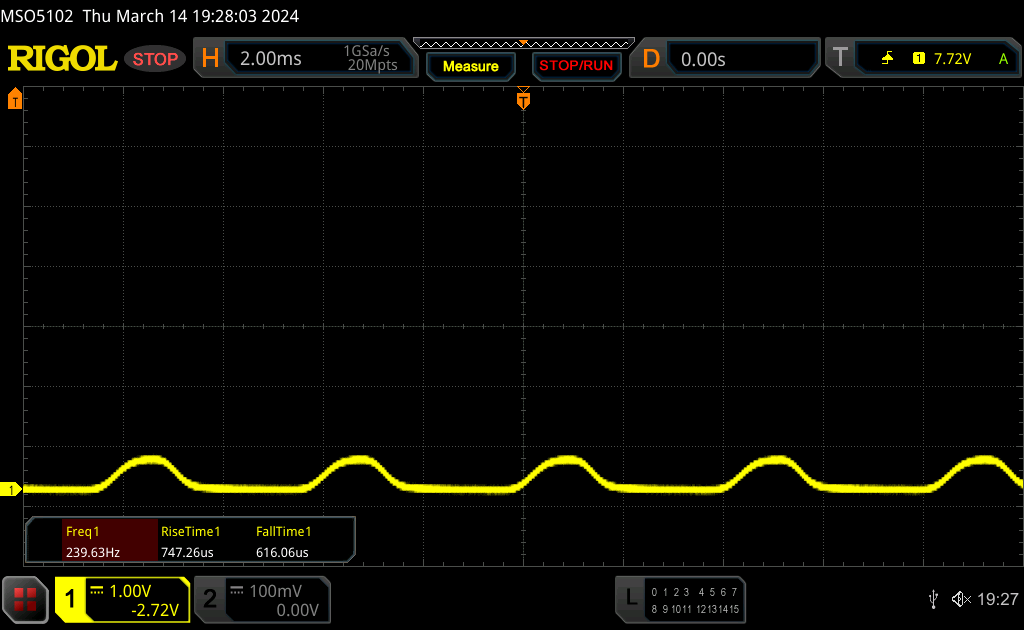
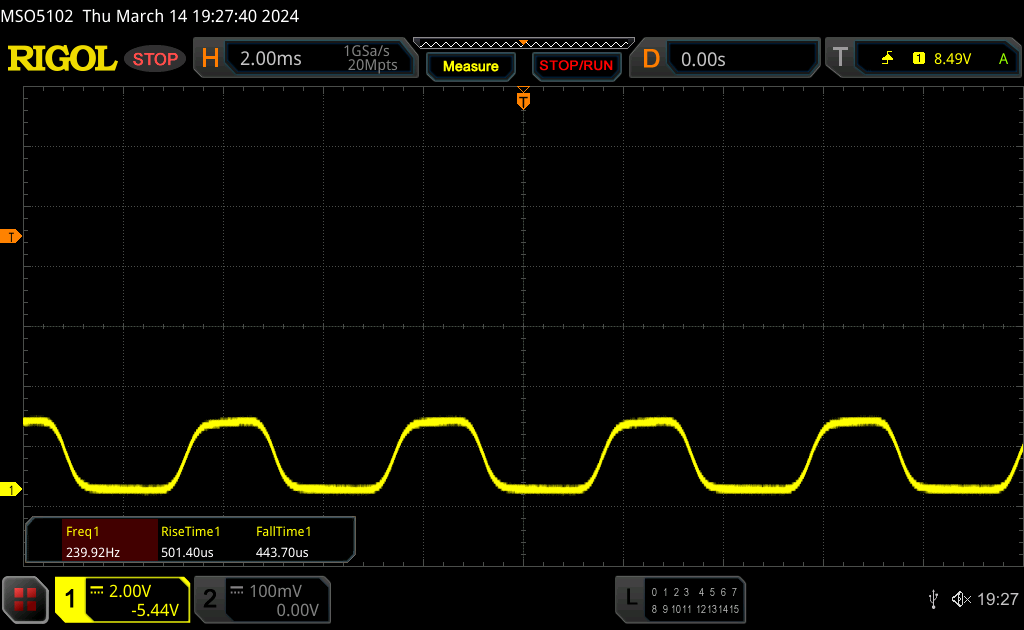
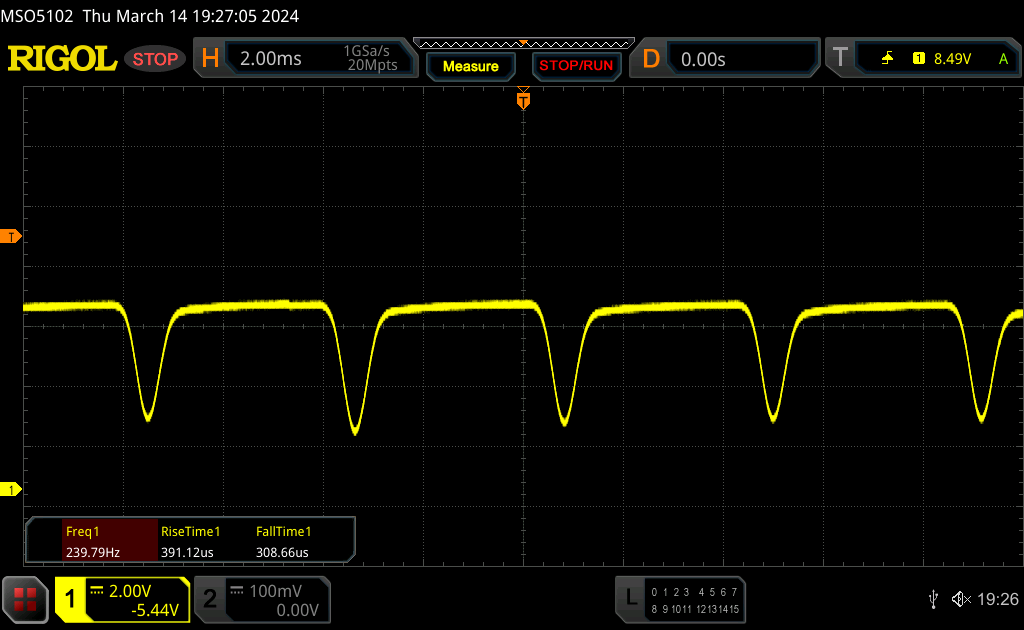
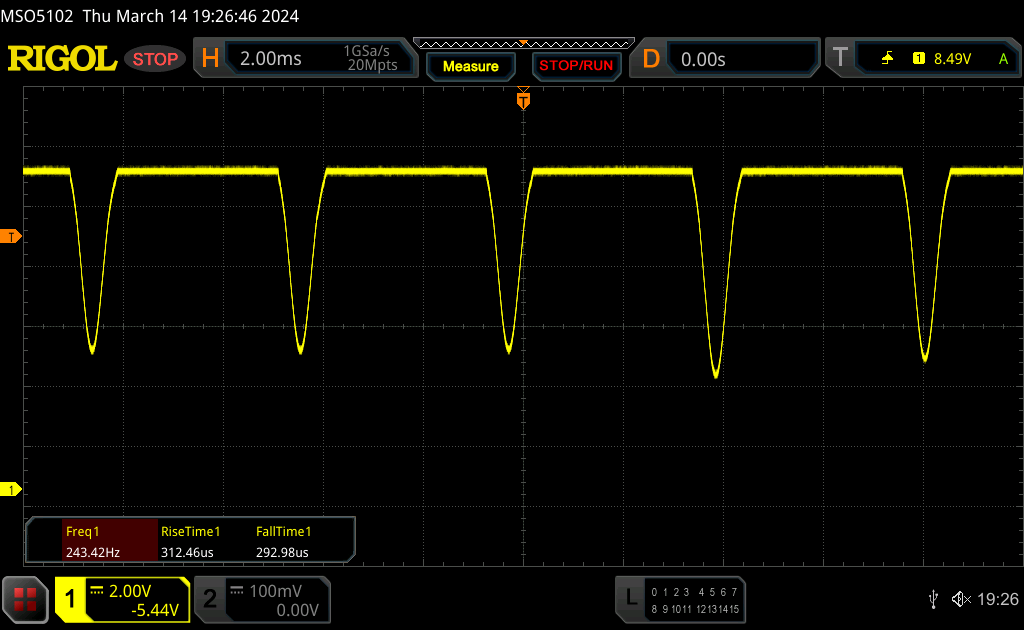
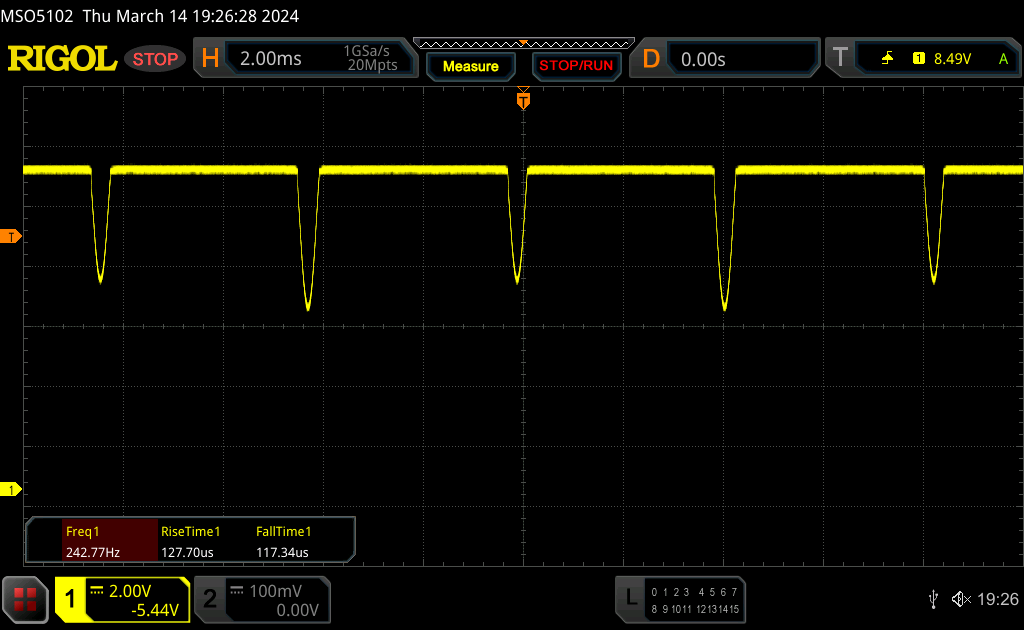
Scintillement / MLI (Modulation de largeur d'impulsion)
| Scintillement / MLI (Modulation de largeur d'impulsion) décelé | 240 Hz | ≤ 100 Niveau de luminosité | 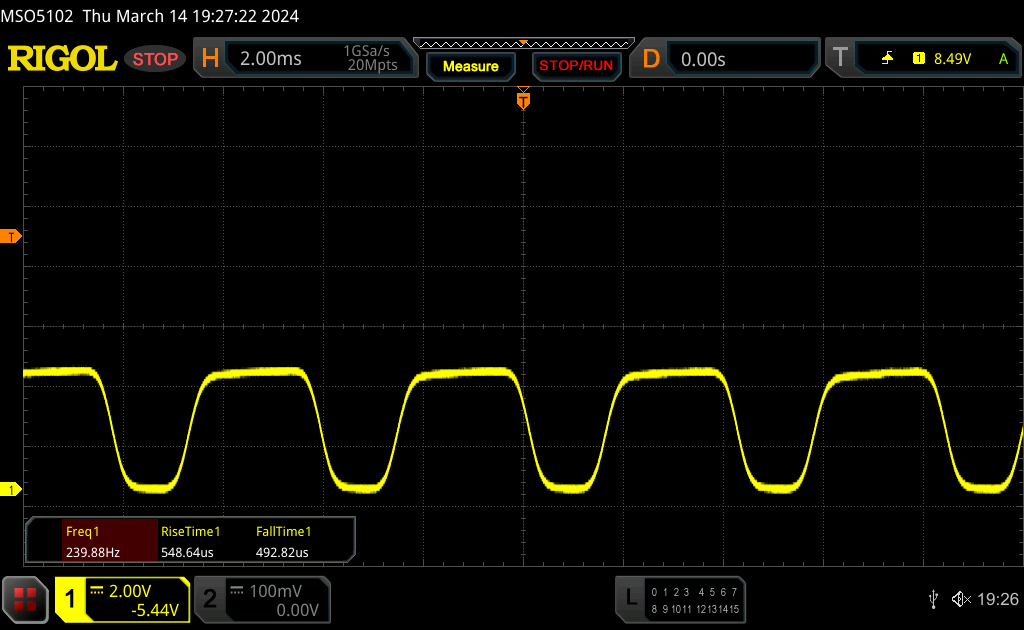 |
Le rétroéclairage de l'écran scintille à la fréquence de 240 Hz (certainement du fait de l'utilisation d'une MDI - Modulation de largeur d'impulsion) à un niveau de luminosité inférieur ou égal à 100 % . Aucun scintillement ne devrait être perceptible au-dessus de cette valeur. La fréquence de rafraîchissement de 240 Hz est relativement faible, les personnes les plus sensibles devraient percevoir un scintillement et être sujettes à une fatigue oculaire accrue (avec le niveau de luminosité indiqué) En comparaison, 52 % des appareils testés n'emploient pas MDI pour assombrir leur écran. Nous avons relevé une moyenne à 7757 (minimum : 5 - maximum : 343500) Hz dans le cas où une MDI était active. | |||
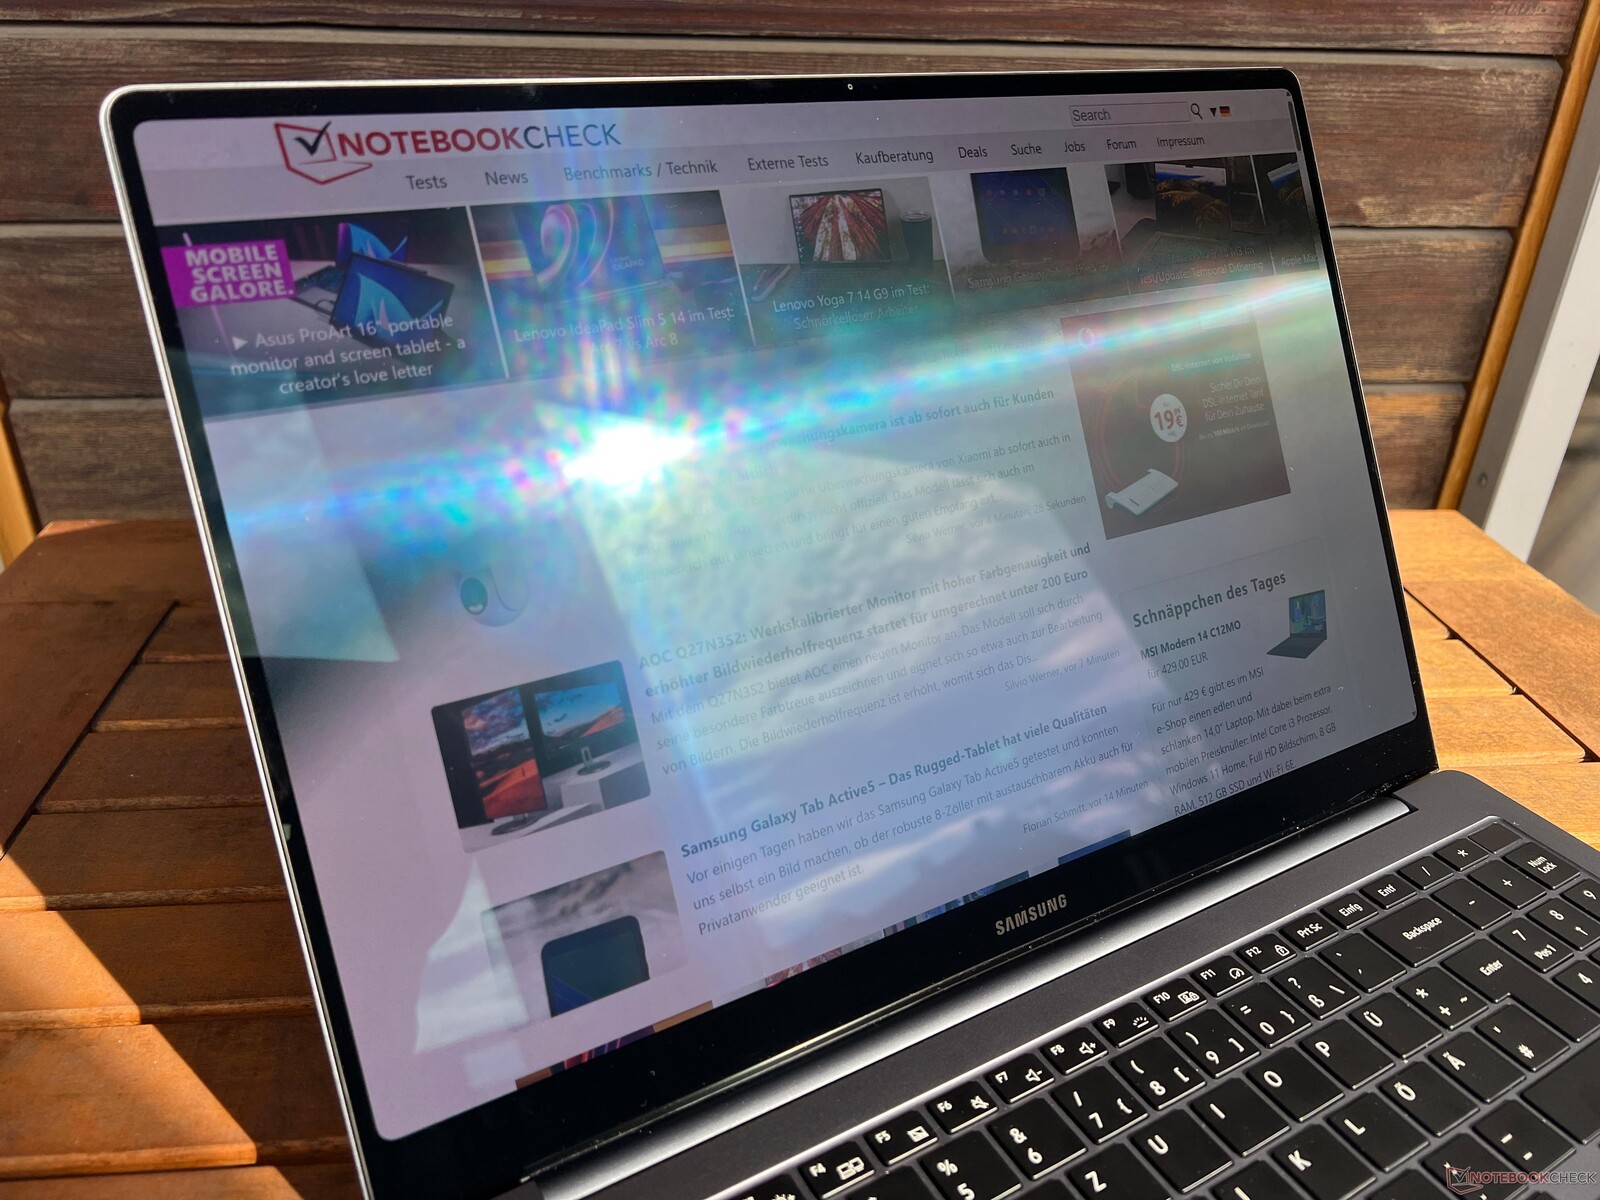
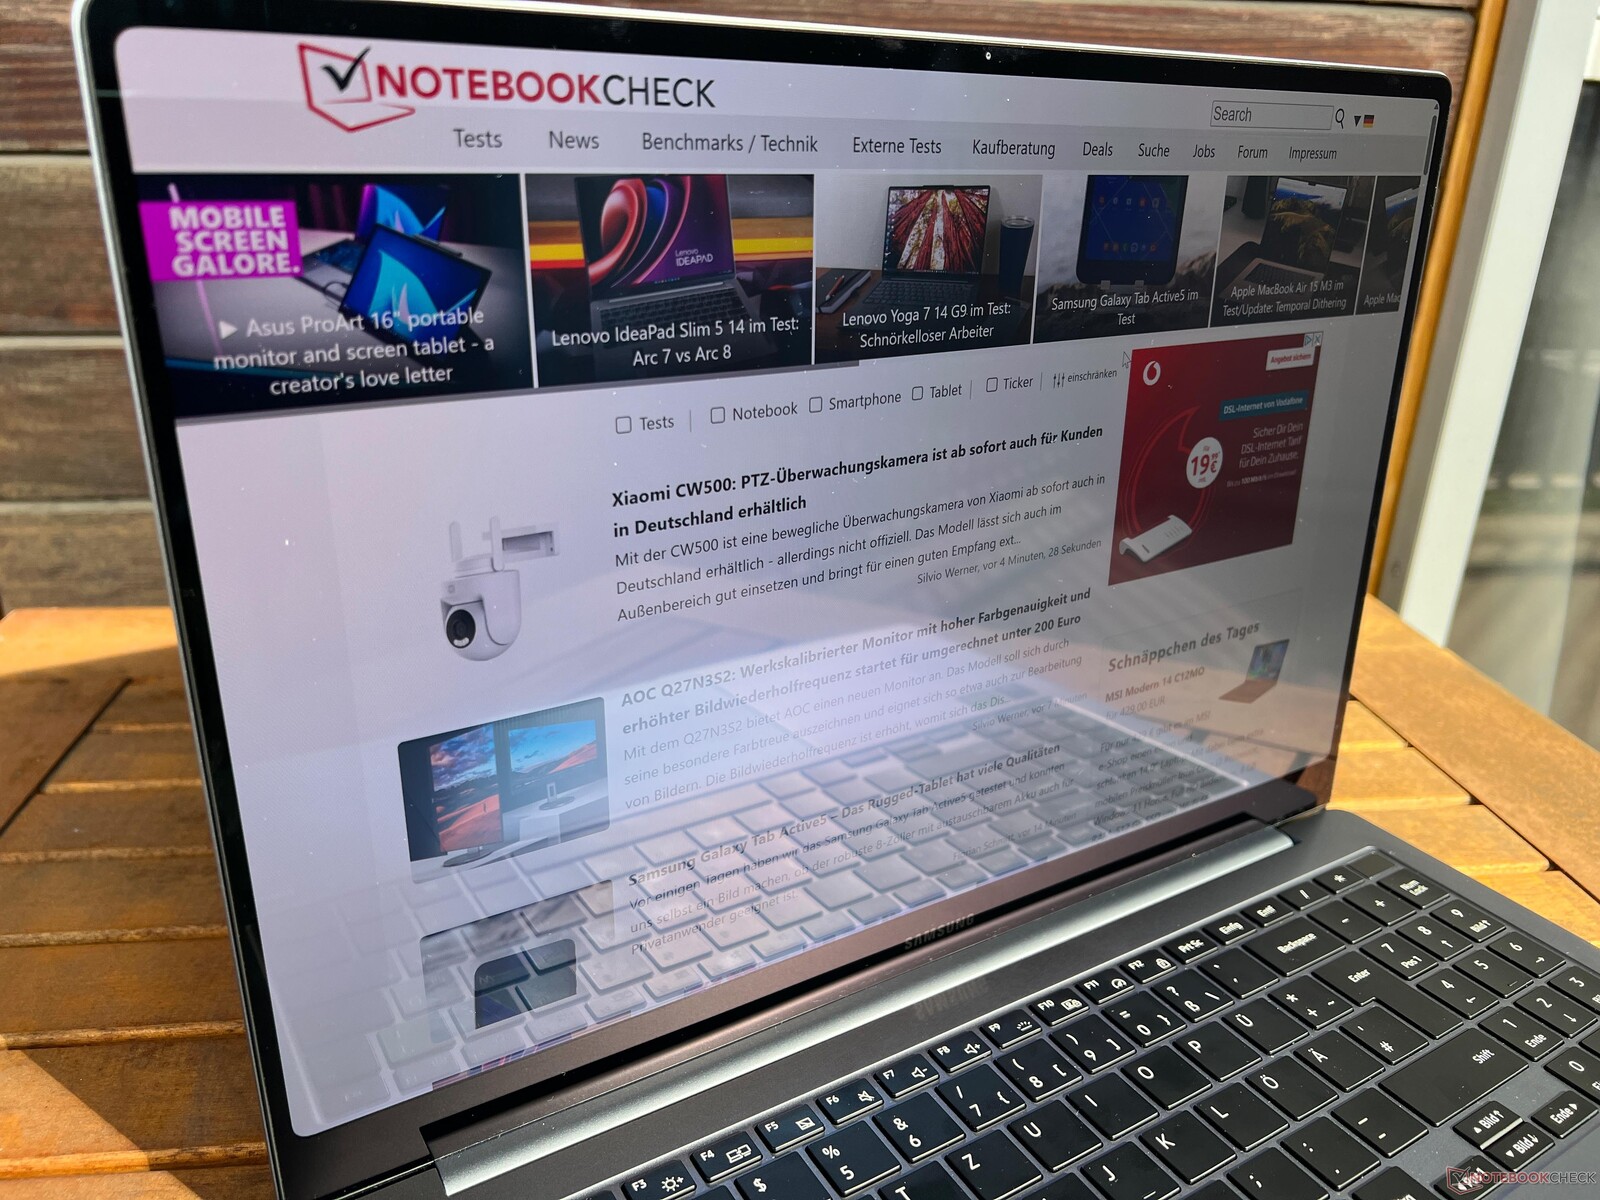
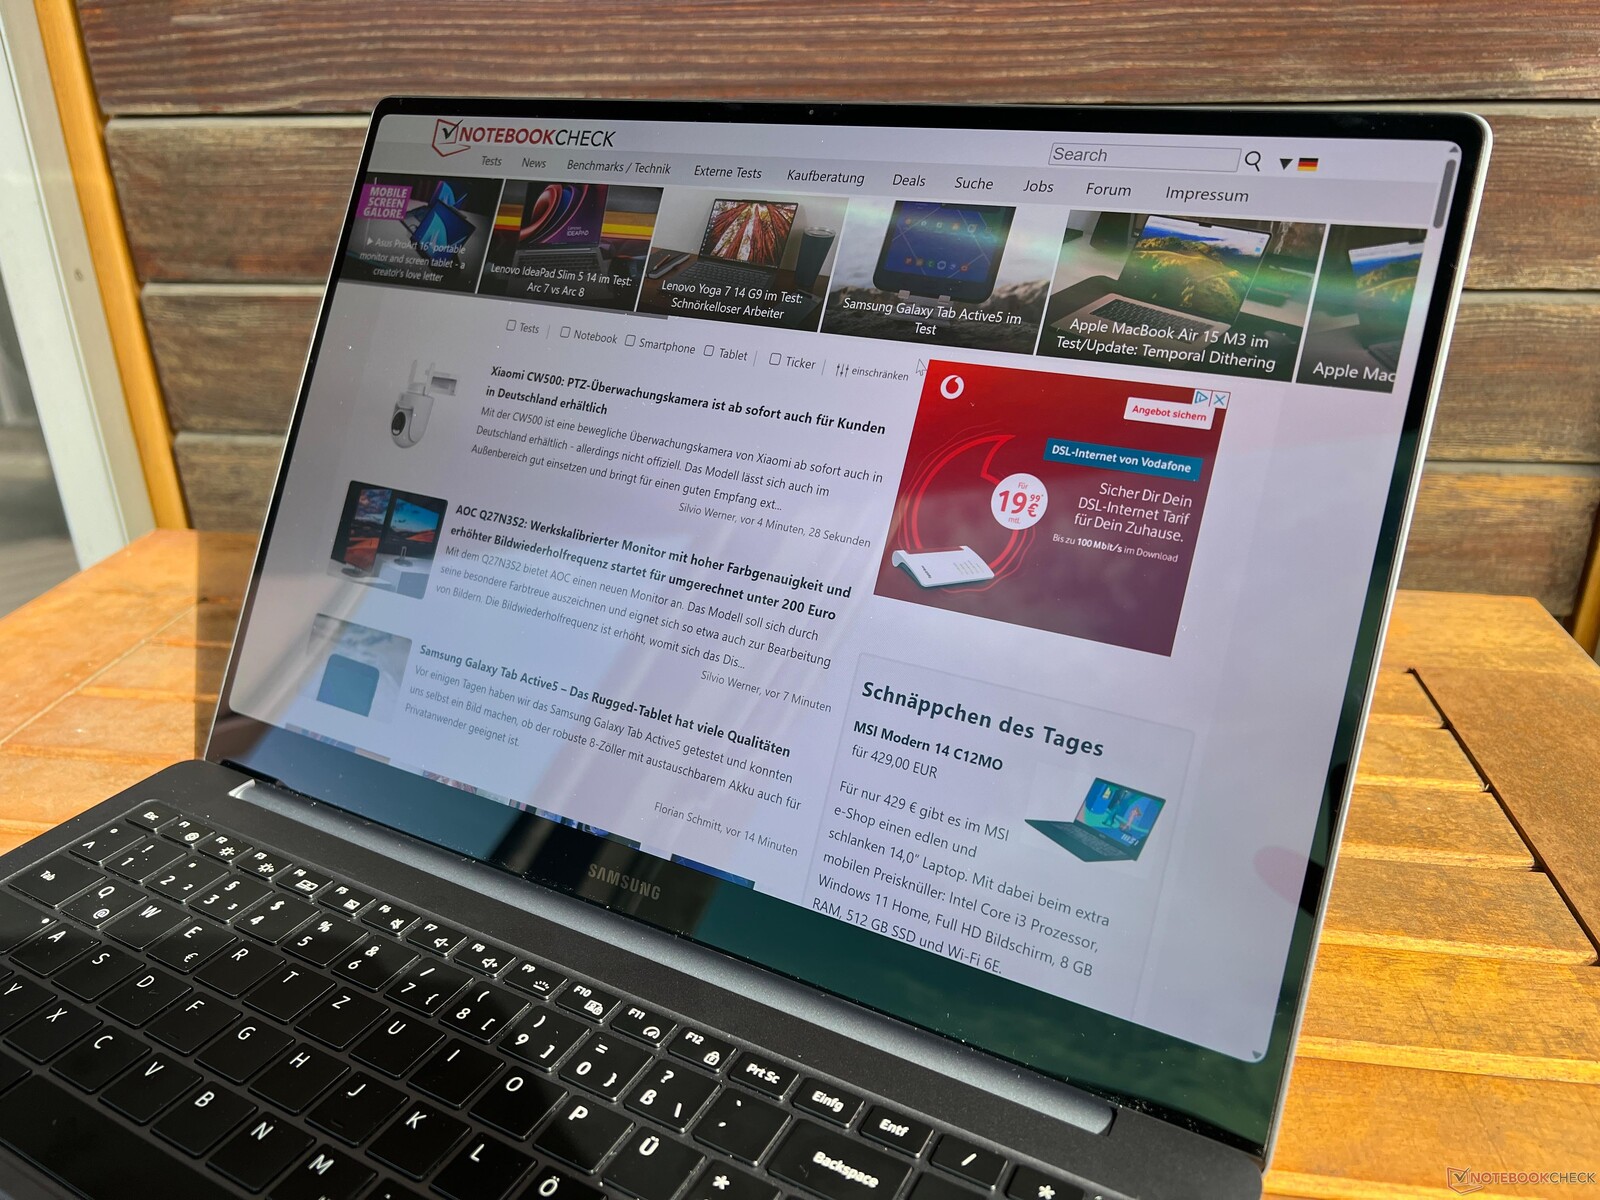
L'écran tactile OLED est fondamentalement réfléchissant mais, grâce à la mise en œuvre de Corning Gorilla Glass DX, le niveau de réflexion est inférieur à celui d'autres panneaux brillants et, à cet égard, Samsung est sur un pied d'égalité avec les MacBooks de Apple. En principe, vous pouvez également utiliser l'appareil à l'extérieur par temps clair, à condition d'éviter les reflets des sources lumineuses. La stabilité de l'angle de vision est très bonne mais, en cas d'écarts importants, vous trouverez le chatoiement bleu typique des OLED.

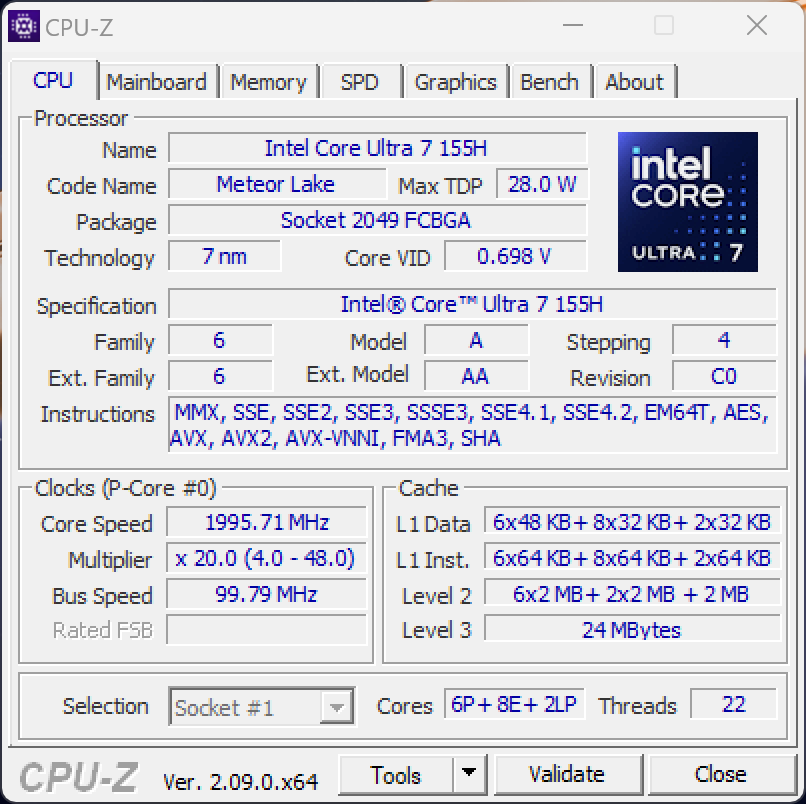
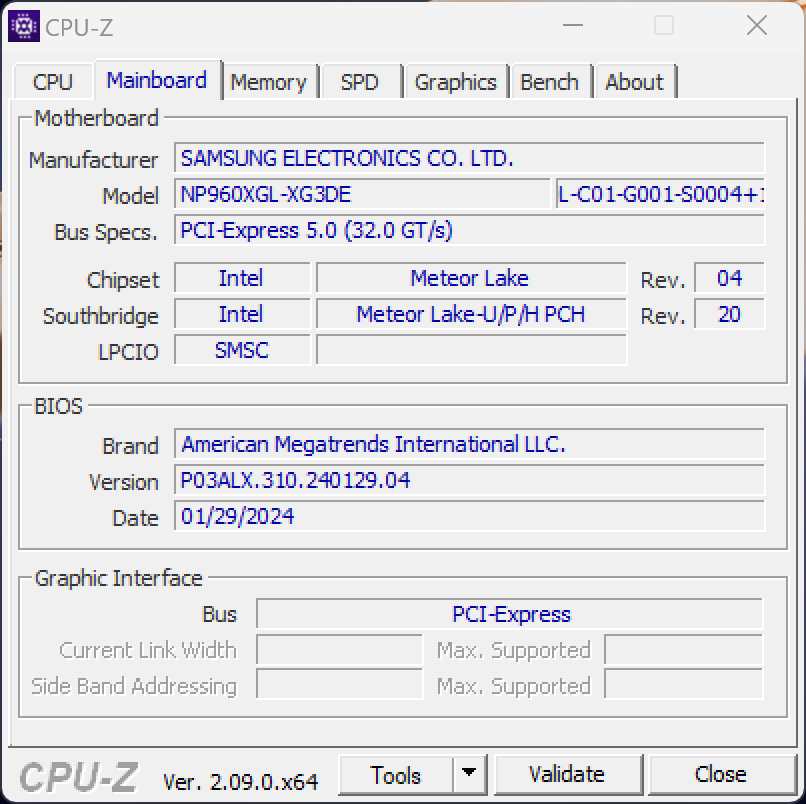
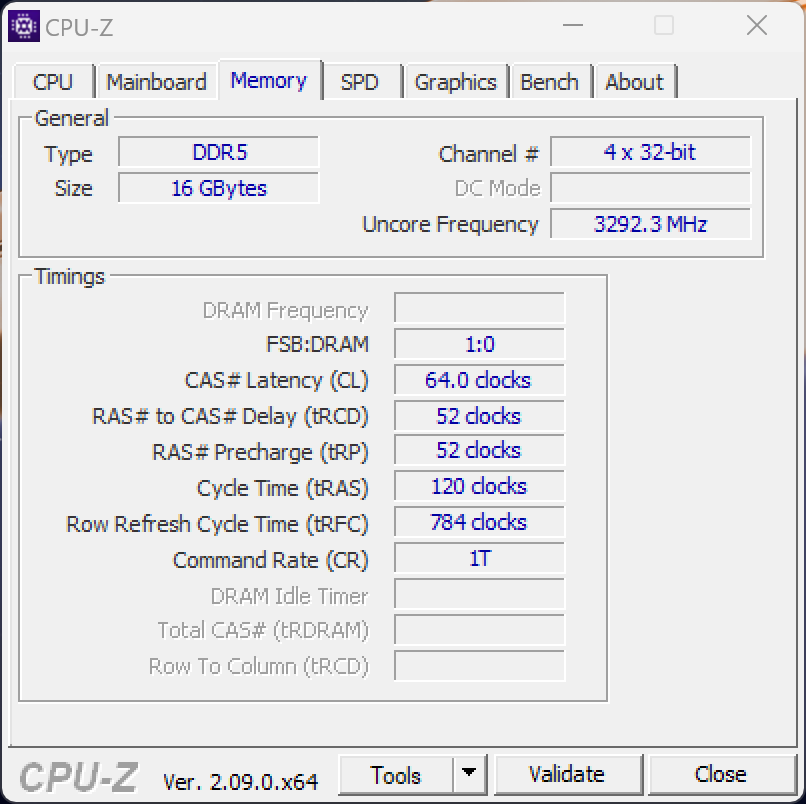
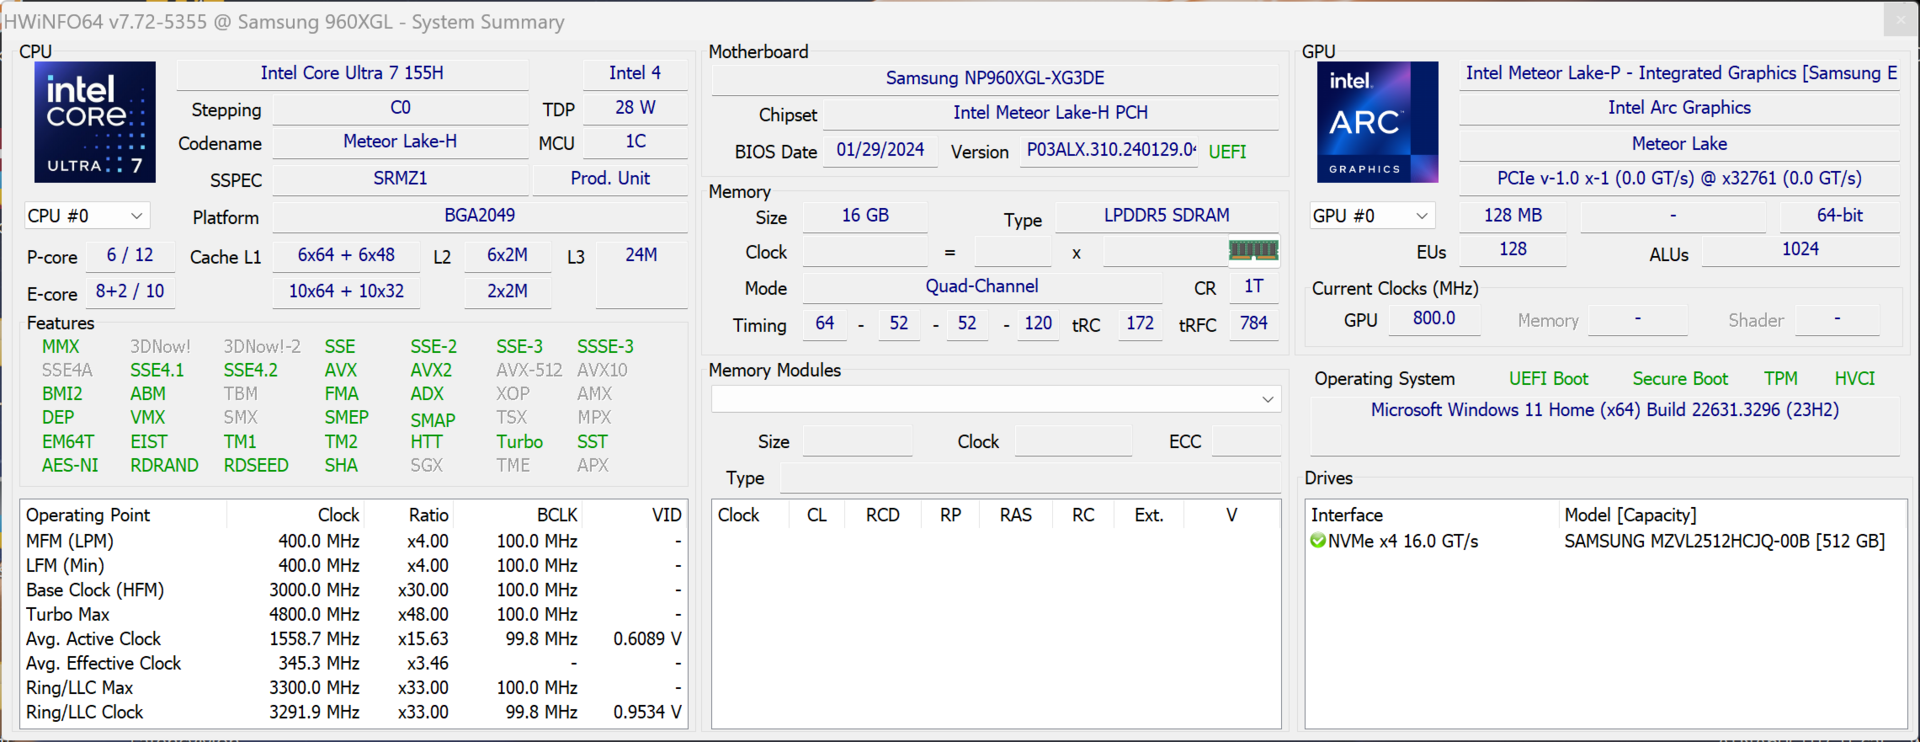
Performance - Le lac Meteor remplace le lac Raptor
Samsung a remplacé les anciennes puces Intel Raptor Lake par les nouveaux processeurs Meteor Lake Core Ultra 7 155H ou le Core Ultra 9 185H. Quel que soit le processeur, vous aurez également 16 ou 32 Go de RAM soudée et, en ce qui concerne les GPU, vous avez le choix entre la GeForce RTX 4050 portable ou le plus rapide RTX 4070 plus rapide.
Conditions d'essai
Dans l'application des paramètres Samsung, il existe différents profils énergétiques, mais la sélection standard est le mode Optimisé. Nous avons également utilisé ce mode pour les tests et mesures suivants. En option, vous pouvez également choisir le mode silencieux ou le mode haute performance. Nous avons résumé les valeurs TDP/TGP correspondantes dans le tableau ci-dessous.
| Profil énergétique | CPU TDP | R23 Multi | GPU TGP | Time Spy Graphics | Stress test | Cyberpunk 2077 1080p Ultra |
force max. du ventilateur |
|---|---|---|---|---|---|---|---|
| Silencieux | 35/25 watts | 11 327 points | 55 watts | 1 529 points | CPU : 20 watts GPU : 20 watts |
12fps | 32 dB(A) |
| Optimisé | 65/40 watts | 15 342 points | 55 watts | 6 073 points | CPU : 25 watts GPU : 33 watts |
39,4fps | 41,7 dB(A) |
| Haute performance | 80/70 watts | 17,088 points | 80 watts | 7,849 points | CPU : 30 watts GPU : 80 watts |
55.4fps | 51.3 dB(A) |
Processeur
Le Core Ultra 7 155H est le successeur du très apprécié Core i7-13700H et offre un total de 16 cœurs/22 threads (6x la performance, 10x l'efficacité). Avec des limites de puissance de 65/40 watts, le processeur offre des performances décentes, même s'il n'y a guère de différences par rapport à l'ancienne génération Raptor Lake. Cela signifie qu'il ne s'agit pas d'une mise à niveau intéressante. Avec le Ryzen 9 Pro 7940HSaMD a une petite longueur d'avance. Le modèle normal M3 Pro se trouve également à ce niveau et bénéficie d'un avantage lors des tests à cœur unique. En cas de charge soutenue, les performances multicœurs chutent d'environ 15 %. En mode batterie, le processeur est autorisé à consommer un maximum de 45 watts, ce qui entraîne un léger déficit de 7 %. Vous trouverez d'autres tests de performance du processeur dans notre section technologie.
Cinebench R15 Multi Continuous Test
Cinebench R23: Multi Core | Single Core
Cinebench R20: CPU (Multi Core) | CPU (Single Core)
Cinebench R15: CPU Multi 64Bit | CPU Single 64Bit
Blender: v2.79 BMW27 CPU
7-Zip 18.03: 7z b 4 | 7z b 4 -mmt1
Geekbench 6.7: Multi-Core | Single-Core
Geekbench 5.5: Multi-Core | Single-Core
HWBOT x265 Benchmark v2.2: 4k Preset
LibreOffice : 20 Documents To PDF
R Benchmark 2.5: Overall mean
| CPU Performance rating | |
| Lenovo Slim Pro 9i 16IRP8 -2! | |
| Apple MacBook Pro 16 2023 M3 Pro -8! | |
| Lenovo ThinkPad Z16 Gen 2 | |
| Moyenne de la classe Multimedia | |
| Samsung Galaxy Book4 Ultra | |
| Schenker VISION 16 Pro (M23) -2! | |
| HP Spectre x360 16 RTX 4050 -1! | |
| Moyenne Intel Core Ultra 7 155H | |
| Samsung Galaxy Book3 Ultra 16 -2! | |
| Cinebench R23 / Multi Core | |
| Lenovo Slim Pro 9i 16IRP8 | |
| Lenovo ThinkPad Z16 Gen 2 | |
| Moyenne de la classe Multimedia (4861 - 33362, n=76, 2 dernières années) | |
| Samsung Galaxy Book4 Ultra | |
| Samsung Galaxy Book3 Ultra 16 | |
| HP Spectre x360 16 RTX 4050 | |
| Apple MacBook Pro 16 2023 M3 Pro | |
| Moyenne Intel Core Ultra 7 155H (9769 - 19007, n=52) | |
| Schenker VISION 16 Pro (M23) | |
| Cinebench R23 / Single Core | |
| Lenovo Slim Pro 9i 16IRP8 | |
| Apple MacBook Pro 16 2023 M3 Pro | |
| Moyenne de la classe Multimedia (1128 - 2459, n=68, 2 dernières années) | |
| Schenker VISION 16 Pro (M23) | |
| Lenovo ThinkPad Z16 Gen 2 | |
| Samsung Galaxy Book4 Ultra | |
| Moyenne Intel Core Ultra 7 155H (1496 - 1815, n=52) | |
| HP Spectre x360 16 RTX 4050 | |
| Samsung Galaxy Book3 Ultra 16 | |
| Cinebench R20 / CPU (Multi Core) | |
| Lenovo Slim Pro 9i 16IRP8 | |
| Lenovo ThinkPad Z16 Gen 2 | |
| Moyenne de la classe Multimedia (1887 - 12912, n=59, 2 dernières années) | |
| Samsung Galaxy Book4 Ultra | |
| Samsung Galaxy Book3 Ultra 16 | |
| Moyenne Intel Core Ultra 7 155H (3798 - 7409, n=50) | |
| Schenker VISION 16 Pro (M23) | |
| HP Spectre x360 16 RTX 4050 | |
| Cinebench R20 / CPU (Single Core) | |
| Lenovo Slim Pro 9i 16IRP8 | |
| Moyenne de la classe Multimedia (425 - 853, n=59, 2 dernières années) | |
| Schenker VISION 16 Pro (M23) | |
| Lenovo ThinkPad Z16 Gen 2 | |
| Samsung Galaxy Book4 Ultra | |
| Moyenne Intel Core Ultra 7 155H (601 - 696, n=50) | |
| HP Spectre x360 16 RTX 4050 | |
| Samsung Galaxy Book3 Ultra 16 | |
| Cinebench R15 / CPU Multi 64Bit | |
| Lenovo Slim Pro 9i 16IRP8 | |
| Lenovo ThinkPad Z16 Gen 2 | |
| Moyenne de la classe Multimedia (856 - 5224, n=63, 2 dernières années) | |
| Samsung Galaxy Book4 Ultra | |
| Samsung Galaxy Book3 Ultra 16 | |
| Moyenne Intel Core Ultra 7 155H (1932 - 2880, n=56) | |
| HP Spectre x360 16 RTX 4050 | |
| Schenker VISION 16 Pro (M23) | |
| Apple MacBook Pro 16 2023 M3 Pro | |
| Cinebench R15 / CPU Single 64Bit | |
| Lenovo Slim Pro 9i 16IRP8 | |
| Moyenne de la classe Multimedia (184.8 - 326, n=61, 2 dernières années) | |
| Lenovo ThinkPad Z16 Gen 2 | |
| Schenker VISION 16 Pro (M23) | |
| Samsung Galaxy Book4 Ultra | |
| HP Spectre x360 16 RTX 4050 | |
| Moyenne Intel Core Ultra 7 155H (99.6 - 268, n=52) | |
| Samsung Galaxy Book3 Ultra 16 | |
| Blender / v2.79 BMW27 CPU | |
| Apple MacBook Pro 16 2023 M3 Pro | |
| Moyenne de la classe Multimedia (100 - 557, n=60, 2 dernières années) | |
| Moyenne Intel Core Ultra 7 155H (175 - 381, n=47) | |
| Schenker VISION 16 Pro (M23) | |
| Samsung Galaxy Book3 Ultra 16 | |
| Samsung Galaxy Book4 Ultra | |
| Lenovo ThinkPad Z16 Gen 2 | |
| Lenovo Slim Pro 9i 16IRP8 | |
| 7-Zip 18.03 / 7z b 4 | |
| Lenovo Slim Pro 9i 16IRP8 | |
| Lenovo ThinkPad Z16 Gen 2 | |
| Samsung Galaxy Book4 Ultra | |
| Schenker VISION 16 Pro (M23) | |
| Samsung Galaxy Book3 Ultra 16 | |
| HP Spectre x360 16 RTX 4050 | |
| Moyenne Intel Core Ultra 7 155H (41739 - 70254, n=50) | |
| Moyenne de la classe Multimedia (26062 - 130368, n=57, 2 dernières années) | |
| 7-Zip 18.03 / 7z b 4 -mmt1 | |
| Schenker VISION 16 Pro (M23) | |
| Lenovo ThinkPad Z16 Gen 2 | |
| Lenovo Slim Pro 9i 16IRP8 | |
| Moyenne de la classe Multimedia (3666 - 7545, n=58, 2 dernières années) | |
| Samsung Galaxy Book4 Ultra | |
| Samsung Galaxy Book3 Ultra 16 | |
| Moyenne Intel Core Ultra 7 155H (4594 - 5621, n=50) | |
| HP Spectre x360 16 RTX 4050 | |
| Geekbench 6.7 / Multi-Core | |
| Apple MacBook Pro 16 2023 M3 Pro | |
| Moyenne de la classe Multimedia (4983 - 29415, n=71, 2 dernières années) | |
| Lenovo ThinkPad Z16 Gen 2 | |
| Samsung Galaxy Book4 Ultra | |
| Moyenne Intel Core Ultra 7 155H (7732 - 13656, n=55) | |
| HP Spectre x360 16 RTX 4050 | |
| Geekbench 6.7 / Single-Core | |
| Apple MacBook Pro 16 2023 M3 Pro | |
| Moyenne de la classe Multimedia (1534 - 4335, n=70, 2 dernières années) | |
| Lenovo ThinkPad Z16 Gen 2 | |
| Samsung Galaxy Book4 Ultra | |
| Moyenne Intel Core Ultra 7 155H (1901 - 2473, n=52) | |
| HP Spectre x360 16 RTX 4050 | |
| Geekbench 5.5 / Multi-Core | |
| Apple MacBook Pro 16 2023 M3 Pro | |
| Lenovo Slim Pro 9i 16IRP8 | |
| Moyenne de la classe Multimedia (4652 - 20422, n=58, 2 dernières années) | |
| Samsung Galaxy Book4 Ultra | |
| HP Spectre x360 16 RTX 4050 | |
| Lenovo ThinkPad Z16 Gen 2 | |
| Moyenne Intel Core Ultra 7 155H (10017 - 13556, n=52) | |
| Schenker VISION 16 Pro (M23) | |
| Samsung Galaxy Book3 Ultra 16 | |
| Geekbench 5.5 / Single-Core | |
| Apple MacBook Pro 16 2023 M3 Pro | |
| Moyenne de la classe Multimedia (805 - 2974, n=58, 2 dernières années) | |
| Lenovo Slim Pro 9i 16IRP8 | |
| Lenovo ThinkPad Z16 Gen 2 | |
| Schenker VISION 16 Pro (M23) | |
| Samsung Galaxy Book4 Ultra | |
| Moyenne Intel Core Ultra 7 155H (1462 - 1824, n=52) | |
| HP Spectre x360 16 RTX 4050 | |
| Samsung Galaxy Book3 Ultra 16 | |
| HWBOT x265 Benchmark v2.2 / 4k Preset | |
| Lenovo Slim Pro 9i 16IRP8 | |
| Lenovo ThinkPad Z16 Gen 2 | |
| Moyenne de la classe Multimedia (5.26 - 36.1, n=58, 2 dernières années) | |
| Samsung Galaxy Book4 Ultra | |
| Samsung Galaxy Book3 Ultra 16 | |
| Schenker VISION 16 Pro (M23) | |
| Moyenne Intel Core Ultra 7 155H (9.93 - 21.2, n=50) | |
| HP Spectre x360 16 RTX 4050 | |
| LibreOffice / 20 Documents To PDF | |
| Moyenne de la classe Multimedia (23.9 - 146.7, n=59, 2 dernières années) | |
| Samsung Galaxy Book3 Ultra 16 | |
| Moyenne Intel Core Ultra 7 155H (37.5 - 79.2, n=49) | |
| Schenker VISION 16 Pro (M23) | |
| Samsung Galaxy Book4 Ultra | |
| Lenovo ThinkPad Z16 Gen 2 | |
| HP Spectre x360 16 RTX 4050 | |
| Lenovo Slim Pro 9i 16IRP8 | |
| R Benchmark 2.5 / Overall mean | |
| HP Spectre x360 16 RTX 4050 | |
| Samsung Galaxy Book3 Ultra 16 | |
| Moyenne Intel Core Ultra 7 155H (0.4457 - 0.53, n=49) | |
| Samsung Galaxy Book4 Ultra | |
| Moyenne de la classe Multimedia (0.3604 - 0.947, n=58, 2 dernières années) | |
| Lenovo ThinkPad Z16 Gen 2 | |
| Schenker VISION 16 Pro (M23) | |
| Lenovo Slim Pro 9i 16IRP8 | |
* ... Moindre est la valeur, meilleures sont les performances
AIDA64: FP32 Ray-Trace | FPU Julia | CPU SHA3 | CPU Queen | FPU SinJulia | FPU Mandel | CPU AES | CPU ZLib | FP64 Ray-Trace | CPU PhotoWorxx
| Performance rating | |
| Lenovo ThinkPad Z16 Gen 2 | |
| Lenovo Slim Pro 9i 16IRP8 | |
| Moyenne de la classe Multimedia | |
| Samsung Galaxy Book3 Ultra 16 | |
| HP Spectre x360 16 RTX 4050 | |
| Samsung Galaxy Book4 Ultra | |
| Moyenne Intel Core Ultra 7 155H | |
| Schenker VISION 16 Pro (M23) | |
| AIDA64 / FP32 Ray-Trace | |
| Lenovo ThinkPad Z16 Gen 2 | |
| Lenovo Slim Pro 9i 16IRP8 | |
| Moyenne de la classe Multimedia (2214 - 50388, n=55, 2 dernières années) | |
| Samsung Galaxy Book3 Ultra 16 | |
| HP Spectre x360 16 RTX 4050 | |
| Samsung Galaxy Book4 Ultra | |
| Schenker VISION 16 Pro (M23) | |
| Moyenne Intel Core Ultra 7 155H (6670 - 18470, n=50) | |
| AIDA64 / FPU Julia | |
| Lenovo ThinkPad Z16 Gen 2 | |
| Lenovo Slim Pro 9i 16IRP8 | |
| Moyenne de la classe Multimedia (12867 - 201874, n=56, 2 dernières années) | |
| HP Spectre x360 16 RTX 4050 | |
| Samsung Galaxy Book4 Ultra | |
| Schenker VISION 16 Pro (M23) | |
| Moyenne Intel Core Ultra 7 155H (40905 - 93181, n=50) | |
| Samsung Galaxy Book3 Ultra 16 | |
| AIDA64 / CPU SHA3 | |
| Lenovo ThinkPad Z16 Gen 2 | |
| Lenovo Slim Pro 9i 16IRP8 | |
| Moyenne de la classe Multimedia (626 - 8623, n=56, 2 dernières années) | |
| HP Spectre x360 16 RTX 4050 | |
| Samsung Galaxy Book4 Ultra | |
| Moyenne Intel Core Ultra 7 155H (1940 - 4436, n=50) | |
| Samsung Galaxy Book3 Ultra 16 | |
| Schenker VISION 16 Pro (M23) | |
| AIDA64 / CPU Queen | |
| Lenovo ThinkPad Z16 Gen 2 | |
| Lenovo Slim Pro 9i 16IRP8 | |
| Samsung Galaxy Book3 Ultra 16 | |
| Schenker VISION 16 Pro (M23) | |
| Samsung Galaxy Book4 Ultra | |
| Moyenne Intel Core Ultra 7 155H (64698 - 94181, n=50) | |
| HP Spectre x360 16 RTX 4050 | |
| Moyenne de la classe Multimedia (13483 - 181505, n=43, 2 dernières années) | |
| AIDA64 / FPU SinJulia | |
| Lenovo ThinkPad Z16 Gen 2 | |
| Lenovo Slim Pro 9i 16IRP8 | |
| Samsung Galaxy Book4 Ultra | |
| HP Spectre x360 16 RTX 4050 | |
| Moyenne Intel Core Ultra 7 155H (5639 - 10647, n=50) | |
| Samsung Galaxy Book3 Ultra 16 | |
| Schenker VISION 16 Pro (M23) | |
| Moyenne de la classe Multimedia (886 - 28794, n=56, 2 dernières années) | |
| AIDA64 / FPU Mandel | |
| Lenovo ThinkPad Z16 Gen 2 | |
| Lenovo Slim Pro 9i 16IRP8 | |
| Moyenne de la classe Multimedia (6395 - 105740, n=55, 2 dernières années) | |
| HP Spectre x360 16 RTX 4050 | |
| Samsung Galaxy Book4 Ultra | |
| Samsung Galaxy Book3 Ultra 16 | |
| Moyenne Intel Core Ultra 7 155H (18236 - 47685, n=50) | |
| Schenker VISION 16 Pro (M23) | |
| AIDA64 / CPU AES | |
| Lenovo ThinkPad Z16 Gen 2 | |
| Lenovo Slim Pro 9i 16IRP8 | |
| Moyenne Intel Core Ultra 7 155H (45713 - 152179, n=50) | |
| HP Spectre x360 16 RTX 4050 | |
| Samsung Galaxy Book4 Ultra | |
| Samsung Galaxy Book3 Ultra 16 | |
| Schenker VISION 16 Pro (M23) | |
| Moyenne de la classe Multimedia (8171 - 126790, n=56, 2 dernières années) | |
| AIDA64 / CPU ZLib | |
| Lenovo Slim Pro 9i 16IRP8 | |
| Lenovo ThinkPad Z16 Gen 2 | |
| Samsung Galaxy Book3 Ultra 16 | |
| HP Spectre x360 16 RTX 4050 | |
| Moyenne de la classe Multimedia (143.8 - 2022, n=56, 2 dernières années) | |
| Samsung Galaxy Book4 Ultra | |
| Moyenne Intel Core Ultra 7 155H (557 - 1250, n=50) | |
| Schenker VISION 16 Pro (M23) | |
| AIDA64 / FP64 Ray-Trace | |
| Lenovo ThinkPad Z16 Gen 2 | |
| Lenovo Slim Pro 9i 16IRP8 | |
| Moyenne de la classe Multimedia (1014 - 26875, n=56, 2 dernières années) | |
| Samsung Galaxy Book3 Ultra 16 | |
| HP Spectre x360 16 RTX 4050 | |
| Schenker VISION 16 Pro (M23) | |
| Samsung Galaxy Book4 Ultra | |
| Moyenne Intel Core Ultra 7 155H (3569 - 9802, n=50) | |
| AIDA64 / CPU PhotoWorxx | |
| Lenovo Slim Pro 9i 16IRP8 | |
| Samsung Galaxy Book4 Ultra | |
| Moyenne de la classe Multimedia (8187 - 88154, n=56, 2 dernières années) | |
| HP Spectre x360 16 RTX 4050 | |
| Samsung Galaxy Book3 Ultra 16 | |
| Moyenne Intel Core Ultra 7 155H (32719 - 54223, n=50) | |
| Schenker VISION 16 Pro (M23) | |
| Lenovo ThinkPad Z16 Gen 2 | |
Performance du système
Dans les benchmarks synthétiques, le Galaxy Book4 Ultra a obtenu de bons résultats et nous avons affaire à un ordinateur rapide et réactif. Nous n'avons détecté aucun problème durant notre test.
CrossMark: Overall | Productivity | Creativity | Responsiveness
WebXPRT 3: Overall
WebXPRT 4: Overall
Mozilla Kraken 1.1: Total
| PCMark 10 / Score | |
| Lenovo ThinkPad Z16 Gen 2 | |
| Moyenne de la classe Multimedia (4325 - 10386, n=54, 2 dernières années) | |
| Lenovo Slim Pro 9i 16IRP8 | |
| Schenker VISION 16 Pro (M23) | |
| Samsung Galaxy Book4 Ultra | |
| Moyenne Intel Core Ultra 7 155H, NVIDIA GeForce RTX 4050 Laptop GPU (6537 - 6973, n=5) | |
| Samsung Galaxy Book3 Ultra 16 | |
| HP Spectre x360 16 RTX 4050 | |
| PCMark 10 / Essentials | |
| Lenovo ThinkPad Z16 Gen 2 | |
| Lenovo Slim Pro 9i 16IRP8 | |
| Schenker VISION 16 Pro (M23) | |
| Samsung Galaxy Book3 Ultra 16 | |
| Moyenne de la classe Multimedia (8025 - 11664, n=53, 2 dernières années) | |
| Samsung Galaxy Book4 Ultra | |
| HP Spectre x360 16 RTX 4050 | |
| Moyenne Intel Core Ultra 7 155H, NVIDIA GeForce RTX 4050 Laptop GPU (9463 - 10446, n=5) | |
| PCMark 10 / Productivity | |
| Moyenne de la classe Multimedia (7323 - 18233, n=53, 2 dernières années) | |
| Lenovo ThinkPad Z16 Gen 2 | |
| Lenovo Slim Pro 9i 16IRP8 | |
| Schenker VISION 16 Pro (M23) | |
| HP Spectre x360 16 RTX 4050 | |
| Samsung Galaxy Book4 Ultra | |
| Moyenne Intel Core Ultra 7 155H, NVIDIA GeForce RTX 4050 Laptop GPU (8769 - 9272, n=5) | |
| Samsung Galaxy Book3 Ultra 16 | |
| PCMark 10 / Digital Content Creation | |
| Lenovo Slim Pro 9i 16IRP8 | |
| Lenovo ThinkPad Z16 Gen 2 | |
| Schenker VISION 16 Pro (M23) | |
| Moyenne de la classe Multimedia (3651 - 16240, n=53, 2 dernières années) | |
| Samsung Galaxy Book4 Ultra | |
| Samsung Galaxy Book3 Ultra 16 | |
| Moyenne Intel Core Ultra 7 155H, NVIDIA GeForce RTX 4050 Laptop GPU (8602 - 10622, n=5) | |
| HP Spectre x360 16 RTX 4050 | |
| CrossMark / Overall | |
| Apple MacBook Pro 16 2023 M3 Pro | |
| Schenker VISION 16 Pro (M23) | |
| Moyenne de la classe Multimedia (866 - 2728, n=62, 2 dernières années) | |
| Lenovo Slim Pro 9i 16IRP8 | |
| Samsung Galaxy Book4 Ultra | |
| Moyenne Intel Core Ultra 7 155H, NVIDIA GeForce RTX 4050 Laptop GPU (1552 - 1740, n=5) | |
| HP Spectre x360 16 RTX 4050 | |
| Samsung Galaxy Book3 Ultra 16 | |
| Lenovo ThinkPad Z16 Gen 2 | |
| CrossMark / Productivity | |
| Schenker VISION 16 Pro (M23) | |
| Apple MacBook Pro 16 2023 M3 Pro | |
| Moyenne de la classe Multimedia (931 - 2489, n=62, 2 dernières années) | |
| Samsung Galaxy Book4 Ultra | |
| Lenovo Slim Pro 9i 16IRP8 | |
| Moyenne Intel Core Ultra 7 155H, NVIDIA GeForce RTX 4050 Laptop GPU (1459 - 1659, n=5) | |
| HP Spectre x360 16 RTX 4050 | |
| Lenovo ThinkPad Z16 Gen 2 | |
| Samsung Galaxy Book3 Ultra 16 | |
| CrossMark / Creativity | |
| Apple MacBook Pro 16 2023 M3 Pro | |
| Moyenne de la classe Multimedia (907 - 3465, n=62, 2 dernières années) | |
| Lenovo Slim Pro 9i 16IRP8 | |
| Schenker VISION 16 Pro (M23) | |
| Samsung Galaxy Book4 Ultra | |
| Moyenne Intel Core Ultra 7 155H, NVIDIA GeForce RTX 4050 Laptop GPU (1811 - 1943, n=5) | |
| HP Spectre x360 16 RTX 4050 | |
| Lenovo ThinkPad Z16 Gen 2 | |
| Samsung Galaxy Book3 Ultra 16 | |
| CrossMark / Responsiveness | |
| Schenker VISION 16 Pro (M23) | |
| Moyenne de la classe Multimedia (605 - 2024, n=62, 2 dernières années) | |
| Samsung Galaxy Book3 Ultra 16 | |
| Samsung Galaxy Book4 Ultra | |
| Apple MacBook Pro 16 2023 M3 Pro | |
| Lenovo Slim Pro 9i 16IRP8 | |
| Lenovo ThinkPad Z16 Gen 2 | |
| Moyenne Intel Core Ultra 7 155H, NVIDIA GeForce RTX 4050 Laptop GPU (1167 - 1467, n=5) | |
| HP Spectre x360 16 RTX 4050 | |
| WebXPRT 3 / Overall | |
| Apple MacBook Pro 16 2023 M3 Pro | |
| Moyenne de la classe Multimedia (136.4 - 596, n=65, 2 dernières années) | |
| Lenovo Slim Pro 9i 16IRP8 | |
| Lenovo ThinkPad Z16 Gen 2 | |
| Schenker VISION 16 Pro (M23) | |
| Samsung Galaxy Book4 Ultra | |
| HP Spectre x360 16 RTX 4050 | |
| Moyenne Intel Core Ultra 7 155H, NVIDIA GeForce RTX 4050 Laptop GPU (262 - 285, n=5) | |
| Samsung Galaxy Book3 Ultra 16 | |
| WebXPRT 4 / Overall | |
| Moyenne de la classe Multimedia (167.3 - 402, n=67, 2 dernières années) | |
| Lenovo Slim Pro 9i 16IRP8 | |
| Schenker VISION 16 Pro (M23) | |
| Samsung Galaxy Book4 Ultra | |
| Lenovo ThinkPad Z16 Gen 2 | |
| HP Spectre x360 16 RTX 4050 | |
| Moyenne Intel Core Ultra 7 155H, NVIDIA GeForce RTX 4050 Laptop GPU (247 - 260, n=5) | |
| Samsung Galaxy Book3 Ultra 16 | |
| Mozilla Kraken 1.1 / Total | |
| Samsung Galaxy Book3 Ultra 16 | |
| Lenovo ThinkPad Z16 Gen 2 | |
| HP Spectre x360 16 RTX 4050 | |
| Moyenne Intel Core Ultra 7 155H, NVIDIA GeForce RTX 4050 Laptop GPU (416 - 561, n=5) | |
| Schenker VISION 16 Pro (M23) | |
| Lenovo Slim Pro 9i 16IRP8 | |
| Moyenne de la classe Multimedia (228 - 835, n=68, 2 dernières années) | |
| Samsung Galaxy Book4 Ultra | |
| Apple MacBook Pro 16 2023 M3 Pro | |
* ... Moindre est la valeur, meilleures sont les performances
| PCMark 10 Score | 6973 points | |
Aide | ||
| AIDA64 / Memory Copy | |
| Samsung Galaxy Book4 Ultra | |
| HP Spectre x360 16 RTX 4050 | |
| Moyenne Intel Core Ultra 7 155H (62397 - 96791, n=50) | |
| Moyenne de la classe Multimedia (11299 - 132135, n=56, 2 dernières années) | |
| Lenovo Slim Pro 9i 16IRP8 | |
| Samsung Galaxy Book3 Ultra 16 | |
| Lenovo ThinkPad Z16 Gen 2 | |
| Schenker VISION 16 Pro (M23) | |
| AIDA64 / Memory Read | |
| Samsung Galaxy Book4 Ultra | |
| HP Spectre x360 16 RTX 4050 | |
| Moyenne de la classe Multimedia (11624 - 174586, n=56, 2 dernières années) | |
| Moyenne Intel Core Ultra 7 155H (60544 - 90647, n=50) | |
| Lenovo Slim Pro 9i 16IRP8 | |
| Schenker VISION 16 Pro (M23) | |
| Samsung Galaxy Book3 Ultra 16 | |
| Lenovo ThinkPad Z16 Gen 2 | |
| AIDA64 / Memory Write | |
| HP Spectre x360 16 RTX 4050 | |
| Lenovo ThinkPad Z16 Gen 2 | |
| Lenovo Slim Pro 9i 16IRP8 | |
| Samsung Galaxy Book3 Ultra 16 | |
| Moyenne de la classe Multimedia (11755 - 134998, n=56, 2 dernières années) | |
| Samsung Galaxy Book4 Ultra | |
| Moyenne Intel Core Ultra 7 155H (58692 - 93451, n=50) | |
| Schenker VISION 16 Pro (M23) | |
| AIDA64 / Memory Latency | |
| Moyenne Intel Core Ultra 7 155H (116.2 - 233, n=50) | |
| Samsung Galaxy Book4 Ultra | |
| HP Spectre x360 16 RTX 4050 | |
| Moyenne de la classe Multimedia (7 - 535, n=55, 2 dernières années) | |
| Lenovo ThinkPad Z16 Gen 2 | |
| Lenovo Slim Pro 9i 16IRP8 | |
| Samsung Galaxy Book3 Ultra 16 | |
| Schenker VISION 16 Pro (M23) | |
* ... Moindre est la valeur, meilleures sont les performances
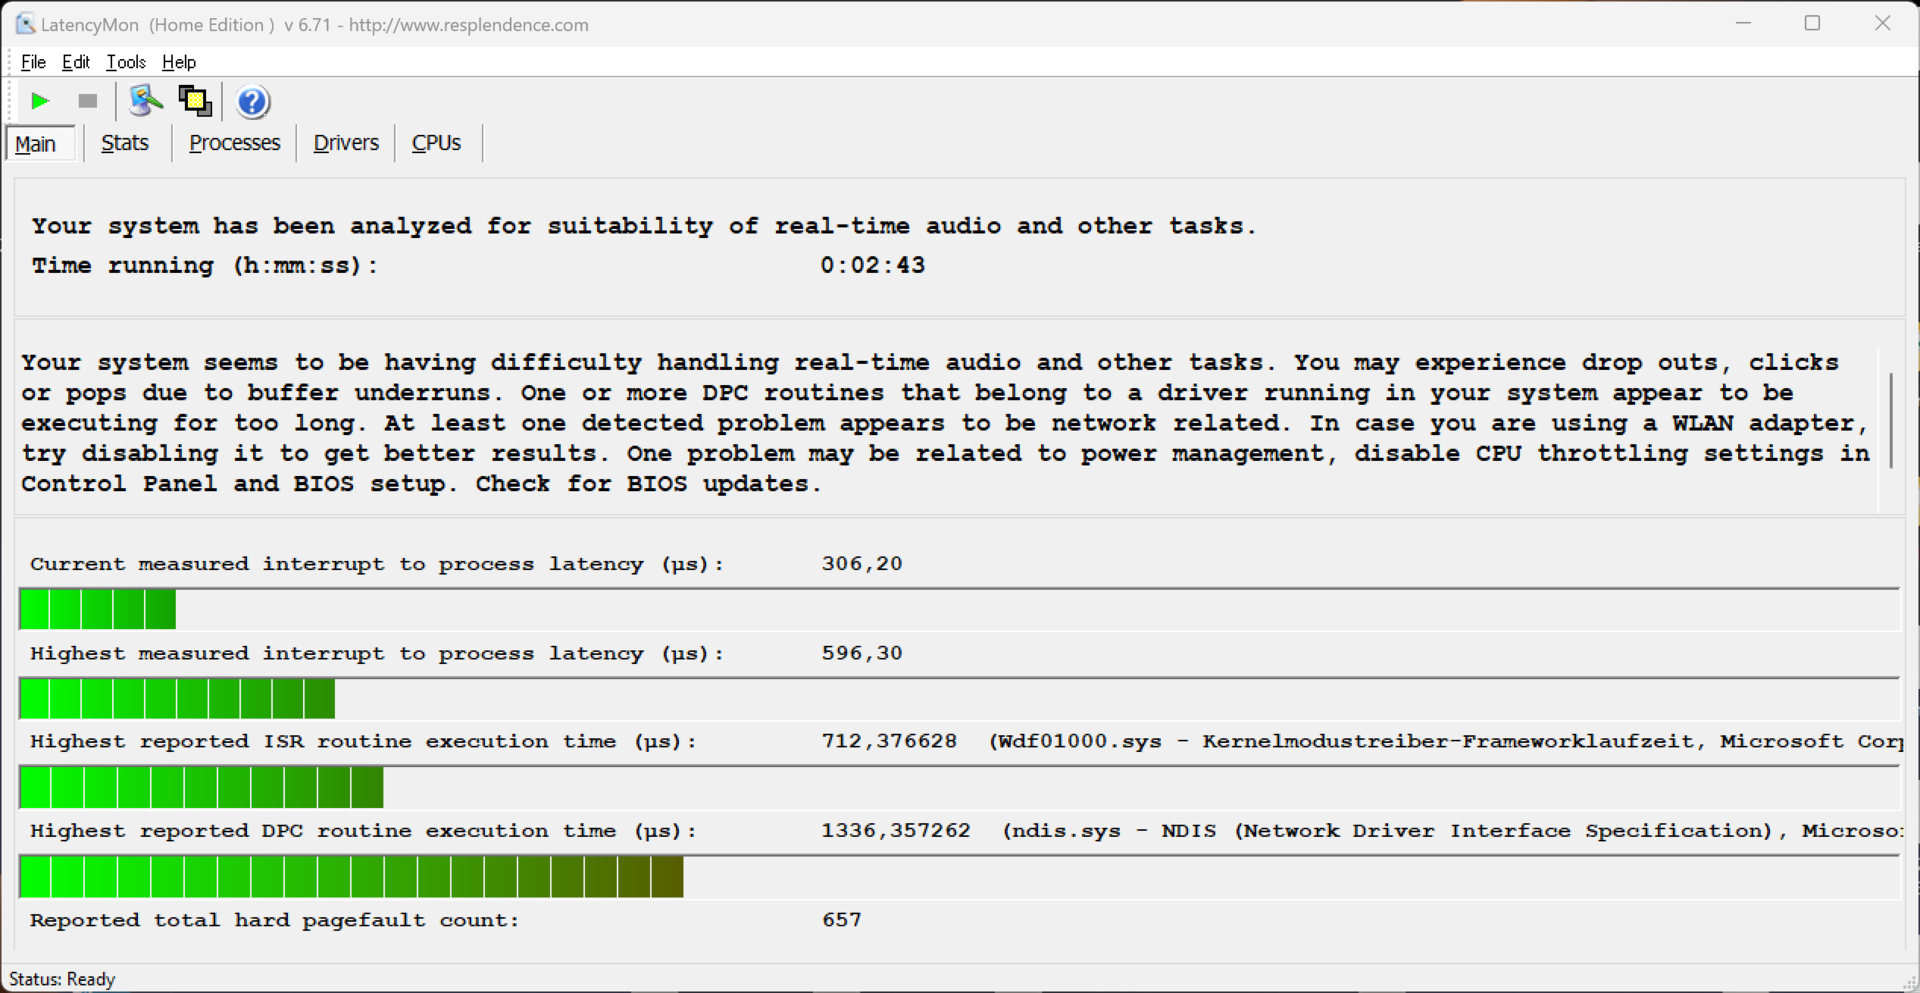
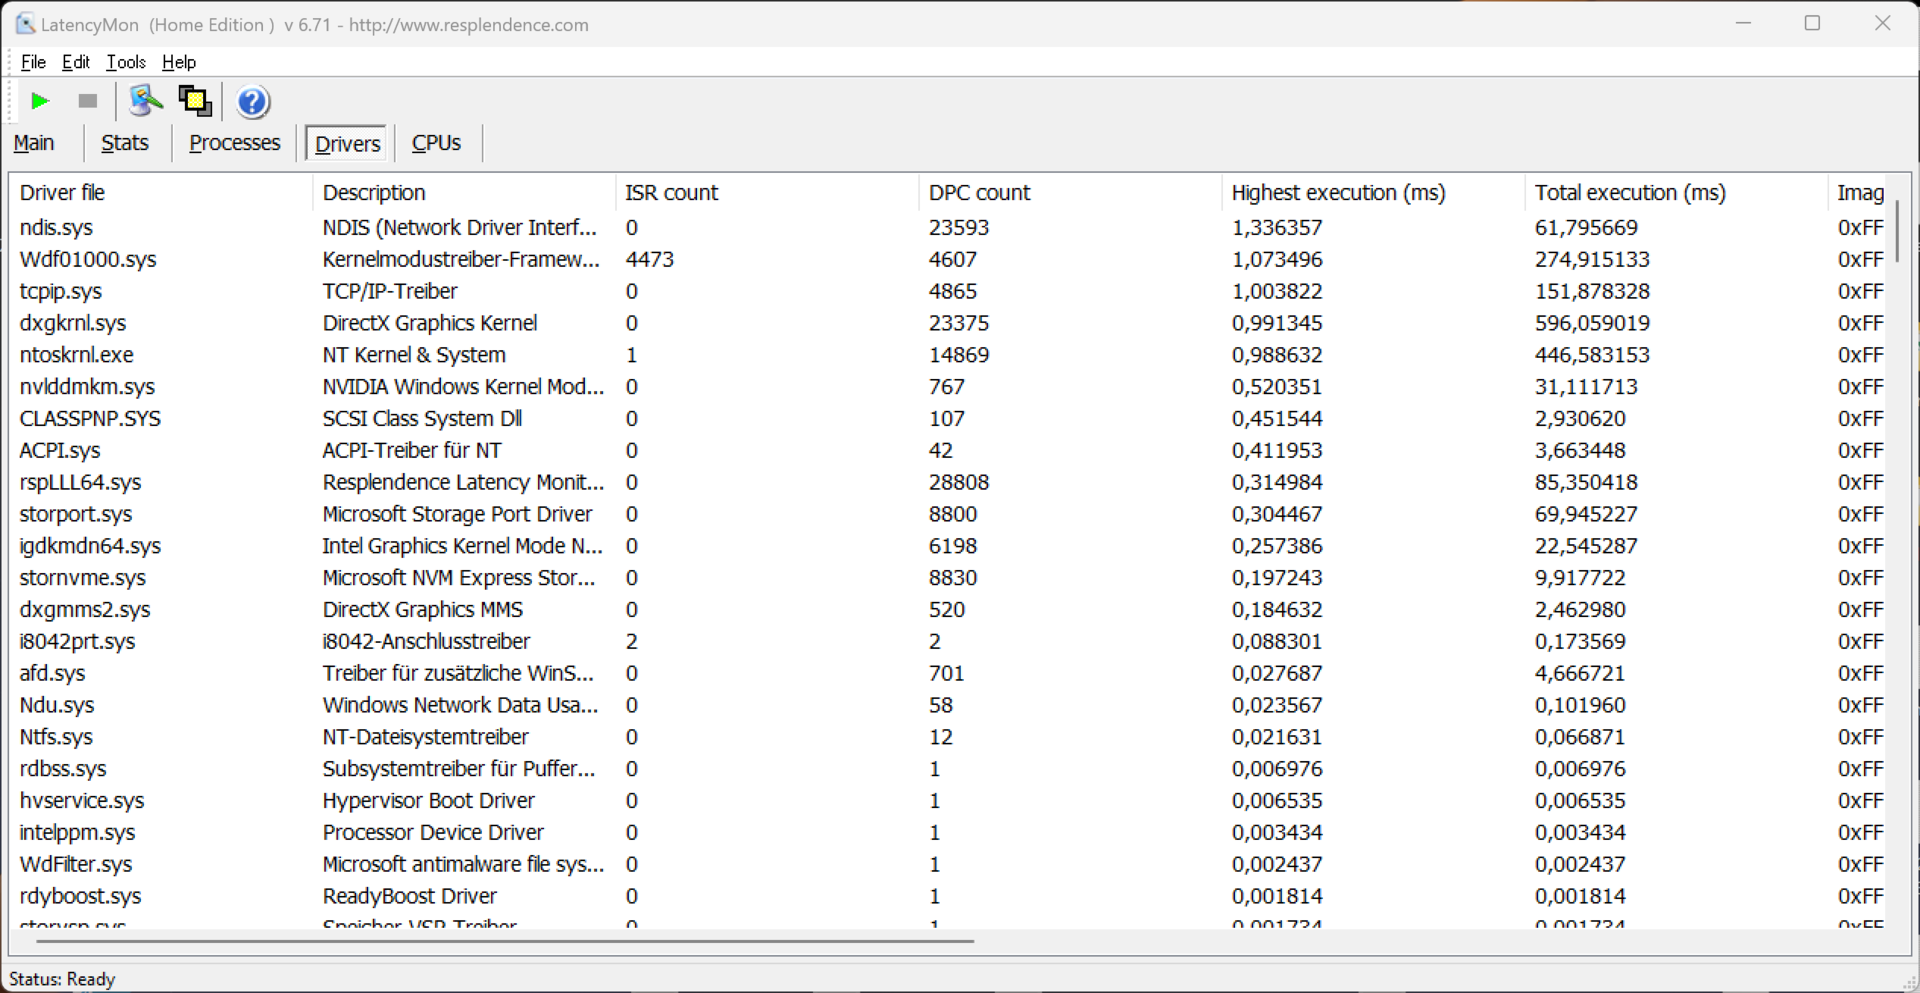
Latences DPC
Lors de notre test de latence standardisé (navigation sur Internet, lecture 4K sur YouTube, charge du processeur), l'appareil examiné et sa version actuelle du BIOS se sont très bien comportés. Un pilote a montré un pic, mais la valeur importante de "latence entre l'interruption et le processus" était très faible.
| DPC Latencies / LatencyMon - interrupt to process latency (max), Web, Youtube, Prime95 | |
| HP Spectre x360 16 RTX 4050 | |
| Samsung Galaxy Book3 Ultra 16 | |
| Lenovo Slim Pro 9i 16IRP8 | |
| Lenovo ThinkPad Z16 Gen 2 | |
| Schenker VISION 16 Pro (M23) | |
| Samsung Galaxy Book4 Ultra | |
* ... Moindre est la valeur, meilleures sont les performances
Mémoire de masse
Sans surprise, Samsung a installé l'un de ses propres disques SSD (PM9A1), qui n'a toutefois qu'une capacité de 512 Go. Après la première installation, l'utilisateur dispose de 403 Go. Au moins, la capacité de stockage peut être étendue facilement et à un prix abordable grâce au deuxième emplacement M.2 2280. Les performances du SSD ne sont pas critiquables et, même en cas de charge prolongée, il n'y a pas de baisse de performance. Vous trouverez d'autres points de référence pour les SSD sont listés ici.

* ... Moindre est la valeur, meilleures sont les performances
Continuous Performance Read : DiskSpd Read Loop, Queue Depth 8
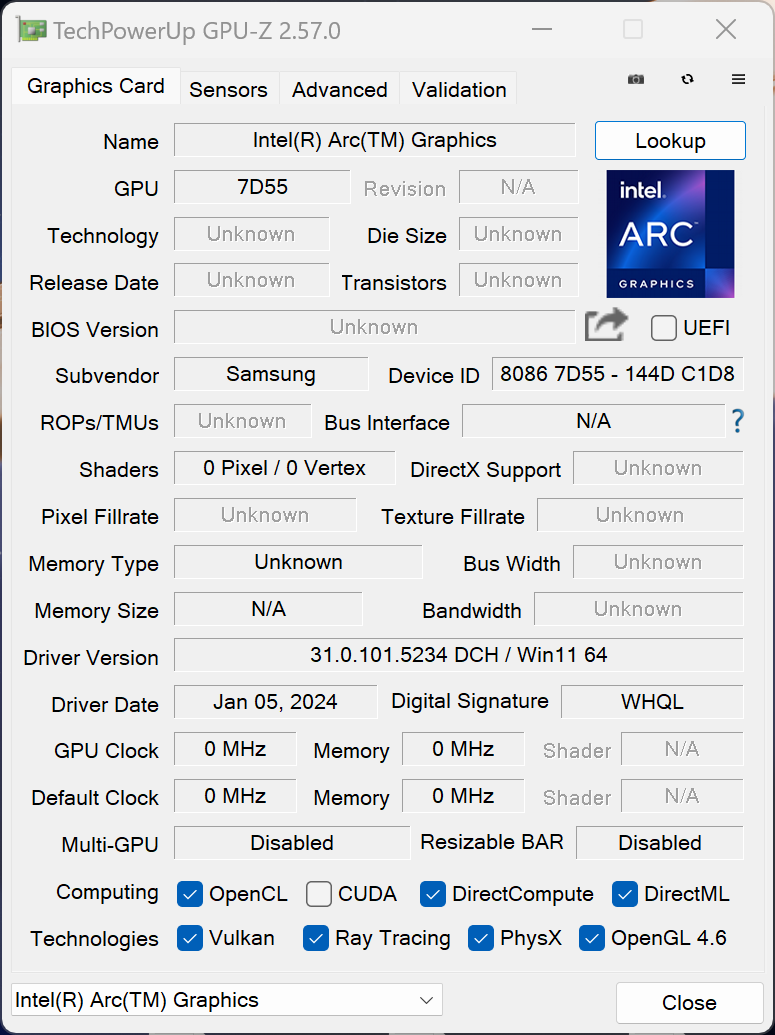
Carte graphique
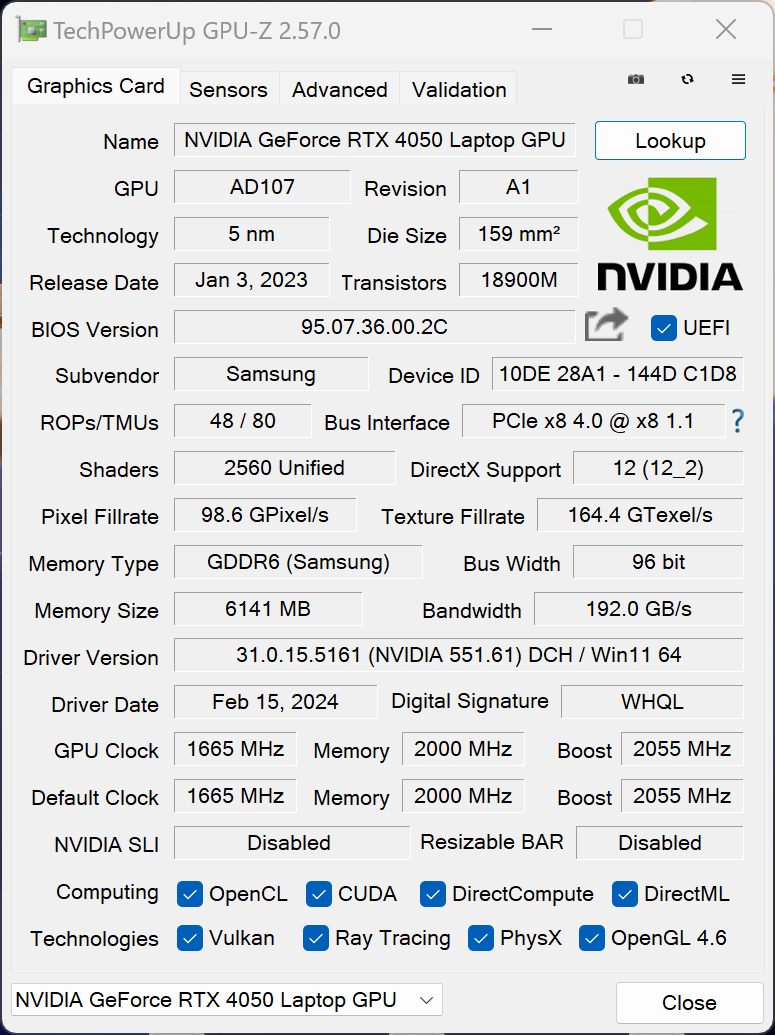
Dans les situations quotidiennes, le GPU Arc intégré prend en charge les calculs graphiques et, pour les applications exigeantes, le GPU Nvidia est automatiquement activé. Le commutateur graphique Optimus normal est utilisé, mais ni le commutateur MUX ni l'Optimus avancé ne sont disponibles. L'ordinateur portable Ordinateur portable RTX 4050 logé dans le Galaxy Book4 Ultra, consomme au maximum 80 watts en mode haute performance et 55 watts en mode optimisé.
Les résultats des tests sont du même ordre que ceux de l'ancien Galaxy Book3 Ultra qui utilisait également un ordinateur portable RTX 4050 à 55 watts. Ce résultat est supérieur à celui de la Radeon RX 6550M mais le GPU M3 Pro est parfois plus rapide. Pour un ordinateur portable multimédia, la RTX 4050 reste un bon choix. Cependant, le Galaxy Book4 Ultra a échoué au test de stress 3DMark (Time Spy) avec une baisse de performance de 7 % en charge soutenue.
En mode batterie, le GPU Nvidia consomme au maximum 35 watts, ce qui explique que les performances du GPU soient inférieures d'environ 13 %. D'autres tests de référence pour le GPU sont disponibles ici.
| 3DMark 11 Performance | 21479 points | |
| 3DMark Fire Strike Score | 14587 points | |
| 3DMark Time Spy Score | 6449 points | |
Aide | ||
| Blender / v3.3 Classroom OPTIX/RTX | |
| Moyenne de la classe Multimedia (12 - 105, n=23, 2 dernières années) | |
| Samsung Galaxy Book3 Ultra 16 | |
| Samsung Galaxy Book4 Ultra | |
| HP Spectre x360 16 RTX 4050 | |
| Moyenne NVIDIA GeForce RTX 4050 Laptop GPU (25 - 37, n=40) | |
| Lenovo Slim Pro 9i 16IRP8 | |
| Schenker VISION 16 Pro (M23) | |
| Blender / v3.3 Classroom CUDA | |
| Samsung Galaxy Book3 Ultra 16 | |
| Moyenne de la classe Multimedia (20 - 186, n=23, 2 dernières années) | |
| Samsung Galaxy Book4 Ultra | |
| HP Spectre x360 16 RTX 4050 | |
| Moyenne NVIDIA GeForce RTX 4050 Laptop GPU (47 - 68, n=39) | |
| Lenovo Slim Pro 9i 16IRP8 | |
| Schenker VISION 16 Pro (M23) | |
| Blender / v3.3 Classroom METAL | |
| Apple MacBook Pro 16 2023 M3 Pro | |
| Moyenne de la classe Multimedia (17.8 - 68, n=5, 2 dernières années) | |
| Blender / v3.3 Classroom CPU | |
| Moyenne de la classe Multimedia (134.5 - 1042, n=63, 2 dernières années) | |
| HP Spectre x360 16 RTX 4050 | |
| Moyenne NVIDIA GeForce RTX 4050 Laptop GPU (243 - 907, n=40) | |
| Schenker VISION 16 Pro (M23) | |
| Samsung Galaxy Book3 Ultra 16 | |
| Samsung Galaxy Book4 Ultra | |
| Apple MacBook Pro 16 2023 M3 Pro | |
| Lenovo Slim Pro 9i 16IRP8 | |
| Lenovo ThinkPad Z16 Gen 2 | |
* ... Moindre est la valeur, meilleures sont les performances
Performances des jeux
Les jeux sont magnifiques sur l'écran OLED du Galaxy Book4 Ultra et même les jeux de tir rapides sont un régal grâce aux temps de réponse extrêmement courts. En revanche, en termes de performances de jeu, vous devez accepter des compromis avec l'ordinateur portable RTX 4050 et les titres actuels sont difficilement jouables dans la résolution native de l'appareil. Le point idéal est la résolution Full HD, avec laquelle vous souhaitez généralement jouer avec un maximum de détails. Avec les jeux très exigeants ou le ray tracing, vous ne pouvez pas éviter d'utiliser des technologies d'upscaling telles que DLSS.
| The Witcher 3 - 1920x1080 Ultra Graphics & Postprocessing (HBAO+) | |
| Schenker VISION 16 Pro (M23) | |
| Lenovo Slim Pro 9i 16IRP8 | |
| HP Spectre x360 16 RTX 4050 | |
| Samsung Galaxy Book3 Ultra 16 | |
| Moyenne de la classe Multimedia (11 - 121, n=10, 2 dernières années) | |
| Samsung Galaxy Book4 Ultra | |
| Lenovo ThinkPad Z16 Gen 2 | |
| GTA V - 1920x1080 Highest AA:4xMSAA + FX AF:16x | |
| Lenovo Slim Pro 9i 16IRP8 | |
| Schenker VISION 16 Pro (M23) | |
| HP Spectre x360 16 RTX 4050 | |
| Samsung Galaxy Book4 Ultra | |
| Samsung Galaxy Book3 Ultra 16 | |
| Moyenne de la classe Multimedia (7.92 - 141.6, n=58, 2 dernières années) | |
| F1 23 - 1920x1080 Ultra High Preset AA:T AF:16x | |
| Moyenne NVIDIA GeForce RTX 4050 Laptop GPU (25.7 - 60.8, n=14) | |
| Moyenne de la classe Multimedia (11 - 70.3, n=4, 2 dernières années) | |
| Samsung Galaxy Book4 Ultra | |
Witcher 3 FPS diagram
| Bas | Moyen | Élevé | Ultra | QHD | |
|---|---|---|---|---|---|
| GTA V (2015) | 142.8 | 67.6 | 48.1 | ||
| The Witcher 3 (2015) | 121 | 54.5 | 46 | ||
| Dota 2 Reborn (2015) | 162.2 | 147.6 | 141.3 | 126.8 | |
| Final Fantasy XV Benchmark (2018) | 130.2 | 77.8 | 56.7 | 40.7 | |
| X-Plane 11.11 (2018) | 122.4 | 104.2 | 81.5 | ||
| Far Cry 5 (2018) | 132 | 93 | 88 | 80 | 58 |
| Strange Brigade (2018) | 321 | 158 | 127 | 113 | 77 |
| F1 23 (2023) | 145.5 | 137 | 93.7 | 25.7 | 16.7 |
| Cyberpunk 2077 (2023) | 74.2 | 54.3 | 45.7 | 39.4 | 23.3 |
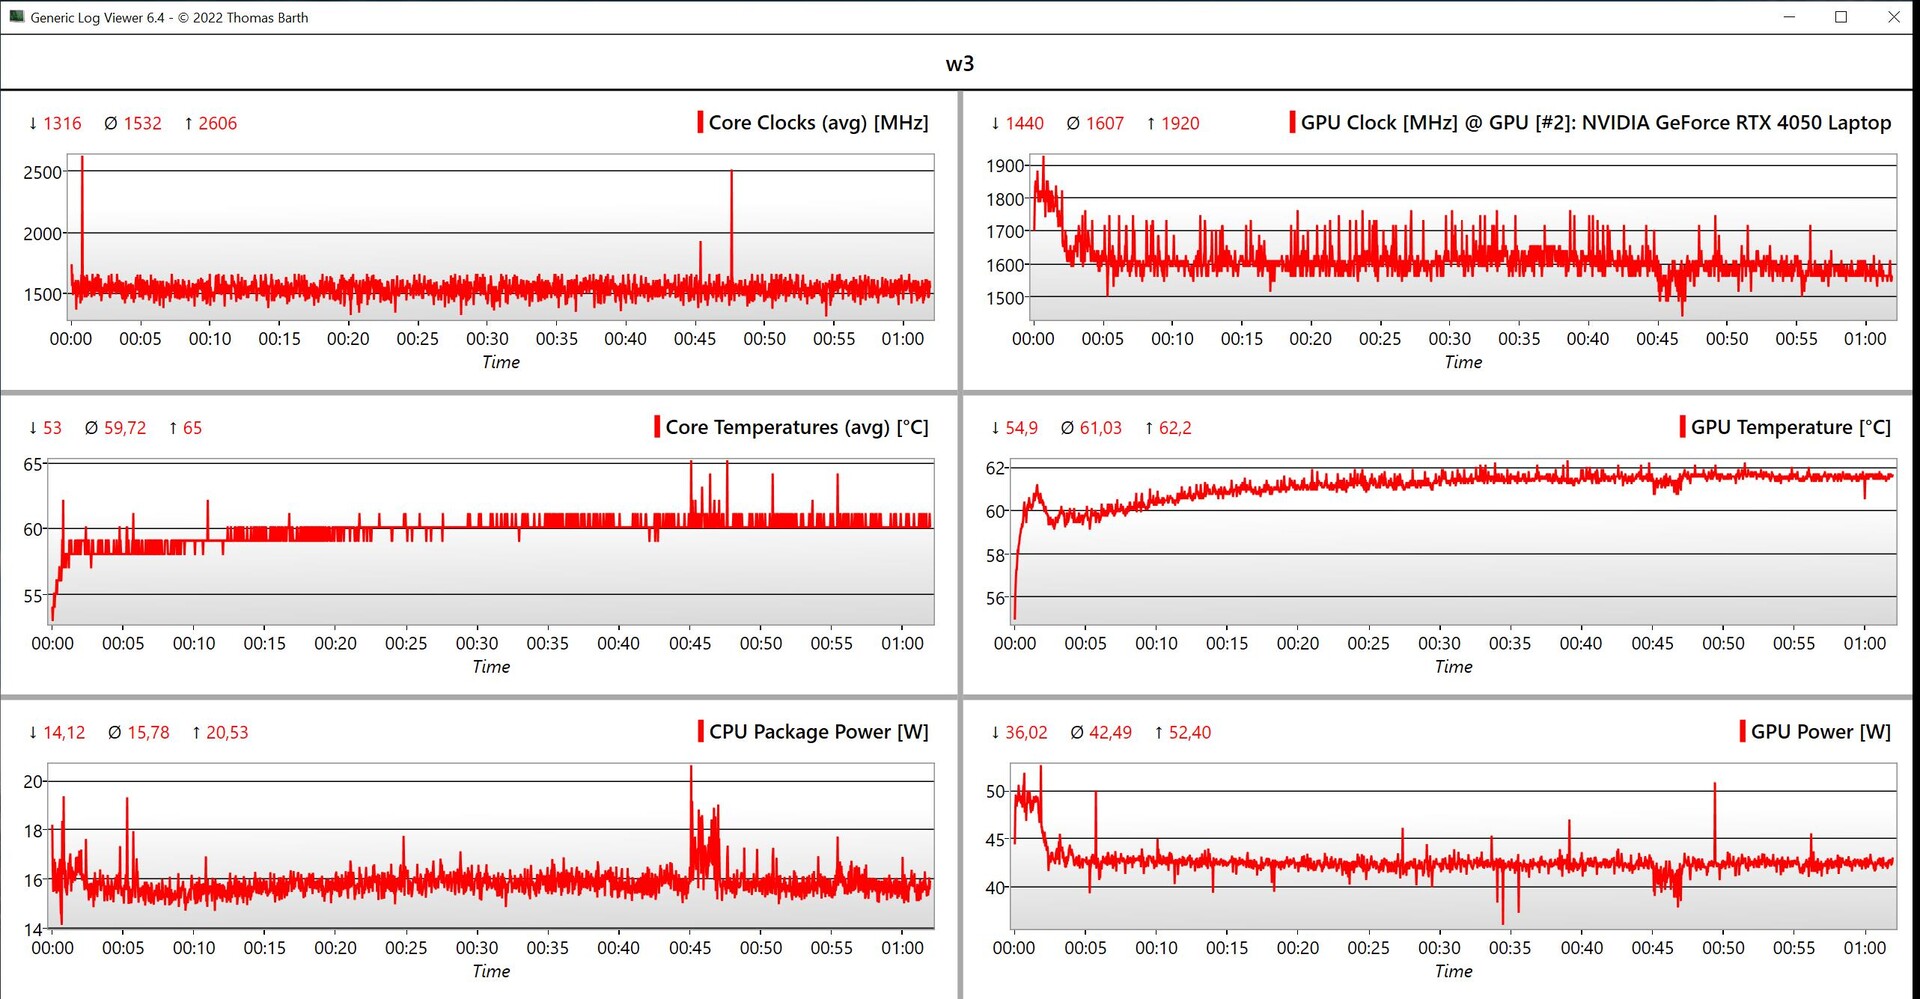
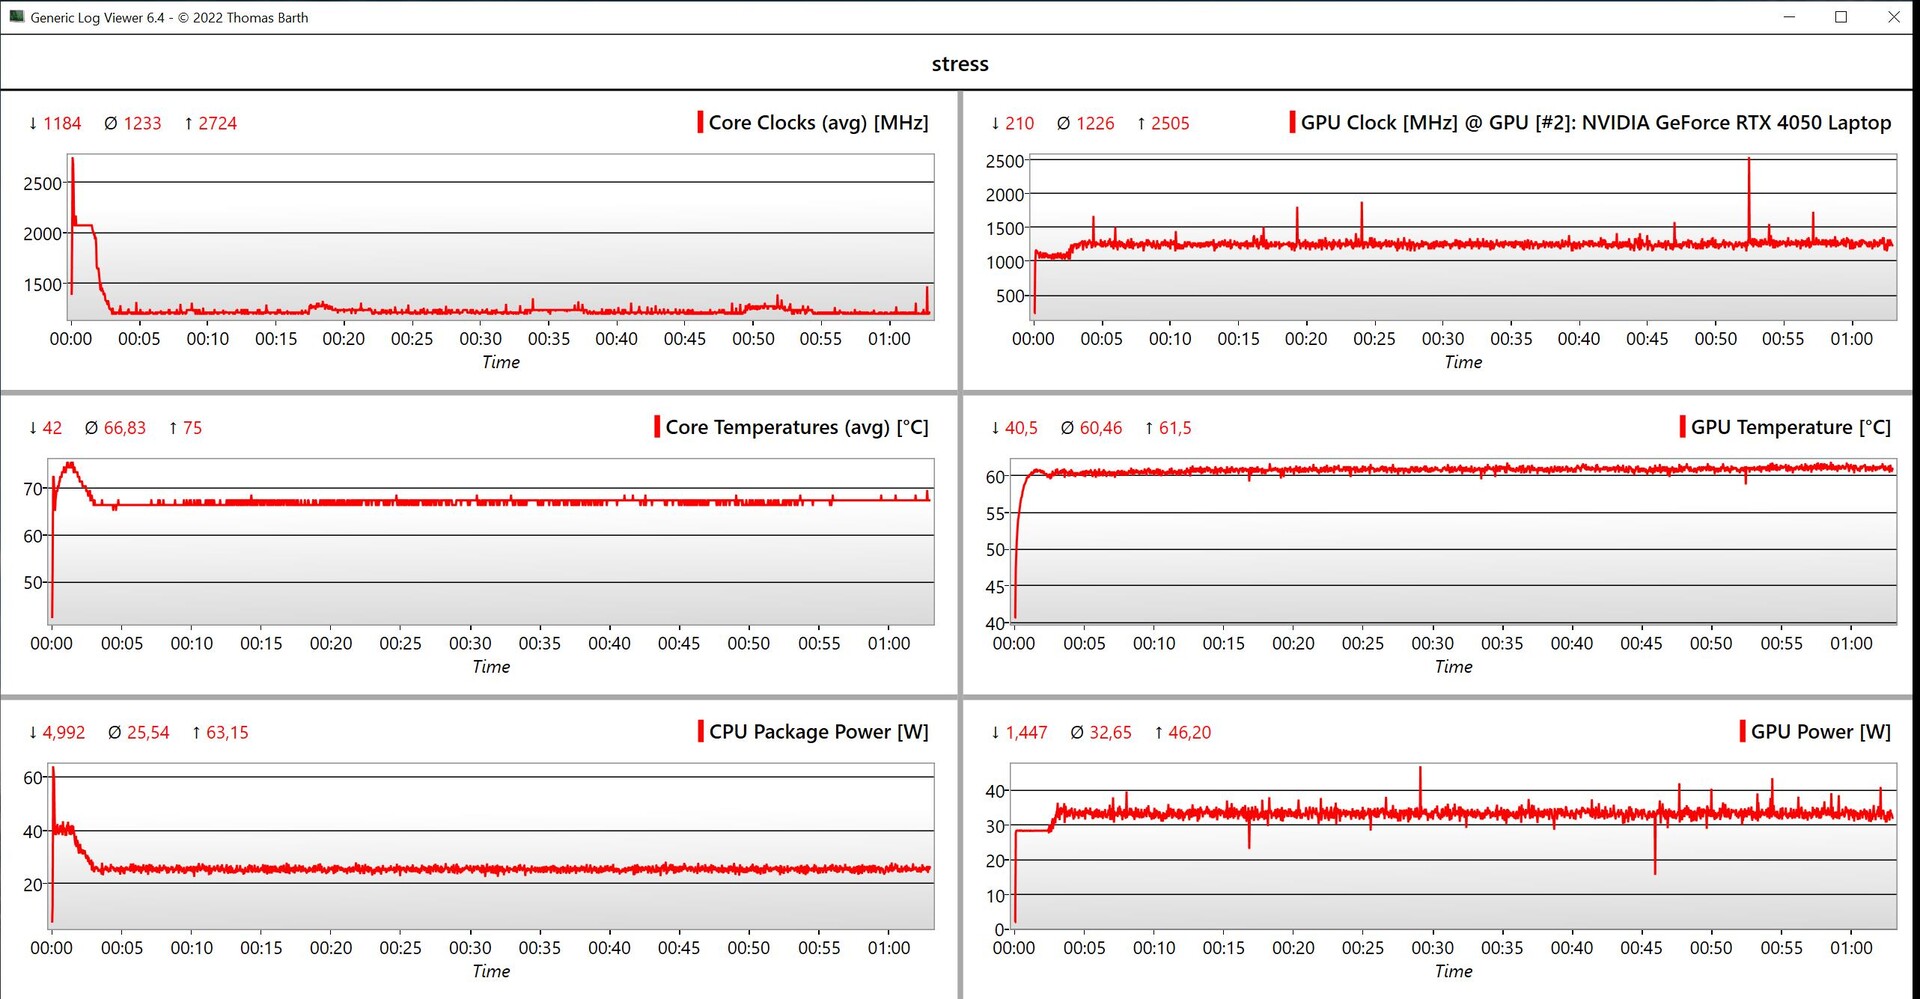
Émissions - Chambre à vapeur dans tous les modèles
Émissions sonores
Samsung a équipé les deux modèles Galaxy Book4 Ultra d'un système de refroidissement par chambre à vapeur avec deux ventilateurs et, dans l'ensemble, c'est très impressionnant. Lors de tâches simples, les ventilateurs restent généralement complètement désactivés et de courts pics de charge sont atteints sans que les ventilateurs ne se déclenchent. Sous charge, les choses deviennent nettement plus bruyantes, mais à un maximum de 41,7 dB(A), l'ordinateur portable est tolérable même sans écouteurs. Inversement, à 51 dB(A) en mode haute performance, il est considérablement plus bruyant. Aucun autre bruit électronique n'était présent dans l'appareil examiné
| Profil énergétique | 3DMark 06 | Witcher 3 | Cyberpunk 2077 | stress test |
|---|---|---|---|---|
| Silencieux | 36,2 dB(A) | 36,2 dB(A) | 36,2 dB(A) | 32 dB(A) |
| Optimisé | 37.9 dB(A) | 41.7 dB(A) | 41.7 dB(A) | 41.7 dB(A) |
| Haute performance | 41,7 dB(A) | 50,5 dB(A) | 51,3 dB(A) | 51,3 dB(A) |
Degré de la nuisance sonore
| Au repos |
| 24.2 / 24.2 / 24.2 dB(A) |
| Fortement sollicité |
| 37.9 / 41.7 dB(A) |
 | ||
30 dB silencieux 40 dB(A) audible 50 dB(A) bruyant |
||
min: | ||
| Samsung Galaxy Book4 Ultra GeForce RTX 4050 Laptop GPU, Ultra 7 155H, Samsung PM9A1 MZVL2512HCJQ | Lenovo ThinkPad Z16 Gen 2 Radeon RX 6550M, R9 PRO 7940HS, Kioxia XG8 KXG8AZNV1T02 | Apple MacBook Pro 16 2023 M3 Pro M3 Pro 18-Core GPU, Apple M3 Pro 12-Core, Apple SSD AP0512Z | Lenovo Slim Pro 9i 16IRP8 GeForce RTX 4050 Laptop GPU, i9-13905H, Samsung PM9A1 MZVL21T0HCLR | HP Spectre x360 16 RTX 4050 GeForce RTX 4050 Laptop GPU, Ultra 7 155H, SK hynix PC801 HFS001TEJ9X101N | Schenker VISION 16 Pro (M23) GeForce RTX 4070 Laptop GPU, i7-13700H, Samsung 990 Pro 1 TB | Samsung Galaxy Book3 Ultra 16 GeForce RTX 4050 Laptop GPU, i7-13700H, Samsung PM9A1 MZVL2512HCJQ | |
|---|---|---|---|---|---|---|---|
| Noise | -8% | 6% | -3% | 11% | -19% | -5% | |
| arrêt / environnement * (dB) | 24.2 | 22.6 7% | 24.4 -1% | 22.7 6% | 23.3 4% | 25.9 -7% | 25 -3% |
| Idle Minimum * (dB) | 24.2 | 22.9 5% | 24.4 -1% | 22.7 6% | 23.6 2% | 25.9 -7% | 26 -7% |
| Idle Average * (dB) | 24.2 | 29.4 -21% | 24.4 -1% | 22.7 6% | 23.6 2% | 25.9 -7% | 27 -12% |
| Idle Maximum * (dB) | 24.2 | 29.4 -21% | 24.4 -1% | 27.5 -14% | 23.6 2% | 32 -32% | 28 -16% |
| Load Average * (dB) | 37.9 | 29.5 22% | 26.9 29% | 28.9 24% | 29.2 23% | 47.2 -25% | 40 -6% |
| Witcher 3 ultra * (dB) | 41.7 | 52 -25% | 25.1 40% | 52.6 -26% | 32.1 23% | 53.1 -27% | 39 6% |
| Load Maximum * (dB) | 41.7 | 52 -25% | 50.4 -21% | 52.5 -26% | 32.1 23% | 53.1 -27% | 41 2% |
* ... Moindre est la valeur, meilleures sont les performances
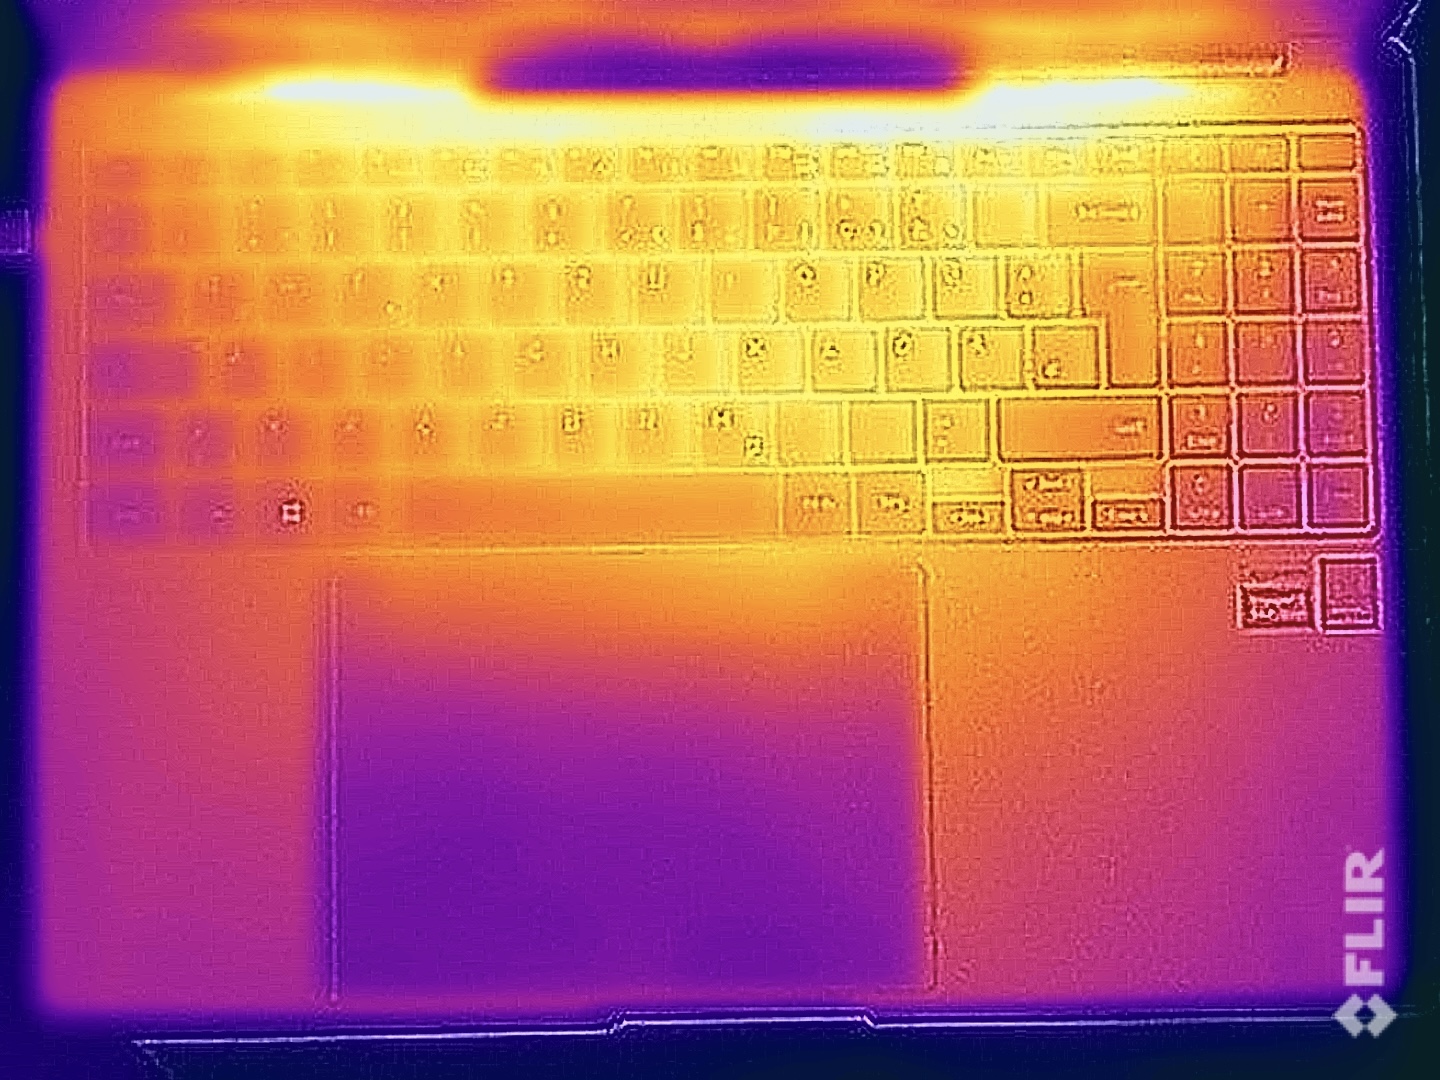
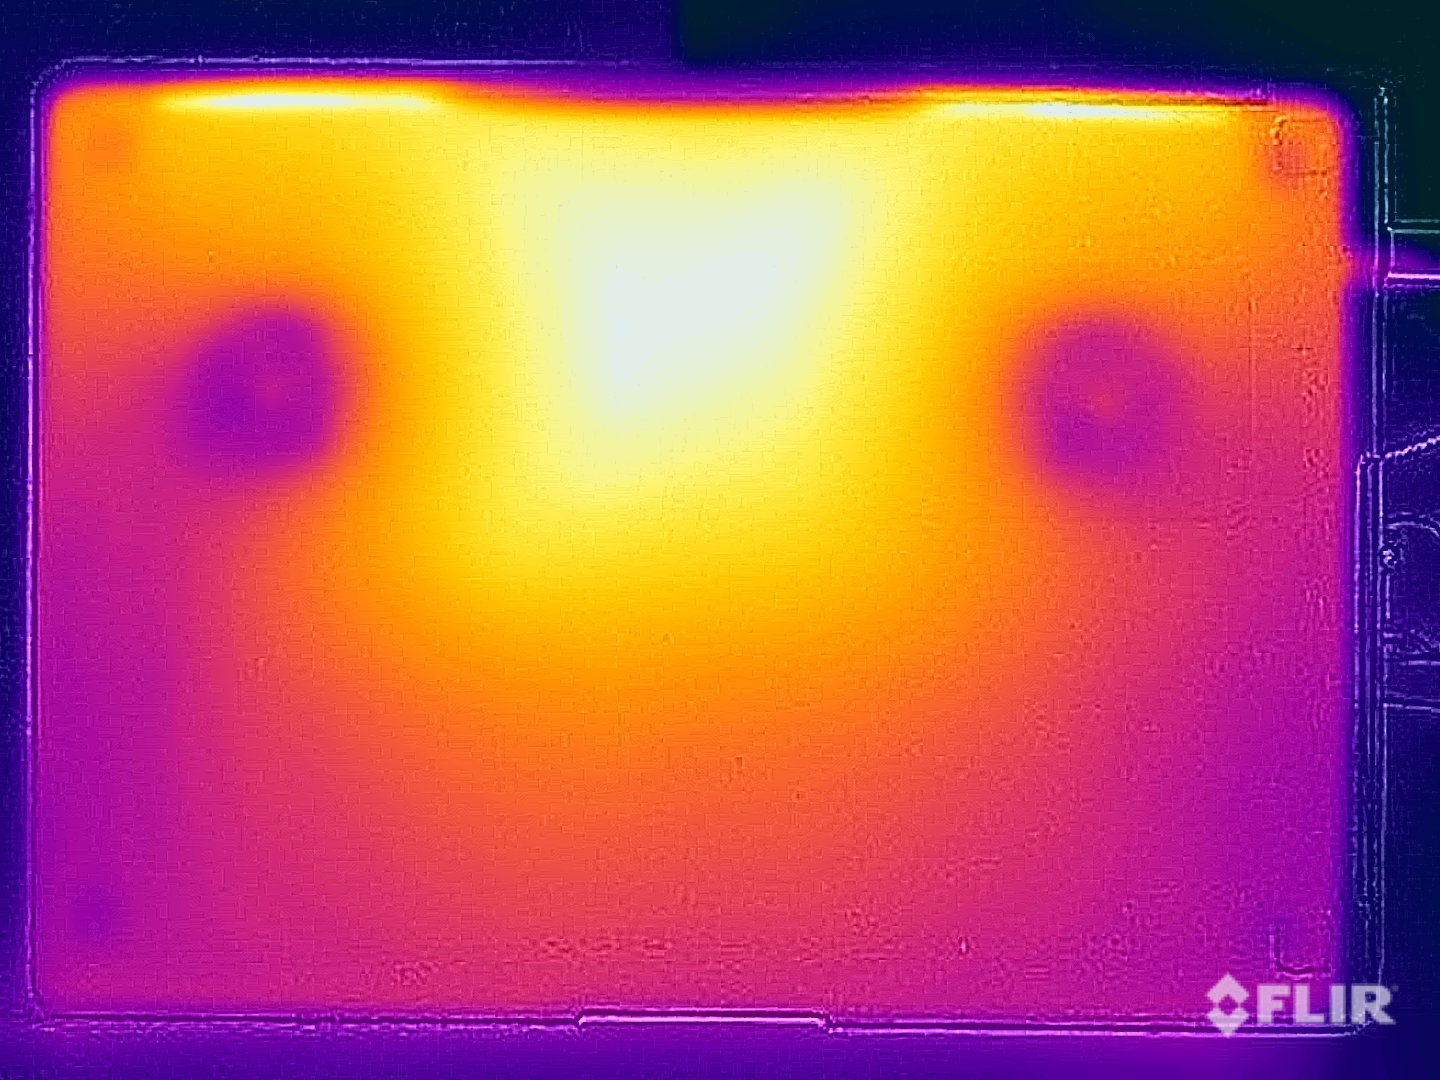
Température
Le boîtier métallique du Galaxy Book4 Ultra ne chauffe pratiquement pas, que ce soit en mode veille ou lors de l'exécution de tâches simples. Même lors du test de stress, les températures de surface restent tout à fait dans les limites puisque nous avons mesuré un peu moins de 39 °C sur la face supérieure de l'unité de base et un maximum de 41,2 °C sur la face inférieure, au milieu de la zone arrière. Cela signifie que vous pouvez utiliser l'appareil sans restriction. Lors du test de stress, le processeur et la carte graphique ont rapidement atteint des valeurs de 25/33 watts.
(+) La température maximale du côté supérieur est de 38.5 °C / 101 F, par rapport à la moyenne de 36.8 °C / 98 F, allant de 21 à 71 °C pour la classe Multimedia.
(±) Le fond chauffe jusqu'à un maximum de 41.2 °C / 106 F, contre une moyenne de 39.1 °C / 102 F
(+) En utilisation inactive, la température moyenne du côté supérieur est de 23.2 °C / 74 F, par rapport à la moyenne du dispositif de 31.3 °C / 88 F.
(±) En jouant à The Witcher 3, la température moyenne du côté supérieur est de 35 °C / 95 F, alors que la moyenne de l'appareil est de 31.3 °C / 88 F.
(+) Les repose-poignets et le pavé tactile sont plus froids que la température de la peau avec un maximum de 31.9 °C / 89.4 F et sont donc froids au toucher.
(-) La température moyenne de la zone de l'appui-paume de dispositifs similaires était de 28.7 °C / 83.7 F (-3.2 °C / #-5.7 F).
| Samsung Galaxy Book4 Ultra Intel Core Ultra 7 155H, NVIDIA GeForce RTX 4050 Laptop GPU | Lenovo ThinkPad Z16 Gen 2 AMD Ryzen 9 PRO 7940HS, AMD Radeon RX 6550M | Apple MacBook Pro 16 2023 M3 Pro Apple M3 Pro 12-Core, Apple M3 Pro 18-Core GPU | Lenovo Slim Pro 9i 16IRP8 Intel Core i9-13905H, NVIDIA GeForce RTX 4050 Laptop GPU | HP Spectre x360 16 RTX 4050 Intel Core Ultra 7 155H, NVIDIA GeForce RTX 4050 Laptop GPU | Schenker VISION 16 Pro (M23) Intel Core i7-13700H, NVIDIA GeForce RTX 4070 Laptop GPU | Samsung Galaxy Book3 Ultra 16 Intel Core i7-13700H, NVIDIA GeForce RTX 4050 Laptop GPU | |
|---|---|---|---|---|---|---|---|
| Heat | 2% | 2% | -17% | -13% | -19% | -5% | |
| Maximum Upper Side * (°C) | 38.5 | 43 -12% | 38.1 1% | 37.8 2% | 39.6 -3% | 46.7 -21% | 41 -6% |
| Maximum Bottom * (°C) | 41.2 | 41.6 -1% | 37 10% | 44.8 -9% | 39.2 5% | 54.1 -31% | 44 -7% |
| Idle Upper Side * (°C) | 23.5 | 21.2 10% | 24.2 -3% | 30.6 -30% | 29 -23% | 26.5 -13% | 23 2% |
| Idle Bottom * (°C) | 24.1 | 21.4 11% | 24.6 -2% | 31 -29% | 31.6 -31% | 26.8 -11% | 26 -8% |
* ... Moindre est la valeur, meilleures sont les performances
Intervenants
Samsung a installé un système de haut-parleurs avec 4 modules et bien que, dans l'ensemble, la qualité soit bonne, le Galaxy Book4 Ultra n'est pas en mesure de suivre le rythme des meilleurs ordinateurs portables multimédias de 16 pouces tels que le MacBook Pro, Yoga Pro 9i ou le HP Spectre x360 16. En particulier, en comparaison directe, les modules pourraient être un peu plus emphatiques.
Samsung Galaxy Book4 Ultra analyse audio
(+) | les haut-parleurs peuvent jouer relativement fort (85# dB)
Basses 100 - 315 Hz
(±) | basse réduite - en moyenne 14.4% inférieure à la médiane
(±) | la linéarité des basses est moyenne (11.3% delta à la fréquence précédente)
Médiums 400 - 2000 Hz
(+) | médiane équilibrée - seulement 3.4% de la médiane
(+) | les médiums sont linéaires (3.4% delta à la fréquence précédente)
Aiguës 2 - 16 kHz
(+) | des sommets équilibrés - à seulement 3% de la médiane
(+) | les aigus sont linéaires (5.6% delta à la fréquence précédente)
Globalement 100 - 16 000 Hz
(+) | le son global est linéaire (11.5% différence à la médiane)
Par rapport à la même classe
» 18% de tous les appareils testés de cette catégorie étaient meilleurs, 4% similaires, 78% pires
» Le meilleur avait un delta de 5%, la moyenne était de 17%, le pire était de 45%.
Par rapport à tous les appareils testés
» 8% de tous les appareils testés étaient meilleurs, 2% similaires, 90% pires
» Le meilleur avait un delta de 4%, la moyenne était de 23%, le pire était de 134%.
Lenovo Slim Pro 9i 16IRP8 analyse audio
(±) | le niveau sonore du haut-parleur est moyen mais bon (79.7# dB)
Basses 100 - 315 Hz
(+) | bonne basse - seulement 2.8% loin de la médiane
(±) | la linéarité des basses est moyenne (8.9% delta à la fréquence précédente)
Médiums 400 - 2000 Hz
(+) | médiane équilibrée - seulement 2.4% de la médiane
(+) | les médiums sont linéaires (4.9% delta à la fréquence précédente)
Aiguës 2 - 16 kHz
(+) | des sommets équilibrés - à seulement 3.6% de la médiane
(+) | les aigus sont linéaires (4.3% delta à la fréquence précédente)
Globalement 100 - 16 000 Hz
(+) | le son global est linéaire (7.3% différence à la médiane)
Par rapport à la même classe
» 6% de tous les appareils testés de cette catégorie étaient meilleurs, 1% similaires, 94% pires
» Le meilleur avait un delta de 5%, la moyenne était de 17%, le pire était de 45%.
Par rapport à tous les appareils testés
» 1% de tous les appareils testés étaient meilleurs, 0% similaires, 99% pires
» Le meilleur avait un delta de 4%, la moyenne était de 23%, le pire était de 134%.
Apple MacBook Pro 16 2023 M3 Max analyse audio
(+) | les haut-parleurs peuvent jouer relativement fort (84.3# dB)
Basses 100 - 315 Hz
(±) | basse réduite - en moyenne 5% inférieure à la médiane
(+) | les basses sont linéaires (5.6% delta à la fréquence précédente)
Médiums 400 - 2000 Hz
(+) | médiane équilibrée - seulement 1.2% de la médiane
(+) | les médiums sont linéaires (3.1% delta à la fréquence précédente)
Aiguës 2 - 16 kHz
(+) | des sommets équilibrés - à seulement 2.4% de la médiane
(+) | les aigus sont linéaires (2.4% delta à la fréquence précédente)
Globalement 100 - 16 000 Hz
(+) | le son global est linéaire (5.3% différence à la médiane)
Par rapport à la même classe
» 1% de tous les appareils testés de cette catégorie étaient meilleurs, 1% similaires, 98% pires
» Le meilleur avait un delta de 5%, la moyenne était de 17%, le pire était de 45%.
Par rapport à tous les appareils testés
» 0% de tous les appareils testés étaient meilleurs, 0% similaires, 100% pires
» Le meilleur avait un delta de 4%, la moyenne était de 23%, le pire était de 134%.
HP Spectre x360 16 RTX 4050 analyse audio
(+) | les haut-parleurs peuvent jouer relativement fort (89.5# dB)
Basses 100 - 315 Hz
(±) | basse réduite - en moyenne 13.2% inférieure à la médiane
(±) | la linéarité des basses est moyenne (7.9% delta à la fréquence précédente)
Médiums 400 - 2000 Hz
(+) | médiane équilibrée - seulement 3.2% de la médiane
(+) | les médiums sont linéaires (3% delta à la fréquence précédente)
Aiguës 2 - 16 kHz
(+) | des sommets équilibrés - à seulement 1.6% de la médiane
(+) | les aigus sont linéaires (3.5% delta à la fréquence précédente)
Globalement 100 - 16 000 Hz
(+) | le son global est linéaire (9.2% différence à la médiane)
Par rapport à la même classe
» 4% de tous les appareils testés de cette catégorie étaient meilleurs, 1% similaires, 95% pires
» Le meilleur avait un delta de 6%, la moyenne était de 20%, le pire était de 57%.
Par rapport à tous les appareils testés
» 3% de tous les appareils testés étaient meilleurs, 1% similaires, 96% pires
» Le meilleur avait un delta de 4%, la moyenne était de 23%, le pire était de 134%.
Gestion de l'énergie - Amélioration de l'endurance
Consommation électrique
Au repos, l'écran OLED se montre très économe, mais le fond d'écran sombre et standard de Samsung y contribue. Dans les jeux, selon le titre, vous pouvez vous attendre à une consommation de 80 à 90 watts. Lors du test de stress, la consommation a été brièvement de 125 watts avant de se stabiliser rapidement à 90 watts. En mode haute performance, la consommation maximale a été de 141,6 watts, puis de 128 watts. Cela signifie que le bloc d'alimentation de 140 watts fourni est bien dimensionné.
| Éteint/en veille | |
| Au repos | |
| Fortement sollicité |
|
Légende:
min: | |
| Samsung Galaxy Book4 Ultra Ultra 7 155H, GeForce RTX 4050 Laptop GPU, Samsung PM9A1 MZVL2512HCJQ, OLED, 2880x1800, 16" | Lenovo ThinkPad Z16 Gen 2 R9 PRO 7940HS, Radeon RX 6550M, Kioxia XG8 KXG8AZNV1T02, OLED, 3840x2400, 16" | Apple MacBook Pro 16 2023 M3 Pro Apple M3 Pro 12-Core, M3 Pro 18-Core GPU, Apple SSD AP0512Z, Mini-LED, 3456x2234, 16.2" | Lenovo Slim Pro 9i 16IRP8 i9-13905H, GeForce RTX 4050 Laptop GPU, Samsung PM9A1 MZVL21T0HCLR, Mini-LED, 3200x2000, 16" | Schenker VISION 16 Pro (M23) i7-13700H, GeForce RTX 4070 Laptop GPU, Samsung 990 Pro 1 TB, IPS, 2560x1600, 16" | Samsung Galaxy Book3 Ultra 16 i7-13700H, GeForce RTX 4050 Laptop GPU, Samsung PM9A1 MZVL2512HCJQ, AMOLED, 2880x1800, 16" | Moyenne NVIDIA GeForce RTX 4050 Laptop GPU | Moyenne de la classe Multimedia | |
|---|---|---|---|---|---|---|---|---|
| Power Consumption | -40% | -25% | -160% | -54% | 11% | -85% | -17% | |
| Idle Minimum * (Watt) | 4.8 | 7.5 -56% | 4.5 6% | 16 -233% | 8.6 -79% | 3 37% | 9.95 ? -107% | 5.72 ? -19% |
| Idle Average * (Watt) | 7.5 | 9.6 -28% | 16.5 -120% | 30 -300% | 12 -60% | 5 33% | 15.8 ? -111% | 10.2 ? -36% |
| Idle Maximum * (Watt) | 7.9 | 18.5 -134% | 16.7 -111% | 30.4 -285% | 12.4 -57% | 11 -39% | 20.1 ? -154% | 12.4 ? -57% |
| Load Average * (Watt) | 79.3 | 57.1 28% | 60.4 24% | 78.9 1% | 80 -1% | 72 9% | 88 ? -11% | 65.5 ? 17% |
| Witcher 3 ultra * (Watt) | 79.2 | 115.8 -46% | 52.1 34% | 155.3 -96% | 147.7 -86% | 69.7 12% | ||
| Load Maximum * (Watt) | 125 | 131.7 -5% | 102.9 18% | 180.4 -44% | 173.1 -38% | 108 14% | 176.3 ? -41% | 114 ? 9% |
* ... Moindre est la valeur, meilleures sont les performances
Power consumption Witcher 3 / stress test
Power consumption with an external monitor
Durée de vie de la batterie
Avec 76 Wh, la capacité de la batterie reste inchangée mais, grâce au nouveau processeur Meteor Lake, l'autonomie est meilleure. Par ailleurs, nous n'avons pu effectuer le test de la batterie qu'à 120 Hz car, bien que nous ayons sélectionné 60 Hz dans le mode de signal actif, il est resté à 120 Hz. C'est un problème que nous avons également découvert sur les autres modèles de la série Galaxy Book4.
Lors du test Wi-Fi à 150 cd/m² (représentant 66 % de la luminosité SDR maximale de l'appareil examiné), nous avons enregistré près de 11 heures, soit 1,5 heure de plus que son prédécesseur. À pleine luminosité, le test Wi-Fi a duré un peu plus de 7 heures. La durée du test vidéo (également 150 cd/m²) est passée d'environ 13,5 heures à près de 18 heures. C'est là que le nouveau processeur Meteor Lake et ses cœurs à faible consommation d'énergie portent leurs fruits.
Sous charge, il est possible de vider la batterie après environ 80 minutes et une vidéo HDR à pleine luminosité sera lue pendant environ 5,5 heures. Un cycle de charge avec l'unité d'alimentation de 140 watts prend presque 2,5 heures et il n'y a pas de fonction de charge rapide.
| Samsung Galaxy Book4 Ultra Ultra 7 155H, GeForce RTX 4050 Laptop GPU, 76 Wh | Lenovo ThinkPad Z16 Gen 2 R9 PRO 7940HS, Radeon RX 6550M, 72 Wh | Apple MacBook Pro 16 2023 M3 Pro Apple M3 Pro 12-Core, M3 Pro 18-Core GPU, 99.6 Wh | Lenovo Slim Pro 9i 16IRP8 i9-13905H, GeForce RTX 4050 Laptop GPU, 75 Wh | HP Spectre x360 16 RTX 4050 Ultra 7 155H, GeForce RTX 4050 Laptop GPU, 83 Wh | Schenker VISION 16 Pro (M23) i7-13700H, GeForce RTX 4070 Laptop GPU, 80 Wh | Samsung Galaxy Book3 Ultra 16 i7-13700H, GeForce RTX 4050 Laptop GPU, 76 Wh | Moyenne de la classe Multimedia | |
|---|---|---|---|---|---|---|---|---|
| Autonomie de la batterie | -7% | 43% | -39% | 1% | -28% | 0% | 11% | |
| H.264 (h) | 17.9 | 24.7 38% | 7.8 -56% | 13.4 -25% | 16.4 ? -8% | |||
| WiFi v1.3 (h) | 10.9 | 6 -45% | 20.1 84% | 6.6 -39% | 11 1% | 7.8 -28% | 9.6 -12% | 12.2 ? 12% |
| Load (h) | 1.3 | 1.7 31% | 1.4 8% | 1.3 0% | 1.8 38% | 1.668 ? 28% | ||
| Reader / Idle (h) | 10.2 | 18.2 | 24.9 ? |
Points positifs
Points négatifs
Verdict - Le Galaxy Book4 Ultra ne présente que de petites améliorations
Fondamentalement, Samsung s'est facilité la vie avec son Galaxy Book4 Ultra actuel, car l'ordinateur multimédia de 16 pouces a été équipé d'un nouveau processeur Meteor Lake. Il existe deux configurations différentes et le Core Ultra 7 155H et GeForce Ordinateur portable RTX 4050 est adapté à une utilisation multimédia. Les performances des composants sont décentes et les différents profils énergétiques sont également bien équilibrés. De plus, le nouveau processeur Meteor Lake améliore l'autonomie de la batterie.
Avec ses 120 Hz, l'écran offre également une très bonne qualité d'image avec différents profils de couleurs qui incluent des profils très précis pour les espaces colorimétriques P3 et sRGB. Malgré cela, il y a des problèmes tels que le scintillement PWM constant à 240 Hz et les capacités HDR de l'appareil sont également fortement limitées, en particulier par rapport à des concurrents mini LED tels que le Lenovo Yoga Pro 9i ou le Apple MacBook Pro 16.
Le Galaxy Book4 Ultra est un très bon ordinateur multimédia qui combine un écran AMOLED avec un boîtier haut de gamme qui abrite une chambre à vapeur efficace, des performances décentes et une longue durée de vie de la batterie. Malheureusement, Samsung a fait des économies sur la mémoire et le stockage. Pour 2 399 dollars, vous ne disposez que de 16 Go de mémoire vive et d'un disque dur SSD de 512 Go.
Le boîtier est impressionnant de stabilité et de finition, mais il présente aussi des inconvénients, comme le large cadre inférieur et la RAM soudée. En particulier, les 16 Go de notre configuration de test ne sont pas particulièrement généreux. Vous disposez également d'un clavier moyen, ce qui est principalement dû à la faible course des touches.
Mais le plus gros problème est le prix, Samsung demandant 2 399 $ pour notre modèle 16 Go de RAM et 512 Go de SSD. Même le MacBook Pro 16 avec le M3 Pro et des capacités HDR nettement supérieures est environ 200 $ moins cher en magasin. La concurrence Windows est également moins chère et offre d'autres avantages. Le Lenovo Yoga Pro 9i offre un meilleur clavier, un mini panneau LED plus lumineux et de meilleurs haut-parleurs. Avec son Vision 16 Pro, Schenker propose toujours un appareil 16 pouces très portable avec la RTX 4070 plus rapide et un écran IPS sans PWM. Le Galaxy Book4 Ultra n'est en aucun cas une mauvaise machine, mais son rapport qualité-prix n'est pas particulièrement bon si l'on considère la force des appareils concurrents dans ce segment et il aura bientôt un autre concurrent sur le marché sous la forme du nouveau Dell XPS 16.
Prix et disponibilité
Le GalaxyBook4 Ultra peut être commandé directement auprès de Samsung à partir de 2 399$.
Samsung Galaxy Book4 Ultra
- 03/16/2024 v7 (old)
Andreas Osthoff
Transparency
La sélection des appareils à examiner est effectuée par notre équipe éditoriale. L'échantillon de test a été prêté à l'auteur par le fabricant ou le détaillant pour les besoins de cet examen. Le prêteur n'a pas eu d'influence sur cette évaluation et le fabricant n'a pas reçu de copie de cette évaluation avant sa publication. Il n'y avait aucune obligation de publier cet article. En tant que média indépendant, Notebookcheck n'est pas soumis à l'autorité des fabricants, des détaillants ou des éditeurs.
Voici comment Notebookcheck teste
Chaque année, Notebookcheck examine de manière indépendante des centaines d'ordinateurs portables et de smartphones en utilisant des procédures standardisées afin de garantir que tous les résultats sont comparables. Nous avons continuellement développé nos méthodes de test depuis environ 20 ans et avons établi des normes industrielles dans le processus. Dans nos laboratoires de test, des équipements de mesure de haute qualité sont utilisés par des techniciens et des rédacteurs expérimentés. Ces tests impliquent un processus de validation en plusieurs étapes. Notre système d'évaluation complexe repose sur des centaines de mesures et de points de référence bien fondés, ce qui garantit l'objectivité.Price comparison

