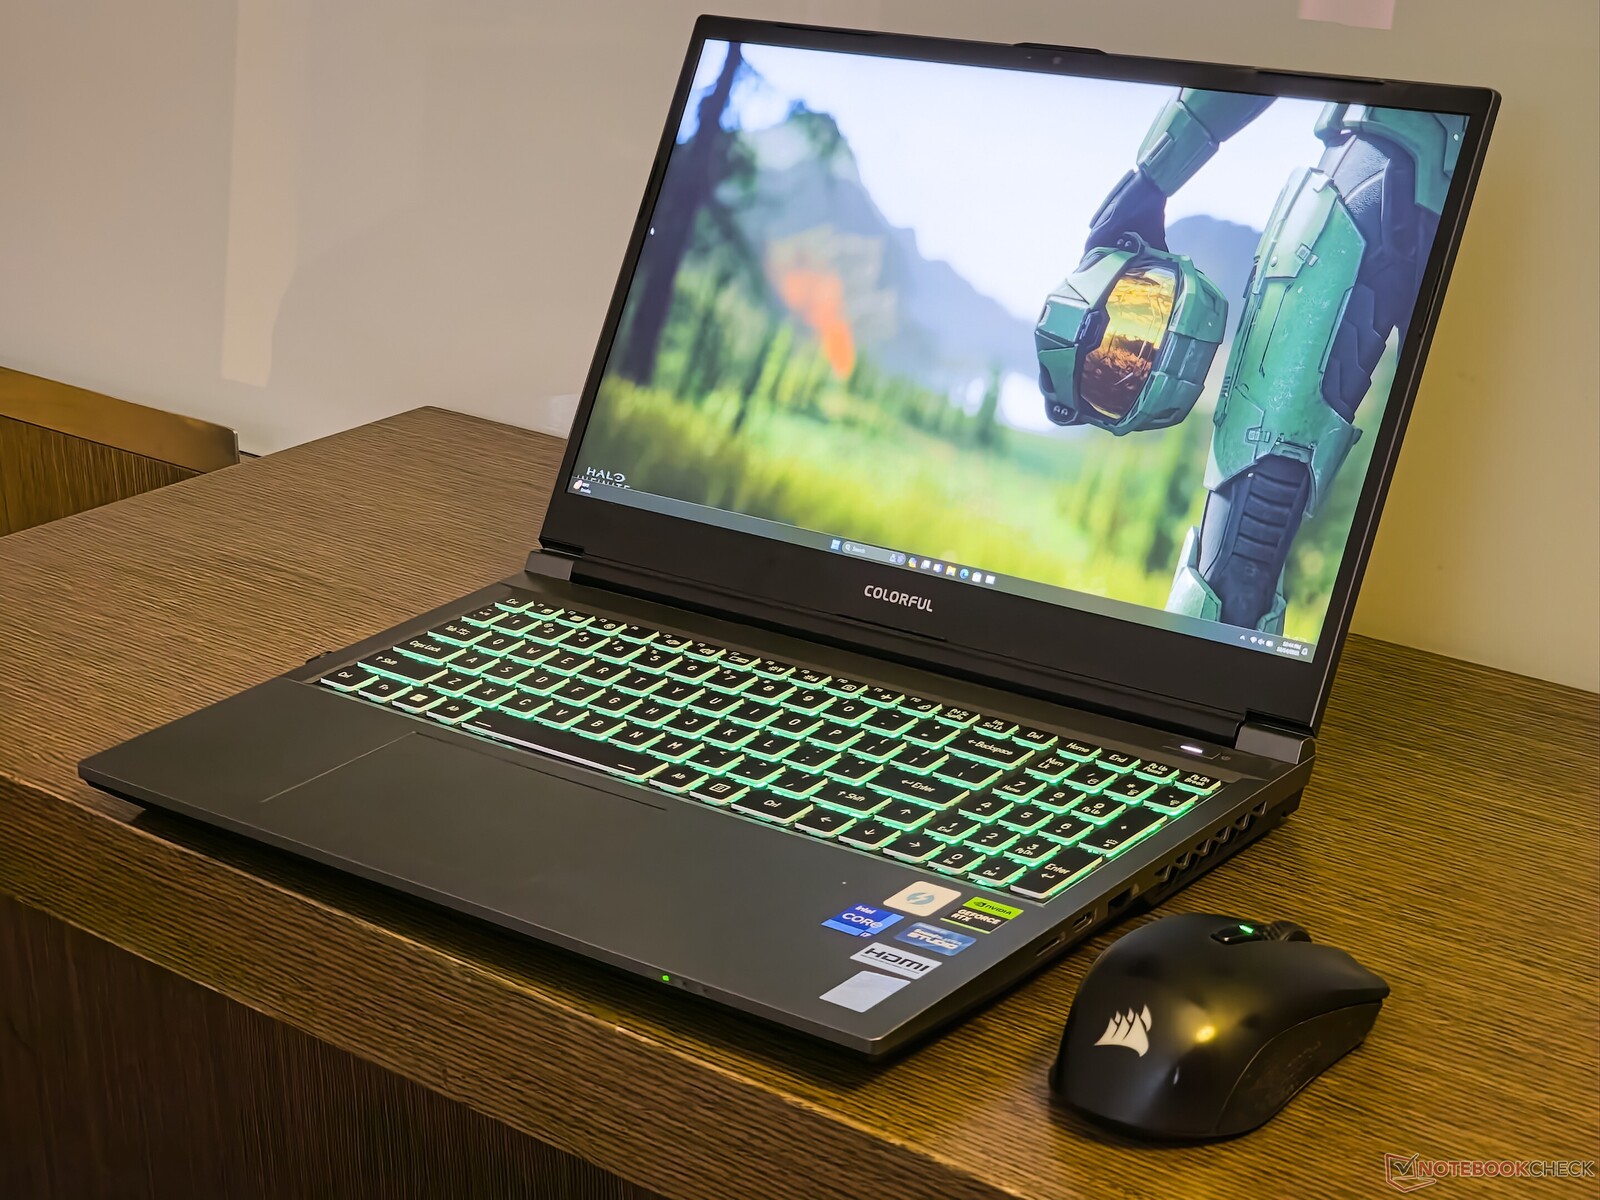
Test du Colorful EVOL X15 AT 23 : gamer QHD impressionnant avec Raptor Lake-HX et quelques bizarreries

Plus connu pour sa gamme de cartes mères et de GPU pour PC, Colorful a commencé à élargir ses horizons pour inclure les ordinateurs portables Alder Lake 12e génération d'Intel. Cette année, le géant chinois de la technologie a mis à jour sa gamme pour proposer plusieurs offres Raptor Lake de 13e génération.
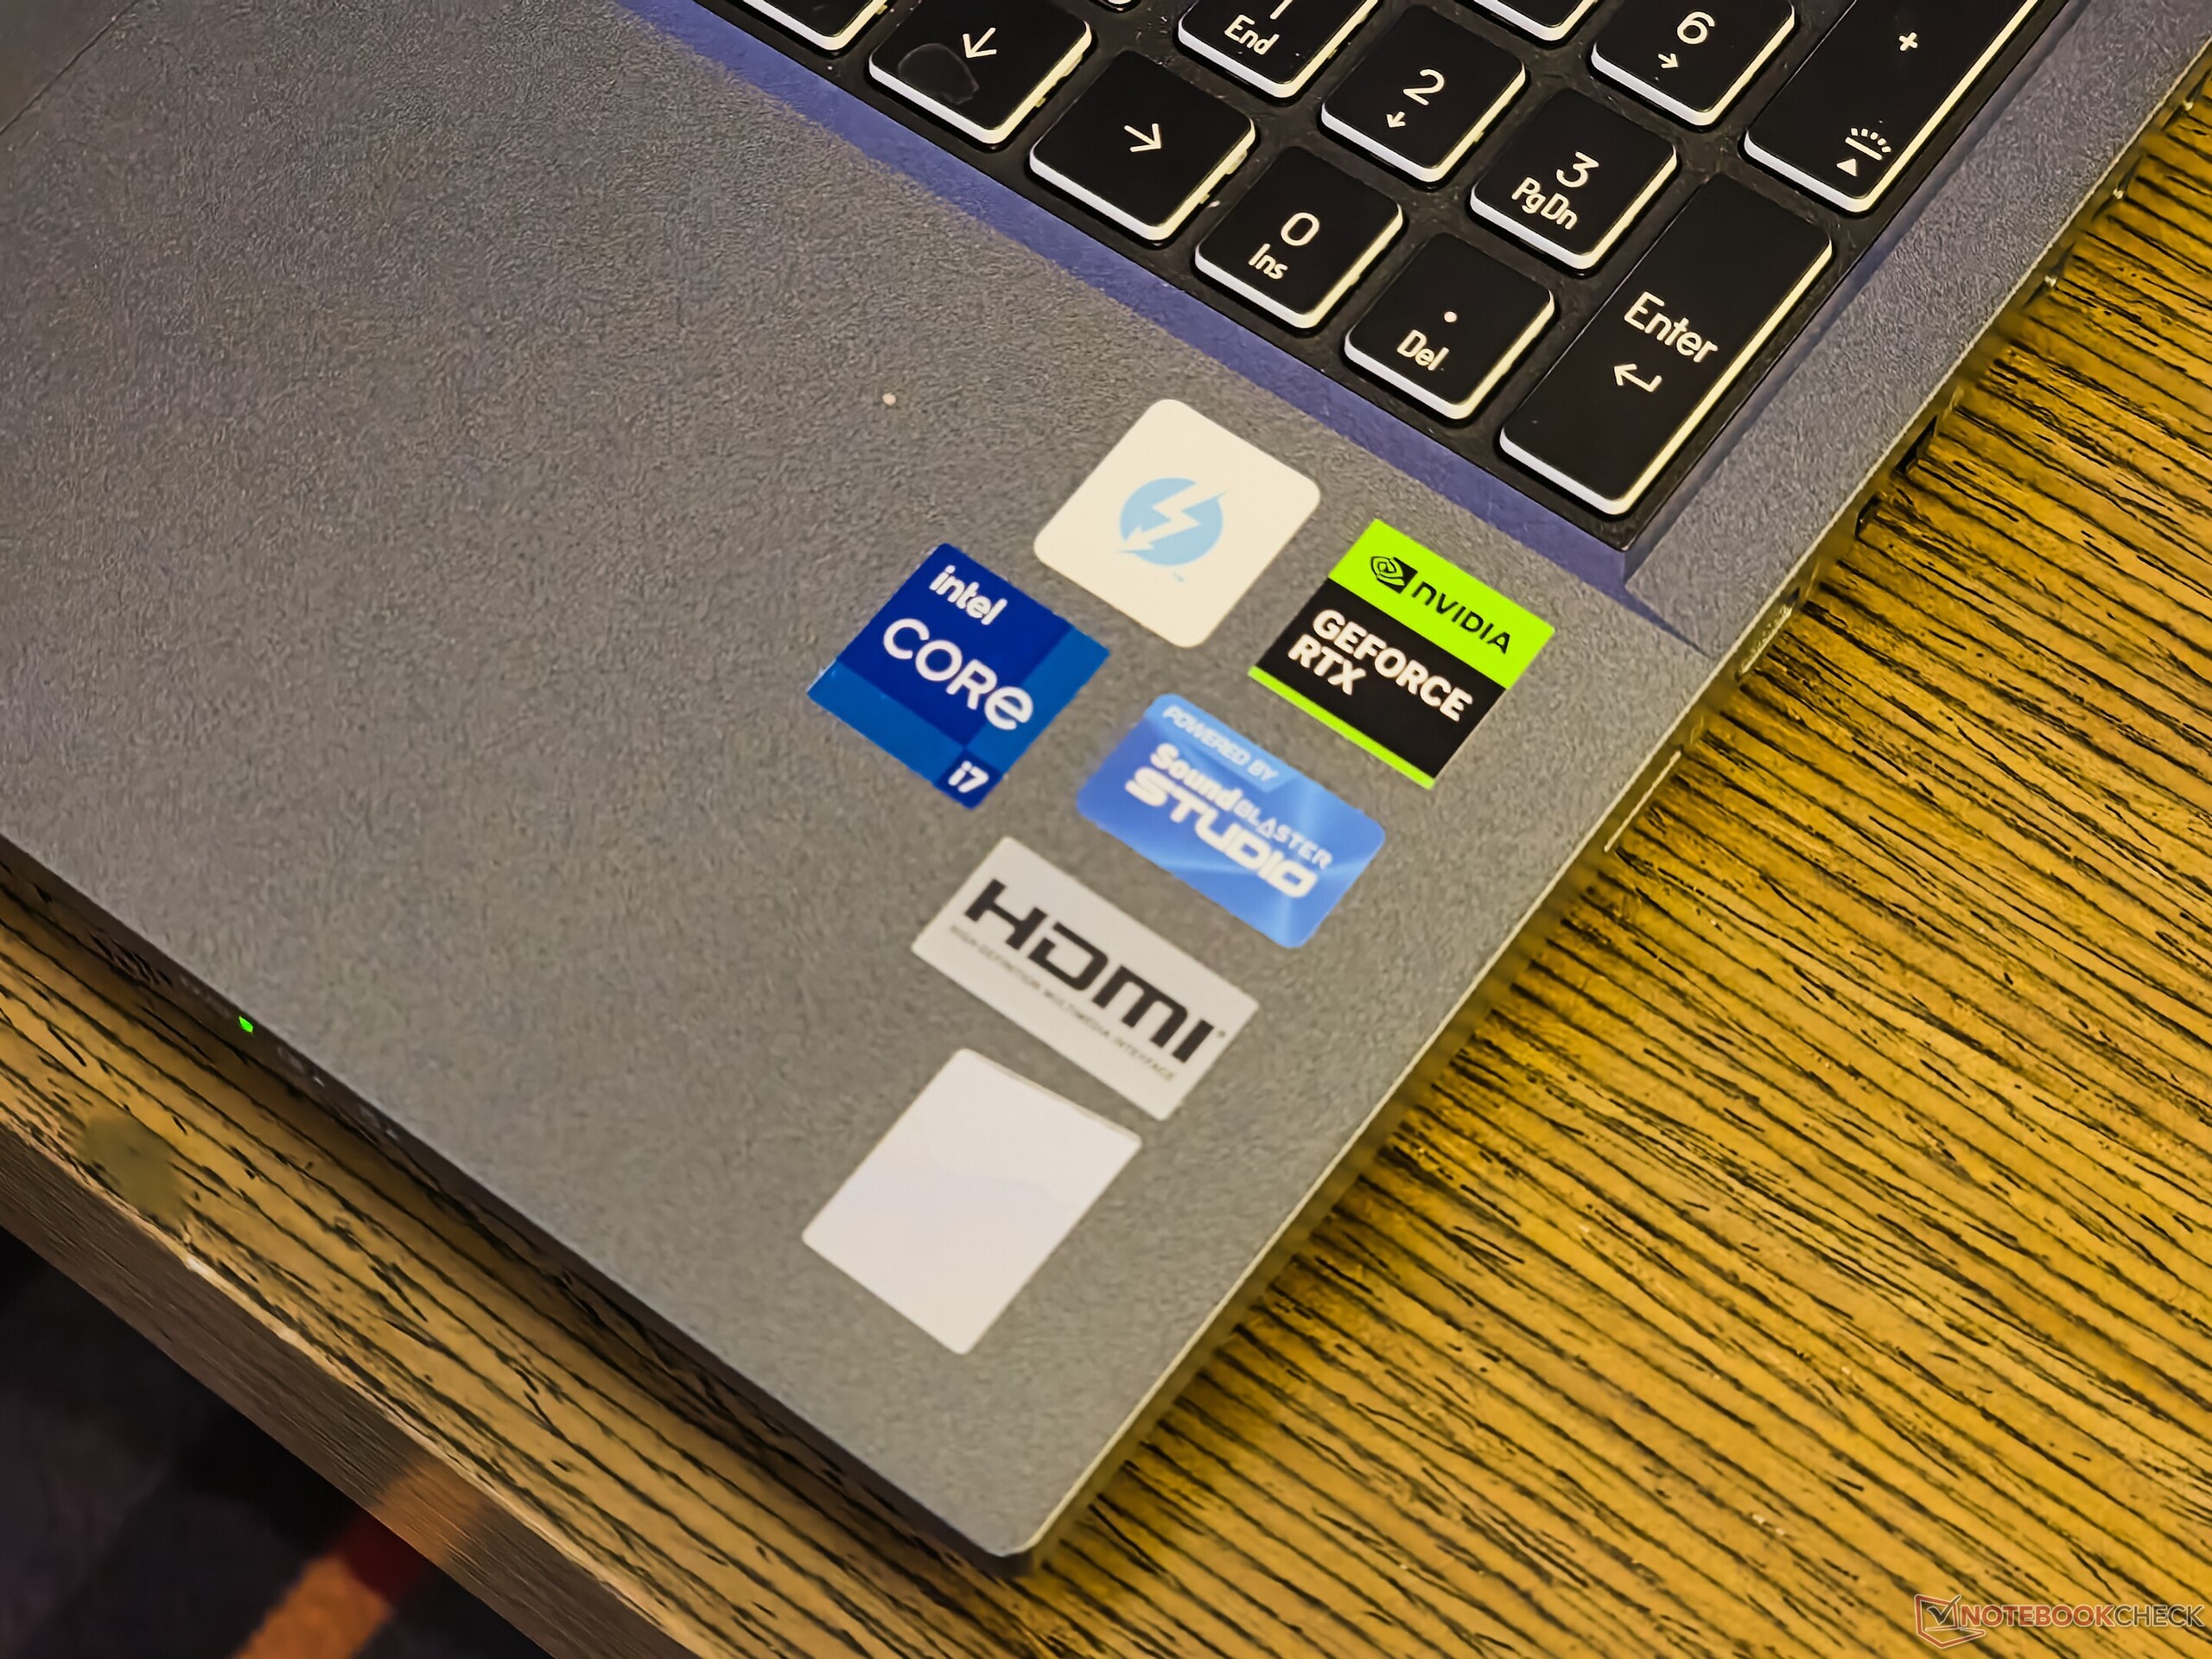
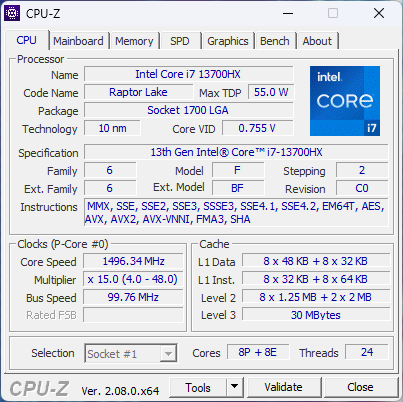
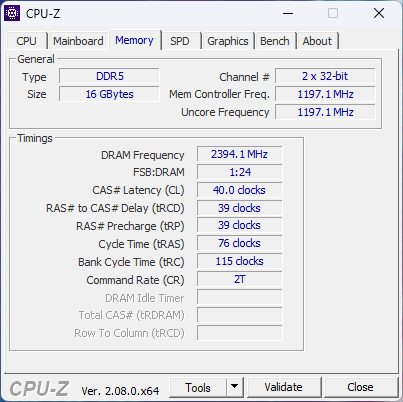
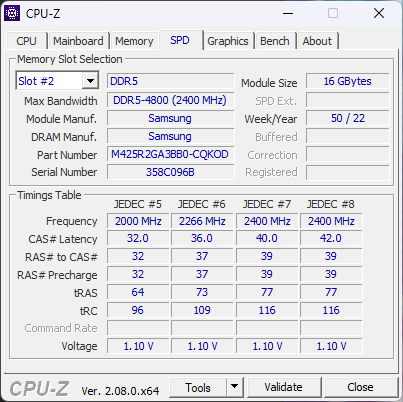
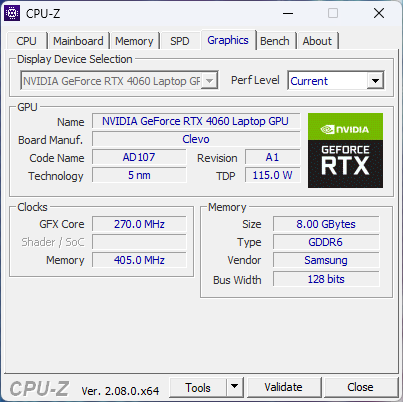
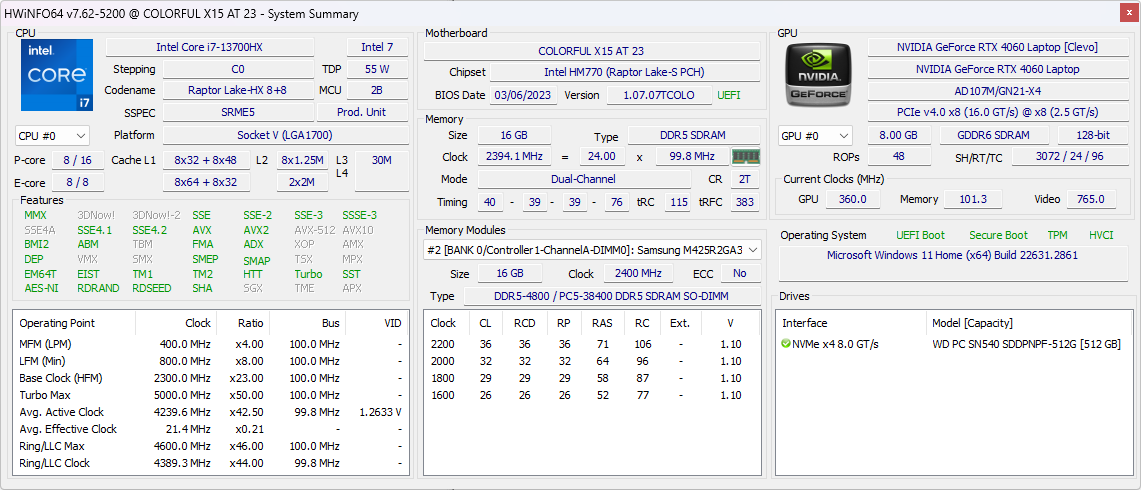
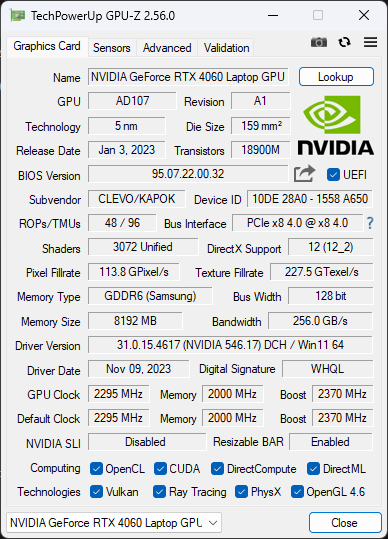
Dans ce contexte, le nouveau Colorful EVOL X15 AT 23 est arrivé récemment dans nos laboratoires de test. Notre EVOL X15 AT est équipé d'un processeur Intel Core i7-13700HX, GPU pour ordinateur portable Nvidia GeForce RTX 4060nvidia RTX 4060, 16 Go de mémoire DDR5-4800 (simple stick), et un SSD NVMe de 512 Go.
L'appareil offre des spécifications impressionnantes, notamment un écran QHD 165 Hz et une batterie de 73 WHr. Il est disponible sur certains marchés asiatiques tels que la Chine, la Thaïlande, la Malaisie, l'Indonésie, les Philippines, et en Russie chez Ozon pour environ 969 $. Newegg vend cette UGS aux États-Unis avec une majoration de 1 759 $.
Dans cet article, nous examinons le nouveau Colorful EVOL X15 AT et voyons s'il peut tenir tête à certains de ses concurrents les plus enracinés.
Comparaison avec les concurrents potentiels
Note | Date | Modèle | Poids | Épaisseur | Taille | Résolution | Prix |
|---|---|---|---|---|---|---|---|
| 84.9 % v7 (old) | 12/23 | Colorful EVOL X15 AT 23 i7-13700HX, GeForce RTX 4060 Laptop GPU | 2.3 kg | 26.9 mm | 15.60" | 2560x1440 | |
| 88.3 % v7 (old) | 09/23 | Alienware m16 R1 Intel i7-13700HX, GeForce RTX 4060 Laptop GPU | 3 kg | 25.4 mm | 16.00" | 2560x1600 | |
| 87.4 % v7 (old) | 07/23 | HP Omen 16-wf000 i7-13700HX, GeForce RTX 4080 Laptop GPU | 2.4 kg | 23.6 mm | 16.10" | 2560x1440 | |
| 89.5 % v7 (old) | 07/23 | Acer Predator Helios 16 PH16-71-731Q i7-13700HX, GeForce RTX 4060 Laptop GPU | 2.6 kg | 26.9 mm | 16.00" | 2560x1600 | |
| 84.2 % v7 (old) | 06/23 | Dell G15 5530 i7-13650HX, GeForce RTX 4060 Laptop GPU | 3 kg | 26.95 mm | 15.60" | 1920x1080 | |
| 86.2 % v7 (old) | 07/23 | Schenker XMG Pro 15 (E23) i9-13900HX, GeForce RTX 4060 Laptop GPU | 2.4 kg | 24.9 mm | 15.60" | 2560x1440 | |
| 89.2 % v7 (old) | 08/23 | Alienware m16 R1 AMD R9 7845HX, GeForce RTX 4080 Laptop GPU | 3.1 kg | 25.4 mm | 16.00" | 2560x1600 | |
| 88.2 % v7 (old) | 03/23 | Uniwill GM6PX7X RTX 4070 i7-13700HX, GeForce RTX 4070 Laptop GPU | 2.2 kg | 22 mm | 16.00" | 2560x1600 |
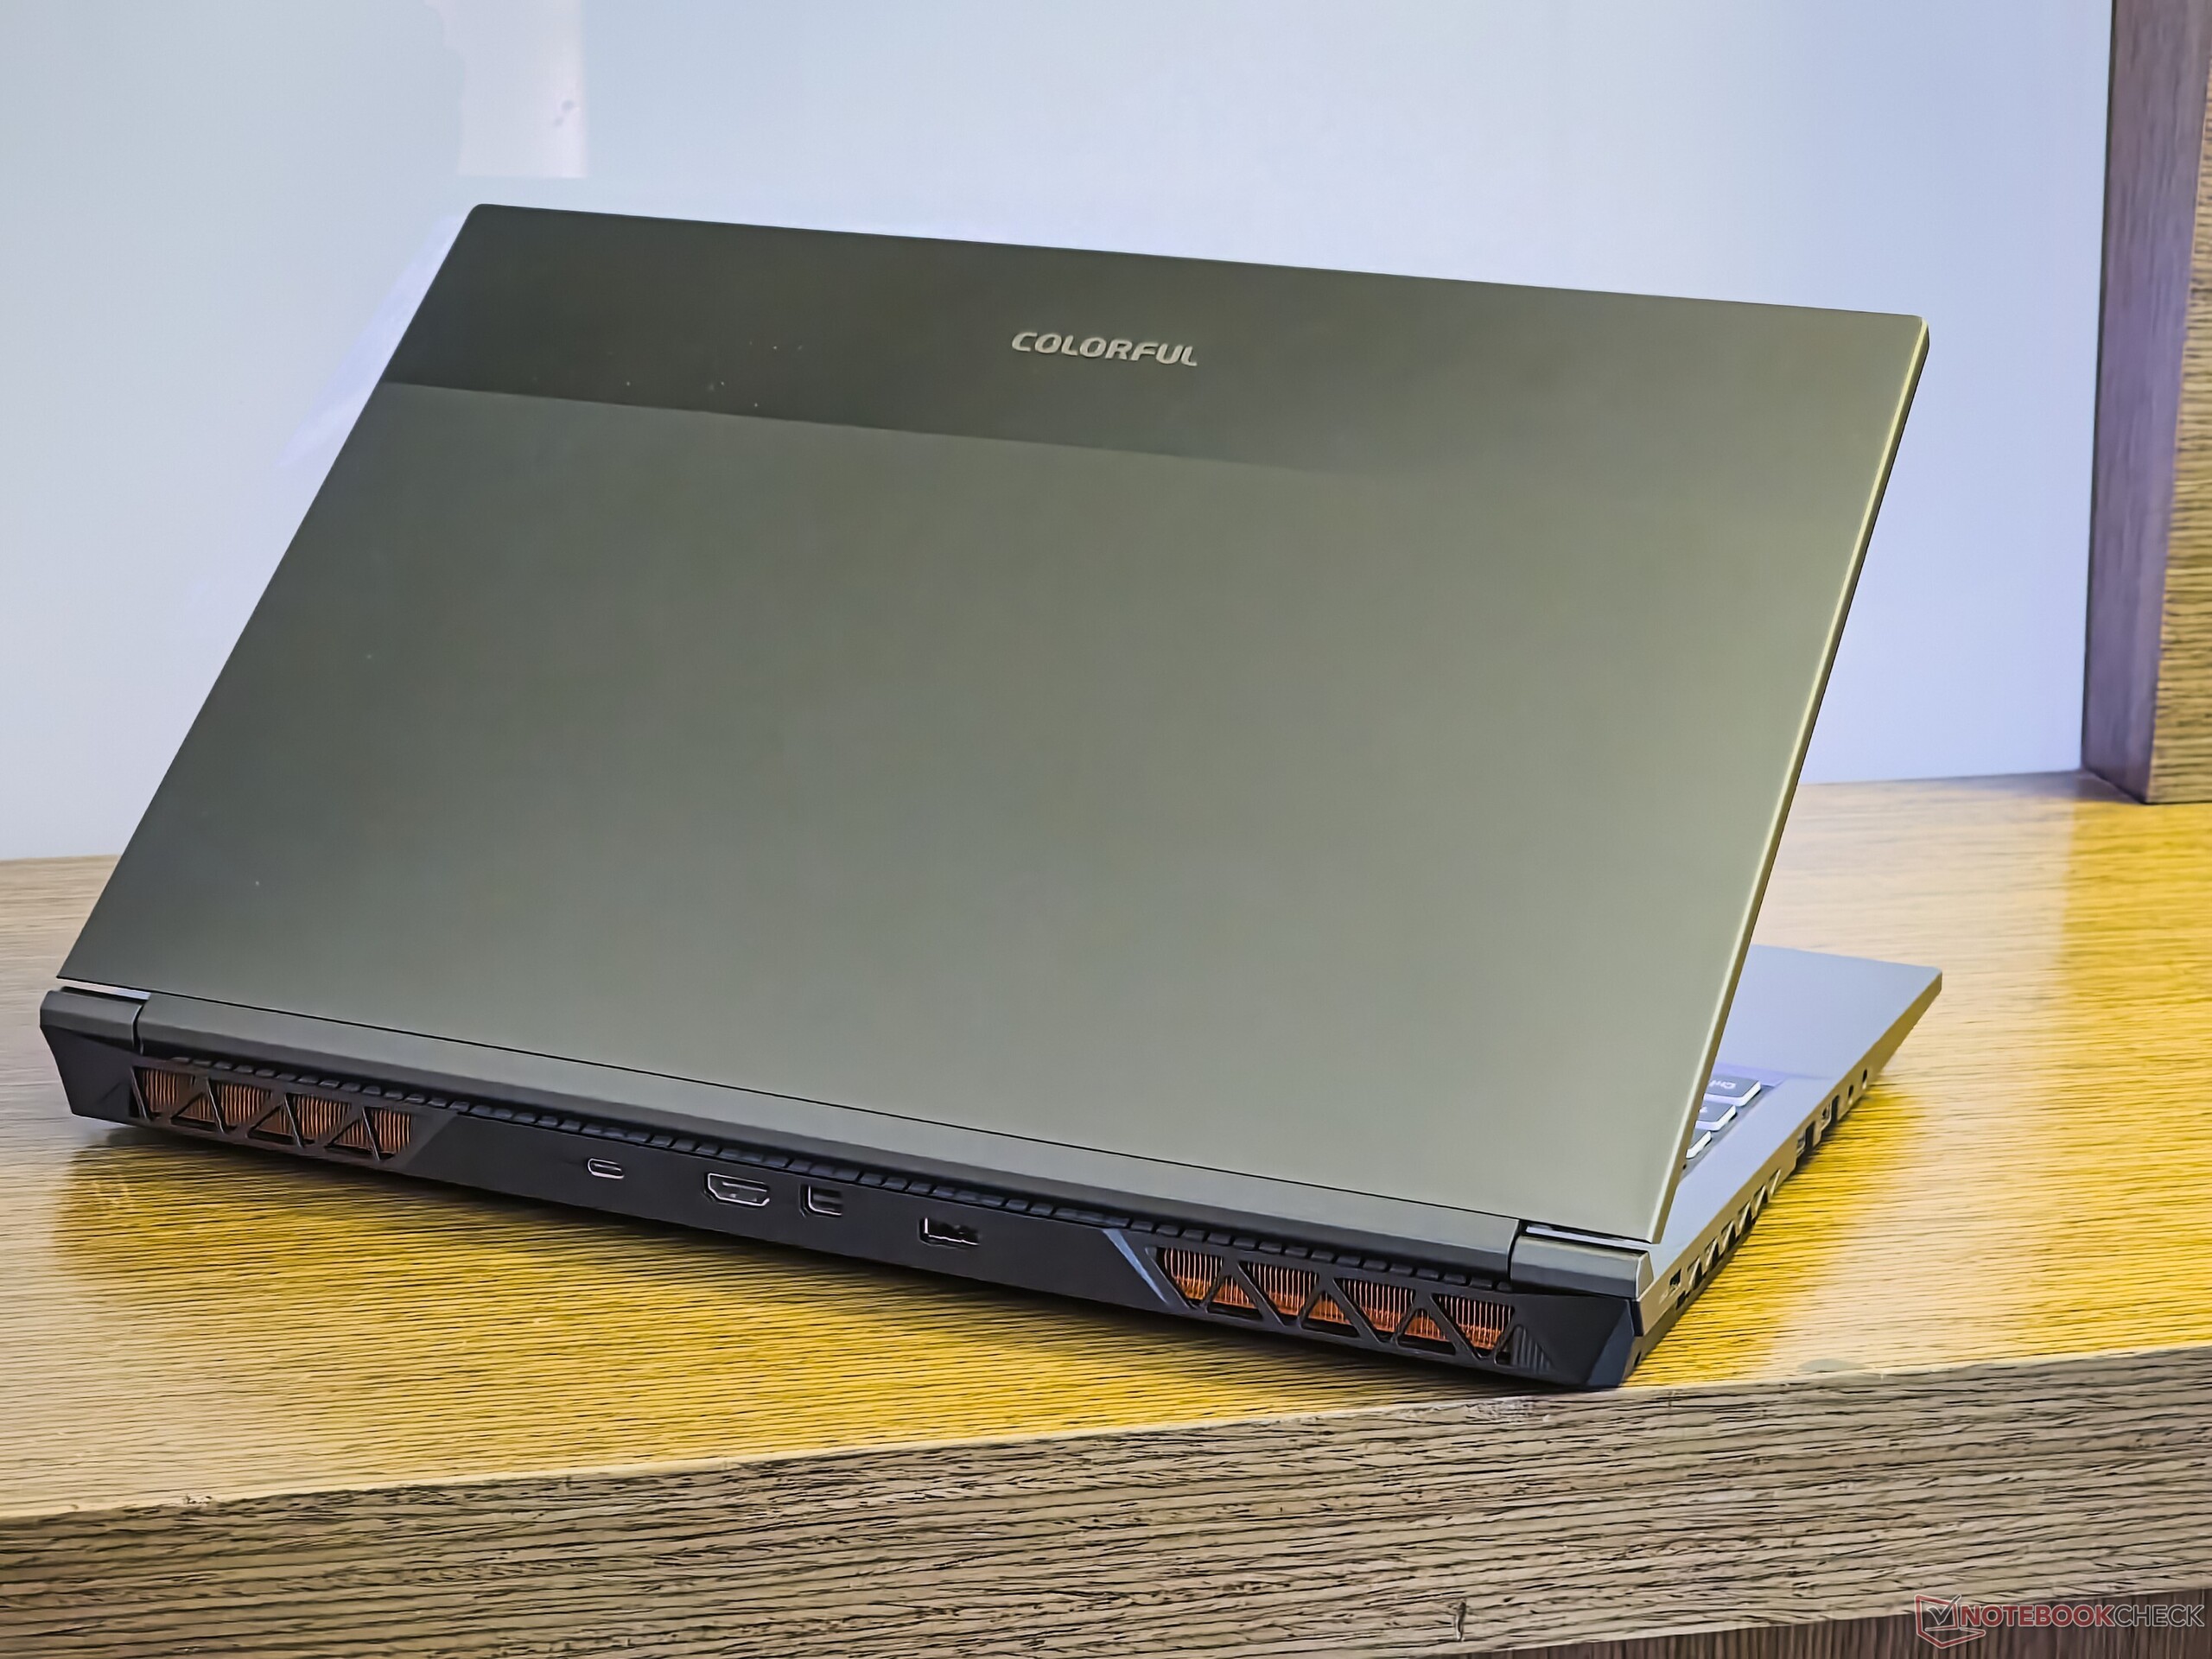
Châssis : La fonction l'emporte sur la forme dans l'esthétique plastique Clevo
Colorful propose l'EVOL X15 AT en trois teintes : violet raisin, bleu pin et gris brumeux (notre modèle d'évaluation). Avec une épaisseur de 27,1 mm et un poids de 2,3 kg, l'EVOL XT15 AT ne remportera aucun prix de minceur. Néanmoins, il est nettement plus portable que le Dell G15 5530 et l Alienware m16 R1.
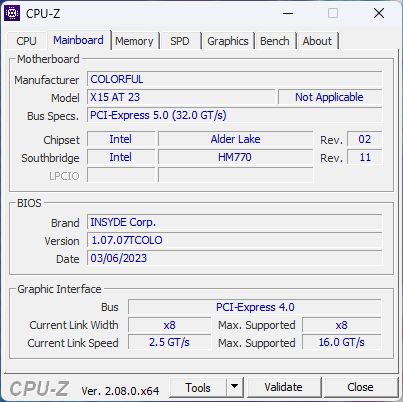
L'EVOL X15 AT, conçu par Clevo, est doté d'un châssis en plastique robuste. La construction rappelle largement celle du Gigabyte G5 KE
, qui est également un rebranding de Clevo. Malgré la robustesse de la construction, nous avons observé une flexion considérable au niveau du clavier. </p> <p style>Le couvercle de l'écran est en métal et ne vacille pas beaucoup. Les charnières ont une tension idéale, ce qui permet d'ouvrir le couvercle avec un seul doigt sans que la base ne glisse <br> Dans l'ensemble, l'EVOL X15 AT ne cherche pas à vous séduire avec un langage de conception suave, mais il est suffisamment utilitaire en tant que portable de jeu.</p>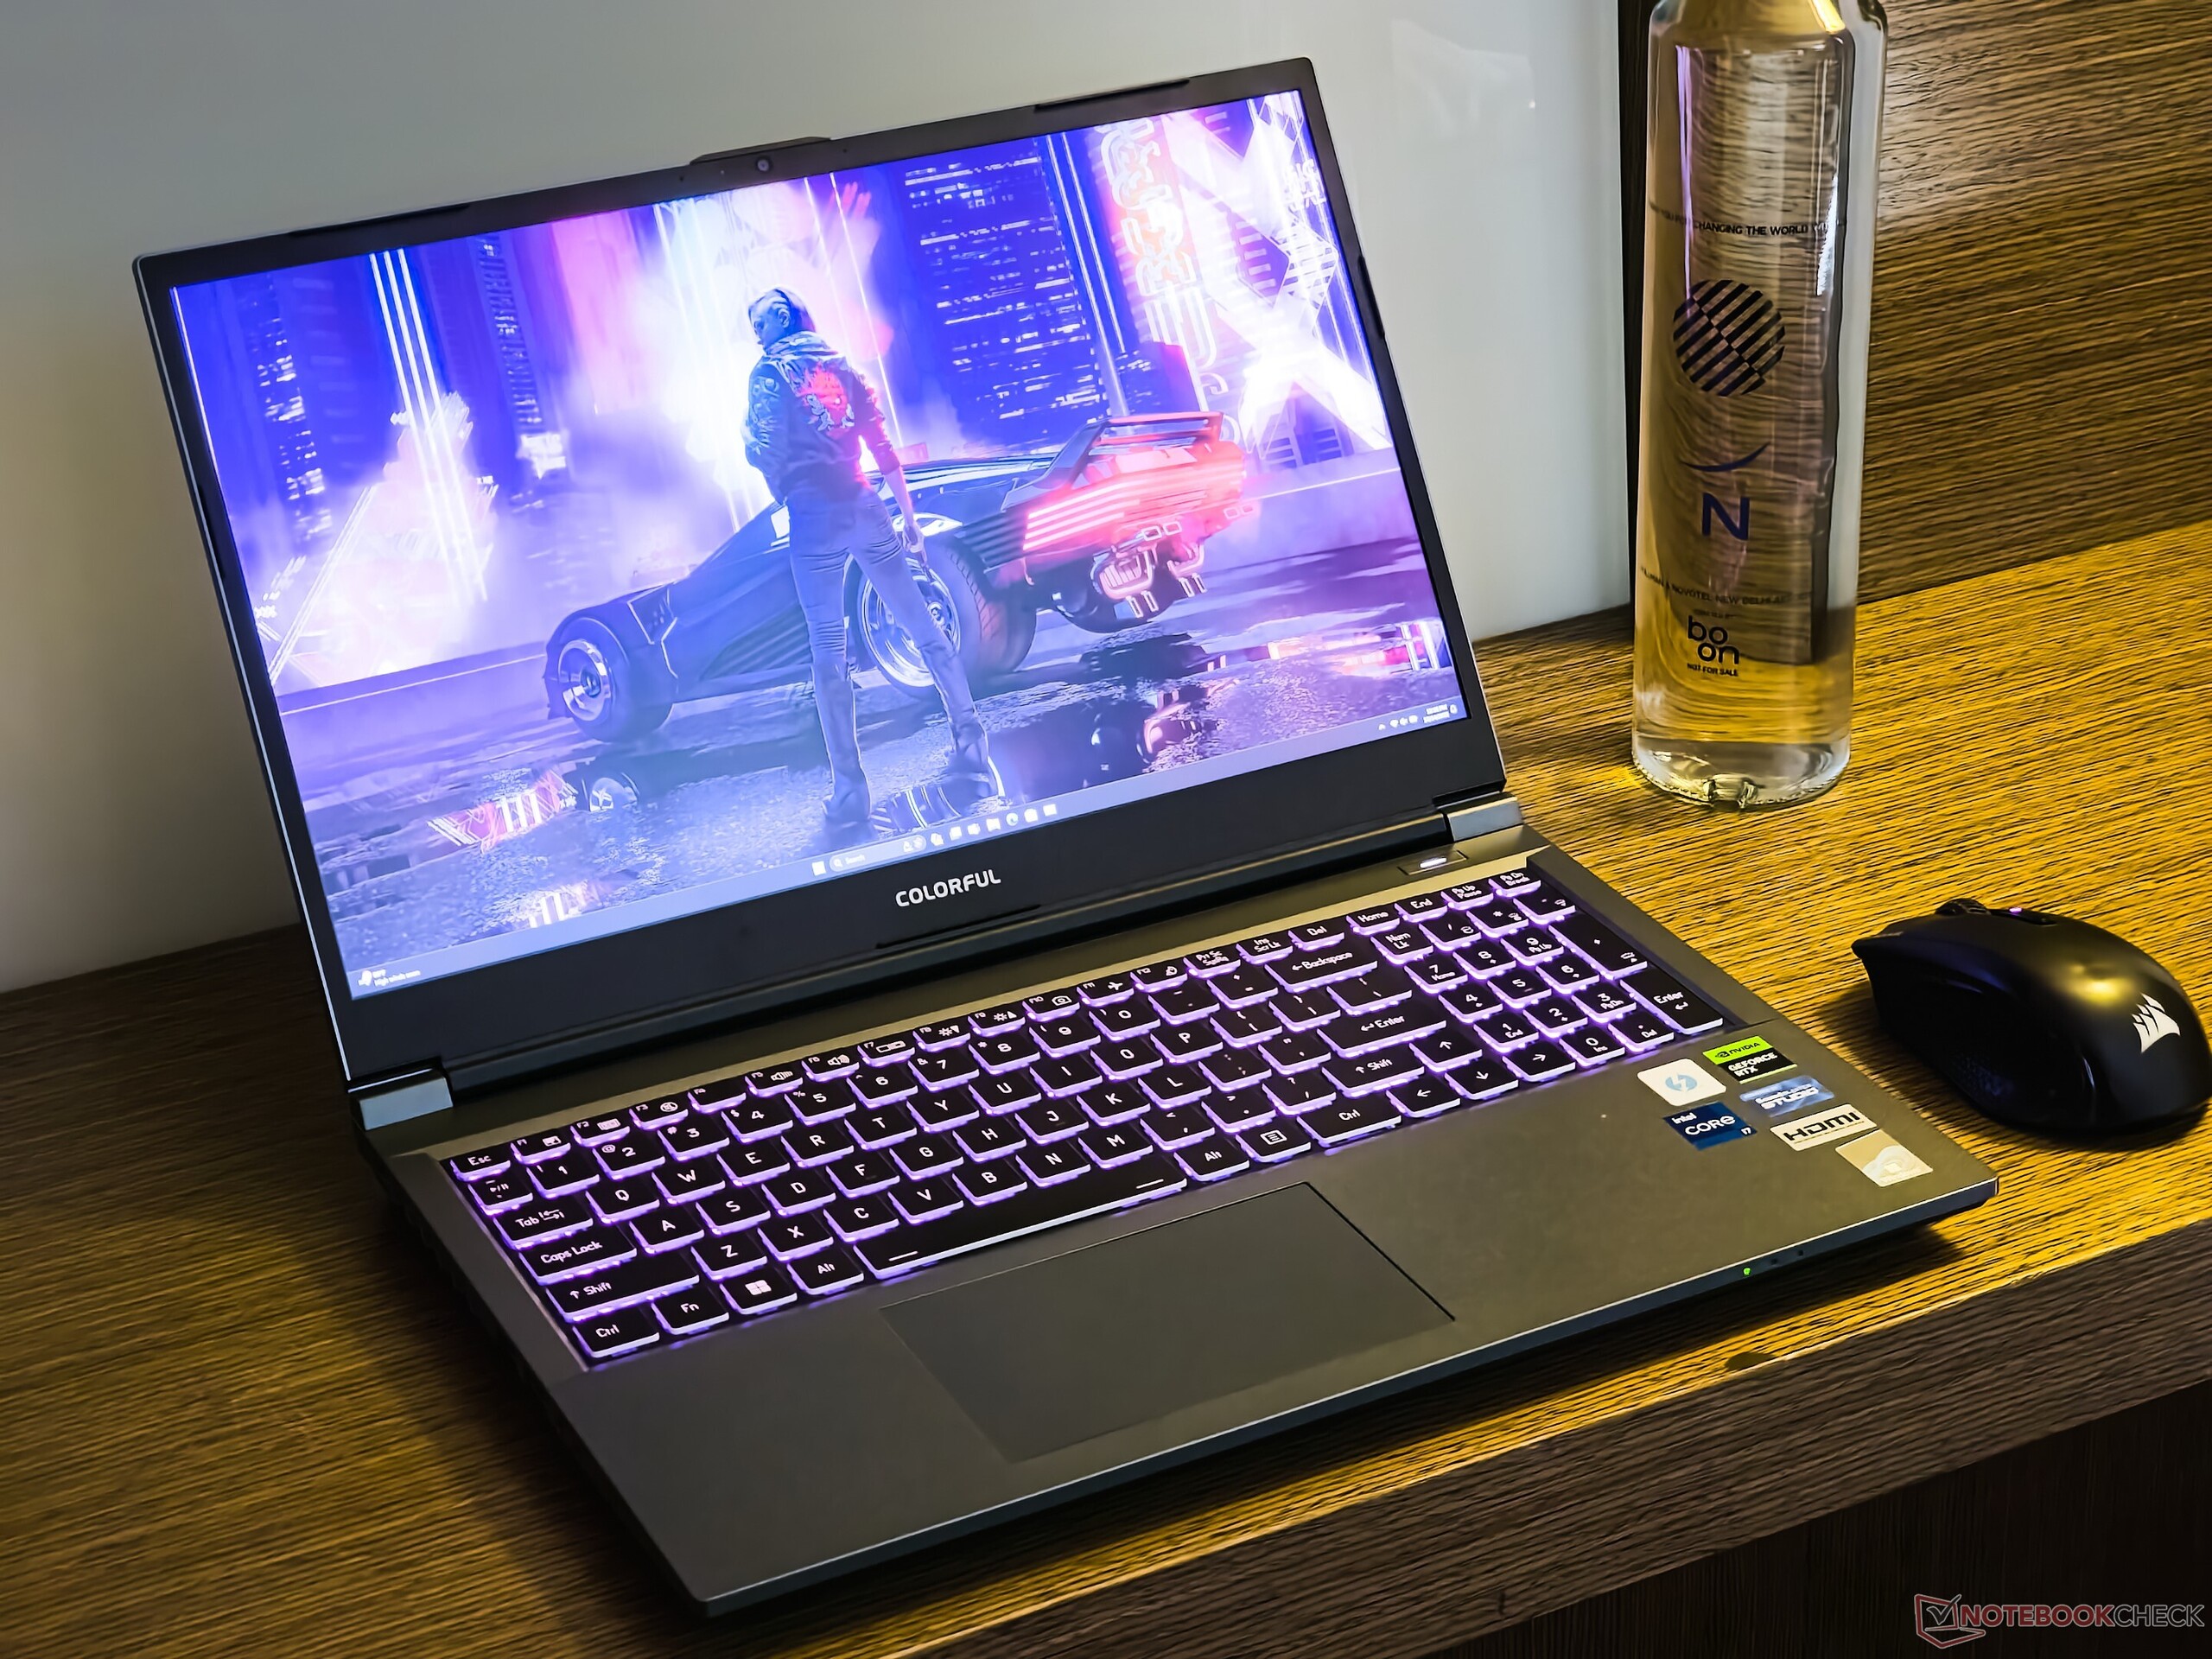

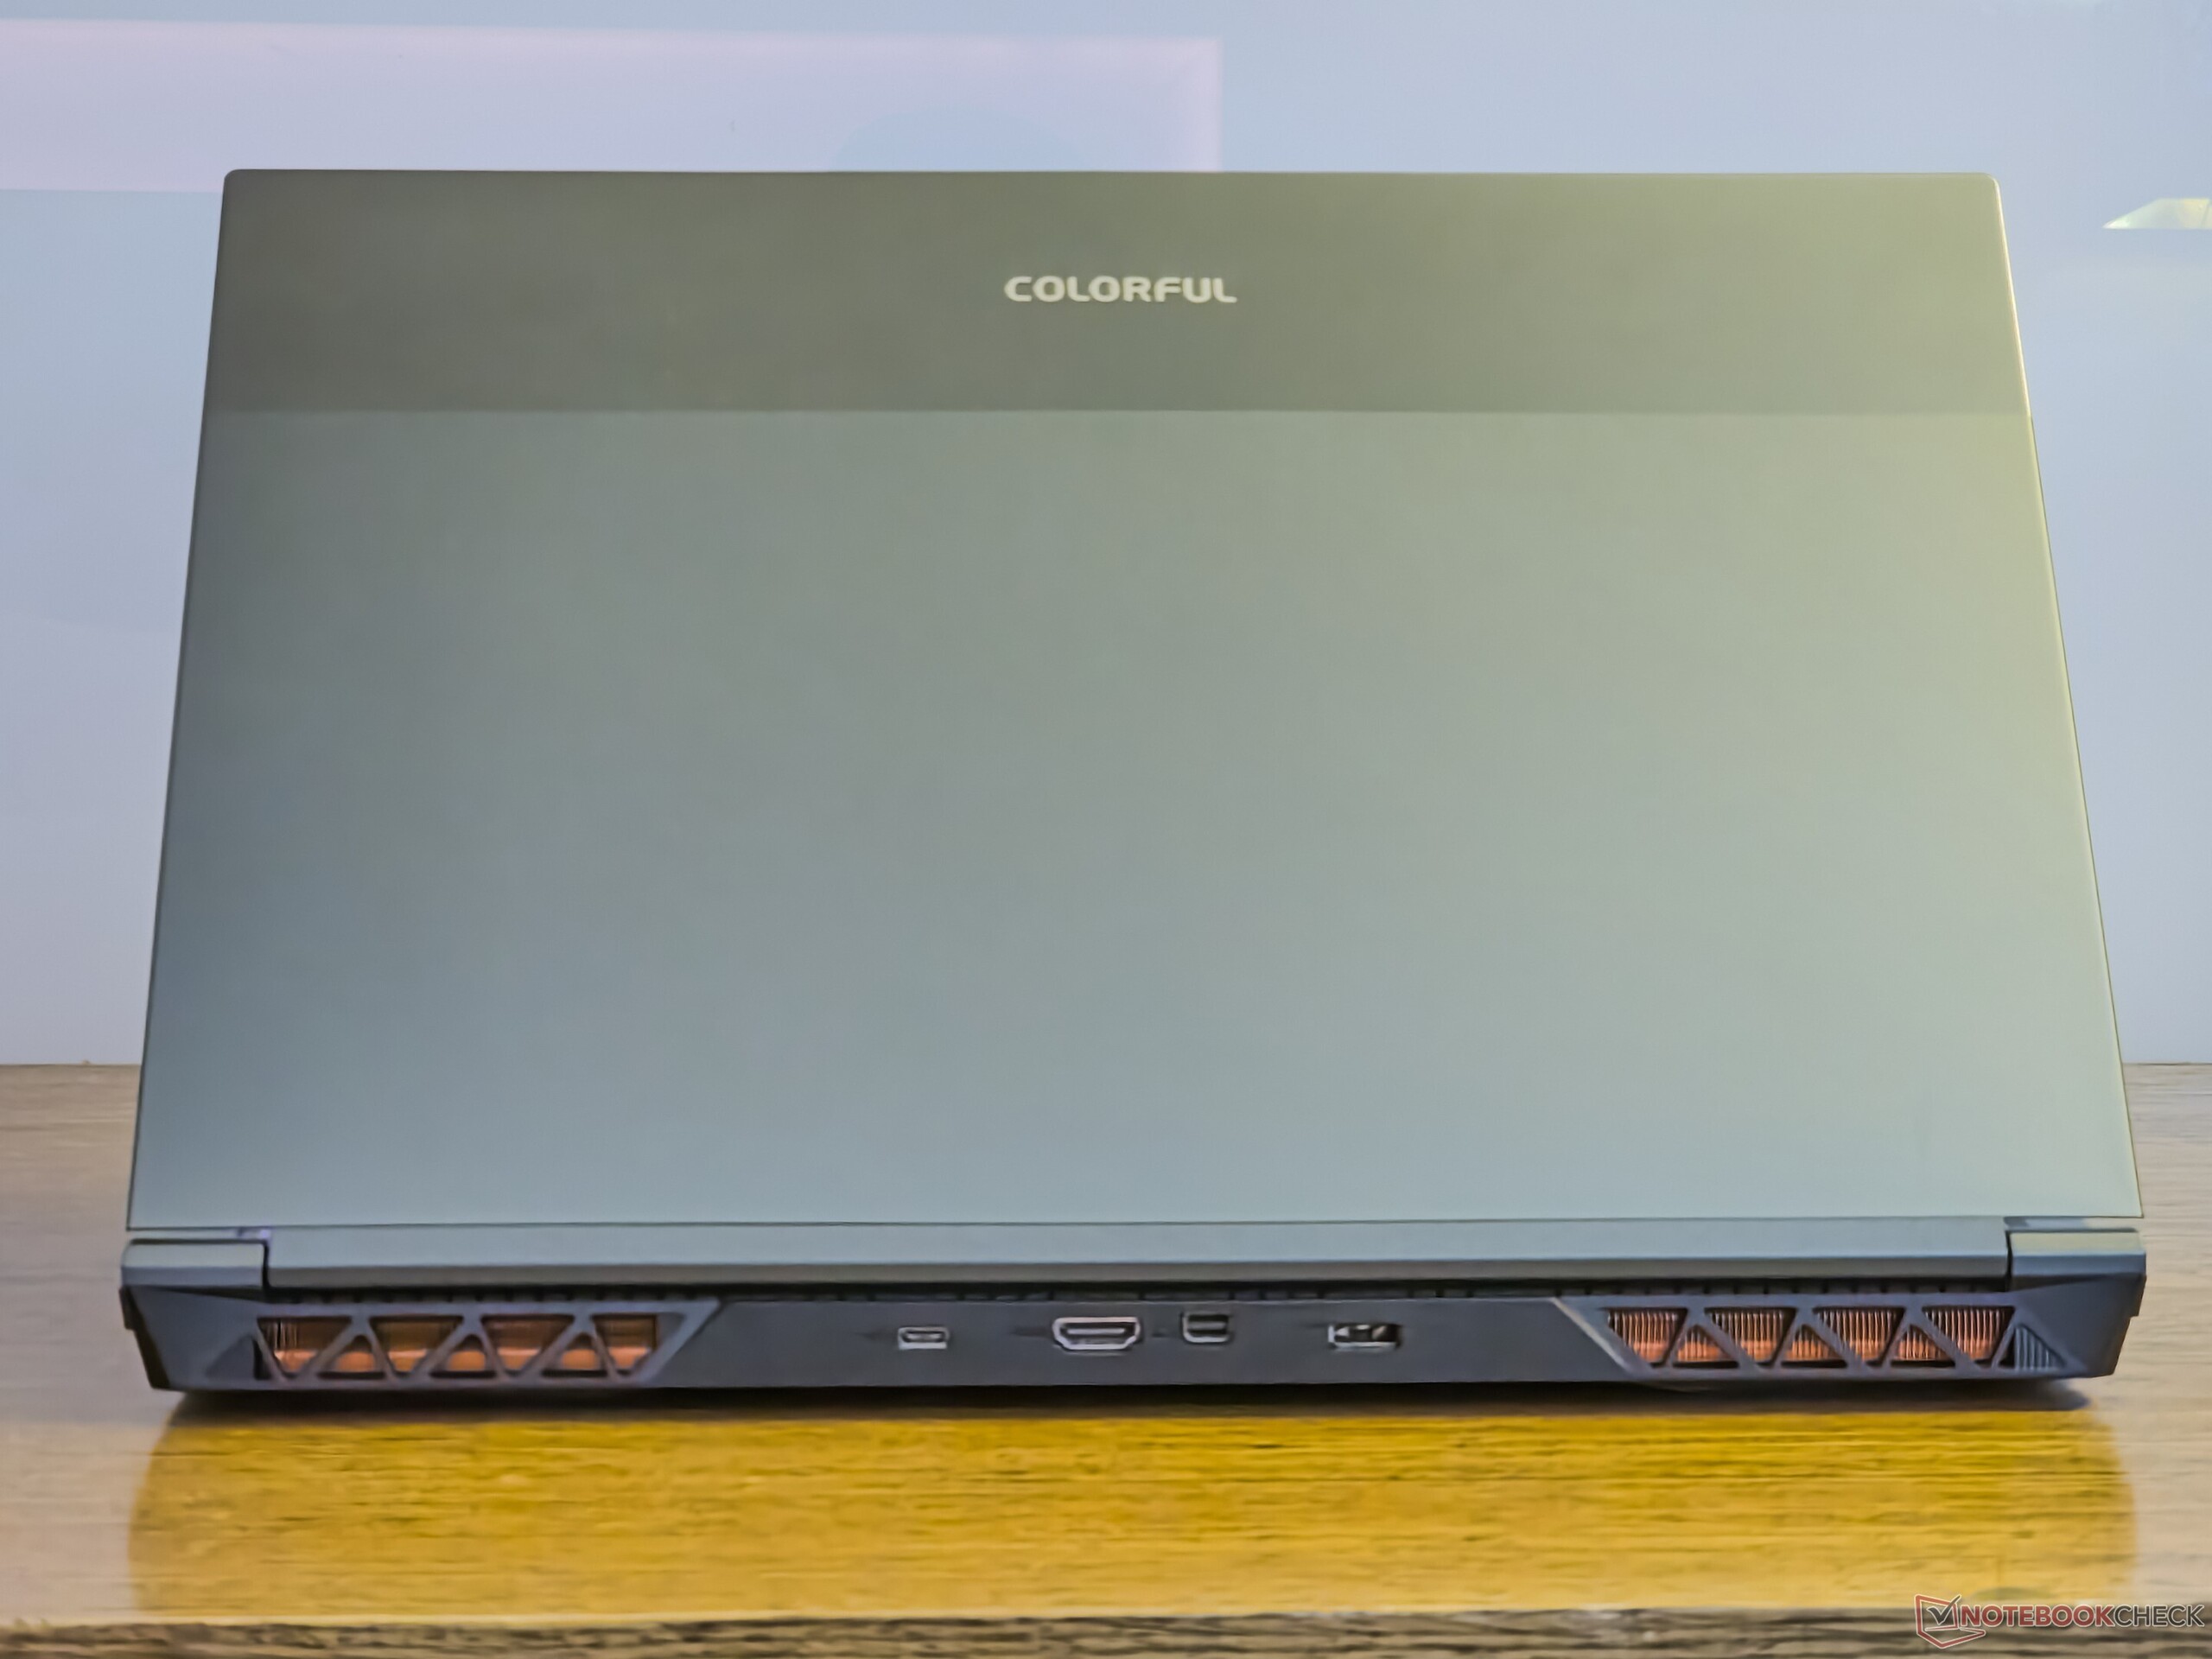
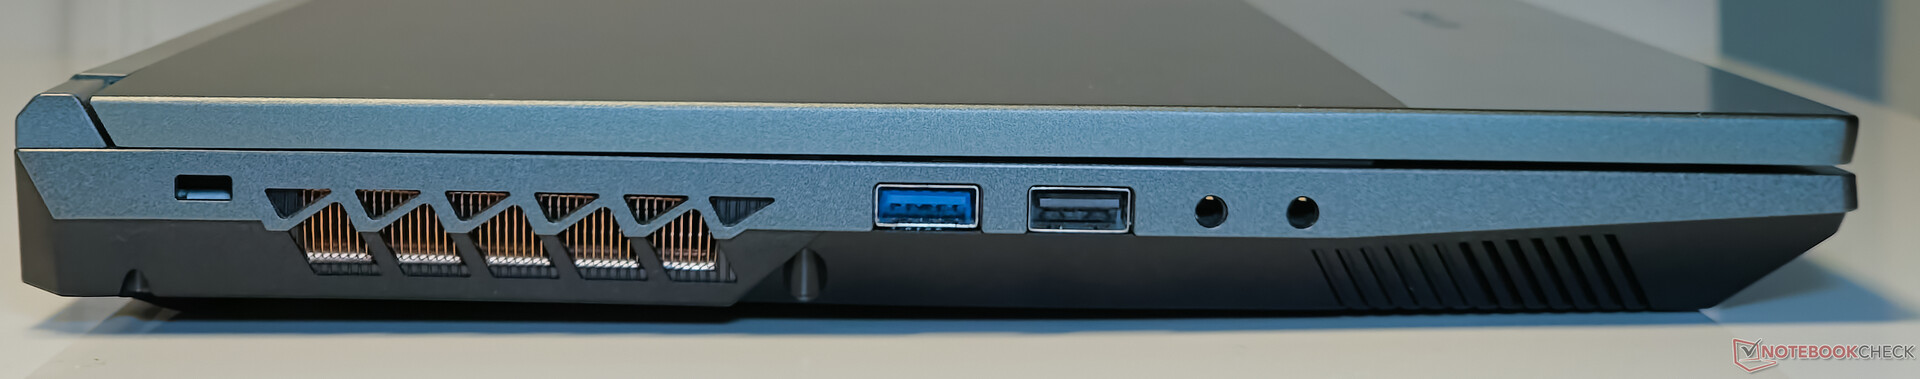
Connectivité : Ports de type C sans alimentation électrique
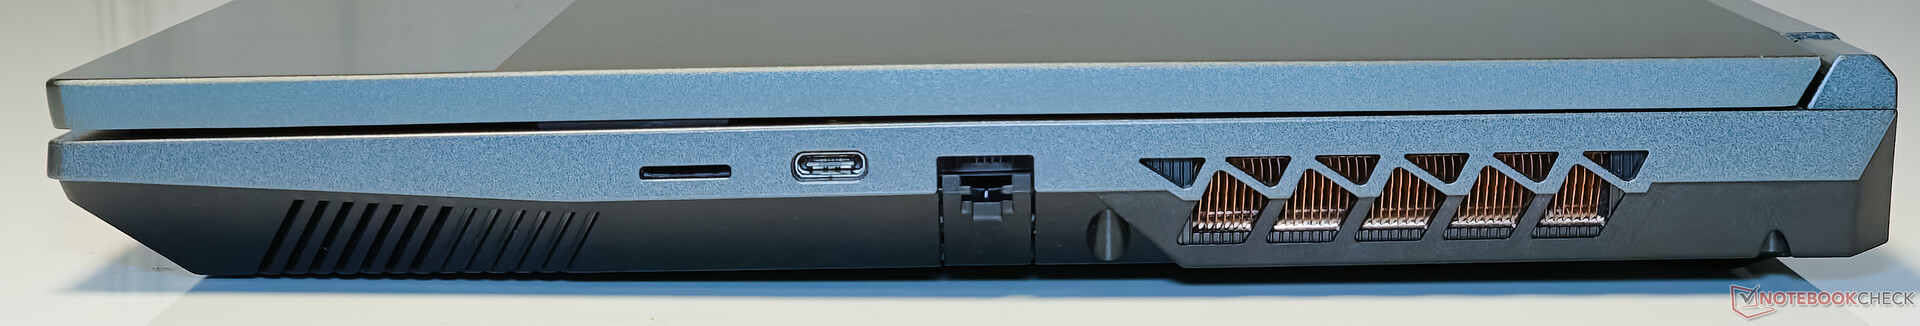
Colorful a doté l'EVOL X15 AT d'une sélection de ports assez décente. Le flanc gauche abrite deux options USB-A (USB 2.0 et USB 3.2 Gen 1) ainsi qu'une prise line-in dédiée à l'entrée audio analogique. Sur le côté droit se trouvent un emplacement microSD, Thunderbolt 4 et un réseau local Gigabit.
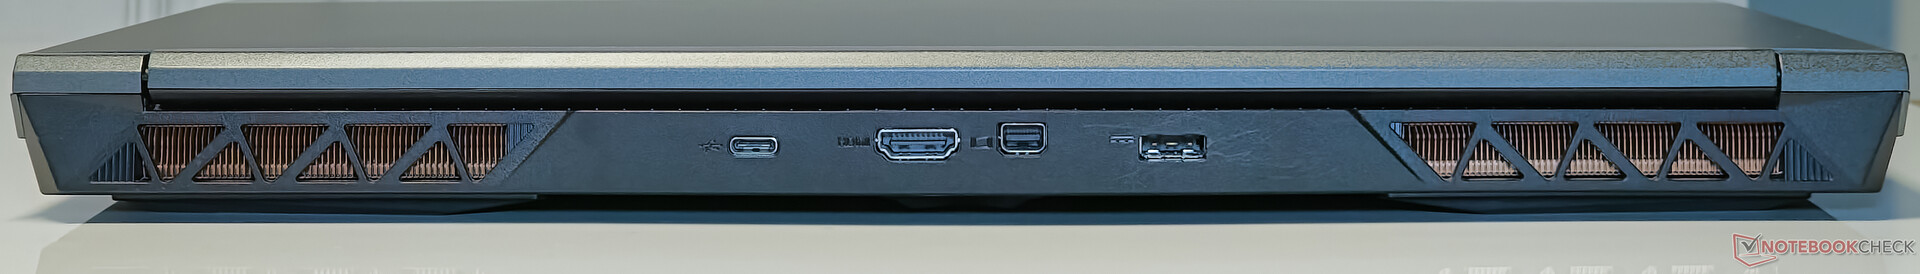
Sur le côté droit, on trouve un lecteur de carte microSD, Thunderbolt 4 et Gigabit LAN. Enfin, l'arrière abrite l'USB 3.2 Gen2 Type-C, la sortie mini-DisplayPort et la sortie HDMI.
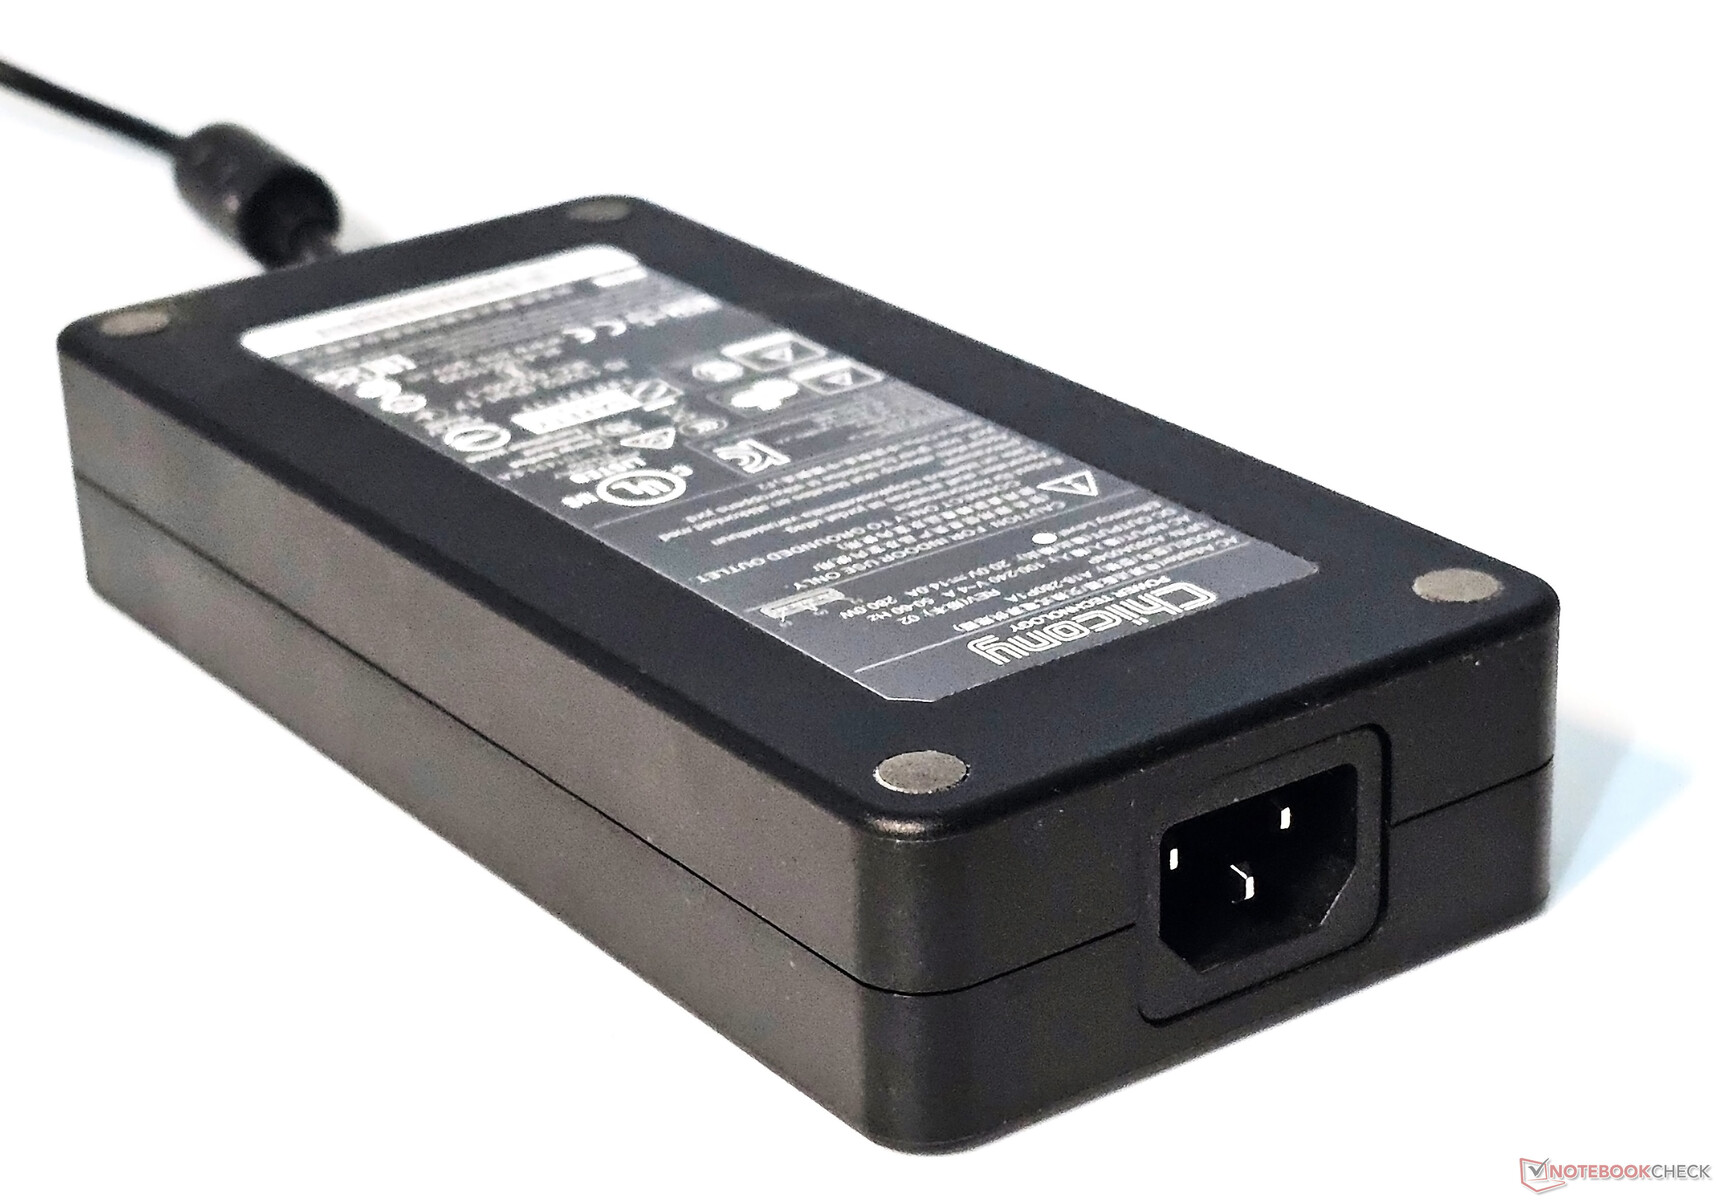
Les ports Type-C ne prennent malheureusement en charge que l'alimentation électrique, de sorte que vous devrez inévitablement trimballer la brique d'alimentation de près de 1 kg partout pour alimenter l'ordinateur portable.
Lecteur de carte SD
Le lecteur de carte microSD de l'EVOL X15 ne bat aucun record de vitesse et est environ 28% plus lent que la moyenne de la catégorie dans les tests de copie JPG et de lecture séquentielle AS SSD.
| SD Card Reader | |
| average JPG Copy Test (av. of 3 runs) | |
| Alienware m16 R1 AMD (Toshiba Exceria Pro SDXC 64 GB UHS-II) | |
| Alienware m16 R1 Intel (AV PRO microSD 128 GB V60) | |
| Moyenne de la classe Gaming (20.9 - 210, n=54, 2 dernières années) | |
| Schenker XMG Pro 15 (E23) | |
| Colorful EVOL X15 AT 23 (AV PRO microSD 128 GB V60) | |
| Acer Predator Helios 16 PH16-71-731Q | |
| Uniwill GM6PX7X RTX 4070 (AV PRO microSD 128 GB V60) | |
| maximum AS SSD Seq Read Test (1GB) | |
| Alienware m16 R1 AMD (Toshiba Exceria Pro SDXC 64 GB UHS-II) | |
| Alienware m16 R1 Intel (AV PRO microSD 128 GB V60) | |
| Moyenne de la classe Gaming (25.5 - 261, n=51, 2 dernières années) | |
| Schenker XMG Pro 15 (E23) | |
| Colorful EVOL X15 AT 23 (AV PRO microSD 128 GB V60) | |
| Uniwill GM6PX7X RTX 4070 (AV PRO microSD 128 GB V60) | |
| Acer Predator Helios 16 PH16-71-731Q | |
Communication
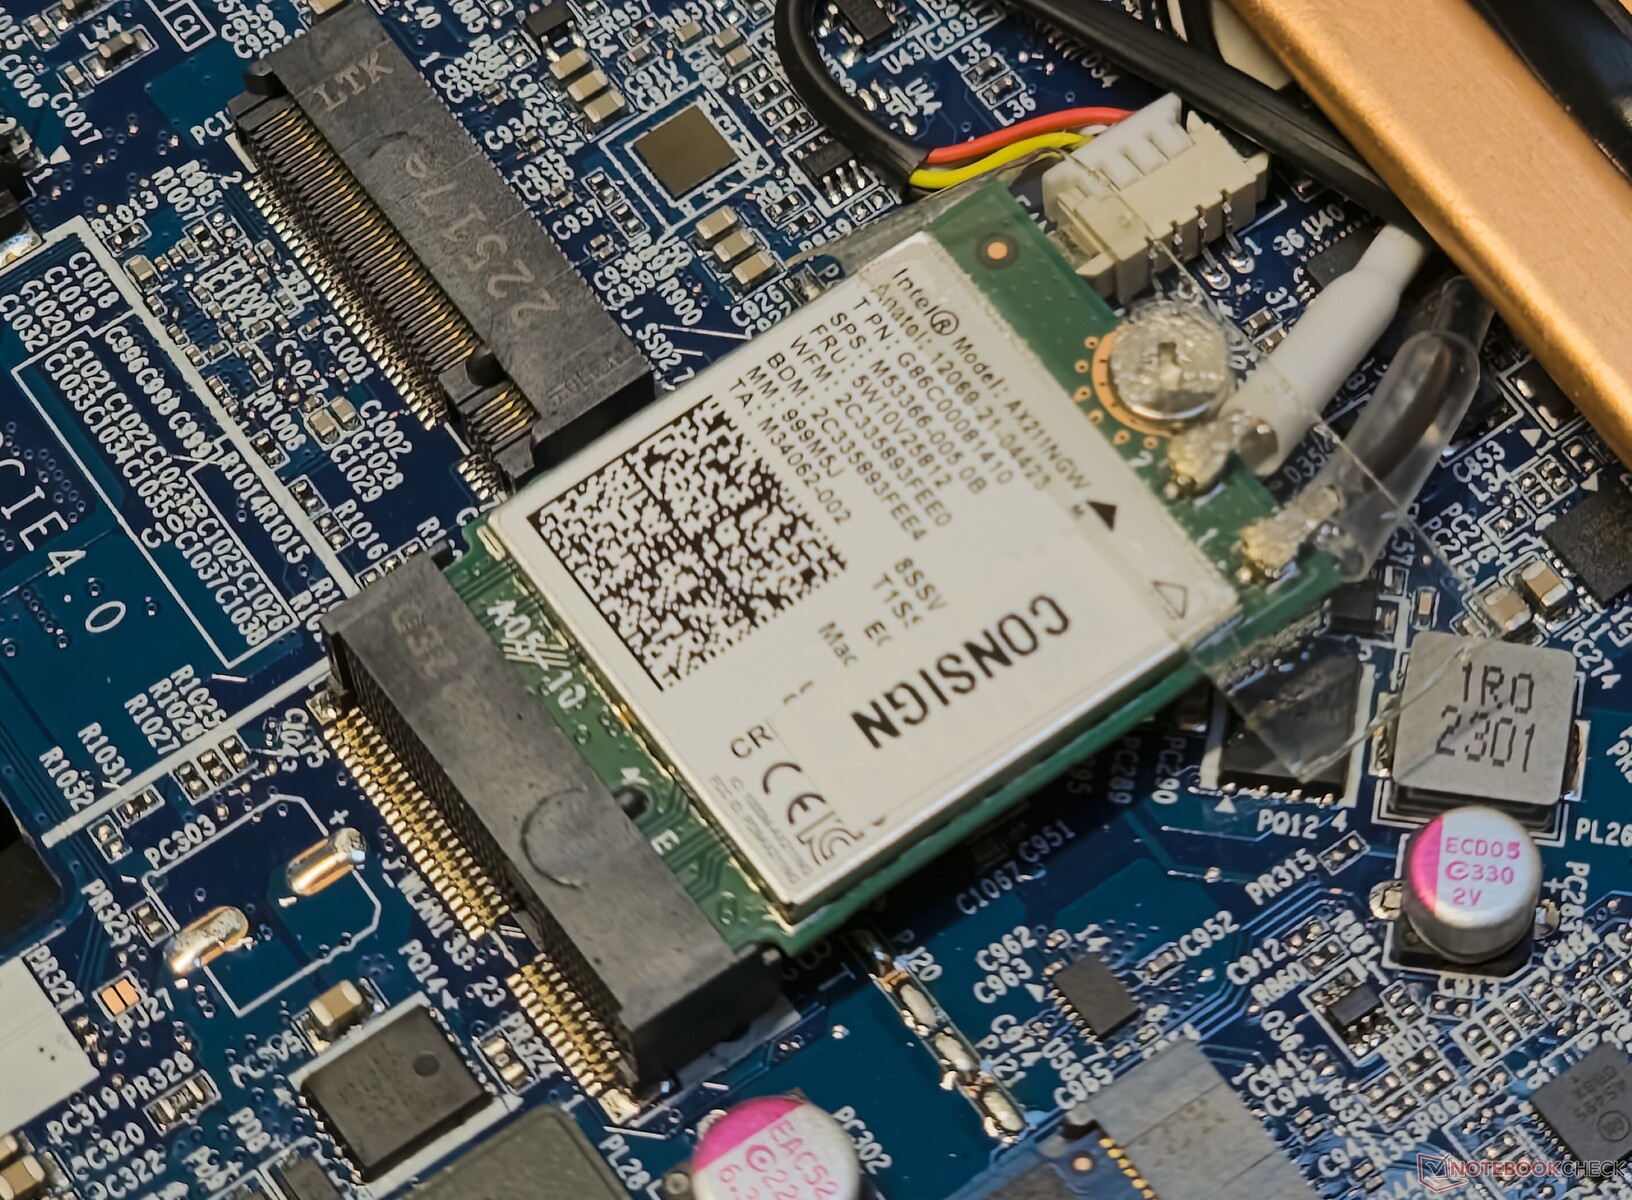
L'EVOL X15 AT est équipé d'une puce WLAN Intel Wi-Fi 6E AX211. Les taux de transfert sont à peu près constants dans les bandes 5 GHz et 6 GHz lorsque nous les testons avec notre routeur de référence Asus ROG Rapture GT-AXE11000.
L'ordinateur portable offre d'excellents débits en émission et en réception dans la bande des 5 GHz. Dans la bande des 6 GHz, l'EVOL X15 n'arrive pas à la cheville du routeur Asus ROG Rapture GT-AXE11000 Alienware m16 R1 AMD dans les tests d'émission iPerf3, mais compense cette lacune dans les tests de réception avec un débit maximal de 1,7 Gbps.
| Networking / iperf3 transmit AXE11000 | |
| Colorful EVOL X15 AT 23 | |
| Dell G15 5530 | |
| Alienware m16 R1 AMD | |
| Acer Predator Helios 16 PH16-71-731Q | |
| Alienware m16 R1 Intel | |
| Moyenne de la classe Gaming (560 - 1862, n=87, 2 dernières années) | |
| Moyenne Intel Wi-Fi 6E AX211 (64 - 1921, n=276) | |
| Uniwill GM6PX7X RTX 4070 | |
| HP Omen 16-wf000 | |
| Schenker XMG Pro 15 (E23) | |
| Networking / iperf3 receive AXE11000 | |
| Colorful EVOL X15 AT 23 | |
| Alienware m16 R1 Intel | |
| Dell G15 5530 | |
| Moyenne de la classe Gaming (680 - 1745, n=87, 2 dernières années) | |
| Acer Predator Helios 16 PH16-71-731Q | |
| Alienware m16 R1 AMD | |
| Moyenne Intel Wi-Fi 6E AX211 (582 - 1890, n=276) | |
| HP Omen 16-wf000 | |
| Uniwill GM6PX7X RTX 4070 | |
| Schenker XMG Pro 15 (E23) | |
| Networking / iperf3 transmit AXE11000 6GHz | |
| Alienware m16 R1 AMD | |
| Acer Predator Helios 16 PH16-71-731Q | |
| Schenker XMG Pro 15 (E23) | |
| Colorful EVOL X15 AT 23 | |
| Moyenne de la classe Gaming (723 - 1868, n=36, 2 dernières années) | |
| Moyenne Intel Wi-Fi 6E AX211 (385 - 1851, n=226) | |
| HP Omen 16-wf000 | |
| Networking / iperf3 receive AXE11000 6GHz | |
| Colorful EVOL X15 AT 23 | |
| Schenker XMG Pro 15 (E23) | |
| Moyenne de la classe Gaming (975 - 1775, n=35, 2 dernières années) | |
| Alienware m16 R1 AMD | |
| Moyenne Intel Wi-Fi 6E AX211 (700 - 1857, n=226) | |
| Acer Predator Helios 16 PH16-71-731Q | |
| HP Omen 16-wf000 | |
Webcam
Étant donné que l'EVOL X15 se concentre principalement sur les jeux, il se contente d'une webcam 720p conventionnelle. La webcam est adéquate pour les chats vidéo rapides, mais elle manque de précision des couleurs, de reproduction des détails et de netteté générale.


Sécurité
Il n'y a pas de fonctions de sécurité dédiées telles que les connexions biométriques intégrées. Un module TPM 2.0 est présent pour répondre aux exigences de sécurité de Windows 11.
Accessoires et garantie
Il n'y a pas d'accessoires séparés dans la boîte à part l'adaptateur 280 W et les documents habituels. Le Colorful EVOL X15 AT est livré avec une garantie standard de deux ans.
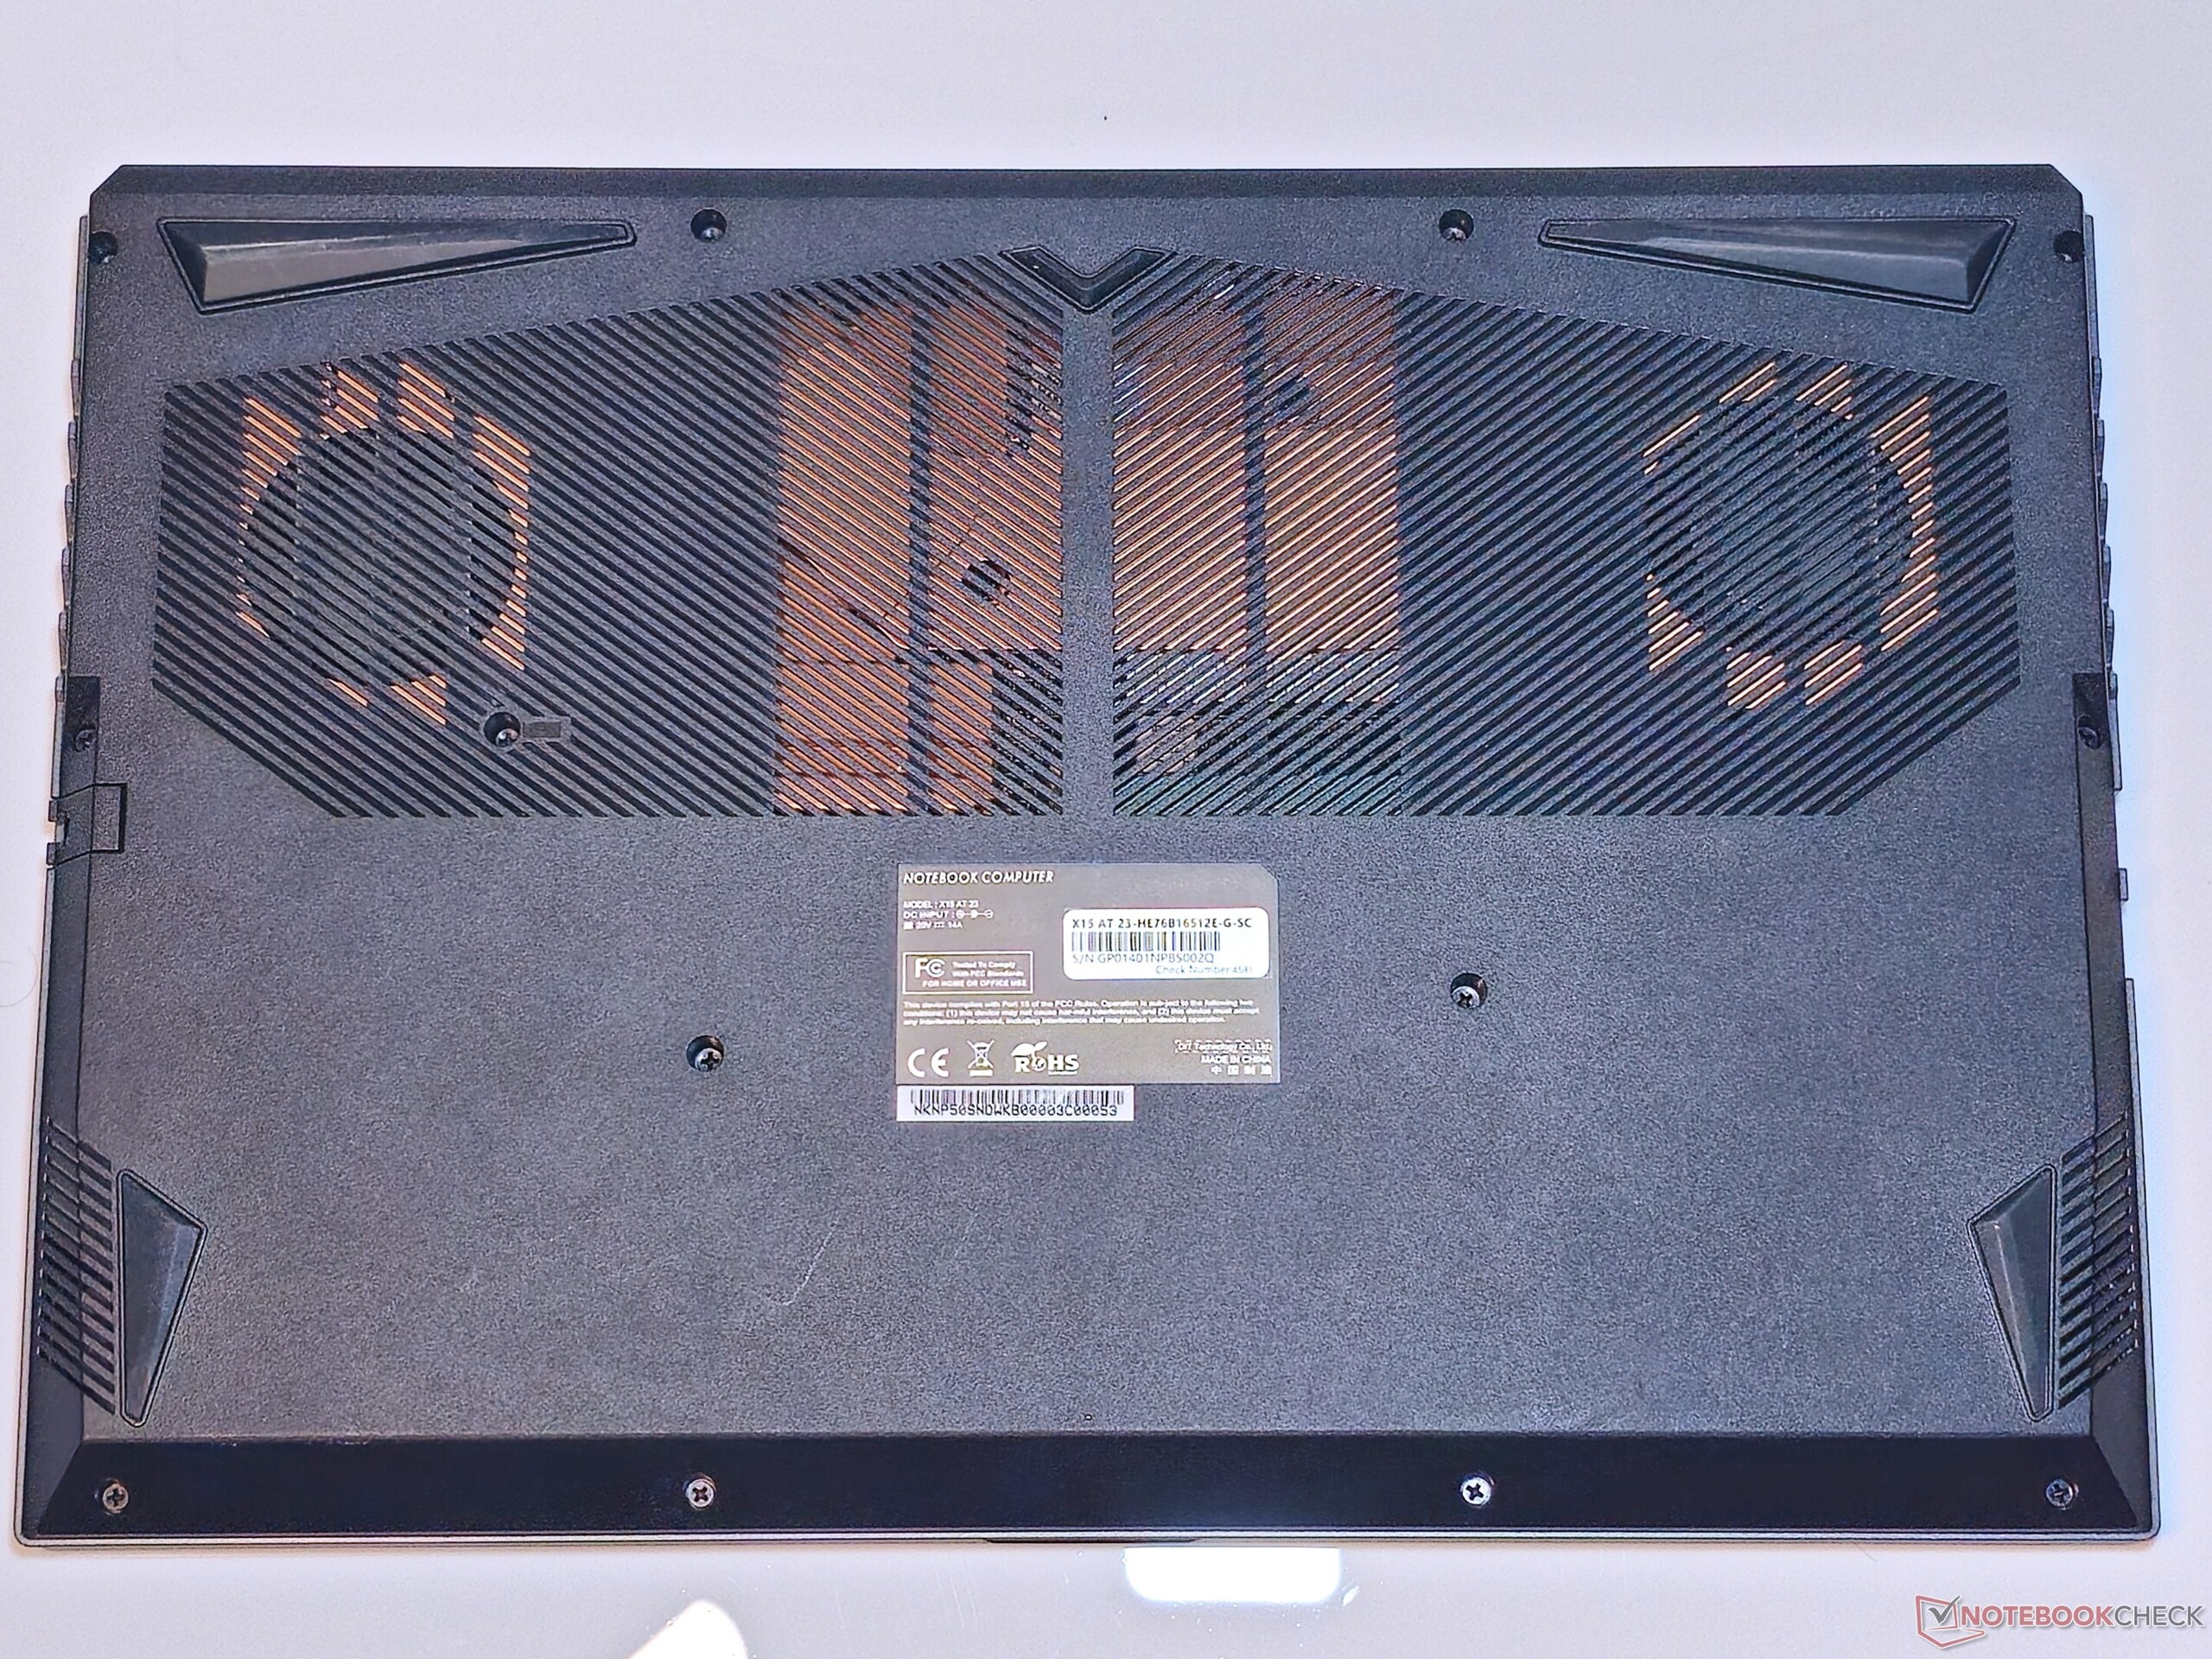
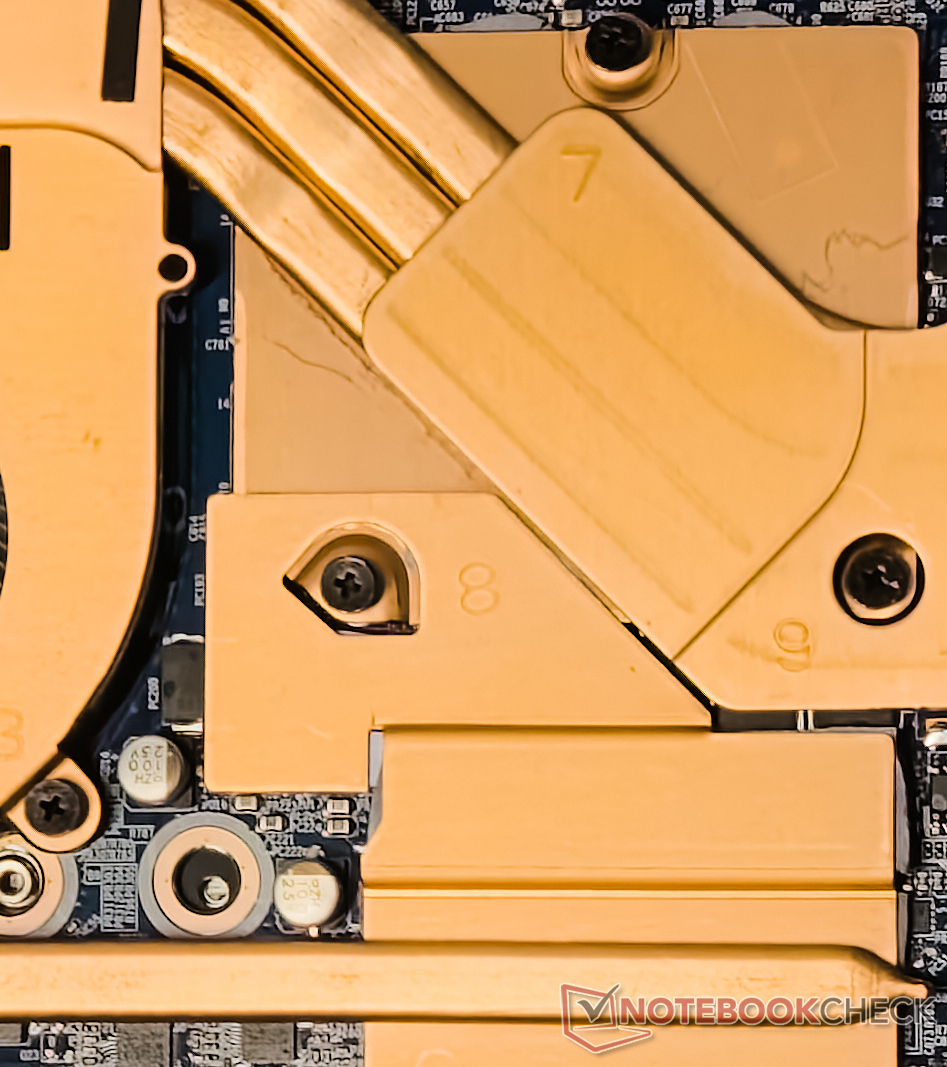
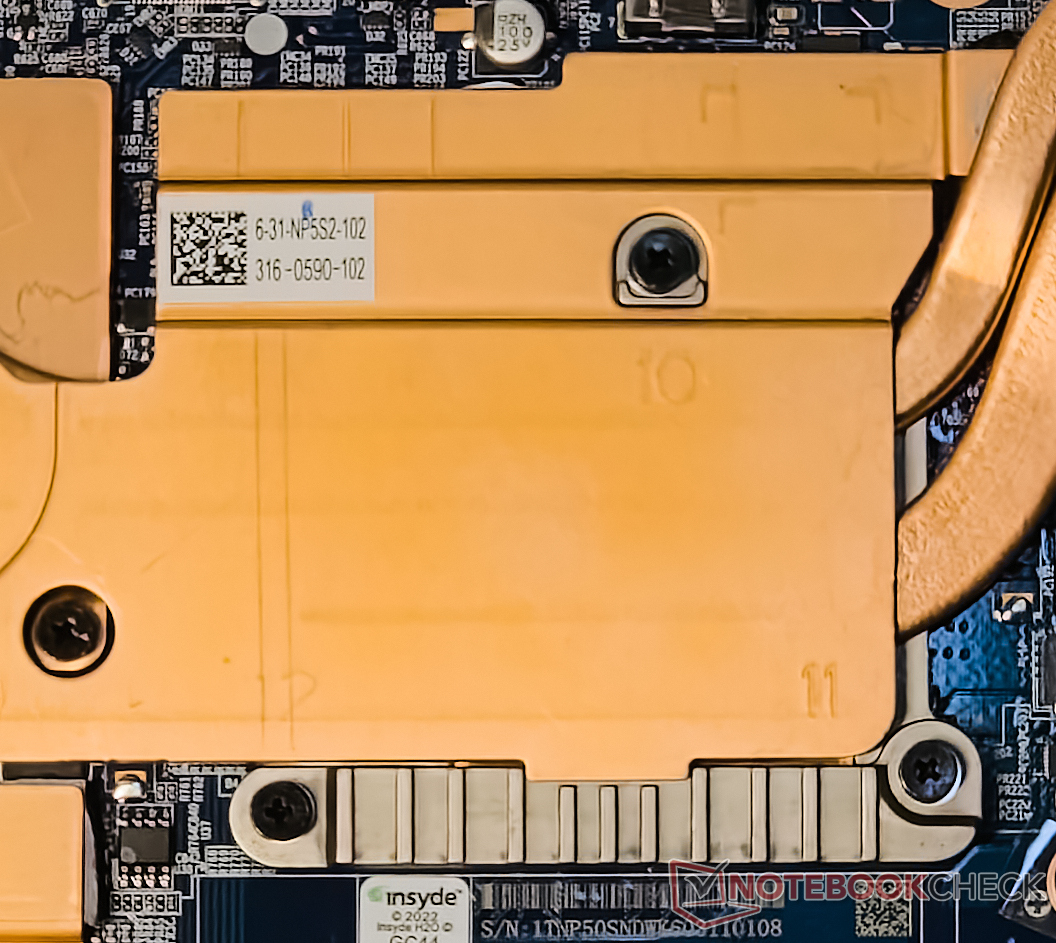
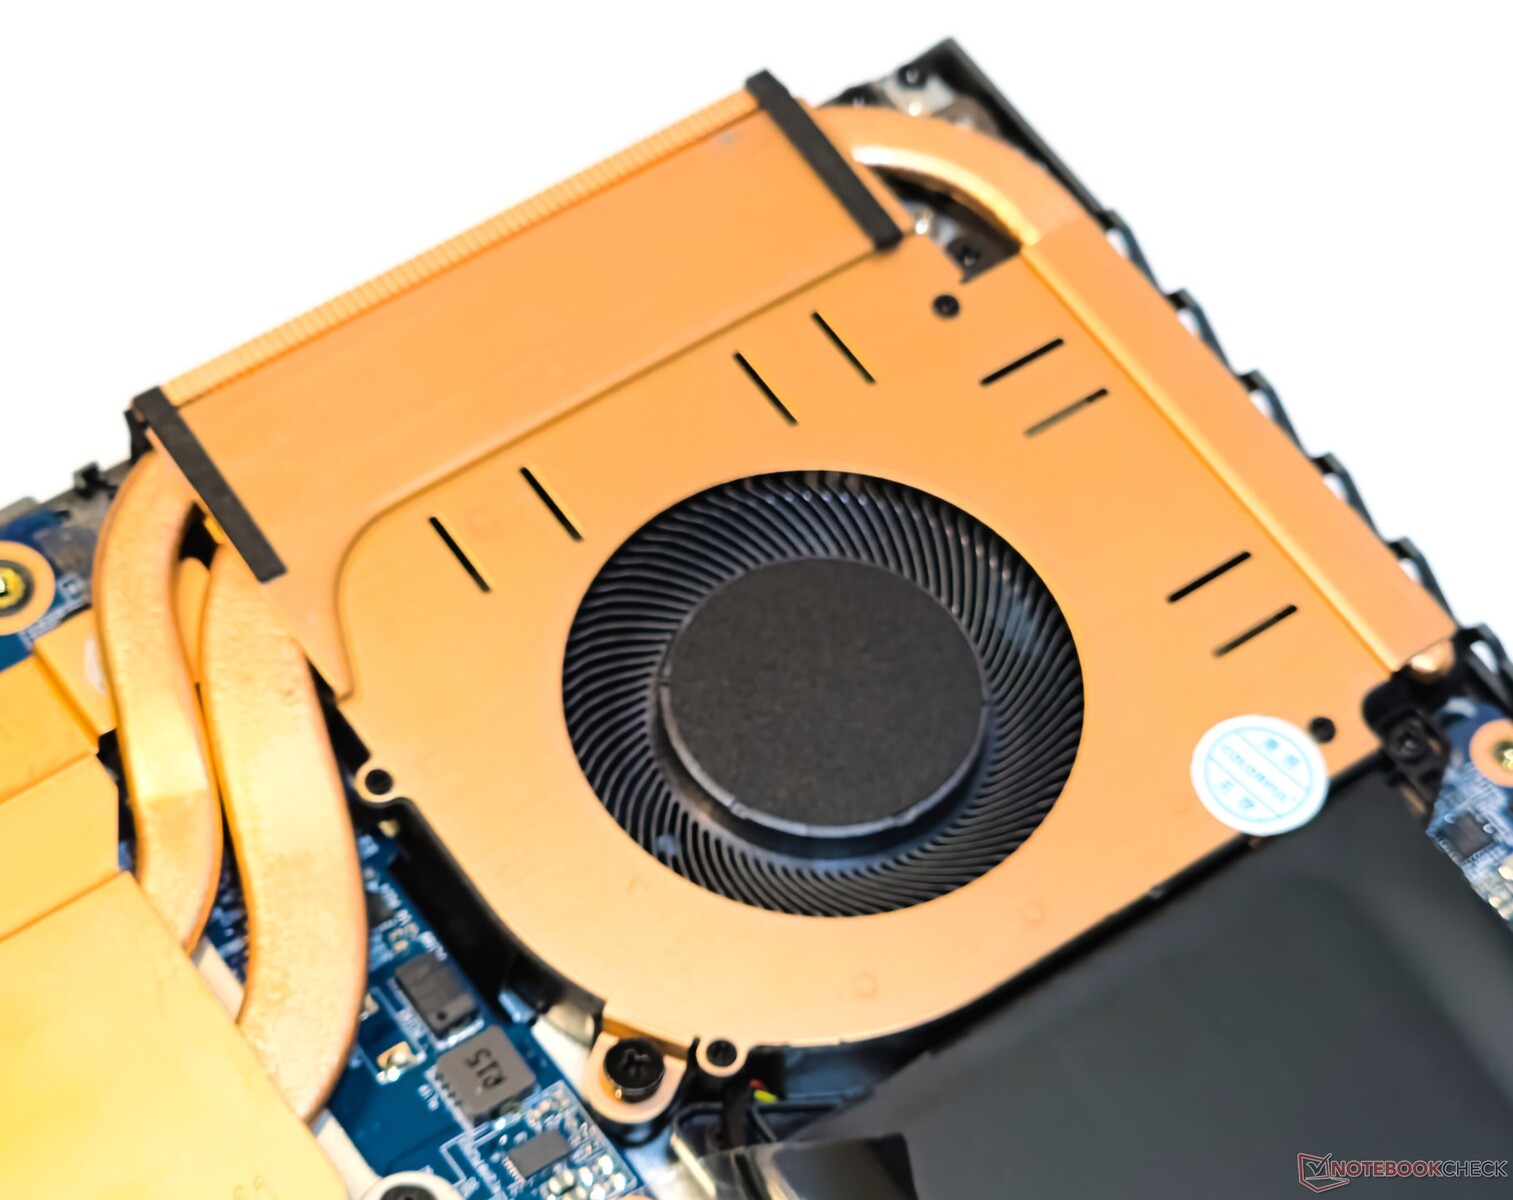
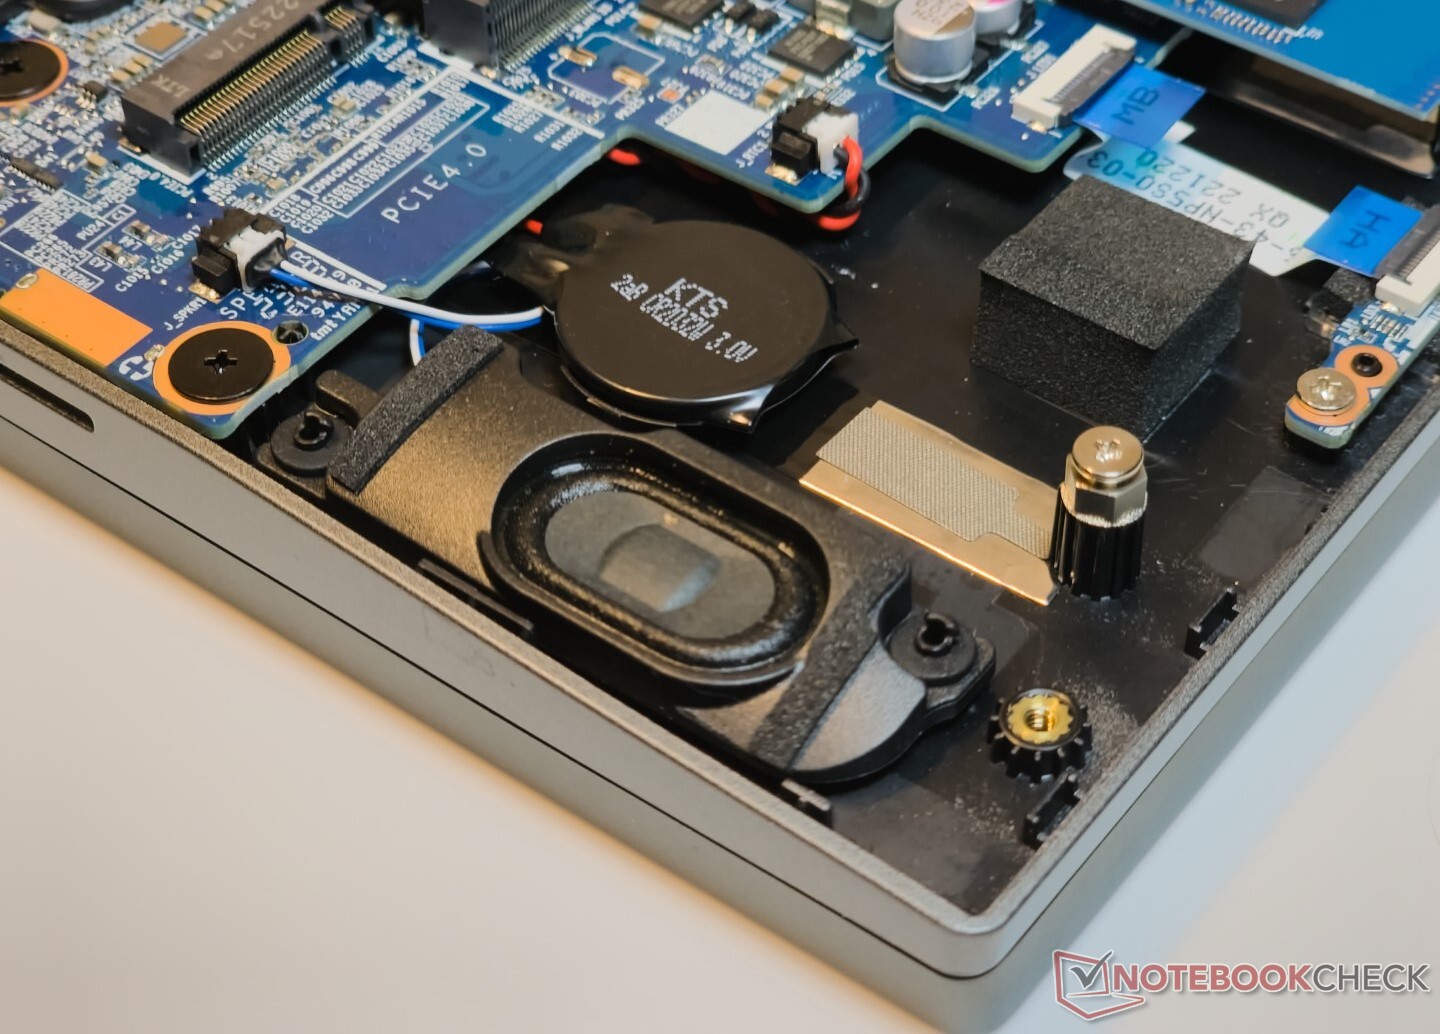
Maintenance
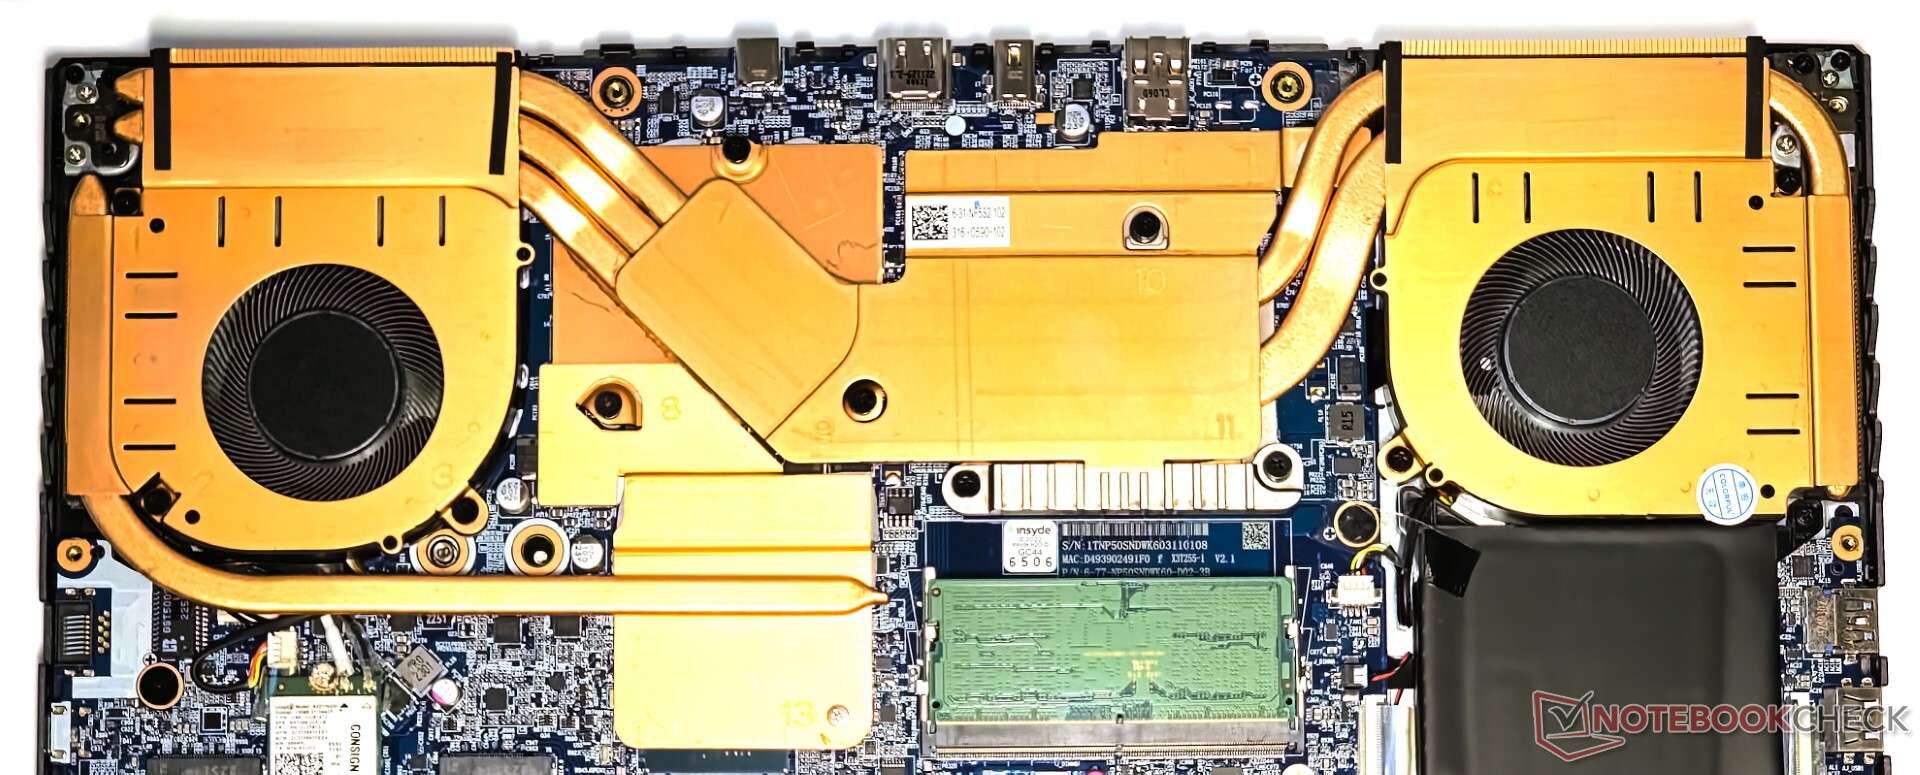
Le panneau arrière se détache facilement après avoir retiré les 13 vis PH0. L'EVOL X15 présente un agencement interne chargé ainsi qu'un système de refroidissement tout en cuivre pour le CPU et le GPU.
Notre appareil était équipé d'une seule carte DDR5-4800 de 16 Go configurée en mode bicanal. La carte WLAN, la RAM et le SSD NVMe peuvent être remplacés ou mis à niveau si nécessaire, et la batterie en forme de L peut être dévissée.

Périphériques d'entrée : Touches molles avec une tactilité décente
Clavier
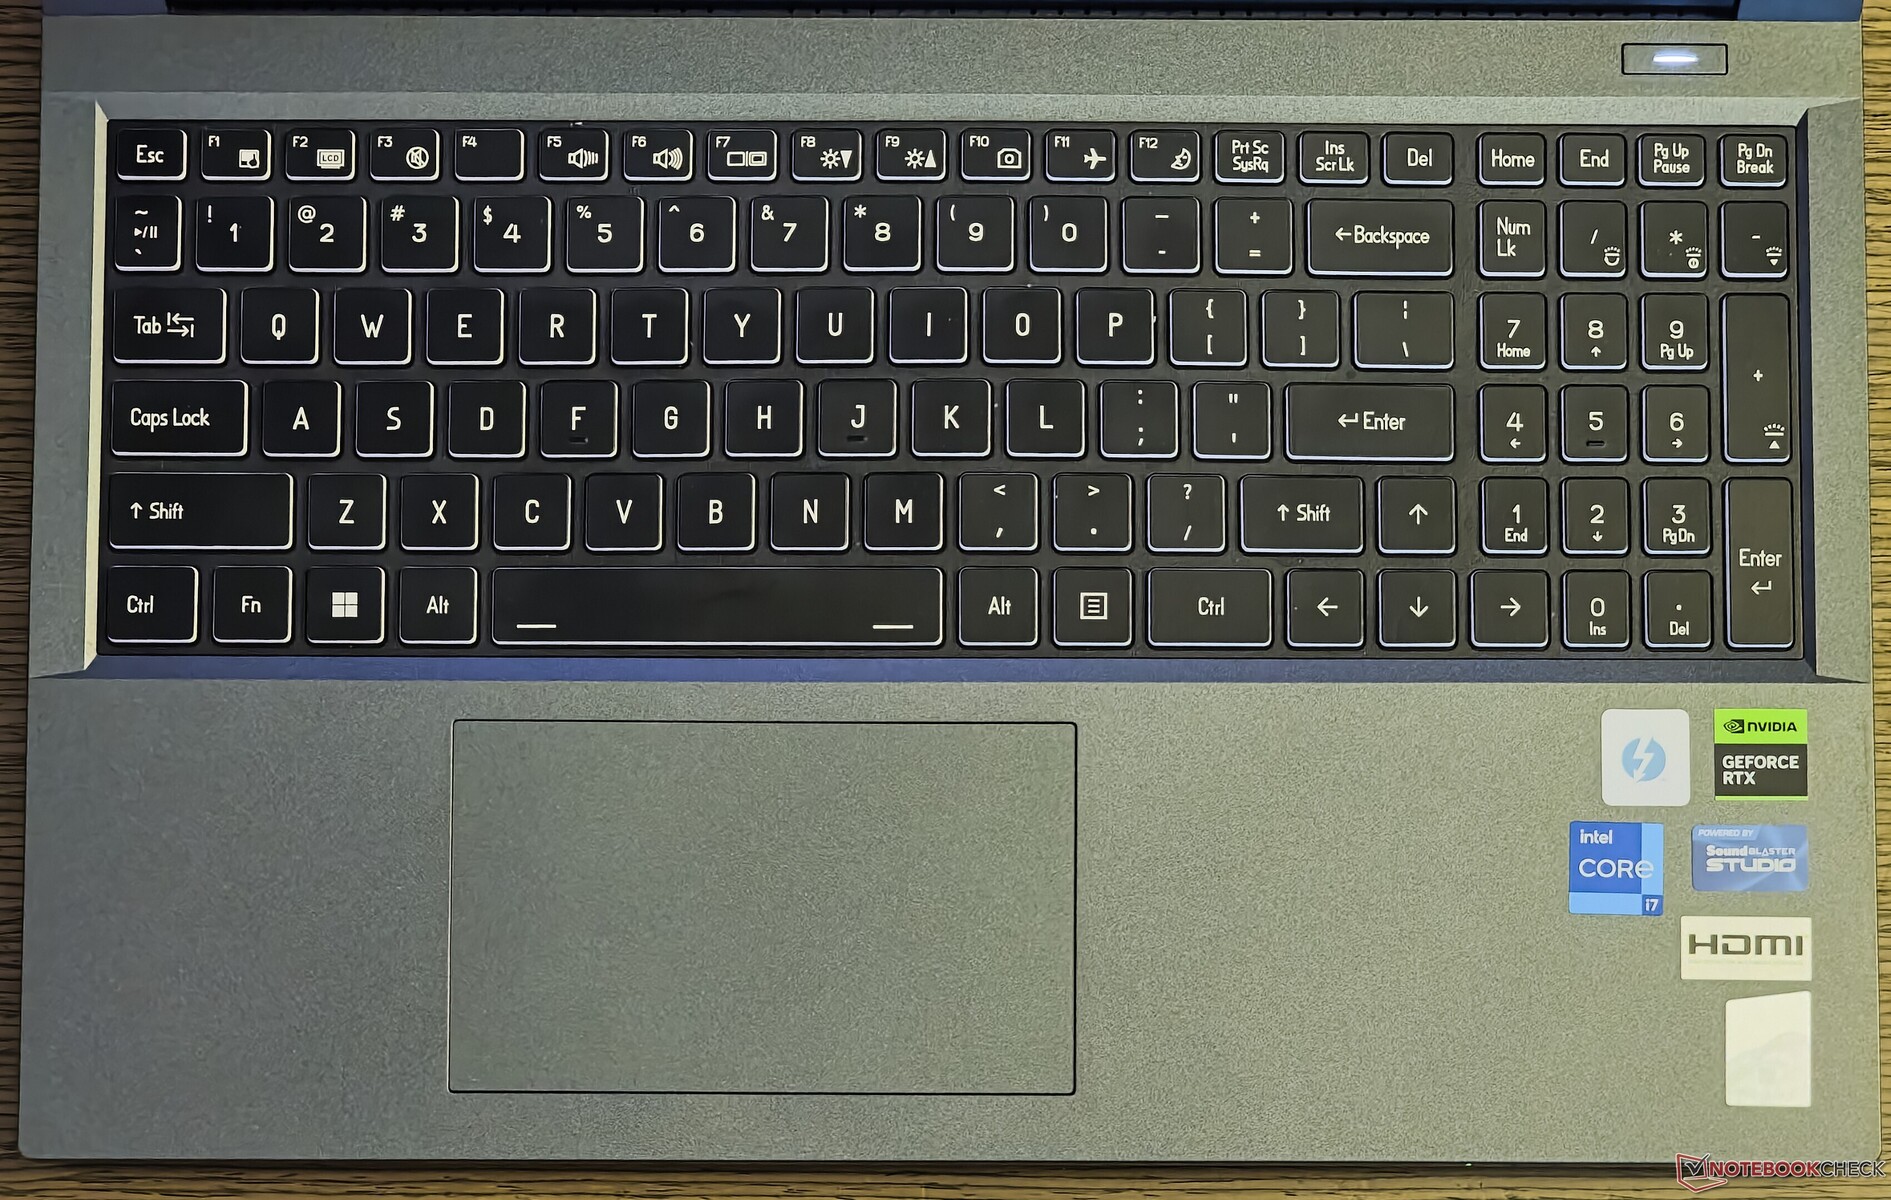
Le clavier pleine taille de l'EVOL X15 comprend un pavé numérique et un espace pour des touches fléchées de taille adéquate - une aubaine pour les titres de course. L'un des inconvénients de cette disposition est la touche Shift droite raccourcie, qui pourrait gêner les utilisateurs en transition d'un clavier d'ordinateur de bureau ou même d'ordinateur portable.
La course des touches est d'abord un peu molle, mais la tactilité est suffisante pour les jeux et la saisie. L'application Control Center de Colorful (lire Clevo) permet d'enregistrer des macros au clavier et à la souris, ce qui devrait s'avérer utile pour les joueurs de MMORPG et de MOBA.
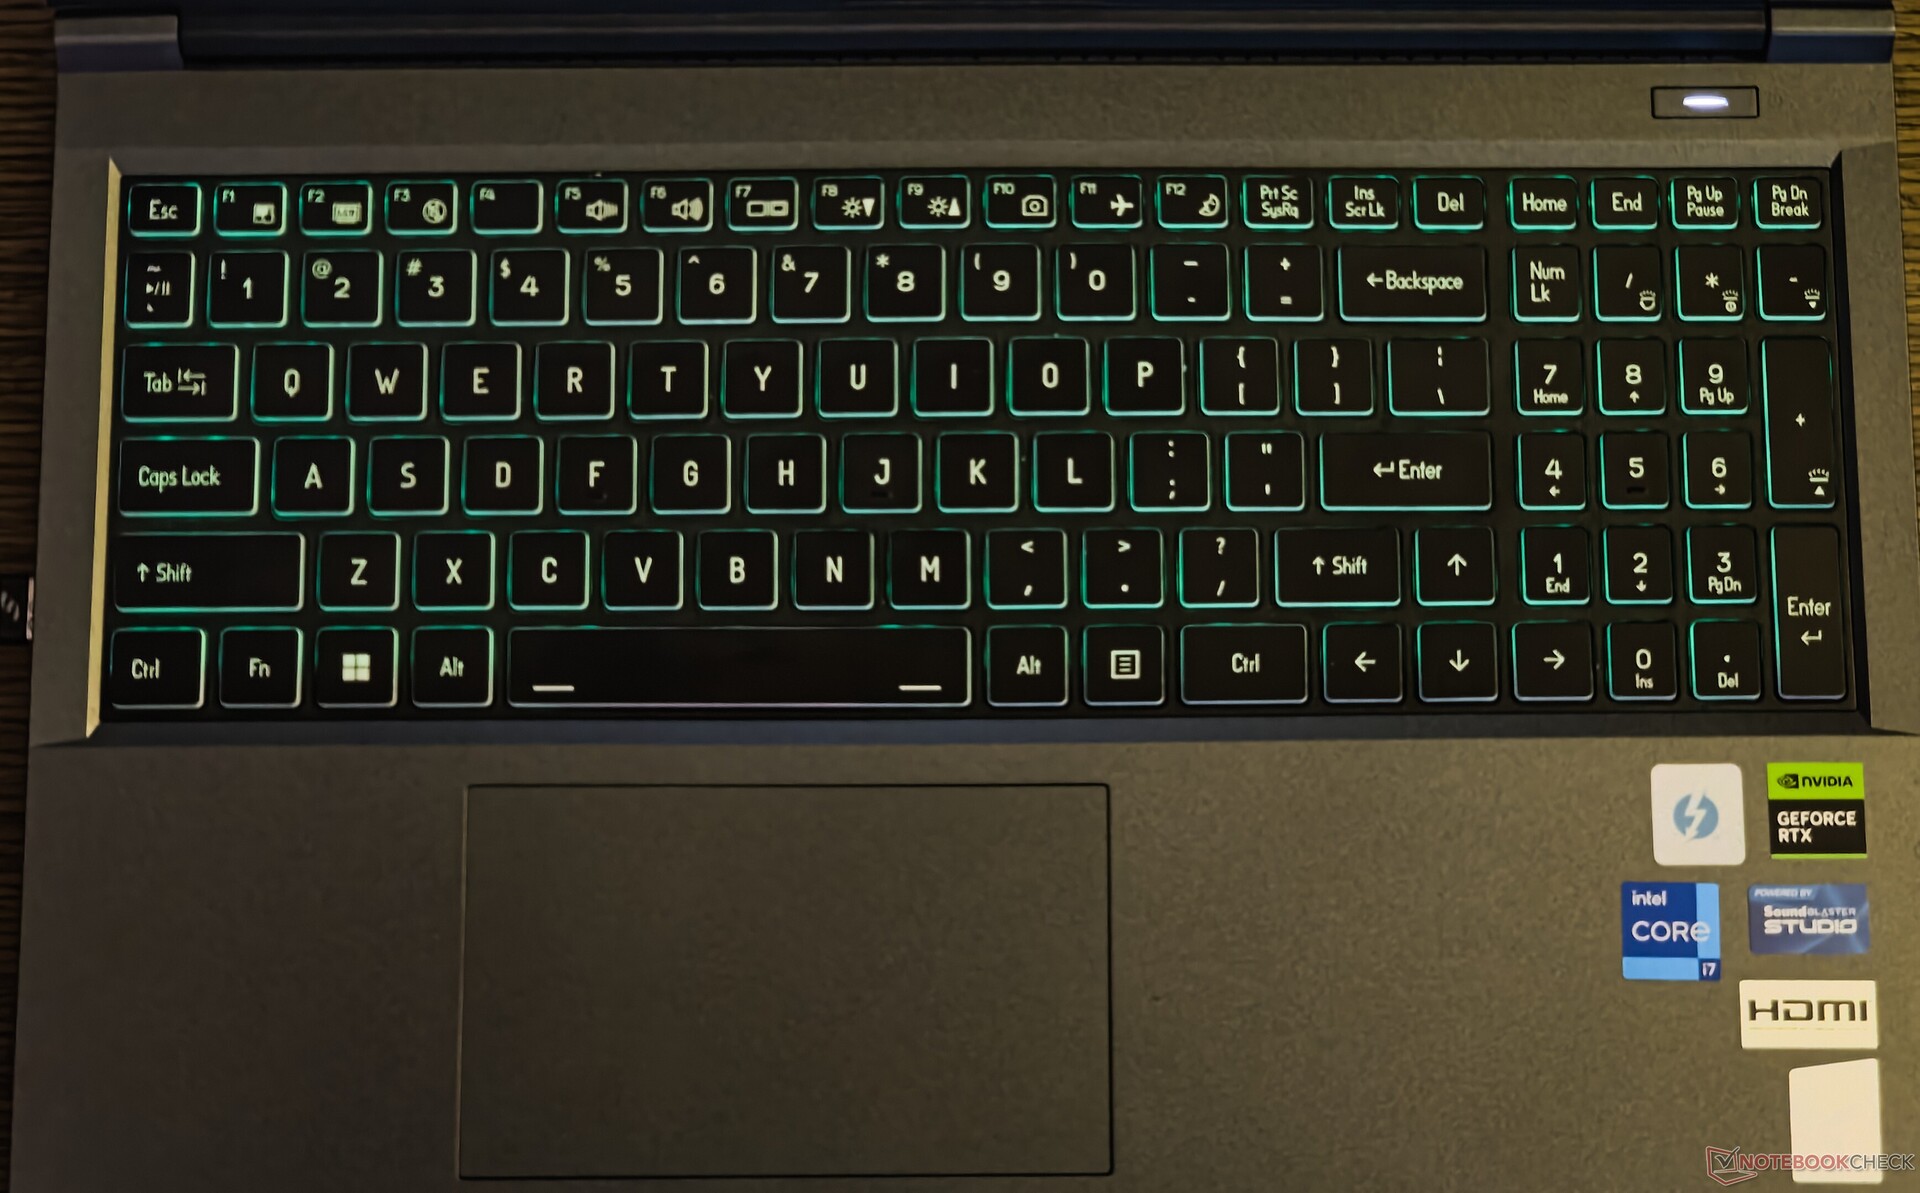
Il n'y a pas de rétroéclairage RVB multizone ou par touche, vous devrez donc vous contenter d'une palette de couleurs limitée dans l'application Control Center. Le rétroéclairage peut être réglé sur quatre niveaux, mais les touches filtrent une bonne partie de la lumière.
Pavé tactile
Le pavé tactile de 12 cm x 7 cm n'est pas le plus grand que nous ayons vu sur les ordinateurs portables de jeu cette année, mais il offre une expérience de glissement relativement fluide et prend entièrement en charge les gestes de Windows Precision.
Toute la surface du pavé tactile sert de bouton gauche de la souris. Cependant, les clics sont plus faciles et moins bruyants dans les zones centrales et inférieures du pavé tactile que dans les coins supérieurs.
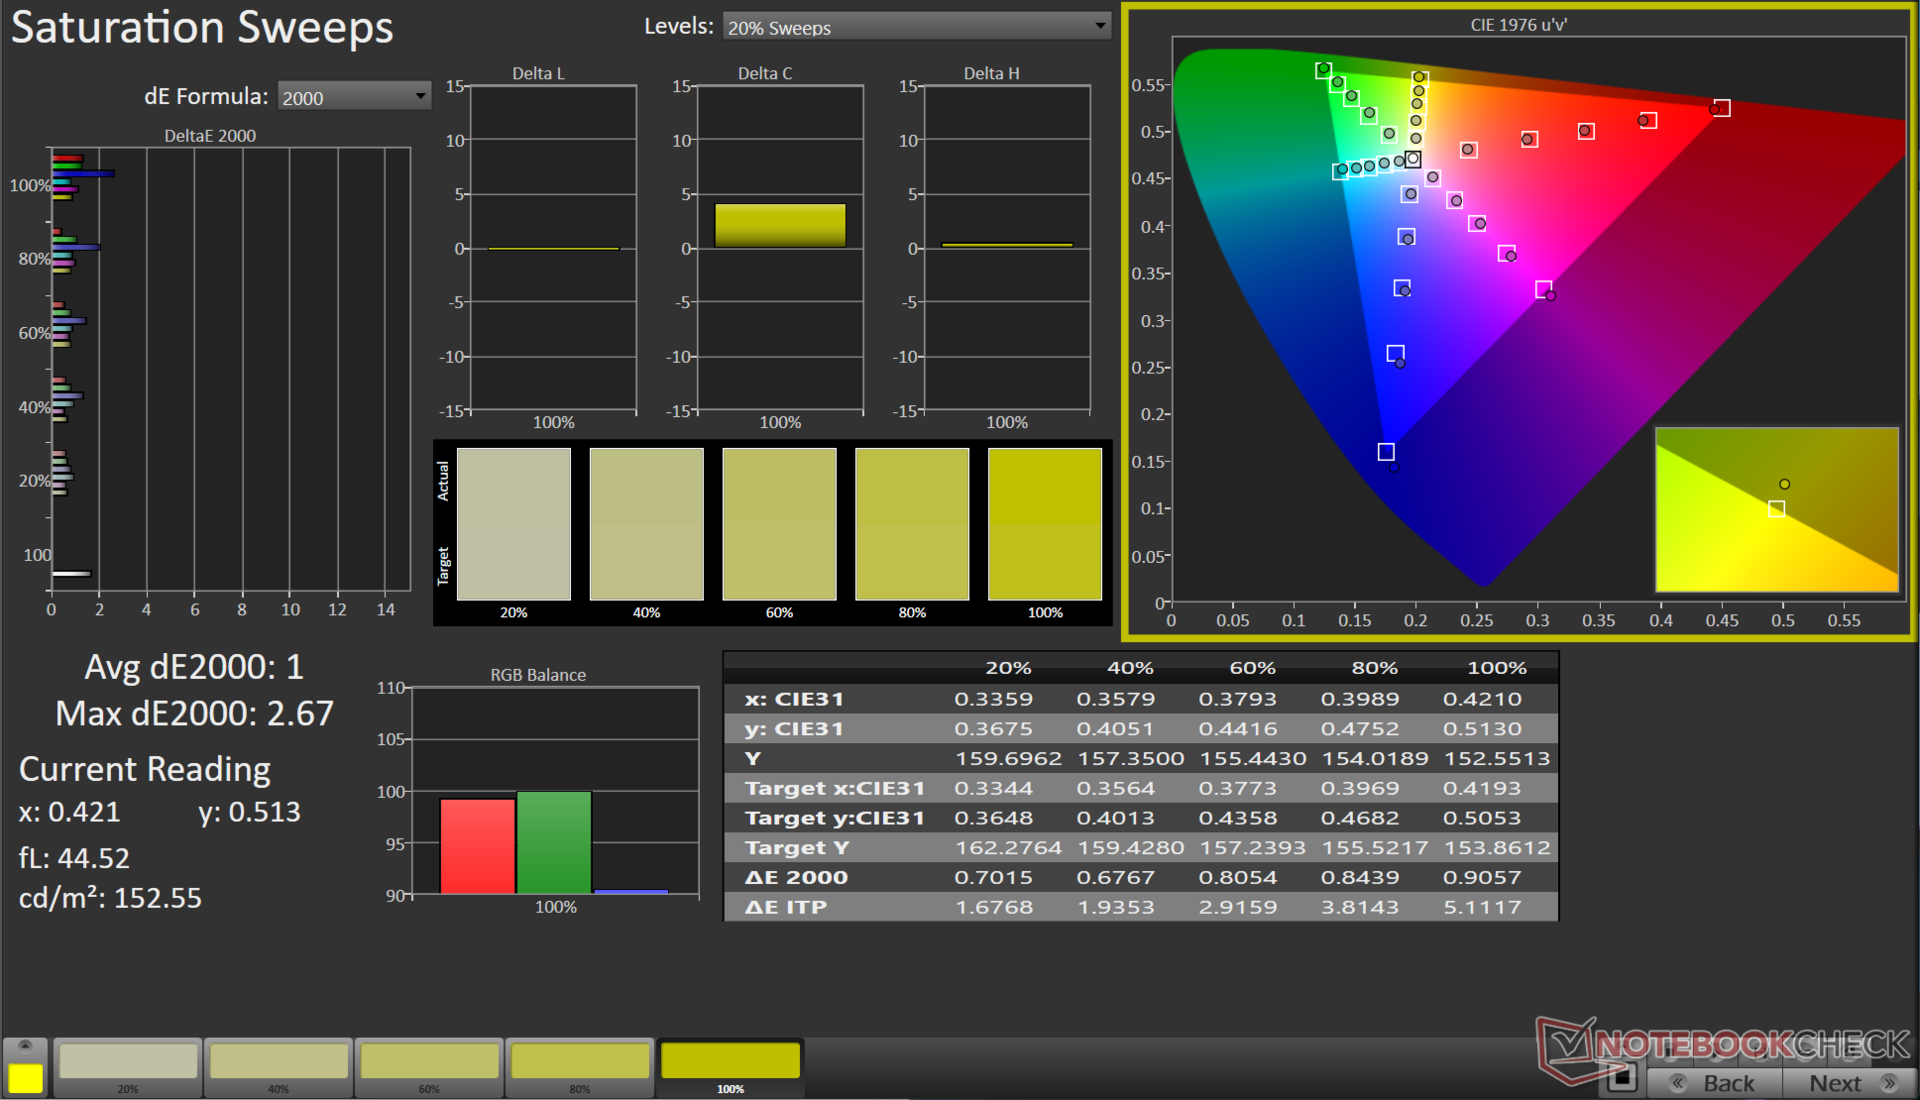
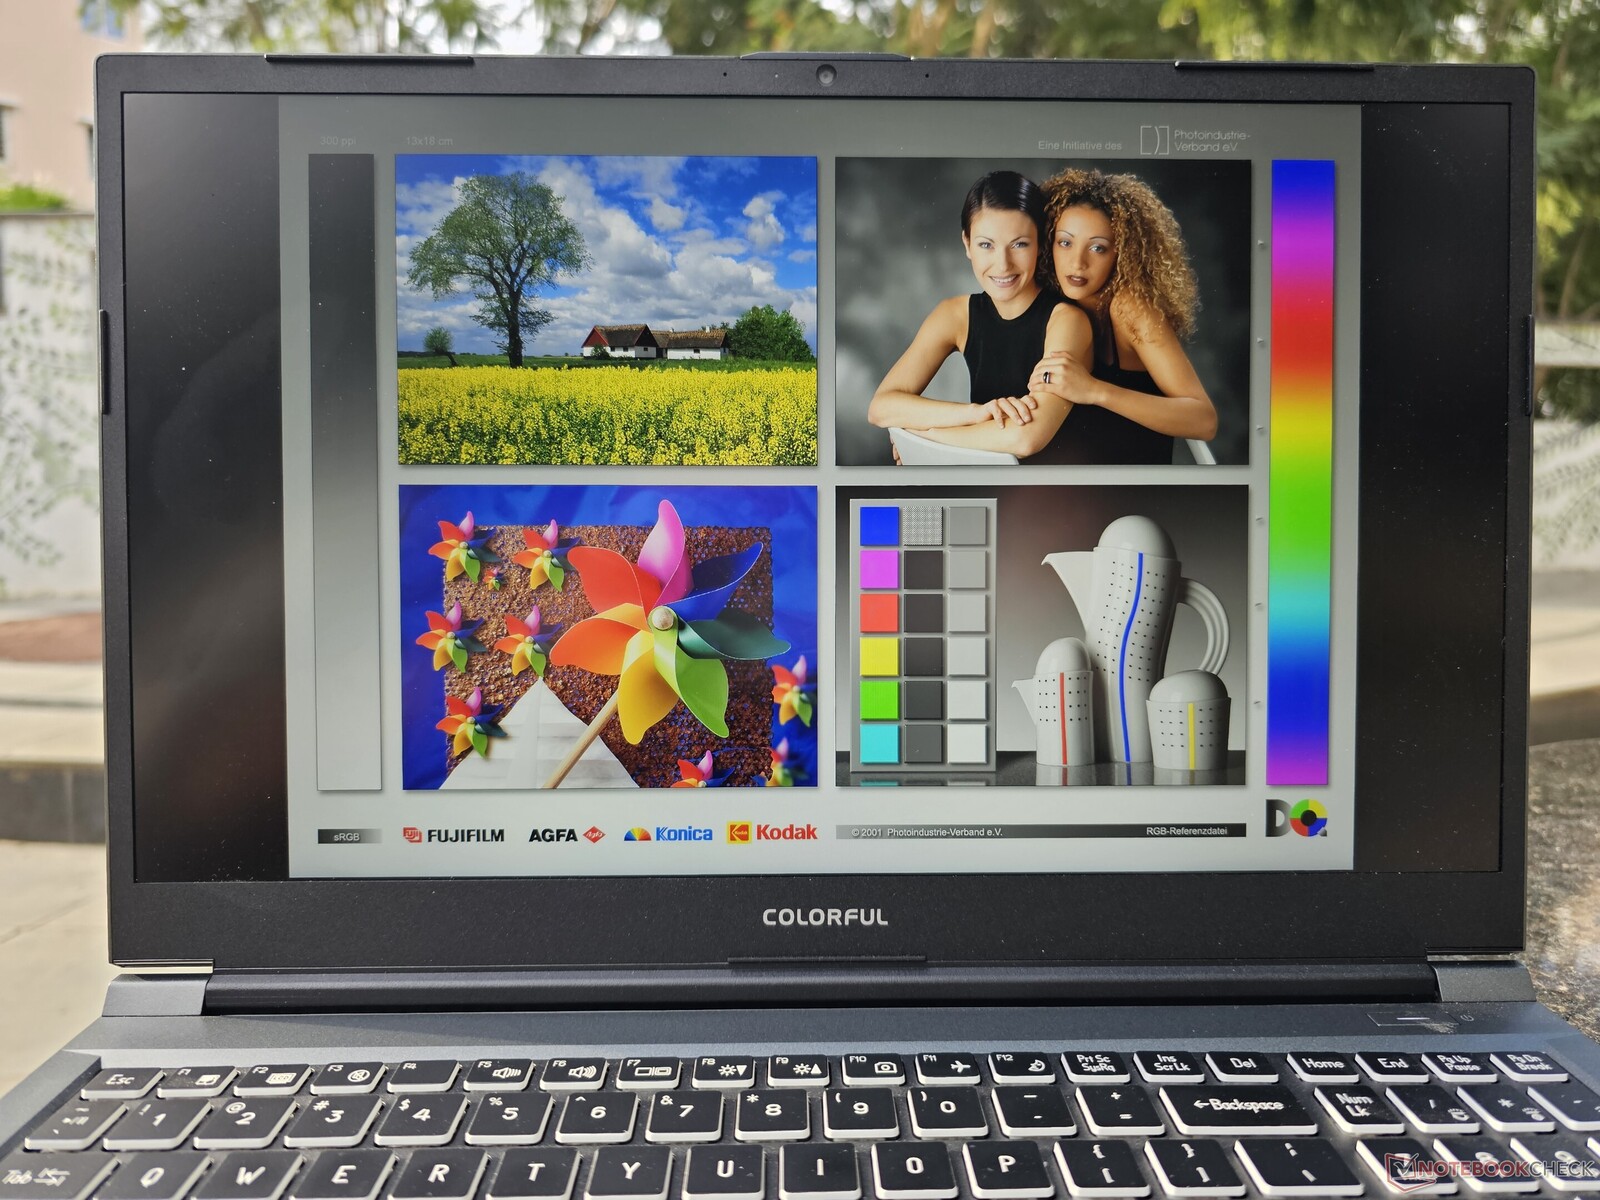
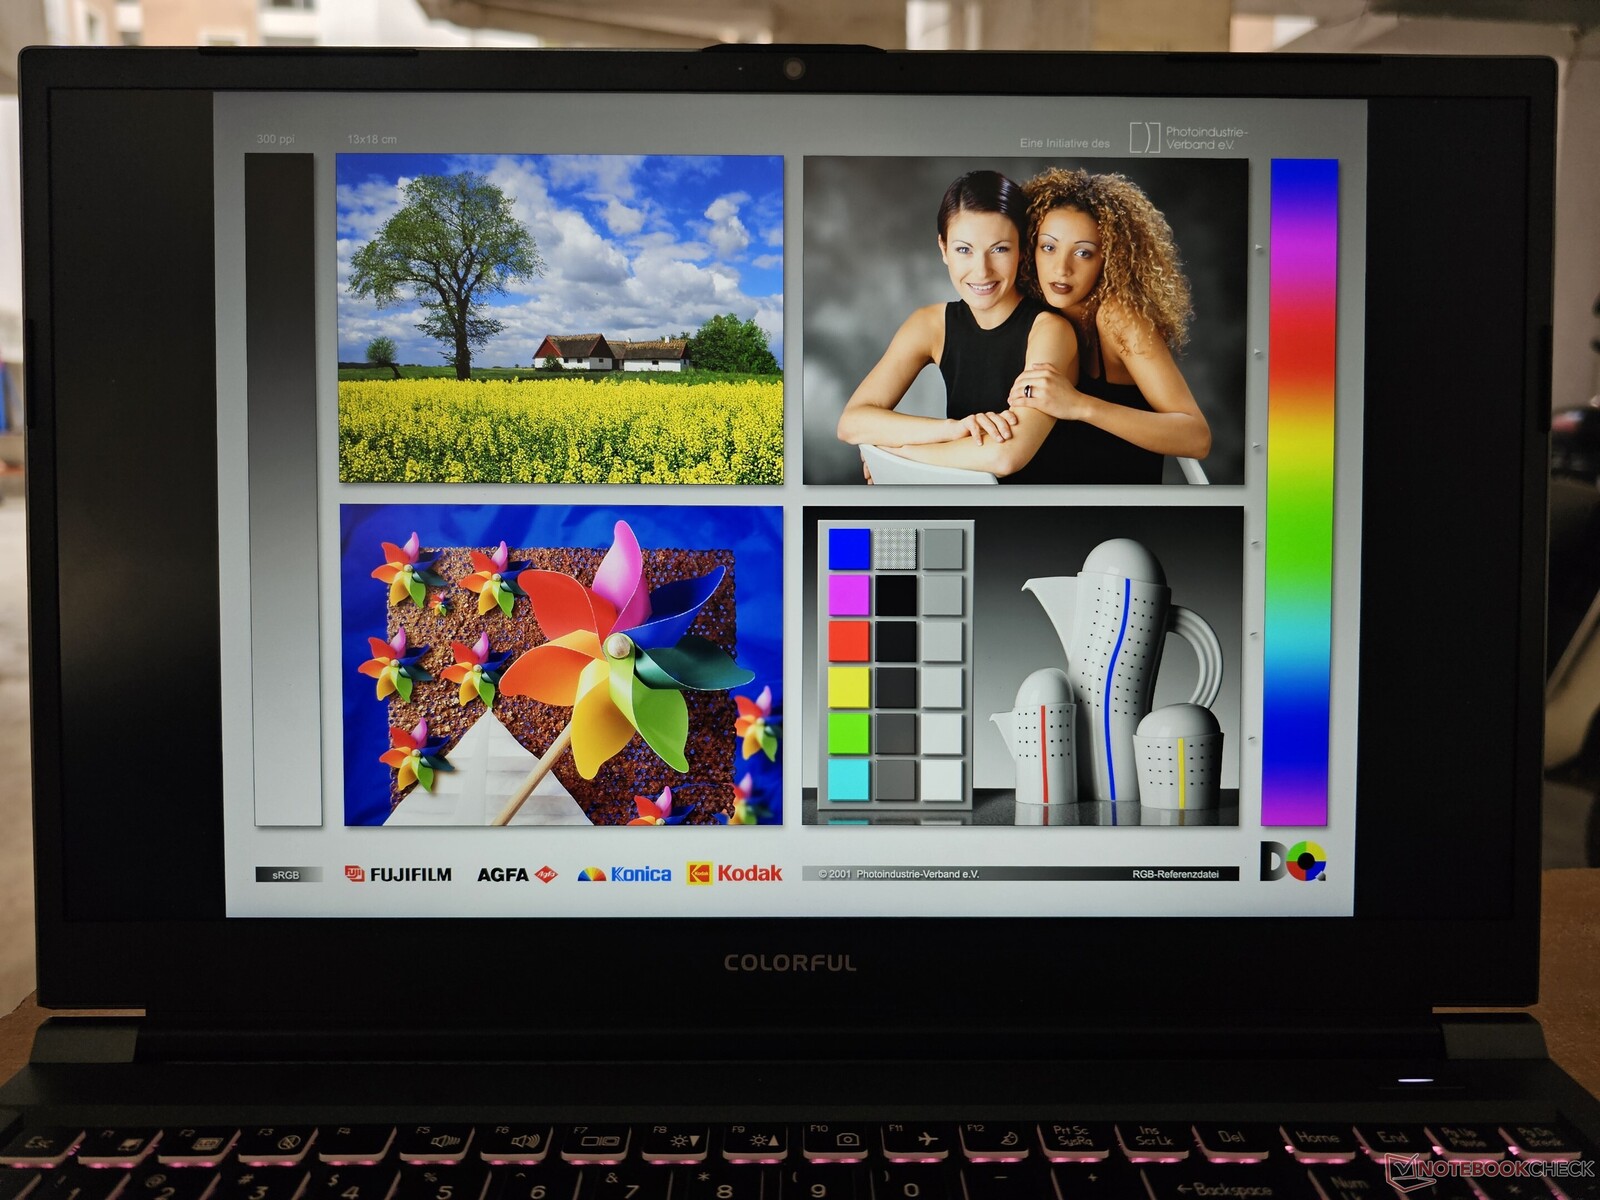
Affichage : panneau QHD 165 Hz sans PWM
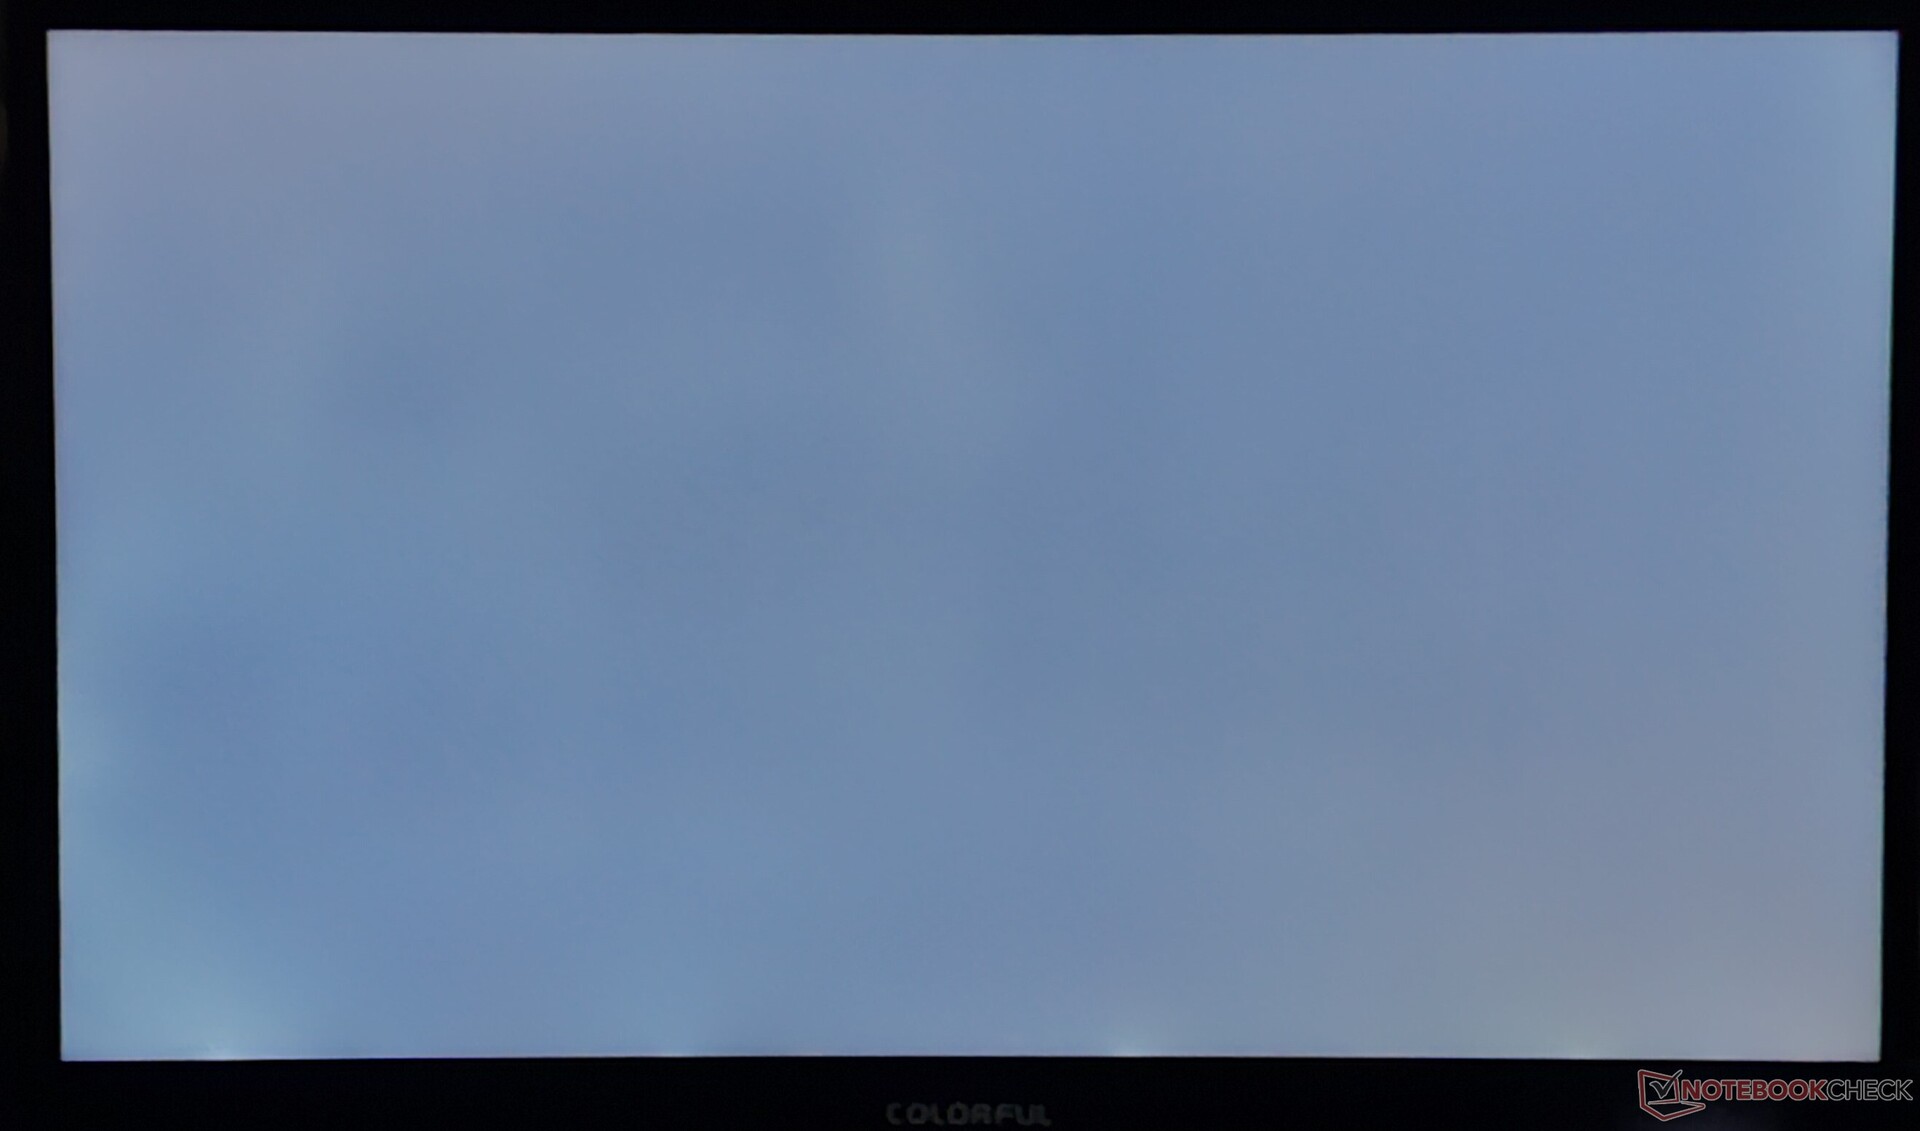
L'EVOL X15 AT est équipé d'un écran QHD 165 Hz BOE de 15,6 pouces. L'écran n'est pas vraiment impressionnant avec ses 345 nits en crête et 318 nits en moyenne, mais il est à la hauteur de la plupart des ordinateurs portables de jeu de ce prix. Les coins de l'écran ne présentent qu'un faible saignement du rétroéclairage.
Le panneau présente une distribution de luminosité décente de 81%, mais le rapport de contraste mesuré de 607:1 est un peu faible, surtout par rapport aux autres panneaux BOE de ce comparatif.

| |||||||||||||||||||||||||
Homogénéité de la luminosité: 81 %
Valeur mesurée au centre, sur batterie: 251 cd/m²
Contraste: 607:1 (Valeurs des noirs: 0.57 cd/m²)
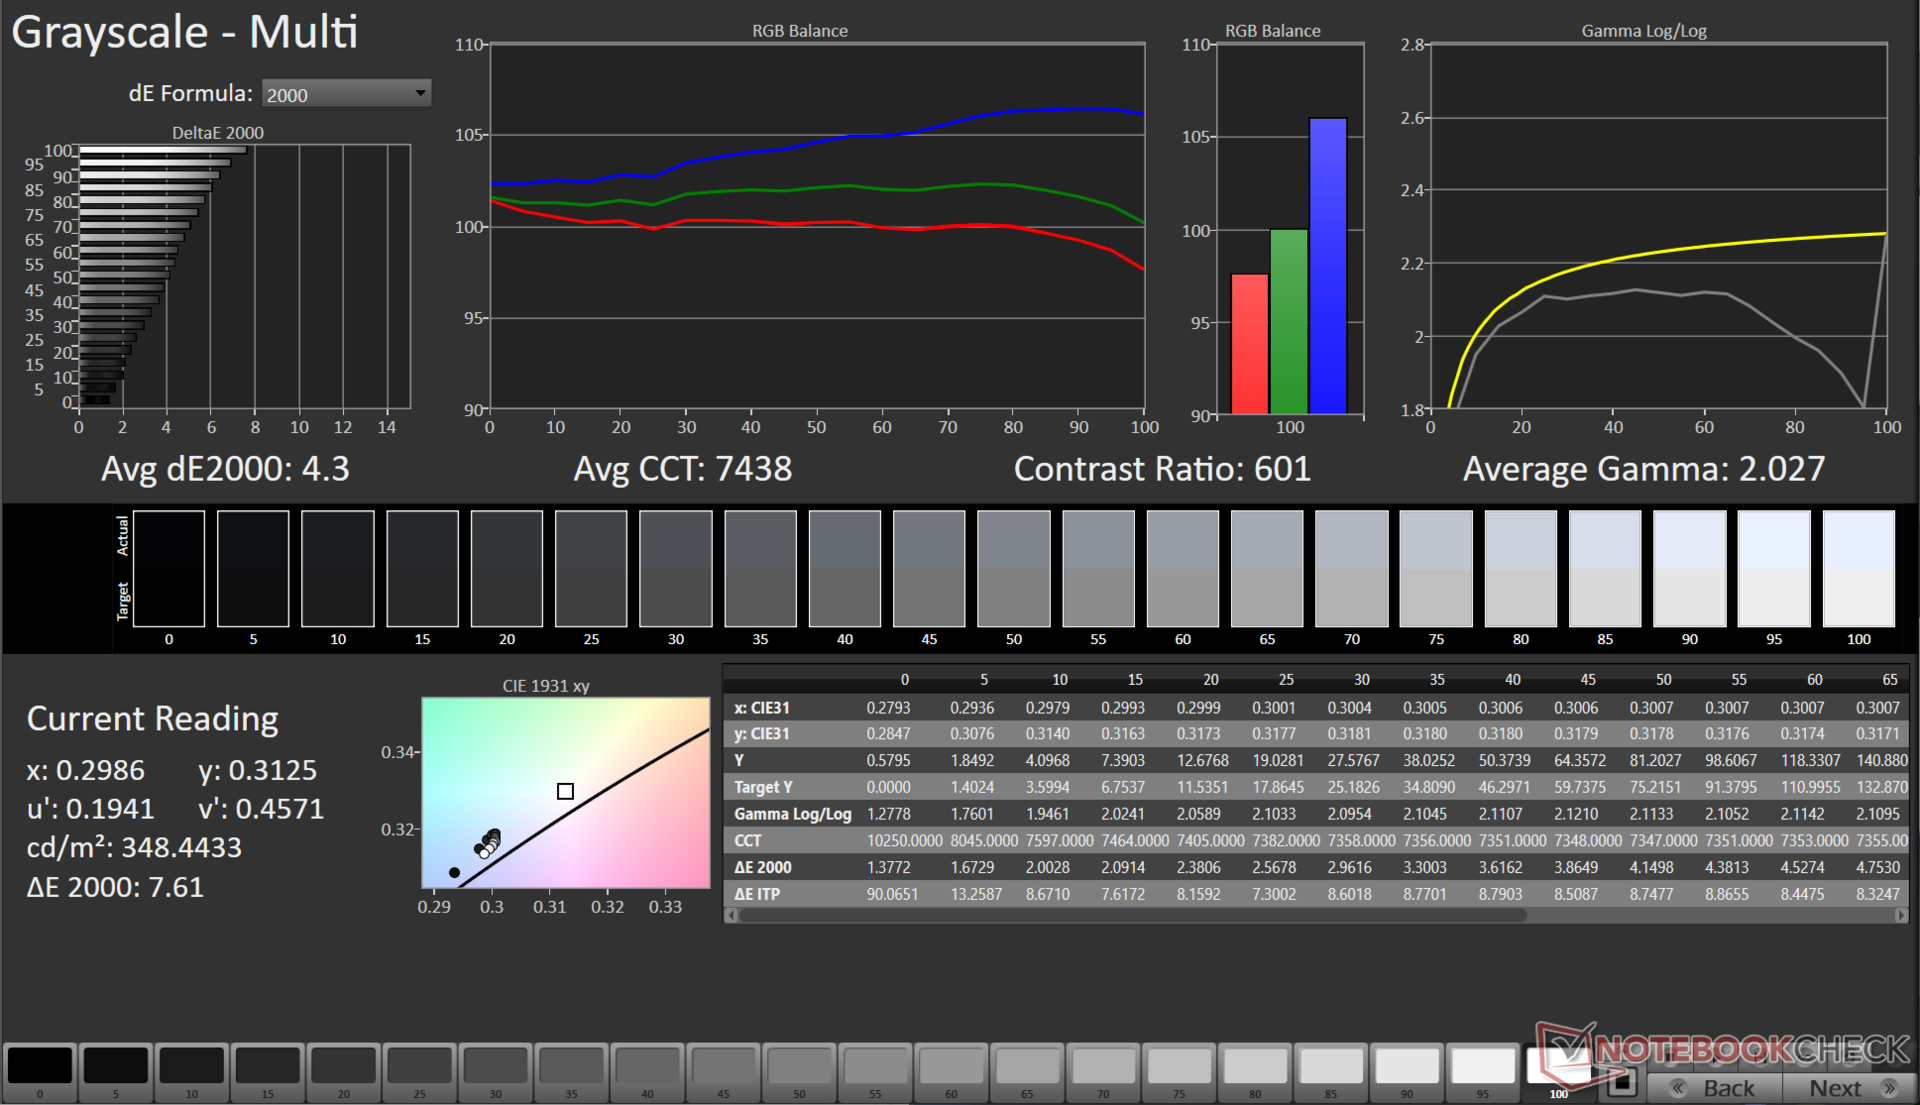
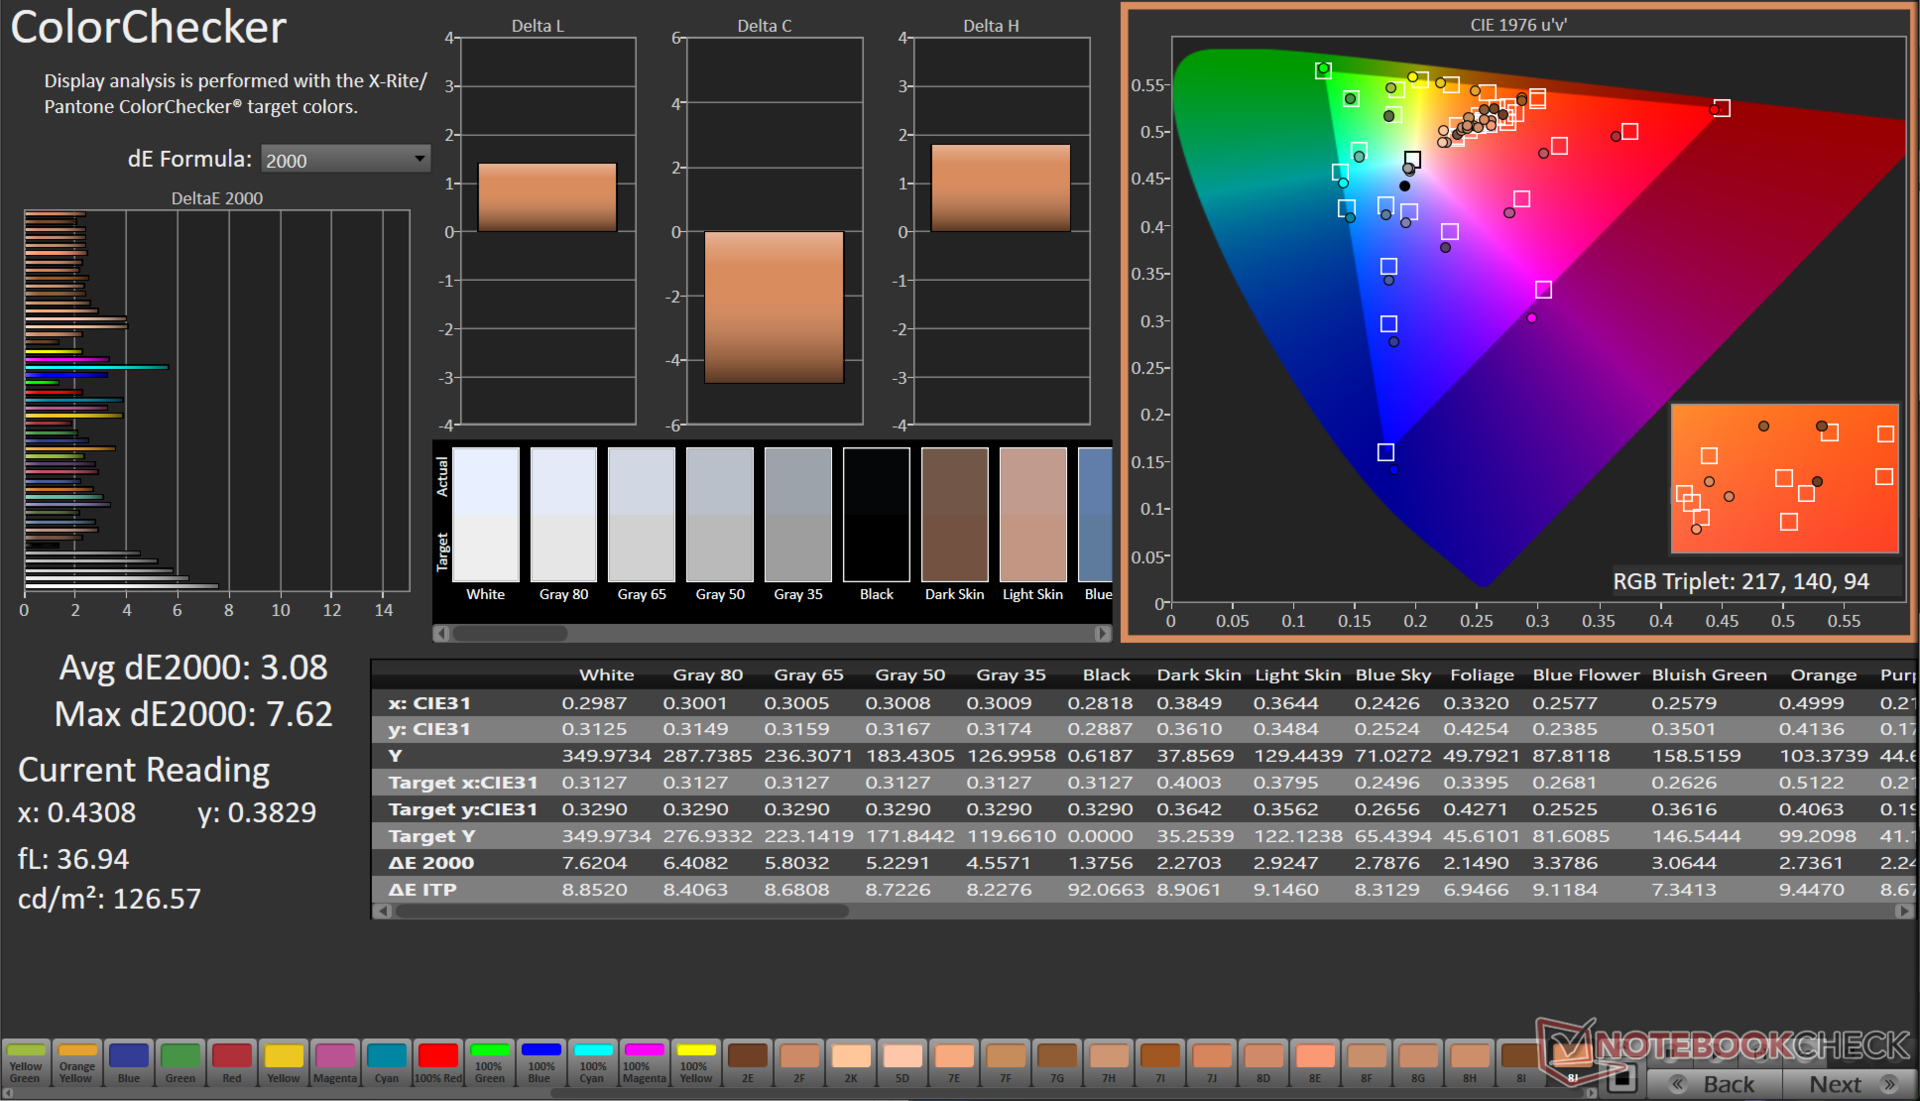
ΔE ColorChecker Calman: 3.08 | ∀{0.5-29.43 Ø4.71}
calibrated: 1.12
ΔE Greyscale Calman: 4.3 | ∀{0.09-98 Ø4.96}
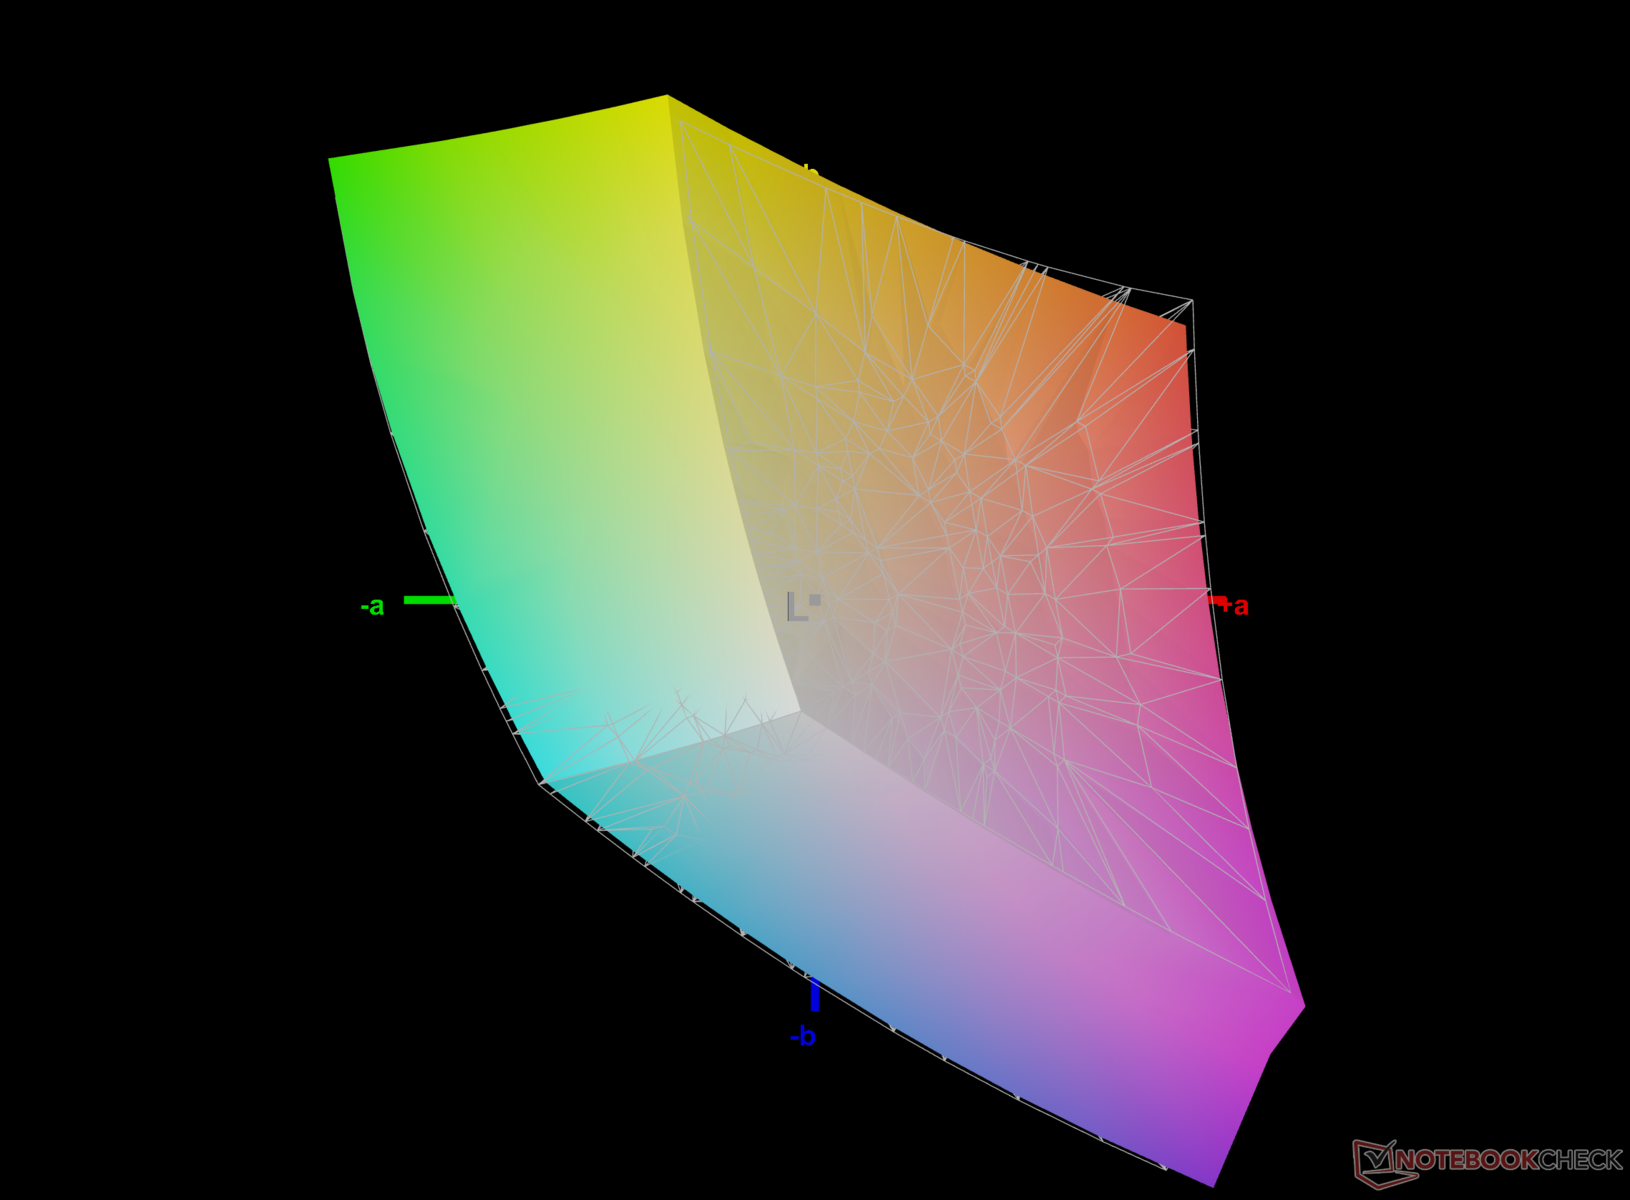
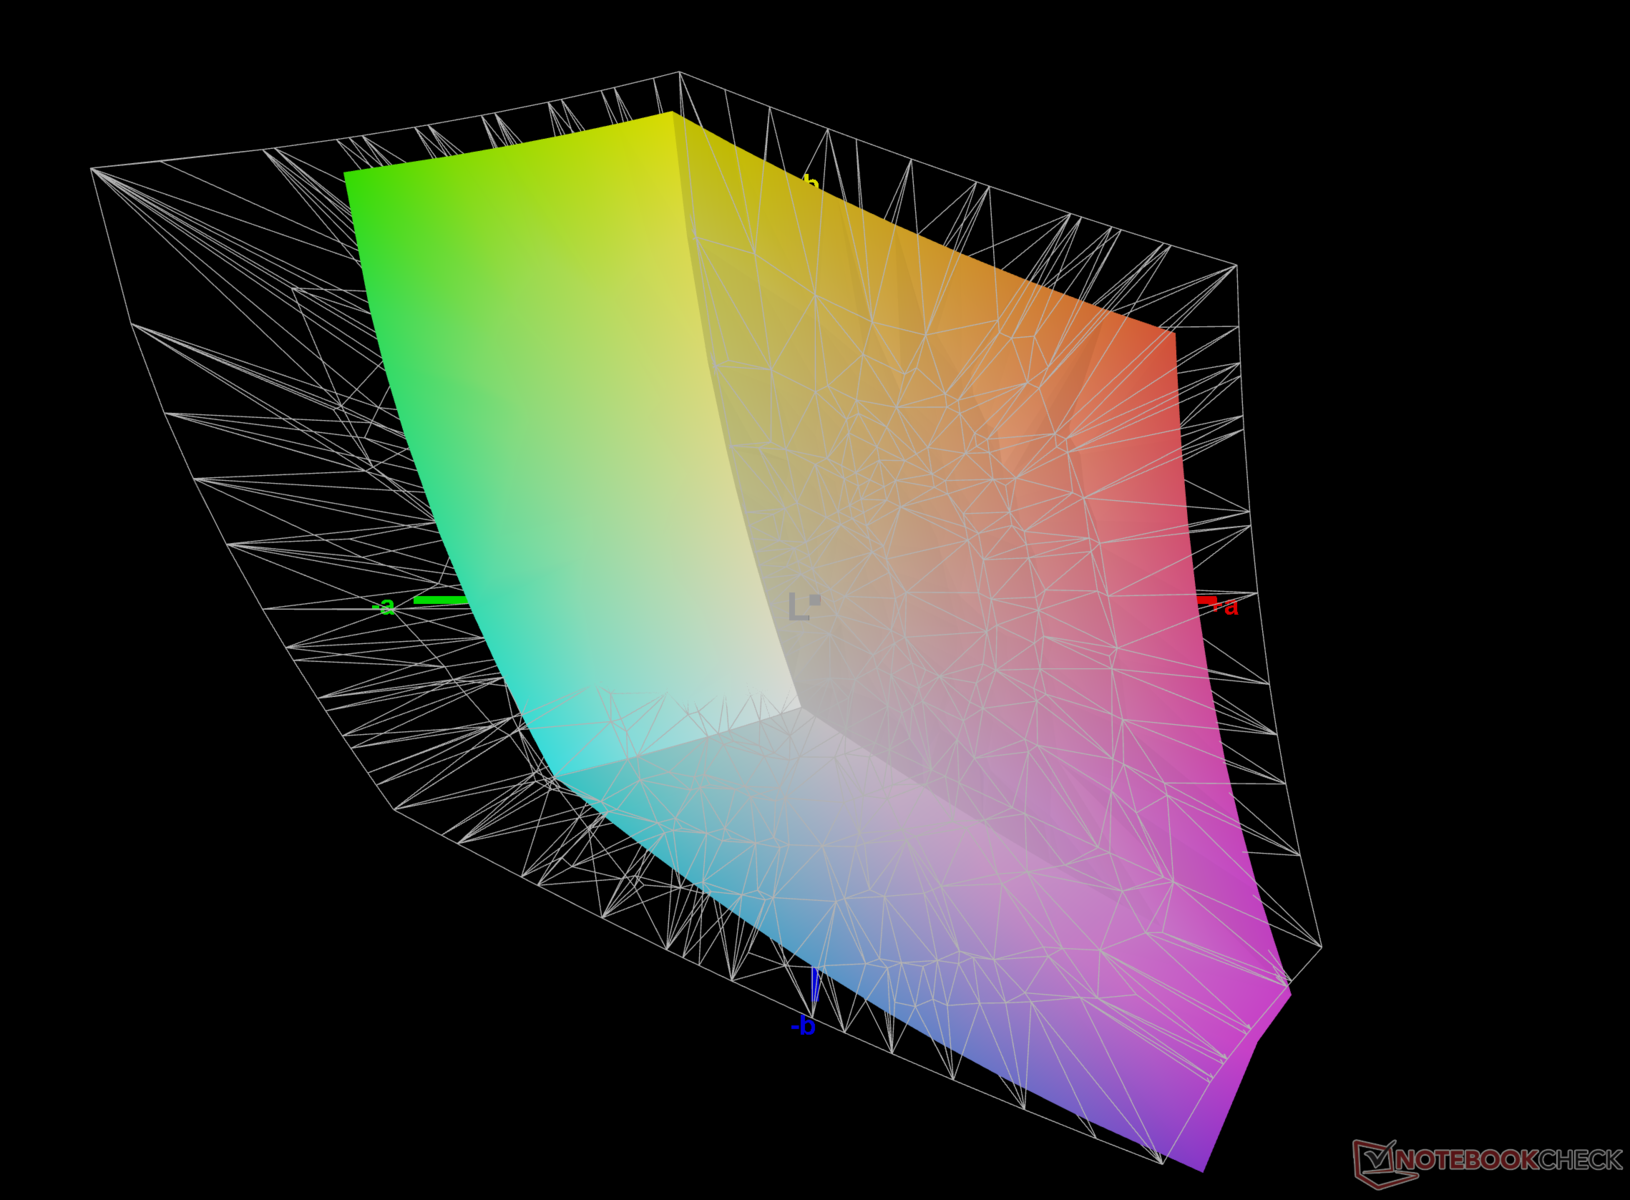
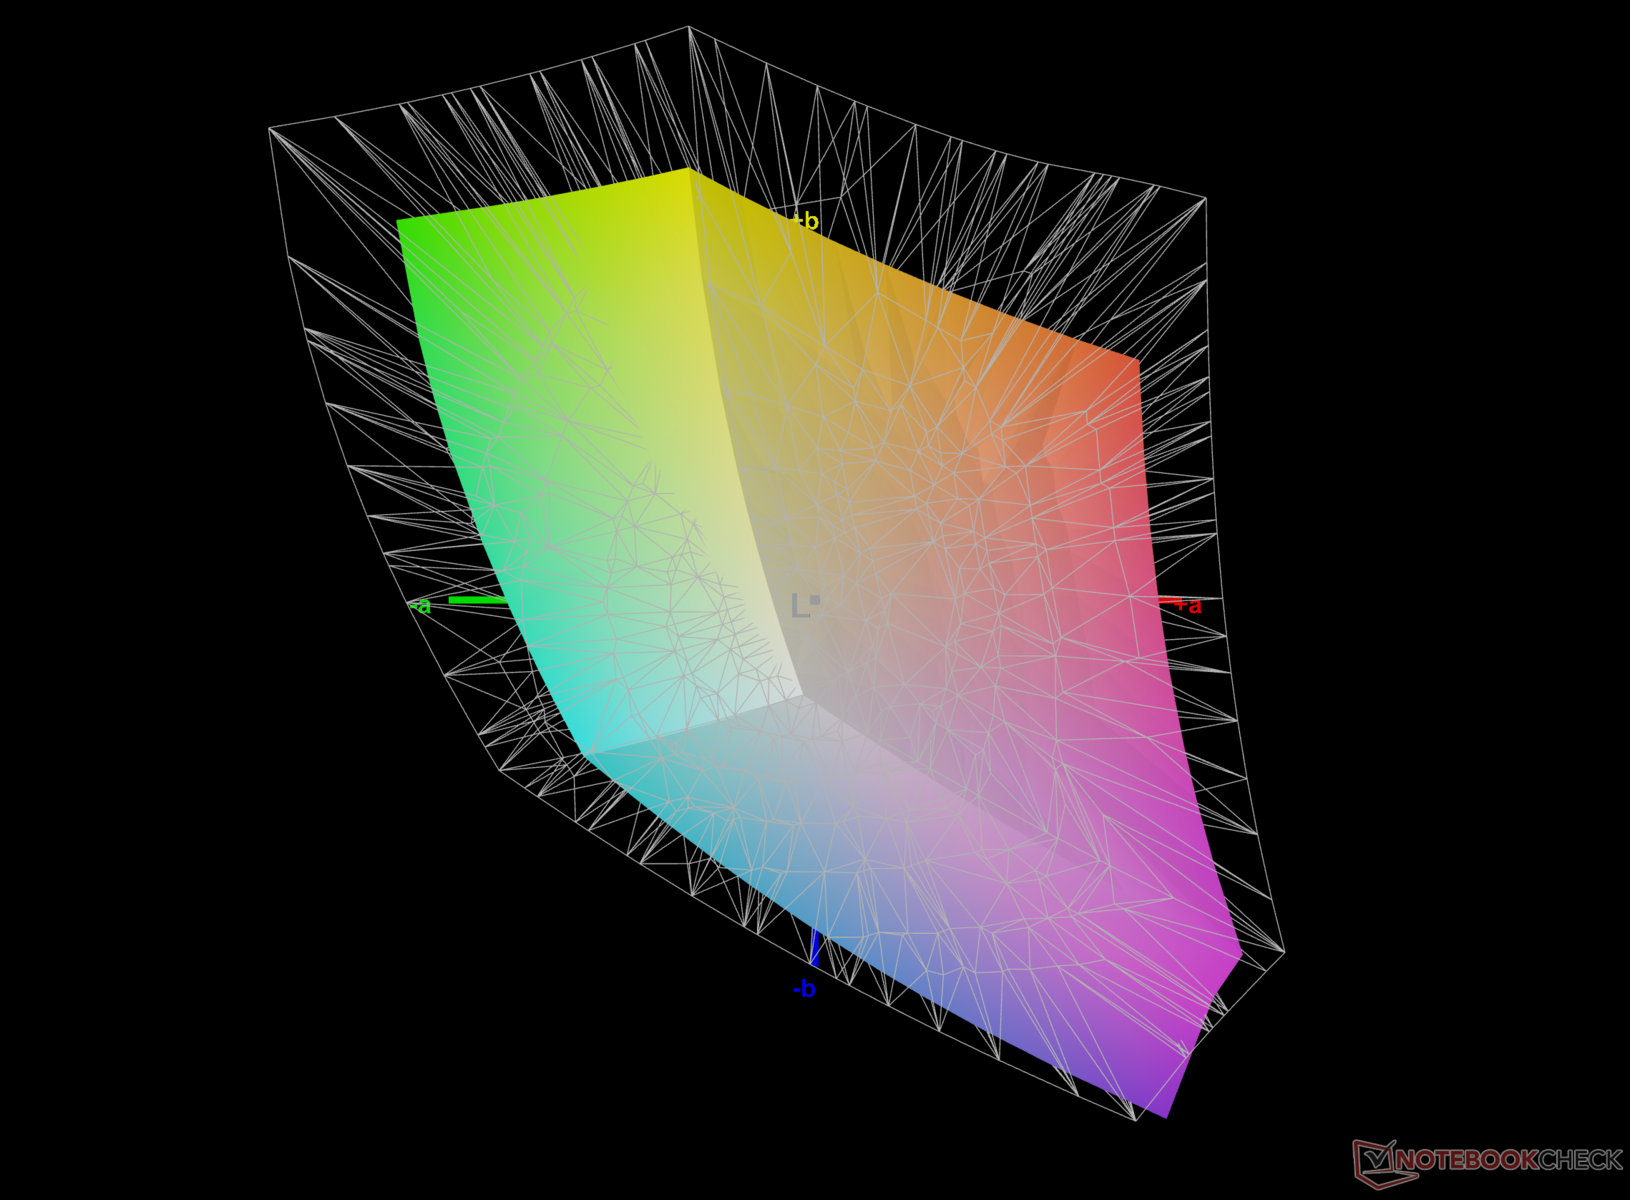
68.2% AdobeRGB 1998 (Argyll 3D)
97.4% sRGB (Argyll 3D)
66.9% Display P3 (Argyll 3D)
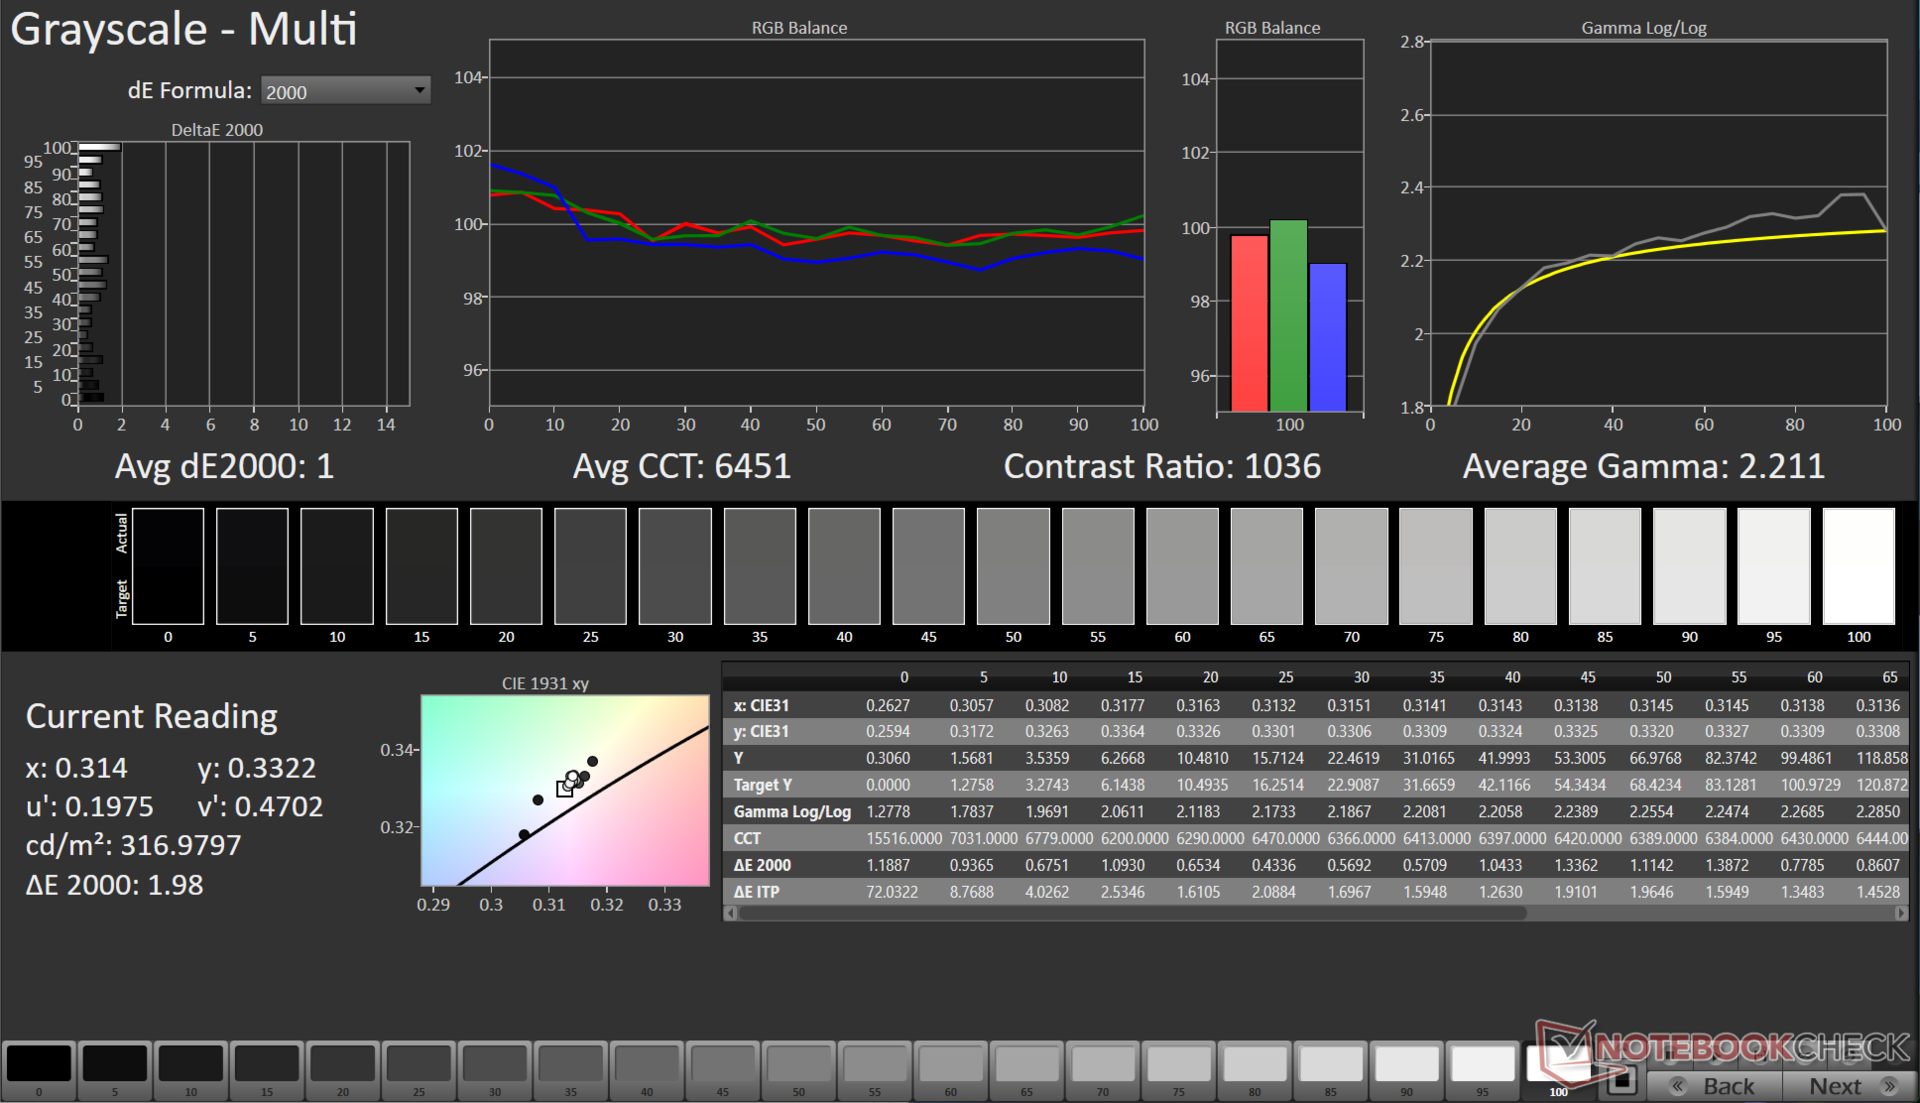
Gamma: 2.02
CCT: 7438 K
| Colorful EVOL X15 AT 23 BOE CQ NE156QHM-NY2, IPS, 2560x1440, 15.6" | Alienware m16 R1 Intel BOE NE16NYB, IPS, 2560x1600, 16" | HP Omen 16-wf000 BOE0B7D, IPS, 2560x1440, 16.1" | Acer Predator Helios 16 PH16-71-731Q BOE NE160QDM-NZ2, IPS-LED, 2560x1600, 16" | Dell G15 5530 AUO B156HAN, IPS, 1920x1080, 15.6" | Schenker XMG Pro 15 (E23) BOE0AD1, IPS, 2560x1440, 15.6" | Alienware m16 R1 AMD BOE NE16NZ4, IPS, 2560x1600, 16" | Uniwill GM6PX7X RTX 4070 BOE CQ NE160QDM-NZ1, IPS, 2560x1600, 16" | |
|---|---|---|---|---|---|---|---|---|
| Display | 1% | 3% | 24% | 6% | 25% | 27% | 0% | |
| Display P3 Coverage (%) | 66.9 | 67.7 1% | 69 3% | 97.1 45% | 73.1 9% | 97.8 46% | 98.6 47% | 67.5 1% |
| sRGB Coverage (%) | 97.4 | 97.2 0% | 99.2 2% | 100 3% | 98.4 1% | 99.9 3% | 99.9 3% | 96.4 -1% |
| AdobeRGB 1998 Coverage (%) | 68.2 | 70 3% | 71.2 4% | 84.7 24% | 74.4 9% | 85.4 25% | 88.9 30% | 68.6 1% |
| Response Times | 35% | 16% | -7% | 49% | -29% | 18% | -23% | |
| Response Time Grey 50% / Grey 80% * (ms) | 10.42 ? | 4 ? 62% | 4.6 ? 56% | 13.6 ? -31% | 3.39 ? 67% | 14 ? -34% | 5.1 ? 51% | 12.6 ? -21% |
| Response Time Black / White * (ms) | 7.81 ? | 7.3 ? 7% | 9.7 ? -24% | 6.4 ? 18% | 5.35 ? 31% | 9.6 ? -23% | 9 ? -15% | 9.8 ? -25% |
| PWM Frequency (Hz) | 21620 ? | |||||||
| Screen | 24% | 28% | 42% | 7% | 12% | 0% | 22% | |
| Brightness middle (cd/m²) | 346 | 306 -12% | 310.9 -10% | 511 48% | 320 -8% | 322 -7% | 329 -5% | 338.6 -2% |
| Brightness (cd/m²) | 318 | 302 -5% | 296 -7% | 498 57% | 316 -1% | 301 -5% | 317 0% | 328 3% |
| Brightness Distribution (%) | 81 | 89 10% | 91 12% | 94 16% | 94 16% | 85 5% | 89 10% | 89 10% |
| Black Level * (cd/m²) | 0.57 | 0.3 47% | 0.35 39% | 0.36 37% | 0.21 63% | 0.36 37% | 0.32 44% | 0.32 44% |
| Contrast (:1) | 607 | 1020 68% | 888 46% | 1419 134% | 1524 151% | 894 47% | 1028 69% | 1058 74% |
| Colorchecker dE 2000 * | 3.08 | 2.57 17% | 2.18 29% | 1.76 43% | 4.55 -48% | 1.98 36% | 3.71 -20% | 2.18 29% |
| Colorchecker dE 2000 max. * | 7.62 | 4.26 44% | 3.58 53% | 3.7 51% | 9.83 -29% | 5.24 31% | 7.23 5% | 7.14 6% |
| Colorchecker dE 2000 calibrated * | 1.12 | 0.85 24% | 0.52 54% | 1.56 -39% | 1.51 -35% | 1.98 -77% | 2.82 -152% | 0.93 17% |
| Greyscale dE 2000 * | 4.3 | 3.3 23% | 2.8 35% | 3 30% | 6.2 -44% | 2.44 43% | 2.2 49% | 3.7 14% |
| Gamma | 2.02 109% | 1.997 110% | 2.18 101% | 2.33 94% | 2.07 106% | 2.42 91% | 2.3 96% | 2.18 101% |
| CCT | 7438 87% | 6895 94% | 6002 108% | 6341 103% | 6479 100% | 6984 93% | 6270 104% | 7245 90% |
| Moyenne finale (programmes/paramètres) | 20% /
21% | 16% /
21% | 20% /
31% | 21% /
13% | 3% /
9% | 15% /
8% | -0% /
11% |
* ... Moindre est la valeur, meilleures sont les performances
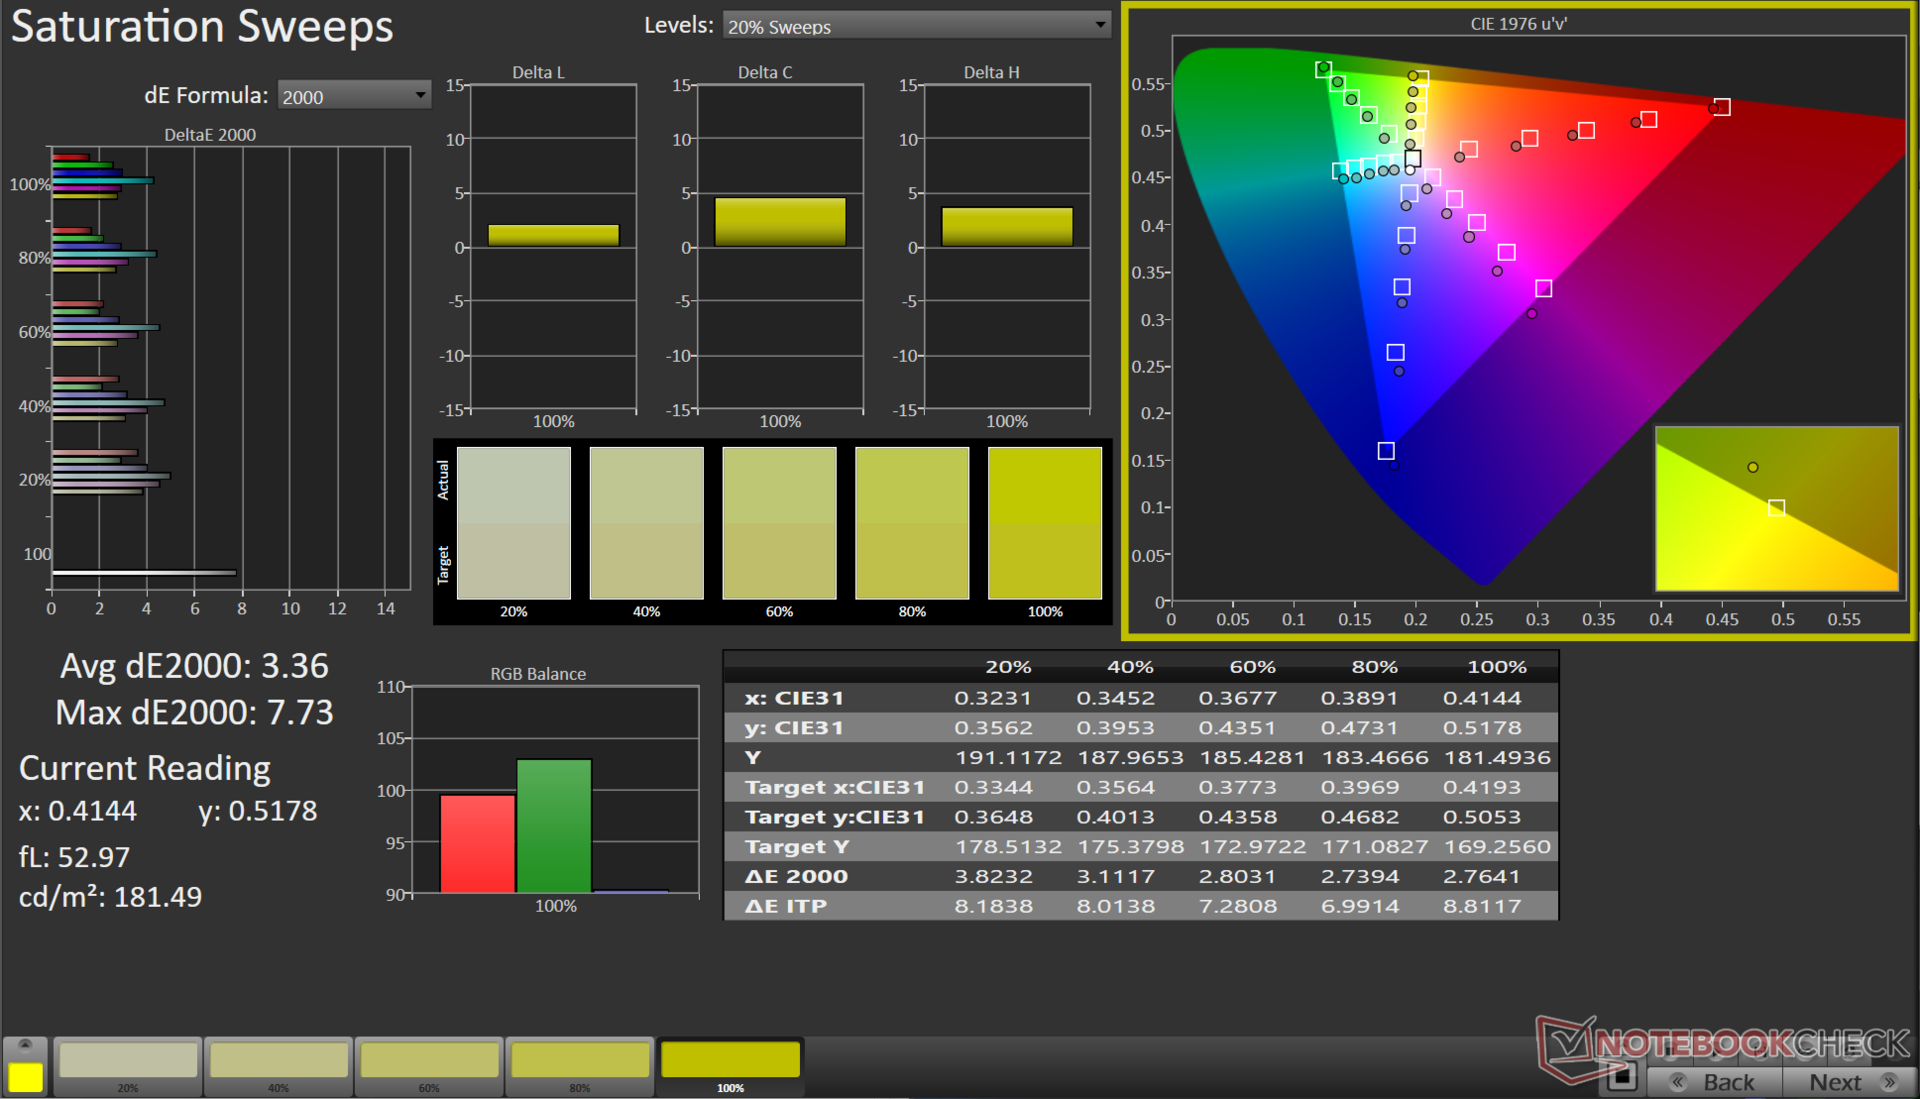
L'EVOL X15 n'est pas destiné aux créateurs de contenu, mais la couverture sRGB de 97 % est de bon augure pour les jeux, le web et les éditions de base. Les créateurs qui souhaitent exploiter les capacités matérielles de l'EVOL X15 peuvent utiliser un écran externe pour améliorer les performances chromatiques.
La reproduction des couleurs de l'écran est généralement satisfaisante, avec des valeurs moyennes en niveaux de gris et des valeurs ColorChecker Delta E 2000 de 4,3 et 3,08, respectivement.
Notre routine d'étalonnage, utilisant le spectrophotomètre X-Rite i1Basic Pro 3 et le logiciel Calman Ultimate de Portrait Display, améliore considérablement ces valeurs correspondantes à 1 et 1,12.
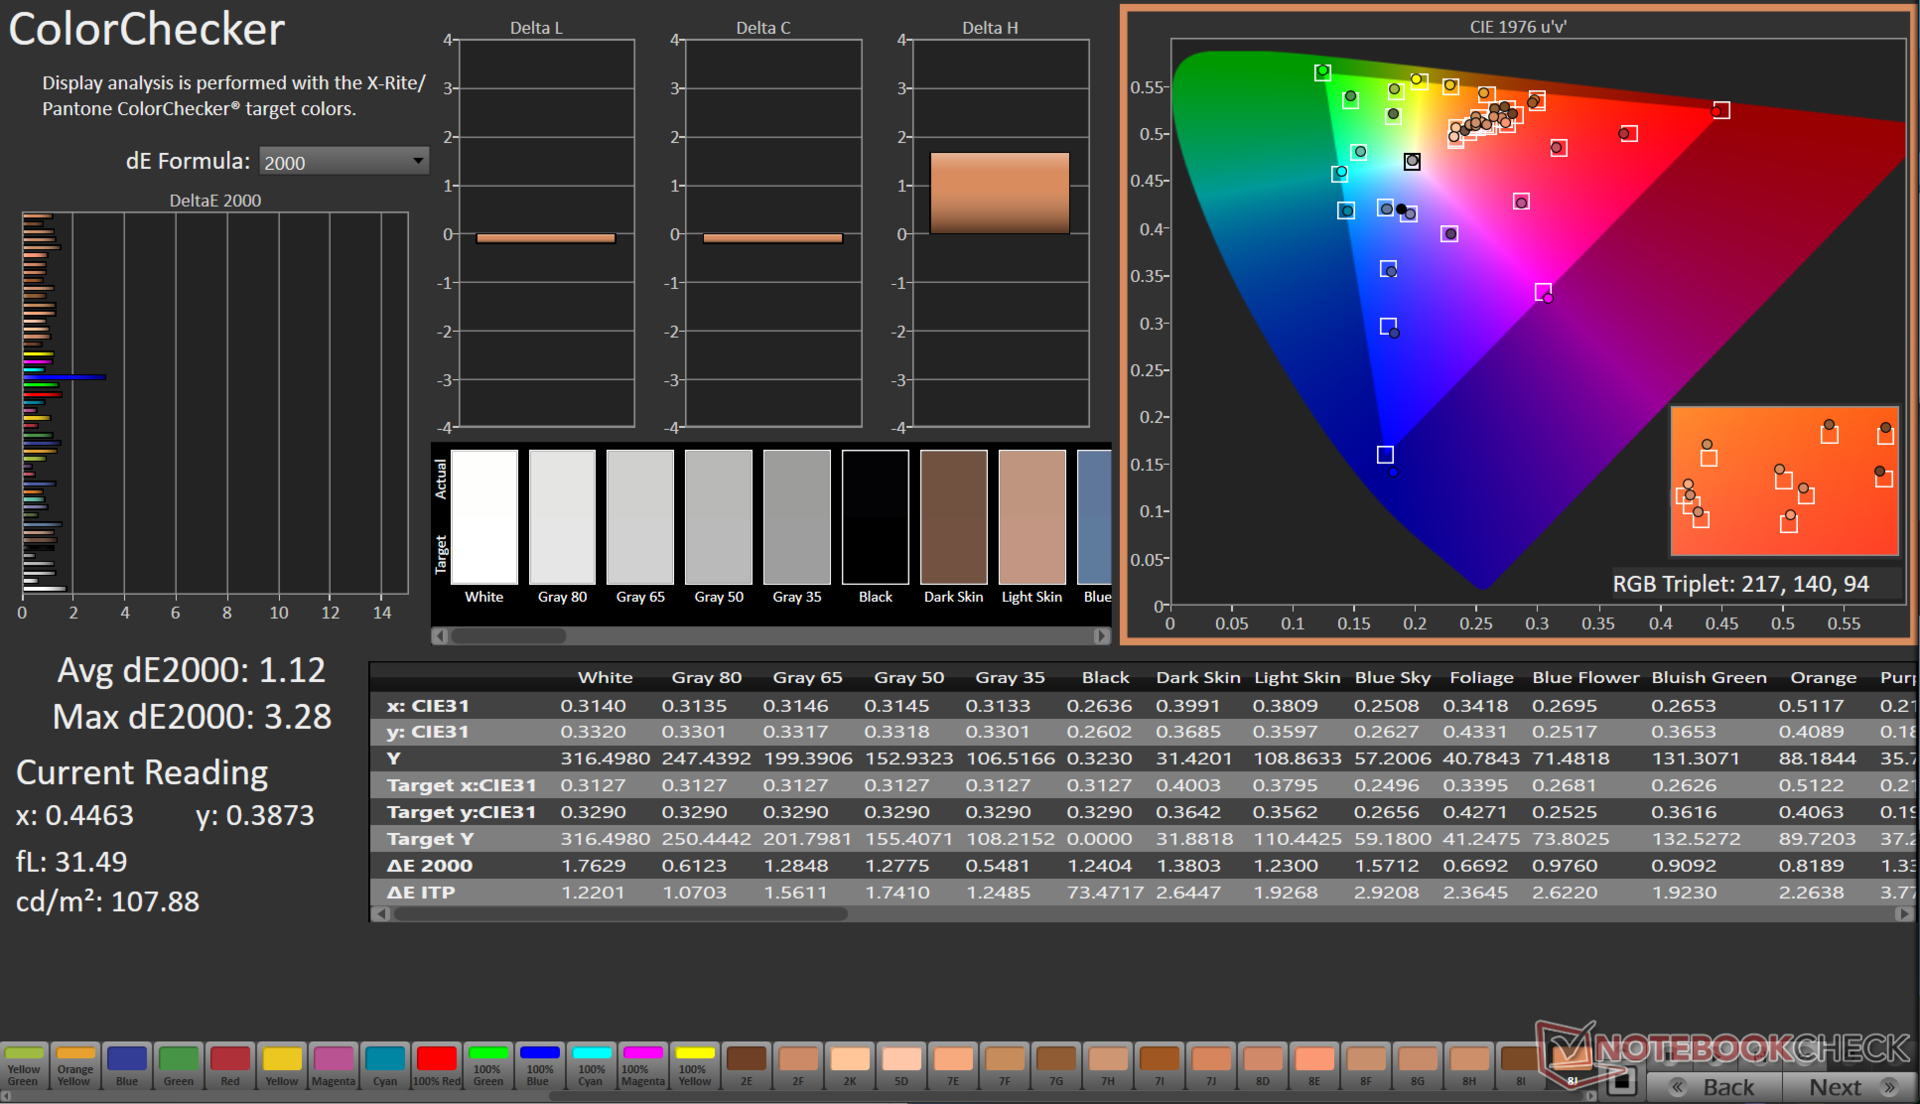
Le fichier ICC calibré peut être téléchargé à partir du lien ci-dessus.
Temps de réponse de l'écran
| ↔ Temps de réponse noir à blanc | ||
|---|---|---|
| 7.81 ms ... hausse ↗ et chute ↘ combinées | ↗ 4.01 ms hausse | 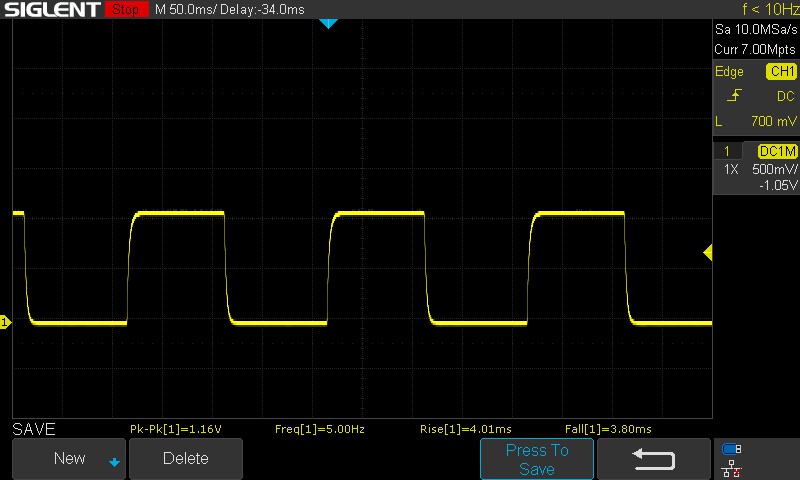 |
| ↘ 3.8 ms chute | ||
| L'écran montre de très faibles temps de réponse, parfait pour le jeu. En comparaison, tous les appareils testés affichent entre 0.1 (minimum) et 240 (maximum) ms. » 22 % des appareils testés affichent de meilleures performances. Cela signifie que les latences relevées sont meilleures que la moyenne (19.8 ms) de tous les appareils testés. | ||
| ↔ Temps de réponse gris 50% à gris 80% | ||
| 10.42 ms ... hausse ↗ et chute ↘ combinées | ↗ 4.73 ms hausse | 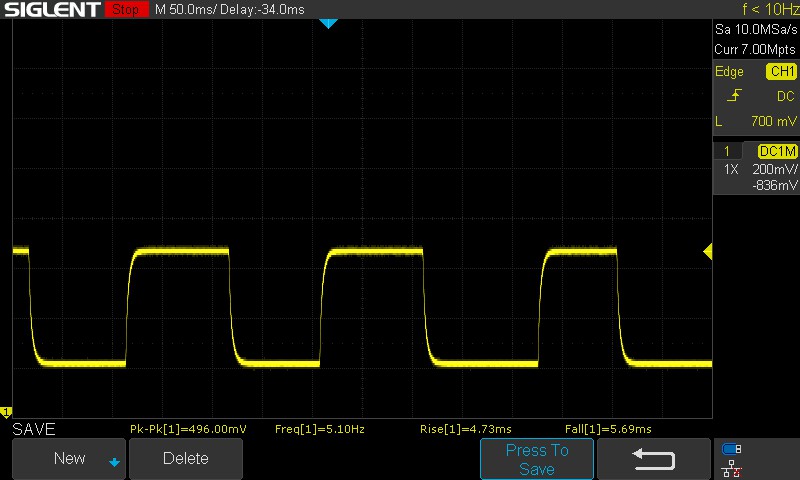 |
| ↘ 5.69 ms chute | ||
| L'écran montre de bons temps de réponse, mais insuffisant pour du jeu compétitif. En comparaison, tous les appareils testés affichent entre 0.165 (minimum) et 636 (maximum) ms. » 24 % des appareils testés affichent de meilleures performances. Cela signifie que les latences relevées sont meilleures que la moyenne (30.9 ms) de tous les appareils testés. | ||
Les temps de réponse sont corrects pour la plupart des jeux. La dalle de l'EVOL X15 AT n'utilise pas d'overdrive et il n'y a pas d'option pour l'activer, ce qui aurait permis de réduire davantage les temps de transition de 50 % de gris à 80 % de gris.
Scintillement / MLI (Modulation de largeur d'impulsion)
| Scintillement / MLI (Modulation de largeur d'impulsion) non décelé | ≤ 100 Niveau de luminosité | 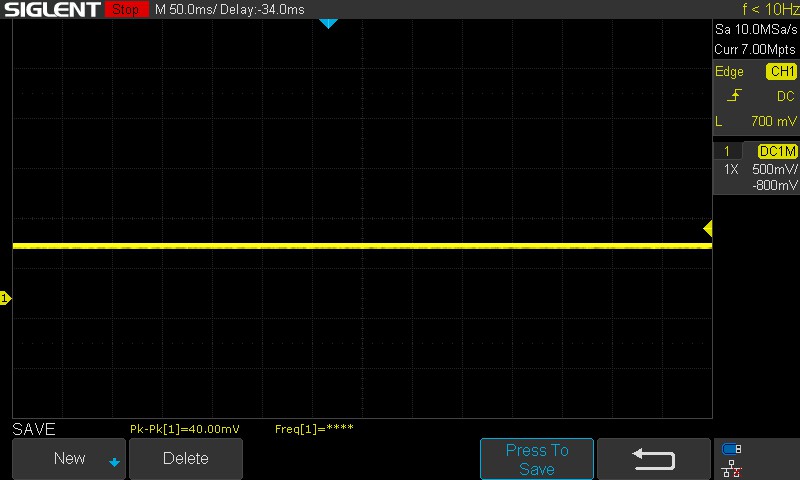 | |
En comparaison, 52 % des appareils testés n'emploient pas MDI pour assombrir leur écran. Nous avons relevé une moyenne à 7744 (minimum : 5 - maximum : 343500) Hz dans le cas où une MDI était active. | |||
Nous n'avons pas détecté de PWM ou de scintillement à aucun des niveaux de luminosité testés.
Pour plus d'informations, consultez notre article "Pourquoi le PWM est un tel casse-tête"et notre Tableau de classement PWM.
La visualisation en extérieur est correcte, mais la luminosité de l'écran risque de ne pas être suffisante pour une utilisation en plein soleil. Les angles de vision sont relativement stables, avec une légère perte de luminosité aux extrêmes.

Performances : Le Core i7-13700HX et la RTX 4060 sont de bon augure pour les jeux AAA de milieu de gamme
Le Colorful EVOL X15 AT est disponible avec les deux modèles suivants Intel Core i5-13500HX et Core i7-13700HX, les options GPU correspondantes étant le GPU pour ordinateur portable Nvidia GeForce RTX 4050 et le GPU pour ordinateur portable RTX 4060.
Conditions d'essai
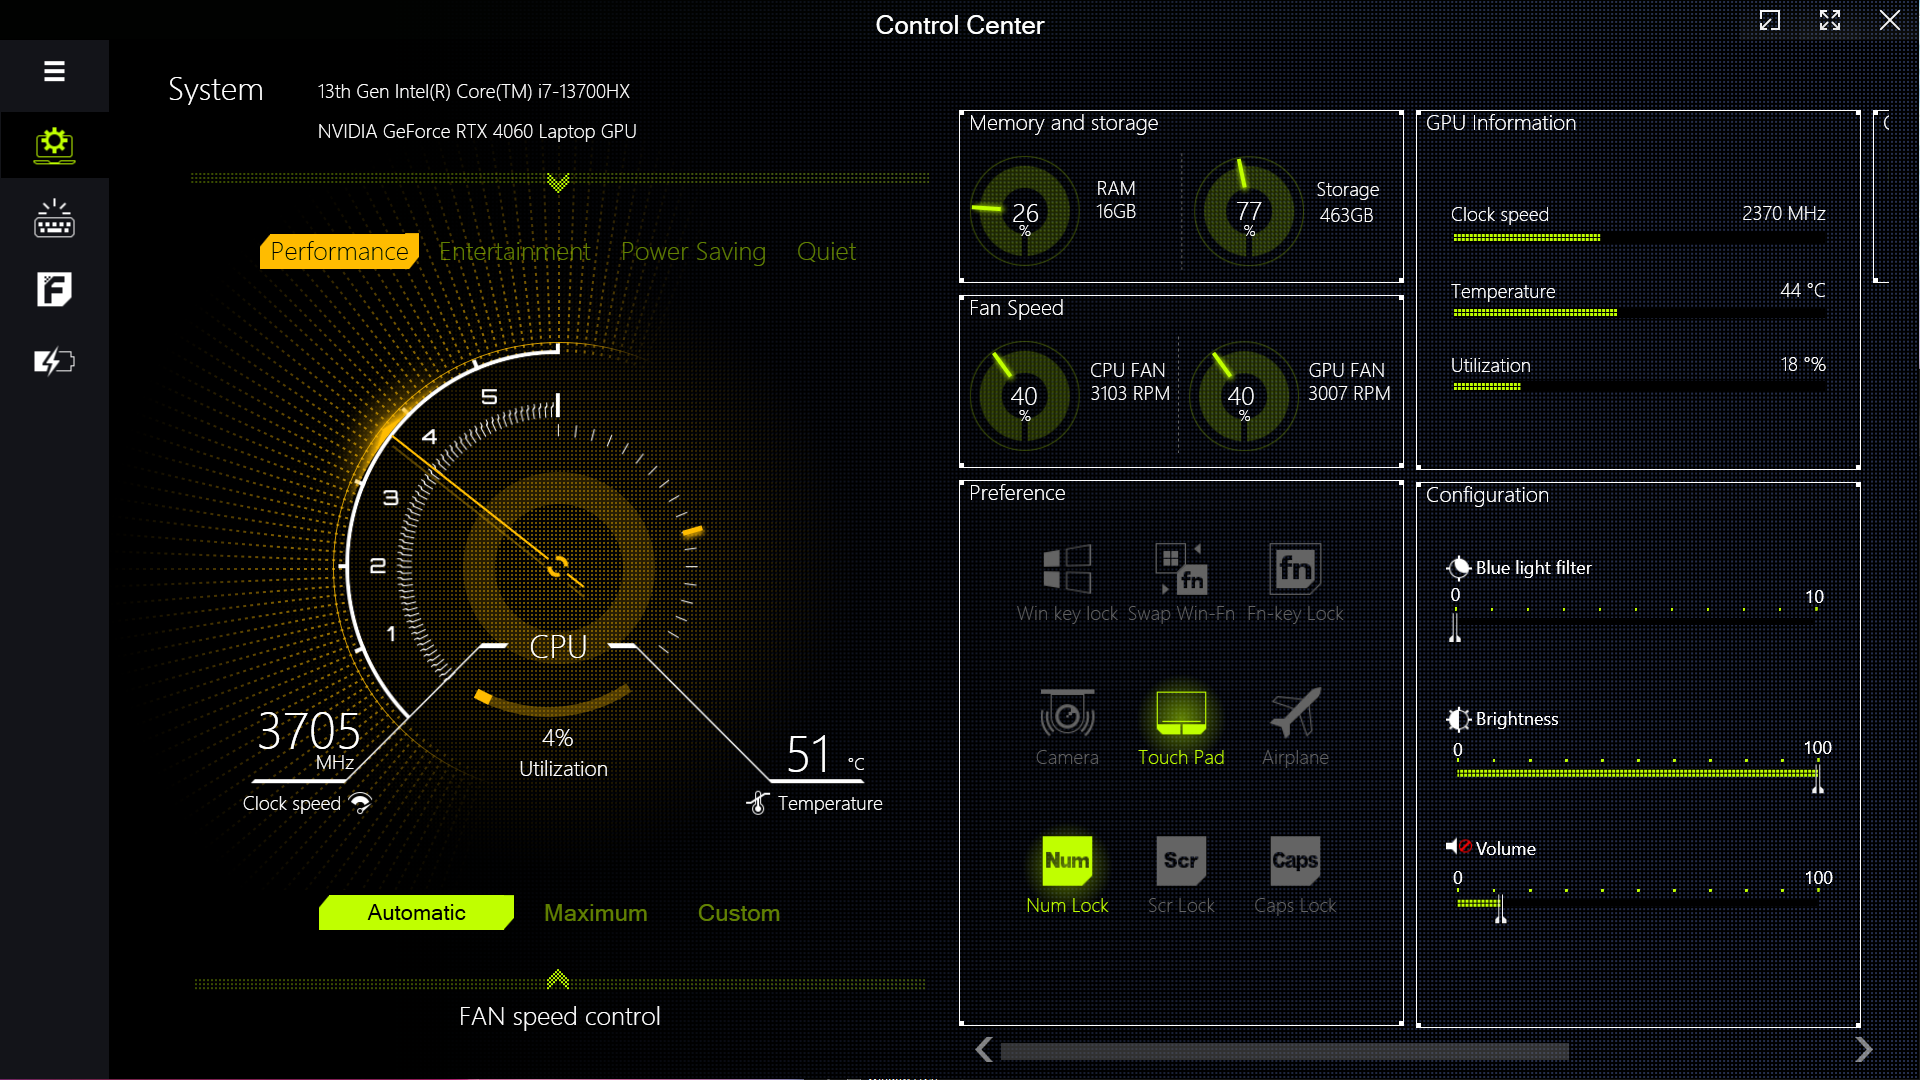
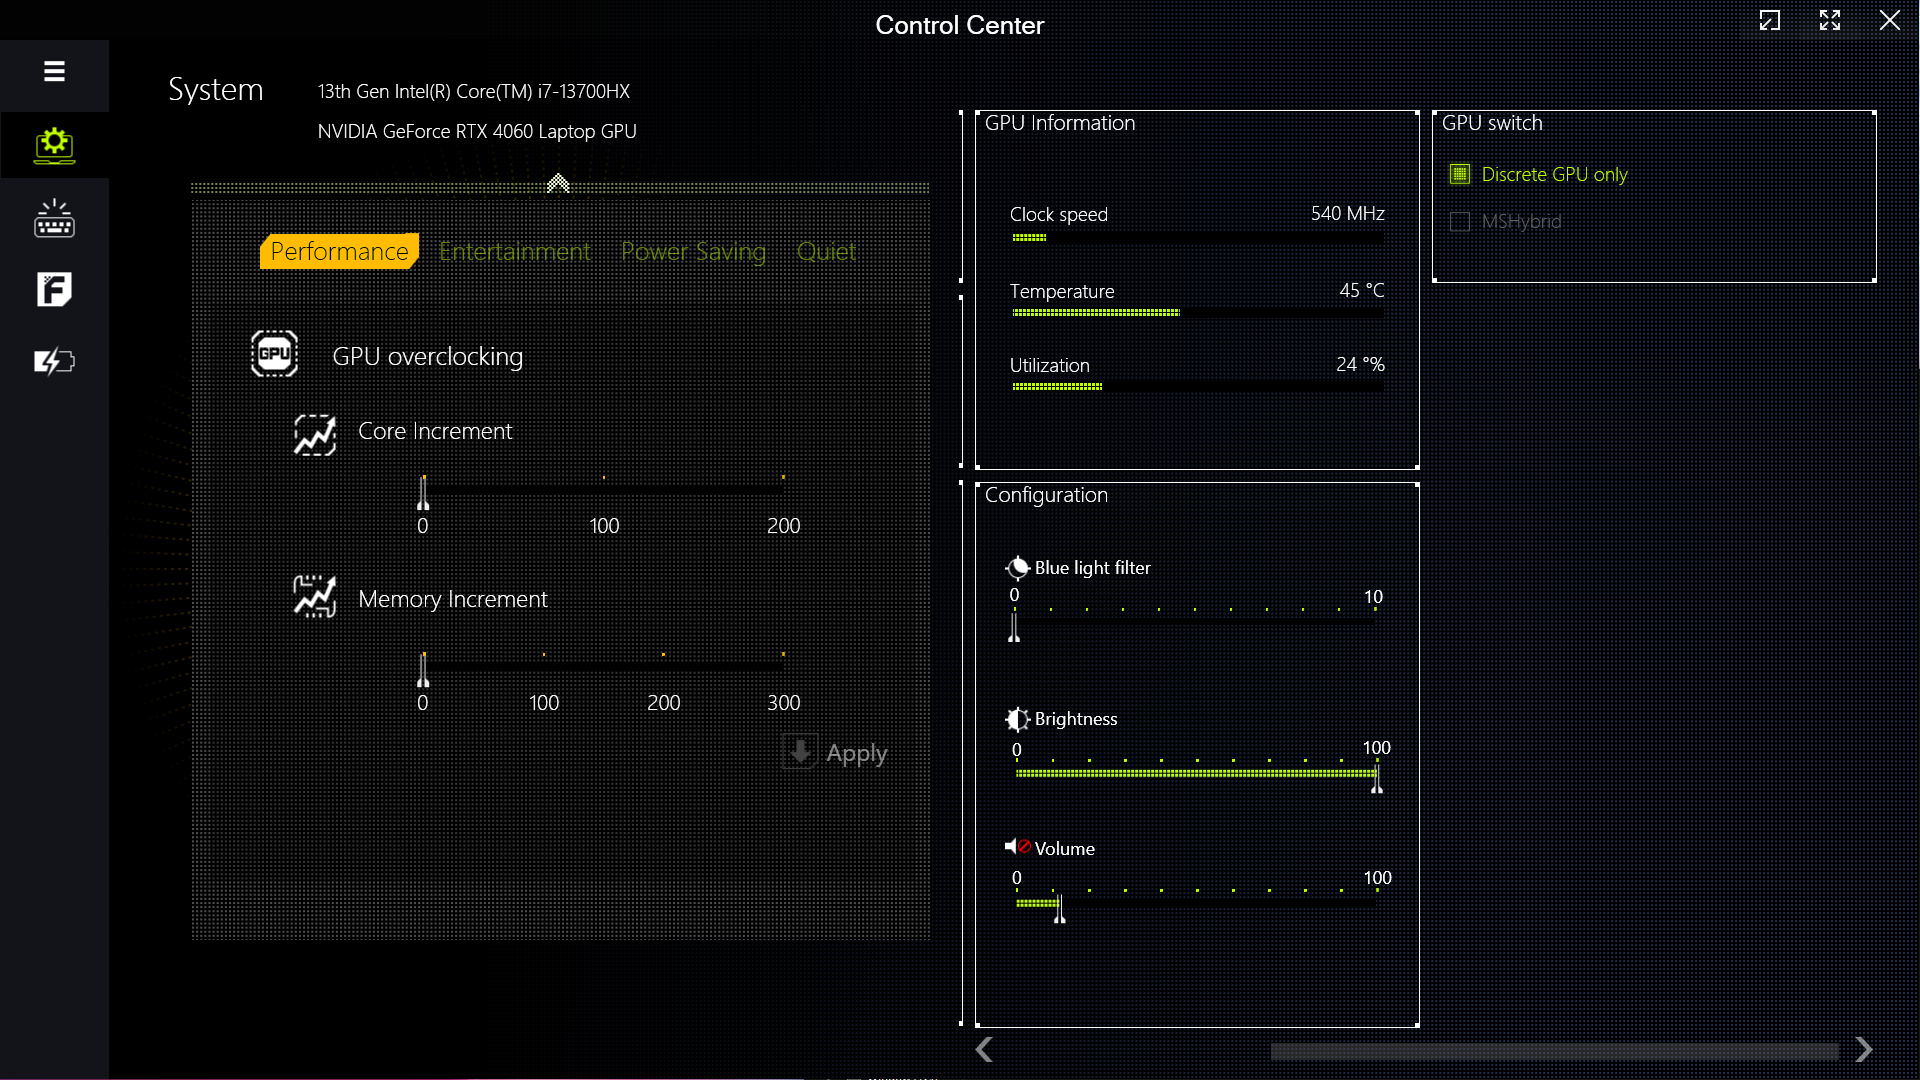
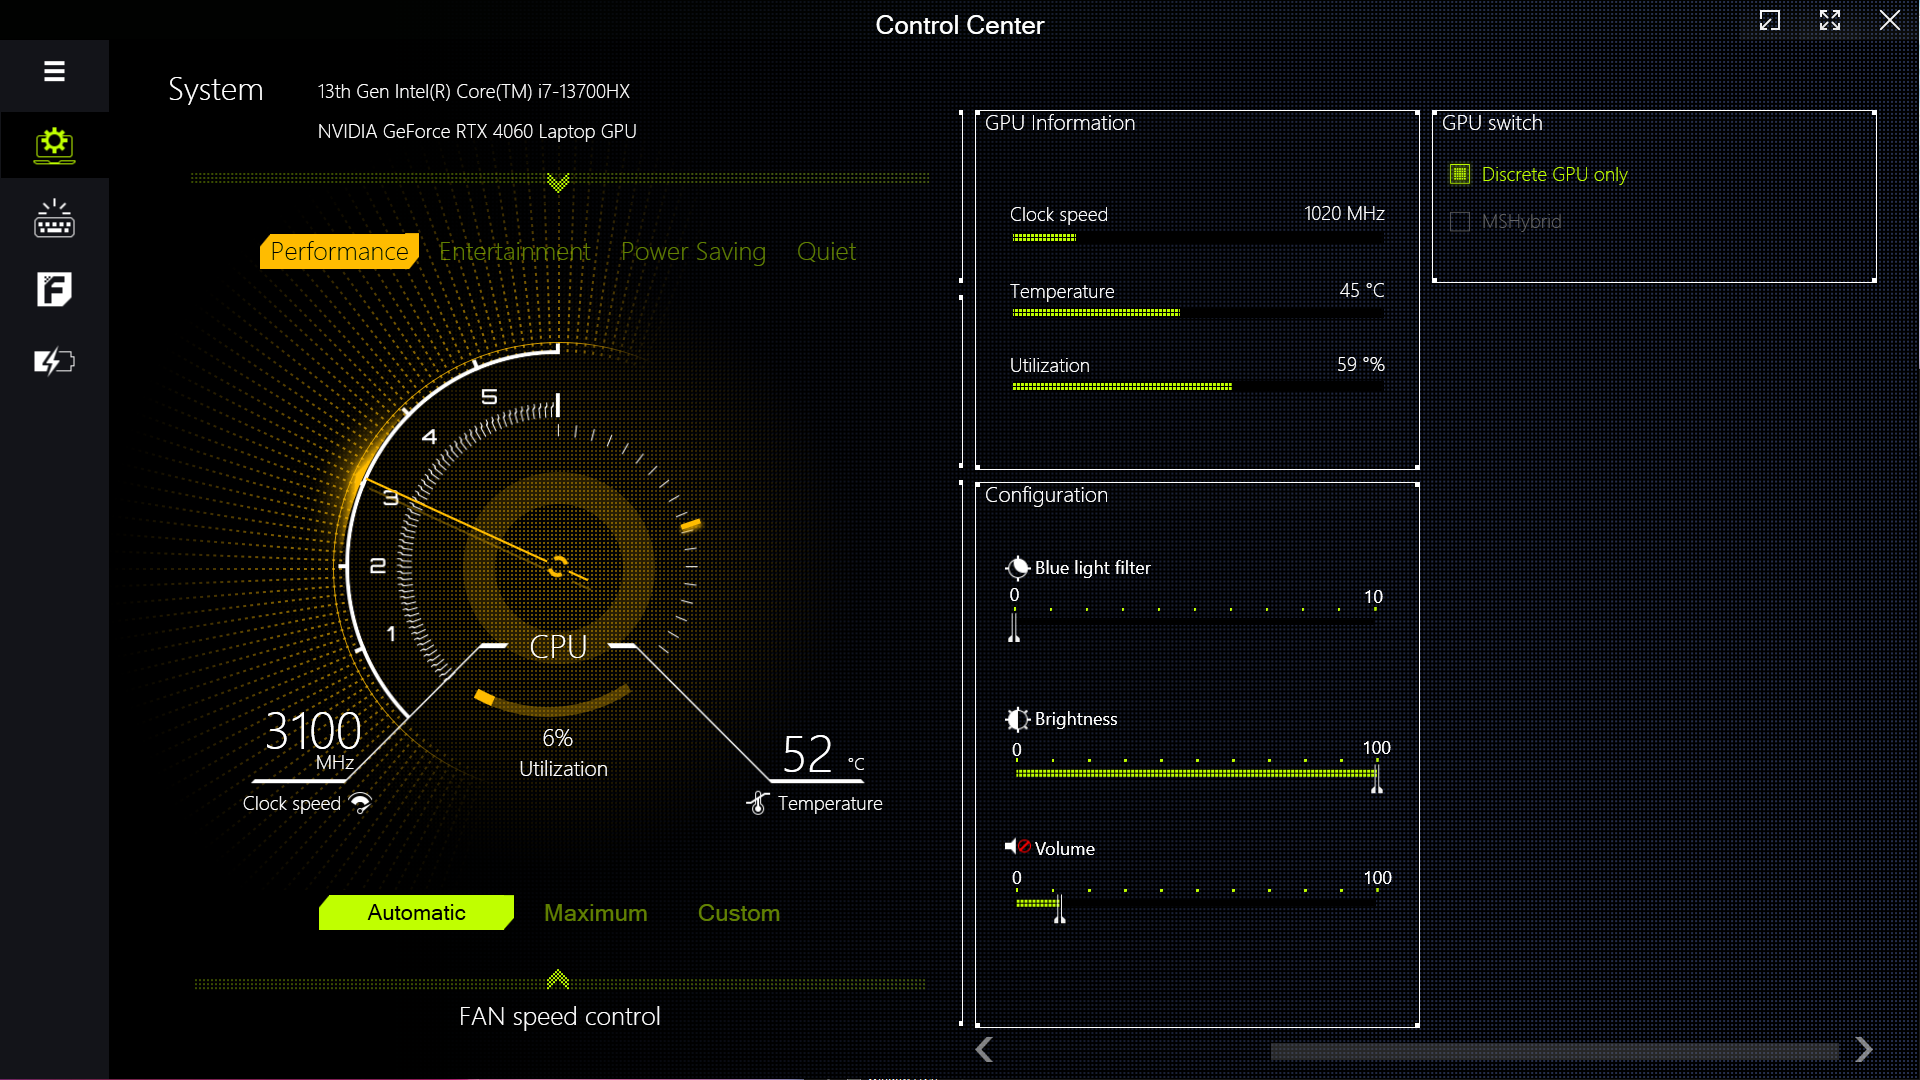
Colorful propose l'application Control Center de Clevo pour régler les performances et ajuster les différents effets RGB. Au total, quatre modes de performance sont proposés.
Tous les benchmarks ont été réalisés en mode Performance, qui permet au Core i7-13700HX de déployer pleinement ses muscles. Le mode GPU discret a été utilisé pour les tests graphiques et les tests de jeu.
Les tests de batterie ont été effectués en mode silencieux avec MSHybrid activé.
Colorful limite la puissance du PL2 à 30 W en mode silencieux et en mode économie d'énergie, ce qui représente une réduction significative de la consommation par rapport aux autres modes. Cela se reflète dans la chute drastique des scores Cinebench R15, comme l'illustre le tableau ci-dessous.
| Mode performance | PL1 (PBP) / Tau | PL2 (MTP) / Tau | Cinebench R15 Multi score | Cinebench R15 Multi score (30 boucles) |
|---|---|---|---|---|
| Silence | 15 W / 8 s | 30 W / 2,44 ms | 567 (-83%) | 542 (-82,28%) |
| Économie d'énergie | 45 W / 8 s | 30 W / 2,44 ms | 557 (-84%) | 548 (-82,08%) |
| Divertissement | 65 W / 56 s | 130 W / 2,44 ms | 2814 (-19,18%) | 2168 (-29,12%) |
| Performance | 135 W / 96 s | 162 W / 2.44 ms | 3482 (100%) | 3059 (100%) |
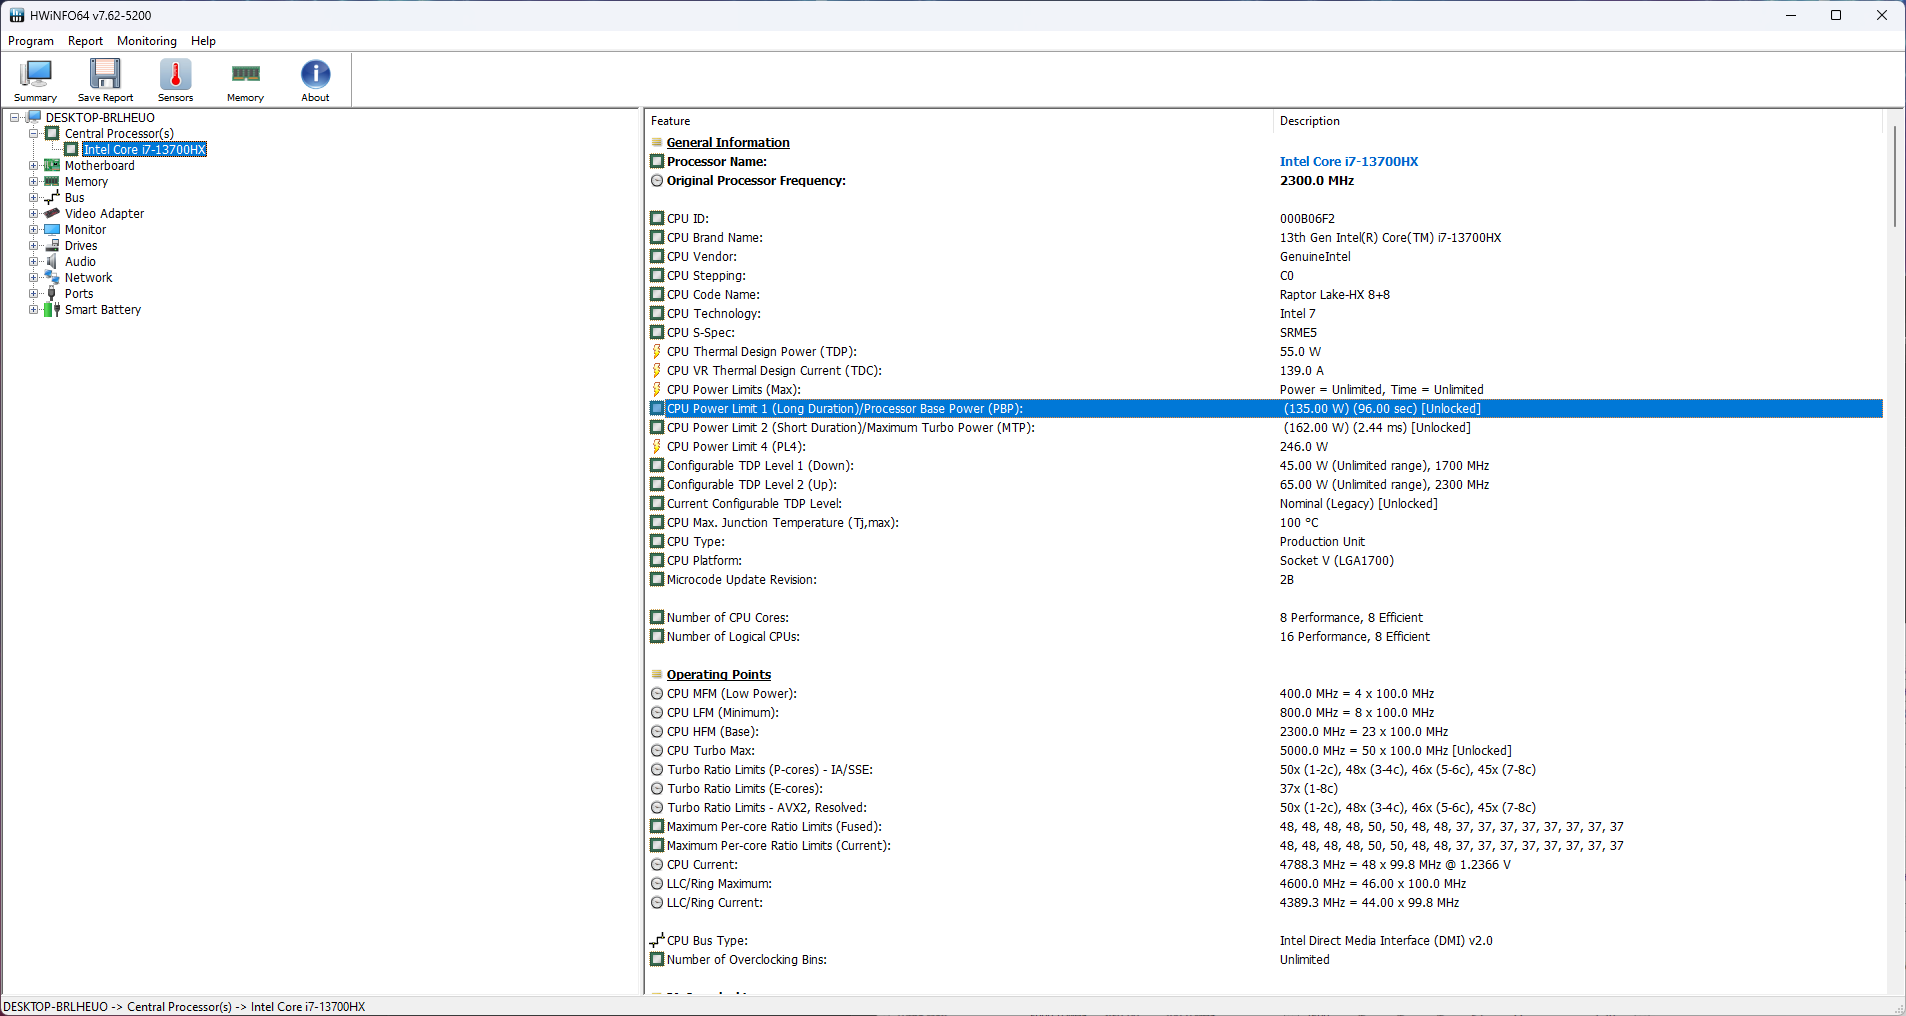
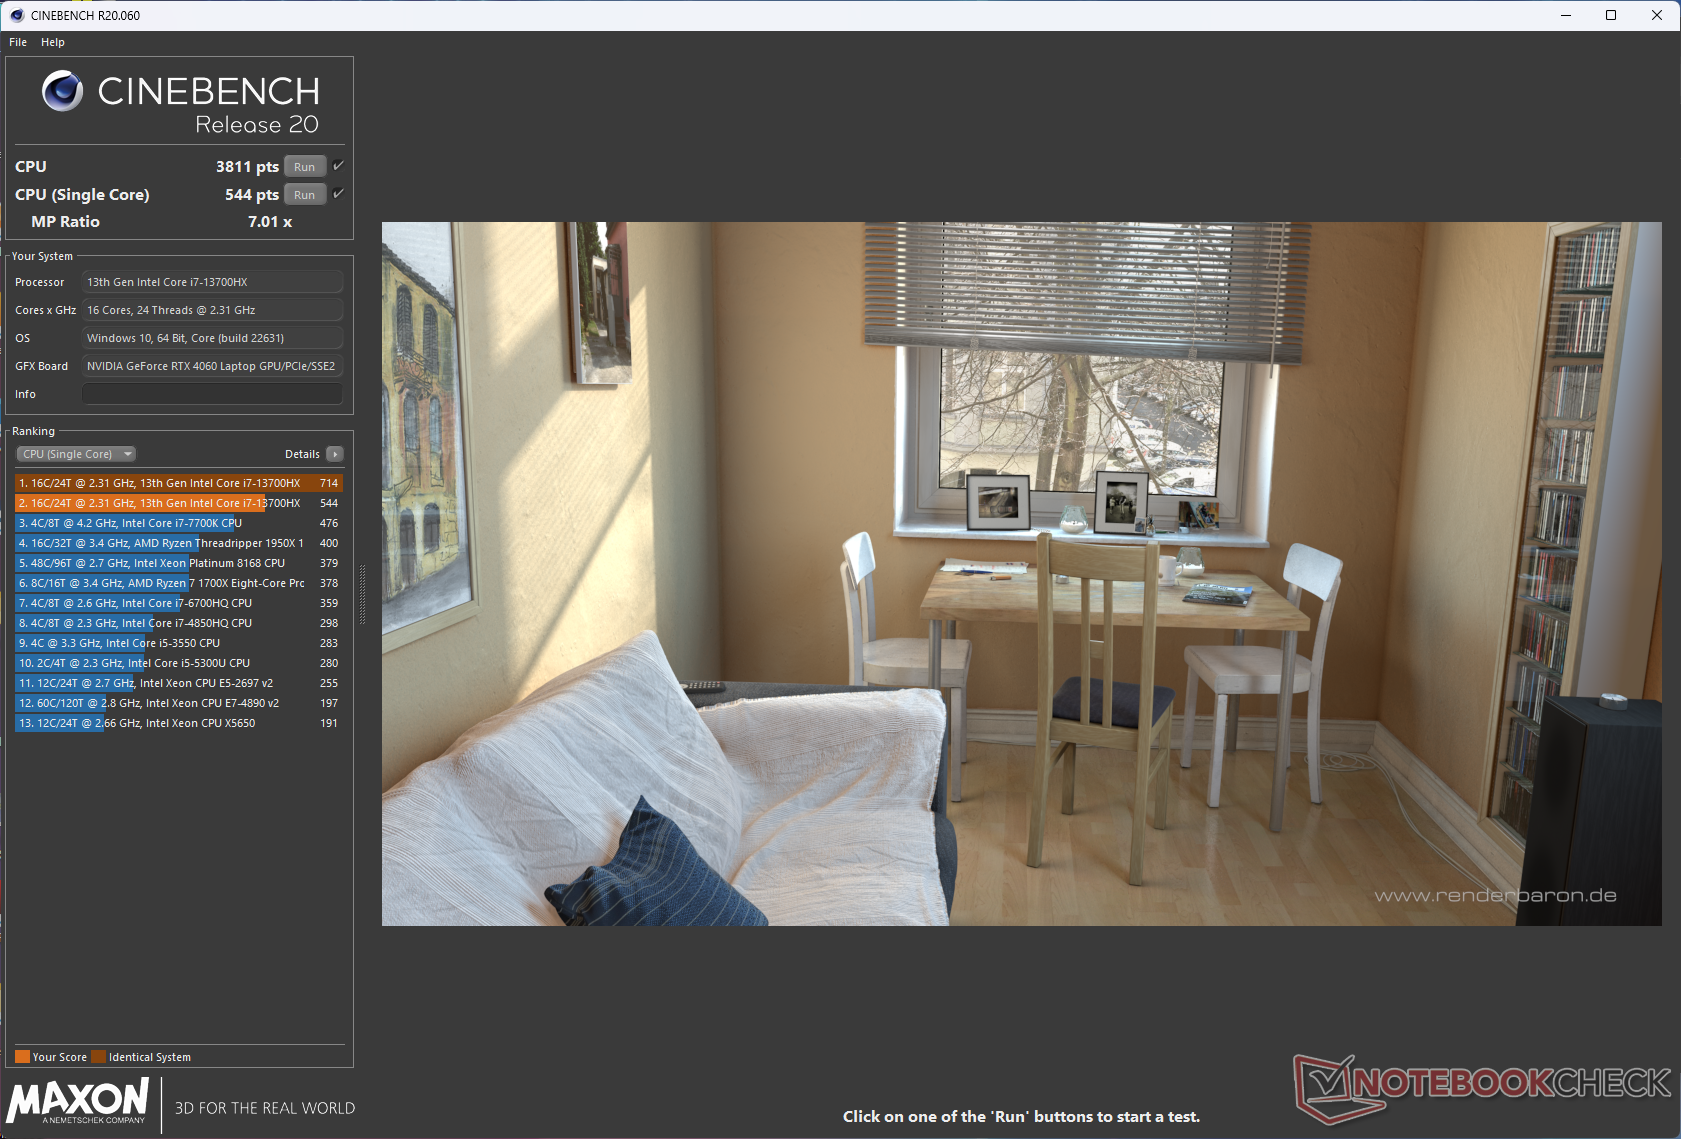
Processeur
Le Core i7-13700HX dispose de 16 cœurs et 24 threads avec une horloge boostée jusqu'à 5 GHz. Ce processeur dans l'EVOL X15 AT a des performances comparables à celles de son homologue dans l'Alienware m16 R1, et dans d'autres ordinateurs portables. Cependant, il est nettement moins performant que le processeur 12 cœurs 24 threads AMD Ryzen 9 7845HX dans les tests multicœurs.
Bien que prévu pour 162 W, le Core i7-13700HX peut utiliser jusqu'à 145 W en mode Performance. Néanmoins, cela n'offre qu'un avantage minime en termes de performances monocœur par rapport aux 115 W PL2 de l'ordinateur de bureau HP Omen 16.
En dehors de la diminution progressive initiale des scores, il n'y a pas de ralentissement perceptible pendant le test en boucle multicœur Cinebench R15.
Cinebench R15 Multi Loop
Cinebench R23: Multi Core | Single Core
Cinebench R20: CPU (Multi Core) | CPU (Single Core)
Cinebench R15: CPU Multi 64Bit | CPU Single 64Bit
Blender: v2.79 BMW27 CPU
7-Zip 18.03: 7z b 4 | 7z b 4 -mmt1
Geekbench 5.5: Multi-Core | Single-Core
HWBOT x265 Benchmark v2.2: 4k Preset
LibreOffice : 20 Documents To PDF
R Benchmark 2.5: Overall mean
| CPU Performance rating | |
| Alienware m16 R1 AMD | |
| Moyenne de la classe Gaming | |
| Schenker XMG Pro 15 (E23) | |
| Acer Predator Helios 16 PH16-71-731Q | |
| HP Omen 16-wf000 -1! | |
| Uniwill GM6PX7X RTX 4070 | |
| Alienware m16 R1 Intel | |
| Dell G15 5530 | |
| Colorful EVOL X15 AT 23 | |
| Moyenne Intel Core i7-13700HX | |
| Cinebench R23 / Multi Core | |
| Alienware m16 R1 AMD | |
| Moyenne de la classe Gaming (10488 - 42661, n=104, 2 dernières années) | |
| Schenker XMG Pro 15 (E23) | |
| Acer Predator Helios 16 PH16-71-731Q | |
| Colorful EVOL X15 AT 23 | |
| Alienware m16 R1 Intel | |
| Uniwill GM6PX7X RTX 4070 | |
| Dell G15 5530 | |
| Moyenne Intel Core i7-13700HX (15558 - 22598, n=11) | |
| HP Omen 16-wf000 | |
| Cinebench R23 / Single Core | |
| Moyenne de la classe Gaming (1601 - 2415, n=104, 2 dernières années) | |
| Alienware m16 R1 Intel | |
| Colorful EVOL X15 AT 23 | |
| Acer Predator Helios 16 PH16-71-731Q | |
| Schenker XMG Pro 15 (E23) | |
| HP Omen 16-wf000 | |
| Alienware m16 R1 AMD | |
| Dell G15 5530 | |
| Moyenne Intel Core i7-13700HX (1666 - 1933, n=11) | |
| Uniwill GM6PX7X RTX 4070 | |
| Cinebench R20 / CPU (Multi Core) | |
| Alienware m16 R1 AMD | |
| Moyenne de la classe Gaming (4029 - 16433, n=103, 2 dernières années) | |
| Schenker XMG Pro 15 (E23) | |
| Acer Predator Helios 16 PH16-71-731Q | |
| Colorful EVOL X15 AT 23 | |
| Uniwill GM6PX7X RTX 4070 | |
| Alienware m16 R1 Intel | |
| Dell G15 5530 | |
| Moyenne Intel Core i7-13700HX (6160 - 8610, n=11) | |
| HP Omen 16-wf000 | |
| Cinebench R20 / CPU (Single Core) | |
| Moyenne de la classe Gaming (622 - 913, n=103, 2 dernières années) | |
| Colorful EVOL X15 AT 23 | |
| Alienware m16 R1 Intel | |
| Acer Predator Helios 16 PH16-71-731Q | |
| Schenker XMG Pro 15 (E23) | |
| HP Omen 16-wf000 | |
| Alienware m16 R1 AMD | |
| Dell G15 5530 | |
| Uniwill GM6PX7X RTX 4070 | |
| Moyenne Intel Core i7-13700HX (644 - 740, n=11) | |
| Cinebench R15 / CPU Multi 64Bit | |
| Alienware m16 R1 AMD | |
| Moyenne de la classe Gaming (1578 - 6330, n=102, 2 dernières années) | |
| Schenker XMG Pro 15 (E23) | |
| Colorful EVOL X15 AT 23 | |
| Acer Predator Helios 16 PH16-71-731Q | |
| Acer Predator Helios 16 PH16-71-731Q | |
| Uniwill GM6PX7X RTX 4070 | |
| Moyenne Intel Core i7-13700HX (2548 - 3482, n=12) | |
| Alienware m16 R1 Intel | |
| Dell G15 5530 | |
| HP Omen 16-wf000 | |
| Cinebench R15 / CPU Single 64Bit | |
| Moyenne de la classe Gaming (188.8 - 350, n=103, 2 dernières années) | |
| Alienware m16 R1 AMD | |
| Alienware m16 R1 Intel | |
| Colorful EVOL X15 AT 23 | |
| Dell G15 5530 | |
| Acer Predator Helios 16 PH16-71-731Q | |
| Moyenne Intel Core i7-13700HX (243 - 279, n=11) | |
| HP Omen 16-wf000 | |
| Uniwill GM6PX7X RTX 4070 | |
| Schenker XMG Pro 15 (E23) | |
| Blender / v2.79 BMW27 CPU | |
| Moyenne Intel Core i7-13700HX (138 - 207, n=10) | |
| Dell G15 5530 | |
| Acer Predator Helios 16 PH16-71-731Q | |
| Alienware m16 R1 Intel | |
| Colorful EVOL X15 AT 23 | |
| Uniwill GM6PX7X RTX 4070 | |
| Schenker XMG Pro 15 (E23) | |
| Moyenne de la classe Gaming (79 - 330, n=101, 2 dernières années) | |
| Alienware m16 R1 AMD | |
| 7-Zip 18.03 / 7z b 4 | |
| Alienware m16 R1 AMD | |
| Moyenne de la classe Gaming (33491 - 148086, n=102, 2 dernières années) | |
| Schenker XMG Pro 15 (E23) | |
| Uniwill GM6PX7X RTX 4070 | |
| Alienware m16 R1 Intel | |
| Acer Predator Helios 16 PH16-71-731Q | |
| HP Omen 16-wf000 | |
| Dell G15 5530 | |
| Moyenne Intel Core i7-13700HX (58912 - 89294, n=11) | |
| Colorful EVOL X15 AT 23 | |
| 7-Zip 18.03 / 7z b 4 -mmt1 | |
| Alienware m16 R1 AMD | |
| Moyenne de la classe Gaming (4824 - 7436, n=102, 2 dernières années) | |
| Alienware m16 R1 Intel | |
| Colorful EVOL X15 AT 23 | |
| Schenker XMG Pro 15 (E23) | |
| Acer Predator Helios 16 PH16-71-731Q | |
| Moyenne Intel Core i7-13700HX (5552 - 6409, n=11) | |
| Uniwill GM6PX7X RTX 4070 | |
| HP Omen 16-wf000 | |
| Dell G15 5530 | |
| Geekbench 5.5 / Multi-Core | |
| Schenker XMG Pro 15 (E23) | |
| Moyenne de la classe Gaming (6460 - 28263, n=102, 2 dernières années) | |
| Acer Predator Helios 16 PH16-71-731Q | |
| Uniwill GM6PX7X RTX 4070 | |
| Alienware m16 R1 AMD | |
| HP Omen 16-wf000 | |
| Alienware m16 R1 Intel | |
| Dell G15 5530 | |
| Moyenne Intel Core i7-13700HX (10156 - 15850, n=12) | |
| Colorful EVOL X15 AT 23 | |
| Geekbench 5.5 / Single-Core | |
| Moyenne de la classe Gaming (1403 - 2474, n=102, 2 dernières années) | |
| Alienware m16 R1 AMD | |
| Acer Predator Helios 16 PH16-71-731Q | |
| HP Omen 16-wf000 | |
| Dell G15 5530 | |
| Alienware m16 R1 Intel | |
| Colorful EVOL X15 AT 23 | |
| Uniwill GM6PX7X RTX 4070 | |
| Schenker XMG Pro 15 (E23) | |
| Moyenne Intel Core i7-13700HX (1666 - 1899, n=12) | |
| HWBOT x265 Benchmark v2.2 / 4k Preset | |
| Alienware m16 R1 AMD | |
| Moyenne de la classe Gaming (11.5 - 44.4, n=102, 2 dernières années) | |
| Uniwill GM6PX7X RTX 4070 | |
| Acer Predator Helios 16 PH16-71-731Q | |
| Schenker XMG Pro 15 (E23) | |
| Dell G15 5530 | |
| Alienware m16 R1 Intel | |
| Moyenne Intel Core i7-13700HX (17.1 - 25.5, n=11) | |
| Colorful EVOL X15 AT 23 | |
| HP Omen 16-wf000 | |
| LibreOffice / 20 Documents To PDF | |
| Colorful EVOL X15 AT 23 | |
| Schenker XMG Pro 15 (E23) | |
| Moyenne de la classe Gaming (33.2 - 88.8, n=102, 2 dernières années) | |
| Dell G15 5530 | |
| HP Omen 16-wf000 | |
| Alienware m16 R1 Intel | |
| Moyenne Intel Core i7-13700HX (36.5 - 52.9, n=11) | |
| Alienware m16 R1 AMD | |
| Uniwill GM6PX7X RTX 4070 | |
| Acer Predator Helios 16 PH16-71-731Q | |
| R Benchmark 2.5 / Overall mean | |
| Uniwill GM6PX7X RTX 4070 | |
| Moyenne Intel Core i7-13700HX (0.4274 - 0.513, n=11) | |
| Schenker XMG Pro 15 (E23) | |
| HP Omen 16-wf000 | |
| Colorful EVOL X15 AT 23 | |
| Alienware m16 R1 Intel | |
| Acer Predator Helios 16 PH16-71-731Q | |
| Dell G15 5530 | |
| Alienware m16 R1 AMD | |
| Moyenne de la classe Gaming (0.3439 - 0.59, n=102, 2 dernières années) | |
* ... Moindre est la valeur, meilleures sont les performances
Le Core i7-13700HX de l'EVOL X15 peut utiliser un maximum de 145 W avec des boosts jusqu'à 4,2 GHz en exécutant la boucle multi-cœur Cinebench R15 en mode Performance. En mode Divertissement, le Core i7-13700HX peut encore atteindre 4,2 GHz à 113 W, mais la consommation moyenne chute à environ 21 W pendant l'exécution.
En mode silencieux, l'EVOL X15 atteint 4 GHz en pointe tout en consommant seulement 30 W. Cependant, les horloges moyennes chutent à un peu moins de 1 GHz tout en consommant 15 W.
Les scores Cinebench R20 sur batterie chutent de 26,5 % et 54 % en mode monocœur et multicœur, respectivement.
AIDA64: FP32 Ray-Trace | FPU Julia | CPU SHA3 | CPU Queen | FPU SinJulia | FPU Mandel | CPU AES | CPU ZLib | FP64 Ray-Trace | CPU PhotoWorxx
| Performance rating | |
| Alienware m16 R1 AMD | |
| Moyenne de la classe Gaming | |
| Uniwill GM6PX7X RTX 4070 | |
| Alienware m16 R1 Intel | |
| Acer Predator Helios 16 PH16-71-731Q | |
| Schenker XMG Pro 15 (E23) | |
| Moyenne Intel Core i7-13700HX | |
| HP Omen 16-wf000 | |
| Colorful EVOL X15 AT 23 | |
| Dell G15 5530 | |
| AIDA64 / FP32 Ray-Trace | |
| Alienware m16 R1 AMD | |
| Moyenne de la classe Gaming (10227 - 85542, n=102, 2 dernières années) | |
| Uniwill GM6PX7X RTX 4070 | |
| Alienware m16 R1 Intel | |
| Acer Predator Helios 16 PH16-71-731Q | |
| Colorful EVOL X15 AT 23 | |
| Moyenne Intel Core i7-13700HX (14261 - 21999, n=11) | |
| HP Omen 16-wf000 | |
| Dell G15 5530 | |
| Schenker XMG Pro 15 (E23) | |
| AIDA64 / FPU Julia | |
| Alienware m16 R1 AMD | |
| Moyenne de la classe Gaming (51376 - 372155, n=102, 2 dernières années) | |
| Uniwill GM6PX7X RTX 4070 | |
| Alienware m16 R1 Intel | |
| Colorful EVOL X15 AT 23 | |
| Acer Predator Helios 16 PH16-71-731Q | |
| HP Omen 16-wf000 | |
| Moyenne Intel Core i7-13700HX (74636 - 109364, n=11) | |
| Schenker XMG Pro 15 (E23) | |
| Dell G15 5530 | |
| AIDA64 / CPU SHA3 | |
| Alienware m16 R1 AMD | |
| Moyenne de la classe Gaming (2180 - 10115, n=102, 2 dernières années) | |
| Uniwill GM6PX7X RTX 4070 | |
| Alienware m16 R1 Intel | |
| Schenker XMG Pro 15 (E23) | |
| Colorful EVOL X15 AT 23 | |
| Acer Predator Helios 16 PH16-71-731Q | |
| Dell G15 5530 | |
| Moyenne Intel Core i7-13700HX (3359 - 5053, n=11) | |
| HP Omen 16-wf000 | |
| AIDA64 / CPU Queen | |
| Alienware m16 R1 AMD | |
| Schenker XMG Pro 15 (E23) | |
| Moyenne de la classe Gaming (49785 - 173351, n=86, 2 dernières années) | |
| Alienware m16 R1 Intel | |
| Acer Predator Helios 16 PH16-71-731Q | |
| Colorful EVOL X15 AT 23 | |
| Uniwill GM6PX7X RTX 4070 | |
| Moyenne Intel Core i7-13700HX (86532 - 114717, n=11) | |
| Dell G15 5530 | |
| HP Omen 16-wf000 | |
| AIDA64 / FPU SinJulia | |
| Alienware m16 R1 AMD | |
| Moyenne de la classe Gaming (4424 - 33636, n=102, 2 dernières années) | |
| Alienware m16 R1 Intel | |
| Uniwill GM6PX7X RTX 4070 | |
| Acer Predator Helios 16 PH16-71-731Q | |
| Colorful EVOL X15 AT 23 | |
| Schenker XMG Pro 15 (E23) | |
| Moyenne Intel Core i7-13700HX (9290 - 13519, n=11) | |
| HP Omen 16-wf000 | |
| Dell G15 5530 | |
| AIDA64 / FPU Mandel | |
| Alienware m16 R1 AMD | |
| Moyenne de la classe Gaming (25115 - 196829, n=102, 2 dernières années) | |
| Uniwill GM6PX7X RTX 4070 | |
| Alienware m16 R1 Intel | |
| Acer Predator Helios 16 PH16-71-731Q | |
| Colorful EVOL X15 AT 23 | |
| HP Omen 16-wf000 | |
| Moyenne Intel Core i7-13700HX (35751 - 53484, n=11) | |
| Schenker XMG Pro 15 (E23) | |
| Dell G15 5530 | |
| AIDA64 / CPU AES | |
| Uniwill GM6PX7X RTX 4070 | |
| Alienware m16 R1 Intel | |
| Acer Predator Helios 16 PH16-71-731Q | |
| Moyenne Intel Core i7-13700HX (67846 - 182575, n=11) | |
| Moyenne de la classe Gaming (39258 - 247074, n=102, 2 dernières années) | |
| Alienware m16 R1 AMD | |
| Colorful EVOL X15 AT 23 | |
| Schenker XMG Pro 15 (E23) | |
| HP Omen 16-wf000 | |
| Dell G15 5530 | |
| AIDA64 / CPU ZLib | |
| Alienware m16 R1 AMD | |
| Moyenne de la classe Gaming (574 - 2531, n=102, 2 dernières années) | |
| Acer Predator Helios 16 PH16-71-731Q | |
| Schenker XMG Pro 15 (E23) | |
| Uniwill GM6PX7X RTX 4070 | |
| Alienware m16 R1 Intel | |
| HP Omen 16-wf000 | |
| Colorful EVOL X15 AT 23 | |
| Dell G15 5530 | |
| Moyenne Intel Core i7-13700HX (981 - 1451, n=11) | |
| AIDA64 / FP64 Ray-Trace | |
| Alienware m16 R1 AMD | |
| Moyenne de la classe Gaming (5509 - 45446, n=102, 2 dernières années) | |
| Uniwill GM6PX7X RTX 4070 | |
| Alienware m16 R1 Intel | |
| Colorful EVOL X15 AT 23 | |
| Acer Predator Helios 16 PH16-71-731Q | |
| Moyenne Intel Core i7-13700HX (7728 - 11837, n=11) | |
| HP Omen 16-wf000 | |
| Dell G15 5530 | |
| Schenker XMG Pro 15 (E23) | |
| AIDA64 / CPU PhotoWorxx | |
| Schenker XMG Pro 15 (E23) | |
| Moyenne de la classe Gaming (12271 - 89891, n=102, 2 dernières années) | |
| Uniwill GM6PX7X RTX 4070 | |
| HP Omen 16-wf000 | |
| Dell G15 5530 | |
| Alienware m16 R1 Intel | |
| Acer Predator Helios 16 PH16-71-731Q | |
| Moyenne Intel Core i7-13700HX (19678 - 42415, n=11) | |
| Alienware m16 R1 AMD | |
| Colorful EVOL X15 AT 23 | |
Pour plus d'informations, consultez notre site dédié Intel Core i7-13700HX dédiée.
Performance du système
L'EVOL X15 AT est plus performant dans PCMark 10 que dans CrossMark. Les scores de la mémoire AIDA64 sont plus faibles en raison de la présence d'une seule carte DDR5-4800 à double canal dans l'EVOL X15 par rapport à l'implémentation de deux cartes à quadruple canal dans ses concurrents.
Ceci étant dit, nous n'avons pas rencontré de problèmes lors de l'utilisation de l'EVOL X15 pour des tâches courantes de productivité et de navigation sur le web.
CrossMark: Overall | Productivity | Creativity | Responsiveness
AIDA64: Memory Copy | Memory Read | Memory Write | Memory Latency
| PCMark 10 / Score | |
| Alienware m16 R1 AMD | |
| Moyenne de la classe Gaming (5828 - 12414, n=93, 2 dernières années) | |
| Uniwill GM6PX7X RTX 4070 | |
| HP Omen 16-wf000 | |
| Acer Predator Helios 16 PH16-71-731Q | |
| Colorful EVOL X15 AT 23 | |
| Schenker XMG Pro 15 (E23) | |
| Moyenne Intel Core i7-13700HX, NVIDIA GeForce RTX 4060 Laptop GPU (6909 - 7743, n=5) | |
| Alienware m16 R1 Intel | |
| Dell G15 5530 | |
| PCMark 10 / Essentials | |
| Uniwill GM6PX7X RTX 4070 | |
| Alienware m16 R1 AMD | |
| Schenker XMG Pro 15 (E23) | |
| Acer Predator Helios 16 PH16-71-731Q | |
| Dell G15 5530 | |
| Alienware m16 R1 Intel | |
| Moyenne de la classe Gaming (8810 - 11935, n=97, 2 dernières années) | |
| Moyenne Intel Core i7-13700HX, NVIDIA GeForce RTX 4060 Laptop GPU (9760 - 11313, n=5) | |
| Colorful EVOL X15 AT 23 | |
| HP Omen 16-wf000 | |
| PCMark 10 / Productivity | |
| Moyenne de la classe Gaming (6845 - 25323, n=95, 2 dernières années) | |
| Acer Predator Helios 16 PH16-71-731Q | |
| Uniwill GM6PX7X RTX 4070 | |
| Schenker XMG Pro 15 (E23) | |
| Alienware m16 R1 AMD | |
| Dell G15 5530 | |
| Moyenne Intel Core i7-13700HX, NVIDIA GeForce RTX 4060 Laptop GPU (9131 - 11018, n=5) | |
| Alienware m16 R1 Intel | |
| Colorful EVOL X15 AT 23 | |
| HP Omen 16-wf000 | |
| PCMark 10 / Digital Content Creation | |
| Alienware m16 R1 AMD | |
| Moyenne de la classe Gaming (7602 - 19954, n=95, 2 dernières années) | |
| Uniwill GM6PX7X RTX 4070 | |
| HP Omen 16-wf000 | |
| Colorful EVOL X15 AT 23 | |
| Moyenne Intel Core i7-13700HX, NVIDIA GeForce RTX 4060 Laptop GPU (9393 - 12434, n=5) | |
| Acer Predator Helios 16 PH16-71-731Q | |
| Alienware m16 R1 Intel | |
| Schenker XMG Pro 15 (E23) | |
| Dell G15 5530 | |
| CrossMark / Overall | |
| Acer Predator Helios 16 PH16-71-731Q | |
| Alienware m16 R1 Intel | |
| Alienware m16 R1 AMD | |
| Moyenne de la classe Gaming (1366 - 2409, n=94, 2 dernières années) | |
| Uniwill GM6PX7X RTX 4070 | |
| Schenker XMG Pro 15 (E23) | |
| Moyenne Intel Core i7-13700HX, NVIDIA GeForce RTX 4060 Laptop GPU (1663 - 2105, n=5) | |
| Dell G15 5530 | |
| Colorful EVOL X15 AT 23 | |
| HP Omen 16-wf000 | |
| CrossMark / Productivity | |
| Acer Predator Helios 16 PH16-71-731Q | |
| Alienware m16 R1 Intel | |
| Alienware m16 R1 AMD | |
| Moyenne de la classe Gaming (1386 - 2254, n=94, 2 dernières années) | |
| Uniwill GM6PX7X RTX 4070 | |
| Schenker XMG Pro 15 (E23) | |
| Moyenne Intel Core i7-13700HX, NVIDIA GeForce RTX 4060 Laptop GPU (1618 - 1989, n=5) | |
| Dell G15 5530 | |
| Colorful EVOL X15 AT 23 | |
| HP Omen 16-wf000 | |
| CrossMark / Creativity | |
| Acer Predator Helios 16 PH16-71-731Q | |
| Moyenne de la classe Gaming (1343 - 2786, n=94, 2 dernières années) | |
| Alienware m16 R1 Intel | |
| Schenker XMG Pro 15 (E23) | |
| Alienware m16 R1 AMD | |
| Uniwill GM6PX7X RTX 4070 | |
| Dell G15 5530 | |
| Moyenne Intel Core i7-13700HX, NVIDIA GeForce RTX 4060 Laptop GPU (1710 - 2274, n=5) | |
| HP Omen 16-wf000 | |
| Colorful EVOL X15 AT 23 | |
| CrossMark / Responsiveness | |
| Acer Predator Helios 16 PH16-71-731Q | |
| Alienware m16 R1 Intel | |
| Uniwill GM6PX7X RTX 4070 | |
| Schenker XMG Pro 15 (E23) | |
| Alienware m16 R1 AMD | |
| Moyenne de la classe Gaming (1226 - 2334, n=94, 2 dernières années) | |
| Moyenne Intel Core i7-13700HX, NVIDIA GeForce RTX 4060 Laptop GPU (1269 - 1983, n=5) | |
| Dell G15 5530 | |
| HP Omen 16-wf000 | |
| Colorful EVOL X15 AT 23 | |
| AIDA64 / Memory Copy | |
| Schenker XMG Pro 15 (E23) | |
| Moyenne de la classe Gaming (21750 - 129946, n=102, 2 dernières années) | |
| Uniwill GM6PX7X RTX 4070 | |
| HP Omen 16-wf000 | |
| Dell G15 5530 | |
| Alienware m16 R1 Intel | |
| Acer Predator Helios 16 PH16-71-731Q | |
| Moyenne Intel Core i7-13700HX, NVIDIA GeForce RTX 4060 Laptop GPU (36504 - 58458, n=5) | |
| Alienware m16 R1 AMD | |
| Colorful EVOL X15 AT 23 | |
| AIDA64 / Memory Read | |
| Schenker XMG Pro 15 (E23) | |
| Moyenne de la classe Gaming (22956 - 118858, n=102, 2 dernières années) | |
| Uniwill GM6PX7X RTX 4070 | |
| Dell G15 5530 | |
| Alienware m16 R1 Intel | |
| HP Omen 16-wf000 | |
| Acer Predator Helios 16 PH16-71-731Q | |
| Moyenne Intel Core i7-13700HX, NVIDIA GeForce RTX 4060 Laptop GPU (36510 - 67644, n=5) | |
| Alienware m16 R1 AMD | |
| Colorful EVOL X15 AT 23 | |
| AIDA64 / Memory Write | |
| Acer Predator Helios 16 PH16-71-731Q | |
| Moyenne de la classe Gaming (22297 - 135096, n=102, 2 dernières années) | |
| Schenker XMG Pro 15 (E23) | |
| HP Omen 16-wf000 | |
| Uniwill GM6PX7X RTX 4070 | |
| Moyenne Intel Core i7-13700HX, NVIDIA GeForce RTX 4060 Laptop GPU (33598 - 85675, n=5) | |
| Dell G15 5530 | |
| Alienware m16 R1 Intel | |
| Alienware m16 R1 AMD | |
| Colorful EVOL X15 AT 23 | |
| AIDA64 / Memory Latency | |
| Moyenne de la classe Gaming (75.3 - 165.4, n=102, 2 dernières années) | |
| Alienware m16 R1 AMD | |
| Dell G15 5530 | |
| Alienware m16 R1 Intel | |
| Uniwill GM6PX7X RTX 4070 | |
| HP Omen 16-wf000 | |
| Moyenne Intel Core i7-13700HX, NVIDIA GeForce RTX 4060 Laptop GPU (81.9 - 93, n=5) | |
| Acer Predator Helios 16 PH16-71-731Q | |
| Schenker XMG Pro 15 (E23) | |
| Colorful EVOL X15 AT 23 | |
* ... Moindre est la valeur, meilleures sont les performances
| PCMark 8 Home Score Accelerated v2 | 5769 points | |
| PCMark 8 Work Score Accelerated v2 | 5995 points | |
| PCMark 10 Score | 7655 points | |
Aide | ||
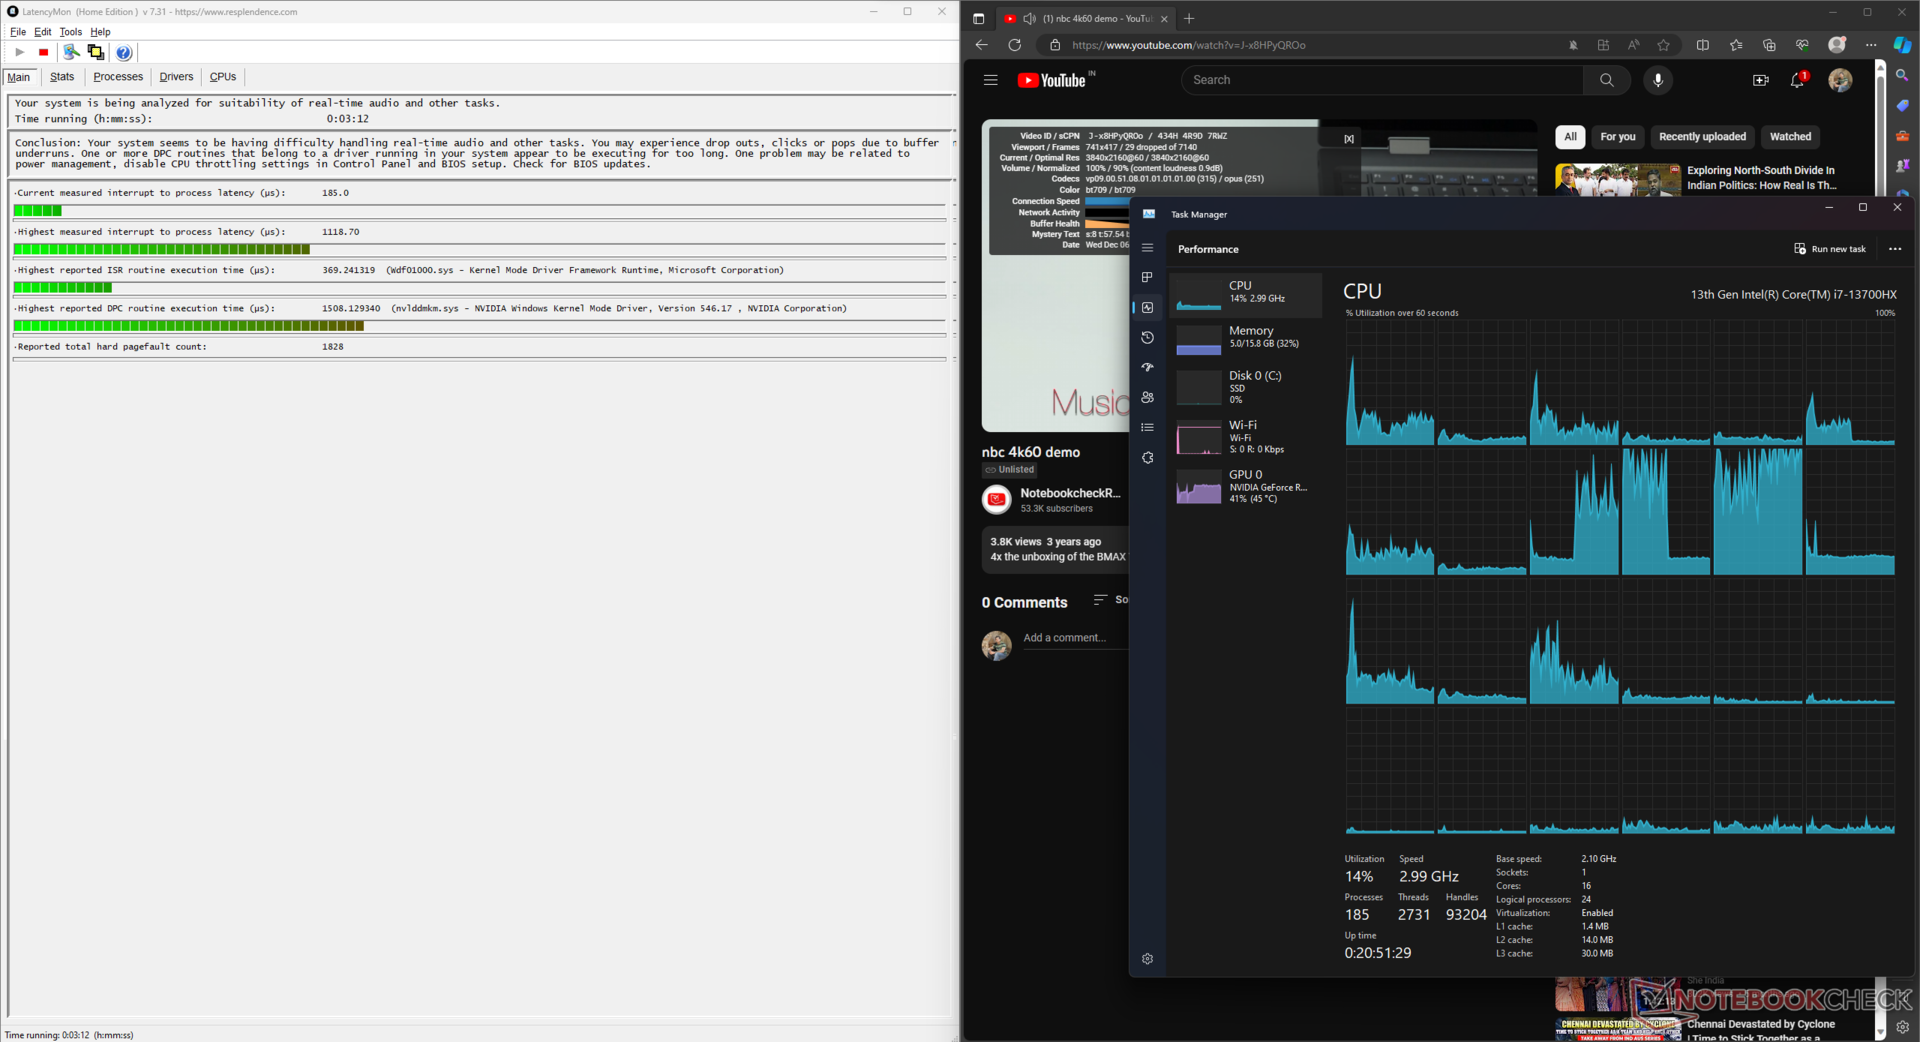
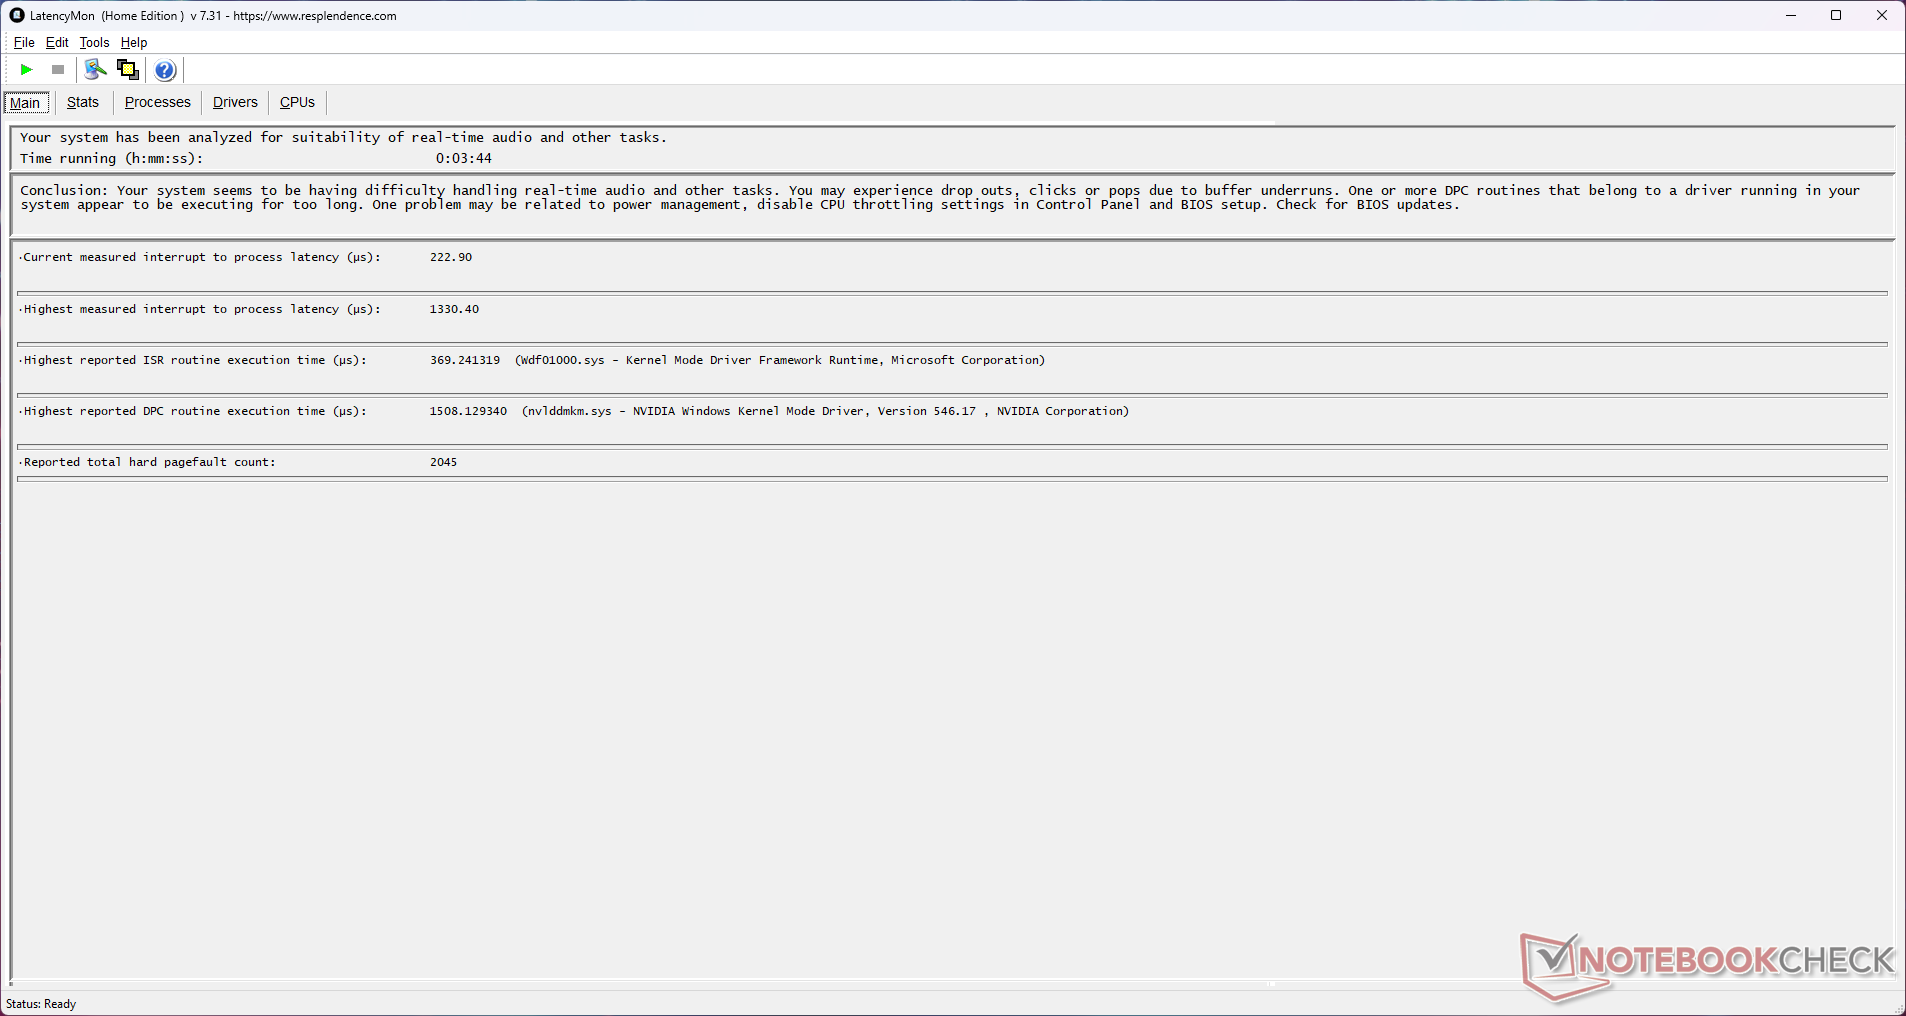
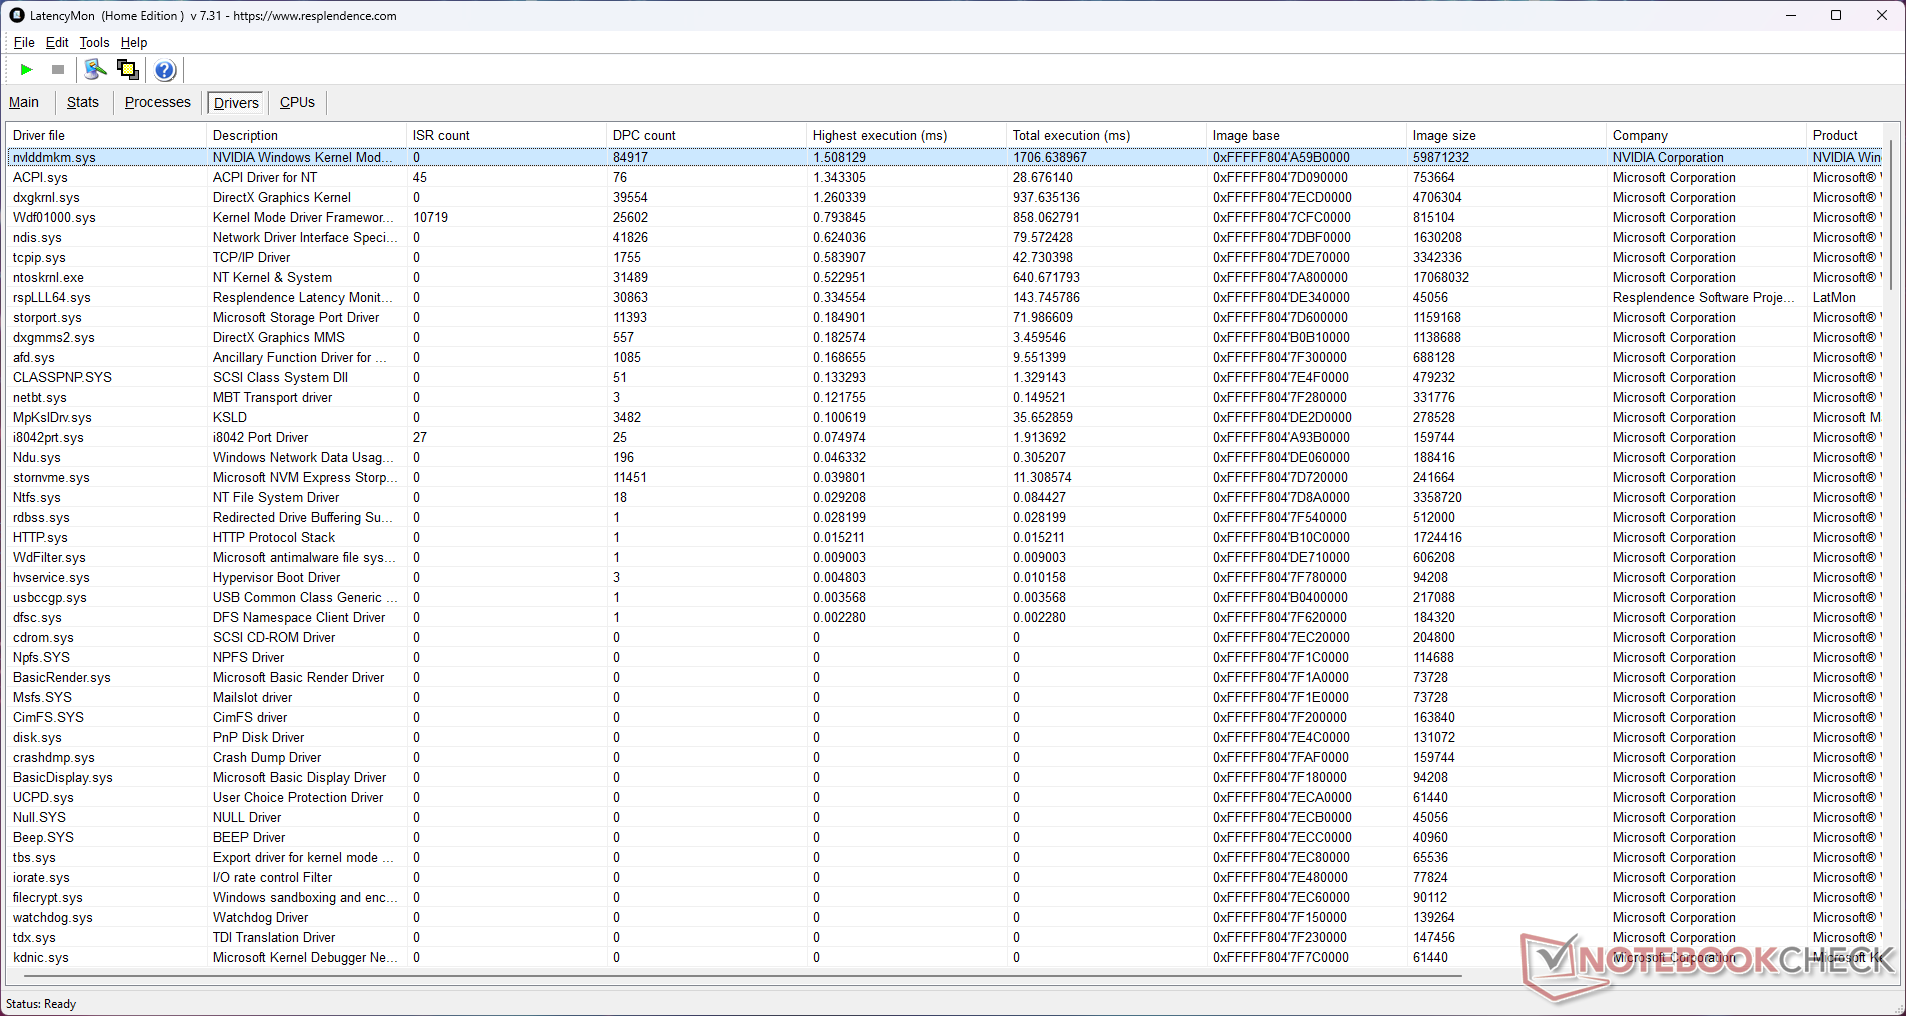
Latence DPC
La latence DPC élevée est un problème connu des ordinateurs portables équipés de cartes Nvidia, et l'EVOL X15 ne fait pas exception, même s'il s'en sort mieux que ses concurrents.
Nous avons enregistré une latence entre l'interruption et le processus de 1 330,4 µs à l'aide de LatencyMon, après la lecture d'un échantillon de YouTube 4K60 et un stress Prime95 de 10 secondes. Le pilote Nvidia Windows Kernel Mode Driver Framework (nvlddmkm.sys) contribue à cette latence élevée.
| DPC Latencies / LatencyMon - interrupt to process latency (max), Web, Youtube, Prime95 | |
| Dell G15 5530 | |
| Alienware m16 R1 Intel | |
| HP Omen 16-wf000 | |
| Alienware m16 R1 AMD | |
| Acer Predator Helios 16 PH16-71-731Q | |
| Colorful EVOL X15 AT 23 | |
| Uniwill GM6PX7X RTX 4070 | |
| Schenker XMG Pro 15 (E23) | |
* ... Moindre est la valeur, meilleures sont les performances
Notre Classement de latence DPC fournit d'autres comparaisons de LatencyMon entre les appareils testés.
Dispositifs de stockage
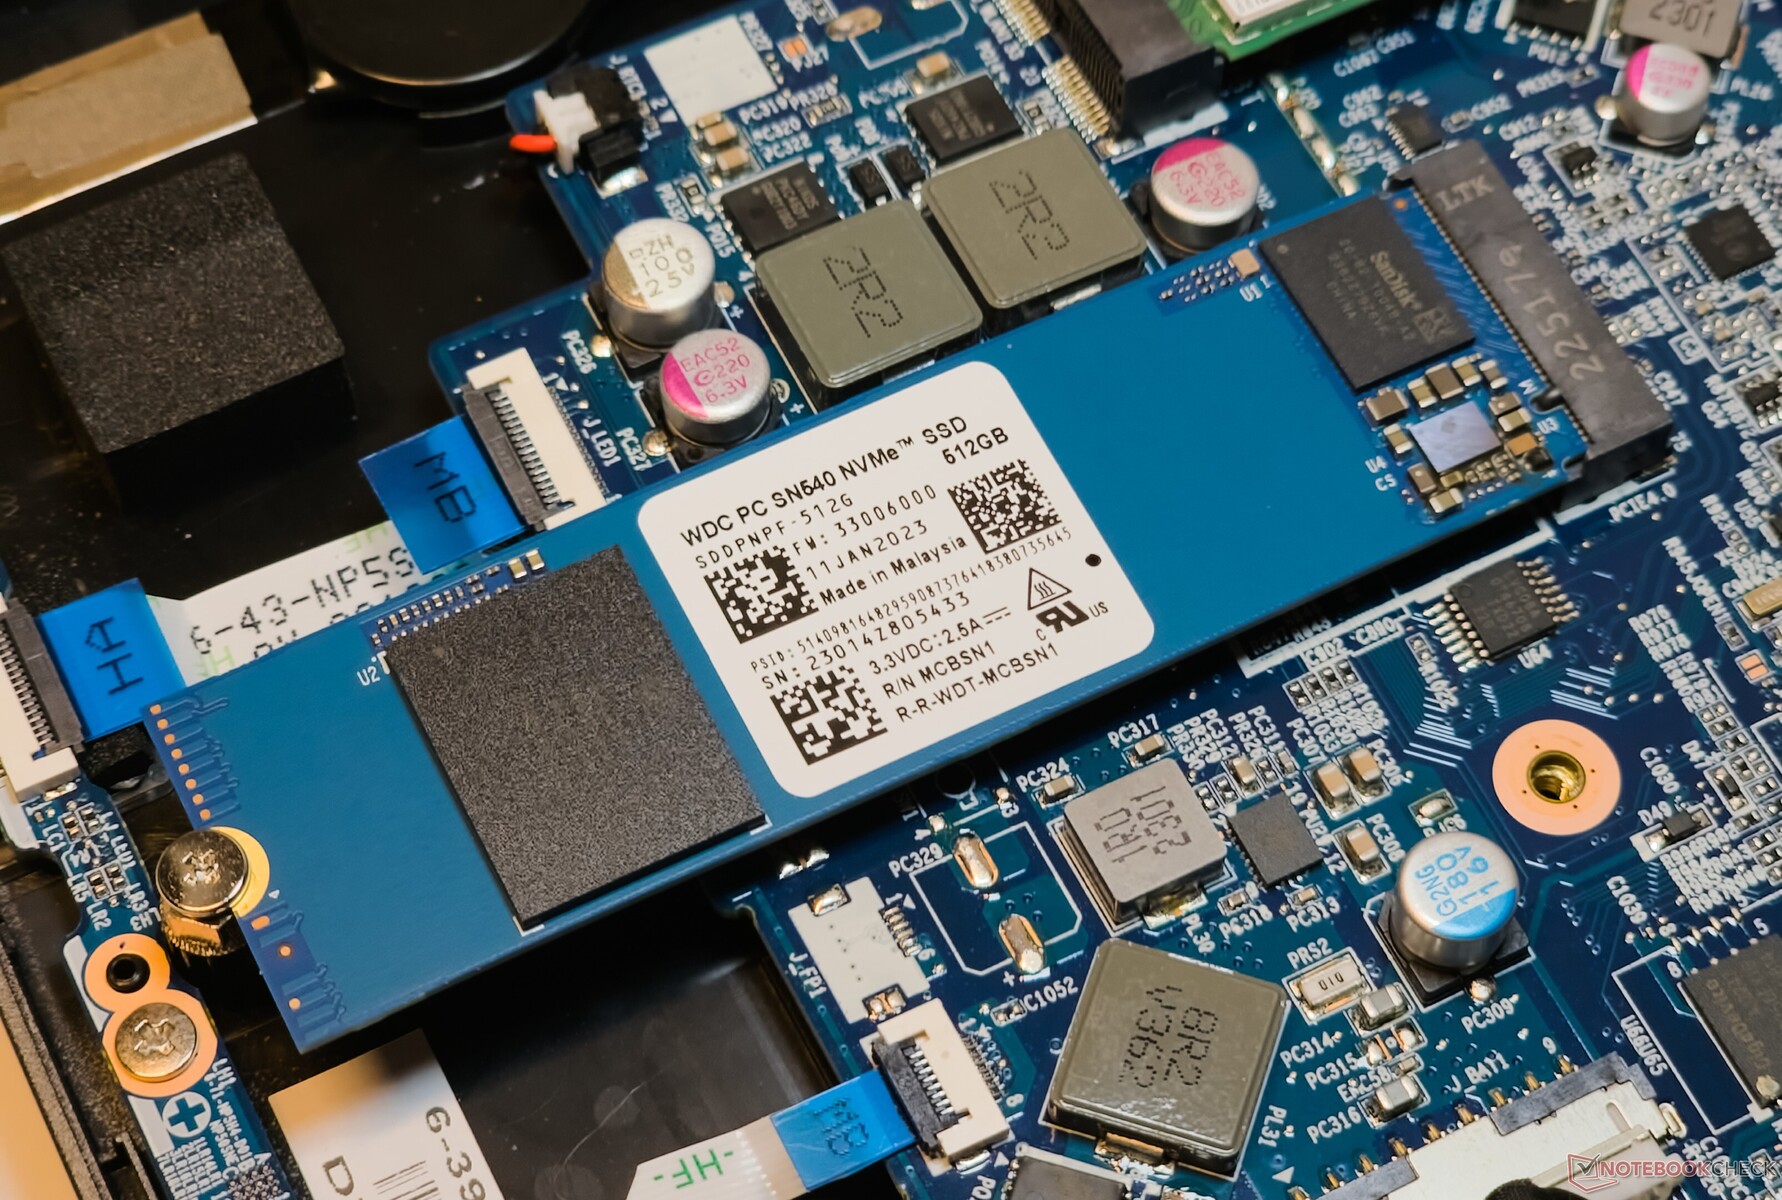
Le SSD Western Digital SN540 NVMe de 512 Go de l'EVOL X15 n'a rien à envier aux disques Kioxia et SK Hynix utilisés par ses concurrents. Néanmoins, les lectures 4k q1 t1 et les écritures 4k q1 t1 dépassent celles du Kioxia XG8 dans l'Alienware m16 R1 AMD.
Colorful vous permet d'ajouter un autre disque NVMe PCIe Gen4. En revanche, il n'est pas possible d'ajouter un stockage de masse SATA de 2,5 pouces.

* ... Moindre est la valeur, meilleures sont les performances
Throttoir de disque : Boucle de lecture DiskSpd, profondeur de la file d'attente 8
Le lecteur commence à s'étrangler après la 17ème boucle lors du test DiskSpd Read Loop avec une profondeur de file d'attente de 8. Il n'y a pas de couverture thermique ou de rembourrage sur le lecteur.
Performance du GPU
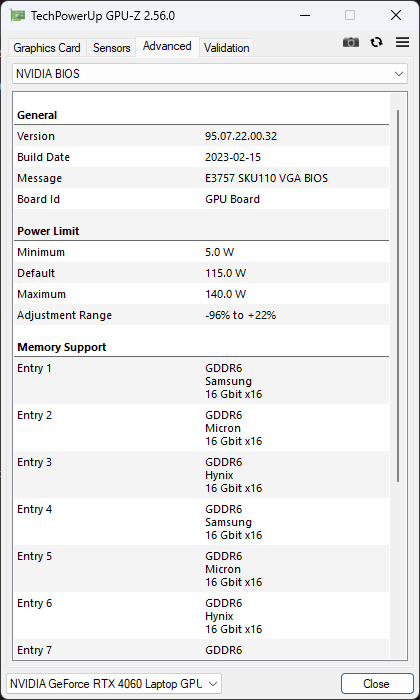
Le GPU pour ordinateur portable Nvidia GeForce RTX 4060 de l'EVOL X15 AT fonctionne à 140 W TGP. Ses performances 3DMark globales sont comparables à celles d'autres ordinateurs portables utilisant le même GPU.
Nous constatons également que la RTX 4060 est à portée de main du GPU pour ordinateur portable RTX 4070 de 140 watts RTX 4070 pour ordinateur portable de l'ordinateur portable Uniwill GM6PX7Xmais il lui manque 31% par rapport au GPU pour ordinateur portable 175 W RTX 4080 pour ordinateur portable qui équipe l'ordinateur portable Alienware m16 R1 AMD.
les scores graphiques de 3DMark Time Spy peuvent chuter de près de 54 % sur batterie.
| 3DMark 11 Performance | 30245 points | |
| 3DMark Ice Storm Standard Score | 278340 points | |
| 3DMark Cloud Gate Standard Score | 63582 points | |
| 3DMark Fire Strike Score | 24674 points | |
| 3DMark Fire Strike Extreme Score | 12089 points | |
| 3DMark Time Spy Score | 10590 points | |
Aide | ||
| Blender / v3.3 Classroom OPTIX/RTX | |
| Schenker XMG Pro 15 (E23) | |
| Colorful EVOL X15 AT 23 | |
| Alienware m16 R1 Intel | |
| Moyenne NVIDIA GeForce RTX 4060 Laptop GPU (19 - 28, n=53) | |
| Acer Predator Helios 16 PH16-71-731Q | |
| Dell G15 5530 | |
| Uniwill GM6PX7X RTX 4070 | |
| Moyenne de la classe Gaming (9 - 32, n=103, 2 dernières années) | |
| HP Omen 16-wf000 | |
| Alienware m16 R1 AMD | |
| Blender / v3.3 Classroom CUDA | |
| Schenker XMG Pro 15 (E23) | |
| Moyenne NVIDIA GeForce RTX 4060 Laptop GPU (39 - 53, n=53) | |
| Colorful EVOL X15 AT 23 | |
| Acer Predator Helios 16 PH16-71-731Q | |
| Dell G15 5530 | |
| Alienware m16 R1 Intel | |
| Uniwill GM6PX7X RTX 4070 | |
| Moyenne de la classe Gaming (15 - 228, n=103, 2 dernières années) | |
| Alienware m16 R1 AMD | |
| HP Omen 16-wf000 | |
| Blender / v3.3 Classroom CPU | |
| Moyenne NVIDIA GeForce RTX 4060 Laptop GPU (189 - 452, n=53) | |
| HP Omen 16-wf000 | |
| Dell G15 5530 | |
| Acer Predator Helios 16 PH16-71-731Q | |
| Colorful EVOL X15 AT 23 | |
| Schenker XMG Pro 15 (E23) | |
| Alienware m16 R1 Intel | |
| Uniwill GM6PX7X RTX 4070 | |
| Moyenne de la classe Gaming (122 - 565, n=99, 2 dernières années) | |
| Alienware m16 R1 AMD | |
* ... Moindre est la valeur, meilleures sont les performances
Performances des jeux
L'EVOL X15 a une petite longueur d'avance sur les ordinateurs portables concurrents aux spécifications similaires, notamment le Acer Predator Helios 16 et l'Alienware m16 R1 Intel en termes de performances de jeu globales en 1080p Ultra.
Le jeu en QHD 60 fps est réalisable dans de nombreux titres AAA, et il est possible d'obtenir des taux de rafraîchissement encore plus élevés avec l'aide d'upscalers tels que Nvidia DLSS, AMD FSR, ou Intel XeSS.
| The Witcher 3 - 1920x1080 Ultra Graphics & Postprocessing (HBAO+) | |
| Moyenne de la classe Gaming (104.7 - 240, n=7, 2 dernières années) | |
| Alienware m16 R1 AMD | |
| HP Omen 16-wf000 | |
| Schenker XMG Pro 15 (E23) | |
| Uniwill GM6PX7X RTX 4070 | |
| Alienware m16 R1 Intel | |
| Dell G15 5530 | |
| Colorful EVOL X15 AT 23 | |
| Acer Predator Helios 16 PH16-71-731Q | |
| GTA V - 1920x1080 Highest AA:4xMSAA + FX AF:16x | |
| Moyenne de la classe Gaming (67.1 - 186.9, n=90, 2 dernières années) | |
| Uniwill GM6PX7X RTX 4070 | |
| Colorful EVOL X15 AT 23 | |
| HP Omen 16-wf000 | |
| Acer Predator Helios 16 PH16-71-731Q | |
| Dell G15 5530 | |
| Schenker XMG Pro 15 (E23) | |
| Final Fantasy XV Benchmark - 1920x1080 High Quality | |
| Alienware m16 R1 AMD | |
| HP Omen 16-wf000 | |
| Moyenne de la classe Gaming (64.2 - 215, n=91, 2 dernières années) | |
| Uniwill GM6PX7X RTX 4070 | |
| Alienware m16 R1 Intel | |
| Colorful EVOL X15 AT 23 | |
| Acer Predator Helios 16 PH16-71-731Q | |
| Dell G15 5530 | |
Le tableau des FPS de Witcher 3
Le refroidissement du sous-système graphique de l'EVOL X15 semble être assez efficace, comme en témoignent les taux d'images stables observés sous contrainte avec The Witcher 3 à 1080p Ultra.
| Bas | Moyen | Élevé | Ultra | QHD | |
|---|---|---|---|---|---|
| GTA V (2015) | 185.6 | 182.3 | 177.3 | 114.6 | 85.6 |
| The Witcher 3 (2015) | 450 | 333 | 205 | 103.4 | 75.7 |
| Dota 2 Reborn (2015) | 192.2 | 169.7 | 164.6 | 153.1 | |
| Final Fantasy XV Benchmark (2018) | 206 | 143.9 | 101 | 74 | |
| X-Plane 11.11 (2018) | 176.1 | 155.9 | 116.4 | ||
| Far Cry 5 (2018) | 162 | 146 | 141 | 135 | 101 |
| Strange Brigade (2018) | 480 | 288 | 225 | 192 | 127.4 |
| F1 22 (2022) | 253 | 253 | 194.5 | 65.8 | 42.3 |
| F1 23 (2023) | 248 | 250 | 184.1 | 58.3 | 37 |
| Cyberpunk 2077 (2023) | 119.4 | 96.5 | 82.8 | 71.1 | 42.8 |
| Assassin's Creed Mirage (2023) | 137 | 125 | 116 | 89 | 65 |
| Call of Duty Modern Warfare 3 2023 (2023) | 128 | 114 | 86 | 65 | 56 |
| Avatar Frontiers of Pandora (2023) | 77.3 | 71.1 | 60.8 | 45.2 | 29.8 |
Consultez notre site dédié GPU pour ordinateur portable Nvidia GeForce RTX 4060 pour plus d'informations et des comparaisons de performances.
Émissions : Faibles températures de surface accompagnées d'un bruit de ventilateur élevé
Bruit du système
Colorful limite le bruit du ventilateur de l'EVOL X15 AT à moins de 30 db(A) en mode silencieux.
Cependant, les modes Divertissement et Performance affichent des niveaux de bruit proches de 55 db(A), même avec des charges 3DMark 06 moyennes.
Les profils d'alimentation fournis ont un impact perceptible sur les performances de jeu. Par exemple, nous constatons que les taux d'images moyens chutent de 33 % dans The Witcher 3 à 1080p Ultra lorsque l'on passe du mode Performance au mode Silencieux.
Degré de la nuisance sonore
| Au repos |
| 33.16 / 33.16 / 33.16 dB(A) |
| Fortement sollicité |
| 54.62 / 54.53 dB(A) |
 | ||
30 dB silencieux 40 dB(A) audible 50 dB(A) bruyant |
||
min: | ||
| Mode de performance | Ralenti dB(A) | Charge moyenne dB(A) | Charge maximale dB(A) | Le Witcher 3 1080p Ultra dB(A) |
|---|---|---|---|---|
| Silencieux | 24.73 | 26.61 | 26.08 | 26.82 / 67 fps |
| Économie d'énergie | 24.85 | 26.02 | 41.05 | 46.10 / 75 fps |
| Divertissement | 25.07 | 54.06 | 54.56 | 53.29 / 97 fps |
| Performance | 33.16 | 54.62 | 54.53 | 54.62 / 100 fps |
| Colorful EVOL X15 AT 23 i7-13700HX, GeForce RTX 4060 Laptop GPU | Alienware m16 R1 Intel i7-13700HX, GeForce RTX 4060 Laptop GPU | HP Omen 16-wf000 i7-13700HX, GeForce RTX 4080 Laptop GPU | Acer Predator Helios 16 PH16-71-731Q i7-13700HX, GeForce RTX 4060 Laptop GPU | Dell G15 5530 i7-13650HX, GeForce RTX 4060 Laptop GPU | Schenker XMG Pro 15 (E23) i9-13900HX, GeForce RTX 4060 Laptop GPU | Alienware m16 R1 AMD R9 7845HX, GeForce RTX 4080 Laptop GPU | Uniwill GM6PX7X RTX 4070 i7-13700HX, GeForce RTX 4070 Laptop GPU | |
|---|---|---|---|---|---|---|---|---|
| Noise | 9% | 7% | 14% | 19% | 11% | 13% | 13% | |
| arrêt / environnement * (dB) | 21.32 | 25 -17% | 23 -8% | 24 -13% | 20.41 4% | 24 -13% | 22.9 -7% | 22.4 -5% |
| Idle Minimum * (dB) | 33.16 | 25 25% | 29.6 11% | 24 28% | 26.85 19% | 24 28% | 22.9 31% | 22.9 31% |
| Idle Average * (dB) | 33.16 | 26 22% | 29.8 10% | 24 28% | 26.85 19% | 24 28% | 29.7 10% | 29 13% |
| Idle Maximum * (dB) | 33.16 | 27 19% | 30.4 8% | 32.32 3% | 26.85 19% | 24 28% | 29.7 10% | 29 13% |
| Load Average * (dB) | 54.62 | 52 5% | 33.8 38% | 36.66 33% | 27.65 49% | 53.65 2% | 29.8 45% | 40.2 26% |
| Witcher 3 ultra * (dB) | 54.6 | 51 7% | 57 -4% | 49.06 10% | 47.9 12% | 53.53 2% | 54.7 -0% | 48.7 11% |
| Load Maximum * (dB) | 54.53 | 53 3% | 58.3 -7% | 49.49 9% | 47.86 12% | 53.65 2% | 54.7 -0% | 55 -1% |
* ... Moindre est la valeur, meilleures sont les performances
Température
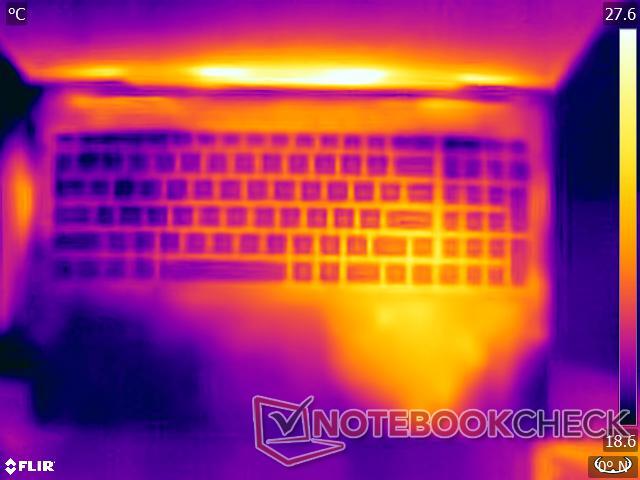
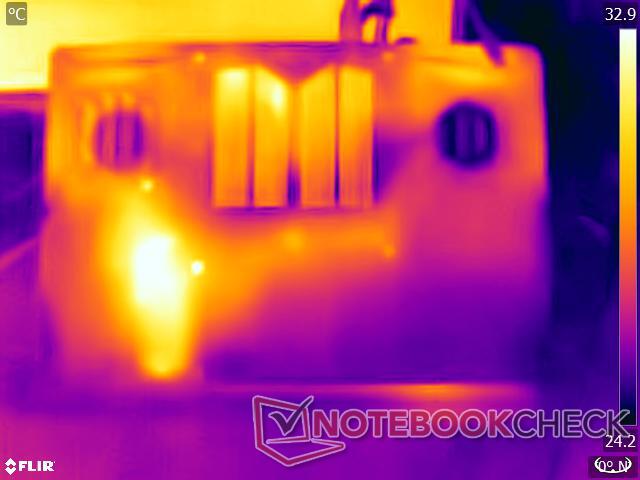
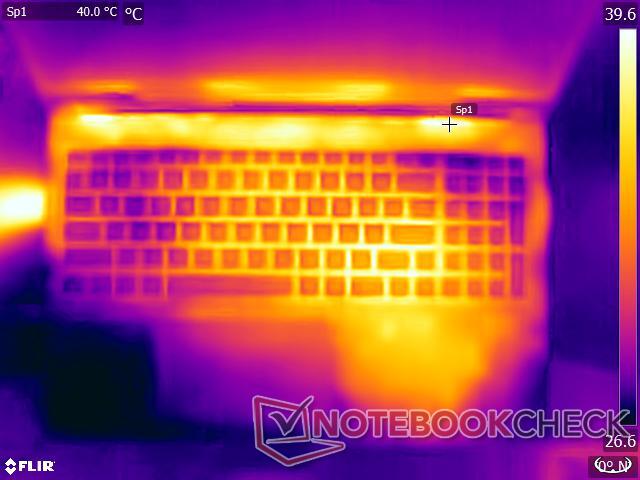
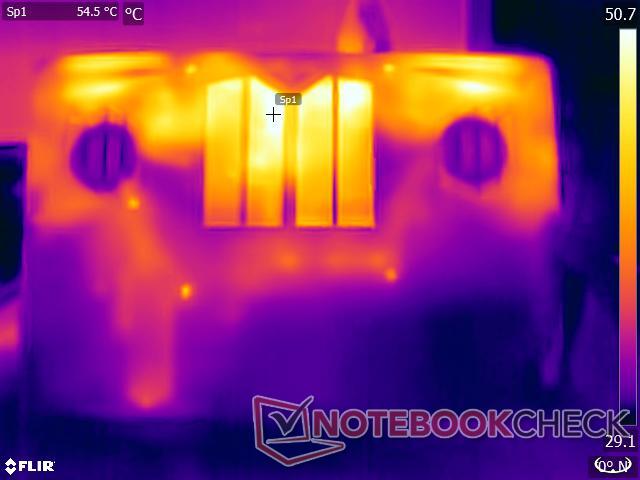
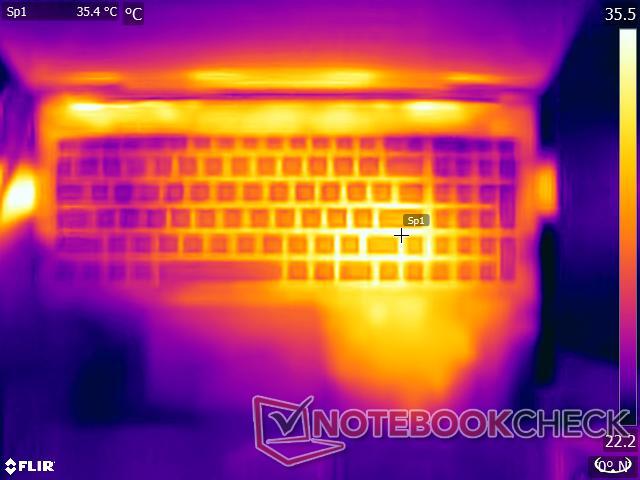
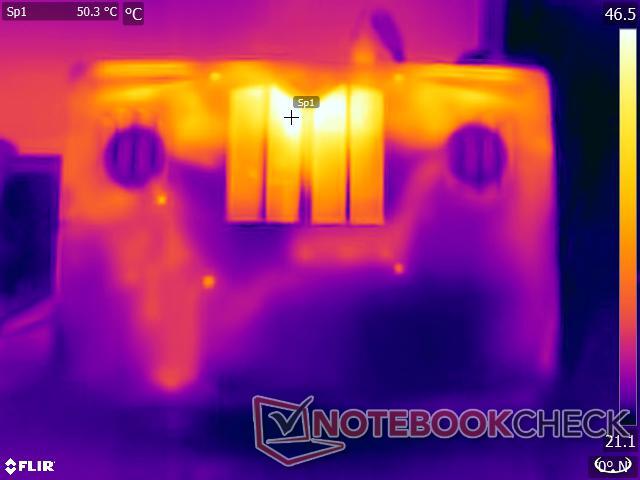
L'EVOL X15 dispose d'un système de refroidissement robuste qui couvre entièrement le CPU, le GPU et le chipset. Les températures de surface sont gérables en cas de forte charge grâce à la construction en plastique solide et à l'espace suffisant entre le panneau arrière et la carte mère. Seul un point chaud situé en bas de l'écran atteint 51 °C.
Malgré son poids, l'EVOL X15 peut être utilisé sur les genoux si vous ne le poussez pas trop fort. Les zones du touchpad et du repose-paume restent relativement froides et ne chauffent que légèrement en cas de sollicitation extrême.
(+) La température maximale du côté supérieur est de 37 °C / 99 F, par rapport à la moyenne de 40.4 °C / 105 F, allant de 21.2 à 68.8 °C pour la classe Gaming.
(-) Le fond chauffe jusqu'à un maximum de 51.2 °C / 124 F, contre une moyenne de 43.2 °C / 110 F
(+) En utilisation inactive, la température moyenne du côté supérieur est de 29.3 °C / 85 F, par rapport à la moyenne du dispositif de 33.9 °C / 93 F.
(+) En jouant à The Witcher 3, la température moyenne du côté supérieur est de 31.7 °C / 89 F, alors que la moyenne de l'appareil est de 33.9 °C / 93 F.
(+) Les repose-poignets et le pavé tactile atteignent la température maximale de la peau (34.8 °C / 94.6 F) et ne sont donc pas chauds.
(-) La température moyenne de la zone de l'appui-paume de dispositifs similaires était de 28.8 °C / 83.8 F (-6 °C / #-10.8 F).
| Colorful EVOL X15 AT 23 Intel Core i7-13700HX, NVIDIA GeForce RTX 4060 Laptop GPU | Alienware m16 R1 Intel Intel Core i7-13700HX, NVIDIA GeForce RTX 4060 Laptop GPU | HP Omen 16-wf000 Intel Core i7-13700HX, NVIDIA GeForce RTX 4080 Laptop GPU | Acer Predator Helios 16 PH16-71-731Q Intel Core i7-13700HX, NVIDIA GeForce RTX 4060 Laptop GPU | Dell G15 5530 Intel Core i7-13650HX, NVIDIA GeForce RTX 4060 Laptop GPU | Schenker XMG Pro 15 (E23) Intel Core i9-13900HX, NVIDIA GeForce RTX 4060 Laptop GPU | Alienware m16 R1 AMD AMD Ryzen 9 7845HX, NVIDIA GeForce RTX 4080 Laptop GPU | Uniwill GM6PX7X RTX 4070 Intel Core i7-13700HX, NVIDIA GeForce RTX 4070 Laptop GPU | |
|---|---|---|---|---|---|---|---|---|
| Heat | -18% | 0% | -17% | -19% | -9% | -9% | -5% | |
| Maximum Upper Side * (°C) | 37 | 49 -32% | 45 -22% | 41 -11% | 54 -46% | 50 -35% | 48 -30% | 38.2 -3% |
| Maximum Bottom * (°C) | 51.2 | 48 6% | 48.8 5% | 66 -29% | 62.2 -21% | 50 2% | 39 24% | 45 12% |
| Idle Upper Side * (°C) | 31.2 | 40 -28% | 29.2 6% | 36 -15% | 33.4 -7% | 33 -6% | 37 -19% | 33.6 -8% |
| Idle Bottom * (°C) | 32.8 | 39 -19% | 28.8 12% | 37 -13% | 33.4 -2% | 32 2% | 36.2 -10% | 39.6 -21% |
* ... Moindre est la valeur, meilleures sont les performances
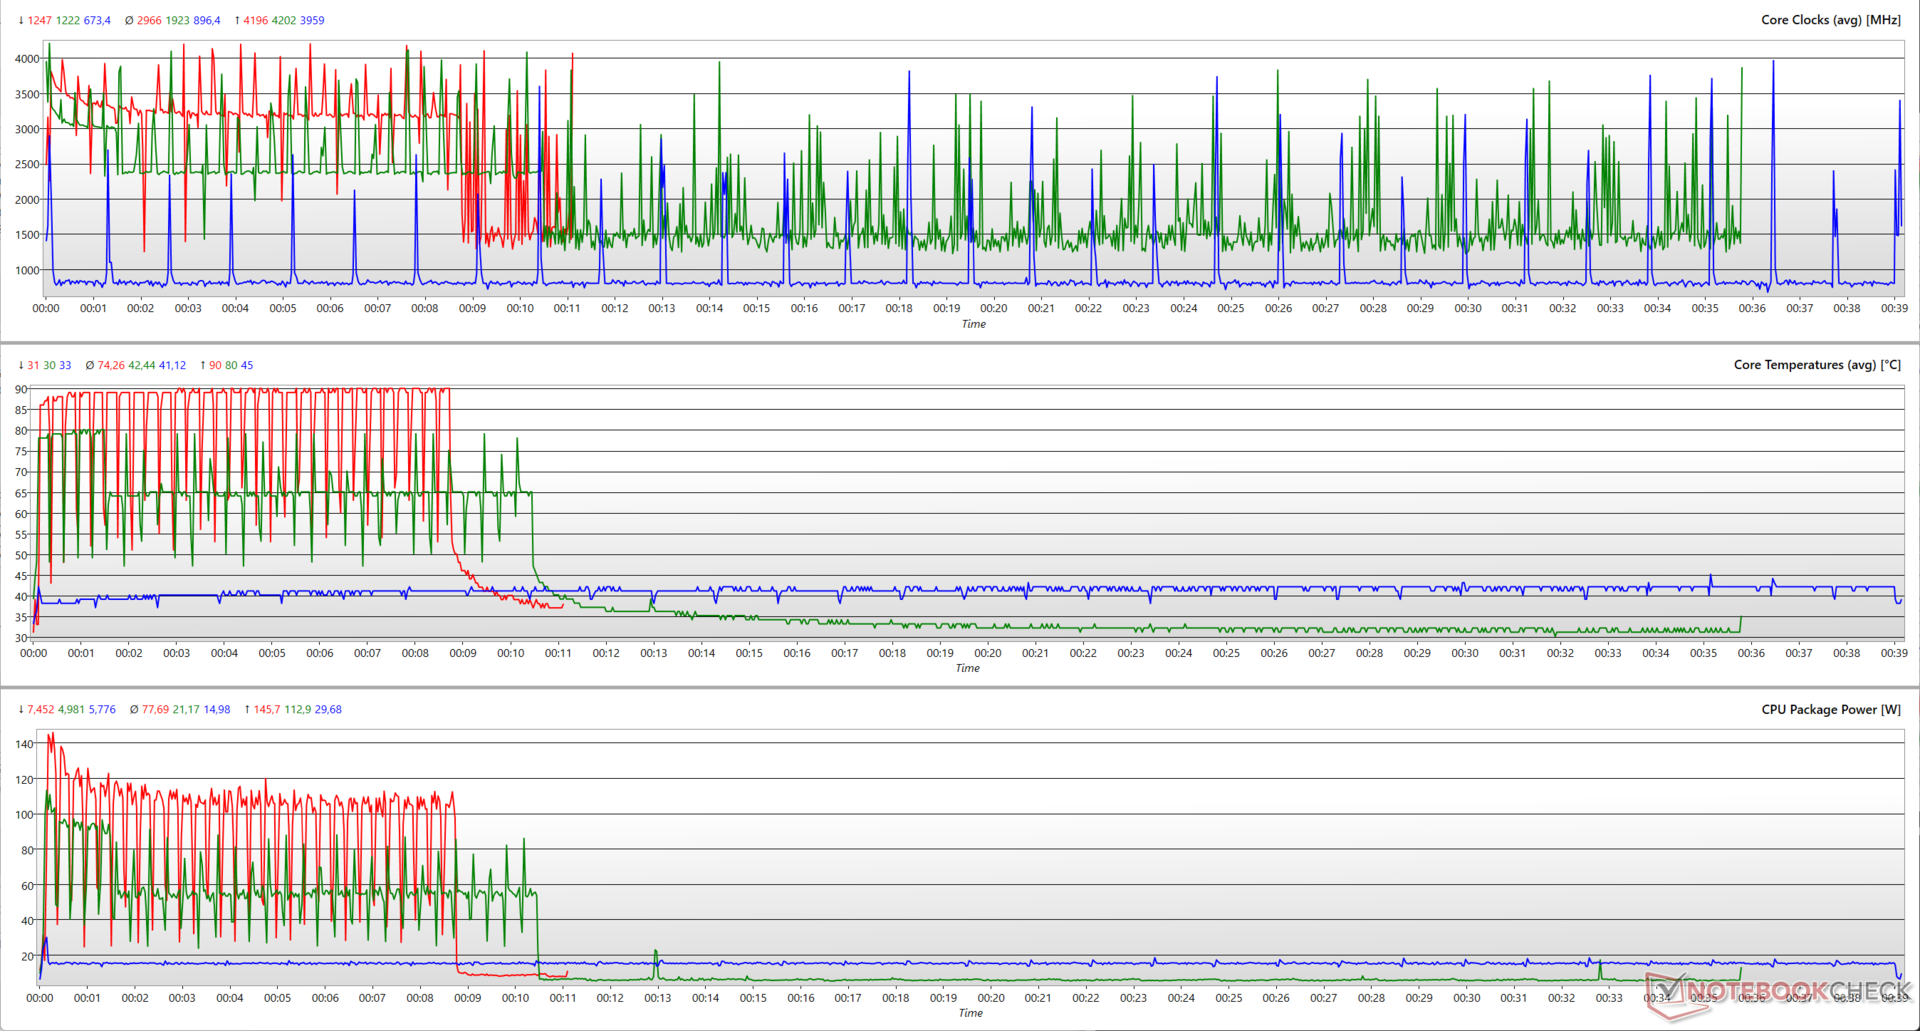
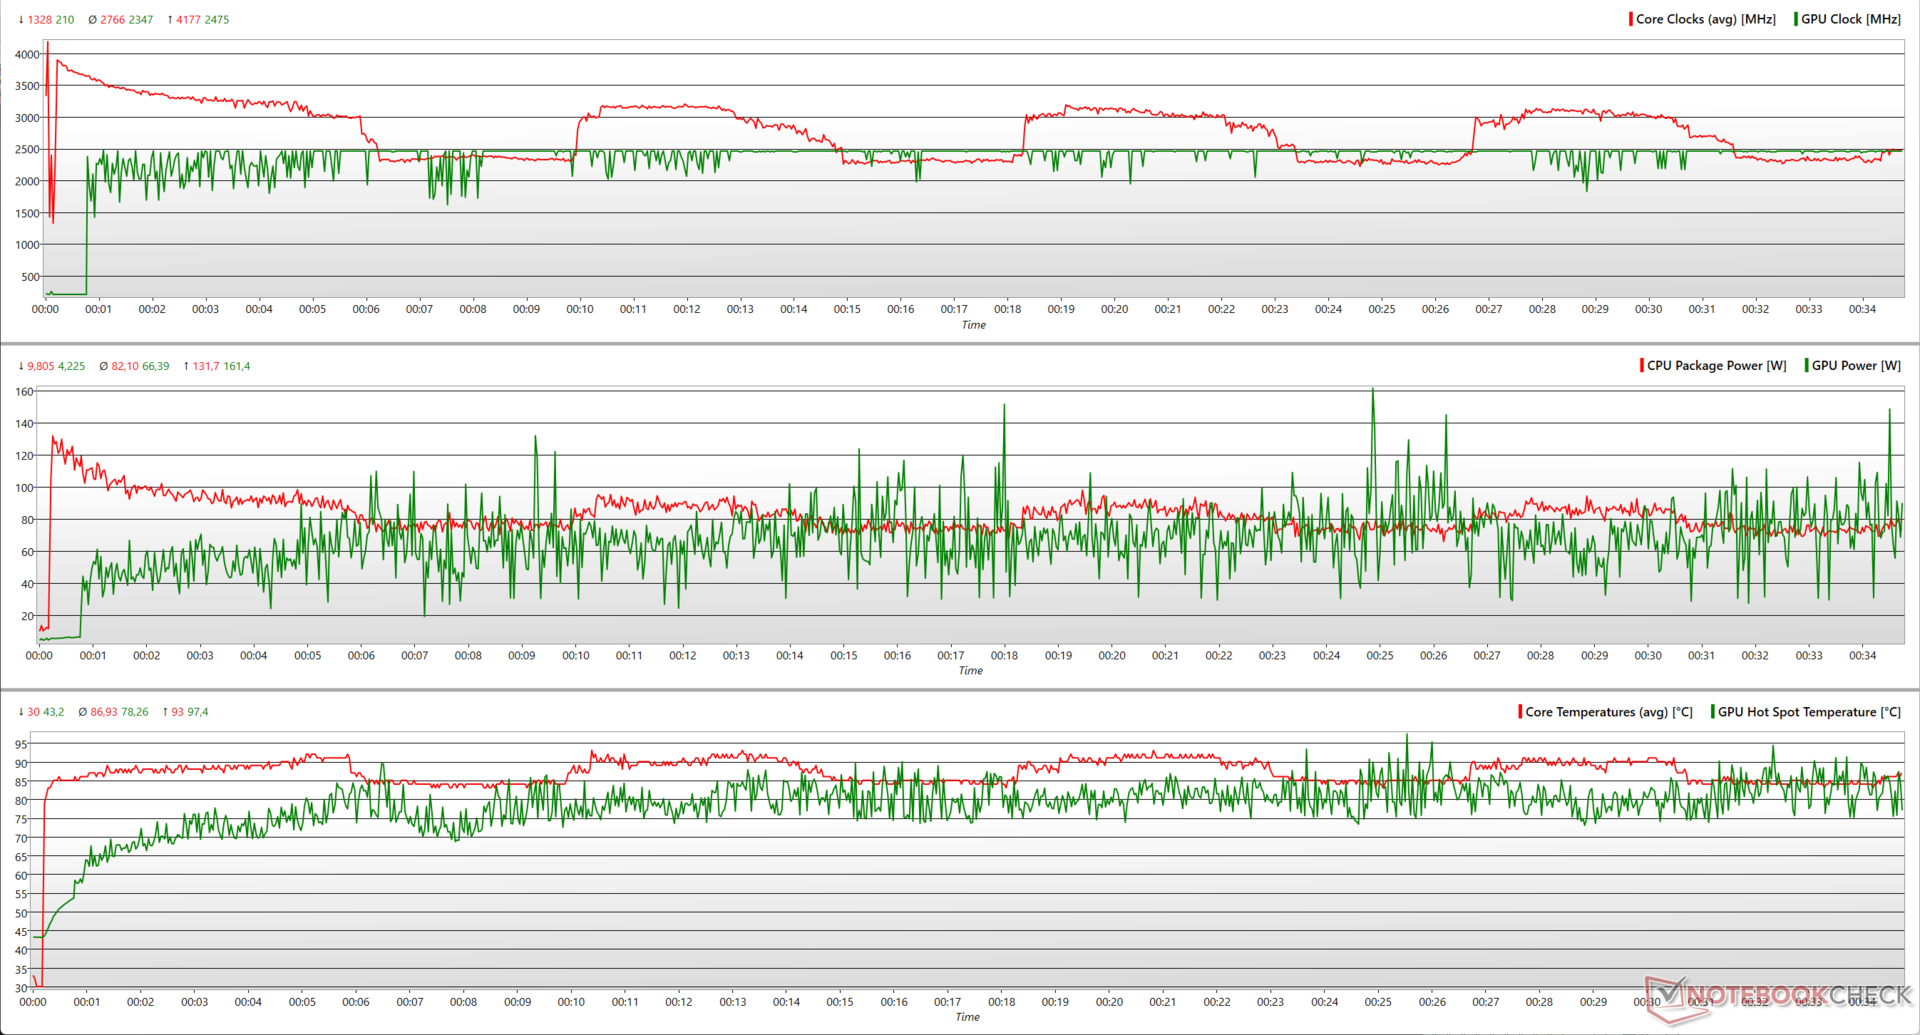
Test de stress
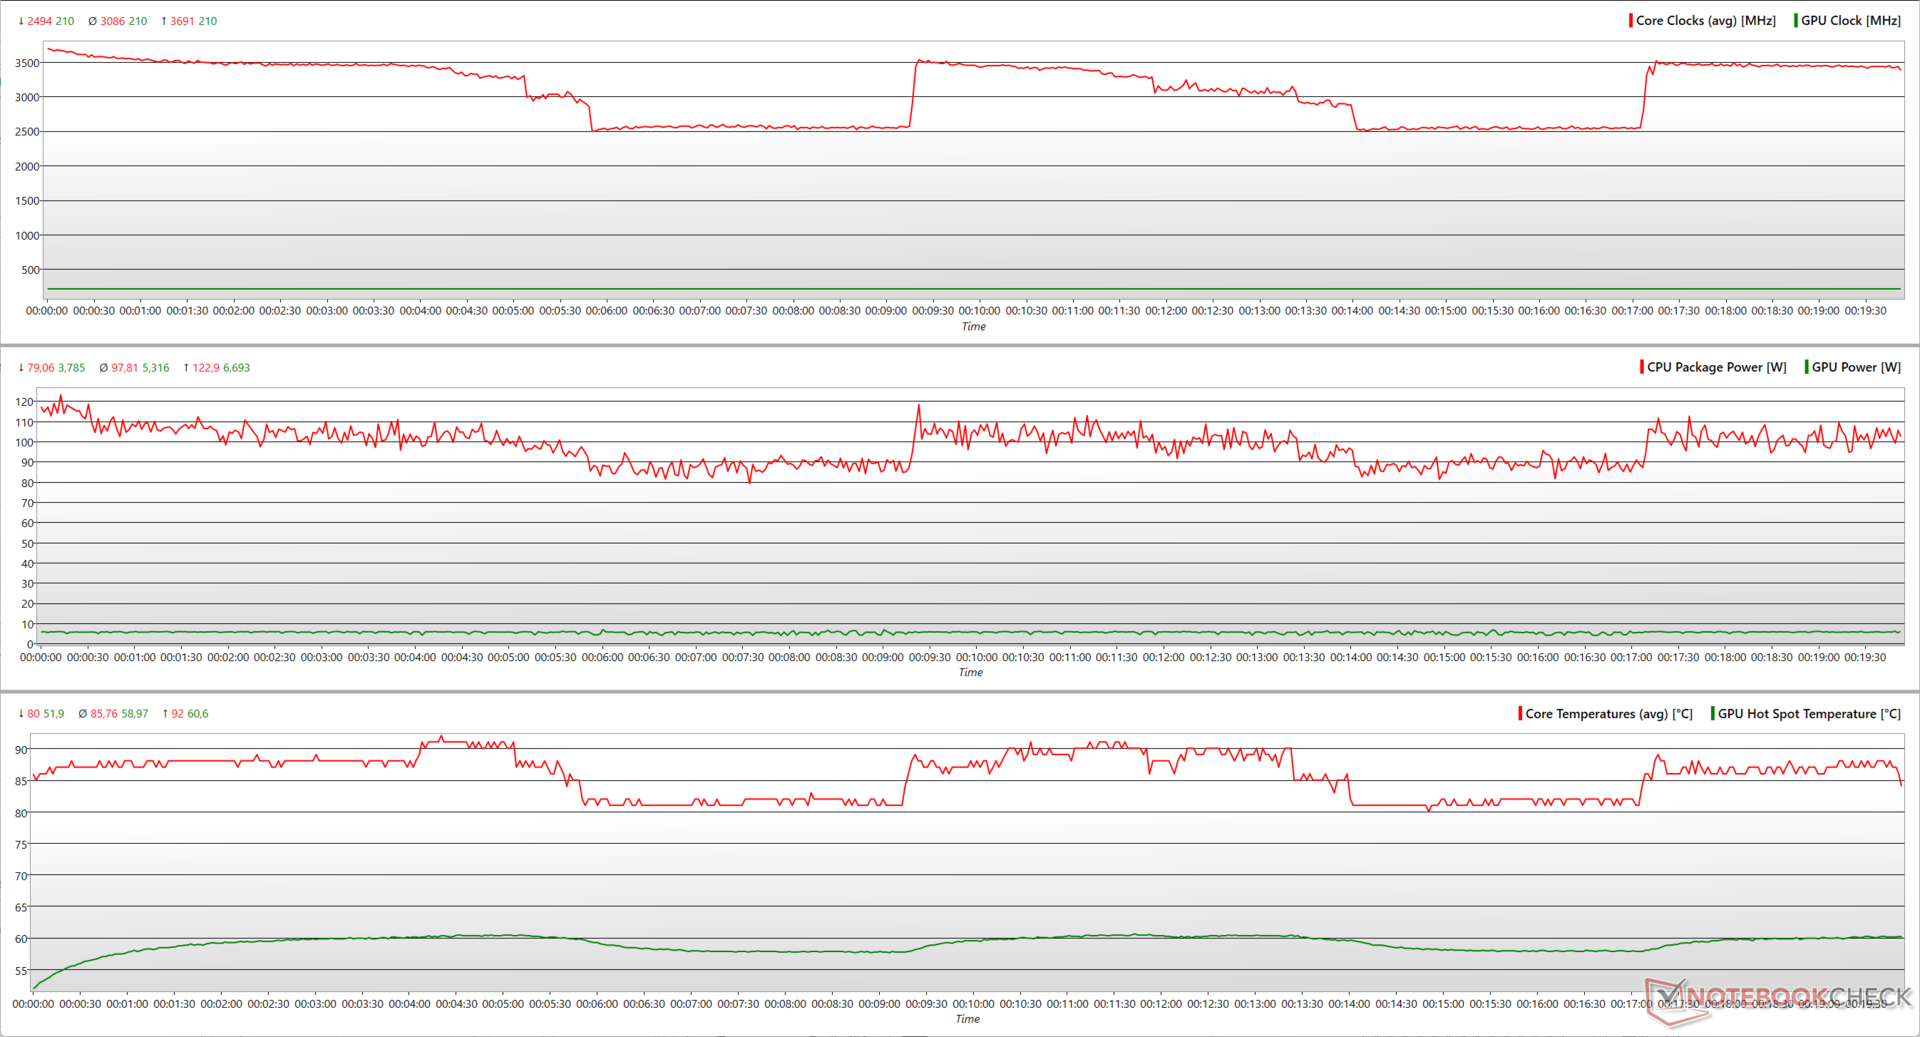
En sollicitant l'EVOL X15 avec des FFTs Prime95 en place, le Core i7-13700HX atteint des pics de 3,7 GHz en utilisant 123 W. Malgré un refroidissement complet, le CPU chute périodiquement à 2,5 GHz à 80 W avant d'essayer de remonter à 3,7 GHz.
En ajoutant FurMark, le Core i7-13700HX peut maintenant utiliser jusqu'à 132 W pour atteindre 4,2 GHz, mais il s'approche encore par intermittence de la barre des 2,5 GHz. La RTX 4060 peut utiliser la marge de puissance et atteindre 2 475 MHz en pointe tout en utilisant 161 W.
| Test de stress | Horloge du CPU (GHz) | Horloge du GPU (MHz) | Température moyenne du CPU (°C) | Température moyenne du GPU (°C) |
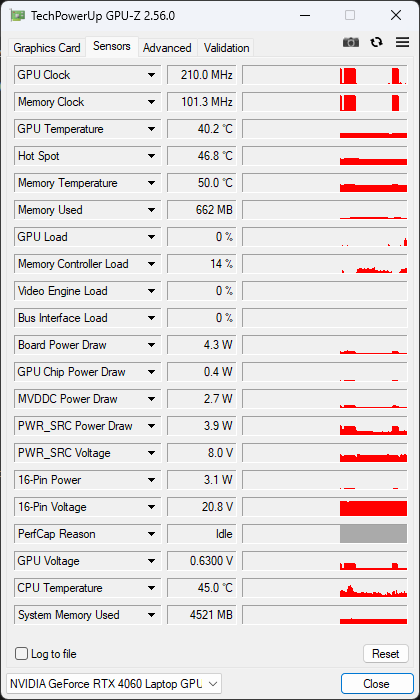
| Système au repos | 1,42 | 210 | 31 | 37,1 |
| Prime95 | 3,42 | 210 | 85 | 50,8 |
| Prime95 + FurMark | 2.99 | 2,460 | 86 | 70.8 |
| The Witcher 3 1080p Ultra | 3.12 | 2,460 | 64 | 73.7 |
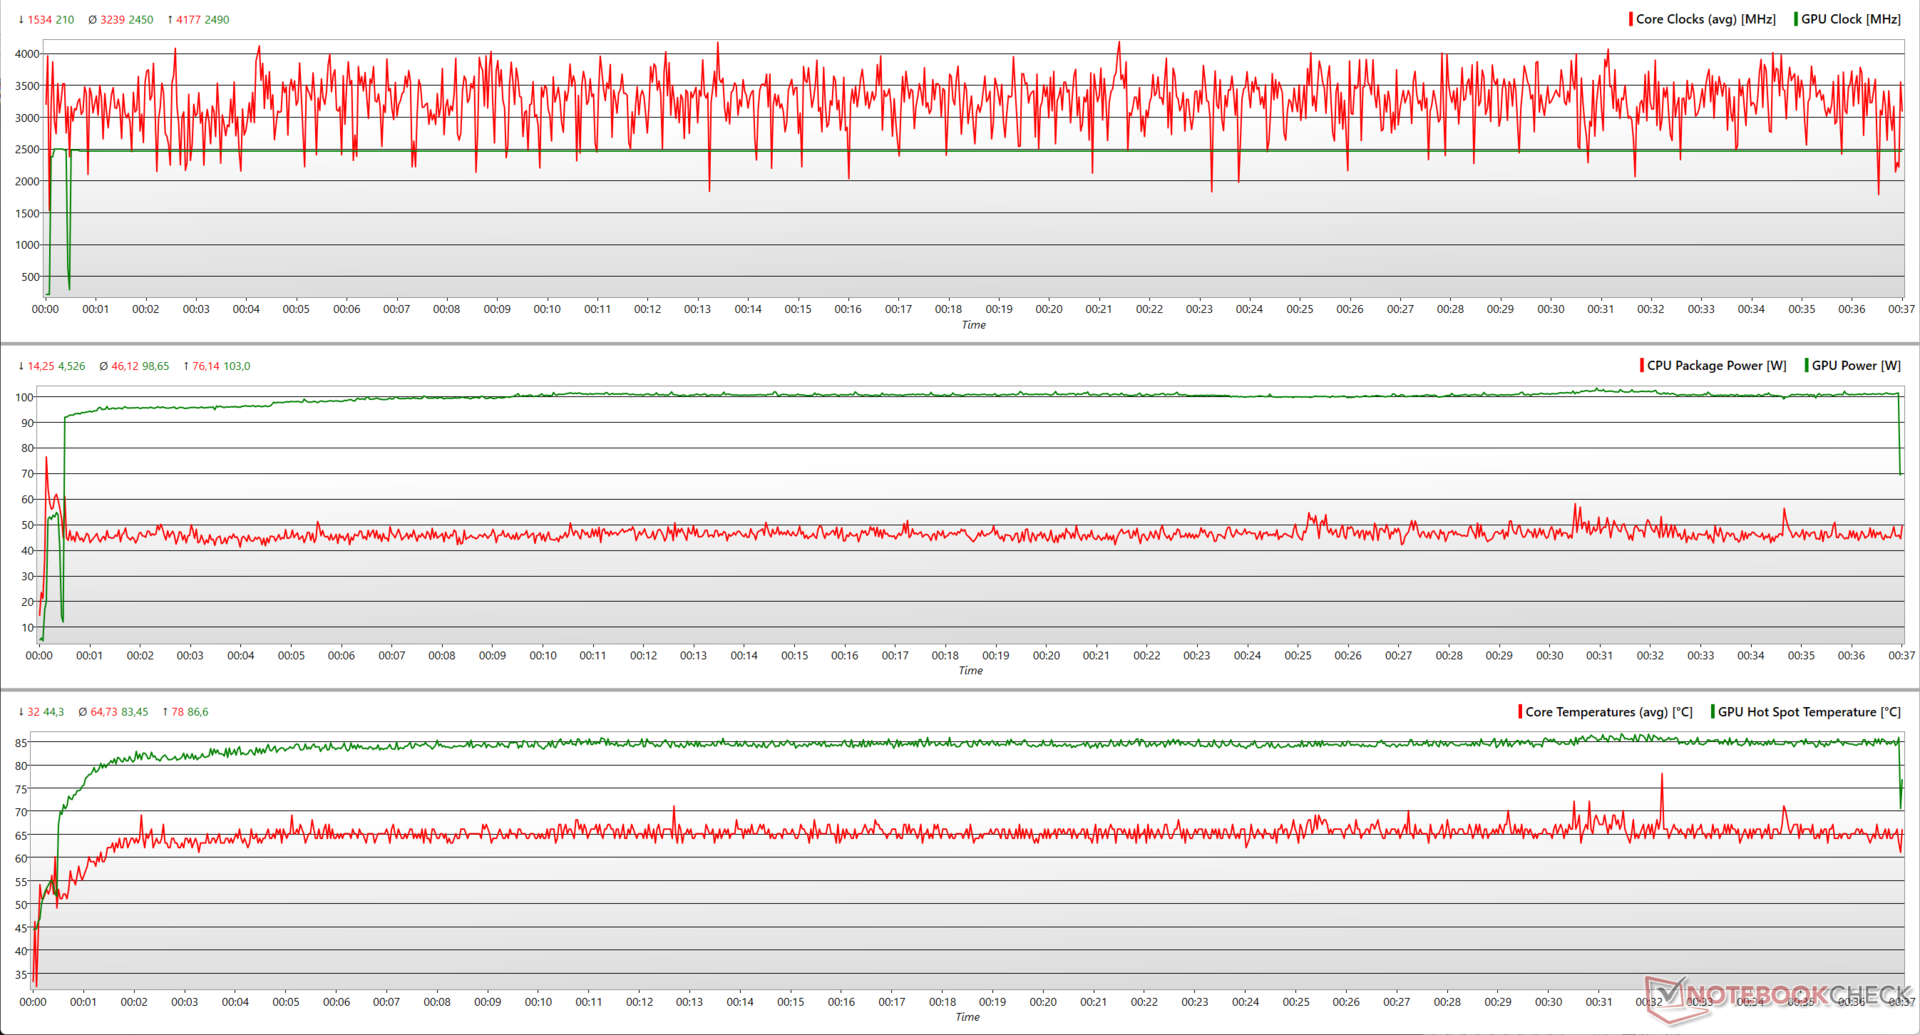
Avec The Witcher 3 à 1080p Ultra, le Core i7-13700HX est capable d'atteindre 4,2 GHz en pointe en utilisant seulement 76 W, tout en maintenant des horloges moyennes de 3,2 GHz à 46 W. Cela laisse suffisamment d'espace pour que la RTX 4060 atteigne un boost presque cohérent de 2 490 MHz à 103 W.
Intervenants
Les haut-parleurs stéréo de l'EVOL X15 sont suffisamment puissants pour une pièce de taille moyenne. Colorful annonce l'accord Creative SoundBlaster Studio, mais l'audio semble étriqué en raison du manque de réponse dans les basses et des médiums moyens. Les hautes fréquences, en revanche, sont assez bien reproduites.
Idéalement, Colorful aurait pu profiter du grand châssis pour inclure des radiateurs passifs plus puissants. Néanmoins, les utilisateurs peuvent bénéficier d'une meilleure qualité audio grâce à la prise audio combo de 3,5 mm ou au Bluetooth 5.2.
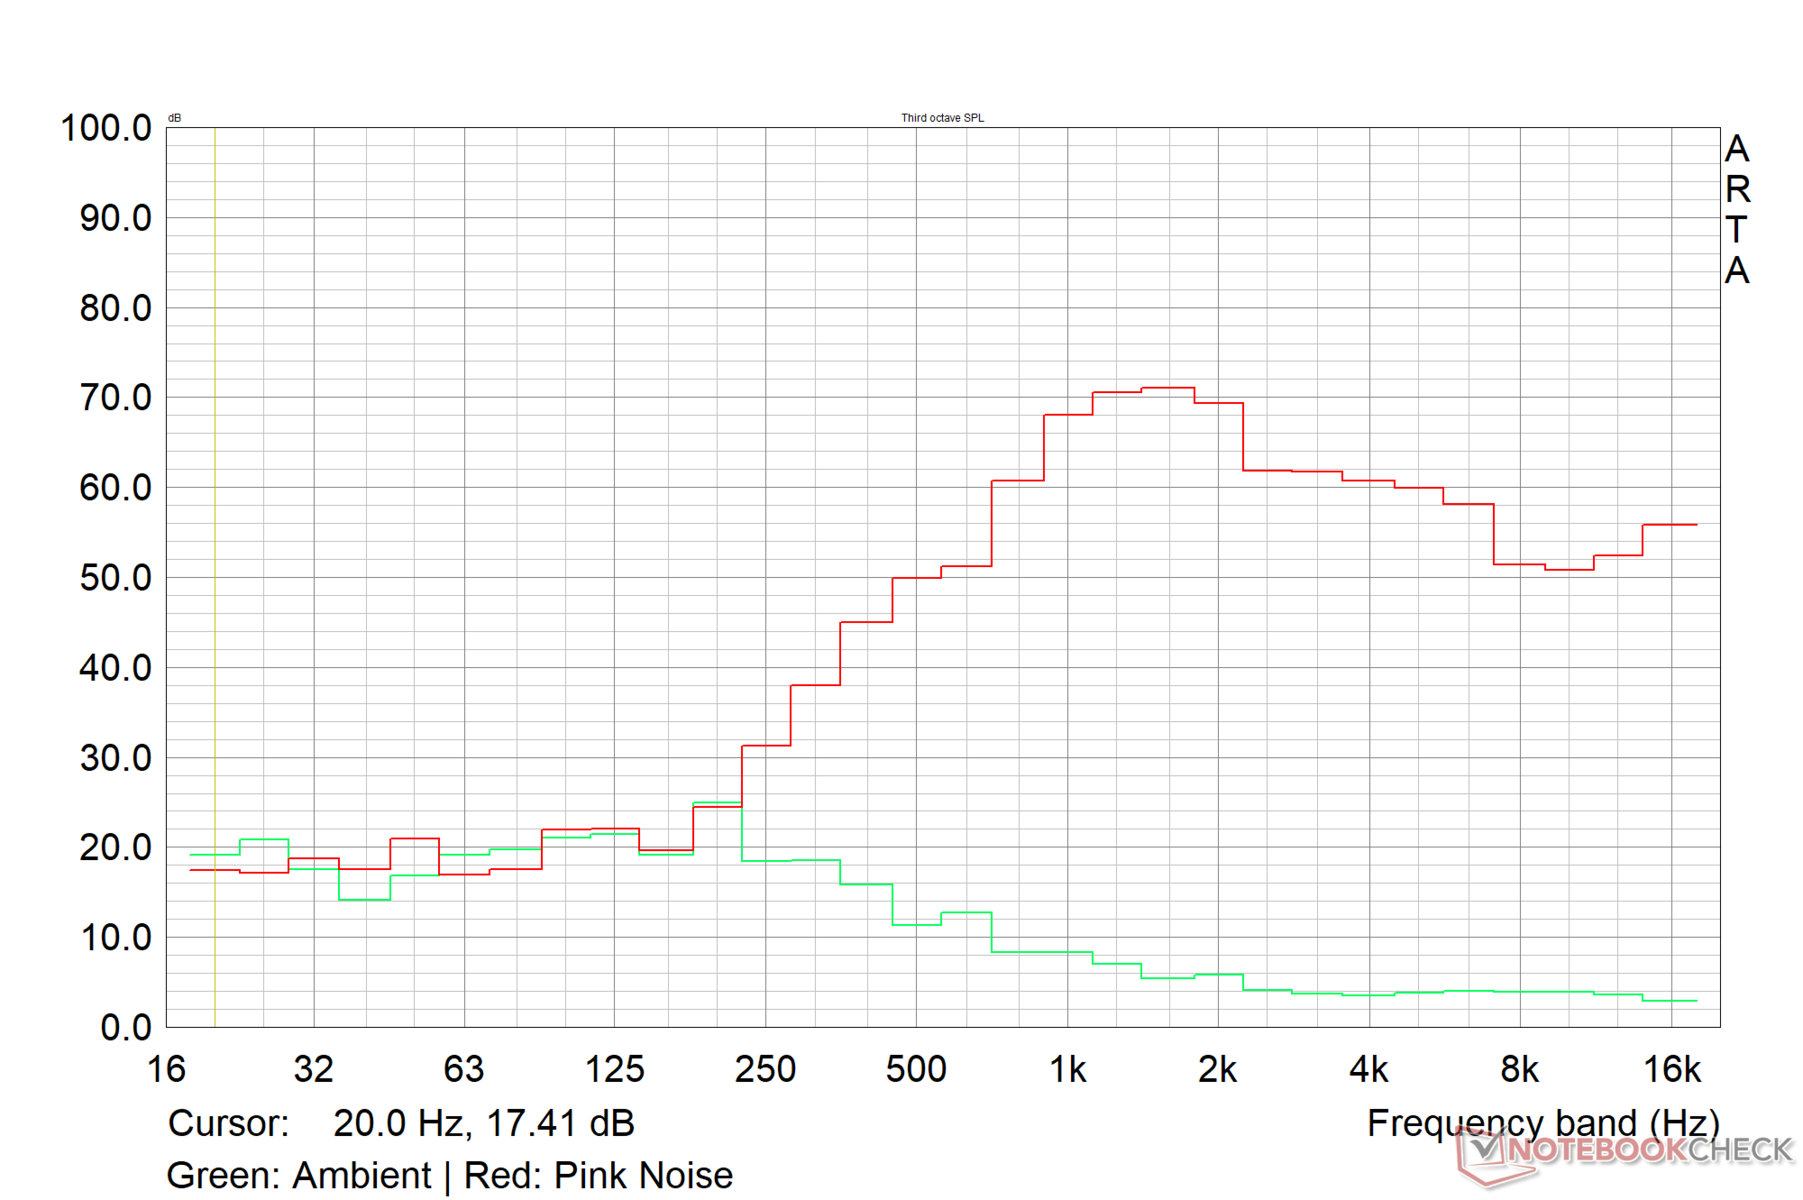
Colorful EVOL X15 AT 23 analyse audio
(±) | le niveau sonore du haut-parleur est moyen mais bon (77.5# dB)
Basses 100 - 315 Hz
(-) | presque aucune basse - en moyenne 26.2% plus bas que la médiane
(±) | la linéarité des basses est moyenne (9.2% delta à la fréquence précédente)
Médiums 400 - 2000 Hz
(±) | médiane supérieure - en moyenne 11.1% supérieure à la médiane
(±) | la linéarité des médiums est moyenne (9.6% delta à la fréquence précédente)
Aiguës 2 - 16 kHz
(±) | sommets plus élevés - en moyenne 6.1% plus élevés que la médiane
(+) | les aigus sont linéaires (5.8% delta à la fréquence précédente)
Globalement 100 - 16 000 Hz
(±) | la linéarité du son global est moyenne (29.7% de différence avec la médiane)
Par rapport à la même classe
» 95% de tous les appareils testés de cette catégorie étaient meilleurs, 2% similaires, 3% pires
» Le meilleur avait un delta de 6%, la moyenne était de 18%, le pire était de 132%.
Par rapport à tous les appareils testés
» 88% de tous les appareils testés étaient meilleurs, 3% similaires, 10% pires
» Le meilleur avait un delta de 4%, la moyenne était de 23%, le pire était de 134%.
Apple MacBook Pro 16 2021 M1 Pro analyse audio
(+) | les haut-parleurs peuvent jouer relativement fort (84.7# dB)
Basses 100 - 315 Hz
(+) | bonne basse - seulement 3.8% loin de la médiane
(+) | les basses sont linéaires (5.2% delta à la fréquence précédente)
Médiums 400 - 2000 Hz
(+) | médiane équilibrée - seulement 1.3% de la médiane
(+) | les médiums sont linéaires (2.1% delta à la fréquence précédente)
Aiguës 2 - 16 kHz
(+) | des sommets équilibrés - à seulement 1.9% de la médiane
(+) | les aigus sont linéaires (2.7% delta à la fréquence précédente)
Globalement 100 - 16 000 Hz
(+) | le son global est linéaire (4.6% différence à la médiane)
Par rapport à la même classe
» 0% de tous les appareils testés de cette catégorie étaient meilleurs, 0% similaires, 100% pires
» Le meilleur avait un delta de 5%, la moyenne était de 17%, le pire était de 45%.
Par rapport à tous les appareils testés
» 0% de tous les appareils testés étaient meilleurs, 0% similaires, 100% pires
» Le meilleur avait un delta de 4%, la moyenne était de 23%, le pire était de 134%.
Gestion de l'énergie : Économique en cas de charge maximale
Consommation électrique
La consommation en veille de l'EVOL X15 est plus élevée que celle de ses concurrents utilisant le Core i7-13700HX et la RTX 4060. Ceci étant dit, la consommation en charge maximale est relativement plus faible avec 224 W.
L'Uniwill GM6PX7X avec une RTX 4070 affiche une consommation d'énergie 33% plus élevée en charge maximale, tout en étant 16% plus économique que l'EVOL X15.
La brique d'alimentation de 280 W fournie peut alimenter l'ordinateur portable de manière adéquate en cas de stress.
| Éteint/en veille | |
| Au repos | |
| Fortement sollicité |
|
Légende:
min: | |
| Colorful EVOL X15 AT 23 i7-13700HX, GeForce RTX 4060 Laptop GPU, IPS, 2560x1440, 15.6" | Alienware m16 R1 Intel i7-13700HX, GeForce RTX 4060 Laptop GPU, IPS, 2560x1600, 16" | HP Omen 16-wf000 i7-13700HX, GeForce RTX 4080 Laptop GPU, IPS, 2560x1440, 16.1" | Acer Predator Helios 16 PH16-71-731Q i7-13700HX, GeForce RTX 4060 Laptop GPU, IPS-LED, 2560x1600, 16" | Dell G15 5530 i7-13650HX, GeForce RTX 4060 Laptop GPU, IPS, 1920x1080, 15.6" | Schenker XMG Pro 15 (E23) i9-13900HX, GeForce RTX 4060 Laptop GPU, IPS, 2560x1440, 15.6" | Alienware m16 R1 AMD R9 7845HX, GeForce RTX 4080 Laptop GPU, IPS, 2560x1600, 16" | Uniwill GM6PX7X RTX 4070 i7-13700HX, GeForce RTX 4070 Laptop GPU, IPS, 2560x1600, 16" | Moyenne NVIDIA GeForce RTX 4060 Laptop GPU | Moyenne de la classe Gaming | |
|---|---|---|---|---|---|---|---|---|---|---|
| Power Consumption | 20% | 2% | 20% | 30% | -11% | -45% | 16% | 36% | 24% | |
| Idle Minimum * (Watt) | 28.3 | 10 65% | 21.8 23% | 15.9 44% | 8.4 70% | 21.6 24% | 39 -38% | 12.6 55% | 11.5 ? 59% | 13.1 ? 54% |
| Idle Average * (Watt) | 32.2 | 14 57% | 26 19% | 20.5 36% | 14.98 53% | 29 10% | 44.6 -39% | 17.7 45% | 16 ? 50% | 19 ? 41% |
| Idle Maximum * (Watt) | 36.5 | 21 42% | 36 1% | 20.9 43% | 15.56 57% | 42.7 -17% | 68.1 -87% | 31.8 13% | 20.3 ? 44% | 24.6 ? 33% |
| Load Average * (Watt) | 119 | 119 -0% | 115.5 3% | 106 11% | 96.8 19% | 190 -60% | 129.8 -9% | 101.4 15% | 92.9 ? 22% | 111.3 ? 6% |
| Witcher 3 ultra * (Watt) | 189.6 | 186.7 2% | 214 -13% | 175 8% | 186 2% | 189 -0% | 285 -50% | 185.3 2% | ||
| Load Maximum * (Watt) | 224.3 | 323 -44% | 269.7 -20% | 276 -23% | 271.42 -21% | 269 -20% | 327.3 -46% | 298 -33% | 210 ? 6% | 260 ? -16% |
* ... Moindre est la valeur, meilleures sont les performances
Power Consumption: The Witcher 3 / Stress test
Power Consumption: External monitor
Autonomie de la batterie
Compte tenu de la puissance de l'EVOL X15, la batterie de 73 WHr ne peut offrir qu'une autonomie moyenne. Avec une luminosité de 150 nits, l'ordinateur portable peut tenir près de 5,5 heures lors de notre test de navigation Wi-Fi standard et environ 6,5 heures lors de la lecture de vidéos H.264 1080p.
| Colorful EVOL X15 AT 23 i7-13700HX, GeForce RTX 4060 Laptop GPU, 73 Wh | Alienware m16 R1 Intel i7-13700HX, GeForce RTX 4060 Laptop GPU, 86 Wh | HP Omen 16-wf000 i7-13700HX, GeForce RTX 4080 Laptop GPU, 83 Wh | Acer Predator Helios 16 PH16-71-731Q i7-13700HX, GeForce RTX 4060 Laptop GPU, 90 Wh | Dell G15 5530 i7-13650HX, GeForce RTX 4060 Laptop GPU, 86 Wh | Schenker XMG Pro 15 (E23) i9-13900HX, GeForce RTX 4060 Laptop GPU, 80 Wh | Alienware m16 R1 AMD R9 7845HX, GeForce RTX 4080 Laptop GPU, 86 Wh | Uniwill GM6PX7X RTX 4070 i7-13700HX, GeForce RTX 4070 Laptop GPU, 62 Wh | Moyenne de la classe Gaming | |
|---|---|---|---|---|---|---|---|---|---|
| Autonomie de la batterie | -15% | -11% | 5% | -11% | 26% | -35% | -26% | 26% | |
| H.264 (h) | 6.3 | 5.6 -11% | 4.8 -24% | 6.8 8% | 8.27 ? 31% | ||||
| WiFi v1.3 (h) | 5.4 | 4.8 -11% | 5.1 -6% | 5.6 4% | 6.5 20% | 5.7 6% | 3.7 -31% | 4 -26% | 7.08 ? 31% |
| Witcher 3 ultra (h) | 1.2 | 1.5 25% | 0.8 -33% | ||||||
| Load (h) | 1.3 | 1 -23% | 1.1 -15% | 1.5 15% | 0.8 -38% | 1.9 46% | 0.8 -38% | 1.496 ? 15% | |
| Reader / Idle (h) | 6.4 | 5.5 | 4 | 7.84 ? |
Points positifs
Points négatifs
Verdict : Un bon choix si vous pouvez l'obtenir pour moins de 1 000 $
Colorful vise à offrir un ordinateur portable de jeu QHD performant pour moins de 1 000 $ et y parvient largement avec l'EVOL X15 AT 23. L'EVOL X15 AT 23 est principalement construit en plastique Clevo, il y a un peu de flexion au niveau du clavier, mais la structure de l'EVOL X15 reste solide dans l'ensemble.
L'EVOL X15 AT possède de nombreux atouts. Les acheteurs potentiels apprécieront la bonne sélection de ports, les vitesses rapides du Wi-Fi 6E et l'accès facile aux composants internes.
La combinaison d'un processeur Intel Core i7-13700HX et d'un processeur Nvidia GPU pour ordinateur portable Nvidia GeForce RTX 4060 permet à l'EVOL X15 AT de rivaliser efficacement avec des modèles plus onéreux tels que le Alienware m16 R1 et le Acer Predator Helios 16.
Le Colorful EVOL X15 AT n'offre peut-être pas toutes les fonctionnalités que l'on trouve chez les concurrents bien établis, mais il parvient à assurer l'essentiel sans limitations notables des performances
Ceci étant dit, il y a aussi plusieurs domaines de critique. Des aspects tels que le manque d'alimentation avec les ports Type-C et des temps de réponse un peu plus longs doivent être pris en compte. Colorful doit également se concentrer sur l'ajustement des courbes de ventilateur avec les profils de performance par défaut et travailler sur l'amélioration de la consommation d'énergie au repos.
Dans l'ensemble, le Colorful EVOL X15 AT mérite d'être pris en considération, à condition que vous puissiez l'obtenir pour moins de 1 000 $ et que vous n'ayez pas à payer une majoration.
Ceci étant dit, les ordinateurs portables équipés de la RTX 3070 Ti Laptop GPUou même la Radeon RX 6800Mpeuvent offrir un meilleur ensemble à des prix similaires si vous n'avez pas peur de perdre la génération d'images de DLSS 3 et les gains d'efficacité d'Ada Lovelace.
Prix et disponibilité
Le Colorful EVOL X15 AT 23 est disponible directement auprès des distributeurs locaux de produits Colorful. La configuration testée de l'EVOL X15 AT est officiellement vendue au prix de 969 $, mais elle est actuellement vendue sur Newegg à un prix nettement plus élevé de 1 759 $.
Par ailleurs, une variante QHD du Acer Nitro 5 avec un AMD Ryzen 7 6800H et un GPU RTX 3070 Ti pour ordinateur portable peut être acheté sur Amazon US pour moins de 1 200 $.
Si les performances brutes du processeur ne sont pas une priorité, le Asus ROG Strix G15 doté d'un AMD Ryzen 9 5900HX et une Radeon RX 6800M est un bon choix pour moins de 1 300 $ sur Amazon US et moins de 1 200 $ sur Best Buy US.
Colorful EVOL X15 AT 23
- 12/20/2023 v7 (old)
Vaidyanathan Subramaniam
Transparency
La sélection des appareils à examiner est effectuée par notre équipe éditoriale. L'échantillon d'essai a été remis gratuitement à l'auteur par le fabricant à des fins d'évaluation. Cet examen n'a pas été influencé par des tiers et le fabricant n'a pas reçu de copie de cet examen avant sa publication. Il n'y avait aucune obligation de publier cet article. En tant que média indépendant, Notebookcheck n'est pas soumis à l'autorité des fabricants, des détaillants ou des éditeurs.
Voici comment Notebookcheck teste
Chaque année, Notebookcheck examine de manière indépendante des centaines d'ordinateurs portables et de smartphones en utilisant des procédures standardisées afin de garantir que tous les résultats sont comparables. Nous avons continuellement développé nos méthodes de test depuis environ 20 ans et avons établi des normes industrielles dans le processus. Dans nos laboratoires de test, des équipements de mesure de haute qualité sont utilisés par des techniciens et des rédacteurs expérimentés. Ces tests impliquent un processus de validation en plusieurs étapes. Notre système d'évaluation complexe repose sur des centaines de mesures et de points de référence bien fondés, ce qui garantit l'objectivité.Price comparison

