Test de l'Uniwill GM6PX7X IDX : les débuts du Core i7-13700HX
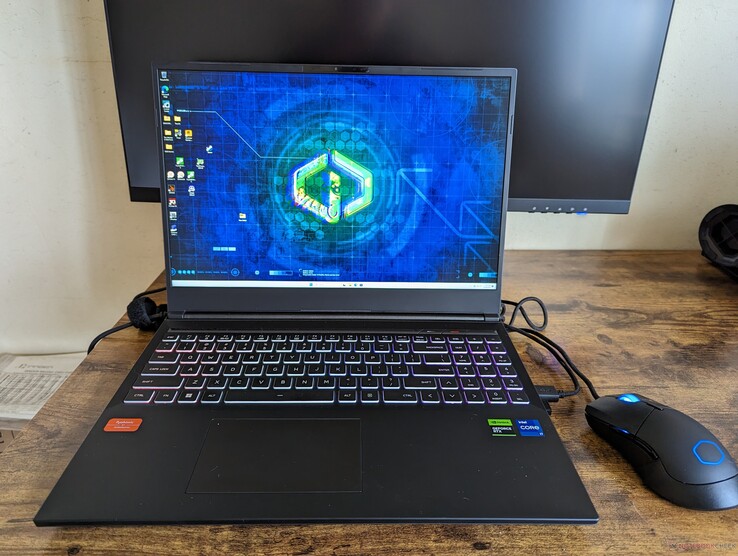
Le GM6PX7X d'Uniwill est un ordinateur portable de jeu de 16 pouces en marque blanche, connu sur certains marchés sous le nom de GM6PX7X Schenker XMG Neo 16 E23. Il s'agit d'un modèle plus récent révélé au CES 2023 aux côtés de la série Raptor Lake-H 13e génération mobile et de la série RTX 40 Ada Lovelace GeForce mobile.
Comme la plupart des autres modèles Uniwill ou Schenker, le GM6PX7X est hautement configurable avec des options de CPU allant jusqu'au Core i9-13900HX et des options de GPU allant du mobile GeForce RTX 4060 au 4090. Notre unité de test spécifique est une configuration de milieu de gamme équipée du Core i7-13700HX et de la RTX 4070.
Voir notre revue complète du Schenker XMG Neo 16 E23 équipé de la RTX 4090 pour plus d'informations sur le châssis et notre Uniwill GM6PX7X équipé de la RTX 4070 utilise le même design. Il y a cependant plusieurs différences physiques entre eux que nous allons noter ci-dessous.
Plus d'avis sur Uniwill/Schenker :
Comparaison avec les concurrents potentiels
Note | Date | Modèle | Poids | Épaisseur | Taille | Résolution | Prix |
|---|---|---|---|---|---|---|---|
| 88.2 % v7 (old) | 03/23 | Uniwill GM6PX7X RTX 4070 i7-13700HX, GeForce RTX 4070 Laptop GPU | 2.2 kg | 22 mm | 16.00" | 2560x1600 | |
| 87.7 % v7 (old) | 04/23 | Schenker XMG Neo 16 E23 i9-13900HX, GeForce RTX 4090 Laptop GPU | 2.5 kg | 29.9 mm | 16.00" | 2560x1600 | |
| 88.4 % v7 (old) | 03/23 | Asus ROG Strix G16 G614JZ i9-13980HX, GeForce RTX 4080 Laptop GPU | 2.4 kg | 30.4 mm | 16.00" | 2560x1600 | |
| 89.4 % v7 (old) | 02/23 | Lenovo Legion Pro 7 16IRX8H i9-13900HX, GeForce RTX 4080 Laptop GPU | 2.7 kg | 26 mm | 16.00" | 2560x1600 | |
| 86.2 % v7 (old) | 03/23 | Gigabyte AERO 16 OLED BSF i9-13900H, GeForce RTX 4070 Laptop GPU | 2.1 kg | 18 mm | 16.00" | 3840x2400 | |
| 91.2 % v7 (old) | 02/23 | Razer Blade 16 Early 2023 i9-13950HX, GeForce RTX 4080 Laptop GPU | 2.4 kg | 21.99 mm | 16.00" | 2560x1600 |
Cas
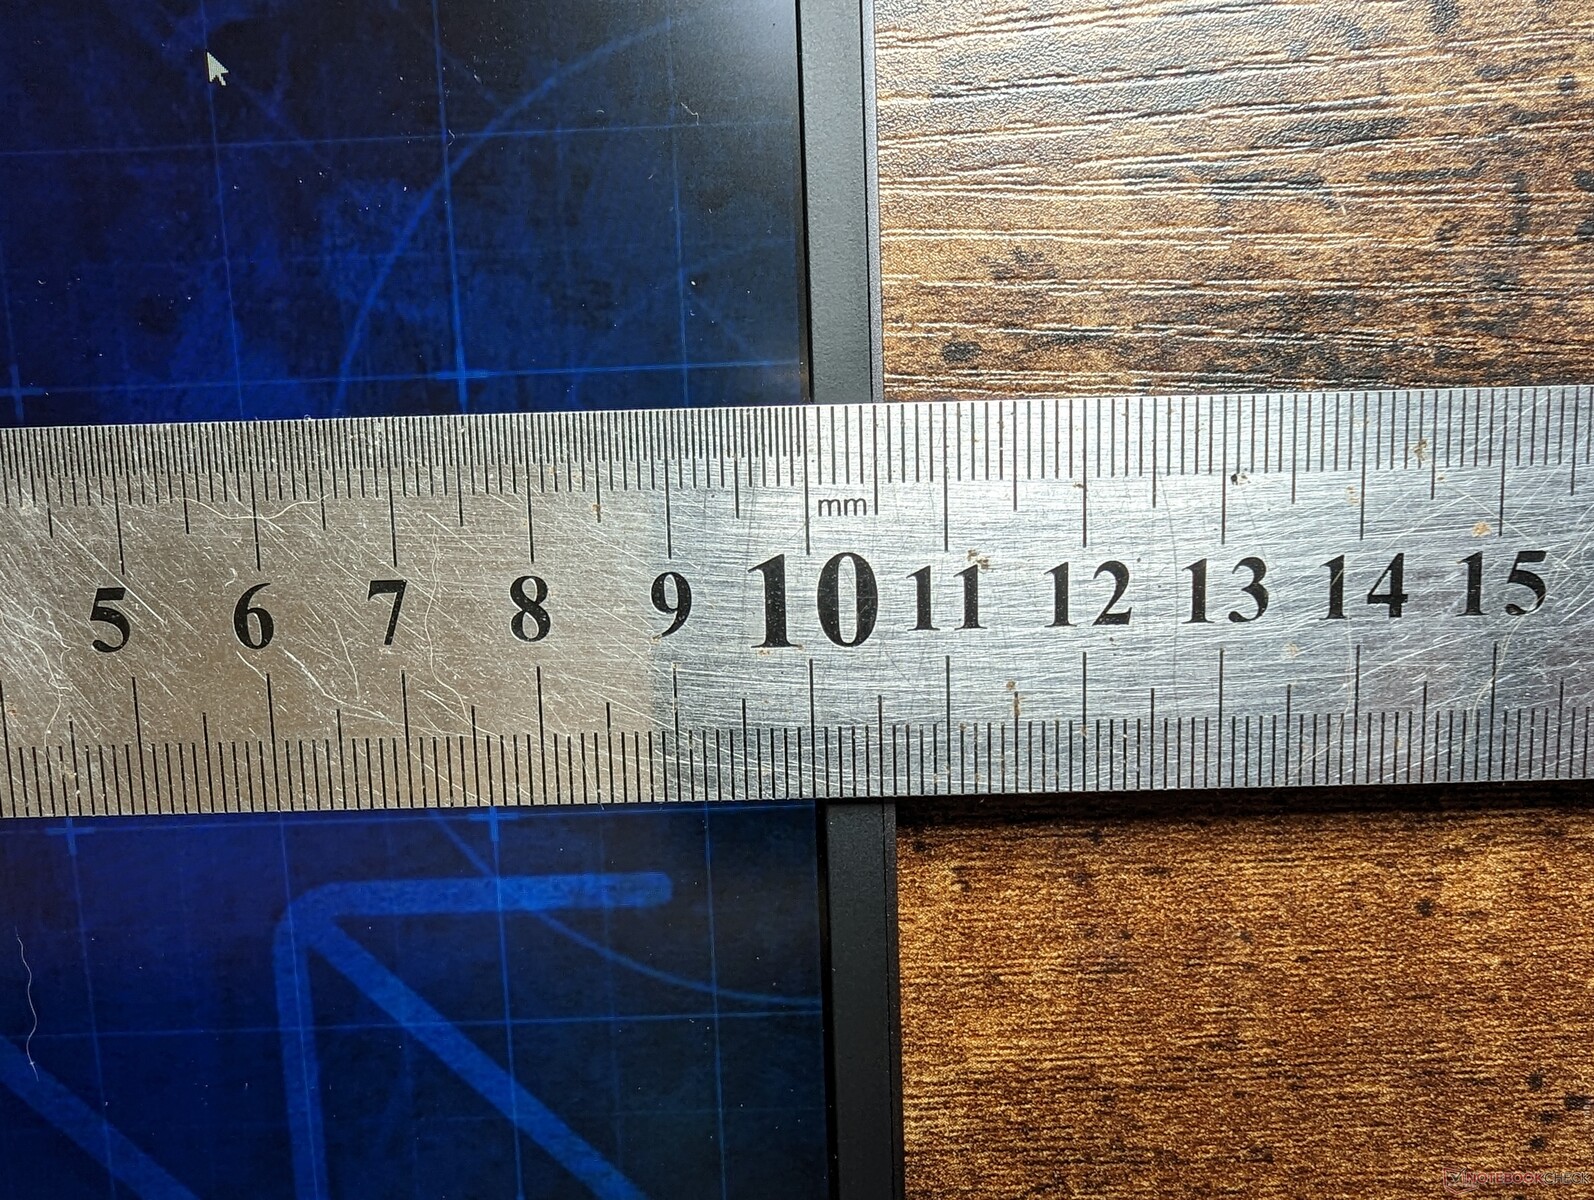
Il existe deux versions de châssis du Schenker XMG Neo 16: une version plus fine pour toutes les configurations RTX 4060 et 4070 et une version plus épaisse pour toutes les configurations RTX 4080 et 4090. Les GPU mobiles RTX 4080/4090 sont plus gourmands en énergie que les RTX 4060/4070 et nécessitent donc un châssis plus grand. Les principales différences entre les deux versions sont les suivantes :
- Epaisseur : 22 mm contre 26,1 mm
- Poids : 2,2 kg contre 2,5 kg
- Capacité de la batterie : 62 Wh contre 99 Wh
- Caméra Web : 1 MP vs. 2 MP
- Adaptateur secteur : 280 W vs. 330 W
Les deux modèles partagent les mêmes options de clavier (à membrane ou mécanique Cherry MX), le même pavé tactile, les mêmes ports, le même écran et les mêmes matériaux pour le châssis.
Lecteur de carte SD
| SD Card Reader | |
| average JPG Copy Test (av. of 3 runs) | |
| Gigabyte AERO 16 OLED BSF | |
| Razer Blade 16 Early 2023 (AV PRO microSD 128 GB V60) | |
| Schenker XMG Neo 16 E23 (AV PRO microSD 128 GB V60) | |
| Uniwill GM6PX7X RTX 4070 (AV PRO microSD 128 GB V60) | |
| maximum AS SSD Seq Read Test (1GB) | |
| Razer Blade 16 Early 2023 (AV PRO microSD 128 GB V60) | |
| Gigabyte AERO 16 OLED BSF | |
| Uniwill GM6PX7X RTX 4070 (AV PRO microSD 128 GB V60) | |
| Schenker XMG Neo 16 E23 (AV PRO microSD 128 GB V60) | |
Communication
| Networking | |
| iperf3 transmit AXE11000 | |
| Schenker XMG Neo 16 E23 | |
| Lenovo Legion Pro 7 16IRX8H | |
| Asus ROG Strix G16 G614JZ | |
| Razer Blade 16 Early 2023 | |
| Uniwill GM6PX7X RTX 4070 | |
| iperf3 receive AXE11000 | |
| Schenker XMG Neo 16 E23 | |
| Lenovo Legion Pro 7 16IRX8H | |
| Asus ROG Strix G16 G614JZ | |
| Razer Blade 16 Early 2023 | |
| Uniwill GM6PX7X RTX 4070 | |
| iperf3 transmit AXE11000 6GHz | |
| Gigabyte AERO 16 OLED BSF | |
| Razer Blade 16 Early 2023 | |
| iperf3 receive AXE11000 6GHz | |
| Gigabyte AERO 16 OLED BSF | |
| Razer Blade 16 Early 2023 | |
Webcam


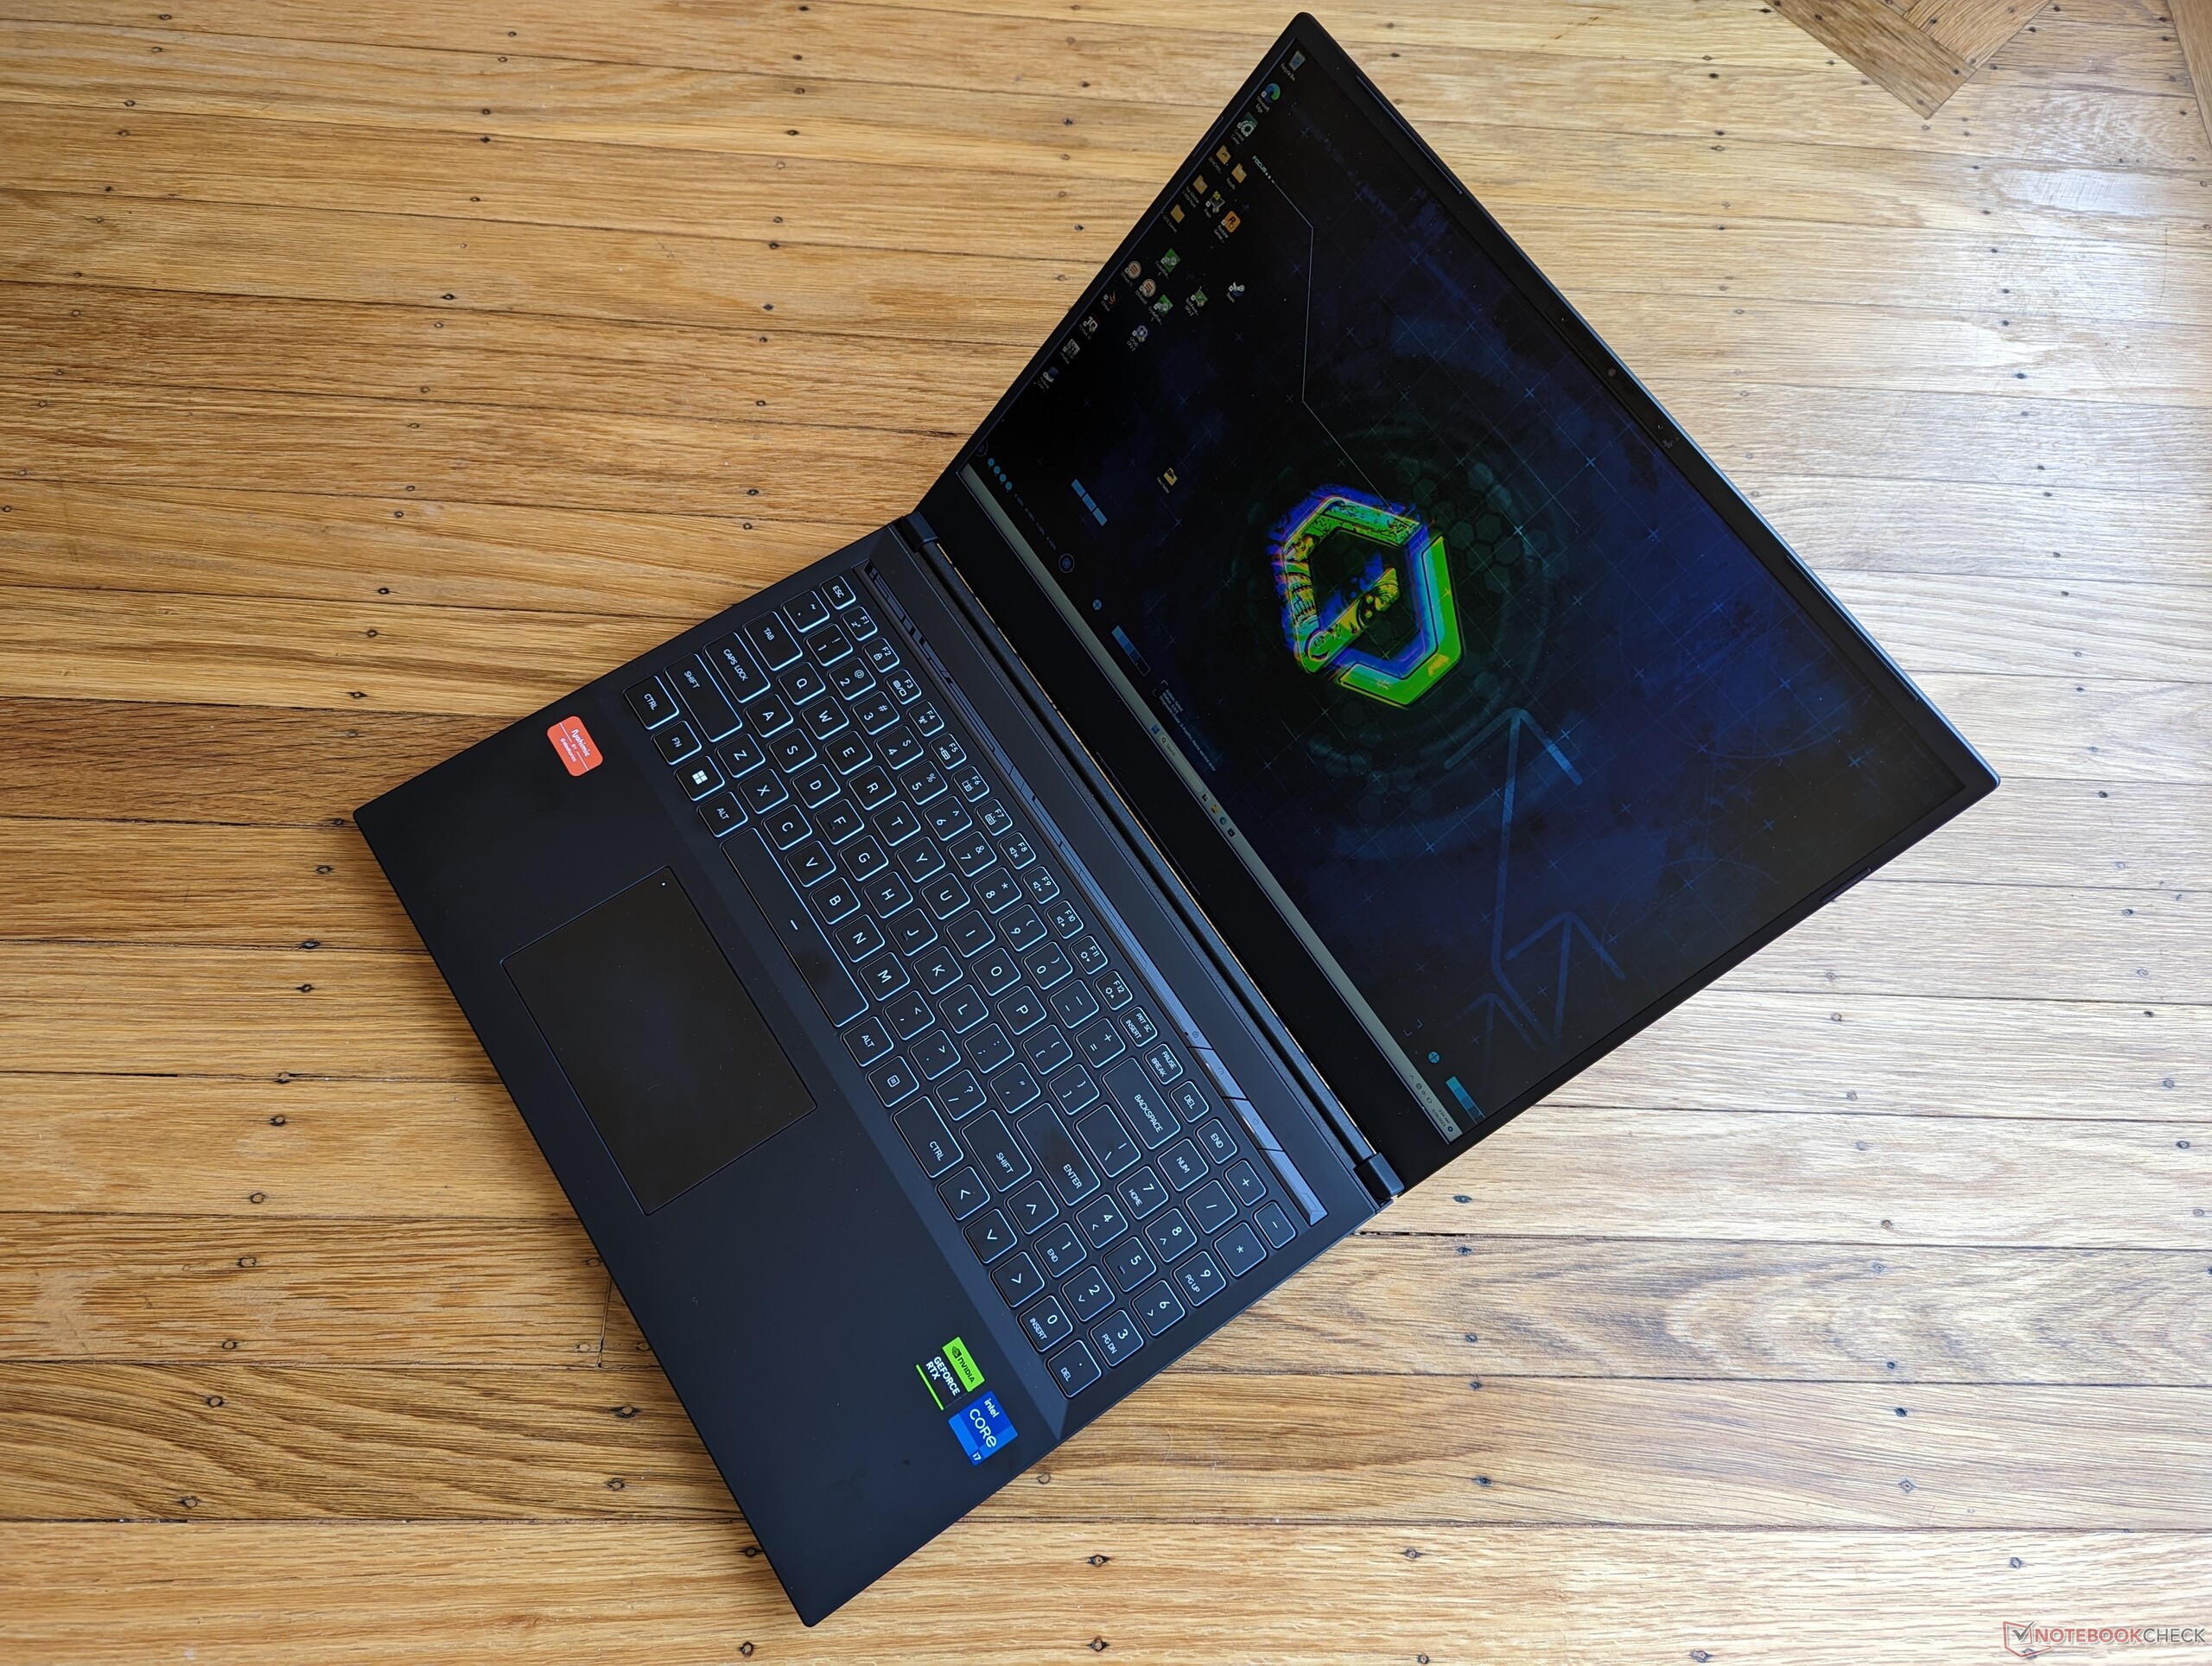
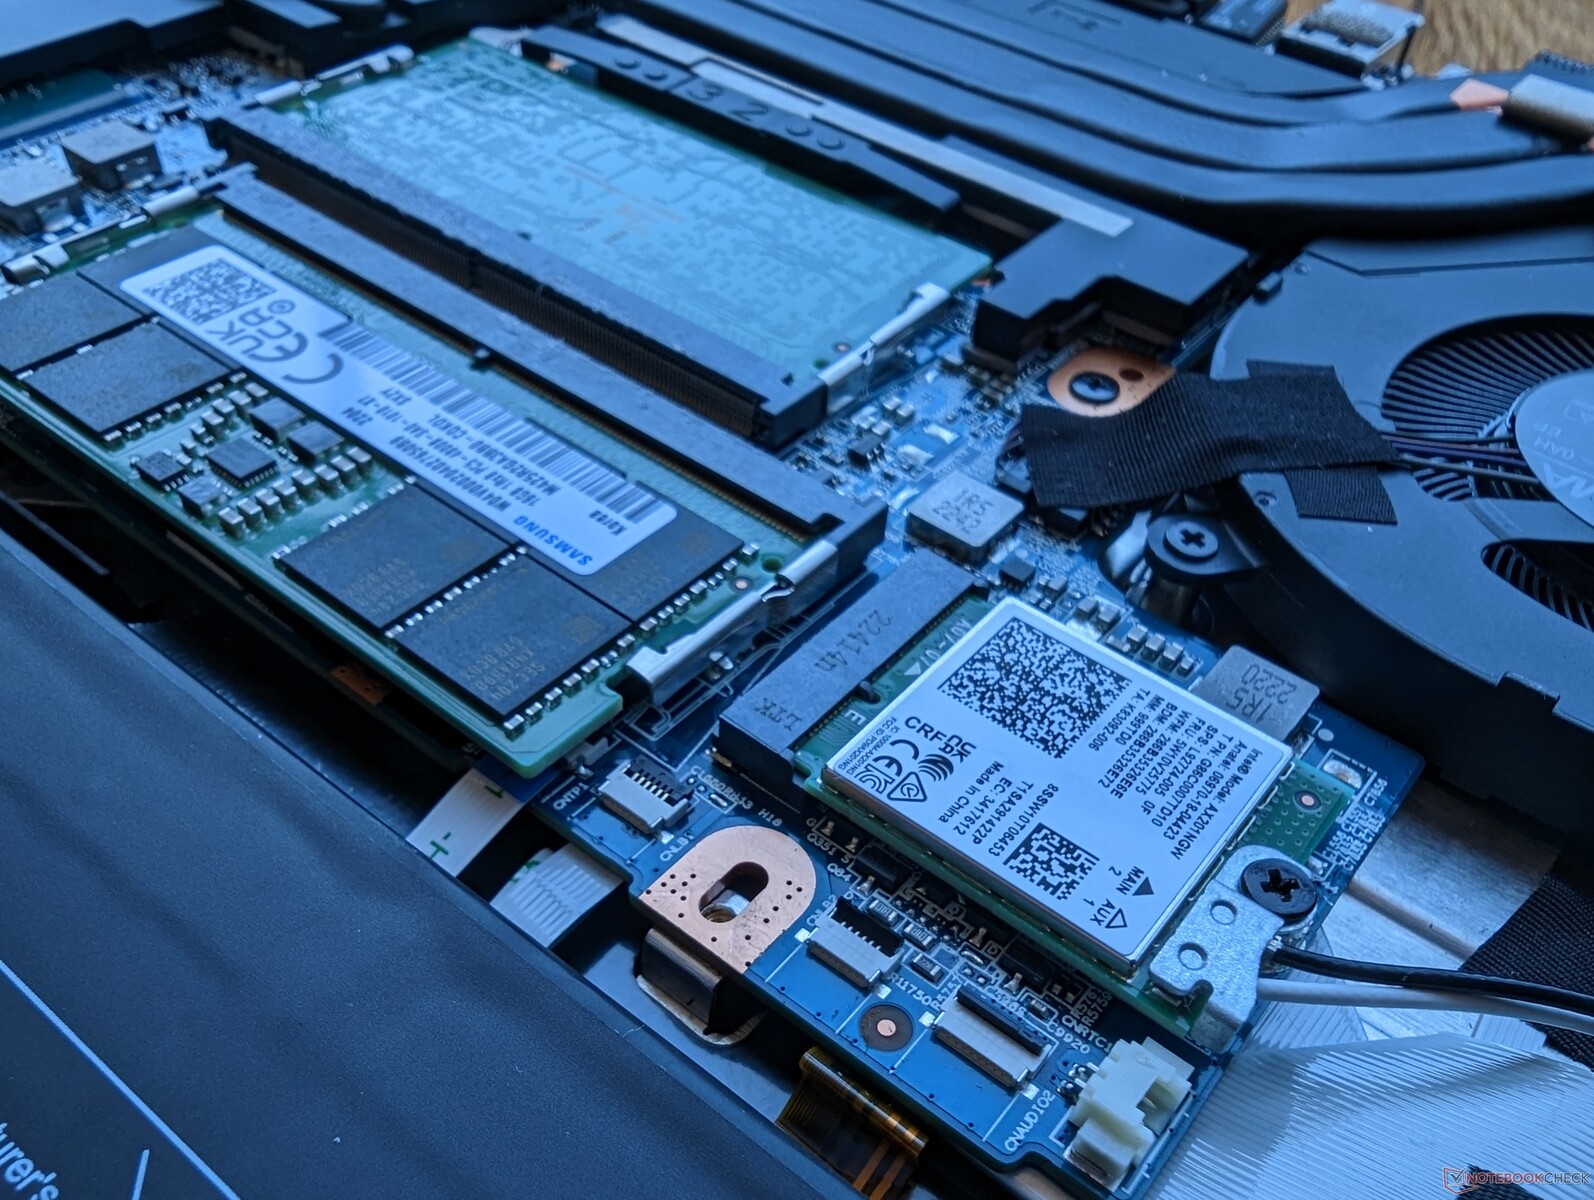
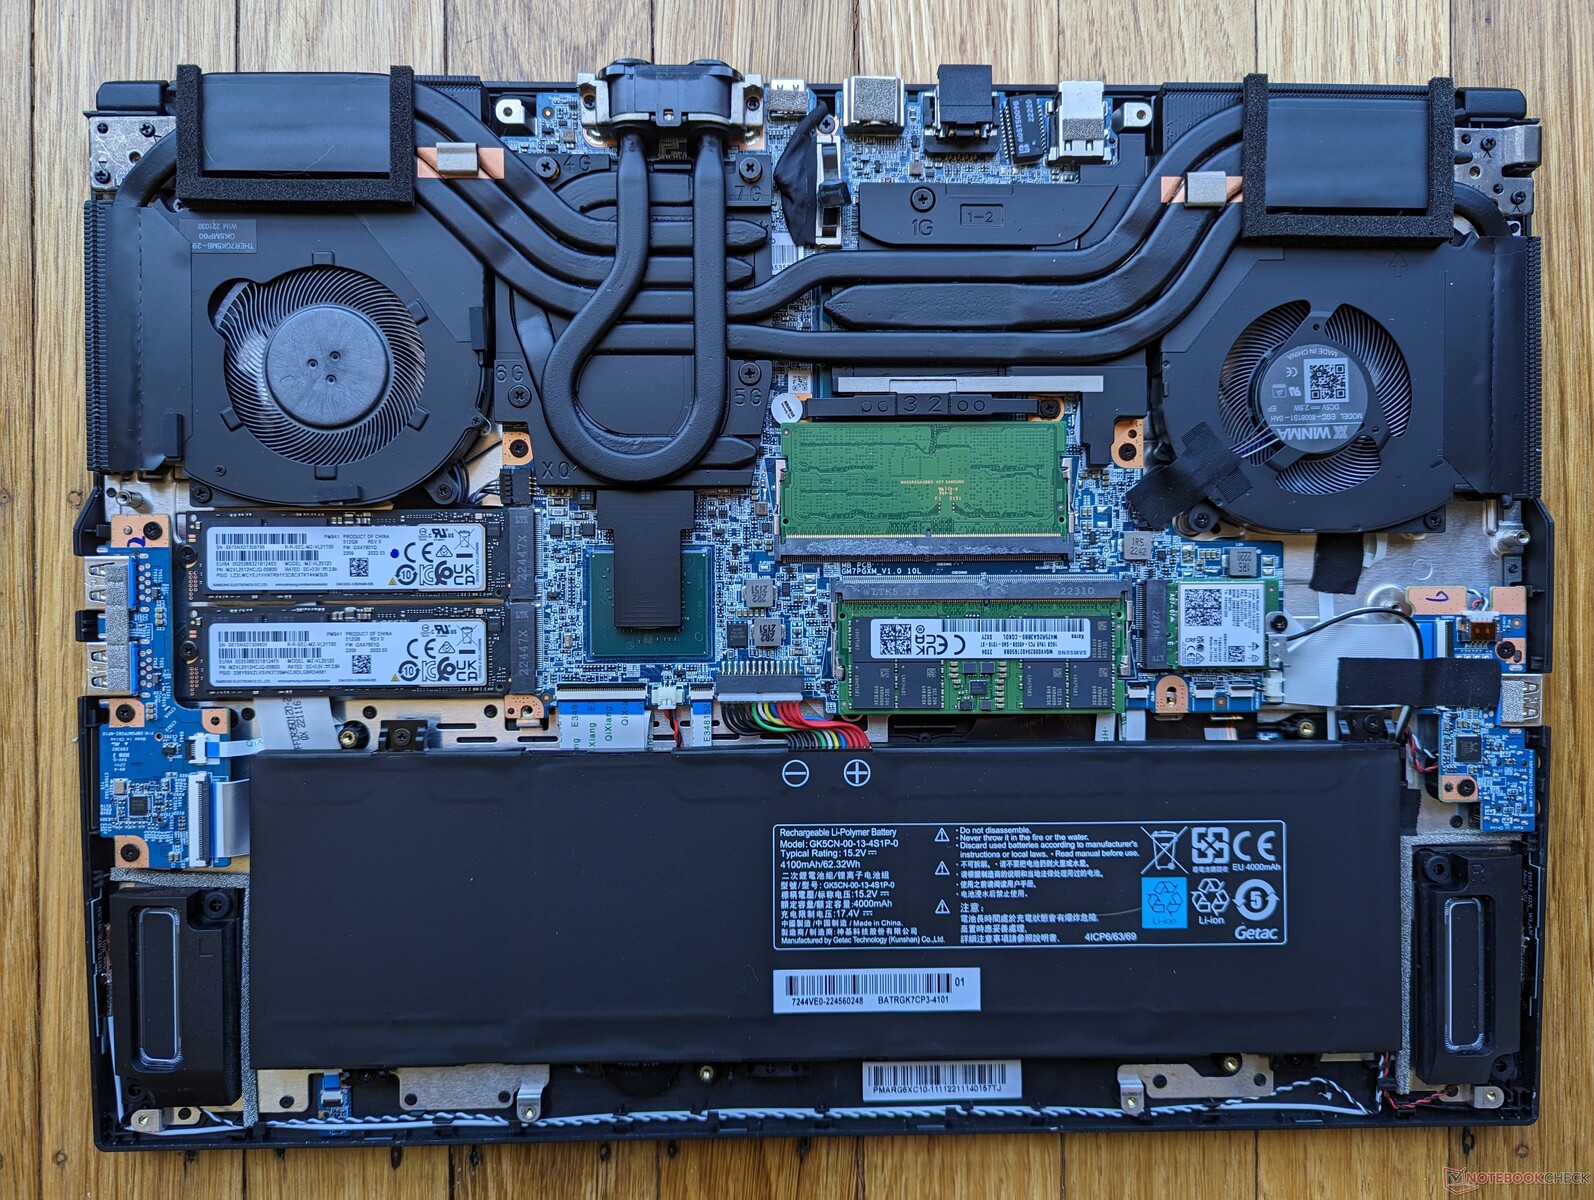
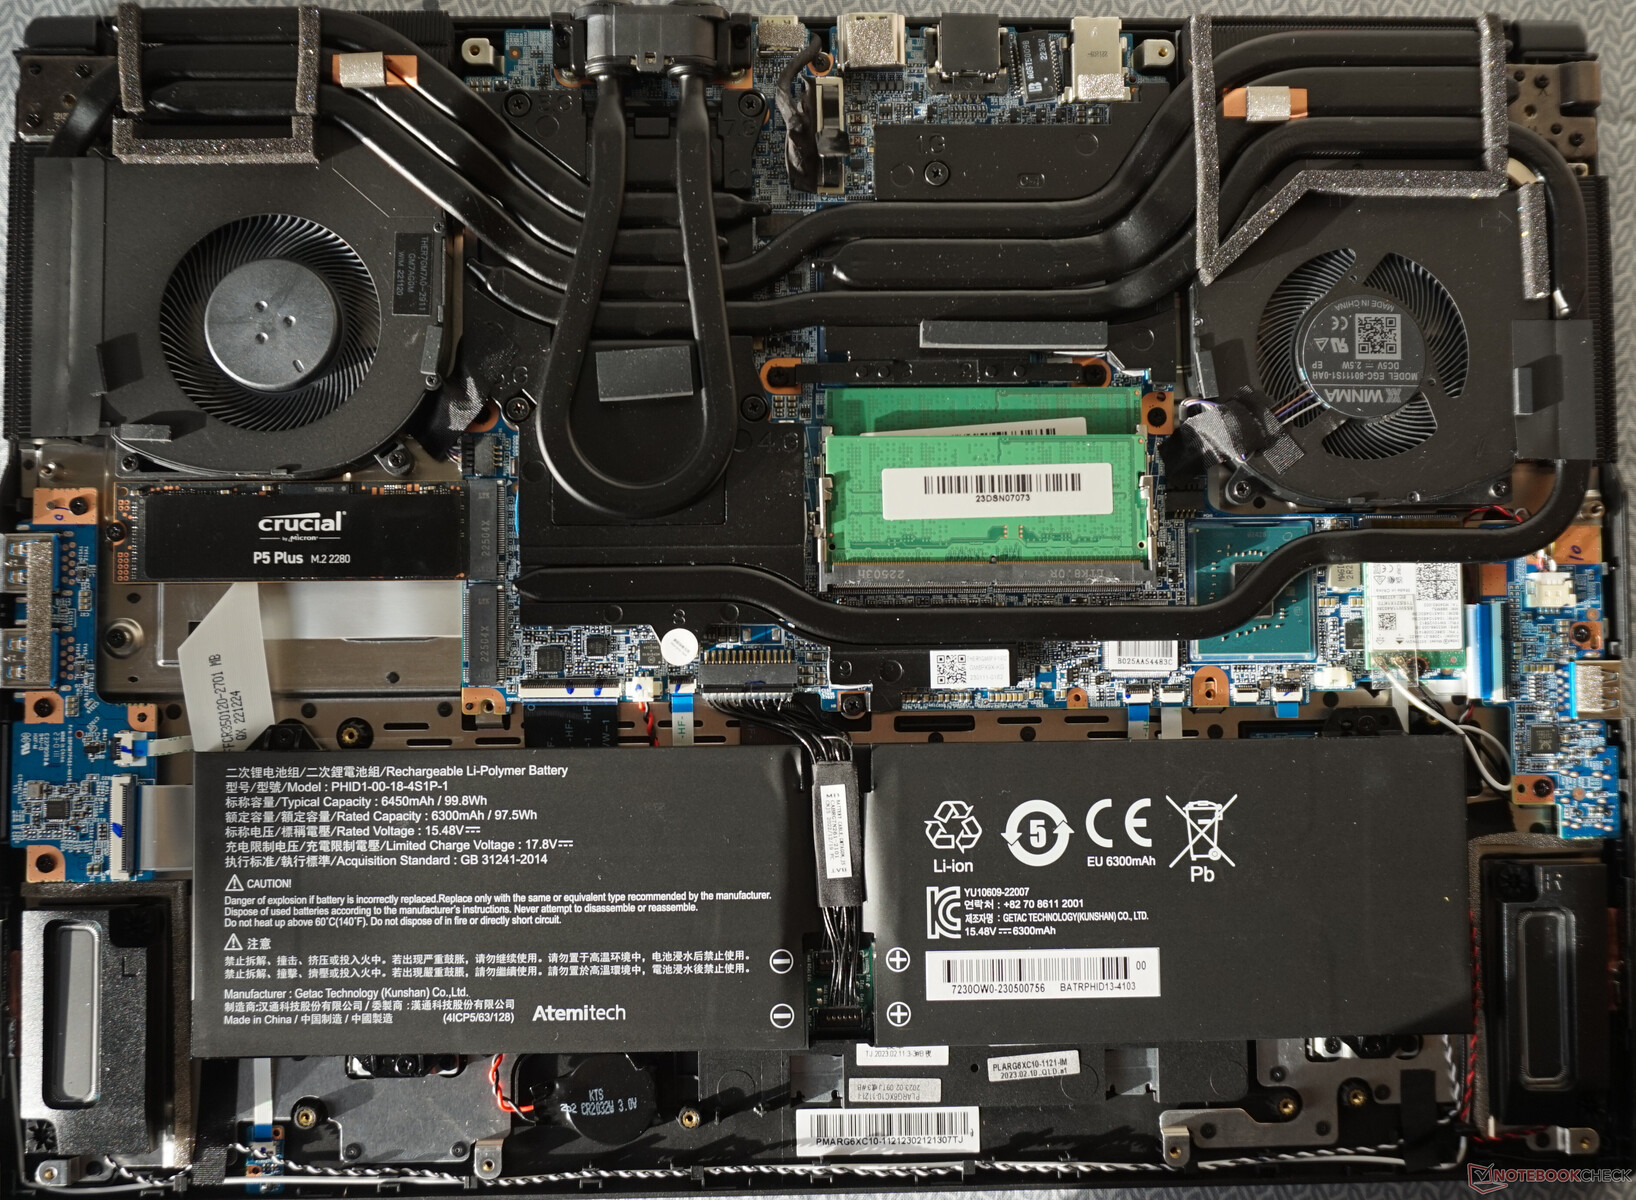
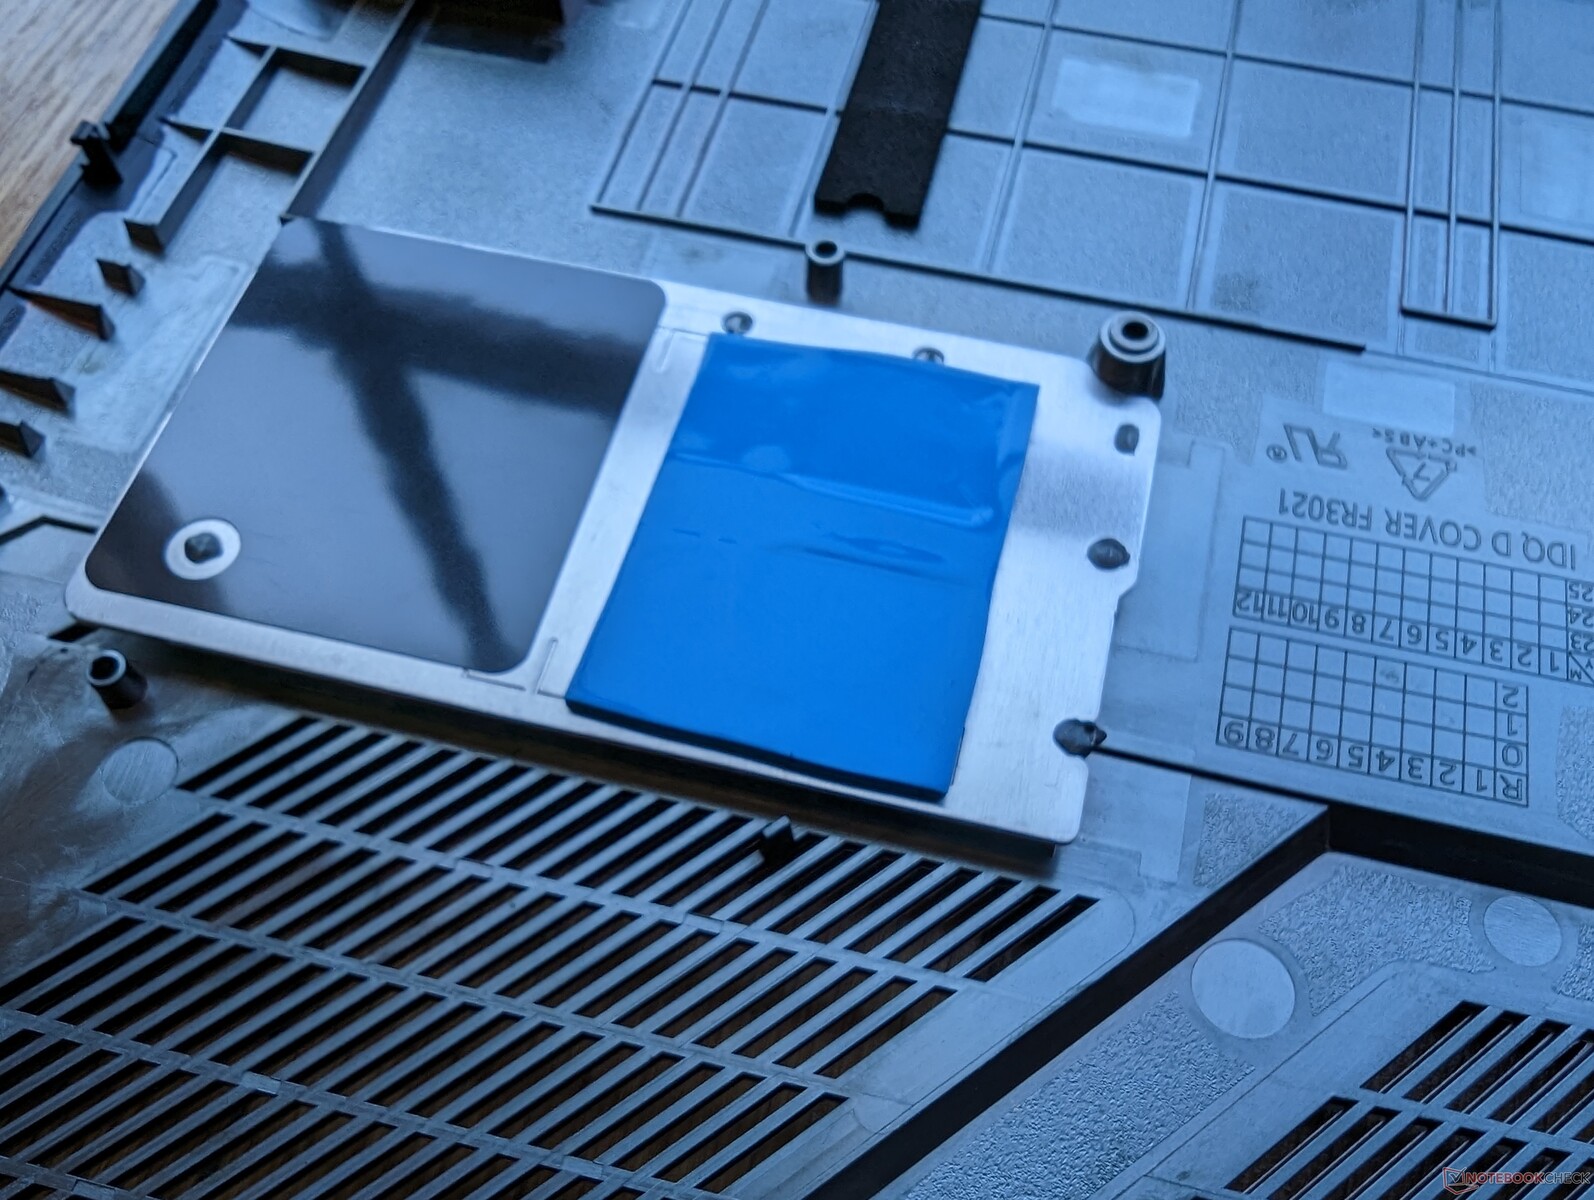
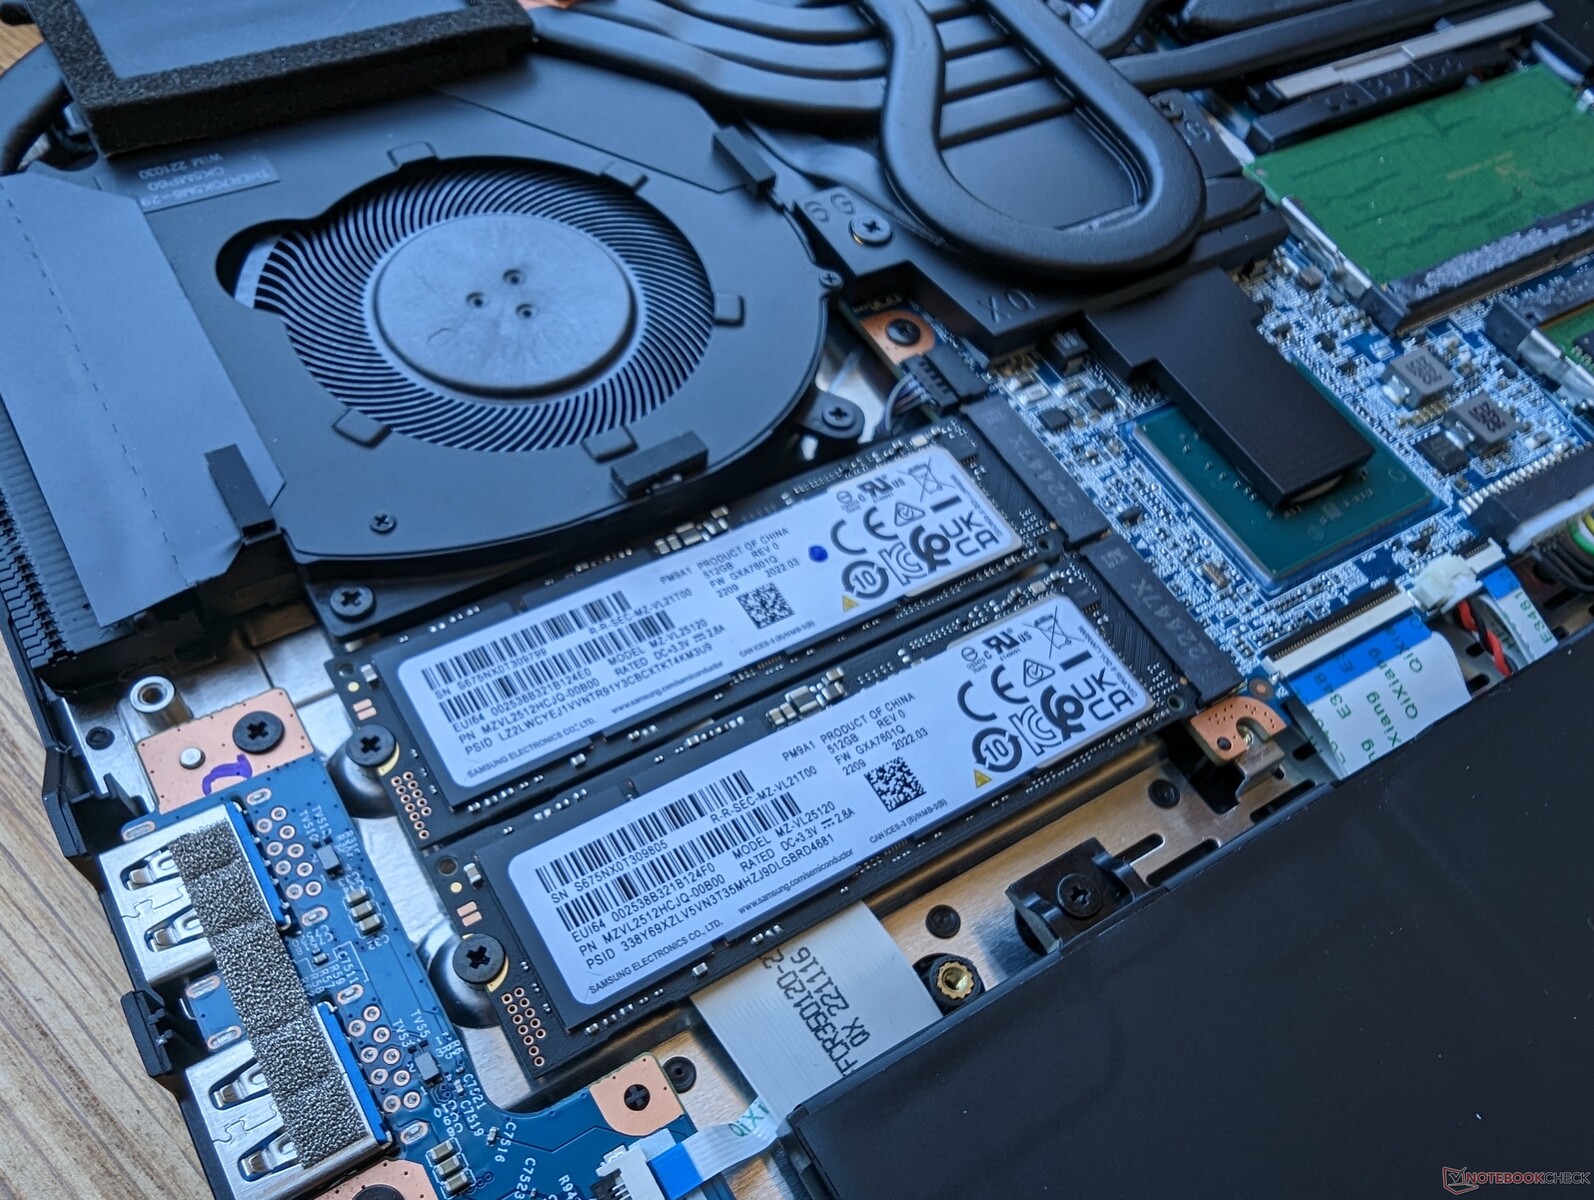
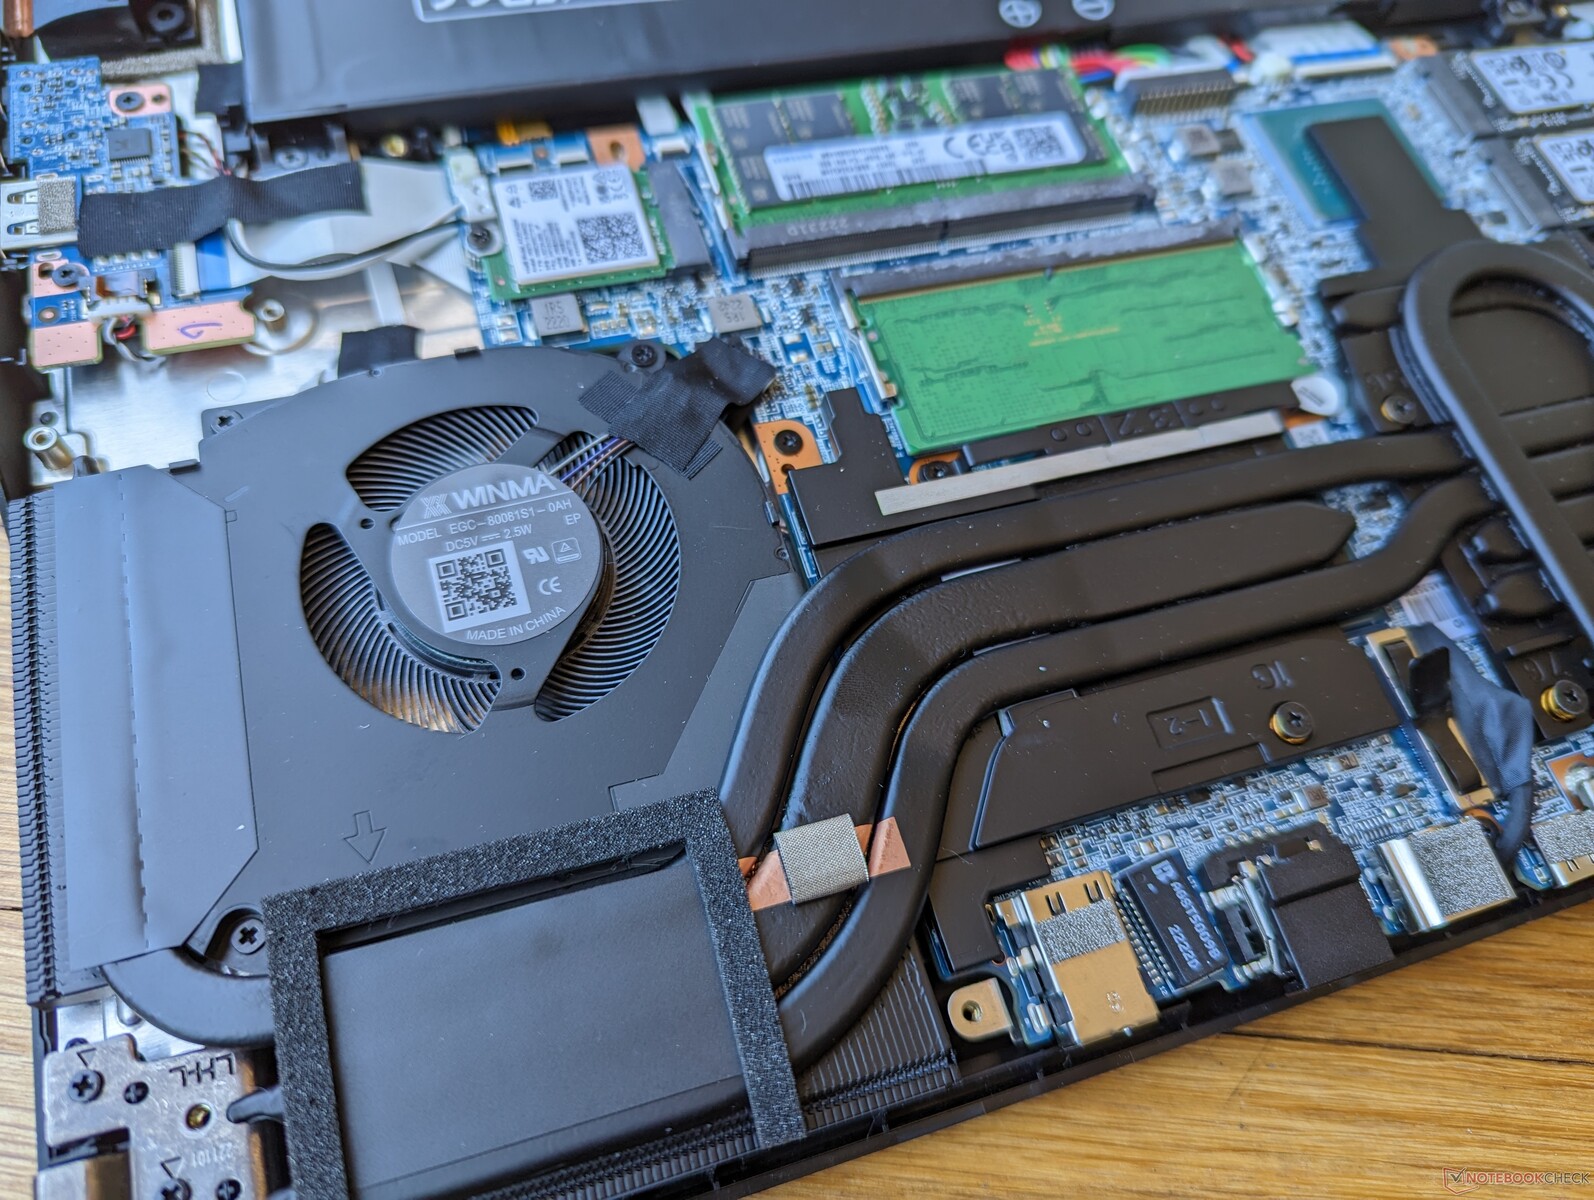
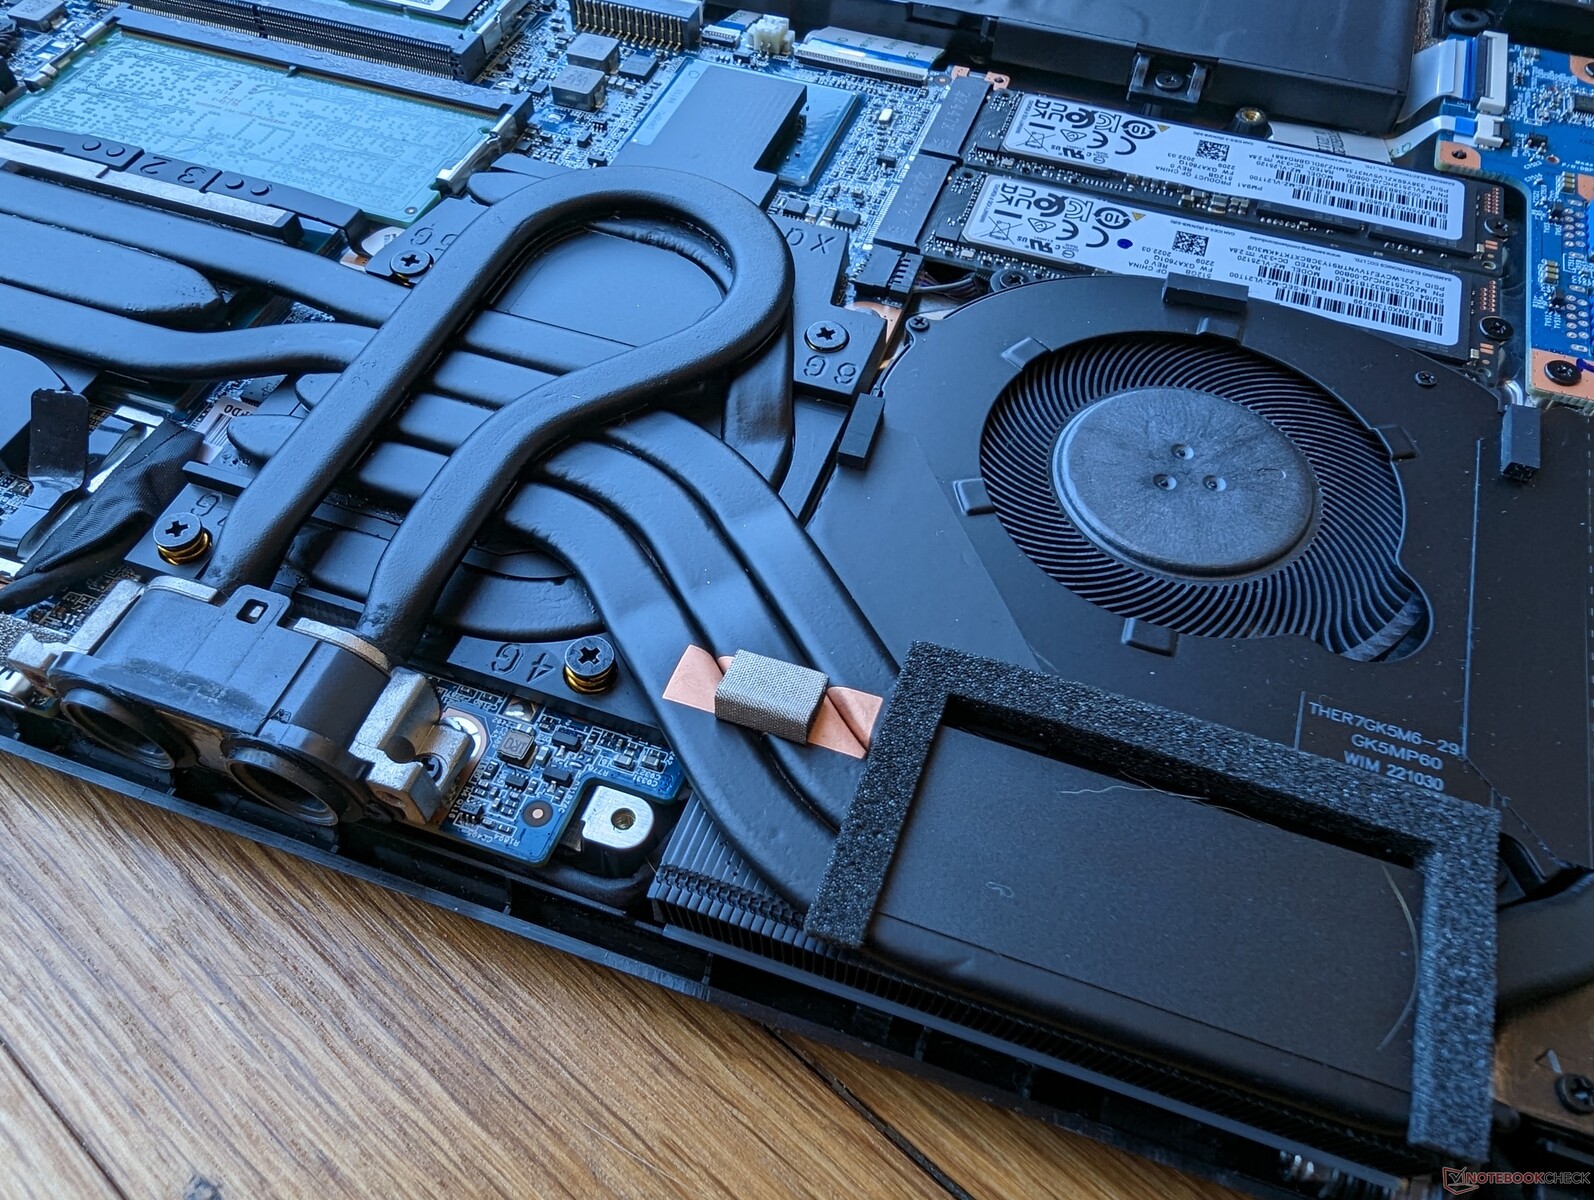
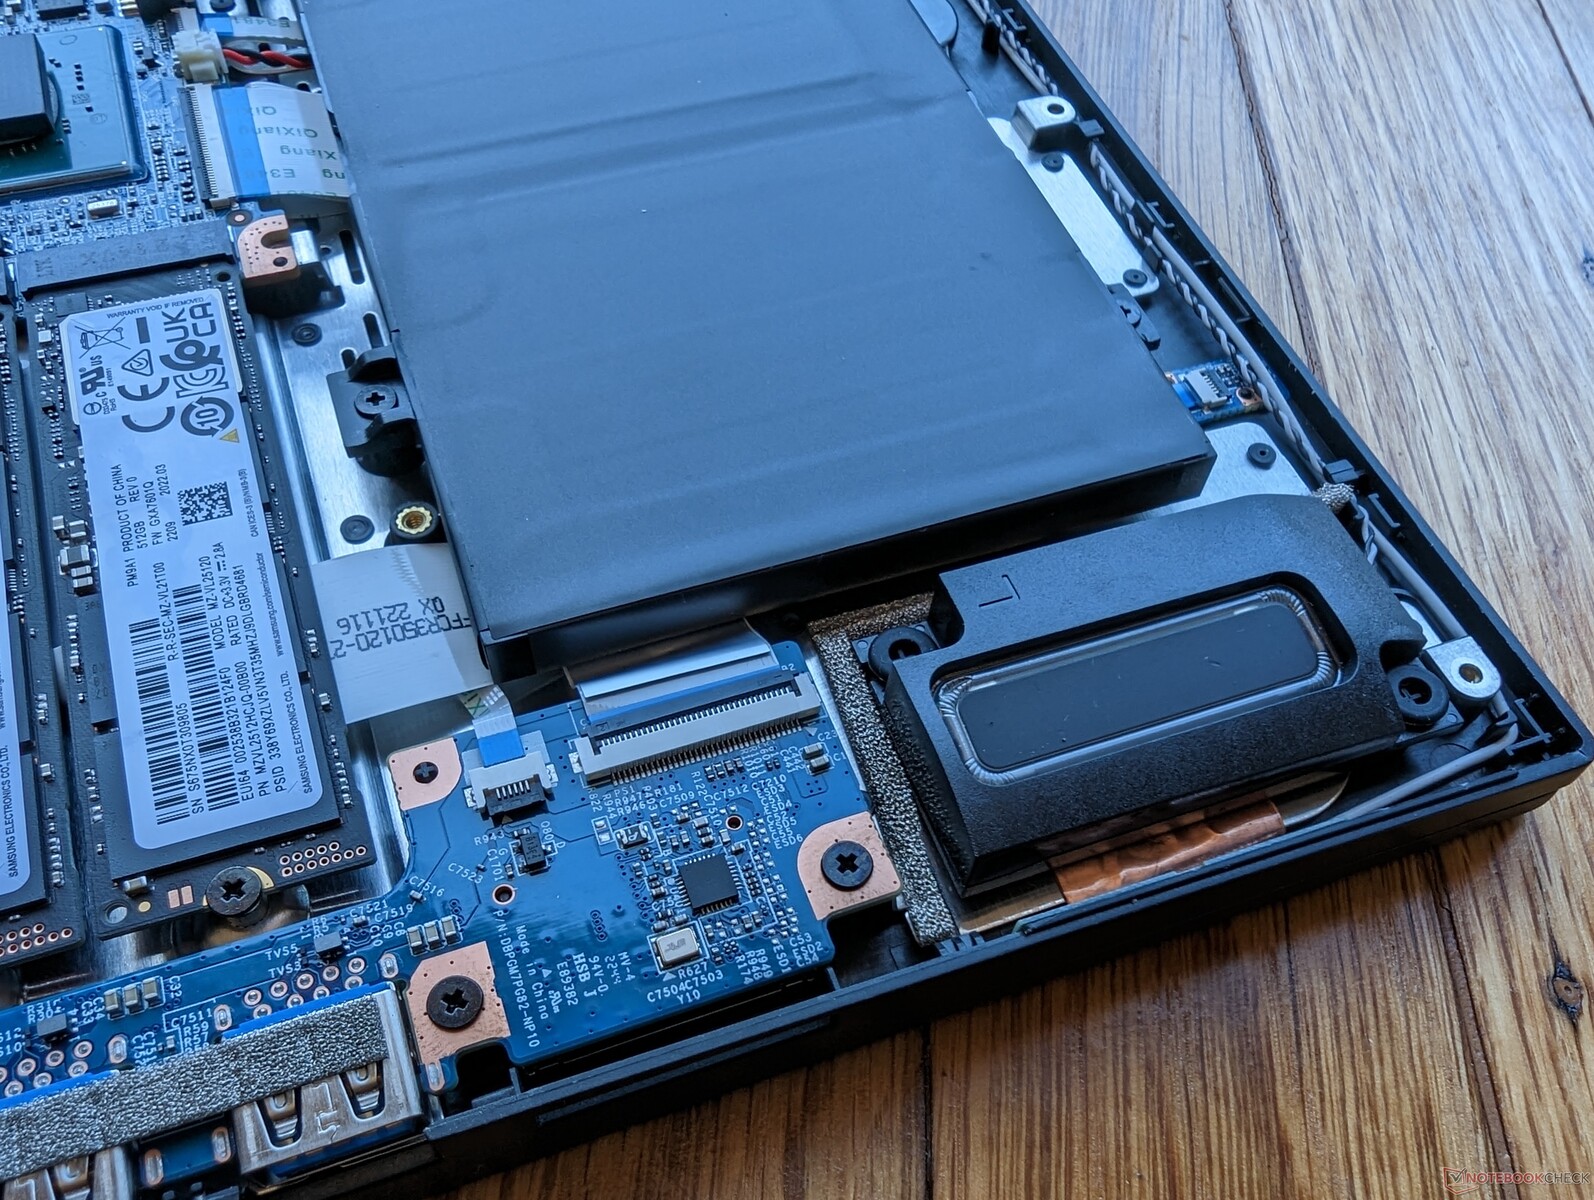
Maintenance
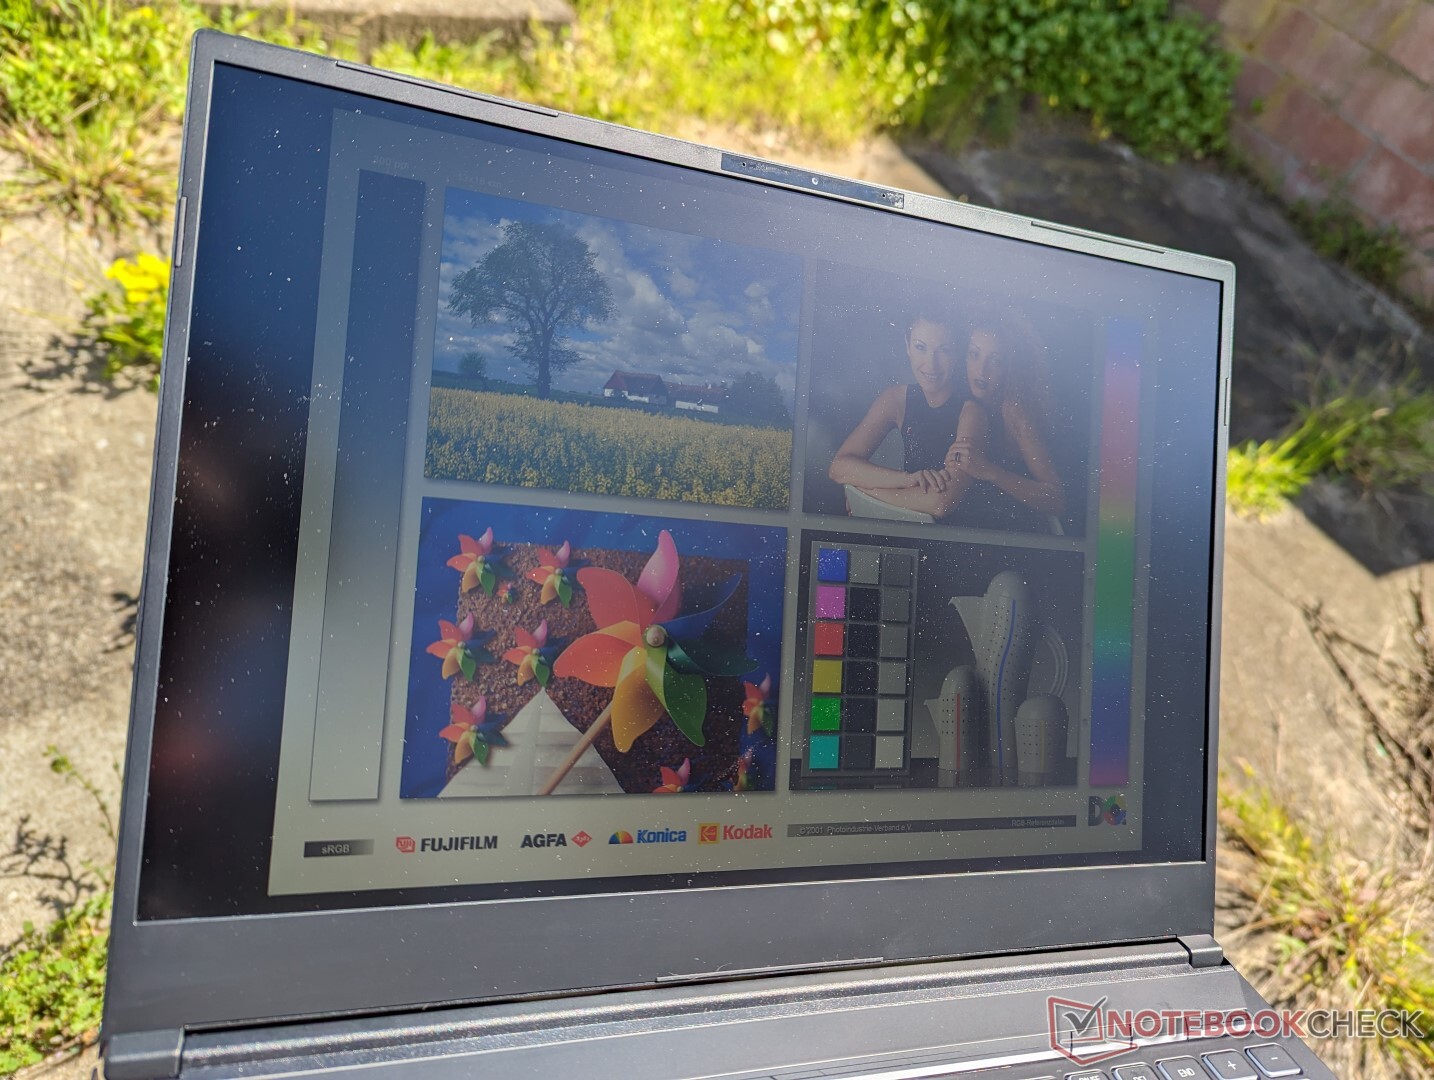
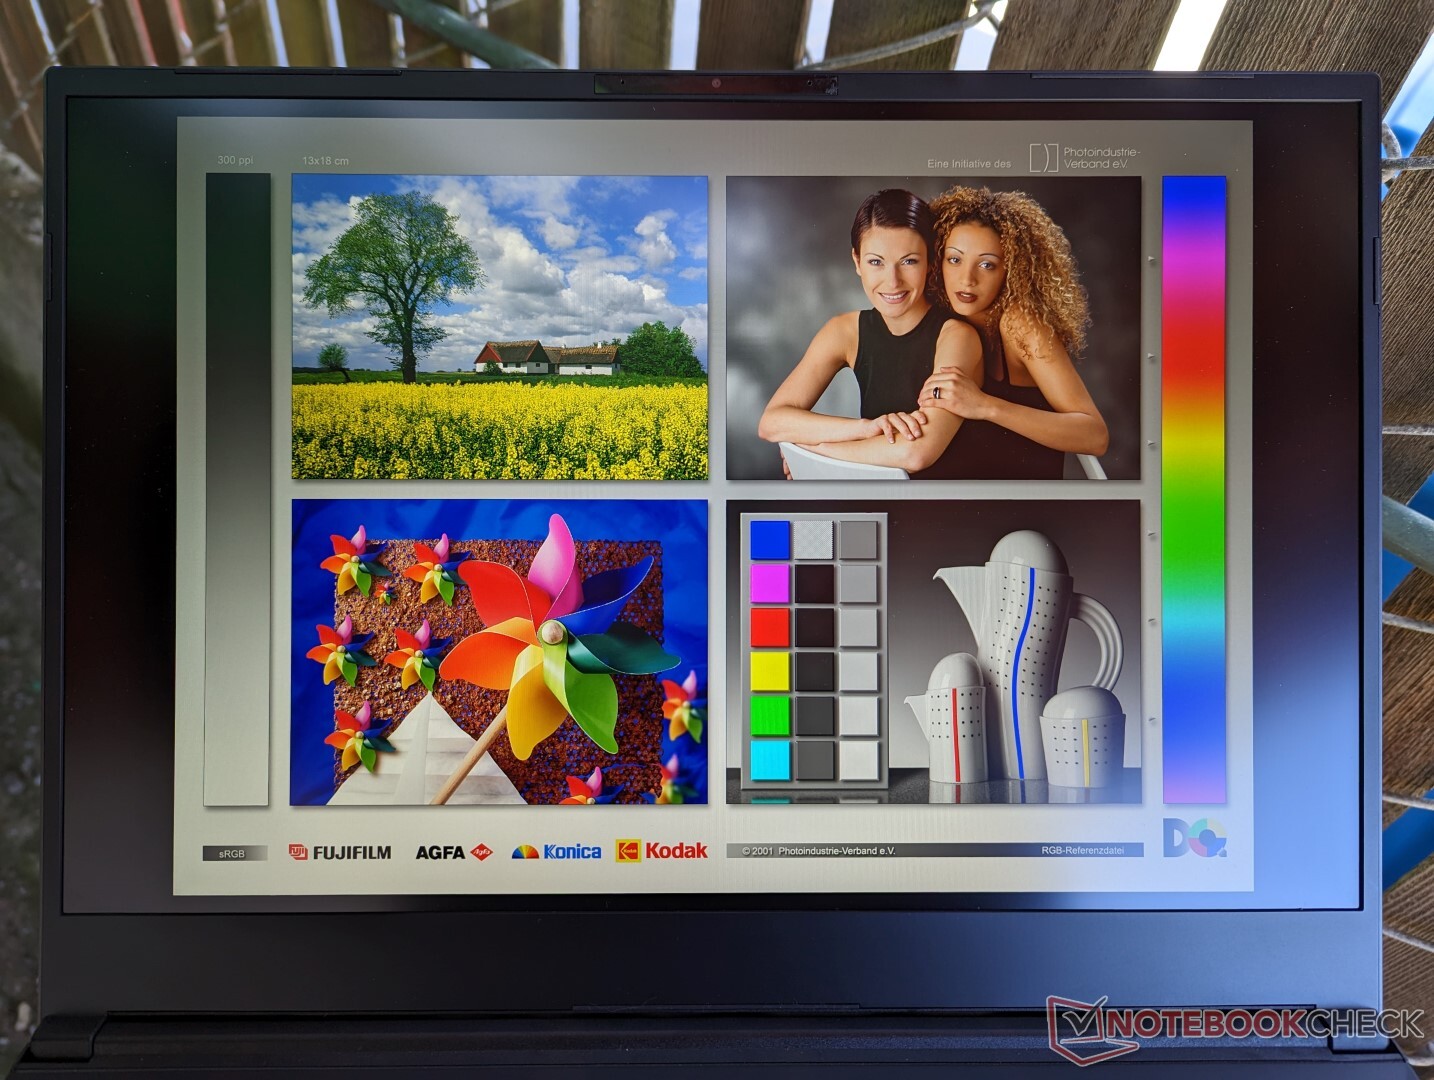
Affichage
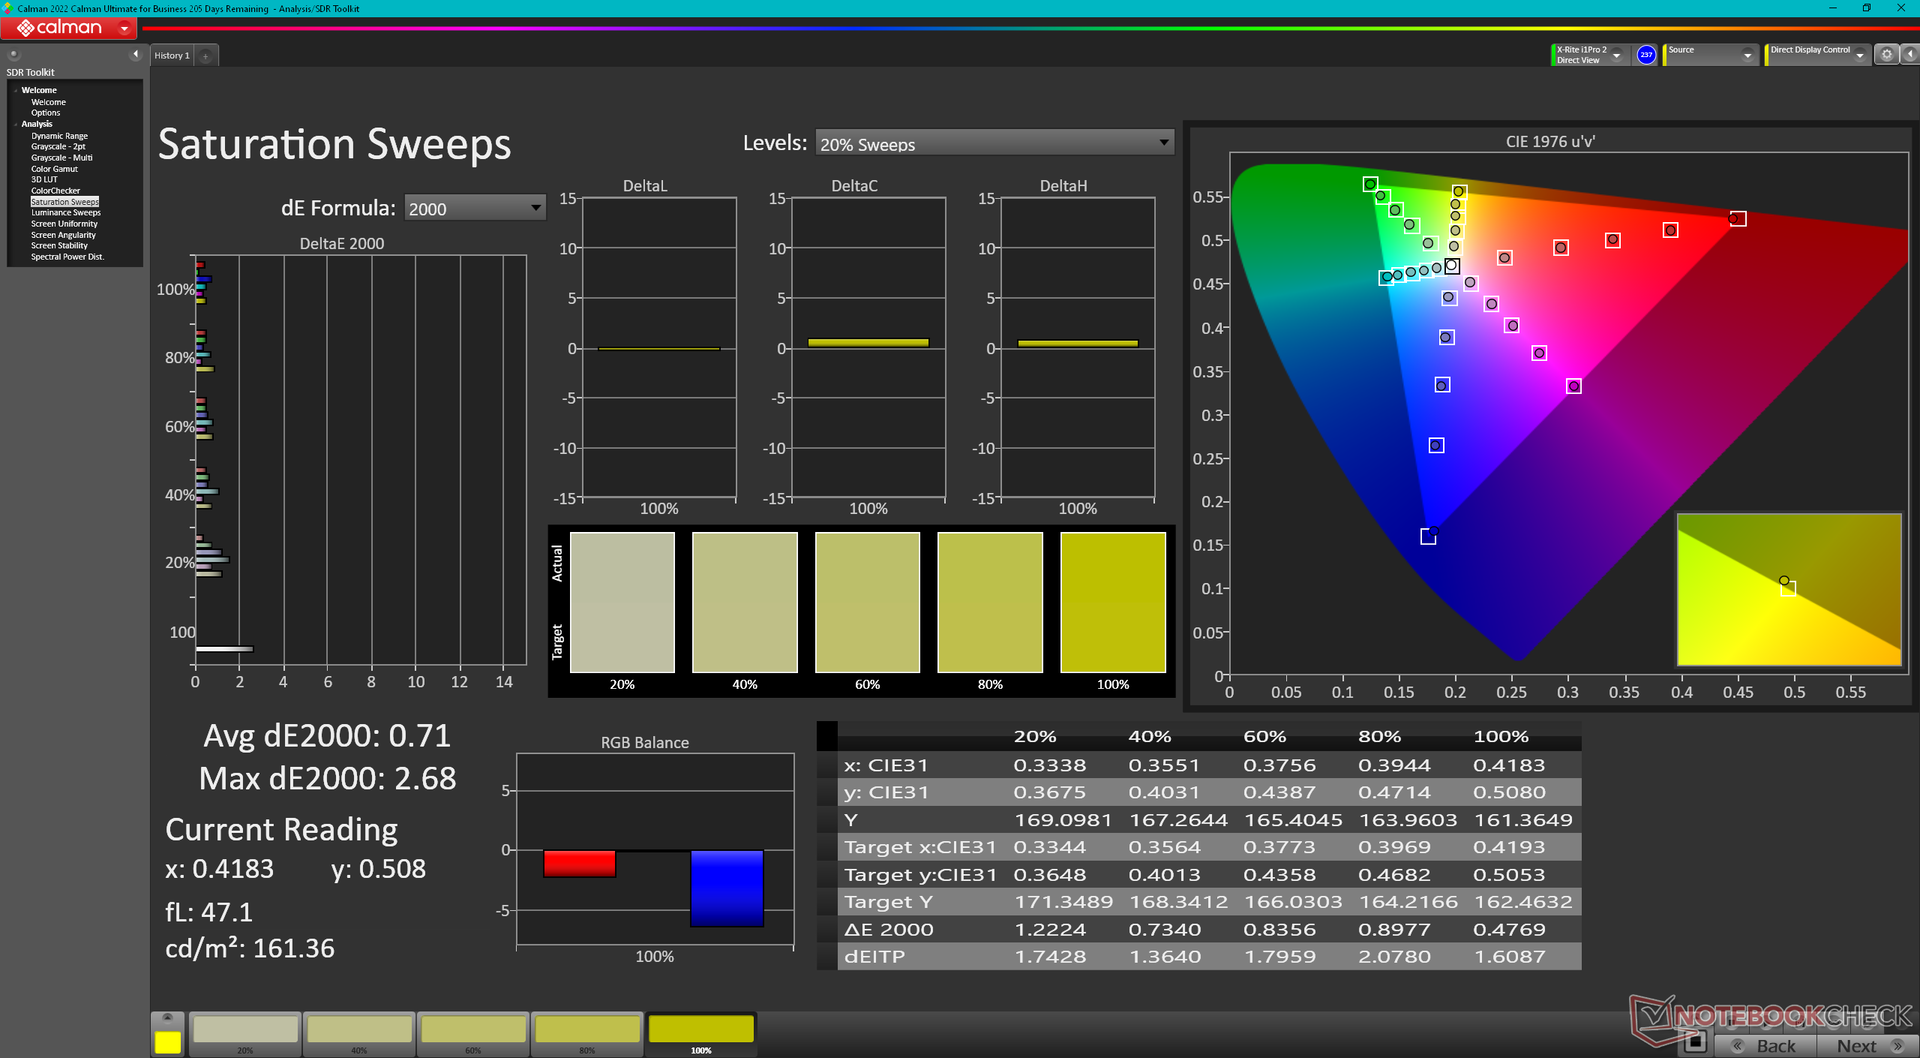
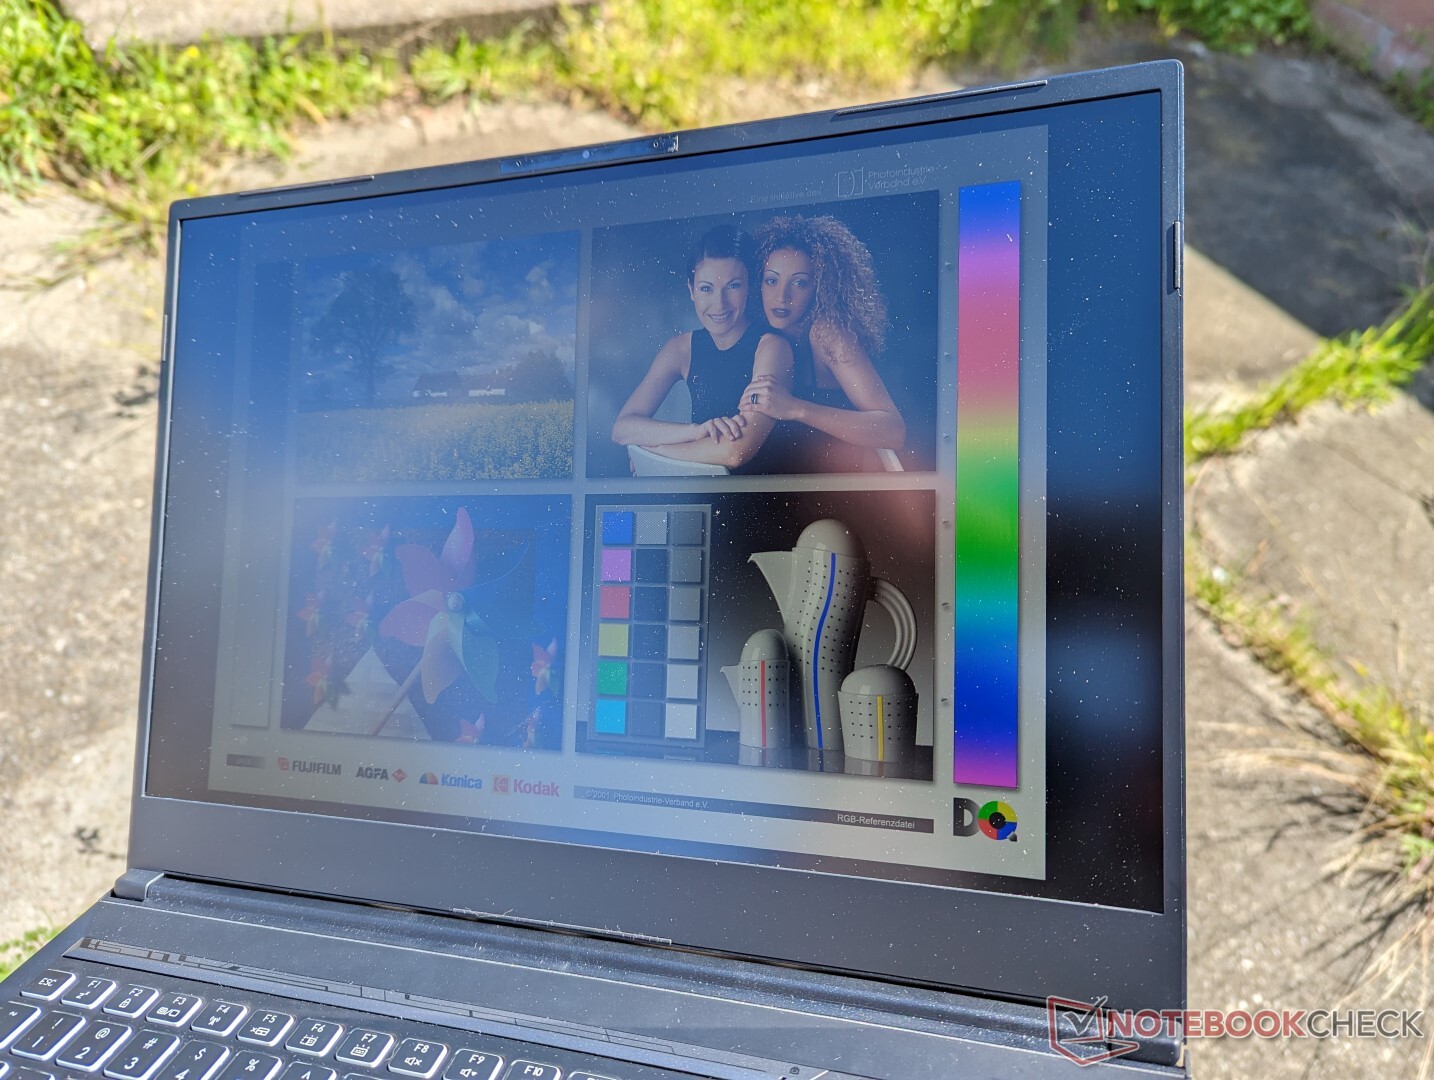
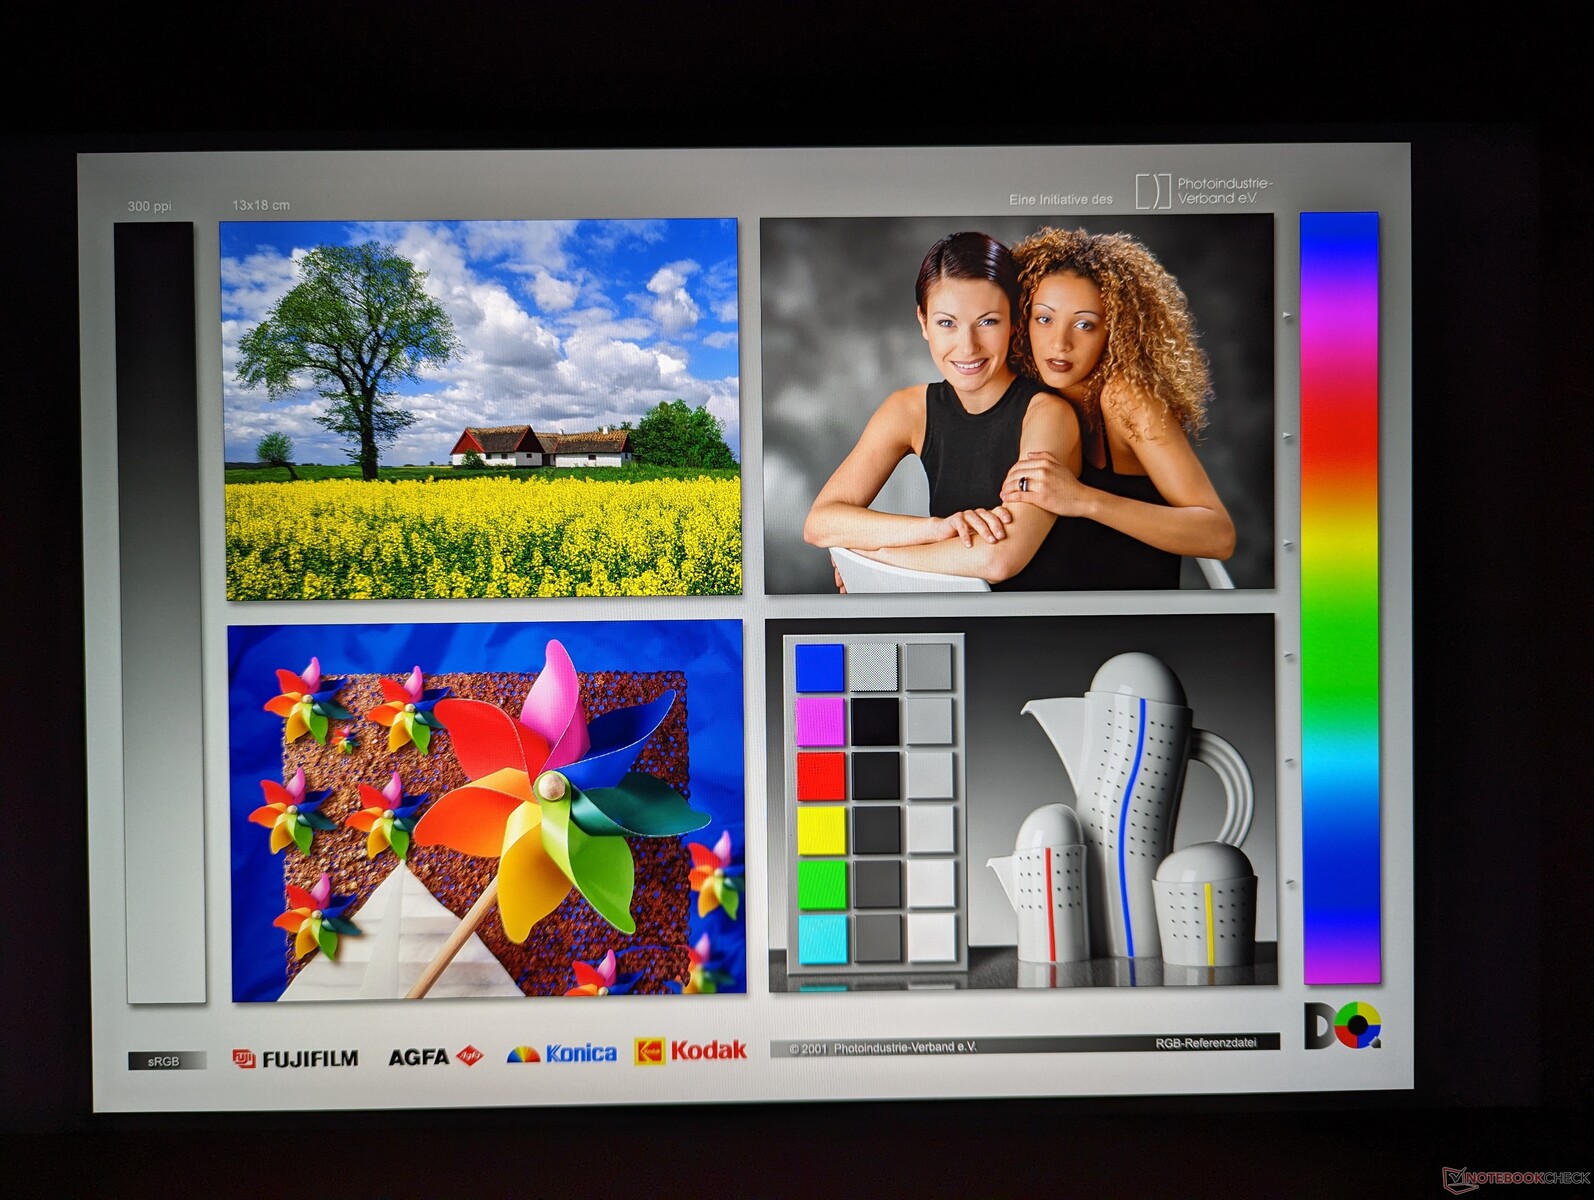
Il n'y a pas de deuxième option d'affichage pour ce design de châssis particulier et notre Uniwill utilise donc le même panneau BOE NE160QDM-NZ1 IPS que celui que l'on trouve sur le Schenker Neo 16 équipé de la RTX 4090. L'écran est remarquable pour son taux de rafraîchissement rapide de 240 Hz et sa couverture sRGB de >95%. Néanmoins, les ordinateurs portables concurrents tels que l'Asus ROG Strix G16Asus ROG Strix G16 ou leGigabyte AERO 16 OLED offrent des couleurs encore plus profondes et des temps de réponse plus rapides que les joueurs invétérés ou les éditeurs graphiques apprécieront.


| |||||||||||||||||||||||||
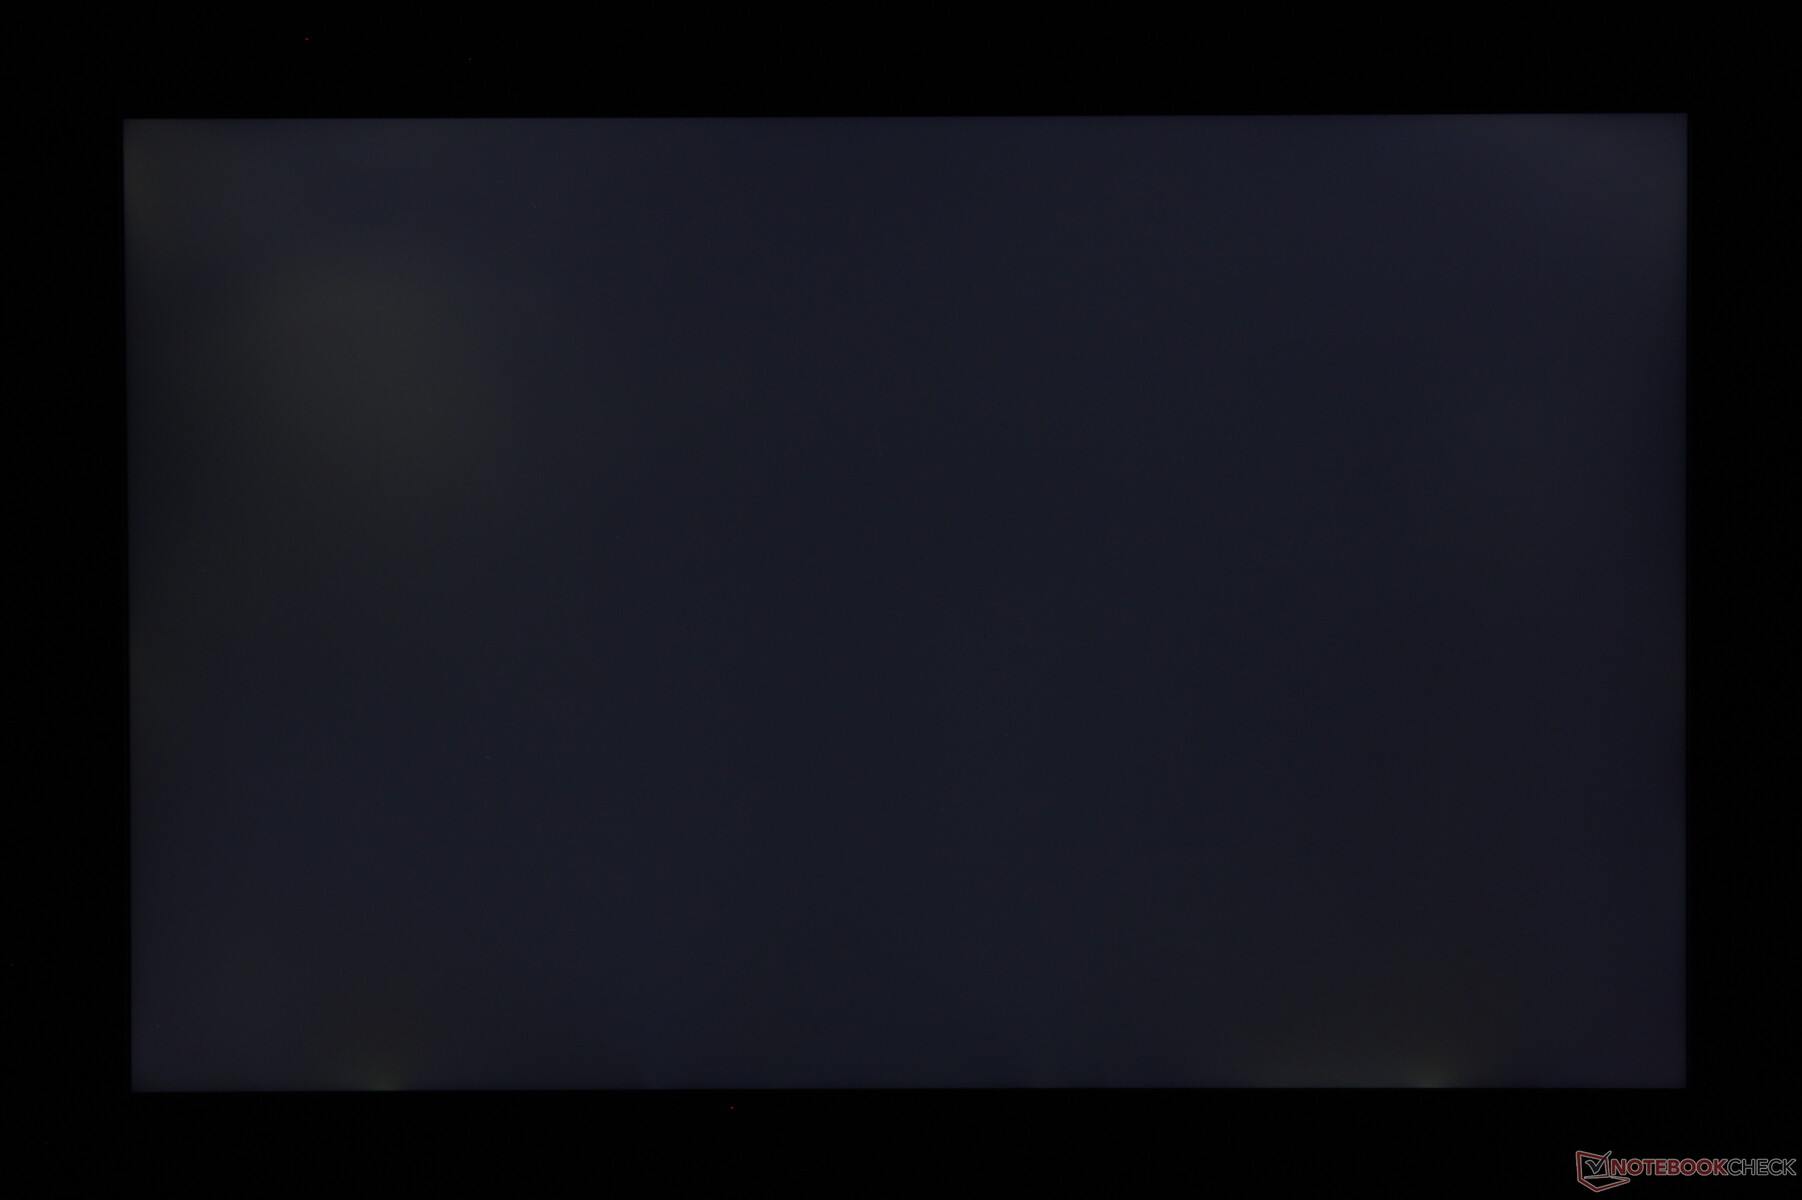
Homogénéité de la luminosité: 89 %
Valeur mesurée au centre, sur batterie: 338.6 cd/m²
Contraste: 1058:1 (Valeurs des noirs: 0.32 cd/m²)
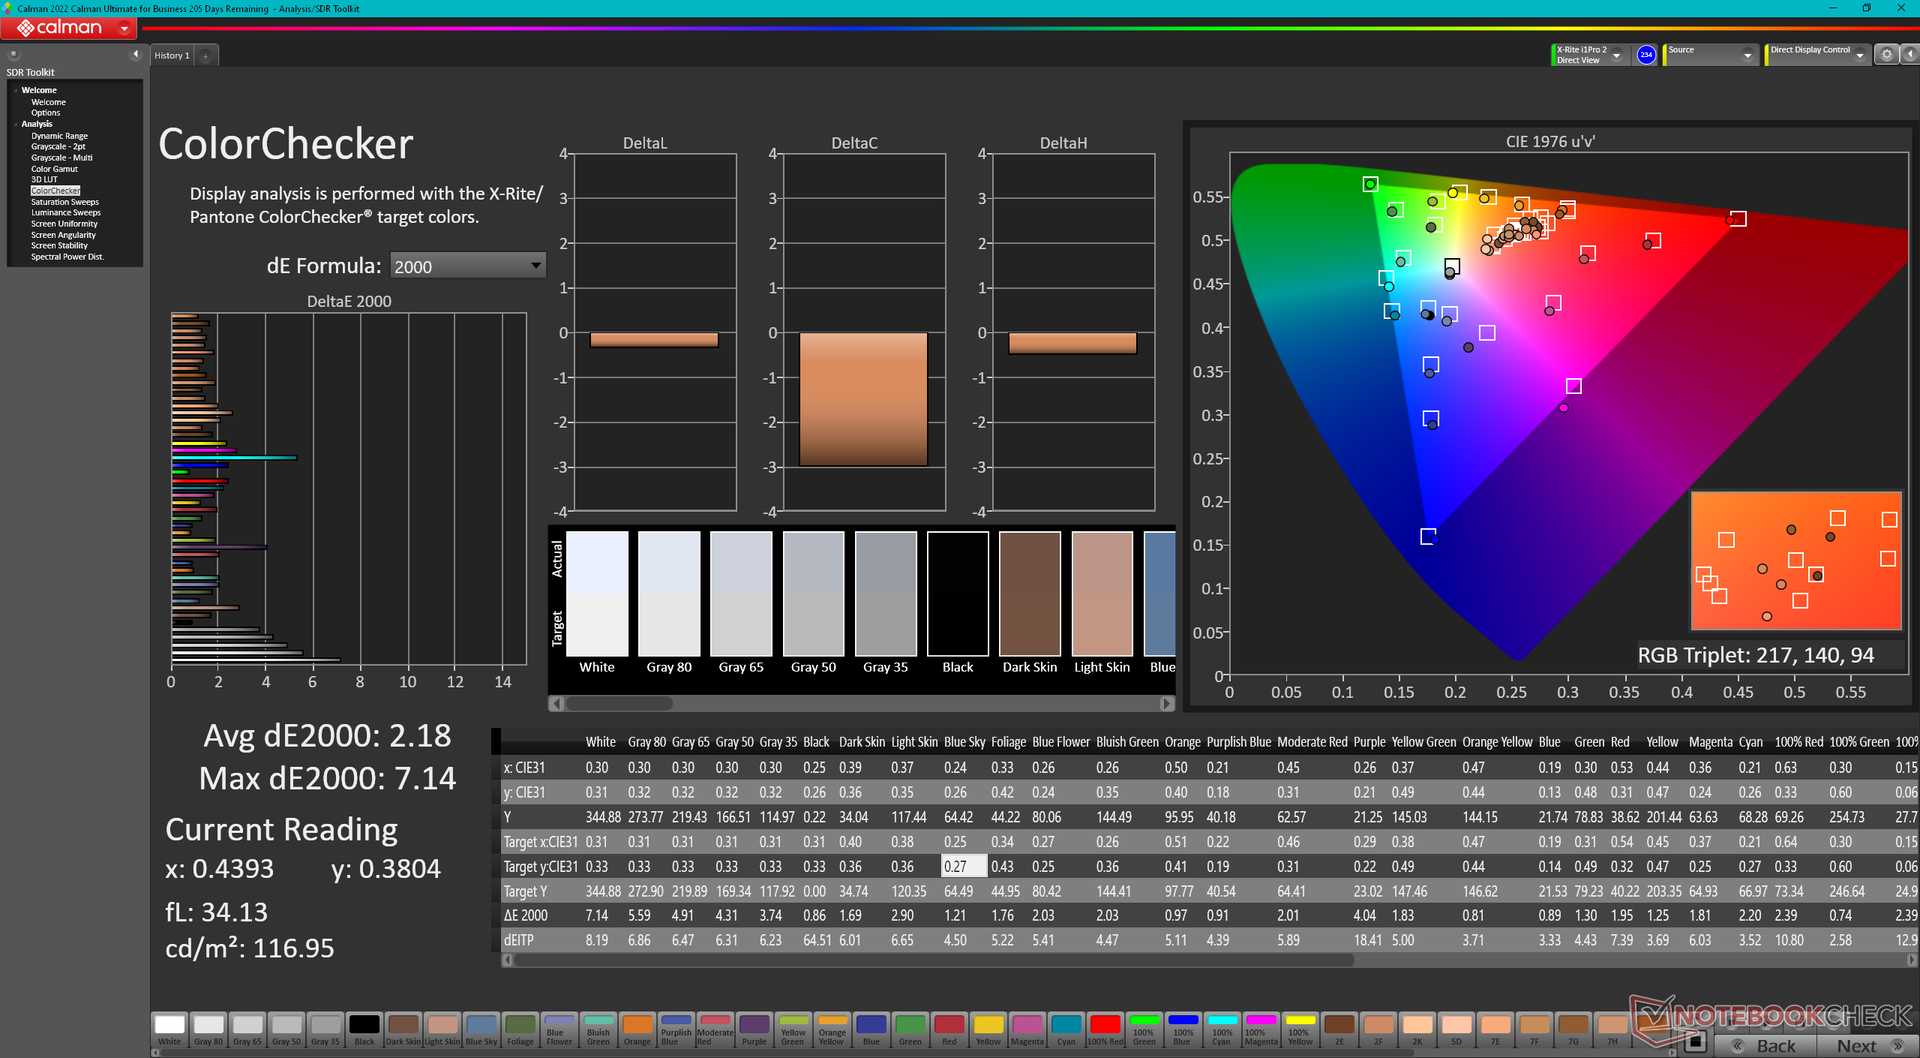
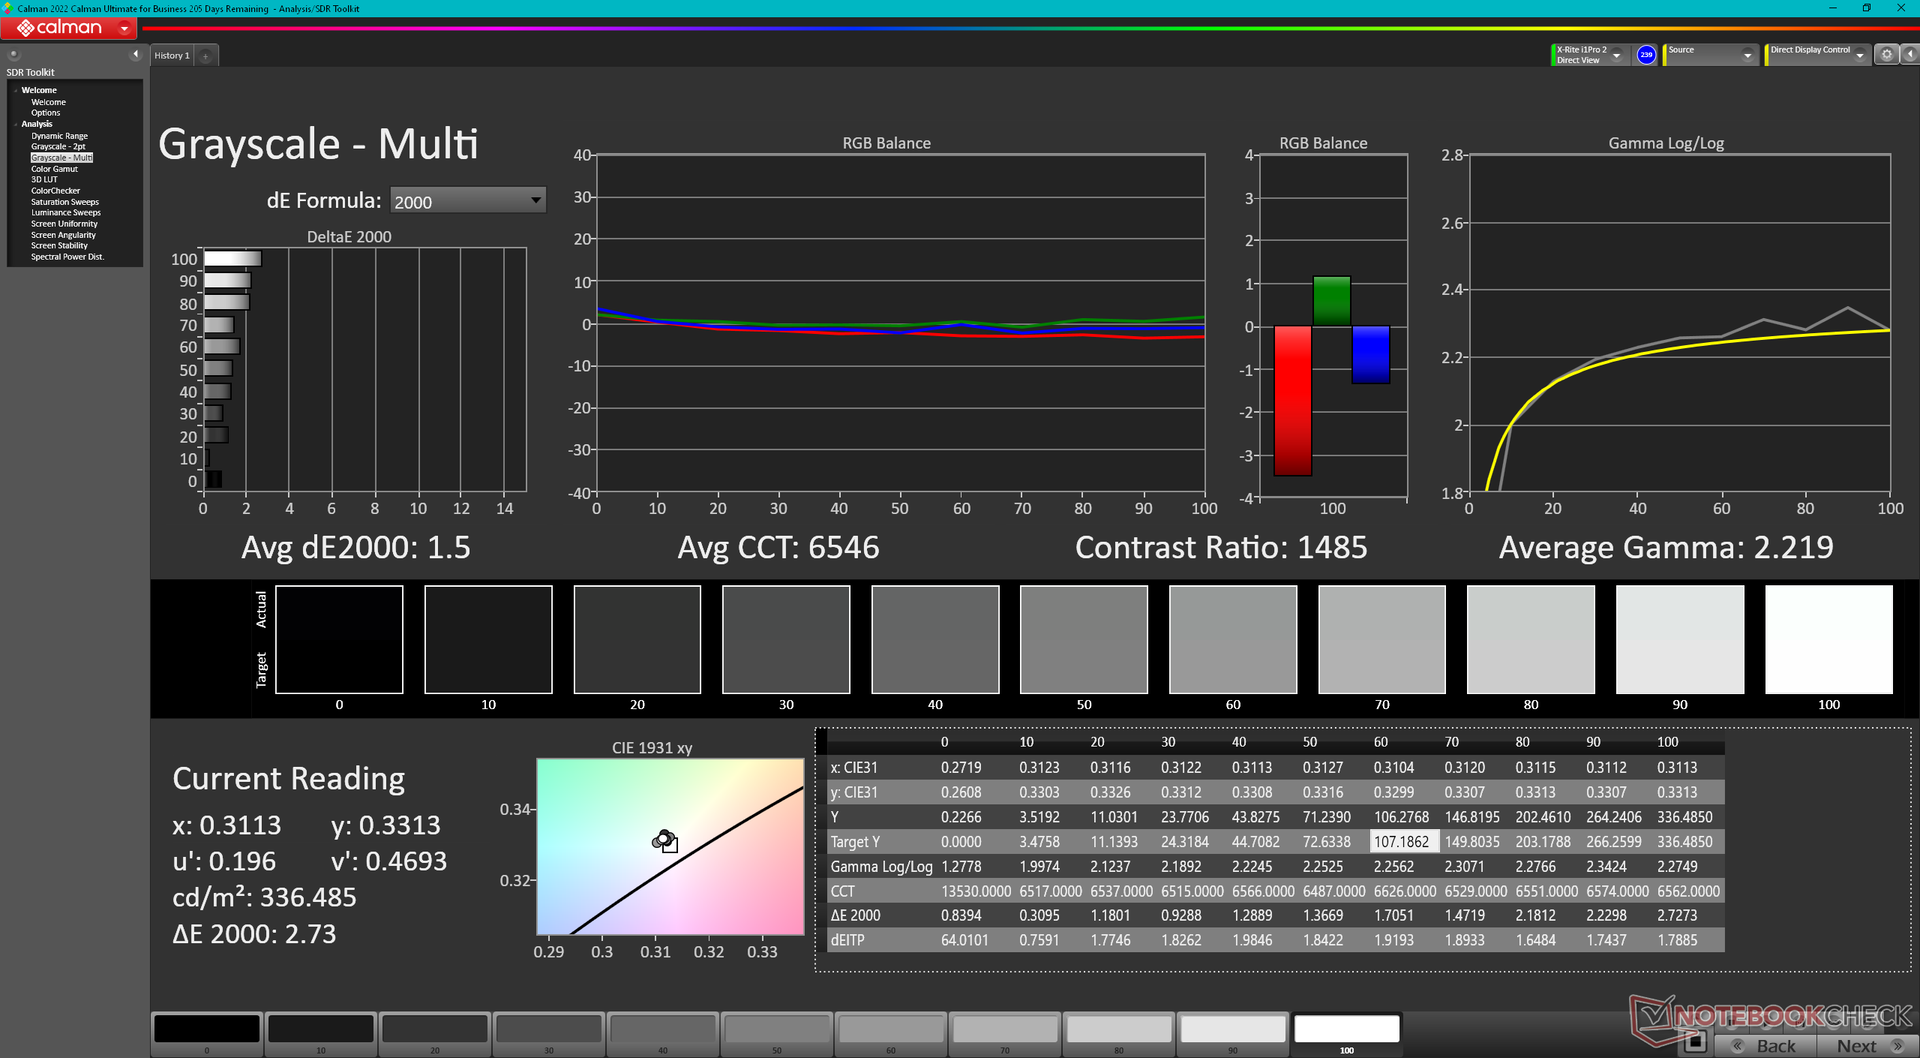
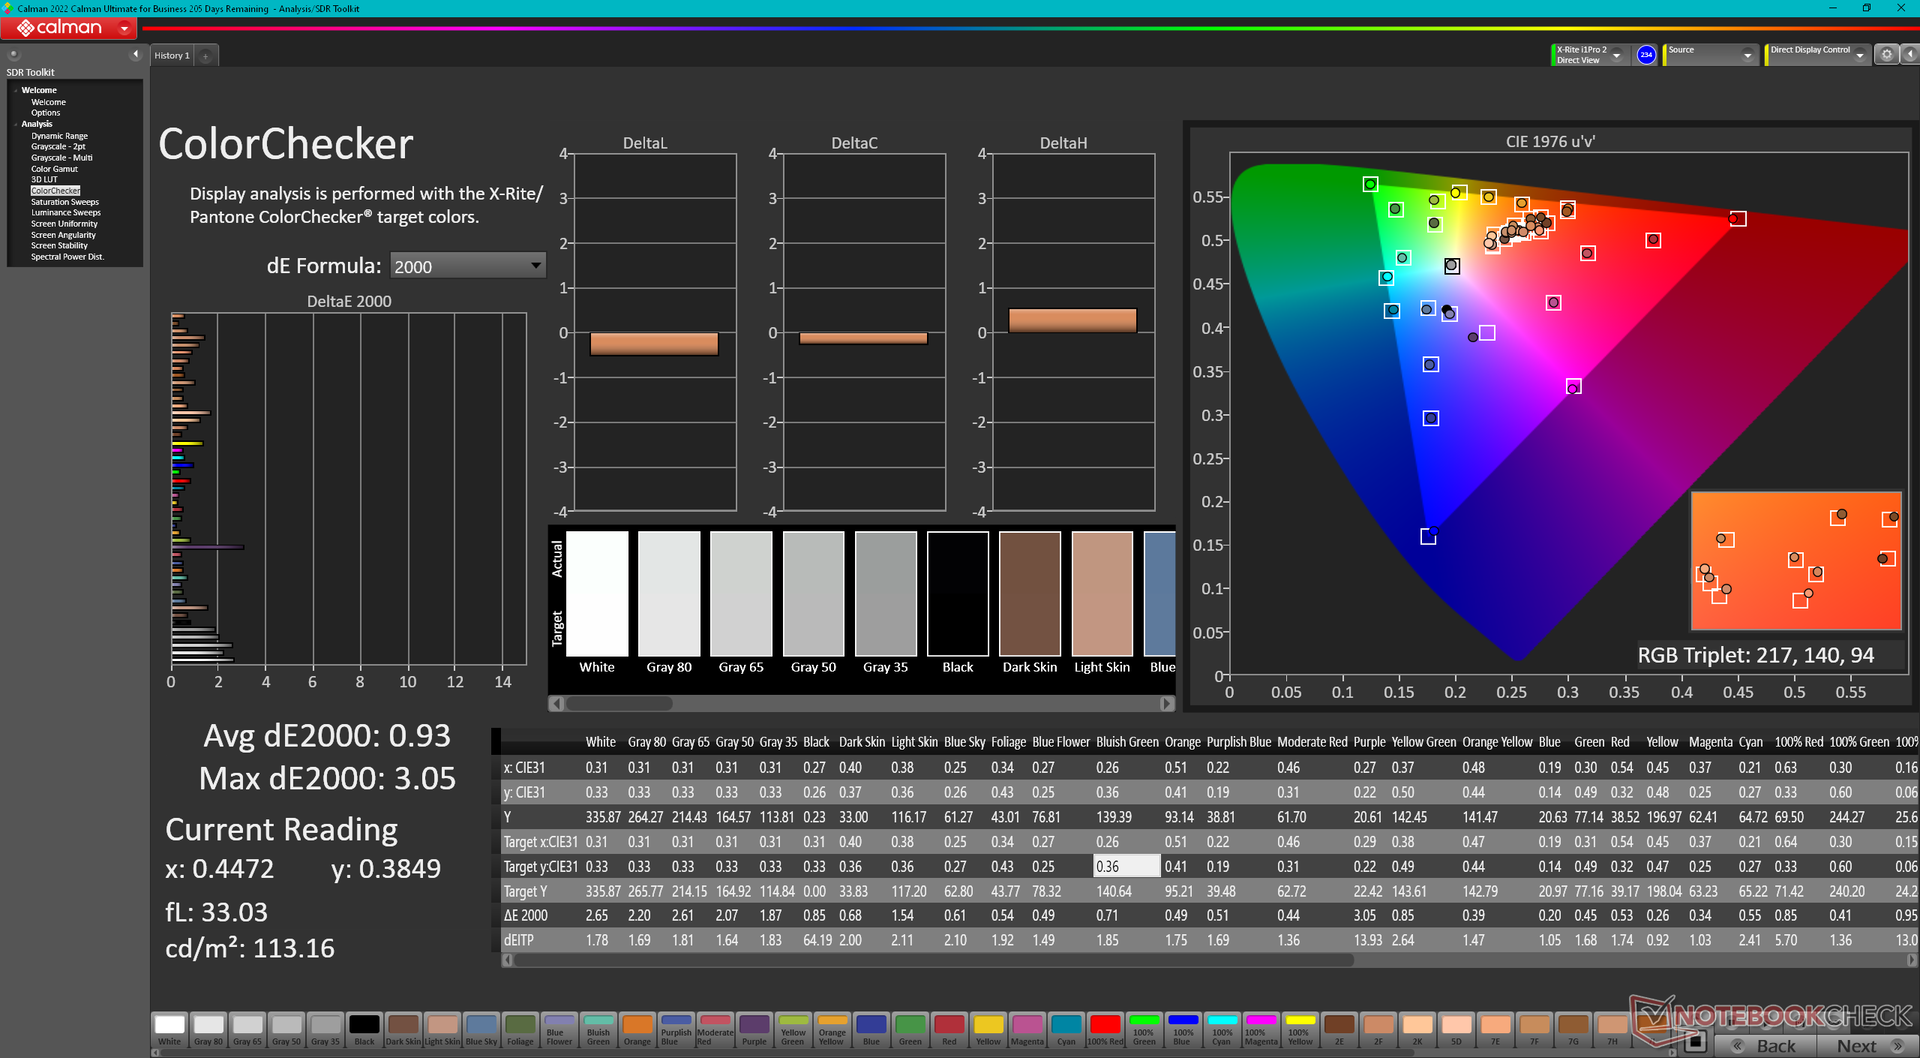
ΔE ColorChecker Calman: 2.18 | ∀{0.5-29.43 Ø4.71}
calibrated: 0.93
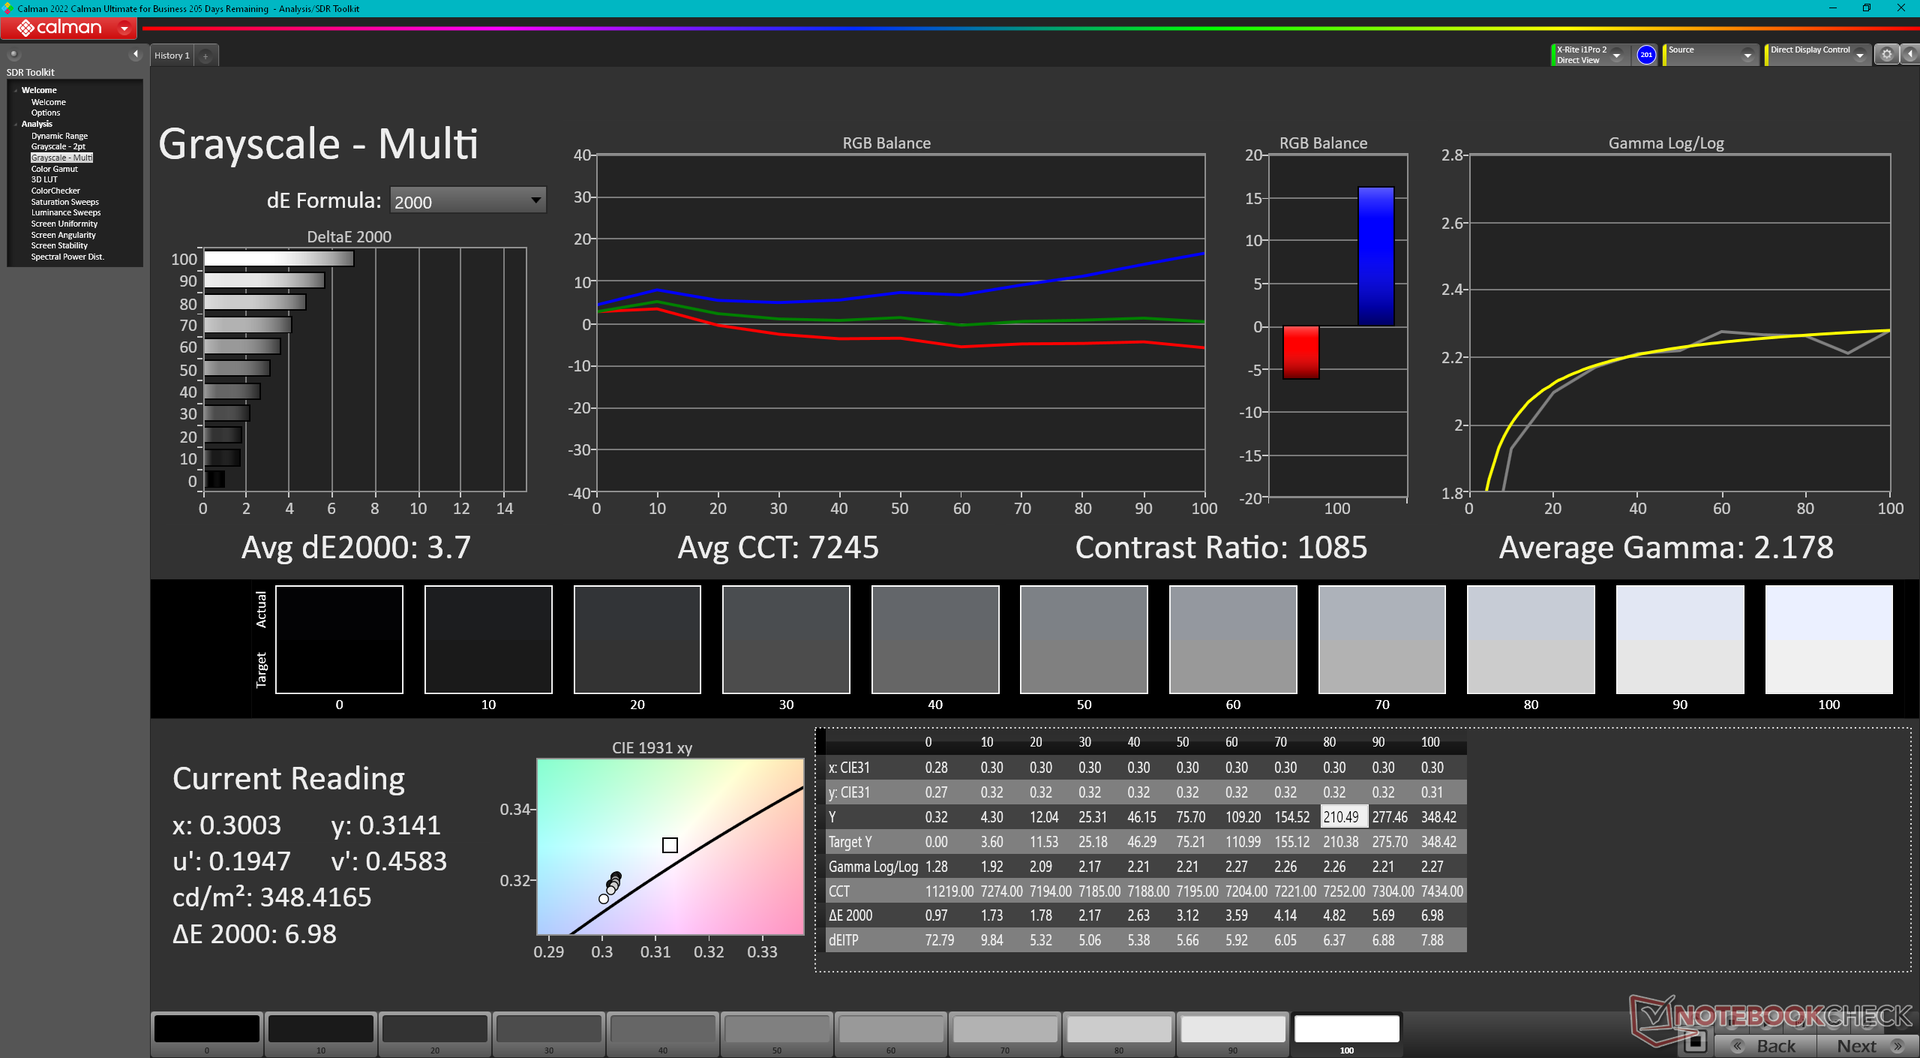
ΔE Greyscale Calman: 3.7 | ∀{0.09-98 Ø4.96}
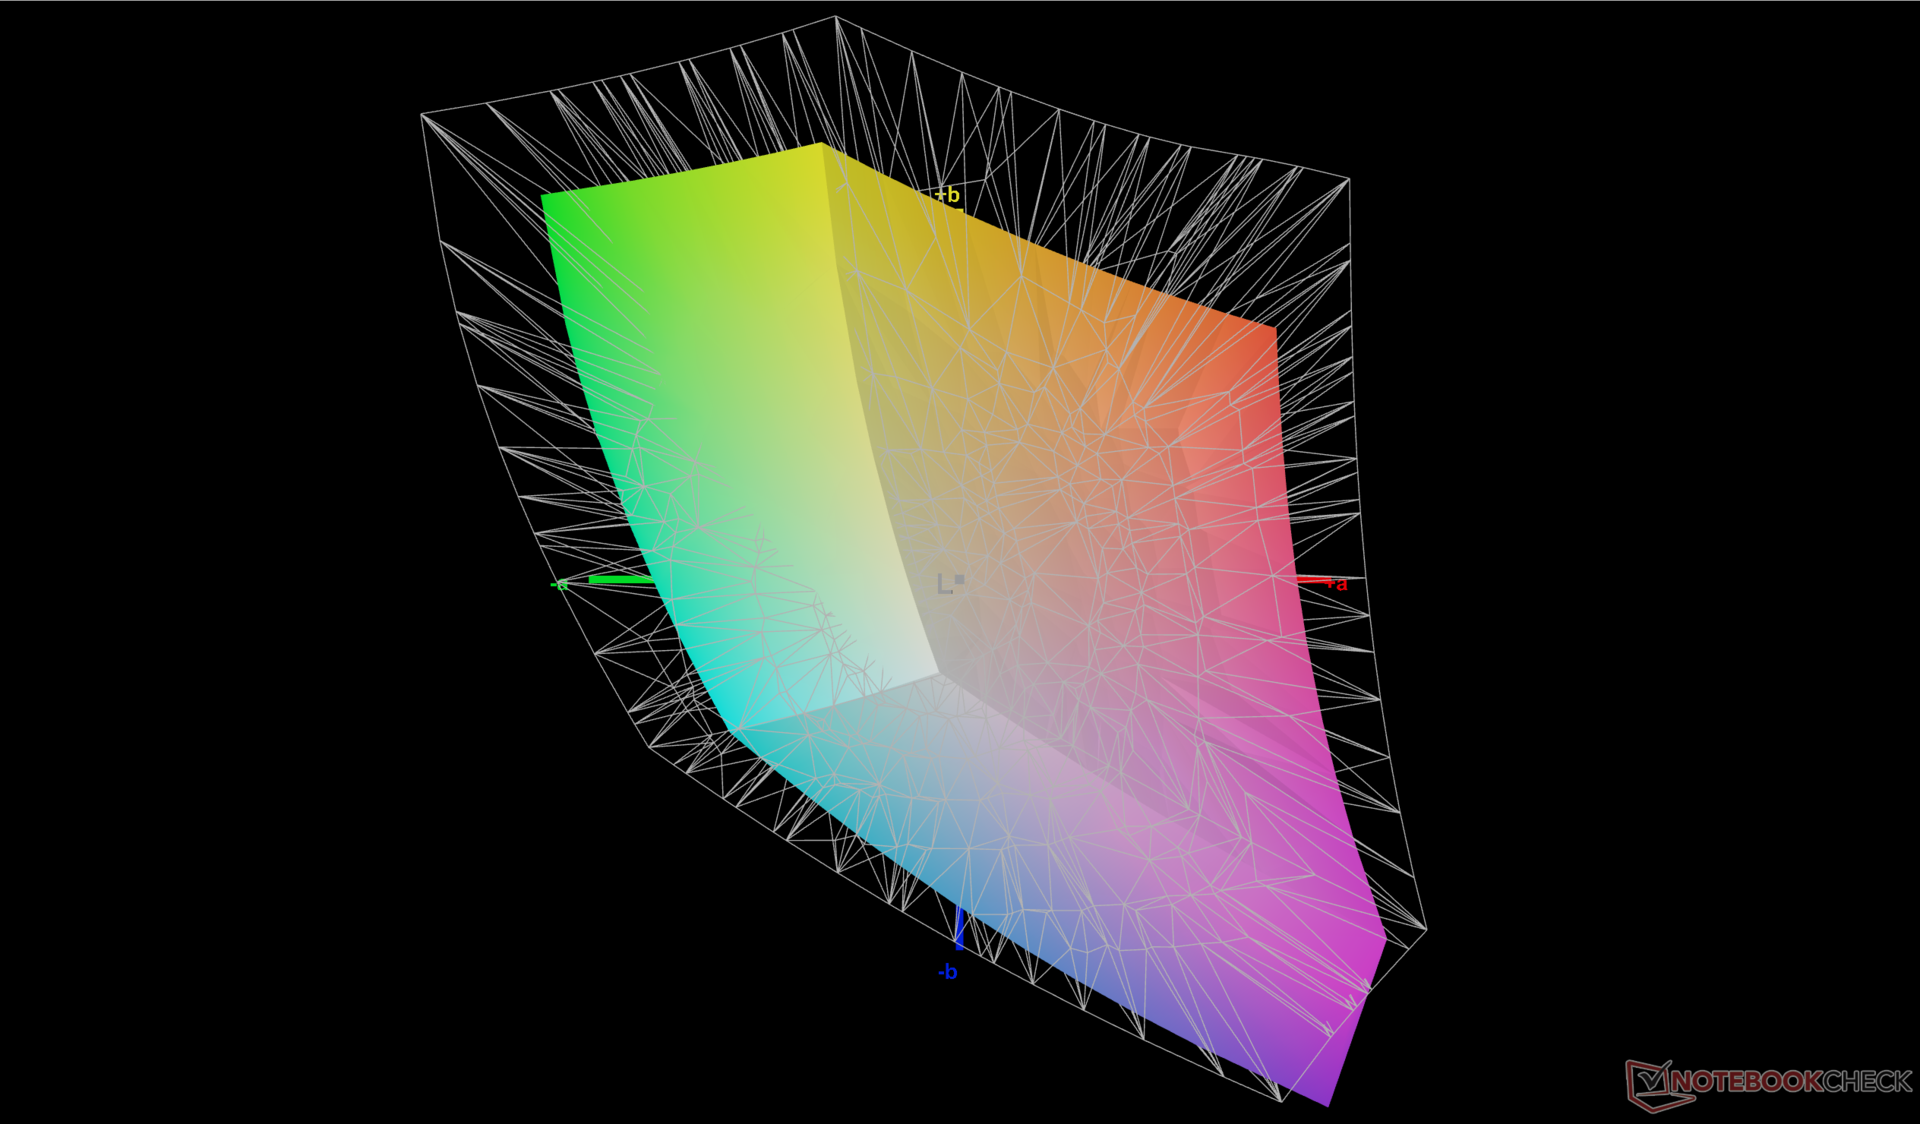
68.6% AdobeRGB 1998 (Argyll 3D)
96.4% sRGB (Argyll 3D)
67.5% Display P3 (Argyll 3D)
Gamma: 2.18
CCT: 7245 K
| Uniwill GM6PX7X RTX 4070 BOE CQ NE160QDM-NZ1, IPS, 2560x1600, 16" | Schenker XMG Neo 16 E23 BOE0AF0 NE160QDM-NZ1, IPS, 2560x1600, 16" | Asus ROG Strix G16 G614JZ TL160ADMP03-0, IPS, 2560x1600, 16" | Lenovo Legion Pro 7 16IRX8H MNG007DA2-3 (CSO1628), IPS, 2560x1600, 16" | Gigabyte AERO 16 OLED BSF Samsung SDC4191 (ATNA60YV09-0, OLED, 3840x2400, 16" | Razer Blade 16 Early 2023 CSOT T3 MNG007DA4-1, IPS, 2560x1600, 16" | |
|---|---|---|---|---|---|---|
| Display | 0% | 24% | 3% | 31% | 27% | |
| Display P3 Coverage (%) | 67.5 | 67.3 0% | 97 44% | 69.1 2% | 99.9 48% | 98.5 46% |
| sRGB Coverage (%) | 96.4 | 96.7 0% | 99.9 4% | 99.7 3% | 100 4% | 100 4% |
| AdobeRGB 1998 Coverage (%) | 68.6 | 68.9 0% | 84.9 24% | 71.2 4% | 96.4 41% | 89.7 31% |
| Response Times | -2% | 47% | 21% | 82% | 13% | |
| Response Time Grey 50% / Grey 80% * (ms) | 12.6 ? | 14.5 ? -15% | 5.1 ? 60% | 12.3 ? 2% | 2 ? 84% | 6.6 ? 48% |
| Response Time Black / White * (ms) | 9.8 ? | 8.6 ? 12% | 6.6 ? 33% | 5.9 ? 40% | 1.98 ? 80% | 12 ? -22% |
| PWM Frequency (Hz) | 60 | |||||
| Screen | 9% | 16% | 33% | 142% | 8% | |
| Brightness middle (cd/m²) | 338.6 | 372 10% | 470 39% | 511 51% | 389.97 15% | 456.8 35% |
| Brightness (cd/m²) | 328 | 349 6% | 459 40% | 469 43% | 395 20% | 437 33% |
| Brightness Distribution (%) | 89 | 88 -1% | 93 4% | 86 -3% | 97 9% | 83 -7% |
| Black Level * (cd/m²) | 0.32 | 0.32 -0% | 0.42 -31% | 0.4 -25% | 0.03 91% | 0.35 -9% |
| Contrast (:1) | 1058 | 1163 10% | 1119 6% | 1278 21% | 12999 1129% | 1305 23% |
| Colorchecker dE 2000 * | 2.18 | 2.06 6% | 1.86 15% | 0.95 56% | 2 8% | 3.7 -70% |
| Colorchecker dE 2000 max. * | 7.14 | 3 58% | 3.87 46% | 2.07 71% | 4.1 43% | 6.42 10% |
| Colorchecker dE 2000 calibrated * | 0.93 | 1.5 -61% | 0.93 -0% | 0.91 2% | 1.68 -81% | 0.66 29% |
| Greyscale dE 2000 * | 3.7 | 1.9 49% | 2.7 27% | 0.6 84% | 2.23 40% | 2.6 30% |
| Gamma | 2.18 101% | 2.312 95% | 2.246 98% | 2.176 101% | 2.41 91% | 2.3 96% |
| CCT | 7245 90% | 6747 96% | 6711 97% | 6545 99% | 6323 103% | 6108 106% |
| Moyenne finale (programmes/paramètres) | 2% /
5% | 29% /
22% | 19% /
25% | 85% /
109% | 16% /
13% |
* ... Moindre est la valeur, meilleures sont les performances
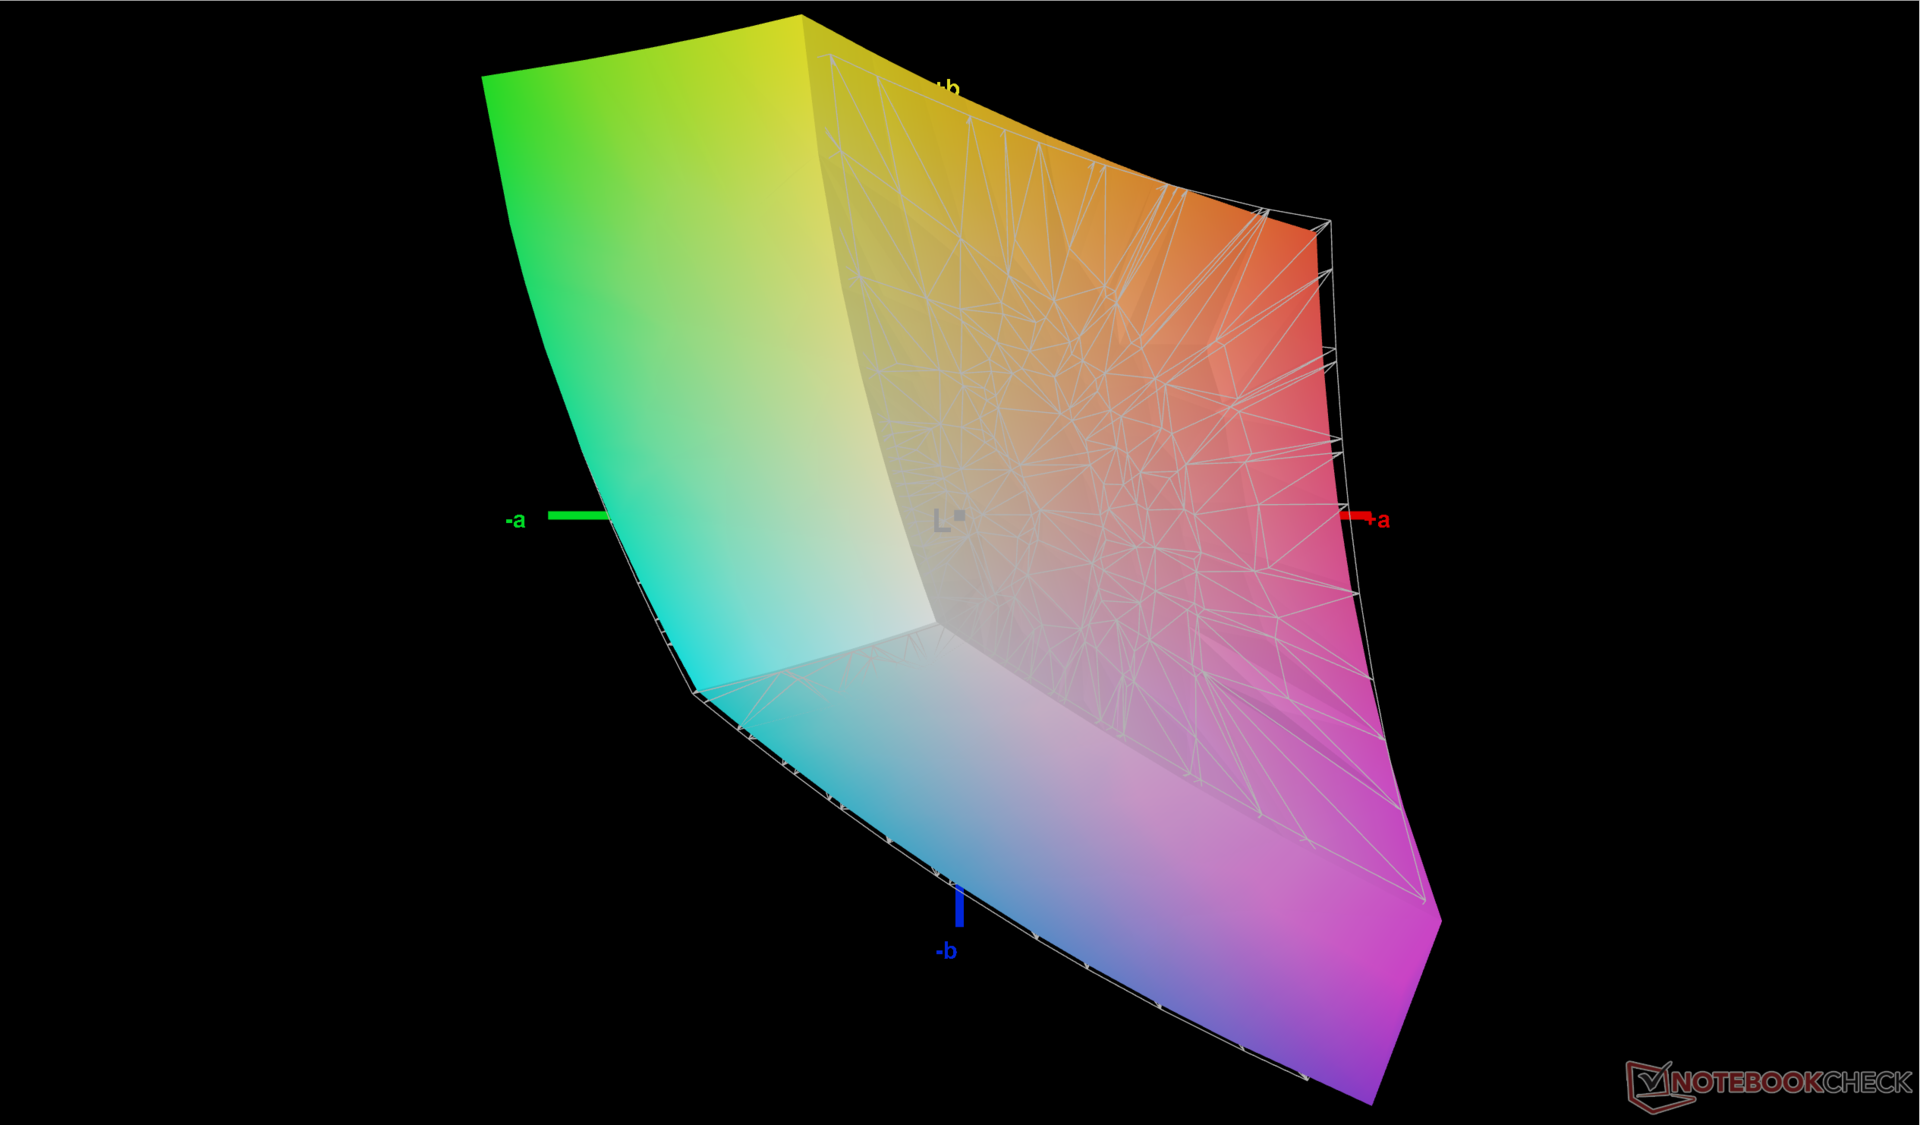
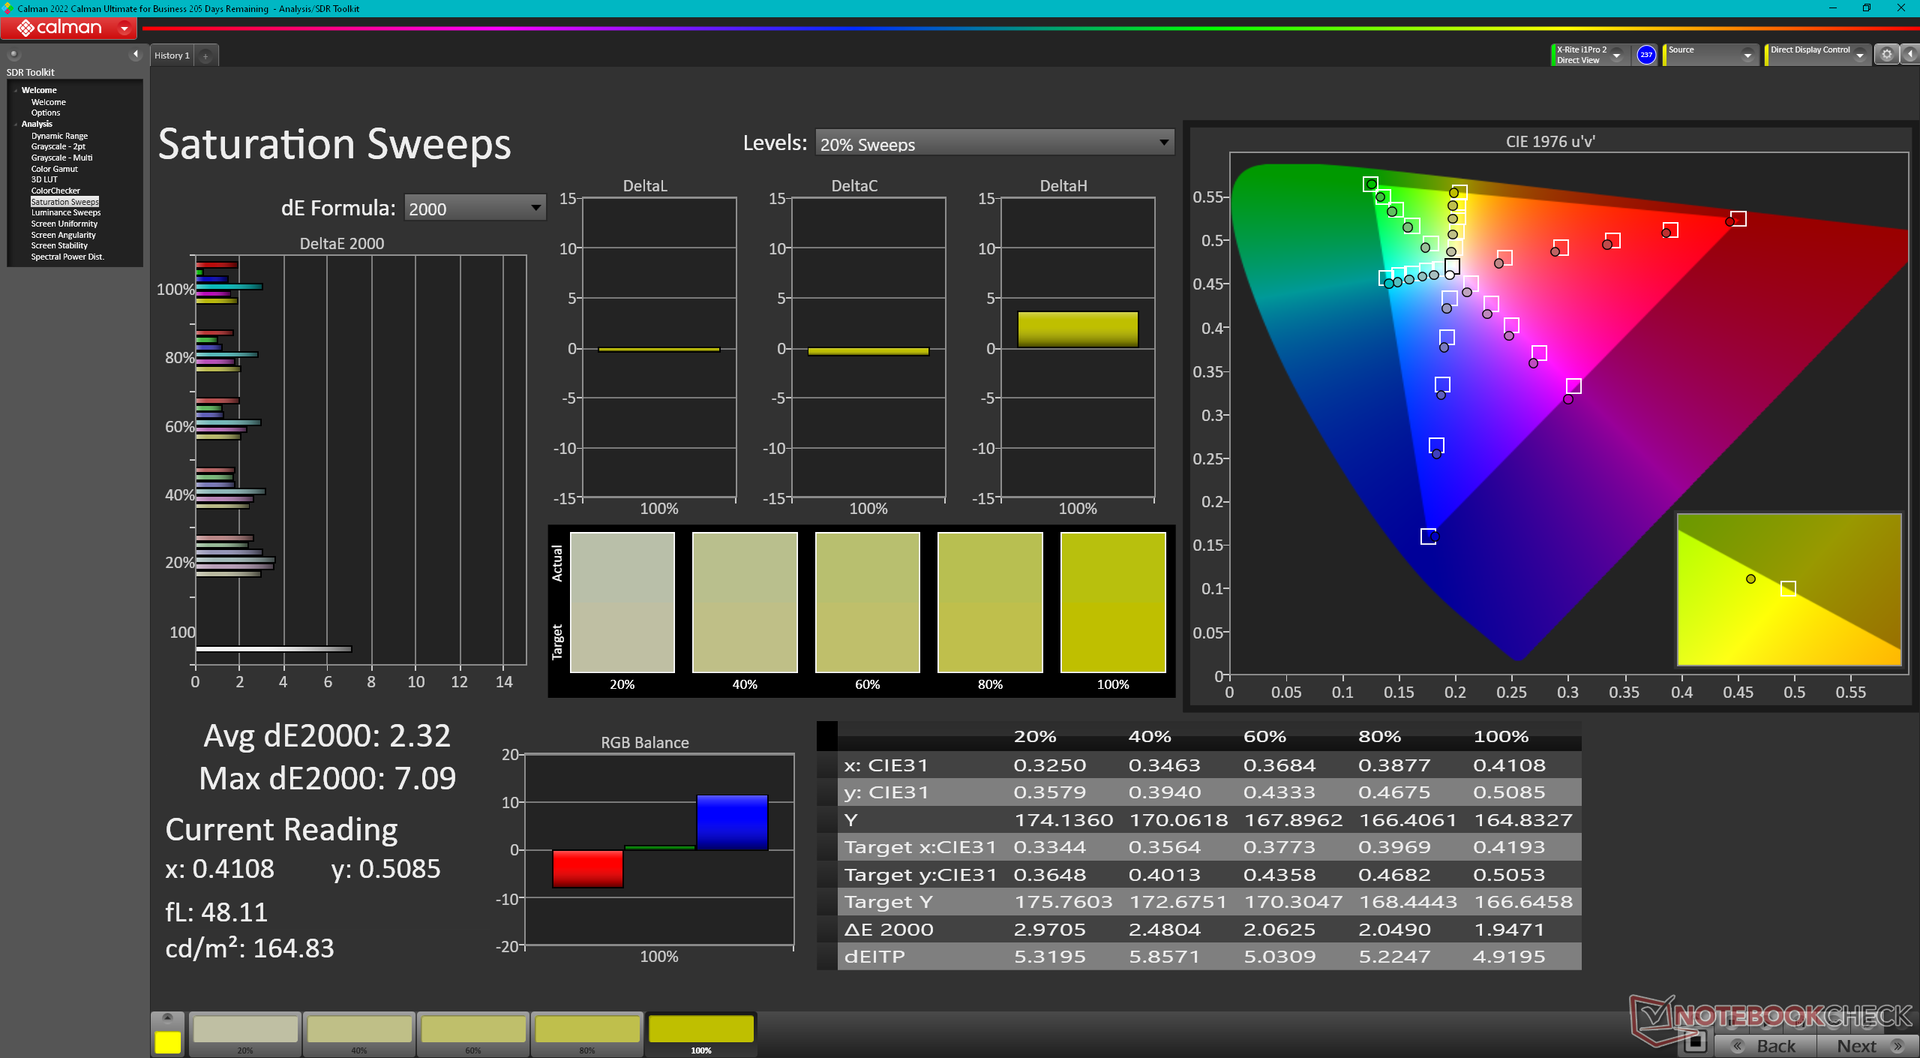
L'écran est correctement calibré dès sa sortie de l'emballage, avec des valeurs moyennes d'échelle de gris et de couleur deltaE de 3,7 et 2,18, respectivement. La température des couleurs est toutefois légèrement froide, ce que notre propre étalonnage X-Rite permet de corriger. Les utilisateurs peuvent appliquer notre profil ICM calibré ci-dessus pour obtenir des couleurs plus précises avec l'Uniwill.
Temps de réponse de l'écran
| ↔ Temps de réponse noir à blanc | ||
|---|---|---|
| 9.8 ms ... hausse ↗ et chute ↘ combinées | ↗ 5.1 ms hausse | 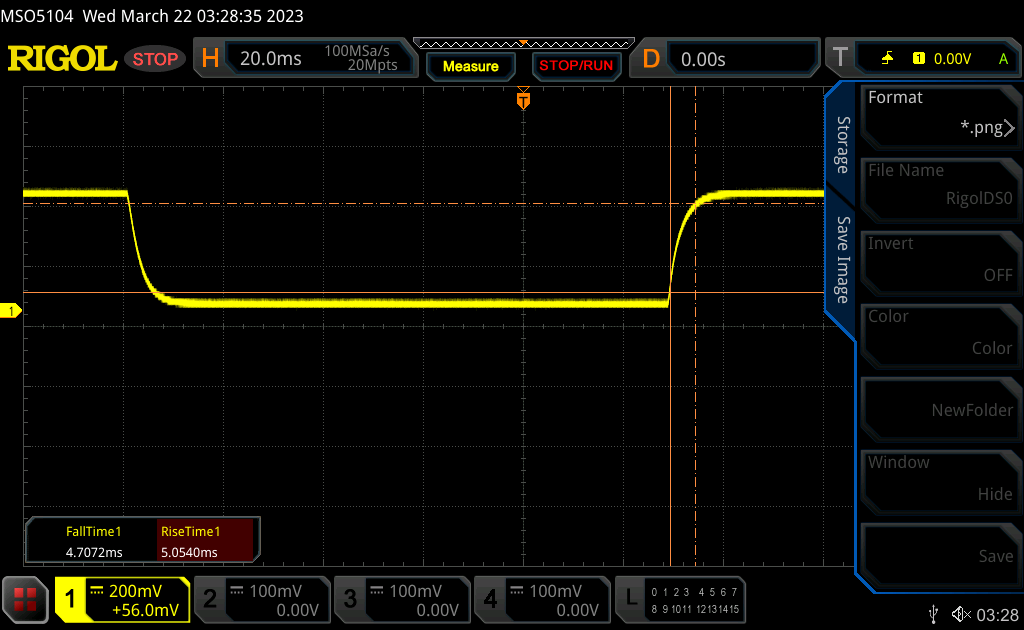 |
| ↘ 4.7 ms chute | ||
| L'écran montre de faibles temps de réponse, un bon écran pour jouer. En comparaison, tous les appareils testés affichent entre 0.1 (minimum) et 240 (maximum) ms. » 27 % des appareils testés affichent de meilleures performances. Cela signifie que les latences relevées sont meilleures que la moyenne (19.8 ms) de tous les appareils testés. | ||
| ↔ Temps de réponse gris 50% à gris 80% | ||
| 12.6 ms ... hausse ↗ et chute ↘ combinées | ↗ 6.3 ms hausse | 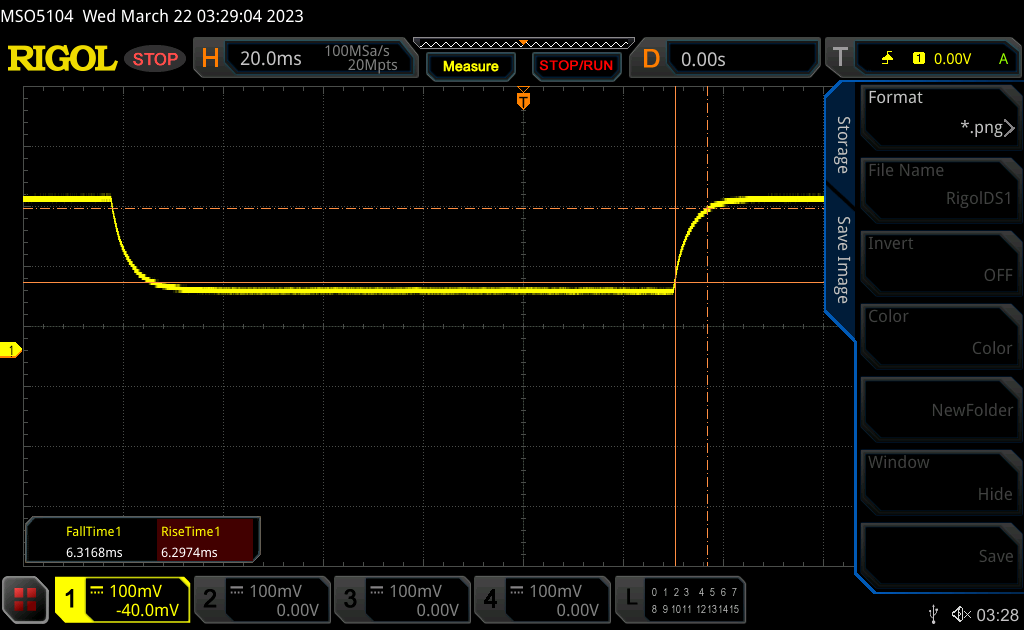 |
| ↘ 6.3 ms chute | ||
| L'écran montre de bons temps de réponse, mais insuffisant pour du jeu compétitif. En comparaison, tous les appareils testés affichent entre 0.165 (minimum) et 636 (maximum) ms. » 26 % des appareils testés affichent de meilleures performances. Cela signifie que les latences relevées sont meilleures que la moyenne (31 ms) de tous les appareils testés. | ||
Scintillement / MLI (Modulation de largeur d'impulsion)
| Scintillement / MLI (Modulation de largeur d'impulsion) non décelé | 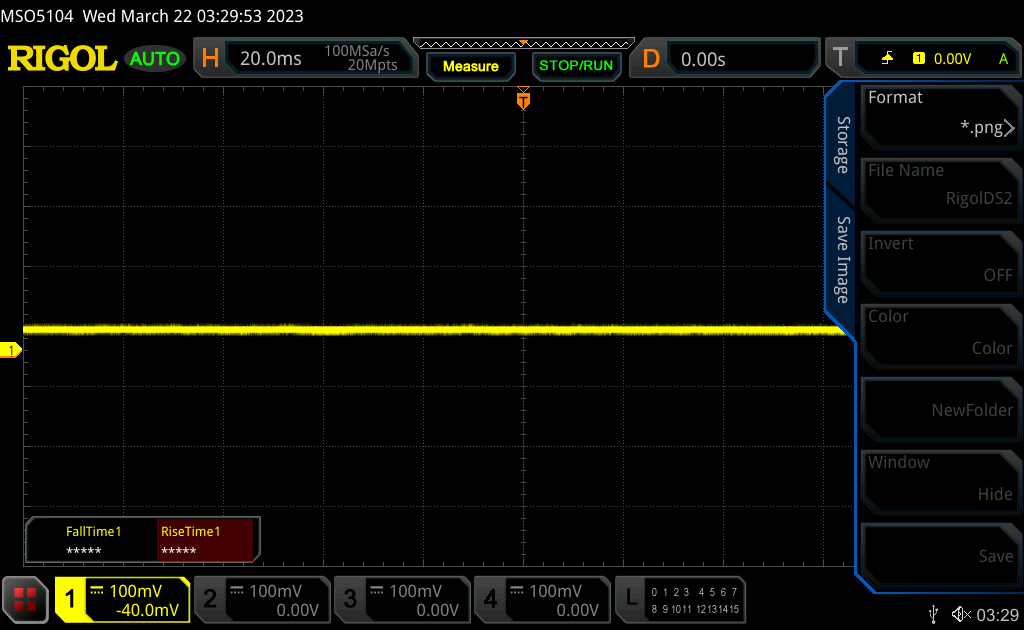 | ||
En comparaison, 52 % des appareils testés n'emploient pas MDI pour assombrir leur écran. Nous avons relevé une moyenne à 7754 (minimum : 5 - maximum : 343500) Hz dans le cas où une MDI était active. | |||

Performance
Conditions d'essai
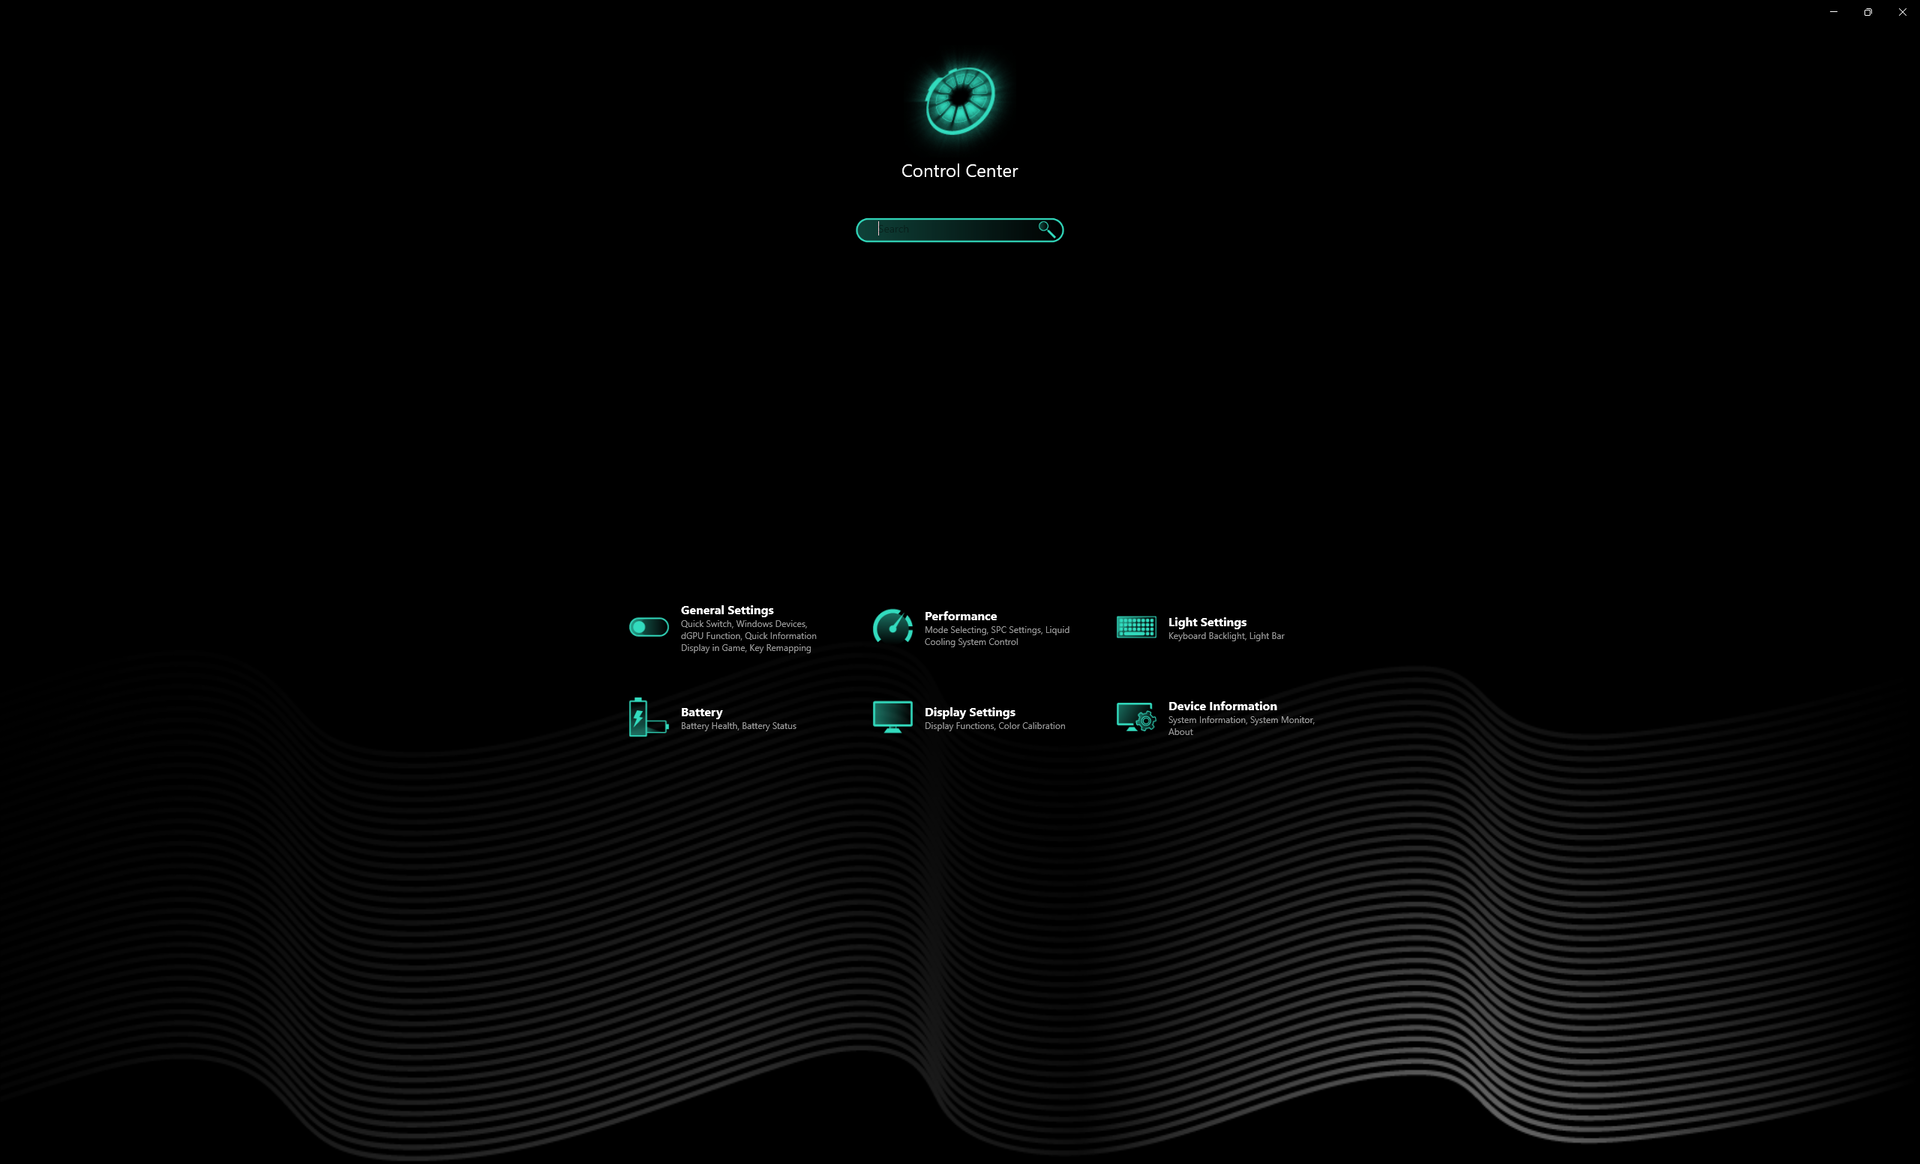
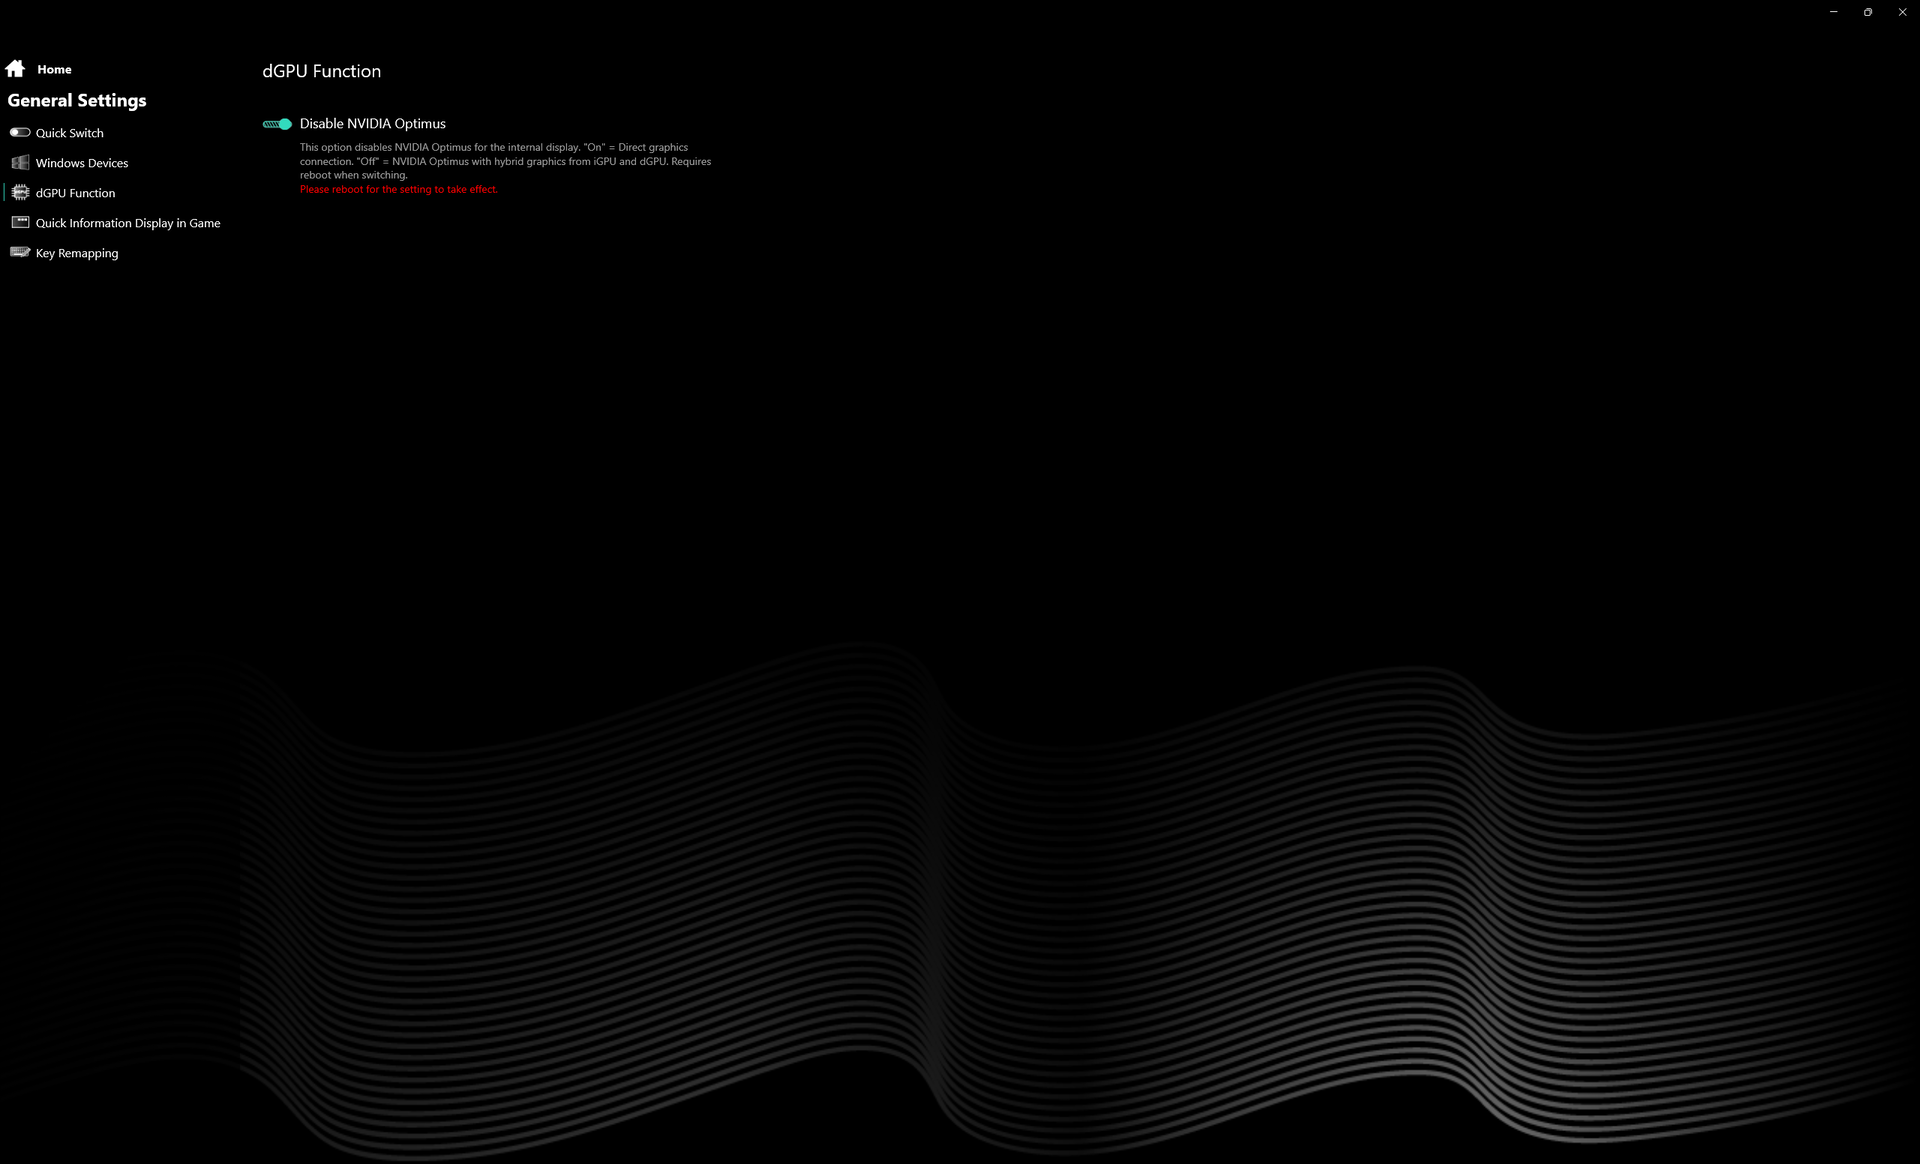
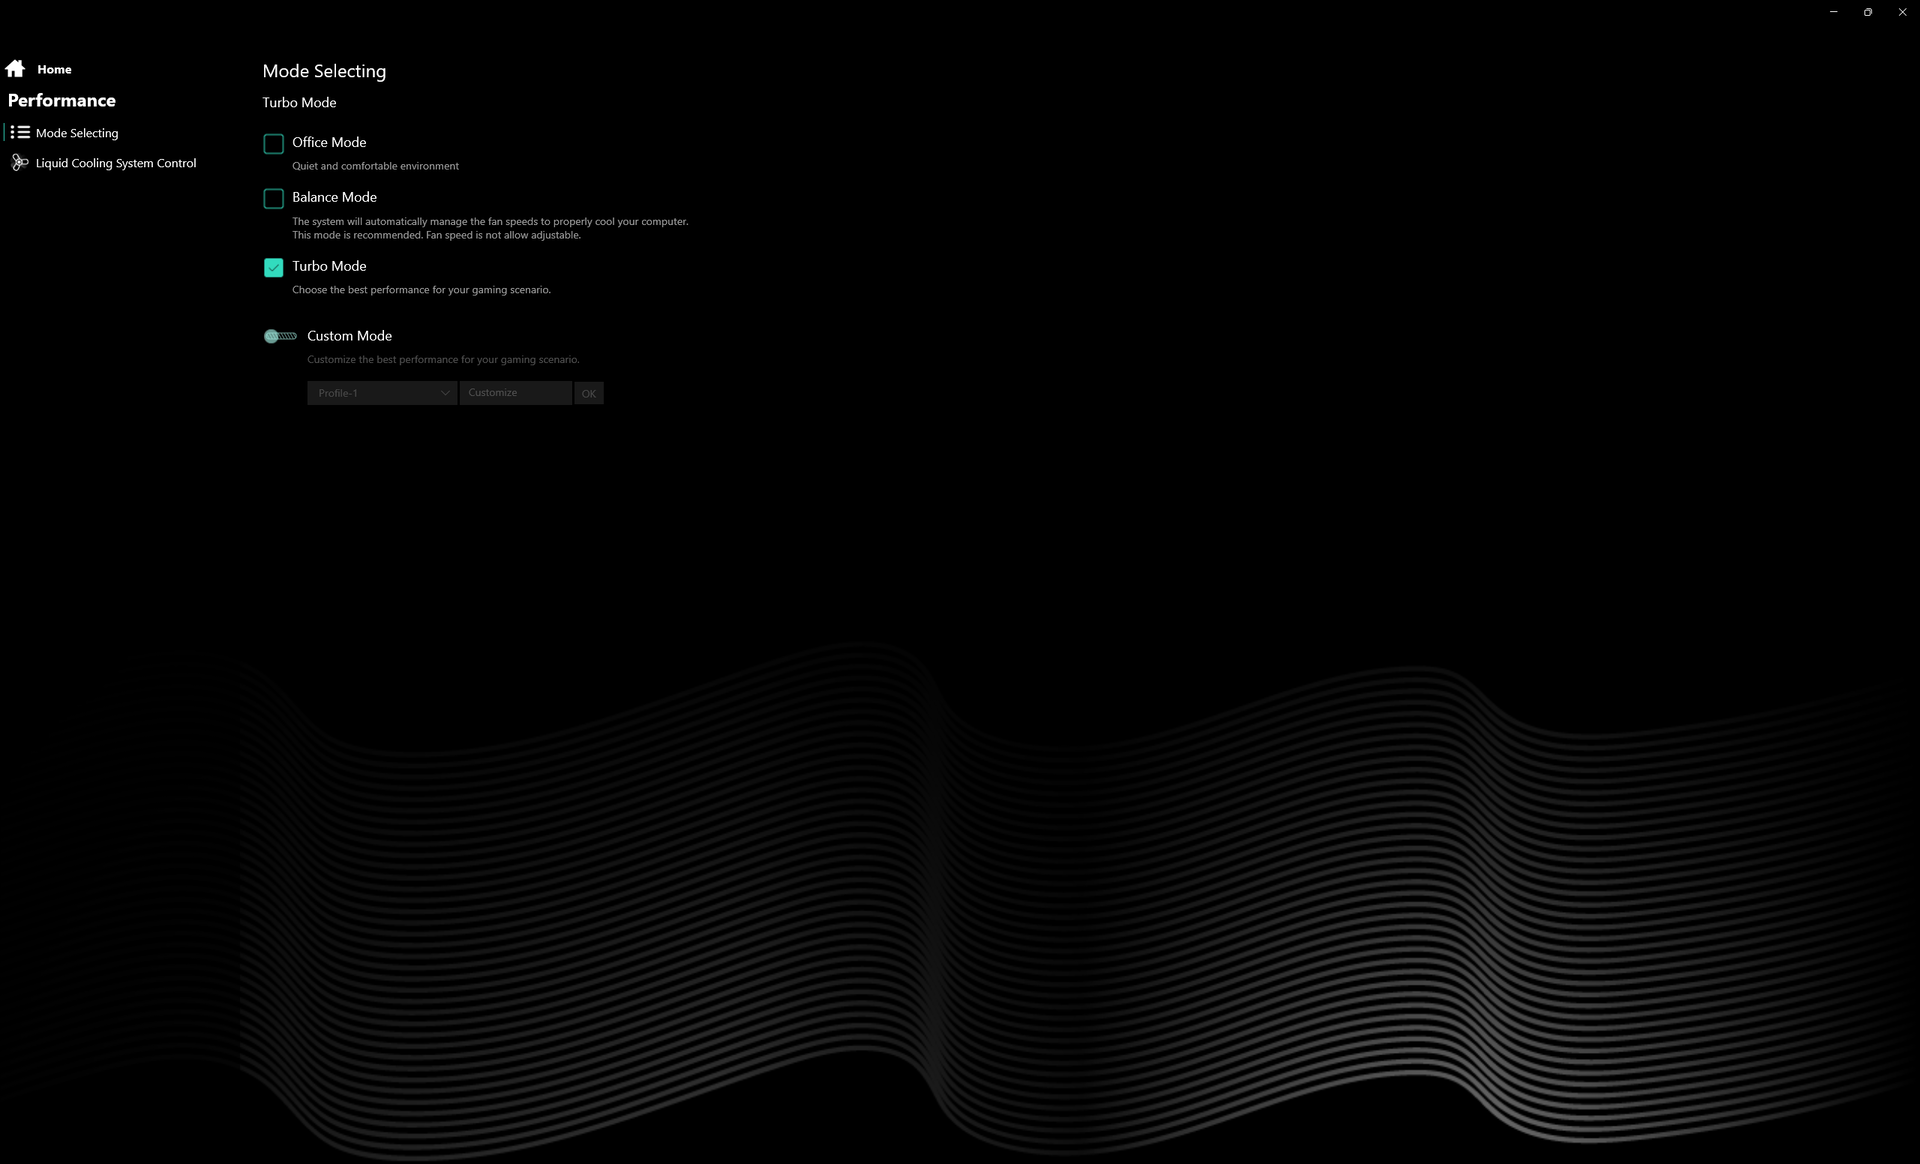
Nous avons réglé notre unité en mode Turbo via le logiciel Control Center préinstallé, avec Optimus désactivé, avant de lancer les benchmarks ci-dessous. Le système ne prend pas en charge l'Optimus avancé, ce qui signifie qu'un redémarrage est nécessaire pour passer du GPU discret à l'Optimus. Les utilisateurs sont encouragés à se familiariser avec le logiciel Control Center préinstallé, car il permet d'ajuster les profils de performance, Optimus, etc.
G-Sync n'est pas pris en charge sur l'écran interne.
Processeur
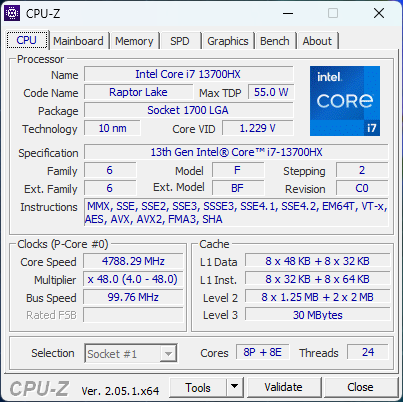
Nous pouvons enfin voir comment le CPU Core i7-13700HX de milieu de gamme supérieur se comporte après avoir testé plusieurs ordinateurs portables de jeu enthousiastes avec des processeurs Core i9 de 13e génération. Les benchmarks montrent qu'il est environ 25 % plus rapide que le processeur Core i7-12700HX de 12e génération de la génération précédente Core i7-12700H que l'on trouve généralement sur la plupart des ordinateurs portables de jeu de milieu et de haut de gamme de 2022. La mise à niveau vers le Core i9-13900HX devrait augmenter les performances de manière significative, de 35 %.
Les performances globales sont bien supérieures à celles de n'importe quel processeur mobile Zen 3+, alors que le dernier Zen 4 Ryzen 9 7945HX reste le processeur le plus rapide de 20 à 50 %. La stabilité des performances est excellente, sans fluctuations majeures de la fréquence d'horloge lorsque le processeur est sollicité.
Vous trouverez plus de détails techniques et de comparaisons sur le Core i7-13700HX sur notre page dédiée ici.
Cinebench R15 Multi Loop
Cinebench R23: Multi Core | Single Core
Cinebench R20: CPU (Multi Core) | CPU (Single Core)
Cinebench R15: CPU Multi 64Bit | CPU Single 64Bit
Blender: v2.79 BMW27 CPU
7-Zip 18.03: 7z b 4 | 7z b 4 -mmt1
Geekbench 5.5: Multi-Core | Single-Core
HWBOT x265 Benchmark v2.2: 4k Preset
LibreOffice : 20 Documents To PDF
R Benchmark 2.5: Overall mean
* ... Moindre est la valeur, meilleures sont les performances
AIDA64: FP32 Ray-Trace | FPU Julia | CPU SHA3 | CPU Queen | FPU SinJulia | FPU Mandel | CPU AES | CPU ZLib | FP64 Ray-Trace | CPU PhotoWorxx
| Performance rating | |
| Lenovo Legion Pro 7 16IRX8H | |
| Asus ROG Strix G16 G614JZ | |
| Schenker XMG Neo 16 E23 | |
| Razer Blade 16 Early 2023 | |
| Uniwill GM6PX7X RTX 4070 | |
| Gigabyte AERO 16 OLED BSF | |
| Moyenne Intel Core i7-13700HX | |
| AIDA64 / FP32 Ray-Trace | |
| Asus ROG Strix G16 G614JZ | |
| Lenovo Legion Pro 7 16IRX8H | |
| Razer Blade 16 Early 2023 | |
| Razer Blade 16 Early 2023 | |
| Razer Blade 16 Early 2023 | |
| Schenker XMG Neo 16 E23 | |
| Uniwill GM6PX7X RTX 4070 | |
| Moyenne Intel Core i7-13700HX (14261 - 21999, n=11) | |
| Gigabyte AERO 16 OLED BSF | |
| AIDA64 / CPU Queen | |
| Asus ROG Strix G16 G614JZ | |
| Schenker XMG Neo 16 E23 | |
| Razer Blade 16 Early 2023 | |
| Razer Blade 16 Early 2023 | |
| Lenovo Legion Pro 7 16IRX8H | |
| Uniwill GM6PX7X RTX 4070 | |
| Moyenne Intel Core i7-13700HX (86532 - 114717, n=11) | |
| Gigabyte AERO 16 OLED BSF | |
| AIDA64 / FP64 Ray-Trace | |
| Lenovo Legion Pro 7 16IRX8H | |
| Asus ROG Strix G16 G614JZ | |
| Razer Blade 16 Early 2023 | |
| Razer Blade 16 Early 2023 | |
| Razer Blade 16 Early 2023 | |
| Schenker XMG Neo 16 E23 | |
| Uniwill GM6PX7X RTX 4070 | |
| Moyenne Intel Core i7-13700HX (7728 - 11837, n=11) | |
| Gigabyte AERO 16 OLED BSF | |
| AIDA64 / CPU PhotoWorxx | |
| Razer Blade 16 Early 2023 | |
| Razer Blade 16 Early 2023 | |
| Razer Blade 16 Early 2023 | |
| Schenker XMG Neo 16 E23 | |
| Lenovo Legion Pro 7 16IRX8H | |
| Gigabyte AERO 16 OLED BSF | |
| Uniwill GM6PX7X RTX 4070 | |
| Asus ROG Strix G16 G614JZ | |
| Moyenne Intel Core i7-13700HX (19678 - 42415, n=11) | |
Performance du système
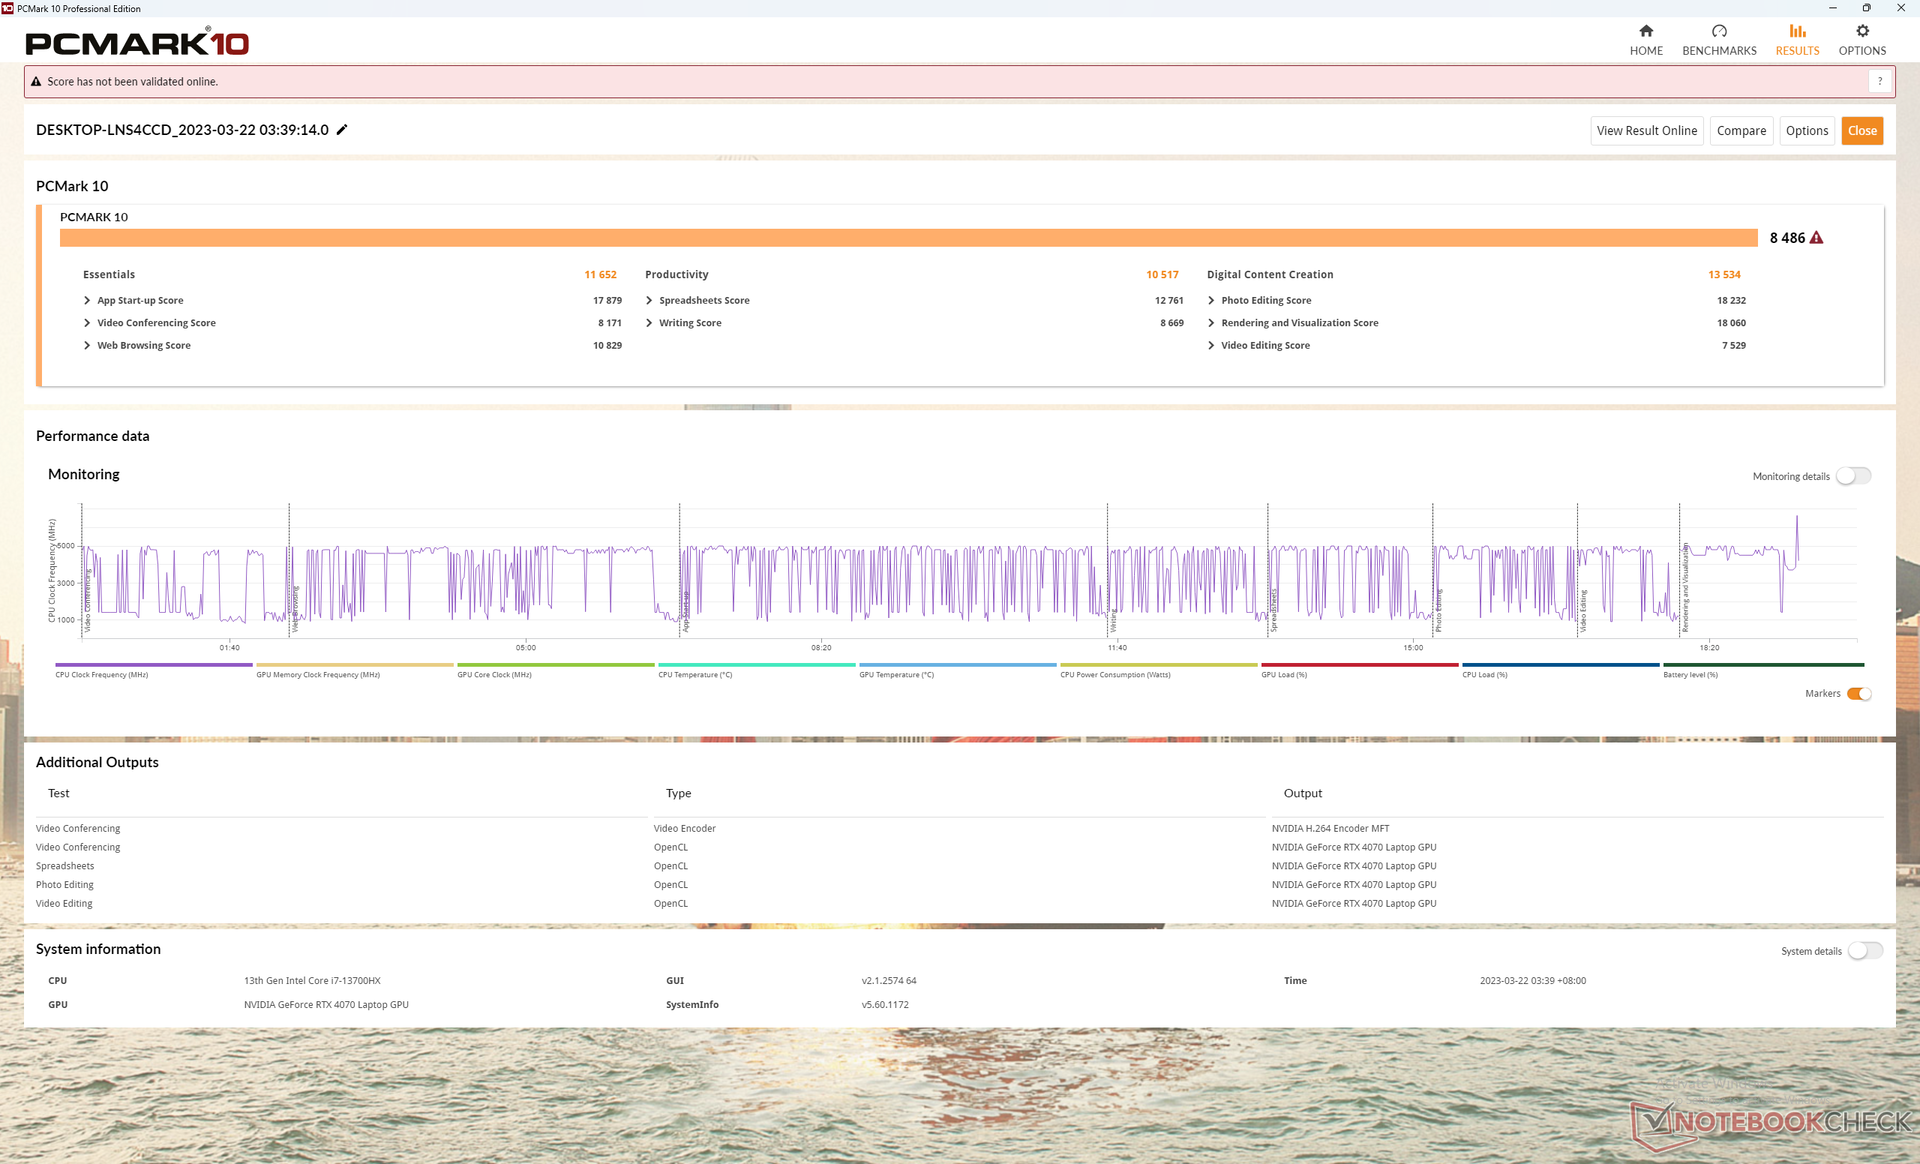
Les résultats de PCMark sont comparables à ceux d'autres ordinateurs portables de jeu haut de gamme équipés de processeurs Core de la 13e génération et de GPU GeForce 40, tels que le Gigabyte AERO 16 ou le Razer Blade 16. Les résultats sont systématiquement supérieurs à ceux du Schenker XMG Neo 15, qui fonctionne avec des processeurs Zen 3+ et GeForce 30 plus anciens.
CrossMark: Overall | Productivity | Creativity | Responsiveness
| PCMark 10 / Score | |
| Uniwill GM6PX7X RTX 4070 | |
| Schenker XMG Neo 16 E23 | |
| Gigabyte AERO 16 OLED BSF | |
| Razer Blade 16 Early 2023 | |
| Lenovo Legion Pro 7 16IRX8H | |
| Asus ROG Strix G16 G614JZ | |
| PCMark 10 / Essentials | |
| Asus ROG Strix G16 G614JZ | |
| Lenovo Legion Pro 7 16IRX8H | |
| Uniwill GM6PX7X RTX 4070 | |
| Gigabyte AERO 16 OLED BSF | |
| Razer Blade 16 Early 2023 | |
| Schenker XMG Neo 16 E23 | |
| PCMark 10 / Productivity | |
| Lenovo Legion Pro 7 16IRX8H | |
| Uniwill GM6PX7X RTX 4070 | |
| Schenker XMG Neo 16 E23 | |
| Gigabyte AERO 16 OLED BSF | |
| Razer Blade 16 Early 2023 | |
| Asus ROG Strix G16 G614JZ | |
| PCMark 10 / Digital Content Creation | |
| Schenker XMG Neo 16 E23 | |
| Razer Blade 16 Early 2023 | |
| Gigabyte AERO 16 OLED BSF | |
| Uniwill GM6PX7X RTX 4070 | |
| Asus ROG Strix G16 G614JZ | |
| Lenovo Legion Pro 7 16IRX8H | |
| CrossMark / Overall | |
| Asus ROG Strix G16 G614JZ | |
| Schenker XMG Neo 16 E23 | |
| Uniwill GM6PX7X RTX 4070 | |
| Gigabyte AERO 16 OLED BSF | |
| Razer Blade 16 Early 2023 | |
| CrossMark / Productivity | |
| Asus ROG Strix G16 G614JZ | |
| Schenker XMG Neo 16 E23 | |
| Uniwill GM6PX7X RTX 4070 | |
| Gigabyte AERO 16 OLED BSF | |
| Razer Blade 16 Early 2023 | |
| CrossMark / Creativity | |
| Schenker XMG Neo 16 E23 | |
| Asus ROG Strix G16 G614JZ | |
| Uniwill GM6PX7X RTX 4070 | |
| Gigabyte AERO 16 OLED BSF | |
| Razer Blade 16 Early 2023 | |
| CrossMark / Responsiveness | |
| Asus ROG Strix G16 G614JZ | |
| Gigabyte AERO 16 OLED BSF | |
| Uniwill GM6PX7X RTX 4070 | |
| Schenker XMG Neo 16 E23 | |
| Razer Blade 16 Early 2023 | |
| PCMark 10 Score | 8486 points | |
Aide | ||
| AIDA64 / Memory Latency | |
| Razer Blade 16 Early 2023 | |
| Razer Blade 16 Early 2023 | |
| Razer Blade 16 Early 2023 | |
| Gigabyte AERO 16 OLED BSF | |
| Asus ROG Strix G16 G614JZ | |
| Uniwill GM6PX7X RTX 4070 | |
| Moyenne Intel Core i7-13700HX (81.5 - 97.9, n=11) | |
| Schenker XMG Neo 16 E23 | |
| Lenovo Legion Pro 7 16IRX8H | |
* ... Moindre est la valeur, meilleures sont les performances
Latence DPC
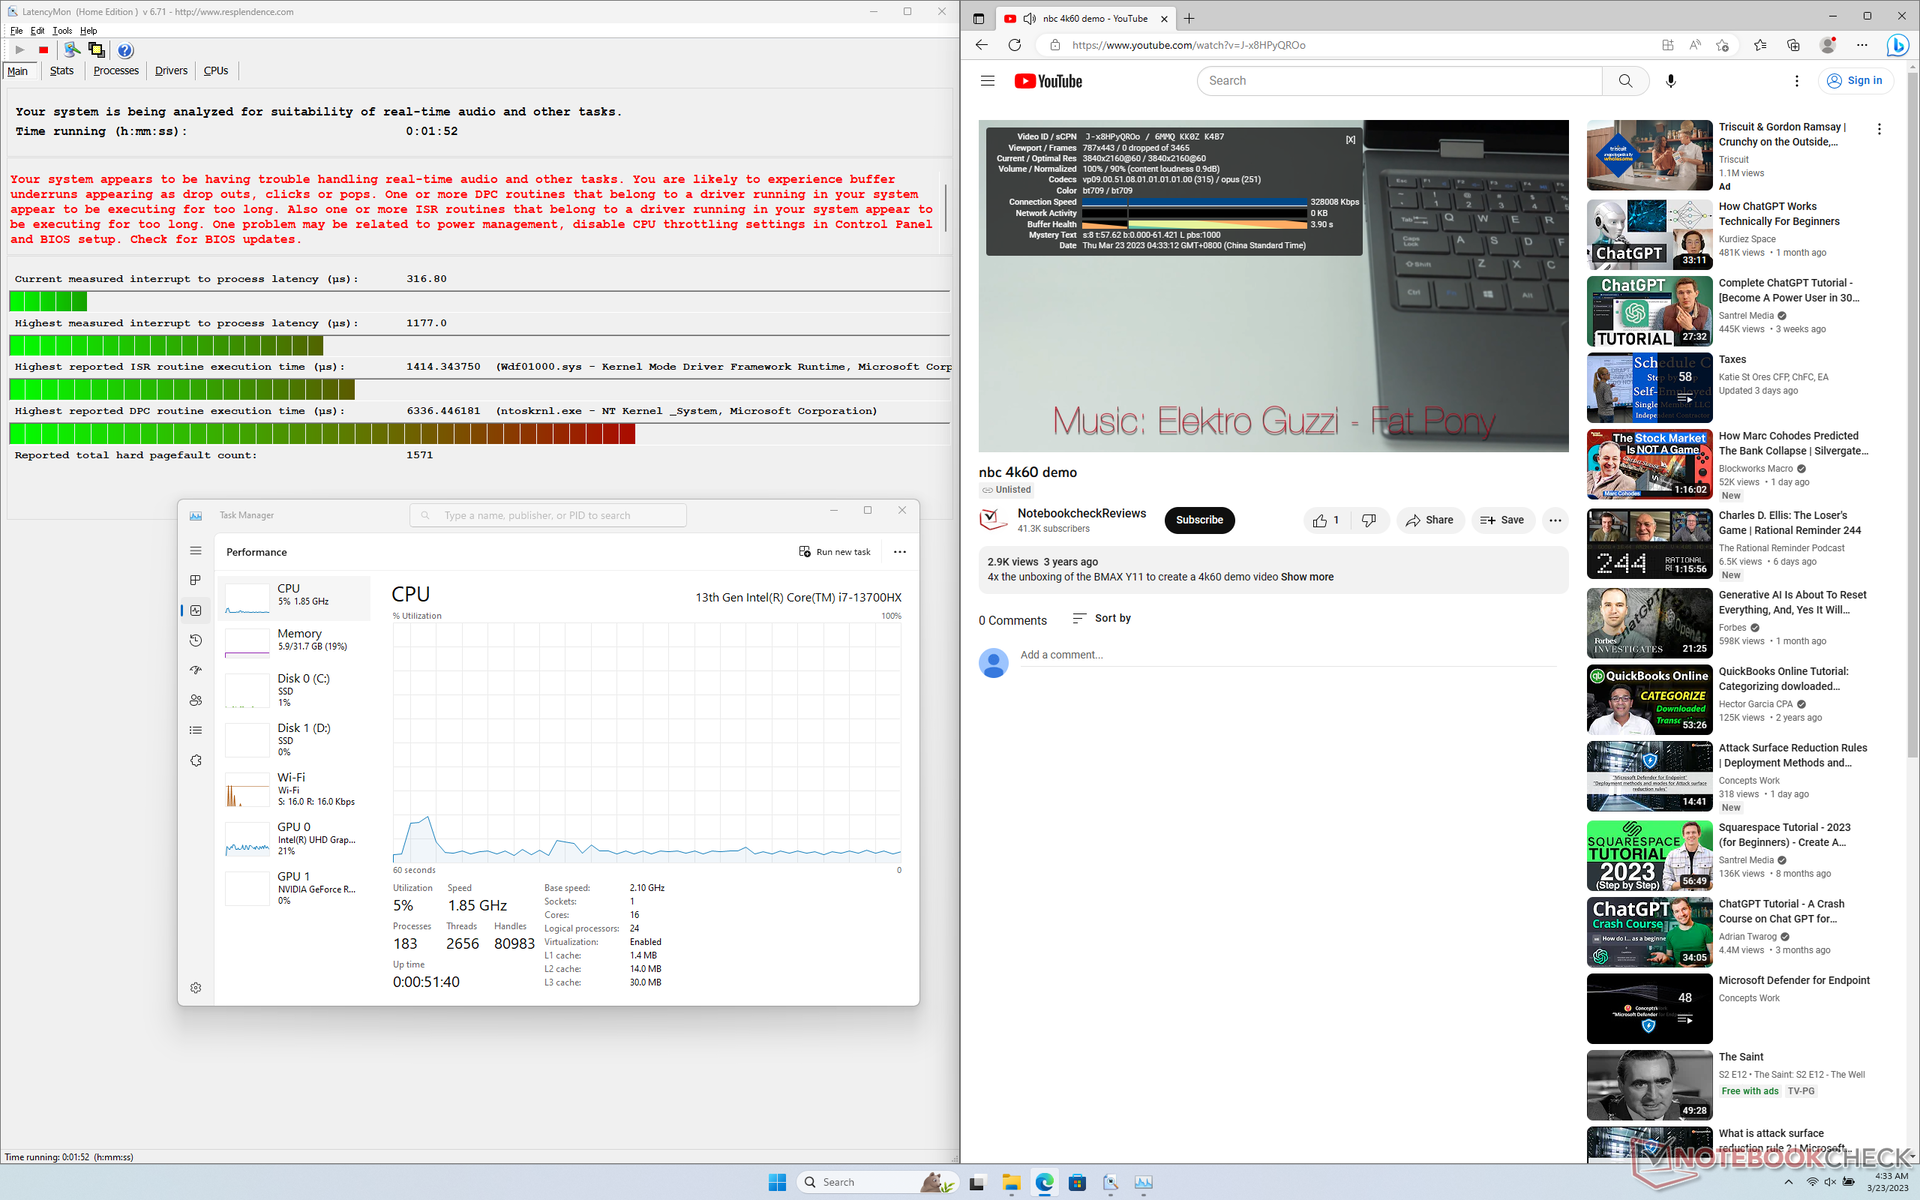
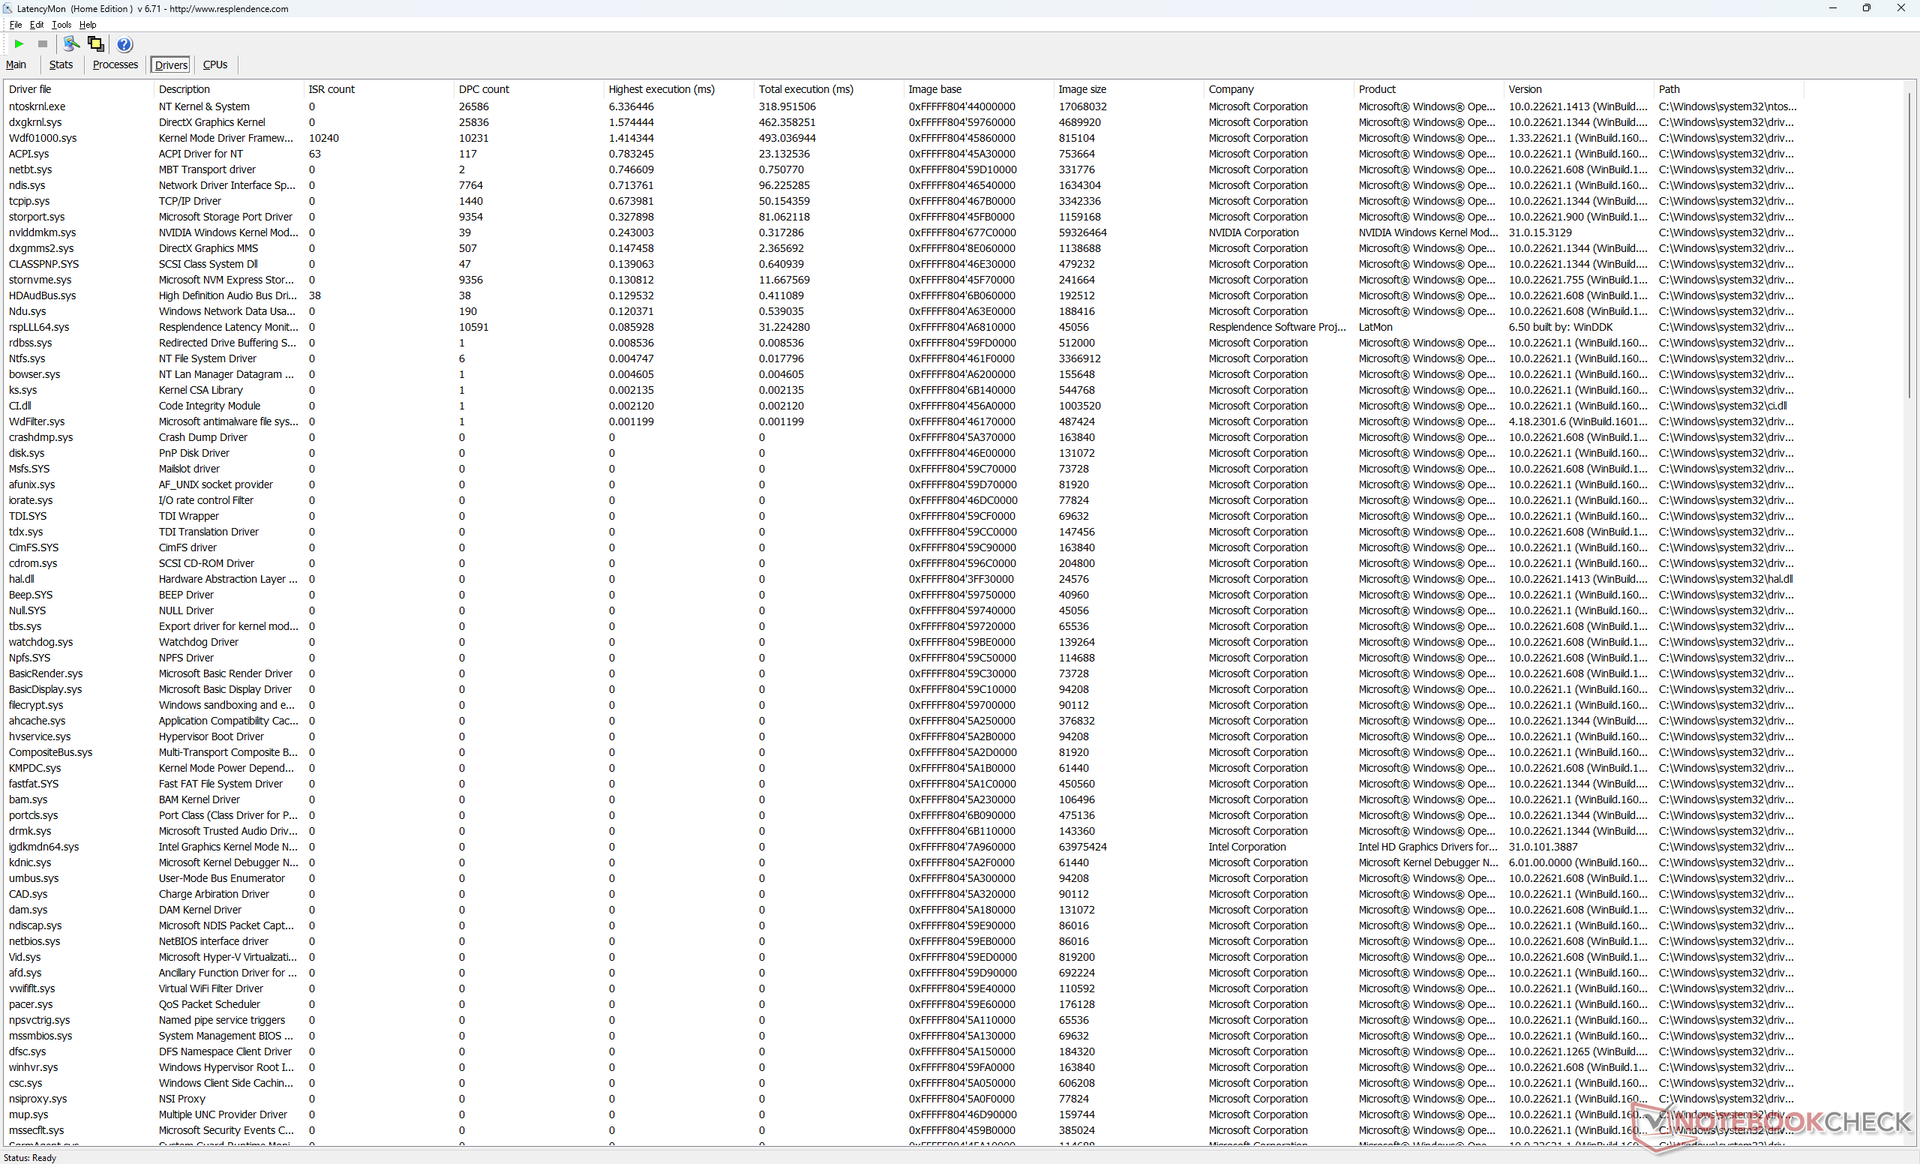
LatencyMon révèle des problèmes de DPC lors de l'ouverture de plusieurs onglets sur notre page d'accueil. la lecture de vidéos 4K à 60 FPS est par ailleurs parfaite, avec une faible utilisation du CPU et du GPU et aucune perte d'images.
| DPC Latencies / LatencyMon - interrupt to process latency (max), Web, Youtube, Prime95 | |
| Schenker XMG Neo 16 E23 | |
| Asus ROG Strix G16 G614JZ | |
| Razer Blade 16 Early 2023 | |
| Uniwill GM6PX7X RTX 4070 | |
| Gigabyte AERO 16 OLED BSF | |
| Lenovo Legion Pro 7 16IRX8H | |
* ... Moindre est la valeur, meilleures sont les performances
Dispositifs de stockage
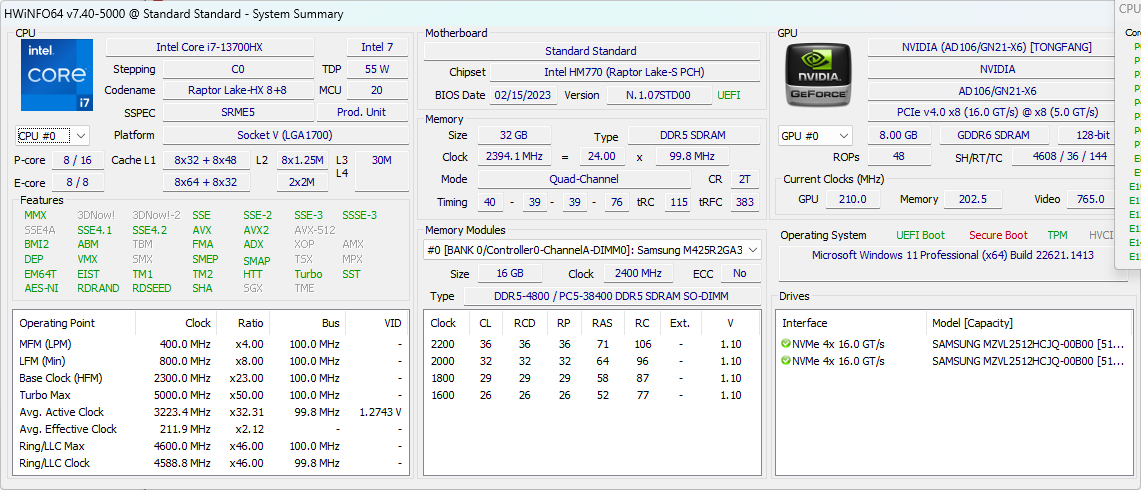
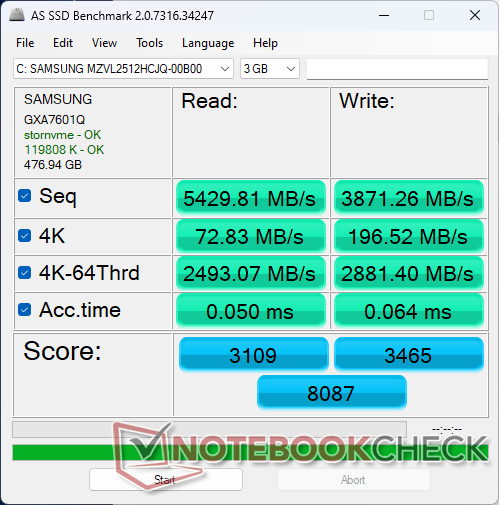
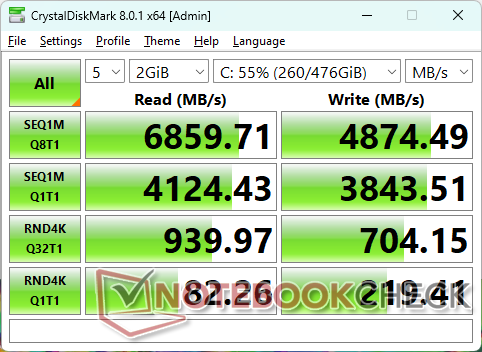
Notre unité de test est livrée avec une carte PCIe4 x4 Samsung PM9A1 MZVL2512HCJQ NVMe SSD prenant en charge des taux de lecture séquentielle de 6700 Mo/s. Les taux rapides sont également durables, sans baisse de performance lorsqu'ils sont sollicités.

| Drive Performance rating - Percent | |
| Lenovo Legion Pro 7 16IRX8H | |
| Uniwill GM6PX7X RTX 4070 | |
| Gigabyte AERO 16 OLED BSF | |
| Razer Blade 16 Early 2023 | |
| Asus ROG Strix G16 G614JZ | |
| Schenker XMG Neo 16 E23 | |
* ... Moindre est la valeur, meilleures sont les performances
Disk Throttling: DiskSpd Read Loop, Queue Depth 8
Performance du GPU
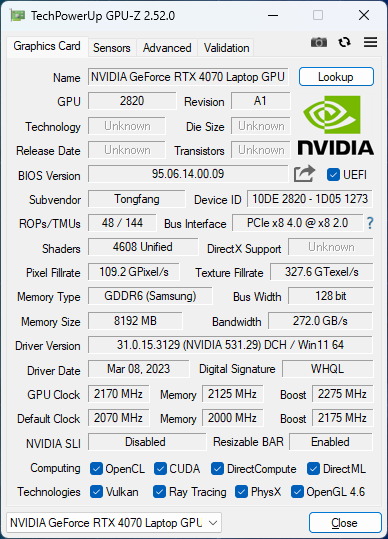
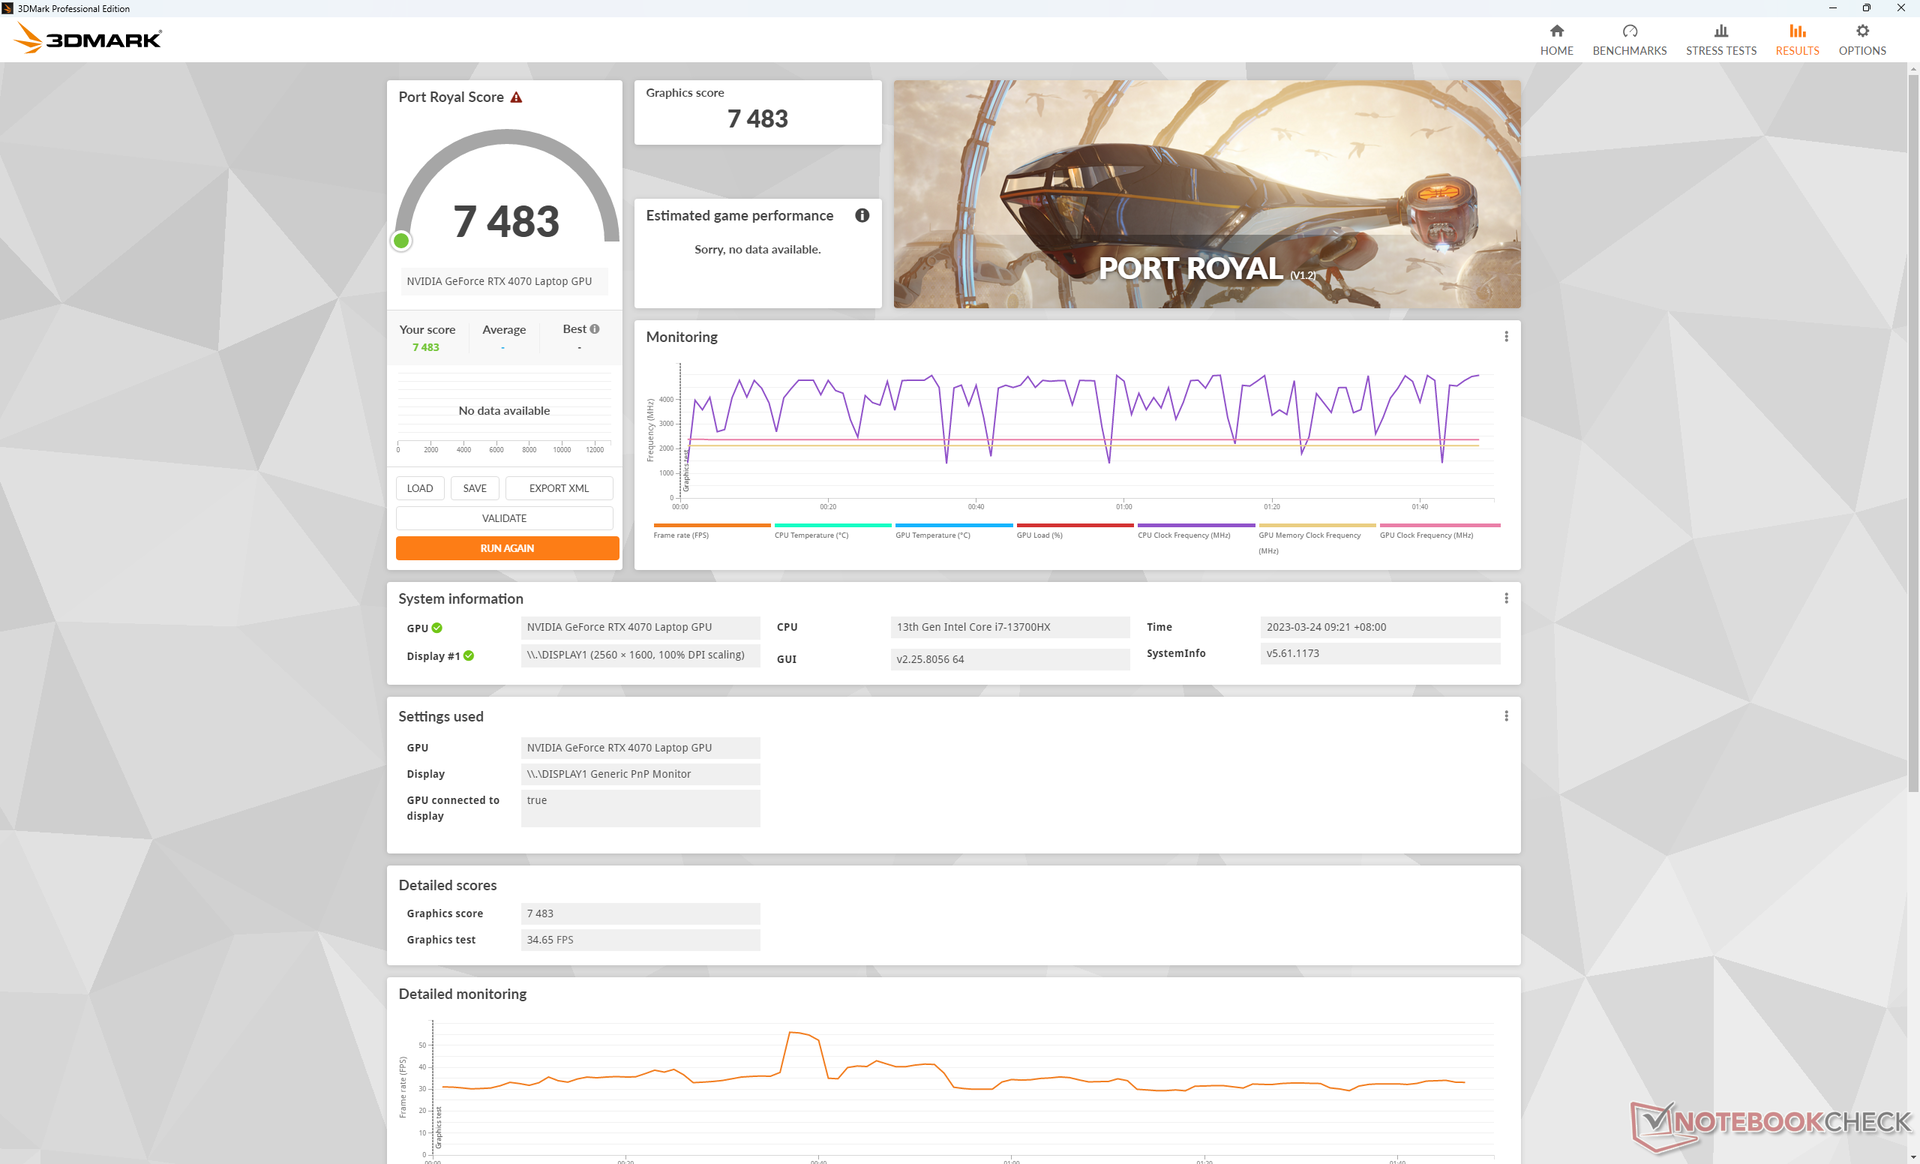
Après avoir testé une poignée de GeForce RTX 4060, 4070, 4080 et 4090 jusqu'à présent, les différences de performances attendues entre les ordinateurs portables sont de plus en plus claires. En ce qui concerne la RTX 4070 mobile de 140 W, les utilisateurs peuvent s'attendre à ce qu'elle soit 15 à 20 % plus rapide que la RTX 4060 mobile et environ 30 à 35 % plus lente que la RTX 4080 mobile de 175 W. Ainsi, l'écart de performance entre la RTX 4070 mobile et la RTX 4080 mobile est beaucoup plus important que l'écart entre la RTX 4060 mobile et la RTX 4070 mobile. C'est peut-être une façon pour Nvidia d'encourager les acheteurs potentiels à considérer les configurations 4080 ou 4090 plus haut de gamme.
Passer de la RTX 4070 mobile à l'option RTX 4090 mobile 175 W augmente les performances brutes d'environ 55 à 80 %. Les jeux extrêmement exigeants en 4K comme Cyberpunk 2077 ou F1 22 ne fonctionnent pas bien sur la RTX 4070 mobile, sauf si le DLSS ou la génération d'images sont pris en charge.
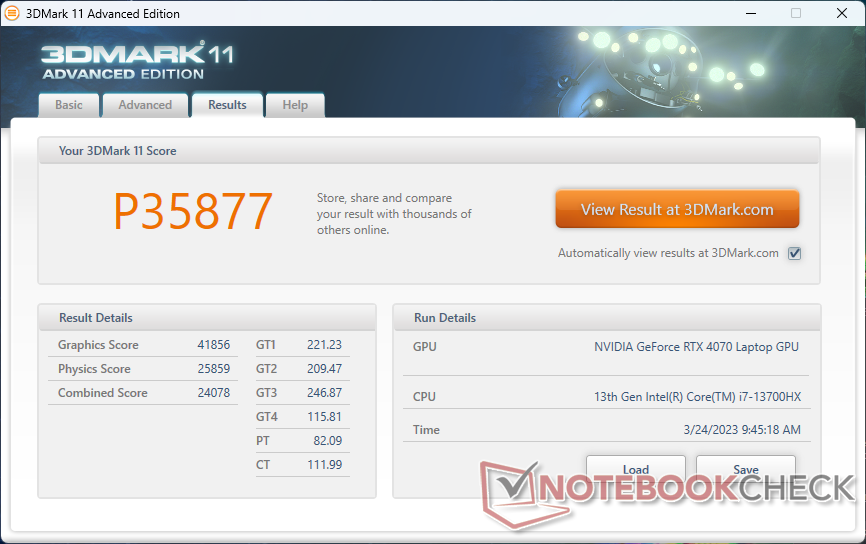
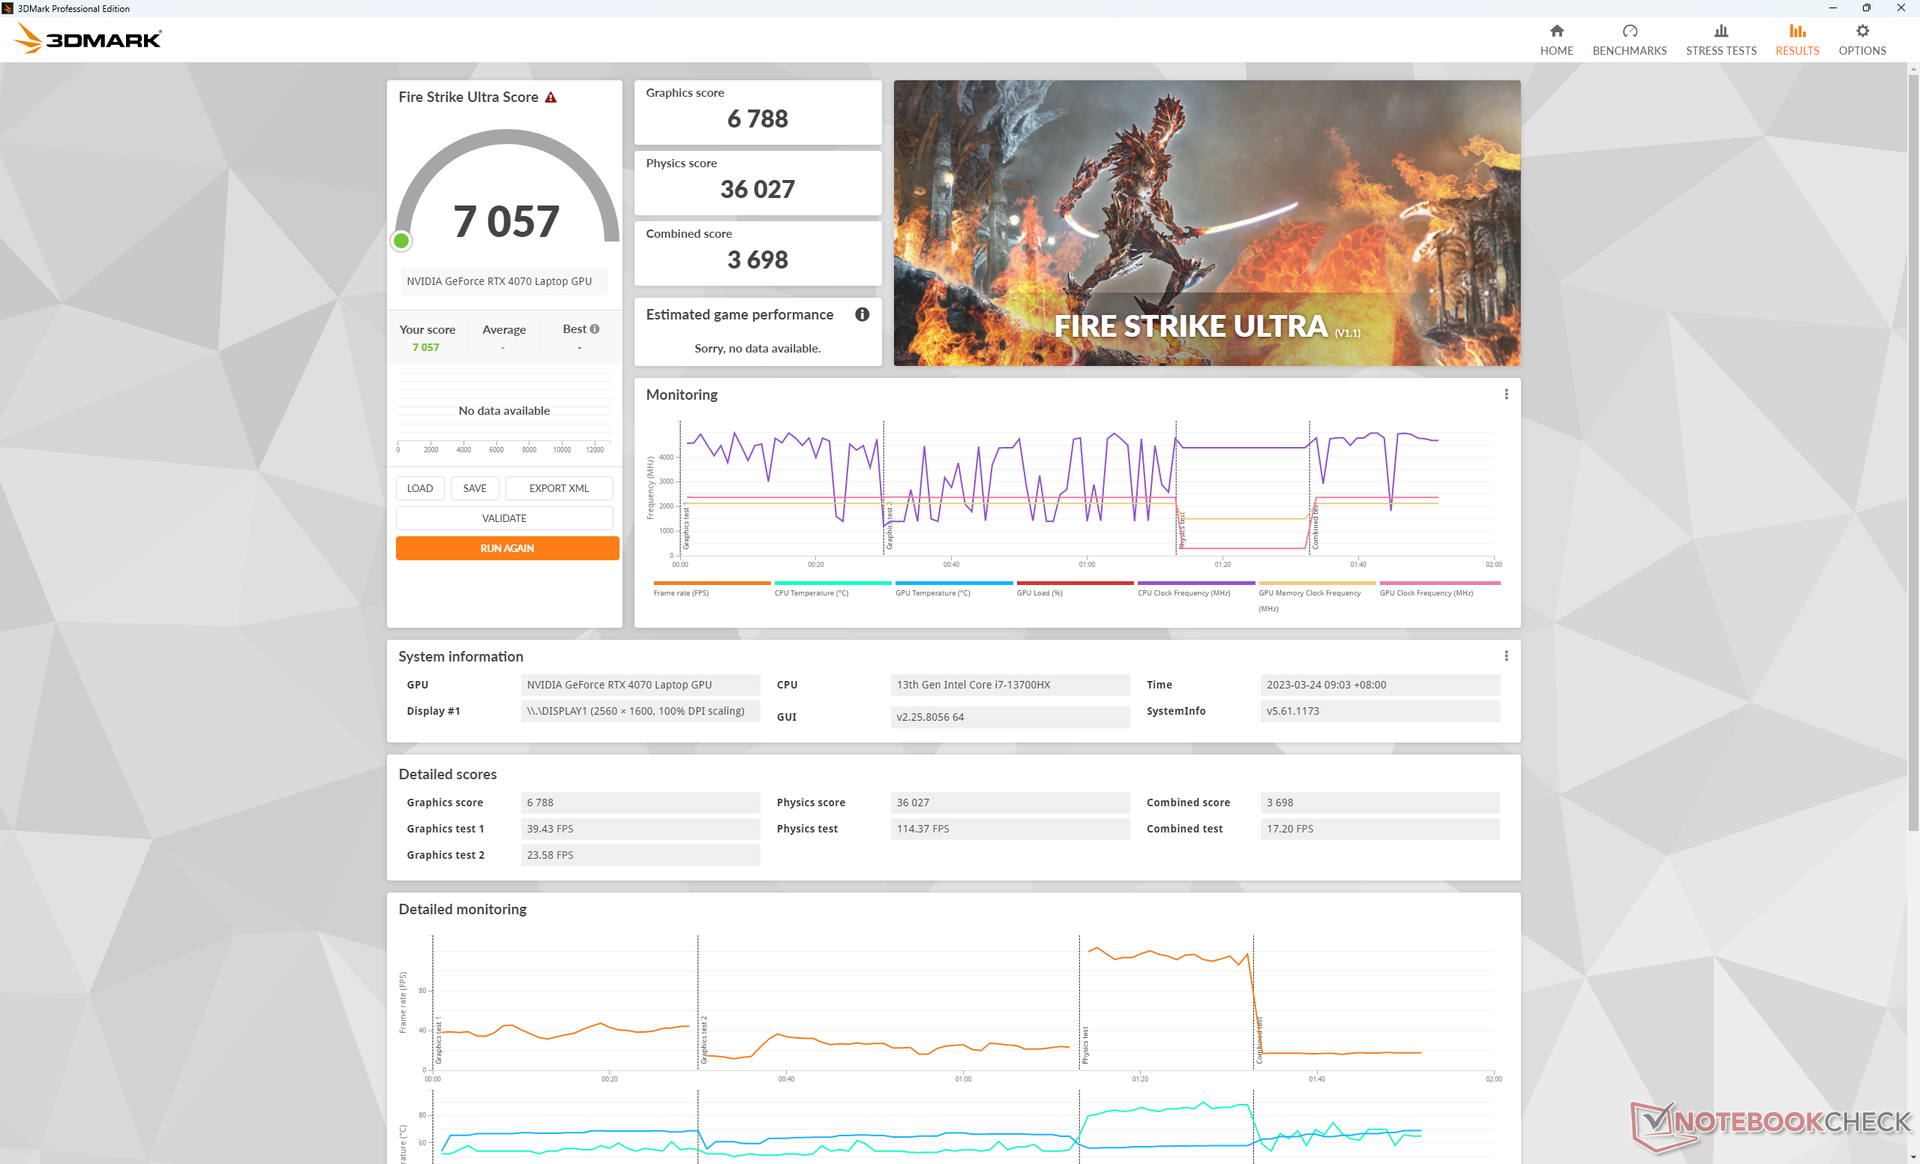
| 3DMark 11 Performance | 35877 points | |
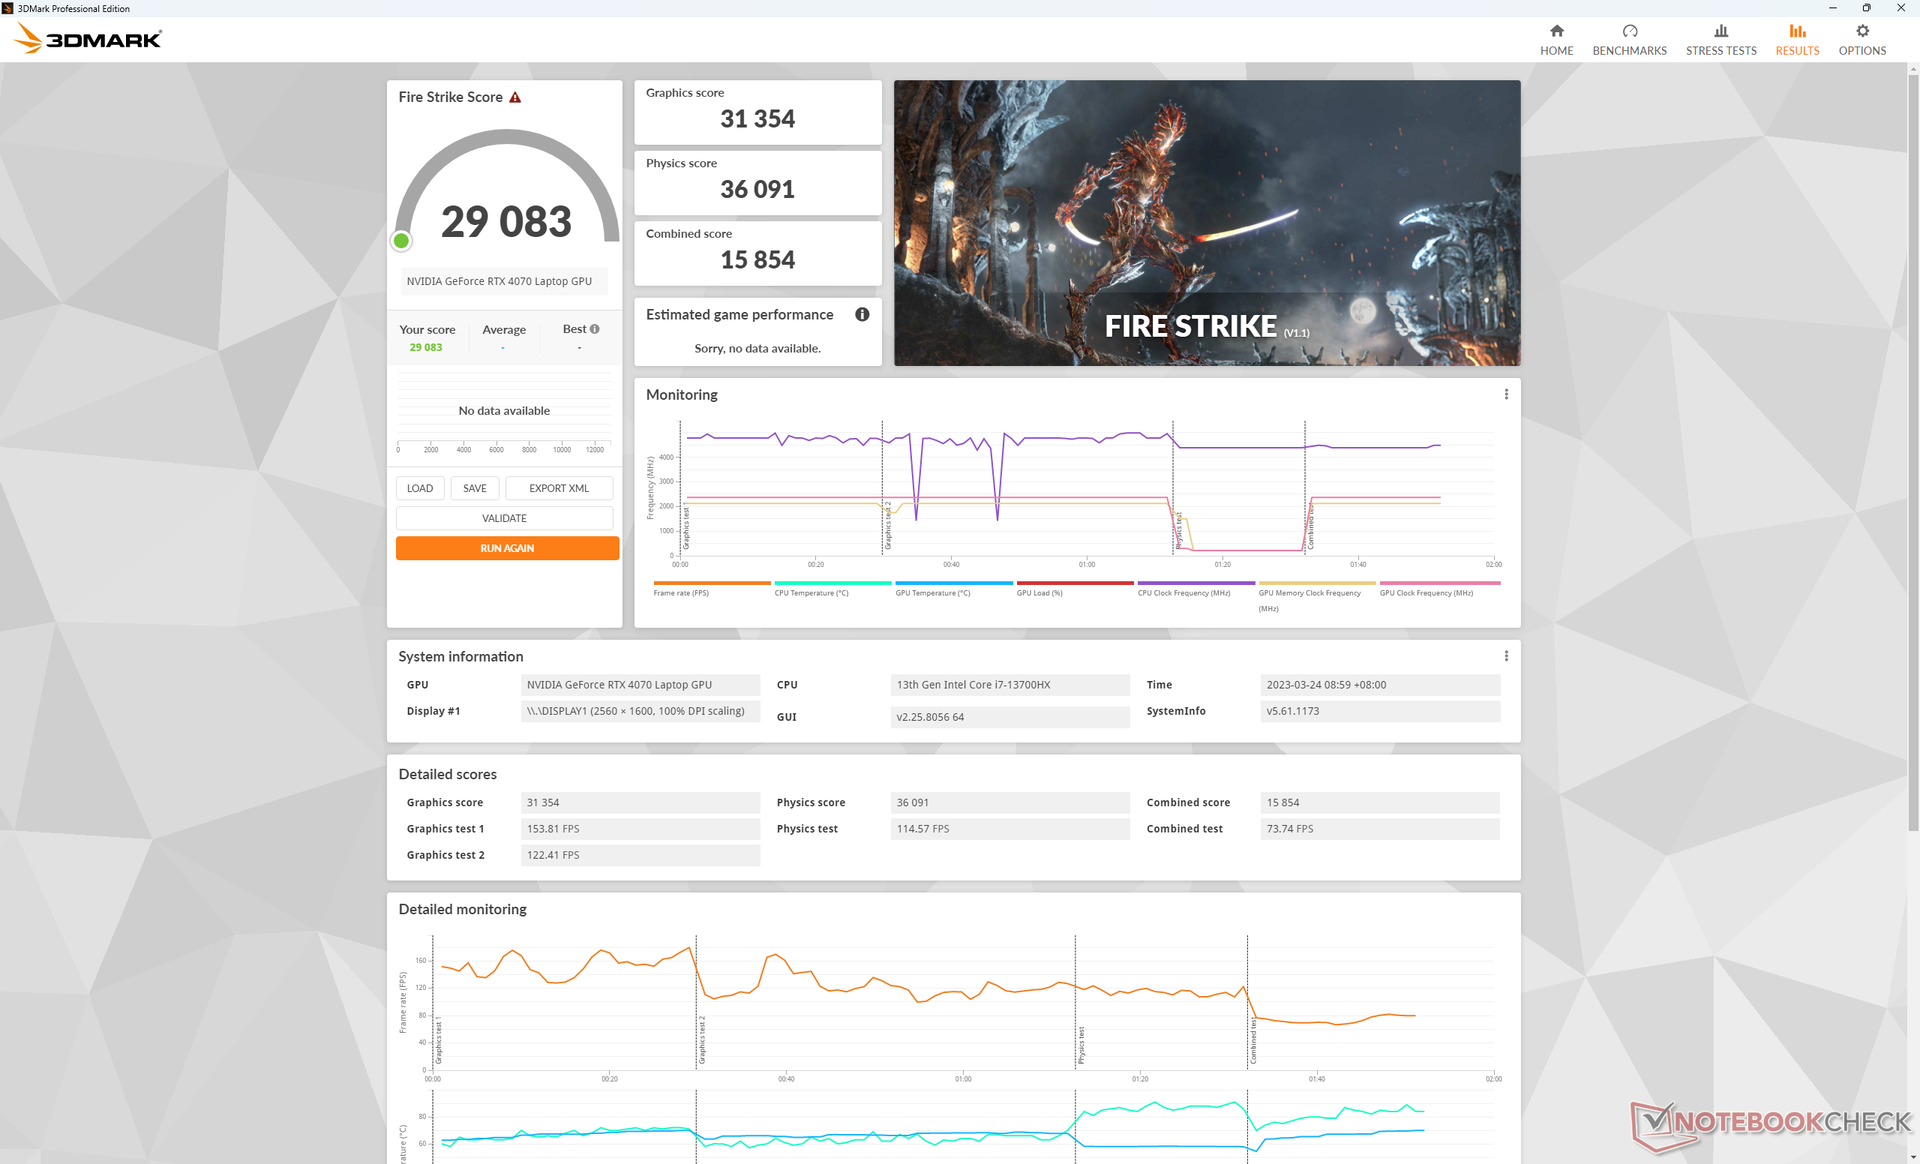
| 3DMark Fire Strike Score | 29083 points | |
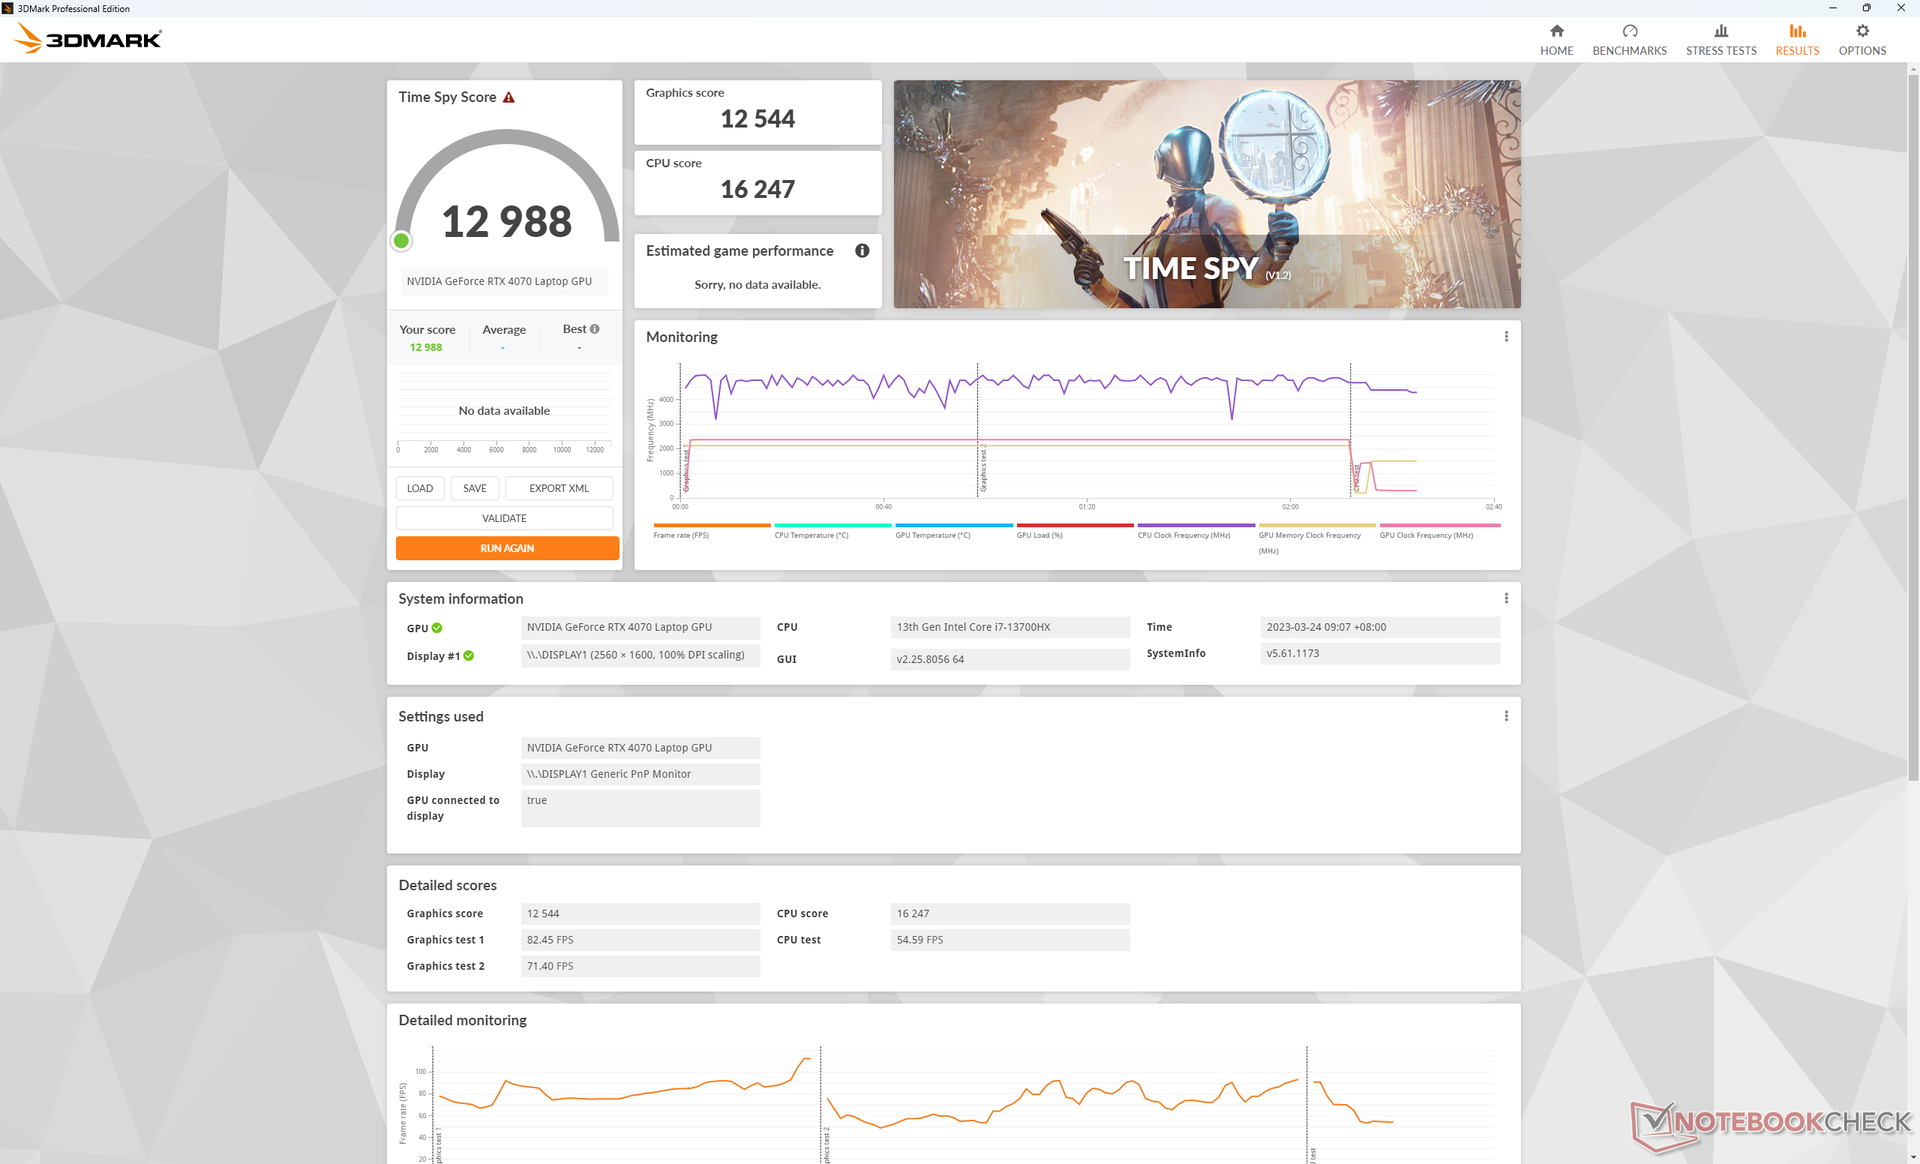
| 3DMark Time Spy Score | 12988 points | |
Aide | ||
* ... Moindre est la valeur, meilleures sont les performances
Witcher 3 FPS Chart
| Bas | Moyen | Élevé | Ultra | QHD | 4K | |
|---|---|---|---|---|---|---|
| GTA V (2015) | 187 | 186.9 | 183.1 | 124.8 | 93.1 | 93.6 |
| The Witcher 3 (2015) | 606.3 | 430.3 | 260.5 | 123.2 | 78.8 | |
| Dota 2 Reborn (2015) | 213 | 187.9 | 187.2 | 170.2 | 146.6 | |
| Final Fantasy XV Benchmark (2018) | 227 | 177.3 | 121.2 | 88.6 | 48.8 | |
| X-Plane 11.11 (2018) | 189.4 | 165.6 | 129.2 | 109.2 | ||
| Strange Brigade (2018) | 567 | 332 | 255 | 217 | 143.3 | 75.3 |
| Cyberpunk 2077 1.6 (2022) | 182.8 | 152.9 | 115.1 | 93.6 | 55.6 | 24.4 |
| F1 22 (2022) | 310 | 306 | 231 | 83.1 | 53.8 | 26.5 |
Émissions
Bruit du système
Le bruit du ventilateur dépend du profil d'alimentation et du réglage du GPU. En mode GPU discret, par exemple, le bruit du ventilateur est de 29 dB(A) lorsqu'il tourne au ralenti sur le bureau, sur un fond silencieux de 22,4 dB(A). En comparaison, le bruit du ventilateur serait beaucoup plus silencieux avec seulement 22,9 dB(A) en mode Optimus. Il est donc préférable de laisser le système en mode Optimus pour les tâches peu exigeantes telles que la navigation sur Internet ou la lecture de vidéos en continu.
Fonctionnement Witcher 3 en mode Performance avec le dGPU actif, le bruit du ventilateur serait légèrement inférieur à 49 dB(A), ce qui est plus silencieux que sur de nombreux autres ordinateurs portables de jeu de 16 pouces, y compris le Neo 16 équipé de la RTX 4090, plus épais, ou le Neo 16 équipé de la RTX 4090, plus léger.Lenovo Legion Pro 7 16. Néanmoins, le bruit du ventilateur peut encore atteindre 55 dB(A) si le titre est beaucoup plus exigeant.
Degré de la nuisance sonore
| Au repos |
| 22.9 / 29 / 29 dB(A) |
| Fortement sollicité |
| 40.2 / 55 dB(A) |
 | ||
30 dB silencieux 40 dB(A) audible 50 dB(A) bruyant |
||
min: | ||
| Uniwill GM6PX7X RTX 4070 GeForce RTX 4070 Laptop GPU, i7-13700HX, Samsung PM9A1 MZVL2512HCJQ | Schenker XMG Neo 16 E23 GeForce RTX 4090 Laptop GPU, i9-13900HX, Crucial P5 Plus 1TB CT1000P5PSSD8 | Asus ROG Strix G16 G614JZ GeForce RTX 4080 Laptop GPU, i9-13980HX, WD PC SN560 SDDPNQE-1T00 | Lenovo Legion Pro 7 16IRX8H GeForce RTX 4080 Laptop GPU, i9-13900HX, Samsung PM9A1 MZVL21T0HCLR | Gigabyte AERO 16 OLED BSF GeForce RTX 4070 Laptop GPU, i9-13900H, Gigabyte AG470S1TB-SI B10 | Razer Blade 16 Early 2023 GeForce RTX 4080 Laptop GPU, i9-13950HX, SSSTC CA6-8D1024 | |
|---|---|---|---|---|---|---|
| Noise | -25% | -6% | -10% | -6% | 6% | |
| arrêt / environnement * (dB) | 22.4 | 25 -12% | 25 -12% | 24 -7% | 23 -3% | 23 -3% |
| Idle Minimum * (dB) | 22.9 | 31 -35% | 26 -14% | 26 -14% | 23 -0% | 23 -0% |
| Idle Average * (dB) | 29 | 33 -14% | 28 3% | 28 3% | 23 21% | 23 21% |
| Idle Maximum * (dB) | 29 | 42 -45% | 30 -3% | 34 -17% | 33.64 -16% | 23.6 19% |
| Load Average * (dB) | 40.2 | 58 -44% | 48 -19% | 47 -17% | 51.49 -28% | 39 3% |
| Witcher 3 ultra * (dB) | 48.7 | 57 -17% | 49 -1% | 55 -13% | 55.27 -13% | 51.6 -6% |
| Load Maximum * (dB) | 55 | 59 -7% | 52 5% | 56 -2% | 55.24 -0% | 51.3 7% |
* ... Moindre est la valeur, meilleures sont les performances
Température
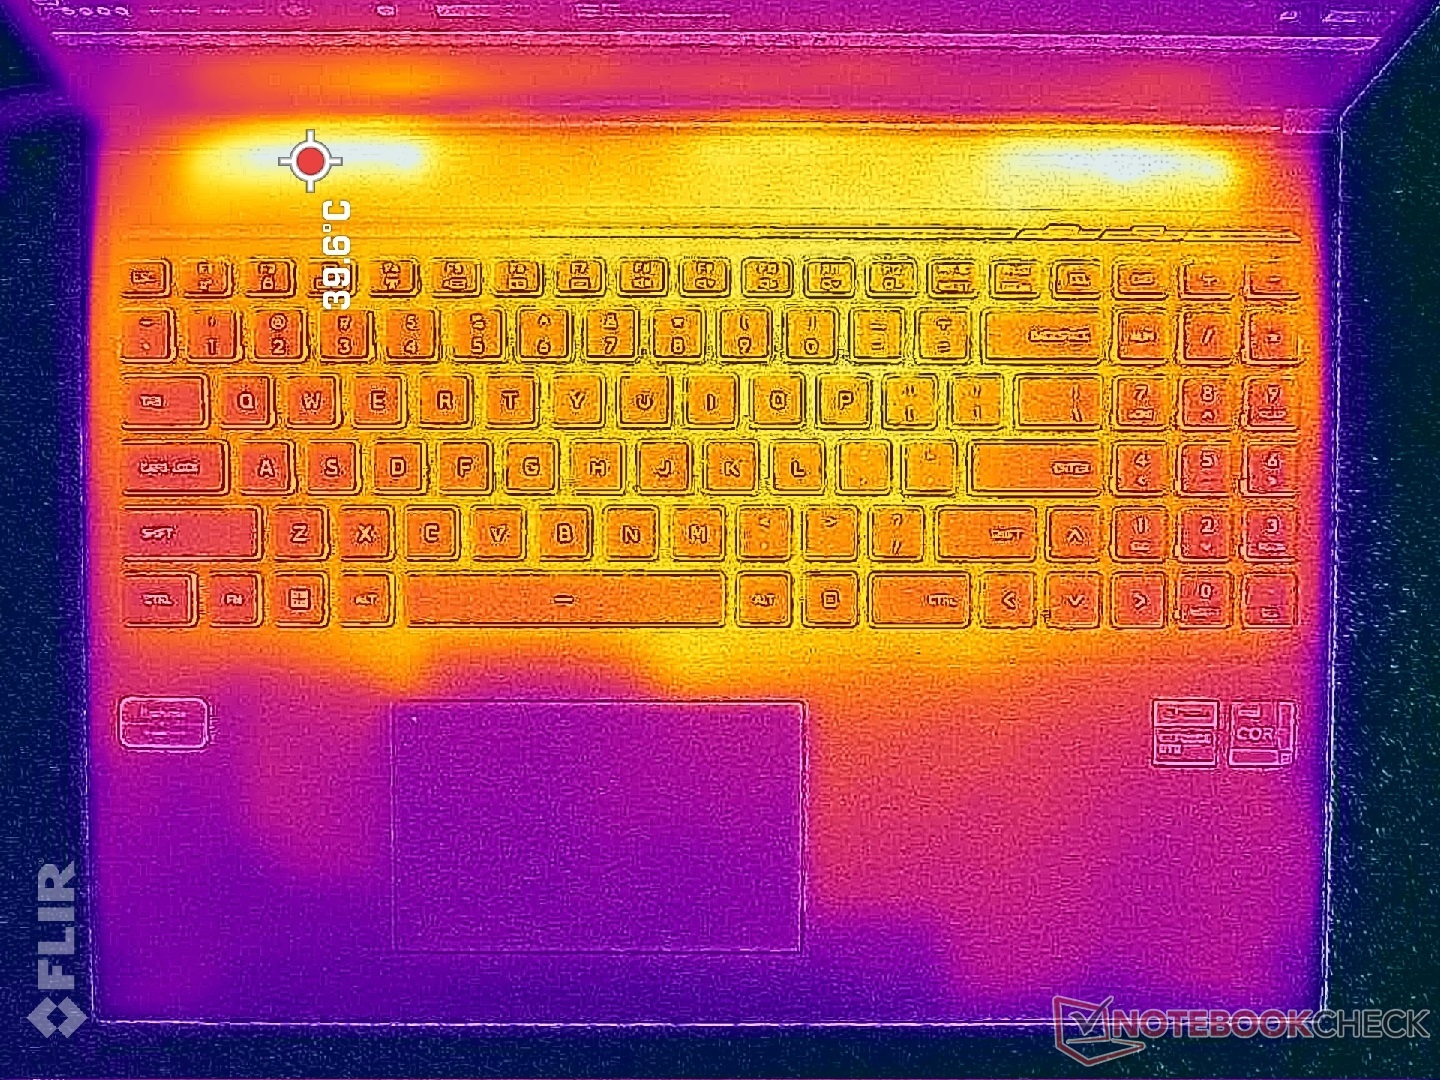
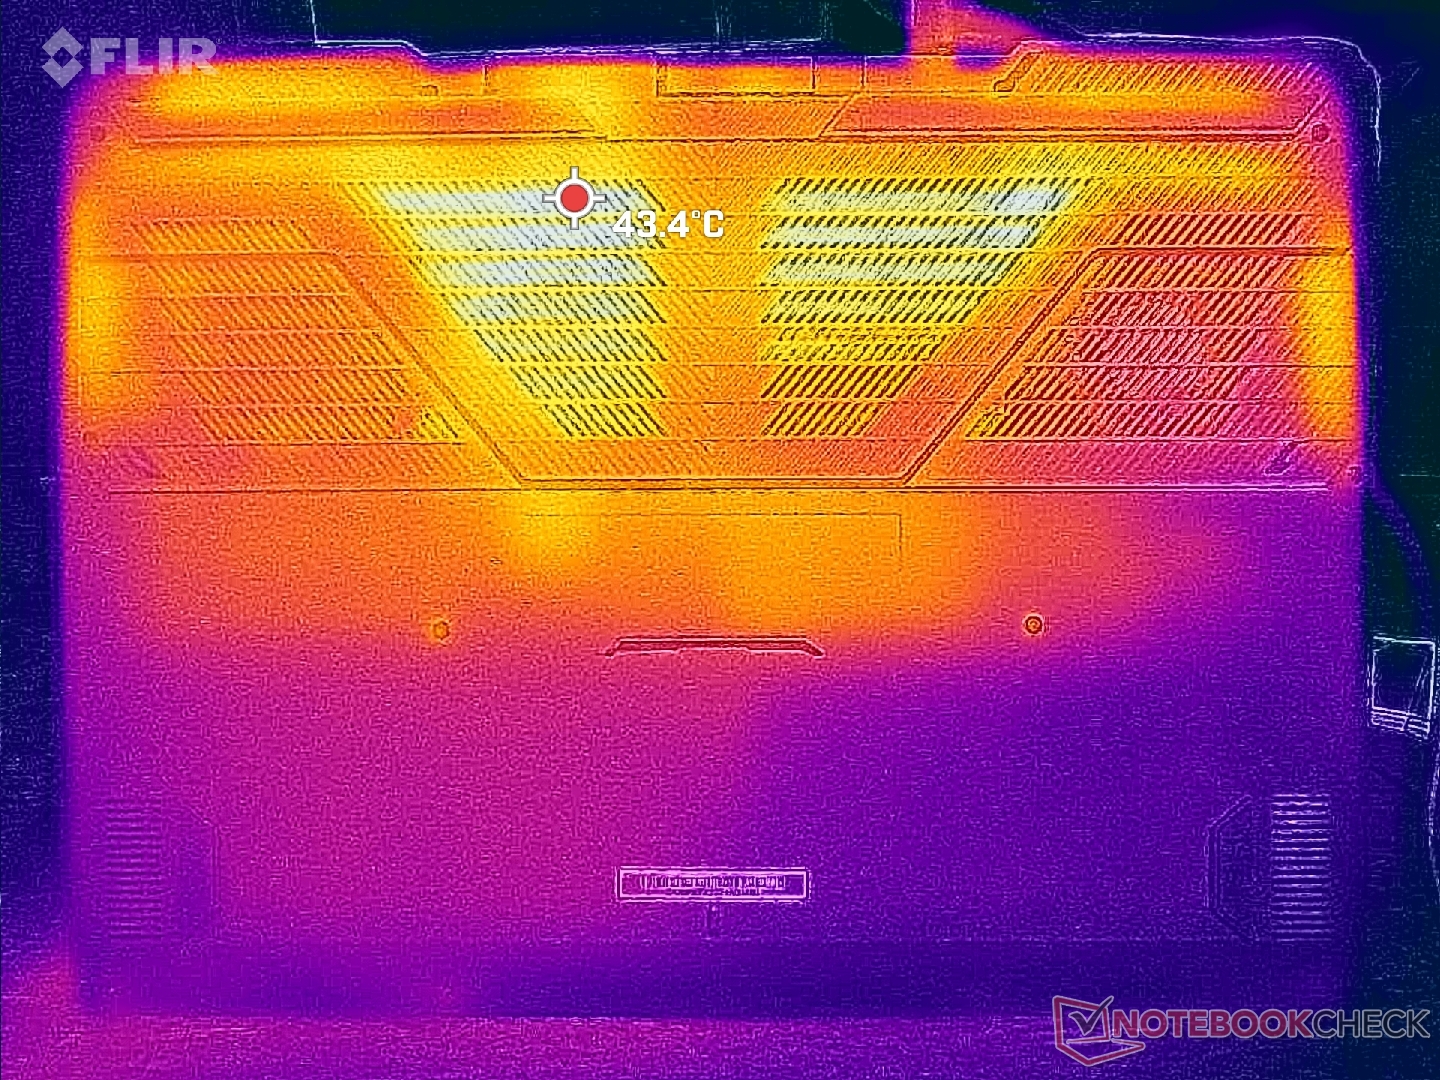
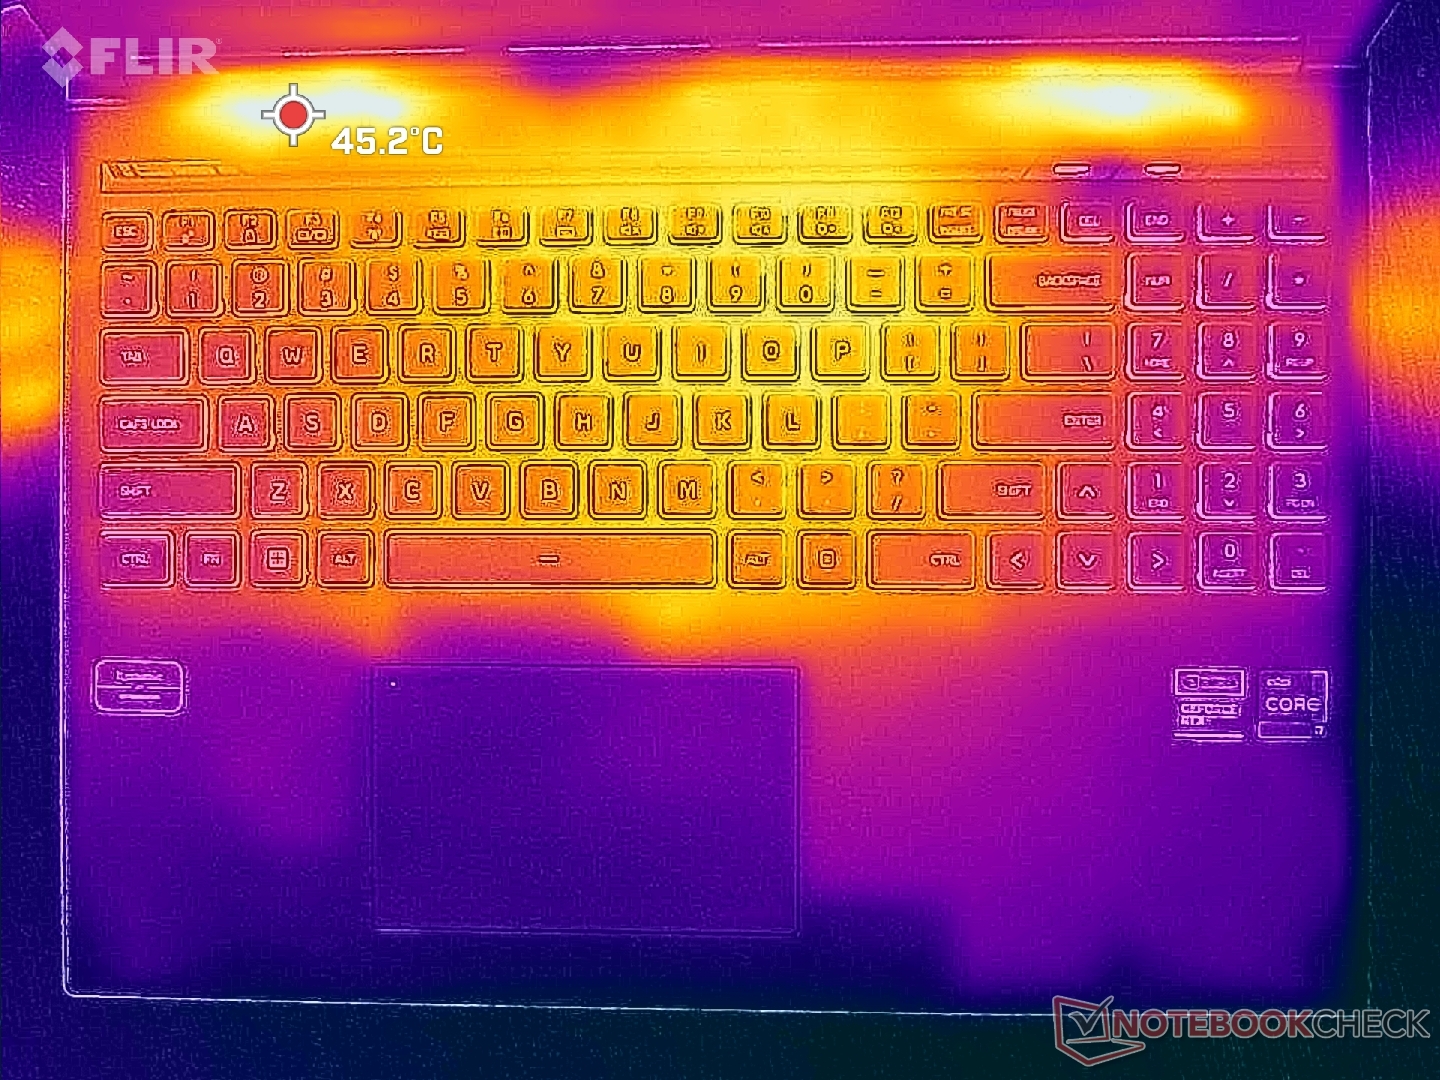
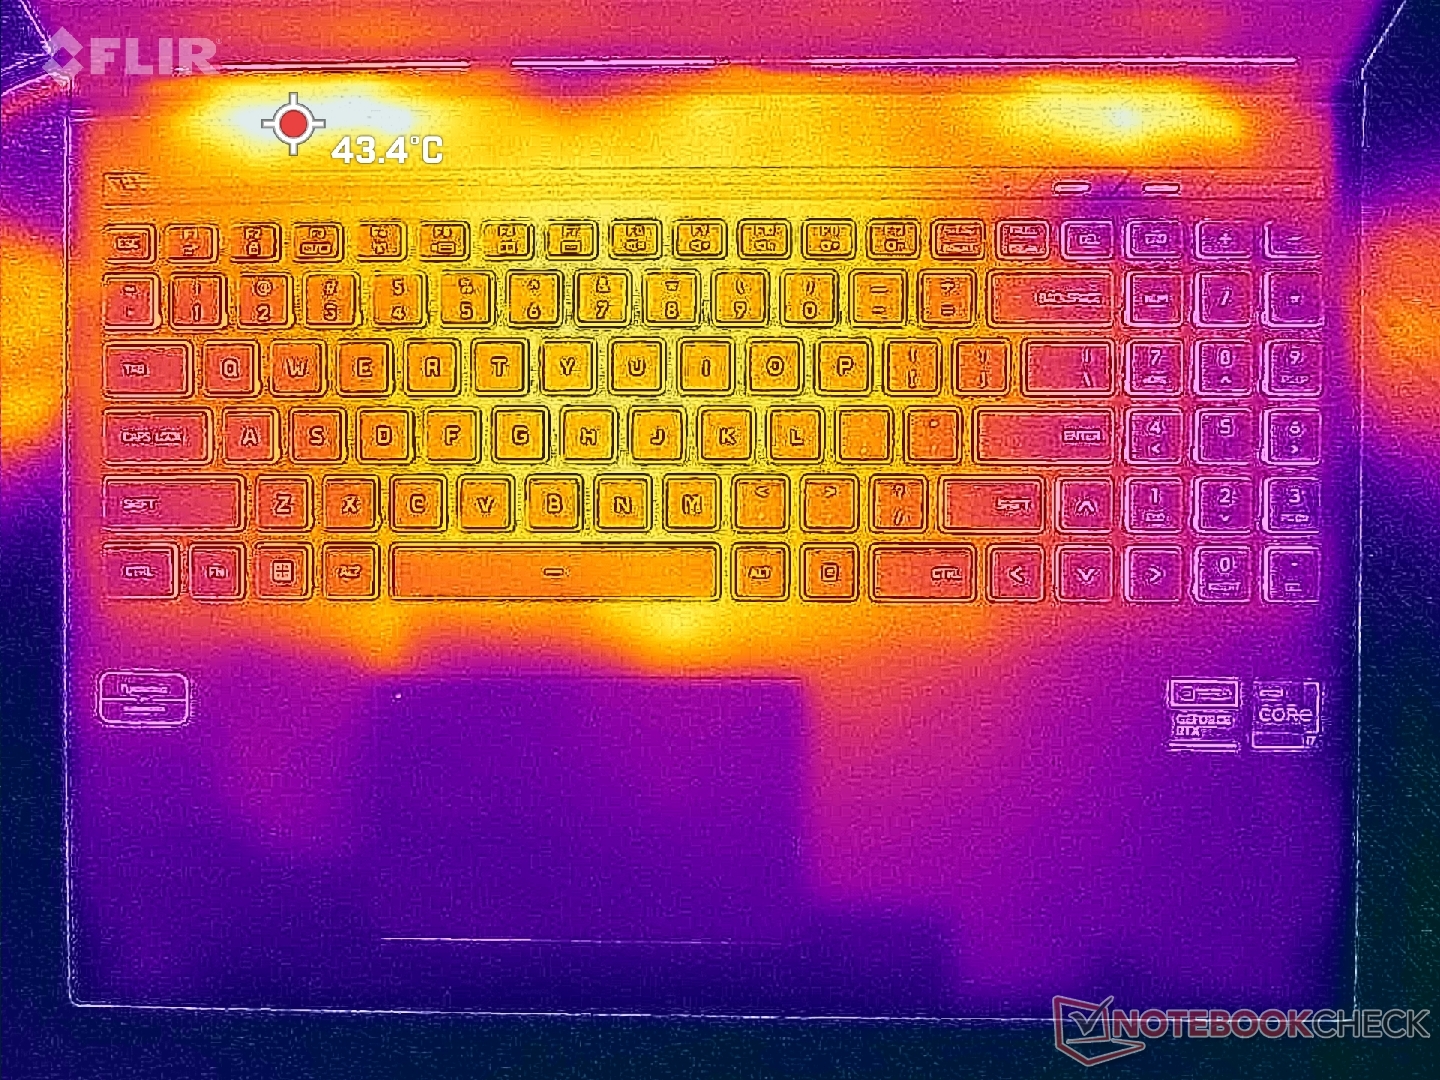
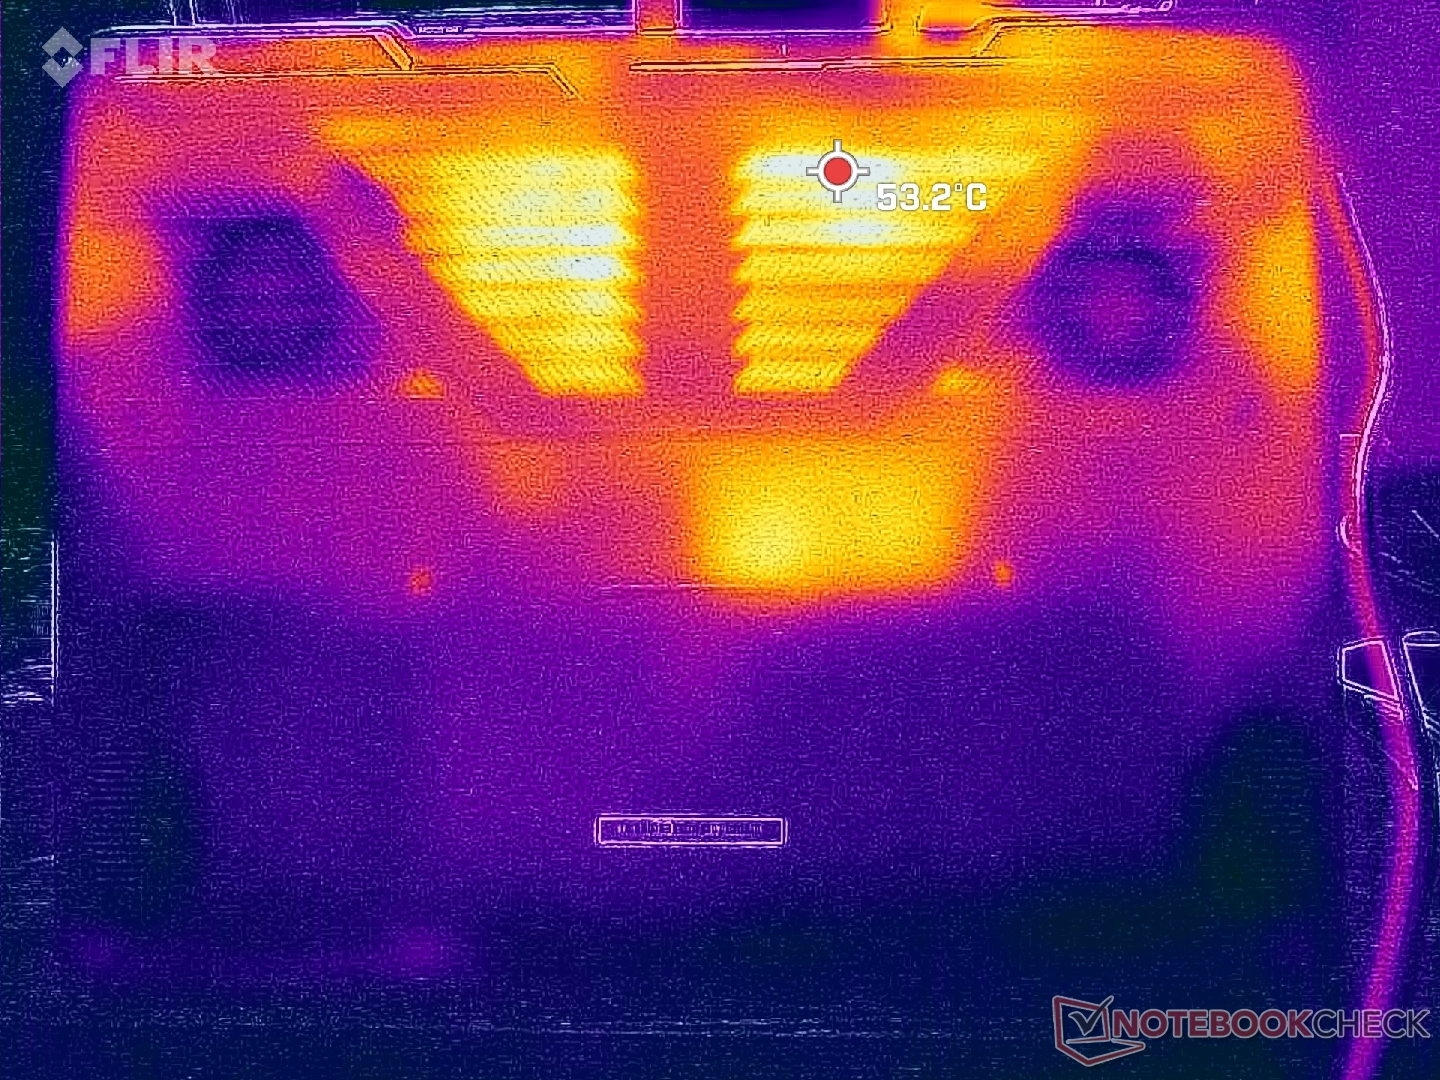
Les températures de surface en jeu sont relativement basses par rapport à d'autres ordinateurs portables de jeu de 16 pouces. L'Asus ROG Strix G16Asus ROG Strix G16par exemple, peut atteindre plus de 54°C alors que les points chauds de l'Uniwill atteignent 40°C sur le dessus et 45°C sur le dessous. Les températures sont plus basses que sur le Neo 16 équipé de la RTX 4090 de quelques degrés Celsius également sous des charges de jeu similaires.
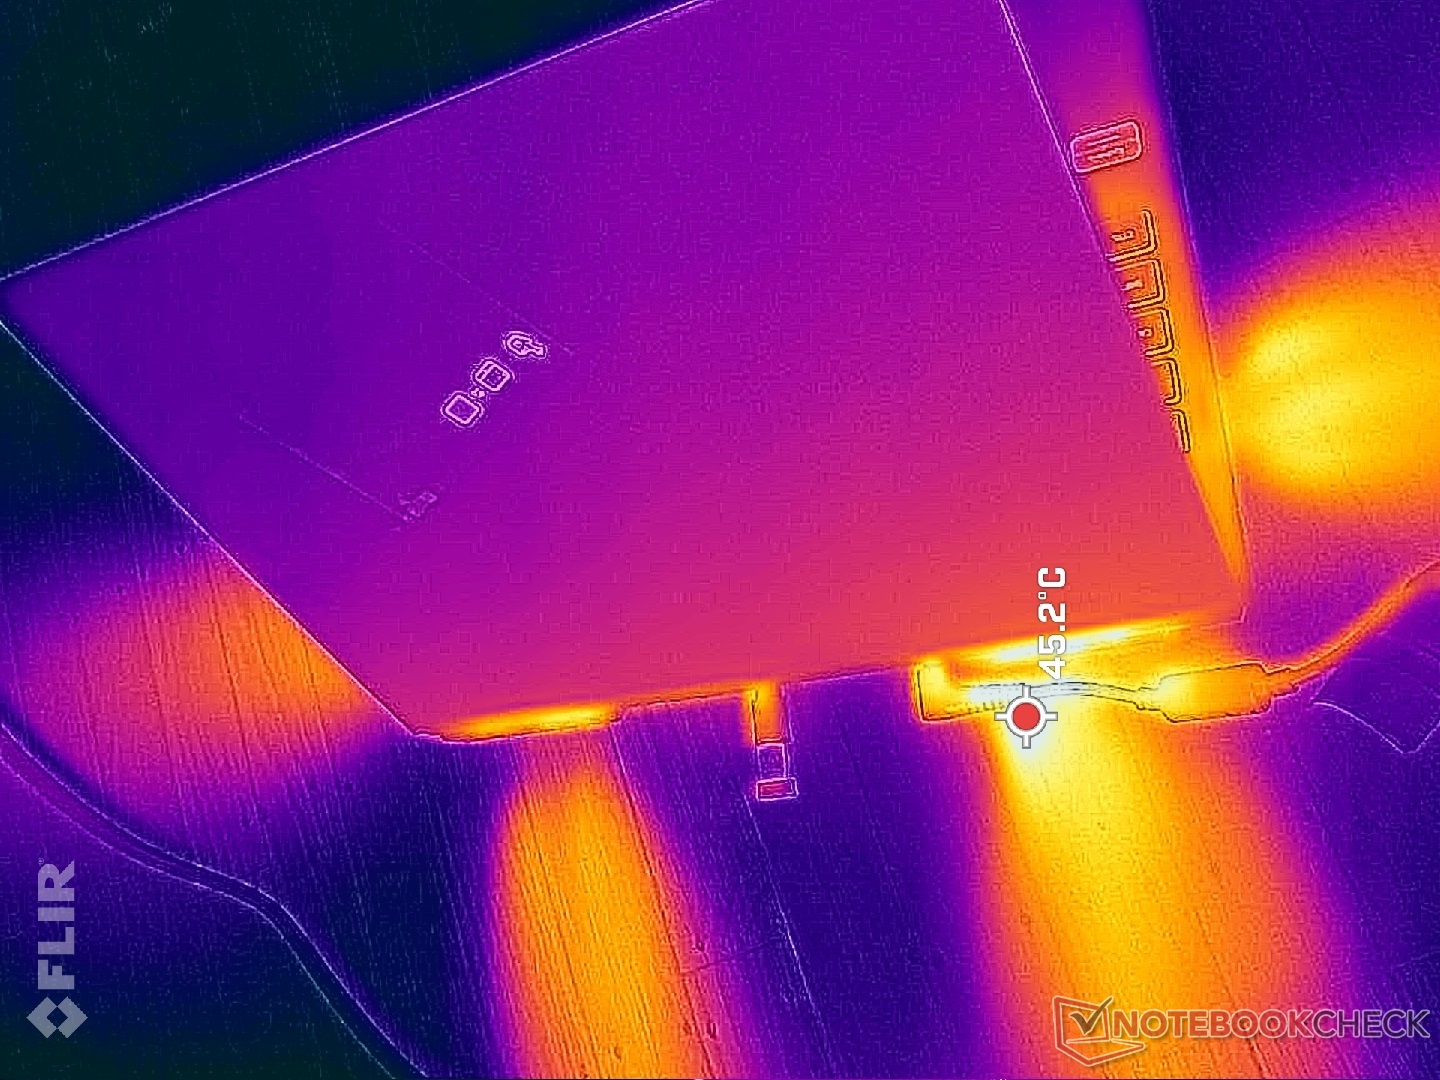
(+) La température maximale du côté supérieur est de 38.2 °C / 101 F, par rapport à la moyenne de 40.4 °C / 105 F, allant de 21.2 à 68.8 °C pour la classe Gaming.
(±) Le fond chauffe jusqu'à un maximum de 45 °C / 113 F, contre une moyenne de 43.2 °C / 110 F
(+) En utilisation inactive, la température moyenne du côté supérieur est de 28.9 °C / 84 F, par rapport à la moyenne du dispositif de 33.9 °C / 93 F.
(±) En jouant à The Witcher 3, la température moyenne du côté supérieur est de 32.7 °C / 91 F, alors que la moyenne de l'appareil est de 33.9 °C / 93 F.
(+) Les repose-poignets et le pavé tactile sont plus froids que la température de la peau avec un maximum de 26.4 °C / 79.5 F et sont donc froids au toucher.
(+) La température moyenne de la zone de l'appui-paume de dispositifs similaires était de 28.8 °C / 83.8 F (+2.4 °C / #4.3 F).
| Uniwill GM6PX7X RTX 4070 Intel Core i7-13700HX, NVIDIA GeForce RTX 4070 Laptop GPU | Schenker XMG Neo 16 E23 Intel Core i9-13900HX, NVIDIA GeForce RTX 4090 Laptop GPU | Asus ROG Strix G16 G614JZ Intel Core i9-13980HX, NVIDIA GeForce RTX 4080 Laptop GPU | Lenovo Legion Pro 7 16IRX8H Intel Core i9-13900HX, NVIDIA GeForce RTX 4080 Laptop GPU | Gigabyte AERO 16 OLED BSF Intel Core i9-13900H, NVIDIA GeForce RTX 4070 Laptop GPU | Razer Blade 16 Early 2023 Intel Core i9-13950HX, NVIDIA GeForce RTX 4080 Laptop GPU | |
|---|---|---|---|---|---|---|
| Heat | 2% | -8% | -9% | 16% | 9% | |
| Maximum Upper Side * (°C) | 38.2 | 50 -31% | 54 -41% | 48 -26% | 41 -7% | 40 -5% |
| Maximum Bottom * (°C) | 45 | 51 -13% | 55 -22% | 49 -9% | 47 -4% | 37.6 16% |
| Idle Upper Side * (°C) | 33.6 | 28 17% | 29 14% | 40 -19% | 23 32% | 32.4 4% |
| Idle Bottom * (°C) | 39.6 | 26 34% | 33 17% | 33 17% | 23 42% | 31.4 21% |
* ... Moindre est la valeur, meilleures sont les performances
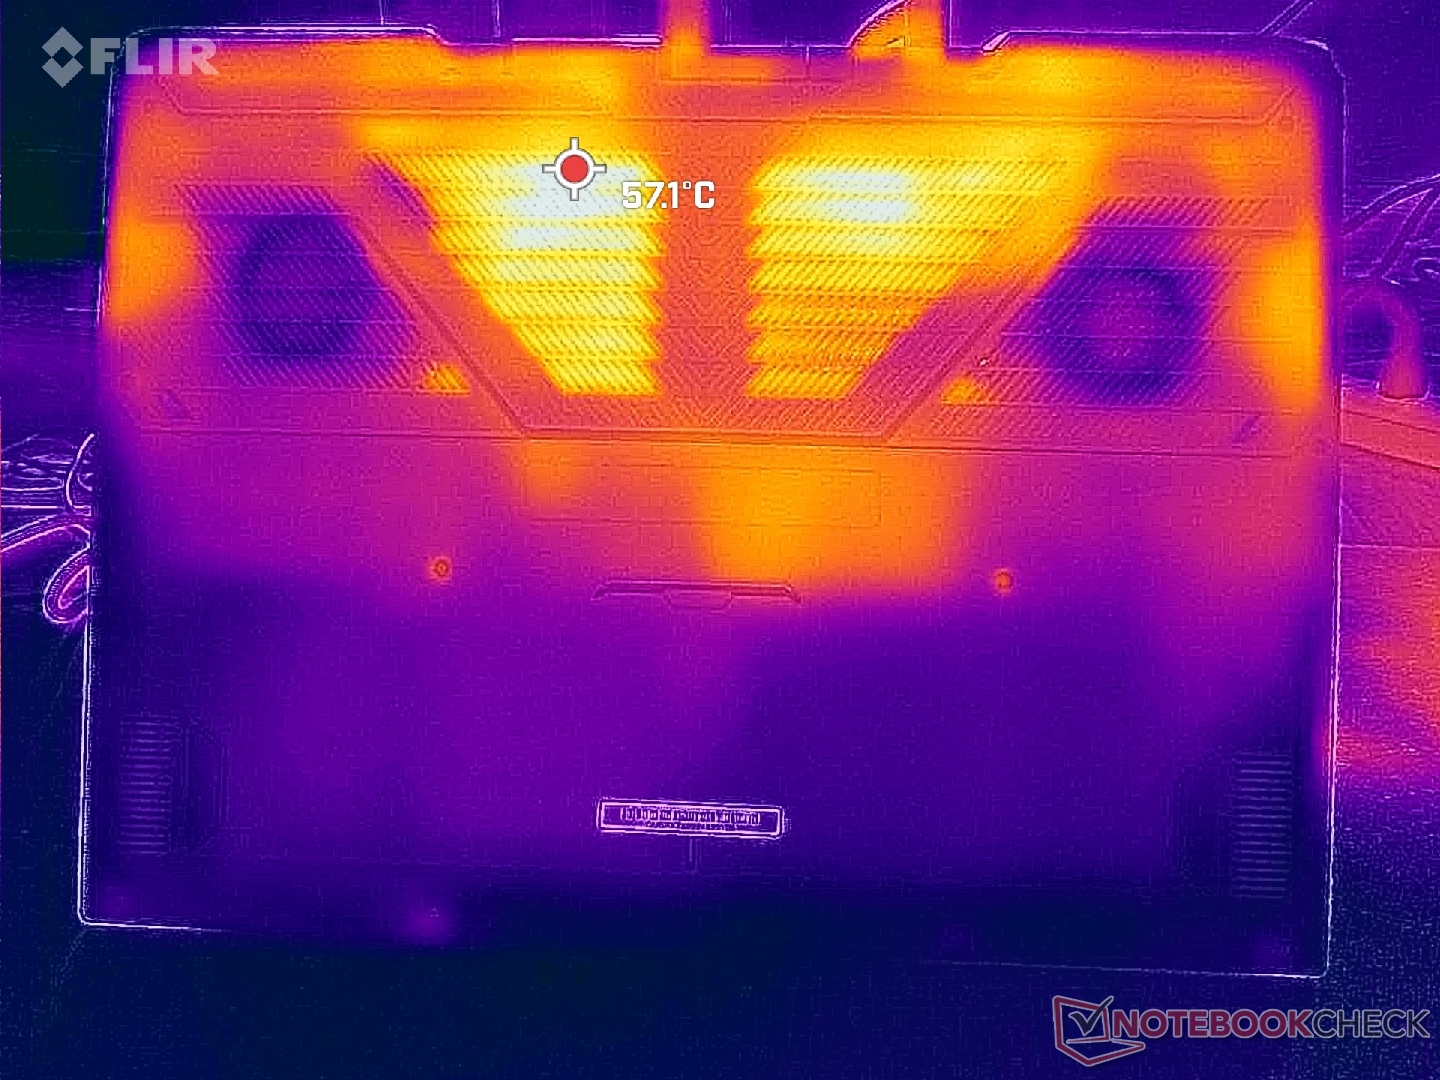
Test de stress
Lorsqu'il est soumis à Prime95, le processeur atteint 4 GHz et 130 W pendant les premières minutes seulement. Par la suite, les fréquences d'horloge et la consommation d'énergie de la carte descendent à 3,4 GHz et 122 W, respectivement. La température du cœur oscille autour de 90°C, ce qui est très chaud, même pour un ordinateur portable de jeu. En effectuant ce même test sur le Razer Blade 16, par exemple, la température du processeur serait beaucoup plus proche de 80 °C.
La température du CPU et du GPU sur Witcher 3 se stabiliserait à 83°C et 73°C, respectivement, contre 78°C sur le Blade 16. La consommation d'énergie de la carte GPU se stabiliserait à seulement 100 W par rapport aux 140 W prévus par le TGP.
L'utilisation de la batterie limite les performances, comme prévu. Un test Fire Strike sur batterie donnerait des scores en physique et en graphique de 9314 et 11777 points, respectivement, contre 36091 et 31354 points sur secteur.
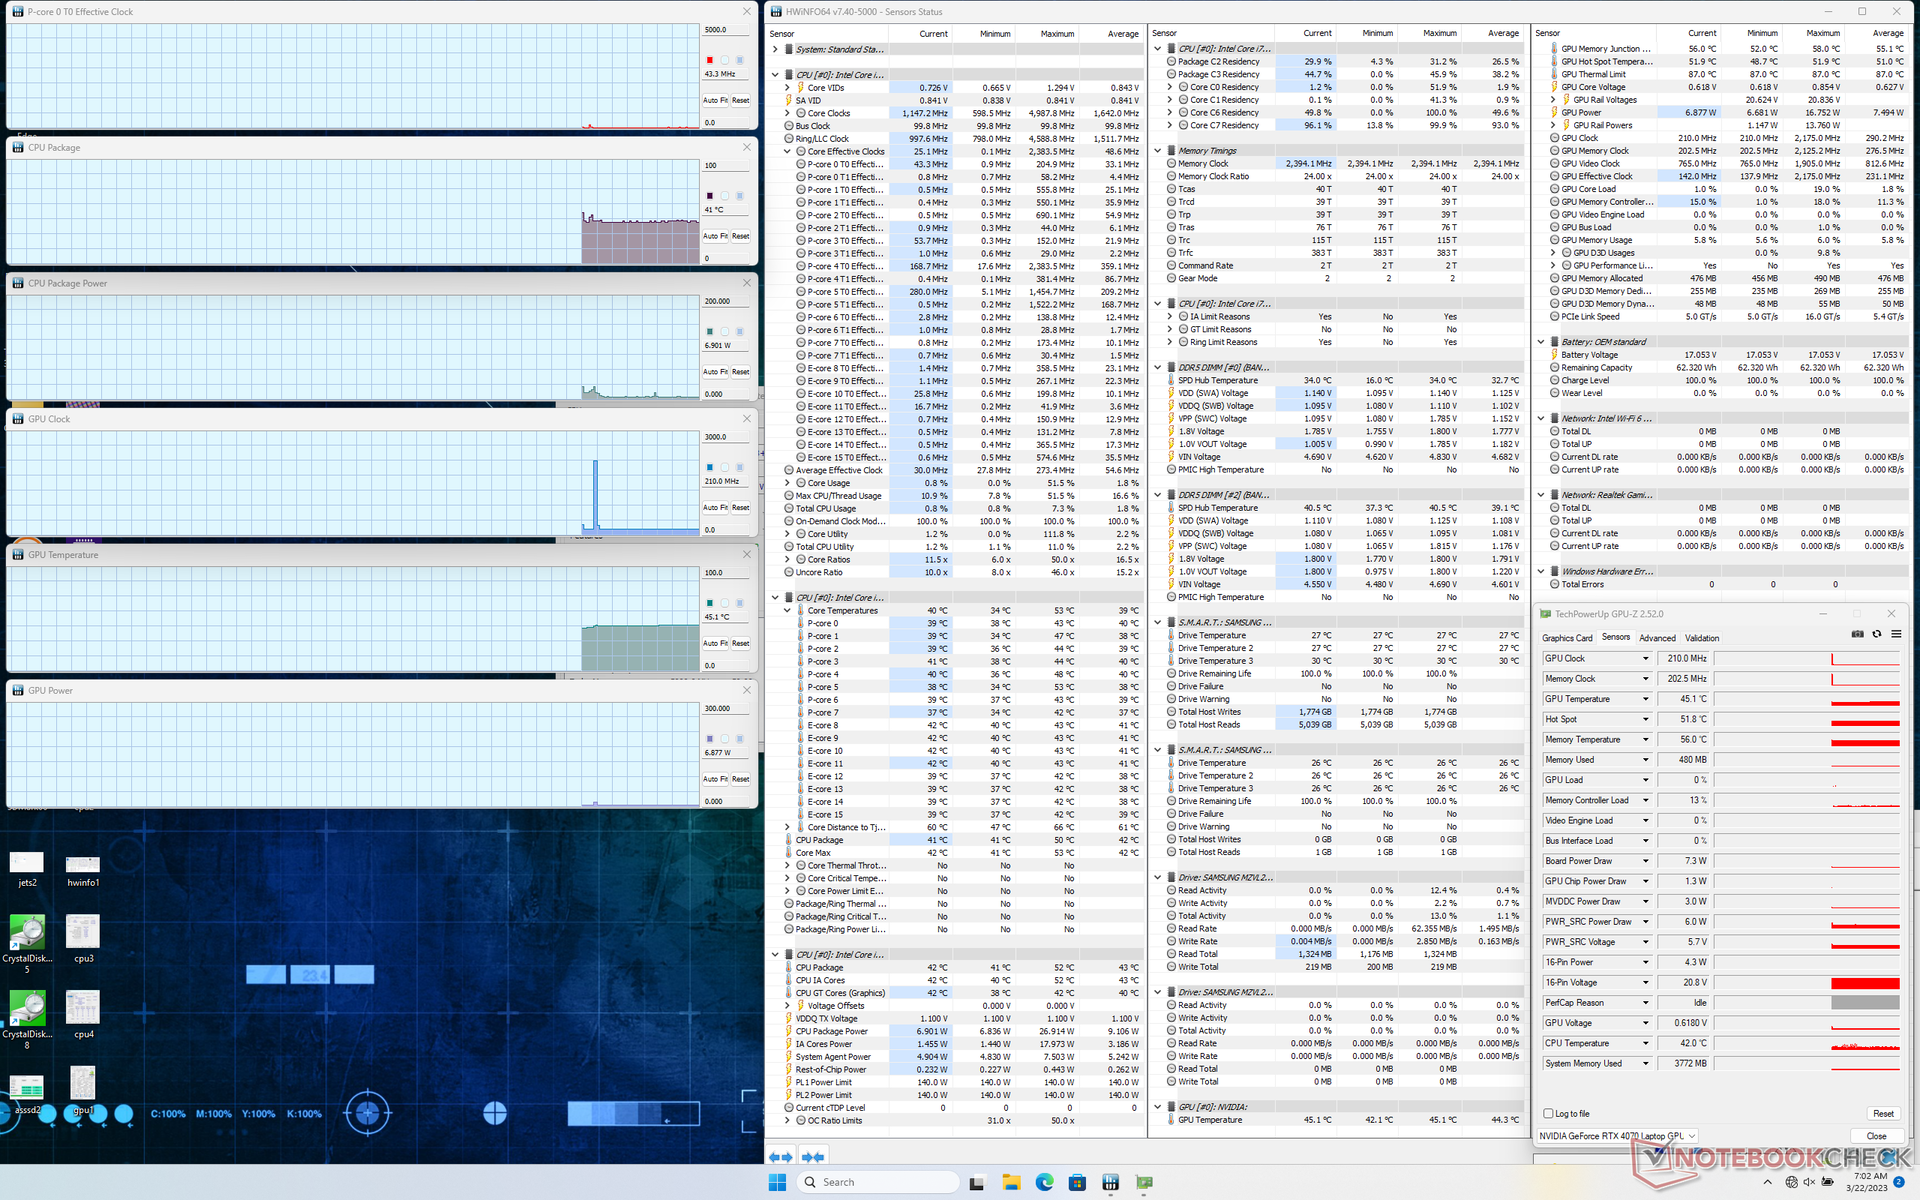
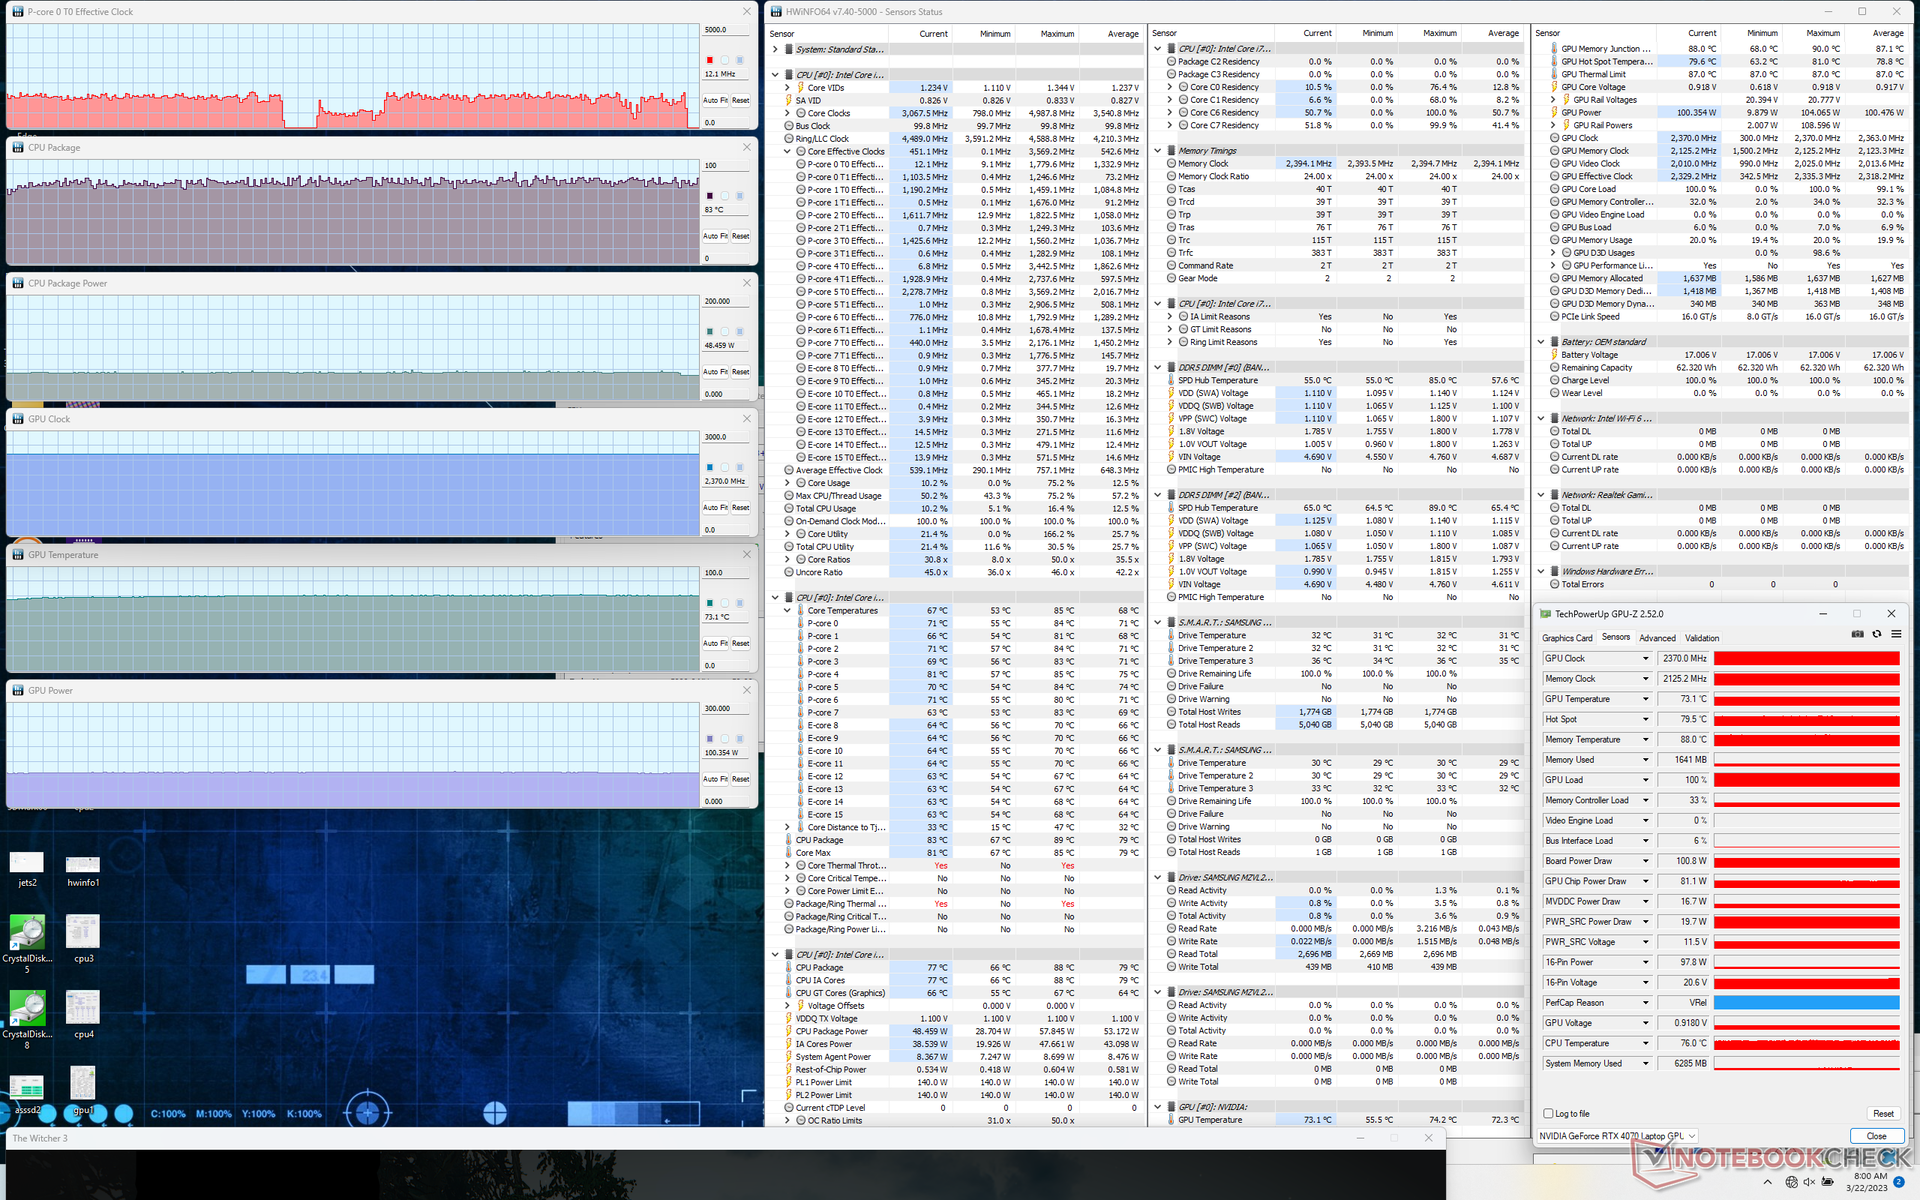
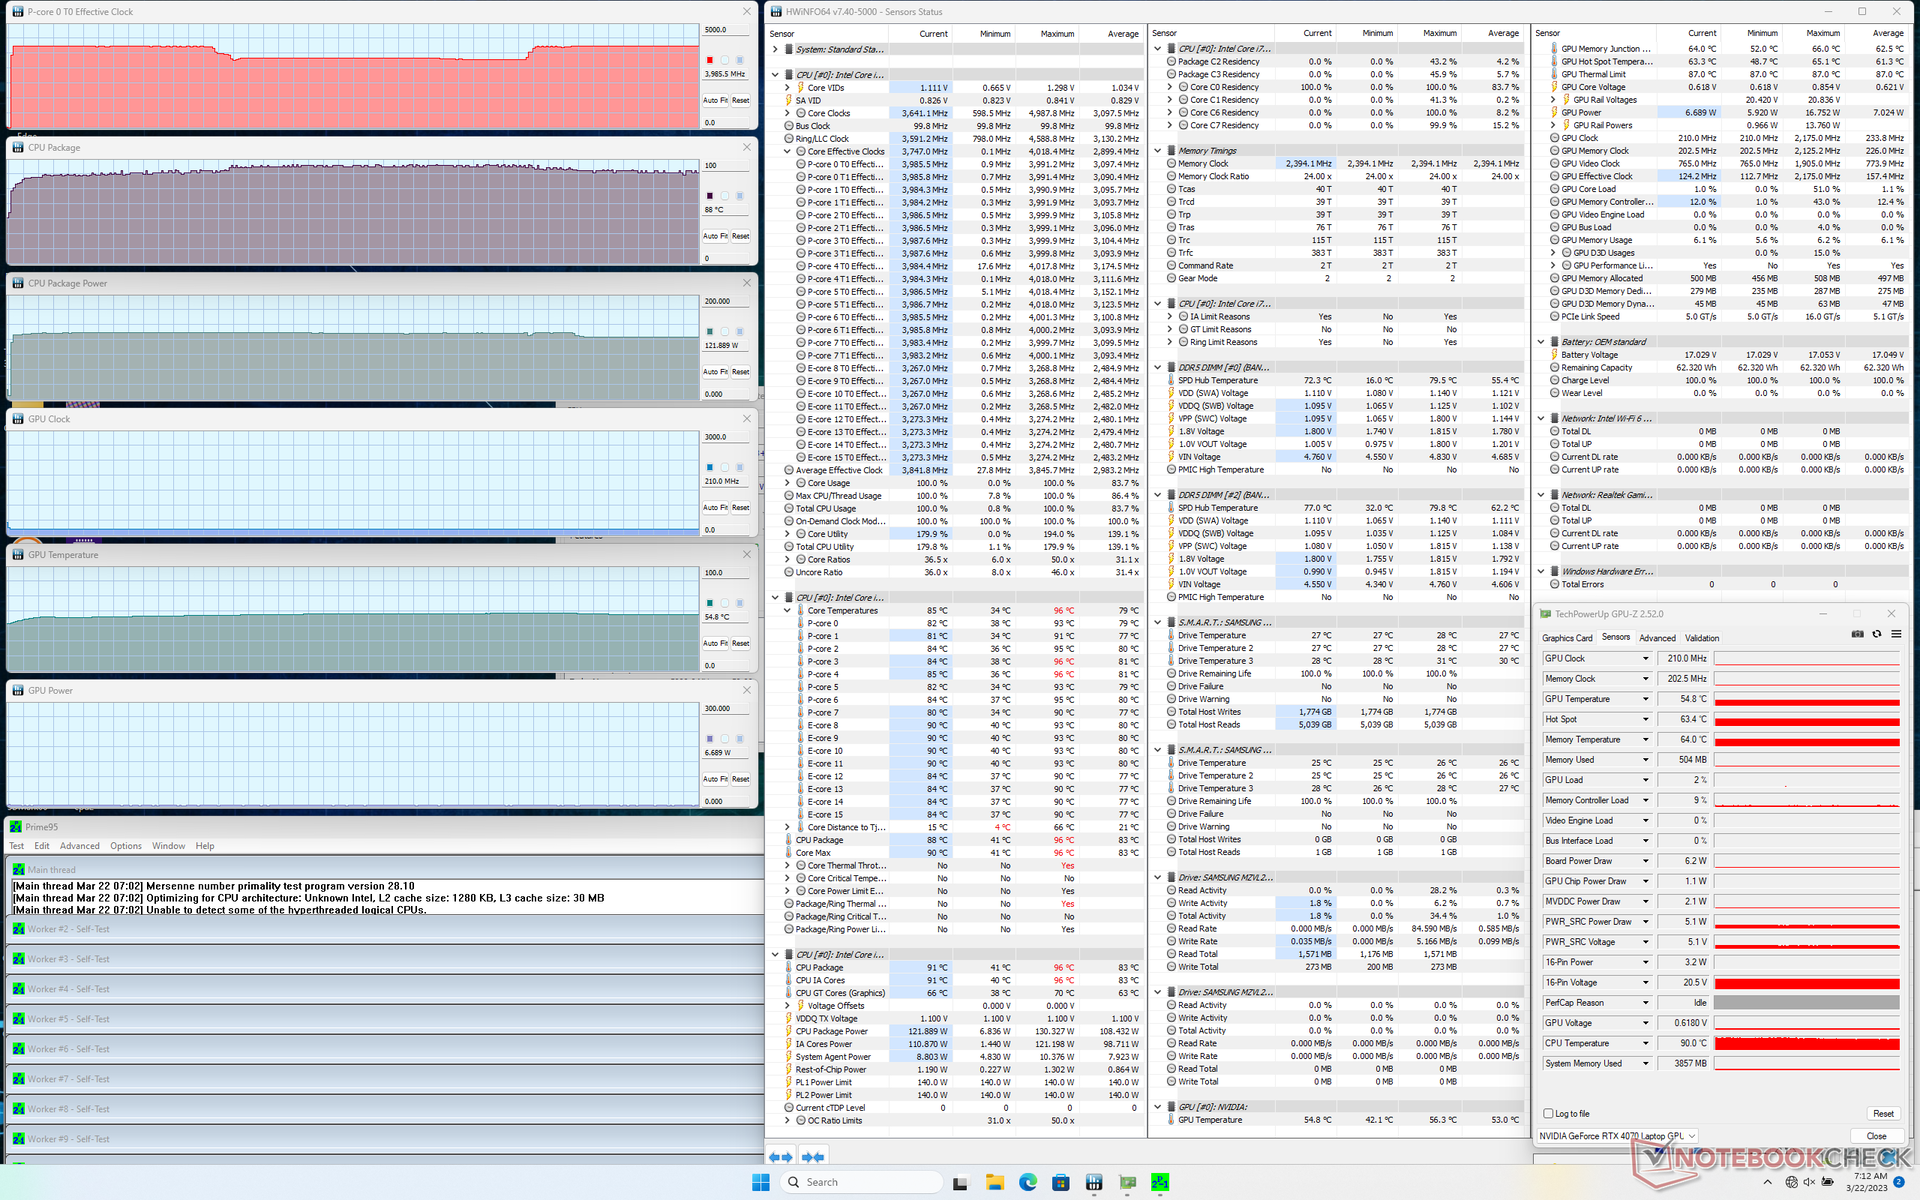
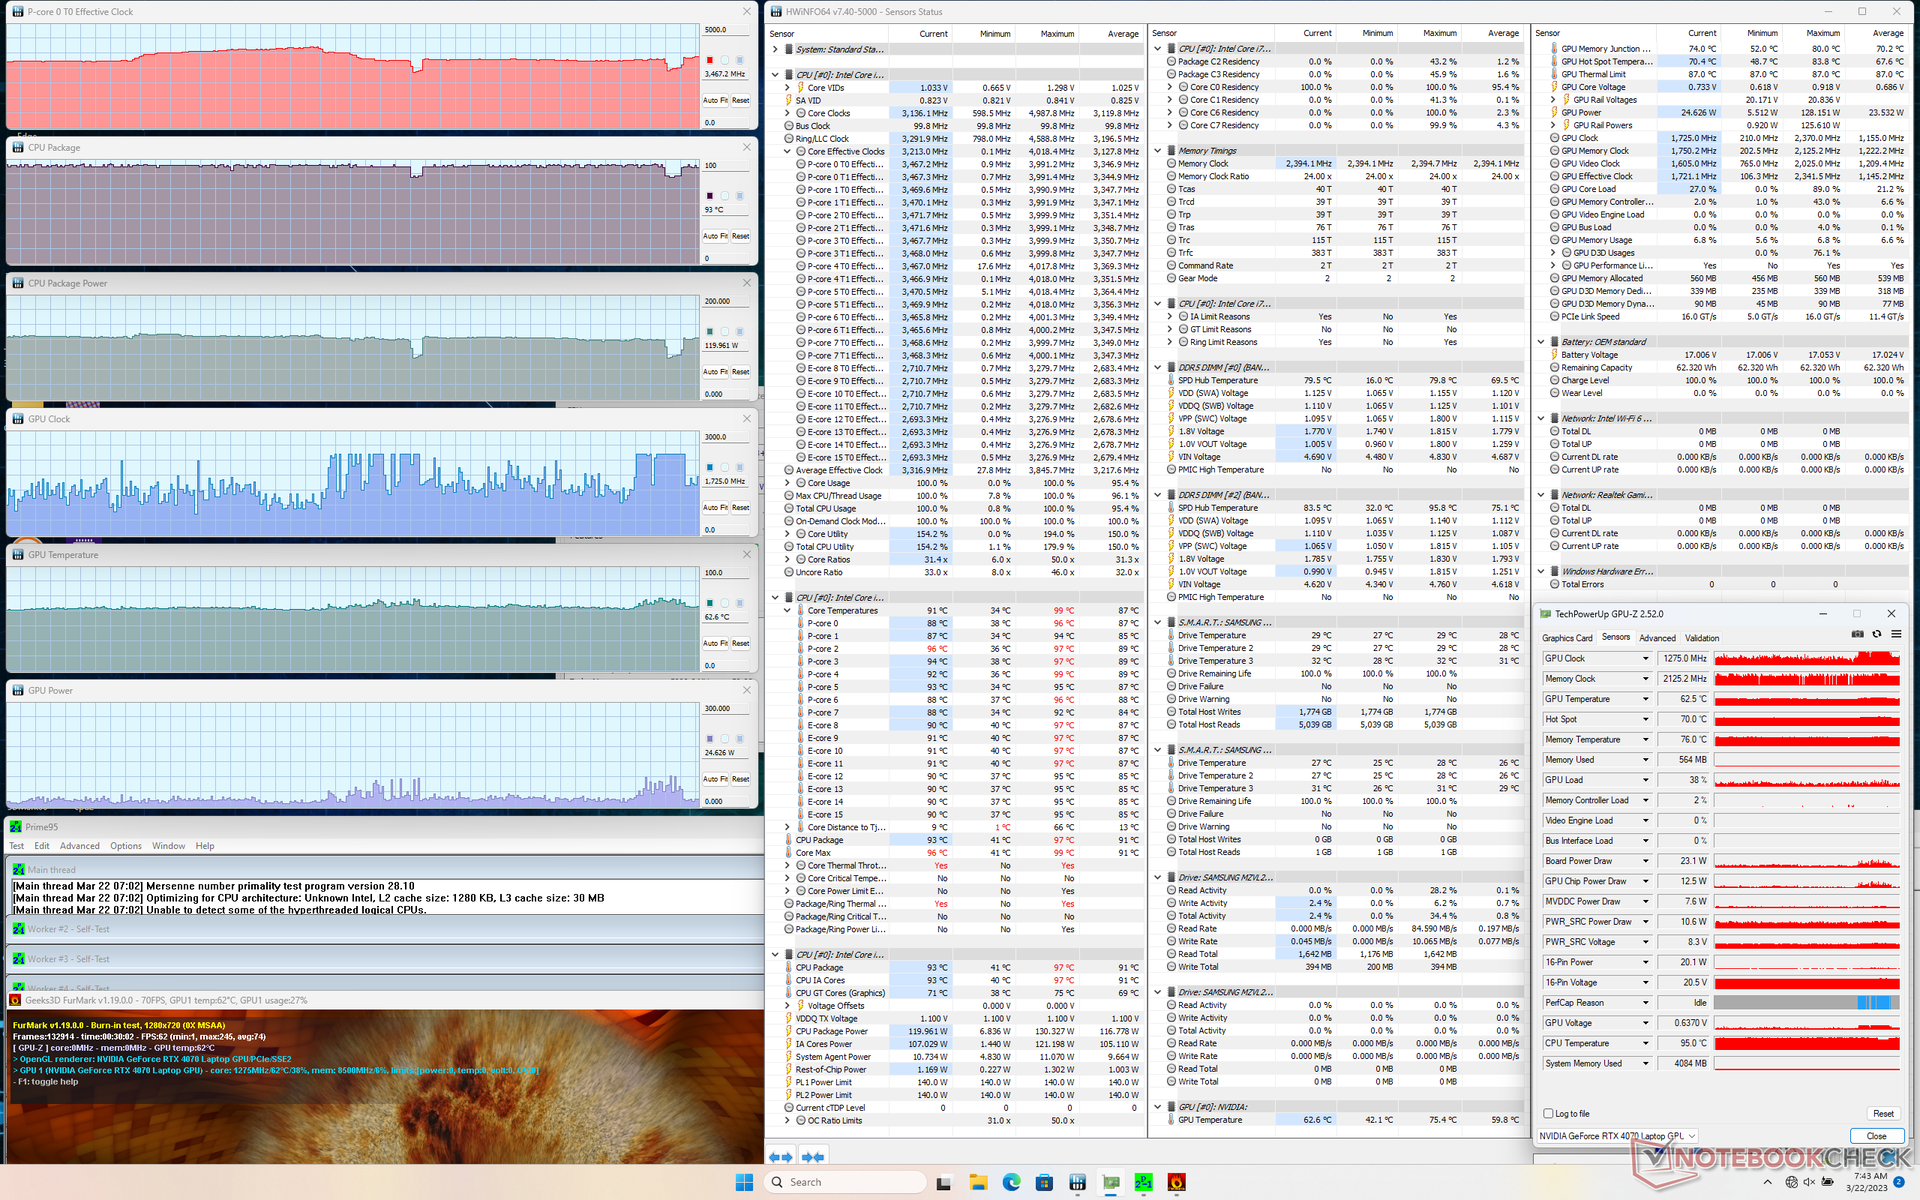
| Horloge du CPU (GHz) | Horloge du GPU (MHz) | Température moyenne du CPU (°C) | Température moyenne du GPU (°C) | |
| Système au repos | -- | -- | 41 | 45 |
| Prime95 Stress | 3.4 - 4.0 | -- | 89 | 55 |
| Prime95 + FurMark Stress | ~3.5 | 1275 - 2350 | 93 | 63 |
| Witcher 3 Stress | ~1450 | 2370 | 83 | 73 |
Intervenants
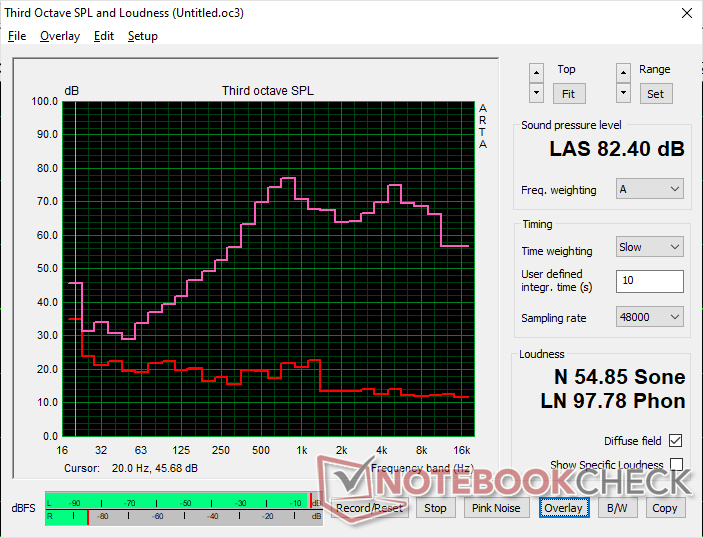
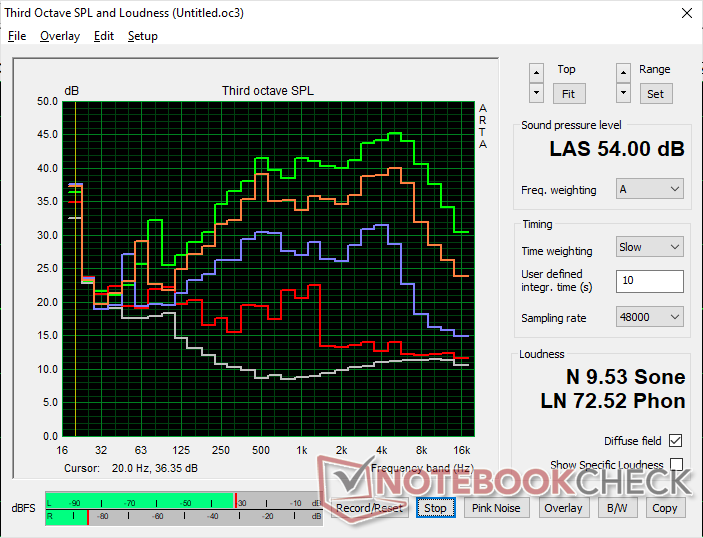
Uniwill GM6PX7X RTX 4070 analyse audio
(+) | les haut-parleurs peuvent jouer relativement fort (82.4# dB)
Basses 100 - 315 Hz
(-) | presque aucune basse - en moyenne 18.6% plus bas que la médiane
(+) | les basses sont linéaires (6.4% delta à la fréquence précédente)
Médiums 400 - 2000 Hz
(+) | médiane équilibrée - seulement 4.4% de la médiane
(±) | la linéarité des médiums est moyenne (8.4% delta à la fréquence précédente)
Aiguës 2 - 16 kHz
(+) | des sommets équilibrés - à seulement 2.9% de la médiane
(+) | les aigus sont linéaires (5.5% delta à la fréquence précédente)
Globalement 100 - 16 000 Hz
(±) | la linéarité du son global est moyenne (16.8% de différence avec la médiane)
Par rapport à la même classe
» 44% de tous les appareils testés de cette catégorie étaient meilleurs, 11% similaires, 45% pires
» Le meilleur avait un delta de 6%, la moyenne était de 18%, le pire était de 132%.
Par rapport à tous les appareils testés
» 30% de tous les appareils testés étaient meilleurs, 8% similaires, 63% pires
» Le meilleur avait un delta de 4%, la moyenne était de 23%, le pire était de 134%.
Apple MacBook Pro 16 2021 M1 Pro analyse audio
(+) | les haut-parleurs peuvent jouer relativement fort (84.7# dB)
Basses 100 - 315 Hz
(+) | bonne basse - seulement 3.8% loin de la médiane
(+) | les basses sont linéaires (5.2% delta à la fréquence précédente)
Médiums 400 - 2000 Hz
(+) | médiane équilibrée - seulement 1.3% de la médiane
(+) | les médiums sont linéaires (2.1% delta à la fréquence précédente)
Aiguës 2 - 16 kHz
(+) | des sommets équilibrés - à seulement 1.9% de la médiane
(+) | les aigus sont linéaires (2.7% delta à la fréquence précédente)
Globalement 100 - 16 000 Hz
(+) | le son global est linéaire (4.6% différence à la médiane)
Par rapport à la même classe
» 0% de tous les appareils testés de cette catégorie étaient meilleurs, 0% similaires, 100% pires
» Le meilleur avait un delta de 5%, la moyenne était de 17%, le pire était de 45%.
Par rapport à tous les appareils testés
» 0% de tous les appareils testés étaient meilleurs, 0% similaires, 100% pires
» Le meilleur avait un delta de 4%, la moyenne était de 23%, le pire était de 134%.
Gestion de l'énergie
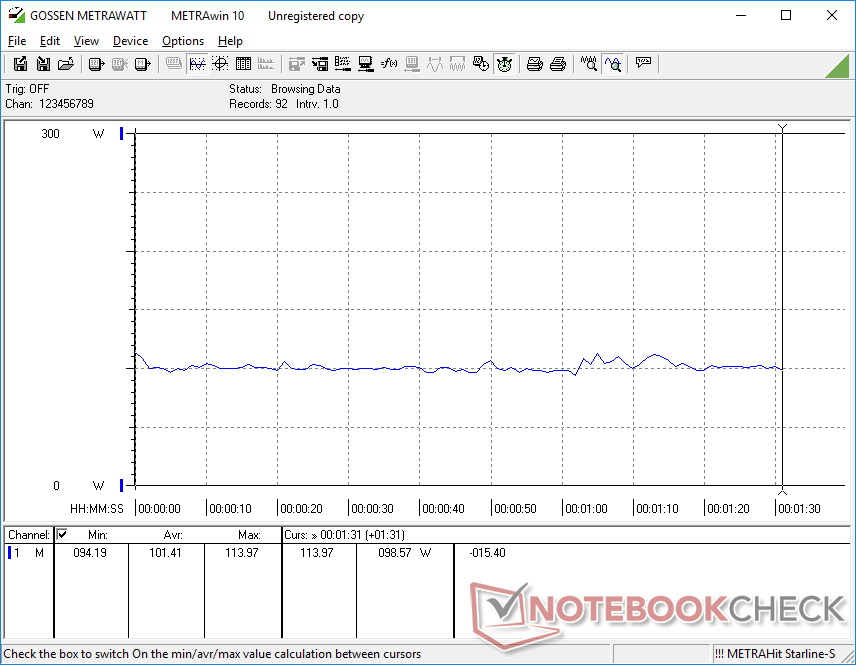
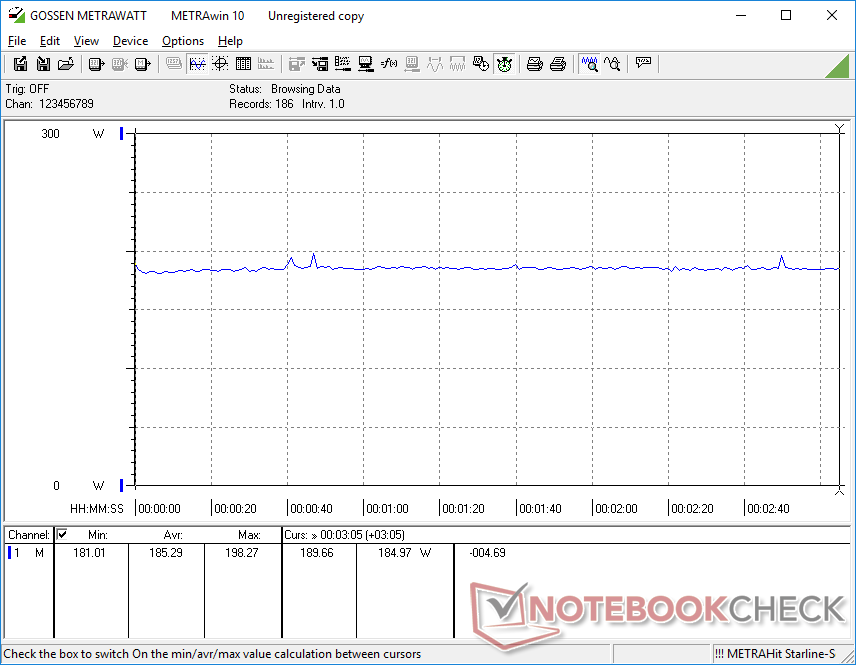
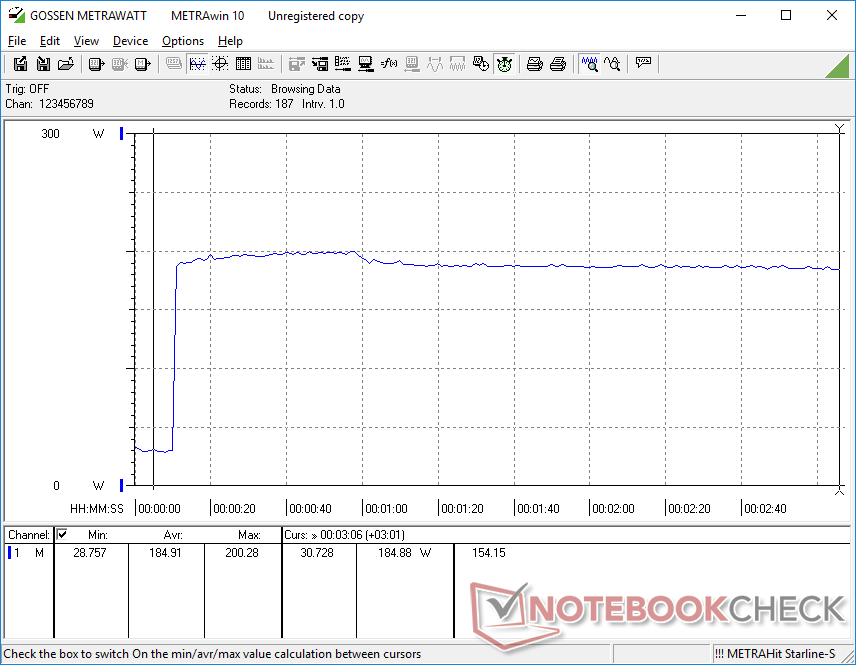
Consommation électrique
La consommation d'énergie devrait être inférieure à celle de la Neo 16 équipée de la RTX 4090 dans tous les cas, mais ce n'est étrangement pas le cas. La Neo 16 équipée de la RTX 4090 consomme entre 12 et 32 W, contre 8 et 28 W pour la Neo 16 équipée de la RTX 4090. Nous avons revérifié nos profils d'alimentation et nos paramètres de luminosité, mais les résultats ne se sont pas améliorés.
L'exécution de charges plus élevées, comme les jeux, consomme de 24 à 37% de moins que la Neo 16. La RTX 4070 mobile est environ 35 à 45% plus lente que la RTX 4090 mobile et la consommation plus faible n'est donc pas inattendue.
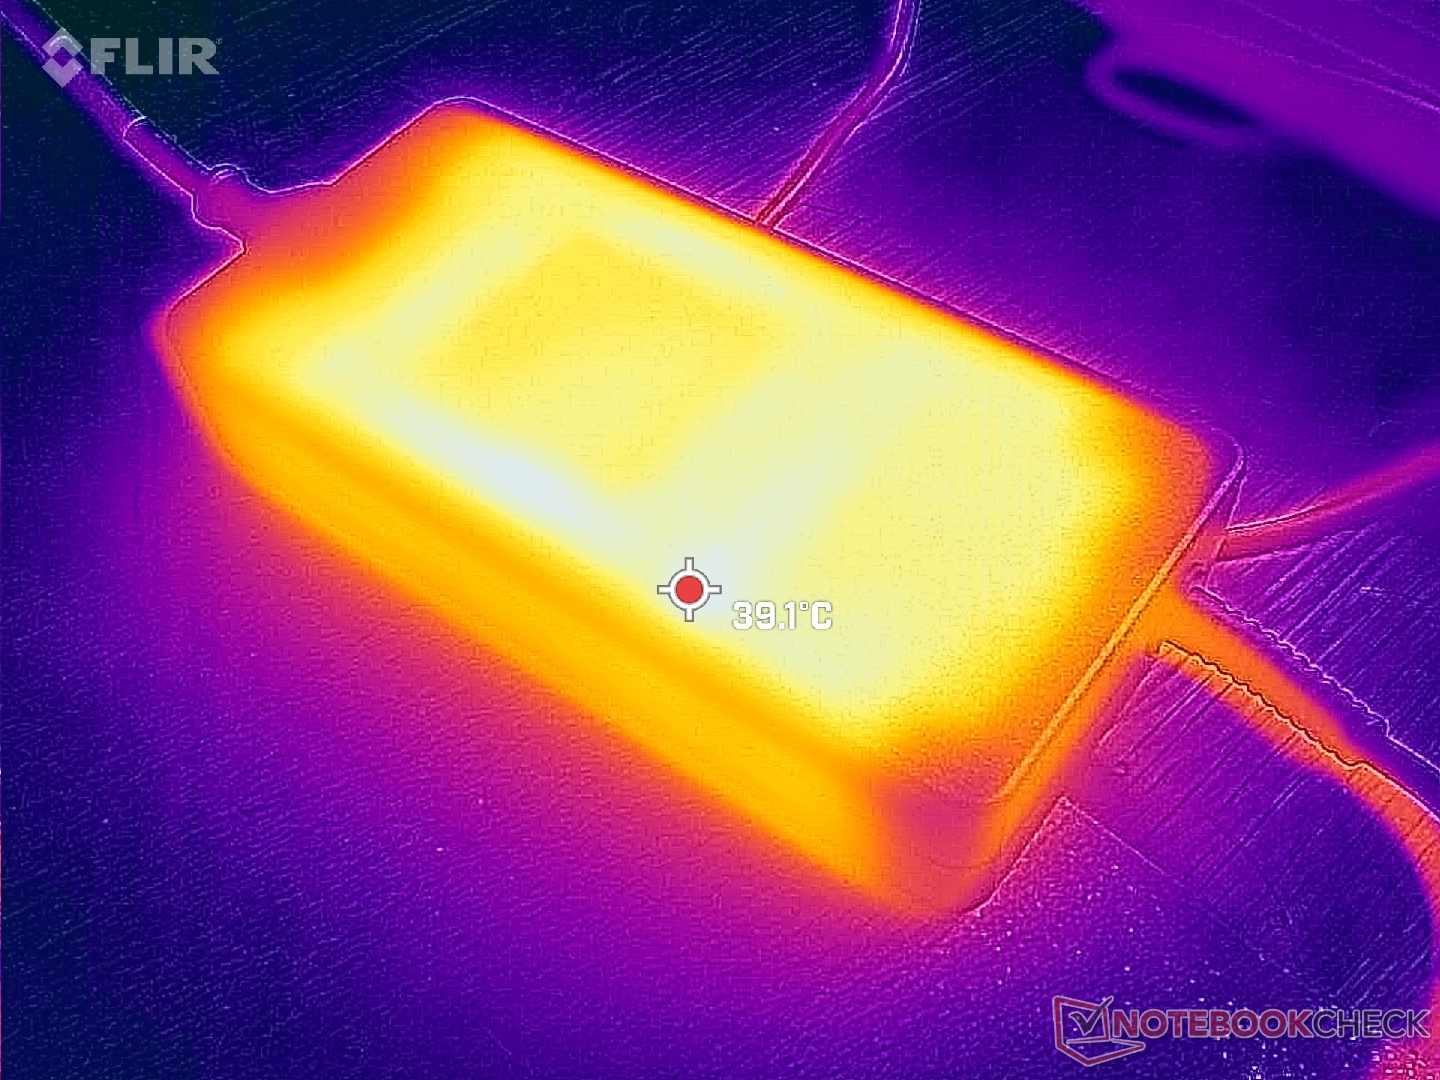
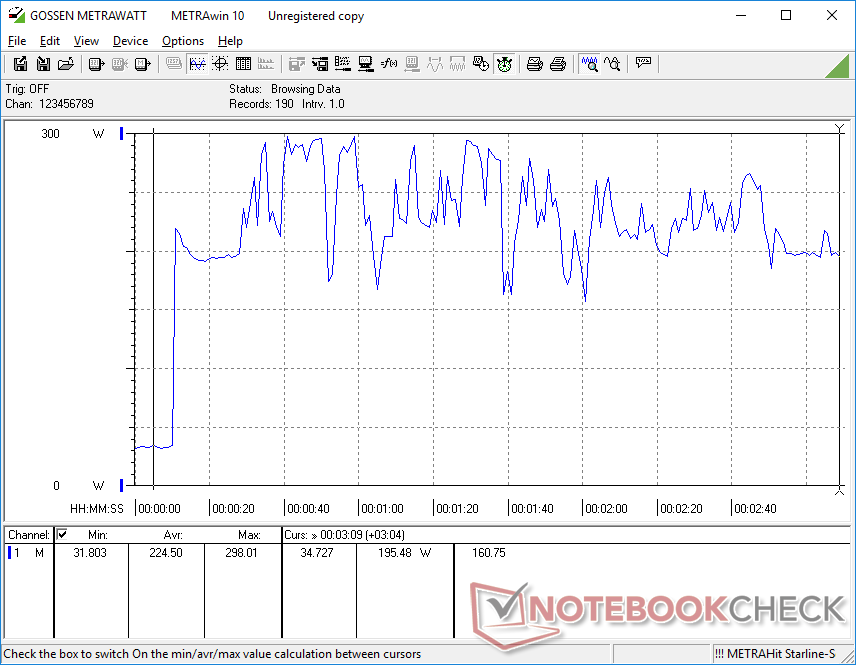
L'exécution simultanée de Prime95 et FurMark a fait varier la consommation de 167 W à 298 W, même si le grand adaptateur secteur (~18 x 8.4 x 3.5 cm) est prévu pour 280 W. La consommation a été beaucoup plus stable en répétant ce test sur la Neo 16 équipée de la RTX 4090, comme le montre le tableau comparatif ci-dessous.
| Éteint/en veille | |
| Au repos | |
| Fortement sollicité |
|
Légende:
min: | |
| Uniwill GM6PX7X RTX 4070 i7-13700HX, GeForce RTX 4070 Laptop GPU, Samsung PM9A1 MZVL2512HCJQ, IPS, 2560x1600, 16" | Schenker XMG Neo 16 E23 i9-13900HX, GeForce RTX 4090 Laptop GPU, Crucial P5 Plus 1TB CT1000P5PSSD8, IPS, 2560x1600, 16" | Asus ROG Strix G16 G614JZ i9-13980HX, GeForce RTX 4080 Laptop GPU, WD PC SN560 SDDPNQE-1T00, IPS, 2560x1600, 16" | Lenovo Legion Pro 7 16IRX8H i9-13900HX, GeForce RTX 4080 Laptop GPU, Samsung PM9A1 MZVL21T0HCLR, IPS, 2560x1600, 16" | Gigabyte AERO 16 OLED BSF i9-13900H, GeForce RTX 4070 Laptop GPU, Gigabyte AG470S1TB-SI B10, OLED, 3840x2400, 16" | Razer Blade 16 Early 2023 i9-13950HX, GeForce RTX 4080 Laptop GPU, SSSTC CA6-8D1024, IPS, 2560x1600, 16" | |
|---|---|---|---|---|---|---|
| Power Consumption | -13% | -5% | -26% | 19% | -25% | |
| Idle Minimum * (Watt) | 12.6 | 8 37% | 10 21% | 18 -43% | 11.8 6% | 15.2 -21% |
| Idle Average * (Watt) | 17.7 | 18 -2% | 16 10% | 24 -36% | 16.1 9% | 22.8 -29% |
| Idle Maximum * (Watt) | 31.8 | 28 12% | 27 15% | 32 -1% | 17 47% | 49.8 -57% |
| Load Average * (Watt) | 101.4 | 133 -31% | 129 -27% | 130 -28% | 100.6 1% | 121.2 -20% |
| Witcher 3 ultra * (Watt) | 185.3 | 294 -59% | 247 -33% | 260 -40% | 158 15% | 242 -31% |
| Load Maximum * (Watt) | 298 | 399 -34% | 342 -15% | 320 -7% | 192 36% | 273.7 8% |
* ... Moindre est la valeur, meilleures sont les performances
Power Consumption Witcher 3 / Stresstest
Power Consumption external Monitor
Autonomie de la batterie
La capacité de la batterie est réduite d'un tiers par rapport à la Neo 16 équipée de la RTX 4090, pour une autonomie WLAN plus courte d'environ 4 heures. La plupart des autres ordinateurs portables de jeu de 16 pouces ont des capacités de batterie et des durées d'utilisation plus importantes en comparaison.
Le chargement d'une batterie vide à une batterie pleine prend un peu moins de deux heures. Aucun de nos chargeurs USB-C n'est en mesure de recharger l'ordinateur portable.
| Uniwill GM6PX7X RTX 4070 i7-13700HX, GeForce RTX 4070 Laptop GPU, 62 Wh | Schenker XMG Neo 16 E23 i9-13900HX, GeForce RTX 4090 Laptop GPU, 99 Wh | Asus ROG Strix G16 G614JZ i9-13980HX, GeForce RTX 4080 Laptop GPU, 90 Wh | Lenovo Legion Pro 7 16IRX8H i9-13900HX, GeForce RTX 4080 Laptop GPU, 99.9 Wh | Gigabyte AERO 16 OLED BSF i9-13900H, GeForce RTX 4070 Laptop GPU, 88 Wh | Razer Blade 16 Early 2023 i9-13950HX, GeForce RTX 4080 Laptop GPU, 95.2 Wh | |
|---|---|---|---|---|---|---|
| Autonomie de la batterie | 68% | 142% | 27% | 88% | 53% | |
| WiFi v1.3 (h) | 4 | 6.7 68% | 9.7 142% | 5.1 27% | 7.5 88% | 6.1 53% |
| H.264 (h) | 5.8 | 7.4 | ||||
| Witcher 3 ultra (h) | 1.4 | |||||
| Load (h) | 1.1 | 2.1 | 2.1 | 1.4 | ||
| Reader / Idle (h) | 6.4 | 8.9 |
Points positifs
Points négatifs
Verdict

L'Uniwill GM6PX7X est un solide ordinateur portable de jeu de 16 pouces, même s'il n'excelle dans aucune catégorie particulière. Le système est léger, par exemple, mais le Gigabyte Aero 16 est encore plus léger. La couverture des couleurs avoisine les 100 % sRGB, mais des couleurs P3 encore plus profondes sont disponibles sur l'Aero 16 de Gigabyte.Asus ROG Strix G16 ou leRazer Blade 16. Les performances graphiques sont excellentes pour la taille, mais l'absence d'Advanced Optimus ou de support G-Sync sur l'écran interne est une épine dans le pied. Le rétroéclairage RGB par zone est pris en charge, mais l'éclairage RGB par touche est lié à une mise à niveau mécanique Cherry en option. Pendant ce temps, la configuration avec la plus rapide GeForce RTX 4080 ou 4090 implique un châssis plus épais et plus lourd qui annule l'un des principaux avantages de la conception Uniwill GM6PX7X. Il n'y a pas de faiblesses notables ou de caractéristiques remarquables à l'Uniwill, ce qui lui donne un sens de la cohérence que certains joueurs pourraient apprécier.
L'Uniwill GM6PX7X est un ordinateur portable de jeu sans fioritures qui est au-dessus de la moyenne dans la plupart des catégories, mais il manque de puissance ou de caractéristiques accrocheuses pour aider à se démarquer de la foule.
Nous pouvons tout de même féliciter ce modèle pour son pavé numérique et ses touches fléchées de taille normale, ainsi que pour la prise en charge d'un refroidisseur d'eau externe en option. Ces mêmes touches de clavier ont tendance à être plus petites et plus exiguës sur d'autres ordinateurs portables de jeu. Les passionnés pourront envisager les modèles RTX 4080 ou 4090 plus haut de gamme pour mieux exploiter le refroidissement par eau en option.
Prix et disponibilité
Le GM6PX7X d'Uniwill est maintenant expédié sous différents noms et prix en fonction de la région. Schenker, par exemple, propose le châssis sous la marque XMG Neo 16.
Uniwill GM6PX7X RTX 4070
- 03/28/2023 v7 (old)
Allen Ngo
Transparency
La sélection des appareils à examiner est effectuée par notre équipe éditoriale. L'échantillon de test a été prêté à l'auteur par le fabricant ou le détaillant pour les besoins de cet examen. Le prêteur n'a pas eu d'influence sur cette évaluation et le fabricant n'a pas reçu de copie de cette évaluation avant sa publication. Il n'y avait aucune obligation de publier cet article. En tant que média indépendant, Notebookcheck n'est pas soumis à l'autorité des fabricants, des détaillants ou des éditeurs.
Voici comment Notebookcheck teste
Chaque année, Notebookcheck examine de manière indépendante des centaines d'ordinateurs portables et de smartphones en utilisant des procédures standardisées afin de garantir que tous les résultats sont comparables. Nous avons continuellement développé nos méthodes de test depuis environ 20 ans et avons établi des normes industrielles dans le processus. Dans nos laboratoires de test, des équipements de mesure de haute qualité sont utilisés par des techniciens et des rédacteurs expérimentés. Ces tests impliquent un processus de validation en plusieurs étapes. Notre système d'évaluation complexe repose sur des centaines de mesures et de points de référence bien fondés, ce qui garantit l'objectivité.Price comparison

