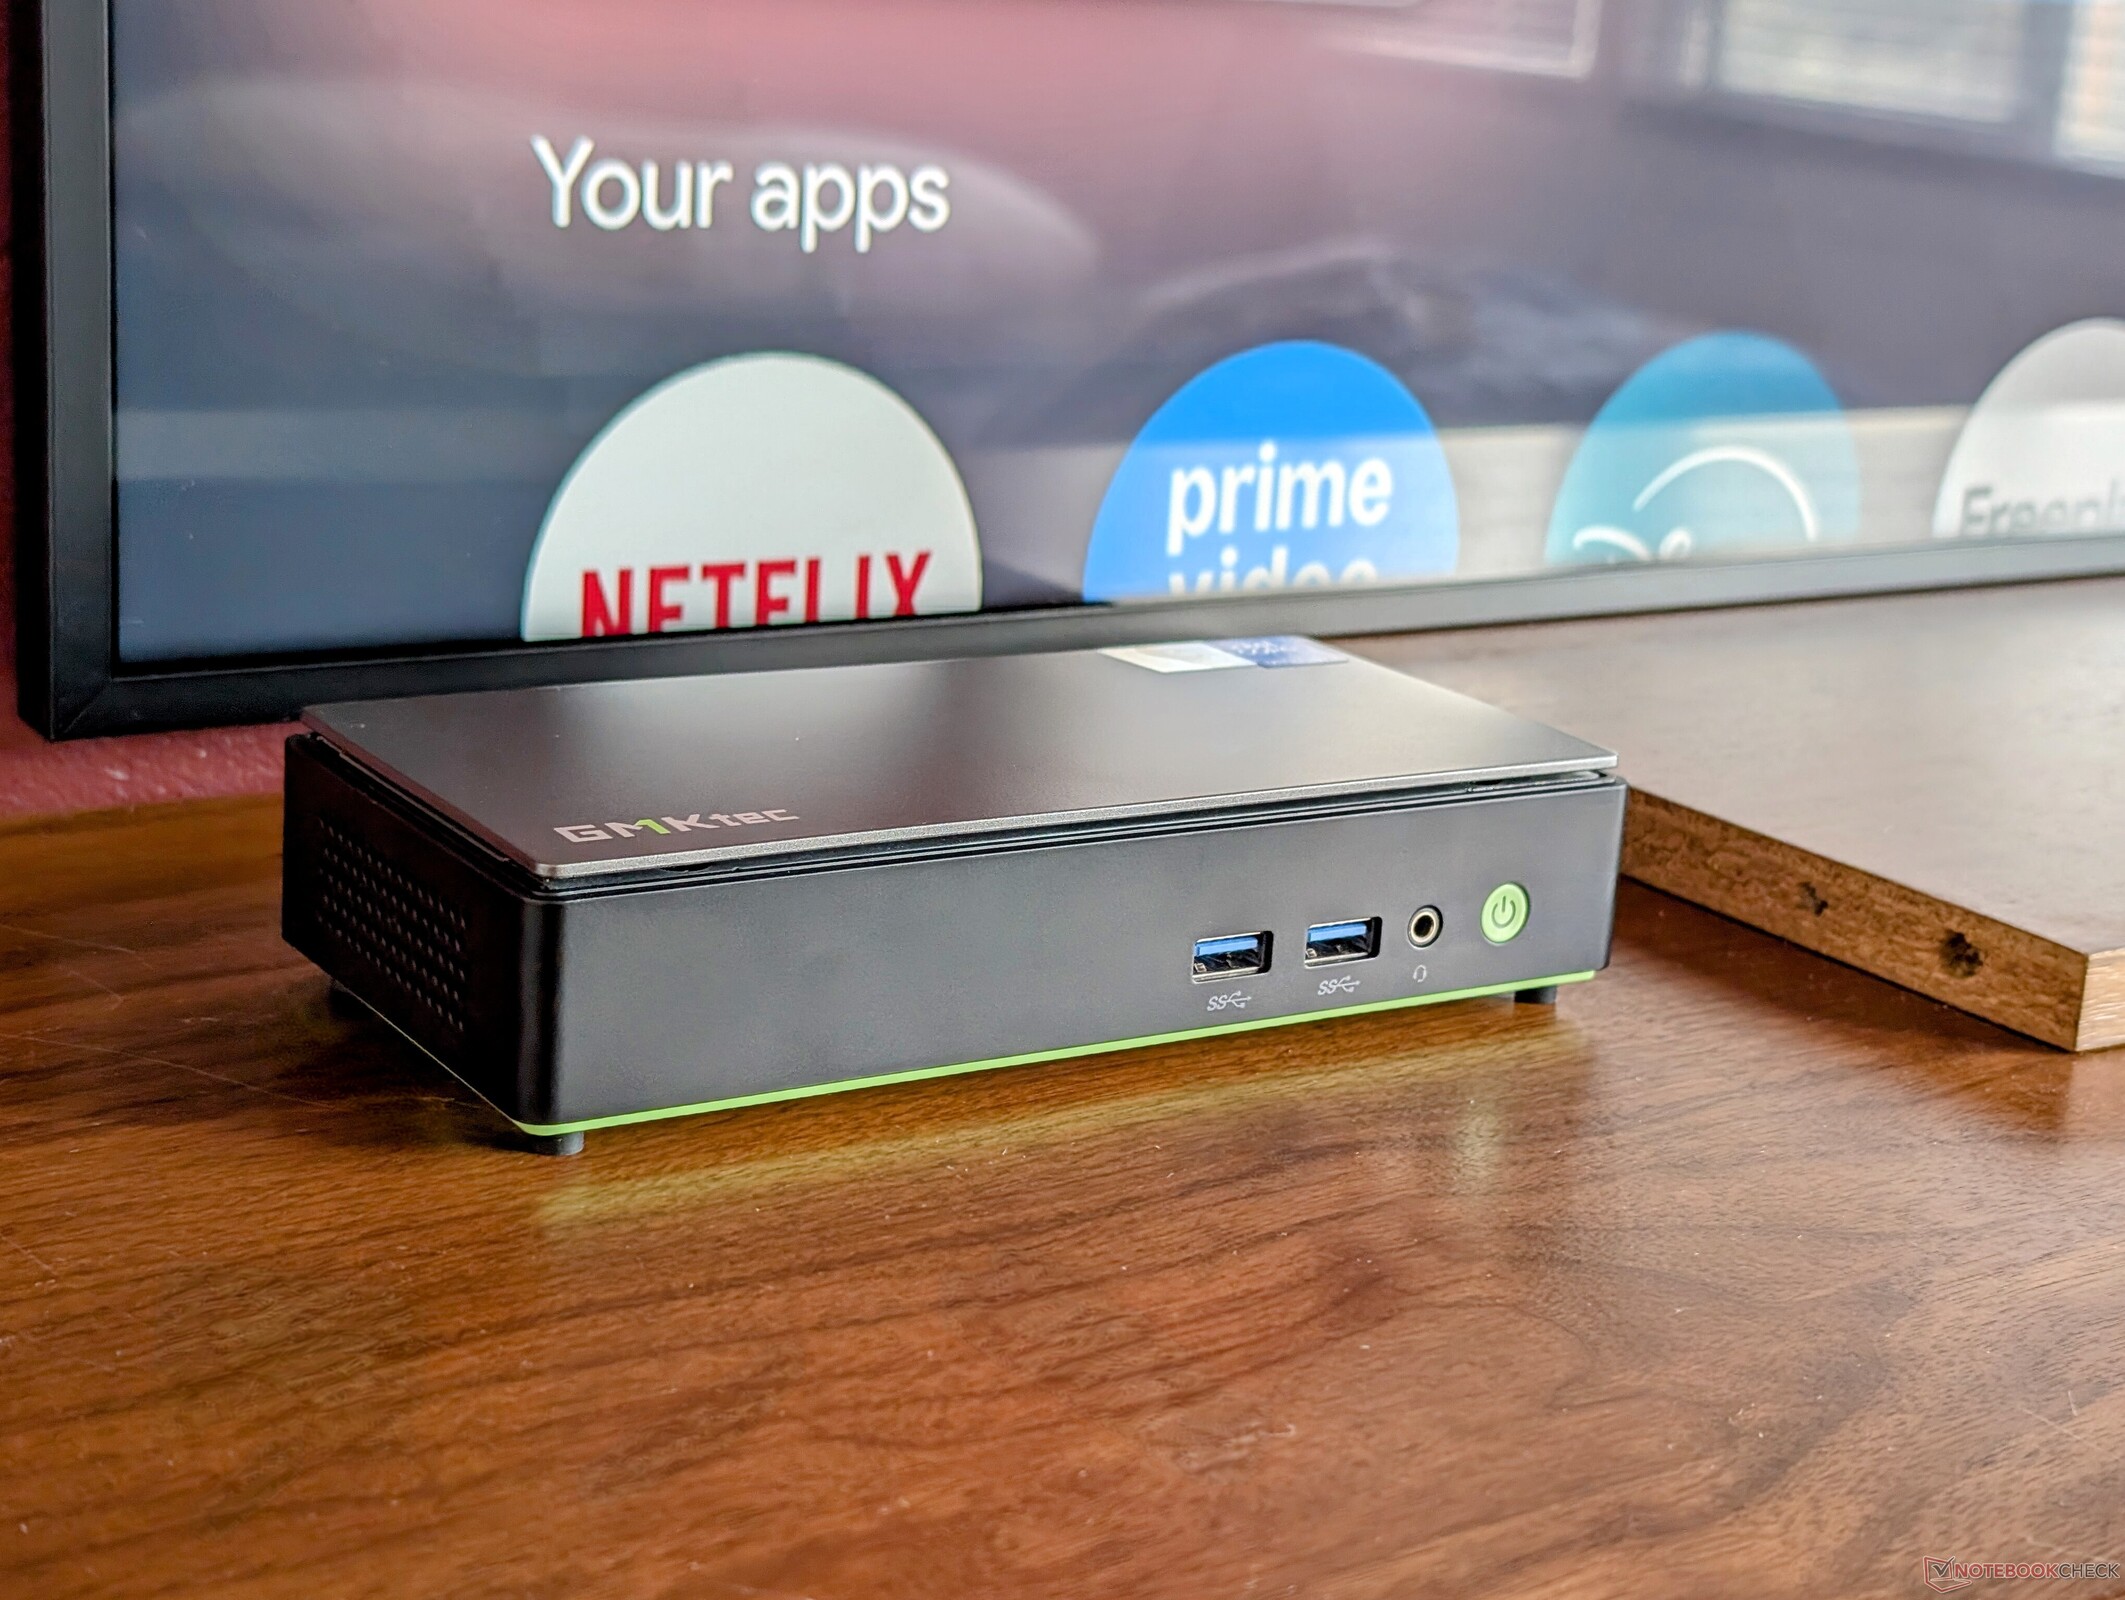
Verdict du test du GMK NucBox K13 : super léger et ultra efficace
Le NucBox K13 a été conçu spécifiquement pour bénéficier des avantages du processeur Intel Lunar Lake. Son design ultracompact, son poids très faible et son adaptateur secteur encore plus petit n'auraient pas été possibles avec un processeur de la série H comme le Core Ultra 7 255H ou le Ryzen AI 9. Le système est encore plus petit que le déjà petit MSI Cubi NUC AI+ 2MG pour les utilisateurs qui ont besoin d'un mini-PC dans des espaces plus étroits ou plus discrets.
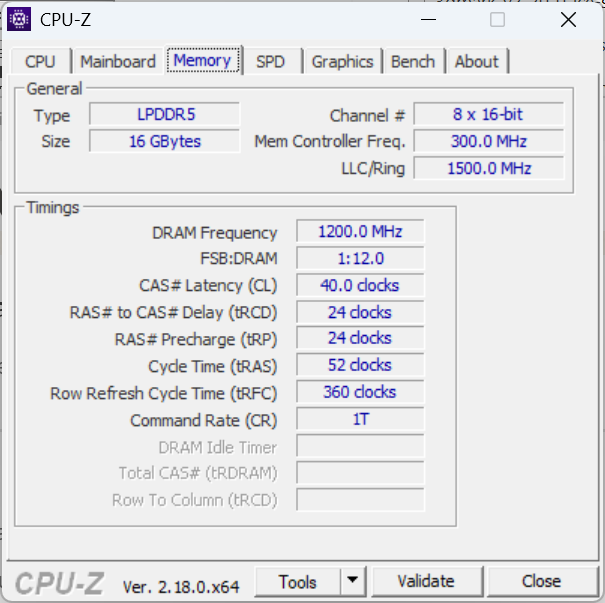
Sa taille réduite présente toutefois plusieurs inconvénients. Contrairement à la MSI susmentionnée, la GMK ne dispose pas d'un haut-parleur intégré ni d'autant de ports que la plus puissante des NucBox K12. Les performances du GPU sont légèrement plus lentes que prévu, la mémoire vive maximale est limitée à 16 Go et le bruit du ventilateur est malheureusement assez perceptible lors de l'exécution de tâches exigeantes. Néanmoins, nous apprécions le fait que le modèle supporte jusqu'à deux SSD M.2 internes malgré le volume restreint et que le prix n'est pas déraisonnable compte tenu de ses spécifications équilibrées et de son encombrement.
Points positifs
Points négatifs
Prix et disponibilité
Le NucBox K13 est disponible sur le site , directement auprès du fabricant à partir de 670 $ pour la configuration de base 16 Go RAM/512 Go SSD jusqu'à 720 $ pour la configuration 16 Go RAM/1 TB SSD.
Les mini PC GMKtec couvrent toute la gamme des processeurs, allant de 15 W de la série U comme le Core Ultra 5 125U jusqu'à l'imposant processeur de 100 W Ryzen AI Max+ 395. La nouvelle NucBox K13 est une solution intermédiaire qui devrait s'avérer plus pertinente pour la majorité des utilisateurs à domicile ou au bureau à la recherche d'un mini PC petit mais équilibré.
Les alternatives à la GMK NucBox K13 comprennent d'autres mini PC équipés de processeurs ULV comme le MSI Cubi NUC, Ninkear M7ou le NiPoGi AM06 Pro.
Plus de commentaires sur GMK :
Spécifications
Cas
Le châssis est en métal gris foncé mais avec un fond vert en plastique pour correspondre à la couleur du logo GMKtec. Sa caractéristique la plus frappante est sans doute sa petite taille et ses dimensions étroites par rapport aux designs plus carrés de la plupart des autres mini-PC, y compris ceux du même fabricant. Le modèle est également près de 25 % plus léger que le MSI Cubi NUC de MSI, qui propose des options similaires pour le processeur Intel Lunar Lake-V.
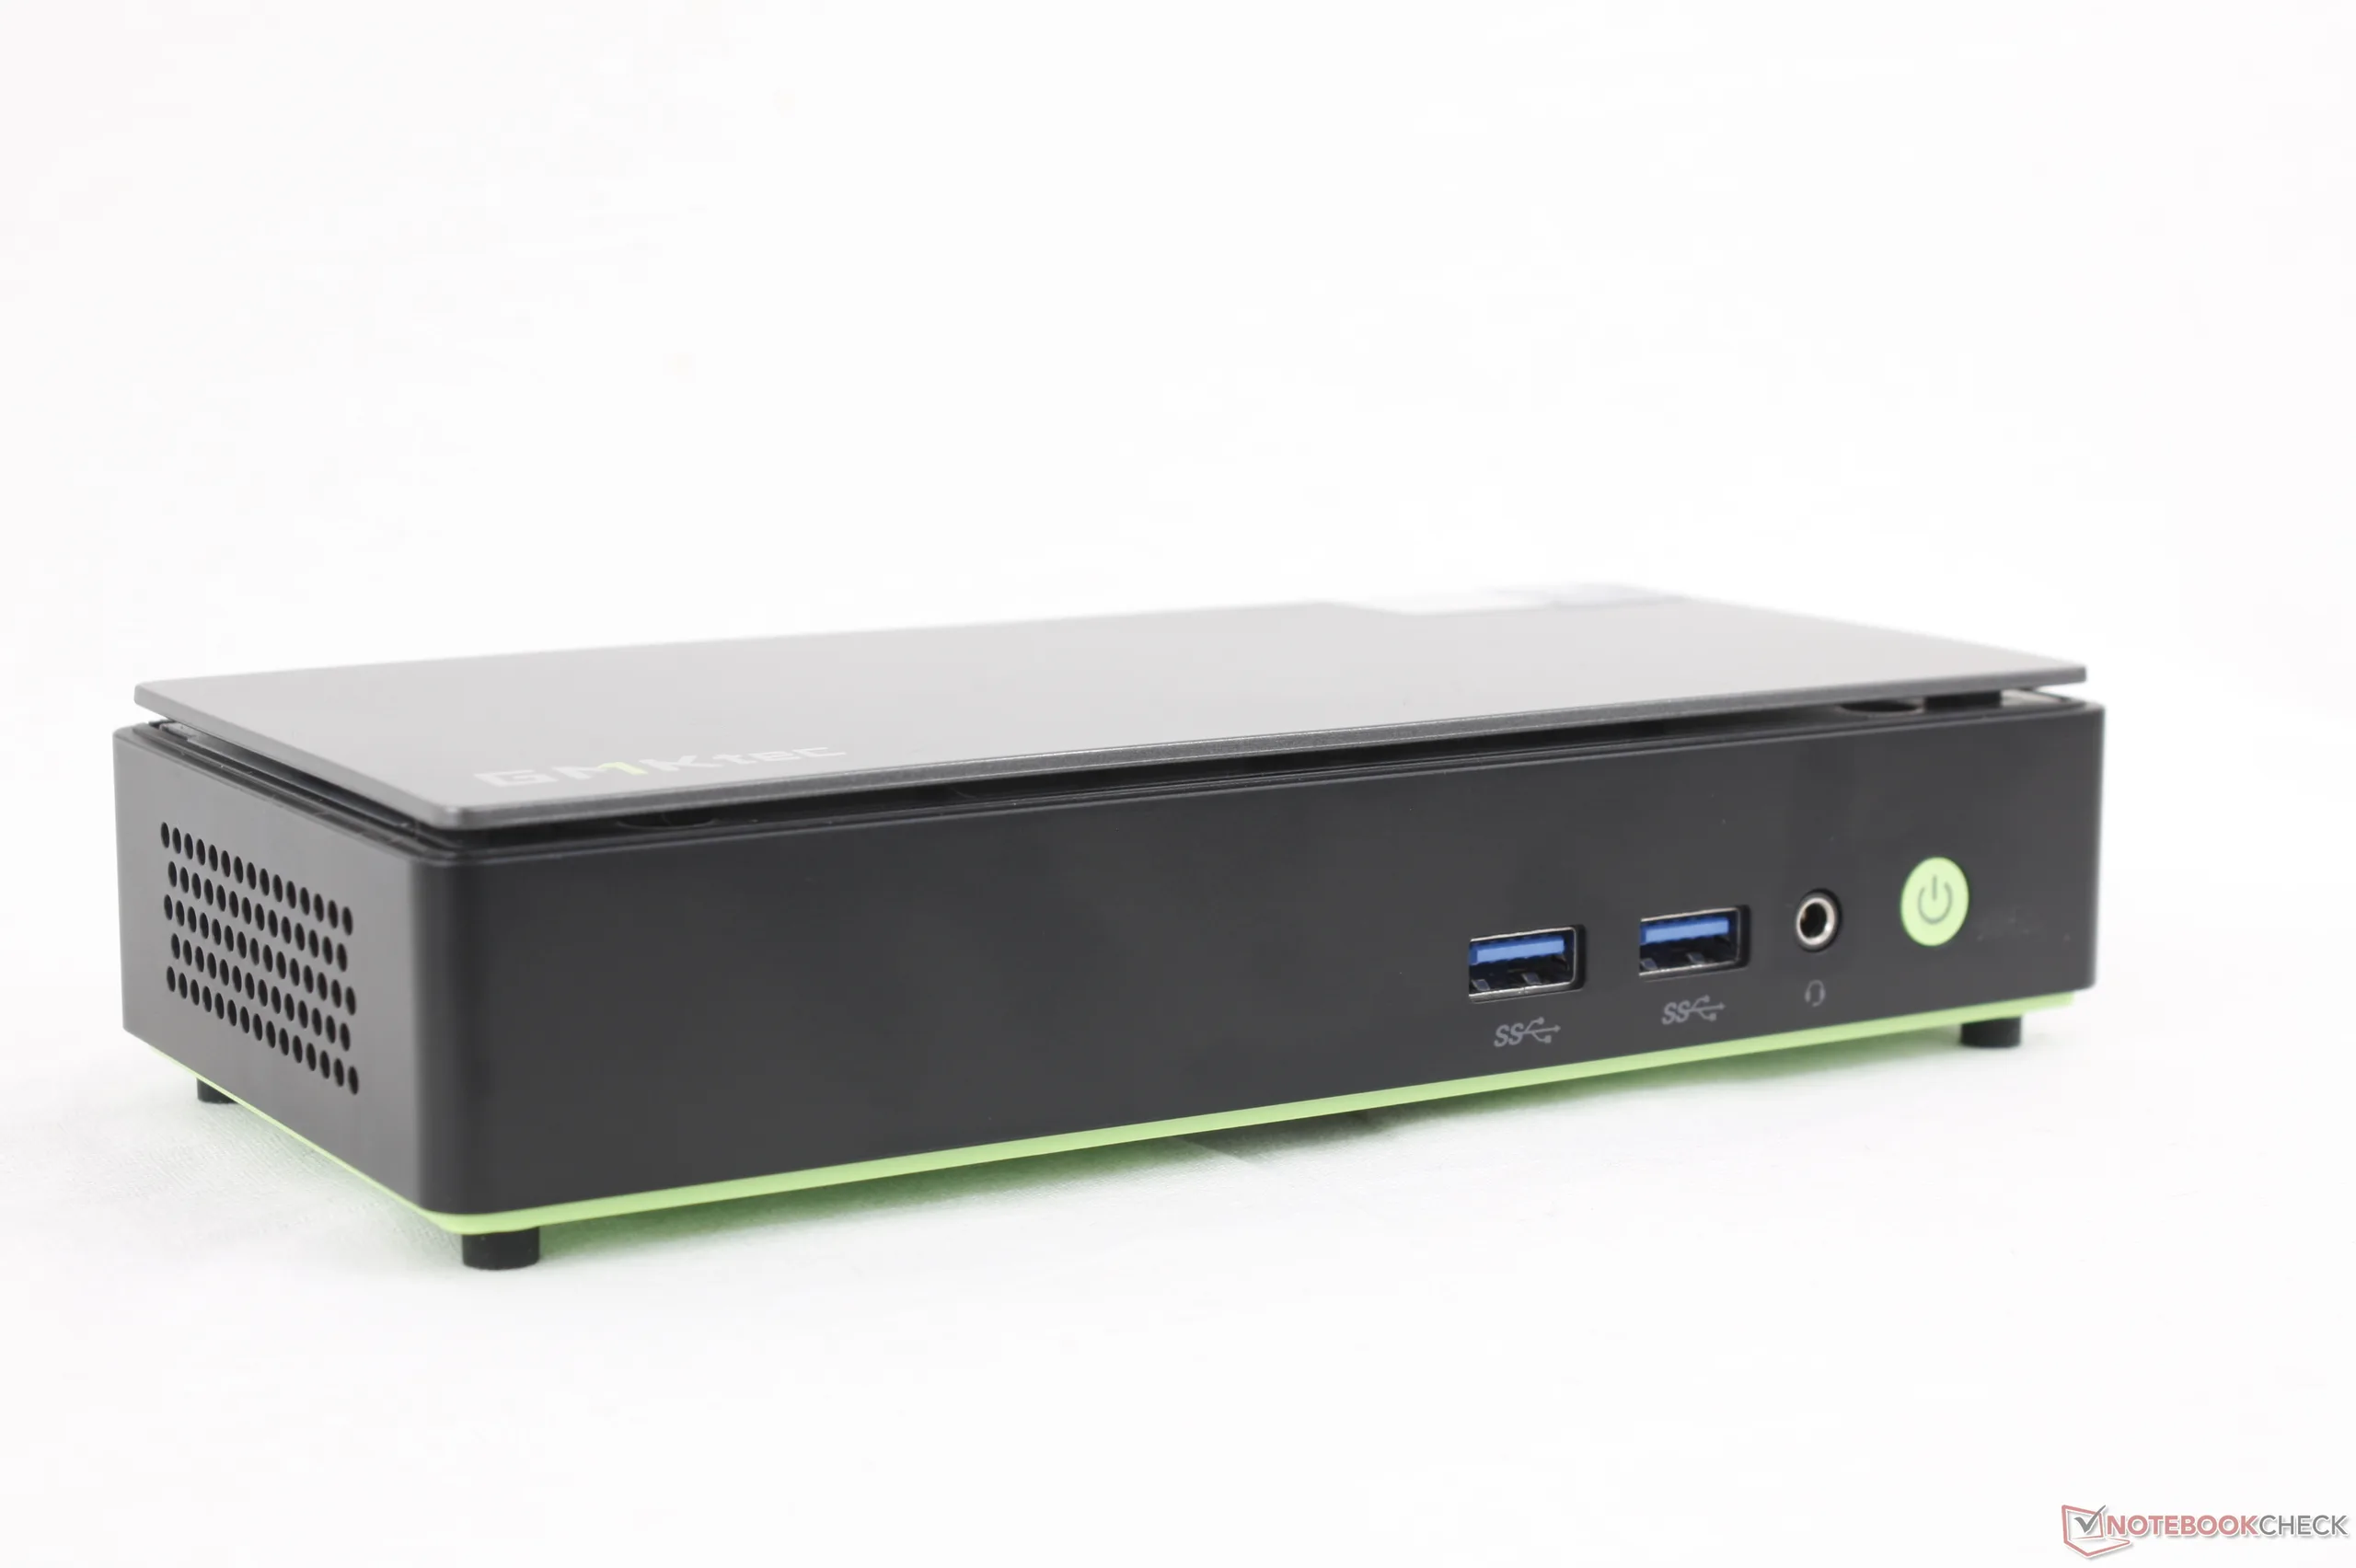
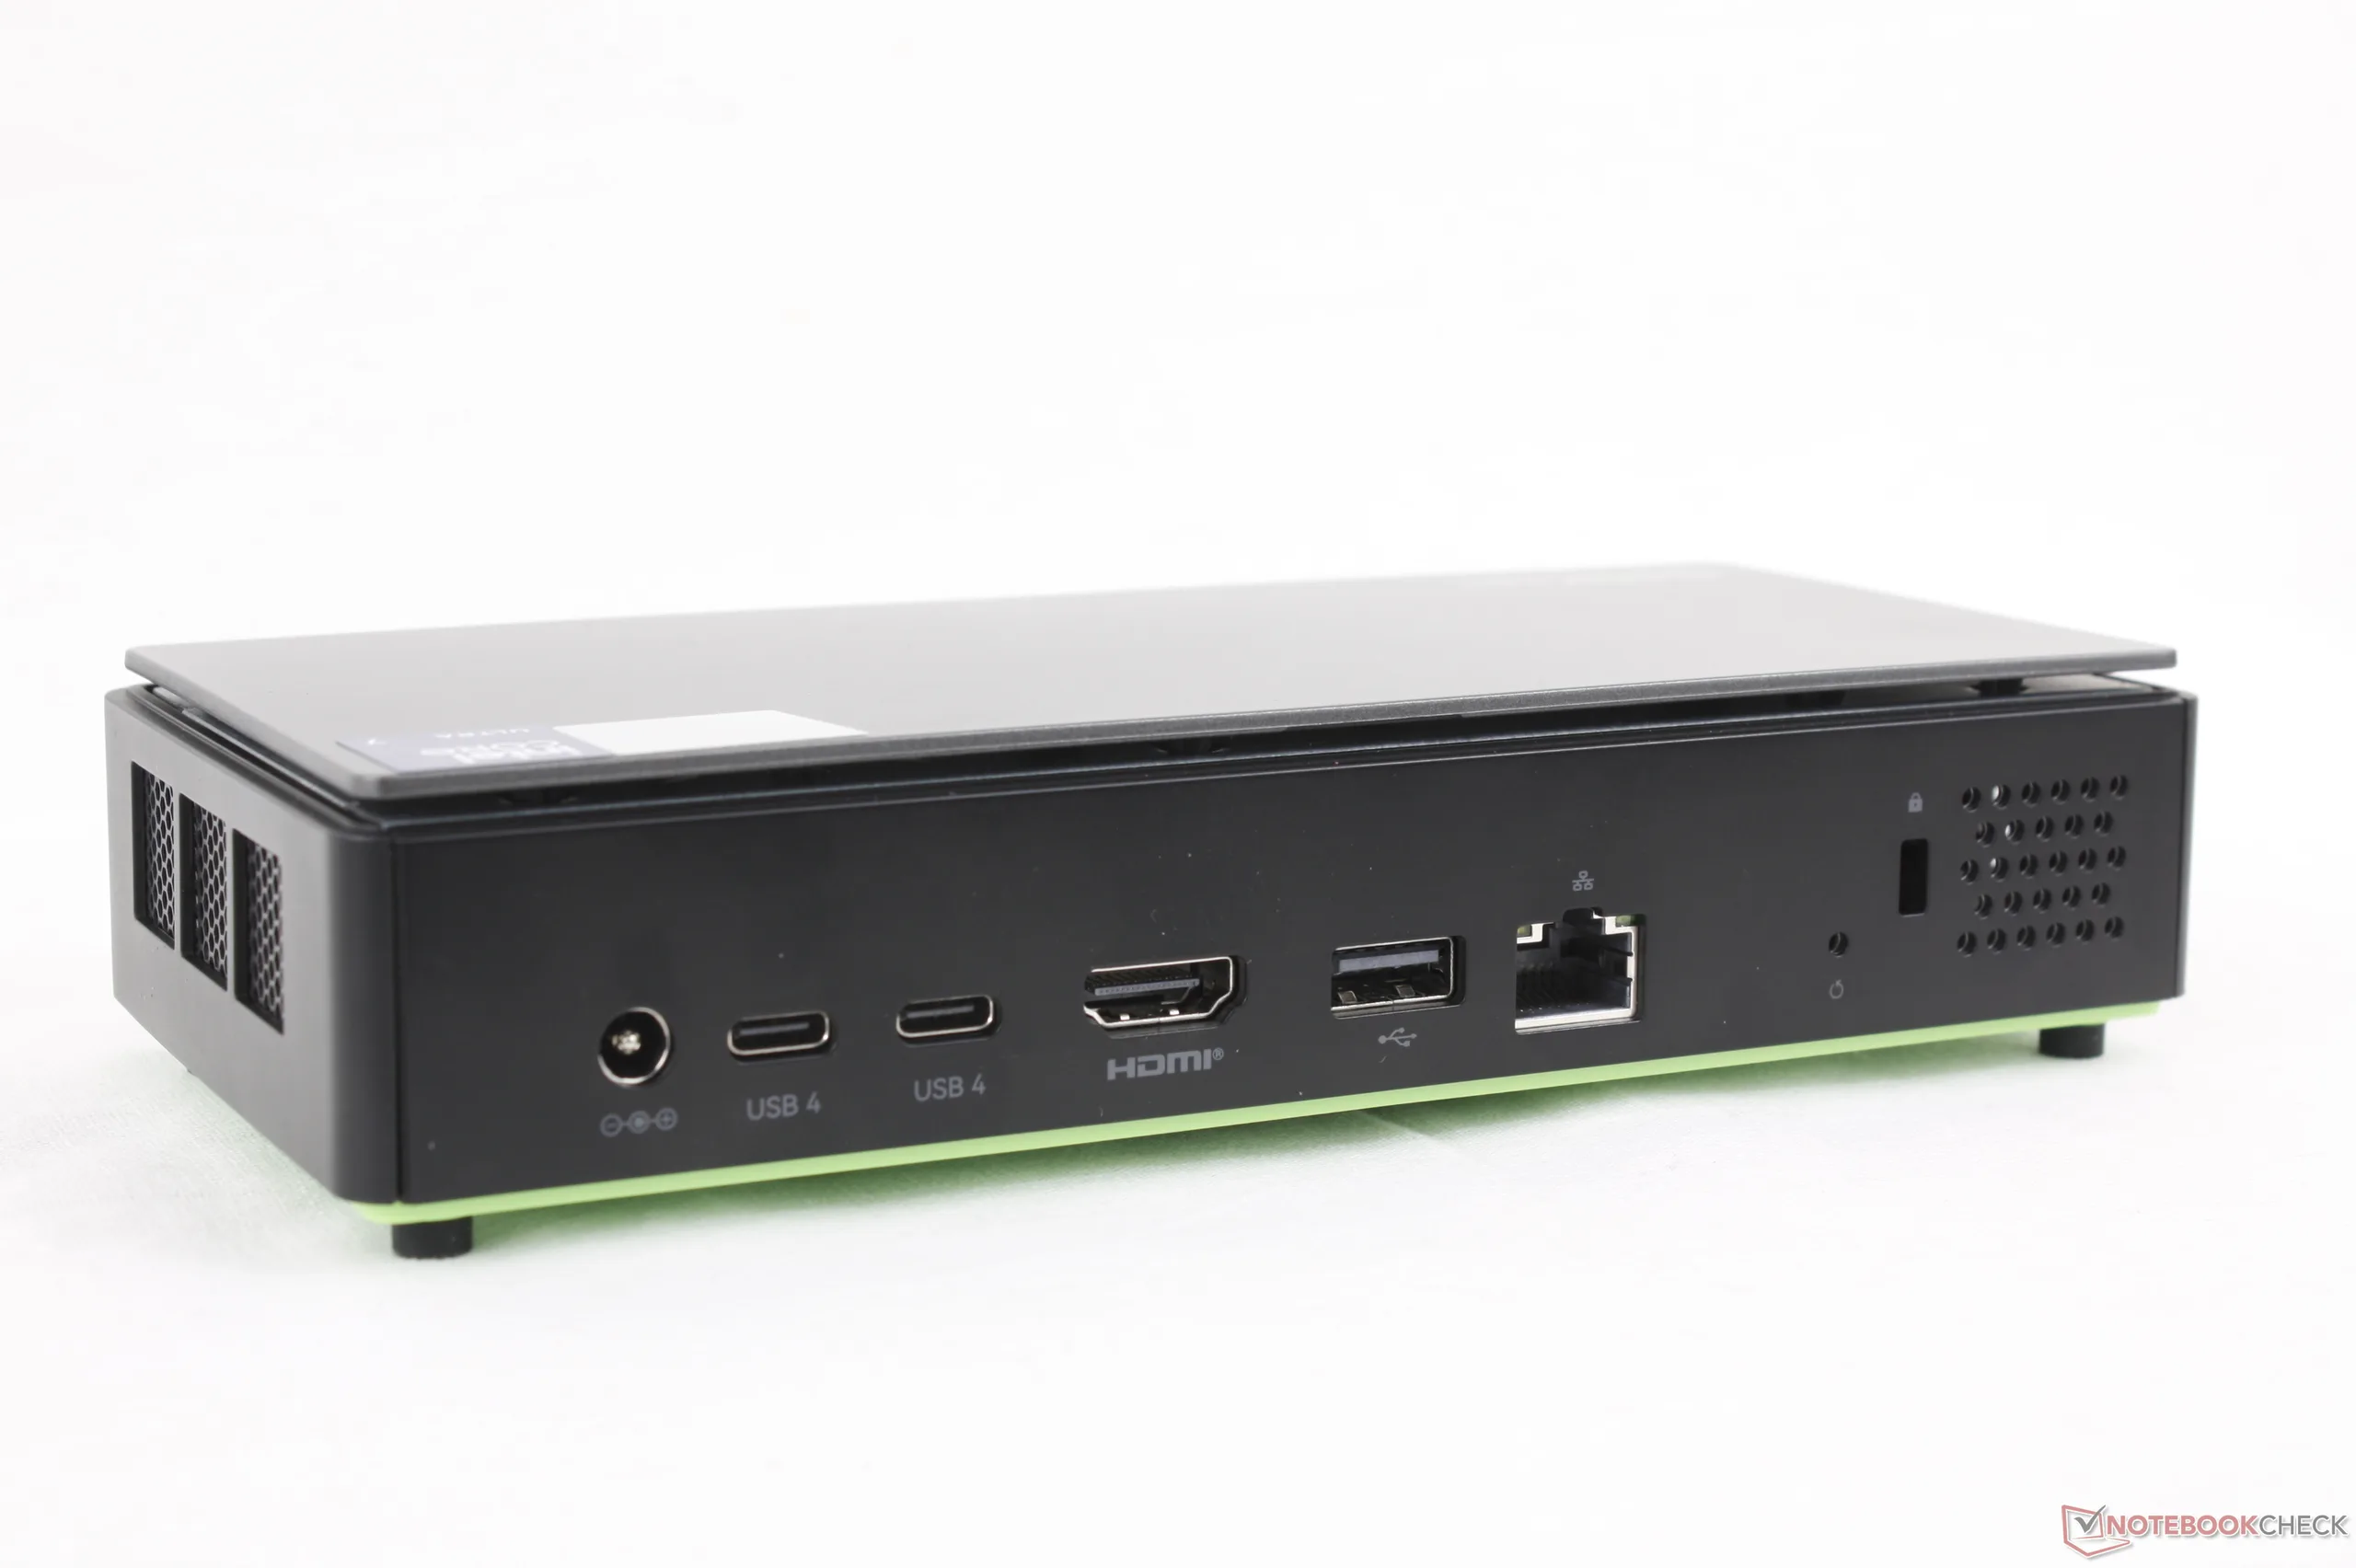
Connectivité
Les options de port sont légèrement plus limitées par rapport à la concurrence. Le modèle ne dispose pas d'OcuLink ou de DisplayPort pleine taille, par exemple, ainsi que de moins de ports USB-A que sur le NucBox K12.
Notez que bien que le système soit livré avec un adaptateur secteur en baril, il peut être alimenté par la plupart des adaptateurs secteur USB-C génériques à la place.
Communication
Le système n'est pas livré avec la prise en charge du Wi-Fi 7, probablement pour réduire les coûts.
| Networking | |
| iperf3 transmit AXE11000 | |
| Asus NUC 15 Pro+ | |
| GMK EVO-T1 | |
| MSI Cubi NUC AI+ 2MG | |
| GMK NucBox K12 | |
| GMK NucBox K13 | |
| Beelink SER9 Pro | |
| iperf3 receive AXE11000 | |
| Asus NUC 15 Pro+ | |
| GMK EVO-T1 | |
| MSI Cubi NUC AI+ 2MG | |
| Beelink SER9 Pro | |
| GMK NucBox K12 | |
| GMK NucBox K13 | |
| iperf3 transmit AXE11000 6GHz | |
| Asus NUC 15 Pro+ | |
| MSI Cubi NUC AI+ 2MG | |
| GMK NucBox K13 | |
| GMK NucBox K12 | |
| iperf3 receive AXE11000 6GHz | |
| GMK NucBox K13 | |
| MSI Cubi NUC AI+ 2MG | |
| Asus NUC 15 Pro+ | |
| GMK NucBox K12 | |
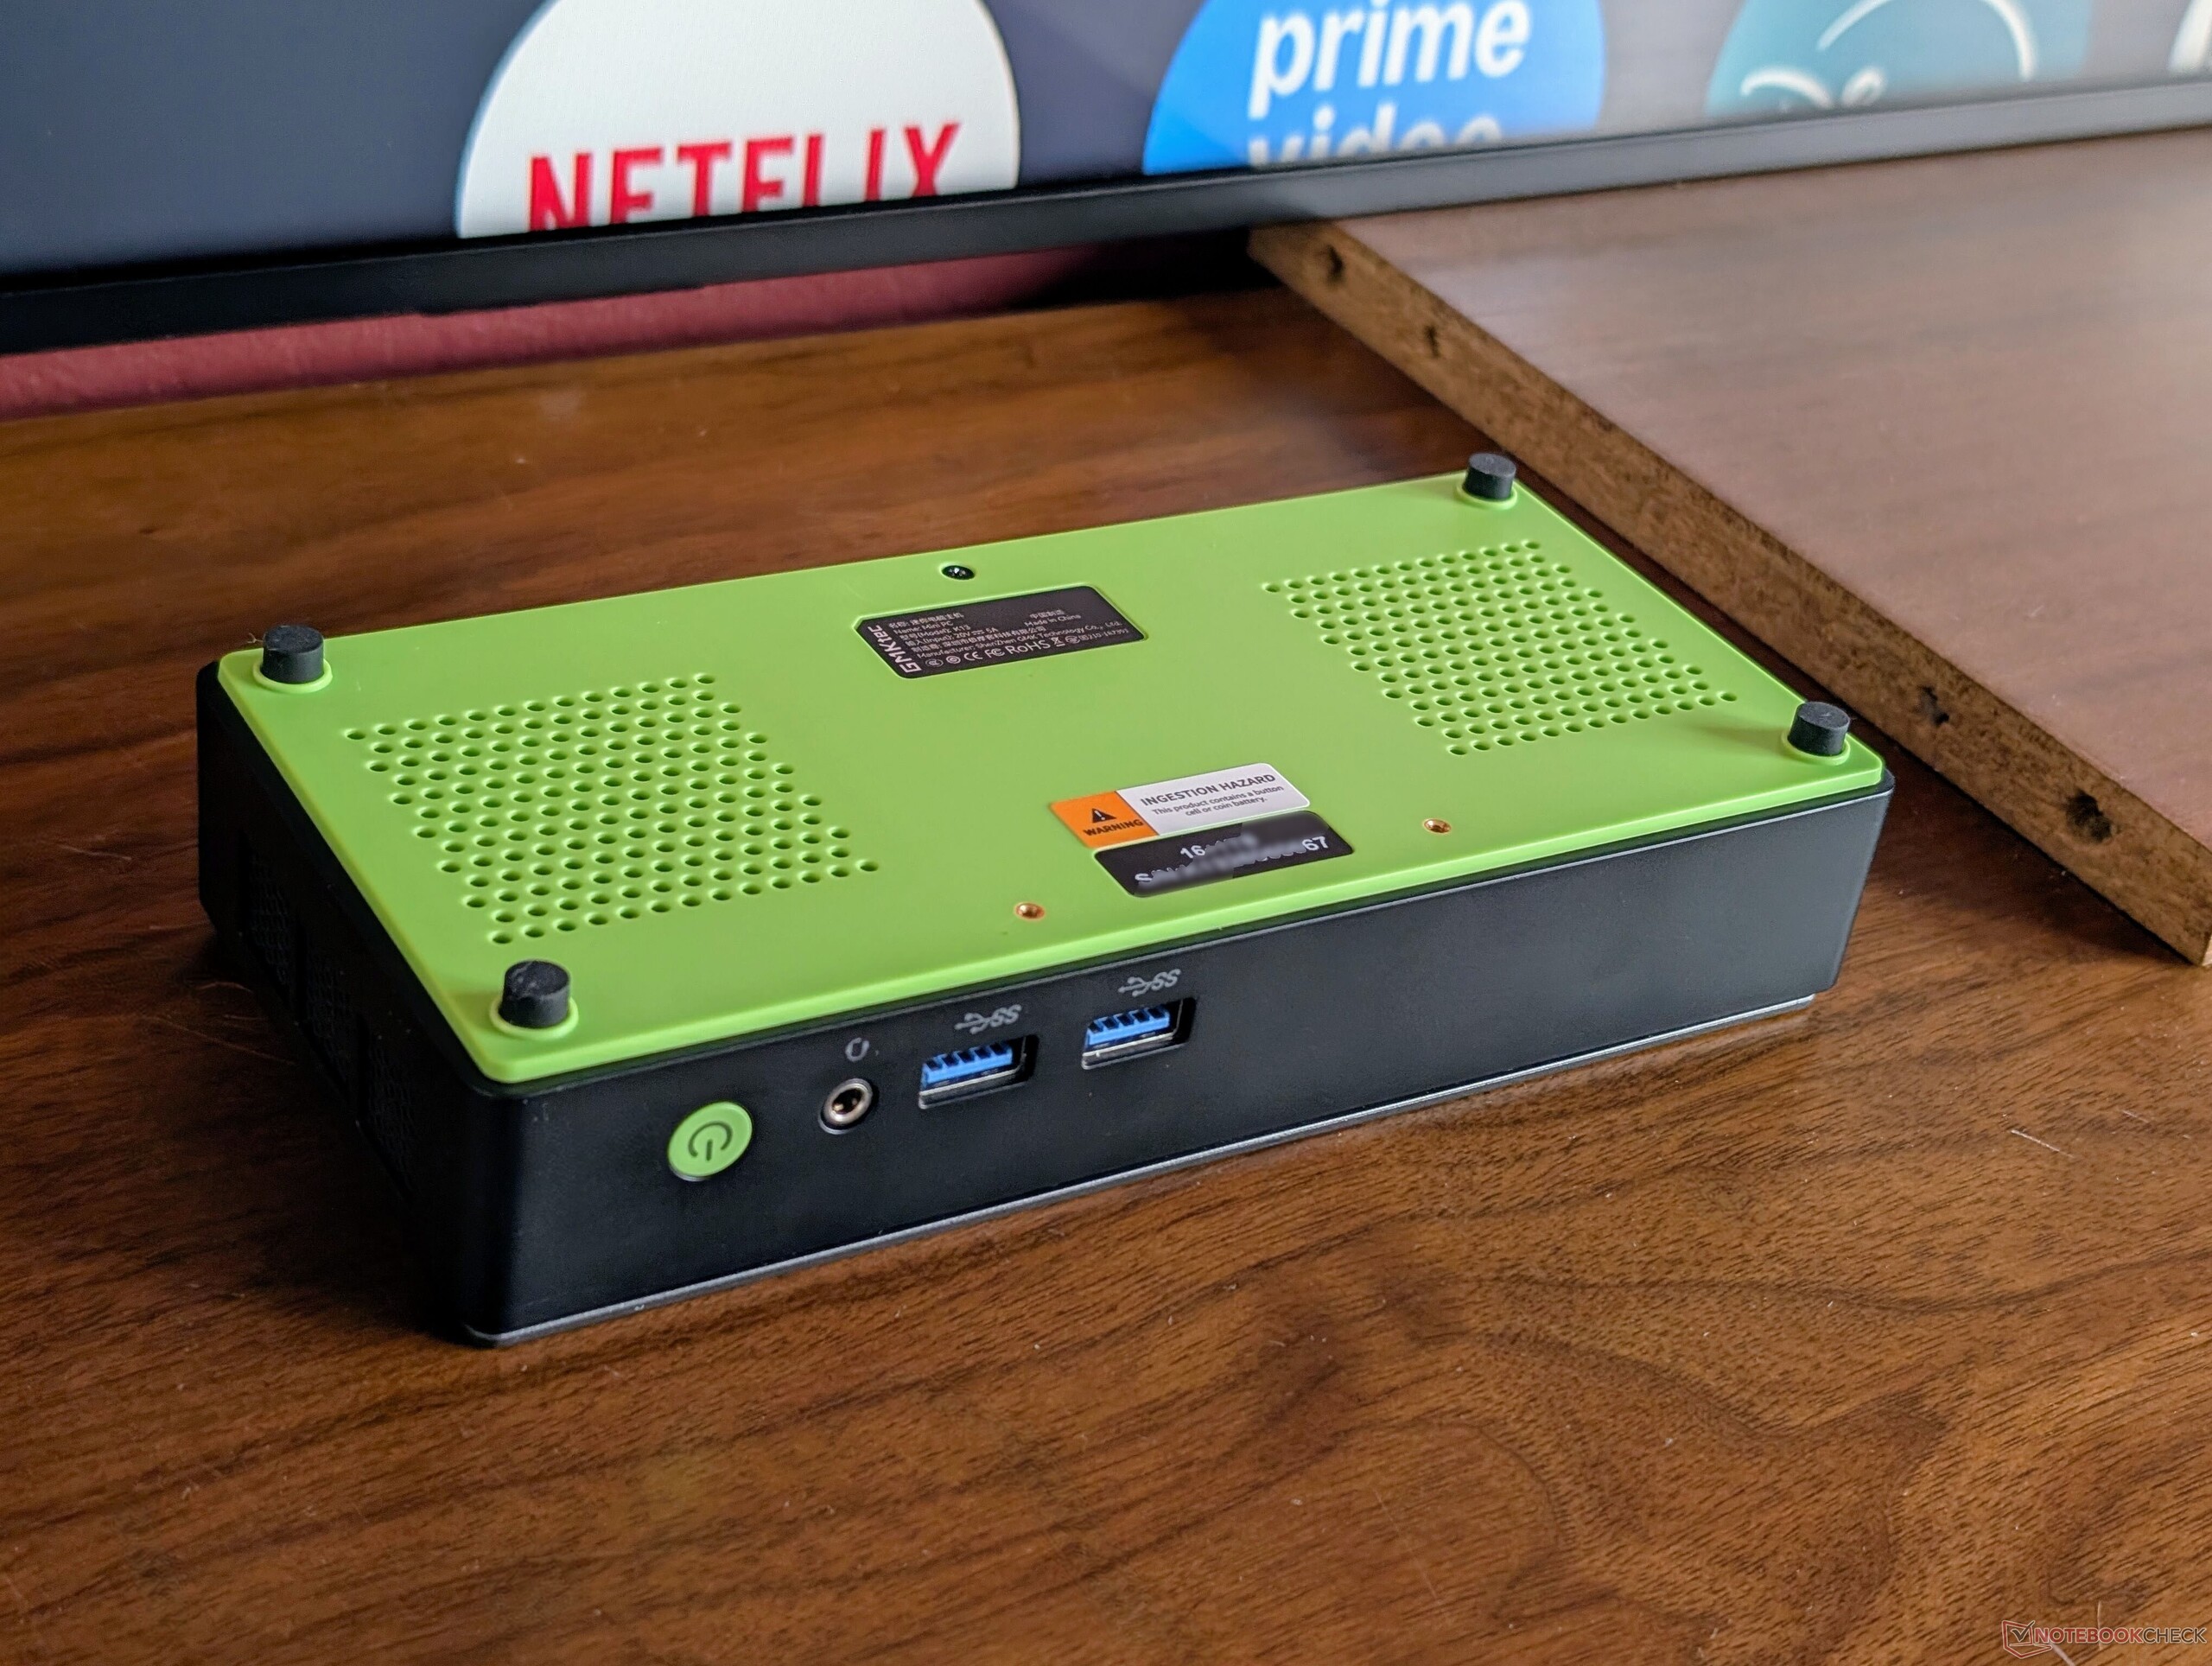
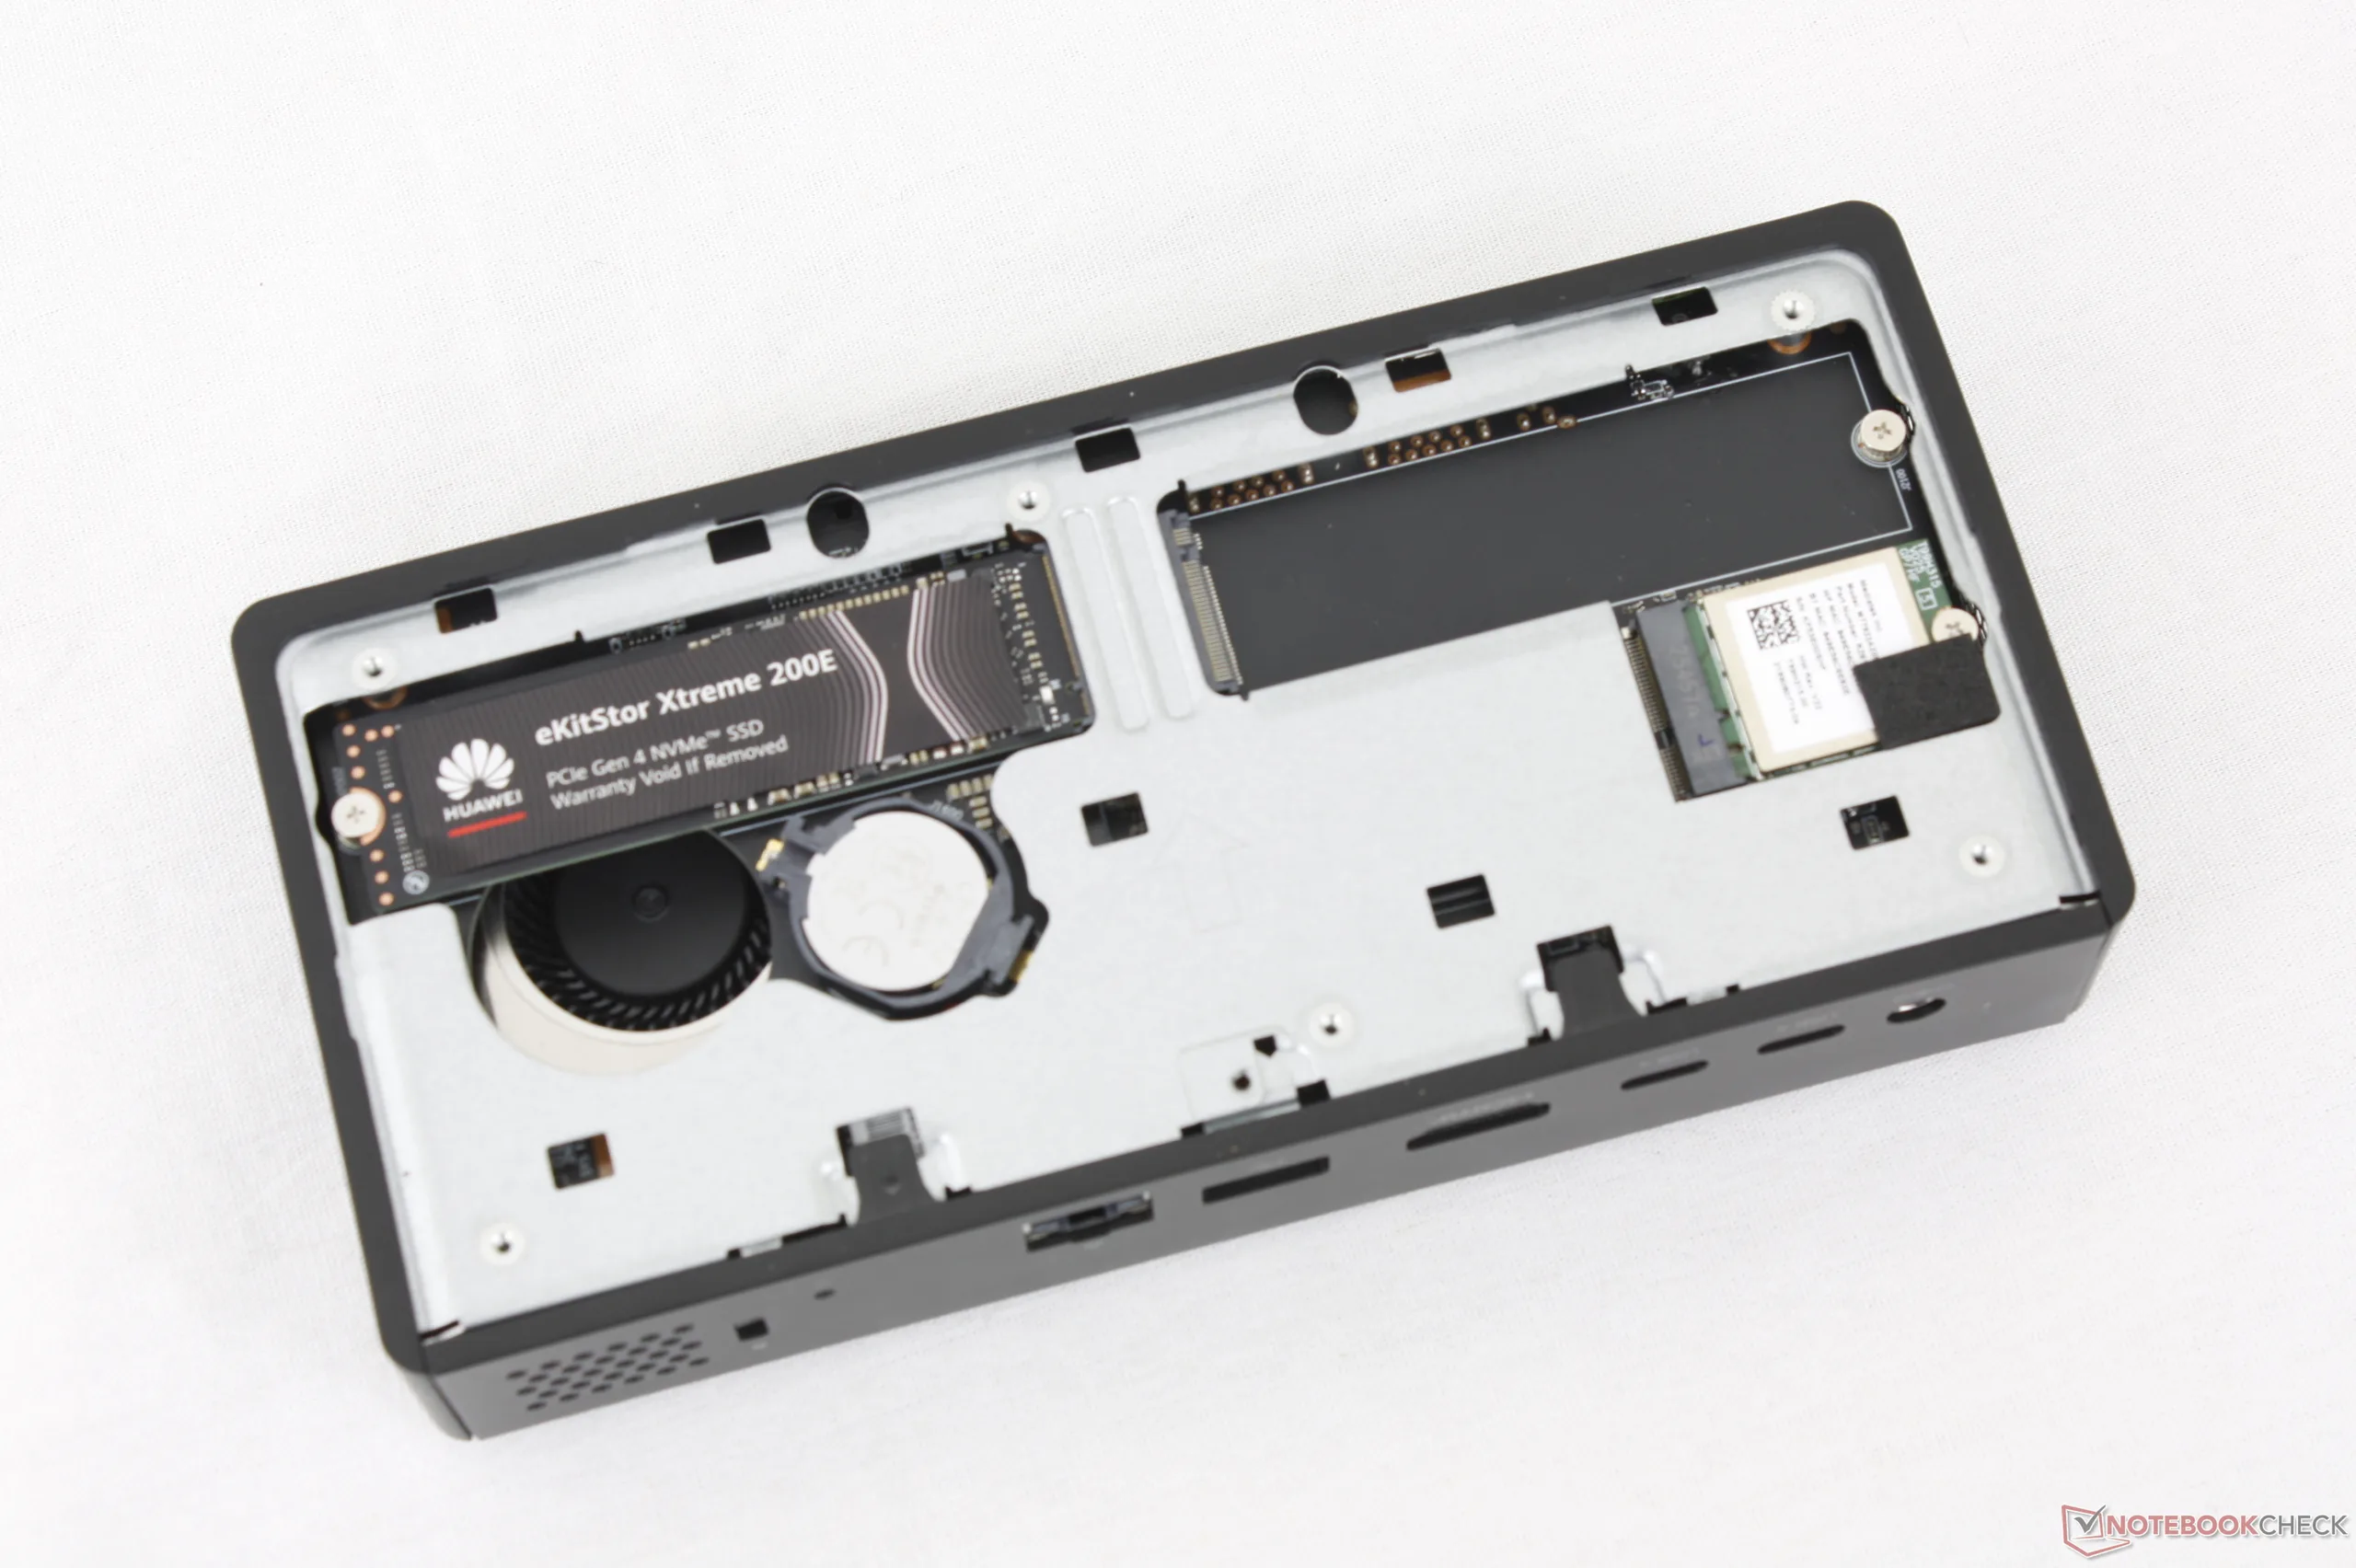
Maintenance
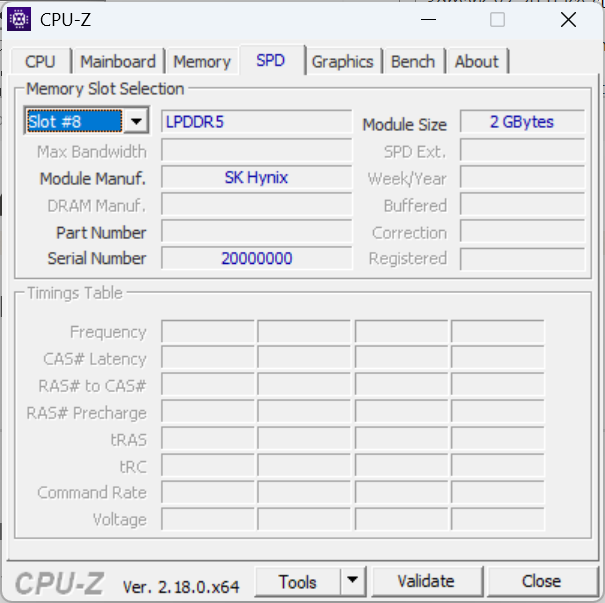
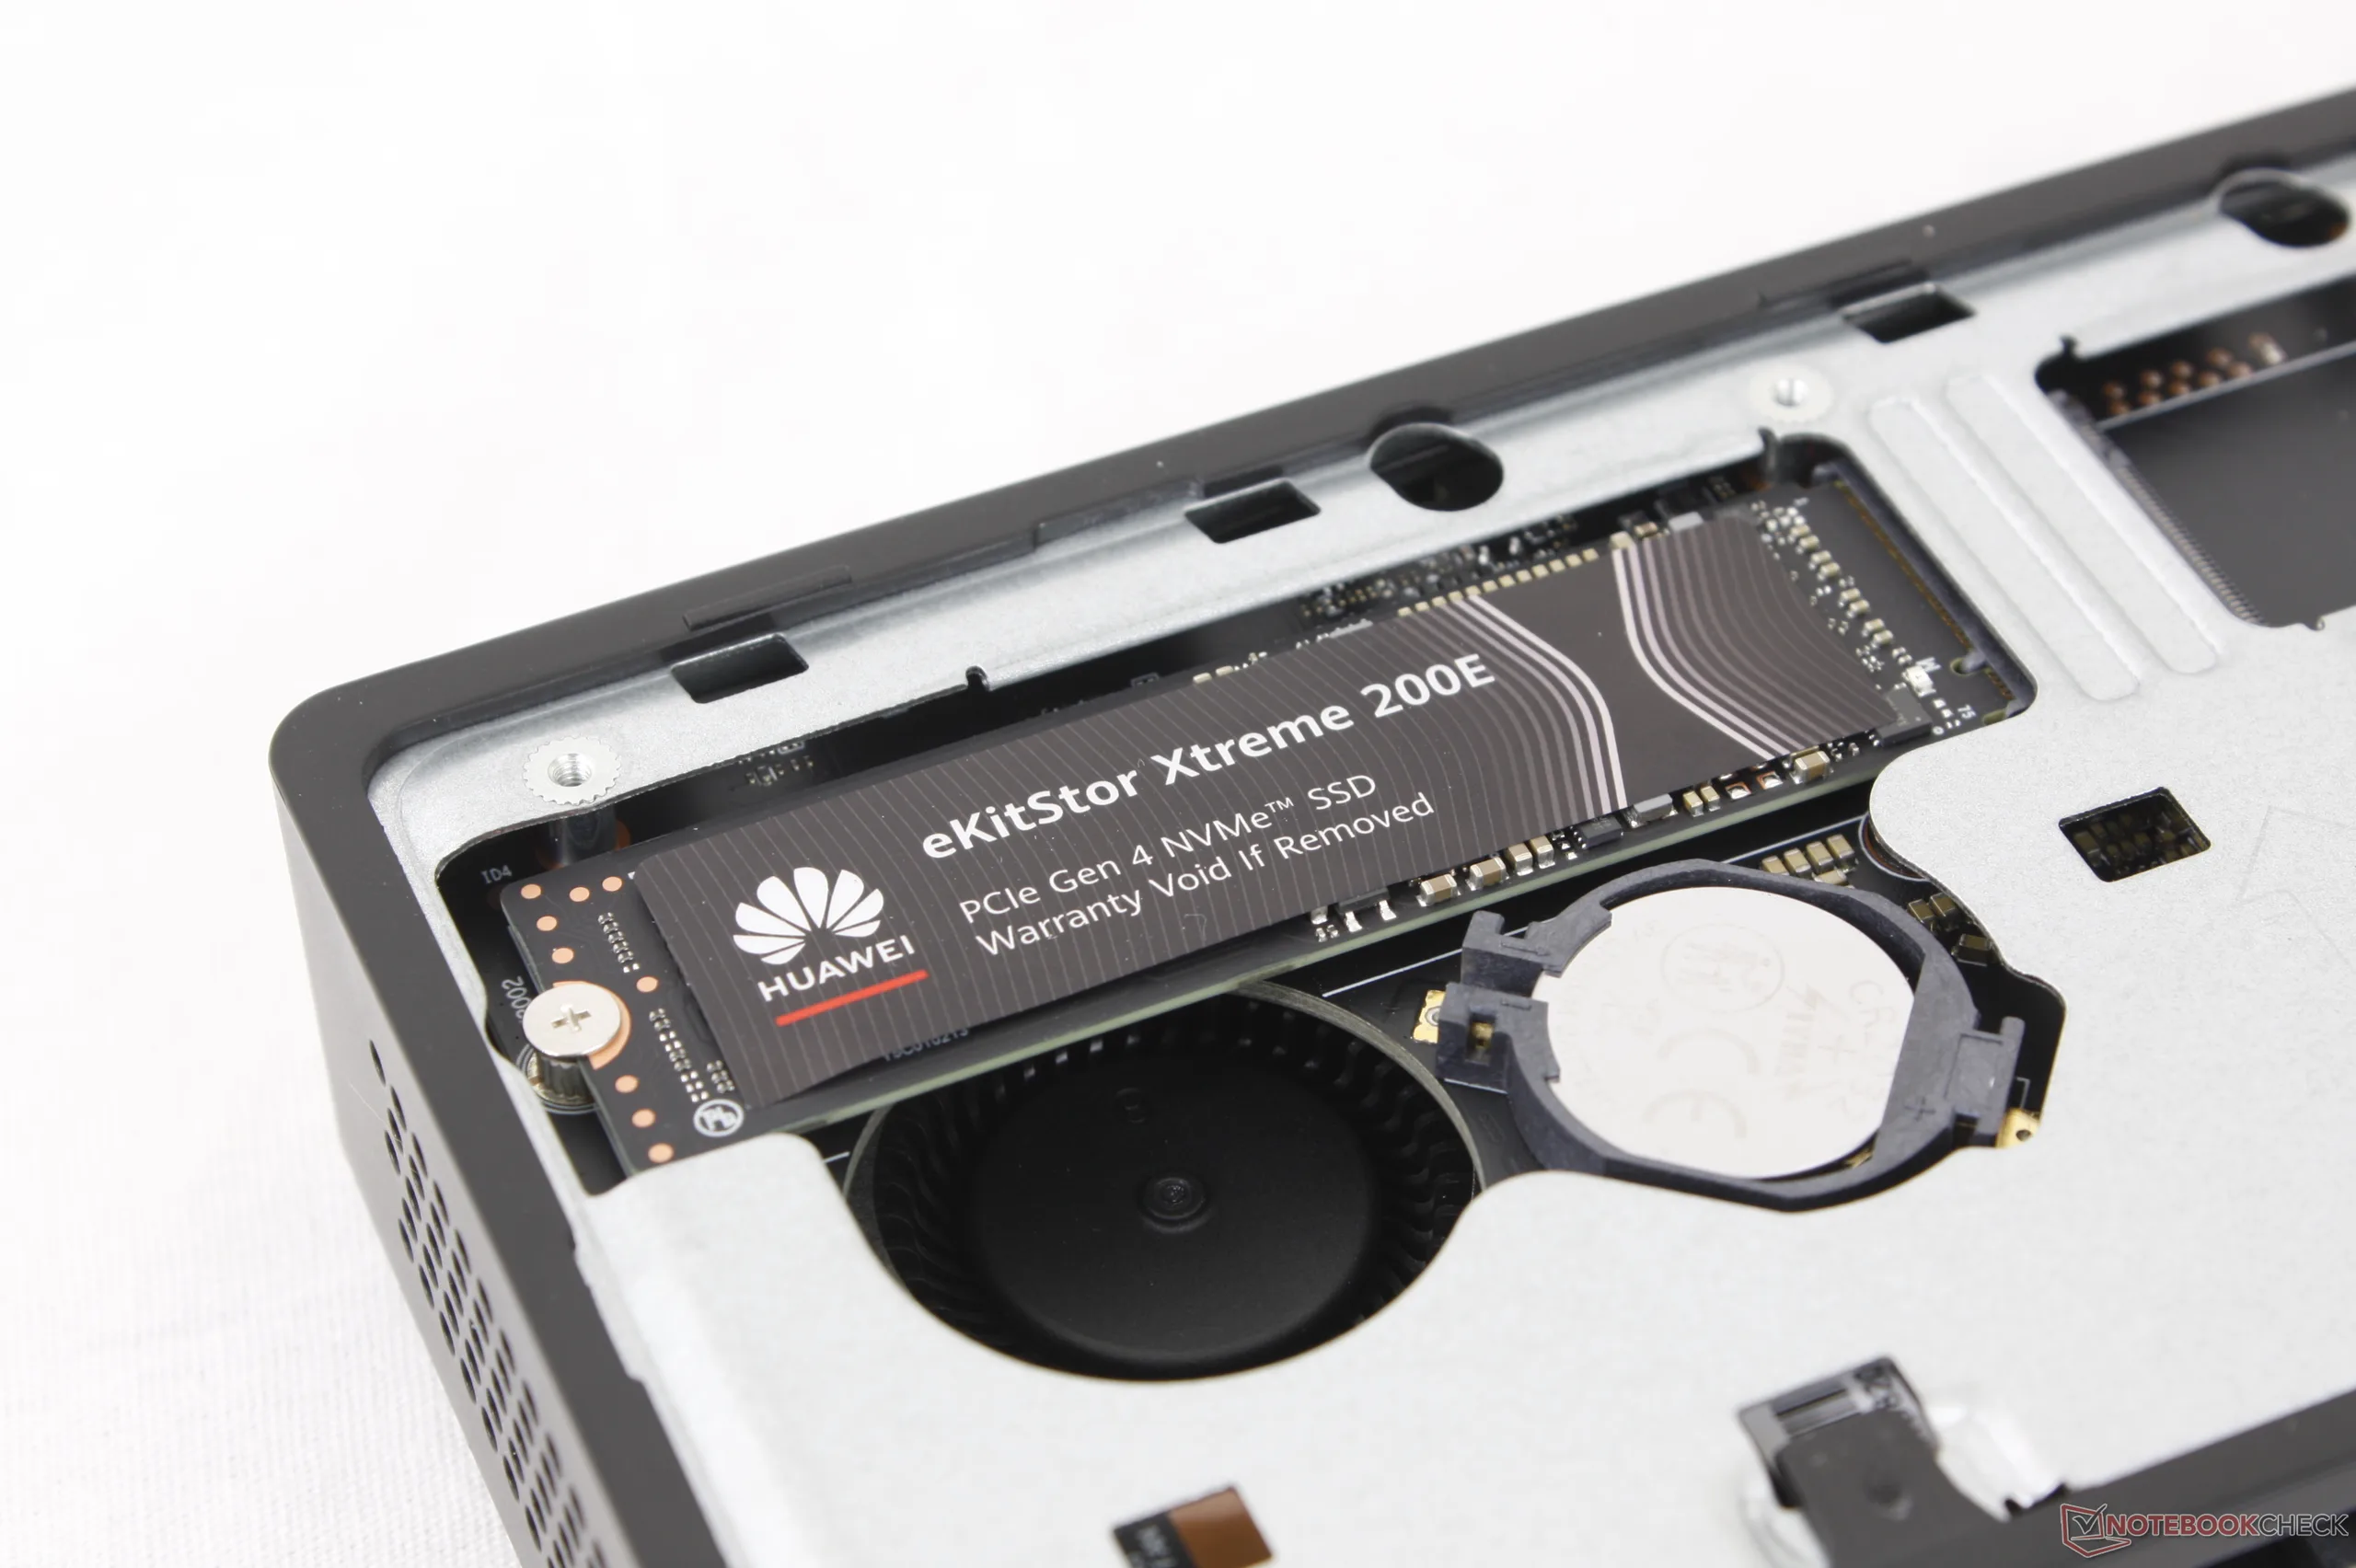
Le panneau inférieur peut être facilement retiré à l'aide d'un tournevis Philips pour révéler les deux emplacements SSD M.2 2280, la batterie BIOS et le module WLAN M.2 amovible. La mémoire vive est soudée et n'est pas extensible.
Durabilité
Le fabricant ne mentionne pas les matériaux recyclés utilisés lors de la fabrication. L'emballage est essentiellement composé de papier et de carton, avec un peu d'emballage en plastique.
Accessoires et garantie
L'emballage comprend un câble HDMI et un support de montage VESA amovible, ainsi qu'un adaptateur secteur. La garantie limitée habituelle d'un an du fabricant s'applique si vous achetez l'appareil aux États-Unis.
Performance - Efficacité du lac Lunar
Conditions d'essai
Nous avons réglé Windows et le BIOS sur le mode Performance avant d'effectuer les tests ci-dessous. Il convient de noter que le BIOS est réglé par défaut sur le mode équilibré.
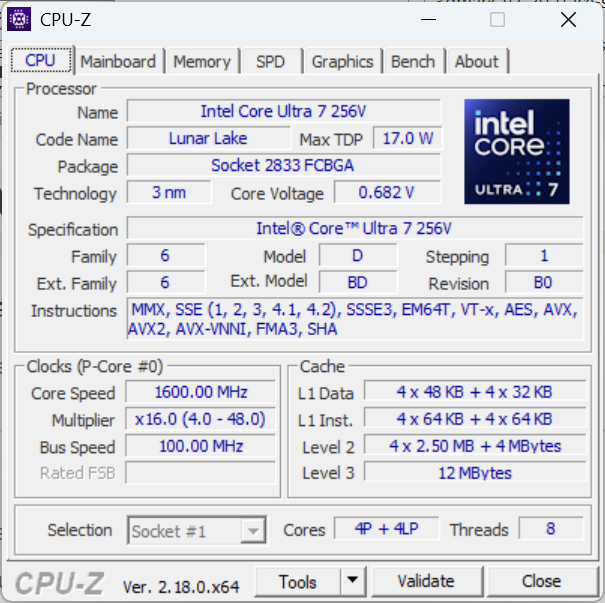
Processeur
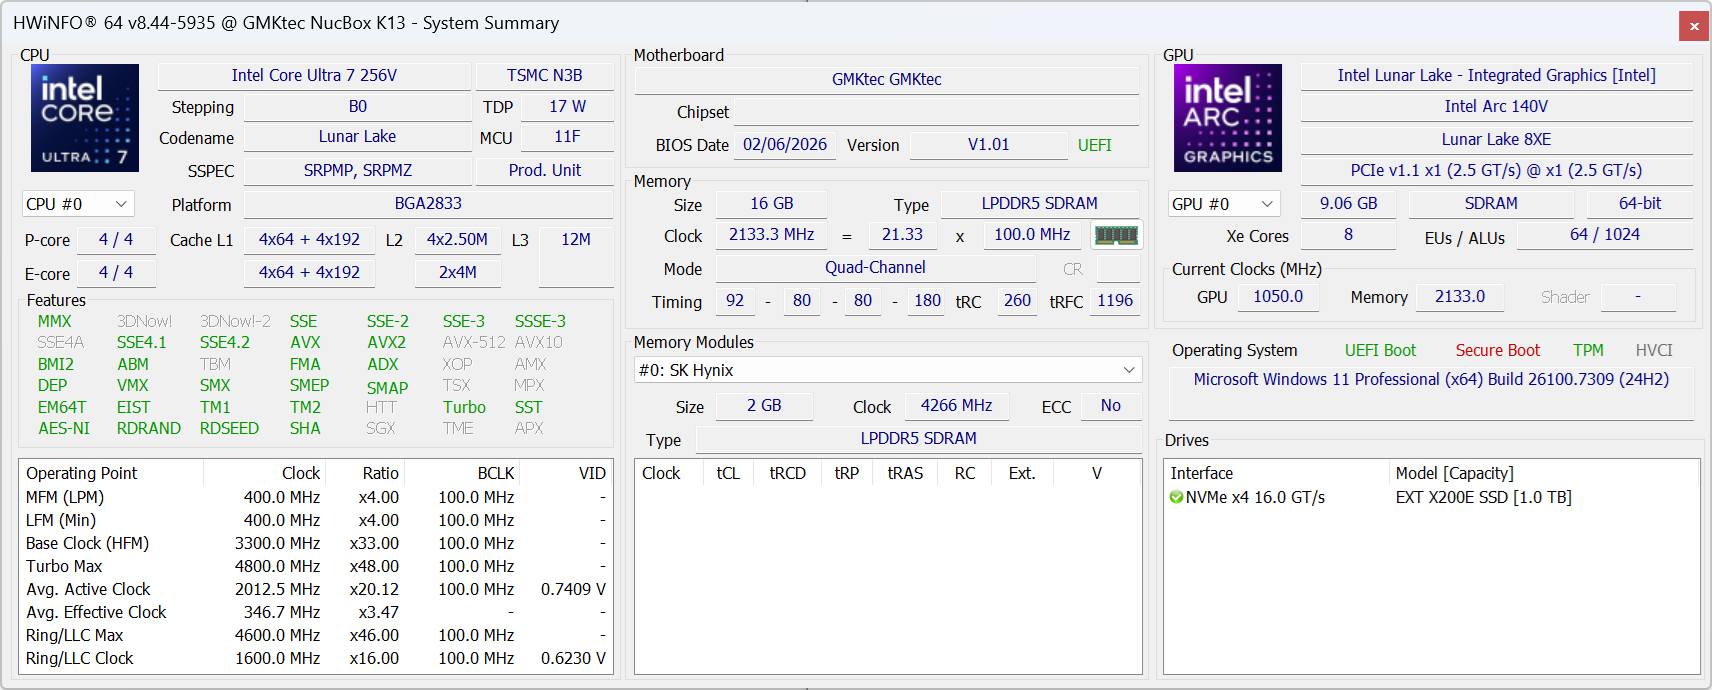
Les performances du processeur sont celles que nous attendons par rapport à d'autres PC dotés des mêmes caractéristiques Core Ultra 7 256V identique. Les performances brutes sont plus faibles, la plupart des anciens processeurs de la série H étant plus performants que notre processeur Lunar Lake-V. En revanche, le processeur excelle en termes de performances par watt et dispose d'un NPU 47 TOPS relativement rapide pour l'accélération de l'intelligence artificielle.
Cinebench R15 Multi Loop
Cinebench R23: Multi Core | Single Core
Cinebench R20: CPU (Multi Core) | CPU (Single Core)
Cinebench R15: CPU Multi 64Bit | CPU Single 64Bit
Blender: v2.79 BMW27 CPU
7-Zip 18.03: 7z b 4 | 7z b 4 -mmt1
Geekbench 6.7: Multi-Core | Single-Core
Geekbench 5.5: Multi-Core | Single-Core
HWBOT x265 Benchmark v2.2: 4k Preset
LibreOffice : 20 Documents To PDF
R Benchmark 2.5: Overall mean
| Cinebench R23 / Multi Core | |
| Acemagic M1A Pro+ | |
| Minisforum AI X1 Pro, HX 470 | |
| Asus NUC 15 Pro+ | |
| Beelink SER8 | |
| Geekom A7 Max, R9 7940HS | |
| GMK NucBox K12 | |
| GMK NucBox M7 Ultra | |
| Alliwava H90 Pro | |
| GMK NucBox K13 | |
| MSI Cubi NUC AI+ 2MG | |
| GMK NucBox M6 | |
| GMK NucBox M3 Ultra | |
| Moyenne Intel Core Ultra 7 256V (8589 - 10864, n=8) | |
| MSI Cubi NUC 1M | |
| Cinebench R23 / Single Core | |
| Asus NUC 15 Pro+ | |
| Minisforum AI X1 Pro, HX 470 | |
| Acemagic M1A Pro+ | |
| MSI Cubi NUC AI+ 2MG | |
| GMK NucBox K13 | |
| MSI Cubi NUC 1M | |
| Moyenne Intel Core Ultra 7 256V (1799 - 1909, n=8) | |
| Geekom A7 Max, R9 7940HS | |
| GMK NucBox M3 Ultra | |
| Beelink SER8 | |
| GMK NucBox K12 | |
| GMK NucBox M7 Ultra | |
| GMK NucBox M6 | |
| Alliwava H90 Pro | |
| Cinebench R20 / CPU (Multi Core) | |
| Acemagic M1A Pro+ | |
| Minisforum AI X1 Pro, HX 470 | |
| Asus NUC 15 Pro+ | |
| Geekom A7 Max, R9 7940HS | |
| Beelink SER8 | |
| GMK NucBox K12 | |
| Alliwava H90 Pro | |
| GMK NucBox M7 Ultra | |
| GMK NucBox K13 | |
| MSI Cubi NUC AI+ 2MG | |
| GMK NucBox M6 | |
| Moyenne Intel Core Ultra 7 256V (3822 - 4233, n=7) | |
| GMK NucBox M3 Ultra | |
| MSI Cubi NUC 1M | |
| Cinebench R20 / CPU (Single Core) | |
| Asus NUC 15 Pro+ | |
| Minisforum AI X1 Pro, HX 470 | |
| Acemagic M1A Pro+ | |
| MSI Cubi NUC AI+ 2MG | |
| GMK NucBox K13 | |
| Moyenne Intel Core Ultra 7 256V (700 - 733, n=7) | |
| MSI Cubi NUC 1M | |
| Beelink SER8 | |
| GMK NucBox M3 Ultra | |
| Geekom A7 Max, R9 7940HS | |
| GMK NucBox K12 | |
| Alliwava H90 Pro | |
| GMK NucBox M7 Ultra | |
| GMK NucBox M6 | |
| Cinebench R15 / CPU Multi 64Bit | |
| Acemagic M1A Pro+ | |
| Minisforum AI X1 Pro, HX 470 | |
| Asus NUC 15 Pro+ | |
| Beelink SER8 | |
| Geekom A7 Max, R9 7940HS | |
| GMK NucBox K12 | |
| GMK NucBox M7 Ultra | |
| Alliwava H90 Pro | |
| GMK NucBox M6 | |
| GMK NucBox K13 | |
| Moyenne Intel Core Ultra 7 256V (1500 - 1627, n=6) | |
| GMK NucBox M3 Ultra | |
| MSI Cubi NUC AI+ 2MG | |
| MSI Cubi NUC 1M | |
| Cinebench R15 / CPU Single 64Bit | |
| Asus NUC 15 Pro+ | |
| Minisforum AI X1 Pro, HX 470 | |
| Acemagic M1A Pro+ | |
| MSI Cubi NUC AI+ 2MG | |
| GMK NucBox K13 | |
| Moyenne Intel Core Ultra 7 256V (275 - 290, n=6) | |
| Beelink SER8 | |
| Geekom A7 Max, R9 7940HS | |
| GMK NucBox K12 | |
| MSI Cubi NUC 1M | |
| GMK NucBox M3 Ultra | |
| Alliwava H90 Pro | |
| GMK NucBox M7 Ultra | |
| GMK NucBox M6 | |
| 7-Zip 18.03 / 7z b 4 -mmt1 | |
| Beelink SER8 | |
| Geekom A7 Max, R9 7940HS | |
| Acemagic M1A Pro+ | |
| Minisforum AI X1 Pro, HX 470 | |
| GMK NucBox K12 | |
| Asus NUC 15 Pro+ | |
| Alliwava H90 Pro | |
| MSI Cubi NUC 1M | |
| GMK NucBox M3 Ultra | |
| MSI Cubi NUC AI+ 2MG | |
| GMK NucBox K13 | |
| GMK NucBox M6 | |
| Moyenne Intel Core Ultra 7 256V (5528 - 5763, n=7) | |
| GMK NucBox M7 Ultra | |
| Geekbench 6.7 / Multi-Core | |
| Acemagic M1A Pro+ | |
| Asus NUC 15 Pro+ | |
| Beelink SER8 | |
| GMK NucBox K12 | |
| Minisforum AI X1 Pro, HX 470 | |
| Alliwava H90 Pro | |
| Moyenne Intel Core Ultra 7 256V (9852 - 11085, n=8) | |
| GMK NucBox K13 | |
| Geekom A7 Max, R9 7940HS | |
| GMK NucBox M7 Ultra | |
| GMK NucBox M6 | |
| MSI Cubi NUC AI+ 2MG | |
| MSI Cubi NUC 1M | |
| GMK NucBox M3 Ultra | |
| Geekbench 6.7 / Single-Core | |
| Acemagic M1A Pro+ | |
| Minisforum AI X1 Pro, HX 470 | |
| GMK NucBox K13 | |
| MSI Cubi NUC AI+ 2MG | |
| Moyenne Intel Core Ultra 7 256V (2680 - 2784, n=8) | |
| Beelink SER8 | |
| Asus NUC 15 Pro+ | |
| MSI Cubi NUC 1M | |
| Geekom A7 Max, R9 7940HS | |
| GMK NucBox K12 | |
| Alliwava H90 Pro | |
| GMK NucBox M3 Ultra | |
| GMK NucBox M7 Ultra | |
| GMK NucBox M6 | |
| Geekbench 5.5 / Multi-Core | |
| Acemagic M1A Pro+ | |
| Asus NUC 15 Pro+ | |
| Minisforum AI X1 Pro, HX 470 | |
| Beelink SER8 | |
| GMK NucBox K12 | |
| Alliwava H90 Pro | |
| Geekom A7 Max, R9 7940HS | |
| Moyenne Intel Core Ultra 7 256V (9044 - 9715, n=7) | |
| GMK NucBox M7 Ultra | |
| GMK NucBox K13 | |
| GMK NucBox M3 Ultra | |
| GMK NucBox M6 | |
| MSI Cubi NUC 1M | |
| MSI Cubi NUC AI+ 2MG | |
| Geekbench 5.5 / Single-Core | |
| Acemagic M1A Pro+ | |
| MSI Cubi NUC AI+ 2MG | |
| Beelink SER8 | |
| GMK NucBox K13 | |
| Moyenne Intel Core Ultra 7 256V (1972 - 2013, n=7) | |
| Minisforum AI X1 Pro, HX 470 | |
| Geekom A7 Max, R9 7940HS | |
| MSI Cubi NUC 1M | |
| GMK NucBox K12 | |
| Alliwava H90 Pro | |
| GMK NucBox M3 Ultra | |
| Asus NUC 15 Pro+ | |
| GMK NucBox M7 Ultra | |
| GMK NucBox M6 | |
| HWBOT x265 Benchmark v2.2 / 4k Preset | |
| Acemagic M1A Pro+ | |
| Asus NUC 15 Pro+ | |
| Minisforum AI X1 Pro, HX 470 | |
| Beelink SER8 | |
| GMK NucBox K12 | |
| Geekom A7 Max, R9 7940HS | |
| GMK NucBox M7 Ultra | |
| Alliwava H90 Pro | |
| GMK NucBox M6 | |
| GMK NucBox K13 | |
| MSI Cubi NUC AI+ 2MG | |
| Moyenne Intel Core Ultra 7 256V (11.9 - 13.9, n=7) | |
| GMK NucBox M3 Ultra | |
| MSI Cubi NUC 1M | |
| LibreOffice / 20 Documents To PDF | |
| GMK NucBox M7 Ultra | |
| GMK NucBox M3 Ultra | |
| Minisforum AI X1 Pro, HX 470 | |
| Asus NUC 15 Pro+ | |
| Geekom A7 Max, R9 7940HS | |
| Acemagic M1A Pro+ | |
| GMK NucBox M6 | |
| Alliwava H90 Pro | |
| GMK NucBox K12 | |
| GMK NucBox K13 | |
| Moyenne Intel Core Ultra 7 256V (42.7 - 55.6, n=7) | |
| Beelink SER8 | |
| MSI Cubi NUC AI+ 2MG | |
| MSI Cubi NUC 1M | |
| R Benchmark 2.5 / Overall mean | |
| Alliwava H90 Pro | |
| GMK NucBox M6 | |
| GMK NucBox M7 Ultra | |
| GMK NucBox M3 Ultra | |
| GMK NucBox K12 | |
| Moyenne Intel Core Ultra 7 256V (0.439 - 0.4645, n=7) | |
| MSI Cubi NUC AI+ 2MG | |
| GMK NucBox K13 | |
| MSI Cubi NUC 1M | |
| Geekom A7 Max, R9 7940HS | |
| Asus NUC 15 Pro+ | |
| Beelink SER8 | |
| Minisforum AI X1 Pro, HX 470 | |
| Acemagic M1A Pro+ | |
Cinebench R23: Multi Core | Single Core
Cinebench R20: CPU (Multi Core) | CPU (Single Core)
Cinebench R15: CPU Multi 64Bit | CPU Single 64Bit
Blender: v2.79 BMW27 CPU
7-Zip 18.03: 7z b 4 | 7z b 4 -mmt1
Geekbench 6.7: Multi-Core | Single-Core
Geekbench 5.5: Multi-Core | Single-Core
HWBOT x265 Benchmark v2.2: 4k Preset
LibreOffice : 20 Documents To PDF
R Benchmark 2.5: Overall mean
* ... Moindre est la valeur, meilleures sont les performances
AIDA64: FP32 Ray-Trace | FPU Julia | CPU SHA3 | CPU Queen | FPU SinJulia | FPU Mandel | CPU AES | CPU ZLib | FP64 Ray-Trace | CPU PhotoWorxx | CPU CheckMate
| Performance rating | |
| Beelink SER9 Pro -1! | |
| GMK NucBox K12 -1! | |
| Asus NUC 15 Pro+ -1! | |
| GMK EVO-T1 | |
| GMK NucBox K13 -1! | |
| Moyenne Intel Core Ultra 7 256V | |
| MSI Cubi NUC AI+ 2MG -1! | |
| AIDA64 / FP32 Ray-Trace | |
| Beelink SER9 Pro (v6.92.6600) | |
| GMK NucBox K12 (v6.92.6600) | |
| Asus NUC 15 Pro+ (v6.92.6600) | |
| GMK EVO-T1 (v6.92.6600) | |
| GMK EVO-T1 (v8.20.8100) | |
| GMK NucBox K13 (v8.20.8100) | |
| Moyenne Intel Core Ultra 7 256V (10524 - 12898, n=7) | |
| MSI Cubi NUC AI+ 2MG (v6.92.6600) | |
| AIDA64 / FPU Julia | |
| Asus NUC 15 Pro+ (v6.92.6600) | |
| GMK EVO-T1 (v6.92.6600) | |
| GMK EVO-T1 (v8.20.8100) | |
| Beelink SER9 Pro (v6.92.6600) | |
| GMK NucBox K12 (v6.92.6600) | |
| GMK NucBox K13 (v8.20.8100) | |
| MSI Cubi NUC AI+ 2MG (v6.92.6600) | |
| Moyenne Intel Core Ultra 7 256V (52443 - 62522, n=7) | |
| AIDA64 / CPU SHA3 | |
| Asus NUC 15 Pro+ (v6.92.6600) | |
| GMK EVO-T1 (v6.92.6600) | |
| GMK EVO-T1 (v8.20.8100) | |
| Beelink SER9 Pro (v6.92.6600) | |
| GMK NucBox K12 (v6.92.6600) | |
| GMK NucBox K13 (v8.20.8100) | |
| MSI Cubi NUC AI+ 2MG (v6.92.6600) | |
| Moyenne Intel Core Ultra 7 256V (2364 - 2915, n=7) | |
| AIDA64 / CPU Queen | |
| Beelink SER9 Pro (v6.92.6600) | |
| GMK NucBox K12 (v6.92.6600) | |
| Asus NUC 15 Pro+ (v6.92.6600) | |
| GMK EVO-T1 (v6.92.6600) | |
| Moyenne Intel Core Ultra 7 256V (49622 - 49794, n=6) | |
| MSI Cubi NUC AI+ 2MG (v6.92.6600) | |
| AIDA64 / FPU SinJulia | |
| Beelink SER9 Pro (v6.92.6600) | |
| GMK NucBox K12 (v6.92.6600) | |
| Asus NUC 15 Pro+ (v6.92.6600) | |
| GMK EVO-T1 (v6.92.6600) | |
| GMK EVO-T1 (v8.20.8100) | |
| GMK NucBox K13 (v8.20.8100) | |
| MSI Cubi NUC AI+ 2MG (v6.92.6600) | |
| Moyenne Intel Core Ultra 7 256V (4401 - 4434, n=7) | |
| AIDA64 / FPU Mandel | |
| GMK EVO-T1 (v6.92.6600) | |
| GMK EVO-T1 (v8.20.8100) | |
| Asus NUC 15 Pro+ (v6.92.6600) | |
| Beelink SER9 Pro (v6.92.6600) | |
| GMK NucBox K12 (v6.92.6600) | |
| GMK NucBox K13 (v8.20.8100) | |
| MSI Cubi NUC AI+ 2MG (v6.92.6600) | |
| Moyenne Intel Core Ultra 7 256V (27382 - 33019, n=7) | |
| AIDA64 / CPU AES | |
| Beelink SER9 Pro (v6.92.6600) | |
| GMK NucBox K12 (v6.92.6600) | |
| Asus NUC 15 Pro+ (v6.92.6600) | |
| GMK NucBox K13 (v8.20.8100) | |
| GMK EVO-T1 (v6.92.6600) | |
| GMK EVO-T1 (v8.20.8100) | |
| Moyenne Intel Core Ultra 7 256V (38495 - 75938, n=7) | |
| MSI Cubi NUC AI+ 2MG (v6.92.6600) | |
| AIDA64 / CPU ZLib | |
| Asus NUC 15 Pro+ (v6.92.6600) | |
| GMK EVO-T1 (v6.92.6600) | |
| GMK EVO-T1 (v8.20.8100) | |
| Beelink SER9 Pro (v6.92.6600) | |
| GMK NucBox K12 (v6.92.6600) | |
| GMK NucBox K13 (v8.20.8100) | |
| MSI Cubi NUC AI+ 2MG (v6.92.6600) | |
| Moyenne Intel Core Ultra 7 256V (536 - 632, n=7) | |
| AIDA64 / FP64 Ray-Trace | |
| Beelink SER9 Pro (v6.92.6600) | |
| GMK NucBox K12 (v6.92.6600) | |
| Asus NUC 15 Pro+ (v6.92.6600) | |
| GMK EVO-T1 (v6.92.6600) | |
| GMK EVO-T1 (v8.20.8100) | |
| GMK NucBox K13 (v8.20.8100) | |
| MSI Cubi NUC AI+ 2MG (v6.92.6600) | |
| Moyenne Intel Core Ultra 7 256V (5655 - 6878, n=7) | |
| AIDA64 / CPU PhotoWorxx | |
| GMK NucBox K13 (v8.20.8100) | |
| GMK EVO-T1 (v8.20.8100) | |
| GMK EVO-T1 (v6.92.6600) | |
| Asus NUC 15 Pro+ (v6.92.6600) | |
| MSI Cubi NUC AI+ 2MG (v6.92.6600) | |
| Moyenne Intel Core Ultra 7 256V (49906 - 57060, n=7) | |
| Beelink SER9 Pro (v6.92.6600) | |
| GMK NucBox K12 (v6.92.6600) | |
| AIDA64 / CPU CheckMate | |
| GMK EVO-T1 (v8.20.8100) | |
| GMK NucBox K13 (v8.20.8100) | |
| Moyenne Intel Core Ultra 7 256V (n=1) | |
Performance du système
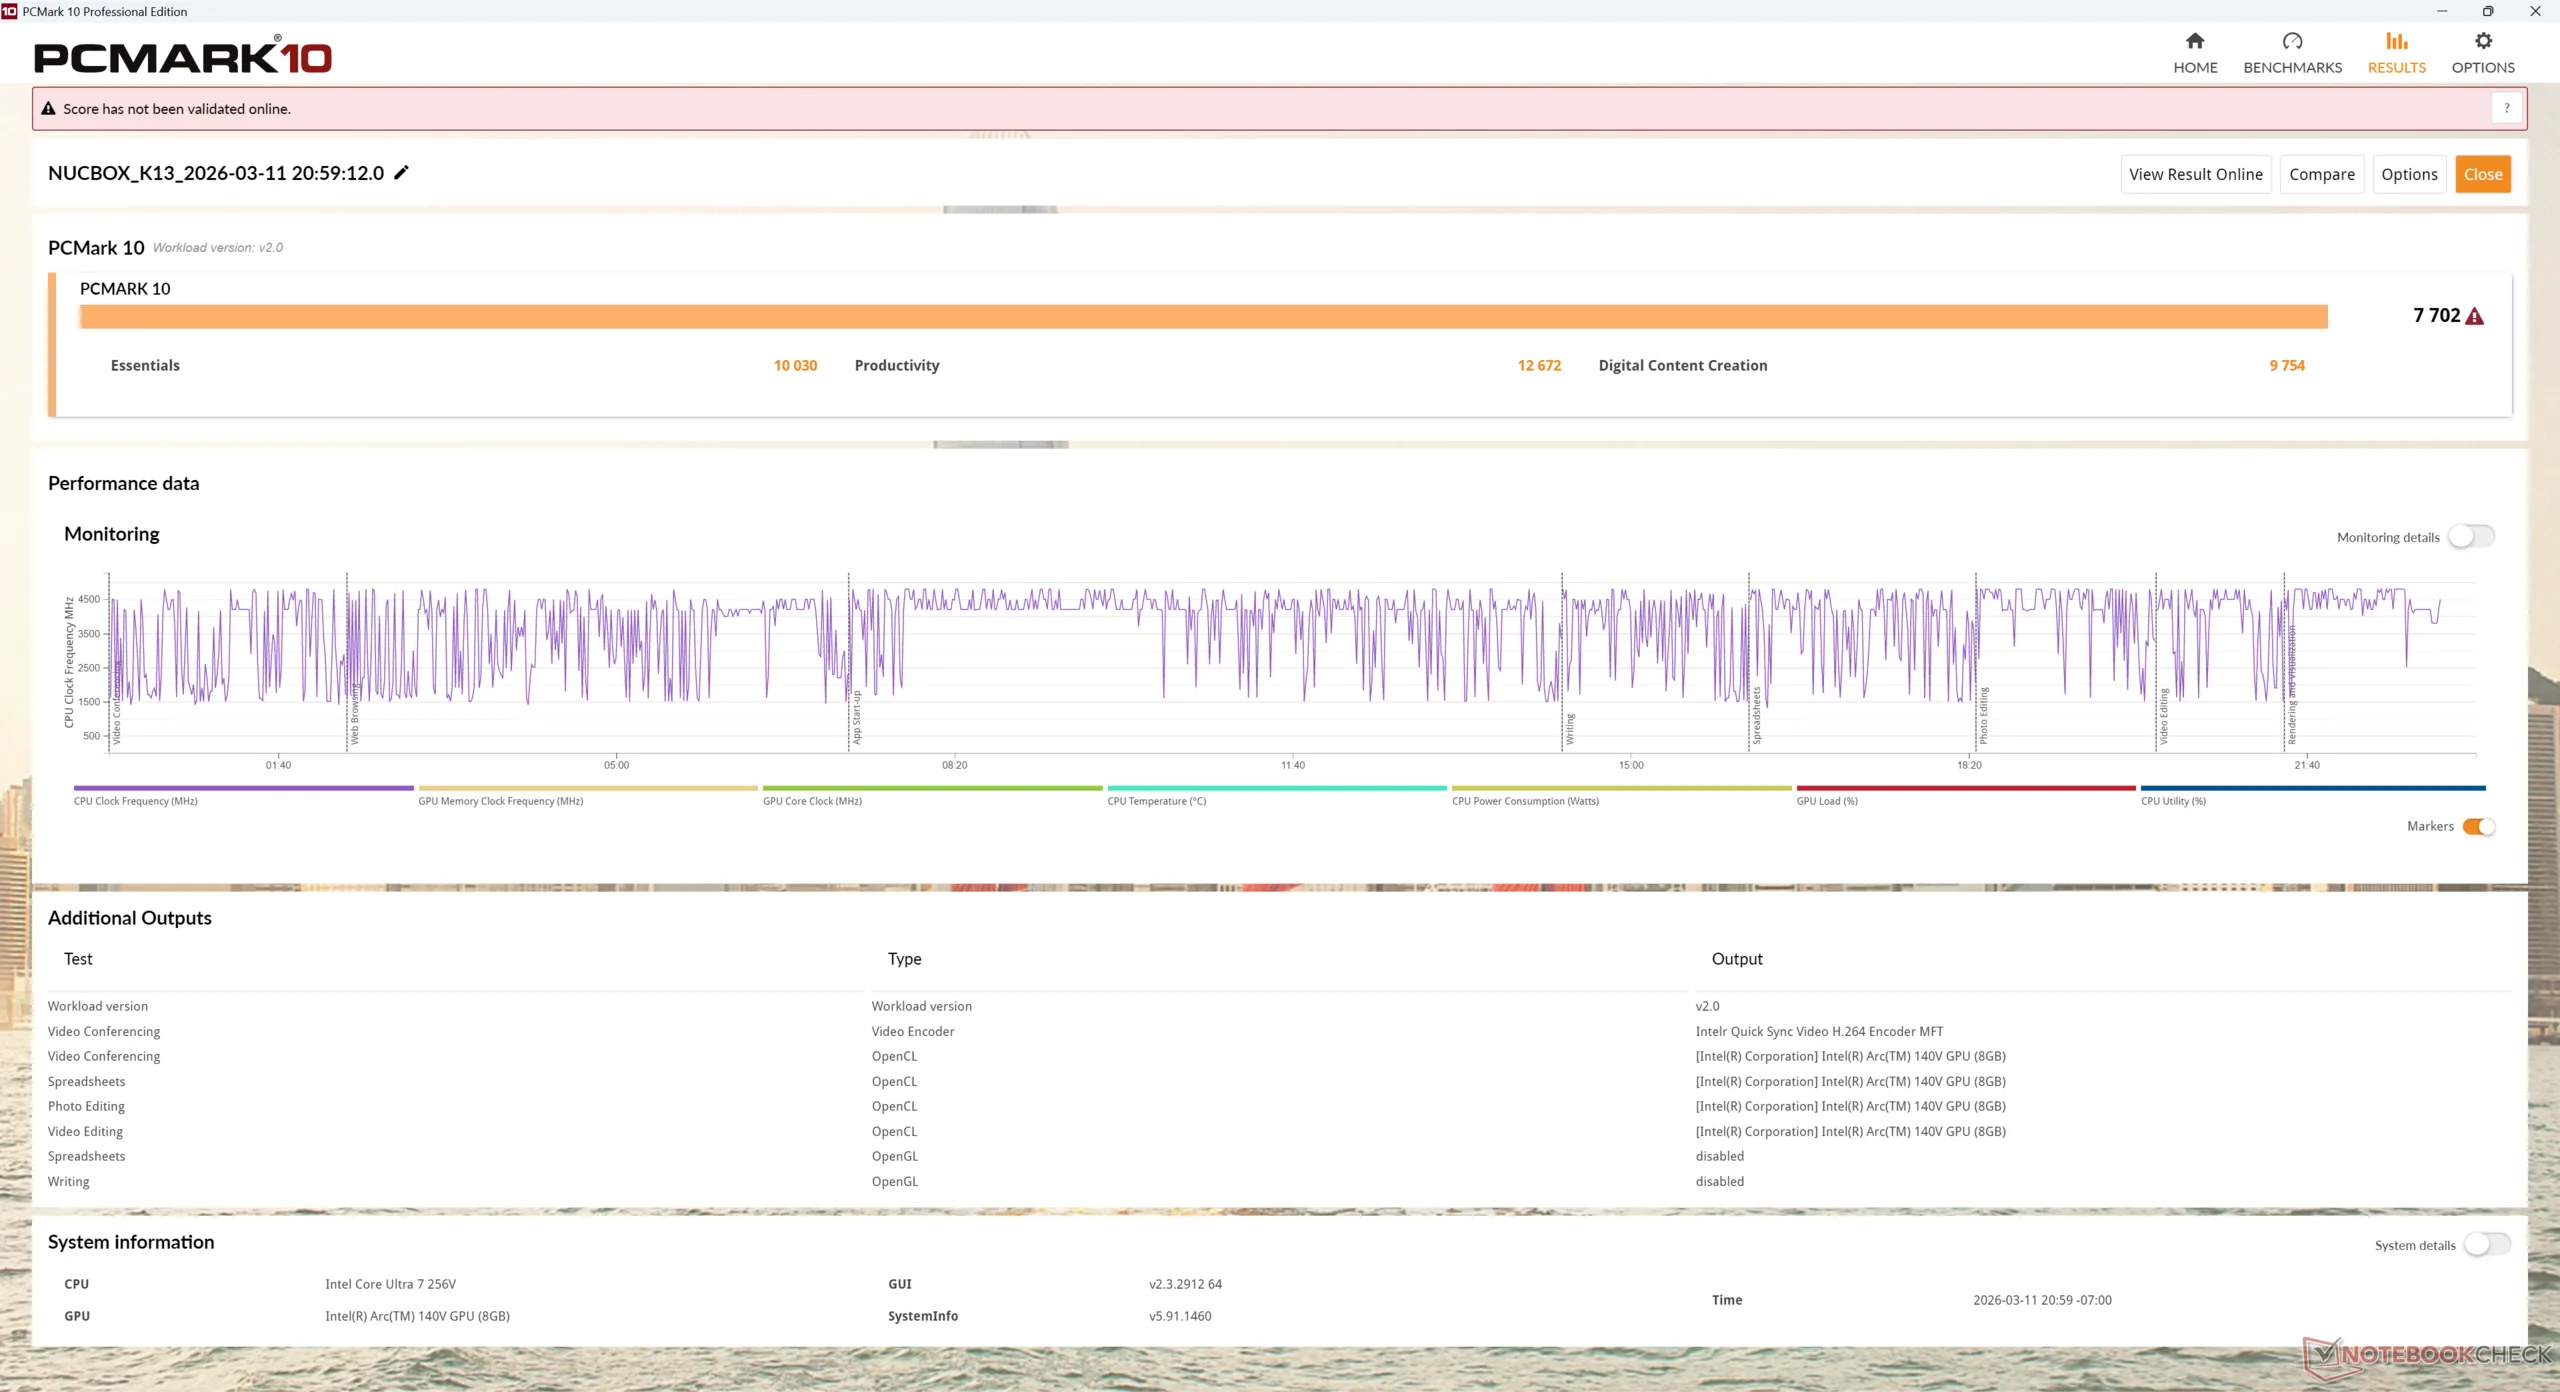
Les résultats de PCMark sont légèrement plus élevés que prévu en raison d'une surestimation du sous-test Productivité, même après la mise à jour vers la dernière version du benchmark au moment de la rédaction de cet article. Il est intéressant de noter que nous avons rencontré des problèmes similaires avec le récent MSI Venture 16 AI MSI Venture 16 AI.
PCMark 10: Score | Essentials | Productivity | Digital Content Creation
CrossMark: Overall | Productivity | Creativity | Responsiveness
WebXPRT 3: Overall
WebXPRT 4: Overall
Mozilla Kraken 1.1: Total
Geekbench AI: Single Precision GPU 1.7 | Half Precision GPU 1.7 | Quantized GPU 1.7
| Performance rating | |
| GMK EVO-T1 | |
| Moyenne Intel Core Ultra 7 256V, Intel Arc Graphics 140V | |
| GMK NucBox K13 | |
| Beelink SER9 Pro | |
| MSI Cubi NUC AI+ 2MG | |
| Asus NUC 15 Pro+ | |
| GMK NucBox K12 | |
| PCMark 10 / Score | |
| GMK EVO-T1 | |
| GMK NucBox K13 | |
| Asus NUC 15 Pro+ | |
| Moyenne Intel Core Ultra 7 256V, Intel Arc Graphics 140V (6677 - 7702, n=7) | |
| GMK NucBox K12 | |
| Beelink SER9 Pro | |
| MSI Cubi NUC AI+ 2MG | |
| PCMark 10 / Essentials | |
| GMK NucBox K12 | |
| Beelink SER9 Pro | |
| GMK EVO-T1 | |
| Moyenne Intel Core Ultra 7 256V, Intel Arc Graphics 140V (9627 - 11365, n=7) | |
| MSI Cubi NUC AI+ 2MG | |
| GMK NucBox K13 | |
| Asus NUC 15 Pro+ | |
| PCMark 10 / Productivity | |
| GMK NucBox K13 | |
| GMK EVO-T1 | |
| Moyenne Intel Core Ultra 7 256V, Intel Arc Graphics 140V (8161 - 12672, n=7) | |
| GMK NucBox K12 | |
| Beelink SER9 Pro | |
| MSI Cubi NUC AI+ 2MG | |
| Asus NUC 15 Pro+ | |
| PCMark 10 / Digital Content Creation | |
| GMK EVO-T1 | |
| Asus NUC 15 Pro+ | |
| Moyenne Intel Core Ultra 7 256V, Intel Arc Graphics 140V (9481 - 10126, n=7) | |
| GMK NucBox K13 | |
| MSI Cubi NUC AI+ 2MG | |
| Beelink SER9 Pro | |
| GMK NucBox K12 | |
| CrossMark / Overall | |
| GMK EVO-T1 | |
| Beelink SER9 Pro | |
| Asus NUC 15 Pro+ | |
| GMK NucBox K12 | |
| GMK NucBox K13 | |
| Moyenne Intel Core Ultra 7 256V, Intel Arc Graphics 140V (1636 - 1736, n=7) | |
| MSI Cubi NUC AI+ 2MG | |
| CrossMark / Productivity | |
| GMK EVO-T1 | |
| Beelink SER9 Pro | |
| GMK NucBox K12 | |
| GMK NucBox K13 | |
| Asus NUC 15 Pro+ | |
| Moyenne Intel Core Ultra 7 256V, Intel Arc Graphics 140V (1563 - 1682, n=7) | |
| MSI Cubi NUC AI+ 2MG | |
| CrossMark / Creativity | |
| GMK EVO-T1 | |
| Asus NUC 15 Pro+ | |
| GMK NucBox K13 | |
| Moyenne Intel Core Ultra 7 256V, Intel Arc Graphics 140V (1862 - 1962, n=7) | |
| Beelink SER9 Pro | |
| GMK NucBox K12 | |
| MSI Cubi NUC AI+ 2MG | |
| CrossMark / Responsiveness | |
| GMK EVO-T1 | |
| Beelink SER9 Pro | |
| GMK NucBox K12 | |
| GMK NucBox K13 | |
| Asus NUC 15 Pro+ | |
| Moyenne Intel Core Ultra 7 256V, Intel Arc Graphics 140V (1215 - 1371, n=7) | |
| MSI Cubi NUC AI+ 2MG | |
| WebXPRT 3 / Overall | |
| GMK EVO-T1 | |
| MSI Cubi NUC AI+ 2MG | |
| Beelink SER9 Pro | |
| GMK NucBox K13 | |
| Moyenne Intel Core Ultra 7 256V, Intel Arc Graphics 140V (243 - 310, n=7) | |
| GMK NucBox K12 | |
| Asus NUC 15 Pro+ | |
| WebXPRT 4 / Overall | |
| GMK EVO-T1 | |
| GMK NucBox K13 | |
| Moyenne Intel Core Ultra 7 256V, Intel Arc Graphics 140V (282 - 286, n=7) | |
| MSI Cubi NUC AI+ 2MG | |
| Beelink SER9 Pro | |
| GMK NucBox K12 | |
| Asus NUC 15 Pro+ | |
| Mozilla Kraken 1.1 / Total | |
| GMK NucBox K12 | |
| Beelink SER9 Pro | |
| MSI Cubi NUC AI+ 2MG | |
| Asus NUC 15 Pro+ | |
| GMK NucBox K13 | |
| Moyenne Intel Core Ultra 7 256V, Intel Arc Graphics 140V (470 - 480, n=7) | |
| GMK EVO-T1 | |
| Geekbench AI / Single Precision GPU 1.7 | |
| MSI Cubi NUC AI+ 2MG | |
| Asus NUC 15 Pro+ | |
| Beelink SER9 Pro | |
| GMK EVO-T1 | |
| Moyenne Intel Core Ultra 7 256V, Intel Arc Graphics 140V (6698 - 8212, n=4) | |
| GMK NucBox K12 | |
| GMK NucBox K13 | |
| Geekbench AI / Half Precision GPU 1.7 | |
| MSI Cubi NUC AI+ 2MG | |
| Moyenne Intel Core Ultra 7 256V, Intel Arc Graphics 140V (11542 - 16259, n=4) | |
| GMK EVO-T1 | |
| Asus NUC 15 Pro+ | |
| GMK NucBox K13 | |
| Beelink SER9 Pro | |
| GMK NucBox K12 | |
| Geekbench AI / Quantized GPU 1.7 | |
| Beelink SER9 Pro | |
| MSI Cubi NUC AI+ 2MG | |
| GMK NucBox K12 | |
| Asus NUC 15 Pro+ | |
| GMK EVO-T1 | |
| Moyenne Intel Core Ultra 7 256V, Intel Arc Graphics 140V (4150 - 5483, n=4) | |
| GMK NucBox K13 | |
* ... Moindre est la valeur, meilleures sont les performances
| PCMark 10 Score | 7702 points | |
Aide | ||
| AIDA64 / Memory Copy | |
| MSI Cubi NUC AI+ 2MG | |
| GMK NucBox K13 | |
| Moyenne Intel Core Ultra 7 256V (99227 - 104459, n=7) | |
| Asus NUC 15 Pro+ | |
| GMK EVO-T1 | |
| GMK EVO-T1 | |
| Beelink SER9 Pro | |
| GMK NucBox K12 | |
| AIDA64 / Memory Read | |
| GMK NucBox K13 | |
| Asus NUC 15 Pro+ | |
| Moyenne Intel Core Ultra 7 256V (86352 - 89848, n=7) | |
| MSI Cubi NUC AI+ 2MG | |
| GMK EVO-T1 | |
| GMK EVO-T1 | |
| GMK NucBox K12 | |
| Beelink SER9 Pro | |
| AIDA64 / Memory Write | |
| MSI Cubi NUC AI+ 2MG | |
| Moyenne Intel Core Ultra 7 256V (108692 - 117933, n=7) | |
| GMK NucBox K13 | |
| Beelink SER9 Pro | |
| GMK NucBox K12 | |
| Asus NUC 15 Pro+ | |
| GMK EVO-T1 | |
| GMK EVO-T1 | |
| AIDA64 / Memory Latency | |
| GMK EVO-T1 | |
| GMK EVO-T1 | |
| Asus NUC 15 Pro+ | |
| Beelink SER9 Pro | |
| GMK NucBox K13 | |
| Moyenne Intel Core Ultra 7 256V (96.1 - 99.6, n=7) | |
| MSI Cubi NUC AI+ 2MG | |
| GMK NucBox K12 | |
* ... Moindre est la valeur, meilleures sont les performances
Latence DPC
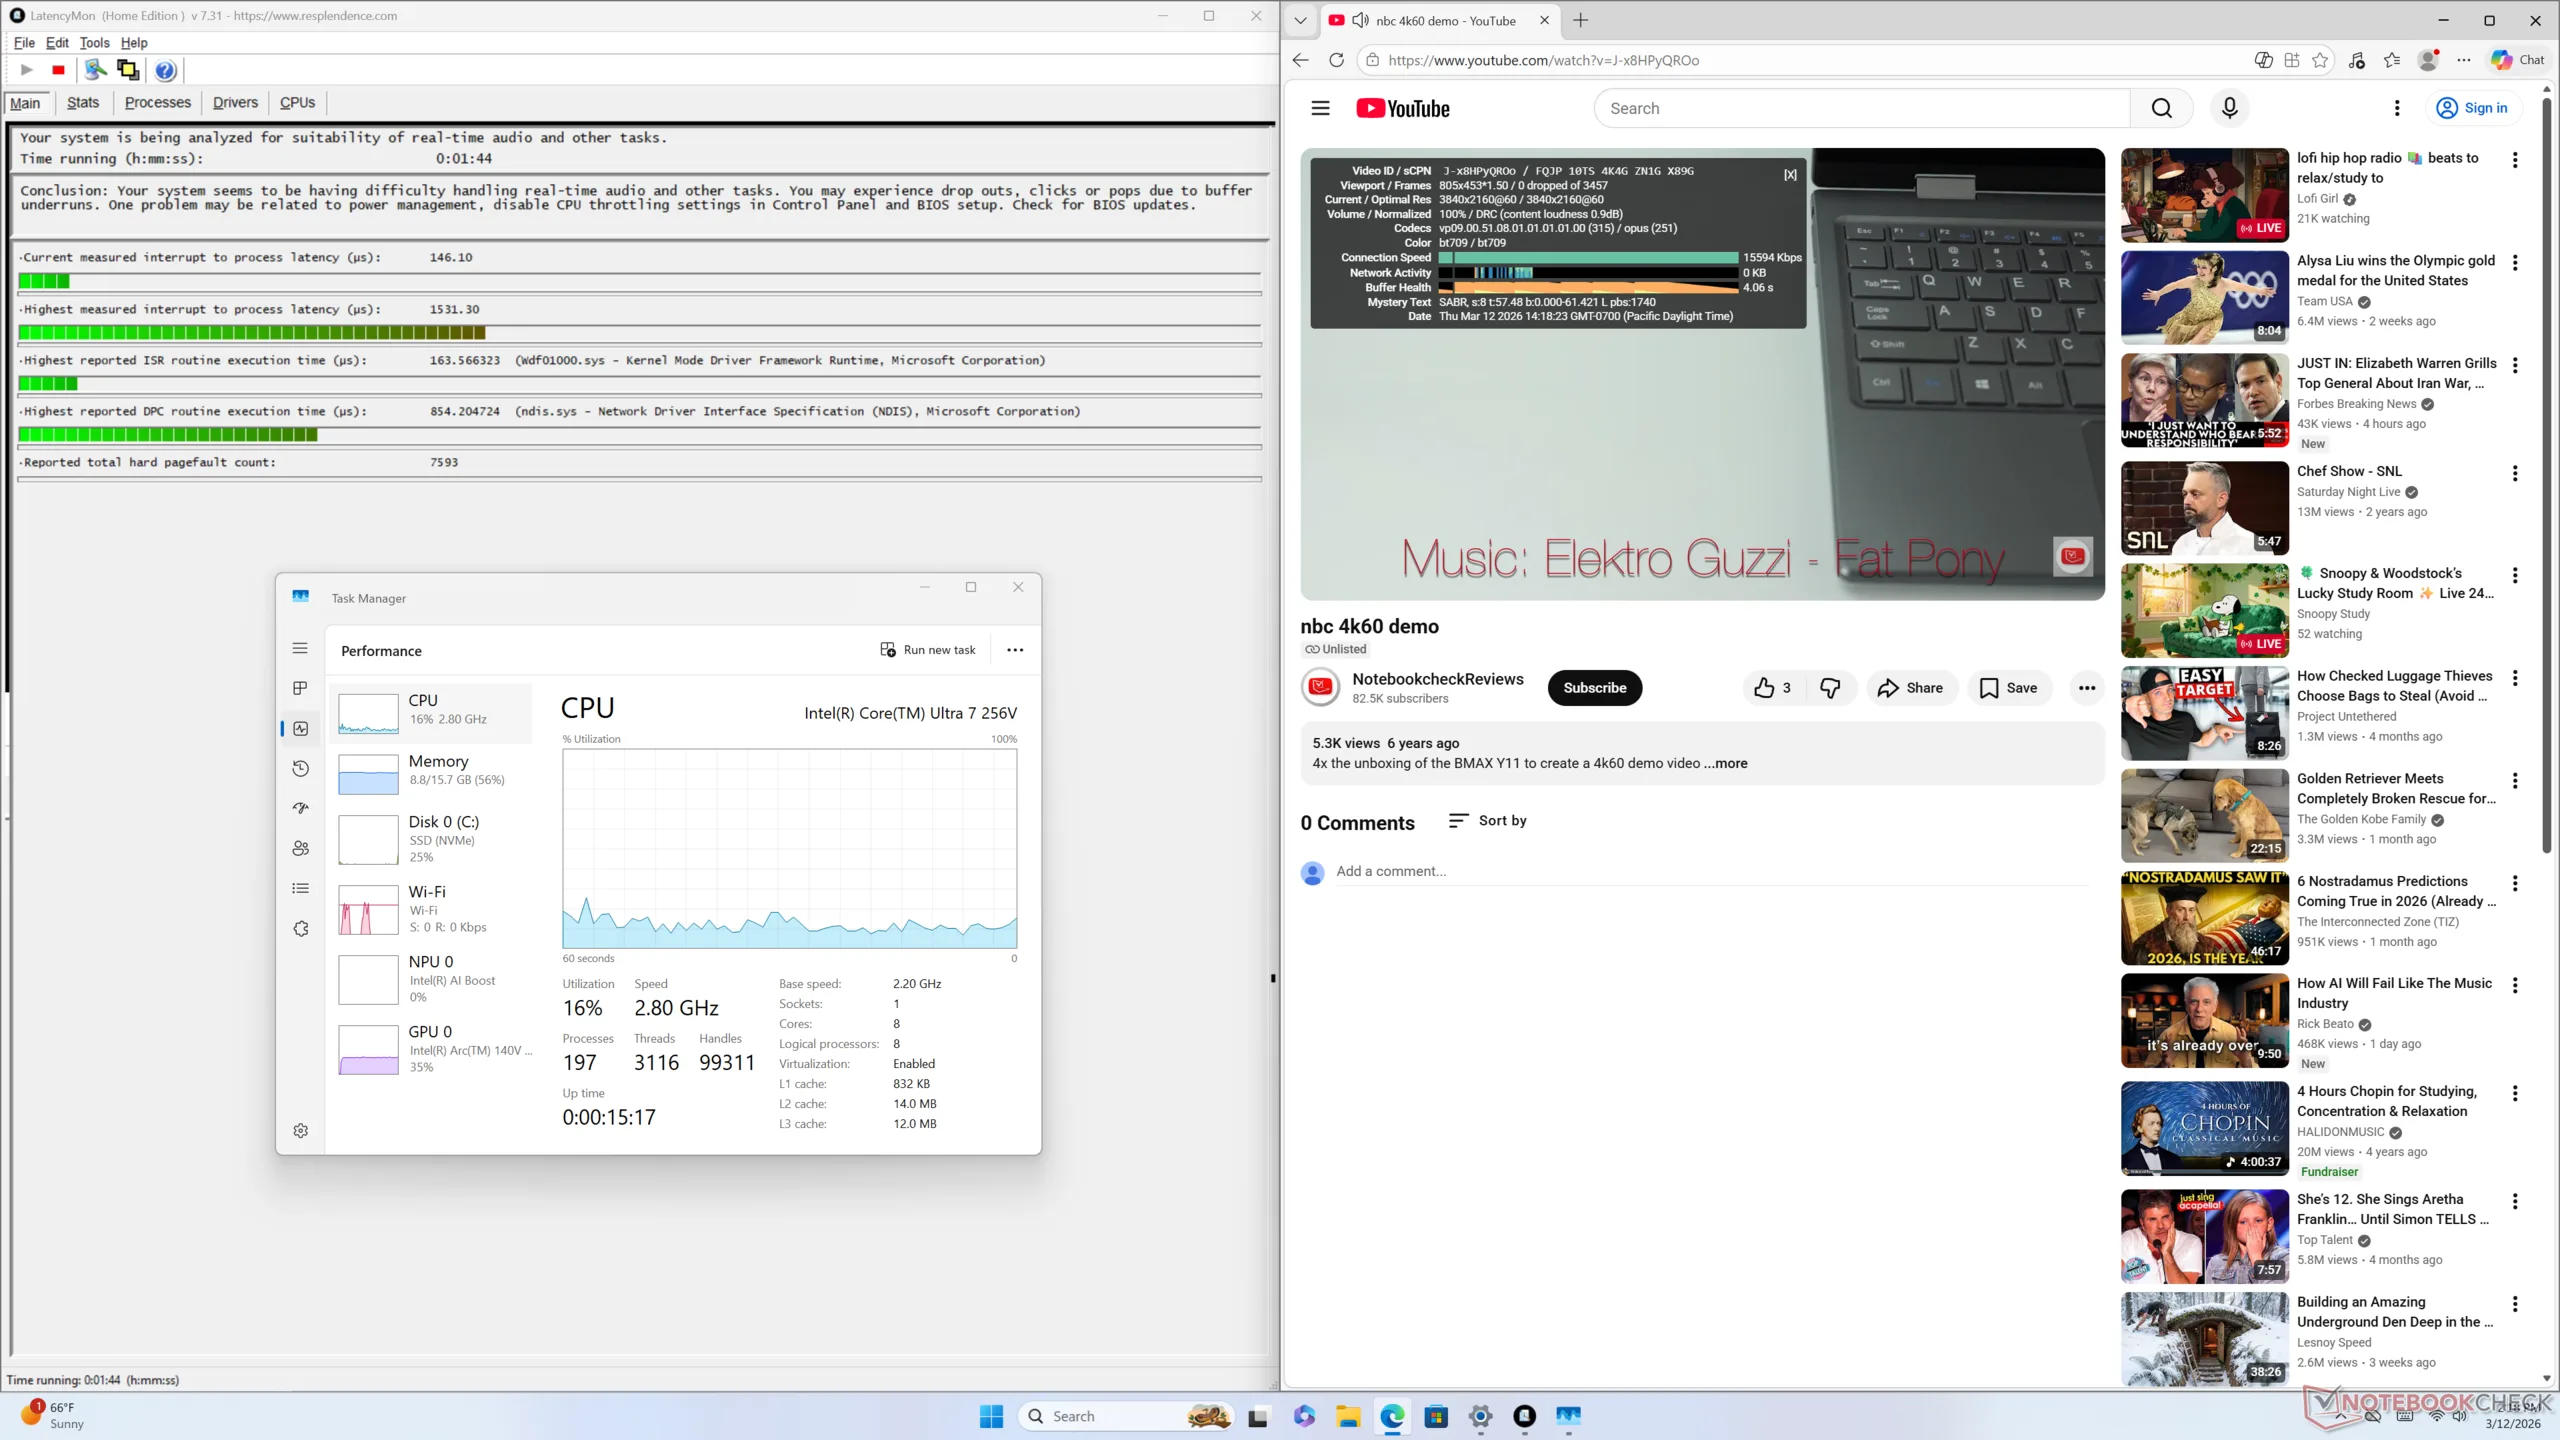
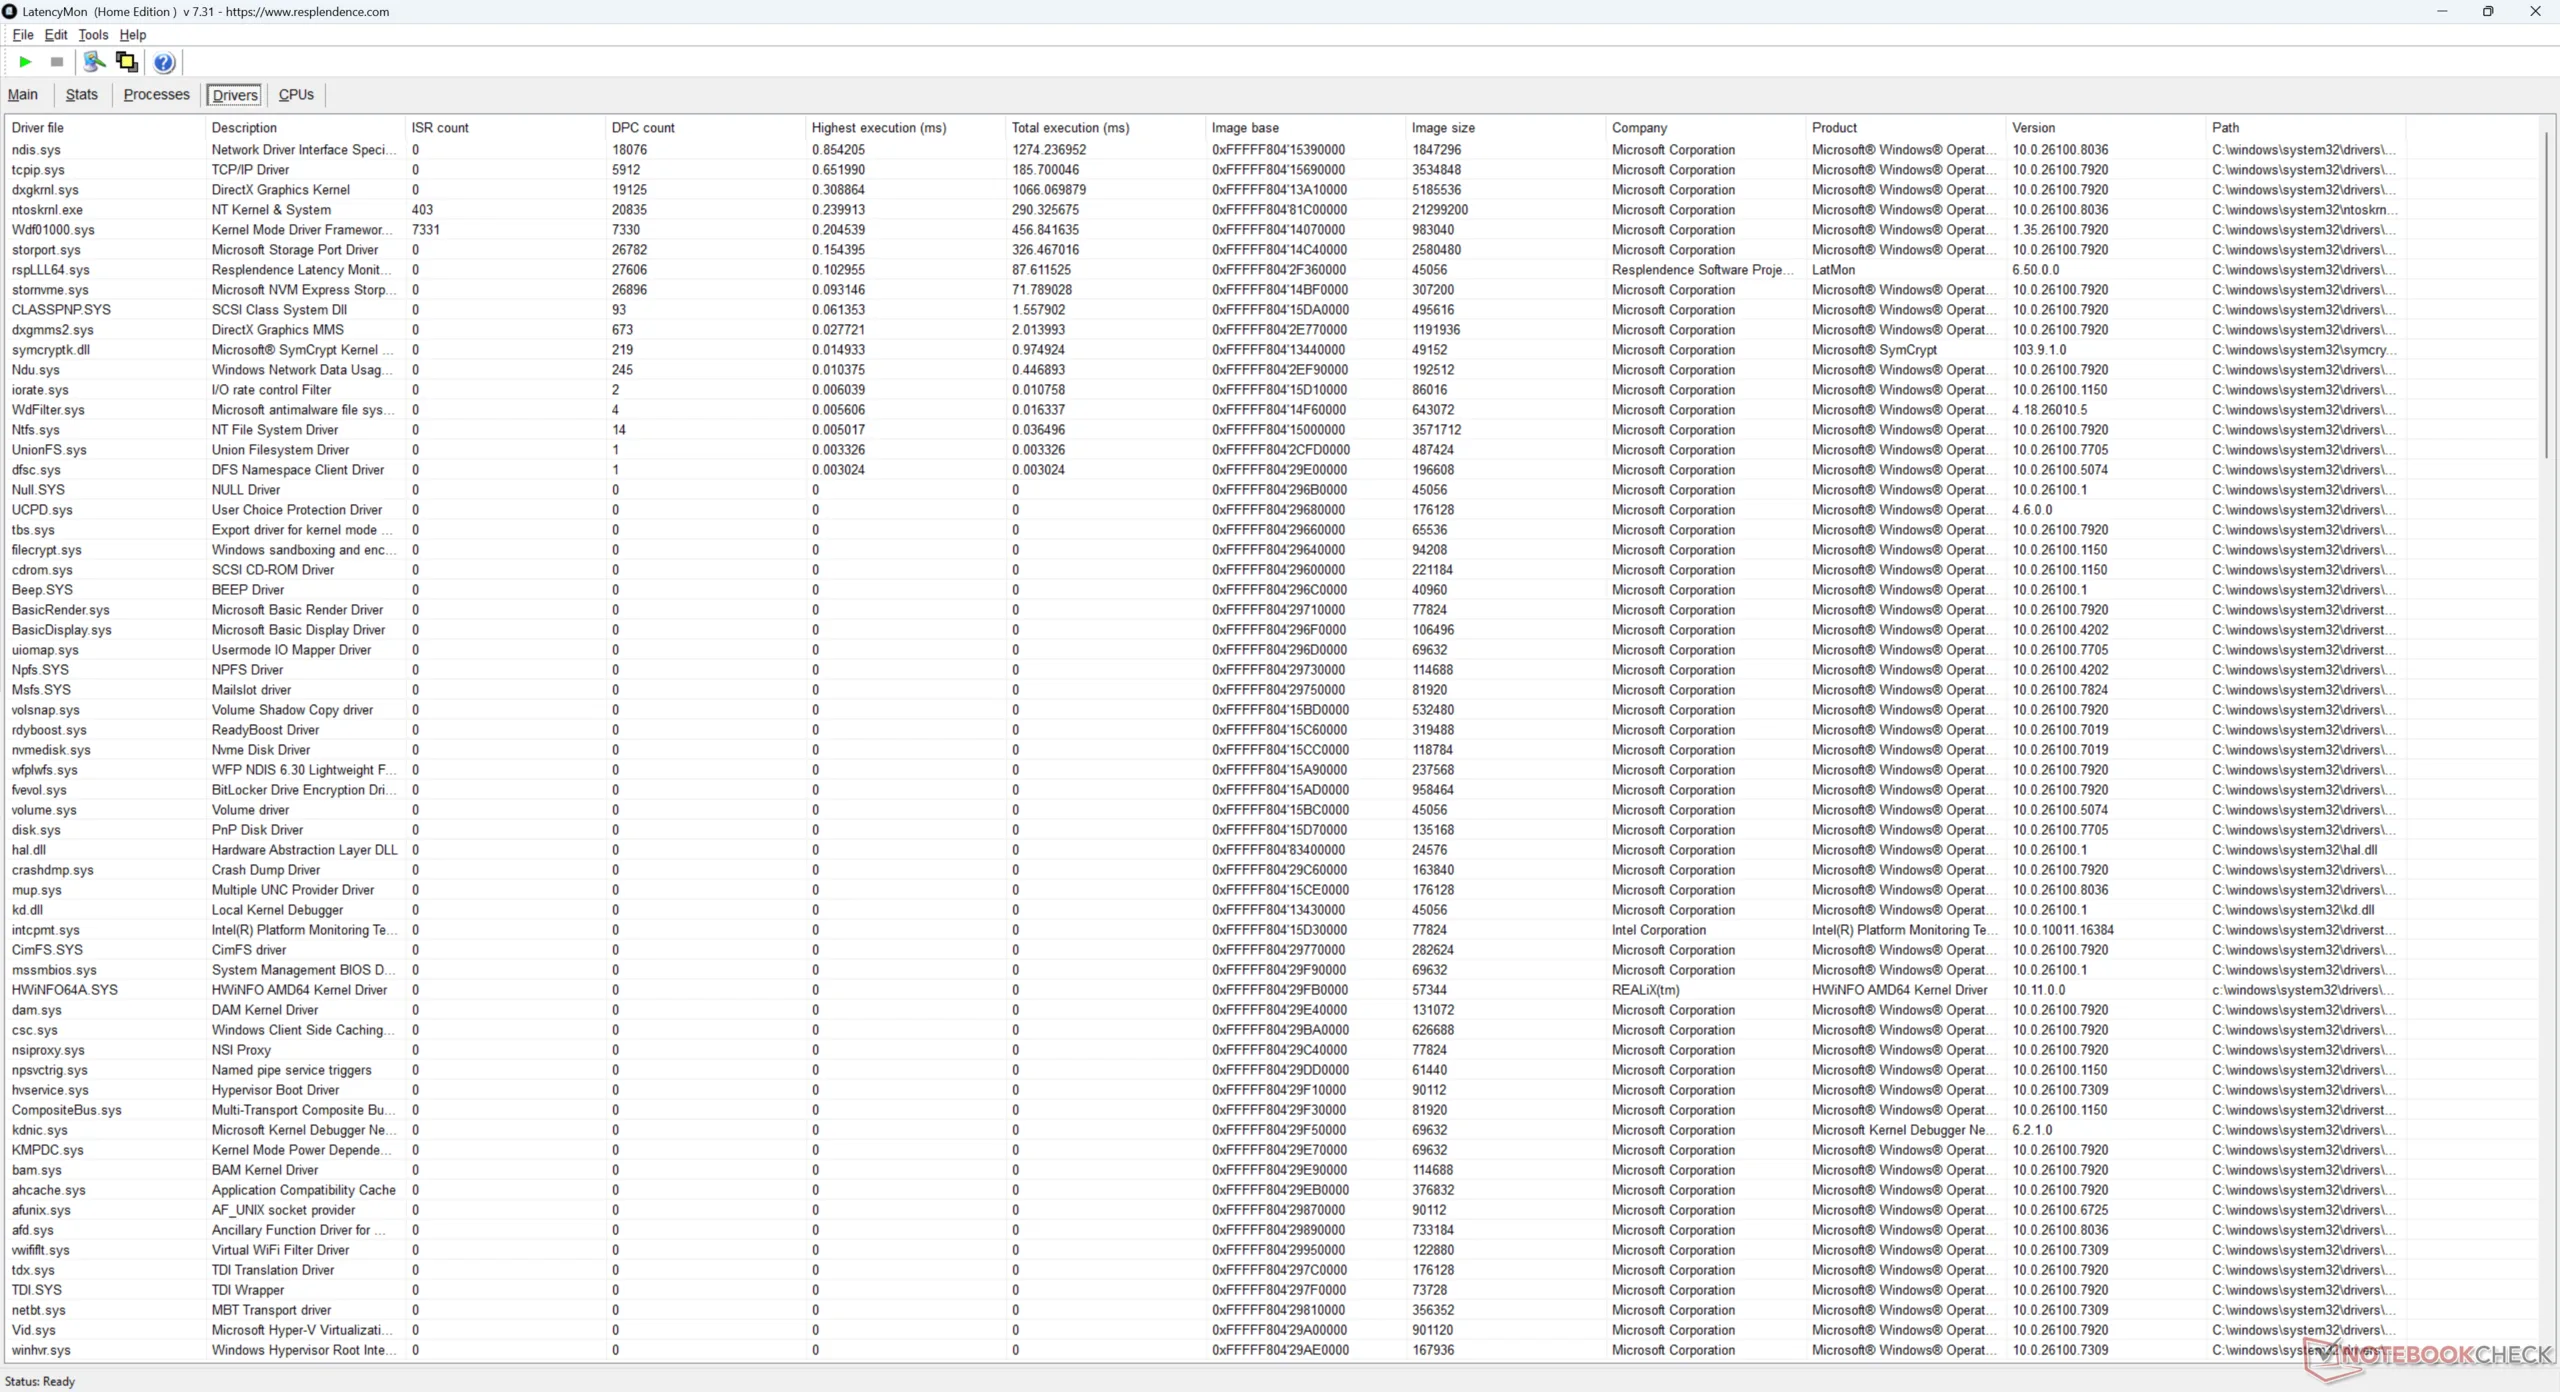
| DPC Latencies / LatencyMon - interrupt to process latency (max), Web, Youtube, Prime95 | |
| GMK NucBox K13 | |
| GMK NucBox K12 | |
| Asus NUC 15 Pro+ | |
| GMK EVO-T1 | |
| MSI Cubi NUC AI+ 2MG | |
| Beelink SER9 Pro | |
* ... Moindre est la valeur, meilleures sont les performances
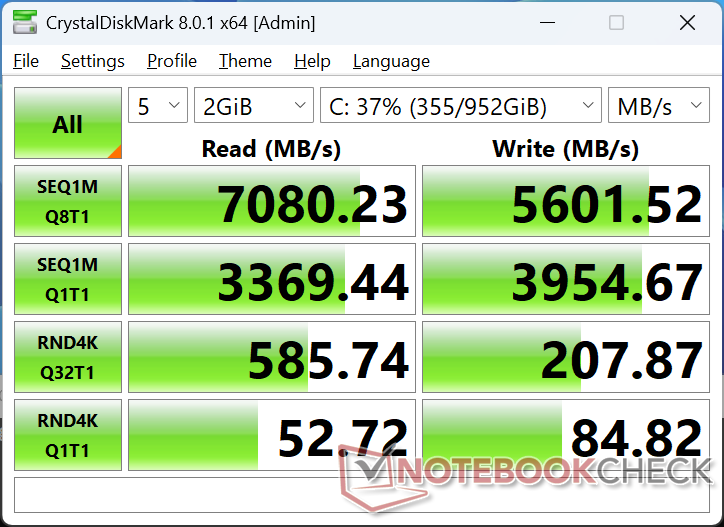
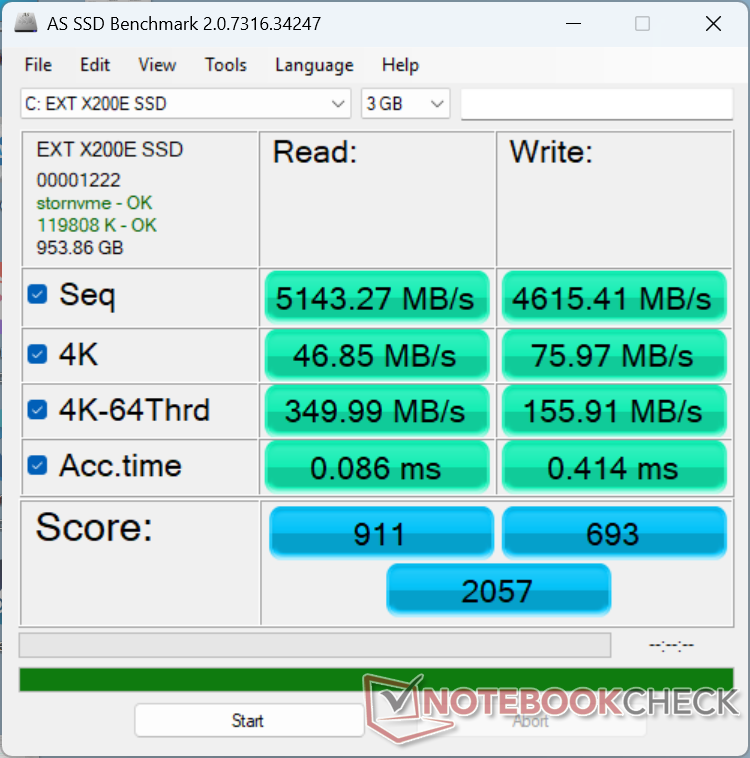
Dispositifs de stockage
Taux de transfert avec le Huawei eKitStor Xtreme 200E atteignent 6800 Mo/s, mais les performances chutent rapidement à 3600 Mo/s lorsqu'elles sont sollicitées, comme le montrent les résultats de notre test en boucle DiskSpd ci-dessous.

| Drive Performance rating - Percent | |
| GMK EVO-T1 | |
| Asus NUC 15 Pro+ | |
| Beelink SER9 Pro | |
| GMK NucBox K12 | |
| MSI Cubi NUC AI+ 2MG | |
| GMK NucBox K13 | |
| Moyenne Huawei eKitStor Xtreme 200e 1 TB | |
* ... Moindre est la valeur, meilleures sont les performances
Throttoir de disque : Boucle de lecture DiskSpd, profondeur de la file d'attente 8
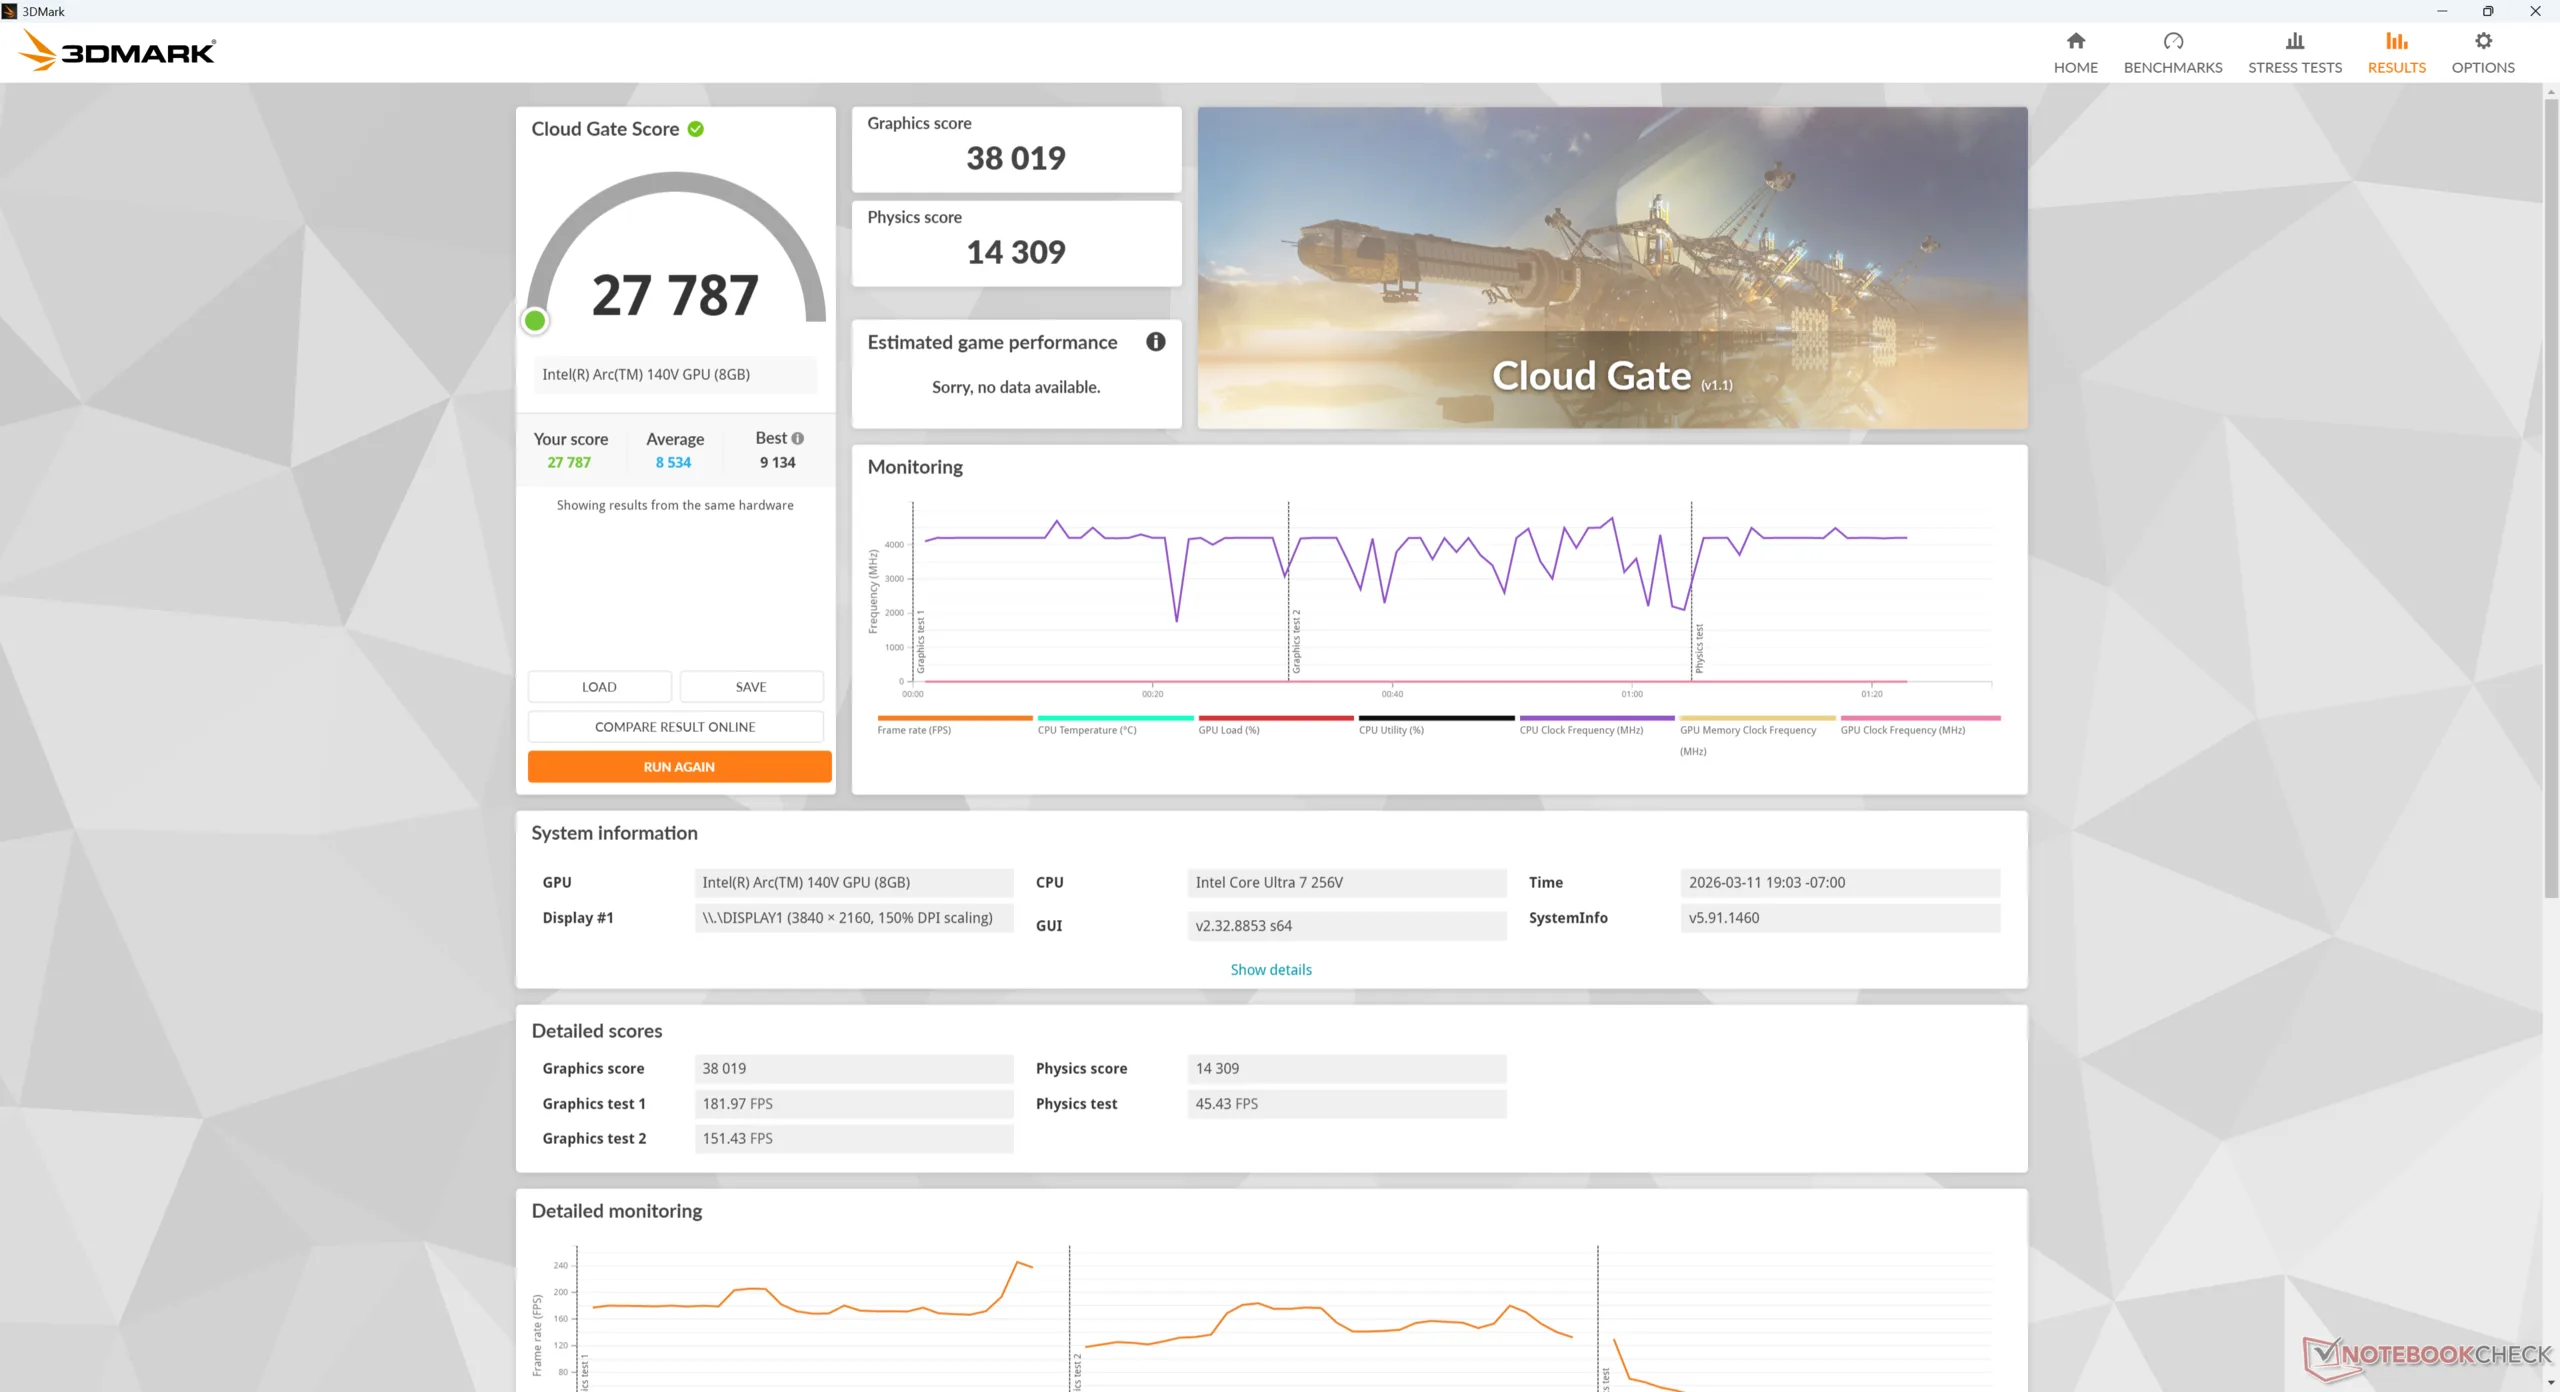
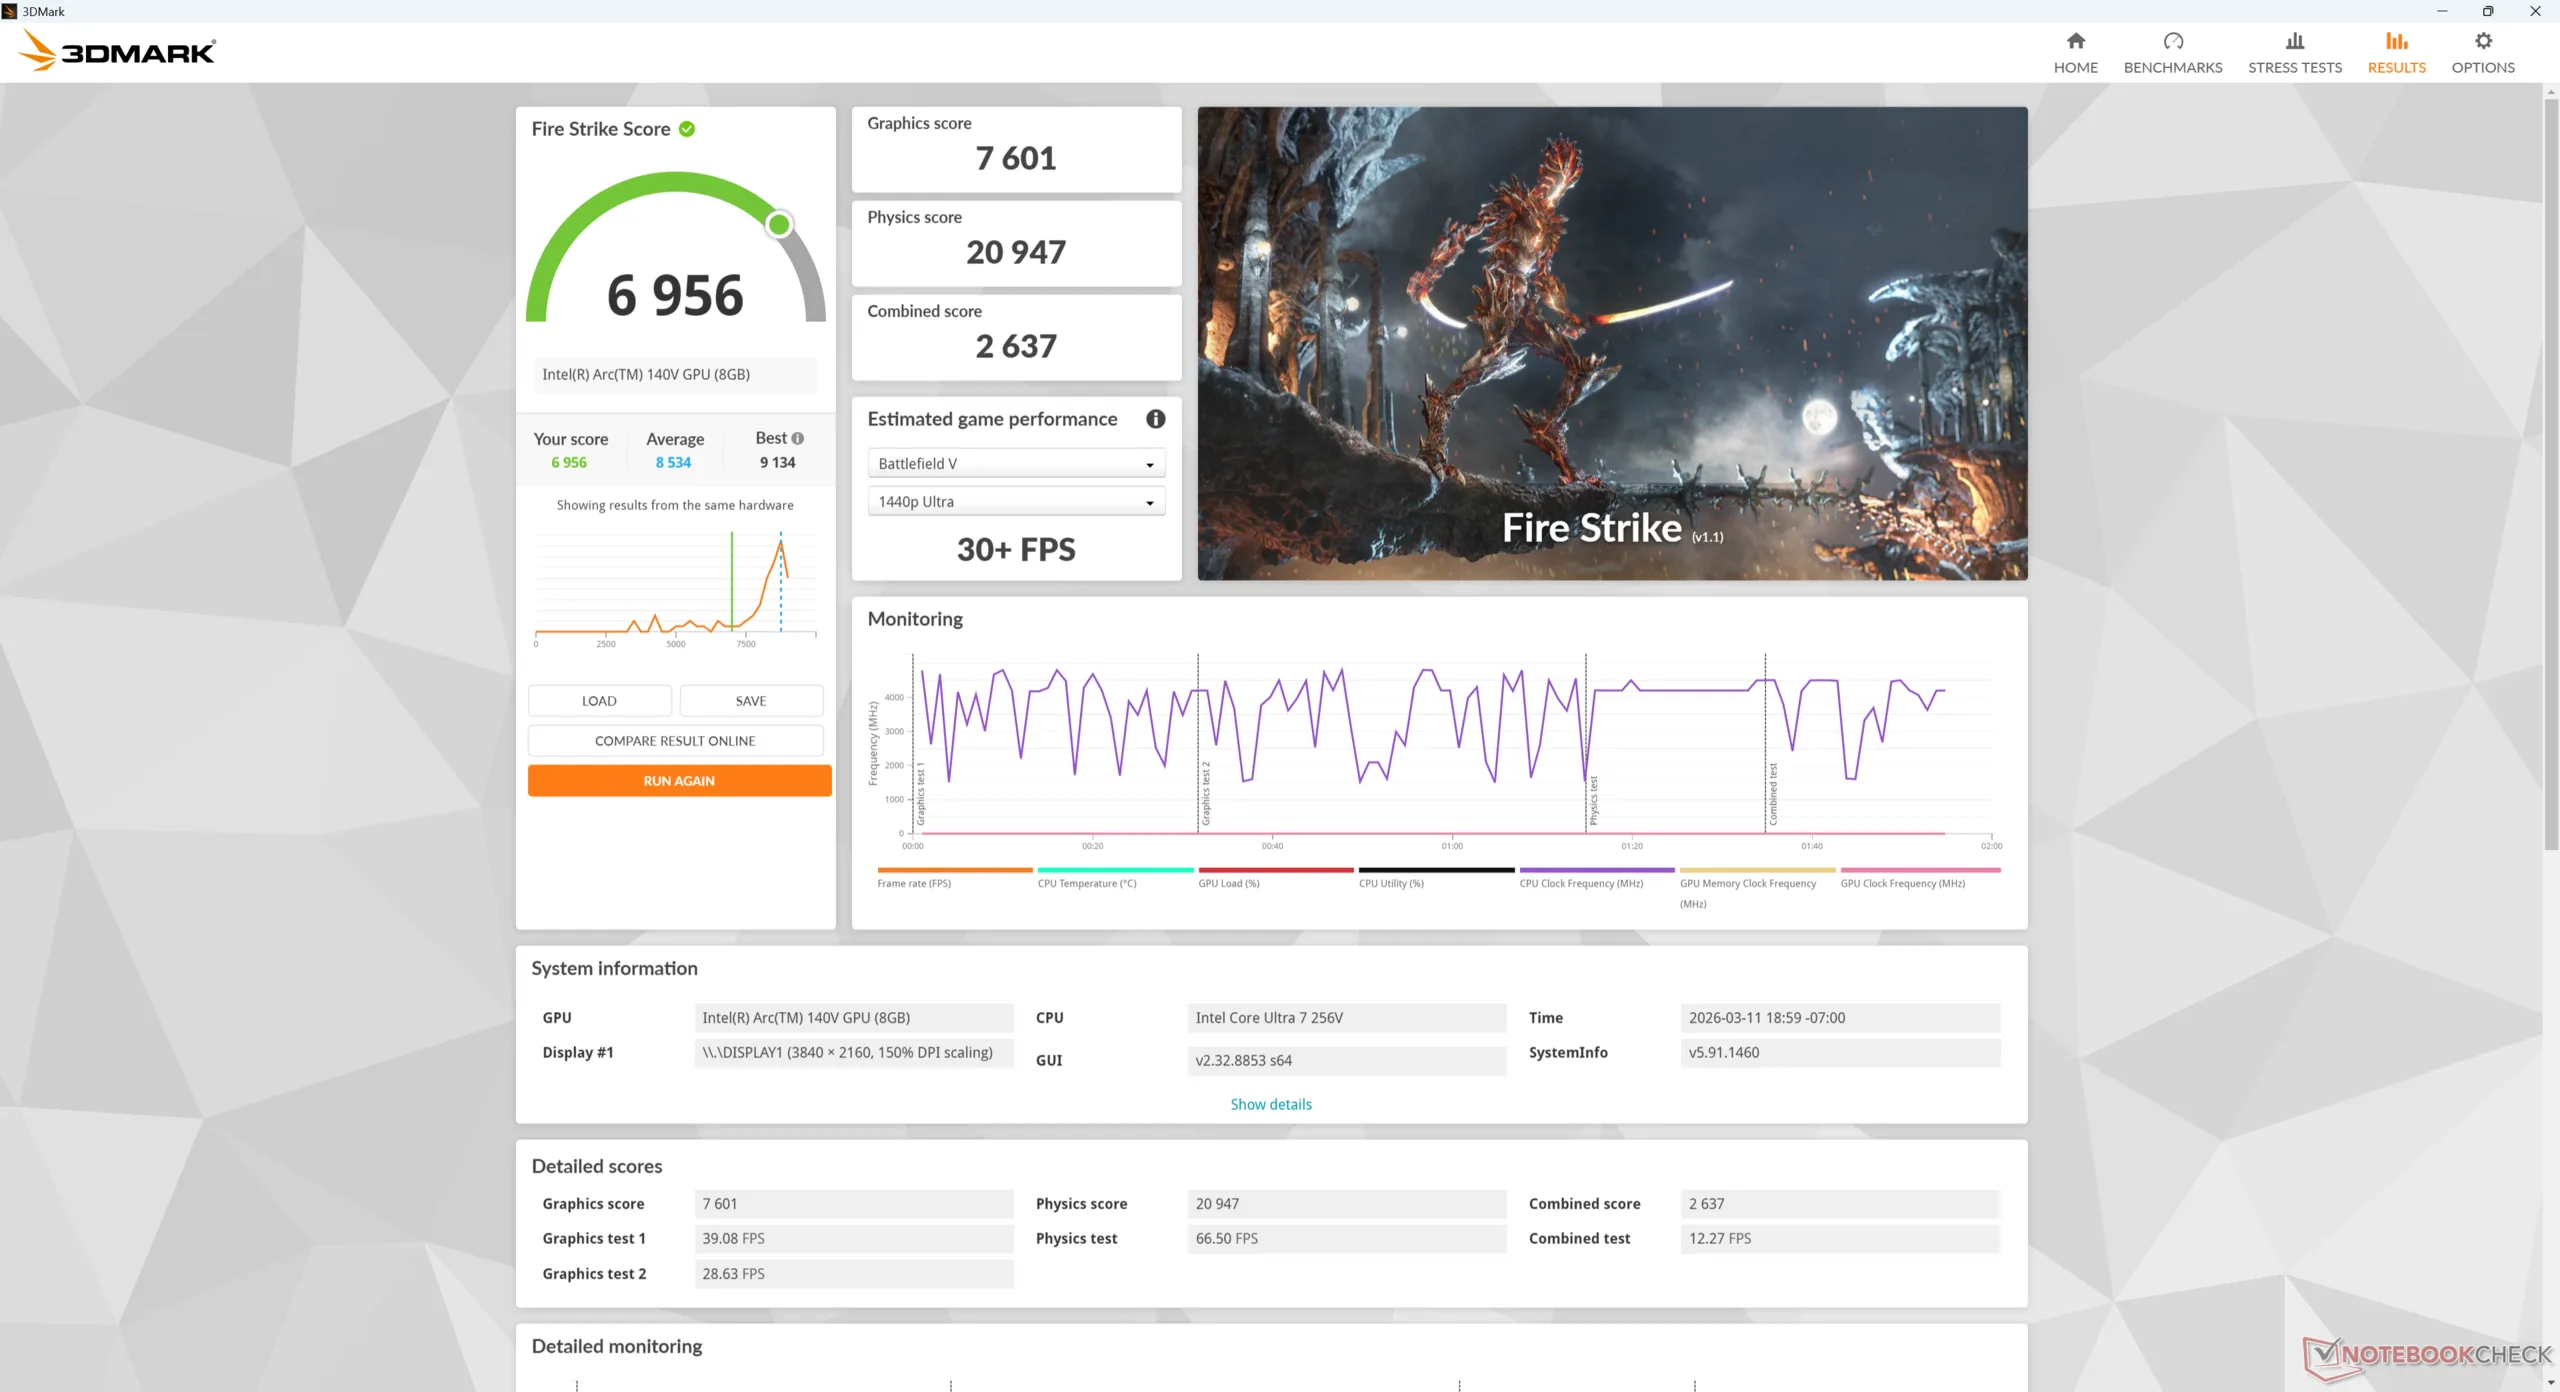
Performance du GPU
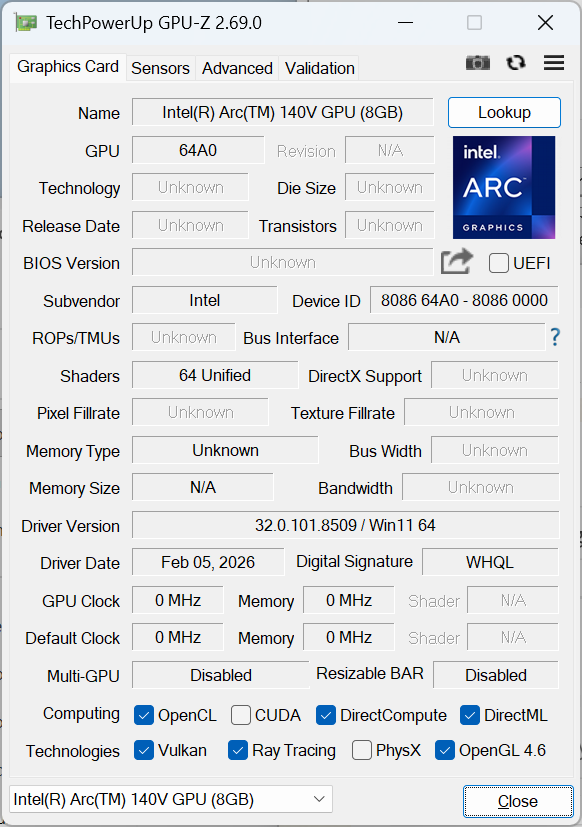
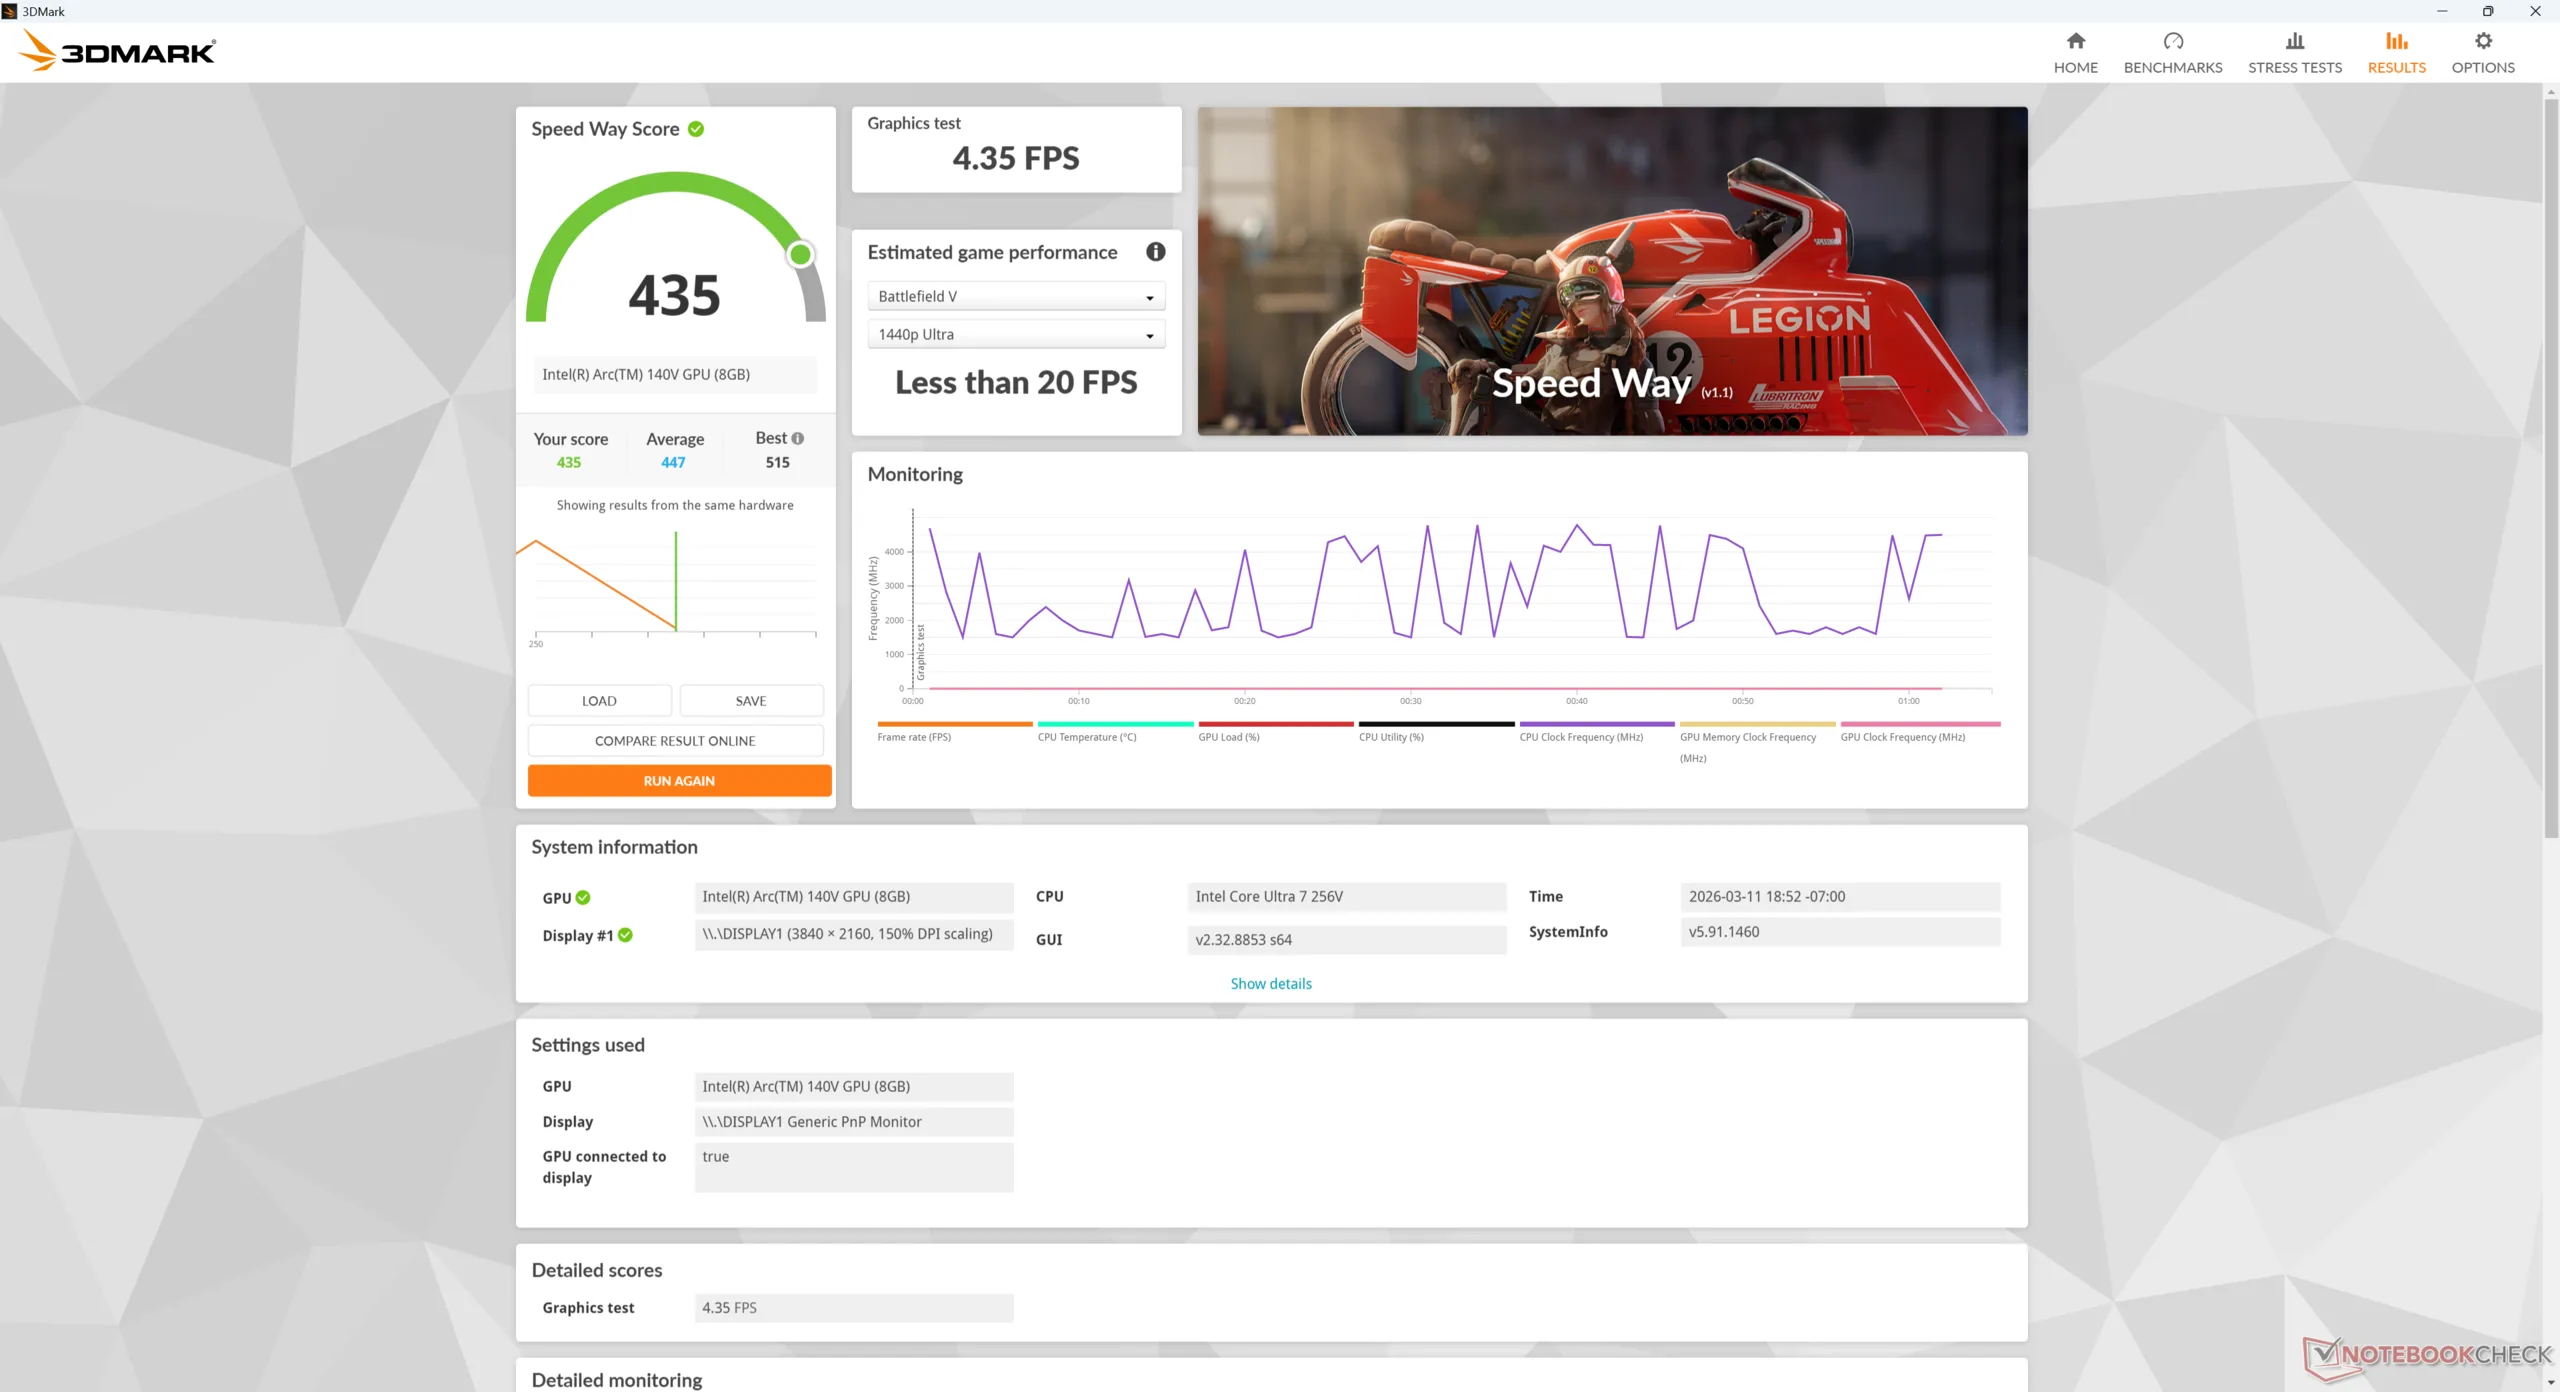
Bien que relativement rapide pour un GPU intégré, le système Arc 140V dans notre GMK est environ 15 à 25 % plus lent que le PC moyen de notre base de données avec le même iGPU selon les benchmarks 3DMark. Malheureusement, cela se répercute sur les jeux réels, où notre GMK est presque toujours un peu plus lent que prévu.
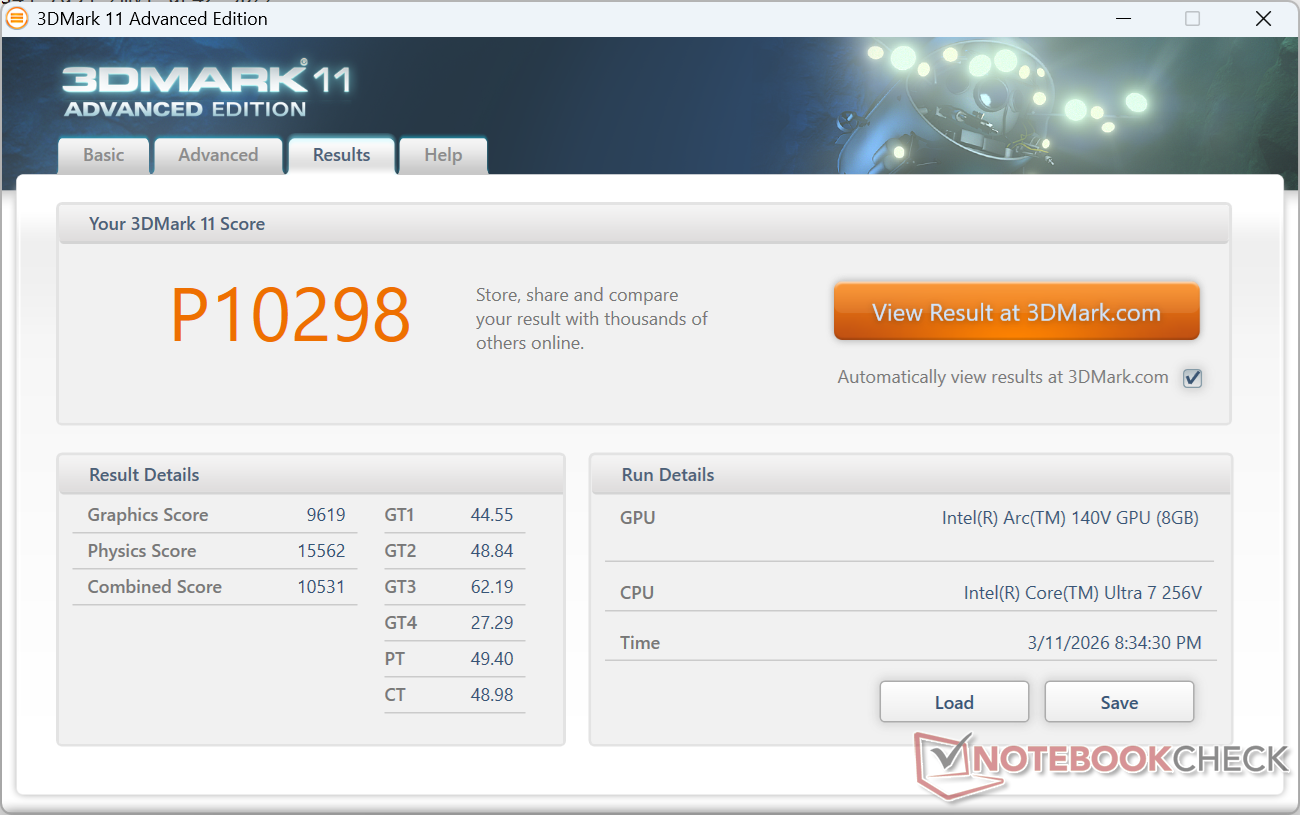
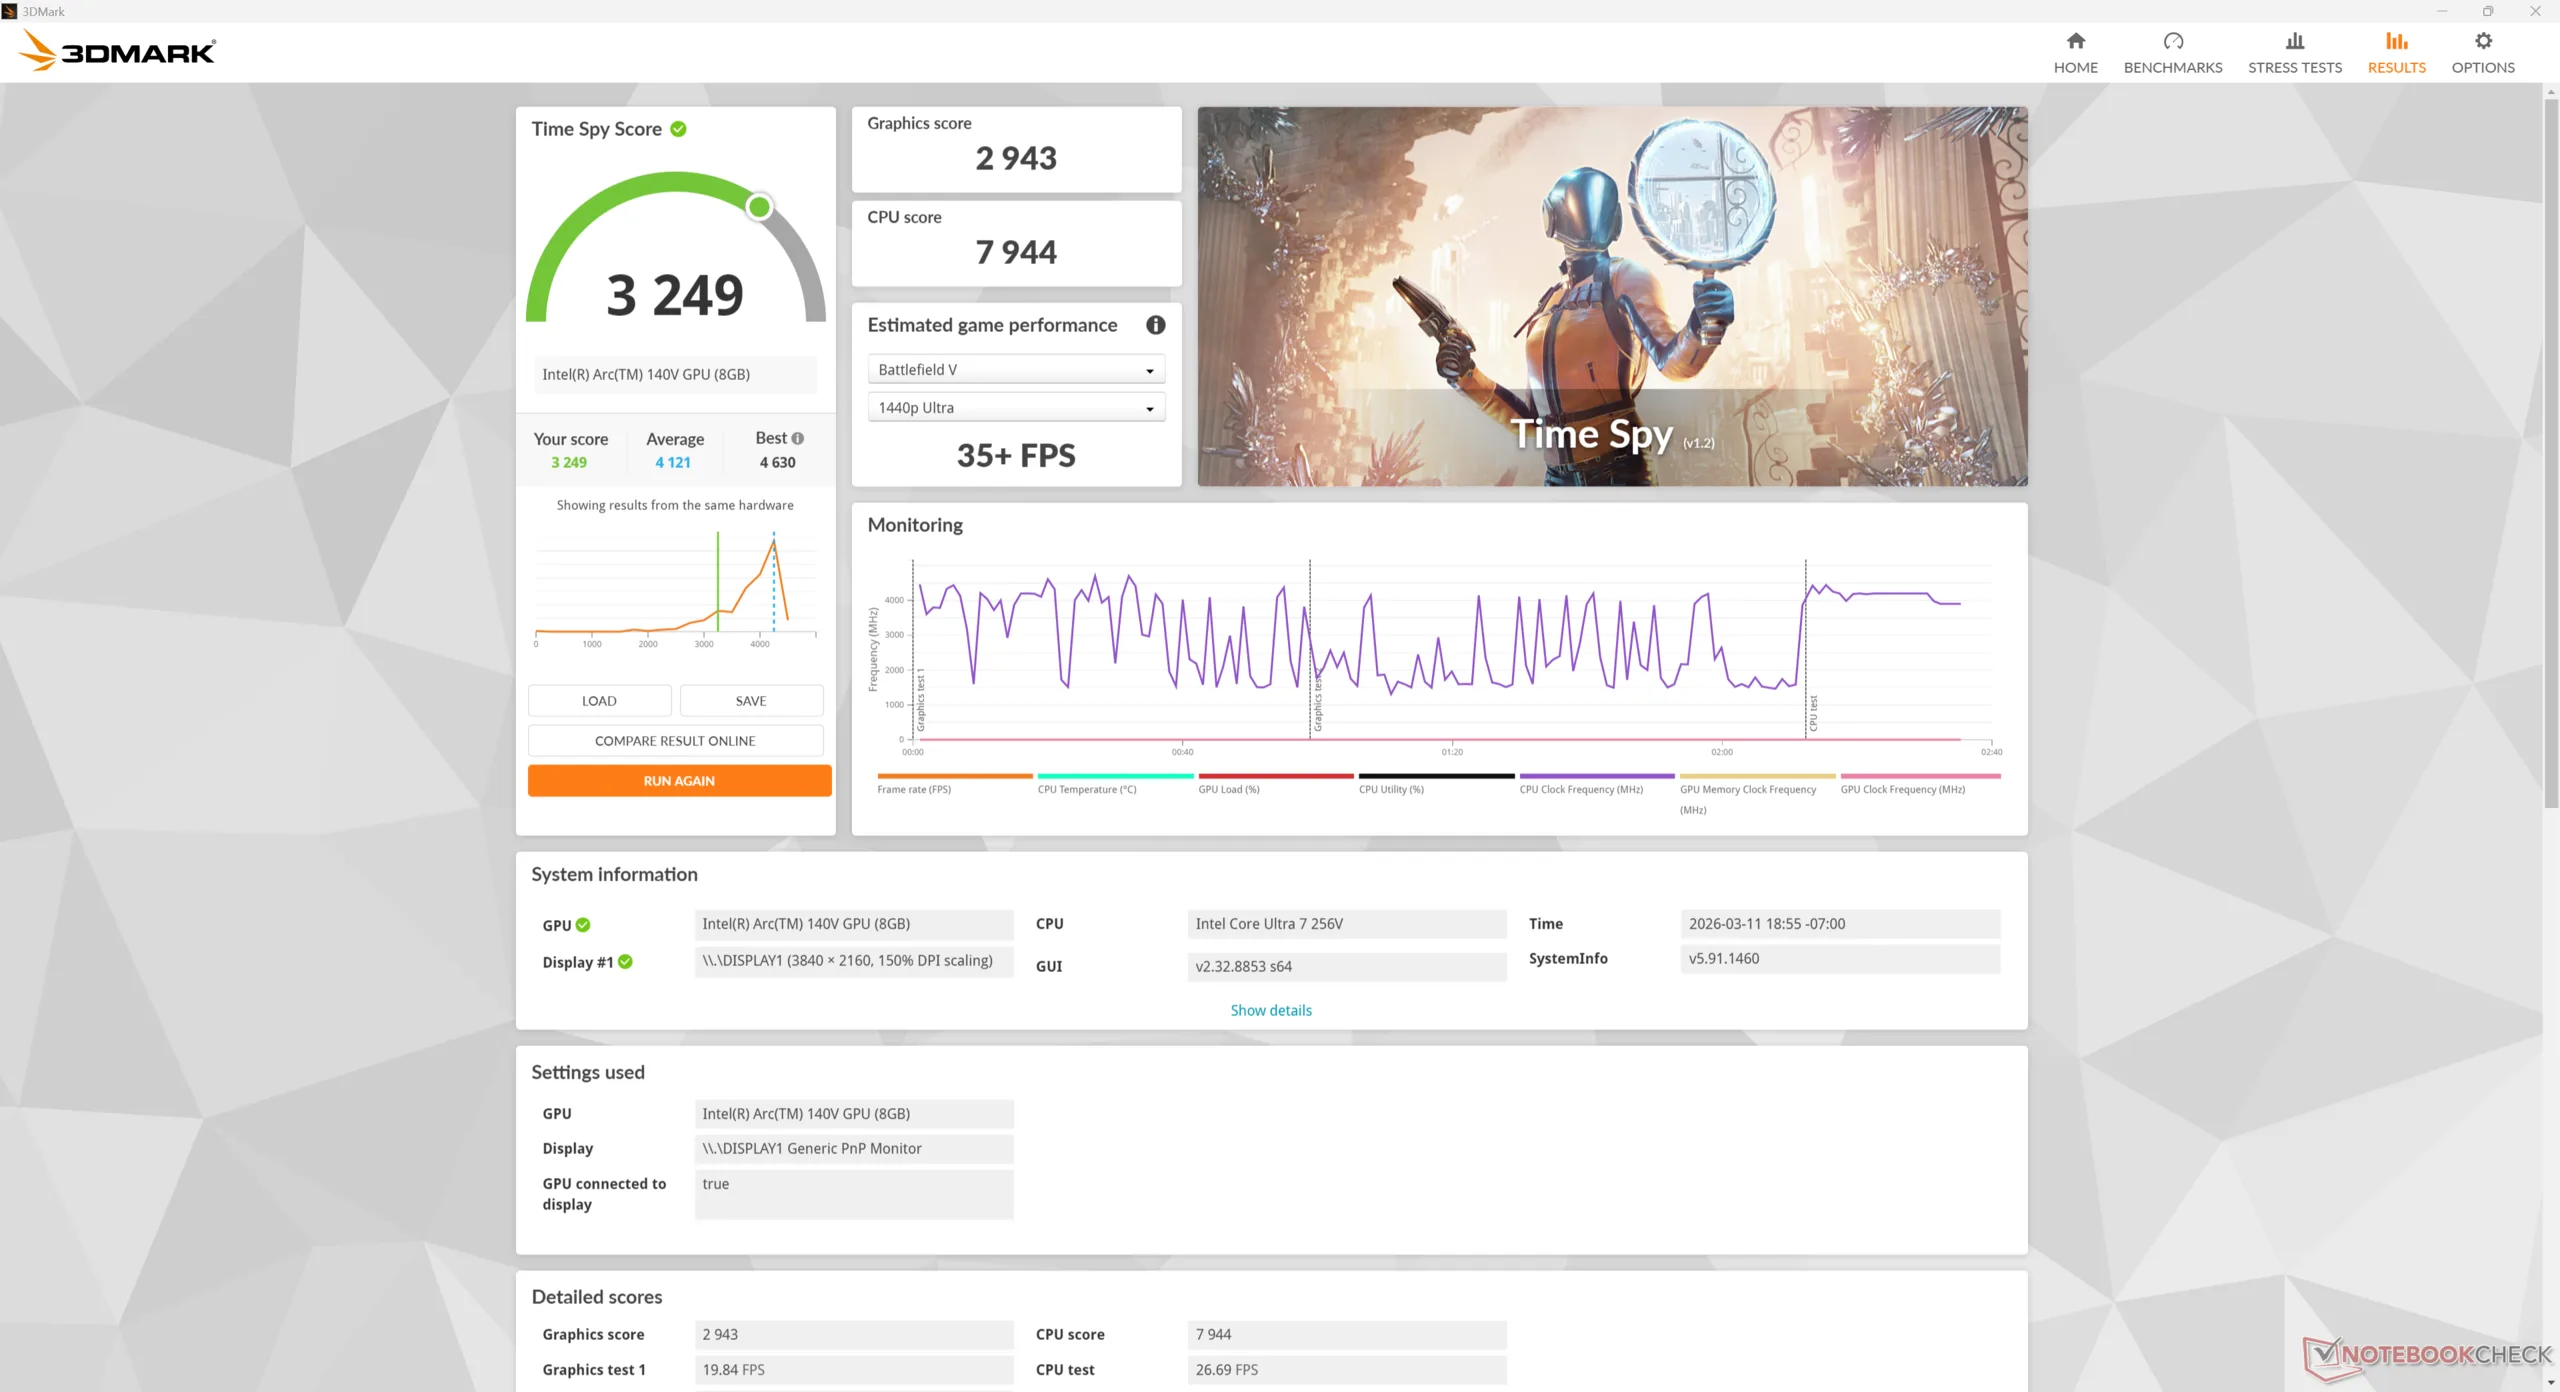
| 3DMark 11 Performance | 10298 points | |
| 3DMark Cloud Gate Standard Score | 27787 points | |
| 3DMark Fire Strike Score | 6956 points | |
| 3DMark Time Spy Score | 3249 points | |
Aide | ||
* ... Moindre est la valeur, meilleures sont les performances
| Performance rating - Percent | |
| Asus NUC 15 Pro+ | |
| Beelink SER9 Pro | |
| GMK NucBox K12 | |
| GMK EVO-T1 -1! | |
| MSI Cubi NUC AI+ 2MG | |
| GMK NucBox K13 | |
| Cyberpunk 2077 - 1920x1080 Ultra Preset (FSR off) | |
| Asus NUC 15 Pro+ | |
| GMK EVO-T1 | |
| GMK NucBox K12 | |
| Beelink SER9 Pro | |
| GMK NucBox K13 | |
| MSI Cubi NUC AI+ 2MG | |
| Baldur's Gate 3 - 1920x1080 Ultra Preset AA:T | |
| Beelink SER9 Pro | |
| GMK NucBox K12 | |
| MSI Cubi NUC AI+ 2MG | |
| Asus NUC 15 Pro+ | |
| GMK NucBox K13 | |
| GMK EVO-T1 | |
| GTA V - 1920x1080 Highest AA:4xMSAA + FX AF:16x | |
| Beelink SER9 Pro | |
| GMK NucBox K12 | |
| MSI Cubi NUC AI+ 2MG | |
| GMK NucBox K13 | |
| Asus NUC 15 Pro+ | |
| GMK EVO-T1 | |
| Final Fantasy XV Benchmark - 1920x1080 High Quality | |
| GMK EVO-T1 | |
| Asus NUC 15 Pro+ | |
| Beelink SER9 Pro | |
| MSI Cubi NUC AI+ 2MG | |
| GMK NucBox K13 | |
| GMK NucBox K12 | |
| Strange Brigade - 1920x1080 ultra AA:ultra AF:16 | |
| MSI Cubi NUC AI+ 2MG | |
| Asus NUC 15 Pro+ | |
| GMK NucBox K13 | |
| Beelink SER9 Pro | |
| GMK NucBox K12 | |
| Dota 2 Reborn - 1920x1080 ultra (3/3) best looking | |
| Asus NUC 15 Pro+ | |
| GMK NucBox K12 | |
| GMK EVO-T1 | |
| GMK NucBox K13 | |
| Beelink SER9 Pro | |
| MSI Cubi NUC AI+ 2MG | |
| X-Plane 11.11 - 1920x1080 high (fps_test=3) | |
| Asus NUC 15 Pro+ | |
| GMK EVO-T1 | |
| GMK NucBox K12 | |
| Beelink SER9 Pro | |
| MSI Cubi NUC AI+ 2MG | |
| GMK NucBox K13 | |
Cyberpunk 2077 ultra FPS Chart
| Bas | Moyen | Élevé | Ultra | |
|---|---|---|---|---|
| GTA V (2015) | 164.2 | 157.7 | 57.4 | 22.8 |
| Dota 2 Reborn (2015) | 104.5 | 88.7 | 68.9 | 78.5 |
| Final Fantasy XV Benchmark (2018) | 78.7 | 42.8 | 28.5 | |
| X-Plane 11.11 (2018) | 31.5 | 28.4 | 22.2 | |
| Strange Brigade (2018) | 231 | 83.5 | 65.8 | 54.5 |
| Baldur's Gate 3 (2023) | 36.6 | 30.6 | 26.5 | 25.8 |
| Cyberpunk 2077 (2023) | 38.4 | 30.2 | 23.7 | 21.7 |
| F1 24 (2024) | 76.8 | 78.4 | 58.7 | 17.2 |
Émissions
Bruit du système
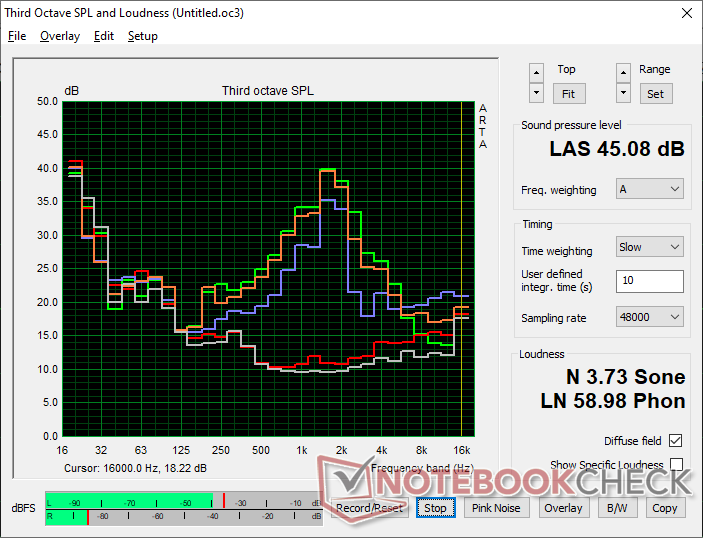
Le bruit du ventilateur est mitigé. Alors que le système est généralement silencieux lorsque vous naviguez sur Internet ou que vous exécutez d'autres tâches peu exigeantes, le bruit du ventilateur augmente rapidement pour atteindre plus de 40 dB(A) lorsque vous exécutez des applications plus intenses telles que des jeux. De plus, le ventilateur émet des sons aigus, comme le montre notre graphique ci-dessous, ce qui signifie que tout changement de régime sera plus perceptible à l'oreille.
Degré de la nuisance sonore
| Au repos |
| 24.5 / 25 / 25.1 dB(A) |
| Fortement sollicité |
| 40.1 / 45.1 dB(A) |
 | ||
30 dB silencieux 40 dB(A) audible 50 dB(A) bruyant |
||
min: | ||
| GMK NucBox K13 Core Ultra 7 256V, Arc 140V | GMK NucBox K12 Ryzen 7 H 255, Radeon 780M | GMK EVO-T1 Ultra 9 285H, Arc 140T | Beelink SER9 Pro Ryzen 7 H 255, Radeon 780M | Asus NUC 15 Pro+ Ultra 9 285H, Arc 140T | MSI Cubi NUC AI+ 2MG Core Ultra 7 258V, Arc 140V | |
|---|---|---|---|---|---|---|
| Noise | -19% | -34% | -0% | -14% | -14% | |
| arrêt / environnement * (dB) | 23.3 | 23.5 -1% | 24.7 -6% | 23 1% | 25.3 -9% | 24.8 -6% |
| Idle Minimum * (dB) | 24.5 | 35.4 -44% | 38.7 -58% | 29.1 -19% | 25.4 -4% | 28 -14% |
| Idle Average * (dB) | 25 | 35.4 -42% | 38.8 -55% | 30.1 -20% | 25.5 -2% | 36.1 -44% |
| Idle Maximum * (dB) | 25.1 | 39 -55% | 38.9 -55% | 31.7 -26% | 37.3 -49% | 36.1 -44% |
| Load Average * (dB) | 40.1 | 42.4 -6% | 51.6 -29% | 33.7 16% | 44.4 -11% | 38.9 3% |
| Cyberpunk 2077 ultra * (dB) | 44.2 | 40.4 9% | 52 -18% | 33.8 24% | 46.2 -5% | 37 16% |
| Load Maximum * (dB) | 45.1 | 41.4 8% | 51.6 -14% | 35.2 22% | 52.7 -17% | 49.2 -9% |
| Witcher 3 ultra * (dB) | 38.7 | 47.7 |
* ... Moindre est la valeur, meilleures sont les performances
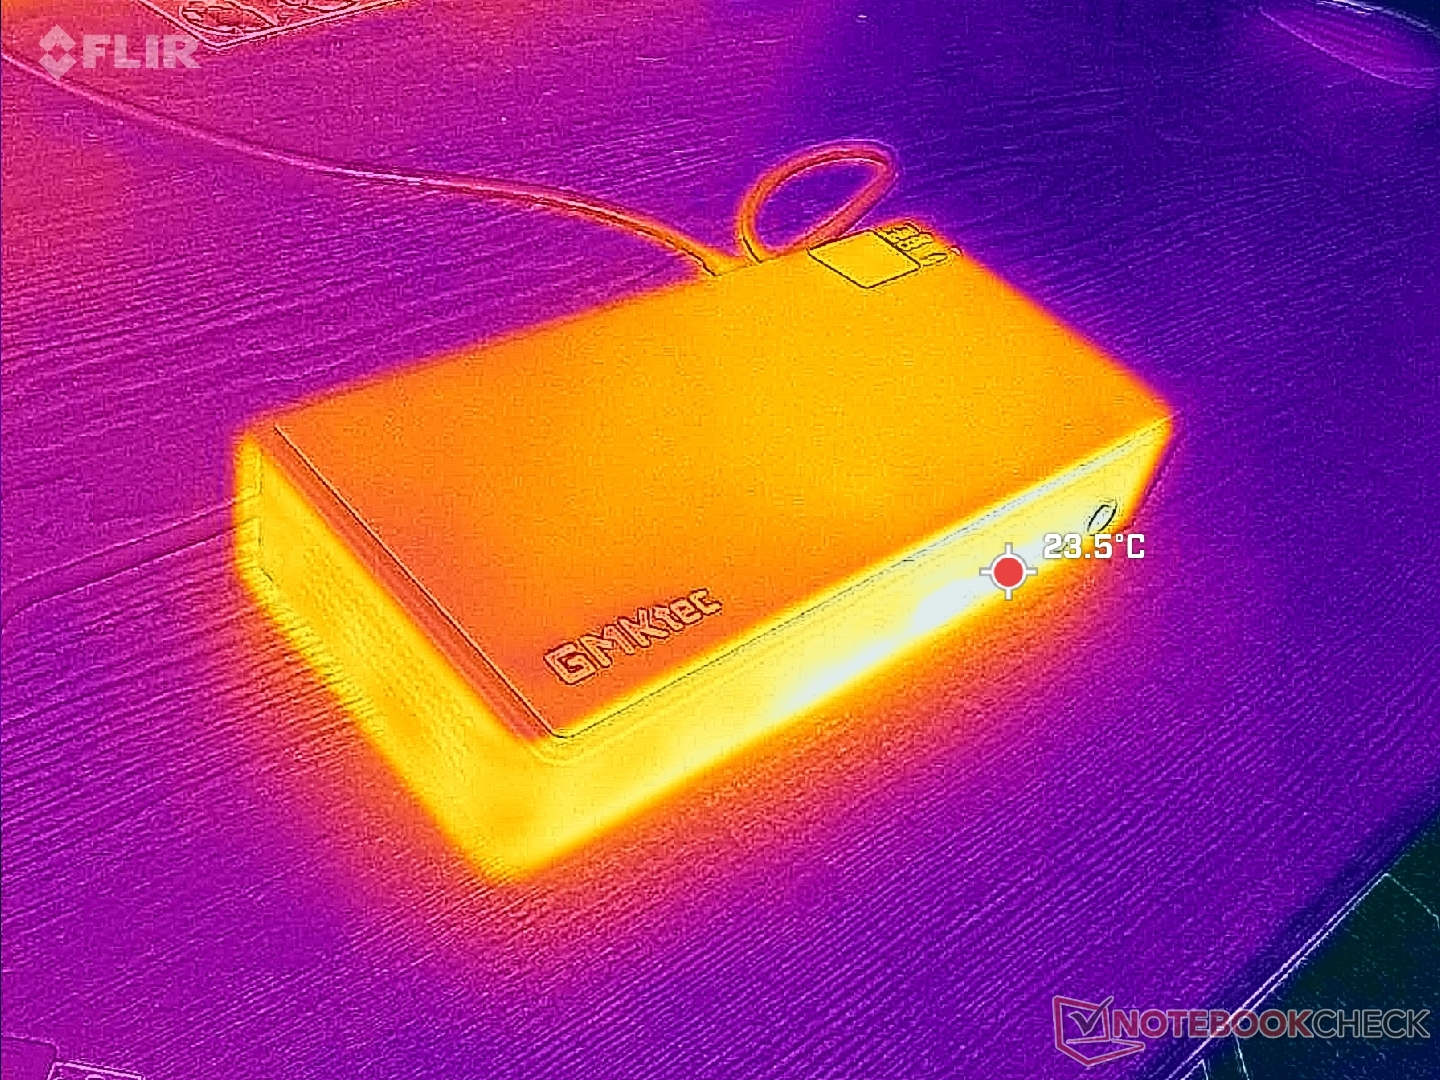
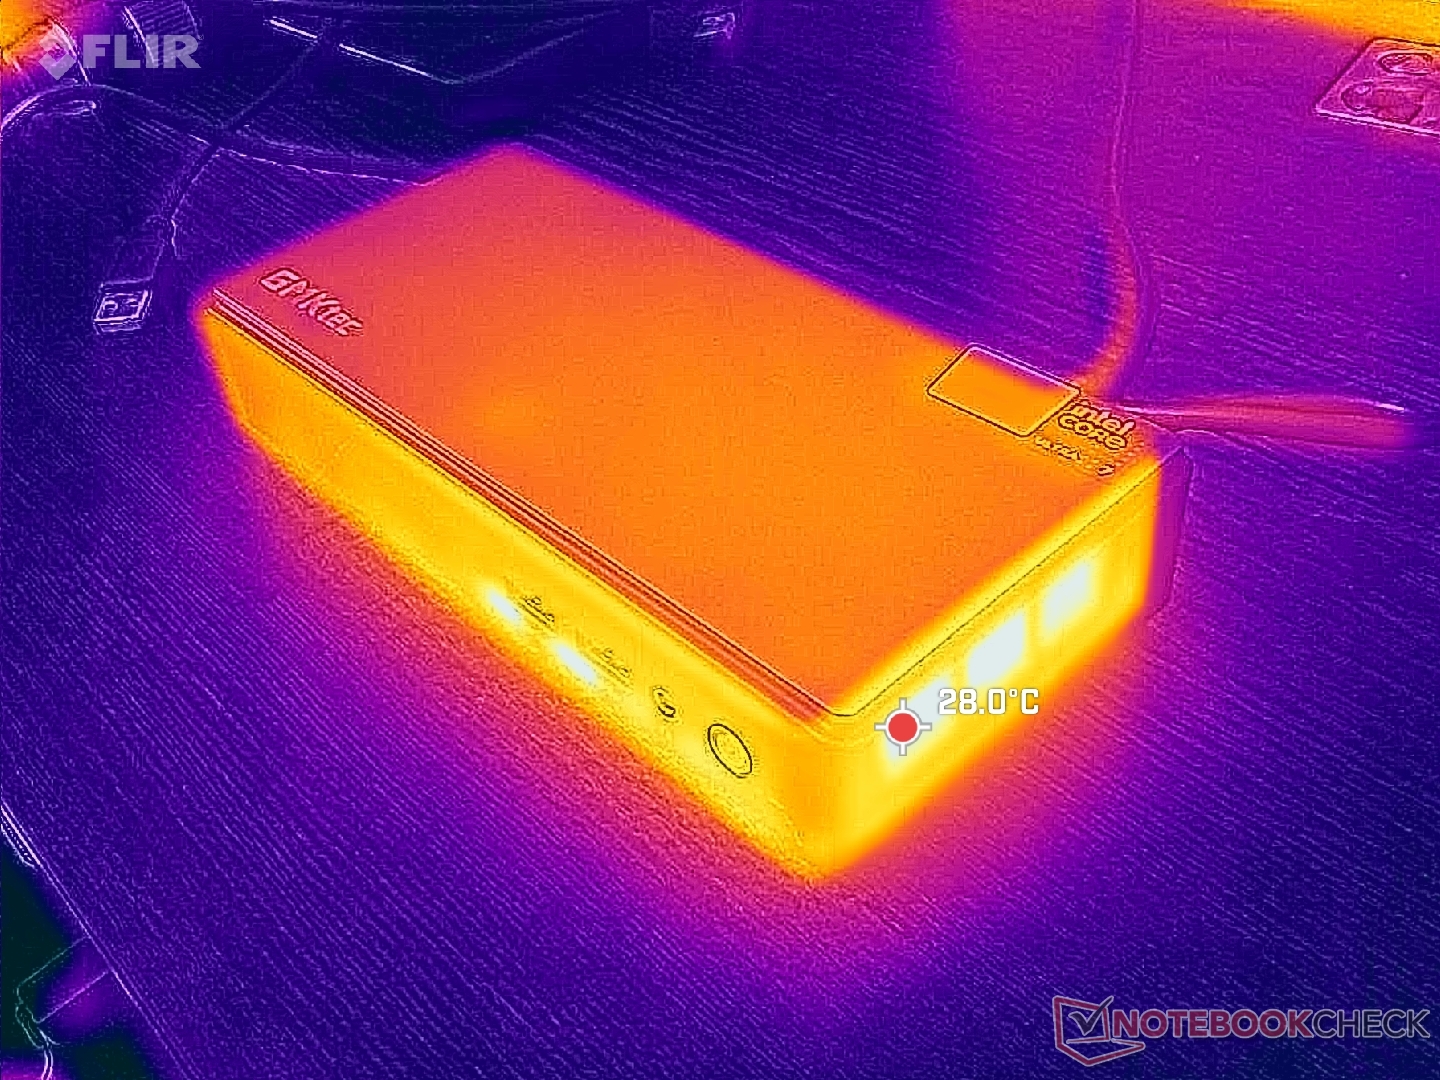
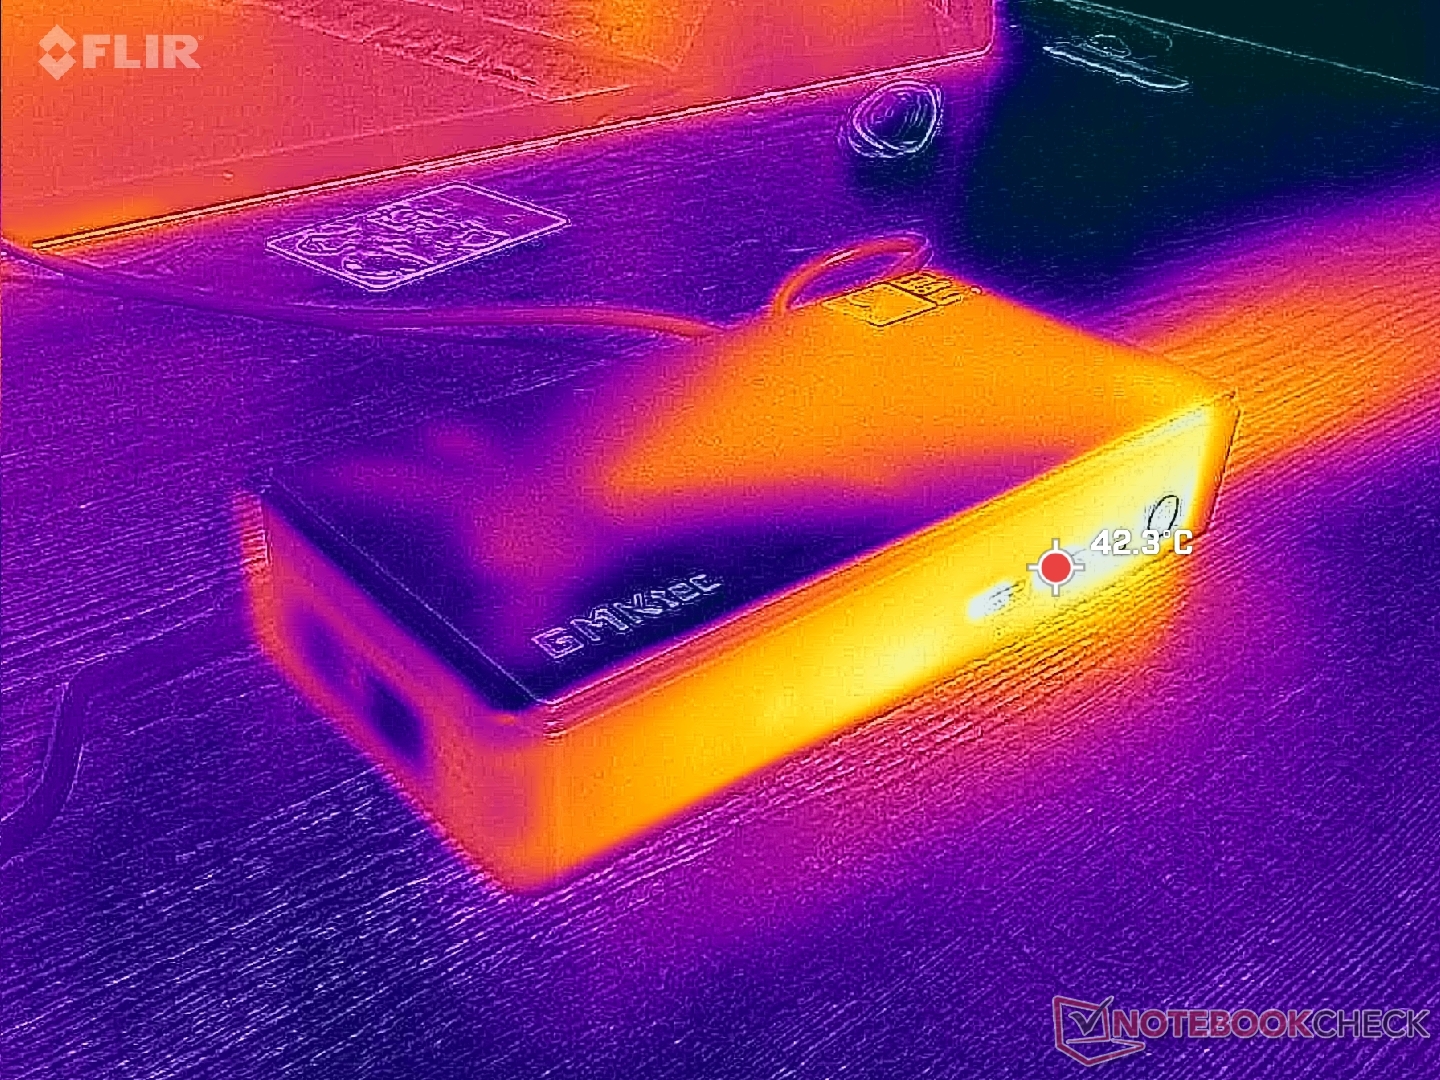
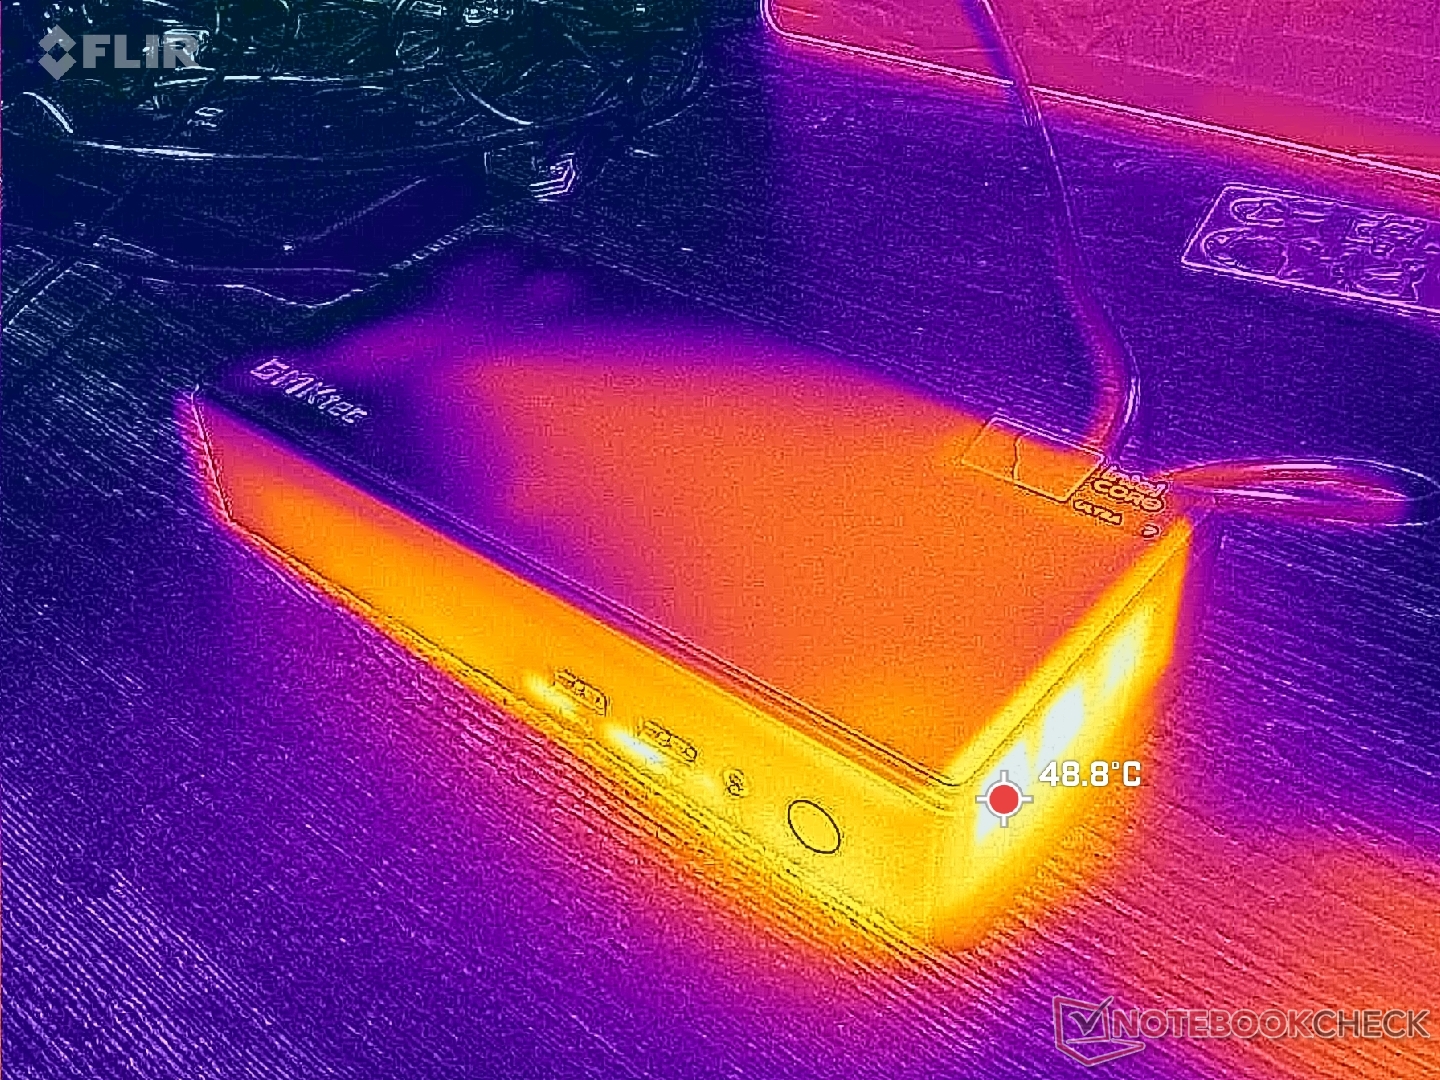
Température
La moitié droite du système sera toujours plus chaude que la moitié gauche en raison de la conception de la solution de refroidissement. La chaleur résiduelle s'échappe par le bord droit, comme le montrent les cartes de température ci-dessous, et il est donc important d'orienter correctement l'unité si elle est positionnée verticalement.
(+) La température maximale du côté supérieur est de 31.6 °C / 89 F, par rapport à la moyenne de 35.4 °C / 96 F, allant de 20.6 à 69.5 °C pour la classe Mini PC.
(-) Le fond chauffe jusqu'à un maximum de 50.6 °C / 123 F, contre une moyenne de 36.1 °C / 97 F
(+) En utilisation inactive, la température moyenne du côté supérieur est de 26.3 °C / 79 F, par rapport à la moyenne du dispositif de 32.1 °C / 90 F.
| GMK NucBox K13 Core Ultra 7 256V, Arc 140V | GMK NucBox K12 Ryzen 7 H 255, Radeon 780M | GMK EVO-T1 Ultra 9 285H, Arc 140T | Beelink SER9 Pro Ryzen 7 H 255, Radeon 780M | Asus NUC 15 Pro+ Ultra 9 285H, Arc 140T | MSI Cubi NUC AI+ 2MG Core Ultra 7 258V, Arc 140V | |
|---|---|---|---|---|---|---|
| Heat | 6% | -4% | 9% | -7% | 18% | |
| Maximum Upper Side * (°C) | 31.6 | 31.6 -0% | 36.4 -15% | 26.8 15% | 42.2 -34% | 30.8 3% |
| Maximum Bottom * (°C) | 50.6 | 35.8 29% | 48.5 4% | 31.3 38% | 26.4 48% | |
| Idle Upper Side * (°C) | 27 | 28.2 -4% | 29.6 -10% | 26.2 3% | 34.9 -29% | 26.4 2% |
| Idle Bottom * (°C) | 31.2 | 31.4 -1% | 30 4% | 32.2 -3% | 25.4 19% |
* ... Moindre est la valeur, meilleures sont les performances
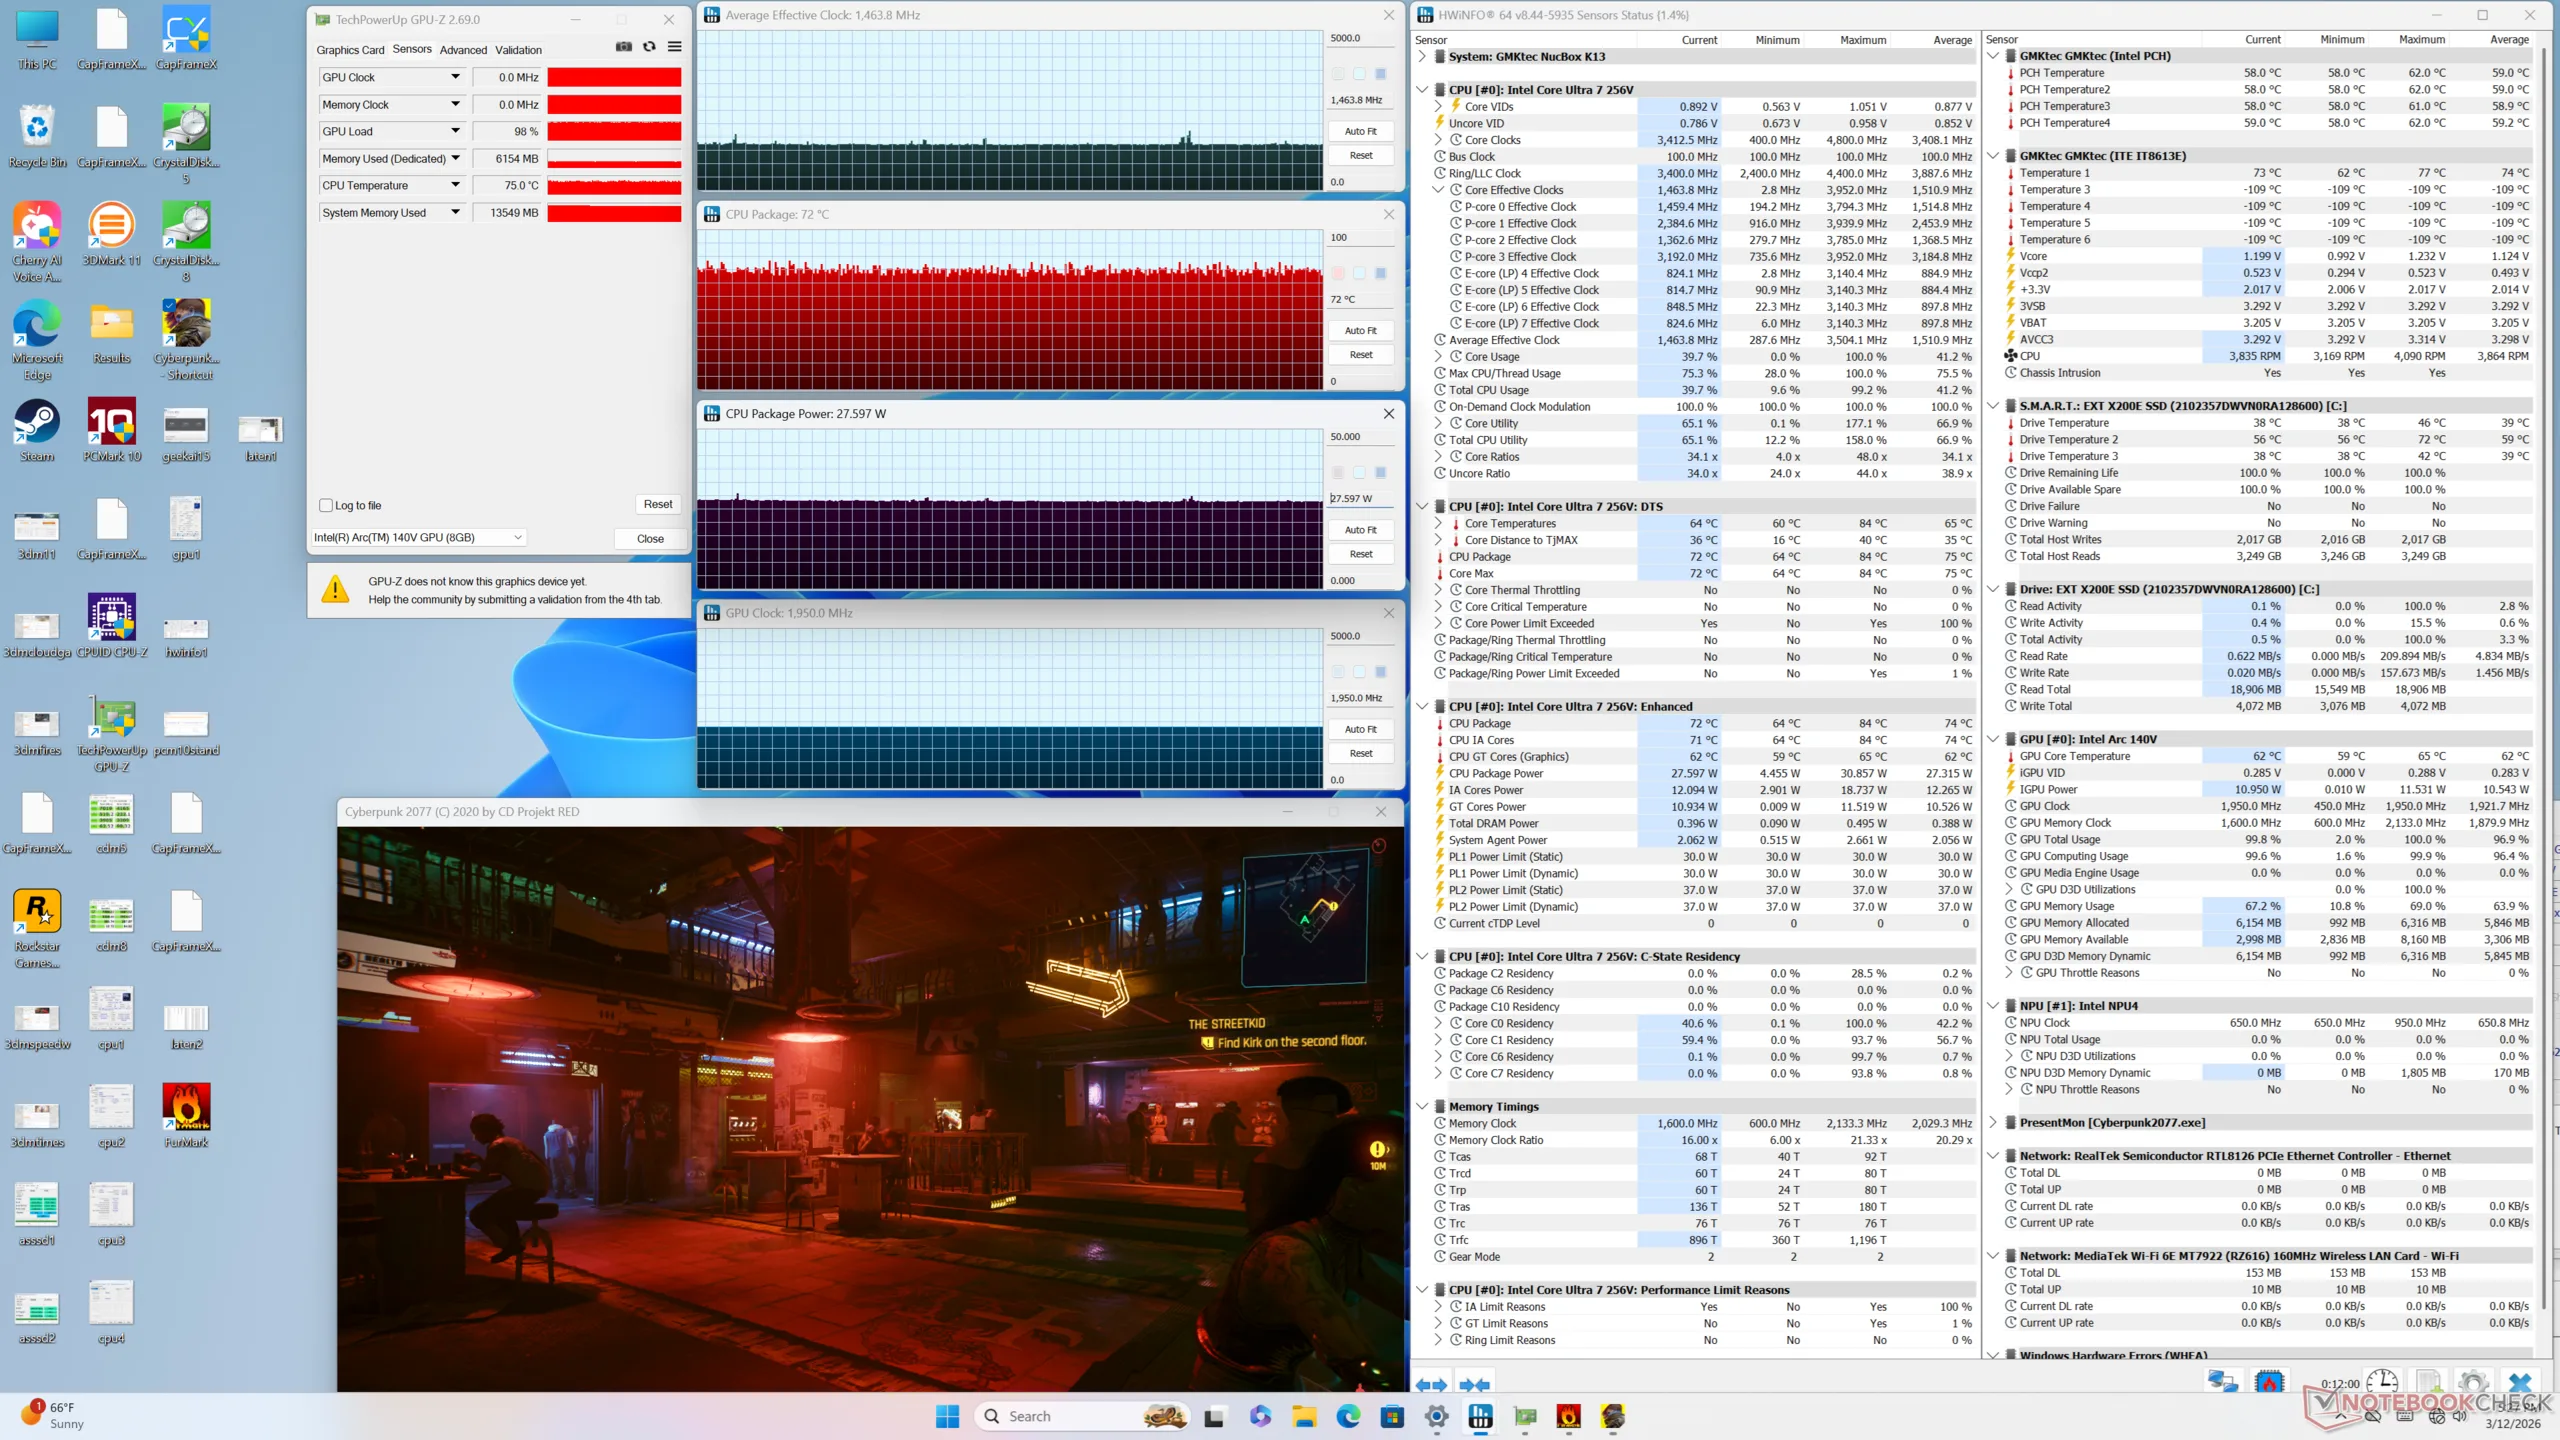
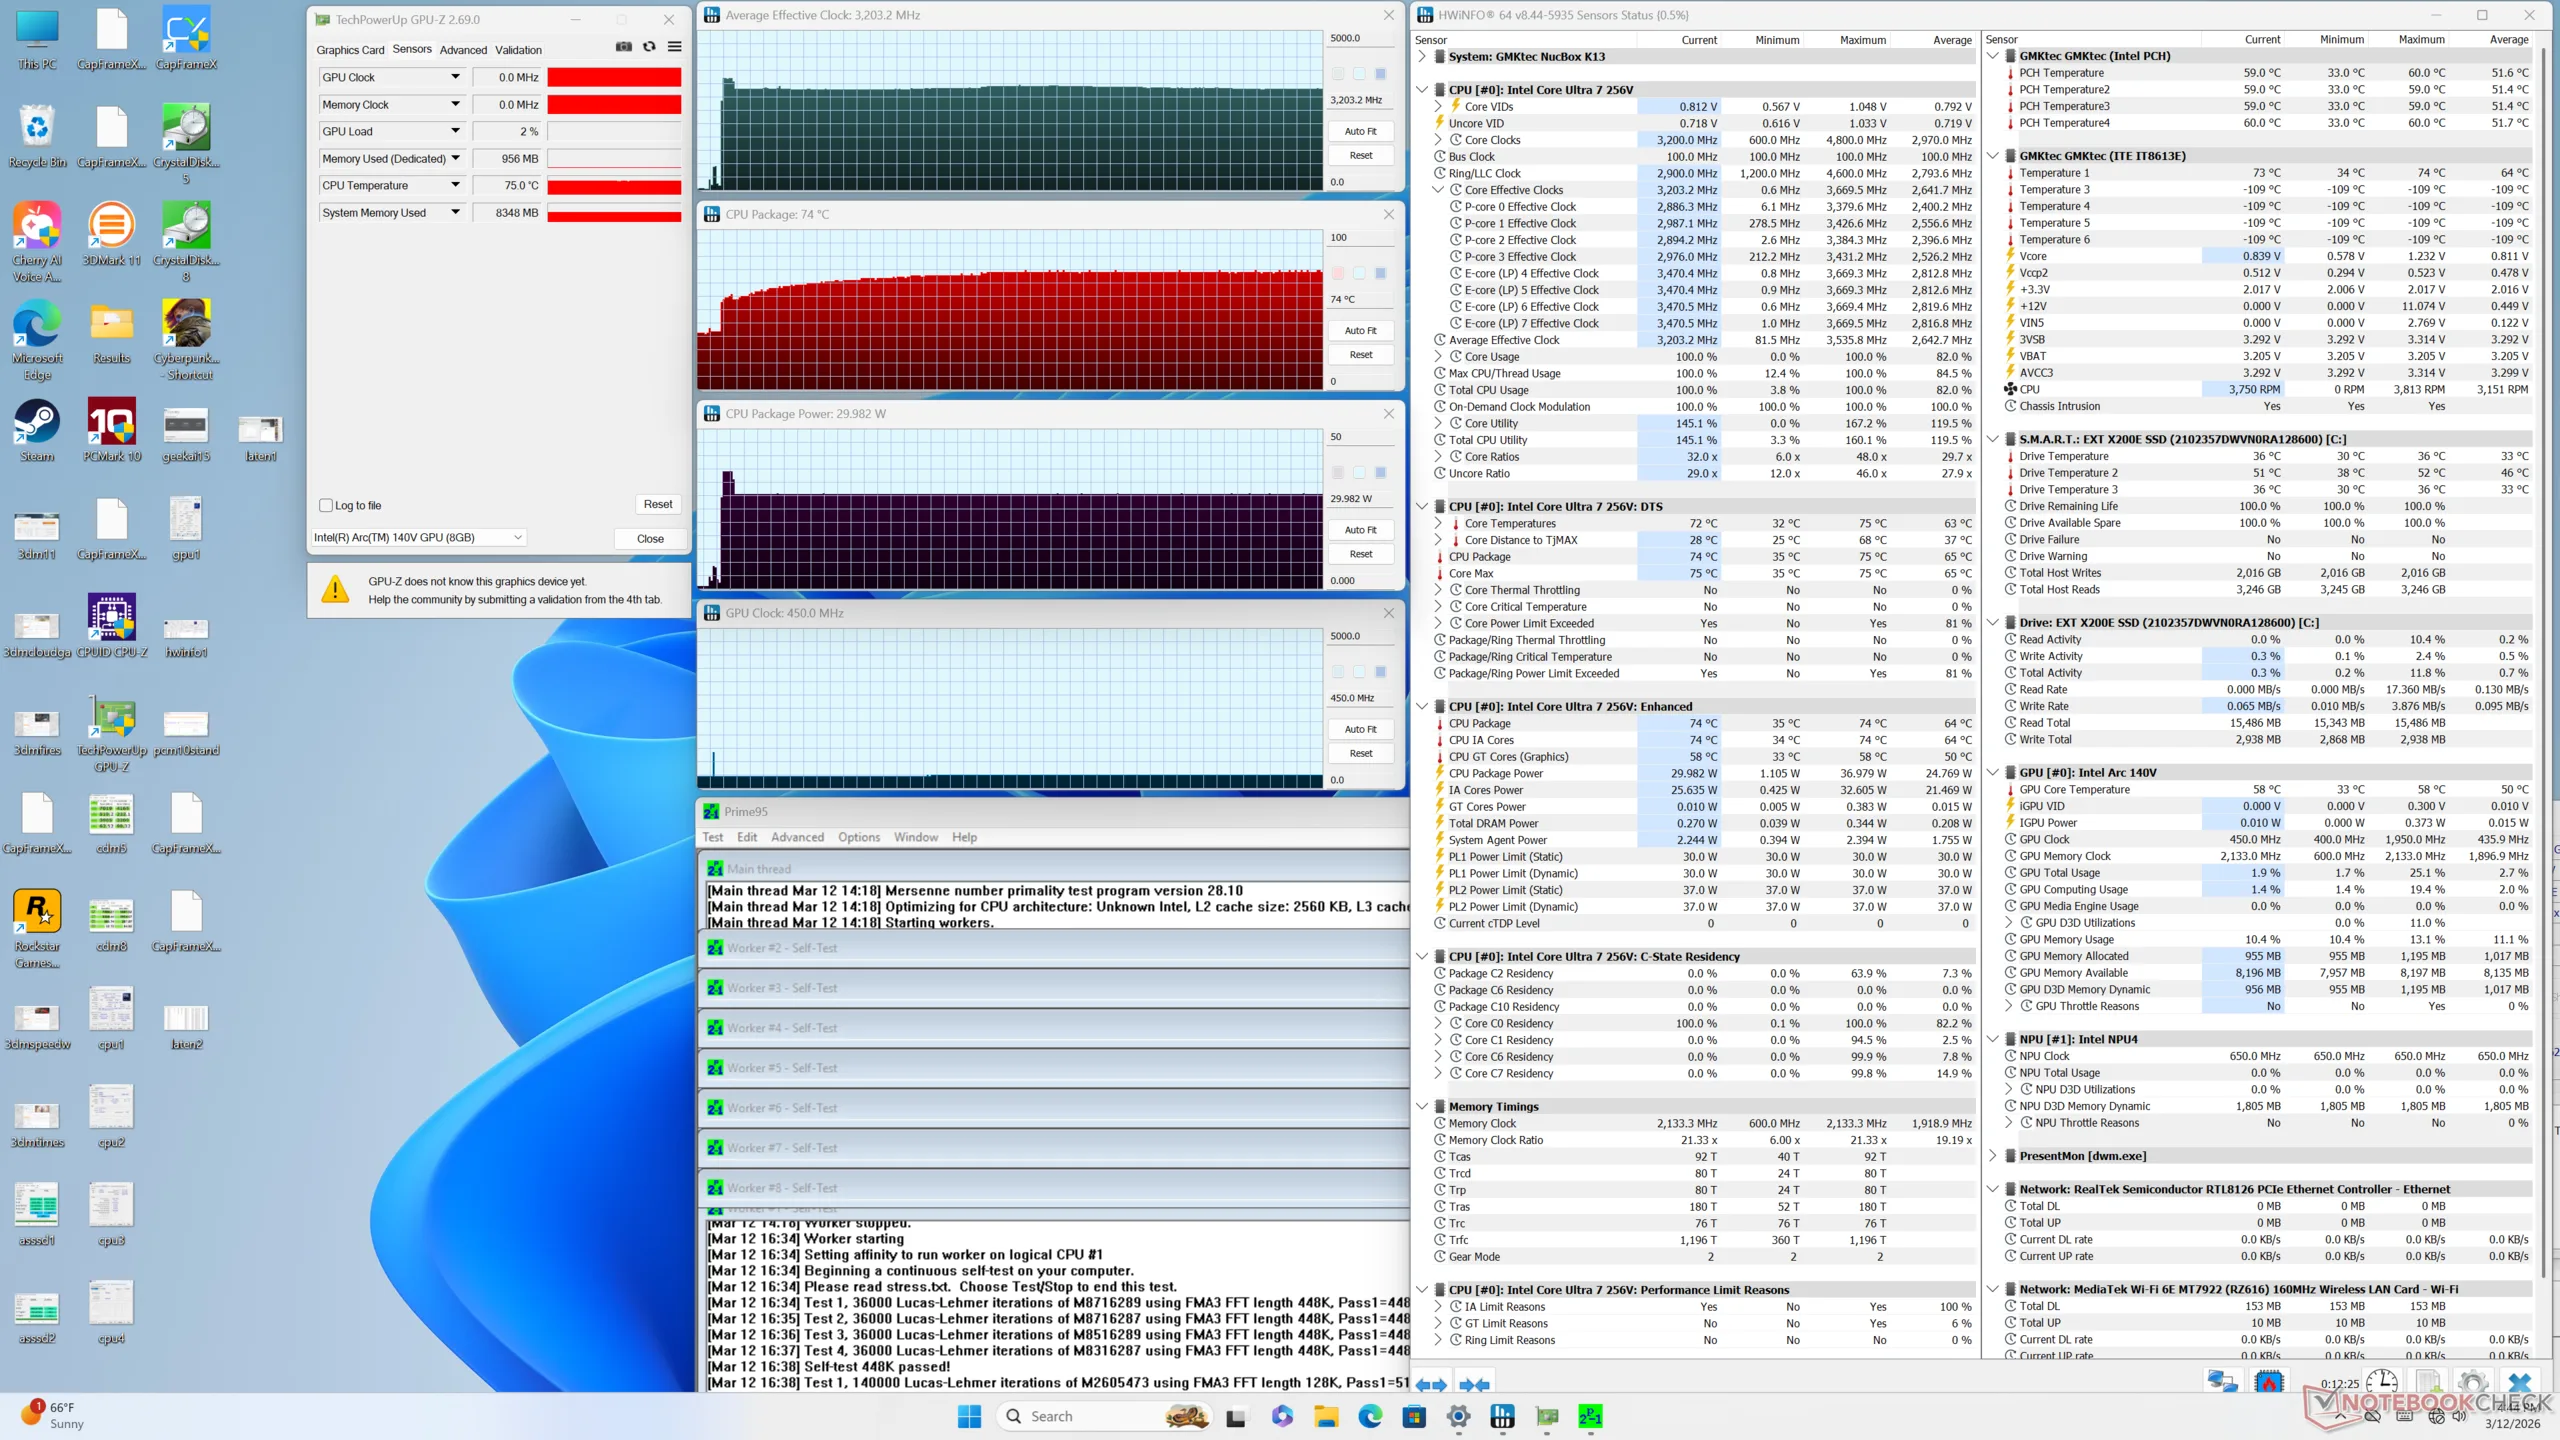
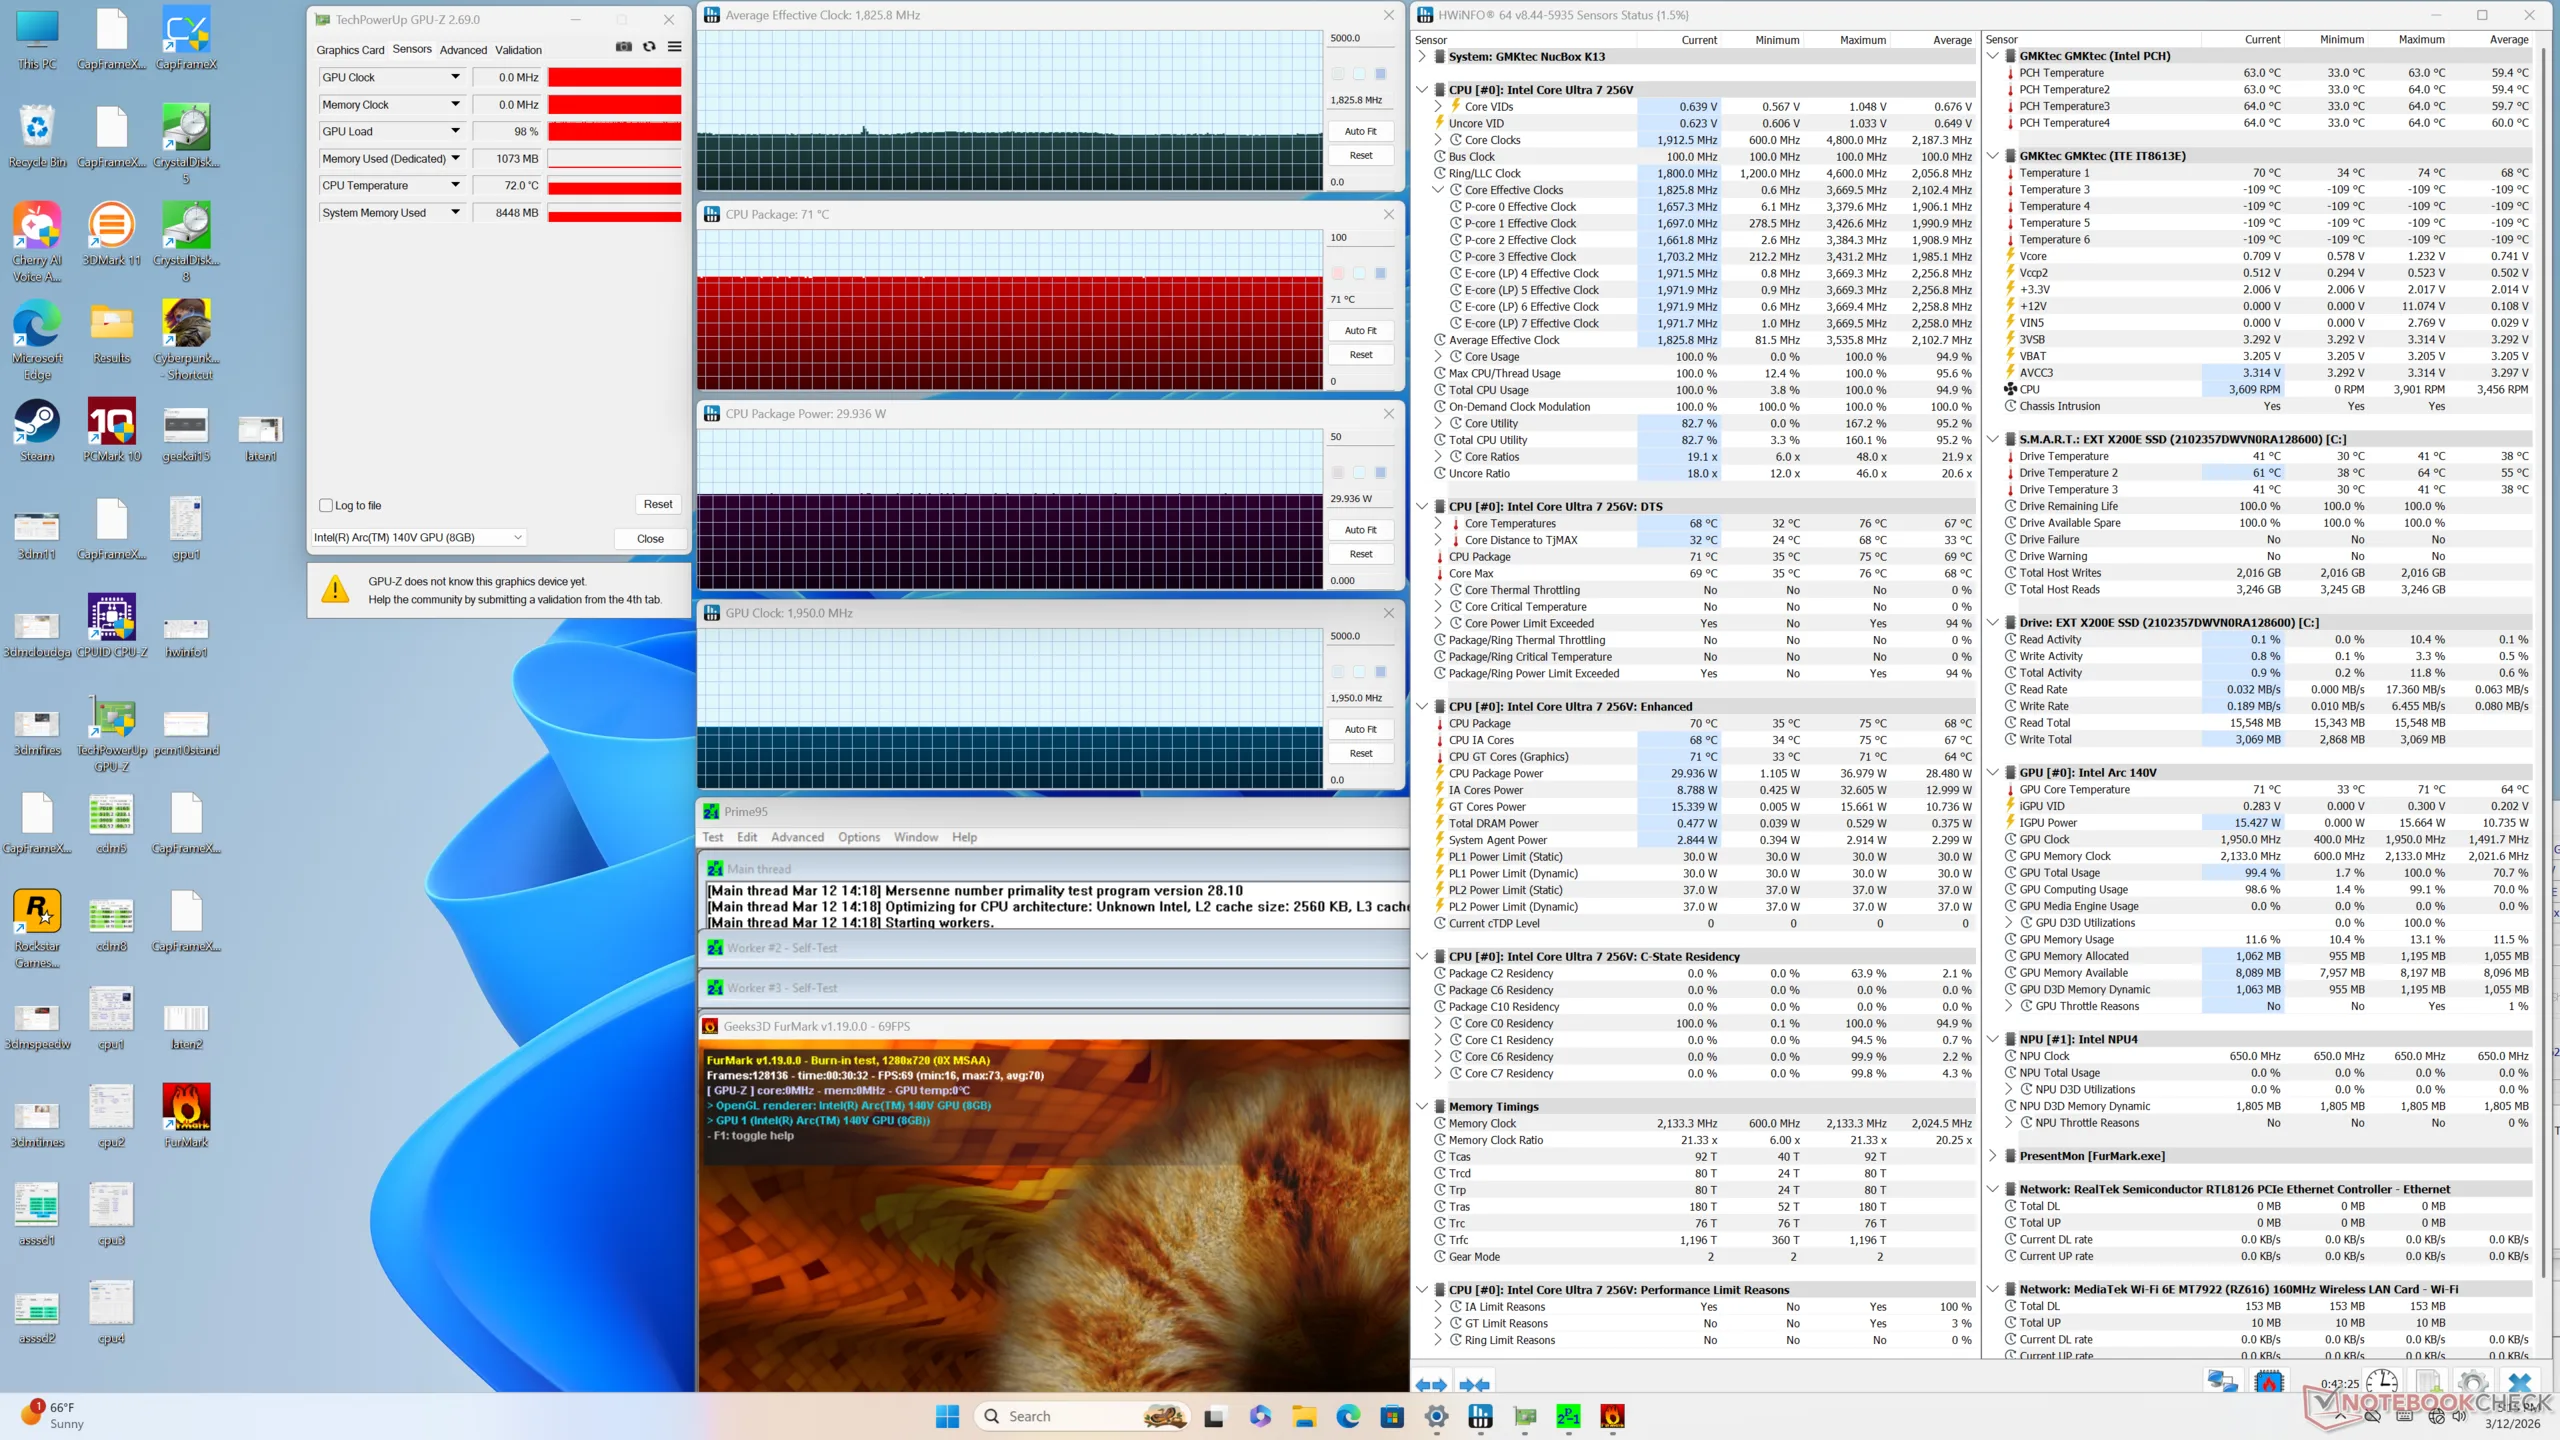
Test de stress
Lors de l'exécution de Prime95, le CPU atteignait 3,5 GHz et 37 W avant de redescendre rapidement à 3,2 GHz et 30 W quelques secondes plus tard, signe d'une durabilité limitée de Turbo Boost. La température du cœur plafonne à 70°C, ce qui est similaire à ce que nous avons observé sur le NucBox K12 malgré leurs différences de taille et de performance.
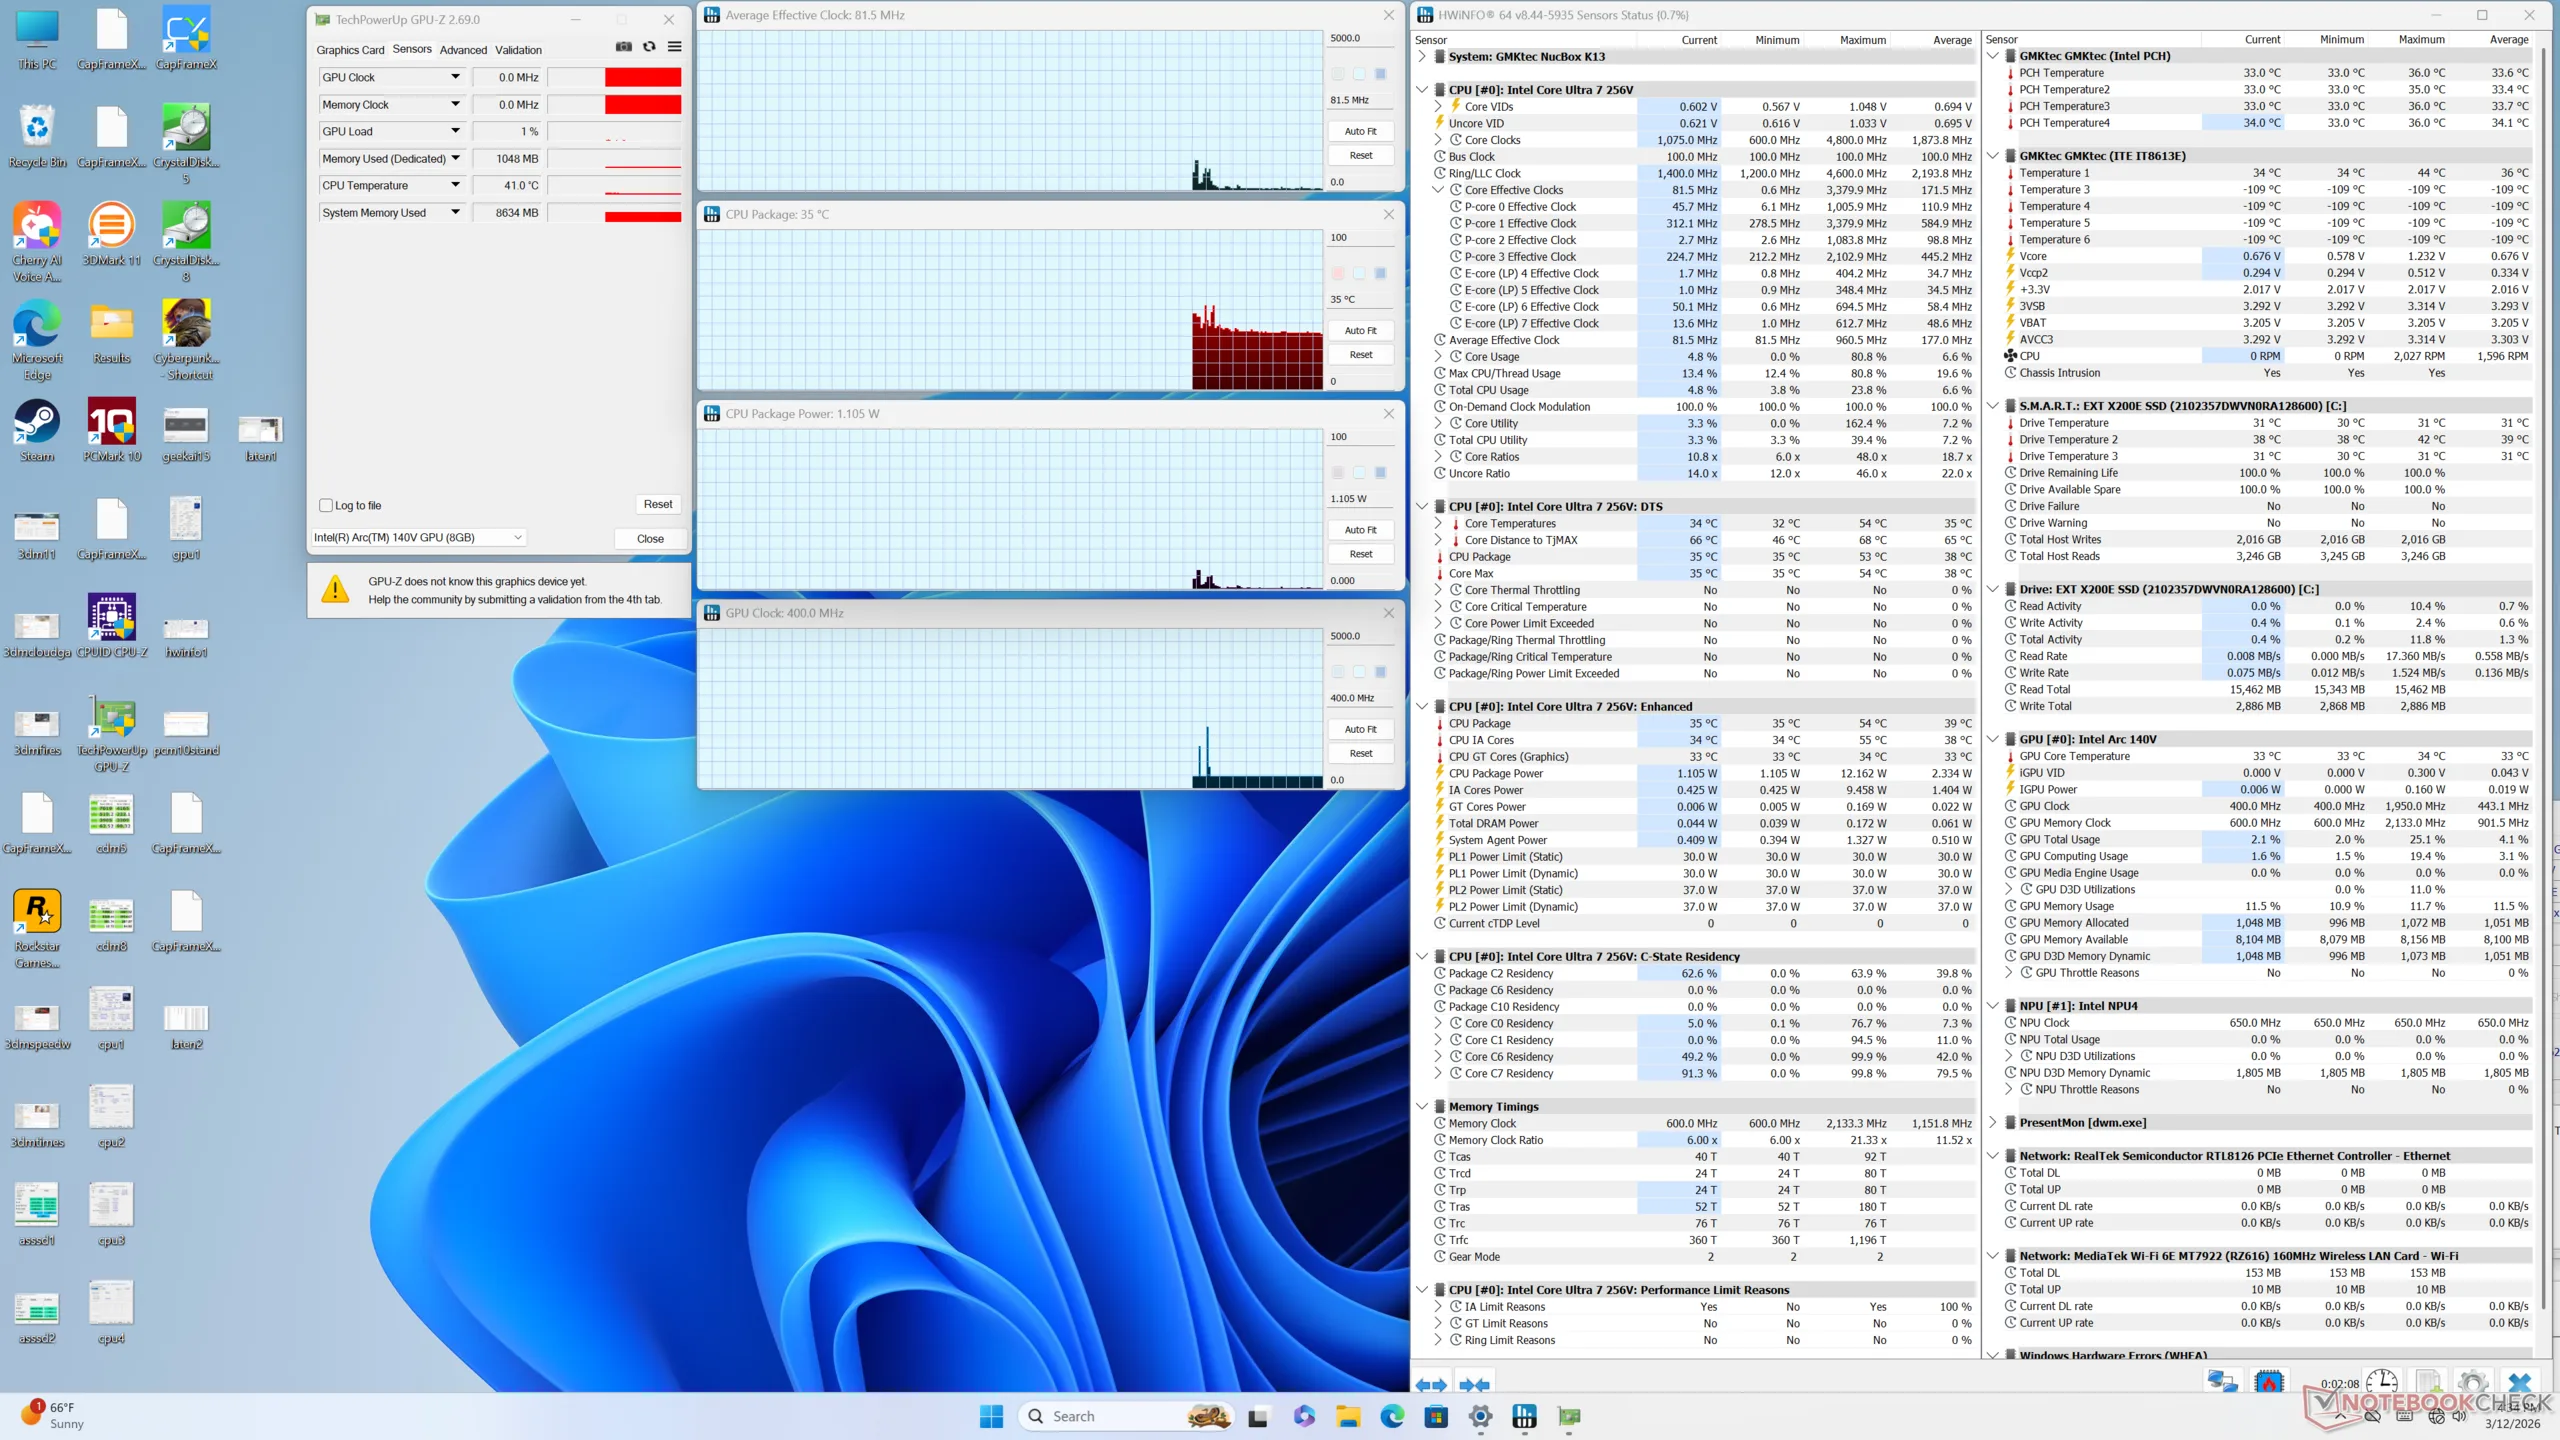
| Horloge du CPU (GHz) | Horloge du GPU (MHz) | Température moyenne du CPU (°C) | |
| Système au repos | -- | -- | 35 |
| Stress Prime95 | 3.2 | -- | 74 |
| Prime95 + FurMark Stress | 1.8 | 1950 | 71 |
| Cyberpunk 2077 Stress | 1.5 | 1950 | 72 |
Gestion de l'énergie
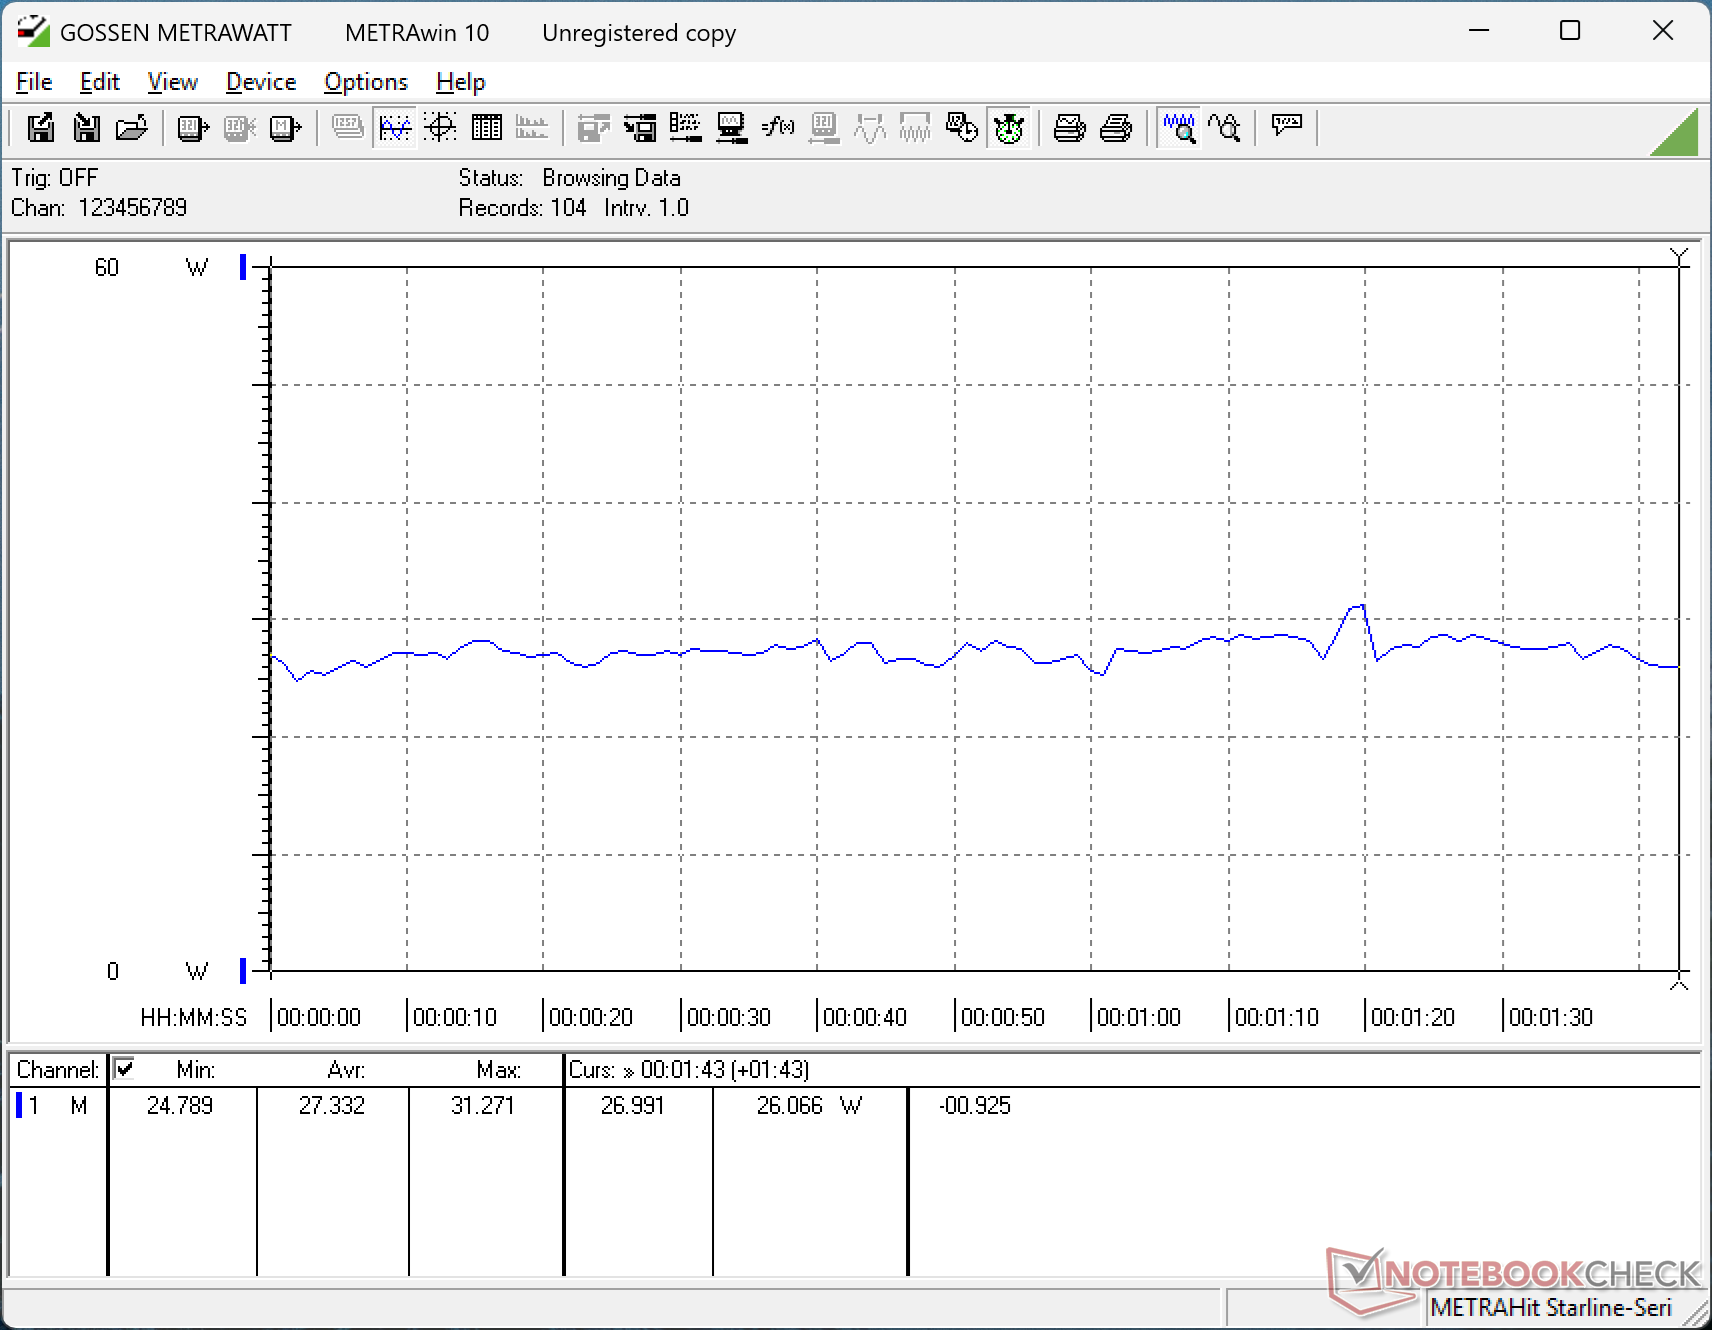
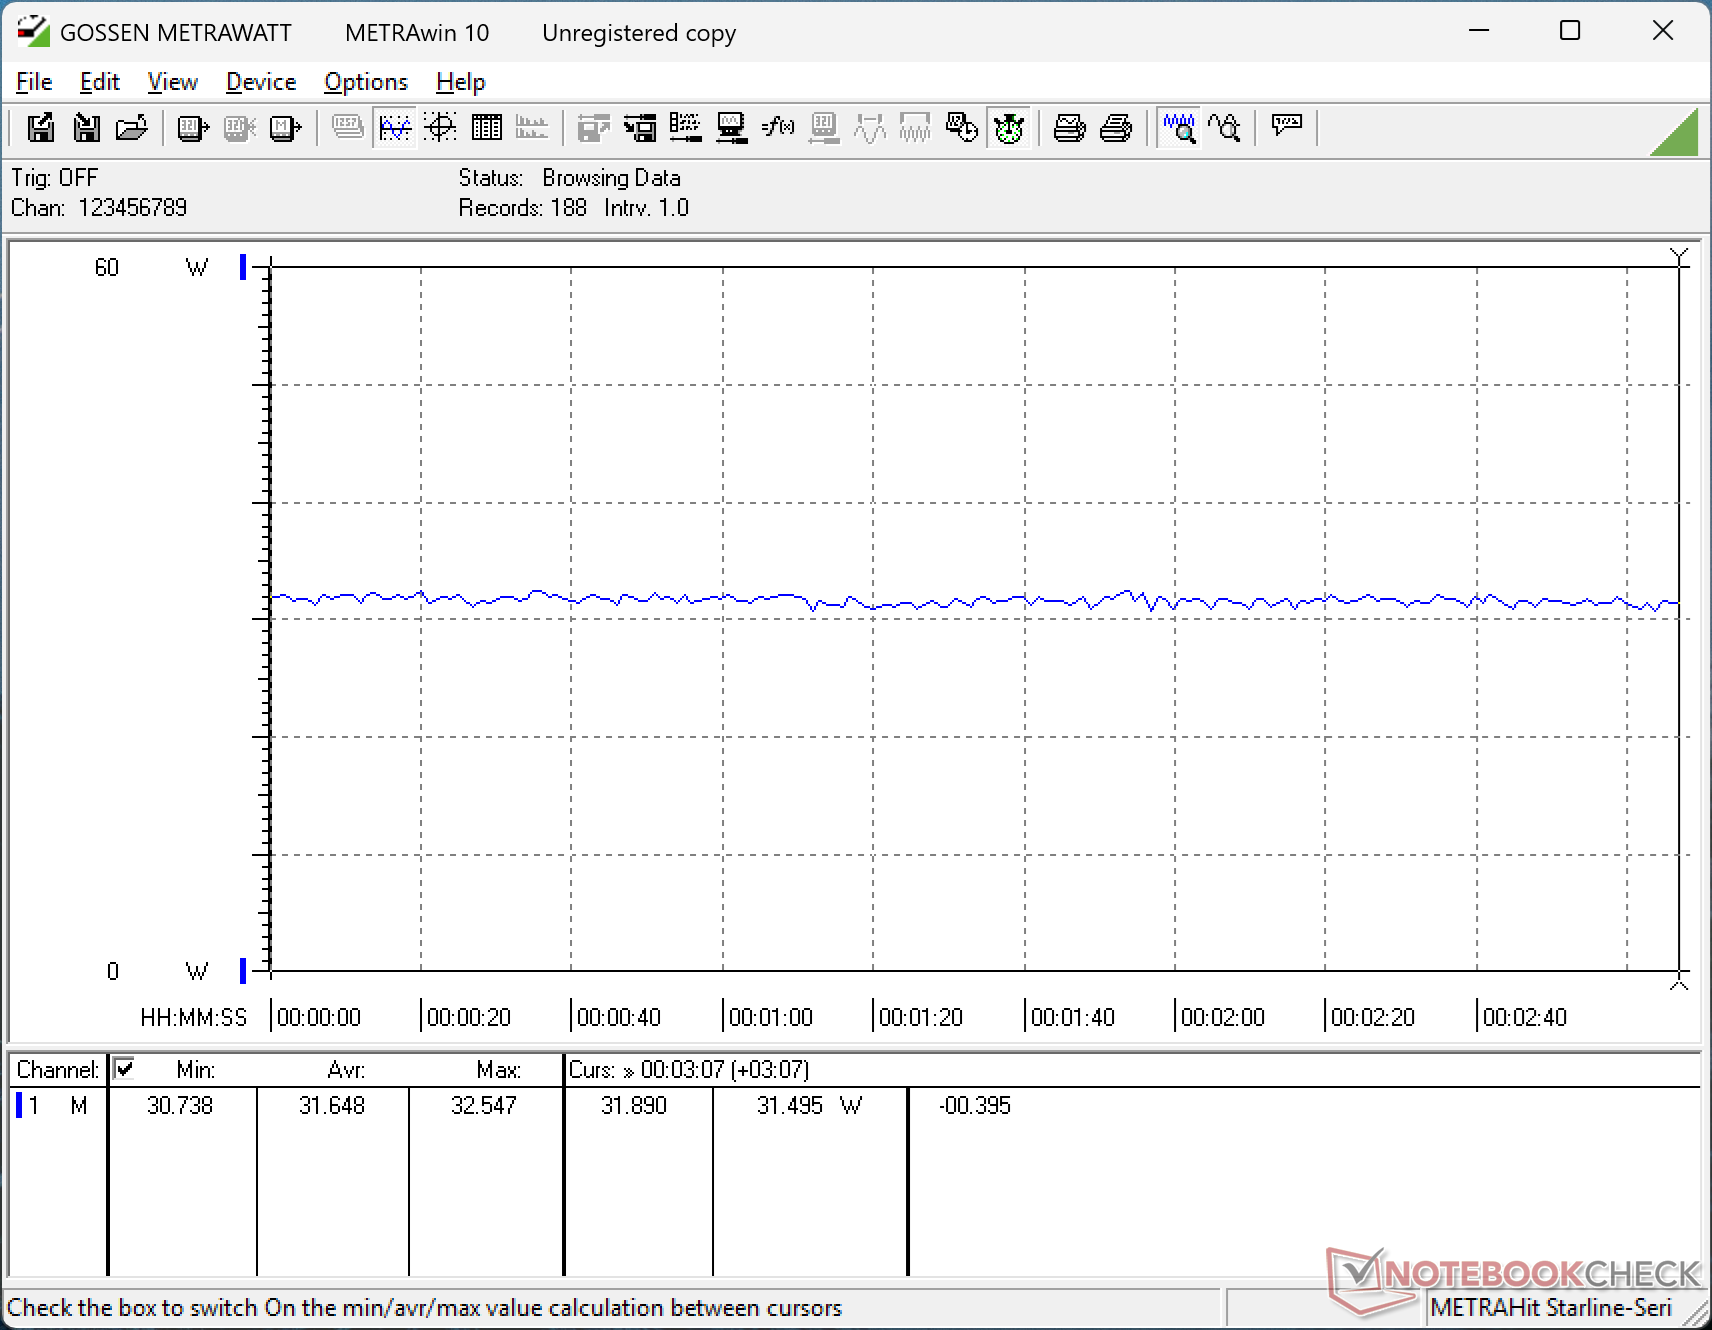
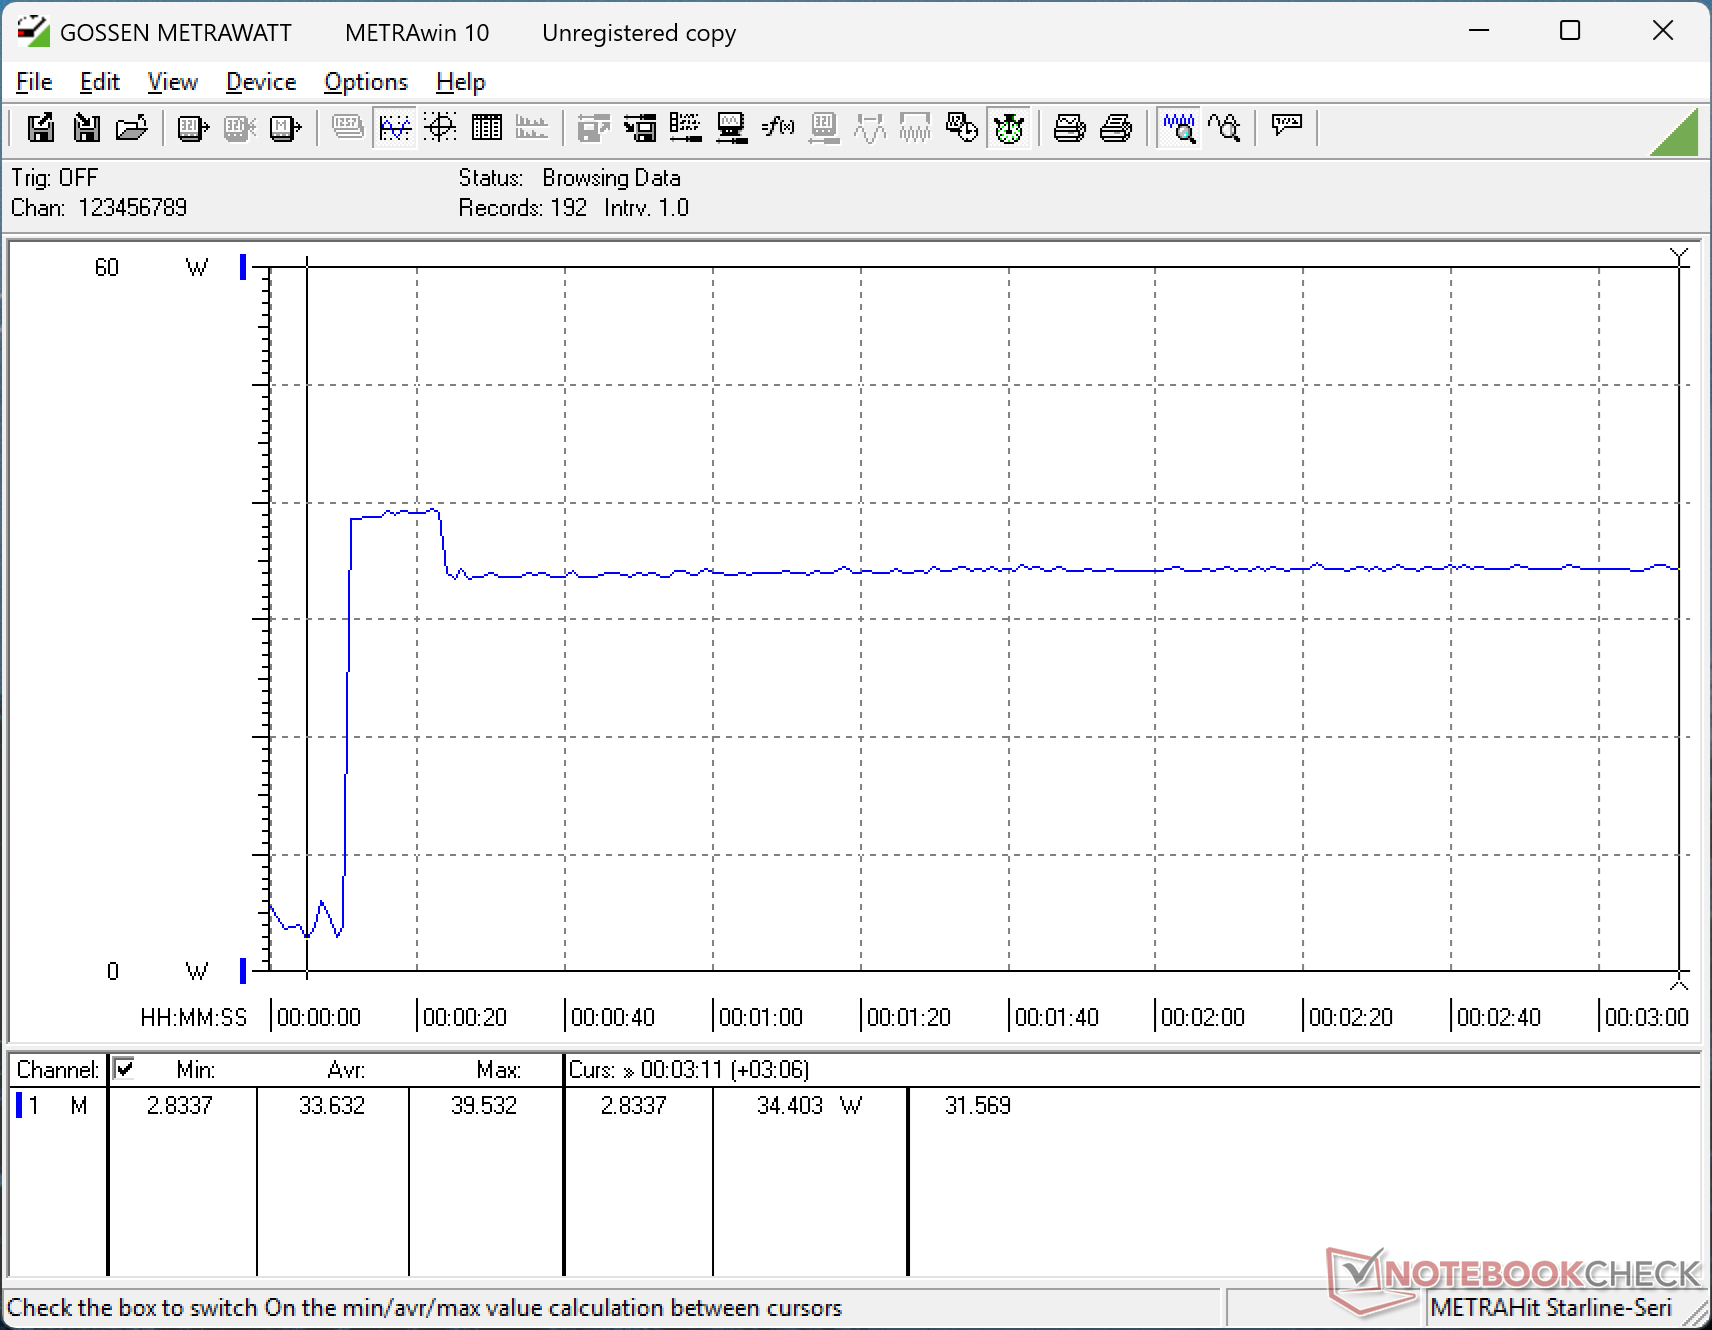
Consommation électrique
Lunar Lake-V est extrêmement efficace, comme le montrent les tableaux ci-dessous. Le système ne consomme que 32 W en moyenne lorsqu'il exécute Cyberpunk 2077, contre 86 W pour le NucBox K12 équipé d'une Radeon 780M. Bien que cette dernière soit plus rapide, elle n'est certainement pas 2x ou 3x plus rapide que notre solution Intel.
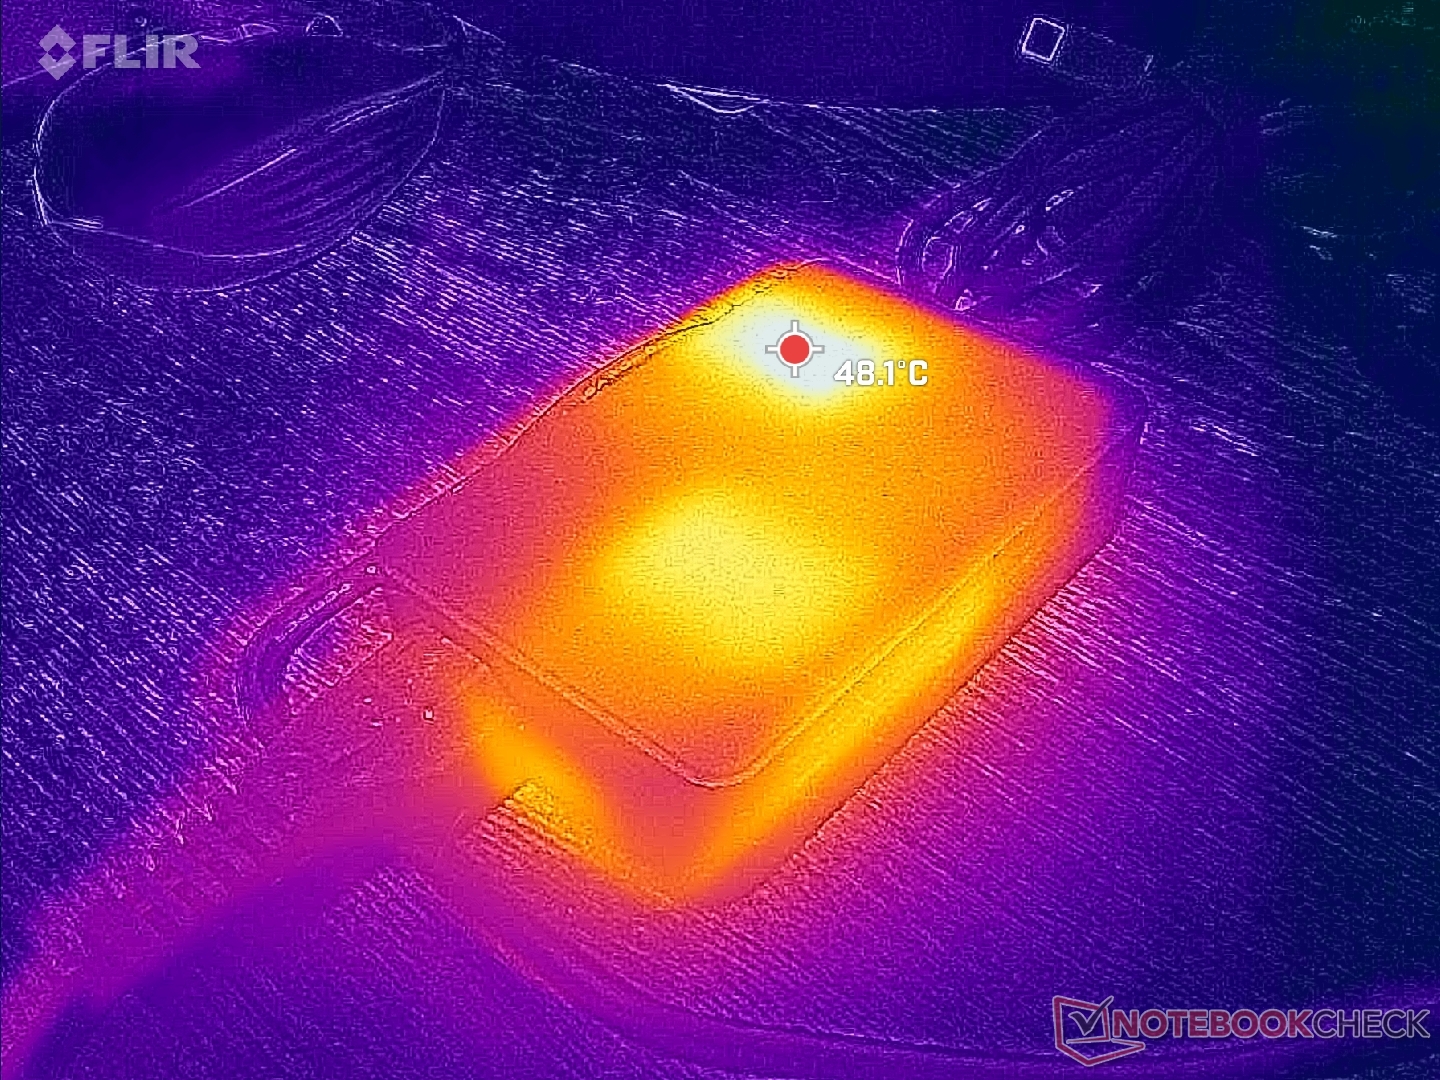
La brique d'alimentation de 100 W est assez compacte avec seulement ~9.9 x 6.3 x 2.3 cm.

| Éteint/en veille | |
| Au repos | |
| Fortement sollicité |
|
Légende:
min: | |
| GMK NucBox K13 Core Ultra 7 256V, Arc 140V, Huawei eKitStor Xtreme 200e 1 TB, , x, | GMK NucBox K12 Ryzen 7 H 255, Radeon 780M, Crucial P3 Plus CT1000P3PSSD8, , x, | GMK EVO-T1 Ultra 9 285H, Arc 140T, Crucial P3 Plus CT1000P3PSSD8, , x, | Beelink SER9 Pro Ryzen 7 H 255, Radeon 780M, Crucial P3 Plus CT1000P3PSSD8, , x, | Asus NUC 15 Pro+ Ultra 9 285H, Arc 140T, Micron 3500 1TB MTFDKBA1T0TGD, , x, | MSI Cubi NUC AI+ 2MG Core Ultra 7 258V, Arc 140V, Phison 1 TB ESR01TBTCCZ-27J, , x, | |
|---|---|---|---|---|---|---|
| Power Consumption | -183% | -141% | -120% | -116% | -47% | |
| Idle Minimum * (Watt) | 2.3 | 9.9 -330% | 6.1 -165% | 7 -204% | 3.9 -70% | 2.9 -26% |
| Idle Average * (Watt) | 3.6 | 10.1 -181% | 7.9 -119% | 7.1 -97% | 6.1 -69% | 5.7 -58% |
| Idle Maximum * (Watt) | 5.8 | 13.1 -126% | 13.2 -128% | 7.5 -29% | 8.2 -41% | 10.2 -76% |
| Load Average * (Watt) | 27.3 | 69.8 -156% | 60.7 -122% | 62.3 -128% | 56.1 -105% | 38.7 -42% |
| Cyberpunk 2077 ultra external monitor * (Watt) | 31.6 | 86.3 -173% | 67.4 -113% | 80.1 -153% | 63.9 -102% | 41.1 -30% |
| Load Maximum * (Watt) | 39.6 | 92.8 -134% | 117.1 -196% | 82.9 -109% | 160.6 -306% | 60 -52% |
* ... Moindre est la valeur, meilleures sont les performances
Consommation électrique Cyberpunk / Stress Test
Consommation électrique du moniteur externe
Notebookcheck Rating
La GMK NucBox K13, très compacte, équilibre très bien taille et performances, mais au prix d'un bruit de ventilateur plus fort et de quelques fonctions auxiliaires manquantes.
GMK NucBox K13
- 03/16/2026 v8
Allen Ngo
 Total Sustainability Score:
 Comparaison avec des concurrents potentiels
Image | Modèle | Prix | Poids | Épaisseur | Écran |
|---|---|---|---|---|---|
1. 77.4% 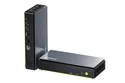 | GMK NucBox K13 Intel Core Ultra 7 256V ⎘ Intel Arc Graphics 140V ⎘ 16 Go Mémoire, 1024 Go SSD | Amazon: Prix de liste: 670 USD | 506 g | 36.6 mm | x |
2. 73.7% 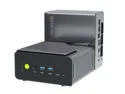 | GMK NucBox K12 AMD Ryzen 7 H 255 ⎘ AMD Radeon 780M ⎘ 32 Go Mémoire, 1024 Go SSD | Amazon: 1. $29.99 19V~20V Charger for GMKtec M... | 938 g | 78 mm | x |
3. 75.4%  | GMK EVO-T1 Intel Core Ultra 9 285H ⎘ Intel Arc Graphics 140T ⎘ 64 Go Mémoire, 1024 Go SSD | Amazon: Prix de liste: 999€ | 946 g | 73.6 mm | x |
4. 80.2% 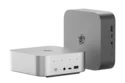 | Beelink SER9 Pro AMD Ryzen 7 H 255 ⎘ AMD Radeon 780M ⎘ 32 Go Mémoire, 1024 Go SSD | Amazon: Prix de liste: 520 USD | 812 g | 44.7 mm | x |
5. 77.5% 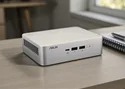 | Asus NUC 15 Pro+ Intel Core Ultra 9 285H ⎘ Intel Arc Graphics 140T ⎘ 32 Go Mémoire, 1024 Go SSD | Amazon: $1,230.00 Prix de liste: 991€ | 690 g | 42 mm | x |
6. 75.2% 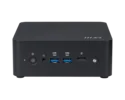 | MSI Cubi NUC AI+ 2MG Intel Core Ultra 7 258V ⎘ Intel Arc Graphics 140V ⎘ 32 Go Mémoire, 1000 Go SSD | Amazon: Prix de liste: 900 USD | 669 g | 50.1 mm | x |
Transparency
La sélection des appareils à examiner est effectuée par notre équipe éditoriale. L'échantillon de test a été prêté à l'auteur par le fabricant ou le détaillant pour les besoins de cet examen. Le prêteur n'a pas eu d'influence sur cette évaluation et le fabricant n'a pas reçu de copie de cette évaluation avant sa publication. Il n'y avait aucune obligation de publier cet article. En tant que média indépendant, Notebookcheck n'est pas soumis à l'autorité des fabricants, des détaillants ou des éditeurs.
Voici comment Notebookcheck teste
Chaque année, Notebookcheck examine de manière indépendante des centaines d'ordinateurs portables et de smartphones en utilisant des procédures standardisées afin de garantir que tous les résultats sont comparables. Nous avons continuellement développé nos méthodes de test depuis environ 20 ans et avons établi des normes industrielles dans le processus. Dans nos laboratoires de test, des équipements de mesure de haute qualité sont utilisés par des techniciens et des rédacteurs expérimentés. Ces tests impliquent un processus de validation en plusieurs étapes. Notre système d'évaluation complexe repose sur des centaines de mesures et de points de référence bien fondés, ce qui garantit l'objectivité.
