Notebookcheck Logo
Teaser

Test du MSI Cubi NUC M1 : mini-PC solide mais plus cher que la concurrence

La performance par euro pourrait être meilleure.

Le Cubi NUC M1 n'est pas nécessairement mauvais, mais il n'excelle pas non plus dans une catégorie clé. Son prix élevé de plus de 900 USD pour la configuration Core 7 se démarque des alternatives moins chères et plus rapides.
Allen Ngo, 👁 Allen Ngo (traduit par DeepL / Ninh Duy) Published 🇺🇸 🇪🇸 ...
MSI Mini PC Raptor Lake

Verdict - Fiable mais cher

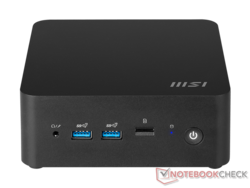
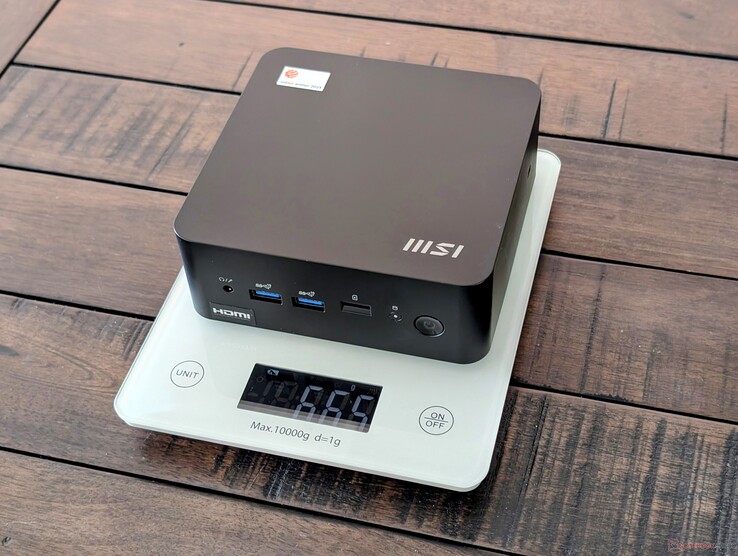
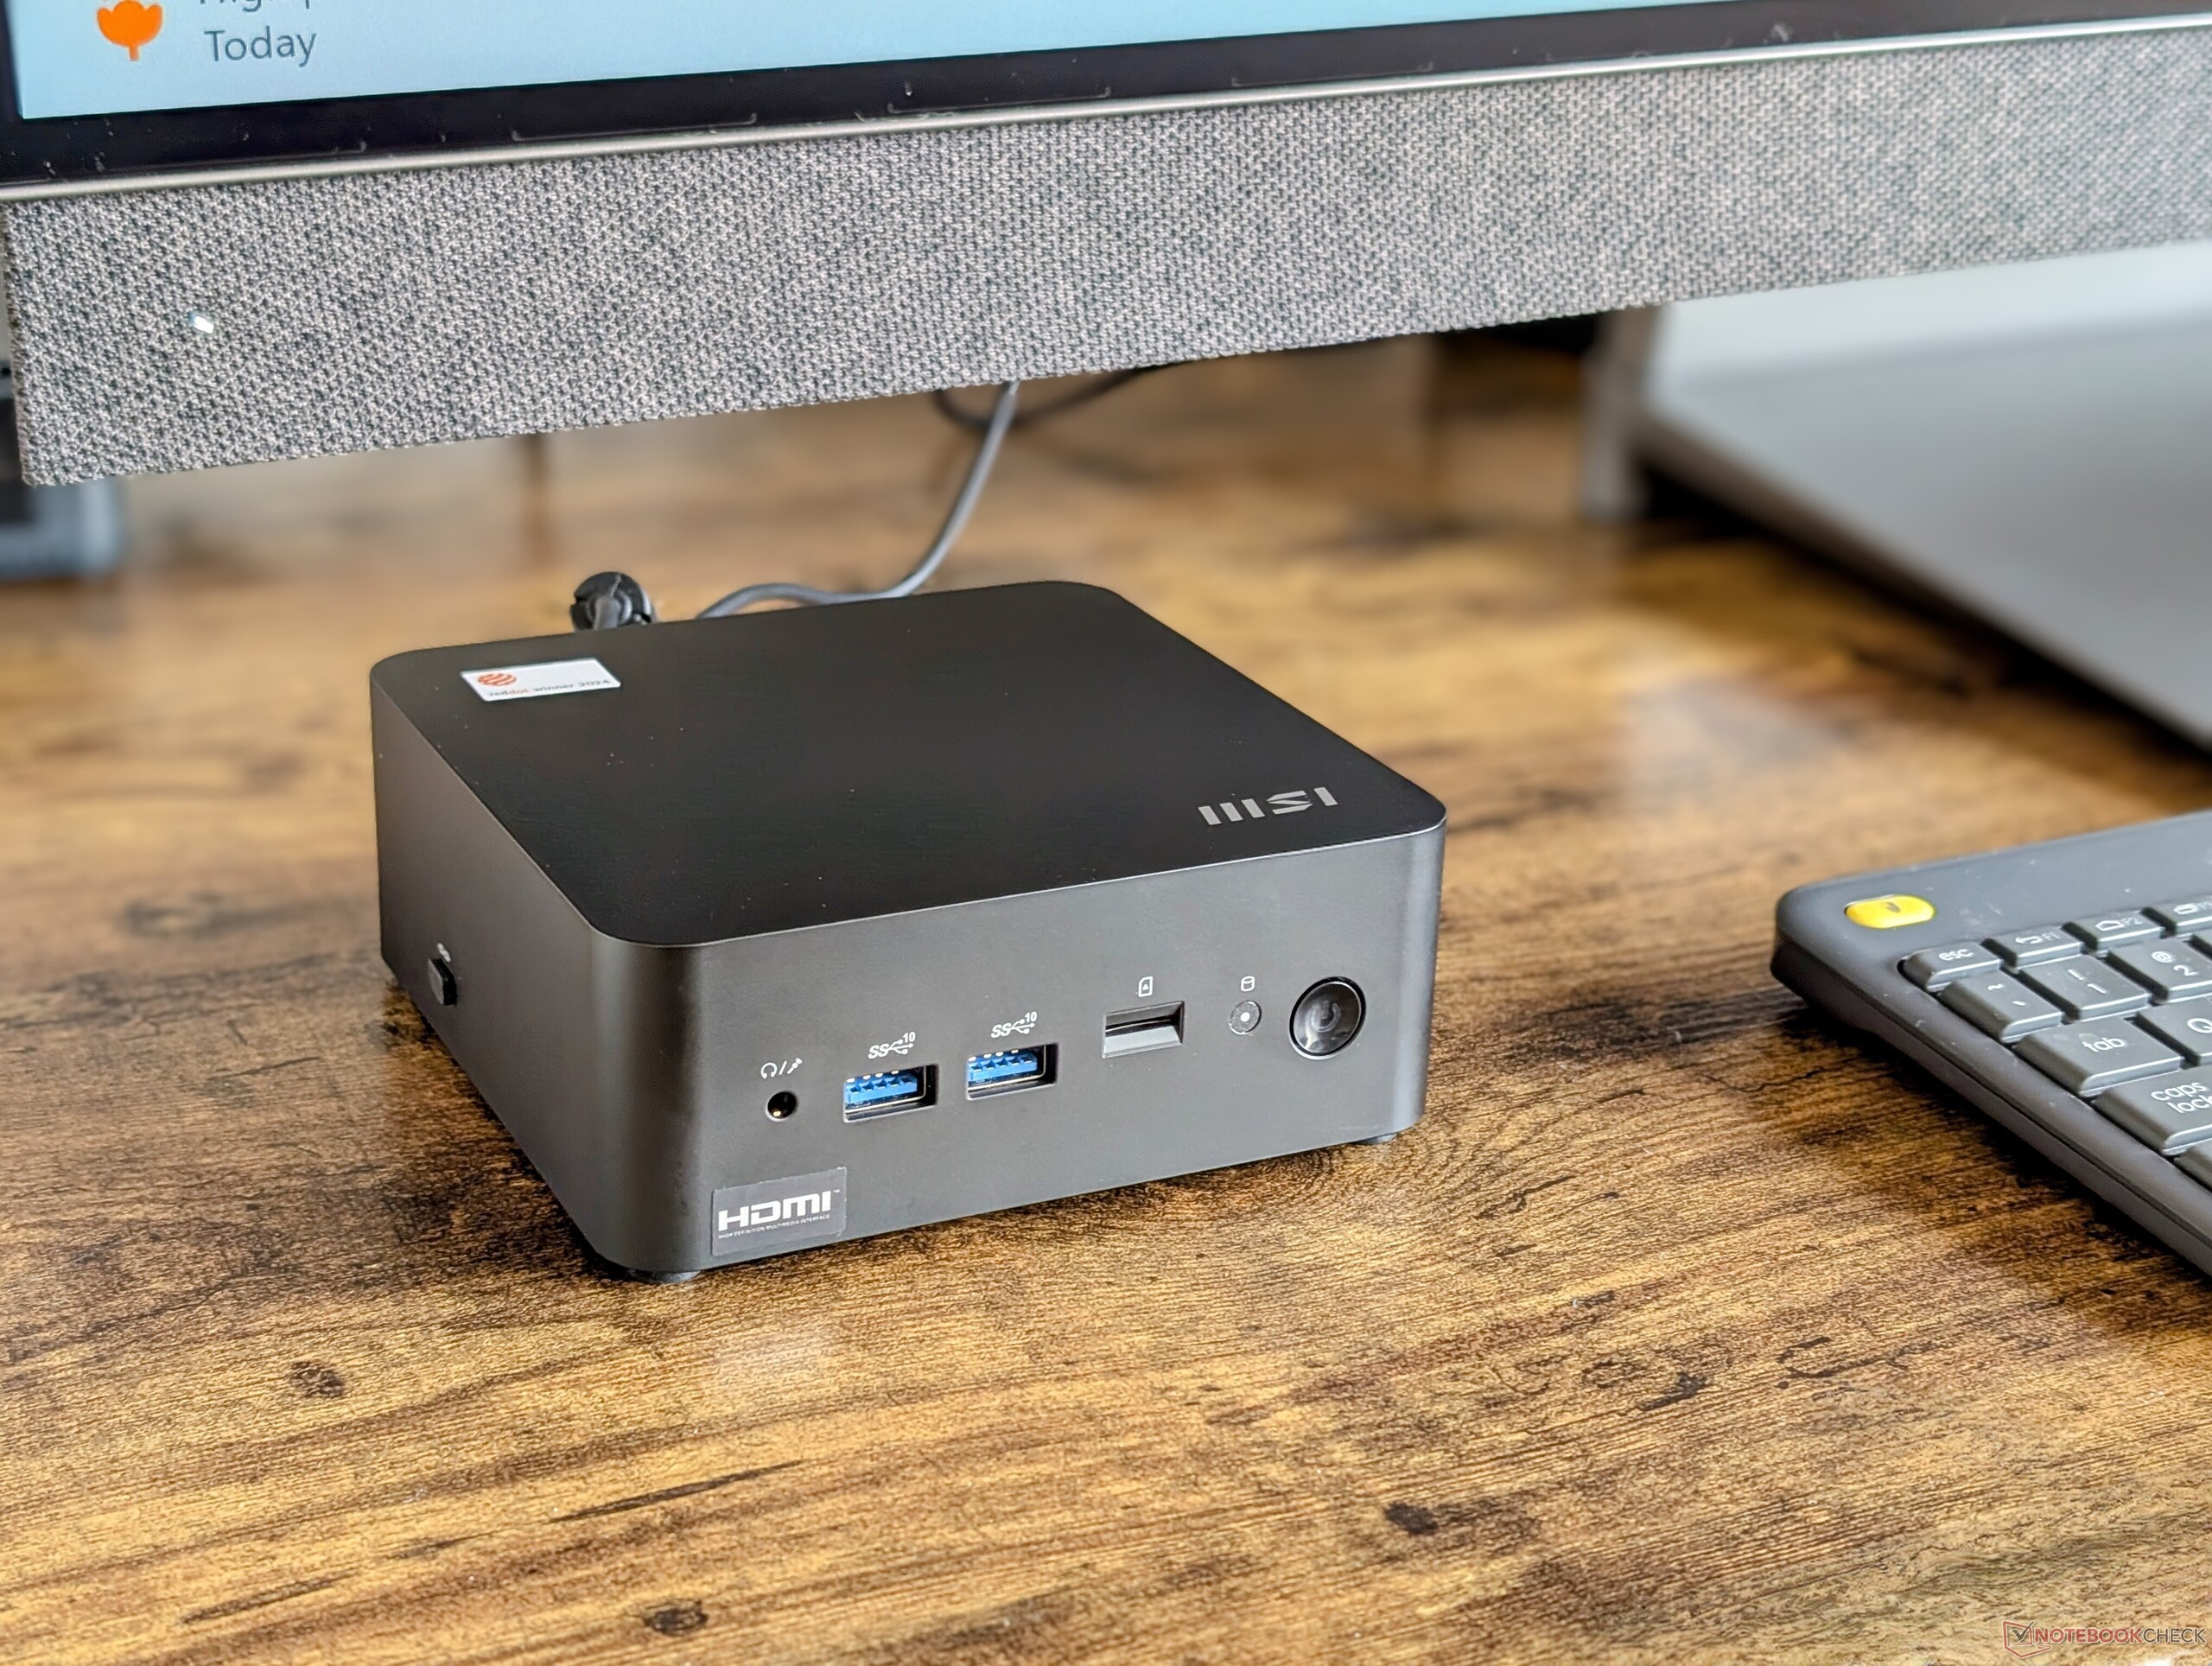
En revue : MSI Cubi NUC M1. Unité de test fournie par MSI

Le Cubi NUC M1 est un mini PC bien conçu pour les applications de bureau ou de salle de conférence. Il intègre deux ports Thunderbolt 4 et un lecteur MicroSD, alors que la plupart des autres mini PC n'ont qu'un seul port Thunderbolt et aucun lecteur SD. Si vos charges de travail peuvent exploiter ces caractéristiques spécifiques au quotidien, le mini PC de MSI peut être une option intéressante.

Le Cubi NUC M1 est un mini PC de bureau de base dont le prix de vente conseillé n'est pas si bas. Des alternatives moins chères et plus rapides sont disponibles si vous n'avez pas peur de perdre le lecteur MicroSD intégré.

Points positifs

+ accessibilité aisée ; prise en charge de 2x SODIMM + 2x SSD M.2
+ plusieurs ports Thunderbolt 4
+ lecteur MicroSD intégré
+ silencieux

Points négatifs

- pas de lecteur d'empreintes digitales intégré
- pas d'options Core Ultra H
- aimant pour empreintes digitales
- coûteux

Le principal problème du Cubi NUC M1 est son prix élevé de $800 USD pour la configuration Core i5 120U et de presque $1000 pour la configuration Core i7 que nous avons testée. Les alternatives de Beelink ou GMK sont plusieurs centaines de dollars moins chers tout en offrant des options de CPU plus rapides et des tailles de châssis similaires. Le rapport qualité/prix est donc moins bon que prévu par rapport à la concurrence.

Prix et disponibilité

Le Cubi NUC M1 est désormais disponible sur Amazon au prix de 800 $ pour la configuration Core i5 ou 950 $ pour l'option Core i7.

Comparaison des alternatives possibles

Image
Modèle
Geizhals
Poids
Épaisseur
Display
1.
66.1%
MSI Cubi NUC 1M
MSI Cubi NUC 1M
Intel Core 7 150U ⎘
Intel Iris Xe Graphics G7 96EUs ⎘
16 Go Mémoire, 1024 Go SSD
Bestpreis 699€ computeruniverse.net
2. 699€ Cyberport Stores Österreich
3. 699€ Cyberport.at
660 g50.1 mmx
2.
67.3%
GMK NucBox K9
GMK NucBox K9
Intel Core Ultra 5 125H ⎘
Intel Arc 7-Core iGPU ⎘
32 Go Mémoire, 1024 Go SSD
Listenpreis 560 USD
Geizhals Suche
528 g47 mmx
3.
74.7%
Asus NUC 14 Pro
Asus NUC 14 Pro
Intel Core Ultra 5 125H ⎘
Intel Arc 7-Core iGPU ⎘
, 2048 Go SSD
Bestpreis 499.9€ alza.de
2. 519.93€ bueromarkt-ag.de
3. 519.95€ reichelt.de
525 g37 mmx
4.
Beelink SEi11 Pro
Beelink SEi11 Pro
Intel Core i5-11320H ⎘
Intel Iris Xe Graphics G7 96EUs ⎘
16 Go Mémoire, 500 Go SSD
Listenpreis 430 USD440 g40 mmx
5.
74.9%
Beelink SER8
Beelink SER8
AMD Ryzen 7 8845HS ⎘
AMD Radeon 780M ⎘
32 Go Mémoire, 1024 Go SSD
Listenpreis 650 USD776 g44.7 mmx
6.
84.5% v7 (old)
BOSGAME M1
BOSGAME M1
AMD Ryzen 7 7840HS ⎘
AMD Radeon 780M ⎘
32 Go Mémoire
Listenpreis 690 USD766 g51 mmx

La série MSI Cubi comble le vide laissé par Intel lorsqu'il a décidé d'arrêter la production de sa propre série NUC. Elle cible les utilisateurs professionnels et les bureaux où les PC à profil bas sont préférés aux alternatives plus performantes.

Notre unité de test est la configuration la plus haut de gamme avec le CPU Raptor Lake-U Refresh Core 7 150U tandis que des options moins importantes sont disponibles avec le Core 5 120U ou le Core 3 100U.

Parmi les alternatives au Cubi NUC M1, on trouve d'autres mini PC à profil bas alimentés par des processeurs de la série U, comme le GMK NucBox M5 ou le Beelink Mini S12 Pro.

Plus d'avis sur MSI :

Spécifications

MSI Cubi NUC 1M
Processeur
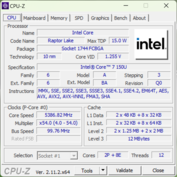
Intel Core 7 150U 10 x 1.2 - 5.4 GHz, 32 W PL2 / Short Burst, 20 W PL1 / Sustained, Raptor Lake-U Refresh
Carte graphique
Intel Iris Xe Graphics G7 96EUs, Processeur: 1300 MHz, Mémoire: 2600 MHz, DDR5, 32.0.101.5972
Mémoire
16 Go 
, Samsung, DDR5-5600, Dual-Channel, 42-42-42-82
Carte mère
Intel Raptor Lake-P PCH
Disque dur
WD PC SN560 SDDPNQE-1T00, 1024 Go 
Carte son
Intel Raptor Lake-P/U/H PCH - cAVS
Connexions
6 USB 3.1 Gen2, 2 Thunderbolt, USB-C Power Delivery (PD), 2 HDMI, 2 DisplayPort, 1 Encoche de Sécurité Kensington, Connectique audio: 3.5 mm combo, Lecteur de cartes mémoires: MicroSD
Réseau
Intel Ethernet Controller I226-V (10/2500MBit/s), Intel Wi-Fi 6E AX211 (a/b/g/h/n = Wi-Fi 4/ac = Wi-Fi 5/ax = Wi-Fi 6/ Wi-Fi 6E 6 GHz), Bluetooth 5.3
Taille
Hauteur x Largeur x Profondeur (en mm): 50.1 x 135.6 x 132.6
Système d'exploitation
Microsoft Windows 11 Pro
Fonctionnalités additionnelles
2.5-inch SATA III adapter, MSI Center, 12 Mois Garantie
Poids
660 g, Alimentation: 536 g
Prix
950 USD
Amazon
Remarque : le fabricant peut utiliser des composants provenant de différents fournisseurs, notamment des panneaux d'affichage, des lecteurs ou des clés USB ayant des spécifications similaires.


Cas

Le châssis est principalement en plastique avec des renforts en métal autour de l'intérieur des côtés. Bien que cela ajoute un peu de poids à l'appareil, cela donne une impression de qualité supérieure, surtout lorsque de nombreuses alternatives de Beelink ou GMK utilisent beaucoup moins de matériaux métalliques pour économiser sur les coûts.

La surface noire mate et lisse est malheureusement un aimant à empreintes digitales. Une option de couleur blanche ou argentée similaire à la série Prestige de MSI, destinée aux entreprises, aurait permis d'atténuer ce problème.

Comparaison des tailles

136 mm 132 mm 51 mm 766 g135.6 mm 132.6 mm 50.1 mm 660 g135 mm 135 mm 44.7 mm 776 g128 mm 126 mm 47 mm 528 g126 mm 113 mm 40 mm 440 g117 mm 112 mm 37 mm 525 g210 mm 148 mm 1 mm 2.9 g

Connectivité

Le système comprend un lecteur de carte MicroSD intégré décemment rapide, contrairement à la plupart des autres mini PC, ce qui devrait plaire à certains utilisateurs d'appareils photo et créateurs de contenu. Nous apprécions également la présence de deux ports USB-C, contrairement à la plupart des mini PC Beelink.

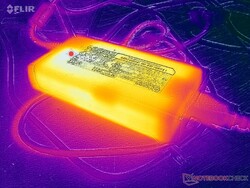
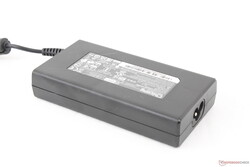
Il convient de noter que le système peut être alimenté par des adaptateurs secteur USB-C tiers si vous perdez l'adaptateur secteur de type tonneau inclus dans la boîte.

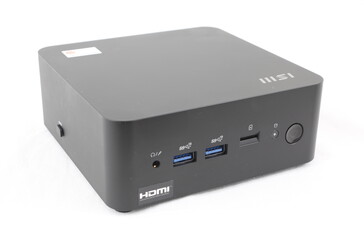
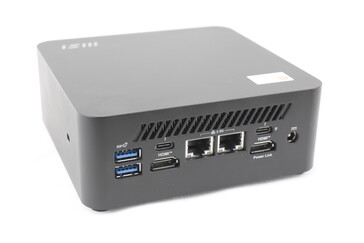
Façade : audio combo 3,5 mm, 2x USB-A 3.2 Gen. 2 (10 Gbps), lecteur MicroSD, bouton d'alimentation, gauche : verrou Kensington
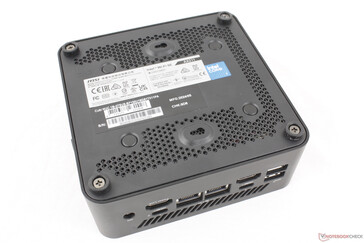
Arrière : 2x USB-A 3.2 Gen. 2 (10 Gbps), 2x USB-C avec Thunderbolt 4 + Power Delivery + DisplayPort, 2x HDMI 2.1, 2x RJ-45 (2,5 Gbps), adaptateur secteur en forme de tonneau

Lecteur de carte SD

SD Card Reader
average JPG Copy Test (av. of 3 runs)
MSI Cubi NUC 1M
Intel Core 7 150U (Angelbird AV Pro V60)
53 MB/s
maximum AS SSD Seq Read Test (1GB)
MSI Cubi NUC 1M
Intel Core 7 150U (Angelbird AV Pro V60)
196.9 MB/s

Communication

La prise en charge du Wi-Fi 6E et du Bluetooth 5.3 est standard. La prise en charge du Wi-Fi 7 aurait été appréciable, surtout à ce niveau de prix.

Networking
iperf3 transmit AXE11000
BOSGAME M1
MediaTek Wi-Fi 6E MT7922 160MHz Wireless LAN Card
1470 (1310min - 1625max) MBit/s +131%
Asus NUC 14 Pro
Intel Wi-Fi 6E AX211
1331 (1187min - 1442max) MBit/s +109%
GMK NucBox K9
Intel Wi-Fi 6 AX201
823 (607min - 901max) MBit/s +29%
Beelink SER8
Intel Wi-Fi 6 AX200
812 (641min - 888max) MBit/s +28%
MSI Cubi NUC 1M
Intel Wi-Fi 6E AX211
636 (430min - 784max) MBit/s
iperf3 receive AXE11000
BOSGAME M1
MediaTek Wi-Fi 6E MT7922 160MHz Wireless LAN Card
1479 (1255min - 1539max) MBit/s +114%
Asus NUC 14 Pro
Intel Wi-Fi 6E AX211
1379 (1016min - 1613max) MBit/s +99%
Beelink SER8
Intel Wi-Fi 6 AX200
784 (679min - 845max) MBit/s +13%
GMK NucBox K9
Intel Wi-Fi 6 AX201
764 (635min - 829max) MBit/s +10%
MSI Cubi NUC 1M
Intel Wi-Fi 6E AX211
692 (506min - 872max) MBit/s
iperf3 transmit AXE11000 6GHz
MSI Cubi NUC 1M
Intel Wi-Fi 6E AX211
1400 (1199min - 1463max) MBit/s
Asus NUC 14 Pro
Intel Wi-Fi 6E AX211
1379 (1299min - 1425max) MBit/s -1%
BOSGAME M1
MediaTek Wi-Fi 6E MT7922 160MHz Wireless LAN Card
1324 (1090min - 1580max) MBit/s -5%
Beelink SEi11 Pro
MediaTek RZ608
722 (447min - 789max) MBit/s -48%
iperf3 receive AXE11000 6GHz
Asus NUC 14 Pro
Intel Wi-Fi 6E AX211
1729 (1594min - 1755max) MBit/s +11%
MSI Cubi NUC 1M
Intel Wi-Fi 6E AX211
1560 (1528min - 1585max) MBit/s
BOSGAME M1
MediaTek Wi-Fi 6E MT7922 160MHz Wireless LAN Card
1321 (1233min - 1393max) MBit/s -15%
Beelink SEi11 Pro
MediaTek RZ608
743 (453min - 793max) MBit/s -52%
050100150200250300350400450500550600650700750800850900950100010501100115012001250130013501400145015001550Tooltip
MSI Cubi NUC 1M; iperf3 transmit AXE11000 6GHz; iperf 3.1.3: Ø1400 (1199-1463)
MSI Cubi NUC 1M; iperf3 receive AXE11000 6GHz; iperf 3.1.3: Ø1559 (1528-1585)

Maintenance

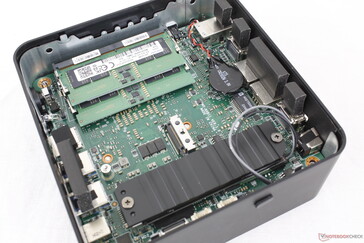
La plaque métallique inférieure peut être facilement retirée à l'aide d'un simple tournevis Phillips pour révéler les composants évolutifs. Notez que les vis ne sont pas des vis à oreilles comme sur de nombreux modèles de NUC d'Intel.

La face inférieure montre la compatibilité VESA
Accès facile aux deux emplacements SODIMM, aux deux emplacements SSD M.2 (2280 + 2242) et au module WLAN M.2 amovible situé sous le SSD principal

Durabilité

MSI utilise 42,9 % de plastiques recyclés après consommation lors de la fabrication, ainsi que de la pulpe de bois provenant de sources durables pour l'emballage. Néanmoins, l'adaptateur secteur et les accessoires sont toujours emballés dans du plastique.

Accessoires et garantie

Un câble SATA III amovible est inclus pour les utilisateurs qui souhaitent connecter un disque externe SATA III de 2,5 pouces à un port spécial situé sur le côté droit de l'appareil. Ce n'est pas une solution très élégante, mais au moins l'option est là, alors que la plupart des autres mini-PC ne prennent plus du tout en charge les disques SATA de 2,5 pouces.

La garantie constructeur standard d'un an s'applique, avec la possibilité de l'étendre jusqu'à trois ans.

Performance


Conditions d'essai

Nous avons réglé Windows et MSI Center sur le mode Performance avant d'effectuer les tests ci-dessous.

Processeur

Alors que le Core 7 150U est relativement nouveau, il est basé sur l'ancienne plateforme Raptor Lake-U et ses performances sont donc très similaires à celles du modèle sortant, le Core i7-1365U. Il ne dispose pas des fonctions d'intelligence artificielle intégrées ni des graphiques Arc intégrés améliorés de la plateforme Meteor Lake.

Si vous passez au Core 5 120U ne devrait pas avoir d'impact significatif sur les performances du processeur puisque les deux CPU partagent le même nombre de cœurs et de threads. Si vous essayez d'économiser de l'argent, le Core 5 SKU peut être intéressant à considérer pour cette raison.

Cinebench R15 Multi Loop

0135270405540675810945108012151350148516201755189020252160229524302565Tooltip
MSI Cubi NUC 1M Intel Core 7 150U: Ø971 (535.59-1039.66)
GMK NucBox K9 Intel Core Ultra 5 125H: Ø1902 (1827.4-1965.8)
Asus NUC 14 Pro Intel Core Ultra 5 125H: Ø2021 (1900.15-2203.13)
Beelink SEi11 Pro Intel Core i5-11320H: Ø851 (845.25-856.84)
Beelink SER8 AMD Ryzen 7 8845HS: Ø2607 (2586.82-2626.57)
BOSGAME M1 AMD Ryzen 7 7840HS: Ø2554 (2501.09-2597.23)
CPU Performance Rating: Percent
Cinebench R23: Multi Core | Single Core
Cinebench R20: CPU (Multi Core) | CPU (Single Core)
Cinebench R15: CPU Multi 64Bit | CPU Single 64Bit
Blender: v2.79 BMW27 CPU
7-Zip 18.03: 7z b 4 | 7z b 4 -mmt1
Geekbench 6.3: Multi-Core | Single-Core
Geekbench 5.5: Multi-Core | Single-Core
HWBOT x265 Benchmark v2.2: 4k Preset
LibreOffice : 20 Documents To PDF
R Benchmark 2.5: Overall mean
CPU Performance Rating
Lenovo ThinkStation P3 Tiny-30H0006AGE
Intel Core i9-14900
90.6 pt
Beelink SER8
AMD Ryzen 7 8845HS
68.8 pt
GMK NucBox K6
AMD Ryzen 7 7840HS
67.9 pt
Geekom AX8 Pro
AMD Ryzen 9 8945H
67 pt
HP Elite Mini 800 G9-5M9X6EA
Intel Core i5-14500
63.4 pt
Geekom XT13 Pro
Intel Core i9-13900H
58.9 pt
GMK NucBox K9 -1!
Intel Core Ultra 5 125H
57.2 pt
Khadas Mind 2
Intel Core Ultra 7 155H
55.2 pt
Asus NUC 14 Pro
Intel Core Ultra 5 125H
54.2 pt
Beelink SER6 Pro Ryzen 7 7735HS -2!
AMD Ryzen 7 7735HS
53 pt
Moyenne Intel Core 7 150U
 
52.7 pt
Lenovo IdeaPad Slim 3i 15IRU9
Intel Core 5 120U
52 pt
Beelink SER6 Pro -2!
AMD Ryzen 7 6800H
51.9 pt
MSI Cubi NUC 1M
Intel Core 7 150U
51.1 pt
GMK NucBox M6
AMD Ryzen 5 6600H
50.7 pt
GMK NucBox M5
AMD Ryzen 7 5700U
36.1 pt
Beelink SEi11 Pro -2!
Intel Core i5-11320H
35.4 pt
Cinebench R23 / Multi Core
Lenovo ThinkStation P3 Tiny-30H0006AGE
Intel Core i9-14900
31070 Points +330%
Beelink SER8
AMD Ryzen 7 8845HS
16661 (16363.9min - 16661max) Points +131%
GMK NucBox K6
AMD Ryzen 7 7840HS
15947 (9378.75min - 15947.3max) Points +121%
Geekom AX8 Pro
AMD Ryzen 9 8945H
15516 Points +115%
HP Elite Mini 800 G9-5M9X6EA
Intel Core i5-14500
15012 Points +108%
Asus NUC 14 Pro
Intel Core Ultra 5 125H
14516 Points +101%
Khadas Mind 2
Intel Core Ultra 7 155H
14099 Points +95%
GMK NucBox K9
Intel Core Ultra 5 125H
12989 (12625.3min - 12989.4max) Points +80%
Geekom XT13 Pro
Intel Core i9-13900H
11997 Points +66%
Beelink SER6 Pro Ryzen 7 7735HS
AMD Ryzen 7 7735HS
11626 (11015.5min - 11625.6max) Points +61%
Beelink SER6 Pro
AMD Ryzen 7 6800H
11481 (10813.7min - 11481.3max) Points +59%
GMK NucBox M6
AMD Ryzen 5 6600H
10418 (10142.8min - 10418max) Points +44%
Moyenne Intel Core 7 150U
  (7226 - 9895, n=4)
8722 Points +21%
Lenovo IdeaPad Slim 3i 15IRU9
Intel Core 5 120U
7862 (6916.06min - 7861.59max) Points +9%
MSI Cubi NUC 1M
Intel Core 7 150U
7226 (6983.97min - 7226.42max) Points
GMK NucBox M5
AMD Ryzen 7 5700U
6649 (6519.7min - 6648.75max) Points -8%
Beelink SEi11 Pro
Intel Core i5-11320H
5720 (5681.08min - 5720.38max) Points -21%
Cinebench R23 / Single Core
Lenovo ThinkStation P3 Tiny-30H0006AGE
Intel Core i9-14900
2212 Points +18%
HP Elite Mini 800 G9-5M9X6EA
Intel Core i5-14500
1917 Points +2%
MSI Cubi NUC 1M
Intel Core 7 150U
1878 Points
Moyenne Intel Core 7 150U
  (1698 - 2032, n=4)
1870 Points 0%
Lenovo IdeaPad Slim 3i 15IRU9
Intel Core 5 120U
1844 Points -2%
Geekom AX8 Pro
AMD Ryzen 9 8945H
1808 Points -4%
Beelink SER8
AMD Ryzen 7 8845HS
1783 Points -5%
GMK NucBox K6
AMD Ryzen 7 7840HS
1770 Points -6%
GMK NucBox K9
Intel Core Ultra 5 125H
1735 Points -8%
Asus NUC 14 Pro
Intel Core Ultra 5 125H
1721 Points -8%
Geekom XT13 Pro
Intel Core i9-13900H
1719 Points -8%
Khadas Mind 2
Intel Core Ultra 7 155H
1643 Points -13%
Beelink SER6 Pro Ryzen 7 7735HS
AMD Ryzen 7 7735HS
1537 Points -18%
Beelink SER6 Pro
AMD Ryzen 7 6800H
1506 Points -20%
GMK NucBox M6
AMD Ryzen 5 6600H
1486 Points -21%
Beelink SEi11 Pro
Intel Core i5-11320H
1467 Points -22%
GMK NucBox M5
AMD Ryzen 7 5700U
1267 Points -33%
Cinebench R20 / CPU (Multi Core)
Lenovo ThinkStation P3 Tiny-30H0006AGE
Intel Core i9-14900
11291 Points +300%
Beelink SER8
AMD Ryzen 7 8845HS
6431 Points +128%
GMK NucBox K6
AMD Ryzen 7 7840HS
6250 Points +122%
Geekom AX8 Pro
AMD Ryzen 9 8945H
6153 Points +118%
HP Elite Mini 800 G9-5M9X6EA
Intel Core i5-14500
5811 Points +106%
Asus NUC 14 Pro
Intel Core Ultra 5 125H
5617 Points +99%
Khadas Mind 2
Intel Core Ultra 7 155H
5448 Points +93%
GMK NucBox K9
Intel Core Ultra 5 125H
4948 Points +75%
Geekom XT13 Pro
Intel Core i9-13900H
4935 Points +75%
Beelink SER6 Pro Ryzen 7 7735HS
AMD Ryzen 7 7735HS
4524 Points +60%
Beelink SER6 Pro
AMD Ryzen 7 6800H
4460 Points +58%
GMK NucBox M6
AMD Ryzen 5 6600H
4106 Points +46%
Moyenne Intel Core 7 150U
  (2821 - 3790, n=4)
3378 Points +20%
Lenovo IdeaPad Slim 3i 15IRU9
Intel Core 5 120U
3046 Points +8%
MSI Cubi NUC 1M
Intel Core 7 150U
2821 Points
GMK NucBox M5
AMD Ryzen 7 5700U
2580 Points -9%
Beelink SEi11 Pro
Intel Core i5-11320H
2208 Points -22%
Cinebench R20 / CPU (Single Core)
Lenovo ThinkStation P3 Tiny-30H0006AGE
Intel Core i9-14900
846 Points +18%
HP Elite Mini 800 G9-5M9X6EA
Intel Core i5-14500
736 Points +3%
MSI Cubi NUC 1M
Intel Core 7 150U
718 Points
Lenovo IdeaPad Slim 3i 15IRU9
Intel Core 5 120U
714 Points -1%
Moyenne Intel Core 7 150U
  (652 - 782, n=4)
713 Points -1%
Geekom AX8 Pro
AMD Ryzen 9 8945H
703 Points -2%
Beelink SER8
AMD Ryzen 7 8845HS
698 Points -3%
GMK NucBox K6
AMD Ryzen 7 7840HS
688 Points -4%
GMK NucBox K9
Intel Core Ultra 5 125H
664 Points -8%
Geekom XT13 Pro
Intel Core i9-13900H
649 Points -10%
Asus NUC 14 Pro
Intel Core Ultra 5 125H
622 Points -13%
Khadas Mind 2
Intel Core Ultra 7 155H
609 Points -15%
Beelink SER6 Pro Ryzen 7 7735HS
AMD Ryzen 7 7735HS
598 Points -17%
Beelink SER6 Pro
AMD Ryzen 7 6800H
584 Points -19%
GMK NucBox M6
AMD Ryzen 5 6600H
584 Points -19%
Beelink SEi11 Pro
Intel Core i5-11320H
561 Points -22%
GMK NucBox M5
AMD Ryzen 7 5700U
495 Points -31%
Cinebench R15 / CPU Multi 64Bit
Lenovo ThinkStation P3 Tiny-30H0006AGE
Intel Core i9-14900
4793 Points +361%
Beelink SER8
AMD Ryzen 7 8845HS
2627 (2586.82min - 2626.57max) Points +153%
GMK NucBox K6
AMD Ryzen 7 7840HS
2537 (2510.2min - 2537.27max) Points +144%
Geekom AX8 Pro
AMD Ryzen 9 8945H
2521 Points +142%
Geekom XT13 Pro
Intel Core i9-13900H
2448 Points +135%
HP Elite Mini 800 G9-5M9X6EA
Intel Core i5-14500
2435 Points +134%
Khadas Mind 2
Intel Core Ultra 7 155H
2280 Points +119%
Asus NUC 14 Pro
Intel Core Ultra 5 125H
2141 Points +106%
GMK NucBox K9
Intel Core Ultra 5 125H
1966 (1827.4min - 1965.8max) Points +89%
Beelink SER6 Pro Ryzen 7 7735HS
AMD Ryzen 7 7735HS
1953 (1862.98min - 1952.55max) Points +88%
Beelink SER6 Pro
AMD Ryzen 7 6800H
1931 (1821.83min - 1930.5max) Points +86%
GMK NucBox M6
AMD Ryzen 5 6600H
1737 (1708.16min - 1737.02max) Points +67%
Lenovo IdeaPad Slim 3i 15IRU9
Intel Core 5 120U
1432 (1020.02min - 1432.1max) Points +38%
Moyenne Intel Core 7 150U
  (1040 - 1609, n=4)
1415 Points +36%
GMK NucBox M5
AMD Ryzen 7 5700U
1130 (1041.59min - 1129.53max) Points +9%
MSI Cubi NUC 1M
Intel Core 7 150U
1040 (535.59min - 1039.66max) Points
Beelink SEi11 Pro
Intel Core i5-11320H
857 (845.25min - 856.84max) Points -18%
Cinebench R15 / CPU Single 64Bit
Lenovo ThinkStation P3 Tiny-30H0006AGE
Intel Core i9-14900
315 Points +22%
Geekom AX8 Pro
AMD Ryzen 9 8945H
284 Points +10%
Beelink SER8
AMD Ryzen 7 8845HS
283 Points +10%
GMK NucBox K6
AMD Ryzen 7 7840HS
280 Points +9%
HP Elite Mini 800 G9-5M9X6EA
Intel Core i5-14500
273 Points +6%
Moyenne Intel Core 7 150U
  (243 - 290, n=4)
260 Points +1%
MSI Cubi NUC 1M
Intel Core 7 150U
258 Points
Lenovo IdeaPad Slim 3i 15IRU9
Intel Core 5 120U
257 Points 0%
GMK NucBox K9
Intel Core Ultra 5 125H
251 Points -3%
Asus NUC 14 Pro
Intel Core Ultra 5 125H
248 Points -4%
Beelink SER6 Pro Ryzen 7 7735HS
AMD Ryzen 7 7735HS
247 Points -4%
Geekom XT13 Pro
Intel Core i9-13900H
245 Points -5%
GMK NucBox M6
AMD Ryzen 5 6600H
243 Points -6%
Beelink SER6 Pro
AMD Ryzen 7 6800H
242 Points -6%
Khadas Mind 2
Intel Core Ultra 7 155H
234 Points -9%
Beelink SEi11 Pro
Intel Core i5-11320H
214 Points -17%
GMK NucBox M5
AMD Ryzen 7 5700U
188.1 Points -27%
Blender / v2.79 BMW27 CPU
Beelink SEi11 Pro
Intel Core i5-11320H
541 Seconds * -20%
MSI Cubi NUC 1M
Intel Core 7 150U
451 Seconds *
Lenovo IdeaPad Slim 3i 15IRU9
Intel Core 5 120U
437 Seconds * +3%
GMK NucBox M5
AMD Ryzen 7 5700U
427 Seconds * +5%
Moyenne Intel Core 7 150U
  (344 - 451, n=4)
378 Seconds * +16%
GMK NucBox M6
AMD Ryzen 5 6600H
293 Seconds * +35%
Beelink SER6 Pro
AMD Ryzen 7 6800H
268 Seconds * +41%
Beelink SER6 Pro Ryzen 7 7735HS
AMD Ryzen 7 7735HS
263 Seconds * +42%
Geekom XT13 Pro
Intel Core i9-13900H
261 Seconds * +42%
GMK NucBox K9
Intel Core Ultra 5 125H
248 Seconds * +45%
Khadas Mind 2
Intel Core Ultra 7 155H
248 Seconds * +45%
Asus NUC 14 Pro
Intel Core Ultra 5 125H
228 Seconds * +49%
HP Elite Mini 800 G9-5M9X6EA
Intel Core i5-14500
223 Seconds * +51%
Geekom AX8 Pro
AMD Ryzen 9 8945H
206 Seconds * +54%
GMK NucBox K6
AMD Ryzen 7 7840HS
199 Seconds * +56%
Beelink SER8
AMD Ryzen 7 8845HS
191 Seconds * +58%
Lenovo ThinkStation P3 Tiny-30H0006AGE
Intel Core i9-14900
131 Seconds * +71%
7-Zip 18.03 / 7z b 4
Lenovo ThinkStation P3 Tiny-30H0006AGE
Intel Core i9-14900
101652 MIPS +223%
Beelink SER8
AMD Ryzen 7 8845HS
70937 MIPS +126%
GMK NucBox K6
AMD Ryzen 7 7840HS
70782 MIPS +125%
Geekom AX8 Pro
AMD Ryzen 9 8945H
66557 MIPS +112%
Beelink SER6 Pro Ryzen 7 7735HS
AMD Ryzen 7 7735HS
57693 MIPS +83%
Geekom XT13 Pro
Intel Core i9-13900H
56068 MIPS +78%
Beelink SER6 Pro
AMD Ryzen 7 6800H
55963 MIPS +78%
Khadas Mind 2
Intel Core Ultra 7 155H
55271 MIPS +76%
HP Elite Mini 800 G9-5M9X6EA
Intel Core i5-14500
54851 MIPS +74%
GMK NucBox M6
AMD Ryzen 5 6600H
49353 MIPS +57%
Moyenne Intel Core 7 150U
  (31447 - 39286, n=4)
36682 MIPS +17%
GMK NucBox M5
AMD Ryzen 7 5700U
34172 MIPS +9%
Lenovo IdeaPad Slim 3i 15IRU9
Intel Core 5 120U
33657 MIPS +7%
MSI Cubi NUC 1M
Intel Core 7 150U
31447 MIPS
Beelink SEi11 Pro
Intel Core i5-11320H
24798 MIPS -21%
Asus NUC 14 Pro
Intel Core Ultra 5 125H
0 MIPS -100%
7-Zip 18.03 / 7z b 4 -mmt1
Lenovo ThinkStation P3 Tiny-30H0006AGE
Intel Core i9-14900
7276 MIPS +23%
Beelink SER8
AMD Ryzen 7 8845HS
6714 MIPS +14%
Geekom AX8 Pro
AMD Ryzen 9 8945H
6691 MIPS +13%
GMK NucBox K6
AMD Ryzen 7 7840HS
6676 MIPS +13%
HP Elite Mini 800 G9-5M9X6EA
Intel Core i5-14500
6198 MIPS +5%
MSI Cubi NUC 1M
Intel Core 7 150U
5898 MIPS
Lenovo IdeaPad Slim 3i 15IRU9
Intel Core 5 120U
5882 MIPS 0%
Geekom XT13 Pro
Intel Core i9-13900H
5828 MIPS -1%
Moyenne Intel Core 7 150U
  (5407 - 6261, n=4)
5828 MIPS -1%
Beelink SER6 Pro Ryzen 7 7735HS
AMD Ryzen 7 7735HS
5809 MIPS -2%
Beelink SER6 Pro
AMD Ryzen 7 6800H
5768 MIPS -2%
GMK NucBox M6
AMD Ryzen 5 6600H
5720 MIPS -3%
Asus NUC 14 Pro
Intel Core Ultra 5 125H
5136 MIPS -13%
Beelink SEi11 Pro
Intel Core i5-11320H
5105 MIPS -13%
GMK NucBox K9
Intel Core Ultra 5 125H
5004 MIPS -15%
Khadas Mind 2
Intel Core Ultra 7 155H
4795 MIPS -19%
GMK NucBox M5
AMD Ryzen 7 5700U
4599 MIPS -22%
Geekbench 6.3 / Multi-Core
Lenovo ThinkStation P3 Tiny-30H0006AGE
Intel Core i9-14900
15962 Points +82%
Beelink SER8
AMD Ryzen 7 8845HS
13362 Points +53%
GMK NucBox K6
AMD Ryzen 7 7840HS
13184 Points +51%
Geekom AX8 Pro
AMD Ryzen 9 8945H
13162 Points +50%
Khadas Mind 2
Intel Core Ultra 7 155H
11782 Points +35%
Asus NUC 14 Pro
Intel Core Ultra 5 125H
11749 Points +34%
Geekom XT13 Pro
Intel Core i9-13900H
11541 Points +32%
GMK NucBox K9
Intel Core Ultra 5 125H
11087 Points +27%
HP Elite Mini 800 G9-5M9X6EA
Intel Core i5-14500
10644 Points +22%
Lenovo IdeaPad Slim 3i 15IRU9
Intel Core 5 120U
9733 Points +11%
GMK NucBox M6
AMD Ryzen 5 6600H
9240 Points +6%
Moyenne Intel Core 7 150U
  (7737 - 10160, n=4)
8993 Points +3%
MSI Cubi NUC 1M
Intel Core 7 150U
8756 Points
GMK NucBox M5
AMD Ryzen 7 5700U
6260 Points -29%
Geekbench 6.3 / Single-Core
Lenovo ThinkStation P3 Tiny-30H0006AGE
Intel Core i9-14900
3022 Points +14%
Beelink SER8
AMD Ryzen 7 8845HS
2694 Points +2%
GMK NucBox K6
AMD Ryzen 7 7840HS
2687 Points +2%
Geekom AX8 Pro
AMD Ryzen 9 8945H
2651 Points 0%
MSI Cubi NUC 1M
Intel Core 7 150U
2646 Points
Moyenne Intel Core 7 150U
  (2253 - 2781, n=4)
2586 Points -2%
HP Elite Mini 800 G9-5M9X6EA
Intel Core i5-14500
2583 Points -2%
Lenovo IdeaPad Slim 3i 15IRU9
Intel Core 5 120U
2570 Points -3%
Geekom XT13 Pro
Intel Core i9-13900H
2415 Points -9%
Asus NUC 14 Pro
Intel Core Ultra 5 125H
2316 Points -12%
GMK NucBox K9
Intel Core Ultra 5 125H
2297 Points -13%
Khadas Mind 2
Intel Core Ultra 7 155H
2218 Points -16%
GMK NucBox M6
AMD Ryzen 5 6600H
2042 Points -23%
GMK NucBox M5
AMD Ryzen 7 5700U
1625 Points -39%
Geekbench 5.5 / Multi-Core
Lenovo ThinkStation P3 Tiny-30H0006AGE
Intel Core i9-14900
17395 Points +123%
Beelink SER8
AMD Ryzen 7 8845HS
12196 Points +57%
Geekom AX8 Pro
AMD Ryzen 9 8945H
11980 Points +54%
GMK NucBox K6
AMD Ryzen 7 7840HS
11769 Points +51%
Geekom XT13 Pro
Intel Core i9-13900H
11536 Points +48%
Khadas Mind 2
Intel Core Ultra 7 155H
11449 Points +47%
Asus NUC 14 Pro
Intel Core Ultra 5 125H
10856 Points +39%
HP Elite Mini 800 G9-5M9X6EA
Intel Core i5-14500
10543 Points +35%
GMK NucBox K9
Intel Core Ultra 5 125H
10025 Points +29%
Beelink SER6 Pro Ryzen 7 7735HS
AMD Ryzen 7 7735HS
9357 Points +20%
Beelink SER6 Pro
AMD Ryzen 7 6800H
9218 Points +18%
Lenovo IdeaPad Slim 3i 15IRU9
Intel Core 5 120U
8576 Points +10%
GMK NucBox M6
AMD Ryzen 5 6600H
8195 Points +5%
Moyenne Intel Core 7 150U
  (7178 - 8354, n=4)
7877 Points +1%
MSI Cubi NUC 1M
Intel Core 7 150U
7788 Points
GMK NucBox M5
AMD Ryzen 7 5700U
5593 Points -28%
Beelink SEi11 Pro
Intel Core i5-11320H
4959 Points -36%
Geekbench 5.5 / Single-Core
Lenovo ThinkStation P3 Tiny-30H0006AGE
Intel Core i9-14900
2140 Points +12%
Beelink SER8
AMD Ryzen 7 8845HS
2004 Points +5%
Geekom AX8 Pro
AMD Ryzen 9 8945H
1994 Points +4%
GMK NucBox K6
AMD Ryzen 7 7840HS
1986 Points +4%
MSI Cubi NUC 1M
Intel Core 7 150U
1910 Points
HP Elite Mini 800 G9-5M9X6EA
Intel Core i5-14500
1898 Points -1%
Lenovo IdeaPad Slim 3i 15IRU9
Intel Core 5 120U
1858 Points -3%
Moyenne Intel Core 7 150U
  (1631 - 1969, n=4)
1855 Points -3%
Geekom XT13 Pro
Intel Core i9-13900H
1708 Points -11%
Asus NUC 14 Pro
Intel Core Ultra 5 125H
1685 Points -12%
GMK NucBox K9
Intel Core Ultra 5 125H
1668 Points -13%
Beelink SER6 Pro Ryzen 7 7735HS
AMD Ryzen 7 7735HS
1580 Points -17%
Khadas Mind 2
Intel Core Ultra 7 155H
1578 Points -17%
Beelink SER6 Pro
AMD Ryzen 7 6800H
1554 Points -19%
Beelink SEi11 Pro
Intel Core i5-11320H
1518 Points -21%
GMK NucBox M6
AMD Ryzen 5 6600H
1513 Points -21%
GMK NucBox M5
AMD Ryzen 7 5700U
1203 Points -37%
HWBOT x265 Benchmark v2.2 / 4k Preset
Lenovo ThinkStation P3 Tiny-30H0006AGE
Intel Core i9-14900
31.6 fps +269%
Beelink SER8
AMD Ryzen 7 8845HS
21.1 fps +146%
Geekom AX8 Pro
AMD Ryzen 9 8945H
20.6 fps +140%
GMK NucBox K6
AMD Ryzen 7 7840HS
20.5 fps +139%
HP Elite Mini 800 G9-5M9X6EA
Intel Core i5-14500
16.4 fps +91%
Asus NUC 14 Pro
Intel Core Ultra 5 125H
15.7 fps +83%
Khadas Mind 2
Intel Core Ultra 7 155H
15.7 fps +83%
Beelink SER6 Pro Ryzen 7 7735HS
AMD Ryzen 7 7735HS
15.1 fps +76%
Beelink SER6 Pro
AMD Ryzen 7 6800H
15 fps +75%
Geekom XT13 Pro
Intel Core i9-13900H
14.7 fps +72%
GMK NucBox M6
AMD Ryzen 5 6600H
13.9 fps +62%
GMK NucBox K9
Intel Core Ultra 5 125H
13.8 fps +61%
Moyenne Intel Core 7 150U
  (8.57 - 11.1, n=4)
9.74 fps +14%
Lenovo IdeaPad Slim 3i 15IRU9
Intel Core 5 120U
8.69 fps +1%
MSI Cubi NUC 1M
Intel Core 7 150U
8.57 fps
GMK NucBox M5
AMD Ryzen 7 5700U
8.44 fps -2%
Beelink SEi11 Pro
Intel Core i5-11320H
7.28 fps -15%
LibreOffice / 20 Documents To PDF
Khadas Mind 2
Intel Core Ultra 7 155H
63.2 s * -67%
GMK NucBox M5
AMD Ryzen 7 5700U
58 s * -53%
Asus NUC 14 Pro
Intel Core Ultra 5 125H
55.7 s * -47%
GMK NucBox M6
AMD Ryzen 5 6600H
52.4 s * -38%
Geekom AX8 Pro
AMD Ryzen 9 8945H
49.8 s * -31%
Beelink SEi11 Pro
Intel Core i5-11320H
49.1 s * -30%
Beelink SER6 Pro
AMD Ryzen 7 6800H
48.8 s * -29%
Geekom XT13 Pro
Intel Core i9-13900H
46.8 s * -23%
Beelink SER8
AMD Ryzen 7 8845HS
46.1 s * -22%
HP Elite Mini 800 G9-5M9X6EA
Intel Core i5-14500
46 s * -21%
Beelink SER6 Pro Ryzen 7 7735HS
AMD Ryzen 7 7735HS
44.3 s * -17%
GMK NucBox K6
AMD Ryzen 7 7840HS
44.1 s * -16%
GMK NucBox K9
Intel Core Ultra 5 125H
44 s * -16%
Moyenne Intel Core 7 150U
  (29 - 69.2, n=4)
43.6 s * -15%
Lenovo IdeaPad Slim 3i 15IRU9
Intel Core 5 120U
40.1 s * -6%
Lenovo ThinkStation P3 Tiny-30H0006AGE
Intel Core i9-14900
38.2 s * -1%
MSI Cubi NUC 1M
Intel Core 7 150U
37.9 s *
R Benchmark 2.5 / Overall mean
GMK NucBox M5
AMD Ryzen 7 5700U
0.584 sec * -32%
Beelink SEi11 Pro
Intel Core i5-11320H
0.581 sec * -31%
Khadas Mind 2
Intel Core Ultra 7 155H
0.522 sec * -18%
Beelink SER6 Pro Ryzen 7 7735HS
AMD Ryzen 7 7735HS
0.512 sec * -15%
GMK NucBox M6
AMD Ryzen 5 6600H
0.4995 sec * -13%
Beelink SER6 Pro
AMD Ryzen 7 6800H
0.4989 sec * -12%
Asus NUC 14 Pro
Intel Core Ultra 5 125H
0.4982 sec * -12%
GMK NucBox K9
Intel Core Ultra 5 125H
0.4898 sec * -10%
Geekom XT13 Pro
Intel Core i9-13900H
0.4693 sec * -6%
Lenovo IdeaPad Slim 3i 15IRU9
Intel Core 5 120U
0.4586 sec * -3%
Geekom AX8 Pro
AMD Ryzen 9 8945H
0.4576 sec * -3%
Moyenne Intel Core 7 150U
  (0.4386 - 0.502, n=4)
0.4569 sec * -3%
MSI Cubi NUC 1M
Intel Core 7 150U
0.4438 sec *
HP Elite Mini 800 G9-5M9X6EA
Intel Core i5-14500
0.4356 sec * +2%
GMK NucBox K6
AMD Ryzen 7 7840HS
0.4343 sec * +2%
Beelink SER8
AMD Ryzen 7 8845HS
0.4336 sec * +2%
Lenovo ThinkStation P3 Tiny-30H0006AGE
Intel Core i9-14900
0.3803 sec * +14%
CPU Performance Rating: Percent
Cinebench R23: Multi Core | Single Core
Cinebench R20: CPU (Multi Core) | CPU (Single Core)
Cinebench R15: CPU Multi 64Bit | CPU Single 64Bit
Blender: v2.79 BMW27 CPU
7-Zip 18.03: 7z b 4 | 7z b 4 -mmt1
Geekbench 6.3: Multi-Core | Single-Core
Geekbench 5.5: Multi-Core | Single-Core
HWBOT x265 Benchmark v2.2: 4k Preset
LibreOffice : 20 Documents To PDF
R Benchmark 2.5: Overall mean

* ... Moindre est la valeur, meilleures sont les performances

Cinebench R15 CPU Multi 64Bit
1040 Points
Cinebench R15 OpenGL 64Bit
108 fps
Cinebench R15 Ref. Match 64Bit
97.8 %
Cinebench R15 CPU Single 64Bit
258 Points
Cinebench R20 CPU (Single Core)
718 Points
Cinebench R20 CPU (Multi Core)
2821 Points
Cinebench R23 Multi Core
7226 Points
Cinebench R23 Single Core
1878 Points
Cinebench 2024 CPU Single Core
108.5 Points
Cinebench 2024 CPU Multi Core
432 Points
Aide
Performance Rating
Beelink SER8
AMD Ryzen 7 8845HS, Radeon 780M
98.4 pt
BOSGAME M1
AMD Ryzen 7 7840HS, Radeon 780M
97.4 pt
Asus NUC 14 Pro
Intel Core Ultra 5 125H, Arc 7-Core
63.2 pt
GMK NucBox K9
Intel Core Ultra 5 125H, Arc 7-Core
59.6 pt
Moyenne Intel Core 7 150U
 
40.2 pt
MSI Cubi NUC 1M
Intel Core 7 150U, Iris Xe G7 96EUs
36.4 pt
Beelink SEi11 Pro
Intel Core i5-11320H, Iris Xe G7 96EUs
35.2 pt
AIDA64 / FP32 Ray-Trace
Beelink SER8
AMD Ryzen 7 8845HS, Radeon 780M
26305 KRay/s +317%
BOSGAME M1
AMD Ryzen 7 7840HS, Radeon 780M
26022 KRay/s +313%
Asus NUC 14 Pro
Intel Core Ultra 5 125H, Arc 7-Core
13347 KRay/s +112%
GMK NucBox K9
Intel Core Ultra 5 125H, Arc 7-Core
10755 KRay/s +71%
Moyenne Intel Core 7 150U
  (6306 - 7909, n=4)
7480 KRay/s +19%
Beelink SEi11 Pro
Intel Core i5-11320H, Iris Xe G7 96EUs
7047 KRay/s +12%
MSI Cubi NUC 1M
Intel Core 7 150U, Iris Xe G7 96EUs
6306 KRay/s
AIDA64 / FPU Julia
Beelink SER8
AMD Ryzen 7 8845HS, Radeon 780M
111508 Points +242%
BOSGAME M1
AMD Ryzen 7 7840HS, Radeon 780M
110752 Points +240%
Asus NUC 14 Pro
Intel Core Ultra 5 125H, Arc 7-Core
68551 Points +110%
GMK NucBox K9
Intel Core Ultra 5 125H, Arc 7-Core
58422 Points +79%
Moyenne Intel Core 7 150U
  (32582 - 41382, n=4)
38359 Points +18%
MSI Cubi NUC 1M
Intel Core 7 150U, Iris Xe G7 96EUs
32582 Points
Beelink SEi11 Pro
Intel Core i5-11320H, Iris Xe G7 96EUs
29972 Points -8%
AIDA64 / CPU SHA3
Beelink SER8
AMD Ryzen 7 8845HS, Radeon 780M
4933 MB/s +198%
BOSGAME M1
AMD Ryzen 7 7840HS, Radeon 780M
4854 MB/s +193%
Asus NUC 14 Pro
Intel Core Ultra 5 125H, Arc 7-Core
3323 MB/s +101%
GMK NucBox K9
Intel Core Ultra 5 125H, Arc 7-Core
2922 MB/s +76%
Beelink SEi11 Pro
Intel Core i5-11320H, Iris Xe G7 96EUs
1992 MB/s +20%
Moyenne Intel Core 7 150U
  (1656 - 2165, n=4)
1991 MB/s +20%
MSI Cubi NUC 1M
Intel Core 7 150U, Iris Xe G7 96EUs
1656 MB/s
AIDA64 / CPU Queen
BOSGAME M1
AMD Ryzen 7 7840HS, Radeon 780M
117809 Points +89%
Beelink SER8
AMD Ryzen 7 8845HS, Radeon 780M
115546 Points +86%
Asus NUC 14 Pro
Intel Core Ultra 5 125H, Arc 7-Core
79866 Points +28%
GMK NucBox K9
Intel Core Ultra 5 125H, Arc 7-Core
78797 Points +27%
Moyenne Intel Core 7 150U
  (58025 - 70820, n=4)
64562 Points +4%
MSI Cubi NUC 1M
Intel Core 7 150U, Iris Xe G7 96EUs
62280 Points
Beelink SEi11 Pro
Intel Core i5-11320H, Iris Xe G7 96EUs
48212 Points -23%
AIDA64 / FPU SinJulia
Beelink SER8
AMD Ryzen 7 8845HS, Radeon 780M
15420 Points +251%
BOSGAME M1
AMD Ryzen 7 7840HS, Radeon 780M
14915 Points +240%
Asus NUC 14 Pro
Intel Core Ultra 5 125H, Arc 7-Core
7851 Points +79%
GMK NucBox K9
Intel Core Ultra 5 125H, Arc 7-Core
7780 Points +77%
Moyenne Intel Core 7 150U
  (4387 - 5293, n=4)
4987 Points +14%
Beelink SEi11 Pro
Intel Core i5-11320H, Iris Xe G7 96EUs
4771 Points +9%
MSI Cubi NUC 1M
Intel Core 7 150U, Iris Xe G7 96EUs
4387 Points
AIDA64 / FPU Mandel
Beelink SER8
AMD Ryzen 7 8845HS, Radeon 780M
59522 Points +271%
BOSGAME M1
AMD Ryzen 7 7840HS, Radeon 780M
59072 Points +268%
Asus NUC 14 Pro
Intel Core Ultra 5 125H, Arc 7-Core
34225 Points +113%
GMK NucBox K9
Intel Core Ultra 5 125H, Arc 7-Core
27972 Points +74%
Moyenne Intel Core 7 150U
  (16042 - 20259, n=4)
18959 Points +18%
Beelink SEi11 Pro
Intel Core i5-11320H, Iris Xe G7 96EUs
17987 Points +12%
MSI Cubi NUC 1M
Intel Core 7 150U, Iris Xe G7 96EUs
16042 Points
AIDA64 / CPU AES
Beelink SER8
AMD Ryzen 7 8845HS, Radeon 780M
172642 MB/s +423%
BOSGAME M1
AMD Ryzen 7 7840HS, Radeon 780M
166944 MB/s +406%
GMK NucBox K9
Intel Core Ultra 5 125H, Arc 7-Core
108402 MB/s +228%
Beelink SEi11 Pro
Intel Core i5-11320H, Iris Xe G7 96EUs
68683 MB/s +108%
Asus NUC 14 Pro
Intel Core Ultra 5 125H, Arc 7-Core
64107 MB/s +94%
Moyenne Intel Core 7 150U
  (33007 - 41731, n=4)
39259 MB/s +19%
MSI Cubi NUC 1M
Intel Core 7 150U, Iris Xe G7 96EUs
33007 MB/s
AIDA64 / CPU ZLib
Beelink SER8
AMD Ryzen 7 8845HS, Radeon 780M
1073 MB/s +119%
BOSGAME M1
AMD Ryzen 7 7840HS, Radeon 780M
1051 MB/s +114%
Asus NUC 14 Pro
Intel Core Ultra 5 125H, Arc 7-Core
969 MB/s +97%
GMK NucBox K9
Intel Core Ultra 5 125H, Arc 7-Core
844 MB/s +72%
Moyenne Intel Core 7 150U
  (491 - 695, n=4)
616 MB/s +25%
MSI Cubi NUC 1M
Intel Core 7 150U, Iris Xe G7 96EUs
491 MB/s
Beelink SEi11 Pro
Intel Core i5-11320H, Iris Xe G7 96EUs
368 MB/s -25%
AIDA64 / FP64 Ray-Trace
Beelink SER8
AMD Ryzen 7 8845HS, Radeon 780M
14041 KRay/s +311%
BOSGAME M1
AMD Ryzen 7 7840HS, Radeon 780M
13897 KRay/s +307%
Asus NUC 14 Pro
Intel Core Ultra 5 125H, Arc 7-Core
6786 KRay/s +99%
GMK NucBox K9
Intel Core Ultra 5 125H, Arc 7-Core
5657 KRay/s +66%
Moyenne Intel Core 7 150U
  (3417 - 4243, n=4)
4006 KRay/s +17%
Beelink SEi11 Pro
Intel Core i5-11320H, Iris Xe G7 96EUs
3811 KRay/s +12%
MSI Cubi NUC 1M
Intel Core 7 150U, Iris Xe G7 96EUs
3417 KRay/s
AIDA64 / CPU PhotoWorxx
Asus NUC 14 Pro
Intel Core Ultra 5 125H, Arc 7-Core
47377 MPixel/s +25%
GMK NucBox K9
Intel Core Ultra 5 125H, Arc 7-Core
46296 MPixel/s +22%
BOSGAME M1
AMD Ryzen 7 7840HS, Radeon 780M
41516 MPixel/s +10%
Beelink SER8
AMD Ryzen 7 8845HS, Radeon 780M
40489 MPixel/s +7%
MSI Cubi NUC 1M
Intel Core 7 150U, Iris Xe G7 96EUs
37889 MPixel/s
Moyenne Intel Core 7 150U
  (21802 - 38866, n=4)
33751 MPixel/s -11%
Beelink SEi11 Pro
Intel Core i5-11320H, Iris Xe G7 96EUs
25964 MPixel/s -31%

Test de stress

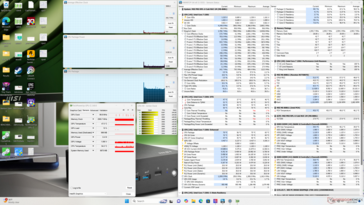
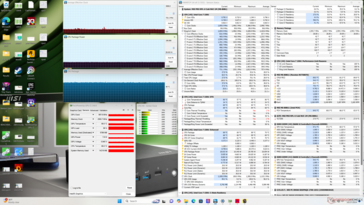
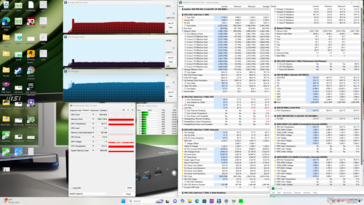
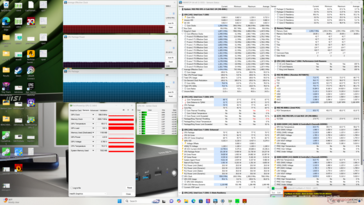
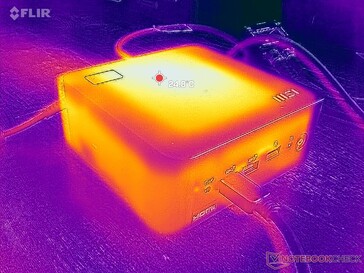
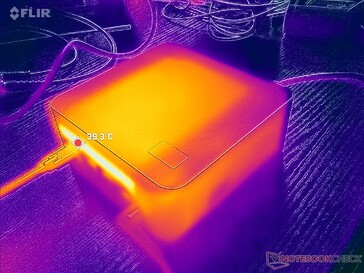
Lors d'un test Prime95, le CPU atteint 2,6 GHz et 31 W pendant quelques secondes avant de redescendre et de se stabiliser à 1,9 GHz et 20 W, comme le montrent les captures d'écran ci-dessous. Le Turbo Boost maximum n'est pas durable, comme on peut s'y attendre d'un PC de la série U.

La température du cœur se stabilise à 69°C lors de l'exécution de Cyberpunk 2077, contre 72°C avec la NucBox K9, plus rapide NucBox K9.

Système en veille
Système en veille
Cyberpunk 2077 stress
Prime95 stress
Prime95 stress
Prime95+FurMark stress
Horloge du CPU (GHz) Horloge du GPU (MHz) Température moyenne du CPU (°C)
Système au repos -- -- 50
Prime95 Stress 1.9 -- 72
Prime95 + FurMark Stress 1.4 599 70
Cyberpunk 2077 Stress 0.7 998 69

Performance du système

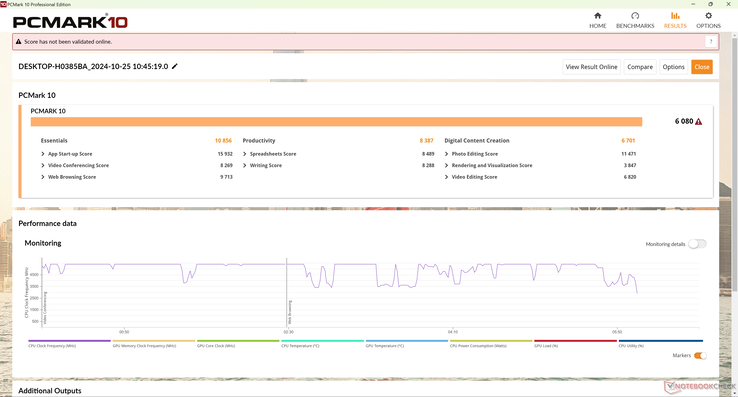
Les résultats de PCMark 10 sont corrects, mais ils sont moins bons dans le sous-test de création de contenu numérique en raison de la lenteur du GPU Iris Xe
PCMark 10 / Score
Beelink SER8
Radeon 780M, R7 8845HS, Crucial P3 Plus CT1000P3PSSD8
7641 Points +26%
BOSGAME M1
Radeon 780M, R7 7840HS
7198 Points +18%
GMK NucBox K9
Arc 7-Core, Ultra 5 125H, MasonSemi 1TB MC7000
6463 Points +6%
Asus NUC 14 Pro
Arc 7-Core, Ultra 5 125H, Kingston KC3000 2048G SKC3000D2048G
6282 Points +3%
Moyenne Intel Core 7 150U, Intel Iris Xe Graphics G7 96EUs
  (6080 - 6173, n=2)
6127 Points +1%
MSI Cubi NUC 1M
Iris Xe G7 96EUs, Core 7 150U, WD PC SN560 SDDPNQE-1T00
6080 Points
Beelink SEi11 Pro
Iris Xe G7 96EUs, i5-11320H, Kingston NV1 SNVS/500GCN
5095 Points -16%
PCMark 10 / Essentials
Beelink SER8
Radeon 780M, R7 8845HS, Crucial P3 Plus CT1000P3PSSD8
11570 Points +7%
BOSGAME M1
Radeon 780M, R7 7840HS
11211 Points +3%
Moyenne Intel Core 7 150U, Intel Iris Xe Graphics G7 96EUs
  (10856 - 11219, n=2)
11038 Points +2%
MSI Cubi NUC 1M
Iris Xe G7 96EUs, Core 7 150U, WD PC SN560 SDDPNQE-1T00
10856 Points
GMK NucBox K9
Arc 7-Core, Ultra 5 125H, MasonSemi 1TB MC7000
10697 Points -1%
Beelink SEi11 Pro
Iris Xe G7 96EUs, i5-11320H, Kingston NV1 SNVS/500GCN
10281 Points -5%
Asus NUC 14 Pro
Arc 7-Core, Ultra 5 125H, Kingston KC3000 2048G SKC3000D2048G
10050 Points -7%
PCMark 10 / Productivity
Beelink SER8
Radeon 780M, R7 8845HS, Crucial P3 Plus CT1000P3PSSD8
10457 Points +25%
BOSGAME M1
Radeon 780M, R7 7840HS
9075 Points +8%
Moyenne Intel Core 7 150U, Intel Iris Xe Graphics G7 96EUs
  (8387 - 8399, n=2)
8393 Points 0%
MSI Cubi NUC 1M
Iris Xe G7 96EUs, Core 7 150U, WD PC SN560 SDDPNQE-1T00
8387 Points
GMK NucBox K9
Arc 7-Core, Ultra 5 125H, MasonSemi 1TB MC7000
7659 Points -9%
Asus NUC 14 Pro
Arc 7-Core, Ultra 5 125H, Kingston KC3000 2048G SKC3000D2048G
7042 Points -16%
Beelink SEi11 Pro
Iris Xe G7 96EUs, i5-11320H, Kingston NV1 SNVS/500GCN
6915 Points -18%
PCMark 10 / Digital Content Creation
Beelink SER8
Radeon 780M, R7 8845HS, Crucial P3 Plus CT1000P3PSSD8
10009 Points +49%
BOSGAME M1
Radeon 780M, R7 7840HS
9948 Points +48%
Asus NUC 14 Pro
Arc 7-Core, Ultra 5 125H, Kingston KC3000 2048G SKC3000D2048G
9506 Points +42%
GMK NucBox K9
Arc 7-Core, Ultra 5 125H, MasonSemi 1TB MC7000
8940 Points +33%
Moyenne Intel Core 7 150U, Intel Iris Xe Graphics G7 96EUs
  (6701 - 6775, n=2)
6738 Points +1%
MSI Cubi NUC 1M
Iris Xe G7 96EUs, Core 7 150U, WD PC SN560 SDDPNQE-1T00
6701 Points
Beelink SEi11 Pro
Iris Xe G7 96EUs, i5-11320H, Kingston NV1 SNVS/500GCN
5048 Points -25%
CrossMark / Overall
BOSGAME M1
Radeon 780M, R7 7840HS
1891 Points +9%
Beelink SER8
Radeon 780M, R7 8845HS, Crucial P3 Plus CT1000P3PSSD8
1875 Points +8%
MSI Cubi NUC 1M
Iris Xe G7 96EUs, Core 7 150U, WD PC SN560 SDDPNQE-1T00
1734 Points
Moyenne Intel Core 7 150U, Intel Iris Xe Graphics G7 96EUs
  (1660 - 1734, n=2)
1697 Points -2%
GMK NucBox K9
Arc 7-Core, Ultra 5 125H, MasonSemi 1TB MC7000
1633 Points -6%
Asus NUC 14 Pro
Arc 7-Core, Ultra 5 125H, Kingston KC3000 2048G SKC3000D2048G
1522 Points -12%
Beelink SEi11 Pro
Iris Xe G7 96EUs, i5-11320H, Kingston NV1 SNVS/500GCN
1335 Points -23%
CrossMark / Productivity
BOSGAME M1
Radeon 780M, R7 7840HS
1823 Points +3%
Beelink SER8
Radeon 780M, R7 8845HS, Crucial P3 Plus CT1000P3PSSD8
1802 Points +1%
MSI Cubi NUC 1M
Iris Xe G7 96EUs, Core 7 150U, WD PC SN560 SDDPNQE-1T00
1778 Points
Moyenne Intel Core 7 150U, Intel Iris Xe Graphics G7 96EUs
  (1649 - 1778, n=2)
1714 Points -4%
GMK NucBox K9
Arc 7-Core, Ultra 5 125H, MasonSemi 1TB MC7000
1594 Points -10%
Asus NUC 14 Pro
Arc 7-Core, Ultra 5 125H, Kingston KC3000 2048G SKC3000D2048G
1432 Points -19%
Beelink SEi11 Pro
Iris Xe G7 96EUs, i5-11320H, Kingston NV1 SNVS/500GCN
1419 Points -20%
CrossMark / Creativity
BOSGAME M1
Radeon 780M, R7 7840HS
2013 Points +18%
Beelink SER8
Radeon 780M, R7 8845HS, Crucial P3 Plus CT1000P3PSSD8
2009 Points +18%
Asus NUC 14 Pro
Arc 7-Core, Ultra 5 125H, Kingston KC3000 2048G SKC3000D2048G
1765 Points +3%
Moyenne Intel Core 7 150U, Intel Iris Xe Graphics G7 96EUs
  (1708 - 1730, n=2)
1719 Points +1%
GMK NucBox K9
Arc 7-Core, Ultra 5 125H, MasonSemi 1TB MC7000
1714 Points 0%
MSI Cubi NUC 1M
Iris Xe G7 96EUs, Core 7 150U, WD PC SN560 SDDPNQE-1T00
1708 Points
Beelink SEi11 Pro
Iris Xe G7 96EUs, i5-11320H, Kingston NV1 SNVS/500GCN
1256 Points -26%
CrossMark / Responsiveness
BOSGAME M1
Radeon 780M, R7 7840HS
1749 Points +4%
Beelink SER8
Radeon 780M, R7 8845HS, Crucial P3 Plus CT1000P3PSSD8
1718 Points +2%
MSI Cubi NUC 1M
Iris Xe G7 96EUs, Core 7 150U, WD PC SN560 SDDPNQE-1T00
1685 Points
Moyenne Intel Core 7 150U, Intel Iris Xe Graphics G7 96EUs
  (1493 - 1685, n=2)
1589 Points -6%
GMK NucBox K9
Arc 7-Core, Ultra 5 125H, MasonSemi 1TB MC7000
1520 Points -10%
Beelink SEi11 Pro
Iris Xe G7 96EUs, i5-11320H, Kingston NV1 SNVS/500GCN
1336 Points -21%
Asus NUC 14 Pro
Arc 7-Core, Ultra 5 125H, Kingston KC3000 2048G SKC3000D2048G
1171 Points -31%
WebXPRT 3 / Overall
Beelink SER8
Radeon 780M, R7 8845HS, Crucial P3 Plus CT1000P3PSSD8
334 Points +7%
BOSGAME M1
Radeon 780M, R7 7840HS
319 Points +3%
MSI Cubi NUC 1M
Iris Xe G7 96EUs, Core 7 150U, WD PC SN560 SDDPNQE-1T00
311 Points
Moyenne Intel Core 7 150U, Intel Iris Xe Graphics G7 96EUs
  (307 - 311, n=2)
309 Points -1%
Beelink SEi11 Pro
Iris Xe G7 96EUs, i5-11320H, Kingston NV1 SNVS/500GCN
264 Points -15%
GMK NucBox K9
Arc 7-Core, Ultra 5 125H, MasonSemi 1TB MC7000
262 Points -16%
Asus NUC 14 Pro
Arc 7-Core, Ultra 5 125H, Kingston KC3000 2048G SKC3000D2048G
254 Points -18%
WebXPRT 4 / Overall
Moyenne Intel Core 7 150U, Intel Iris Xe Graphics G7 96EUs
  (271 - 276, n=2)
274 Points +1%
MSI Cubi NUC 1M
Iris Xe G7 96EUs, Core 7 150U, WD PC SN560 SDDPNQE-1T00
271 Points
Beelink SER8
Radeon 780M, R7 8845HS, Crucial P3 Plus CT1000P3PSSD8
266 Points -2%
BOSGAME M1
Radeon 780M, R7 7840HS
258 Points -5%
Asus NUC 14 Pro
Arc 7-Core, Ultra 5 125H, Kingston KC3000 2048G SKC3000D2048G
231 Points -15%
GMK NucBox K9
Arc 7-Core, Ultra 5 125H, MasonSemi 1TB MC7000
231 Points -15%
Beelink SEi11 Pro
Iris Xe G7 96EUs, i5-11320H, Kingston NV1 SNVS/500GCN
206 Points -24%
Mozilla Kraken 1.1 / Total
Beelink SEi11 Pro
Iris Xe G7 96EUs, i5-11320H, Kingston NV1 SNVS/500GCN
663 ms * -36%
Asus NUC 14 Pro
Arc 7-Core, Ultra 5 125H, Kingston KC3000 2048G SKC3000D2048G
567 ms * -16%
GMK NucBox K9
Arc 7-Core, Ultra 5 125H, MasonSemi 1TB MC7000
566 ms * -16%
BOSGAME M1
Radeon 780M, R7 7840HS
526 ms * -8%
Beelink SER8
Radeon 780M, R7 8845HS, Crucial P3 Plus CT1000P3PSSD8
501 ms * -2%
Moyenne Intel Core 7 150U, Intel Iris Xe Graphics G7 96EUs
  (489 - 502, n=2)
496 ms * -1%
MSI Cubi NUC 1M
Iris Xe G7 96EUs, Core 7 150U, WD PC SN560 SDDPNQE-1T00
489 ms *

* ... Moindre est la valeur, meilleures sont les performances

PCMark 10 Score
6080 points
Aide
AIDA64 / Memory Copy
BOSGAME M1
AMD Ryzen 7 7840HS, Radeon 780M
69508 MB/s +17%
Asus NUC 14 Pro
Intel Core Ultra 5 125H, Arc 7-Core
69264 MB/s +16%
Beelink SER8
AMD Ryzen 7 8845HS, Radeon 780M
68283 MB/s +15%
GMK NucBox K9
Intel Core Ultra 5 125H, Arc 7-Core
67482 MB/s +13%
MSI Cubi NUC 1M
Intel Core 7 150U, Iris Xe G7 96EUs
59609 MB/s
Moyenne Intel Core 7 150U
  (36579 - 61190, n=4)
53226 MB/s -11%
Beelink SEi11 Pro
Intel Core i5-11320H, Iris Xe G7 96EUs
41106 MB/s -31%
AIDA64 / Memory Read
Asus NUC 14 Pro
Intel Core Ultra 5 125H, Arc 7-Core
74415 MB/s +8%
GMK NucBox K9
Intel Core Ultra 5 125H, Arc 7-Core
70520 MB/s +3%
MSI Cubi NUC 1M
Intel Core 7 150U, Iris Xe G7 96EUs
68780 MB/s
Beelink SER8
AMD Ryzen 7 8845HS, Radeon 780M
61976 MB/s -10%
BOSGAME M1
AMD Ryzen 7 7840HS, Radeon 780M
61765 MB/s -10%
Moyenne Intel Core 7 150U
  (39827 - 68780, n=4)
55315 MB/s -20%
Beelink SEi11 Pro
Intel Core i5-11320H, Iris Xe G7 96EUs
46516 MB/s -32%
AIDA64 / Memory Write
BOSGAME M1
AMD Ryzen 7 7840HS, Radeon 780M
86719 MB/s +43%
Beelink SER8
AMD Ryzen 7 8845HS, Radeon 780M
85464 MB/s +41%
Asus NUC 14 Pro
Intel Core Ultra 5 125H, Arc 7-Core
72443 MB/s +19%
GMK NucBox K9
Intel Core Ultra 5 125H, Arc 7-Core
71218 MB/s +17%
Moyenne Intel Core 7 150U
  (44925 - 78327, n=4)
60724 MB/s 0%
MSI Cubi NUC 1M
Intel Core 7 150U, Iris Xe G7 96EUs
60626 MB/s
Beelink SEi11 Pro
Intel Core i5-11320H, Iris Xe G7 96EUs
46760 MB/s -23%
AIDA64 / Memory Latency
GMK NucBox K9
Intel Core Ultra 5 125H, Arc 7-Core
140.2 ns * -88%
Asus NUC 14 Pro
Intel Core Ultra 5 125H, Arc 7-Core
127.3 ns * -71%
BOSGAME M1
AMD Ryzen 7 7840HS, Radeon 780M
89.8 ns * -21%
Beelink SER8
AMD Ryzen 7 8845HS, Radeon 780M
88.9 ns * -19%
Moyenne Intel Core 7 150U
  (74.5 - 100, n=4)
87.9 ns * -18%
Beelink SEi11 Pro
Intel Core i5-11320H, Iris Xe G7 96EUs
81 ns * -9%
MSI Cubi NUC 1M
Intel Core 7 150U, Iris Xe G7 96EUs
74.5 ns *

* ... Moindre est la valeur, meilleures sont les performances

Latence DPC

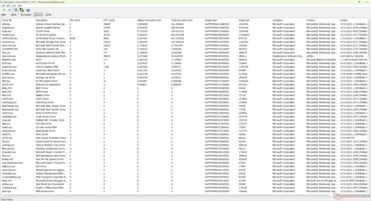
LatencyMon révèle des problèmes mineurs de DPC lors de l'ouverture de plusieurs onglets de notre page d'accueil. la lecture de vidéos 4K à 60 FPS est par ailleurs excellente, avec une seule image perdue enregistrée sur une période de 60 secondes.

LatencyMon
LatencyMon
Liste des conducteurs
DPC Latencies / LatencyMon - interrupt to process latency (max), Web, Youtube, Prime95
GMK NucBox K9
Arc 7-Core, Ultra 5 125H, MasonSemi 1TB MC7000
29083.3 μs * -609%
MSI Cubi NUC 1M
Iris Xe G7 96EUs, Core 7 150U, WD PC SN560 SDDPNQE-1T00
4103.1 μs *
Asus NUC 14 Pro
Arc 7-Core, Ultra 5 125H, Kingston KC3000 2048G SKC3000D2048G
2776 μs * +32%
BOSGAME M1
Radeon 780M, R7 7840HS
1179.5 μs * +71%
Beelink SER8
Radeon 780M, R7 8845HS, Crucial P3 Plus CT1000P3PSSD8
1071.2 μs * +74%
Beelink SEi11 Pro
Iris Xe G7 96EUs, i5-11320H, Kingston NV1 SNVS/500GCN
167.2 μs * +96%

* ... Moindre est la valeur, meilleures sont les performances

Dispositifs de stockage

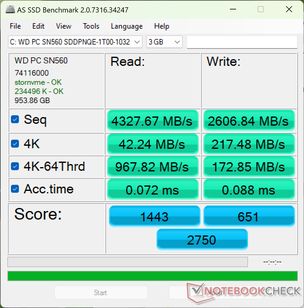
Notre appareil est livré avec le modèle de milieu de gamme WD PC SN560 SDDPNQE-1T00 M.2 PCIe4 x4 NVMe SSD offrant des taux de transfert stables allant jusqu'à 5000 Mo/s. Nous apprécions que le répartiteur de chaleur SSD soit livré en standard et préinstallé.

AS SSD
AS SSD
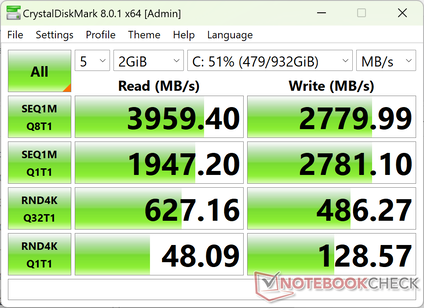
CDM 8
CDM 8
WD PC SN560 SDDPNQE-1T00
CDM 5/6 Read Seq Q32T1: 4996 MB/s
CDM 5/6 Write Seq Q32T1: 2784 MB/s
CDM 5/6 Read 4K Q32T1: 846.2 MB/s
CDM 5/6 Write 4K Q32T1: 551.3 MB/s
CDM 5 Read Seq: 4572 MB/s
CDM 5 Write Seq: 2754 MB/s
CDM 5/6 Read 4K: 74.62 MB/s
CDM 5/6 Write 4K: 260.7 MB/s
Drive Performance Rating - Percent
GMK NucBox K9
MasonSemi 1TB MC7000
83.9 pt
Beelink SER8
Crucial P3 Plus CT1000P3PSSD8
64.2 pt
Asus NUC 14 Pro
Kingston KC3000 2048G SKC3000D2048G
63.5 pt
BOSGAME M1
 
57 pt
MSI Cubi NUC 1M
WD PC SN560 SDDPNQE-1T00
56.9 pt
Beelink SEi11 Pro
Kingston NV1 SNVS/500GCN
37.7 pt
DiskSpd
seq read
MSI Cubi NUC 1M
WD PC SN560 SDDPNQE-1T00
4128 (4092.8min - 4128.38max) MB/s
GMK NucBox K9
MasonSemi 1TB MC7000
3783 (3597.81min - 3782.84max) MB/s -8%
Asus NUC 14 Pro
Kingston KC3000 2048G SKC3000D2048G
3706 (3594.04min - 3706.37max) MB/s -10%
Beelink SER8
Crucial P3 Plus CT1000P3PSSD8
3106 (3062.47min - 3106.43max) MB/s -25%
BOSGAME M1
 
2533 (2518.88min - 2532.52max) MB/s -39%
Beelink SEi11 Pro
Kingston NV1 SNVS/500GCN
1638 (1628.34min - 1637.59max) MB/s -60%
seq write
GMK NucBox K9
MasonSemi 1TB MC7000
5556 (1352.45min - 5556.19max) MB/s +73%
Beelink SER8
Crucial P3 Plus CT1000P3PSSD8
4604 (4532.99min - 4603.88max) MB/s +43%
MSI Cubi NUC 1M
WD PC SN560 SDDPNQE-1T00
3215 (3133.8min - 3214.8max) MB/s
BOSGAME M1
 
3176 (2921.36min - 3176.08max) MB/s -1%
Asus NUC 14 Pro
Kingston KC3000 2048G SKC3000D2048G
2928 (1958.53min - 2927.62max) MB/s -9%
Beelink SEi11 Pro
Kingston NV1 SNVS/500GCN
1661 (336.85min - 1661.33max) MB/s -48%
seq q8 t1 read
Asus NUC 14 Pro
Kingston KC3000 2048G SKC3000D2048G
7110 (6058.21min - 7110.02max) MB/s +43%
GMK NucBox K9
MasonSemi 1TB MC7000
7066 (6607.49min - 7066.35max) MB/s +42%
Beelink SER8
Crucial P3 Plus CT1000P3PSSD8
5195 (4594.02min - 5195.39max) MB/s +4%
MSI Cubi NUC 1M
WD PC SN560 SDDPNQE-1T00
4987 (4558.37min - 4987.33max) MB/s
BOSGAME M1
 
4109 (3651.18min - 4108.53max) MB/s -18%
Beelink SEi11 Pro
Kingston NV1 SNVS/500GCN
2374 (2218.75min - 2374.19max) MB/s -52%
seq q8 t1 write
GMK NucBox K9
MasonSemi 1TB MC7000
6647 (1260.59min - 6647.13max) MB/s +101%
Beelink SER8
Crucial P3 Plus CT1000P3PSSD8
4725 (4657.36min - 4724.88max) MB/s +43%
Asus NUC 14 Pro
Kingston KC3000 2048G SKC3000D2048G
4712 (3064.99min - 4711.88max) MB/s +42%
MSI Cubi NUC 1M
WD PC SN560 SDDPNQE-1T00
3308 (3211.45min - 3307.84max) MB/s
BOSGAME M1
 
3187 (3142.8min - 3187.38max) MB/s -4%
Beelink SEi11 Pro
Kingston NV1 SNVS/500GCN
1433 (67.32min - 1432.98max) MB/s -57%
4k q1 t1 read
Beelink SER8
Crucial P3 Plus CT1000P3PSSD8
79.7 (77.93min - 79.74max) MB/s +9%
GMK NucBox K9
MasonSemi 1TB MC7000
79.5 (78.92min - 79.5max) MB/s +8%
MSI Cubi NUC 1M
WD PC SN560 SDDPNQE-1T00
73.3 (72.01min - 73.31max) MB/s
BOSGAME M1
 
64.4 (64.2min - 64.35max) MB/s -12%
Asus NUC 14 Pro
Kingston KC3000 2048G SKC3000D2048G
53.4 (49.89min - 53.35max) MB/s -27%
Beelink SEi11 Pro
Kingston NV1 SNVS/500GCN
50.5 (48.13min - 50.48max) MB/s -31%
4k q1 t1 write
Beelink SER8
Crucial P3 Plus CT1000P3PSSD8
289 (283.17min - 289.07max) MB/s +2%
MSI Cubi NUC 1M
WD PC SN560 SDDPNQE-1T00
282 (265.11min - 281.58max) MB/s
BOSGAME M1
 
261 (258.95min - 260.75max) MB/s -7%
GMK NucBox K9
MasonSemi 1TB MC7000
205 (173.87min - 205.2max) MB/s -27%
Beelink SEi11 Pro
Kingston NV1 SNVS/500GCN
173.6 (113.3min - 173.62max) MB/s -38%
Asus NUC 14 Pro
Kingston KC3000 2048G SKC3000D2048G
83.1 (75.3min - 83.11max) MB/s -71%
4k q32 t16 read
Beelink SER8
Crucial P3 Plus CT1000P3PSSD8
3139 (3067min - 3138.94max) MB/s +105%
GMK NucBox K9
MasonSemi 1TB MC7000
2243 (1941.91min - 2243.48max) MB/s +46%
MSI Cubi NUC 1M
WD PC SN560 SDDPNQE-1T00
1533 (1419.74min - 1533.25max) MB/s
BOSGAME M1
 
791 (751.42min - 791.35max) MB/s -48%
Beelink SEi11 Pro
Kingston NV1 SNVS/500GCN
745 (742.2min - 744.53max) MB/s -51%
Asus NUC 14 Pro
Kingston KC3000 2048G SKC3000D2048G
731 (660.89min - 731.29max) MB/s -52%
4k q32 t16 write
Beelink SER8
Crucial P3 Plus CT1000P3PSSD8
4288 (4275.2min - 4287.55max) MB/s +113%
GMK NucBox K9
MasonSemi 1TB MC7000
3232 (3002.64min - 3232.41max) MB/s +61%
BOSGAME M1
 
3112 (3068.44min - 3111.56max) MB/s +55%
MSI Cubi NUC 1M
WD PC SN560 SDDPNQE-1T00
2010 (1622.95min - 2010.14max) MB/s
Beelink SEi11 Pro
Kingston NV1 SNVS/500GCN
733 (332min - 733.18max) MB/s -64%
Asus NUC 14 Pro
Kingston KC3000 2048G SKC3000D2048G
186.7 (155.05min - 186.74max) MB/s -91%
AS SSD
Score Total
GMK NucBox K9
MasonSemi 1TB MC7000
7509 Points +173%
Asus NUC 14 Pro
Kingston KC3000 2048G SKC3000D2048G
5131 Points +87%
BOSGAME M1
 
4263 Points +55%
MSI Cubi NUC 1M
WD PC SN560 SDDPNQE-1T00
2750 Points
Beelink SEi11 Pro
Kingston NV1 SNVS/500GCN
2742 Points 0%
Beelink SER8
Crucial P3 Plus CT1000P3PSSD8
2646 Points -4%
Score Read
GMK NucBox K9
MasonSemi 1TB MC7000
3258 Points +126%
MSI Cubi NUC 1M
WD PC SN560 SDDPNQE-1T00
1443 Points
Asus NUC 14 Pro
Kingston KC3000 2048G SKC3000D2048G
1275 Points -12%
BOSGAME M1
 
1146 Points -21%
Beelink SER8
Crucial P3 Plus CT1000P3PSSD8
1108 Points -23%
Beelink SEi11 Pro
Kingston NV1 SNVS/500GCN
975 Points -32%
Score Write
Asus NUC 14 Pro
Kingston KC3000 2048G SKC3000D2048G
3313 Points +409%
GMK NucBox K9
MasonSemi 1TB MC7000
2593 Points +298%
BOSGAME M1
 
2547 Points +291%
Beelink SEi11 Pro
Kingston NV1 SNVS/500GCN
1282 Points +97%
Beelink SER8
Crucial P3 Plus CT1000P3PSSD8
1057 Points +62%
MSI Cubi NUC 1M
WD PC SN560 SDDPNQE-1T00
651 Points
Seq Read
GMK NucBox K9
MasonSemi 1TB MC7000
5766.47 MB/s +33%
Asus NUC 14 Pro
Kingston KC3000 2048G SKC3000D2048G
5158 MB/s +19%
MSI Cubi NUC 1M
WD PC SN560 SDDPNQE-1T00
4327.67 MB/s
Beelink SER8
Crucial P3 Plus CT1000P3PSSD8
3913.46 MB/s -10%
BOSGAME M1
 
3438.69 MB/s -21%
Beelink SEi11 Pro
Kingston NV1 SNVS/500GCN
2246.84 MB/s -48%
Seq Write
GMK NucBox K9
MasonSemi 1TB MC7000
5653.88 MB/s +117%
BOSGAME M1
 
2877.44 MB/s +10%
Asus NUC 14 Pro
Kingston KC3000 2048G SKC3000D2048G
2646 MB/s +2%
MSI Cubi NUC 1M
WD PC SN560 SDDPNQE-1T00
2606.84 MB/s
Beelink SER8
Crucial P3 Plus CT1000P3PSSD8
1944.73 MB/s -25%
Beelink SEi11 Pro
Kingston NV1 SNVS/500GCN
1764.26 MB/s -32%
4K Read
GMK NucBox K9
MasonSemi 1TB MC7000
67.66 MB/s +60%
Asus NUC 14 Pro
Kingston KC3000 2048G SKC3000D2048G
63.6 MB/s +51%
Beelink SER8
Crucial P3 Plus CT1000P3PSSD8
51.6 MB/s +22%
BOSGAME M1
 
48.27 MB/s +14%
Beelink SEi11 Pro
Kingston NV1 SNVS/500GCN
44.12 MB/s +4%
MSI Cubi NUC 1M
WD PC SN560 SDDPNQE-1T00
42.24 MB/s
4K Write
Beelink SER8
Crucial P3 Plus CT1000P3PSSD8
219.02 MB/s +1%
MSI Cubi NUC 1M
WD PC SN560 SDDPNQE-1T00
217.48 MB/s
Beelink SEi11 Pro
Kingston NV1 SNVS/500GCN
192.62 MB/s -11%
Asus NUC 14 Pro
Kingston KC3000 2048G SKC3000D2048G
169.5 MB/s -22%
GMK NucBox K9
MasonSemi 1TB MC7000
148.58 MB/s -32%
BOSGAME M1
 
114.69 MB/s -47%
4K-64 Read
GMK NucBox K9
MasonSemi 1TB MC7000
2614.06 MB/s +170%
MSI Cubi NUC 1M
WD PC SN560 SDDPNQE-1T00
967.82 MB/s
BOSGAME M1
 
754.28 MB/s -22%
Beelink SEi11 Pro
Kingston NV1 SNVS/500GCN
706.35 MB/s -27%
Asus NUC 14 Pro
Kingston KC3000 2048G SKC3000D2048G
695 MB/s -28%
Beelink SER8
Crucial P3 Plus CT1000P3PSSD8
664.76 MB/s -31%
4K-64 Write
Asus NUC 14 Pro
Kingston KC3000 2048G SKC3000D2048G
2878 MB/s +1565%
BOSGAME M1
 
2144.62 MB/s +1141%
GMK NucBox K9
MasonSemi 1TB MC7000
1879.53 MB/s +987%
Beelink SEi11 Pro
Kingston NV1 SNVS/500GCN
912.72 MB/s +428%
Beelink SER8
Crucial P3 Plus CT1000P3PSSD8
643.31 MB/s +272%
MSI Cubi NUC 1M
WD PC SN560 SDDPNQE-1T00
172.85 MB/s
Access Time Read
BOSGAME M1
 
0.088 ms * -22%
Beelink SER8
Crucial P3 Plus CT1000P3PSSD8
0.077 ms * -7%
MSI Cubi NUC 1M
WD PC SN560 SDDPNQE-1T00
0.072 ms *
GMK NucBox K9
MasonSemi 1TB MC7000
0.06 ms * +17%
Beelink SEi11 Pro
Kingston NV1 SNVS/500GCN
0.053 ms * +26%
Asus NUC 14 Pro
Kingston KC3000 2048G SKC3000D2048G
0.053 ms * +26%
Access Time Write
Beelink SEi11 Pro
Kingston NV1 SNVS/500GCN
0.342 ms * -289%
GMK NucBox K9
MasonSemi 1TB MC7000
0.195 ms * -122%
MSI Cubi NUC 1M
WD PC SN560 SDDPNQE-1T00
0.088 ms *
Beelink SER8
Crucial P3 Plus CT1000P3PSSD8
0.075 ms * +15%
BOSGAME M1
 
0.058 ms * +34%
Asus NUC 14 Pro
Kingston KC3000 2048G SKC3000D2048G
0.043 ms * +51%

* ... Moindre est la valeur, meilleures sont les performances

Disk Throttling: DiskSpd Read Loop, Queue Depth 8

02605207801040130015601820208023402600286031203380364039004160442046804940Tooltip
MSI Cubi NUC 1M WD PC SN560 SDDPNQE-1T00; diskspd 2.0.17 f: Ø4962 (4554.8-4986.07)
Beelink SER8 Crucial P3 Plus CT1000P3PSSD8; diskspd 2.0.17 f: Ø5188 (4957.94-5197.46)

Performance du GPU

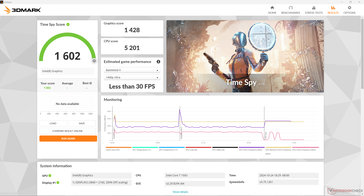
L'Iris Xe G7 Iris Xe G7 96 EUs a maintenant plusieurs années et est donc loin derrière la plupart des mini PC plus récents fonctionnant sur des plateformes Meteor Lake ou Zen 4 ou plus. Le Cubi NUC M1 est donc plus adapté au streaming et aux jeux 2D légers.

L'exécution en mode équilibré au lieu du mode performance ne semble pas avoir d'impact sur les performances, car leurs scores 3DMark seraient presque identiques dans nos tests.

Le passage à la configuration Core 5 120U devrait avoir un impact sur les performances graphiques d'environ 10 à 20 % car le processeur Core 5 est associé à la carte graphique intégrée plus lente Iris Xe 80 EU au lieu de cela.

X-Plane n'a pas pu être lancé sur notre Cubi M1 et ses résultats ne sont donc pas disponibles ci-dessous.

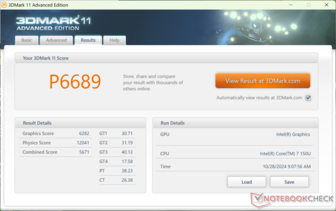
3DMark 11
3DMark 11
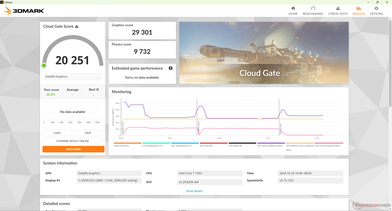
Cloud Gate
Cloud Gate
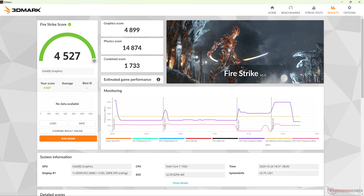
Fire Strike
Fire Strike
Time Spy
Time Spy
3DMark Performance Rating - Percent
Beelink SER8
AMD Radeon 780M, AMD Ryzen 7 8845HS
97.2 pt
GMK NucBox K6 -1!
AMD Radeon 780M, AMD Ryzen 7 7840HS
94.7 pt
Lenovo ThinkStation P3 Tiny-30H0006AGE
NVIDIA T1000, Intel Core i9-14900
93.4 pt
Geekom AX8 Pro
AMD Radeon 780M, AMD Ryzen 9 8945H
92.3 pt
Khadas Mind 2
Intel Arc 8-Core iGPU, Intel Core Ultra 7 155H
92.2 pt
Asus NUC 14 Pro
Intel Arc 7-Core iGPU, Intel Core Ultra 5 125H
88.7 pt
GMK NucBox K9
Intel Arc 7-Core iGPU, Intel Core Ultra 5 125H
81.6 pt
Beelink SER6 Pro
AMD Radeon 680M, AMD Ryzen 7 6800H
80.4 pt
Beelink SER6 Pro Ryzen 7 7735HS -1!
AMD Radeon 680M, AMD Ryzen 7 7735HS
78.4 pt
Geekom XT13 Pro
Intel Iris Xe Graphics G7 96EUs, Intel Core i9-13900H
59.6 pt
GMK NucBox M6
AMD Radeon 660M, AMD Ryzen 5 6600H
54.7 pt
MSI Cubi NUC 1M
Intel Iris Xe Graphics G7 96EUs, Intel Core 7 150U
50.4 pt
Moyenne Intel Iris Xe Graphics G7 96EUs
 
49.8 pt
Beelink SEi11 Pro
Intel Iris Xe Graphics G7 96EUs, Intel Core i5-11320H
48.4 pt
Lenovo IdeaPad Slim 3i 15IRU9
Intel Iris Xe Graphics G7 80EUs, Intel Core 5 120U
46.5 pt
GMK NucBox M5
AMD Radeon RX Vega 8 (Ryzen 4000/5000), AMD Ryzen 7 5700U
41.1 pt
HP Elite Mini 800 G9-5M9X6EA
Intel UHD Graphics 770, Intel Core i5-14500
27.3 pt
3DMark 11 - 1280x720 Performance GPU
GMK NucBox K6
AMD Radeon 780M, AMD Ryzen 7 7840HS
13716 Points +118%
Beelink SER8
AMD Radeon 780M, AMD Ryzen 7 8845HS
13673 Points +118%
Geekom AX8 Pro
AMD Radeon 780M, AMD Ryzen 9 8945H
13281 Points +111%
Khadas Mind 2
Intel Arc 8-Core iGPU, Intel Core Ultra 7 155H
11902 Points +89%
Lenovo ThinkStation P3 Tiny-30H0006AGE
NVIDIA T1000, Intel Core i9-14900
11793 Points +88%
Asus NUC 14 Pro
Intel Arc 7-Core iGPU, Intel Core Ultra 5 125H
11785 Points +88%
Beelink SER6 Pro
AMD Radeon 680M, AMD Ryzen 7 6800H
10807 Points +72%
GMK NucBox K9
Intel Arc 7-Core iGPU, Intel Core Ultra 5 125H
10737 Points +71%
Beelink SER6 Pro Ryzen 7 7735HS
AMD Radeon 680M, AMD Ryzen 7 7735HS
10734 Points +71%
Geekom XT13 Pro
Intel Iris Xe Graphics G7 96EUs, Intel Core i9-13900H
7428 Points +18%
GMK NucBox M6
AMD Radeon 660M, AMD Ryzen 5 6600H
7184 Points +14%
Beelink SEi11 Pro
Intel Iris Xe Graphics G7 96EUs, Intel Core i5-11320H
6571 Points +5%
Moyenne Intel Iris Xe Graphics G7 96EUs
  (2867 - 7676, n=202)
6353 Points +1%
MSI Cubi NUC 1M
Intel Iris Xe Graphics G7 96EUs, Intel Core 7 150U
6282 Points
Lenovo IdeaPad Slim 3i 15IRU9
Intel Iris Xe Graphics G7 80EUs, Intel Core 5 120U
5606 Points -11%
GMK NucBox M5
AMD Radeon RX Vega 8 (Ryzen 4000/5000), AMD Ryzen 7 5700U
5388 Points -14%
HP Elite Mini 800 G9-5M9X6EA
Intel UHD Graphics 770, Intel Core i5-14500
3428 Points -45%
3DMark
1280x720 Cloud Gate Standard Graphics
Beelink SER8
AMD Radeon 780M, AMD Ryzen 7 8845HS
53347 Points +82%
Lenovo ThinkStation P3 Tiny-30H0006AGE
NVIDIA T1000, Intel Core i9-14900
50553 Points +73%
Geekom AX8 Pro
AMD Radeon 780M, AMD Ryzen 9 8945H
48166 Points +64%
Beelink SER6 Pro
AMD Radeon 680M, AMD Ryzen 7 6800H
45727 Points +56%
Khadas Mind 2
Intel Arc 8-Core iGPU, Intel Core Ultra 7 155H
45726 Points +56%
Asus NUC 14 Pro
Intel Arc 7-Core iGPU, Intel Core Ultra 5 125H
41975 Points +43%
GMK NucBox K9
Intel Arc 7-Core iGPU, Intel Core Ultra 5 125H
39695 Points +35%
Geekom XT13 Pro
Intel Iris Xe Graphics G7 96EUs, Intel Core i9-13900H
34469 Points +18%
GMK NucBox M6
AMD Radeon 660M, AMD Ryzen 5 6600H
31849 Points +9%
MSI Cubi NUC 1M
Intel Iris Xe Graphics G7 96EUs, Intel Core 7 150U
29301 Points
Lenovo IdeaPad Slim 3i 15IRU9
Intel Iris Xe Graphics G7 80EUs, Intel Core 5 120U
26873 Points -8%
Moyenne Intel Iris Xe Graphics G7 96EUs
  (13162 - 38578, n=180)
26508 Points -10%
Beelink SEi11 Pro
Intel Iris Xe Graphics G7 96EUs, Intel Core i5-11320H
26093 Points -11%
GMK NucBox M5
AMD Radeon RX Vega 8 (Ryzen 4000/5000), AMD Ryzen 7 5700U
25003 Points -15%
HP Elite Mini 800 G9-5M9X6EA
Intel UHD Graphics 770, Intel Core i5-14500
16443 Points