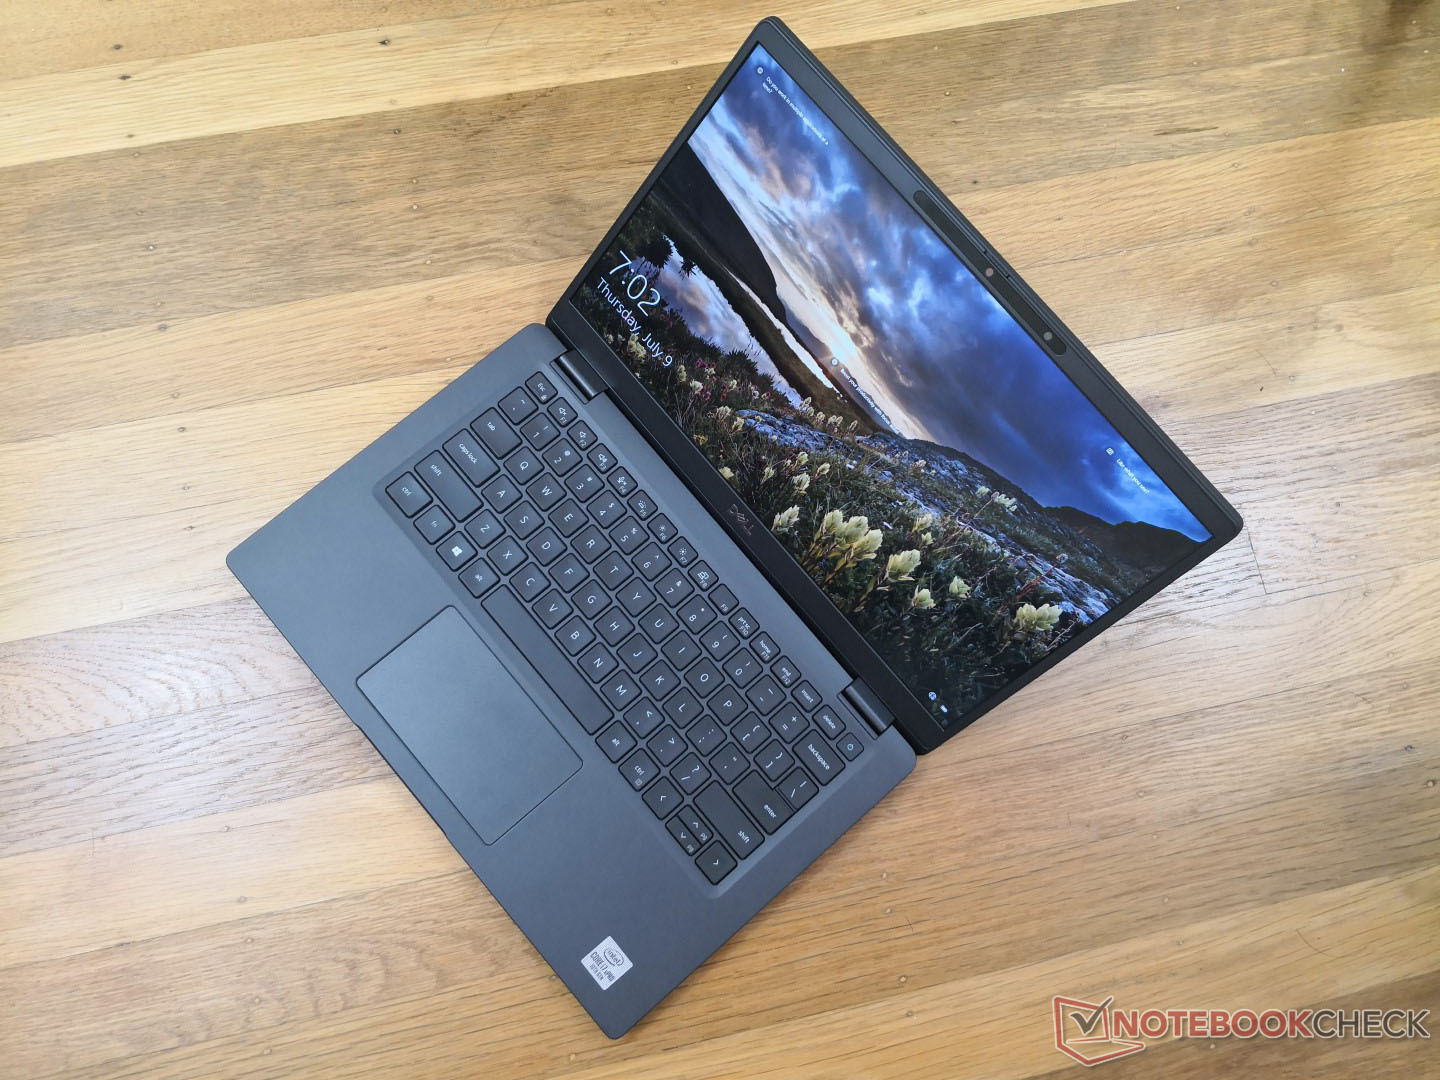
Test du Dell Latitude 7310 (i7-10610U, UHD 620, FHD) : plus élégant, performances identiques
Note | Date | Modèle | Poids | Épaisseur | Taille | Résolution | Prix |
|---|---|---|---|---|---|---|---|
| 89.4 % v7 (old) | 08/20 | Dell Latitude 7310 i7-10610U, UHD Graphics 620 | 1.2 kg | 18.3 mm | 13.30" | 1920x1080 | |
| 88.8 % v7 (old) | 10/19 | Lenovo ThinkPad X395 R3 PRO 3300U, Vega 6 | 1.3 kg | 16.9 mm | 13.30" | 1920x1080 | |
| 86 % v7 (old) | 07/20 | HP EliteBook 735 G6 7KN29EA R5 PRO 3500U, Vega 8 | 1.5 kg | 17.7 mm | 13.30" | 1920x1080 | |
| 92.1 % v7 (old) | 07/20 | Apple MacBook Pro 13 2020 2GHz i5 10th-Gen i5-1038NG7, Iris Plus Graphics G7 (Ice Lake 64 EU) | 1.4 kg | 15.6 mm | 13.30" | 2560x1600 | |
| 82.6 % v7 (old) | 09/20 | HP ProBook 455 G7-175W8EA R7 4700U, Vega 7 | 1.8 kg | 19 mm | 15.60" | 1920x1080 |
| SD Card Reader | |
| average JPG Copy Test (av. of 3 runs) | |
| Dell Latitude 7300-P99G (Toshiba Exceria Pro M501 microSDXC 64GB) | |
| Dell Latitude 7310 (Toshiba Exceria Pro M501 64 GB UHS-II) | |
| Lenovo ThinkPad X395 | |
| Asus ZenBook S13 UX392FN (Toshiba Exceria Pro M501 64 GB UHS-II) | |
| maximum AS SSD Seq Read Test (1GB) | |
| Dell Latitude 7310 (Toshiba Exceria Pro M501 64 GB UHS-II) | |
| Dell Latitude 7300-P99G (Toshiba Exceria Pro M501 microSDXC 64GB) | |
| Lenovo ThinkPad X395 | |
| Asus ZenBook S13 UX392FN (Toshiba Exceria Pro M501 64 GB UHS-II) | |
| Networking | |
| iperf3 transmit AX12 | |
| Asus Zephyrus G14 GA401IV | |
| Dell Latitude 7310 | |
| Dell XPS 13 9300 4K UHD | |
| Dell Latitude 7410 | |
| iperf3 receive AX12 | |
| Dell XPS 13 9300 4K UHD | |
| Asus Zephyrus G14 GA401IV | |
| Dell Latitude 7410 | |
| Dell Latitude 7310 | |


| |||||||||||||||||||||||||
Homogénéité de la luminosité: 89 %
Valeur mesurée au centre, sur batterie: 332.7 cd/m²
Contraste: 1331:1 (Valeurs des noirs: 0.25 cd/m²)
ΔE ColorChecker Calman: 2.15 | ∀{0.5-29.43 Ø4.72}
calibrated: 1.09
ΔE Greyscale Calman: 2.5 | ∀{0.09-98 Ø4.97}
99.4% sRGB (Argyll 1.6.3 3D)
64.1% AdobeRGB 1998 (Argyll 1.6.3 3D)
72.4% AdobeRGB 1998 (Argyll 3D)
99.3% sRGB (Argyll 3D)
71.8% Display P3 (Argyll 3D)
Gamma: 2.3
CCT: 6347 K
| Dell Latitude 7310 AU Optronics B133HAN, IPS, 13.3", 1920x1080 | Dell Latitude 7300-P99G B133HAK, IPS LED, 13.3", 1920x1080 | Asus ZenBook S13 UX392FN Tianma XM, IPS, 13.9", 1920x1080 | Lenovo ThinkPad X395 LP133WF7-SPB1, IPS, 13.3", 1920x1080 | HP EliteBook 735 G6 7KN29EA CMN139E, IPS LED, 13.3", 1920x1080 | Apple MacBook Pro 13 2020 2GHz i5 10th-Gen APPA03D, IPS, 13.3", 2560x1600 | |
|---|---|---|---|---|---|---|
| Display | -9% | -5% | -8% | -40% | 19% | |
| Display P3 Coverage (%) | 71.8 | 64.6 -10% | 67.5 -6% | 64.1 -11% | 41.53 -42% | 98.8 38% |
| sRGB Coverage (%) | 99.3 | 91.5 -8% | 95.8 -4% | 95.2 -4% | 61.7 -38% | 99.9 1% |
| AdobeRGB 1998 Coverage (%) | 72.4 | 65.5 -10% | 69 -5% | 65.8 -9% | 43 -41% | 86.4 19% |
| Response Times | 5% | -1% | -23% | 8% | -13% | |
| Response Time Grey 50% / Grey 80% * (ms) | 40.8 ? | 39 ? 4% | 47.2 ? -16% | 55 ? -35% | 38 ? 7% | 46 ? -13% |
| Response Time Black / White * (ms) | 28.8 ? | 27 ? 6% | 24.8 ? 14% | 32 ? -11% | 26.4 ? 8% | 32.4 ? -13% |
| PWM Frequency (Hz) | 26040 | 113600 ? | ||||
| Screen | -66% | -0% | -9% | -114% | 17% | |
| Brightness middle (cd/m²) | 332.7 | 341 2% | 466 40% | 356 7% | 294 -12% | 512 54% |
| Brightness (cd/m²) | 329 | 306 -7% | 462 40% | 336 2% | 277 -16% | 491 49% |
| Brightness Distribution (%) | 89 | 79 -11% | 90 1% | 88 -1% | 87 -2% | 91 2% |
| Black Level * (cd/m²) | 0.25 | 0.31 -24% | 0.33 -32% | 0.16 36% | 0.18 28% | 0.32 -28% |
| Contrast (:1) | 1331 | 1100 -17% | 1412 6% | 2225 67% | 1633 23% | 1600 20% |
| Colorchecker dE 2000 * | 2.15 | 6.43 -199% | 1.93 10% | 3.6 -67% | 6.8 -216% | 1.7 21% |
| Colorchecker dE 2000 max. * | 3.89 | 10.33 -166% | 4.26 -10% | 5.5 -41% | 23.8 -512% | 3.4 13% |
| Colorchecker dE 2000 calibrated * | 1.09 | 2.36 -117% | 1.99 -83% | 1.11 -2% | 4.8 -340% | 1 8% |
| Greyscale dE 2000 * | 2.5 | 6.9 -176% | 1.7 32% | 4.7 -88% | 5.9 -136% | 1.9 24% |
| Gamma | 2.3 96% | 2.23 99% | 2.15 102% | 2.92 75% | 1.96 112% | 2.19 100% |
| CCT | 6347 102% | 8338 78% | 6382 102% | 6222 104% | 6979 93% | 6817 95% |
| Color Space (Percent of AdobeRGB 1998) (%) | 64.1 | 59 -8% | 62.2 -3% | 61 -5% | 39.6 -38% | 77.4 21% |
| Color Space (Percent of sRGB) (%) | 99.4 | 91 -8% | 95.7 -4% | 96 -3% | 61.5 -38% | 99.9 1% |
| Moyenne finale (programmes/paramètres) | -23% /
-47% | -2% /
-1% | -13% /
-10% | -49% /
-85% | 8% /
14% |
* ... Moindre est la valeur, meilleures sont les performances
Temps de réponse de l'écran
| ↔ Temps de réponse noir à blanc | ||
|---|---|---|
| 28.8 ms ... hausse ↗ et chute ↘ combinées | ↗ 14.8 ms hausse | 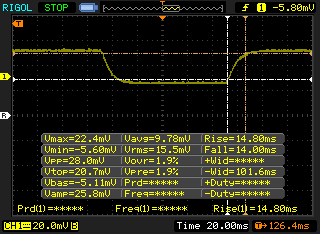 |
| ↘ 14 ms chute | ||
| L'écran souffre de latences relativement élevées, insuffisant pour le jeu. En comparaison, tous les appareils testés affichent entre 0.1 (minimum) et 240 (maximum) ms. » 76 % des appareils testés affichent de meilleures performances. Cela signifie que les latences relevées sont moins bonnes que la moyenne (19.8 ms) de tous les appareils testés. | ||
| ↔ Temps de réponse gris 50% à gris 80% | ||
| 40.8 ms ... hausse ↗ et chute ↘ combinées | ↗ 22.4 ms hausse | 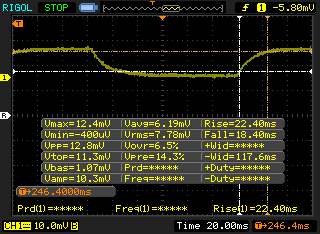 |
| ↘ 18.4 ms chute | ||
| L'écran souffre de latences très élevées, à éviter pour le jeu. En comparaison, tous les appareils testés affichent entre 0.165 (minimum) et 636 (maximum) ms. » 64 % des appareils testés affichent de meilleures performances. Cela signifie que les latences relevées sont moins bonnes que la moyenne (31 ms) de tous les appareils testés. | ||
Scintillement / MLI (Modulation de largeur d'impulsion)
| Scintillement / MLI (Modulation de largeur d'impulsion) non décelé | 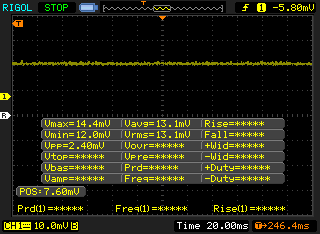 | ||
En comparaison, 52 % des appareils testés n'emploient pas MDI pour assombrir leur écran. Nous avons relevé une moyenne à 7763 (minimum : 5 - maximum : 343500) Hz dans le cas où une MDI était active. | |||
Cinebench R15: CPU Multi 64Bit | CPU Single 64Bit
Blender: v2.79 BMW27 CPU
7-Zip 18.03: 7z b 4 -mmt1 | 7z b 4
Geekbench 5.5: Single-Core | Multi-Core
HWBOT x265 Benchmark v2.2: 4k Preset
LibreOffice : 20 Documents To PDF
R Benchmark 2.5: Overall mean
| Cinebench R15 / CPU Multi 64Bit | |
| Dell XPS 13 7390 Core i7-10710U | |
| HP ProBook 455 G7-175W8EA | |
| HP Envy x360 13-ay0010nr | |
| Dell XPS 13 9300 4K UHD | |
| Lenovo ThinkPad X1 Carbon 2020-20UAS04T00 | |
| Dell Latitude 7300-P99G | |
| Dell XPS 13 9300 i5 FHD | |
| Dell XPS 13 9300 i5 FHD | |
| Moyenne Intel Core i7-10610U (548 - 738, n=6) | |
| Acer Swift 3 SF314-42-R27B | |
| Dell Latitude 7310 | |
| HP EliteBook x360 830 G6 | |
| Lenovo ThinkPad L13 Yoga 20R6S00800 | |
| Dell XPS 13 7390 2-in-1 Core i3 | |
| Lenovo ThinkPad 13 20J1005TPB | |
| Cinebench R15 / CPU Single 64Bit | |
| Dell Latitude 7300-P99G | |
| Lenovo ThinkPad X1 Carbon 2020-20UAS04T00 | |
| Dell XPS 13 9300 4K UHD | |
| HP ProBook 455 G7-175W8EA | |
| Dell XPS 13 7390 Core i7-10710U | |
| Dell Latitude 7310 | |
| Moyenne Intel Core i7-10610U (133 - 200, n=6) | |
| HP Envy x360 13-ay0010nr | |
| Dell XPS 13 9300 i5 FHD | |
| Acer Swift 3 SF314-42-R27B | |
| Lenovo ThinkPad L13 Yoga 20R6S00800 | |
| HP EliteBook x360 830 G6 | |
| Dell XPS 13 7390 2-in-1 Core i3 | |
| Lenovo ThinkPad 13 20J1005TPB | |
| Geekbench 5.5 / Single-Core | |
| Dell XPS 13 9300 4K UHD | |
| Dell Latitude 7310 | |
| Dell XPS 13 9300 i5 FHD | |
| Moyenne Intel Core i7-10610U (1155 - 1261, n=6) | |
| Lenovo ThinkPad X1 Carbon 2020-20UAS04T00 | |
| HP ProBook 455 G7-175W8EA | |
| Lenovo ThinkPad L13 Yoga 20R6S00800 | |
| HP Envy x360 13-ay0010nr | |
| Acer Swift 3 SF314-42-R27B | |
| Geekbench 5.5 / Multi-Core | |
| Dell XPS 13 9300 4K UHD | |
| HP ProBook 455 G7-175W8EA | |
| HP Envy x360 13-ay0010nr | |
| Dell XPS 13 9300 i5 FHD | |
| Lenovo ThinkPad L13 Yoga 20R6S00800 | |
| Moyenne Intel Core i7-10610U (3731 - 4622, n=6) | |
| Lenovo ThinkPad X1 Carbon 2020-20UAS04T00 | |
| Dell Latitude 7310 | |
| Acer Swift 3 SF314-42-R27B | |
| LibreOffice / 20 Documents To PDF | |
| HP ProBook 455 G7-175W8EA | |
| Dell XPS 13 9300 4K UHD | |
| Moyenne Intel Core i7-10610U (56.1 - 106, n=6) | |
| Acer Swift 3 SF314-42-R27B | |
| HP Envy x360 13-ay0010nr | |
| Dell Latitude 7310 | |
| Lenovo ThinkPad X1 Carbon 2020-20UAS04T00 | |
| R Benchmark 2.5 / Overall mean | |
| Dell XPS 13 9300 i5 FHD | |
| Moyenne Intel Core i7-10610U (0.637 - 0.855, n=6) | |
| Lenovo ThinkPad L13 Yoga 20R6S00800 | |
| Acer Swift 3 SF314-42-R27B | |
| Dell XPS 13 9300 4K UHD | |
| Lenovo ThinkPad X1 Carbon 2020-20UAS04T00 | |
| Dell Latitude 7310 | |
| HP ProBook 455 G7-175W8EA | |
| HP Envy x360 13-ay0010nr | |
Cinebench R15: CPU Multi 64Bit | CPU Single 64Bit
Blender: v2.79 BMW27 CPU
7-Zip 18.03: 7z b 4 -mmt1 | 7z b 4
Geekbench 5.5: Single-Core | Multi-Core
HWBOT x265 Benchmark v2.2: 4k Preset
LibreOffice : 20 Documents To PDF
R Benchmark 2.5: Overall mean
* ... Moindre est la valeur, meilleures sont les performances
| PCMark 8 Home Score Accelerated v2 | 3783 points | |
| PCMark 8 Work Score Accelerated v2 | 5232 points | |
| PCMark 10 Score | 4437 points | |
Aide | ||
| DPC Latencies / LatencyMon - interrupt to process latency (max), Web, Youtube, Prime95 | |
| Dell XPS 13 9300 4K UHD | |
| HP EliteBook 735 G6 7KN29EA | |
| Dell XPS 13 9300 i5 FHD | |
| HP Envy x360 13-ay0010nr | |
| HP ProBook 455 G7-175W8EA | |
| Acer Swift 3 SF314-42-R27B | |
| Dell Latitude 7410 | |
| Dell Latitude 7310 | |
* ... Moindre est la valeur, meilleures sont les performances
| Dell Latitude 7310 Samsung SSD PM981a MZVLB512HBJQ | Dell Latitude 7300-P99G Samsung SSD PM981 MZVLB512HAJQ | Asus ZenBook S13 UX392FN WDC PC SN520 SDAPNUW-512G | HP EliteBook 735 G6 7KN29EA WDC PC SN520 SDAPNUW-256G | Apple MacBook Pro 13 2020 2GHz i5 10th-Gen Apple SSD SM0512F | |
|---|---|---|---|---|---|
| AS SSD | 21% | -4% | -53% | -70% | |
| Seq Read (MB/s) | 2054 | 2749 34% | 1224 -40% | 1499 -27% | 1300 -37% |
| Seq Write (MB/s) | 1575 | 1367 -13% | 907 -42% | 1172 -26% | 1518 -4% |
| 4K Read (MB/s) | 52.1 | 49.94 -4% | 41.46 -20% | 35.42 -32% | 14.09 -73% |
| 4K Write (MB/s) | 137.3 | 137.6 0% | 126.2 -8% | 77.2 -44% | 24.25 -82% |
| 4K-64 Read (MB/s) | 618 | 987 60% | 1021 65% | 463.6 -25% | 725 17% |
| 4K-64 Write (MB/s) | 1317 | 1465 11% | 1251 -5% | 413.3 -69% | 169.6 -87% |
| Access Time Read * (ms) | 0.044 | 0.042 5% | 0.053 -20% | 0.133 -202% | 0.172 -291% |
| Access Time Write * (ms) | 0.083 | 0.029 65% | 0.027 67% | 0.049 41% | 0.155 -87% |
| Score Read (Points) | 876 | 1312 50% | 1185 35% | 649 -26% | 869 -1% |
| Score Write (Points) | 1611 | 1739 8% | 1468 -9% | 608 -62% | 346 -79% |
| Score Total (Points) | 2927 | 3662 25% | 3250 11% | 1582 -46% | 1667 -43% |
| Copy ISO MB/s (MB/s) | 2297 | 2761 20% | 1404 -39% | 1249 -46% | |
| Copy Program MB/s (MB/s) | 540 | 622 15% | 402.4 -25% | 53.5 -90% | |
| Copy Game MB/s (MB/s) | 1288 | 1584 23% | 902 -30% | 201.3 -84% | |
| CrystalDiskMark 5.2 / 6 | 2% | -14% | -41% | -38% | |
| Write 4K (MB/s) | 135.2 | 141.1 4% | 149.2 10% | 116 -14% | 28.16 -79% |
| Read 4K (MB/s) | 50.7 | 46.37 -9% | 47.18 -7% | 39.81 -21% | 17.5 -65% |
| Write Seq (MB/s) | 2155 | 1994 -7% | 750 -65% | 1300 -40% | 1195 -45% |
| Read Seq (MB/s) | 2504 | 2275 -9% | 1137 -55% | 803 -68% | 1470 -41% |
| Write 4K Q32T1 (MB/s) | 395.6 | 493.3 25% | 749 89% | 187.6 -53% | 205 -48% |
| Read 4K Q32T1 (MB/s) | 394.5 | 429 9% | 478.7 21% | 305.9 -22% | 692 75% |
| Write Seq Q32T1 (MB/s) | 2987 | 2992 0% | 1453 -51% | 1299 -57% | 1475 -51% |
| Read Seq Q32T1 (MB/s) | 3564 | 3562 0% | 1713 -52% | 1741 -51% | 1920 -46% |
| Write 4K Q8T8 (MB/s) | 409.1 | ||||
| Read 4K Q8T8 (MB/s) | 1137 | ||||
| Moyenne finale (programmes/paramètres) | 12% /
14% | -9% /
-8% | -47% /
-48% | -54% /
-56% |
* ... Moindre est la valeur, meilleures sont les performances

Disk Throttling: DiskSpd Read Loop, Queue Depth 8
| 3DMark 11 Performance | 2197 points | |
| 3DMark Cloud Gate Standard Score | 8989 points | |
| 3DMark Fire Strike Score | 1209 points | |
| 3DMark Time Spy Score | 476 points | |
Aide | ||
| Bas | Moyen | Élevé | Ultra | |
|---|---|---|---|---|
| The Witcher 3 (2015) | 20.7 | 10.9 | ||
| Dota 2 Reborn (2015) | 84.5 | 49.3 | 22.8 | 20.3 |
| X-Plane 11.11 (2018) | 13.2 | 10.7 | 11.2 |
| Dell Latitude 7310 UHD Graphics 620, i7-10610U, Samsung SSD PM981a MZVLB512HBJQ | Dell Latitude 7300-P99G UHD Graphics 620, i7-8665U, Samsung SSD PM981 MZVLB512HAJQ | Asus ZenBook S13 UX392FN GeForce MX150, i7-8565U, WDC PC SN520 SDAPNUW-512G | Lenovo ThinkPad X395 Vega 6, R3 PRO 3300U, Samsung SSD PM981a MZVLB256HBHQ | HP EliteBook 735 G6 7KN29EA Vega 8, R5 PRO 3500U, WDC PC SN520 SDAPNUW-256G | Apple MacBook Pro 13 2020 2GHz i5 10th-Gen Iris Plus Graphics G7 (Ice Lake 64 EU), i5-1038NG7, Apple SSD SM0512F | |
|---|---|---|---|---|---|---|
| Noise | -2% | -5% | -2% | -1% | -4% | |
| arrêt / environnement * (dB) | 29 | 30 -3% | 28.1 3% | 30.2 -4% | 29.6 -2% | 29.6 -2% |
| Idle Minimum * (dB) | 29 | 30 -3% | 28.1 3% | 30.2 -4% | 29.6 -2% | 29.6 -2% |
| Idle Average * (dB) | 29 | 30 -3% | 28.1 3% | 30.2 -4% | 29.6 -2% | 29.6 -2% |
| Idle Maximum * (dB) | 29 | 30 -3% | 29 -0% | 30.2 -4% | 30.9 -7% | 29.6 -2% |
| Load Average * (dB) | 30.1 | 35 -16% | 41.1 -37% | 34.3 -14% | 33.9 -13% | 34.4 -14% |
| Load Maximum * (dB) | 41.3 | 35 15% | 41.1 -0% | 34.3 17% | 33.9 18% | 42.1 -2% |
| Witcher 3 ultra * (dB) | 41.1 | 36.1 |
* ... Moindre est la valeur, meilleures sont les performances
Degré de la nuisance sonore
| Au repos |
| 29 / 29 / 29 dB(A) |
| Fortement sollicité |
| 30.1 / 41.3 dB(A) |
 | ||
30 dB silencieux 40 dB(A) audible 50 dB(A) bruyant |
||
min: | ||
(-) La température maximale du côté supérieur est de 45.2 °C / 113 F, par rapport à la moyenne de 34.3 °C / 94 F, allant de 21.2 à 62.5 °C pour la classe Office.
(-) Le fond chauffe jusqu'à un maximum de 52.8 °C / 127 F, contre une moyenne de 36.8 °C / 98 F
(+) En utilisation inactive, la température moyenne du côté supérieur est de 26.3 °C / 79 F, par rapport à la moyenne du dispositif de 29.5 °C / 85 F.
(+) Les repose-poignets et le pavé tactile sont plus froids que la température de la peau avec un maximum de 27.2 °C / 81 F et sont donc froids au toucher.
(±) La température moyenne de la zone de l'appui-paume de dispositifs similaires était de 27.5 °C / 81.5 F (+0.3 °C / #0.5 F).
Dell Latitude 7310 analyse audio
(+) | les haut-parleurs peuvent jouer relativement fort (84# dB)
Basses 100 - 315 Hz
(-) | presque aucune basse - en moyenne 16.2% plus bas que la médiane
(±) | la linéarité des basses est moyenne (11.5% delta à la fréquence précédente)
Médiums 400 - 2000 Hz
(+) | médiane équilibrée - seulement 2.8% de la médiane
(+) | les médiums sont linéaires (4.4% delta à la fréquence précédente)
Aiguës 2 - 16 kHz
(+) | des sommets équilibrés - à seulement 2.5% de la médiane
(+) | les aigus sont linéaires (4% delta à la fréquence précédente)
Globalement 100 - 16 000 Hz
(+) | le son global est linéaire (12.4% différence à la médiane)
Par rapport à la même classe
» 5% de tous les appareils testés de cette catégorie étaient meilleurs, 2% similaires, 93% pires
» Le meilleur avait un delta de 7%, la moyenne était de 21%, le pire était de 53%.
Par rapport à tous les appareils testés
» 11% de tous les appareils testés étaient meilleurs, 2% similaires, 87% pires
» Le meilleur avait un delta de 4%, la moyenne était de 24%, le pire était de 134%.
Apple MacBook 12 (Early 2016) 1.1 GHz analyse audio
(+) | les haut-parleurs peuvent jouer relativement fort (83.6# dB)
Basses 100 - 315 Hz
(±) | basse réduite - en moyenne 11.3% inférieure à la médiane
(±) | la linéarité des basses est moyenne (14.2% delta à la fréquence précédente)
Médiums 400 - 2000 Hz
(+) | médiane équilibrée - seulement 2.4% de la médiane
(+) | les médiums sont linéaires (5.5% delta à la fréquence précédente)
Aiguës 2 - 16 kHz
(+) | des sommets équilibrés - à seulement 2% de la médiane
(+) | les aigus sont linéaires (4.5% delta à la fréquence précédente)
Globalement 100 - 16 000 Hz
(+) | le son global est linéaire (10.2% différence à la médiane)
Par rapport à la même classe
» 7% de tous les appareils testés de cette catégorie étaient meilleurs, 2% similaires, 91% pires
» Le meilleur avait un delta de 5%, la moyenne était de 18%, le pire était de 53%.
Par rapport à tous les appareils testés
» 5% de tous les appareils testés étaient meilleurs, 1% similaires, 94% pires
» Le meilleur avait un delta de 4%, la moyenne était de 24%, le pire était de 134%.
| Éteint/en veille | |
| Au repos | |
| Fortement sollicité |
|
Légende:
min: | |
| Dell Latitude 7310 i7-10610U, UHD Graphics 620, Samsung SSD PM981a MZVLB512HBJQ, IPS, 1920x1080, 13.3" | Dell Latitude 7300-P99G i7-8665U, UHD Graphics 620, Samsung SSD PM981 MZVLB512HAJQ, IPS LED, 1920x1080, 13.3" | Asus ZenBook S13 UX392FN i7-8565U, GeForce MX150, WDC PC SN520 SDAPNUW-512G, IPS, 1920x1080, 13.9" | Lenovo ThinkPad X395 R3 PRO 3300U, Vega 6, Samsung SSD PM981a MZVLB256HBHQ, IPS, 1920x1080, 13.3" | HP EliteBook 735 G6 7KN29EA R5 PRO 3500U, Vega 8, WDC PC SN520 SDAPNUW-256G, IPS LED, 1920x1080, 13.3" | Apple MacBook Pro 13 2020 2GHz i5 10th-Gen i5-1038NG7, Iris Plus Graphics G7 (Ice Lake 64 EU), Apple SSD SM0512F, IPS, 2560x1600, 13.3" | |
|---|---|---|---|---|---|---|
| Power Consumption | -26% | -46% | -29% | -53% | -60% | |
| Idle Minimum * (Watt) | 2.7 | 2.5 7% | 3.4 -26% | 4 -48% | 5.6 -107% | 3.8 -41% |
| Idle Average * (Watt) | 4.4 | 6.6 -50% | 6.3 -43% | 6.3 -43% | 8.1 -84% | 8.6 -95% |
| Idle Maximum * (Watt) | 4.8 | 8.7 -81% | 10.4 -117% | 9.3 -94% | 9.6 -100% | 10.3 -115% |
| Load Average * (Watt) | 33.4 | 35.4 -6% | 51 -53% | 34 -2% | 34.3 -3% | 52.1 -56% |
| Load Maximum * (Watt) | 69.7 | 68.1 2% | 62.7 10% | 42 40% | 48.6 30% | 65.2 6% |
| Witcher 3 ultra * (Watt) | 39 | 48.2 |
* ... Moindre est la valeur, meilleures sont les performances
| Dell Latitude 7310 i7-10610U, UHD Graphics 620, 52 Wh | Dell Latitude 7300-P99G i7-8665U, UHD Graphics 620, 60 Wh | Asus ZenBook S13 UX392FN i7-8565U, GeForce MX150, 50 Wh | Lenovo ThinkPad X395 R3 PRO 3300U, Vega 6, 48 Wh | HP EliteBook 735 G6 7KN29EA R5 PRO 3500U, Vega 8, 50 Wh | Apple MacBook Pro 13 2020 2GHz i5 10th-Gen i5-1038NG7, Iris Plus Graphics G7 (Ice Lake 64 EU), 58 Wh | |
|---|---|---|---|---|---|---|
| Autonomie de la batterie | -4% | -21% | 16% | -35% | -4% | |
| Reader / Idle (h) | 37.4 | 28.5 -24% | 18.4 -51% | |||
| WiFi v1.3 (h) | 12.6 | 10.8 -14% | 8.4 -33% | 10.9 -13% | 8.2 -35% | 12.1 -4% |
| Load (h) | 1.8 | 1.9 6% | 1.7 -6% | 3.8 111% |
Points positifs
Points négatifs
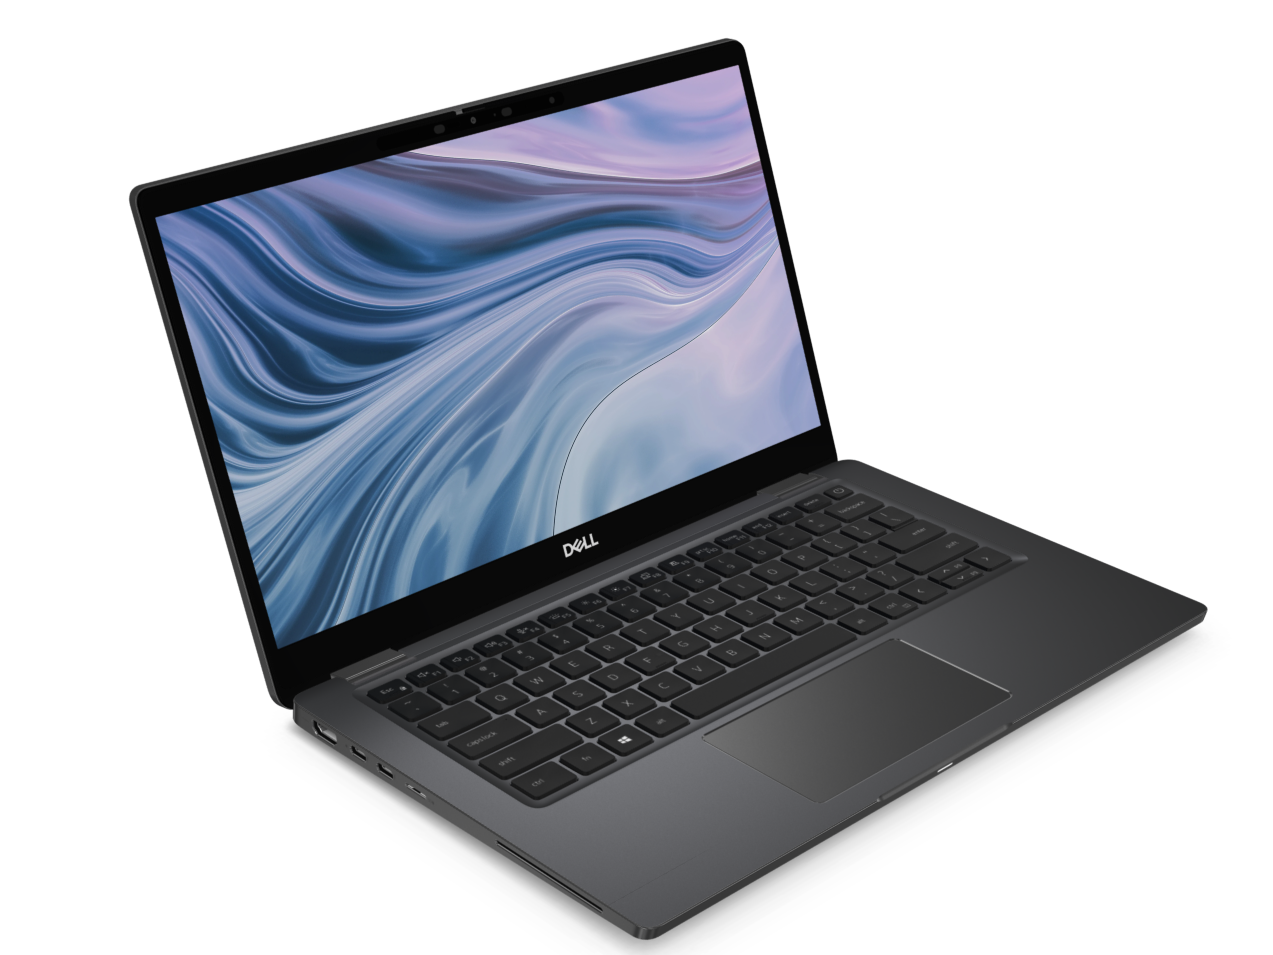
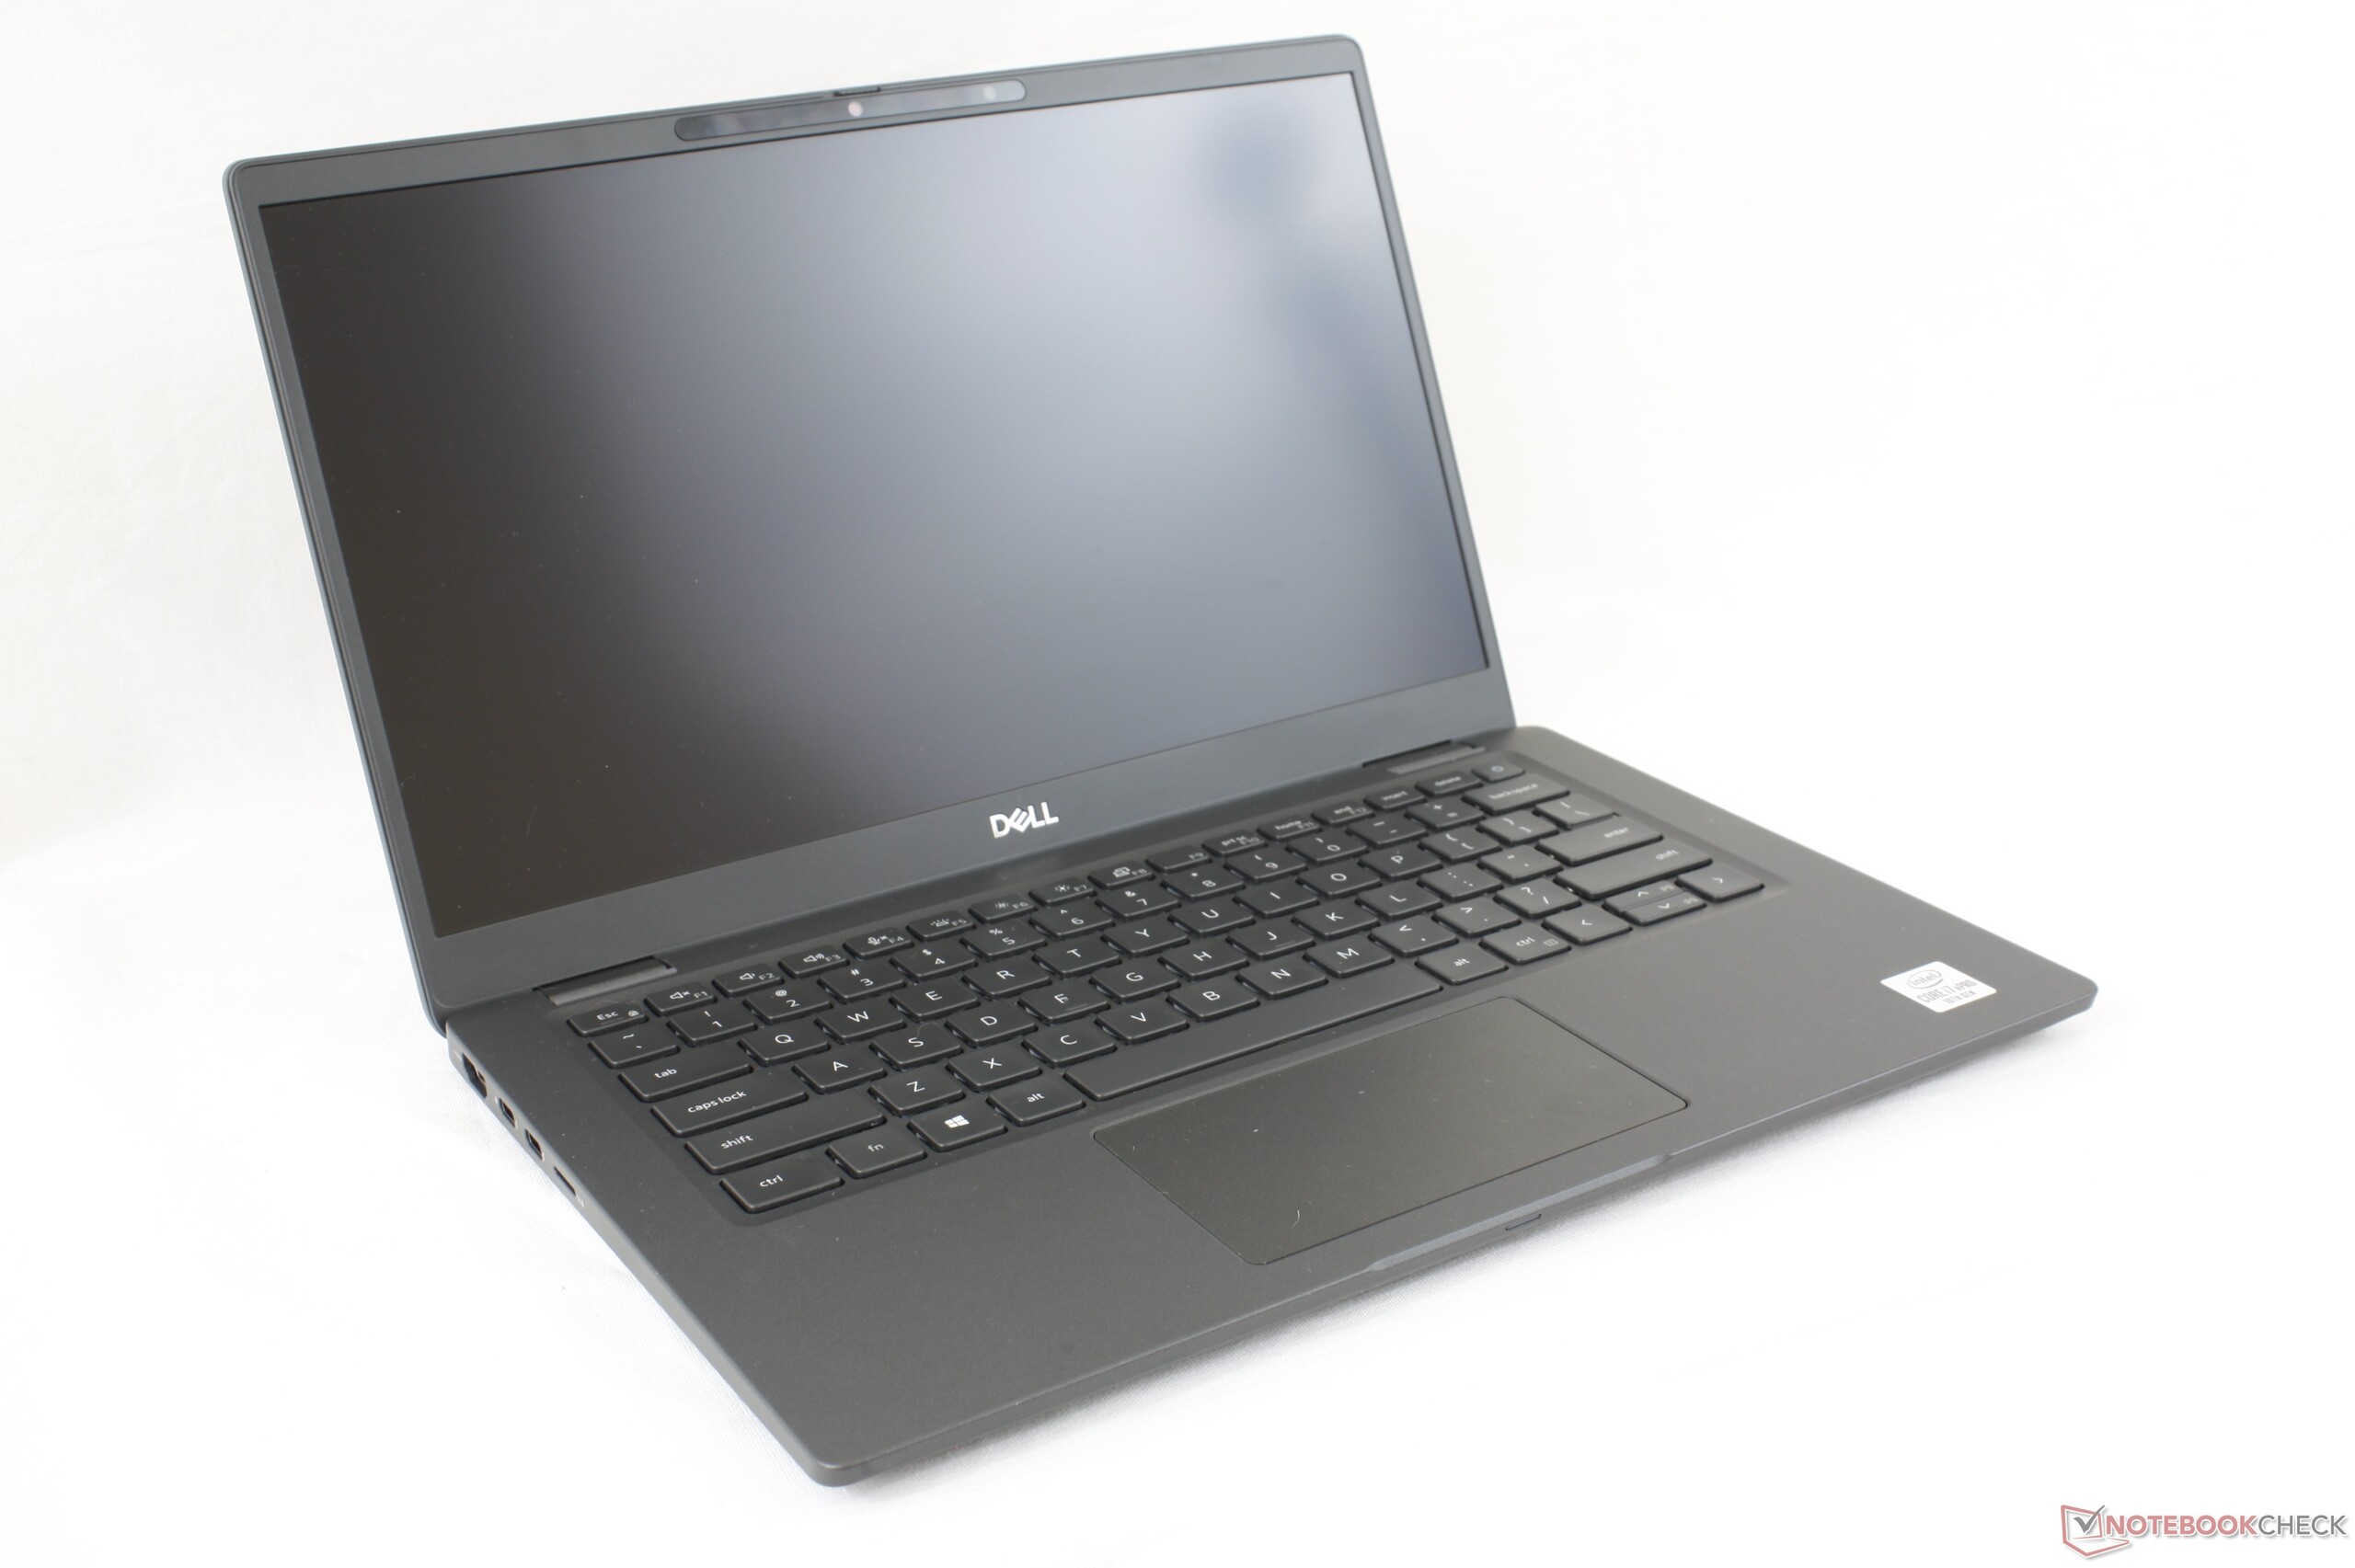
Comme si le Latitude 7300 de l'an dernier n'était pas assez compact, le Latitude 7310 est maintenant encore plus petit, léger et discret, tout de discrétion dans n'importe quel environnement de travail. Mis à part le clickpad mou, le dernier ultraportable haut de gamme de Dell n'a pas beaucoup de défauts.
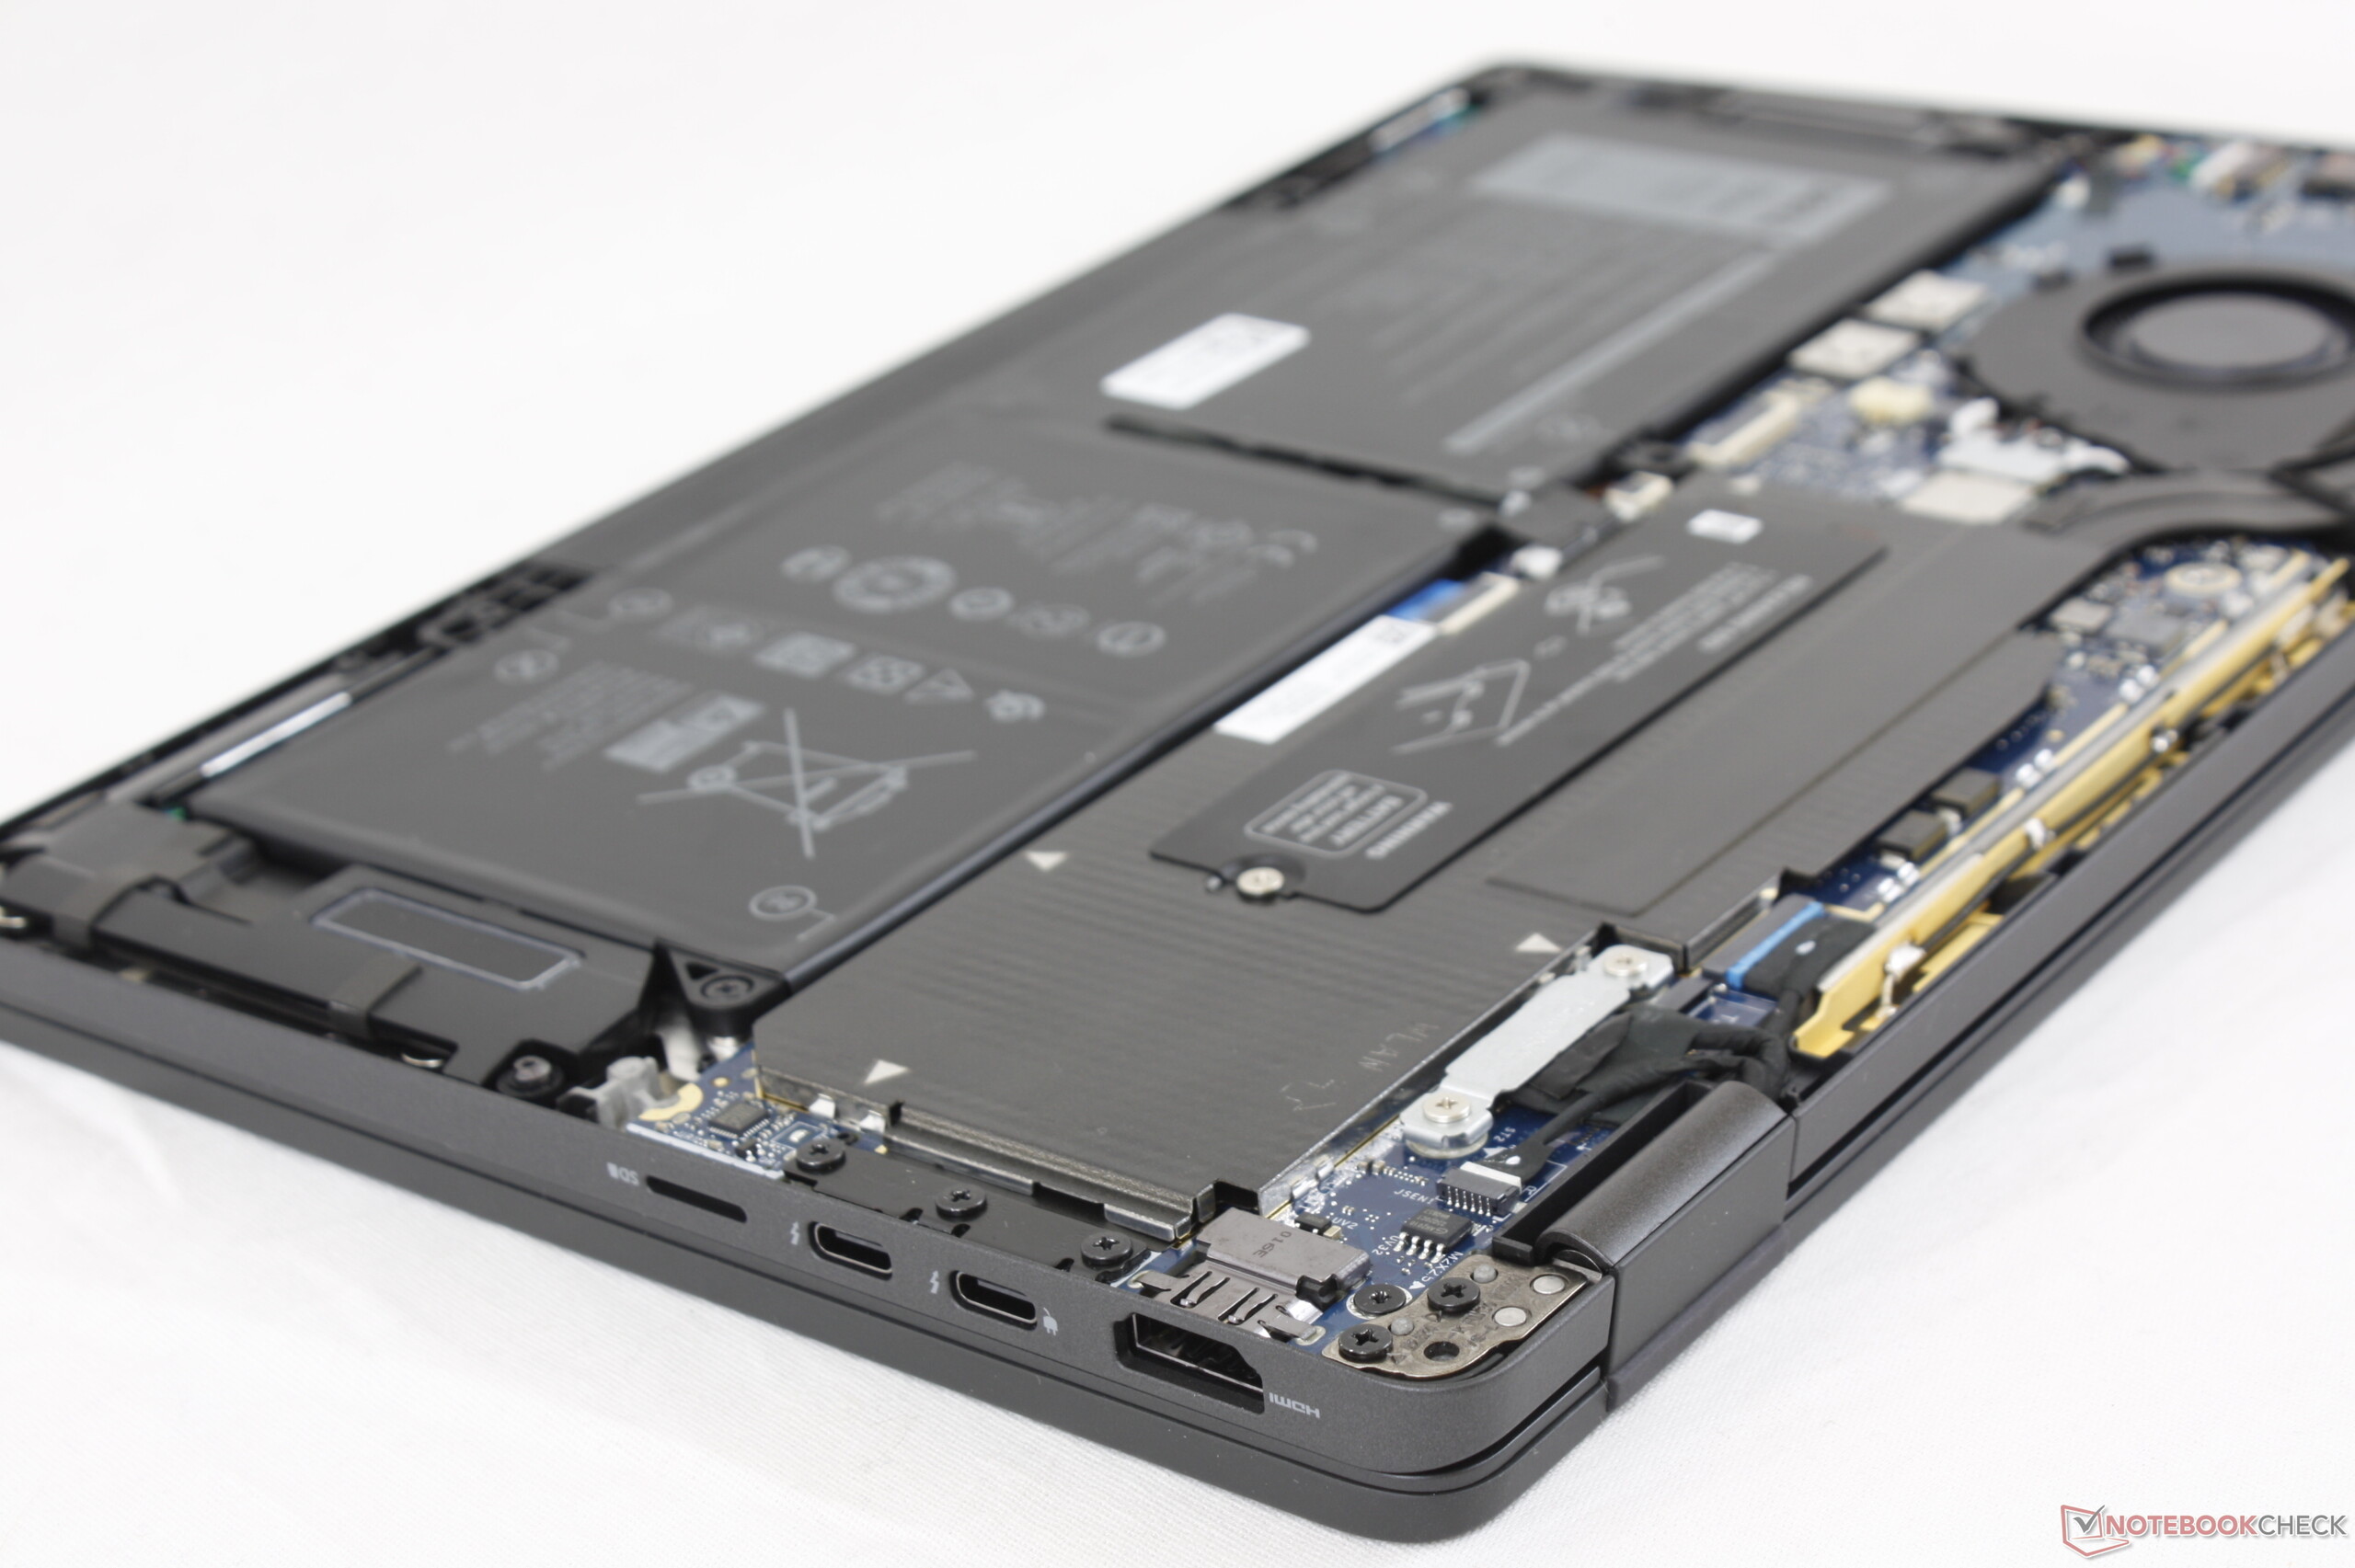
Ce qui nous gêne plus est l'absence de certaines fonctionnalités. Le TrackPoint et les touches dédiées de souris auraient rendus le clic et le contrôle du curseur bien plus aisé et précis. Ceux qui préfèrent avoir des boutons de souris tactiles, et de la RAM et du WLAN amovibles devront plutôt préférer le Latitude 7300 au 7310. De plus, un écran plus lumineux à 500 cd/m² aurait fait du portable un meilleur appareil pour l'extérieur ou les déplacements.
L'absence de meilleur processeur au-delà du Comet Lake U quadricoeur est également flagrante. Même si le PC portable ne vise pas les utilisateurs à la recherche du maximum de performances, les concurrents commencent à offrir des processeur AMD Ryzen à la même enveloppe thermique plus puissants ou au meilleur rapport performances par Watt. Le fait que le Latitude ne soit qu'à peu près aussi puissant que le Latitude 7310 ne l'aide pas.
Le Latitude 7310 est une version peaufinée du Latitude 7300. Il abandonne quelques fonctionnalités en chemin, mais sa conception plus élégante et plus portable peut s'avérer gagnante pour les nomades ou les professionnels en déplacements constants.
L’intégralité de cette critique est disponible en anglais en suivant ce lien.
Dell Latitude 7310
- 07/13/2020 v7 (old)
Allen Ngo
Price comparison
