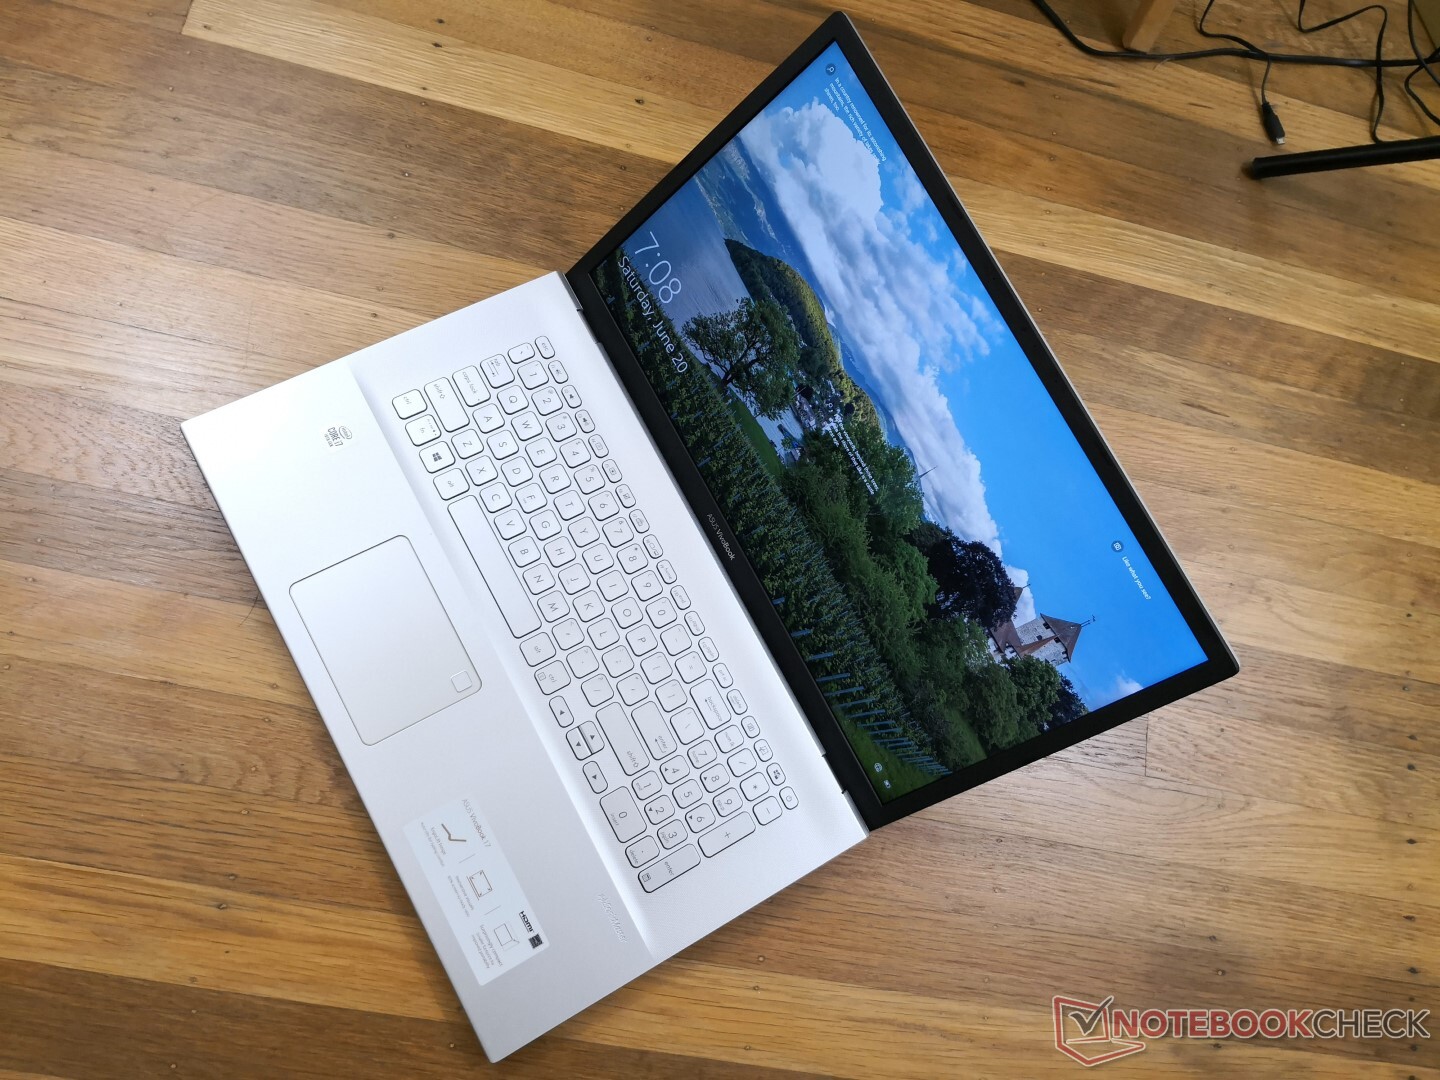
Test de l'Asus Vivobook 17 S712FA (i7-10510U, UHD 620, FHD) : poids plume, prix réduit
Note | Date | Modèle | Poids | Épaisseur | Taille | Résolution | Prix |
|---|---|---|---|---|---|---|---|
| 76 % v7 (old) | 08/20 | Asus VivoBook 17 S712FA-DS76 i7-10510U, UHD Graphics 620 | 2.3 kg | 21 mm | 17.30" | 1920x1080 | |
| 78.9 % v6 (old) | 05/19 | Dell Inspiron 17 3780 i7-8565U, Radeon 520 | 2.8 kg | 25 mm | 17.30" | 1920x1080 | |
| 81.5 % v7 (old) | 05/20 | Acer Aspire 5 A515-54G i5-10210U, GeForce MX250 | 1.7 kg | 17.9 mm | 15.60" | 1920x1080 | |
| 82 % v6 (old) | 06/19 | Lenovo Ideapad 330S-15ARR-81FB00C7GE R5 2500U, Vega 8 | 1.9 kg | 19.4 mm | 15.60" | 1920x1080 | |
| 75.2 % v7 (old) | 06/20 | HP 17-by2437ng i3-10110U, UHD Graphics 620 | 2.4 kg | 24.5 mm | 17.30" | 1600x900 |
| SD Card Reader | |
| average JPG Copy Test (av. of 3 runs) | |
| Asus VivoBook 17 S712FA-DS76 (Toshiba Exceria Pro M501 microSDXC 64GB) | |
| HP Envy 17t-cg000 (Toshiba Exceria Pro SDXC 64 GB UHS-II) | |
| Lenovo Ideapad 330S-15ARR-81FB00C7GE (Toshiba Exceria Pro SDXC 64 GB UHS-II) | |
| Asus VivoBook 17 M712DA-AU017T (Toshiba Exceria Pro M501 microSDXC 64GB) | |
| HP 17-by2437ng (Toshiba Exceria Pro SDXC 64 GB UHS-II) | |
| Dell Inspiron 17 3780 (Toshiba Exceria Pro SDXC 64 GB UHS-II) | |
| maximum AS SSD Seq Read Test (1GB) | |
| Asus VivoBook 17 S712FA-DS76 (Toshiba Exceria Pro M501 microSDXC 64GB) | |
| HP Envy 17t-cg000 (Toshiba Exceria Pro SDXC 64 GB UHS-II) | |
| Lenovo Ideapad 330S-15ARR-81FB00C7GE (Toshiba Exceria Pro SDXC 64 GB UHS-II) | |
| Asus VivoBook 17 M712DA-AU017T (Toshiba Exceria Pro M501 microSDXC 64GB) | |
| HP 17-by2437ng (Toshiba Exceria Pro SDXC 64 GB UHS-II) | |
| Dell Inspiron 17 3780 (Toshiba Exceria Pro SDXC 64 GB UHS-II) | |
| Networking | |
| iperf3 transmit AX12 | |
| Huawei MateBook X Pro 2020 i7 | |
| HP Envy 17t-cg000 | |
| HP Envy x360 15-dr1679cl | |
| HP 14s-dq1431ng | |
| Asus VivoBook 17 S712FA-DS76 | |
| iperf3 receive AX12 | |
| HP Envy 17t-cg000 | |
| HP Envy x360 15-dr1679cl | |
| Huawei MateBook X Pro 2020 i7 | |
| HP 14s-dq1431ng | |
| Asus VivoBook 17 S712FA-DS76 | |


| |||||||||||||||||||||||||
Homogénéité de la luminosité: 81 %
Valeur mesurée au centre, sur batterie: 289.5 cd/m²
Contraste: 591:1 (Valeurs des noirs: 0.49 cd/m²)
ΔE ColorChecker Calman: 4.83 | ∀{0.5-29.43 Ø4.71}
calibrated: 4.41
ΔE Greyscale Calman: 2.7 | ∀{0.09-98 Ø4.96}
59.2% sRGB (Argyll 1.6.3 3D)
38.1% AdobeRGB 1998 (Argyll 1.6.3 3D)
41.5% AdobeRGB 1998 (Argyll 3D)
59.5% sRGB (Argyll 3D)
40.17% Display P3 (Argyll 3D)
Gamma: 2.21
CCT: 6868 K
| Asus VivoBook 17 S712FA-DS76 BOE NV173FHM-N49, IPS, 17.3", 1920x1080 | HP Envy 17t-cg000 AU Optronics AUO168E, IPS, 17.3", 3840x2160 | Dell Inspiron 17 3780 AU Optronics B173HAN01.3, IPS, 17.3", 1920x1080 | Asus VivoBook 17 M712DA-AU017T BOE084E, IPS, 17.3", 1920x1080 | Acer Aspire ES1-732-P7YA Chi Mei N173FGE-E23, TN LED, 17.3", 1600x900 | Lenovo IdeaPad 330-17IKB 81DM BOE0685, TN LED, 17.3", 1600x900 | |
|---|---|---|---|---|---|---|
| Display | 108% | 55% | 1% | 33% | 35% | |
| Display P3 Coverage (%) | 40.17 | 86.2 115% | 63.7 59% | 40.76 1% | 53.5 33% | 56.9 42% |
| sRGB Coverage (%) | 59.5 | 100 68% | 88.9 49% | 59.7 0% | 80.1 35% | 76.3 28% |
| AdobeRGB 1998 Coverage (%) | 41.5 | 99.8 140% | 64.6 56% | 42.11 1% | 54.9 32% | 55.9 35% |
| Response Times | -132% | -153% | -31% | -93% | -59% | |
| Response Time Grey 50% / Grey 80% * (ms) | 17.2 ? | 45.2 ? -163% | 46 ? -167% | 24 ? -40% | 49 ? -185% | 38.8 ? -126% |
| Response Time Black / White * (ms) | 14.8 ? | 29.6 ? -100% | 35.2 ? -138% | 18 ? -22% | 15 ? -1% | 13.6 ? 8% |
| PWM Frequency (Hz) | 961 | |||||
| Screen | 27% | 29% | 14% | -37% | -43% | |
| Brightness middle (cd/m²) | 289.5 | 383.4 32% | 322.9 12% | 262 -9% | 227 -22% | 210.5 -27% |
| Brightness (cd/m²) | 263 | 382 45% | 322 22% | 234 -11% | 209 -21% | 204 -22% |
| Brightness Distribution (%) | 81 | 86 6% | 84 4% | 84 4% | 80 -1% | 94 16% |
| Black Level * (cd/m²) | 0.49 | 0.34 31% | 0.26 47% | 0.265 46% | 0.15 69% | 0.63 -29% |
| Contrast (:1) | 591 | 1128 91% | 1242 110% | 989 67% | 1513 156% | 334 -43% |
| Colorchecker dE 2000 * | 4.83 | 6.24 -29% | 4.19 13% | 5.13 -6% | 12.93 -168% | 9.48 -96% |
| Colorchecker dE 2000 max. * | 19.23 | 10.18 47% | 7.04 63% | 19.16 -0% | 20.92 -9% | 17.19 11% |
| Colorchecker dE 2000 calibrated * | 4.41 | 3.7 16% | 3.55 20% | 3.96 10% | 4.04 8% | |
| Greyscale dE 2000 * | 2.7 | 6.6 -144% | 4.5 -67% | 1.22 55% | 14.69 -444% | 12 -344% |
| Gamma | 2.21 100% | 2.272 97% | 1.97 112% | 2.42 91% | 2.38 92% | 2.12 104% |
| CCT | 6868 95% | 5973 109% | 7041 92% | 6584 99% | 19863 33% | 13874 47% |
| Color Space (Percent of AdobeRGB 1998) (%) | 38.1 | 88 131% | 57.6 51% | 38 0% | 51 34% | 49.4 30% |
| Color Space (Percent of sRGB) (%) | 59.2 | 100 69% | 88.4 49% | 59 0% | 80 35% | 75.8 28% |
| Moyenne finale (programmes/paramètres) | 1% /
22% | -23% /
11% | -5% /
6% | -32% /
-30% | -22% /
-30% |
* ... Moindre est la valeur, meilleures sont les performances
Temps de réponse de l'écran
| ↔ Temps de réponse noir à blanc | ||
|---|---|---|
| 14.8 ms ... hausse ↗ et chute ↘ combinées | ↗ 7.6 ms hausse | 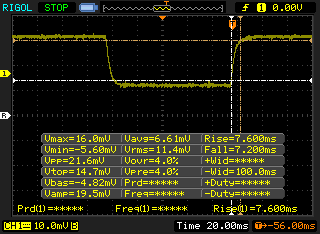 |
| ↘ 7.2 ms chute | ||
| L'écran montre de bons temps de réponse, mais insuffisant pour du jeu compétitif. En comparaison, tous les appareils testés affichent entre 0.1 (minimum) et 240 (maximum) ms. » 36 % des appareils testés affichent de meilleures performances. Cela signifie que les latences relevées sont meilleures que la moyenne (19.8 ms) de tous les appareils testés. | ||
| ↔ Temps de réponse gris 50% à gris 80% | ||
| 17.2 ms ... hausse ↗ et chute ↘ combinées | ↗ 8.8 ms hausse | 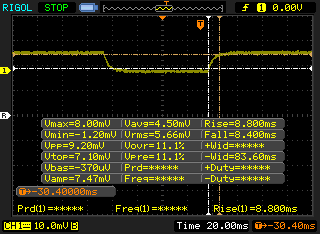 |
| ↘ 8.4 ms chute | ||
| L'écran montre de bons temps de réponse, mais insuffisant pour du jeu compétitif. En comparaison, tous les appareils testés affichent entre 0.165 (minimum) et 636 (maximum) ms. » 31 % des appareils testés affichent de meilleures performances. Cela signifie que les latences relevées sont meilleures que la moyenne (31 ms) de tous les appareils testés. | ||
Scintillement / MLI (Modulation de largeur d'impulsion)
| Scintillement / MLI (Modulation de largeur d'impulsion) non décelé | 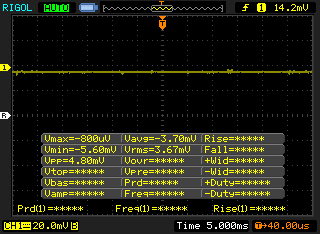 | ||
En comparaison, 52 % des appareils testés n'emploient pas MDI pour assombrir leur écran. Nous avons relevé une moyenne à 7757 (minimum : 5 - maximum : 343500) Hz dans le cas où une MDI était active. | |||
Cinebench R20: CPU (Multi Core) | CPU (Single Core)
Blender: v2.79 BMW27 CPU
7-Zip 18.03: 7z b 4 -mmt1 | 7z b 4
Geekbench 5.5: Single-Core | Multi-Core
HWBOT x265 Benchmark v2.2: 4k Preset
LibreOffice : 20 Documents To PDF
R Benchmark 2.5: Overall mean
| Cinebench R20 / CPU (Multi Core) | |
| MSI Prestige 15 A10SC | |
| Lenovo Yoga S740-14IIL-81RS001DGE | |
| Lenovo Ideapad C340-15IWL-81N5004QGE | |
| Schenker VIA 15 | |
| Asus VivoBook 17 S712FA-DS76 | |
| Microsoft Surface Book 3 15 | |
| Dell Inspiron 15 5000 5585 | |
| Moyenne Intel Core i7-10510U (1015 - 1897, n=38) | |
| Acer Aspire 5 A515-54G | |
| HP Pavilion x360 15-dq0065cl | |
| Cinebench R20 / CPU (Single Core) | |
| MSI Prestige 15 A10SC | |
| Microsoft Surface Book 3 15 | |
| Asus VivoBook 17 S712FA-DS76 | |
| Moyenne Intel Core i7-10510U (362 - 497, n=37) | |
| Lenovo Yoga S740-14IIL-81RS001DGE | |
| Acer Aspire 5 A515-54G | |
| HP Pavilion x360 15-dq0065cl | |
| Lenovo Ideapad C340-15IWL-81N5004QGE | |
| Dell Inspiron 15 5000 5585 | |
| Schenker VIA 15 | |
| Blender / v2.79 BMW27 CPU | |
| Microsoft Surface Book 3 15 | |
| Acer Aspire 5 A515-54G | |
| Moyenne Intel Core i7-10510U (628 - 1051, n=31) | |
| Asus VivoBook 17 S712FA-DS76 | |
| Lenovo Yoga S740-14IIL-81RS001DGE | |
| Schenker VIA 15 | |
| 7-Zip 18.03 / 7z b 4 -mmt1 | |
| Asus VivoBook 17 S712FA-DS76 | |
| Moyenne Intel Core i7-10510U (3747 - 4981, n=31) | |
| Microsoft Surface Book 3 15 | |
| Acer Aspire 5 A515-54G | |
| Lenovo Yoga S740-14IIL-81RS001DGE | |
| Schenker VIA 15 | |
| 7-Zip 18.03 / 7z b 4 | |
| Asus VivoBook 17 S712FA-DS76 | |
| Lenovo Yoga S740-14IIL-81RS001DGE | |
| Microsoft Surface Book 3 15 | |
| Moyenne Intel Core i7-10510U (12196 - 21298, n=31) | |
| Acer Aspire 5 A515-54G | |
| Schenker VIA 15 | |
| Geekbench 5.5 / Single-Core | |
| Microsoft Surface Book 3 15 | |
| Asus VivoBook 17 S712FA-DS76 | |
| Lenovo Yoga S740-14IIL-81RS001DGE | |
| Moyenne Intel Core i7-10510U (977 - 1287, n=31) | |
| Acer Aspire 5 A515-54G | |
| Schenker VIA 15 | |
| Geekbench 5.5 / Multi-Core | |
| Microsoft Surface Book 3 15 | |
| Lenovo Yoga S740-14IIL-81RS001DGE | |
| Asus VivoBook 17 S712FA-DS76 | |
| Acer Aspire 5 A515-54G | |
| Moyenne Intel Core i7-10510U (2474 - 4484, n=31) | |
| Schenker VIA 15 | |
| HWBOT x265 Benchmark v2.2 / 4k Preset | |
| Lenovo Yoga S740-14IIL-81RS001DGE | |
| Asus VivoBook 17 S712FA-DS76 | |
| Moyenne Intel Core i7-10510U (3.41 - 6.04, n=31) | |
| Microsoft Surface Book 3 15 | |
| Acer Aspire 5 A515-54G | |
| Schenker VIA 15 | |
| LibreOffice / 20 Documents To PDF | |
| Microsoft Surface Book 3 15 | |
| Acer Aspire 5 A515-54G | |
| Moyenne Intel Core i7-10510U (50.7 - 77.8, n=27) | |
| Lenovo Yoga S740-14IIL-81RS001DGE | |
| Asus VivoBook 17 S712FA-DS76 | |
| R Benchmark 2.5 / Overall mean | |
| Schenker VIA 15 | |
| Lenovo Yoga S740-14IIL-81RS001DGE | |
| Acer Aspire 5 A515-54G | |
| Microsoft Surface Book 3 15 | |
| Moyenne Intel Core i7-10510U (0.637 - 0.81, n=28) | |
| Asus VivoBook 17 S712FA-DS76 | |
* ... Moindre est la valeur, meilleures sont les performances
| PCMark 8 Home Score Accelerated v2 | 3601 points | |
| PCMark 8 Work Score Accelerated v2 | 5022 points | |
| PCMark 10 Score | 4317 points | |
Aide | ||
| DPC Latencies / LatencyMon - interrupt to process latency (max), Web, Youtube, Prime95 | |
| Dell XPS 15 9500 Core i7 4K UHD | |
| HP Envy x360 15-dr1679cl | |
| HP Envy 17t-cg000 | |
| Asus VivoBook 17 S712FA-DS76 | |
* ... Moindre est la valeur, meilleures sont les performances
| Asus VivoBook 17 S712FA-DS76 Crucial P1 SSD CT1000P1SSD8 | Dell Inspiron 17 3780 SK Hynix BC501 NVMe 256 GB | Acer Aspire 5 A515-54G Kingston RBUSNS8154P3512GJ1 | Lenovo Ideapad 330S-15ARR-81FB00C7GE WDC PC SN520 SDAPNUW-256G | Asus VivoBook 17 M712DA-AU017T Intel SSD 660p SSDPEKNW512G8 | HP 17-by2437ng Toshiba KBG30ZMV256G | |
|---|---|---|---|---|---|---|
| AS SSD | -27% | 27% | -37% | 8% | -37% | |
| Seq Read (MB/s) | 1303 | 1061 -19% | 1405 8% | 1530 17% | 1592 22% | 1359 4% |
| Seq Write (MB/s) | 1544 | 491.4 -68% | 953 -38% | 1087 -30% | 900 -42% | 759 -51% |
| 4K Read (MB/s) | 55.9 | 39.13 -30% | 54 -3% | 34.7 -38% | 45.24 -19% | 45.04 -19% |
| 4K Write (MB/s) | 134.6 | 104 -23% | 93 -31% | 79.9 -41% | 104.3 -23% | 105.7 -21% |
| 4K-64 Read (MB/s) | 639 | 505 -21% | 959 50% | 464.7 -27% | 324 -49% | 628 -2% |
| 4K-64 Write (MB/s) | 312 | 314.8 1% | 772 147% | 326.1 5% | 835 168% | 333.8 7% |
| Access Time Read * (ms) | 0.036 | 0.063 -75% | 0.051 -42% | 0.102 -183% | 0.058 -61% | 0.09 -150% |
| Access Time Write * (ms) | 0.115 | 0.034 70% | 0.044 62% | 0.047 59% | 0.047 59% | 0.157 -37% |
| Score Read (Points) | 826 | 650 -21% | 1153 40% | 652 -21% | 528 -36% | 809 -2% |
| Score Write (Points) | 601 | 468 -22% | 961 60% | 515 -14% | 1030 71% | 515 -14% |
| Score Total (Points) | 1880 | 1434 -24% | 2695 43% | 1489 -21% | 1810 -4% | 1722 -8% |
| Copy ISO MB/s (MB/s) | 2218 | 876 -61% | 690 -69% | 448.4 -80% | ||
| Copy Program MB/s (MB/s) | 864 | 653 -24% | 153.9 -82% | 248.3 -71% | ||
| Copy Game MB/s (MB/s) | 1440 | 512 -64% | 339.7 -76% | 416.4 -71% | ||
| CrystalDiskMark 5.2 / 6 | -14% | -8% | -9% | -12% | -21% | |
| Write 4K (MB/s) | 188.1 | 120.3 -36% | 100.4 -47% | 120.4 -36% | 132 -30% | 126.7 -33% |
| Read 4K (MB/s) | 63.7 | 41.81 -34% | 47.16 -26% | 41.23 -35% | 52 -18% | 52.5 -18% |
| Write Seq (MB/s) | 561 | 619 10% | 993 77% | 1293 130% | 973 73% | 669 19% |
| Read Seq (MB/s) | 1653 | 1119 -32% | 1176 -29% | 1289 -22% | 1606 -3% | 881 -47% |
| Write 4K Q32T1 (MB/s) | 279.4 | 492.2 76% | 354.7 27% | 206 -26% | 210.4 -25% | 272.2 -3% |
| Read 4K Q32T1 (MB/s) | 545 | 398.8 -27% | 473 -13% | 275.7 -49% | 312.2 -43% | 483.5 -11% |
| Write Seq Q32T1 (MB/s) | 1660 | 812 -51% | 1034 -38% | 1301 -22% | 982 -41% | 796 -52% |
| Read Seq Q32T1 (MB/s) | 1985 | 1616 -19% | 1635 -18% | 1739 -12% | 1847 -7% | 1503 -24% |
| Moyenne finale (programmes/paramètres) | -21% /
-22% | 10% /
12% | -23% /
-27% | -2% /
-0% | -29% /
-31% |
* ... Moindre est la valeur, meilleures sont les performances

Disk Throttling: DiskSpd Read Loop, Queue Depth 8
| 3DMark 11 Performance | 2199 points | |
| 3DMark Cloud Gate Standard Score | 8919 points | |
| 3DMark Fire Strike Score | 1259 points | |
| 3DMark Time Spy Score | 507 points | |
Aide | ||
| Bas | Moyen | Élevé | Ultra | |
|---|---|---|---|---|
| Dota 2 Reborn (2015) | 82.2 | 57.1 | 21.8 | 19.6 |
| X-Plane 11.11 (2018) | 17.4 | 11.7 | 11.1 |
| Asus VivoBook 17 S712FA-DS76 UHD Graphics 620, i7-10510U, Crucial P1 SSD CT1000P1SSD8 | Dell Inspiron 17 3780 Radeon 520, i7-8565U, SK Hynix BC501 NVMe 256 GB | Asus VivoBook 17 M712DA-AU017T Vega 8, R5 3500U, Intel SSD 660p SSDPEKNW512G8 | HP 17-by2437ng UHD Graphics 620, i3-10110U, Toshiba KBG30ZMV256G | Acer Aspire ES1-732-P7YA HD Graphics 505, Pentium N4200, Toshiba MQ01ABD100 | Lenovo IdeaPad 330-17IKB 81DM GeForce MX150, i5-8550U, WDC Blue WD10SPZX-24Z10T0 | |
|---|---|---|---|---|---|---|
| Noise | -0% | 9% | 7% | 6% | 7% | |
| arrêt / environnement * (dB) | 28.1 | 28.1 -0% | 30.3 -8% | 30.1 -7% | 30.2 -7% | 28.6 -2% |
| Idle Minimum * (dB) | 31.4 | 31.7 -1% | 30.3 4% | 31.4 -0% | 31 1% | 29 8% |
| Idle Average * (dB) | 31.4 | 31.8 -1% | 30.3 4% | 31.4 -0% | 31 1% | 29 8% |
| Idle Maximum * (dB) | 31.4 | 31.8 -1% | 30.3 4% | 31.4 -0% | 31 1% | 31.8 -1% |
| Load Average * (dB) | 44 | 38.7 12% | 31.6 28% | 32.6 26% | 35.1 20% | 34.8 21% |
| Load Maximum * (dB) | 44 | 48.5 -10% | 35.7 19% | 33 25% | 35.1 20% | 40.8 7% |
| Witcher 3 ultra * (dB) | 39.9 |
* ... Moindre est la valeur, meilleures sont les performances
Degré de la nuisance sonore
| Au repos |
| 31.4 / 31.4 / 31.4 dB(A) |
| Fortement sollicité |
| 44 / 44 dB(A) |
 | ||
30 dB silencieux 40 dB(A) audible 50 dB(A) bruyant |
||
min: | ||
(±) La température maximale du côté supérieur est de 41 °C / 106 F, par rapport à la moyenne de 36.8 °C / 98 F, allant de 21 à 71 °C pour la classe Multimedia.
(-) Le fond chauffe jusqu'à un maximum de 47.6 °C / 118 F, contre une moyenne de 39.1 °C / 102 F
(+) En utilisation inactive, la température moyenne du côté supérieur est de 26.8 °C / 80 F, par rapport à la moyenne du dispositif de 31.3 °C / 88 F.
(+) Les repose-poignets et le pavé tactile sont plus froids que la température de la peau avec un maximum de 30.6 °C / 87.1 F et sont donc froids au toucher.
(±) La température moyenne de la zone de l'appui-paume de dispositifs similaires était de 28.7 °C / 83.7 F (-1.9 °C / #-3.4 F).
| Éteint/en veille | |
| Au repos | |
| Fortement sollicité |
|
Légende:
min: | |
| Asus VivoBook 17 S712FA-DS76 i7-10510U, UHD Graphics 620, Crucial P1 SSD CT1000P1SSD8, IPS, 1920x1080, 17.3" | Dell Inspiron 17 3780 i7-8565U, Radeon 520, SK Hynix BC501 NVMe 256 GB, IPS, 1920x1080, 17.3" | Asus VivoBook 17 M712DA-AU017T R5 3500U, Vega 8, Intel SSD 660p SSDPEKNW512G8, IPS, 1920x1080, 17.3" | HP 17-by2437ng i3-10110U, UHD Graphics 620, Toshiba KBG30ZMV256G, TN LED, 1600x900, 17.3" | Acer Aspire ES1-732-P7YA Pentium N4200, HD Graphics 505, Toshiba MQ01ABD100, TN LED, 1600x900, 17.3" | Lenovo IdeaPad 330-17IKB 81DM i5-8550U, GeForce MX150, WDC Blue WD10SPZX-24Z10T0, TN LED, 1600x900, 17.3" | |
|---|---|---|---|---|---|---|
| Power Consumption | 2% | 31% | 34% | 36% | 0% | |
| Idle Minimum * (Watt) | 9.4 | 5 47% | 4.2 55% | 5.7 39% | 6 36% | 4.7 50% |
| Idle Average * (Watt) | 13 | 10.9 16% | 7.9 39% | 8.6 34% | 9.6 26% | 9.2 29% |
| Idle Maximum * (Watt) | 14.3 | 12 16% | 8.4 41% | 9 37% | 10.7 25% | 10.6 26% |
| Load Average * (Watt) | 41.5 | 49.6 -20% | 34 18% | 29.3 29% | 21.2 49% | 56.3 -36% |
| Load Maximum * (Watt) | 44.8 | 66.9 -49% | 43.7 2% | 30.5 32% | 26 42% | 75.3 -68% |
| Witcher 3 ultra * (Watt) | 55 |
* ... Moindre est la valeur, meilleures sont les performances
| Asus VivoBook 17 S712FA-DS76 i7-10510U, UHD Graphics 620, 37 Wh | Dell Inspiron 17 3780 i7-8565U, Radeon 520, 42 Wh | Asus VivoBook 17 M712DA-AU017T R5 3500U, Vega 8, 37 Wh | HP 17-by2437ng i3-10110U, UHD Graphics 620, 41 Wh | Acer Aspire ES1-732-P7YA Pentium N4200, HD Graphics 505, 37 Wh | Lenovo IdeaPad 330-17IKB 81DM i5-8550U, GeForce MX150, 34 Wh | |
|---|---|---|---|---|---|---|
| Autonomie de la batterie | -29% | -44% | -3% | -14% | -34% | |
| WiFi v1.3 (h) | 5.9 | 4.2 -29% | 3.3 -44% | 5.7 -3% | 5.1 -14% | 3.9 -34% |
| Reader / Idle (h) | 9.6 | 8.5 | ||||
| Load (h) | 1.1 | 1.5 |
Points positifs
Points négatifs
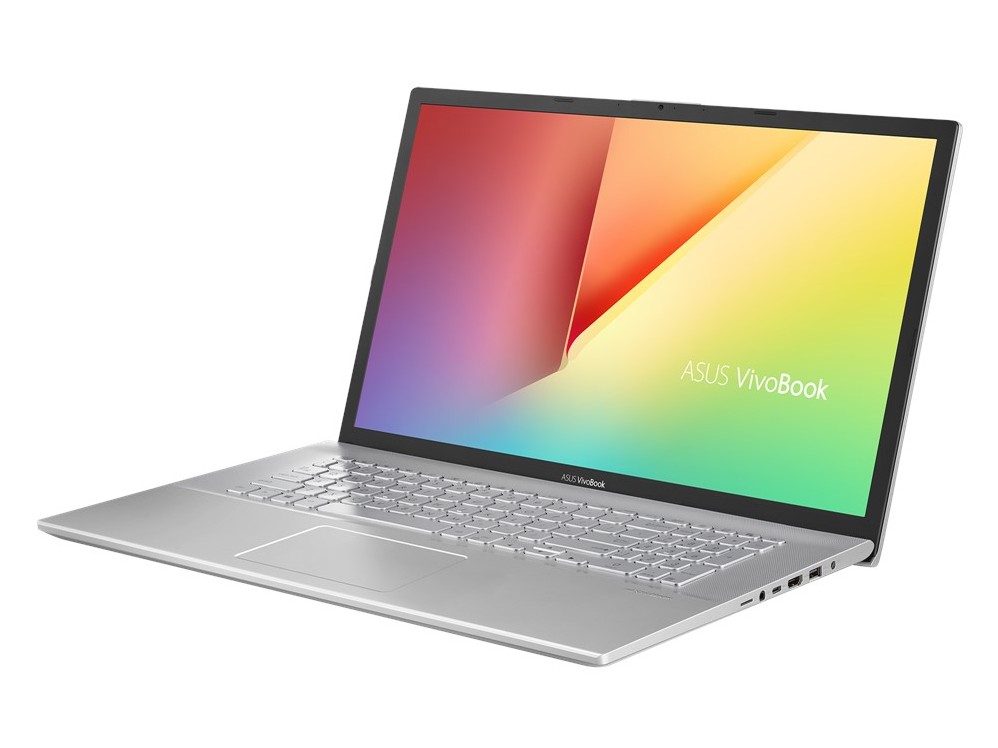

Les principaux avantages du VivoBook 17 sont son choix de processeurs et sa maintenance aisée. L'ajout d'un deuxième disque dur est plus simple que sur la plupart des autres PC portables à prix réduit, et les utilisateurs ont le choix entre la série U d'Intel, avec carte graphique GeForce MX, et l'AMD Ryzen. Ceux qui ont un budget réduit peuvent économiser en prenant une version avec un petit SSD et ensuite ajouter plus de stockage. Le système est léger et plutôt rigide vu son prix et sa taille.
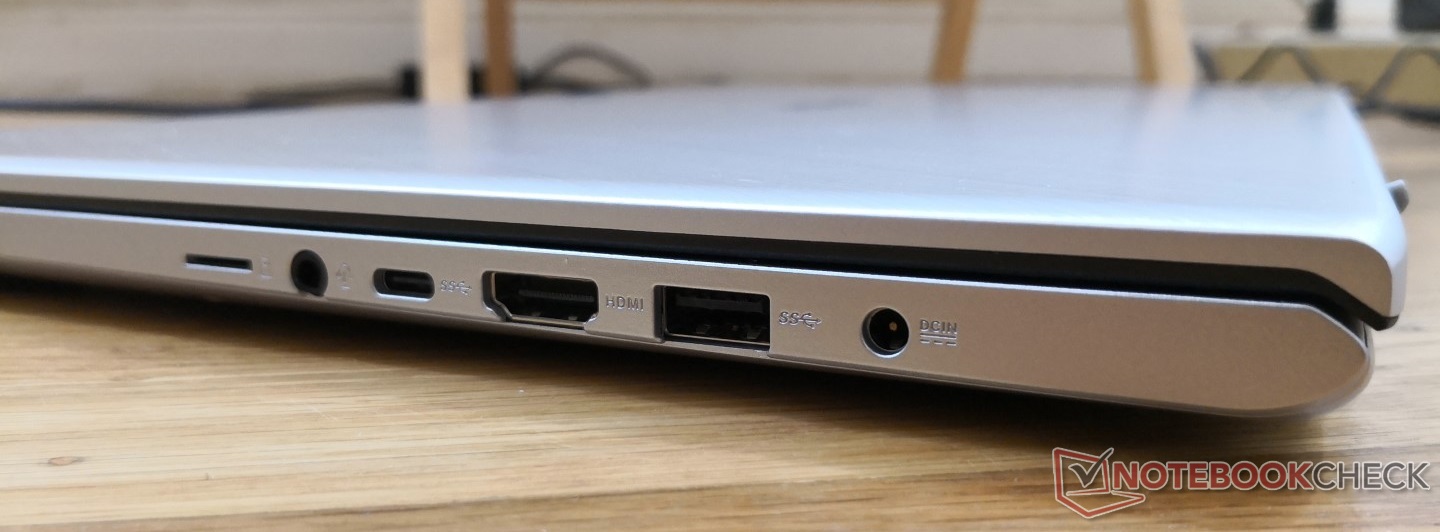
Beaucoup de choses peuvent cependant être améliorées : des touches et un clickpad plus fermes, un cache de webcam, un lecteur de carte grand format et des ventilateurs plus discrets amélioreraient l'expérience utilisateur. Un angle d'ouverture de l'écran plus grand et la charge USB C rendraient également l'appareil plus facile à utiliser. Pour le reste, c'est un PC portable sans fioritures, avec rien d'exceptionnel ni de catastrophique.
Nous avons là un PC portable de 17,3 pouces à petit prix au stockage facilement évolutif, aux ports nombreux et au châssis plutôt robuste. L'écran et le clavier auraient en revanche pu être un peu meilleurs.
L’intégralité de cette critique est disponible en anglais en suivant ce lien.
Asus VivoBook 17 S712FA-DS76
- 06/21/2020 v7 (old)
Allen Ngo
Price comparison
