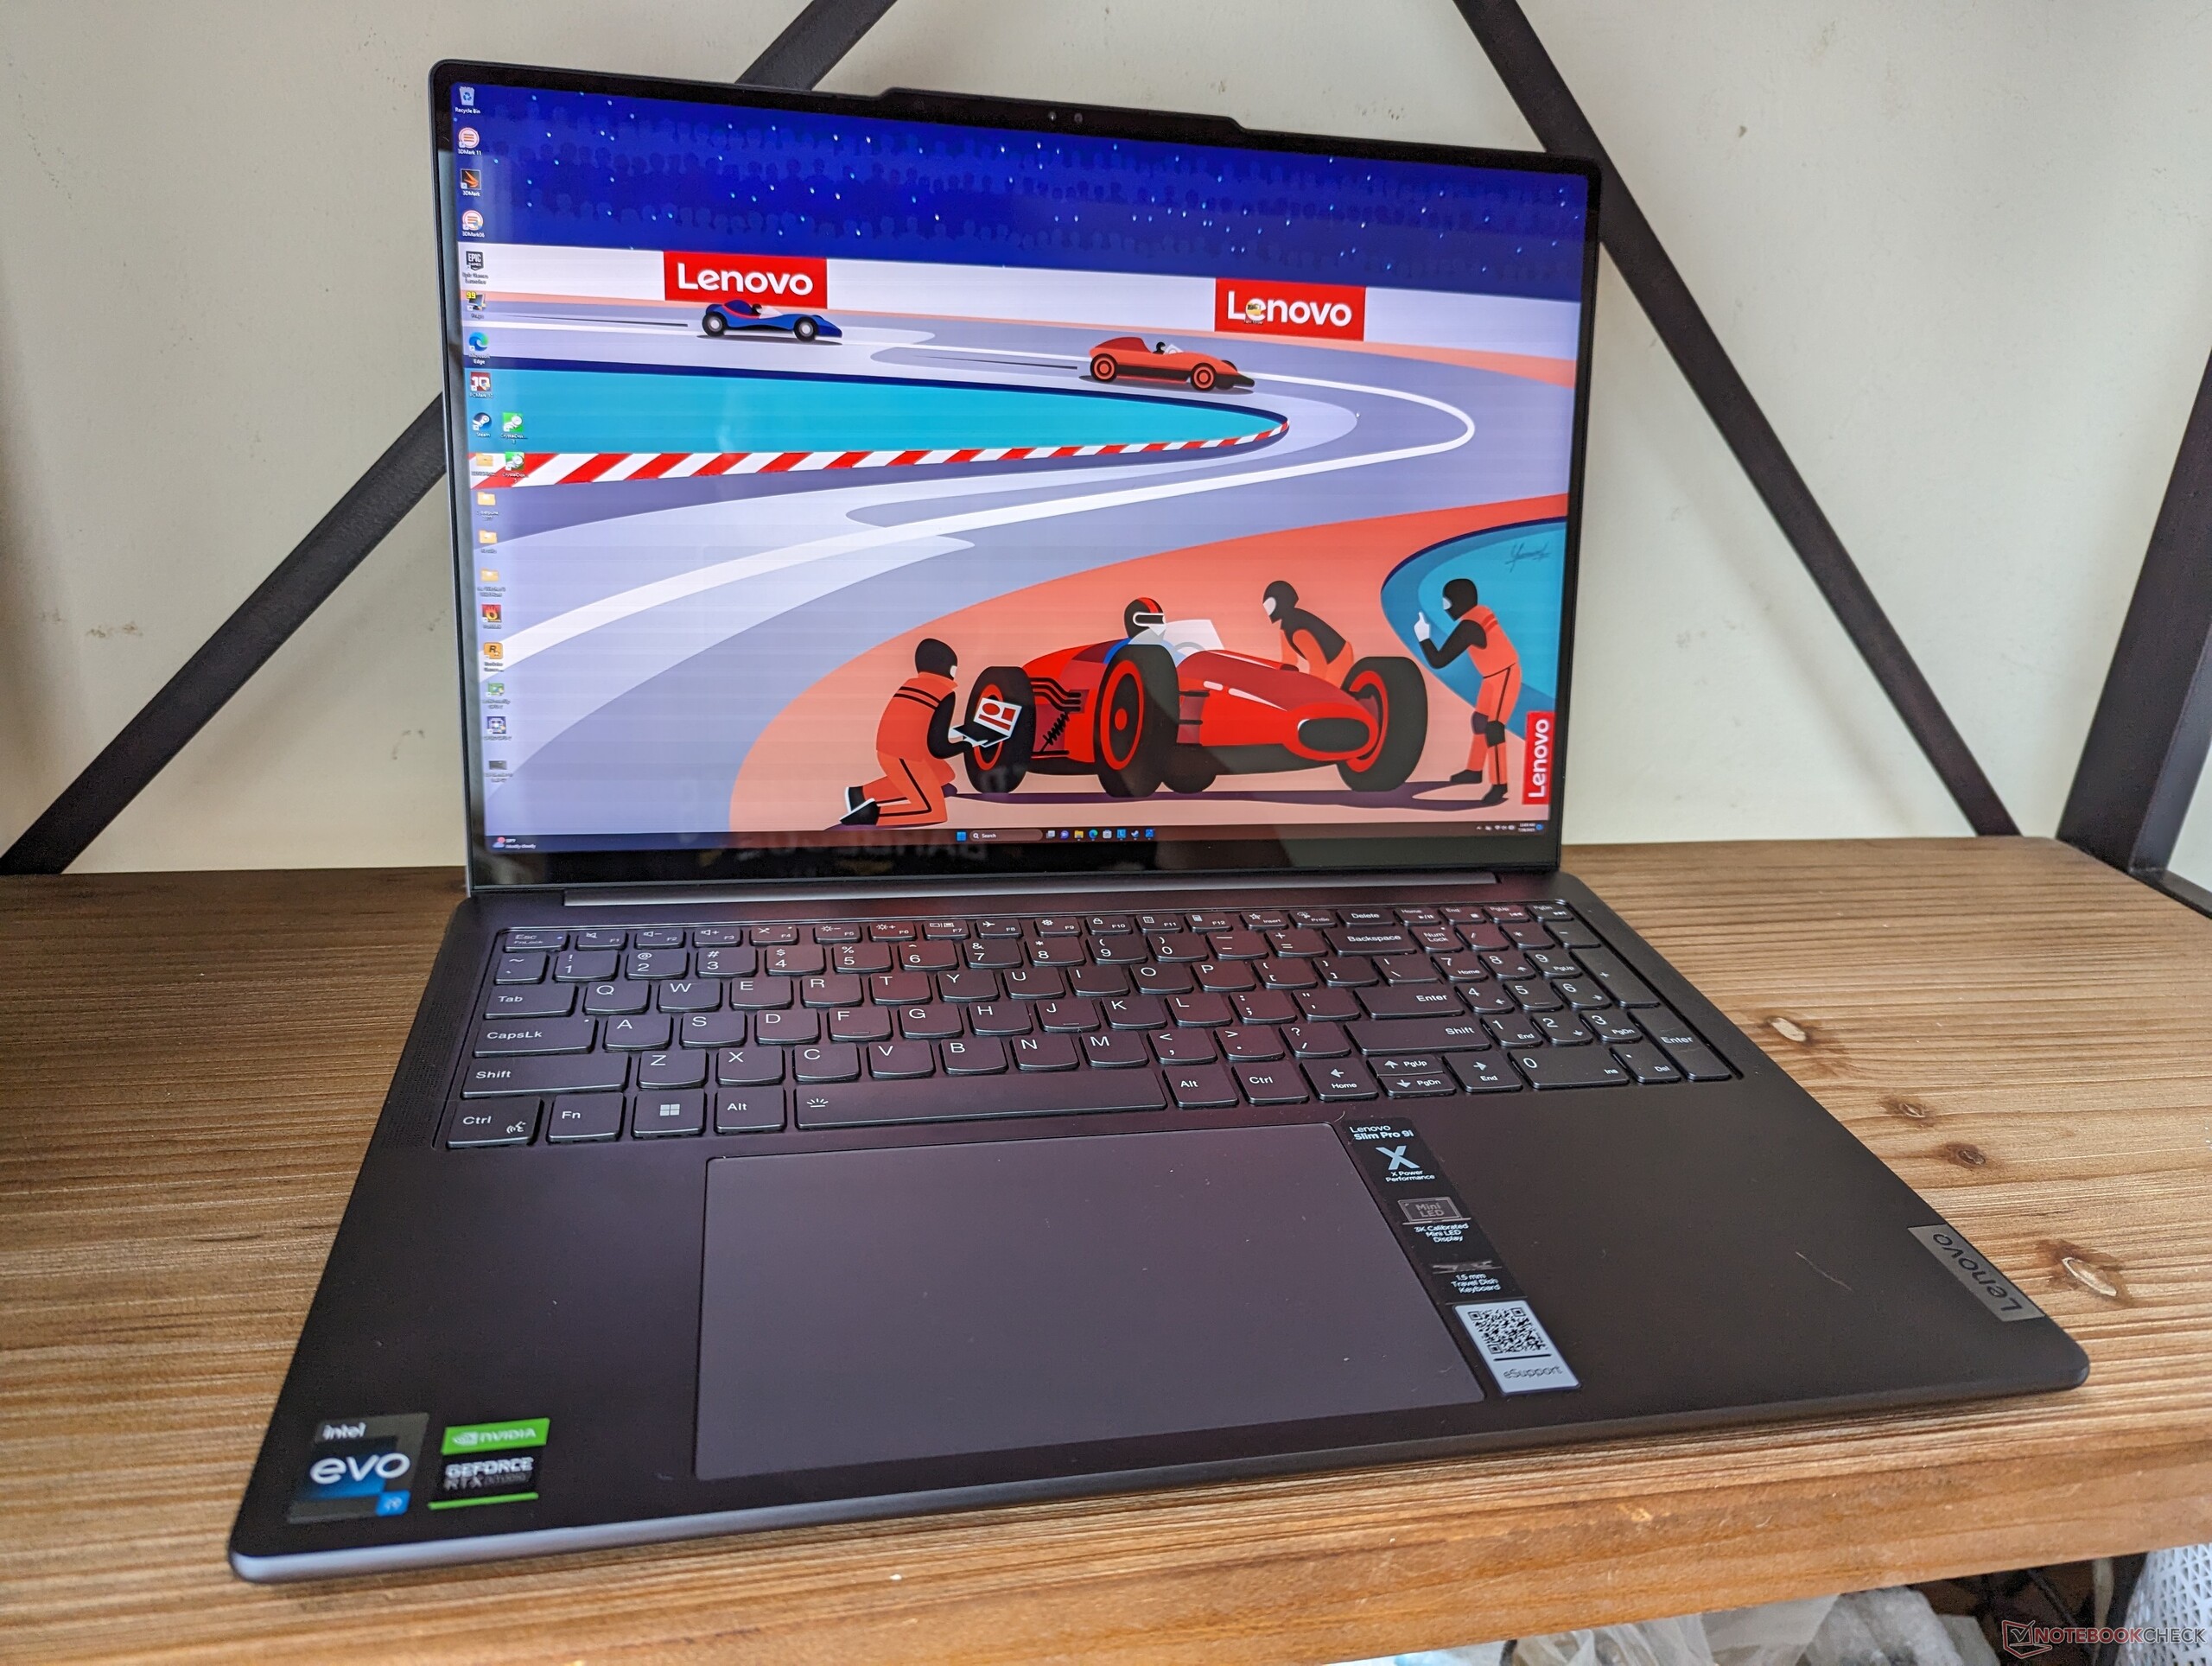
Test du Lenovo Slim Pro 9i 16IRP8 : l'alternative à l'Apple MacBook Pro 16

Le Lenovo Slim Pro 9i 16 G8 est un ordinateur portable haut de gamme conçu pour la création de contenu et le multimédia. Il est en concurrence avec des modèles de 16 pouces axés sur la création, tels que le MSI CreatorPro Z16P, Apple MacBook Pro 16, HP Envy 16ou le Asus ProArt StudioBook 16.
Ce qui est déroutant, c'est que le nom de ce modèle est différent selon les régions. En Europe, par exemple, ce modèle est connu sous le nom de Yoga Pro 9i 16 alors qu'il s'agit du Slim Pro 9i 16 en Amérique du Nord. Nous vous recommandons de consulter notre avis sur le Yoga Pro 9i 16 pour en savoir plus sur les caractéristiques physiques de cet ordinateur portable.
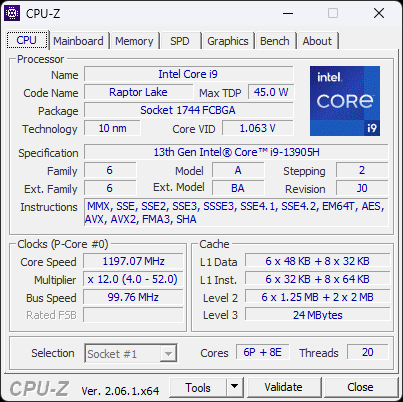
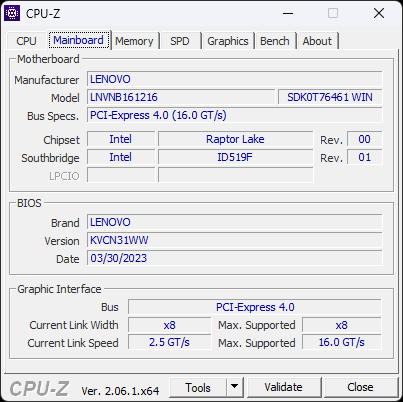
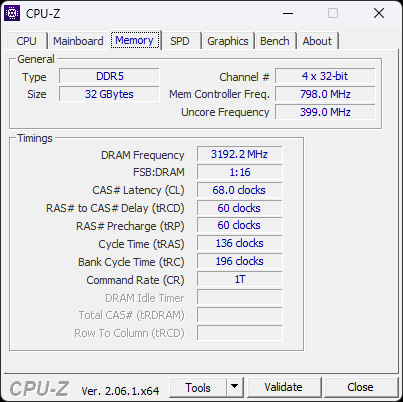
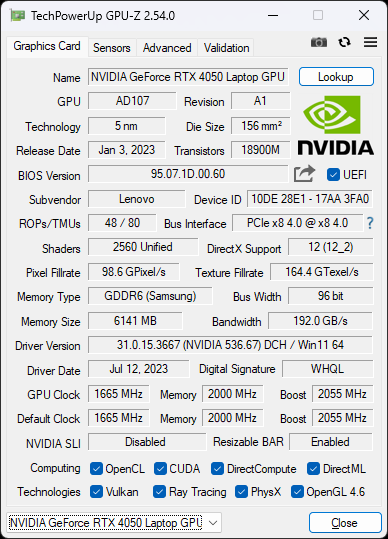
Notre configuration est livrée avec le CPU Core i9-13905H de la 13ème génération Raptor Lake et la RTX 4050 de 100 W GeForce, contrairement au Core i7-13705H et à la RTX 4060 de notre Yoga Pro 9i 16. Les deux configurations sont par ailleurs livrées avec le même écran tactile mini-LED 3,2K (3200 x 2000) avec toutes les couleurs DCI-P3.
Une version 14 pouces de ce modèle est également disponible, appelée Slim Pro 9i 14 ou Yoga Pro 9i 14.
Plus de commentaires sur Lenovo :
Comparaison avec les concurrents potentiels
Note | Date | Modèle | Poids | Épaisseur | Taille | Résolution | Prix |
|---|---|---|---|---|---|---|---|
| 88 % v7 (old) | 08/23 | Lenovo Slim Pro 9i 16IRP8 i9-13905H, GeForce RTX 4050 Laptop GPU | 2.2 kg | 18.2 mm | 16.00" | 3200x2000 | |
| 88.4 % v7 (old) | 08/23 | Lenovo Yoga Pro 9 16-IRP G8 i7-13705H, GeForce RTX 4060 Laptop GPU | 2.2 kg | 18.2 mm | 16.00" | 3200x2000 | |
| 86.3 % v7 (old) | 05/23 | Asus VivoBook Pro 16 i7-12700H, GeForce RTX 3050 Ti Laptop GPU | 1.9 kg | 20 mm | 16.00" | 2560x1600 | |
| 87.5 % v7 (old) | 06/23 | Acer Swift Edge SFE16-42-R1GM R7 7735U, Radeon 680M | 1.2 kg | 13.95 mm | 16.00" | 3840x2400 | |
| 87.4 % v7 (old) | 08/22 | Dell Inspiron 16 Plus 7620 i7-12700H, GeForce RTX 3050 Ti Laptop GPU | 2.1 kg | 18.99 mm | 16.00" | 3072x1920 | |
| 86.9 % v7 (old) | 09/22 | HP Envy 16 h0112nr i7-12700H, GeForce RTX 3060 Laptop GPU | 2.3 kg | 19.8 mm | 16.00" | 3840x2400 |
Cas
Lecteur de carte SD
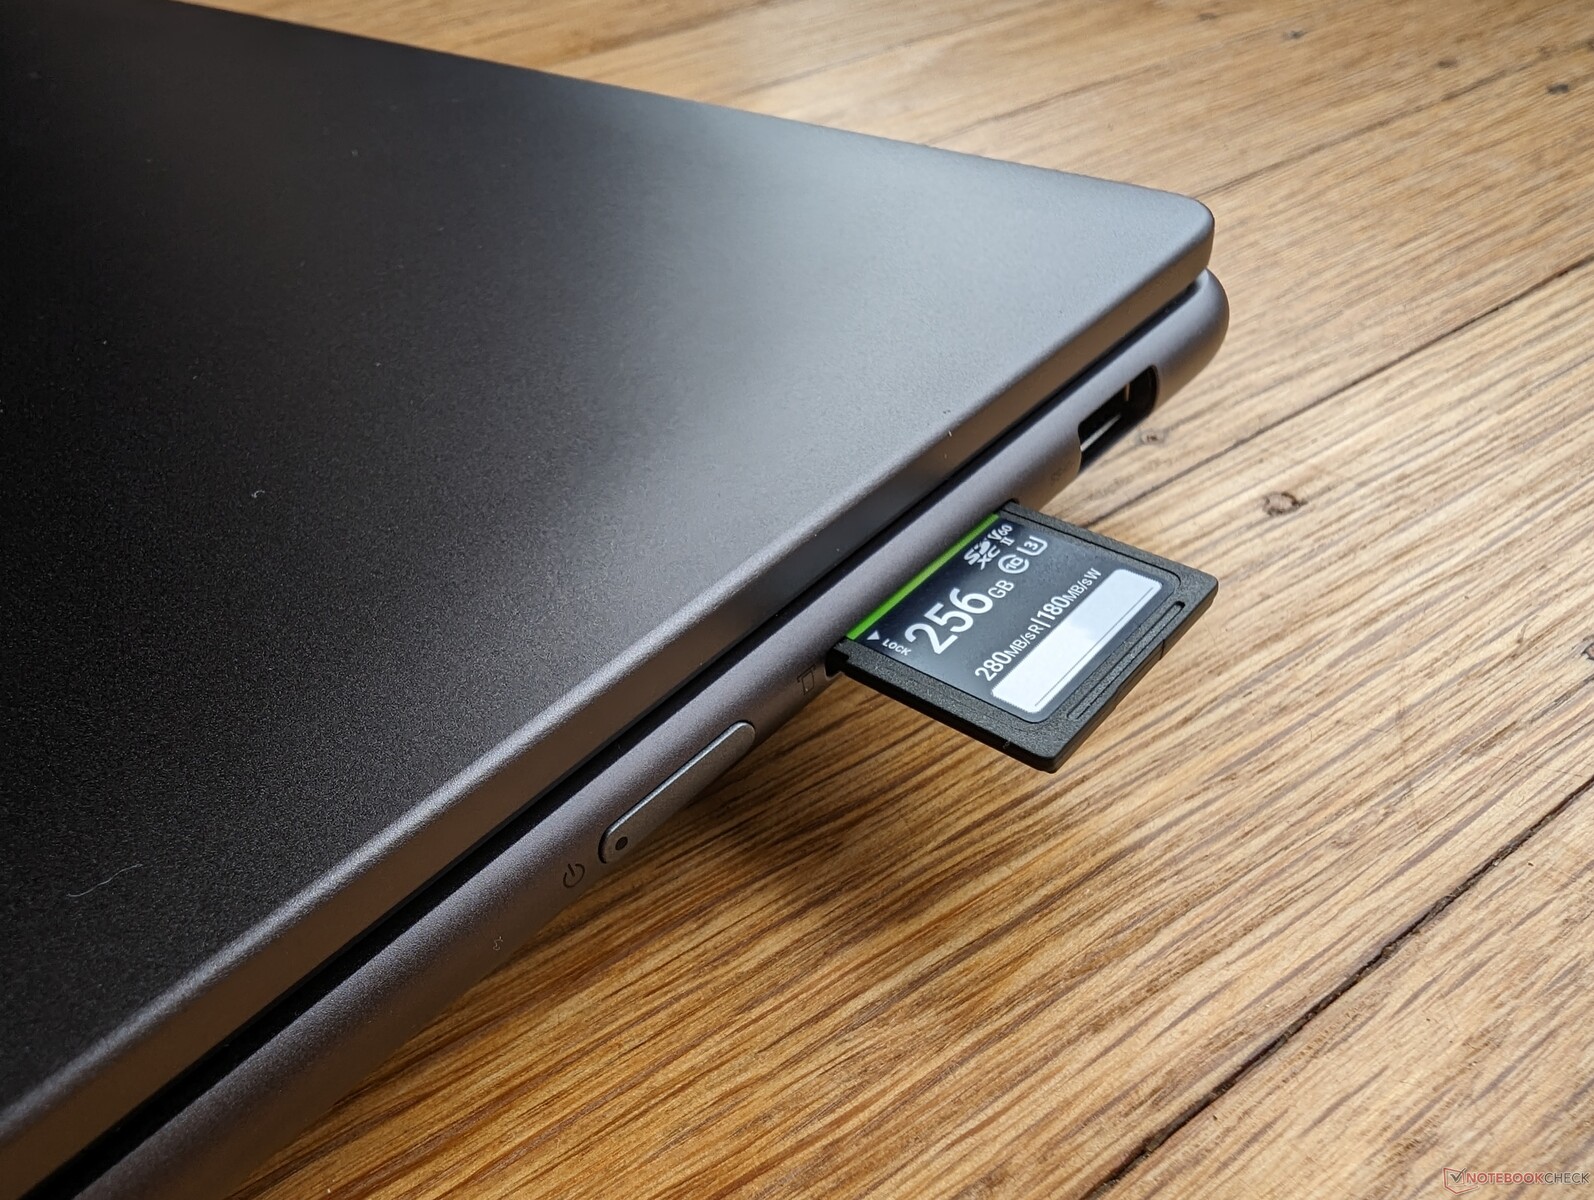
Les taux de transfert sont moyens pour la catégorie avec notre carte de test PNY EliteX-Pro60 V60 UHS-II. Malheureusement, le lecteur de cartes du Lenovo est peu profond et la carte SD dépasserait de plus de la moitié de sa longueur, ce qui rendrait le transport peu sûr.
| SD Card Reader | |
| average JPG Copy Test (av. of 3 runs) | |
| Lenovo Slim Pro 9i 16IRP8 (PNY EliteX-Pro60 V60 256 GB) | |
| Lenovo Yoga Pro 9 16-IRP G8 (Angelibird AV Pro V60) | |
| Asus VivoBook Pro 16 (AV Pro SD microSD 128 GB V60) | |
| HP Envy 16 h0112nr (AV Pro SD microSD 128 GB V60) | |
| Dell Inspiron 16 Plus 7620 (Toshiba Exceria Pro SDXC 64 GB UHS-II) | |
| maximum AS SSD Seq Read Test (1GB) | |
| Lenovo Slim Pro 9i 16IRP8 (PNY EliteX-Pro60 V60 256 GB) | |
| HP Envy 16 h0112nr (AV Pro SD microSD 128 GB V60) | |
| Lenovo Yoga Pro 9 16-IRP G8 (Angelibird AV Pro V60) | |
| Asus VivoBook Pro 16 (AV Pro SD microSD 128 GB V60) | |
| Dell Inspiron 16 Plus 7620 (Toshiba Exceria Pro SDXC 64 GB UHS-II) | |
Communication
| Networking | |
| iperf3 transmit AXE11000 | |
| Lenovo Yoga Pro 9 16-IRP G8 | |
| Asus VivoBook Pro 16 | |
| Lenovo Slim Pro 9i 16IRP8 | |
| Acer Swift Edge SFE16-42-R1GM | |
| iperf3 receive AXE11000 | |
| Lenovo Yoga Pro 9 16-IRP G8 | |
| Lenovo Slim Pro 9i 16IRP8 | |
| Acer Swift Edge SFE16-42-R1GM | |
| iperf3 transmit AXE11000 6GHz | |
| Lenovo Slim Pro 9i 16IRP8 | |
| Acer Swift Edge SFE16-42-R1GM | |
| HP Envy 16 h0112nr | |
| Dell Inspiron 16 Plus 7620 | |
| iperf3 receive AXE11000 6GHz | |
| Asus VivoBook Pro 16 | |
| Acer Swift Edge SFE16-42-R1GM | |
| Lenovo Slim Pro 9i 16IRP8 | |
| HP Envy 16 h0112nr | |
| Dell Inspiron 16 Plus 7620 | |
Webcam
Le capteur de 5 MP est d'une qualité supérieure à celle des webcams de la plupart des autres ordinateurs portables, où les capteurs de 2 MP ou de 1 MP sont encore monnaie courante. Un interrupteur infrarouge et un interrupteur d'arrêt de la caméra sont inclus.


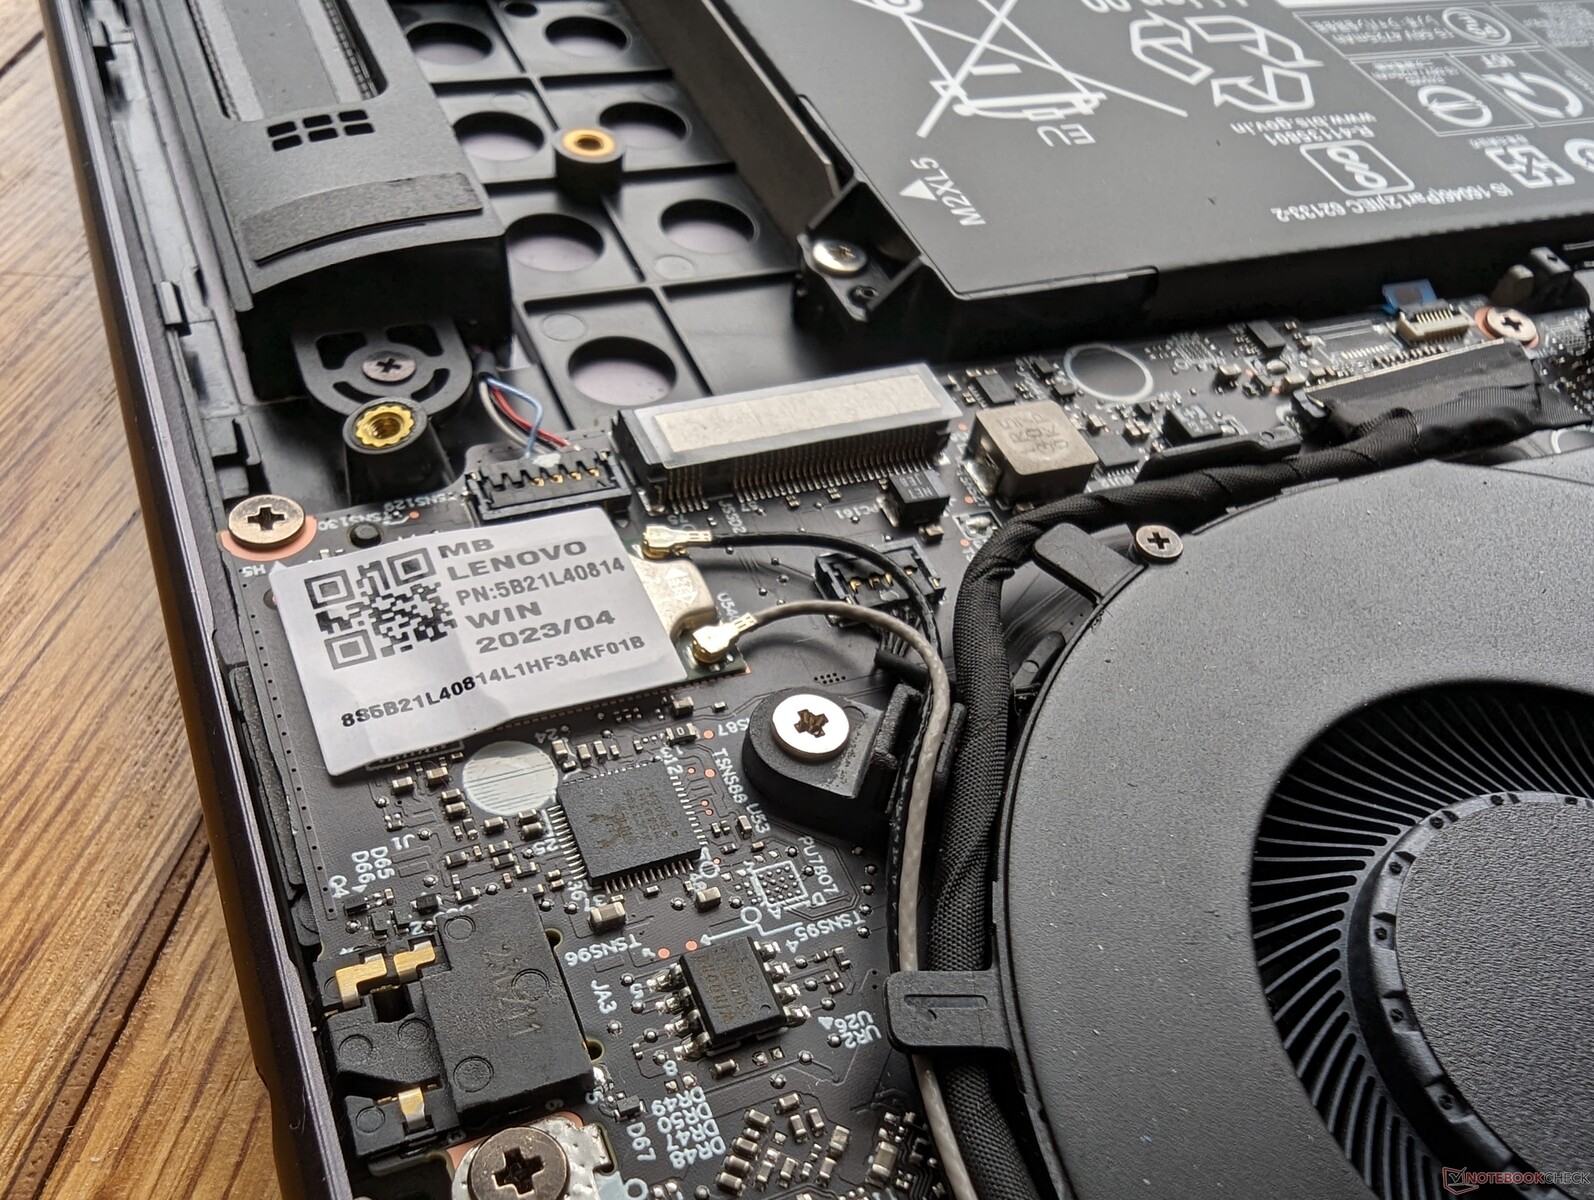
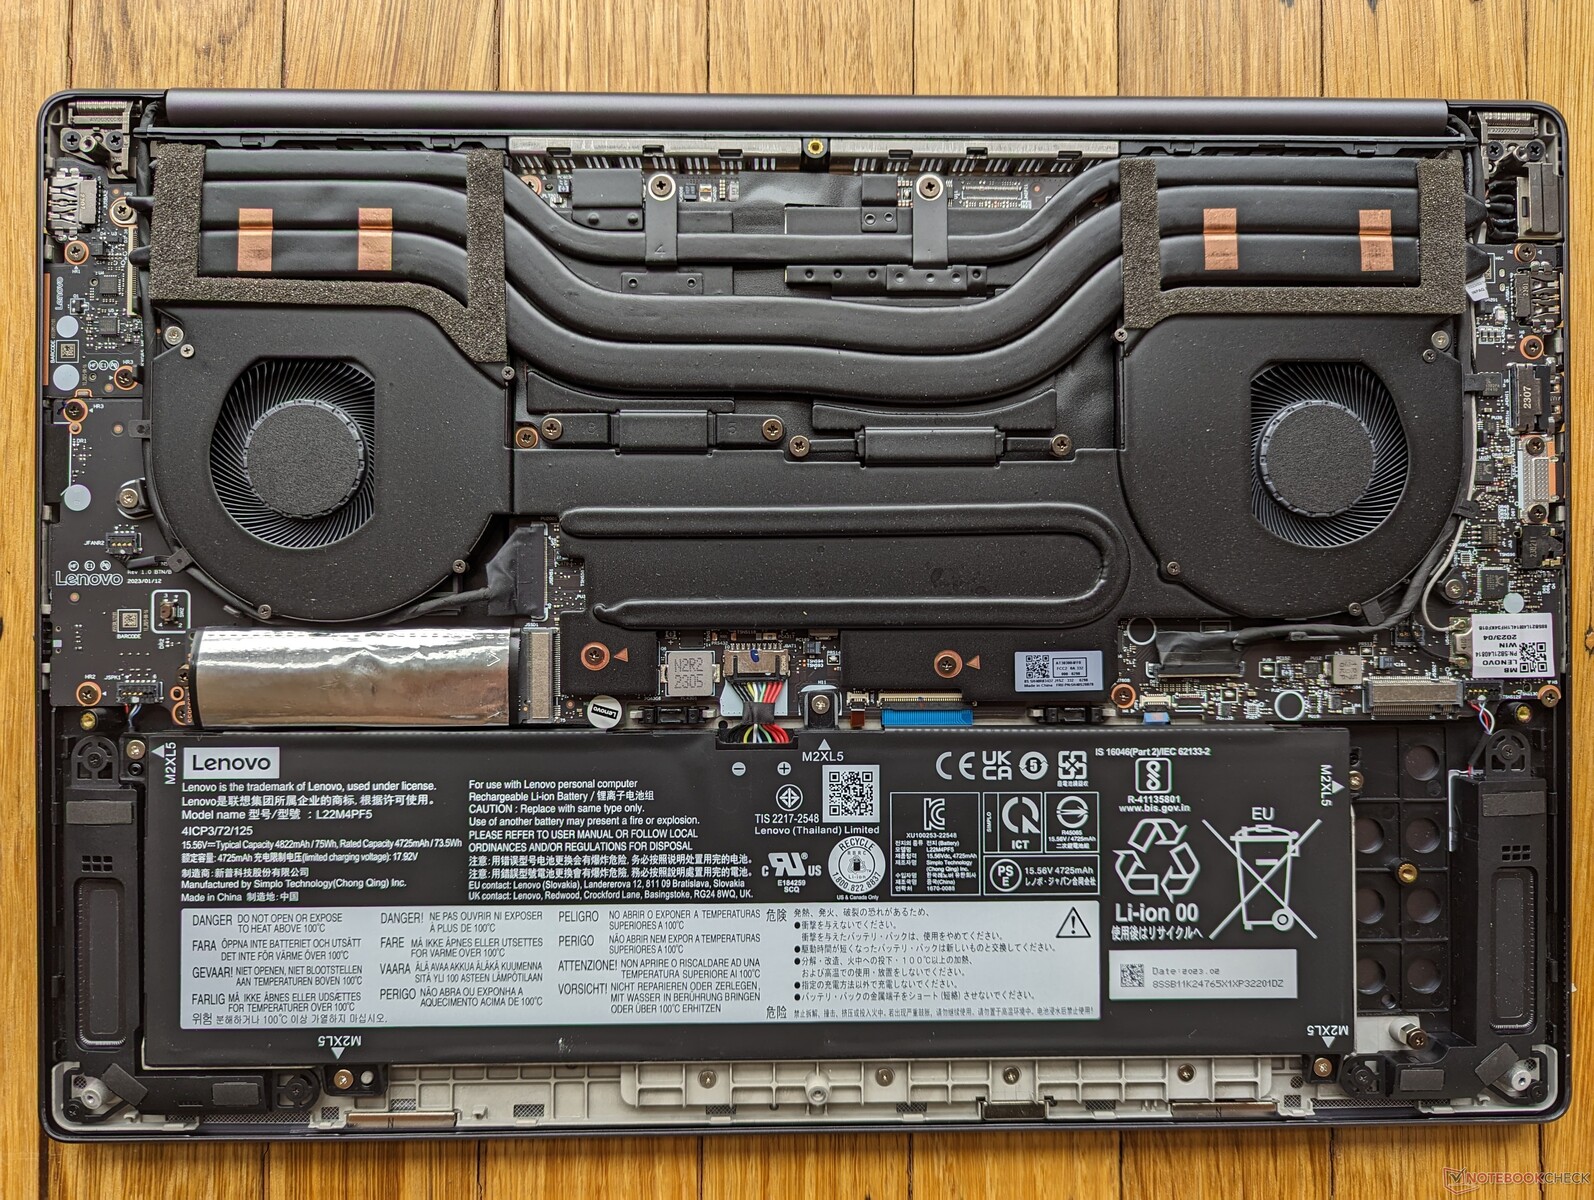
Maintenance
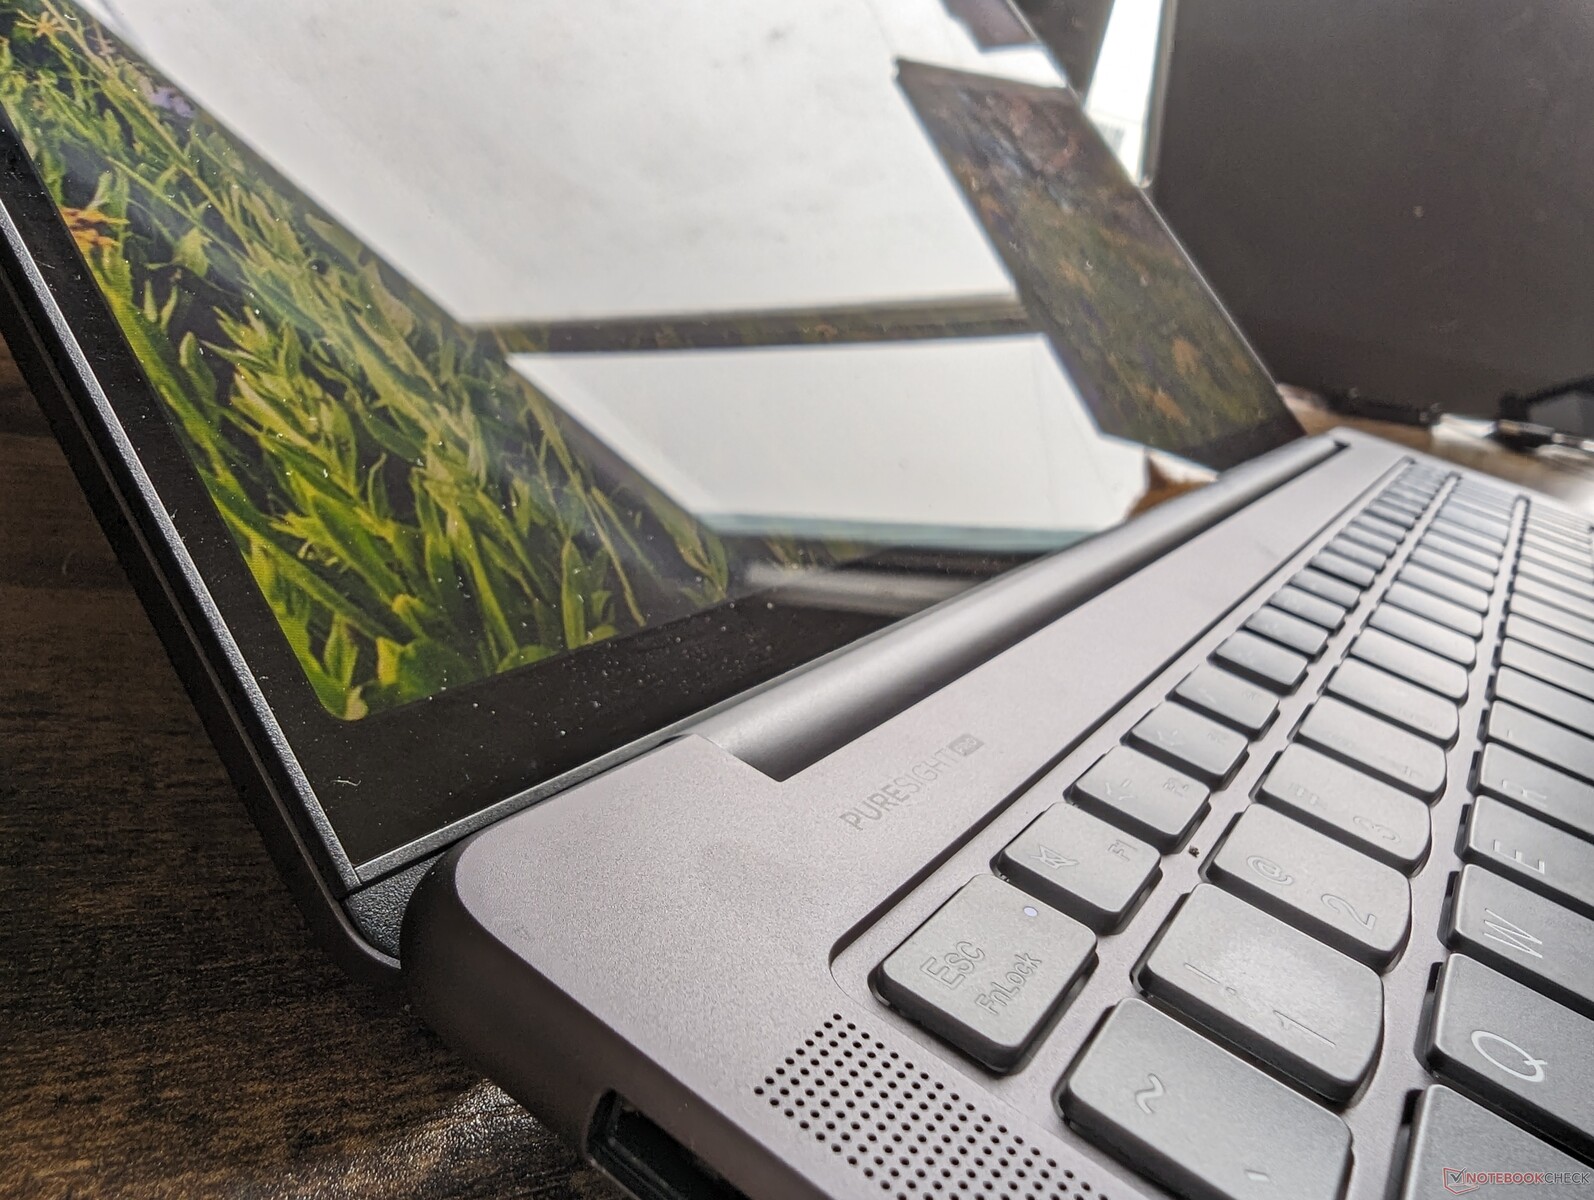
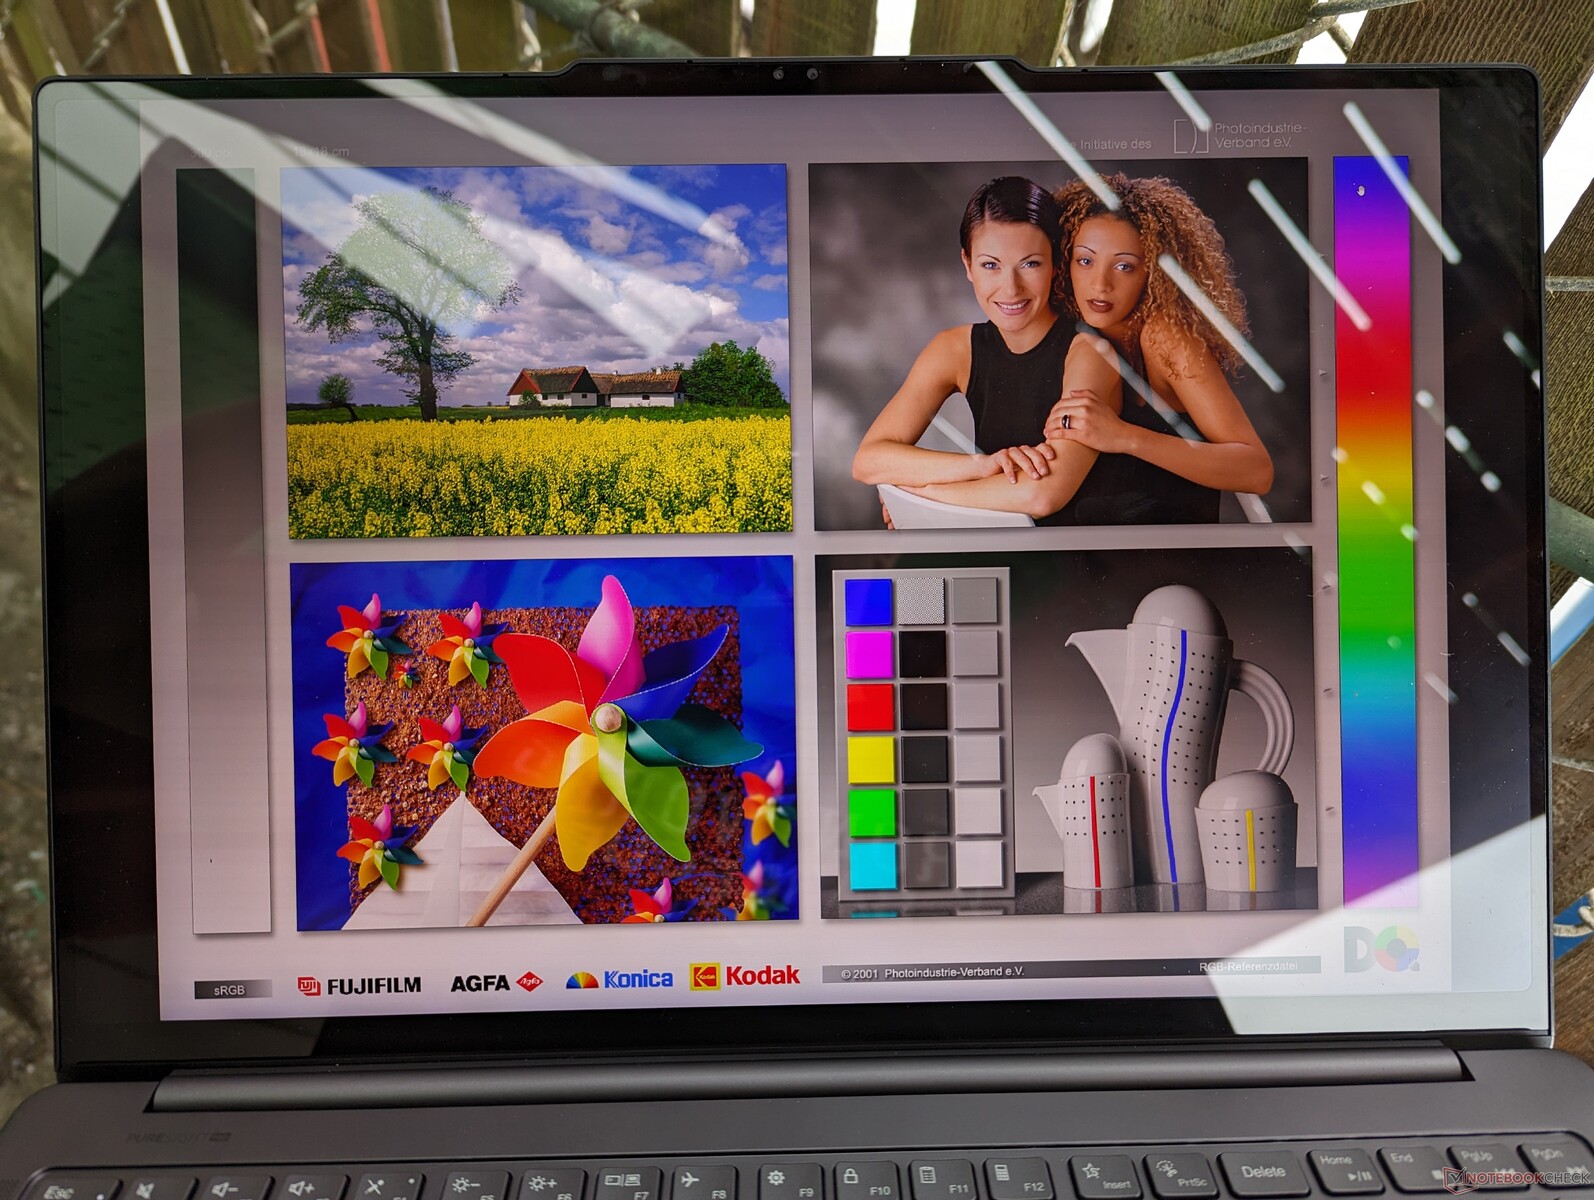
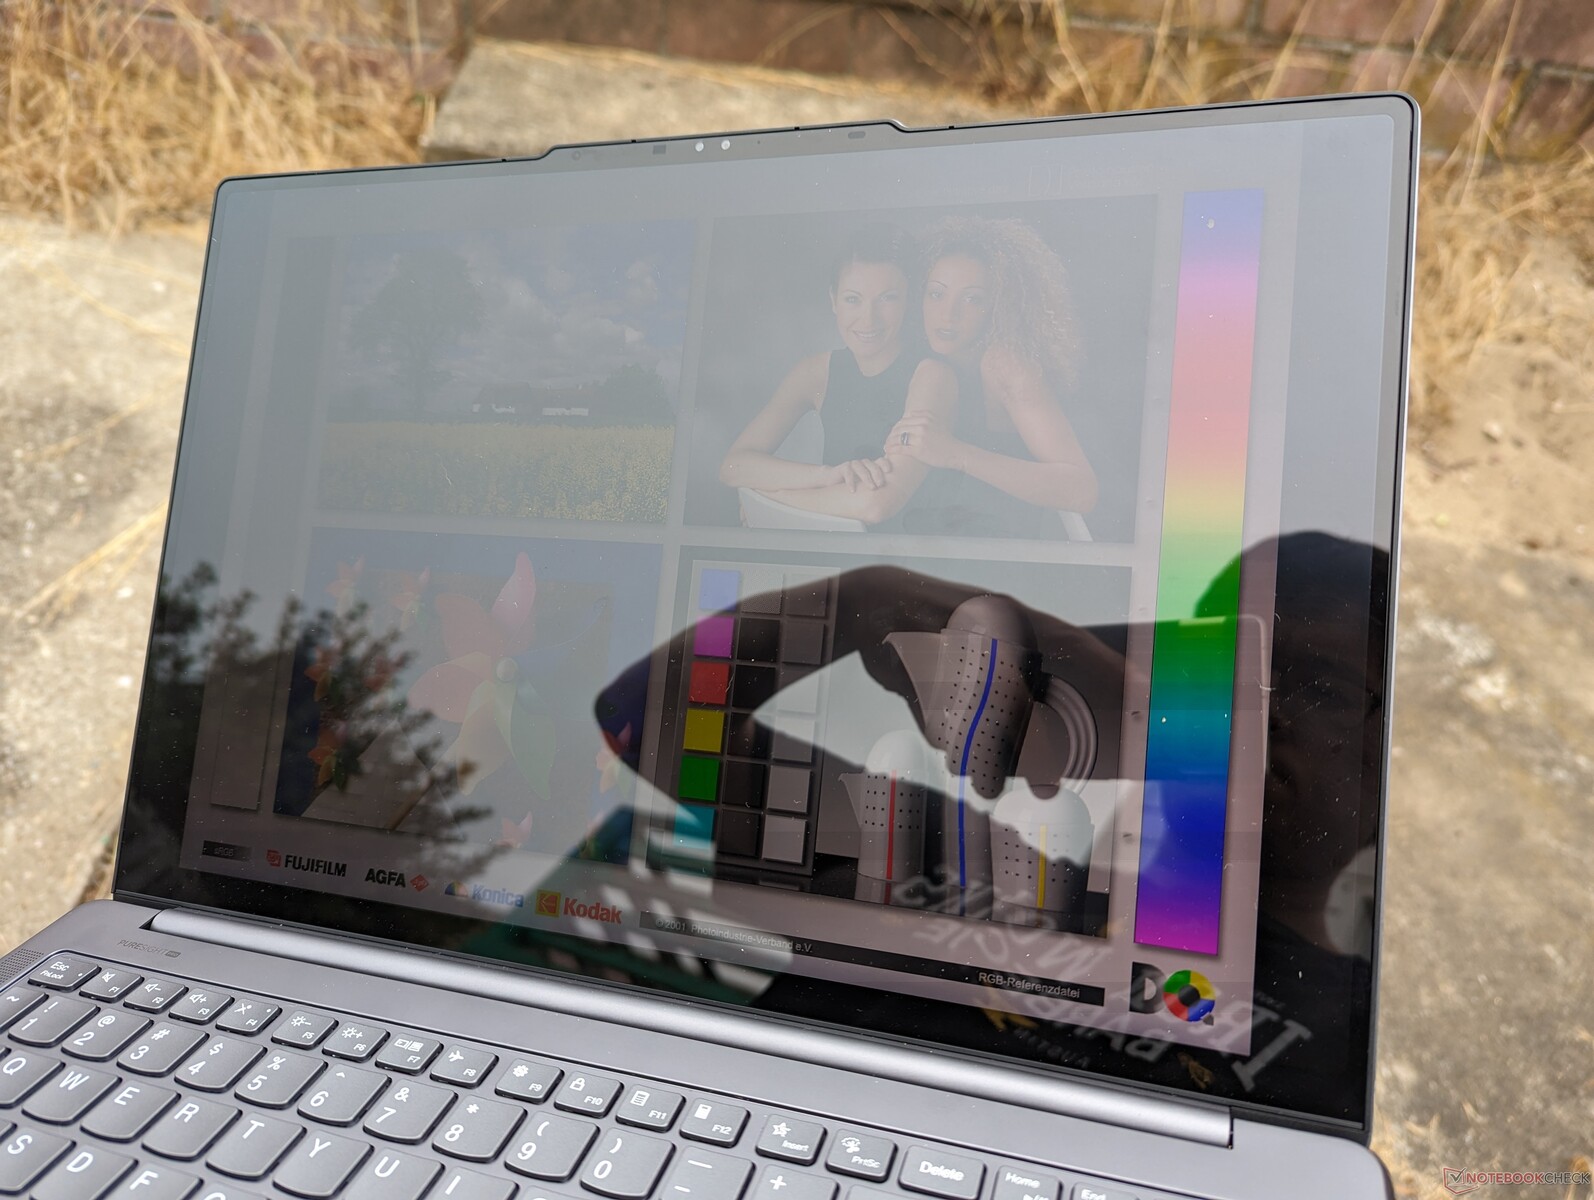
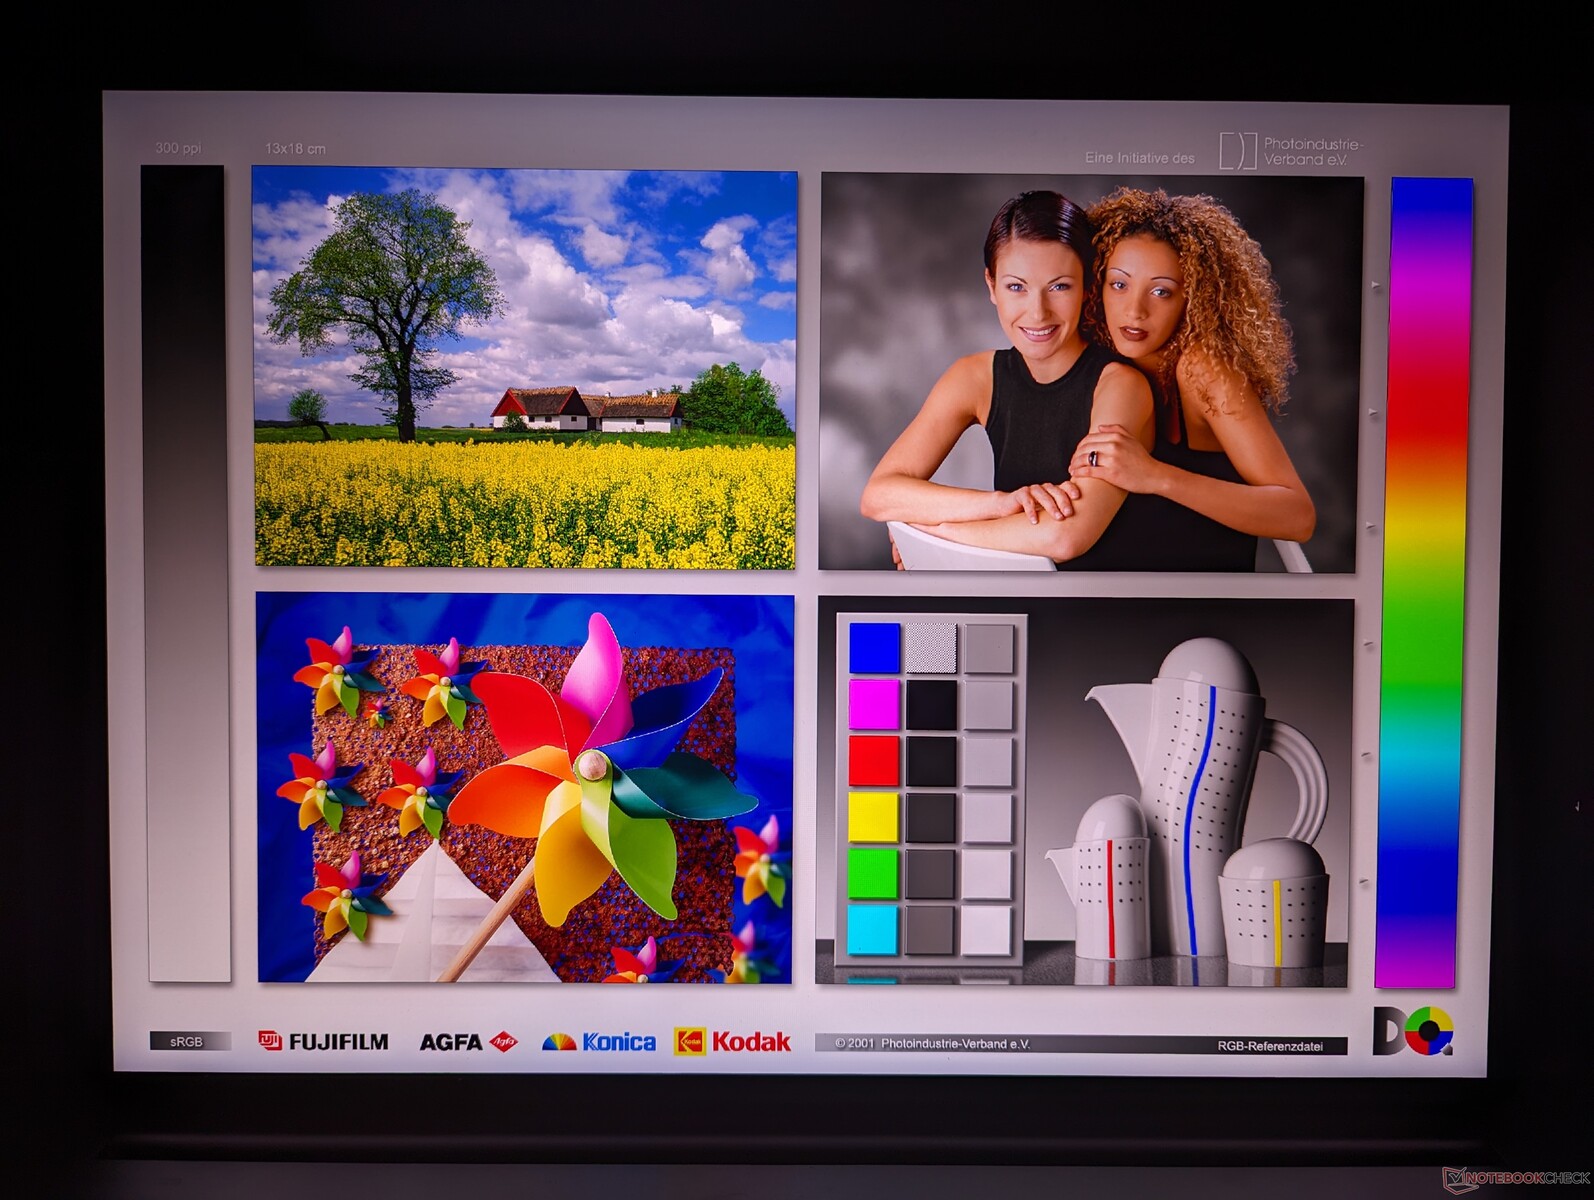
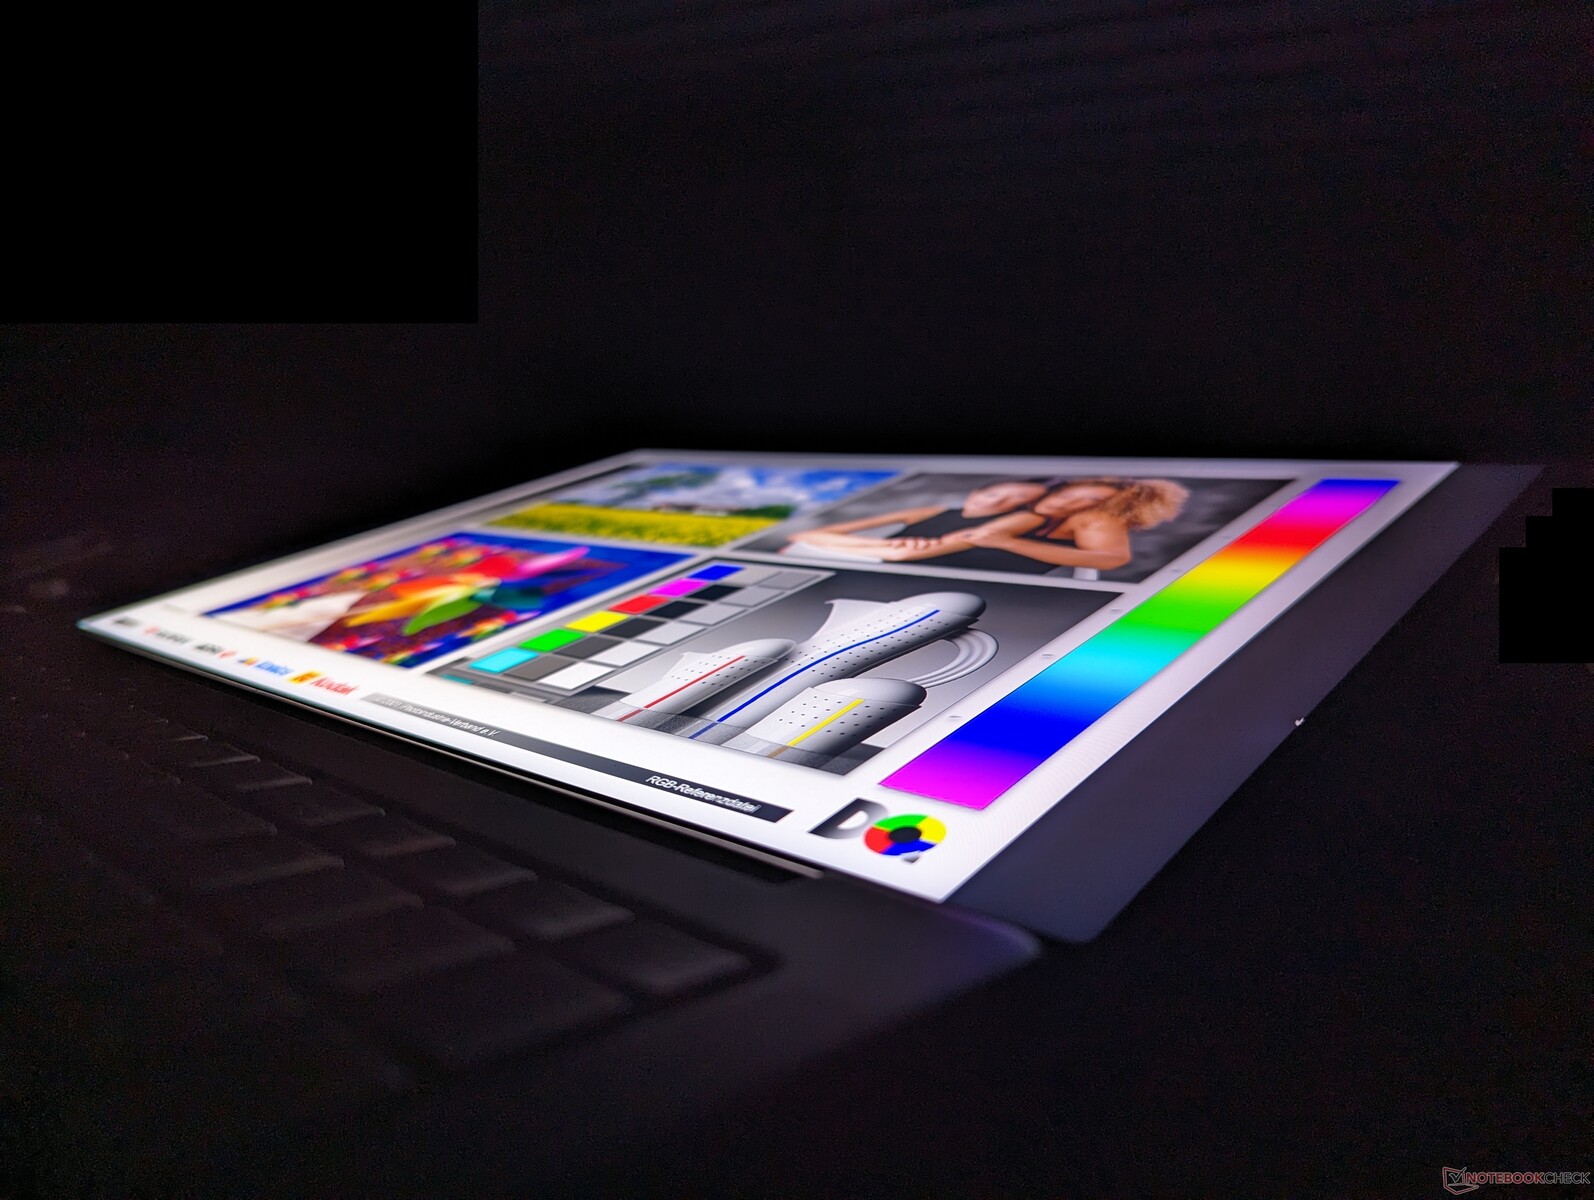
Affichage - 100% DCI-P3, 165 Hz, Mini-LED, faible lumière bleue, 3.2K
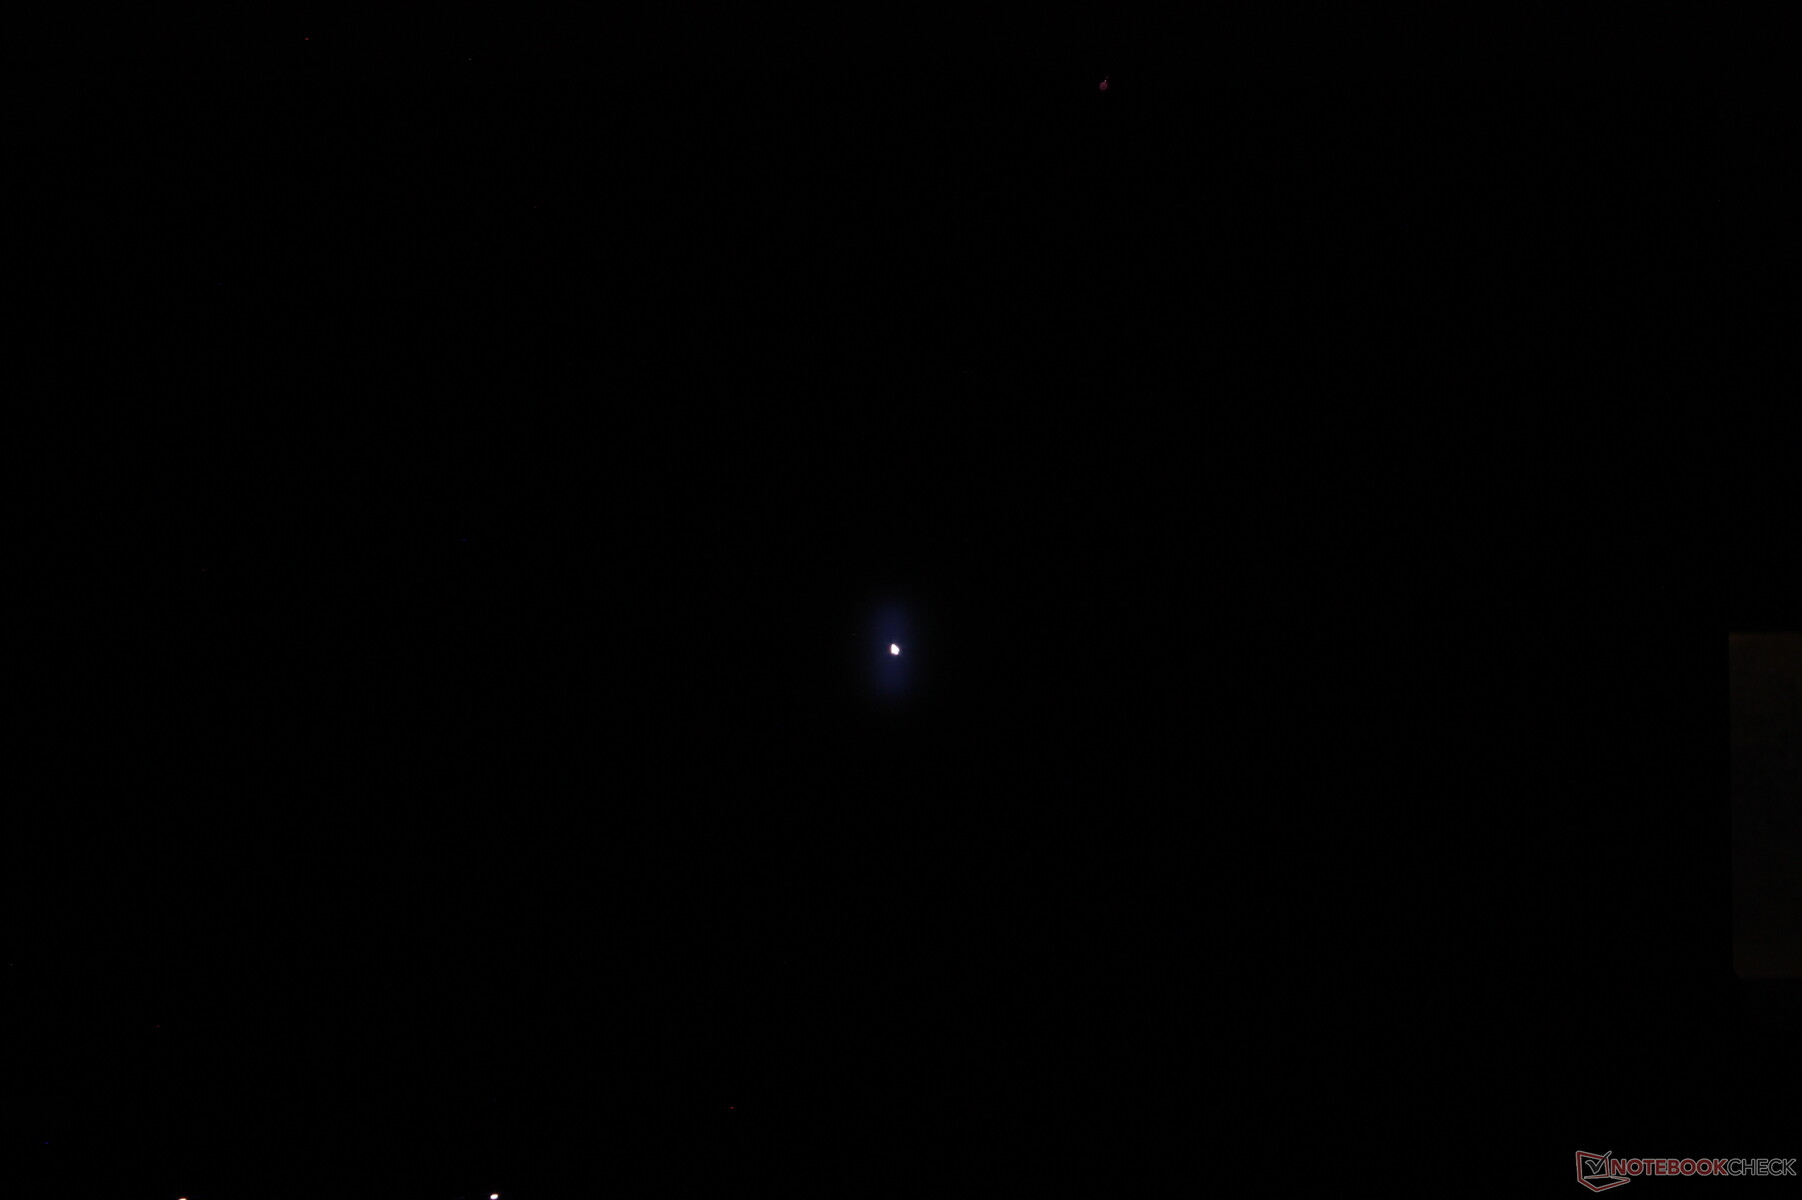
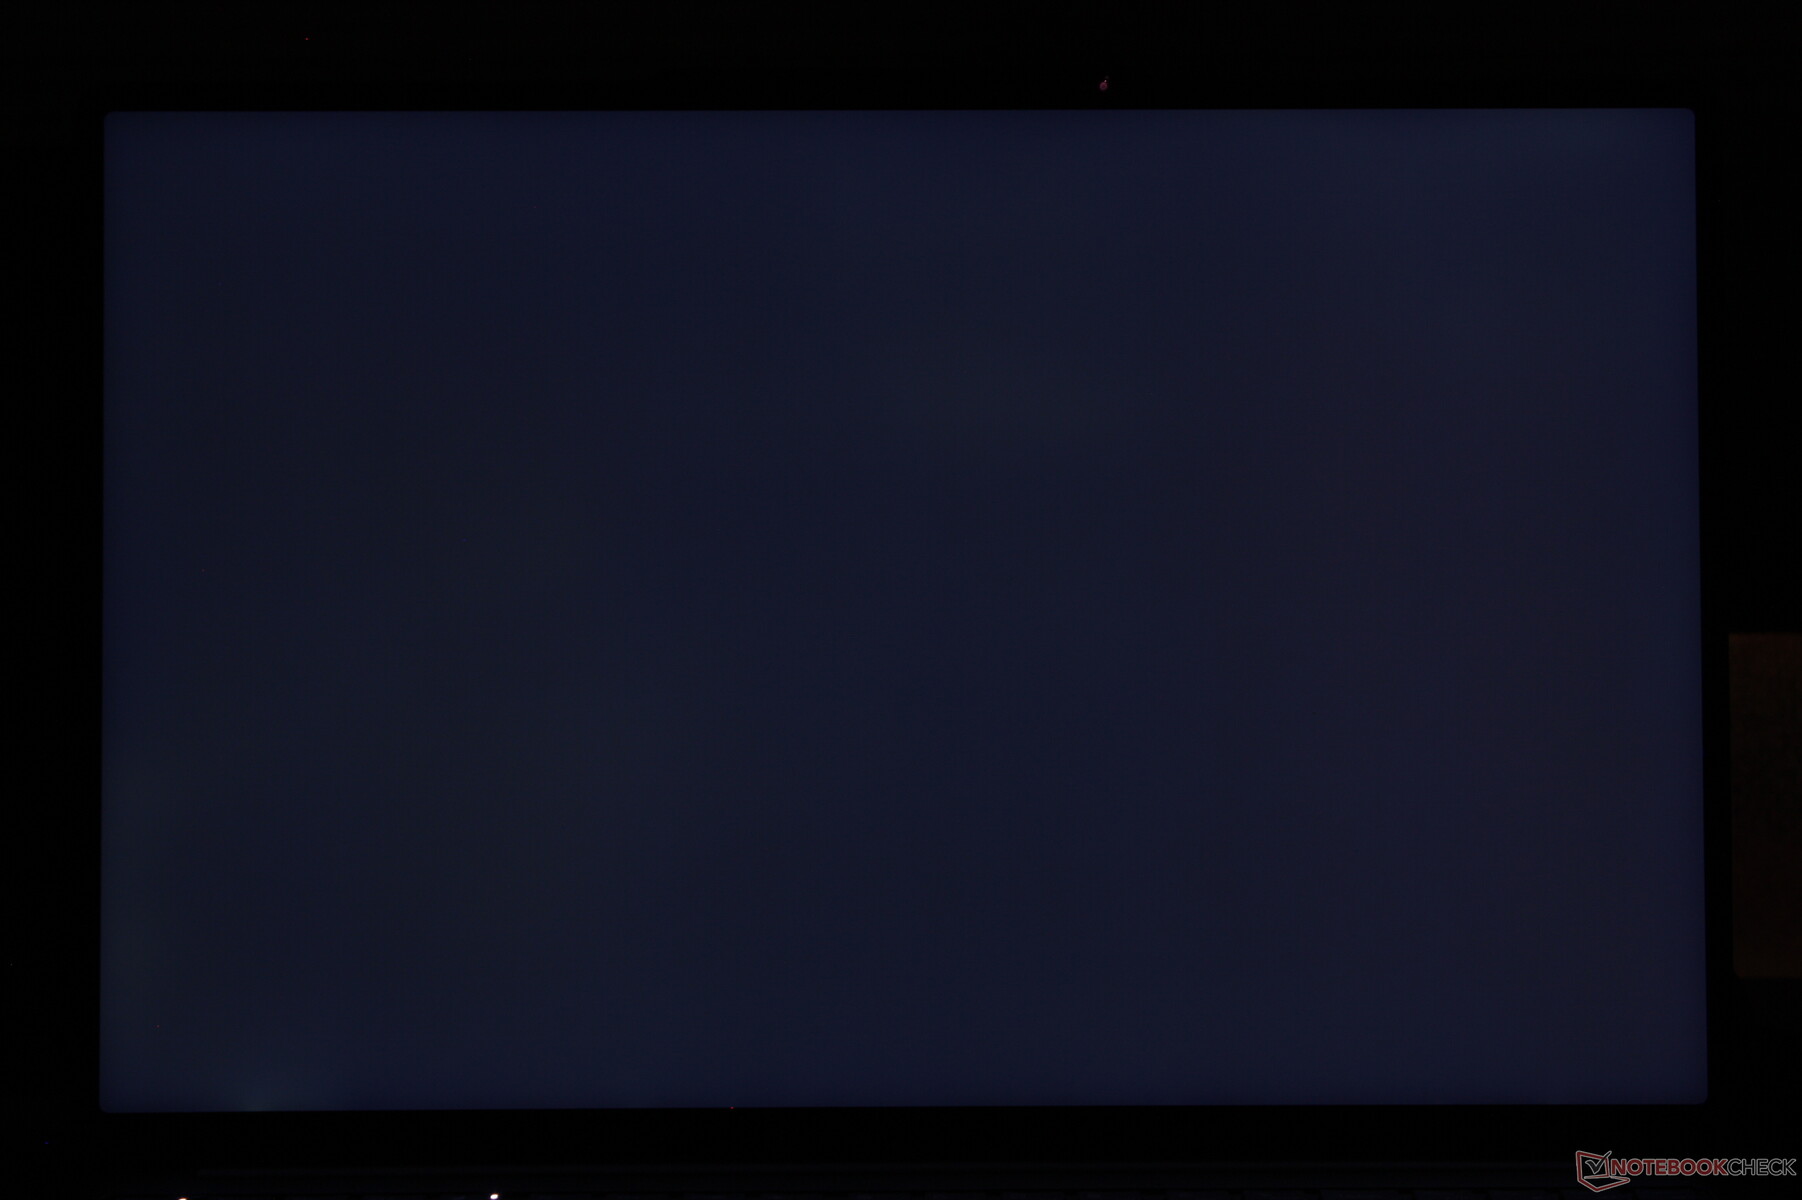
Le Mini-LED combine les avantages de l'IPS, moins cher, et de l'OLED, plus onéreux. Il offre les taux de rafraîchissement natifs très rapides de l'IPS avec la luminosité maximale plus élevée de l'OLED via la gradation locale pour des couleurs plus vives. L'inconvénient, cependant, est un effet de "halo" perceptible lors de l'affichage d'un objet très lumineux sur un fond très sombre. La capture d'écran ci-dessous, par exemple, montre un curseur de souris blanc sur un fond entièrement noir. Le curseur serait net avec des bords définis sur un panneau OLED, mais il brille sur un panneau mini-LED car la gradation locale n'est pas parfaite.
La luminosité maximale est limitée à environ 600 nits lors de l'affichage d'une image entièrement blanche. En exécutant ce test HDRnous avons pu mesurer une luminosité maximale plus élevée de 1330 nits, ce qui correspond aux 1200 nits annoncés par Lenovo.
| |||||||||||||||||||||||||
Homogénéité de la luminosité: 95 %
Valeur mesurée au centre, sur batterie: 627.4 cd/m²
Contraste: 3302:1 (Valeurs des noirs: 0.19 cd/m²)
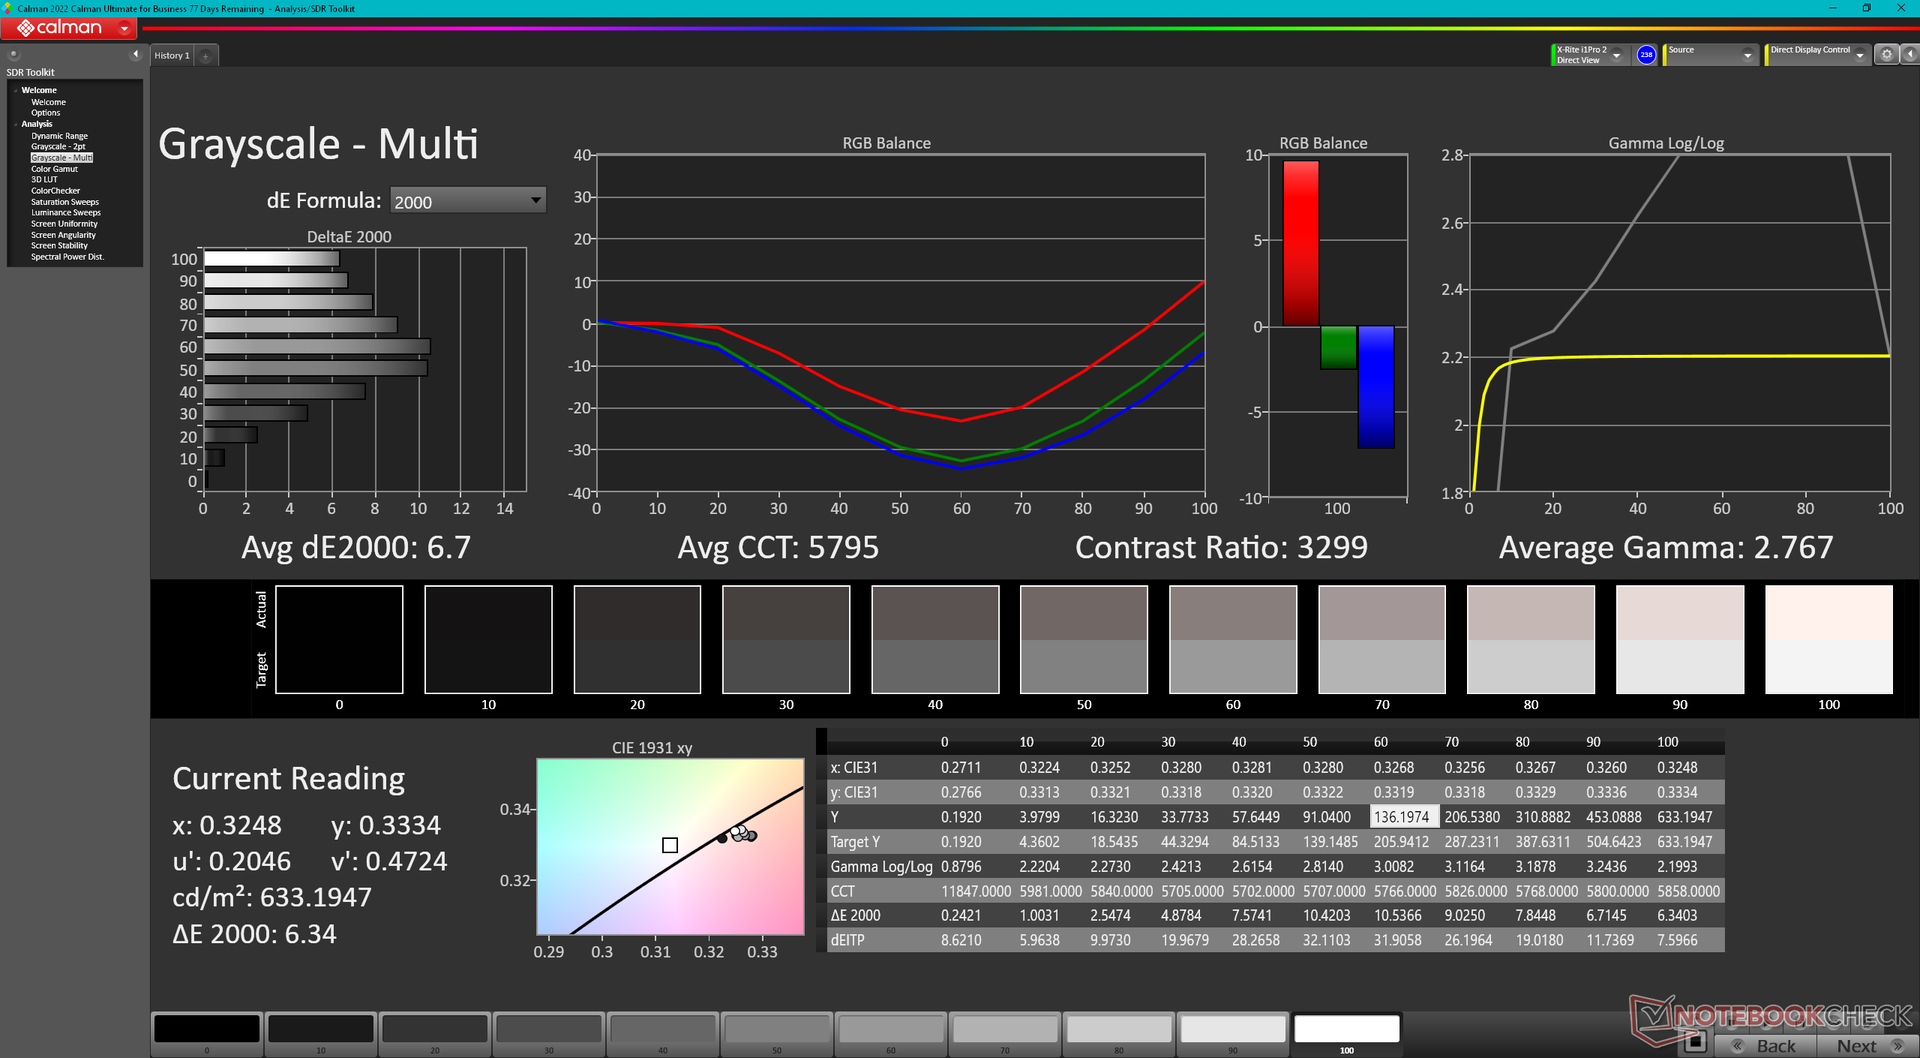
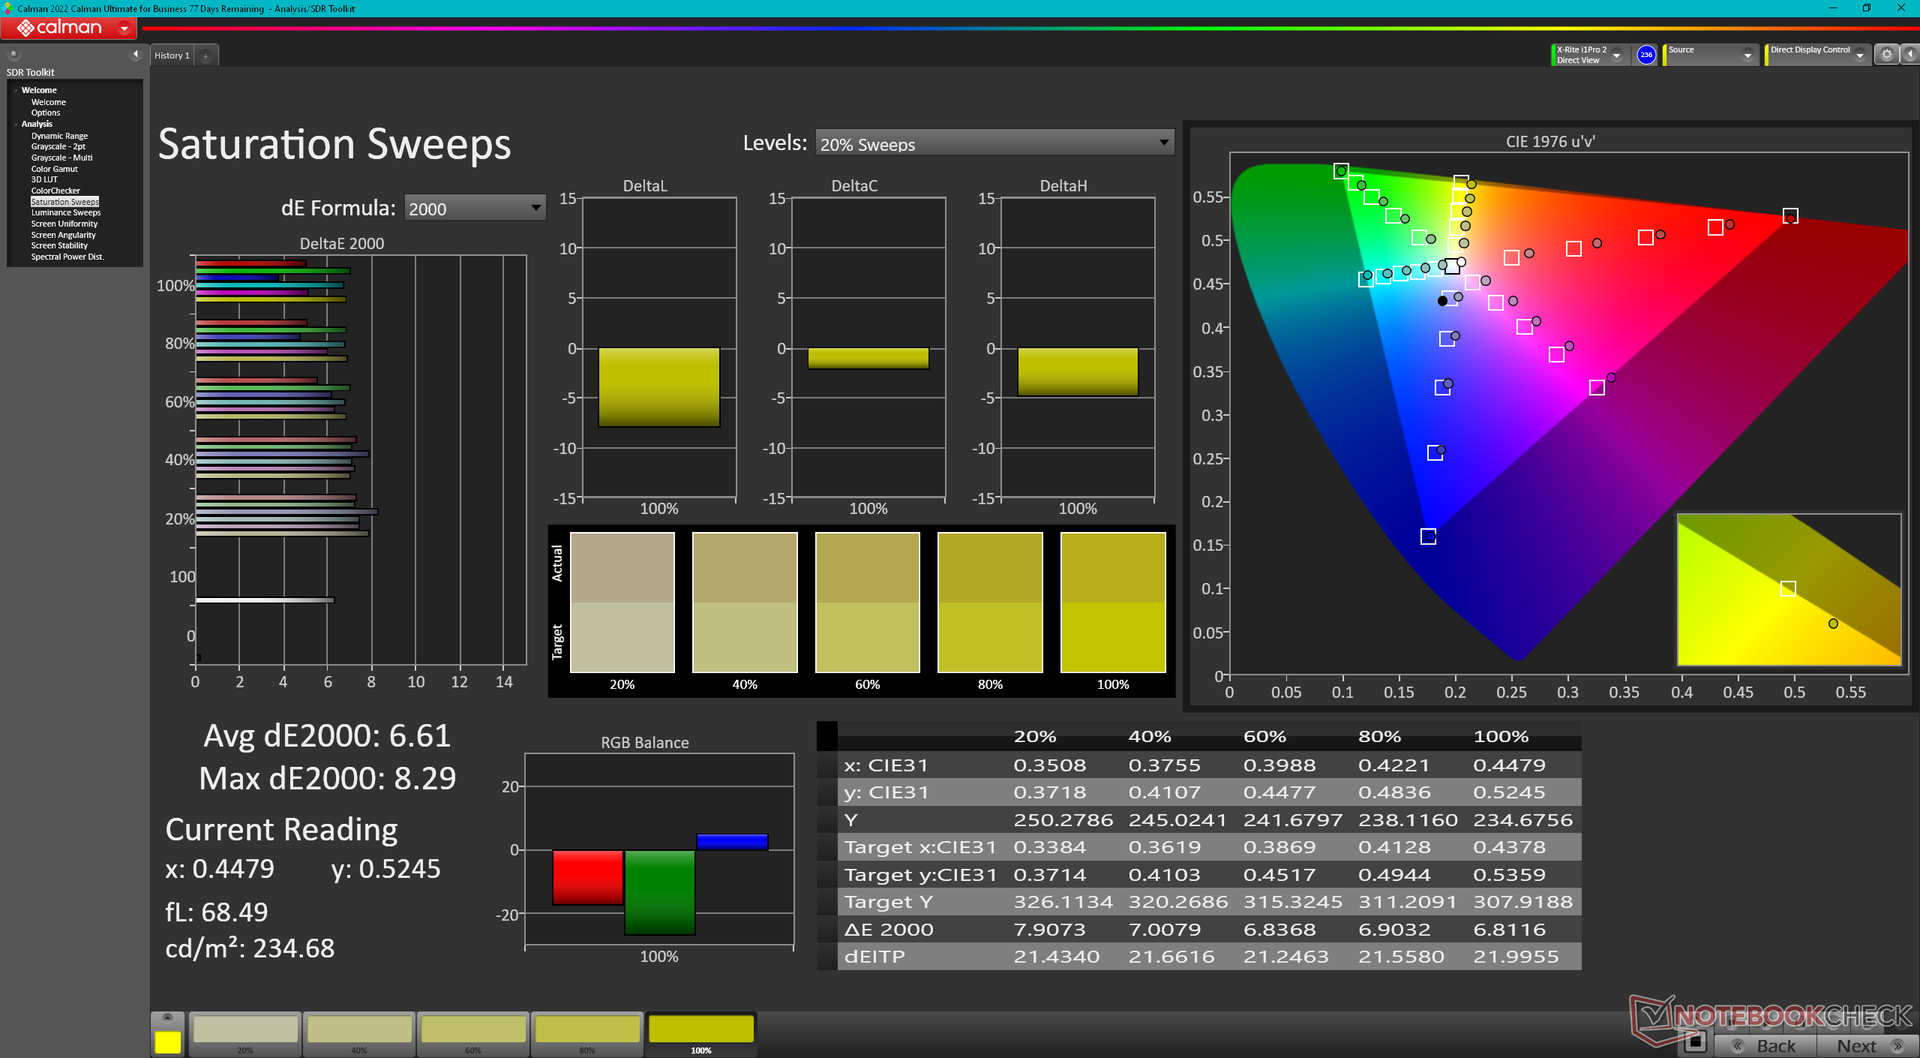
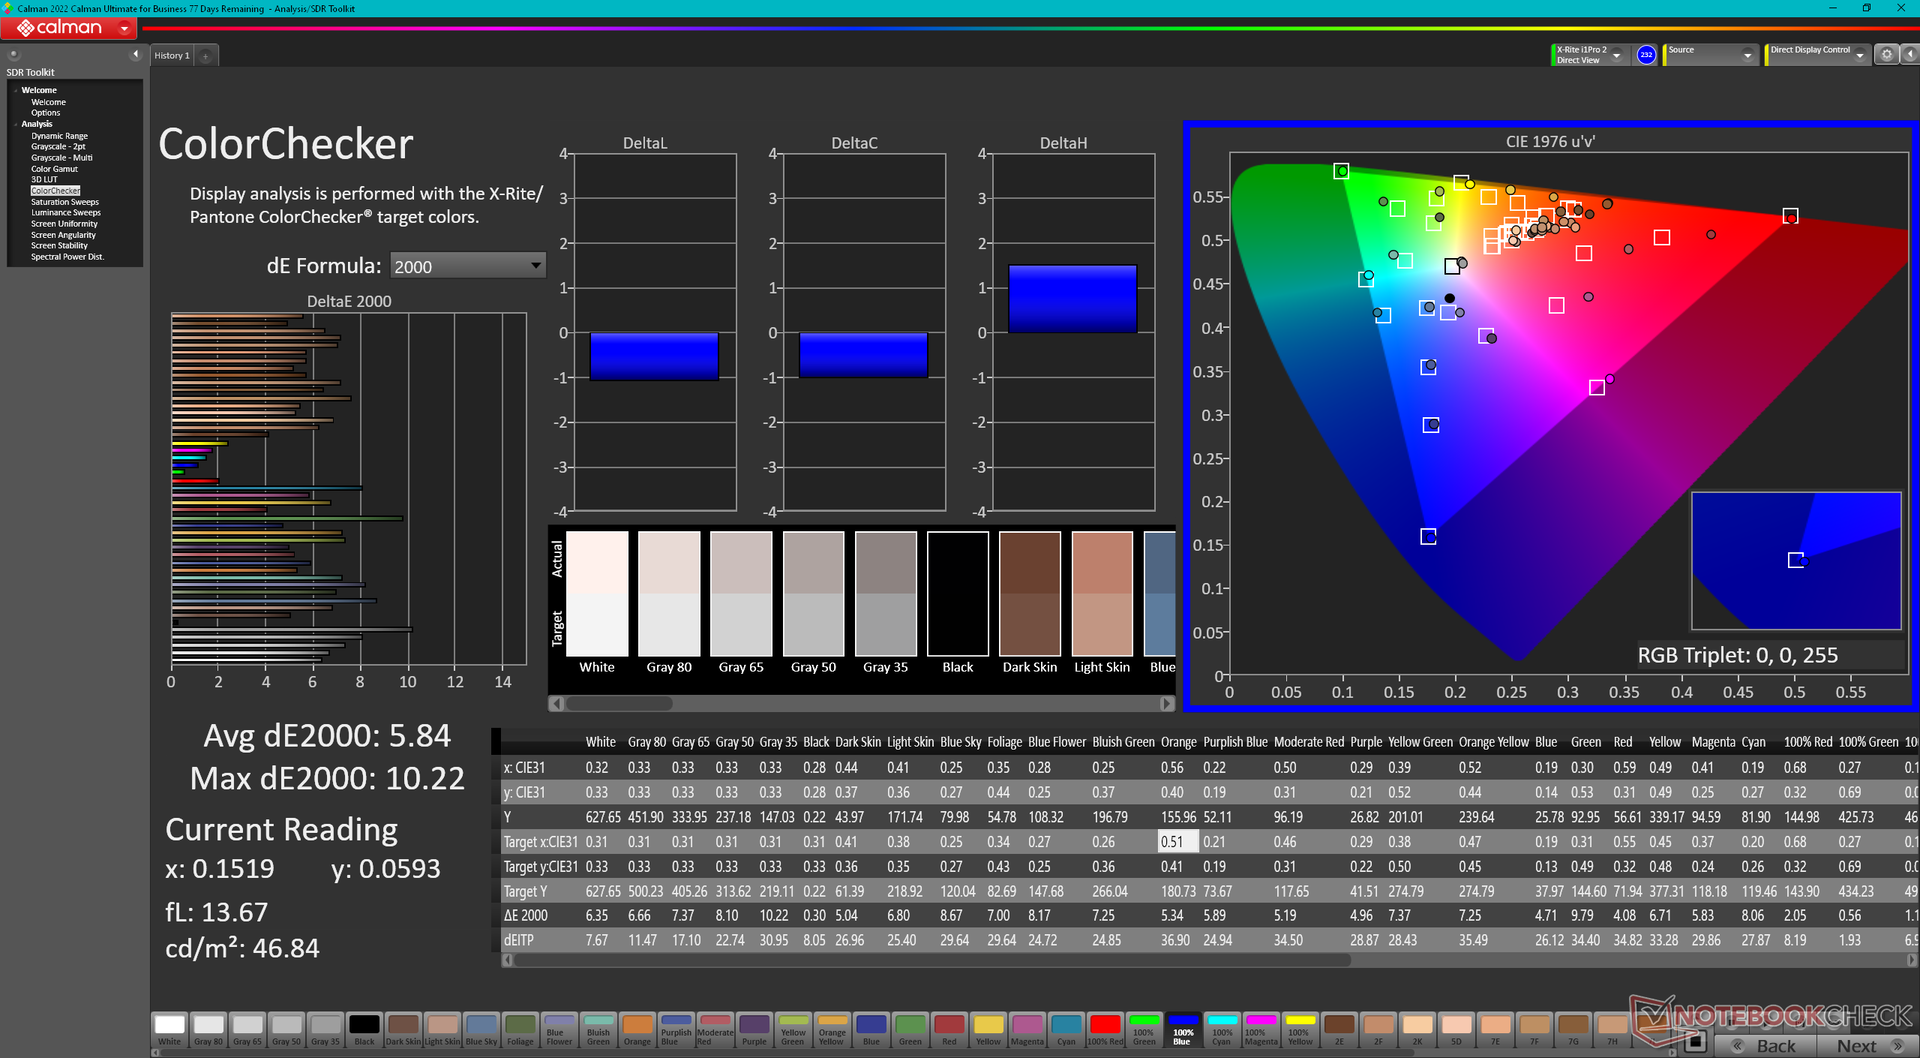
ΔE ColorChecker Calman: 5.84 | ∀{0.5-29.43 Ø4.71}
calibrated: 4.45
ΔE Greyscale Calman: 6.7 | ∀{0.09-98 Ø4.96}
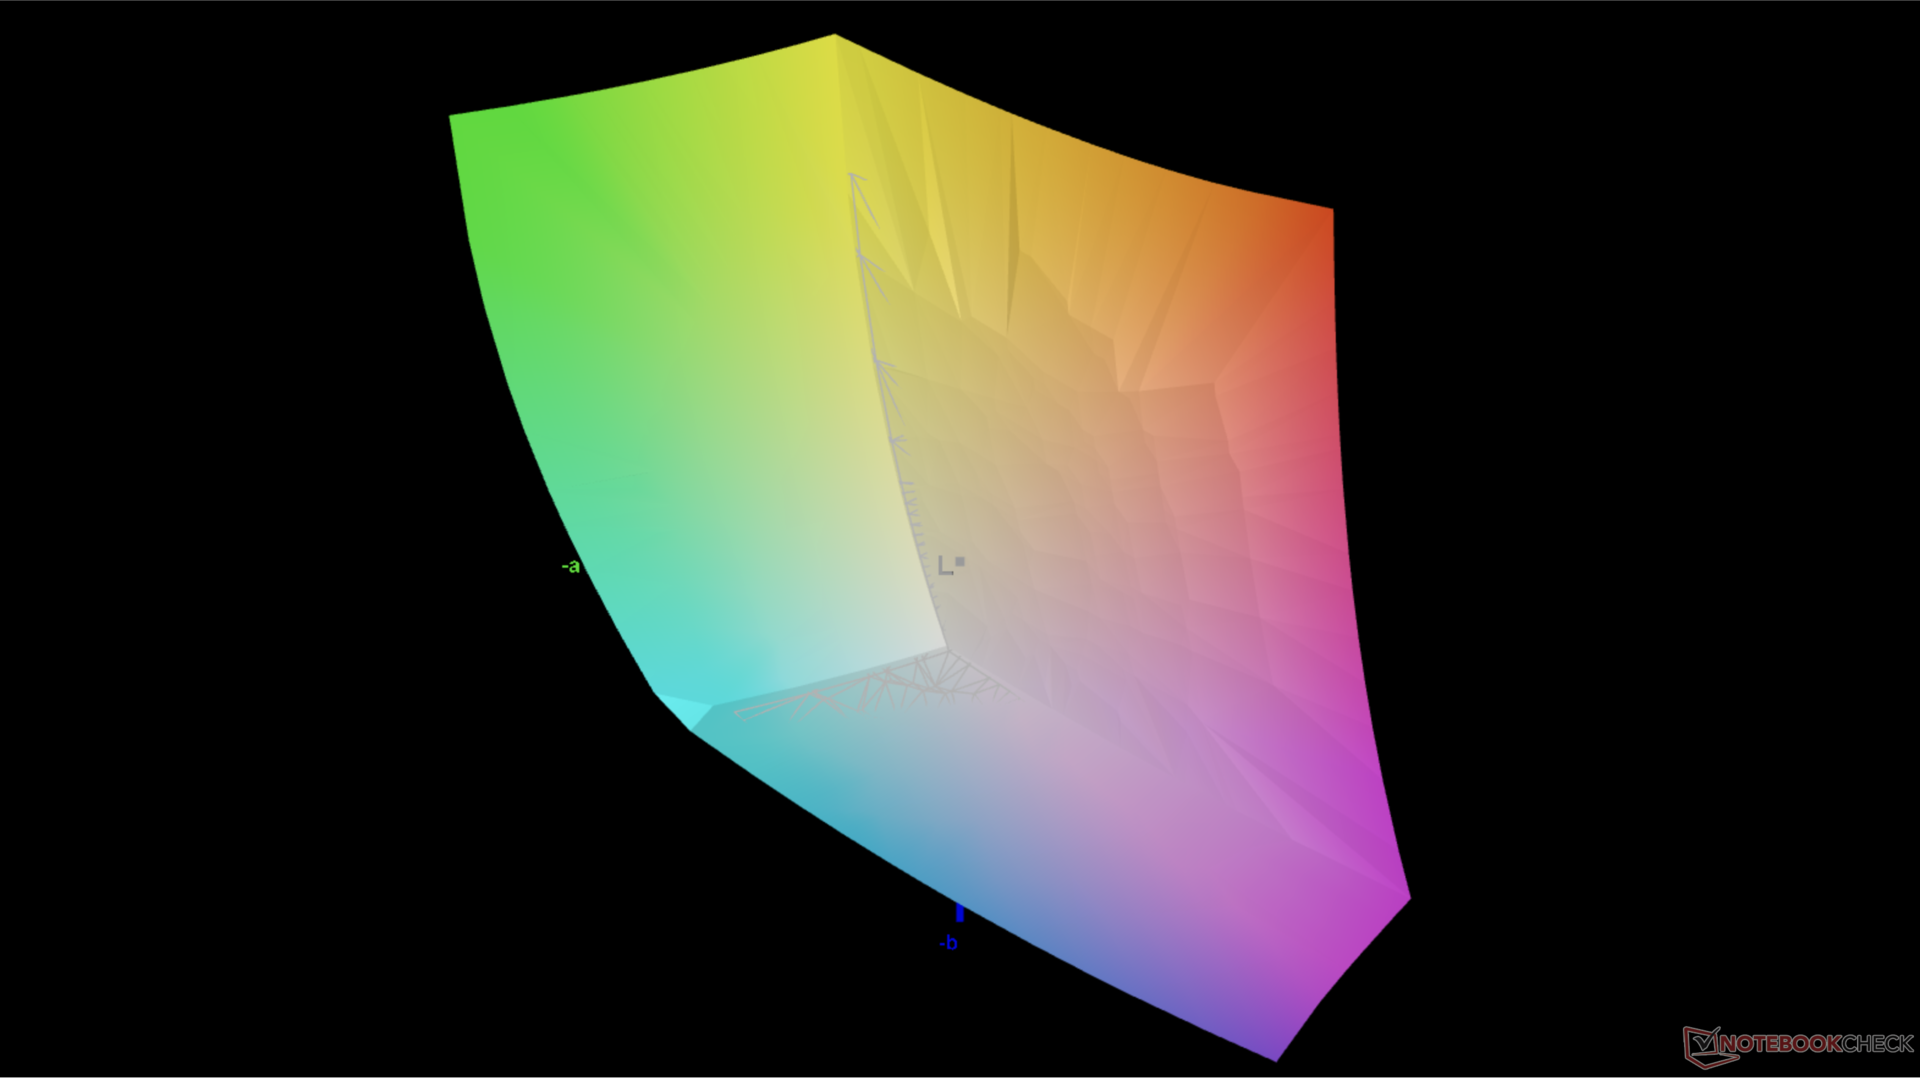
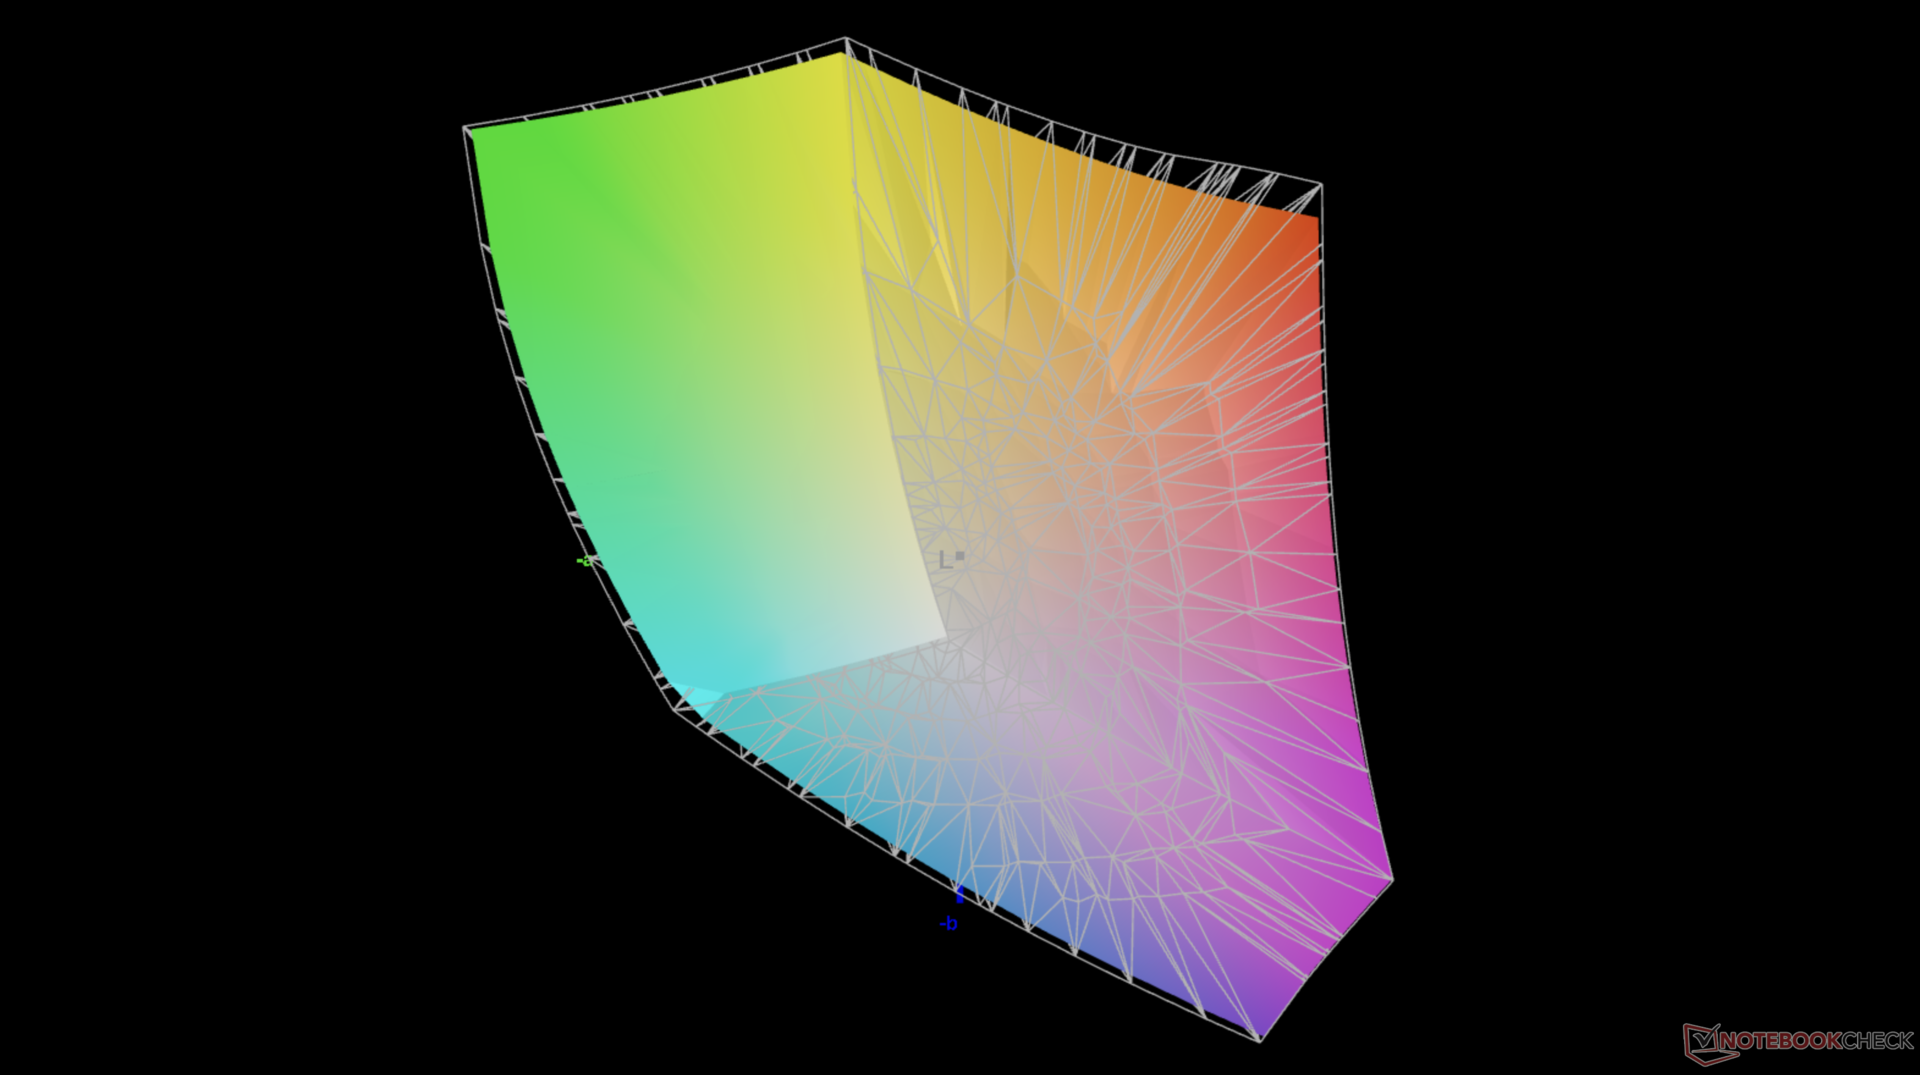
84.6% AdobeRGB 1998 (Argyll 3D)
99.9% sRGB (Argyll 3D)
95.1% Display P3 (Argyll 3D)
Gamma: 2.77
CCT: 5795 K
| Lenovo Slim Pro 9i 16IRP8 LEN160-3.2K, Mini-LED, 3200x2000, 16" | Lenovo Yoga Pro 9 16-IRP G8 LEN160-3.2K, Mini-LED, 3200x2000, 16" | Asus VivoBook Pro 16 Au Optronics B160QAN02.L, IPS, 2560x1600, 16" | Acer Swift Edge SFE16-42-R1GM Samsung SDC4168, OLED, 3840x2400, 16" | Dell Inspiron 16 Plus 7620 BOE NE16N41, IPS, 3072x1920, 16" | HP Envy 16 h0112nr Samsung SDC4174, OLED, 3840x2400, 16" | |
|---|---|---|---|---|---|---|
| Display | 5% | 2% | 7% | -13% | 3% | |
| Display P3 Coverage (%) | 95.1 | 97 2% | 98.5 4% | 99.7 5% | 70.8 -26% | 99.3 4% |
| sRGB Coverage (%) | 99.9 | 99.8 0% | 99.9 0% | 100 0% | 99.5 0% | 100 0% |
| AdobeRGB 1998 Coverage (%) | 84.6 | 95.1 12% | 86.1 2% | 97.2 15% | 73.2 -13% | 88 4% |
| Response Times | 0% | 50% | 77% | -188% | 83% | |
| Response Time Grey 50% / Grey 80% * (ms) | 14 ? | 14 ? -0% | 2 ? 86% | 2 ? 86% | 38 ? -171% | 2 ? 86% |
| Response Time Black / White * (ms) | 9.2 ? | 9.2 ? -0% | 8 ? 13% | 3 ? 67% | 28 ? -204% | 1.9 ? 79% |
| PWM Frequency (Hz) | 5784 ? | 5800 ? | 239 ? | 240.4 ? | ||
| Screen | 24% | 5% | 21% | 9% | 17% | |
| Brightness middle (cd/m²) | 627.4 | 539 -14% | 504 -20% | 369 -41% | 288.9 -54% | 328.8 -48% |
| Brightness (cd/m²) | 618 | 546 -12% | 465 -25% | 371 -40% | 276 -55% | 332 -46% |
| Brightness Distribution (%) | 95 | 96 1% | 87 -8% | 97 2% | 92 -3% | 97 2% |
| Black Level * (cd/m²) | 0.19 | 0.18 5% | 0.35 -84% | 0.26 -37% | ||
| Contrast (:1) | 3302 | 2994 -9% | 1440 -56% | 1111 -66% | ||
| Colorchecker dE 2000 * | 5.84 | 1.4 76% | 1.83 69% | 2.3 61% | 1.88 68% | 1.53 74% |
| Colorchecker dE 2000 max. * | 10.22 | 2.1 79% | 5.51 46% | 4.37 57% | 4.37 57% | 6.04 41% |
| Colorchecker dE 2000 calibrated * | 4.45 | 1.34 70% | 2.87 36% | 0.42 91% | ||
| Greyscale dE 2000 * | 6.7 | 2.2 67% | 3.02 55% | 1.83 73% | 1.4 79% | 1.3 81% |
| Gamma | 2.77 79% | 2.19 100% | 2.39 92% | 2.39 92% | 2.3 96% | 2.18 101% |
| CCT | 5795 112% | 6479 100% | 6688 97% | 6392 102% | 6634 98% | 6362 102% |
| Moyenne finale (programmes/paramètres) | 10% /
16% | 19% /
11% | 35% /
27% | -64% /
-24% | 34% /
25% |
* ... Moindre est la valeur, meilleures sont les performances
La température des couleurs est plus chaude que prévu en mode P3. Contrairement à de nombreux modèles MSI, le logiciel Lenovo Vantage ne dispose pas d'un curseur pour régler la température des couleurs.
Temps de réponse de l'écran
| ↔ Temps de réponse noir à blanc | ||
|---|---|---|
| 9.2 ms ... hausse ↗ et chute ↘ combinées | ↗ 2.2 ms hausse | 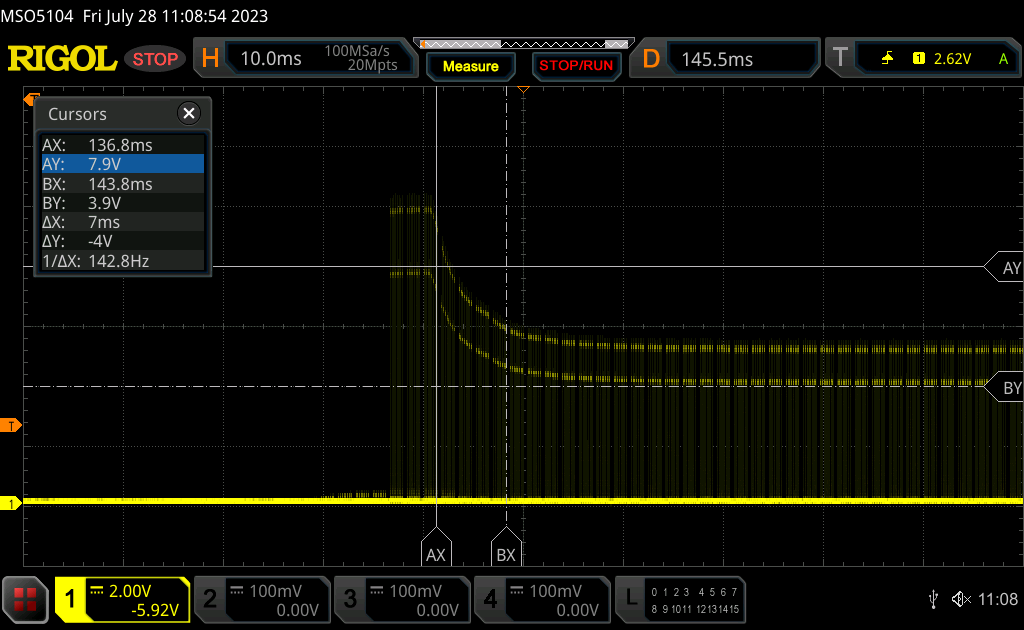 |
| ↘ 7 ms chute | ||
| L'écran montre de faibles temps de réponse, un bon écran pour jouer. En comparaison, tous les appareils testés affichent entre 0.1 (minimum) et 240 (maximum) ms. » 26 % des appareils testés affichent de meilleures performances. Cela signifie que les latences relevées sont meilleures que la moyenne (19.8 ms) de tous les appareils testés. | ||
| ↔ Temps de réponse gris 50% à gris 80% | ||
| 14 ms ... hausse ↗ et chute ↘ combinées | ↗ 7.4 ms hausse | 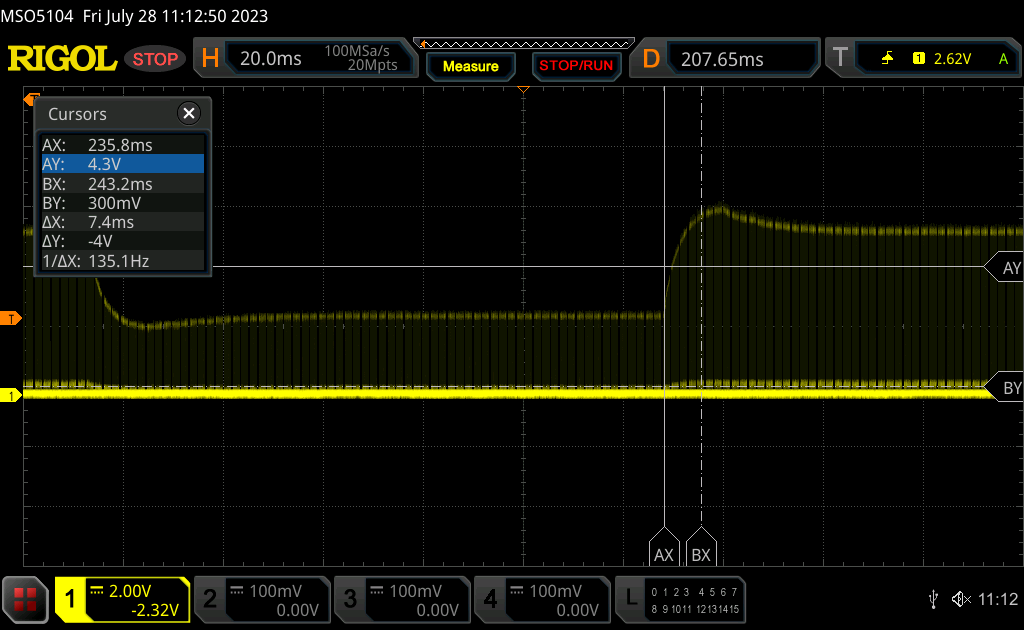 |
| ↘ 6.6 ms chute | ||
| L'écran montre de bons temps de réponse, mais insuffisant pour du jeu compétitif. En comparaison, tous les appareils testés affichent entre 0.165 (minimum) et 636 (maximum) ms. » 28 % des appareils testés affichent de meilleures performances. Cela signifie que les latences relevées sont meilleures que la moyenne (31 ms) de tous les appareils testés. | ||
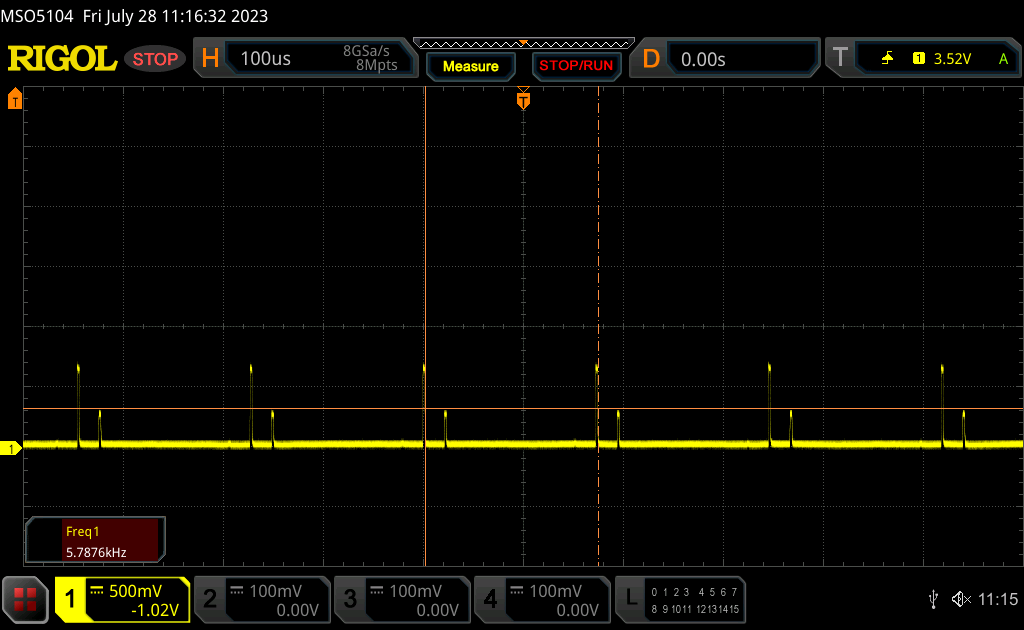
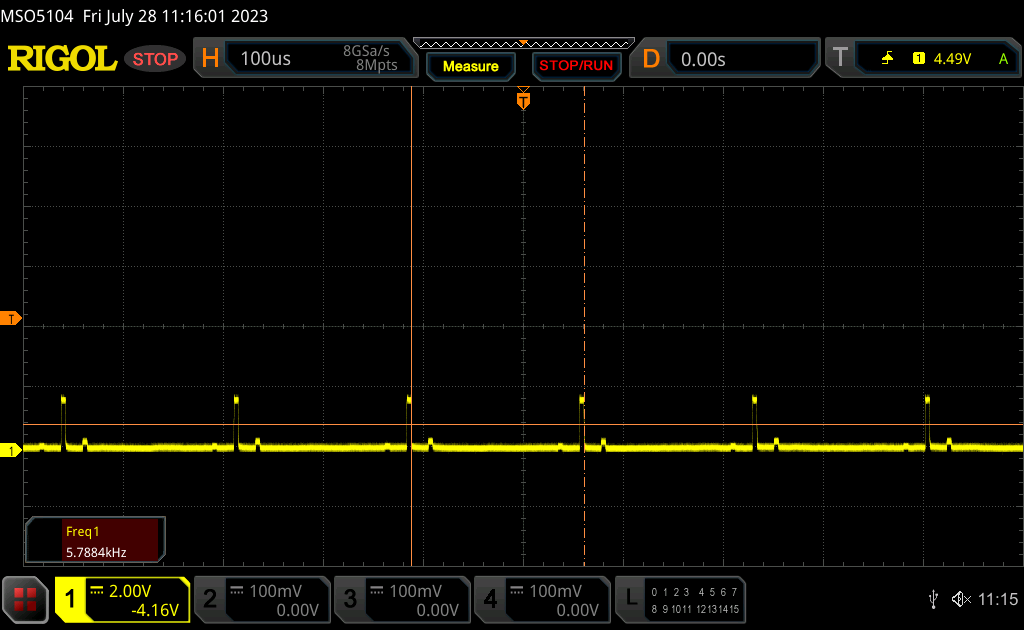
Scintillement / MLI (Modulation de largeur d'impulsion)
| Scintillement / MLI (Modulation de largeur d'impulsion) décelé | 5784 Hz | ≤ 100 Niveau de luminosité | 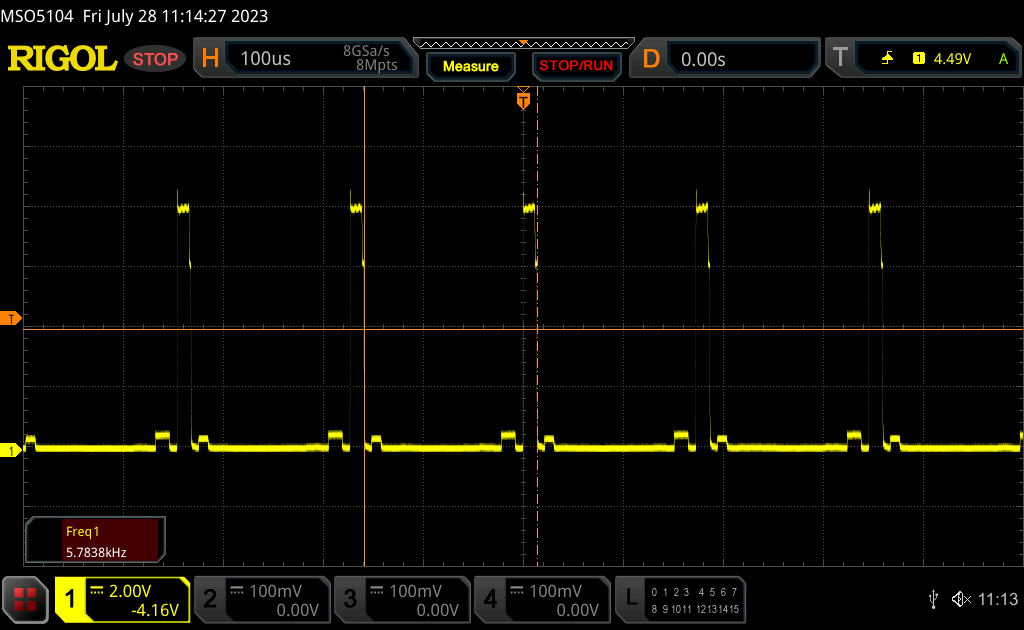 |
Le rétroéclairage de l'écran scintille à la fréquence de 5784 Hz (certainement du fait de l'utilisation d'une MDI - Modulation de largeur d'impulsion) à un niveau de luminosité inférieur ou égal à 100 % . Aucun scintillement ne devrait être perceptible au-dessus de cette valeur. La fréquence de rafraîchissement de 5784 Hz est élevée, la grande majorité des utilisateurs ne devrait pas percevoir de scintillements et être sujette à une fatigue oculaire accrue. En comparaison, 52 % des appareils testés n'emploient pas MDI pour assombrir leur écran. Nous avons relevé une moyenne à 7757 (minimum : 5 - maximum : 343500) Hz dans le cas où une MDI était active. | |||
Le scintillement est présent à tous les niveaux de luminosité en mode SDR. Toutefois, sa fréquence est relativement élevée (5784 Hz) et ne devrait donc pas poser de problème à la grande majorité des utilisateurs.
Performance - 13th Gen Raptor Lake-H
Conditions d'essai
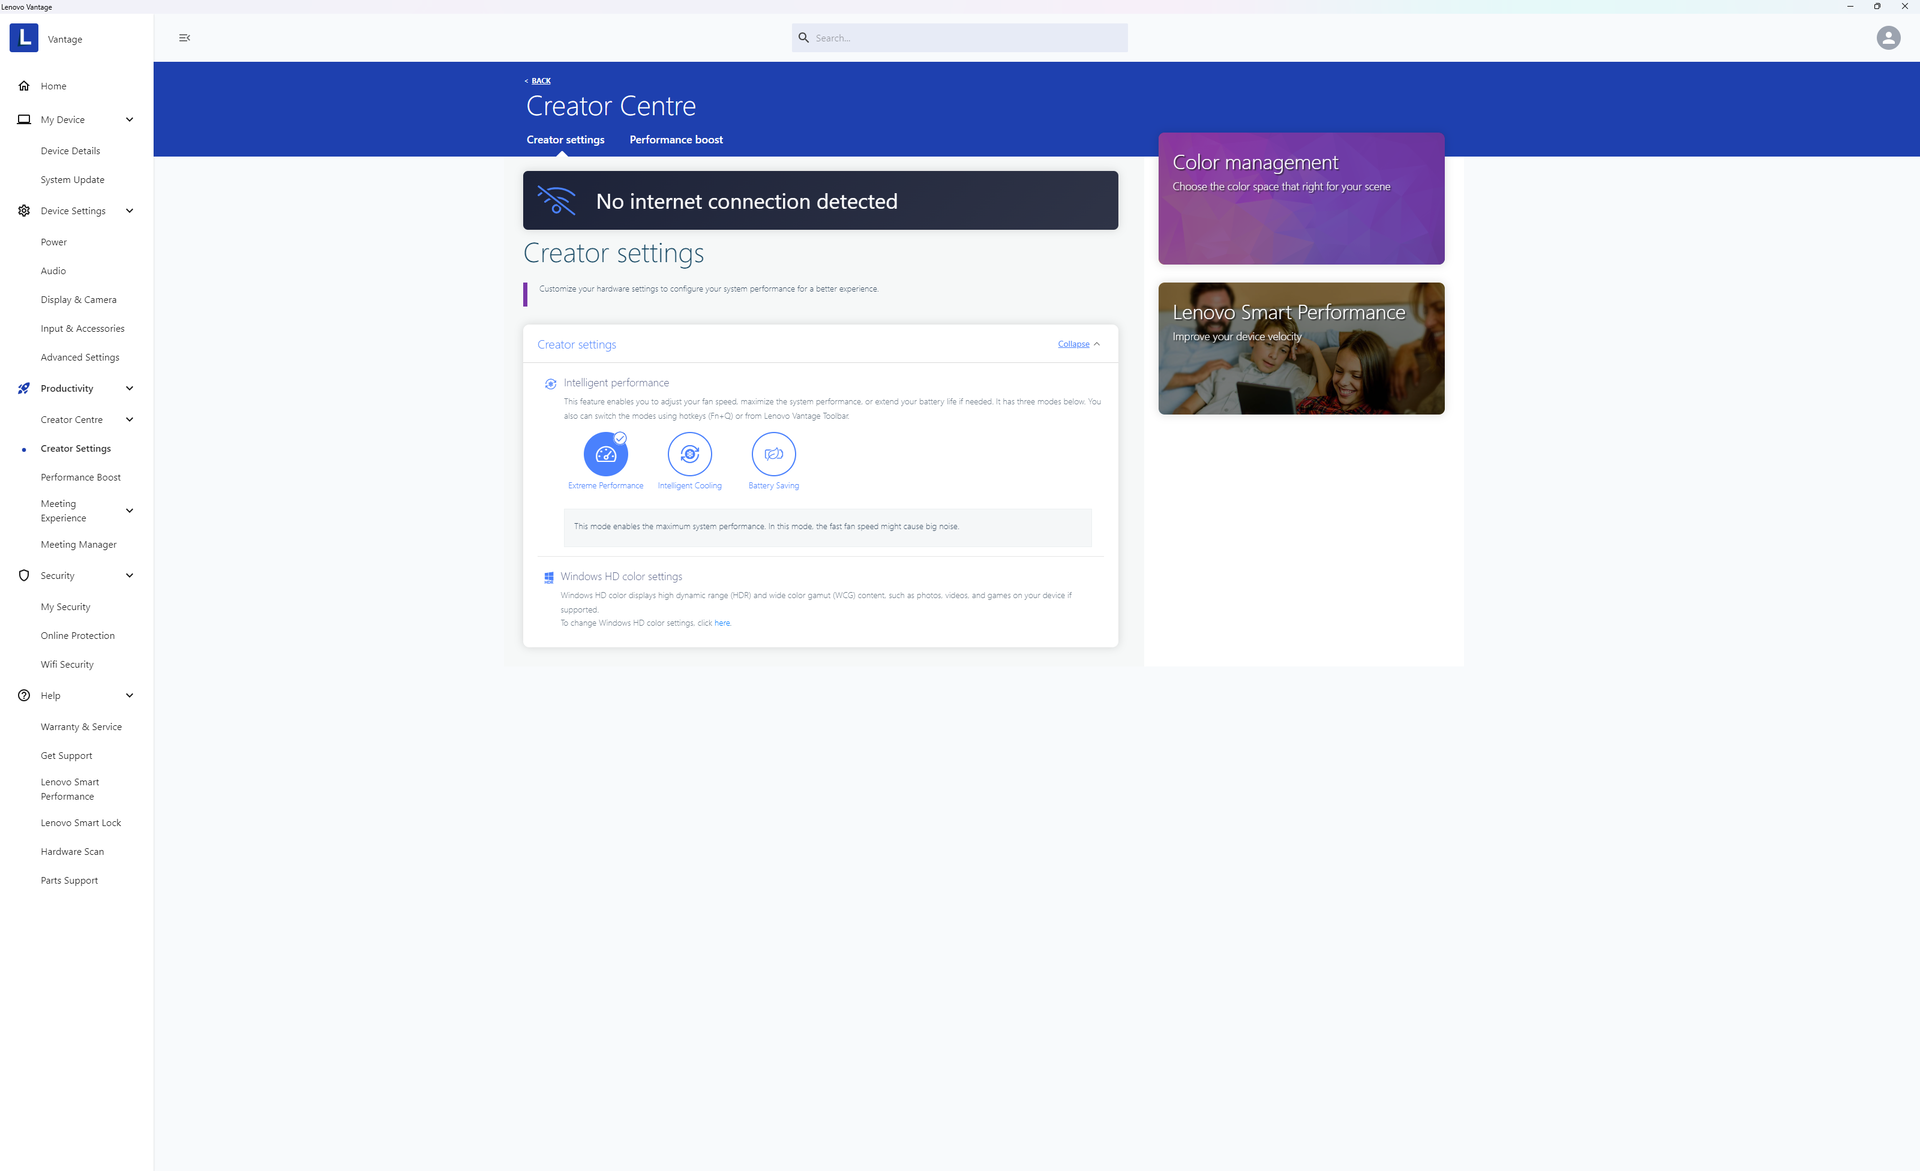
Nous avons réglé notre appareil en mode Performance via Windows et en mode Performance extrême via Lenovo Vantage avant d'effectuer les tests ci-dessous. Il est ennuyeux de constater que Lenovo modifie fréquemment l'interface utilisateur de Vantage, de sorte que tous les paramètres se trouvent dans des sous-menus différents par rapport au même logiciel sur d'autres ordinateurs portables Lenovo.
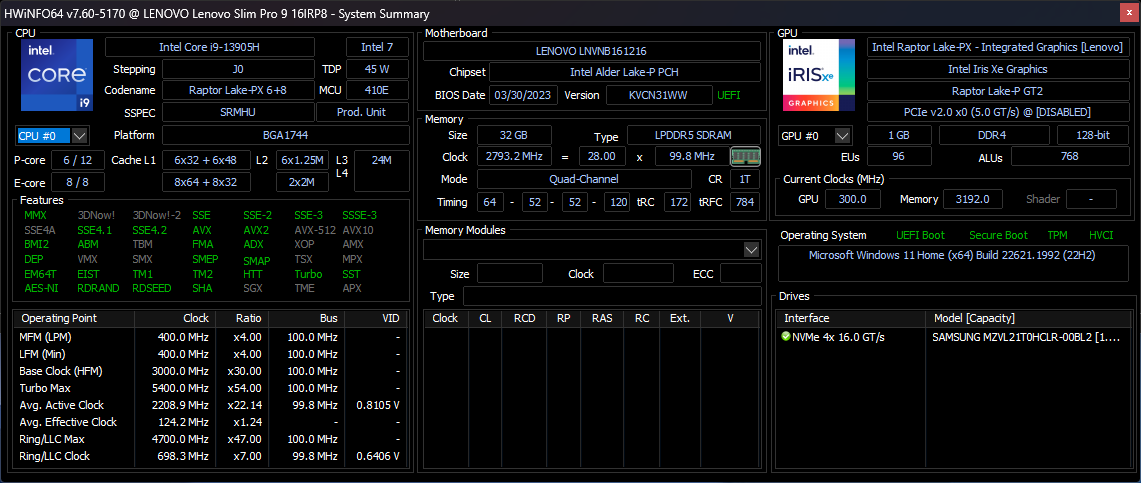
Processeur
LeCore i9-13905H peut être plus rapide que leCore i7-13705H sur le papier, mais les avantages sont au mieux mineurs. Les performances multithread sont presque identiques entre les deux, tandis que les performances single-thread ne sont que 5 à 10 % plus rapides avec notre Core i9.
Cinebench R15 Multi Loop
Cinebench R23: Multi Core | Single Core
Cinebench R20: CPU (Multi Core) | CPU (Single Core)
Cinebench R15: CPU Multi 64Bit | CPU Single 64Bit
Blender: v2.79 BMW27 CPU
7-Zip 18.03: 7z b 4 | 7z b 4 -mmt1
Geekbench 5.5: Multi-Core | Single-Core
HWBOT x265 Benchmark v2.2: 4k Preset
LibreOffice : 20 Documents To PDF
R Benchmark 2.5: Overall mean
* ... Moindre est la valeur, meilleures sont les performances
AIDA64: FP32 Ray-Trace | FPU Julia | CPU SHA3 | CPU Queen | FPU SinJulia | FPU Mandel | CPU AES | CPU ZLib | FP64 Ray-Trace | CPU PhotoWorxx
| Performance rating | |
| Lenovo Slim Pro 9i 16IRP8 | |
| Moyenne Intel Core i9-13905H | |
| Lenovo Yoga Pro 9 16-IRP G8 | |
| HP Envy 16 h0112nr | |
| Asus VivoBook Pro 16 | |
| Dell Inspiron 16 Plus 7620 | |
| Acer Swift Edge SFE16-42-R1GM | |
| AIDA64 / FP32 Ray-Trace | |
| Moyenne Intel Core i9-13905H (17642 - 19900, n=3) | |
| Lenovo Slim Pro 9i 16IRP8 | |
| Lenovo Yoga Pro 9 16-IRP G8 | |
| Asus VivoBook Pro 16 | |
| Dell Inspiron 16 Plus 7620 | |
| HP Envy 16 h0112nr | |
| Acer Swift Edge SFE16-42-R1GM | |
| AIDA64 / FPU Julia | |
| Lenovo Yoga Pro 9 16-IRP G8 | |
| Lenovo Slim Pro 9i 16IRP8 | |
| Moyenne Intel Core i9-13905H (89198 - 94350, n=3) | |
| Asus VivoBook Pro 16 | |
| Acer Swift Edge SFE16-42-R1GM | |
| Dell Inspiron 16 Plus 7620 | |
| HP Envy 16 h0112nr | |
| AIDA64 / CPU SHA3 | |
| Lenovo Slim Pro 9i 16IRP8 | |
| Lenovo Yoga Pro 9 16-IRP G8 | |
| Moyenne Intel Core i9-13905H (3945 - 4296, n=3) | |
| Asus VivoBook Pro 16 | |
| Dell Inspiron 16 Plus 7620 | |
| HP Envy 16 h0112nr | |
| Acer Swift Edge SFE16-42-R1GM | |
| AIDA64 / CPU Queen | |
| Lenovo Slim Pro 9i 16IRP8 | |
| Lenovo Yoga Pro 9 16-IRP G8 | |
| Moyenne Intel Core i9-13905H (94506 - 117697, n=3) | |
| Asus VivoBook Pro 16 | |
| HP Envy 16 h0112nr | |
| Dell Inspiron 16 Plus 7620 | |
| Acer Swift Edge SFE16-42-R1GM | |
| AIDA64 / FPU SinJulia | |
| Lenovo Slim Pro 9i 16IRP8 | |
| Lenovo Yoga Pro 9 16-IRP G8 | |
| Acer Swift Edge SFE16-42-R1GM | |
| Moyenne Intel Core i9-13905H (10478 - 11328, n=3) | |
| Asus VivoBook Pro 16 | |
| Dell Inspiron 16 Plus 7620 | |
| HP Envy 16 h0112nr | |
| AIDA64 / FPU Mandel | |
| Moyenne Intel Core i9-13905H (43922 - 48884, n=3) | |
| Lenovo Slim Pro 9i 16IRP8 | |
| Lenovo Yoga Pro 9 16-IRP G8 | |
| Acer Swift Edge SFE16-42-R1GM | |
| Asus VivoBook Pro 16 | |
| Dell Inspiron 16 Plus 7620 | |
| HP Envy 16 h0112nr | |
| AIDA64 / CPU AES | |
| HP Envy 16 h0112nr | |
| Lenovo Slim Pro 9i 16IRP8 | |
| Lenovo Yoga Pro 9 16-IRP G8 | |
| Moyenne Intel Core i9-13905H (80275 - 86469, n=3) | |
| Asus VivoBook Pro 16 | |
| Dell Inspiron 16 Plus 7620 | |
| Acer Swift Edge SFE16-42-R1GM | |
| AIDA64 / CPU ZLib | |
| Lenovo Slim Pro 9i 16IRP8 | |
| Lenovo Yoga Pro 9 16-IRP G8 | |
| Moyenne Intel Core i9-13905H (1154 - 1234, n=3) | |
| Dell Inspiron 16 Plus 7620 | |
| Asus VivoBook Pro 16 | |
| HP Envy 16 h0112nr | |
| Acer Swift Edge SFE16-42-R1GM | |
| AIDA64 / FP64 Ray-Trace | |
| Moyenne Intel Core i9-13905H (9483 - 10804, n=3) | |
| Lenovo Slim Pro 9i 16IRP8 | |
| Lenovo Yoga Pro 9 16-IRP G8 | |
| Asus VivoBook Pro 16 | |
| Dell Inspiron 16 Plus 7620 | |
| HP Envy 16 h0112nr | |
| Acer Swift Edge SFE16-42-R1GM | |
| AIDA64 / CPU PhotoWorxx | |
| Moyenne Intel Core i9-13905H (51720 - 60161, n=3) | |
| Lenovo Slim Pro 9i 16IRP8 | |
| Lenovo Yoga Pro 9 16-IRP G8 | |
| HP Envy 16 h0112nr | |
| Dell Inspiron 16 Plus 7620 | |
| Acer Swift Edge SFE16-42-R1GM | |
| Asus VivoBook Pro 16 | |
Performance du système
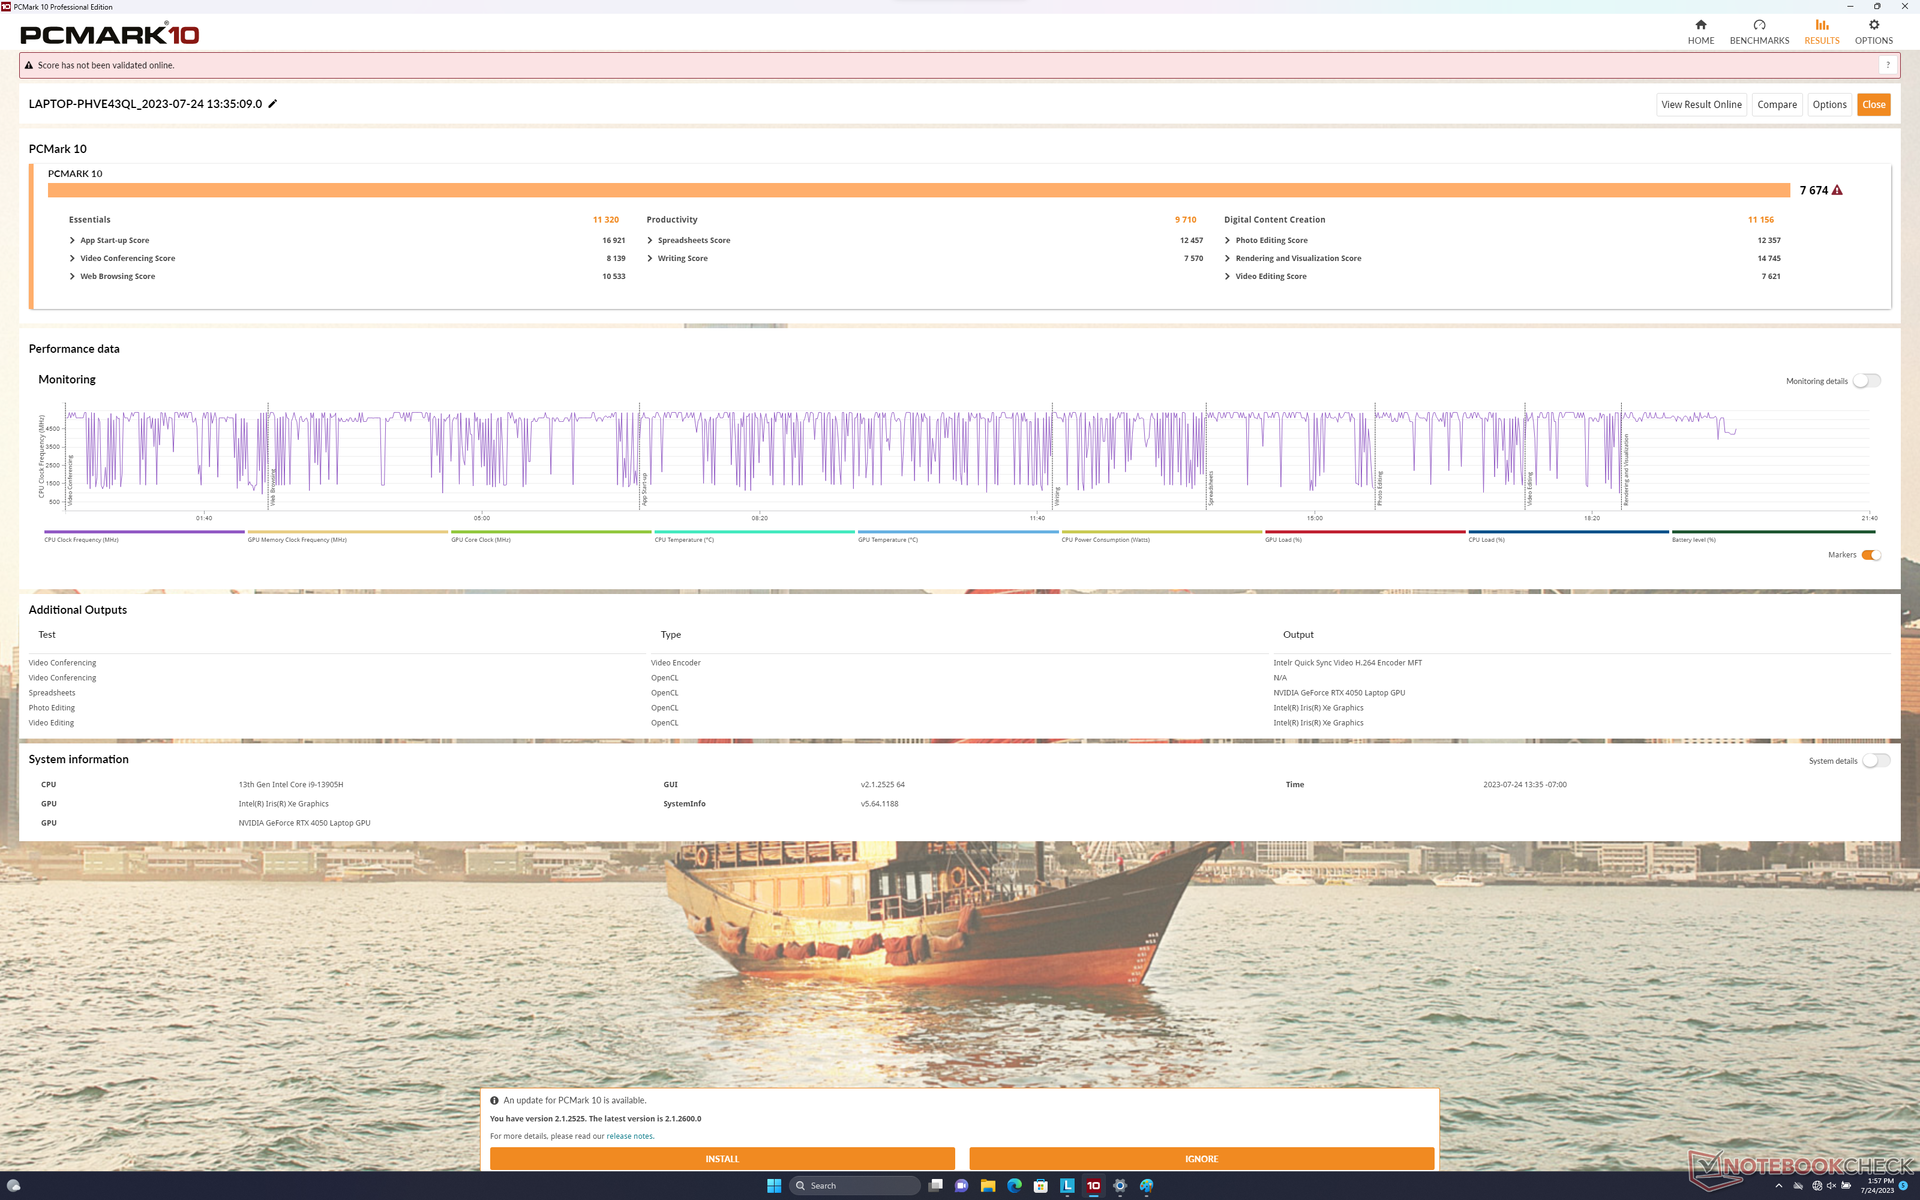
Au cours des tests, nous avons rencontré des problèmes de sortie de veille et même un BSOD. L'écran restait parfois vide lors de la sortie de veille et un redémarrage brutal était alors nécessaire pour revenir à Windows.
CrossMark: Overall | Productivity | Creativity | Responsiveness
| PCMark 10 / Score | |
| Lenovo Slim Pro 9i 16IRP8 | |
| HP Envy 16 h0112nr | |
| Lenovo Yoga Pro 9 16-IRP G8 | |
| Dell Inspiron 16 Plus 7620 | |
| Asus VivoBook Pro 16 | |
| Acer Swift Edge SFE16-42-R1GM | |
| PCMark 10 / Essentials | |
| HP Envy 16 h0112nr | |
| Lenovo Slim Pro 9i 16IRP8 | |
| Lenovo Yoga Pro 9 16-IRP G8 | |
| Dell Inspiron 16 Plus 7620 | |
| Asus VivoBook Pro 16 | |
| Acer Swift Edge SFE16-42-R1GM | |
| PCMark 10 / Productivity | |
| Lenovo Slim Pro 9i 16IRP8 | |
| HP Envy 16 h0112nr | |
| Acer Swift Edge SFE16-42-R1GM | |
| Dell Inspiron 16 Plus 7620 | |
| Asus VivoBook Pro 16 | |
| Lenovo Yoga Pro 9 16-IRP G8 | |
| PCMark 10 / Digital Content Creation | |
| Lenovo Slim Pro 9i 16IRP8 | |
| Lenovo Yoga Pro 9 16-IRP G8 | |
| HP Envy 16 h0112nr | |
| Dell Inspiron 16 Plus 7620 | |
| Asus VivoBook Pro 16 | |
| Acer Swift Edge SFE16-42-R1GM | |
| CrossMark / Overall | |
| Lenovo Yoga Pro 9 16-IRP G8 | |
| HP Envy 16 h0112nr | |
| Lenovo Slim Pro 9i 16IRP8 | |
| Dell Inspiron 16 Plus 7620 | |
| Asus VivoBook Pro 16 | |
| Acer Swift Edge SFE16-42-R1GM | |
| CrossMark / Productivity | |
| HP Envy 16 h0112nr | |
| Lenovo Yoga Pro 9 16-IRP G8 | |
| Asus VivoBook Pro 16 | |
| Dell Inspiron 16 Plus 7620 | |
| Lenovo Slim Pro 9i 16IRP8 | |
| Acer Swift Edge SFE16-42-R1GM | |
| CrossMark / Creativity | |
| Lenovo Yoga Pro 9 16-IRP G8 | |
| Lenovo Slim Pro 9i 16IRP8 | |
| HP Envy 16 h0112nr | |
| Dell Inspiron 16 Plus 7620 | |
| Asus VivoBook Pro 16 | |
| Acer Swift Edge SFE16-42-R1GM | |
| CrossMark / Responsiveness | |
| Asus VivoBook Pro 16 | |
| HP Envy 16 h0112nr | |
| Lenovo Yoga Pro 9 16-IRP G8 | |
| Dell Inspiron 16 Plus 7620 | |
| Lenovo Slim Pro 9i 16IRP8 | |
| Acer Swift Edge SFE16-42-R1GM | |
| PCMark 10 Score | 7674 points | |
Aide | ||
| AIDA64 / Memory Copy | |
| Moyenne Intel Core i9-13905H (76905 - 88014, n=3) | |
| Lenovo Slim Pro 9i 16IRP8 | |
| Lenovo Yoga Pro 9 16-IRP G8 | |
| HP Envy 16 h0112nr | |
| Dell Inspiron 16 Plus 7620 | |
| Acer Swift Edge SFE16-42-R1GM | |
| Asus VivoBook Pro 16 | |
| AIDA64 / Memory Read | |
| Lenovo Yoga Pro 9 16-IRP G8 | |
| Moyenne Intel Core i9-13905H (68837 - 79123, n=3) | |
| Lenovo Slim Pro 9i 16IRP8 | |
| HP Envy 16 h0112nr | |
| Dell Inspiron 16 Plus 7620 | |
| Acer Swift Edge SFE16-42-R1GM | |
| Asus VivoBook Pro 16 | |
| AIDA64 / Memory Write | |
| Lenovo Yoga Pro 9 16-IRP G8 | |
| Moyenne Intel Core i9-13905H (89545 - 103259, n=3) | |
| Lenovo Slim Pro 9i 16IRP8 | |
| HP Envy 16 h0112nr | |
| Dell Inspiron 16 Plus 7620 | |
| Acer Swift Edge SFE16-42-R1GM | |
| Asus VivoBook Pro 16 | |
| AIDA64 / Memory Latency | |
| Lenovo Yoga Pro 9 16-IRP G8 | |
| Moyenne Intel Core i9-13905H (101.4 - 134.8, n=3) | |
| Lenovo Slim Pro 9i 16IRP8 | |
| Acer Swift Edge SFE16-42-R1GM | |
| Dell Inspiron 16 Plus 7620 | |
| HP Envy 16 h0112nr | |
| Asus VivoBook Pro 16 | |
* ... Moindre est la valeur, meilleures sont les performances
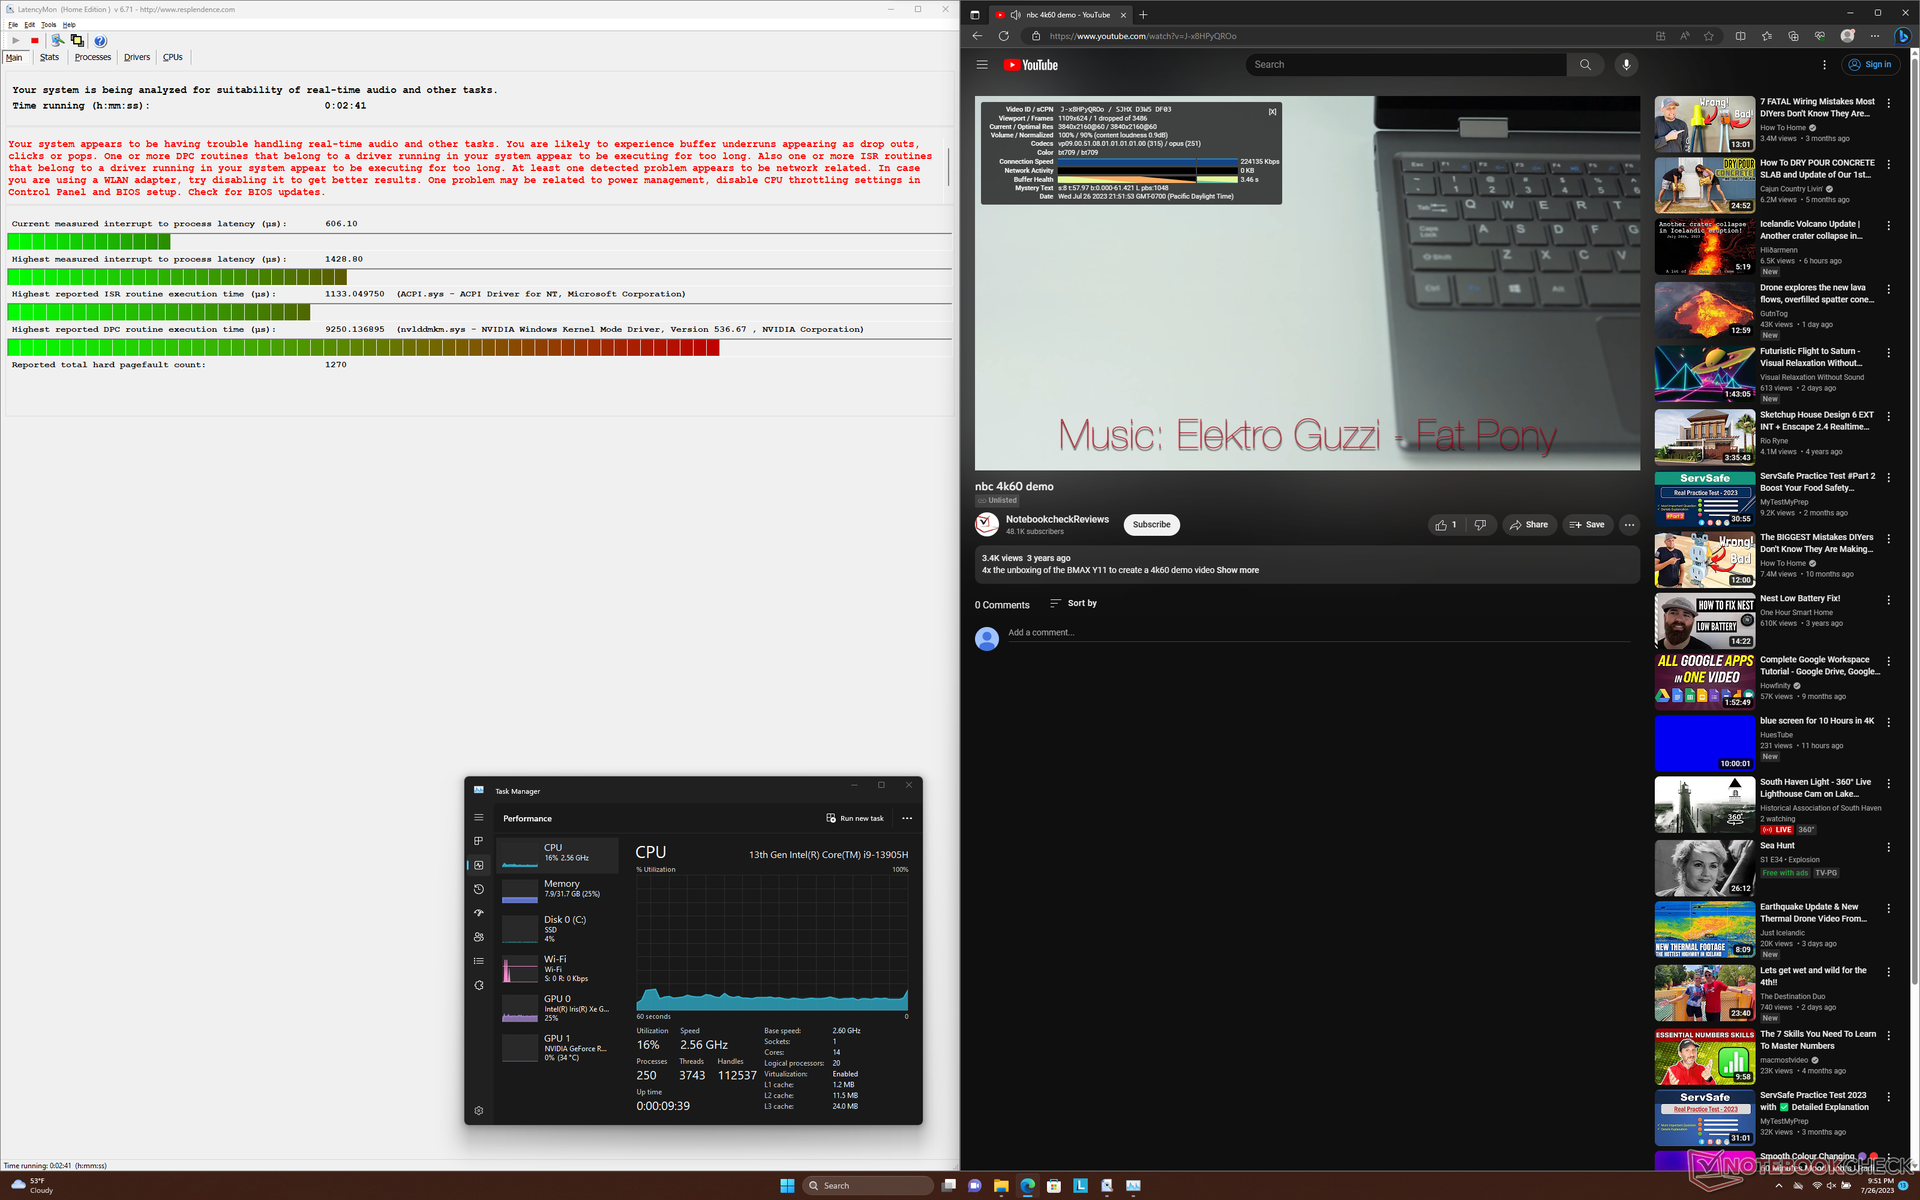
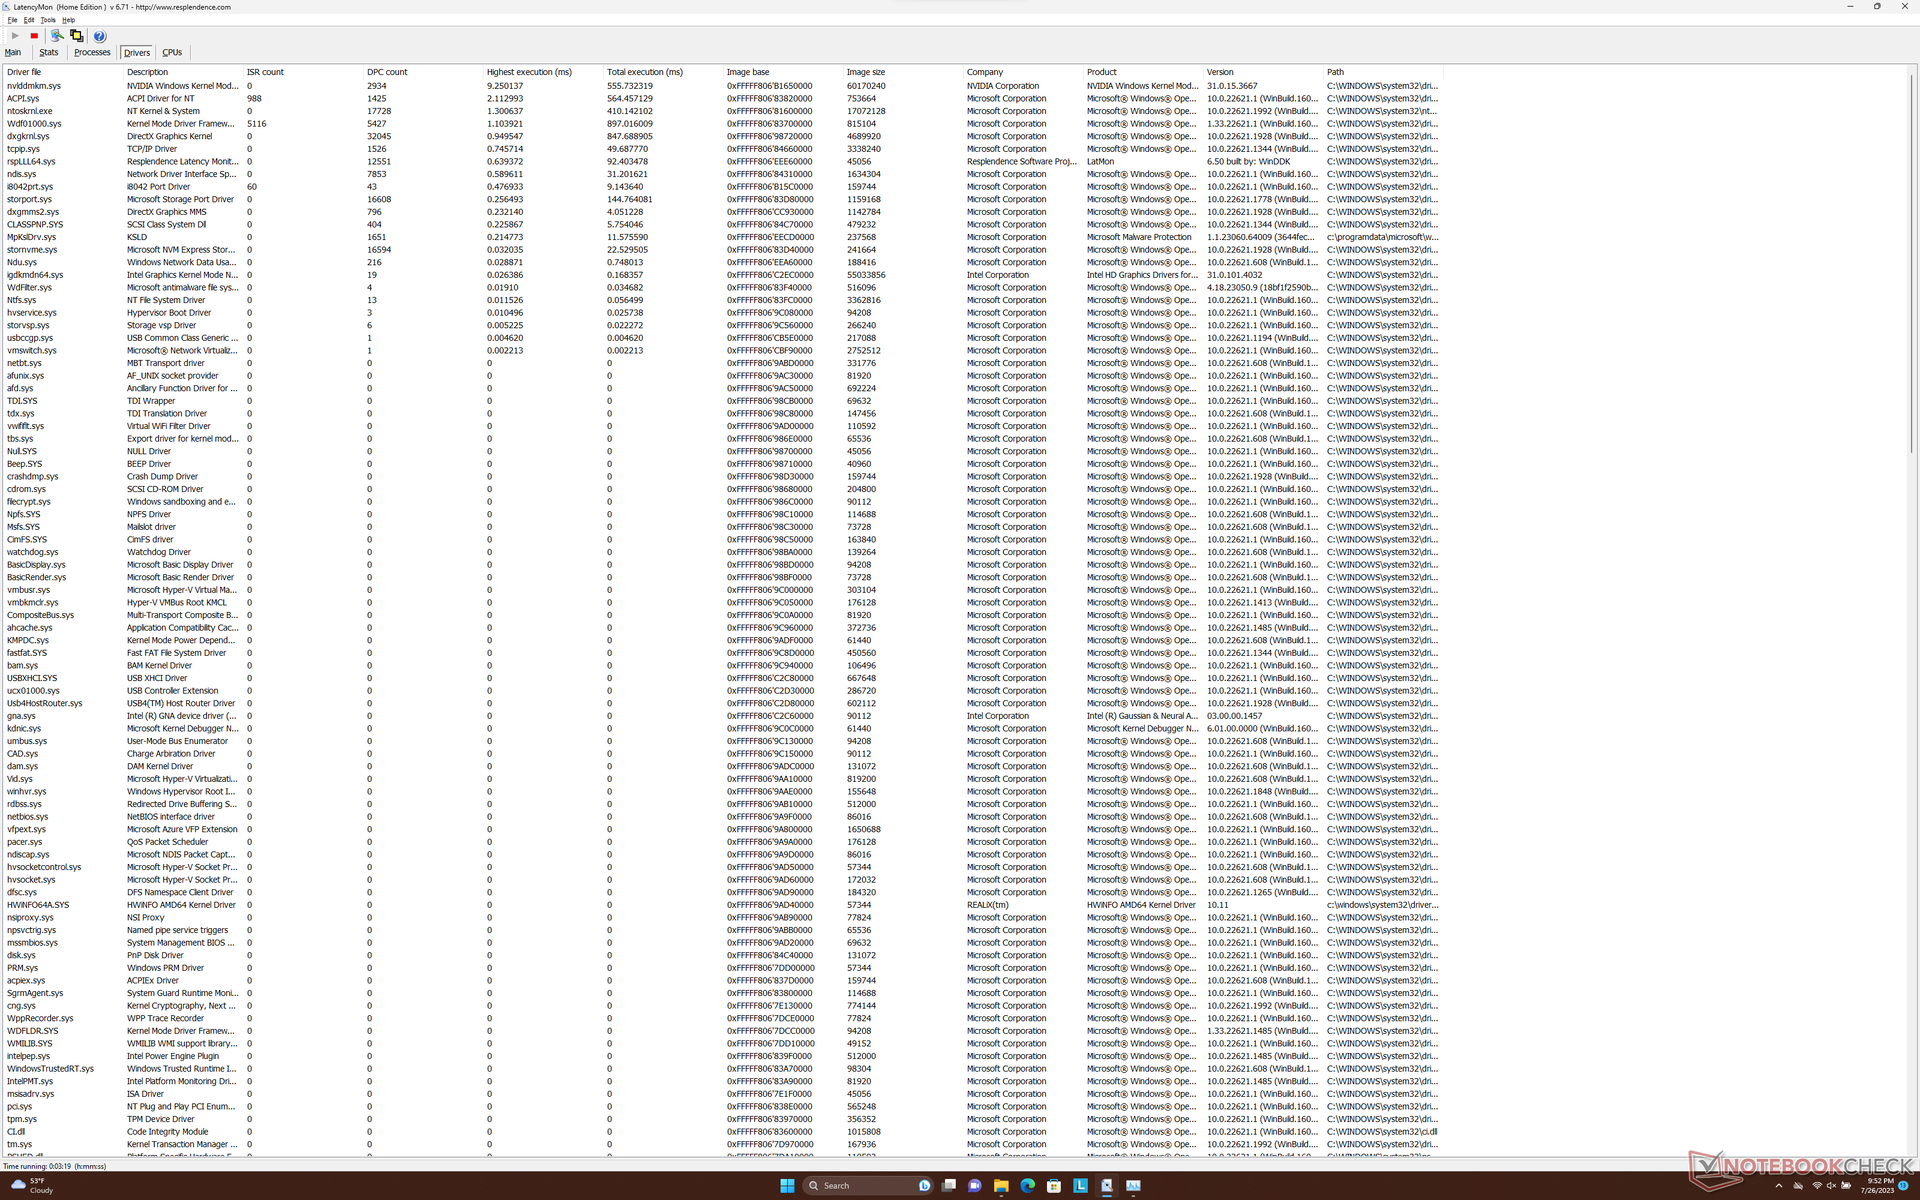
Latence DPC
LatencyMon révèle des problèmes de DPC lors de l'ouverture de plusieurs onglets de notre page d'accueil. la lecture de vidéos 4K à 60 FPS est par ailleurs excellente, avec une seule image perdue sur une période de 60 secondes.
| DPC Latencies / LatencyMon - interrupt to process latency (max), Web, Youtube, Prime95 | |
| Lenovo Yoga Pro 9 16-IRP G8 | |
| Acer Swift Edge SFE16-42-R1GM | |
| Asus VivoBook Pro 16 | |
| Lenovo Slim Pro 9i 16IRP8 | |
| Dell Inspiron 16 Plus 7620 | |
| HP Envy 16 h0112nr | |
* ... Moindre est la valeur, meilleures sont les performances
Dispositifs de stockage
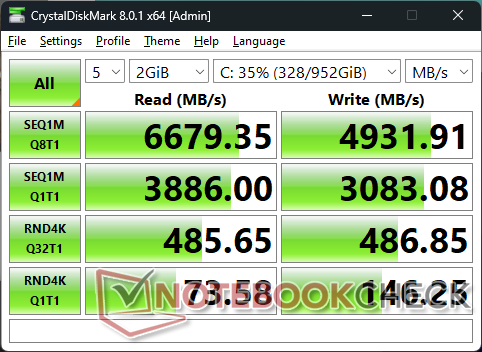
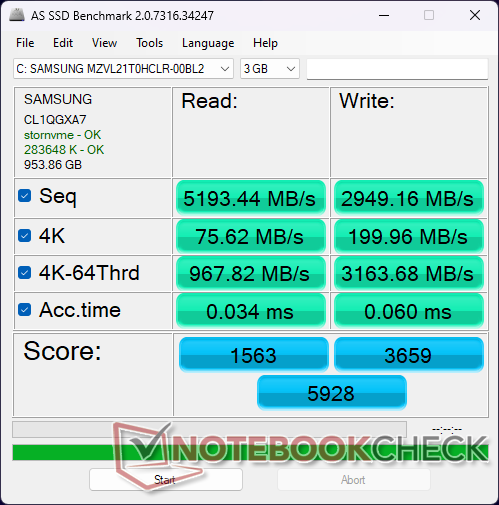

| Drive Performance rating - Percent | |
| Acer Swift Edge SFE16-42-R1GM | |
| Lenovo Yoga Pro 9 16-IRP G8 | |
| Lenovo Slim Pro 9i 16IRP8 | |
| HP Envy 16 h0112nr | |
| Asus VivoBook Pro 16 | |
| Dell Inspiron 16 Plus 7620 | |
* ... Moindre est la valeur, meilleures sont les performances
Disk Throttling: DiskSpd Read Loop, Queue Depth 8
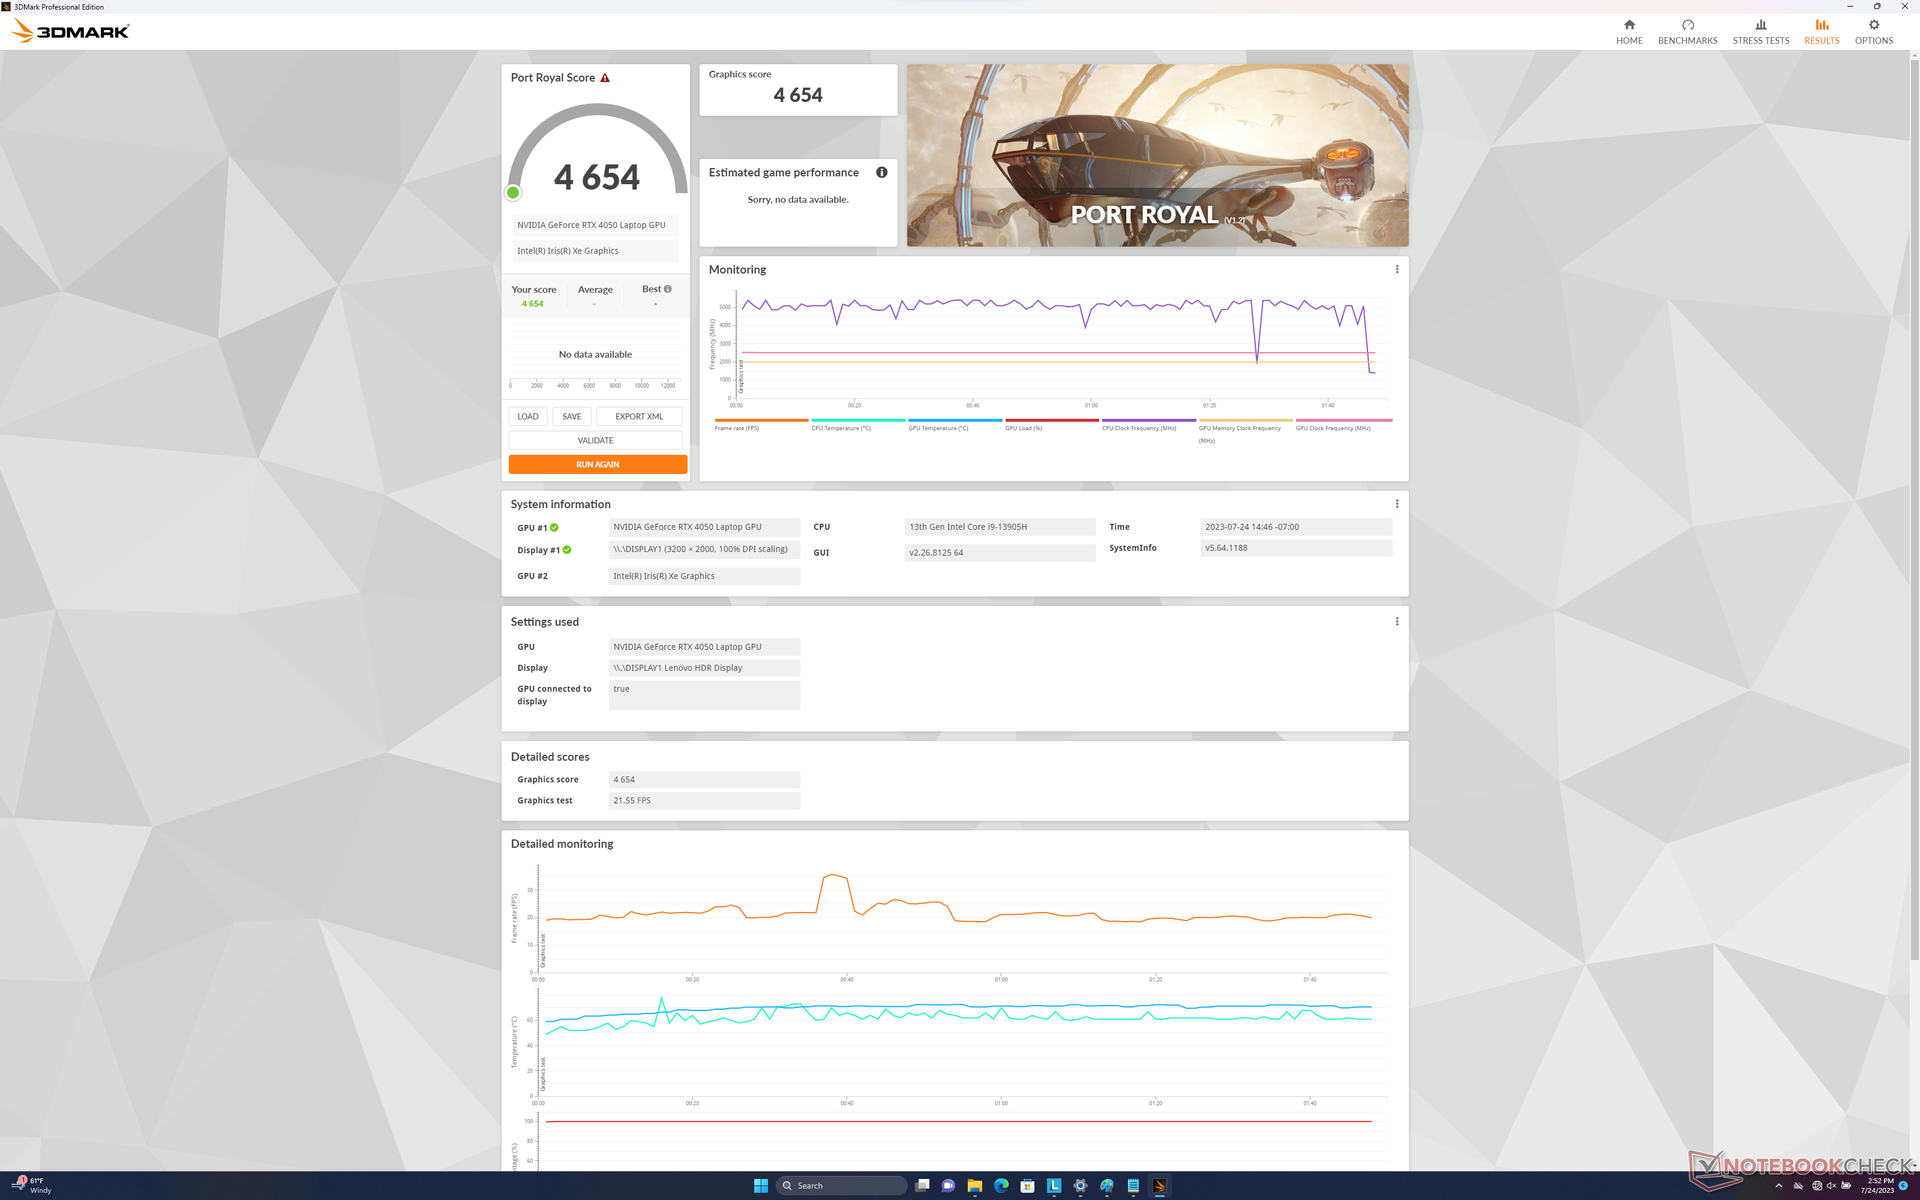
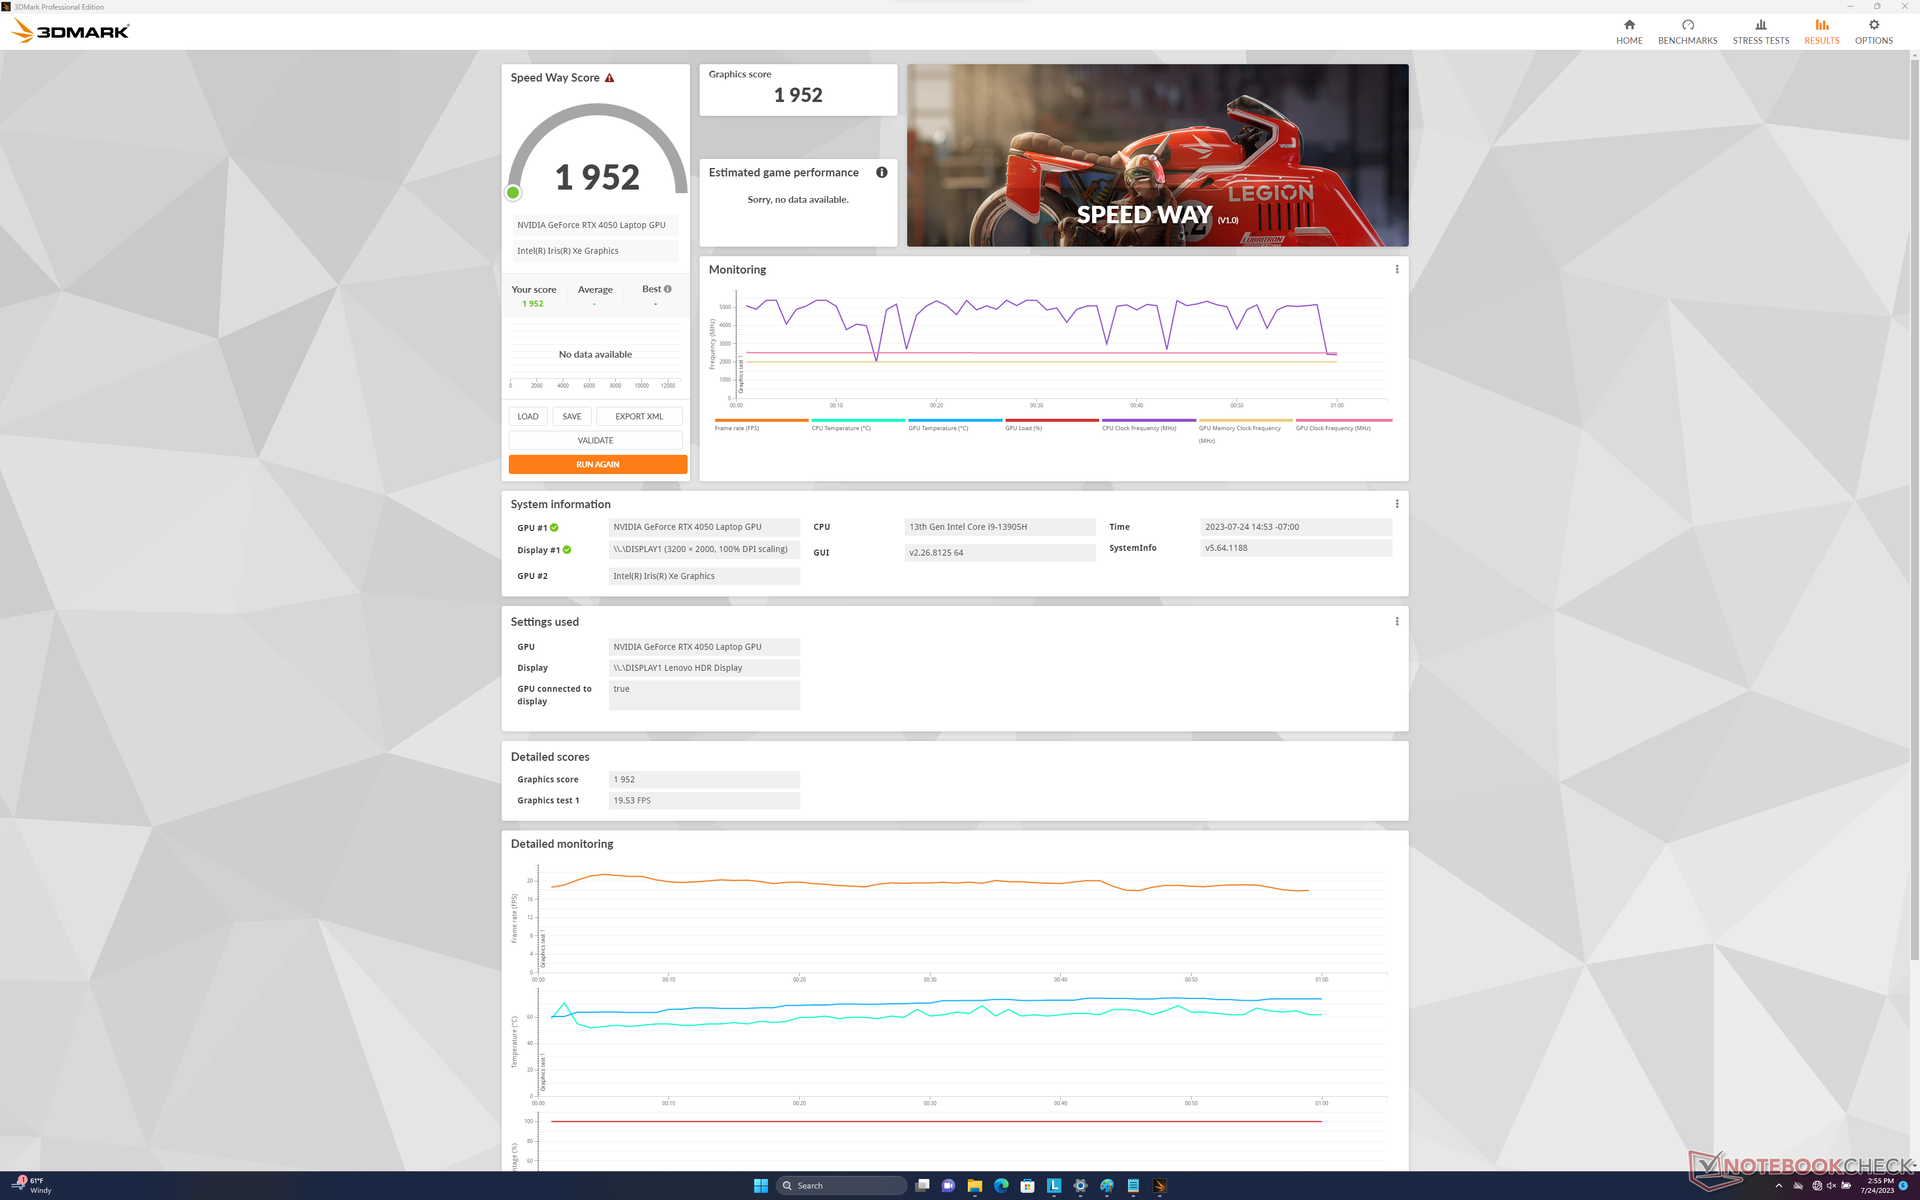
Performance du GPU
La mobile GeForce RTX 4050 est une amélioration significative par rapport à la décevante rTX 3050 décevante de l'année dernière. Les performances graphiques brutes sont 50 à 60 % plus rapides que celles de la RTX 3050 Ti pour être au même niveau que la rTX 3060 mobile.
La mise à niveau vers la RTX 4060 devrait augmenter les performances d'environ 20 %.
L'exécution en mode équilibré au lieu du mode performance a un léger impact sur les performances, comme le montrent les résultats de notre site Fire Strike dans le tableau ci-dessous.
| Profil de puissance | Fire Strike Score physique | Score graphique | Score combiné |
| Batterie | 30199 (-4%) | 12900 (-39%) | 5642 (-43%) |
| Équilibré | 28925 (-8%) | 20047 (-6%) | 7581 (-24%) |
| Performance | 31606 | 21212 | 9969 |

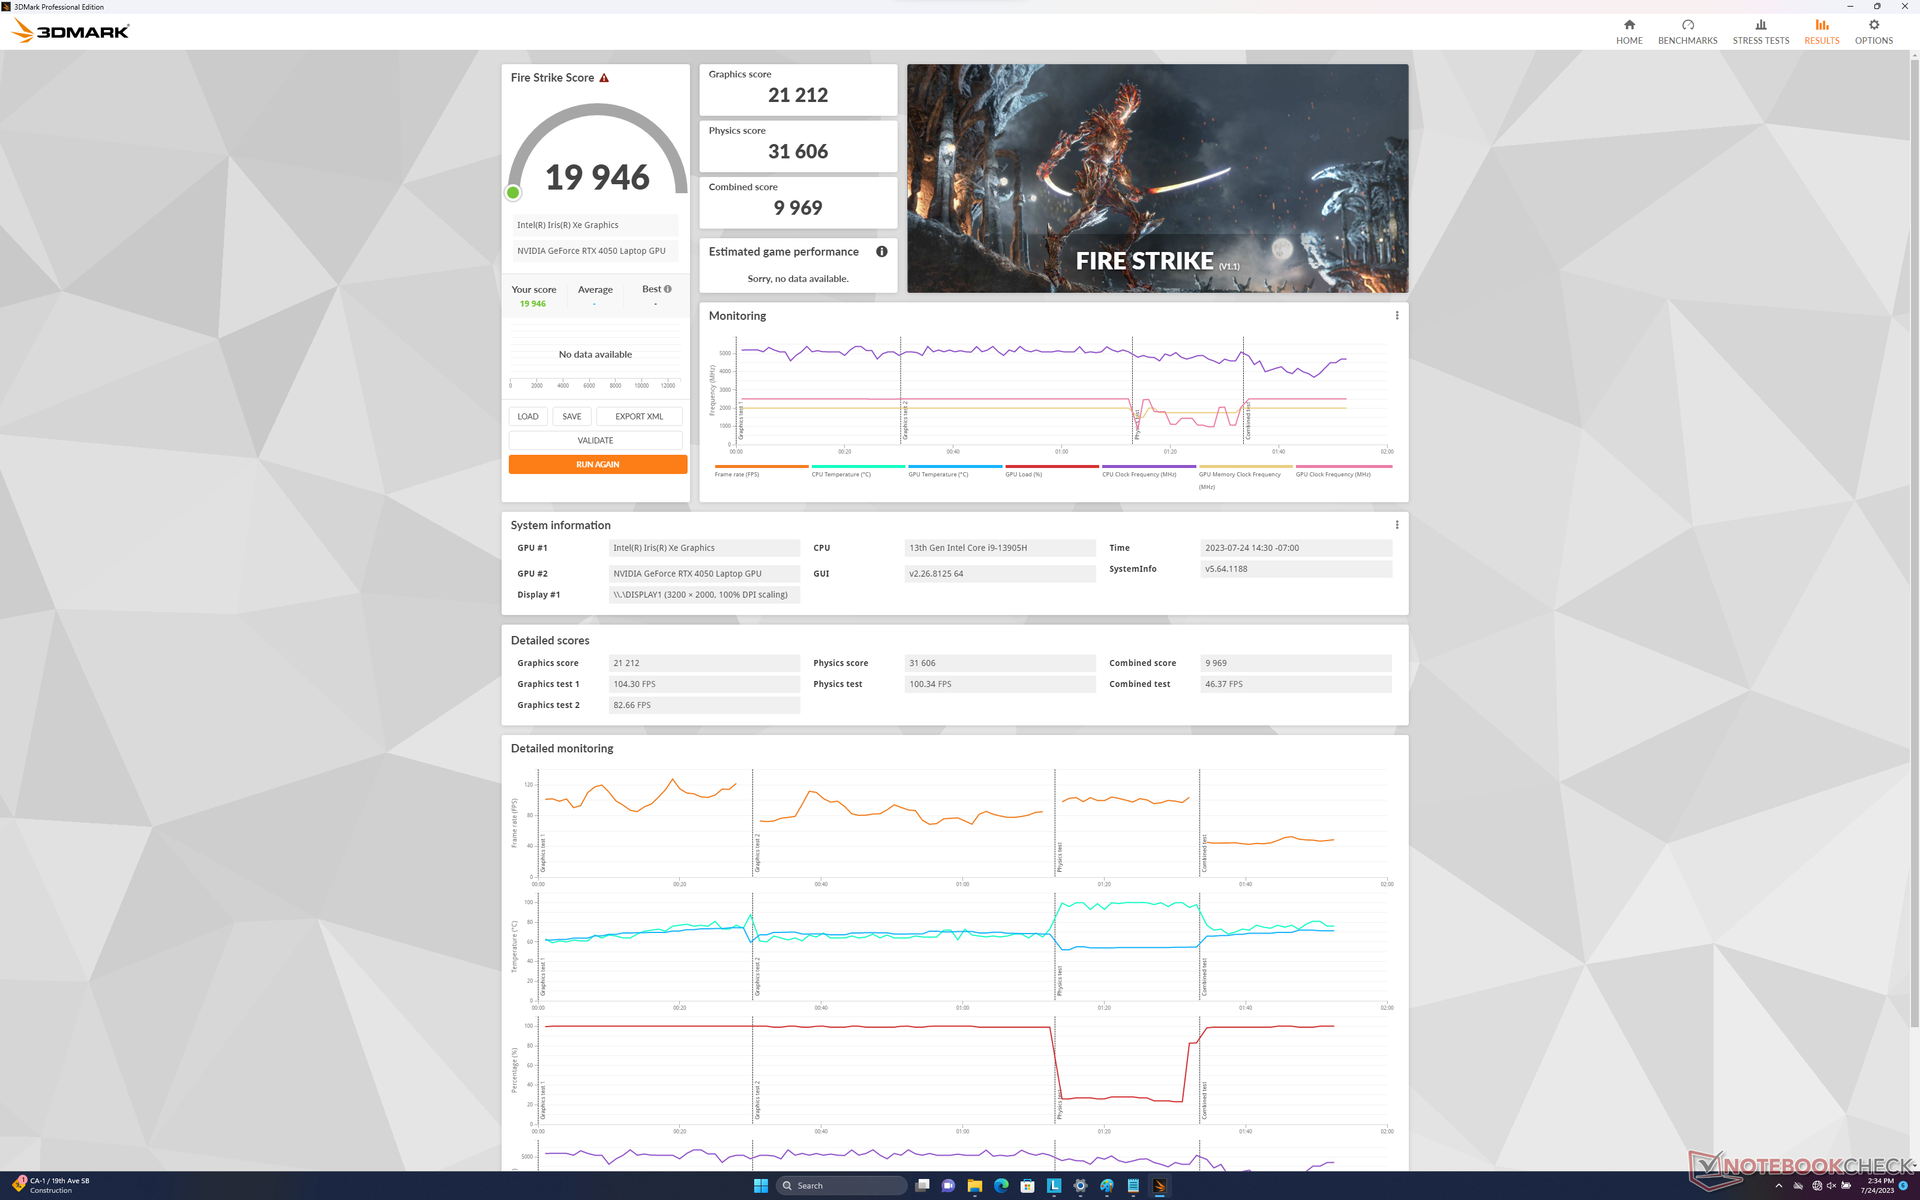
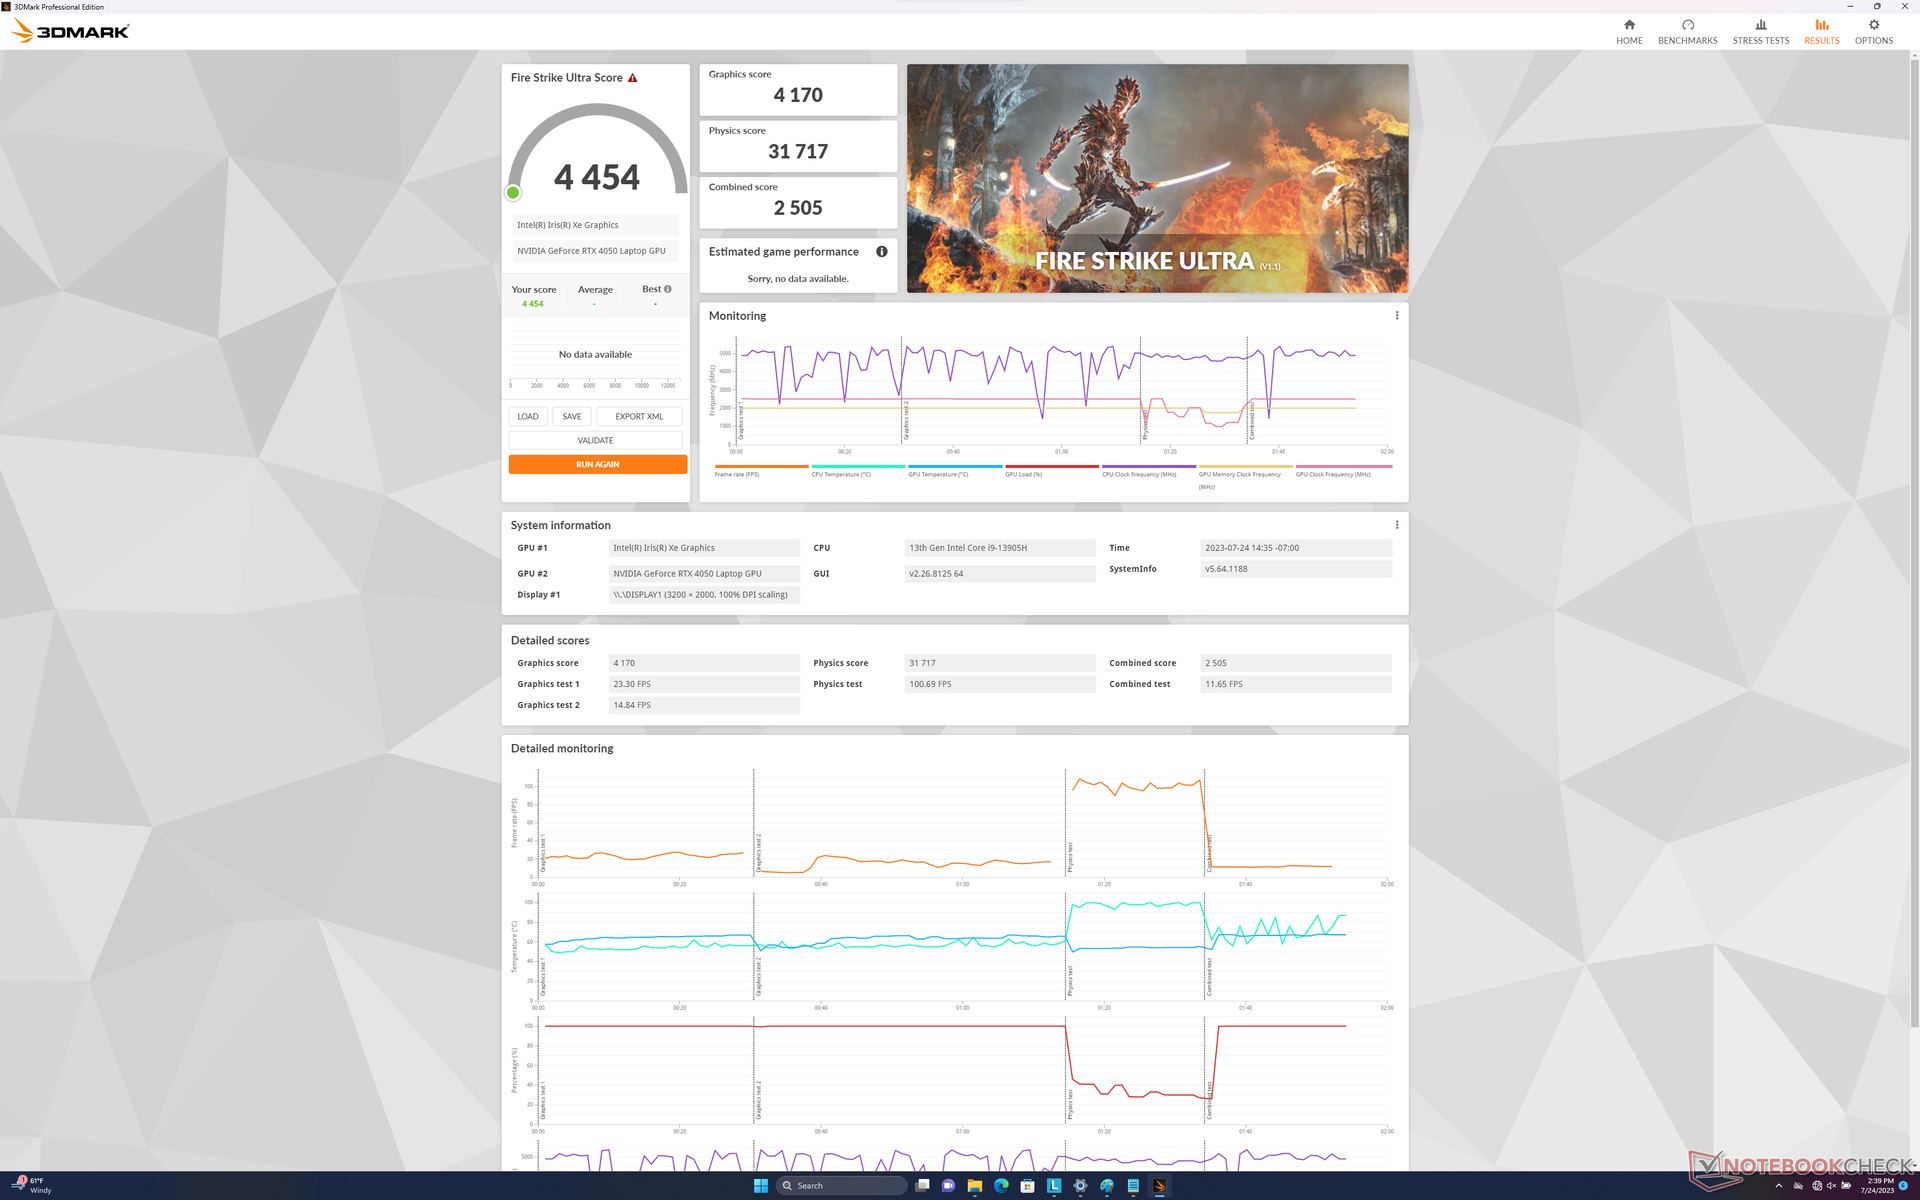
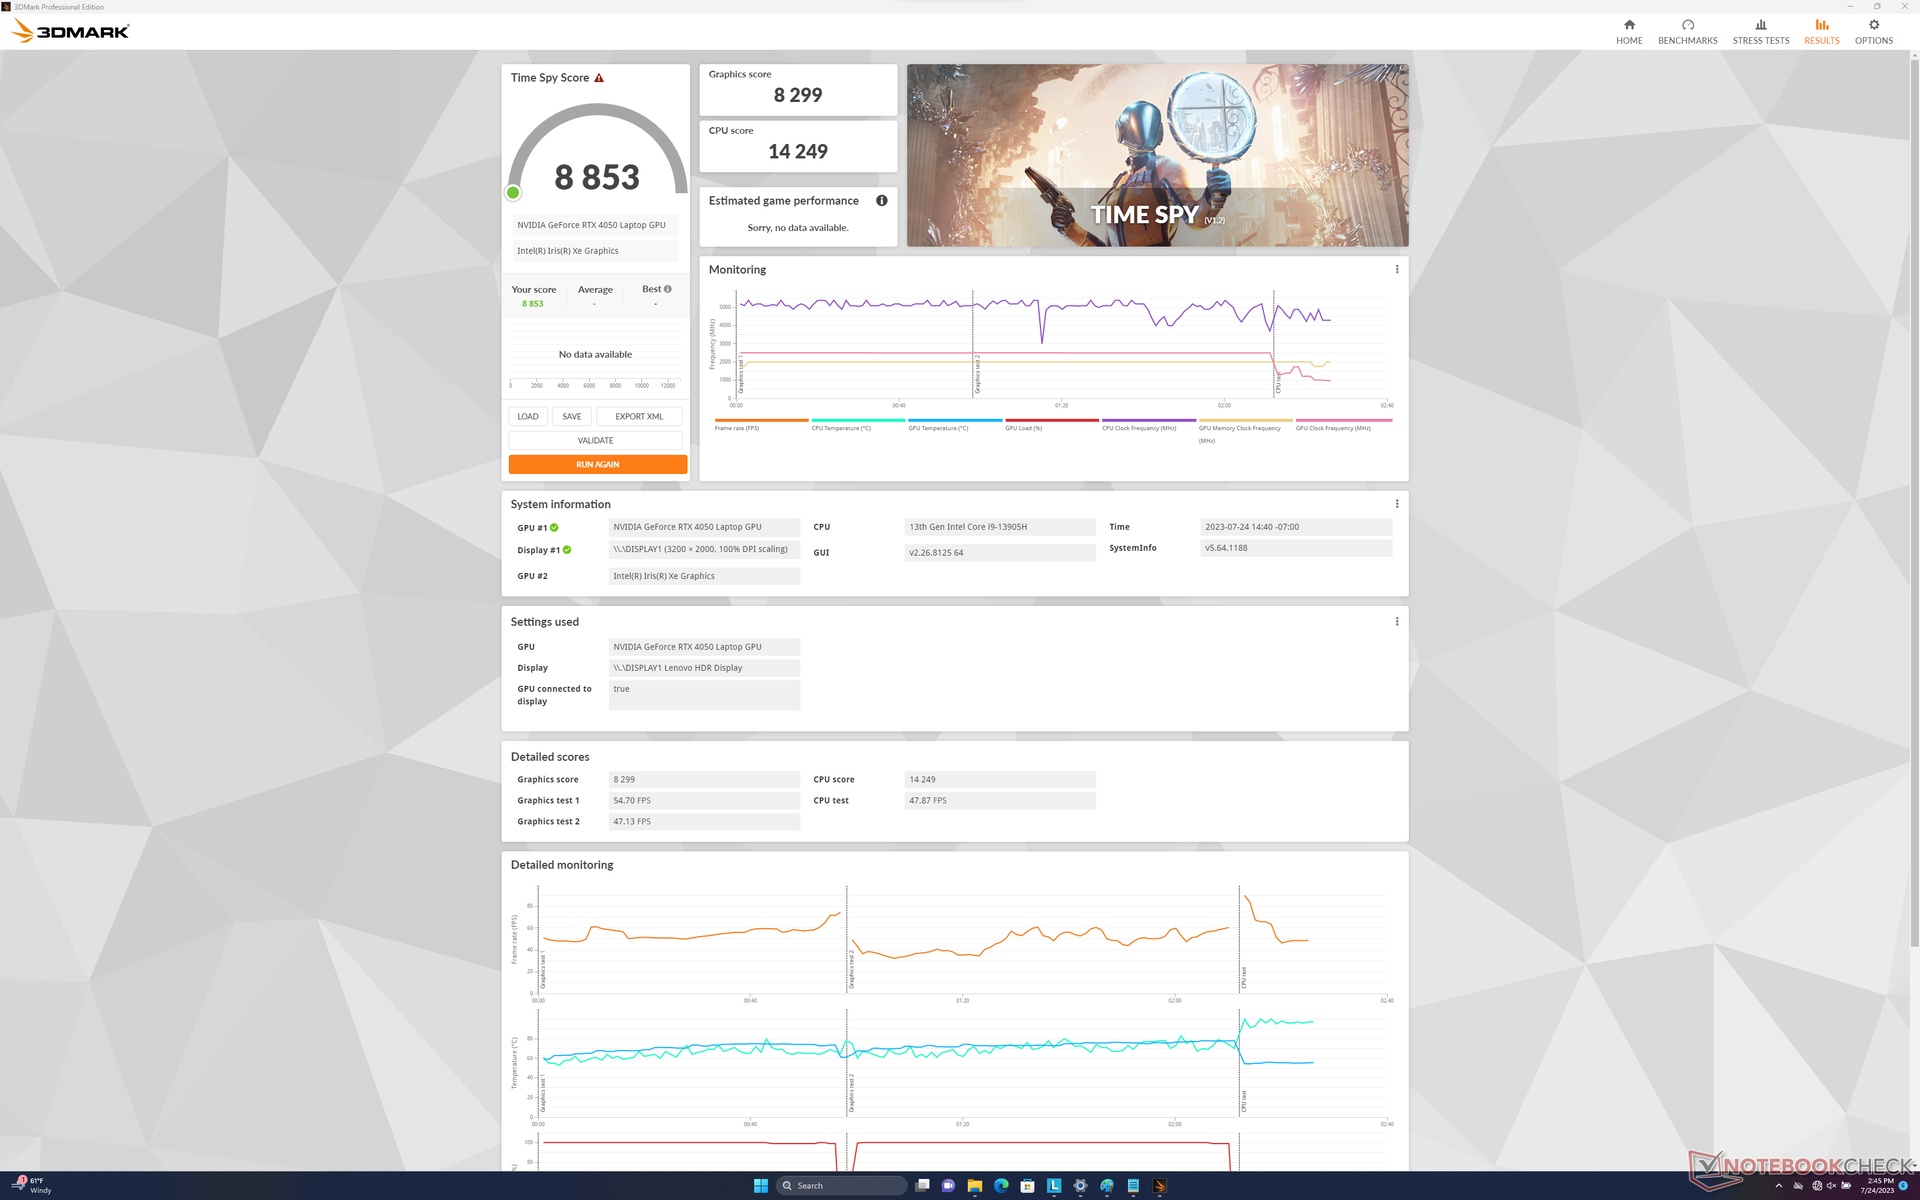
| 3DMark 11 Performance | 28168 points | |
| 3DMark Fire Strike Score | 19946 points | |
| 3DMark Time Spy Score | 8853 points | |
Aide | ||
* ... Moindre est la valeur, meilleures sont les performances
Performance des jeux
Bien qu'il ne s'agisse pas techniquement d'une machine de jeu, le système est tout à fait capable de jouer aux titres les plus récents, même à la résolution native QHD+. Les titres les plus récents et les plus exigeants, comme Returnal, peuvent être joués avec les paramètres maximum, mais DLSS est recommandé pour des taux de rafraîchissement plus tolérables.
G-Sync n'est malheureusement pas pris en charge sur l'écran interne.
Witcher 3 FPS Chart
| Bas | Moyen | Élevé | Ultra | QHD | |
|---|---|---|---|---|---|
| GTA V (2015) | 183.7 | 180.6 | 167.8 | 96.8 | 67.5 |
| The Witcher 3 (2015) | 410.2 | 271.1 | 164.7 | 84.9 | 59.2 |
| Dota 2 Reborn (2015) | 180 | 162.5 | 155 | 138.6 | |
| Final Fantasy XV Benchmark (2018) | 186.9 | 118.6 | 83.5 | 60 | |
| X-Plane 11.11 (2018) | 153 | 130.6 | 103.2 | ||
| Strange Brigade (2018) | 429 | 202 | 164.7 | 144.1 | 96.3 |
| Cyberpunk 2077 1.6 (2022) | 121.3 | 105.9 | 78.7 | 64.1 | 38.5 |
| Tiny Tina's Wonderlands (2022) | 183.3 | 142.8 | 91.5 | 70.2 | 47.7 |
| F1 22 (2022) | 214 | 199.8 | 150.8 | 52.6 | 32.3 |
| Returnal (2023) | 64 | 63 | 59 | 52 | 34 |
Émissions
Bruit du système
Le bruit des ventilateurs tend à se stabiliser entre 25 et 27 dB(A) sur un fond silencieux de 22,7 dB(A) lors de l'exécution de charges peu exigeantes telles que les navigateurs ou les flux vidéo. En revanche, lorsque des charges plus élevées, comme des jeux, sont introduites, le bruit des ventilateurs augmente régulièrement jusqu'à atteindre un maximum de 52,6 dB(A), ce qui le rend aussi bruyant que celui de nombreux ordinateurs portables de jeu.
Il est intéressant de noter que le bruit des ventilateurs diminue considérablement pour atteindre 44,2 dB(A) lorsque les jeux sont exécutés en mode équilibré plutôt qu'en mode performance. La réduction du bruit du ventilateur peut donc valoir une légère diminution des performances en fonction des préférences de l'utilisateur.
Degré de la nuisance sonore
| Au repos |
| 22.7 / 22.7 / 27.5 dB(A) |
| Fortement sollicité |
| 28.9 / 52.5 dB(A) |
 | ||
30 dB silencieux 40 dB(A) audible 50 dB(A) bruyant |
||
min: | ||
| Lenovo Slim Pro 9i 16IRP8 GeForce RTX 4050 Laptop GPU, i9-13905H, Samsung PM9A1 MZVL21T0HCLR | Lenovo Yoga Pro 9 16-IRP G8 GeForce RTX 4060 Laptop GPU, i7-13705H, Samsung PM9A1 MZVL21T0HCLR | Asus VivoBook Pro 16 GeForce RTX 3050 Ti Laptop GPU, i7-12700H, Intel SSD 670p SSDPEKNU010TZ | Acer Swift Edge SFE16-42-R1GM Radeon 680M, R7 7735U, Micron 3400 1TB MTFDKBA1T0TFH | Dell Inspiron 16 Plus 7620 GeForce RTX 3050 Ti Laptop GPU, i7-12700H, Kioxia BG5 KBG50ZNS512G | HP Envy 16 h0112nr GeForce RTX 3060 Laptop GPU, i7-12700H, Micron 3400 1TB MTFDKBA1T0TFH | |
|---|---|---|---|---|---|---|
| Noise | -10% | -22% | -13% | -13% | -7% | |
| arrêt / environnement * (dB) | 22.7 | 24.7 -9% | 25.2 -11% | 25.7 -13% | 23.3 -3% | 22.8 -0% |
| Idle Minimum * (dB) | 22.7 | 24.7 -9% | 25.2 -11% | 25.7 -13% | 25.7 -13% | 22.9 -1% |
| Idle Average * (dB) | 22.7 | 26.2 -15% | 25.2 -11% | 27 -19% | 26.1 -15% | 22.9 -1% |
| Idle Maximum * (dB) | 27.5 | 26.2 5% | 25.2 8% | 29.3 -7% | 30.6 -11% | 30.5 -11% |
| Load Average * (dB) | 28.9 | 39.7 -37% | 55.1 -91% | 42.3 -46% | 46.2 -60% | 41.4 -43% |
| Witcher 3 ultra * (dB) | 52.6 | 53.2 -1% | 49.2 6% | 51.1 3% | ||
| Load Maximum * (dB) | 52.5 | 53.2 -1% | 61.5 -17% | 42.7 19% | 49.4 6% | 51.4 2% |
* ... Moindre est la valeur, meilleures sont les performances
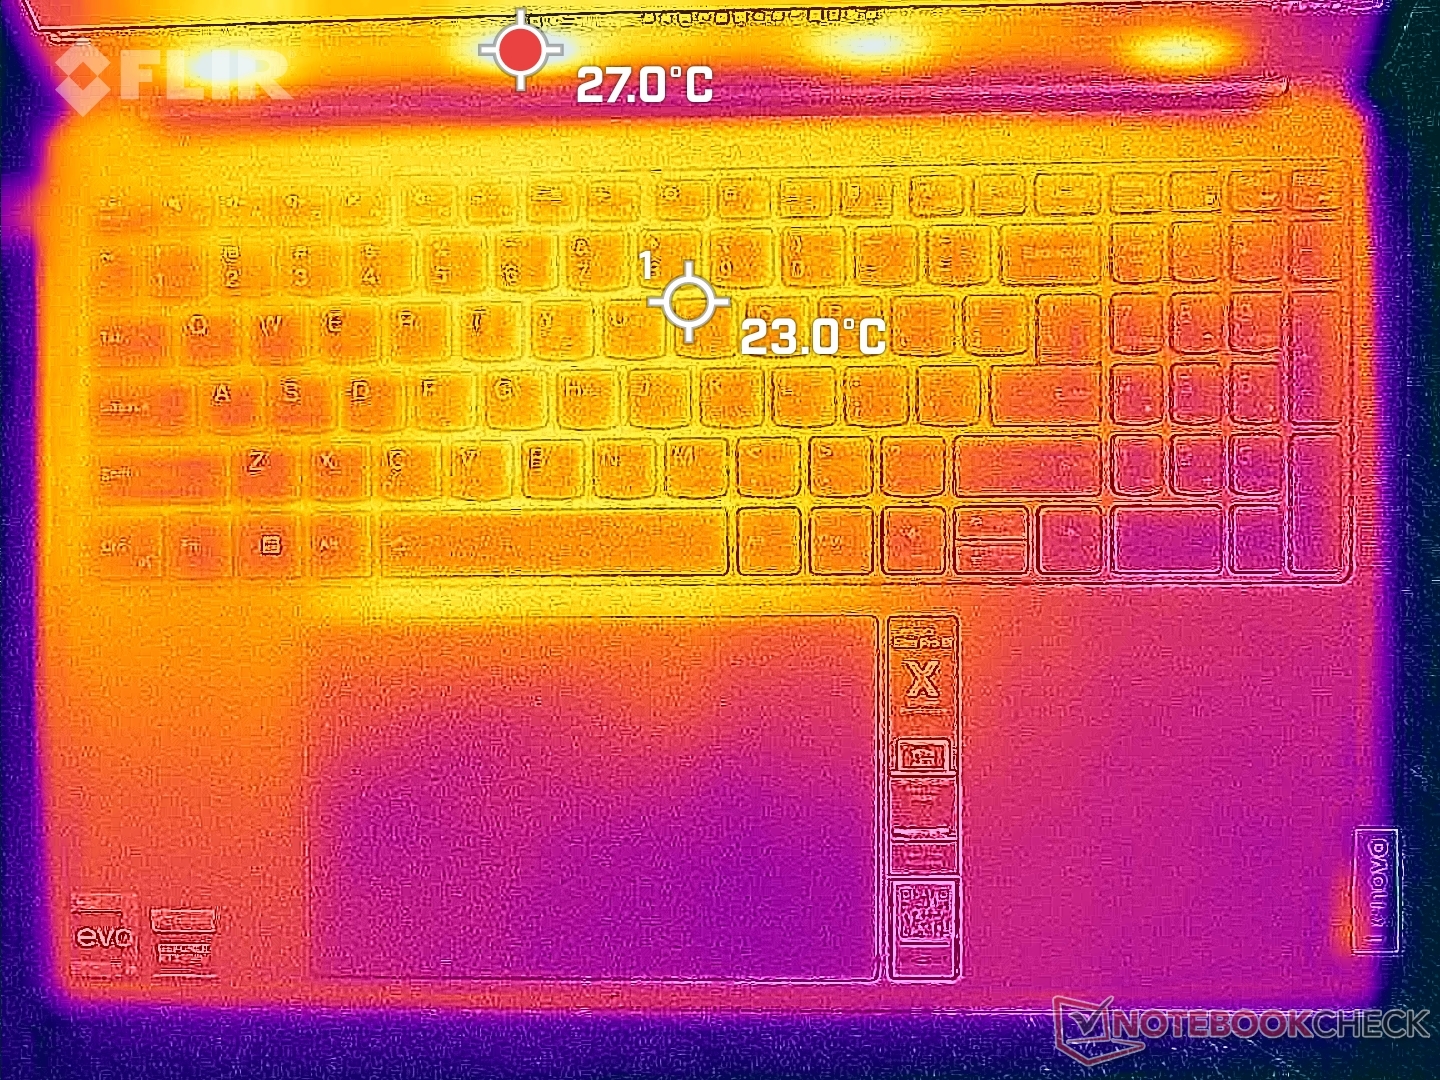
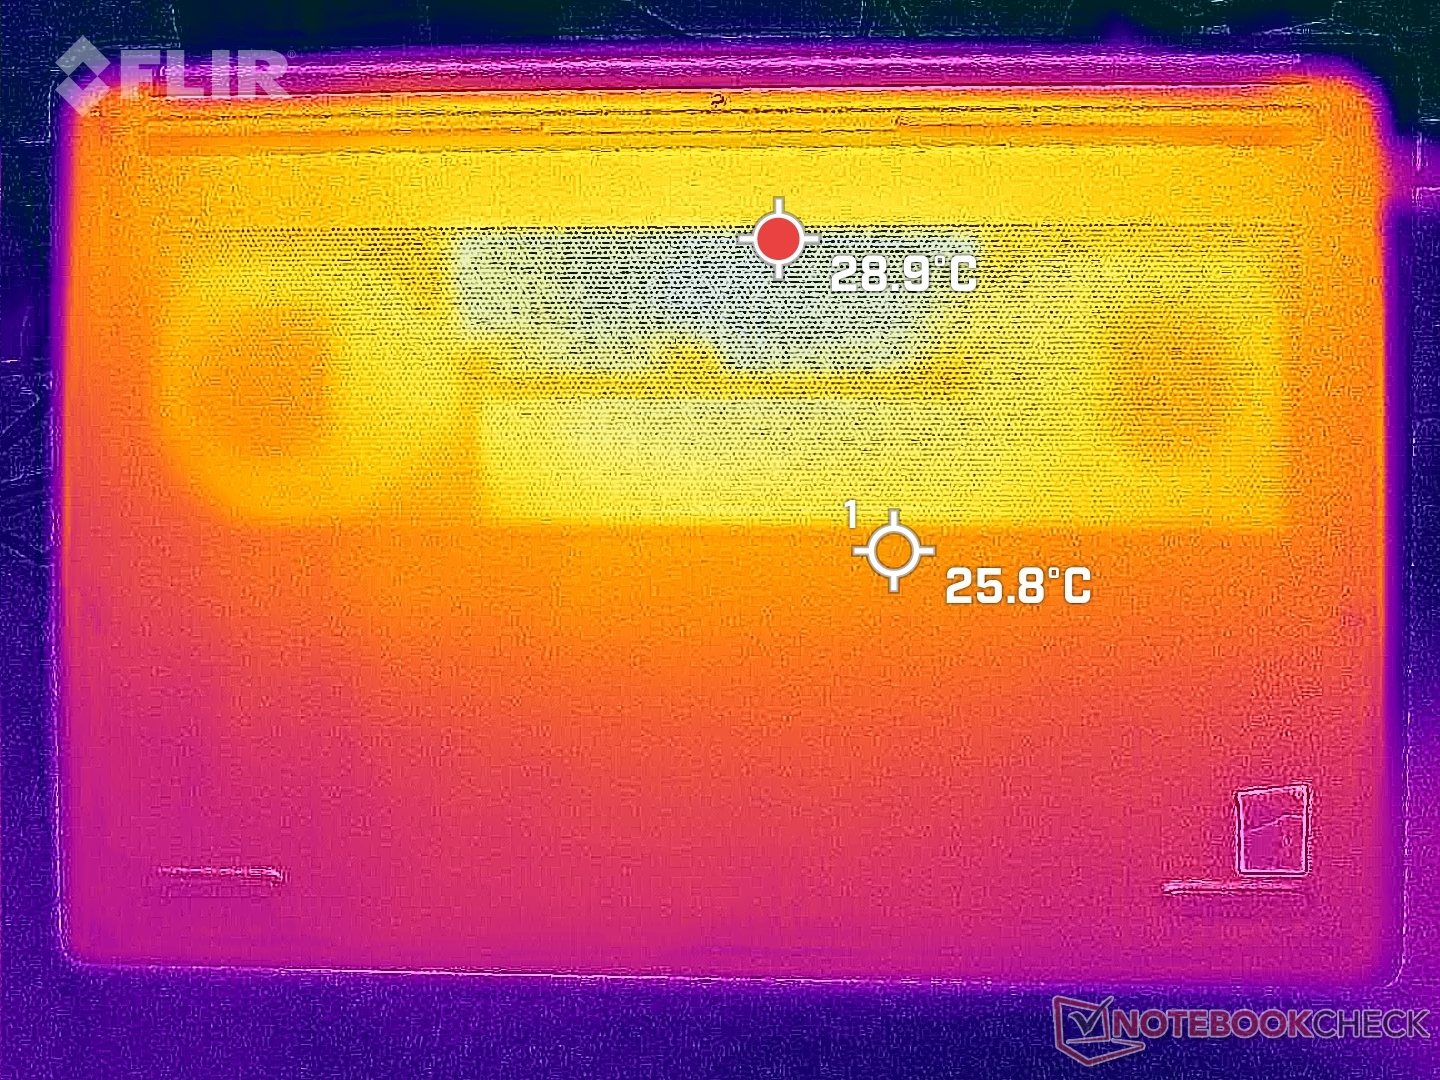
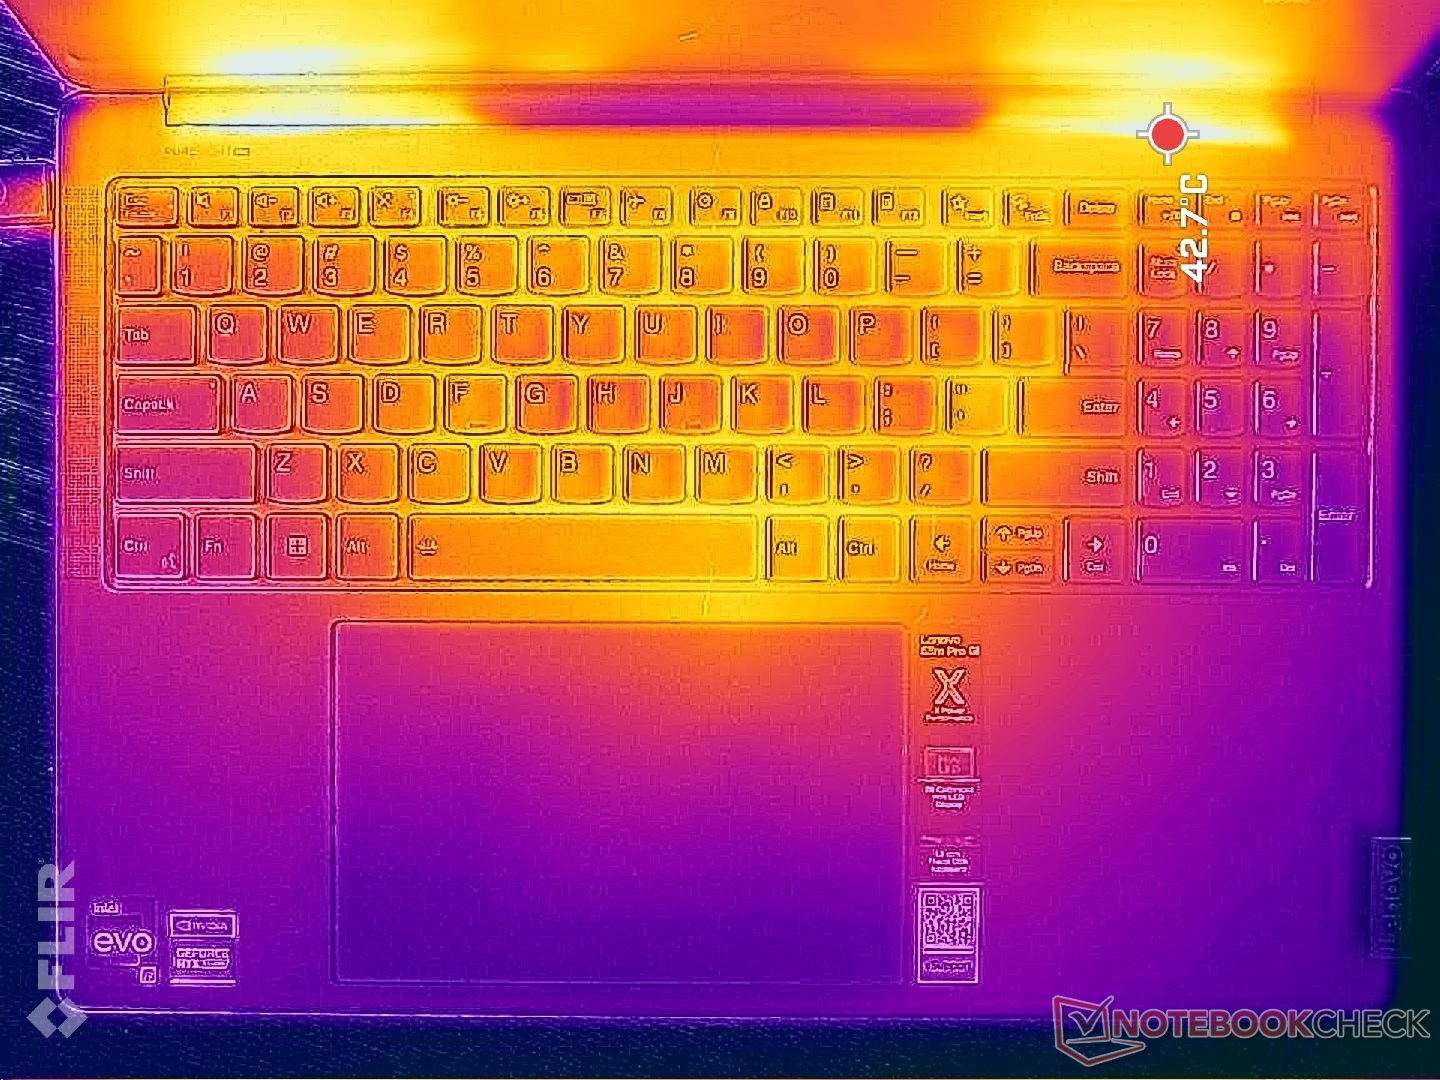
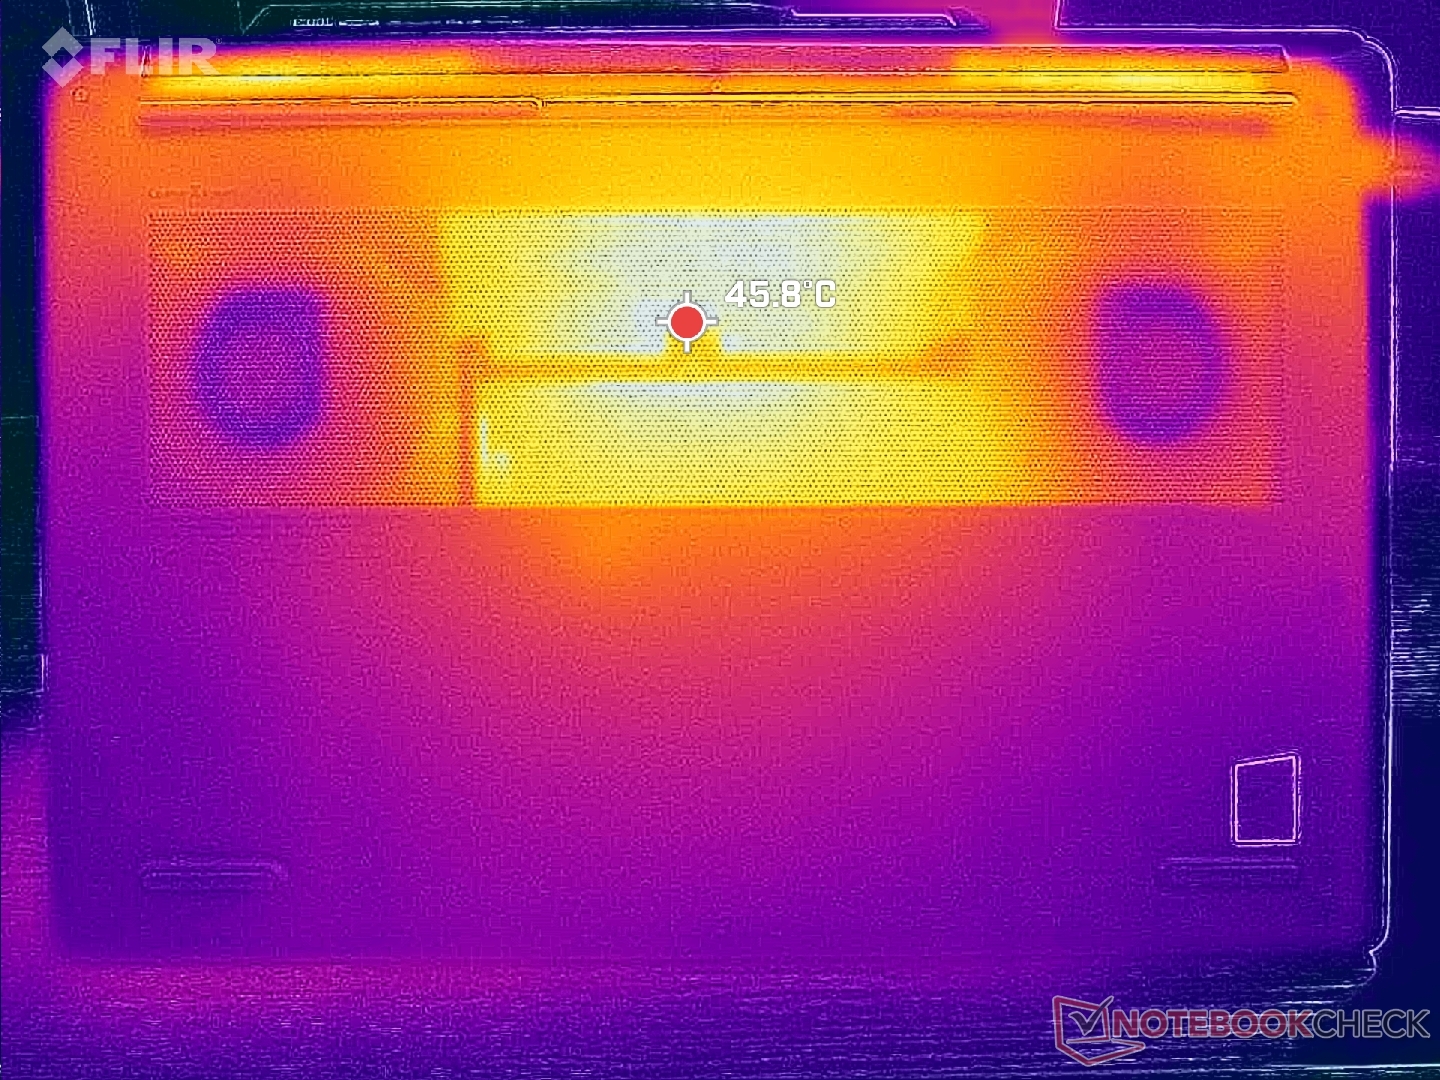
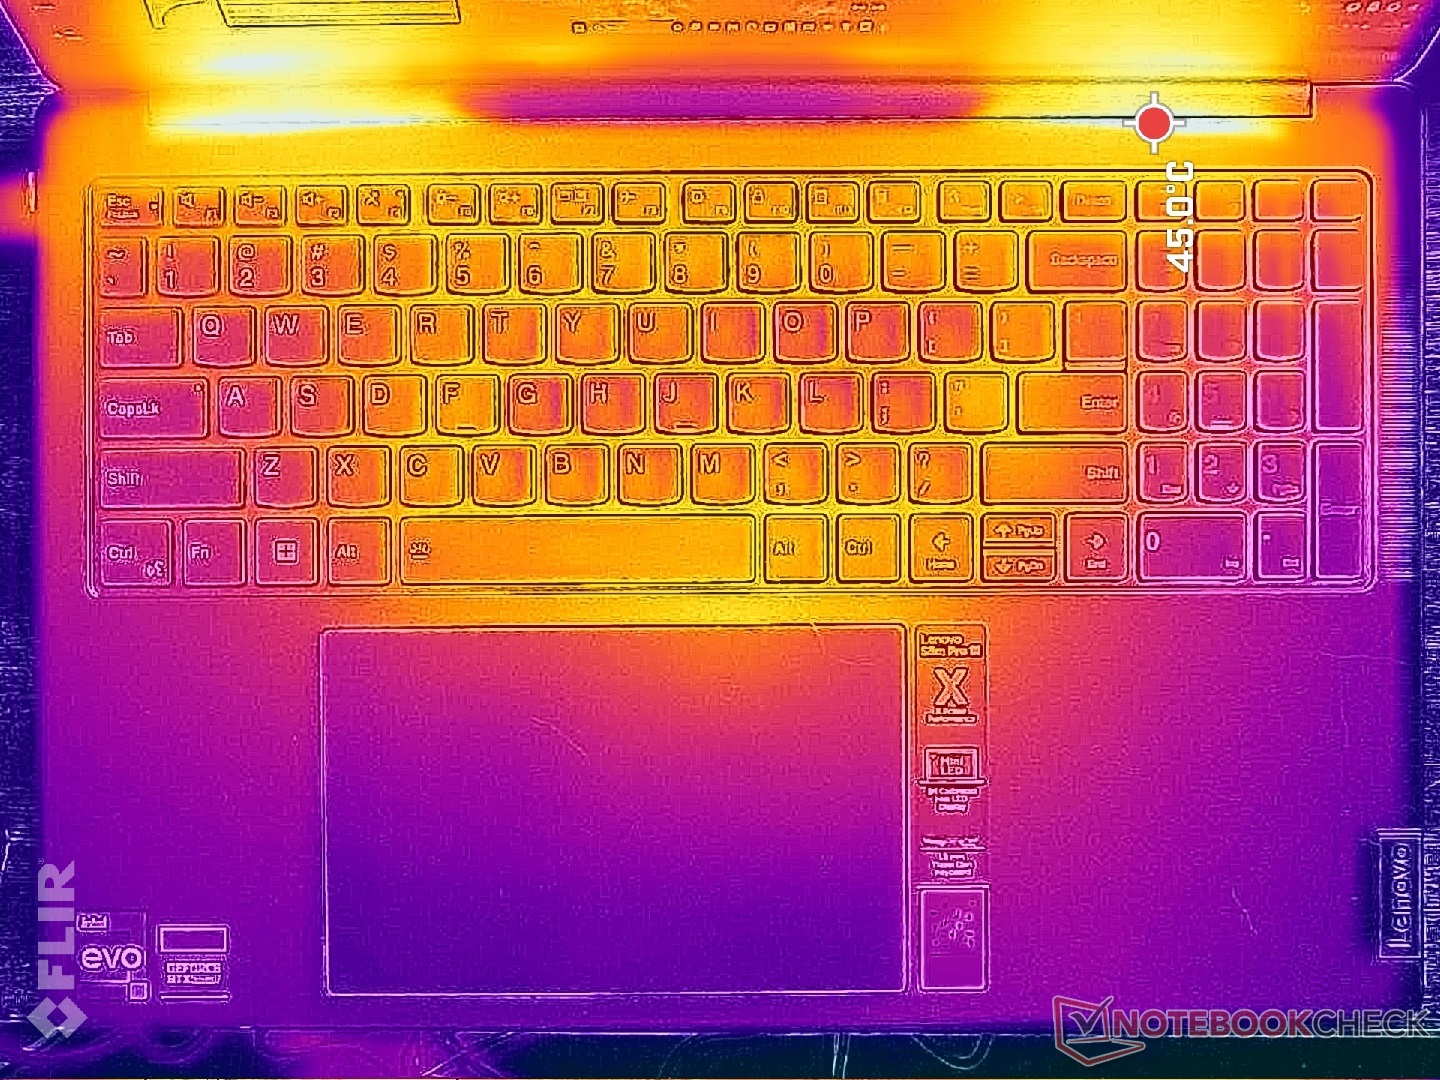
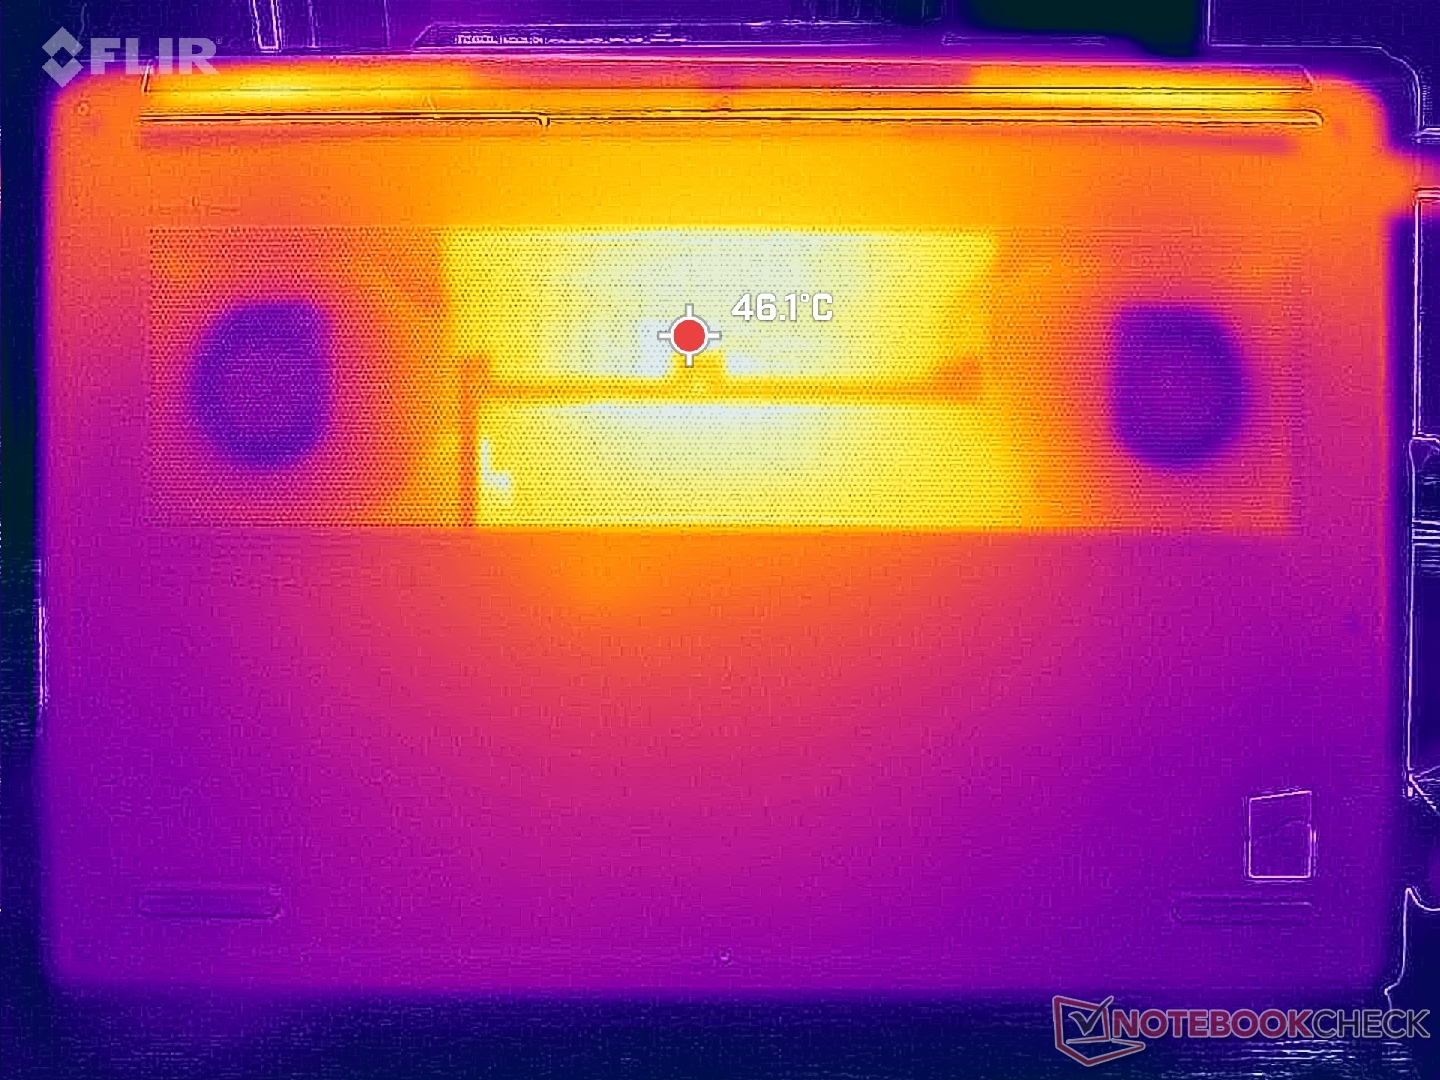
Température
Les températures de surface sont les plus chaudes près des zones centrales, où les points chauds peuvent atteindre plus de 38 °C et 44 °C en haut et en bas, respectivement. Le clavier du Lenovo n'est pas aussi chaud que celui de lInspiron 16 Plus 7620 où le centre peut atteindre 50 °C lorsqu'il est sollicité.
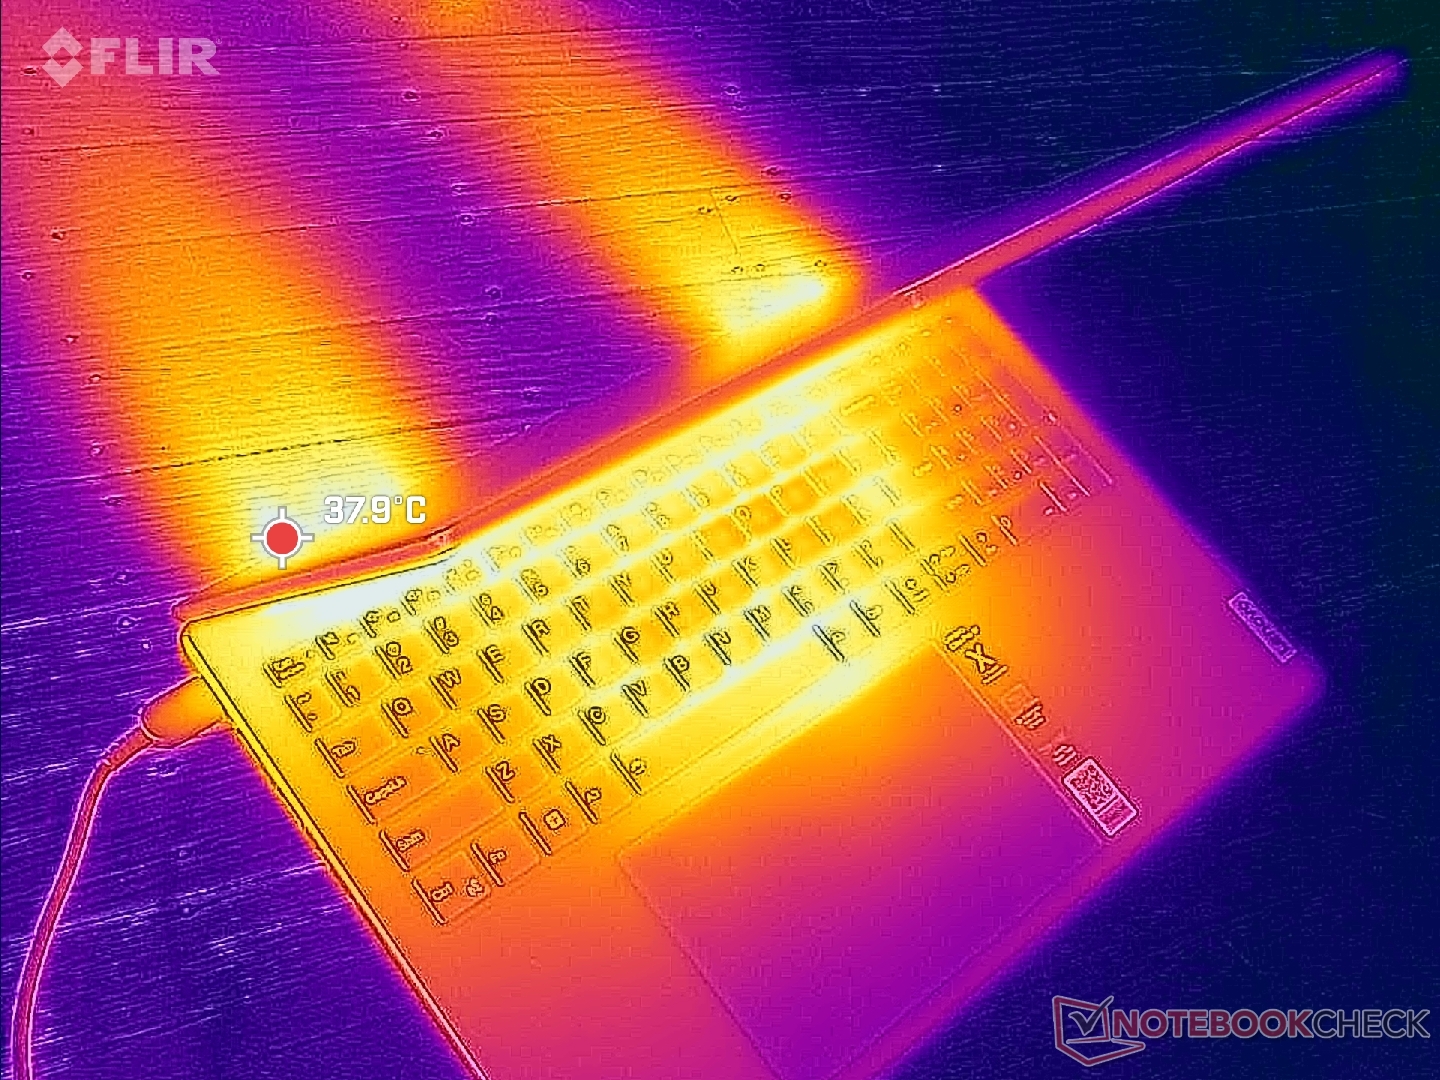
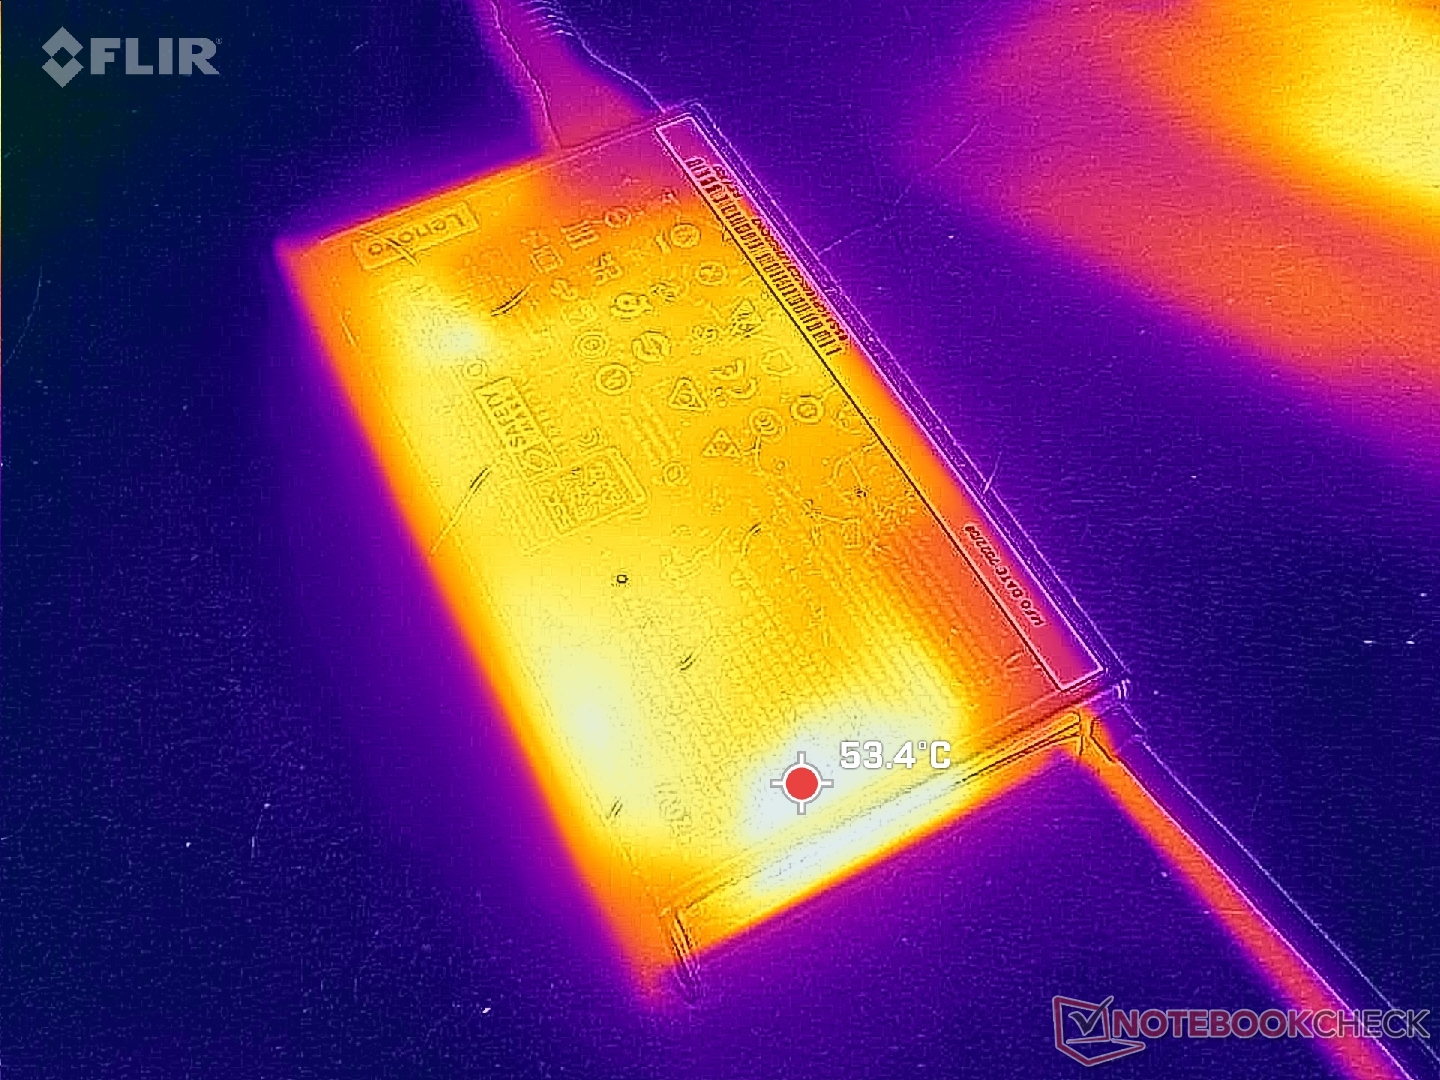
(+) La température maximale du côté supérieur est de 37.8 °C / 100 F, par rapport à la moyenne de 36.8 °C / 98 F, allant de 21 à 71 °C pour la classe Multimedia.
(±) Le fond chauffe jusqu'à un maximum de 44.8 °C / 113 F, contre une moyenne de 39.1 °C / 102 F
(+) En utilisation inactive, la température moyenne du côté supérieur est de 28.8 °C / 84 F, par rapport à la moyenne du dispositif de 31.3 °C / 88 F.
(±) En jouant à The Witcher 3, la température moyenne du côté supérieur est de 35.4 °C / 96 F, alors que la moyenne de l'appareil est de 31.3 °C / 88 F.
(+) Les repose-poignets et le pavé tactile atteignent la température maximale de la peau (32 °C / 89.6 F) et ne sont donc pas chauds.
(-) La température moyenne de la zone de l'appui-paume de dispositifs similaires était de 28.7 °C / 83.7 F (-3.3 °C / #-5.9 F).
| Lenovo Slim Pro 9i 16IRP8 Intel Core i9-13905H, NVIDIA GeForce RTX 4050 Laptop GPU | Lenovo Yoga Pro 9 16-IRP G8 Intel Core i7-13705H, NVIDIA GeForce RTX 4060 Laptop GPU | Asus VivoBook Pro 16 Intel Core i7-12700H, NVIDIA GeForce RTX 3050 Ti Laptop GPU | Acer Swift Edge SFE16-42-R1GM AMD Ryzen 7 7735U, AMD Radeon 680M | Dell Inspiron 16 Plus 7620 Intel Core i7-12700H, NVIDIA GeForce RTX 3050 Ti Laptop GPU | HP Envy 16 h0112nr Intel Core i7-12700H, NVIDIA GeForce RTX 3060 Laptop GPU | |
|---|---|---|---|---|---|---|
| Heat | 0% | -16% | -11% | -5% | -8% | |
| Maximum Upper Side * (°C) | 37.8 | 41.6 -10% | 44.2 -17% | 49.4 -31% | 46 -22% | 45.2 -20% |
| Maximum Bottom * (°C) | 44.8 | 50 -12% | 53 -18% | 44.7 -0% | 45.8 -2% | 44 2% |
| Idle Upper Side * (°C) | 30.6 | 26.8 12% | 32.1 -5% | 34 -11% | 29.2 5% | 33.6 -10% |
| Idle Bottom * (°C) | 31 | 27.9 10% | 38.4 -24% | 31.6 -2% | 31 -0% | 32.6 -5% |
* ... Moindre est la valeur, meilleures sont les performances
Test de stress
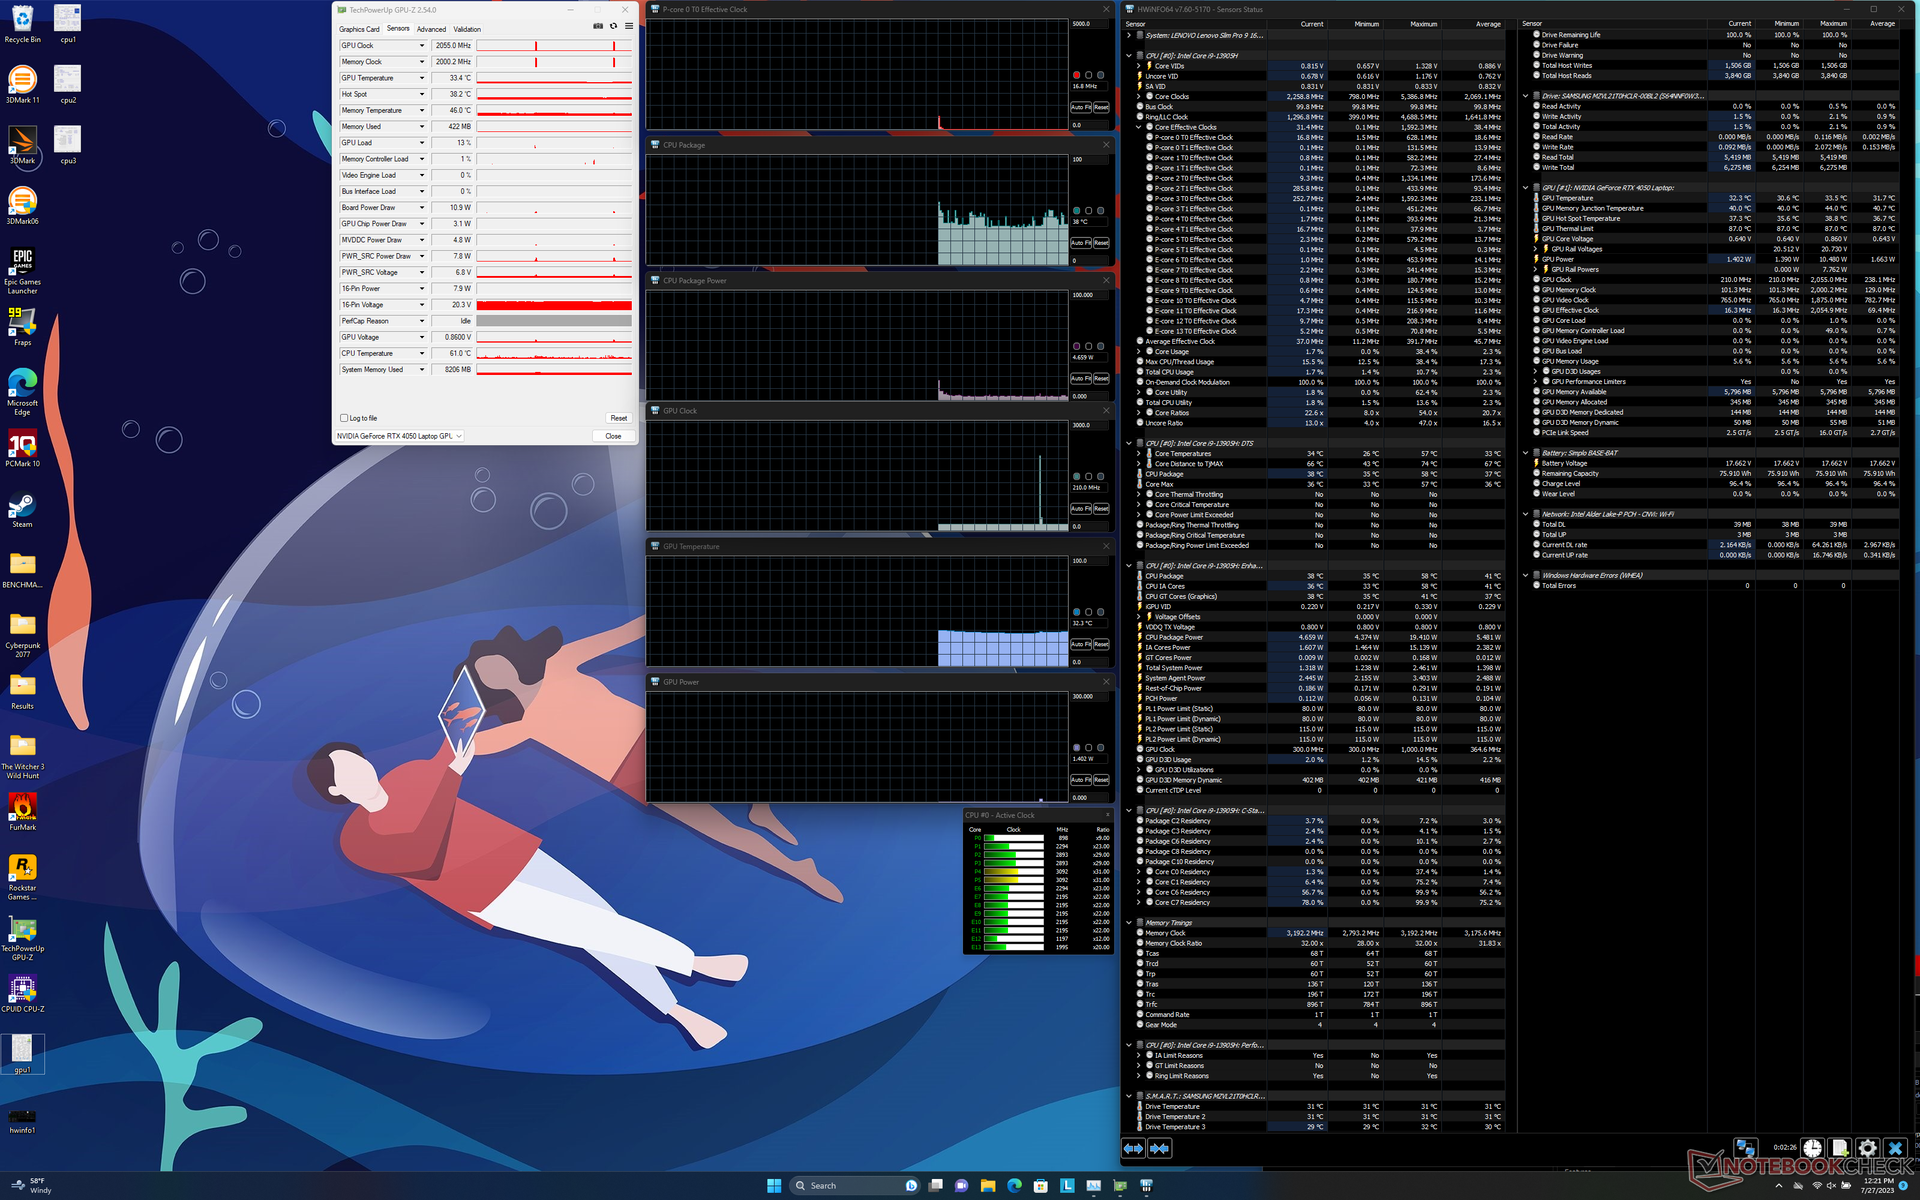
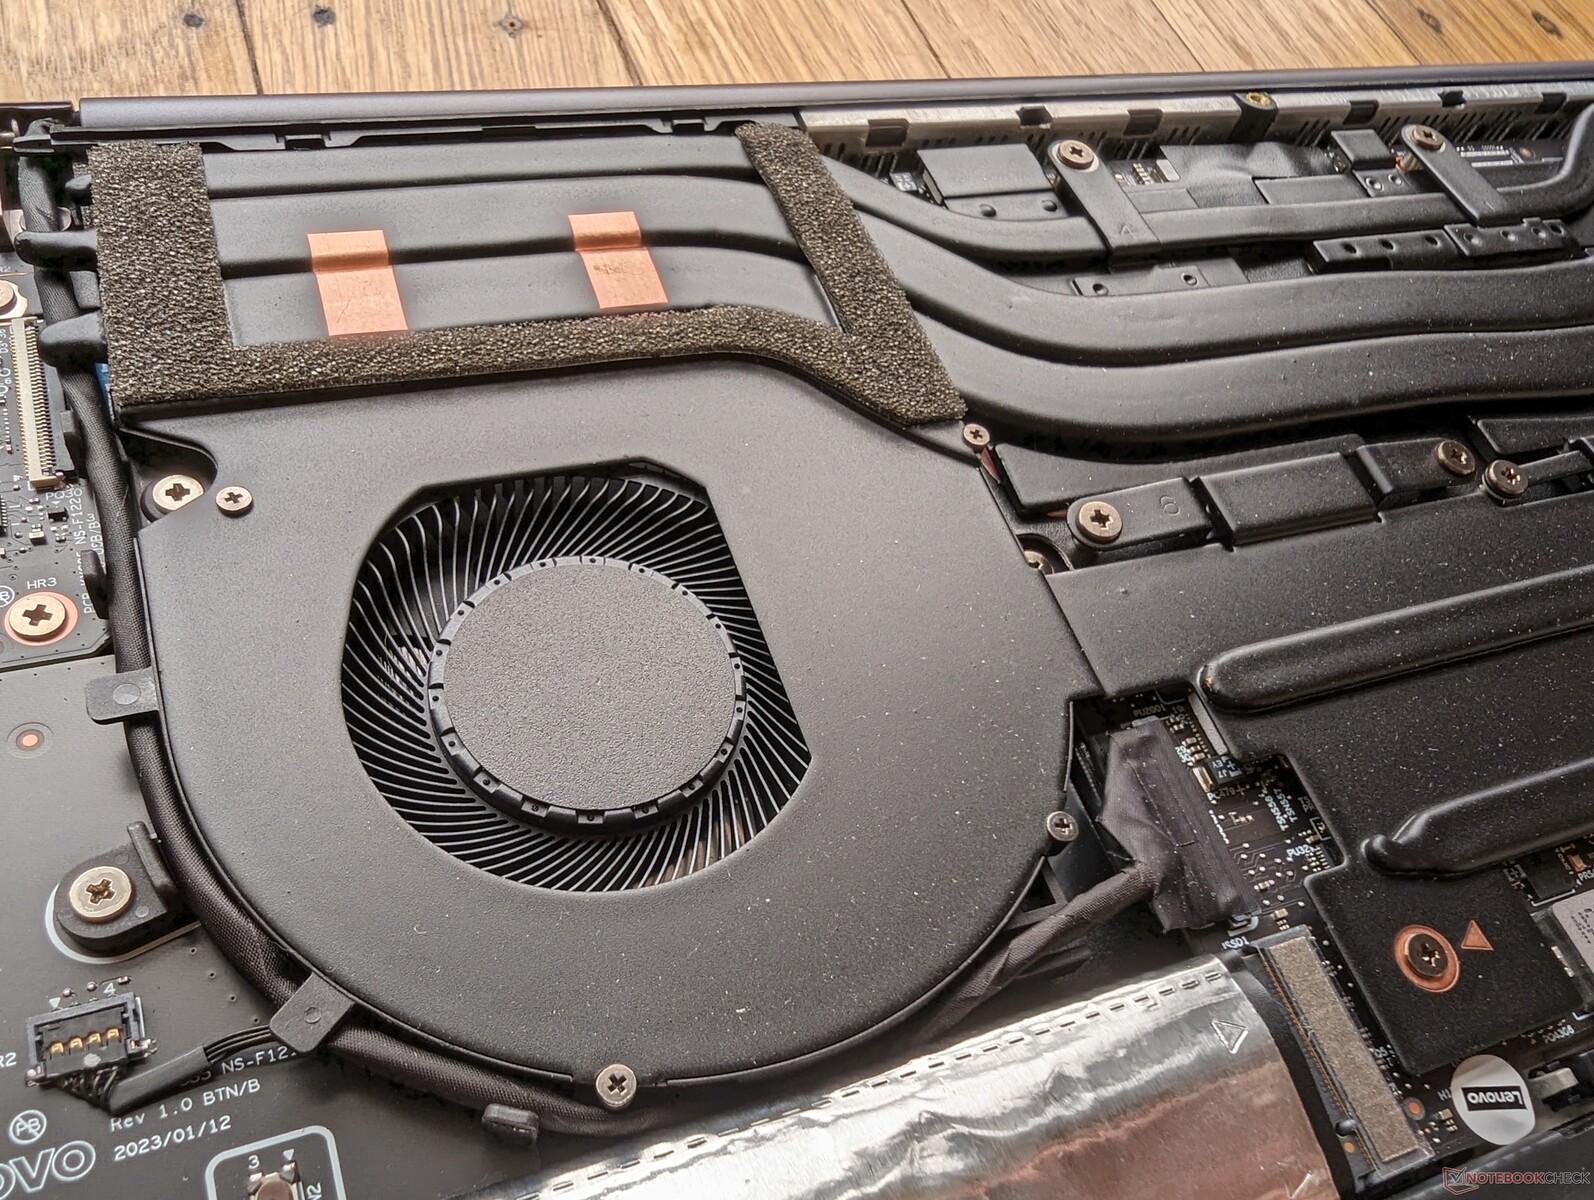
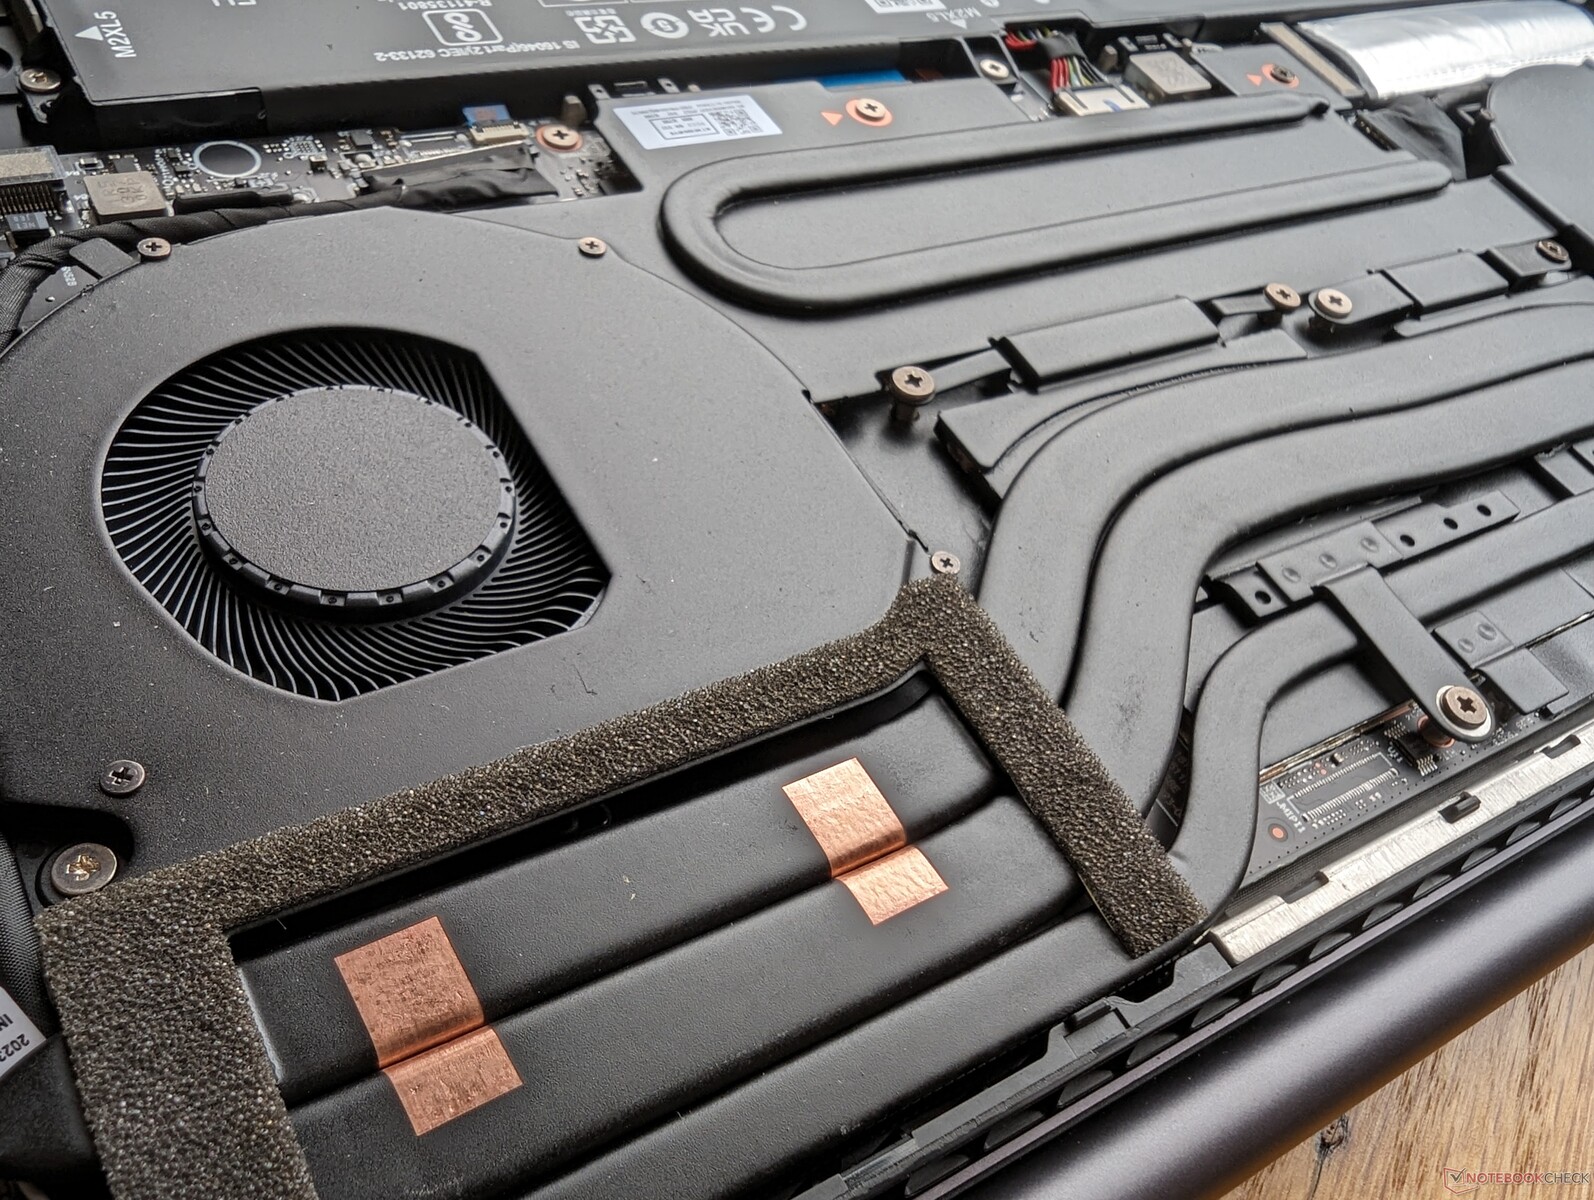
Le processeur atteint 4 GHz, 120 W et 100 C pendant les 40 premières secondes lors de l'initialisation du stress Prime95. Comme une température de 100°C n'est pas idéale, les fréquences d'horloge et la consommation d'énergie de la carte tombent rapidement à 3,0 ou 3,2 GHz et 85 W, respectivement, afin de maintenir une température plus raisonnable de 82°C. Les fréquences d'horloge Turbo Boost élevées du Core i9-13905H ne peuvent donc pas être maintenues sur le Slim Pro 9i en raison des limitations du système de refroidissement.
Le GPU Nvidia se stabiliserait à 2505 MHz, 70 C et 72 W en mode Performance, contre 2460 MHz, 70 C et 72 W en mode Performance Witcher 3 en mode Performance contre 2460 MHz, 62 C et 56 W en mode Equilibré. La consommation du GPU peut approcher les 92 W à son apogée, alors que l'objectif du TGP est de 100 W.
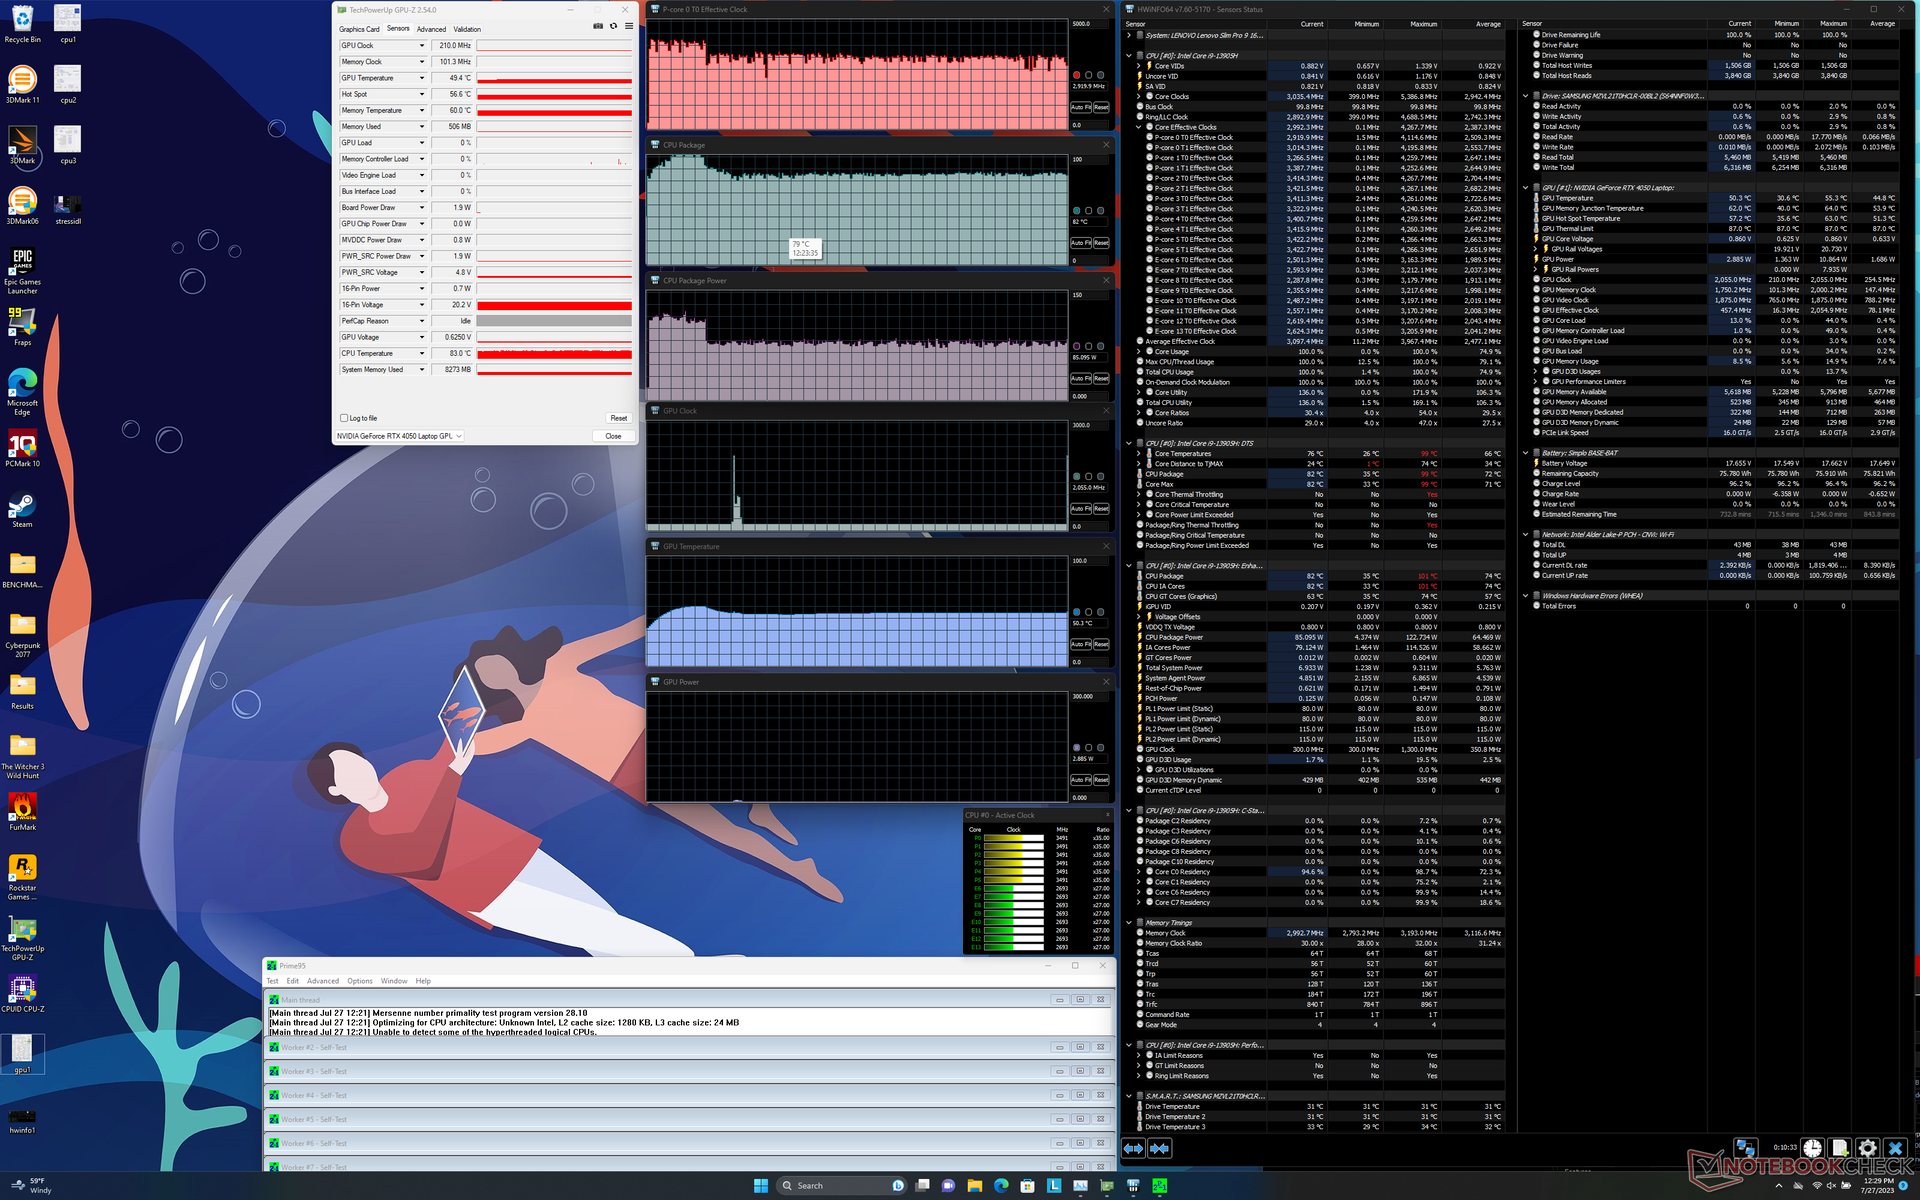
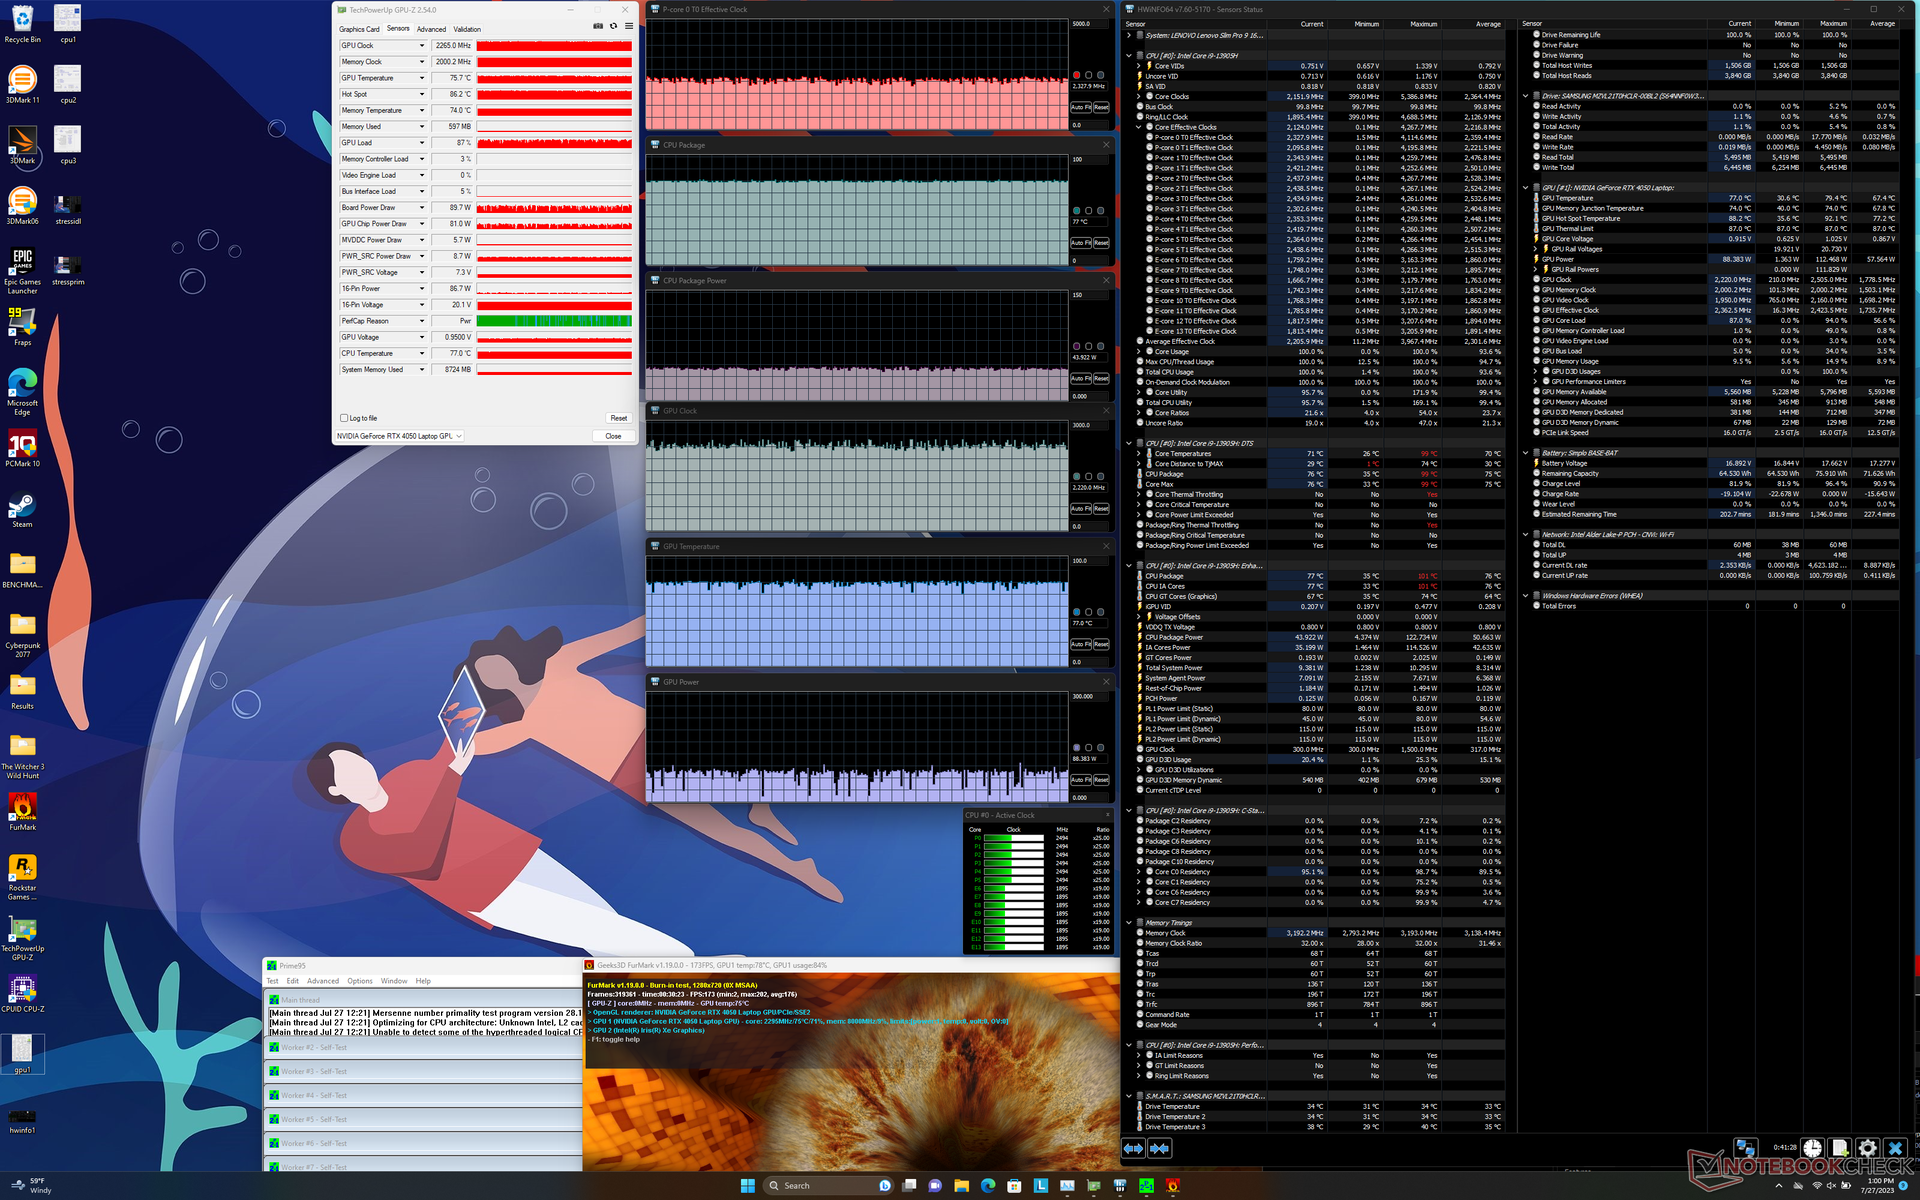
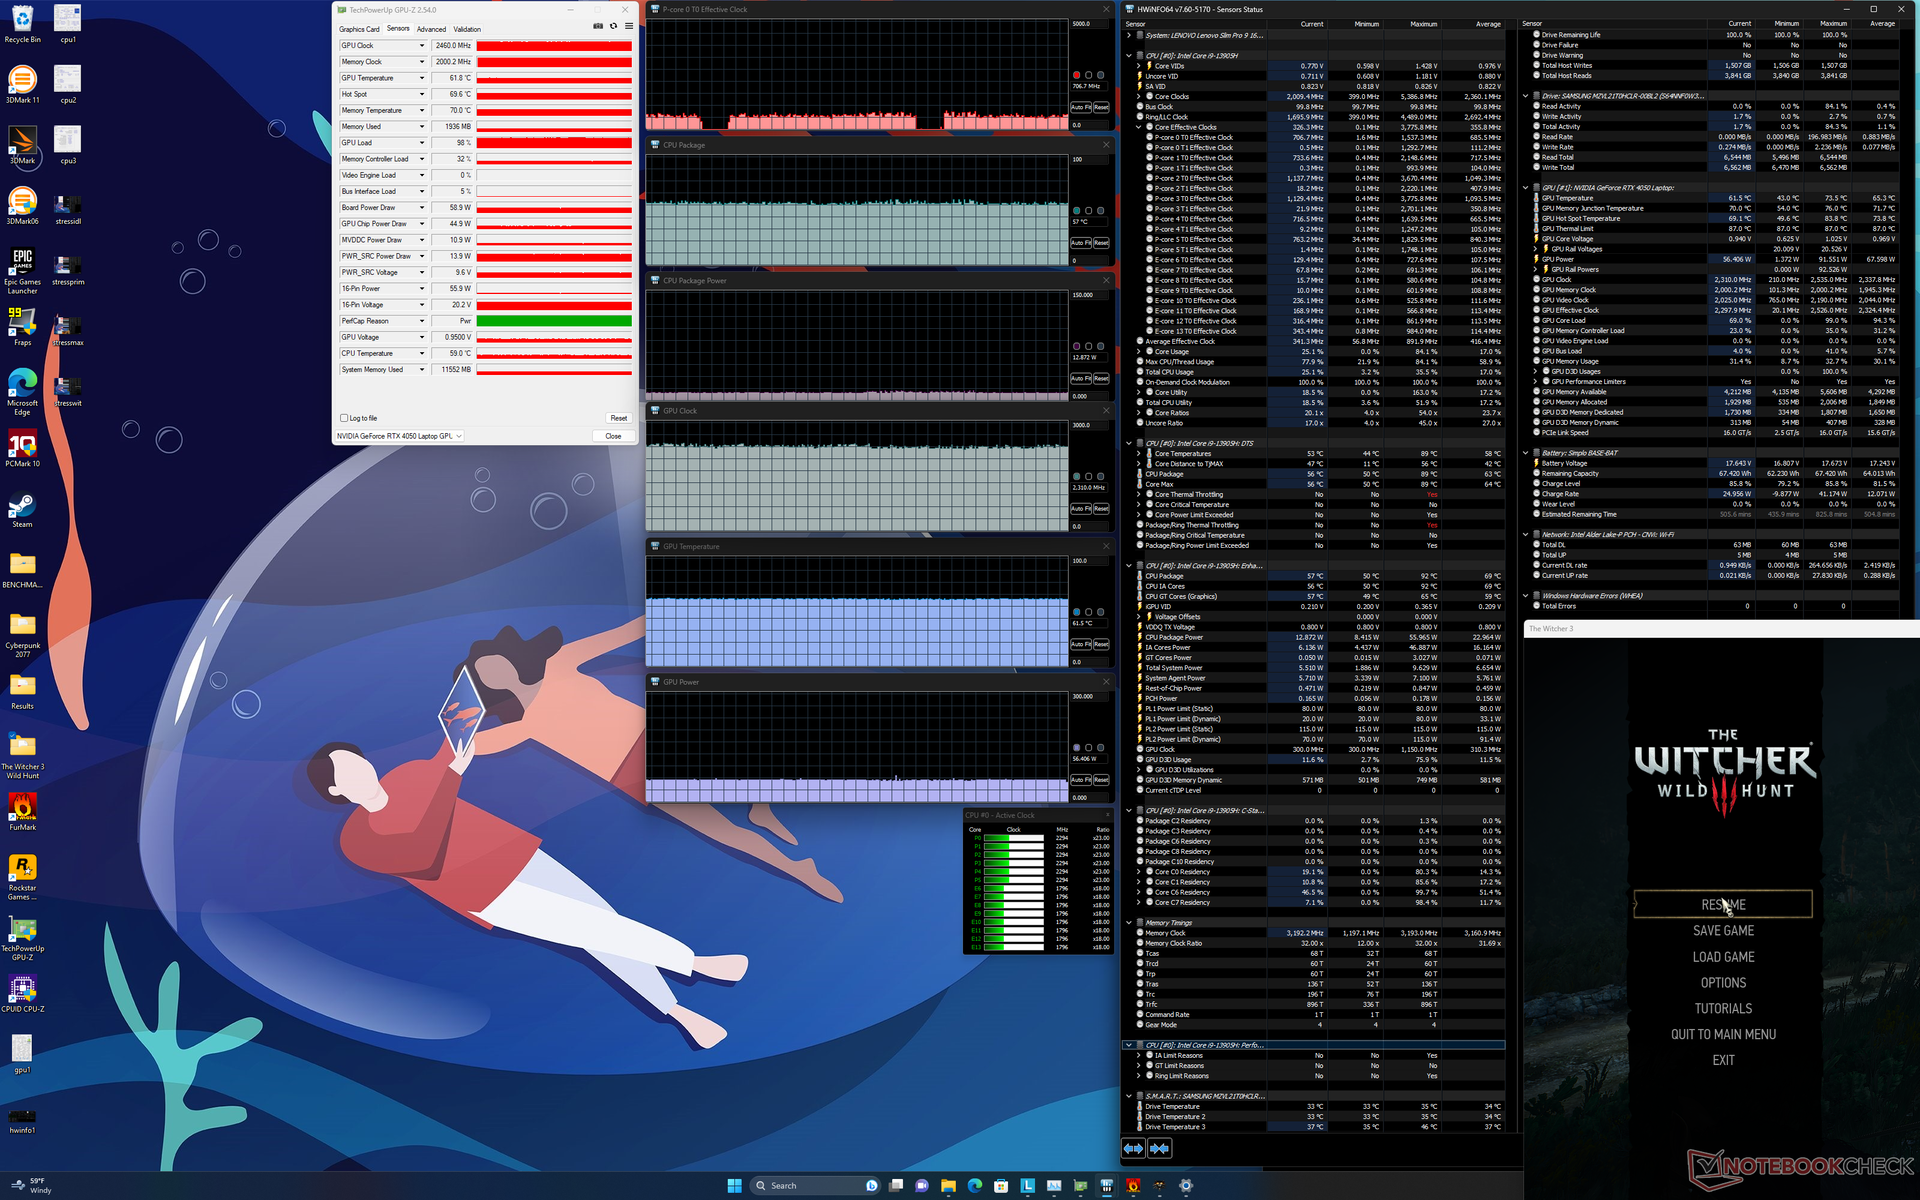
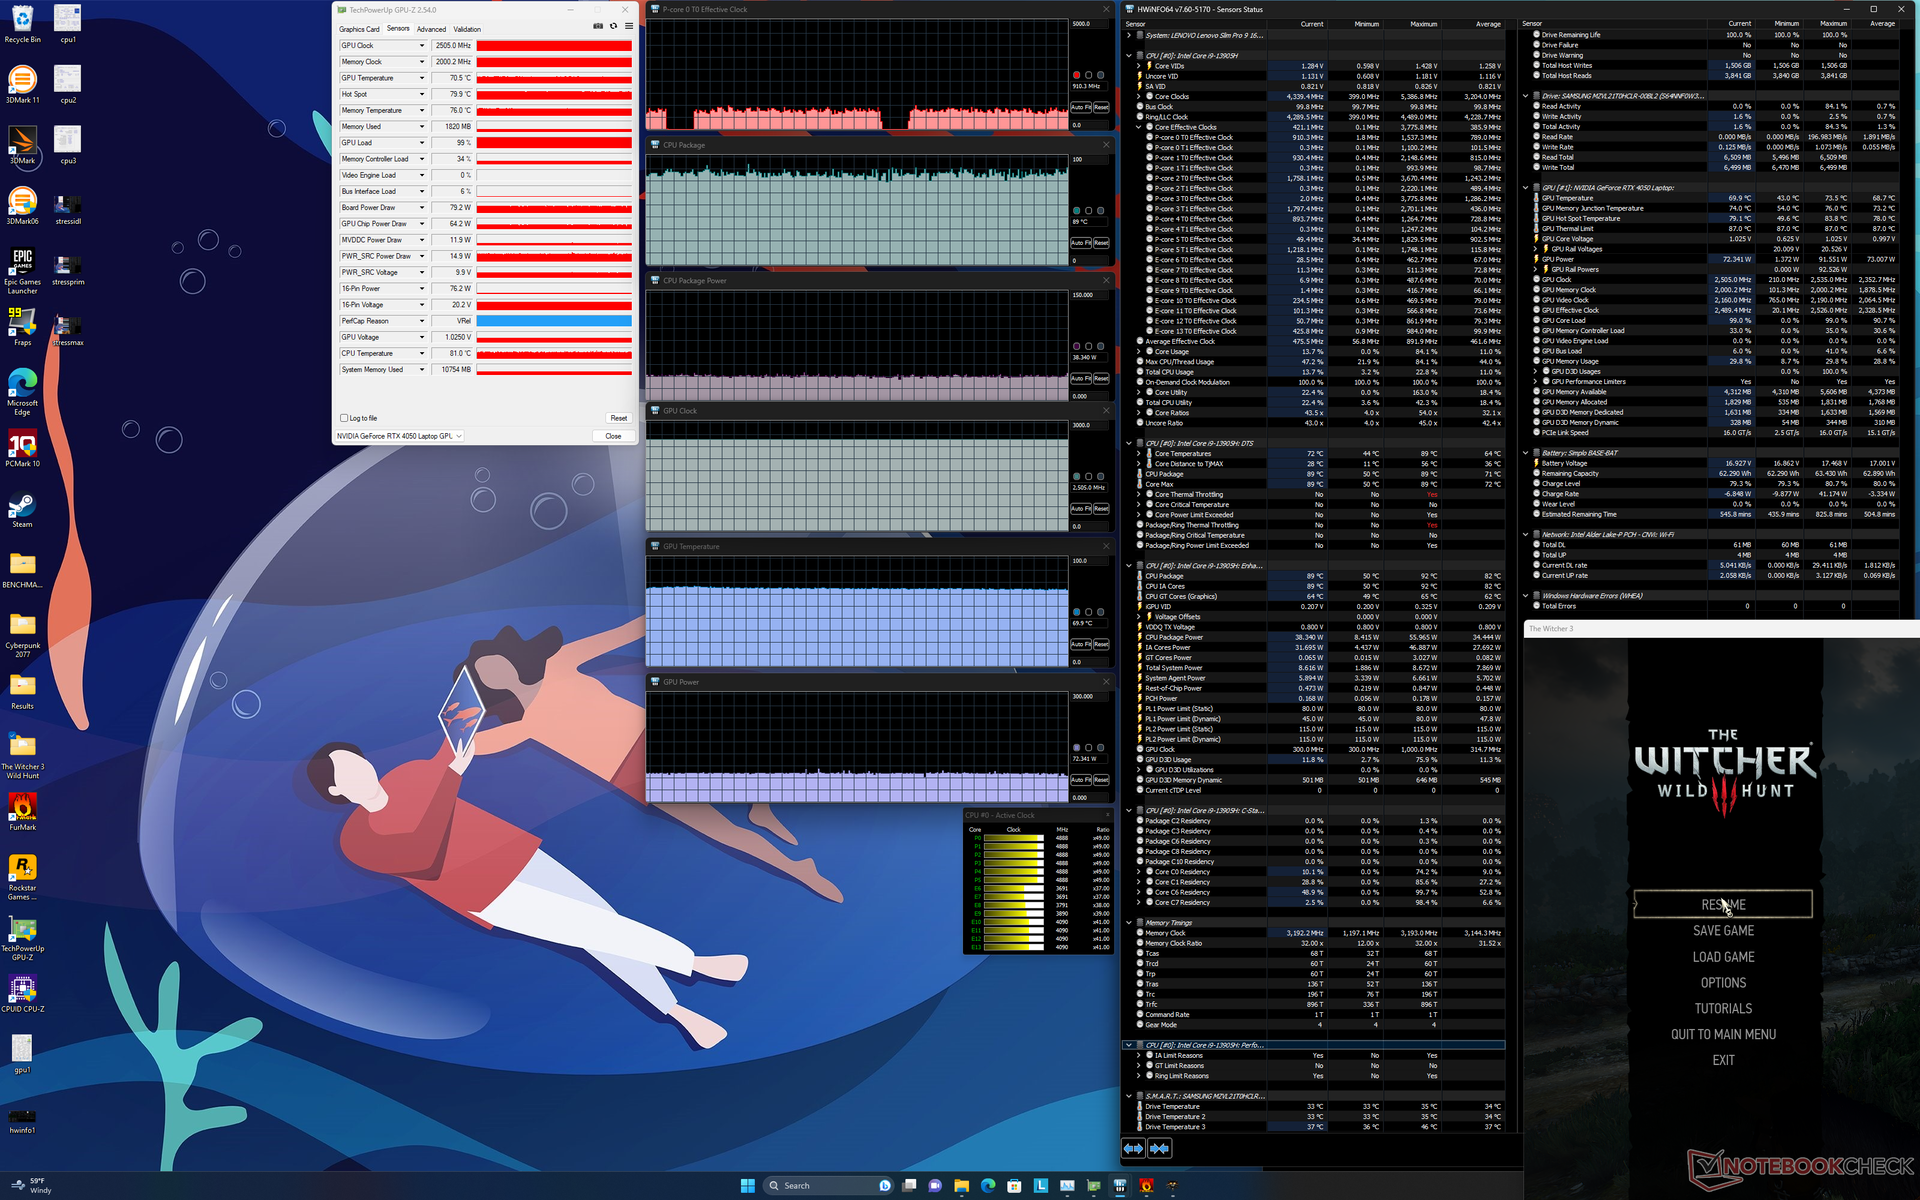
| Horloge du CPU (GHz) | Horloge du GPU (MHz) | Température moyenne du CPU (°C) | Température moyenne du GPU (°C) | |
| Système au repos | -- | -- | 38 | 32 |
| Prime95 Stress | ~3.0 | -- | 82 | 50 |
| Prime95 + FurMark Stress | ~2.4 | 2265 | 77 | 77 |
| Witcher 3 Stress(mode Performance) | ~0,9 | 2505 | 89 | 70 |
| Witcher 3 Stress (mode équilibré) | ~0,7 | 2460 | 57 | 62 |
Intervenants
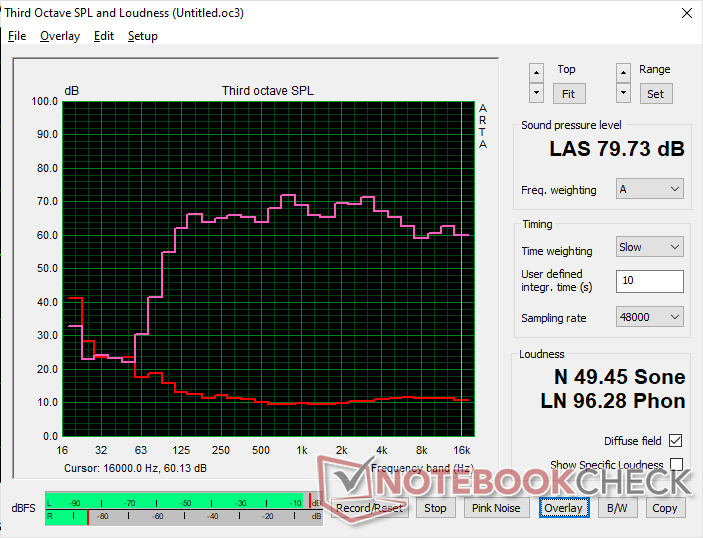
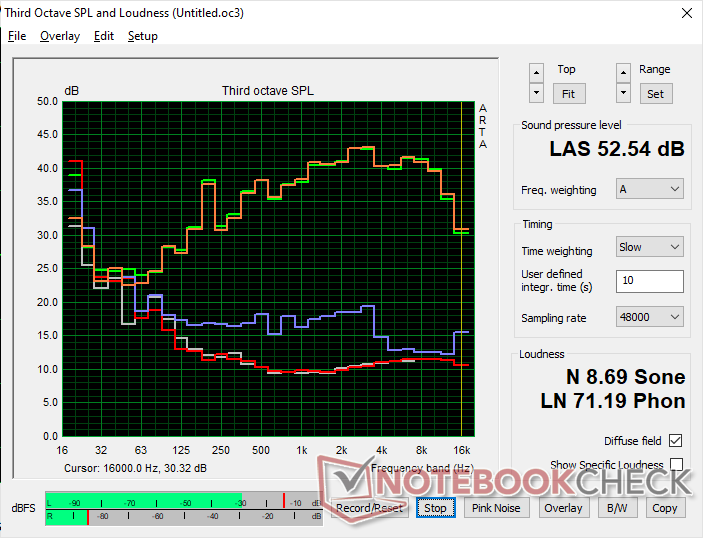
Lenovo Slim Pro 9i 16IRP8 analyse audio
(±) | le niveau sonore du haut-parleur est moyen mais bon (79.7# dB)
Basses 100 - 315 Hz
(+) | bonne basse - seulement 2.8% loin de la médiane
(±) | la linéarité des basses est moyenne (8.9% delta à la fréquence précédente)
Médiums 400 - 2000 Hz
(+) | médiane équilibrée - seulement 2.4% de la médiane
(+) | les médiums sont linéaires (4.9% delta à la fréquence précédente)
Aiguës 2 - 16 kHz
(+) | des sommets équilibrés - à seulement 3.6% de la médiane
(+) | les aigus sont linéaires (4.3% delta à la fréquence précédente)
Globalement 100 - 16 000 Hz
(+) | le son global est linéaire (7.3% différence à la médiane)
Par rapport à la même classe
» 6% de tous les appareils testés de cette catégorie étaient meilleurs, 1% similaires, 94% pires
» Le meilleur avait un delta de 5%, la moyenne était de 17%, le pire était de 45%.
Par rapport à tous les appareils testés
» 1% de tous les appareils testés étaient meilleurs, 0% similaires, 99% pires
» Le meilleur avait un delta de 4%, la moyenne était de 23%, le pire était de 134%.
Apple MacBook Pro 16 2021 M1 Pro analyse audio
(+) | les haut-parleurs peuvent jouer relativement fort (84.7# dB)
Basses 100 - 315 Hz
(+) | bonne basse - seulement 3.8% loin de la médiane
(+) | les basses sont linéaires (5.2% delta à la fréquence précédente)
Médiums 400 - 2000 Hz
(+) | médiane équilibrée - seulement 1.3% de la médiane
(+) | les médiums sont linéaires (2.1% delta à la fréquence précédente)
Aiguës 2 - 16 kHz
(+) | des sommets équilibrés - à seulement 1.9% de la médiane
(+) | les aigus sont linéaires (2.7% delta à la fréquence précédente)
Globalement 100 - 16 000 Hz
(+) | le son global est linéaire (4.6% différence à la médiane)
Par rapport à la même classe
» 0% de tous les appareils testés de cette catégorie étaient meilleurs, 0% similaires, 100% pires
» Le meilleur avait un delta de 5%, la moyenne était de 17%, le pire était de 45%.
Par rapport à tous les appareils testés
» 0% de tous les appareils testés étaient meilleurs, 0% similaires, 100% pires
» Le meilleur avait un delta de 4%, la moyenne était de 23%, le pire était de 134%.
Gestion de l'énergie
Consommation électrique
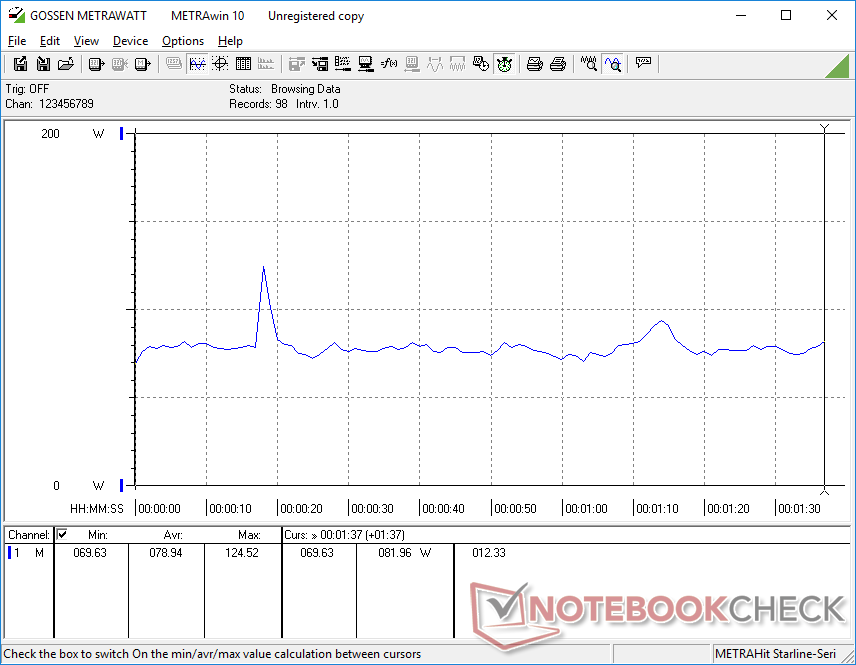
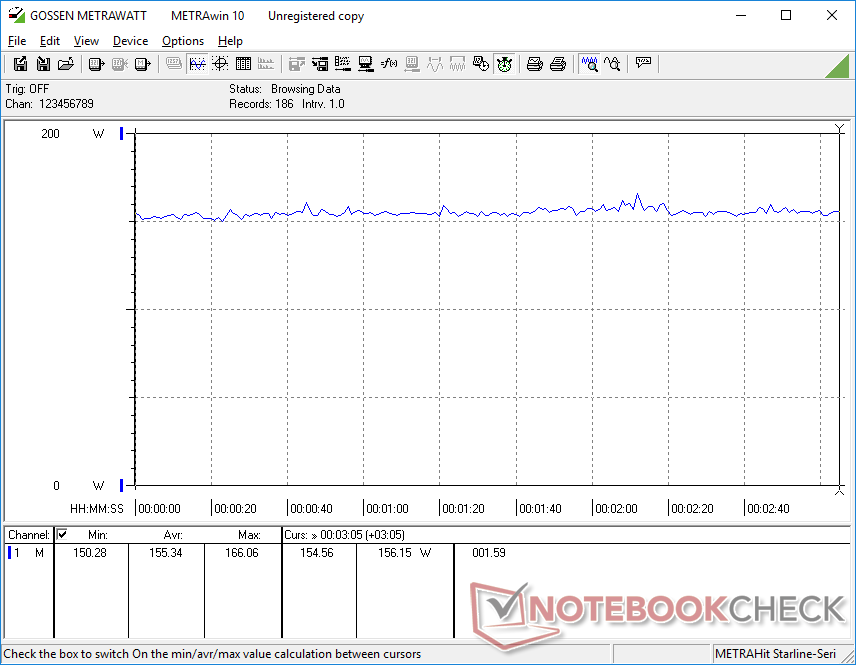
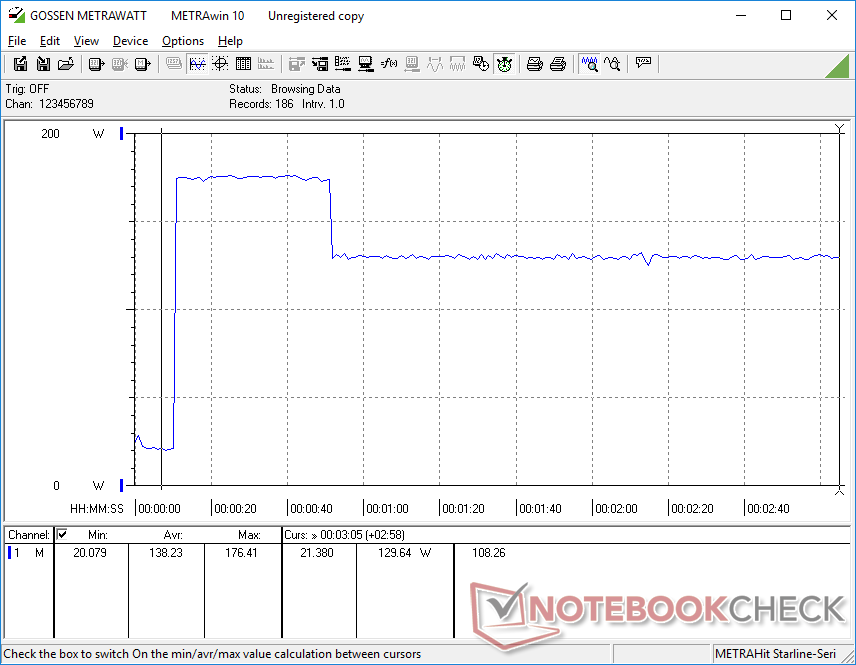
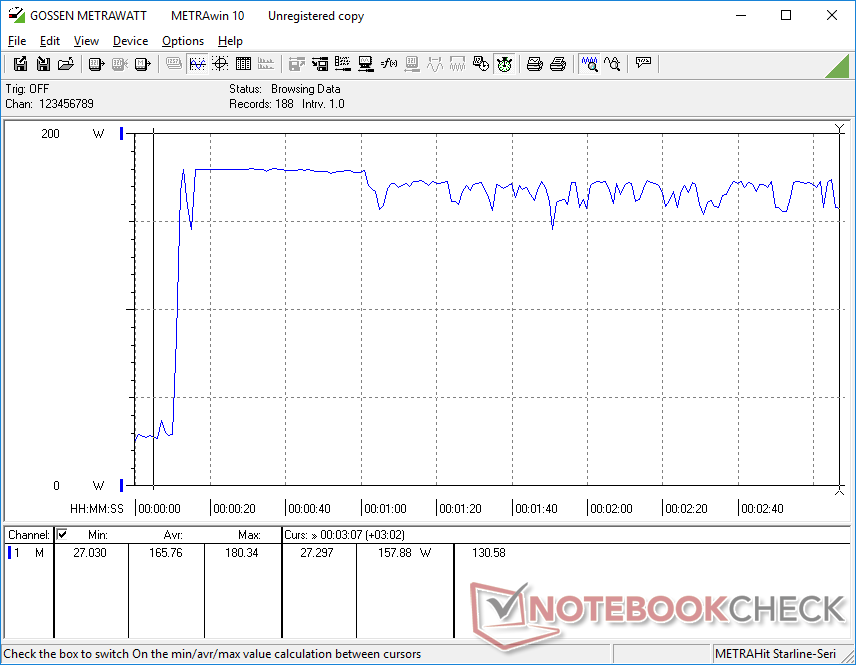
La consommation d'énergie peut varier de 16 W en réglage de luminosité minimum avec l'iGPU actif à 30 W en affichage d'une image entièrement blanche en réglage de luminosité maximum avec le dGPU actif. Il est donc recommandé d'être plus attentif aux paramètres de luminosité et aux couleurs si l'autonomie de la batterie est une préoccupation, comme c'est le cas pour les panneaux OLED.
La consommation d'énergie dans les jeux est presque identique à celle que nous avons enregistrée sur le Yoga Pro 9i, même si ce dernier offre des performances graphiques jusqu'à 20 % plus élevées. Les configurations RTX 4050 et RTX 4060 visent 100 W TGP chacune, ce qui expliquerait leurs niveaux de consommation similaires lorsque le GPU est en charge.
Notre Core i9-13905H atteint des pics légèrement plus élevés que le Core i7-13705H lors du lancement de Prime95 avant de se stabiliser à des niveaux similaires.
| Éteint/en veille | |
| Au repos | |
| Fortement sollicité |
|
Légende:
min: | |
| Lenovo Slim Pro 9i 16IRP8 i9-13905H, GeForce RTX 4050 Laptop GPU, Samsung PM9A1 MZVL21T0HCLR, Mini-LED, 3200x2000, 16" | Lenovo Yoga Pro 9 16-IRP G8 i7-13705H, GeForce RTX 4060 Laptop GPU, Samsung PM9A1 MZVL21T0HCLR, Mini-LED, 3200x2000, 16" | Asus VivoBook Pro 16 i7-12700H, GeForce RTX 3050 Ti Laptop GPU, Intel SSD 670p SSDPEKNU010TZ, IPS, 2560x1600, 16" | Acer Swift Edge SFE16-42-R1GM R7 7735U, Radeon 680M, Micron 3400 1TB MTFDKBA1T0TFH, OLED, 3840x2400, 16" | Dell Inspiron 16 Plus 7620 i7-12700H, GeForce RTX 3050 Ti Laptop GPU, Kioxia BG5 KBG50ZNS512G, IPS, 3072x1920, 16" | HP Envy 16 h0112nr i7-12700H, GeForce RTX 3060 Laptop GPU, Micron 3400 1TB MTFDKBA1T0TFH, OLED, 3840x2400, 16" | |
|---|---|---|---|---|---|---|
| Power Consumption | 12% | 22% | 61% | 29% | 10% | |
| Idle Minimum * (Watt) | 16 | 10.9 32% | 8.7 46% | 8.6 46% | 6.8 57% | 10 37% |
| Idle Average * (Watt) | 30 | 22.6 25% | 13.1 56% | 7.7 74% | 9.6 68% | 10.9 64% |
| Idle Maximum * (Watt) | 30.4 | 23.5 23% | 18.3 40% | 9.3 69% | 17 44% | 27.8 9% |
| Load Average * (Watt) | 78.9 | 84.6 -7% | 116 -47% | 47.9 39% | 117.5 -49% | 116.4 -48% |
| Witcher 3 ultra * (Watt) | 155.3 | 159.5 -3% | 117.6 24% | 46.3 70% | 113.1 27% | 133.7 14% |
| Load Maximum * (Watt) | 180.4 | 177.3 2% | 162 10% | 56 69% | 137.4 24% | 209.8 -16% |
* ... Moindre est la valeur, meilleures sont les performances
Power Consumption Witcher 3 / Stresstest
Power Consumption external Monitor
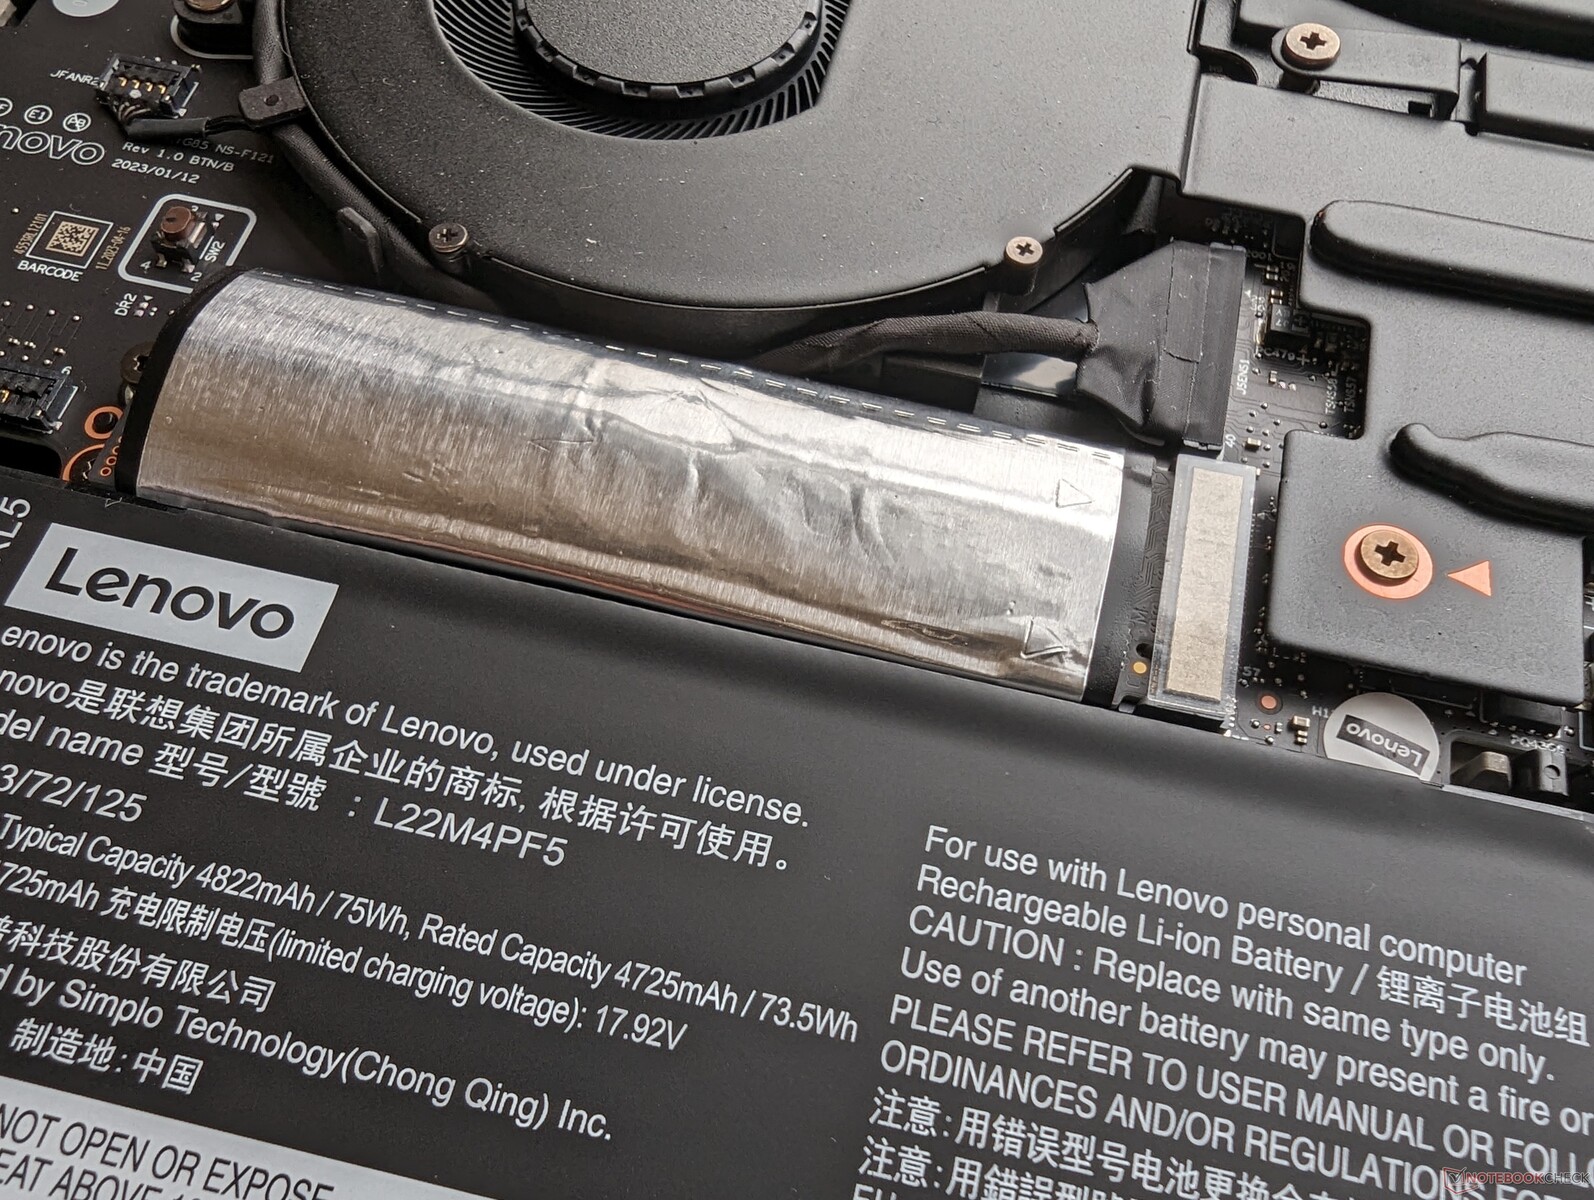
Autonomie de la batterie
Les durées d'utilisation sont essentiellement identiques à celles que nous avons enregistrées sur le Yoga Pro 9 16, soit environ 6,5 heures de navigation dans le monde réel. Le chargement de la batterie de la position vide à la position pleine prend environ 90 minutes, même si la fonction de charge rapide est activée.
La charge de la batterie peut diminuer en cas d'utilisation intensive, même lorsque l'ordinateur est branché sur le secteur. Pendant notre test Prime95 et FurMark d'une durée d'une heure, par exemple, la charge de la batterie passait de 100 % à 79 %, ce qui indique que le modèle aurait pu bénéficier d'un adaptateur secteur de plus grande capacité.
Certains adaptateurs USB-C peuvent charger le système. Notre adaptateur USB-C Dell XPS 15 de 130 W, par exemple, semble incompatible alors que l'adaptateur USB-C Lenovo de 140 W fonctionnerait sans problème.
| Lenovo Slim Pro 9i 16IRP8 i9-13905H, GeForce RTX 4050 Laptop GPU, 75 Wh | Lenovo Yoga Pro 9 16-IRP G8 i7-13705H, GeForce RTX 4060 Laptop GPU, 75 Wh | Asus VivoBook Pro 16 i7-12700H, GeForce RTX 3050 Ti Laptop GPU, 70 Wh | Acer Swift Edge SFE16-42-R1GM R7 7735U, Radeon 680M, 54 Wh | Dell Inspiron 16 Plus 7620 i7-12700H, GeForce RTX 3050 Ti Laptop GPU, 86 Wh | HP Envy 16 h0112nr i7-12700H, GeForce RTX 3060 Laptop GPU, 83 Wh | |
|---|---|---|---|---|---|---|
| Autonomie de la batterie | -3% | 11% | 11% | 45% | 20% | |
| WiFi v1.3 (h) | 6.6 | 6.4 -3% | 7.3 11% | 7.3 11% | 9.6 45% | 7.9 20% |
| H.264 (h) | 7.5 | 8.6 | ||||
| Load (h) | 0.7 | 1.5 | 1.2 | 1.6 | ||
| Reader / Idle (h) | 10.9 | 18.6 | 17.8 |
Points positifs
Points négatifs
Verdict - Le Core i7 avec GeForce RTX 4060 est la meilleure affaire
Il y a au moins deux configurations du Slim Pro 9i 16 disponibles en ce moment : une avec le Core i7-13705H et GeForce RTX 4060 et une avec le Core i9-13905H et GeForce RTX 4050. Les prix des deux étant très proches, l'option Core i7 avec RTX 4060 est fortement recommandée par rapport à l'option Core i9 avec RTX 4050 car le Core i7 a des performances presque identiques à celles du Core i9. En revanche, le passage de la RTX 4050 à la RTX 4060 apporte une amélioration plus importante et plus perceptible des performances graphiques.
La configuration Core i7 et GeForce RTX 4060 est la solution idéale pour ceux qui envisagent d'acquérir le Lenovo Slim Pro 9i 16.
Les autres aspects du modèle sont comparables à des alternatives comme leHP Envy 16 ou le MacBook Pro 16 depuis les nombreuses options de port jusqu'aux performances globales rapides, au poids réduit et aux dimensions raisonnables. Toutefois, vous ne bénéficierez pas de la mémoire vive extensible par l'utilisateur de l'Envy 16, ni de l'écran pré-calibré et de l'autonomie de batterie plus longue du MacBook Pro.
Prix et disponibilité
Lenovo commercialise désormais sa Slim Pro 9i 16 au prix de 2200 USD avec le modèle haut de gamme GeForce RTX 4060. Ce modèle est également disponible chez Best Buy.
Lenovo Slim Pro 9i 16IRP8
- 08/10/2023 v7 (old)
Allen Ngo
Transparency
La sélection des appareils à examiner est effectuée par notre équipe éditoriale. L'échantillon de test a été prêté à l'auteur par le fabricant ou le détaillant pour les besoins de cet examen. Le prêteur n'a pas eu d'influence sur cette évaluation et le fabricant n'a pas reçu de copie de cette évaluation avant sa publication. Il n'y avait aucune obligation de publier cet article. En tant que média indépendant, Notebookcheck n'est pas soumis à l'autorité des fabricants, des détaillants ou des éditeurs.
Voici comment Notebookcheck teste
Chaque année, Notebookcheck examine de manière indépendante des centaines d'ordinateurs portables et de smartphones en utilisant des procédures standardisées afin de garantir que tous les résultats sont comparables. Nous avons continuellement développé nos méthodes de test depuis environ 20 ans et avons établi des normes industrielles dans le processus. Dans nos laboratoires de test, des équipements de mesure de haute qualité sont utilisés par des techniciens et des rédacteurs expérimentés. Ces tests impliquent un processus de validation en plusieurs étapes. Notre système d'évaluation complexe repose sur des centaines de mesures et de points de référence bien fondés, ce qui garantit l'objectivité.Price comparison

