Test du MSI CreatorPro Z16P : station de travail mobile avec des problèmes de température
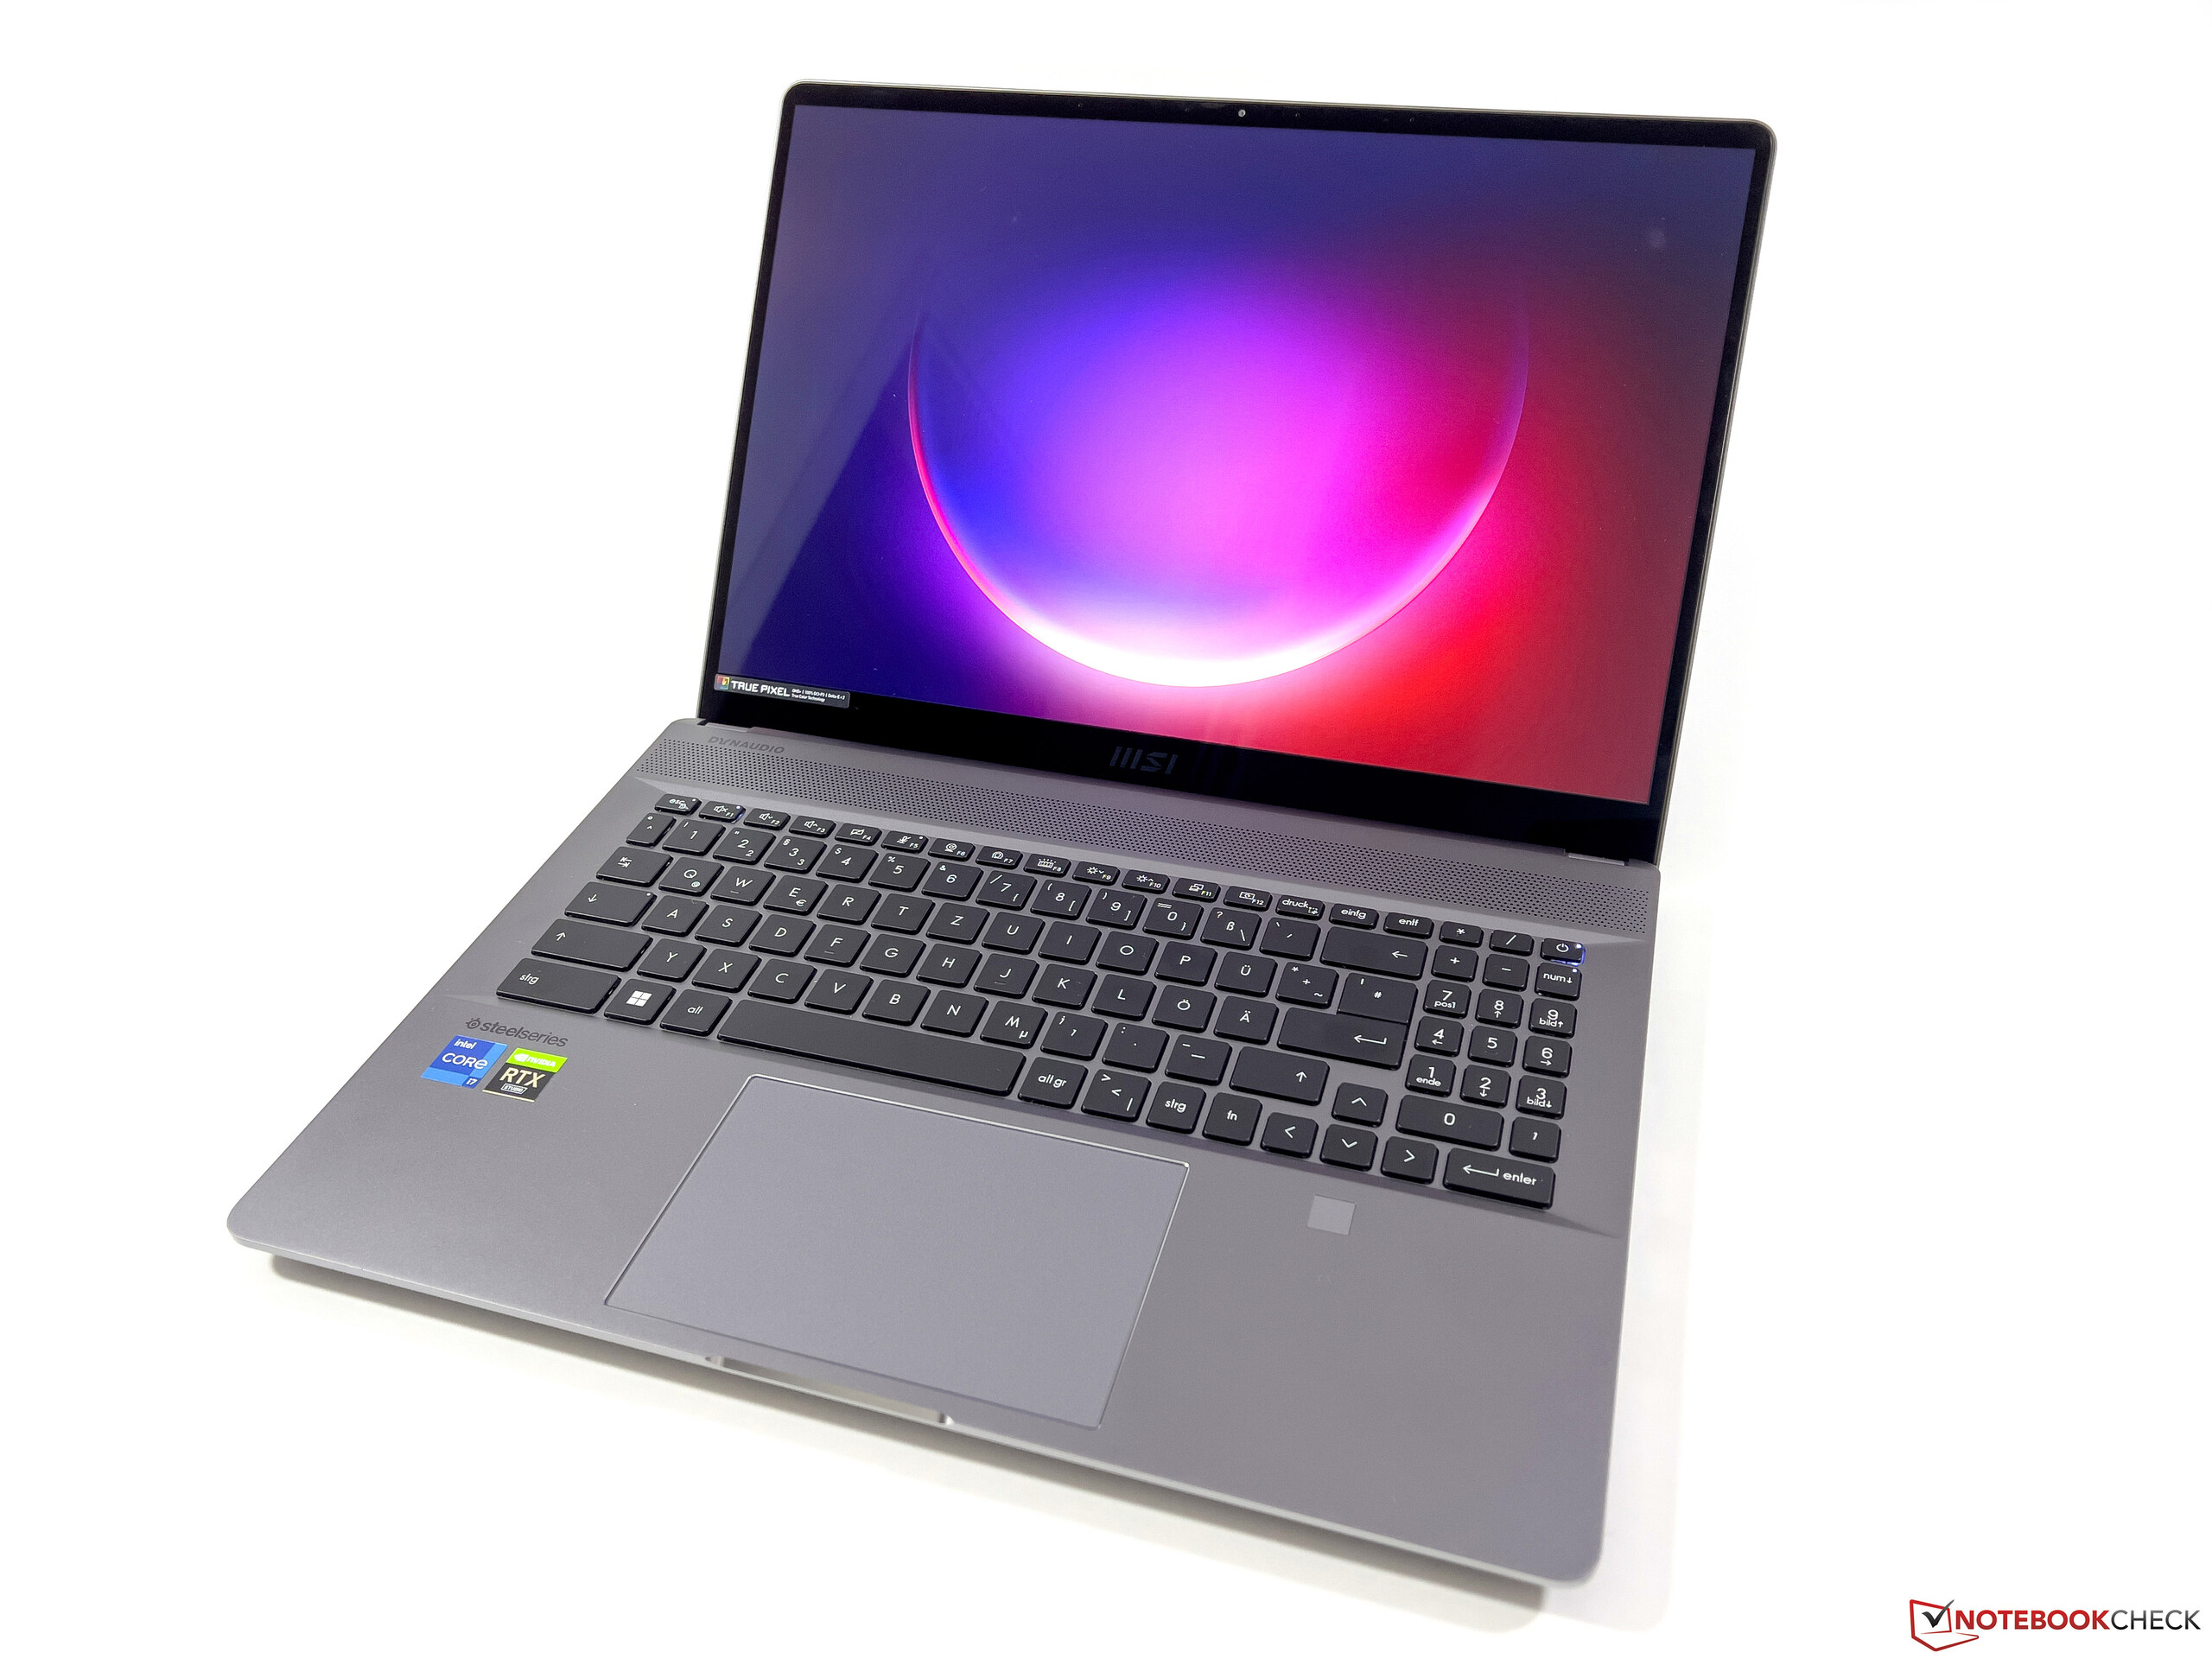
Nous avons déjà testé leCreator Z16P de MSIlargement, qui est un ordinateur portable mince de 16 pouces destiné aux créateurs de contenu. Cependant, le fabricant propose également l'appareil avec des GPU professionnels de Nvidia sous le nom de " CreatorPro Z16P ", que nous examinons aujourd'hui. Nous testons la configuration étiquetée " B12UKST-078 " pour 3 499 euros (~3 620 $), qui associe un Intel Core i7-12700Havec laNvidia RTX A3000. En outre, il y a 32 Go de RAM et un grand SSD de 1 To, ainsi qu'un écran IPS de 16 pouces avec une résolution WQHD et un taux de rafraîchissement de 165 Hz. Dans ce test, nous nous concentrons principalement sur les performances. Vous trouverez des informations détaillées sur le boîtier, l'équipement, les périphériques d'entrée et les haut-parleurs dans notre test du Creator Z16P :
Comparaison avec les concurrents potentiels
Note | Date | Modèle | Poids | Épaisseur | Taille | Résolution | Prix |
|---|---|---|---|---|---|---|---|
| 84.3 % v7 (old) | 11/22 | MSI CreatorPro Z16P B12UKST i7-12700H, RTX A3000 Laptop GPU | 2.4 kg | 19 mm | 16.00" | 2560x1600 | |
| 90.1 % v7 (old) | 11/22 | HP ZBook Studio 16 G9 62U04EA i7-12800H, RTX A2000 Laptop GPU | 1.8 kg | 19 mm | 16.00" | 3840x2400 | |
| 89.8 % v7 (old) | 11/21 | Lenovo ThinkPad P1 G4-20Y4S0KS00 i7-11850H, GeForce RTX 3070 Laptop GPU | 2 kg | 17.7 mm | 16.00" | 3840x2400 | |
| 88.3 % v7 (old) | 10/21 | Dell Precision 5000 5560 i7-11850H, RTX A2000 Laptop GPU | 2 kg | 18 mm | 15.60" | 3840x2400 | |
| 83.7 % v7 (old) | 06/22 | MSI Creator Z16P B12UHST i9-12900H, GeForce RTX 3080 Ti Laptop GPU | 2.4 kg | 20.4 mm | 16.00" | 2560x1600 |
Mallette, équipement et dispositifs d'entrée
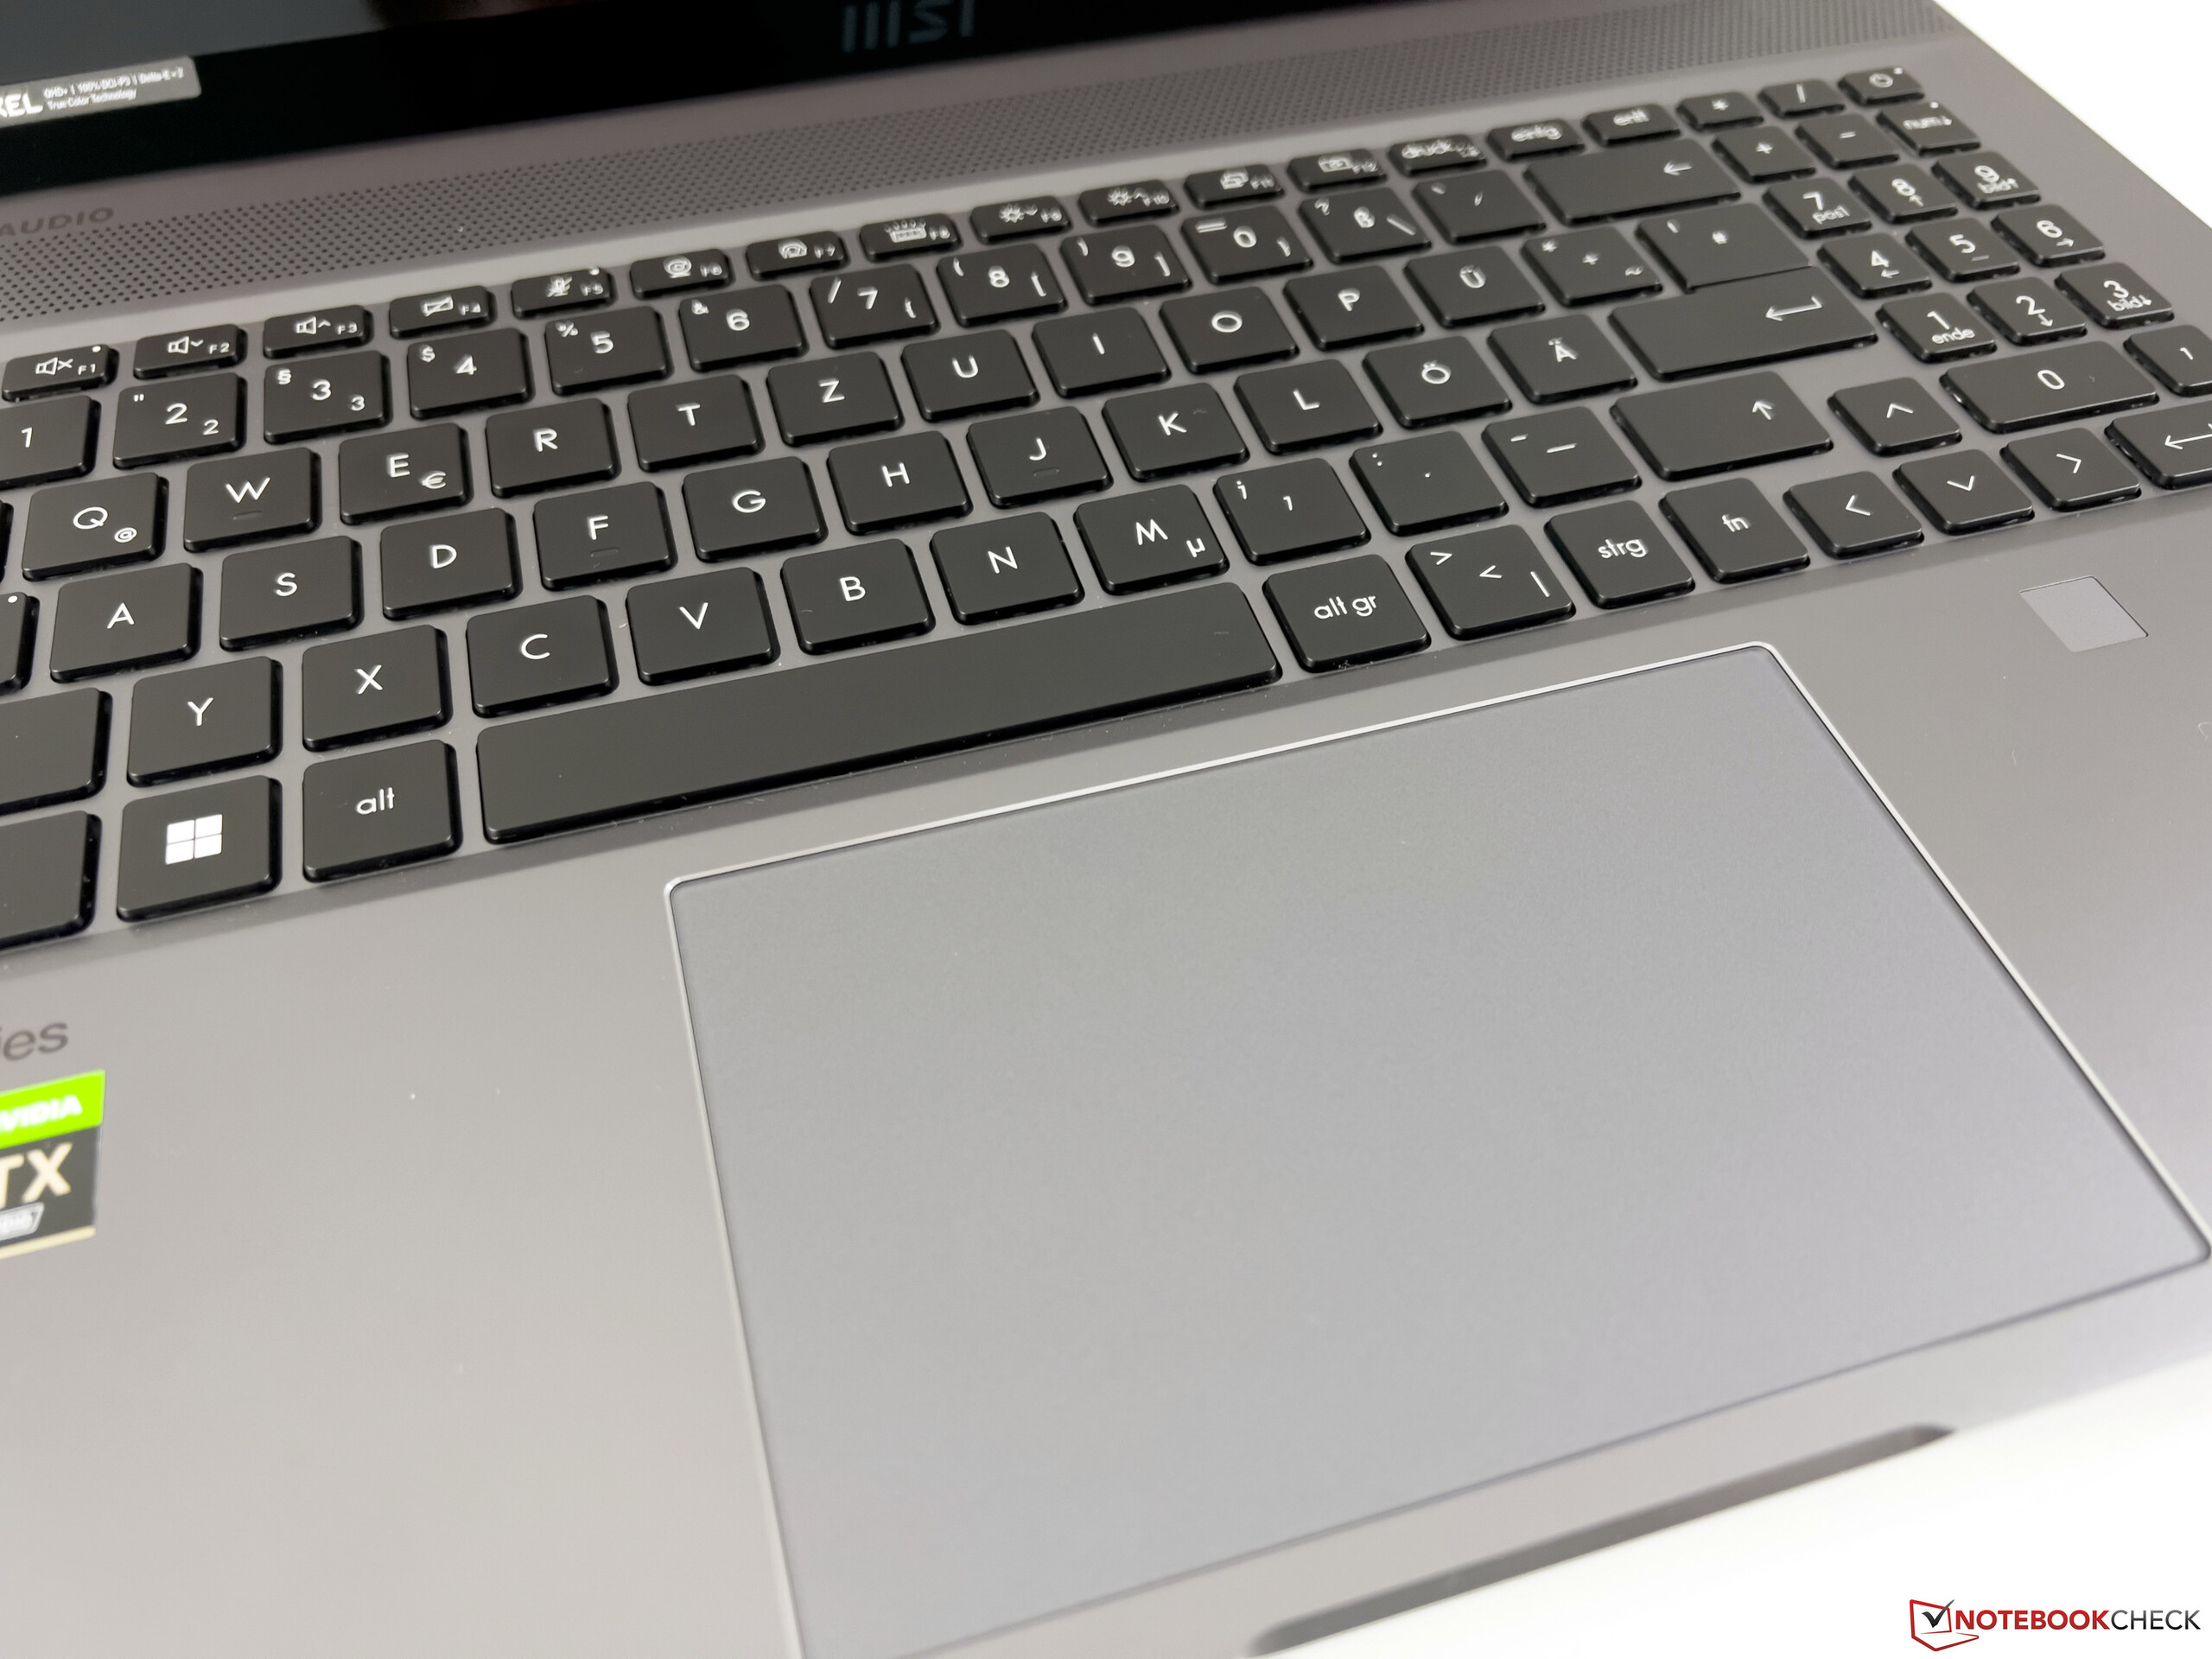
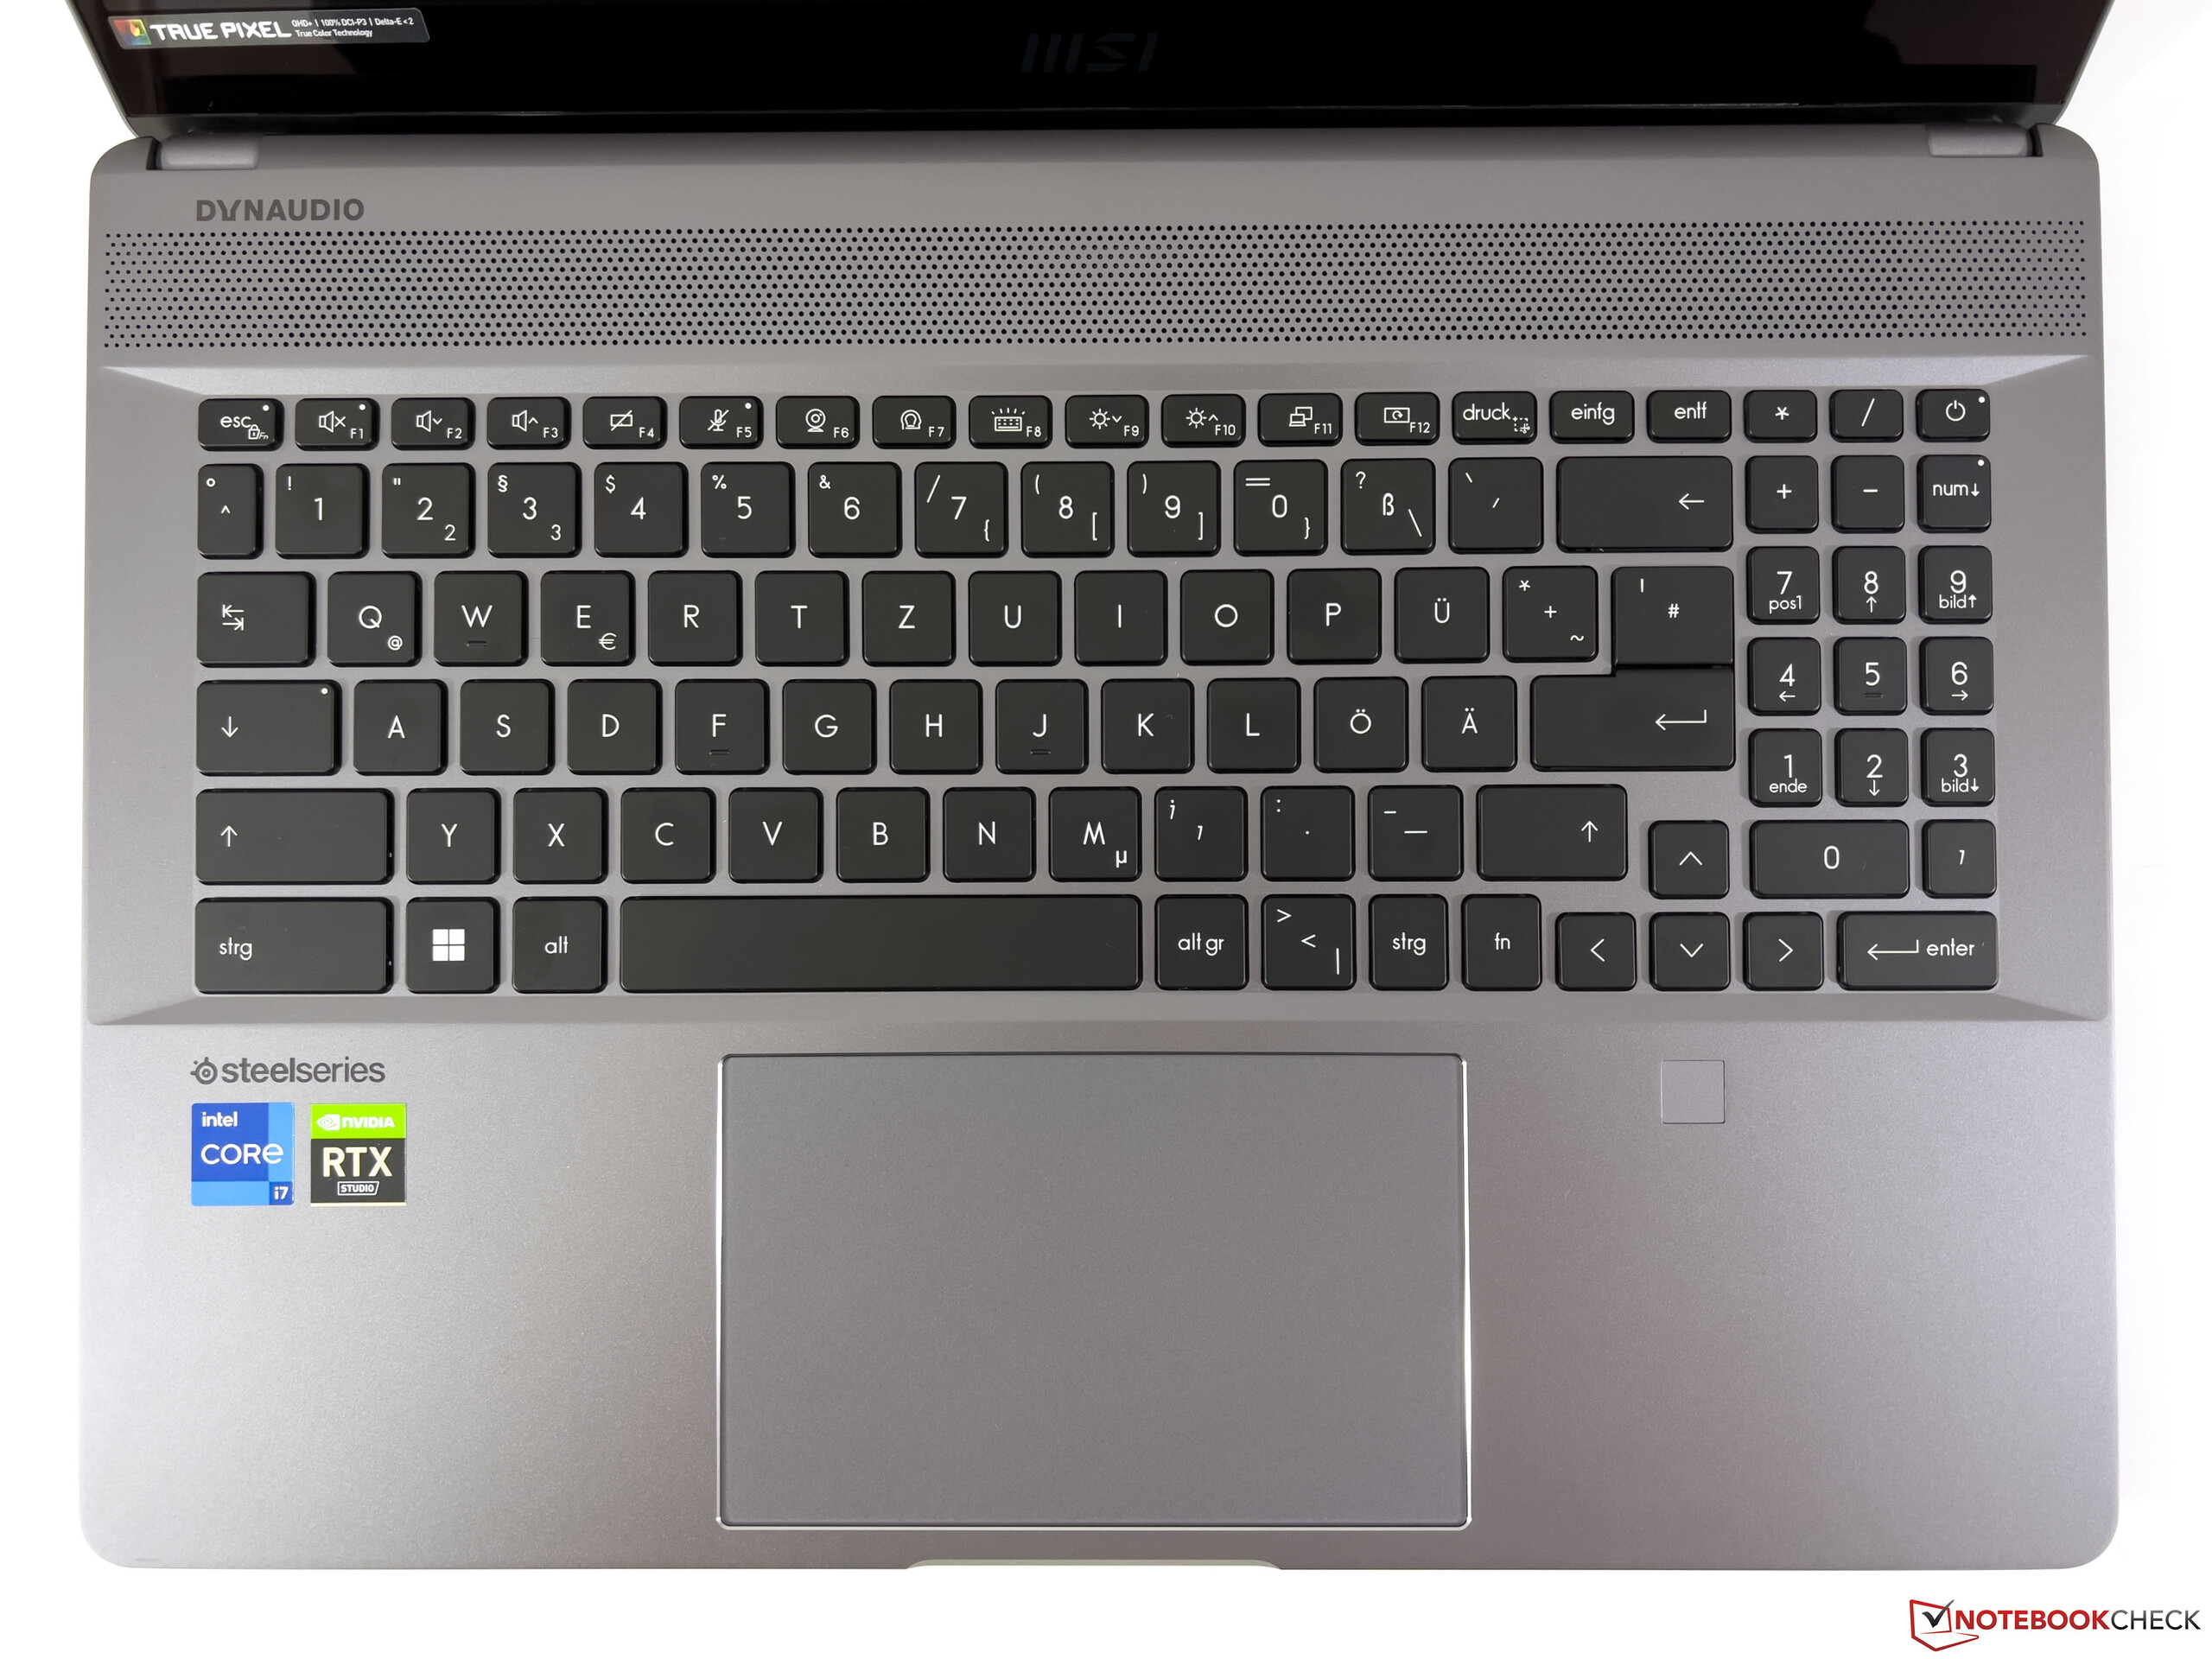
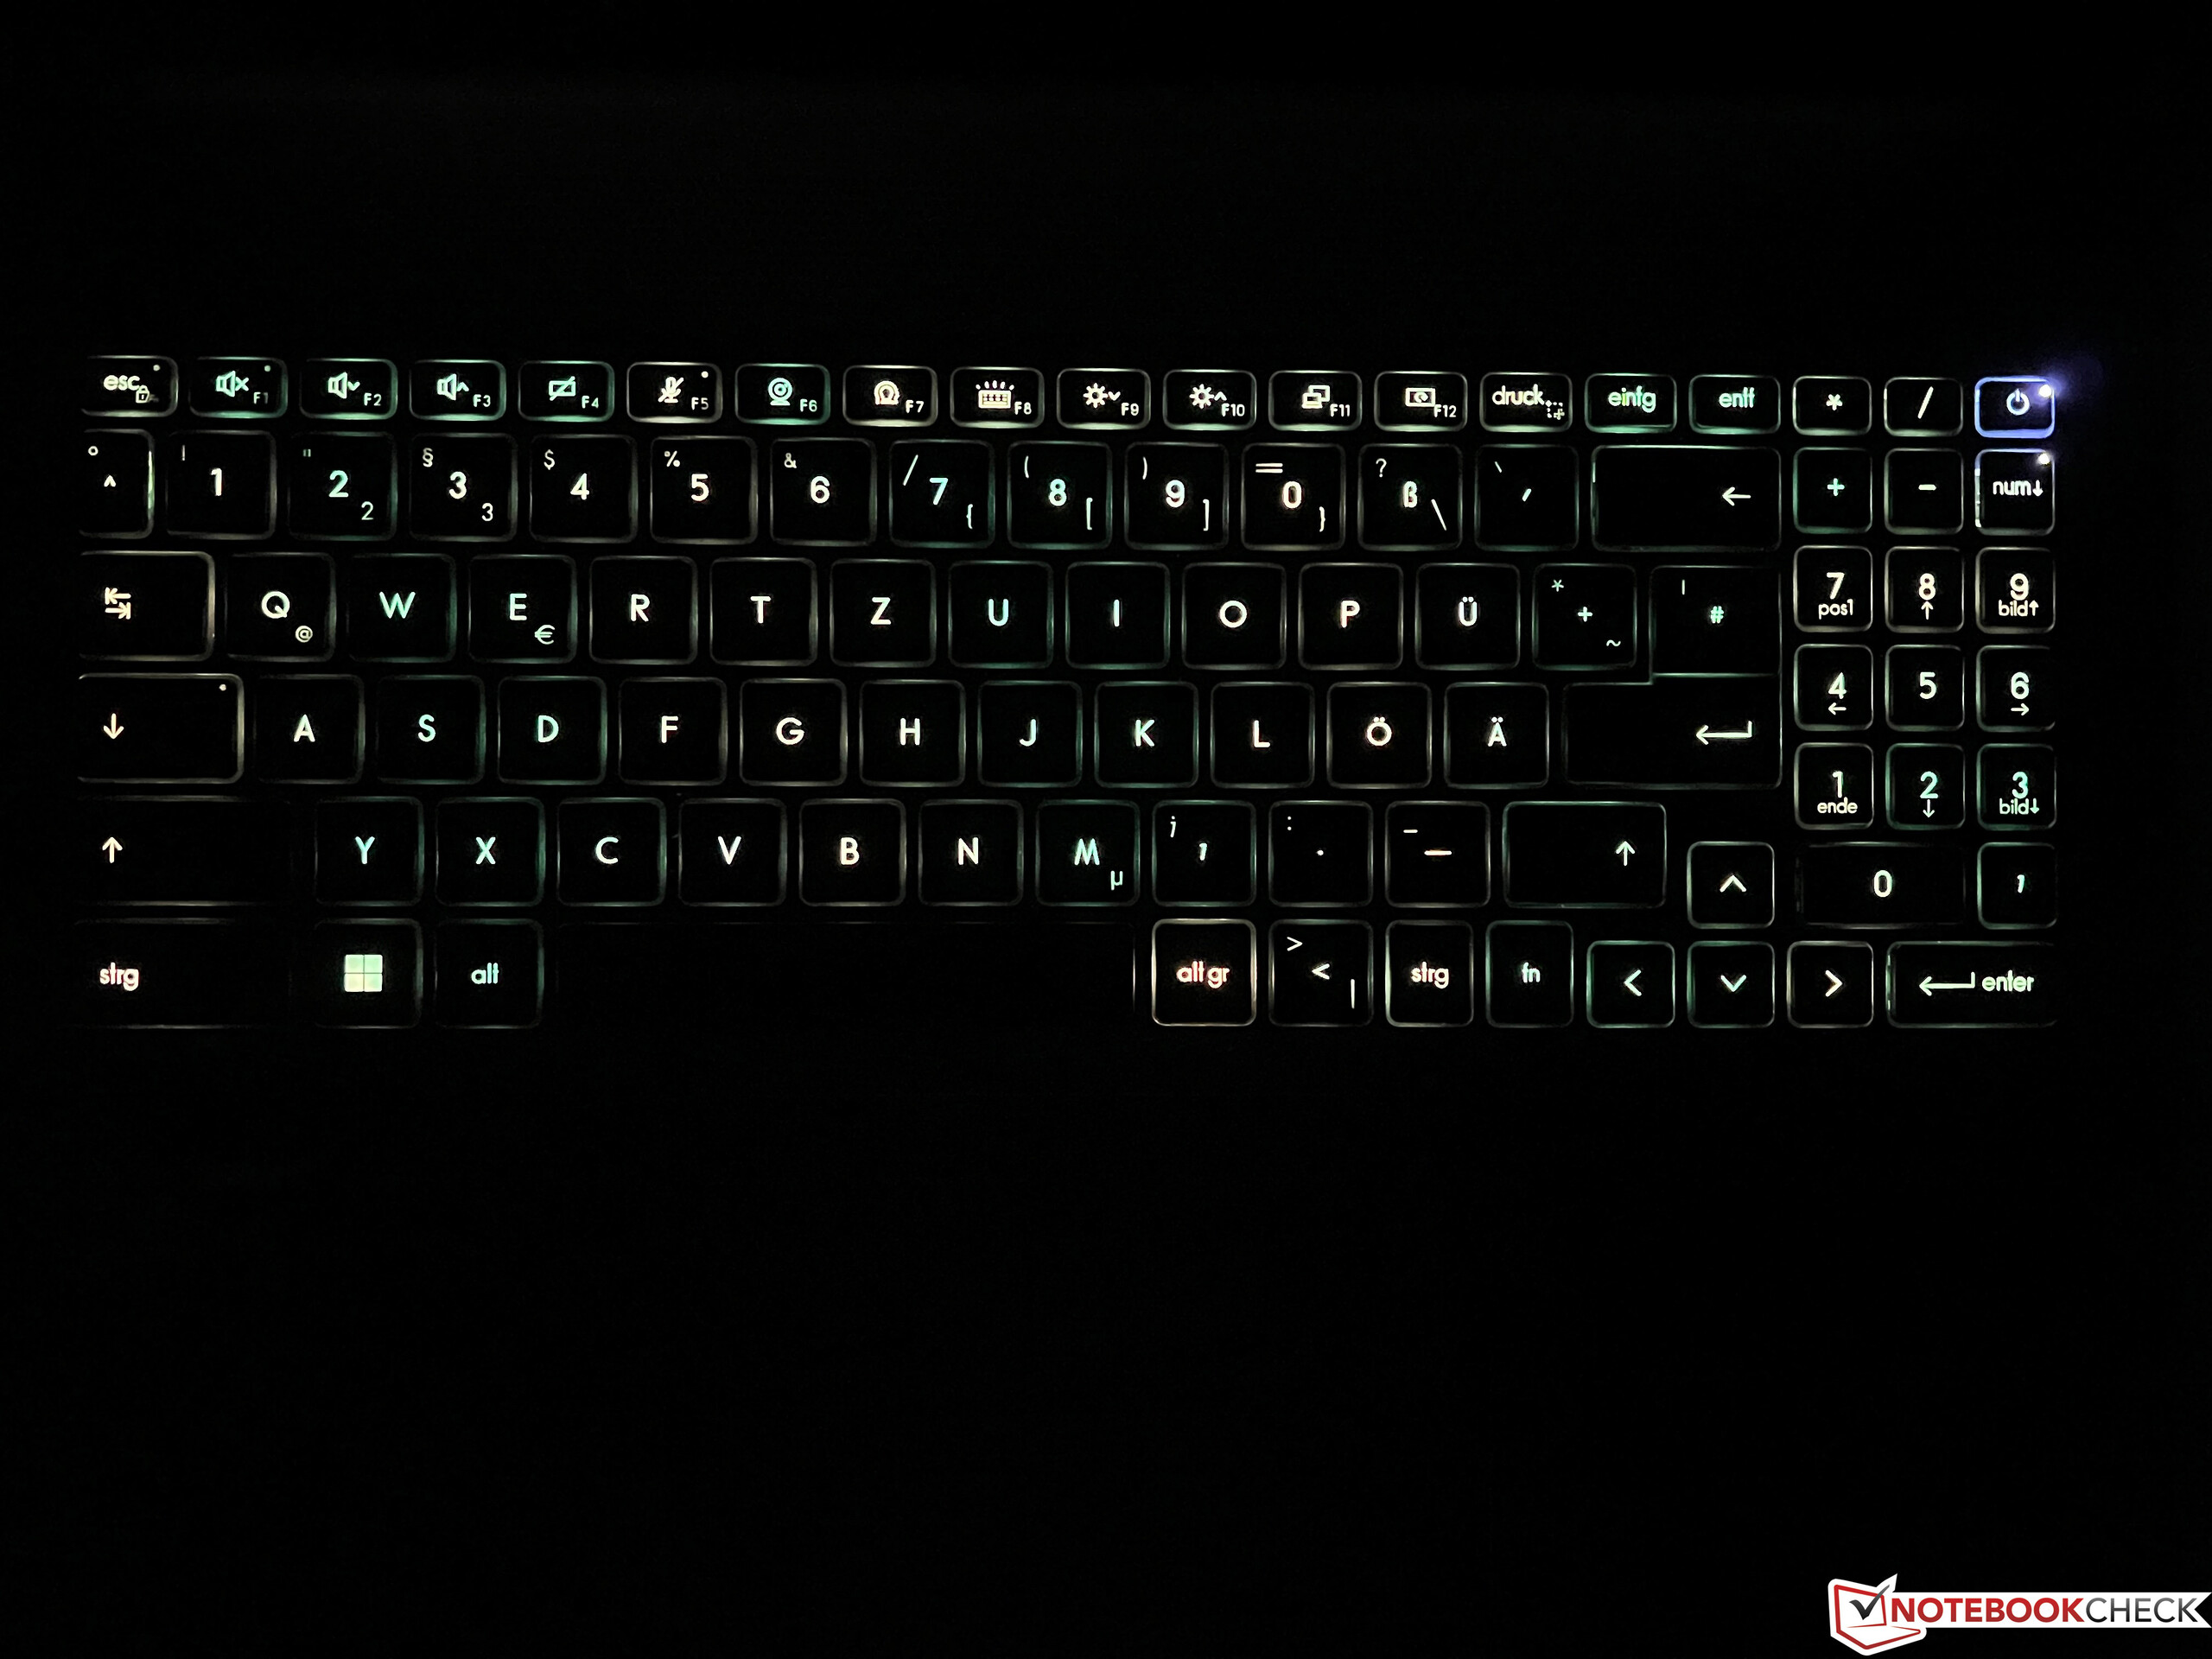
Le boîtier du CreatorPro Z16P ne diffère pas de celui du creator Z16P ordinairece qui inclut bien sûr les connexions et les périphériques d'entrée. Vous ne devriez pas rencontrer de problèmes avec le boîtier gris foncé (Lunar Gray), même au bureau, à condition de vous restreindre à l'éclairage du clavier, dont la couleur peut être configurée individuellement pour chaque touche. Le clavier lui-même offre une expérience de frappe très confortable et bénéficie d'une longue course des touches. À cet égard, le CreatorPro peut même rivaliser avec les bons ordinateurs portables professionnels. Le ClickPad fonctionne également sans aucun problème.
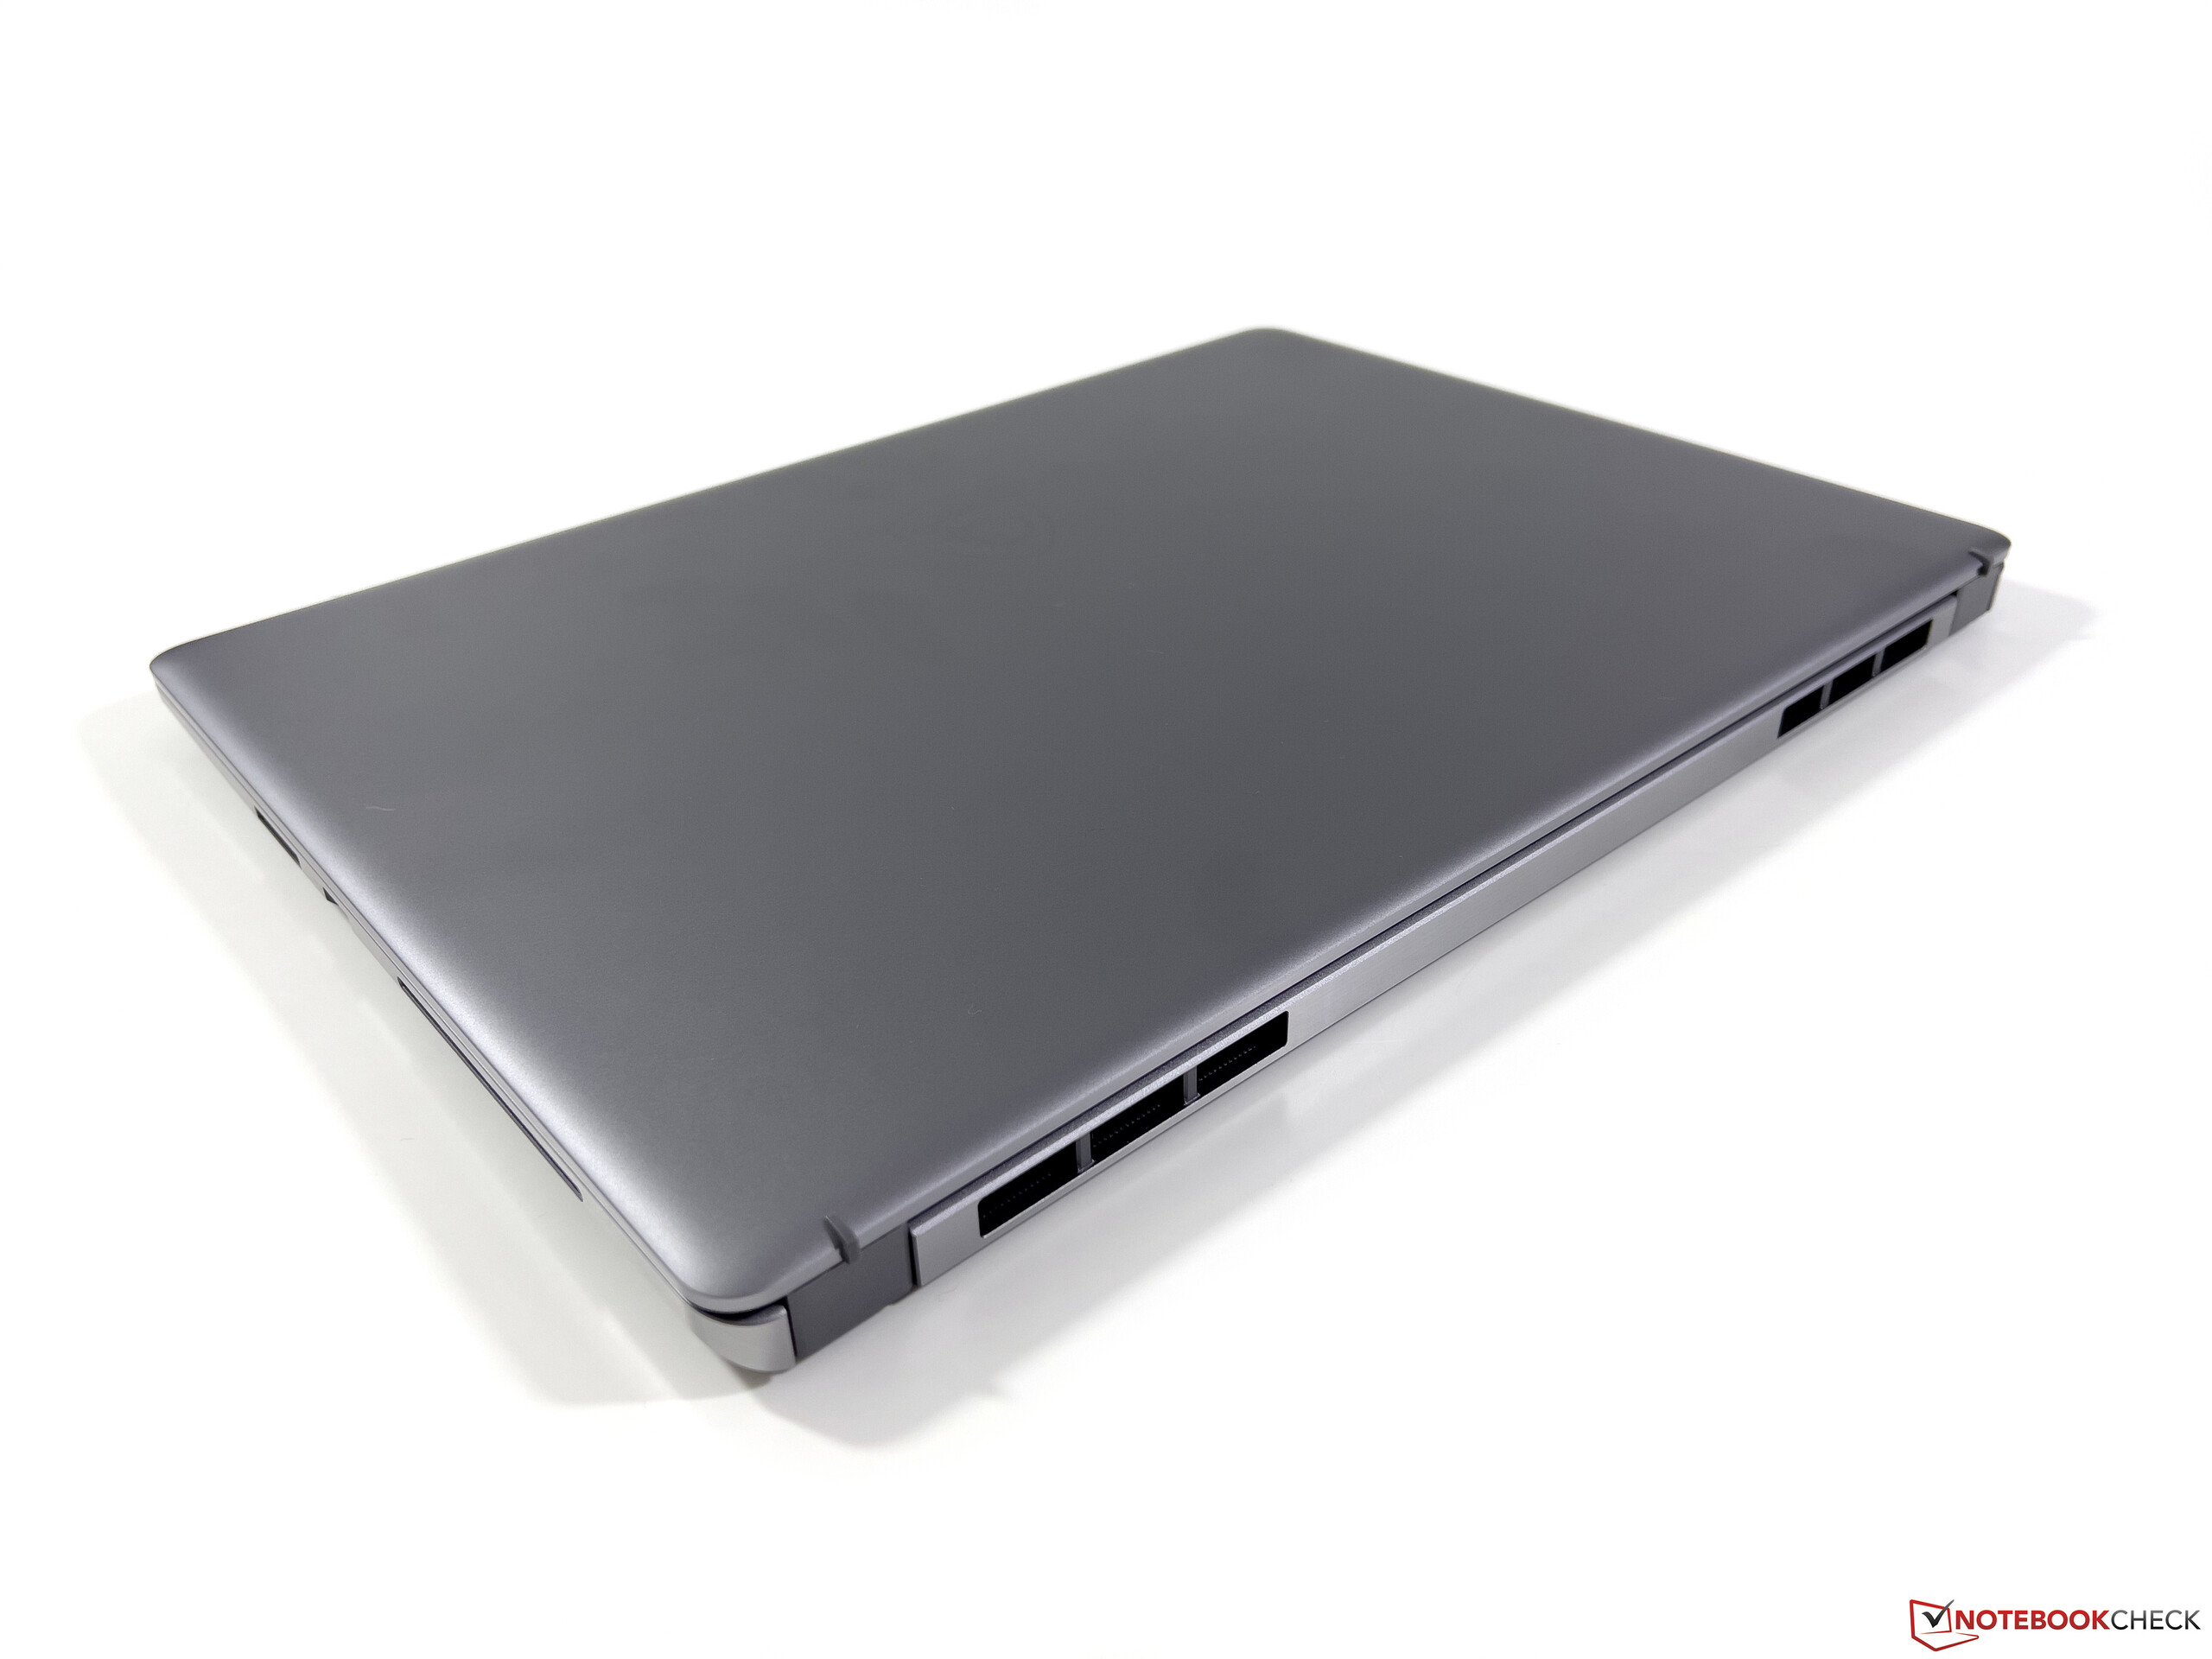
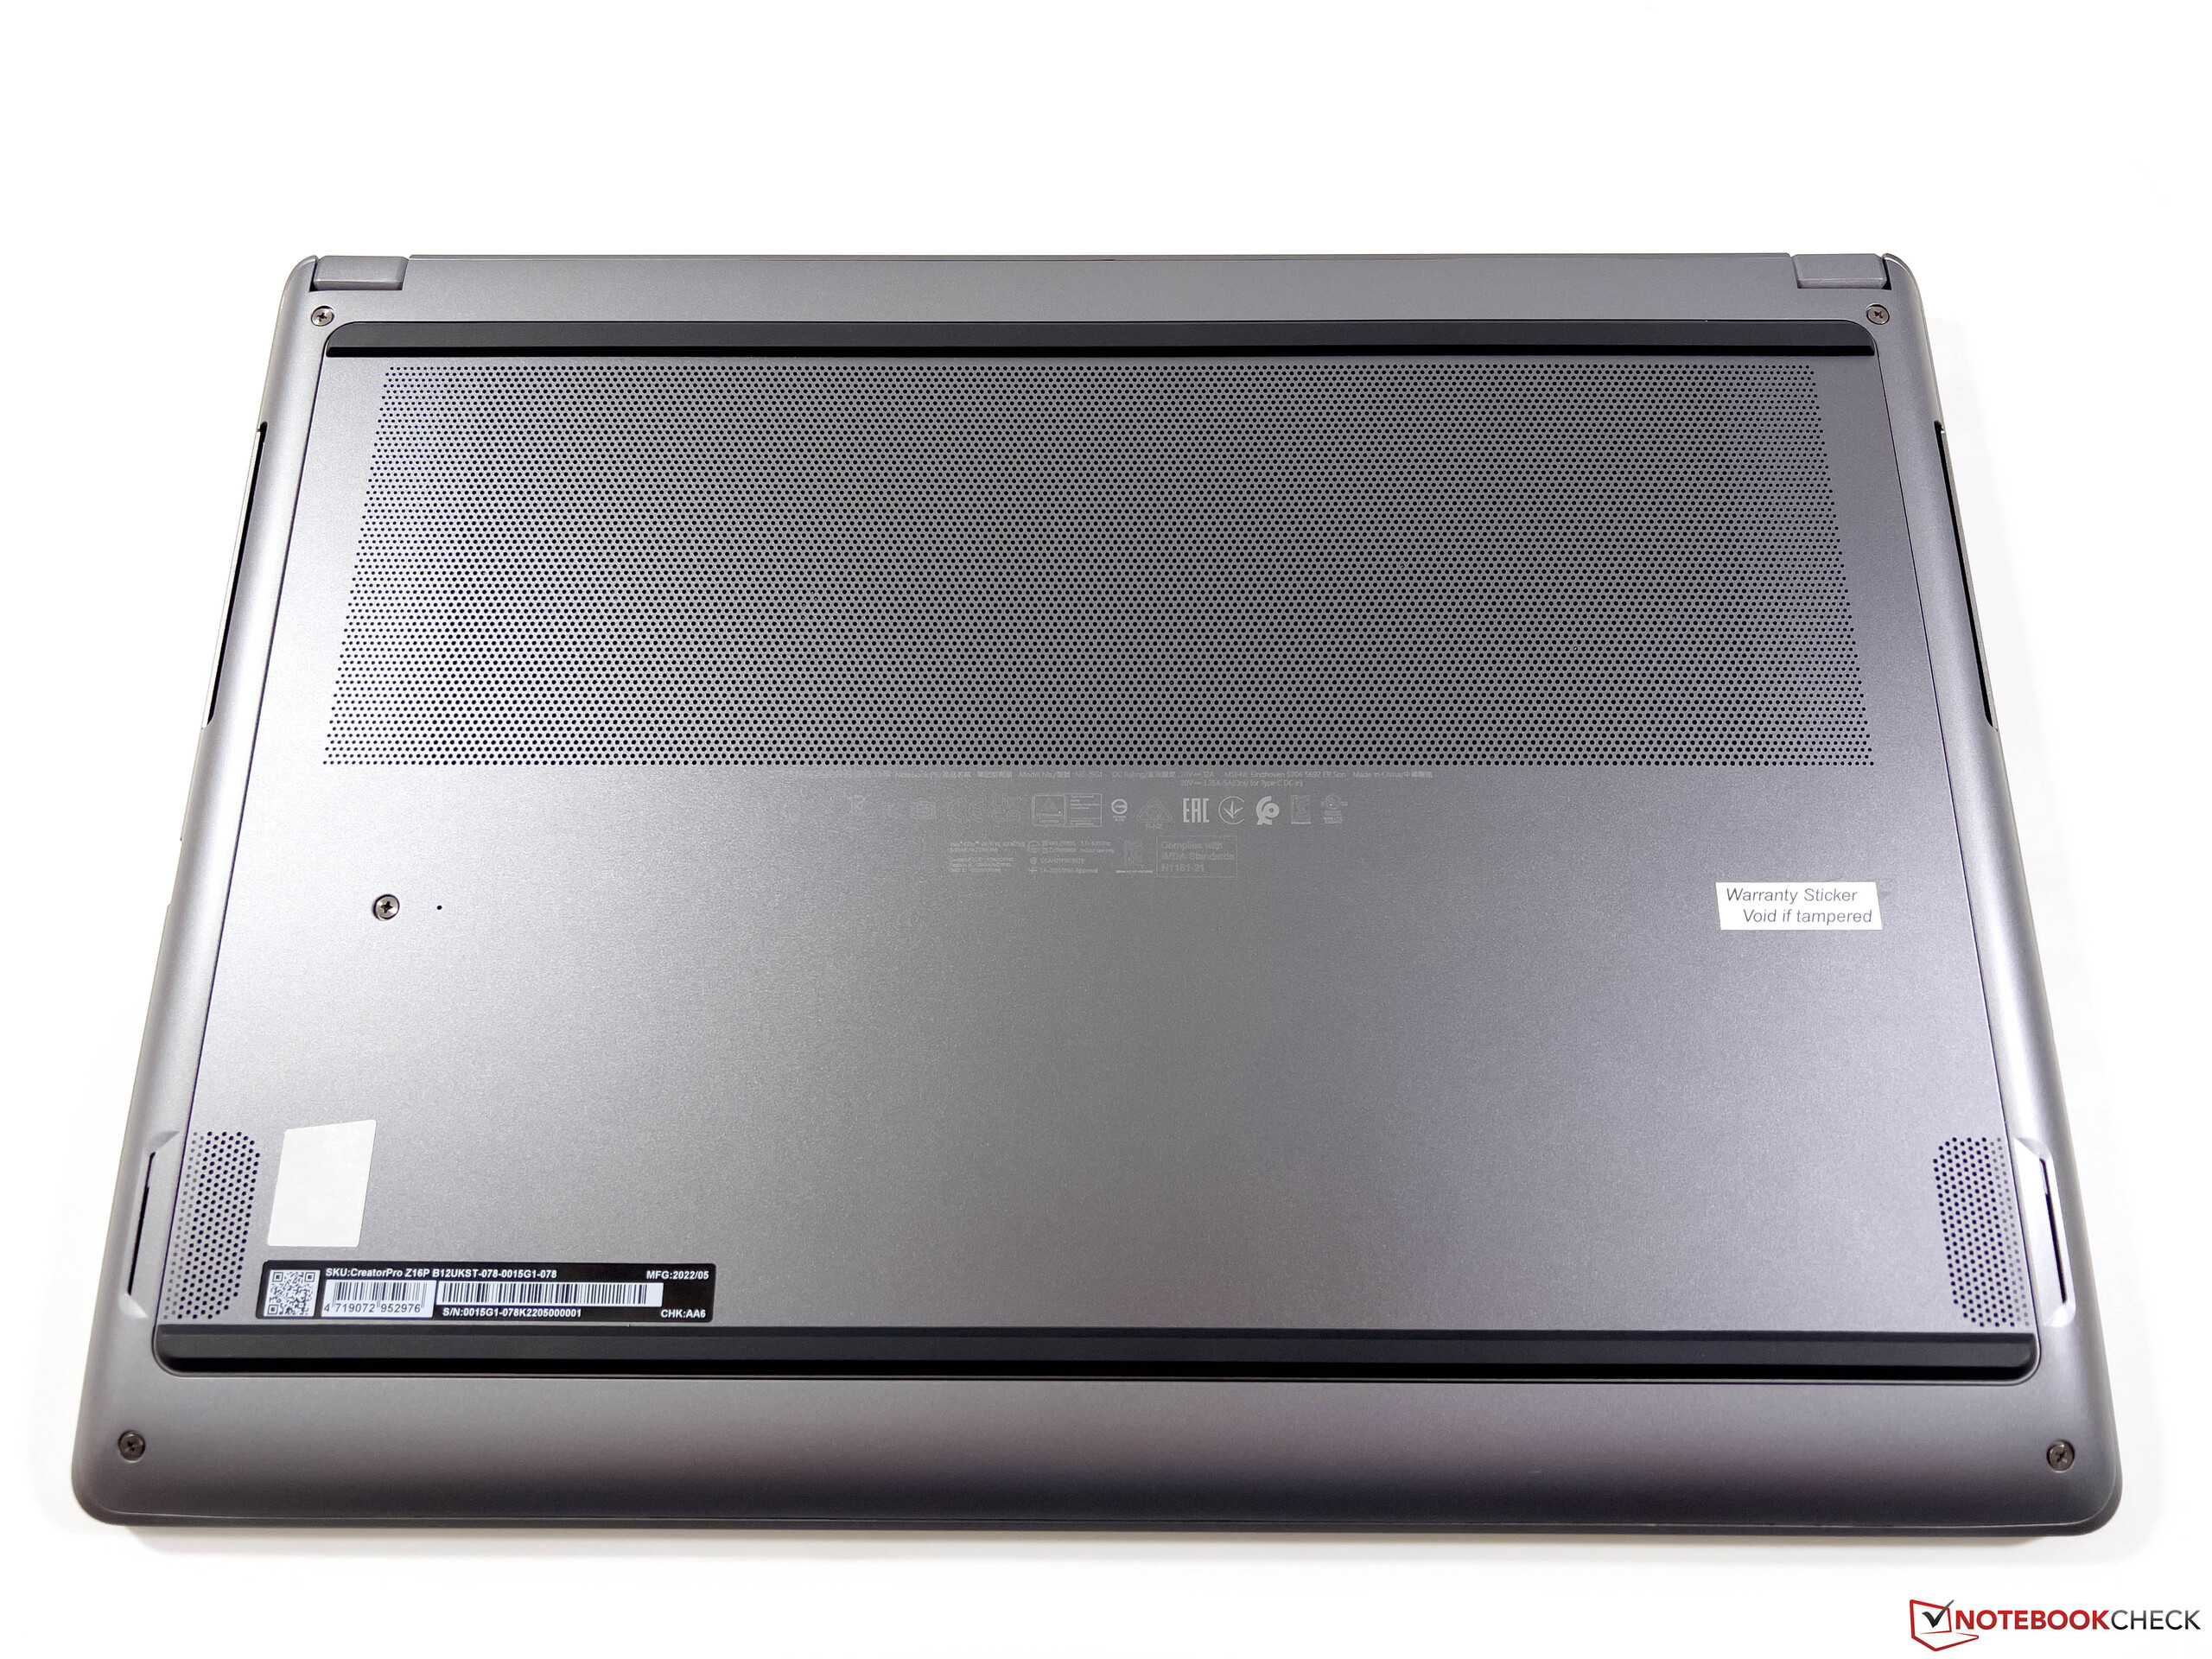
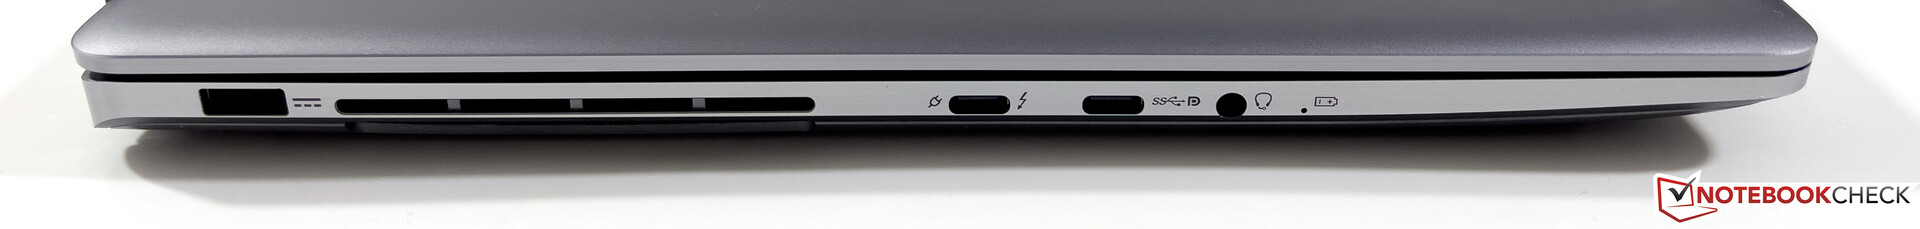
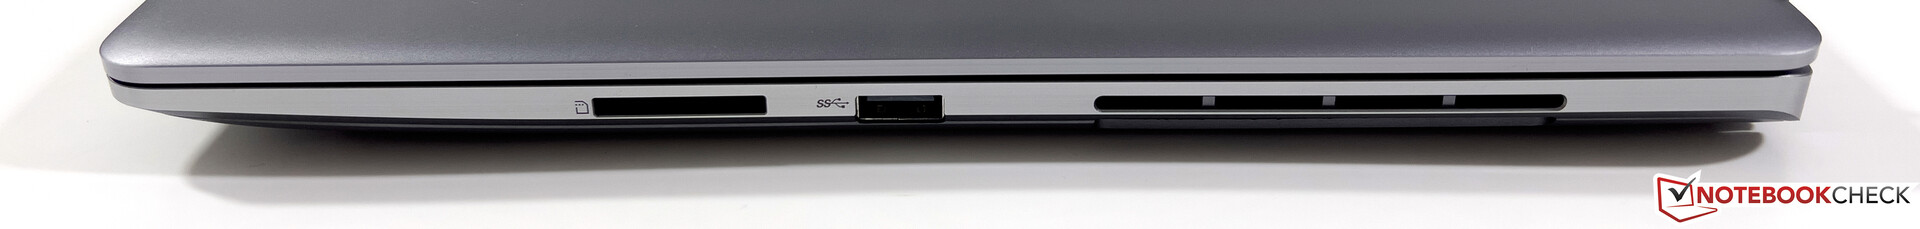
En ce qui concerne les connexions, vous disposez d'un total de trois ports USB, dont l'un inclut Thunderbolt 4, et d'un lecteur de carte SD de taille normale. En revanche, vous devez vous contenter d'une sortie graphique dédiée. En raison du refroidissement, toutes les connexions, à l'exception du port d'alimentation, se trouvent dans les zones avant des deux côtés, ce qui n'est pas optimal au quotidien.
| SD Card Reader | |
| average JPG Copy Test (av. of 3 runs) | |
| Dell Precision 5000 5560 (AV Pro V60) | |
| Moyenne de la classe Workstation (49.6 - 681, n=14, 2 dernières années) | |
| MSI CreatorPro Z16P B12UKST (AV Pro V60) | |
| MSI Creator Z16P B12UHST (AV PRO microSD 128 GB V60) | |
| HP ZBook Studio 16 G9 62U04EA (Angelbird AV PRO V60) | |
| maximum AS SSD Seq Read Test (1GB) | |
| Moyenne de la classe Workstation (87.6 - 1455, n=14, 2 dernières années) | |
| Dell Precision 5000 5560 (AV Pro V60) | |
| MSI CreatorPro Z16P B12UKST (AV Pro V60) | |
| HP ZBook Studio 16 G9 62U04EA (Angelbird AV PRO V60) | |
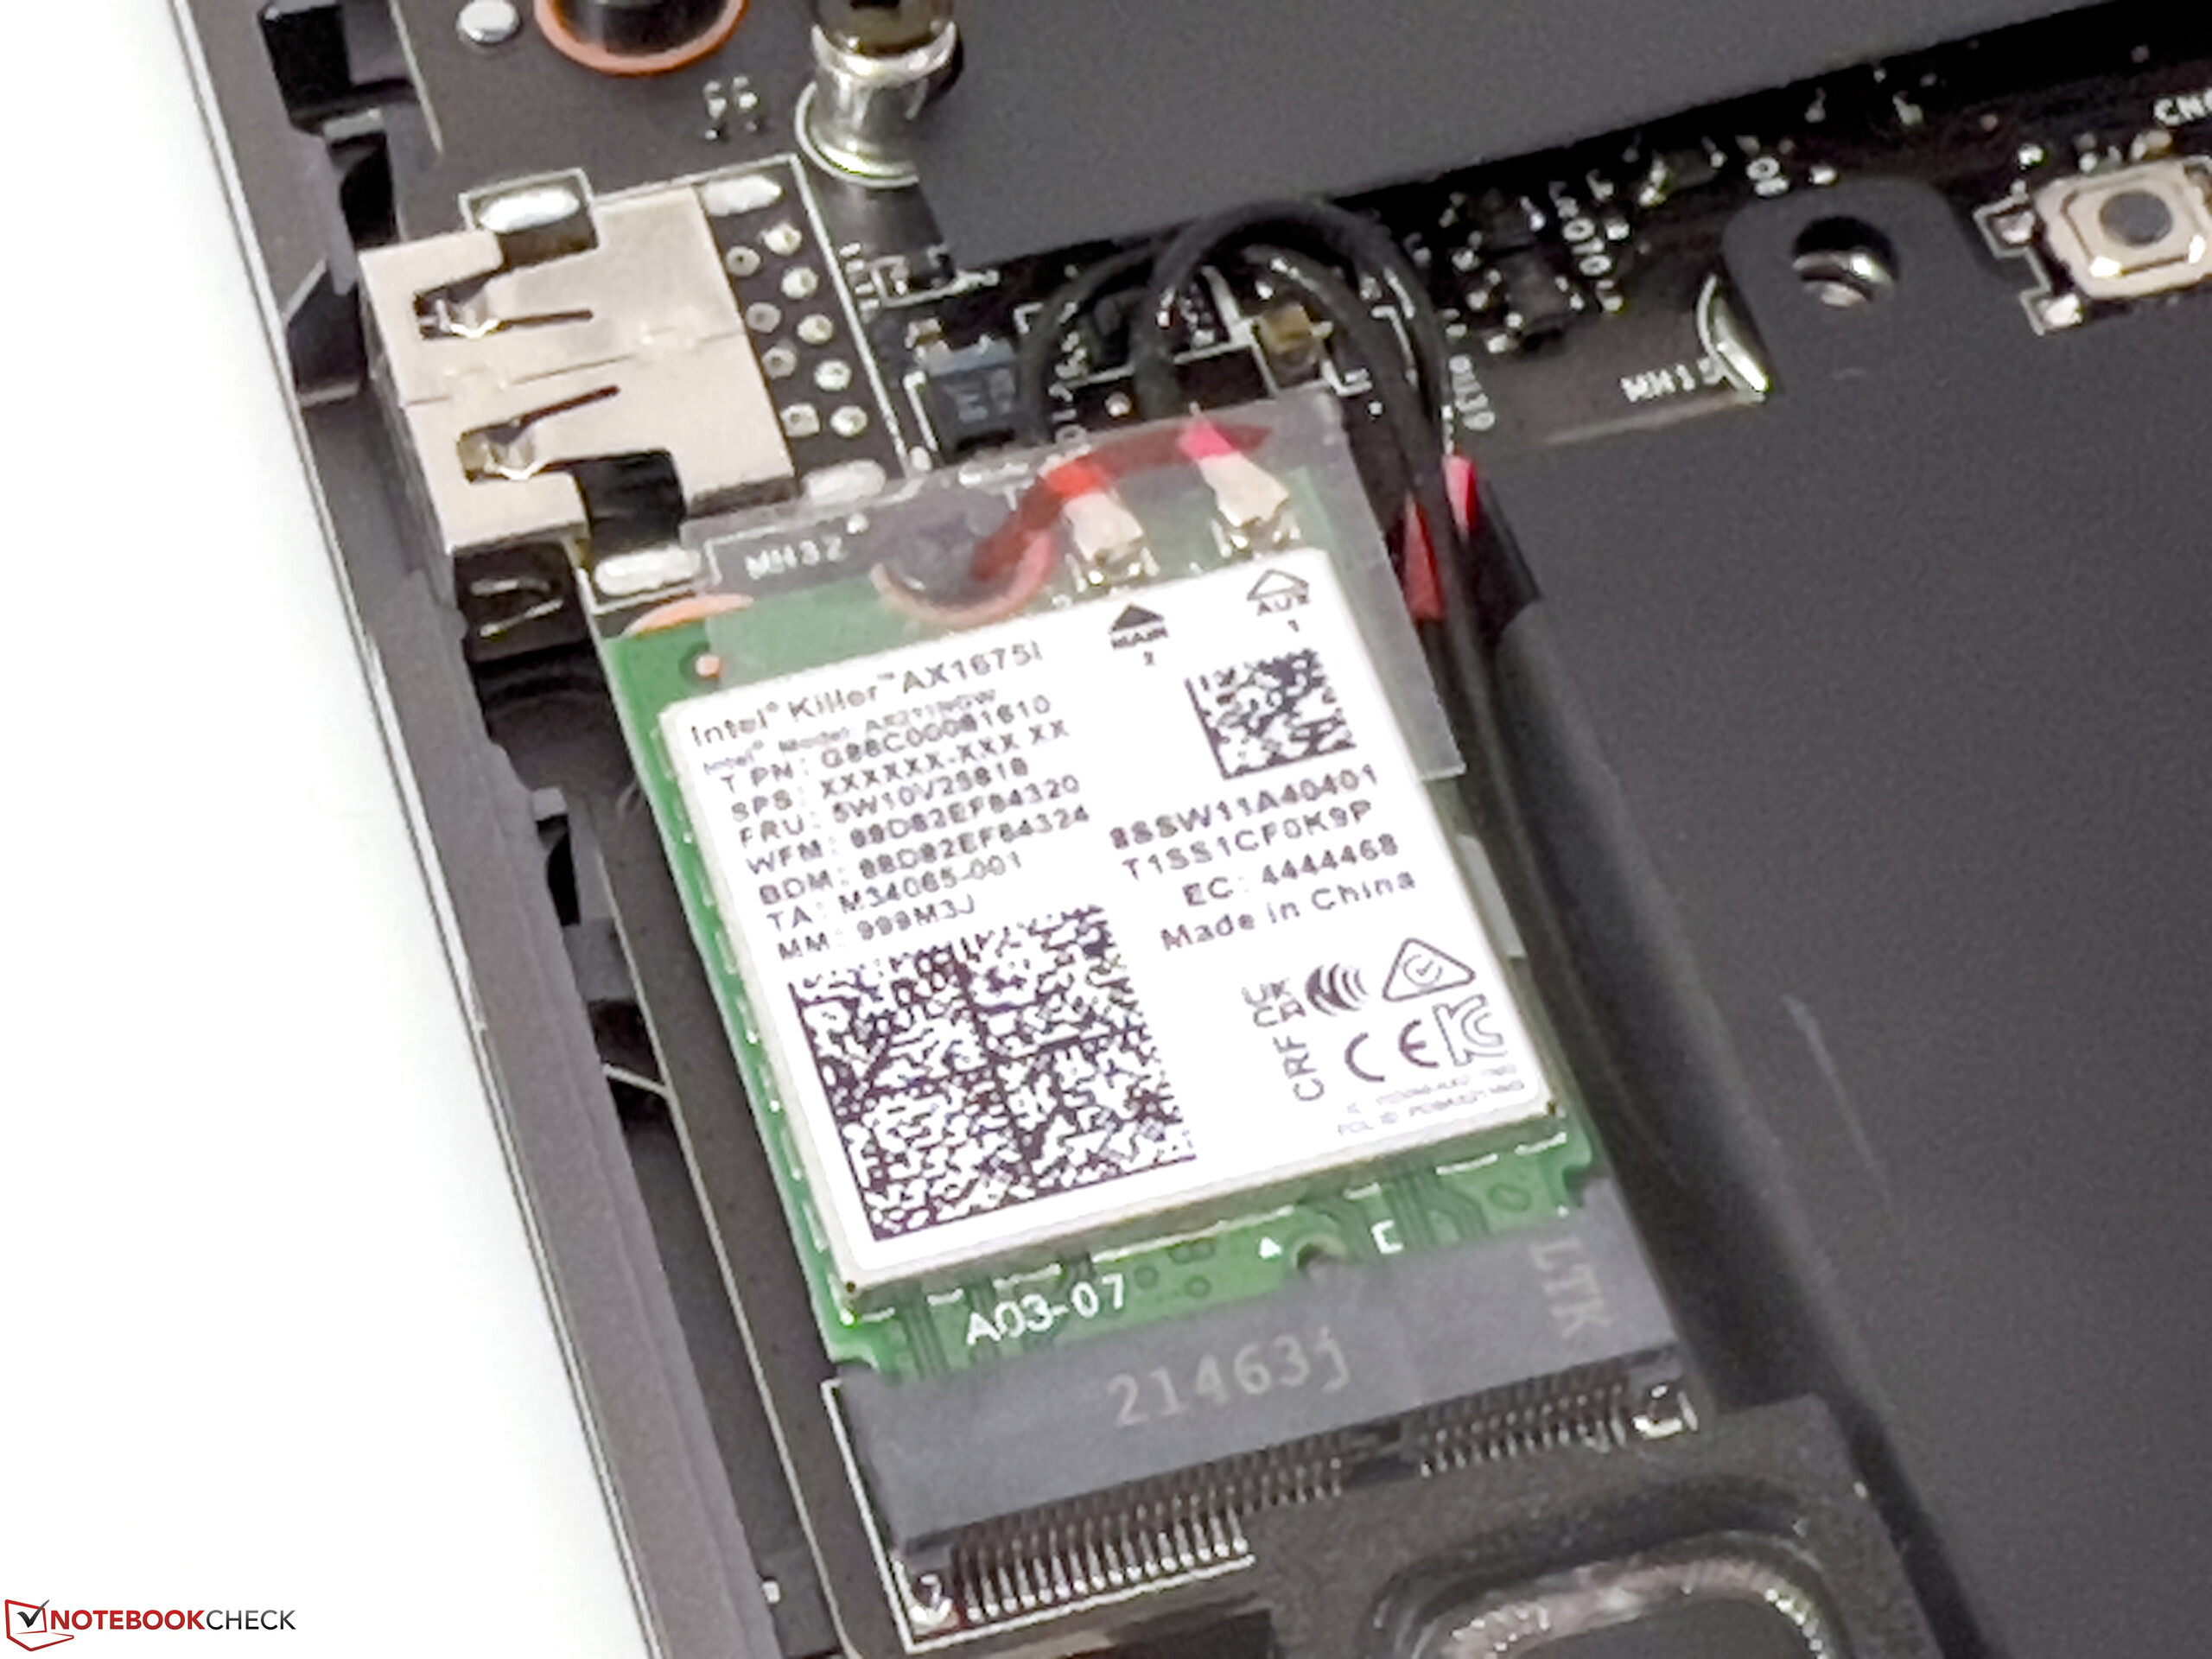
| Networking | |
| MSI CreatorPro Z16P B12UKST | |
| iperf3 receive AXE11000 6GHz | |
| iperf3 transmit AXE11000 6GHz | |
| HP ZBook Studio 16 G9 62U04EA | |
| iperf3 receive AXE11000 6GHz | |
| iperf3 transmit AXE11000 6GHz | |
| Dell Precision 5000 5560 | |
| iperf3 transmit AX12 | |
| iperf3 receive AX12 | |
| MSI Creator Z16P B12UHST | |
| iperf3 receive AXE11000 | |
| Lenovo ThinkPad P1 G4-20Y4Z9DVUS | |
| iperf3 transmit AX12 | |
| iperf3 receive AX12 | |


Affichage - TrueColor avec 165 Hz
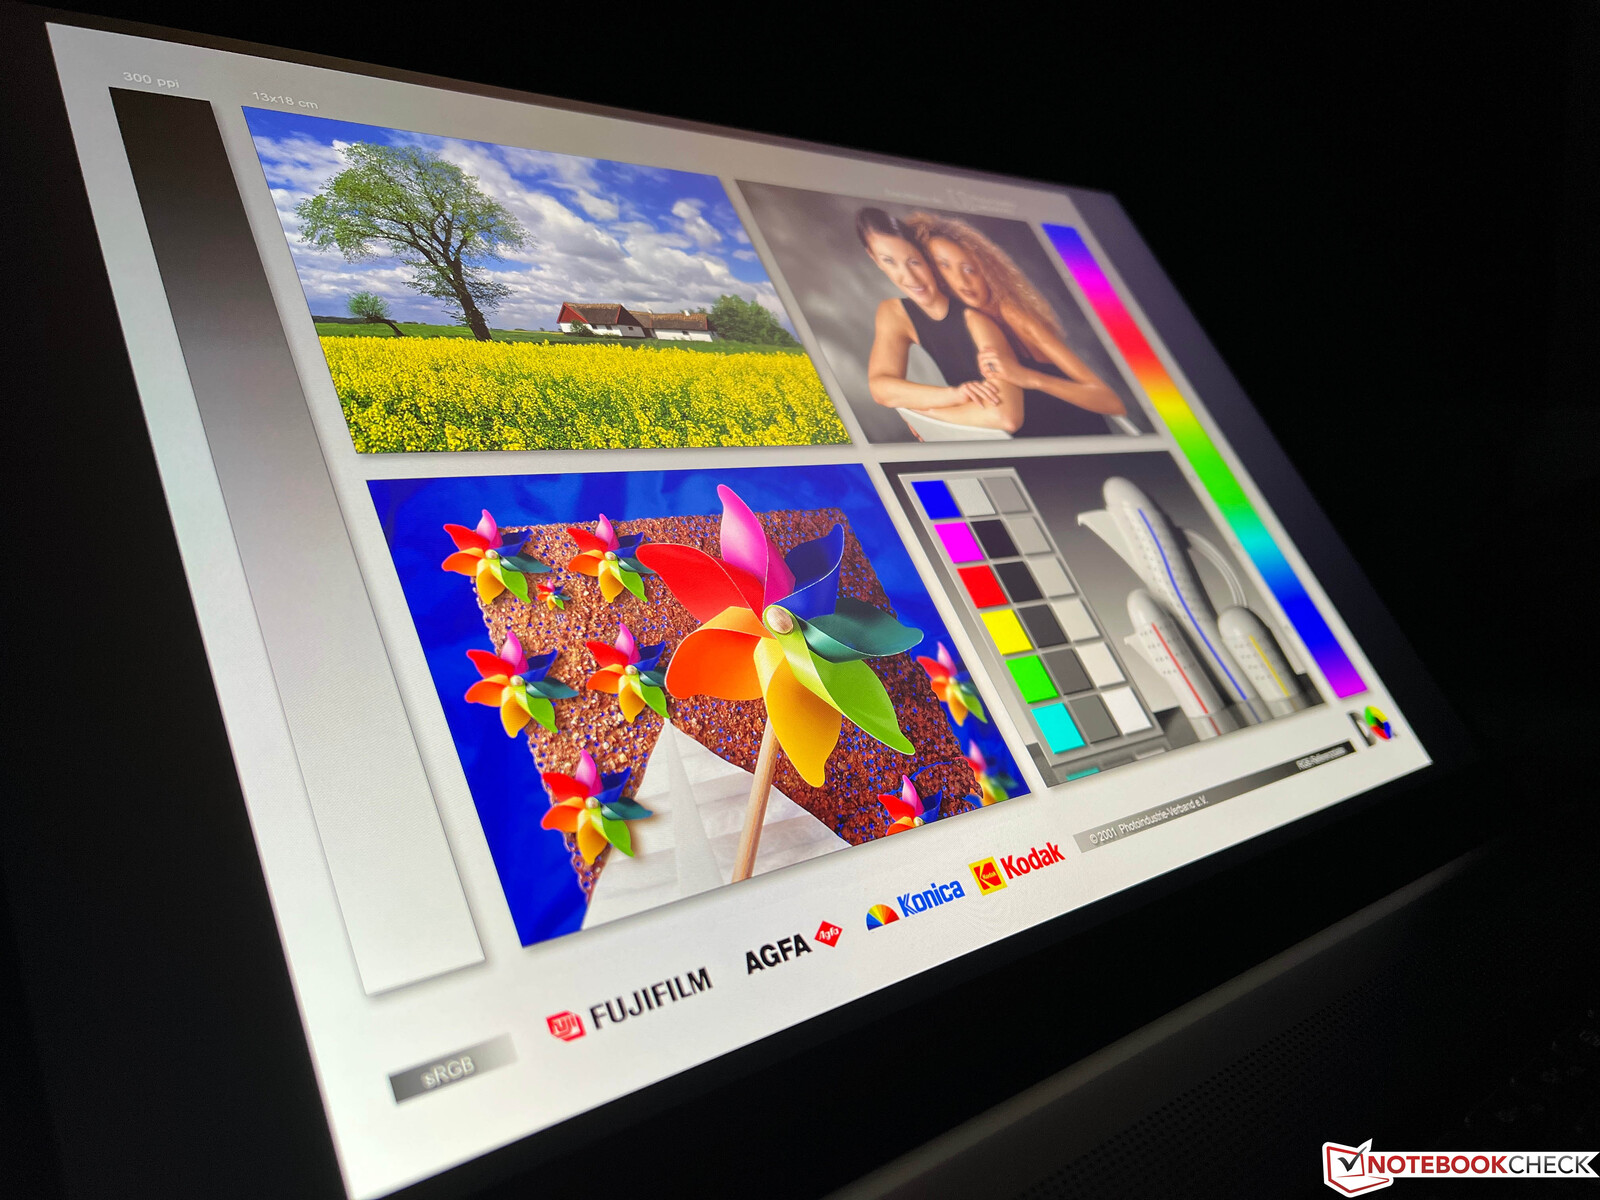
Nous pouvons également être brefs dans la section de l'affichage, puisqu'il n'y a pas non plus de différences par rapport à l'ordinaire Creator Z16Pici. Bien que la conception de l'écran WQHD TrueColor réfléchissant (2560 x 1600 pixels, IPS) au format 16:10 soit davantage destinée à un public de créateurs de contenu, la qualité subjective de l'image est tout simplement très bonne, et les autres utilisateurs apprécieront également beaucoup cet écran.
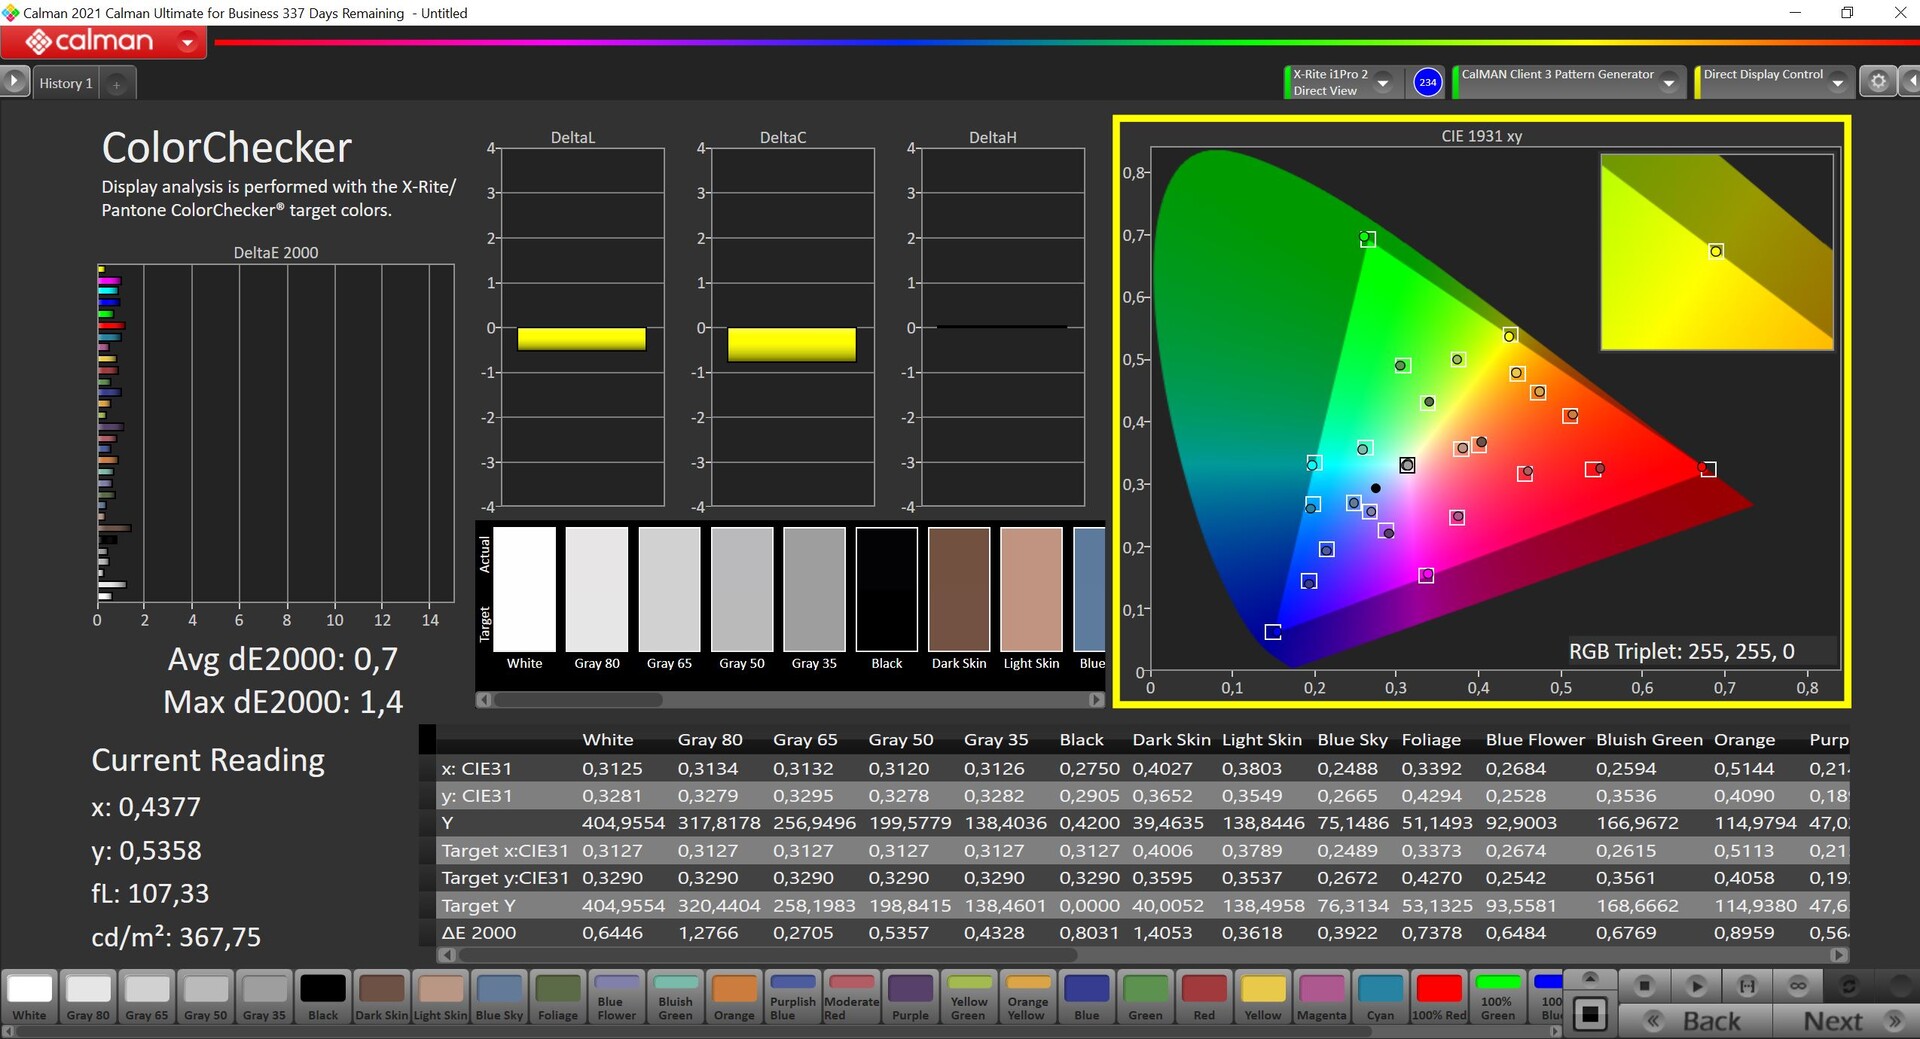
Dans nos mesures, le panneau fournit des valeurs décentes (luminosité moyenne ~390 cd/m²), même si le rapport de contraste de ~1 100:1 aurait pu être encore un peu meilleur et la valeur du noir aurait pu être plus basse. Les temps de réponse de la dalle de 165 Hz sont excellents, et il en va de même pour la stabilité des angles de vision. Les halos lumineux ne seront pas un problème, et le PWM n'est pas non plus utilisé.
| |||||||||||||||||||||||||
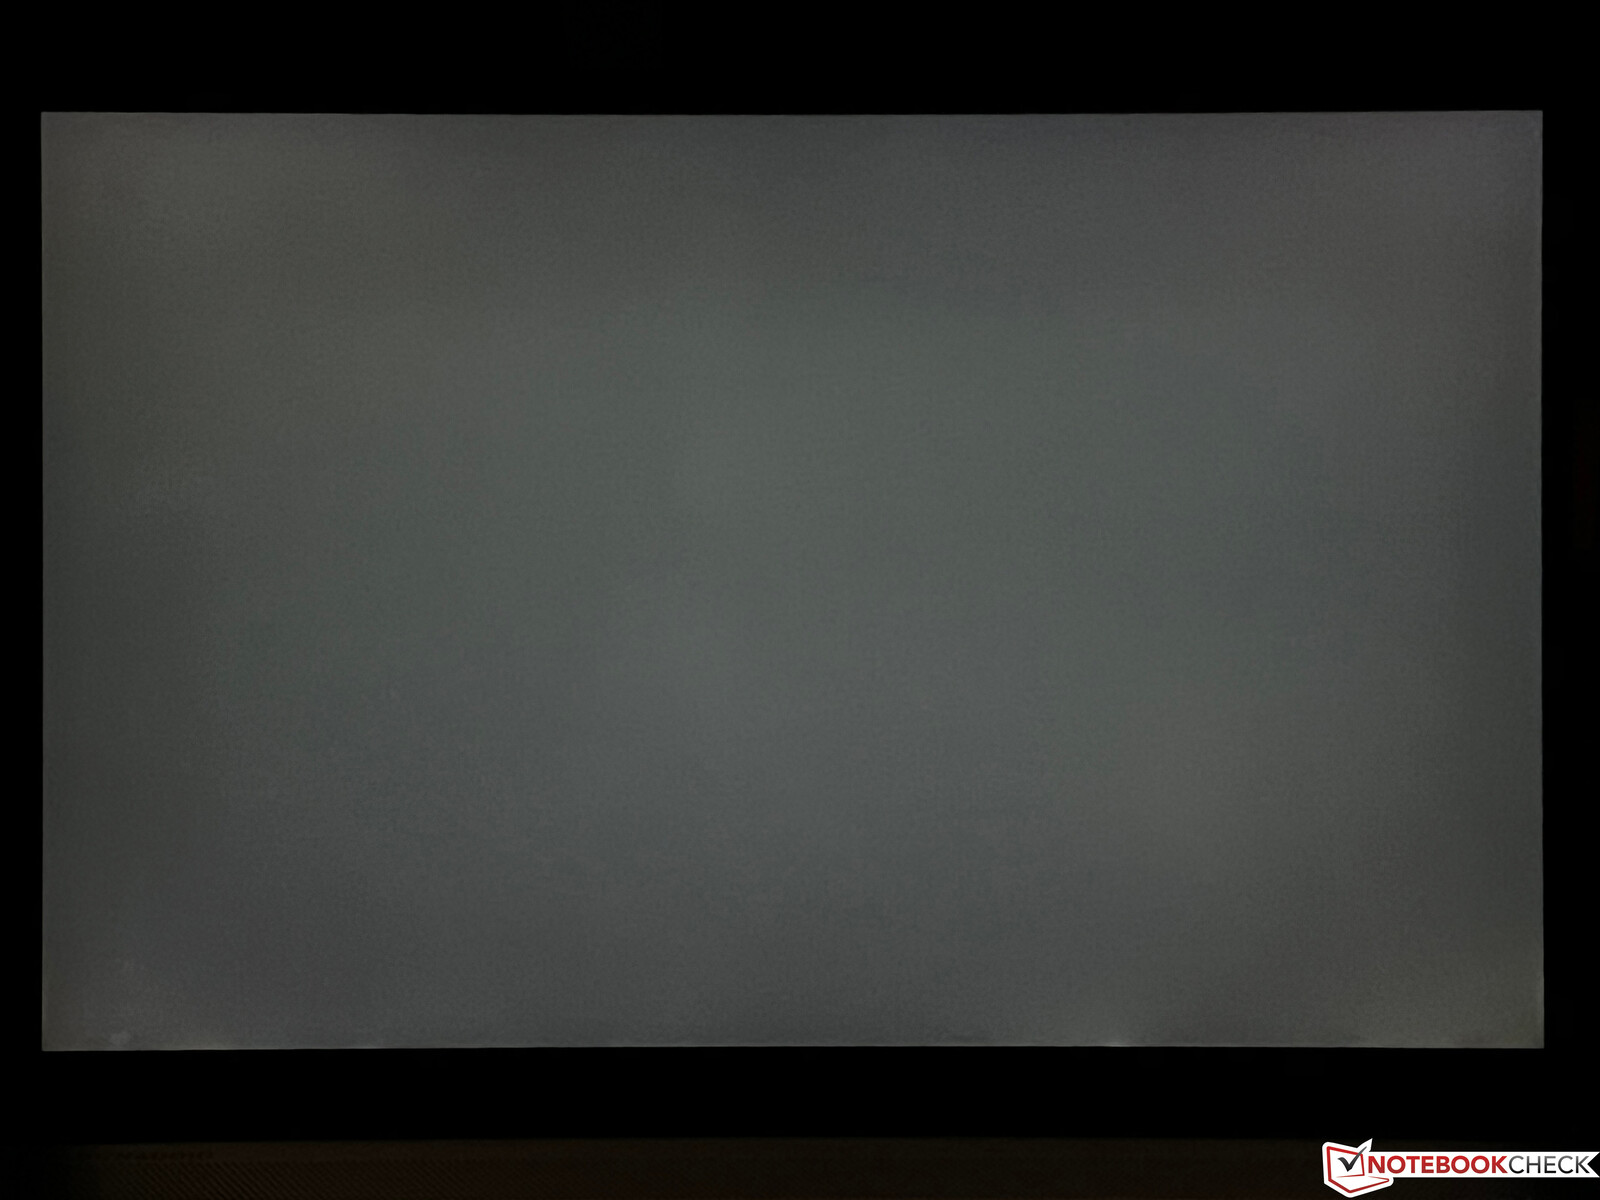
Homogénéité de la luminosité: 88 %
Valeur mesurée au centre, sur batterie: 408 cd/m²
Contraste: 1131:1 (Valeurs des noirs: 0.36 cd/m²)
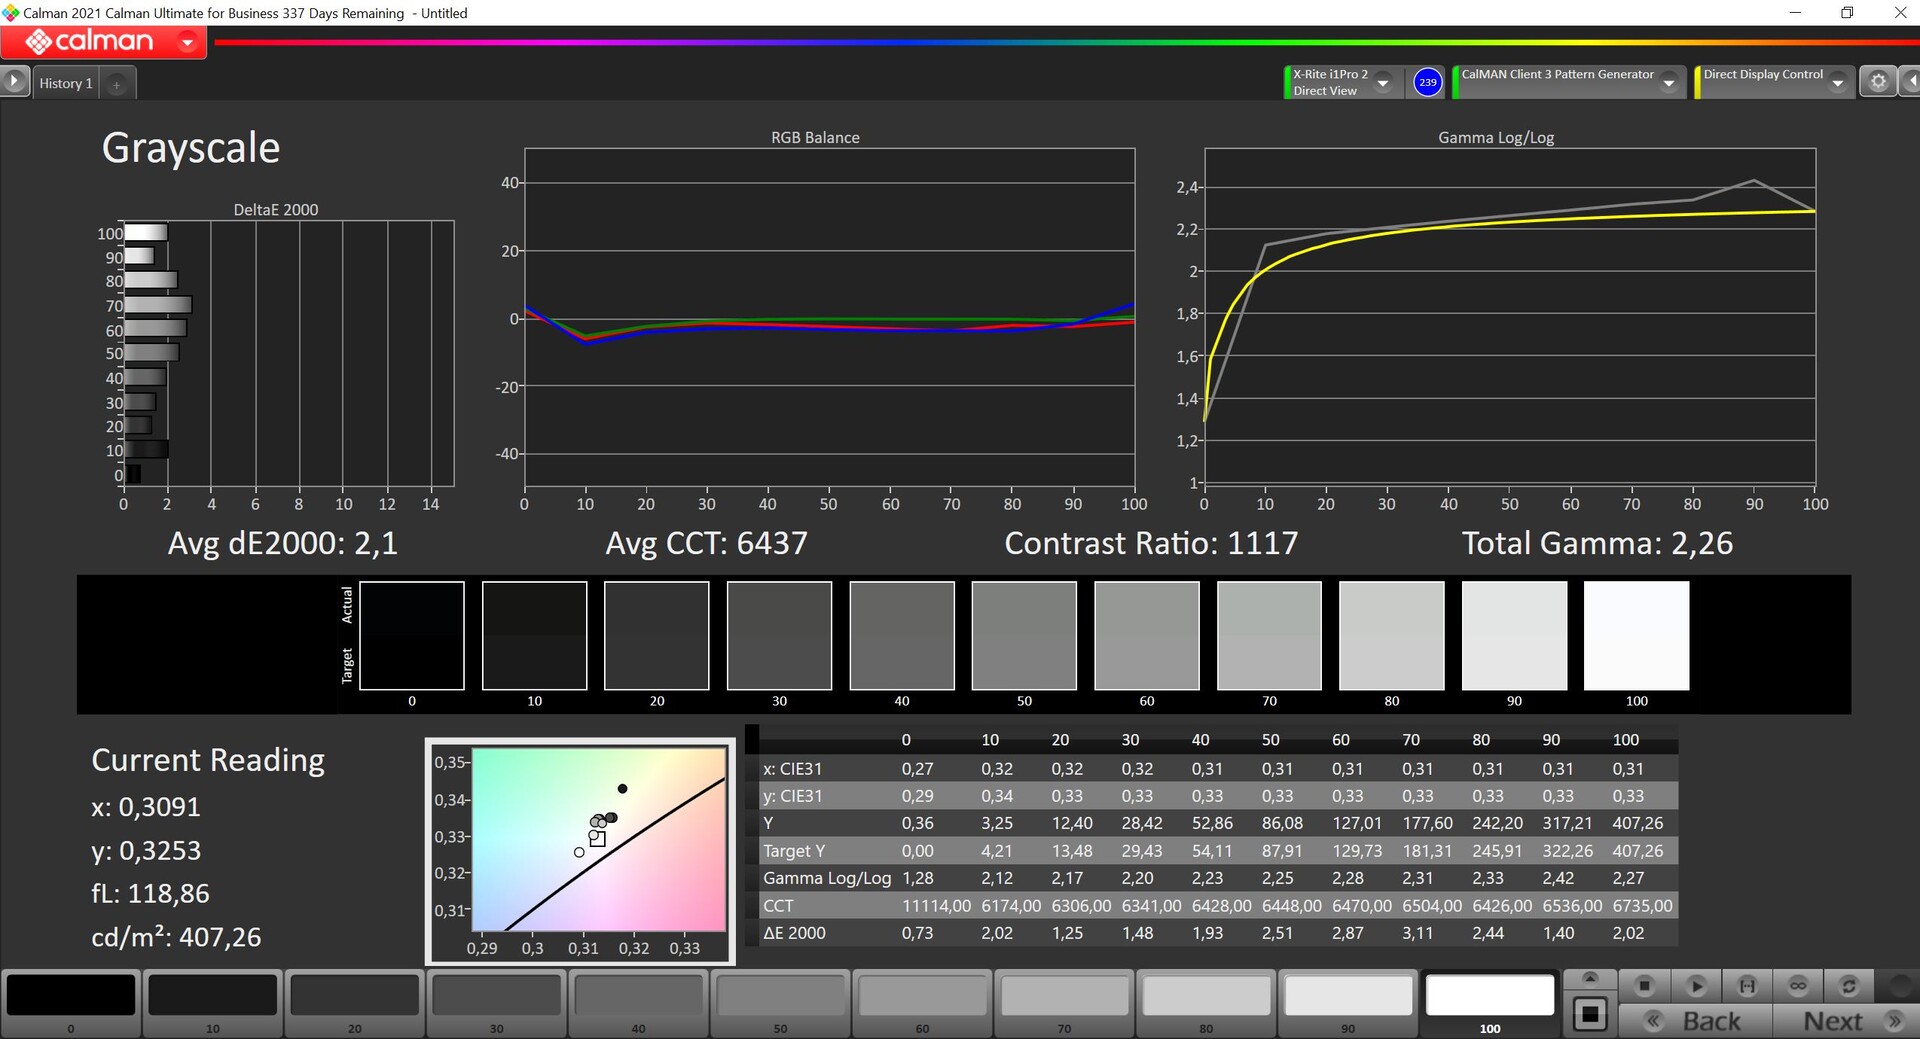
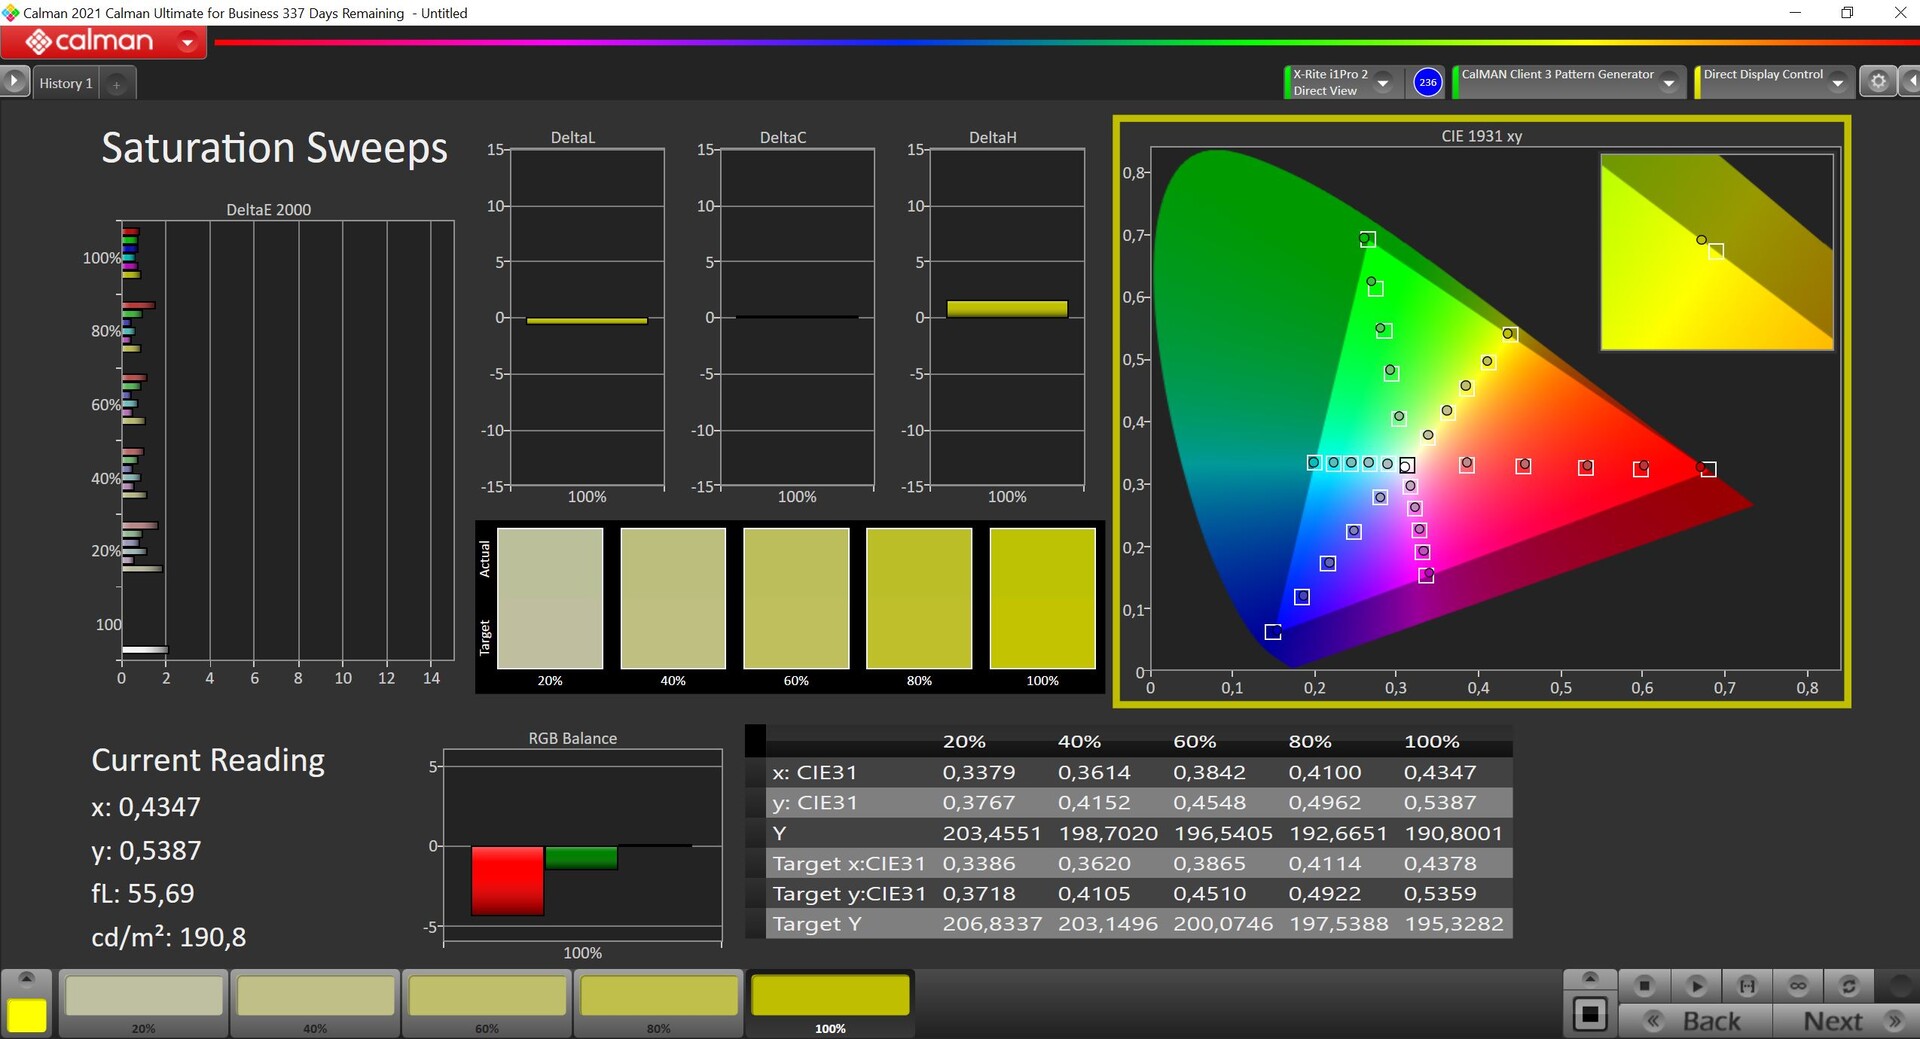
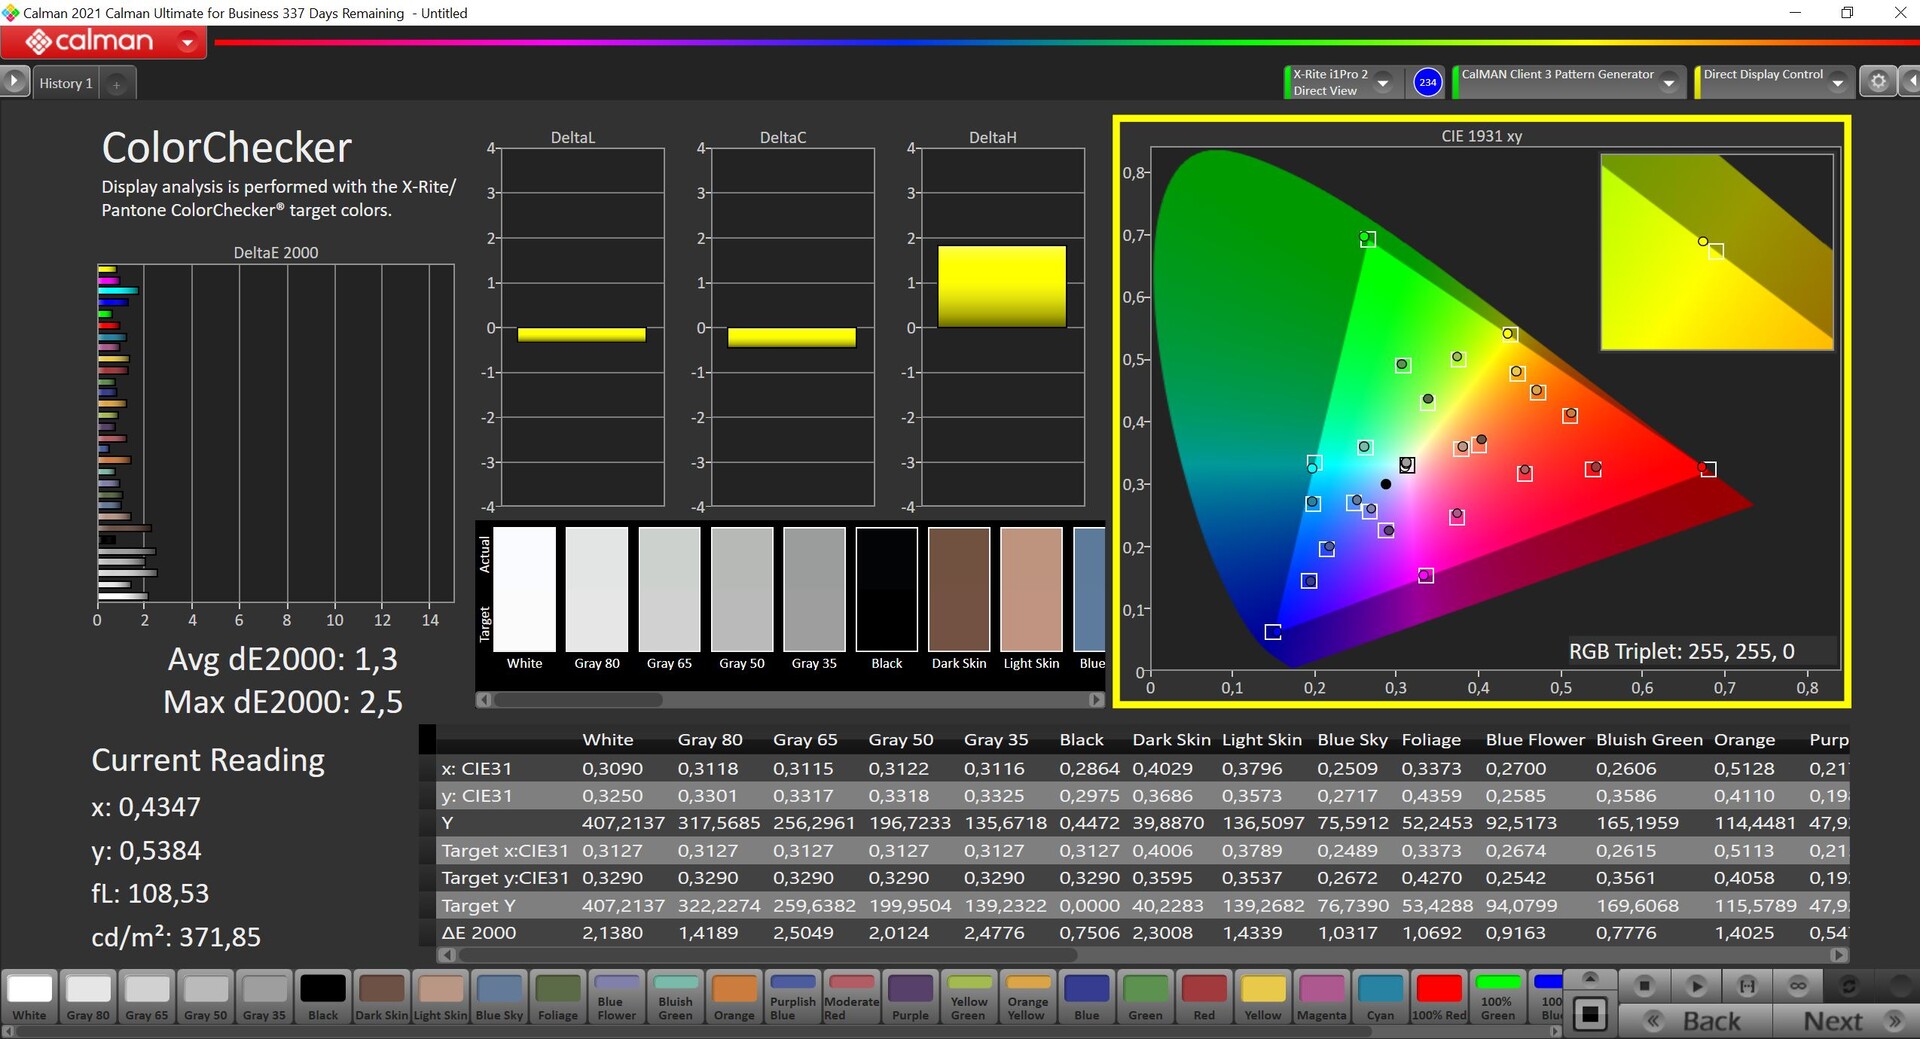
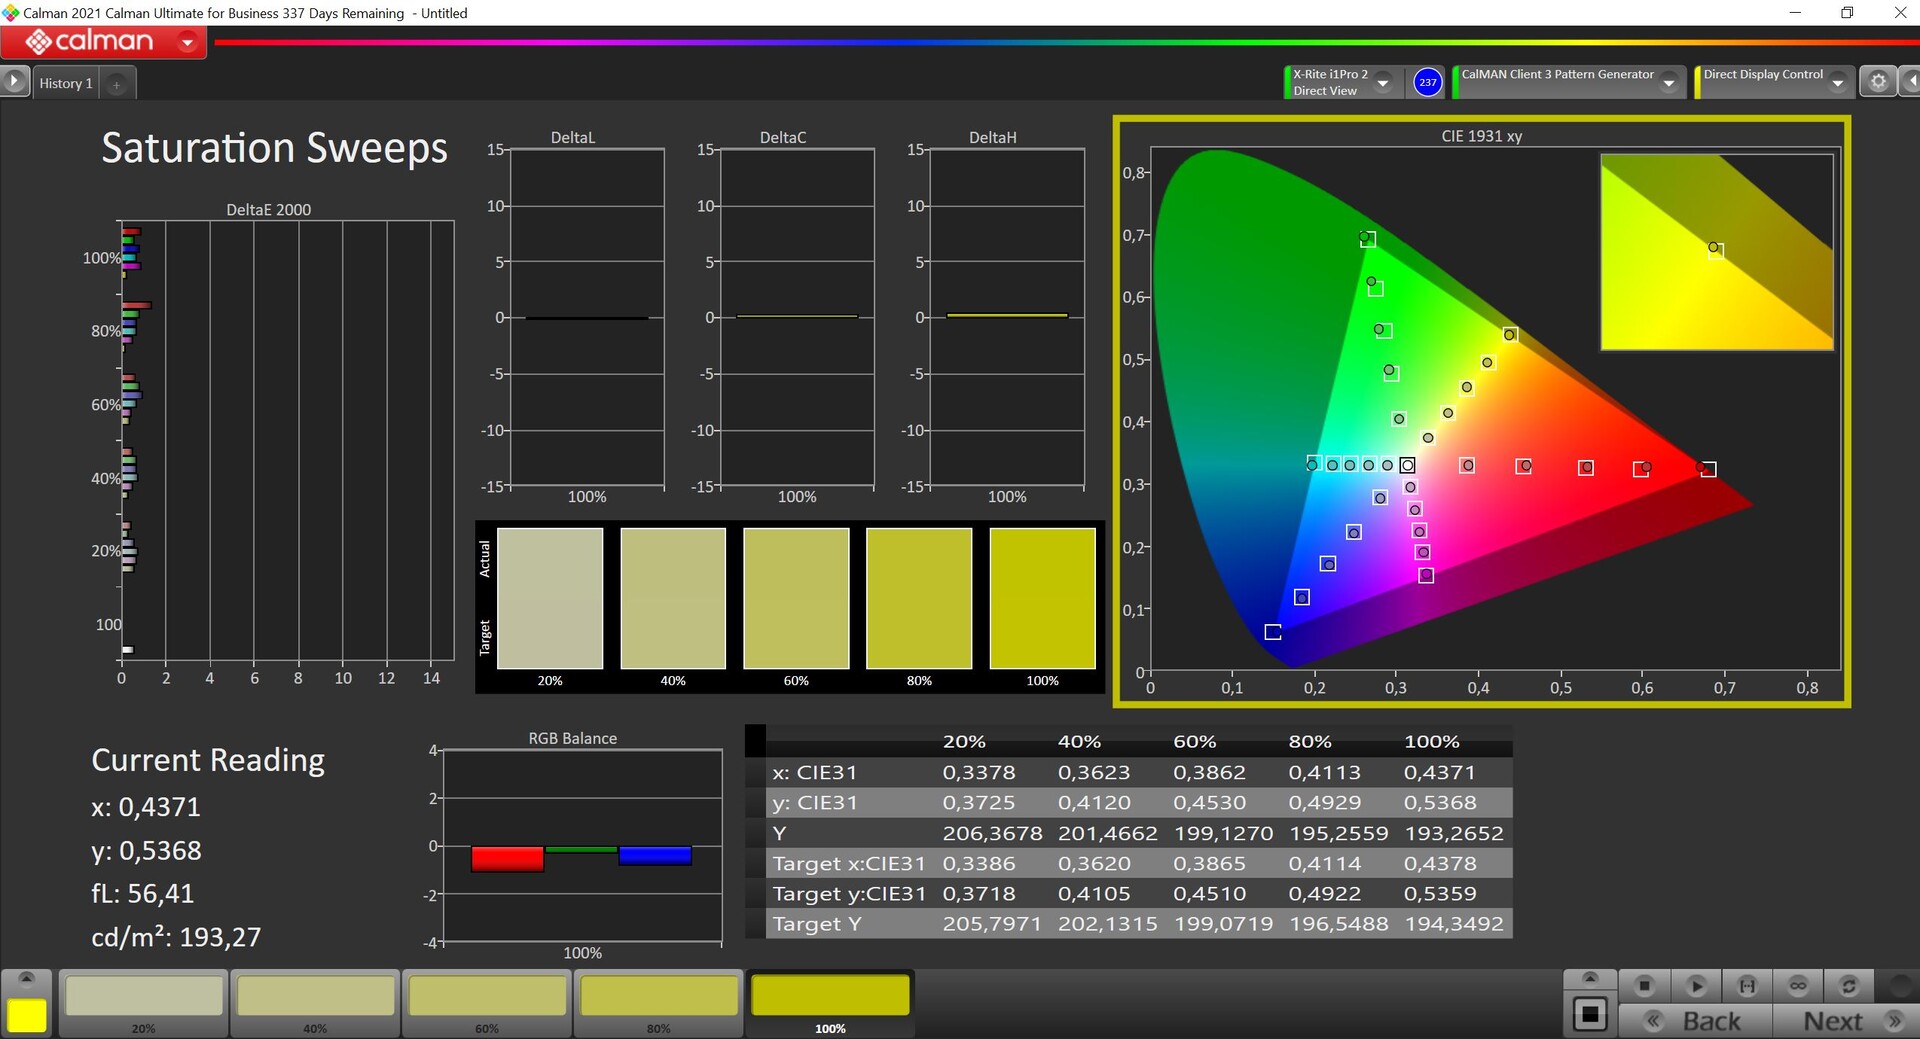
ΔE ColorChecker Calman: 1.3 | ∀{0.5-29.43 Ø4.71}
calibrated: 0.7
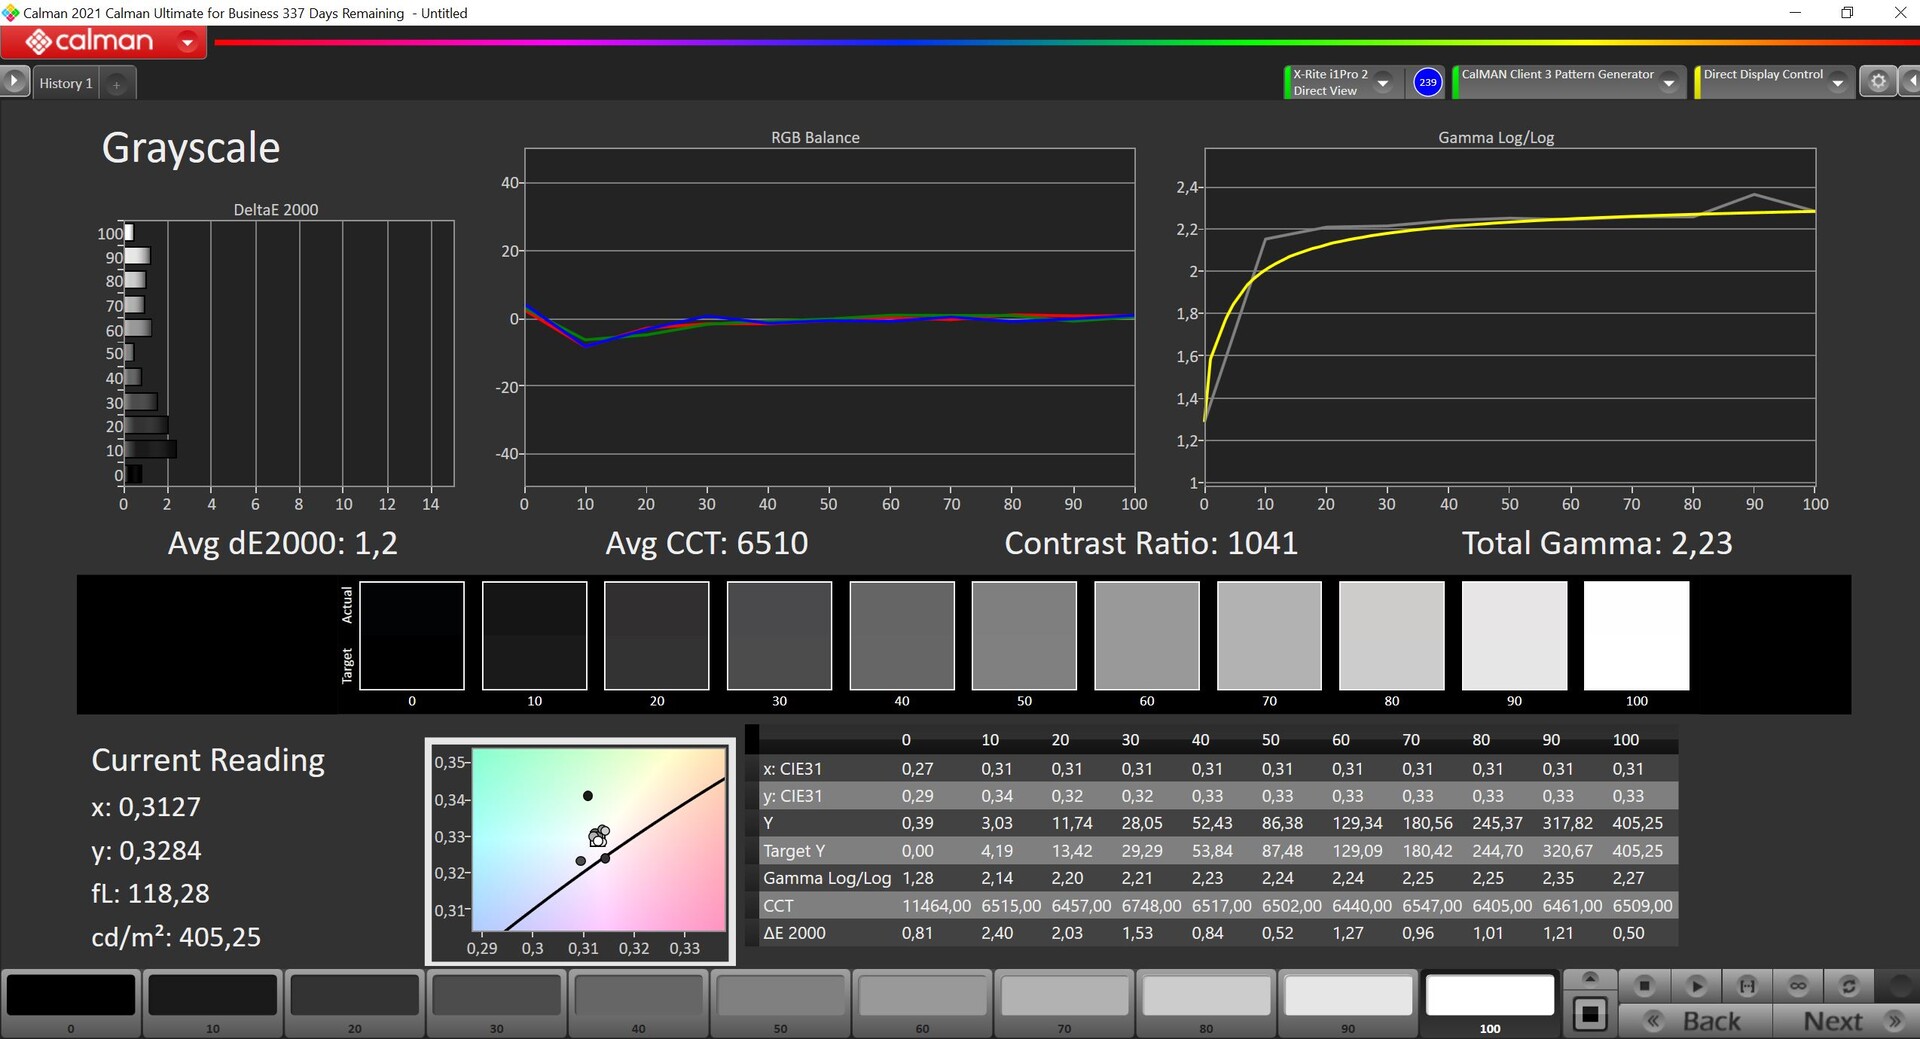
ΔE Greyscale Calman: 2.1 | ∀{0.09-98 Ø4.96}
87.4% AdobeRGB 1998 (Argyll 3D)
99.9% sRGB (Argyll 3D)
97.6% Display P3 (Argyll 3D)
Gamma: 2.26
CCT: 6437 K
| MSI CreatorPro Z16P B12UKST B160QAN02.N, IPS, 2560x1600, 16" | HP ZBook Studio 16 G9 62U04EA BOE0A52, IPS, 3840x2400, 16" | Lenovo ThinkPad P1 G4-20Y4S0KS00 LP160UQ1-SPB1, IPS LED, 3840x2400, 16" | Dell Precision 5000 5560 Sharp LQ156R1, IPS, 3840x2400, 15.6" | MSI Creator Z16P B12UHST AUOD298, IPS True Pixel (~100% DCI-P3), 2560x1600, 16" | |
|---|---|---|---|---|---|
| Display | -0% | 0% | 4% | -0% | |
| Display P3 Coverage (%) | 97.6 | 97.5 0% | 85.7 -12% | 94.9 -3% | 97.6 0% |
| sRGB Coverage (%) | 99.9 | 99.9 0% | 99.4 -1% | 100 0% | 99.9 0% |
| AdobeRGB 1998 Coverage (%) | 87.4 | 86.3 -1% | 98.9 13% | 100 14% | 86.8 -1% |
| Response Times | -1% | -327% | -290% | 7% | |
| Response Time Grey 50% / Grey 80% * (ms) | 12.8 ? | 15.3 ? -20% | 55.2 ? -331% | 47.2 ? -269% | 12.9 ? -1% |
| Response Time Black / White * (ms) | 7.4 ? | 6.1 ? 18% | 31.2 ? -322% | 30.4 ? -311% | 6.4 ? 14% |
| PWM Frequency (Hz) | |||||
| Screen | 11% | -11% | -59% | -25% | |
| Brightness middle (cd/m²) | 407 | 554 36% | 630 55% | 501.5 23% | 428 5% |
| Brightness (cd/m²) | 388 | 516 33% | 622 60% | 467 20% | 394 2% |
| Brightness Distribution (%) | 88 | 84 -5% | 90 2% | 83 -6% | 86 -2% |
| Black Level * (cd/m²) | 0.36 | 0.47 -31% | 0.41 -14% | 0.44 -22% | 0.42 -17% |
| Contrast (:1) | 1131 | 1179 4% | 1537 36% | 1140 1% | 1019 -10% |
| Colorchecker dE 2000 * | 1.3 | 1 23% | 2.2 -69% | 4.73 -264% | 1.67 -28% |
| Colorchecker dE 2000 max. * | 2.5 | 2.4 4% | 5 -100% | 8.45 -238% | 5.71 -128% |
| Colorchecker dE 2000 calibrated * | 0.7 | 0.6 14% | 1 -43% | 0.51 27% | 0.71 -1% |
| Greyscale dE 2000 * | 2.1 | 1.6 24% | 2.7 -29% | 3.6 -71% | 3.1 -48% |
| Gamma | 2.26 97% | 2.29 96% | 2.26 97% | 2.08 106% | 2.195 100% |
| CCT | 6437 101% | 6458 101% | 6886 94% | 6447 101% | 6498 100% |
| Moyenne finale (programmes/paramètres) | 3% /
7% | -113% /
-54% | -115% /
-79% | -6% /
-15% |
* ... Moindre est la valeur, meilleures sont les performances
Notre analyse avec le logiciel professionnel CalMAN (X-Rite i1 Pro 2) montre que le panneau est déjà très bien calibré dans l'état de livraison, et l'écart DeltaE de moins de 2 annoncé par MSI par rapport à l'espace couleur de référence DCI-P3 est correct. L'écart est également très faible dans l'échelle de gris, et il n'y a pas de teinte de couleur. Nous sommes en mesure d'améliorer davantage les écarts avec notre propre calibration (disponible en téléchargement gratuit à partir du lien ci-dessus), mais ce n'est pas vraiment nécessaire.
Le logiciel TrueColor vous permet également de changer d'espace couleur, si vous souhaitez travailler dans l'espace couleur sRGB, par exemple. En outre, le logiciel vous permet également de calibrer l'affichage, et à cet égard, le CreatorPro Z16P offre même quelques avantages par rapport à certaines stations de travail (telles que Les modèles ZBook de HP avec panneaux DreamColorqui, à ce stade, ne proposent plus aucun logiciel d'affichage).
Temps de réponse de l'écran
| ↔ Temps de réponse noir à blanc | ||
|---|---|---|
| 7.4 ms ... hausse ↗ et chute ↘ combinées | ↗ 3.4 ms hausse | 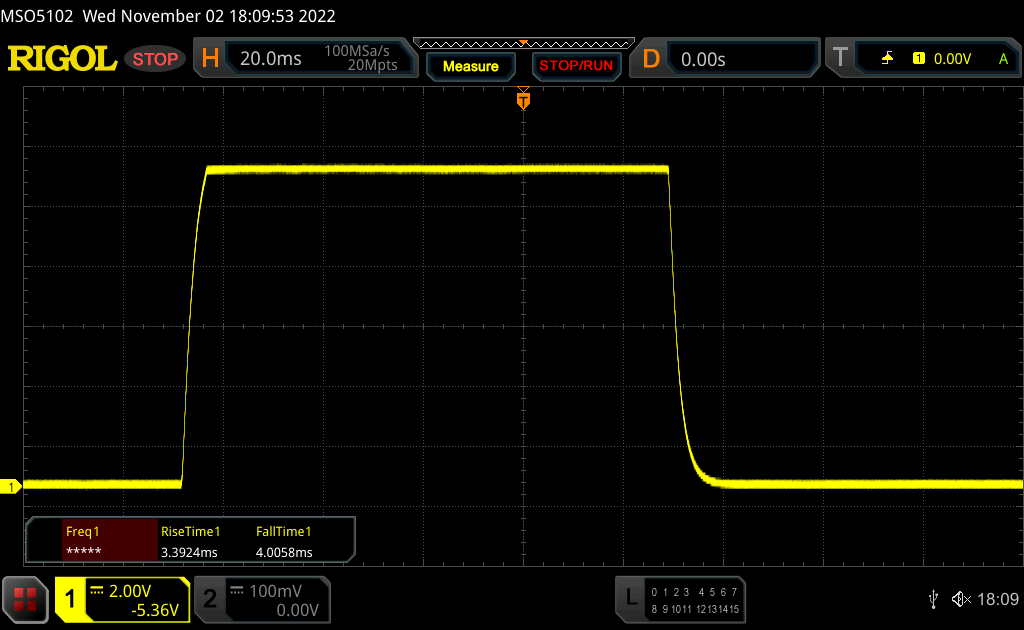 |
| ↘ 4 ms chute | ||
| L'écran montre de très faibles temps de réponse, parfait pour le jeu. En comparaison, tous les appareils testés affichent entre 0.1 (minimum) et 240 (maximum) ms. » 22 % des appareils testés affichent de meilleures performances. Cela signifie que les latences relevées sont meilleures que la moyenne (19.8 ms) de tous les appareils testés. | ||
| ↔ Temps de réponse gris 50% à gris 80% | ||
| 12.8 ms ... hausse ↗ et chute ↘ combinées | ↗ 6.2 ms hausse | 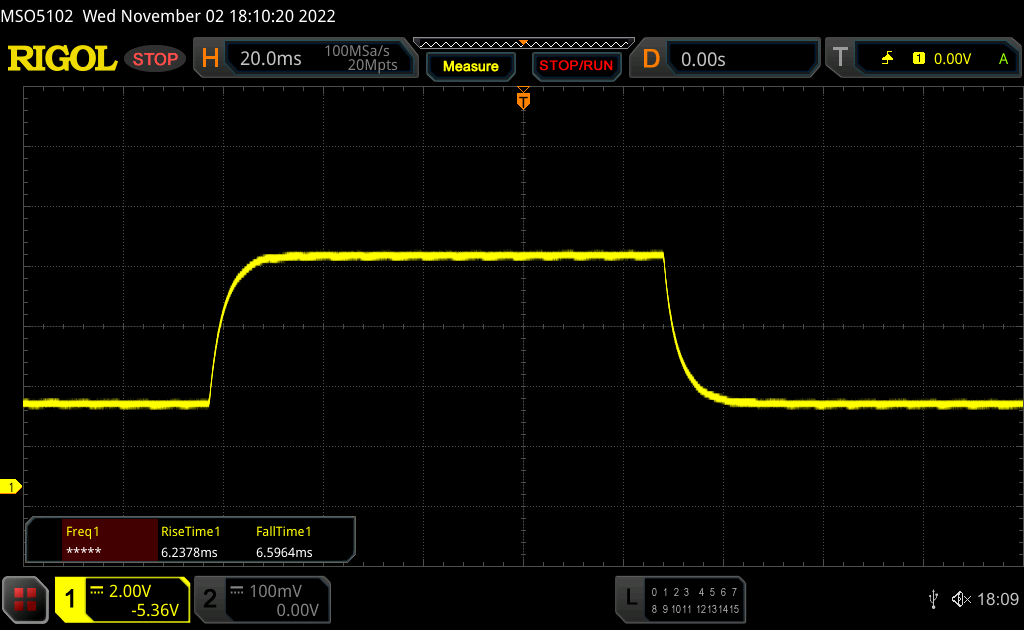 |
| ↘ 6.6 ms chute | ||
| L'écran montre de bons temps de réponse, mais insuffisant pour du jeu compétitif. En comparaison, tous les appareils testés affichent entre 0.165 (minimum) et 636 (maximum) ms. » 26 % des appareils testés affichent de meilleures performances. Cela signifie que les latences relevées sont meilleures que la moyenne (31 ms) de tous les appareils testés. | ||
Scintillement / MLI (Modulation de largeur d'impulsion)
| Scintillement / MLI (Modulation de largeur d'impulsion) non décelé | 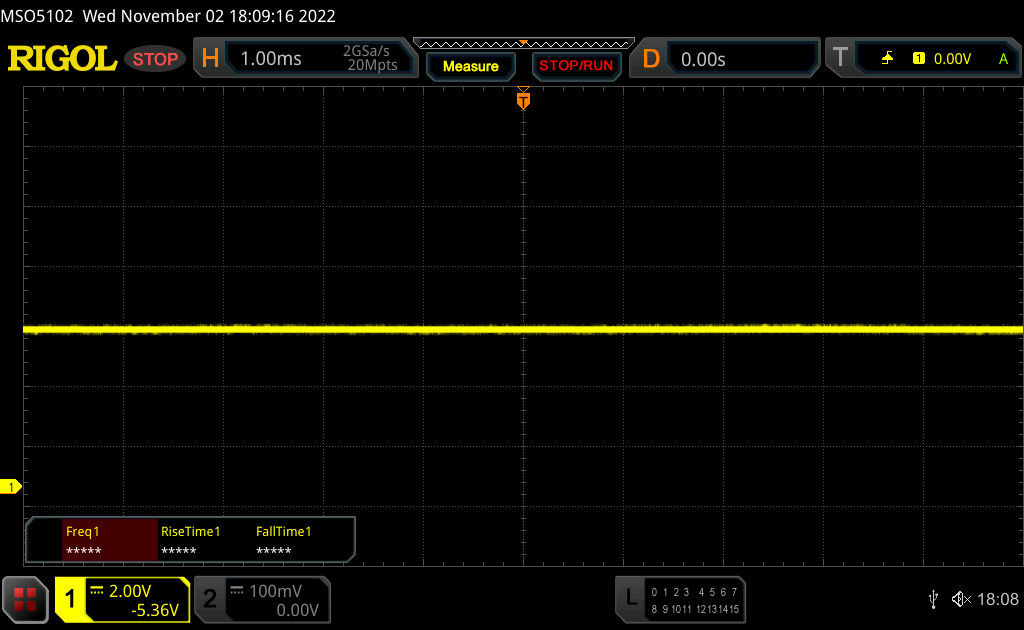 | ||
En comparaison, 52 % des appareils testés n'emploient pas MDI pour assombrir leur écran. Nous avons relevé une moyenne à 7754 (minimum : 5 - maximum : 343500) Hz dans le cas où une MDI était active. | |||
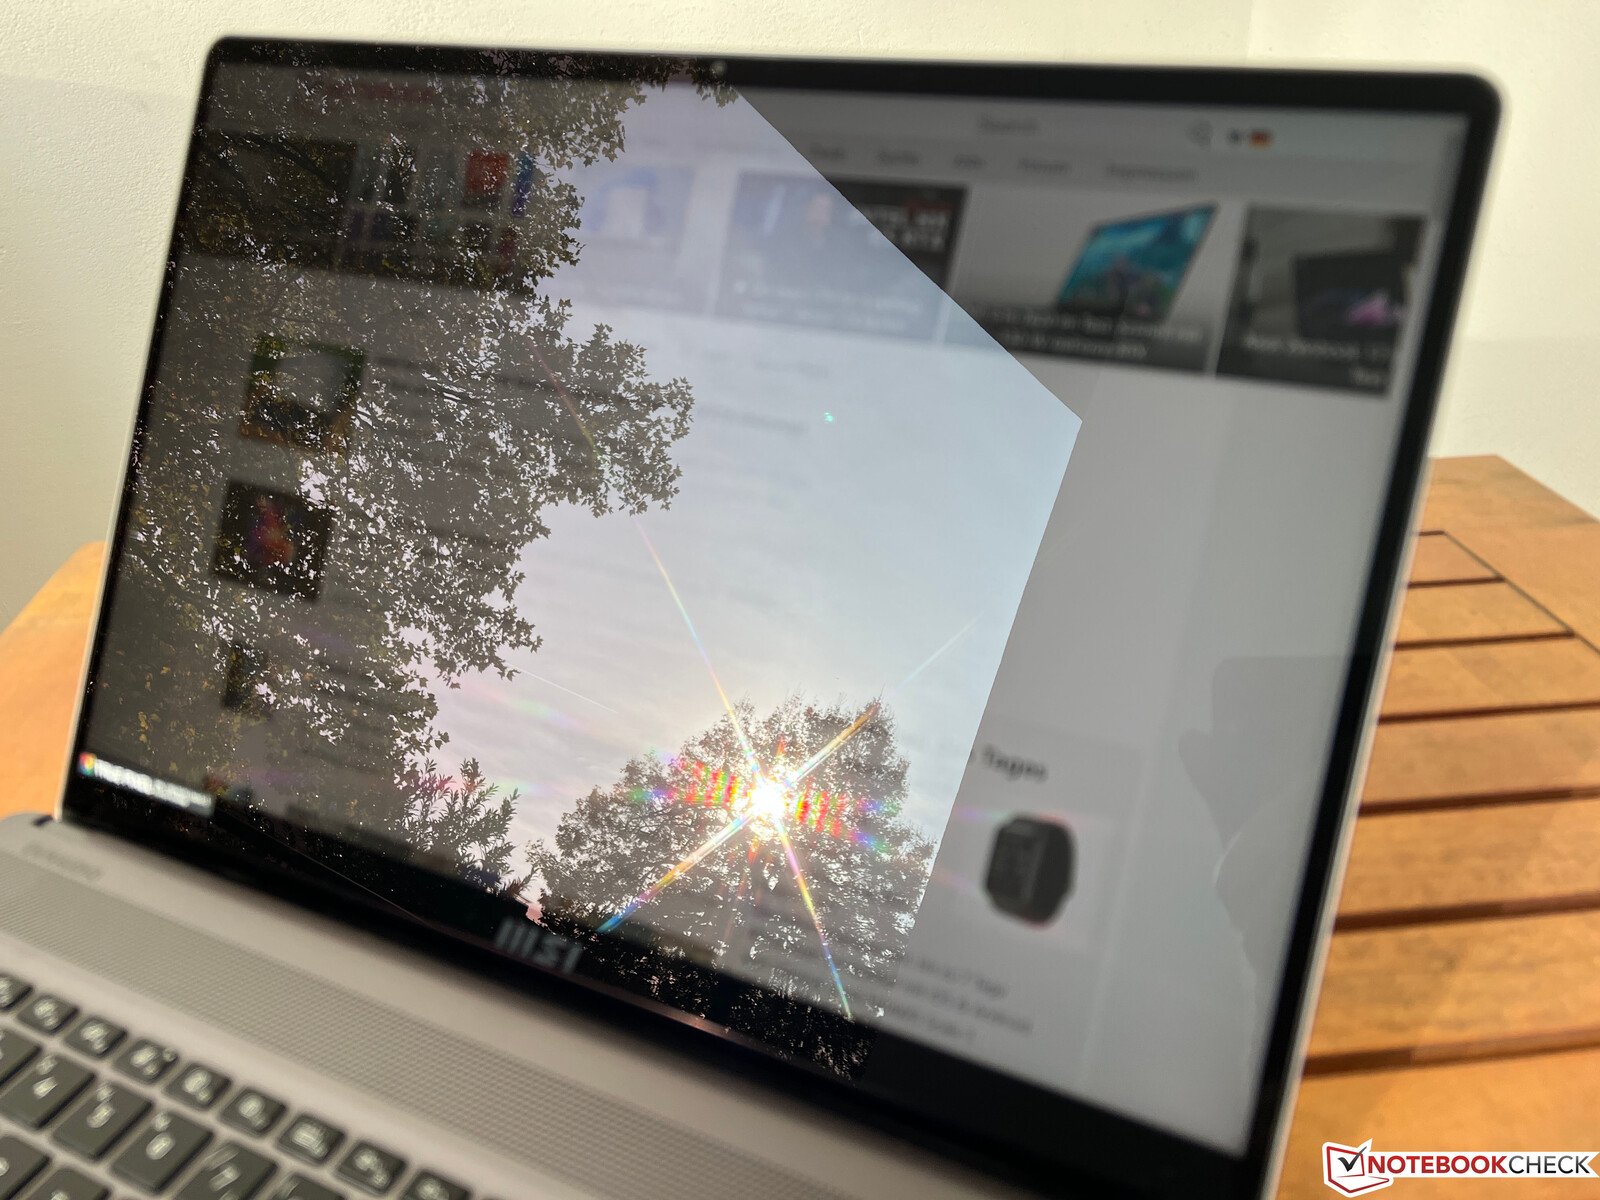
Même si la surface réfléchissante de l'écran contribue à la qualité de l'image, elle rend bien sûr les choses plus difficiles en extérieur. Tant que vous êtes en mesure d'éviter les reflets de sources lumineuses ou de zones claires, le contenu peut encore être reconnu assez facilement, mais ceux qui aiment occasionnellement faire un travail mobile ou qui travaillent dans des conditions de lumière changeantes seraient mieux servis par un écran mat.
Performance - MSI utilise Intel Alder Lake et Nvidia Studio
Conditions d'essai
En plus des paramètres de Windows, MSI propose également ses propres profils d'alimentation dans le logiciel préinstallé CenterPro et aussi un mode Smart Auto AI, qui contrôle les performances indépendamment de la charge. Lors de nos tests, nous avons obtenu des résultats qui variaient en fonction des profils d'alimentation. Nous avons obtenu les meilleurs résultats avec le mode Performance, même s'il y avait également quelques variations ici.
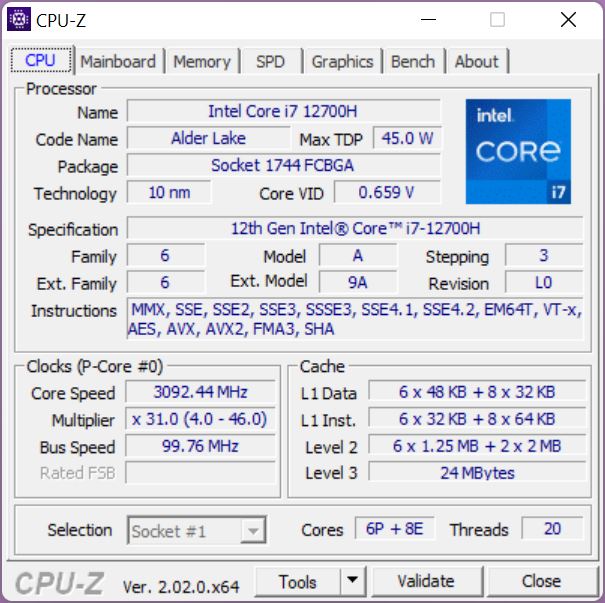
Processeur - Core i7-12700H
Le siteIntel Core i7-12700Hest actuellement utilisé dans de nombreux ordinateurs portables, offrant de très bonnes valeurs de performance avec ses 6 cœurs de performance et 8 cœurs d'efficacité, mais il peut y avoir de grandes différences selon la configuration TDP. Dans le CreatorPro Z16P, les valeurs sont choisies de manière assez conservatrice, et elles ne sont pas toujours stables. Parfois, le processeur est autorisé à consommer jusqu'à 76 watts, mais dans la boucle Cinebench, il ne consomme que 55-60 watts. MSI devrait se pencher à nouveau sur cette question et permettre des résultats reproductibles.
Cependant, à travers tous les benchmarks de CPU, l'exécution est très bonne globalement, plaçant seulement minimalement derrière le HP ZBook Studio 16 G9avec le Core i7-12800H. L'ordinaire Créateur Z16P dans la configuration avec le Core i9-12900H est environ 9 % plus rapide en moyenne. En mode batterie, la consommation d'énergie du processeur est limitée à 45 watts, ce qui entraîne une réduction des performances d'environ 25 % dans les tests multicœurs. Vous pouvez trouver d'autres benchmarks de processeurs dans notre section sur les processeurs mobiles.
Cinebench R15 Multi Constant Load Test
Cinebench R23: Multi Core | Single Core
Cinebench R20: CPU (Multi Core) | CPU (Single Core)
Cinebench R15: CPU Multi 64Bit | CPU Single 64Bit
Blender: v2.79 BMW27 CPU
7-Zip 18.03: 7z b 4 | 7z b 4 -mmt1
Geekbench 5.5: Multi-Core | Single-Core
HWBOT x265 Benchmark v2.2: 4k Preset
LibreOffice : 20 Documents To PDF
R Benchmark 2.5: Overall mean
| CPU Performance rating | |
| Moyenne de la classe Workstation | |
| MSI Creator Z16P B12UHST | |
| HP ZBook Studio 16 G9 62U04EA | |
| MSI CreatorPro Z16P B12UKST | |
| Moyenne Intel Core i7-12700H | |
| Lenovo ThinkPad P1 G4-20Y4S0KS00 | |
| Dell Precision 5000 5560 -2! | |
| Cinebench R23 / Multi Core | |
| Moyenne de la classe Workstation (14621 - 38520, n=23, 2 dernières années) | |
| MSI Creator Z16P B12UHST | |
| MSI CreatorPro Z16P B12UKST | |
| HP ZBook Studio 16 G9 62U04EA | |
| Moyenne Intel Core i7-12700H (4032 - 19330, n=64) | |
| Lenovo ThinkPad P1 G4-20Y4S0KS00 | |
| Dell Precision 5000 5560 | |
| Cinebench R23 / Single Core | |
| Moyenne de la classe Workstation (1712 - 2228, n=23, 2 dernières années) | |
| MSI Creator Z16P B12UHST | |
| HP ZBook Studio 16 G9 62U04EA | |
| Moyenne Intel Core i7-12700H (778 - 1826, n=63) | |
| MSI CreatorPro Z16P B12UKST | |
| Lenovo ThinkPad P1 G4-20Y4S0KS00 | |
| Dell Precision 5000 5560 | |
| Cinebench R20 / CPU (Multi Core) | |
| Moyenne de la classe Workstation (5760 - 15043, n=23, 2 dernières années) | |
| MSI Creator Z16P B12UHST | |
| MSI CreatorPro Z16P B12UKST | |
| HP ZBook Studio 16 G9 62U04EA | |
| Moyenne Intel Core i7-12700H (1576 - 7407, n=64) | |
| Lenovo ThinkPad P1 G4-20Y4S0KS00 | |
| Dell Precision 5000 5560 | |
| Cinebench R20 / CPU (Single Core) | |
| Moyenne de la classe Workstation (671 - 857, n=23, 2 dernières années) | |
| MSI Creator Z16P B12UHST | |
| HP ZBook Studio 16 G9 62U04EA | |
| Moyenne Intel Core i7-12700H (300 - 704, n=64) | |
| MSI CreatorPro Z16P B12UKST | |
| Lenovo ThinkPad P1 G4-20Y4S0KS00 | |
| Dell Precision 5000 5560 | |
| Cinebench R15 / CPU Multi 64Bit | |
| Moyenne de la classe Workstation (2489 - 5810, n=23, 2 dernières années) | |
| MSI Creator Z16P B12UHST | |
| HP ZBook Studio 16 G9 62U04EA | |
| Moyenne Intel Core i7-12700H (1379 - 2916, n=70) | |
| MSI CreatorPro Z16P B12UKST | |
| Lenovo ThinkPad P1 G4-20Y4S0KS00 | |
| Dell Precision 5000 5560 | |
| Cinebench R15 / CPU Single 64Bit | |
| Moyenne de la classe Workstation (191.4 - 328, n=23, 2 dernières années) | |
| MSI Creator Z16P B12UHST | |
| HP ZBook Studio 16 G9 62U04EA | |
| Moyenne Intel Core i7-12700H (113 - 263, n=65) | |
| MSI CreatorPro Z16P B12UKST | |
| Lenovo ThinkPad P1 G4-20Y4S0KS00 | |
| Dell Precision 5000 5560 | |
| Blender / v2.79 BMW27 CPU | |
| Dell Precision 5000 5560 | |
| Lenovo ThinkPad P1 G4-20Y4S0KS00 | |
| Moyenne Intel Core i7-12700H (168 - 732, n=63) | |
| MSI CreatorPro Z16P B12UKST | |
| HP ZBook Studio 16 G9 62U04EA | |
| MSI Creator Z16P B12UHST | |
| Moyenne de la classe Workstation (91 - 222, n=23, 2 dernières années) | |
| 7-Zip 18.03 / 7z b 4 | |
| Moyenne de la classe Workstation (60489 - 116969, n=23, 2 dernières années) | |
| MSI Creator Z16P B12UHST | |
| HP ZBook Studio 16 G9 62U04EA | |
| MSI CreatorPro Z16P B12UKST | |
| Moyenne Intel Core i7-12700H (22844 - 73067, n=63) | |
| Lenovo ThinkPad P1 G4-20Y4S0KS00 | |
| Dell Precision 5000 5560 | |
| 7-Zip 18.03 / 7z b 4 -mmt1 | |
| Moyenne de la classe Workstation (5126 - 6960, n=23, 2 dernières années) | |
| MSI Creator Z16P B12UHST | |
| HP ZBook Studio 16 G9 62U04EA | |
| MSI CreatorPro Z16P B12UKST | |
| Lenovo ThinkPad P1 G4-20Y4S0KS00 | |
| Dell Precision 5000 5560 | |
| Moyenne Intel Core i7-12700H (2743 - 5972, n=63) | |
| Geekbench 5.5 / Multi-Core | |
| Moyenne de la classe Workstation (11542 - 25554, n=23, 2 dernières années) | |
| MSI Creator Z16P B12UHST | |
| HP ZBook Studio 16 G9 62U04EA | |
| MSI CreatorPro Z16P B12UKST | |
| Moyenne Intel Core i7-12700H (5144 - 13745, n=64) | |
| Lenovo ThinkPad P1 G4-20Y4S0KS00 | |
| Geekbench 5.5 / Single-Core | |
| Moyenne de la classe Workstation (1783 - 2183, n=23, 2 dernières années) | |
| MSI Creator Z16P B12UHST | |
| HP ZBook Studio 16 G9 62U04EA | |
| MSI CreatorPro Z16P B12UKST | |
| Moyenne Intel Core i7-12700H (803 - 1851, n=64) | |
| Lenovo ThinkPad P1 G4-20Y4S0KS00 | |
| HWBOT x265 Benchmark v2.2 / 4k Preset | |
| Moyenne de la classe Workstation (17.8 - 40.5, n=23, 2 dernières années) | |
| HP ZBook Studio 16 G9 62U04EA | |
| MSI CreatorPro Z16P B12UKST | |
| MSI Creator Z16P B12UHST | |
| Moyenne Intel Core i7-12700H (4.67 - 21.8, n=64) | |
| Lenovo ThinkPad P1 G4-20Y4S0KS00 | |
| Dell Precision 5000 5560 | |
| LibreOffice / 20 Documents To PDF | |
| Dell Precision 5000 5560 | |
| Moyenne de la classe Workstation (37.1 - 74.7, n=23, 2 dernières années) | |
| Moyenne Intel Core i7-12700H (34.2 - 95.3, n=63) | |
| Lenovo ThinkPad P1 G4-20Y4S0KS00 | |
| HP ZBook Studio 16 G9 62U04EA | |
| MSI Creator Z16P B12UHST | |
| MSI CreatorPro Z16P B12UKST | |
| R Benchmark 2.5 / Overall mean | |
| Dell Precision 5000 5560 | |
| Lenovo ThinkPad P1 G4-20Y4S0KS00 | |
| Moyenne Intel Core i7-12700H (0.4441 - 1.052, n=63) | |
| MSI CreatorPro Z16P B12UKST | |
| HP ZBook Studio 16 G9 62U04EA | |
| Moyenne de la classe Workstation (0.3825 - 0.603, n=23, 2 dernières années) | |
| MSI Creator Z16P B12UHST | |
* ... Moindre est la valeur, meilleures sont les performances
AIDA64: FP32 Ray-Trace | FPU Julia | CPU SHA3 | CPU Queen | FPU SinJulia | FPU Mandel | CPU AES | CPU ZLib | FP64 Ray-Trace | CPU PhotoWorxx
| Performance rating | |
| Moyenne de la classe Workstation | |
| MSI CreatorPro Z16P B12UKST | |
| HP ZBook Studio 16 G9 62U04EA | |
| Lenovo ThinkPad P1 G4-20Y4Z9DVUS | |
| MSI Creator Z16P B12UHST | |
| Moyenne Intel Core i7-12700H | |
| AIDA64 / FP32 Ray-Trace | |
| Moyenne de la classe Workstation (16730 - 61611, n=23, 2 dernières années) | |
| Lenovo ThinkPad P1 G4-20Y4Z9DVUS | |
| HP ZBook Studio 16 G9 62U04EA | |
| MSI CreatorPro Z16P B12UKST | |
| Moyenne Intel Core i7-12700H (2585 - 17957, n=64) | |
| MSI Creator Z16P B12UHST | |
| AIDA64 / FPU Julia | |
| Moyenne de la classe Workstation (89597 - 186971, n=23, 2 dernières années) | |
| HP ZBook Studio 16 G9 62U04EA | |
| MSI CreatorPro Z16P B12UKST | |
| Lenovo ThinkPad P1 G4-20Y4Z9DVUS | |
| Moyenne Intel Core i7-12700H (12439 - 90760, n=64) | |
| MSI Creator Z16P B12UHST | |
| AIDA64 / CPU SHA3 | |
| Moyenne de la classe Workstation (4178 - 8975, n=23, 2 dernières années) | |
| Lenovo ThinkPad P1 G4-20Y4Z9DVUS | |
| HP ZBook Studio 16 G9 62U04EA | |
| MSI CreatorPro Z16P B12UKST | |
| Moyenne Intel Core i7-12700H (833 - 4242, n=64) | |
| MSI Creator Z16P B12UHST | |
| AIDA64 / CPU Queen | |
| Moyenne de la classe Workstation (60778 - 144411, n=23, 2 dernières années) | |
| HP ZBook Studio 16 G9 62U04EA | |
| MSI Creator Z16P B12UHST | |
| MSI CreatorPro Z16P B12UKST | |
| Moyenne Intel Core i7-12700H (57923 - 103202, n=63) | |
| Lenovo ThinkPad P1 G4-20Y4Z9DVUS | |
| AIDA64 / FPU SinJulia | |
| Moyenne de la classe Workstation (8165 - 29343, n=23, 2 dernières années) | |
| MSI Creator Z16P B12UHST | |
| Lenovo ThinkPad P1 G4-20Y4Z9DVUS | |
| HP ZBook Studio 16 G9 62U04EA | |
| MSI CreatorPro Z16P B12UKST | |
| Moyenne Intel Core i7-12700H (3249 - 9939, n=64) | |
| AIDA64 / FPU Mandel | |
| Moyenne de la classe Workstation (44497 - 98153, n=23, 2 dernières années) | |
| HP ZBook Studio 16 G9 62U04EA | |
| Lenovo ThinkPad P1 G4-20Y4Z9DVUS | |
| MSI CreatorPro Z16P B12UKST | |
| Moyenne Intel Core i7-12700H (7135 - 44760, n=64) | |
| MSI Creator Z16P B12UHST | |
| AIDA64 / CPU AES | |
| MSI CreatorPro Z16P B12UKST | |
| Moyenne de la classe Workstation (73133 - 187841, n=23, 2 dernières années) | |
| MSI Creator Z16P B12UHST | |
| Lenovo ThinkPad P1 G4-20Y4Z9DVUS | |
| Moyenne Intel Core i7-12700H (31839 - 144360, n=64) | |
| HP ZBook Studio 16 G9 62U04EA | |
| AIDA64 / CPU ZLib | |
| Moyenne de la classe Workstation (929 - 2148, n=23, 2 dernières années) | |
| MSI Creator Z16P B12UHST | |
| HP ZBook Studio 16 G9 62U04EA | |
| MSI CreatorPro Z16P B12UKST | |
| Moyenne Intel Core i7-12700H (305 - 1171, n=64) | |
| Lenovo ThinkPad P1 G4-20Y4Z9DVUS | |
| AIDA64 / FP64 Ray-Trace | |
| Moyenne de la classe Workstation (8545 - 32891, n=23, 2 dernières années) | |
| HP ZBook Studio 16 G9 62U04EA | |
| Lenovo ThinkPad P1 G4-20Y4Z9DVUS | |
| MSI CreatorPro Z16P B12UKST | |
| Moyenne Intel Core i7-12700H (1437 - 9692, n=64) | |
| MSI Creator Z16P B12UHST | |
| AIDA64 / CPU PhotoWorxx | |
| Moyenne de la classe Workstation (37151 - 93684, n=23, 2 dernières années) | |
| MSI CreatorPro Z16P B12UKST | |
| MSI Creator Z16P B12UHST | |
| HP ZBook Studio 16 G9 62U04EA | |
| Moyenne Intel Core i7-12700H (12863 - 52207, n=64) | |
| Lenovo ThinkPad P1 G4-20Y4Z9DVUS | |
Performance du système
Il n'est pas très surprenant qu'il n'y ait aucun problème dans les performances de base du système. Dans nos tests, l'ordinateur portable est toujours très réactif, et les résultats des tests de référence sont également très bons.
CrossMark: Overall | Productivity | Creativity | Responsiveness
| PCMark 10 / Score | |
| Moyenne de la classe Workstation (6563 - 10409, n=19, 2 dernières années) | |
| MSI Creator Z16P B12UHST | |
| Lenovo ThinkPad P1 G4-20Y4S0KS00 | |
| MSI CreatorPro Z16P B12UKST | |
| Moyenne Intel Core i7-12700H, NVIDIA RTX A3000 Laptop GPU (n=1) | |
| Dell Precision 5000 5560 | |
| HP ZBook Studio 16 G9 62U04EA | |
| PCMark 10 / Essentials | |
| MSI Creator Z16P B12UHST | |
| Lenovo ThinkPad P1 G4-20Y4S0KS00 | |
| Dell Precision 5000 5560 | |
| MSI CreatorPro Z16P B12UKST | |
| Moyenne Intel Core i7-12700H, NVIDIA RTX A3000 Laptop GPU (n=1) | |
| Moyenne de la classe Workstation (9622 - 11157, n=19, 2 dernières années) | |
| HP ZBook Studio 16 G9 62U04EA | |
| PCMark 10 / Productivity | |
| Moyenne de la classe Workstation (8789 - 20616, n=19, 2 dernières années) | |
| MSI Creator Z16P B12UHST | |
| MSI CreatorPro Z16P B12UKST | |
| Moyenne Intel Core i7-12700H, NVIDIA RTX A3000 Laptop GPU (n=1) | |
| Dell Precision 5000 5560 | |
| Lenovo ThinkPad P1 G4-20Y4S0KS00 | |
| HP ZBook Studio 16 G9 62U04EA | |
| PCMark 10 / Digital Content Creation | |
| Moyenne de la classe Workstation (8108 - 15631, n=19, 2 dernières années) | |
| MSI Creator Z16P B12UHST | |
| Lenovo ThinkPad P1 G4-20Y4S0KS00 | |
| MSI CreatorPro Z16P B12UKST | |
| Moyenne Intel Core i7-12700H, NVIDIA RTX A3000 Laptop GPU (n=1) | |
| HP ZBook Studio 16 G9 62U04EA | |
| Dell Precision 5000 5560 | |
| CrossMark / Overall | |
| MSI CreatorPro Z16P B12UKST | |
| Moyenne Intel Core i7-12700H, NVIDIA RTX A3000 Laptop GPU (n=1) | |
| Moyenne de la classe Workstation (1307 - 2267, n=22, 2 dernières années) | |
| HP ZBook Studio 16 G9 62U04EA | |
| Lenovo ThinkPad P1 G4-20Y4S0KS00 | |
| CrossMark / Productivity | |
| MSI CreatorPro Z16P B12UKST | |
| Moyenne Intel Core i7-12700H, NVIDIA RTX A3000 Laptop GPU (n=1) | |
| Moyenne de la classe Workstation (1130 - 2122, n=22, 2 dernières années) | |
| HP ZBook Studio 16 G9 62U04EA | |
| Lenovo ThinkPad P1 G4-20Y4S0KS00 | |
| CrossMark / Creativity | |
| Moyenne de la classe Workstation (1657 - 2725, n=22, 2 dernières années) | |
| HP ZBook Studio 16 G9 62U04EA | |
| MSI CreatorPro Z16P B12UKST | |
| Moyenne Intel Core i7-12700H, NVIDIA RTX A3000 Laptop GPU (n=1) | |
| Lenovo ThinkPad P1 G4-20Y4S0KS00 | |
| CrossMark / Responsiveness | |
| MSI CreatorPro Z16P B12UKST | |
| Moyenne Intel Core i7-12700H, NVIDIA RTX A3000 Laptop GPU (n=1) | |
| Moyenne de la classe Workstation (993 - 2096, n=22, 2 dernières années) | |
| HP ZBook Studio 16 G9 62U04EA | |
| Lenovo ThinkPad P1 G4-20Y4S0KS00 | |
| PCMark 10 Score | 7086 points | |
Aide | ||
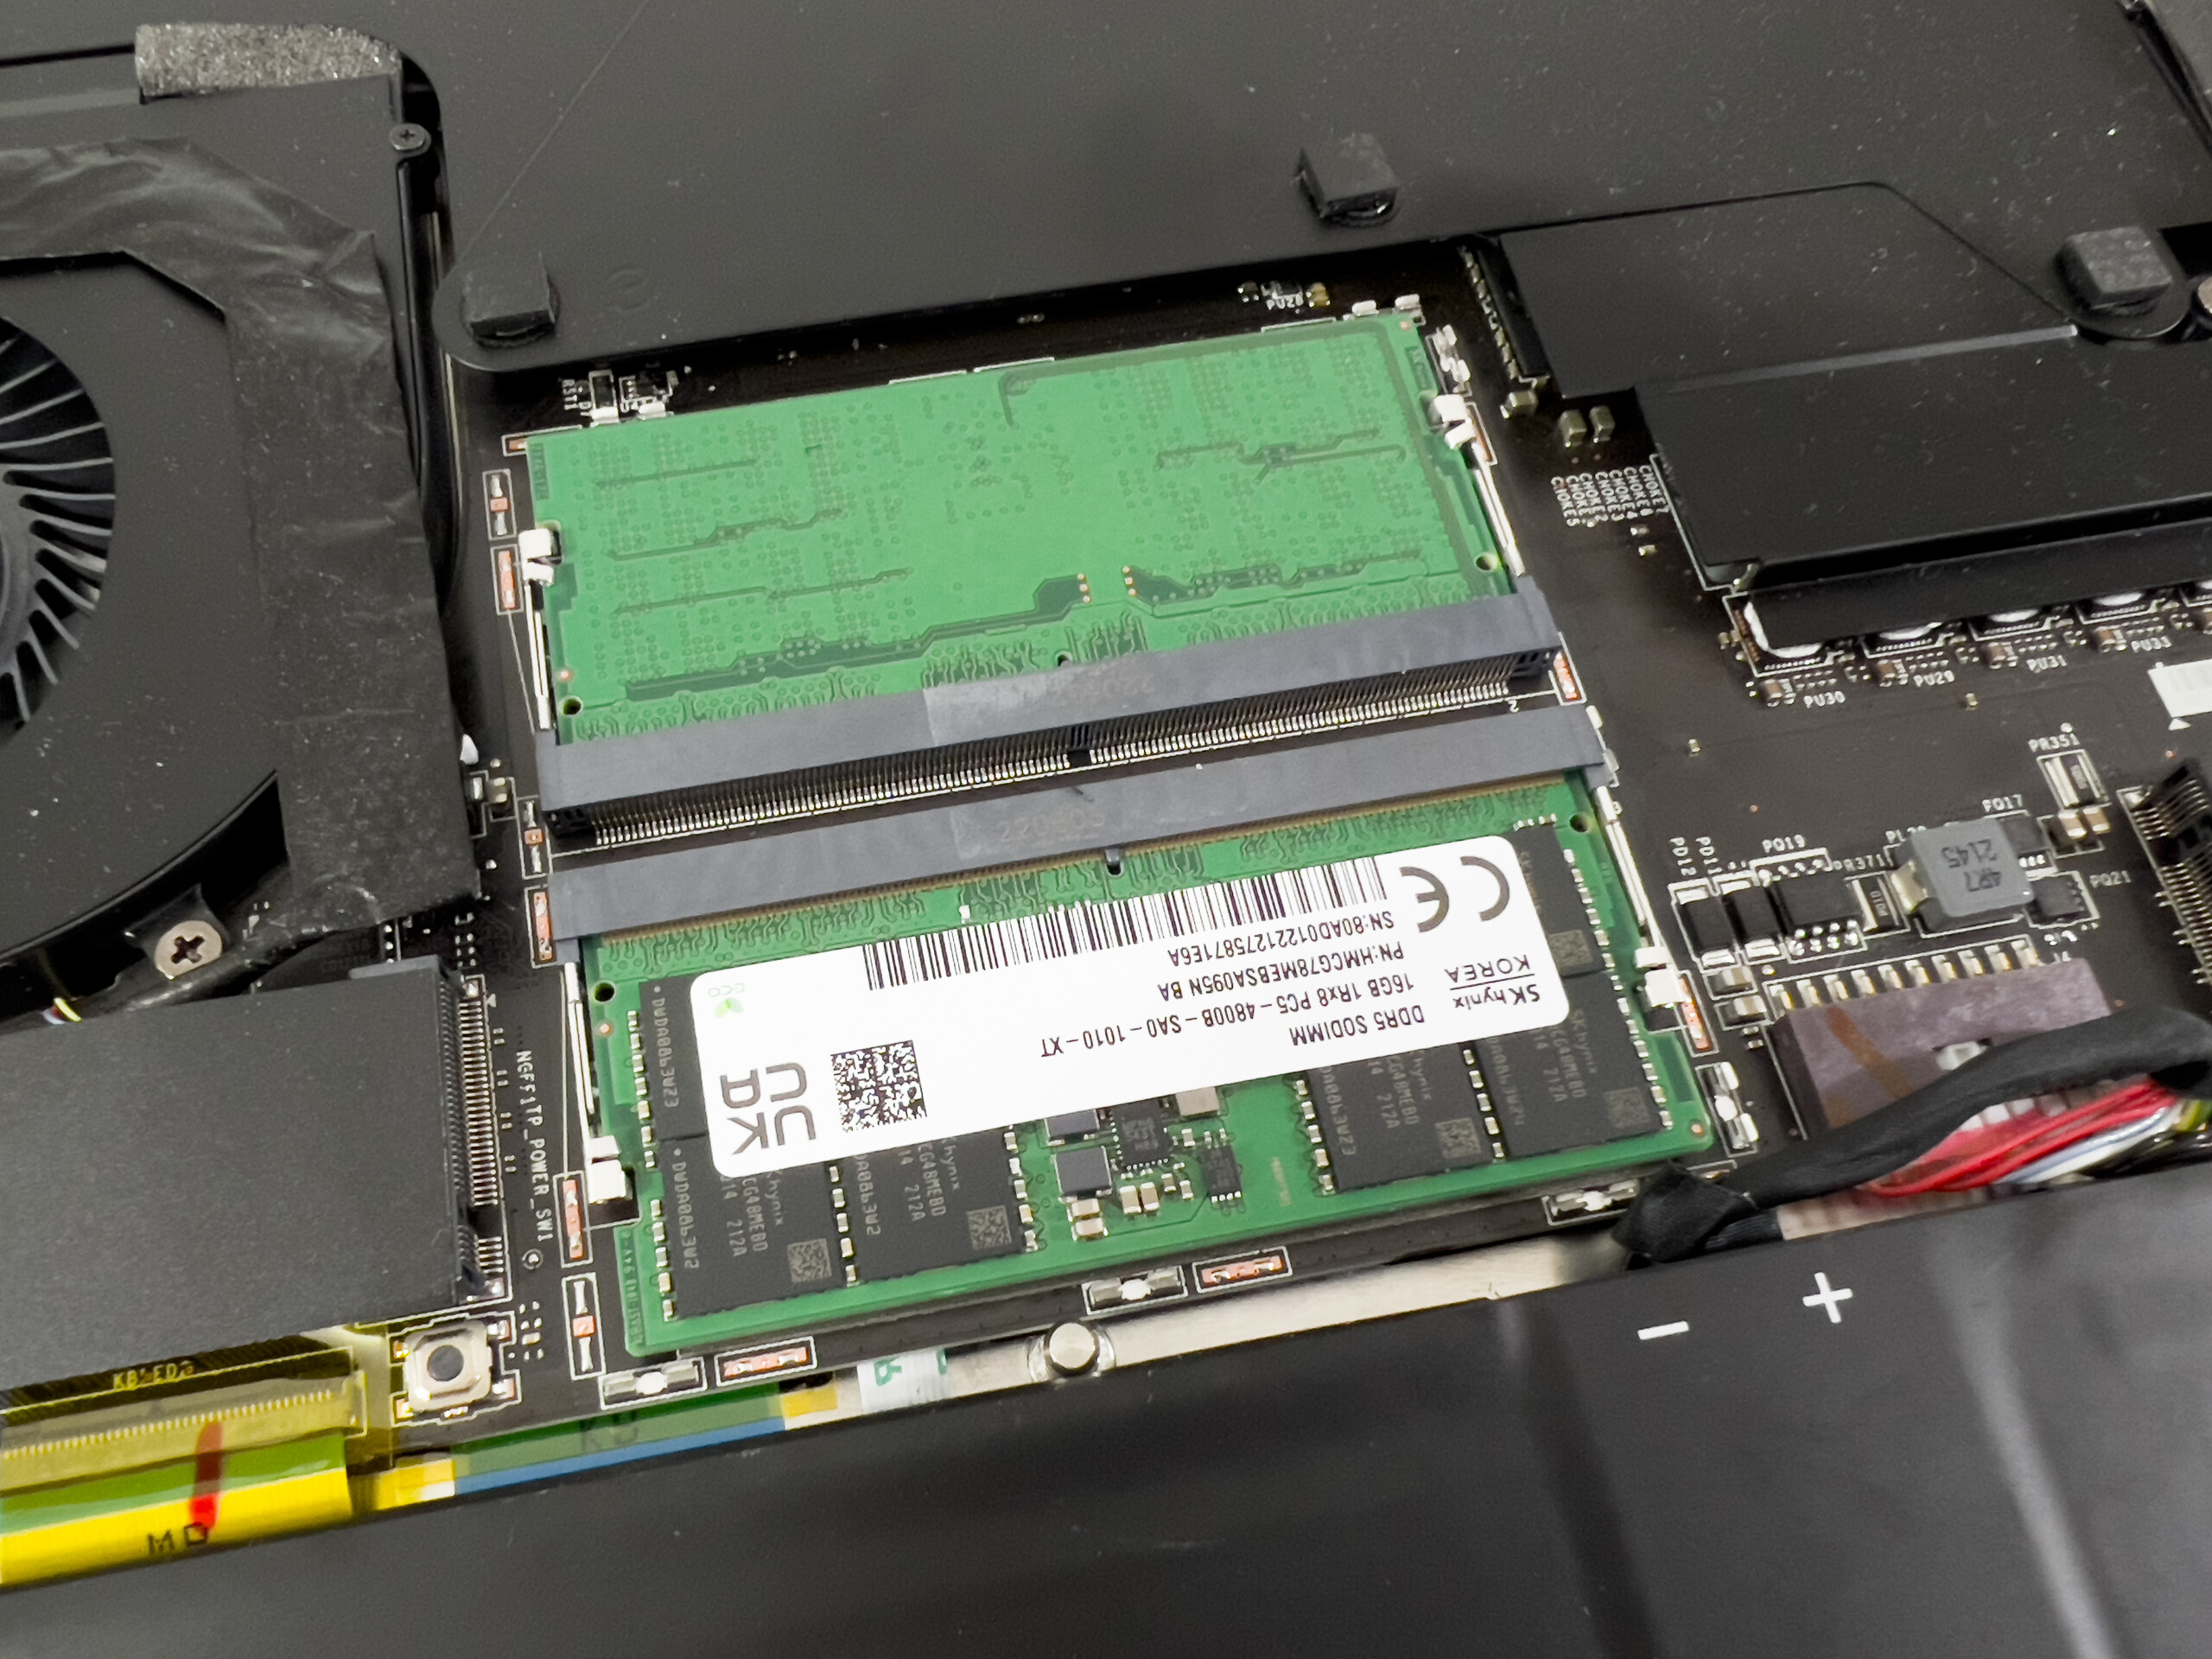
| AIDA64 / Memory Copy | |
| Moyenne de la classe Workstation (56003 - 164795, n=23, 2 dernières années) | |
| MSI Creator Z16P B12UHST | |
| MSI CreatorPro Z16P B12UKST | |
| HP ZBook Studio 16 G9 62U04EA | |
| Moyenne Intel Core i7-12700H (25615 - 80511, n=64) | |
| Lenovo ThinkPad P1 G4-20Y4Z9DVUS | |
| AIDA64 / Memory Read | |
| Moyenne de la classe Workstation (55795 - 121563, n=23, 2 dernières années) | |
| MSI Creator Z16P B12UHST | |
| MSI CreatorPro Z16P B12UKST | |
| HP ZBook Studio 16 G9 62U04EA | |
| Moyenne Intel Core i7-12700H (25586 - 79442, n=64) | |
| Lenovo ThinkPad P1 G4-20Y4Z9DVUS | |
| AIDA64 / Memory Write | |
| Moyenne de la classe Workstation (55663 - 214520, n=23, 2 dernières années) | |
| MSI CreatorPro Z16P B12UKST | |
| MSI Creator Z16P B12UHST | |
| HP ZBook Studio 16 G9 62U04EA | |
| Moyenne Intel Core i7-12700H (23679 - 88660, n=64) | |
| Lenovo ThinkPad P1 G4-20Y4Z9DVUS | |
| AIDA64 / Memory Latency | |
| Moyenne de la classe Workstation (84.5 - 165.2, n=23, 2 dernières années) | |
| MSI CreatorPro Z16P B12UKST | |
| MSI Creator Z16P B12UHST | |
| HP ZBook Studio 16 G9 62U04EA | |
| Lenovo ThinkPad P1 G4-20Y4Z9DVUS | |
| Moyenne Intel Core i7-12700H (76.2 - 133.9, n=62) | |
* ... Moindre est la valeur, meilleures sont les performances
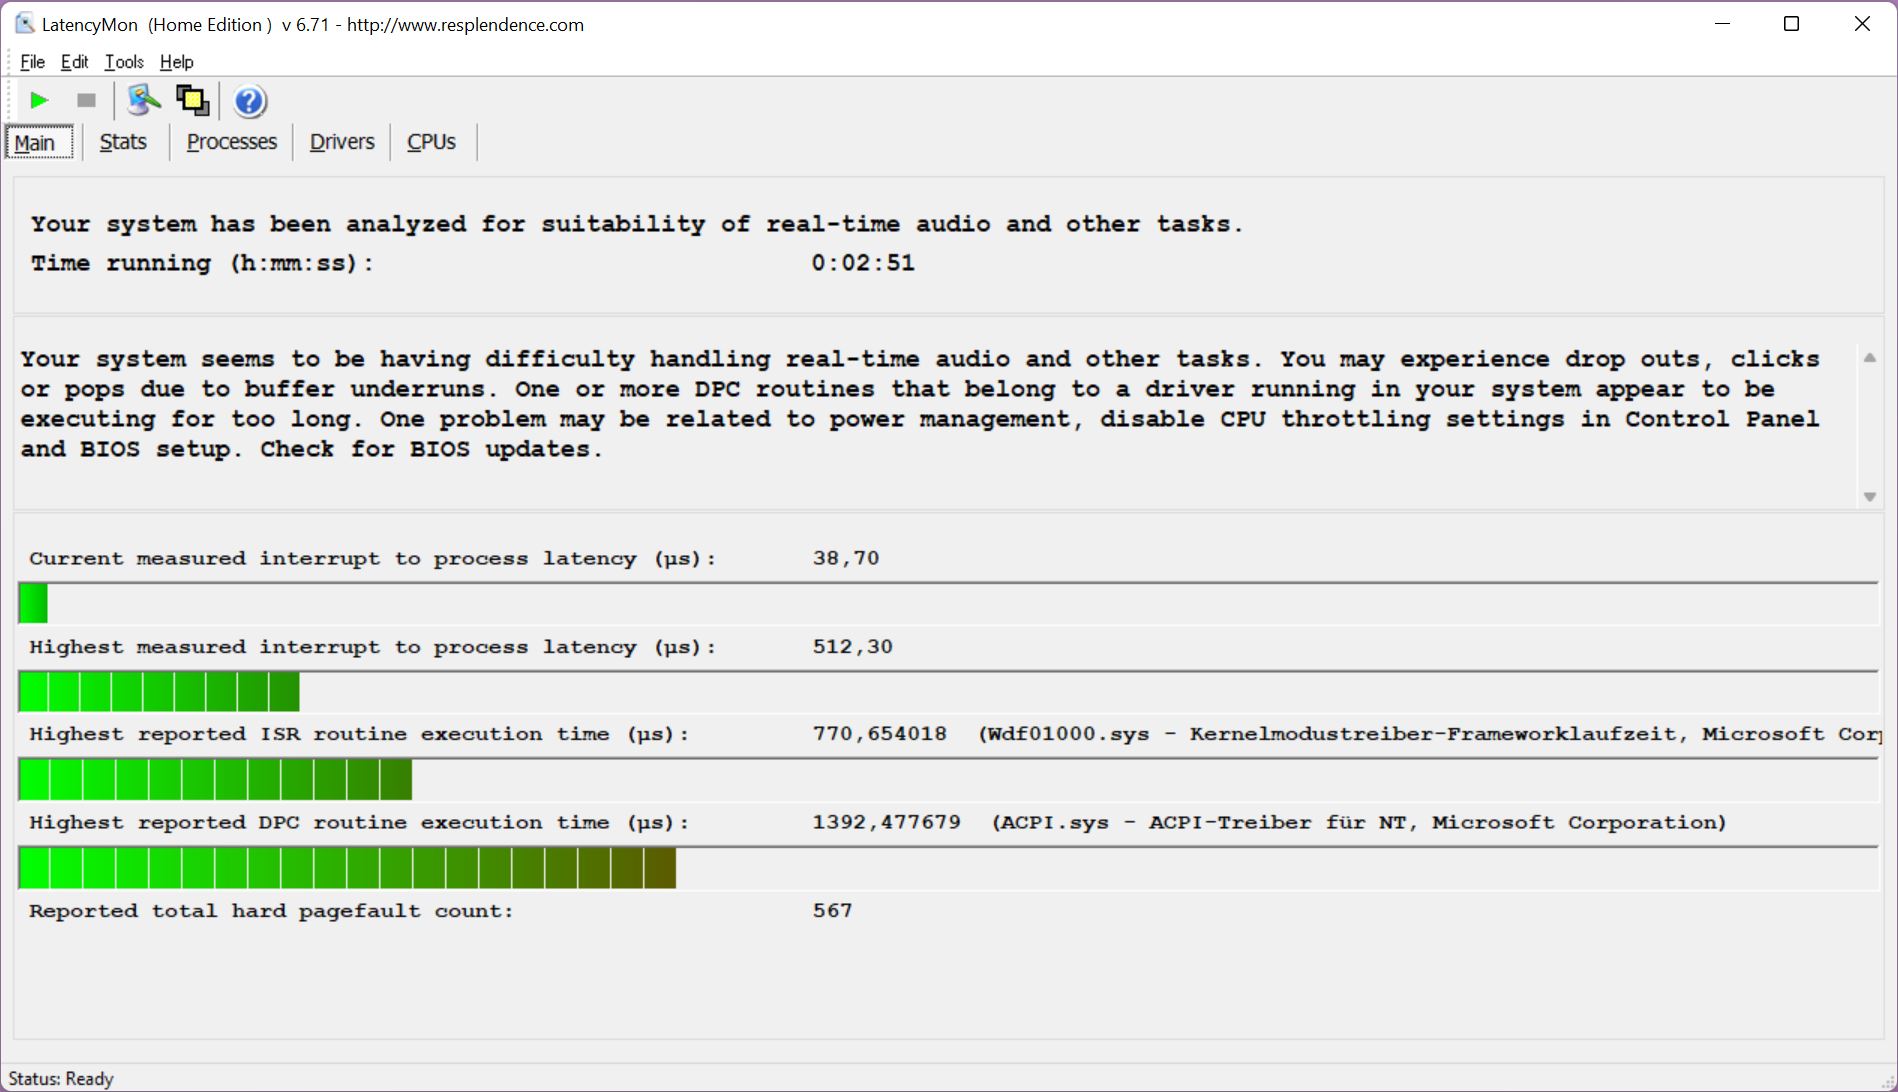
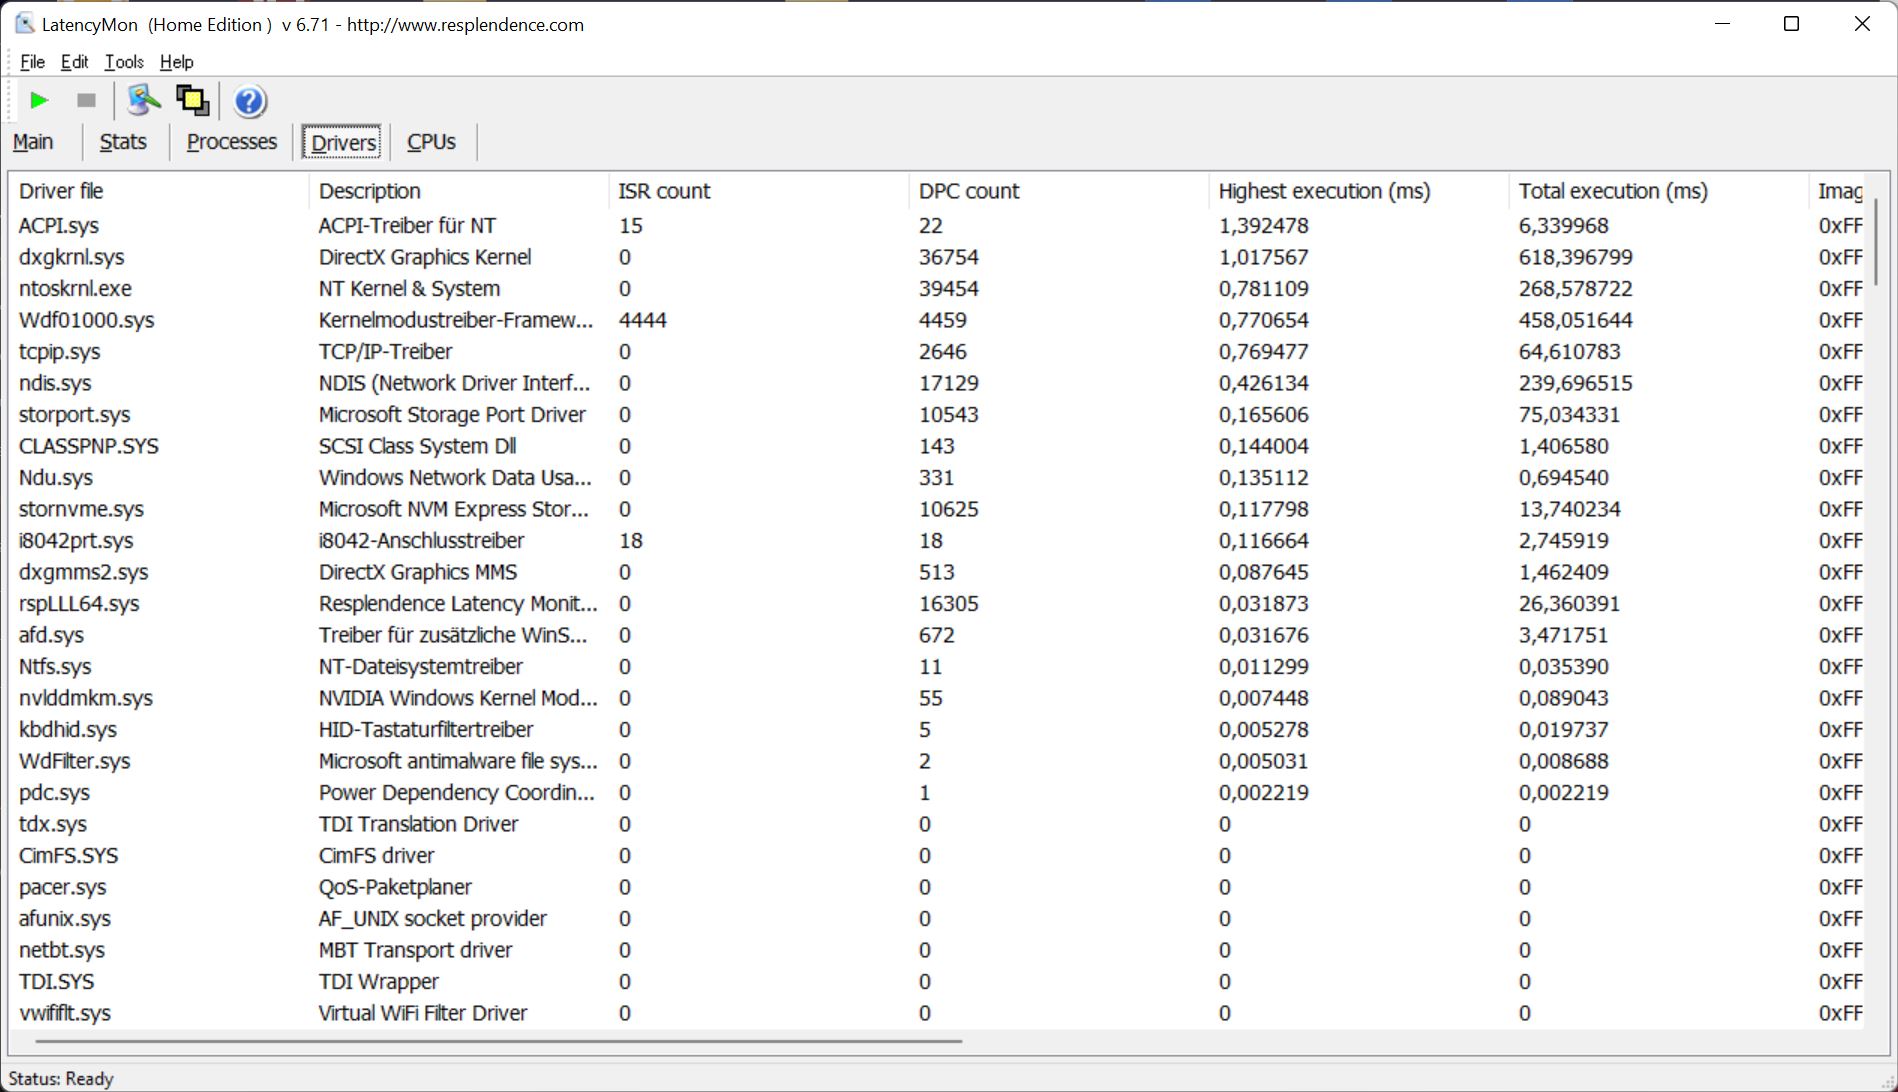
Latences DPC
Avec le BIOS au moment de notre test, l'appareil ne montre aucune limitation dans notre test de latence (navigation sur Internet, reproduction YouTube 4K, charge CPU). Même si l'un des pilotes provoque une légère aberration, l'utilisation d'applications audio en temps réel ne devrait pas poser de problème.
| DPC Latencies / LatencyMon - interrupt to process latency (max), Web, Youtube, Prime95 | |
| HP ZBook Studio 16 G9 62U04EA | |
| MSI Creator Z16P B12UHST | |
| Dell Precision 5000 5560 | |
| Lenovo ThinkPad P1 G4-20Y4S0KS00 | |
| MSI CreatorPro Z16P B12UKST | |
* ... Moindre est la valeur, meilleures sont les performances
Solution de stockage
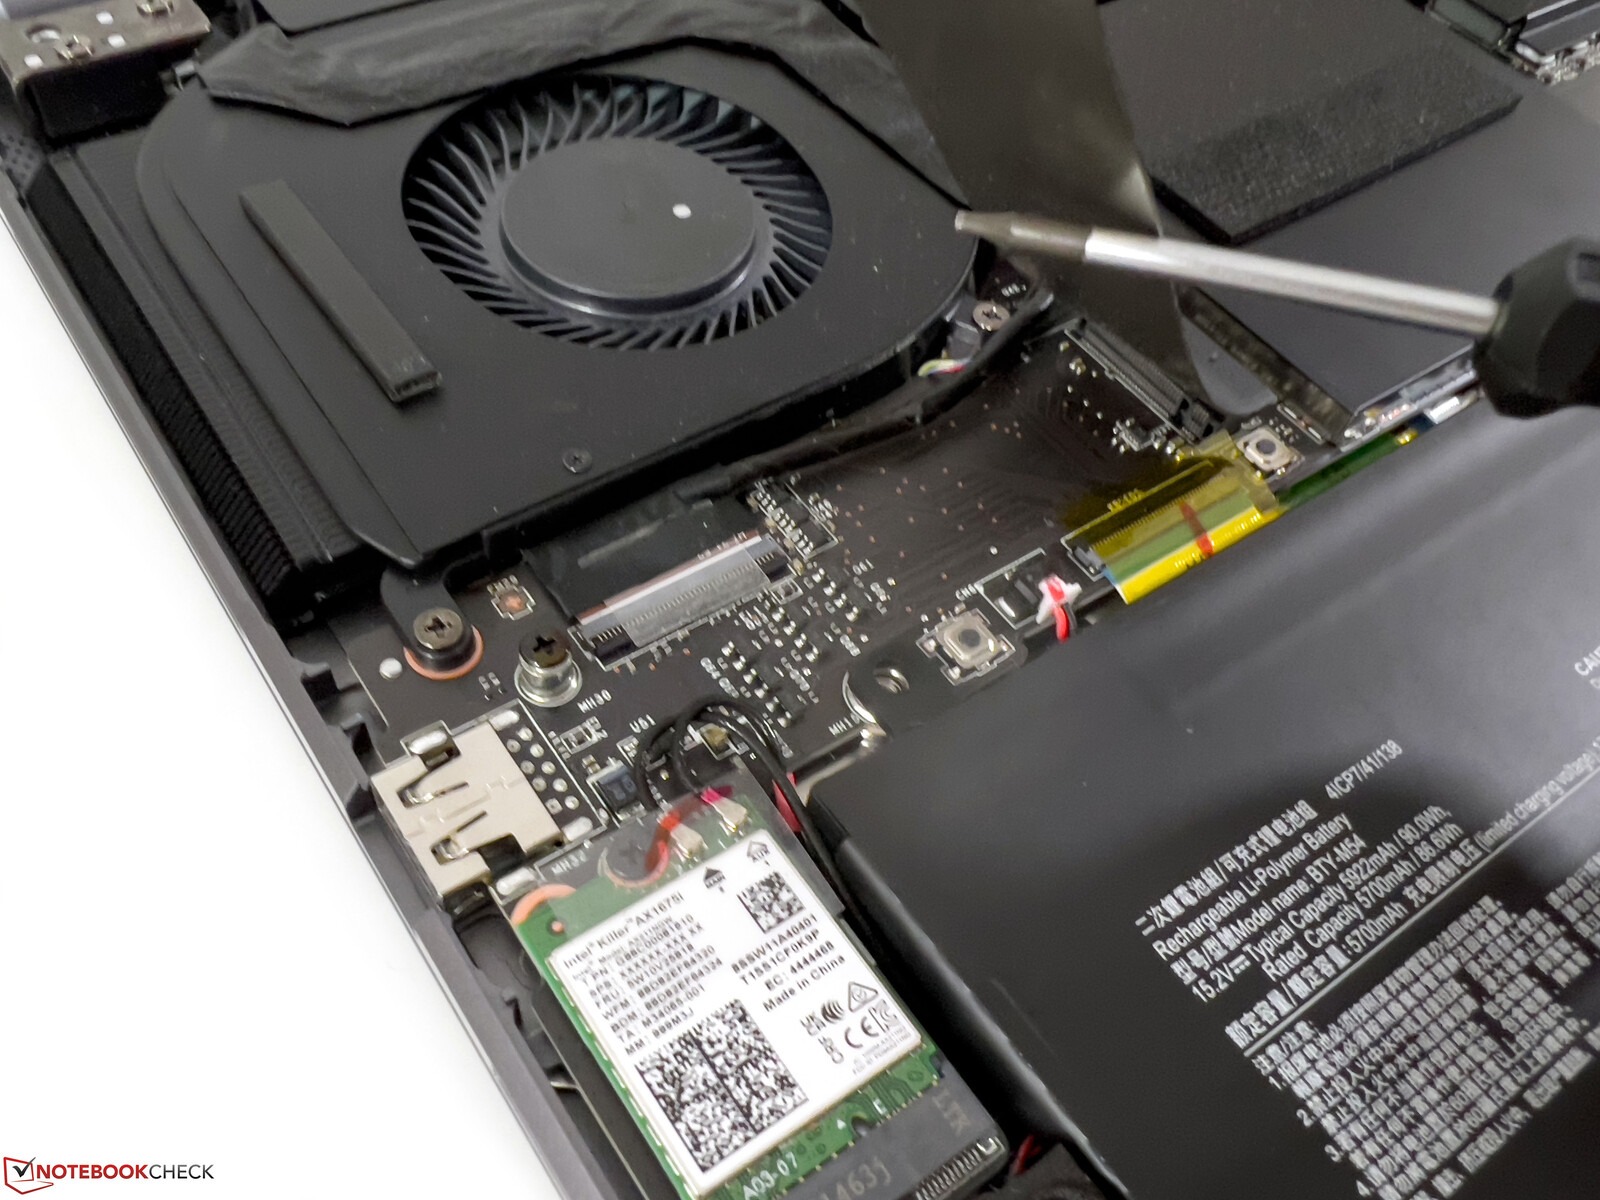
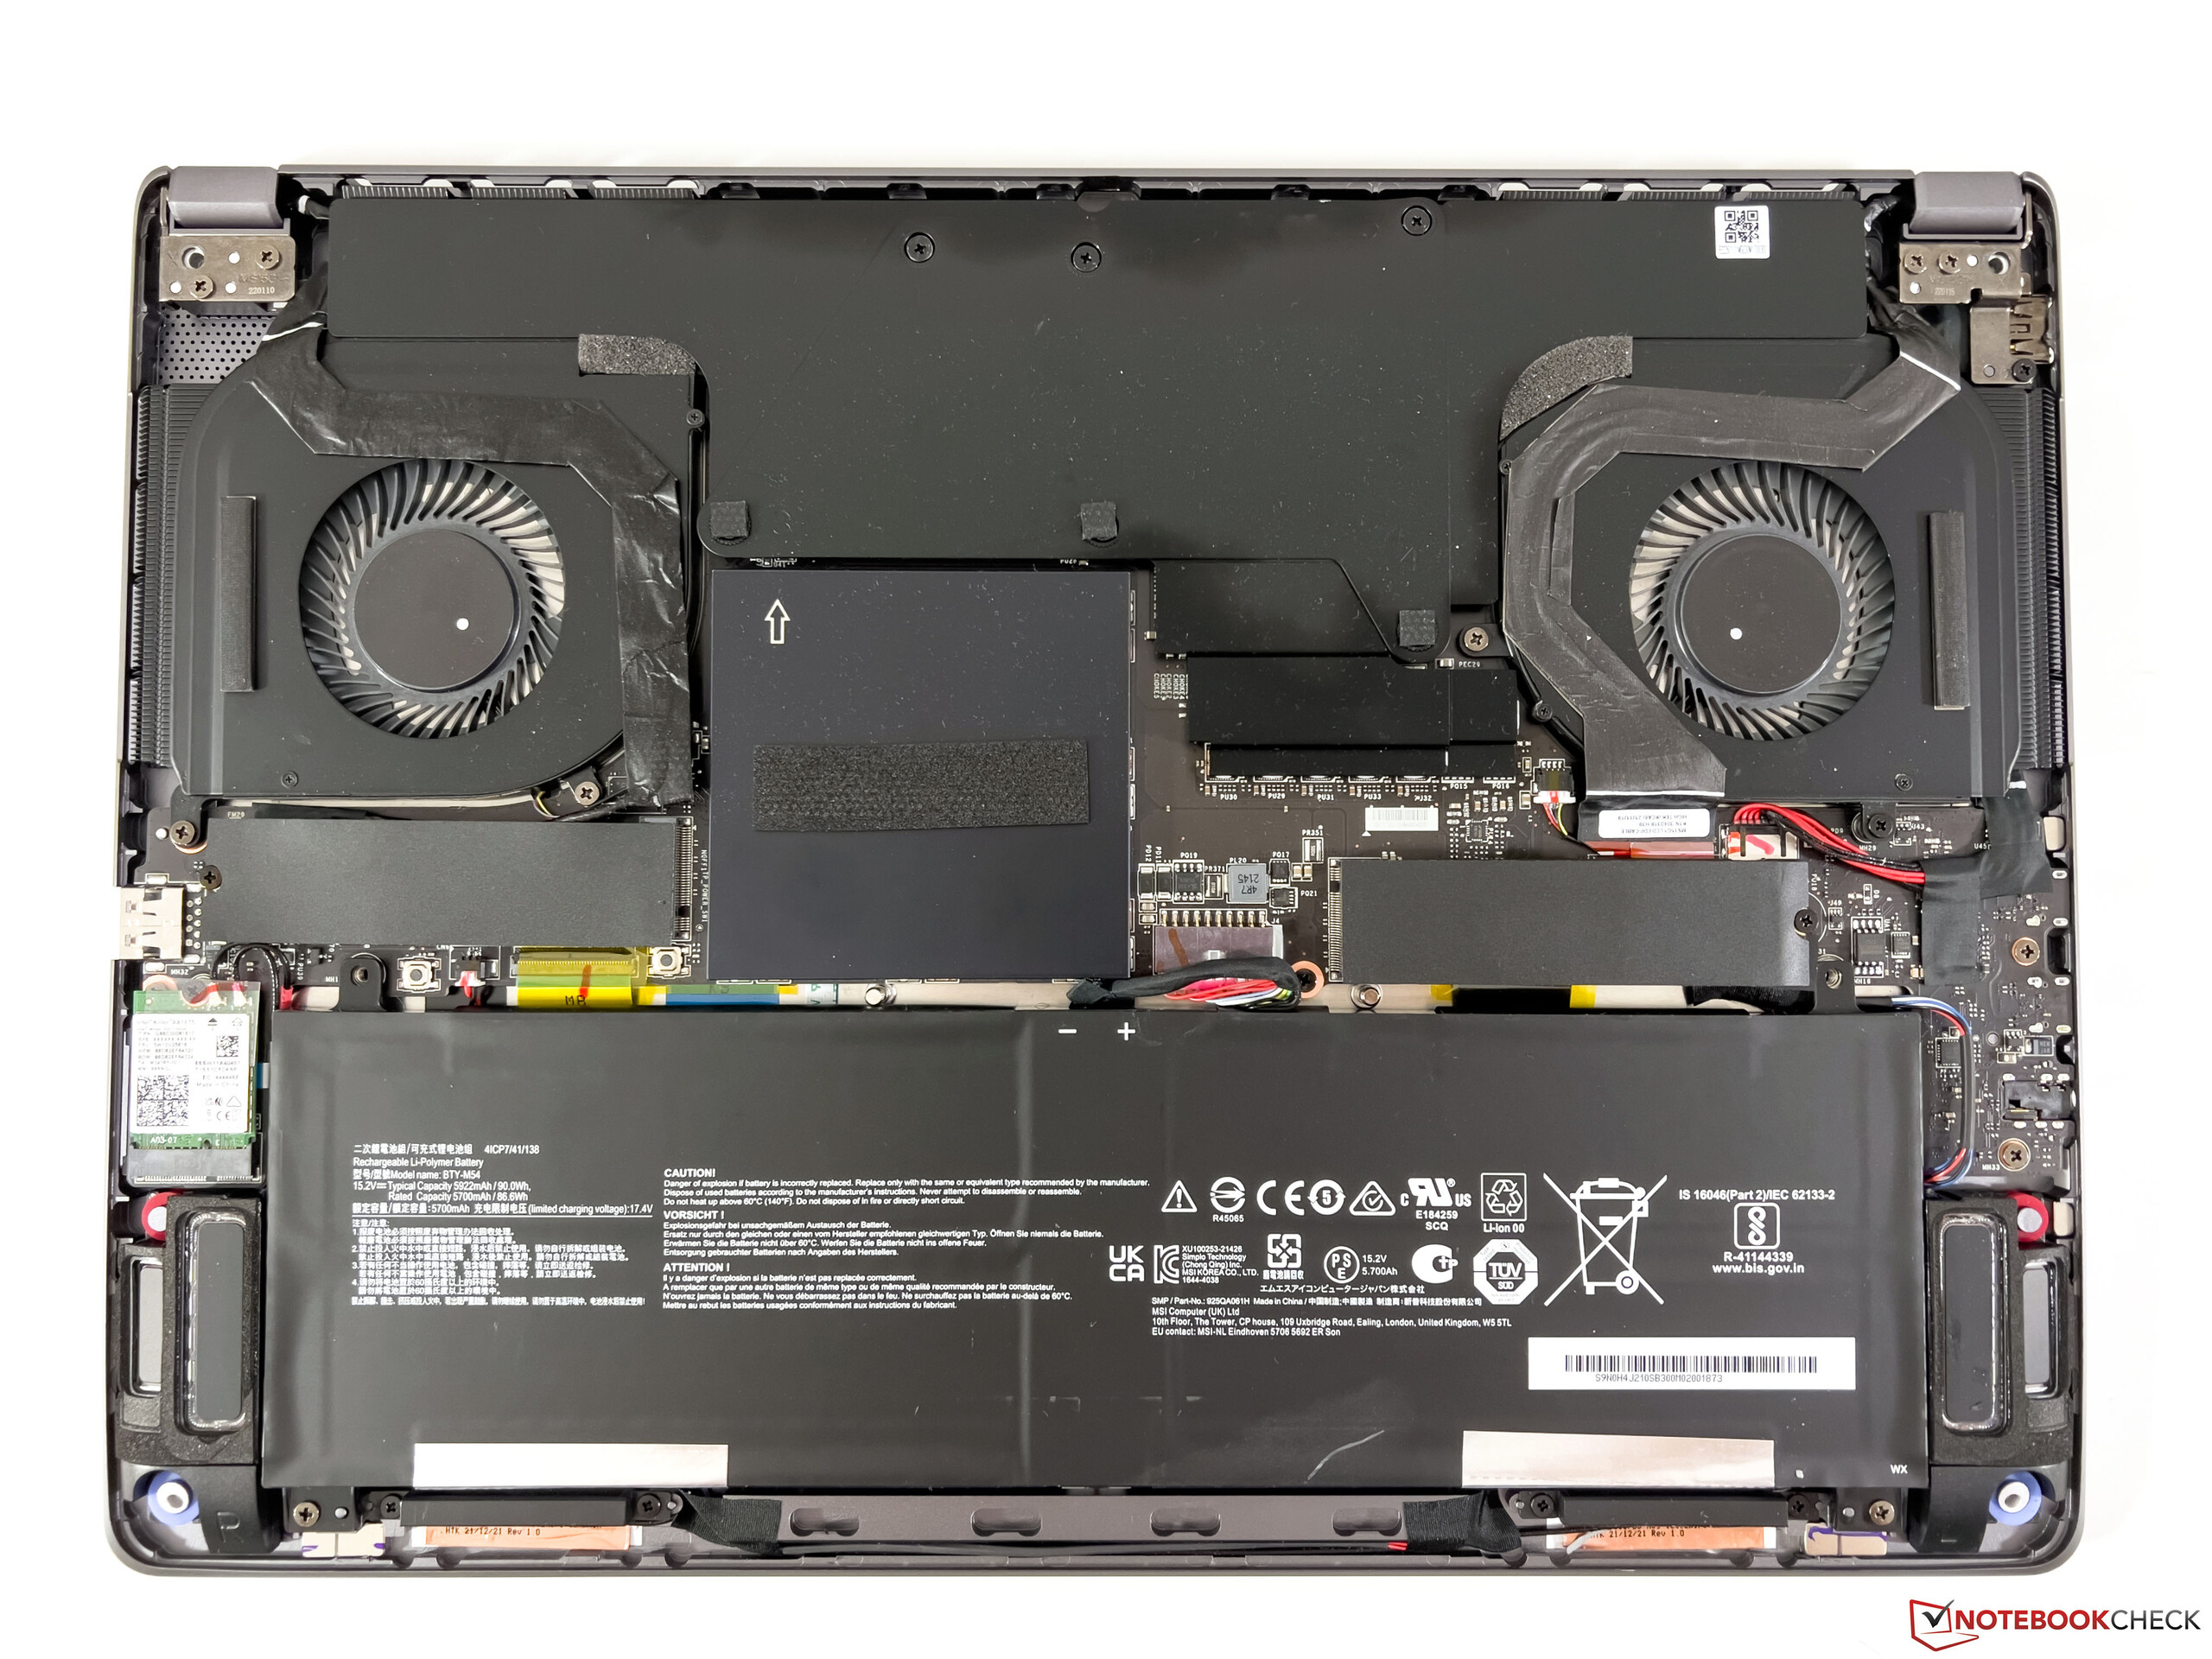
Le MSI CreatorPro Z16P comprend deux emplacements pour des SSD M.2-2280 avec l'interface rapide PCIe 4.0. Notre unité de test est équipée du rapide PM9A1 de Samsung (version OEM du 980 Pro). Sa capacité de stockage est de 1 To, dont 870 Go sont disponibles pour l'utilisateur après le premier démarrage. Les taux de transfert sont très élevés, mais en raison de problèmes de température, les performances ne restent pas stables, passant de plus de 6 à environ 4 Go/s après quelques minutes. Cependant, cela reste rapide, et il ne devrait pas y avoir de limitations dans la pratique. Vous pouvez trouver d'autres benchmarks SSD ici.

* ... Moindre est la valeur, meilleures sont les performances
Disk Throttling: DiskSpd Read Loop, Queue Depth 8
Carte graphique - Nvidia RTX A3000
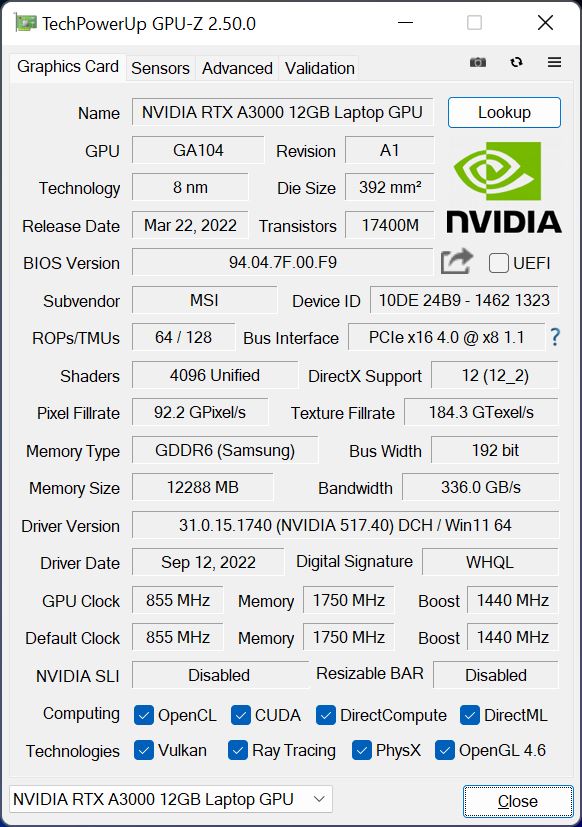
Notre unité de test est équipée du système professionnel Nvidia RTX A3000qui a reçu une mise à niveau de 6 à 12 Go de GDDR6-VRAM en 2022. Il existe de nombreuses similitudes techniques avec la GeForce RTX 3060grand public, mais la RTX A3000 offre 256 cœurs CUDA supplémentaires. Il s'agit de la version avec un TGP de 80 watts, avec 10 watts supplémentaires de boost dynamique qui peuvent être utilisés par le CPU
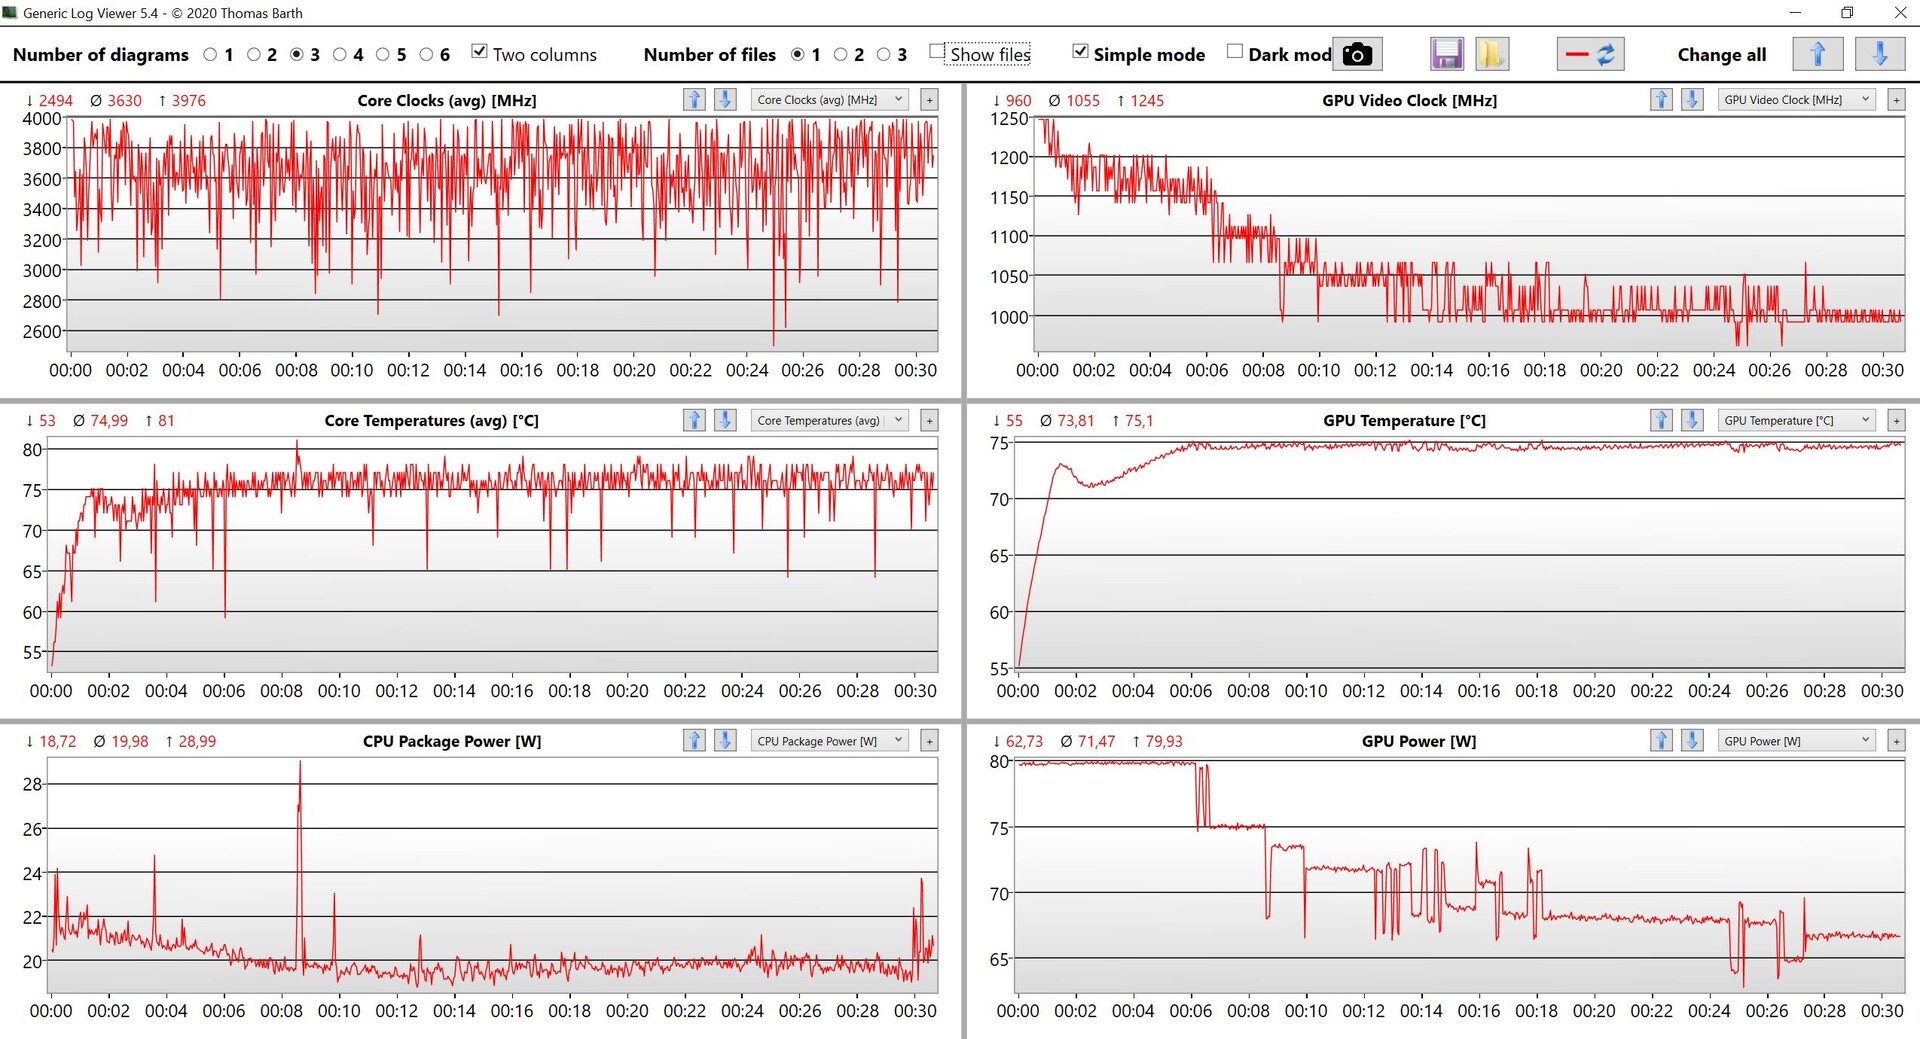
Les performances graphiques sont tout à fait conformes à l'objectif de la RTX A3000, et nous constatons également un avantage significatif par rapport à la petite RTX A2000 dans le ZBook Studio 16 G9. En termes de performance pure, la RTX 3070 ou 3080 Tisont bien sûr plus rapides, mais les tests professionnels montrent également l'avantage des certifications des pilotes. Le MSI passe le test de stress 3DMark Time Spy avec 97,9%.
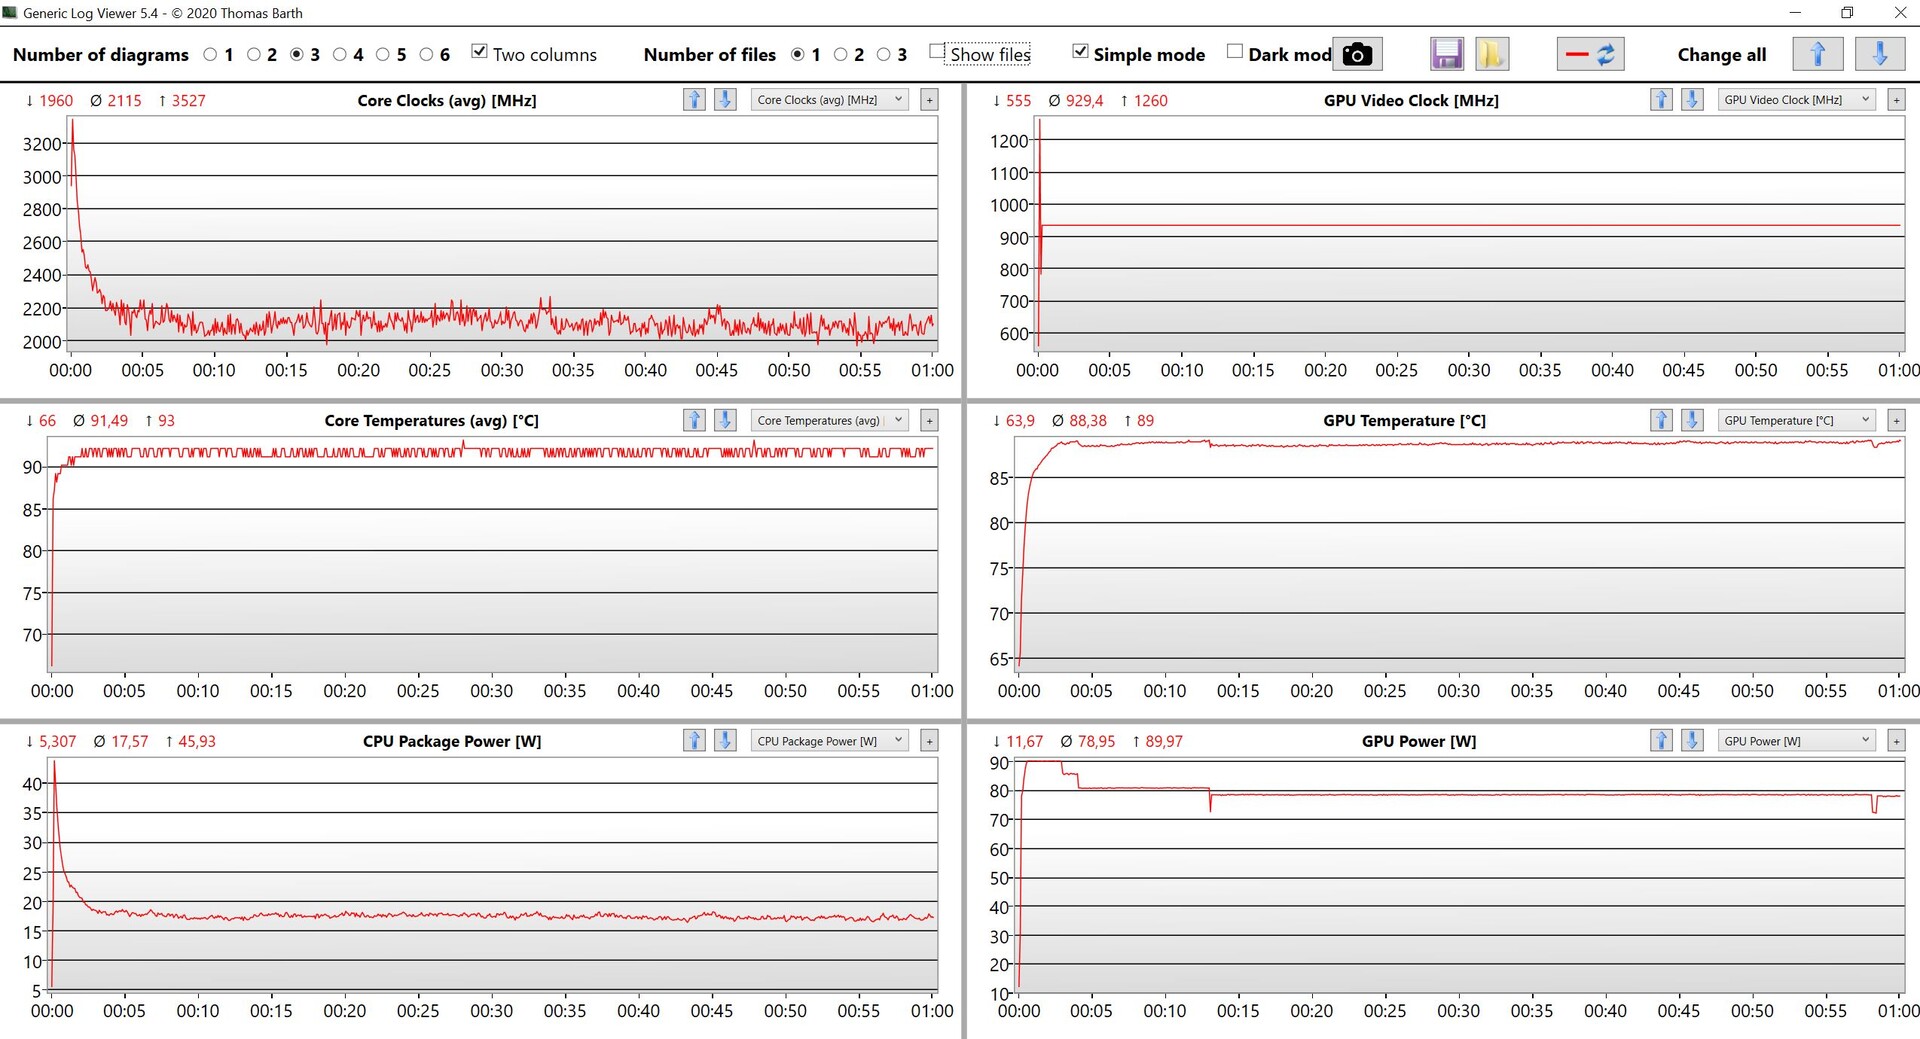
D'autre part, les benchmarks de jeu montrent une image légèrement différente, puisque la performance chute après quelques minutes ici, comme vous pouvez également le voir clairement dans notre test The Witcher 3. Nous avons pu observer un comportement similaire dans le test du Creator Z16Pavec la RTX 3080 Ti, bien qu'il n'y ait aucune raison technique réelle pour cela, et nous soupçonnons à nouveau des problèmes avec les profils de performance comme étant les coupables ici
En fonctionnement sur batterie, la RTX A3000 est autorisée à consommer un maximum de 40 watts, ce qui entraîne une réduction significative des performances de 75%. Vous pouvez trouver des benchmarks GPU supplémentaires ici.
| 3DMark 11 Performance | 24865 points | |
| 3DMark Fire Strike Score | 18097 points | |
| 3DMark Time Spy Score | 7703 points | |
Aide | ||
| Blender / v3.3 Classroom OPTIX/RTX | |
| HP ZBook Firefly 14 G9-6B8A2EA | |
| Dell Precision 5000 5470 | |
| HP Envy 16 h0112nr | |
| HP ZBook Studio 16 G9 62U04EA | |
| Dell Precision 7670 | |
| MSI CreatorPro Z16P B12UKST | |
| Moyenne NVIDIA RTX A3000 Laptop GPU (n=1) | |
| Moyenne de la classe Workstation (10 - 43, n=17, 2 dernières années) | |
| Blender / v3.3 Classroom CUDA | |
| HP ZBook Firefly 14 G9-6B8A2EA | |
| Dell Precision 5000 5470 | |
| HP ZBook Studio 16 G9 62U04EA | |
| HP Envy 16 h0112nr | |
| Dell Precision 7670 | |
| MSI CreatorPro Z16P B12UKST | |
| Moyenne NVIDIA RTX A3000 Laptop GPU (n=1) | |
| Moyenne de la classe Workstation (16 - 74, n=17, 2 dernières années) | |
| Blender / v3.3 Classroom CPU | |
| HP ZBook Firefly 14 G9-6B8A2EA | |
| HP Envy 16 h0112nr | |
| Dell Precision 5000 5470 | |
| Dell Precision 7670 | |
| MSI CreatorPro Z16P B12UKST | |
| Moyenne NVIDIA RTX A3000 Laptop GPU (n=1) | |
| HP ZBook Studio 16 G9 62U04EA | |
| Moyenne de la classe Workstation (148 - 364, n=23, 2 dernières années) | |
* ... Moindre est la valeur, meilleures sont les performances
The Witcher 3 FPS Chart
| Bas | Moyen | Élevé | Ultra | QHD | |
|---|---|---|---|---|---|
| GTA V (2015) | 185.8 | 182.5 | 168.5 | 95.3 | 71.3 |
| The Witcher 3 (2015) | 381 | 262 | 151 | 59.6 | |
| Dota 2 Reborn (2015) | 182 | 166.8 | 155.8 | 147.1 | |
| Final Fantasy XV Benchmark (2018) | 176 | 83.8 | 64.3 | 45.6 | |
| X-Plane 11.11 (2018) | 142.1 | 120.7 | 97.5 | ||
| Far Cry 5 (2018) | 170 | 128 | 117 | 108 | 76 |
| Strange Brigade (2018) | 344 | 152 | 121 | 108 | 85 |
| F1 2021 (2021) | 334 | 187 | 151.1 | 77.5 | 56.3 |
| Cyberpunk 2077 1.6 (2022) | 77 | 66 | 53 | 43 | 27 |
| F1 22 (2022) | 181 | 167.5 | 120.9 | 39 | 26.2 |
Émissions et gestion de l'énergie
Niveaux de bruit
Les deux ventilateurs du CreatorPro Z16P fonctionnent en permanence, mais vous ne pouvez entendre leur ronronnement que si vous tendez l'oreille directement vers le boîtier dans une pièce calme. En utilisation quotidienne, vous bénéficiez également de la courbe défensive des ventilateurs, puisqu'il faut environ 30 secondes, même à pleine charge, avant qu'ils ne deviennent plus bruyants. En jouant, nous mesurons alors environ 44 et sous pleine charge 47 dB(A), le ronronnement étant clairement audible sans être offensif. Nous n'entendons pas d'autres bruits électroniques tels que le ronronnement des bobines.
Degré de la nuisance sonore
| Au repos |
| 27.1 / 27.1 / 27.1 dB(A) |
| Fortement sollicité |
| 42.9 / 47 dB(A) |
 | ||
30 dB silencieux 40 dB(A) audible 50 dB(A) bruyant |
||
min: | ||
| MSI CreatorPro Z16P B12UKST RTX A3000 Laptop GPU, i7-12700H, Samsung PM9A1 MZVL21T0HCLR | HP ZBook Studio 16 G9 62U04EA RTX A2000 Laptop GPU, i7-12800H, Micron 3400 1TB MTFDKBA1T0TFH | Lenovo ThinkPad P1 G4-20Y4S0KS00 GeForce RTX 3070 Laptop GPU, i7-11850H, Samsung PM9A1 MZVL21T0HCLR | Dell Precision 5000 5560 RTX A2000 Laptop GPU, i7-11850H, Samsung PM9A1 MZVL22T0HBLB | MSI Creator Z16P B12UHST GeForce RTX 3080 Ti Laptop GPU, i9-12900H, Samsung PM9A1 MZVL22T0HBLB | |
|---|---|---|---|---|---|
| Noise | 2% | 3% | 15% | -4% | |
| arrêt / environnement * (dB) | 24.1 | 24 -0% | 23.8 1% | 23.4 3% | 26 -8% |
| Idle Minimum * (dB) | 27.1 | 24 11% | 23.8 12% | 23.6 13% | 27 -0% |
| Idle Average * (dB) | 27.1 | 27.7 -2% | 23.8 12% | 23.6 13% | 29 -7% |
| Idle Maximum * (dB) | 27.1 | 27.7 -2% | 28.3 -4% | 23.6 13% | 31 -14% |
| Load Average * (dB) | 42.9 | 39.8 7% | 38.6 10% | 25.8 40% | 43 -0% |
| Witcher 3 ultra * (dB) | 44 | 44.3 -1% | 47.4 -8% | 40.1 9% | 43 2% |
| Load Maximum * (dB) | 47 | 47.7 -1% | 47.4 -1% | 41.4 12% | 46 2% |
* ... Moindre est la valeur, meilleures sont les performances
Températures
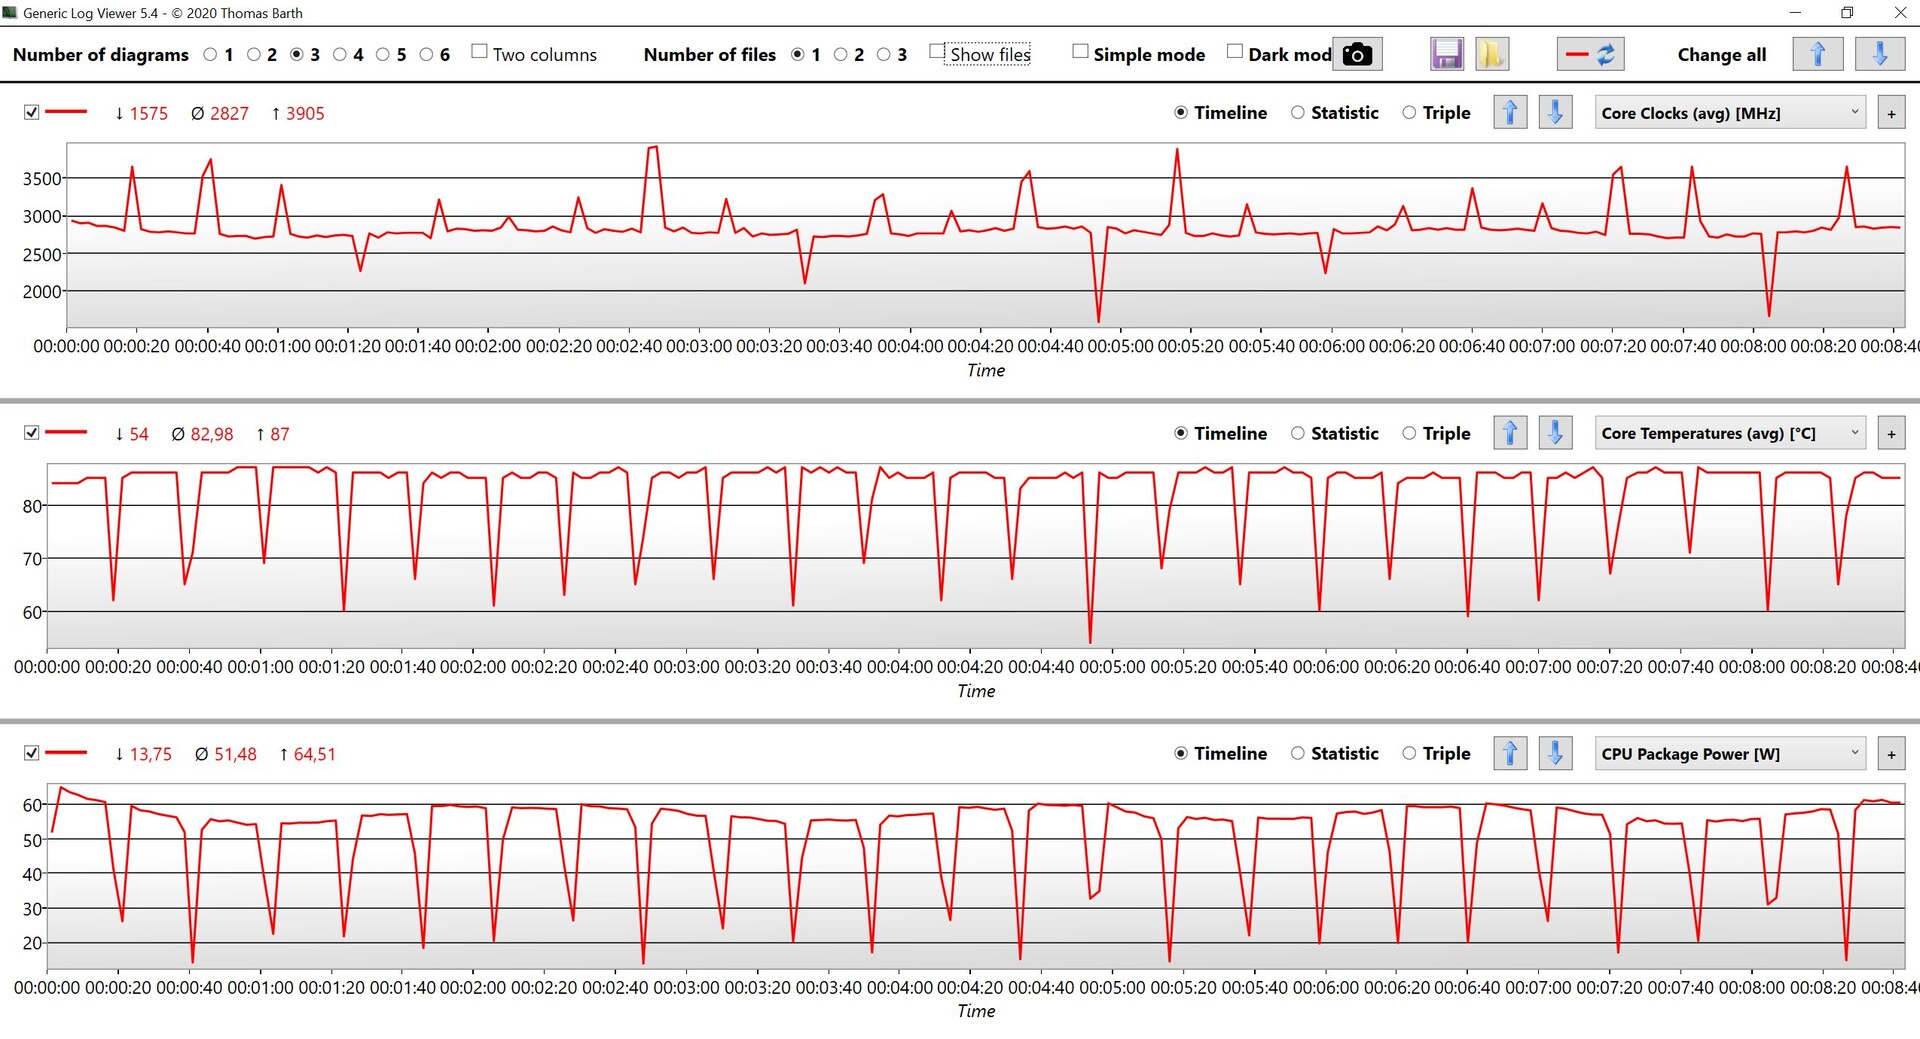
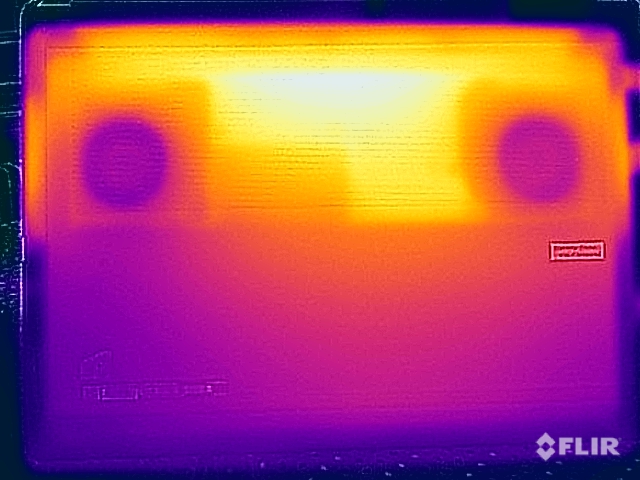
Le développement de la température était déjà un gros problème dans notre unité de test du Creator Z16Pavec le Core i9 et la RTX 3080 Ti. Le CreatorPro avec le Core i7 plus faible et la RTX A3000 s'en sort un peu mieux mais reste toujours problématique, même s'il utilise également un système de refroidissement à chambre à vapeur. Subjectivement, le problème est également accru par le boîtier métallique. Avec des tâches moins exigeantes, il n'y a pas de limites, mais déjà après quelques brèves phases de charge de quelques minutes seulement, le dessus de l'unité de base chauffe très fortement, et l'utilisation du clavier devient réellement inconfortable. En outre, il ne faut en aucun cas faire fonctionner l'appareil sur vos genoux en charge, car nous mesurons près de 70 °C au fond du boîtier. Le système de refroidissement est tout simplement trop faible dans l'ensemble, même pour les composants les plus lents.
Le test de stress montre que le système donne la préférence à la GPU, qui reste assez stable à environ 80 watts, tandis que le CPU tombe en dessous de 20 watts. Il n'y a pas de reproduction des performances après le test de stress.
(-) La température maximale du côté supérieur est de 56.3 °C / 133 F, par rapport à la moyenne de 38.2 °C / 101 F, allant de 22.2 à 69.8 °C pour la classe Workstation.
(-) Le fond chauffe jusqu'à un maximum de 68.3 °C / 155 F, contre une moyenne de 41.1 °C / 106 F
(+) En utilisation inactive, la température moyenne du côté supérieur est de 24.1 °C / 75 F, par rapport à la moyenne du dispositif de 32 °C / 90 F.
(-) En jouant à The Witcher 3, la température moyenne du côté supérieur est de 44 °C / 111 F, alors que la moyenne de l'appareil est de 32 °C / 90 F.
(±) Les repose-poignets et le pavé tactile peuvent devenir très chauds au toucher, avec un maximum de 38.2 °C / 100.8# F.
(-) La température moyenne de la zone de l'appui-paume de dispositifs similaires était de 27.8 °C / 82 F (-10.4 °C / #-18.8 F).

| MSI CreatorPro Z16P B12UKST Intel Core i7-12700H, NVIDIA RTX A3000 Laptop GPU | HP ZBook Studio 16 G9 62U04EA Intel Core i7-12800H, NVIDIA RTX A2000 Laptop GPU | Lenovo ThinkPad P1 G4-20Y4S0KS00 Intel Core i7-11850H, NVIDIA GeForce RTX 3070 Laptop GPU | Dell Precision 5000 5560 Intel Core i7-11850H, NVIDIA RTX A2000 Laptop GPU | MSI Creator Z16P B12UHST Intel Core i9-12900H, NVIDIA GeForce RTX 3080 Ti Laptop GPU | |
|---|---|---|---|---|---|
| Heat | 6% | 1% | -6% | -12% | |
| Maximum Upper Side * (°C) | 56.3 | 38.7 31% | 51 9% | 48.2 14% | 67 -19% |
| Maximum Bottom * (°C) | 68.3 | 53.4 22% | 53.5 22% | 42.6 38% | 69 -1% |
| Idle Upper Side * (°C) | 25.2 | 27.3 -8% | 28.8 -14% | 34.8 -38% | 29 -15% |
| Idle Bottom * (°C) | 25.9 | 31.6 -22% | 29.3 -13% | 35.2 -36% | 29 -12% |
* ... Moindre est la valeur, meilleures sont les performances
Haut-parleurs
MSI CreatorPro Z16P B12UKST analyse audio
(+) | les haut-parleurs peuvent jouer relativement fort (83.3# dB)
Basses 100 - 315 Hz
(-) | presque aucune basse - en moyenne 18.7% plus bas que la médiane
(±) | la linéarité des basses est moyenne (7% delta à la fréquence précédente)
Médiums 400 - 2000 Hz
(+) | médiane équilibrée - seulement 3% de la médiane
(+) | les médiums sont linéaires (6.8% delta à la fréquence précédente)
Aiguës 2 - 16 kHz
(+) | des sommets équilibrés - à seulement 4.6% de la médiane
(+) | les aigus sont linéaires (6.4% delta à la fréquence précédente)
Globalement 100 - 16 000 Hz
(±) | la linéarité du son global est moyenne (15.2% de différence avec la médiane)
Par rapport à la même classe
» 33% de tous les appareils testés de cette catégorie étaient meilleurs, 10% similaires, 57% pires
» Le meilleur avait un delta de 7%, la moyenne était de 17%, le pire était de 35%.
Par rapport à tous les appareils testés
» 22% de tous les appareils testés étaient meilleurs, 4% similaires, 74% pires
» Le meilleur avait un delta de 4%, la moyenne était de 23%, le pire était de 134%.
HP ZBook Studio 16 G9 62U04EA analyse audio
(±) | le niveau sonore du haut-parleur est moyen mais bon (81.6# dB)
Basses 100 - 315 Hz
(±) | basse réduite - en moyenne 8.7% inférieure à la médiane
(±) | la linéarité des basses est moyenne (10.4% delta à la fréquence précédente)
Médiums 400 - 2000 Hz
(+) | médiane équilibrée - seulement 3.7% de la médiane
(+) | les médiums sont linéaires (4.6% delta à la fréquence précédente)
Aiguës 2 - 16 kHz
(+) | des sommets équilibrés - à seulement 2.7% de la médiane
(+) | les aigus sont linéaires (3.5% delta à la fréquence précédente)
Globalement 100 - 16 000 Hz
(+) | le son global est linéaire (10.6% différence à la médiane)
Par rapport à la même classe
» 9% de tous les appareils testés de cette catégorie étaient meilleurs, 5% similaires, 87% pires
» Le meilleur avait un delta de 7%, la moyenne était de 17%, le pire était de 35%.
Par rapport à tous les appareils testés
» 6% de tous les appareils testés étaient meilleurs, 1% similaires, 93% pires
» Le meilleur avait un delta de 4%, la moyenne était de 23%, le pire était de 134%.
Consommation d'énergie
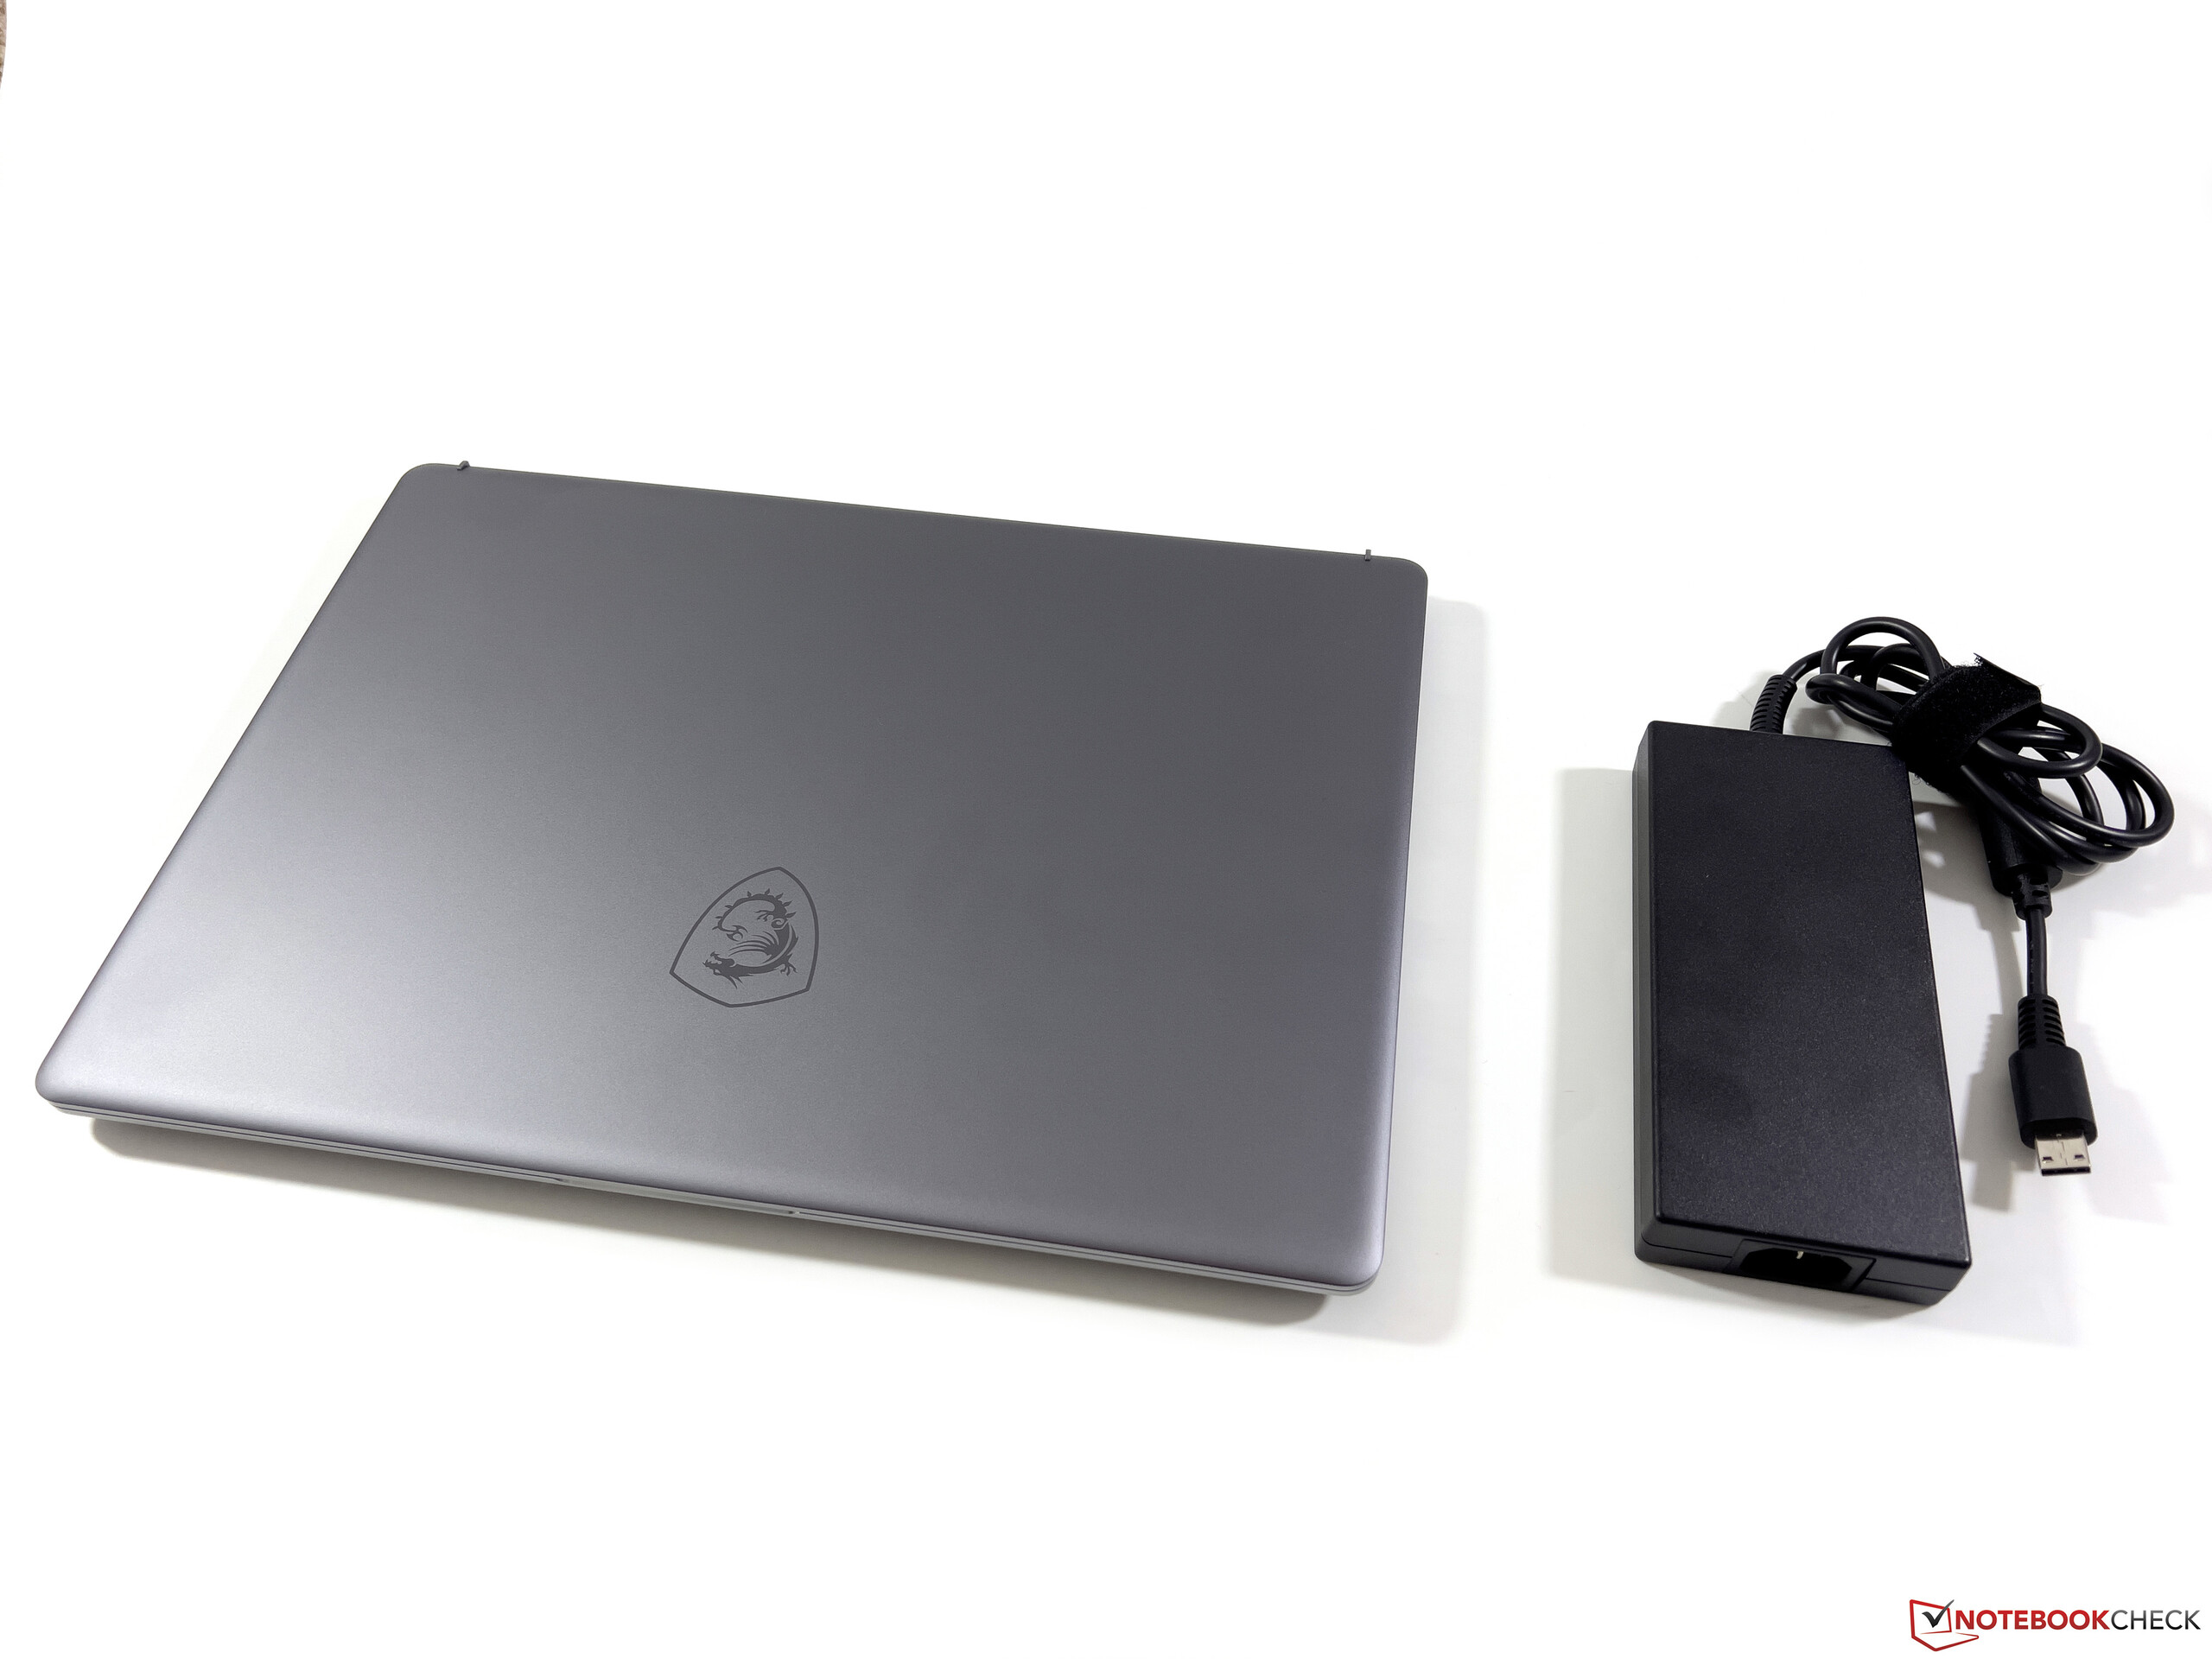
Nos mesures de la consommation montrent maintenant des surprises. Les puissants composants, dont la dalle WQHD, ont tout simplement besoin d'énergie, et nous mesurons déjà près de 17 watts à pleine luminosité de l'écran en mode veille. En charge, les valeurs augmentent ensuite de manière significative, et nous mesurons environ 150 watts en jouant. Pendant le test de stress, il y a un court pic de charge à presque 180 watts, mais la valeur se stabilise également rapidement à environ 157 watts ici. Comme déjà avec le Creator Z16PmSI fournit une alimentation de 240 watts avec le CreatorPro, même si dans notre configuration, une alimentation plus compacte de 200 watts (ou même seulement 180 watts) aurait été tout à fait suffisante.
| Éteint/en veille | |
| Au repos | |
| Fortement sollicité |
|
Légende:
min: | |
Power Consumption The Witcher 3 / Stress Test
Power Consumption With External Monitor
Autonomie de la batterie
Les stations de travail mobiles ne sont que rarement capables de se distinguer par une longue autonomie, en particulier les configurations dotées d'écrans haute résolution. Bien que la batterie de 90 Wh du CreatorPro Z16P soit très importante, nous ne mesurons qu'à peine 6 heures dans notre test WLAN à 150 cd/m², ce qui correspond à 39% de la luminosité maximale. En pleine luminosité, elle ne dure même que 4,5 heures environ
Lorsque l'ordinateur portable est allumé, un processus de charge complet prend 142 minutes, mais 65% de la capacité sont déjà atteints après presque 37 minutes et environ 80% après 54 minutes. La courbe de charge ne s'aplatit sensiblement qu'après cela.
Points positifs
Points négatifs
Verdict - Le refroidissement du CreatorPro Z16P est débordant
Si la carte graphique professionnelle transforme le MSI Creator Z16P en CreatorPro Z16P, il n'y a pas d'autres différences. Il n'est donc pas surprenant que les appareils partagent également les avantages et les inconvénients. Parmi les avantages, il y a sans aucun doute le bon boîtier, le superbe écran et le bon clavier. Mais il y a aussi quelques problèmes, car la performance des composants n'était pas toujours fiable (même si nous avons utilisé le profil Highest Performance). L'évolution de la température reste aussi un problème massif. L'utilisation du clavier devient inconfortable déjà après de courtes phases de charge, et sous des charges plus longues, nous avons pu mesurer des températures de surface supérieures à 65 °C (149 °F)
Les performances du MSI CreatorPro Z16P ne sont pas toujours stables, et les températures de surface deviennent trop élevées sous charge. L'utilisation du clavier devient inconfortable déjà après quelques minutes.
Dans l'ensemble, nous avons quelques difficultés à recommander le MSI CreatorPro Z16P comme station de travail. Bien qu'il y ait quelques aspects positifs, les problèmes de performance et les températures de surface extrêmes ne sont pas de bonnes qualifications pour une station de travail. L'ordinateur récemment testé HP ZBook Studio 16 G9récemment testé, a laissé une bien meilleure impression générale et est également disponible avec des GPU plus puissants. Dans les semaines à venir, nous testerons également les autres modèles de stations de travail actuels de la concurrence.
Prix et disponibilité
Une configuration supérieure du MSI CreatorPro Z16P avec un Intel Core i9-12900H, une RTX A5500, 64 Go de RAM, un SSD de 1 To et un écran QHD+ est disponible sur Amazon pour 4862 $.
MSI CreatorPro Z16P B12UKST
- 11/14/2022 v7 (old)
Andreas Osthoff
Price comparison

