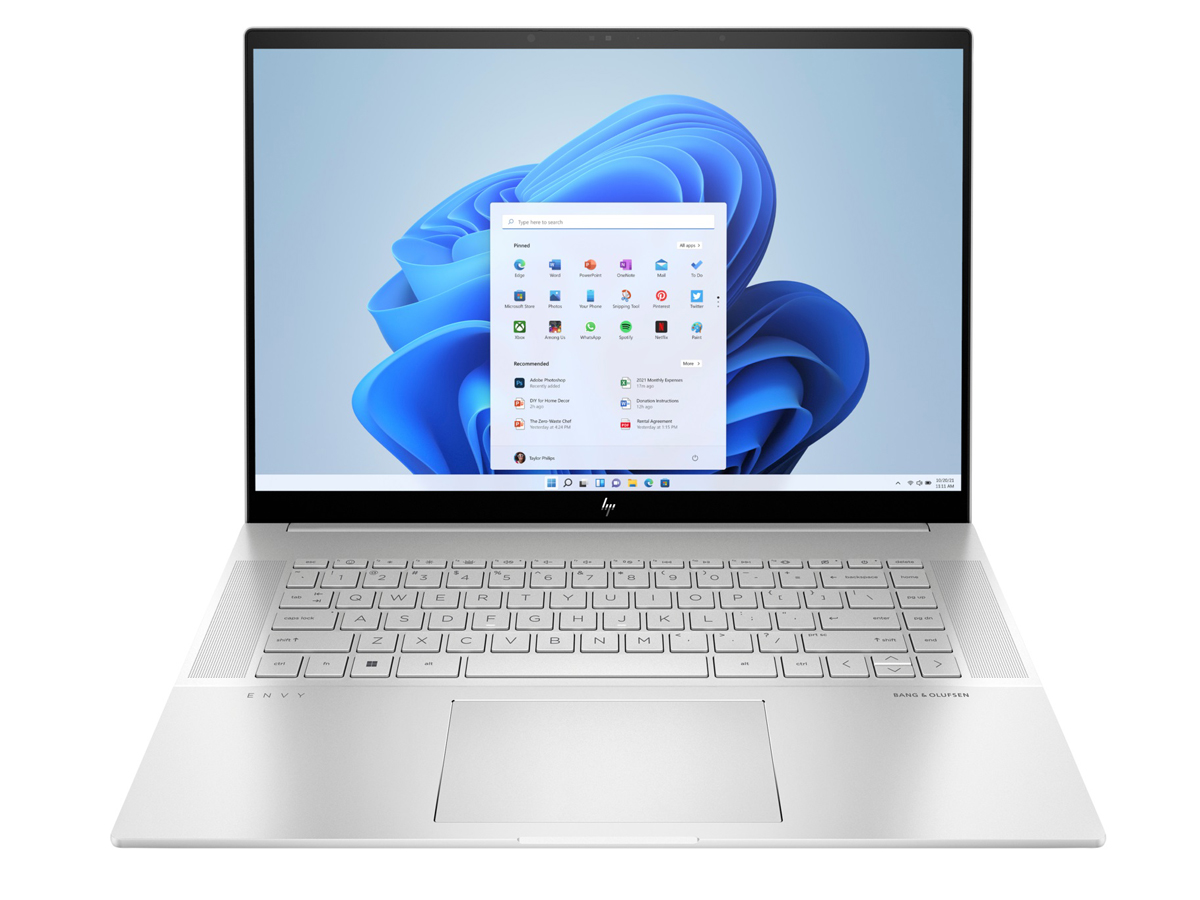
Test du HP Envy 16 2022 : pour le multimédia, les joueurs, les créateurs
Le Envy 16 remplace l'Envy 15 de 6 pouces de l'année dernière 15.envy 15 de 6 pouces de 6 pouces de l'année dernière, en adoptant un nouveau format de 16 pouces, ainsi que les derniers processeurs Intel de 12e génération et les options graphiques discrètes Nvidia et Intel. Contrairement à la série moins coûteuse Pavilion, la série Envy abrite des modèles prosommateurs haut de gamme avec des performances généralement plus élevées, moins de plastiques et une meilleure qualité de fabrication
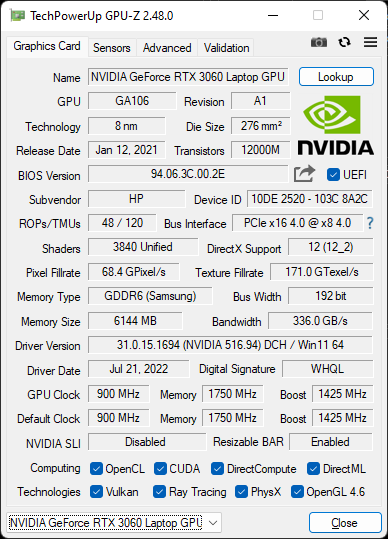
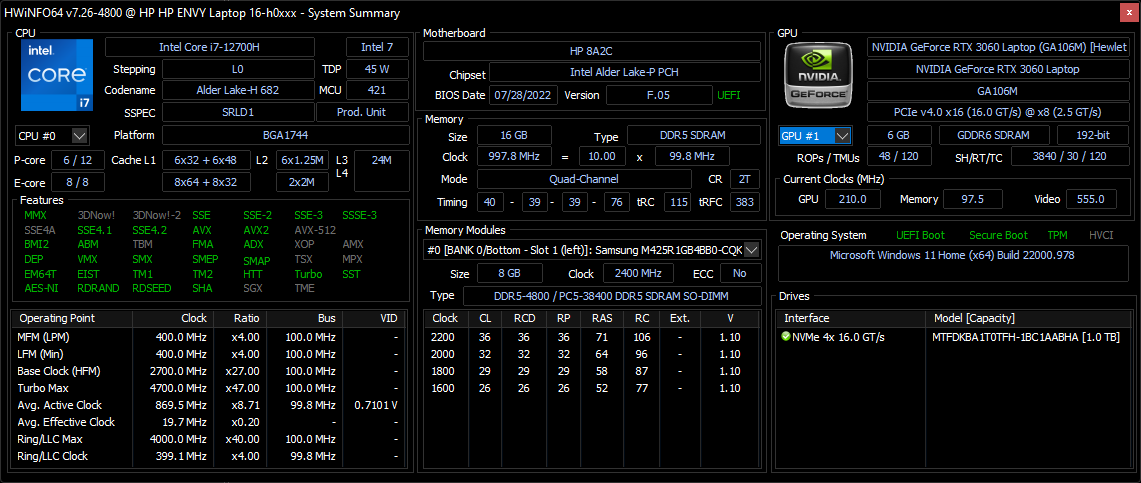
Notre configuration spécifique est un SKU haut de gamme avec le Core i7-12700H, GeForce RTX 3060, et un écran tactile 2400p OLED pour environ $1700 USD. D'autres configurations sont disponibles avec le Core i5-12500H plus lent, le i9-12900H plus rapide, la carte graphique Intel Arc A370M ou l'écran IPS 1600p pour un prix compris entre 1180 et 2380 dollars américains
Les alternatives à l'Envy 16 incluent d'autres ordinateurs portables prosumer haut de gamme comme le Dell XPS 15 series, MacBook Pro 16,Huawei MateBook 16sou leLG Gram 16.
Plus de commentaires sur HP :
Comparaison avec les concurrents potentiels
Note | Date | Modèle | Poids | Épaisseur | Taille | Résolution | Prix |
|---|---|---|---|---|---|---|---|
| 86.9 % v7 (old) | 09/22 | HP Envy 16 h0112nr i7-12700H, GeForce RTX 3060 Laptop GPU | 2.3 kg | 19.8 mm | 16.00" | 3840x2400 | |
| 88.4 % v7 (old) | 09/22 | Lenovo ThinkBook 16 G4+ IAP i7-12700H, GeForce RTX 2050 Mobile | 1.8 kg | 16.5 mm | 16.00" | 2560x1600 | |
| 83.7 % v7 (old) | 06/22 | MSI Creator Z16P B12UHST i9-12900H, GeForce RTX 3080 Ti Laptop GPU | 2.4 kg | 20.4 mm | 16.00" | 2560x1600 | |
| 82.6 % v7 (old) | 11/21 | Dell Inspiron 16 Plus 7610-MHJ8F i7-11800H, UHD Graphics Xe 32EUs (Tiger Lake-H) | 2 kg | 19 mm | 16.00" | 3072x1920 | |
| 93.2 % v7 (old) | 11/21 | Apple MacBook Pro 16 2021 M1 Pro M1 Pro, M1 Pro 16-Core GPU | 2.2 kg | 16.8 mm | 16.20" | 3456x2234 | |
| 86.4 % v7 (old) | 07/22 | Huawei MateBook 16s i7 i7-12700H, Iris Xe G7 96EUs | 2 kg | 17.8 mm | 16.00" | 2520x1680 |
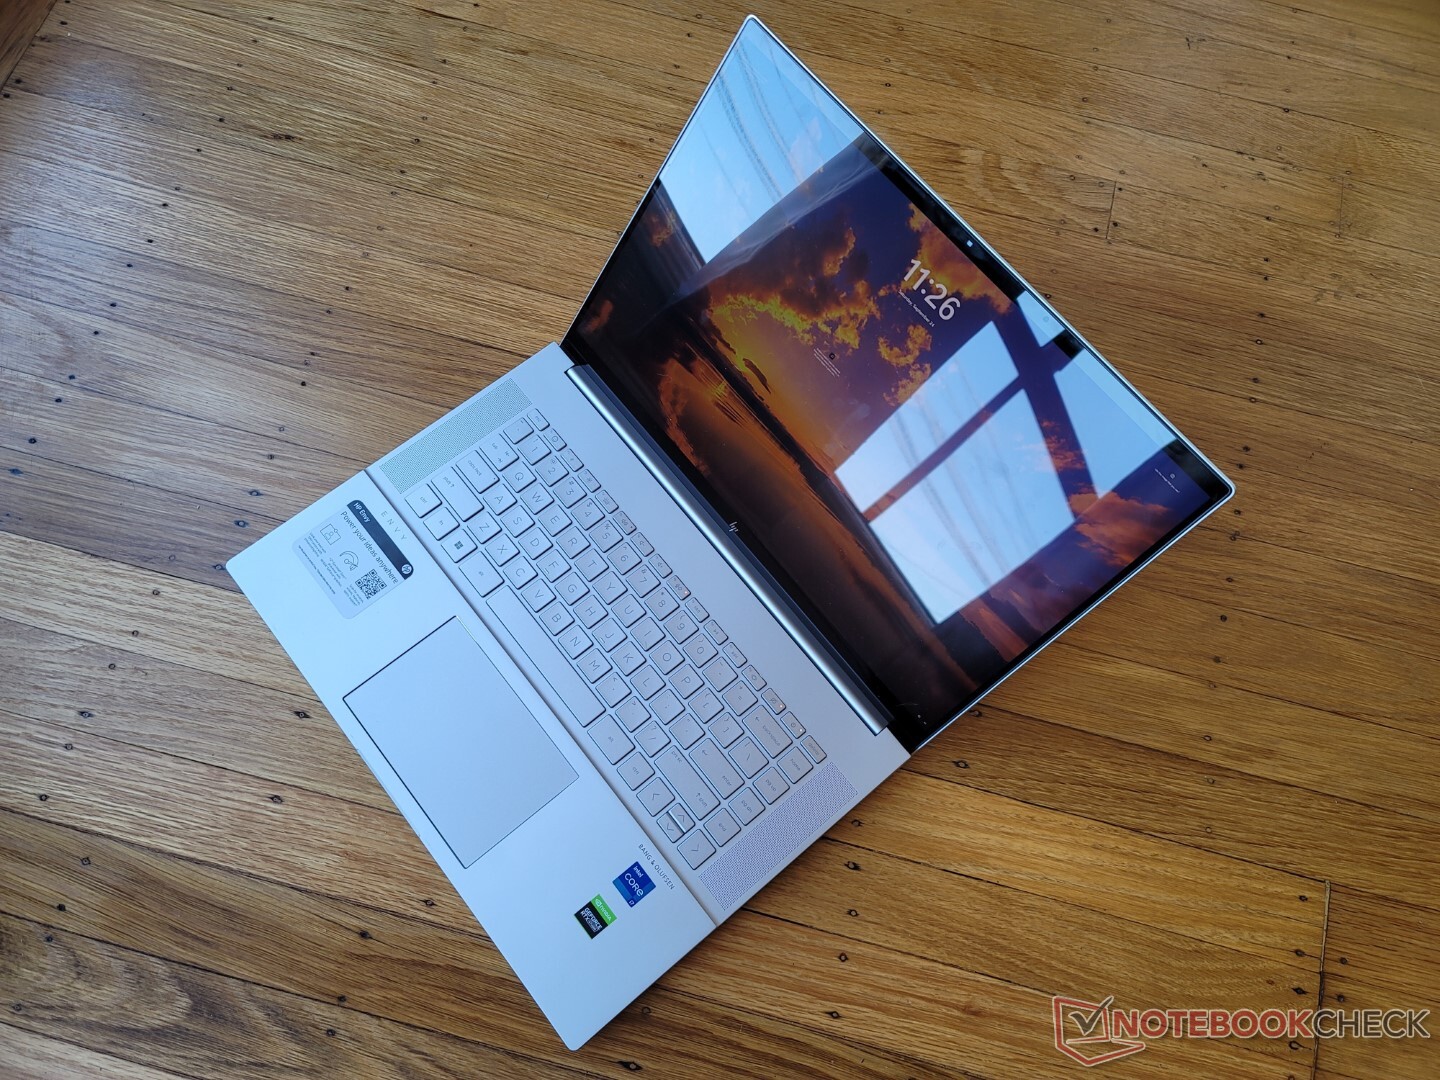
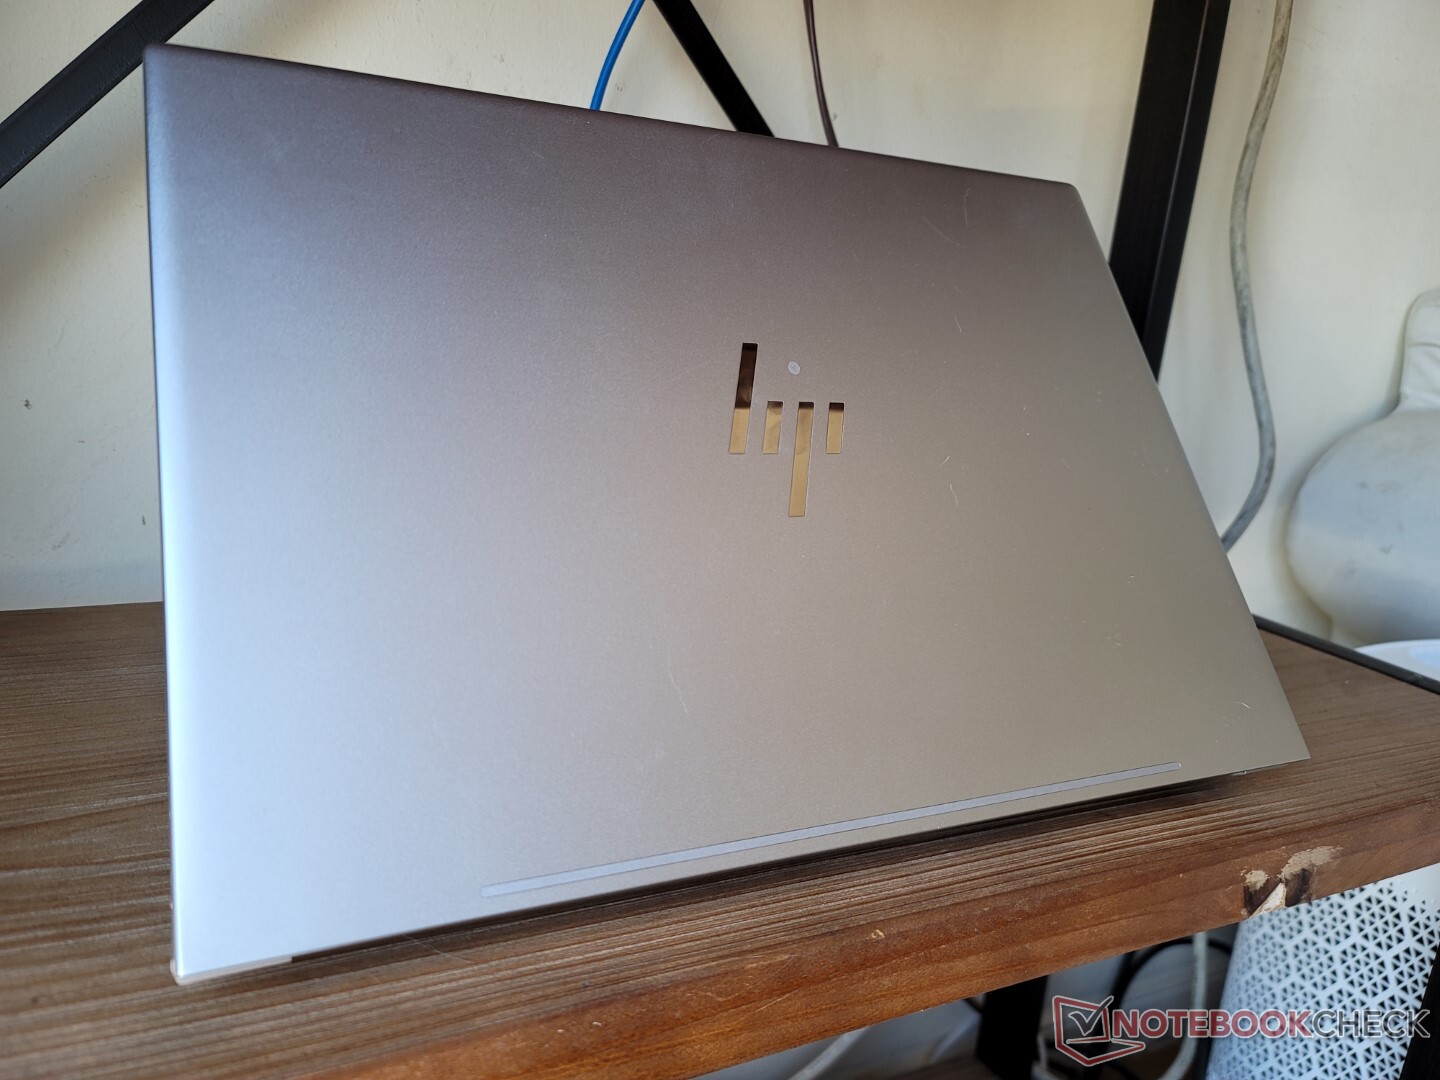
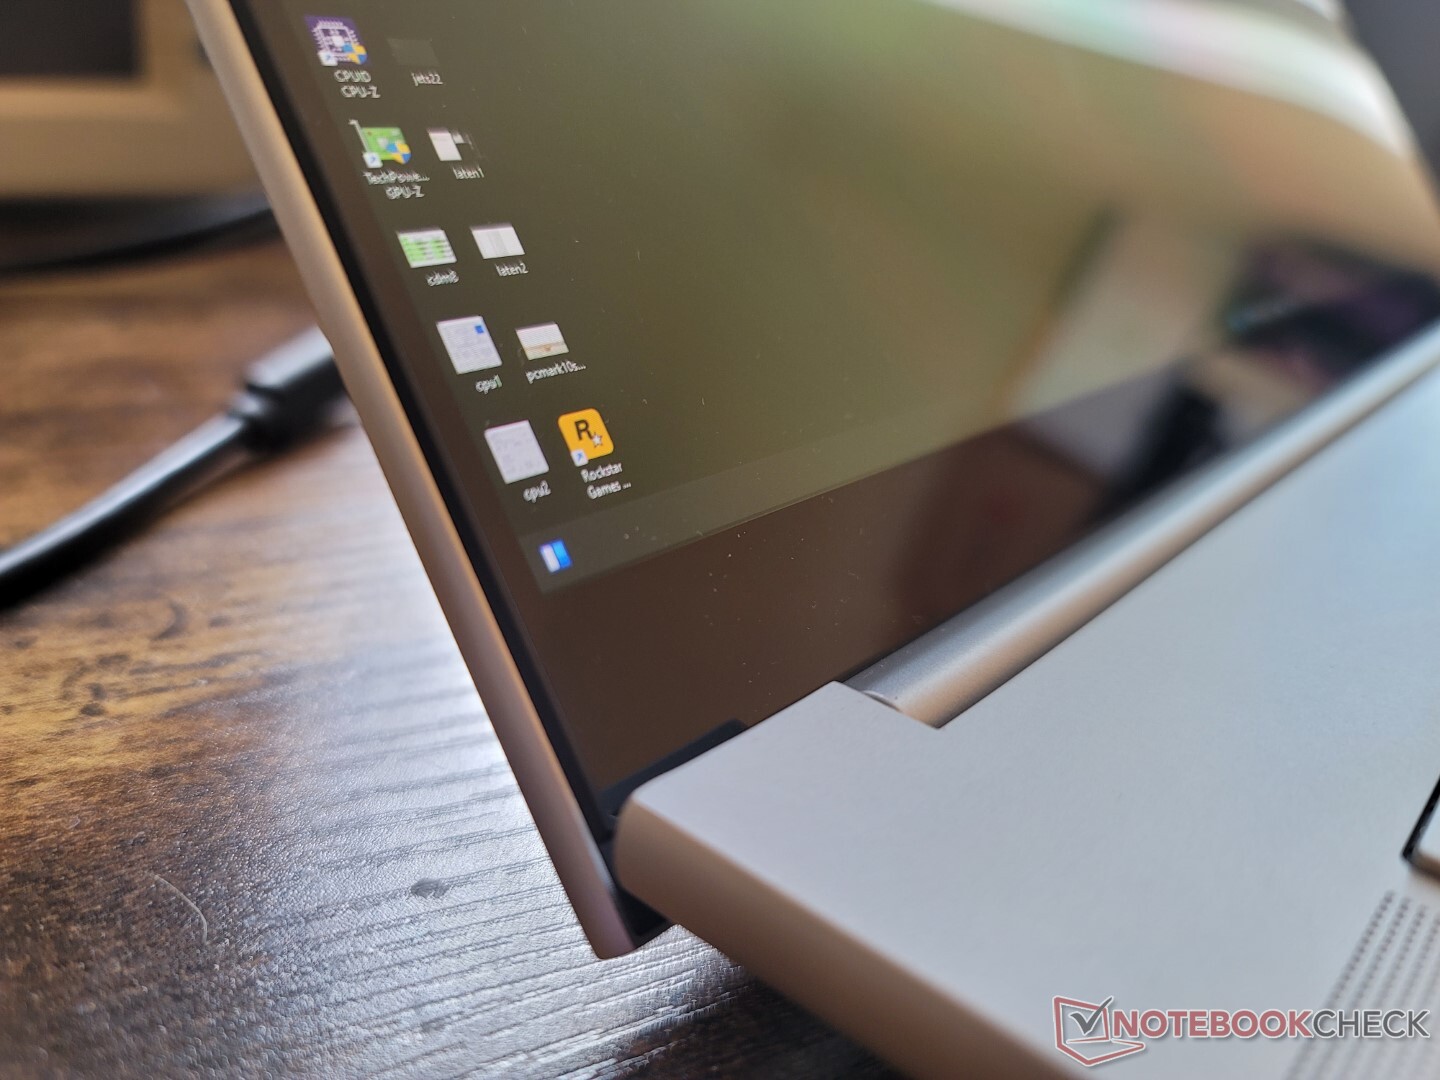
Case - Les mêmes couleurs avec de nombreuses modifications
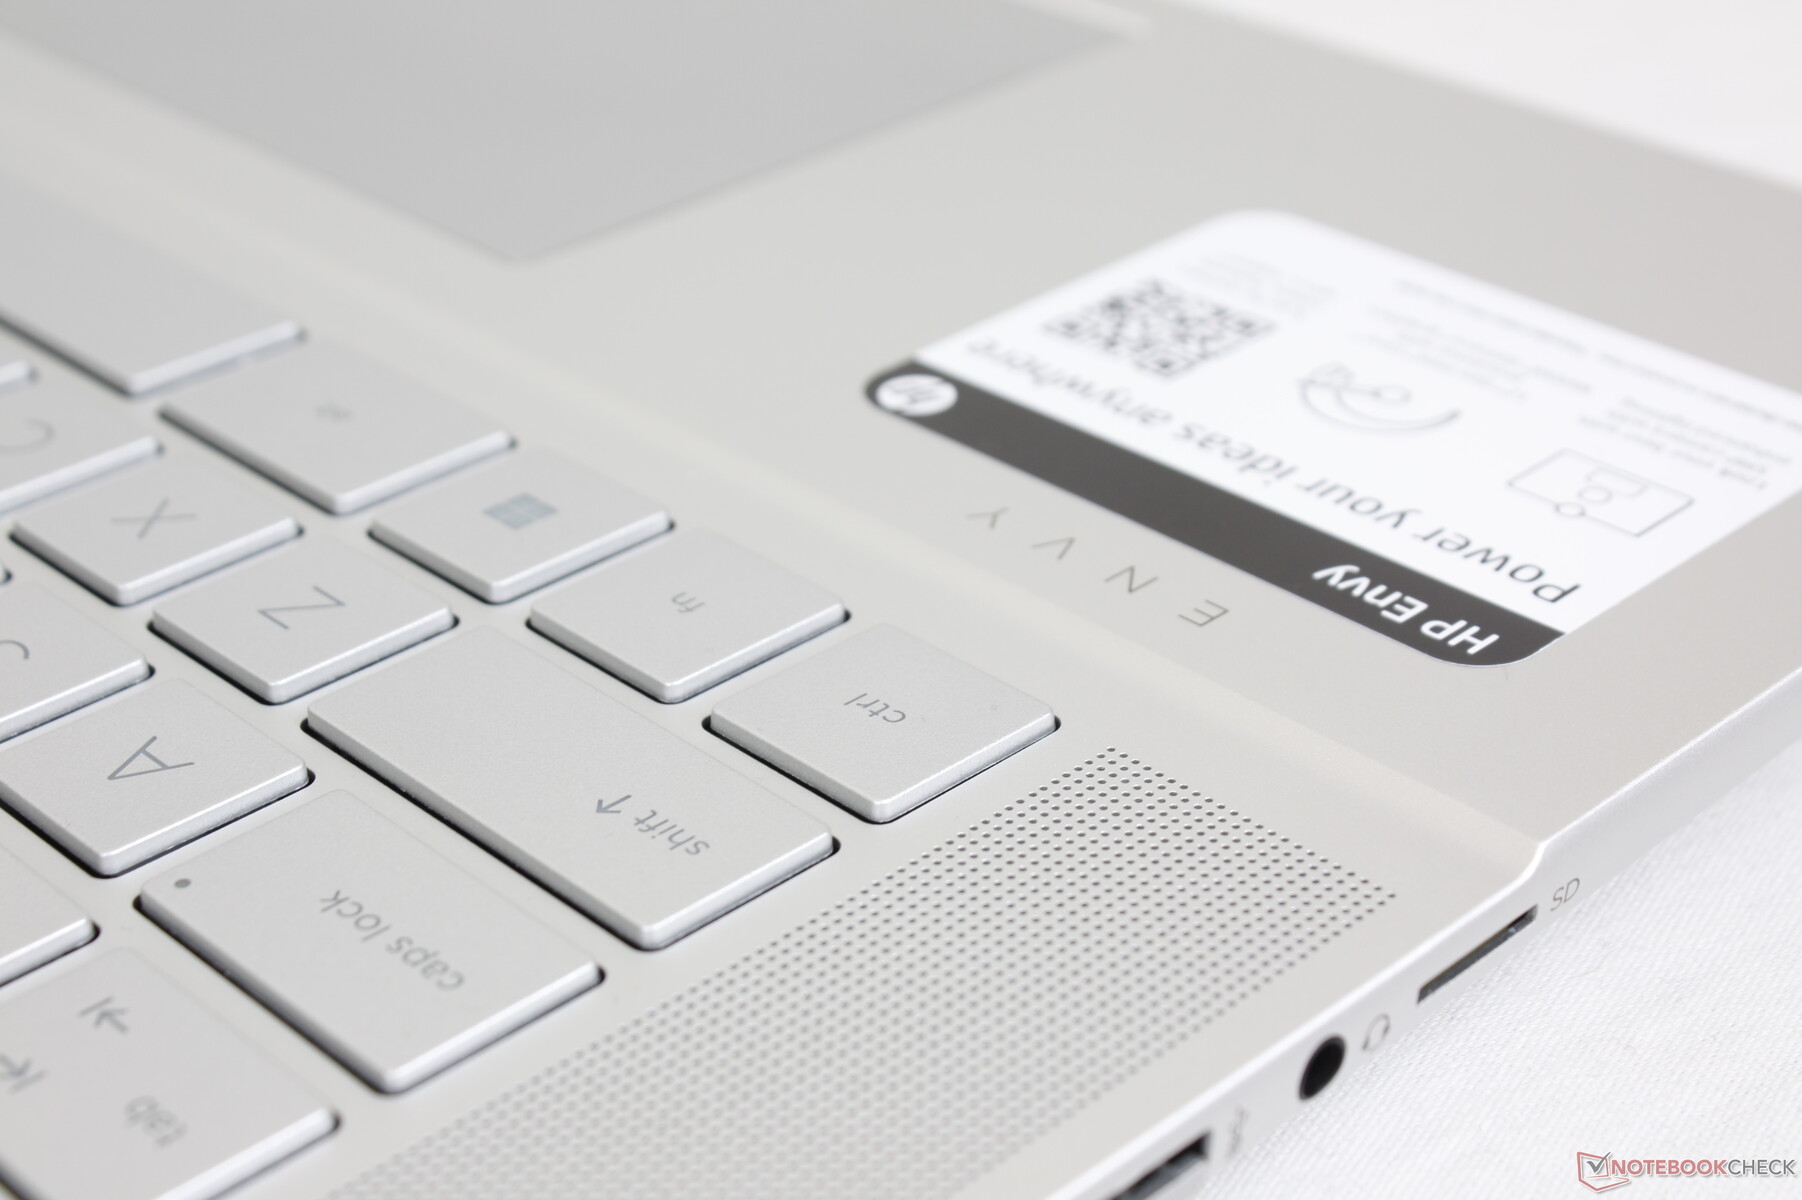
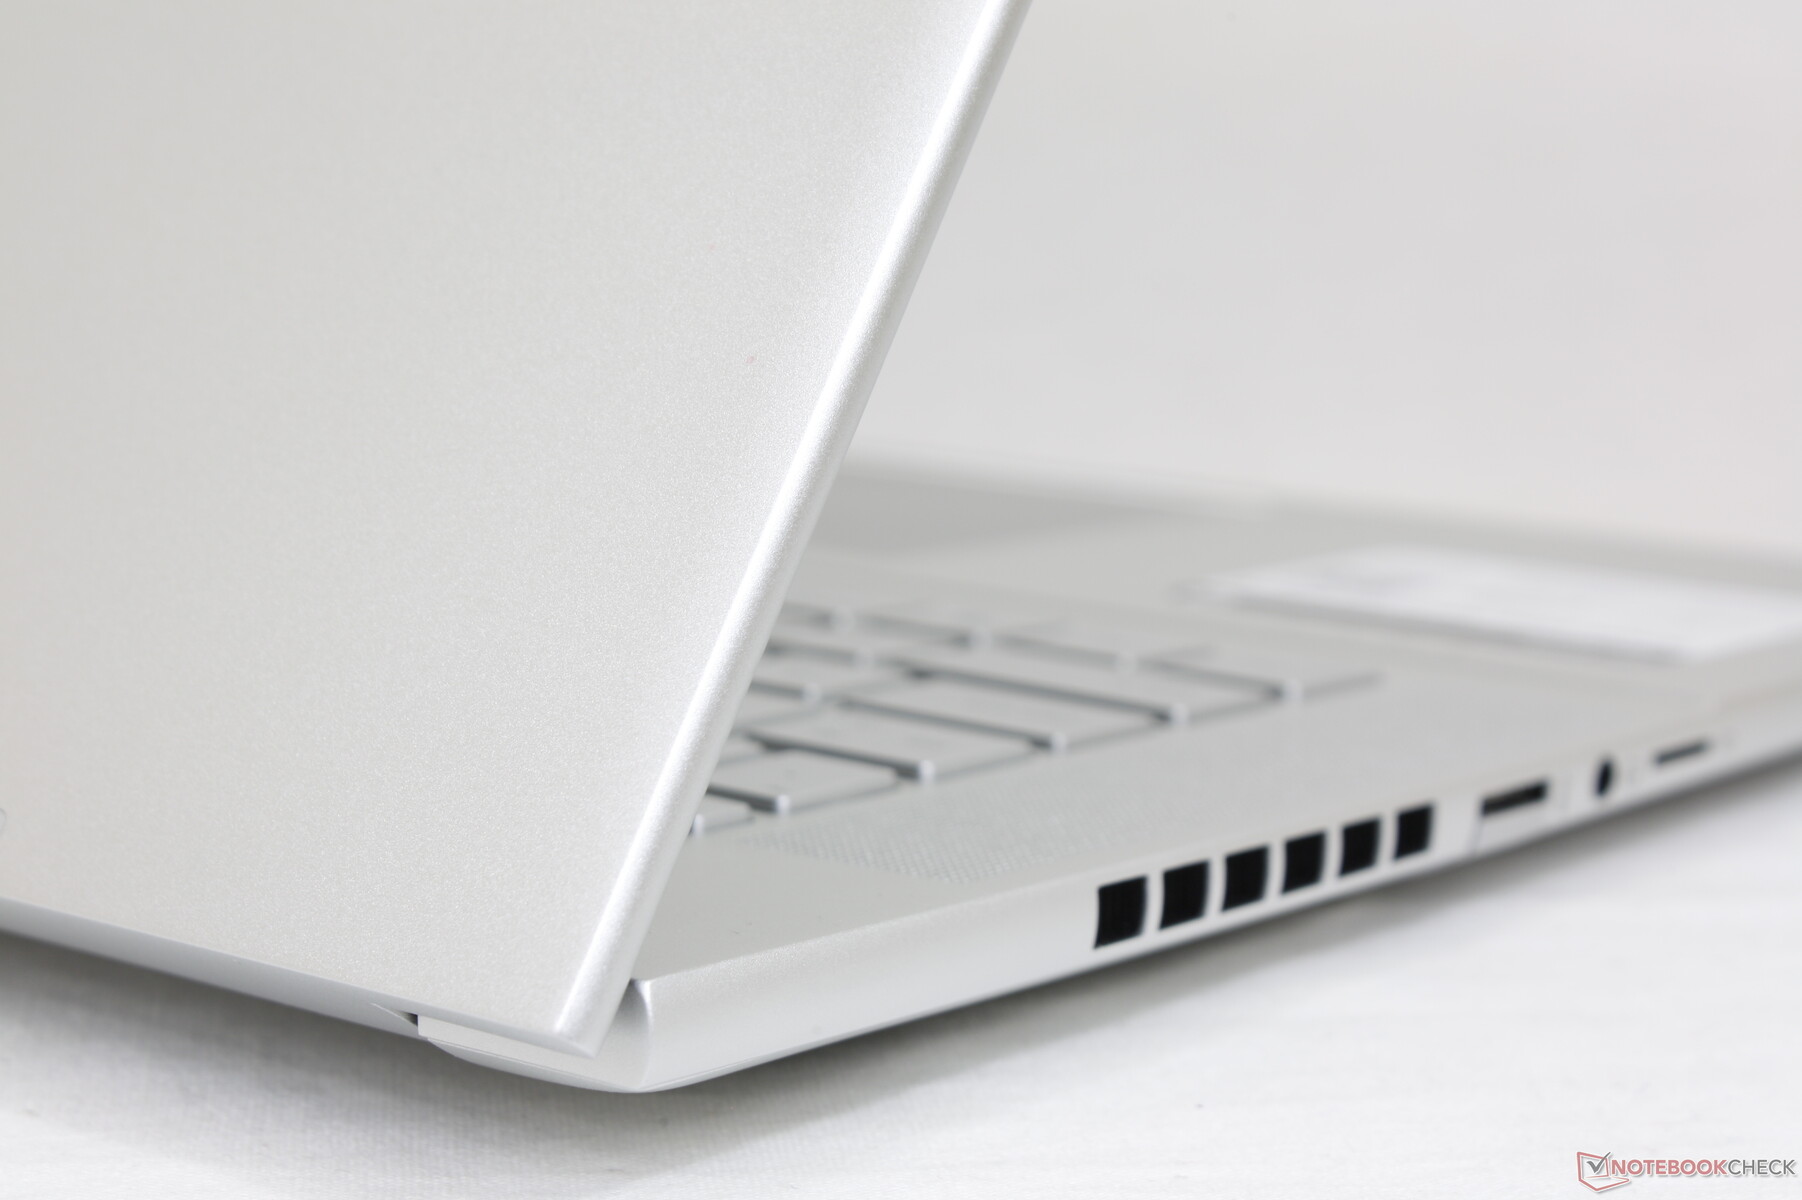
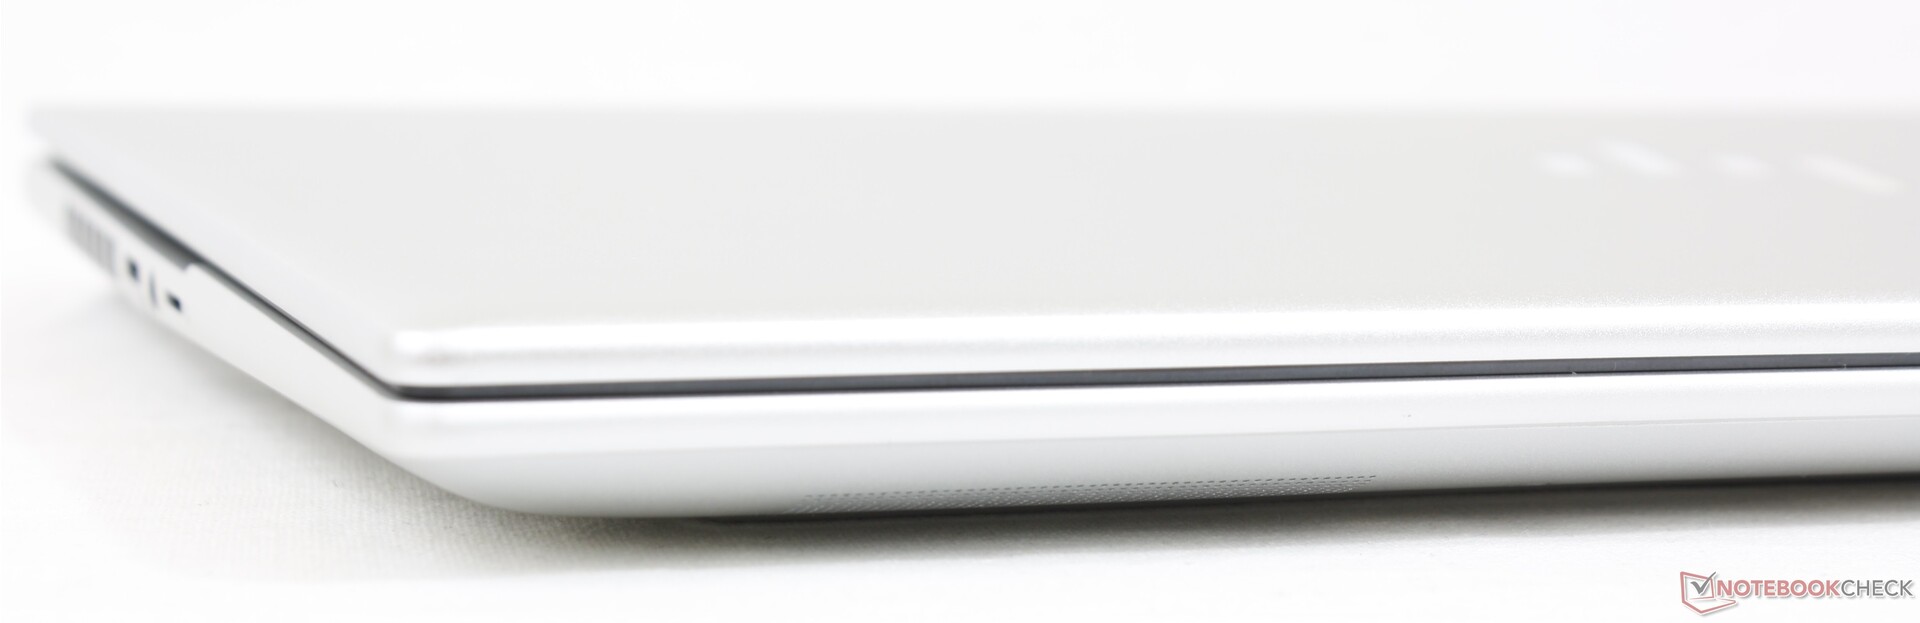
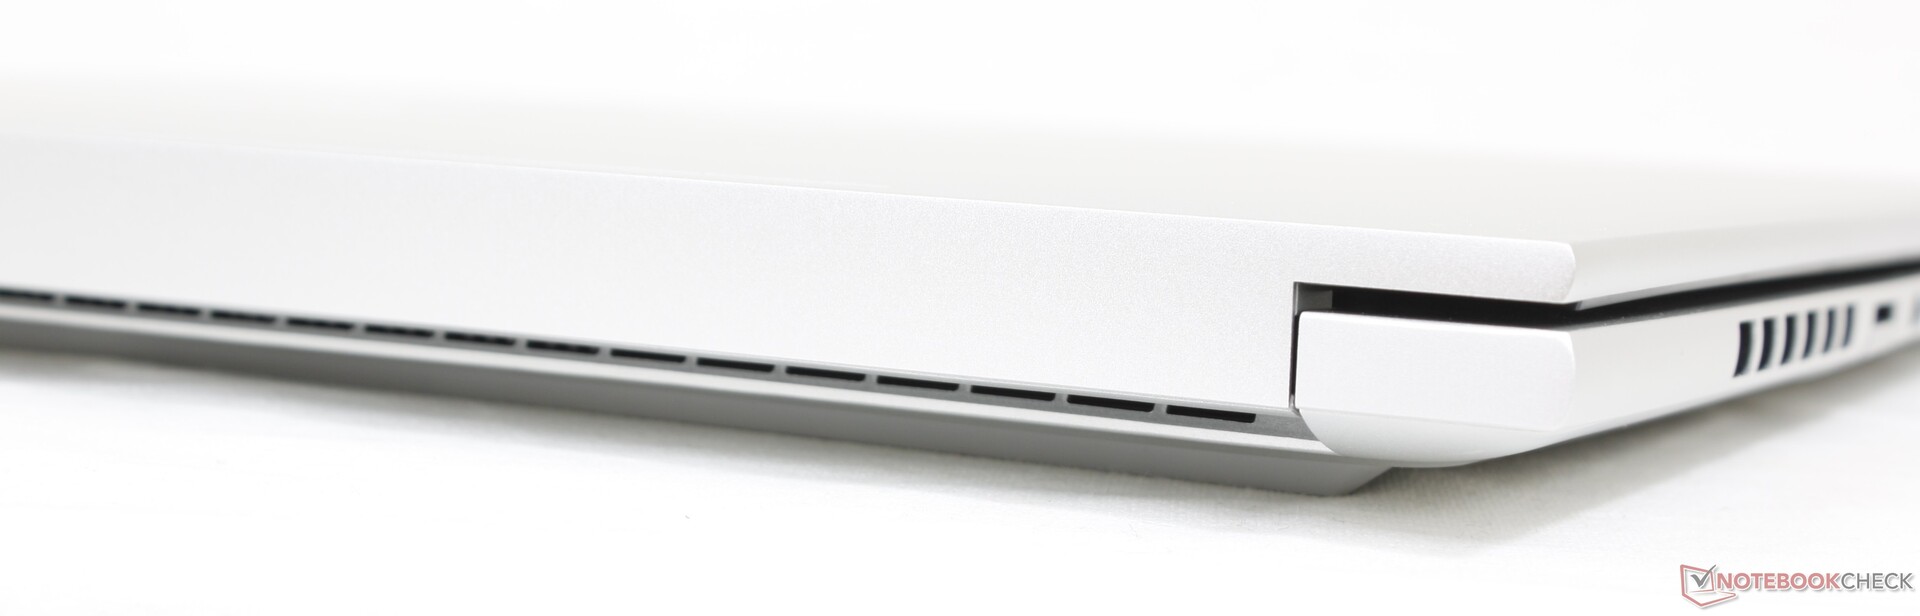
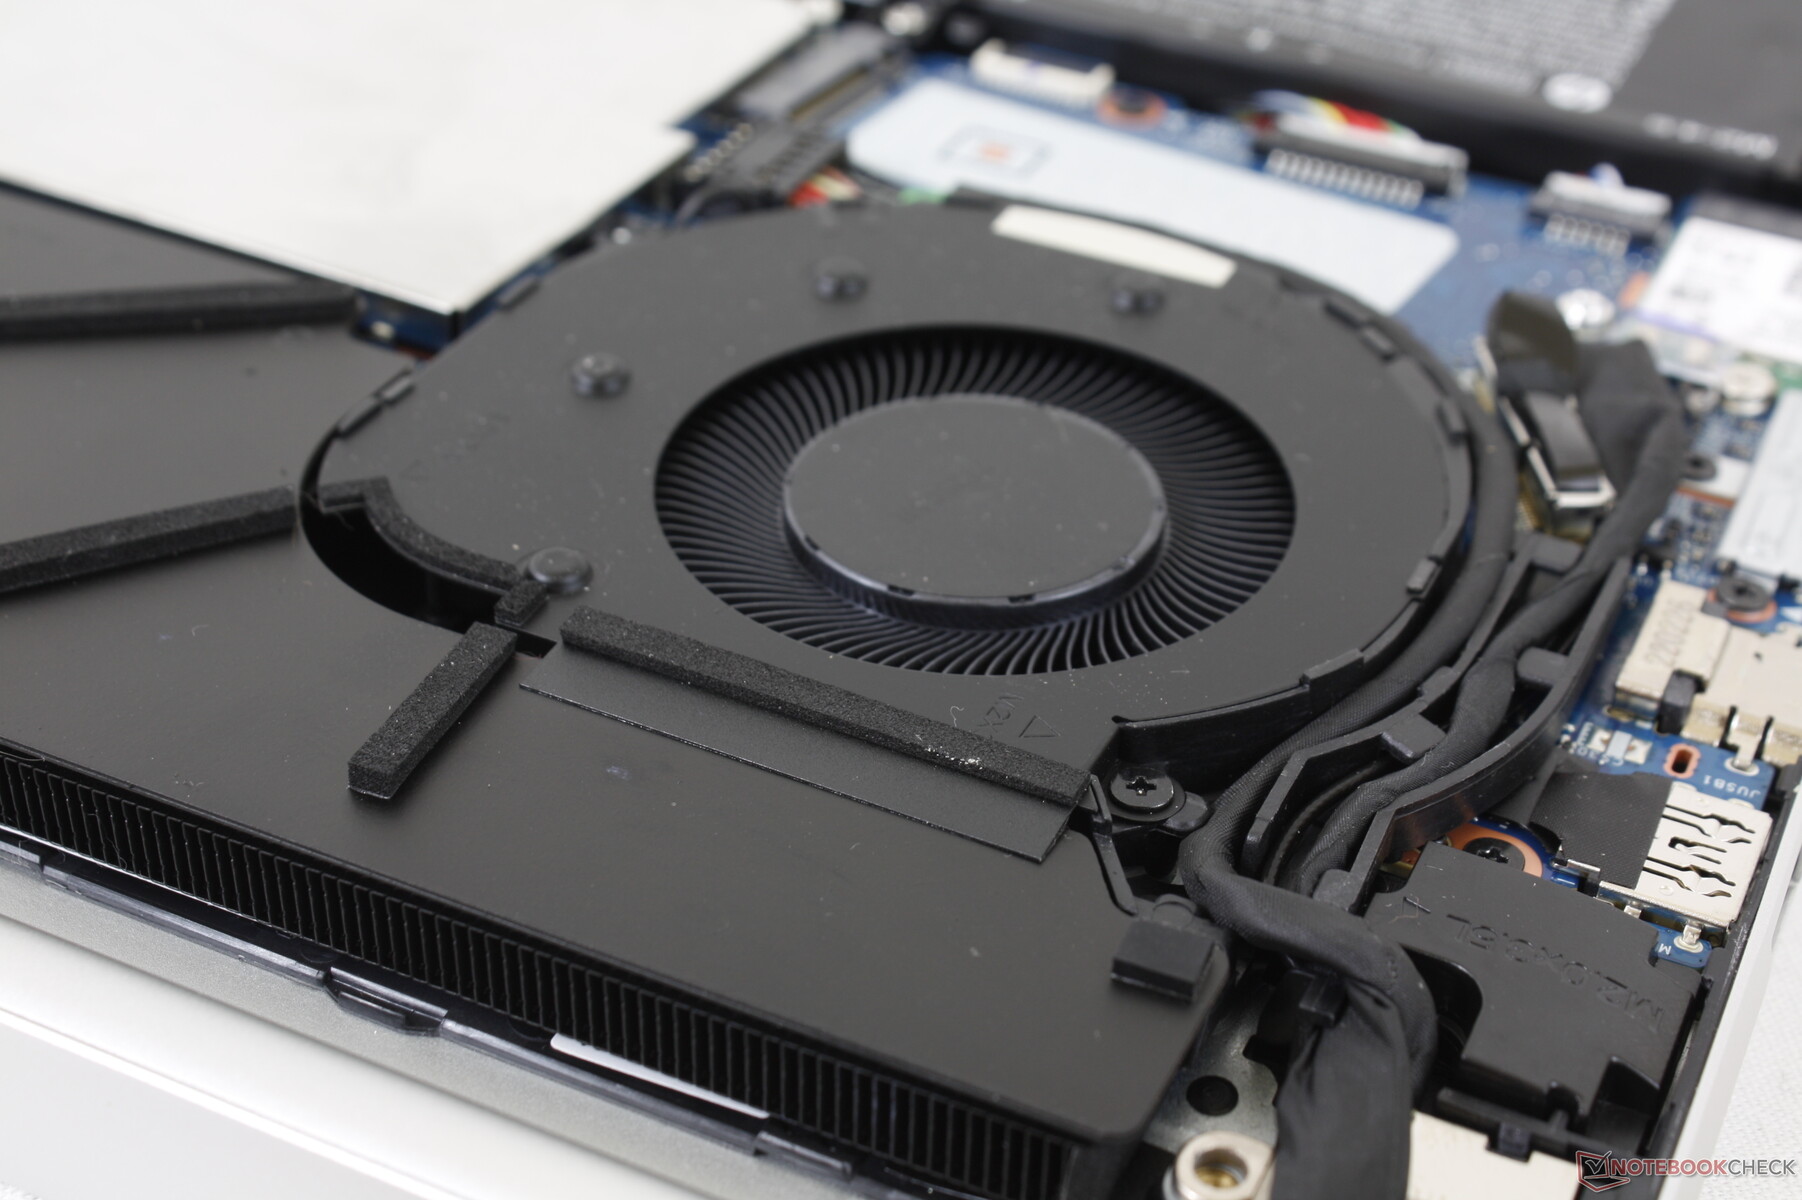
L'Envy 16 peut ressembler à l'Envy 15 à première vue en raison de leurs couleurs similaires, mais il y a en fait de nombreux changements à l'intérieur et à l'extérieur. Le plus remarquable est que le Envy 16 est plus arrondi au niveau de ses bords et de ses coins, par opposition au Envy 15, qui est plus fin et plus plat. Par ailleurs, la partie ventilation du panneau inférieur est surélevée au lieu d'être plate, comme le montrent les photos ci-dessous. Le repose-poignet et les grilles des haut-parleurs ont également été redessinés. Certains de ces changements semblent être superficiels tandis que d'autres devraient améliorer les capacités de refroidissement du modèle.
La qualité du châssis reste tout aussi bonne que celle de l'Envy 15 2020 envy 15 2020 2020, malgré l'augmentation de la taille. La base ne présente que des torsions et des déformations mineures et le couvercle est assez rigide en raison du verre bord à bord et du support en aluminium. Les charnières auraient pu être plus rigides, cependant, car le couvercle vacille lors du réglage des angles plus que sur le ZenBook Pro ou le Razer Blade 15.
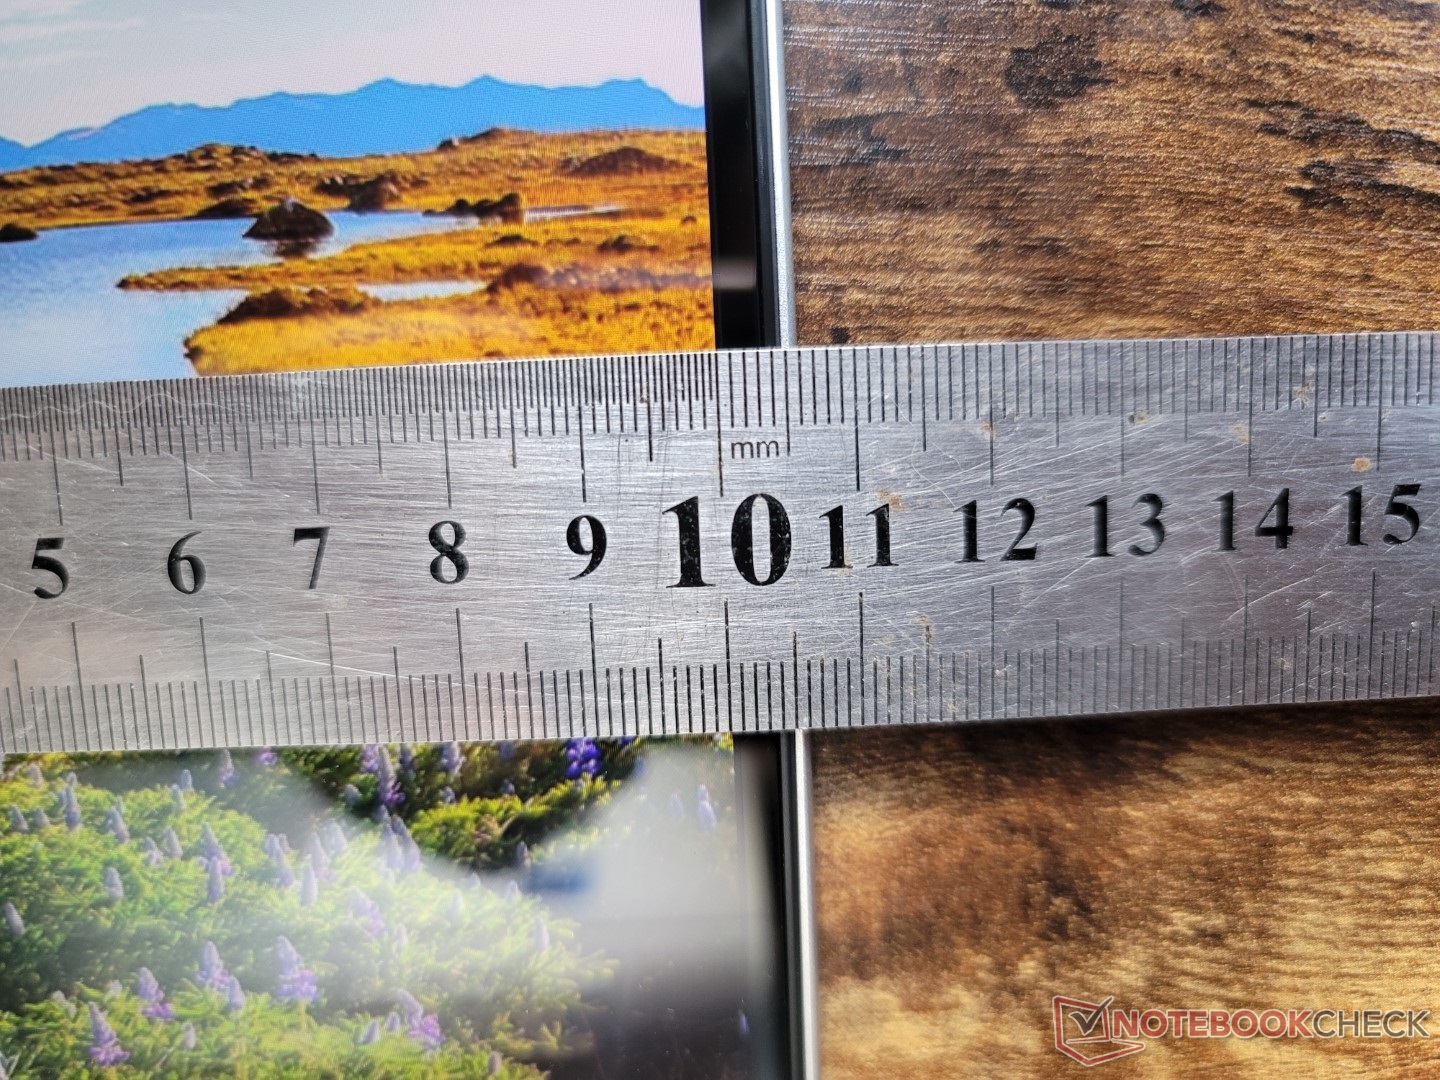
Le modèle 2022 est plus épais, plus lourd et plus grand que le modèle 2020, comme le montre le tableau comparatif ci-dessous. La taille plus grande n'est peut-être pas inattendue étant donné le passage d'un facteur de forme de 15,6 pouces à un facteur de forme de 16 pouces. Malgré cela, le HP est toujours légèrement plus grand et plus lourd que de nombreux ordinateurs portables multimédias 16 pouces concurrents, notamment le MacBook Pro 16, le Huawei MateBook 16s ou le Dell Inspiron 16 Plus 7610.Dell Inspiron 16 Plus 7610.
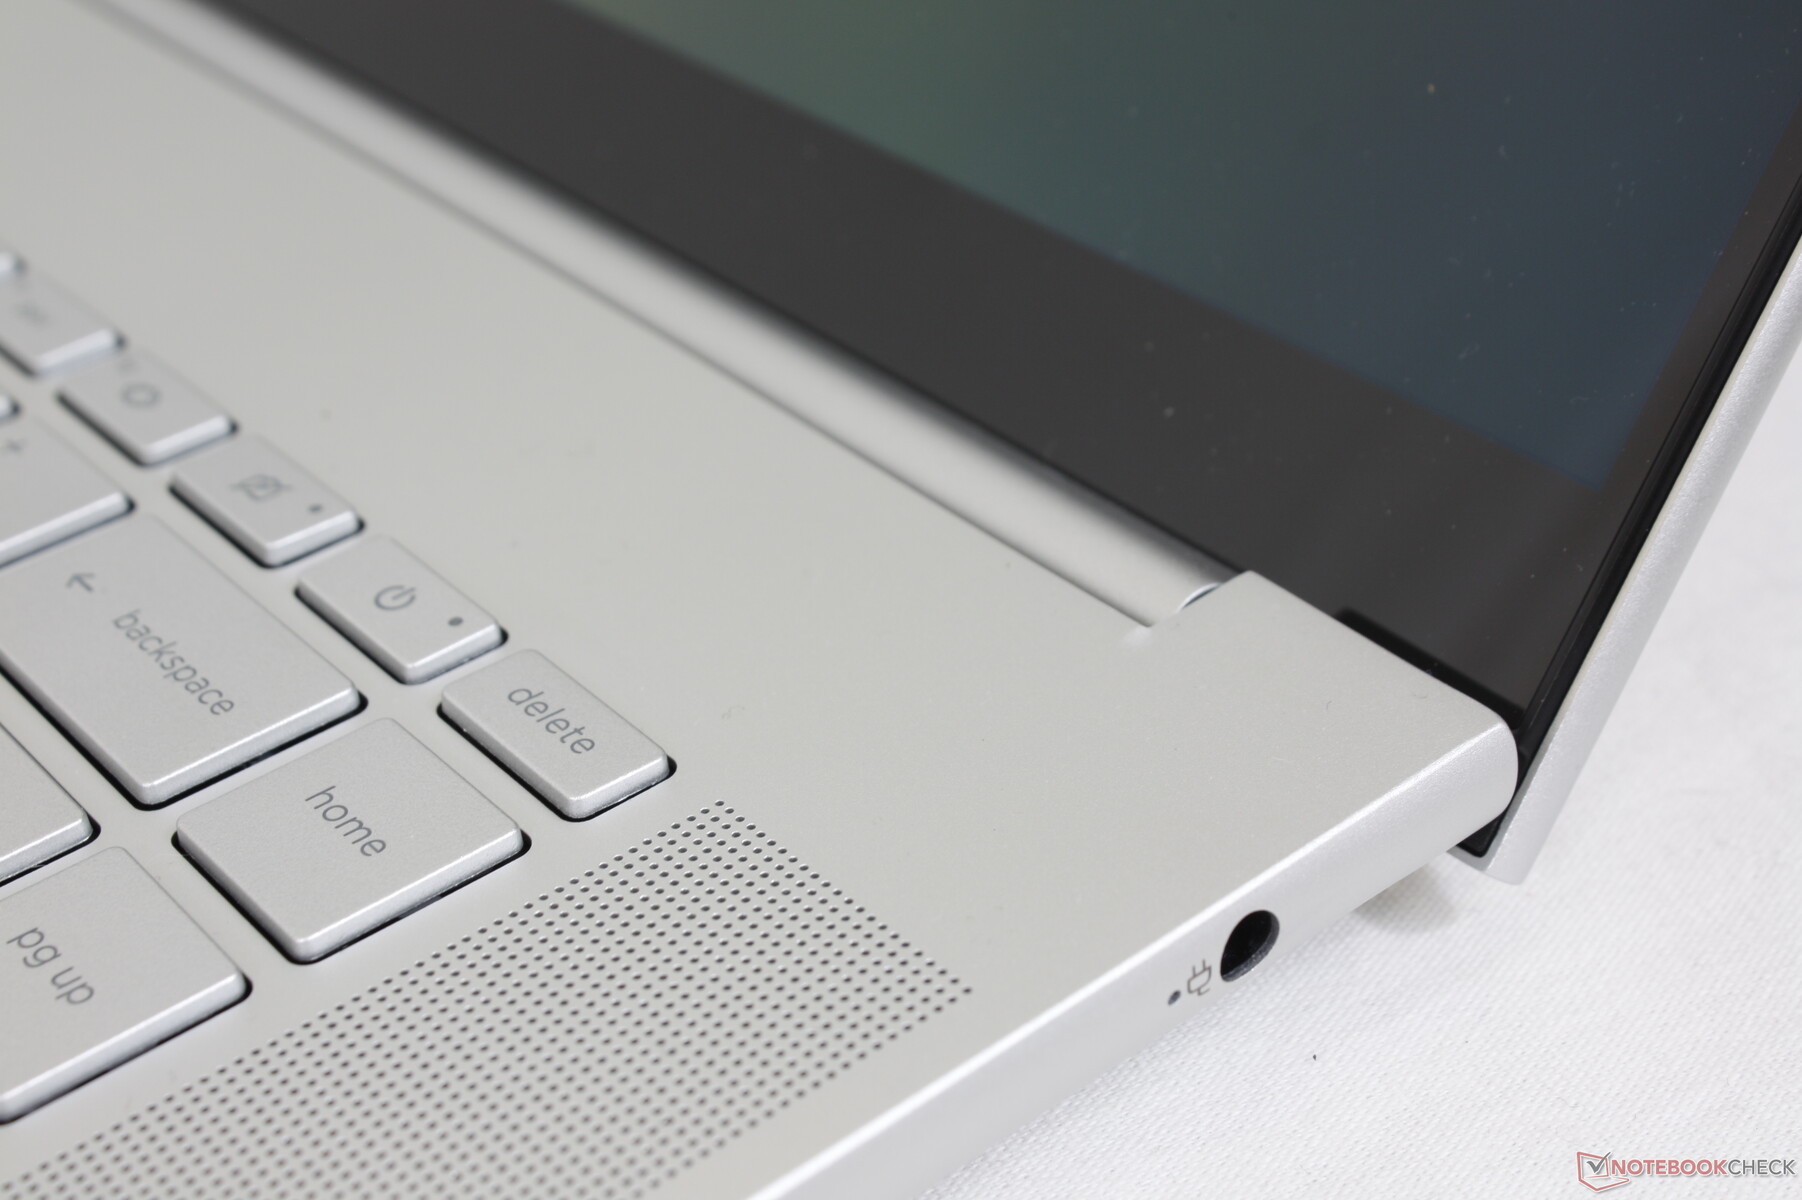
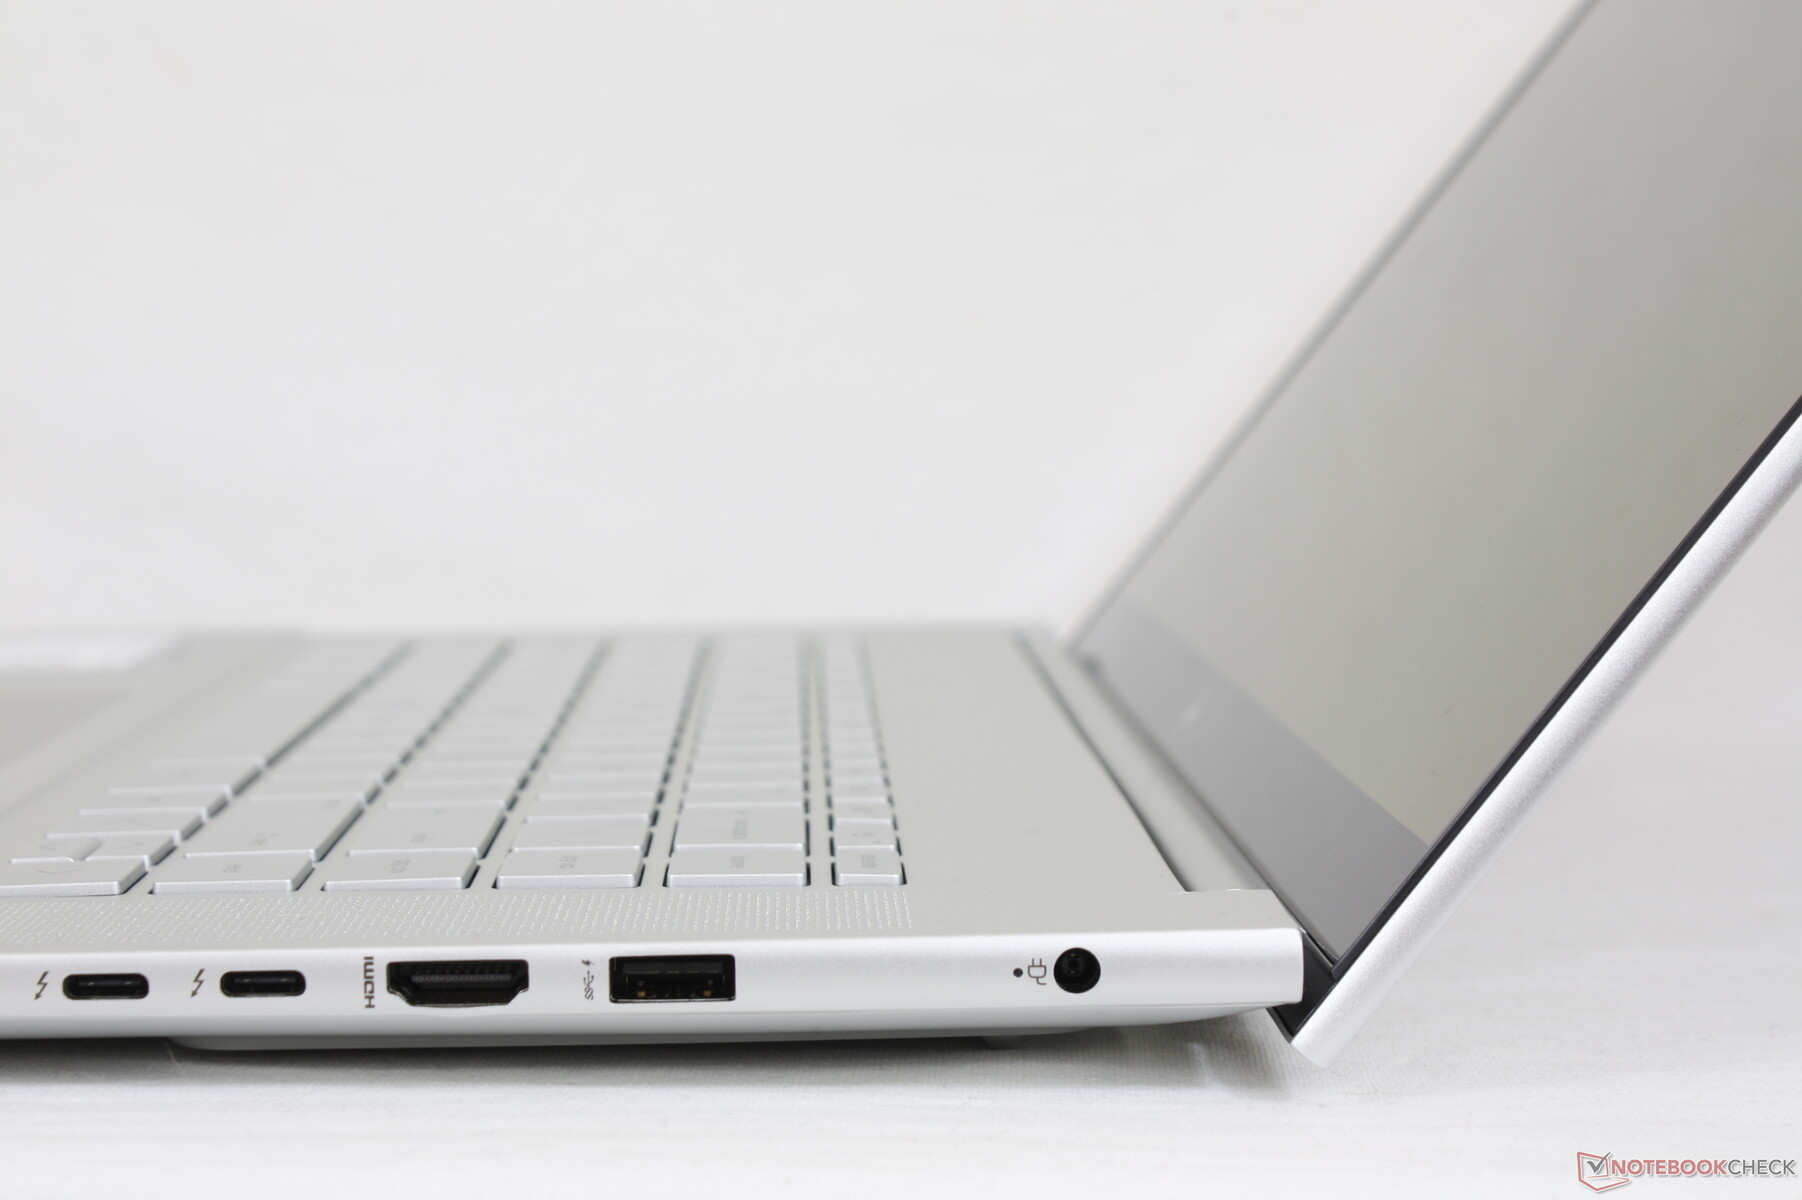
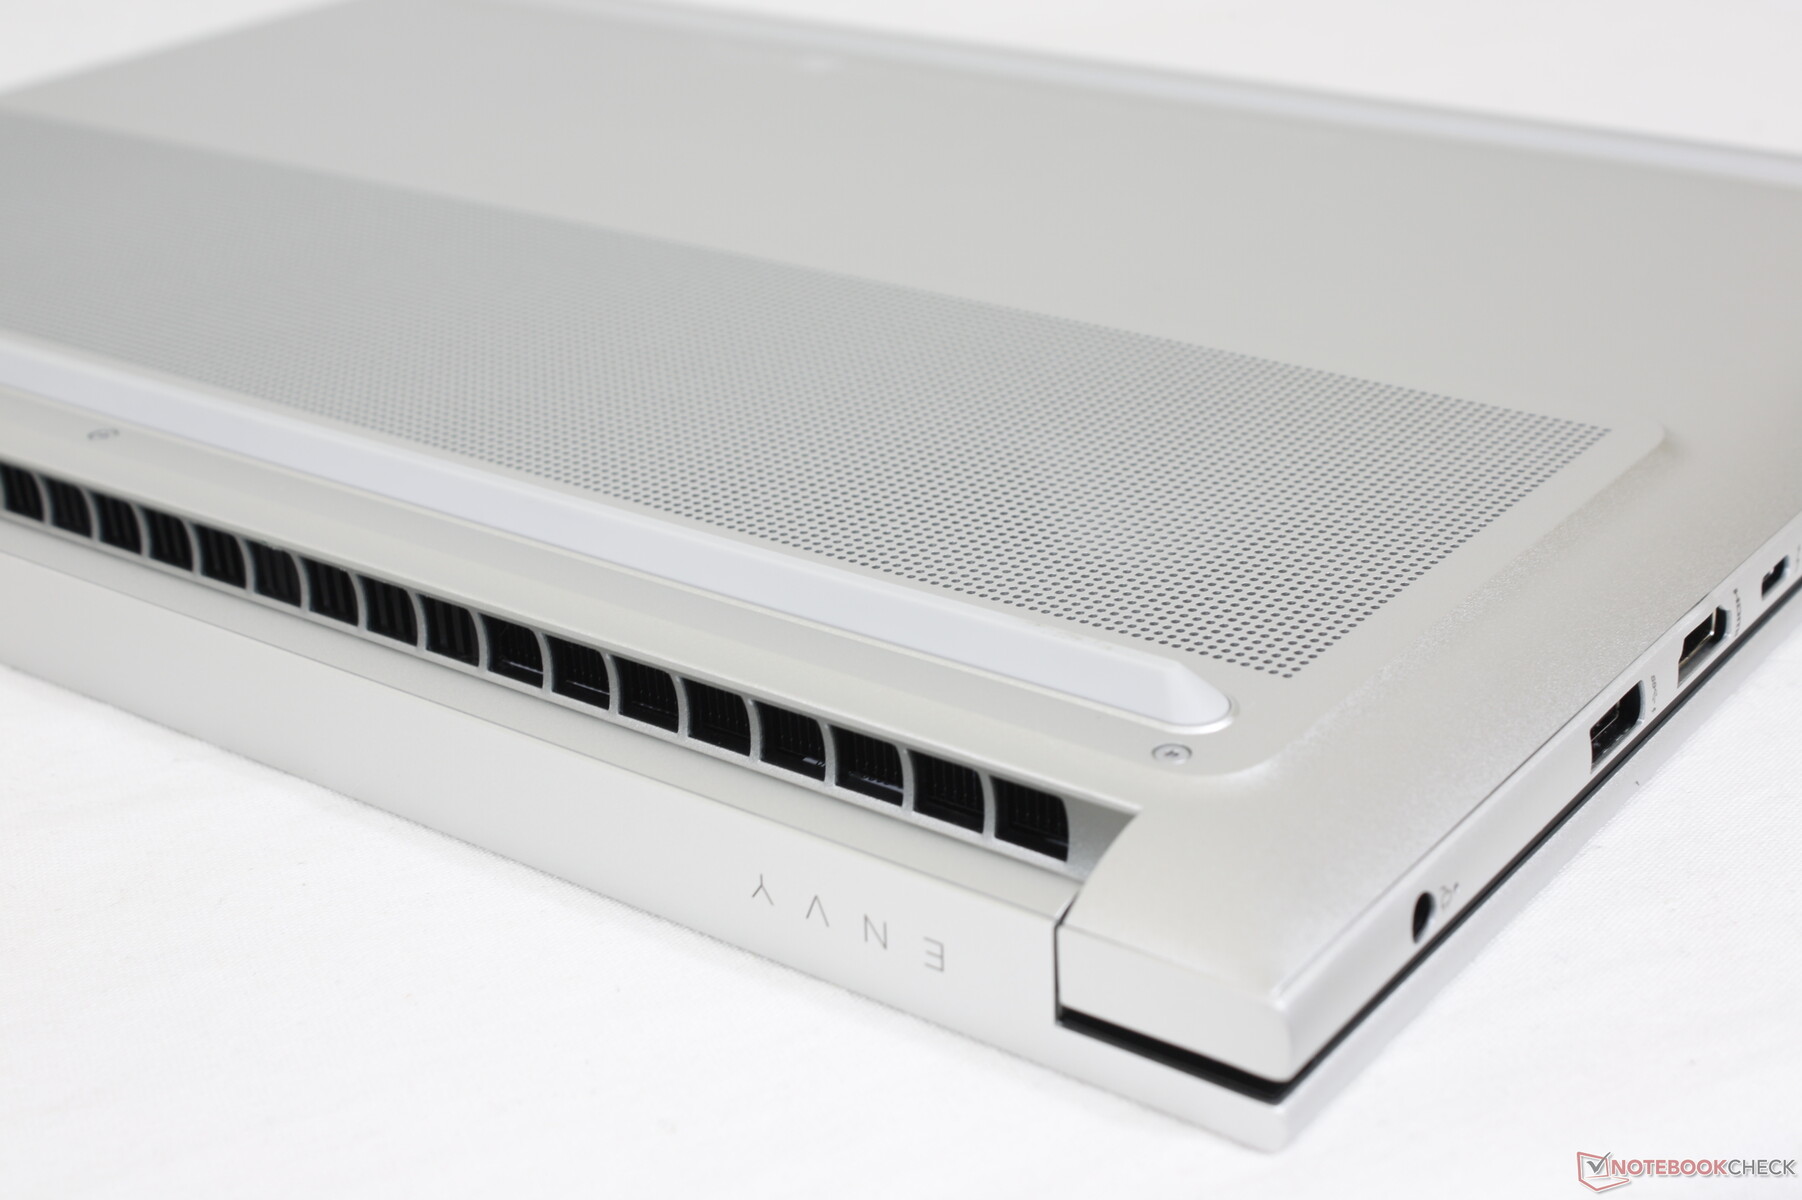
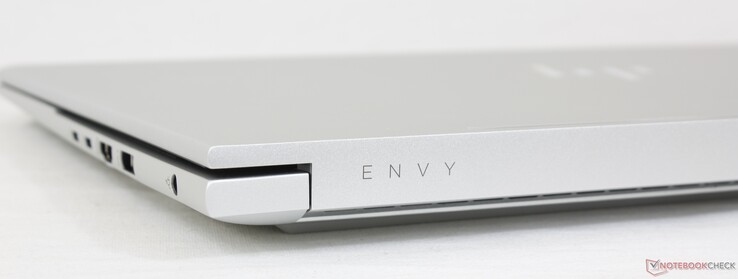
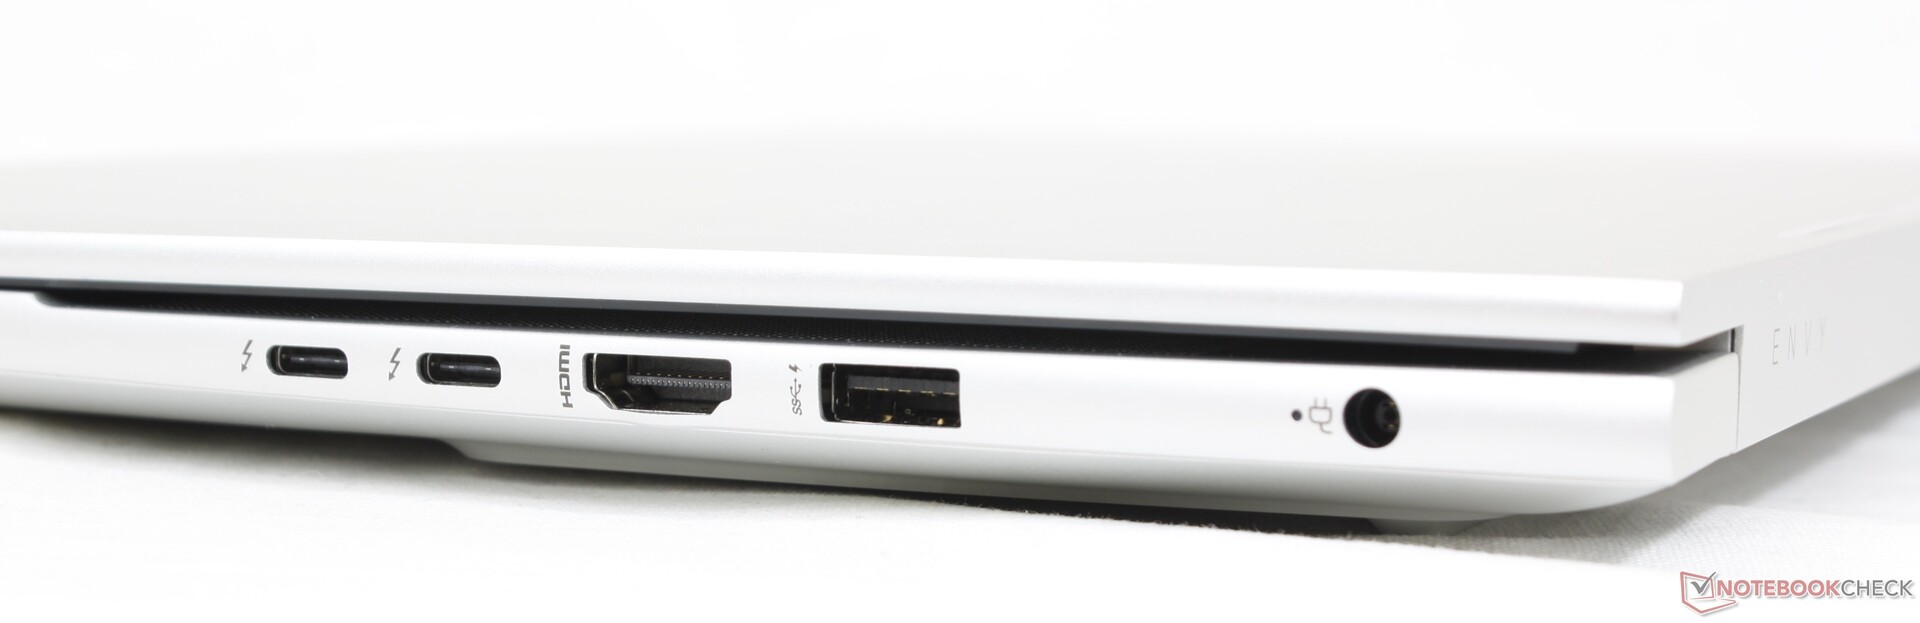
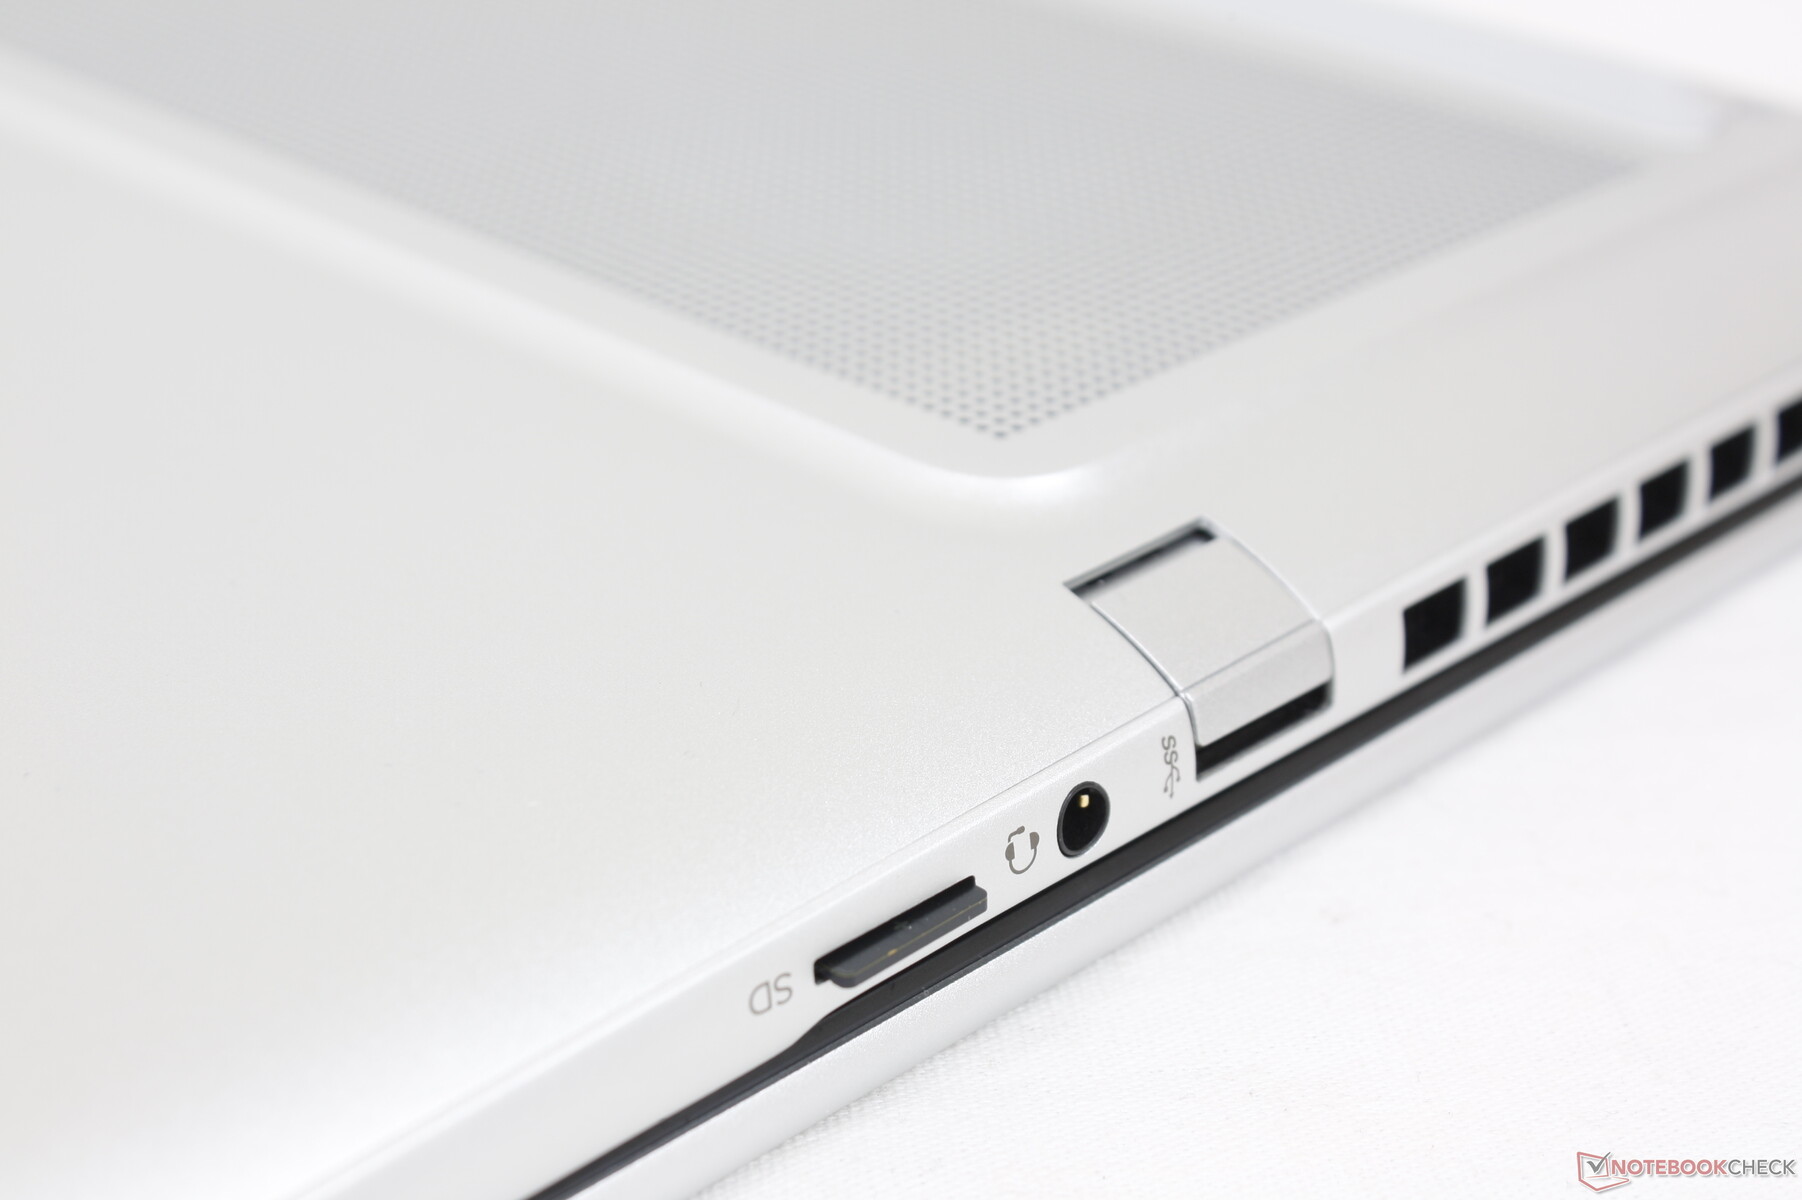
Connectivité - Support standard Thunderbolt 4
Tous les ports du Envy 15 de 2020 sont de retour sur cette révision de 2022, bien que réarrangés. La majorité des ports se trouvent maintenant le long du bord droit du châssis au lieu du bord gauche, pour le meilleur ou pour le pire. Il n'y a toujours pas de fente de verrouillage Kensington.
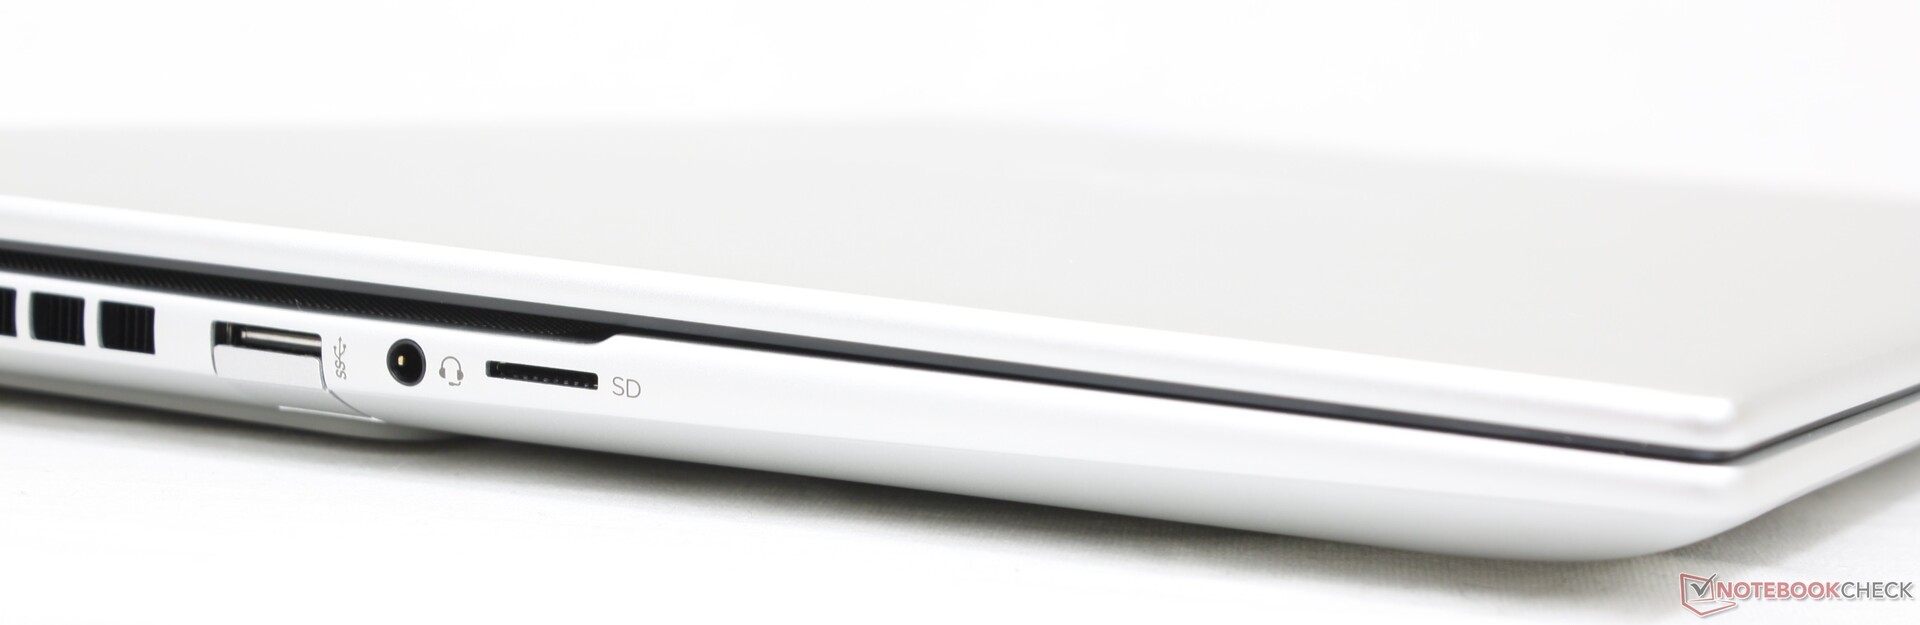
Lecteur de carte SD
Les taux de transfert du lecteur MicroSD intégré sont moyens. Le transfert de 1 Go de photos de notre carte de test UHS-II vers le bureau prend environ 17 secondes.
| SD Card Reader | |
| average JPG Copy Test (av. of 3 runs) | |
| Apple MacBook Pro 16 2021 M1 Pro (Angelbird AV Pro V60) | |
| Lenovo ThinkBook 16 G4+ IAP (Angelbird AV Pro V60) | |
| MSI Creator Z16P B12UHST (AV PRO microSD 128 GB V60) | |
| HP Envy 16 h0112nr (AV Pro SD microSD 128 GB V60) | |
| Dell Inspiron 16 Plus 7610-MHJ8F (AV Pro SD microSD 128 GB V60) | |
| maximum AS SSD Seq Read Test (1GB) | |
| Lenovo ThinkBook 16 G4+ IAP (Angelbird AV Pro V60) | |
| HP Envy 16 h0112nr (AV Pro SD microSD 128 GB V60) | |
| Dell Inspiron 16 Plus 7610-MHJ8F (AV Pro SD microSD 128 GB V60) | |
Communication
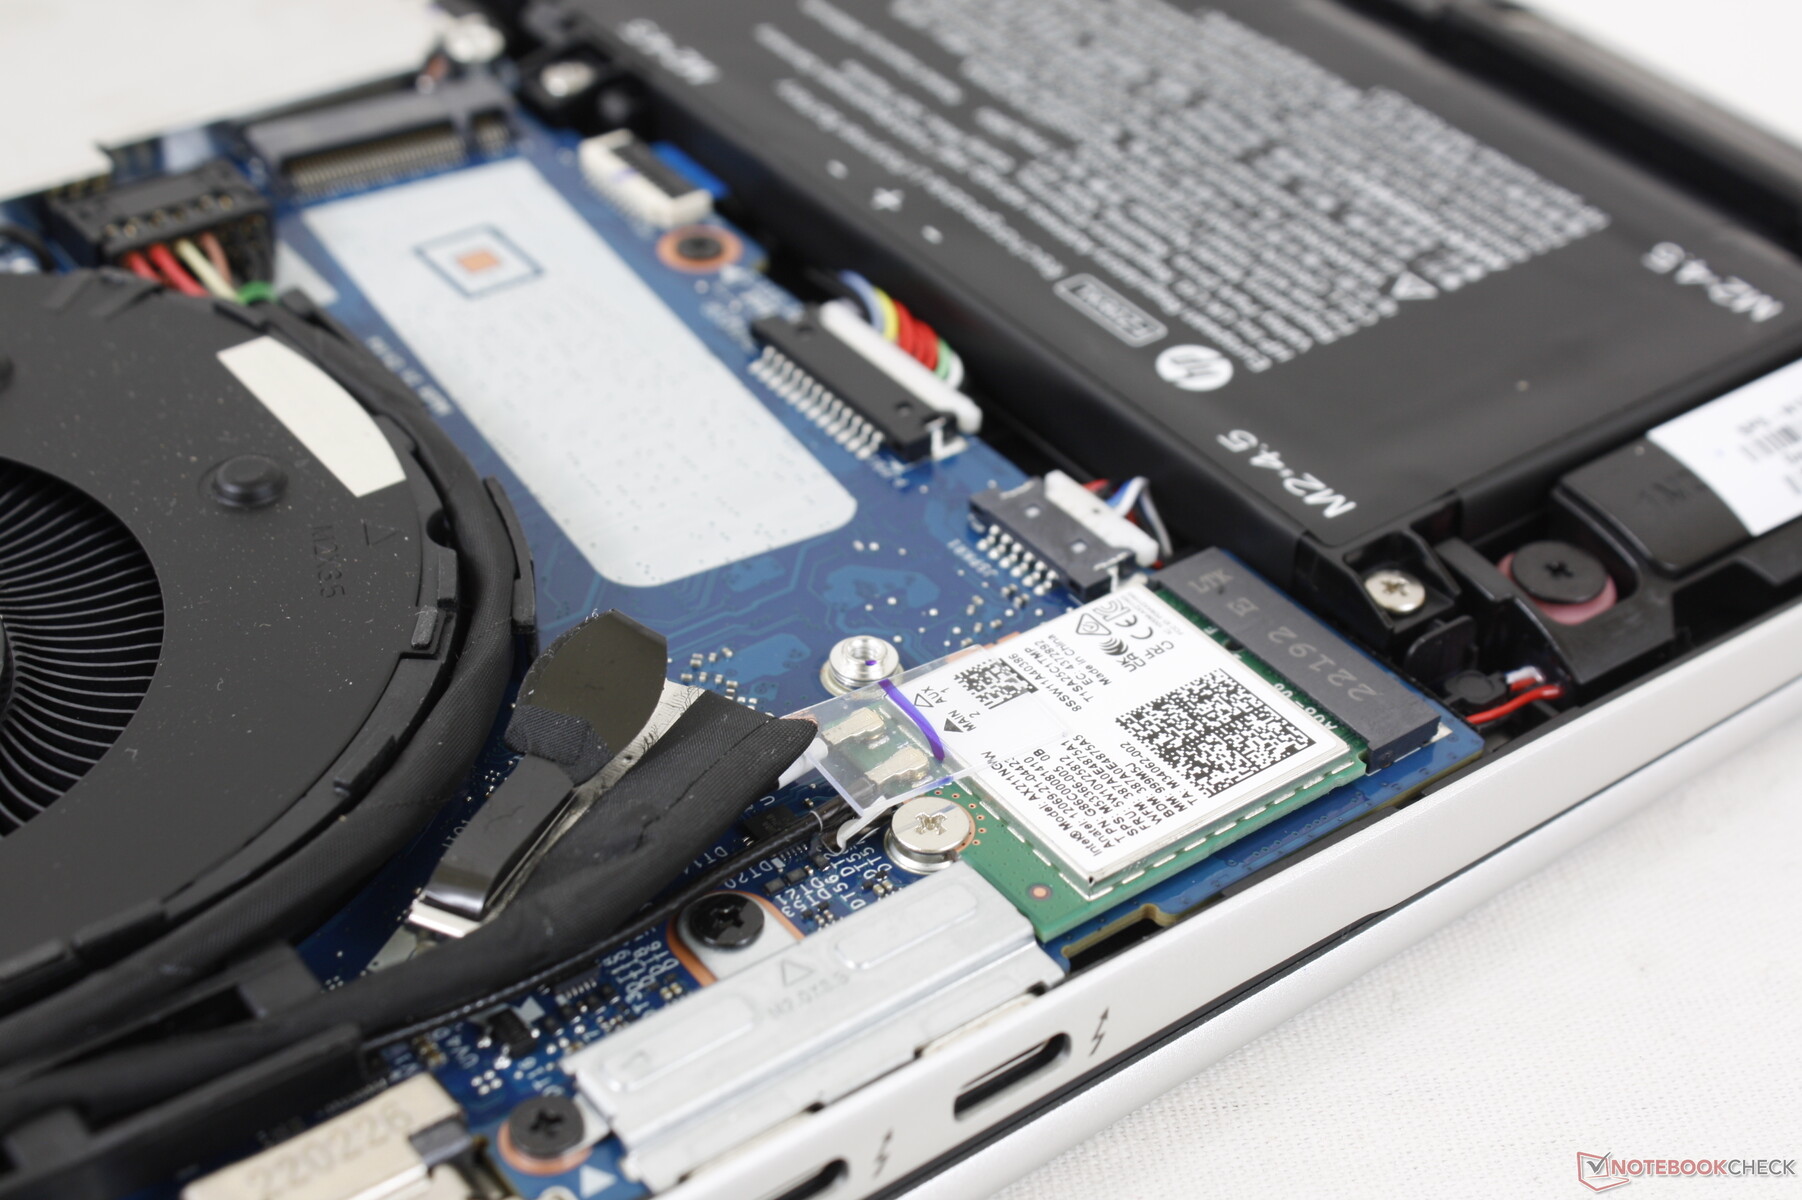
Un Intel AX211 est fourni en standard pour la connectivité Wi-Fi 6E et Bluetooth 5.2. Nous n'avons rencontré aucun problème de fiabilité lorsque nous l'avons couplé à notre réseau 6 GHz.
| Networking | |
| iperf3 transmit AX12 | |
| Dell Inspiron 16 Plus 7610-MHJ8F | |
| Apple MacBook Pro 16 2021 M1 Pro | |
| iperf3 receive AX12 | |
| Dell Inspiron 16 Plus 7610-MHJ8F | |
| Apple MacBook Pro 16 2021 M1 Pro | |
| iperf3 receive AXE11000 6GHz | |
| Huawei MateBook 16s i7 | |
| HP Envy 16 h0112nr | |
| iperf3 receive AXE11000 | |
| MSI Creator Z16P B12UHST | |
| Lenovo ThinkBook 16 G4+ IAP | |
| Apple MacBook Pro 16 2021 M1 Pro | |
| iperf3 transmit AXE11000 6GHz | |
| Huawei MateBook 16s i7 | |
| HP Envy 16 h0112nr | |
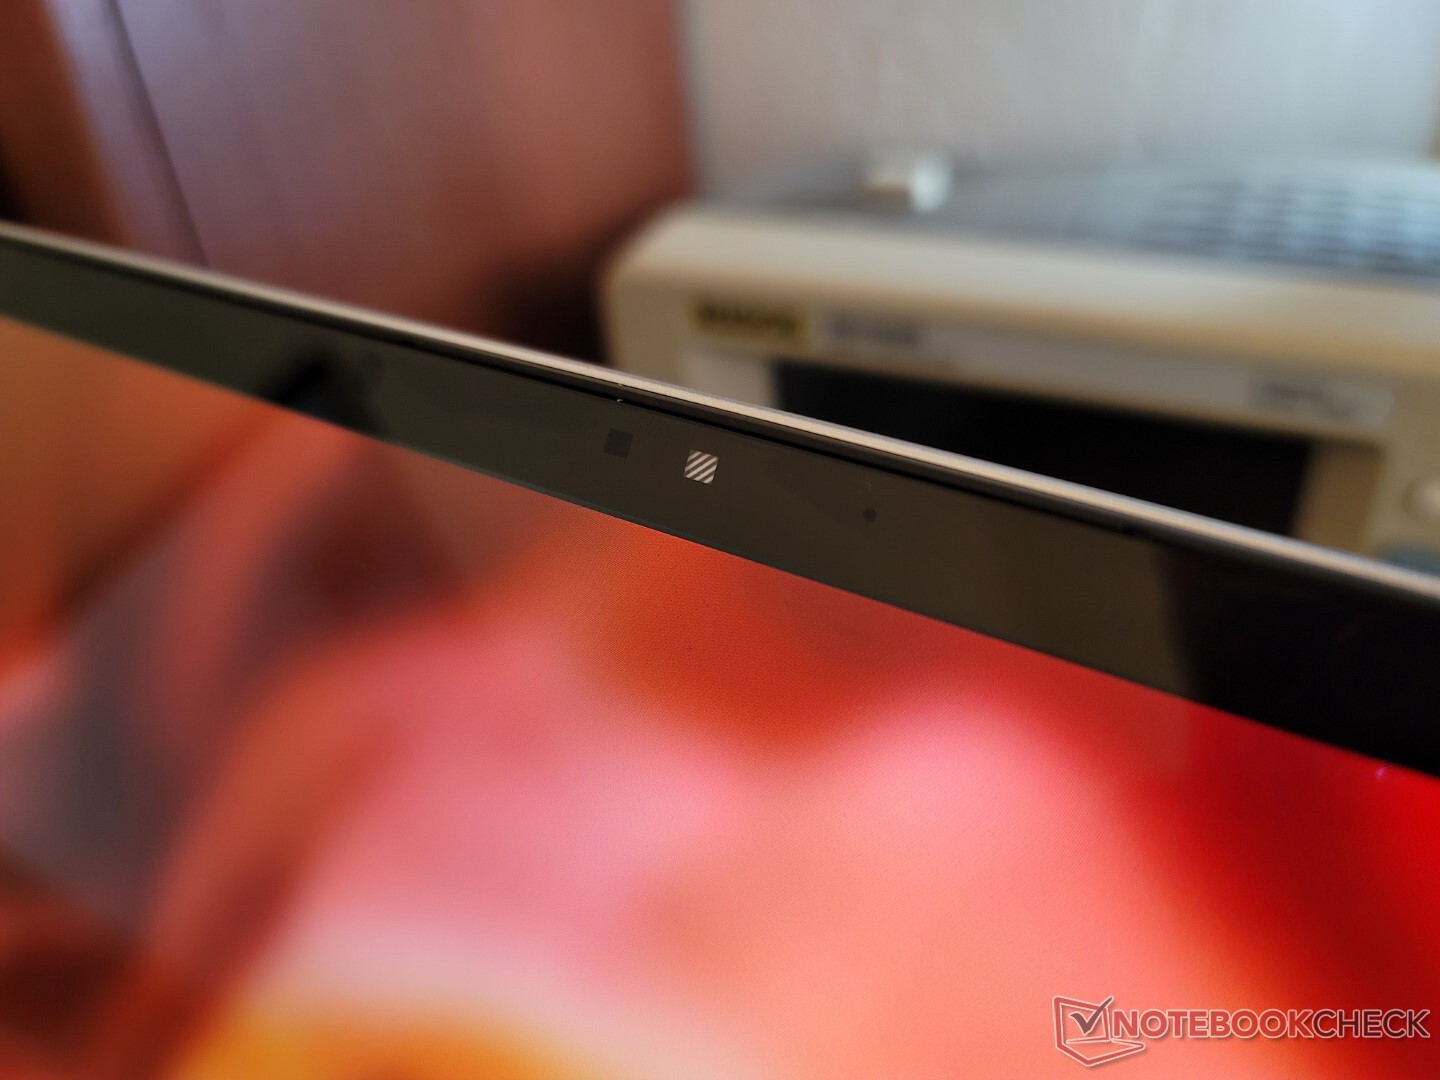
Webcam - 5 MP !
Le système intègre une caméra de 5 MP similaire à celle du dernier Spectre et EliteBook. La qualité d'image est sensiblement plus nette que sur la plupart des autres ordinateurs portables où les webcams de 1 MP et 2 MP sont encore la norme.
Un obturateur de webcam est fourni en standard ainsi qu'un support IR pour Hello.


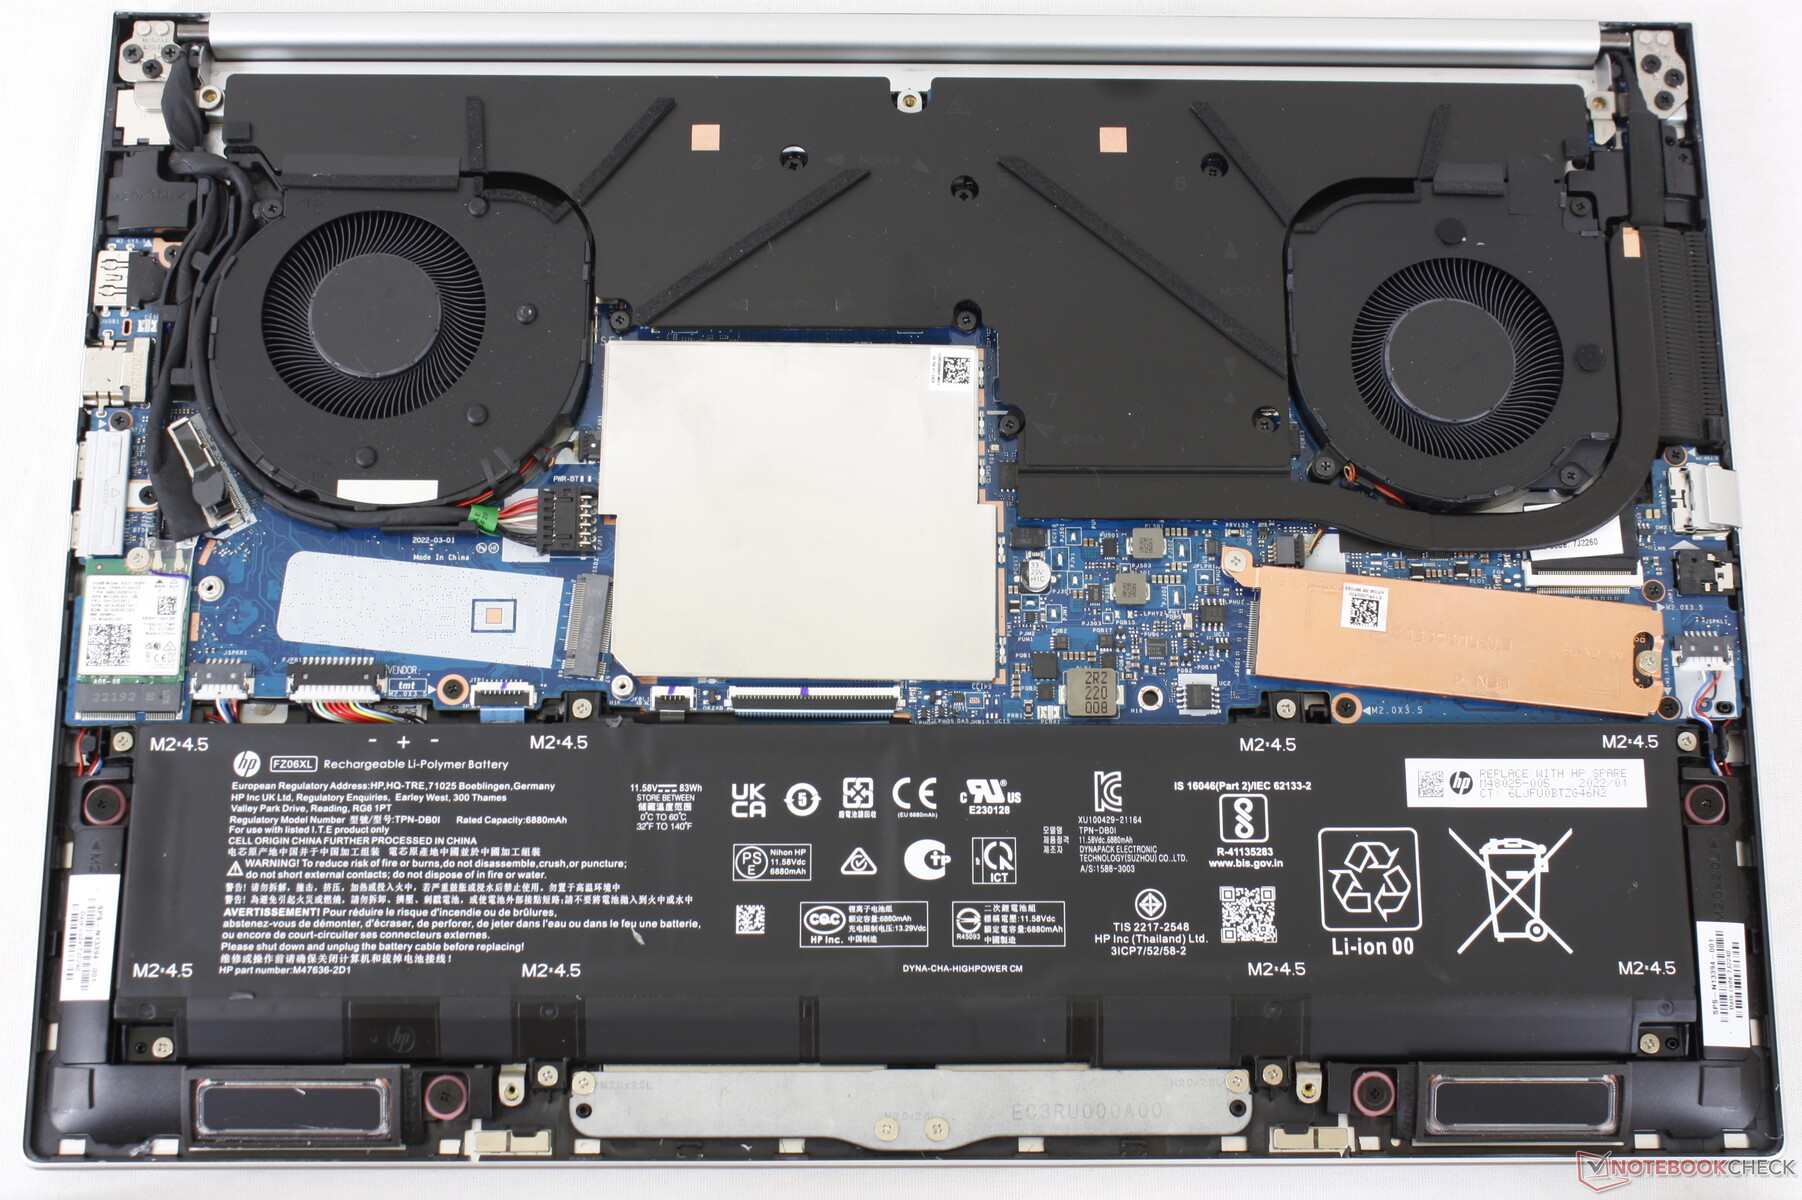
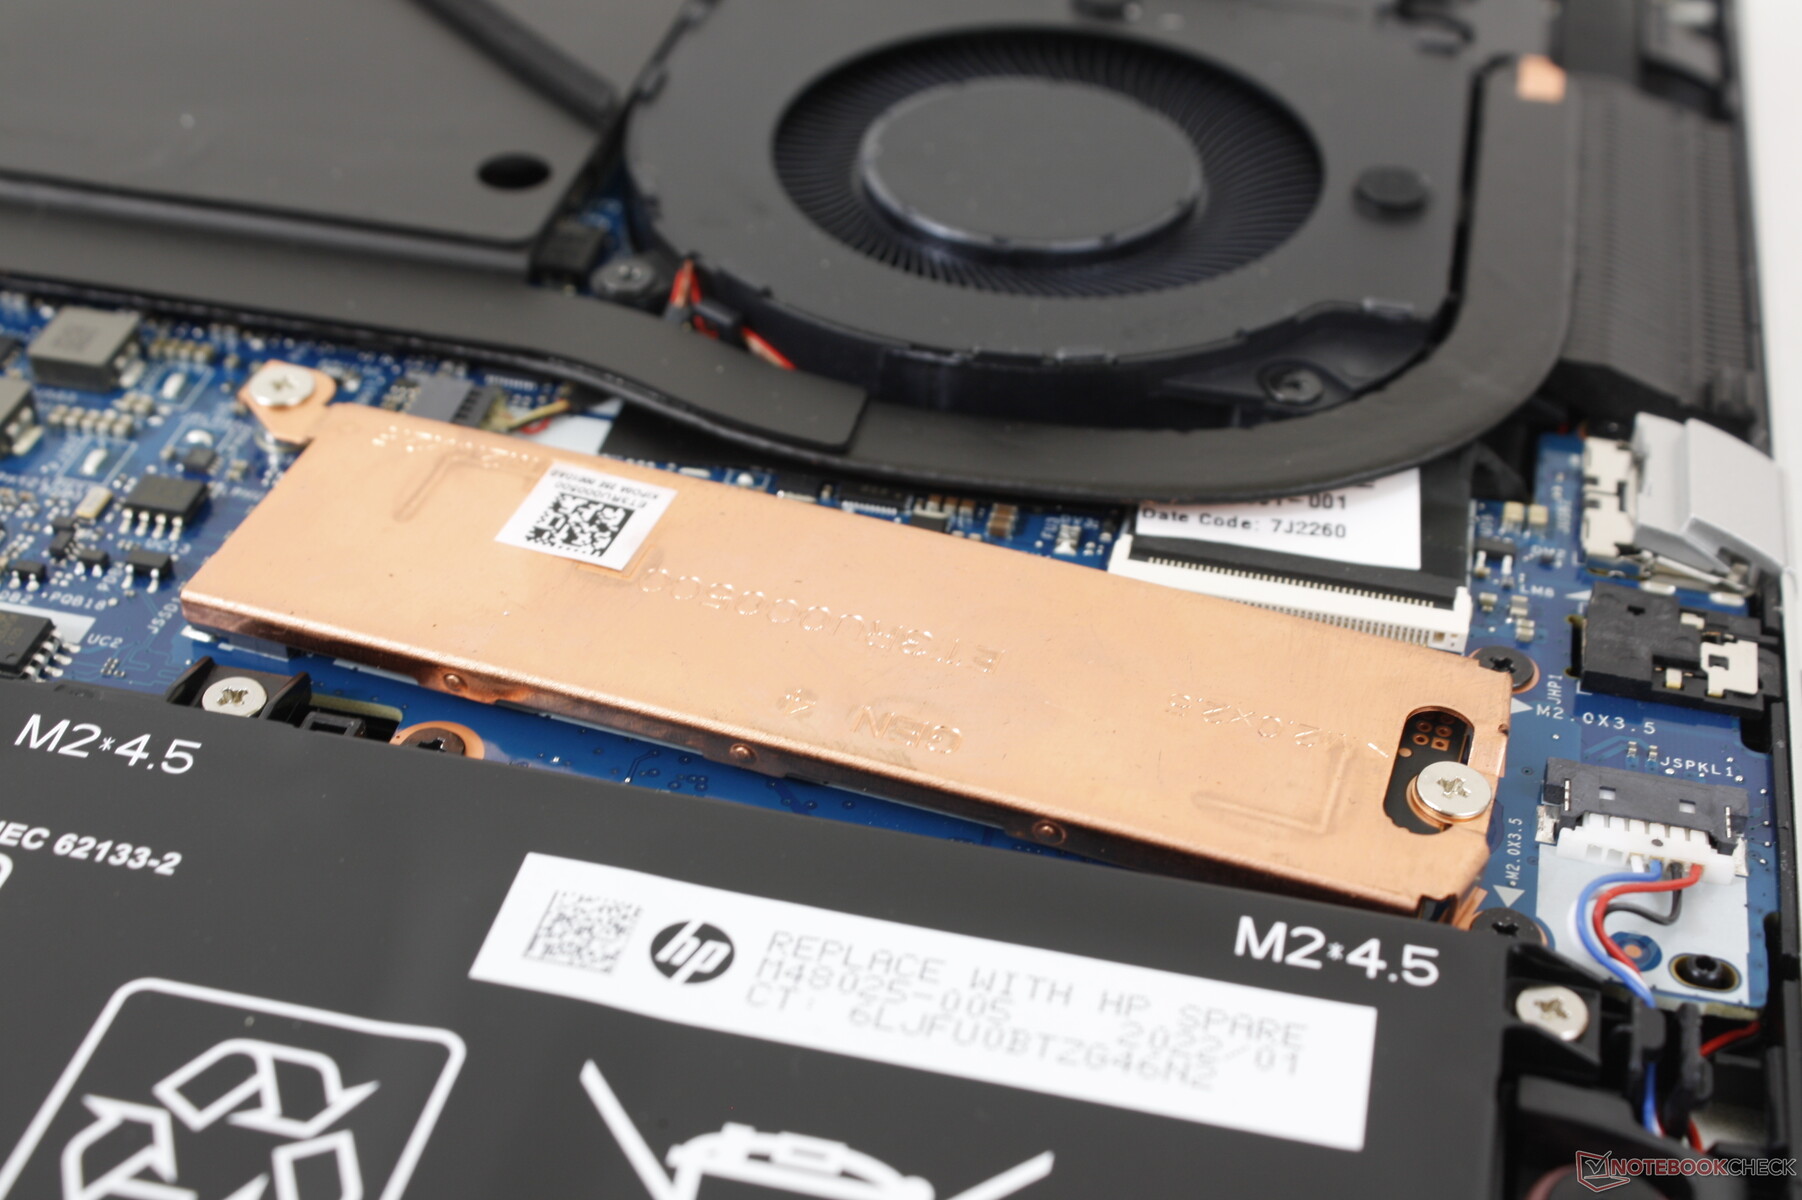
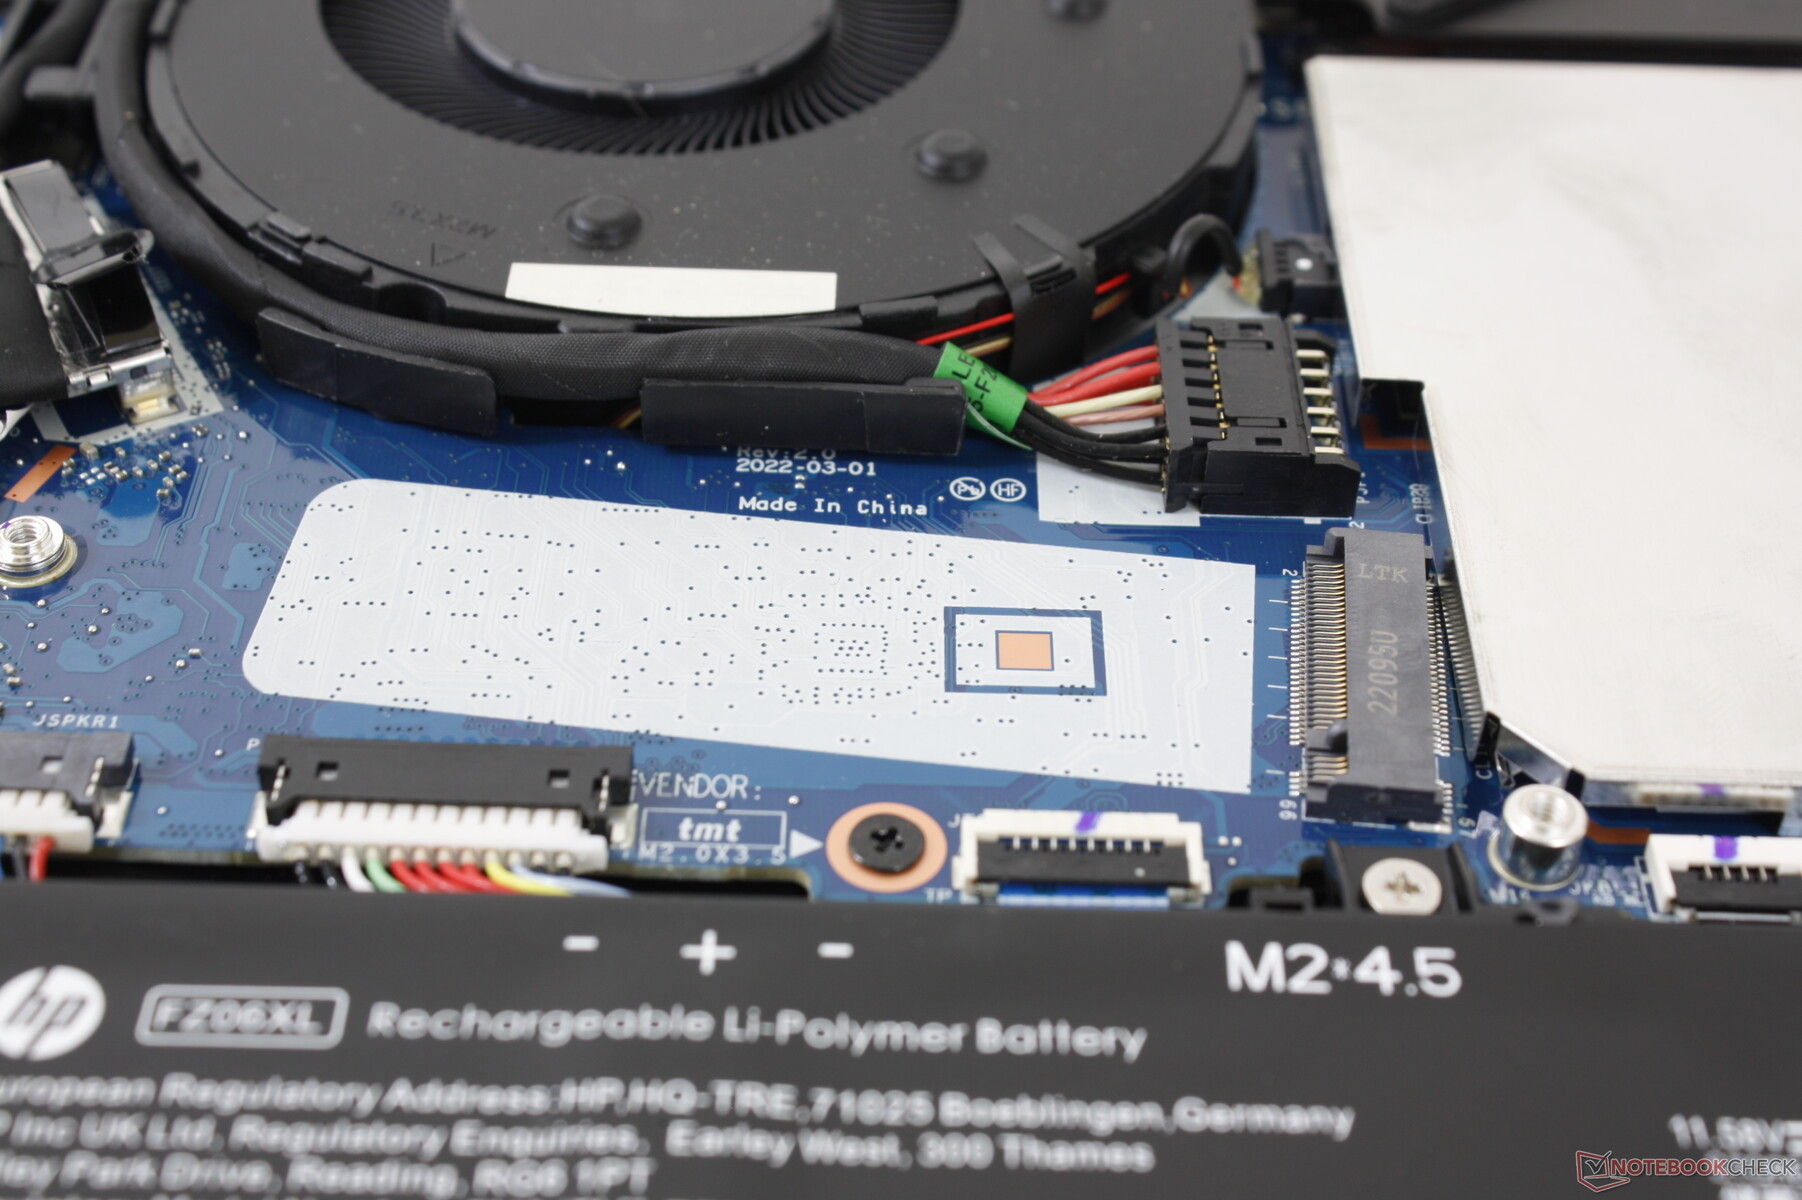
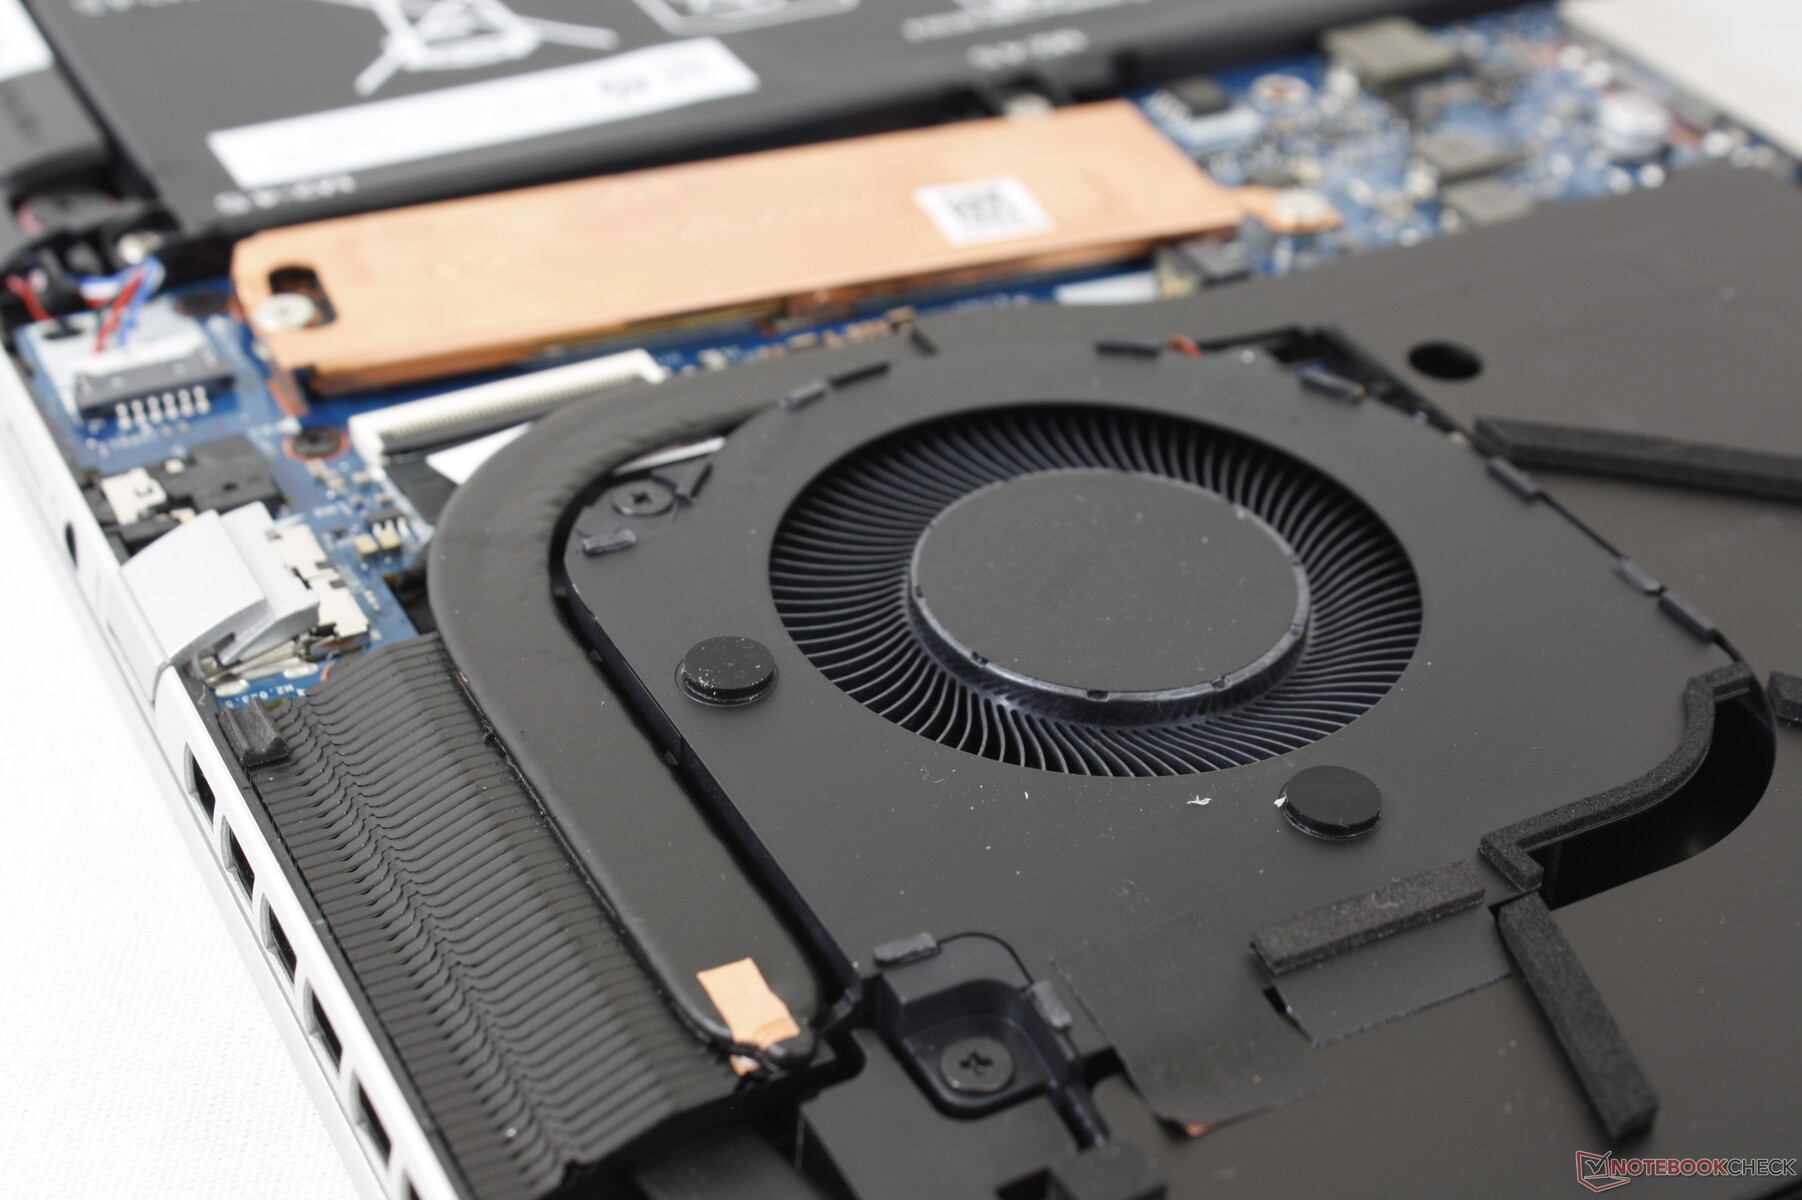
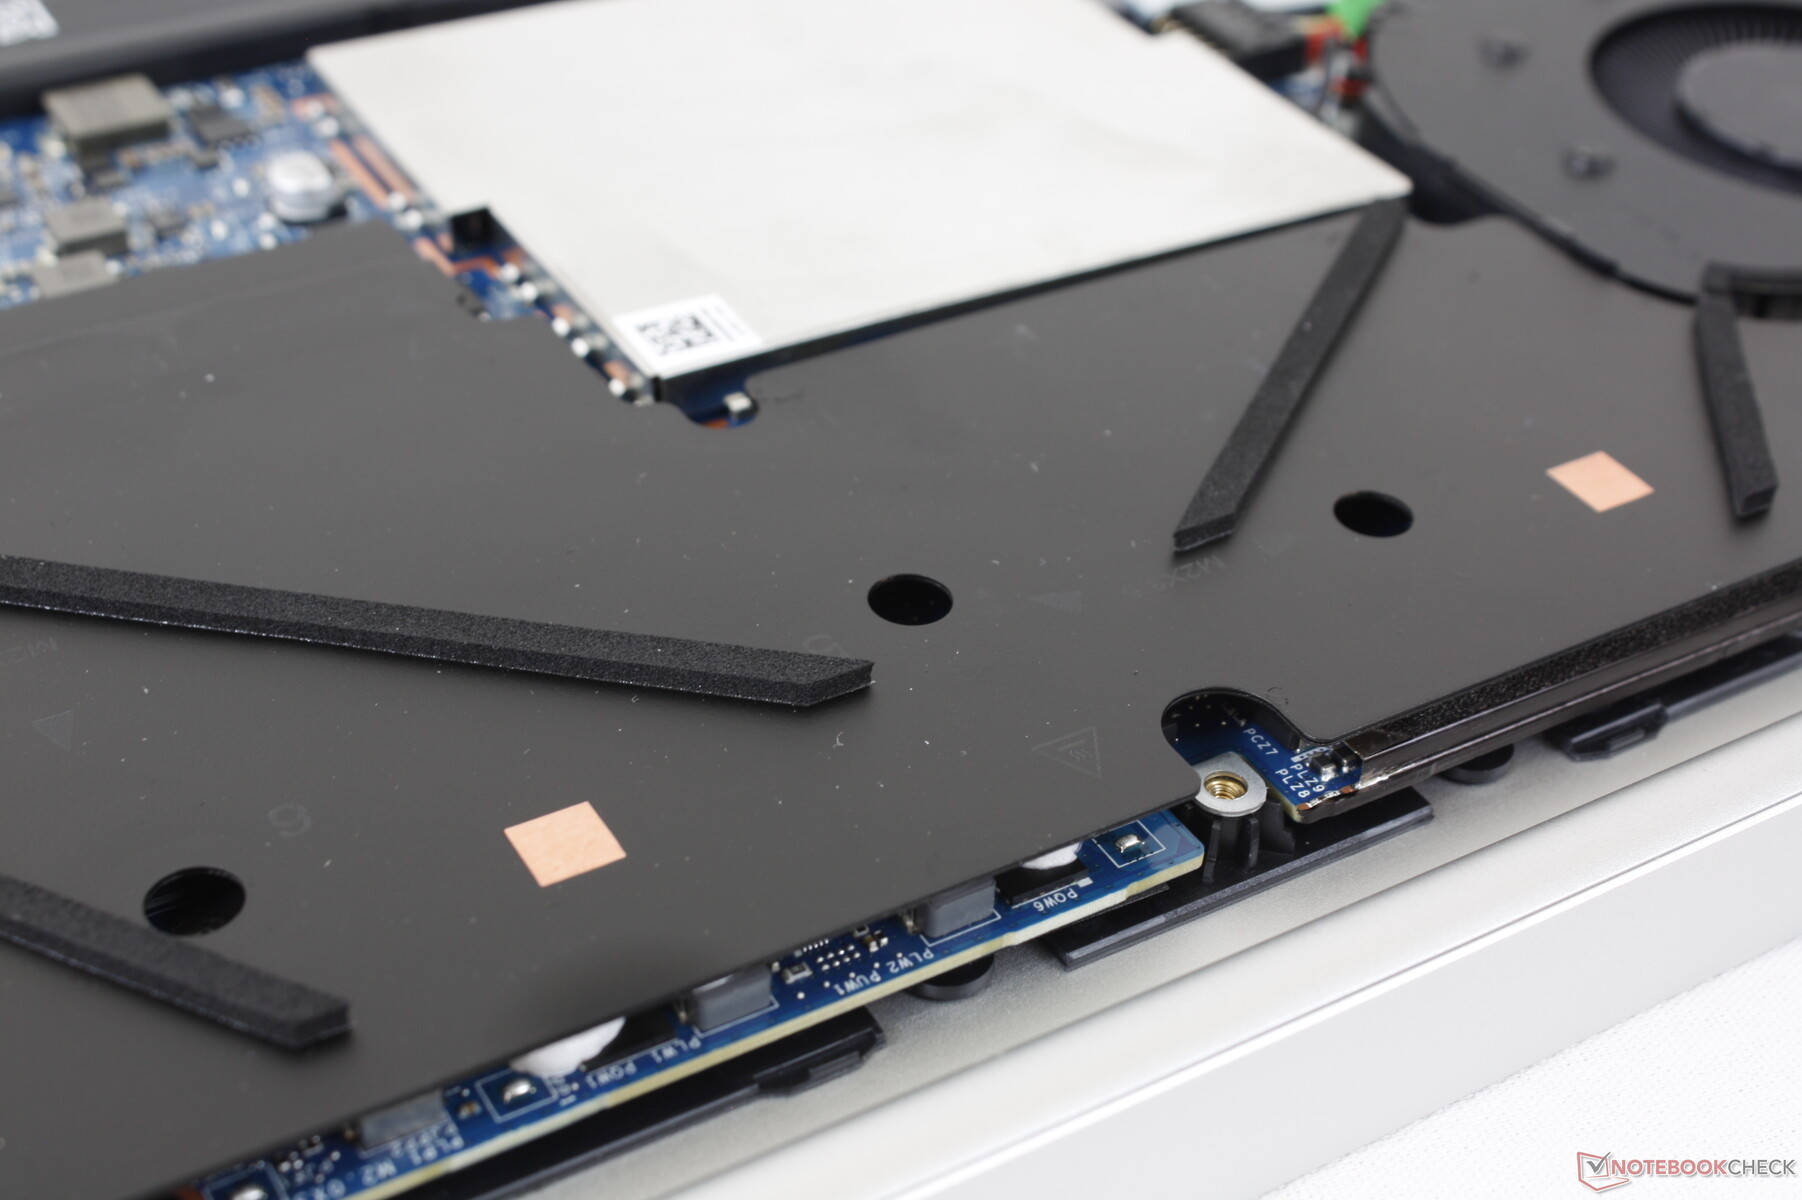
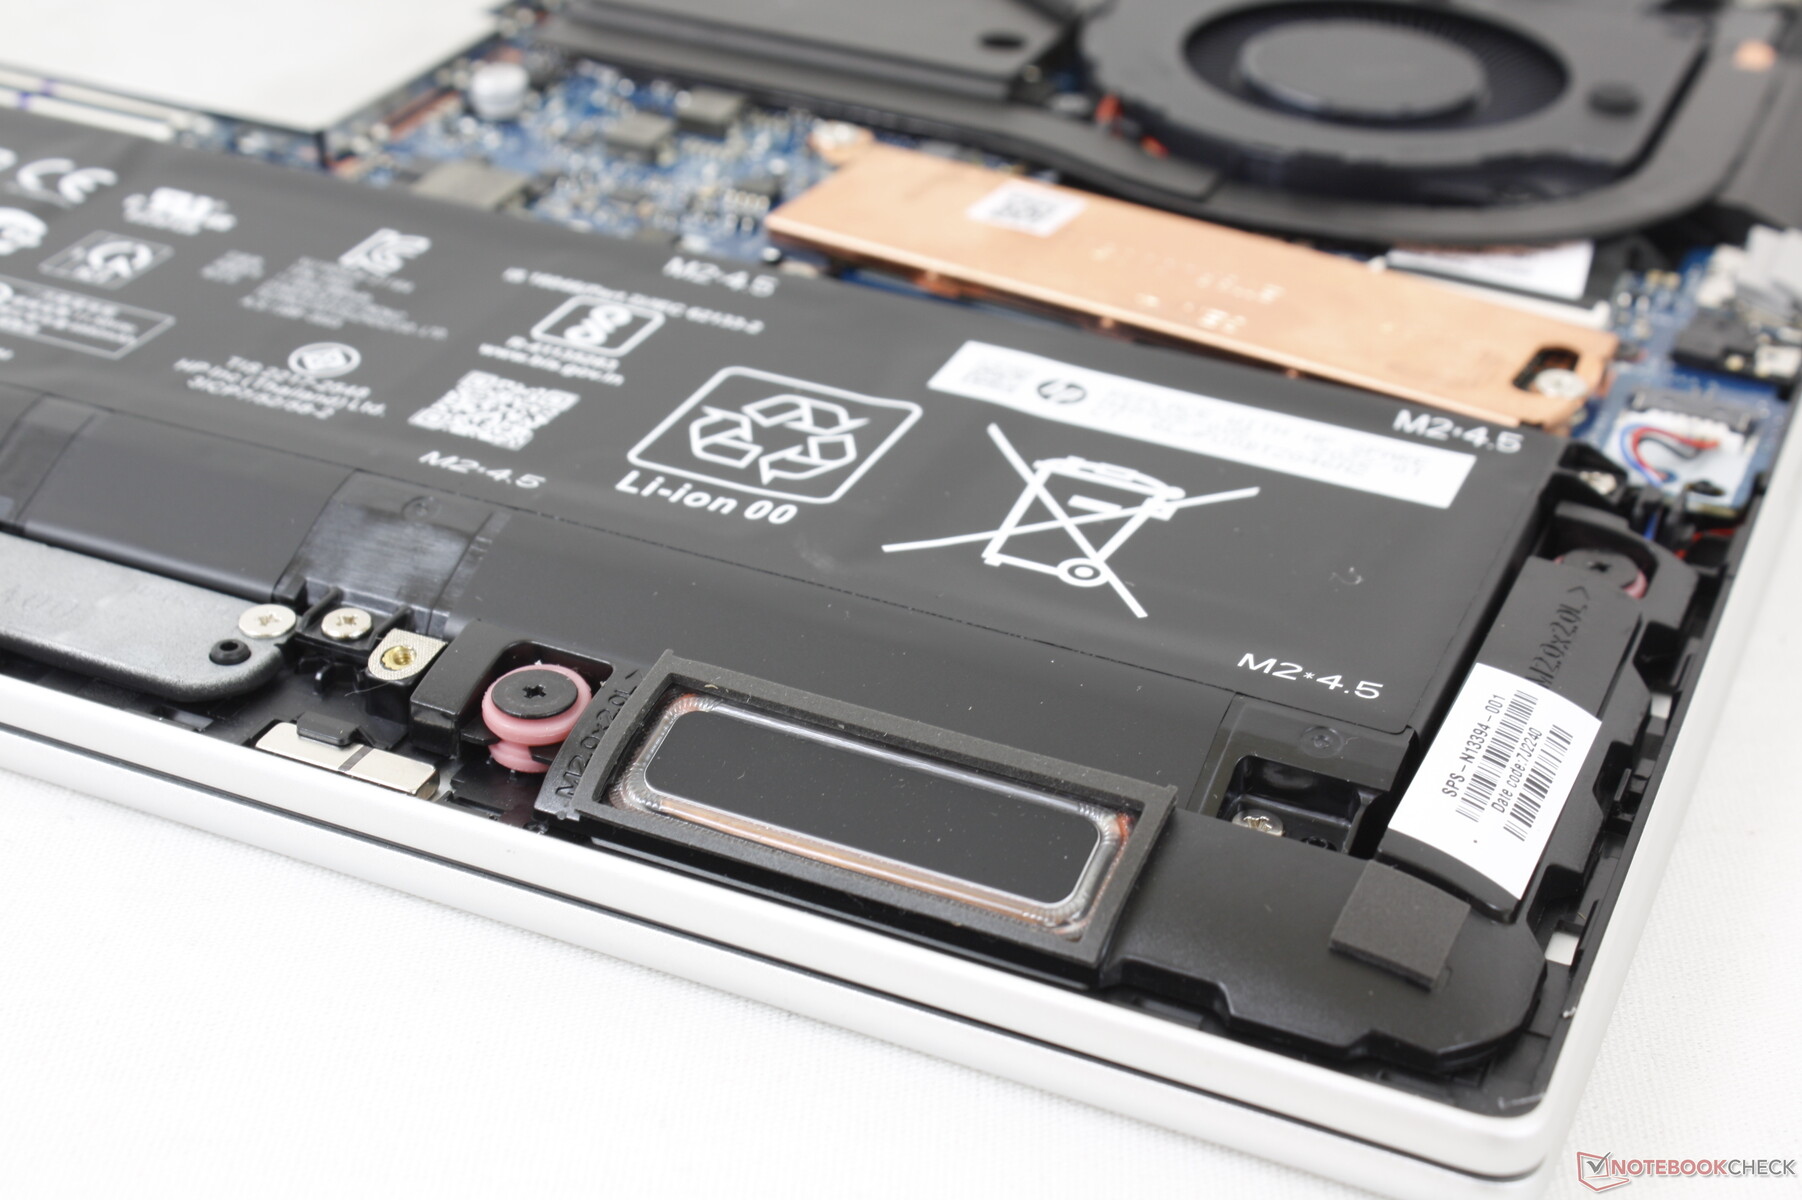
Maintenance
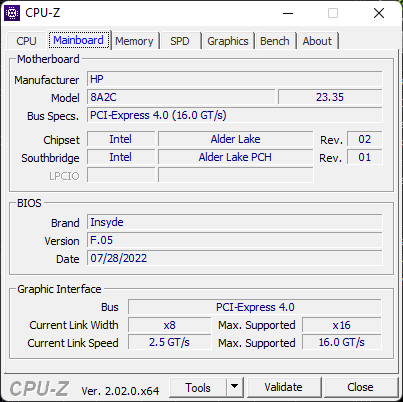
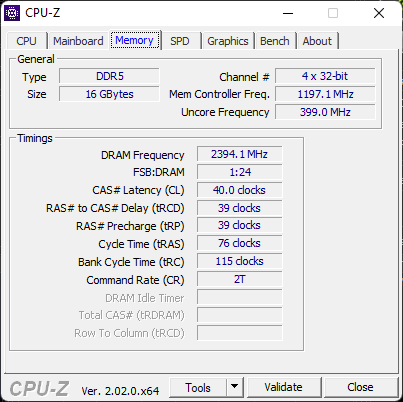
Le panneau inférieur est fixé par seulement 5 vis Torx pour un entretien facile. En fait, HP a une vidéo YouTube très utile très utile sur la façon de démonter l'ordinateur portable étape par étape. Une fois à l'intérieur, les utilisateurs peuvent accéder aux 2 slots SODIMM, aux 2 slots de stockage et au module WLAN.
Accessoires et garantie
Il n'y a pas d'autres éléments dans la boîte de détail que l'adaptateur secteur et les documents. La garantie limitée habituelle d'un an s'applique si l'appareil est acheté aux États-Unis.
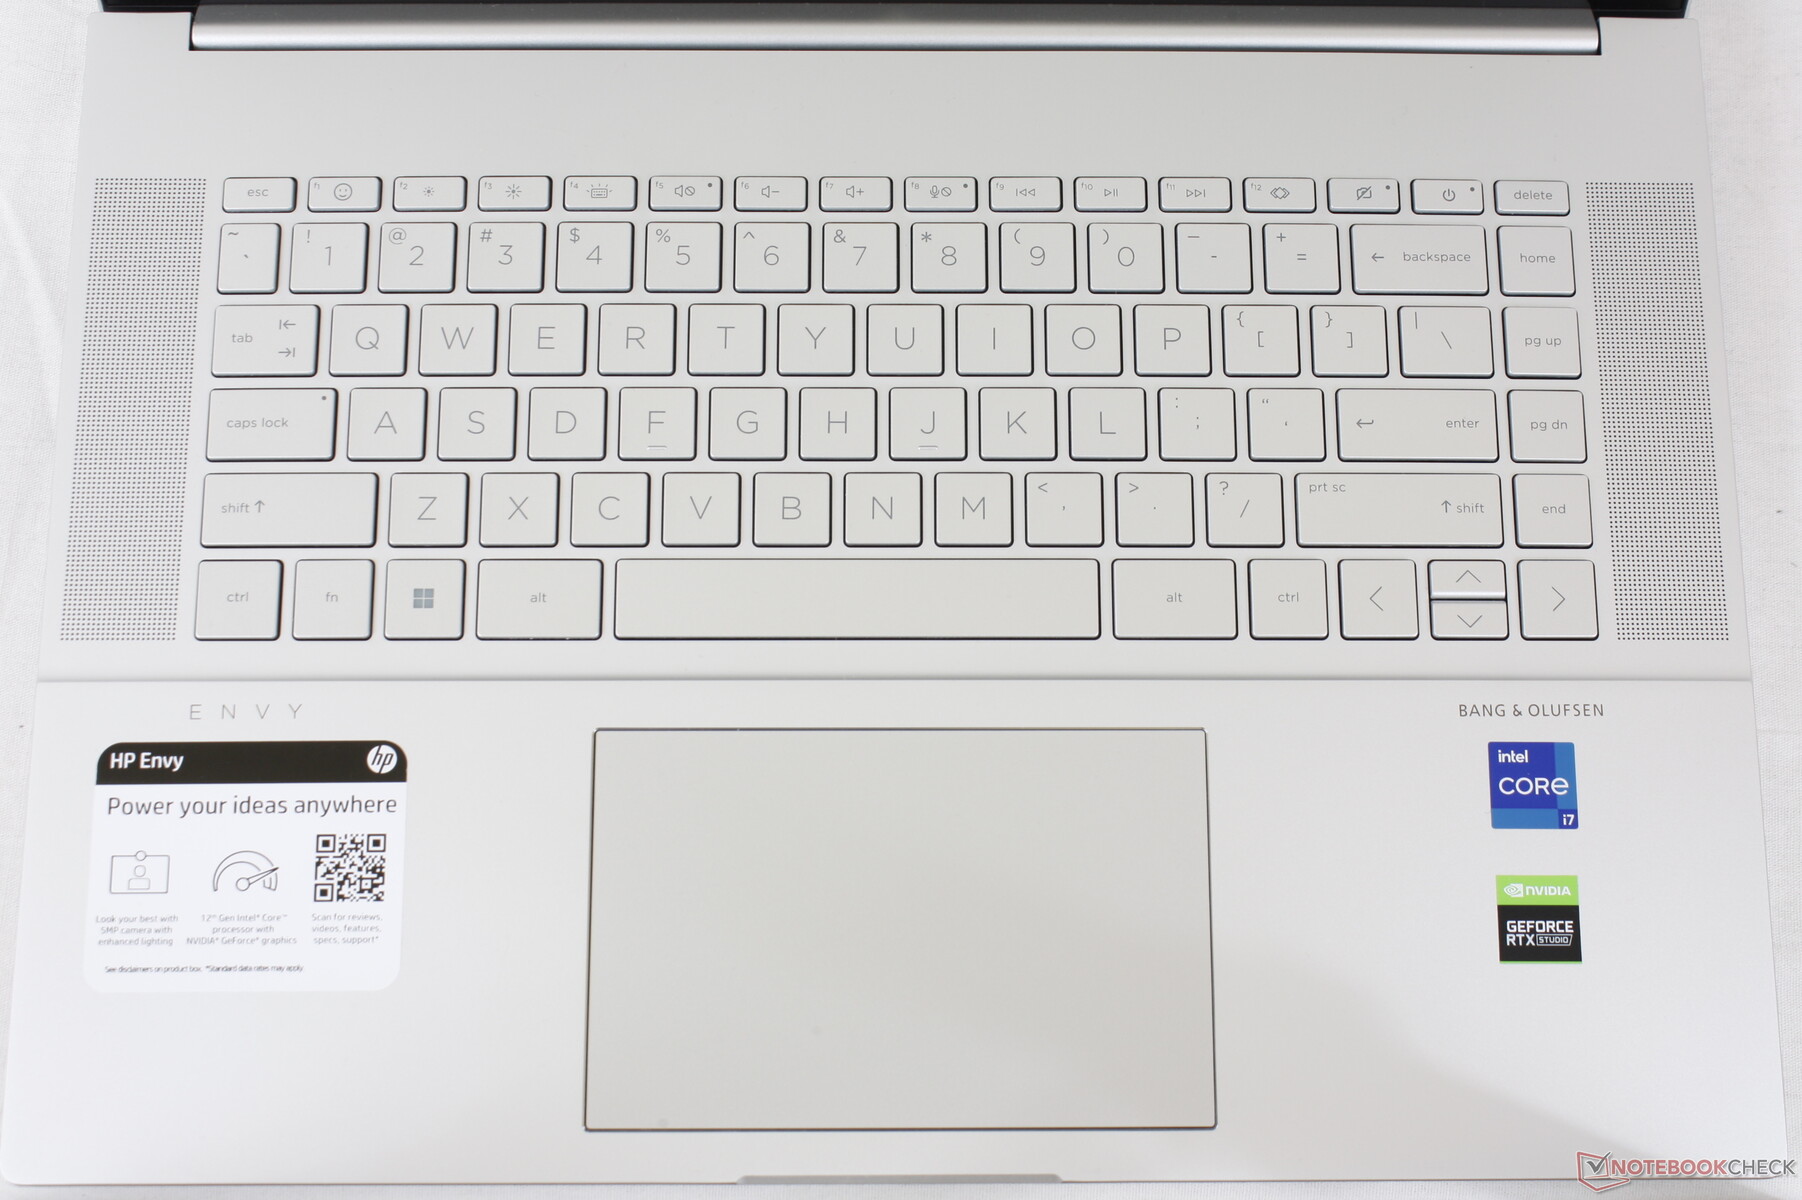
Dispositifs de saisie - Pavé tactile plus grand, clavier familier
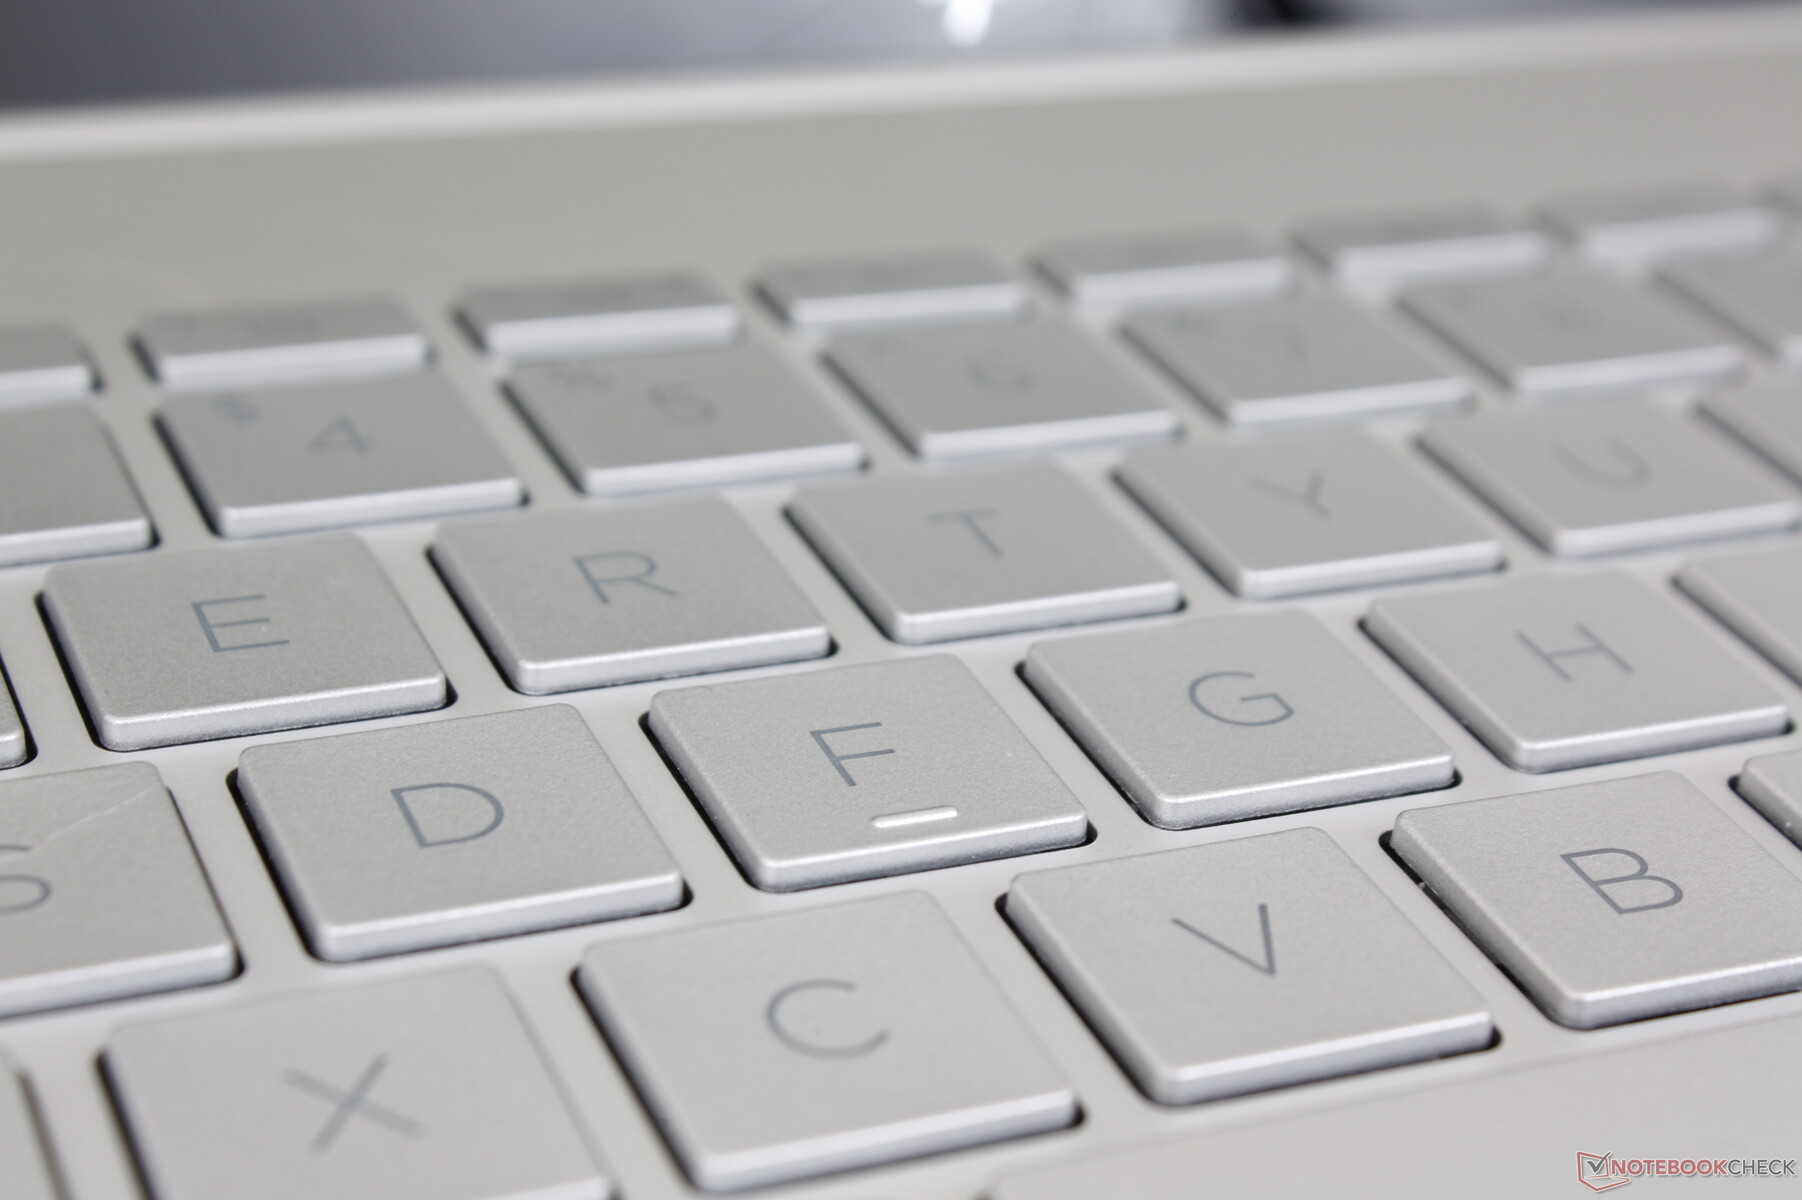
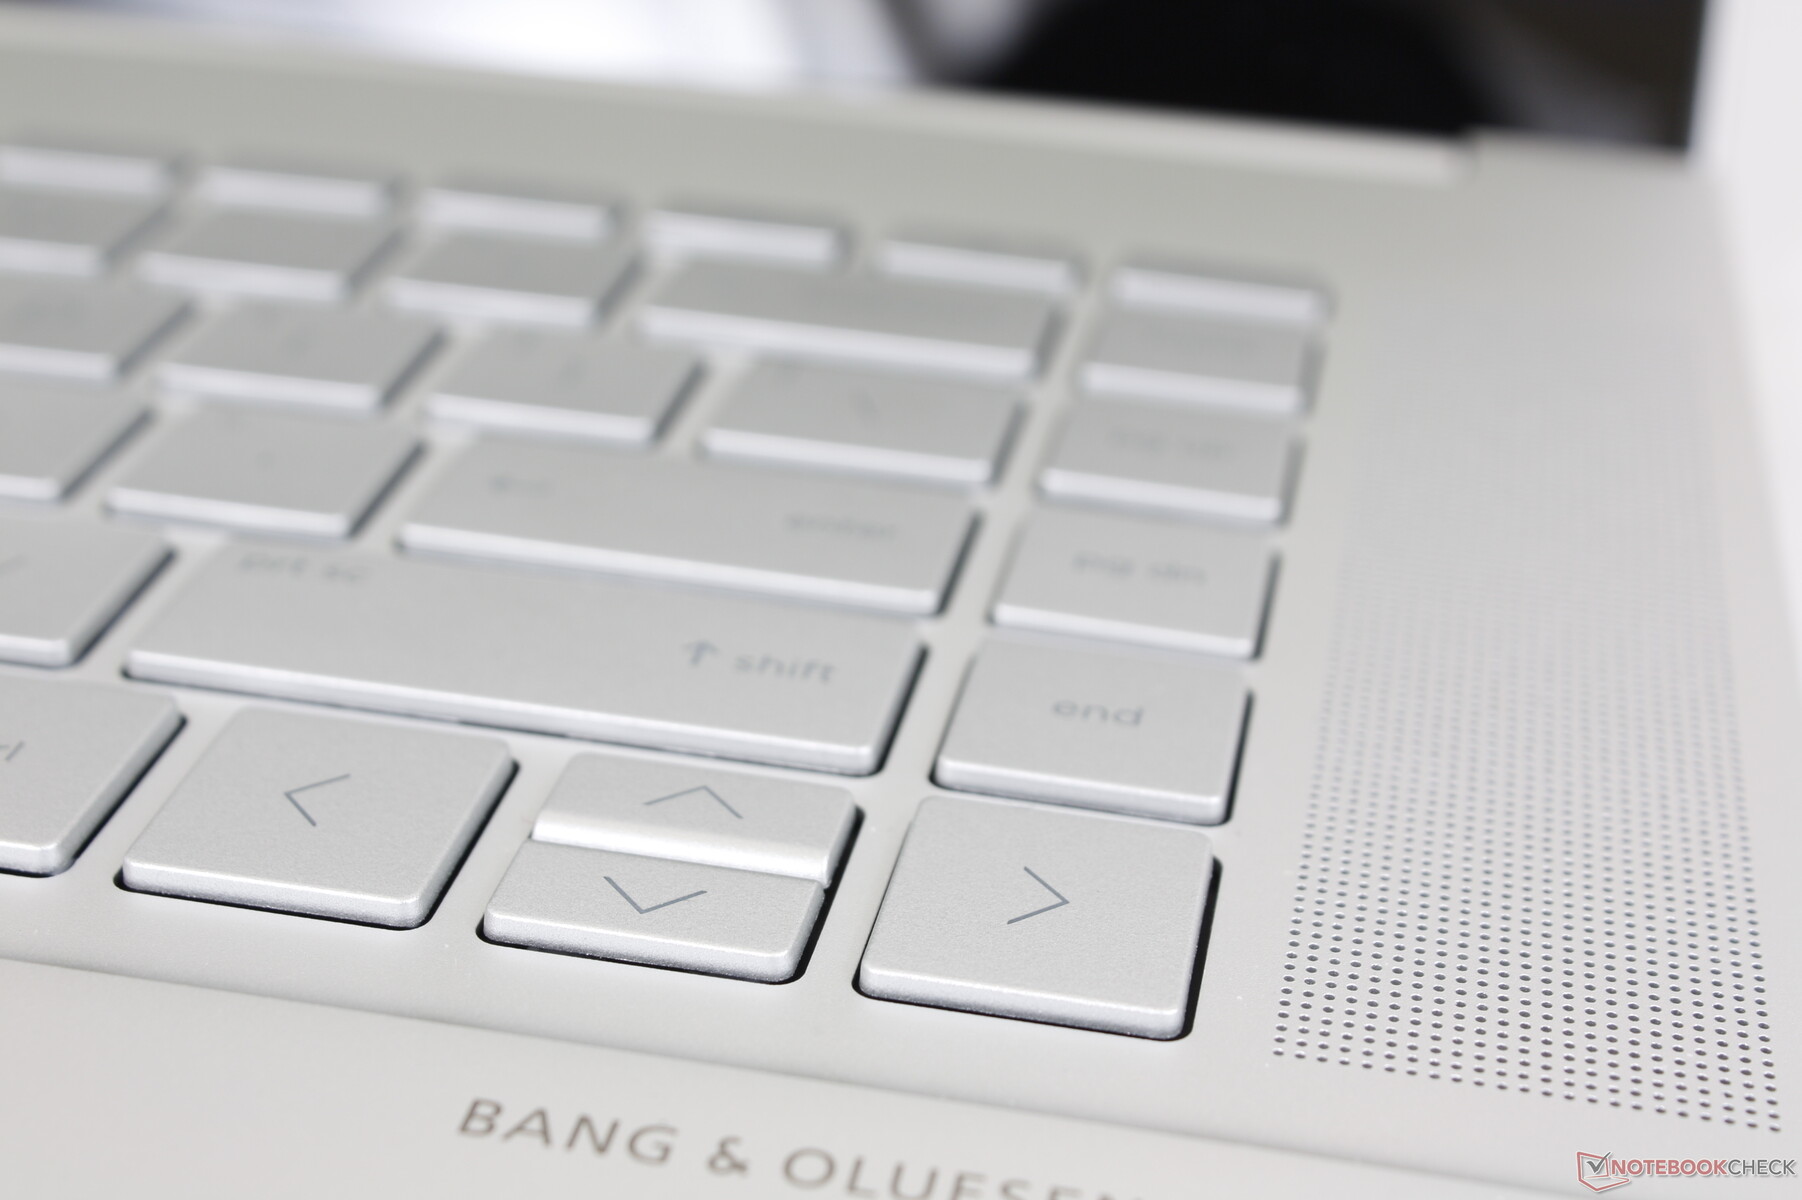
Clavier
HP n'a apporté aucune modification à la rétroaction ou à la sensation du clavier par rapport au Envy 15 de 2020. D'une part, les utilisateurs qui sont habitués aux claviers Envy n'auront aucun problème, mais d'autre part, nous aurions préféré une expérience de frappe plus proche des touches plus fermes et plus satisfaisantes d'un Spectre 15 ou d'un EliteBook ou d'un modèle EliteBook
Il y a deux petits changements superficiels qui méritent d'être mentionnés. La fonction secondaire de la touche F12 a été modifiée pour devenir une fonction " System Event Utility " qui est essentiellement une touche de lancement rapide pour HP Command Center, Omen Gaming Hub, myHP et HP Palette. Deuxièmement, la fonction secondaire de la touche F1 lance maintenant une fenêtre contextuelle pour sélectionner des emojis et des GIFs, comme sur la dernier Pavilion.
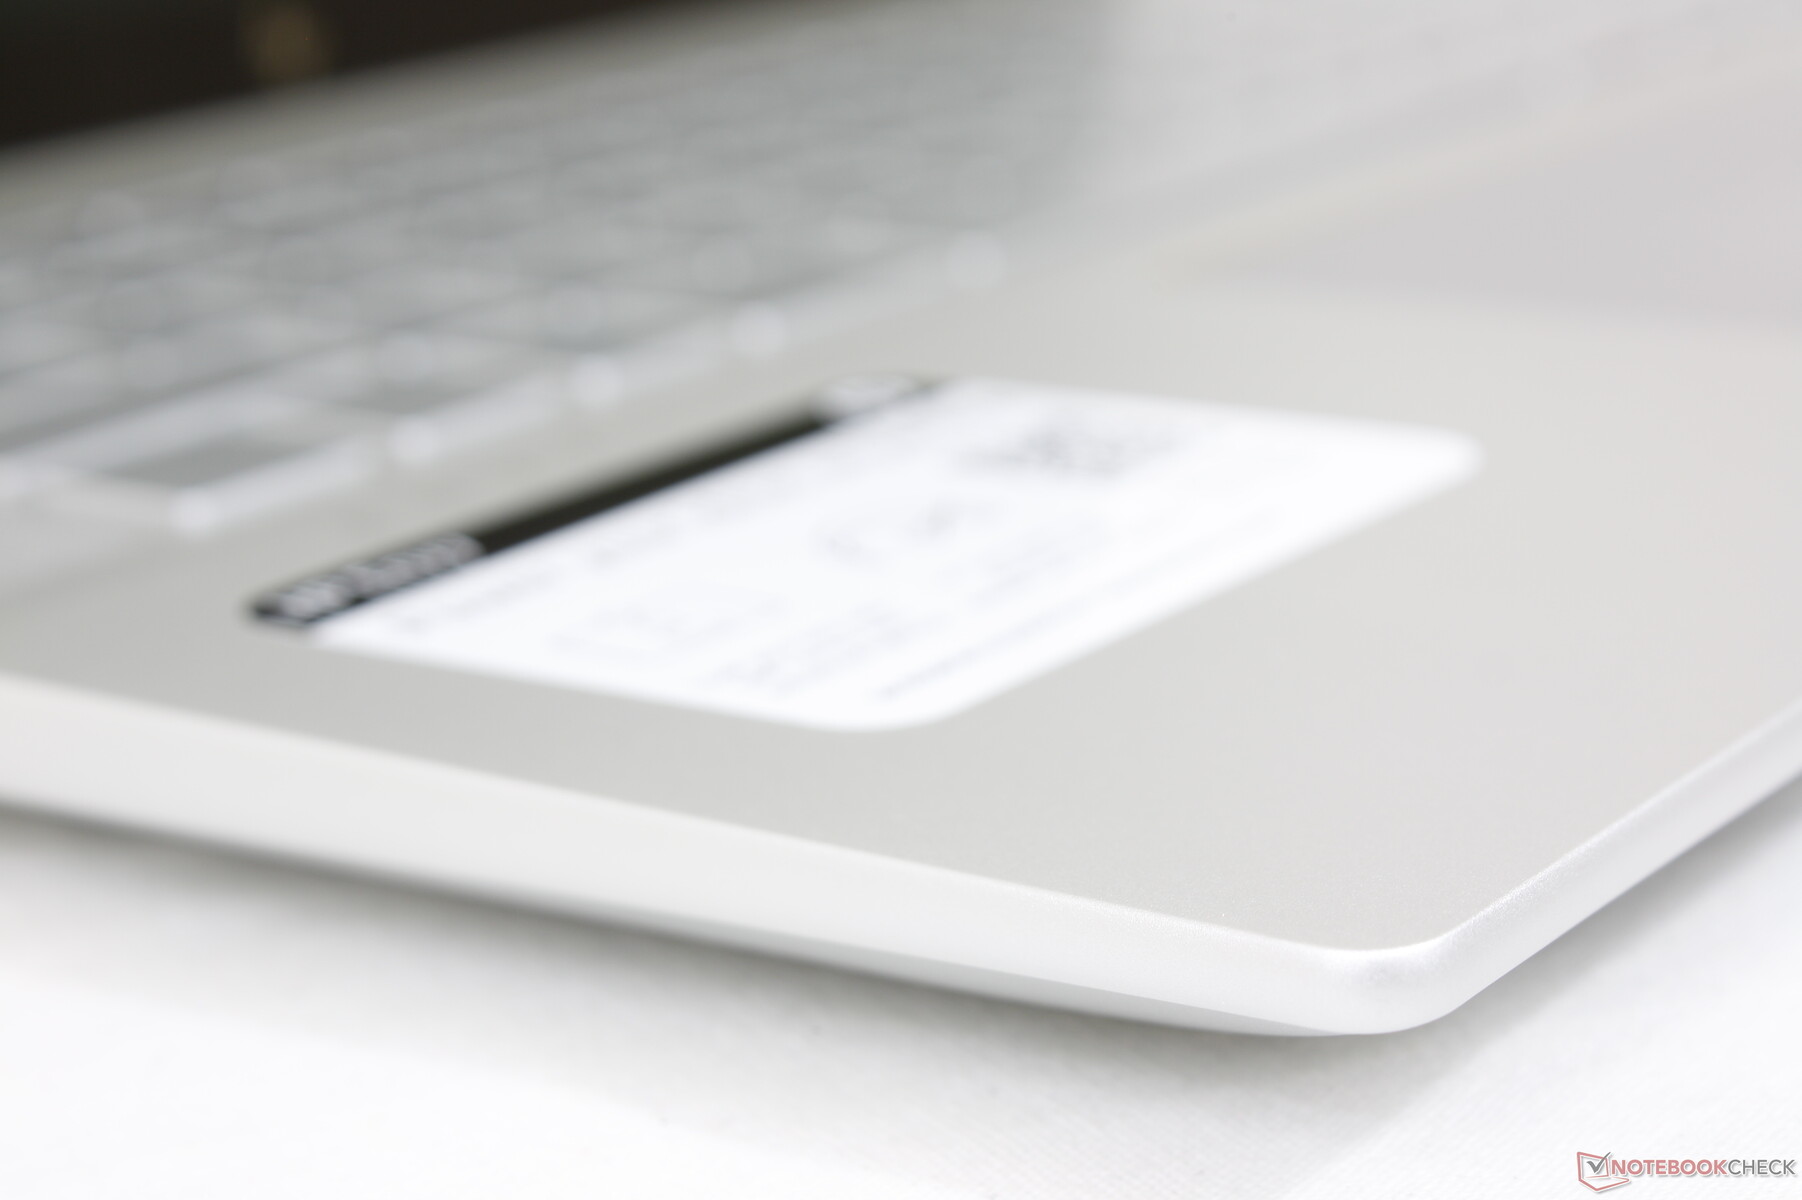
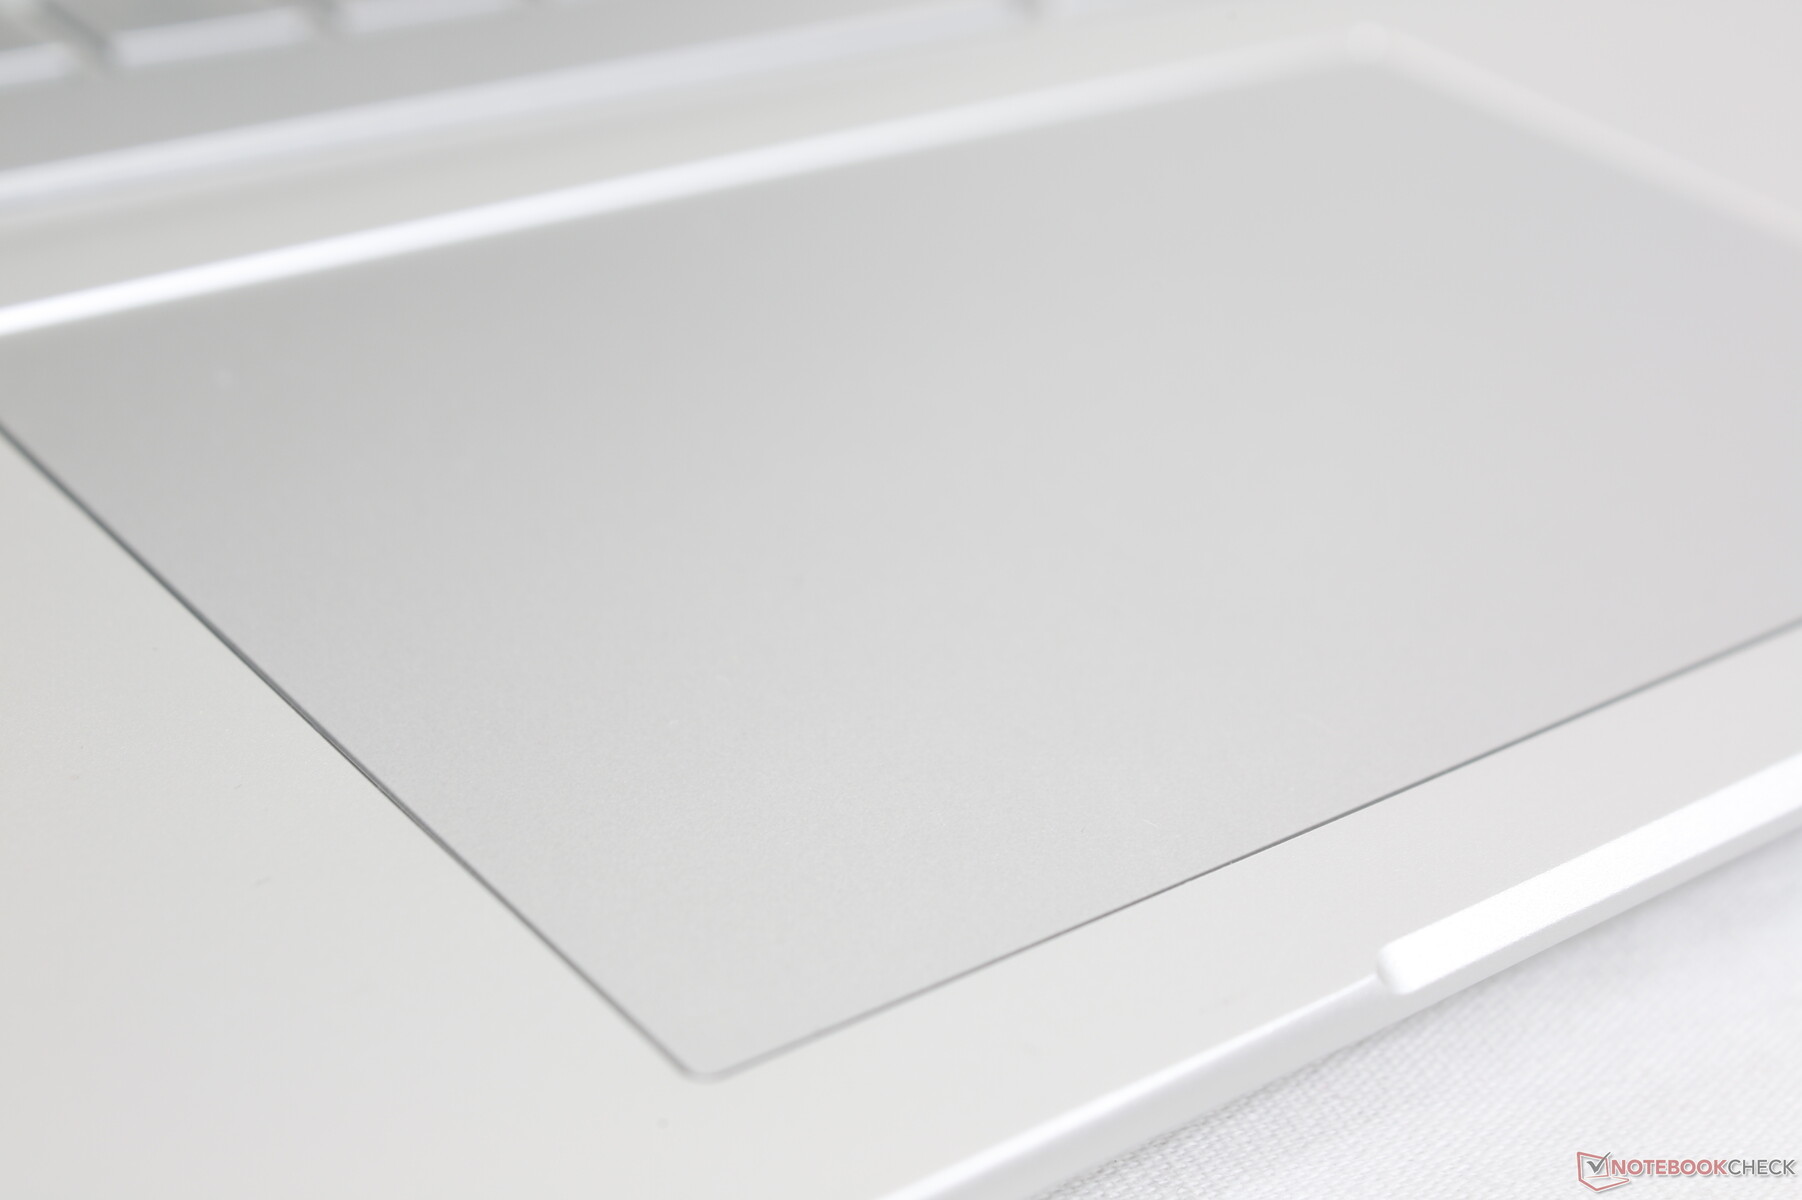
Pavé tactile
Le pavé tactile est plus grand que celui du Envy 15 sortant (12,5 x 8 cm contre 11,5 x 7,5 cm). La surface est lisse et presque sans texture, avec juste un minimum d'adhérence si l'on glisse à des vitesses plus lentes pour des clics plus précis. En revanche, le retour d'information lors des clics sur le pavé tactile est relativement doux et silencieux pour une sensation spongieuse. Un clic plus fort et plus satisfaisant aurait rendu le pavé tactile plus facile à utiliser.
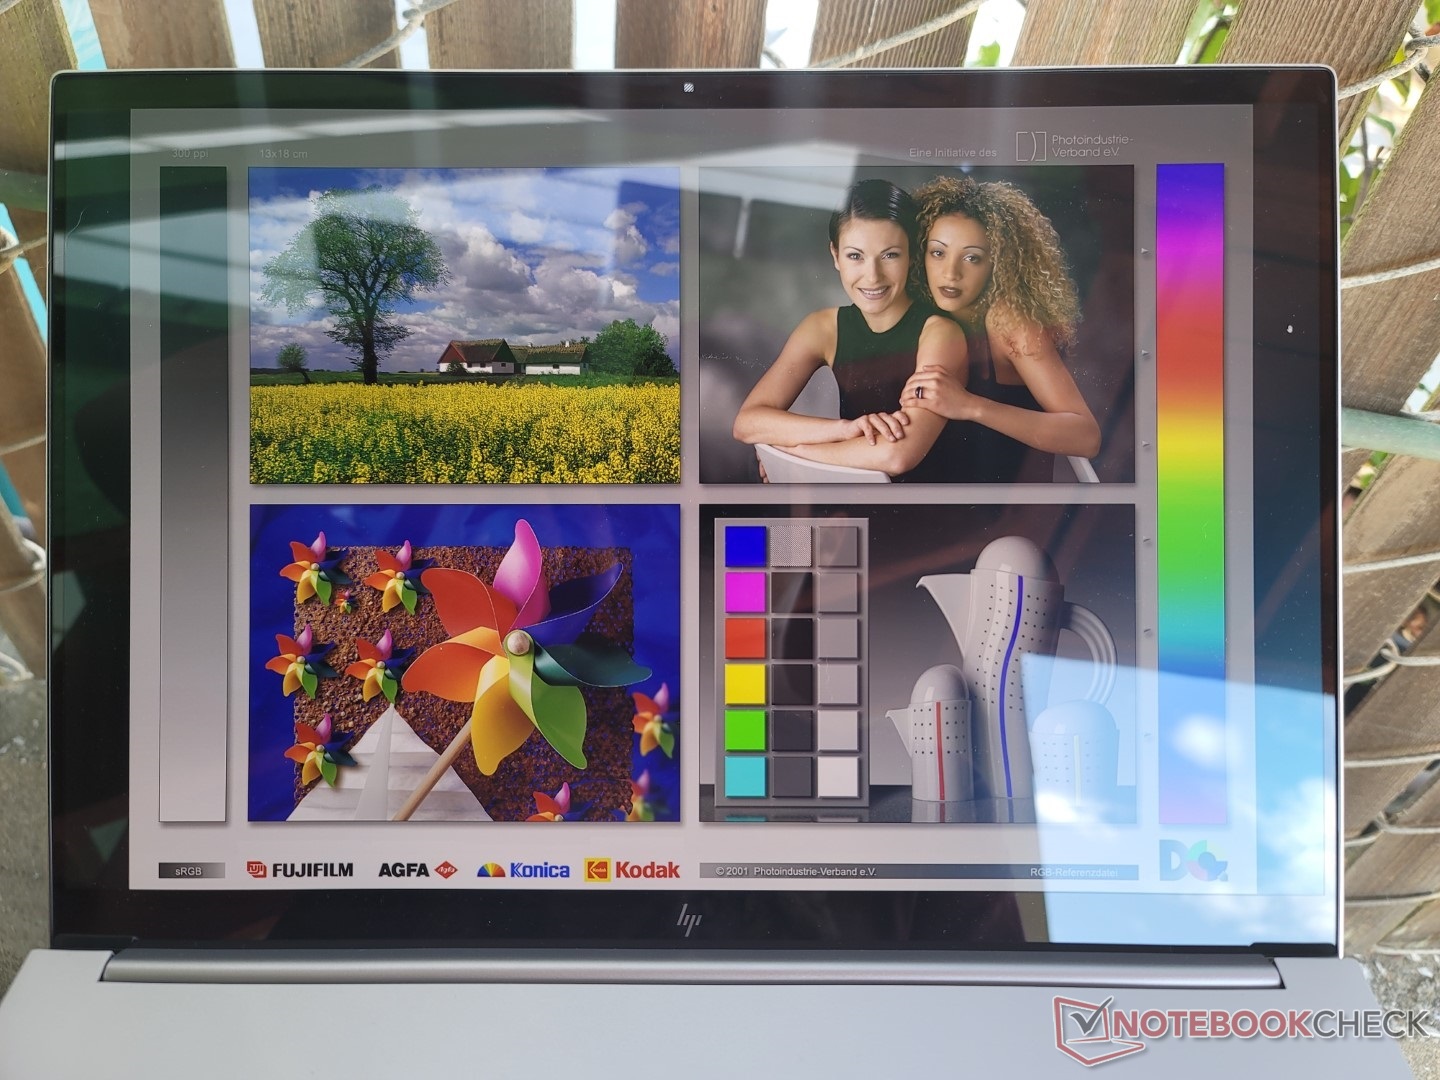
Écran - IPS ou OLED ?
Deux options d'affichage sont disponibles
- 2560 x 1600, 120 Hz, IPS, 100% sRGB
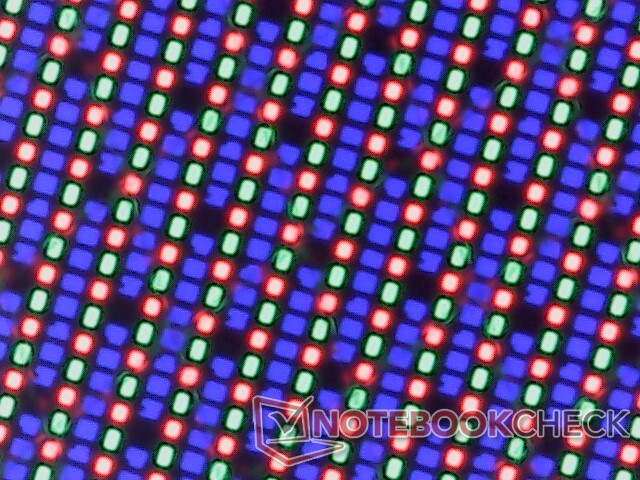
- 3840 x 2400, 60 Hz, OLED, 100% P3
Nos mesures ci-dessous reflètent uniquement l'option OLED. Ses principaux avantages incluent des couleurs plus profondes, un taux de contraste de noir absolu et des temps de réponse noir-blanc et gris-gris nettement plus rapides que ceux de l'IPS, au prix d'une consommation d'énergie plus élevée et d'un scintillement de l'écran qui peut affecter un petit sous-ensemble d'utilisateurs.
La qualité d'image est nette mais avec des grains de couleur perceptibles qui deviennent plus apparents lors de l'affichage de couleurs blanches à des paramètres de luminosité élevés. L'option IPS peut être préférable pour ceux qui n'ont pas besoin de couleurs P3 car le taux de rafraîchissement de 120 Hz offre une expérience beaucoup plus fluide.
| |||||||||||||||||||||||||
Homogénéité de la luminosité: 97 %
Valeur mesurée au centre, sur batterie: 328.8 cd/m²
Contraste: ∞:1 (Valeurs des noirs: 0 cd/m²)
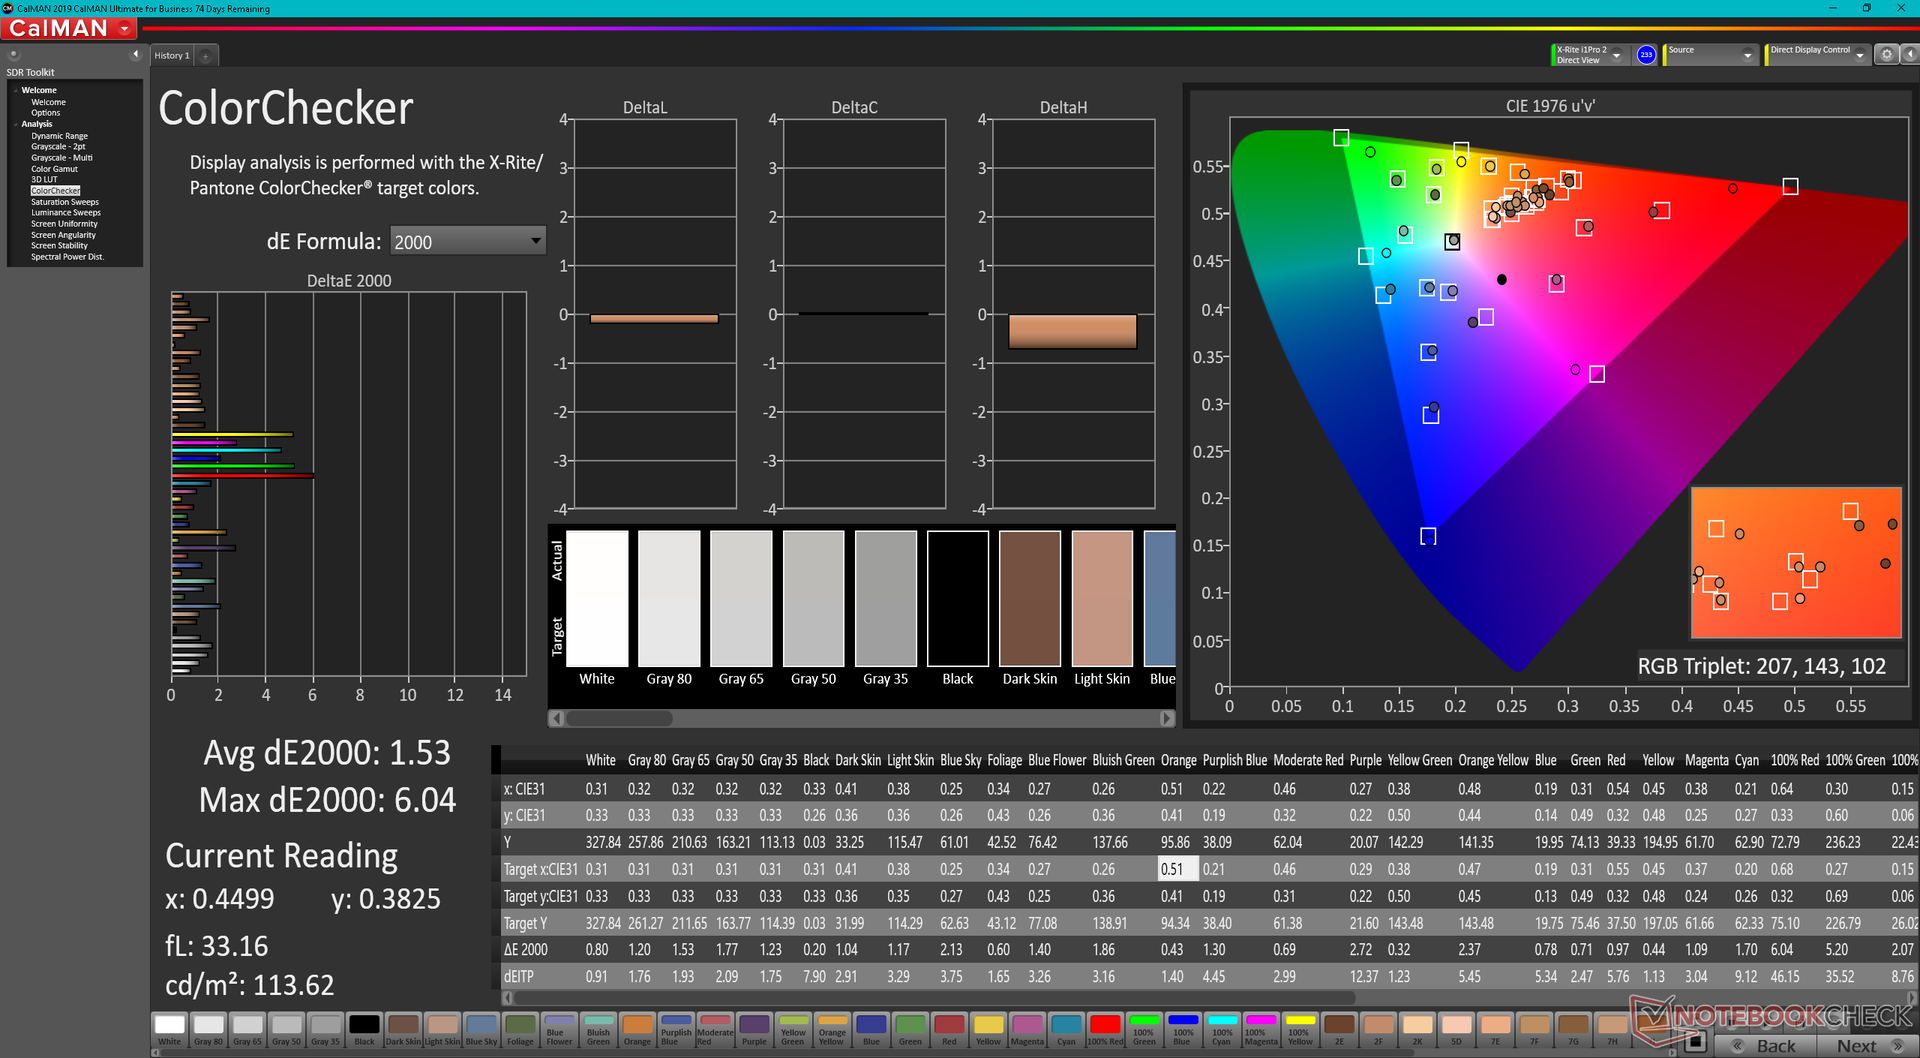
ΔE ColorChecker Calman: 1.53 | ∀{0.5-29.43 Ø4.72}
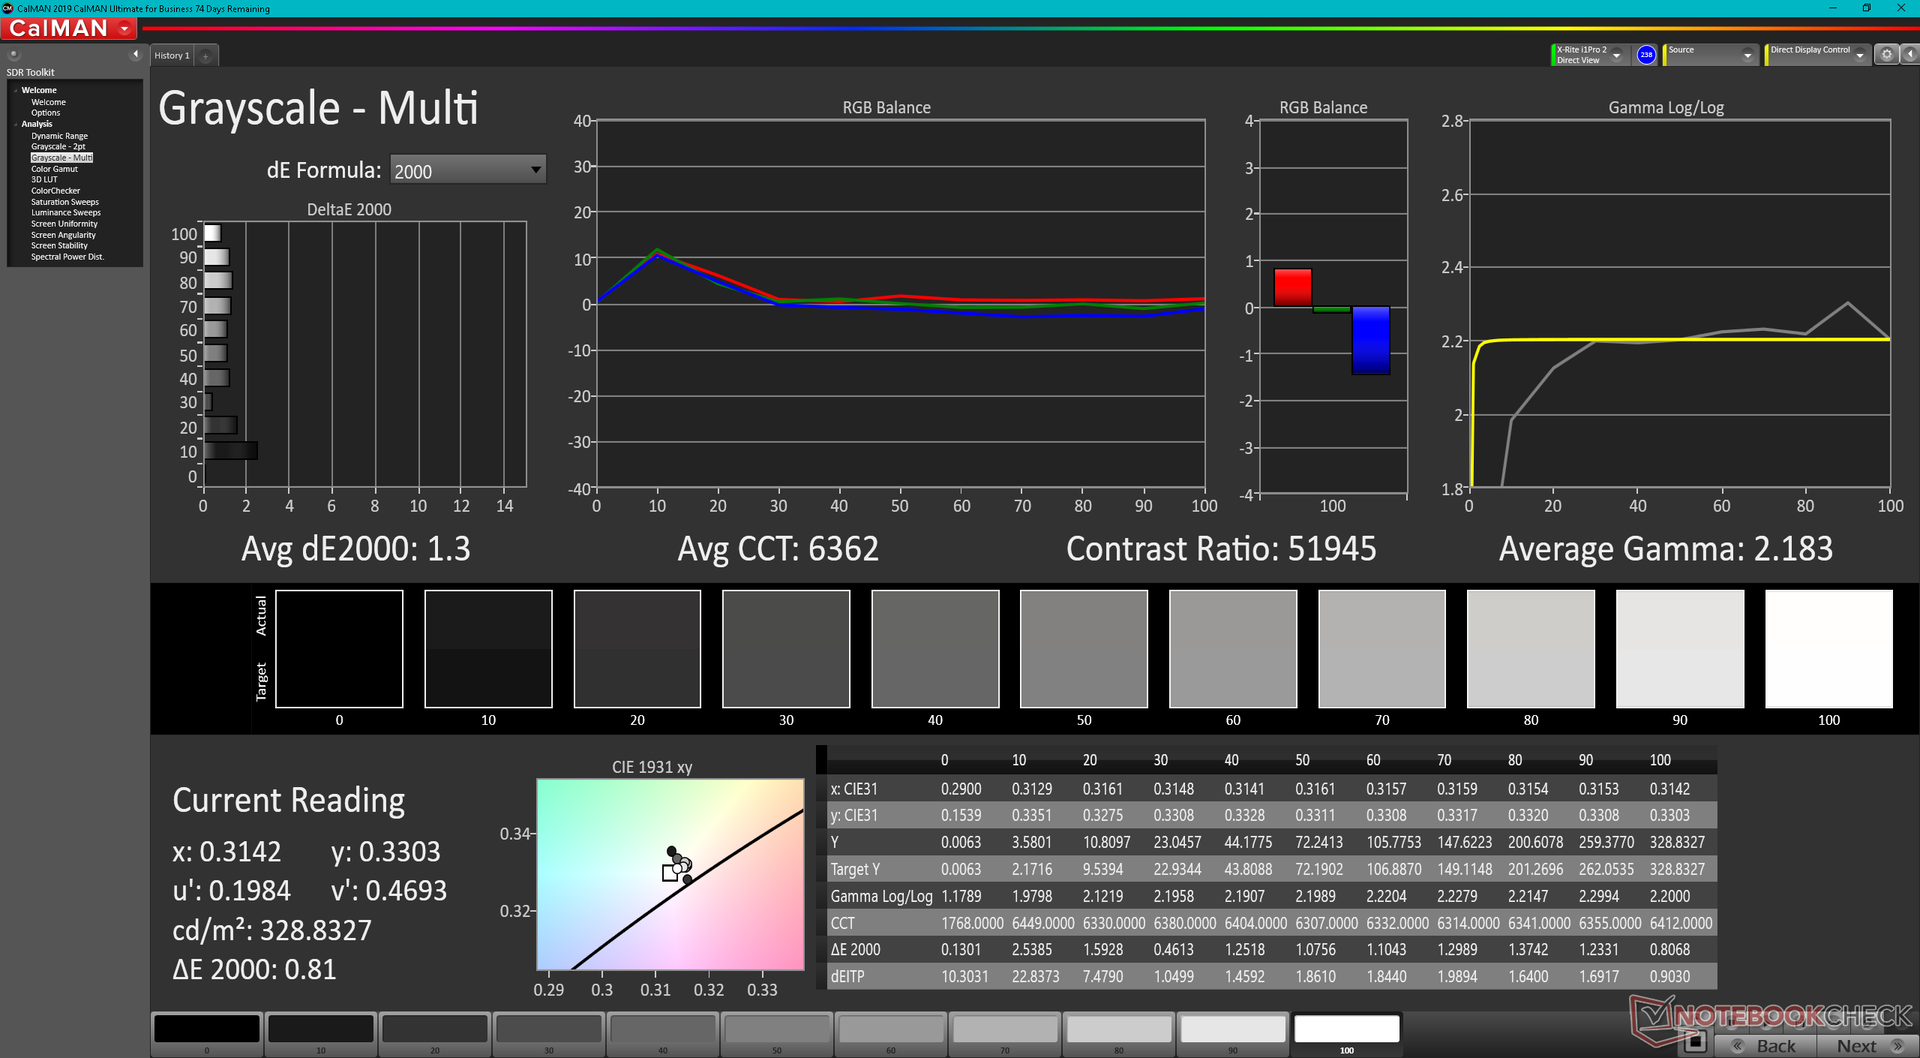
ΔE Greyscale Calman: 1.3 | ∀{0.09-98 Ø4.97}
88% AdobeRGB 1998 (Argyll 3D)
100% sRGB (Argyll 3D)
99.3% Display P3 (Argyll 3D)
Gamma: 2.18
CCT: 6362 K
| HP Envy 16 h0112nr Samsung SDC4174, OLED, 3840x2400, 16" | Lenovo ThinkBook 16 G4+ IAP LEN160WQXGA, IPS, 2560x1600, 16" | MSI Creator Z16P B12UHST AUOD298, IPS True Pixel (~100% DCI-P3), 2560x1600, 16" | Dell Inspiron 16 Plus 7610-MHJ8F AU Optronics B160QAN, AUO9F91, IPS, 3072x1920, 16" | Apple MacBook Pro 16 2021 M1 Pro Liquid Retina XDR, Mini-LED, 3456x2234, 16.2" | Huawei MateBook 16s i7 BOE XS TV160DKT-NH0, IPS, 2520x1680, 16" | |
|---|---|---|---|---|---|---|
| Display | -17% | -1% | -13% | 0% | -21% | |
| Display P3 Coverage (%) | 99.3 | 69.6 -30% | 97.6 -2% | 75 -24% | 99.1 0% | 64.5 -35% |
| sRGB Coverage (%) | 100 | 97.5 -2% | 99.9 0% | 100 0% | 100 0% | 96.7 -3% |
| AdobeRGB 1998 Coverage (%) | 88 | 71.7 -19% | 86.8 -1% | 76 -14% | 88 0% | 66.6 -24% |
| Response Times | -1160% | -391% | -2092% | -3381% | -1403% | |
| Response Time Grey 50% / Grey 80% * (ms) | 2 ? | 32.7 ? -1535% | 12.9 ? -545% | 54 ? -2600% | 42.8 ? -2040% | 35.7 ? -1685% |
| Response Time Black / White * (ms) | 1.9 ? | 16.8 ? -784% | 6.4 ? -237% | 32 ? -1584% | 91.6 ? -4721% | 23.2 ? -1121% |
| PWM Frequency (Hz) | 240.4 ? | 14880 | ||||
| Screen | -36% | -17% | -37% | 15% | 13% | |
| Brightness middle (cd/m²) | 328.8 | 371 13% | 428 30% | 290 -12% | 514 56% | 311 -5% |
| Brightness (cd/m²) | 332 | 357 8% | 394 19% | 285 -14% | 497 50% | 319 -4% |
| Brightness Distribution (%) | 97 | 91 -6% | 86 -11% | 88 -9% | 95 -2% | 91 -6% |
| Black Level * (cd/m²) | 0.23 | 0.42 | 0.21 | 0.02 | 0.17 | |
| Colorchecker dE 2000 * | 1.53 | 2.6 -70% | 1.67 -9% | 2.57 -68% | 1.4 8% | 1 35% |
| Colorchecker dE 2000 max. * | 6.04 | 4.4 27% | 5.71 5% | 4.78 21% | 2.8 54% | 1.7 72% |
| Greyscale dE 2000 * | 1.3 | 3.7 -185% | 3.1 -138% | 3.14 -142% | 2.3 -77% | 1.5 -15% |
| Gamma | 2.18 101% | 2.32 95% | 2.195 100% | 2.34 94% | 2.27 97% | 2.15 102% |
| CCT | 6362 102% | 7271 89% | 6498 100% | 6408 101% | 6792 96% | 6432 101% |
| Contrast (:1) | 1613 | 1019 | 1381 | 25700 | 1829 | |
| Colorchecker dE 2000 calibrated * | 1.3 | 0.71 | 1.89 | 0.8 | ||
| Moyenne finale (programmes/paramètres) | -404% /
-235% | -136% /
-81% | -714% /
-404% | -1122% /
-607% | -470% /
-254% |
* ... Moindre est la valeur, meilleures sont les performances
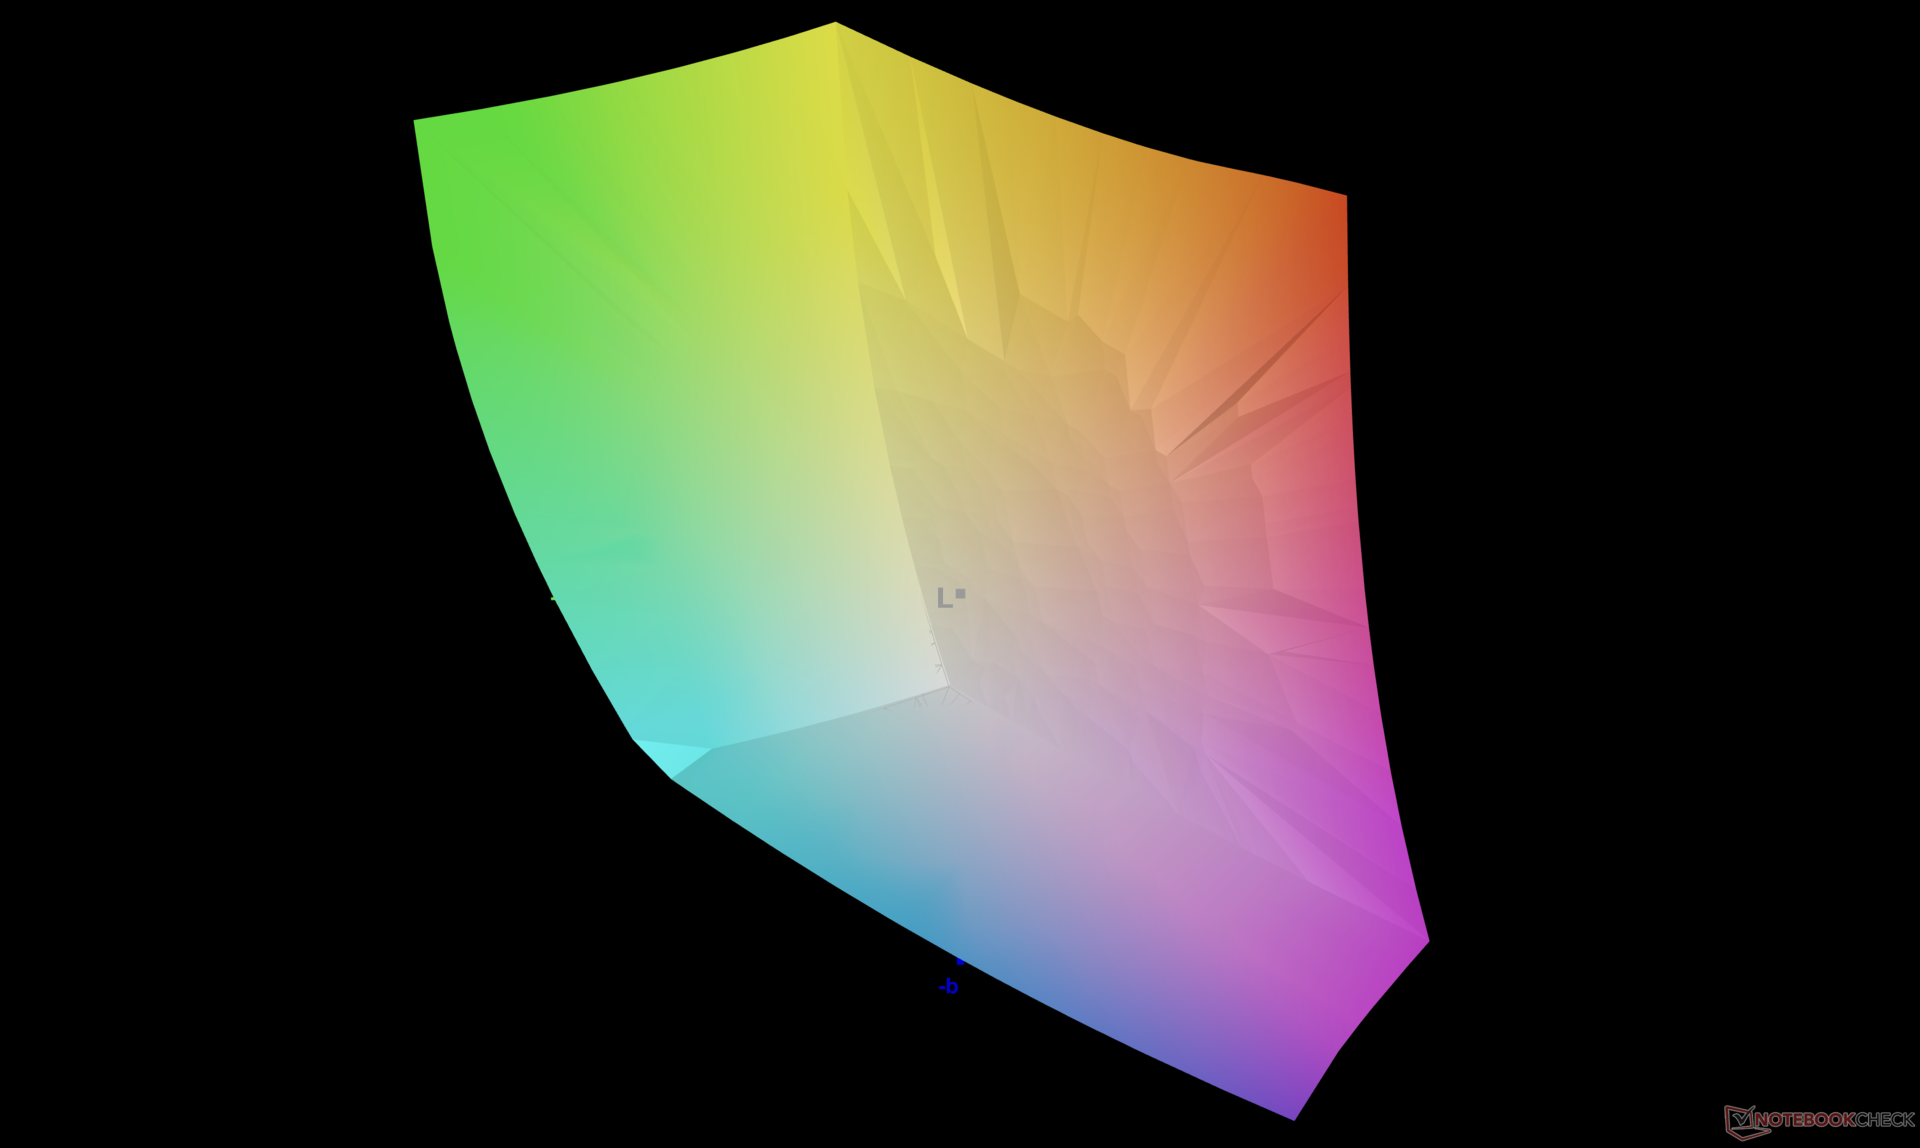
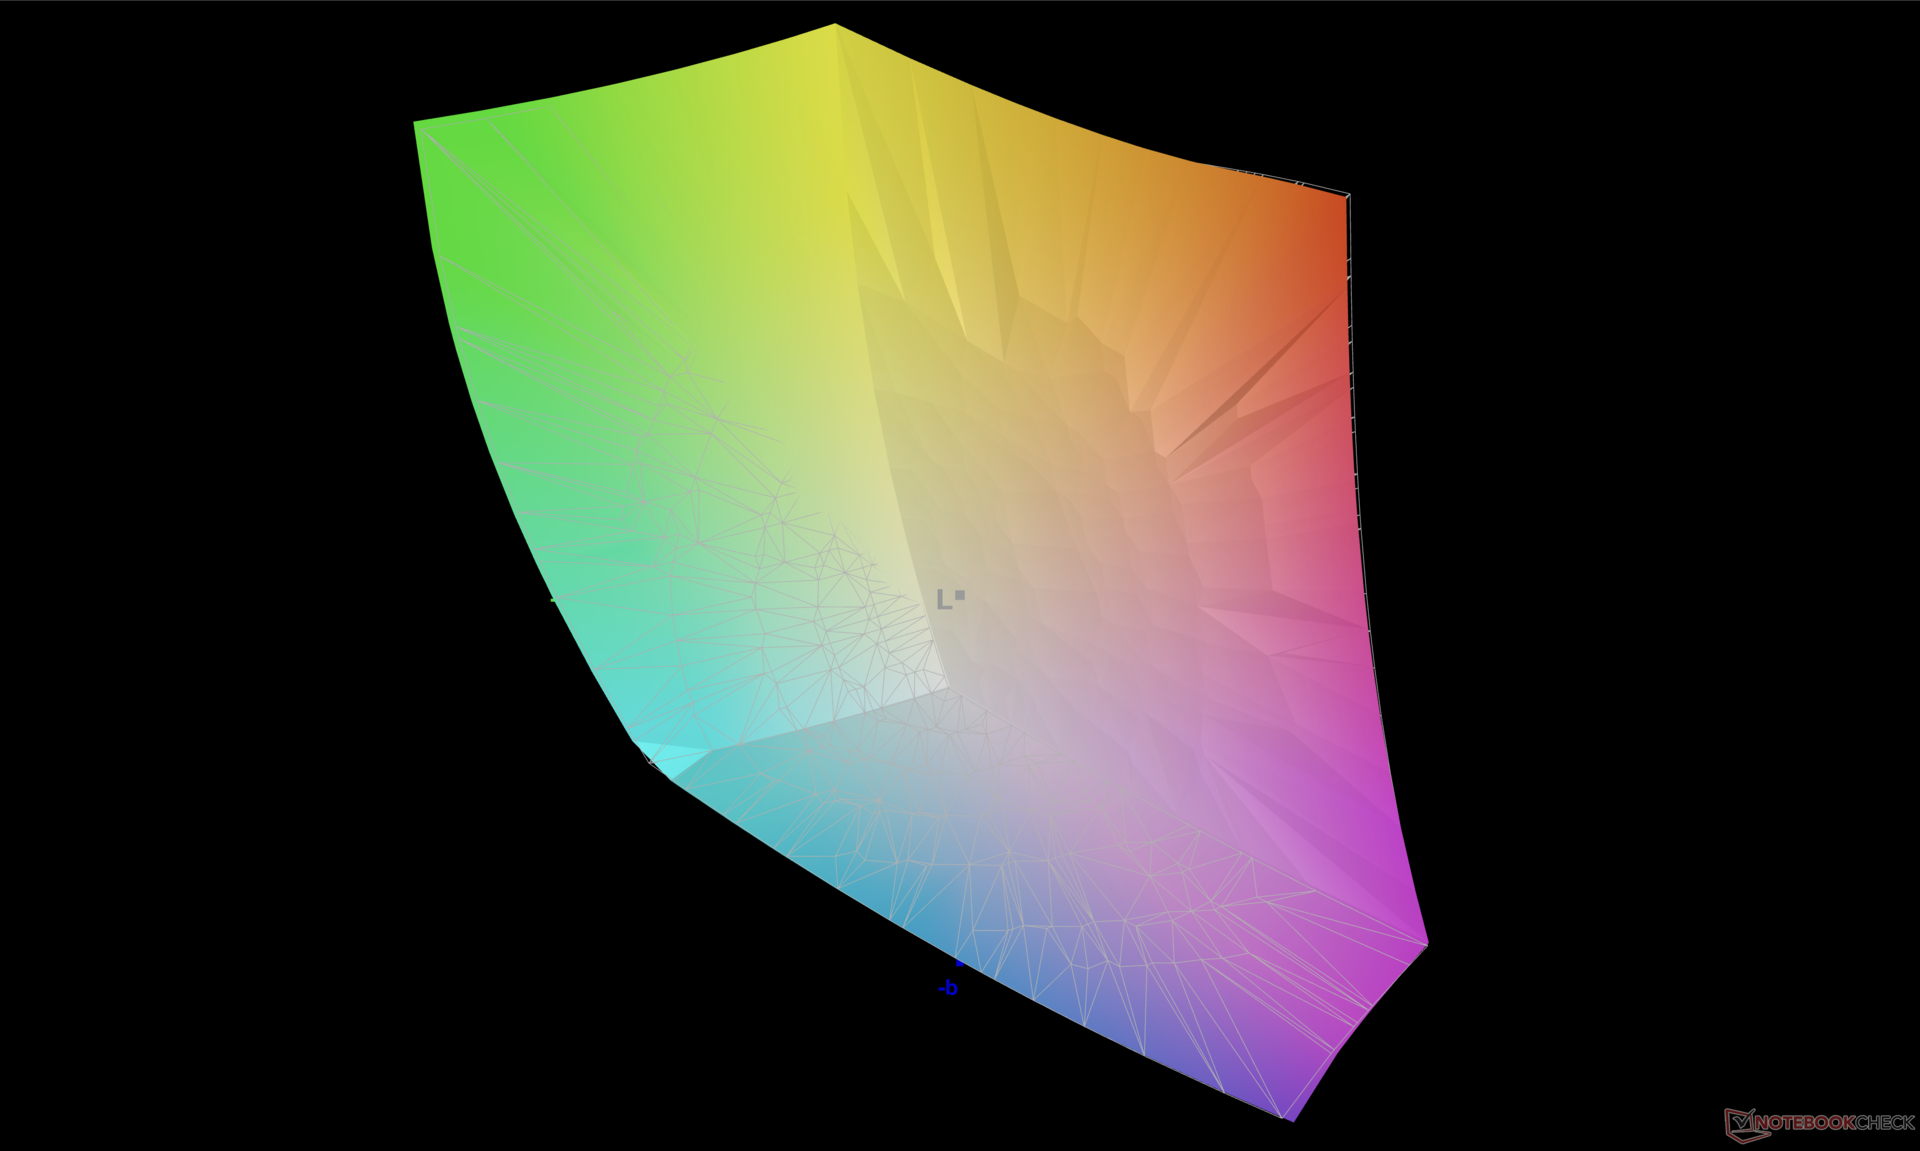
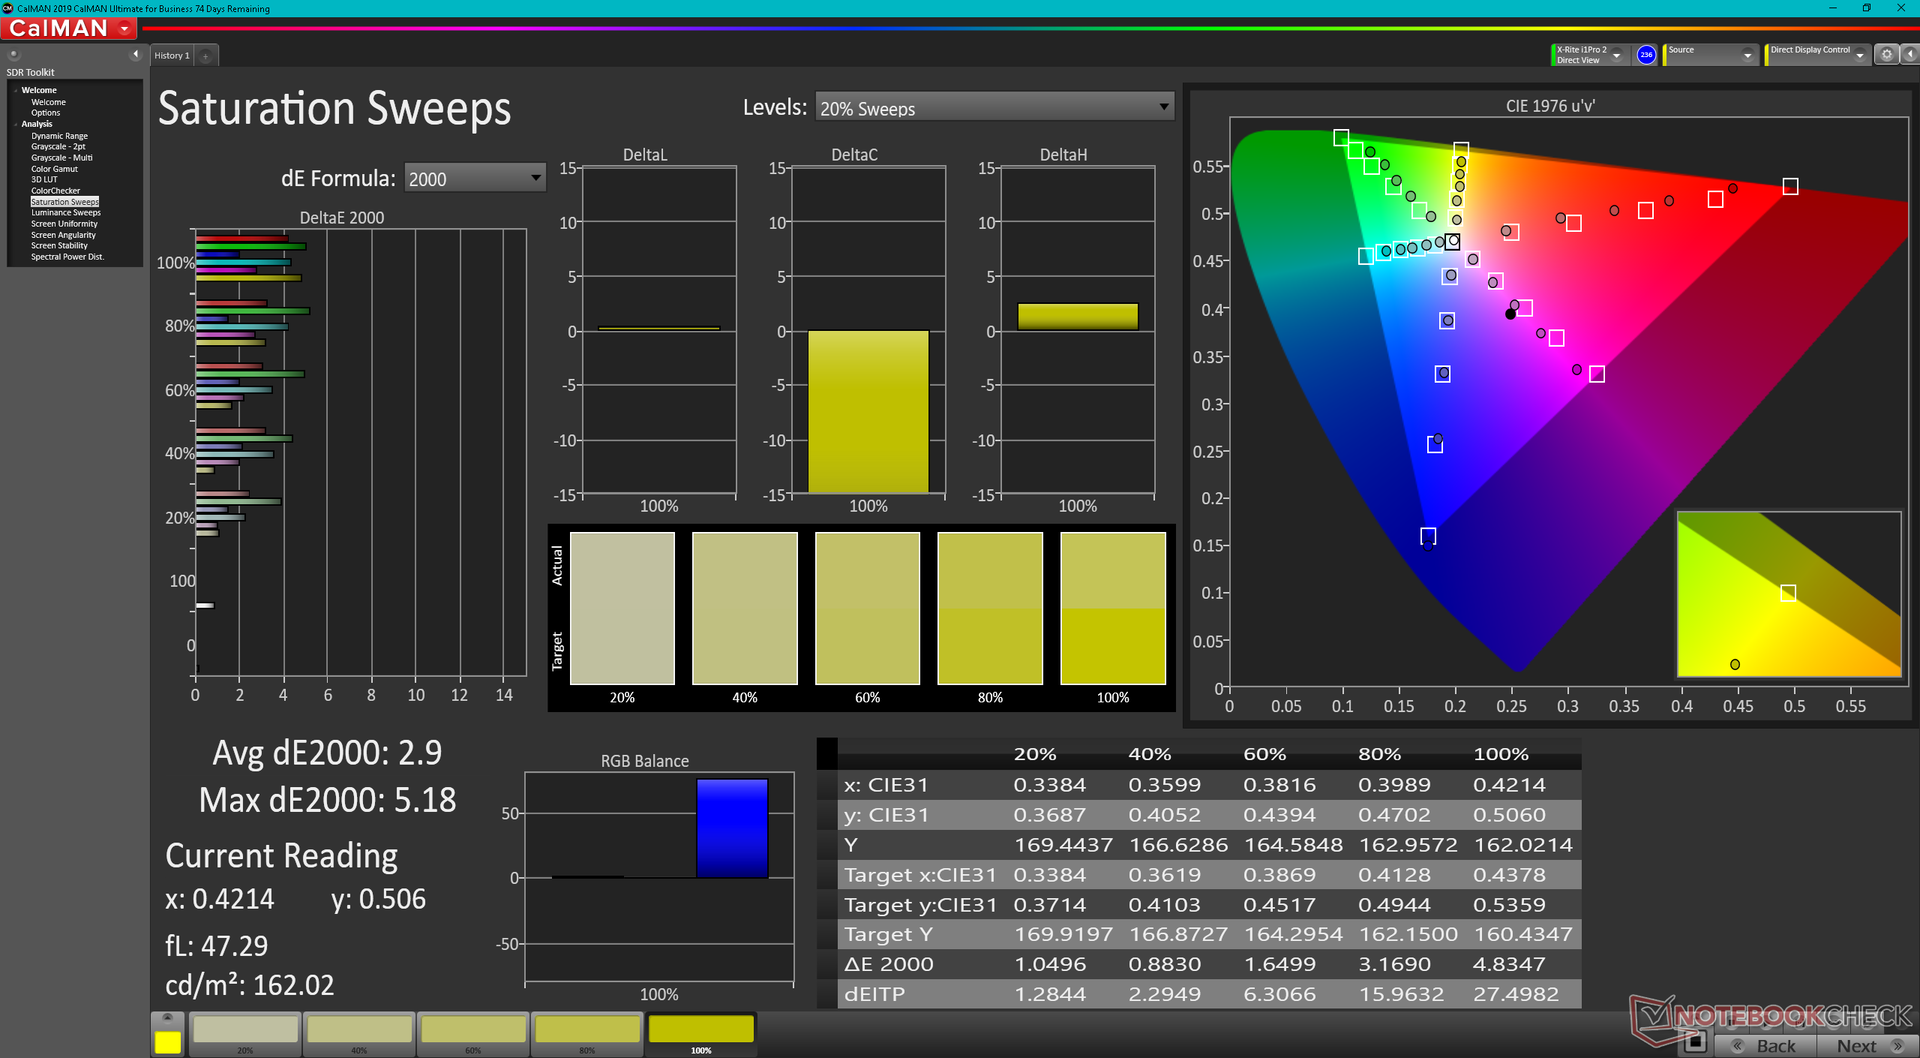
L'écran est étalonné par rapport à la norme P3 avec des valeurs DeltaE moyennes pour les niveaux de gris et les couleurs de seulement 1,3 et 1,53, respectivement. Les couleurs semblent être plus imprécises à des niveaux de saturation élevés qu'à des niveaux de saturation faibles.
Temps de réponse de l'écran
| ↔ Temps de réponse noir à blanc | ||
|---|---|---|
| 1.9 ms ... hausse ↗ et chute ↘ combinées | ↗ 0.8 ms hausse | 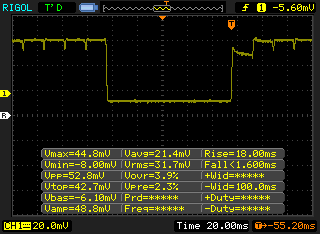 |
| ↘ 1.1 ms chute | ||
| L'écran montre de très faibles temps de réponse, parfait pour le jeu. En comparaison, tous les appareils testés affichent entre 0.1 (minimum) et 240 (maximum) ms. » 11 % des appareils testés affichent de meilleures performances. Cela signifie que les latences relevées sont meilleures que la moyenne (19.8 ms) de tous les appareils testés. | ||
| ↔ Temps de réponse gris 50% à gris 80% | ||
| 2 ms ... hausse ↗ et chute ↘ combinées | ↗ 1 ms hausse | 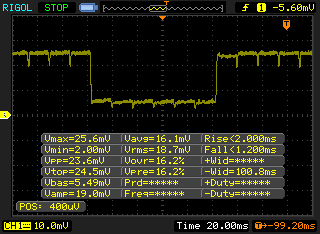 |
| ↘ 1 ms chute | ||
| L'écran montre de très faibles temps de réponse, parfait pour le jeu. En comparaison, tous les appareils testés affichent entre 0.165 (minimum) et 636 (maximum) ms. » 10 % des appareils testés affichent de meilleures performances. Cela signifie que les latences relevées sont meilleures que la moyenne (31 ms) de tous les appareils testés. | ||
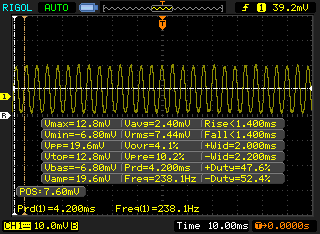
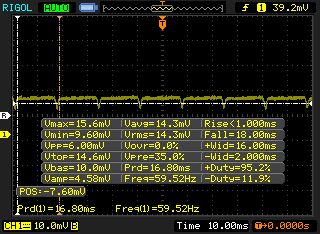
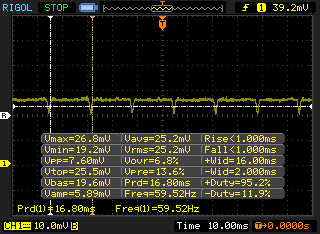
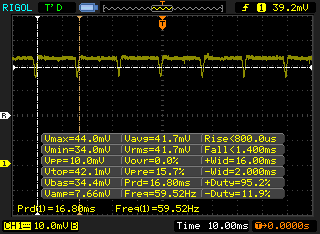
Scintillement / MLI (Modulation de largeur d'impulsion)
| Scintillement / MLI (Modulation de largeur d'impulsion) décelé | 240.4 Hz | ≤ 100 Niveau de luminosité |  |
Le rétroéclairage de l'écran scintille à la fréquence de 240.4 Hz (certainement du fait de l'utilisation d'une MDI - Modulation de largeur d'impulsion) à un niveau de luminosité inférieur ou égal à 100 % . Aucun scintillement ne devrait être perceptible au-dessus de cette valeur. La fréquence de rafraîchissement de 240.4 Hz est relativement faible, les personnes les plus sensibles devraient percevoir un scintillement et être sujettes à une fatigue oculaire accrue (avec le niveau de luminosité indiqué) En comparaison, 52 % des appareils testés n'emploient pas MDI pour assombrir leur écran. Nous avons relevé une moyenne à 7765 (minimum : 5 - maximum : 343500) Hz dans le cas où une MDI était active. | |||
Le scintillement ou la modulation de largeur d'impulsion est présent à tous les niveaux de luminosité, tout comme sur les panneaux OLED des derniers VivoBooks Asus VivoBook ou ZenBook d'Asus. La fréquence est de 240,4 Hz de 0 à 40 % de luminosité et de 60 Hz de 41 à 100 % de luminosité.

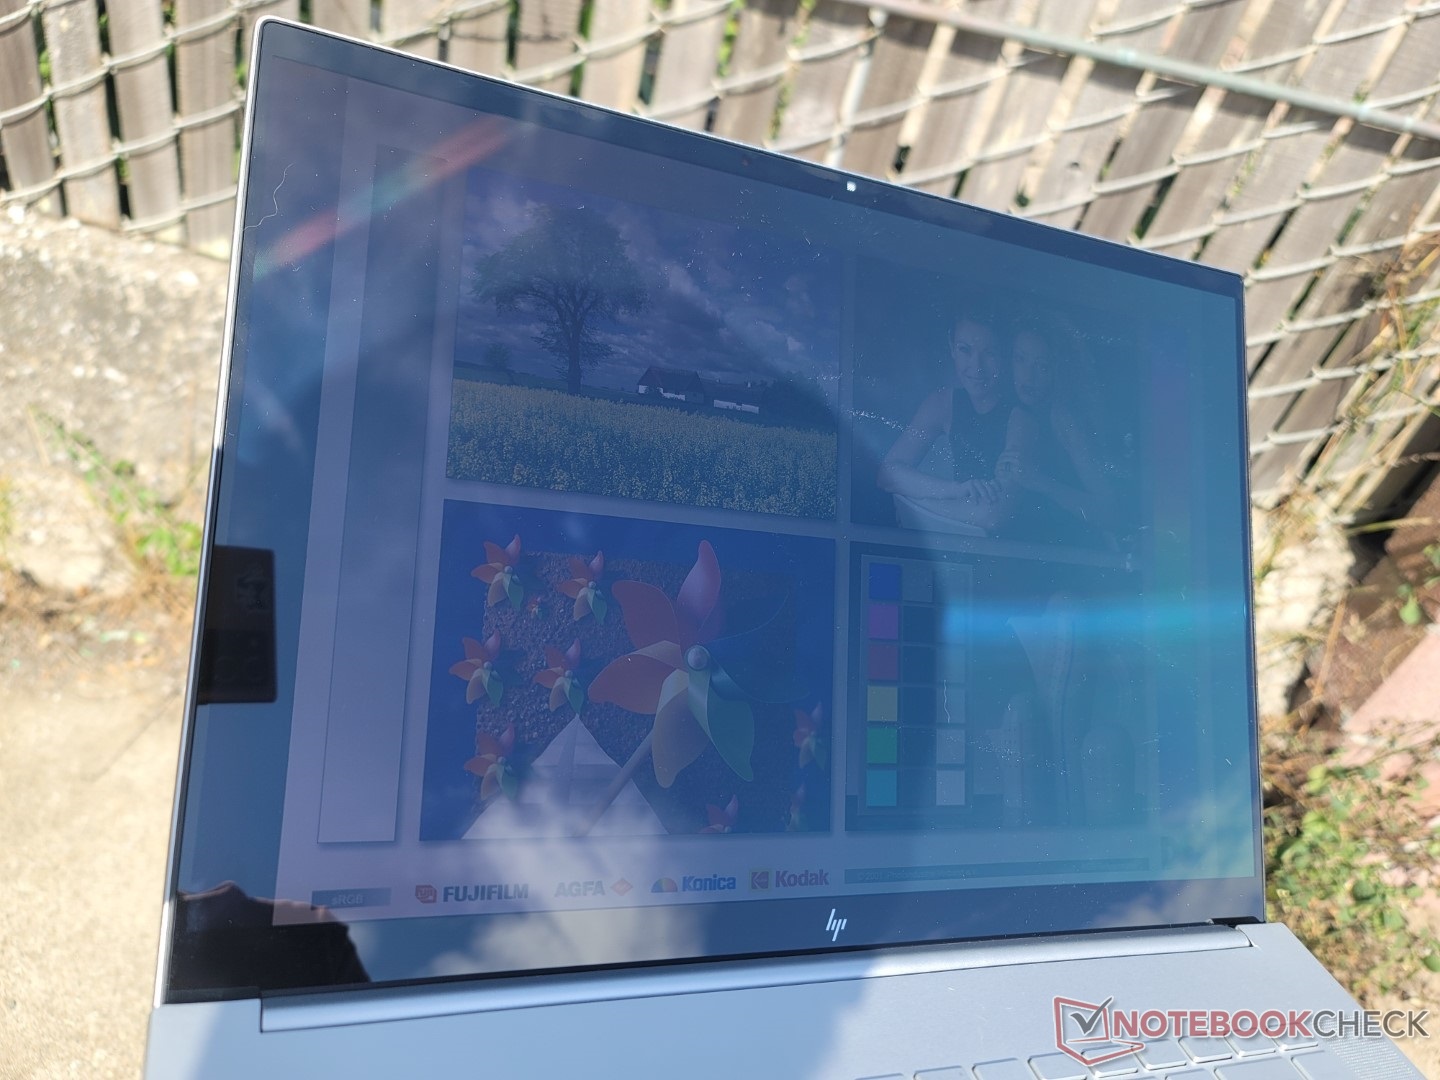
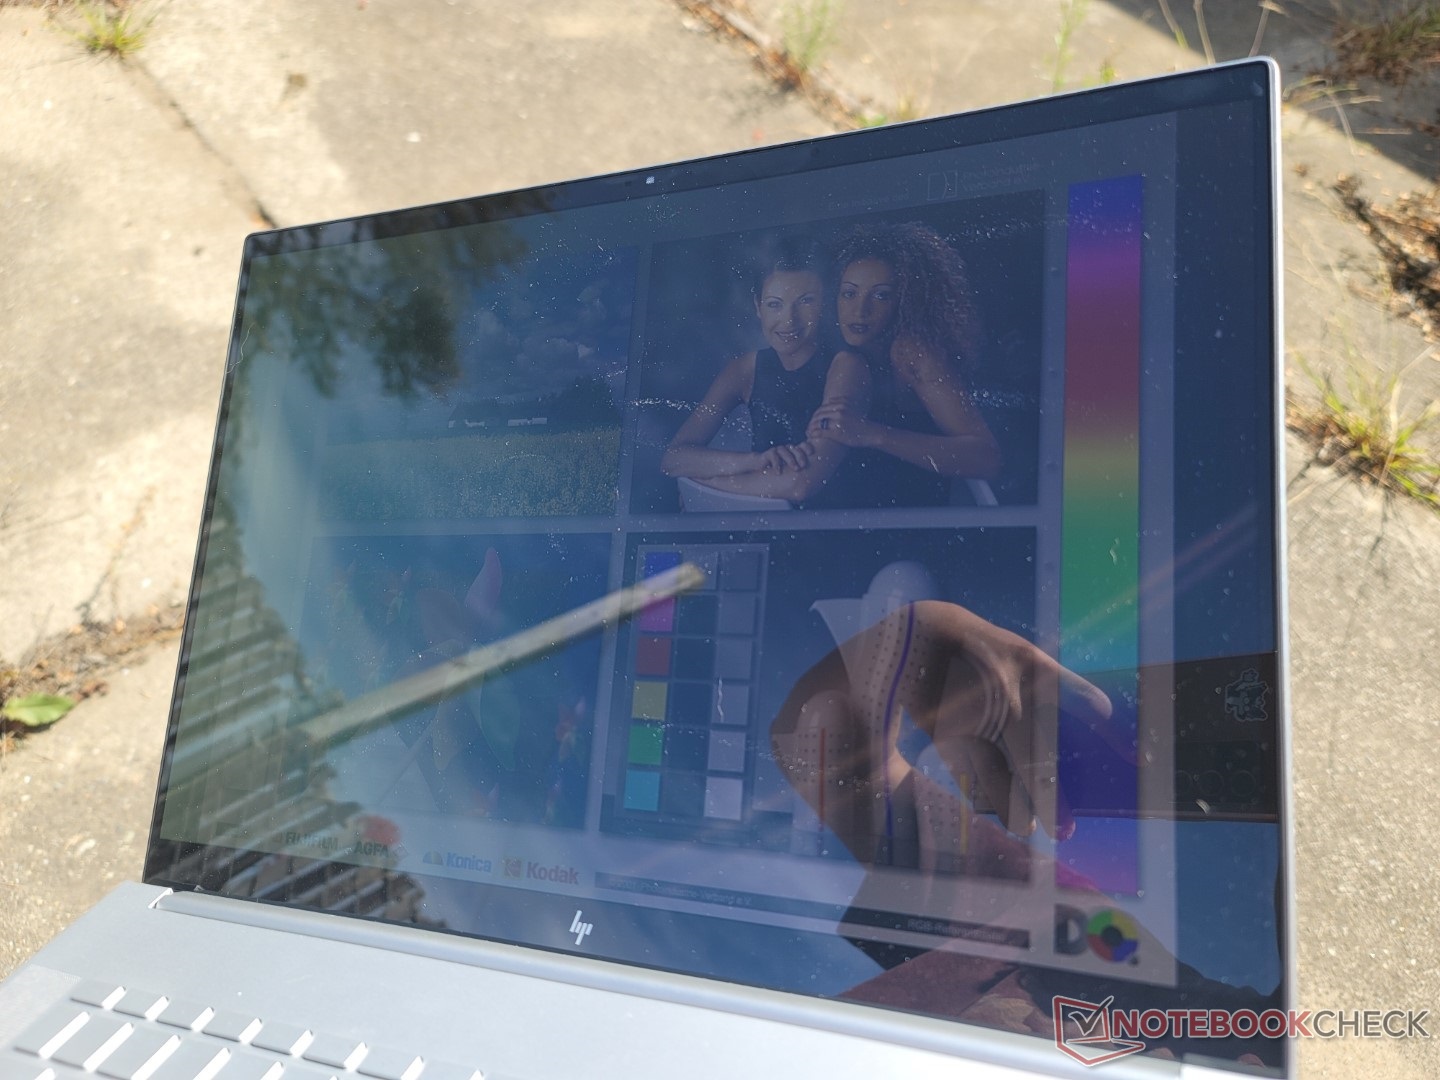
L'éblouissement est inévitable dans la plupart des conditions extérieures. L'écran brillant est loin d'être aussi lumineux que l'écran du MacBook Pro 16. À un peu plus de 320 nits maximum, c'est l'un des panneaux OLED les plus faibles du marché.
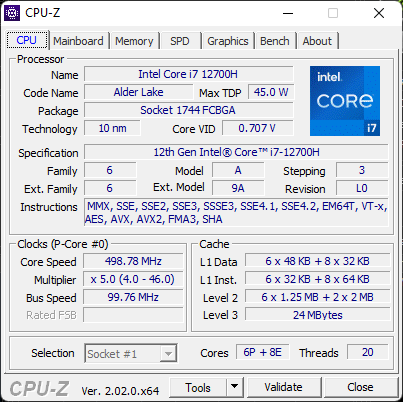
Performances - Intel Core H de 12e génération
Conditions d'essai
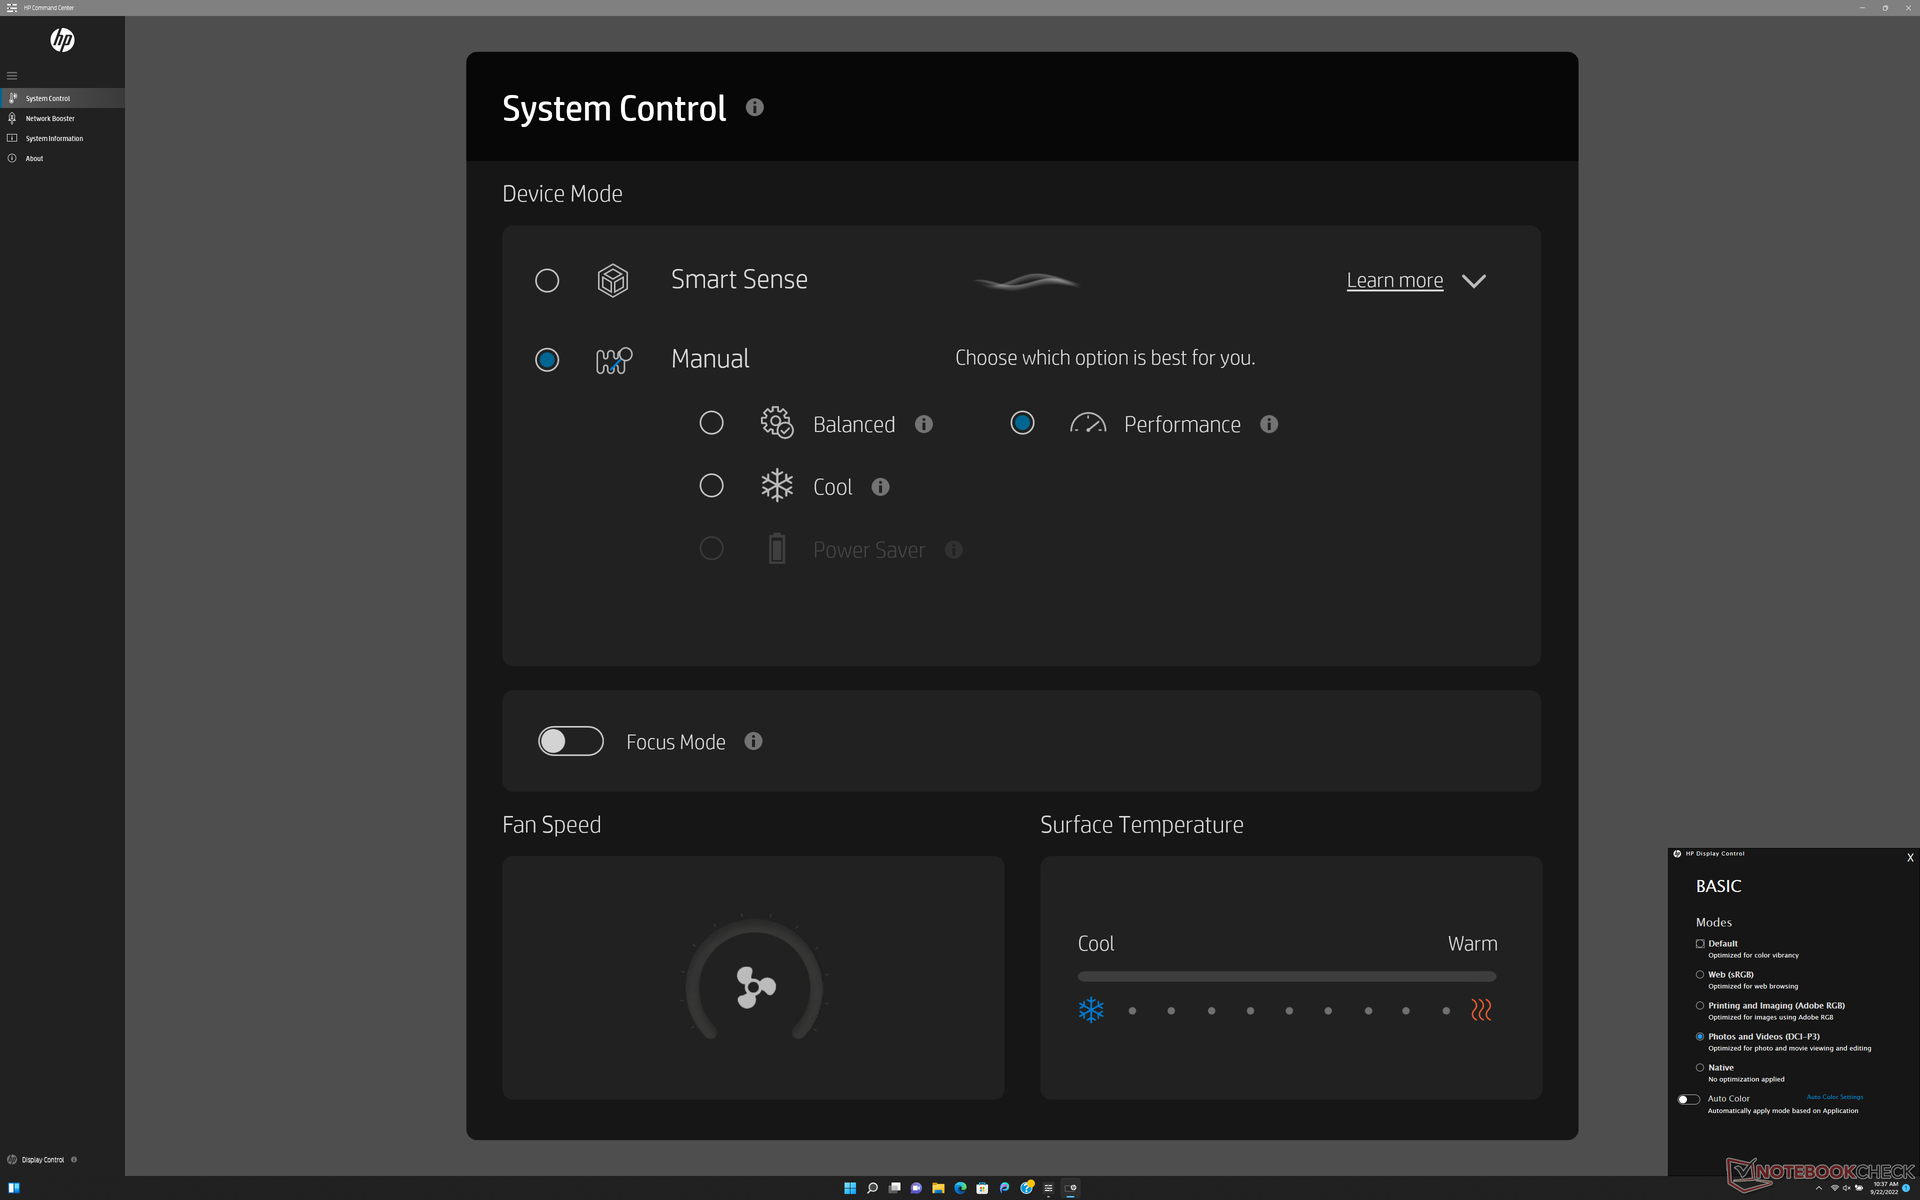
Nous avons réglé notre appareil en mode Performance via Windows et le logiciel HP Command Center avant d'effectuer les tests ci-dessous. Le HP Command Center est le centre de contrôle des profils d'alimentation et des couleurs d'affichage, comme le montre la capture d'écran ci-dessous.
Processeur
La performance multithread est environ 15 % plus lente que celle de l'ordinateur portable moyen de notre base de données équipé du même Core i7-12700H CPU. Le Lenovo Legion Slim 7 16, par exemple, est capable d'exécuter le même processeur plus rapidement, même après avoir pris en compte tout étranglement. Néanmoins, les performances sont toujours nettement supérieures à celles du 10e génération duCore i7-10750H de l'Envy 15 2020 d'environ 60 %
La mise à niveau vers le Core i9-12900H Devrait améliorer les performances multithread de 30 à 40 % par rapport à notre Core i7-12700H.
Cinebench R15 Multi Loop
Cinebench R23: Multi Core | Single Core
Cinebench R15: CPU Multi 64Bit | CPU Single 64Bit
Blender: v2.79 BMW27 CPU
7-Zip 18.03: 7z b 4 | 7z b 4 -mmt1
Geekbench 5.5: Multi-Core | Single-Core
HWBOT x265 Benchmark v2.2: 4k Preset
LibreOffice : 20 Documents To PDF
R Benchmark 2.5: Overall mean
Cinebench R23: Multi Core | Single Core
Cinebench R15: CPU Multi 64Bit | CPU Single 64Bit
Blender: v2.79 BMW27 CPU
7-Zip 18.03: 7z b 4 | 7z b 4 -mmt1
Geekbench 5.5: Multi-Core | Single-Core
HWBOT x265 Benchmark v2.2: 4k Preset
LibreOffice : 20 Documents To PDF
R Benchmark 2.5: Overall mean
* ... Moindre est la valeur, meilleures sont les performances
AIDA64: FP32 Ray-Trace | FPU Julia | CPU SHA3 | CPU Queen | FPU SinJulia | FPU Mandel | CPU AES | CPU ZLib | FP64 Ray-Trace | CPU PhotoWorxx
| Performance rating | |
| Lenovo ThinkBook 16 G4+ IAP | |
| HP Envy 16 h0112nr | |
| MSI Creator Z16P B12UHST | |
| Moyenne Intel Core i7-12700H | |
| Dell Inspiron 16 Plus 7610-MHJ8F | |
| Huawei MateBook 16s i7 | |
| AIDA64 / FP32 Ray-Trace | |
| Lenovo ThinkBook 16 G4+ IAP | |
| HP Envy 16 h0112nr | |
| Moyenne Intel Core i7-12700H (2585 - 17957, n=64) | |
| Dell Inspiron 16 Plus 7610-MHJ8F | |
| MSI Creator Z16P B12UHST | |
| Huawei MateBook 16s i7 | |
| AIDA64 / FPU Julia | |
| Lenovo ThinkBook 16 G4+ IAP | |
| HP Envy 16 h0112nr | |
| Dell Inspiron 16 Plus 7610-MHJ8F | |
| Moyenne Intel Core i7-12700H (12439 - 90760, n=64) | |
| MSI Creator Z16P B12UHST | |
| Huawei MateBook 16s i7 | |
| AIDA64 / CPU SHA3 | |
| Dell Inspiron 16 Plus 7610-MHJ8F | |
| Lenovo ThinkBook 16 G4+ IAP | |
| Moyenne Intel Core i7-12700H (833 - 4242, n=64) | |
| MSI Creator Z16P B12UHST | |
| HP Envy 16 h0112nr | |
| Huawei MateBook 16s i7 | |
| AIDA64 / CPU Queen | |
| MSI Creator Z16P B12UHST | |
| Lenovo ThinkBook 16 G4+ IAP | |
| HP Envy 16 h0112nr | |
| Moyenne Intel Core i7-12700H (57923 - 103202, n=63) | |
| Huawei MateBook 16s i7 | |
| Dell Inspiron 16 Plus 7610-MHJ8F | |
| AIDA64 / FPU SinJulia | |
| MSI Creator Z16P B12UHST | |
| Lenovo ThinkBook 16 G4+ IAP | |
| Moyenne Intel Core i7-12700H (3249 - 9939, n=64) | |
| Dell Inspiron 16 Plus 7610-MHJ8F | |
| HP Envy 16 h0112nr | |
| Huawei MateBook 16s i7 | |
| AIDA64 / FPU Mandel | |
| Lenovo ThinkBook 16 G4+ IAP | |
| Dell Inspiron 16 Plus 7610-MHJ8F | |
| HP Envy 16 h0112nr | |
| Moyenne Intel Core i7-12700H (7135 - 44760, n=64) | |
| MSI Creator Z16P B12UHST | |
| Huawei MateBook 16s i7 | |
| AIDA64 / CPU AES | |
| Dell Inspiron 16 Plus 7610-MHJ8F | |
| HP Envy 16 h0112nr | |
| MSI Creator Z16P B12UHST | |
| Moyenne Intel Core i7-12700H (31839 - 144360, n=64) | |
| Lenovo ThinkBook 16 G4+ IAP | |
| Huawei MateBook 16s i7 | |
| AIDA64 / CPU ZLib | |
| MSI Creator Z16P B12UHST | |
| Lenovo ThinkBook 16 G4+ IAP | |
| Moyenne Intel Core i7-12700H (305 - 1171, n=64) | |
| HP Envy 16 h0112nr | |
| Dell Inspiron 16 Plus 7610-MHJ8F | |
| Huawei MateBook 16s i7 | |
| AIDA64 / FP64 Ray-Trace | |
| Lenovo ThinkBook 16 G4+ IAP | |
| HP Envy 16 h0112nr | |
| Moyenne Intel Core i7-12700H (1437 - 9692, n=64) | |
| Dell Inspiron 16 Plus 7610-MHJ8F | |
| MSI Creator Z16P B12UHST | |
| Huawei MateBook 16s i7 | |
| AIDA64 / CPU PhotoWorxx | |
| Huawei MateBook 16s i7 | |
| MSI Creator Z16P B12UHST | |
| Lenovo ThinkBook 16 G4+ IAP | |
| HP Envy 16 h0112nr | |
| Moyenne Intel Core i7-12700H (12863 - 52207, n=64) | |
| Dell Inspiron 16 Plus 7610-MHJ8F | |
Performance du système
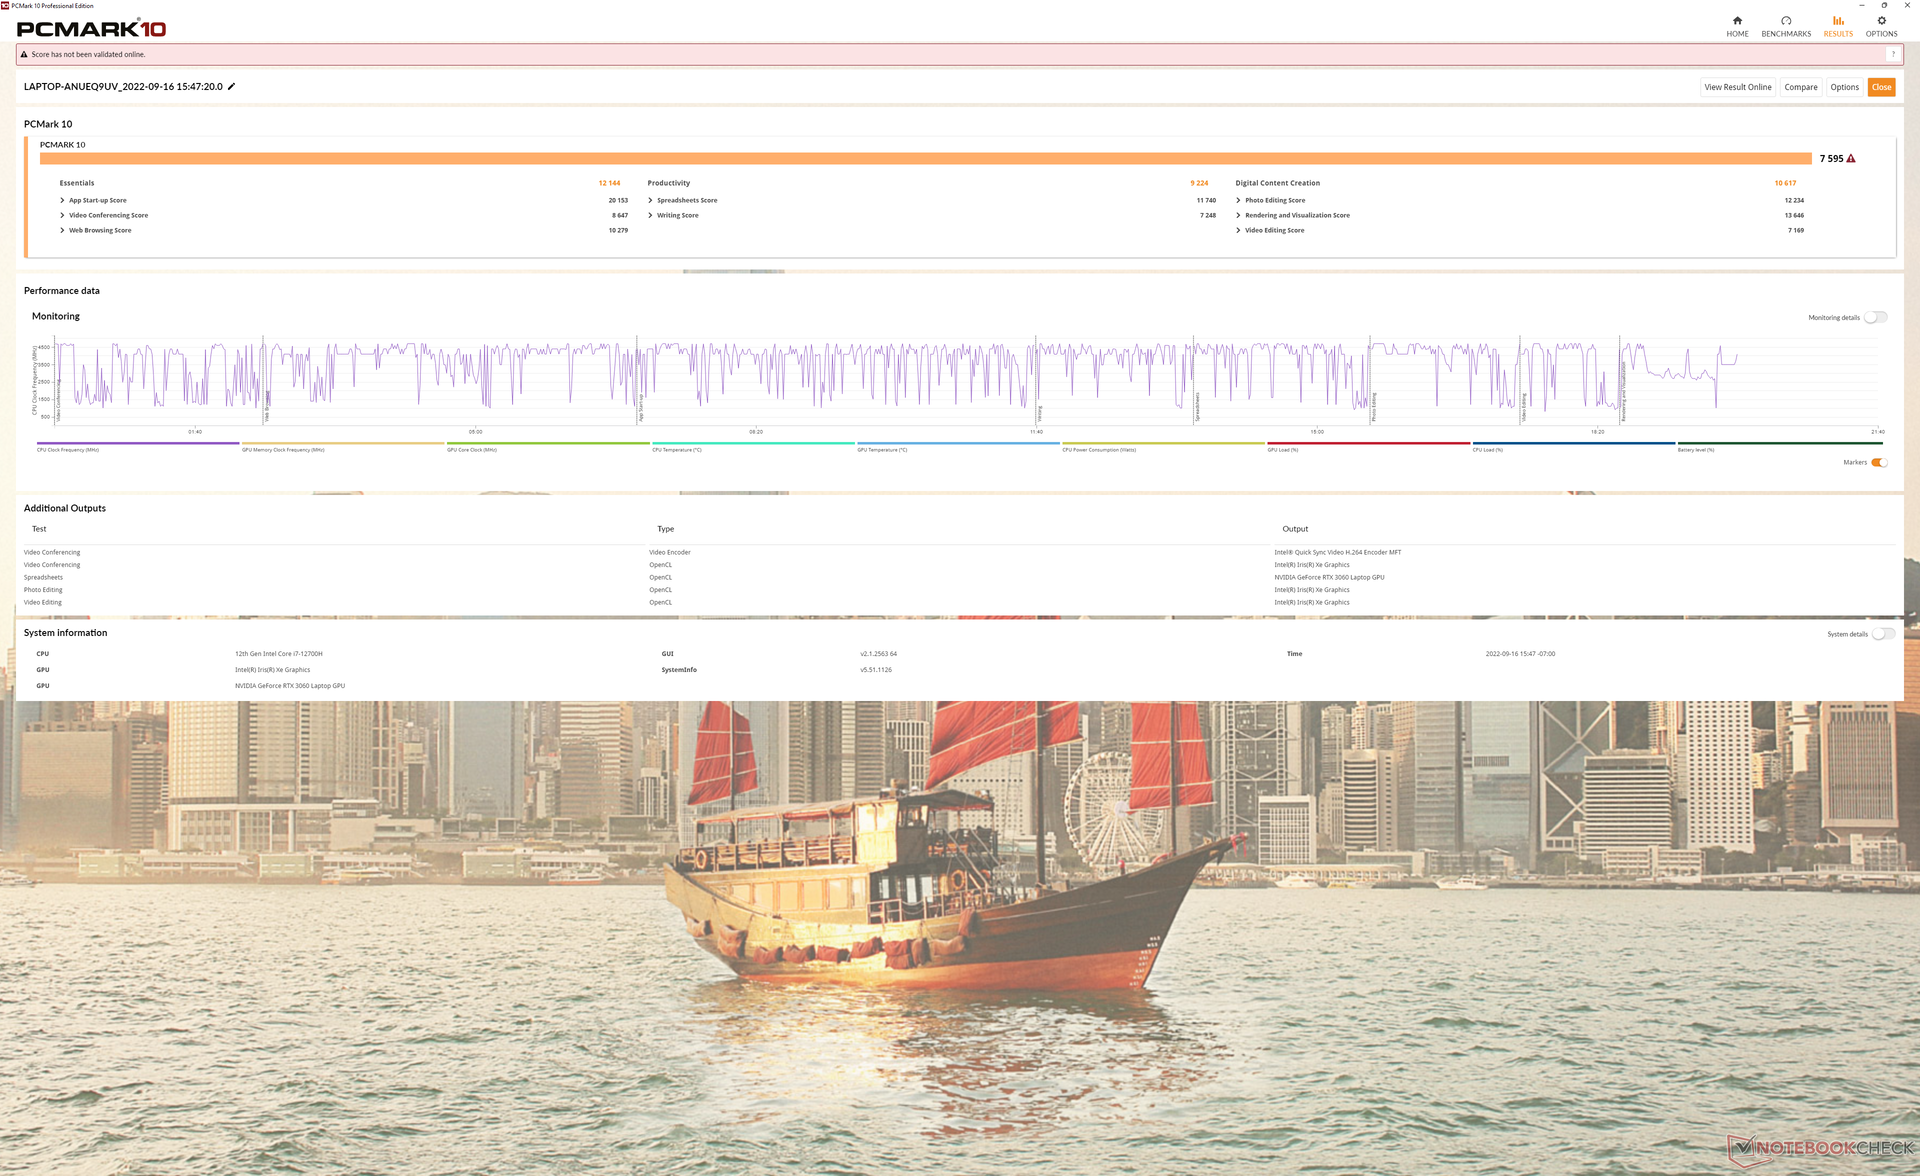
Les résultats de PCMark sont systématiquement supérieurs à ceux du Envy 15 de 2020 par de larges marges. Nous soupçonnons que l'abandon de l'Intel Optane a joué un rôle important dans l'augmentation des scores.
CrossMark: Overall | Productivity | Creativity | Responsiveness
| PCMark 10 / Score | |
| MSI Creator Z16P B12UHST | |
| HP Envy 16 h0112nr | |
| Moyenne Intel Core i7-12700H, NVIDIA GeForce RTX 3060 Laptop GPU (5986 - 8156, n=12) | |
| Huawei MateBook 16s i7 | |
| HP Envy 15-ep0098nr | |
| Dell Inspiron 16 Plus 7610-MHJ8F | |
| PCMark 10 / Essentials | |
| HP Envy 16 h0112nr | |
| Huawei MateBook 16s i7 | |
| MSI Creator Z16P B12UHST | |
| Moyenne Intel Core i7-12700H, NVIDIA GeForce RTX 3060 Laptop GPU (9289 - 12144, n=12) | |
| Dell Inspiron 16 Plus 7610-MHJ8F | |
| HP Envy 15-ep0098nr | |
| PCMark 10 / Productivity | |
| MSI Creator Z16P B12UHST | |
| HP Envy 16 h0112nr | |
| Moyenne Intel Core i7-12700H, NVIDIA GeForce RTX 3060 Laptop GPU (6161 - 10362, n=12) | |
| Huawei MateBook 16s i7 | |
| HP Envy 15-ep0098nr | |
| Dell Inspiron 16 Plus 7610-MHJ8F | |
| PCMark 10 / Digital Content Creation | |
| MSI Creator Z16P B12UHST | |
| Moyenne Intel Core i7-12700H, NVIDIA GeForce RTX 3060 Laptop GPU (8950 - 12554, n=12) | |
| HP Envy 16 h0112nr | |
| Huawei MateBook 16s i7 | |
| HP Envy 15-ep0098nr | |
| Dell Inspiron 16 Plus 7610-MHJ8F | |
| CrossMark / Overall | |
| Huawei MateBook 16s i7 | |
| HP Envy 16 h0112nr | |
| Moyenne Intel Core i7-12700H, NVIDIA GeForce RTX 3060 Laptop GPU (1649 - 2017, n=11) | |
| Lenovo ThinkBook 16 G4+ IAP | |
| Apple MacBook Pro 16 2021 M1 Pro | |
| CrossMark / Productivity | |
| Huawei MateBook 16s i7 | |
| HP Envy 16 h0112nr | |
| Moyenne Intel Core i7-12700H, NVIDIA GeForce RTX 3060 Laptop GPU (1536 - 1958, n=11) | |
| Lenovo ThinkBook 16 G4+ IAP | |
| Apple MacBook Pro 16 2021 M1 Pro | |
| CrossMark / Creativity | |
| Apple MacBook Pro 16 2021 M1 Pro | |
| HP Envy 16 h0112nr | |
| Huawei MateBook 16s i7 | |
| Lenovo ThinkBook 16 G4+ IAP | |
| Moyenne Intel Core i7-12700H, NVIDIA GeForce RTX 3060 Laptop GPU (1816 - 2084, n=11) | |
| CrossMark / Responsiveness | |
| Huawei MateBook 16s i7 | |
| Moyenne Intel Core i7-12700H, NVIDIA GeForce RTX 3060 Laptop GPU (1210 - 2207, n=11) | |
| HP Envy 16 h0112nr | |
| Lenovo ThinkBook 16 G4+ IAP | |
| Apple MacBook Pro 16 2021 M1 Pro | |
| PCMark 10 Score | 7595 points | |
Aide | ||
| AIDA64 / Memory Copy | |
| Huawei MateBook 16s i7 | |
| Lenovo ThinkBook 16 G4+ IAP | |
| MSI Creator Z16P B12UHST | |
| HP Envy 16 h0112nr | |
| Moyenne Intel Core i7-12700H (25615 - 80511, n=64) | |
| Dell Inspiron 16 Plus 7610-MHJ8F | |
| AIDA64 / Memory Read | |
| Lenovo ThinkBook 16 G4+ IAP | |
| Huawei MateBook 16s i7 | |
| MSI Creator Z16P B12UHST | |
| HP Envy 16 h0112nr | |
| Moyenne Intel Core i7-12700H (25586 - 79442, n=64) | |
| Dell Inspiron 16 Plus 7610-MHJ8F | |
| AIDA64 / Memory Write | |
| MSI Creator Z16P B12UHST | |
| Huawei MateBook 16s i7 | |
| HP Envy 16 h0112nr | |
| Lenovo ThinkBook 16 G4+ IAP | |
| Moyenne Intel Core i7-12700H (23679 - 88660, n=64) | |
| Dell Inspiron 16 Plus 7610-MHJ8F | |
| AIDA64 / Memory Latency | |
| Lenovo ThinkBook 16 G4+ IAP | |
| Huawei MateBook 16s i7 | |
| Dell Inspiron 16 Plus 7610-MHJ8F | |
| MSI Creator Z16P B12UHST | |
| HP Envy 16 h0112nr | |
| Moyenne Intel Core i7-12700H (76.2 - 133.9, n=62) | |
* ... Moindre est la valeur, meilleures sont les performances
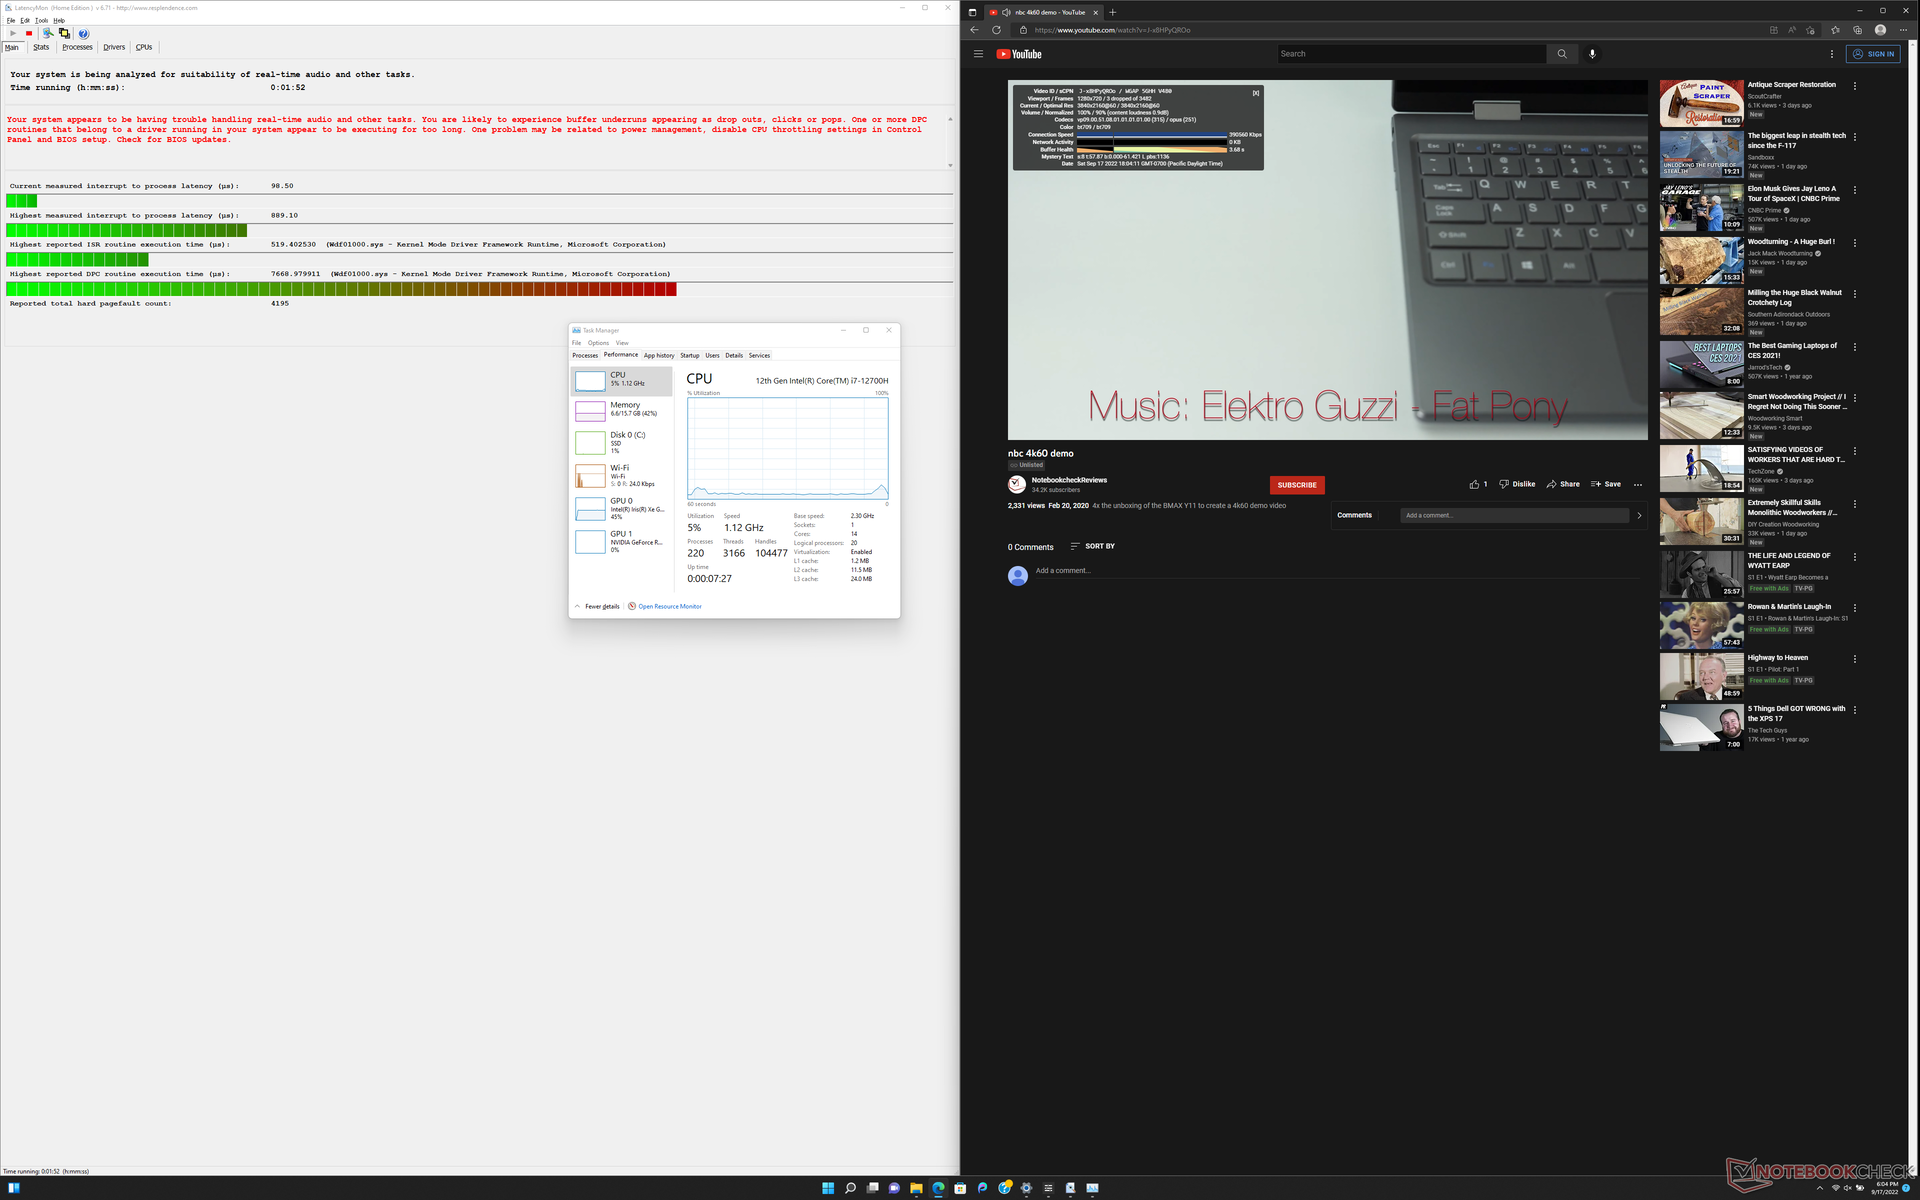
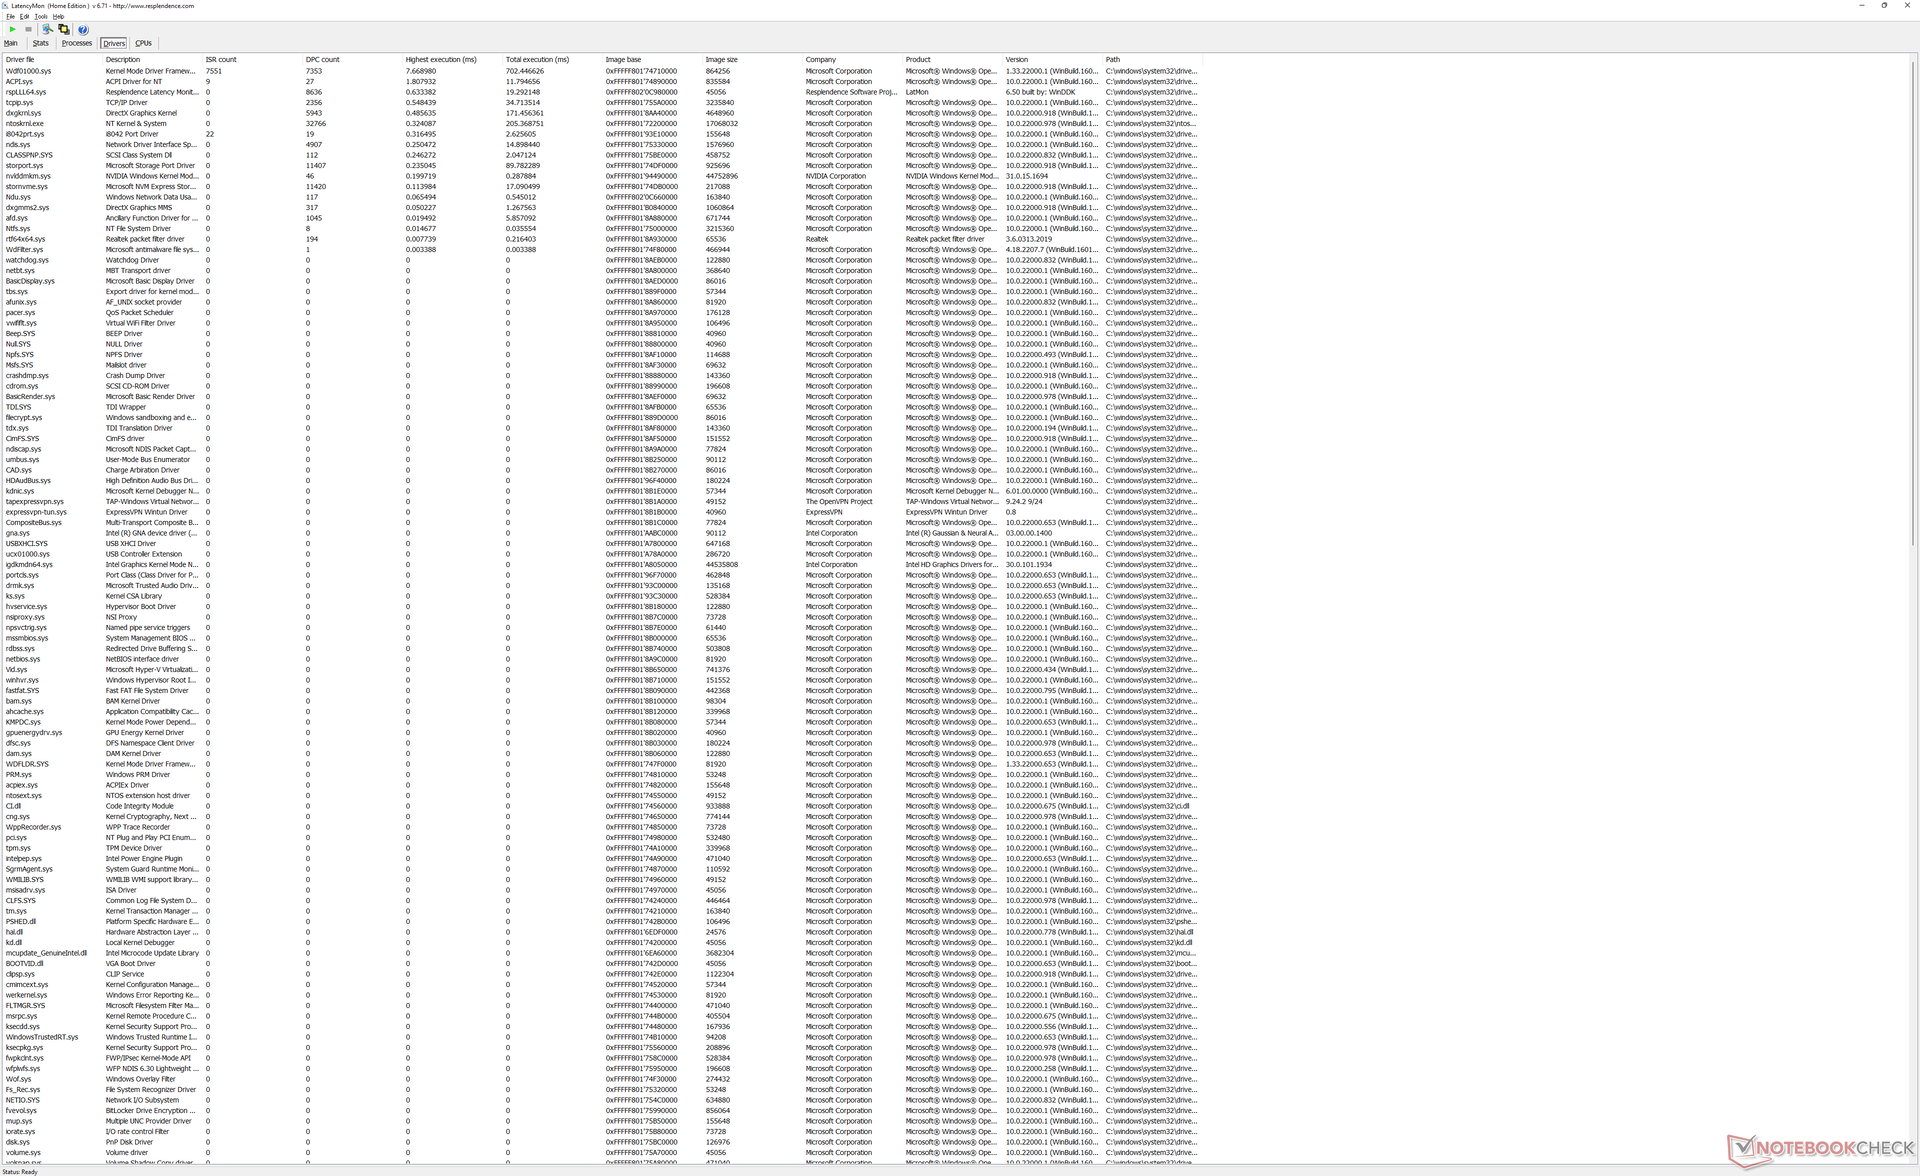
Latence DPC
LatencyMon révèle des problèmes de CPD lors de l'ouverture de plusieurs onglets de navigateur de notre page d'accueil. la lecture de vidéos 4K à 60 FPS est également imparfaite avec 3 images perdues pendant notre vidéo de test d'une minute.
| DPC Latencies / LatencyMon - interrupt to process latency (max), Web, Youtube, Prime95 | |
| Lenovo ThinkBook 16 G4+ IAP | |
| HP Envy 16 h0112nr | |
| MSI Creator Z16P B12UHST | |
* ... Moindre est la valeur, meilleures sont les performances
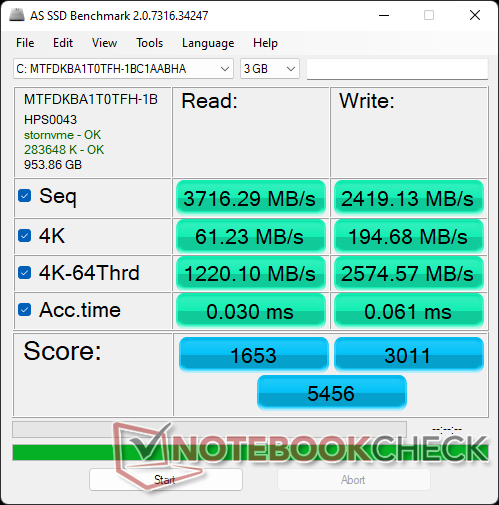
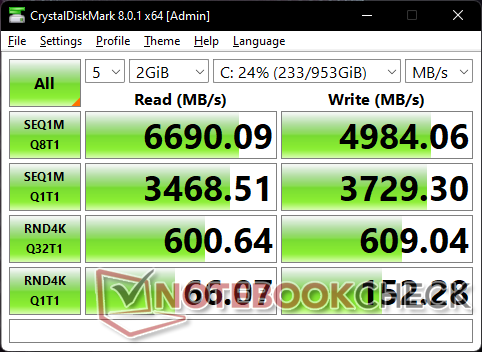
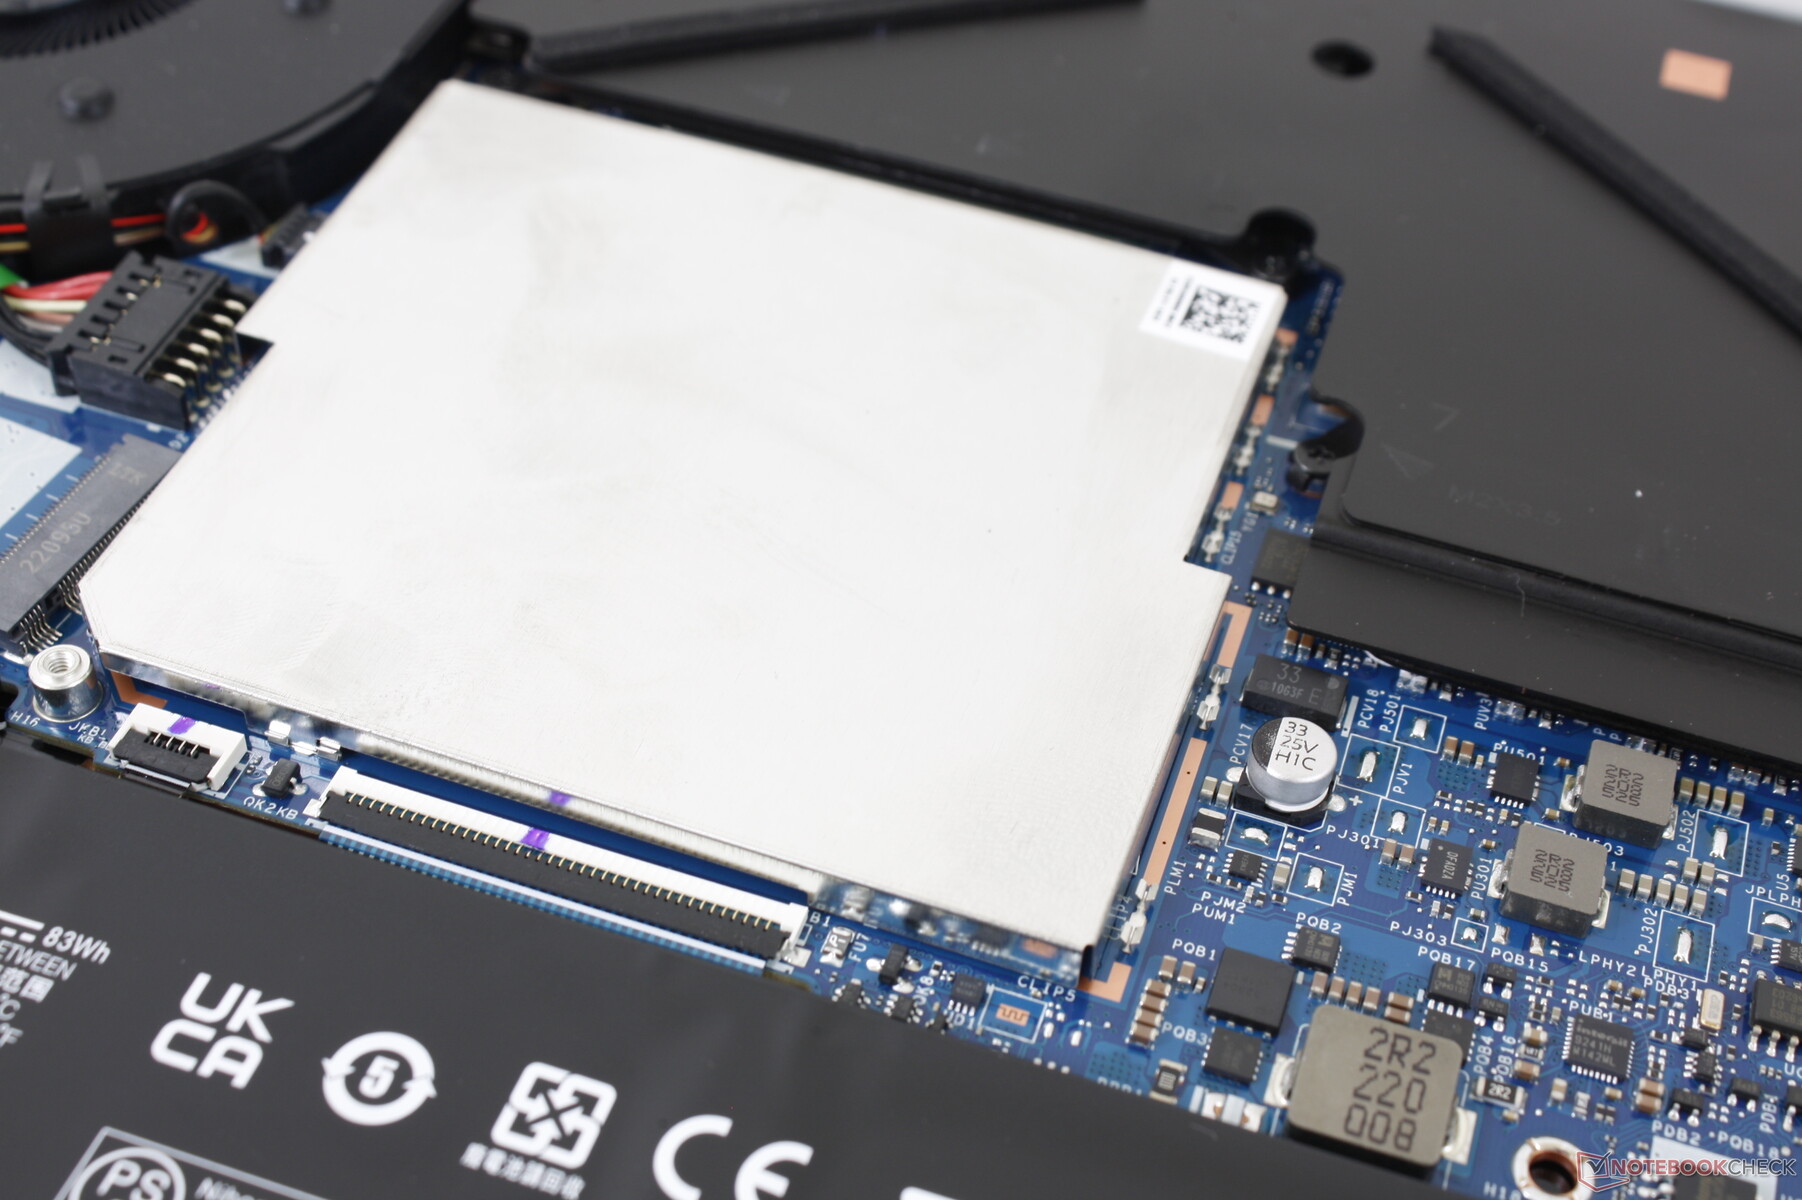
Périphériques de stockage - Support RAID 0
Notre unité de test est livrée avec le mêmeMicron 3400 PCIe4 x4 NVMe SSD que l'on trouve sur de nombreux autres systèmes haut de gamme, dont le MSI Stealth GS77 ou HP Spectre x360 13.5. Le disque ne présente aucun problème d'étranglement sur notre unité de test, mais les taux d'écriture sont loin d'être aussi rapides que sur la série concurrente Samsung PM9A1.
HP n'inclut qu'un seul couvercle de SSD, malgré la présence de deux emplacements pour SSD. Si vous prévoyez d'installer un deuxième disque, il y a de fortes chances qu'il fonctionne à des températures plus élevées.

| Drive Performance rating - Percent | |
| MSI Creator Z16P B12UHST | |
| HP Envy 16 h0112nr | |
| Huawei MateBook 16s i7 | |
| Lenovo ThinkBook 16 G4+ IAP | |
| Dell Inspiron 16 Plus 7610-MHJ8F -1! | |
* ... Moindre est la valeur, meilleures sont les performances
Disk Throttling: DiskSpd Read Loop, Queue Depth 8
Performances du GPU - TGP 95 W GeForce RTX 3060
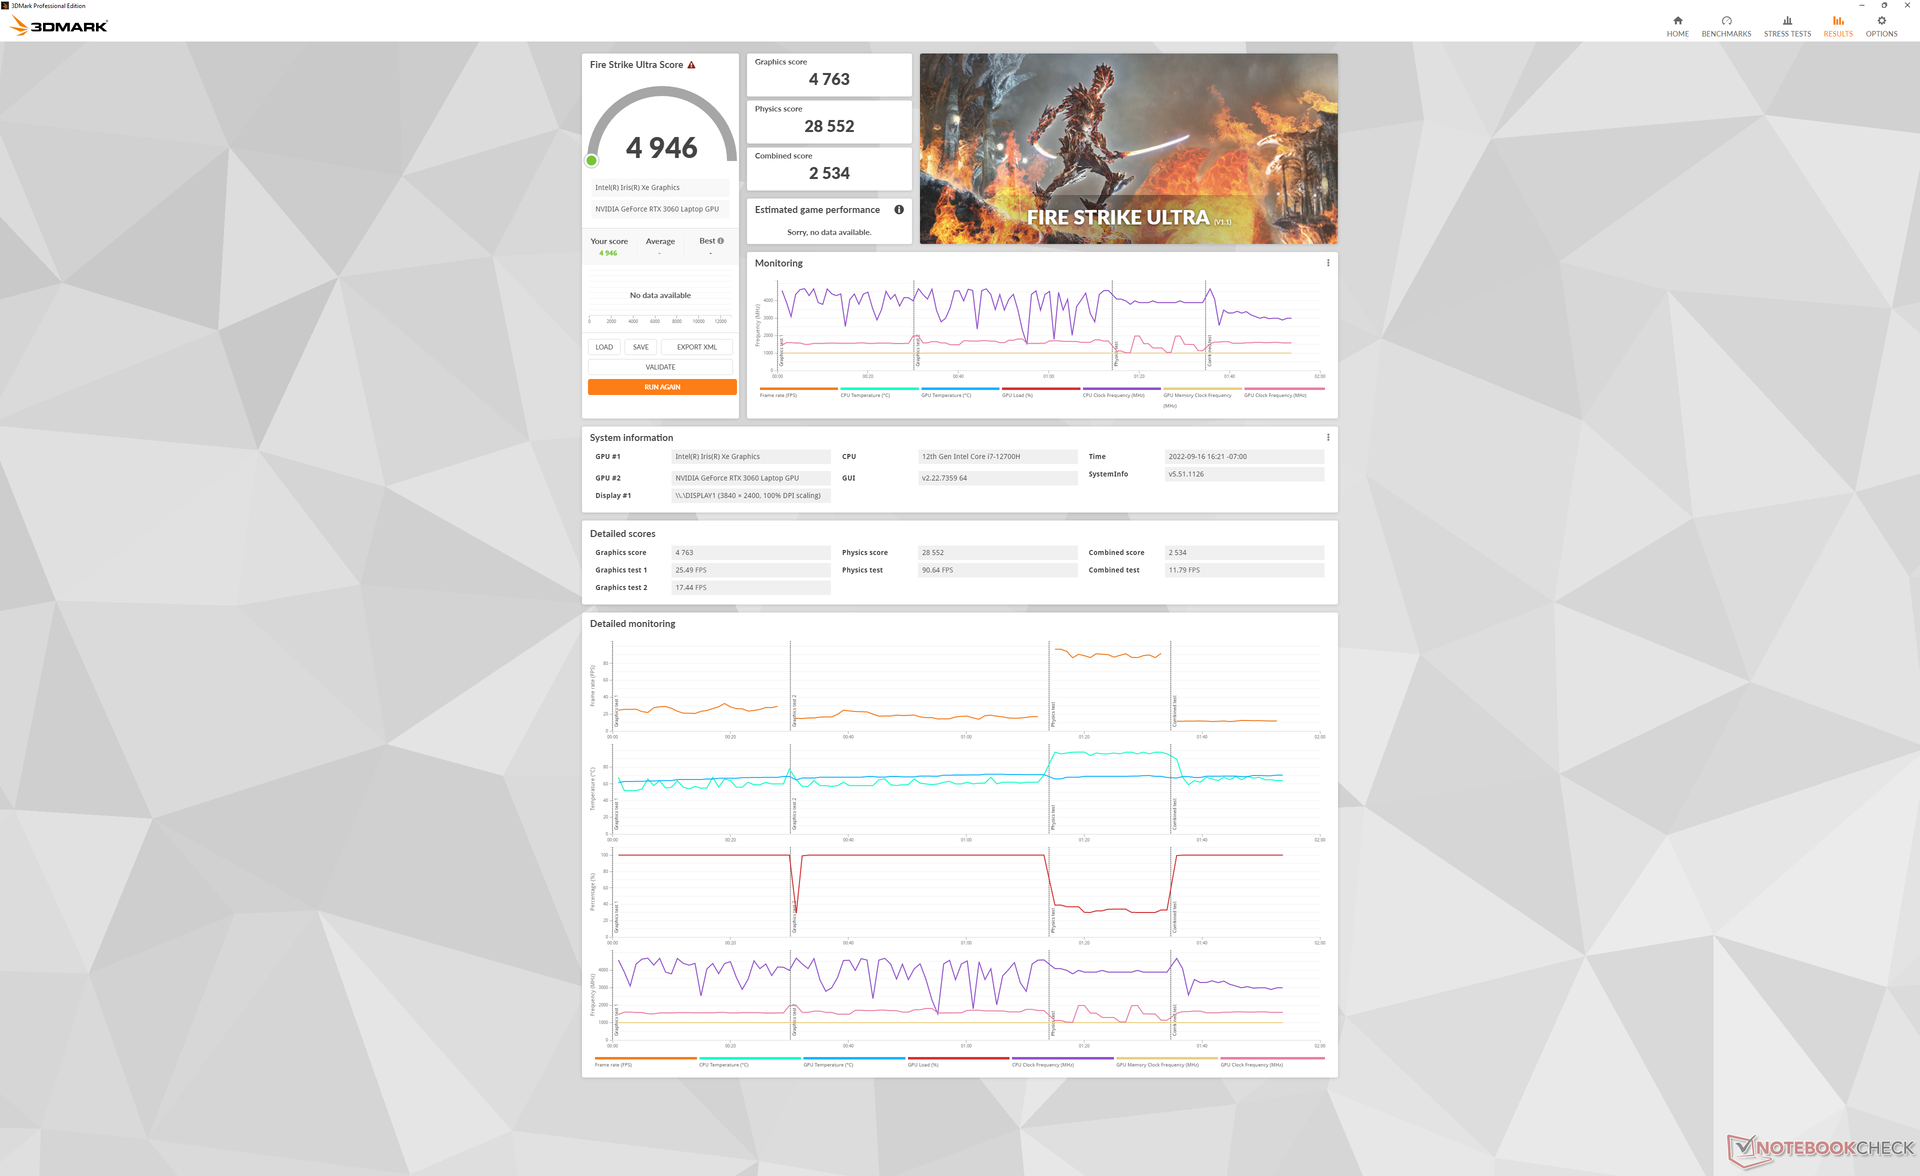
Les performances graphiques sont environ 5 % plus lentes que celles de l'ordinateur portable moyen de notre base de données équipé de la même GeForce RTX 3060. Le déficit est suffisamment mineur pour que les utilisateurs ne le remarquent probablement pas.
Si vous passez du modèle inférieur Arc A370M à GeForce RTX 3060 permettra aux utilisateurs de multiplier par deux les performances graphiques brutes.
L'utilisation du mode Équilibré au lieu du mode Performance réduit les performances graphiques de 6 % pour des ventilateurs beaucoup plus silencieux, comme nous l'expliquons dans notre section Bruit du système.
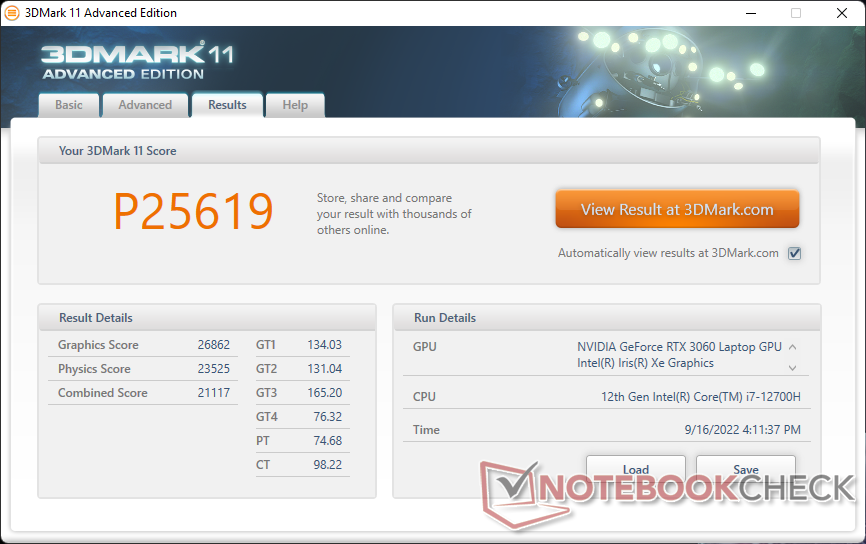
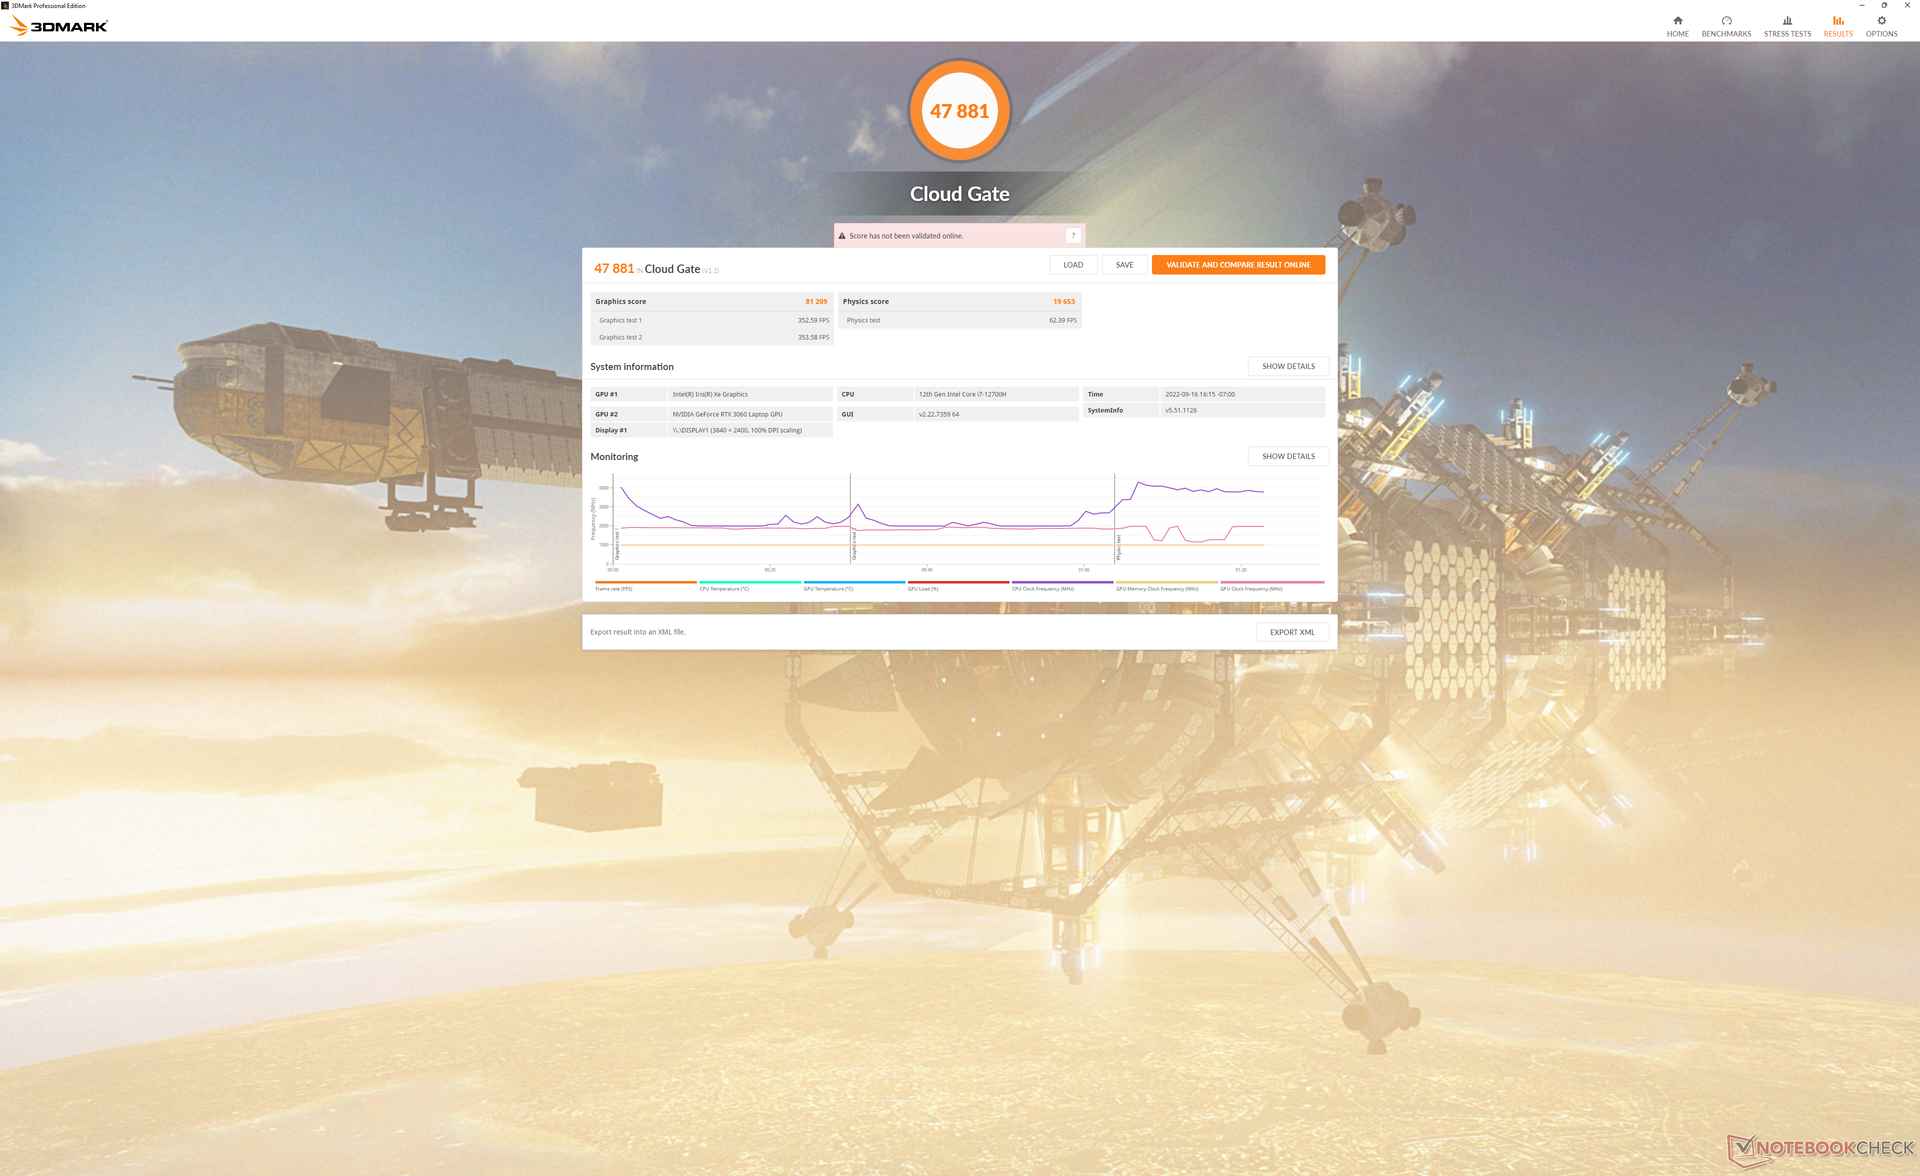

| 3DMark 11 Performance | 25619 points | |
| 3DMark Cloud Gate Standard Score | 47881 points | |
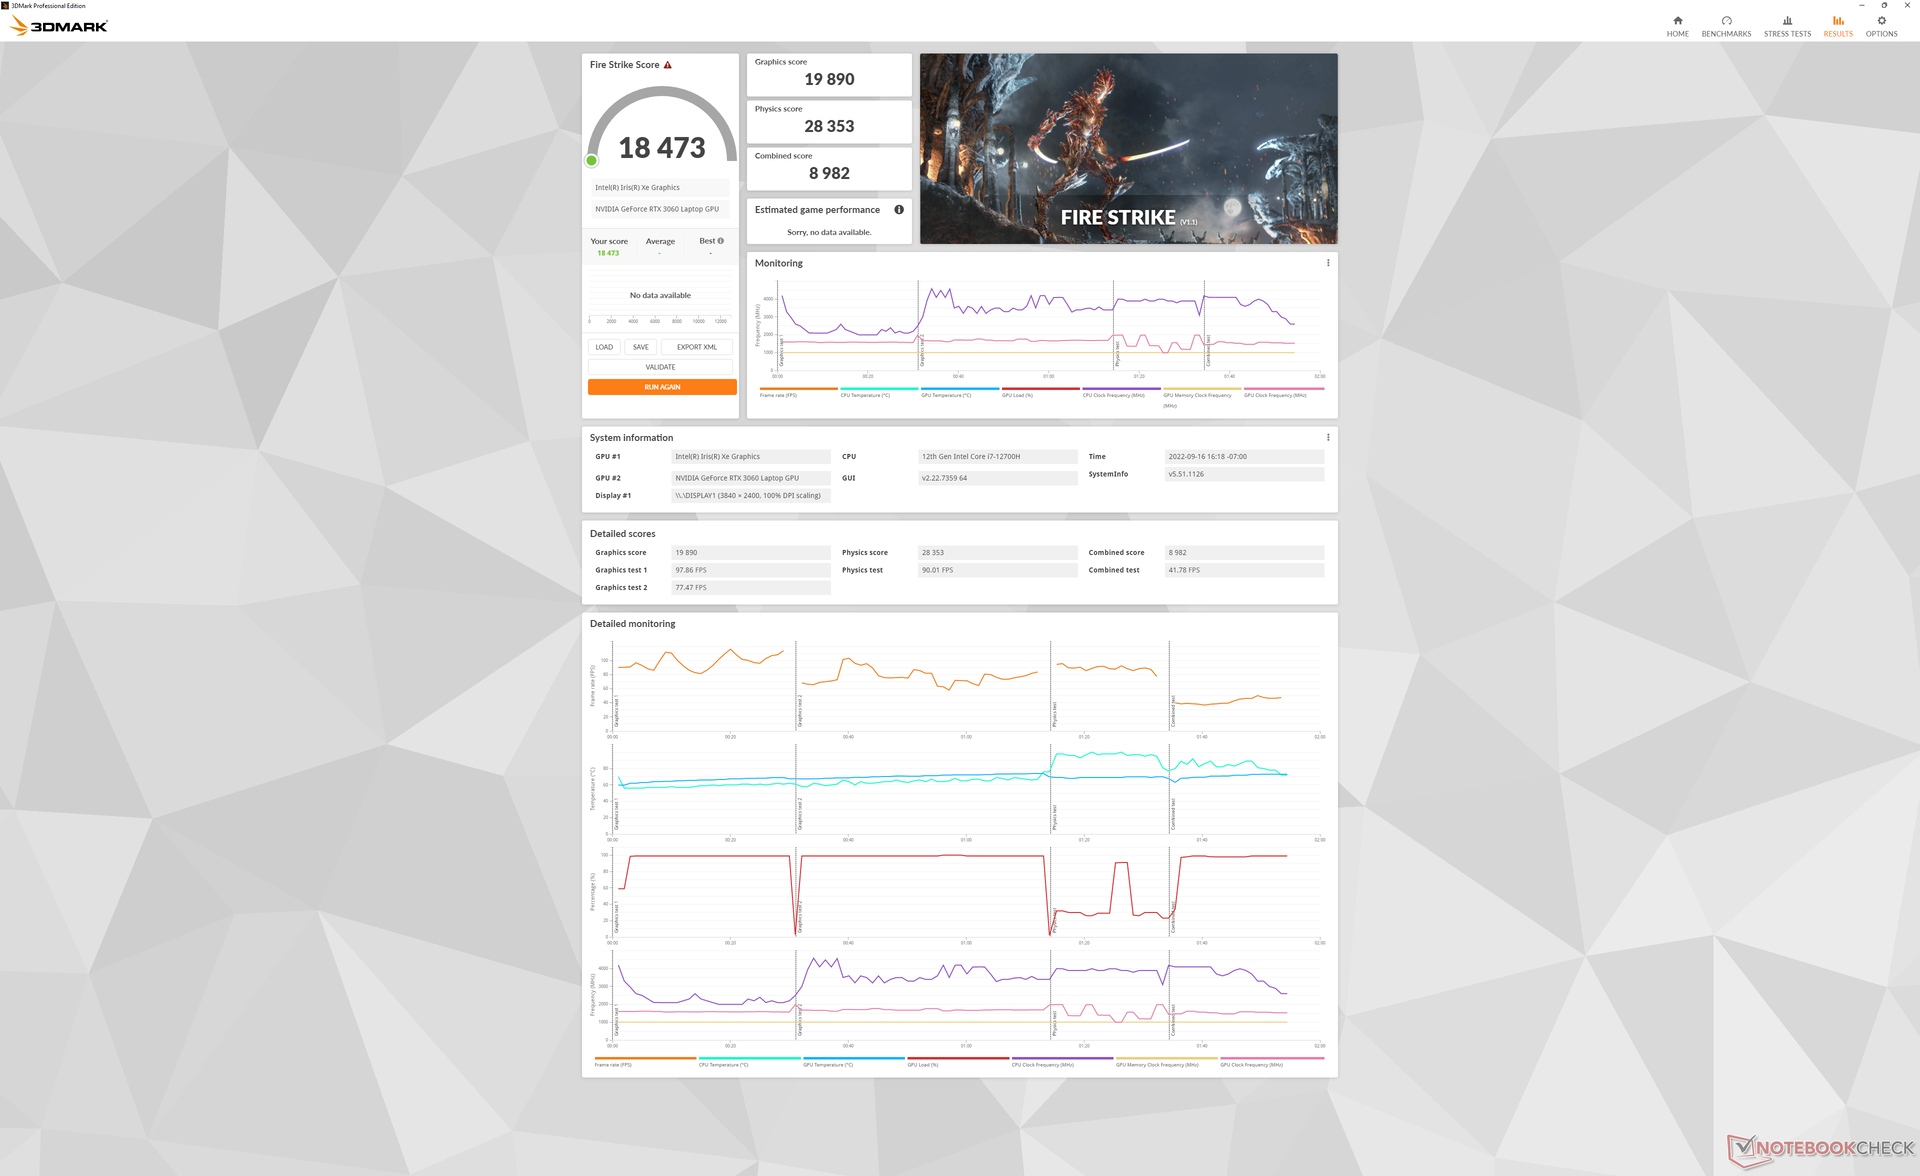
| 3DMark Fire Strike Score | 17118 points | |
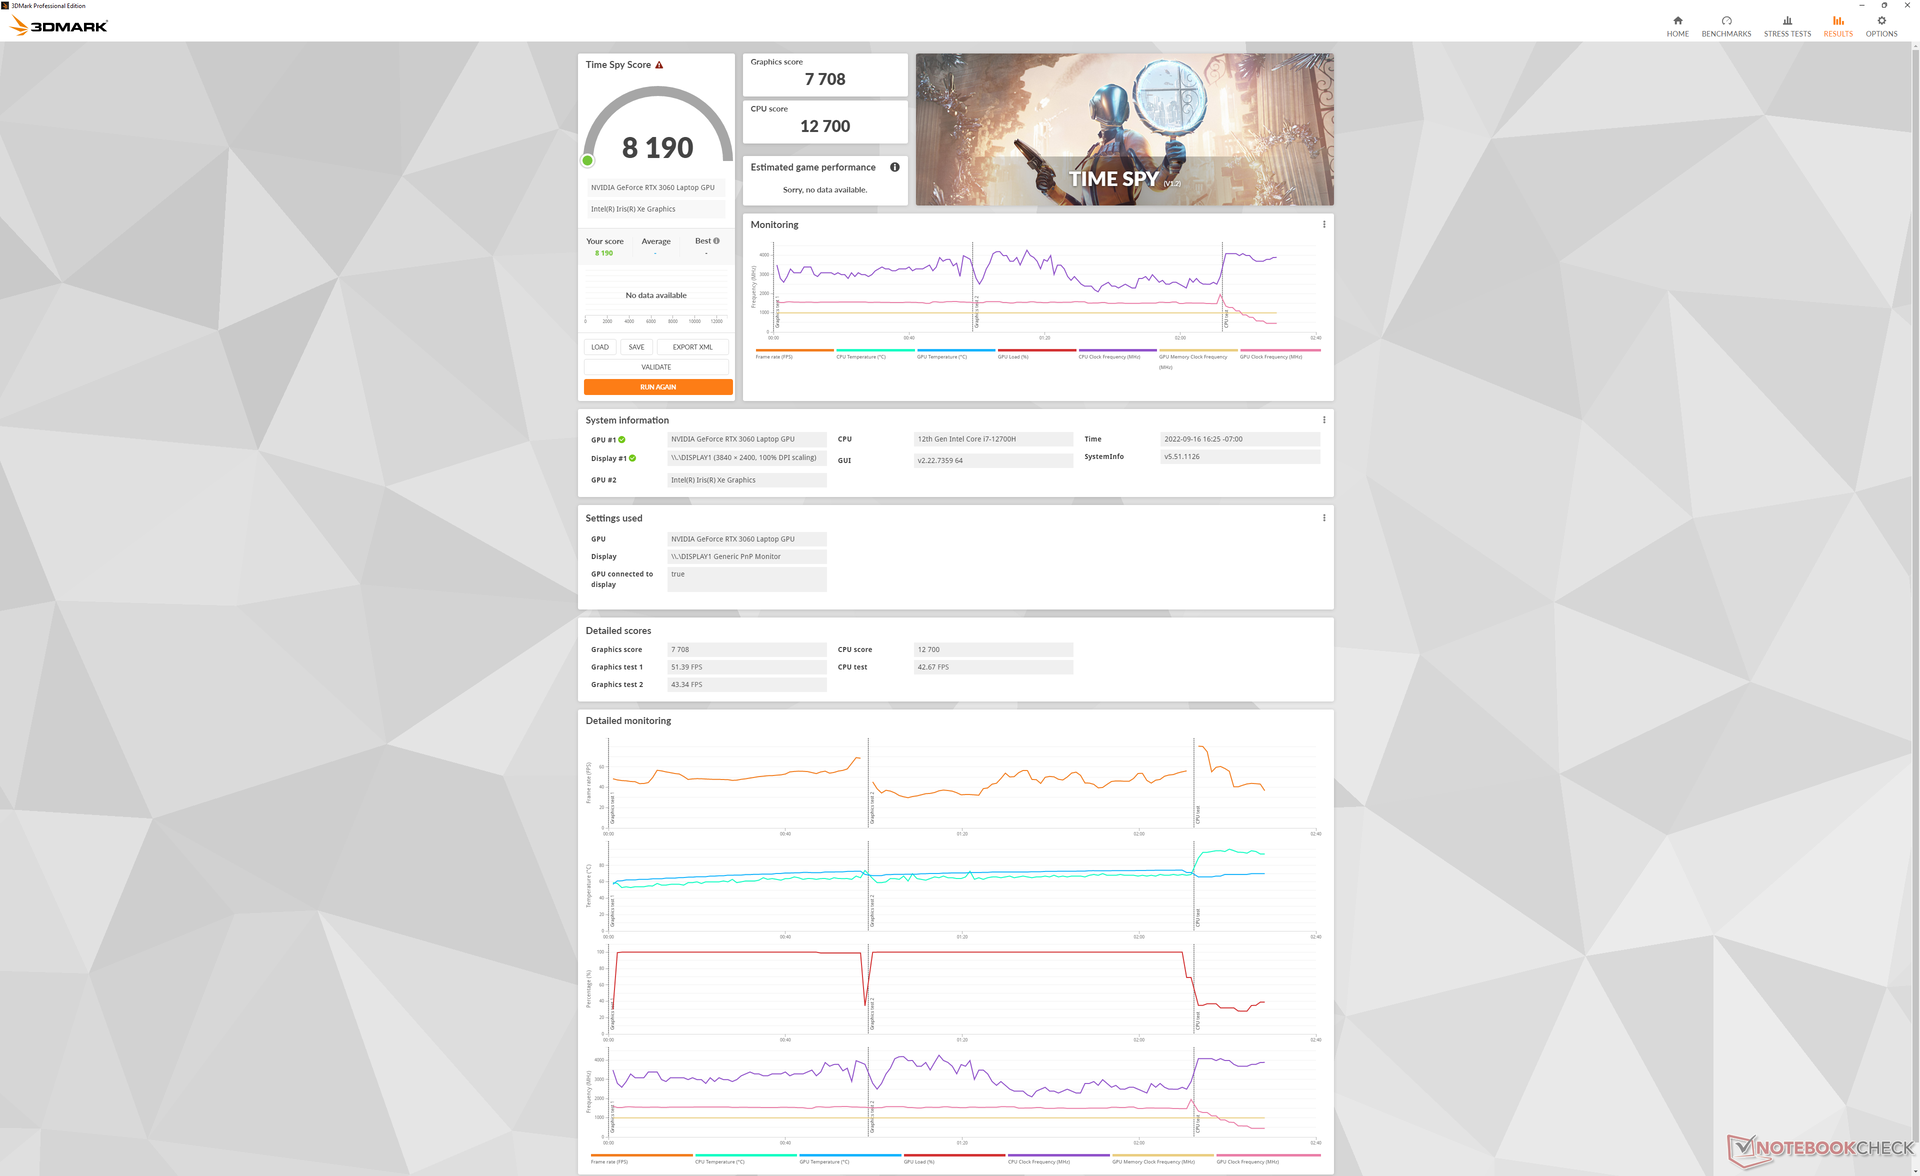
| 3DMark Time Spy Score | 8190 points | |
Aide | ||
Witcher 3 FPS Chart
| Bas | Moyen | Élevé | Ultra | QHD | 4K | |
|---|---|---|---|---|---|---|
| GTA V (2015) | 185.6 | 181.2 | 174.1 | 103.3 | 76.7 | |
| The Witcher 3 (2015) | 402.3 | 264 | 161.2 | 82.8 | 55.1 | |
| Dota 2 Reborn (2015) | 180.6 | 164.8 | 149.1 | 139 | 46.9 | |
| Final Fantasy XV Benchmark (2018) | 177.2 | 111.7 | 83.9 | 62 | 34.6 | |
| X-Plane 11.11 (2018) | 140.3 | 127 | 103 | 60.5 | ||
| Strange Brigade (2018) | 418 | 202 | 162 | 140.4 | 103.5 | |
| Cyberpunk 2077 1.6 (2022) | 115.7 | 94.4 | 72.3 | 59.5 | 17.9 |
Émissions
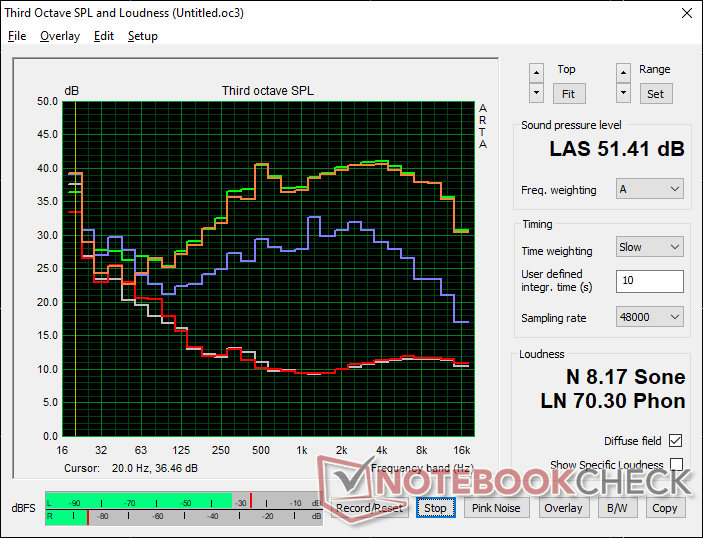
Bruit du système - aussi fort que celui de nombreux ordinateurs portables de jeu
Le bruit du ventilateur a tendance à pulser s'il est réglé sur le profil de puissance Balanced ou supérieur. Attendez-vous à ce que les ventilateurs fassent entre 30 et 34 dB(A) contre un bruit de fond silencieux de 22,8 dB(A) lors de la navigation sur le web ou de la lecture de vidéos. D'autres ordinateurs portables de 16 pouces comme leHuawei MateBook 16s ou le MacBook Pro 16 sont tous capables de rester plus silencieux pendant plus longtemps que le Envy 16.
Les ventilateurs peuvent atteindre 41 dB(A) lors de l'exécution de 3DMark 06, contre seulement 26 dB(A) et 34 dB(A) sur les Apple et Huawei susmentionnés, respectivement
Le bruit du ventilateur devient encore plus fort avec un peu plus de 51 dB(A) lorsque vous exécutez Witcher 3 en mode Performance. Il diminue de manière significative à 41,6 dB(A) en mode Équilibré, mais les performances graphiques sont plus lentes de 5 à 10 %, comme indiqué ci-dessus. Dans l'ensemble, il s'agit d'un ordinateur portable assez bruyant si vous souhaitez exploiter ses performances.
Degré de la nuisance sonore
| Au repos |
| 22.9 / 22.9 / 30.5 dB(A) |
| Fortement sollicité |
| 41.4 / 51.4 dB(A) |
 | ||
30 dB silencieux 40 dB(A) audible 50 dB(A) bruyant |
||
min: | ||
| HP Envy 16 h0112nr GeForce RTX 3060 Laptop GPU, i7-12700H, Micron 3400 1TB MTFDKBA1T0TFH | Lenovo ThinkBook 16 G4+ IAP GeForce RTX 2050 Mobile, i7-12700H, Micron 2450 1TB MTFDKCD1T0TFK | MSI Creator Z16P B12UHST GeForce RTX 3080 Ti Laptop GPU, i9-12900H, Samsung PM9A1 MZVL22T0HBLB | Dell Inspiron 16 Plus 7610-MHJ8F UHD Graphics Xe 32EUs (Tiger Lake-H), i7-11800H, OM3PDP3-AD NVMe KDI 512GB | Apple MacBook Pro 16 2021 M1 Pro M1 Pro 16-Core GPU, M1 Pro, Apple SSD AP1024R | Huawei MateBook 16s i7 Iris Xe G7 96EUs, i7-12700H, Silicon Motion PCIe-8 SSD | |
|---|---|---|---|---|---|---|
| Noise | 1% | -5% | -1% | 10% | 9% | |
| arrêt / environnement * (dB) | 22.8 | 24.2 -6% | 26 -14% | 26.3 -15% | 24.7 -8% | 24 -5% |
| Idle Minimum * (dB) | 22.9 | 24.2 -6% | 27 -18% | 26.3 -15% | 24.7 -8% | 24 -5% |
| Idle Average * (dB) | 22.9 | 24.2 -6% | 29 -27% | 26.3 -15% | 24.7 -8% | 25.2 -10% |
| Idle Maximum * (dB) | 30.5 | 24.2 21% | 31 -2% | 24.7 19% | 27.2 11% | |
| Load Average * (dB) | 41.4 | 47 -14% | 43 -4% | 33 20% | 26.1 37% | 34.8 16% |
| Witcher 3 ultra * (dB) | 51.1 | 47 8% | 43 16% | 44 14% | 34.8 32% | |
| Load Maximum * (dB) | 51.4 | 47 9% | 46 11% | 49.2 4% | 37.4 27% | 39 24% |
* ... Moindre est la valeur, meilleures sont les performances
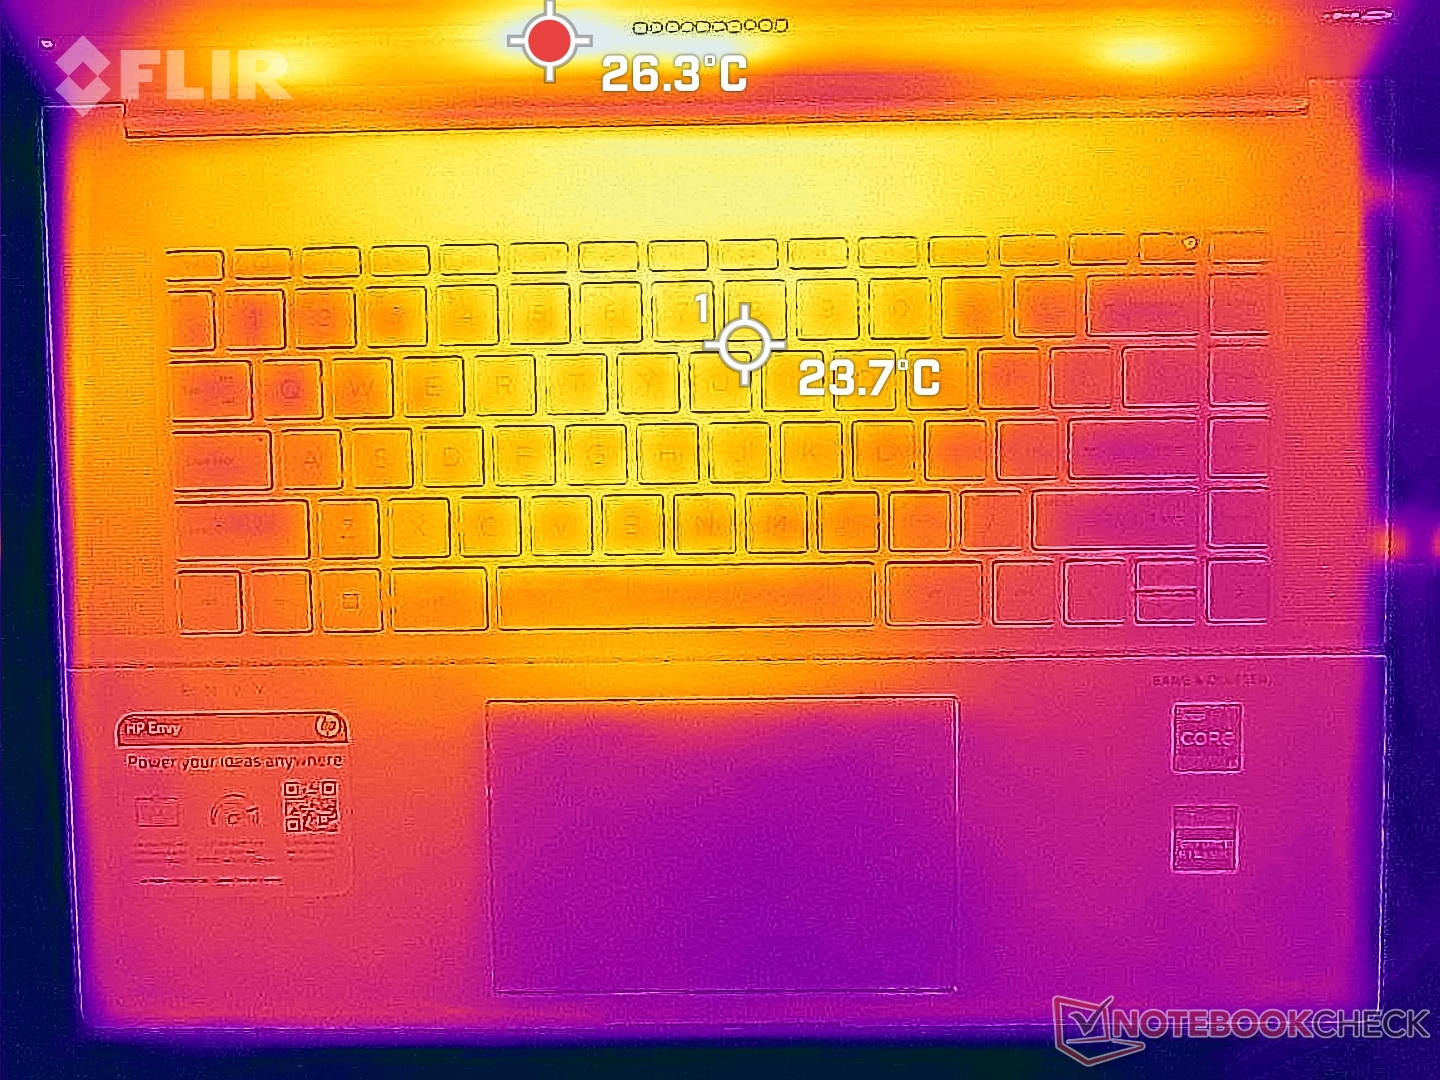
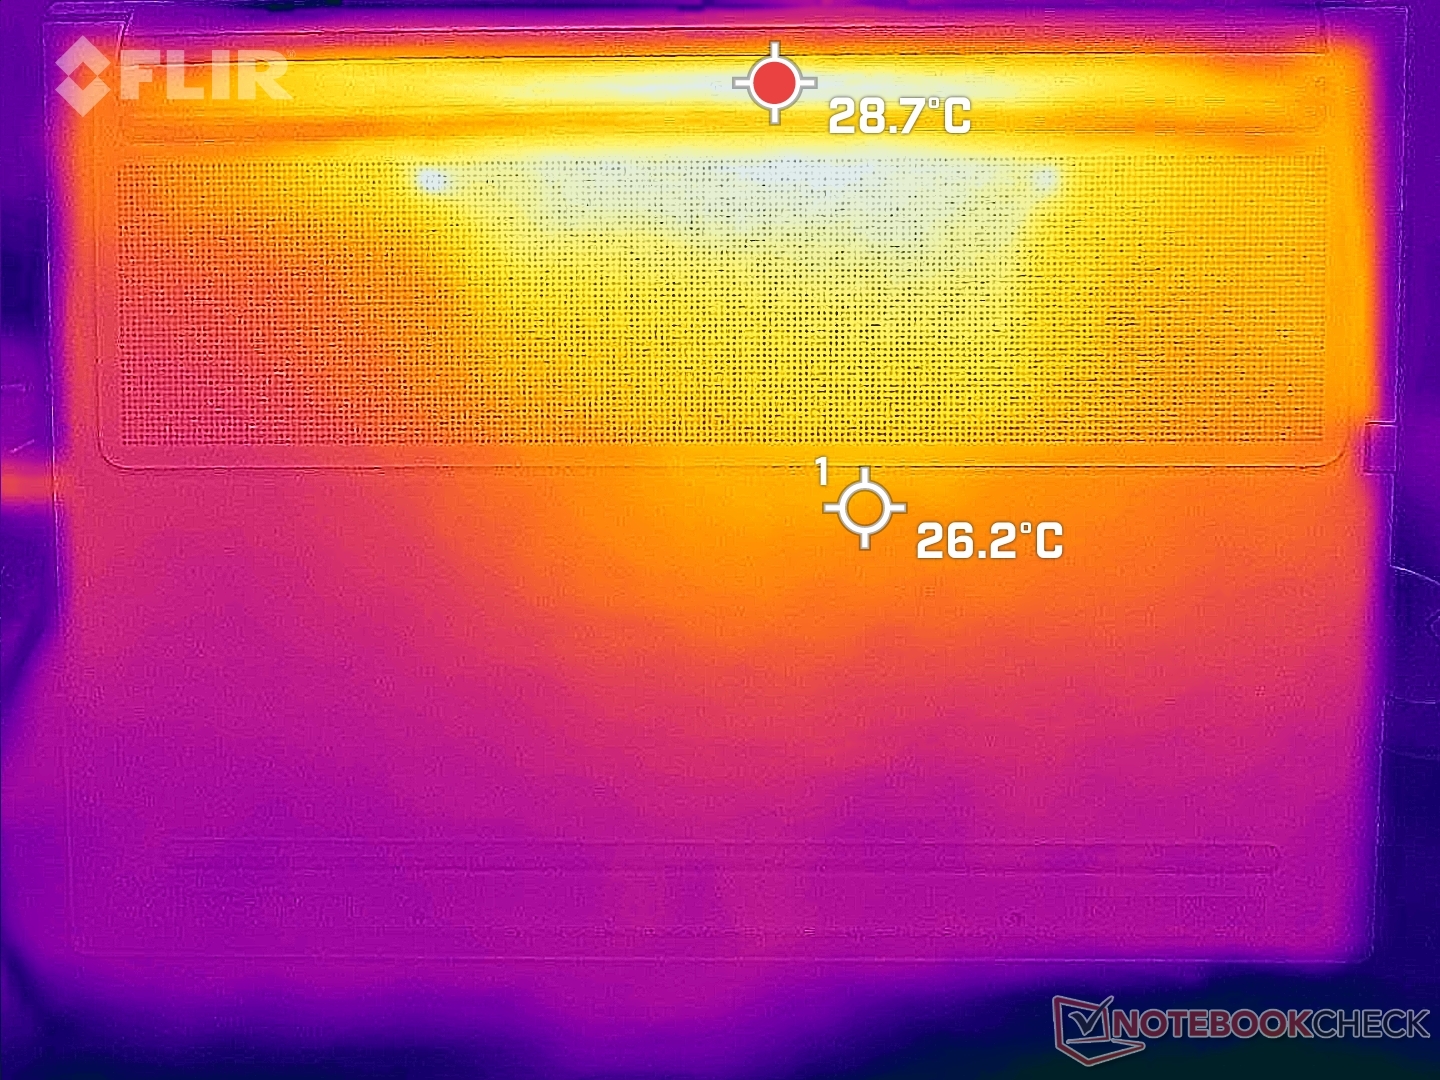
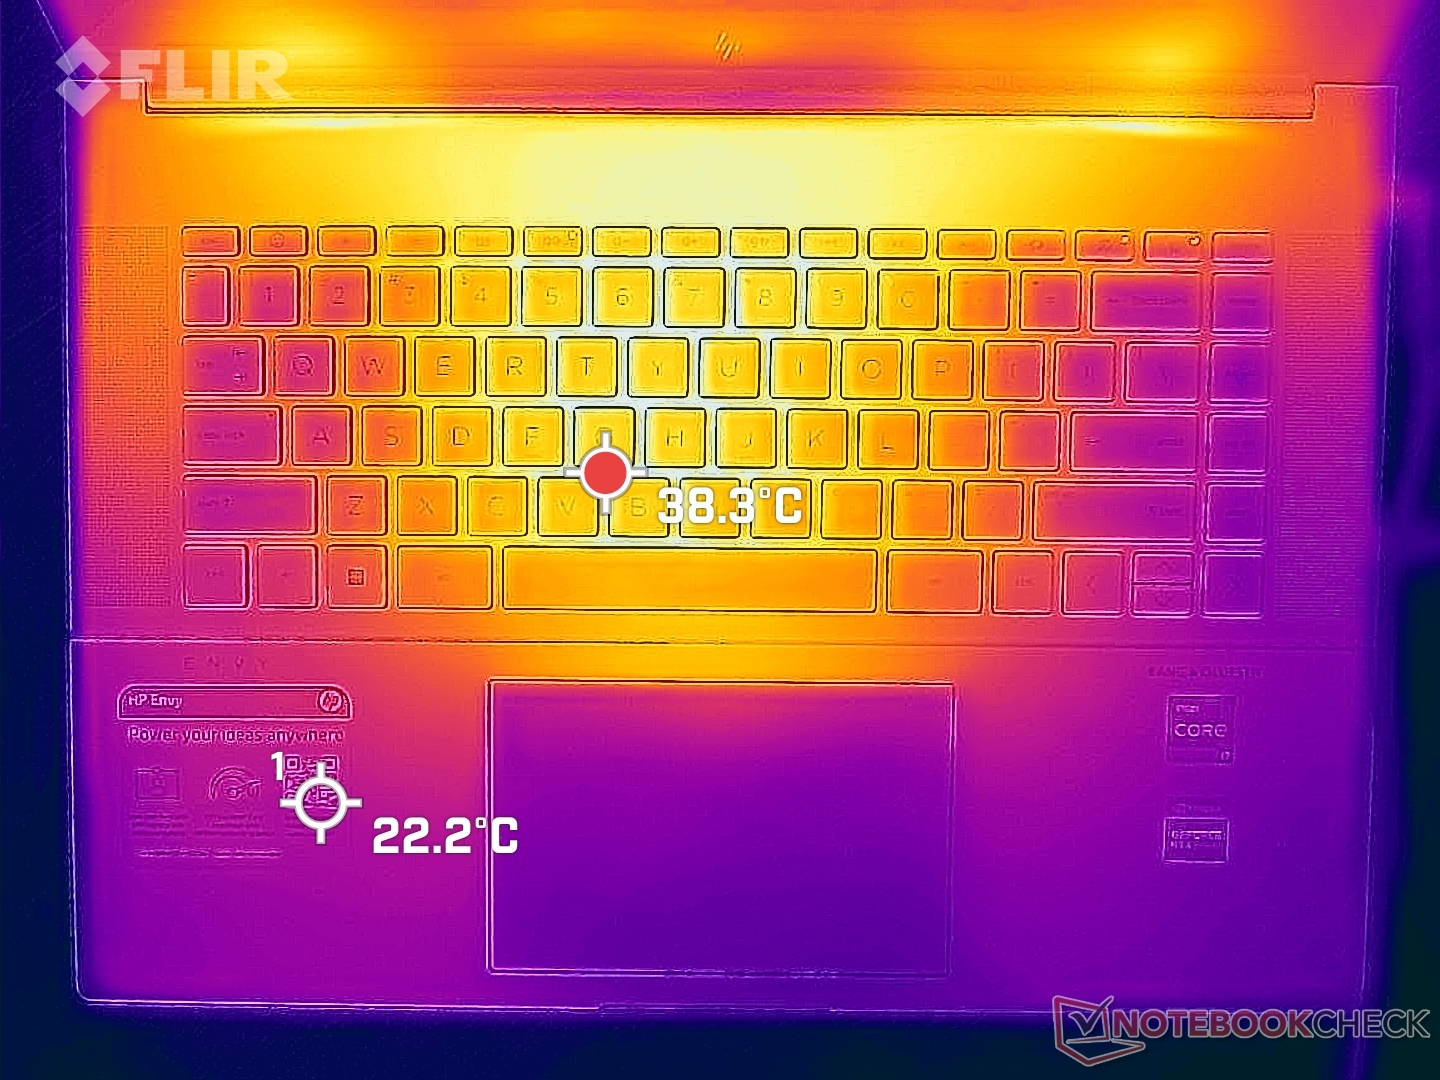
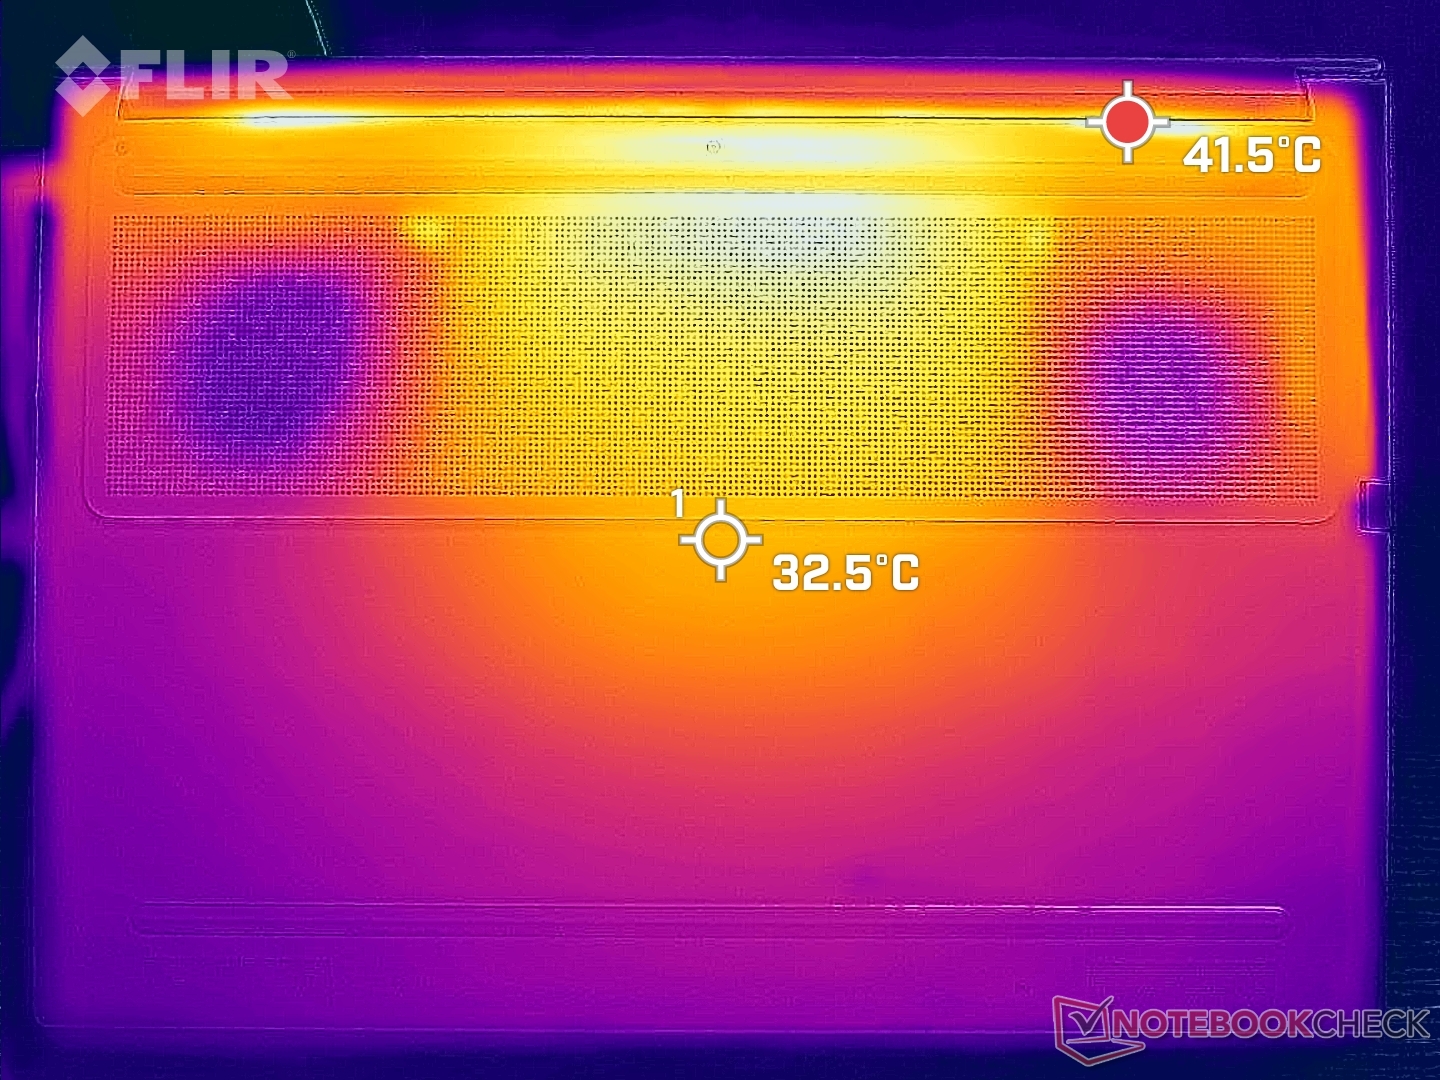
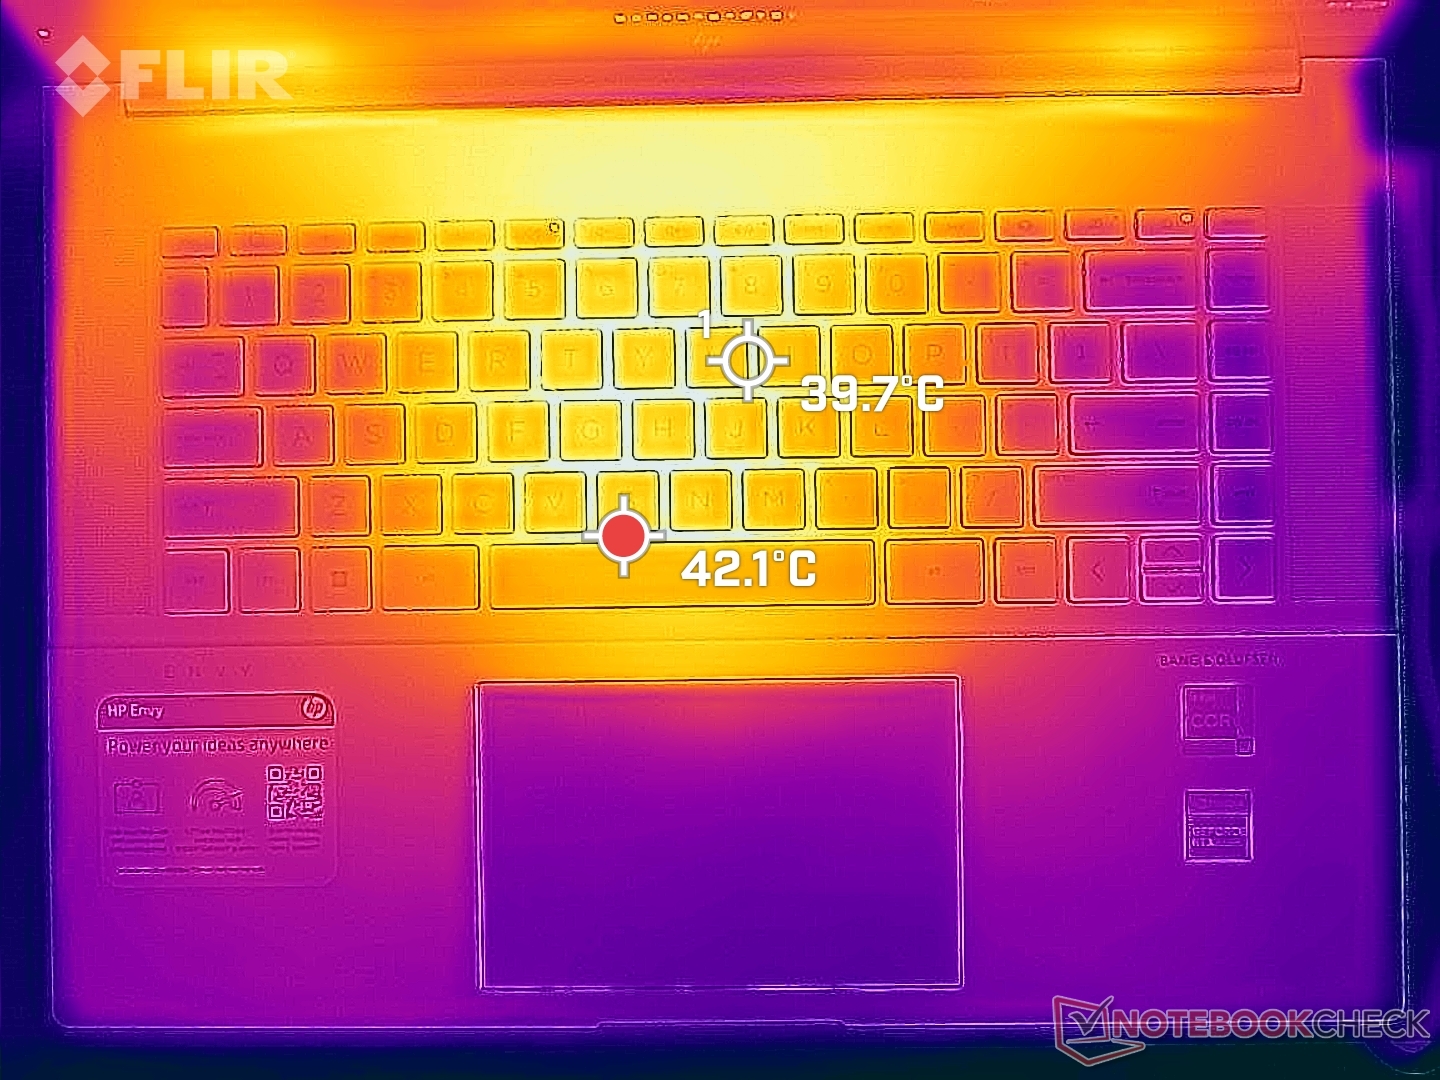
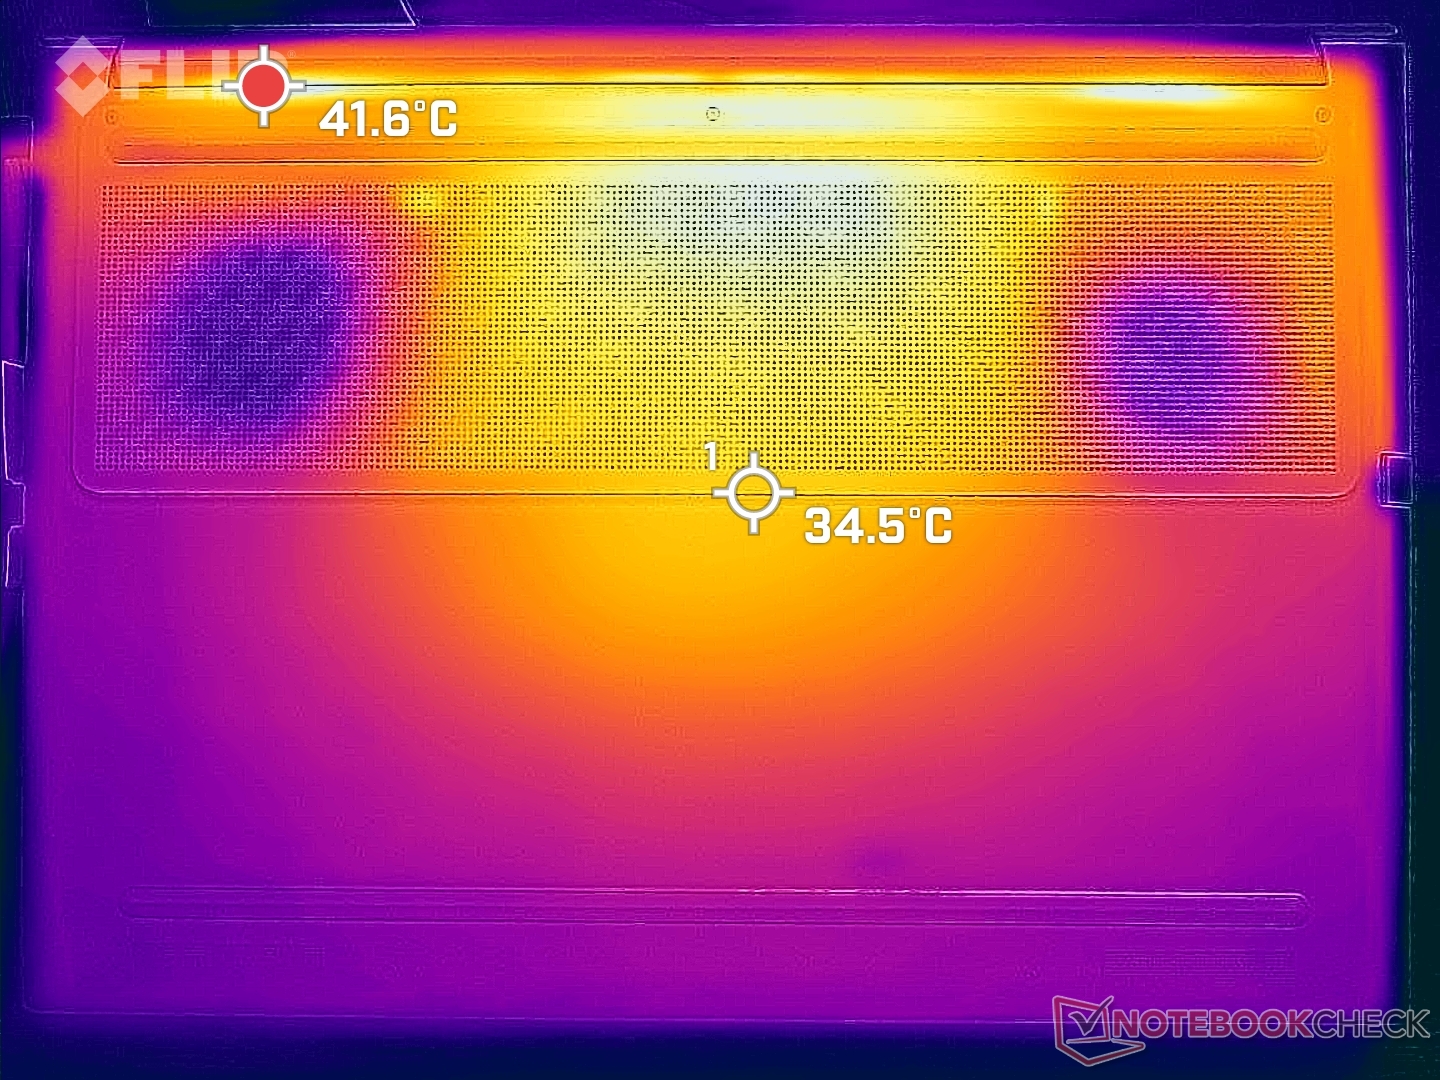
Température
Les températures de surface sont assez élevées, même lorsque l'ordinateur tourne au ralenti et qu'aucune application n'est en cours d'exécution. Les points chauds dans ces conditions peuvent atteindre 33 C sur le dessus et le dessous, contre seulement 26 C sur le ThinkBook 16 G4. En cas de charge élevée, ces mêmes zones peuvent atteindre plus de 45 °C. Les repose-poignets restent relativement frais, mais la partie inférieure peut être inconfortable pour la peau.
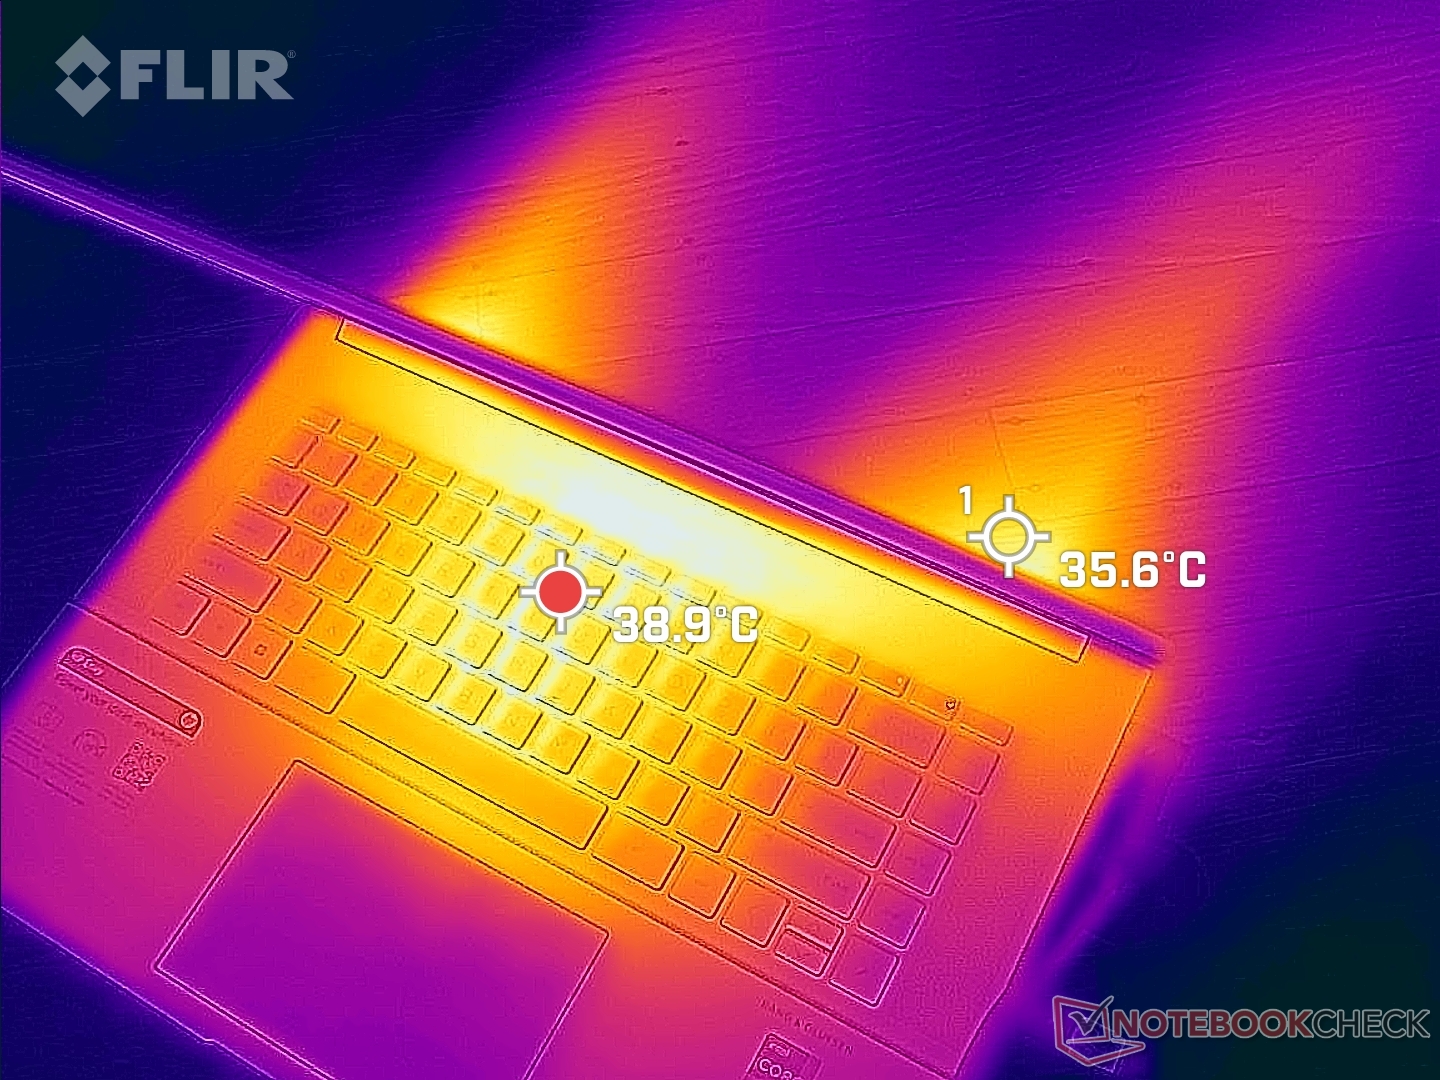
(-) La température maximale du côté supérieur est de 45.2 °C / 113 F, par rapport à la moyenne de 36.8 °C / 98 F, allant de 21 à 71 °C pour la classe Multimedia.
(±) Le fond chauffe jusqu'à un maximum de 44 °C / 111 F, contre une moyenne de 39.1 °C / 102 F
(+) En utilisation inactive, la température moyenne du côté supérieur est de 31 °C / 88 F, par rapport à la moyenne du dispositif de 31.3 °C / 88 F.
(±) En jouant à The Witcher 3, la température moyenne du côté supérieur est de 33.6 °C / 92 F, alors que la moyenne de l'appareil est de 31.3 °C / 88 F.
(+) Les repose-poignets et le pavé tactile sont plus froids que la température de la peau avec un maximum de 29.8 °C / 85.6 F et sont donc froids au toucher.
(±) La température moyenne de la zone de l'appui-paume de dispositifs similaires était de 28.7 °C / 83.7 F (-1.1 °C / #-1.9 F).
| HP Envy 16 h0112nr Intel Core i7-12700H, NVIDIA GeForce RTX 3060 Laptop GPU | Lenovo ThinkBook 16 G4+ IAP Intel Core i7-12700H, NVIDIA GeForce RTX 2050 Mobile | MSI Creator Z16P B12UHST Intel Core i9-12900H, NVIDIA GeForce RTX 3080 Ti Laptop GPU | Dell Inspiron 16 Plus 7610-MHJ8F Intel Core i7-11800H, Intel UHD Graphics Xe 32EUs (Tiger Lake-H) | Apple MacBook Pro 16 2021 M1 Pro Apple M1 Pro, Apple M1 Pro 16-Core GPU | Huawei MateBook 16s i7 Intel Core i7-12700H, Intel Iris Xe Graphics G7 96EUs | |
|---|---|---|---|---|---|---|
| Heat | 8% | -20% | 4% | 19% | 5% | |
| Maximum Upper Side * (°C) | 45.2 | 42.9 5% | 67 -48% | 43.4 4% | 41 9% | 40.9 10% |
| Maximum Bottom * (°C) | 44 | 50.6 -15% | 69 -57% | 45.1 -3% | 39 11% | 48.3 -10% |
| Idle Upper Side * (°C) | 33.6 | 26 23% | 29 14% | 30.6 9% | 24 29% | 29.2 13% |
| Idle Bottom * (°C) | 32.6 | 26.5 19% | 29 11% | 31.1 5% | 24 26% | 30.4 7% |
* ... Moindre est la valeur, meilleures sont les performances
Test de stress - Turbo Boost limité
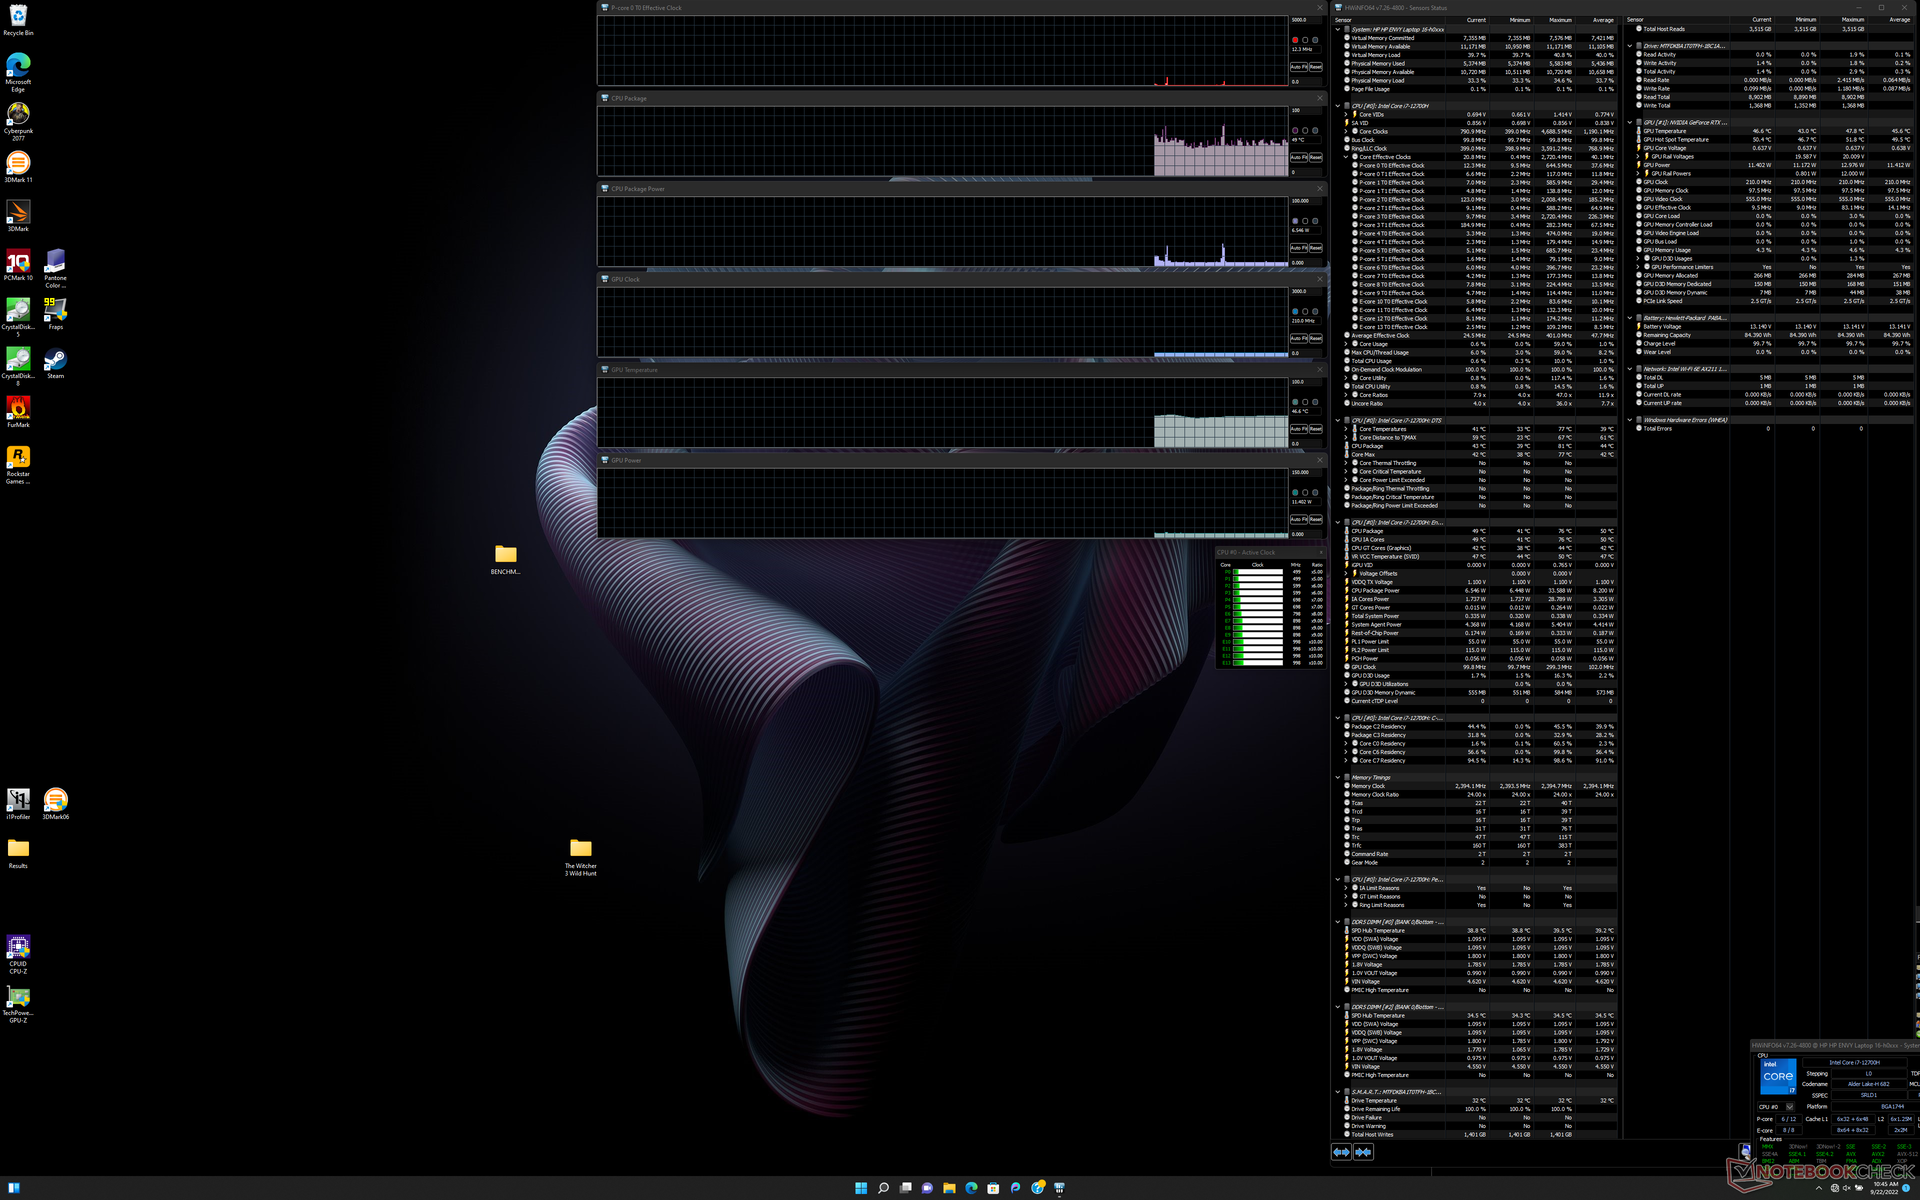
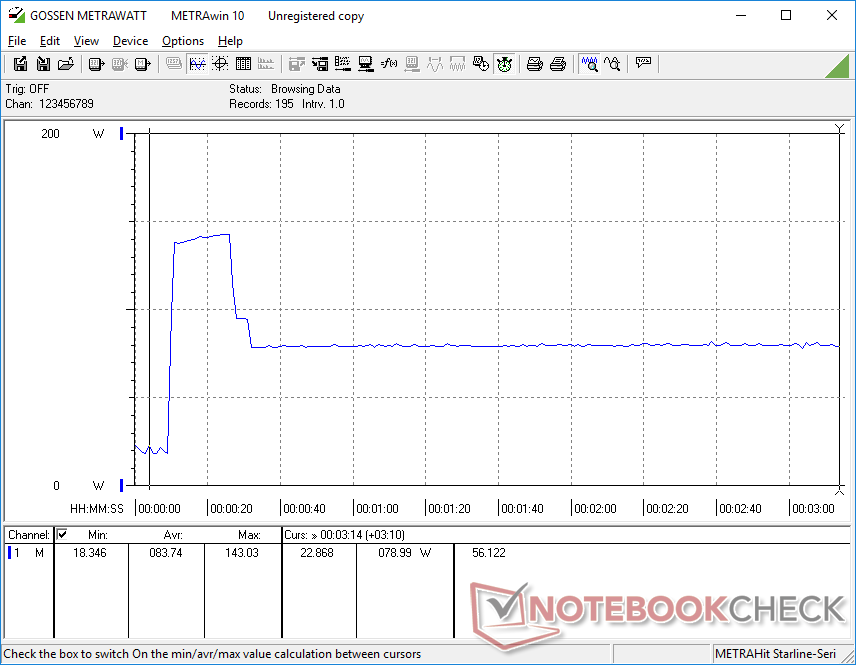
L'exécution de Prime95 fait grimper la fréquence d'horloge du CPU, la température et la consommation d'énergie de la carte à 3,7 GHz, 80 C et 115 W, respectivement, pendant environ 15 secondes. Ensuite, le CPU baisse et se stabilise à 2.1 ou 2.2 GHz, 66 C, et 55 W, respectivement. En comparaison, l'exécution de ce même test sur le MSI GS77 avec le même processeur Core i7-12700H, on obtient des fréquences d'horloge stables plus élevées et des températures du cœur de 2,7 à 3,0 GHz et 96 C, respectivement. HP a peut-être choisi la voie la plus sûre avec son Envy 16 en utilisant des fréquences d'horloge Turbo Boost plus basses afin de maintenir des températures plus basses.
Les fréquences d'horloge du GPU, la température et la consommation d'énergie de la carte se stabilisent à 1717 MHz, 74 C et 94 W, respectivement, en mode Performance Witcher 3 en mode Performance. Cela tombe à 1542 MHz, 72 C et 80 W si le jeu est exécuté en mode équilibré. Les utilisateurs devront supporter le bruit maximal du ventilateur du système s'ils souhaitent exploiter le GPU au maximum.
Le fonctionnement sur batterie limite les performances. Un test Fire Strike sur batterie donnerait des scores de physique et de graphisme de 17295 et 10572 points, respectivement, contre 28353 et 19890 points sur secteur.
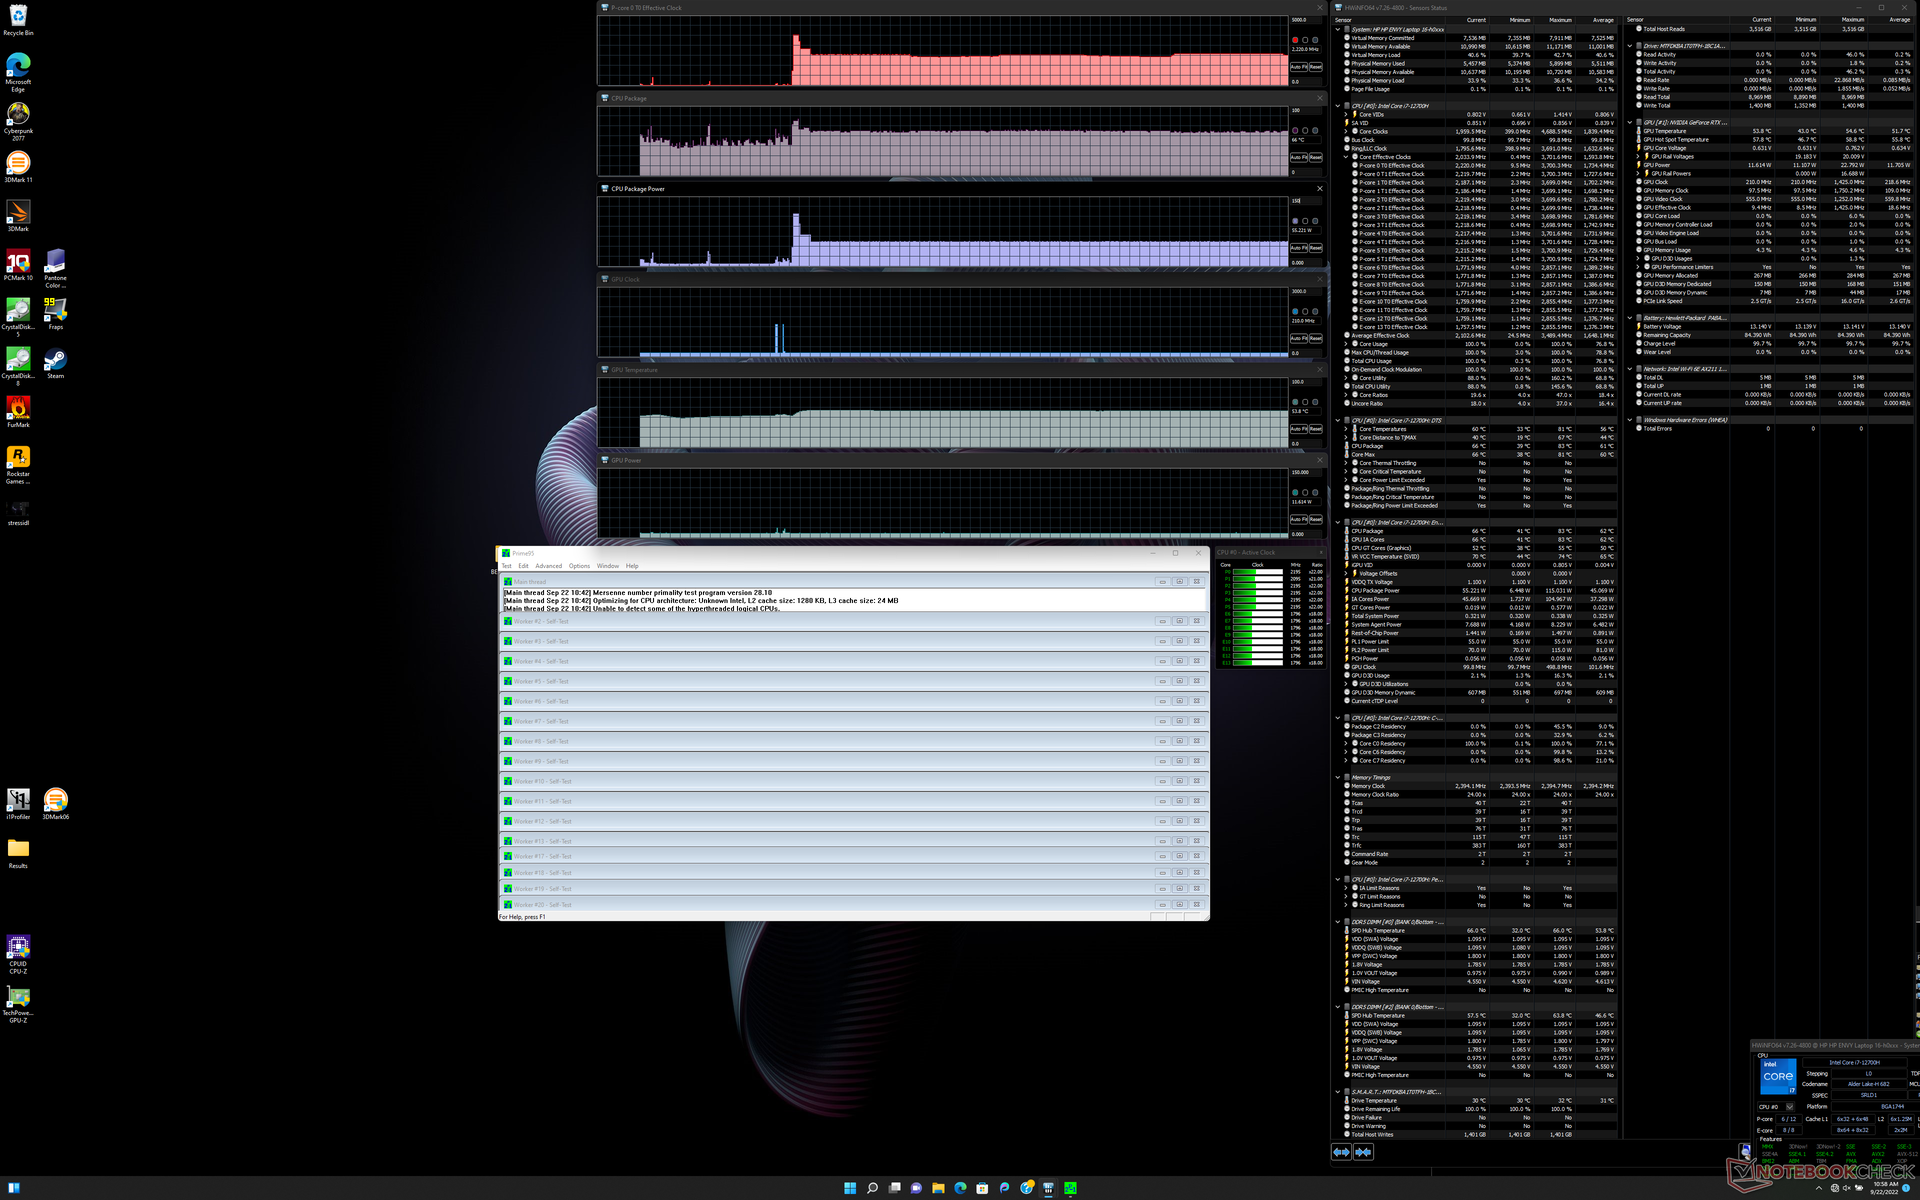
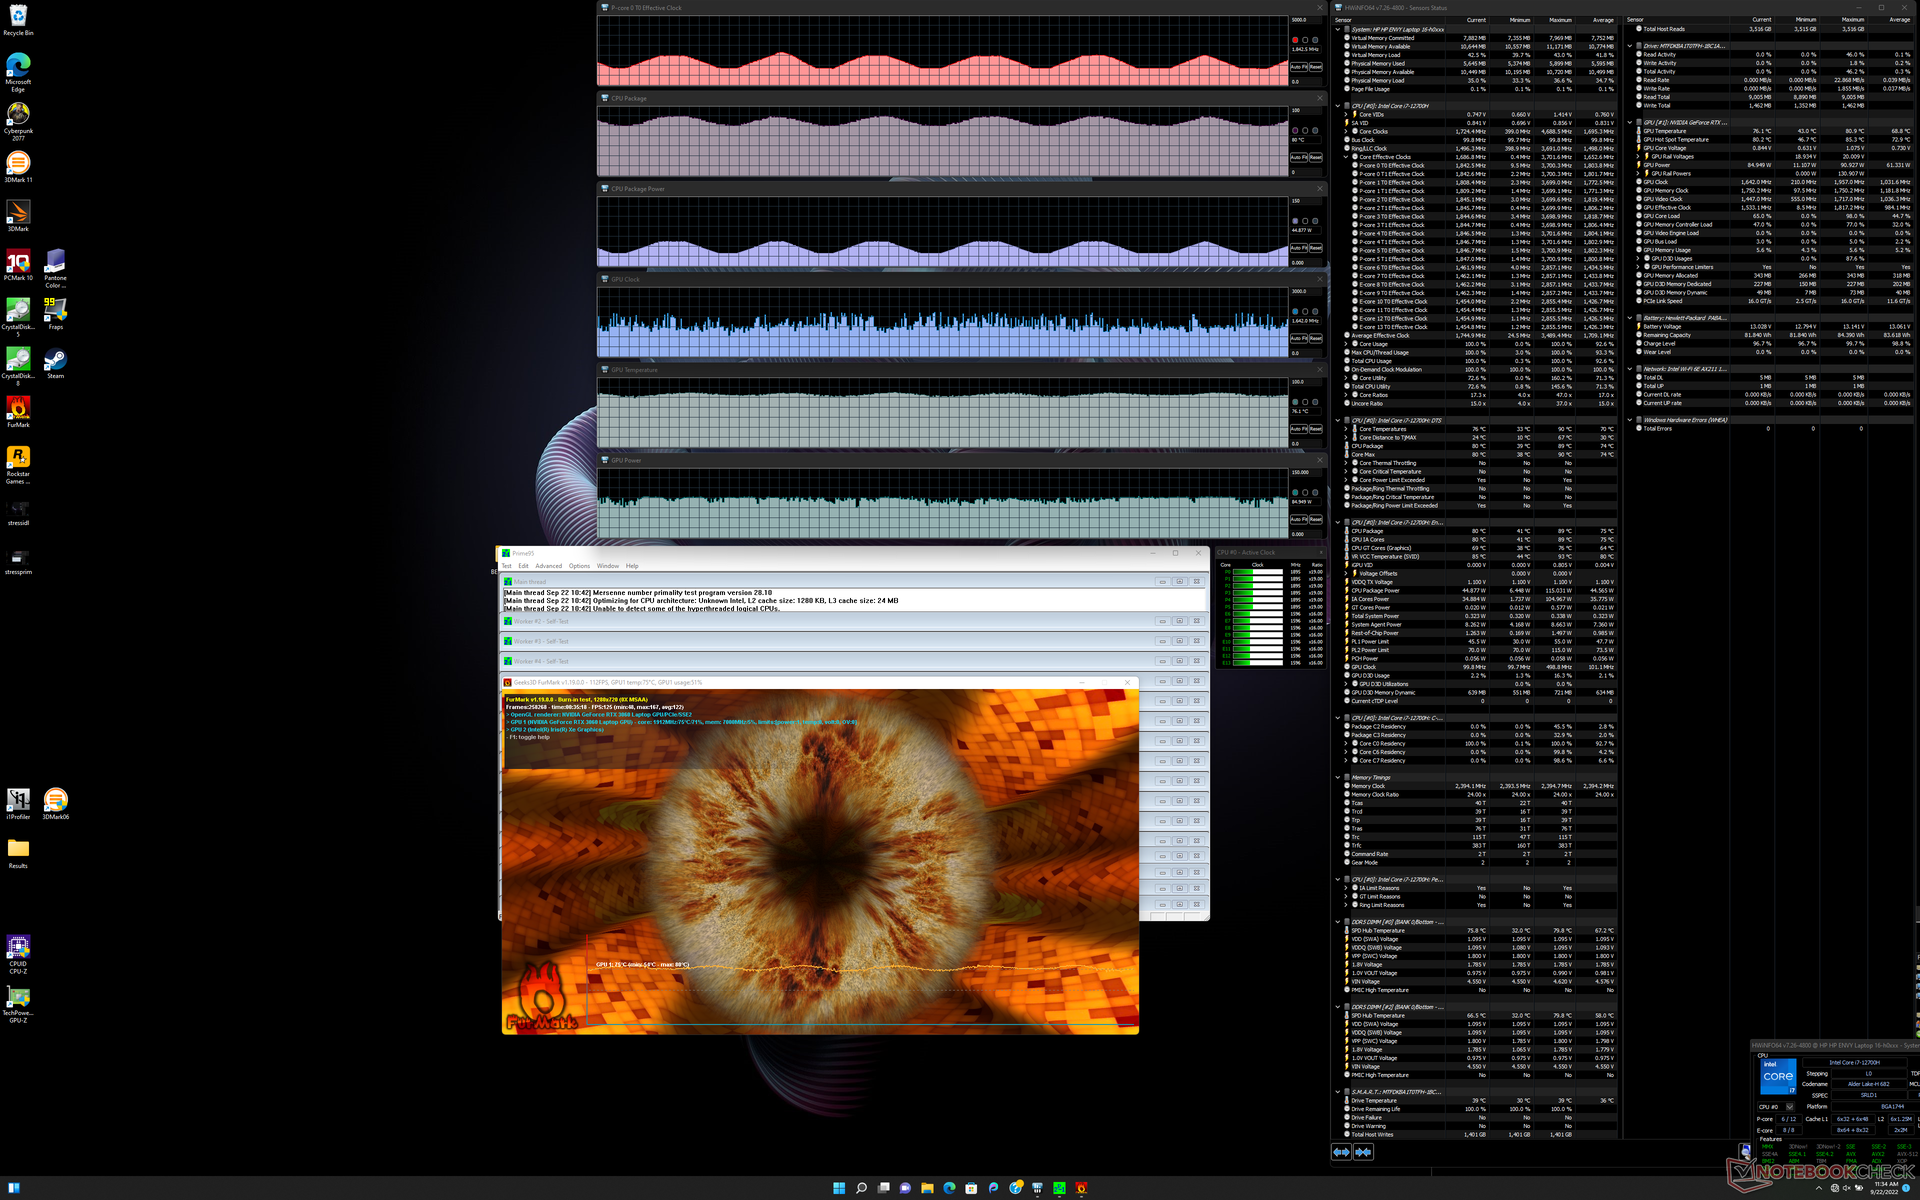
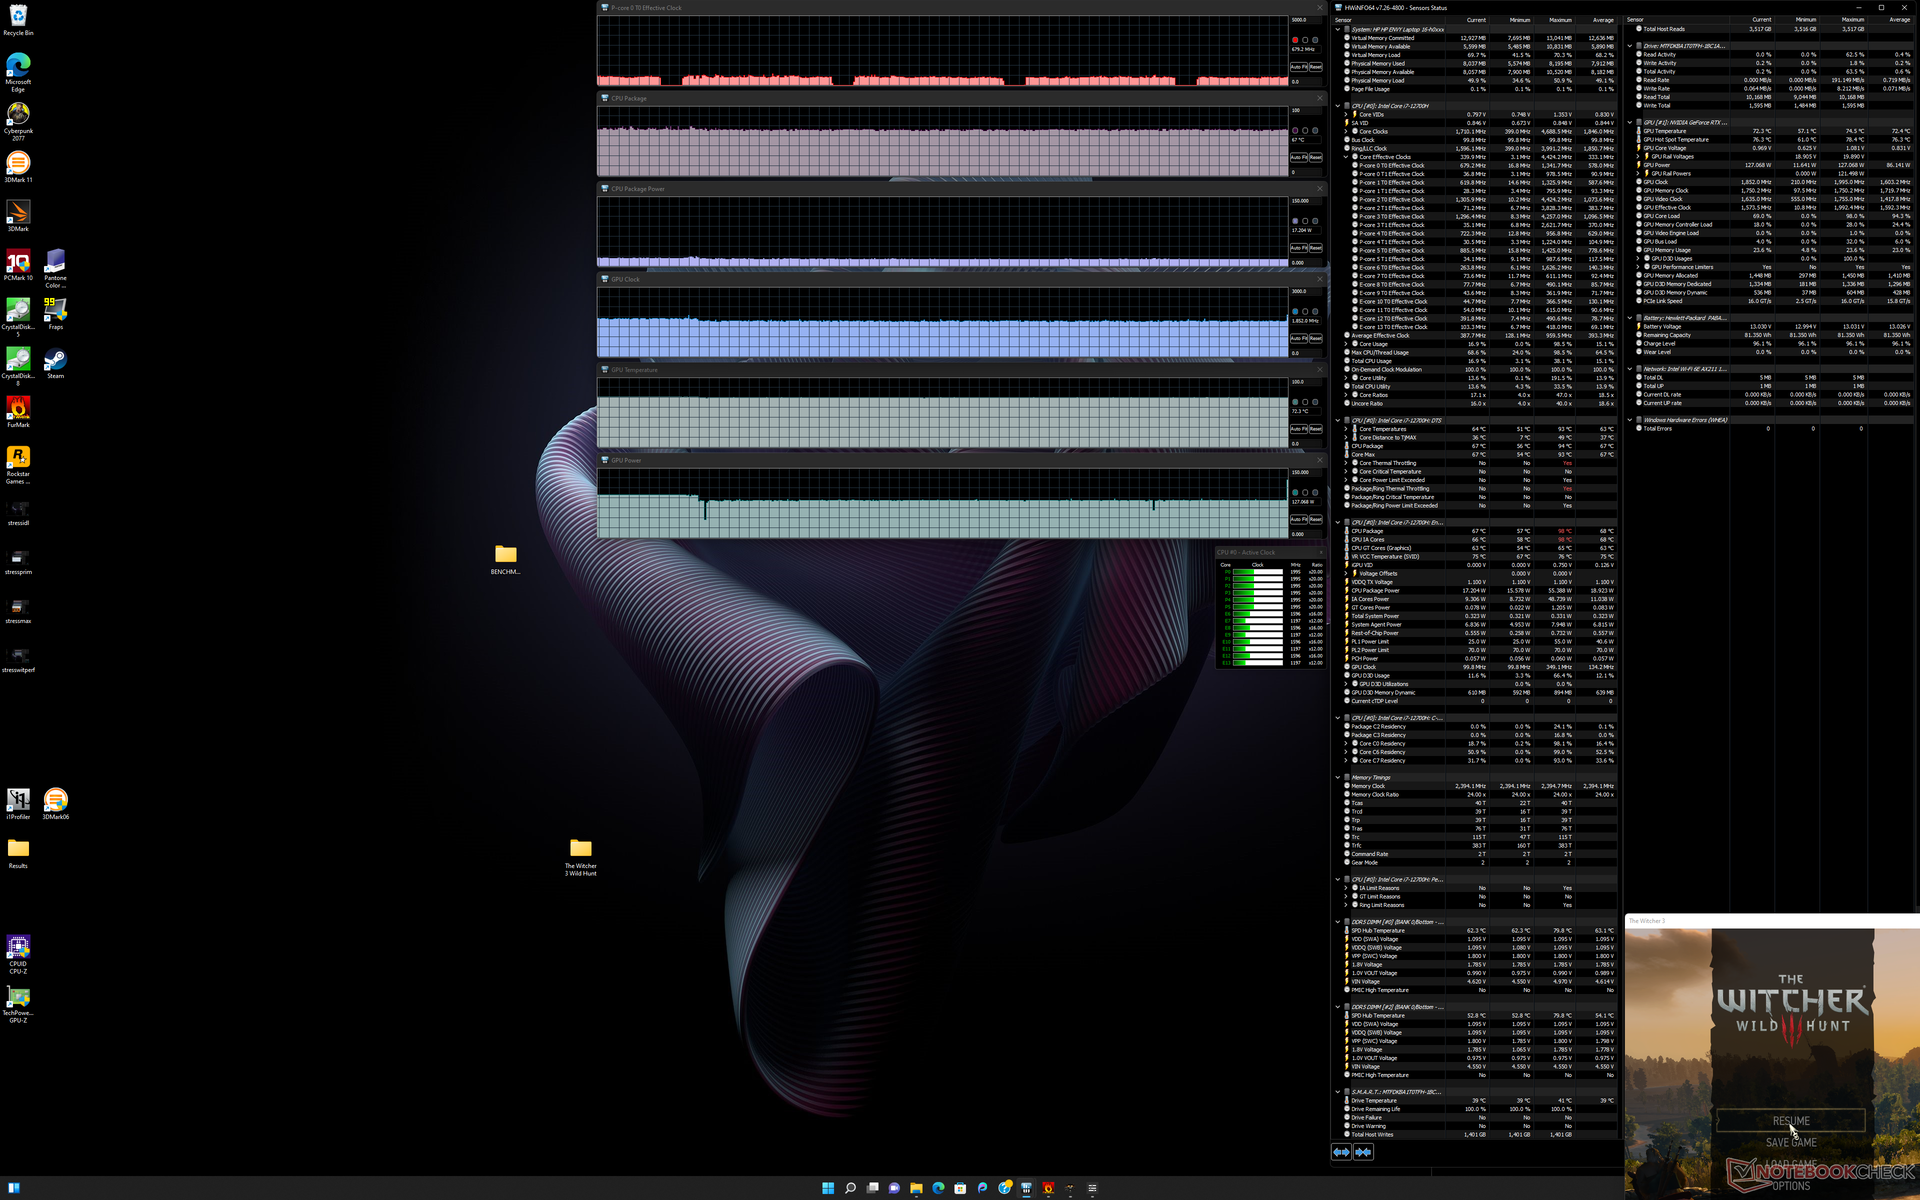
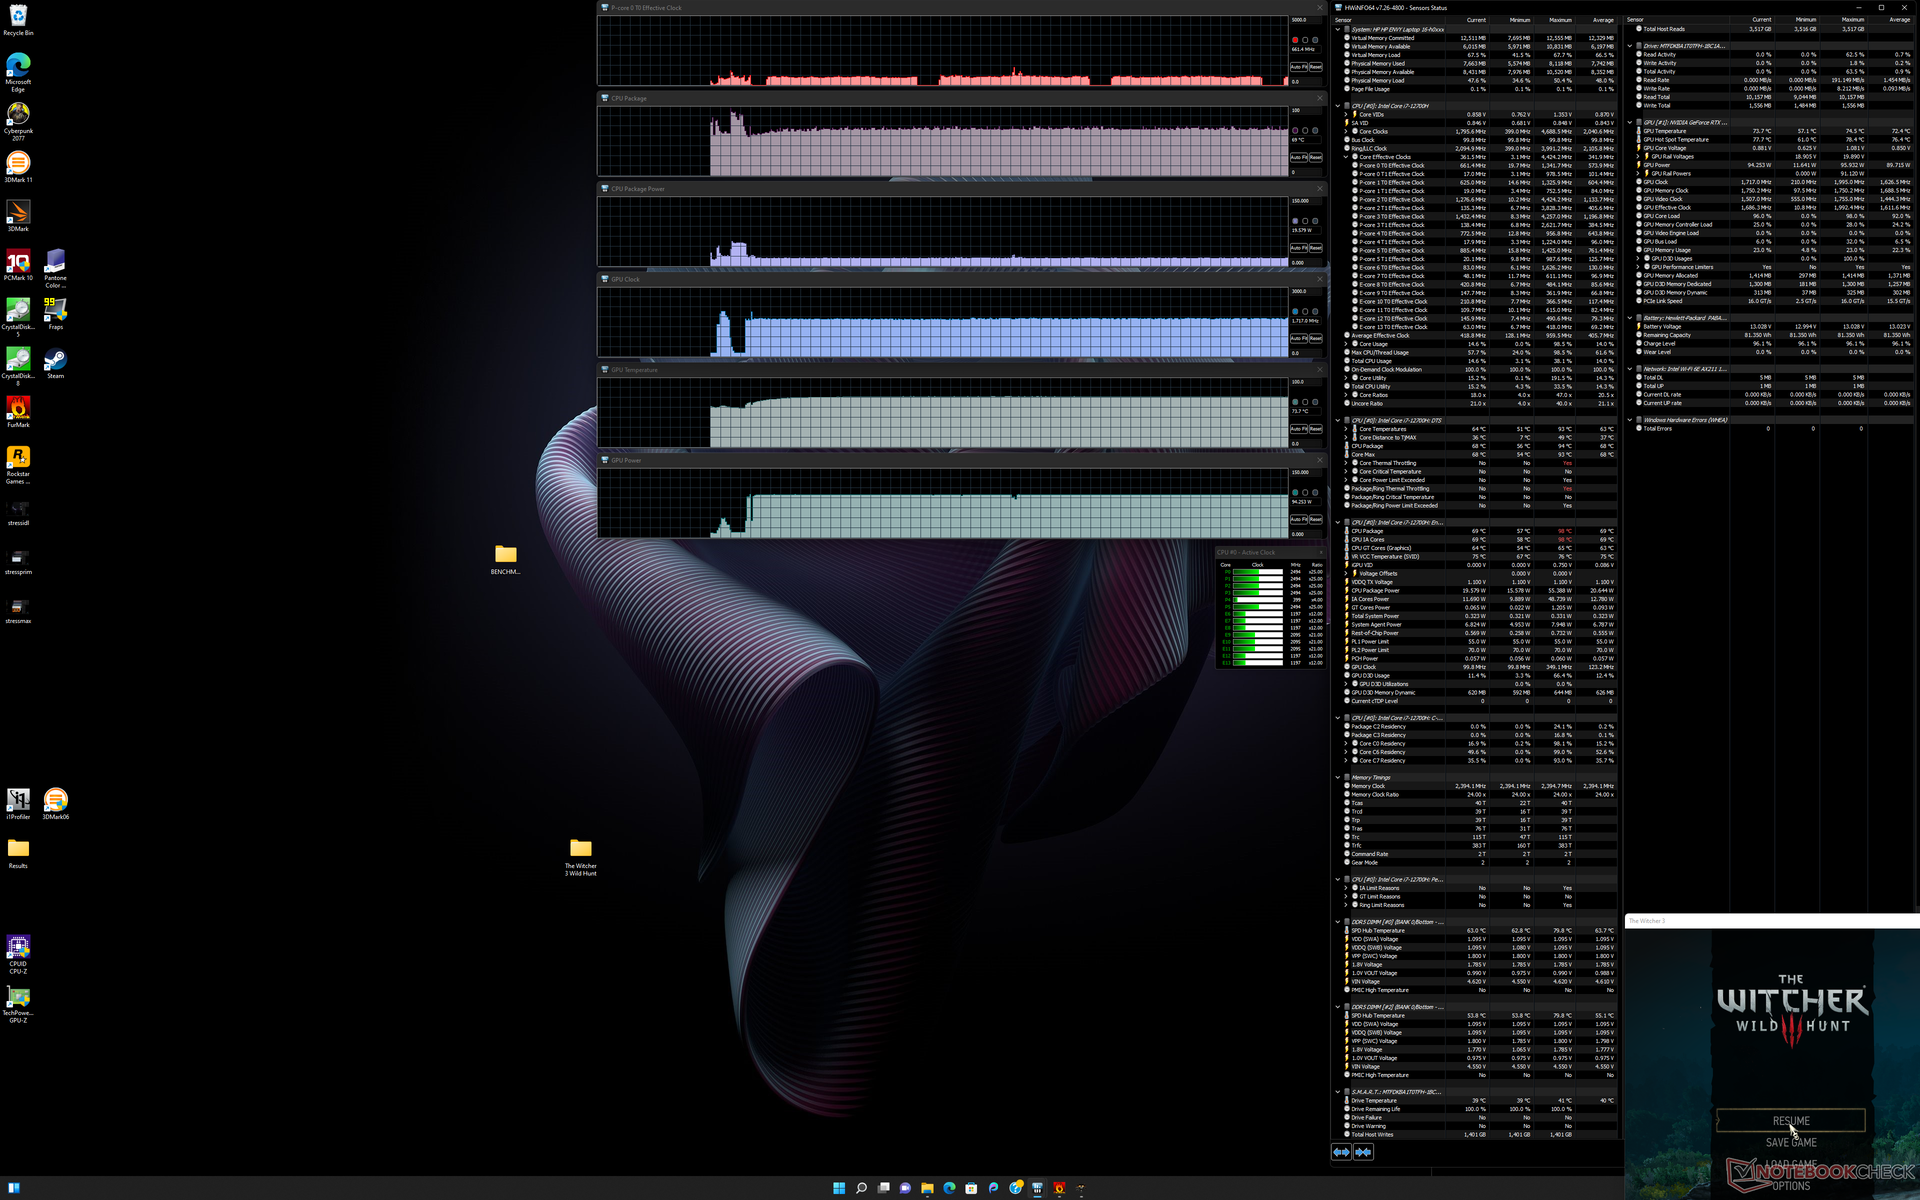
| Fréquence CPU (GHz) | Fréquence GPU (MHz) | Température CPU moyenne (°C) | Température GPU moyenne (°C) | |
| Système au repos | -- | -- | 49 | 47 |
| Prime95 Stress | 2.1 - 2.2 | -- | 66 | 54 |
| Prime95 + FurMark Stress | 1.2 - 2.2 | ~1642 | 74 - 87 | 76 |
| Witcher 3 Stress (mode équilibré) | 0.67 | 1542 | 67 | 72 |
| Witcher 3 Stress (mode Performance) | 0.67 | 1717 | 69 | 74 |
Haut-parleurs
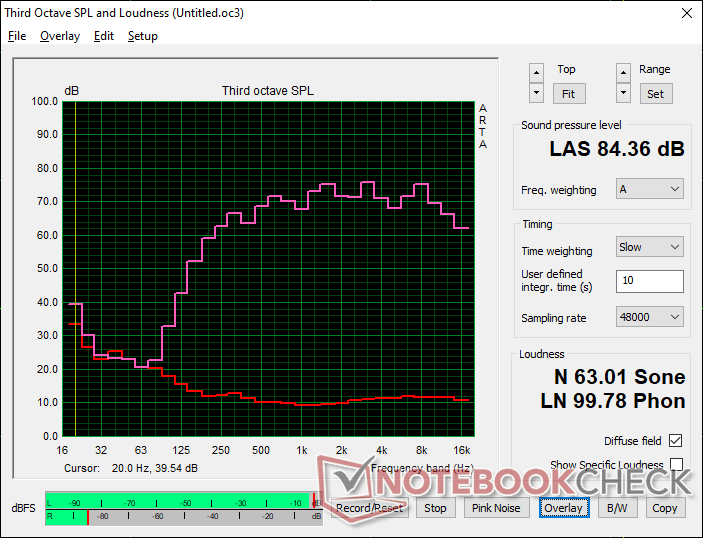
HP Envy 16 h0112nr analyse audio
(+) | les haut-parleurs peuvent jouer relativement fort (84.4# dB)
Basses 100 - 315 Hz
(-) | presque aucune basse - en moyenne 15.9% plus bas que la médiane
(±) | la linéarité des basses est moyenne (12.8% delta à la fréquence précédente)
Médiums 400 - 2000 Hz
(+) | médiane équilibrée - seulement 3.1% de la médiane
(+) | les médiums sont linéaires (5.5% delta à la fréquence précédente)
Aiguës 2 - 16 kHz
(+) | des sommets équilibrés - à seulement 3.4% de la médiane
(+) | les aigus sont linéaires (6.3% delta à la fréquence précédente)
Globalement 100 - 16 000 Hz
(+) | le son global est linéaire (12.1% différence à la médiane)
Par rapport à la même classe
» 22% de tous les appareils testés de cette catégorie étaient meilleurs, 3% similaires, 76% pires
» Le meilleur avait un delta de 5%, la moyenne était de 17%, le pire était de 45%.
Par rapport à tous les appareils testés
» 9% de tous les appareils testés étaient meilleurs, 2% similaires, 88% pires
» Le meilleur avait un delta de 4%, la moyenne était de 24%, le pire était de 134%.
Apple MacBook Pro 16 2021 M1 Pro analyse audio
(+) | les haut-parleurs peuvent jouer relativement fort (84.7# dB)
Basses 100 - 315 Hz
(+) | bonne basse - seulement 3.8% loin de la médiane
(+) | les basses sont linéaires (5.2% delta à la fréquence précédente)
Médiums 400 - 2000 Hz
(+) | médiane équilibrée - seulement 1.3% de la médiane
(+) | les médiums sont linéaires (2.1% delta à la fréquence précédente)
Aiguës 2 - 16 kHz
(+) | des sommets équilibrés - à seulement 1.9% de la médiane
(+) | les aigus sont linéaires (2.7% delta à la fréquence précédente)
Globalement 100 - 16 000 Hz
(+) | le son global est linéaire (4.6% différence à la médiane)
Par rapport à la même classe
» 0% de tous les appareils testés de cette catégorie étaient meilleurs, 0% similaires, 100% pires
» Le meilleur avait un delta de 5%, la moyenne était de 17%, le pire était de 45%.
Par rapport à tous les appareils testés
» 0% de tous les appareils testés étaient meilleurs, 0% similaires, 100% pires
» Le meilleur avait un delta de 4%, la moyenne était de 24%, le pire était de 134%.
Gestion de l'énergie
Consommation d'énergie
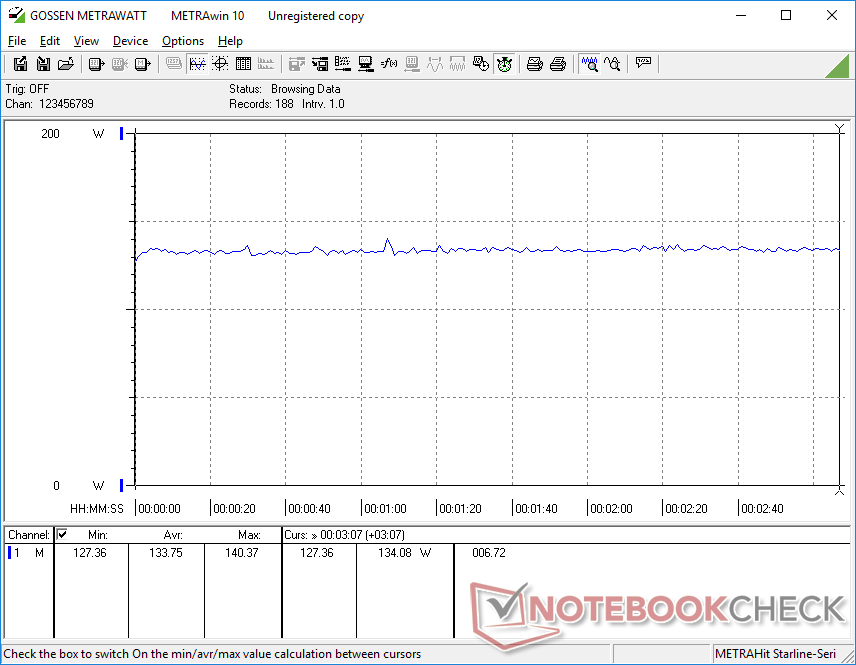
La marche au ralenti sur le bureau consomme entre 10 et 28 W selon le niveau de luminosité, le profil d'alimentation et le réglage Optimus, contre seulement 9 à 18 W sur le Envy 15 2020, en raison de la dalle OLED plus exigeante et du CPU de 12e génération. Gardez à l'esprit que certaines couleurs demanderont plus d'énergie que d'autres sur un panneau OLED, comme détaillée ici.
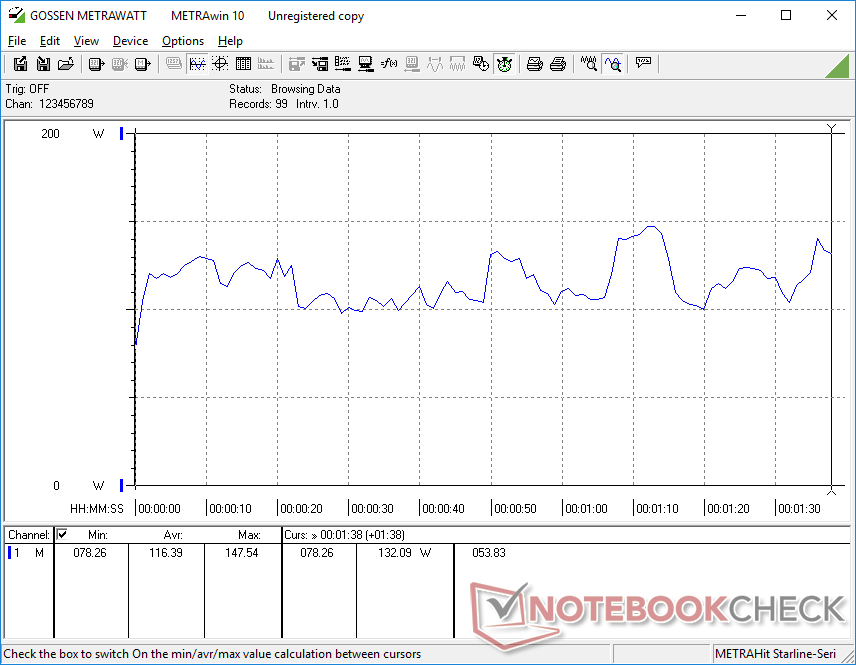
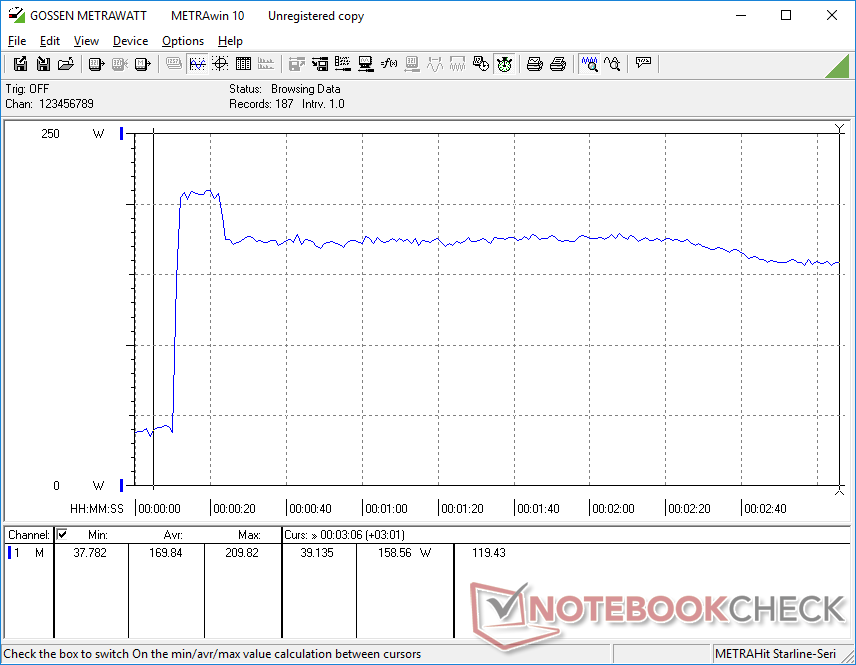
La consommation d'énergie lors des jeux est élevée à environ 134 W pour être comparable auMSI Creator Z16P doté d'un processeur Core i9-12900H plus rapide et d'un GPU RTX 3080 Ti ou au Lenovo Legion Slim 7 16 doté du même processeur Core i7 et du même GPU. Toutefois, par rapport au Envy 15 de 2020, la consommation n'est supérieure que d'environ 7 % lors des jeux, malgré des performances graphiques 20 à 30 % plus rapides, pour un meilleur rendement par watt.
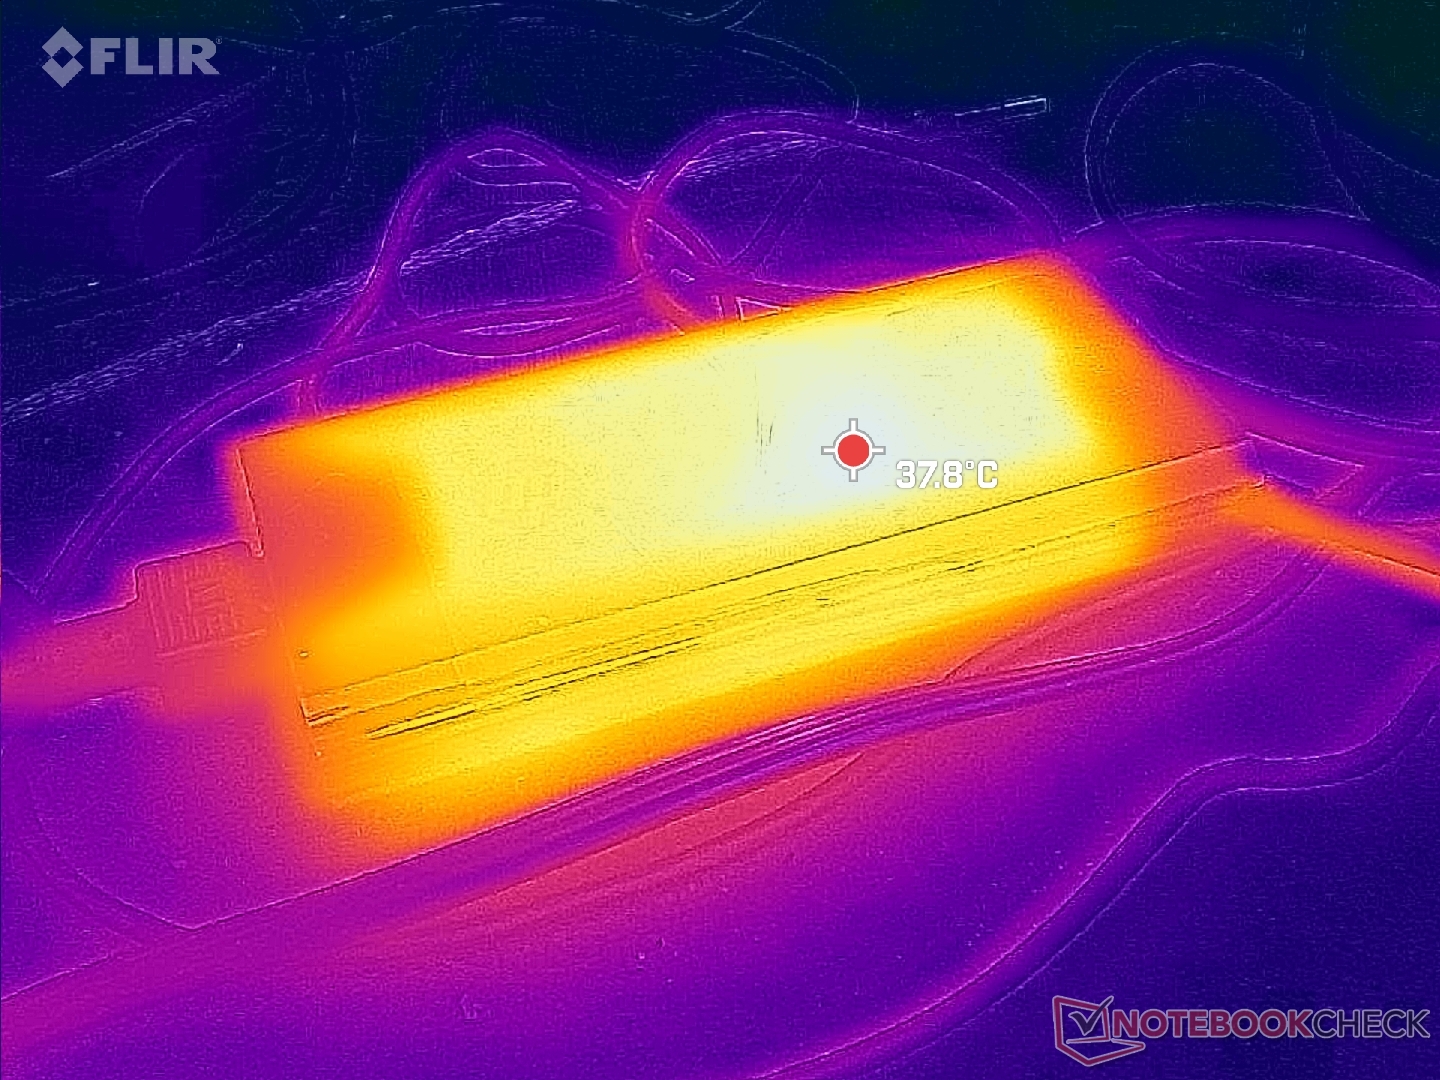
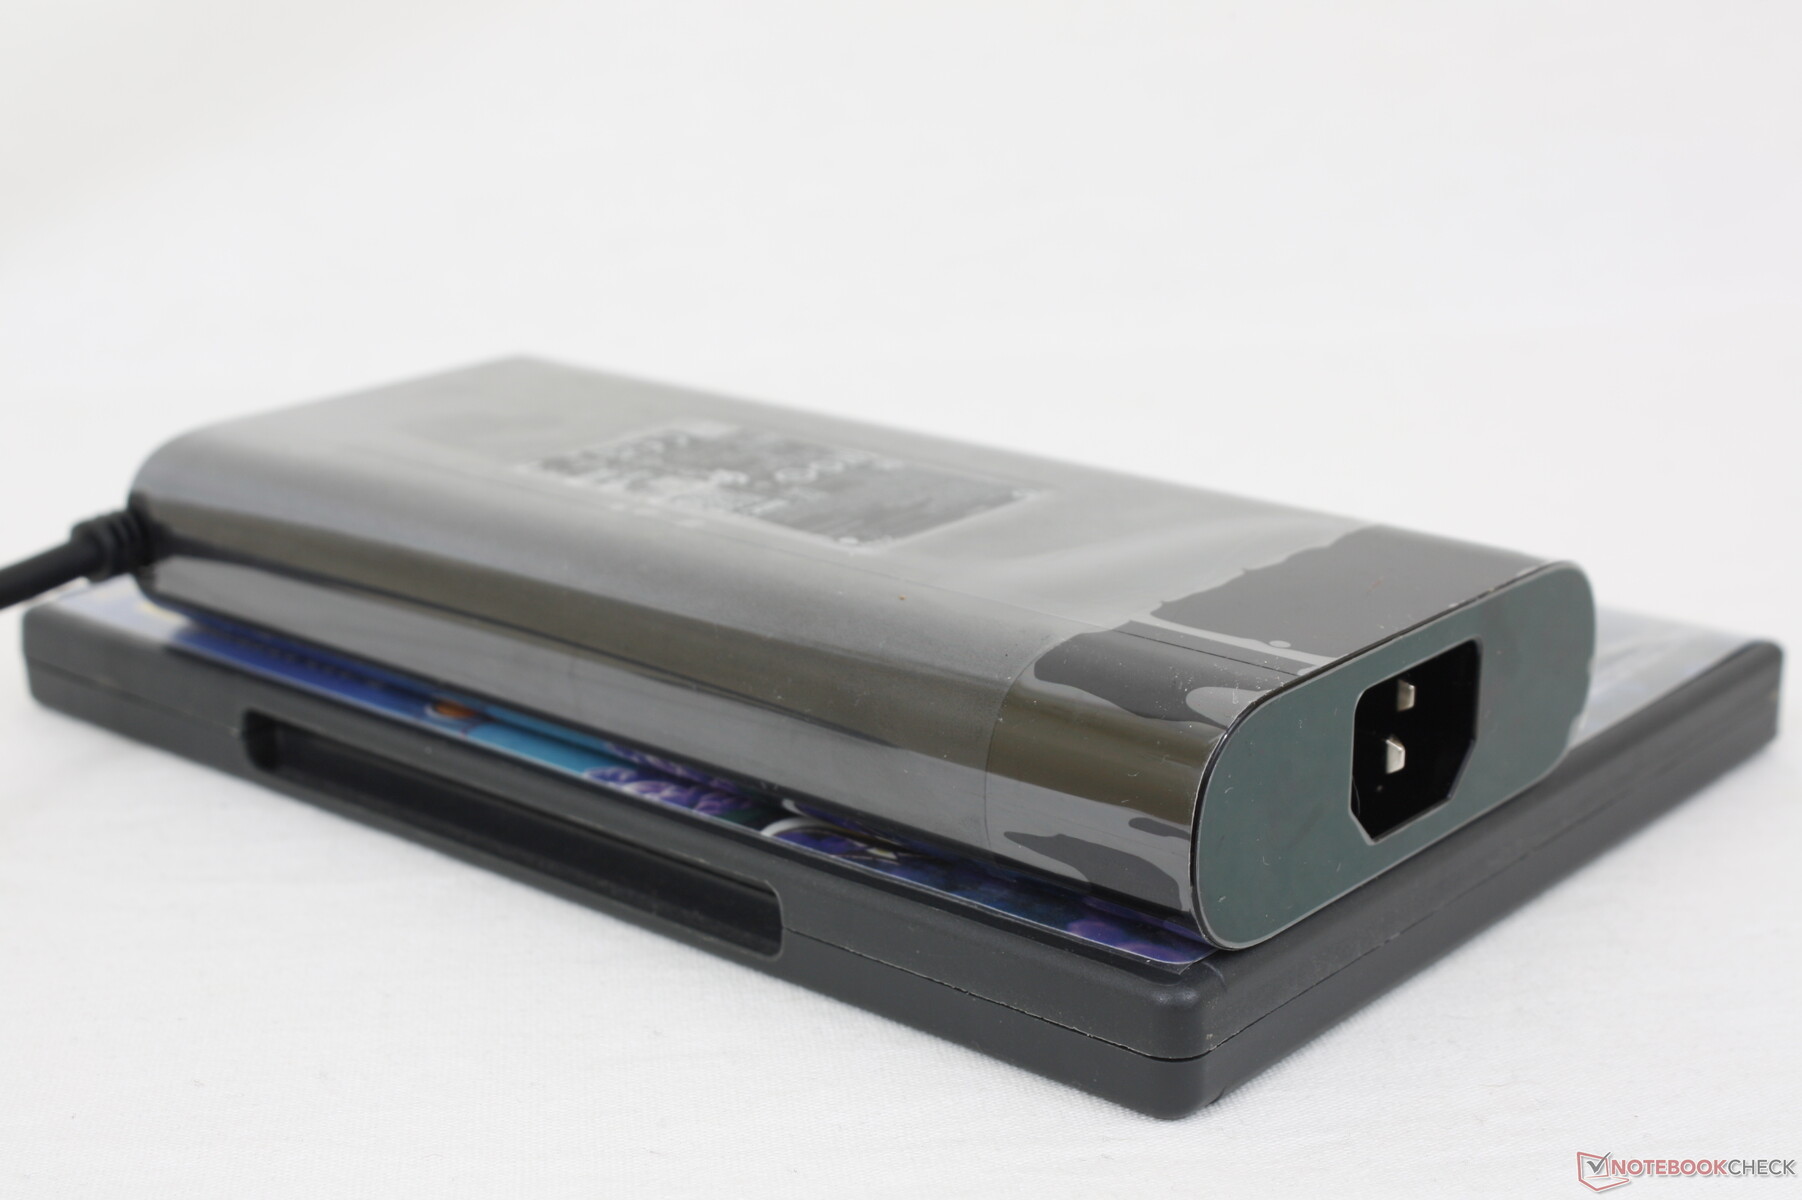
Nous avons pu mesurer une consommation maximale temporaire de 209,8 W sur l'adaptateur secteur 200 W de taille moyenne (~16,5 x 7,8 x 2,5 cm) lorsque le processeur et le GPU sont tous deux utilisés à 100 %. La consommation se stabilise à environ 160 W en cas de charges extrêmes.
| Éteint/en veille | |
| Au repos | |
| Fortement sollicité |
|
Légende:
min: | |
| HP Envy 16 h0112nr i7-12700H, GeForce RTX 3060 Laptop GPU, Micron 3400 1TB MTFDKBA1T0TFH, OLED, 3840x2400, 16" | Lenovo ThinkBook 16 G4+ IAP i7-12700H, GeForce RTX 2050 Mobile, Micron 2450 1TB MTFDKCD1T0TFK, IPS, 2560x1600, 16" | MSI Creator Z16P B12UHST i9-12900H, GeForce RTX 3080 Ti Laptop GPU, Samsung PM9A1 MZVL22T0HBLB, IPS True Pixel (~100% DCI-P3), 2560x1600, 16" | Dell Inspiron 16 Plus 7610-MHJ8F i7-11800H, UHD Graphics Xe 32EUs (Tiger Lake-H), OM3PDP3-AD NVMe KDI 512GB, IPS, 3072x1920, 16" | Apple MacBook Pro 16 2021 M1 Pro M1 Pro, M1 Pro 16-Core GPU, Apple SSD AP1024R, Mini-LED, 3456x2234, 16.2" | Huawei MateBook 16s i7 i7-12700H, Iris Xe G7 96EUs, Silicon Motion PCIe-8 SSD, IPS, 2520x1680, 16" | |
|---|---|---|---|---|---|---|
| Power Consumption | 36% | -11% | 50% | 33% | 35% | |
| Idle Minimum * (Watt) | 10 | 5 50% | 11 -10% | 5.4 46% | 5 50% | 6.8 32% |
| Idle Average * (Watt) | 10.9 | 11.2 -3% | 17 -56% | 9.8 10% | 15.1 -39% | 13.2 -21% |
| Idle Maximum * (Watt) | 27.8 | 11.6 58% | 26 6% | 14 50% | 15.5 44% | 13.8 50% |
| Load Average * (Watt) | 116.4 | 89.3 23% | 124 -7% | 44 62% | 54 54% | 75.2 35% |
| Witcher 3 ultra * (Watt) | 133.7 | 83 38% | 133.5 -0% | 44 67% | 56.1 58% | |
| Load Maximum * (Watt) | 209.8 | 102 51% | 212 -1% | 76.8 63% | 90 57% | 90.6 57% |
* ... Moindre est la valeur, meilleures sont les performances
Power Consumption Witcher 3 / Stresstest
Power Consumption external Monitor
Autonomie de la batterie
L'autonomie du WLAN est comparable à celle du MateBook 16s i7 ou du ThinkBook 16 G4+ IAP, soit environ 8 heures. La capacité de la batterie reste identique à celle du Envy 15 de 2020, malgré le passage à une taille d'écran plus grande.
La charge de vide à plein avec l'adaptateur de baril inclus prend environ 1,5 heure. Le système ne peut pas être rechargé via USB-C malgré ce que les spécifications officielles peuvent prétendre. Lorsqu'un chargeur USB-C de 100 W est branché, le système émet simplement un avertissement indiquant d'utiliser plutôt un chargeur de plus grande capacité. Nous avons contacté HP pour obtenir des précisions et nous mettrons à jour cette section en conséquence.
| HP Envy 16 h0112nr i7-12700H, GeForce RTX 3060 Laptop GPU, 83 Wh | Lenovo ThinkBook 16 G4+ IAP i7-12700H, GeForce RTX 2050 Mobile, 71 Wh | MSI Creator Z16P B12UHST i9-12900H, GeForce RTX 3080 Ti Laptop GPU, 90 Wh | Dell Inspiron 16 Plus 7610-MHJ8F i7-11800H, UHD Graphics Xe 32EUs (Tiger Lake-H), 86 Wh | Apple MacBook Pro 16 2021 M1 Pro M1 Pro, M1 Pro 16-Core GPU, 99.6 Wh | Huawei MateBook 16s i7 i7-12700H, Iris Xe G7 96EUs, 84 Wh | |
|---|---|---|---|---|---|---|
| Autonomie de la batterie | -1% | -36% | 67% | 114% | 11% | |
| Reader / Idle (h) | 17.8 | 22.5 26% | ||||
| WiFi v1.3 (h) | 7.9 | 8.2 4% | 5.2 -34% | 9.5 20% | 16.9 114% | 8.1 3% |
| Load (h) | 1.6 | 1.5 -6% | 1 -37% | 4.1 156% | 1.9 19% | |
| H.264 (h) | 12.6 | 5.8 | 17.5 | 9.3 | ||
| WiFi (h) | 9.5 |
Points positifs
Points négatifs
Verdict - Comme un MacBook Pro 16 économique
Le Envy 16 est plus rapide que le Envy 15, bien sûr, mais certains des inconvénients que nous avons mentionnés sur le Envy 15 n'ont pas encore été abordés. Les ventilateurs bruyants, l'absence de verrou Kensington, le clickpad spongieux, et les charnières relativement faibles sont un pas en arrière par rapport à des alternatives comme le MacBook Pro 16 ou Dell Inspiron 16 Plus. Il s'agit également de l'un des ordinateurs portables de 16 pouces les plus grands et les plus lourds du marché, ce qui peut dissuader les voyageurs et les étudiants.
Le HP Envy 16 est presque 1000 $ moins cher que le MacBook Pro 16 de base tout en offrant des caractéristiques de performance et des couleurs compétitives. Il s'agit cependant d'un système lourd et bruyant.
Les utilisateurs qui ne sont pas rebutés par le poids trouveront que le Envy 16 est un système polyvalent avec des performances, une taille d'écran et des couleurs adaptées aux jeux et à l'édition. Nous apprécions particulièrement la simplicité avec laquelle il est possible d'ajouter du stockage ou de la RAM si nécessaire. Si vos tâches n'exigent pas beaucoup de puissance, cependant, alors des options plus légères de 16 pouces devraient être considérées comme le LG Gram 16 ou Huawei MateBook 16s.
Prix et disponibilité
L'Envy 16 est désormais disponible chez les principaux détaillants, notamment Newegg, Best Buy Costcomicro Center, et HP.com dans différentes configurations. Notre configuration spécifique peut être trouvée sur Micro Center pour $1700 USD alors que les SKUs Intel Arc A370M peuvent être trouvés ailleurs.
HP Envy 16 h0112nr
- 09/24/2022 v7 (old)
Allen Ngo
Price comparison

