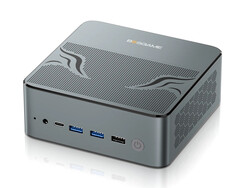
Test du M1 de BOSGAME : le Ryzen 7 7840HS est encore une bête pour mini-PC
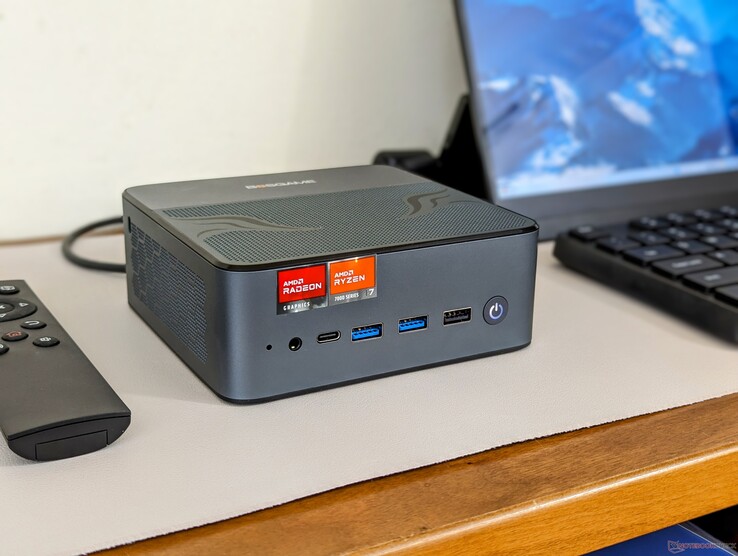
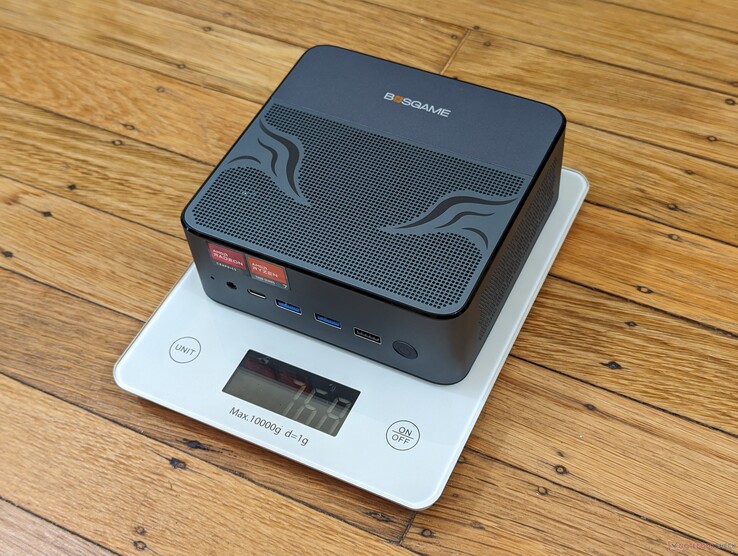
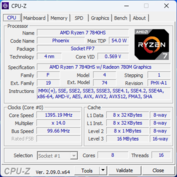
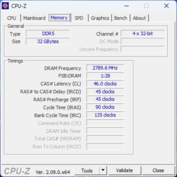
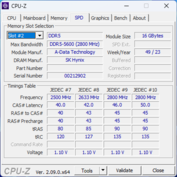
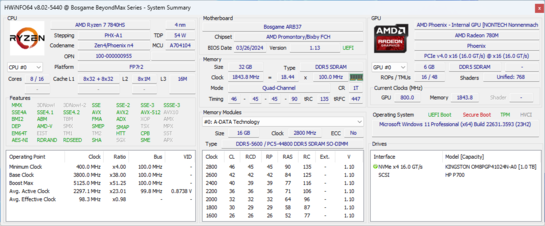
Alors que le Bosgame N95 cible les utilisateurs de HTPC à petit budget, le M1 vise les utilisateurs de bureau et les utilisateurs chevronnés qui ont besoin de plus de performances pour leurs mini-PC. Le modèle est équipé d'un CPU Ryzen 7 7840HS de classe gaming avec carte graphique Radeon 780M intégrée, d'un SSD NVMe de 1 To et de 32 Go de RAM amovible pour un prix d'environ 690 USD. Le M1 se distingue par ses haut-parleurs stéréo intégrés, alors que la grande majorité des mini-PC utilisent des haut-parleurs externes.
Parmi les alternatives au Bosgame M1, on trouve d'autres mini PC de la taille d'un NUC, comme le GMK NucBox K6,Intel NUC 13 Proou le Beelink SER7.
Plus d'avis Bosgame :
Comparaison avec les concurrents potentiels
Note | Date | Modèle | Poids | Épaisseur | Taille | Résolution | Prix |
|---|---|---|---|---|---|---|---|
| 84.5 % v7 (old) | 05/24 | BOSGAME M1 R7 7840HS, Radeon 780M | 766 g | 51 mm | x | ||
| 78.9 % v7 (old) | 04/24 | GMK NucBox M5 R7 5700U, Vega 8 | 505 g | 48 mm | x | ||
| 83.6 % v7 (old) | 04/24 | GMK NucBox K6 R7 7840HS, Radeon 780M | 514 g | 47 mm | x | ||
| 80.8 % v7 (old) | 04/23 | Intel NUC 13 Pro Kit NUC13ANK i7-1360P, Iris Xe G7 96EUs | 538 g | 37 mm | x | ||
| 86.6 % v7 (old) | 09/23 | Beelink SER7 R7 7840HS, Radeon 780M | 640 g | 49 mm | x | ||
v (old) | 11/22 | Beelink GTR6 R9 6900HX, Radeon 680M | 815 g | 43 mm | x |
Top 10
» Le Top 10 des PC portables multimédia
» Le Top 10 des PC portables de jeu
» Le Top 10 des PC portables de jeu légers
» Le Top 10 des ordinateurs portables bureautiques
» Le Top 10 des PC portables bureautiques premium/professionnels
» Le Top 10 des Stations de travail mobiles
» Le Top 10 des Ultraportables
» Le Top 10 des Ultrabooks
» Le Top 10 des Convertibles
» Le Top 10 des Tablettes
» Le Top 10 des Tablettes Windows
» Le Top 10 des Smartphones
» Le Top 10 des PC Portables á moins de 300 euros
» Le Top 10 des PC Portables á moins de 500 euros
» Le Top 25 des meilleurs écrans d'ordinateurs
Boîtier - Solide et lourd
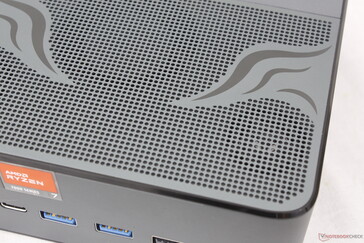
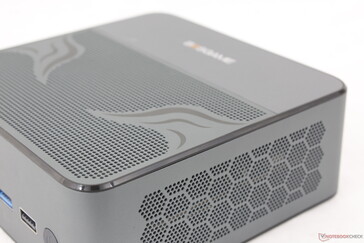
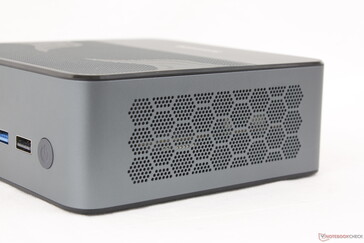
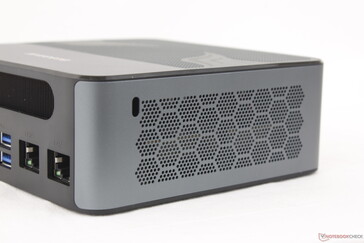
Hormis la plaque métallique amovible sur le fond, le reste du châssis est constitué d'une seule pièce de métal pour une construction solide et une sensation rivalisant avec la série NUC. Cela contraste avec certains modèles de Beelink qui ont des dessus en plastique ou en maille pour un look un peu moins bon marché. Le principal inconvénient est le manque de couleurs et d'options de personnalisation, mais nous ne pensons pas qu'il s'agisse d'un obstacle.
Bien que son design général soit décrit comme "NUC-like", le M1 est en fait plus grand et plus lourd que beaucoup d'autres mini PC de la classe NUC sur le marché, y compris le NUC 13 Pro et le NUC 12 Pro GMK NucBox K6. Cela peut être attribué en partie aux haut-parleurs intégrés dont la plupart des autres mini PC sont dépourvus. Le design plus large a cependant ses avantages, comme le montrent nos sections sur les performances ci-dessous.
Connectivité
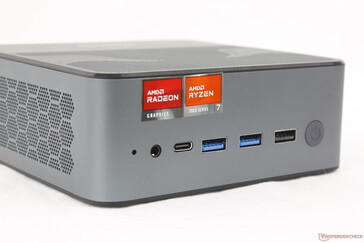
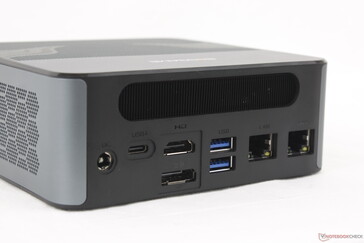
Les options de port sont larges et variées, comme on peut s'y attendre de la part d'un mini PC. Les ports qui se démarquent sur le M1 comprennent un DisplayPort pleine taille et deux ports USB-C 4.0 pour un système compatible avec les stations d'accueil. Notez que les ports USB-C sont également compatibles avec Power Delivery jusqu'à 100 W ; si jamais vous perdez l'adaptateur secteur propriétaire livré avec le système, alors des adaptateurs secteur USB-C tiers universels peuvent être utilisés pour alimenter le modèle à la place. Notre adaptateur USB-C Lenovo de 135 W, par exemple, est compatible avec le Bosgame M1. Espérons que le fabricant abandonnera tout simplement l'adaptateur de baril CA spécial en faveur d'adaptateurs USB-C universels sur les futurs modèles.
Communication
| Networking | |
| iperf3 transmit AXE11000 | |
| BOSGAME M1 | |
| GMK NucBox M5 | |
| Beelink SER7 | |
| Beelink GTR6 | |
| Intel NUC 13 Pro Kit NUC13ANK | |
| GMK NucBox K6 | |
| iperf3 receive AXE11000 | |
| BOSGAME M1 | |
| GMK NucBox M5 | |
| GMK NucBox K6 | |
| Beelink SER7 | |
| Intel NUC 13 Pro Kit NUC13ANK | |
| Beelink GTR6 | |
| iperf3 transmit AXE11000 6GHz | |
| Intel NUC 13 Pro Kit NUC13ANK | |
| GMK NucBox M5 | |
| BOSGAME M1 | |
| Beelink GTR6 | |
| GMK NucBox K6 | |
| iperf3 receive AXE11000 6GHz | |
| Intel NUC 13 Pro Kit NUC13ANK | |
| GMK NucBox M5 | |
| BOSGAME M1 | |
| GMK NucBox K6 | |
| Beelink GTR6 | |
Maintenance
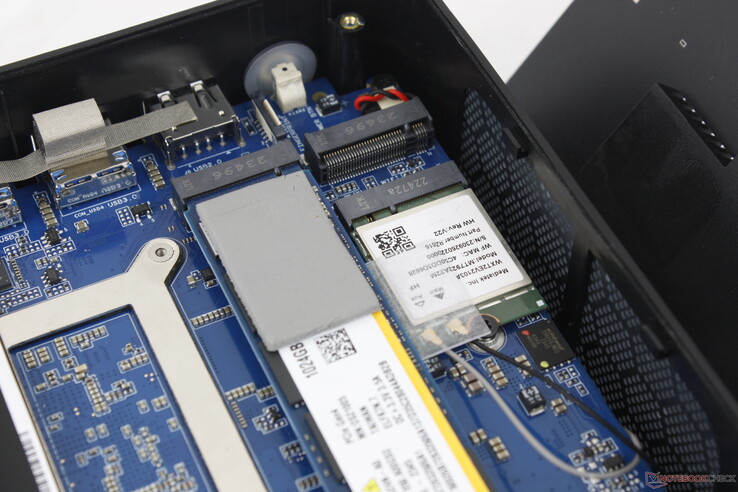
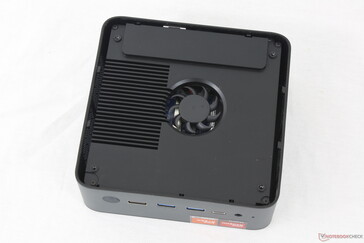
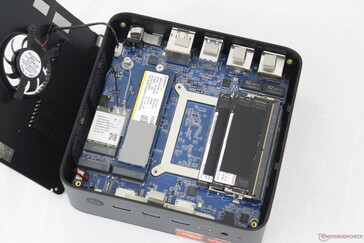
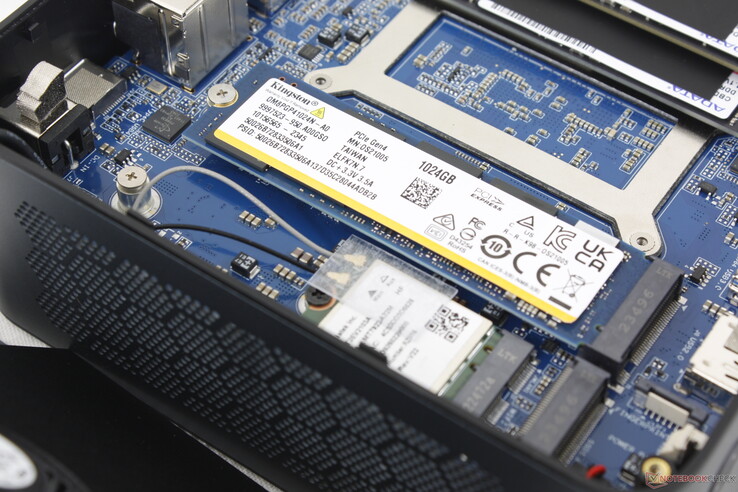
L'entretien se fait en deux étapes car la carte mère se trouve sous le système de refroidissement et la plaque inférieure amovible. Heureusement, seul un tournevis Phillips est nécessaire pour retirer ces deux pièces. Les propriétaires ont accès à deux emplacements SODIMM, deux emplacements M.2 2280 PCIe4 x4 et au module WLAN amovible, comme indiqué ci-dessous.
Pour accéder à l'autre côté de la carte mère, il faut la retirer entièrement du châssis. Le nettoyage du deuxième ventilateur situé au-dessus de la carte mère est donc beaucoup plus complexe que celui du premier ventilateur situé sous la carte mère.
Accessoires et garantie
L'emballage comprend un support VESA amovible avec des vis, un câble HDMI, l'adaptateur secteur habituel et la documentation. Une garantie limitée du fabricant d'un an s'applique si l'appareil est acheté aux États-Unis.
Performance - La Radeon 7 7840HS fait des merveilles pour les mini PC
Conditions d'essai
Nous avons réglé Windows sur le mode Performance avant d'effectuer les tests de référence ci-dessous. Il n'y a pas d'applications spécialisées préinstallées pour une expérience Windows propre.
Processeur
Les Ryzen 7 7840HS est encore puissant et comparable aux nouveaux CPU Meteor Lake-H et Hawk Point-HS d'Intel et d'AMD, respectivement. Le Core Ultra 9 185H dans le modèle beaucoup plus cher Minisforum AtomMan X7 Tipar exemple, n'est que 10 à 15 % plus rapide que notre Bosgame, pour un rapport performance/dollar inférieur.
Si vous vous en tenez à l'ancien modèle Ryzen 7 7840HS, vous ne bénéficierez pas du NPU intégré du modèle Ryzen 7 8840HS Ryzen 7 8840HS ou de la série Intel Meteor Lake. Cependant, les utilisateurs qui ne sont pas intéressés par l'accélération locale de l'IA peuvent trouver le Ryzen 7 7840HS favorable car il peut souvent surpasser le Ryzen 7 8840HS lorsqu'il s'agit d'applications non liées à l'IA.
Cinebench R15 Multi Loop
Cinebench R23: Multi Core | Single Core
Cinebench R20: CPU (Multi Core) | CPU (Single Core)
Cinebench R15: CPU Multi 64Bit | CPU Single 64Bit
Blender: v2.79 BMW27 CPU
7-Zip 18.03: 7z b 4 | 7z b 4 -mmt1
Geekbench 6.5: Multi-Core | Single-Core
Geekbench 5.5: Multi-Core | Single-Core
HWBOT x265 Benchmark v2.2: 4k Preset
LibreOffice : 20 Documents To PDF
R Benchmark 2.5: Overall mean
* ... Moindre est la valeur, meilleures sont les performances
AIDA64: FP32 Ray-Trace | FPU Julia | CPU SHA3 | CPU Queen | FPU SinJulia | FPU Mandel | CPU AES | CPU ZLib | FP64 Ray-Trace | CPU PhotoWorxx
| Performance rating | |
| BOSGAME M1 | |
| GMK NucBox K6 | |
| Beelink SER7 | |
| Moyenne AMD Ryzen 7 7840HS | |
| Beelink GTR6 | |
| Intel NUC 13 Pro Kit NUC13ANK | |
| GMK NucBox M5 | |
| AIDA64 / FP32 Ray-Trace | |
| Moyenne AMD Ryzen 7 7840HS (22845 - 28921, n=21) | |
| BOSGAME M1 | |
| Beelink SER7 | |
| GMK NucBox K6 | |
| Beelink GTR6 | |
| Intel NUC 13 Pro Kit NUC13ANK | |
| GMK NucBox M5 | |
| AIDA64 / FPU Julia | |
| Moyenne AMD Ryzen 7 7840HS (97164 - 123167, n=21) | |
| BOSGAME M1 | |
| Beelink SER7 | |
| GMK NucBox K6 | |
| Beelink GTR6 | |
| Intel NUC 13 Pro Kit NUC13ANK | |
| GMK NucBox M5 | |
| AIDA64 / CPU SHA3 | |
| BOSGAME M1 | |
| Beelink SER7 | |
| Moyenne AMD Ryzen 7 7840HS (4293 - 5155, n=21) | |
| GMK NucBox K6 | |
| Beelink GTR6 | |
| Intel NUC 13 Pro Kit NUC13ANK | |
| GMK NucBox M5 | |
| AIDA64 / CPU Queen | |
| BOSGAME M1 | |
| Moyenne AMD Ryzen 7 7840HS (102271 - 125820, n=21) | |
| Beelink SER7 | |
| GMK NucBox K6 | |
| Beelink GTR6 | |
| Intel NUC 13 Pro Kit NUC13ANK | |
| GMK NucBox M5 | |
| AIDA64 / FPU SinJulia | |
| BOSGAME M1 | |
| Moyenne AMD Ryzen 7 7840HS (13767 - 15525, n=21) | |
| GMK NucBox K6 | |
| Beelink SER7 | |
| Beelink GTR6 | |
| GMK NucBox M5 | |
| Intel NUC 13 Pro Kit NUC13ANK | |
| AIDA64 / FPU Mandel | |
| Moyenne AMD Ryzen 7 7840HS (52084 - 65812, n=21) | |
| BOSGAME M1 | |
| Beelink SER7 | |
| GMK NucBox K6 | |
| Beelink GTR6 | |
| Intel NUC 13 Pro Kit NUC13ANK | |
| GMK NucBox M5 | |
| AIDA64 / CPU AES | |
| BOSGAME M1 | |
| GMK NucBox K6 | |
| Beelink SER7 | |
| Moyenne AMD Ryzen 7 7840HS (67389 - 177158, n=21) | |
| Beelink GTR6 | |
| Intel NUC 13 Pro Kit NUC13ANK | |
| GMK NucBox M5 | |
| AIDA64 / CPU ZLib | |
| Moyenne AMD Ryzen 7 7840HS (944 - 1123, n=21) | |
| BOSGAME M1 | |
| GMK NucBox K6 | |
| Beelink SER7 | |
| Intel NUC 13 Pro Kit NUC13ANK | |
| Beelink GTR6 | |
| GMK NucBox M5 | |
| AIDA64 / FP64 Ray-Trace | |
| Moyenne AMD Ryzen 7 7840HS (12248 - 15599, n=21) | |
| Beelink SER7 | |
| BOSGAME M1 | |
| GMK NucBox K6 | |
| Beelink GTR6 | |
| Intel NUC 13 Pro Kit NUC13ANK | |
| GMK NucBox M5 | |
| AIDA64 / CPU PhotoWorxx | |
| BOSGAME M1 | |
| Beelink SER7 | |
| GMK NucBox K6 | |
| Moyenne AMD Ryzen 7 7840HS (17615 - 41516, n=21) | |
| Beelink GTR6 | |
| Intel NUC 13 Pro Kit NUC13ANK | |
| GMK NucBox M5 | |
Test de stress
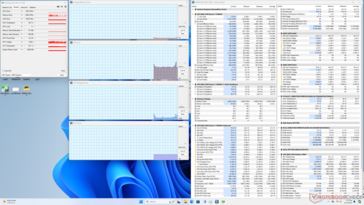
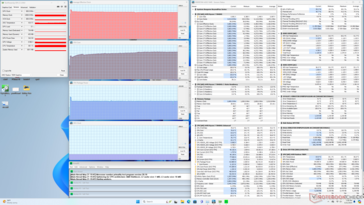
L'exécution du stress Prime95 fait monter le CPU à 4,3 GHz et 65 W pendant les premières secondes avant de se stabiliser à 4 GHz, 54 W et 80 C. En répétant ce test sur le serveur Beelink SER7 avec le même CPU Ryzen 7 donnerait des résultats très similaires, même si notre M1 est nettement plus grand et plus lourd que le Beelink.
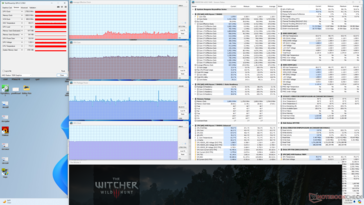
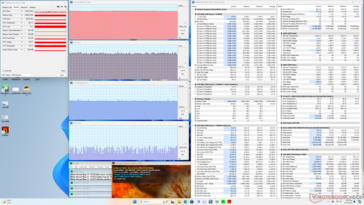
La fréquence d'horloge et la température du GPU Witcher 3 pour représenter le stress du jeu se stabiliseraient à 2700 MHz et 67 C, respectivement, par rapport à ~2500 MHz sur la Beelink SER7 ou la GMK NucBox K6, et à 67 C sur la Beelink SER7 GMK NucBox K6 toutes équipées du même processeur AMD. La fréquence d'horloge du GPU légèrement plus élevée dans notre Bosgame est en corrélation avec les performances graphiques légèrement plus élevées dans la section Performances du GPU ci-dessous.
| Horloge moyenne du CPU (GHz) | Horloge du GPU (MHz) | Température moyenne du CPU (°C) | |
| Système au repos | -- | -- | 35 |
| Prime95 Stress | 3.9 | -- | 80 |
| Prime95 + FurMark Stress | 4.0 | 833 - 2100 | 70 |
| Witcher 3 Stress | ~0.8 | 2700 | 67 |
Performance du système
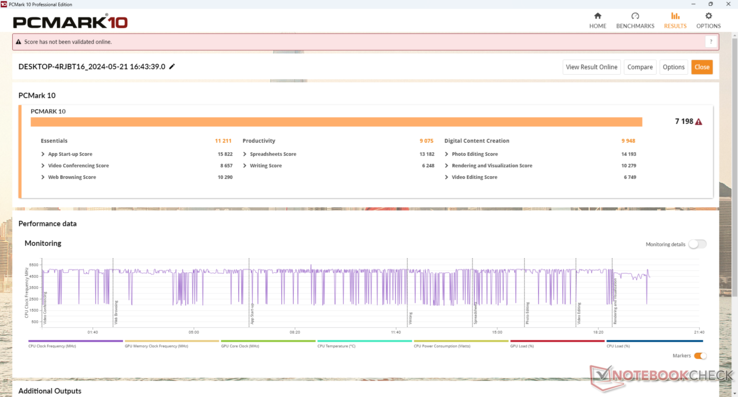
Les résultats PCMark sont comparables à ceux d'autres mini PC haut de gamme tels que la GMK NucBox K6 ou la Beelink SER7. Son score pour la création de contenu numérique, en particulier, est bien plus élevé que celui de n'importe quel autre mini-PC fonctionnant avec du matériel Iris Xe ou RX Vega plus ancien.
Bien que nous n'ayons rencontré aucun problème majeur sur notre unité de test, le système émettait des bips gênants toutes les minutes environ au démarrage lorsque ses haut-parleurs Bluetooth étaient en recherche active. La déconnexion des haut-parleurs via le menu Bluetooth met fin au bip.
CrossMark: Overall | Productivity | Creativity | Responsiveness
WebXPRT 3: Overall
WebXPRT 4: Overall
Mozilla Kraken 1.1: Total
| PCMark 10 / Score | |
| GMK NucBox K6 | |
| Moyenne AMD Ryzen 7 7840HS, AMD Radeon 780M (6914 - 7651, n=10) | |
| Beelink SER7 | |
| BOSGAME M1 | |
| Beelink GTR6 | |
| Intel NUC 13 Pro Kit NUC13ANK | |
| GMK NucBox M5 | |
| PCMark 10 / Essentials | |
| Intel NUC 13 Pro Kit NUC13ANK | |
| Beelink GTR6 | |
| GMK NucBox K6 | |
| BOSGAME M1 | |
| Moyenne AMD Ryzen 7 7840HS, AMD Radeon 780M (10519 - 11214, n=10) | |
| Beelink SER7 | |
| GMK NucBox M5 | |
| PCMark 10 / Productivity | |
| GMK NucBox K6 | |
| Beelink SER7 | |
| Beelink GTR6 | |
| Moyenne AMD Ryzen 7 7840HS, AMD Radeon 780M (9075 - 10970, n=10) | |
| BOSGAME M1 | |
| GMK NucBox M5 | |
| Intel NUC 13 Pro Kit NUC13ANK | |
| PCMark 10 / Digital Content Creation | |
| BOSGAME M1 | |
| GMK NucBox K6 | |
| Moyenne AMD Ryzen 7 7840HS, AMD Radeon 780M (9052 - 9987, n=10) | |
| Beelink SER7 | |
| Beelink GTR6 | |
| Intel NUC 13 Pro Kit NUC13ANK | |
| GMK NucBox M5 | |
| CrossMark / Overall | |
| BOSGAME M1 | |
| GMK NucBox K6 | |
| Intel NUC 13 Pro Kit NUC13ANK | |
| Moyenne AMD Ryzen 7 7840HS, AMD Radeon 780M (1566 - 1891, n=10) | |
| Beelink SER7 | |
| Beelink GTR6 | |
| GMK NucBox M5 | |
| CrossMark / Productivity | |
| BOSGAME M1 | |
| GMK NucBox K6 | |
| Intel NUC 13 Pro Kit NUC13ANK | |
| Beelink GTR6 | |
| Moyenne AMD Ryzen 7 7840HS, AMD Radeon 780M (1535 - 1823, n=10) | |
| Beelink SER7 | |
| GMK NucBox M5 | |
| CrossMark / Creativity | |
| BOSGAME M1 | |
| GMK NucBox K6 | |
| Intel NUC 13 Pro Kit NUC13ANK | |
| Beelink SER7 | |
| Moyenne AMD Ryzen 7 7840HS, AMD Radeon 780M (1556 - 2040, n=10) | |
| Beelink GTR6 | |
| GMK NucBox M5 | |
| CrossMark / Responsiveness | |
| BOSGAME M1 | |
| GMK NucBox K6 | |
| Beelink GTR6 | |
| Intel NUC 13 Pro Kit NUC13ANK | |
| Moyenne AMD Ryzen 7 7840HS, AMD Radeon 780M (1293 - 1749, n=10) | |
| Beelink SER7 | |
| GMK NucBox M5 | |
| WebXPRT 3 / Overall | |
| Beelink SER7 | |
| GMK NucBox K6 | |
| Moyenne AMD Ryzen 7 7840HS, AMD Radeon 780M (297 - 339, n=10) | |
| BOSGAME M1 | |
| Intel NUC 13 Pro Kit NUC13ANK | |
| Beelink GTR6 | |
| GMK NucBox M5 | |
| WebXPRT 4 / Overall | |
| Intel NUC 13 Pro Kit NUC13ANK | |
| GMK NucBox K6 | |
| Moyenne AMD Ryzen 7 7840HS, AMD Radeon 780M (245 - 319, n=9) | |
| Beelink SER7 | |
| BOSGAME M1 | |
| Beelink GTR6 | |
| GMK NucBox M5 | |
| Mozilla Kraken 1.1 / Total | |
| GMK NucBox M5 | |
| Beelink GTR6 | |
| GMK NucBox K6 | |
| BOSGAME M1 | |
| Beelink SER7 | |
| Moyenne AMD Ryzen 7 7840HS, AMD Radeon 780M (485 - 544, n=10) | |
| Intel NUC 13 Pro Kit NUC13ANK | |
* ... Moindre est la valeur, meilleures sont les performances
| PCMark 10 Score | 7198 points | |
Aide | ||
| AIDA64 / Memory Copy | |
| BOSGAME M1 | |
| Beelink SER7 | |
| GMK NucBox K6 | |
| Moyenne AMD Ryzen 7 7840HS (30937 - 72158, n=21) | |
| Beelink GTR6 | |
| Intel NUC 13 Pro Kit NUC13ANK | |
| GMK NucBox M5 | |
| AIDA64 / Memory Read | |
| Beelink SER7 | |
| BOSGAME M1 | |
| GMK NucBox K6 | |
| Moyenne AMD Ryzen 7 7840HS (30497 - 62147, n=21) | |
| Beelink GTR6 | |
| GMK NucBox M5 | |
| Intel NUC 13 Pro Kit NUC13ANK | |
| AIDA64 / Memory Write | |
| Beelink SER7 | |
| BOSGAME M1 | |
| GMK NucBox K6 | |
| Moyenne AMD Ryzen 7 7840HS (34590 - 93323, n=21) | |
| Beelink GTR6 | |
| GMK NucBox M5 | |
| Intel NUC 13 Pro Kit NUC13ANK | |
| AIDA64 / Memory Latency | |
| GMK NucBox M5 | |
| Intel NUC 13 Pro Kit NUC13ANK | |
| Moyenne AMD Ryzen 7 7840HS (85.1 - 112, n=21) | |
| BOSGAME M1 | |
| GMK NucBox K6 | |
| Beelink SER7 | |
| Beelink GTR6 | |
* ... Moindre est la valeur, meilleures sont les performances
Latence DPC
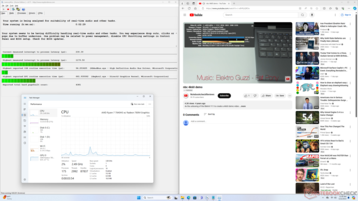
LatencyMon ne révèle que des problèmes mineurs de DPC lors de l'ouverture de plusieurs onglets de notre page d'accueil. Cependant, la lecture de vidéos 4K à 60 FPS est malheureusement imparfaite avec 11 images perdues enregistrées sur une période de 60 secondes. Dans l'idéal, il ne devrait pas y avoir de perte d'images, compte tenu de la puissance du processeur Zen 4. C'est là que les PC à base de processeur Intel se sont montrés les plus performants en matière de lecture vidéo.
| DPC Latencies / LatencyMon - interrupt to process latency (max), Web, Youtube, Prime95 | |
| GMK NucBox K6 | |
| GMK NucBox M5 | |
| BOSGAME M1 | |
| Intel NUC 13 Pro Kit NUC13ANK | |
| Beelink SER7 | |
| Beelink GTR6 | |
* ... Moindre est la valeur, meilleures sont les performances
Dispositifs de stockage
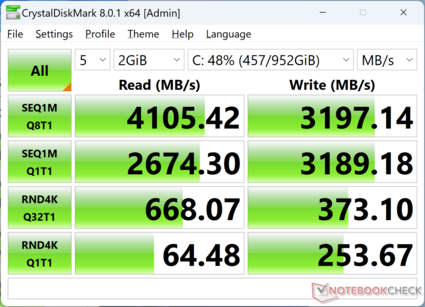
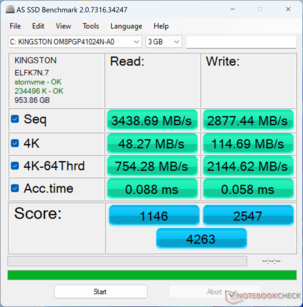
Notre appareil est livré avec une carte de milieu de gamme Kingston OM8SEP41024N-A0 PCIe4 x4 NVMe SSD offrant des taux de transfert d'environ 4000 Mo/s par rapport à >6500 Mo/s sur les disques PCIe4 plus haut de gamme. Bien que nous ne refusions jamais un disque plus rapide, le disque Kingston s'accorde bien avec cette classe de processeur particulière et cette gamme de prix cible.
Un coussin de refroidissement est inclus pour le disque afin de dissiper la chaleur sur le ventilateur métallique situé sous le couvercle inférieur. Cependant, vous devrez fournir votre propre coussin de refroidissement si vous installez un second SSD.
| Drive Performance rating - Percent | |
| GMK NucBox K6 | |
| Beelink GTR6 | |
| Intel NUC 13 Pro Kit NUC13ANK | |
| BOSGAME M1 | |
| GMK NucBox M5 | |
| Beelink SER7 | |
* ... Moindre est la valeur, meilleures sont les performances
Disk Throttling: DiskSpd Read Loop, Queue Depth 8
Performance du GPU
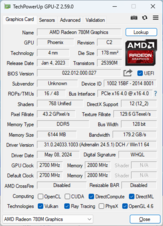
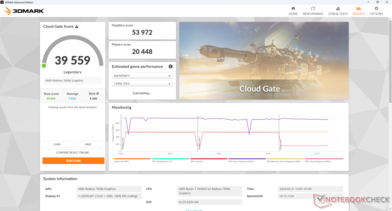
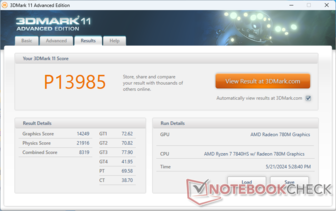
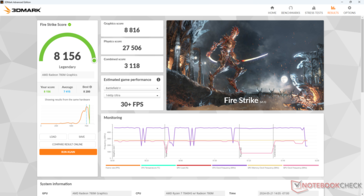
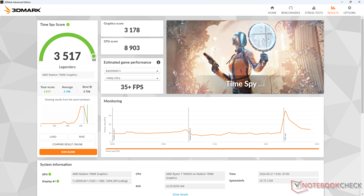
La Radeon 780M est l'un des GPU intégrés les plus rapides du marché et il est encore plus rapide sur une plateforme mini-PC que sur la plupart des ordinateurs portables. Dans ce cas, l'iGPU de notre Bosgame est 15 à 20 % plus rapide que celui d'un ordinateur portable moyen équipé de la même Radeon 780M. Ce delta est suffisant pour égaler ou même dépasser légèrement les derniers mini-PC fonctionnant avec des processeurs Intel Arc 8 tels que les plus chers Acemagic F2A.
| 3DMark 11 Performance | 13985 points | |
| 3DMark Cloud Gate Standard Score | 39559 points | |
| 3DMark Fire Strike Score | 8156 points | |
| 3DMark Time Spy Score | 3517 points | |
Aide | ||
* ... Moindre est la valeur, meilleures sont les performances
Performances de jeu - Graphiques de niveau Playstation 4
Les excellents scores 3DMark ci-dessus se traduisent bien dans les jeux réels, puisque le Bosgame M1 affiche des taux de rafraîchissement supérieurs à la moyenne dans tous les jeux testés. Le mini PC est suffisamment puissant pour faire tourner Cyberpunk 2077 Phantom Liberty en réglages moyens 1080p à un taux stable de 30 FPS ou F1 22 en réglages élevés 1080p à un taux stable de 60 FPS. Un écran à synchronisation adaptative se marierait donc très bien avec le Bosgame pour les jeux.
Les utilisateurs qui passent d'une ancienne carte Iris Xe 96 EUs Peuvent s'attendre à des performances de jeu plus de deux fois supérieures.
| Performance rating - Percent | |
| BOSGAME M1 | |
| GMK NucBox K6 | |
| Beelink SER7 | |
| Beelink GTR6 -1! | |
| Intel NUC 13 Pro Kit NUC13ANK -2! | |
| GMK NucBox M5 | |
| The Witcher 3 - 1920x1080 Ultra Graphics & Postprocessing (HBAO+) | |
| BOSGAME M1 | |
| GMK NucBox K6 | |
| Beelink SER7 | |
| Beelink GTR6 | |
| Intel NUC 13 Pro Kit NUC13ANK | |
| GMK NucBox M5 | |
| Final Fantasy XV Benchmark - 1920x1080 High Quality | |
| BOSGAME M1 | |
| GMK NucBox K6 | |
| Beelink SER7 | |
| Beelink GTR6 | |
| GMK NucBox M5 | |
| Strange Brigade - 1920x1080 ultra AA:ultra AF:16 | |
| BOSGAME M1 | |
| GMK NucBox K6 | |
| Beelink SER7 | |
| Beelink GTR6 | |
| Intel NUC 13 Pro Kit NUC13ANK | |
| GMK NucBox M5 | |
| Dota 2 Reborn - 1920x1080 ultra (3/3) best looking | |
| BOSGAME M1 | |
| GMK NucBox K6 | |
| Beelink SER7 | |
| Beelink GTR6 | |
| Intel NUC 13 Pro Kit NUC13ANK | |
| GMK NucBox M5 | |
| X-Plane 11.11 - 1920x1080 high (fps_test=3) | |
| Beelink GTR6 | |
| GMK NucBox K6 | |
| BOSGAME M1 | |
| Beelink SER7 | |
| GMK NucBox M5 | |
| Far Cry 5 - 1920x1080 Ultra Preset AA:T | |
| BOSGAME M1 | |
| Beelink SER7 | |
| GMK NucBox K6 | |
| Intel NUC 13 Pro Kit NUC13ANK | |
| GMK NucBox M5 | |
| Baldur's Gate 3 | |
| 1280x720 Low Preset AA:SM | |
| Geekom A8, R9 8945HS | |
| BOSGAME M1 | |
| Moyenne AMD Radeon 780M (30.7 - 67.6, n=34) | |
| Minisforum AtomMan X7 Ti | |
| GMK NucBox M5 | |
| 1920x1080 Low Preset AA:SM | |
| BOSGAME M1 | |
| Geekom A8, R9 8945HS | |
| Moyenne AMD Radeon 780M (20.2 - 44.1, n=47) | |
| Minisforum AtomMan X7 Ti | |
| GMK NucBox M5 | |
| 1920x1080 Medium Preset AA:T | |
| BOSGAME M1 | |
| Moyenne AMD Radeon 780M (15.7 - 36.8, n=50) | |
| Geekom A8, R9 8945HS | |
| Minisforum AtomMan X7 Ti | |
| 1920x1080 High Preset AA:T | |
| BOSGAME M1 | |
| Moyenne AMD Radeon 780M (13.3 - 30.6, n=50) | |
| Minisforum AtomMan X7 Ti | |
| Geekom A8, R9 8945HS | |
| 1920x1080 Ultra Preset AA:T | |
| BOSGAME M1 | |
| Moyenne AMD Radeon 780M (12.8 - 29.6, n=49) | |
| Minisforum AtomMan X7 Ti | |
| Geekom A8, R9 8945HS | |
Witcher 3 FPS Chart
| Bas | Moyen | Élevé | Ultra | |
|---|---|---|---|---|
| The Witcher 3 (2015) | 160.7 | 103.8 | 52.2 | 33.3 |
| Dota 2 Reborn (2015) | 159.5 | 126.5 | 98.8 | 88.5 |
| Final Fantasy XV Benchmark (2018) | 84.5 | 40.9 | 30.8 | |
| X-Plane 11.11 (2018) | 64.2 | 46.3 | 38.7 | |
| Far Cry 5 (2018) | 88 | 54 | 49 | 47 |
| Strange Brigade (2018) | 175.9 | 70.9 | 60.6 | 52.1 |
| Tiny Tina's Wonderlands (2022) | 77.7 | 55.9 | 37.9 | 30.3 |
| F1 22 (2022) | 109.9 | 95 | 70.6 | 19.2 |
| Baldur's Gate 3 (2023) | 43.9 | 36.8 | 29.9 | 29.2 |
| Cyberpunk 2077 (2023) | 47.9 | 37.5 | 29.6 | 25.8 |
Émissions
Bruit du système - audible, mais pas trop fort
Le modèle intègre deux ventilateurs, l'un en haut de la carte mère et l'autre en bas. Les ventilateurs sont toujours actifs, quelle que soit la charge à l'écran, pour un faible bourdonnement de 32 dB(A) lorsque vous utilisez des charges peu exigeantes comme la navigation ou le streaming vidéo. C'est typique de la plupart des mini PC et nous sommes heureux de constater que les ventilateurs du M1 sont généralement léthargiques et ne produisent pas de pulsations gênantes.
Le bruit du ventilateur lors de l'exécution de charges plus élevées comme les jeux induira un bruit de ventilateur constant de 42 dB(A). C'est plus silencieux que sur la GMK NucBox K6 et le Beelink SER7, tous équipés du même processeur Ryzen 7 7840HS. Nous ne trouvons pas le bruit du ventilateur assez fort pour être gênant, d'autant plus que les utilisateurs sont plus susceptibles de s'asseoir plus loin de leur mini PC que de leur ordinateur portable.
Degré de la nuisance sonore
| Au repos |
| 32 / 32 / 32 dB(A) |
| Fortement sollicité |
| 38.7 / 42 dB(A) |
 | ||
30 dB silencieux 40 dB(A) audible 50 dB(A) bruyant |
||
min: | ||
| BOSGAME M1 Radeon 780M, R7 7840HS, Kingston OM8PGP41024N-A0 | GMK NucBox M5 Vega 8, R7 5700U, Lexar 1024GB LNM6A1X001T-HNNNG | GMK NucBox K6 Radeon 780M, R7 7840HS, MasonSemi 1TB MC7000 | Intel NUC 13 Pro Kit NUC13ANK Iris Xe G7 96EUs, i7-1360P, Samsung PM9A1 MZVL2512HCJQ | Beelink SER7 Radeon 780M, R7 7840HS, Crucial P3 Plus CT1000P3PSSD8 | Beelink GTR6 Radeon 680M, R9 6900HX, Kingston KC3000 512G SKC3000S512G | |
|---|---|---|---|---|---|---|
| Noise | 2% | -6% | -3% | 11% | 5% | |
| arrêt / environnement * (dB) | 23.2 | 23.4 -1% | 23.2 -0% | 29.8 -28% | 24.5 -6% | 23.2 -0% |
| Idle Minimum * (dB) | 32 | 33.8 -6% | 31.3 2% | 30.2 6% | 25.1 22% | 23.6 26% |
| Idle Average * (dB) | 32 | 33.8 -6% | 31.3 2% | 31.1 3% | 25.1 22% | 23.8 26% |
| Idle Maximum * (dB) | 32 | 33.8 -6% | 33.4 -4% | 31.9 -0% | 25.1 22% | 36.2 -13% |
| Load Average * (dB) | 38.7 | 36.5 6% | 47.5 -23% | 40 -3% | 35.9 7% | 39.7 -3% |
| Witcher 3 ultra * (dB) | 41.7 | 36.8 12% | 43.6 -5% | 35.6 15% | 41 2% | |
| Load Maximum * (dB) | 42 | 36.9 12% | 47.7 -14% | 40.5 4% | 45.4 -8% | 43 -2% |
* ... Moindre est la valeur, meilleures sont les performances
Température
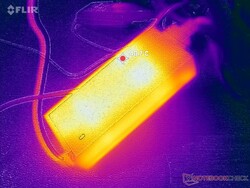
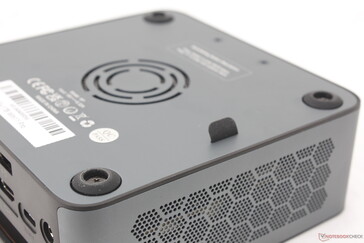
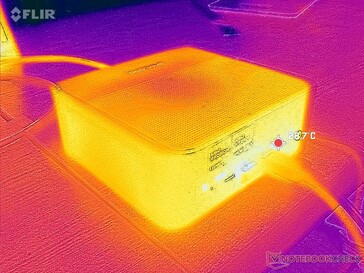
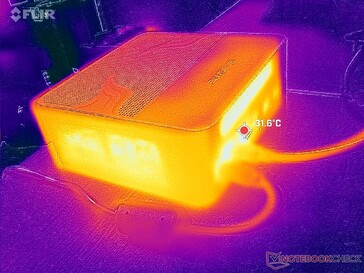
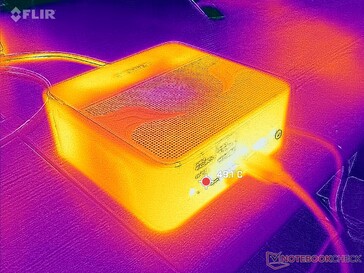
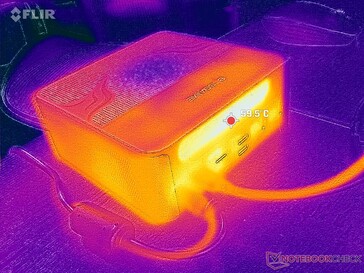
Les températures de surface sont les plus élevées sur la face avant et à l'arrière de l'appareil, comme le montrent les cartes de température ci-dessous. L'air frais est aspiré par le haut tandis que la chaleur résiduelle s'échappe par l'arrière. Il n'est donc pas recommandé de placer des objets sur le dessus de l'unité car la circulation de l'air sera entravée.
Le design de la GMK NucBox K6 est sans doute plus convivial en ce qui concerne le contrôle de la température. Au lieu d'aspirer l'air par la surface supérieure, le système GMK l'aspire par des fentes situées sur les côtés. Cette méthode permet une plus grande liberté de positionnement que le système Bosgame M1.
Intervenants
Les haut-parleurs stéréo intégrés de 26 mm contribuent à distinguer le M1 de la plupart des autres mini-PC. Si votre espace est limité ou minimaliste, par exemple, vous pouvez utiliser les haut-parleurs intégrés au lieu de recourir à des solutions externes.
Malheureusement, les haut-parleurs intégrés sont plutôt une solution de "plan B" en raison de leur qualité audio moyenne, de leur volume moyen et de leur léger retard audio. Ils doivent être couplés à Windows via Bluetooth et nous pouvons remarquer un retard d'une demi-seconde par rapport aux haut-parleurs externes de 3,5 mm. Ce décalage peut être négligé pour la musique et la plupart des lectures vidéo occasionnelles, mais il est certainement perceptible dans les jeux ou les vidéos où les voix ne sont pas parfaitement synchronisées.
Par ailleurs, la qualité audio et le volume n'ont rien d'exceptionnel. Certains ordinateurs portables, comme le HP Spectre x360 16, ont des haut-parleurs intégrés plus forts et plus clairs que le Bosgame M1. Les haut-parleurs du M1 sont suffisamment décents pour les bureaux ou les salles de conférence, mais ils manquent de puissance pour les environnements HTPC de salon.
BOSGAME M1 analyse audio
(+) | les haut-parleurs peuvent jouer relativement fort (82.4# dB)
Basses 100 - 315 Hz
(±) | basse réduite - en moyenne 13.6% inférieure à la médiane
(±) | la linéarité des basses est moyenne (9.2% delta à la fréquence précédente)
Médiums 400 - 2000 Hz
(±) | médiane supérieure - en moyenne 6.8% supérieure à la médiane
(+) | les médiums sont linéaires (5.2% delta à la fréquence précédente)
Aiguës 2 - 16 kHz
(+) | des sommets équilibrés - à seulement 3.2% de la médiane
(+) | les aigus sont linéaires (4.6% delta à la fréquence précédente)
Globalement 100 - 16 000 Hz
(±) | la linéarité du son global est moyenne (20.4% de différence avec la médiane)
Par rapport à la même classe
» 28% de tous les appareils testés de cette catégorie étaient meilleurs, 20% similaires, 52% pires
» Le meilleur avait un delta de 13%, la moyenne était de 25%, le pire était de 64%.
Par rapport à tous les appareils testés
» 53% de tous les appareils testés étaient meilleurs, 8% similaires, 39% pires
» Le meilleur avait un delta de 4%, la moyenne était de 24%, le pire était de 134%.
Apple MacBook Pro 16 2021 M1 Pro analyse audio
(+) | les haut-parleurs peuvent jouer relativement fort (84.7# dB)
Basses 100 - 315 Hz
(+) | bonne basse - seulement 3.8% loin de la médiane
(+) | les basses sont linéaires (5.2% delta à la fréquence précédente)
Médiums 400 - 2000 Hz
(+) | médiane équilibrée - seulement 1.3% de la médiane
(+) | les médiums sont linéaires (2.1% delta à la fréquence précédente)
Aiguës 2 - 16 kHz
(+) | des sommets équilibrés - à seulement 1.9% de la médiane
(+) | les aigus sont linéaires (2.7% delta à la fréquence précédente)
Globalement 100 - 16 000 Hz
(+) | le son global est linéaire (4.6% différence à la médiane)
Par rapport à la même classe
» 0% de tous les appareils testés de cette catégorie étaient meilleurs, 0% similaires, 100% pires
» Le meilleur avait un delta de 5%, la moyenne était de 17%, le pire était de 45%.
Par rapport à tous les appareils testés
» 0% de tous les appareils testés étaient meilleurs, 0% similaires, 100% pires
» Le meilleur avait un delta de 4%, la moyenne était de 24%, le pire était de 134%.
Gestion de l'énergie
Consommation électrique
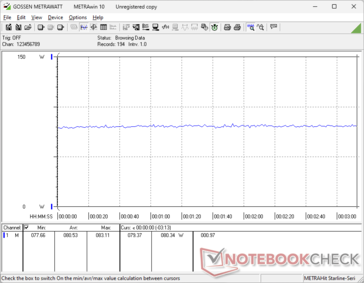
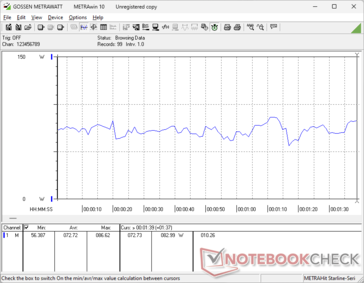
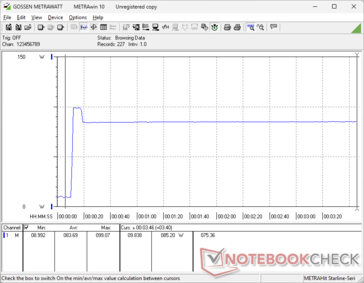
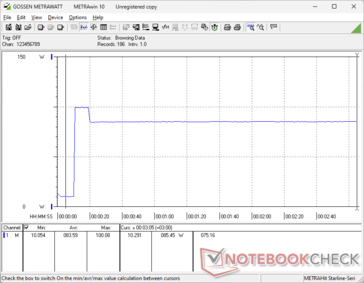
En mode ralenti, il consomme moins de 9 W en moyenne, ce qui le rend légèrement plus efficace que le Beelink SER7 et la GMK NucBox K6, à quelques watts près. Lors de l'exécution de jeux, cependant, le Bosgame demandera quelques watts de plus en moyenne, probablement en raison de sa Radeon 780M à cadence plus élevée mentionnée ci-dessus.
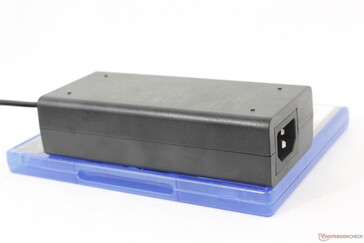
Nous avons pu enregistrer une consommation maximale de 99 W sur l'adaptateur secteur de taille moyenne (~13,9 x 6,3 x 3,5 cm) de 120 W lorsque le CPU est utilisé à 100 %. Cette surcharge peut s'avérer utile pour connecter des périphériques ou des lecteurs USB externes.
| Éteint/en veille | |
| Au repos | |
| Fortement sollicité |
|
Légende:
min: | |
| BOSGAME M1 R7 7840HS, Radeon 780M, Kingston OM8PGP41024N-A0, , x, | GMK NucBox M5 R7 5700U, Vega 8, Lexar 1024GB LNM6A1X001T-HNNNG, , x, | GMK NucBox K6 R7 7840HS, Radeon 780M, MasonSemi 1TB MC7000, , x, | Intel NUC 13 Pro Kit NUC13ANK i7-1360P, Iris Xe G7 96EUs, Samsung PM9A1 MZVL2512HCJQ, , x, | Beelink SER7 R7 7840HS, Radeon 780M, Crucial P3 Plus CT1000P3PSSD8, , x, | Beelink GTR6 R9 6900HX, Radeon 680M, Kingston KC3000 512G SKC3000S512G, , x, | |
|---|---|---|---|---|---|---|
| Power Consumption | 43% | 7% | 5% | -1% | -4% | |
| Idle Minimum * (Watt) | 7.3 | 5.9 19% | 6.7 8% | 5.1 30% | 6.7 8% | 7.6 -4% |
| Idle Average * (Watt) | 7.3 | 6.2 15% | 7 4% | 5.8 21% | 7.3 -0% | 9.9 -36% |
| Idle Maximum * (Watt) | 8.4 | 6.4 24% | 7.6 10% | 10.2 -21% | 11.6 -38% | 10.6 -26% |
| Load Average * (Watt) | 72.7 | 28.2 61% | 74.3 -2% | 68.1 6% | 64.1 12% | 64 12% |
| Witcher 3 ultra * (Watt) | 80.5 | 27.5 66% | 75 7% | 75.8 6% | 69 14% | |
| Load Maximum * (Watt) | 99.1 | 29.5 70% | 85.7 14% | 108.3 -9% | 94.8 4% | 80.4 19% |
* ... Moindre est la valeur, meilleures sont les performances
Power Consumption Witcher 3 / Stresstest
Power Consumption external Monitor
Points positifs
Points négatifs
Verdict - Une excellente option même sans les haut-parleurs intégrés
Les haut-parleurs stéréo intégrés sont un argument de vente unique pour le Bosgame M1. Bien qu'ils soient très pratiques lorsqu'aucune option externe n'est disponible, leur qualité audio laisse à désirer pour des usages autres que le bureau ou la salle de conférence. Il est toujours préférable d'utiliser des haut-parleurs externes pour la lecture multimédia ou si vous vous trouvez dans une pièce plus grande.
Heureusement, le M1 est très performant sur tous les autres points. Le châssis entièrement métallique est de haute qualité, la connectivité est excellente avec plusieurs ports USB-C 4.0, l'entretien est relativement facile et les performances sont plus rapides que prévu. Les joueurs occasionnels apprécieront qu'il puisse faire tourner la plupart des jeux à 1080p, tandis que les hardcore gamers apprécieront sa prise en charge de l'eGPU. Le prix de <700 USD est également très raisonnable si l'on considère qu'il est livré avec 32 Go de RAM, 1 To de stockage et une licence Windows 11 Pro. Une option plus simple aurait rendu le M1 encore moins cher et compétitif par rapport à de nombreuses alternatives de Beelink Alternatives à Beelink.
Le Bosgame M1 est une alternative solide au NUC, avec des niveaux de performance qui rivalisent avec les options haut de gamme basées sur Intel. Il est un peu plus grand et plus lourd que la plupart des autres, mais les performances et la qualité compensent largement sa taille.
Les principaux inconvénients, outre les haut-parleurs quelque peu décevants, sont le châssis légèrement plus grand, l'adaptateur secteur 120 W encombrant et quelques images perdues lors de la lecture de vidéos en 4K60. Il s'agit de problèmes relativement mineurs qui ne nuisent pas à la valeur globale ou à la qualité de construction du modèle.
Prix et disponibilité
Le Bosgame M1 est désormais disponible sur Amazon au prix de 690 $ avec 32 Go de RAM, 1 To de SSD et Windows 11 Pro tel qu'il a été testé. Les utilisateurs peuvent également acheter directement auprès du fabricant pour le même prix.
BOSGAME M1
- 05/25/2024 v7 (old)
Allen Ngo
Transparency
La sélection des appareils à examiner est effectuée par notre équipe éditoriale. L'échantillon de test a été prêté à l'auteur par le fabricant ou le détaillant pour les besoins de cet examen. Le prêteur n'a pas eu d'influence sur cette évaluation et le fabricant n'a pas reçu de copie de cette évaluation avant sa publication. Il n'y avait aucune obligation de publier cet article. En tant que média indépendant, Notebookcheck n'est pas soumis à l'autorité des fabricants, des détaillants ou des éditeurs.
Voici comment Notebookcheck teste
Chaque année, Notebookcheck examine de manière indépendante des centaines d'ordinateurs portables et de smartphones en utilisant des procédures standardisées afin de garantir que tous les résultats sont comparables. Nous avons continuellement développé nos méthodes de test depuis environ 20 ans et avons établi des normes industrielles dans le processus. Dans nos laboratoires de test, des équipements de mesure de haute qualité sont utilisés par des techniciens et des rédacteurs expérimentés. Ces tests impliquent un processus de validation en plusieurs étapes. Notre système d'évaluation complexe repose sur des centaines de mesures et de points de référence bien fondés, ce qui garantit l'objectivité.

