Test du Predator Helios Neo 16 : Acer a créé une chimère pour le jeu
En principe, le Predator Helios Neo 16 d'Acer, un ordinateur portable de jeu de milieu de gamme, est une version allégée du Predator Helios 16 d'Acer.Predator Helios 16(Non-Neo). Quelques caractéristiques du modèle Helio classique ont été conservées, ce qui lui permet de se démarquer de la série Nitro d'Acer d'entrée de gamme Nitro d'Acer.
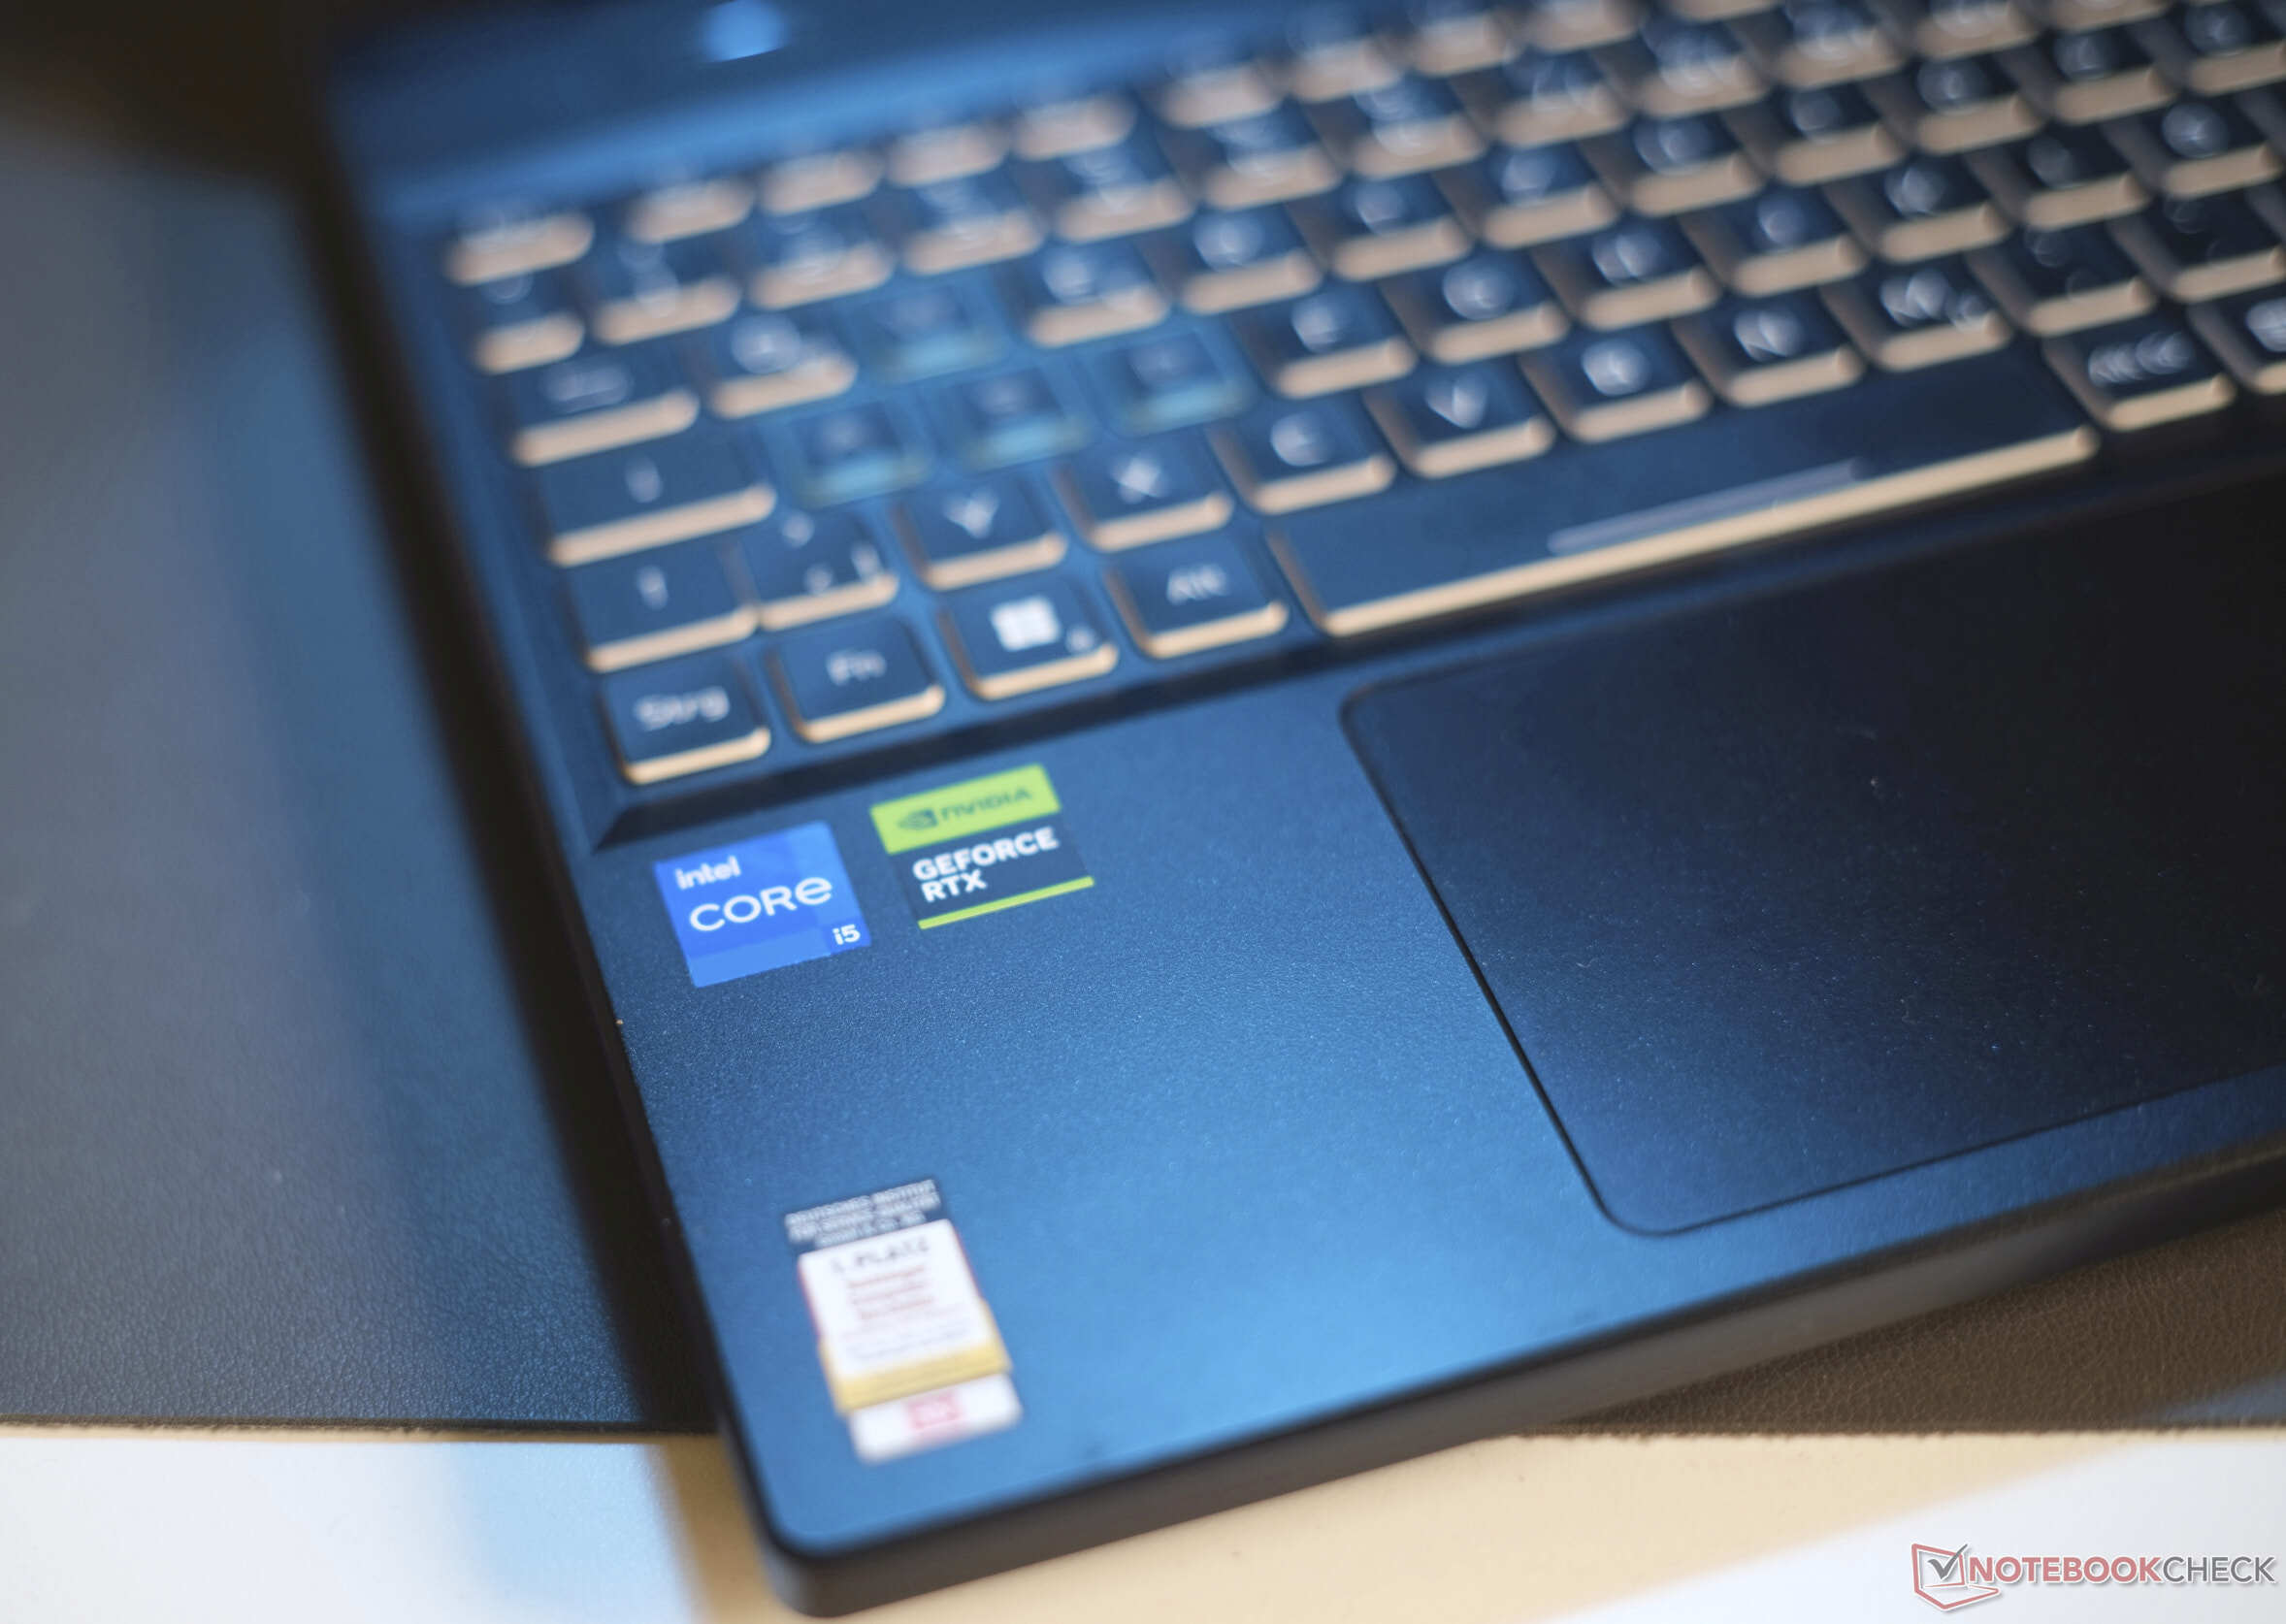
Malgré cela, certains aspects peuvent être classés comme des caractéristiques d'entrée de gamme, comme la RTX 4050 installée - à un prix de 1 069 dollars, c'est un peu discutable. Cependant, le processeur Intel Core i5-13500HX de l'ordinateur portable est un puissant processeur de bureau qui consomme 55 watts. Cette caractéristique, ainsi que d'autres, ne se retrouvent normalement pas dans les ordinateurs portables vraiment économiques. En outre, il existe des variantes avec une RTX 4060 ou une RTX 4070.
Au cours de cet article, nous analyserons si ces caractéristiques sont suffisantes pour que l'ordinateur portable vaille son prix. Son principal concurrent est le Lenovo Legion Pro 5, mais aussi le HP Victus 16, le XMG Apex 15 et le Dell G15.
Comparaison avec les concurrents potentiels
Note | Date | Modèle | Poids | Épaisseur | Taille | Résolution | Prix |
|---|---|---|---|---|---|---|---|
| 86.6 % v7 (old) | 11/23 | Acer Predator Helios Neo 16 NH.QLTEG.002 i5-13500HX, GeForce RTX 4050 Laptop GPU | 2.6 kg | 28.25 mm | 16.00" | 1920x1200 | |
| 89 % v7 (old) | 08/23 | Lenovo Legion Pro 5 16ARX8 (R5 7645HX, RTX 4050) R5 7645HX, GeForce RTX 4050 Laptop GPU | 2.5 kg | 27.3 mm | 16.00" | 2560x1600 | |
| 87.3 % v7 (old) | 09/23 | Lenovo LOQ 16IRH8 i7-13620H, GeForce RTX 4060 Laptop GPU | 2.7 kg | 25.9 mm | 16.00" | 2560x1600 | |
| 86.2 % v7 (old) | 10/23 | Schenker XMG Apex 15 (Late 23) R7 7840HS, GeForce RTX 4050 Laptop GPU | 2.2 kg | 26.7 mm | 15.60" | 2560x1440 | |
| 85.6 % v7 (old) | 09/23 | HP Victus 16-r0076TX i5-13500HX, GeForce RTX 4050 Laptop GPU | 2.3 kg | 22.9 mm | 16.10" | 1920x1080 | |
| 84.2 % v7 (old) | 06/23 | Dell G15 5530 i7-13650HX, GeForce RTX 4060 Laptop GPU | 3 kg | 26.95 mm | 15.60" | 1920x1080 |
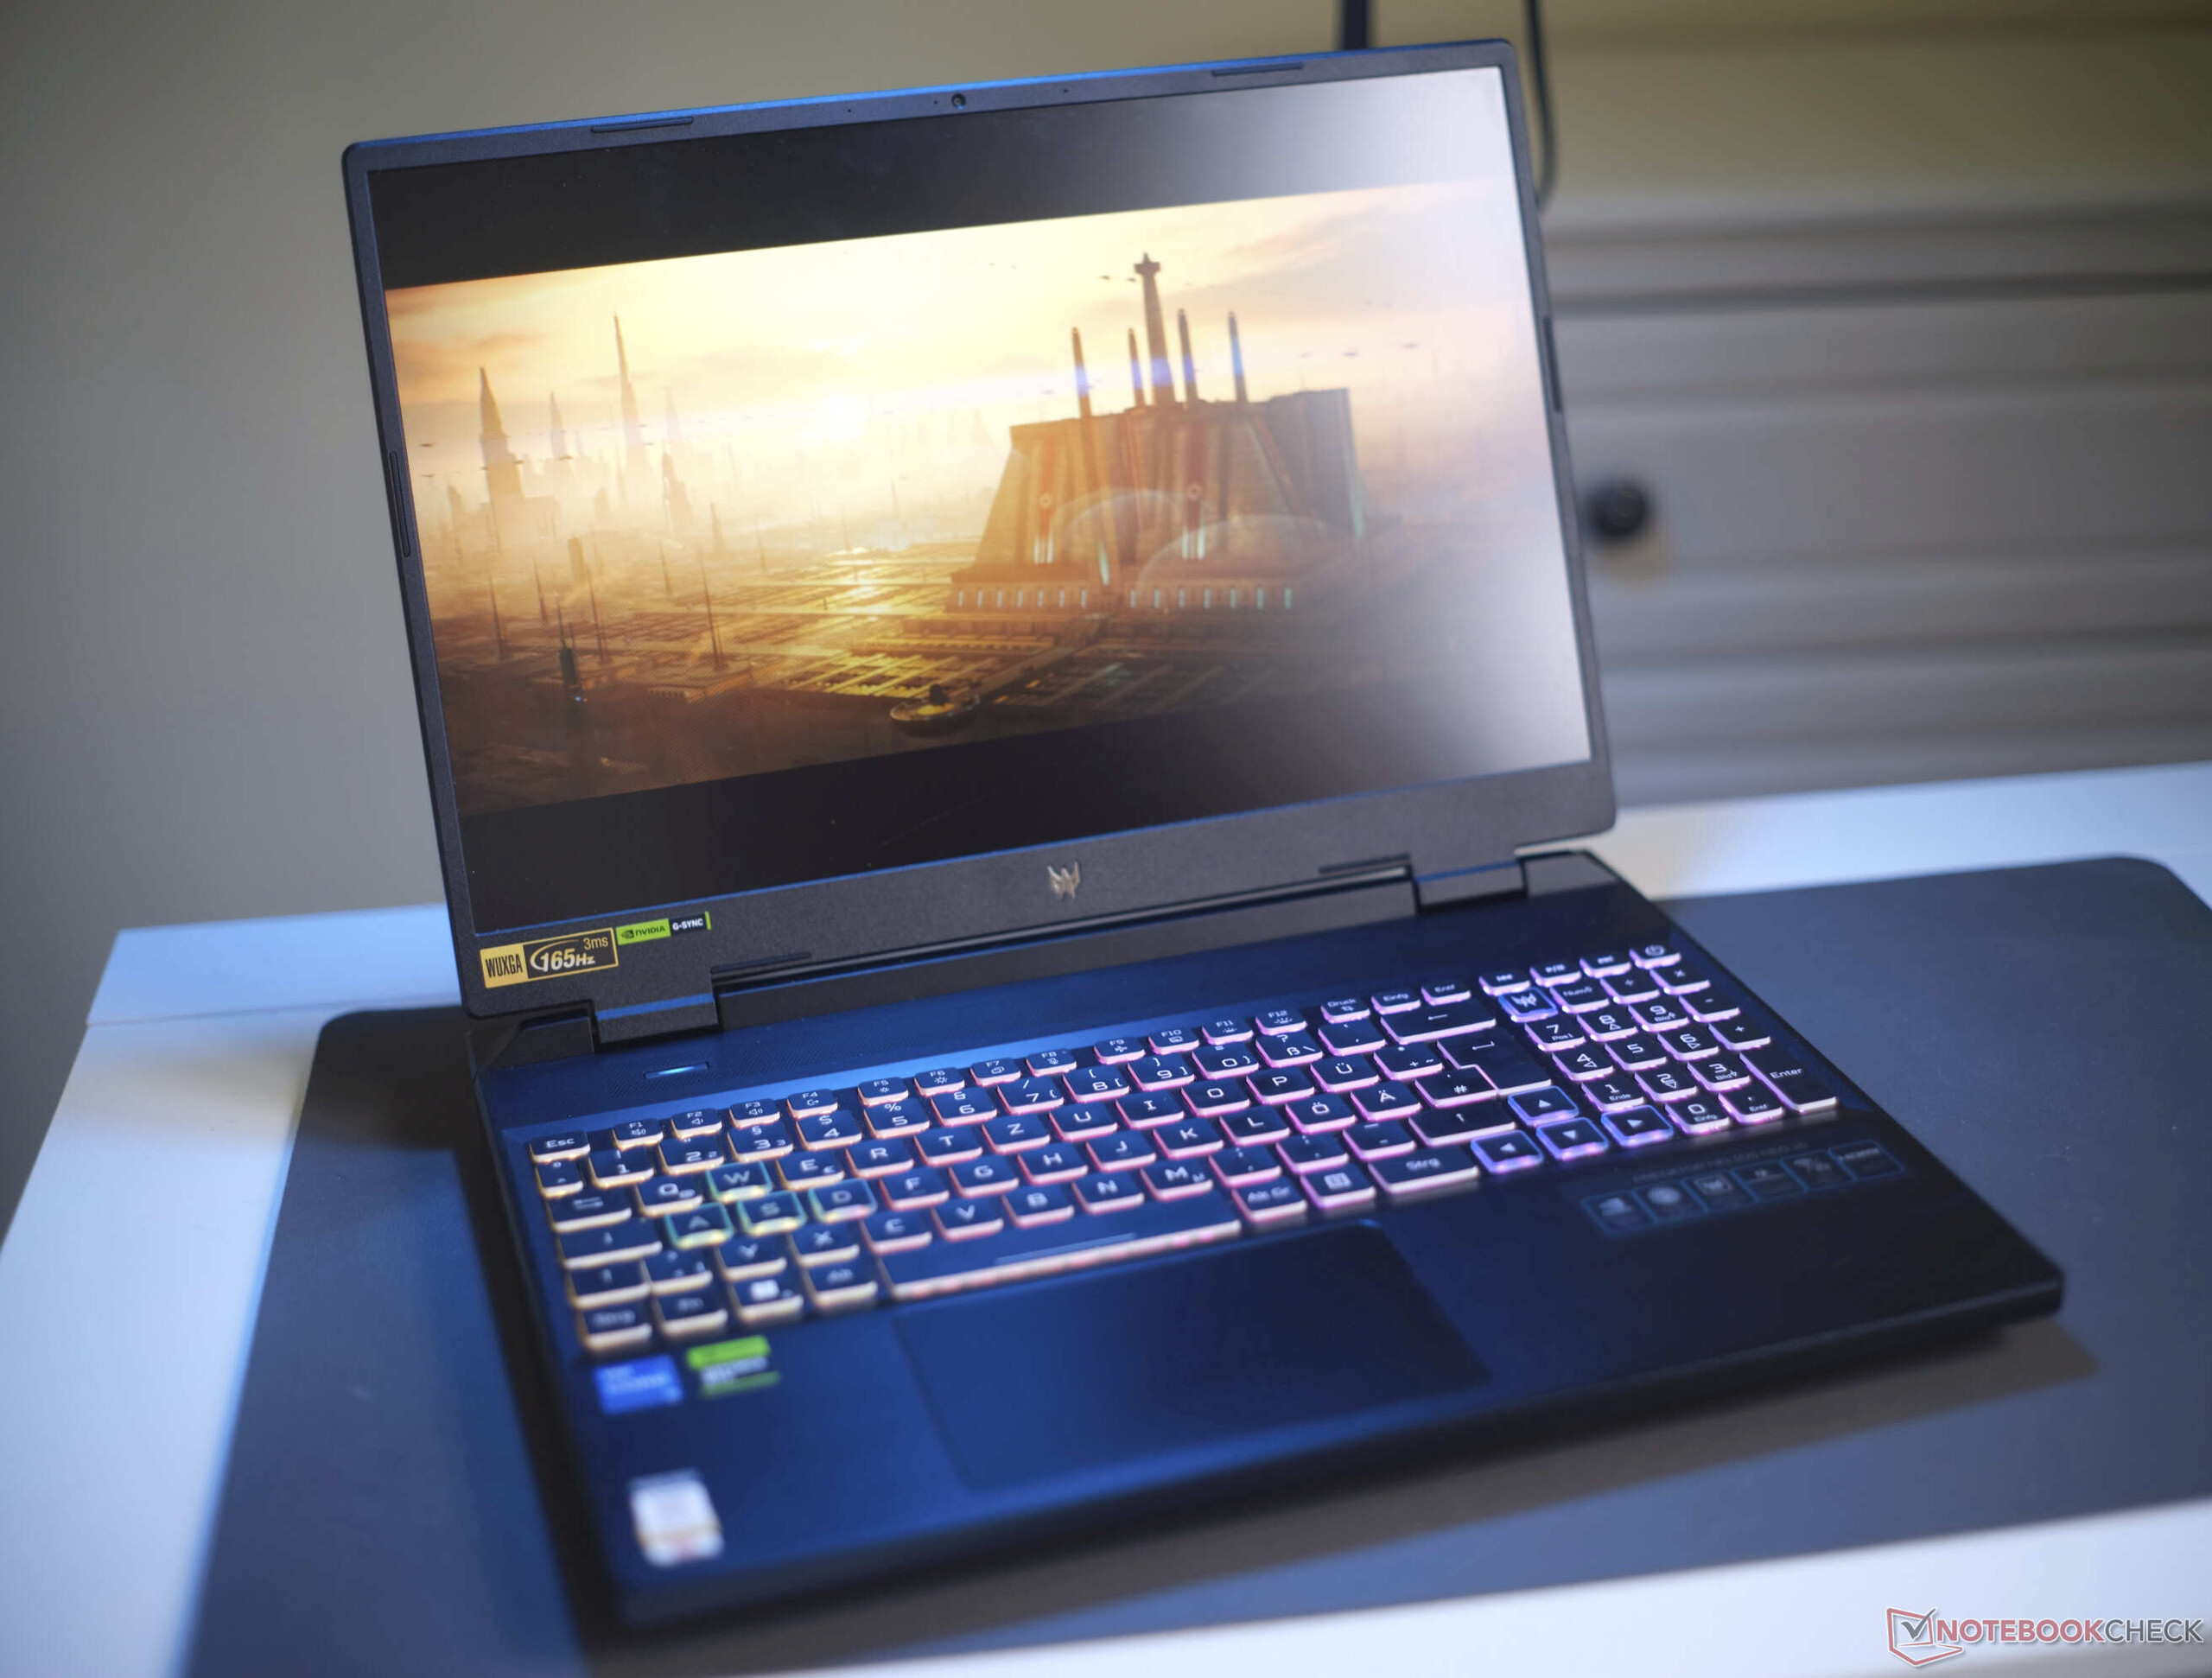
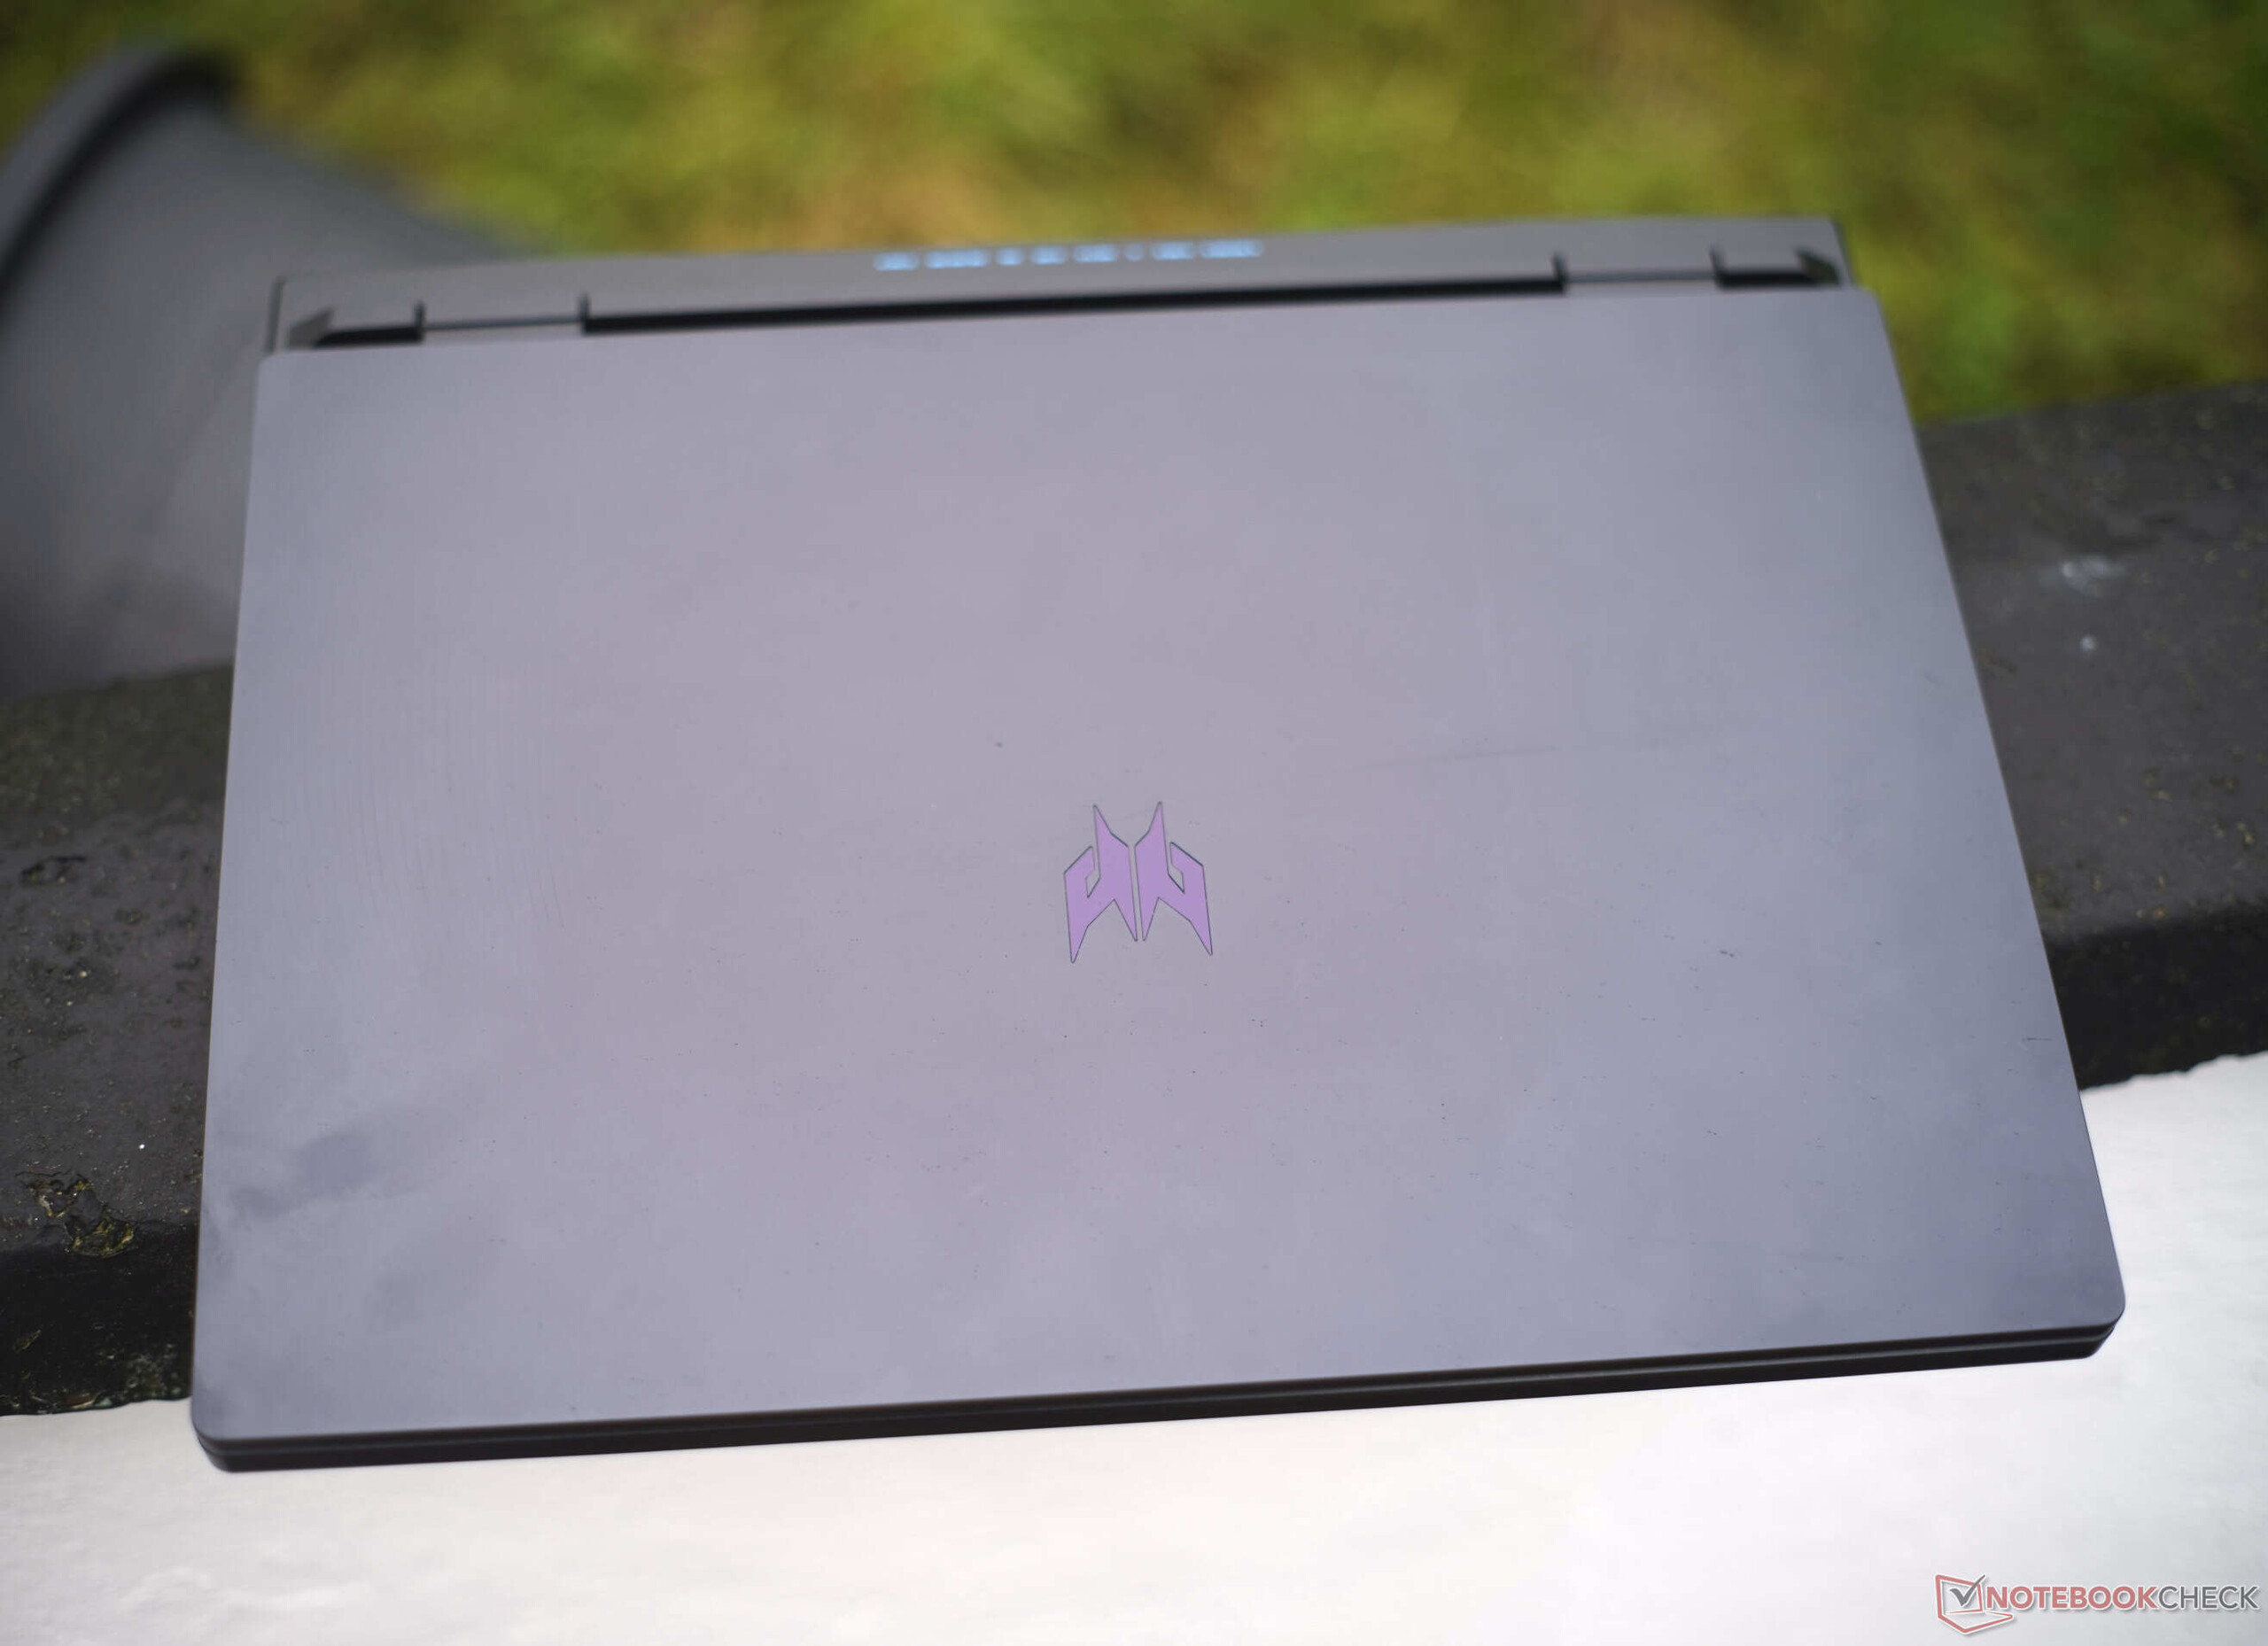
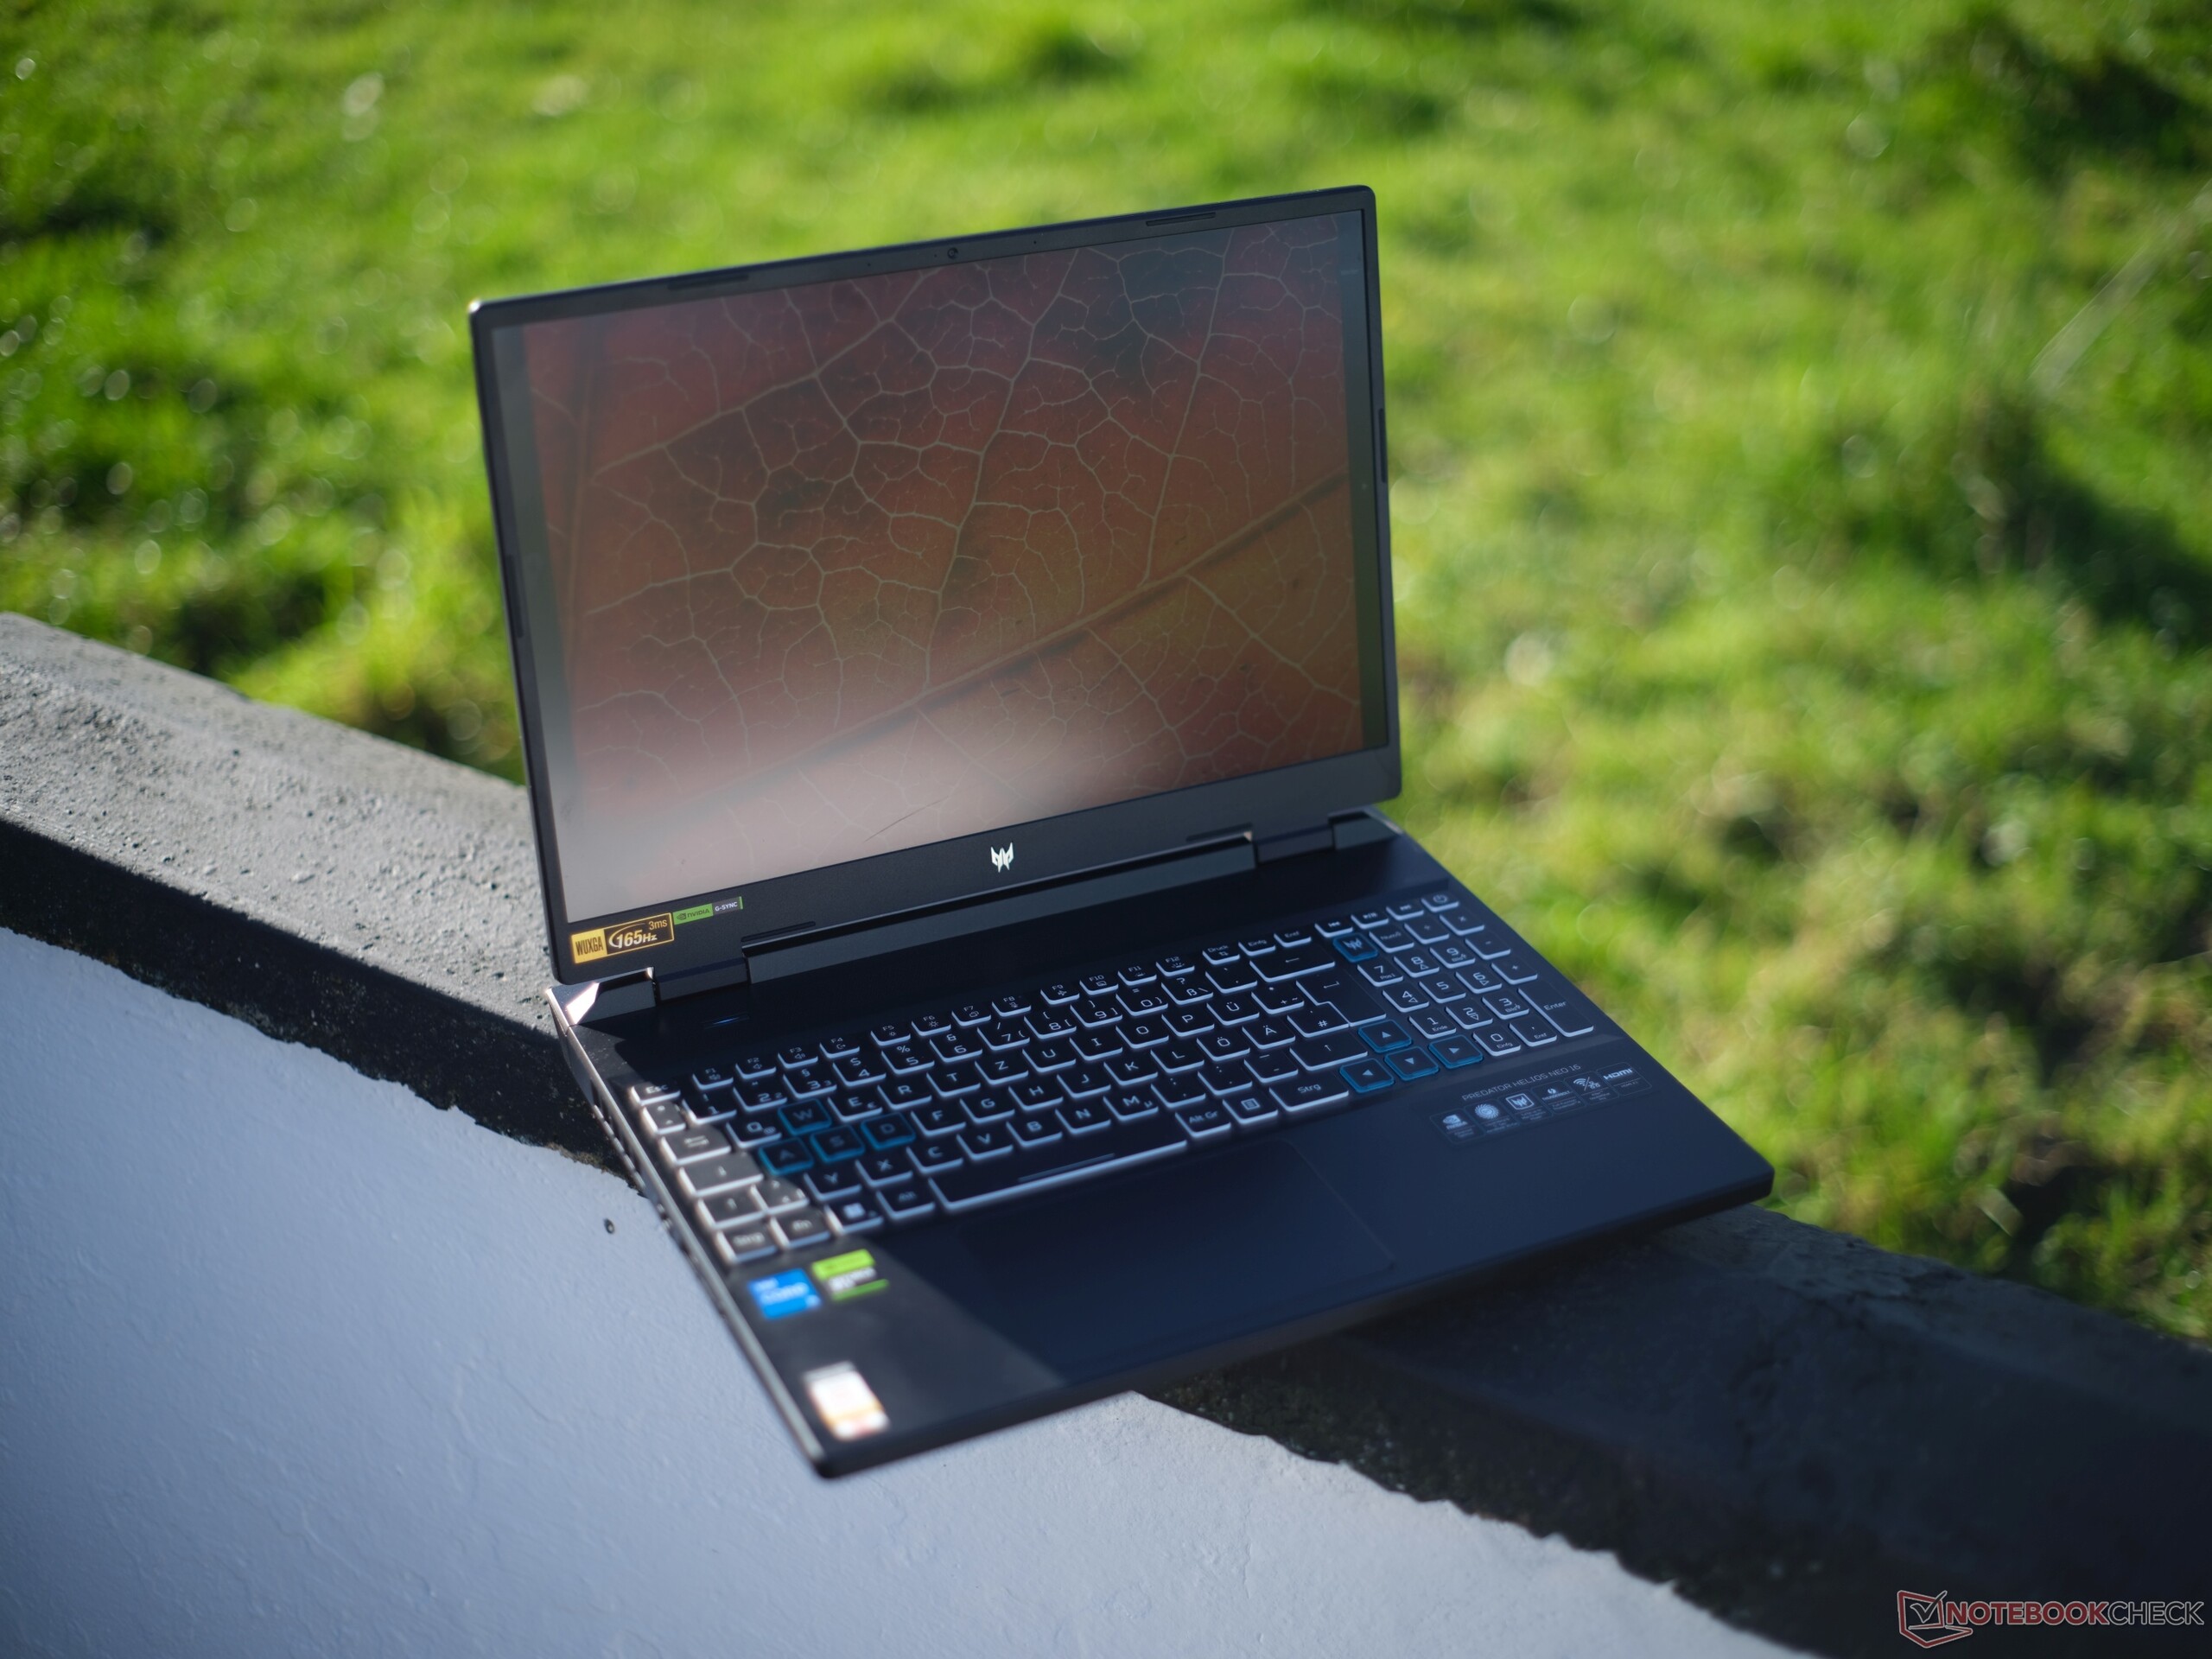
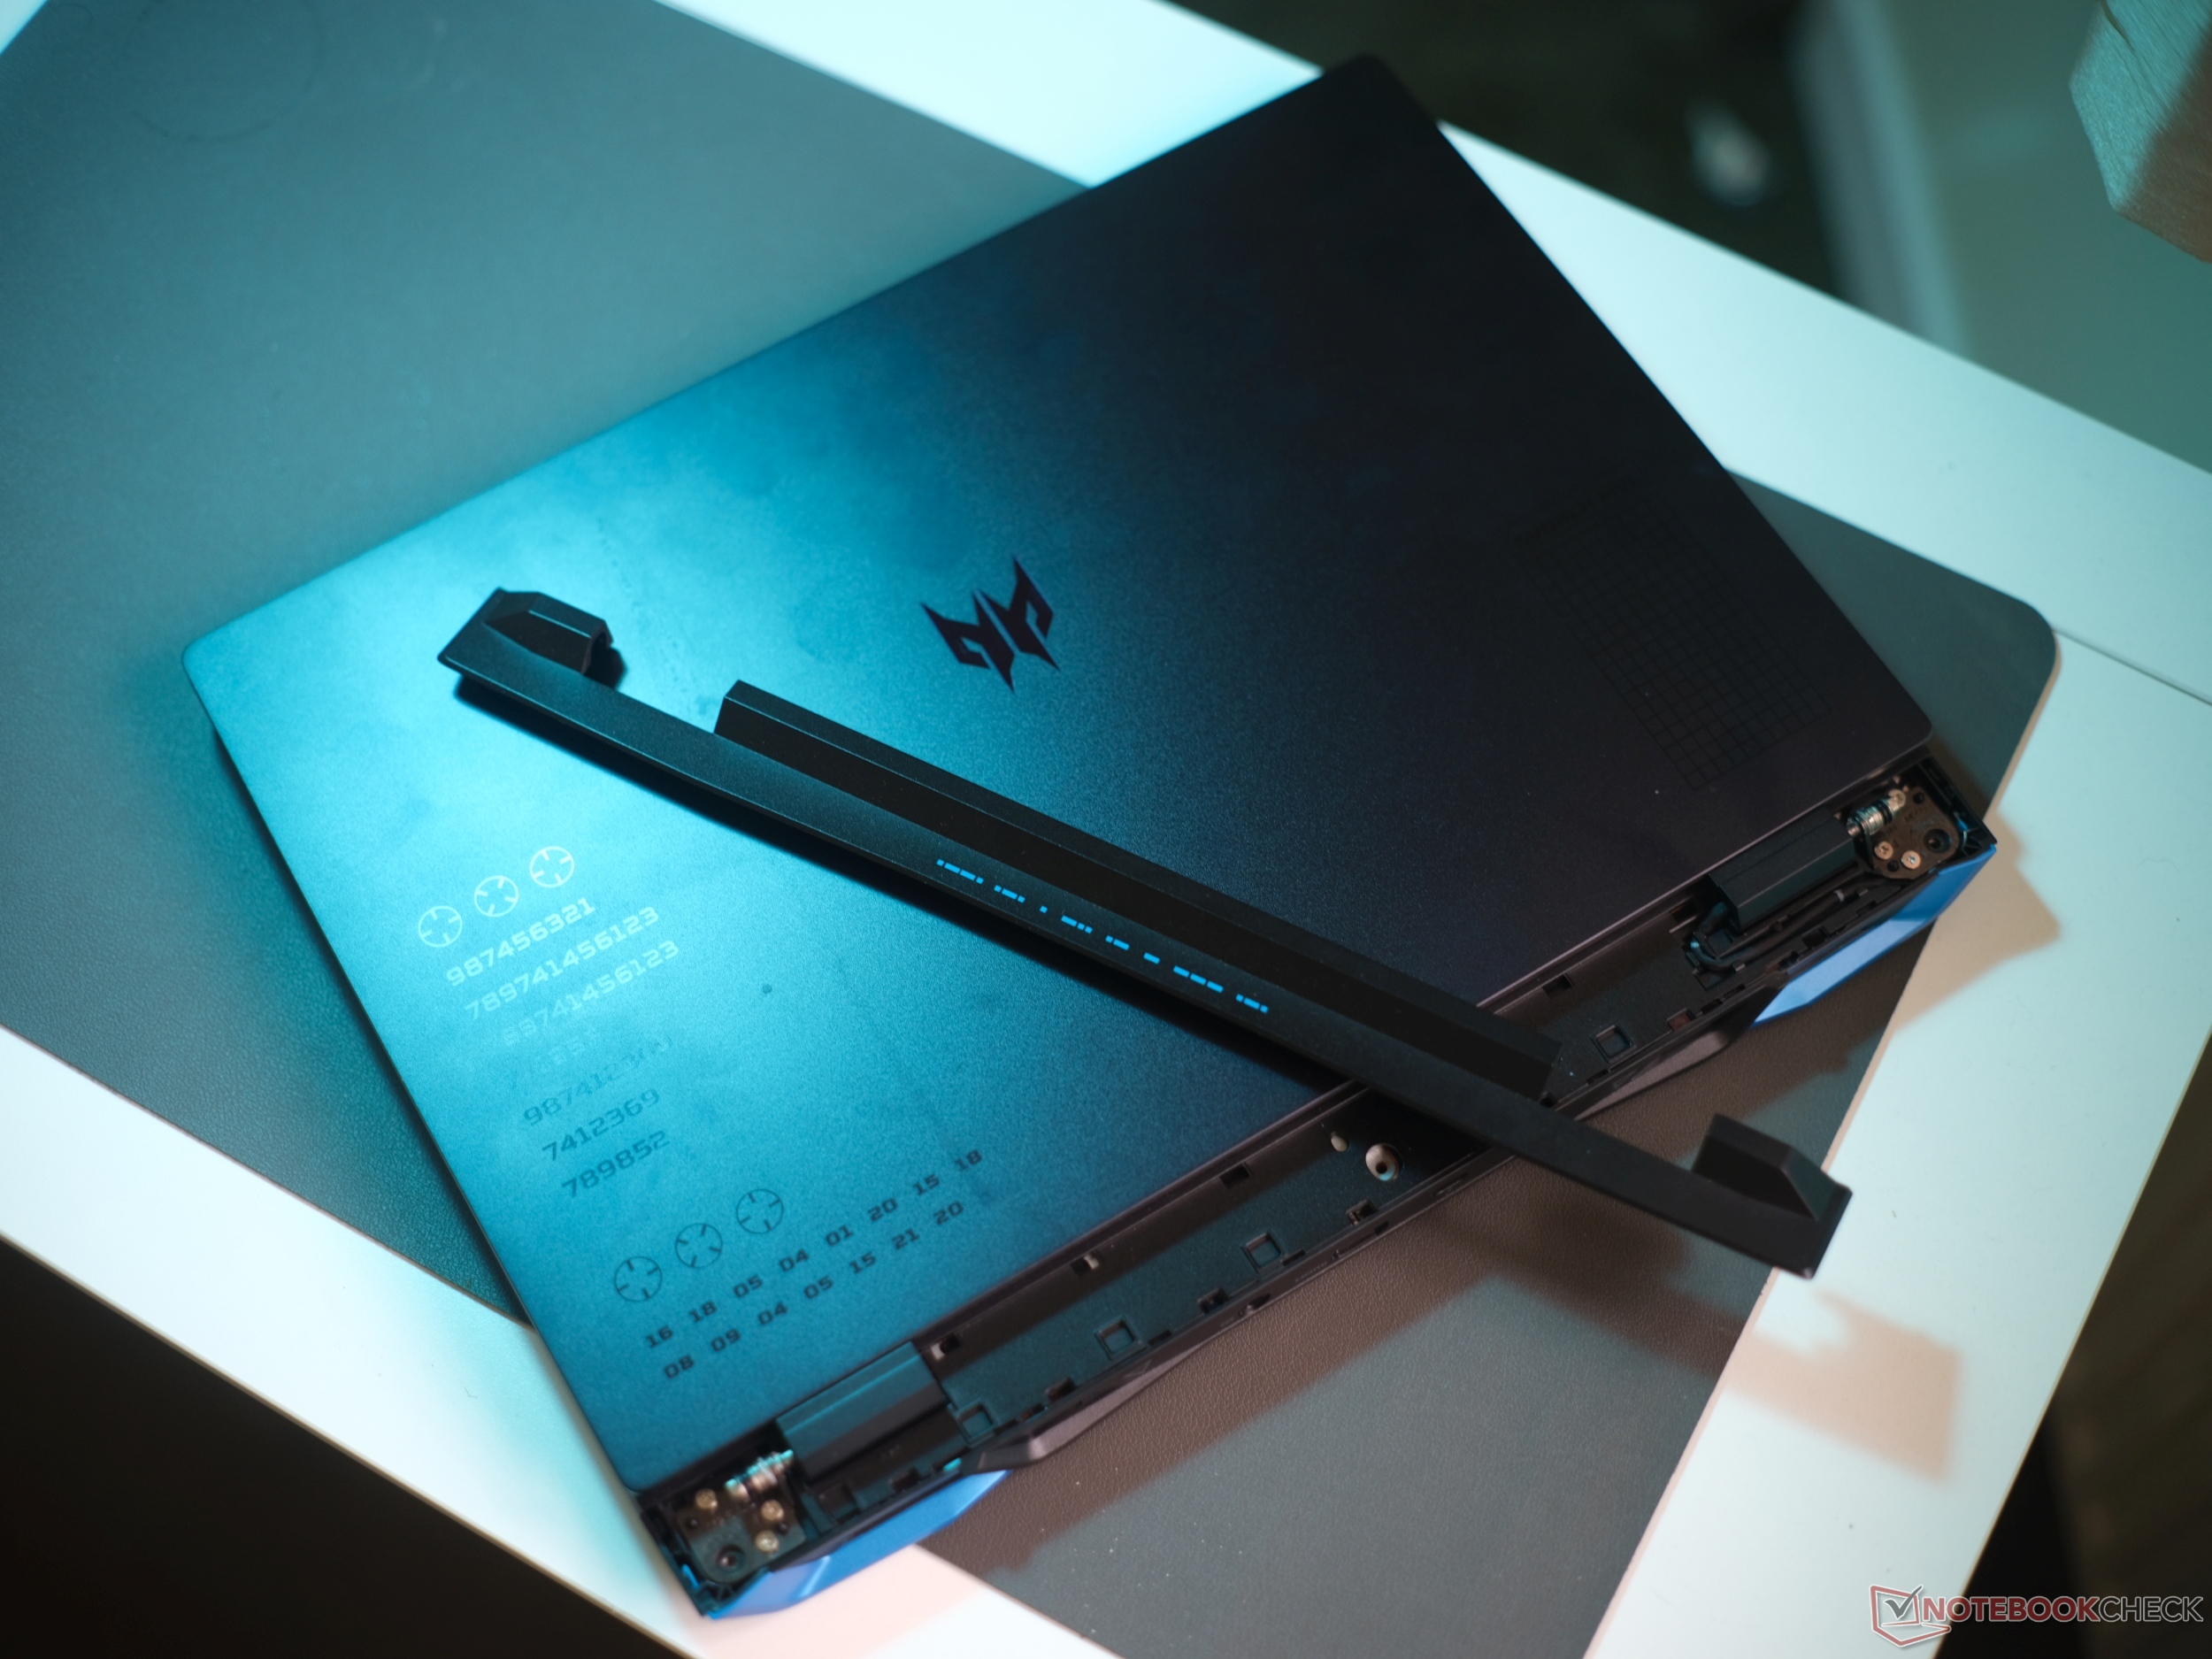
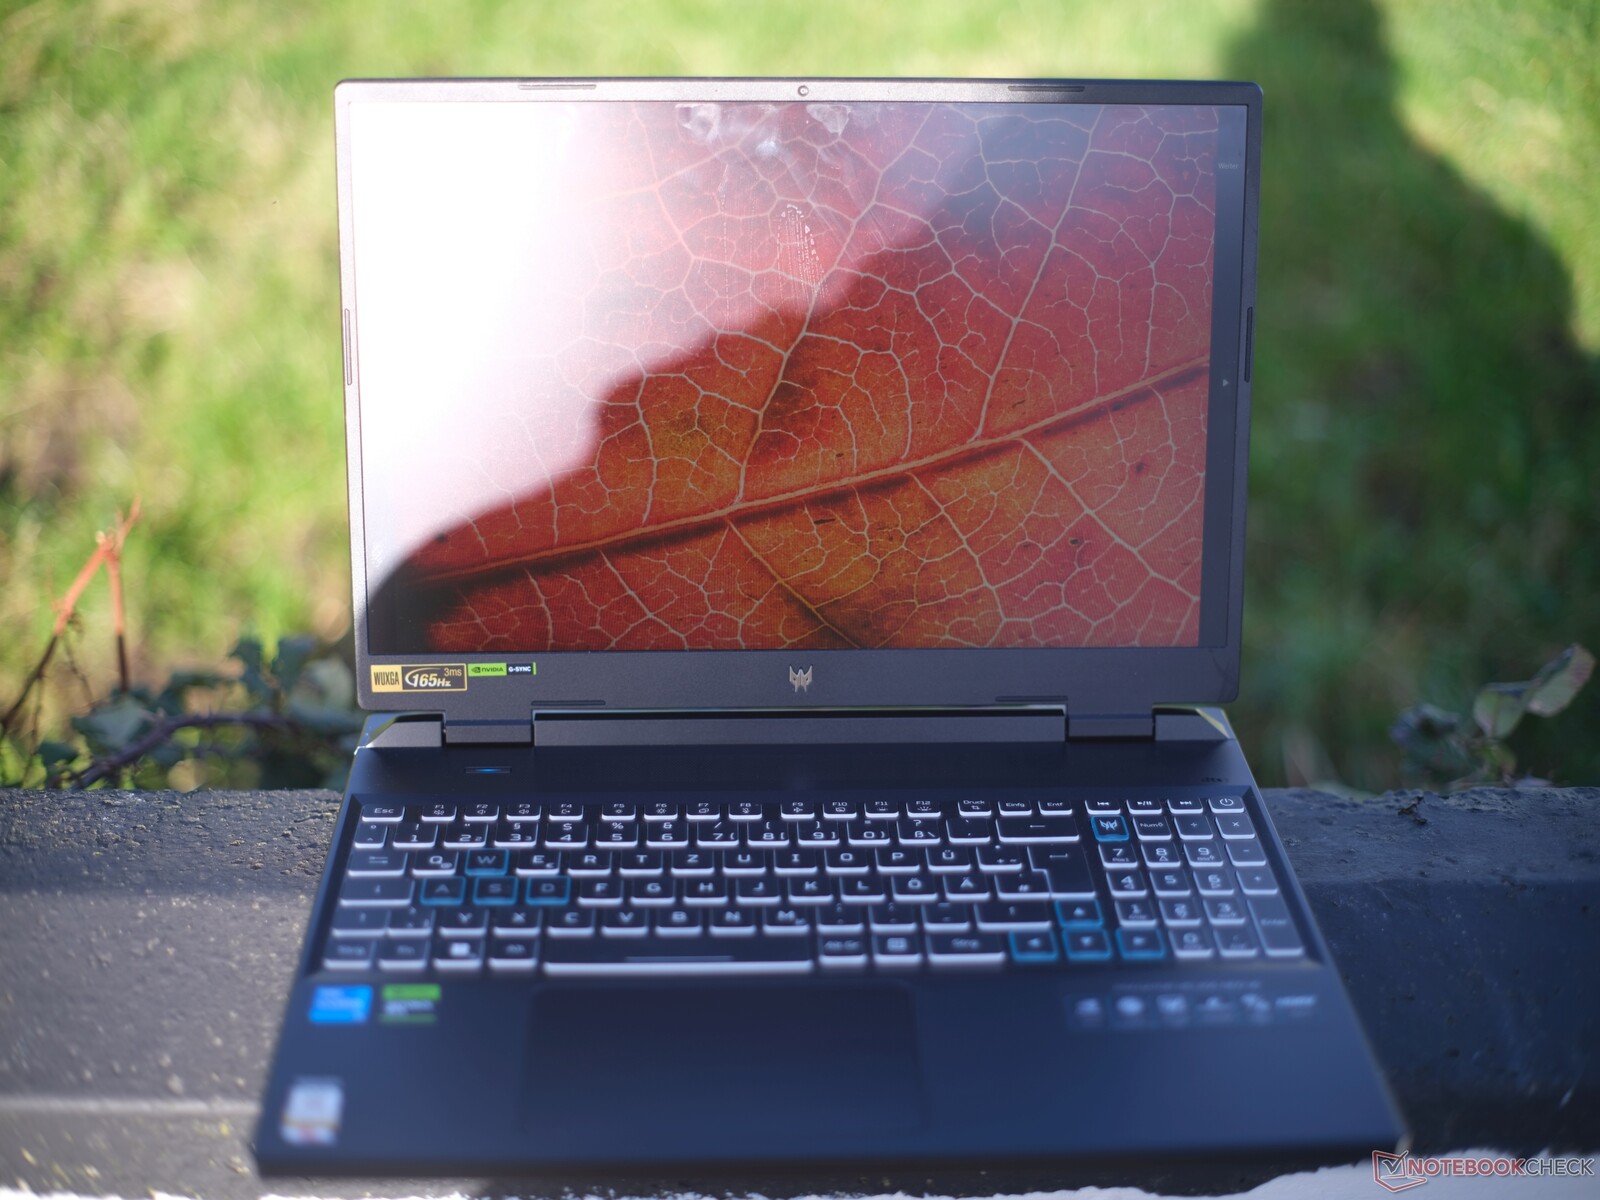
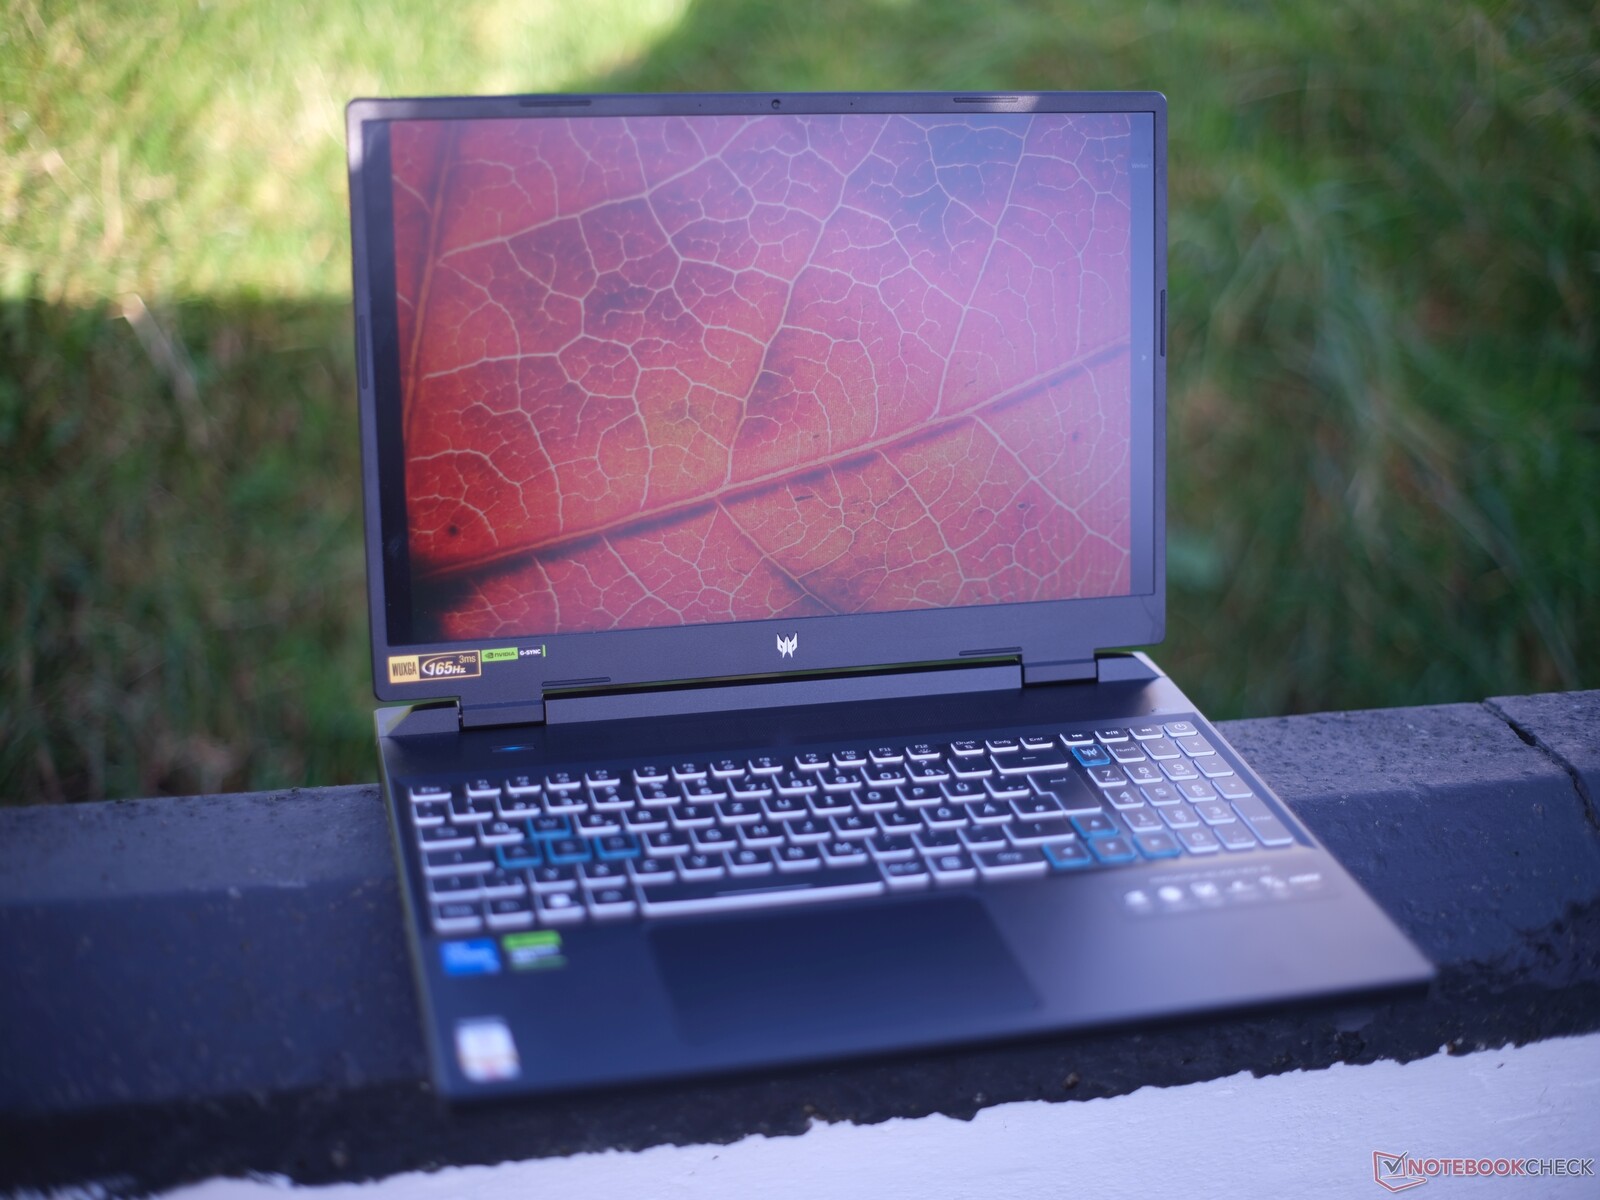
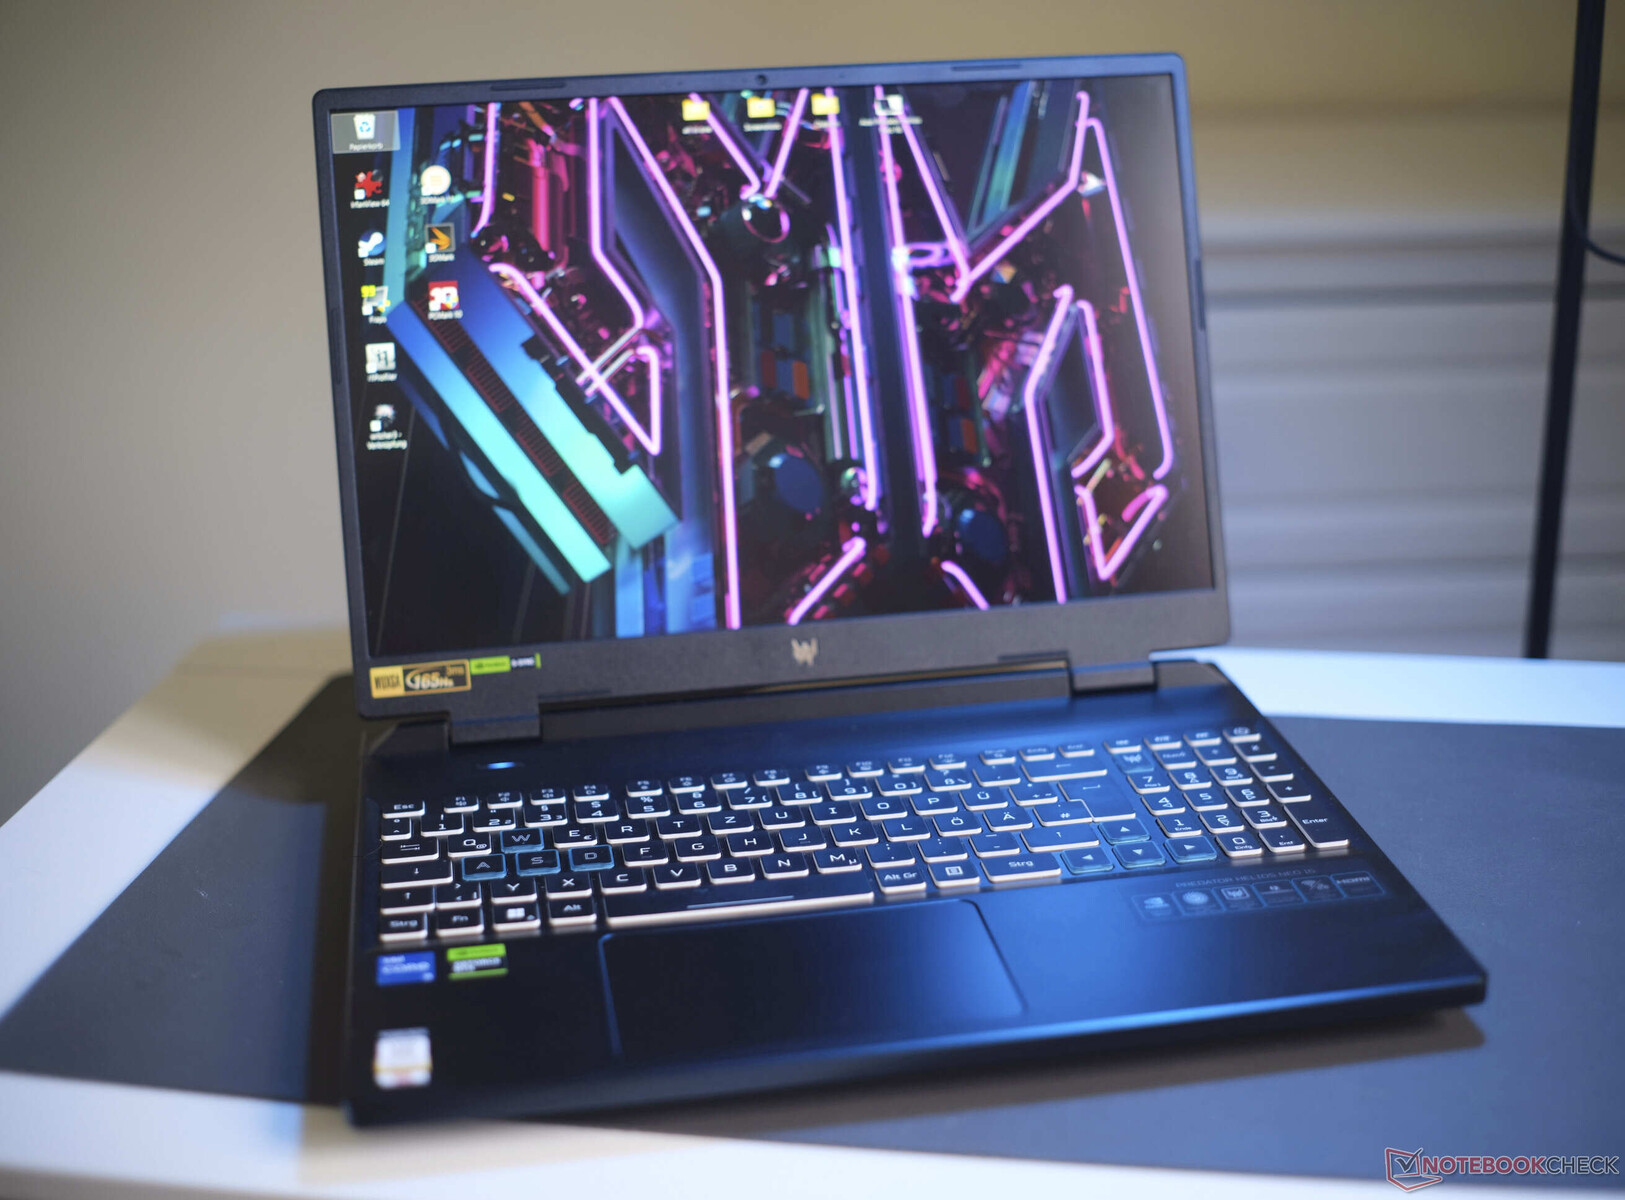
Boîtier : L'Helios Neo 16 se distingue par sa robustesse et son aspect
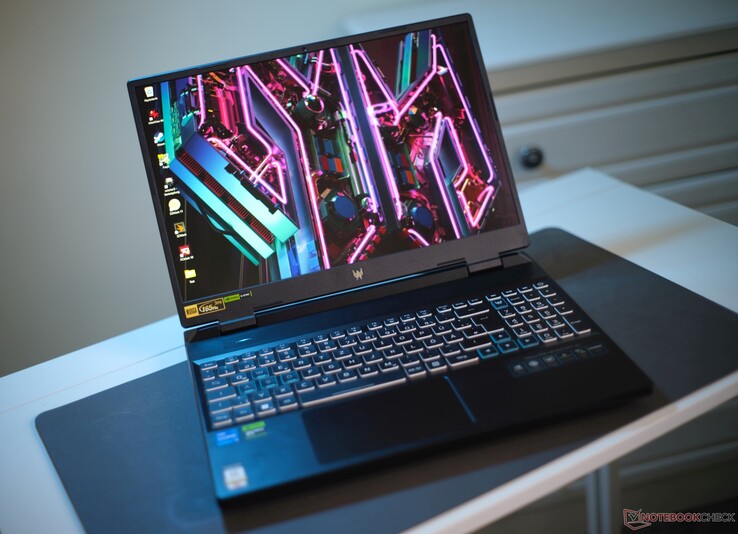
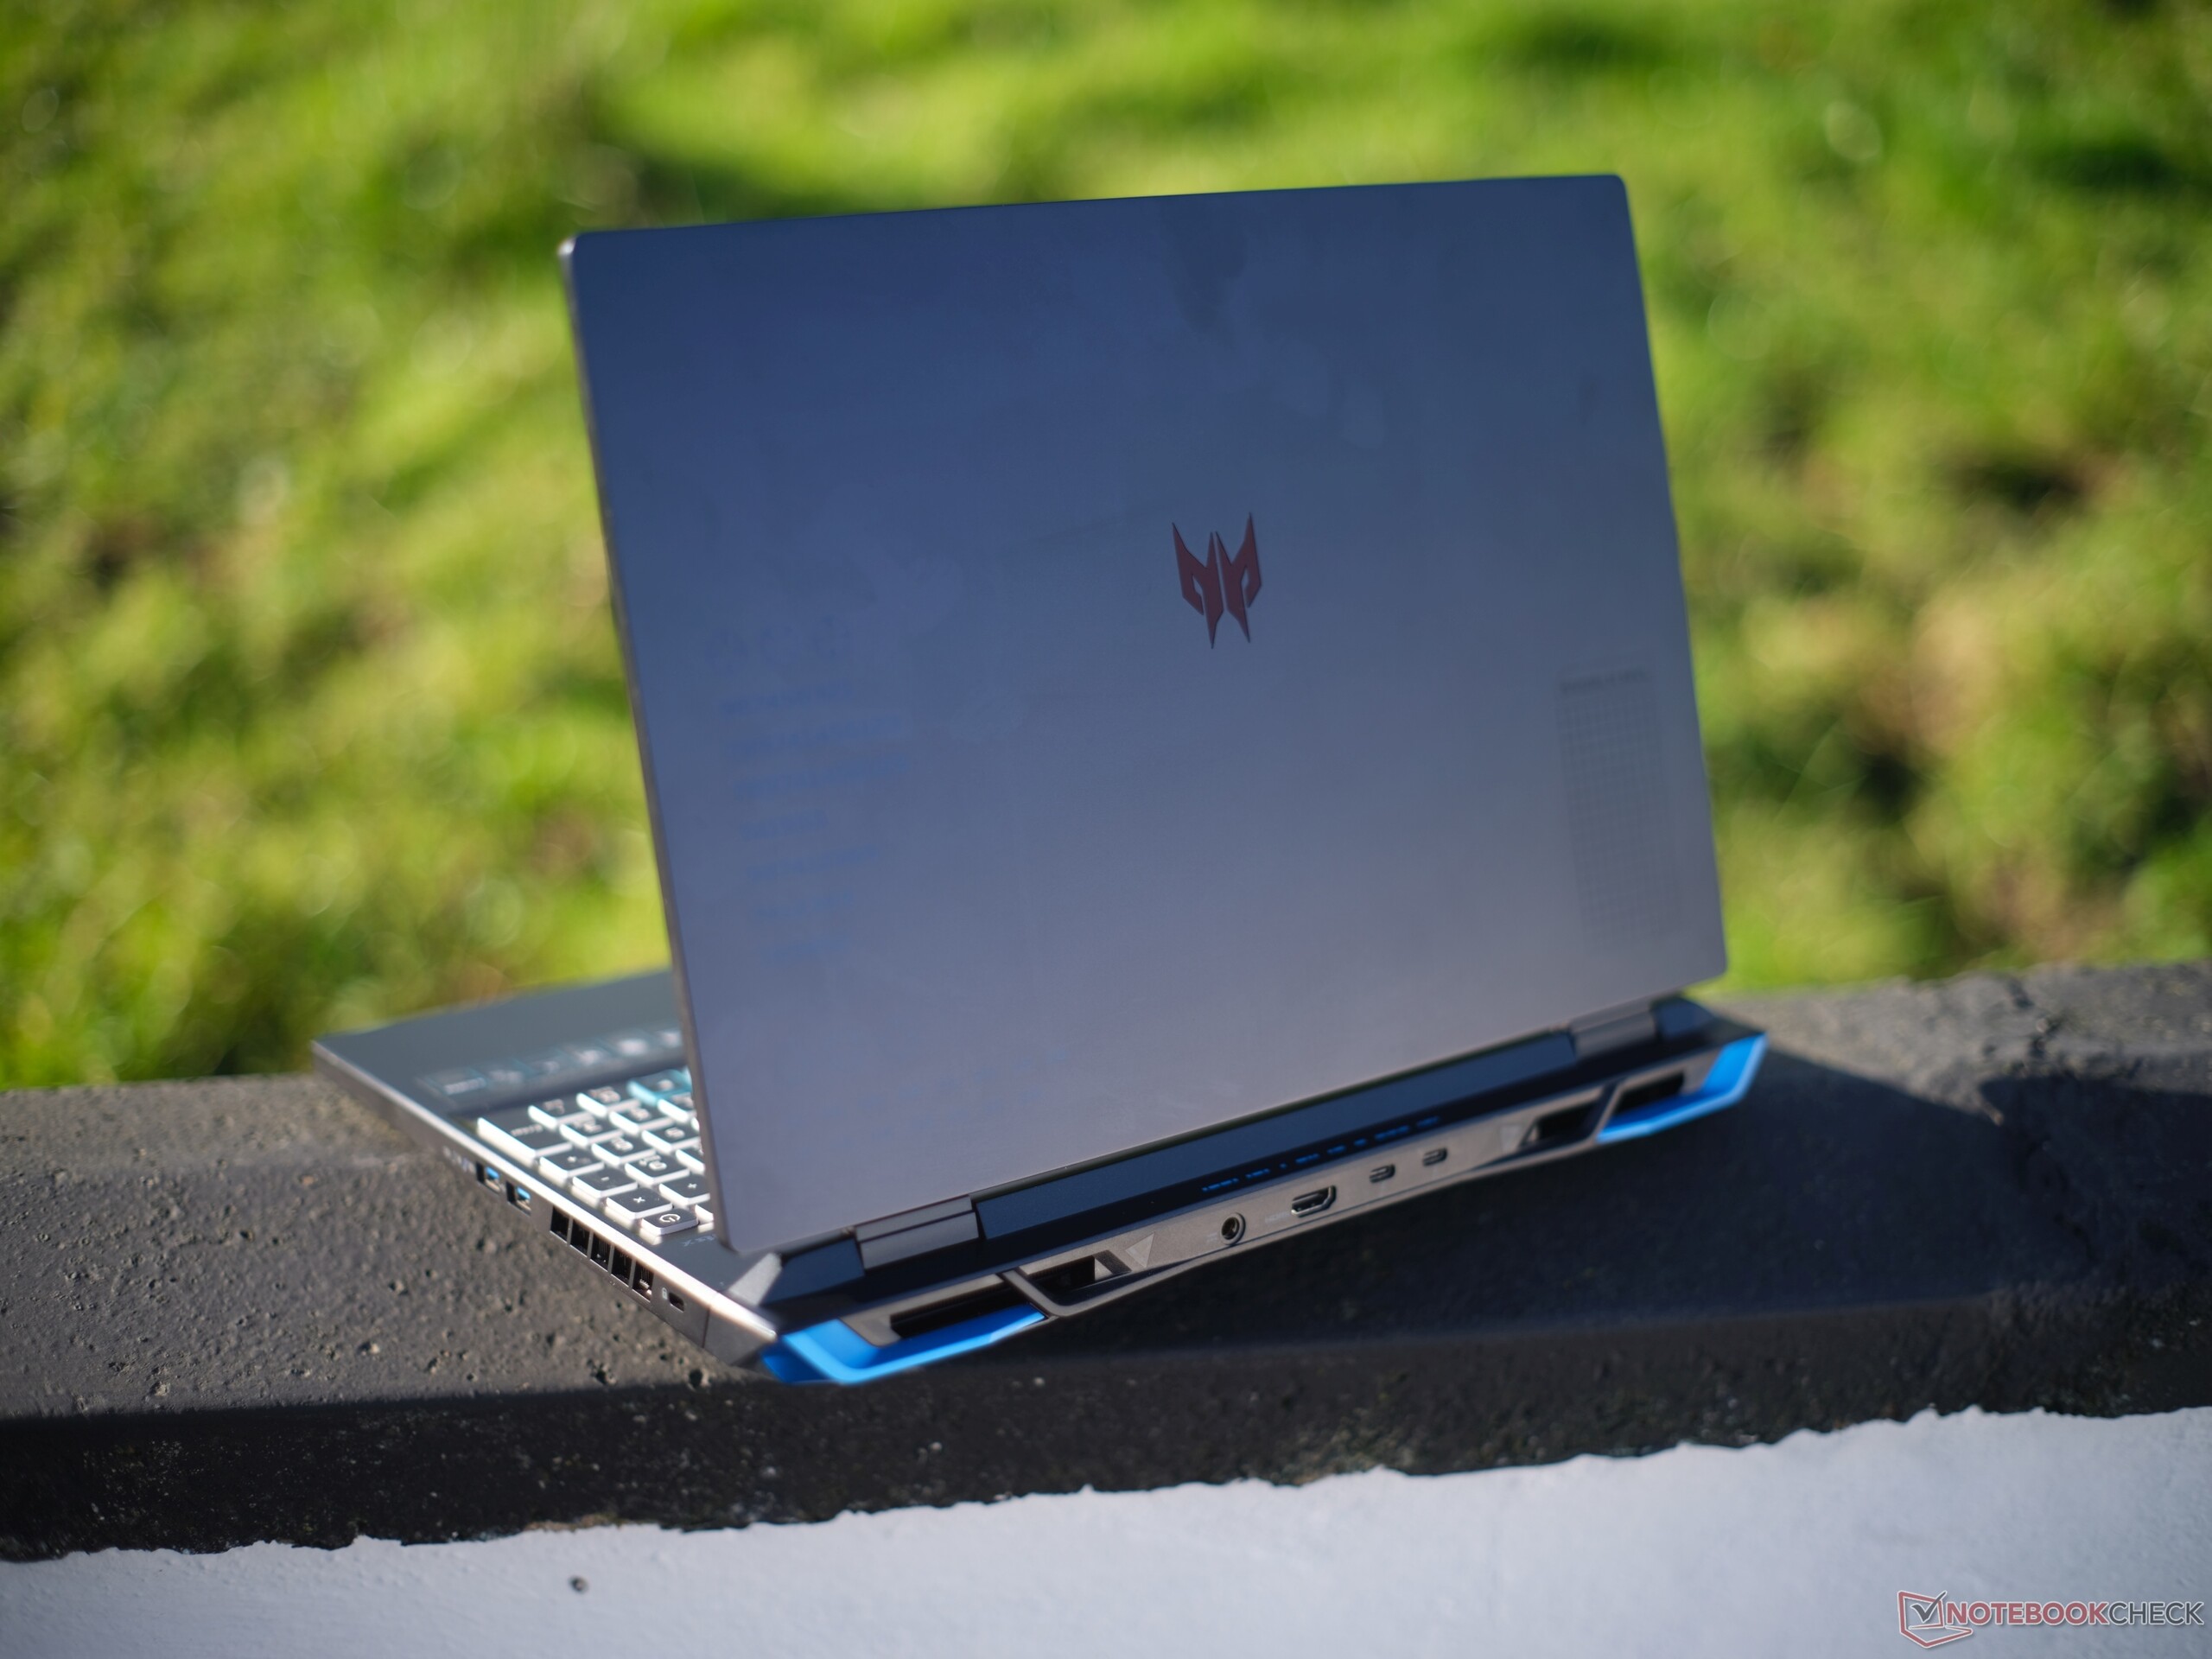
La stabilité du boîtier du Predator Helios Neo est excellente, ce qui le différencie de beaucoup de joueurs à petit budget. Le couvercle en aluminium et la base en plastique sont d'un noir profond (Obsidian Black) avec un subtil reflet bleu foncé.
Il y a quelques éléments gravés sur le couvercle qui, avec les grilles de ventilation bleues à l'arrière, donnent à l'appareil une apparence intéressante, mais aussi un effet de furtivité plus faible. L'un des inconvénients de l'appareil est que ses surfaces attirent les traces de doigts.
Le couvercle peut être ouvert d'une seule main et jusqu'à un maximum de ~150° - en même temps, les charnières sont assez rigides, ce qui signifie qu'il n'oscille pratiquement pas lorsque vous le positionnez. Malheureusement, il peut être tordu assez facilement (même si cela n'entraîne pas d'erreur d'image), mais en contrepartie, l'unité de base est très stable. Dans l'ensemble, l'Helios Neo 16 nous a laissé une bonne, voire une très bonne impression, tout comme la variante non Neo Test de l'Acer Predator Helios 16 : PC portable de jeu silencieux avec de nombreux atouts . La seule différence est que ce modèle ne dispose pas d'un dos éclairé ou d'une grille de refroidissement interchangeable.

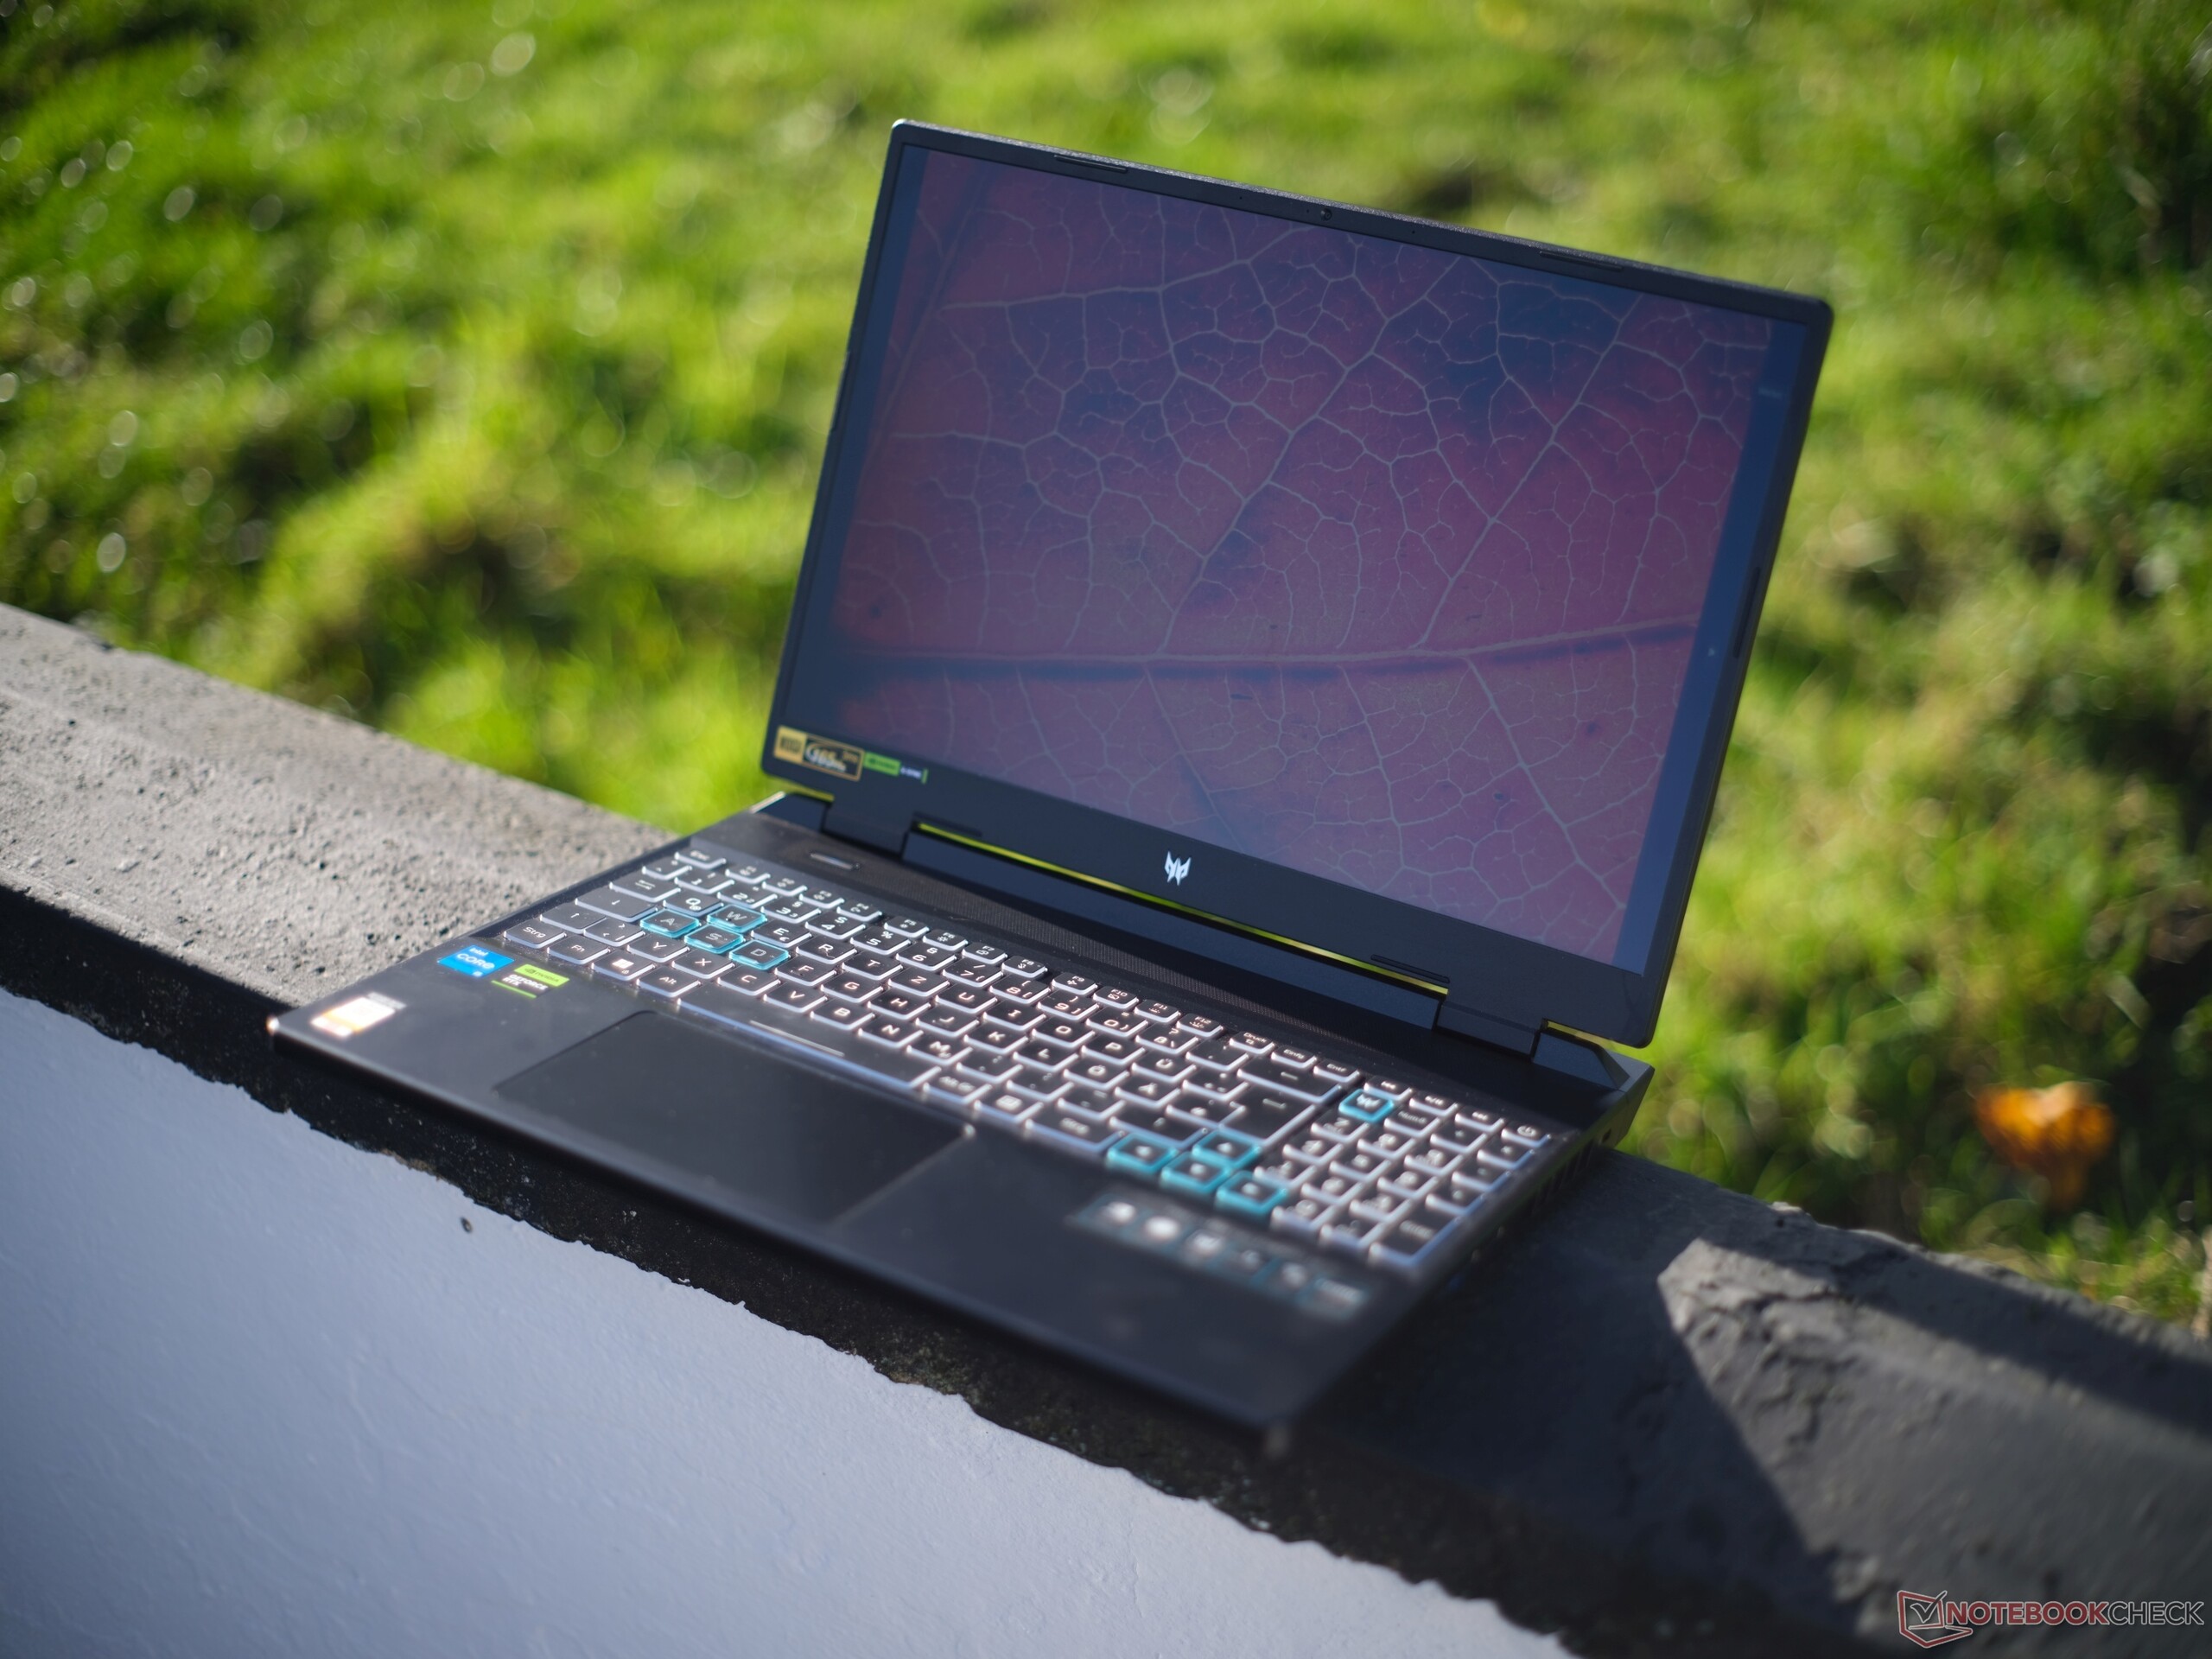
Avec un poids de 2,6 kg et une épaisseur de 28,25 mm, l'Helios Neo se situe dans la moyenne des ordinateurs portables de jeu de 16 pouces. Dans notre comparatif, seul leHP Victus 16a des valeurs inférieures, avec un poids de 2,3 kg et une épaisseur de 22,9 mm. Le XMG Apex 15 de 15,6 pouces est également un peu plus léger.
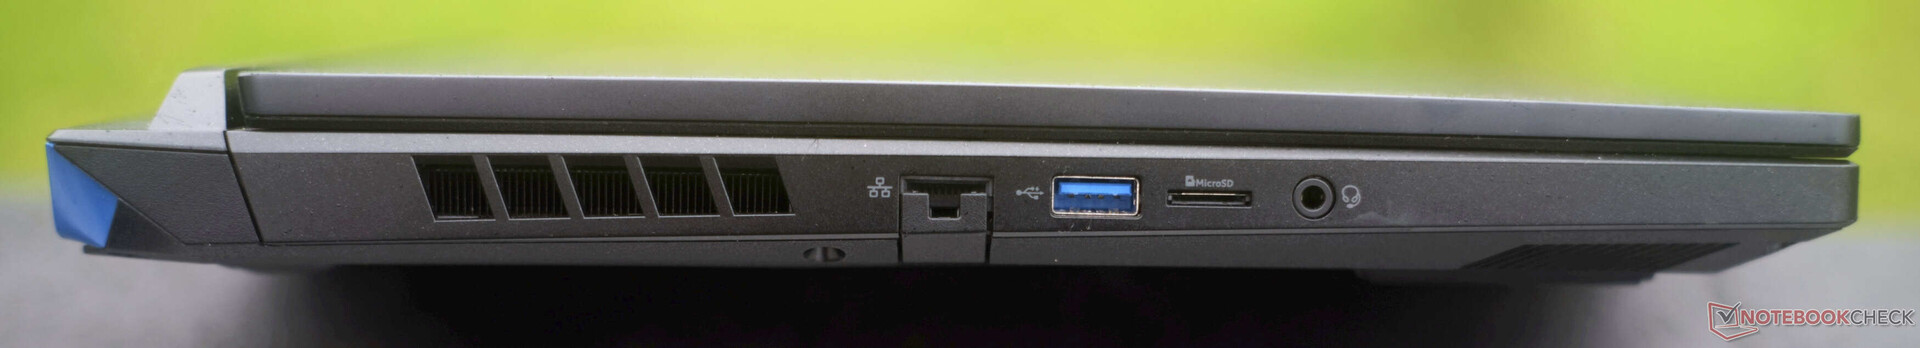
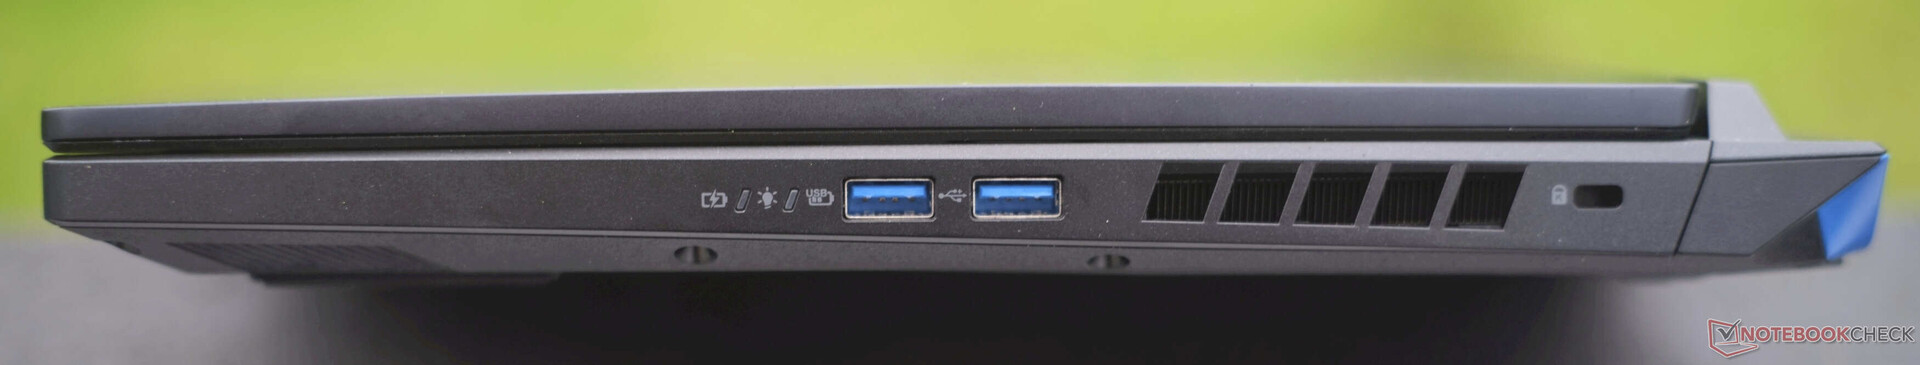
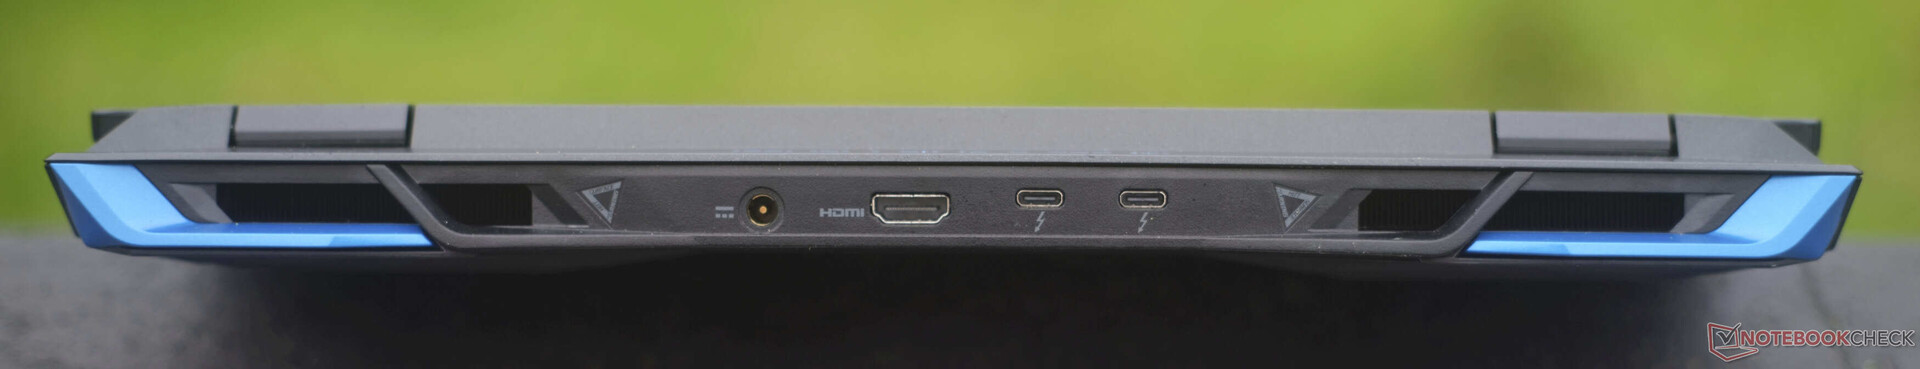
Connectivité : Nombreuses connexions, mais lenteur du WiFi et de Power Delivery
L'ordinateur portable de jeu d'Acer dispose de 1x USB-A 3.1 (5 GBit/s), 2x USB-A 3.2 (10 GBit/s), ainsi que 2x Thunderbolt 4 incl. DisplayPort 1.4 et Power Delivery (65 watts) à l'arrière. À l'arrière, vous trouverez un Gigabit-RJ45, un lecteur de carte microSD, une prise audio 3,5 mm, un verrou Kensington, une connexion d'alimentation ainsi qu'un port HDMI 2.1 qui est connecté directement au dGPU et qui prend en charge la 4K à 120 Hz avec G-Sync simultané.
En fin de compte, le Predator Helios Neo n'est pas désavantagé par rapport à son frère plus cher,, à l'exception de sa performance PD inférieure.
Lecteur de carte SD
Les taux de transfert du lecteur de carte microSD sont moyens lorsqu'il est utilisé avec notre carte de référence AV PRO microSD 128 GB V60. Le lecteurLegion Slim 5,Acer Nitro 16,XMG Focus 15etGigabyte G5lisent et copient tous des données avec des taux de transfert similaires. En revanche, l'Apex 15 de XMGApex 15 de XMG de XMG est plus de deux fois plus lent, tandis que leM16 R1 d'Alienware d'Alienware est deux fois plus rapide.
| SD Card Reader | |
| average JPG Copy Test (av. of 3 runs) | |
| Alienware m16 R1 Intel (AV PRO microSD 128 GB V60) | |
| Moyenne de la classe Gaming (20.9 - 210, n=54, 2 dernières années) | |
| Lenovo Legion Slim 5 14APH8 (Toshiba Exceria Pro SDXC 64 GB UHS-II) | |
| Acer Nitro 16 AN16-41-R7YE (AV PRO microSD 128 GB V60) | |
| Acer Predator Helios Neo 16 NH.QLTEG.002 | |
| Gigabyte G5 KF | |
| Schenker XMG Apex 15 (Late 23) (AV PRO microSD 128 GB V60) | |
| maximum AS SSD Seq Read Test (1GB) | |
| Alienware m16 R1 Intel (AV PRO microSD 128 GB V60) | |
| Moyenne de la classe Gaming (25.5 - 261, n=51, 2 dernières années) | |
| Schenker XMG Focus 15 (E23) | |
| Gigabyte G5 KF | |
| Acer Predator Helios Neo 16 NH.QLTEG.002 | |
| Acer Nitro 16 AN16-41-R7YE (AV PRO microSD 128 GB V60) | |
| Lenovo Legion Slim 5 14APH8 (Toshiba Exceria Pro SDXC 64 GB UHS-II) | |
| Schenker XMG Apex 15 (Late 23) (AV PRO microSD 128 GB V60) | |
Communication
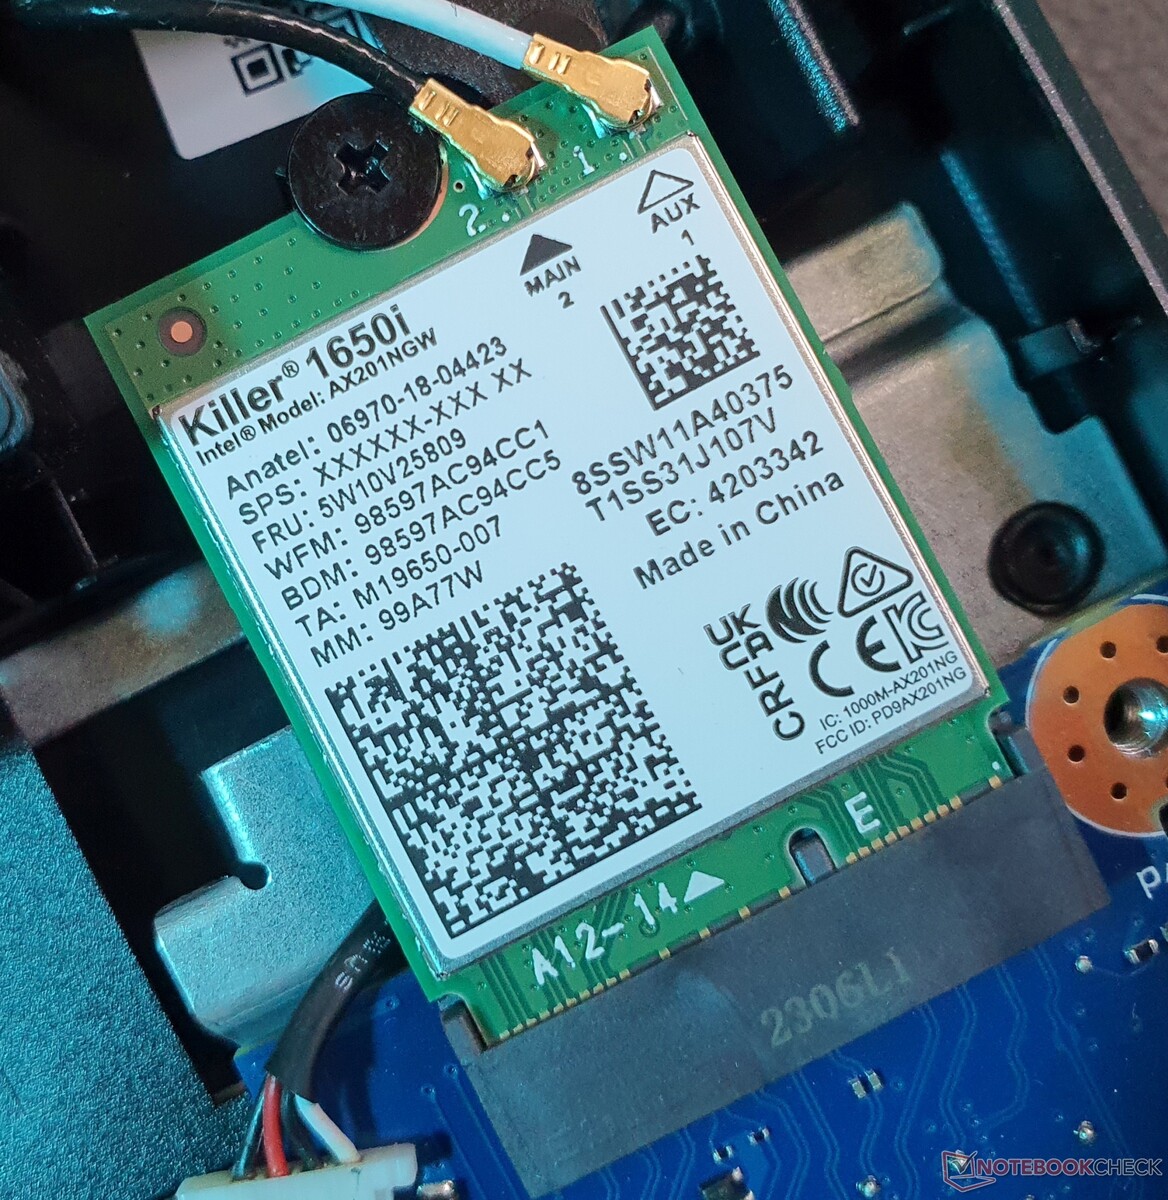
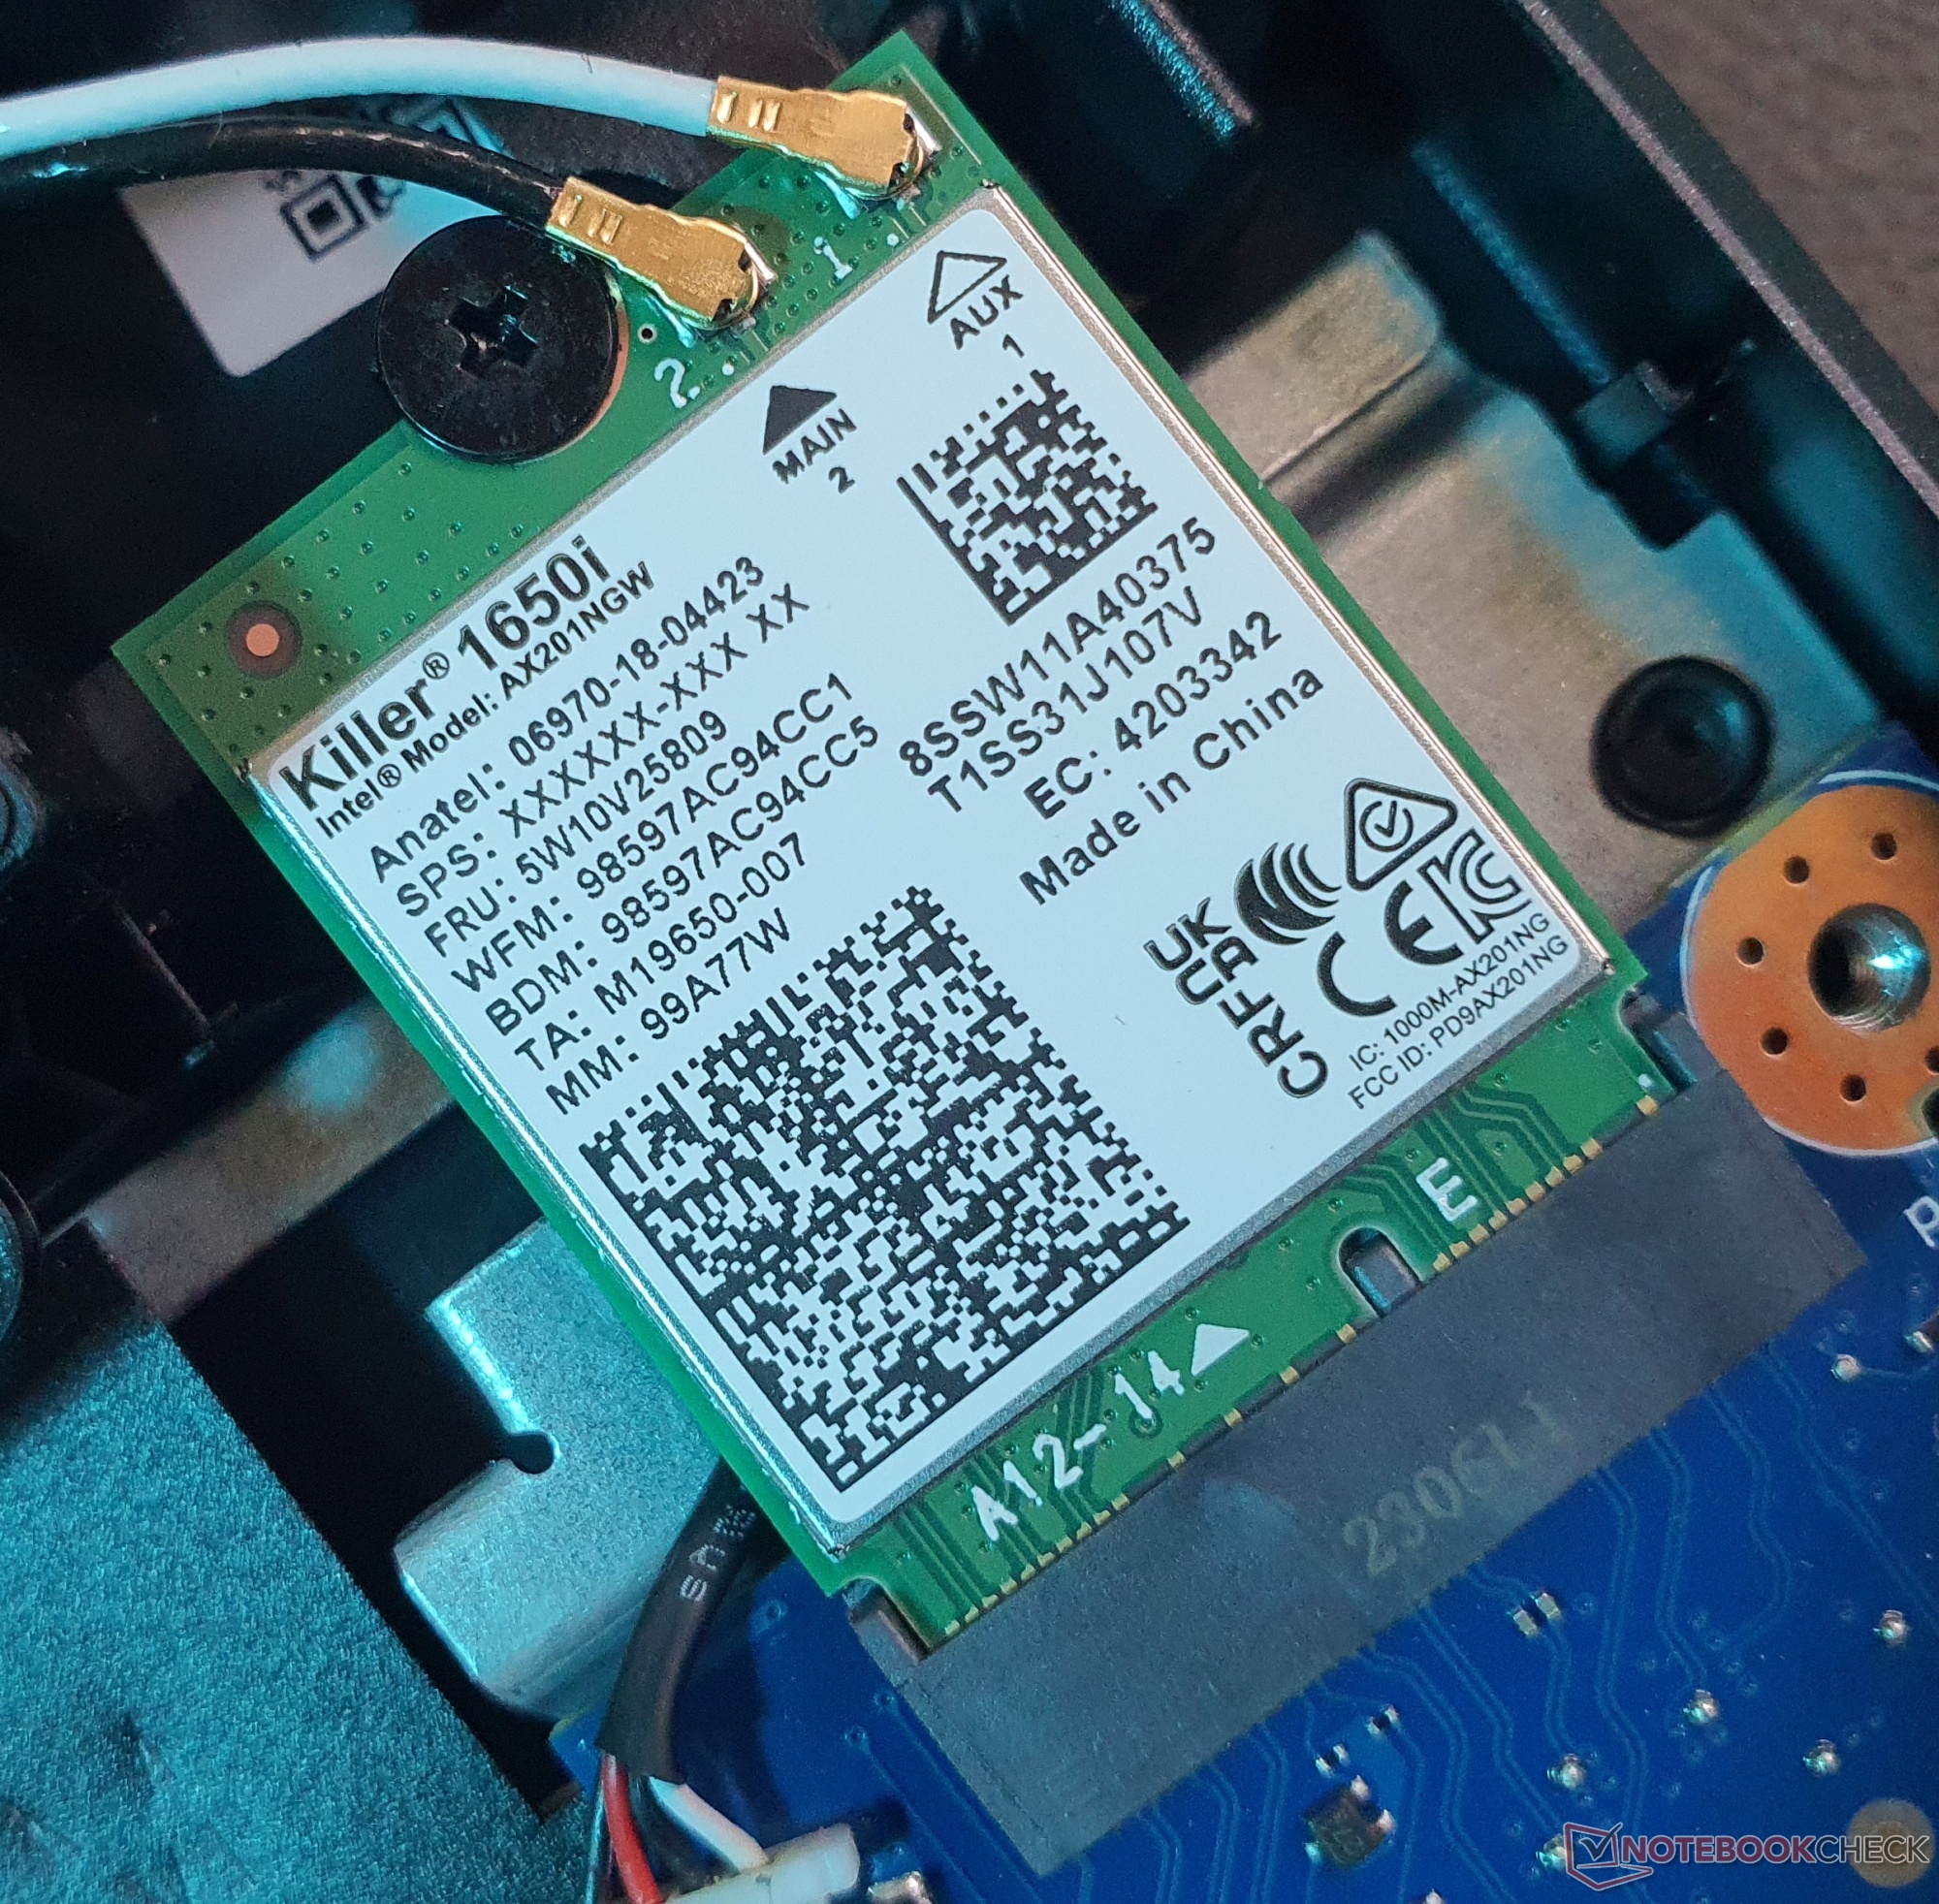
Le module WLAN Intel Killer AX1650i installé sur l'ordinateur portable correspond à l'ancienne norme WiFi 6 et, avec des taux de transfert de ~900 MBit/s, il est aussi lent que la puce Realtek dans l'ordinateur portable Lenovo LOQ 16.
Le module WLAN Helios 16en revanche, atteint jusqu'à 1,6 GBit/s avec l'Intel Killer AX1675i (WiFi 6E), tandis que leLegion Pro 5 16 est arrivé de justesse en tête de notre comparaison. Le contrôleur Gigabit Killer E2600 d'Intel se charge des connexions filaires, tandis que le Bluetooth 5.2 est également de la partie.
Webcam


Contrairement au Predator Helios 16acer n'a installé qu'une webcam 720p dans le Neo, ce que nous trouvons vraiment dommage compte tenu de son prix. La qualité de l'image laisse donc à désirer, même dans des conditions optimales. Windows Hello n'est pas non plus inclus. Cependant, les microphones à double réseau offrent une qualité sonore décente.


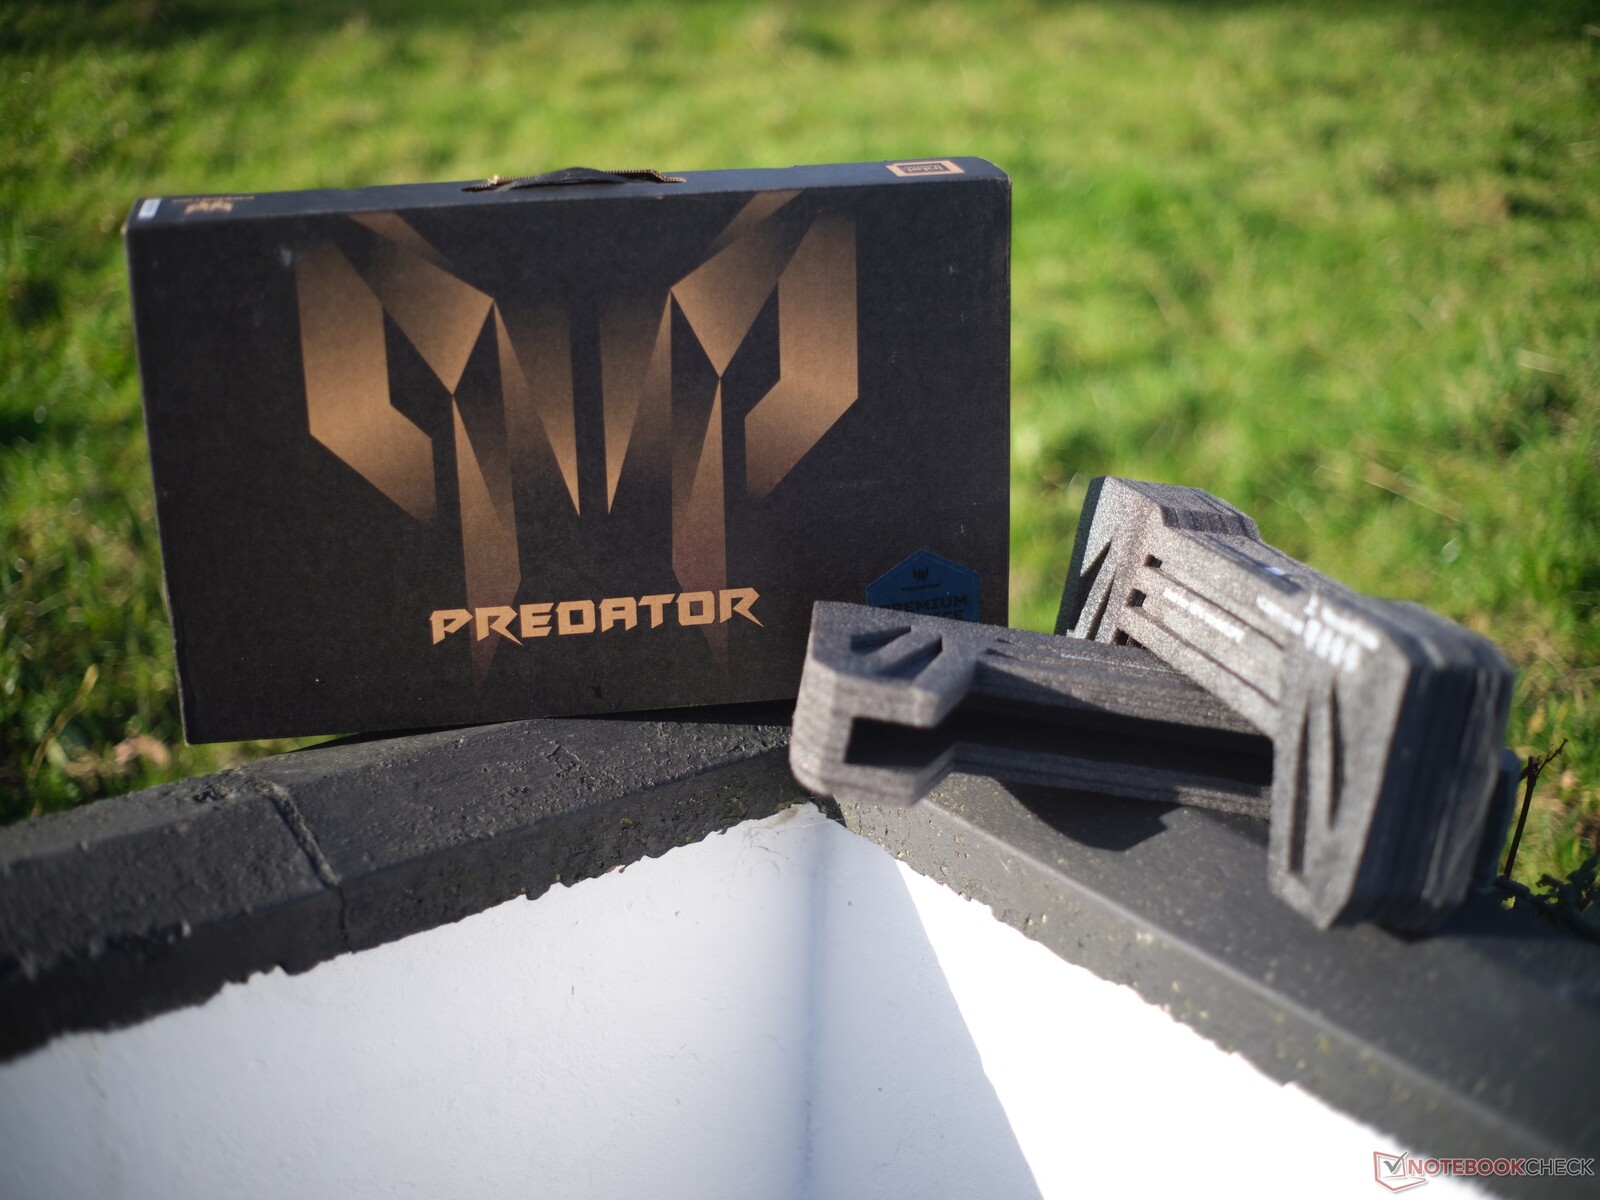
Accessoires
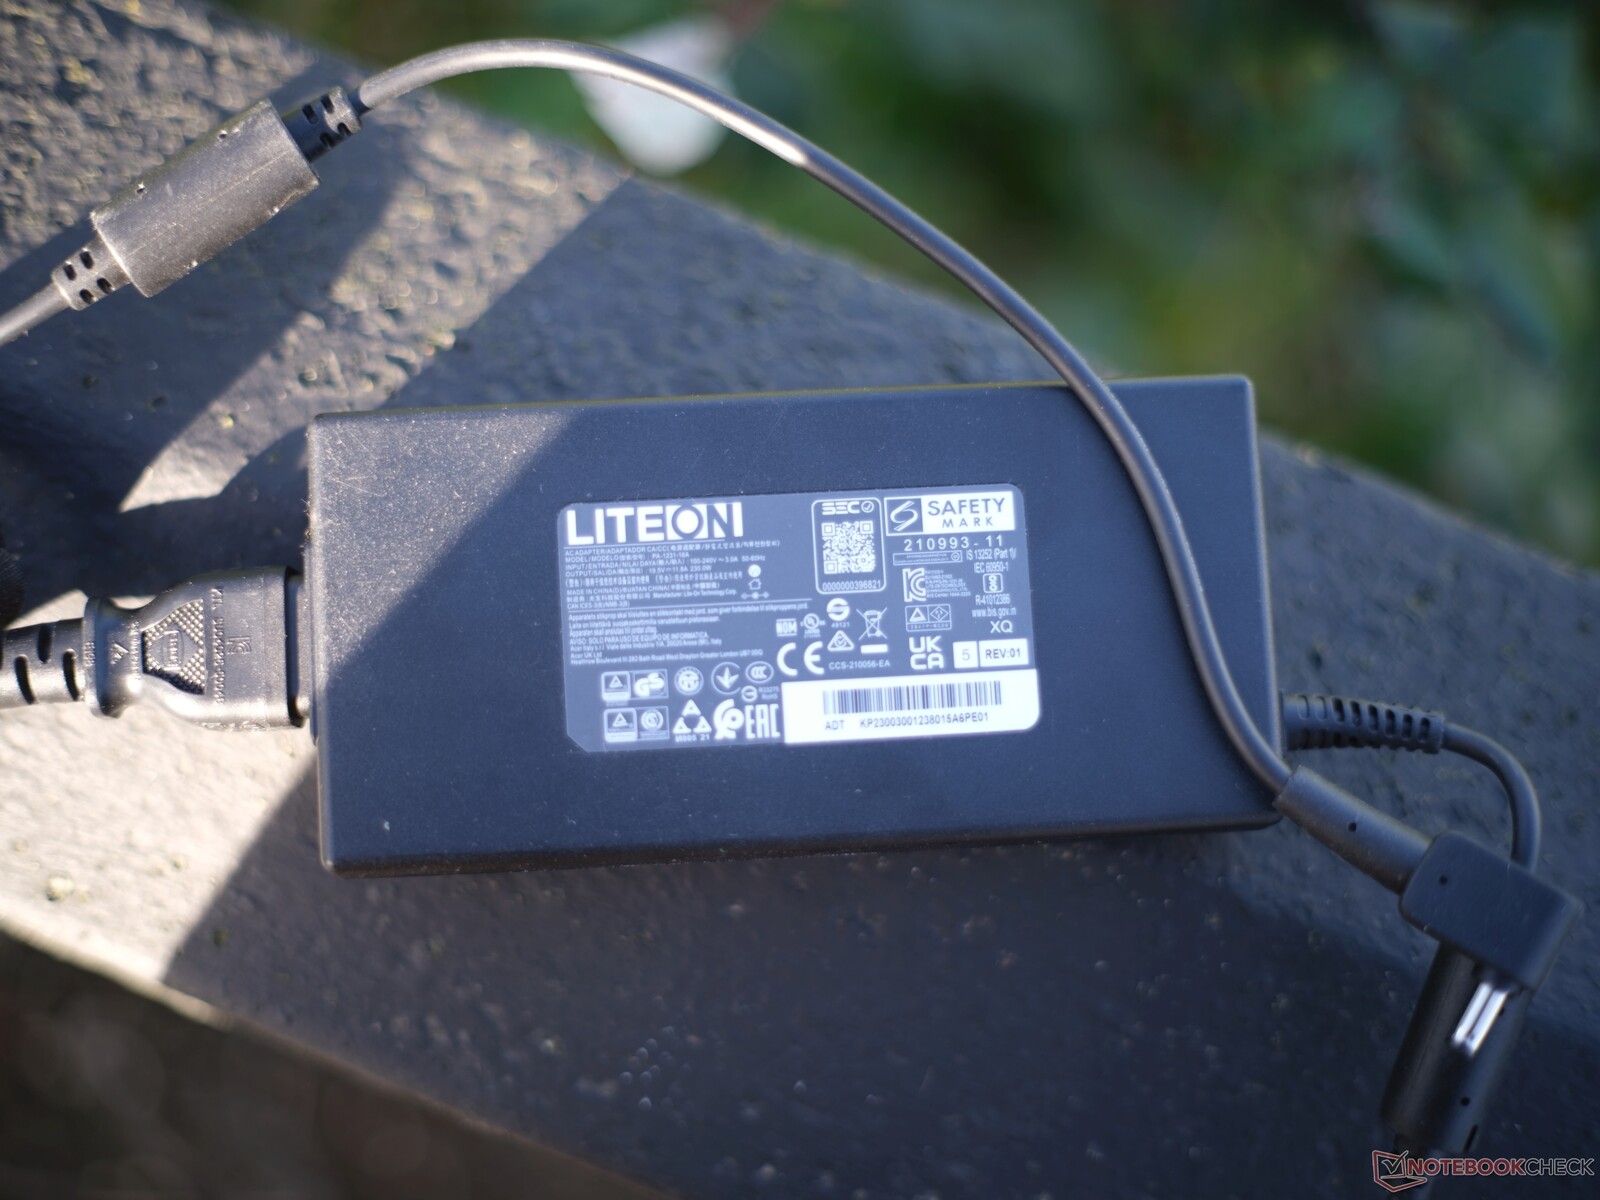
Outre l'appareil lui-même, la livraison de l'ordinateur portable ne comprend qu'un bloc d'alimentation de 230 watts. D'une manière générale, nous aurions aimé que l'emballage soit plus respectueux de l'environnement et ne contienne pas de plastique, même si les matériaux utilisés sont au moins recyclés.
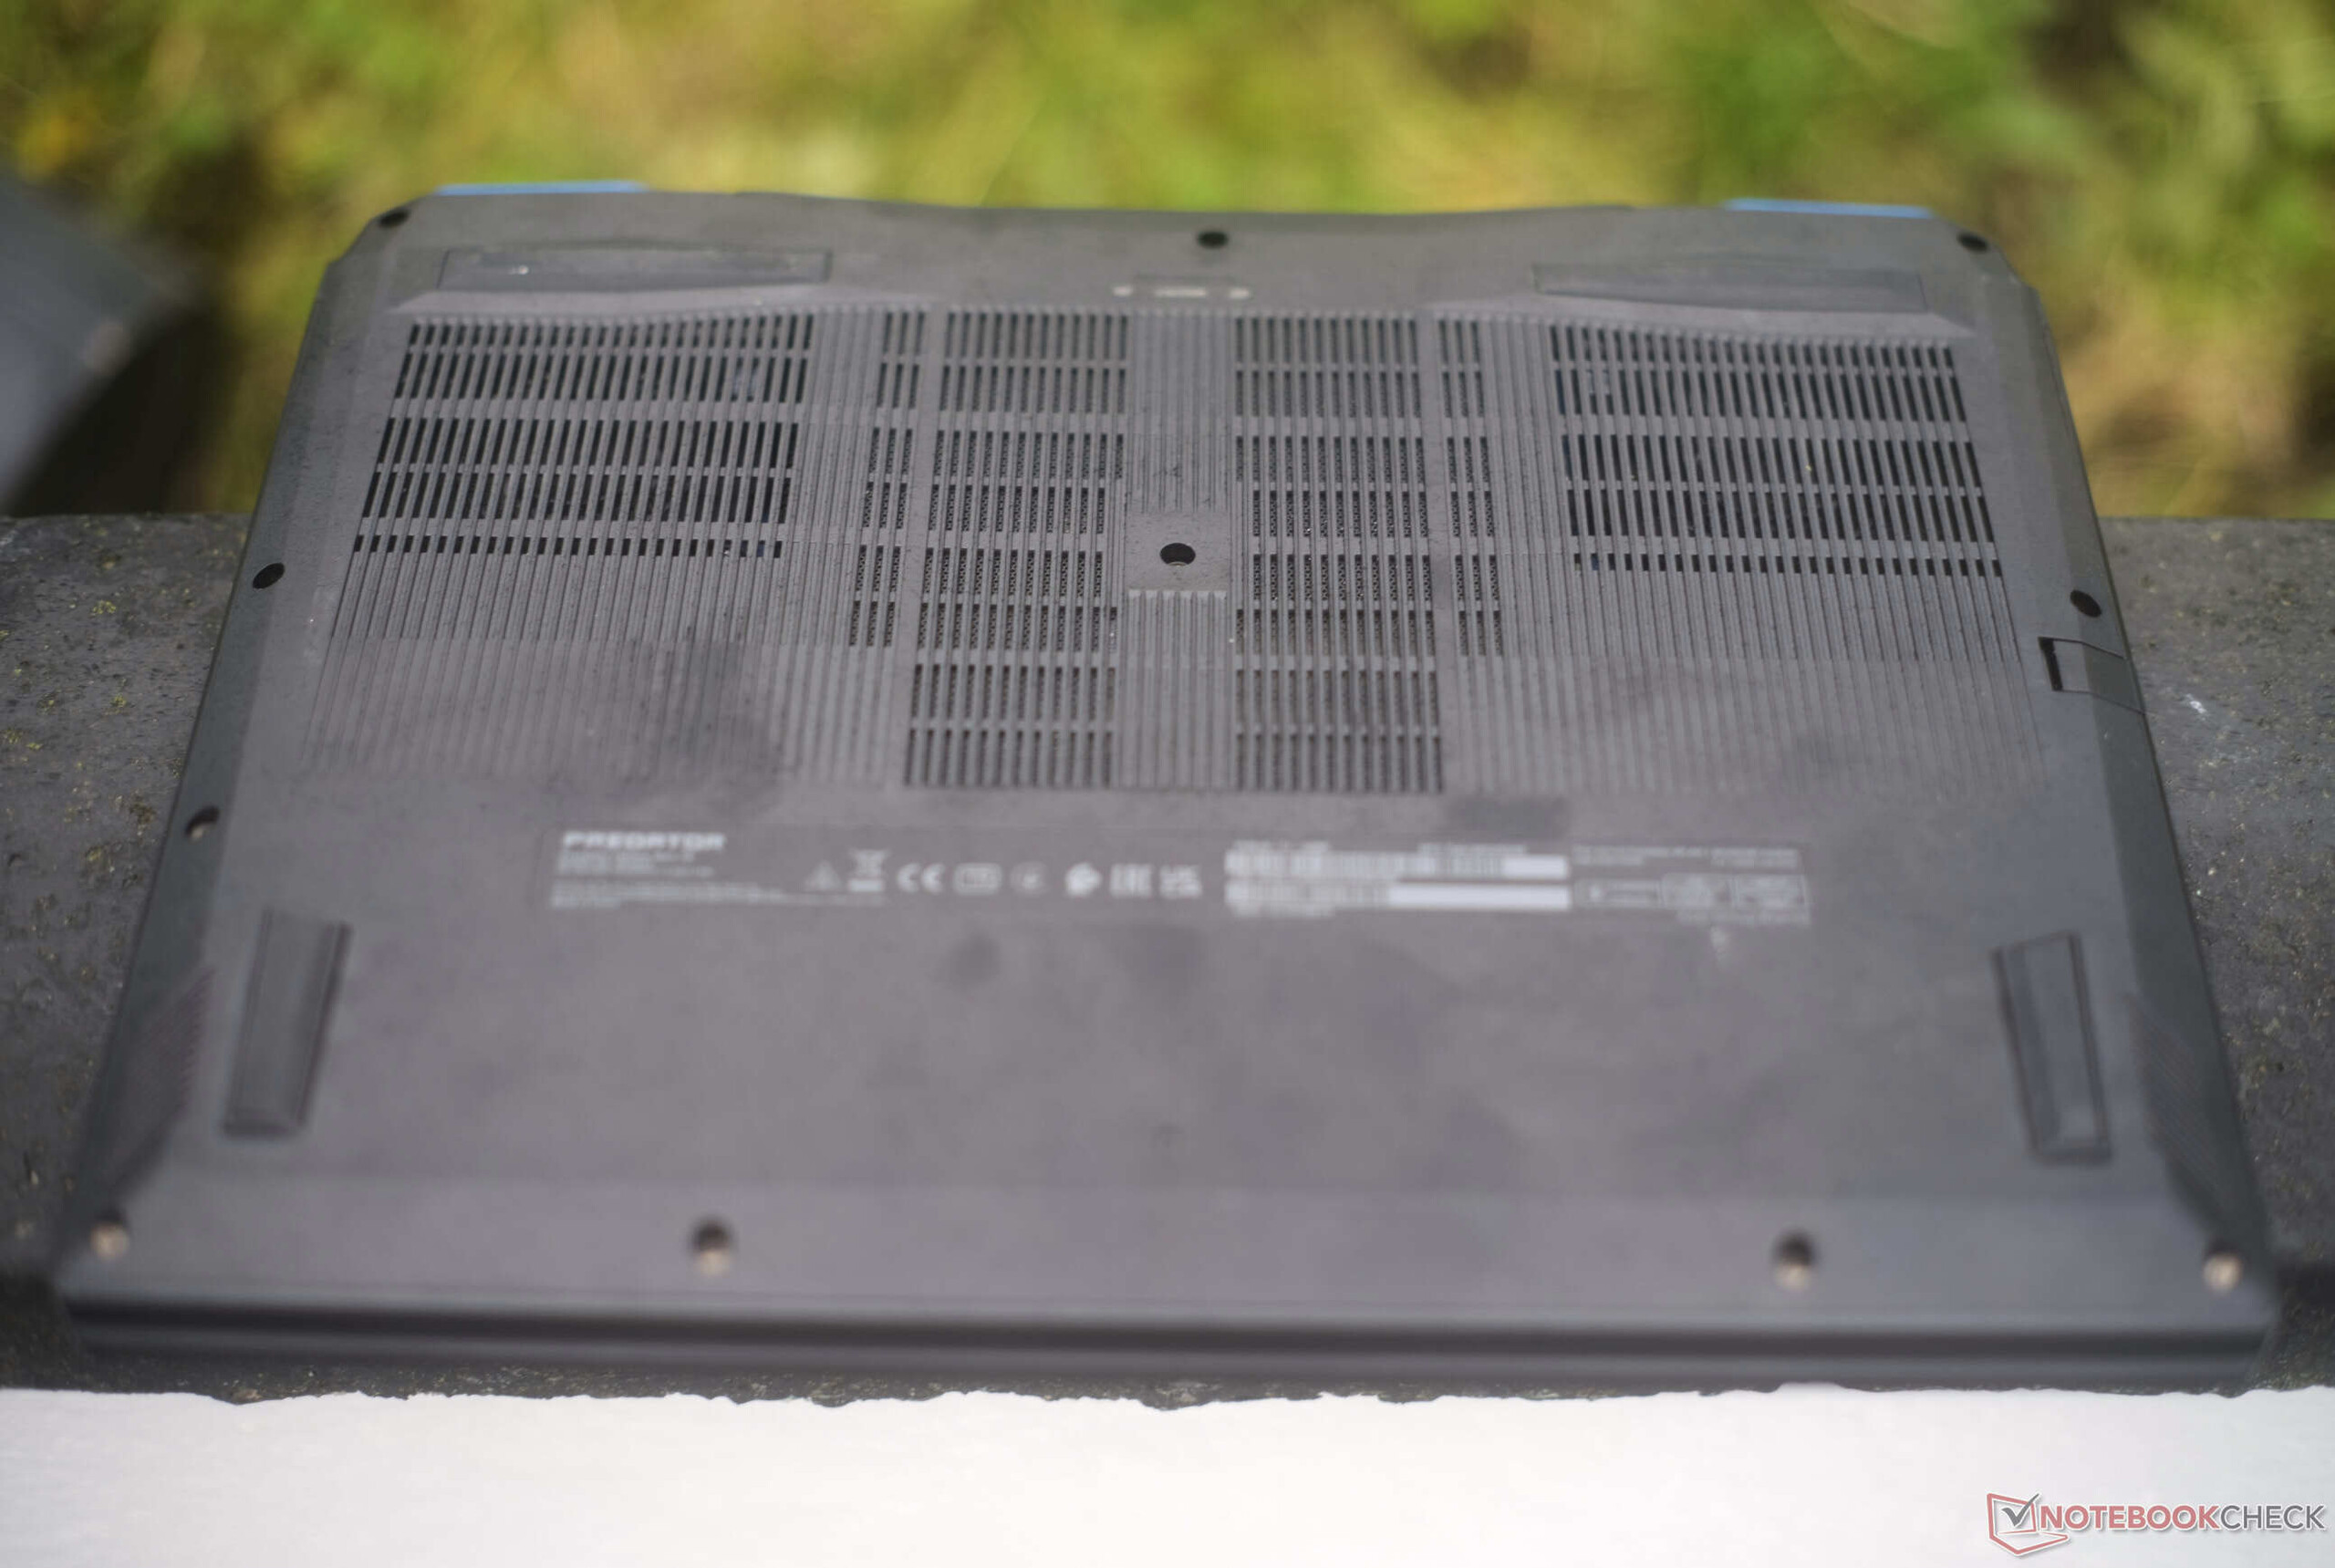
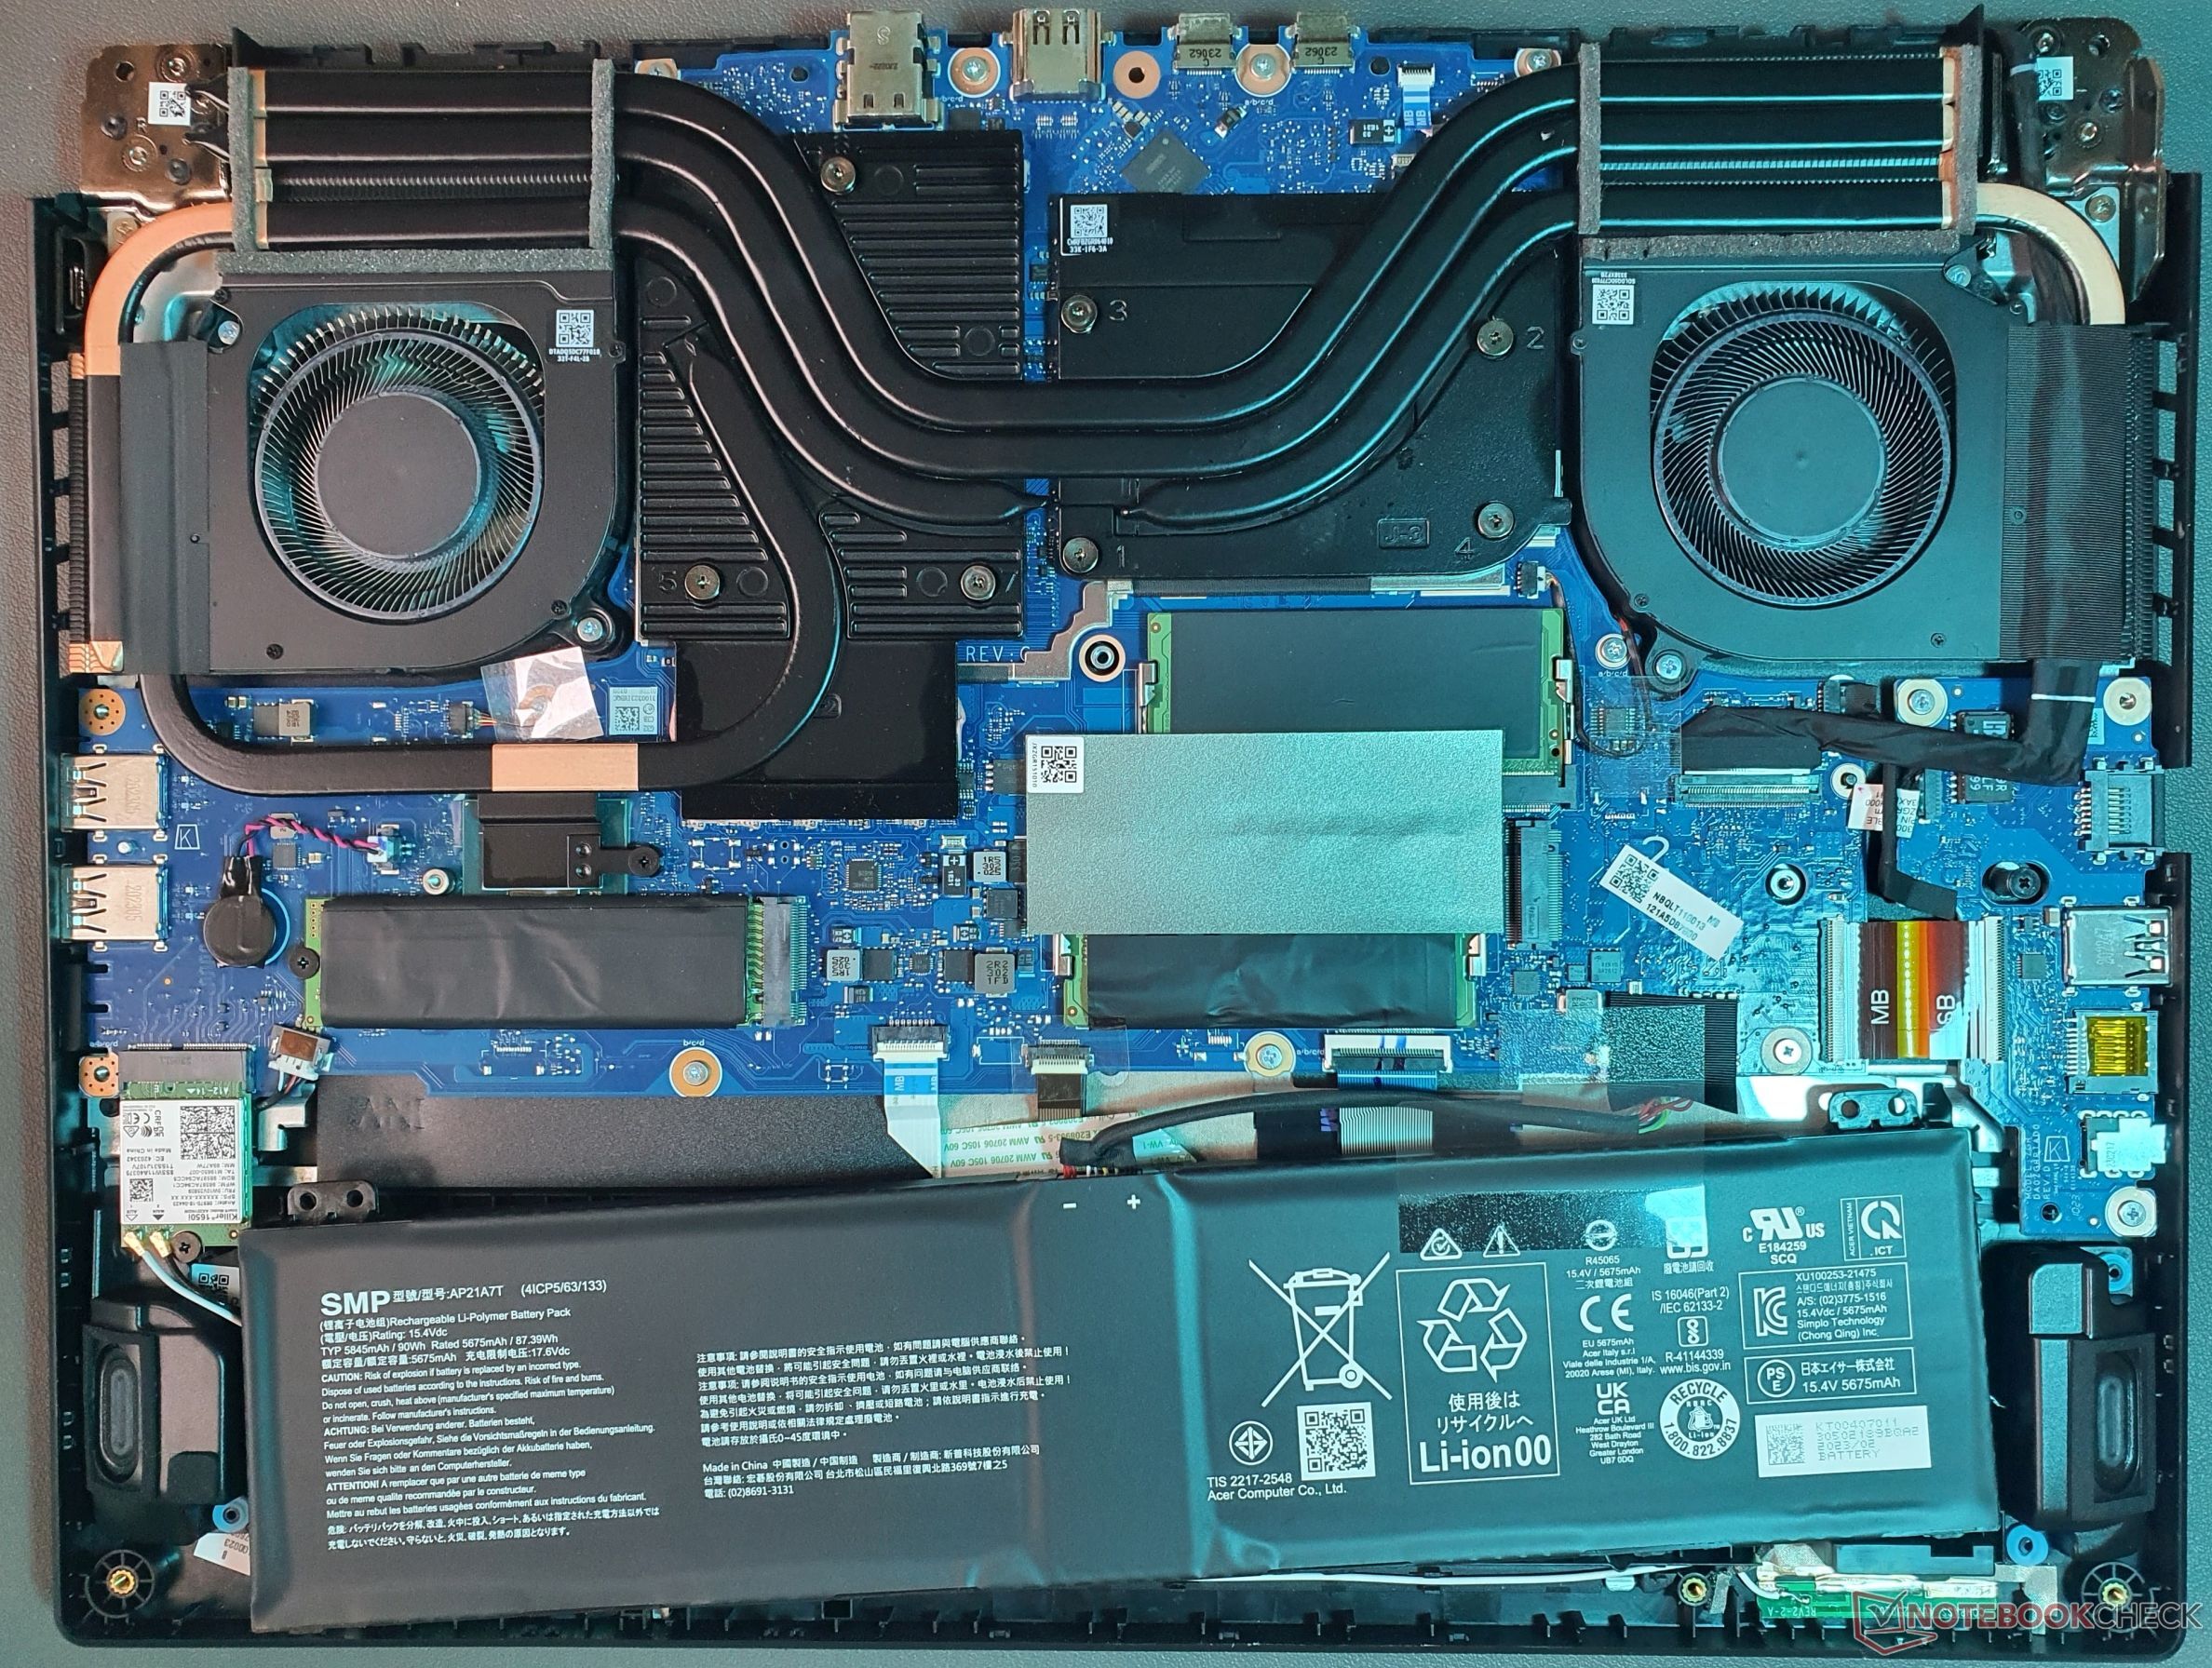
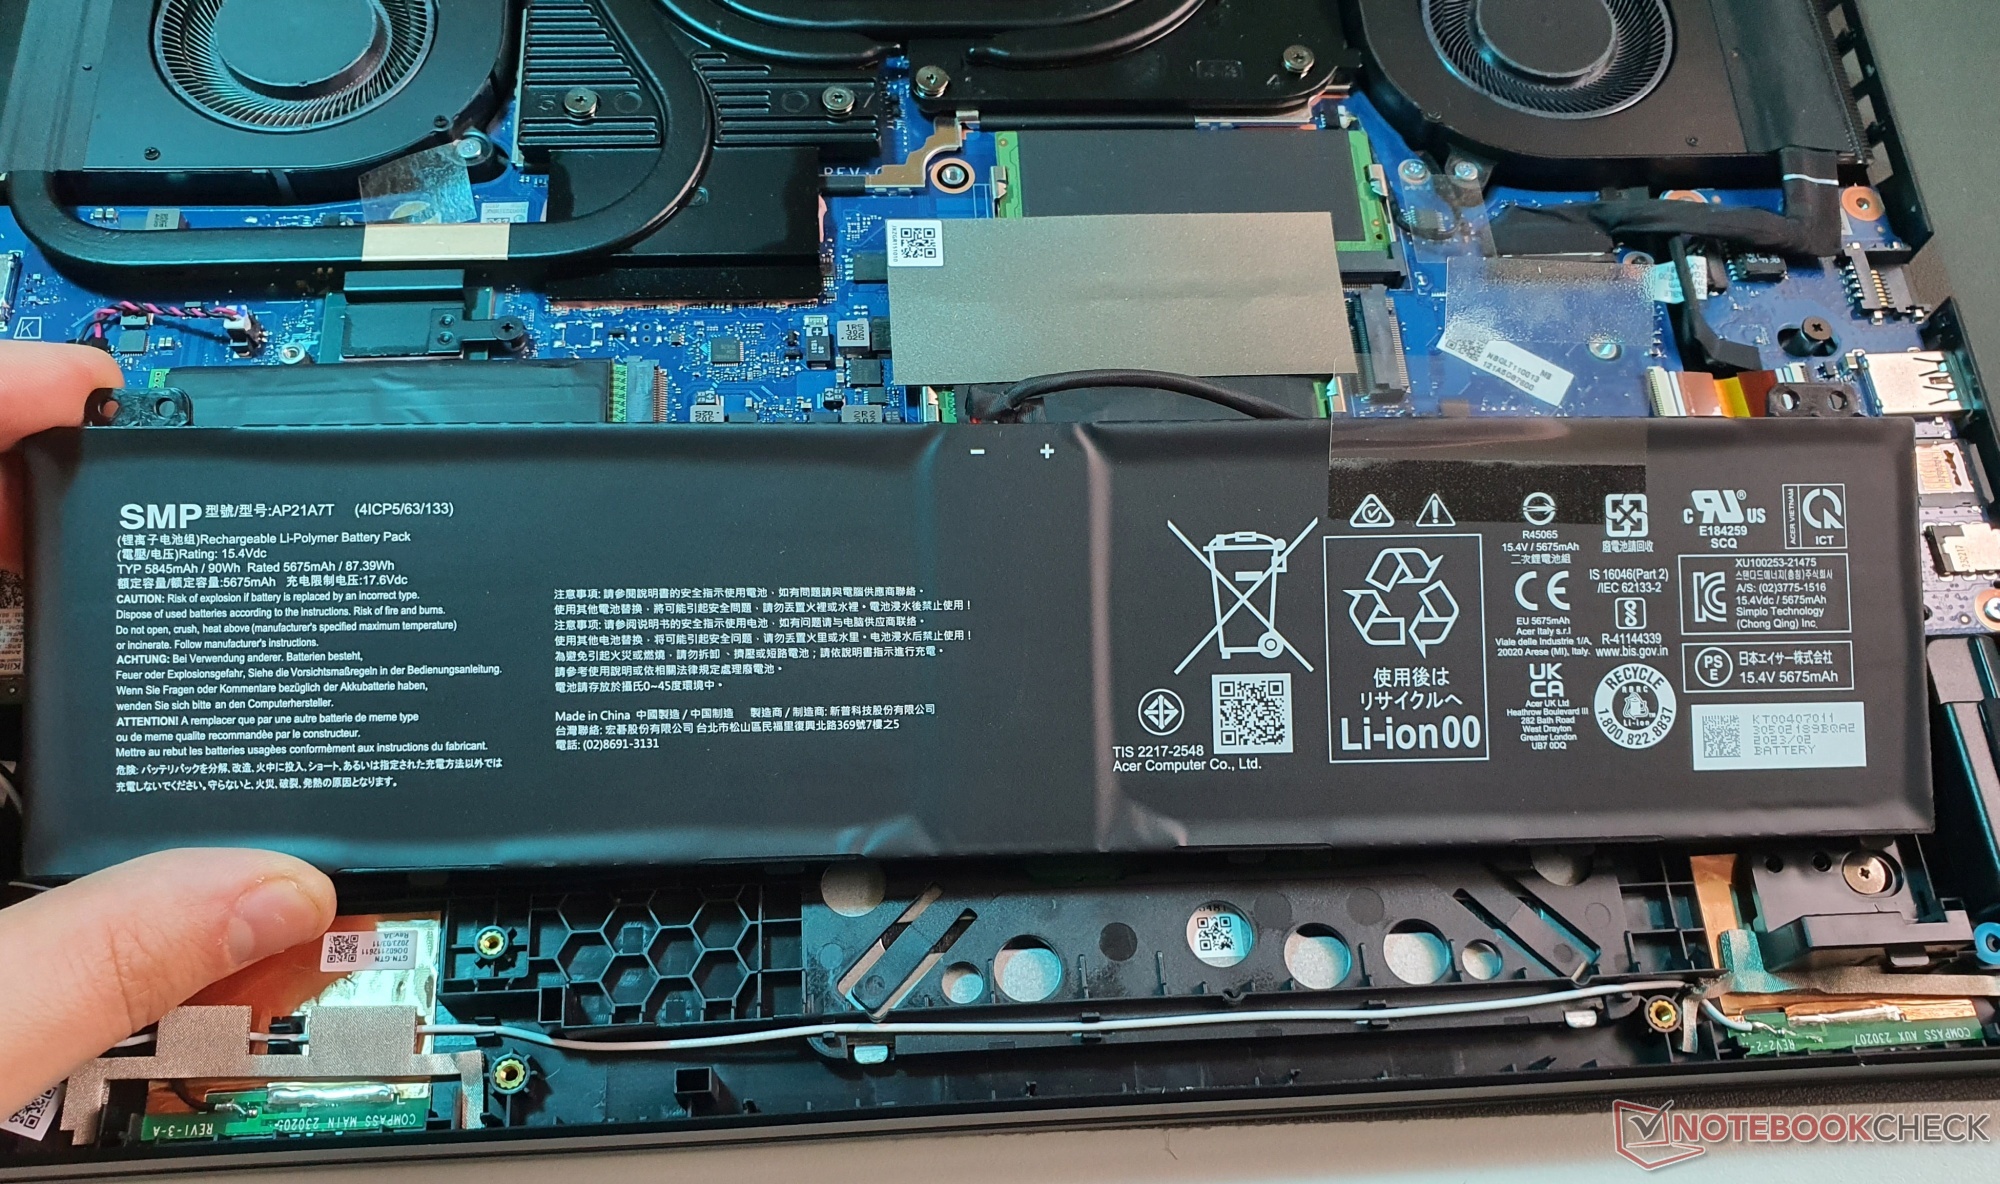
Maintenance
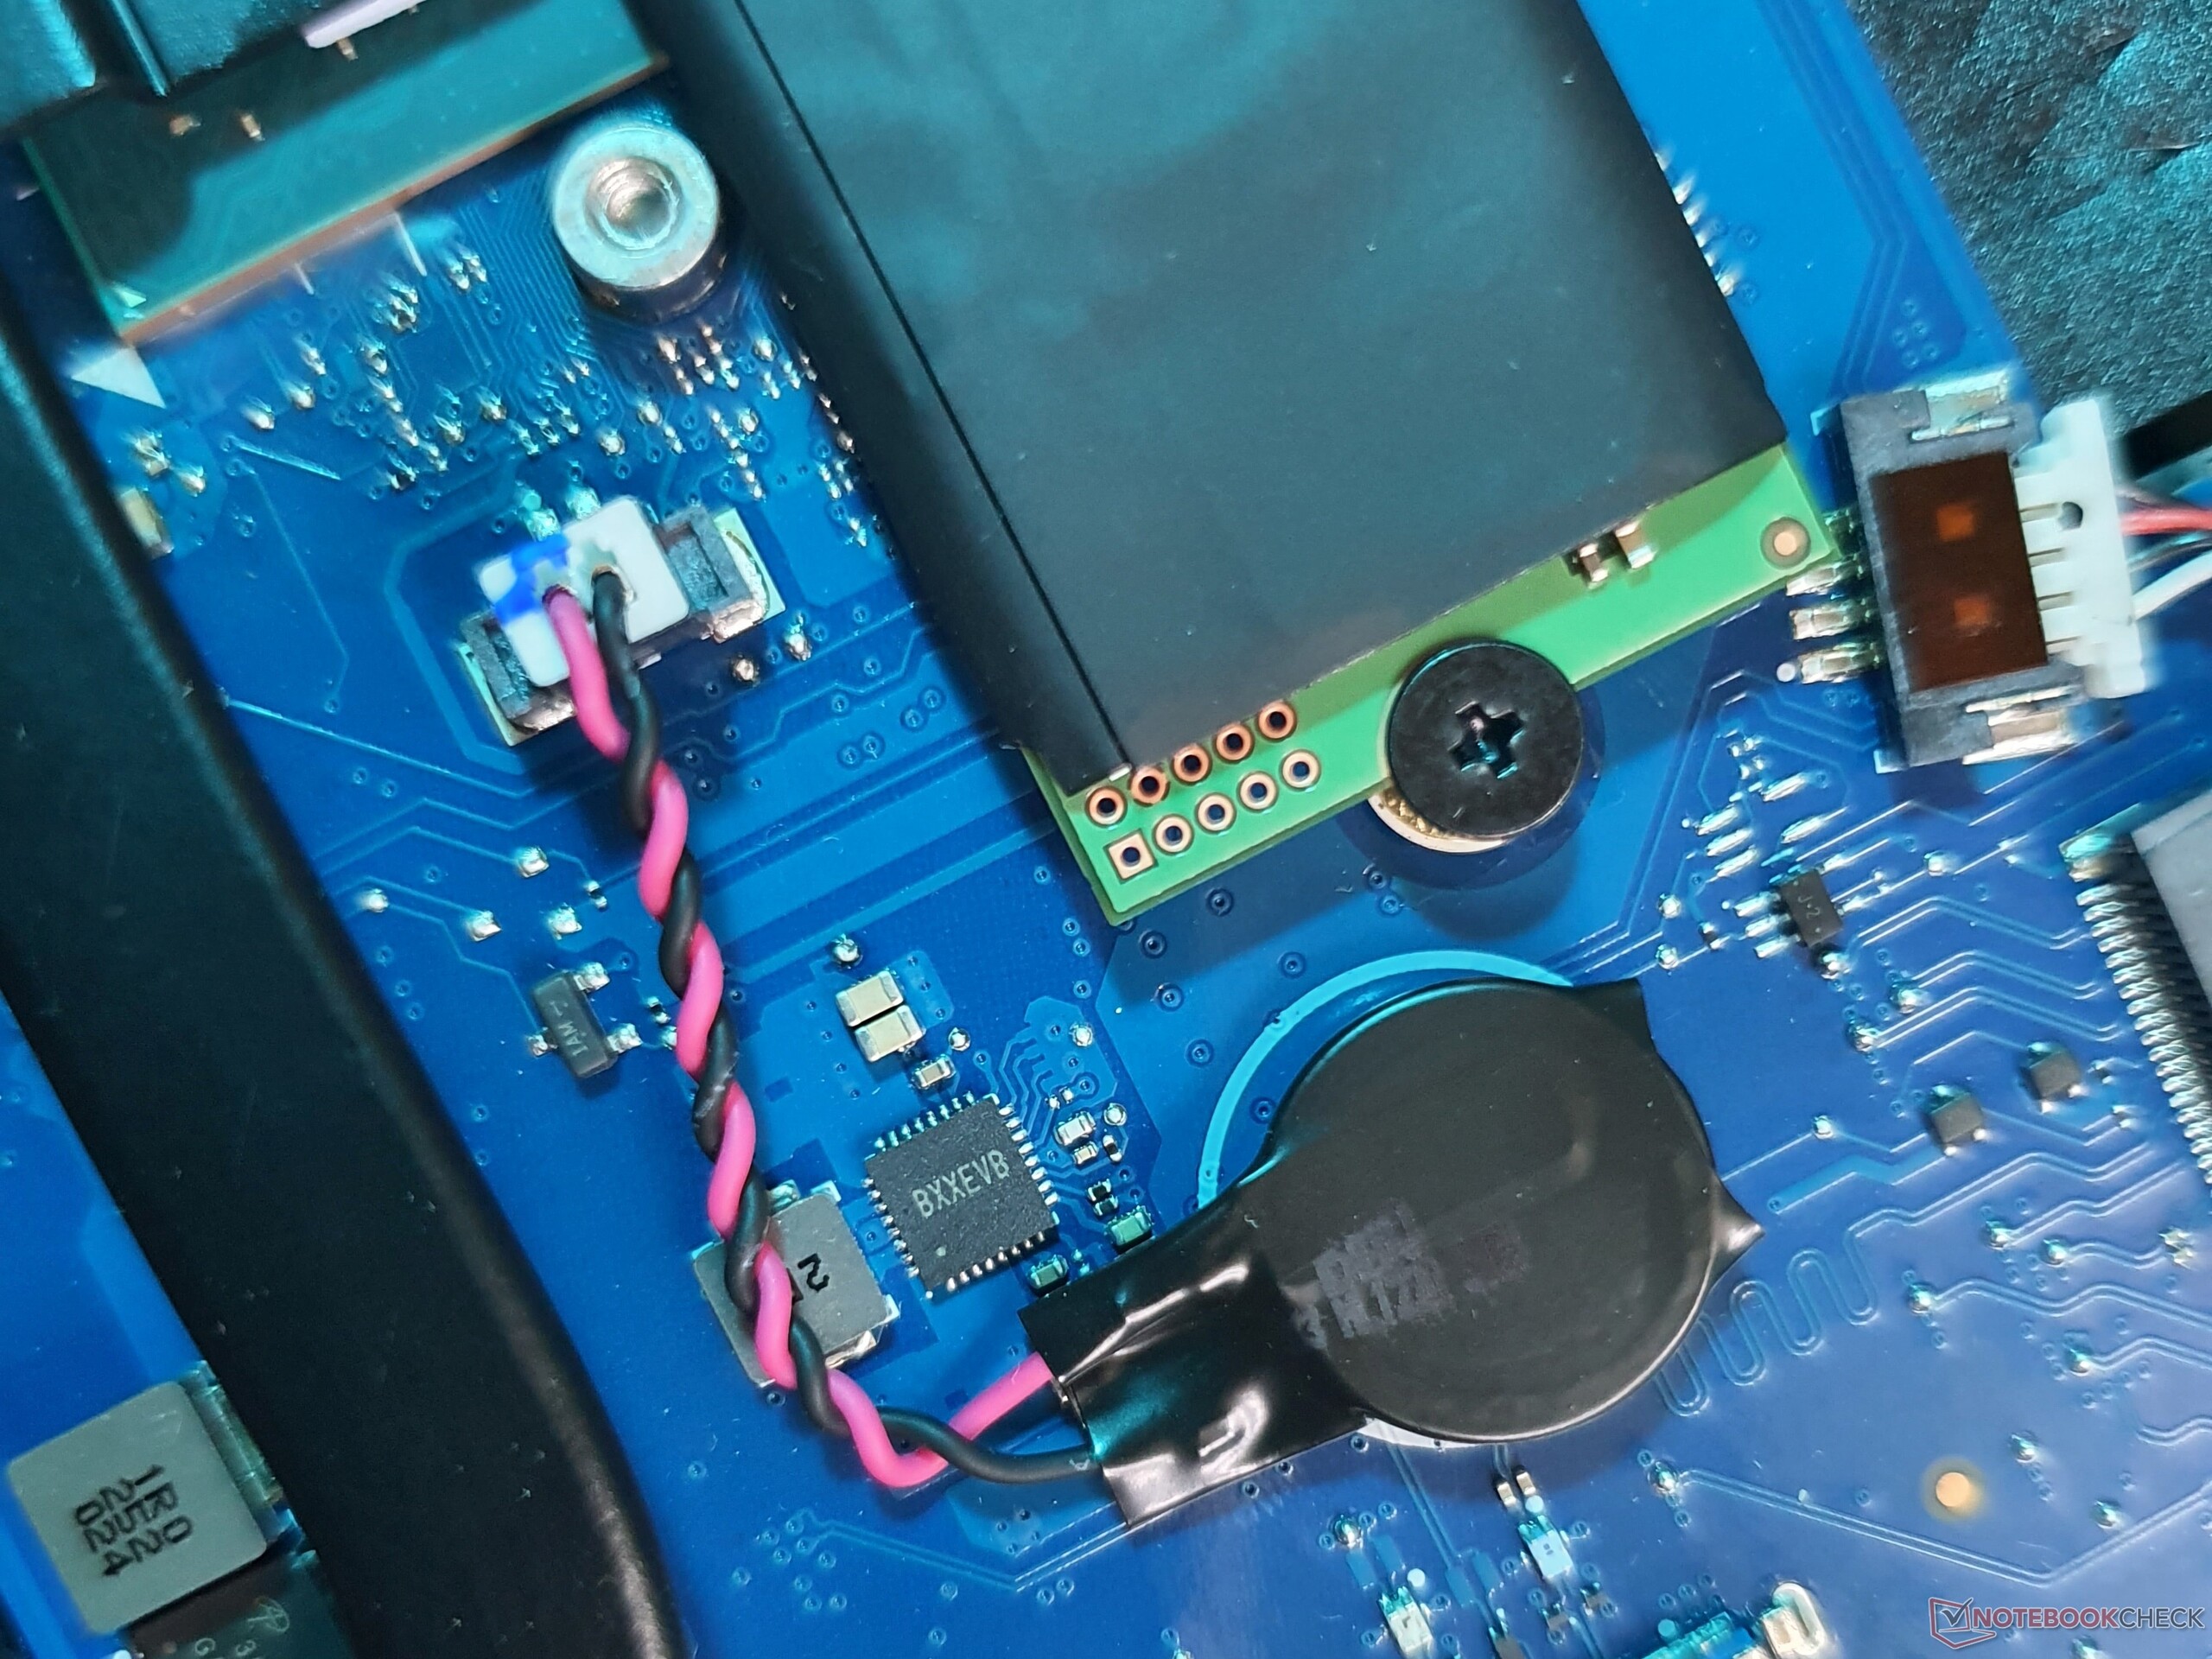
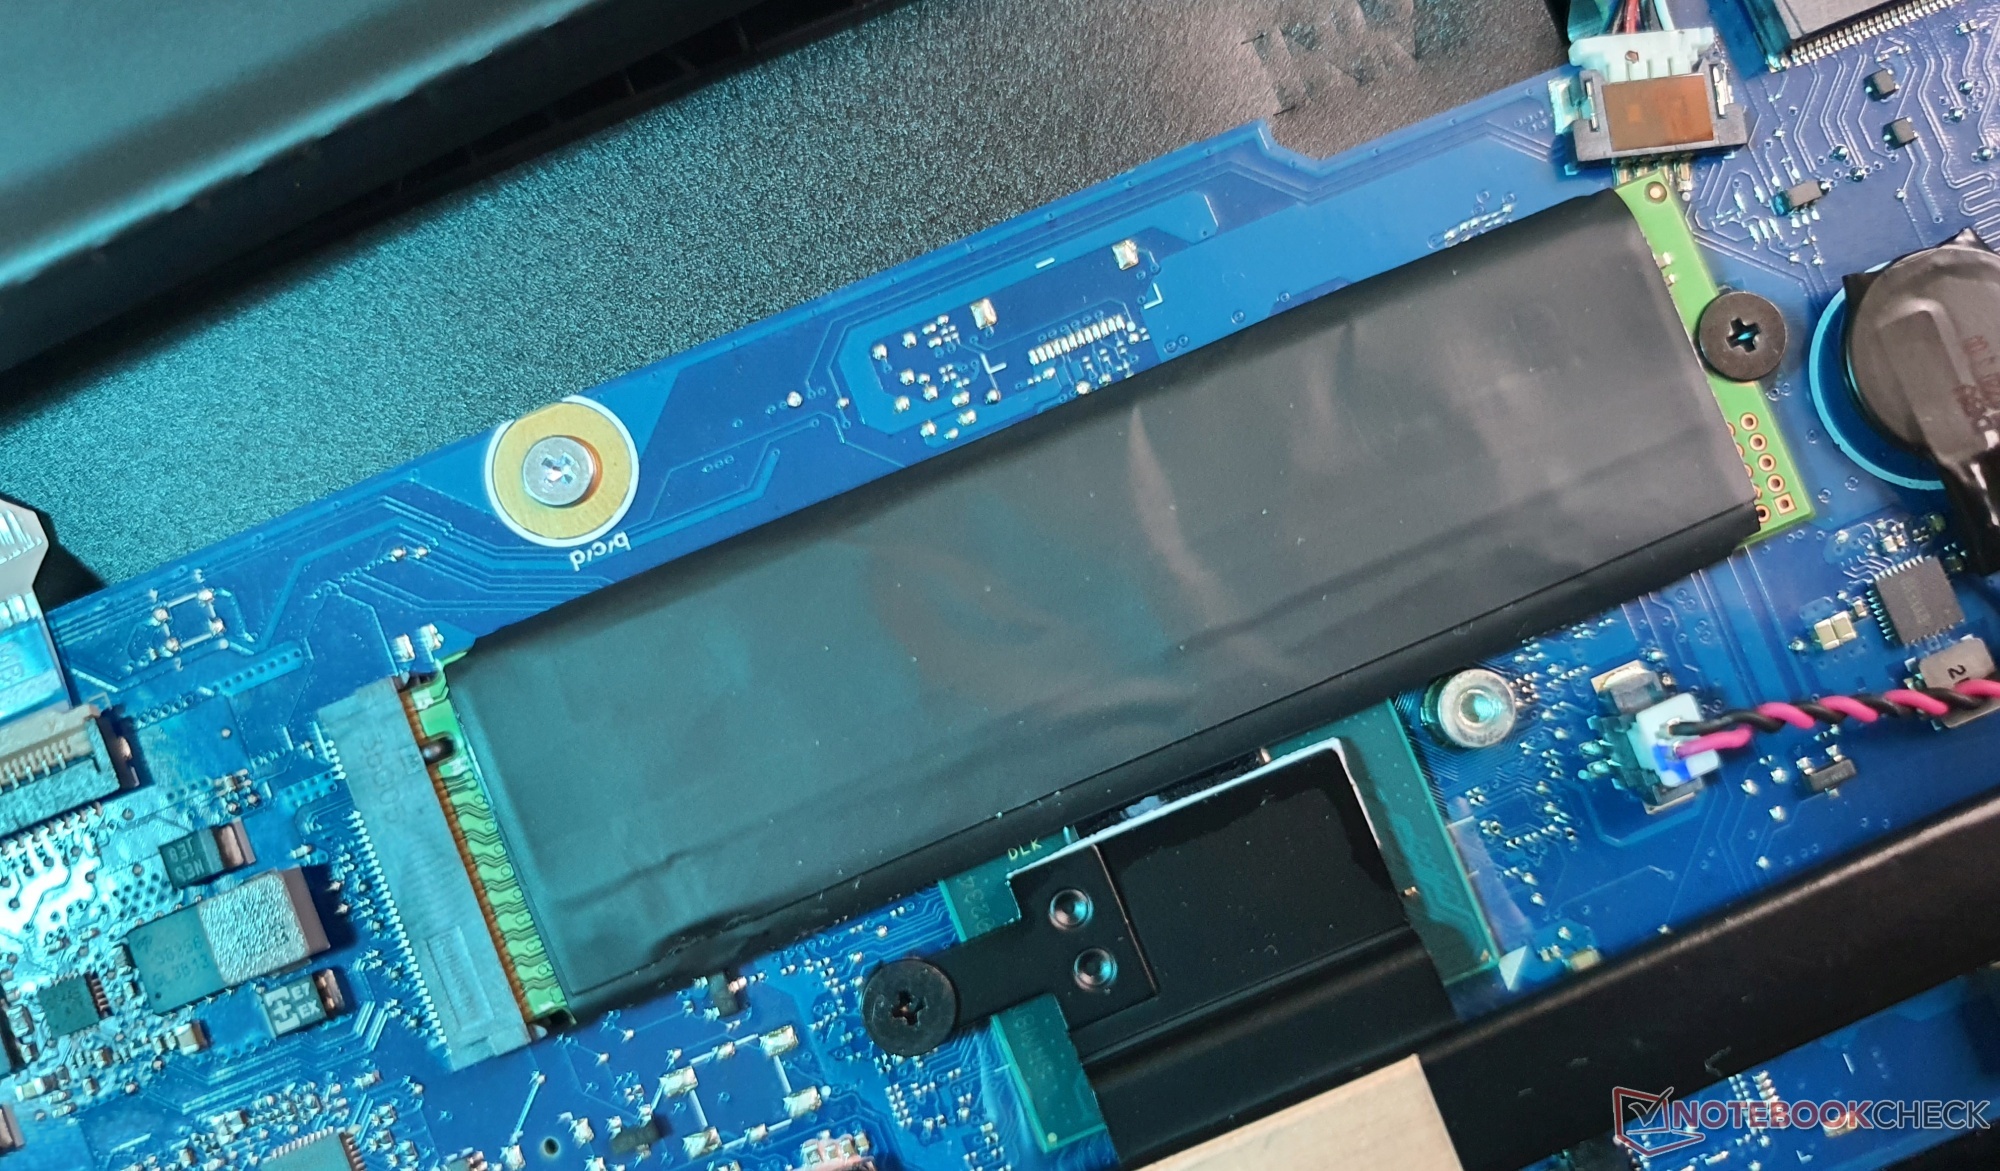
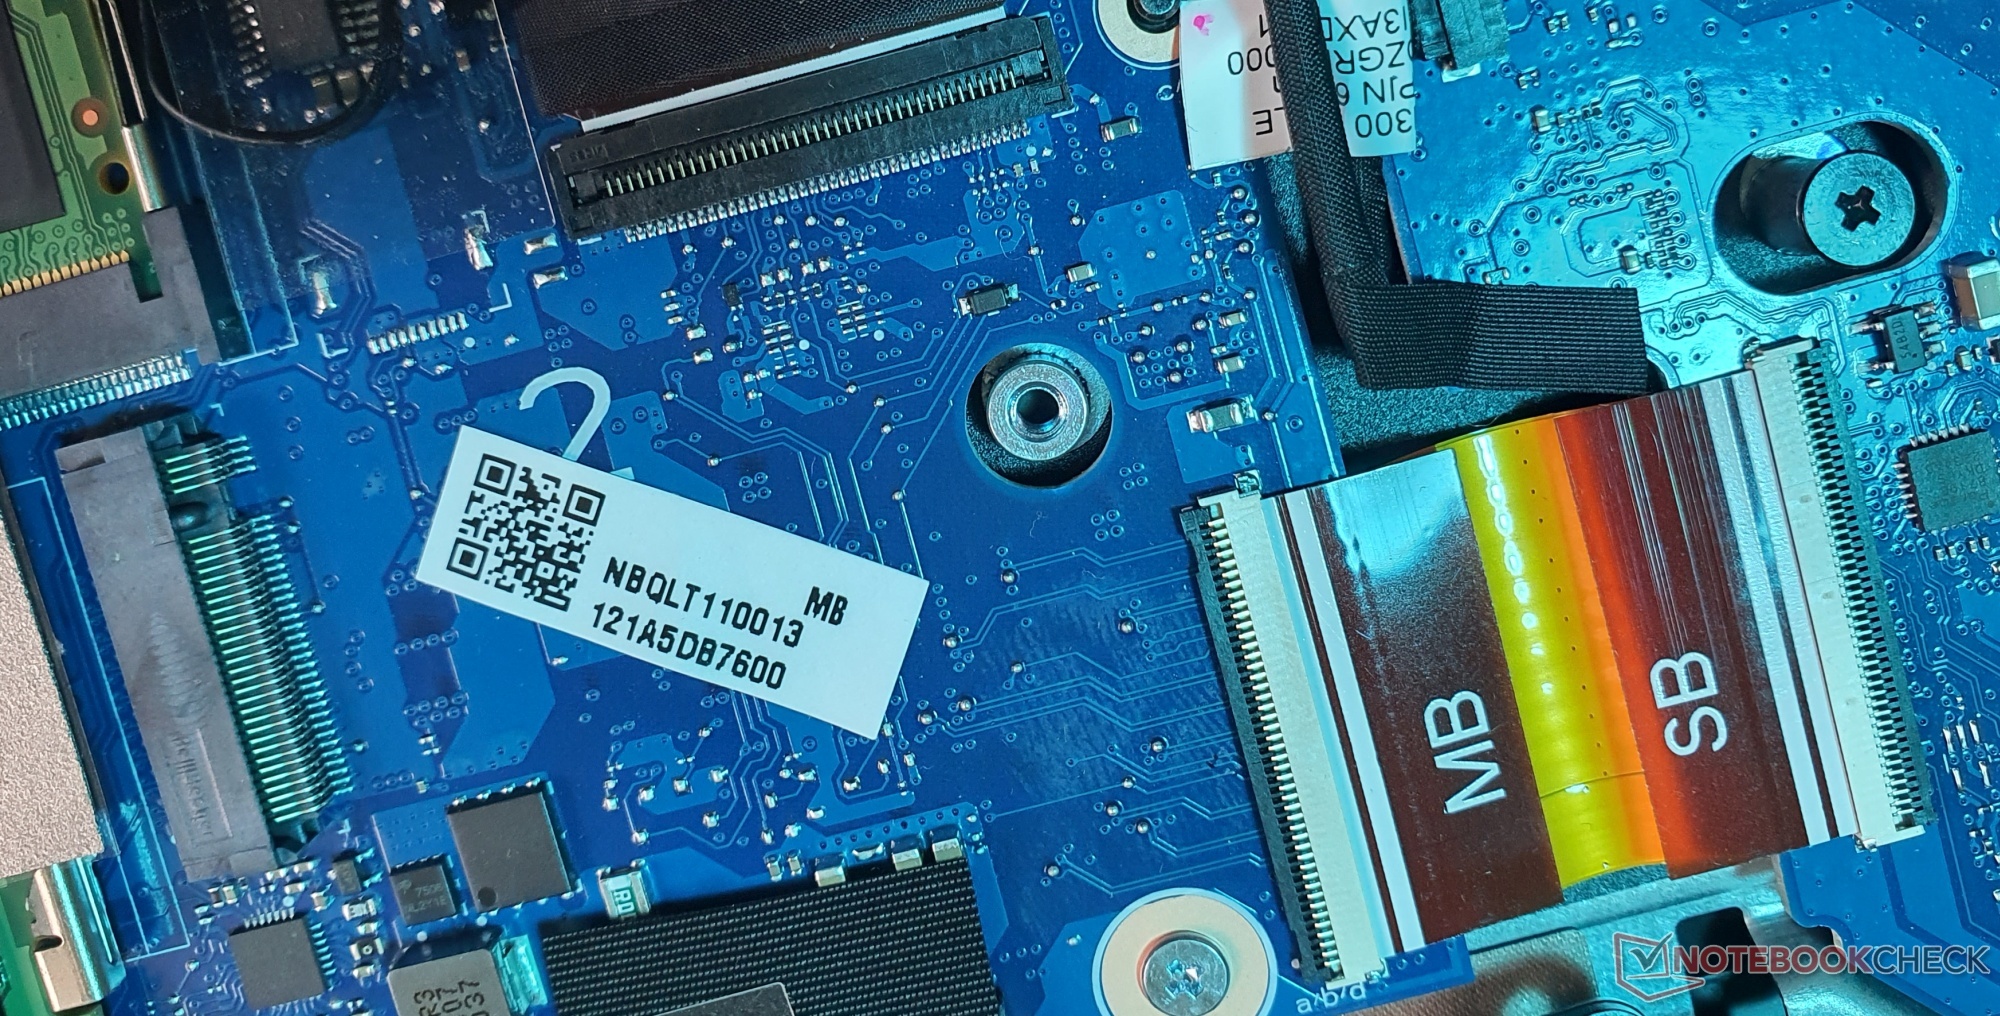
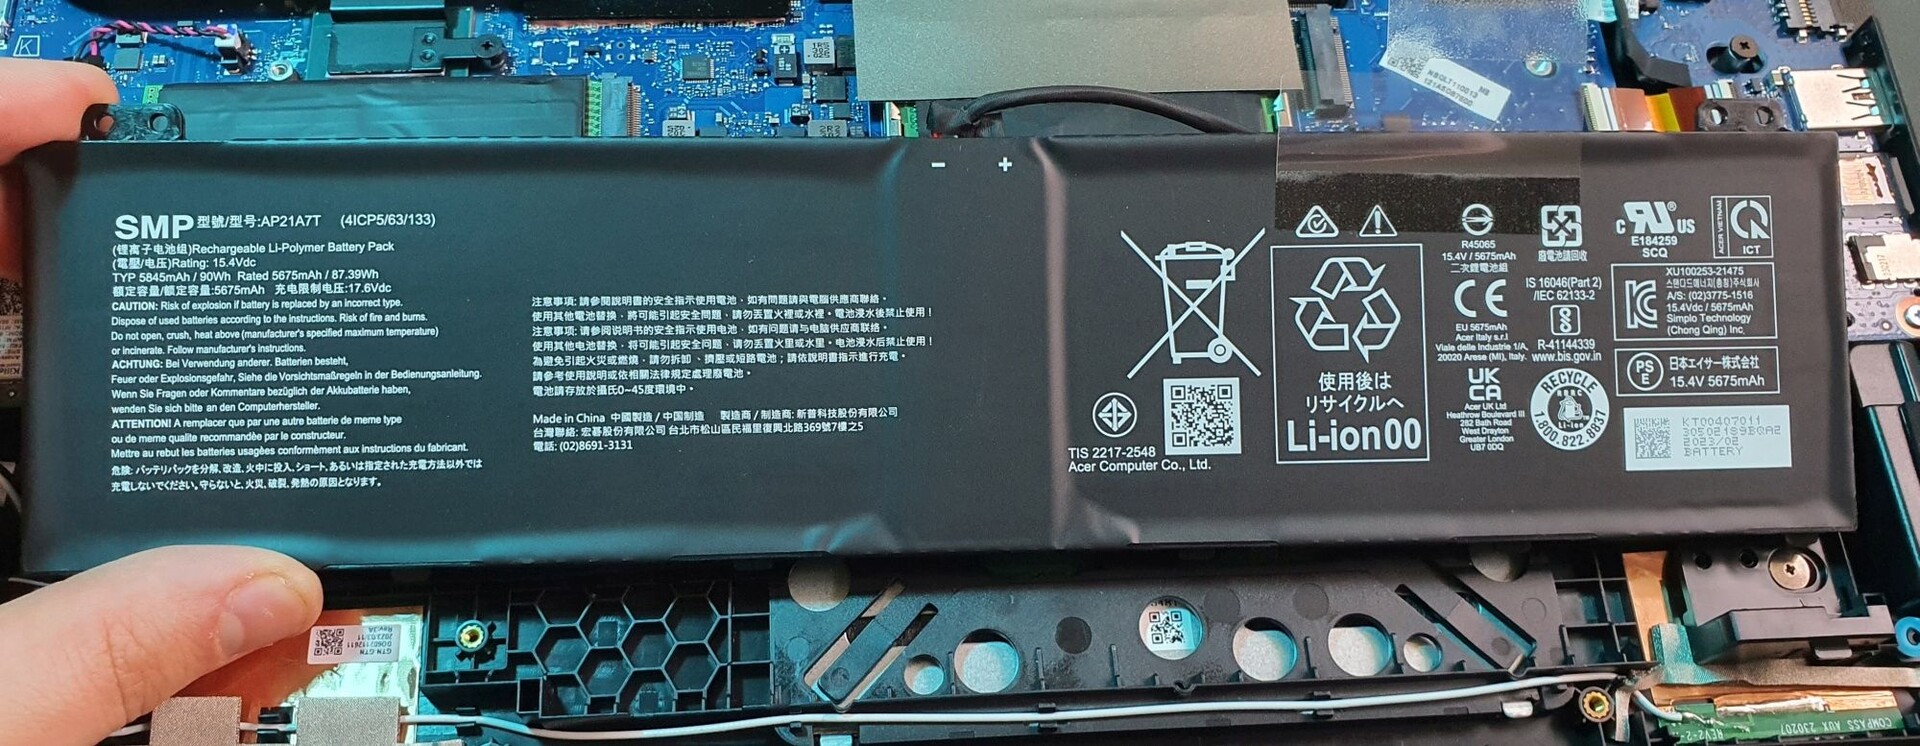
Après avoir retiré onze vis Phillips, vous pouvez facilement accéder à l'intérieur du boîtier. Vous y trouverez deux banques de mémoire et deux emplacements M.2-2280, qui prennent également en charge les disques durs SSD installés des deux côtés. La puce WiFi et la batterie du BIOS peuvent également être remplacées. La batterie est maintenue en place par les vis du boîtier et la coque inférieure, de sorte qu'elle semble d'abord reposer librement dans le boîtier.
Garantie
Acer offre à l'ordinateur portable une garantie limitée d'un an, avec des plans de service étendus disponibles sur Acer Care Plus.
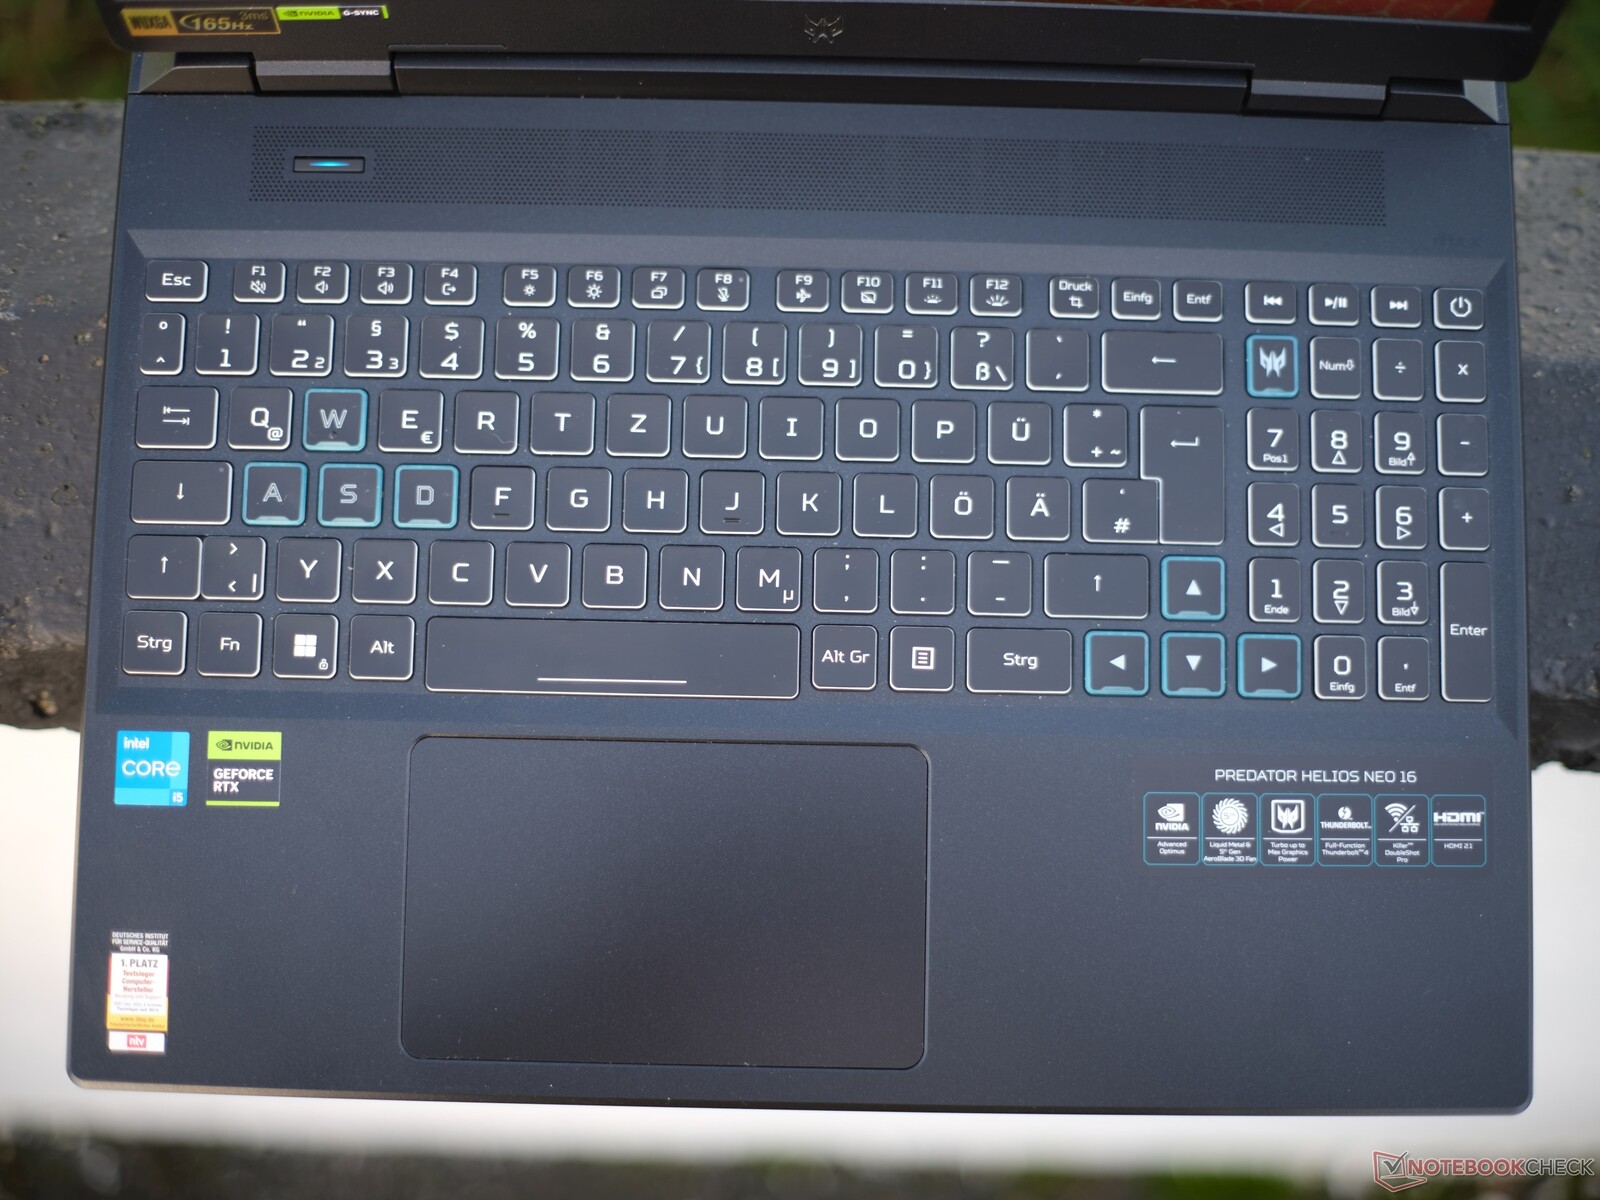
Input devices: Solid standard features with four-zone RGB lighting
Clavier
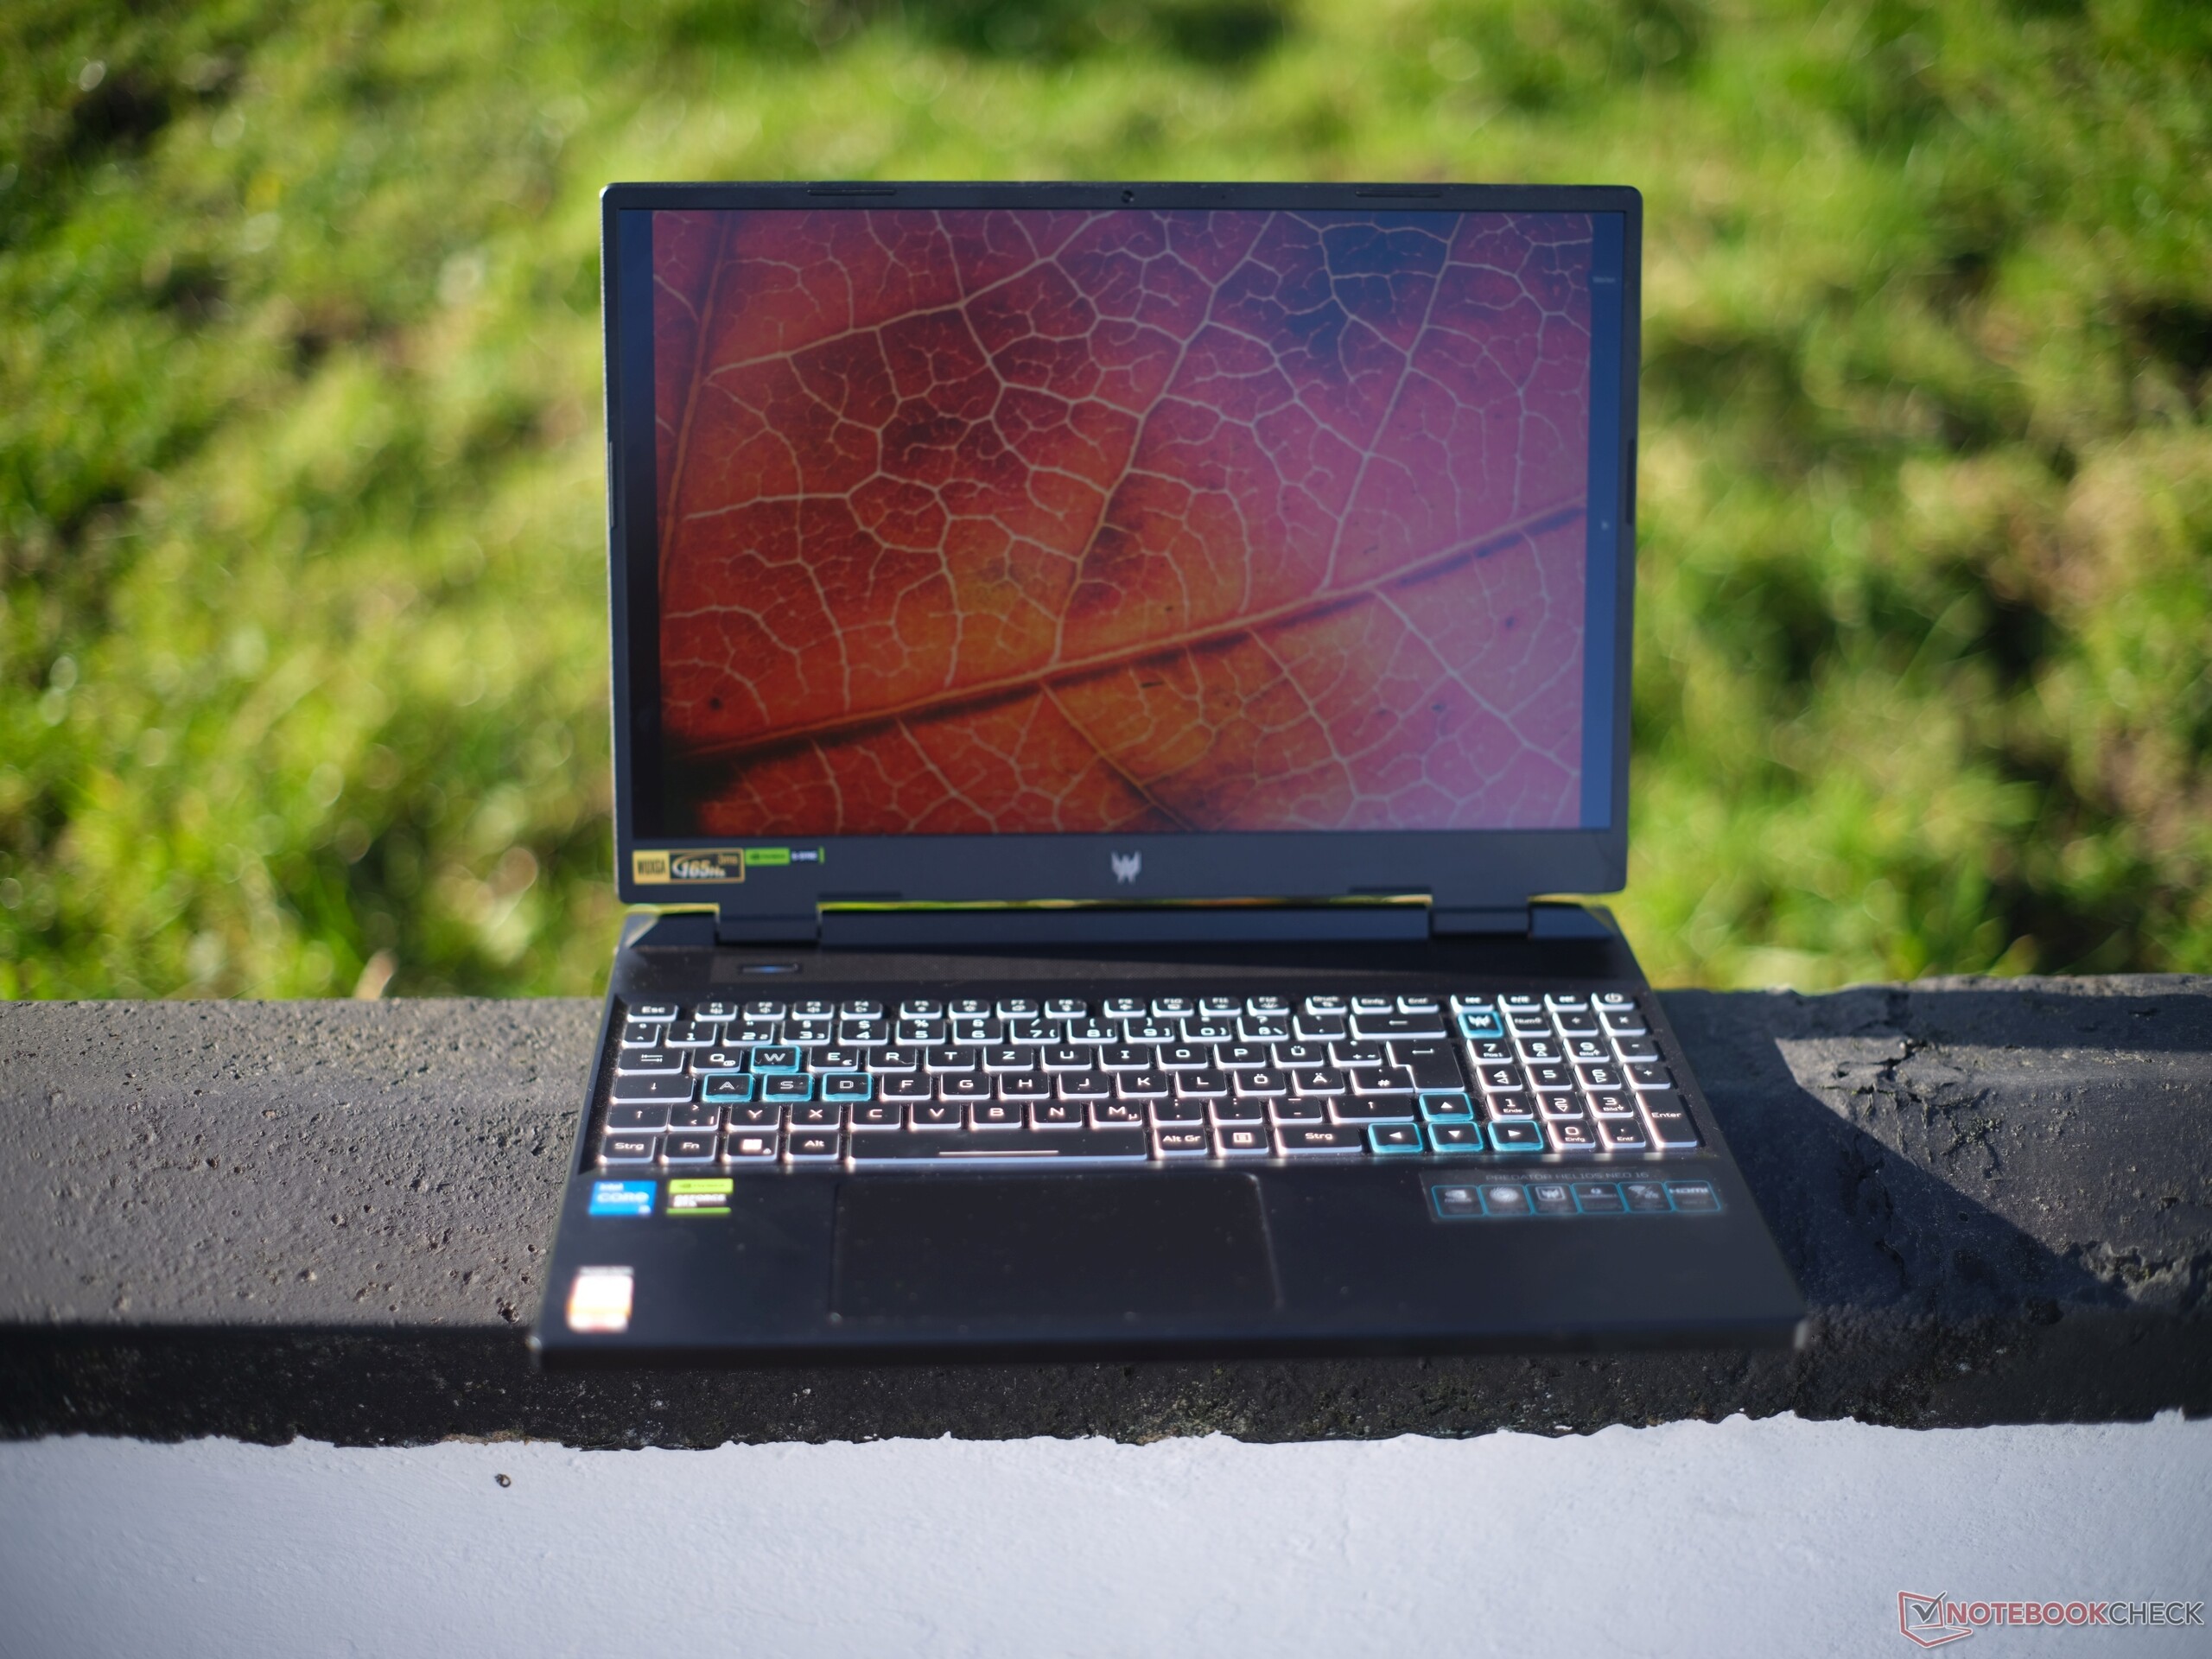
Acer a installé dans cet appareil un clavier chiclet à 6 rangées de touches suffisamment grandes et espacées. Ce clavier n'a pratiquement rien à voir avec celui de l'Helios 16, mais il est similaire, en termes de mécanique et d'apparence, aux claviers de nombreux ordinateurs portables de jeu bon marché, tels que leXMG Apex 15,Gigabyte G5ou leCaptiva Advanced. C'est exactement la même chose que sur le Acer Nitro 16.
La levée de touche généreuse de 1,5 mm s'accompagne d'un point de pression bien visible. Cependant, la résistance des touches aurait pu être un peu plus claire. Le clavier se déforme légèrement lors de la frappe (qui est d'ailleurs très silencieuse), mais ce n'est pas un problème au quotidien. La disposition est plutôt agréable, mais la touche shift droite est un peu trop petite car les touches fléchées sont de taille normale, tandis que la touche shift gauche est encore plus petite.
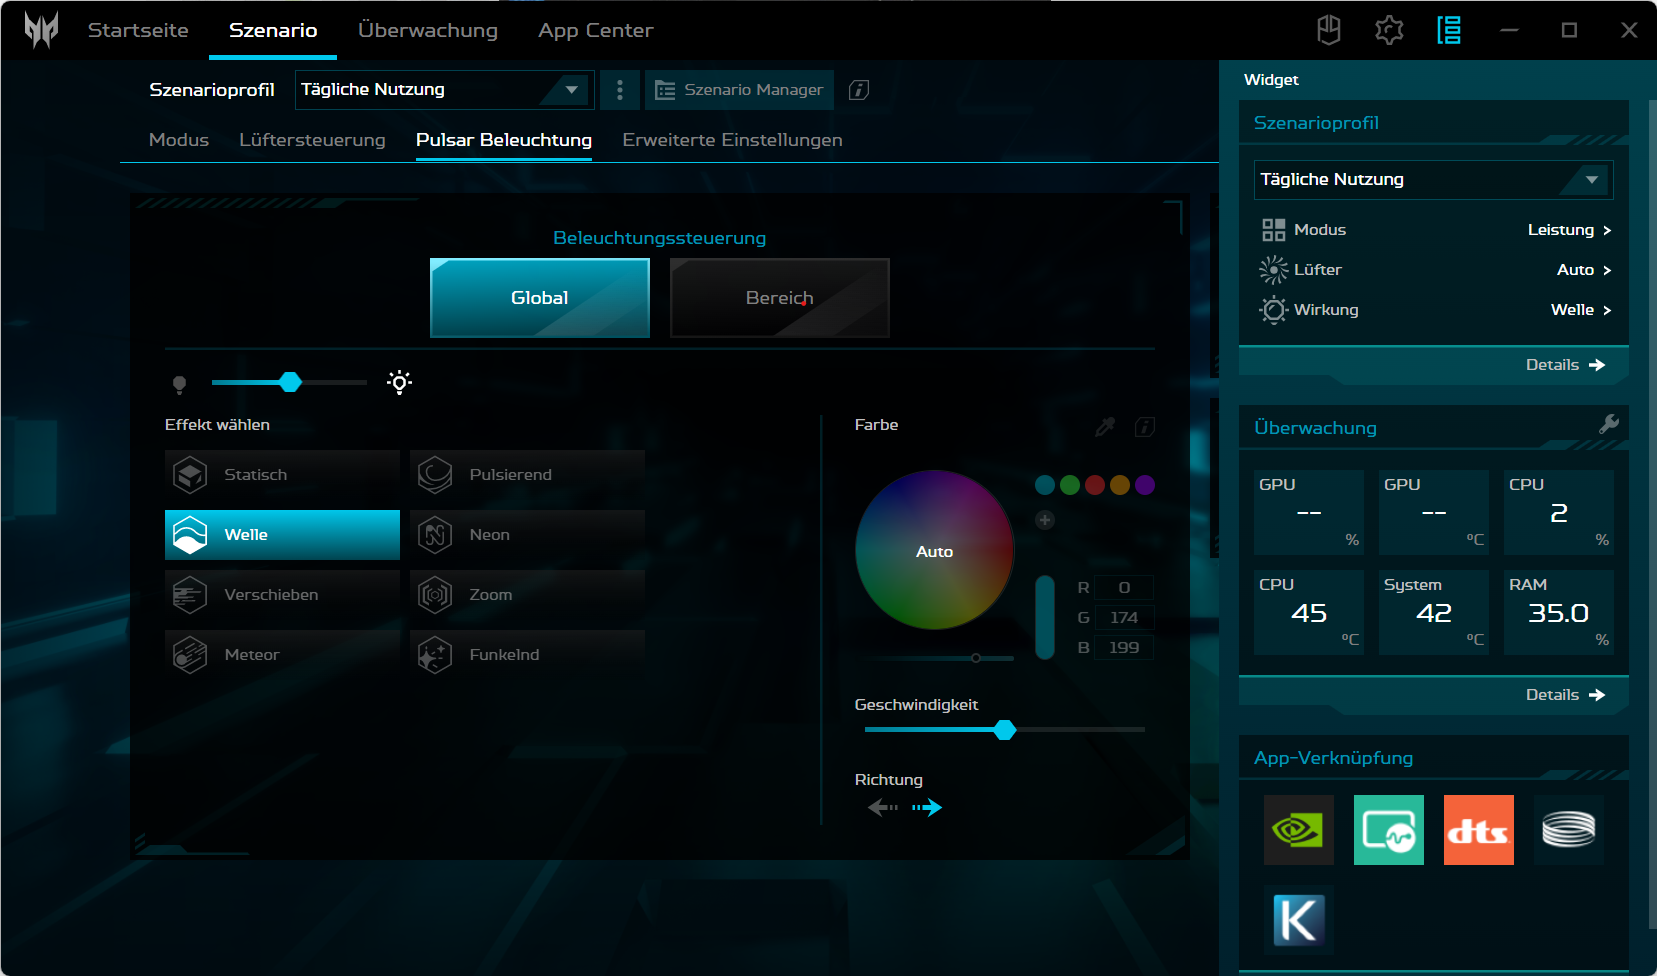
Acer a doté ce clavier d'un éclairage RGB à quatre zones avec quatre niveaux d'intensité, tandis que la version non-Neo dispose d'un éclairage micro-LED particulièrement homogène. Alors que le bouton logo sur le pavé numérique lance l'application Predator Sense, le bouton allumé en permanence en haut à gauche sert à basculer entre les modes de performance.
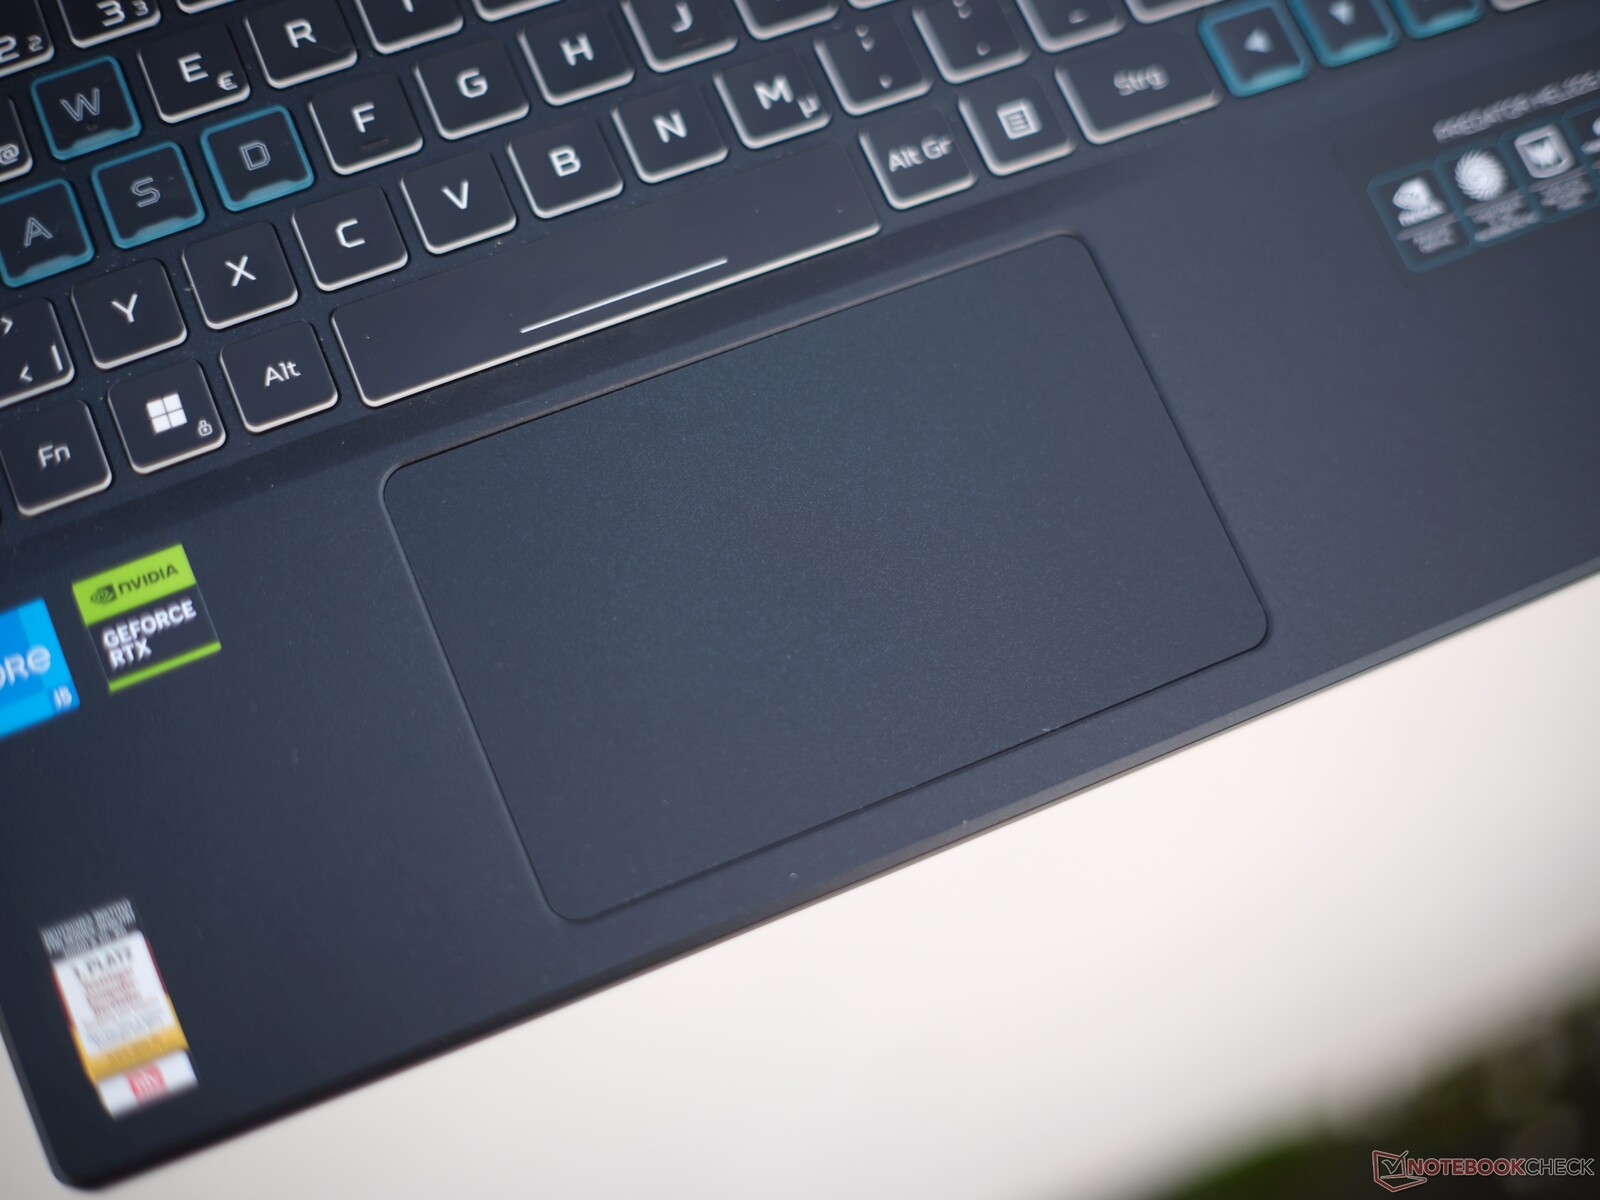
Pavé tactile
Le pavé tactile de 12,6 x 8,3 mm fonctionne très précisément et est agréable et fluide, bien qu'il soit en plastique et non en verre comme leHelios 16est en plastique et non en verre. Il est facile de faire défiler les pages et d'effectuer des gestes multi-touch. Les boutons de clics intégrés ont une levée courte et un clic satisfaisant.
Affichage : L'Helios Neo 16 est bien équipé pour les jeux en Full HD
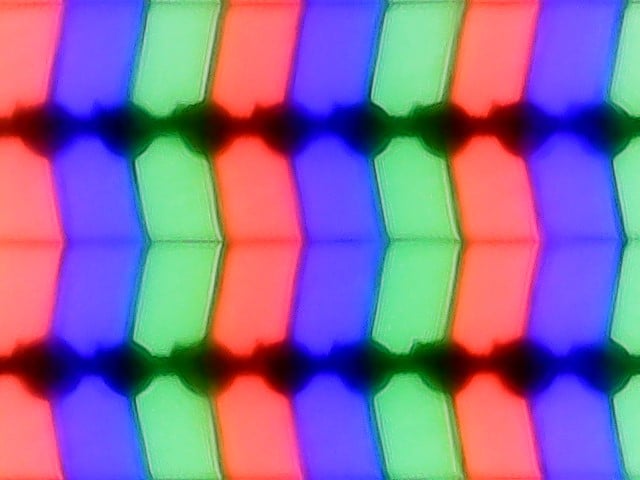

Notre appareil de test est équipé d'un écran IPS WUXGA mat (FHD+) au format 16:10, tandis que d'autres variantes offrent une option QHD. Les deux écrans ont un taux de rafraîchissement de 165 Hz.
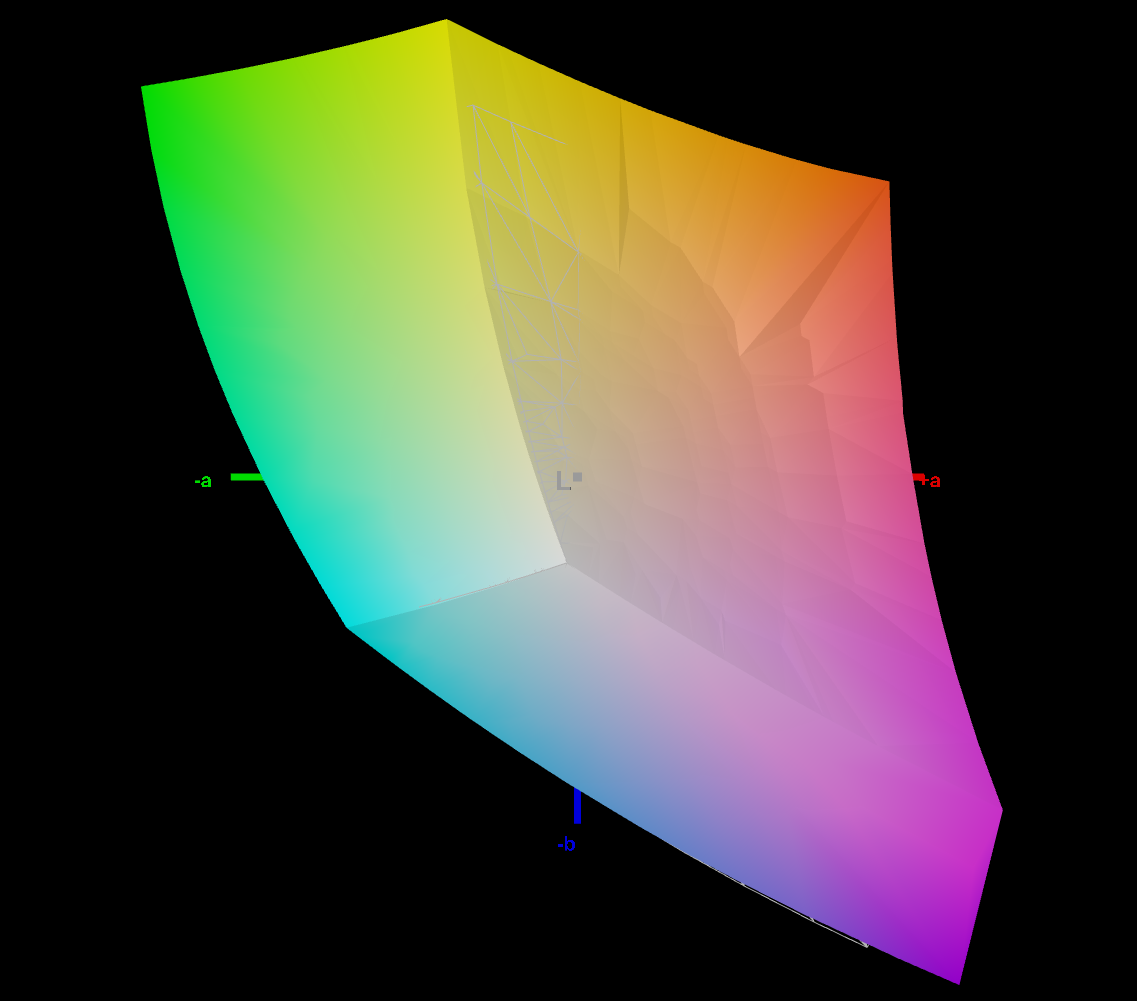
Contrairement au Predator Helios 16, l'option QHD ne couvre pas l'espace colorimétrique DCI-P3 mais se limite à 100% sRGB comme la variante FHD+ que nous avons testée. la luminosité de 373 cd/m² est suffisante - dans notre champ de comparaison, seul leLegion Pro 5 brille davantage avec 516 cd/m², et offre une résolution plus élevée pour un prix similaire (tout comme leLOQ 16 et le XMG Apex 15).
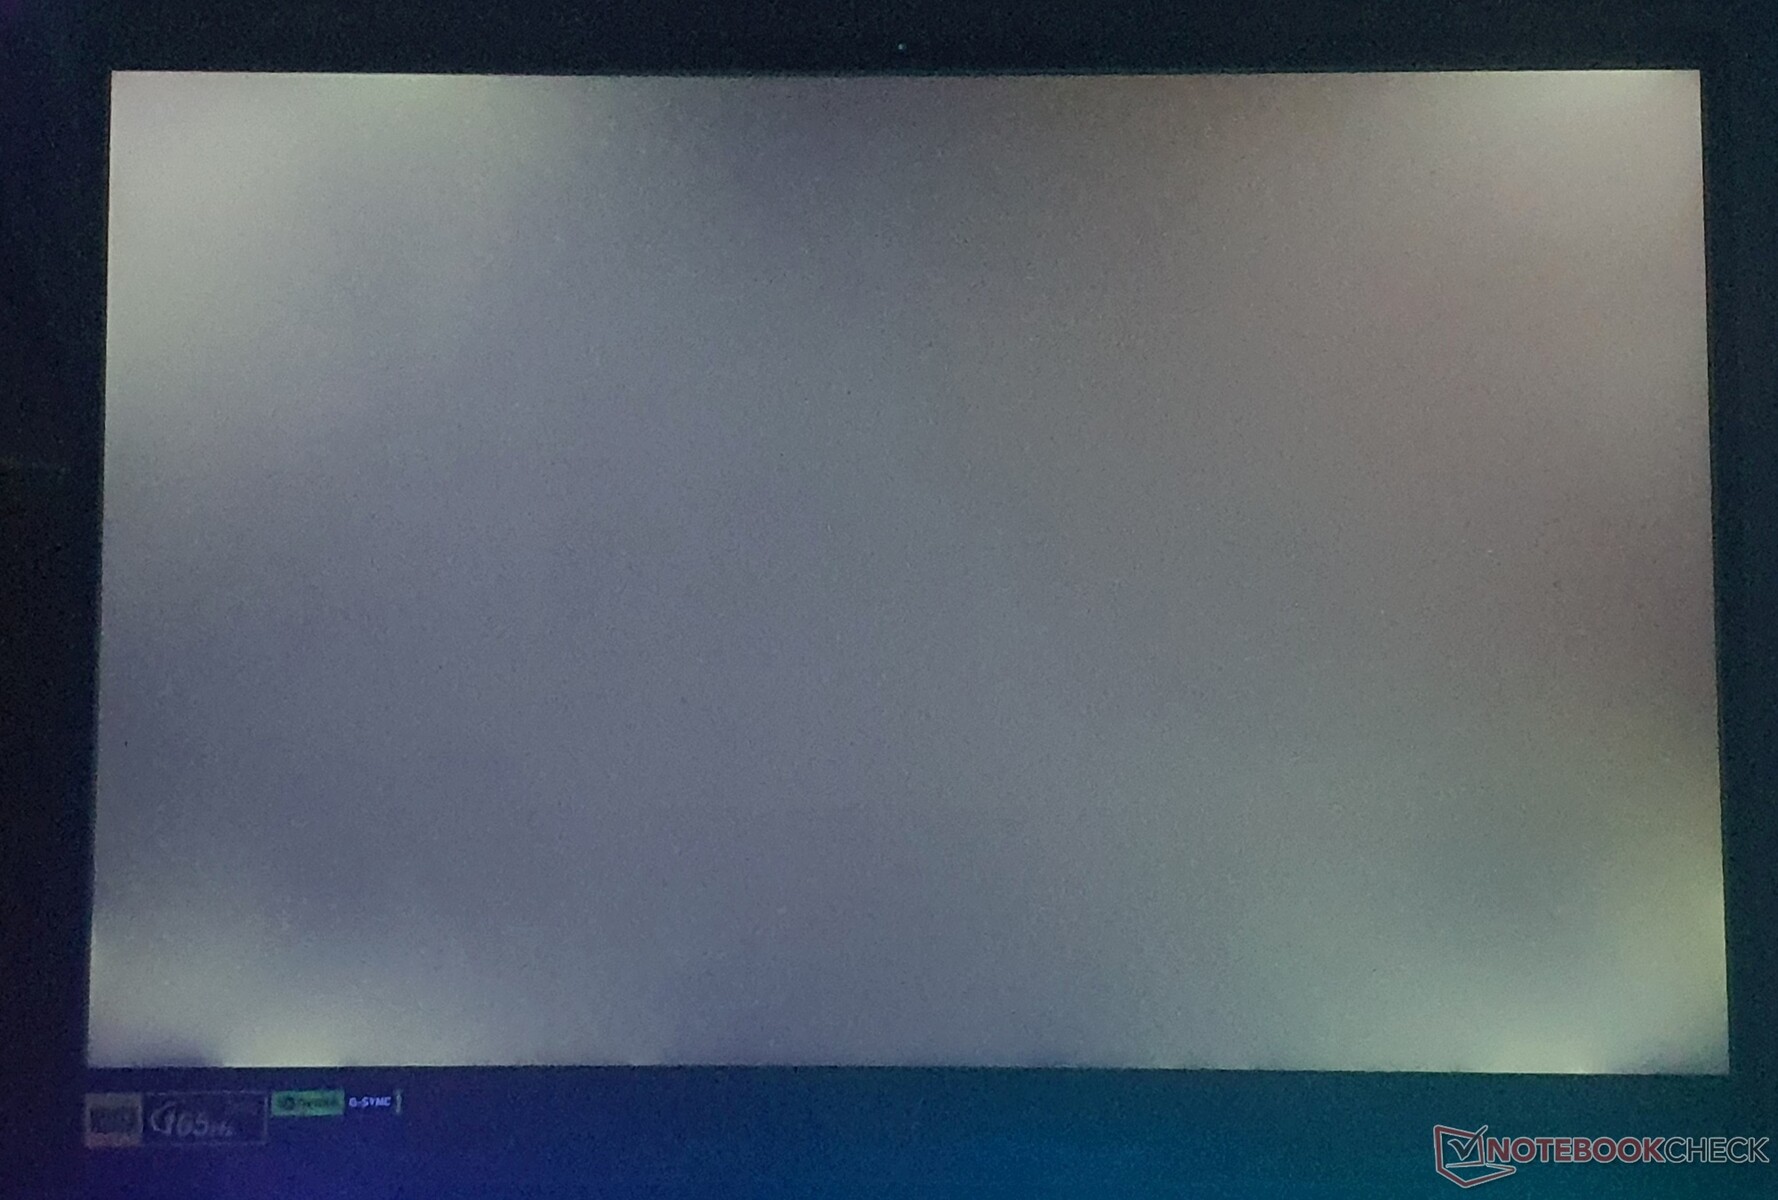
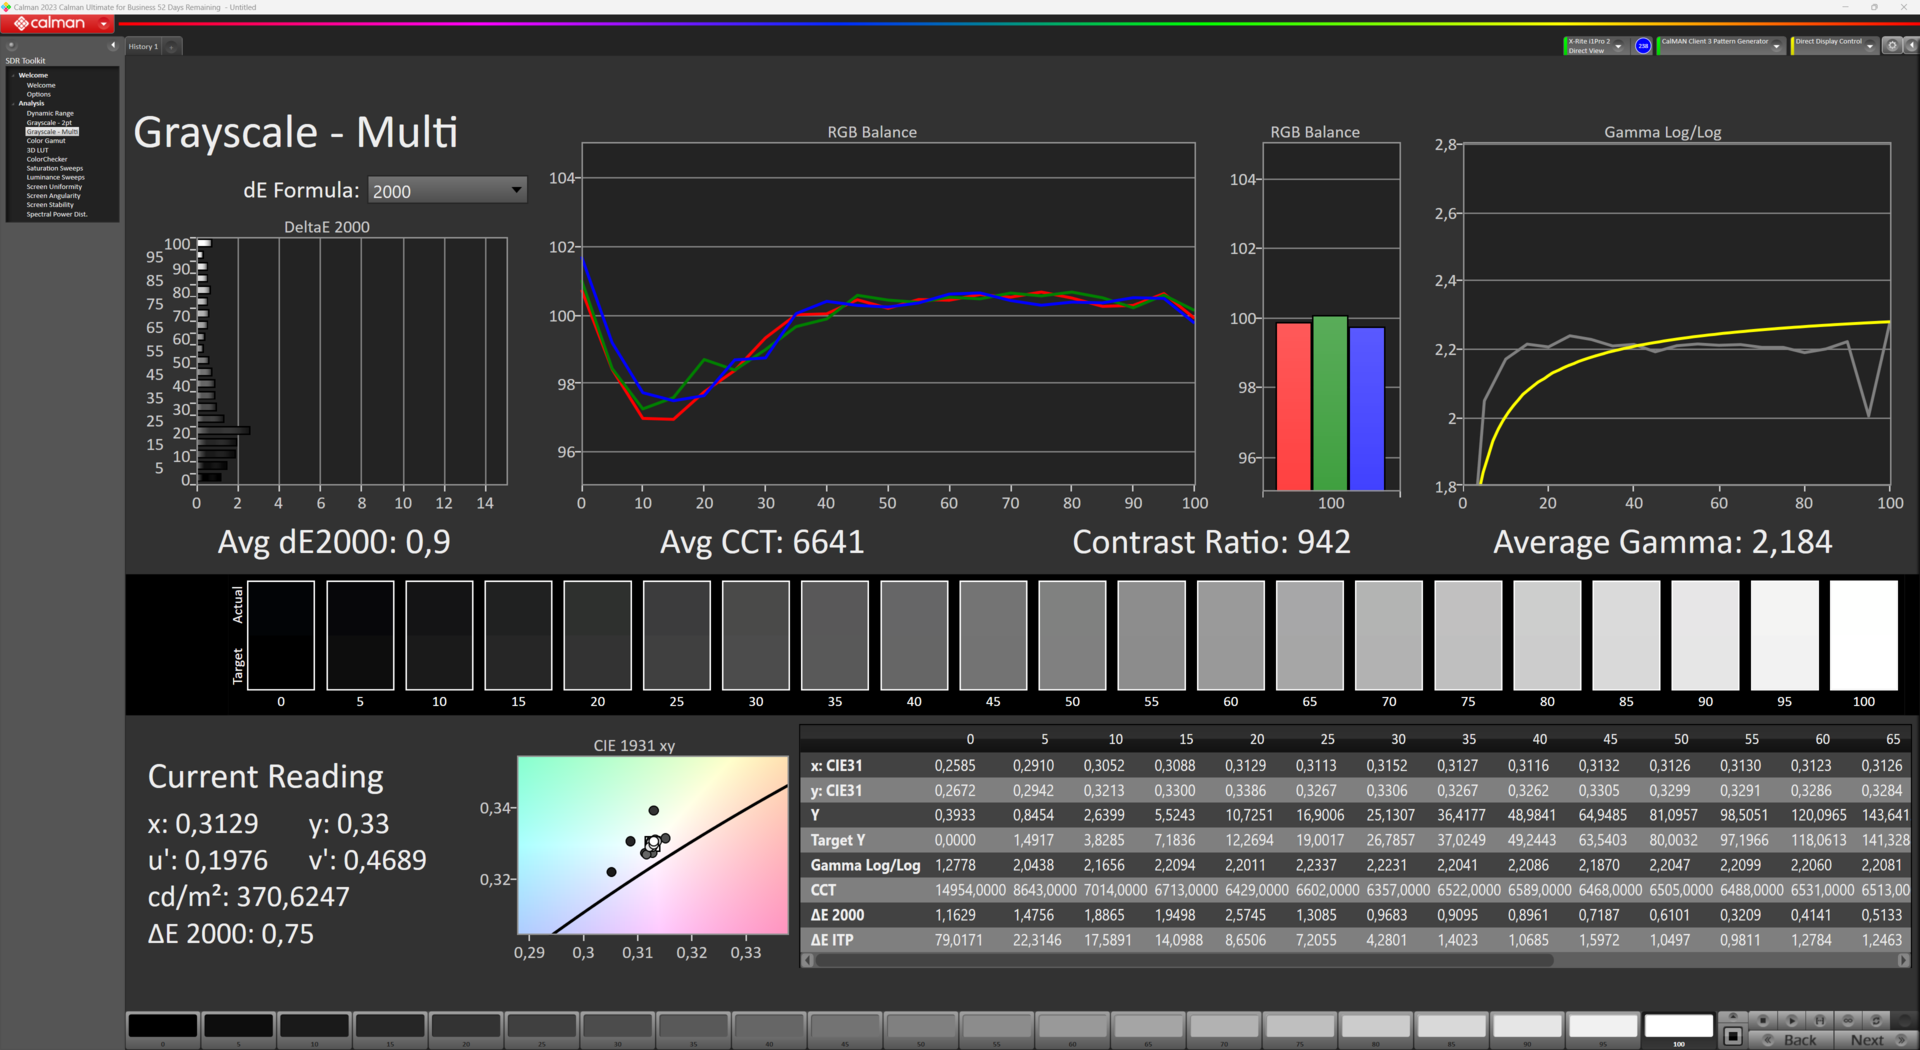
Il atteint des niveaux de contraste moyens de 1 025:1, tandis que son éclairage de 86 % n'est pas terriblement uniforme et nous avons noté quelques halos clairement visibles. Le PWM, qui peut potentiellement entraîner une gêne oculaire ou des maux de tête, n'est au moins pas utilisé sur cet appareil.
Les temps de réponse de l'écran de 8 ms (gris à gris) et de 8 ms (noir à blanc) sont courts - seul le modèleDell G15 5530 se distingue avec des temps de réponse de seulement 3,4 ms (gris à gris). La technologie Nvidia G-Sync est également prise en charge. Dans l'ensemble, l'écran est agréable et coloré, ce qui est probablement dû à sa couverture de l'espace colorimétrique DCI-P3 d'au moins 80 %.
| |||||||||||||||||||||||||
Homogénéité de la luminosité: 86 %
Valeur mesurée au centre, sur batterie: 422.2 cd/m²
Contraste: 1025:1 (Valeurs des noirs: 0.41 cd/m²)
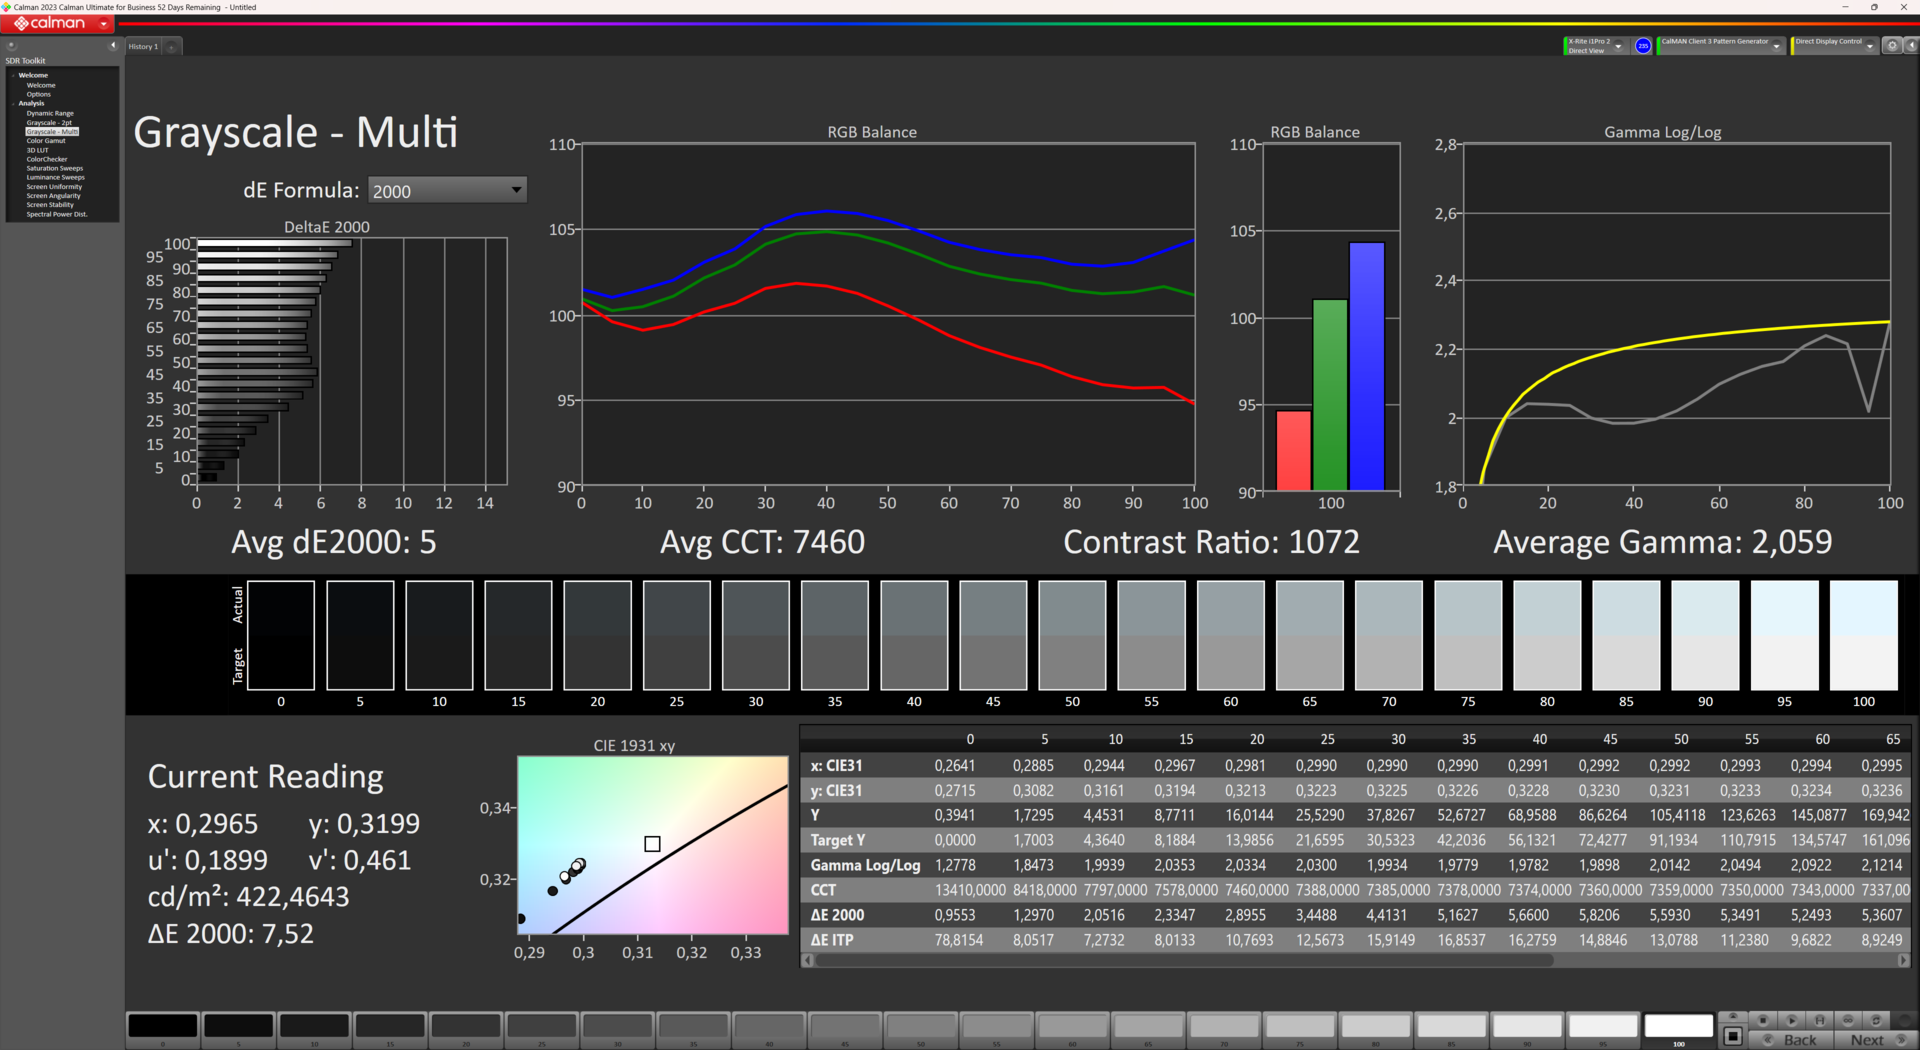
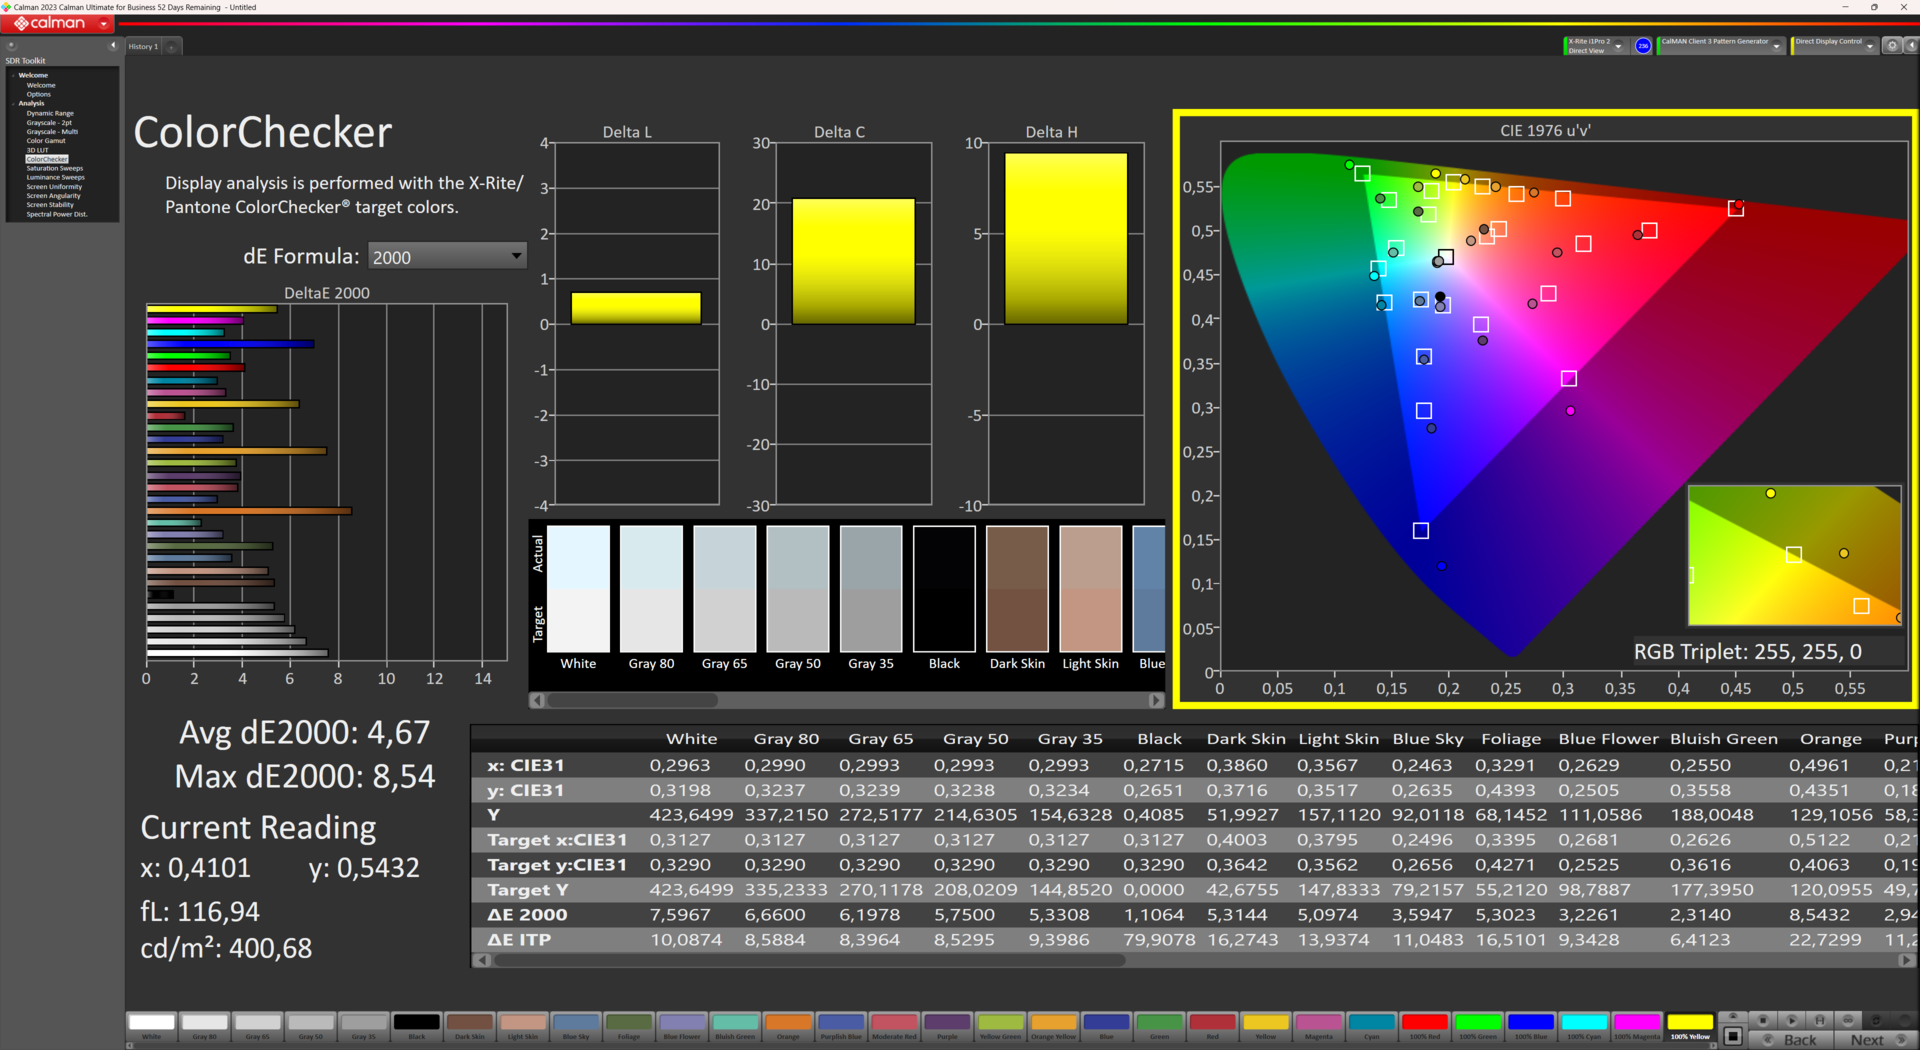
ΔE ColorChecker Calman: 4.67 | ∀{0.5-29.43 Ø4.71}
calibrated: 2.44
ΔE Greyscale Calman: 7.52 | ∀{0.09-98 Ø4.96}
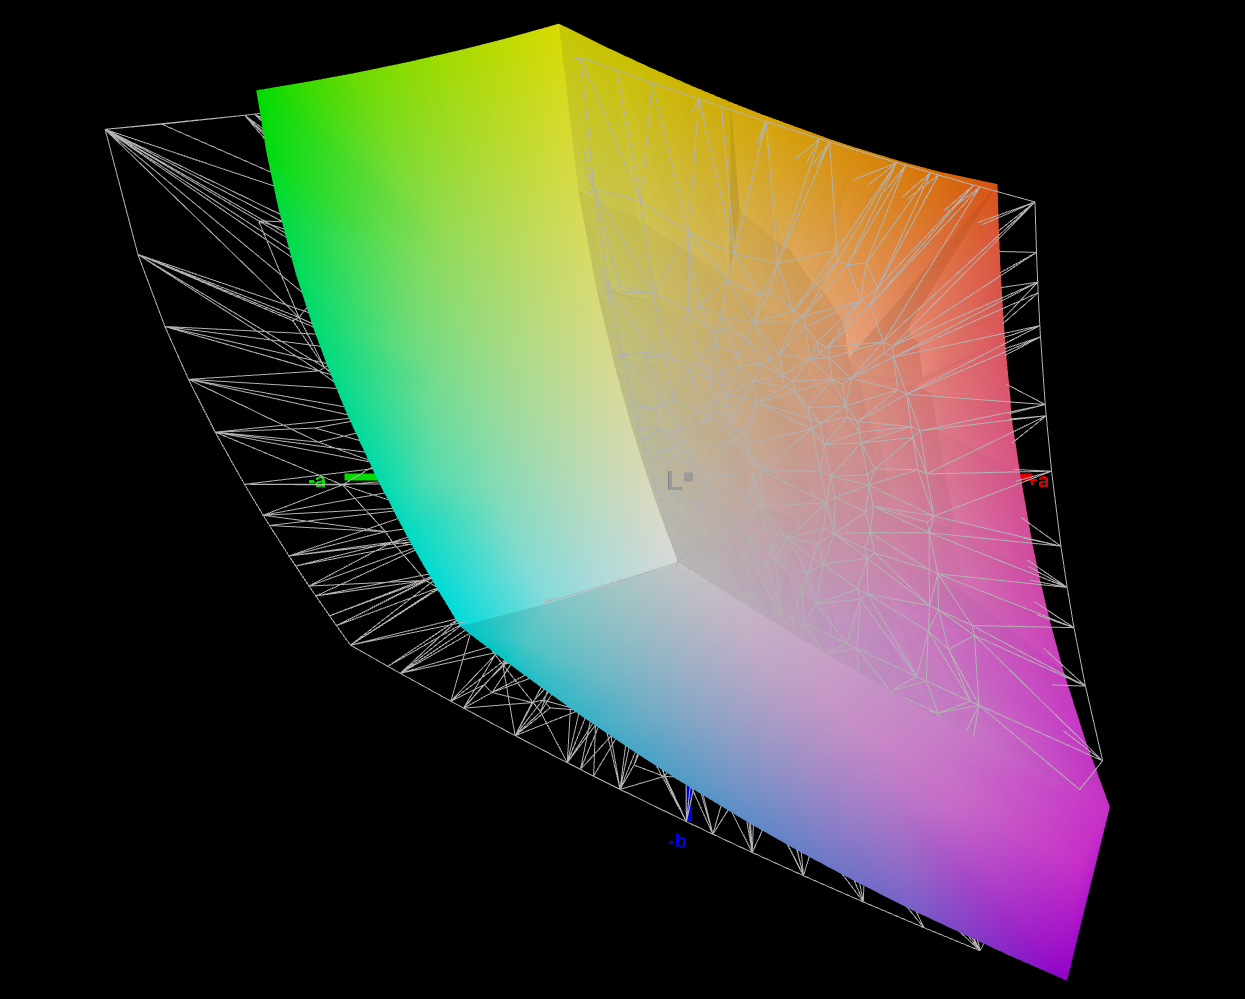
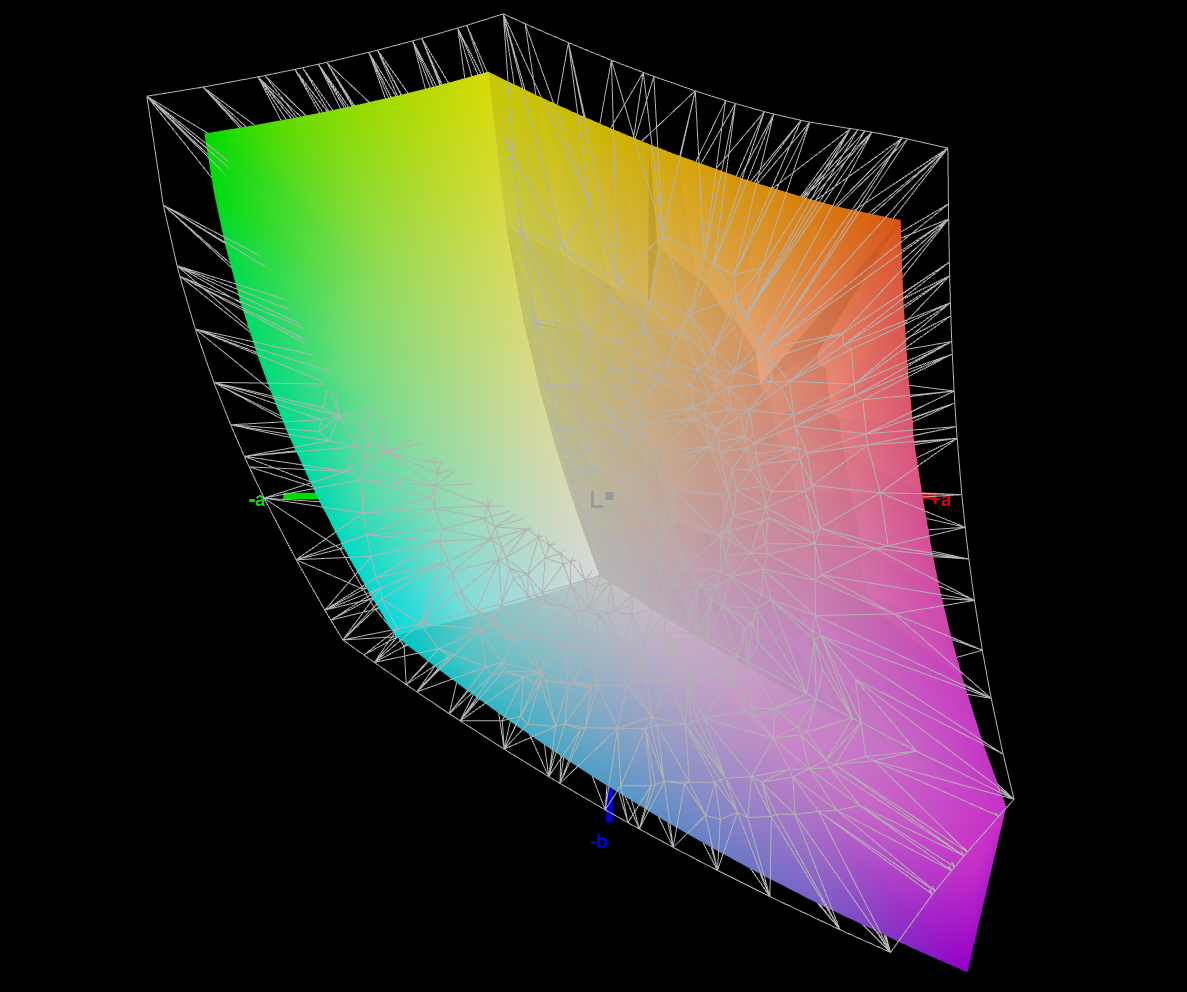
71.36% AdobeRGB 1998 (Argyll 3D)
99.16% sRGB (Argyll 3D)
79.56% Display P3 (Argyll 3D)
Gamma: 2.184
CCT: 6641 K
| Acer Predator Helios Neo 16 NH.QLTEG.002 B160UAN01.Q, IPS, 1920x1200, 16" | Lenovo Legion Pro 5 16ARX8 (R5 7645HX, RTX 4050) CSOT T3 MNG007DA2-2, IPS, 2560x1600, 16" | Lenovo LOQ 16IRH8 AUOC1A5 (B160QAN03.L), IPS, 2560x1600, 16" | Schenker XMG Apex 15 (Late 23) BOE CQ NE156QHM-NY2, IPS, 2560x1440, 15.6" | HP Victus 16-r0076TX Chi Mei CMN1629, IPS, 1920x1080, 16.1" | Dell G15 5530 AUO B156HAN, IPS, 1920x1080, 15.6" | |
|---|---|---|---|---|---|---|
| Display | -2% | -3% | -7% | -6% | -2% | |
| Display P3 Coverage (%) | 79.56 | 71.6 -10% | 70.5 -11% | 67.5 -15% | 67.5 -15% | 73.1 -8% |
| sRGB Coverage (%) | 99.16 | 99.8 1% | 98.9 0% | 97.6 -2% | 97.5 -2% | 98.4 -1% |
| AdobeRGB 1998 Coverage (%) | 71.36 | 72.9 2% | 72.6 2% | 68.9 -3% | 69.7 -2% | 74.4 4% |
| Response Times | -8% | 9% | -38% | 14% | 46% | |
| Response Time Grey 50% / Grey 80% * (ms) | 8 ? | 12 ? -50% | 7.2 ? 10% | 13.2 ? -65% | 6.18 ? 23% | 3.39 ? 58% |
| Response Time Black / White * (ms) | 8 ? | 5.2 ? 35% | 7.4 ? 7% | 8.8 ? -10% | 7.62 ? 5% | 5.35 ? 33% |
| PWM Frequency (Hz) | 21620 ? | |||||
| Screen | 31% | 27% | 18% | 32% | 12% | |
| Brightness middle (cd/m²) | 420.2 | 543 29% | 407 -3% | 336 -20% | 290 -31% | 320 -24% |
| Brightness (cd/m²) | 373 | 516 38% | 369 -1% | 307 -18% | 275 -26% | 316 -15% |
| Brightness Distribution (%) | 86 | 87 1% | 85 -1% | 77 -10% | 82 -5% | 94 9% |
| Black Level * (cd/m²) | 0.41 | 0.58 -41% | 0.45 -10% | 0.38 7% | 0.21 49% | 0.21 49% |
| Contrast (:1) | 1025 | 936 -9% | 904 -12% | 884 -14% | 1381 35% | 1524 49% |
| Colorchecker dE 2000 * | 4.67 | 1.35 71% | 1.43 69% | 1.96 58% | 1.7 64% | 4.55 3% |
| Colorchecker dE 2000 max. * | 8.54 | 3.22 62% | 3.58 58% | 5.07 41% | 3.57 58% | 9.83 -15% |
| Colorchecker dE 2000 calibrated * | 2.44 | 1.31 46% | 1.07 56% | 1.27 48% | 0.93 62% | 1.51 38% |
| Greyscale dE 2000 * | 7.52 | 1.03 86% | 1.13 85% | 2.3 69% | 1.5 80% | 6.2 18% |
| Gamma | 2.184 101% | 2.38 92% | 2.5 88% | 2.017 109% | 2.1 105% | 2.07 106% |
| CCT | 6641 98% | 6452 101% | 6526 100% | 6644 98% | 6538 99% | 6479 100% |
| Moyenne finale (programmes/paramètres) | 7% /
19% | 11% /
18% | -9% /
5% | 13% /
21% | 19% /
14% |
* ... Moindre est la valeur, meilleures sont les performances
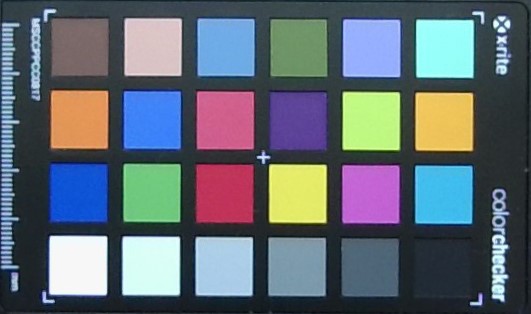
L'espace colorimétrique sRGB étant entièrement couvert, il est tout à fait possible de réaliser des montages professionnels d'images et de vidéos qui reposent sur des couleurs précises, à condition que la résolution FHD+ plutôt faible n'interfère pas avec ces utilisations.
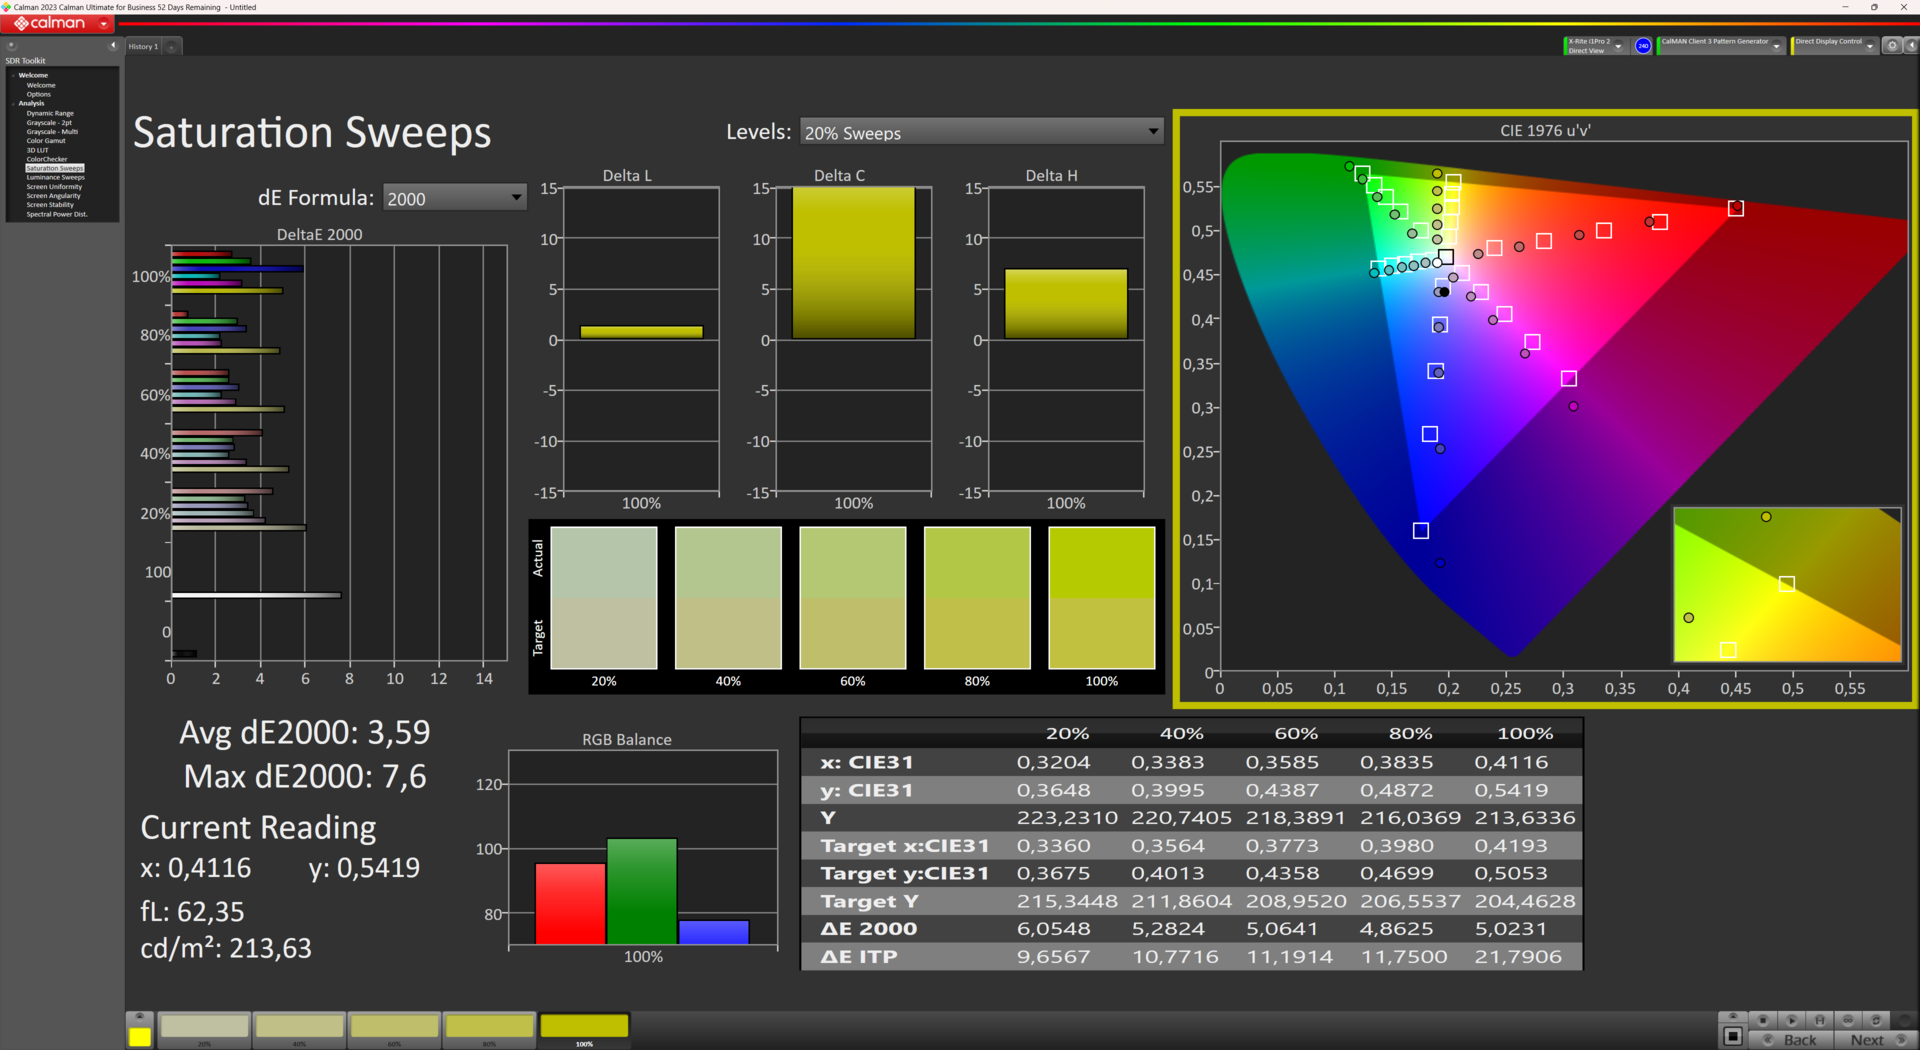
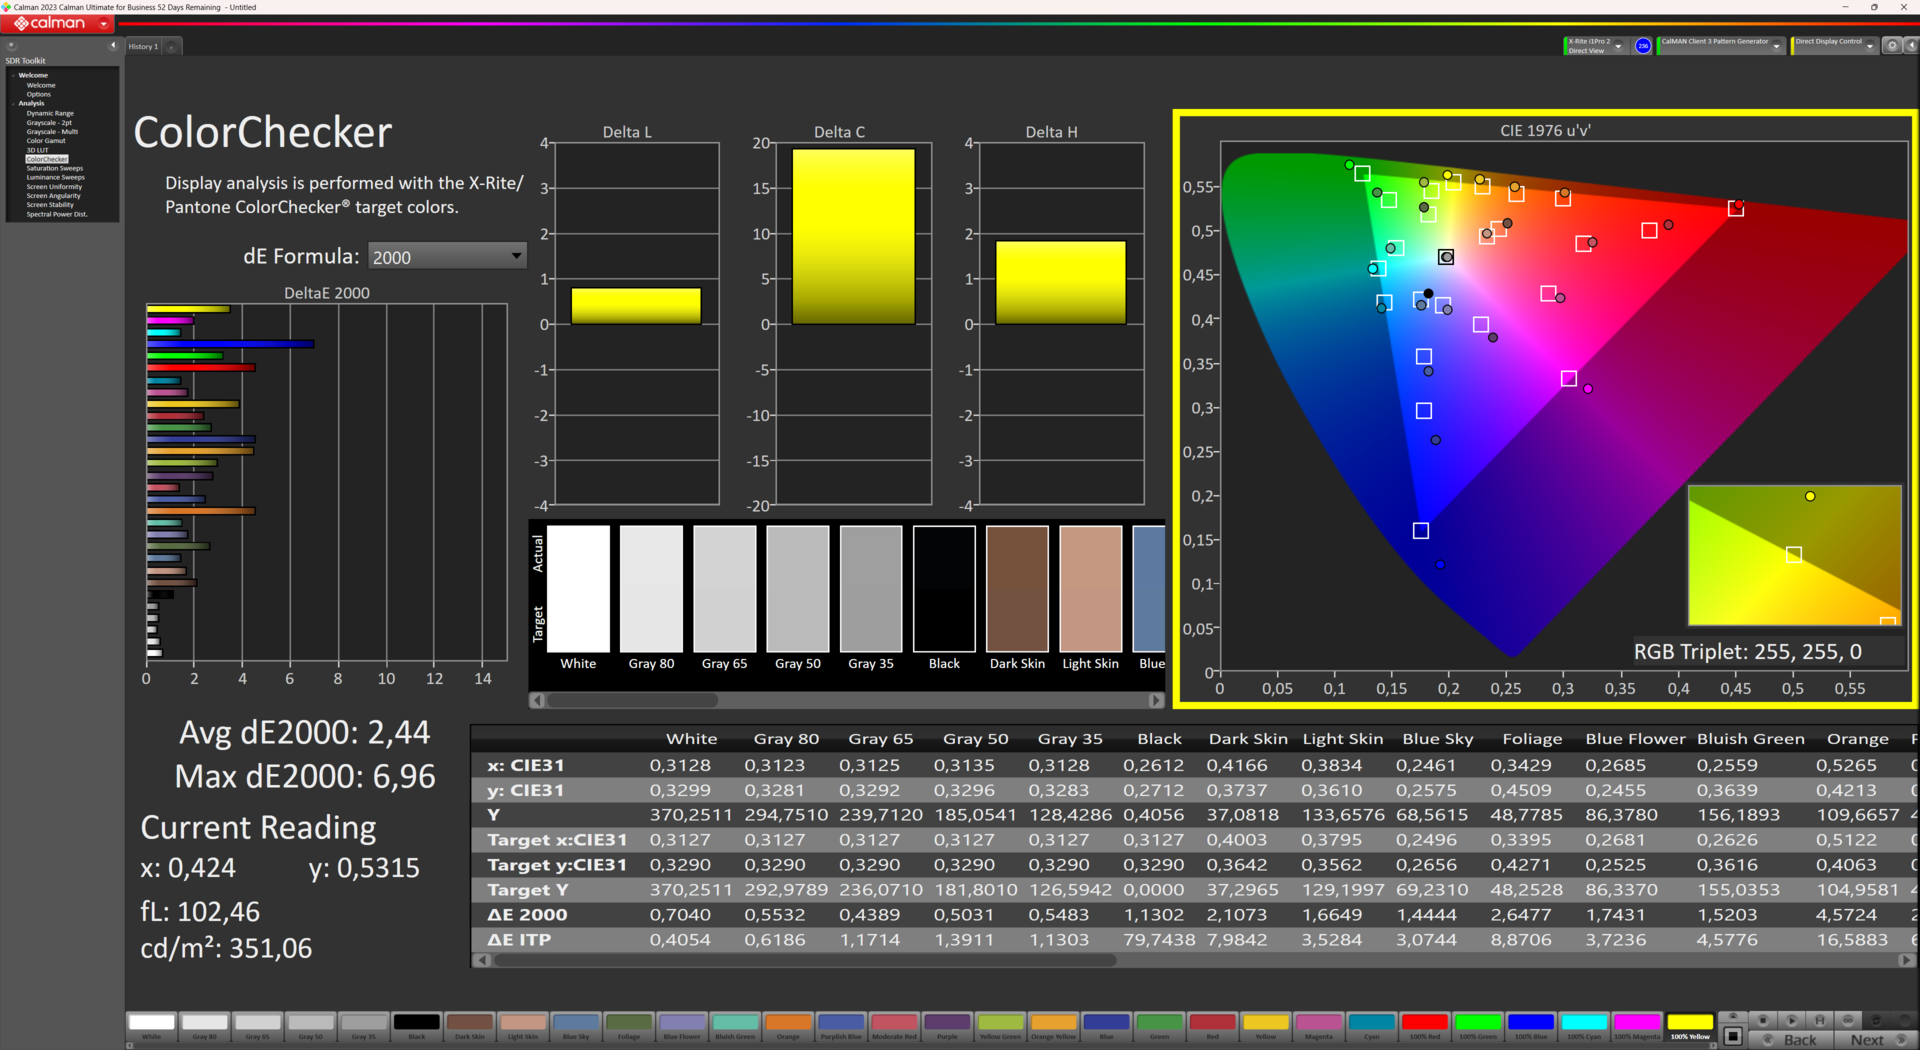
Dans notre champ de comparaison, l'Helios Neo 16 est le seul ordinateur portable, avec le Dell G15 5530, à dépasser la limite critique du DeltaE 3 (jusqu'à laquelle l'œil humain peut percevoir les écarts de couleur) avec une valeur de 4,67 dès la sortie de l'emballage.
Heureusement, sa valeur DeltaE a été réduite à seulement 2,44 après notre étalonnage, bien que les tons bleus s'écartent encore de manière significative avec une valeur de 7. La teinte cyan pourrait également être corrigée. Notre profil de couleurs calibré peut être téléchargé ici.

Temps de réponse de l'écran
| ↔ Temps de réponse noir à blanc | ||
|---|---|---|
| 8 ms ... hausse ↗ et chute ↘ combinées | ↗ 4.5 ms hausse |  |
| ↘ 3.5 ms chute | ||
| L'écran montre de faibles temps de réponse, un bon écran pour jouer. En comparaison, tous les appareils testés affichent entre 0.1 (minimum) et 240 (maximum) ms. » 22 % des appareils testés affichent de meilleures performances. Cela signifie que les latences relevées sont meilleures que la moyenne (19.8 ms) de tous les appareils testés. | ||
| ↔ Temps de réponse gris 50% à gris 80% | ||
| 8 ms ... hausse ↗ et chute ↘ combinées | ↗ 4.5 ms hausse |  |
| ↘ 3.5 ms chute | ||
| L'écran montre de faibles temps de réponse, un bon écran pour jouer. En comparaison, tous les appareils testés affichent entre 0.165 (minimum) et 636 (maximum) ms. » 21 % des appareils testés affichent de meilleures performances. Cela signifie que les latences relevées sont meilleures que la moyenne (31 ms) de tous les appareils testés. | ||
Scintillement / MLI (Modulation de largeur d'impulsion)
| Scintillement / MLI (Modulation de largeur d'impulsion) non décelé |  | ||
En comparaison, 52 % des appareils testés n'emploient pas MDI pour assombrir leur écran. Nous avons relevé une moyenne à 7754 (minimum : 5 - maximum : 343500) Hz dans le cas où une MDI était active. | |||
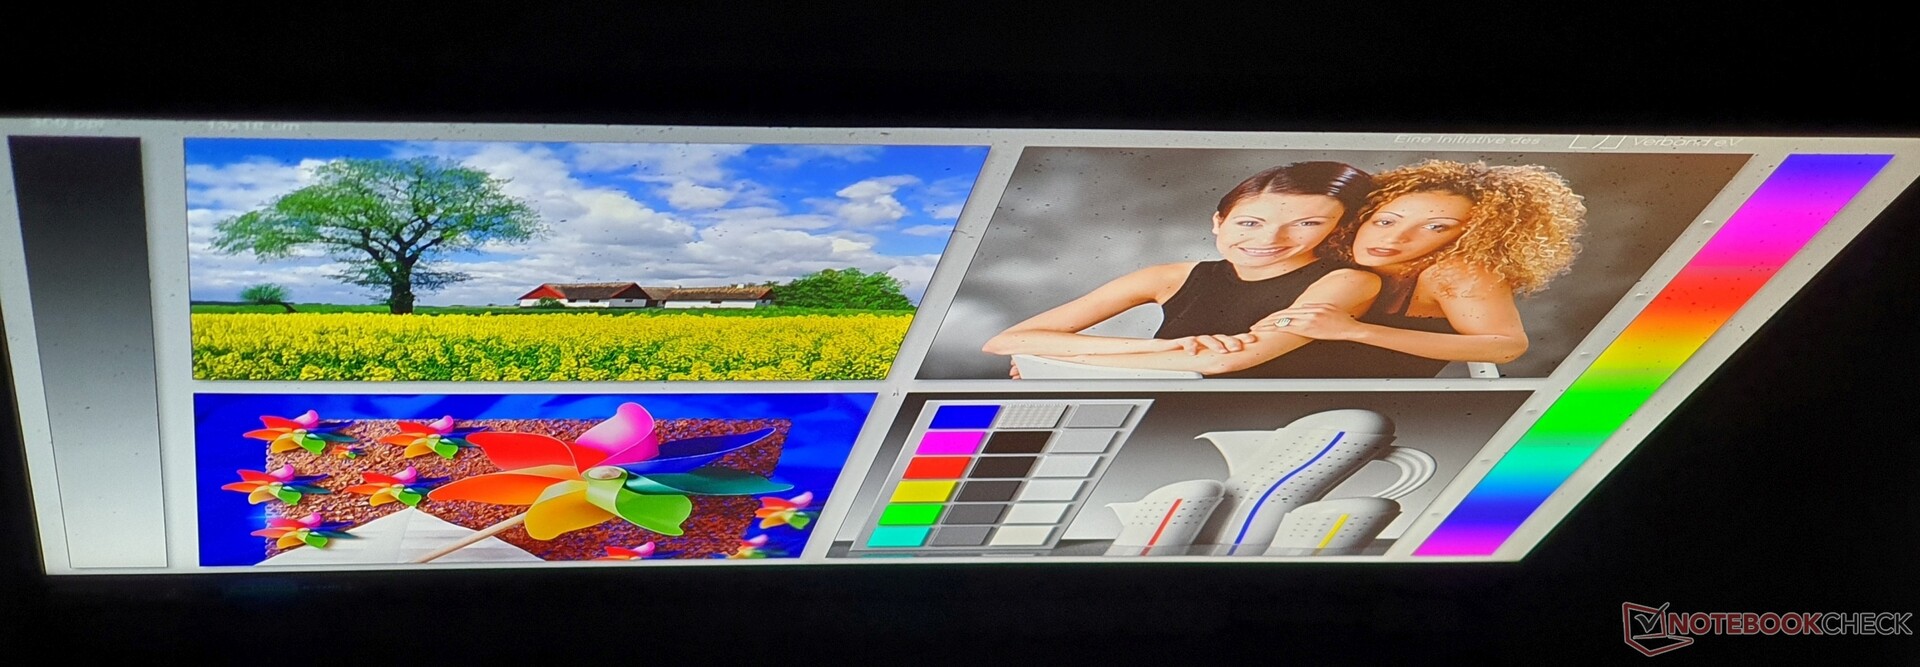
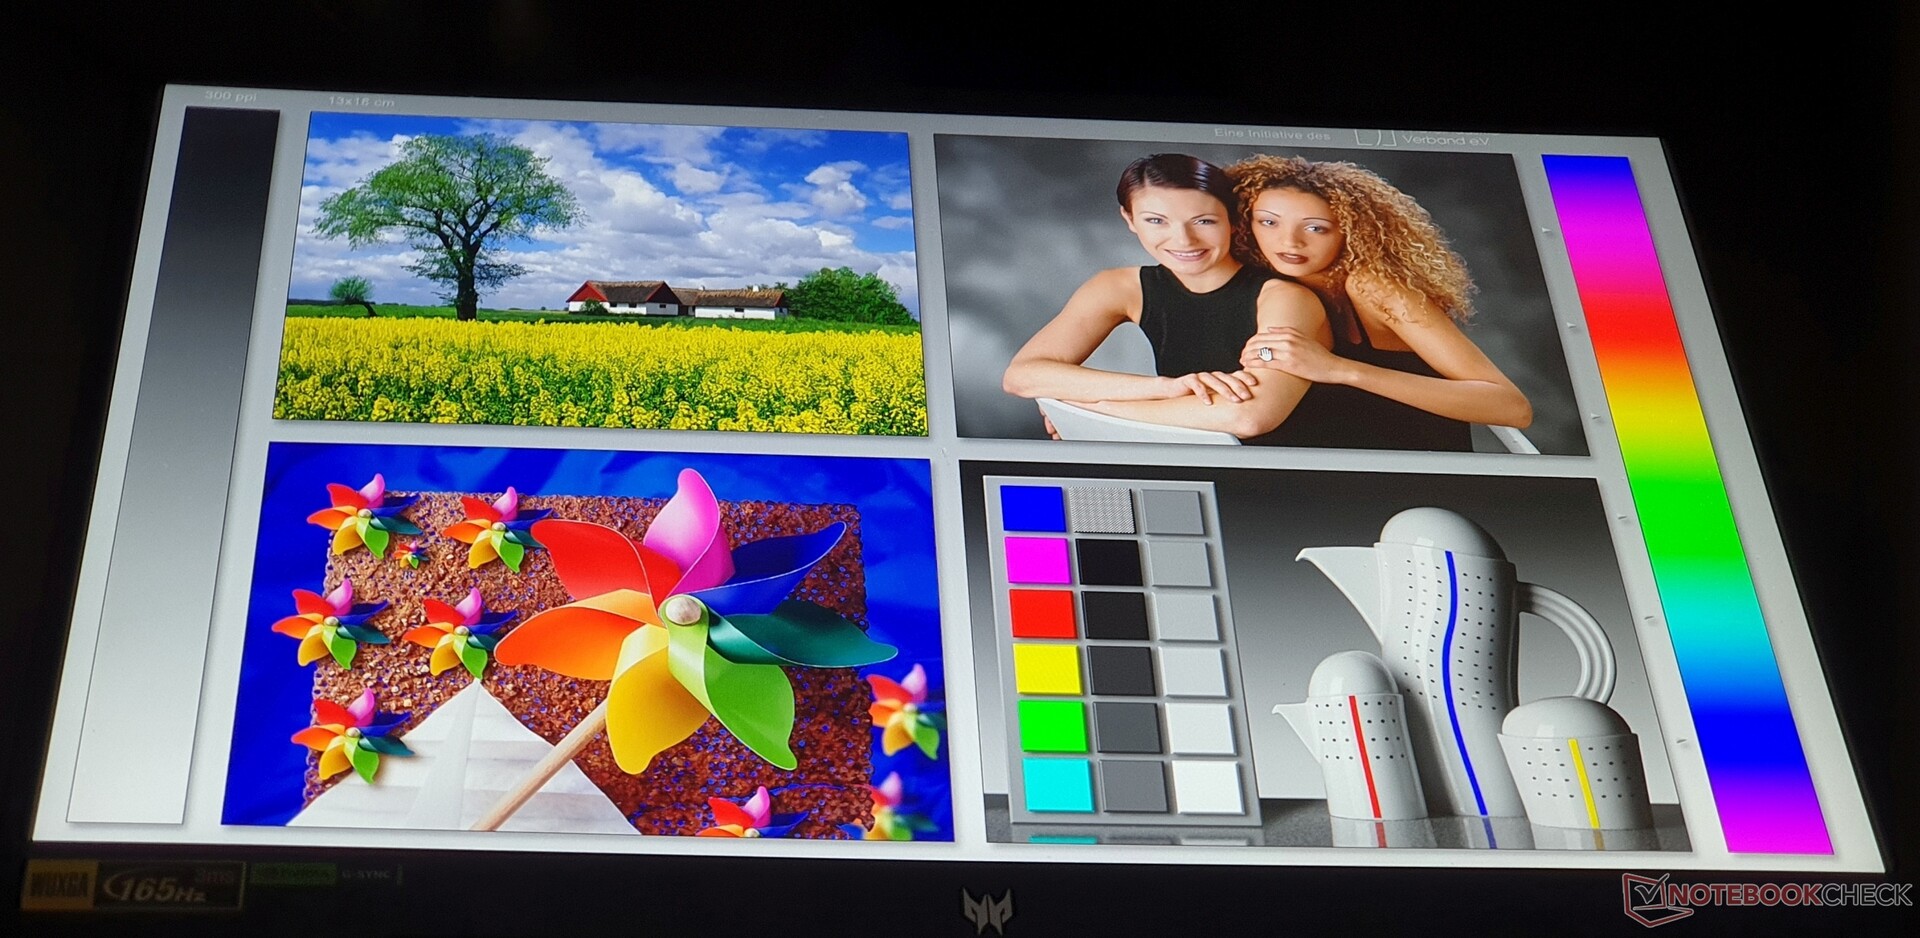
Grâce à la surface d'affichage mate de l'appareil et à sa luminosité de 373 cd/m², l'écran reste lisible à l'extérieur, à condition de ne pas s'exposer directement au soleil.
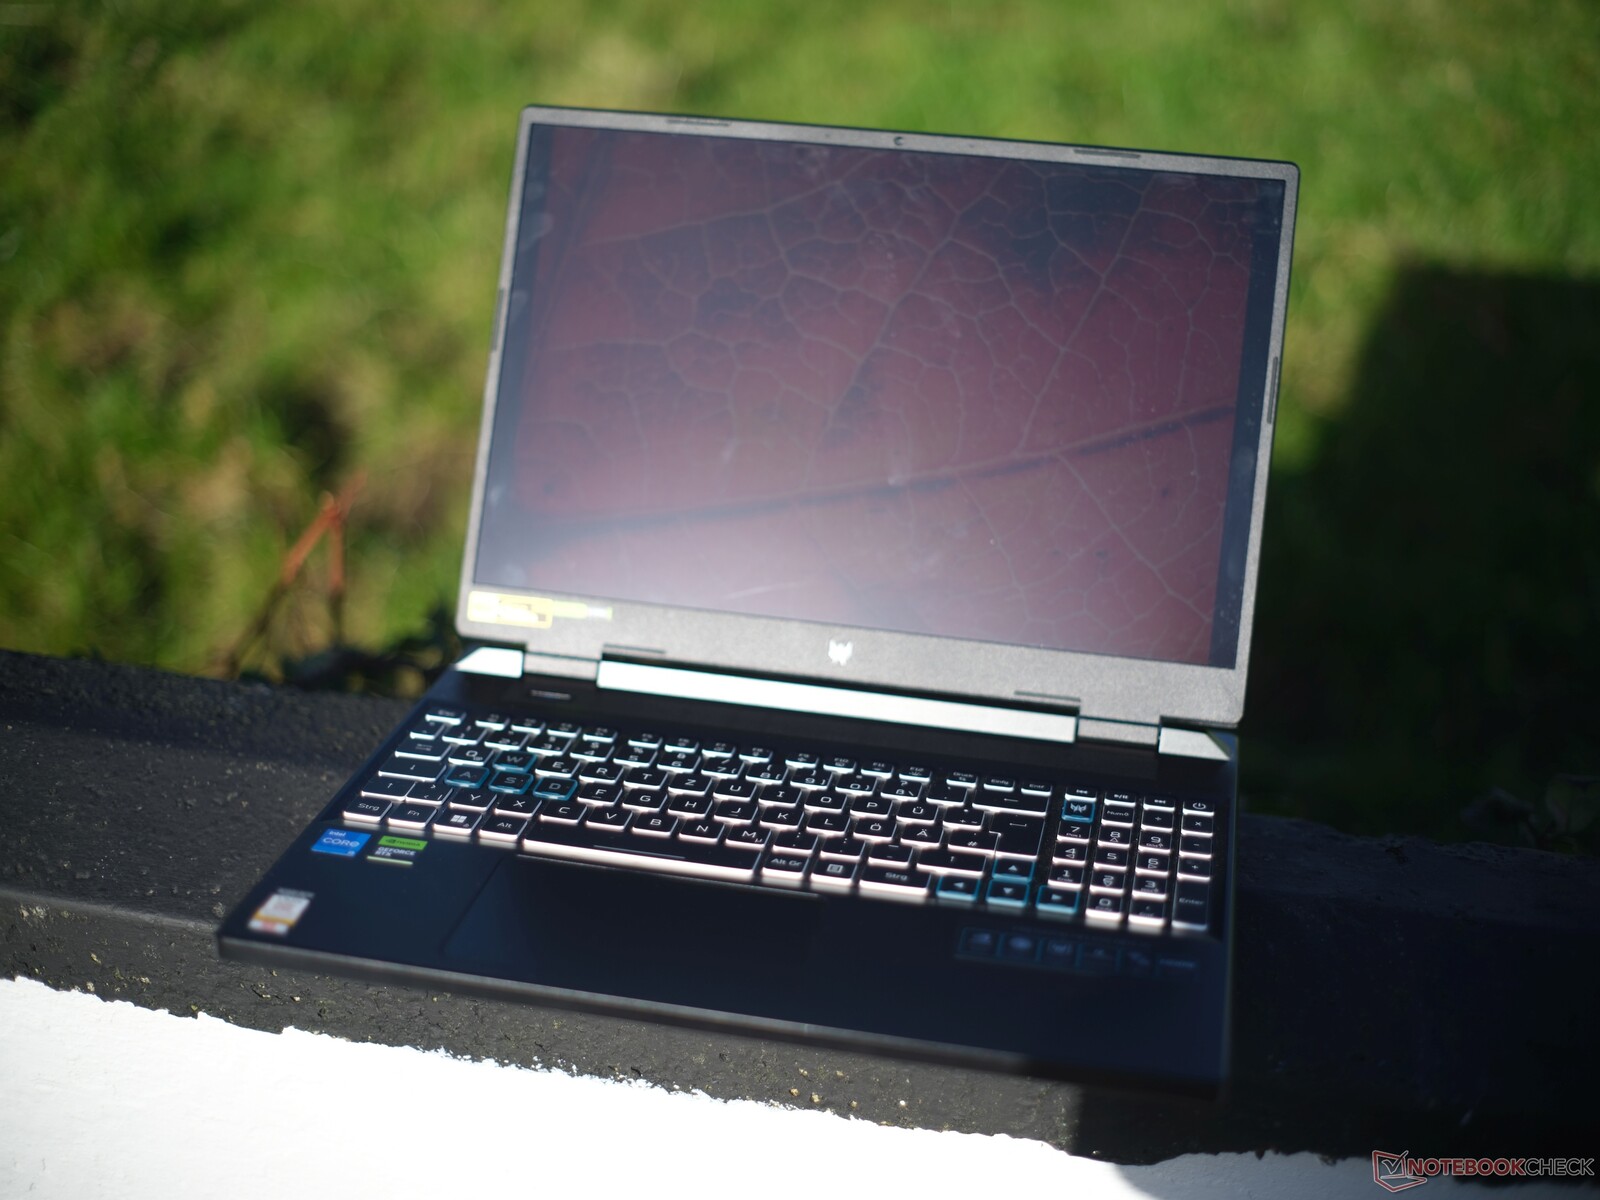
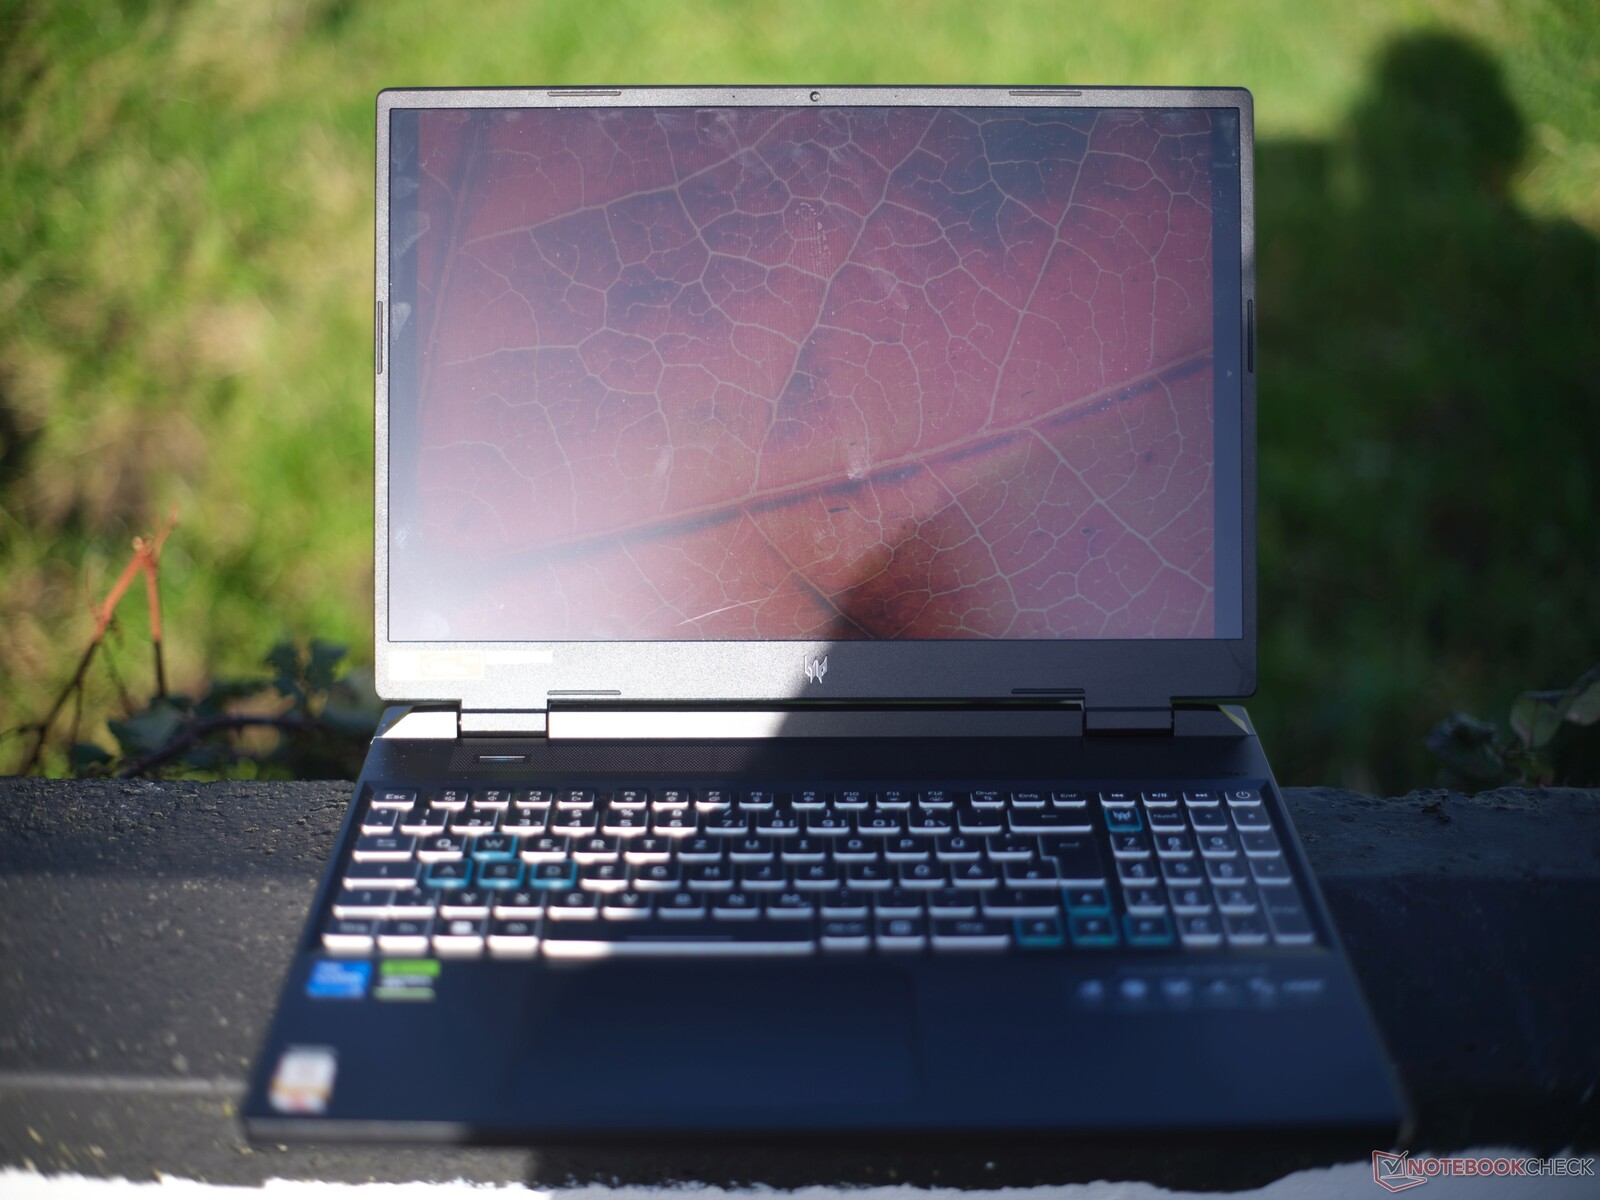
Comme c'est généralement le cas pour les écrans IPS, il reste lisible même sous des angles de vue extrêmes.


Performances : Un processeur de classe bureau dans un ordinateur portable de jeu de milieu de gamme
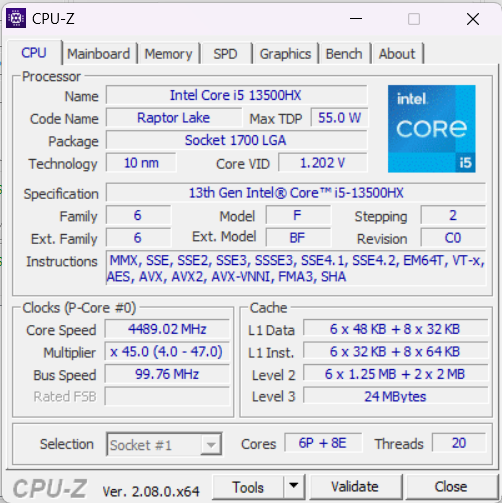
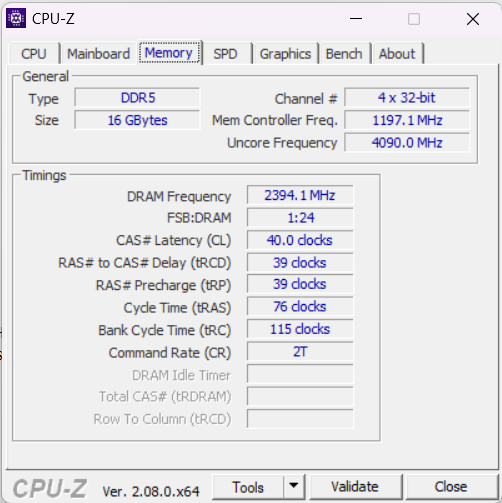
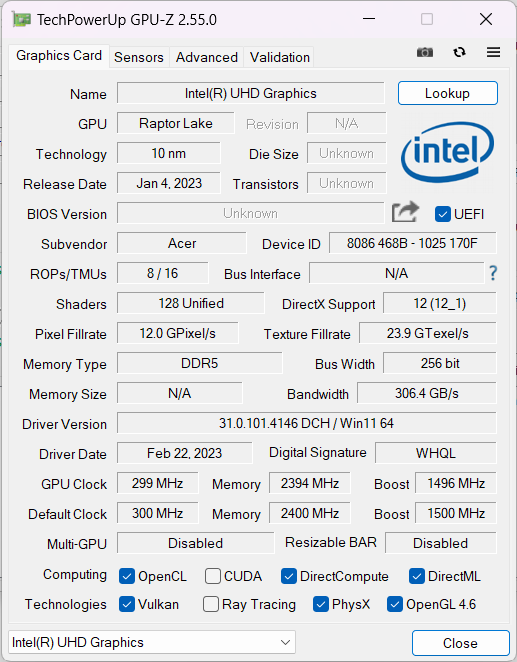
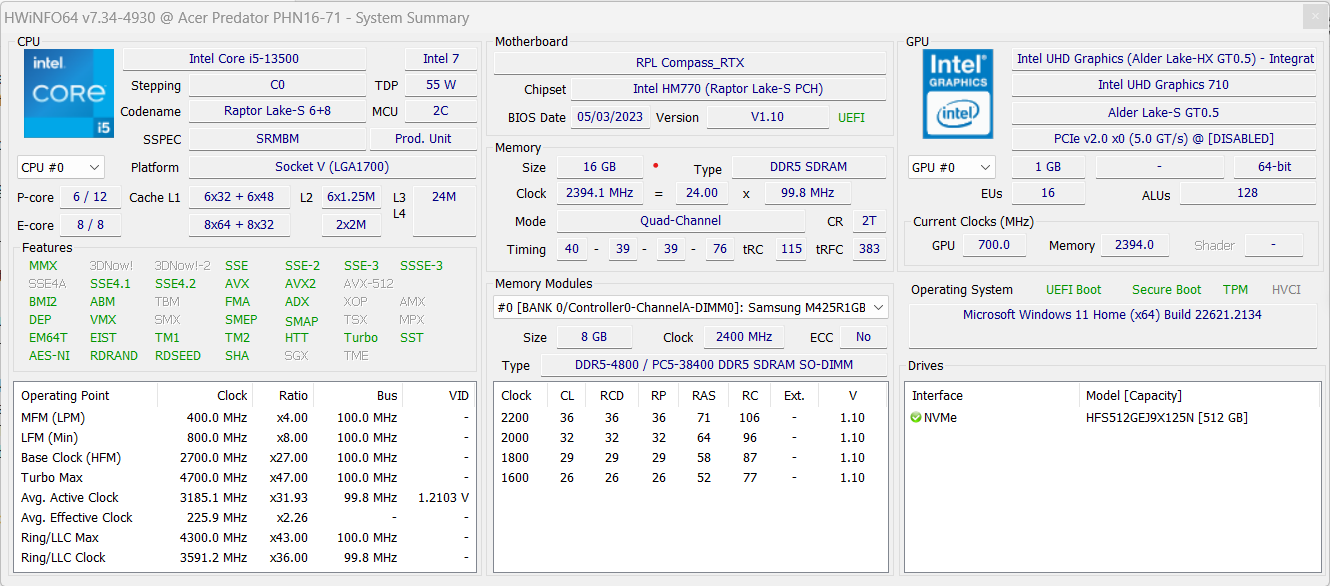
Nous testons l'Acer Predator Helios Neo 16 avec un processeur IntelCore i5-13500HX(6 cœurs P + 8 cœurs E), 16 Go de RAM DDR5-4800, un SSD de 512 Go et une carte Nvidia GeForce RTX 4050avec un TGP de 130 watts. D'autres variantes peuvent être trouvées, qui ont jusqu'à unCore i9-13900HX(8 cœurs P + 16 cœurs E) et jusqu'à une Nvidia GeForce RTX 4070.
Le marché cible de la version que nous avons testée comprend les joueurs qui souhaitent jouer à de nouveaux jeux en résolution FHD+ native, mais qui seront également satisfaits avec des taux de FPS à deux chiffres. D'autres tâches graphiques sont également possibles avec ce modèle d'entrée de gamme de l'Helios Neo 16, bien que 8 au lieu de 6 Go de VRAM serait idéal pour l'édition vidéo 4K en particulier.
Conditions d'essai
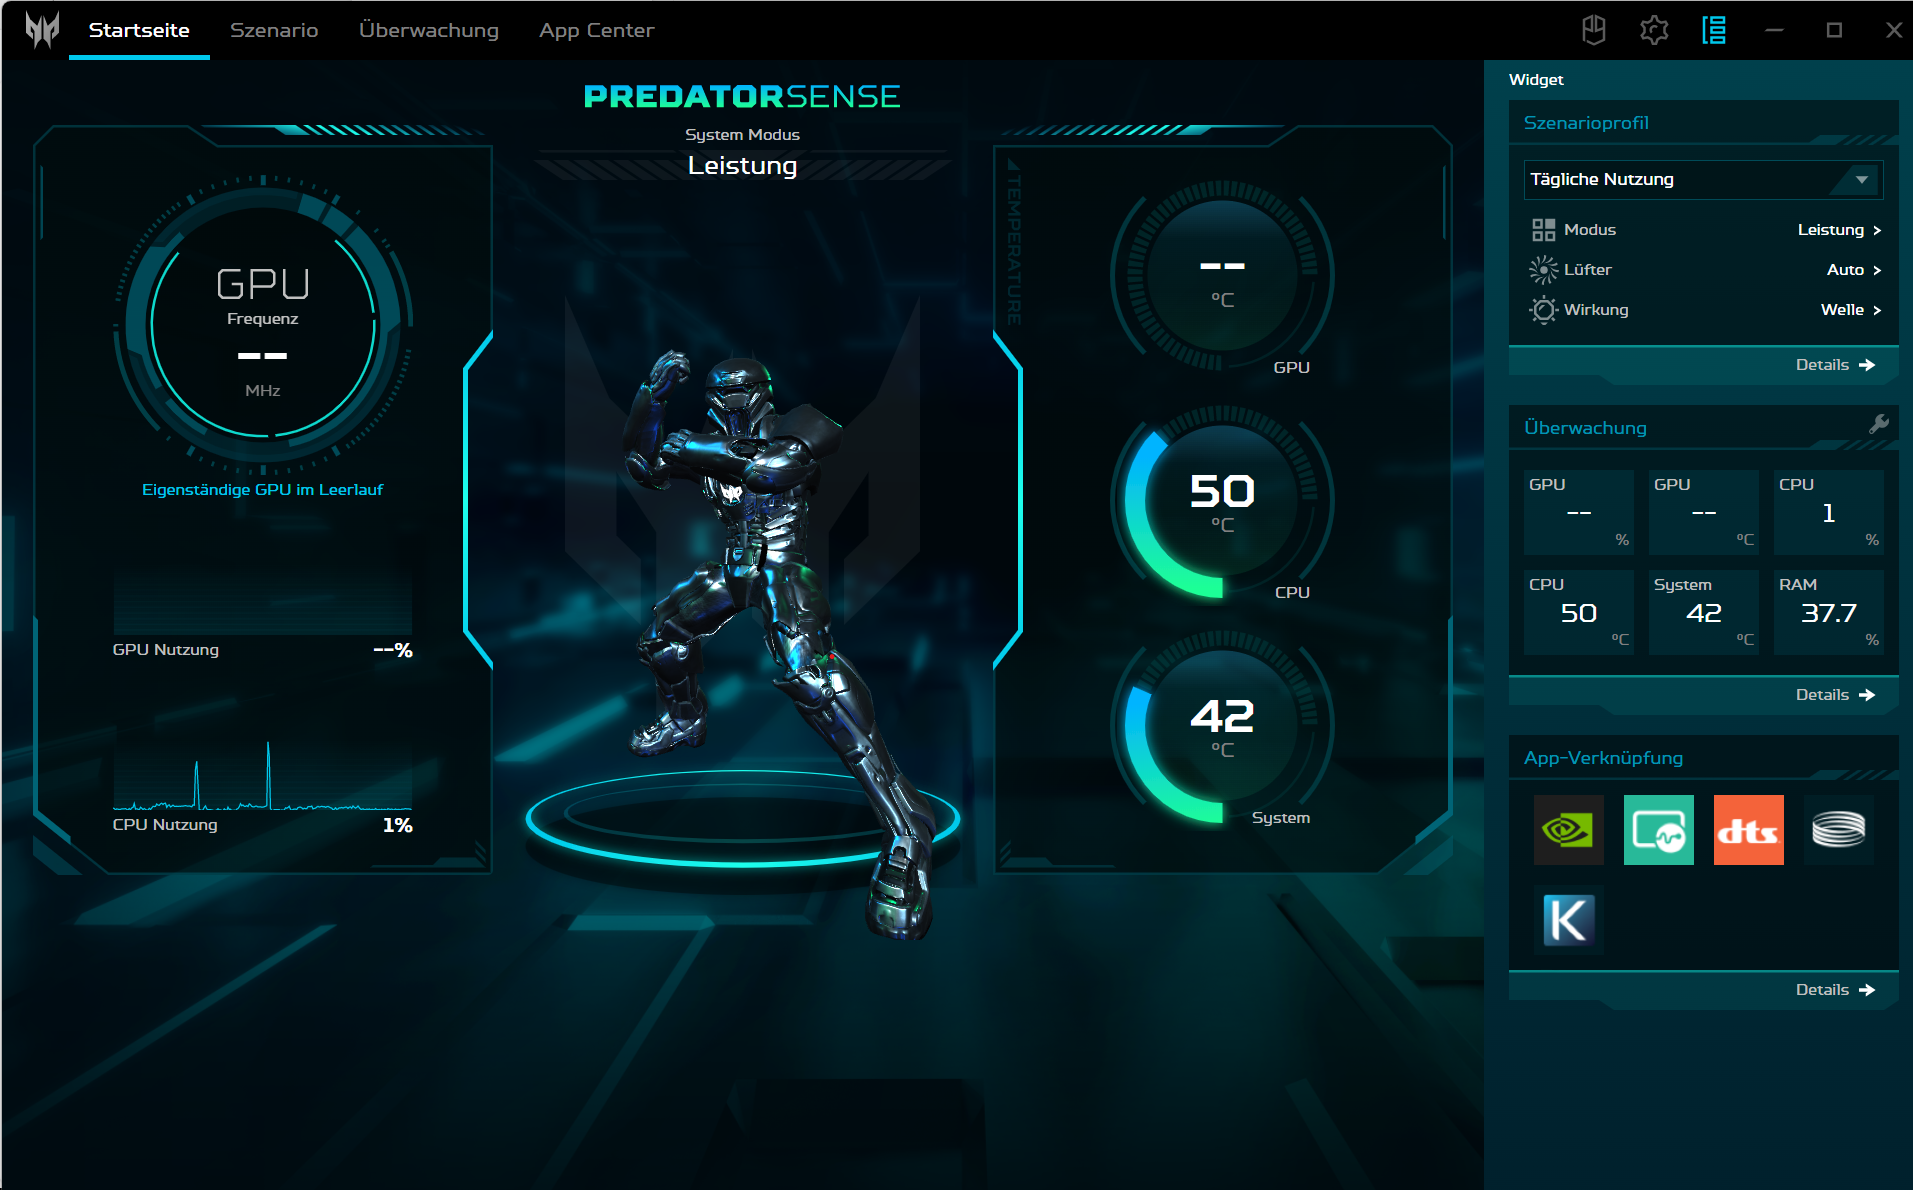
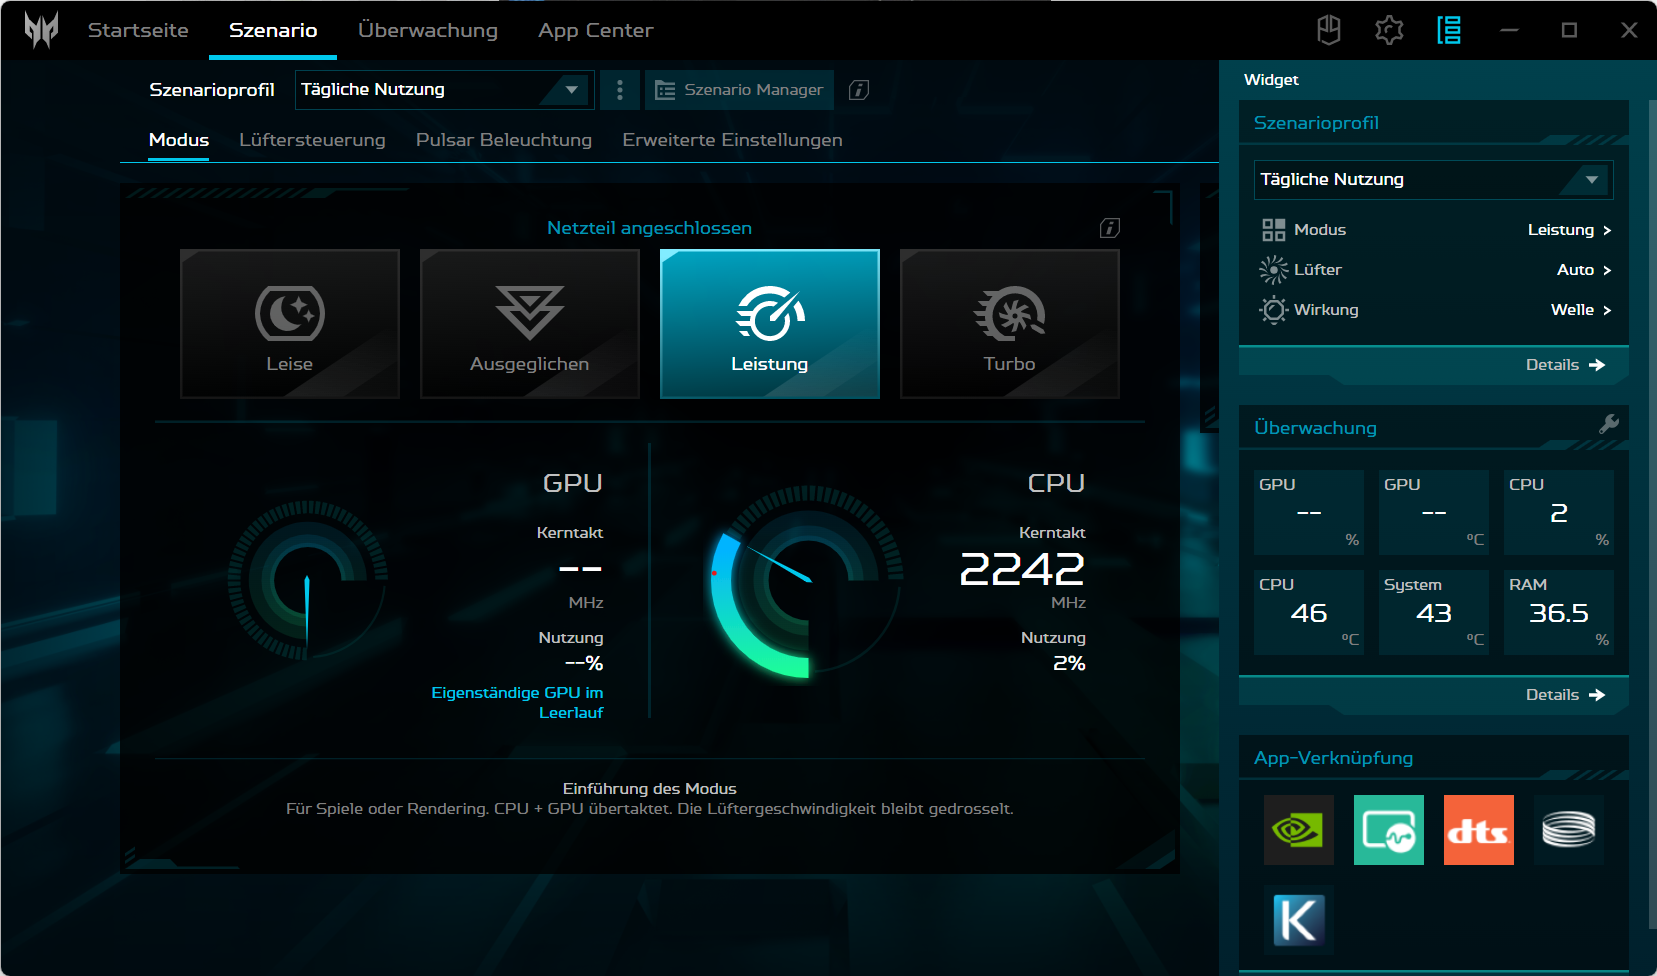
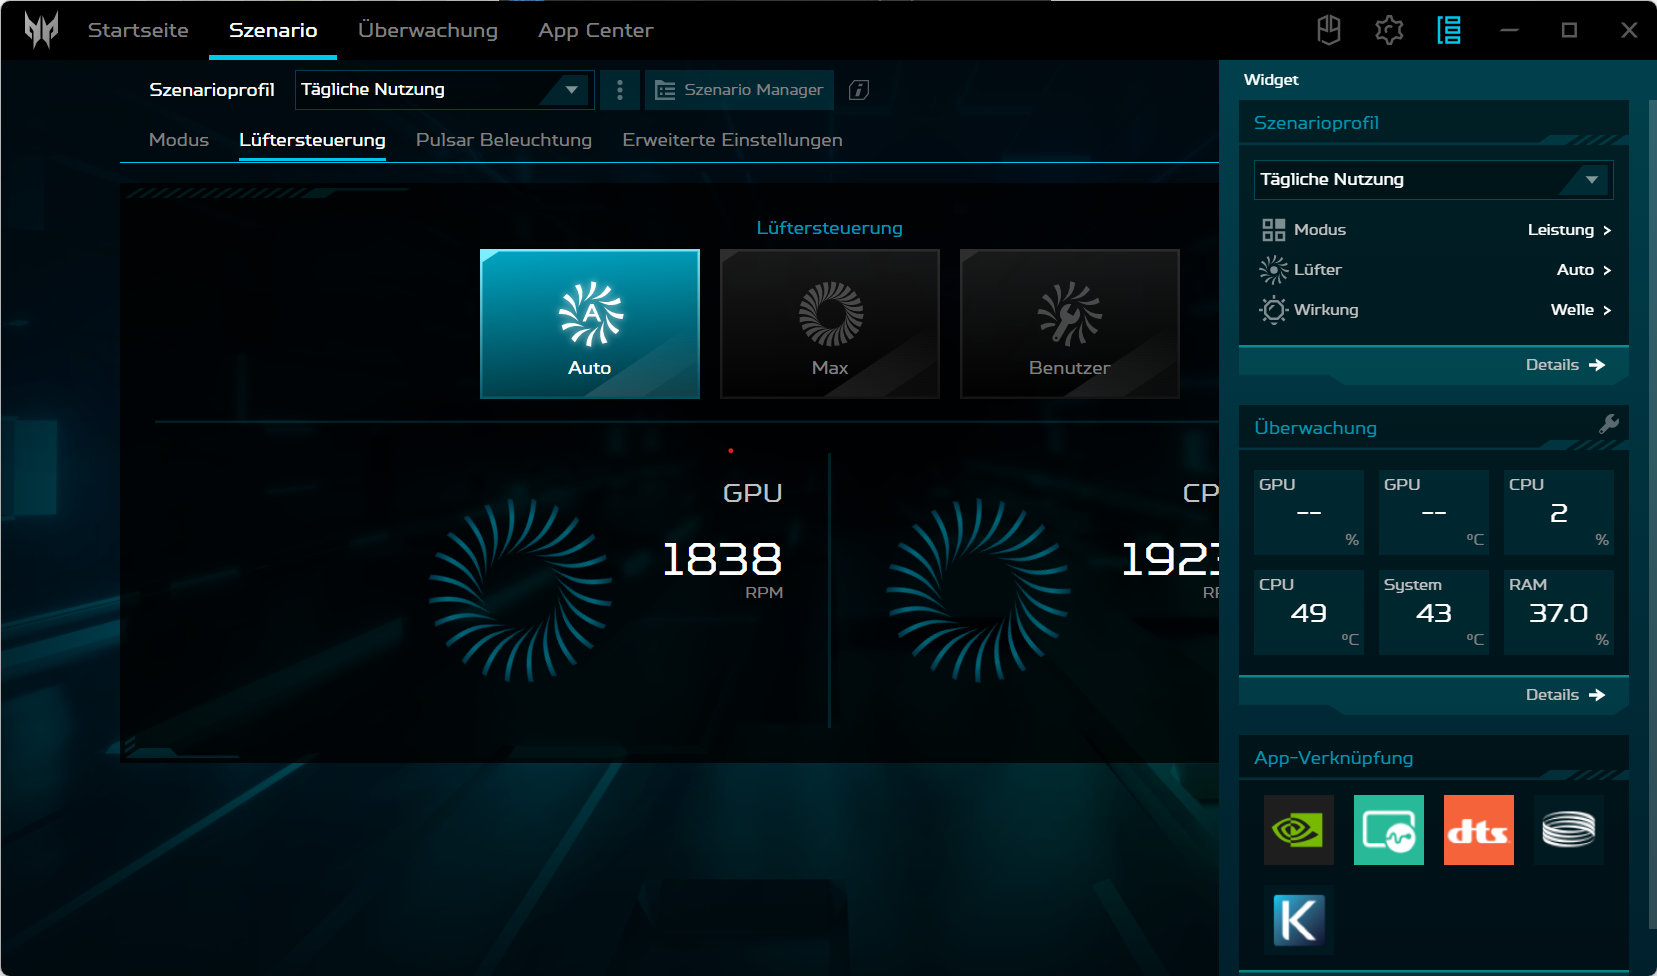
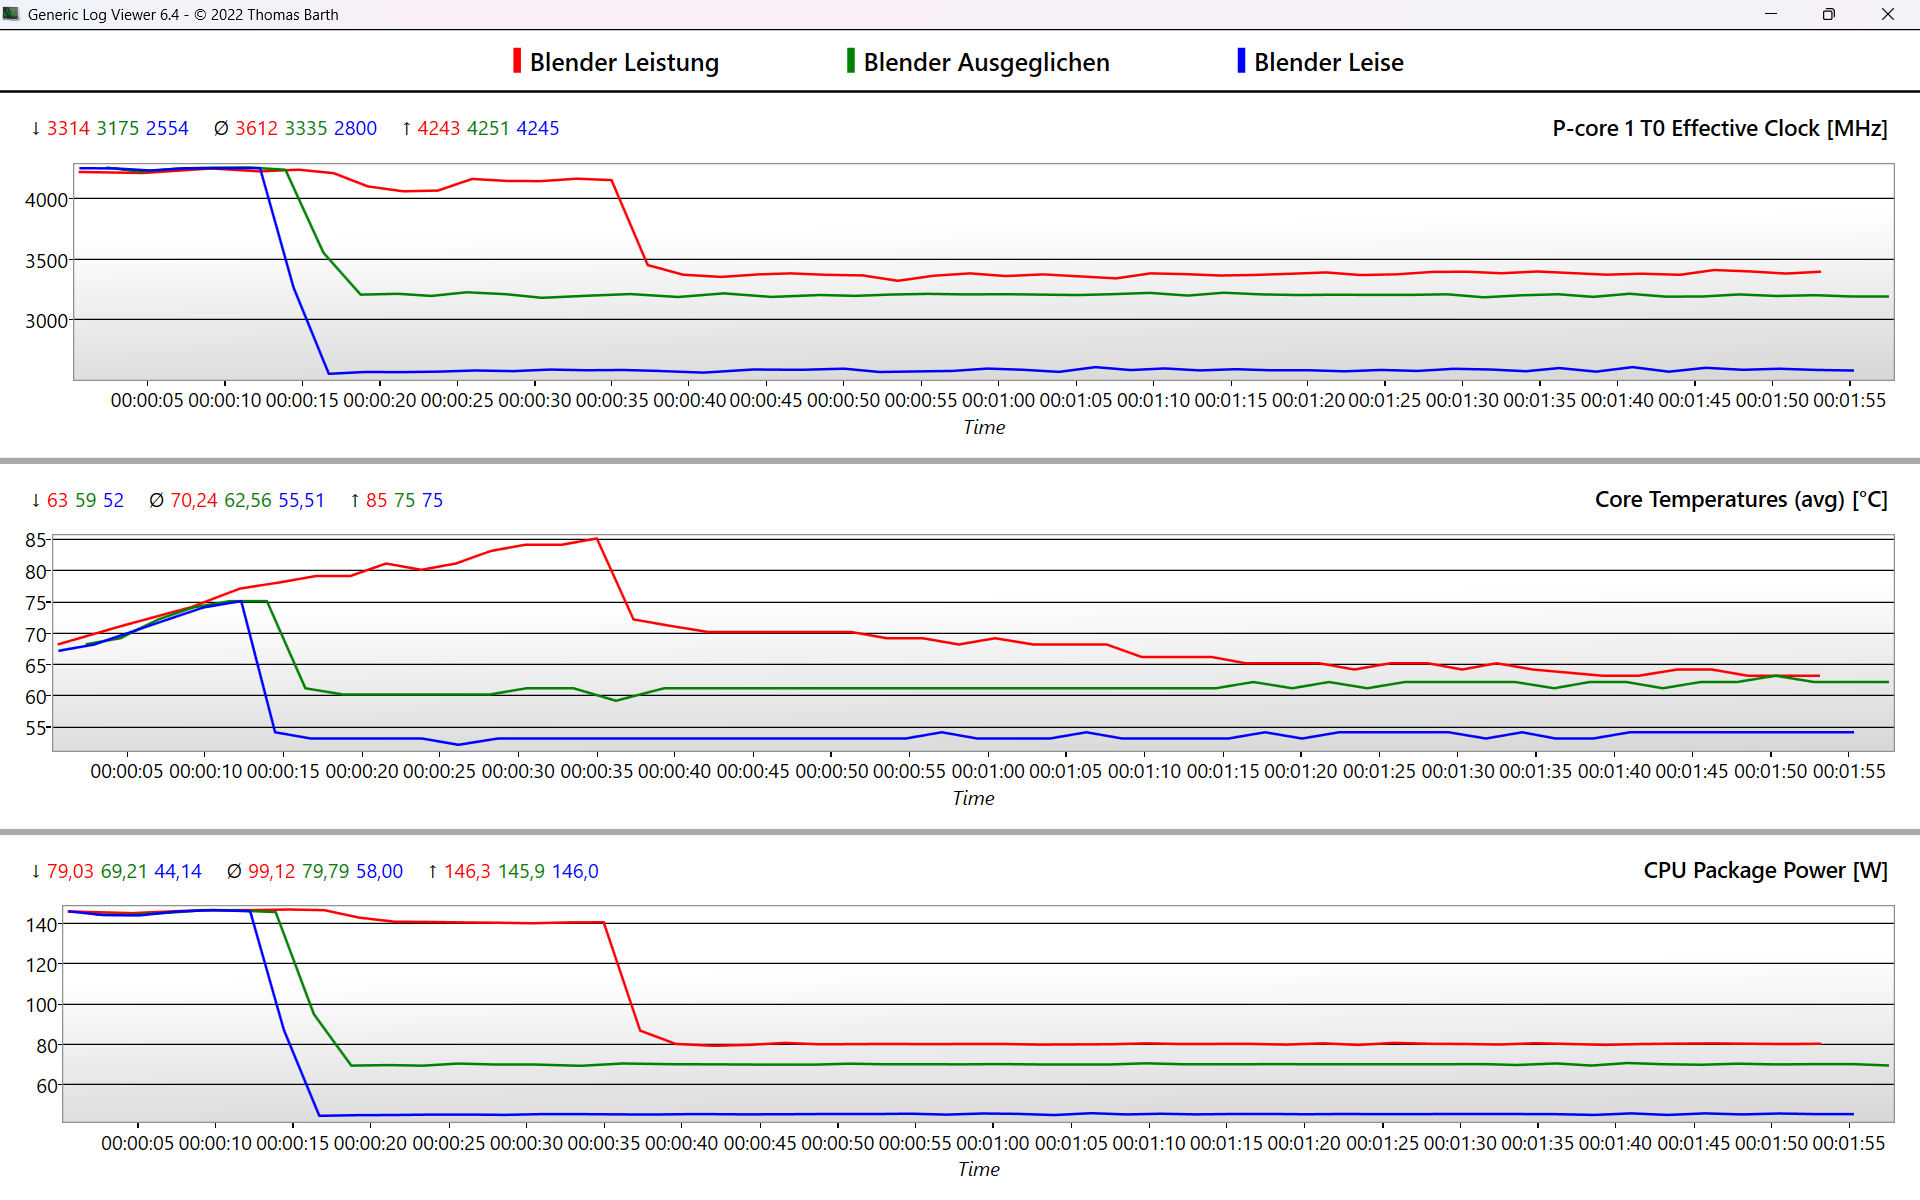
Quatre modes de performance sont disponibles dans le logiciel du centre de contrôle Acer "Predator Sense", qui peuvent être basculés via le bouton situé à gauche au-dessus du clavier. Nous avons effectué nos tests de performance en mode "performance", tandis que le système passait automatiquement en mode "équilibré" en mode batterie. Le Predator Helios Neo 16 doit également avoir un niveau de charge d'au moins 40 % pour que les modes de performance puissent être contrôlés.
Le tableau suivant montre que la perte de performance du GPU en mode équilibré est très faible et que les ventilateurs restent agréablement silencieux. Le mode Turbo, en revanche, est insupportablement bruyant et n'est donc utile que pour les longues sessions de rendu vidéo ou autres.
| Scénario | Turbo | Performance | Équilibré | Silencieux | Batterie |
|---|---|---|---|---|---|
| CPU PL2 | 147 W | 147 W | 147 W | 147 W | 27 W |
| CPU PL1 | 100 W | 80 W | 70 W | 45 W | 27 W |
| GPU @The Witcher 3 | 88 W | 86 W | 86 W | 56 W | 43 W |
| GPU@FurMark | 130 W | 130 W | 105 W | 80 W | 13 W |
| Performance (The Witcher 3 @FHD/Ultra) | 81 FPS | 79 FPS | 79 FPS | 46 FPS | 30 FPS |
Processeur
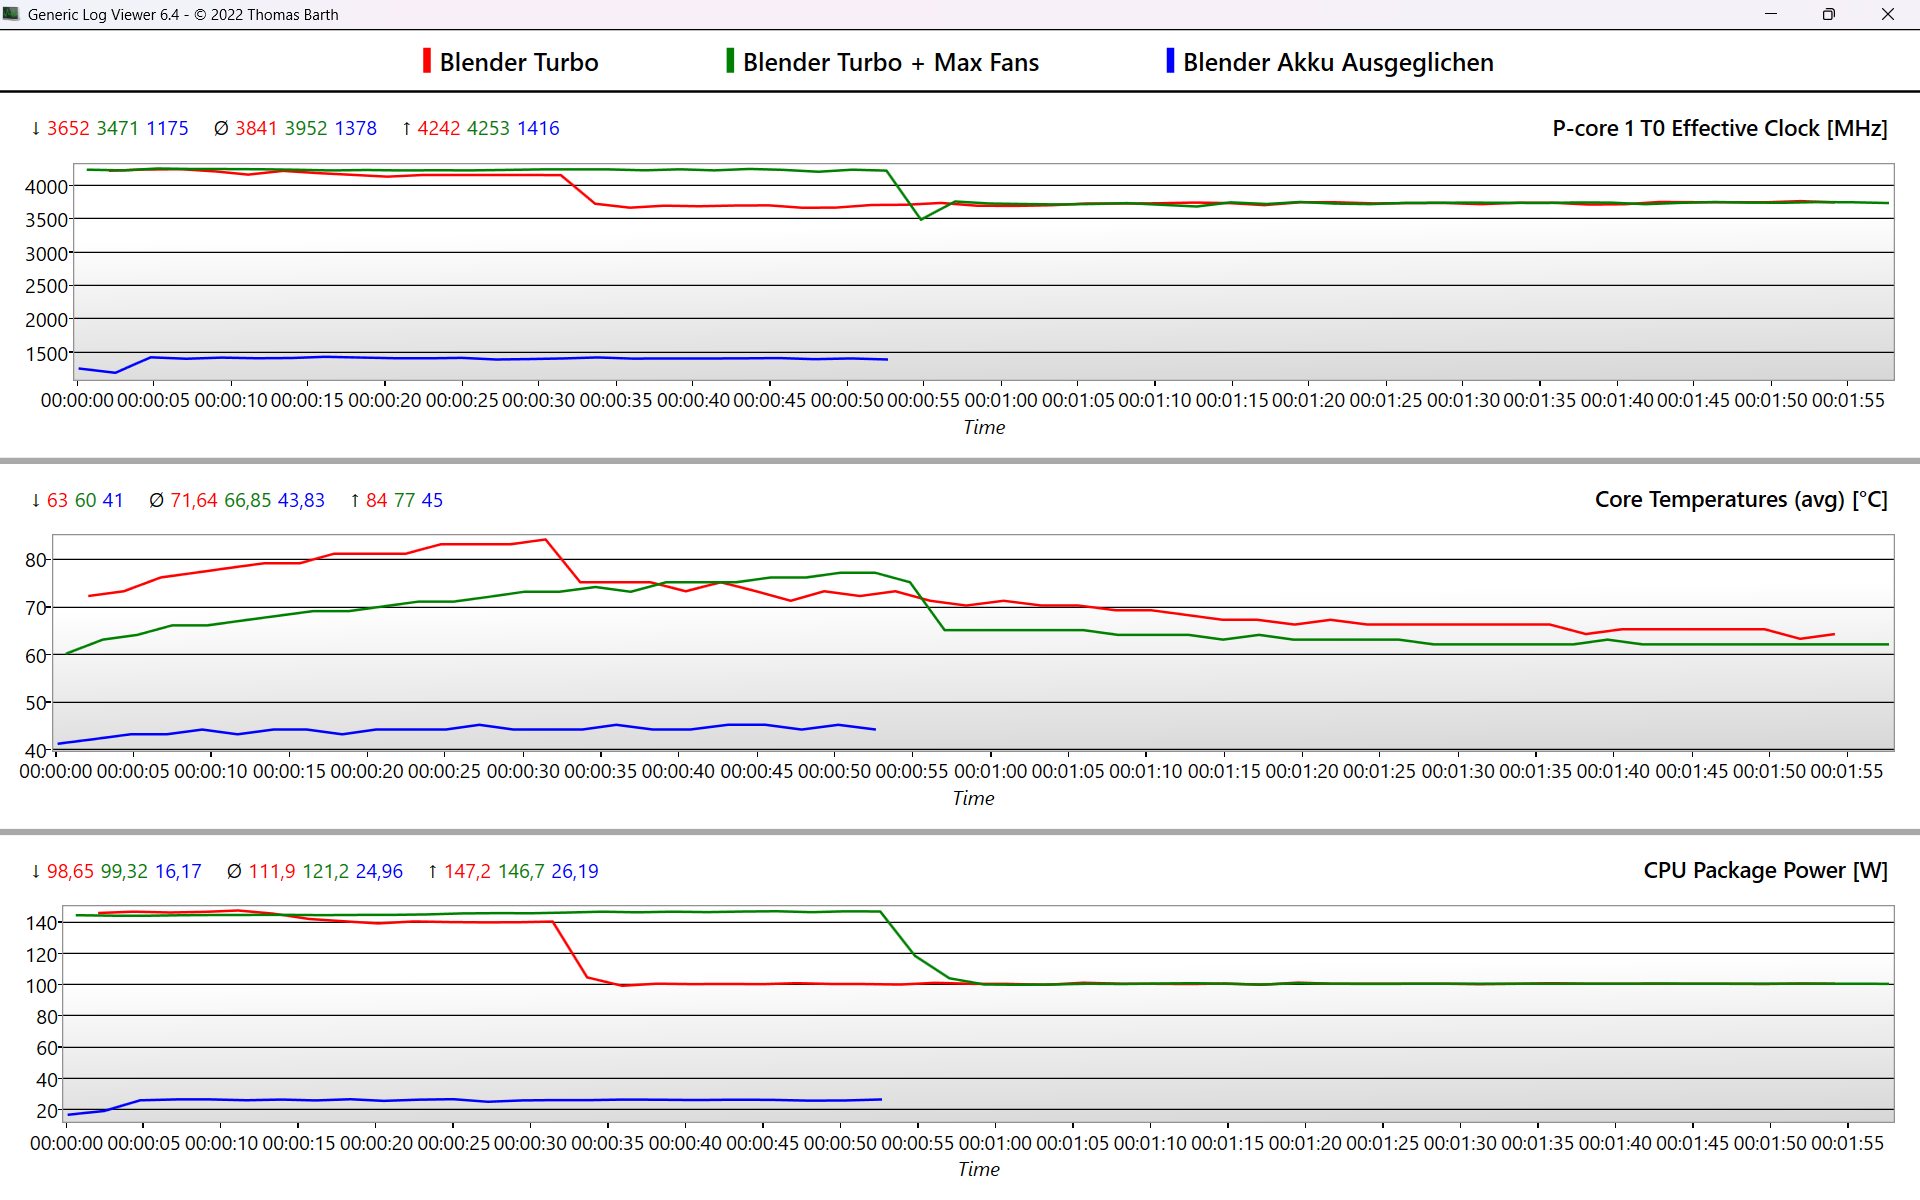
L'ordinateur portable est équipé d'un processeur IntelCore i5-13500HX est un processeur de bureau avec 14 cœurs, 20 threads (6 cœurs P + 8 cœurs E) et un TDP de 55 watts. Les cœurs P tournent initialement à environ 4,2 GHz et, par conséquent, manquent de peu leur Turbo maximal possible de 4,5 GHz. Après environ 30 secondes, les fréquences diminuent légèrement pour atteindre 3,8 GHz (mode Turbo) ou 3,4 GHz (mode Performance).
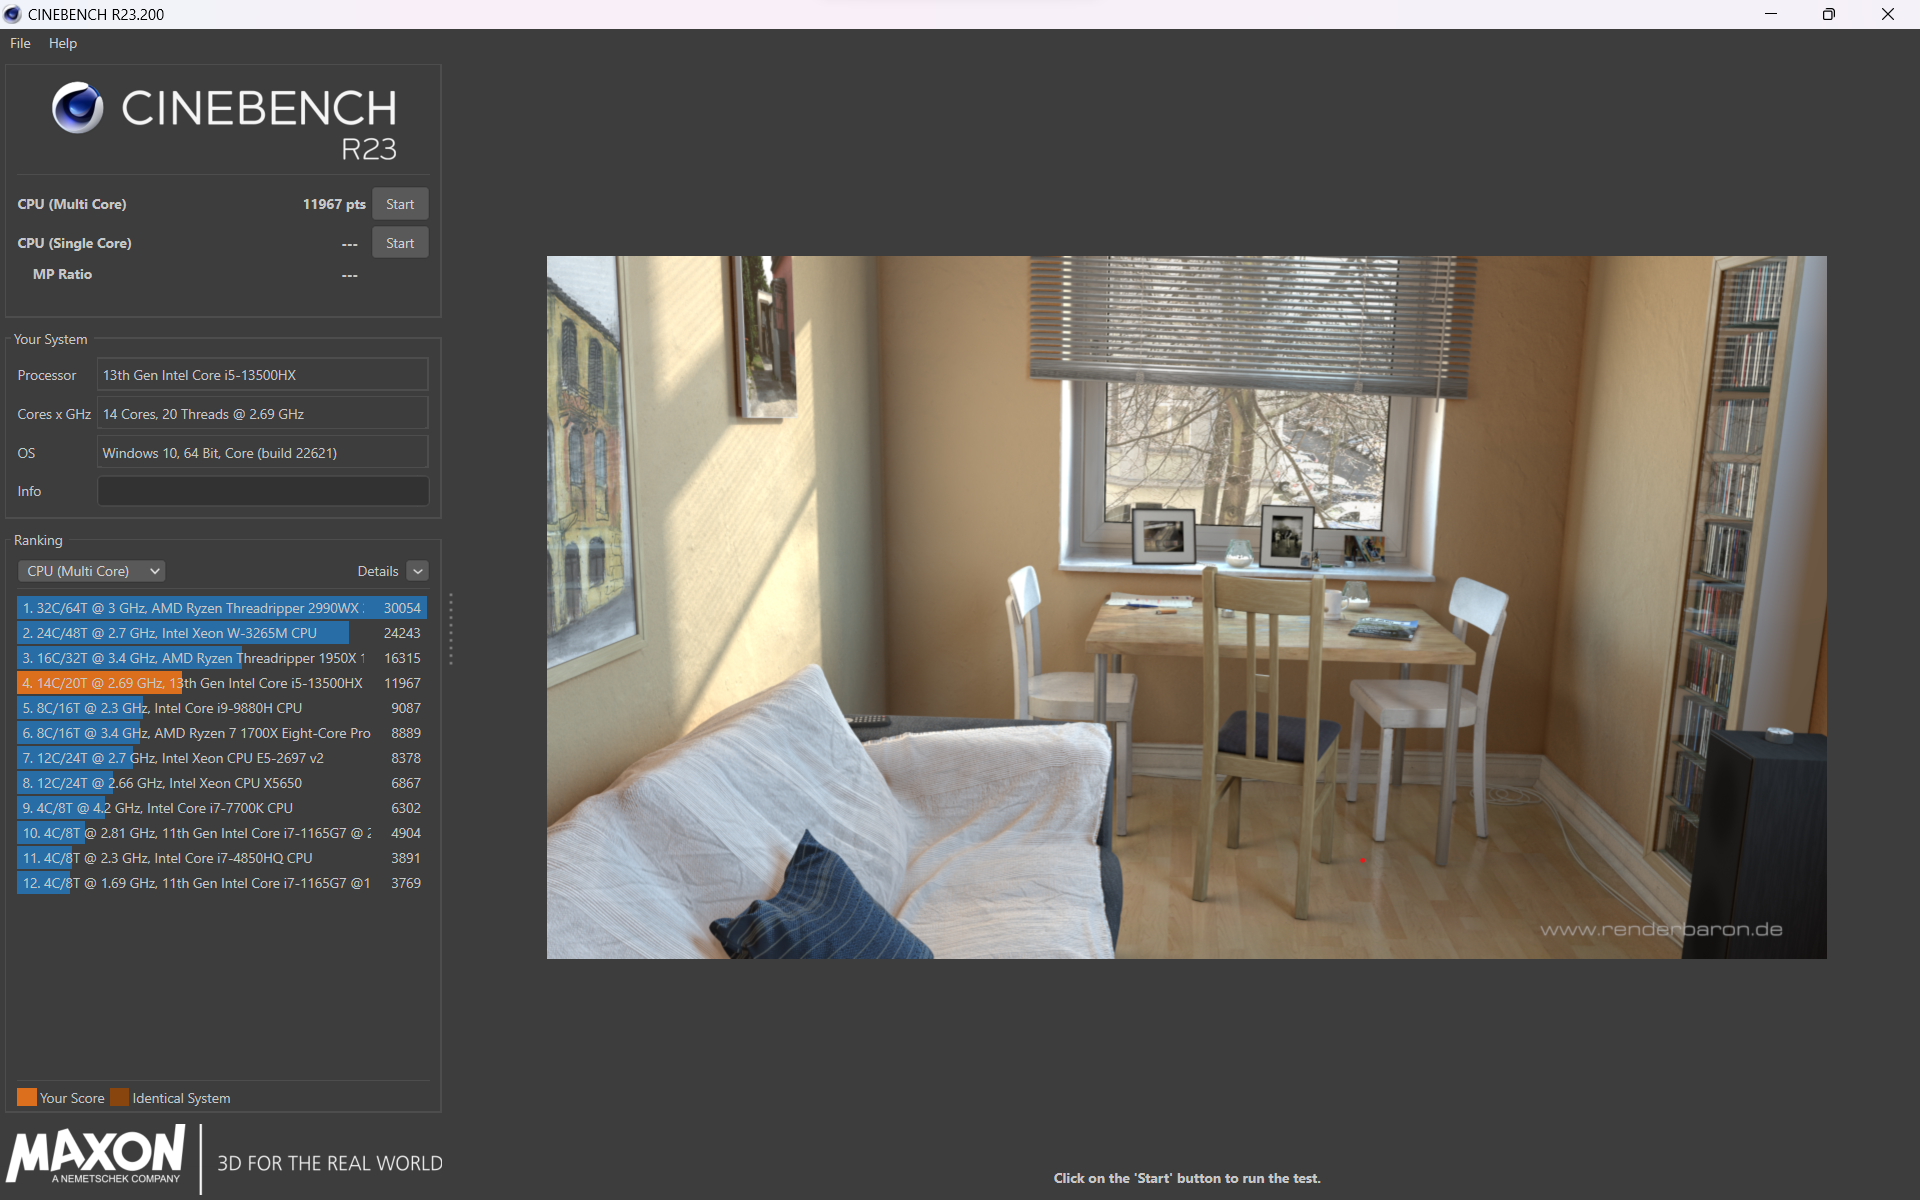
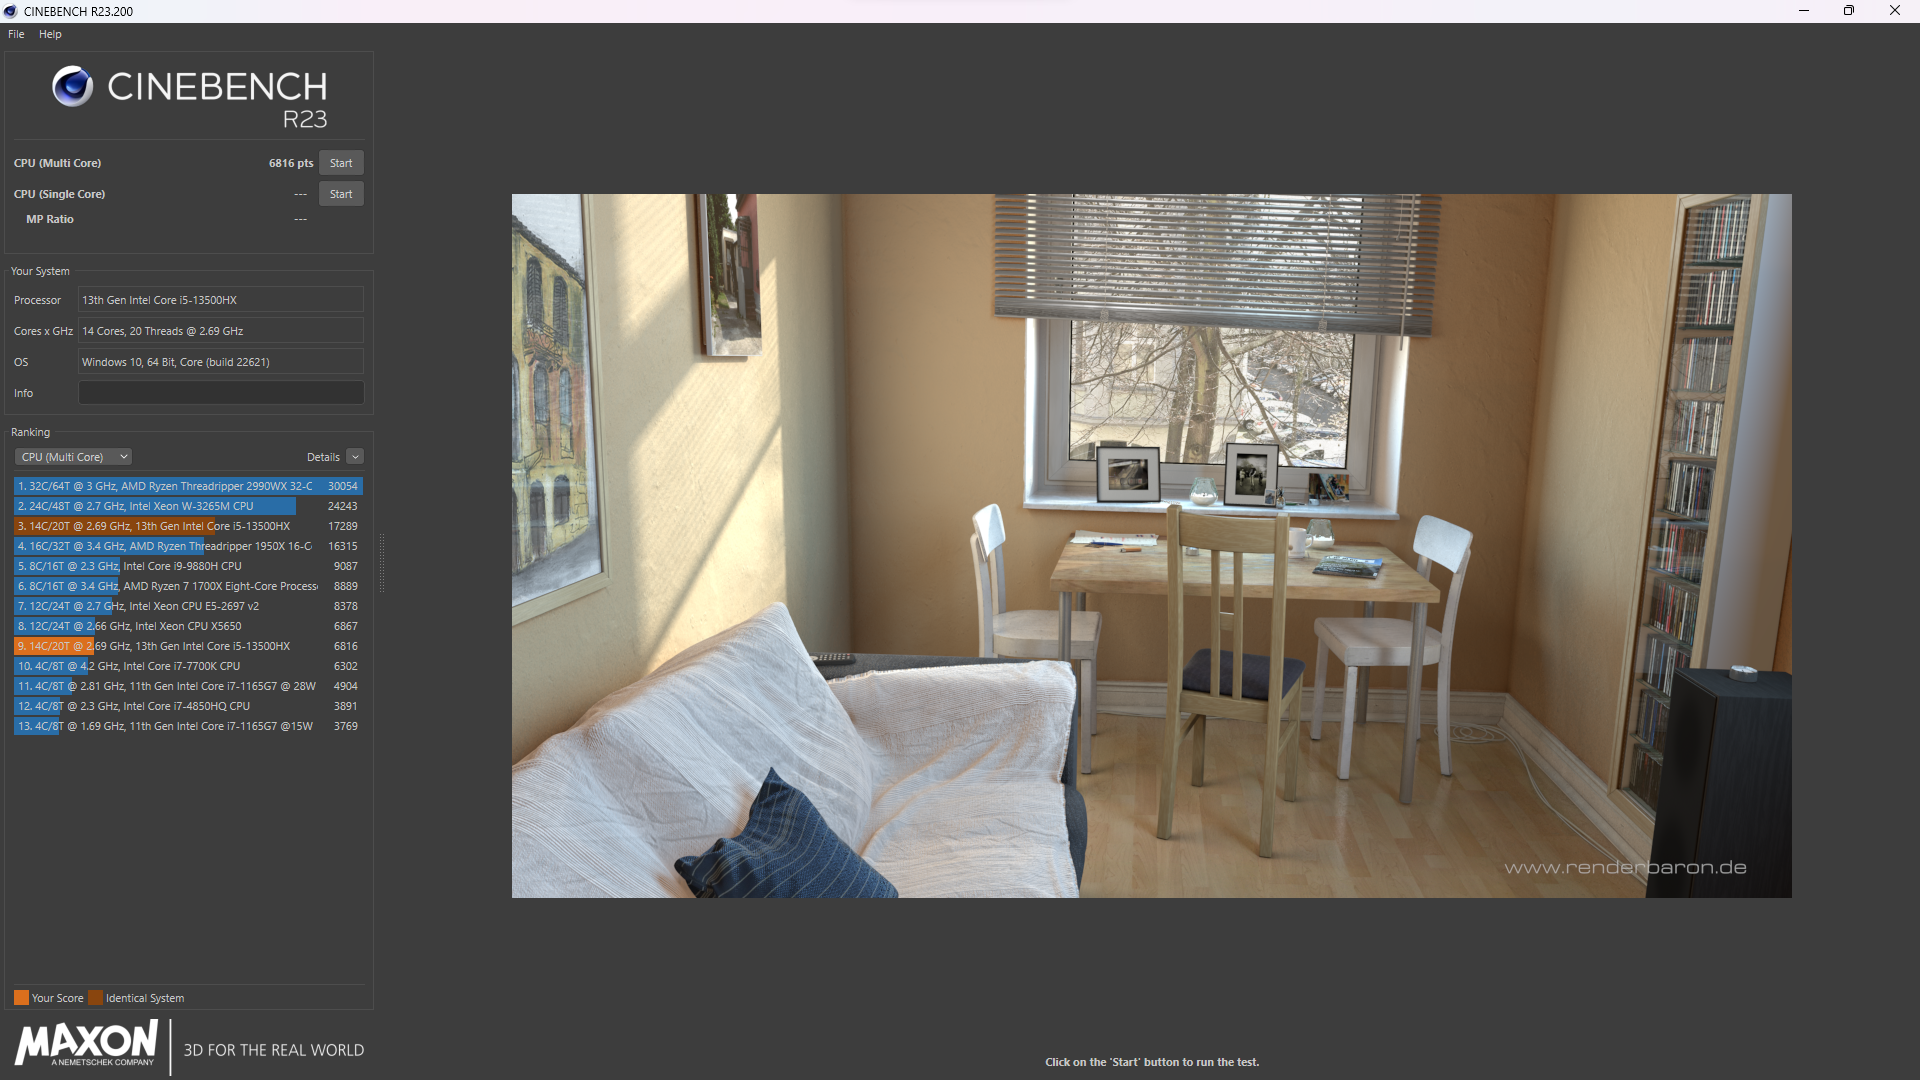
En ce qui concerne les performances multicœurs, l'Helios Neo se situe à 10 % derrière leDell G15 5530 équipé d'un Corei7-13650HX et 15 % derrière leHelios 16 avec un Core i7-13700HX. Le Corei7-12700H dans son prédécesseur direct, le Predator Helios 300a été surpassé de 12 % et le modèle à huit cœurs AMDRyzen 7 7840HS dans le SchenkerXMG Apex 15 a été surpassé de 20 %.
À partir de la cinquième exécution de Cinebench R15, ses performances ont été ralenties d'environ 17 %, mais cela peut presque être évité en activant le mode Turbo fort. Le Corei9-13900HX disponible en option, dispose de 24 cœurs et fonctionne 60 % plus rapidement dans les tâches multicœurs dans le cadre de l'application Helios 18. En mode batterie, son TDP est limité à 27 watts, ce qui se traduit par une baisse de performance de près de 60 %.


Cinebench R15 Multi continuous test
Cinebench R23: Multi Core | Single Core
Cinebench R20: CPU (Multi Core) | CPU (Single Core)
Cinebench R15: CPU Multi 64Bit | CPU Single 64Bit
Blender: v2.79 BMW27 CPU
7-Zip 18.03: 7z b 4 | 7z b 4 -mmt1
Geekbench 5.5: Multi-Core | Single-Core
HWBOT x265 Benchmark v2.2: 4k Preset
LibreOffice : 20 Documents To PDF
R Benchmark 2.5: Overall mean
| CPU Performance rating | |
| Acer Predator Helios 18 N23Q2 | |
| Moyenne de la classe Gaming | |
| Acer Predator Helios 16 PH16-71-731Q | |
| Dell G15 5530 | |
| Acer Predator Helios Neo 16 NH.QLTEG.002 | |
| Schenker XMG Apex 15 (Late 23) | |
| Moyenne Intel Core i5-13500HX | |
| Lenovo Legion Pro 5 16ARX8 (R5 7645HX, RTX 4050) | |
| Lenovo LOQ 16IRH8 | |
| Acer Predator Helios 300 (i7-12700H, RTX 3070 Ti) | |
| Acer Nitro 16 AN16-41-R7YE | |
| Cinebench R23 / Multi Core | |
| Acer Predator Helios 18 N23Q2 | |
| Moyenne de la classe Gaming (10488 - 42661, n=107, 2 dernières années) | |
| Acer Predator Helios 16 PH16-71-731Q | |
| Dell G15 5530 | |
| Acer Predator Helios Neo 16 NH.QLTEG.002 | |
| Moyenne Intel Core i5-13500HX (18235 - 19176, n=3) | |
| Acer Predator Helios 300 (i7-12700H, RTX 3070 Ti) | |
| Schenker XMG Apex 15 (Late 23) | |
| Lenovo LOQ 16IRH8 | |
| Lenovo Legion Pro 5 16ARX8 (R5 7645HX, RTX 4050) | |
| Acer Nitro 16 AN16-41-R7YE | |
| Cinebench R23 / Single Core | |
| Acer Predator Helios 18 N23Q2 | |
| Moyenne de la classe Gaming (1166 - 2415, n=107, 2 dernières années) | |
| Acer Predator Helios 16 PH16-71-731Q | |
| Lenovo LOQ 16IRH8 | |
| Dell G15 5530 | |
| Lenovo Legion Pro 5 16ARX8 (R5 7645HX, RTX 4050) | |
| Acer Predator Helios Neo 16 NH.QLTEG.002 | |
| Schenker XMG Apex 15 (Late 23) | |
| Acer Predator Helios 300 (i7-12700H, RTX 3070 Ti) | |
| Moyenne Intel Core i5-13500HX (1689 - 1772, n=2) | |
| Acer Nitro 16 AN16-41-R7YE | |
| Cinebench R20 / CPU (Multi Core) | |
| Acer Predator Helios 18 N23Q2 | |
| Moyenne de la classe Gaming (4029 - 16433, n=106, 2 dernières années) | |
| Acer Predator Helios 16 PH16-71-731Q | |
| Dell G15 5530 | |
| Acer Predator Helios Neo 16 NH.QLTEG.002 | |
| Moyenne Intel Core i5-13500HX (6978 - 7371, n=3) | |
| Schenker XMG Apex 15 (Late 23) | |
| Acer Predator Helios 300 (i7-12700H, RTX 3070 Ti) | |
| Lenovo LOQ 16IRH8 | |
| Lenovo Legion Pro 5 16ARX8 (R5 7645HX, RTX 4050) | |
| Acer Nitro 16 AN16-41-R7YE | |
| Cinebench R20 / CPU (Single Core) | |
| Acer Predator Helios 18 N23Q2 | |
| Moyenne de la classe Gaming (442 - 913, n=106, 2 dernières années) | |
| Acer Predator Helios 16 PH16-71-731Q | |
| Dell G15 5530 | |
| Lenovo LOQ 16IRH8 | |
| Lenovo Legion Pro 5 16ARX8 (R5 7645HX, RTX 4050) | |
| Acer Predator Helios 300 (i7-12700H, RTX 3070 Ti) | |
| Schenker XMG Apex 15 (Late 23) | |
| Acer Predator Helios Neo 16 NH.QLTEG.002 | |
| Moyenne Intel Core i5-13500HX (648 - 695, n=3) | |
| Acer Nitro 16 AN16-41-R7YE | |
| Cinebench R15 / CPU Single 64Bit | |
| Moyenne de la classe Gaming (188.8 - 350, n=106, 2 dernières années) | |
| Acer Predator Helios 18 N23Q2 | |
| Lenovo Legion Pro 5 16ARX8 (R5 7645HX, RTX 4050) | |
| Schenker XMG Apex 15 (Late 23) | |
| Dell G15 5530 | |
| Acer Predator Helios 16 PH16-71-731Q | |
| Lenovo LOQ 16IRH8 | |
| Acer Predator Helios 300 (i7-12700H, RTX 3070 Ti) | |
| Acer Predator Helios Neo 16 NH.QLTEG.002 | |
| Moyenne Intel Core i5-13500HX (242 - 263, n=3) | |
| Acer Nitro 16 AN16-41-R7YE | |
| Blender / v2.79 BMW27 CPU | |
| Acer Nitro 16 AN16-41-R7YE | |
| Lenovo Legion Pro 5 16ARX8 (R5 7645HX, RTX 4050) | |
| Lenovo LOQ 16IRH8 | |
| Acer Predator Helios 300 (i7-12700H, RTX 3070 Ti) | |
| Schenker XMG Apex 15 (Late 23) | |
| Acer Predator Helios Neo 16 NH.QLTEG.002 | |
| Moyenne Intel Core i5-13500HX (178 - 193, n=3) | |
| Dell G15 5530 | |
| Acer Predator Helios 16 PH16-71-731Q | |
| Moyenne de la classe Gaming (79 - 330, n=104, 2 dernières années) | |
| Acer Predator Helios 18 N23Q2 | |
| 7-Zip 18.03 / 7z b 4 -mmt1 | |
| Lenovo Legion Pro 5 16ARX8 (R5 7645HX, RTX 4050) | |
| Acer Predator Helios 18 N23Q2 | |
| Schenker XMG Apex 15 (Late 23) | |
| Moyenne de la classe Gaming (4199 - 7436, n=105, 2 dernières années) | |
| Acer Predator Helios 16 PH16-71-731Q | |
| Lenovo LOQ 16IRH8 | |
| Dell G15 5530 | |
| Acer Predator Helios 300 (i7-12700H, RTX 3070 Ti) | |
| Acer Predator Helios Neo 16 NH.QLTEG.002 | |
| Acer Nitro 16 AN16-41-R7YE | |
| Moyenne Intel Core i5-13500HX (5377 - 5850, n=3) | |
| Geekbench 5.5 / Multi-Core | |
| Acer Predator Helios 18 N23Q2 | |
| Moyenne de la classe Gaming (6460 - 28263, n=105, 2 dernières années) | |
| Acer Predator Helios 16 PH16-71-731Q | |
| Dell G15 5530 | |
| Acer Predator Helios Neo 16 NH.QLTEG.002 | |
| Acer Predator Helios 300 (i7-12700H, RTX 3070 Ti) | |
| Moyenne Intel Core i5-13500HX (12683 - 13767, n=3) | |
| Lenovo LOQ 16IRH8 | |
| Schenker XMG Apex 15 (Late 23) | |
| Lenovo Legion Pro 5 16ARX8 (R5 7645HX, RTX 4050) | |
| Acer Nitro 16 AN16-41-R7YE | |
| Geekbench 5.5 / Single-Core | |
| Moyenne de la classe Gaming (986 - 2474, n=105, 2 dernières années) | |
| Acer Predator Helios 18 N23Q2 | |
| Lenovo Legion Pro 5 16ARX8 (R5 7645HX, RTX 4050) | |
| Schenker XMG Apex 15 (Late 23) | |
| Acer Predator Helios 16 PH16-71-731Q | |
| Dell G15 5530 | |
| Lenovo LOQ 16IRH8 | |
| Moyenne Intel Core i5-13500HX (1688 - 1779, n=3) | |
| Acer Predator Helios Neo 16 NH.QLTEG.002 | |
| Acer Predator Helios 300 (i7-12700H, RTX 3070 Ti) | |
| Acer Nitro 16 AN16-41-R7YE | |
| HWBOT x265 Benchmark v2.2 / 4k Preset | |
| Acer Predator Helios 18 N23Q2 | |
| Moyenne de la classe Gaming (11.5 - 44.4, n=105, 2 dernières années) | |
| Acer Predator Helios 16 PH16-71-731Q | |
| Dell G15 5530 | |
| Moyenne Intel Core i5-13500HX (20.3 - 20.9, n=3) | |
| Acer Predator Helios Neo 16 NH.QLTEG.002 | |
| Schenker XMG Apex 15 (Late 23) | |
| Lenovo Legion Pro 5 16ARX8 (R5 7645HX, RTX 4050) | |
| Lenovo LOQ 16IRH8 | |
| Acer Predator Helios 300 (i7-12700H, RTX 3070 Ti) | |
| Acer Nitro 16 AN16-41-R7YE | |
| LibreOffice / 20 Documents To PDF | |
| Acer Predator Helios 300 (i7-12700H, RTX 3070 Ti) | |
| Lenovo Legion Pro 5 16ARX8 (R5 7645HX, RTX 4050) | |
| Moyenne de la classe Gaming (33.2 - 88.8, n=105, 2 dernières années) | |
| Acer Predator Helios 18 N23Q2 | |
| Dell G15 5530 | |
| Acer Nitro 16 AN16-41-R7YE | |
| Lenovo LOQ 16IRH8 | |
| Acer Predator Helios Neo 16 NH.QLTEG.002 | |
| Schenker XMG Apex 15 (Late 23) | |
| Moyenne Intel Core i5-13500HX (42.5 - 45, n=2) | |
| Acer Predator Helios 16 PH16-71-731Q | |
| R Benchmark 2.5 / Overall mean | |
| Acer Nitro 16 AN16-41-R7YE | |
| Moyenne Intel Core i5-13500HX (0.4512 - 0.4891, n=3) | |
| Acer Predator Helios Neo 16 NH.QLTEG.002 | |
| Acer Predator Helios 300 (i7-12700H, RTX 3070 Ti) | |
| Lenovo LOQ 16IRH8 | |
| Schenker XMG Apex 15 (Late 23) | |
| Lenovo Legion Pro 5 16ARX8 (R5 7645HX, RTX 4050) | |
| Moyenne de la classe Gaming (0.3439 - 0.759, n=106, 2 dernières années) | |
| Acer Predator Helios 16 PH16-71-731Q | |
| Dell G15 5530 | |
| Acer Predator Helios 18 N23Q2 | |
* ... Moindre est la valeur, meilleures sont les performances
AIDA64: FP32 Ray-Trace | FPU Julia | CPU SHA3 | CPU Queen | FPU SinJulia | FPU Mandel | CPU AES | CPU ZLib | FP64 Ray-Trace | CPU PhotoWorxx
| Performance rating | |
| Moyenne de la classe Gaming | |
| Schenker XMG Apex 15 (Late 23) | |
| Dell G15 5530 | |
| Acer Predator Helios Neo 16 NH.QLTEG.002 | |
| Moyenne Intel Core i5-13500HX | |
| Lenovo Legion Pro 5 16ARX8 (R5 7645HX, RTX 4050) | |
| HP Victus 16-r0076TX | |
| Lenovo LOQ 16IRH8 | |
| AIDA64 / FP32 Ray-Trace | |
| Moyenne de la classe Gaming (10227 - 85542, n=105, 2 dernières années) | |
| Schenker XMG Apex 15 (Late 23) | |
| Lenovo Legion Pro 5 16ARX8 (R5 7645HX, RTX 4050) | |
| Dell G15 5530 | |
| Moyenne Intel Core i5-13500HX (15888 - 16544, n=3) | |
| Acer Predator Helios Neo 16 NH.QLTEG.002 | |
| HP Victus 16-r0076TX | |
| Lenovo LOQ 16IRH8 | |
| AIDA64 / FPU Julia | |
| Moyenne de la classe Gaming (51376 - 238426, n=105, 2 dernières années) | |
| Schenker XMG Apex 15 (Late 23) | |
| Lenovo Legion Pro 5 16ARX8 (R5 7645HX, RTX 4050) | |
| Dell G15 5530 | |
| HP Victus 16-r0076TX | |
| Moyenne Intel Core i5-13500HX (80761 - 85623, n=3) | |
| Acer Predator Helios Neo 16 NH.QLTEG.002 | |
| Lenovo LOQ 16IRH8 | |
| AIDA64 / CPU SHA3 | |
| Moyenne de la classe Gaming (2180 - 10115, n=105, 2 dernières années) | |
| Dell G15 5530 | |
| Schenker XMG Apex 15 (Late 23) | |
| Moyenne Intel Core i5-13500HX (3868 - 4017, n=3) | |
| HP Victus 16-r0076TX | |
| Acer Predator Helios Neo 16 NH.QLTEG.002 | |
| Lenovo Legion Pro 5 16ARX8 (R5 7645HX, RTX 4050) | |
| Lenovo LOQ 16IRH8 | |
| AIDA64 / CPU Queen | |
| Moyenne de la classe Gaming (49785 - 173351, n=90, 2 dernières années) | |
| Dell G15 5530 | |
| Acer Predator Helios Neo 16 NH.QLTEG.002 | |
| Moyenne Intel Core i5-13500HX (105168 - 107075, n=3) | |
| Schenker XMG Apex 15 (Late 23) | |
| HP Victus 16-r0076TX | |
| Lenovo Legion Pro 5 16ARX8 (R5 7645HX, RTX 4050) | |
| Lenovo LOQ 16IRH8 | |
| AIDA64 / FPU SinJulia | |
| Schenker XMG Apex 15 (Late 23) | |
| Moyenne de la classe Gaming (4424 - 33636, n=105, 2 dernières années) | |
| Lenovo Legion Pro 5 16ARX8 (R5 7645HX, RTX 4050) | |
| Dell G15 5530 | |
| Moyenne Intel Core i5-13500HX (10334 - 10793, n=3) | |
| Acer Predator Helios Neo 16 NH.QLTEG.002 | |
| HP Victus 16-r0076TX | |
| Lenovo LOQ 16IRH8 | |
| AIDA64 / FPU Mandel | |
| Moyenne de la classe Gaming (25115 - 128721, n=105, 2 dernières années) | |
| Schenker XMG Apex 15 (Late 23) | |
| Lenovo Legion Pro 5 16ARX8 (R5 7645HX, RTX 4050) | |
| Dell G15 5530 | |
| Moyenne Intel Core i5-13500HX (39805 - 41418, n=3) | |
| Acer Predator Helios Neo 16 NH.QLTEG.002 | |
| HP Victus 16-r0076TX | |
| Lenovo LOQ 16IRH8 | |
| AIDA64 / CPU AES | |
| Schenker XMG Apex 15 (Late 23) | |
| Acer Predator Helios Neo 16 NH.QLTEG.002 | |
| Moyenne de la classe Gaming (39258 - 247074, n=105, 2 dernières années) | |
| Moyenne Intel Core i5-13500HX (79903 - 154368, n=3) | |
| Dell G15 5530 | |
| HP Victus 16-r0076TX | |
| Lenovo LOQ 16IRH8 | |
| Lenovo Legion Pro 5 16ARX8 (R5 7645HX, RTX 4050) | |
| AIDA64 / CPU ZLib | |
| Moyenne de la classe Gaming (574 - 2531, n=105, 2 dernières années) | |
| Dell G15 5530 | |
| Acer Predator Helios Neo 16 NH.QLTEG.002 | |
| Moyenne Intel Core i5-13500HX (1104 - 1233, n=3) | |
| HP Victus 16-r0076TX | |
| Schenker XMG Apex 15 (Late 23) | |
| Lenovo Legion Pro 5 16ARX8 (R5 7645HX, RTX 4050) | |
| Lenovo LOQ 16IRH8 | |
| AIDA64 / FP64 Ray-Trace | |
| Moyenne de la classe Gaming (5509 - 45446, n=105, 2 dernières années) | |
| Schenker XMG Apex 15 (Late 23) | |
| Lenovo Legion Pro 5 16ARX8 (R5 7645HX, RTX 4050) | |
| Dell G15 5530 | |
| Moyenne Intel Core i5-13500HX (8587 - 9008, n=3) | |
| Acer Predator Helios Neo 16 NH.QLTEG.002 | |
| HP Victus 16-r0076TX | |
| Lenovo LOQ 16IRH8 | |
| AIDA64 / CPU PhotoWorxx | |
| Moyenne de la classe Gaming (12271 - 89891, n=105, 2 dernières années) | |
| Moyenne Intel Core i5-13500HX (36861 - 42683, n=3) | |
| Dell G15 5530 | |
| HP Victus 16-r0076TX | |
| Acer Predator Helios Neo 16 NH.QLTEG.002 | |
| Schenker XMG Apex 15 (Late 23) | |
| Lenovo LOQ 16IRH8 | |
| Lenovo Legion Pro 5 16ARX8 (R5 7645HX, RTX 4050) | |
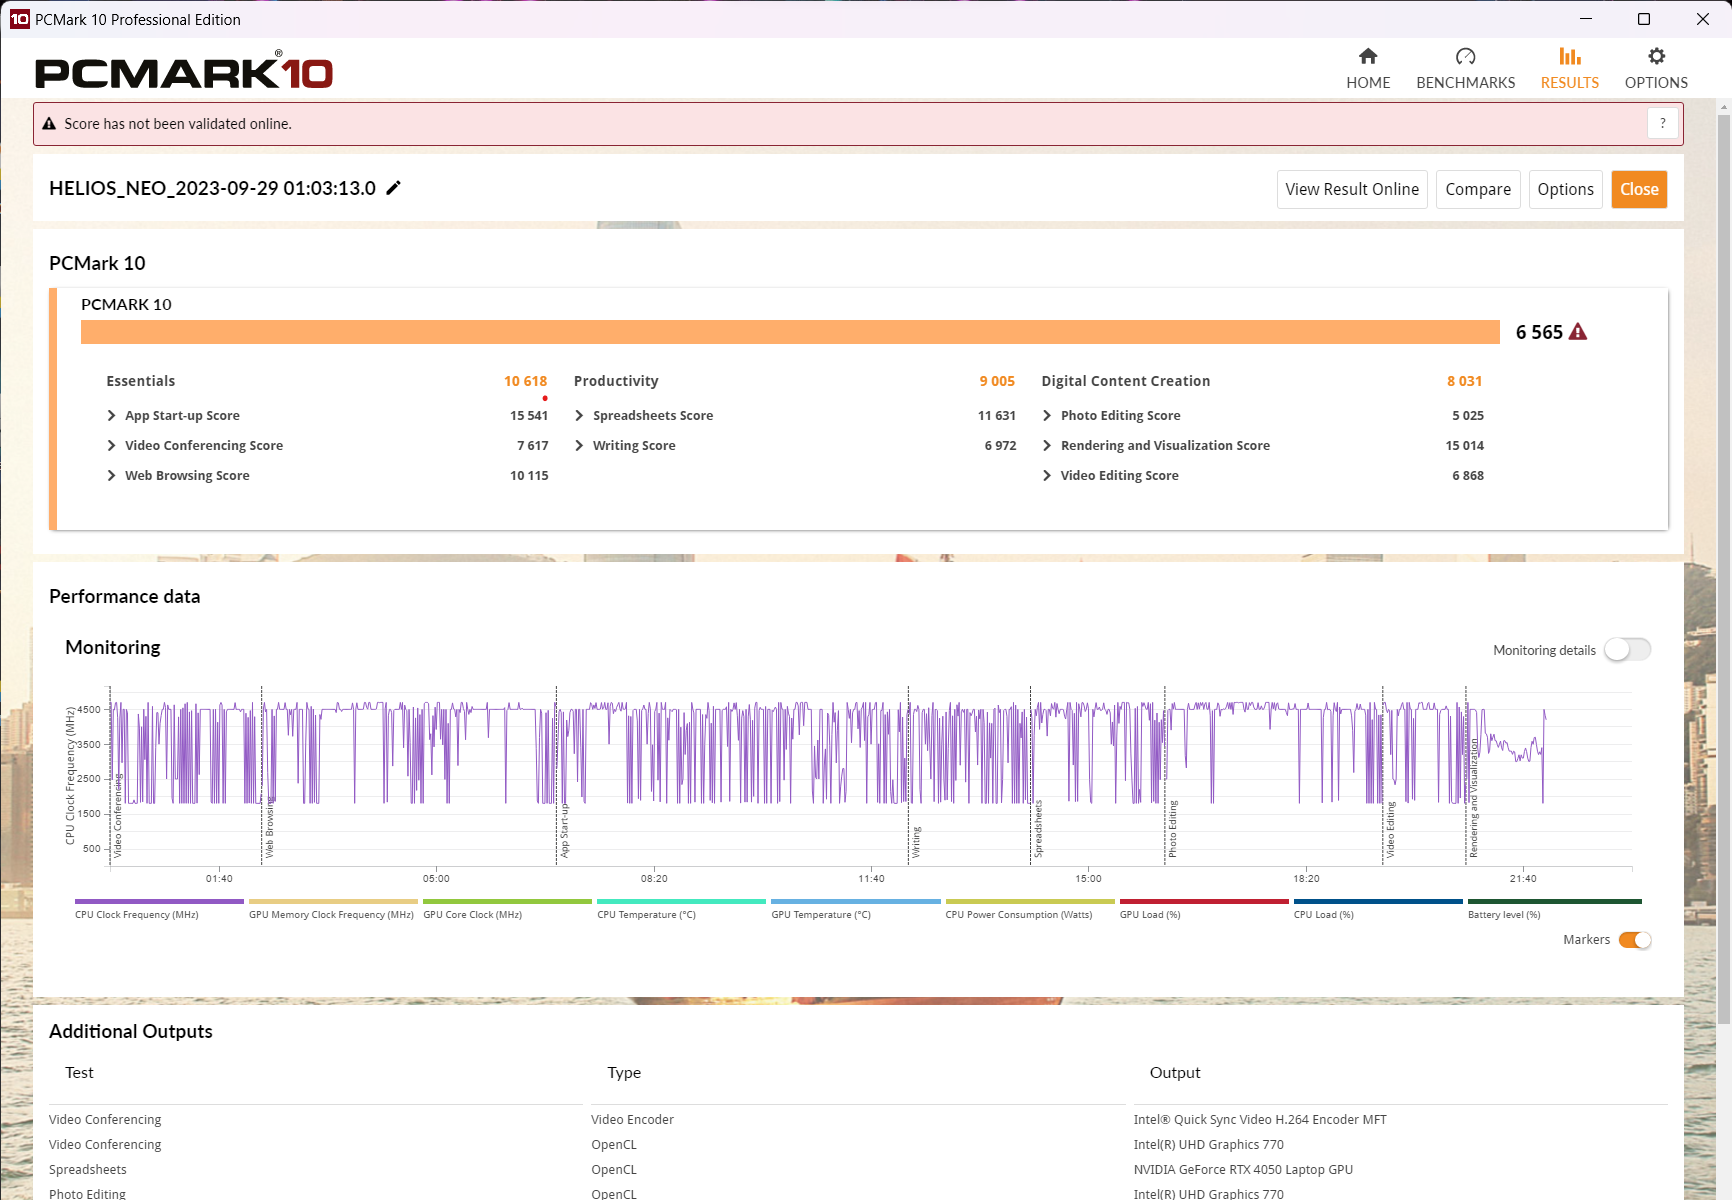
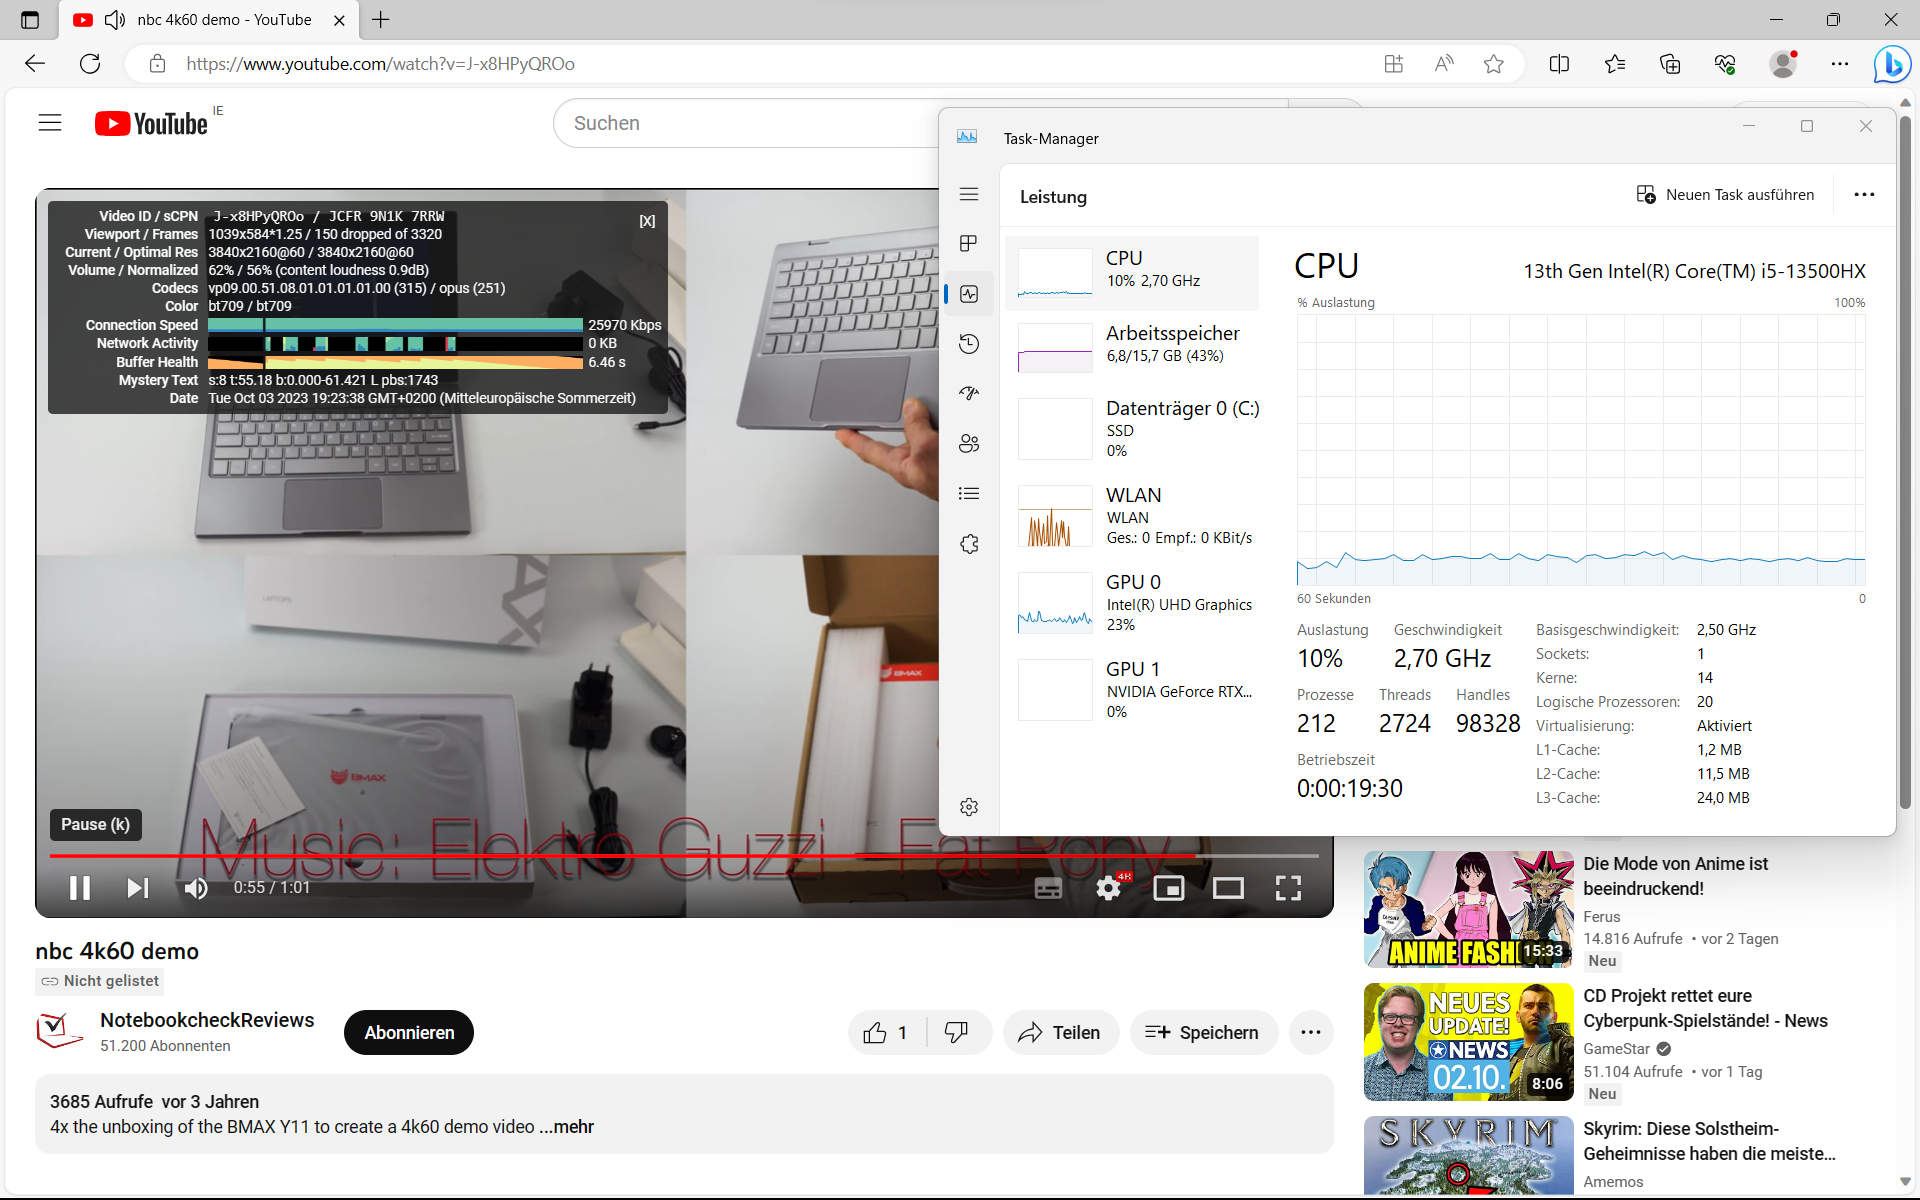
Performance du système
L'ordinateur portable de jeu d'Acer est très réactif dans les tâches quotidiennes. Surfer sur le web pendant que YouTube en 4K joue ressemble à des vacances pour le système Intel HX. Dans le benchmark PCMark 10, le Predator Helios Neo est à la traîne par rapport aux systèmes AMD LenovoLegion Pro 5 et SchenkerXMG Apex 15 d'environ 30 %, surtout en ce qui concerne la création de contenu. Cependant, le Neo a presque atteint la première place lors du test Crossmark.
Ses performances de navigation sur le web, par exemple avec Mozilla Kraken 1.1 et WebXPRT, sont très bonnes grâce à la forte performance monocœur de l'ordinateur portable - mais pas aussi bonnes que celles du Legion Pro 5.
CrossMark: Overall | Productivity | Creativity | Responsiveness
Mozilla Kraken 1.1: Total
Octane V2: Total Score
Speedometer 2.0: Result 2.0
Jetstream 2: 2.0 Total
WebXPRT 3: Overall
WebXPRT 4: Overall
| PCMark 10 / Score | |
| Moyenne de la classe Gaming (5828 - 12414, n=93, 2 dernières années) | |
| Lenovo Legion Pro 5 16ARX8 (R5 7645HX, RTX 4050) | |
| Schenker XMG Apex 15 (Late 23) | |
| Dell G15 5530 | |
| Lenovo LOQ 16IRH8 | |
| Acer Predator Helios Neo 16 NH.QLTEG.002 | |
| Moyenne Intel Core i5-13500HX, NVIDIA GeForce RTX 4050 Laptop GPU (6125 - 6565, n=2) | |
| HP Victus 16-r0076TX | |
| PCMark 10 / Essentials | |
| Lenovo Legion Pro 5 16ARX8 (R5 7645HX, RTX 4050) | |
| Dell G15 5530 | |
| Schenker XMG Apex 15 (Late 23) | |
| Moyenne de la classe Gaming (8810 - 11935, n=97, 2 dernières années) | |
| Acer Predator Helios Neo 16 NH.QLTEG.002 | |
| Moyenne Intel Core i5-13500HX, NVIDIA GeForce RTX 4050 Laptop GPU (9625 - 10618, n=2) | |
| Lenovo LOQ 16IRH8 | |
| HP Victus 16-r0076TX | |
| PCMark 10 / Productivity | |
| Moyenne de la classe Gaming (6845 - 25323, n=95, 2 dernières années) | |
| Lenovo Legion Pro 5 16ARX8 (R5 7645HX, RTX 4050) | |
| Schenker XMG Apex 15 (Late 23) | |
| Dell G15 5530 | |
| Acer Predator Helios Neo 16 NH.QLTEG.002 | |
| Moyenne Intel Core i5-13500HX, NVIDIA GeForce RTX 4050 Laptop GPU (8471 - 9005, n=2) | |
| Lenovo LOQ 16IRH8 | |
| HP Victus 16-r0076TX | |
| PCMark 10 / Digital Content Creation | |
| Moyenne de la classe Gaming (7602 - 19954, n=95, 2 dernières années) | |
| Schenker XMG Apex 15 (Late 23) | |
| Lenovo Legion Pro 5 16ARX8 (R5 7645HX, RTX 4050) | |
| Lenovo LOQ 16IRH8 | |
| Dell G15 5530 | |
| Acer Predator Helios Neo 16 NH.QLTEG.002 | |
| Moyenne Intel Core i5-13500HX, NVIDIA GeForce RTX 4050 Laptop GPU (7649 - 8031, n=2) | |
| HP Victus 16-r0076TX | |
| CrossMark / Overall | |
| Moyenne de la classe Gaming (1366 - 2409, n=94, 2 dernières années) | |
| Acer Predator Helios Neo 16 NH.QLTEG.002 | |
| Lenovo LOQ 16IRH8 | |
| Lenovo Legion Pro 5 16ARX8 (R5 7645HX, RTX 4050) | |
| Dell G15 5530 | |
| Moyenne Intel Core i5-13500HX, NVIDIA GeForce RTX 4050 Laptop GPU (1701 - 1964, n=2) | |
| Schenker XMG Apex 15 (Late 23) | |
| HP Victus 16-r0076TX | |
| CrossMark / Productivity | |
| Lenovo Legion Pro 5 16ARX8 (R5 7645HX, RTX 4050) | |
| Acer Predator Helios Neo 16 NH.QLTEG.002 | |
| Lenovo LOQ 16IRH8 | |
| Moyenne de la classe Gaming (1386 - 2254, n=94, 2 dernières années) | |
| Dell G15 5530 | |
| Moyenne Intel Core i5-13500HX, NVIDIA GeForce RTX 4050 Laptop GPU (1585 - 1878, n=2) | |
| Schenker XMG Apex 15 (Late 23) | |
| HP Victus 16-r0076TX | |
| CrossMark / Creativity | |
| Moyenne de la classe Gaming (1343 - 2786, n=94, 2 dernières années) | |
| Dell G15 5530 | |
| Lenovo LOQ 16IRH8 | |
| Lenovo Legion Pro 5 16ARX8 (R5 7645HX, RTX 4050) | |
| Acer Predator Helios Neo 16 NH.QLTEG.002 | |
| Moyenne Intel Core i5-13500HX, NVIDIA GeForce RTX 4050 Laptop GPU (1912 - 2022, n=2) | |
| Schenker XMG Apex 15 (Late 23) | |
| HP Victus 16-r0076TX | |
| CrossMark / Responsiveness | |
| Acer Predator Helios Neo 16 NH.QLTEG.002 | |
| Lenovo LOQ 16IRH8 | |
| Lenovo Legion Pro 5 16ARX8 (R5 7645HX, RTX 4050) | |
| Moyenne Intel Core i5-13500HX, NVIDIA GeForce RTX 4050 Laptop GPU (1478 - 2053, n=2) | |
| Moyenne de la classe Gaming (1226 - 2334, n=94, 2 dernières années) | |
| Dell G15 5530 | |
| Schenker XMG Apex 15 (Late 23) | |
| HP Victus 16-r0076TX | |
| Mozilla Kraken 1.1 / Total | |
| HP Victus 16-r0076TX | |
| Moyenne Intel Core i5-13500HX, NVIDIA GeForce RTX 4050 Laptop GPU (521 - 550, n=3) | |
| Acer Predator Helios Neo 16 NH.QLTEG.002 | |
| Schenker XMG Apex 15 (Late 23) | |
| Dell G15 5530 | |
| Lenovo LOQ 16IRH8 | |
| Lenovo LOQ 16IRH8 | |
| Lenovo Legion Pro 5 16ARX8 (R5 7645HX, RTX 4050) | |
| Moyenne de la classe Gaming (391 - 590, n=100, 2 dernières années) | |
| Octane V2 / Total Score | |
| Moyenne de la classe Gaming (93292 - 139447, n=27, 2 dernières années) | |
| Schenker XMG Apex 15 (Late 23) | |
| Acer Predator Helios Neo 16 NH.QLTEG.002 | |
| Moyenne Intel Core i5-13500HX, NVIDIA GeForce RTX 4050 Laptop GPU (n=1) | |
| Lenovo Legion Pro 5 16ARX8 (R5 7645HX, RTX 4050) | |
| Speedometer 2.0 / Result 2.0 | |
| Moyenne de la classe Gaming (29 - 736, n=27, 2 dernières années) | |
| Moyenne Intel Core i5-13500HX, NVIDIA GeForce RTX 4050 Laptop GPU (n=1) | |
| Acer Predator Helios Neo 16 NH.QLTEG.002 | |
| Schenker XMG Apex 15 (Late 23) | |
| Jetstream 2 / 2.0 Total | |
| Moyenne de la classe Gaming (334 - 516, n=27, 2 dernières années) | |
| Acer Predator Helios Neo 16 NH.QLTEG.002 | |
| Moyenne Intel Core i5-13500HX, NVIDIA GeForce RTX 4050 Laptop GPU (n=1) | |
| Schenker XMG Apex 15 (Late 23) | |
| Lenovo Legion Pro 5 16ARX8 (R5 7645HX, RTX 4050) | |
| WebXPRT 3 / Overall | |
| Lenovo Legion Pro 5 16ARX8 (R5 7645HX, RTX 4050) | |
| Lenovo LOQ 16IRH8 | |
| Lenovo LOQ 16IRH8 | |
| Moyenne de la classe Gaming (220 - 532, n=98, 2 dernières années) | |
| Schenker XMG Apex 15 (Late 23) | |
| Acer Predator Helios Neo 16 NH.QLTEG.002 | |
| Dell G15 5530 | |
| Moyenne Intel Core i5-13500HX, NVIDIA GeForce RTX 4050 Laptop GPU (255 - 294, n=3) | |
| HP Victus 16-r0076TX | |
| WebXPRT 4 / Overall | |
| Moyenne de la classe Gaming (165 - 354, n=98, 2 dernières années) | |
| Dell G15 5530 | |
| Lenovo Legion Pro 5 16ARX8 (R5 7645HX, RTX 4050) | |
| Moyenne Intel Core i5-13500HX, NVIDIA GeForce RTX 4050 Laptop GPU (240 - 257, n=3) | |
| HP Victus 16-r0076TX | |
| Acer Predator Helios Neo 16 NH.QLTEG.002 | |
* ... Moindre est la valeur, meilleures sont les performances
| PCMark 10 Score | 6565 points | |
Aide | ||
| AIDA64 / Memory Latency | |
| Lenovo LOQ 16IRH8 | |
| Moyenne de la classe Gaming (75.3 - 259, n=105, 2 dernières années) | |
| Acer Predator Helios 300 (i7-12700H, RTX 3070 Ti) | |
| Moyenne Intel Core i5-13500HX (87.1 - 96.8, n=3) | |
| Dell G15 5530 | |
| Acer Predator Helios Neo 16 NH.QLTEG.002 | |
| Acer Nitro 16 AN16-41-R7YE | |
| Schenker XMG Apex 15 (Late 23) | |
| Acer Predator Helios 16 PH16-71-731Q | |
| Lenovo Legion Pro 5 16ARX8 (R5 7645HX, RTX 4050) | |
| Acer Predator Helios 18 N23Q2 | |
* ... Moindre est la valeur, meilleures sont les performances
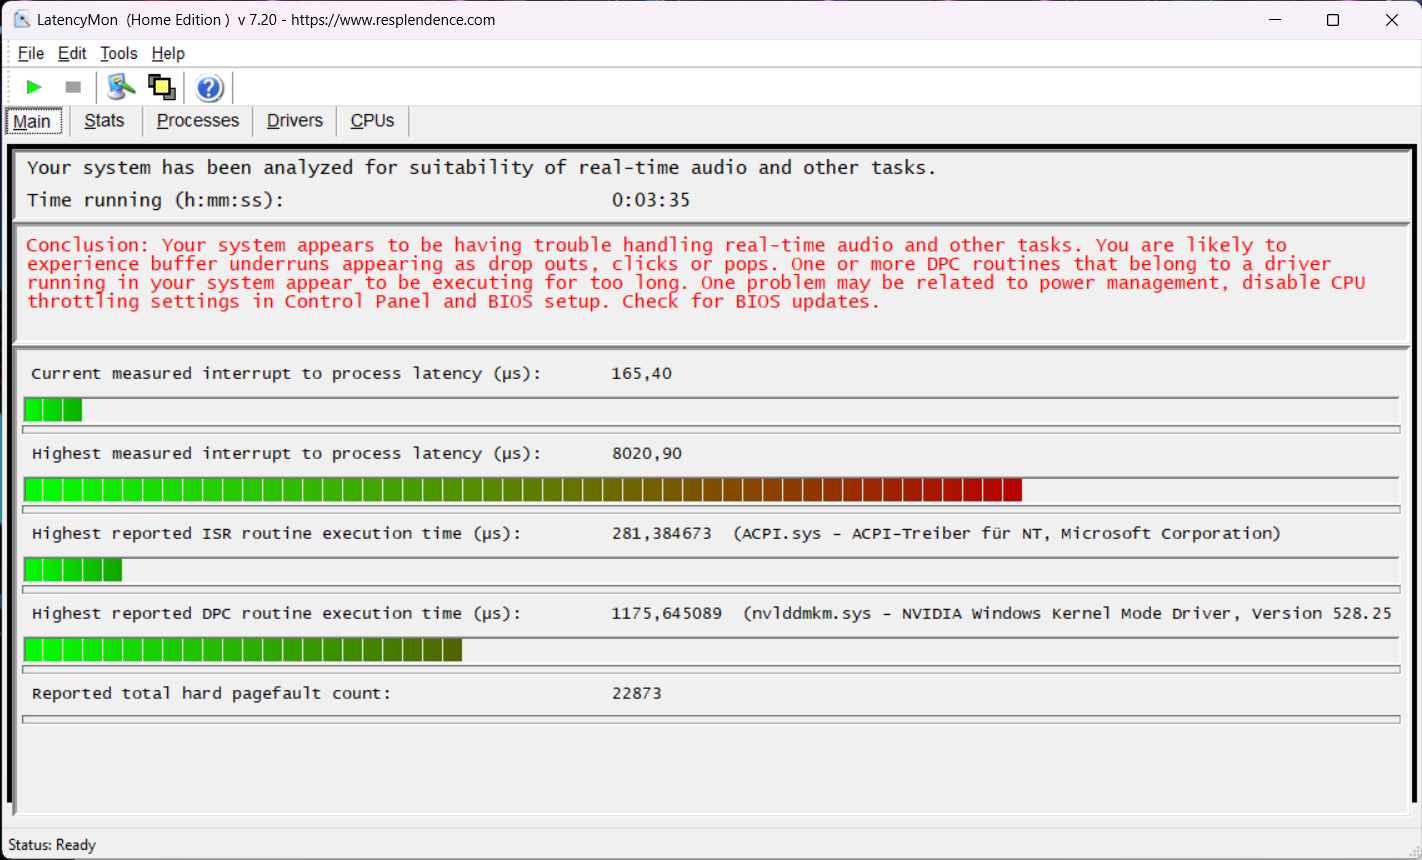
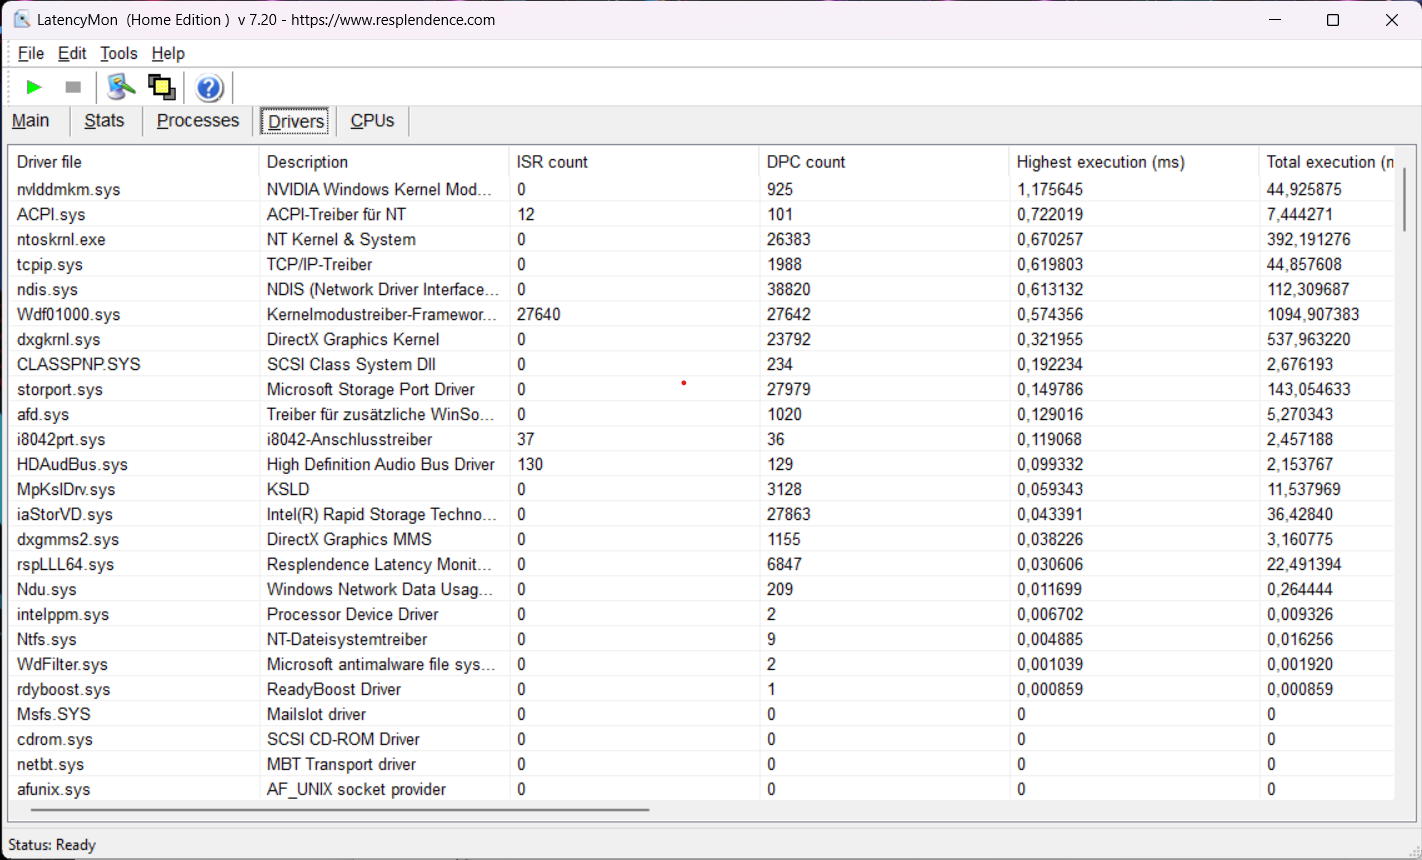
Latence DPC
Les latences DPC très élevées de l'appareil Acer (8 021 µs, testées à plusieurs reprises) empêchent l'utilisation de logiciels multimédias en temps réel. La raison principale en est le pilote graphique Nvidia. Les mises à jour du pilote et du BIOS peuvent améliorer ou aggraver le résultat.
| DPC Latencies / LatencyMon - interrupt to process latency (max), Web, Youtube, Prime95 | |
| Acer Predator Helios Neo 16 NH.QLTEG.002 | |
| Dell G15 5530 | |
| HP Victus 16-r0076TX | |
| Lenovo LOQ 16IRH8 | |
| Lenovo Legion Pro 5 16ARX8 (R5 7645HX, RTX 4050) | |
| Schenker XMG Apex 15 (Late 23) | |
* ... Moindre est la valeur, meilleures sont les performances
Dispositifs de stockage
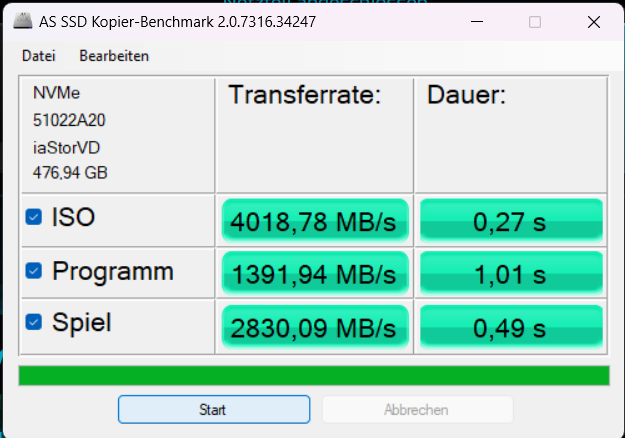
Le disque SSD PCIe 4.0 installé de SK Hynix a une capacité de 512 Go. Ses taux de transfert allant jusqu'à 5 330 Mo/s (lecture séquentielle) sont élevés, tout comme ses taux d'écriture et ses valeurs 4K. L'Helios Neo 16 occupe ainsi la première place parmi les appareils de comparaison dans notre évaluation des performances.
Cependant, un étranglement cyclique d'origine thermique se produit au bout d'un certain temps, comme le montre le graphique "DiskSpd Read Loop" ci-dessous. Jusqu'à deux disques SSD M.2 internes (également double face) sont pris en charge.
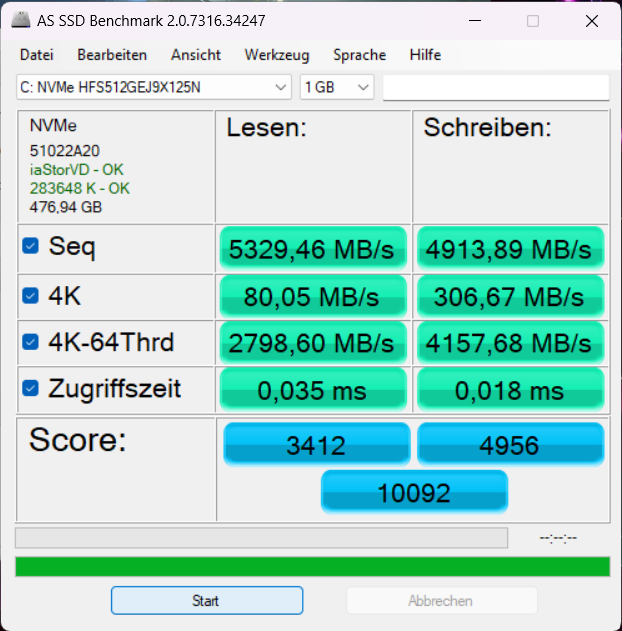
| Acer Predator Helios Neo 16 NH.QLTEG.002 SK hynix HFS512GEJ9X125N | Lenovo Legion Pro 5 16ARX8 (R5 7645HX, RTX 4050) SK hynix PC801 HFS512GEJ9X115N | Lenovo LOQ 16IRH8 Solidigm SSDPFINW512GZL | Schenker XMG Apex 15 (Late 23) Samsung 990 Pro 1 TB | HP Victus 16-r0076TX SK hynix PC801 HFS512GEJ9X101N BF | Dell G15 5530 SSTC CL4-3D512-Q11 | |
|---|---|---|---|---|---|---|
| AS SSD | -11% | -59% | -18% | -27% | -142% | |
| Seq Read (MB/s) | 5329.5 | 5872 10% | 2603 -51% | 5586.1 5% | 5149.98 -3% | 2603.73 -51% |
| Seq Write (MB/s) | 4913.9 | 4253 -13% | 1427 -71% | 5512.25 12% | 3064.93 -38% | 494.63 -90% |
| 4K Read (MB/s) | 80.05 | 70.52 -12% | 64.4 -20% | 65.32 -18% | 62.73 -22% | 36.37 -55% |
| 4K Write (MB/s) | 306.67 | 251.8 -18% | 237 -23% | 193.71 -37% | 219.1 -29% | 188.64 -38% |
| 4K-64 Read (MB/s) | 2798.6 | 2755 -2% | 451 -84% | 2970.82 6% | 902.17 -68% | 932.26 -67% |
| 4K-64 Write (MB/s) | 4157.7 | 2647 -36% | 1265 -70% | 3872.46 -7% | 2901.89 -30% | 276.64 -93% |
| Access Time Read * (ms) | 0.035 | 0.039 -11% | 0.055 -57% | 0.038 -9% | 0.036 -3% | 0.103 -194% |
| Access Time Write * (ms) | 0.018 | 0.017 6% | 0.036 -100% | 0.02 -11% | 0.018 -0% | 0.182 -911% |
| Score Read (Points) | 3412 | 3413 0% | 776 -77% | 3595 5% | 1480 -57% | 1229 -64% |
| Score Write (Points) | 4956 | 3324 -33% | 1645 -67% | 4617 -7% | 3427 -31% | 515 -90% |
| Score Total (Points) | 10092 | 8397 -17% | 2782 -72% | 10039 -1% | 5574 -45% | 2271 -77% |
| Copy ISO MB/s (MB/s) | 4018.8 | 2397.08 -40% | 1100.94 -73% | 3765 -6% | 488.98 -88% | |
| Copy Program MB/s (MB/s) | 1391.9 | 751.31 -46% | 579.88 -58% | 1030 -26% | 296.26 -79% | |
| Copy Game MB/s (MB/s) | 2830.1 | 1329.99 -53% | 1006.61 -64% | 2124 -25% | 452.22 -84% | |
| DiskSpd | -1% | -48% | 5% | -29% | -64% | |
| seq read (MB/s) | 3283 | 4770 45% | 2171 -34% | 3181 -3% | 4378 33% | 2726 -17% |
| seq write (MB/s) | 4923 | 4938 0% | 1640 -67% | 5612 14% | 3325 -32% | 535 -89% |
| seq q8 t1 read (MB/s) | 6309 | 7328 16% | 3507 -44% | 7148 13% | 7109 13% | 2985 -53% |
| seq q8 t1 write (MB/s) | 4968 | 4936 -1% | 1645 -67% | 6887 39% | 5027 1% | 539 -89% |
| 4k q1 t1 read (MB/s) | 78.3 | 75.5 -4% | 82.1 5% | 68 -13% | 61.5 -21% | 34 -57% |
| 4k q1 t1 write (MB/s) | 393 | 296 -25% | 288 -27% | 231 -41% | 157.3 -60% | 224 -43% |
| 4k q32 t16 read (MB/s) | 4255 | 3794 -11% | 478 -89% | 4920 16% | 954 -78% | 1054 -75% |
| 4k q32 t16 write (MB/s) | 3869 | 2679 -31% | 1631 -58% | 4336 12% | 527 -86% | 507 -87% |
| Moyenne finale (programmes/paramètres) | -6% /
-7% | -54% /
-55% | -7% /
-10% | -28% /
-28% | -103% /
-113% |
* ... Moindre est la valeur, meilleures sont les performances
* ... Moindre est la valeur, meilleures sont les performances
Reading continuous performance: DiskSpd Read Loop, Queue Depth 8
Carte graphique
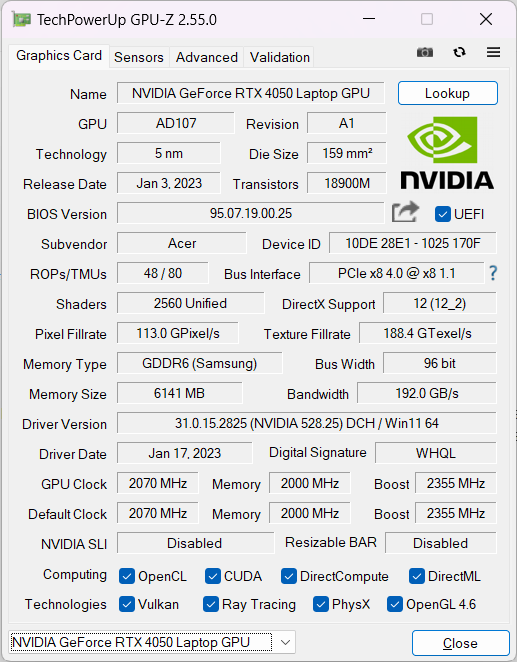
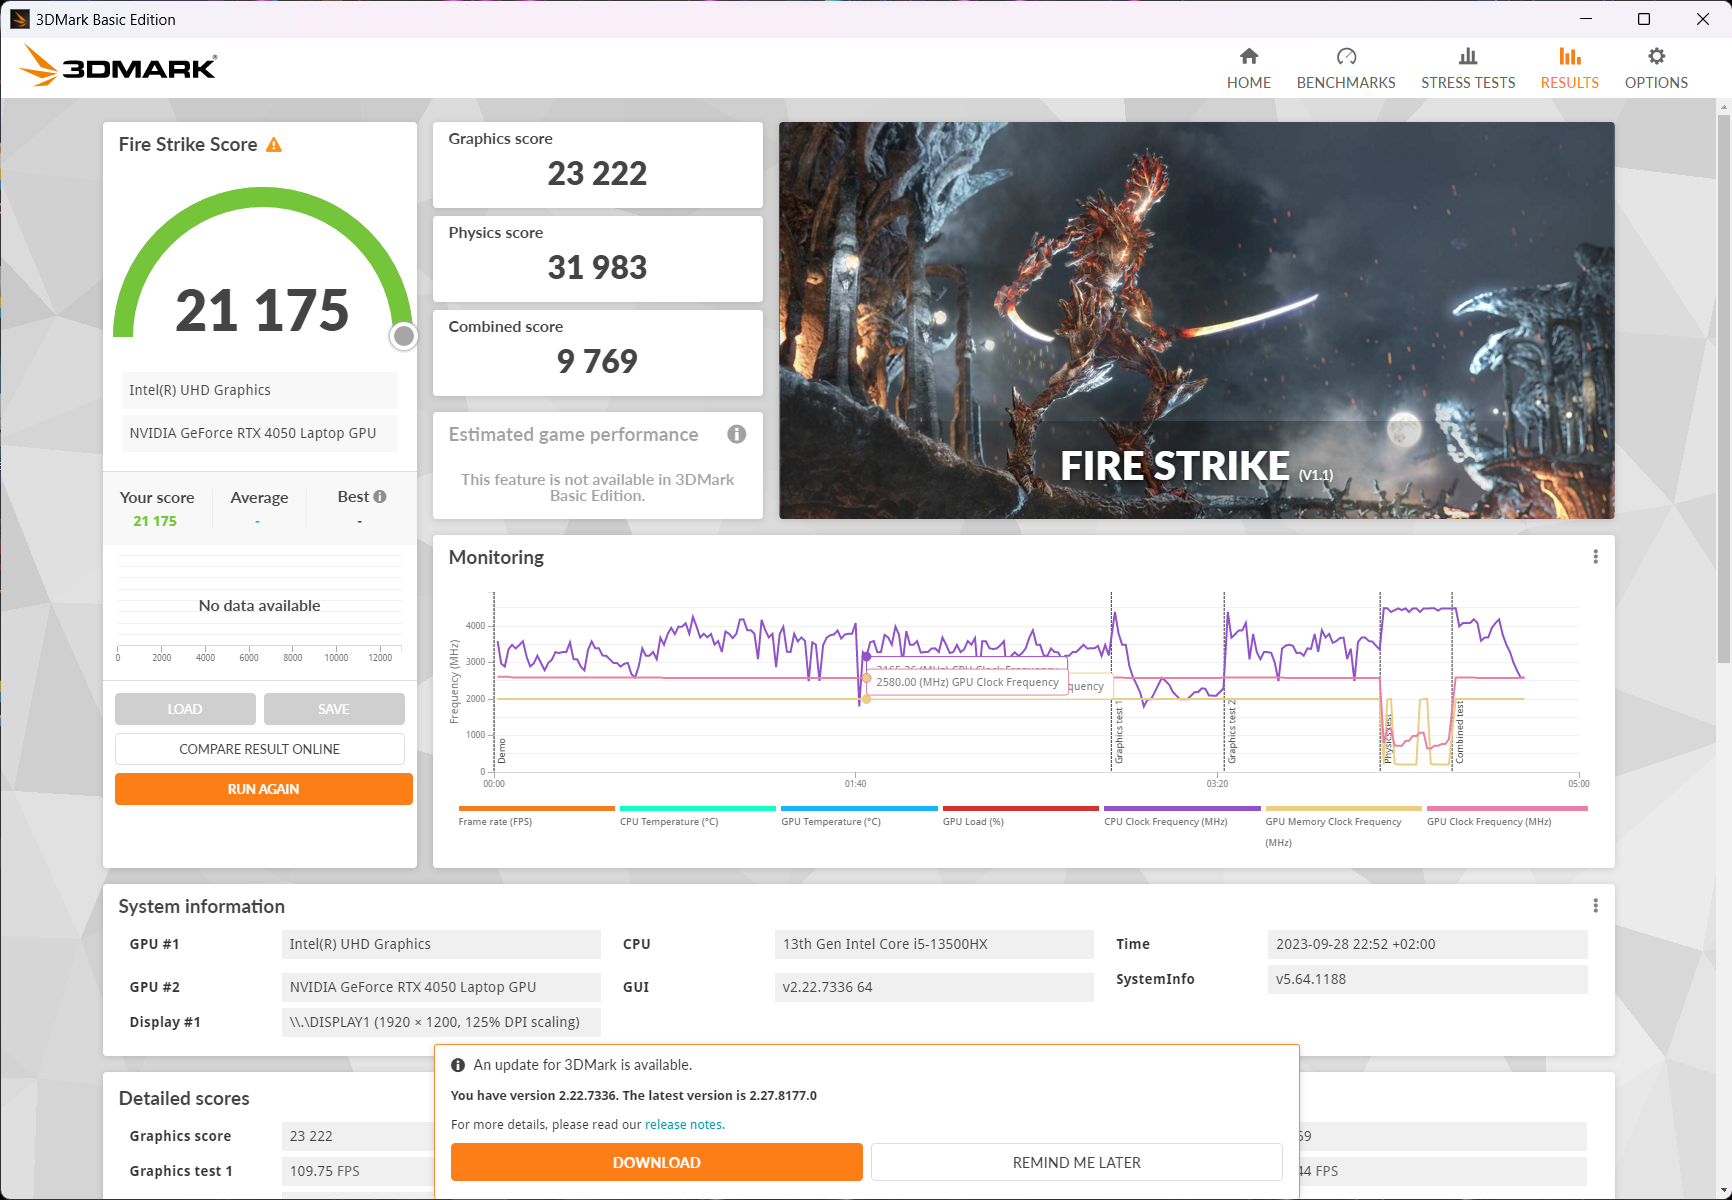
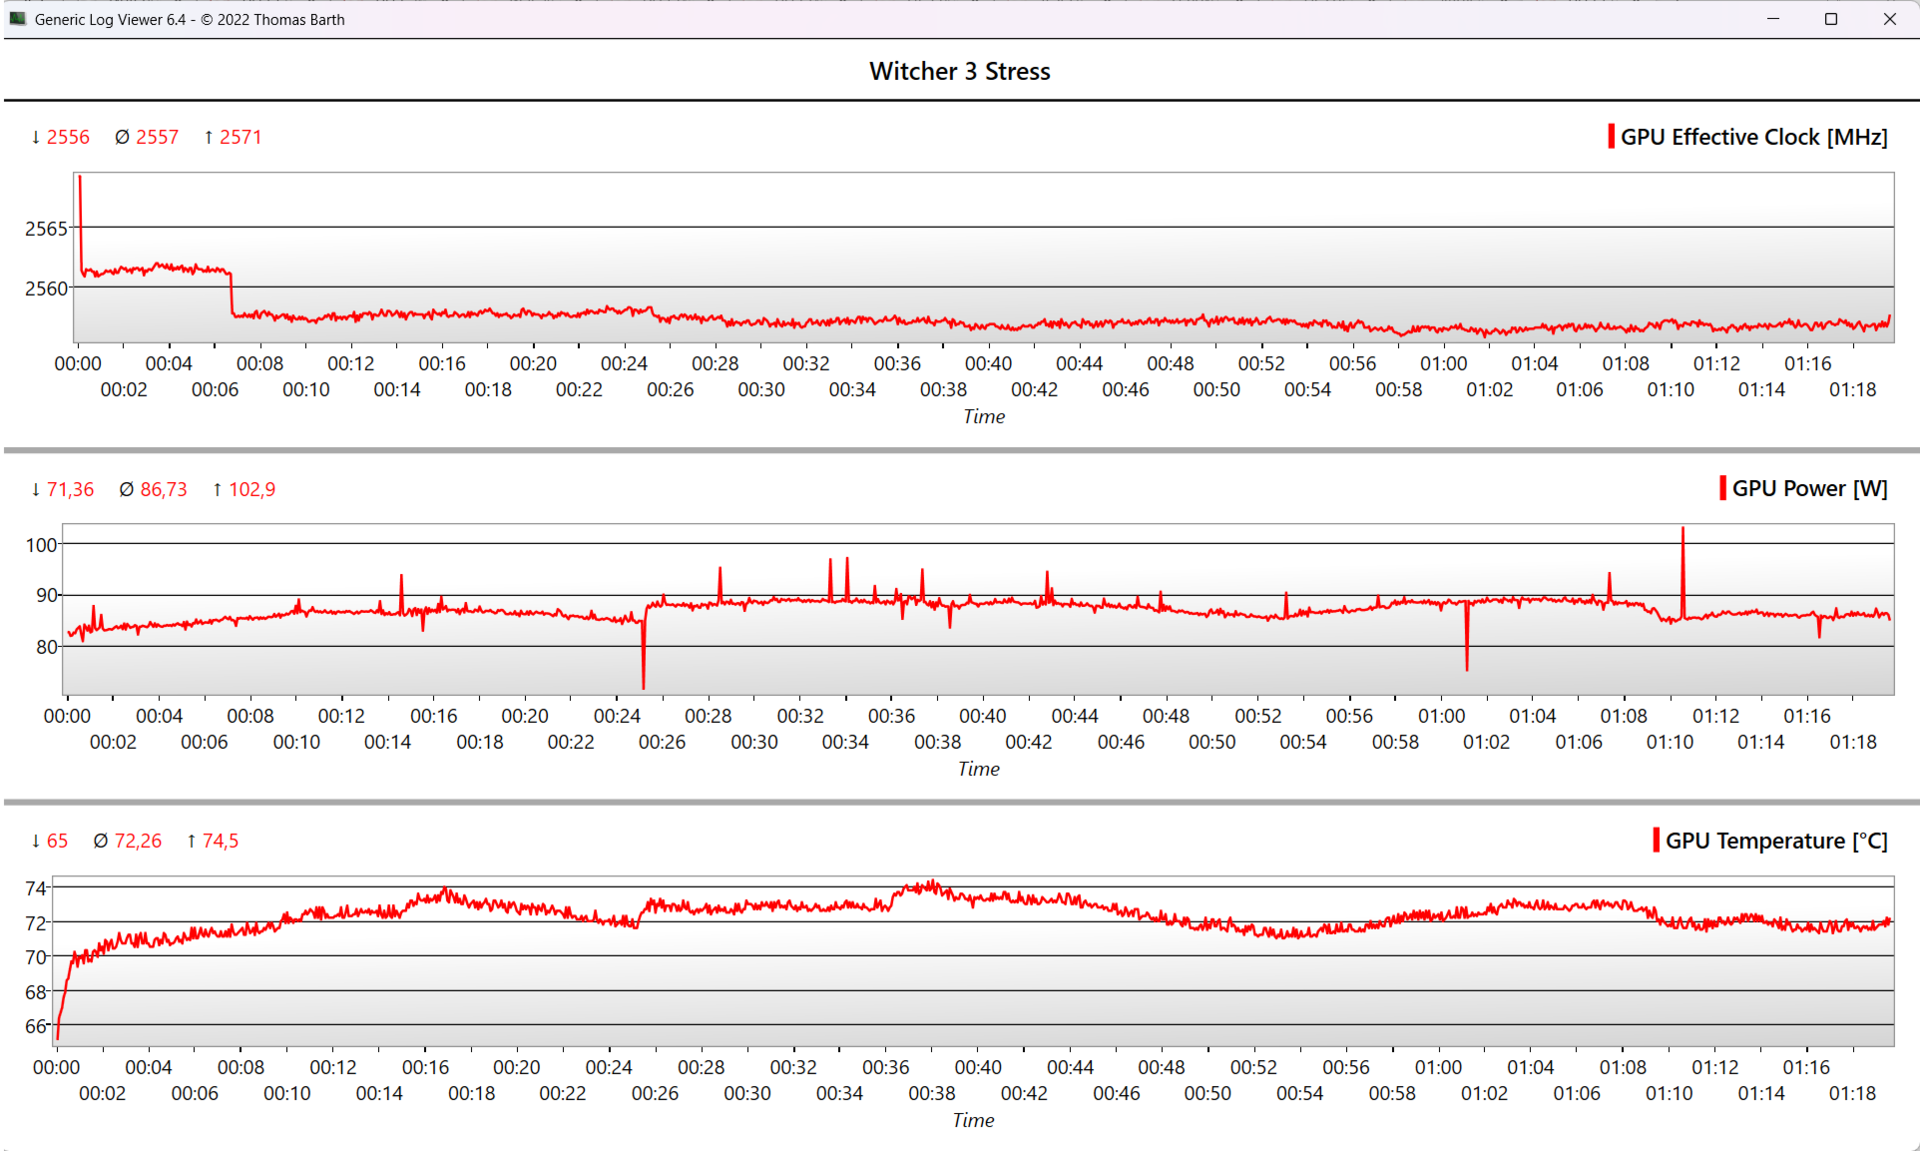
LaGeForce RTX 4050 est un GPU d'entrée de gamme avec 6 Go de VRAM, qui consomme un maximum de 130 watts (115 watts + 15 watts Dynamic Boost) dans l'Helios Neo 16. Cependant, sa fréquence d'horloge maximale de 2 570 MHz est déjà atteinte avec 85 watts à 90 watts. Seul le test de stress FurMark peut utiliser la totalité des 130 watts, alors que le GPU de l'ordinateur portable n'a jamais besoin de plus de 88 watts lors de l'exécution de jeux.
Les performances de l'appareil sont donc comparables à celles d'autres ordinateurs portables de jeu dotés du même GPU, tels que leLegion Pro 5 16le XMG Apex 15, SchenkerXMG Apex 15et leHP Victus 16. Dans les benchmarks synthétiques, uneRTX 4060a également obtenu des résultats similaires (10 % d'avance), comme dans le cas duLenovo LOQ 16 et leHelios 16 (non-Neo). Ses résultats synthétiques sont deux fois moins bons en mode batterie.
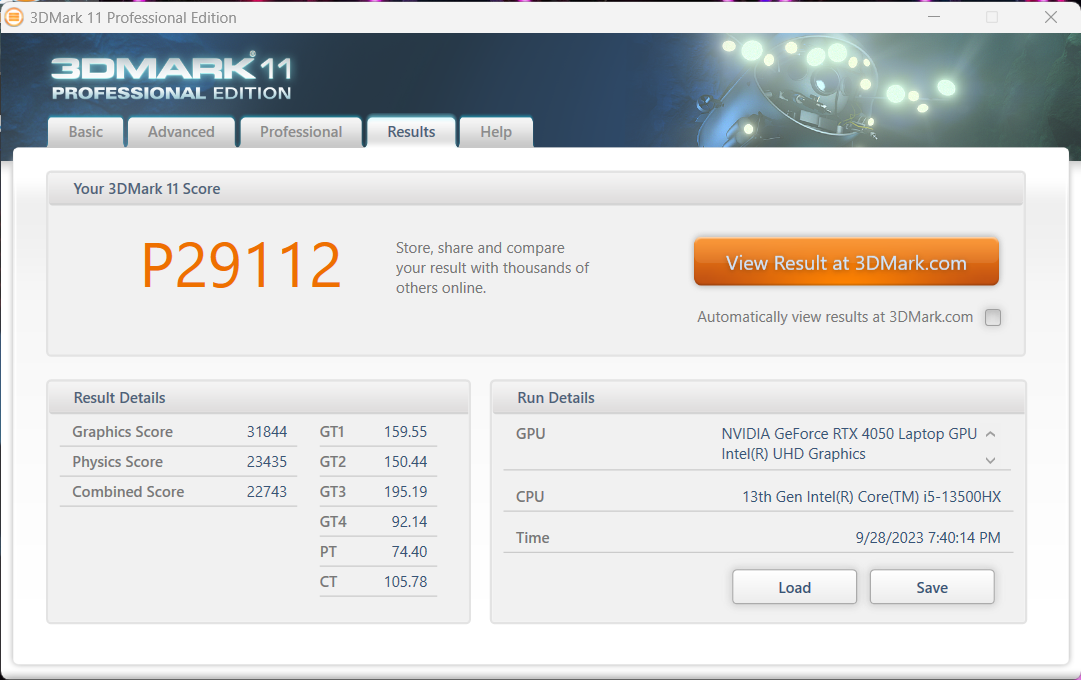
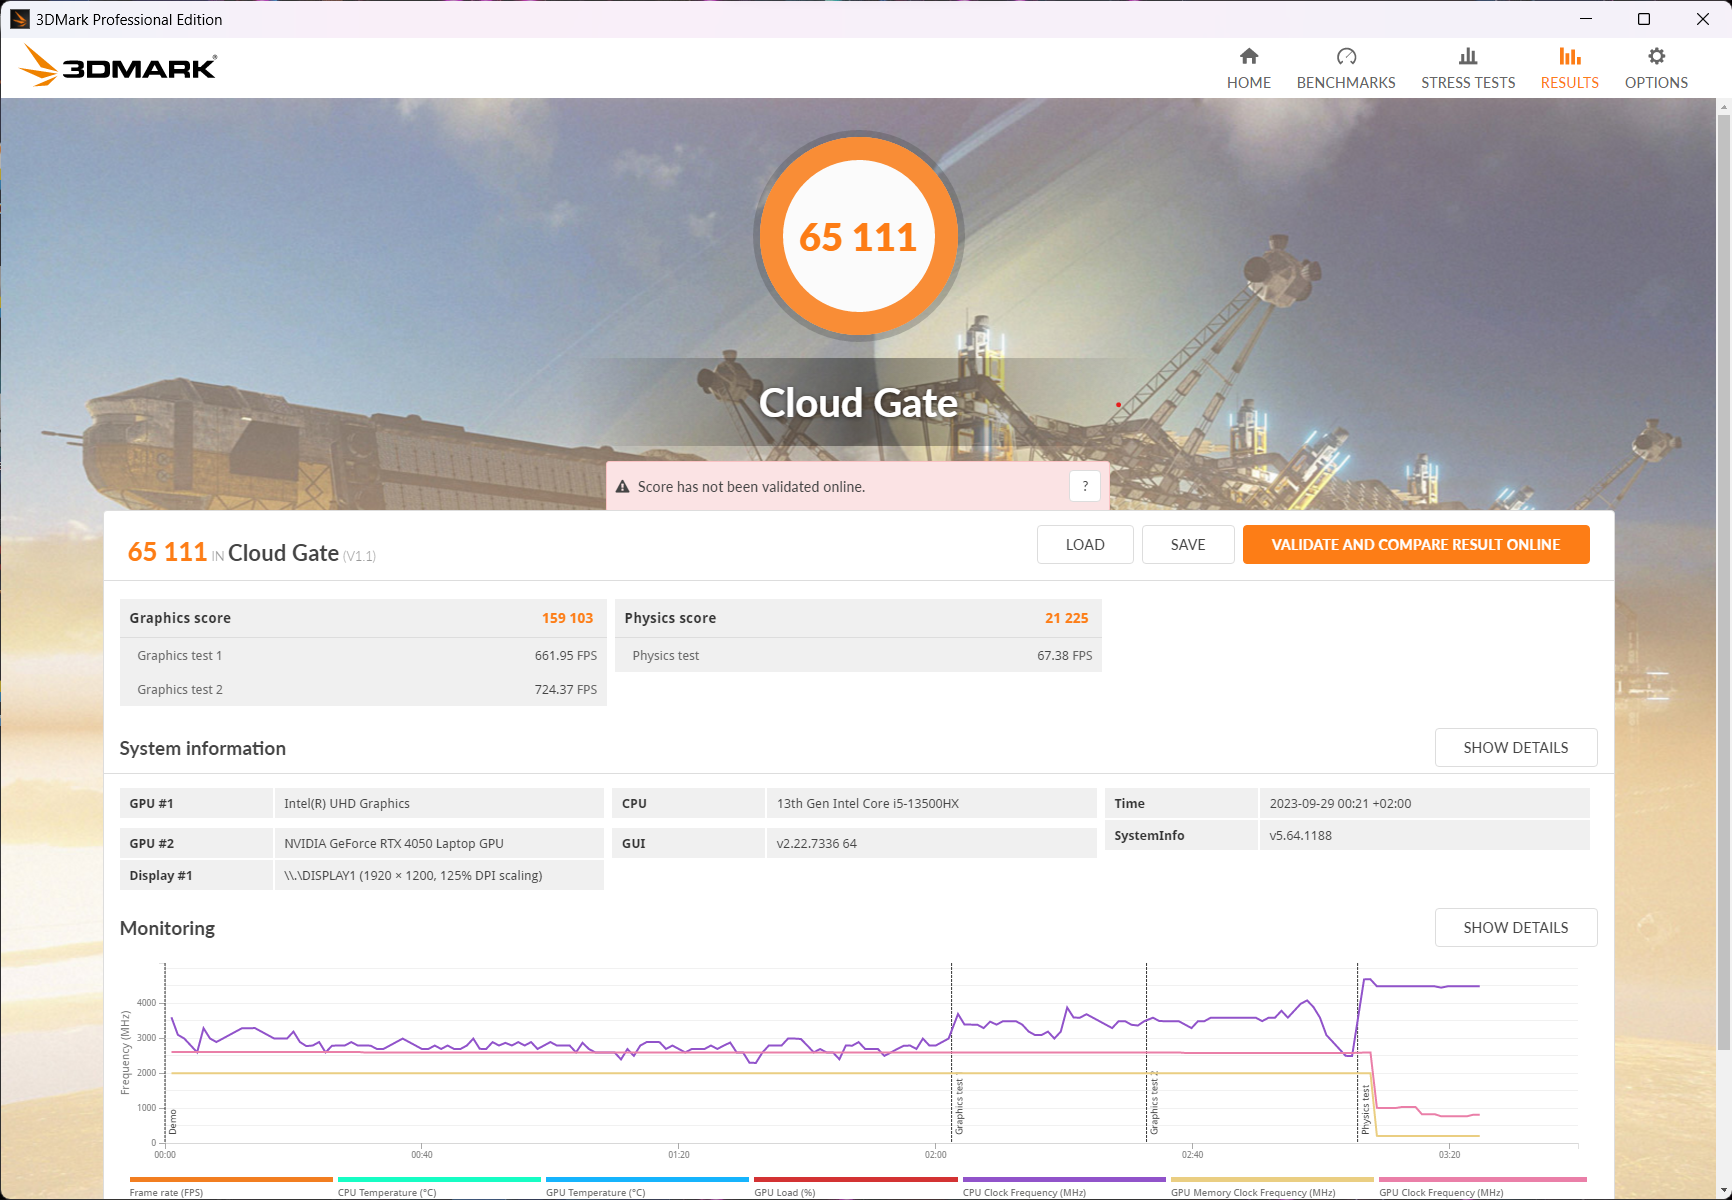
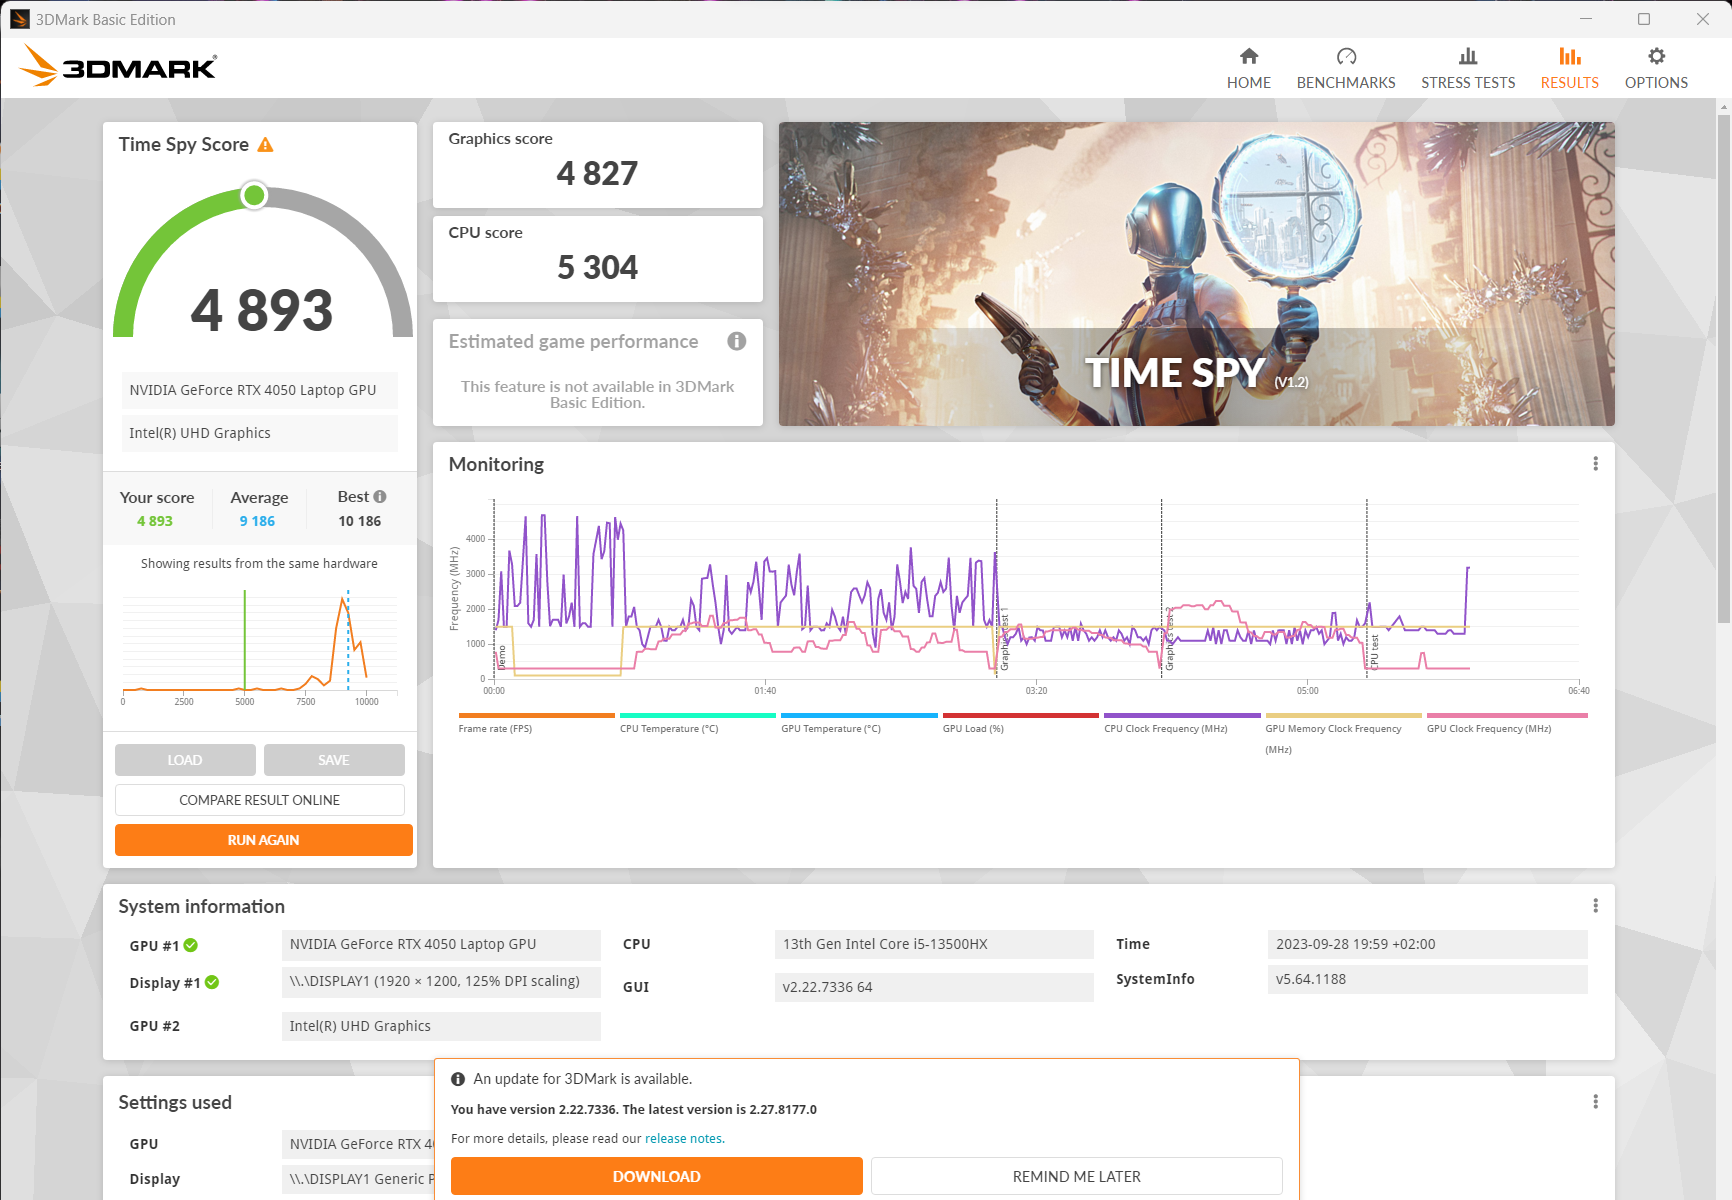
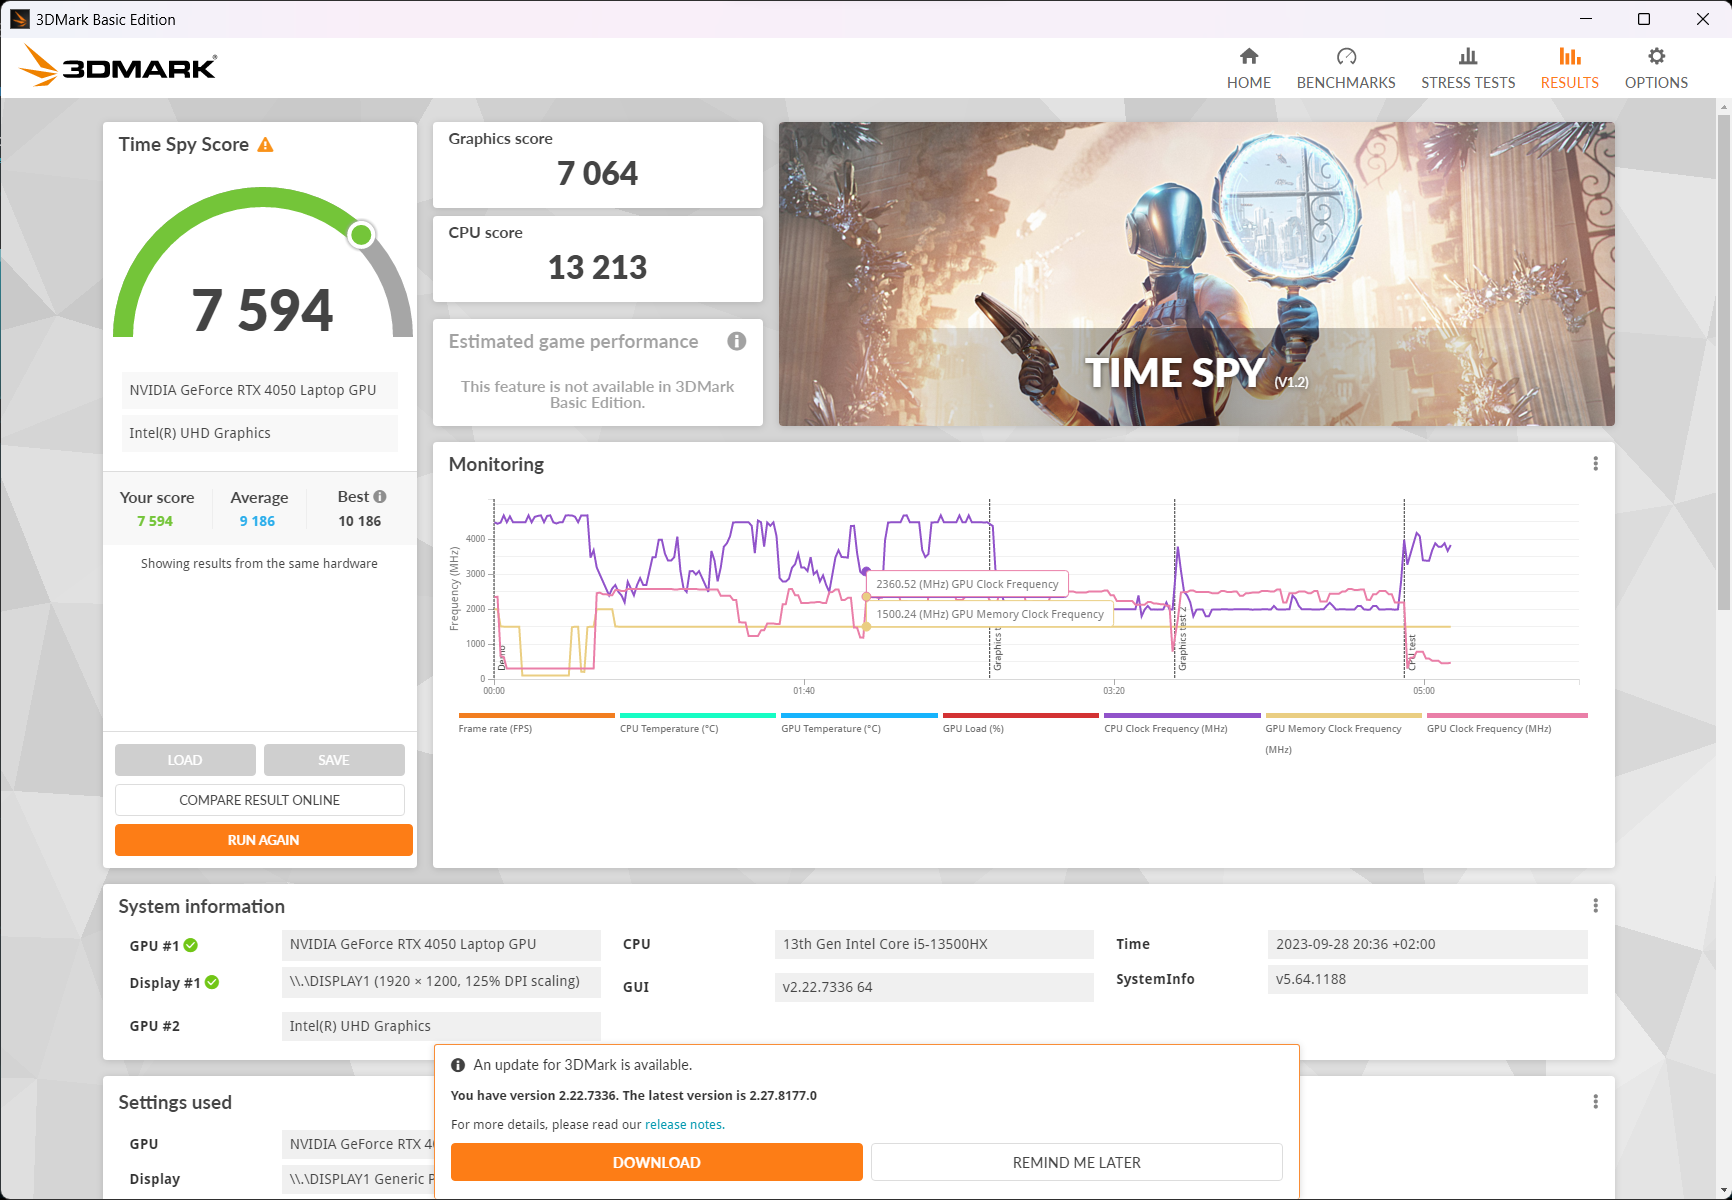
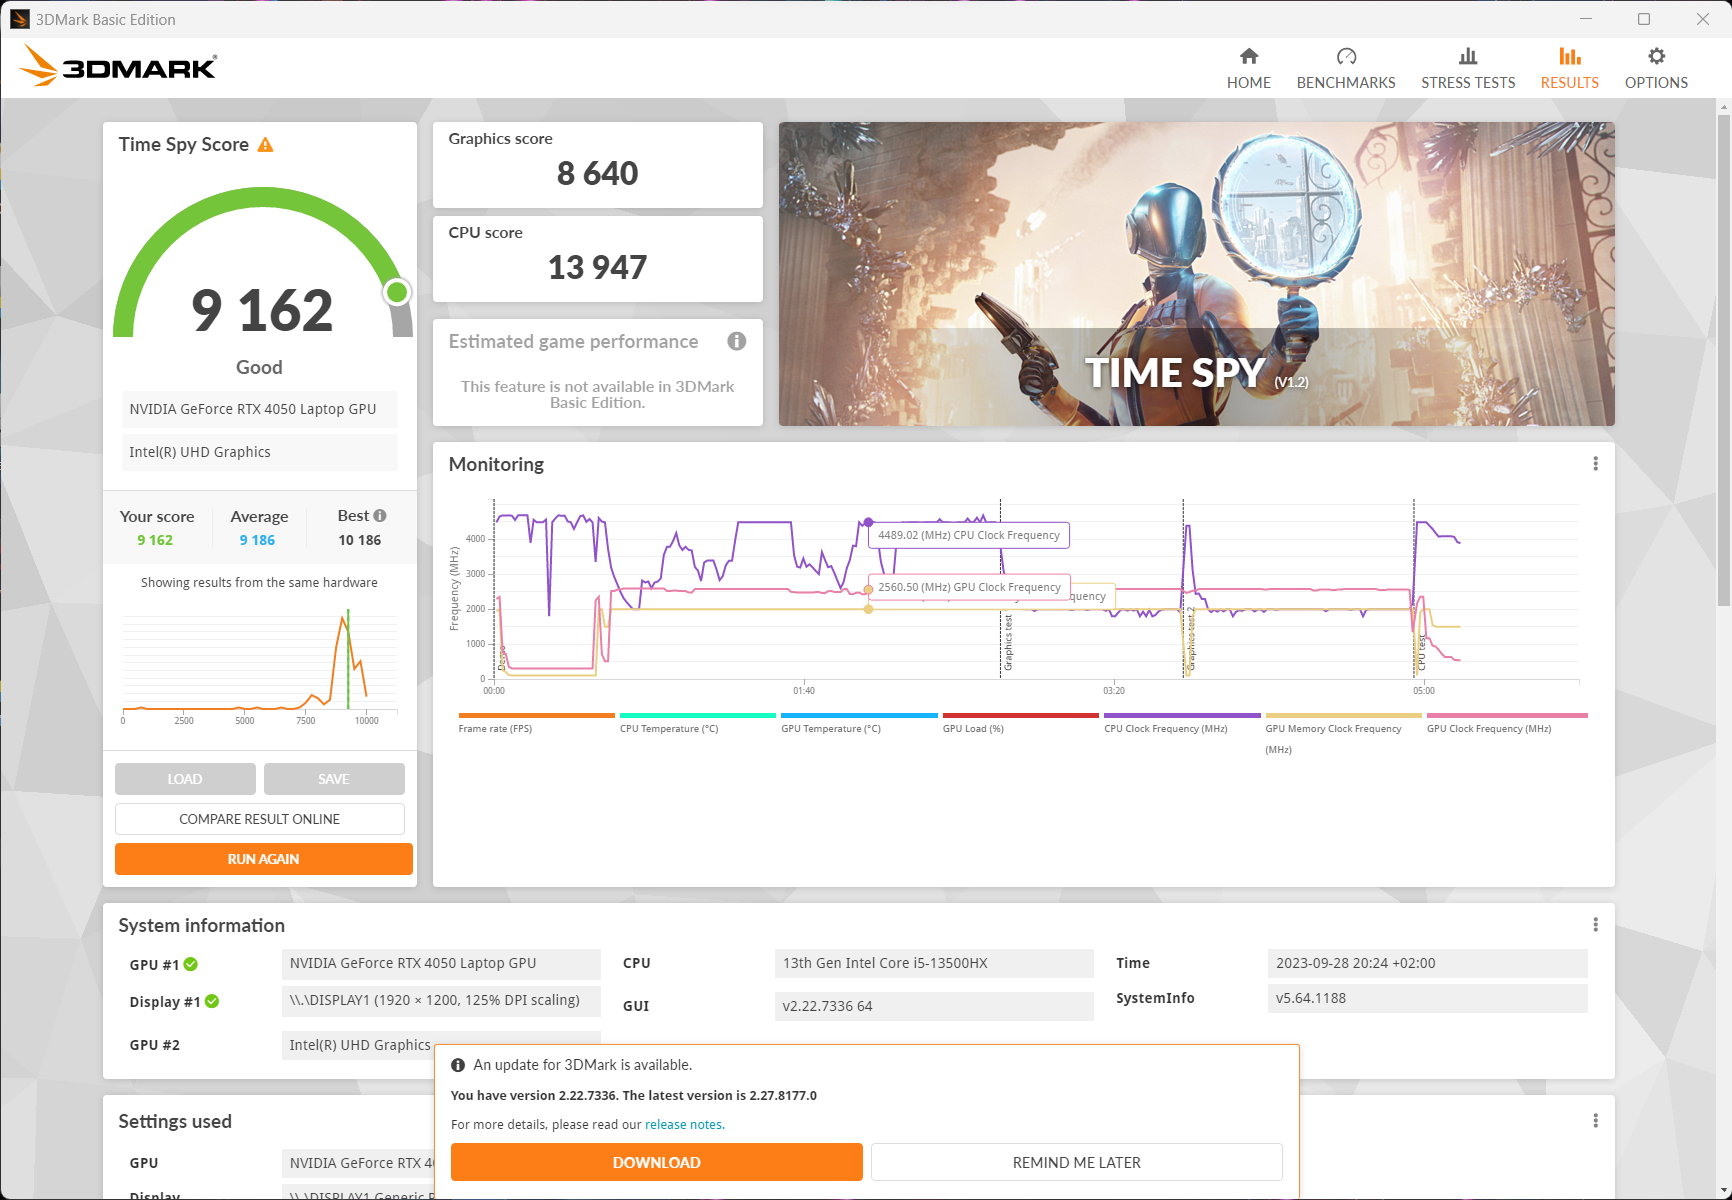
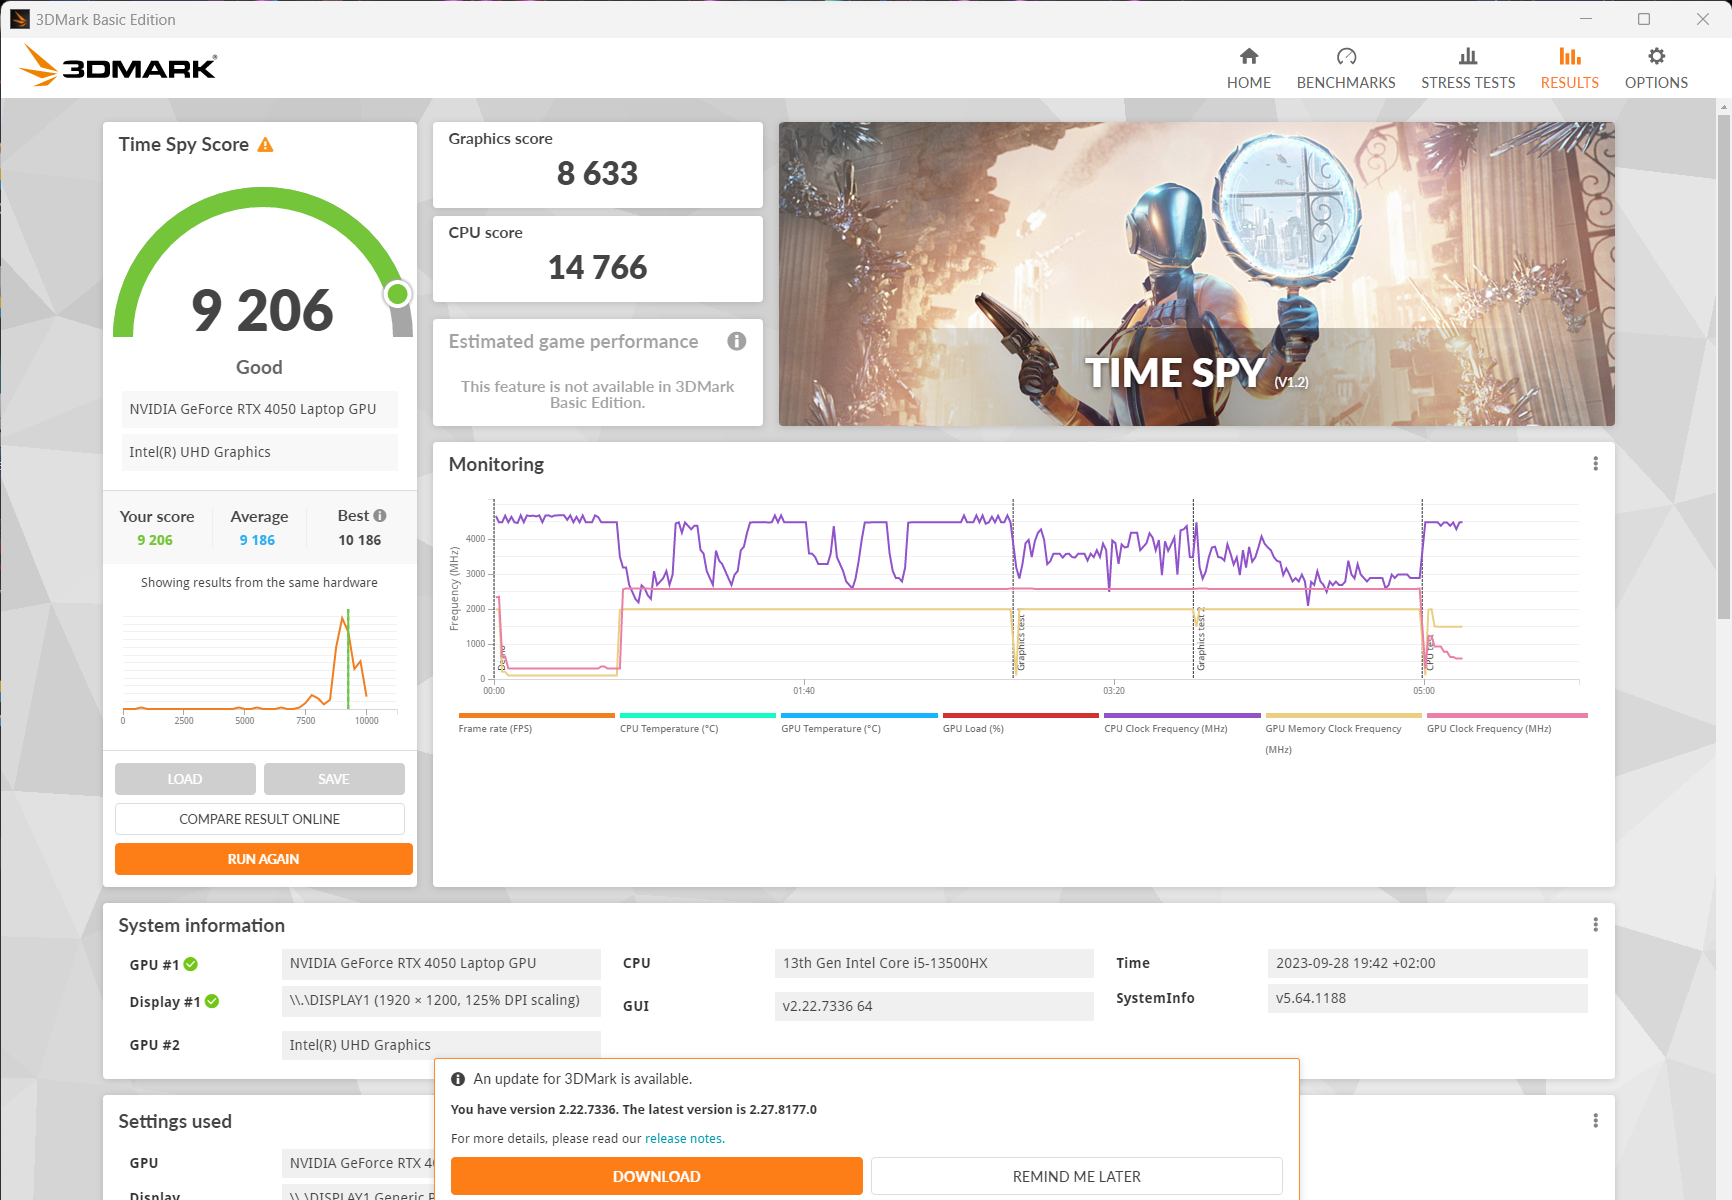
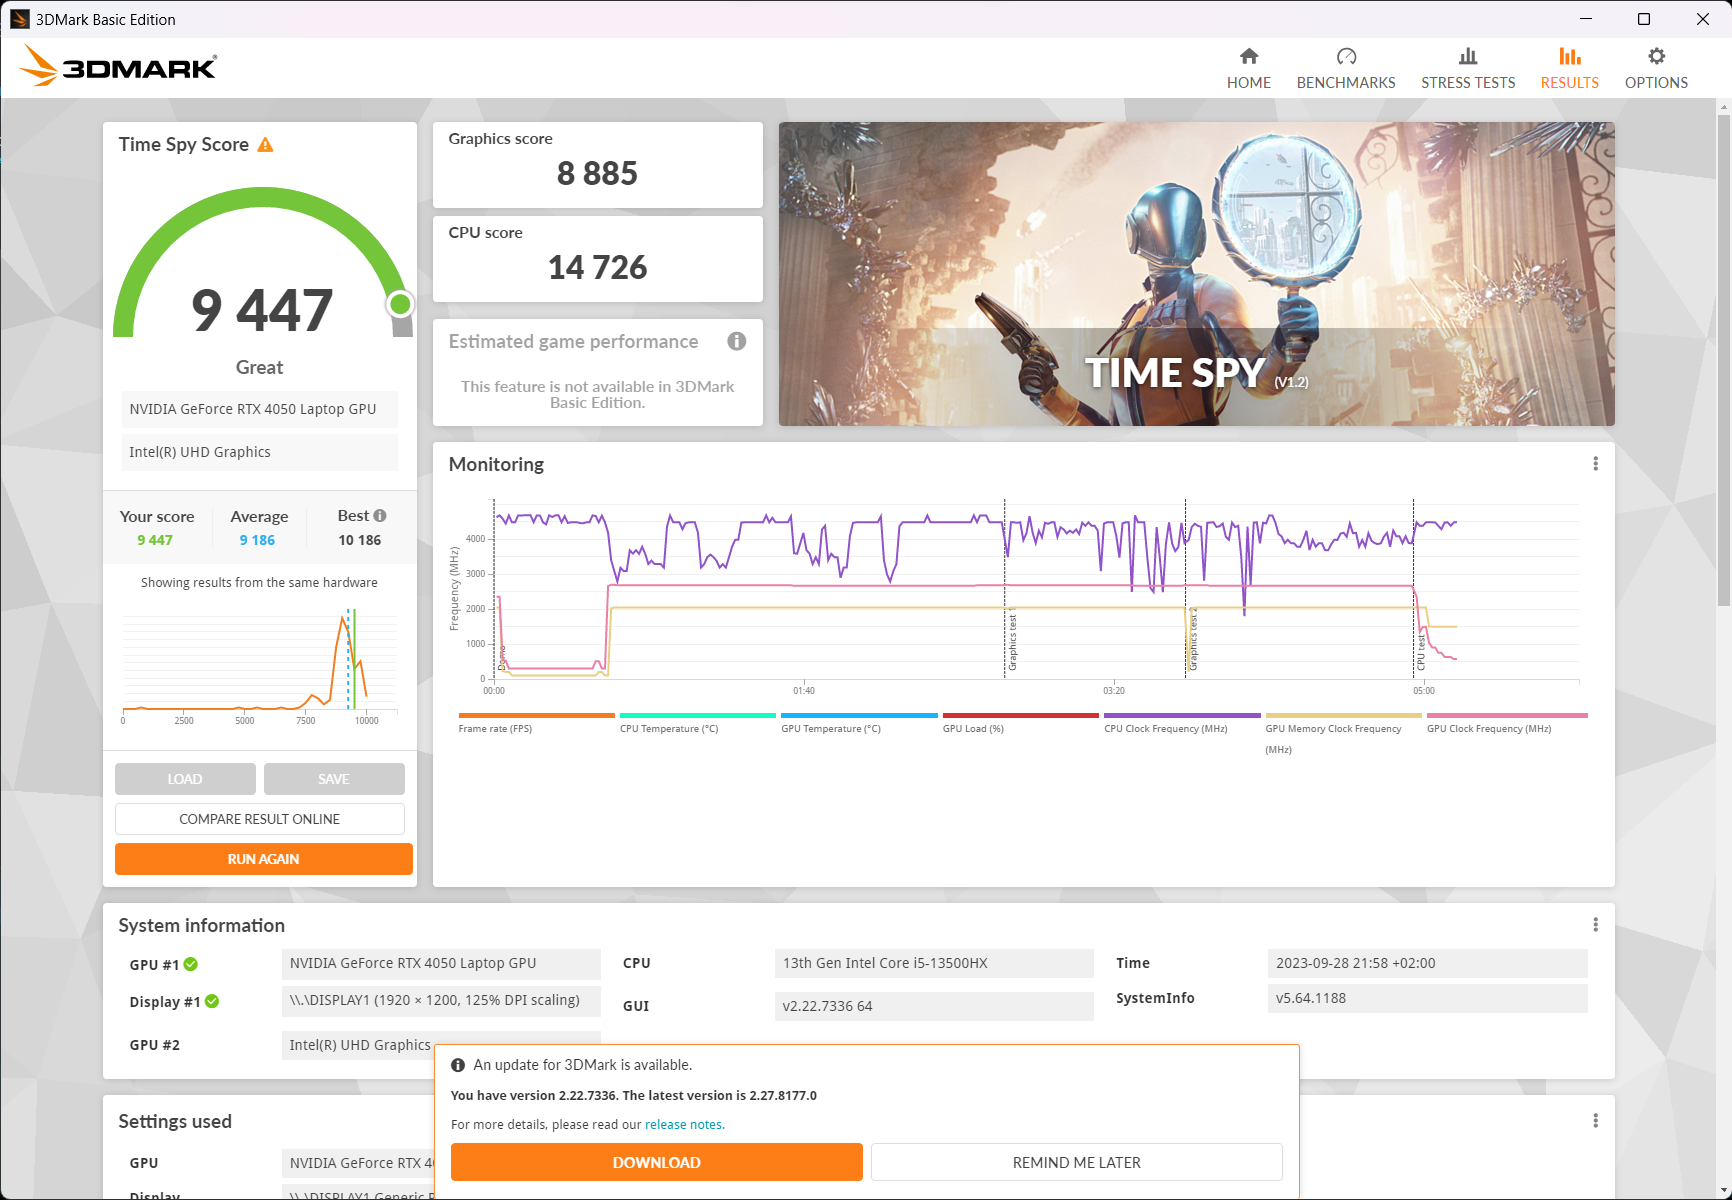
| 3DMark 11 Performance | 29112 points | |
| 3DMark Cloud Gate Standard Score | 65111 points | |
| 3DMark Fire Strike Score | 21175 points | |
| 3DMark Time Spy Score | 9206 points | |
Aide | ||
* ... Moindre est la valeur, meilleures sont les performances
Performances des jeux
Dans notre classement des performances, leLegion Pro 5 16 est supérieur d'environ 7 % à l'Helios Neo 16, tandis que le Dell G15 5530 est plus performant que l'Helios Neo 16.Dell G15 5530 et le LenovoLOQ 16 ont tous deux amélioré leurs performances d'environ 15 % avec uneRTX 4060. Selon le jeu, l'écart avec la RTX 4060 s'est creusé - jusqu'à 30 % pour God of War et 20 % pour Hogwarts Legacy.
Nous vous recommandons d'utiliser le mode équilibré, car seuls 2 à 3 % des performances 3D sont perdus et le bruit du ventilateur est nettement plus faible. En mode batterie, les performances sont trois fois moins bonnes.
| Sons of the Forest | |
| 1920x1080 Ultra Preset AA:T | |
| Lenovo Legion Pro 5 16ARX8 (R5 7645HX, RTX 4050) | |
| Moyenne NVIDIA GeForce RTX 4050 Laptop GPU (61.9 - 76, n=4) | |
| Acer Predator Helios Neo 16 NH.QLTEG.002 | |
| 1920x1080 High Preset AA:T | |
| Lenovo Legion Pro 5 16ARX8 (R5 7645HX, RTX 4050) | |
| Acer Predator Helios Neo 16 NH.QLTEG.002 | |
| Moyenne NVIDIA GeForce RTX 4050 Laptop GPU (63.5 - 76, n=4) | |
Witcher 3 FPS diagram
| Bas | Moyen | Élevé | Ultra | |
|---|---|---|---|---|
| GTA V (2015) | 186.7 | 185.1 | 176.3 | 96.5 |
| The Witcher 3 (2015) | 286 | 154.4 | 81 | |
| Dota 2 Reborn (2015) | 180.9 | 167.9 | 156.4 | 147 |
| Final Fantasy XV Benchmark (2018) | 215 | 118.6 | 84.6 | |
| X-Plane 11.11 (2018) | 152.4 | 134.7 | 106.1 | |
| Strange Brigade (2018) | 476 | 211 | 171.9 | 149.4 |
| F1 2021 (2021) | 291 | 222 | 119.5 | |
| God of War (2022) | 86.8 | 71.1 | 50.1 | |
| Hogwarts Legacy (2023) | 64 | 53.1 | 51.1 | |
| Sons of the Forest (2023) | 78.8 | 74.5 | 70 | |
| Star Wars Jedi Survivor (2023) | 58 | 53.6 | 50.7 | |
| F1 23 (2023) | 262 | 208 | 150.7 | 44.5 |
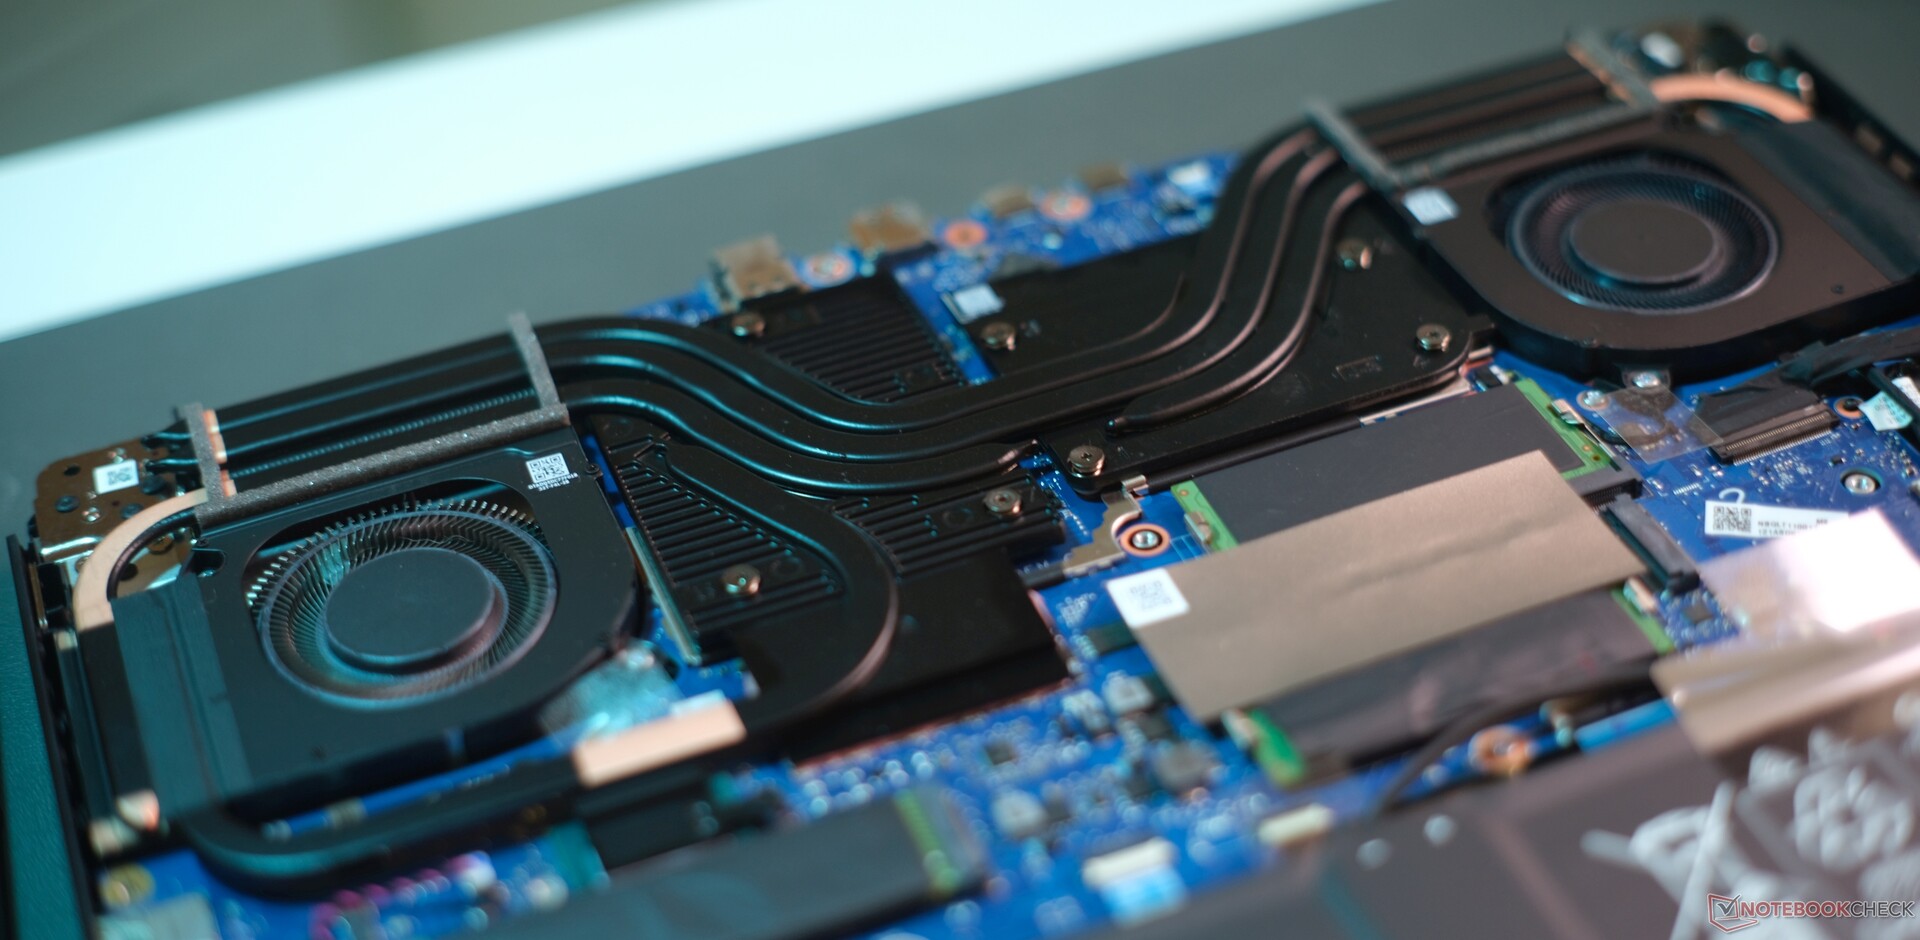
Émissions : Du métal liquide à l'intérieur de l'Helios Neo 16 de milieu de gamme
Émissions sonores
L'Acer Predator Helios Neo 16 reste pratiquement silencieux dans tous les modes de performance - non seulement en mode veille, mais aussi en surfant sur le web et en effectuant des tâches bureautiques simples, bien que le ventilateur émette toujours un ronronnement silencieux.
Lorsque le processeur est en pleine charge, le niveau sonore atteint 37,7 dB(A), ce qui n'est pas trop gênant. Le mode équilibré est recommandé pour les jeux - dans ce mode, les émissions sonores de l'ordinateur portable sont presque agréables. Le mode équilibré est recommandé pour les jeux Legion Pro 5 16en revanche, n'atteint que 43,8 dB(A), ce qui n'est pas gênant pour les jeux. Le Dell G15 5530 est également très silencieux, surtout à charge moyenne. Nous n'avons pu détecter aucun bruit électronique dans notre modèle.
Degré de la nuisance sonore
| Au repos |
| 25.9 / 25.9 / 29.3 dB(A) |
| Fortement sollicité |
| 37.7 / 62.7 dB(A) |
 | ||
30 dB silencieux 40 dB(A) audible 50 dB(A) bruyant |
||
min: | ||
| Acer Predator Helios Neo 16 NH.QLTEG.002 GeForce RTX 4050 Laptop GPU, i5-13500HX, SK hynix HFS512GEJ9X125N | Lenovo Legion Pro 5 16ARX8 (R5 7645HX, RTX 4050) GeForce RTX 4050 Laptop GPU, R5 7645HX, SK hynix PC801 HFS512GEJ9X115N | Lenovo LOQ 16IRH8 GeForce RTX 4060 Laptop GPU, i7-13620H, Solidigm SSDPFINW512GZL | HP Victus 16-r0076TX GeForce RTX 4050 Laptop GPU, i5-13500HX, SK hynix PC801 HFS512GEJ9X101N BF | Dell G15 5530 GeForce RTX 4060 Laptop GPU, i7-13650HX, SSTC CL4-3D512-Q11 | Schenker XMG Apex 15 (Late 23) GeForce RTX 4050 Laptop GPU, R7 7840HS, Samsung 990 Pro 1 TB | |
|---|---|---|---|---|---|---|
| Noise | 13% | 2% | 10% | 12% | 1% | |
| arrêt / environnement * (dB) | 25.9 | 23 11% | 23 11% | 21.57 17% | 20.41 21% | 24 7% |
| Idle Minimum * (dB) | 25.9 | 23 11% | 23 11% | 23.68 9% | 26.85 -4% | 25 3% |
| Idle Average * (dB) | 25.9 | 23 11% | 23 11% | 23.68 9% | 26.85 -4% | 29 -12% |
| Idle Maximum * (dB) | 29.3 | 24.42 17% | 27.66 6% | 23.68 19% | 26.85 8% | 33 -13% |
| Load Average * (dB) | 37.7 | 34.94 7% | 53.62 -42% | 39.44 -5% | 27.65 27% | 36 5% |
| Load Maximum * (dB) | 62.7 | 50 20% | 53.5 15% | 55.37 12% | 47.86 24% | 53 15% |
| Witcher 3 ultra * (dB) | 43.79 | 53.5 | 55.4 | 47.9 | 48 |
* ... Moindre est la valeur, meilleures sont les performances
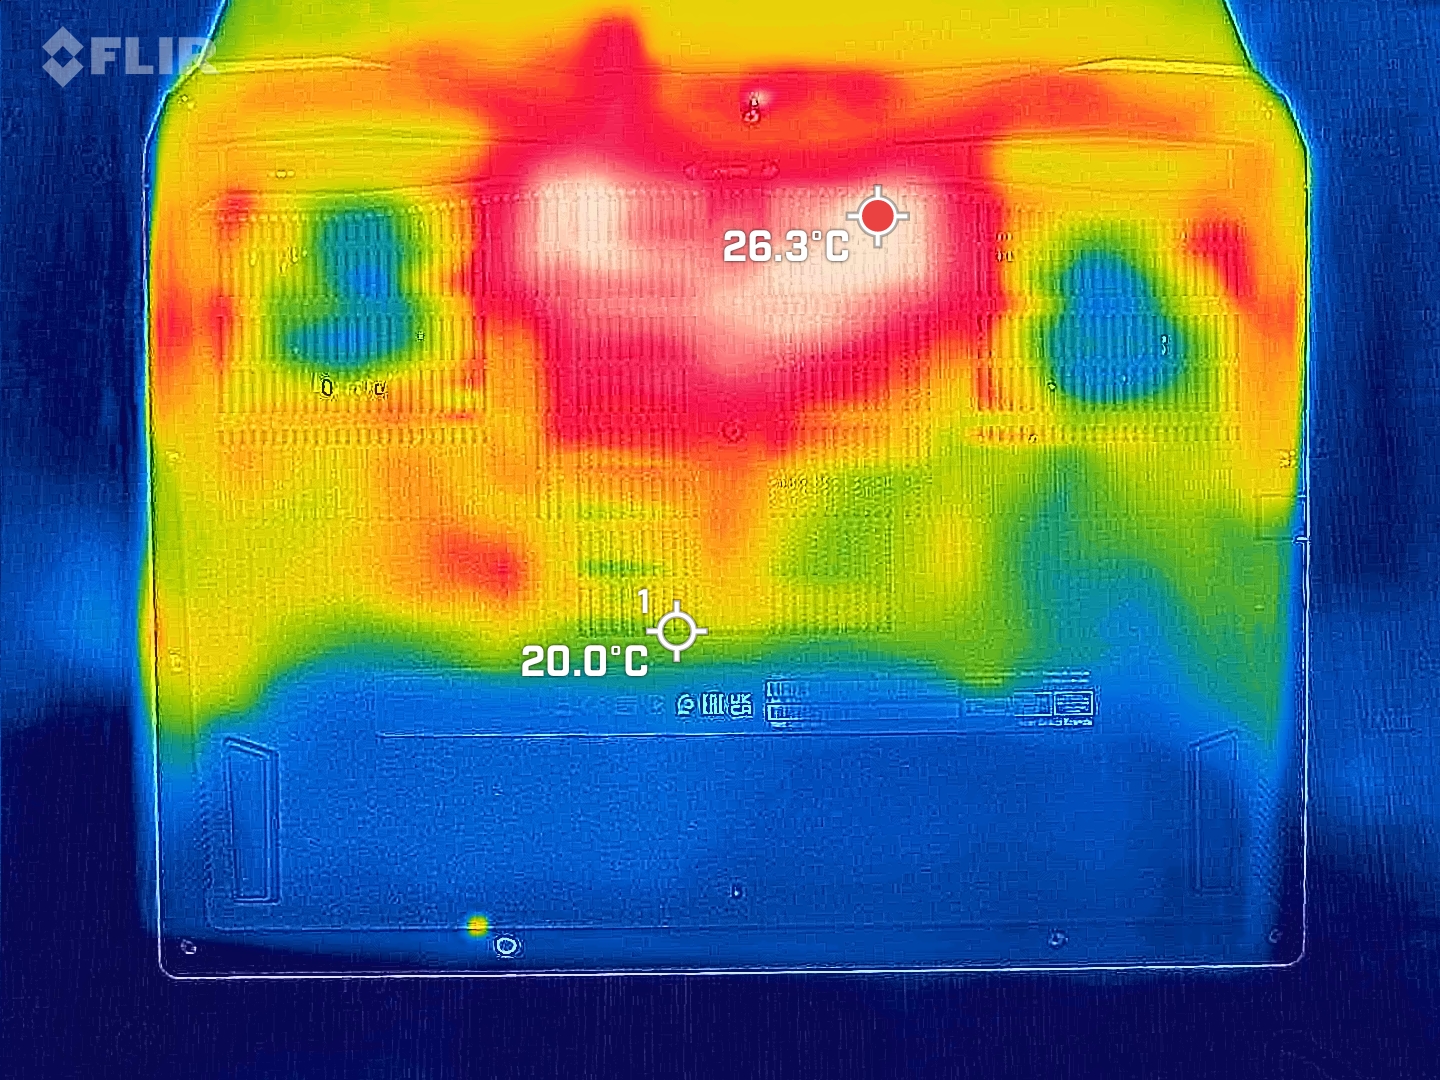
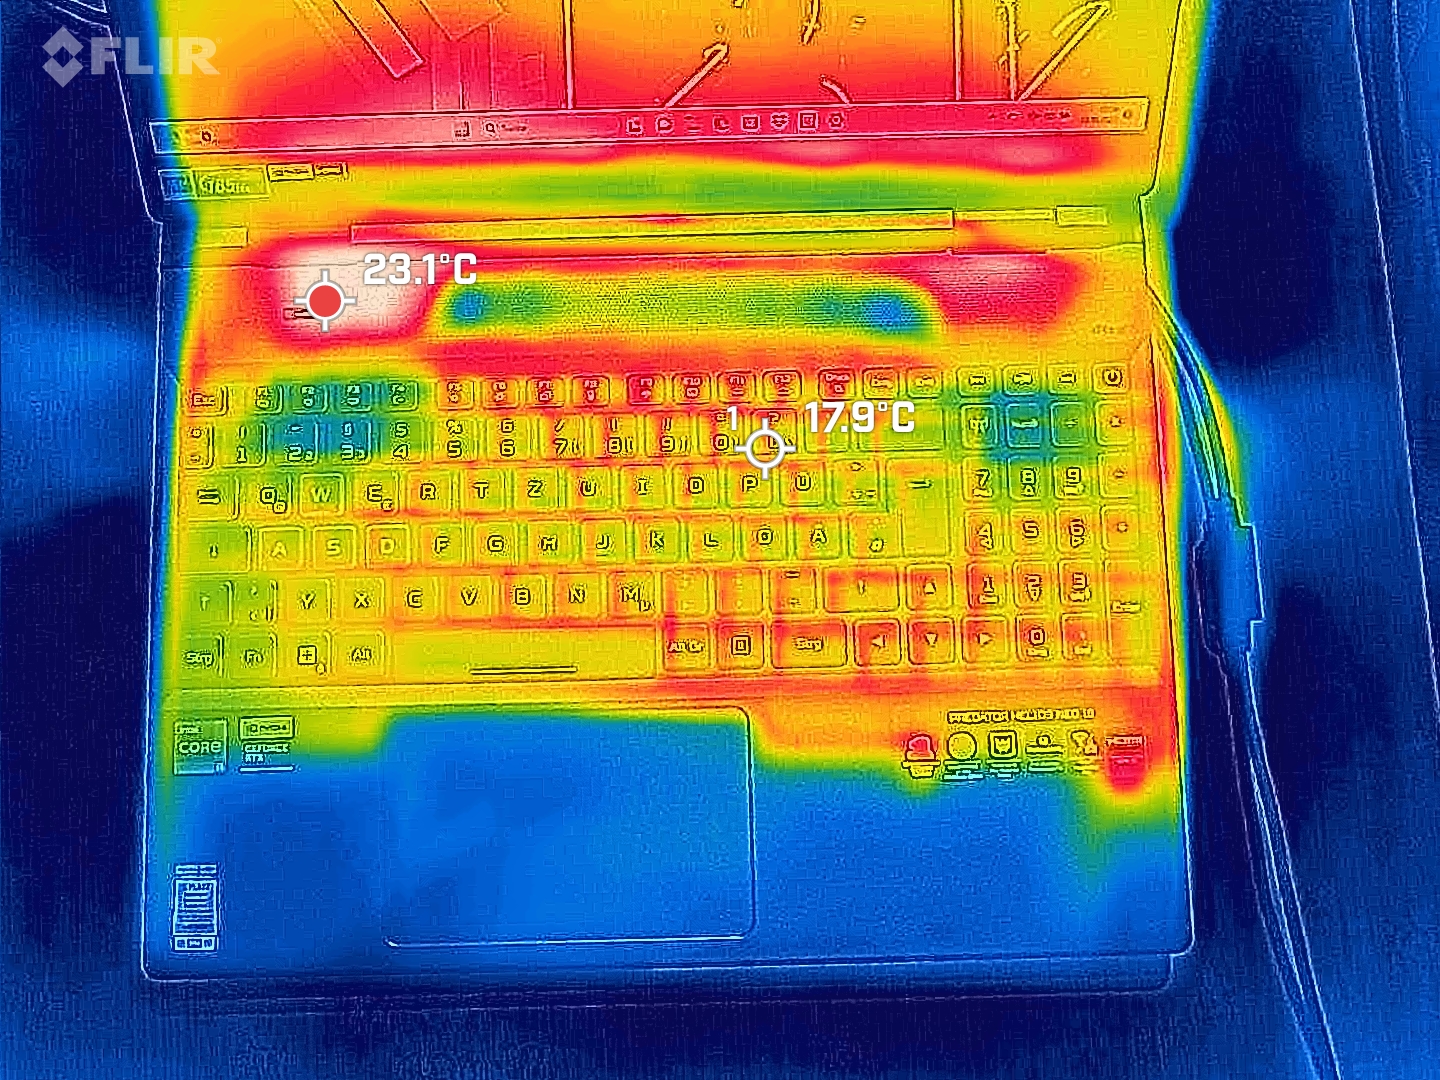
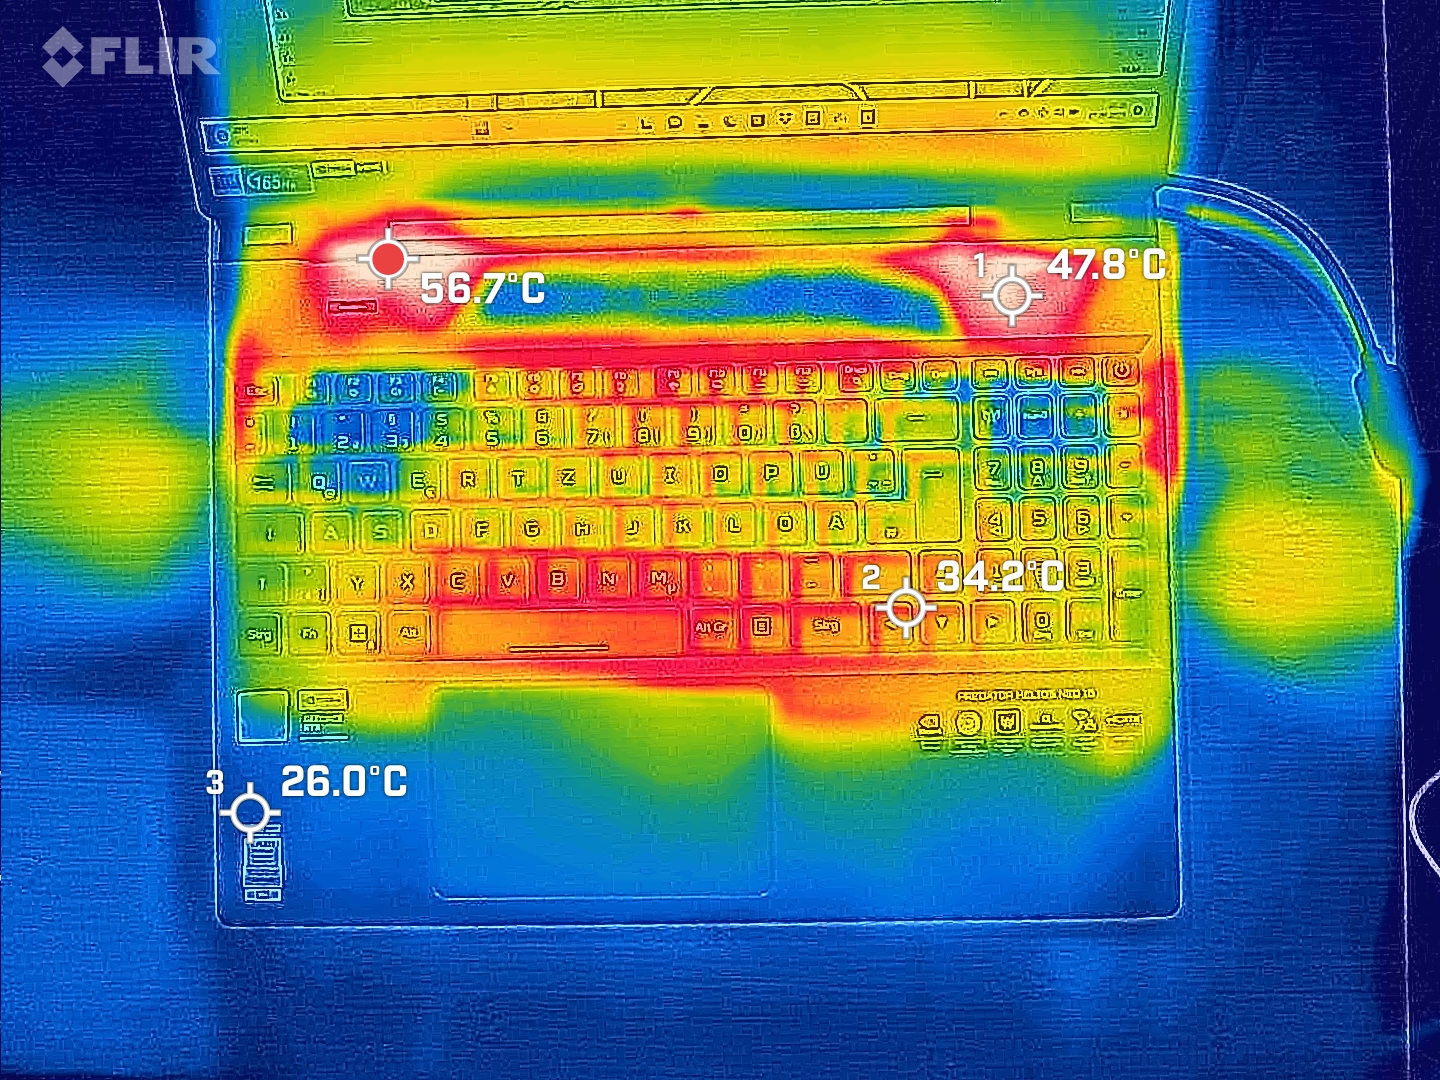
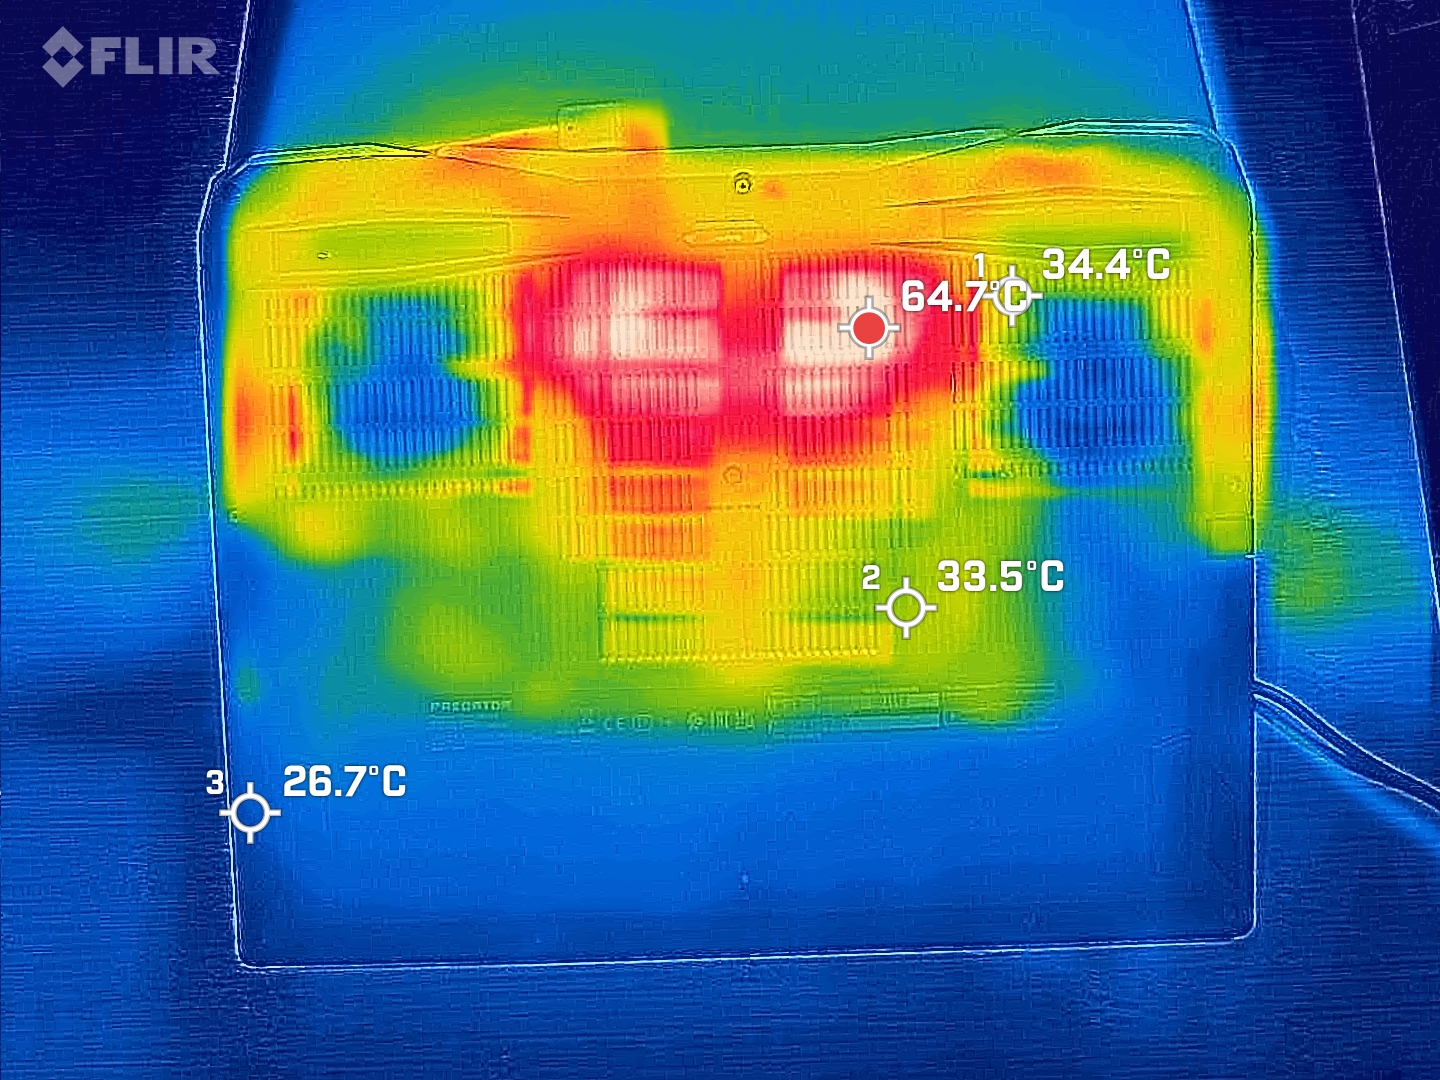
Température
Dans l'ensemble, l'ordinateur portable de jeu d'Acer reste assez froid, ses surfaces n'atteignant généralement que 25 à 35 °C à pleine charge. Cependant, nous avons noté quelques points chauds avec des températures allant jusqu'à 56 °C : à gauche au-dessus du clavier et à l'arrière au centre de la partie supérieure. Ce dernier point peut s'avérer inconfortable lorsque vous jouez avec l'ordinateur portable posé sur vos genoux, par exemple.
(-) La température maximale du côté supérieur est de 55.7 °C / 132 F, par rapport à la moyenne de 40.4 °C / 105 F, allant de 21.2 à 68.8 °C pour la classe Gaming.
(-) Le fond chauffe jusqu'à un maximum de 55 °C / 131 F, contre une moyenne de 43.2 °C / 110 F
(+) En utilisation inactive, la température moyenne du côté supérieur est de 24.1 °C / 75 F, par rapport à la moyenne du dispositif de 33.9 °C / 93 F.
(+) Les repose-poignets et le pavé tactile sont plus froids que la température de la peau avec un maximum de 26.1 °C / 79 F et sont donc froids au toucher.
(+) La température moyenne de la zone de l'appui-paume de dispositifs similaires était de 28.8 °C / 83.8 F (+2.7 °C / #4.8 F).
| Acer Predator Helios Neo 16 NH.QLTEG.002 Intel Core i5-13500HX, NVIDIA GeForce RTX 4050 Laptop GPU | Lenovo Legion Pro 5 16ARX8 (R5 7645HX, RTX 4050) AMD Ryzen 5 7645HX, NVIDIA GeForce RTX 4050 Laptop GPU | Lenovo LOQ 16IRH8 Intel Core i7-13620H, NVIDIA GeForce RTX 4060 Laptop GPU | Schenker XMG Apex 15 (Late 23) AMD Ryzen 7 7840HS, NVIDIA GeForce RTX 4050 Laptop GPU | HP Victus 16-r0076TX Intel Core i5-13500HX, NVIDIA GeForce RTX 4050 Laptop GPU | Dell G15 5530 Intel Core i7-13650HX, NVIDIA GeForce RTX 4060 Laptop GPU | |
|---|---|---|---|---|---|---|
| Heat | -15% | -2% | -7% | -0% | -16% | |
| Maximum Upper Side * (°C) | 55.7 | 45 19% | 48 14% | 52 7% | 48 14% | 54 3% |
| Maximum Bottom * (°C) | 55 | 54 2% | 59 -7% | 47 15% | 48 13% | 62.2 -13% |
| Idle Upper Side * (°C) | 26 | 36 -38% | 28 -8% | 33 -27% | 29.6 -14% | 33.4 -28% |
| Idle Bottom * (°C) | 26.6 | 38 -43% | 28 -5% | 33 -24% | 30.2 -14% | 33.4 -26% |
* ... Moindre est la valeur, meilleures sont les performances
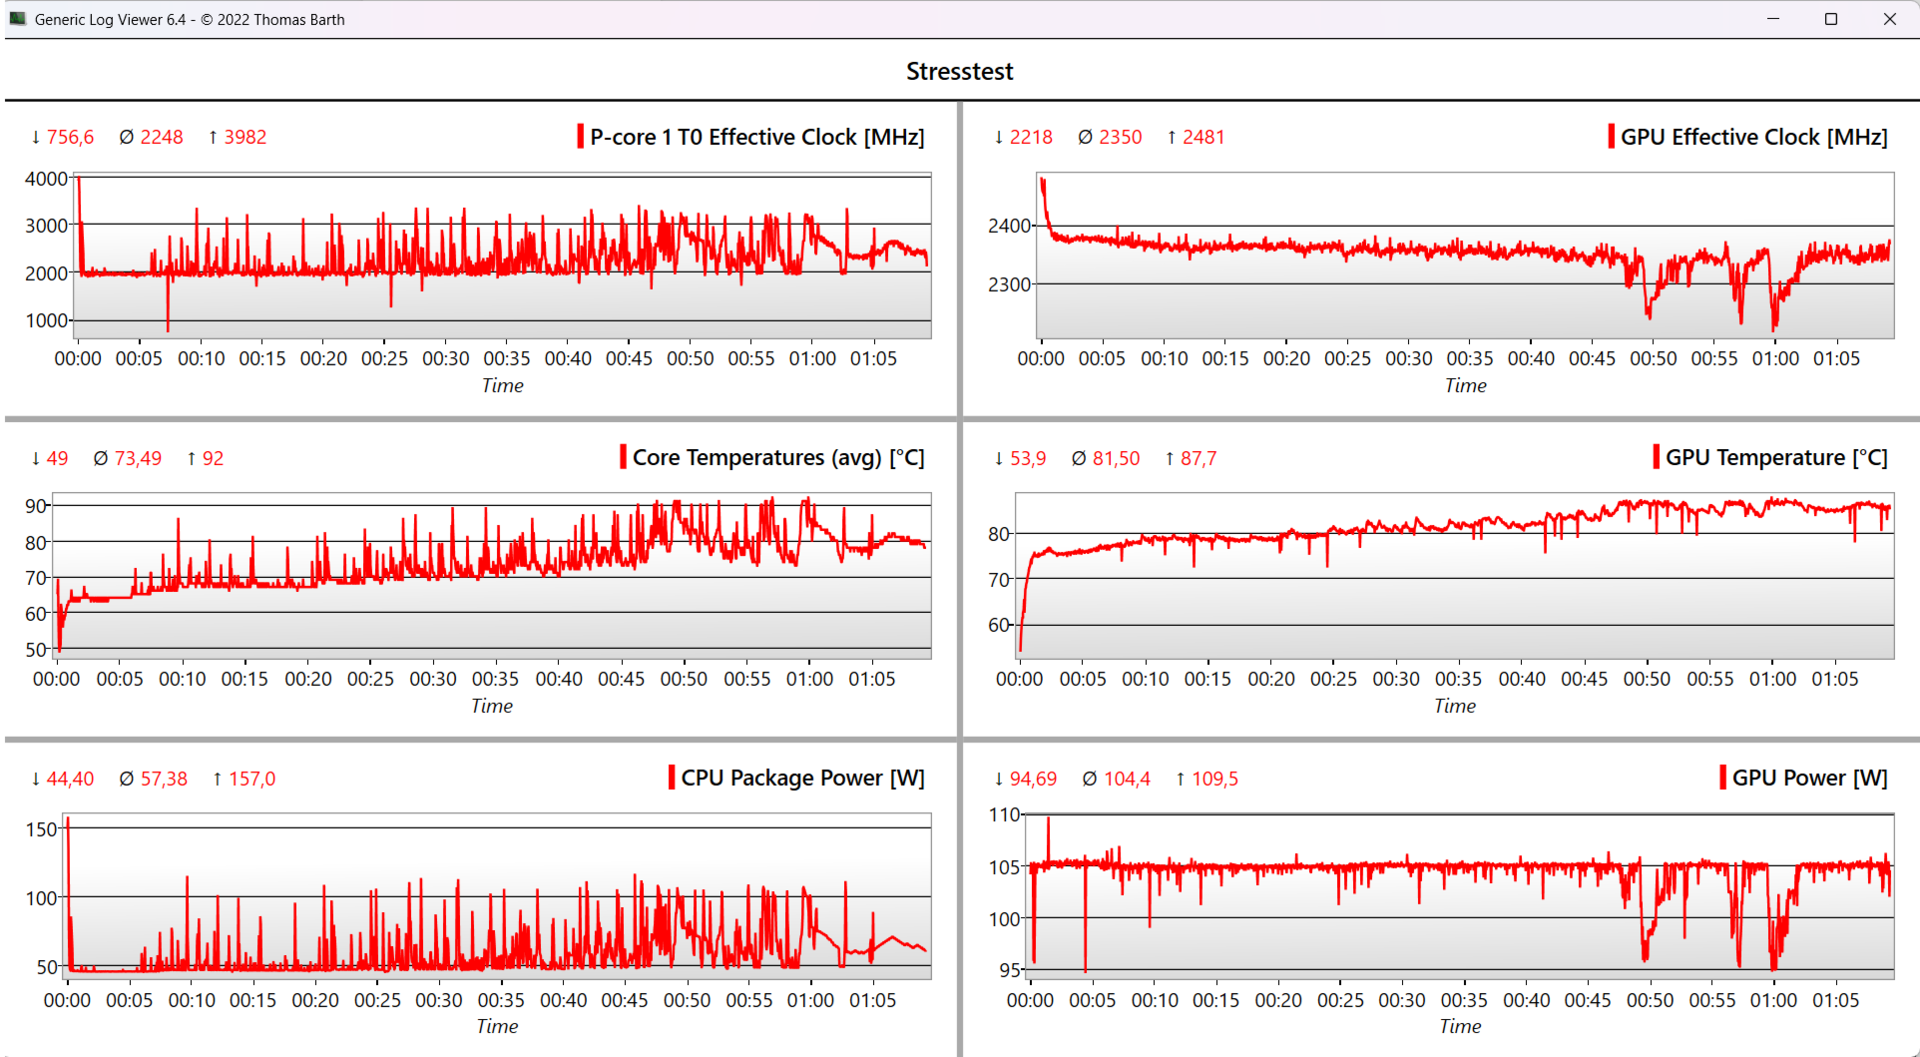
Épreuve d'effort
Lors de notre test de stress combiné (FurMark + Prime95), la fréquence d'horloge des cœurs P est passée de 4 GHz à seulement 2 GHz après une minute et a commencé à fluctuer autour de 2,25 GHz à partir de la cinquième minute, ce qui est supérieur à l'horloge de base de 1,8 GHz.
Le processeur a atteint jusqu'à 92 °C mais a tellement fluctué que, même après une heure, il est encore tombé occasionnellement sous la barre des 80 °C. Sa consommation moyenne est de 58 watts, alors que leHelios 16 (non-Neo) avec un processeuri7-13700HX consomme 100 watts malgré un système de refroidissement (presque) identique. La fréquence d'horloge du GPU est rapidement passée de 2 560 MHz (horloge maximale) à environ 2 350 MHz et a atteint des températures allant jusqu'à 87 °C.
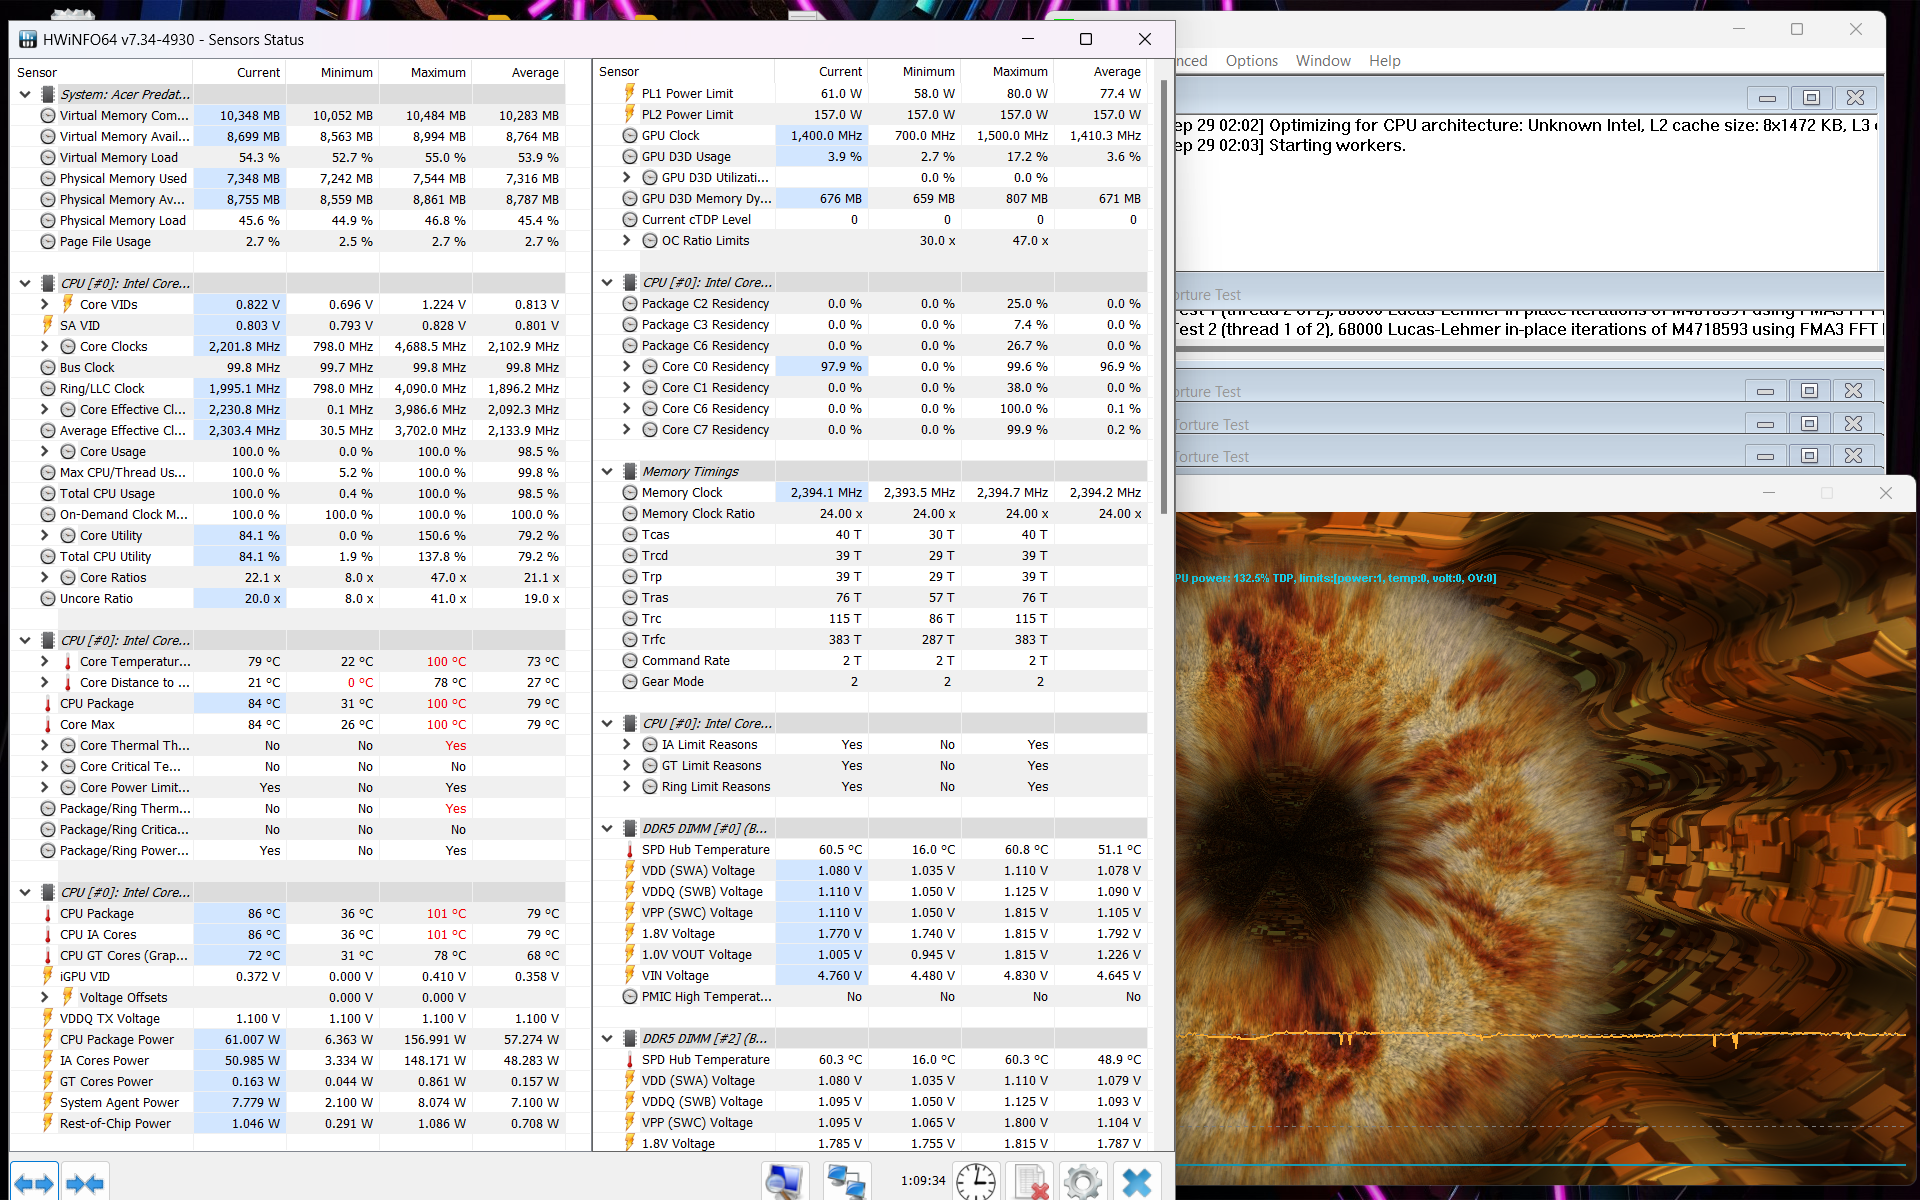
| Horloge du CPU (GHz) | Horloge du GPU (MHz) | Température moyenne du CPU (°C) | Température moyenne du GPU (°C) | |
| Prime95+FurMark | 2,25 | 2.350 | 74 | 82 |
Haut-parleurs
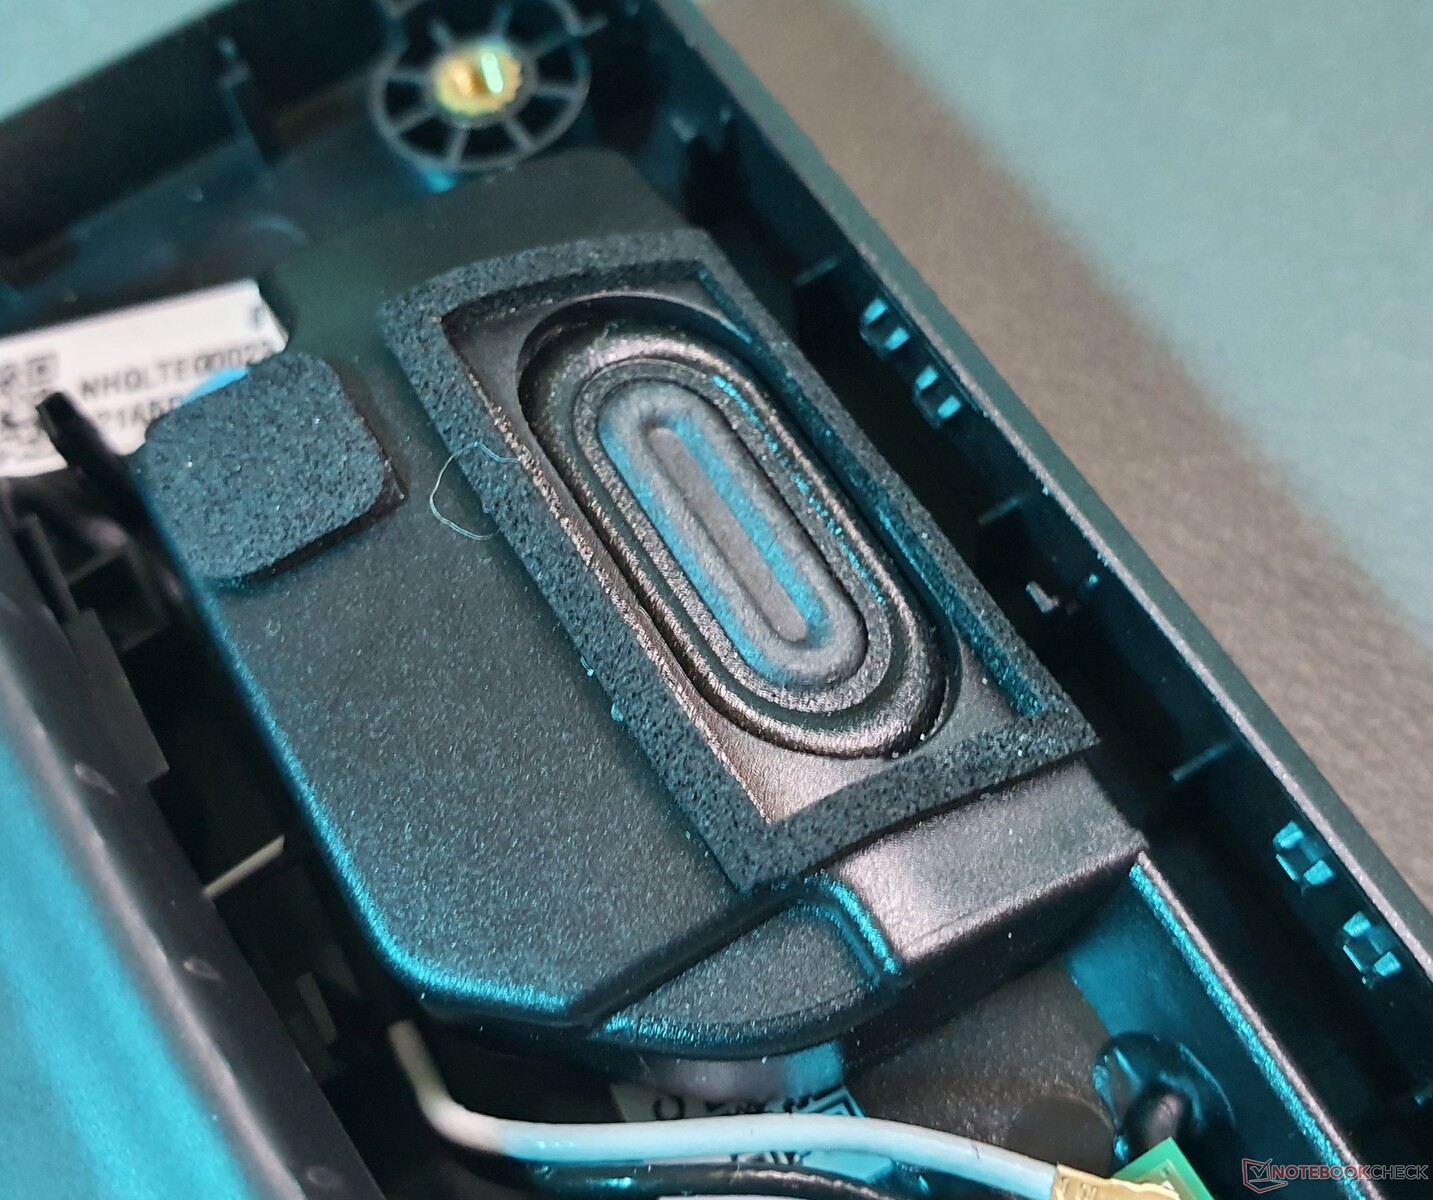
Les haut-parleurs stéréo de 2 watts orientés vers le bas produisent des médiums et des aigus équilibrés, mais les basses sont presque totalement absentes. Leur volume maximal de 78,5 dB(A) est également moyen. Les ordinateurs portables de jeu de notre comparatif n'offrent pas non plus un meilleur son.
Un casque ou un système audio connecté via la prise audio ou Bluetooth est donc recommandé pour une expérience sonore immersive.
Acer Predator Helios Neo 16 NH.QLTEG.002 analyse audio
(±) | le niveau sonore du haut-parleur est moyen mais bon (78.5# dB)
Basses 100 - 315 Hz
(-) | presque aucune basse - en moyenne 24.6% plus bas que la médiane
(±) | la linéarité des basses est moyenne (12.3% delta à la fréquence précédente)
Médiums 400 - 2000 Hz
(+) | médiane équilibrée - seulement 2.4% de la médiane
(+) | les médiums sont linéaires (5.7% delta à la fréquence précédente)
Aiguës 2 - 16 kHz
(+) | des sommets équilibrés - à seulement 1.9% de la médiane
(+) | les aigus sont linéaires (3.3% delta à la fréquence précédente)
Globalement 100 - 16 000 Hz
(±) | la linéarité du son global est moyenne (17.4% de différence avec la médiane)
Par rapport à la même classe
» 48% de tous les appareils testés de cette catégorie étaient meilleurs, 12% similaires, 40% pires
» Le meilleur avait un delta de 6%, la moyenne était de 18%, le pire était de 132%.
Par rapport à tous les appareils testés
» 33% de tous les appareils testés étaient meilleurs, 8% similaires, 58% pires
» Le meilleur avait un delta de 4%, la moyenne était de 23%, le pire était de 134%.
Lenovo Legion Pro 5 16ARX8 (R5 7645HX, RTX 4050) analyse audio
(±) | le niveau sonore du haut-parleur est moyen mais bon (78.06# dB)
Basses 100 - 315 Hz
(-) | presque aucune basse - en moyenne 20.9% plus bas que la médiane
(±) | la linéarité des basses est moyenne (11.7% delta à la fréquence précédente)
Médiums 400 - 2000 Hz
(±) | médiane supérieure - en moyenne 6.8% supérieure à la médiane
(+) | les médiums sont linéaires (5.7% delta à la fréquence précédente)
Aiguës 2 - 16 kHz
(+) | des sommets équilibrés - à seulement 2.8% de la médiane
(±) | la linéarité des aigus est moyenne (7.5% delta à la fréquence précédente)
Globalement 100 - 16 000 Hz
(±) | la linéarité du son global est moyenne (21.5% de différence avec la médiane)
Par rapport à la même classe
» 77% de tous les appareils testés de cette catégorie étaient meilleurs, 5% similaires, 18% pires
» Le meilleur avait un delta de 6%, la moyenne était de 18%, le pire était de 132%.
Par rapport à tous les appareils testés
» 61% de tous les appareils testés étaient meilleurs, 7% similaires, 32% pires
» Le meilleur avait un delta de 4%, la moyenne était de 23%, le pire était de 134%.
Gestion de l'énergie : Le processeur d'un ordinateur de bureau fait des ravages sur l'ordinateur portable de jeu
Consommation électrique
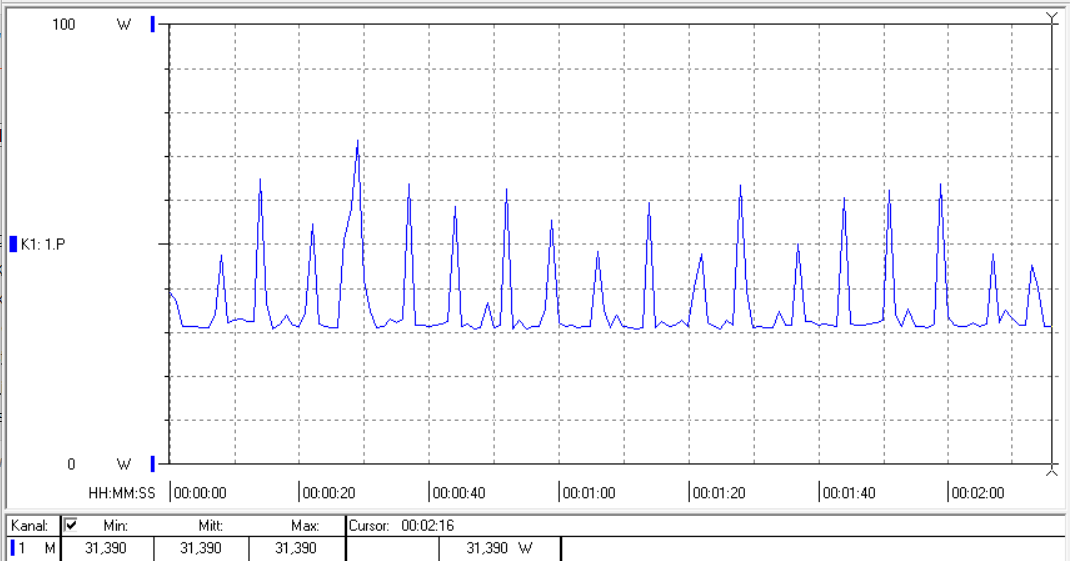
La consommation d'énergie de 15,5 watts en mode veille n'est pas surprenante compte tenu de l'utilisation d'un processeur de classe bureau. Les autres systèmes HX (55 watts TDP), qu'ils soient Intel ou AMD, consomment souvent jusqu'à 20 watts. Les systèmes HS AMD (TDP de 35 watts) tels que leXMG Apex 15 (qui ne consomme que 10 watts en mode veille) ont souvent un avantage correspondant.
Une consommation de 145 watts pendant le jeu est relativement faible, mais pas si l'on considère que laRTX 4050 atteint déjà son horloge maximale à ~87 watts. Ce n'est que lors du test de stress non quotidien qu'elle a atteint un pic de 239 watts, ce que l'alimentation de 230 watts peut encore gérer.
| Éteint/en veille | |
| Au repos | |
| Fortement sollicité |
|
Légende:
min: | |
| Acer Predator Helios Neo 16 NH.QLTEG.002 i5-13500HX, GeForce RTX 4050 Laptop GPU, SK hynix HFS512GEJ9X125N, IPS, 1920x1200, 16" | Lenovo Legion Pro 5 16ARX8 (R5 7645HX, RTX 4050) R5 7645HX, GeForce RTX 4050 Laptop GPU, SK hynix PC801 HFS512GEJ9X115N, IPS, 2560x1600, 16" | Lenovo LOQ 16IRH8 i7-13620H, GeForce RTX 4060 Laptop GPU, Solidigm SSDPFINW512GZL, IPS, 2560x1600, 16" | Schenker XMG Apex 15 (Late 23) R7 7840HS, GeForce RTX 4050 Laptop GPU, Samsung 990 Pro 1 TB, IPS, 2560x1440, 15.6" | HP Victus 16-r0076TX i5-13500HX, GeForce RTX 4050 Laptop GPU, SK hynix PC801 HFS512GEJ9X101N BF, IPS, 1920x1080, 16.1" | Dell G15 5530 i7-13650HX, GeForce RTX 4060 Laptop GPU, SSTC CL4-3D512-Q11, IPS, 1920x1080, 15.6" | Moyenne NVIDIA GeForce RTX 4050 Laptop GPU | Moyenne de la classe Gaming | |
|---|---|---|---|---|---|---|---|---|
| Power Consumption | 4% | -6% | 31% | -9% | 7% | 15% | -10% | |
| Idle Minimum * (Watt) | 11.95 | 13 -9% | 17.2 -44% | 6 50% | 16.12 -35% | 8.4 30% | 9.95 ? 17% | 13 ? -9% |
| Idle Average * (Watt) | 32 | 17.4 46% | 19.3 40% | 11 66% | 20.47 36% | 14.98 53% | 15.8 ? 51% | 19 ? 41% |
| Idle Maximum * (Watt) | 15.5 | 21.8 -41% | 21.2 -37% | 14 10% | 22.11 -43% | 15.56 -0% | 20.1 ? -30% | 24.6 ? -59% |
| Load Average * (Watt) | 97.5 | 96.4 1% | 90 8% | 65 33% | 94.8 3% | 96.8 1% | 88 ? 10% | 110.7 ? -14% |
| Witcher 3 ultra * (Watt) | 144.9 | 125 14% | 168 -16% | 136.5 6% | 166.9 -15% | 186 -28% | ||
| Load Maximum * (Watt) | 239 | 204 15% | 211 12% | 195 18% | 237 1% | 271.42 -14% | 176.3 ? 26% | 259 ? -8% |
* ... Moindre est la valeur, meilleures sont les performances
Power consumption Witcher 3 / stress test
Power consumption with external monitor
Délais d'exécution
Avec une autonomie de 4 heures et 16 minutes, l'Helios Neo 16 n'est pas très endurant, même dans le contexte des appareils de jeu. Le taux de rafraîchissement est automatiquement réglé de manière variable entre 83 Hz et 120 Hz.
L'écranHP Victus 16 (9 heures) et l'AMDXMG Apex 15 (7 heures) offrent des durées d'autonomie nettement plus longues, bien que ce dernier ait une batterie plus petite de 63 Wh.
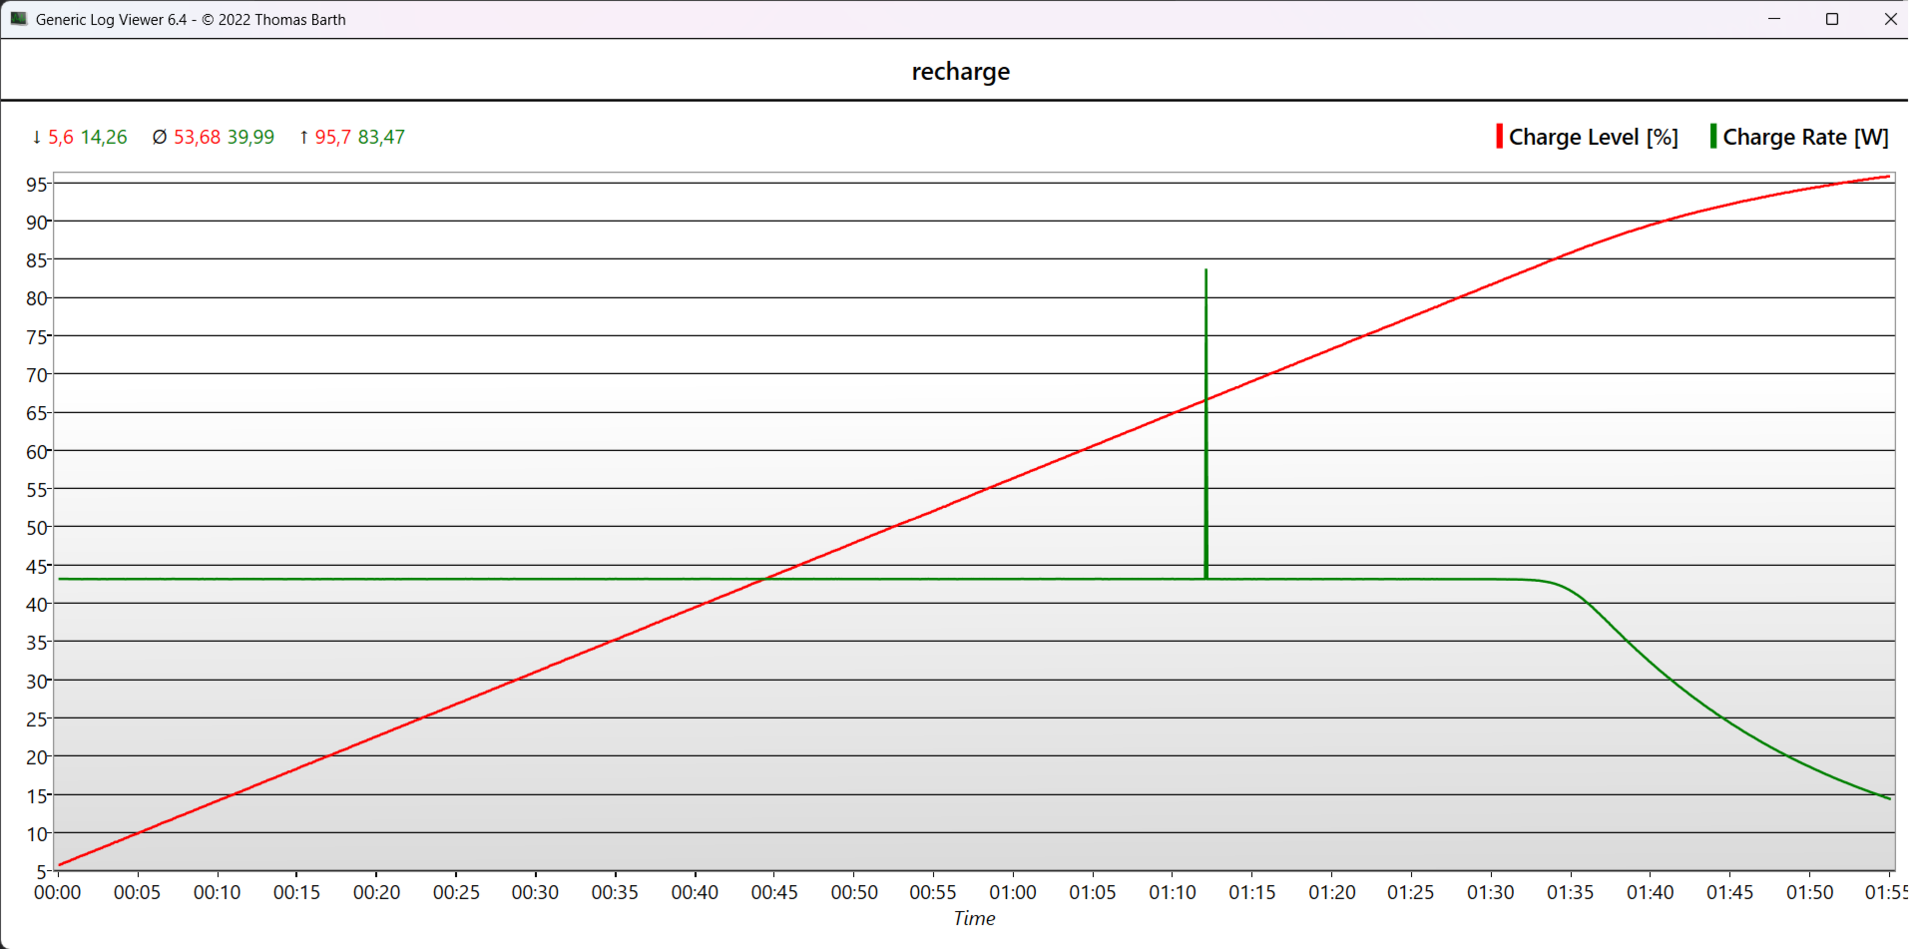
Une heure complète est nécessaire pour charger la batterie à 50 % et une charge complète prend deux heures. Le chargement via l'USB-C prend encore plus de temps.
| Acer Predator Helios Neo 16 NH.QLTEG.002 i5-13500HX, GeForce RTX 4050 Laptop GPU, 90 Wh | Lenovo Legion Pro 5 16ARX8 (R5 7645HX, RTX 4050) R5 7645HX, GeForce RTX 4050 Laptop GPU, 80 Wh | Acer Predator Helios 16 PH16-71-731Q i7-13700HX, GeForce RTX 4060 Laptop GPU, 90 Wh | Lenovo LOQ 16IRH8 i7-13620H, GeForce RTX 4060 Laptop GPU, 80 Wh | Schenker XMG Apex 15 (Late 23) R7 7840HS, GeForce RTX 4050 Laptop GPU, 62.32 Wh | HP Victus 16-r0076TX i5-13500HX, GeForce RTX 4050 Laptop GPU, 83 Wh | Dell G15 5530 i7-13650HX, GeForce RTX 4060 Laptop GPU, 86 Wh | Moyenne de la classe Gaming | |
|---|---|---|---|---|---|---|---|---|
| Autonomie de la batterie | 3% | -7% | 6% | 23% | 27% | -4% | 21% | |
| H.264 (h) | 7.2 | 5.4 -25% | 4.8 -33% | 6.4 -11% | 8.3 15% | 7.7 7% | 6.8 -6% | 8.32 ? 16% |
| WiFi v1.3 (h) | 4.3 | 5.6 30% | 5.6 30% | 6.3 47% | 7.1 65% | 8.9 107% | 6.5 51% | 7.11 ? 65% |
| Load (h) | 1.8 | 1.5 -17% | 1.5 -17% | 1.6 -11% | 1.2 -33% | 0.8 -56% | 1.502 ? -17% | |
| Witcher 3 ultra (h) | 0.8 | 1.5 | 1.5 | 0.8 |
Points positifs
Points négatifs
Verdict : Le joueur de milieu de gamme avec une RTX 4050 n'est pas très prometteur
Le Predator Helios Neo 16 d'Acer est une chimère composée d'un solide ordinateur portable de jeu de milieu de gamme et de quelques caractéristiques d'entrée de gamme. En particulier, ce dernier inclut laRTX 4050installée dans notre appareil de test - mais sa dalle Full HD, qui peut offrir des valeurs décentes, est plutôt standard. Il en va de même pour son clavier, que l'on retrouve dans de nombreux autres ordinateurs portables de jeu à bas prix.
Acer a associé tout cela à un puissant processeur Intel Corei5-13500HXde classe bureau, avec une solution de refroidissement par liquide métallique, un boîtier élégant, robuste et bien construit, ainsi que de nombreuses options de connectivité, dont un véritable HDMI 2.1 connecté au dGPU et deux ports Thunderbolt 4. La configuration est complétée par Advanced Optimus et G-Sync.
Malheureusement, nous ne sommes pas tout à fait sûrs que cette combinaison (en relation avec son MRSP de 1 069 $ US) puisse trouver son marché cible. Elle nécessiterait plutôt uneRTX 4060ou uneRTX 4070pour la rentabiliser, ce qui n'est souvent possible qu'avec la Neo 16 moyennant un supplément de prix. Contrairement à la version normale de lHelios 16ce modèle n'offre pas la possibilité d'opter pour un i9-13900HX, une dalle QHD avec une couverture sRGB à 100 % ou une option Mini LED. Sa webcam 720p est également une grande différence et, compte tenu du prix de l'ordinateur portable, c'est une véritable raison de le critiquer. Son autonomie de 4 heures et demie n'est pas non plus la meilleure.
L'Acer Predator Helios Neo 16 est une version allégée du solide Helios 16. En théorie, c'est une bonne idée, mais cela ne fonctionnerait que si la différence de prix entre les deux n'était pas aussi faible.
Son puissant système de refroidissement a été repris presque à l'identique de celui de l'Helios 16, ce qui se traduit par de faibles températures internes et de faibles émissions sonores (au plus tard en mode équilibré), et ce au détriment des performances. En revanche, les restrictions de puissance du GPU et du CPU en mode batterie sont un peu exagérées.
Nous trouvons tout à fait bizarre que vous puissiez obtenir l'Helios 16 normal avec la même configuration mais avec plus de fonctionnalités pour le même prix. Vous pouvez également jeter un coup d'œil auLegion Pro 5 16(Intel), qui coûte un peu plus cher mais bénéficie d'une dalle QHD 240 Hz, d'une RTX 4060 plus puissante, d'un clavier confortable, ainsi que d'un refroidissement plus silencieux lors des jeux. En revanche, si vous recherchez un véritable ordinateur de jeu à petit budget, vous feriez mieux de jeter un coup d'œil auLenovo LOQ 16qui est équipé d'un ordinateur AMDRyzen 9 7940HSune dalle QHD et une RTX 4050 (1 200 $) ou une RTX 4060 (1 400 $).
Prix et disponibilité
La version de l'Acer Predator Helios 16 que nous avons testée, avec un Intel Core i5-13500HX, une RTX 4050 et un écran FHD+, est disponible sur Amazon pour 1 069 dollars.
Acer Predator Helios Neo 16 NH.QLTEG.002
- 11/02/2023 v7 (old)
Marvin Gollor
Transparency
La sélection des appareils à examiner est effectuée par notre équipe éditoriale. L'échantillon de test a été prêté à l'auteur par le fabricant ou le détaillant pour les besoins de cet examen. Le prêteur n'a pas eu d'influence sur cette évaluation et le fabricant n'a pas reçu de copie de cette évaluation avant sa publication. Il n'y avait aucune obligation de publier cet article. En tant que média indépendant, Notebookcheck n'est pas soumis à l'autorité des fabricants, des détaillants ou des éditeurs.
Voici comment Notebookcheck teste
Chaque année, Notebookcheck examine de manière indépendante des centaines d'ordinateurs portables et de smartphones en utilisant des procédures standardisées afin de garantir que tous les résultats sont comparables. Nous avons continuellement développé nos méthodes de test depuis environ 20 ans et avons établi des normes industrielles dans le processus. Dans nos laboratoires de test, des équipements de mesure de haute qualité sont utilisés par des techniciens et des rédacteurs expérimentés. Ces tests impliquent un processus de validation en plusieurs étapes. Notre système d'évaluation complexe repose sur des centaines de mesures et de points de référence bien fondés, ce qui garantit l'objectivité.Price comparison

