Test du Schenker XMG Focus 17 (E23) : PC portable de jeu avec RTX 4070 très puissant
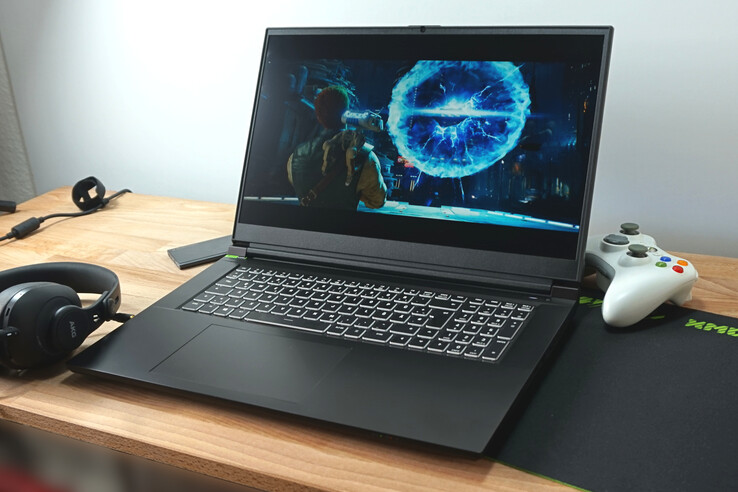
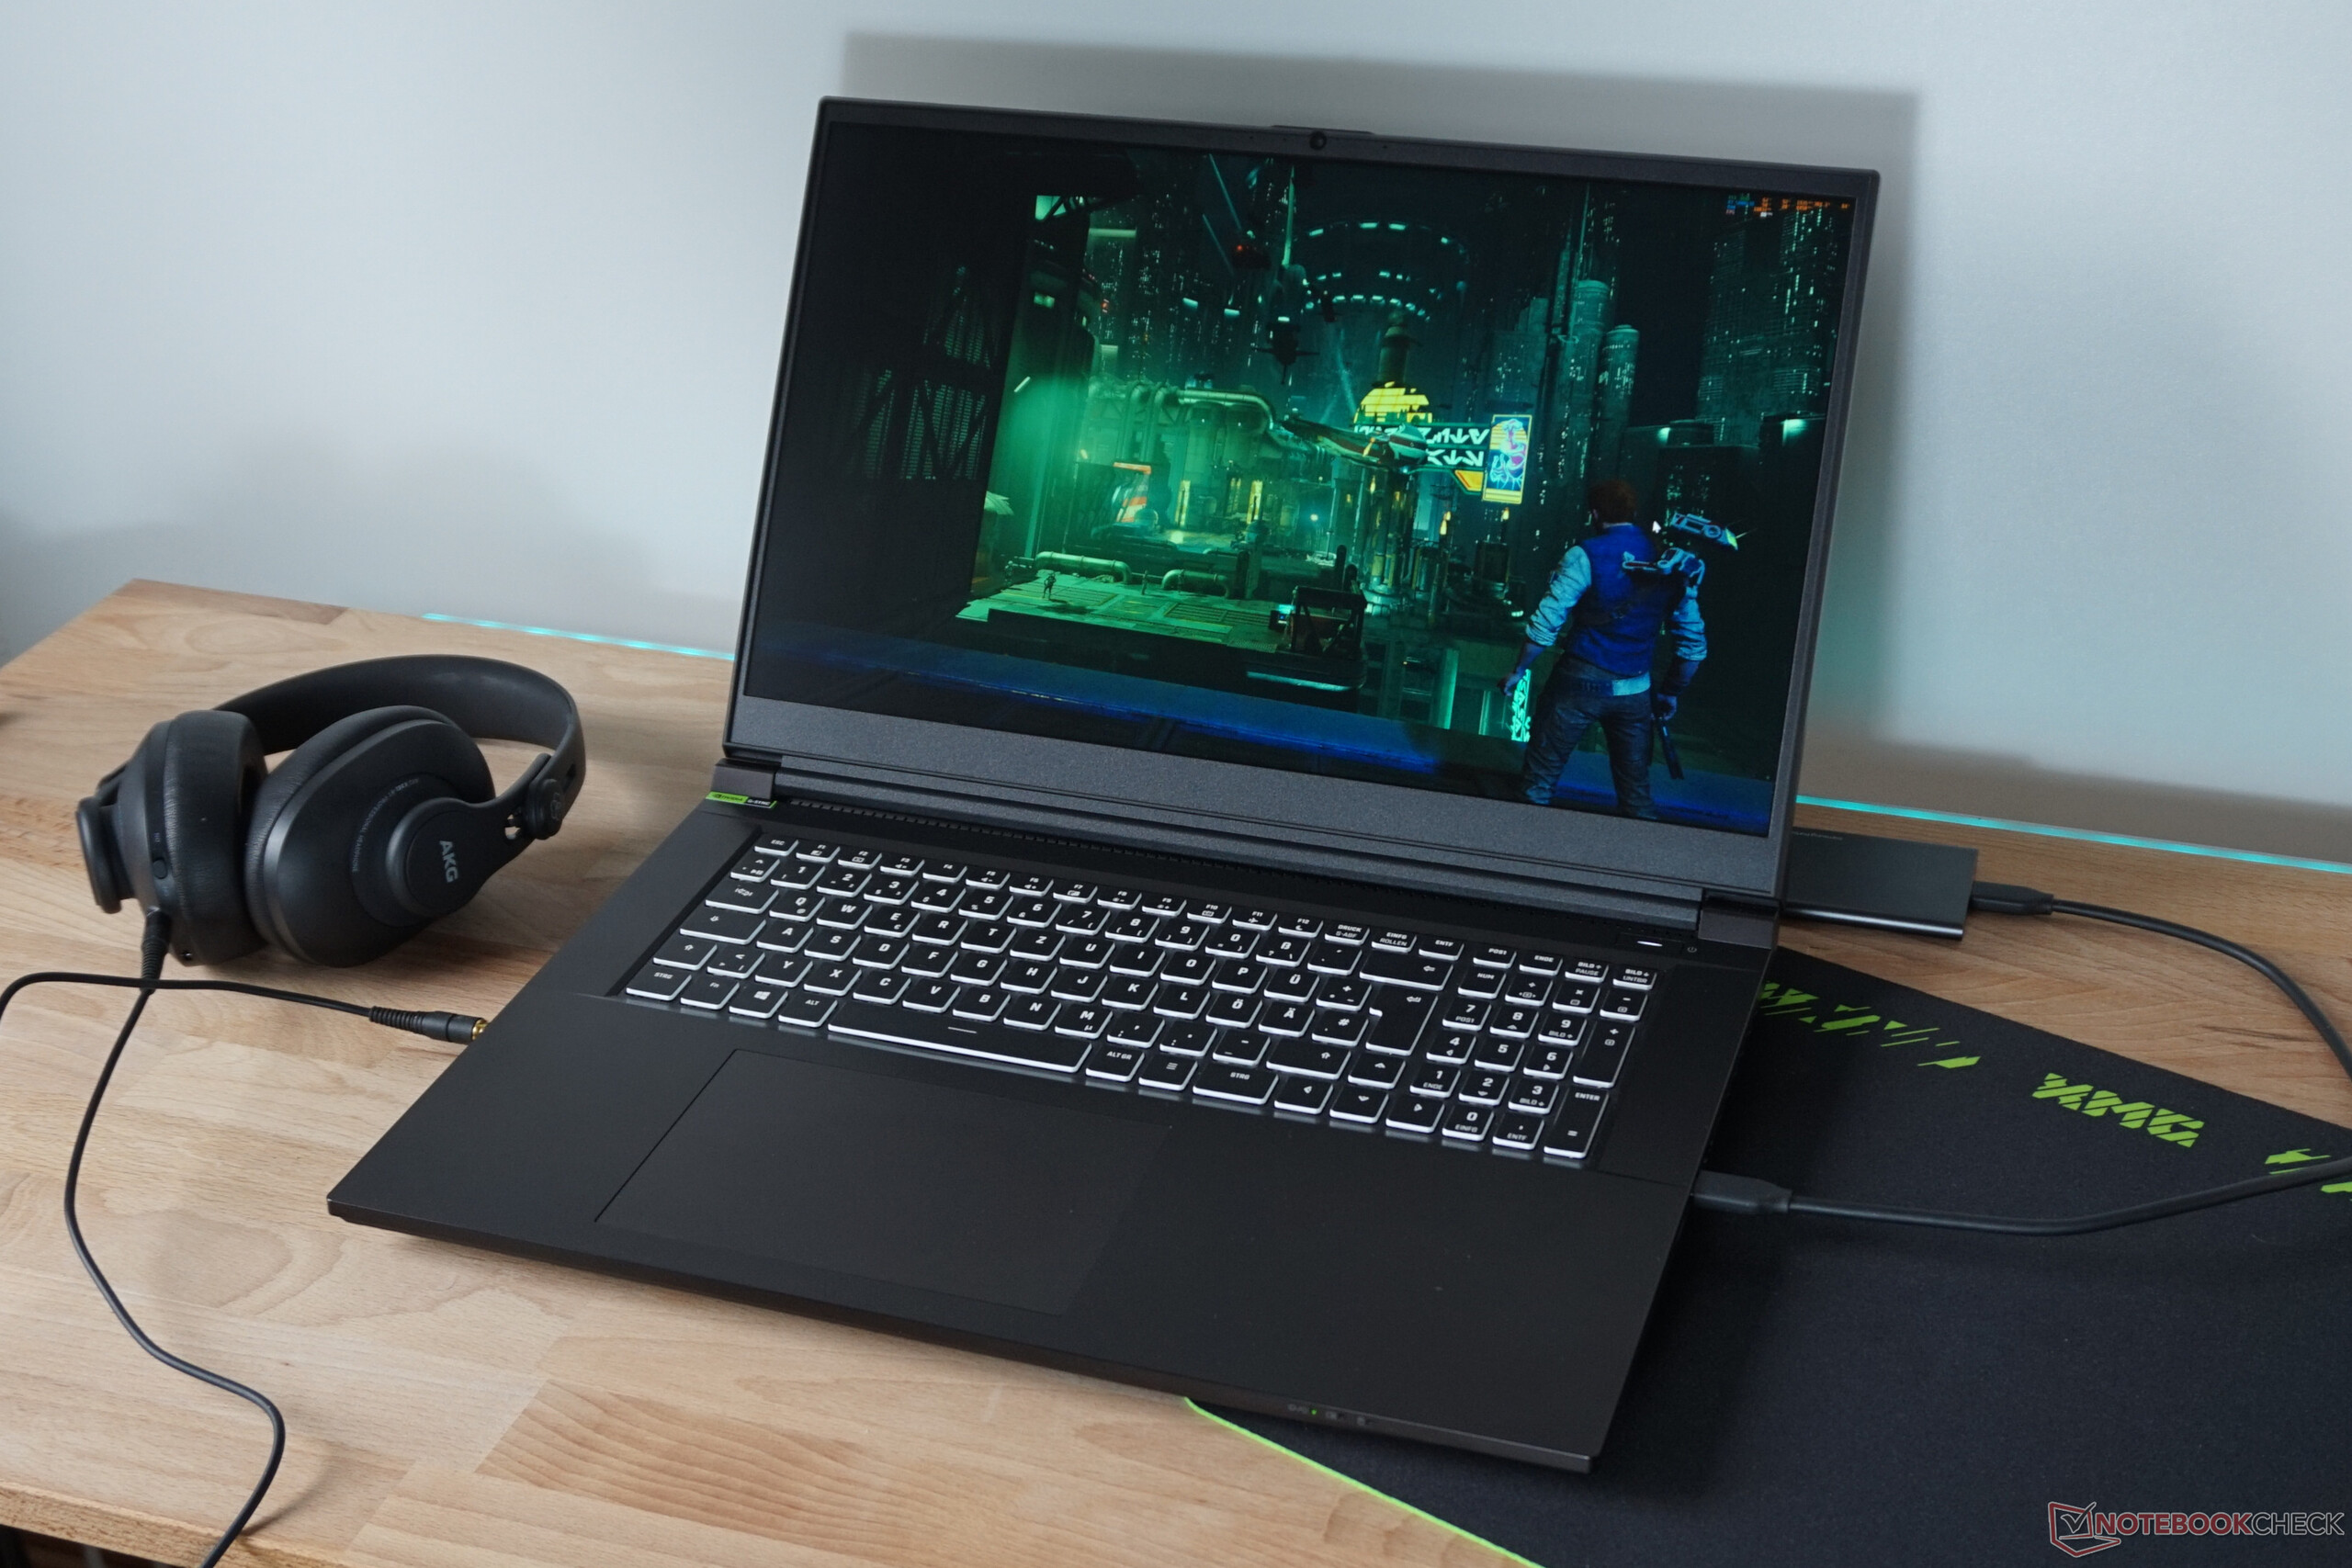
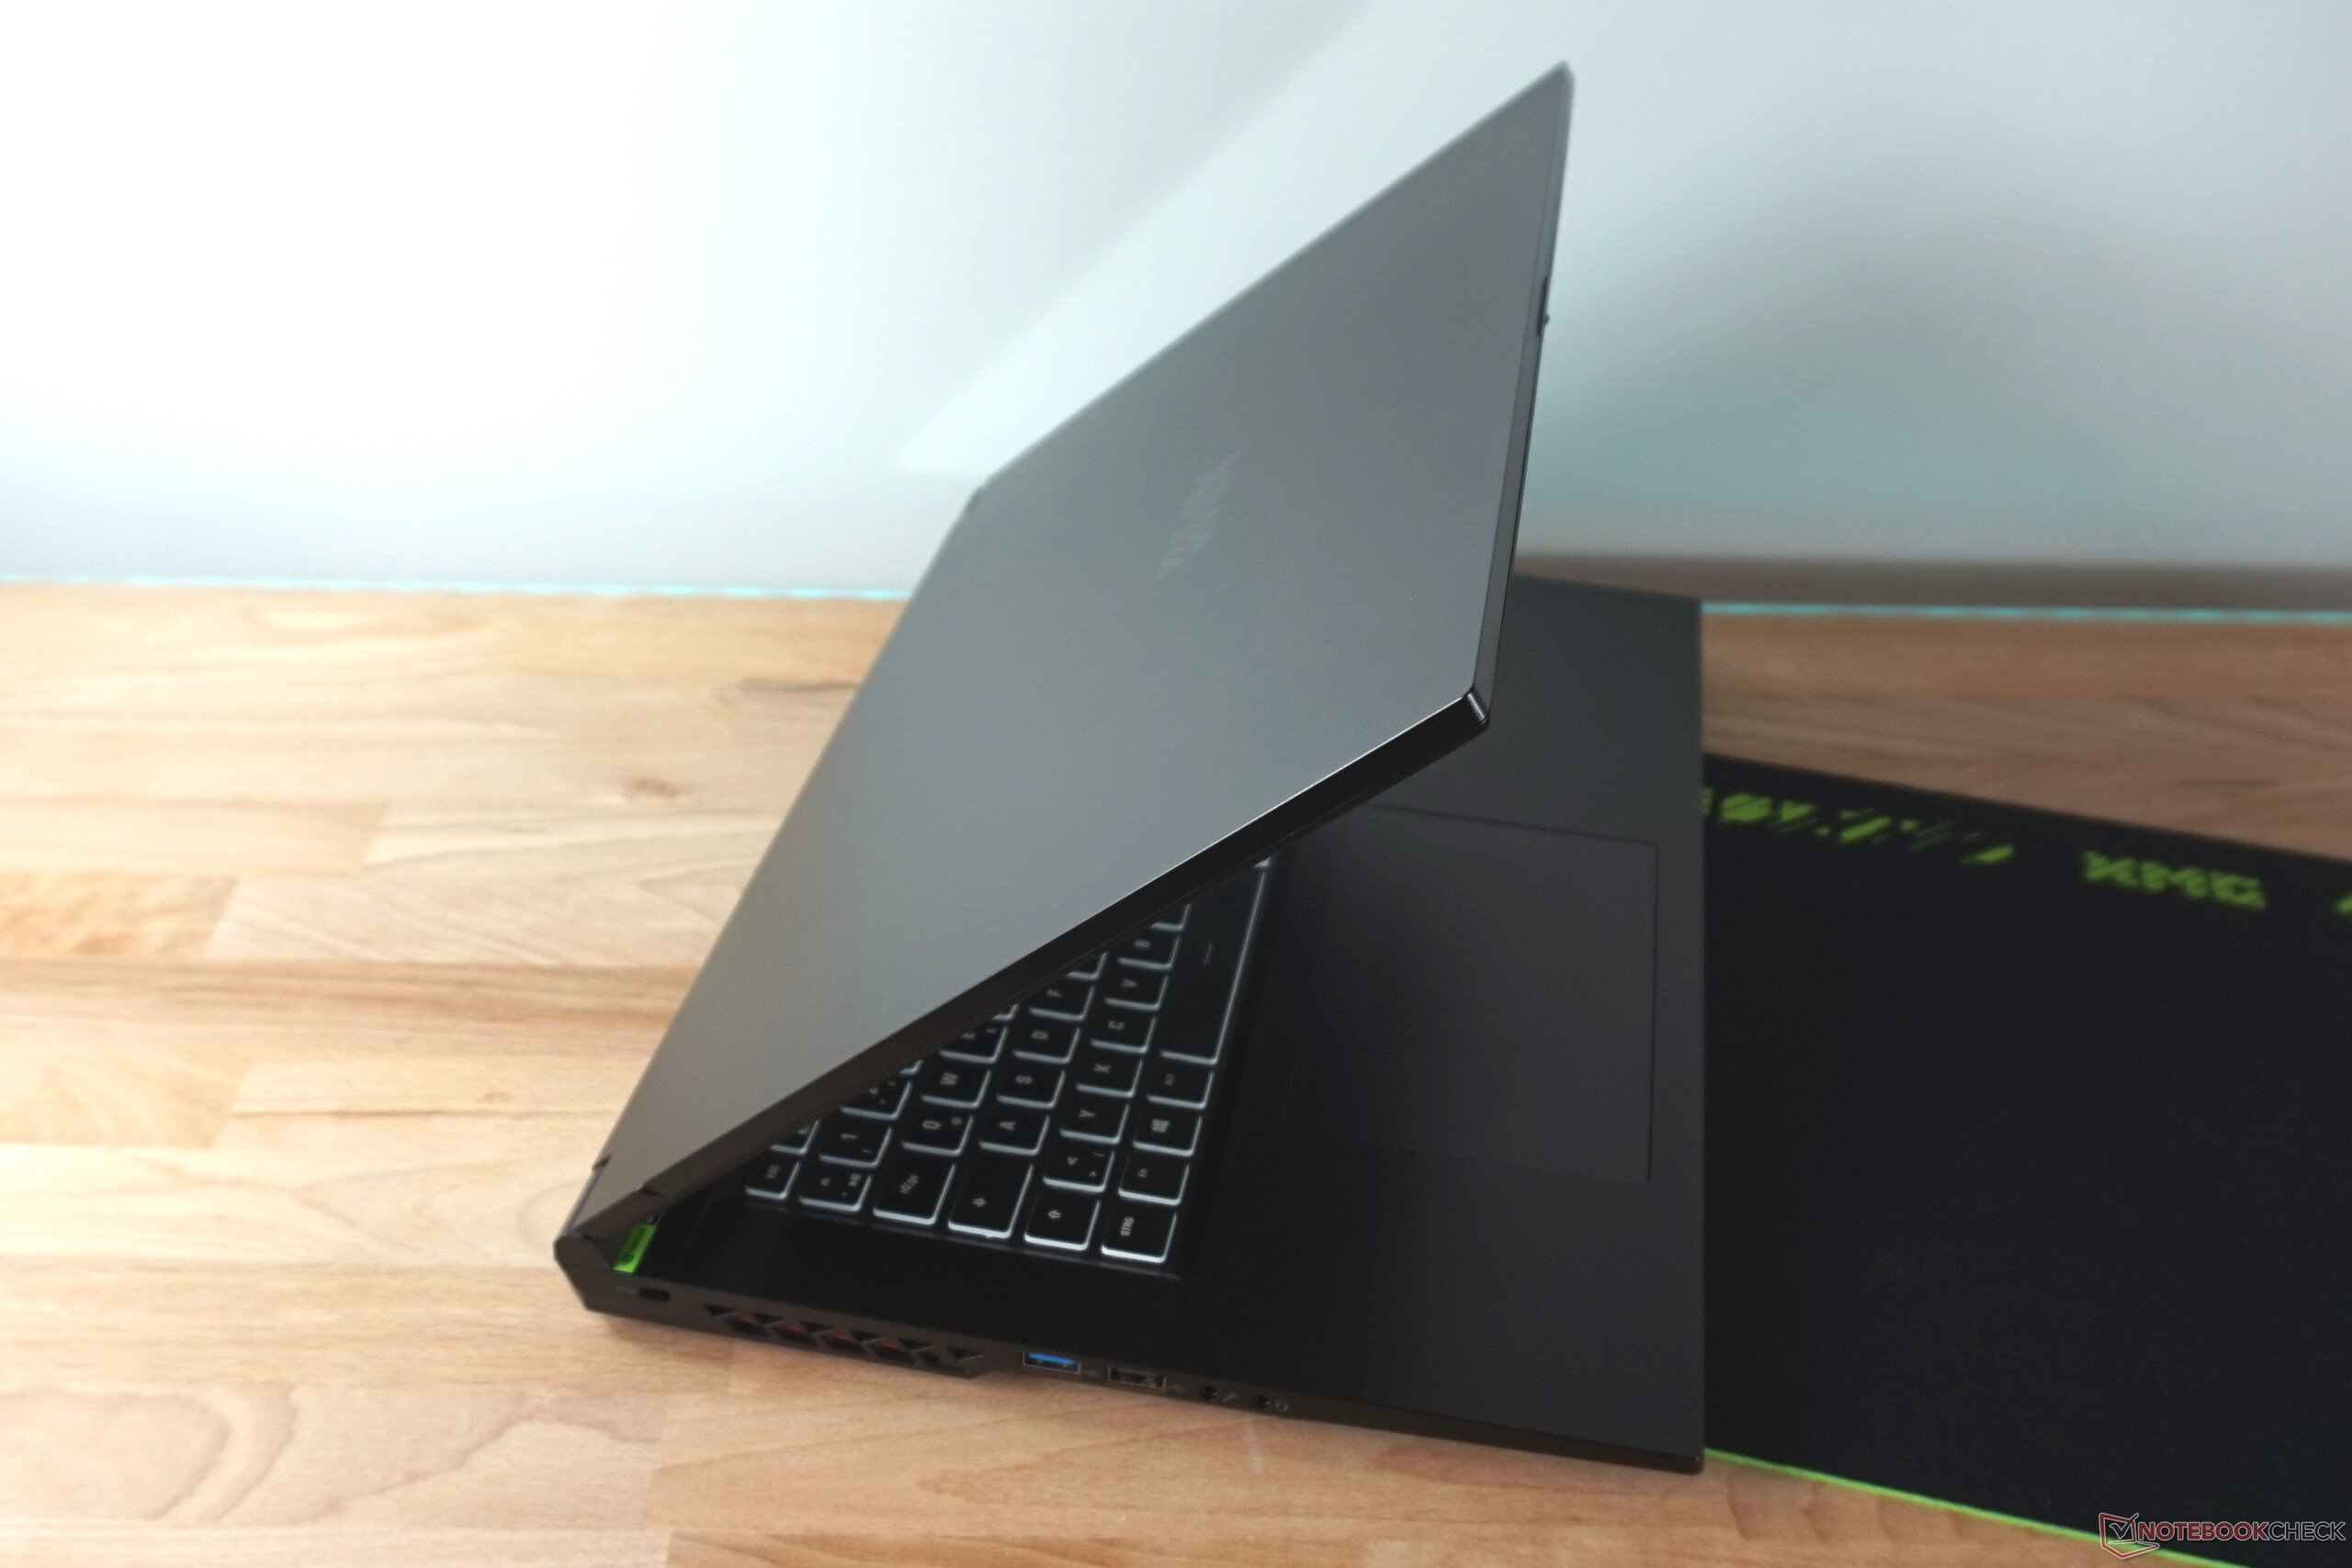
L'ordinateur portable de jeu Schenker XMG Focus 17 E23 (barebone : NP70SNE-G) se concentre sur l'essentiel. Avec le remarquable processeur i9 et, en option, une carteRTX 4050, 4060ou 4070les performances sont suffisantes pour les jeux. L'écran offre également une fréquence de 240 Hz et un nombre suffisant de pixels.
Cependant, il n'y a pas d'extras extraordinaires, de caractéristiques spéciales ou de meilleur design. Le boîtier a changé par rapport à notre dernière évaluation du XMG Focus 17 XMG Focus 17 (Clevo NP70HK)de 2021, de sorte que des informations plus détaillées sur le boîtier, la construction et l'équipement peuvent être trouvées dans cet article. En dehors des performances de jeu, l'ordinateur portable est également plutôt modeste. En contrepartie, il reste bien en dessous des 2000 euros (selon la configuration) et n'est pas beaucoup plus cher dans la configuration la plus élevée que nous avons testée.
Les concurrents comme le Medion Erazer Major X20 ou un Lenovo Legion Pro 5 suivent des voies similaires et utilisent du matériel comparable. Cependant, ils ne sont pas aussi performants que l'ordinateur portable de Schenker, comme le montre notre test détaillé.
Comparaison avec les concurrents potentiels
Note | Date | Modèle | Poids | Épaisseur | Taille | Résolution | Prix |
|---|---|---|---|---|---|---|---|
| 85.9 % v7 (old) | 06/23 | Schenker XMG Focus 17 (E23) i9-13900HX, GeForce RTX 4070 Laptop GPU | 2.9 kg | 29.3 mm | 17.30" | 2560x1440 | |
| 88.4 % v7 (old) | 05/23 | Lenovo Legion Pro 5 16ARX8 R7 7745HX, GeForce RTX 4070 Laptop GPU | 2.5 kg | 26.8 mm | 16.00" | 2560x1600 | |
| 89 % v7 (old) | 04/23 | Medion Erazer Major X20 i9-13900HX, GeForce RTX 4070 Laptop GPU | 2.4 kg | 29 mm | 16.00" | 2560x1600 | |
| 87.6 % v7 (old) | 09/22 | Schenker XMG Neo 17 M22 R9 6900HX, GeForce RTX 3080 Ti Laptop GPU | 2.8 kg | 27 mm | 17.00" | 2560x1600 | |
| 85.4 % v7 (old) | 03/23 | HP Omen 17-ck2097ng i9-13900HX, GeForce RTX 4080 Laptop GPU | 2.8 kg | 27 mm | 17.30" | 2560x1440 | |
| 84.6 % v7 (old) | 05/23 | Medion Erazer Defender P40 i7-13700HX, GeForce RTX 4060 Laptop GPU | 2.9 kg | 33 mm | 17.30" | 2560x1440 |
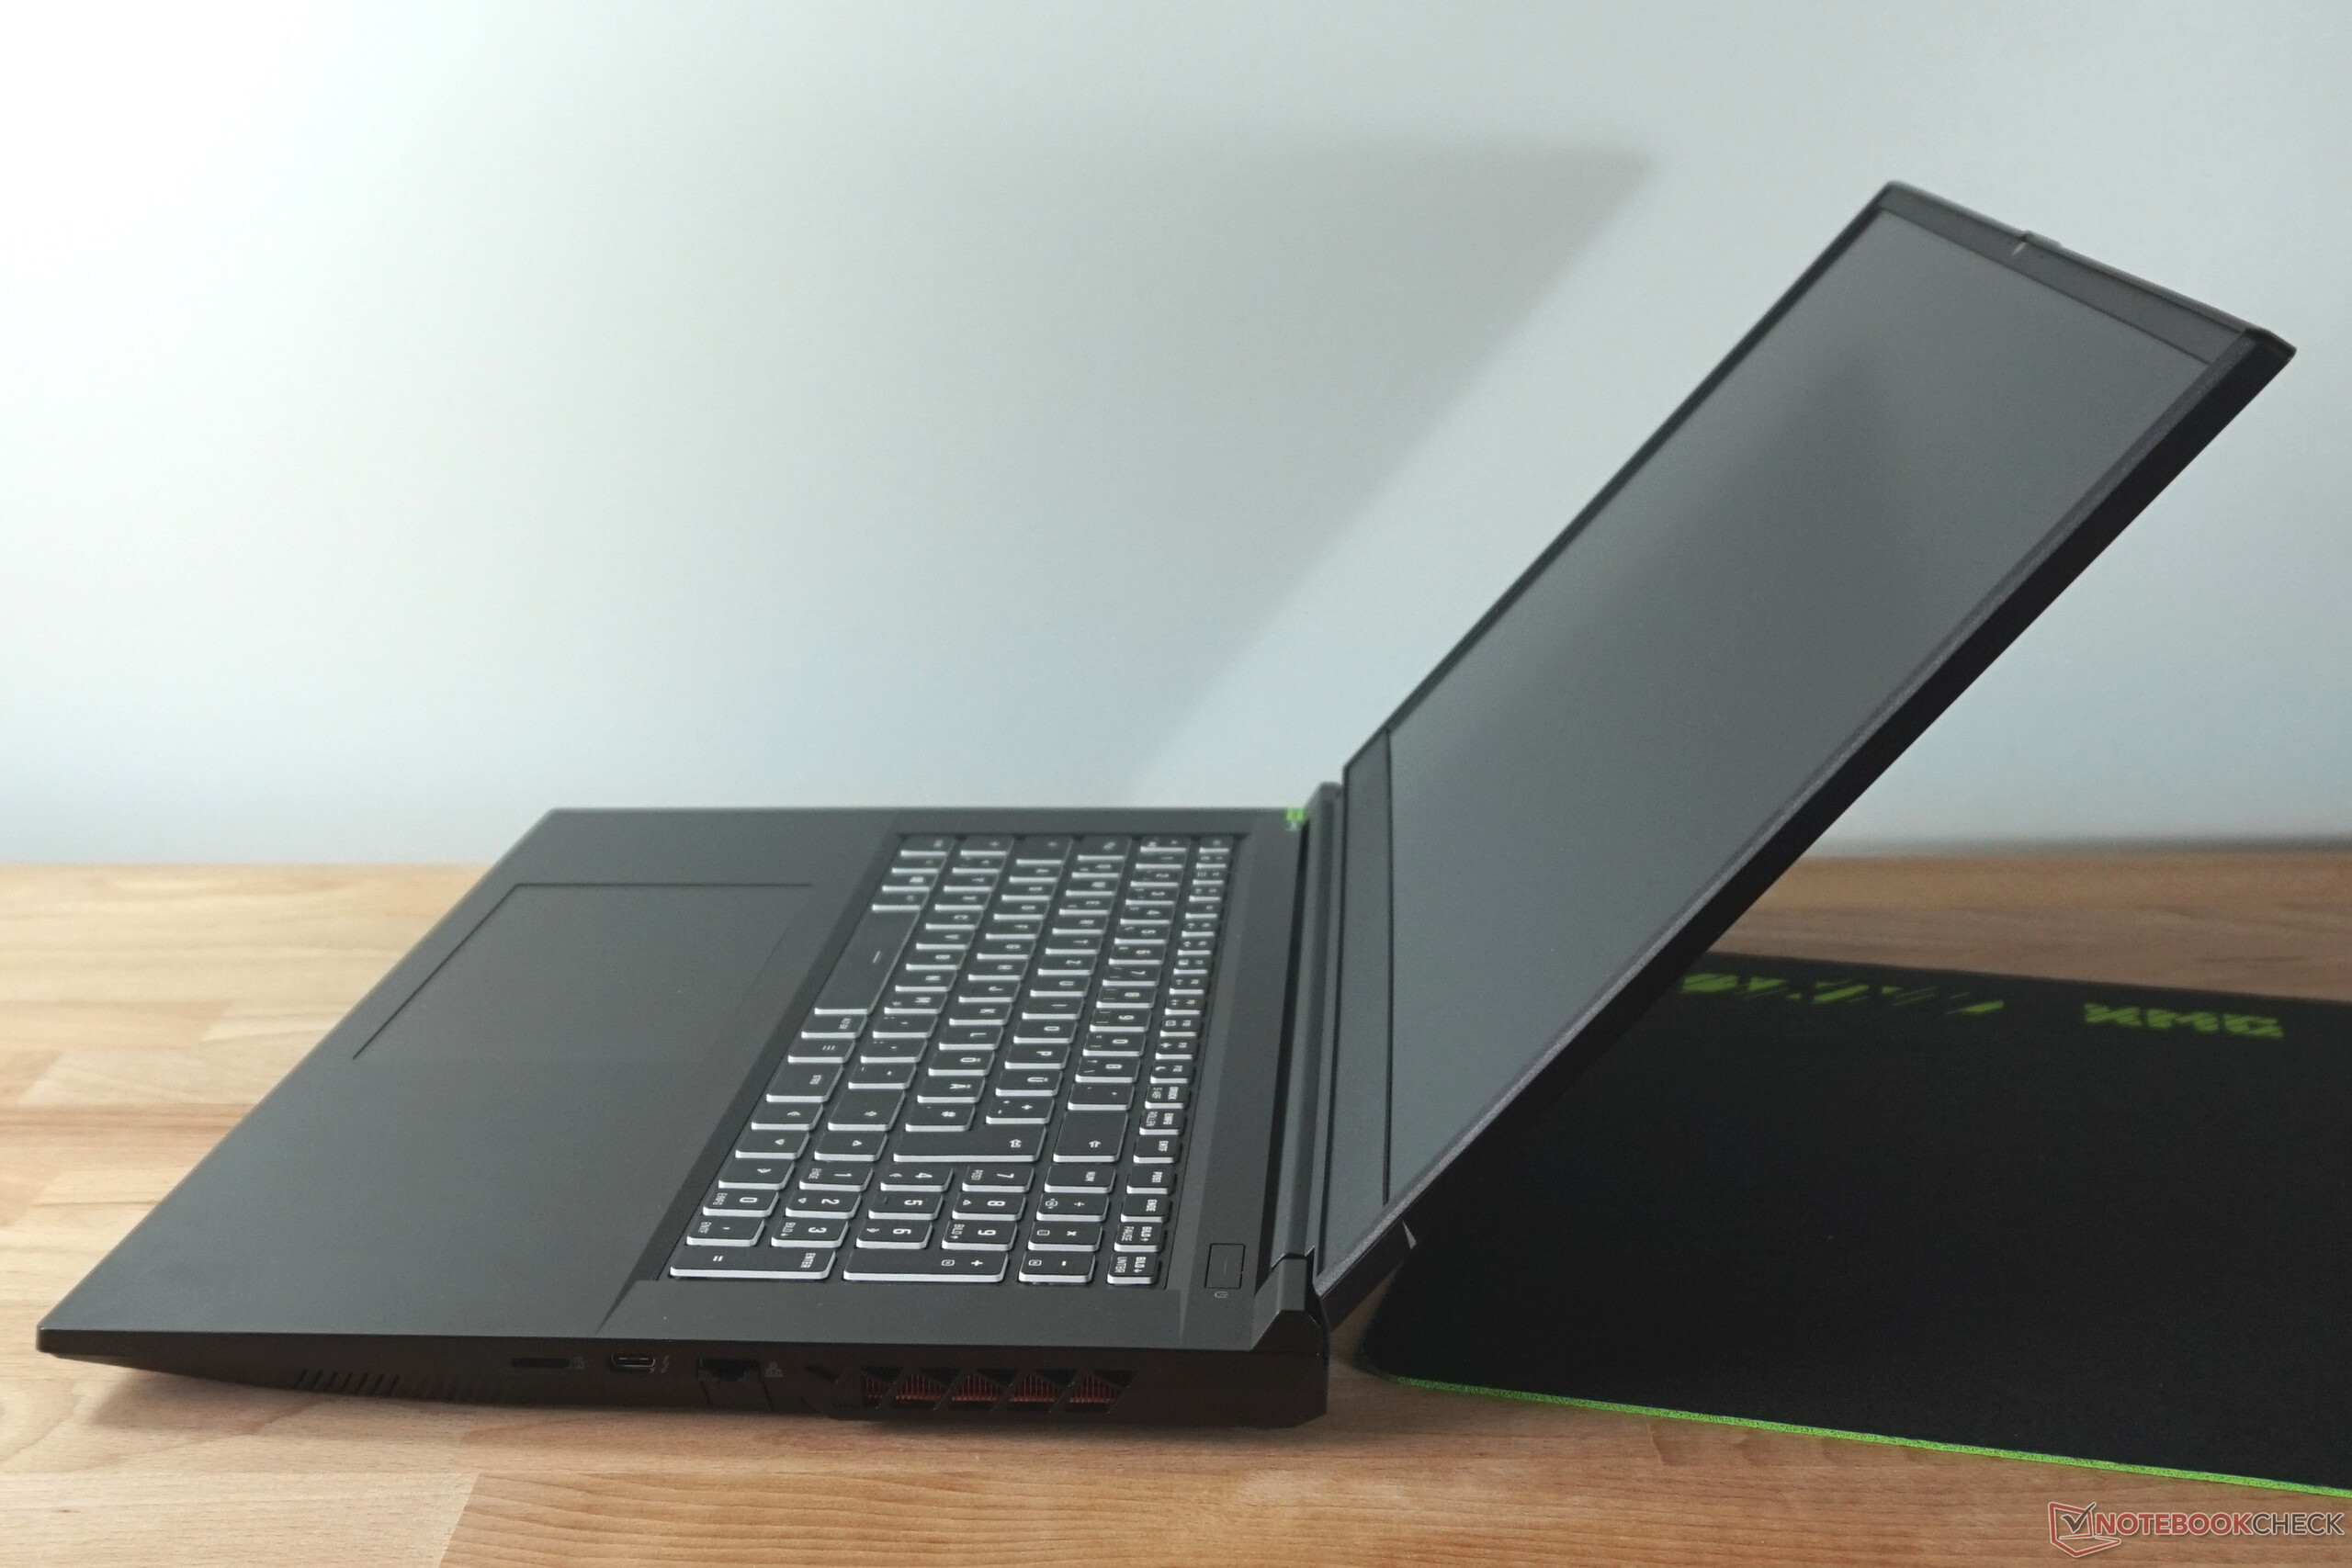
Équipement - Tout ce qui va de TB4 à USB 2.0
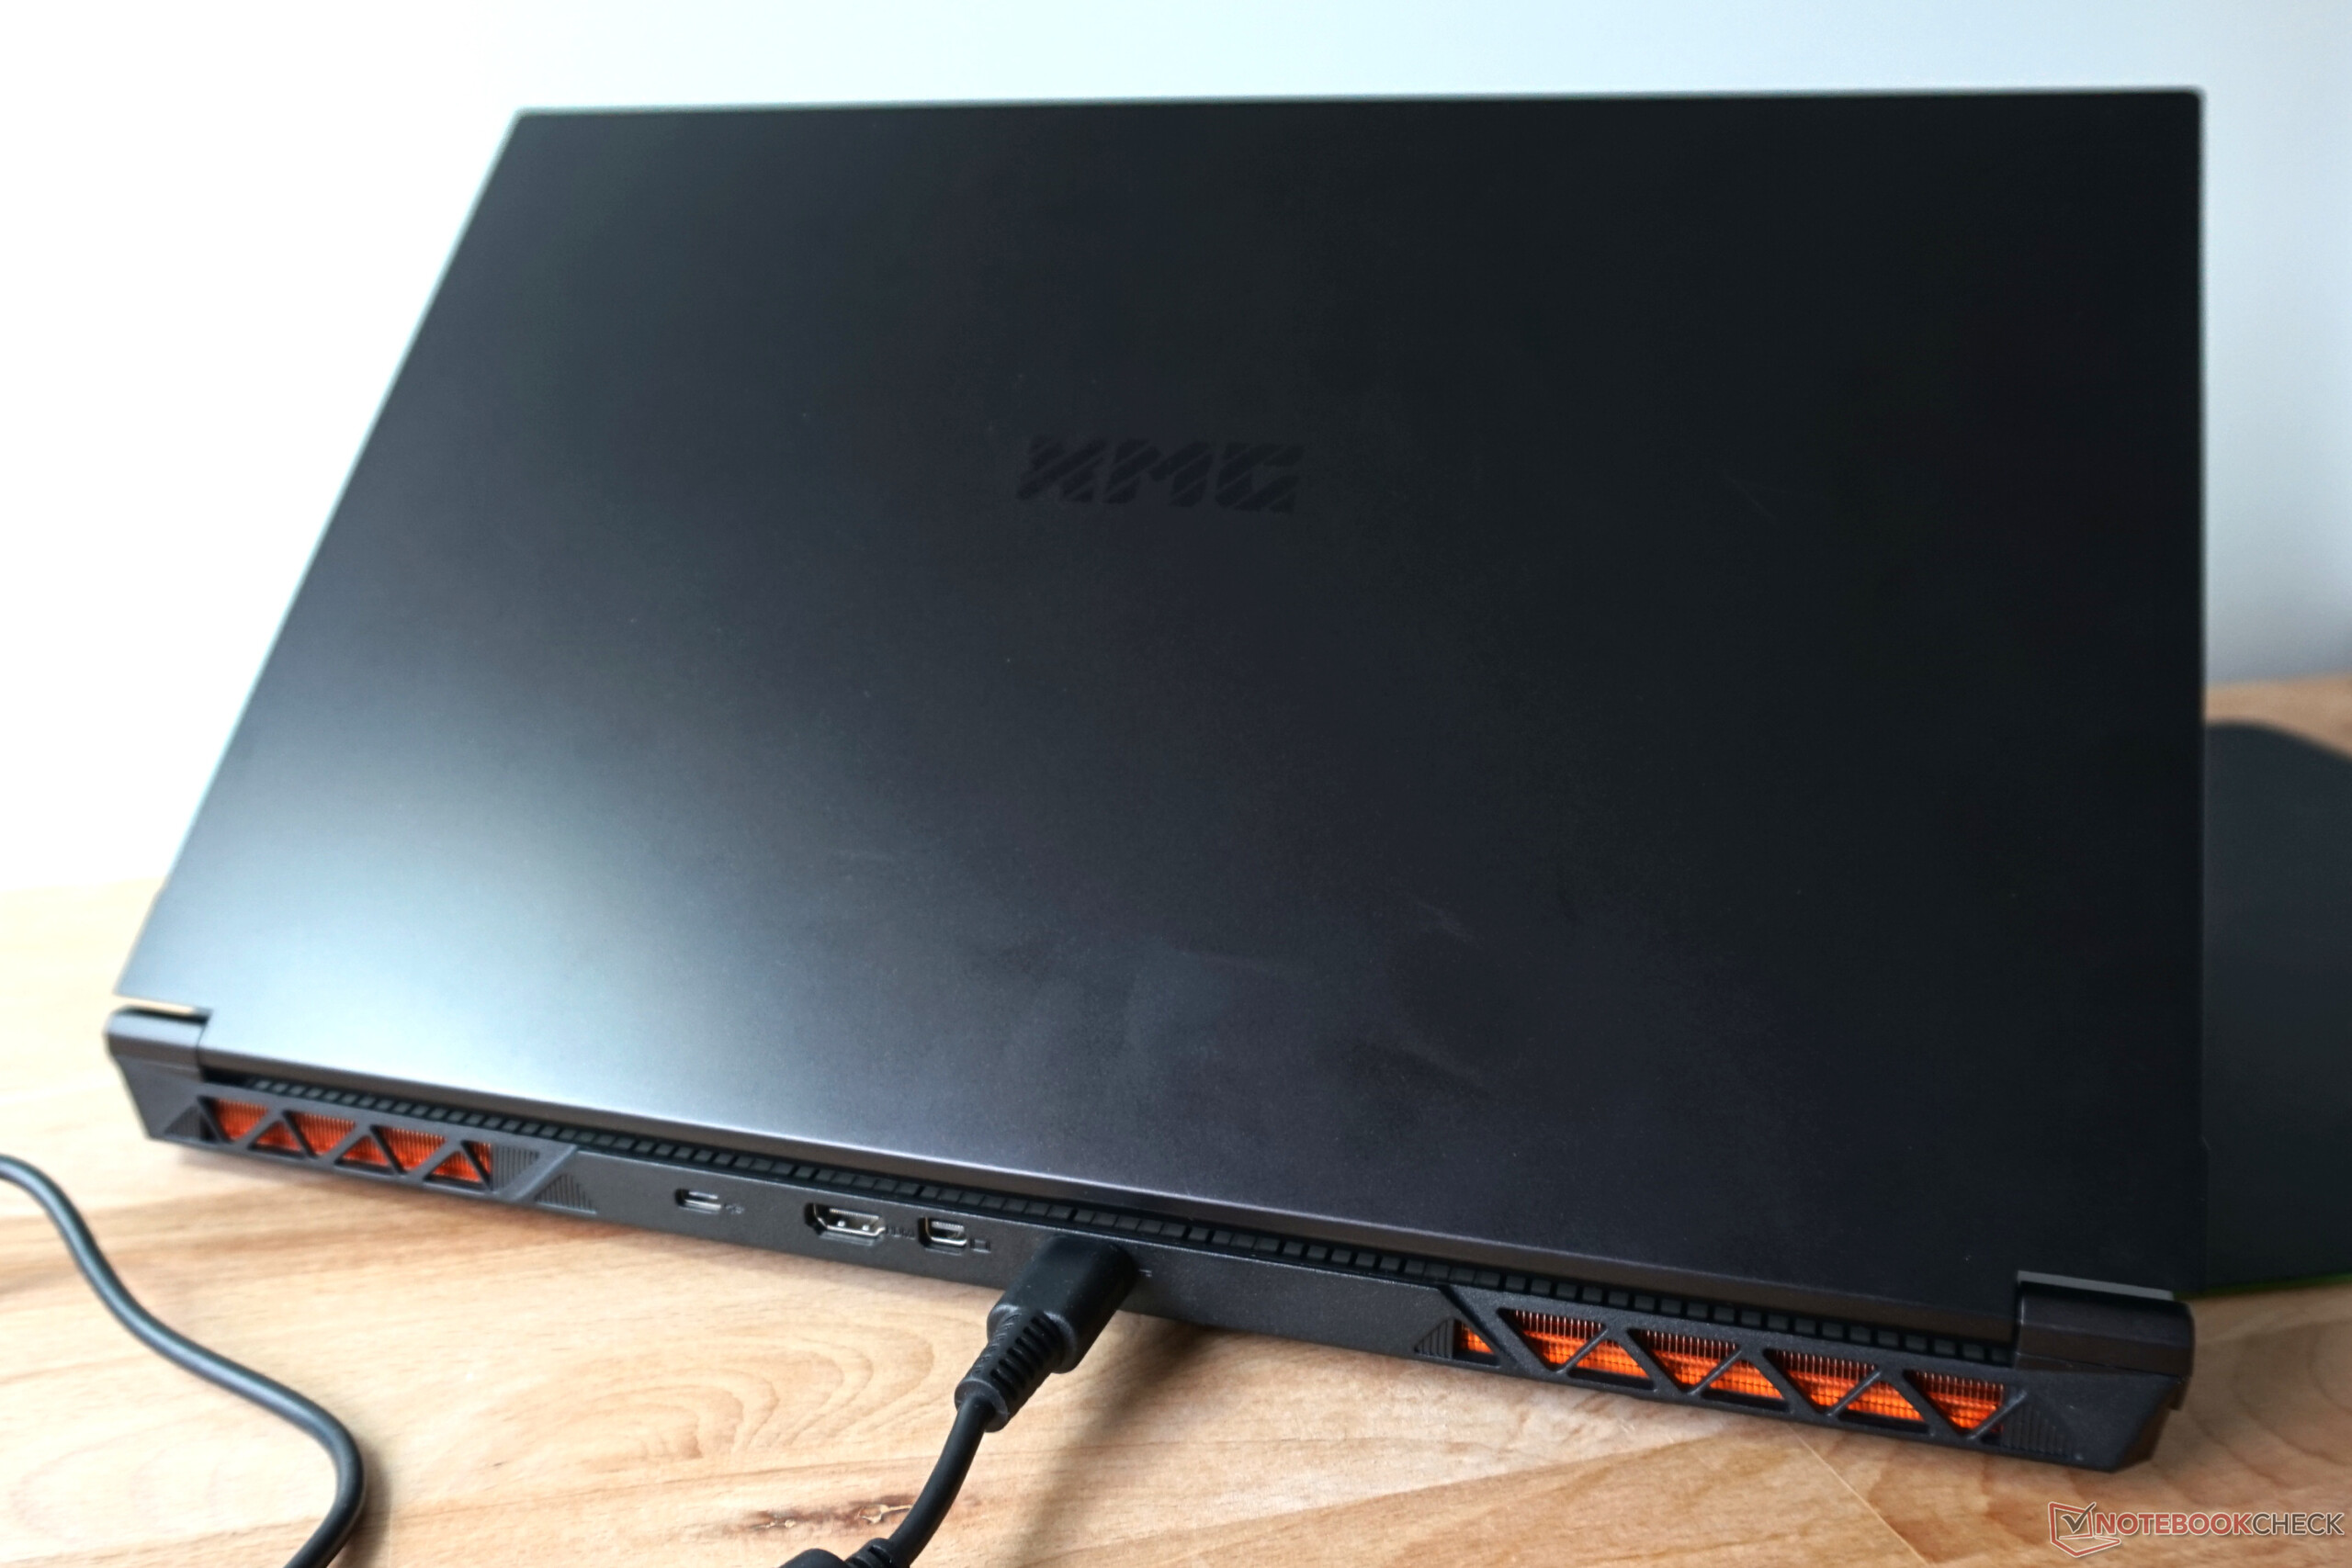
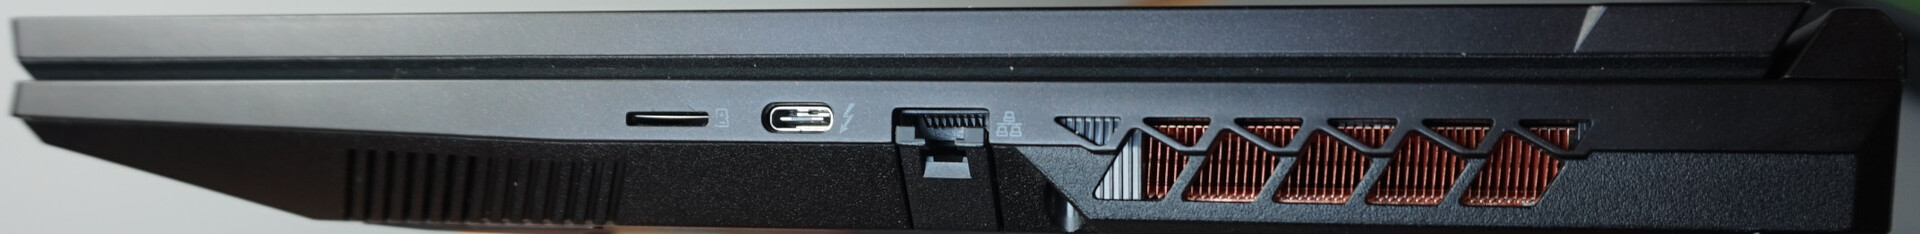
Par rapport à son prédécesseur, il y a beaucoup de similitudes dans les ports, mais heureusement quelques rafraîchissements. Il y a toujours un port USB 2.0, qui devrait suffire pour une souris ou une imprimante. Le mini-DP a également été conservé.
Le simple connecteur USB-C a été déplacé à l'arrière et délivre des débits allant jusqu'à 10 Gbit/s, mais ni PD ni DP ne sont pris en charge. Thunderbolt 4 se trouve à droite, mais il n'y a malheureusement plus de port USB-A. En outre, l'emplacement de carte s'est réduit à microSD dans la version actuelle, ce qui limite considérablement la polyvalence.


Lecteur de carte SD
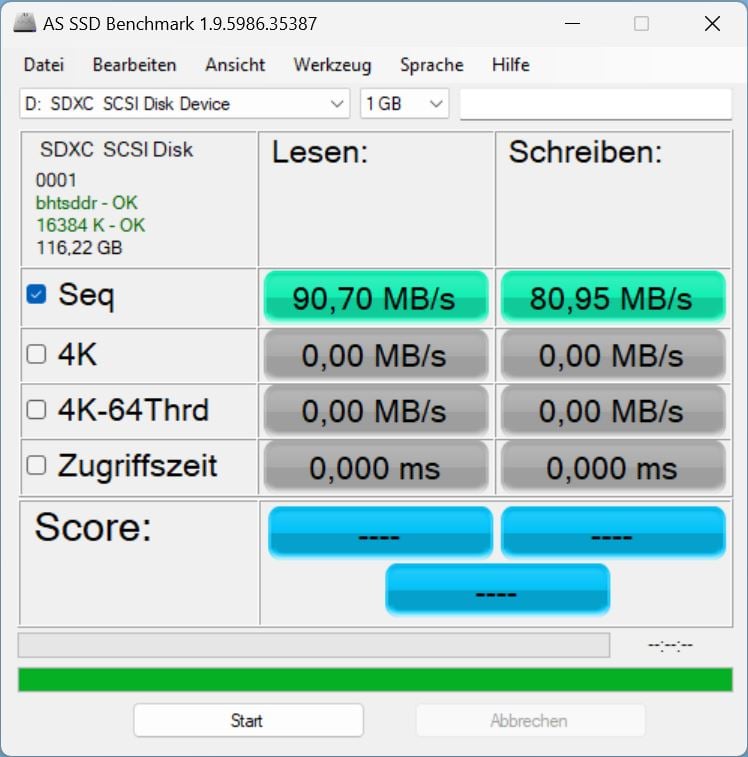
Nos mesures avec la carte de référence AV PRO V60 microSD 128 GB ne sont pas tout à fait moyennes, mais en partie un peu meilleures que celles de la concurrence. Cela suffit pour copier quelques milliers de photos en quelques minutes.
| SD Card Reader | |
| average JPG Copy Test (av. of 3 runs) | |
| Moyenne de la classe Gaming (20.9 - 210, n=54, 2 dernières années) | |
| Medion Erazer Defender P40 (AV PRO microSD 128 GB V60) | |
| Schenker XMG Focus 17 (E23) | |
| Medion Erazer Major X20 (AV PRO microSD 128 GB V60) | |
| HP Omen 17-ck2097ng (AV PRO microSD 128 GB V60) | |
| Schenker XMG Neo 17 M22 (AV PRO microSD 128 GB V60) | |
| maximum AS SSD Seq Read Test (1GB) | |
| Moyenne de la classe Gaming (25.5 - 261, n=51, 2 dernières années) | |
| Medion Erazer Defender P40 (AV PRO microSD 128 GB V60) | |
| Schenker XMG Focus 17 (E23) | |
| Medion Erazer Major X20 (AV PRO microSD 128 GB V60) | |
| HP Omen 17-ck2097ng (AV PRO microSD 128 GB V60) | |
Communication
Le module WLAN Intel AX211 répond aux attentes. Cependant, les taux moyens typiques ne sont atteints que dans un réseau de 6 GHz dans nos mesures et même légèrement dépassés. La légère faiblesse à 5 GHz s'explique très probablement par les influences parasites des réseaux sans fil voisins, que nous n'avons naturellement pas pu désactiver lors du test.

 GeForce RTX 4070 Laptop GPU, i9-13900HX, Crucial P5 Plus 1TB CT1000P5PSSD8")
 GeForce RTX 4070 Laptop GPU, i9-13900HX, Crucial P5 Plus 1TB CT1000P5PSSD8")
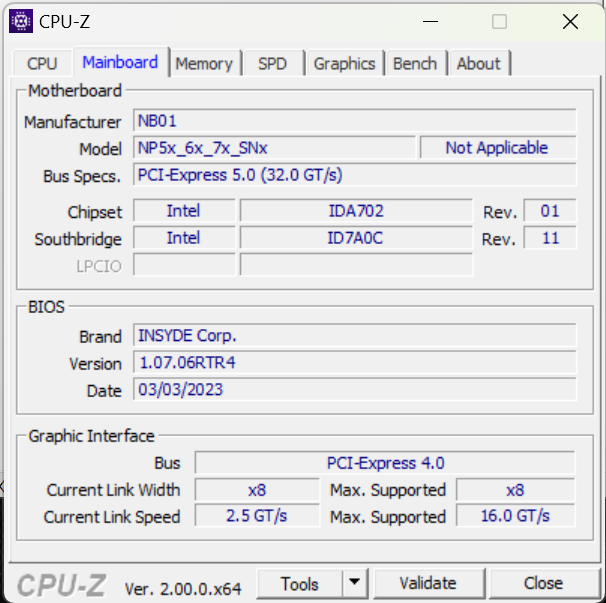
Maintenance
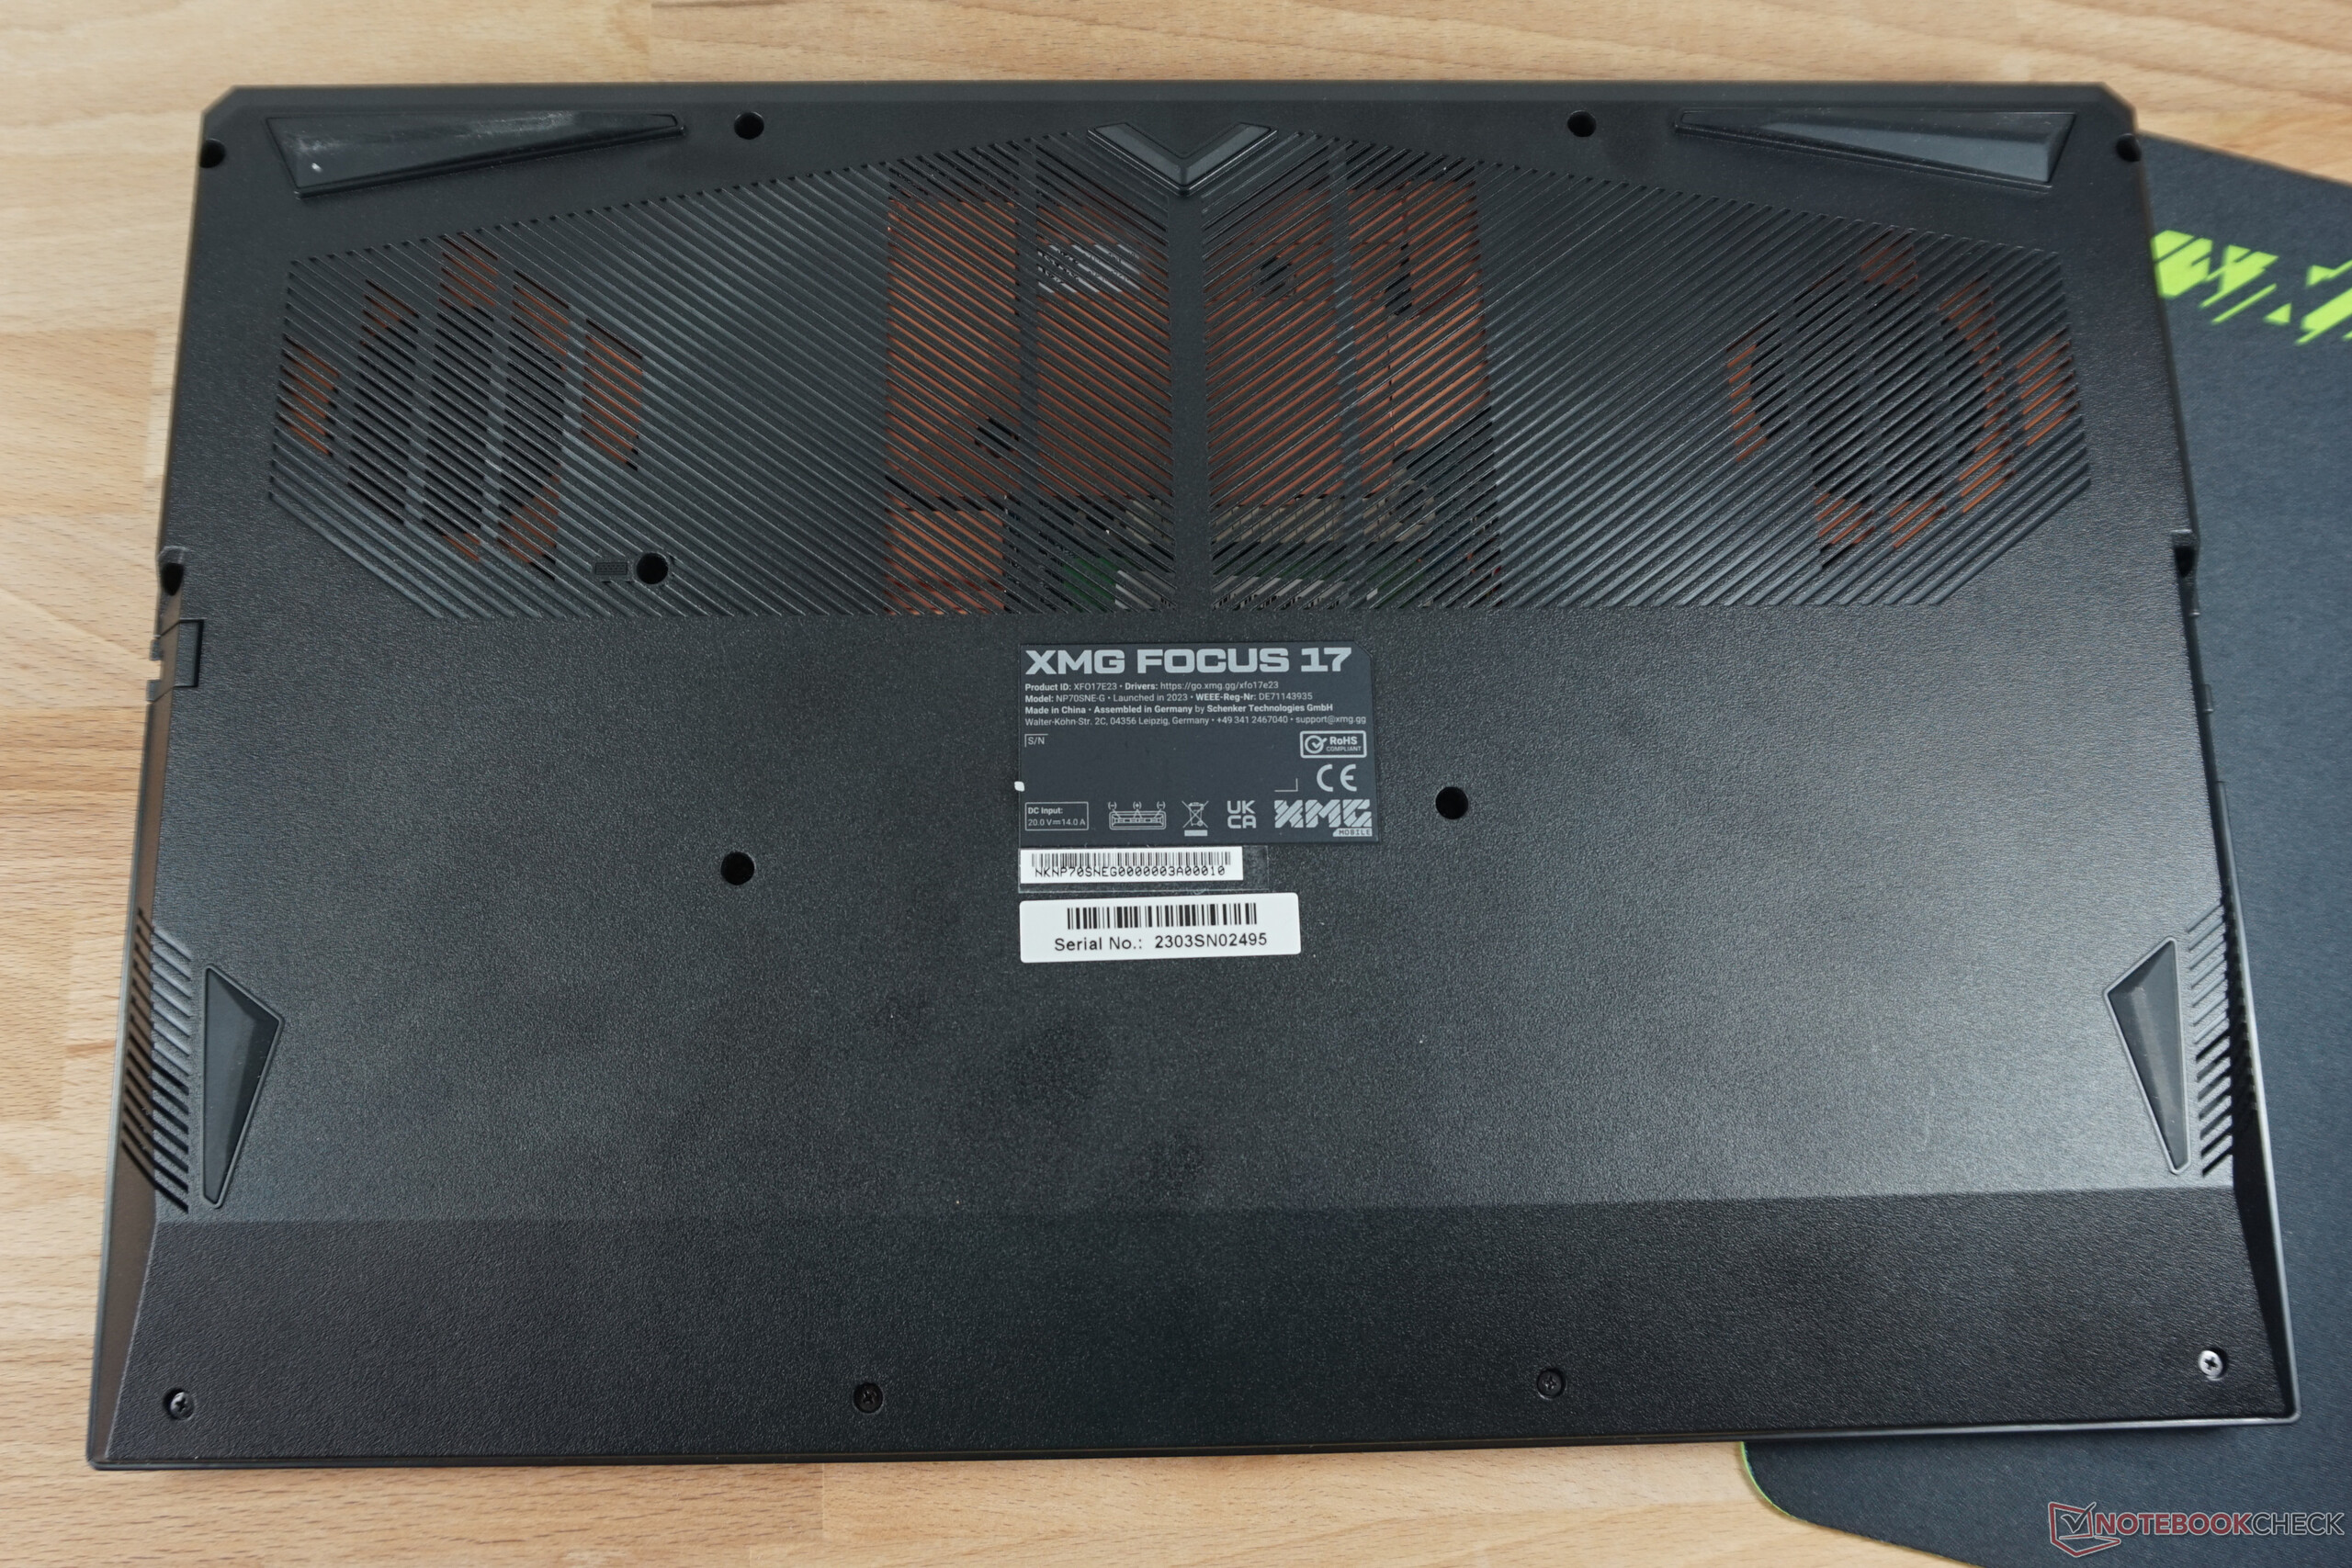
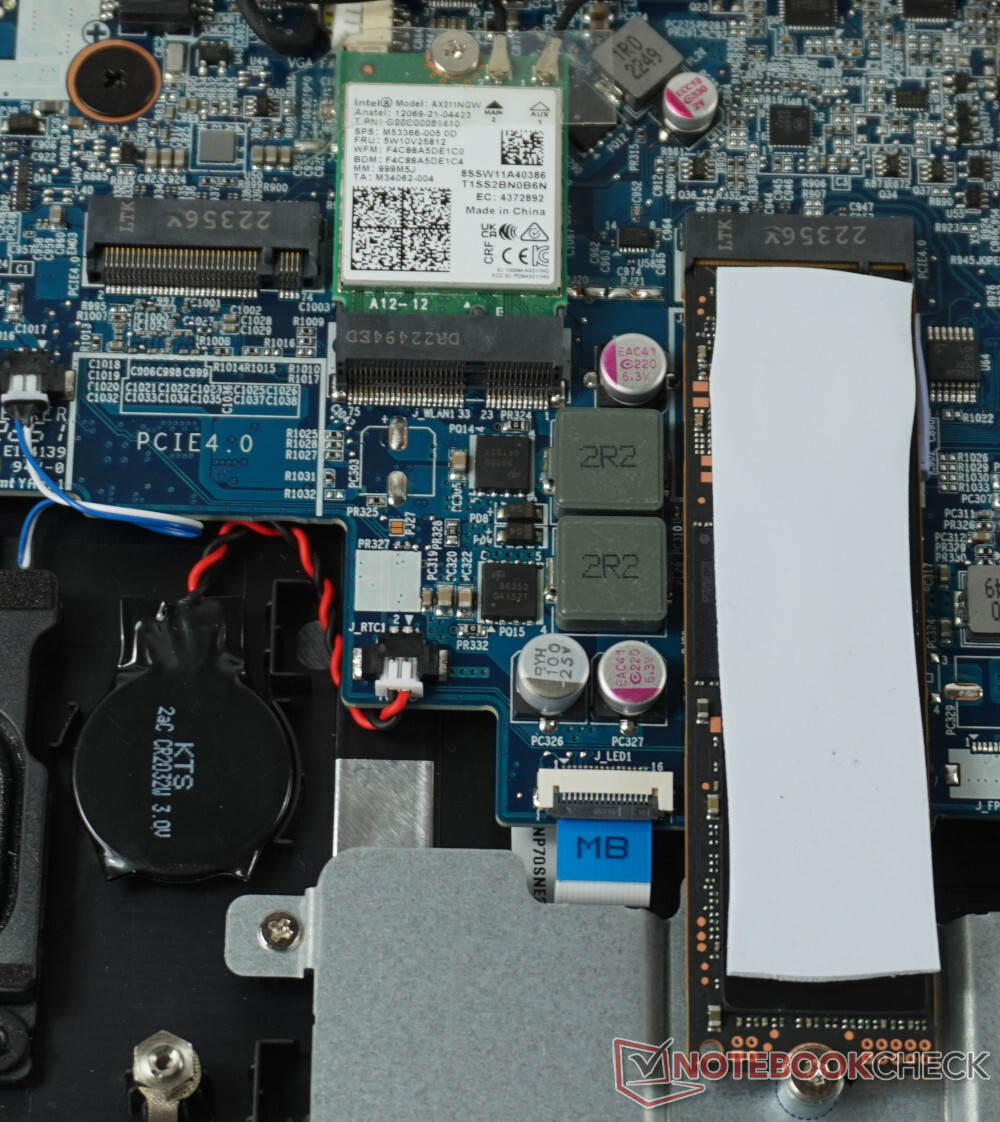
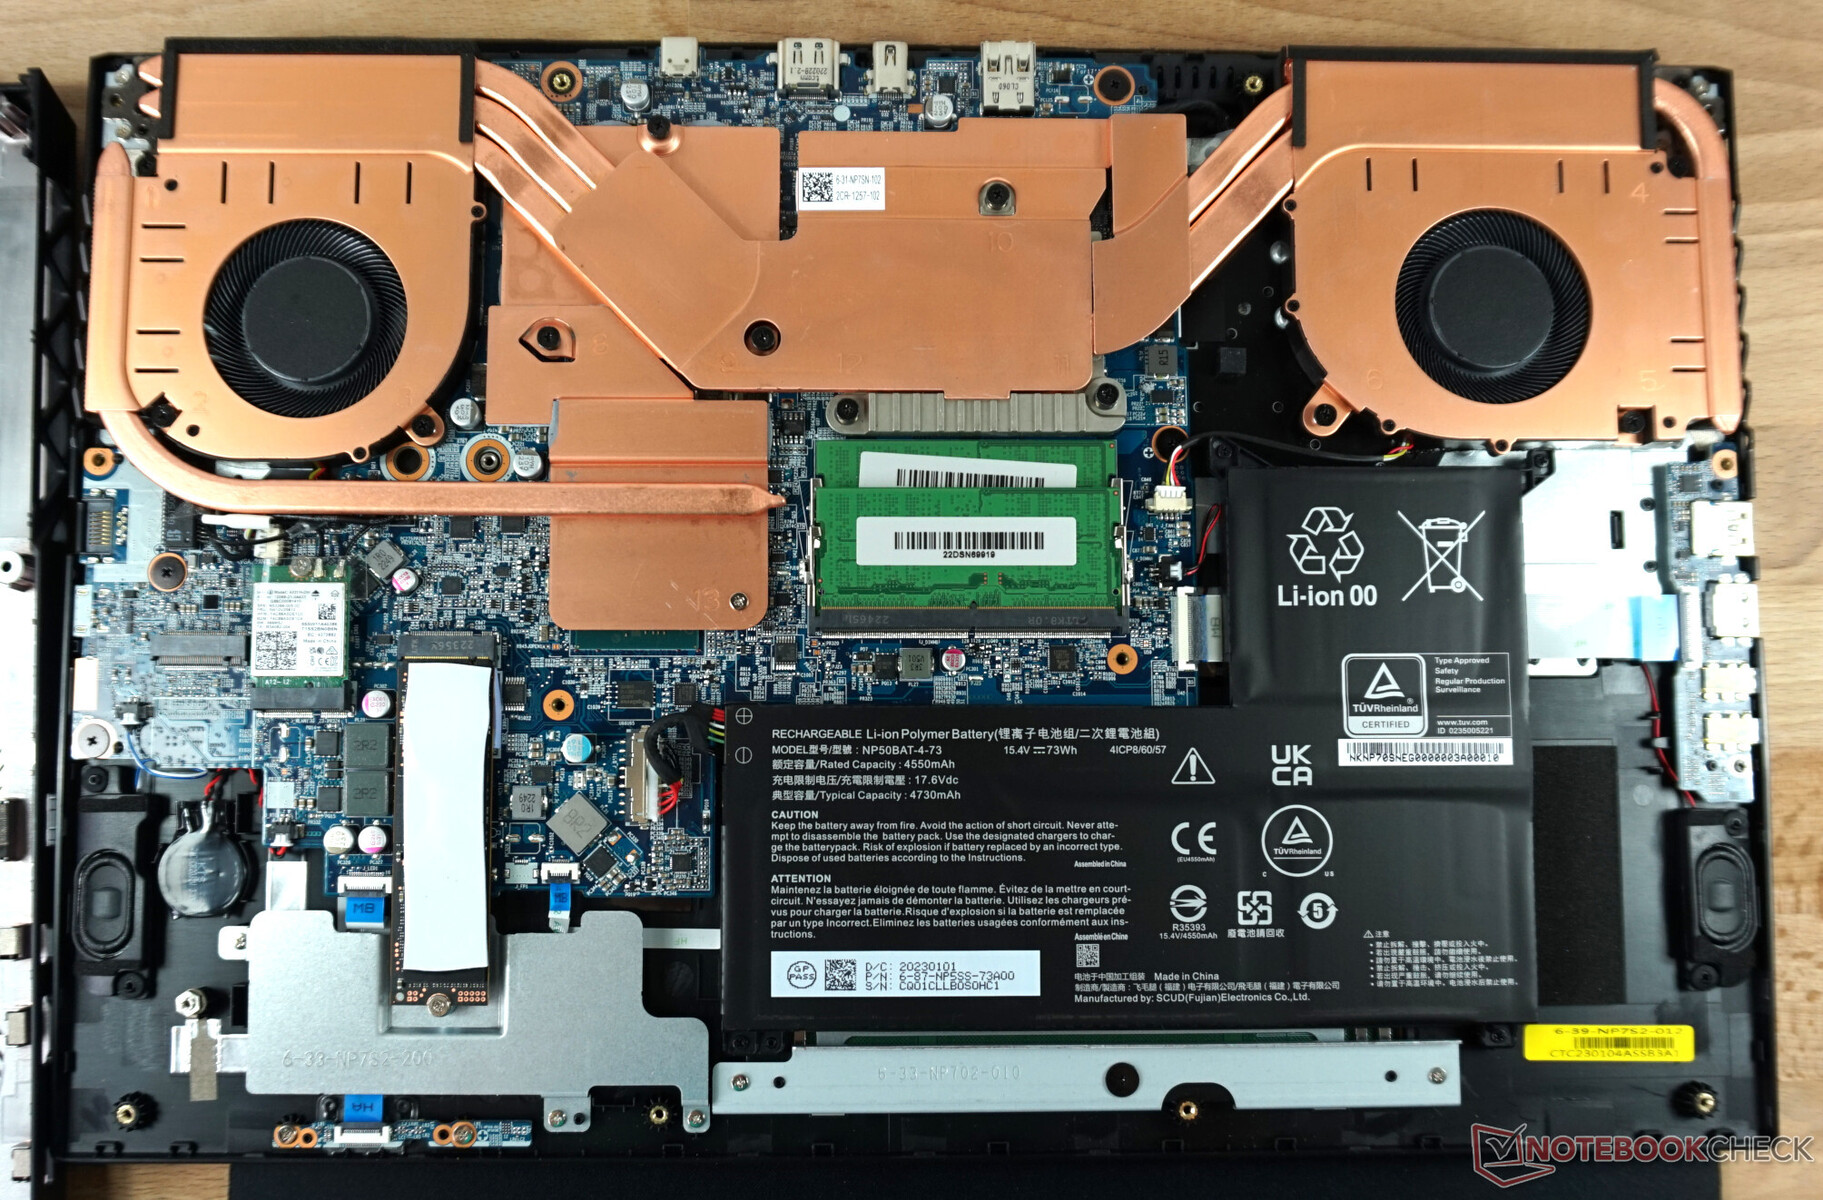
Des changements considérables en vue de la XMG Focus 17 à partir de 2021 ont été apportées à l'intérieur. Tous les éléments de refroidissement sont désormais en cuivre et l'air peut s'échapper des deux côtés. Le port SATA pour SSD de 2,5 pouces a disparu. À la place, il y a un deuxième emplacement pour un SSD M.2 NVMe.
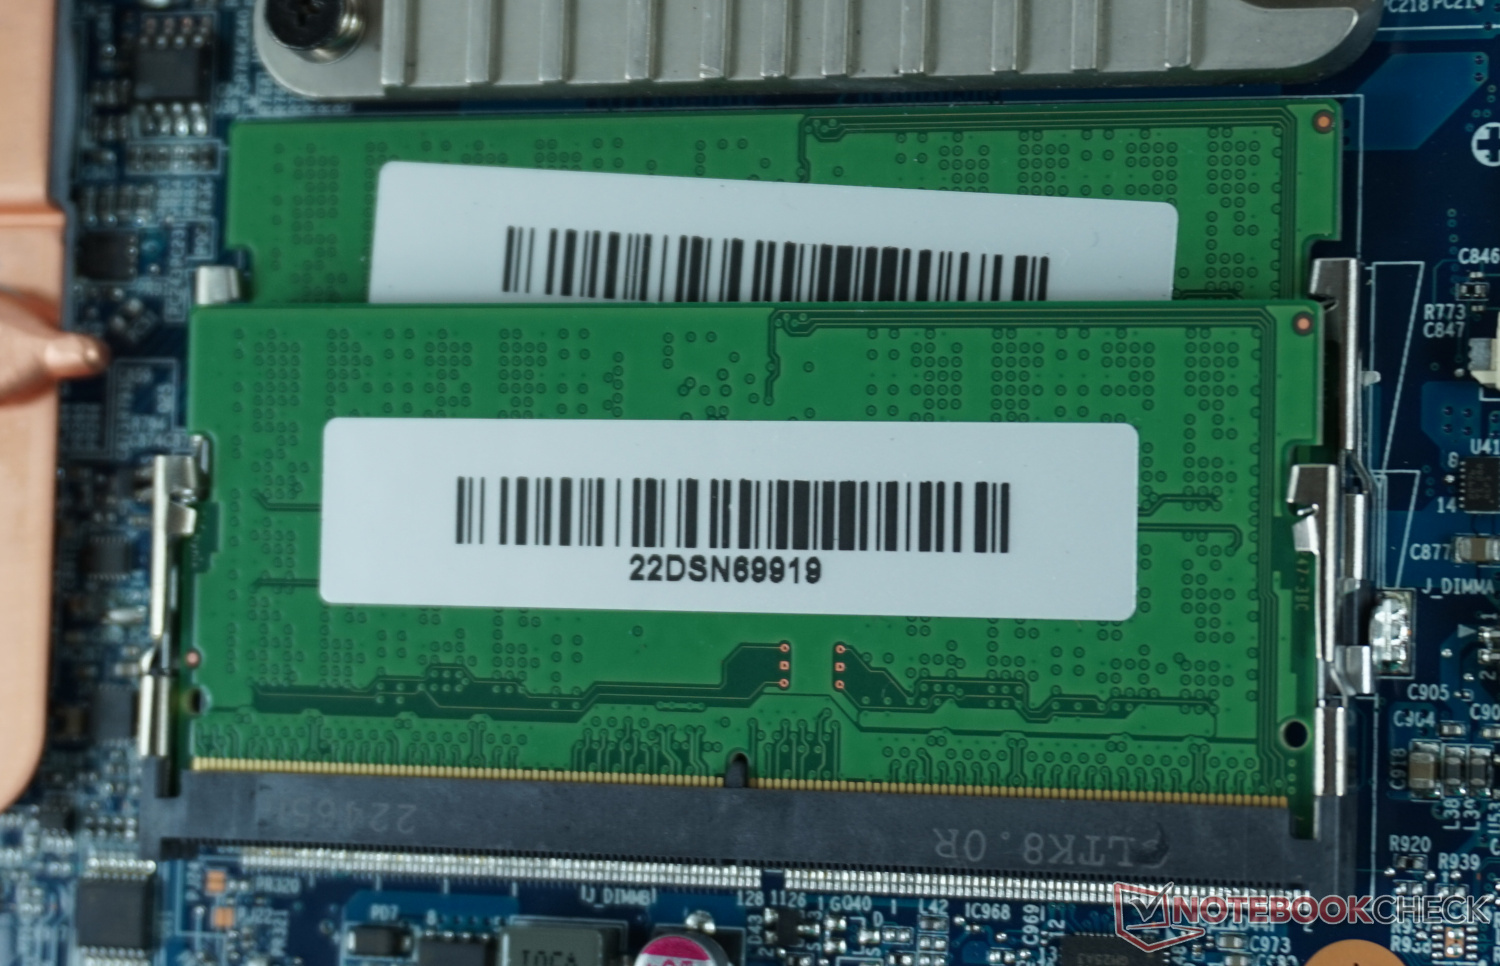
Comme on pouvait s'y attendre de la part de Schenker, l'accès aux composants est facile. Après avoir desserré douze vis identiques, le fond peut être retiré avec peu d'effort en commençant par le refroidissement arrière. La RAM, le SSD, le module WLAN et la batterie sont alors facilement accessibles et remplaçables.
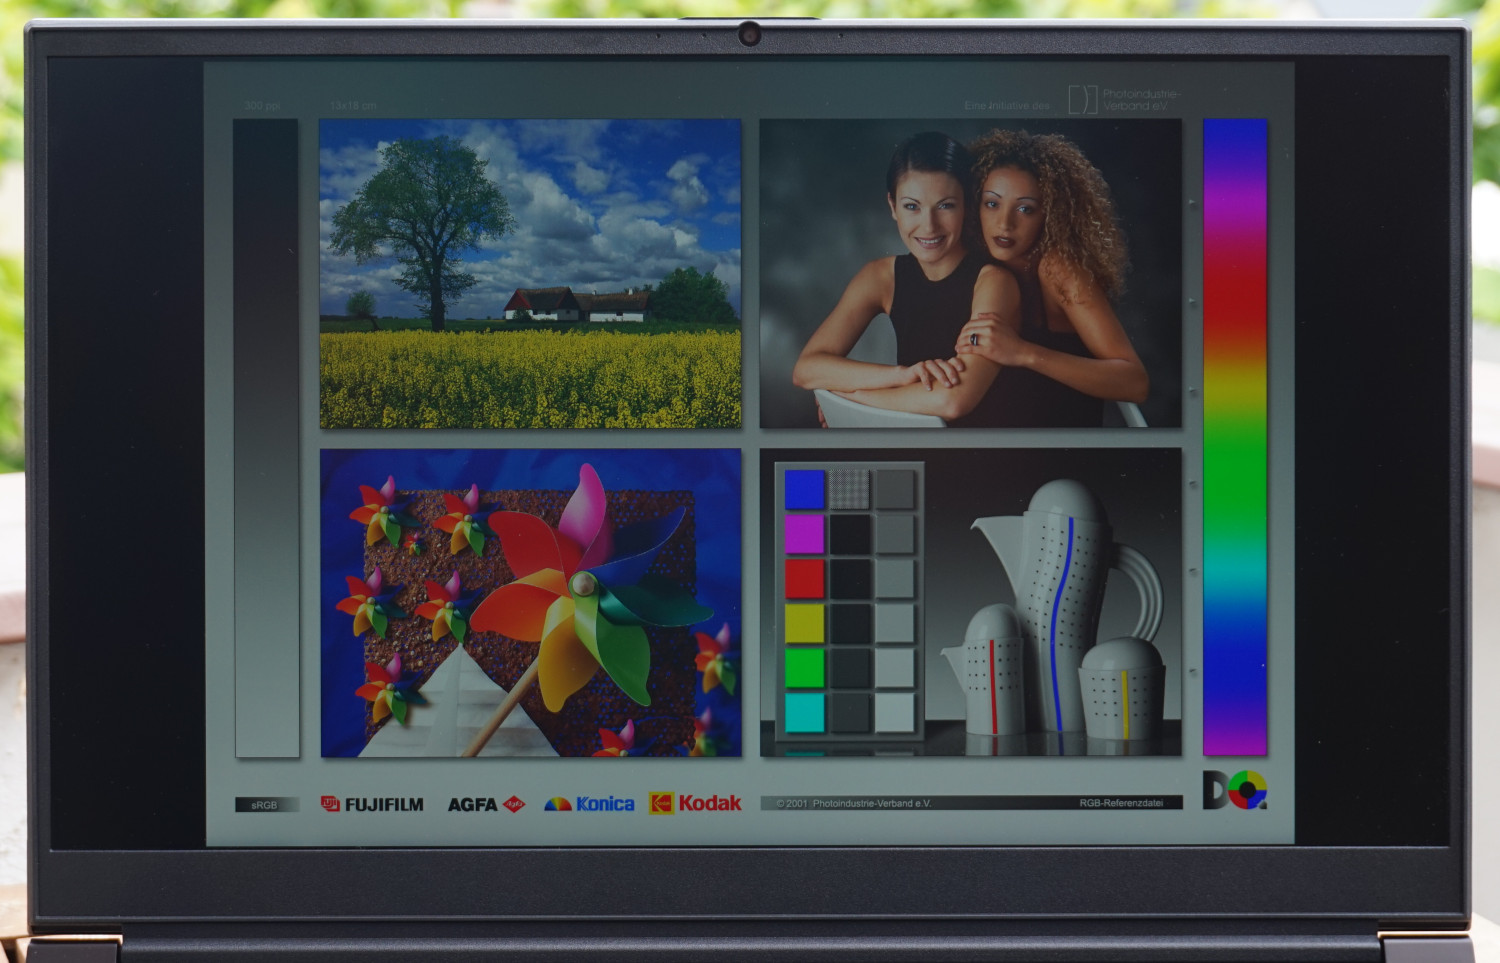
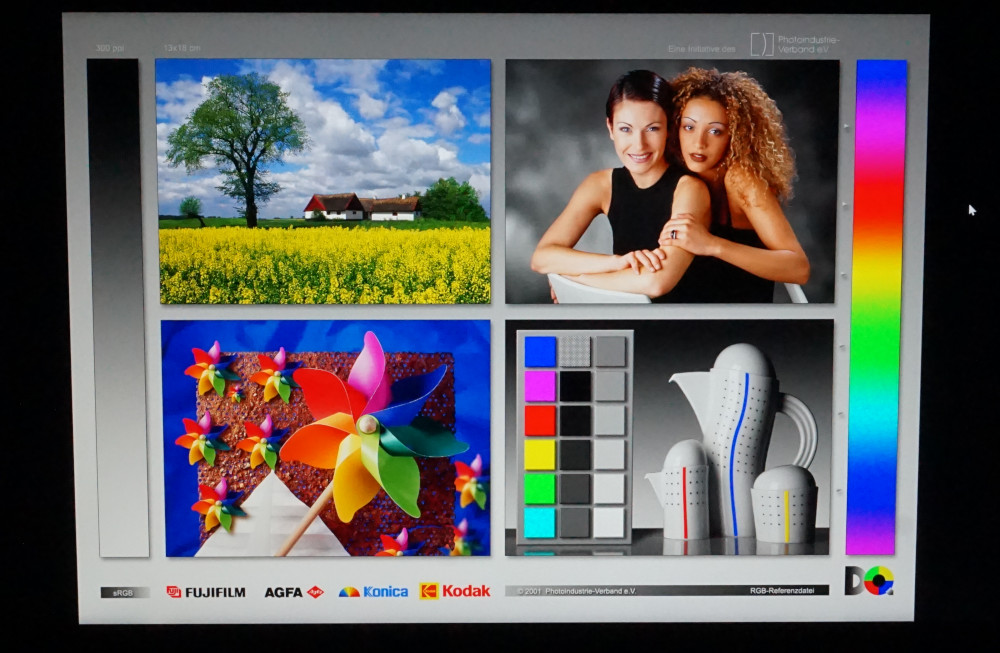
Affichage - Couleurs vives, contrastes faibles sur l'ordinateur portable de jeu XMG

La dalle IPS mate du XMG Focus 17 répond aux attentes d'un ordinateur portable de jeu solide mais pas exceptionnel. La résolution QHD s'impose sur la grande diagonale de 17,3 pouces/ En outre, le taux de rafraîchissement de 240 Hz garantit de faibles latences, même lorsque le taux de rafraîchissement n'est pas atteint dans les jeux.
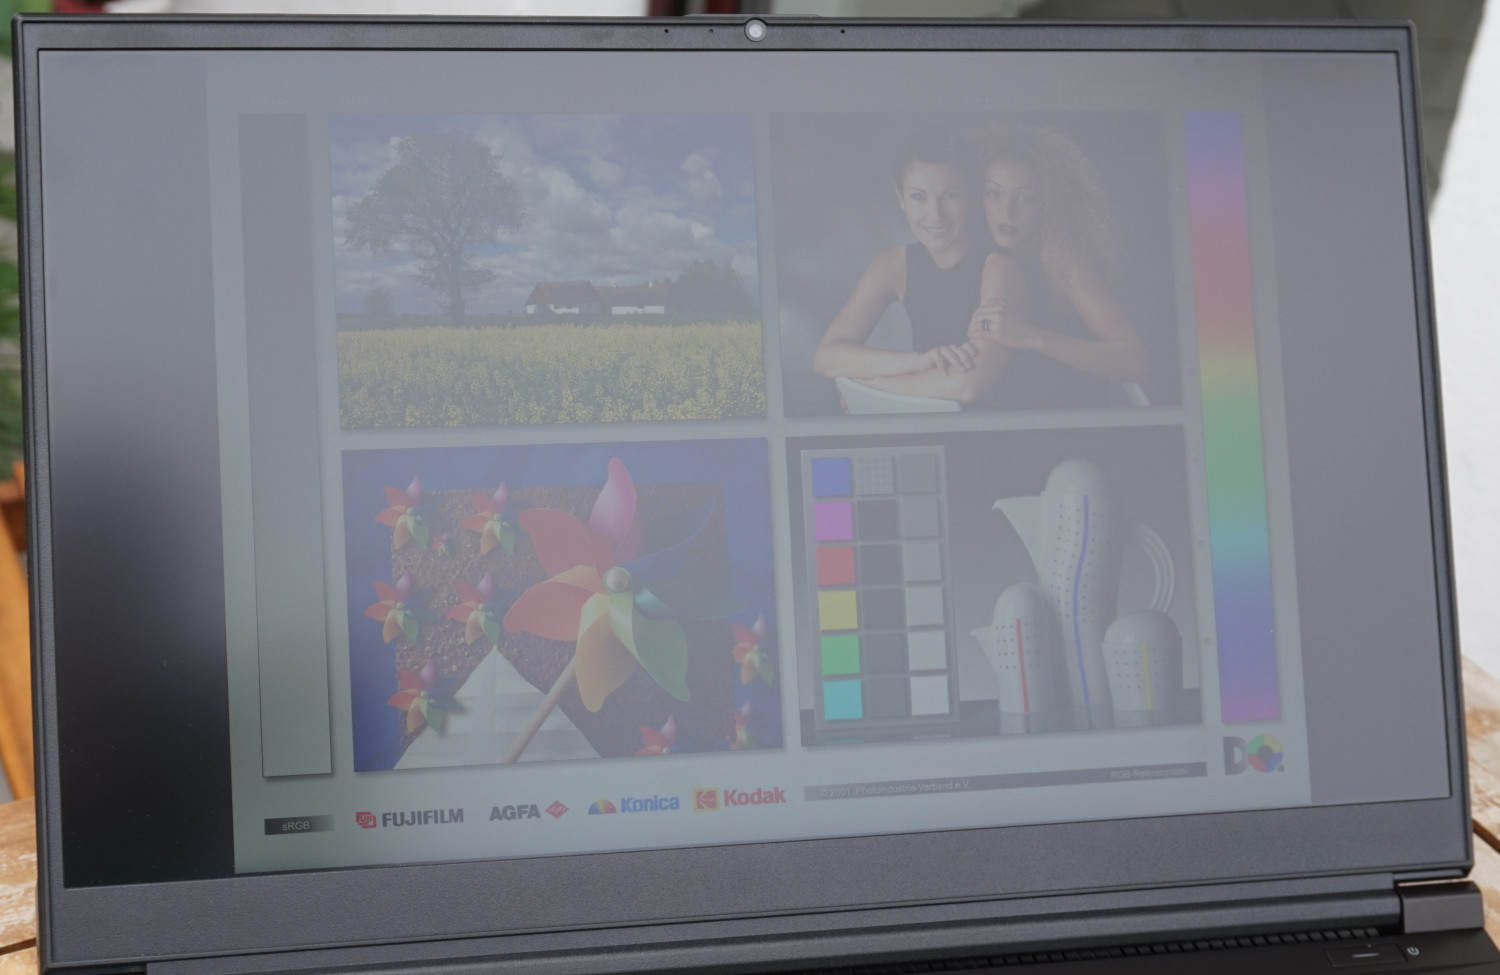
Les temps de réponse, qui ne sont pas optimaux (plus de 10 ms) mais acceptables, ne sont pas tout à fait convaincants. Le niveau de noir médiocre empêche d'obtenir un meilleur contraste. Un voile gris est visible dans les scènes très sombres avec un éclairage minimal dans la pièce. Avec un ratio de 623:1 mesuré par nos soins, le contraste n'atteint qu'un peu moins de la moitié de la valeur du Medion Erazer Defender P40 ou du HP Omen 17-ck. Le saignement de l'écran est aussi clairement visible.
L'éclairage pourrait être un peu plus homogène et la luminosité de 320 cd/m² un peu plus élevée. Les taux d'affichage sont donc inférieurs à la moyenne par rapport à de nombreux modèles de prix similaires.
| |||||||||||||||||||||||||
Homogénéité de la luminosité: 82 %
Valeur mesurée au centre, sur batterie: 349 cd/m²
Contraste: 623:1 (Valeurs des noirs: 0.56 cd/m²)
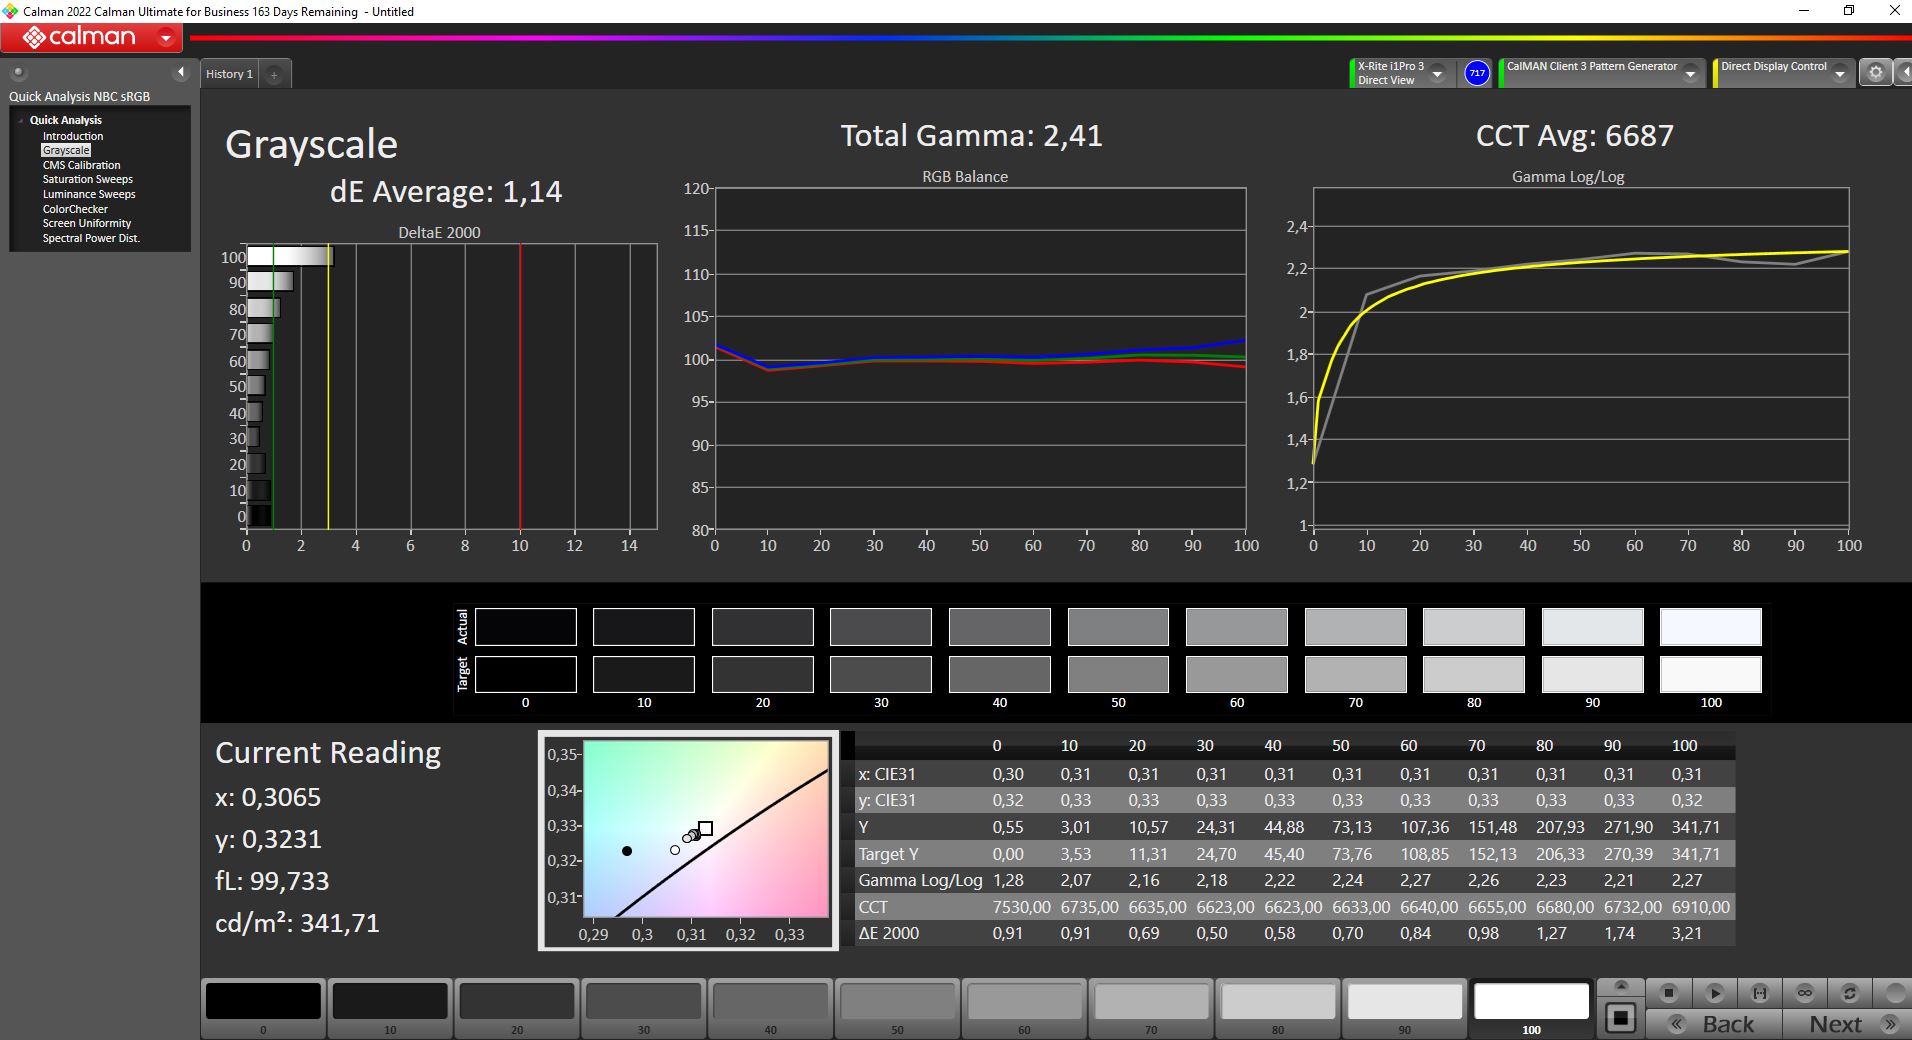
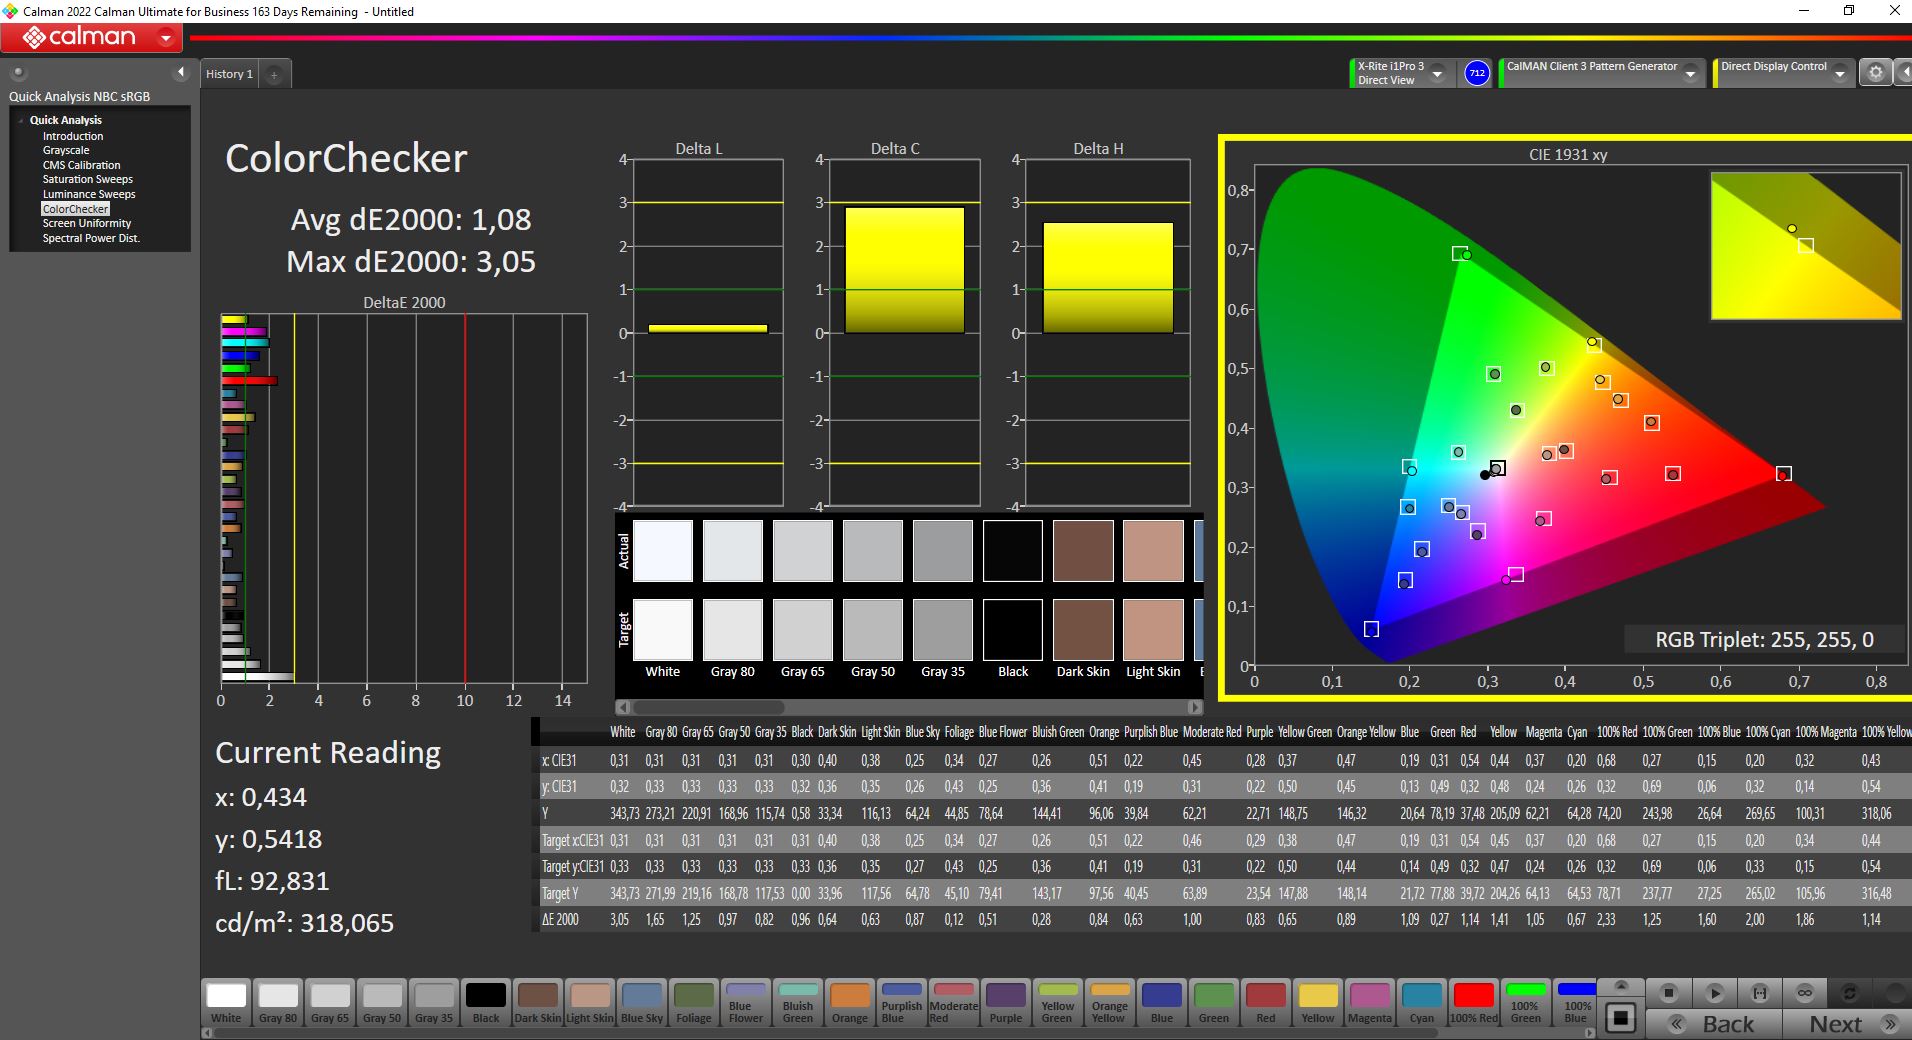
ΔE ColorChecker Calman: 1.08 | ∀{0.5-29.43 Ø4.71}
calibrated: 1.08
ΔE Greyscale Calman: 1.14 | ∀{0.09-98 Ø4.96}
84.5% AdobeRGB 1998 (Argyll 3D)
99.9% sRGB (Argyll 3D)
96.6% Display P3 (Argyll 3D)
Gamma: 2.41
CCT: 6687 K
| Schenker XMG Focus 17 (E23) BOE09F9 NE173QHM-NZ1, IPS, 2560x1440, 17.3" | Lenovo Legion Pro 5 16ARX8 CSOT T3 MNG007DA1-Q, IPS, 2560x1600, 16" | Medion Erazer Major X20 BOE CQ NE160QDM-NZ1, IPS, 2560x1600, 16" | Schenker XMG Neo 17 M22 BOE0A99, IPS, 2560x1600, 17" | HP Omen 17-ck2097ng BOE BOE09BF, IPS, 2560x1440, 17.3" | Medion Erazer Defender P40 BOE CQ NE173QHM-NZ3, IPS, 2560x1440, 17.3" | |
|---|---|---|---|---|---|---|
| Display | -14% | -15% | -16% | -17% | -16% | |
| Display P3 Coverage (%) | 96.6 | 70.4 -27% | 69.4 -28% | 69 -29% | 67.4 -30% | 68.3 -29% |
| sRGB Coverage (%) | 99.9 | 99.6 0% | 98 -2% | 99.8 0% | 97.6 -2% | 98.1 -2% |
| AdobeRGB 1998 Coverage (%) | 84.5 | 72.6 -14% | 70.9 -16% | 69.6 -18% | 69.6 -18% | 69.8 -17% |
| Response Times | 37% | 26% | 39% | 12% | 15% | |
| Response Time Grey 50% / Grey 80% * (ms) | 16.4 ? | 7 ? 57% | 13.1 ? 20% | 10.8 ? 34% | 15.6 ? 5% | 14.6 ? 11% |
| Response Time Black / White * (ms) | 10.8 ? | 9.1 ? 16% | 7.3 ? 32% | 6.1 ? 44% | 8.9 ? 18% | 8.7 ? 19% |
| PWM Frequency (Hz) | ||||||
| Screen | 21% | -23% | 9% | -7% | 11% | |
| Brightness middle (cd/m²) | 349 | 355.3 2% | 374 7% | 415 19% | 371 6% | 364 4% |
| Brightness (cd/m²) | 318 | 340 7% | 357 12% | 399 25% | 350 10% | 343 8% |
| Brightness Distribution (%) | 82 | 91 11% | 92 12% | 90 10% | 90 10% | 86 5% |
| Black Level * (cd/m²) | 0.56 | 0.32 43% | 0.33 41% | 0.43 23% | 0.32 43% | 0.28 50% |
| Contrast (:1) | 623 | 1110 78% | 1133 82% | 965 55% | 1159 86% | 1300 109% |
| Colorchecker dE 2000 * | 1.08 | 1.13 -5% | 2.43 -125% | 1.44 -33% | 1.74 -61% | 1.67 -55% |
| Colorchecker dE 2000 max. * | 3.05 | 2.78 9% | 3.97 -30% | 2.33 24% | 3.59 -18% | 2.78 9% |
| Colorchecker dE 2000 calibrated * | 1.08 | 0.32 70% | 1.4 -30% | 0.89 18% | 1.01 6% | 1.14 -6% |
| Greyscale dE 2000 * | 1.14 | 1.4 -23% | 3.1 -172% | 1.8 -58% | 2.8 -146% | 1.4 -23% |
| Gamma | 2.41 91% | 2.24 98% | 2.191 100% | 2.132 103% | 2.19 100% | 2.091 105% |
| CCT | 6687 97% | 6372 102% | 6194 105% | 6327 103% | 6474 100% | 6568 99% |
| Moyenne finale (programmes/paramètres) | 15% /
16% | -4% /
-14% | 11% /
8% | -4% /
-7% | 3% /
6% |
* ... Moindre est la valeur, meilleures sont les performances
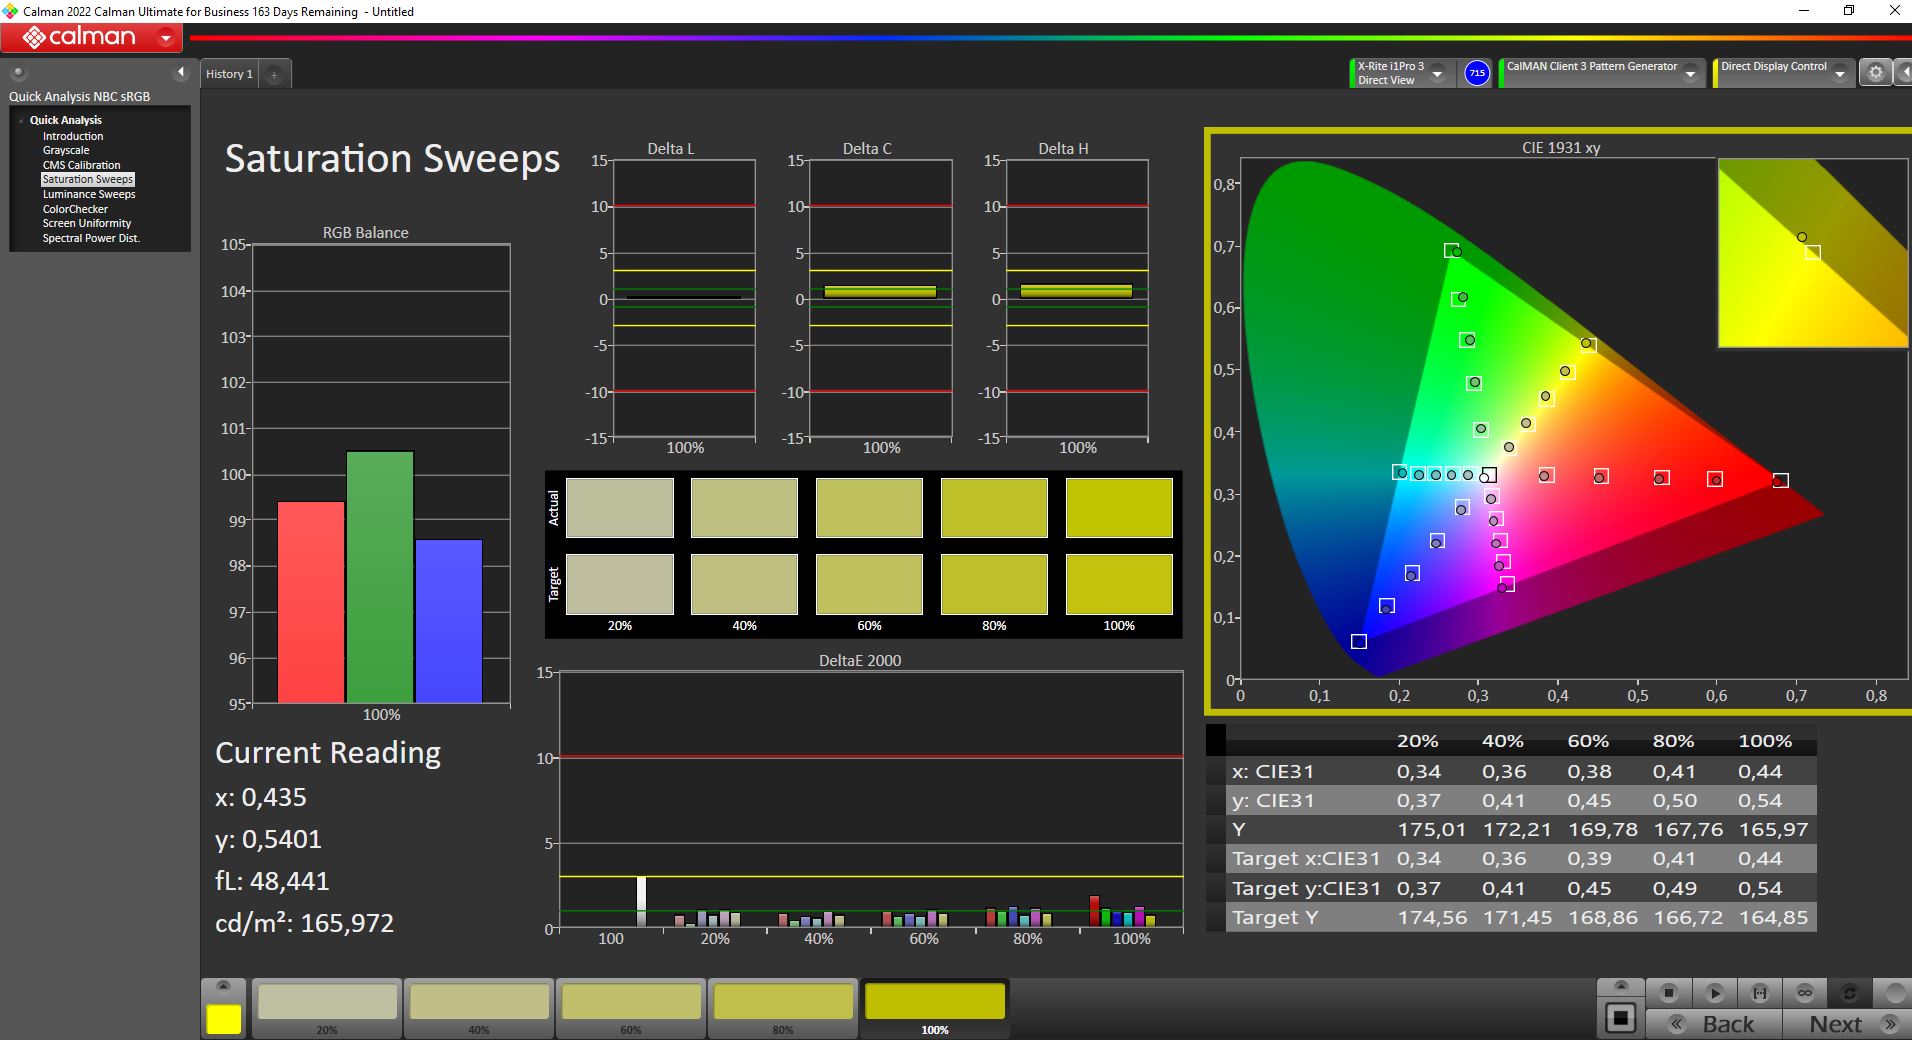
La reproduction des couleurs est très bonne. L'espace colorimétrique sRGB utilisé pour les jeux et la plupart des applications non professionnelles est entièrement couvert. Même la norme DCI-P3 peut être représentée dans une large mesure. La reproduction des couleurs est donc supérieure à la moyenne.
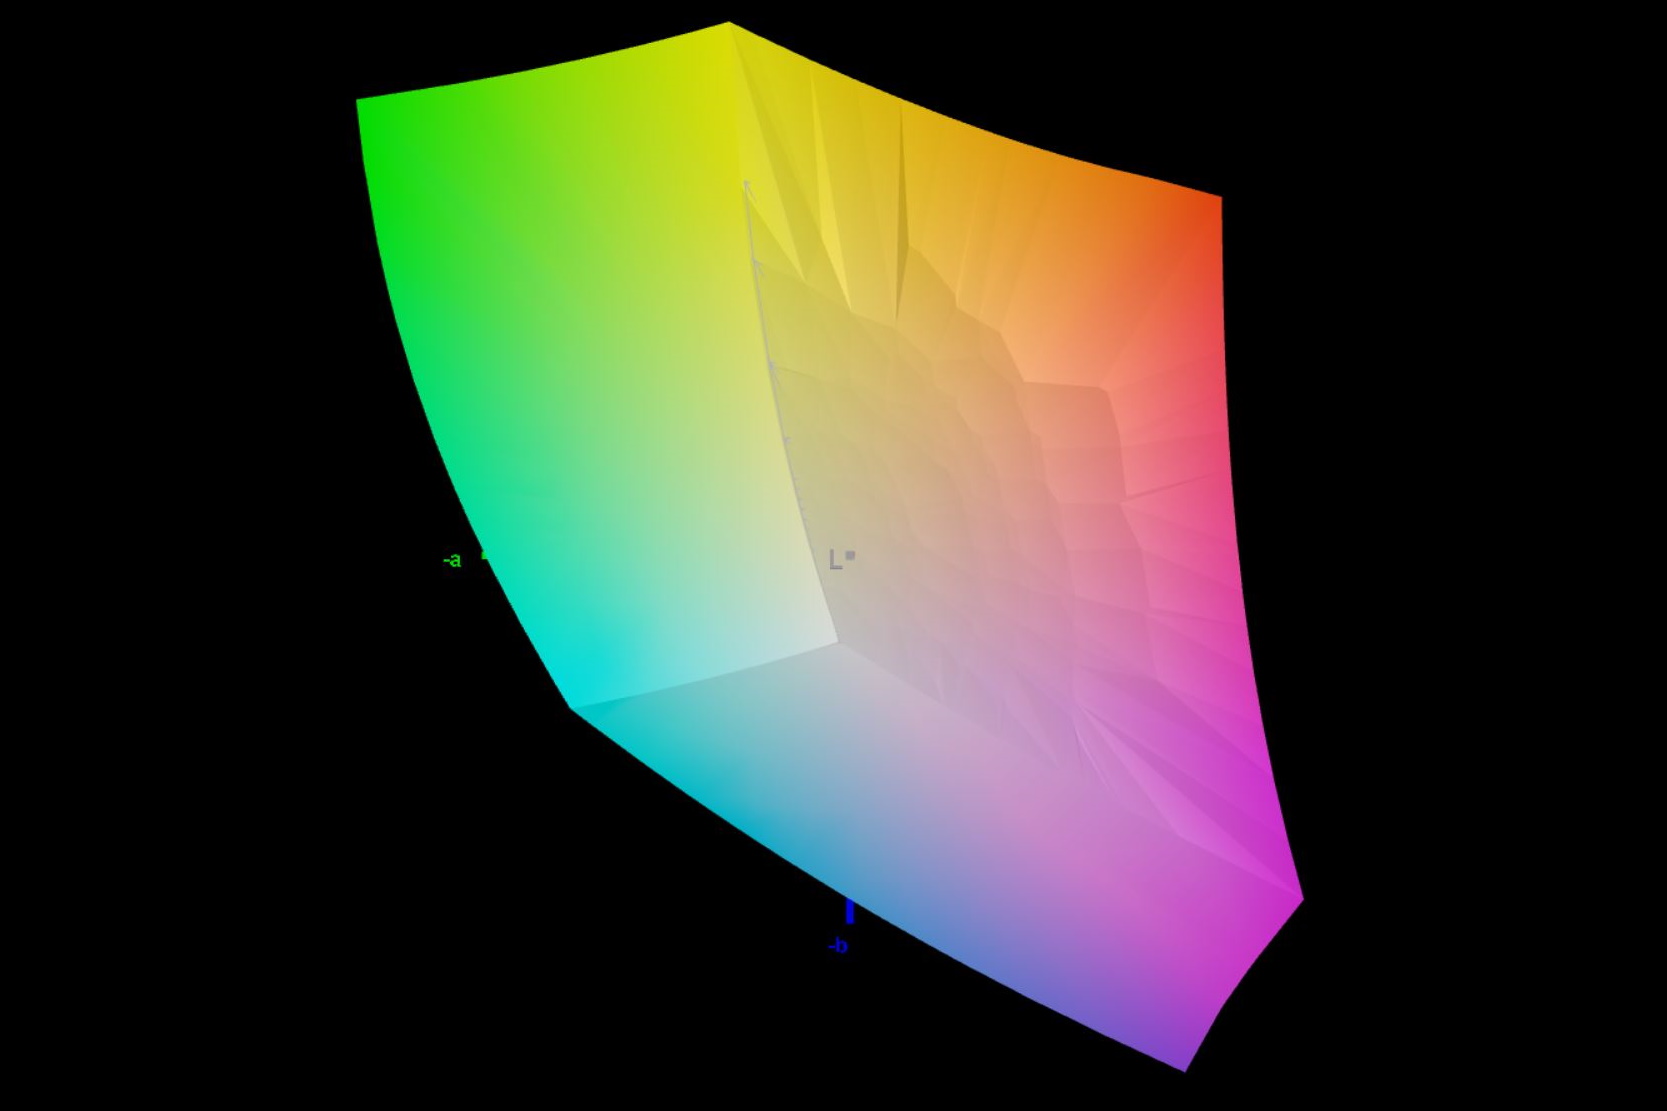
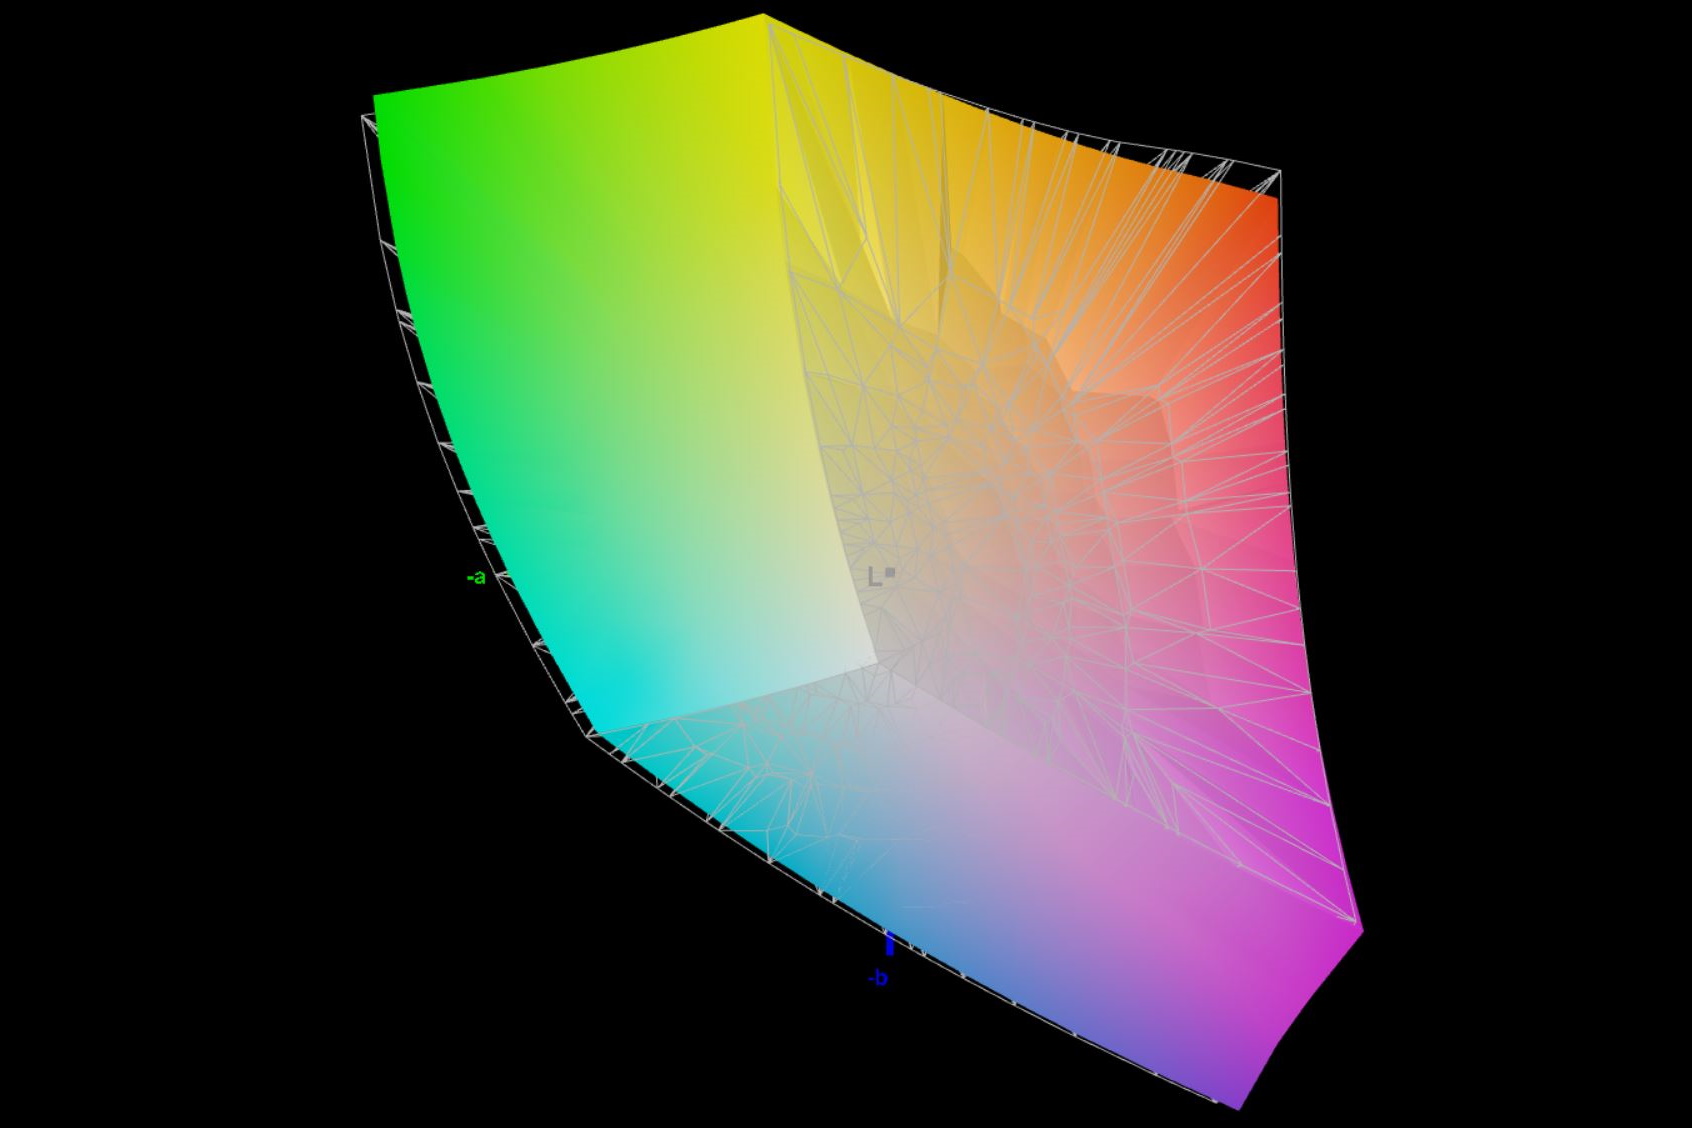
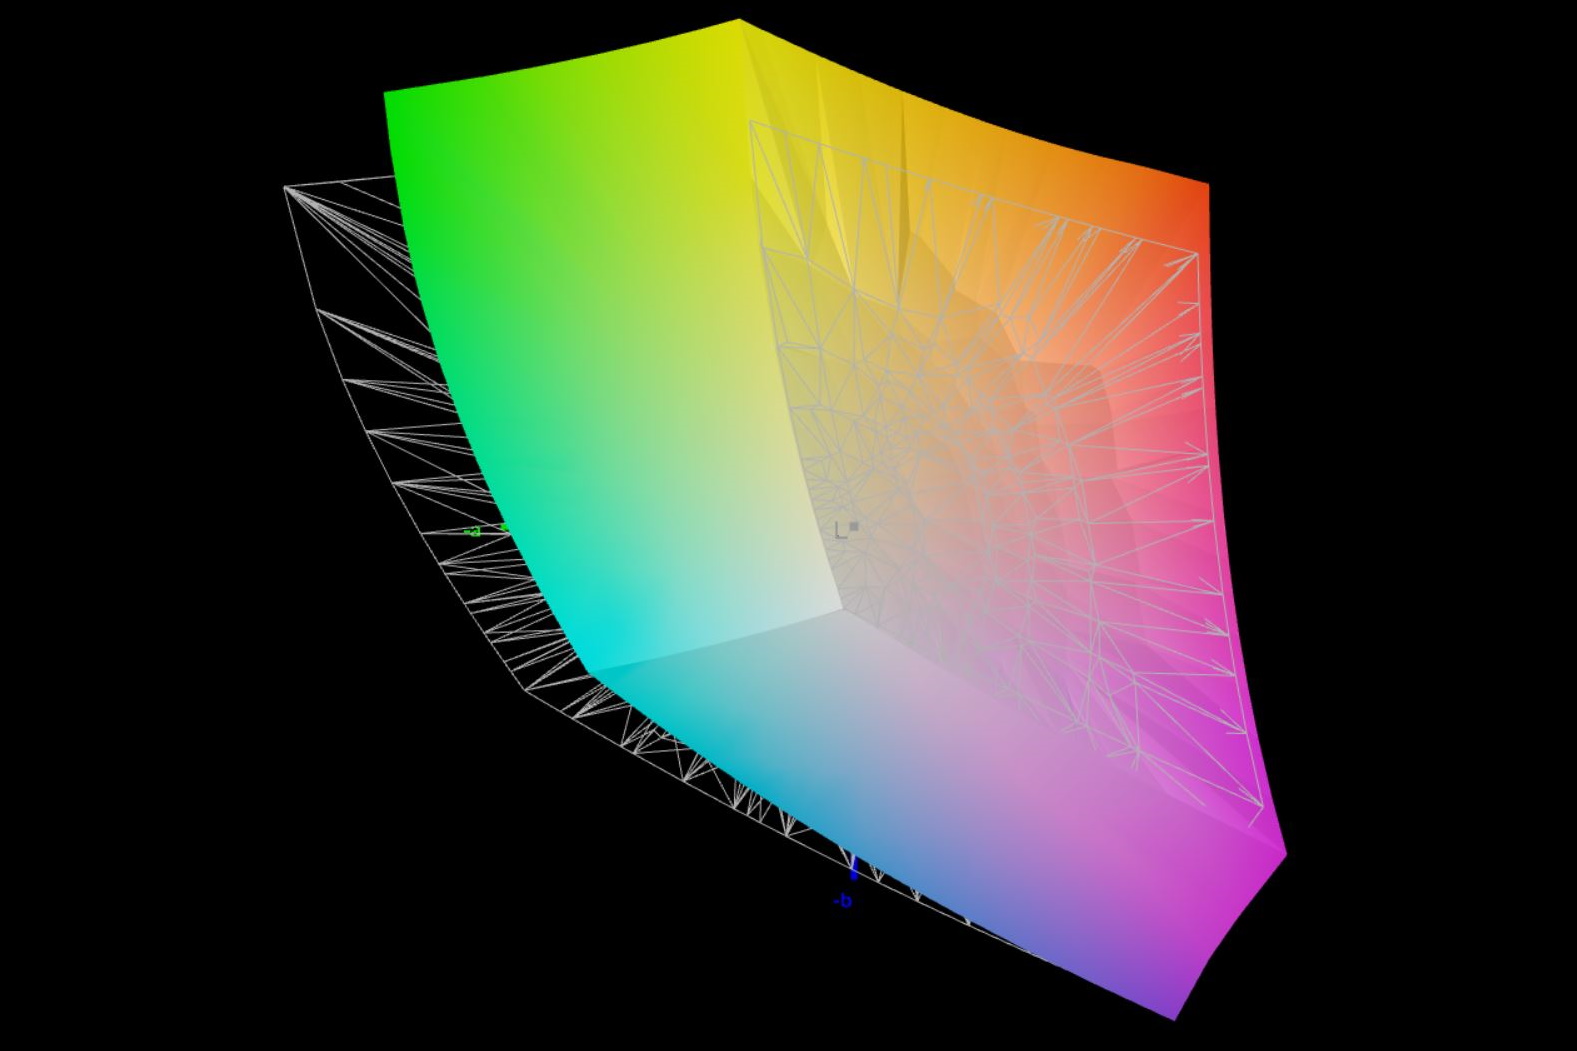
Les faibles écarts de couleur mesurés sans étalonnage préalable sont remarquables. Même le DeltaE maximum déterminé d'un peu moins de 3 signifie qu'aucune différence ne peut être détectée à l'œil nu. Il n'est donc pas nécessaire de régler l'écran par la suite pour obtenir un affichage optimal.
Temps de réponse de l'écran
| ↔ Temps de réponse noir à blanc | ||
|---|---|---|
| 10.8 ms ... hausse ↗ et chute ↘ combinées | ↗ 4.6 ms hausse | 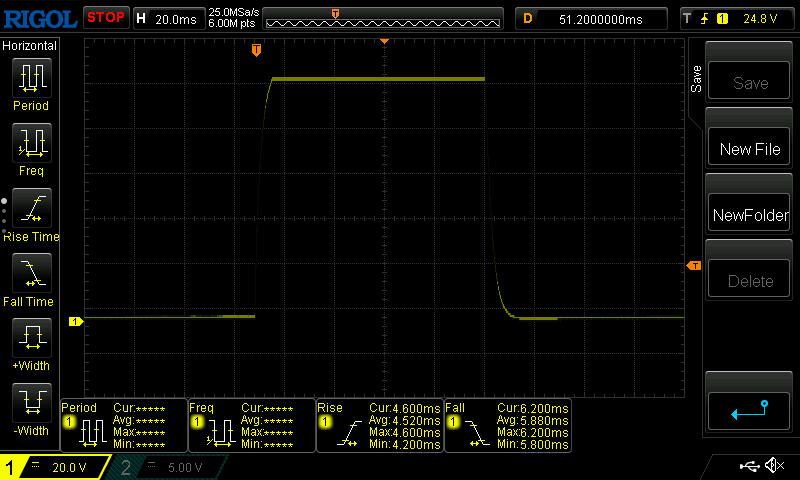 |
| ↘ 6.2 ms chute | ||
| L'écran montre de bons temps de réponse, mais insuffisant pour du jeu compétitif. En comparaison, tous les appareils testés affichent entre 0.1 (minimum) et 240 (maximum) ms. » 29 % des appareils testés affichent de meilleures performances. Cela signifie que les latences relevées sont meilleures que la moyenne (19.8 ms) de tous les appareils testés. | ||
| ↔ Temps de réponse gris 50% à gris 80% | ||
| 16.4 ms ... hausse ↗ et chute ↘ combinées | ↗ 7.4 ms hausse | 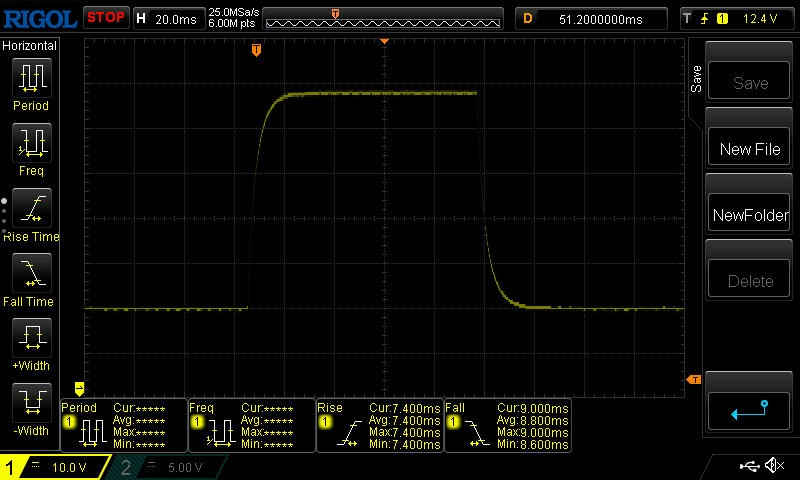 |
| ↘ 9 ms chute | ||
| L'écran montre de bons temps de réponse, mais insuffisant pour du jeu compétitif. En comparaison, tous les appareils testés affichent entre 0.165 (minimum) et 636 (maximum) ms. » 31 % des appareils testés affichent de meilleures performances. Cela signifie que les latences relevées sont meilleures que la moyenne (31 ms) de tous les appareils testés. | ||
Scintillement / MLI (Modulation de largeur d'impulsion)
| Scintillement / MLI (Modulation de largeur d'impulsion) non décelé | 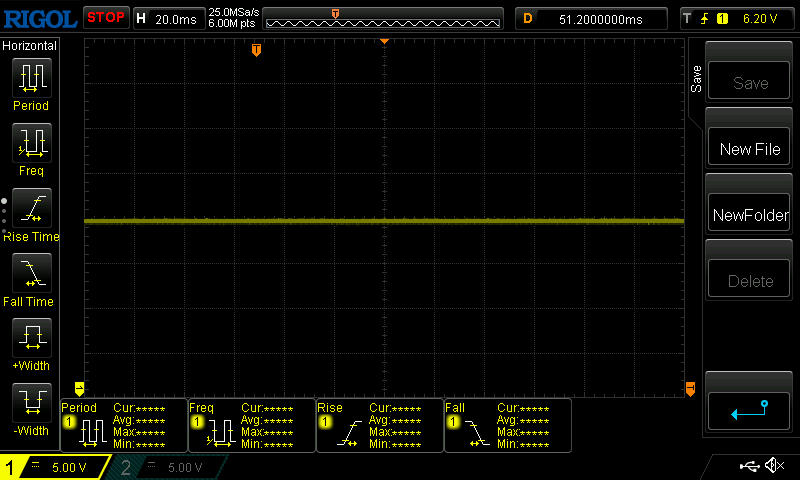 | ||
En comparaison, 52 % des appareils testés n'emploient pas MDI pour assombrir leur écran. Nous avons relevé une moyenne à 7757 (minimum : 5 - maximum : 343500) Hz dans le cas où une MDI était active. | |||
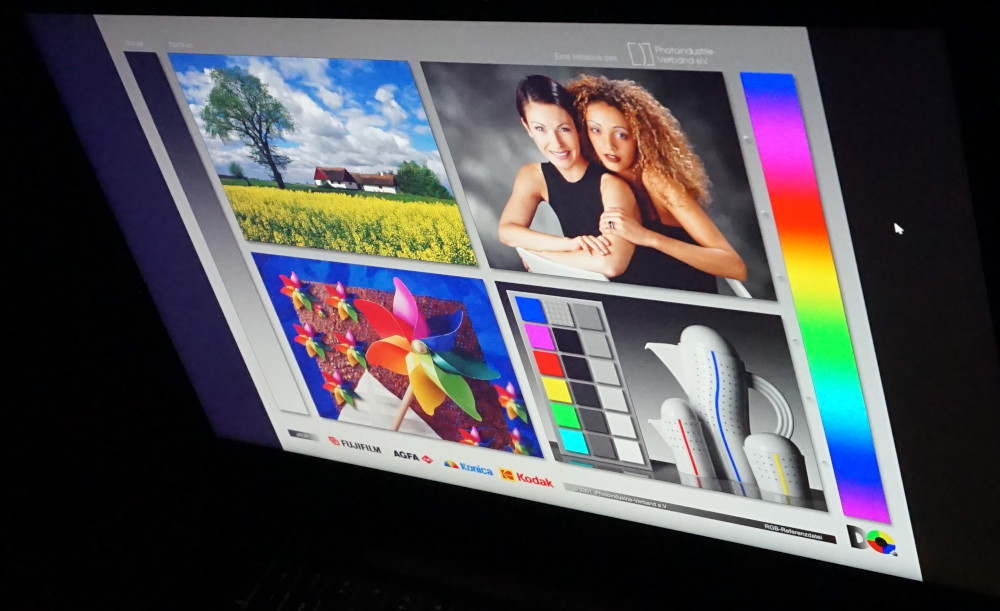
Avec seulement 350 cd/m², la visibilité extérieure est considérablement réduite. Les couleurs sont encore bien reconnaissables dans un endroit ombragé. Cependant, si un peu plus de lumière tombe sur l'écran, les textes peuvent tout au plus être reconnus suffisamment bien. Il en va de même par temps nuageux.

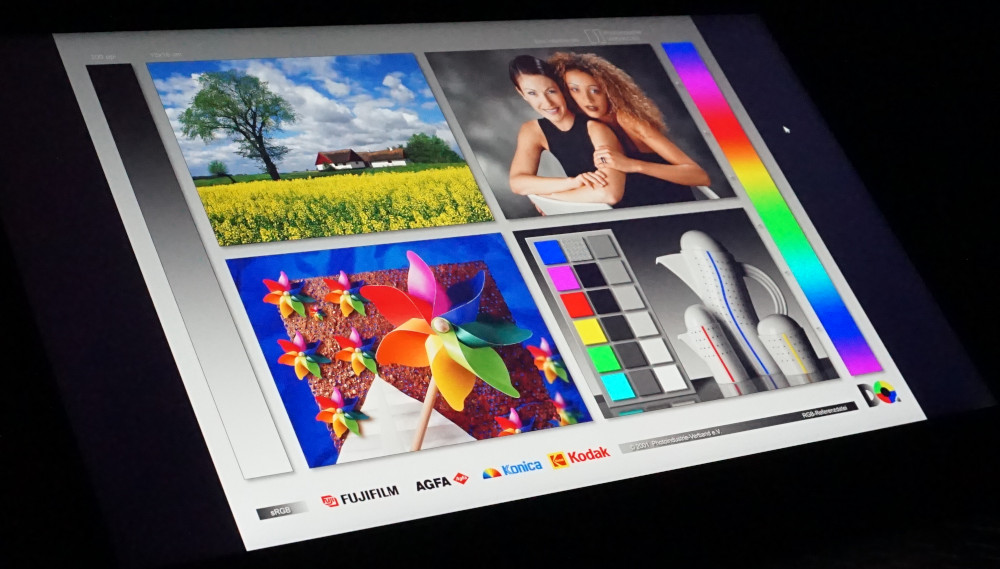
La reproduction des couleurs à partir de différents angles de vue est bonne, comme on peut s'y attendre. La dalle IPS ne révèle aucun changement de couleur et la luminosité reste pratiquement constante, même sous un angle très prononcé.
Performances - Des jeux solides avec le Focus 17
En particulier, la forte Nvidia Geforce RTX 4070 détermine les possibilités d'utilisation du Focus 17 E23. Le GPU offre beaucoup de performance avec assez de VRAM pour les titres actuels qui peuvent être joués à la résolution native QHD et presque tous les détails. Cela devrait également s'appliquer aux jeux à venir dans un futur proche.
Dans le même temps, une bonne vitesse de travail est garantie grâce au processeur Intel Core i9-13900HX. Les applications complexes peuvent être traitées rapidement. Le multitâche ne pose pas de problème, même à un niveau élevé. Cependant, la performance du processeur est au mieux secondaire dans un ordinateur portable de jeu.
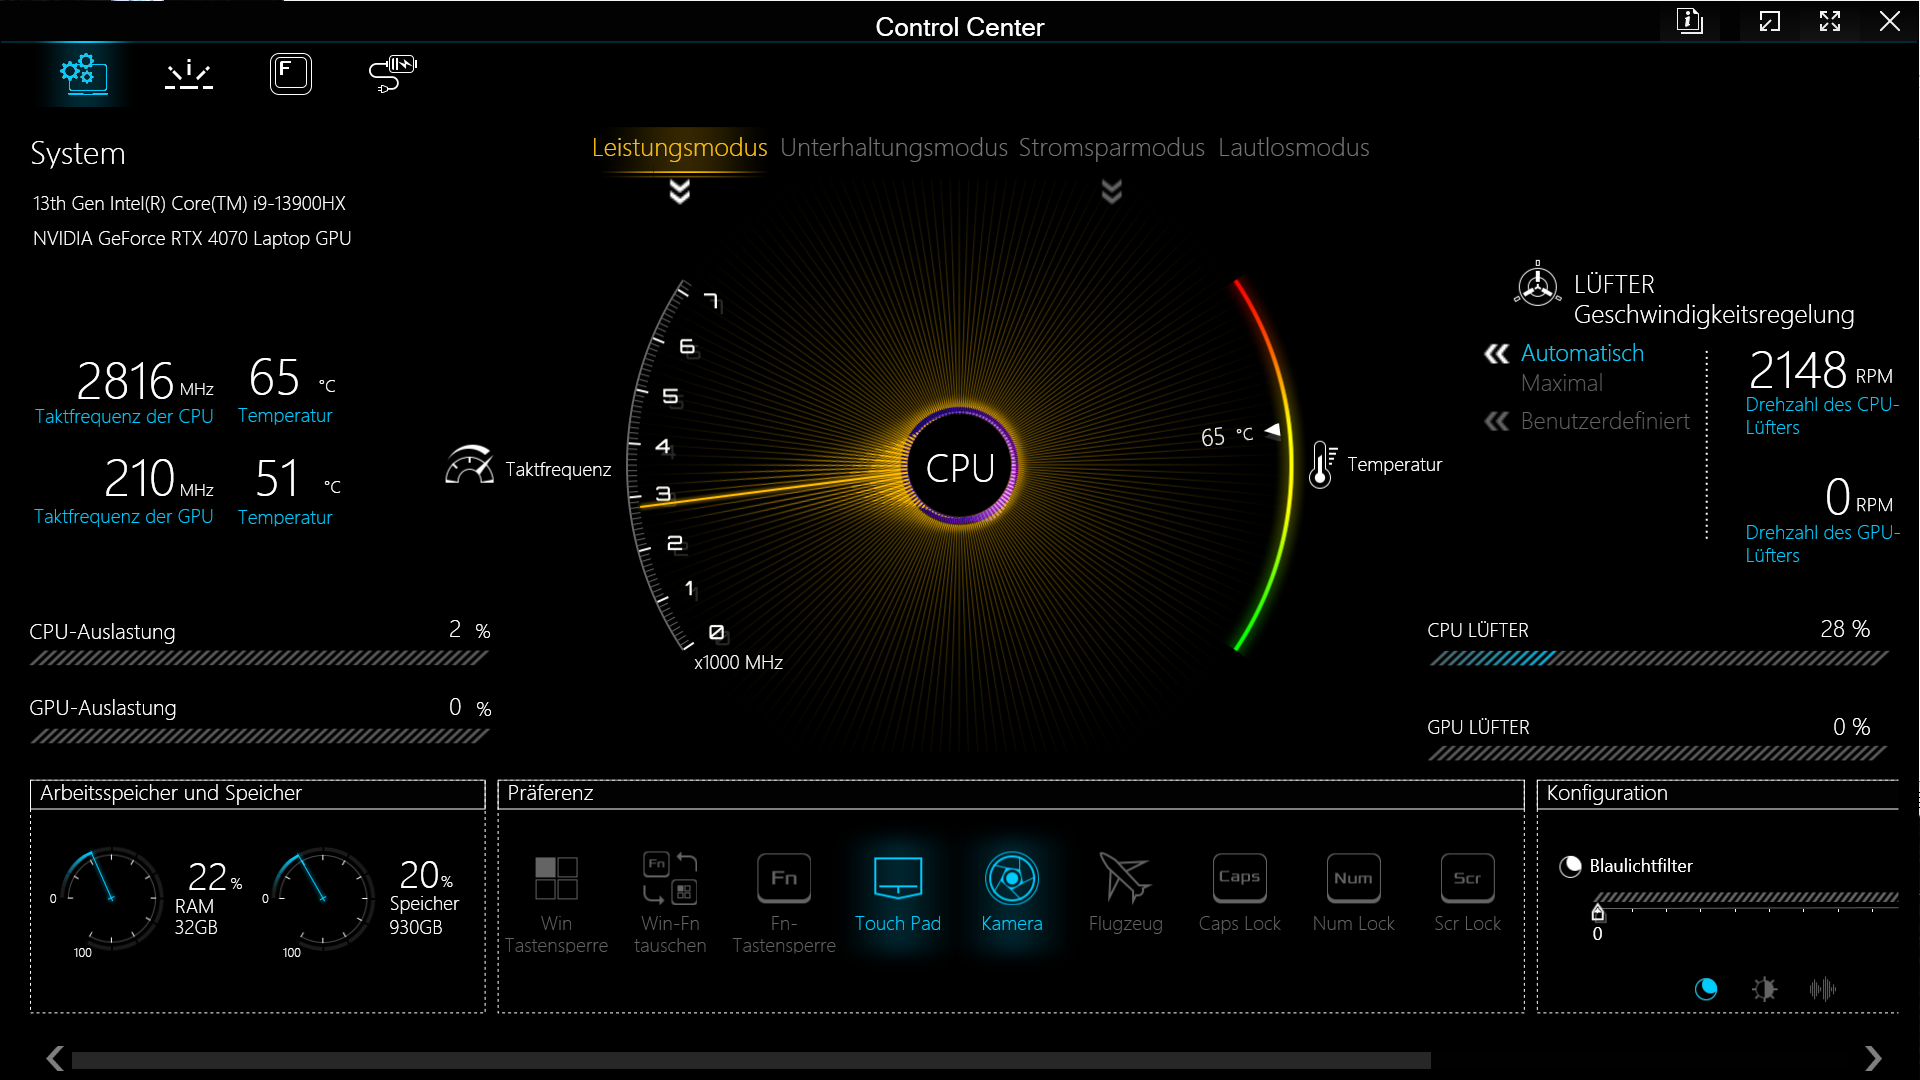
Conditions d'essai
Quatre modes de performance prédéfinis peuvent être sélectionnés dans le ControlCenter préinstallé. Nous avons toujours utilisé le mode "Performance" pour nos tests et benchmarks, ce qui garantit les vitesses de ventilation les plus élevées et une alimentation maximale du GPU et du CPU.
Les valeurs sont légèrement plus faibles en "Mode Divertissement". Seules les performances du processeur sont légèrement réduites dans ce mode, il ne faut donc pas s'attendre à des effets notables sur les jeux. le "mode silencieux", quant à lui, limite considérablement les performances du système, mais le bruit s'estompe en arrière-plan, même s'il ne disparaît pas complètement. Les jeux les moins exigeants restent jouables même dans ce mode. Entre autres, Witcher 3 atteint plus de 60 fps avec les paramètres les plus élevés et en Full HD.
Le "mode économie d'énergie" désactive complètement la puce graphique dédiée et est, dans l'état actuel des choses, obligatoire pour obtenir des durées de fonctionnement de la batterie à peu près acceptables, du moins sur le système que nous avons testé.
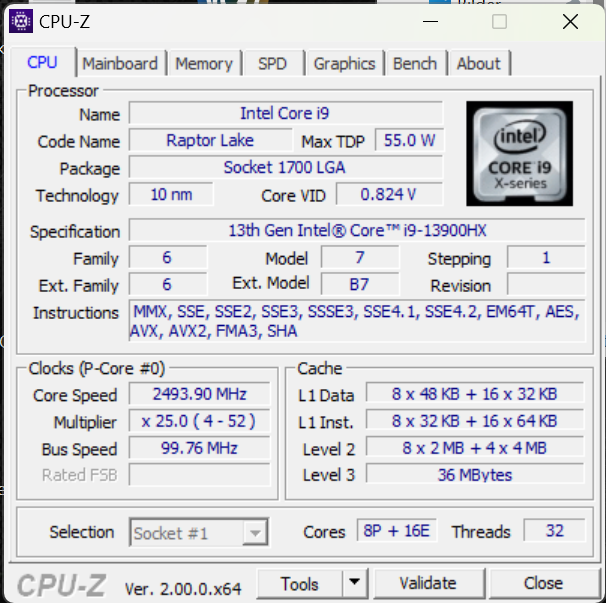
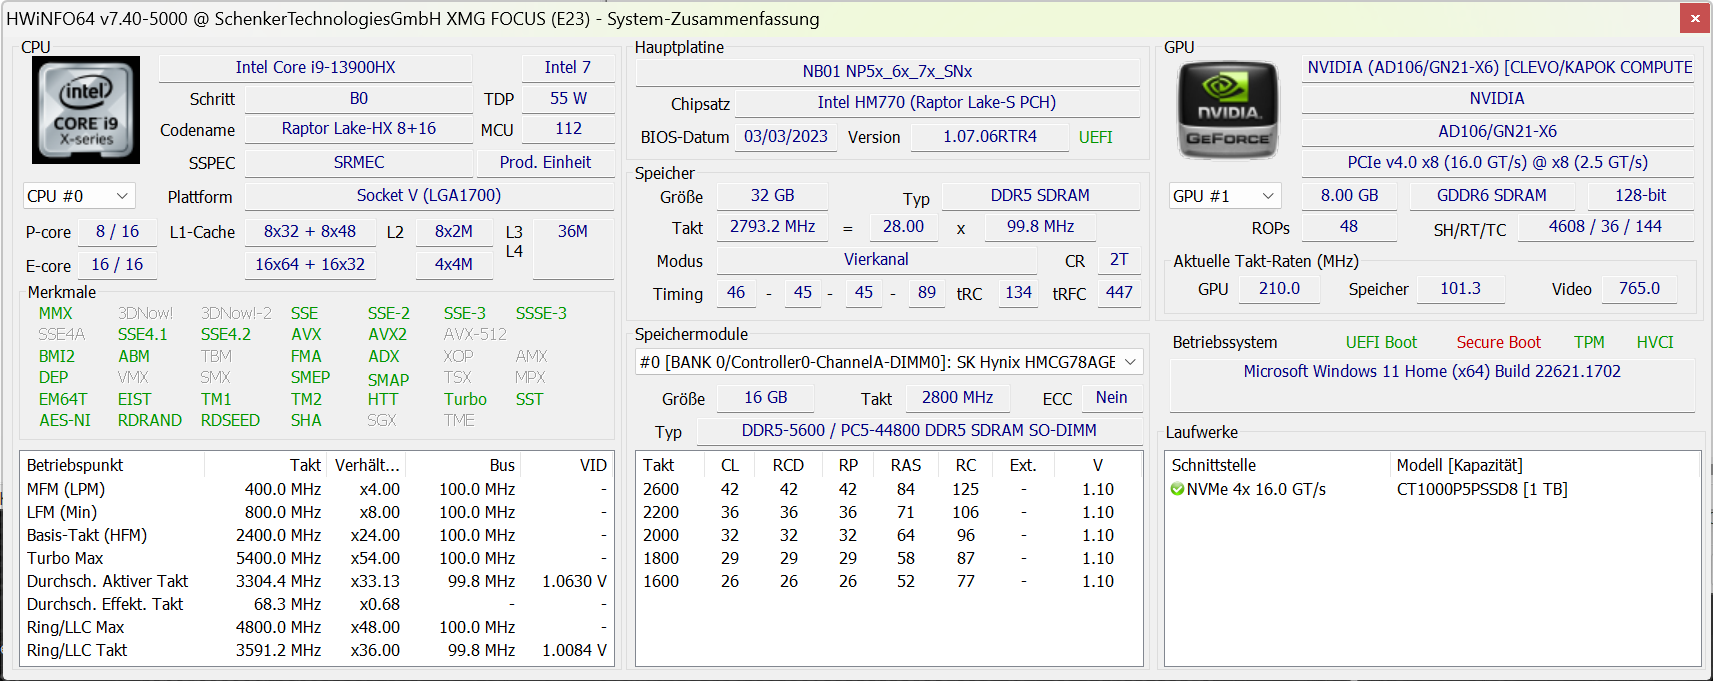
Processeur
Un total de 32 threads et 36 Mo de cache de niveau 3, ainsi qu'une fréquence d'horloge maximale de 5,4 GHz en témoignent : Le Intel Core i9-13900HX est actuellement l'un des meilleurs processeurs mobiles. Il est utilisé de manière optimale pour les applications multitâches et les calculs intensifs Intel Core i9-12900HX ou un AMD Ryzen 7 7745HX derrière.
Dans le XMG Focus 17, le CPU reçoit jusqu'à 162 W pendant quelques fractions de seconde. Au moins 135 W peuvent être fournis pendant une demi-minute. Malheureusement, le système de refroidissement n'est pas en mesure de faire face au développement de la chaleur. Dans le Medion Erazer Major X20, le même processeur reste stable au maximum de ses performances. Dans le Focus 17, les performances chutent de plus de 20 % dans le test Cinebench R15. Cependant, le i9 de l'Omen 17-ck2097ng de HP perd même 30%, donc le comportement général semble acceptable.
Le fait que le processeur soit quelque peu surdimensionné devient évident lorsque nous regardons le "Entertainment Mode". Ici aussi, le ventilateur reste bruyant, bien que l'alimentation soit réduite de 135 W à 55 W. En même temps, nous ne mesurons pas de réduction sérieuse des performances, en particulier dans les jeux. Cela s'explique par le fait que le processeur ne peut fonctionner de manière suffisamment stable avec cette consommation d'énergie qu'à long terme. Par conséquent, le mode d'alimentation n'a d'effet que pour les charges à court terme.
Seuls 15 W sont accordés en mode silencieux et en mode d'économie d'énergie, et 30 W pour de courtes périodes.
Vous trouverez davantage de mesures, de données de comparaison et d'informations dans notre Liste de référence des processeurs.
Cinebench R15 Multi loop
Cinebench R23: Multi Core | Single Core
Cinebench R20: CPU (Multi Core) | CPU (Single Core)
Cinebench R15: CPU Multi 64Bit | CPU Single 64Bit
Blender: v2.79 BMW27 CPU
7-Zip 18.03: 7z b 4 | 7z b 4 -mmt1
Geekbench 5.5: Multi-Core | Single-Core
HWBOT x265 Benchmark v2.2: 4k Preset
LibreOffice : 20 Documents To PDF
R Benchmark 2.5: Overall mean
| CPU Performance rating | |
| Moyenne Intel Core i9-13900HX | |
| Medion Erazer Major X20 | |
| HP Omen 17-ck2097ng | |
| Schenker XMG Focus 17 (E23) | |
| Moyenne de la classe Gaming | |
| MSI Titan GT77 12UHS | |
| Lenovo Legion Pro 5 16ARX8 | |
| Medion Erazer Defender P40 | |
| Schenker XMG Neo 17 M22 | |
| Cinebench R23 / Multi Core | |
| Moyenne Intel Core i9-13900HX (24270 - 32623, n=23) | |
| Medion Erazer Major X20 | |
| Schenker XMG Focus 17 (E23) | |
| HP Omen 17-ck2097ng | |
| Moyenne de la classe Gaming (10488 - 42661, n=107, 2 dernières années) | |
| MSI Titan GT77 12UHS | |
| Medion Erazer Defender P40 | |
| Lenovo Legion Pro 5 16ARX8 | |
| Schenker XMG Neo 17 M22 | |
| Cinebench R23 / Single Core | |
| HP Omen 17-ck2097ng | |
| Moyenne Intel Core i9-13900HX (1867 - 2105, n=20) | |
| Medion Erazer Major X20 | |
| Moyenne de la classe Gaming (1166 - 2415, n=107, 2 dernières années) | |
| Schenker XMG Focus 17 (E23) | |
| MSI Titan GT77 12UHS | |
| Lenovo Legion Pro 5 16ARX8 | |
| Medion Erazer Defender P40 | |
| Schenker XMG Neo 17 M22 | |
| Cinebench R20 / CPU (Multi Core) | |
| Moyenne Intel Core i9-13900HX (9152 - 12541, n=21) | |
| Medion Erazer Major X20 | |
| Moyenne de la classe Gaming (4029 - 16433, n=106, 2 dernières années) | |
| Schenker XMG Focus 17 (E23) | |
| HP Omen 17-ck2097ng | |
| MSI Titan GT77 12UHS | |
| Medion Erazer Defender P40 | |
| Lenovo Legion Pro 5 16ARX8 | |
| Schenker XMG Neo 17 M22 | |
| Cinebench R20 / CPU (Single Core) | |
| HP Omen 17-ck2097ng | |
| Moyenne Intel Core i9-13900HX (722 - 810, n=21) | |
| Moyenne de la classe Gaming (442 - 913, n=106, 2 dernières années) | |
| Medion Erazer Major X20 | |
| Schenker XMG Focus 17 (E23) | |
| MSI Titan GT77 12UHS | |
| Lenovo Legion Pro 5 16ARX8 | |
| Medion Erazer Defender P40 | |
| Schenker XMG Neo 17 M22 | |
| Cinebench R15 / CPU Multi 64Bit | |
| Moyenne Intel Core i9-13900HX (3913 - 4970, n=22) | |
| Schenker XMG Focus 17 (E23) | |
| Medion Erazer Major X20 | |
| HP Omen 17-ck2097ng | |
| Moyenne de la classe Gaming (1578 - 6330, n=105, 2 dernières années) | |
| MSI Titan GT77 12UHS | |
| Medion Erazer Defender P40 | |
| Lenovo Legion Pro 5 16ARX8 | |
| Schenker XMG Neo 17 M22 | |
| Cinebench R15 / CPU Single 64Bit | |
| HP Omen 17-ck2097ng | |
| Medion Erazer Major X20 | |
| Moyenne de la classe Gaming (188.8 - 350, n=106, 2 dernières années) | |
| Lenovo Legion Pro 5 16ARX8 | |
| Moyenne Intel Core i9-13900HX (247 - 304, n=22) | |
| Schenker XMG Focus 17 (E23) | |
| MSI Titan GT77 12UHS | |
| Schenker XMG Neo 17 M22 | |
| Medion Erazer Defender P40 | |
| Blender / v2.79 BMW27 CPU | |
| Schenker XMG Neo 17 M22 | |
| Medion Erazer Defender P40 | |
| Lenovo Legion Pro 5 16ARX8 | |
| HP Omen 17-ck2097ng | |
| Moyenne de la classe Gaming (79 - 330, n=104, 2 dernières années) | |
| MSI Titan GT77 12UHS | |
| Schenker XMG Focus 17 (E23) | |
| Moyenne Intel Core i9-13900HX (101 - 153, n=22) | |
| Medion Erazer Major X20 | |
| 7-Zip 18.03 / 7z b 4 | |
| Medion Erazer Major X20 | |
| Moyenne Intel Core i9-13900HX (90675 - 127283, n=21) | |
| Schenker XMG Focus 17 (E23) | |
| HP Omen 17-ck2097ng | |
| Moyenne de la classe Gaming (33491 - 148086, n=105, 2 dernières années) | |
| MSI Titan GT77 12UHS | |
| Lenovo Legion Pro 5 16ARX8 | |
| Medion Erazer Defender P40 | |
| Schenker XMG Neo 17 M22 | |
| 7-Zip 18.03 / 7z b 4 -mmt1 | |
| Lenovo Legion Pro 5 16ARX8 | |
| HP Omen 17-ck2097ng | |
| Medion Erazer Major X20 | |
| Moyenne Intel Core i9-13900HX (6340 - 7177, n=21) | |
| Schenker XMG Focus 17 (E23) | |
| Moyenne de la classe Gaming (4199 - 7436, n=105, 2 dernières années) | |
| MSI Titan GT77 12UHS | |
| Schenker XMG Neo 17 M22 | |
| Medion Erazer Defender P40 | |
| Geekbench 5.5 / Multi-Core | |
| HP Omen 17-ck2097ng | |
| Moyenne Intel Core i9-13900HX (17614 - 21075, n=22) | |
| Medion Erazer Major X20 | |
| Schenker XMG Focus 17 (E23) | |
| Moyenne de la classe Gaming (6460 - 28263, n=105, 2 dernières années) | |
| MSI Titan GT77 12UHS | |
| Medion Erazer Defender P40 | |
| Lenovo Legion Pro 5 16ARX8 | |
| Schenker XMG Neo 17 M22 | |
| Geekbench 5.5 / Single-Core | |
| HP Omen 17-ck2097ng | |
| Moyenne de la classe Gaming (986 - 2474, n=105, 2 dernières années) | |
| Lenovo Legion Pro 5 16ARX8 | |
| Medion Erazer Major X20 | |
| Moyenne Intel Core i9-13900HX (1345 - 2093, n=22) | |
| Schenker XMG Focus 17 (E23) | |
| MSI Titan GT77 12UHS | |
| Medion Erazer Defender P40 | |
| Schenker XMG Neo 17 M22 | |
| HWBOT x265 Benchmark v2.2 / 4k Preset | |
| Moyenne Intel Core i9-13900HX (23.5 - 34.4, n=22) | |
| Medion Erazer Major X20 | |
| Moyenne de la classe Gaming (11.5 - 44.4, n=105, 2 dernières années) | |
| Schenker XMG Focus 17 (E23) | |
| MSI Titan GT77 12UHS | |
| HP Omen 17-ck2097ng | |
| Lenovo Legion Pro 5 16ARX8 | |
| Medion Erazer Defender P40 | |
| Schenker XMG Neo 17 M22 | |
| LibreOffice / 20 Documents To PDF | |
| Schenker XMG Neo 17 M22 | |
| Schenker XMG Focus 17 (E23) | |
| Medion Erazer Defender P40 | |
| Moyenne de la classe Gaming (33.2 - 88.8, n=105, 2 dernières années) | |
| HP Omen 17-ck2097ng | |
| Moyenne Intel Core i9-13900HX (32.8 - 51.1, n=21) | |
| Medion Erazer Major X20 | |
| MSI Titan GT77 12UHS | |
| Lenovo Legion Pro 5 16ARX8 | |
| R Benchmark 2.5 / Overall mean | |
| Medion Erazer Defender P40 | |
| Schenker XMG Neo 17 M22 | |
| Moyenne de la classe Gaming (0.3439 - 0.759, n=106, 2 dernières années) | |
| Schenker XMG Focus 17 (E23) | |
| Lenovo Legion Pro 5 16ARX8 | |
| MSI Titan GT77 12UHS | |
| Moyenne Intel Core i9-13900HX (0.375 - 0.4564, n=22) | |
| Medion Erazer Major X20 | |
| HP Omen 17-ck2097ng | |
* ... Moindre est la valeur, meilleures sont les performances
AIDA64: FP32 Ray-Trace | FPU Julia | CPU SHA3 | CPU Queen | FPU SinJulia | FPU Mandel | CPU AES | CPU ZLib | FP64 Ray-Trace | CPU PhotoWorxx
| Performance rating | |
| Moyenne de la classe Gaming | |
| Moyenne Intel Core i9-13900HX | |
| Medion Erazer Major X20 | |
| Schenker XMG Focus 17 (E23) | |
| Lenovo Legion Pro 5 16ARX8 | |
| HP Omen 17-ck2097ng | |
| Schenker XMG Neo 17 M22 | |
| Medion Erazer Defender P40 | |
| AIDA64 / FP32 Ray-Trace | |
| Moyenne de la classe Gaming (10227 - 85542, n=105, 2 dernières années) | |
| Lenovo Legion Pro 5 16ARX8 | |
| Medion Erazer Major X20 | |
| Moyenne Intel Core i9-13900HX (17589 - 27615, n=22) | |
| Schenker XMG Focus 17 (E23) | |
| HP Omen 17-ck2097ng | |
| Schenker XMG Neo 17 M22 | |
| Medion Erazer Defender P40 | |
| AIDA64 / FPU Julia | |
| Moyenne de la classe Gaming (51376 - 238426, n=105, 2 dernières années) | |
| Medion Erazer Major X20 | |
| Moyenne Intel Core i9-13900HX (88686 - 137015, n=22) | |
| Lenovo Legion Pro 5 16ARX8 | |
| Schenker XMG Focus 17 (E23) | |
| Schenker XMG Neo 17 M22 | |
| HP Omen 17-ck2097ng | |
| Medion Erazer Defender P40 | |
| AIDA64 / CPU SHA3 | |
| Moyenne de la classe Gaming (2180 - 10115, n=105, 2 dernières années) | |
| Medion Erazer Major X20 | |
| Moyenne Intel Core i9-13900HX (4362 - 7029, n=22) | |
| Schenker XMG Focus 17 (E23) | |
| Lenovo Legion Pro 5 16ARX8 | |
| HP Omen 17-ck2097ng | |
| Schenker XMG Neo 17 M22 | |
| Medion Erazer Defender P40 | |
| AIDA64 / CPU Queen | |
| Schenker XMG Focus 17 (E23) | |
| HP Omen 17-ck2097ng | |
| Medion Erazer Major X20 | |
| Moyenne Intel Core i9-13900HX (125644 - 141385, n=22) | |
| Lenovo Legion Pro 5 16ARX8 | |
| Moyenne de la classe Gaming (49785 - 173351, n=90, 2 dernières années) | |
| Medion Erazer Defender P40 | |
| Schenker XMG Neo 17 M22 | |
| AIDA64 / FPU SinJulia | |
| Lenovo Legion Pro 5 16ARX8 | |
| Medion Erazer Major X20 | |
| Moyenne Intel Core i9-13900HX (12334 - 17179, n=22) | |
| Moyenne de la classe Gaming (4424 - 33636, n=105, 2 dernières années) | |
| Schenker XMG Focus 17 (E23) | |
| Schenker XMG Neo 17 M22 | |
| HP Omen 17-ck2097ng | |
| Medion Erazer Defender P40 | |
| AIDA64 / FPU Mandel | |
| Moyenne de la classe Gaming (25115 - 128721, n=105, 2 dernières années) | |
| Lenovo Legion Pro 5 16ARX8 | |
| Medion Erazer Major X20 | |
| Moyenne Intel Core i9-13900HX (43850 - 69202, n=22) | |
| Schenker XMG Neo 17 M22 | |
| Schenker XMG Focus 17 (E23) | |
| HP Omen 17-ck2097ng | |
| Medion Erazer Defender P40 | |
| AIDA64 / CPU AES | |
| Moyenne Intel Core i9-13900HX (89413 - 237881, n=22) | |
| Schenker XMG Neo 17 M22 | |
| Medion Erazer Major X20 | |
| Moyenne de la classe Gaming (39258 - 247074, n=105, 2 dernières années) | |
| Schenker XMG Focus 17 (E23) | |
| HP Omen 17-ck2097ng | |
| Medion Erazer Defender P40 | |
| Lenovo Legion Pro 5 16ARX8 | |
| AIDA64 / CPU ZLib | |
| Medion Erazer Major X20 | |
| Moyenne Intel Core i9-13900HX (1284 - 1958, n=22) | |
| Schenker XMG Focus 17 (E23) | |
| Moyenne de la classe Gaming (574 - 2531, n=105, 2 dernières années) | |
| HP Omen 17-ck2097ng | |
| Lenovo Legion Pro 5 16ARX8 | |
| Medion Erazer Defender P40 | |
| Schenker XMG Neo 17 M22 | |
| AIDA64 / FP64 Ray-Trace | |
| Moyenne de la classe Gaming (5509 - 45446, n=105, 2 dernières années) | |
| Lenovo Legion Pro 5 16ARX8 | |
| Medion Erazer Major X20 | |
| Moyenne Intel Core i9-13900HX (9481 - 15279, n=22) | |
| Schenker XMG Focus 17 (E23) | |
| HP Omen 17-ck2097ng | |
| Schenker XMG Neo 17 M22 | |
| Medion Erazer Defender P40 | |
| AIDA64 / CPU PhotoWorxx | |
| HP Omen 17-ck2097ng | |
| Schenker XMG Focus 17 (E23) | |
| Moyenne Intel Core i9-13900HX (42994 - 51994, n=22) | |
| Moyenne de la classe Gaming (12271 - 89891, n=105, 2 dernières années) | |
| Medion Erazer Major X20 | |
| Medion Erazer Defender P40 | |
| Schenker XMG Neo 17 M22 | |
| Lenovo Legion Pro 5 16ARX8 | |
Performance du système
De nombreux cœurs de processeur, beaucoup de RAM avec un accès rapide, et un SSD rapide propulsent le système dans toutes les situations. Même un jeu en pause en arrière-plan ne ralentit que légèrement. Du multitâche intensif avec un logiciel de montage vidéo ouvert à d'innombrables onglets de navigateur, presque rien ne cause de problèmes sérieux à Focus 17.
Bien qu'il soit relativement loin derrière ses concurrents avec un matériel similaire, il obtient néanmoins une note plus que solide qui promet des performances plus que suffisantes pour les tâches exigeantes.
CrossMark: Overall | Productivity | Creativity | Responsiveness
| PCMark 10 / Score | |
| Moyenne de la classe Gaming (5828 - 12414, n=93, 2 dernières années) | |
| Lenovo Legion Pro 5 16ARX8 | |
| HP Omen 17-ck2097ng | |
| Medion Erazer Major X20 | |
| Moyenne Intel Core i9-13900HX, NVIDIA GeForce RTX 4070 Laptop GPU (6956 - 8153, n=3) | |
| Schenker XMG Neo 17 M22 | |
| Schenker XMG Focus 17 (E23) | |
| Medion Erazer Defender P40 | |
| PCMark 10 / Essentials | |
| HP Omen 17-ck2097ng | |
| Medion Erazer Major X20 | |
| Lenovo Legion Pro 5 16ARX8 | |
| Moyenne Intel Core i9-13900HX, NVIDIA GeForce RTX 4070 Laptop GPU (9865 - 11653, n=3) | |
| Moyenne de la classe Gaming (8810 - 11935, n=97, 2 dernières années) | |
| Schenker XMG Focus 17 (E23) | |
| Medion Erazer Defender P40 | |
| Schenker XMG Neo 17 M22 | |
| PCMark 10 / Productivity | |
| Moyenne de la classe Gaming (6845 - 25323, n=95, 2 dernières années) | |
| Lenovo Legion Pro 5 16ARX8 | |
| HP Omen 17-ck2097ng | |
| Medion Erazer Major X20 | |
| Medion Erazer Defender P40 | |
| Moyenne Intel Core i9-13900HX, NVIDIA GeForce RTX 4070 Laptop GPU (9470 - 9850, n=3) | |
| Schenker XMG Neo 17 M22 | |
| Schenker XMG Focus 17 (E23) | |
| PCMark 10 / Digital Content Creation | |
| Moyenne de la classe Gaming (7602 - 19954, n=95, 2 dernières années) | |
| Lenovo Legion Pro 5 16ARX8 | |
| Moyenne Intel Core i9-13900HX, NVIDIA GeForce RTX 4070 Laptop GPU (9776 - 13370, n=3) | |
| Medion Erazer Major X20 | |
| HP Omen 17-ck2097ng | |
| Schenker XMG Neo 17 M22 | |
| Schenker XMG Focus 17 (E23) | |
| Medion Erazer Defender P40 | |
| CrossMark / Overall | |
| Schenker XMG Focus 17 (E23) | |
| Lenovo Legion Pro 5 16ARX8 | |
| HP Omen 17-ck2097ng | |
| Moyenne de la classe Gaming (1366 - 2409, n=94, 2 dernières années) | |
| Moyenne Intel Core i9-13900HX, NVIDIA GeForce RTX 4070 Laptop GPU (1842 - 2029, n=3) | |
| Medion Erazer Major X20 | |
| Medion Erazer Defender P40 | |
| Schenker XMG Neo 17 M22 | |
| CrossMark / Productivity | |
| Lenovo Legion Pro 5 16ARX8 | |
| Schenker XMG Focus 17 (E23) | |
| Moyenne de la classe Gaming (1386 - 2254, n=94, 2 dernières années) | |
| HP Omen 17-ck2097ng | |
| Moyenne Intel Core i9-13900HX, NVIDIA GeForce RTX 4070 Laptop GPU (1700 - 1872, n=3) | |
| Medion Erazer Major X20 | |
| Schenker XMG Neo 17 M22 | |
| Medion Erazer Defender P40 | |
| CrossMark / Creativity | |
| Schenker XMG Focus 17 (E23) | |
| Moyenne de la classe Gaming (1343 - 2786, n=94, 2 dernières années) | |
| HP Omen 17-ck2097ng | |
| Moyenne Intel Core i9-13900HX, NVIDIA GeForce RTX 4070 Laptop GPU (2088 - 2316, n=3) | |
| Lenovo Legion Pro 5 16ARX8 | |
| Medion Erazer Major X20 | |
| Medion Erazer Defender P40 | |
| Schenker XMG Neo 17 M22 | |
| CrossMark / Responsiveness | |
| HP Omen 17-ck2097ng | |
| Lenovo Legion Pro 5 16ARX8 | |
| Schenker XMG Focus 17 (E23) | |
| Moyenne de la classe Gaming (1226 - 2334, n=94, 2 dernières années) | |
| Moyenne Intel Core i9-13900HX, NVIDIA GeForce RTX 4070 Laptop GPU (1557 - 1752, n=3) | |
| Medion Erazer Major X20 | |
| Medion Erazer Defender P40 | |
| Schenker XMG Neo 17 M22 | |
| PCMark 10 Score | 6956 points | |
Aide | ||
| AIDA64 / Memory Copy | |
| HP Omen 17-ck2097ng | |
| Schenker XMG Focus 17 (E23) | |
| Moyenne Intel Core i9-13900HX (67716 - 79193, n=22) | |
| Moyenne de la classe Gaming (21750 - 129946, n=105, 2 dernières années) | |
| Medion Erazer Major X20 | |
| Medion Erazer Defender P40 | |
| Schenker XMG Neo 17 M22 | |
| Lenovo Legion Pro 5 16ARX8 | |
| AIDA64 / Memory Read | |
| HP Omen 17-ck2097ng | |
| Schenker XMG Focus 17 (E23) | |
| Moyenne Intel Core i9-13900HX (73998 - 88462, n=22) | |
| Moyenne de la classe Gaming (22956 - 118858, n=105, 2 dernières années) | |
| Medion Erazer Major X20 | |
| Medion Erazer Defender P40 | |
| Schenker XMG Neo 17 M22 | |
| Lenovo Legion Pro 5 16ARX8 | |
| AIDA64 / Memory Write | |
| HP Omen 17-ck2097ng | |
| Moyenne de la classe Gaming (22297 - 135096, n=105, 2 dernières années) | |
| Schenker XMG Focus 17 (E23) | |
| Moyenne Intel Core i9-13900HX (65472 - 77045, n=22) | |
| Medion Erazer Major X20 | |
| Medion Erazer Defender P40 | |
| Schenker XMG Neo 17 M22 | |
| Lenovo Legion Pro 5 16ARX8 | |
| AIDA64 / Memory Latency | |
| Moyenne de la classe Gaming (75.3 - 259, n=105, 2 dernières années) | |
| Medion Erazer Defender P40 | |
| Schenker XMG Focus 17 (E23) | |
| Schenker XMG Neo 17 M22 | |
| Medion Erazer Major X20 | |
| Lenovo Legion Pro 5 16ARX8 | |
| Moyenne Intel Core i9-13900HX (75.3 - 91.1, n=22) | |
| HP Omen 17-ck2097ng | |
* ... Moindre est la valeur, meilleures sont les performances
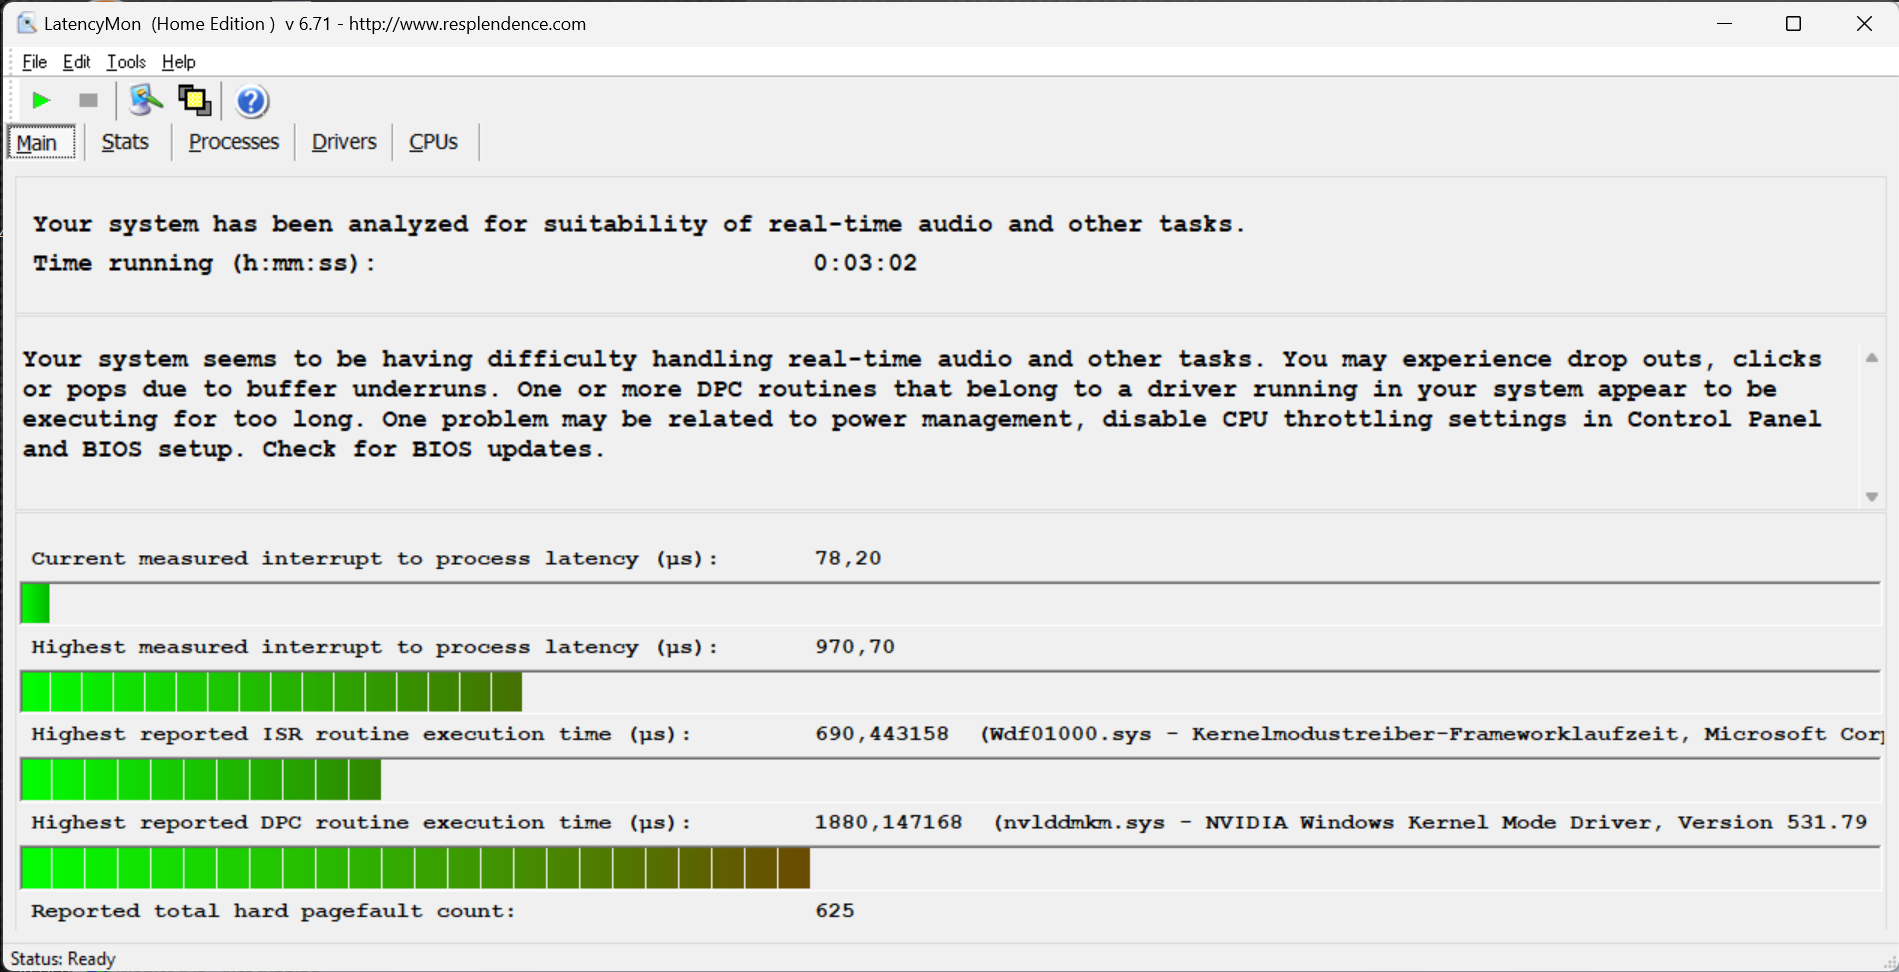
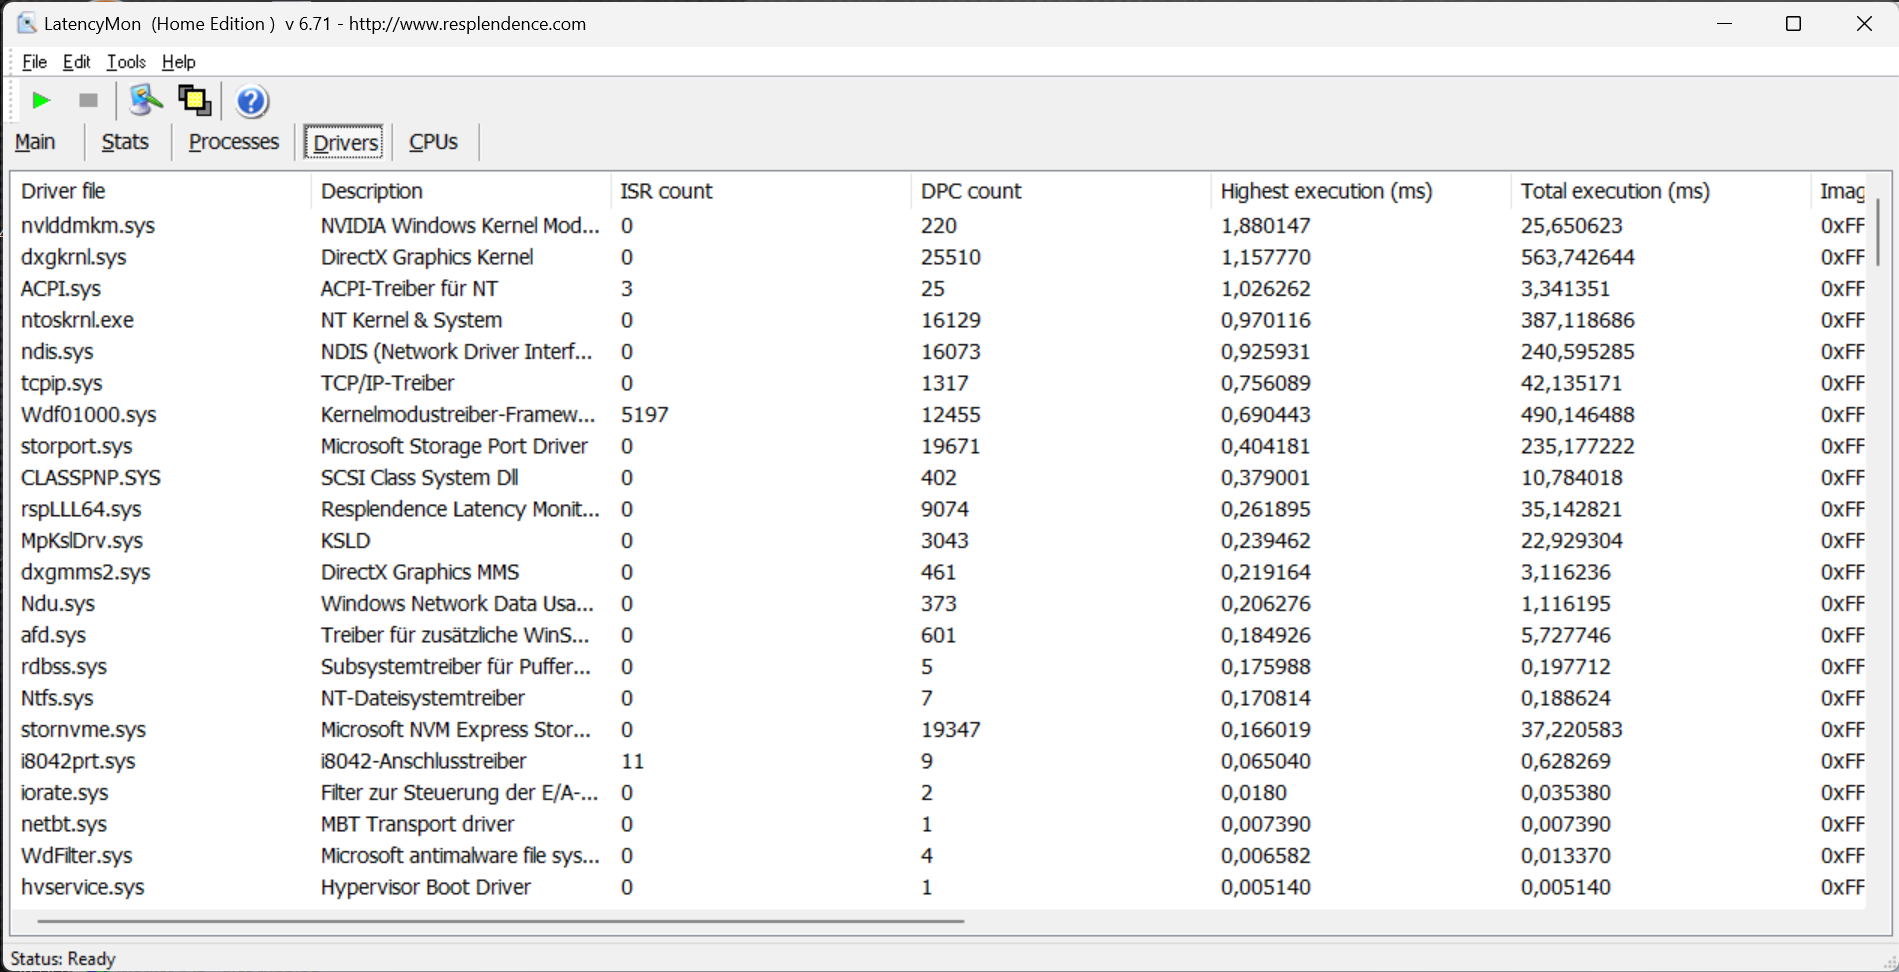
Latences DPC
D'autres ordinateurs portables de jeu dotés du même processeur ont des performances bien inférieures à celles du XMG Focus 17. Il n'atteint pas un résultat optimal mais devrait fonctionner de manière satisfaisante dans la plupart des tâches nécessitant un processus fluide. Il peut faire encore mieux, mais cela ne devrait être que secondaire pour la plupart des utilisateurs.
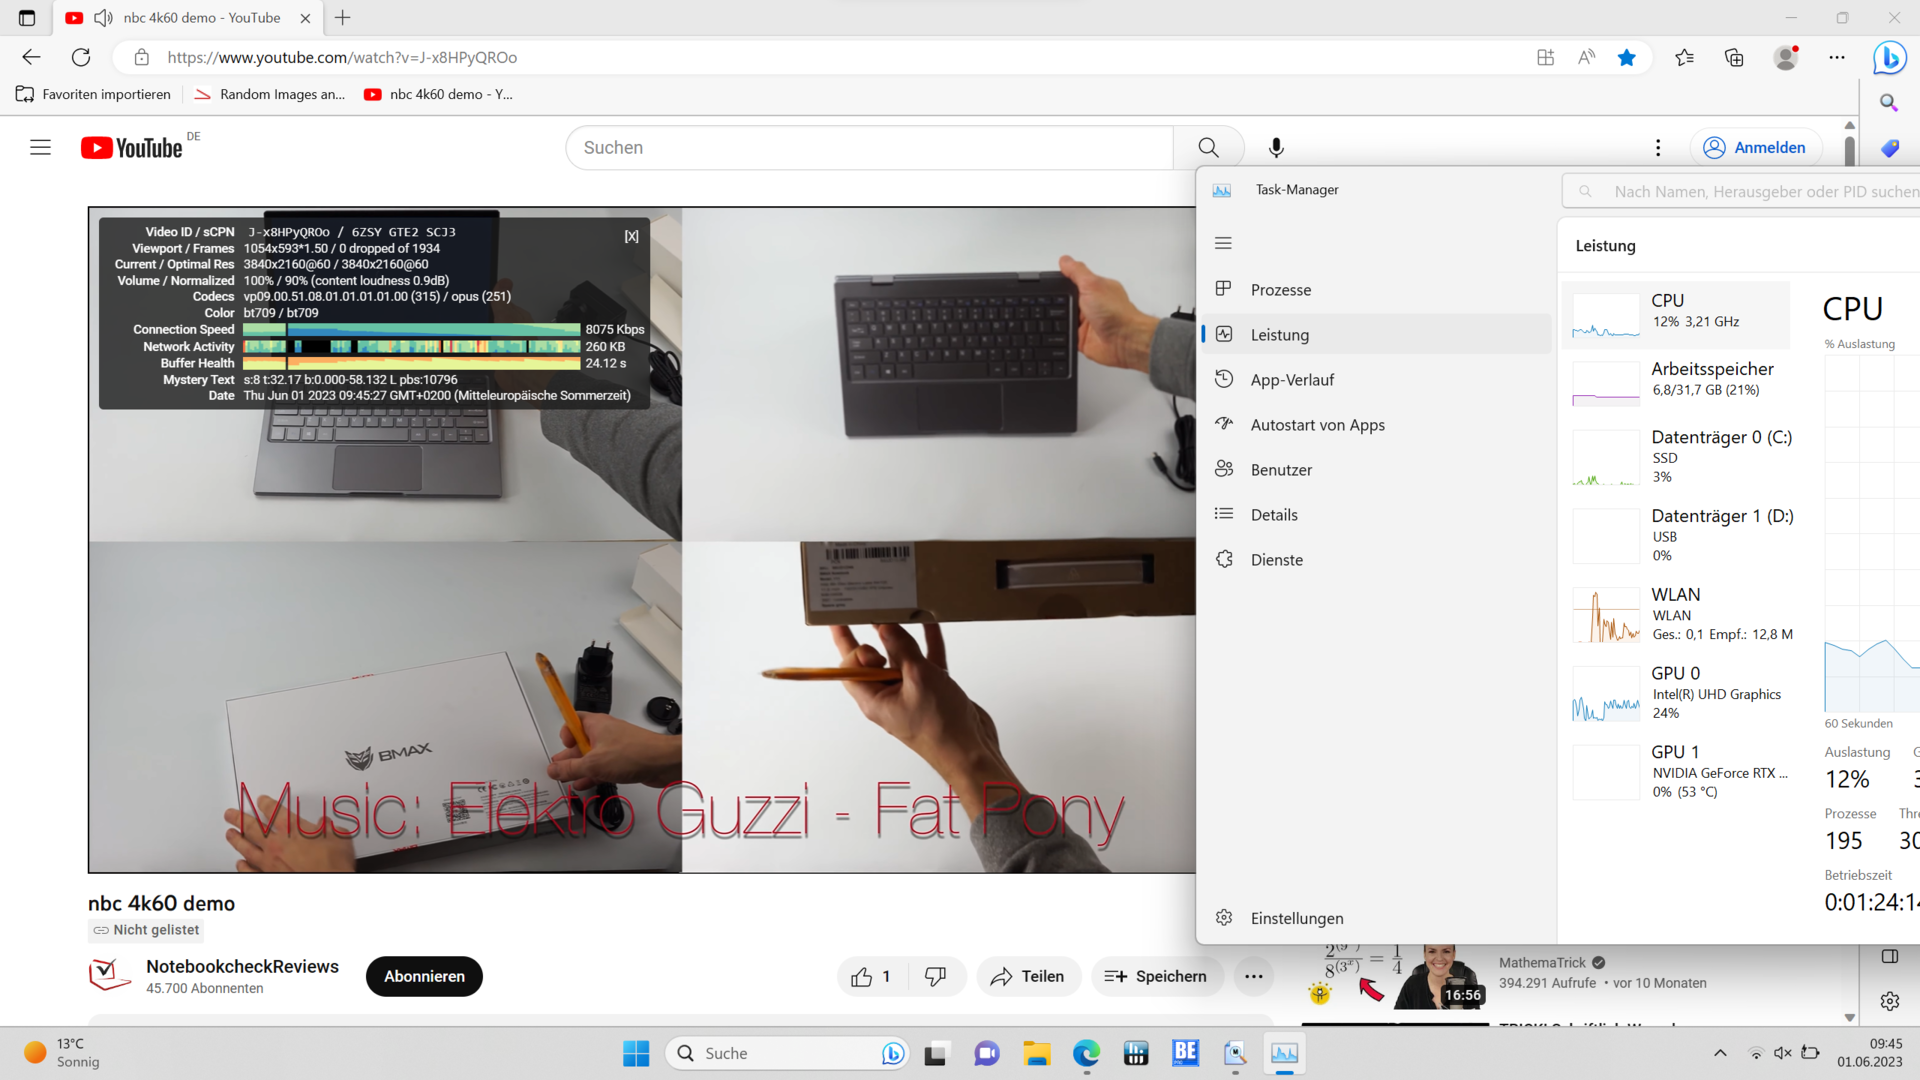
Les plus grandes difficultés sont causées par le pilote de la carte graphique de Nvidia, qui, espérons-le, sera amélioré par une mise à jour à l'avenir. Il convient également de saluer la fluidité de la lecture vidéo en 4K sans perte d'images, ce qui n'est en aucun cas la norme. Ainsi, la construction actuelle et l'équipement du pilote semblent s'harmoniser.
| DPC Latencies / LatencyMon - interrupt to process latency (max), Web, Youtube, Prime95 | |
| Schenker XMG Neo 17 M22 | |
| Medion Erazer Defender P40 | |
| HP Omen 17-ck2097ng | |
| Medion Erazer Major X20 | |
| Schenker XMG Focus 17 (E23) | |
| Lenovo Legion Pro 5 16ARX8 | |
* ... Moindre est la valeur, meilleures sont les performances
Mémoire de masse
Le SSD M.2 Crucial P5 Plus installé n'est pas un modèle haut de gamme. Cependant, il atteint de bons taux de transfert via PCIe 4.0 et reste très stable dans le test à long terme, ce qui est dû au refroidissement supplémentaire dans la plaque de base de l'ordinateur portable de jeu.
Il ne faut donc pas s'attendre à des blocages ou à des retards lors du chargement, de l'exécution des programmes, etc. de la mémoire de masse.

* ... Moindre est la valeur, meilleures sont les performances
Continuous reading: DiskSpd Read Loop, Queue Depth 8
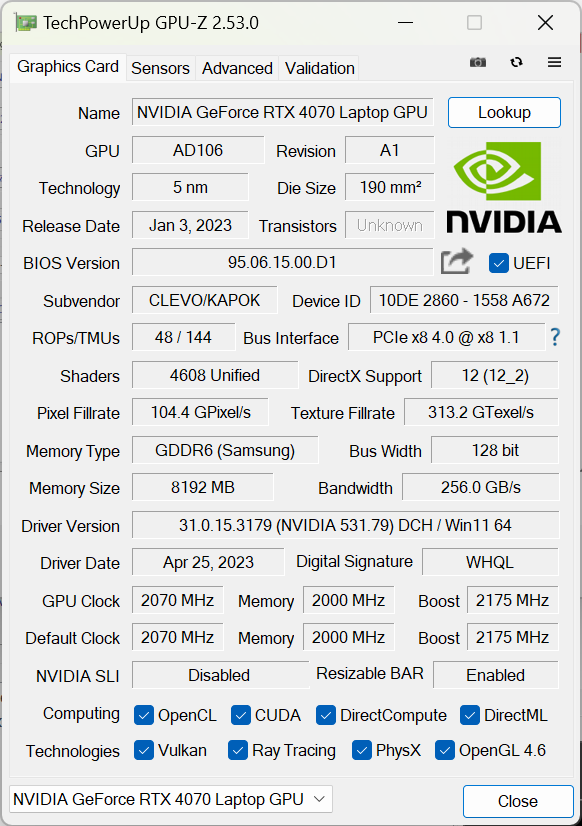
Carte graphique
Seuls quelques GPU sont plus rapides que le Nvidia GeForce RTX 4070, qui peut à juste titre être classé dans le milieu de gamme supérieur. Il offre 4 608 shaders, 144 cœurs de tenseur pour Nvidia DLSS et 36 cœurs de ray tracing. C'est suffisant pour les tâches exigeantes et les jeux complexes au niveau de détail le plus élevé. Seule la VRAM est un peu juste avec 8 Go. Cependant, cela ne devrait poser problème que si un moniteur 4K est connecté. Lors de tests aléatoires individuels dans la résolution native QHD de l'écran, plus de 7 Go n'ont jamais été occupés dans les jeux courants
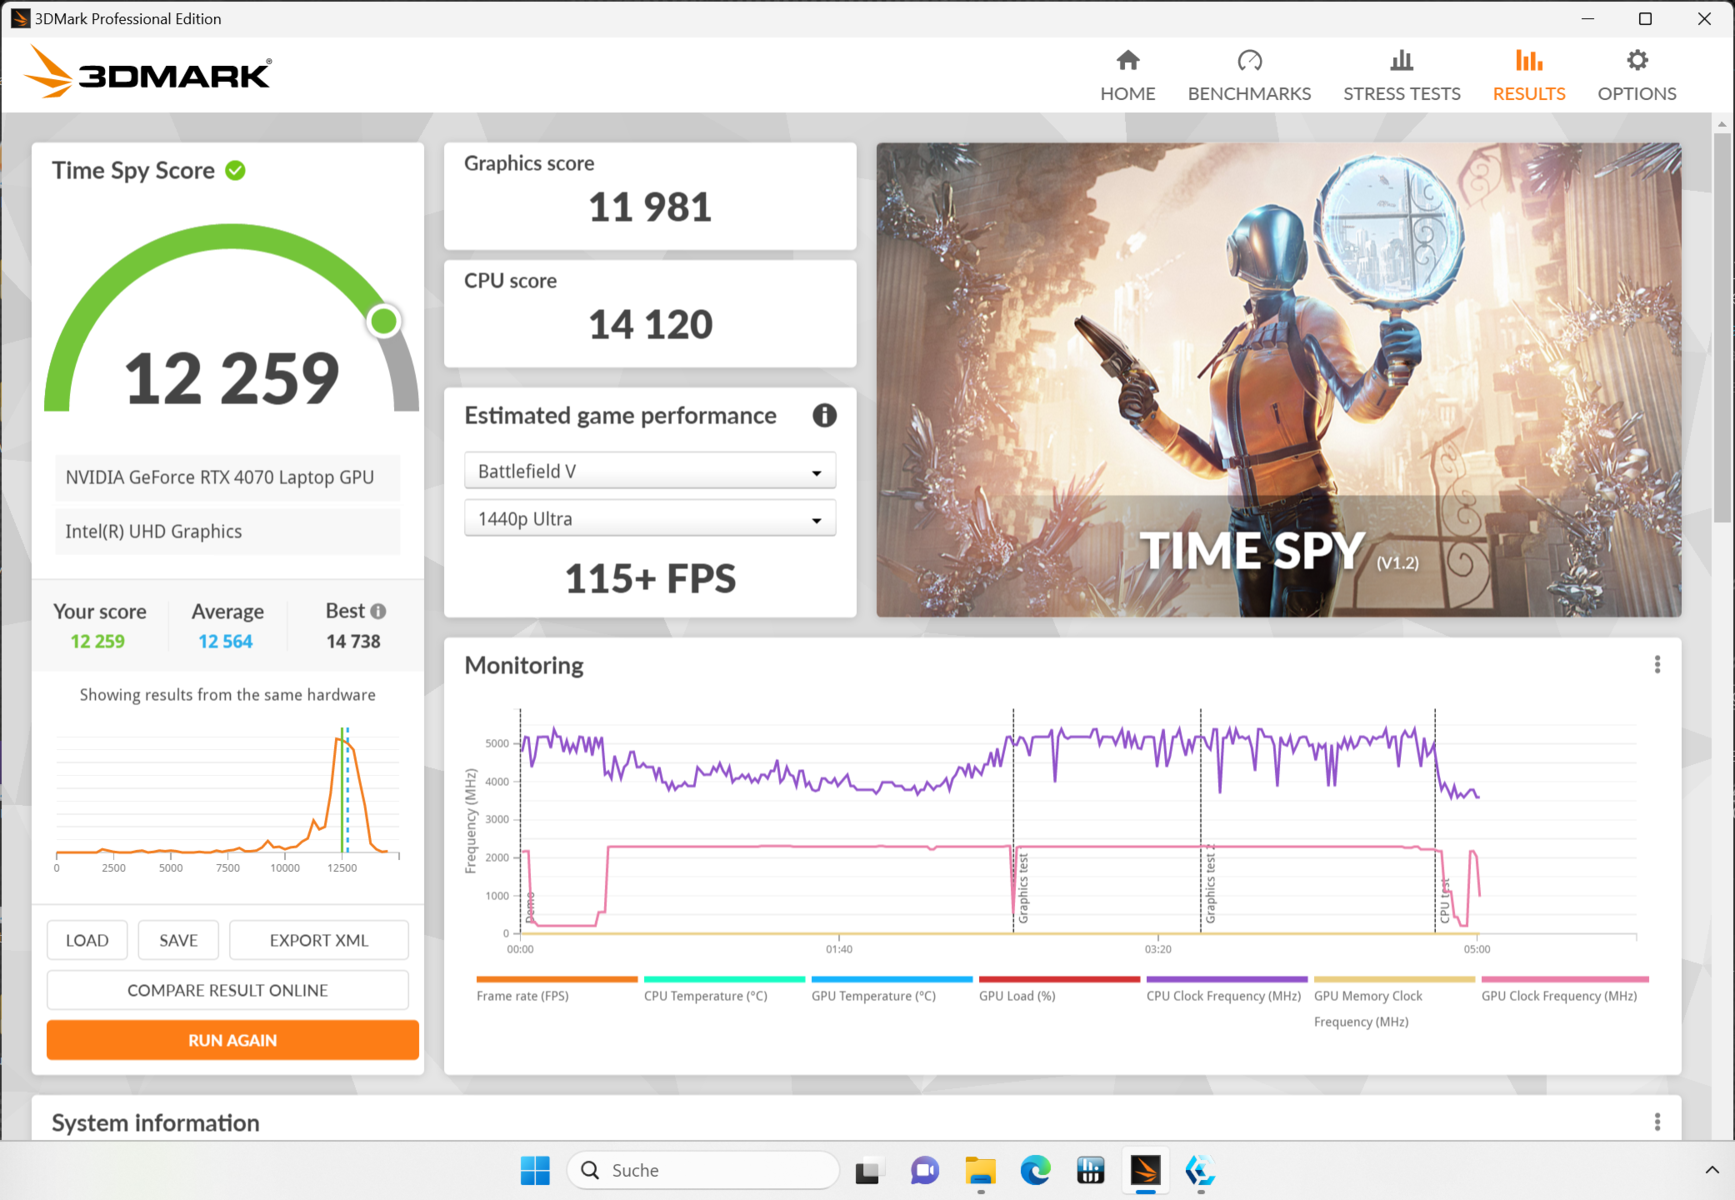
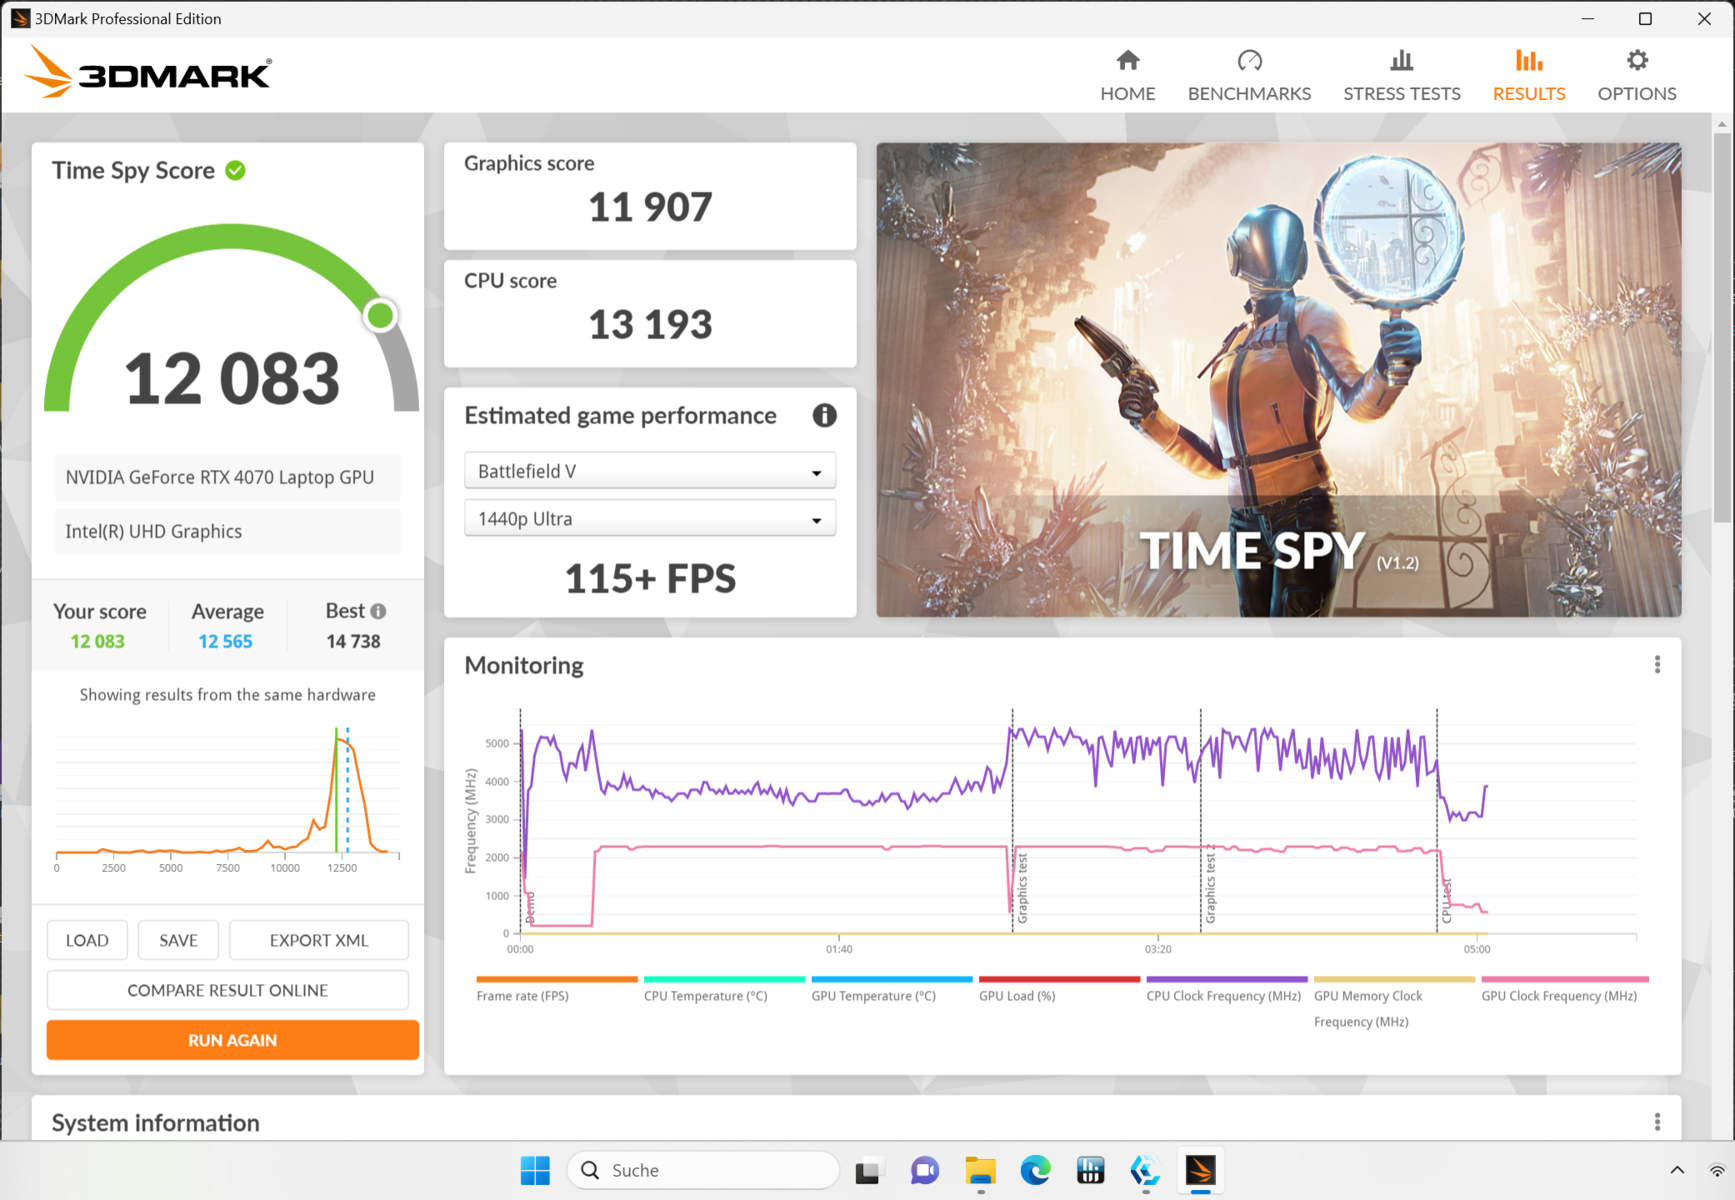
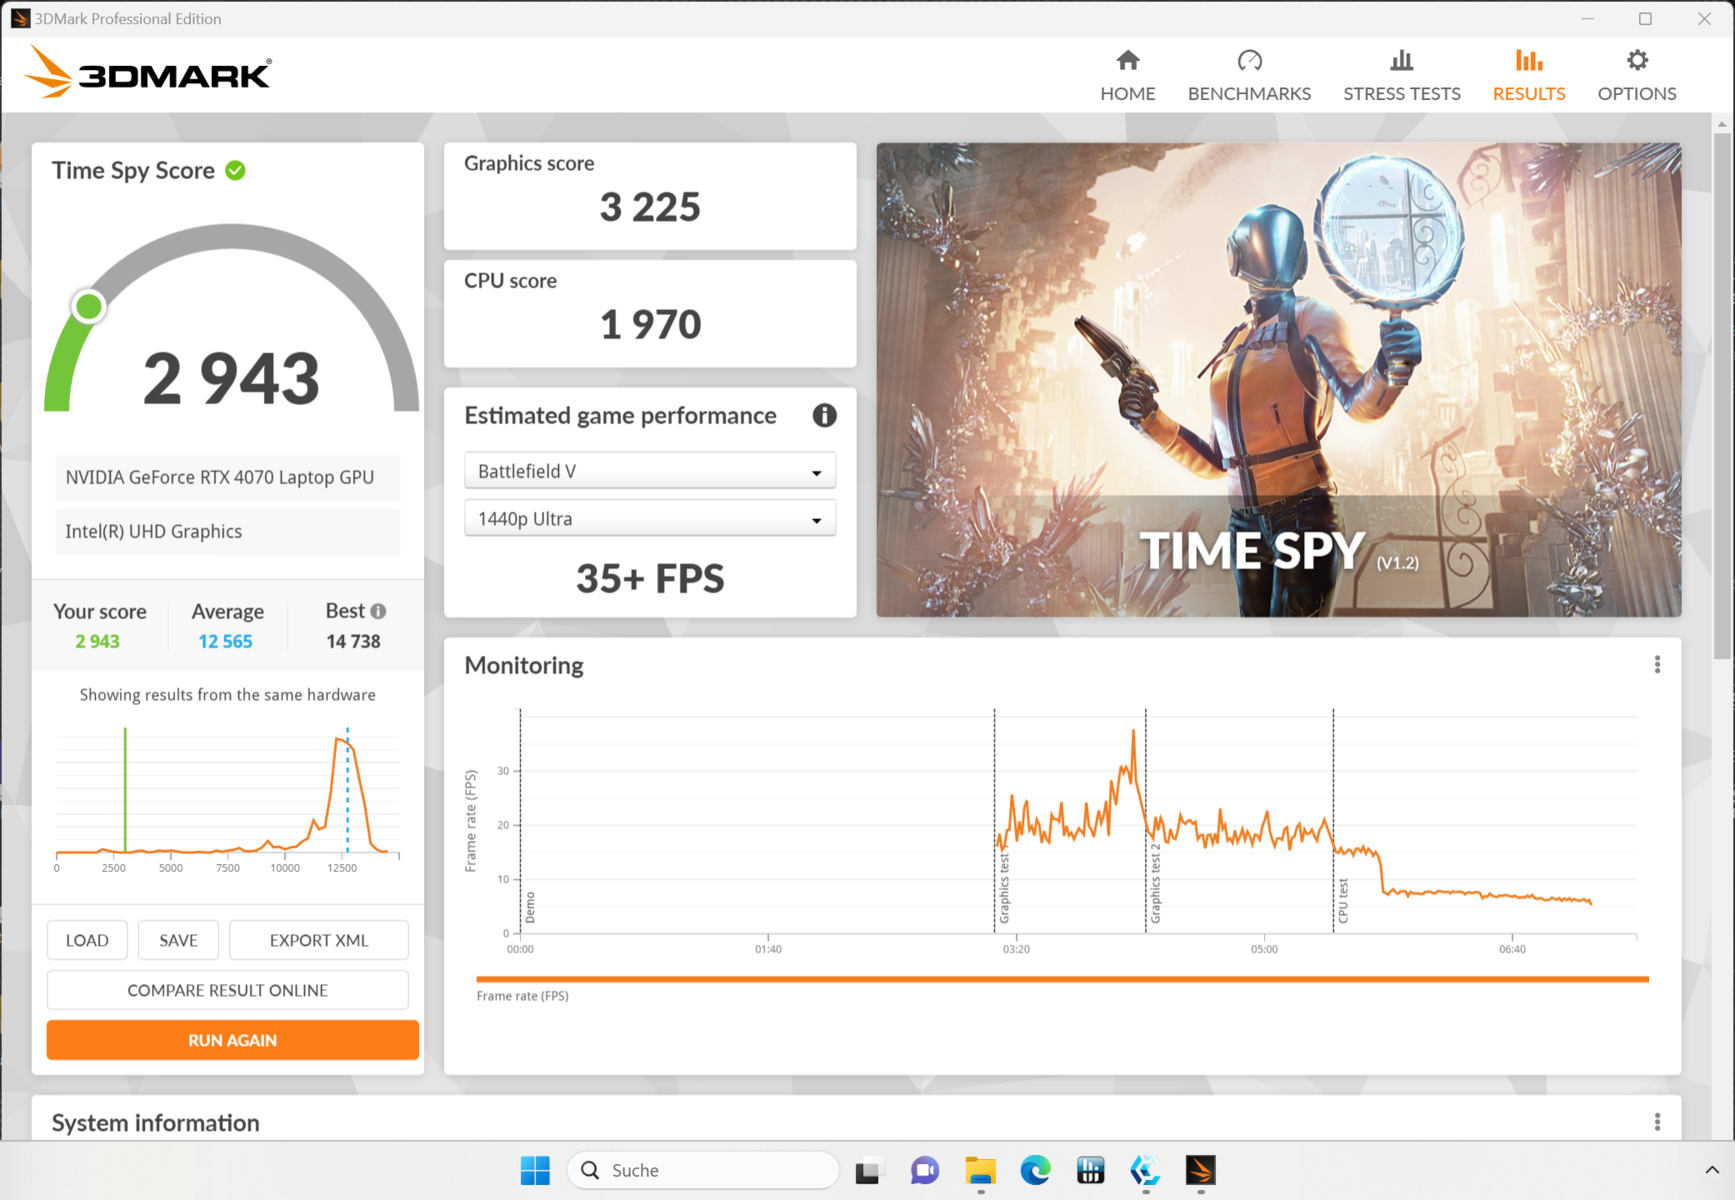
Dans le Focus 17 E23, la puce graphique est autorisée à consommer un maximum de 140 W, 25 W étant détournés du processeur en tant que boost dynamique. Cela correspond aux paramètres typiques de la RTX 4070 dans un ordinateur portable de jeu. Cependant, les benchmarks synthétiques que nous avons réalisés ne sont pas à la hauteur des attentes car la consommation d'énergie élevée ne peut pas être maintenue sur la durée.
Dans les scores 3DMark ainsi que dans les jeux, le Focus 17 est toujours derrière un ordinateur presque identique Medion Erazer Major X20 ou le Lenovo Legion Pro 5 avec un CPU différent. Apparemment, le grand i9-13900HX avec les exigences de refroidissement correspondantes gêne plutôt qu'il n'aide dans les applications graphiques. Outre le Legion Pro, le Asus ROG Strix G18 avec RTX 4070 mais le plus petit i7-13650HX peut être mentionné comme exemple, qui atteint approximativement les mêmes taux de performance
.En outre, les modes de performance ne semblent pas encore mûrs. Si l'on compare les résultats du benchmark Time Spy, les modes performance et divertissement sont presque au même niveau. Même dans les jeux individuels que nous avons testés, l'écart entre les FPS mesurés n'était que minime. Le mode silencieux, qui fonctionne au moins très silencieusement, chute en revanche de manière trop importante. Les 2 943 points obtenus le sont également par la puce graphique intégrée AMD Radeon 780M
Vous trouverez d'autres repères et données de performance dans notre liste de repères GPU Cartes graphiques mobiles - indice de référence .
| 3DMark 11 Performance | 33424 points | |
| 3DMark Cloud Gate Standard Score | 58621 points | |
| 3DMark Fire Strike Score | 25541 points | |
| 3DMark Time Spy Score | 12339 points | |
Aide | ||
* ... Moindre est la valeur, meilleures sont les performances
Performances de jeu
Tous les jeux que nous avons testés atteignent au moins des taux de rafraîchissement satisfaisants. Les taux ne sont inférieurs à 60 fps que dans les jeux actuels et assez exigeants au niveau de détail le plus élevé et à la résolution QHD. Le matériel devrait donc suffire pour les jeux à venir pendant un bon moment. La plupart des jeux sont jouables à 100 fps ou plus lorsque vous renoncez à quelques détails et utilisez la résolution Full HD
Le XMG Focus 17 se situe entre nos concurrents sélectionnés avec des GPU identiques dans les jeux pour lesquels des taux de comparaison sont disponibles. Il est également à peu près au même niveau qu'un MSI Titan GT77 avec une RTX 3080 Ti, qui était environ deux fois plus cher lorsqu'il est sorti l'année dernière. Les ordinateurs portables de jeu équipés du GPU précédent RTX 3070 peuvent être surpassés de plus de 10 % selon le modèle
.Le CPU étant moins sollicité dans les jeux que dans de nombreux autres benchmarks, la faiblesse du refroidissement n'a pas beaucoup d'importance. Seul le GPU doit dissiper beaucoup de chaleur, tandis que les performances du processeur peuvent être ralenties sans perte significative du taux de rafraîchissement. Ainsi, l'ordinateur portable XMG ne montre aucune faiblesse dans les jeux, même si quelques points de pourcentage de plus à pleine charge semblent réalistes.
Entre autres, le maximum de 140 W que le GPU est autorisé à consommer n'est presque jamais atteint. Nous avons pu provoquer un seul pic de 143 W dans un scénario spécial de notre test de stress. Sinon, la consommation moyenne dans les jeux est de 100 W, ce qui est encore une fois bien en dessous des 115 W que la puce graphique devrait consommer même sans boost dynamique.
Tout indique que le système de refroidissement ne parvient pas à dissiper la chaleur résiduelle assez rapidement. Schenker XMG a souvent démontré qu'un ventilateur d'ordinateur portable peut également supporter en permanence la consommation maximale de la puce graphique XMG Neo 16 E23.
| Star Wars Jedi Survivor | |
| 1920x1080 Epic Preset | |
| Lenovo Legion Pro 5 16ARX8 | |
| Schenker XMG Focus 17 (E23) | |
| Moyenne NVIDIA GeForce RTX 4070 Laptop GPU (61.5 - 80.1, n=8) | |
| Medion Erazer Defender P40 | |
| 2560x1440 Epic Preset | |
| Lenovo Legion Pro 5 16ARX8 | |
| Moyenne NVIDIA GeForce RTX 4070 Laptop GPU (39.5 - 51.1, n=8) | |
| Schenker XMG Focus 17 (E23) | |
| Medion Erazer Defender P40 | |
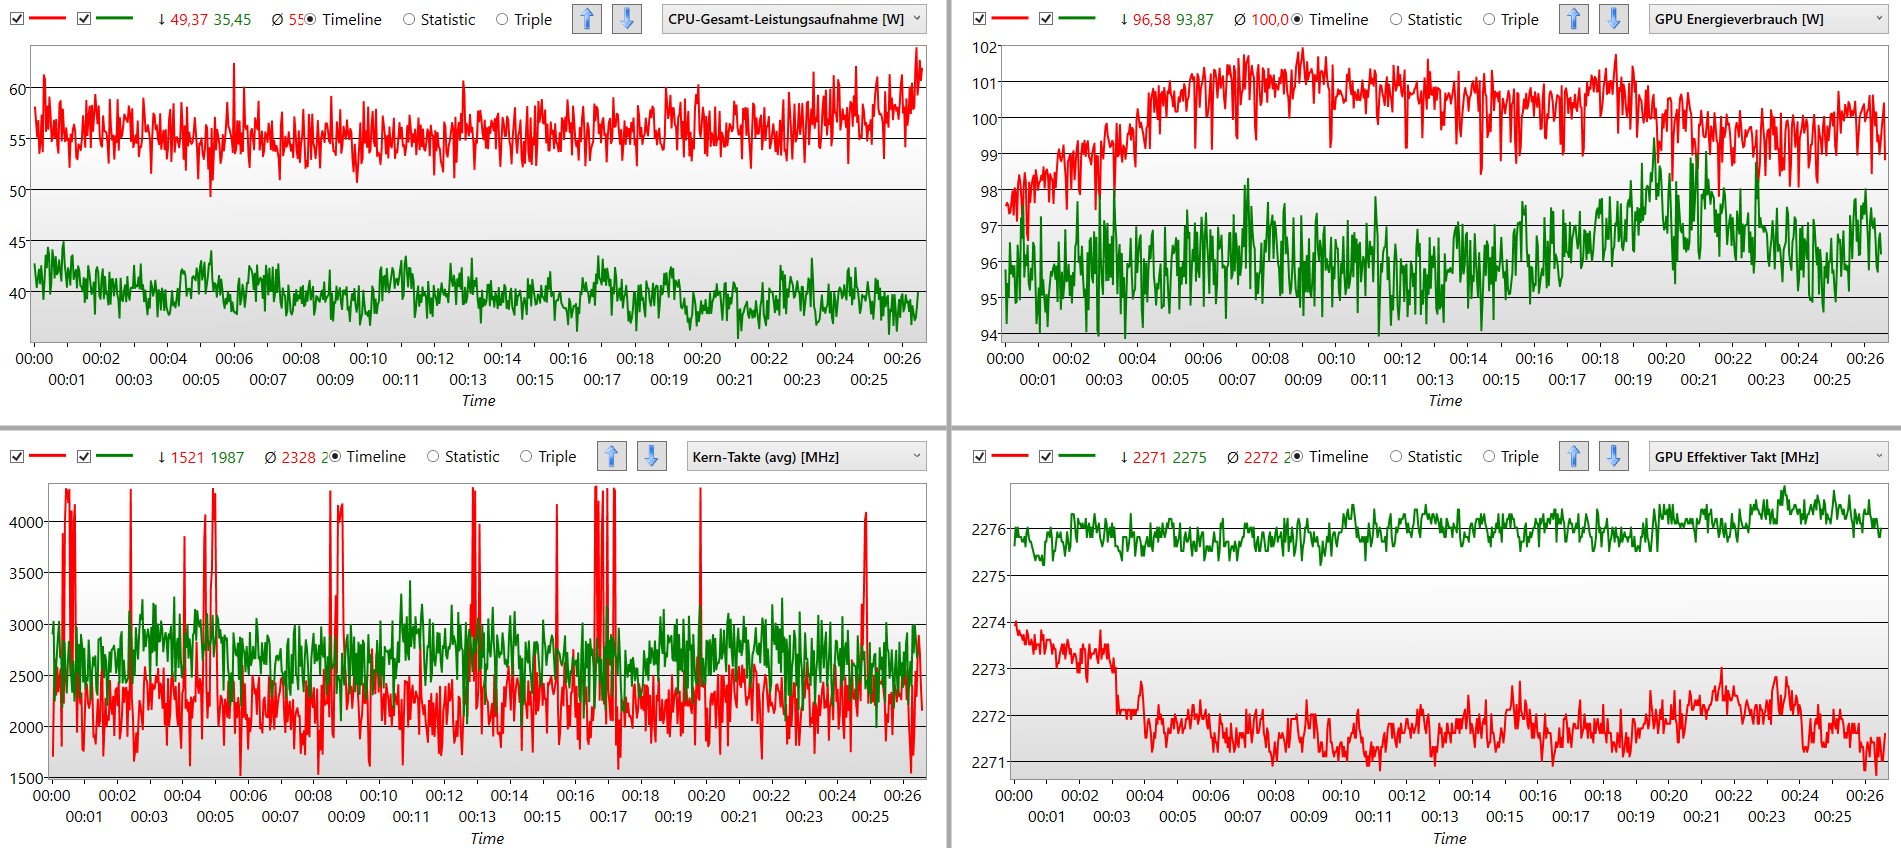
Le test d'endurance avec Witcher 3 ne réserve aucune surprise. Il s'agit d'un résultat tout à fait positif. Il est impossible d'observer des baisses de performance ou un étranglement constant. Les fluctuations typiques s'expliquent par le changement d'heure du jeu. Par conséquent, aucune baisse des taux de rafraîchissement ne devrait être observée dans d'autres jeux au fil du temps.
Lors du test d'endurance du jeu, nous avons pu vérifier une fois de plus le comportement des modes divertissement et performance. En mode divertissement, le système nécessite près de 20 W de moins, tandis que le GPU a une fréquence d'horloge plus élevée qu'en mode performance. Le comportement du CPU semble plus régulier et la fréquence d'horloge (en vert) est également légèrement plus élevée qu'en mode performance. Avec une consommation d'énergie moindre et un bruit légèrement plus faible, nous mesurons également un taux de rafraîchissement identique.
Witcher 3 FPS chart
| Bas | Moyen | Élevé | Ultra | QHD | |
|---|---|---|---|---|---|
| GTA V (2015) | 180.8 | 117.4 | 88.5 | ||
| The Witcher 3 (2015) | 226 | 115 | |||
| Dota 2 Reborn (2015) | 177.3 | 164.5 | |||
| Final Fantasy XV Benchmark (2018) | 114.8 | 81.3 | |||
| X-Plane 11.11 (2018) | 123 | ||||
| Far Cry 5 (2018) | 145 | 136 | 112 | ||
| Strange Brigade (2018) | 247 | 211 | 135.2 | ||
| Cyberpunk 2077 1.6 (2022) | 100.7 | 102.3 | 63.9 | ||
| F1 22 (2022) | 211 | 77.8 | 49 | ||
| Hogwarts Legacy (2023) | 86 | 71 | 50 | ||
| Star Wars Jedi Survivor (2023) | 79 | 73 | 45 |
Émissions - La Focus 17 peut être silencieuse
Émissions sonores
Le Focus 17 est l'un des représentants les plus bruyants de sa catégorie. Il est clairement audible avec environ 58 dB, même à travers une porte fermée. Cependant, leMedion Erazer Defender P40 démontre qu'il peut être encore plus bruyant. Malgré une puce graphique plus petite, il atteint clairement plus de 60 dB.
La montée en régime du ventilateur lors de l'utilisation normale de l'ordinateur portable, loin de la charge permanente, est évidente. Le refroidissement démarre sans raison apparente. Quelques secondes plus tard, la vitesse est à nouveau réduite. En revanche, la vitesse reste constante pendant les jeux, un bruit permanent est donc audible, mais sans changement de vitesse gênant.
Nous avons mesuré quelques décibels de moins sur Witcher 3 en mode divertissement, ce qui est tout à fait perceptible. Par ailleurs, le nombre d'images par seconde reste constant. En "mode silencieux", 15 dB de moins sont mesurables, ce qui correspond à un tiers du volume original. Le notebook est alors audible, mais peu dérangeant, même dans un environnement calme. Nous mesurons toujours un peu moins de la moitié du taux de rafraîchissement sur Witcher 3. Le jeu est encore jouable à 60 fps avec les réglages les plus détaillés, ce qui est probablement vrai pour de nombreux titres peu exigeants ou légèrement plus anciens qui sont alors également jouables aussi silencieusement qu'un chuchotement.
Degré de la nuisance sonore
| Au repos |
| 24 / 24 / 26.47 dB(A) |
| Fortement sollicité |
| 55.72 / 57.94 dB(A) |
 | ||
30 dB silencieux 40 dB(A) audible 50 dB(A) bruyant |
||
min: | ||
| Schenker XMG Focus 17 (E23) GeForce RTX 4070 Laptop GPU, i9-13900HX, Crucial P5 Plus 1TB CT1000P5PSSD8 | Lenovo Legion Pro 5 16ARX8 GeForce RTX 4070 Laptop GPU, R7 7745HX, Samsung PM9A1 MZVL21T0HCLR | Medion Erazer Major X20 GeForce RTX 4070 Laptop GPU, i9-13900HX, Phison E18-1TB-PHISON-SSD-B47R | Schenker XMG Neo 17 M22 GeForce RTX 3080 Ti Laptop GPU, R9 6900HX, Samsung SSD 980 Pro 1TB MZ-V8P1T0BW | HP Omen 17-ck2097ng GeForce RTX 4080 Laptop GPU, i9-13900HX, SK hynix PC801 HFS001TEJ9X101N | Medion Erazer Defender P40 GeForce RTX 4060 Laptop GPU, i7-13700HX, Phison PS5021-E21 1TB | |
|---|---|---|---|---|---|---|
| Noise | 11% | -3% | -8% | -5% | -7% | |
| arrêt / environnement * (dB) | 24 | 23.2 3% | 24 -0% | 26 -8% | 24 -0% | 25 -4% |
| Idle Minimum * (dB) | 24 | 23.2 3% | 25 -4% | 26 -8% | 31 -29% | 26 -8% |
| Idle Average * (dB) | 24 | 23.2 3% | 29 -21% | 29 -21% | 32 -33% | 27 -13% |
| Idle Maximum * (dB) | 26.47 | 26.2 1% | 31 -17% | 40 -51% | 33 -25% | 32 -21% |
| Load Average * (dB) | 55.72 | 31.4 44% | 50 10% | 47 16% | 45 19% | 53 5% |
| Witcher 3 ultra * (dB) | 57.94 | 48.4 16% | 53 9% | 52 10% | 45 22% | 56 3% |
| Load Maximum * (dB) | 57.94 | 53.8 7% | 57 2% | 54 7% | 50 14% | 64 -10% |
* ... Moindre est la valeur, meilleures sont les performances
Température
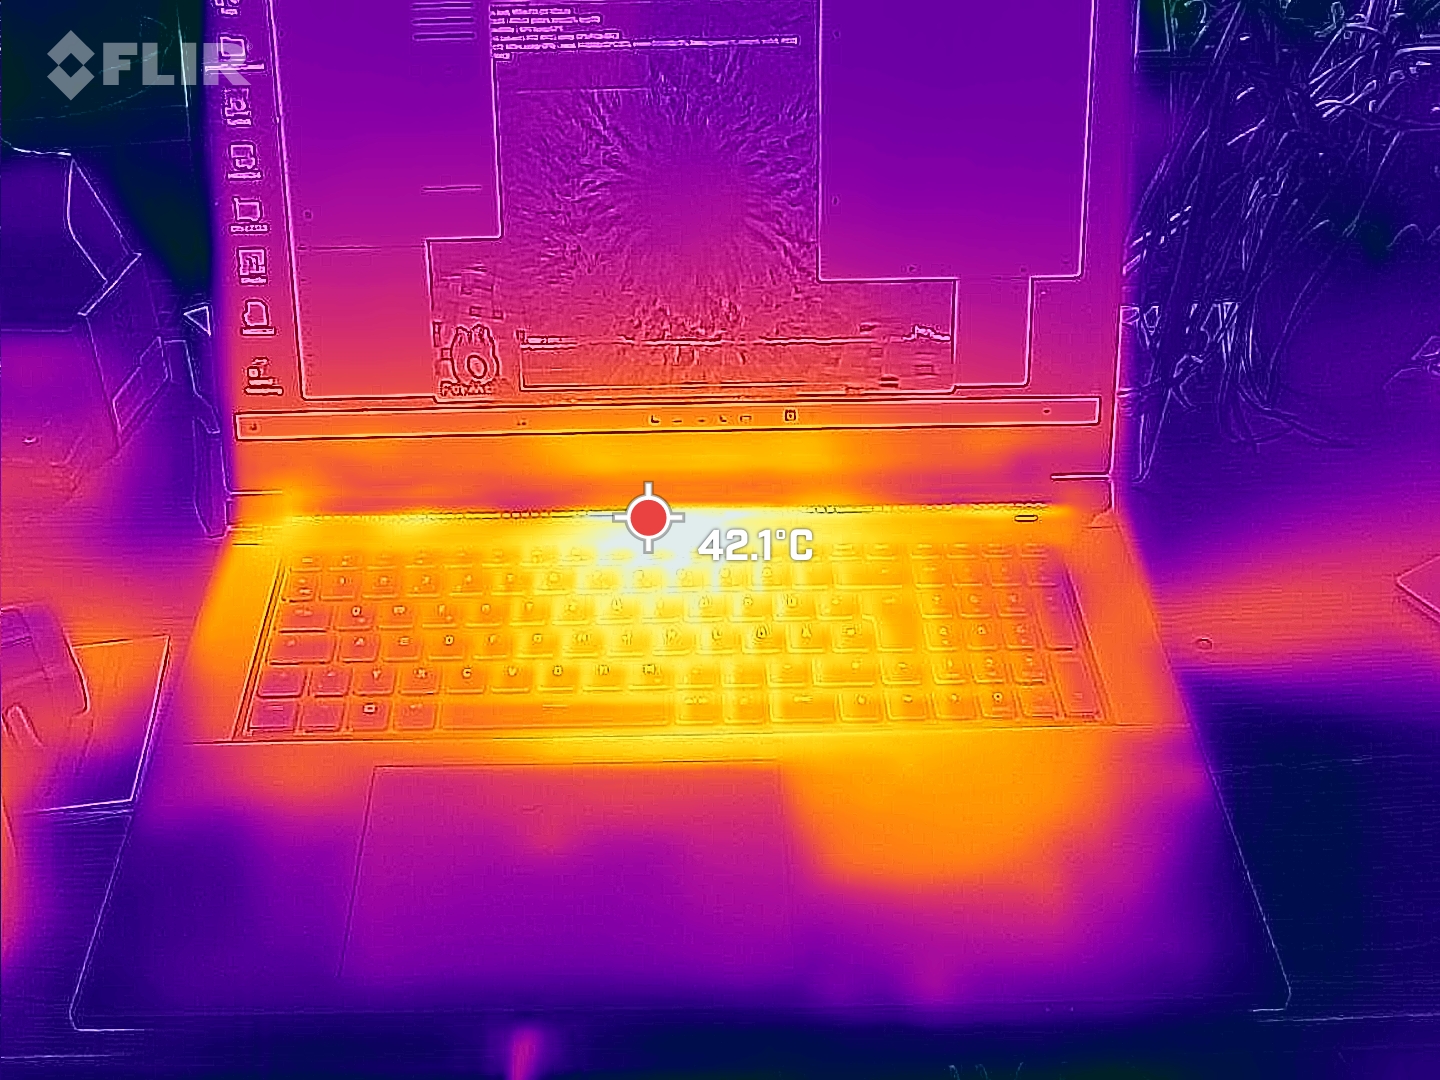
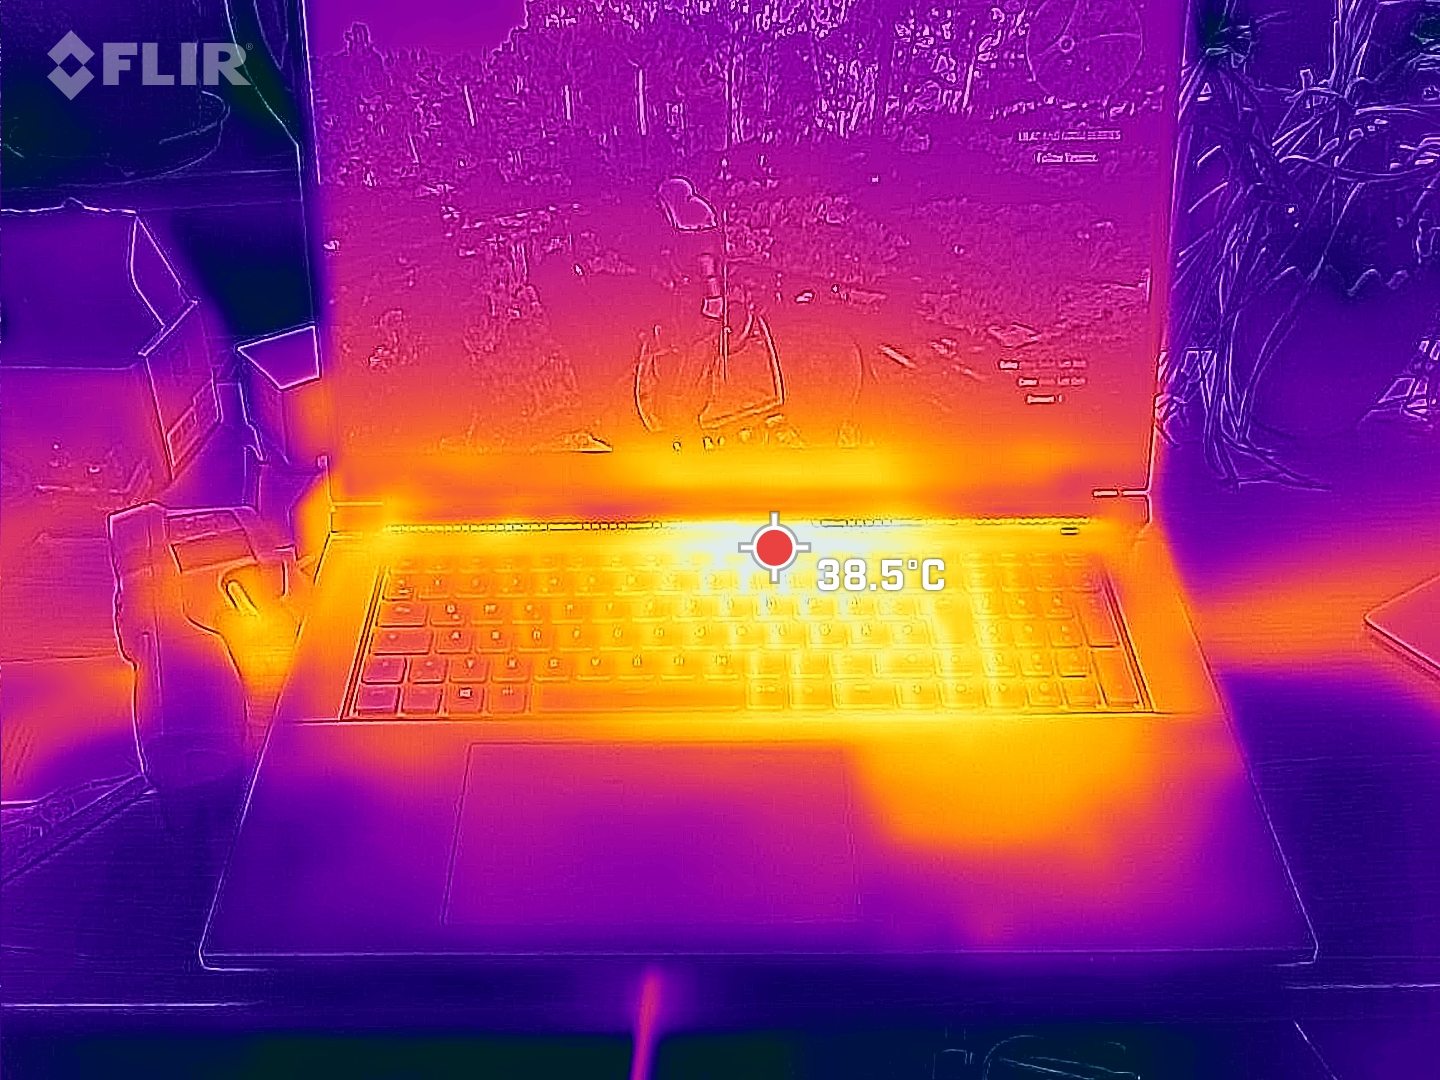
Les appuis palmaires sont chauds, mais pas brûlants (nous avons mesuré un maximum de 36 °C). Cependant, la température est déjà de 42 °C dans la zone clé, et elle est encore de 40 °C à droite du centre. Sur la gauche, l'ordinateur portable de jeu reste un peu plus froid. Cela peut être gênant, surtout lorsqu'il fait chaud et que l'on tape ou que l'on joue.
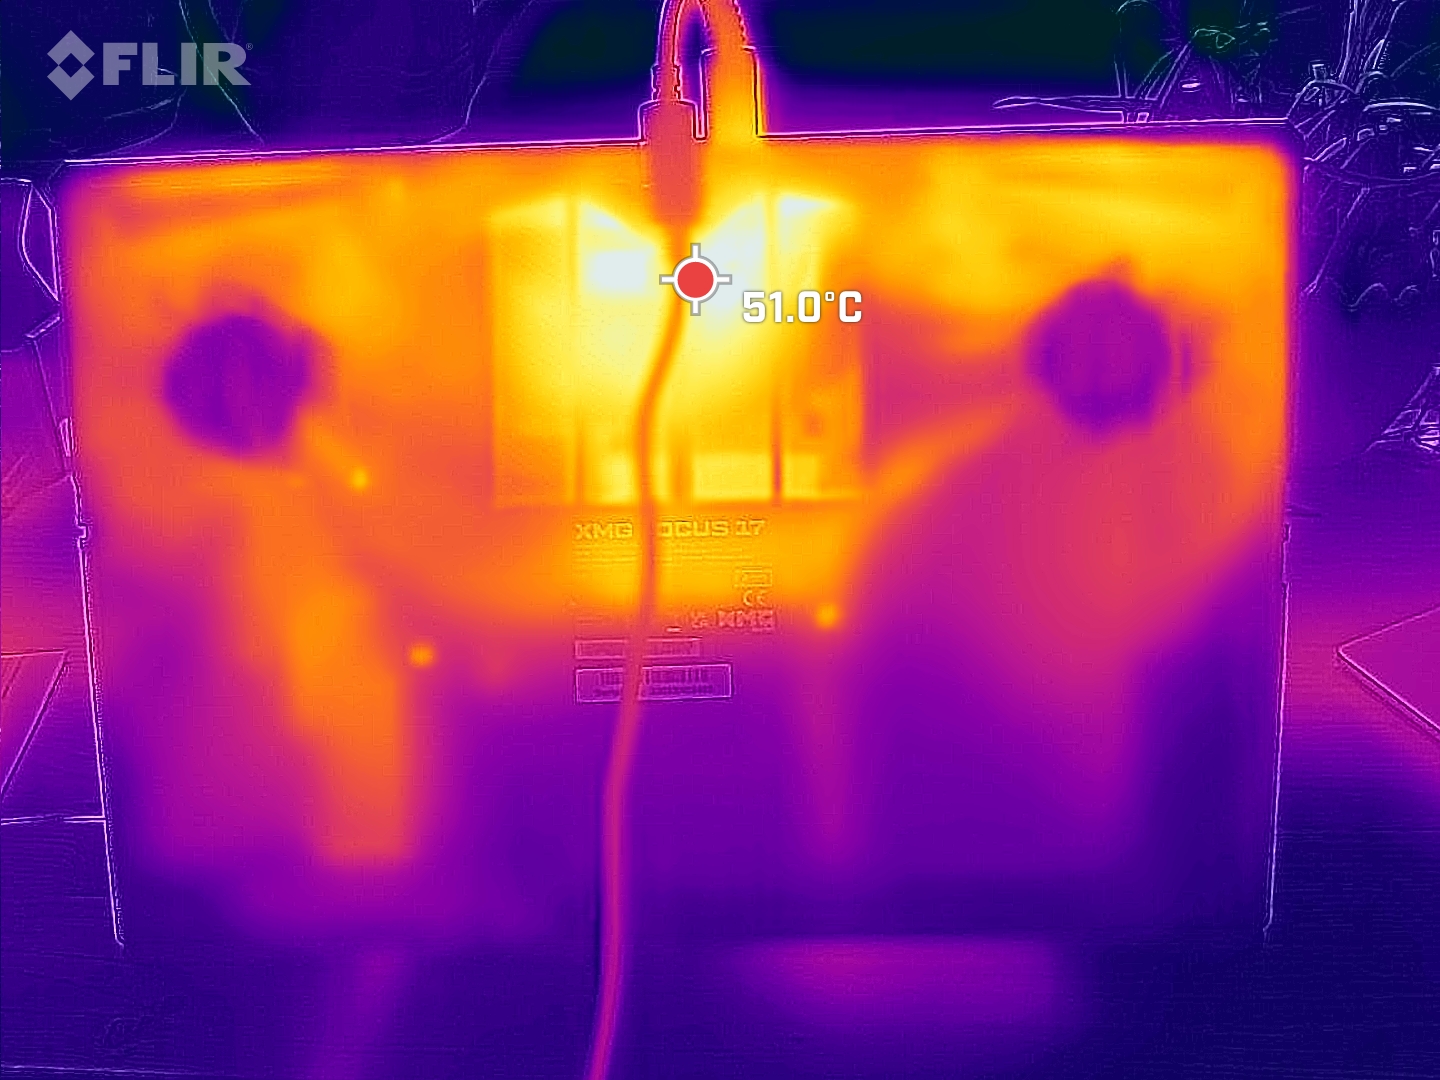
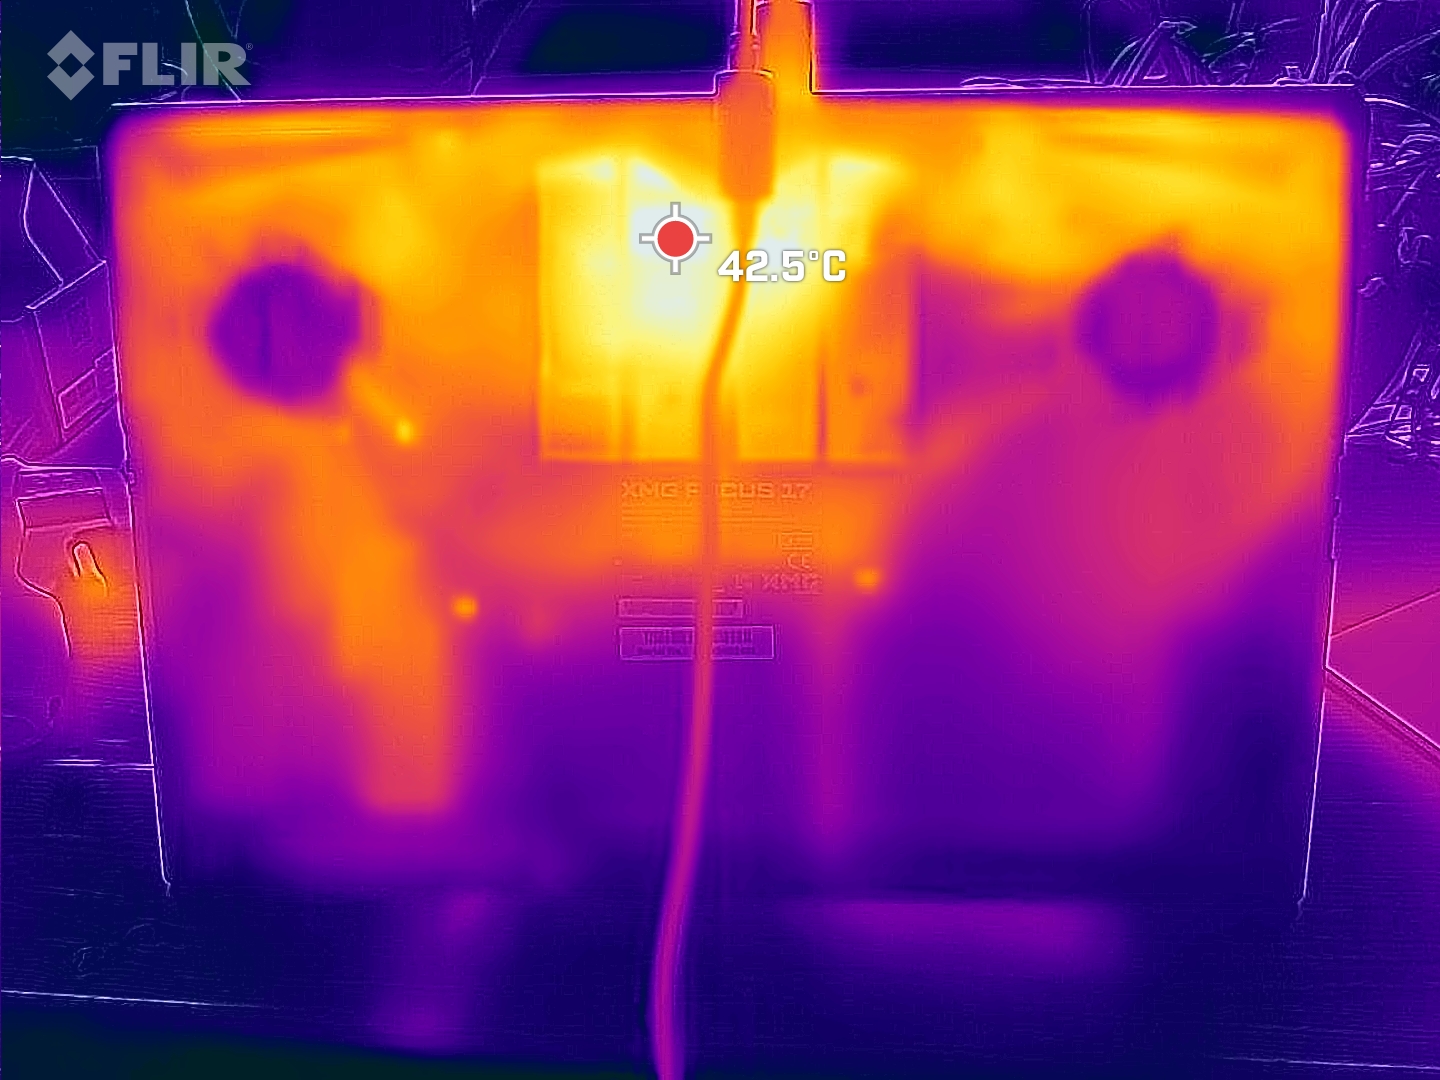
Le dessous de l'ordinateur devient chaud même sans charge importante, c'est pourquoi le XMG Focus 17 E23 ne doit être utilisé que sur une surface plane et dure.
(-) La température maximale du côté supérieur est de 50 °C / 122 F, par rapport à la moyenne de 40.4 °C / 105 F, allant de 21.2 à 68.8 °C pour la classe Gaming.
(-) Le fond chauffe jusqu'à un maximum de 56 °C / 133 F, contre une moyenne de 43.2 °C / 110 F
(+) En utilisation inactive, la température moyenne du côté supérieur est de 30.9 °C / 88 F, par rapport à la moyenne du dispositif de 33.9 °C / 93 F.
(±) En jouant à The Witcher 3, la température moyenne du côté supérieur est de 36.8 °C / 98 F, alors que la moyenne de l'appareil est de 33.9 °C / 93 F.
(±) Les repose-poignets et le pavé tactile peuvent devenir très chauds au toucher, avec un maximum de 37 °C / 98.6# F.
(-) La température moyenne de la zone de l'appui-paume de dispositifs similaires était de 28.8 °C / 83.8 F (-8.2 °C / #-14.8 F).
| Schenker XMG Focus 17 (E23) Intel Core i9-13900HX, NVIDIA GeForce RTX 4070 Laptop GPU | Lenovo Legion Pro 5 16ARX8 AMD Ryzen 7 7745HX, NVIDIA GeForce RTX 4070 Laptop GPU | Medion Erazer Major X20 Intel Core i9-13900HX, NVIDIA GeForce RTX 4070 Laptop GPU | Schenker XMG Neo 17 M22 AMD Ryzen 9 6900HX, NVIDIA GeForce RTX 3080 Ti Laptop GPU | HP Omen 17-ck2097ng Intel Core i9-13900HX, NVIDIA GeForce RTX 4080 Laptop GPU | Medion Erazer Defender P40 Intel Core i7-13700HX, NVIDIA GeForce RTX 4060 Laptop GPU | |
|---|---|---|---|---|---|---|
| Heat | 20% | 4% | 9% | 23% | 19% | |
| Maximum Upper Side * (°C) | 50 | 41.8 16% | 46 8% | 49 2% | 41 18% | 42 16% |
| Maximum Bottom * (°C) | 56 | 41.4 26% | 49 12% | 52 7% | 51 9% | 45 20% |
| Idle Upper Side * (°C) | 37 | 29 22% | 37 -0% | 30 19% | 24 35% | 28 24% |
| Idle Bottom * (°C) | 36 | 30.4 16% | 38 -6% | 33 8% | 25 31% | 30 17% |
* ... Moindre est la valeur, meilleures sont les performances
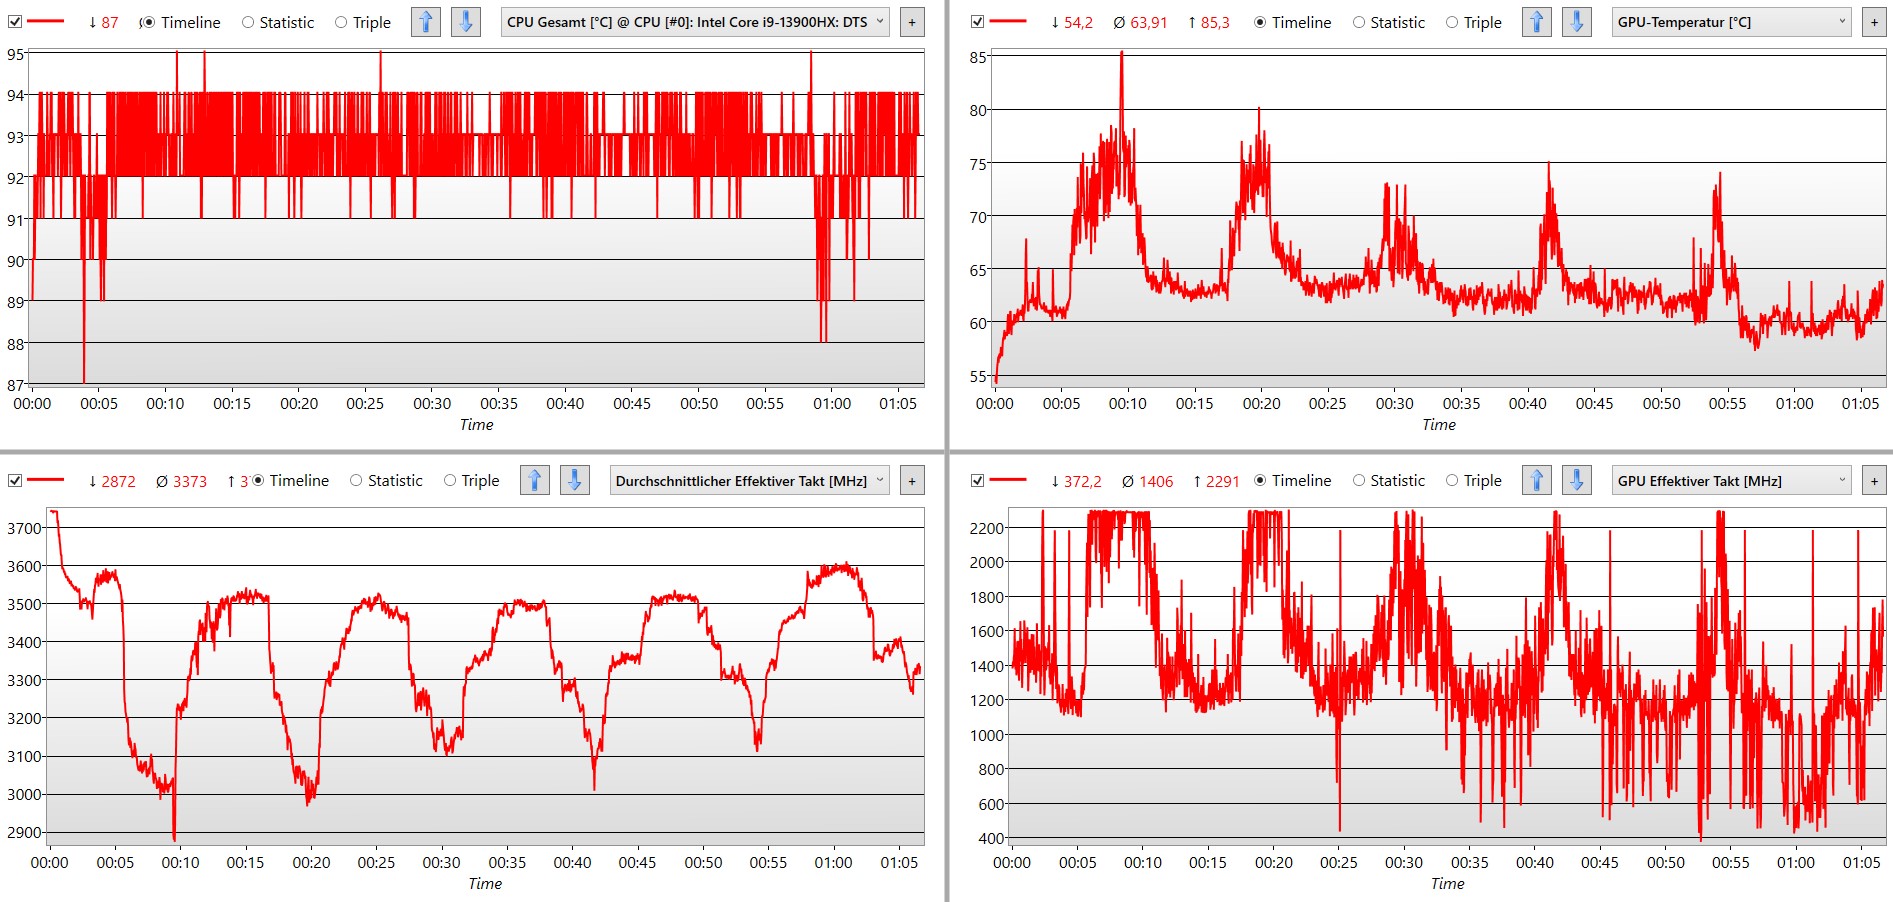
Épreuve d'effort
Lors de nos tests de stress avec Prime95 et Furmark, le CPU atteint des températures supérieures à 95 °C. Le GPU, quant à lui, n'est pas pleinement utilisé et oscille entre 60 et 75 °C. L'alimentation est limitée dans cette situation extrême et se situe autour de 200 W pour le GPU et le CPU ensemble, alors que 240 W seraient théoriquement possibles. De plus, cette situation ne dure que quelques secondes avant que l'alimentation et la fréquence d'horloge ne soient considérablement réduites.
Le refroidissement ne peut pas maintenir en permanence la performance maximale, comme c'est le cas par exemple dans le XMG Neo 16 E23 est le cas.
Intervenants
La reproduction sonore est suffisamment puissante pour un ordinateur portable. Il n'y a rien à redire, surtout dans les basses fréquences et les aigus. La parole et les effets typiques des jeux d'action sont bien reproduits.
Dans la musique ou même dans les films, le manque de qualité sonore et le manque de médiums et de basses, qui est clairement perceptible dans nos mesures, sont également perceptibles. Pour ces tâches, il n'y a guère d'autre solution que d'utiliser des haut-parleurs externes ou un casque.
Schenker XMG Focus 17 (E23) analyse audio
(±) | le niveau sonore du haut-parleur est moyen mais bon (78.08# dB)
Basses 100 - 315 Hz
(-) | presque aucune basse - en moyenne 33.5% plus bas que la médiane
(+) | les basses sont linéaires (6.1% delta à la fréquence précédente)
Médiums 400 - 2000 Hz
(±) | médiane réduite - en moyenne 7.2% inférieure à la médiane
(±) | la linéarité des médiums est moyenne (9.5% delta à la fréquence précédente)
Aiguës 2 - 16 kHz
(+) | des sommets équilibrés - à seulement 4.4% de la médiane
(+) | les aigus sont linéaires (5.2% delta à la fréquence précédente)
Globalement 100 - 16 000 Hz
(±) | la linéarité du son global est moyenne (26.9% de différence avec la médiane)
Par rapport à la même classe
» 93% de tous les appareils testés de cette catégorie étaient meilleurs, 2% similaires, 5% pires
» Le meilleur avait un delta de 6%, la moyenne était de 18%, le pire était de 132%.
Par rapport à tous les appareils testés
» 82% de tous les appareils testés étaient meilleurs, 4% similaires, 14% pires
» Le meilleur avait un delta de 4%, la moyenne était de 23%, le pire était de 134%.
Apple MacBook Pro 16 2021 M1 Pro analyse audio
(+) | les haut-parleurs peuvent jouer relativement fort (84.7# dB)
Basses 100 - 315 Hz
(+) | bonne basse - seulement 3.8% loin de la médiane
(+) | les basses sont linéaires (5.2% delta à la fréquence précédente)
Médiums 400 - 2000 Hz
(+) | médiane équilibrée - seulement 1.3% de la médiane
(+) | les médiums sont linéaires (2.1% delta à la fréquence précédente)
Aiguës 2 - 16 kHz
(+) | des sommets équilibrés - à seulement 1.9% de la médiane
(+) | les aigus sont linéaires (2.7% delta à la fréquence précédente)
Globalement 100 - 16 000 Hz
(+) | le son global est linéaire (4.6% différence à la médiane)
Par rapport à la même classe
» 0% de tous les appareils testés de cette catégorie étaient meilleurs, 0% similaires, 100% pires
» Le meilleur avait un delta de 5%, la moyenne était de 17%, le pire était de 45%.
Par rapport à tous les appareils testés
» 0% de tous les appareils testés étaient meilleurs, 0% similaires, 100% pires
» Le meilleur avait un delta de 4%, la moyenne était de 23%, le pire était de 134%.
Gestion de l'énergie - Le processeur puissant d'un ordinateur portable de jeu est très gourmand
Consommation électrique
La consommation d'énergie est clairement trop élevée lorsqu'aucun processus n'est en cours d'exécution. En particulier les concurrents équipés de processeurs AMD, comme le XMG Neo 17 M22 se débrouillent avec moins de la moitié de la puissance.
Le Focus 17 n'est pas non plus économe en charge. Pour un taux de rafraîchissement identique sur Witcher 3, il a besoin d'un tiers d'énergie en plus que le XMG Neo 17 M22 Lenovo Legion Pro 5. Cela n'est pas efficace et explique en grande partie pourquoi le Legion est deux fois moins bruyant.
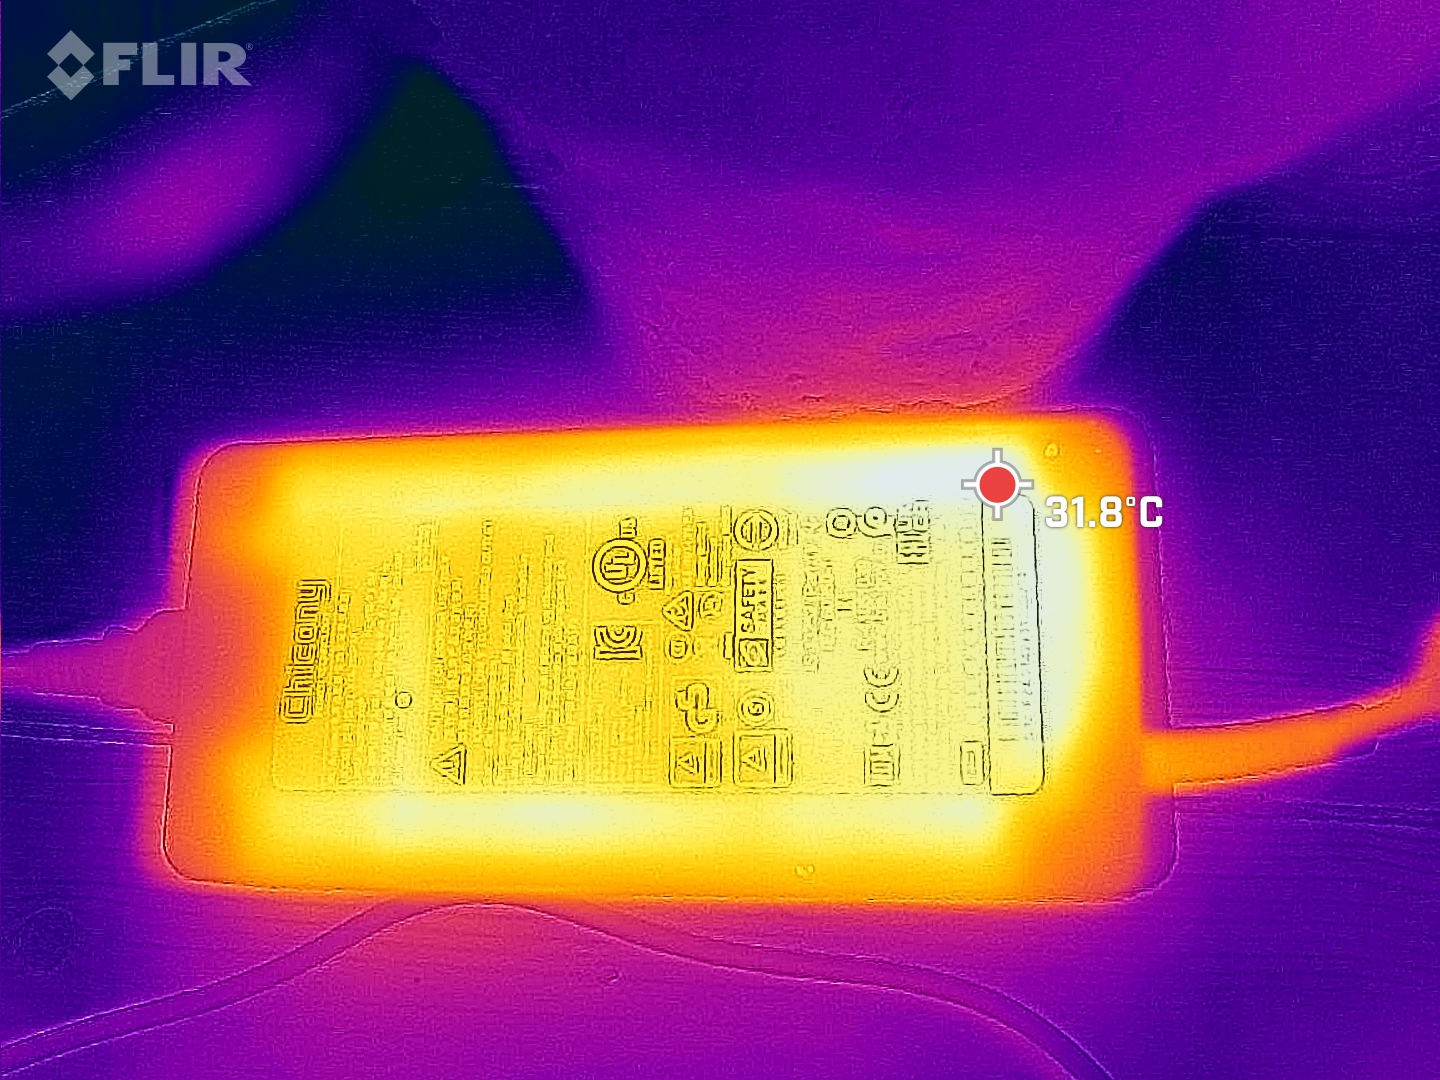
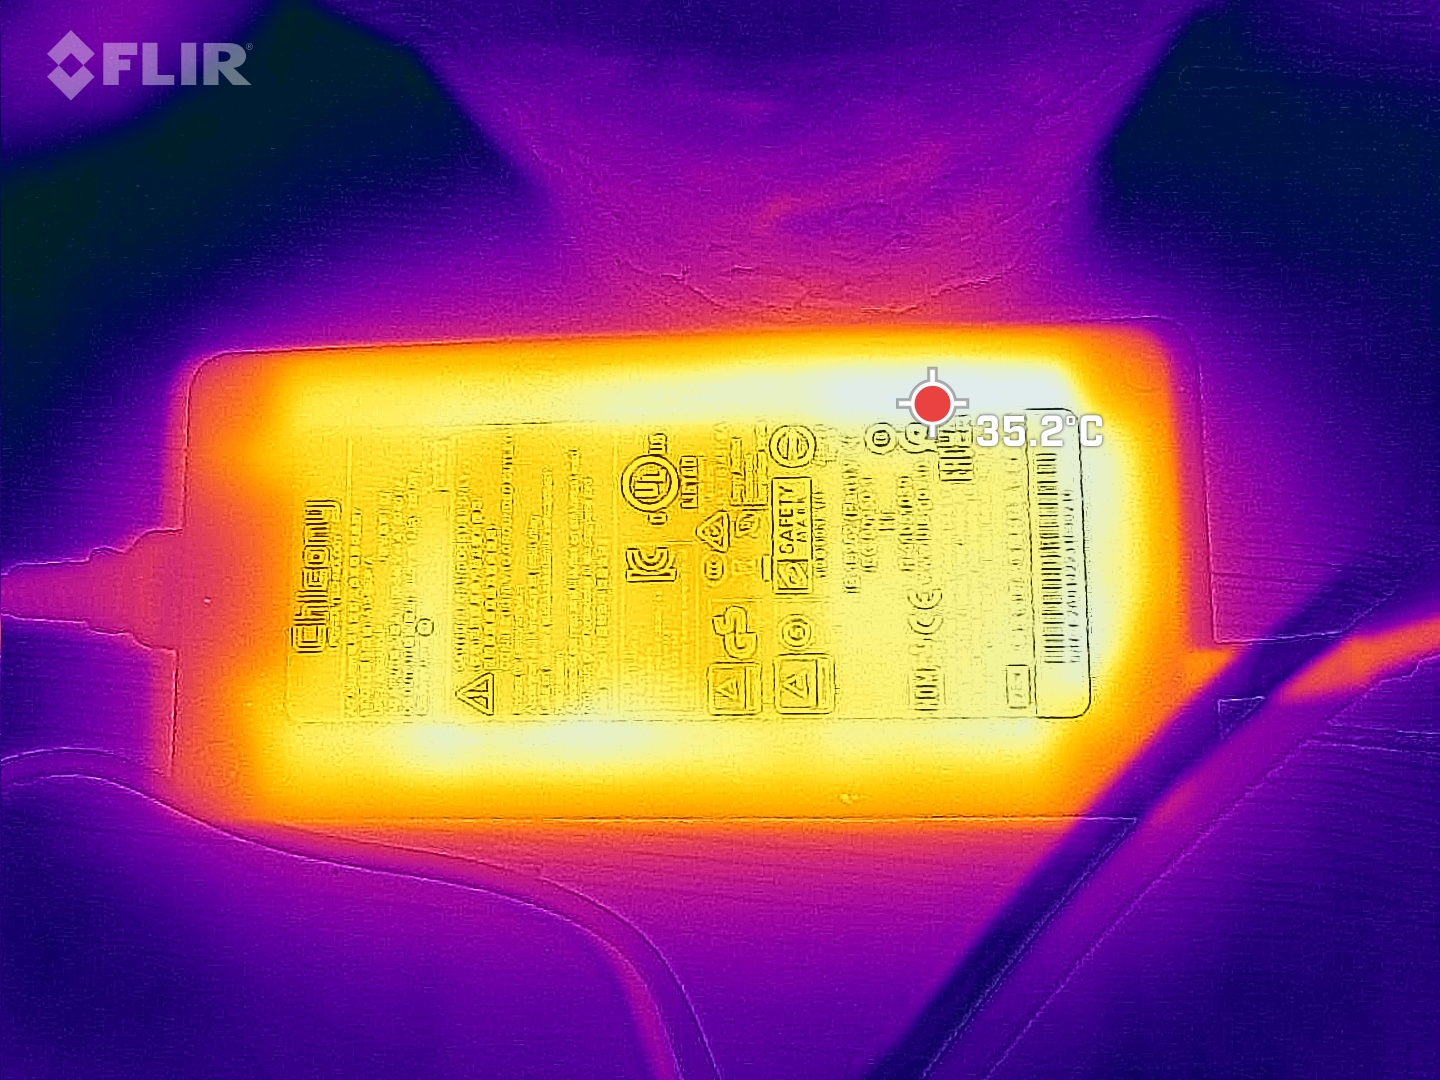
Le bloc d'alimentation de 280 watts est au moins suffisamment puissant, il n'est jamais surchargé et devrait toujours fournir assez d'énergie pour charger la batterie.
| Éteint/en veille | |
| Au repos | |
| Fortement sollicité |
|
Légende:
min: | |
| Schenker XMG Focus 17 (E23) i9-13900HX, GeForce RTX 4070 Laptop GPU, Crucial P5 Plus 1TB CT1000P5PSSD8, IPS, 2560x1440, 17.3" | Lenovo Legion Pro 5 16ARX8 R7 7745HX, GeForce RTX 4070 Laptop GPU, Samsung PM9A1 MZVL21T0HCLR, IPS, 2560x1600, 16" | Schenker XMG Neo 17 M22 R9 6900HX, GeForce RTX 3080 Ti Laptop GPU, Samsung SSD 980 Pro 1TB MZ-V8P1T0BW, IPS, 2560x1600, 17" | HP Omen 17-ck2097ng i9-13900HX, GeForce RTX 4080 Laptop GPU, SK hynix PC801 HFS001TEJ9X101N, IPS, 2560x1440, 17.3" | Medion Erazer Defender P40 i7-13700HX, GeForce RTX 4060 Laptop GPU, Phison PS5021-E21 1TB, IPS, 2560x1440, 17.3" | MSI Titan GT77 12UHS i9-12900HX, GeForce RTX 3080 Ti Laptop GPU, Samsung PM9A1 MZVL21T0HCLR, IPS-Level, 1920x1080, 17.3" | Moyenne NVIDIA GeForce RTX 4070 Laptop GPU | Moyenne de la classe Gaming | |
|---|---|---|---|---|---|---|---|---|
| Power Consumption | 17% | 31% | 5% | 31% | -29% | 18% | 13% | |
| Idle Minimum * (Watt) | 17 | 8.1 52% | 7 59% | 16 6% | 8 53% | 30.21 -78% | 13.2 ? 22% | 13 ? 24% |
| Idle Average * (Watt) | 18 | 15.9 12% | 11 39% | 20 -11% | 12 33% | 32.42 -80% | 18.2 ? -1% | 19 ? -6% |
| Idle Maximum * (Watt) | 25.8 | 37.2 -44% | 17 34% | 26 -1% | 18 30% | 33.7 -31% | 24.6 ? 5% | 24.6 ? 5% |
| Load Average * (Watt) | 178 | 90.9 49% | 92 48% | 135 24% | 101 43% | 125.09 30% | 97 ? 46% | 110.7 ? 38% |
| Witcher 3 ultra * (Watt) | 265 | 189.6 28% | 221 17% | 215 19% | 180.8 32% | 256 3% | ||
| Load Maximum * (Watt) | 275 | 263.5 4% | 306 -11% | 299 -9% | 284 -3% | 321.88 -17% | 221 ? 20% | 259 ? 6% |
* ... Moindre est la valeur, meilleures sont les performances
Power consumption Witcher 3 / Stress test
Power consumption external monitor
Durée de vie de la batterie
La forte consommation d'énergie à vide s'accompagne d'une faible autonomie de la batterie. Même en mode économie d'énergie, il n'est pas possible d'atteindre 4 heures. En mode silencieux, on obtient 20 minutes de plus, ce qui n'était pas prévisible compte tenu de l'activation du dGPU. Si l'on débranche l'appareil en mode performance et qu'Advanced Optimus est activé, l'autonomie n'atteint même pas 2 heures lors de notre test WLAN avec des appels Internet alternés.
XMG a signalé à cet égard que le mode d'économie d'énergie ne fonctionne pas actuellement comme souhaité. Nous pouvons le confirmer au vu des résultats de nos tests. Une mise à jour devrait certainement remédier à la situation.
| Schenker XMG Focus 17 (E23) i9-13900HX, GeForce RTX 4070 Laptop GPU, 73 Wh | Lenovo Legion Pro 5 16ARX8 R7 7745HX, GeForce RTX 4070 Laptop GPU, 80 Wh | Medion Erazer Major X20 i9-13900HX, GeForce RTX 4070 Laptop GPU, 62.3 Wh | Schenker XMG Neo 17 M22 R9 6900HX, GeForce RTX 3080 Ti Laptop GPU, 99 Wh | HP Omen 17-ck2097ng i9-13900HX, GeForce RTX 4080 Laptop GPU, 83 Wh | Medion Erazer Defender P40 i7-13700HX, GeForce RTX 4060 Laptop GPU, 73 Wh | Moyenne de la classe Gaming | |
|---|---|---|---|---|---|---|---|
| Autonomie de la batterie | 3% | 18% | 122% | 6% | 72% | 125% | |
| H.264 (h) | 3.1 | 4.2 35% | 6.6 113% | 3.7 19% | 5.7 84% | 8.32 ? 168% | |
| WiFi v1.3 (h) | 3.9 | 4 3% | 3.9 0% | 9 131% | 3.6 -8% | 6.2 59% | 7.11 ? 82% |
| Witcher 3 ultra (h) | 1 |
Points positifs
Points négatifs
Verdict - Le meilleur pour les jeux, avec quelques inconvénients
Les performances du système ne font aucun doute. Le Focus 17 se classe parmi les concurrents les plus performants. Seul le refroidissement, pas tout à fait convaincant, empêche d'obtenir un meilleur score. Il ne semble pas être ajusté précisément pour l'Intel Core i9 en particulier. Néanmoins, il n'y a probablement aucun jeu actuel qui soit trop exigeant pour la résolution QHD de l'écran aux couleurs précises.
L'accent est mis sur les performances de jeu : Le Focus 17 E23 dispose d'un matériel performant avec un équipement inférieur à la moyenne.
Si l'ordinateur portable ne doit pas être capable de plus, le XMG Focus avec l'accent sur les performances de jeu, ce qui est déjà prédit dans le nom. Pour le reste, l'évaluation s'avère plutôt faible par rapport à la concurrence (presque universellement plus chère).
Le clavier n'offre que quelques réglages de couleur, toujours pour toutes les touches. Comme pour son prédécesseur, le pavé tactile ne convainc pas, mais il ne sera de toute façon pas utilisé pour les jeux. L'autonomie de la batterie est beaucoup trop courte et n'est qu'à moitié acceptable en mode d'économie d'énergie strict. Le son des haut-parleurs est médiocre. De plus, la ventilation est plus bruyante que la moyenne et les composants consomment beaucoup trop d'énergie pour les performances annoncées. En outre, l'USB 2.0 ne semble plus d'actualité et le Mini-DisplayPort est présent sur les casques VR, par exemple, mais l'USB-C avec support DP serait plus variable.
En contrepartie, le prix est très attractif. Le rapport qualité-prix est bon. Si Schenker parvient également à ajuster les modes de performance apparemment inachevés par le biais d'une mise à jour logicielle, certains défauts tels que la faible autonomie de la batterie ou le mauvais comportement du ventilateur pourraient être atténués de manière significative.
Il est possible d'obtenir plus de performances avec des composants comparables, par exemple avec le XMG Neo 16 E23 (équipé de la RTX 4090). Le XMG Focus 17 est à peu près aussi rapide et silencieux que le XMG Neo 16 E23 (équipé de la RTX 4090) Lenovo Legion Pro 5 16 Gen8. Cependant, les deux ordinateurs portables de jeu sont également nettement plus chers avec leur meilleur équipement global.
Prix et disponibilité
Schenker XMG Focus 17 (E23)
- 06/04/2023 v7 (old)
Mario Petzold
Transparency
La sélection des appareils à examiner est effectuée par notre équipe éditoriale. L'échantillon de test a été prêté à l'auteur par le fabricant ou le détaillant pour les besoins de cet examen. Le prêteur n'a pas eu d'influence sur cette évaluation et le fabricant n'a pas reçu de copie de cette évaluation avant sa publication. Il n'y avait aucune obligation de publier cet article. En tant que média indépendant, Notebookcheck n'est pas soumis à l'autorité des fabricants, des détaillants ou des éditeurs.
Voici comment Notebookcheck teste
Chaque année, Notebookcheck examine de manière indépendante des centaines d'ordinateurs portables et de smartphones en utilisant des procédures standardisées afin de garantir que tous les résultats sont comparables. Nous avons continuellement développé nos méthodes de test depuis environ 20 ans et avons établi des normes industrielles dans le processus. Dans nos laboratoires de test, des équipements de mesure de haute qualité sont utilisés par des techniciens et des rédacteurs expérimentés. Ces tests impliquent un processus de validation en plusieurs étapes. Notre système d'évaluation complexe repose sur des centaines de mesures et de points de référence bien fondés, ce qui garantit l'objectivité.Price comparison
