Verdict — Un nouveau look professionnel
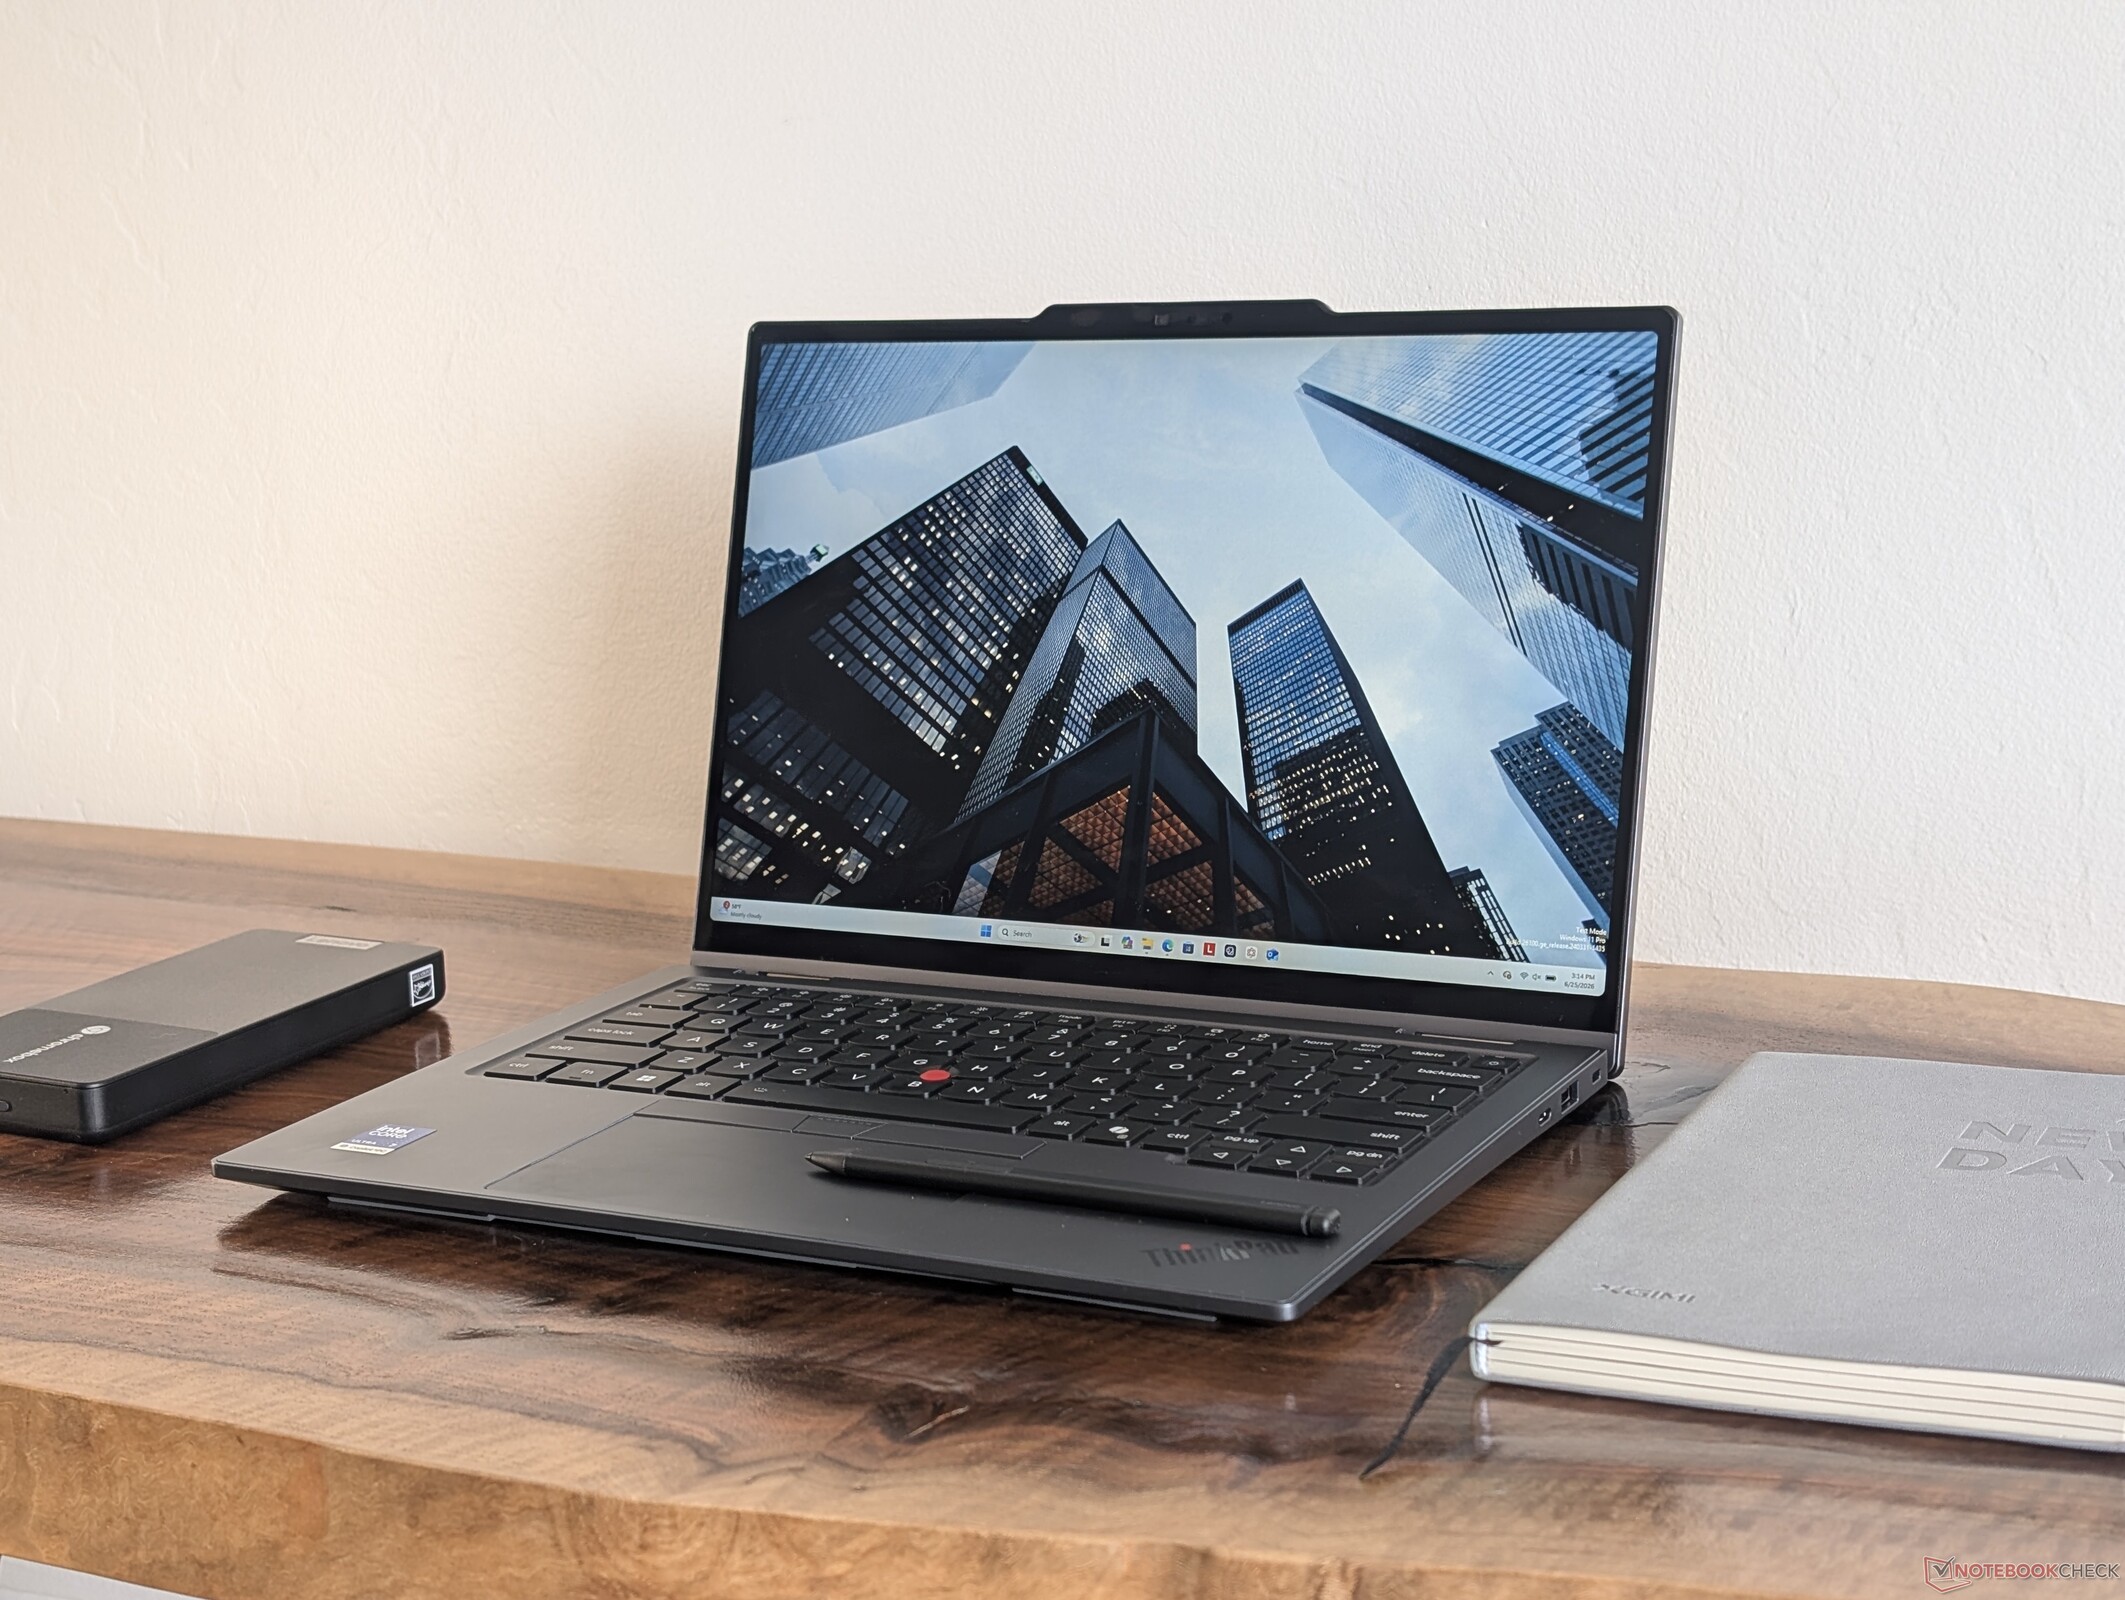
Alors que le modèle de l'année dernière, le ThinkPad X1 2-en-1 Gen 10 de l’année dernière pouvait trop ressembler à un IdeaPad ou à un Yoga, le ThinkPad X1 2-en-1 Gen 11 actualisé intègre davantage d’éléments visuels propres à la gamme ThinkPad, pour une allure plus professionnelle. Les modifications apportées au bouton d’alimentation, au pavé tactile, au système de recharge du stylet, ainsi qu’à la taille et au poids globaux, rendent le ThinkPad X1 2-en-1 Gen 11 plus facile à utiliser dans ses nombreux modes.
Le nouveau logement de recharge du stylet suscite toutefois des avis mitigés. Bien qu’il s’agisse d’une solution esthétiquement plus agréable et plus sûre que celle du modèle de l’année dernière, le nouveau stylet doit être plus fin pour s’y adapter. Le petit Slim Pen 2 peut donc s’avérer moins agréable à tenir en main que le Yoga Pen, plus épais, qui était fourni avec le ThinkPad X1 2-en-1 de 11e génération. En d’autres termes, si nous préférons le design du châssis de la 11e génération à celui de la 10e, c’est l’inverse qui s’applique en ce qui concerne leurs stylets.
En termes de performances, ne vous attendez pas à ce que le modèle de cette année soit beaucoup plus rapide que celui de l'année dernière, à moins qu'il ne soit équipé de l'option haut de gamme Core Ultra X7, dotée du GPU Arc B390, bien plus performant.
Points positifs
Points négatifs
Prix et disponibilité
Lenovo commercialise désormais le ThinkPad X1 2-en-1 de 11e génération, à partir de 2 400 $.
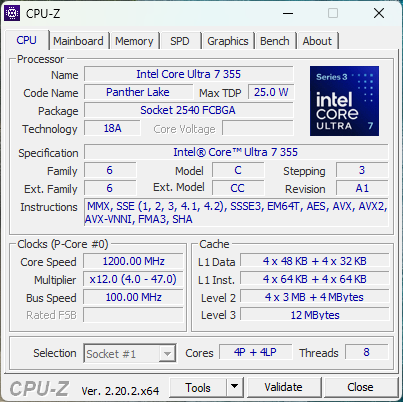
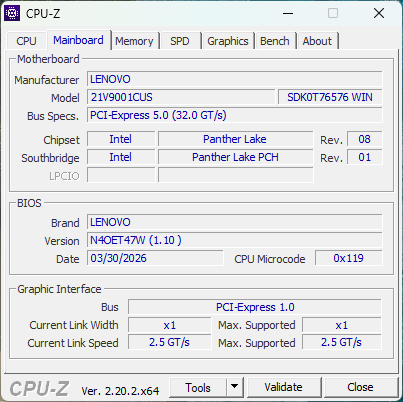
Le ThinkPad X1 2-en-1 11e génération succède directement au modèle de l'année dernière ThinkPad X1 2-en-1 Gen 10. Alors que les deux modèles précédents étaient visuellement identiques, la 11e génération de cette année bénéficie d’une refonte complète, avec à la fois de nouvelles options de processeurs Intel Panther Lake et un design revisité.
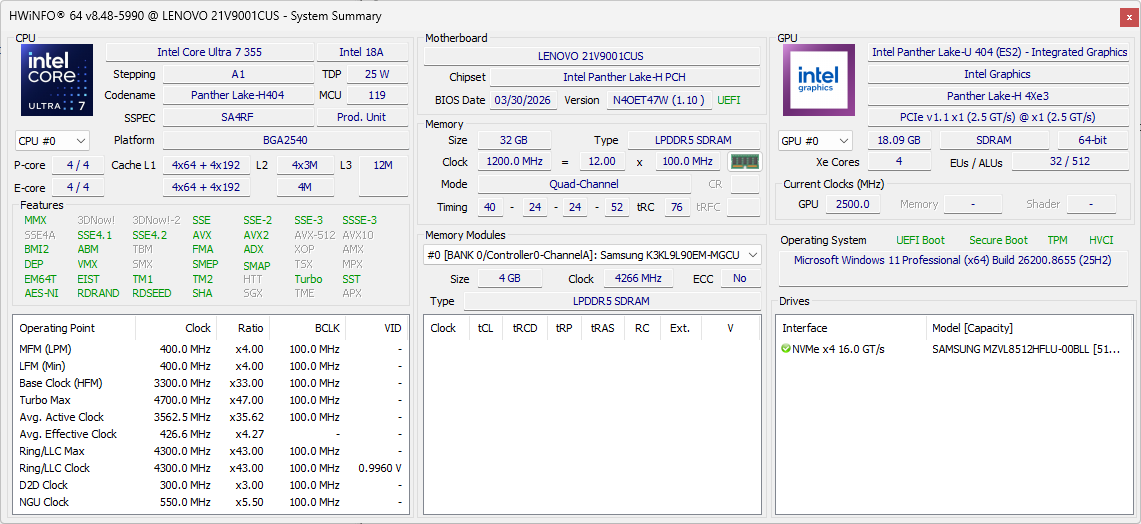
Notre modèle de test est une configuration intermédiaire équipée d’un Core Ultra 7 355 et d’un écran tactile IPS 1200p60, pour un prix d’environ 2 700 $. Les modèles d’entrée de gamme sont équipés du Core Ultra 5 325, tandis que la version haut de gamme intègre le Core Ultra X7 368H, nettement plus rapide, ainsi qu’un écran tactile OLED de 1 800p120.
Parmi les concurrents sur ce segment, on trouve d’autres convertibles destinés aux professionnels, tels que le Latitude 7450 2-en-1 de Dell, HP EliteBook X Flip G1i 14, ou encore la série MSI Prestige 14 Flip.
Autres avis sur Lenovo :
Caractéristiques techniques
Affaire
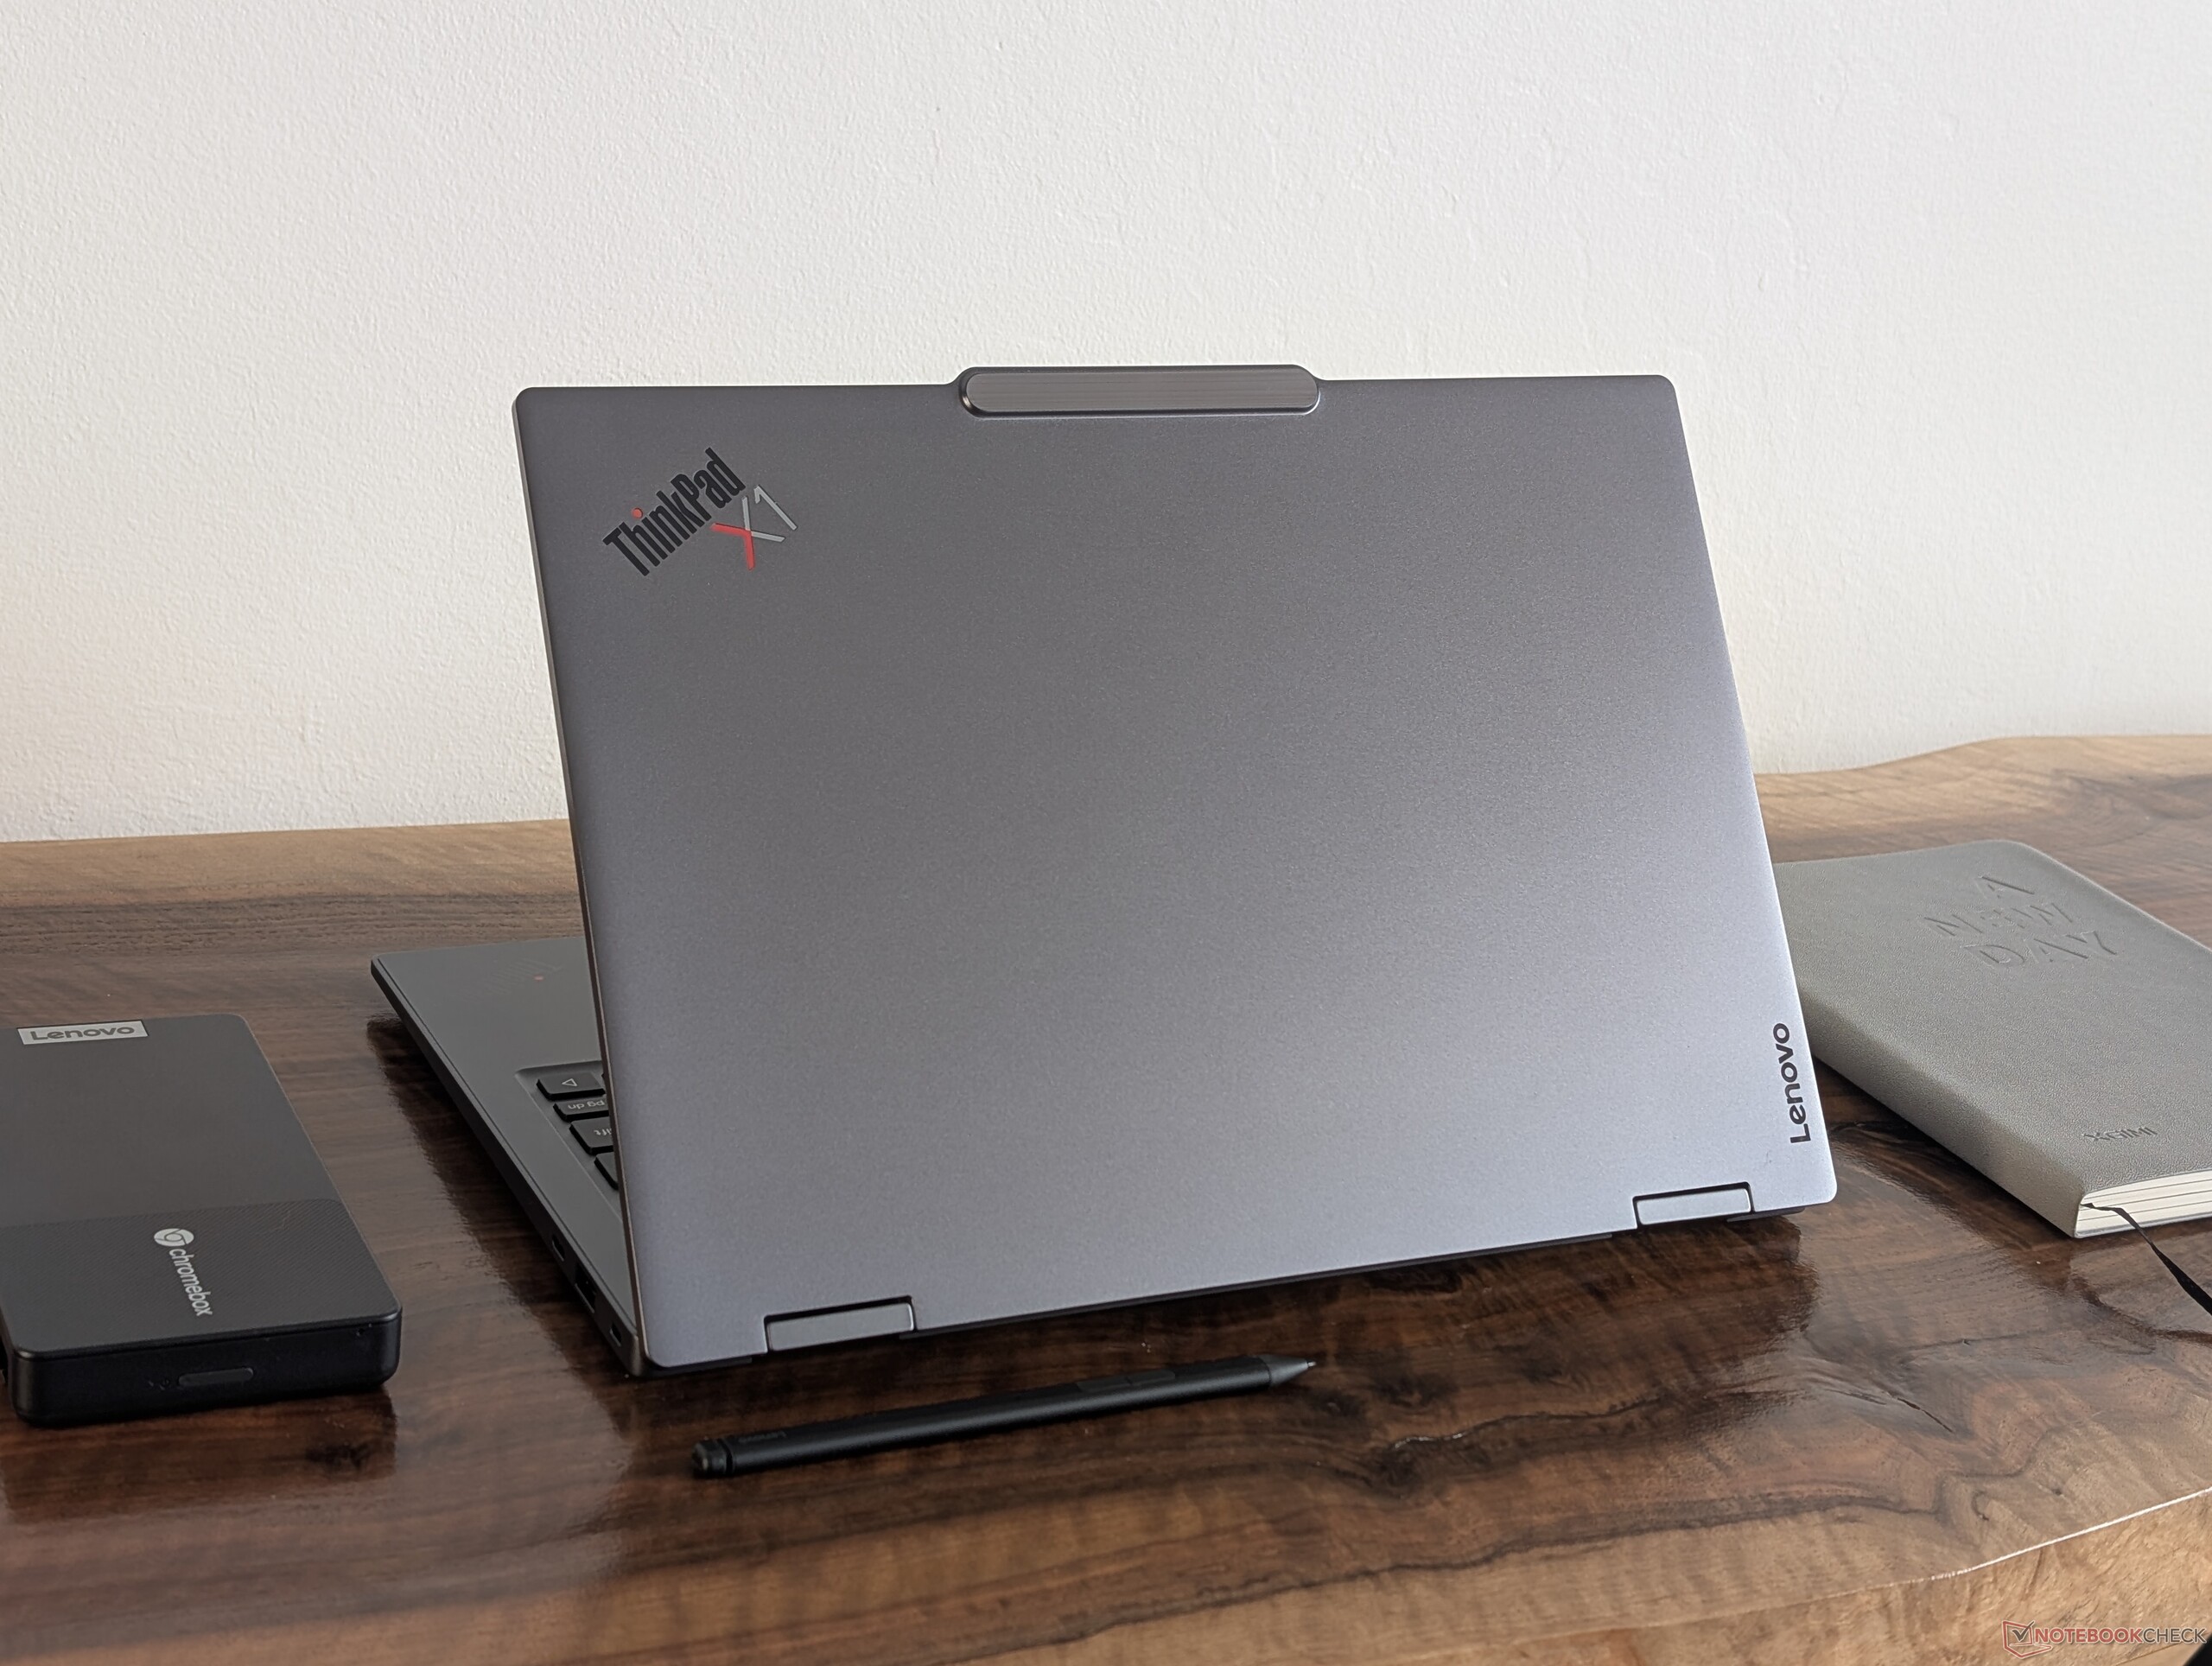
Le nouveau châssis est très légèrement plus fin et plus léger qu’auparavant, d’environ 100 grammes et d’une fraction de millimètre respectivement, sans pour autant donner l’impression d’être moins solide ou de moindre qualité. En effet, bon nombre des changements esthétiques, qu’il s’agisse des logos ou des teintes globalement plus sombres, confèrent un aspect plus professionnel, alors que l’ancien ThinkPad X1 2-en-1 de 10e génération semblait davantage destiné au grand public ou s’apparentait davantage à un IdeaPad.
L’ajout le plus notable de cette refonte est le logement situé sur le panneau inférieur, près du bord avant, destiné à ranger et à recharger le stylet Slim Pen 2. Ce logement maintient le stylet plus solidement en place que les aimants habituels situés le long des bords extérieurs de la plupart des autres ordinateurs convertibles, y compris le modèle de l’année dernière.
Connectivité
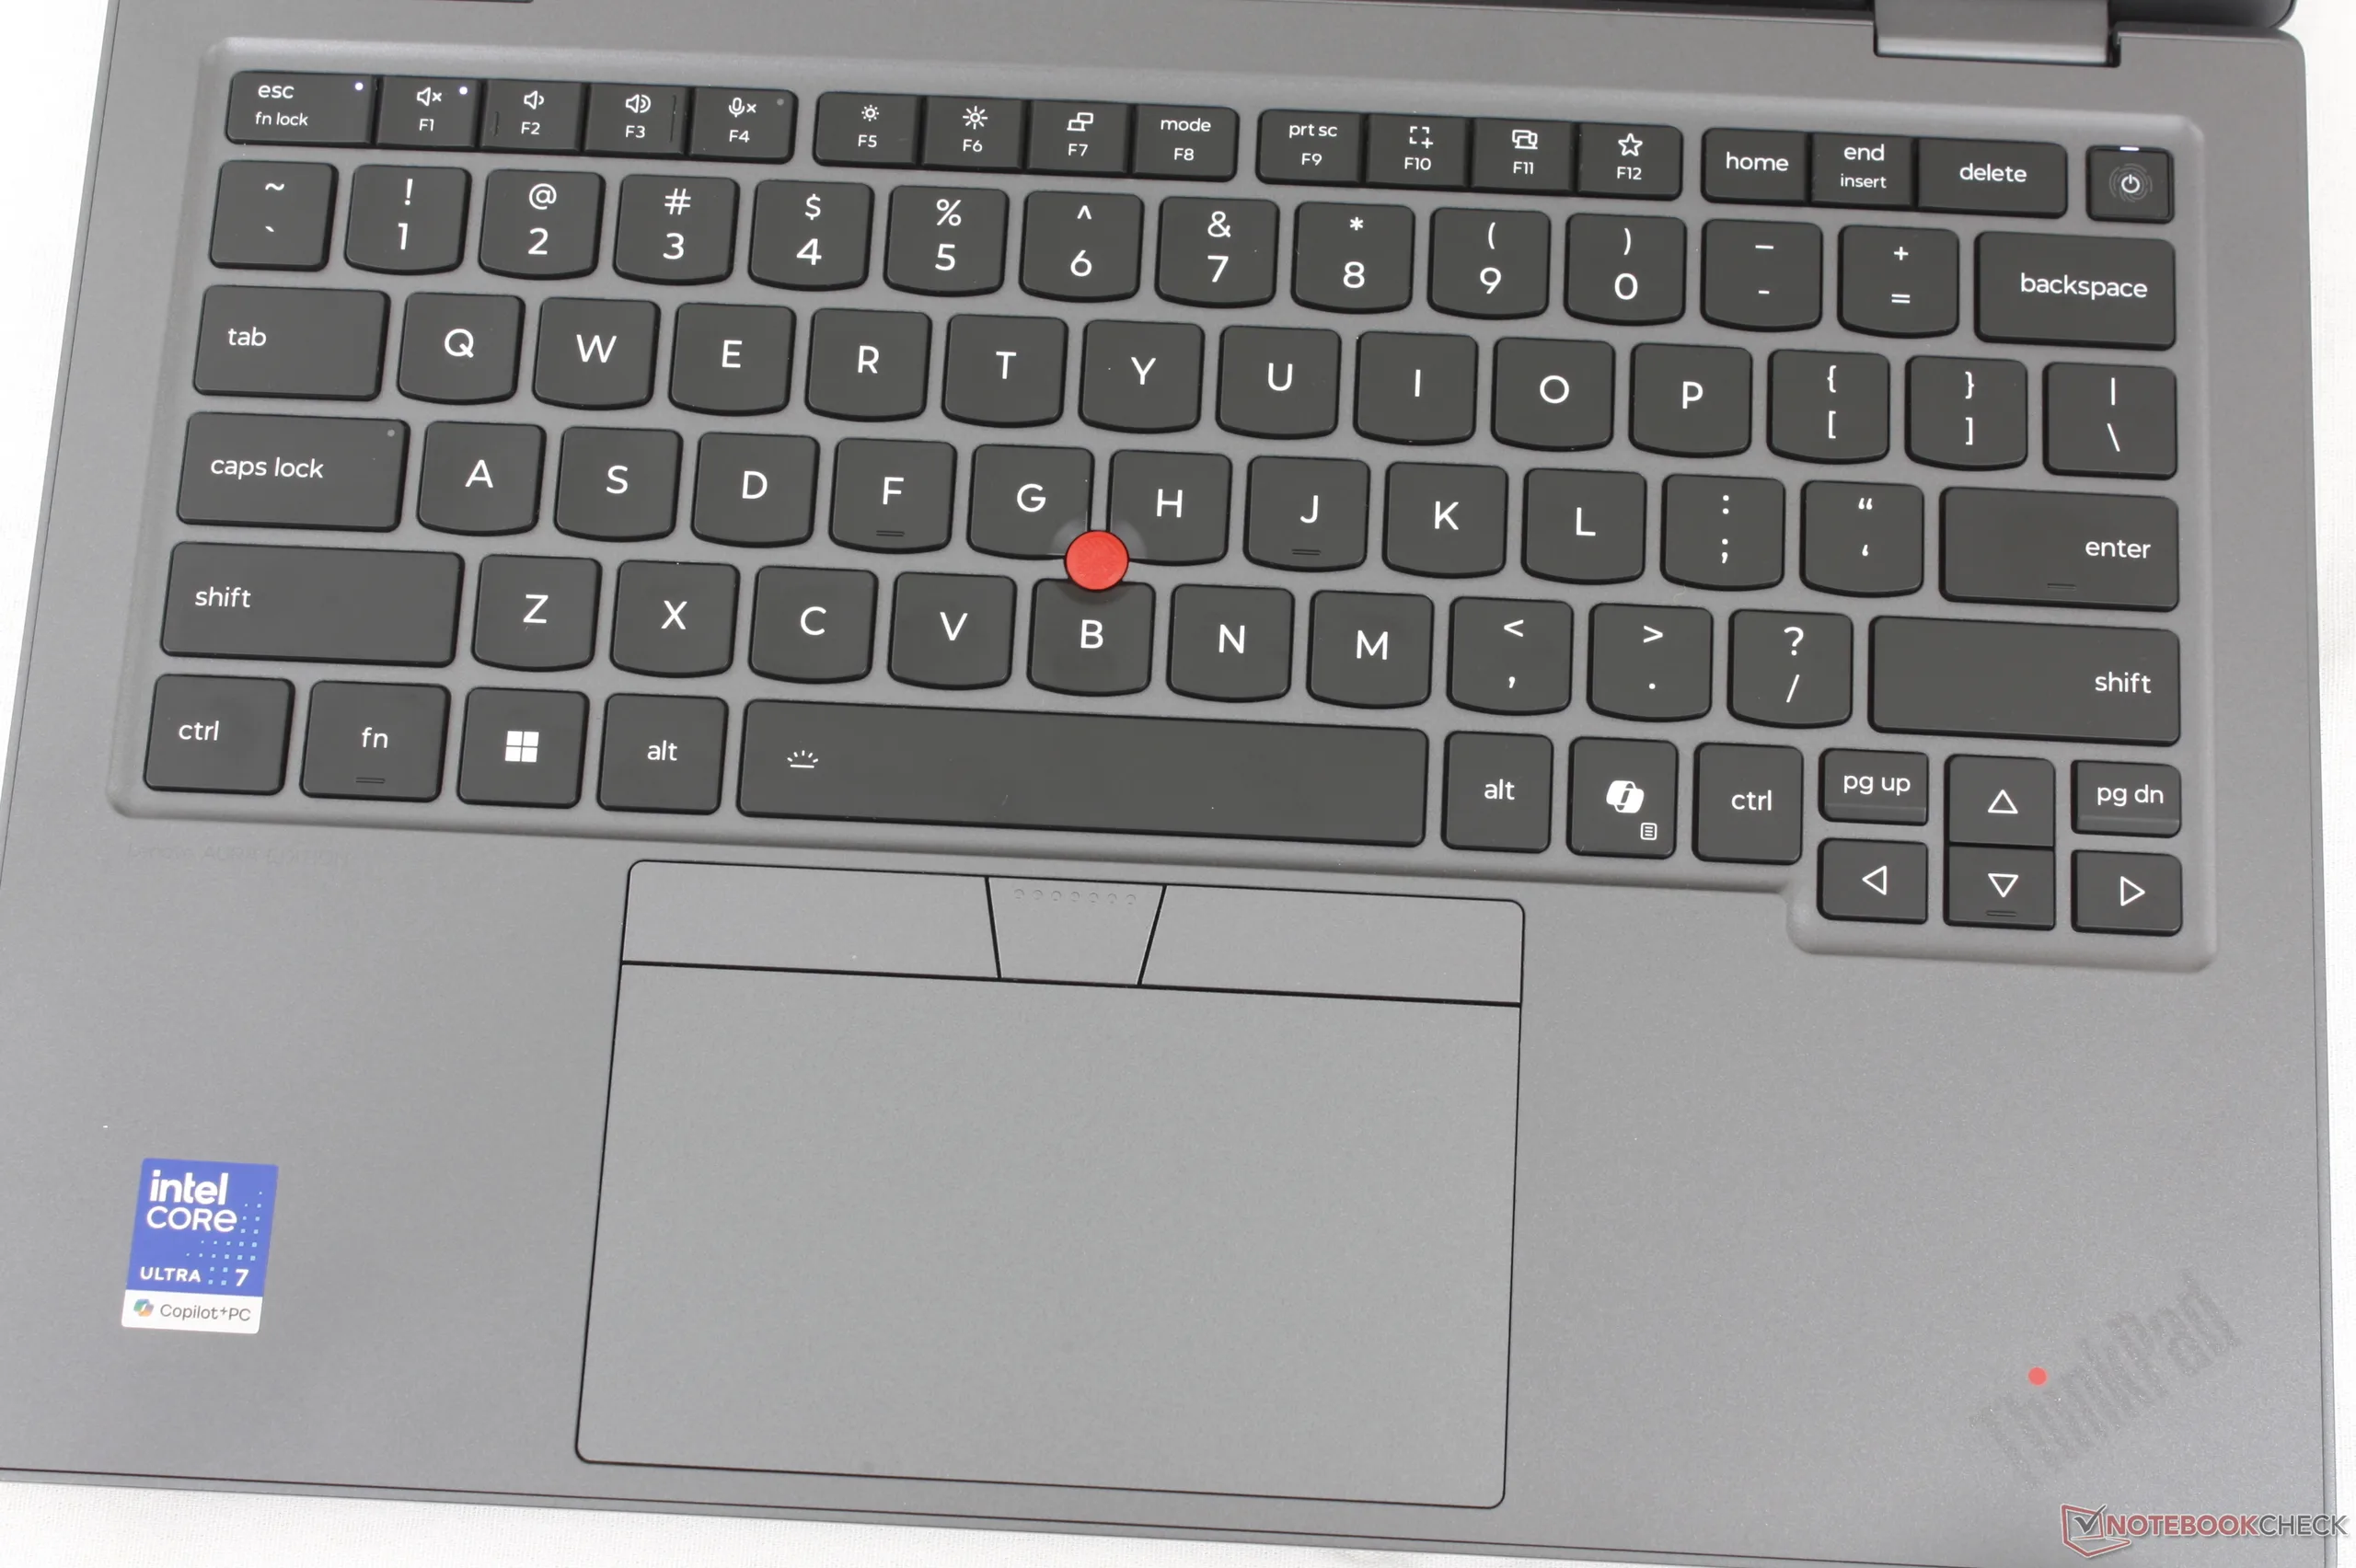
Les connectique sont identiques à celles du modèle de l'année dernière, à l'exception d'un port USB-A en moins. Le bouton d'alimentation, qui a été déplacé, permet également d'éviter les pressions accidentelles lorsque vous utilisez l'appareil en mode tablette.


Communication
Webcam
Une webcam de 5 MP est fournie de série, avec la possibilité de passer à 10 MP.


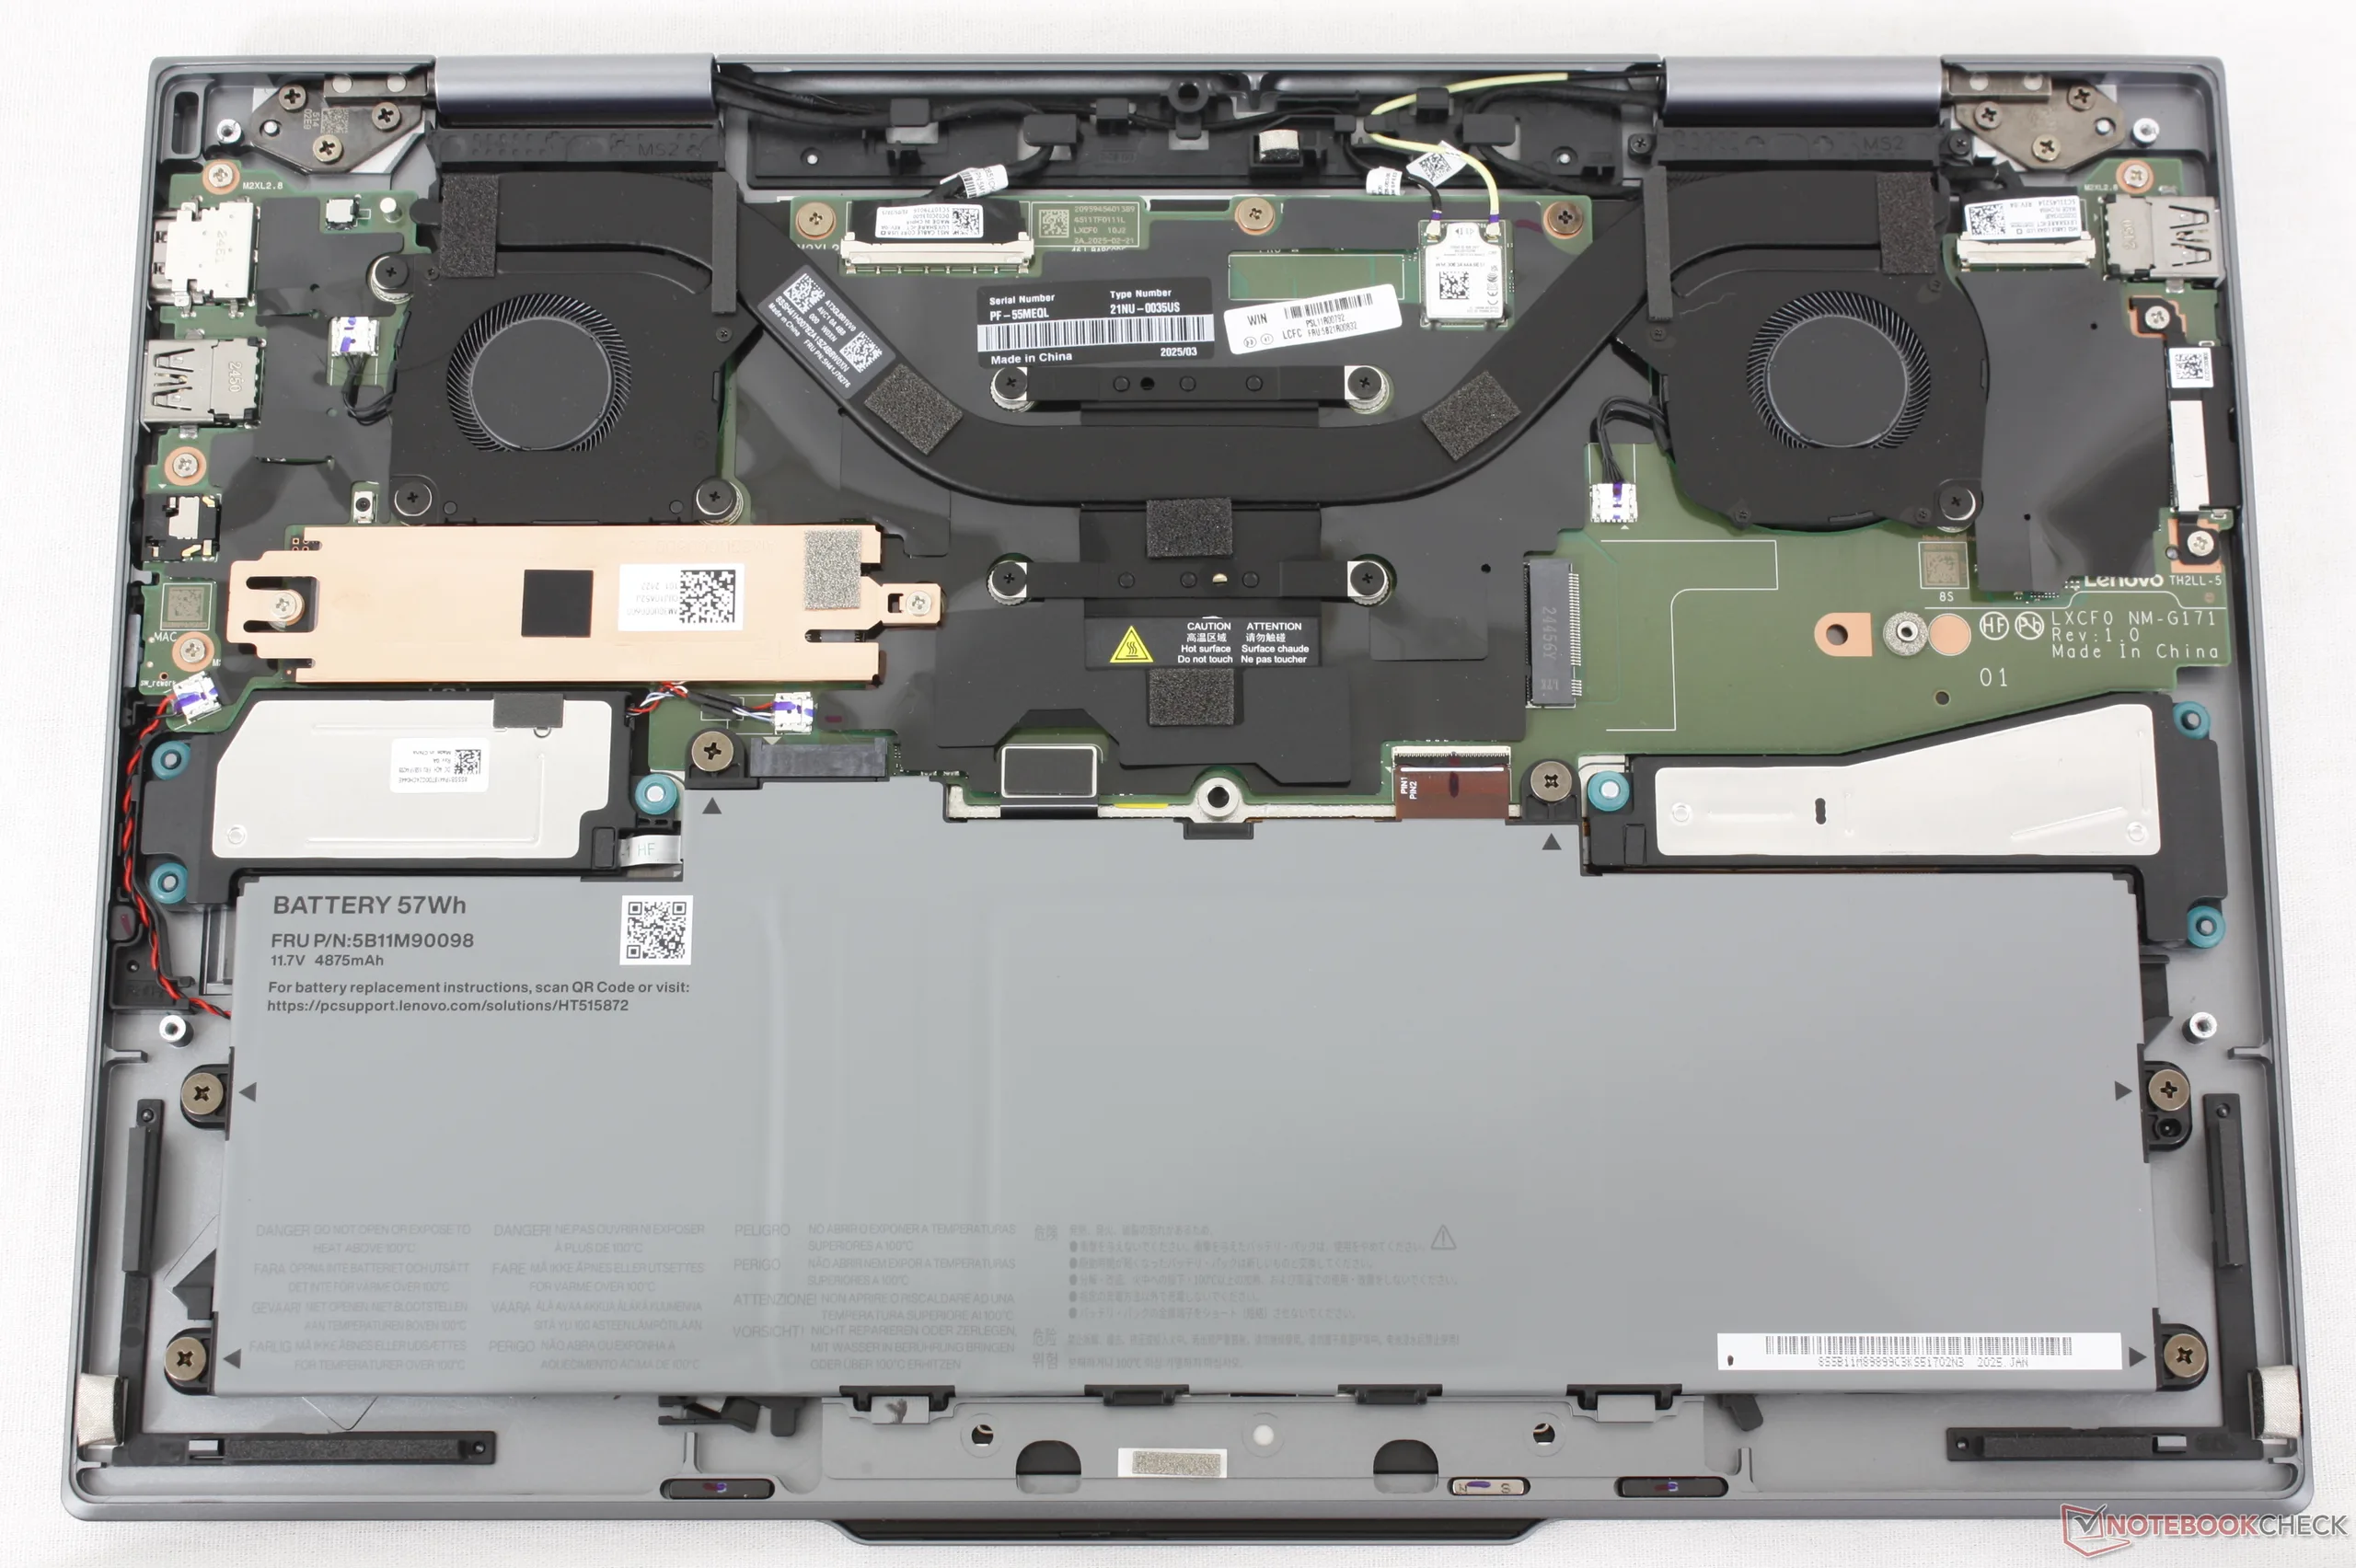
Maintenance
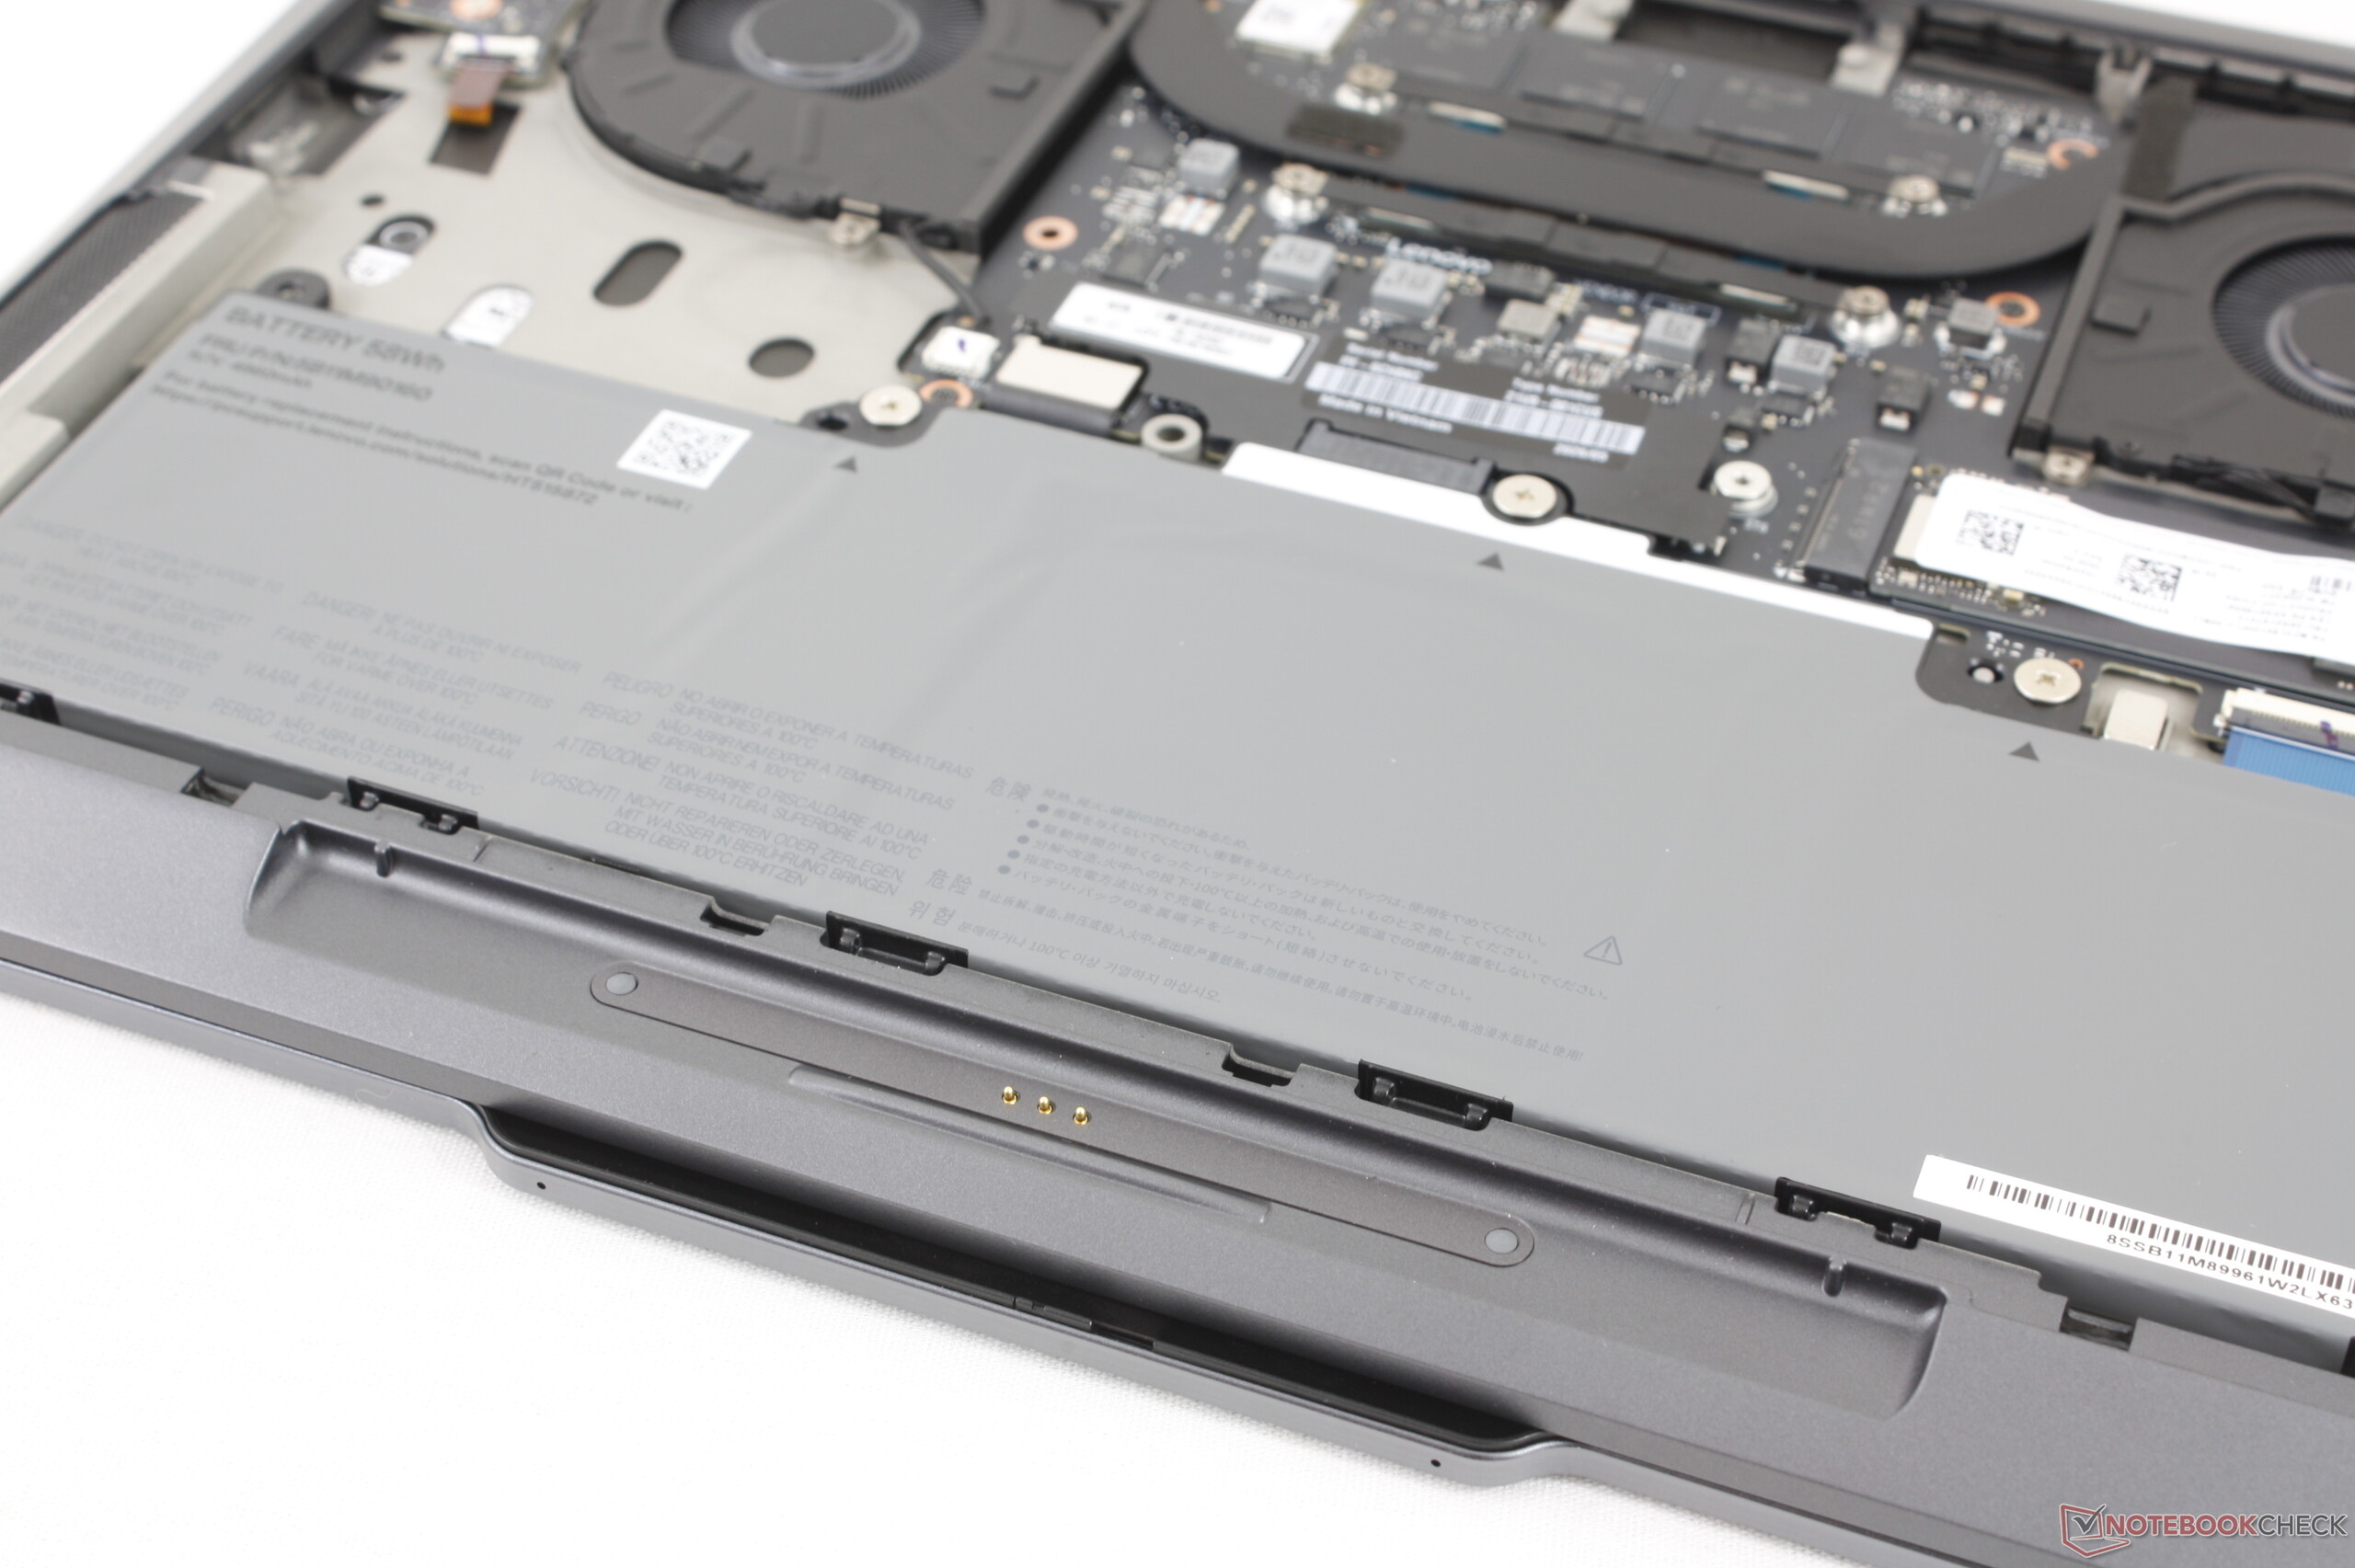
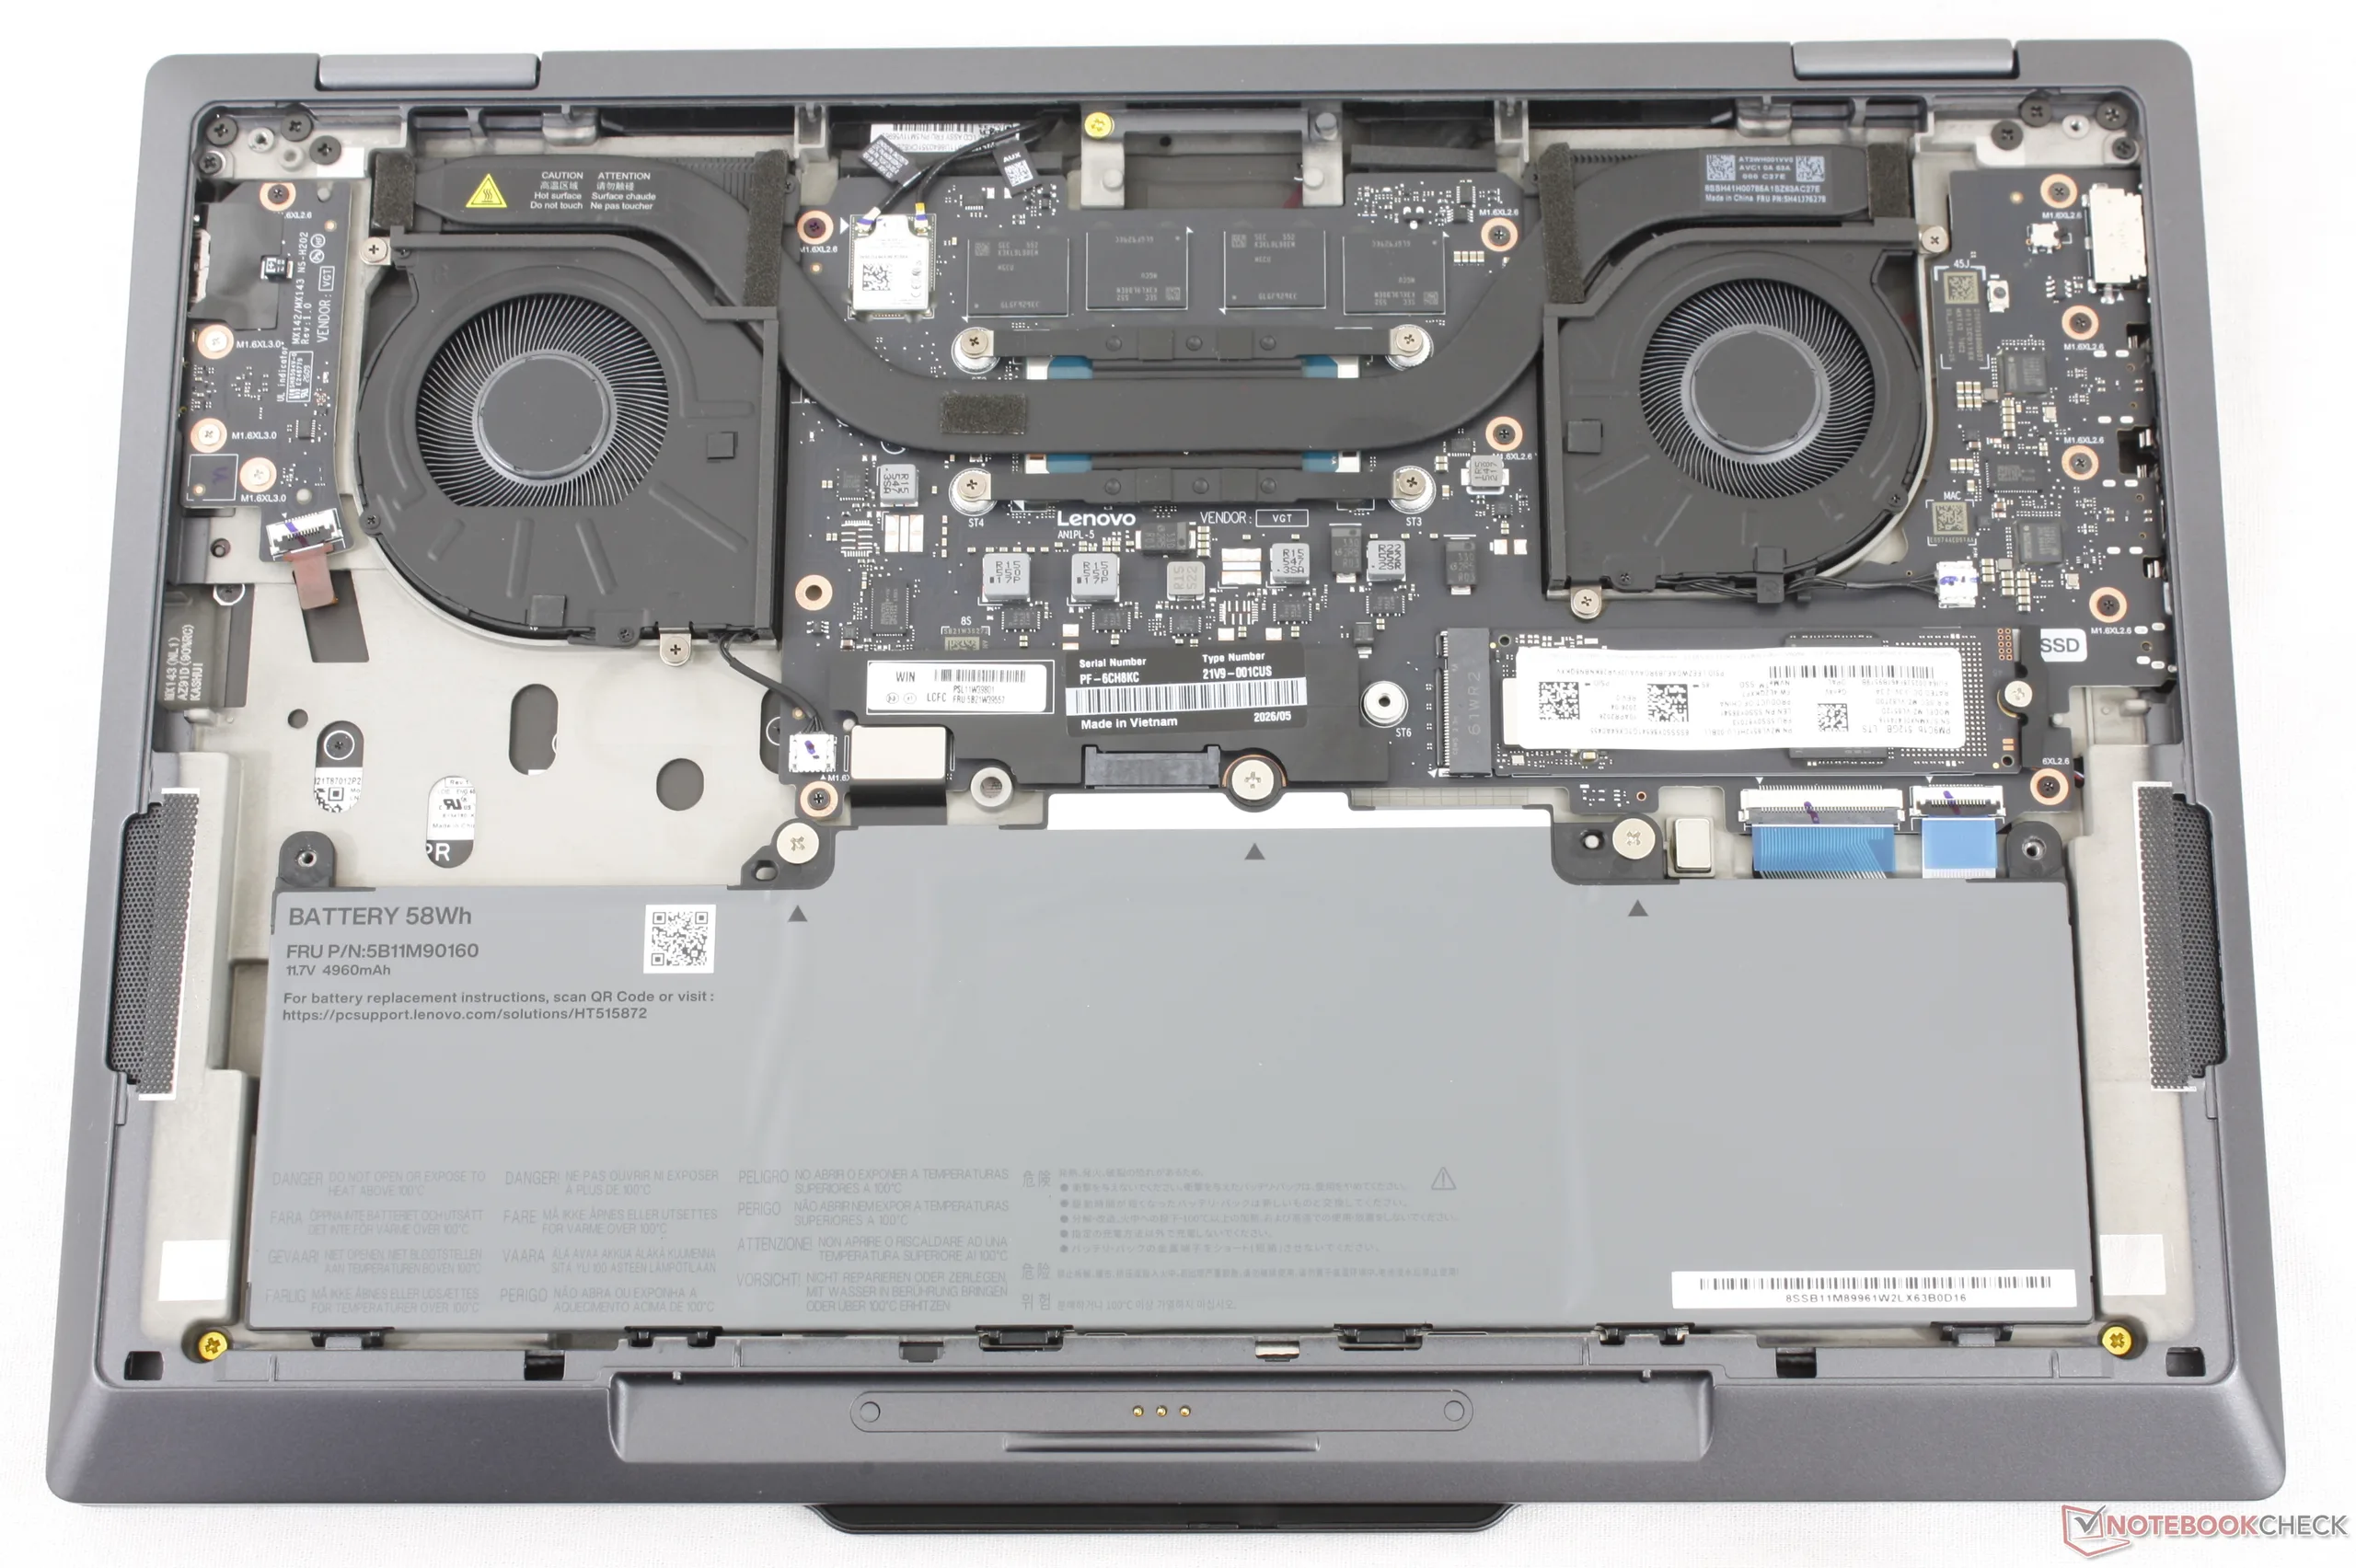
Le panneau inférieur s'ouvre facilement à l'aide d'un simple tournevis cruciforme. Les possibilités d'extension se limitent à un seul emplacement SSD M.2 2280.
Développement durable
Ce modèle utilise largement des matériaux recyclés, notamment jusqu'à 90 % d'aluminium, d'acier et de magnésium recyclés, ainsi que jusqu'à 65 % de plastiques PCC, selon les pièces. La batterie elle-même est composée à 100 % de cobalt recyclé et l'emballage ne contient pas de plastique.
Accessoires et garantie
Le stylet Lenovo Slim Pen 2, disponible en option, est plus fin que le Yoga Pen fourni avec le ThinkPad X1 2-en-1 Gen 10 de l'année dernière. Le logement intégré destiné à la recharge du Slim Pen 2 n'est donc pas compatible avec le stylet de l'année dernière.
La garantie constructeur standard d'un an s'applique.
Périphériques de saisie
Le lecteur d'empreintes digitales dédié qui équipait le modèle de l'année dernière a été supprimé au profit d'un petit bouton d'alimentation intégrant un capteur d'empreintes digitales dans cette dernière version remaniée.
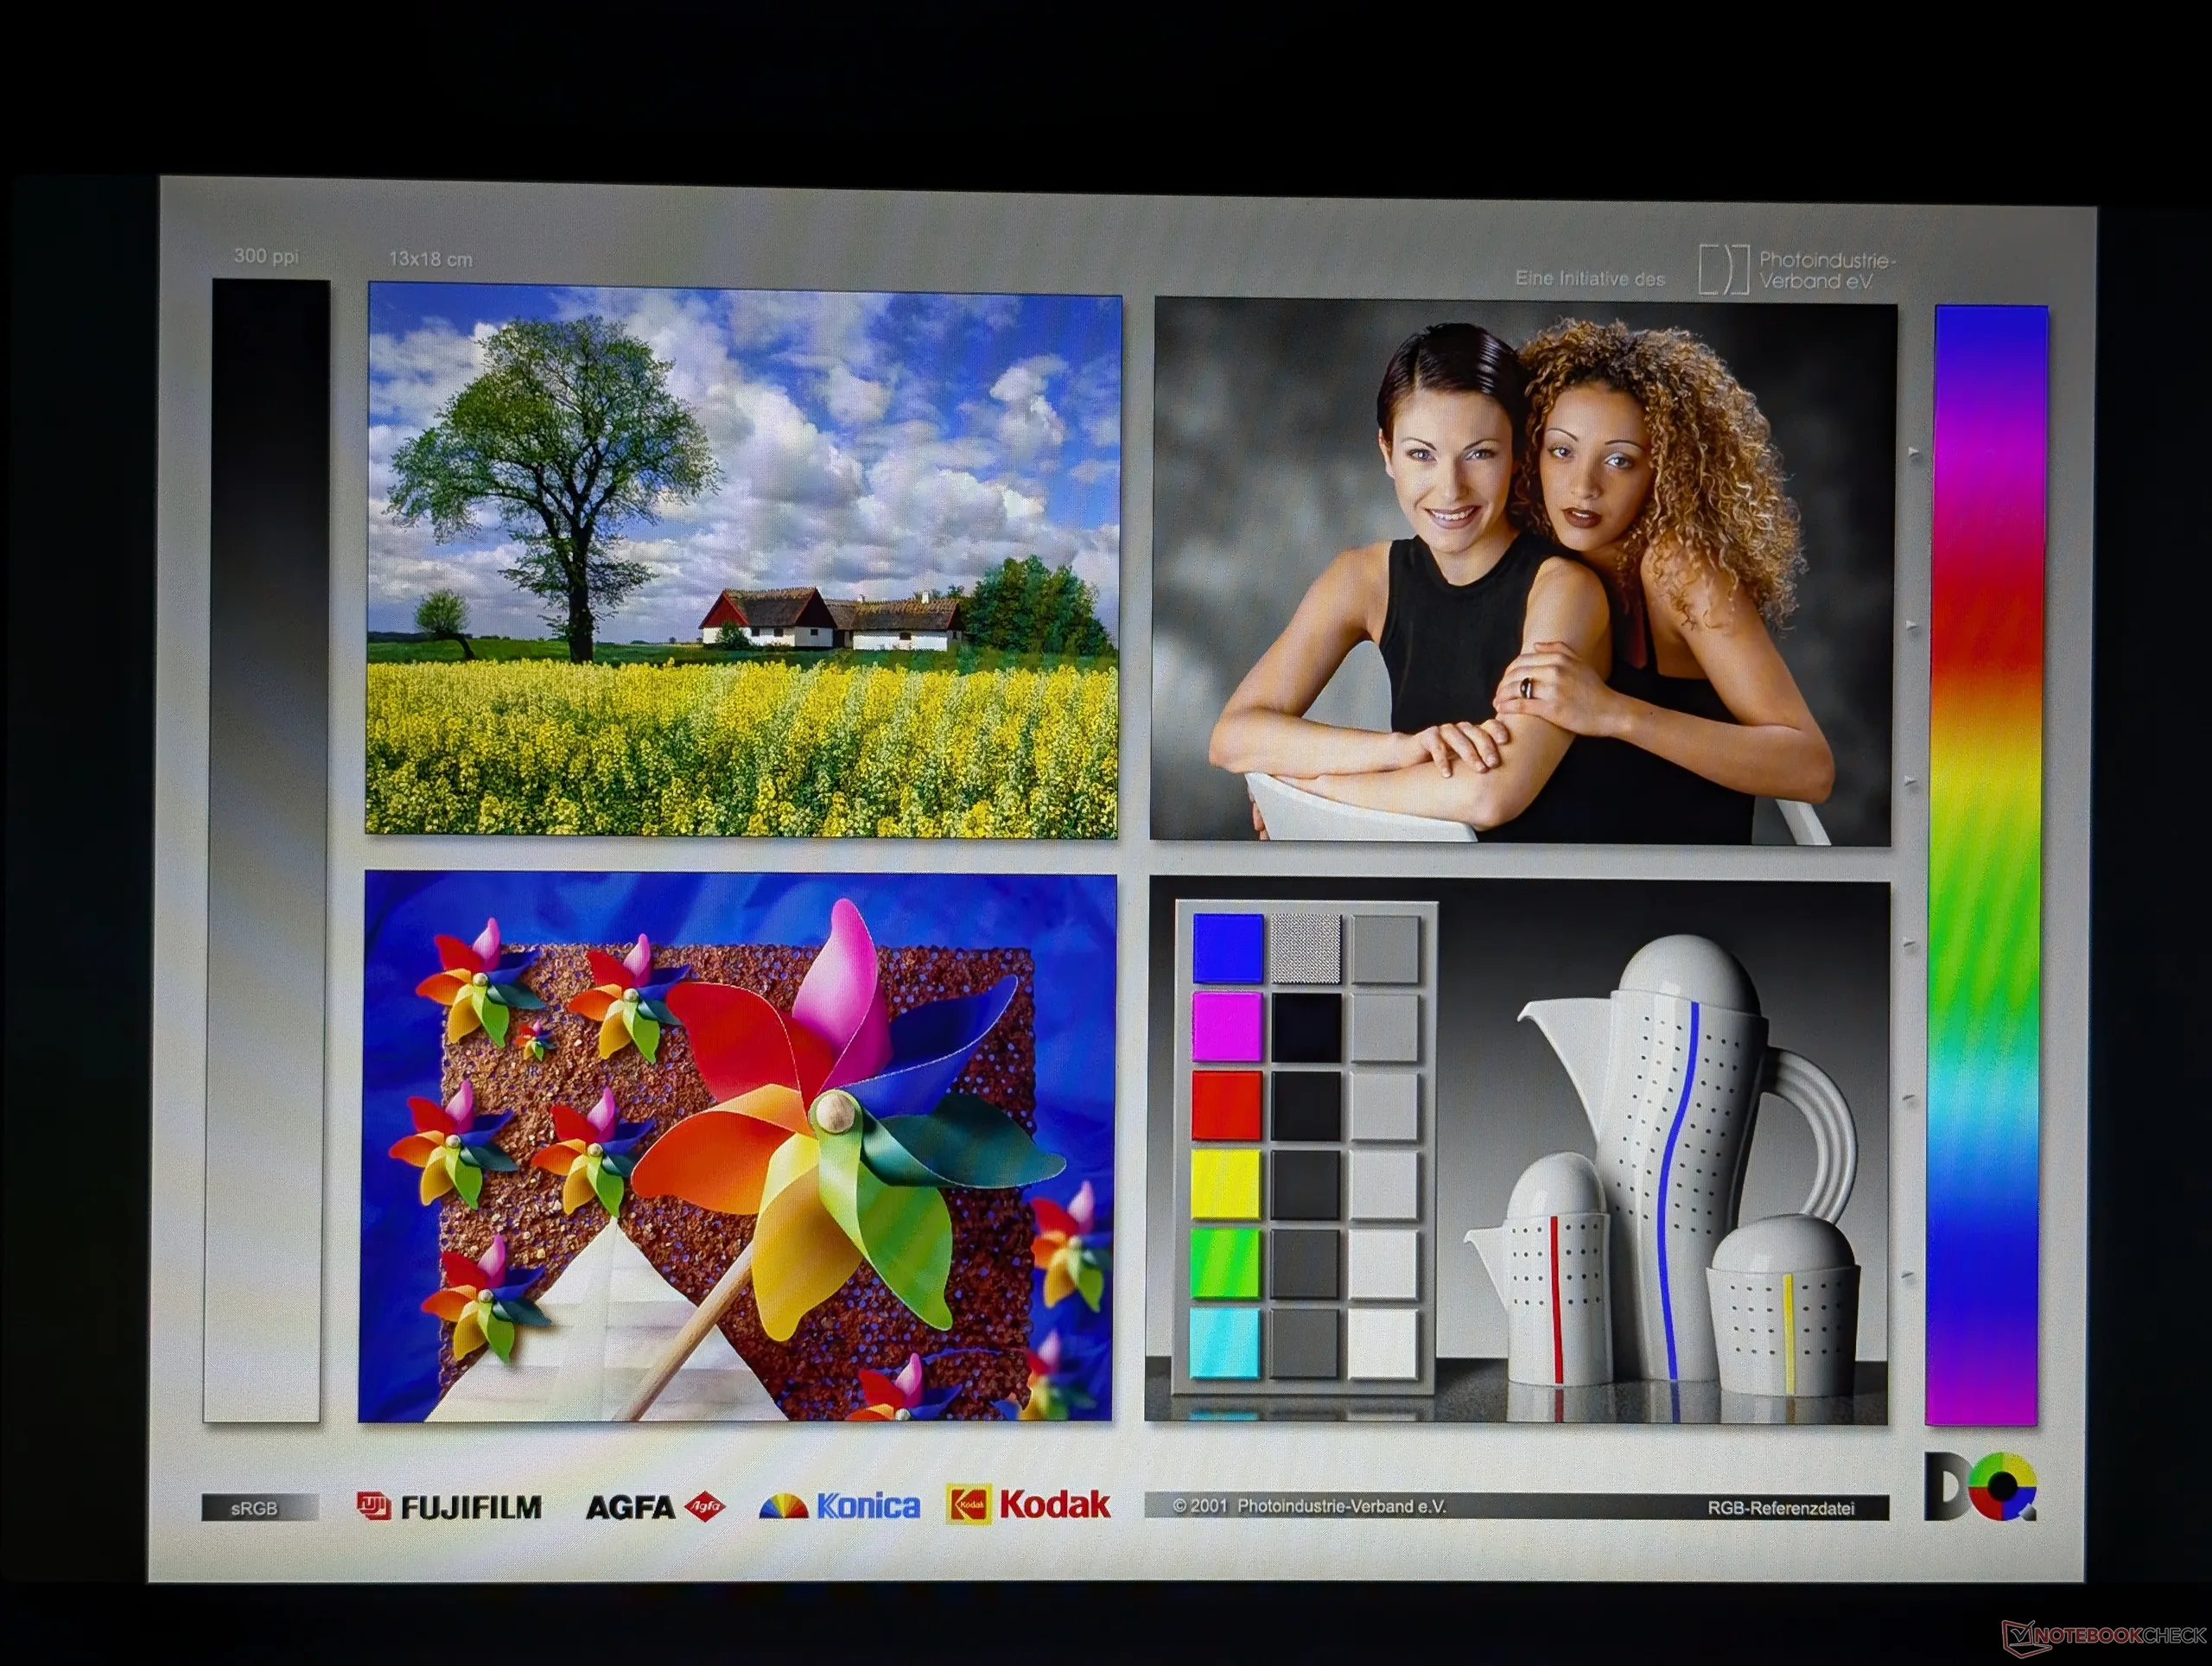
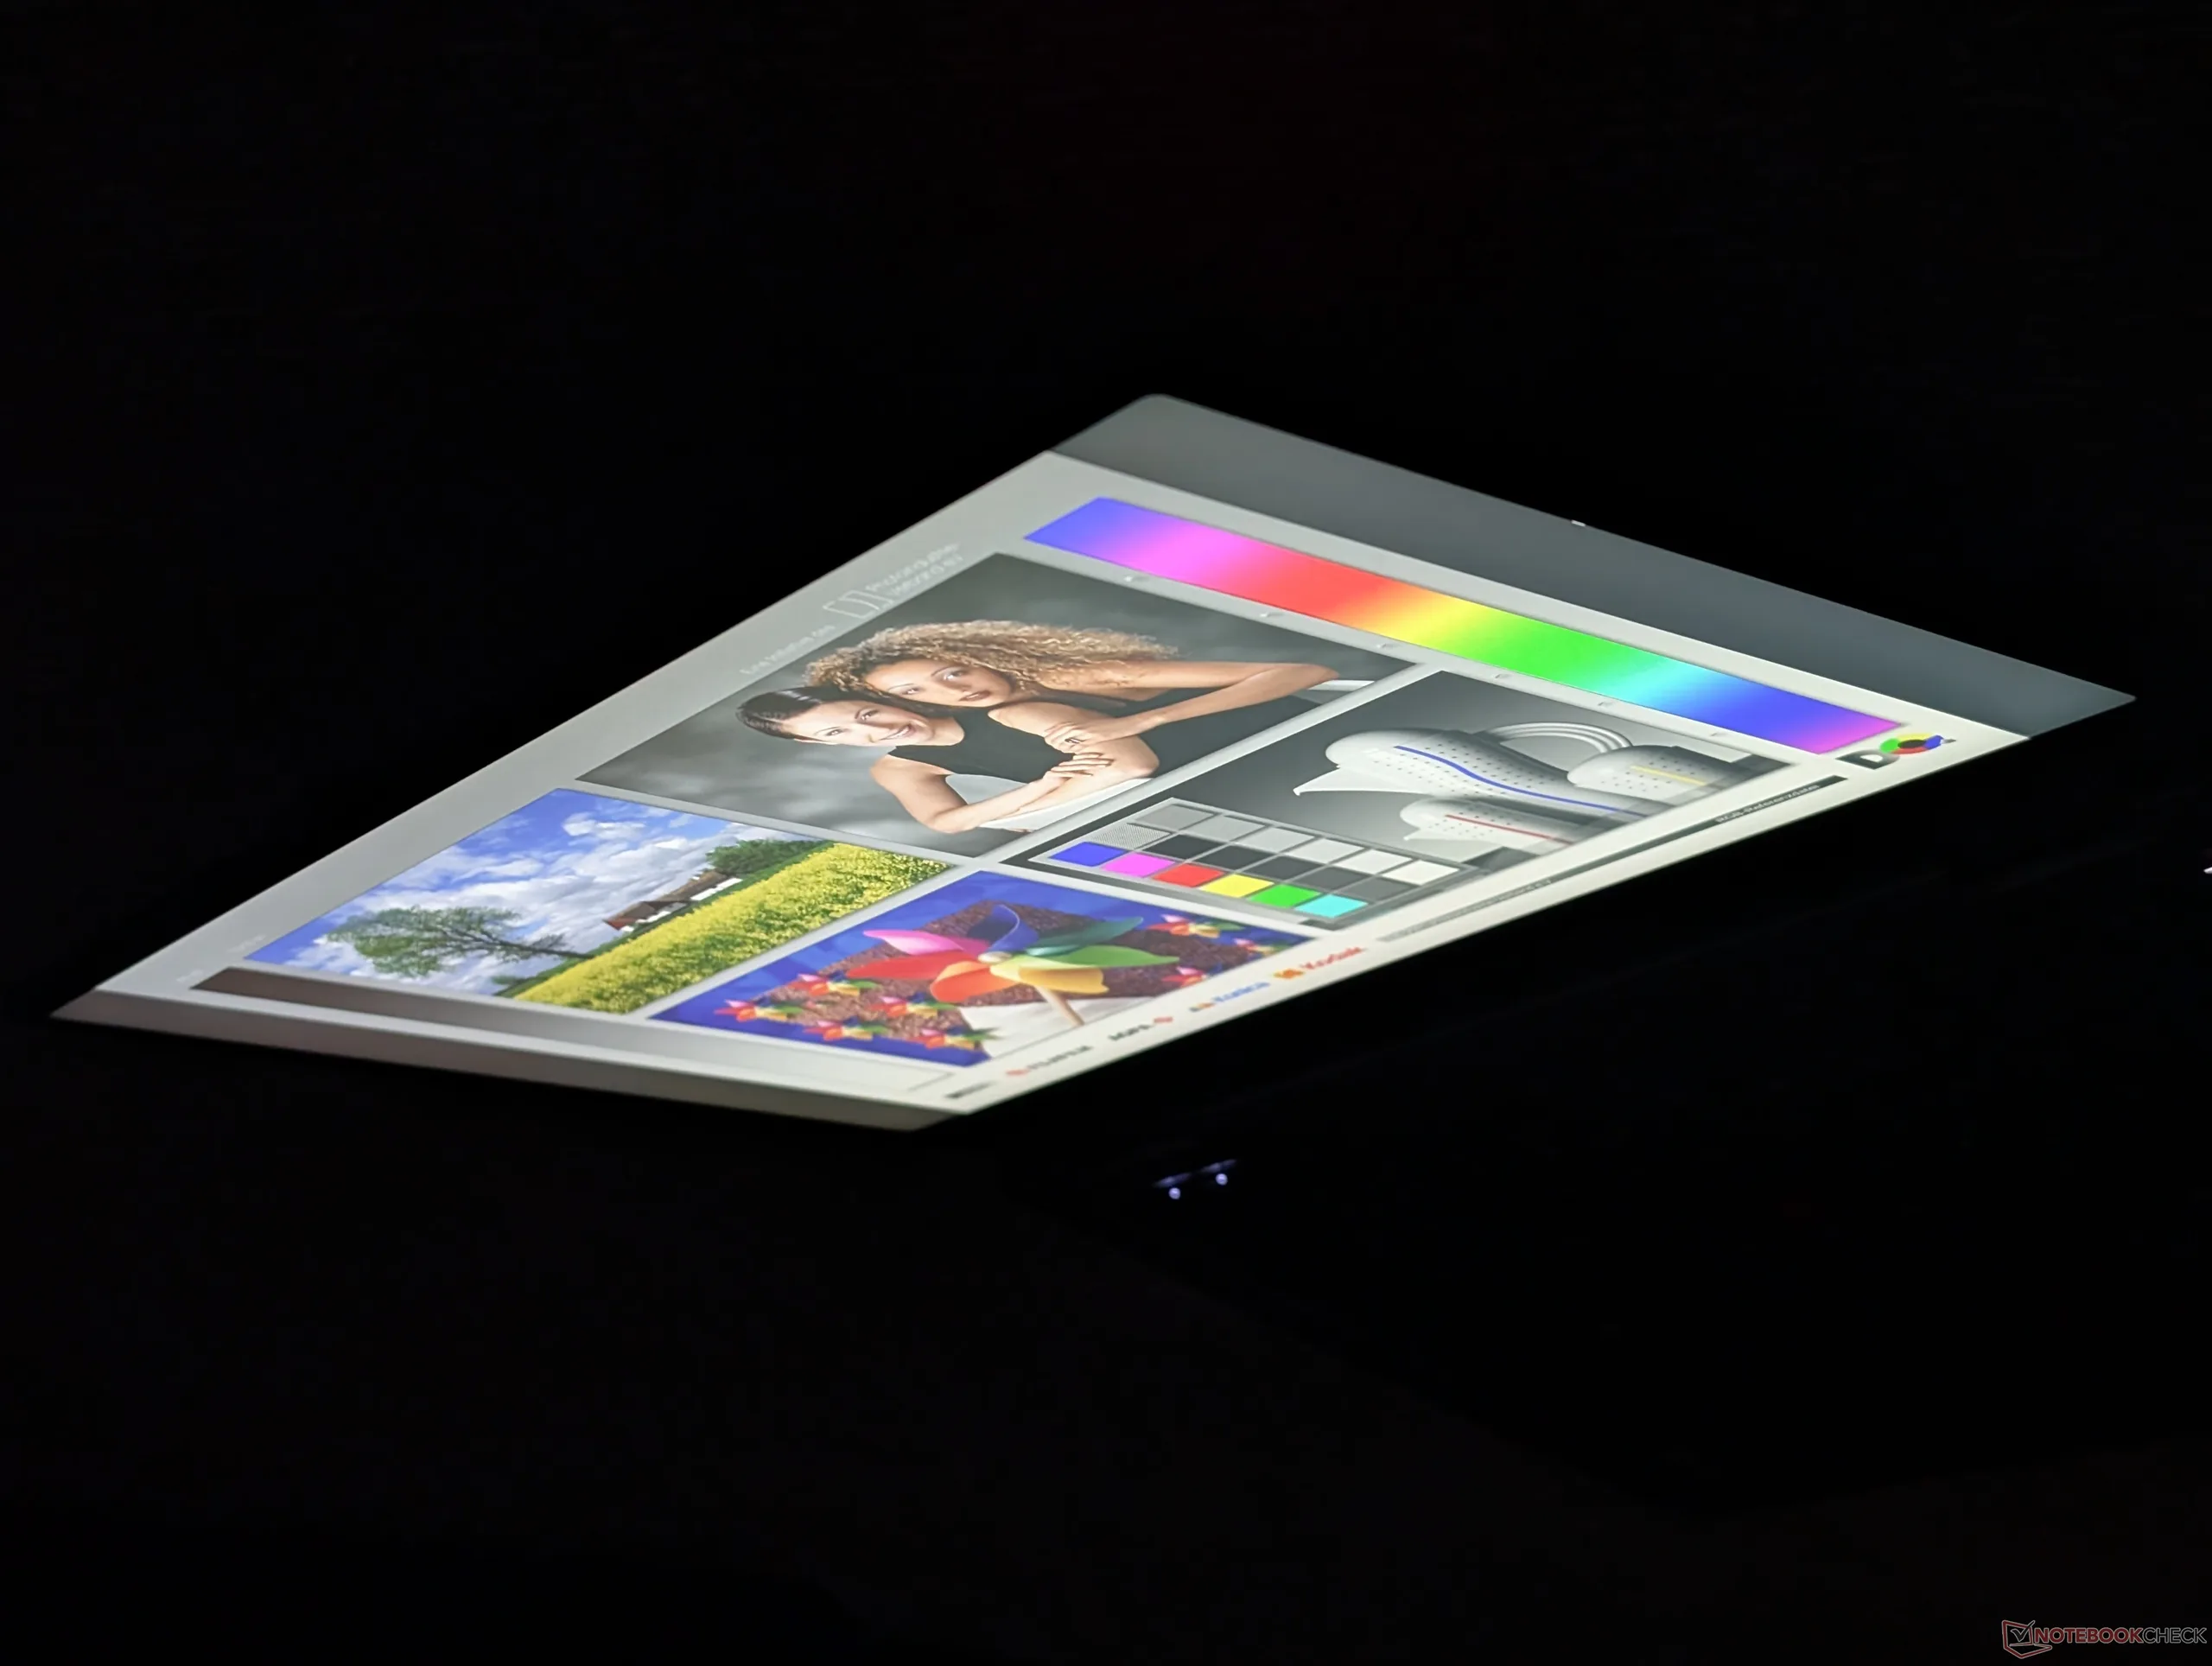
Affichage
Lenovo propose deux options principales d'écrans tactiles, tout comme sur le modèle de la génération précédente :
- 1920 x 1200, IPS, 60 Hz, 100 % sRGB, 500 nits, mat ou brillant
- 2880 x 1800, OLED, 120 Hz, 100 % DCI-P3, 500 nits, brillant
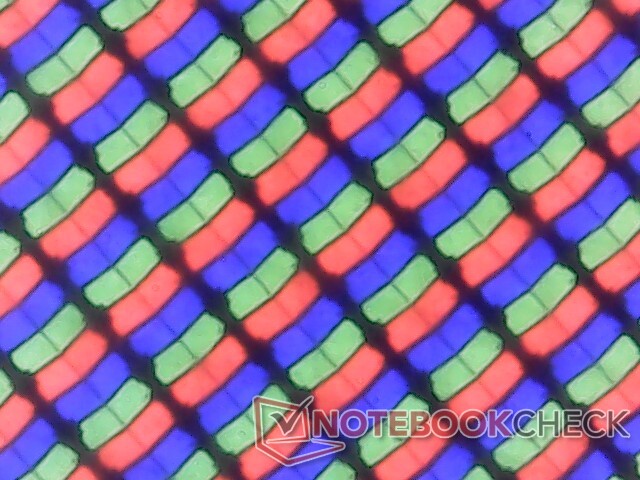
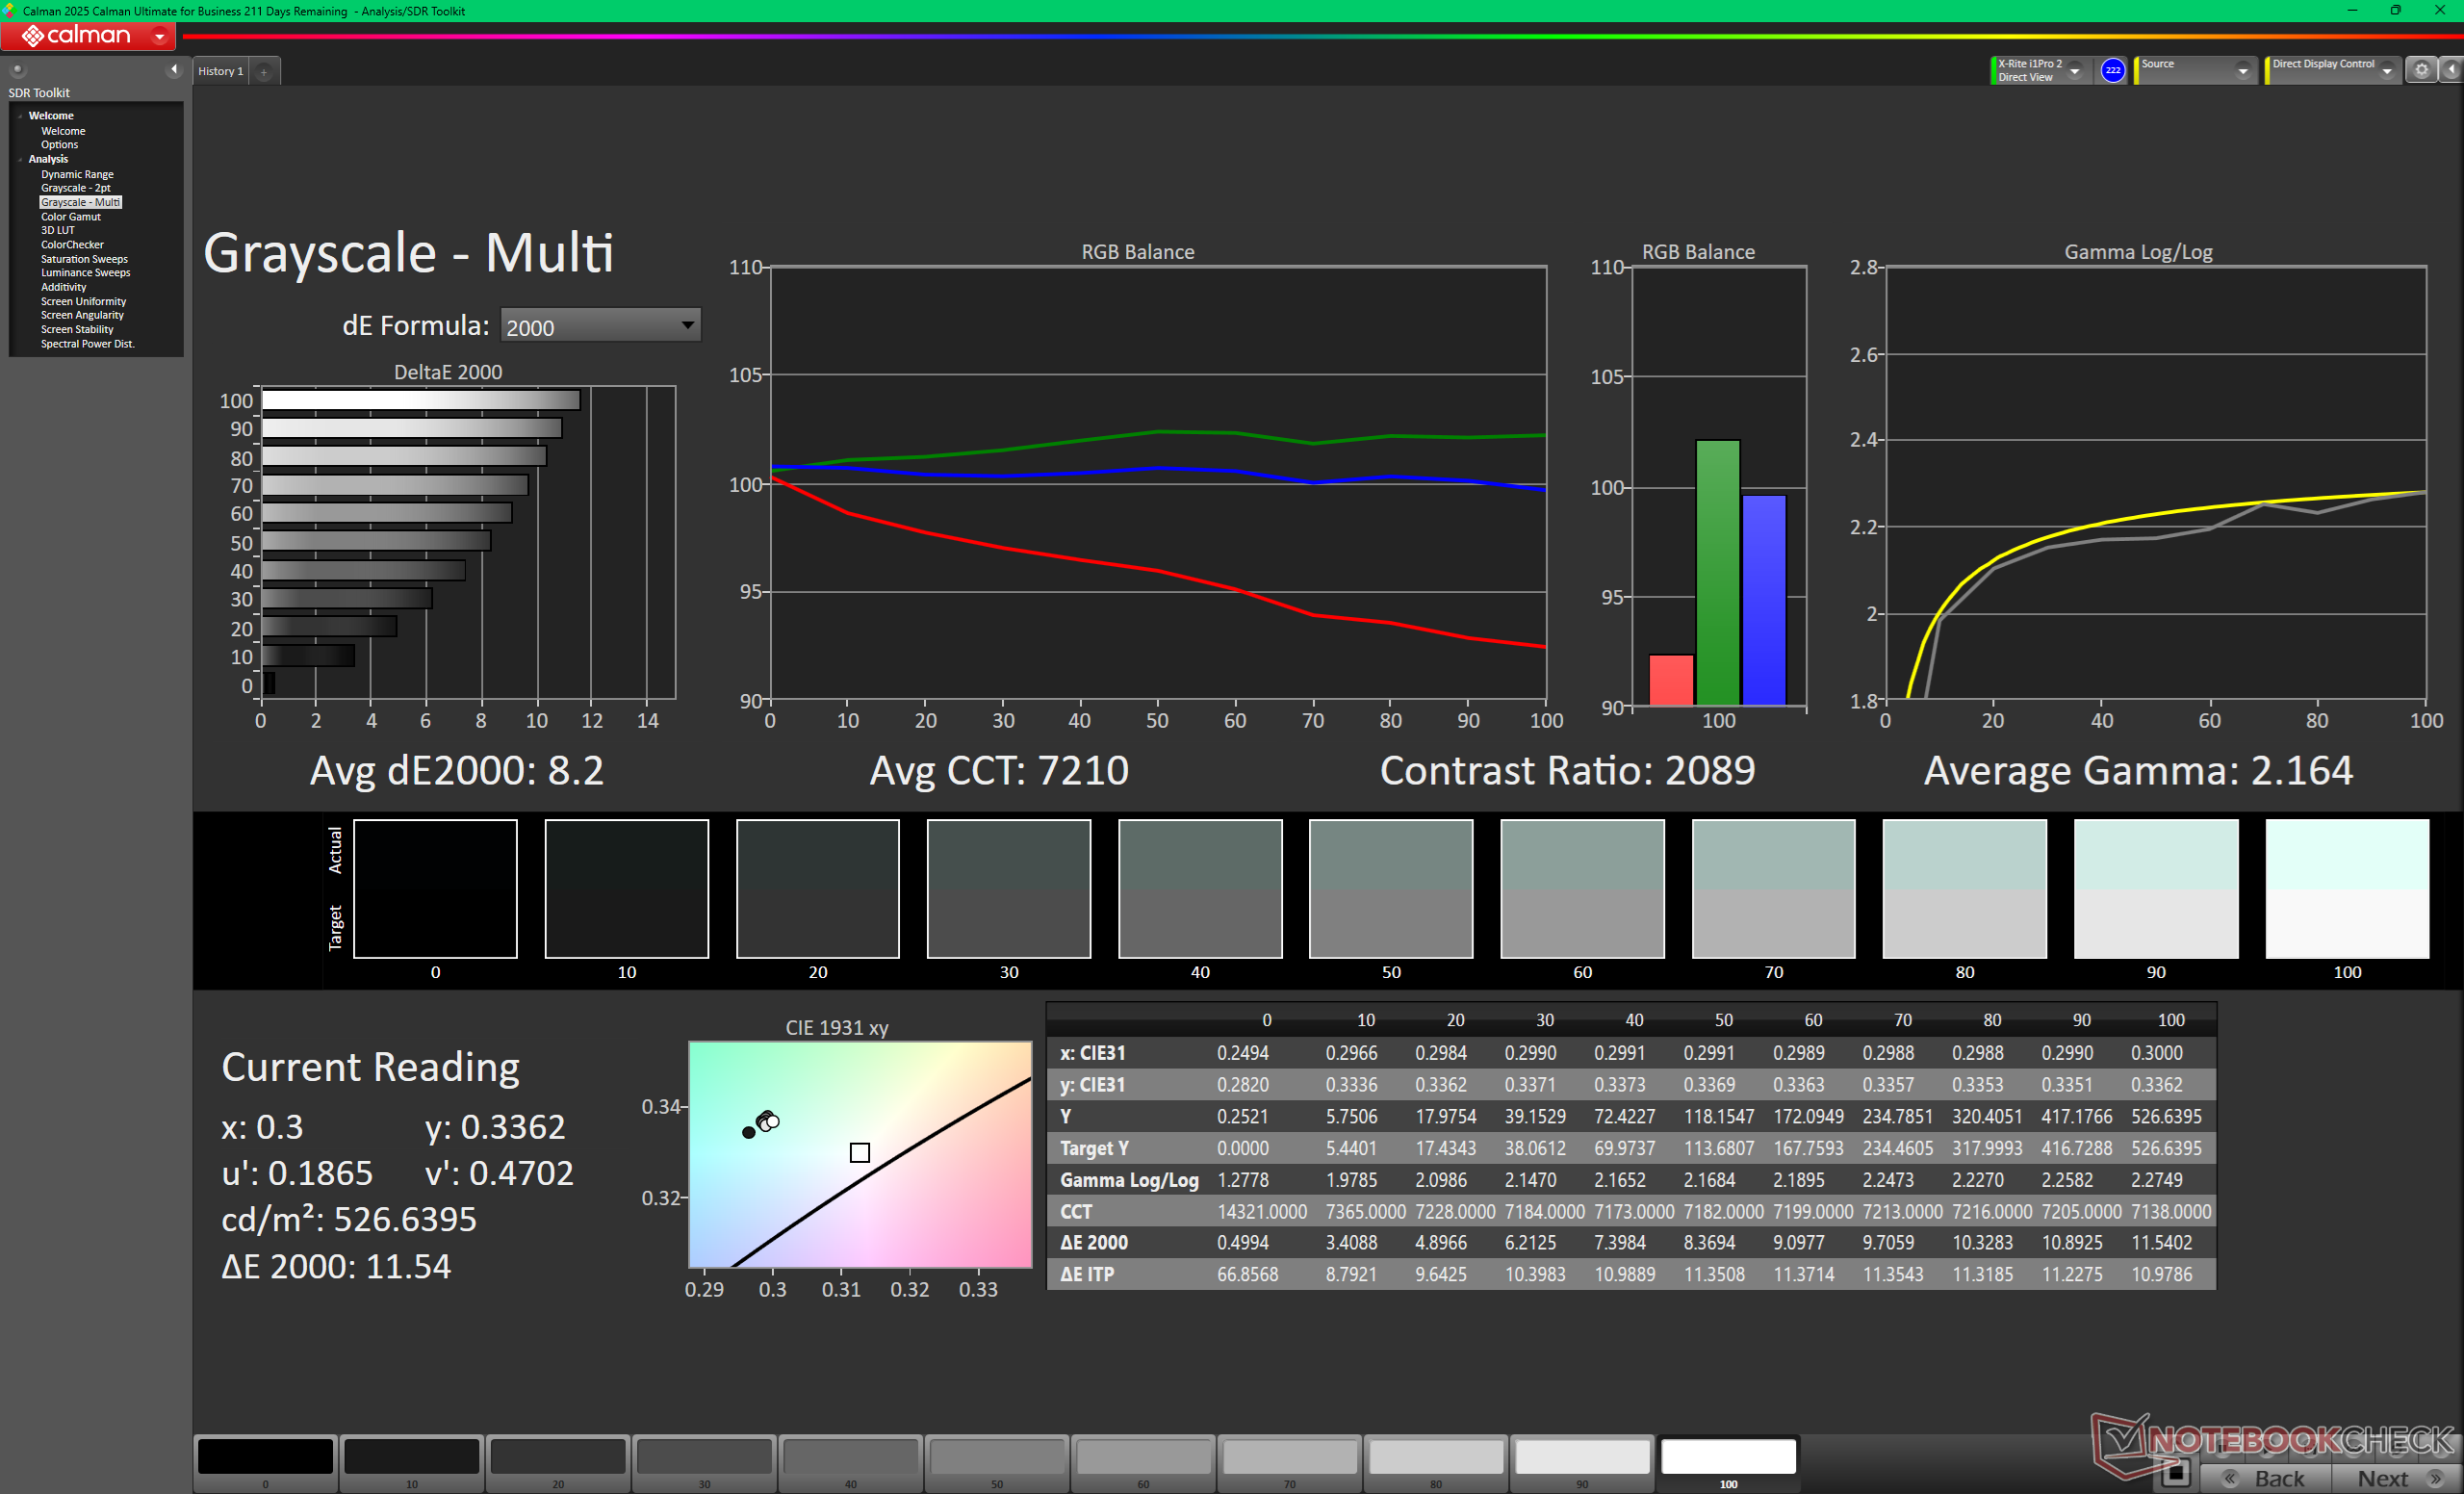
Pour notre modèle de test en 1200p, Lenovo est passé de la dalle Innolux N140JLG-GT3, présente sur le modèle de l’année dernière, à la dalle AUO B140UAN10.0. Les caractéristiques essentielles restent par ailleurs pratiquement identiques, notamment les temps de réponse et les rapports de contraste tout à fait corrects.
| |||||||||||||||||||||||||
Homogénéité de la luminosité: 86 %
Valeur mesurée au centre, sur batterie: 527.7 cd/m²
Contraste: 1885:1 (Valeurs des noirs: 0.28 cd/m²)
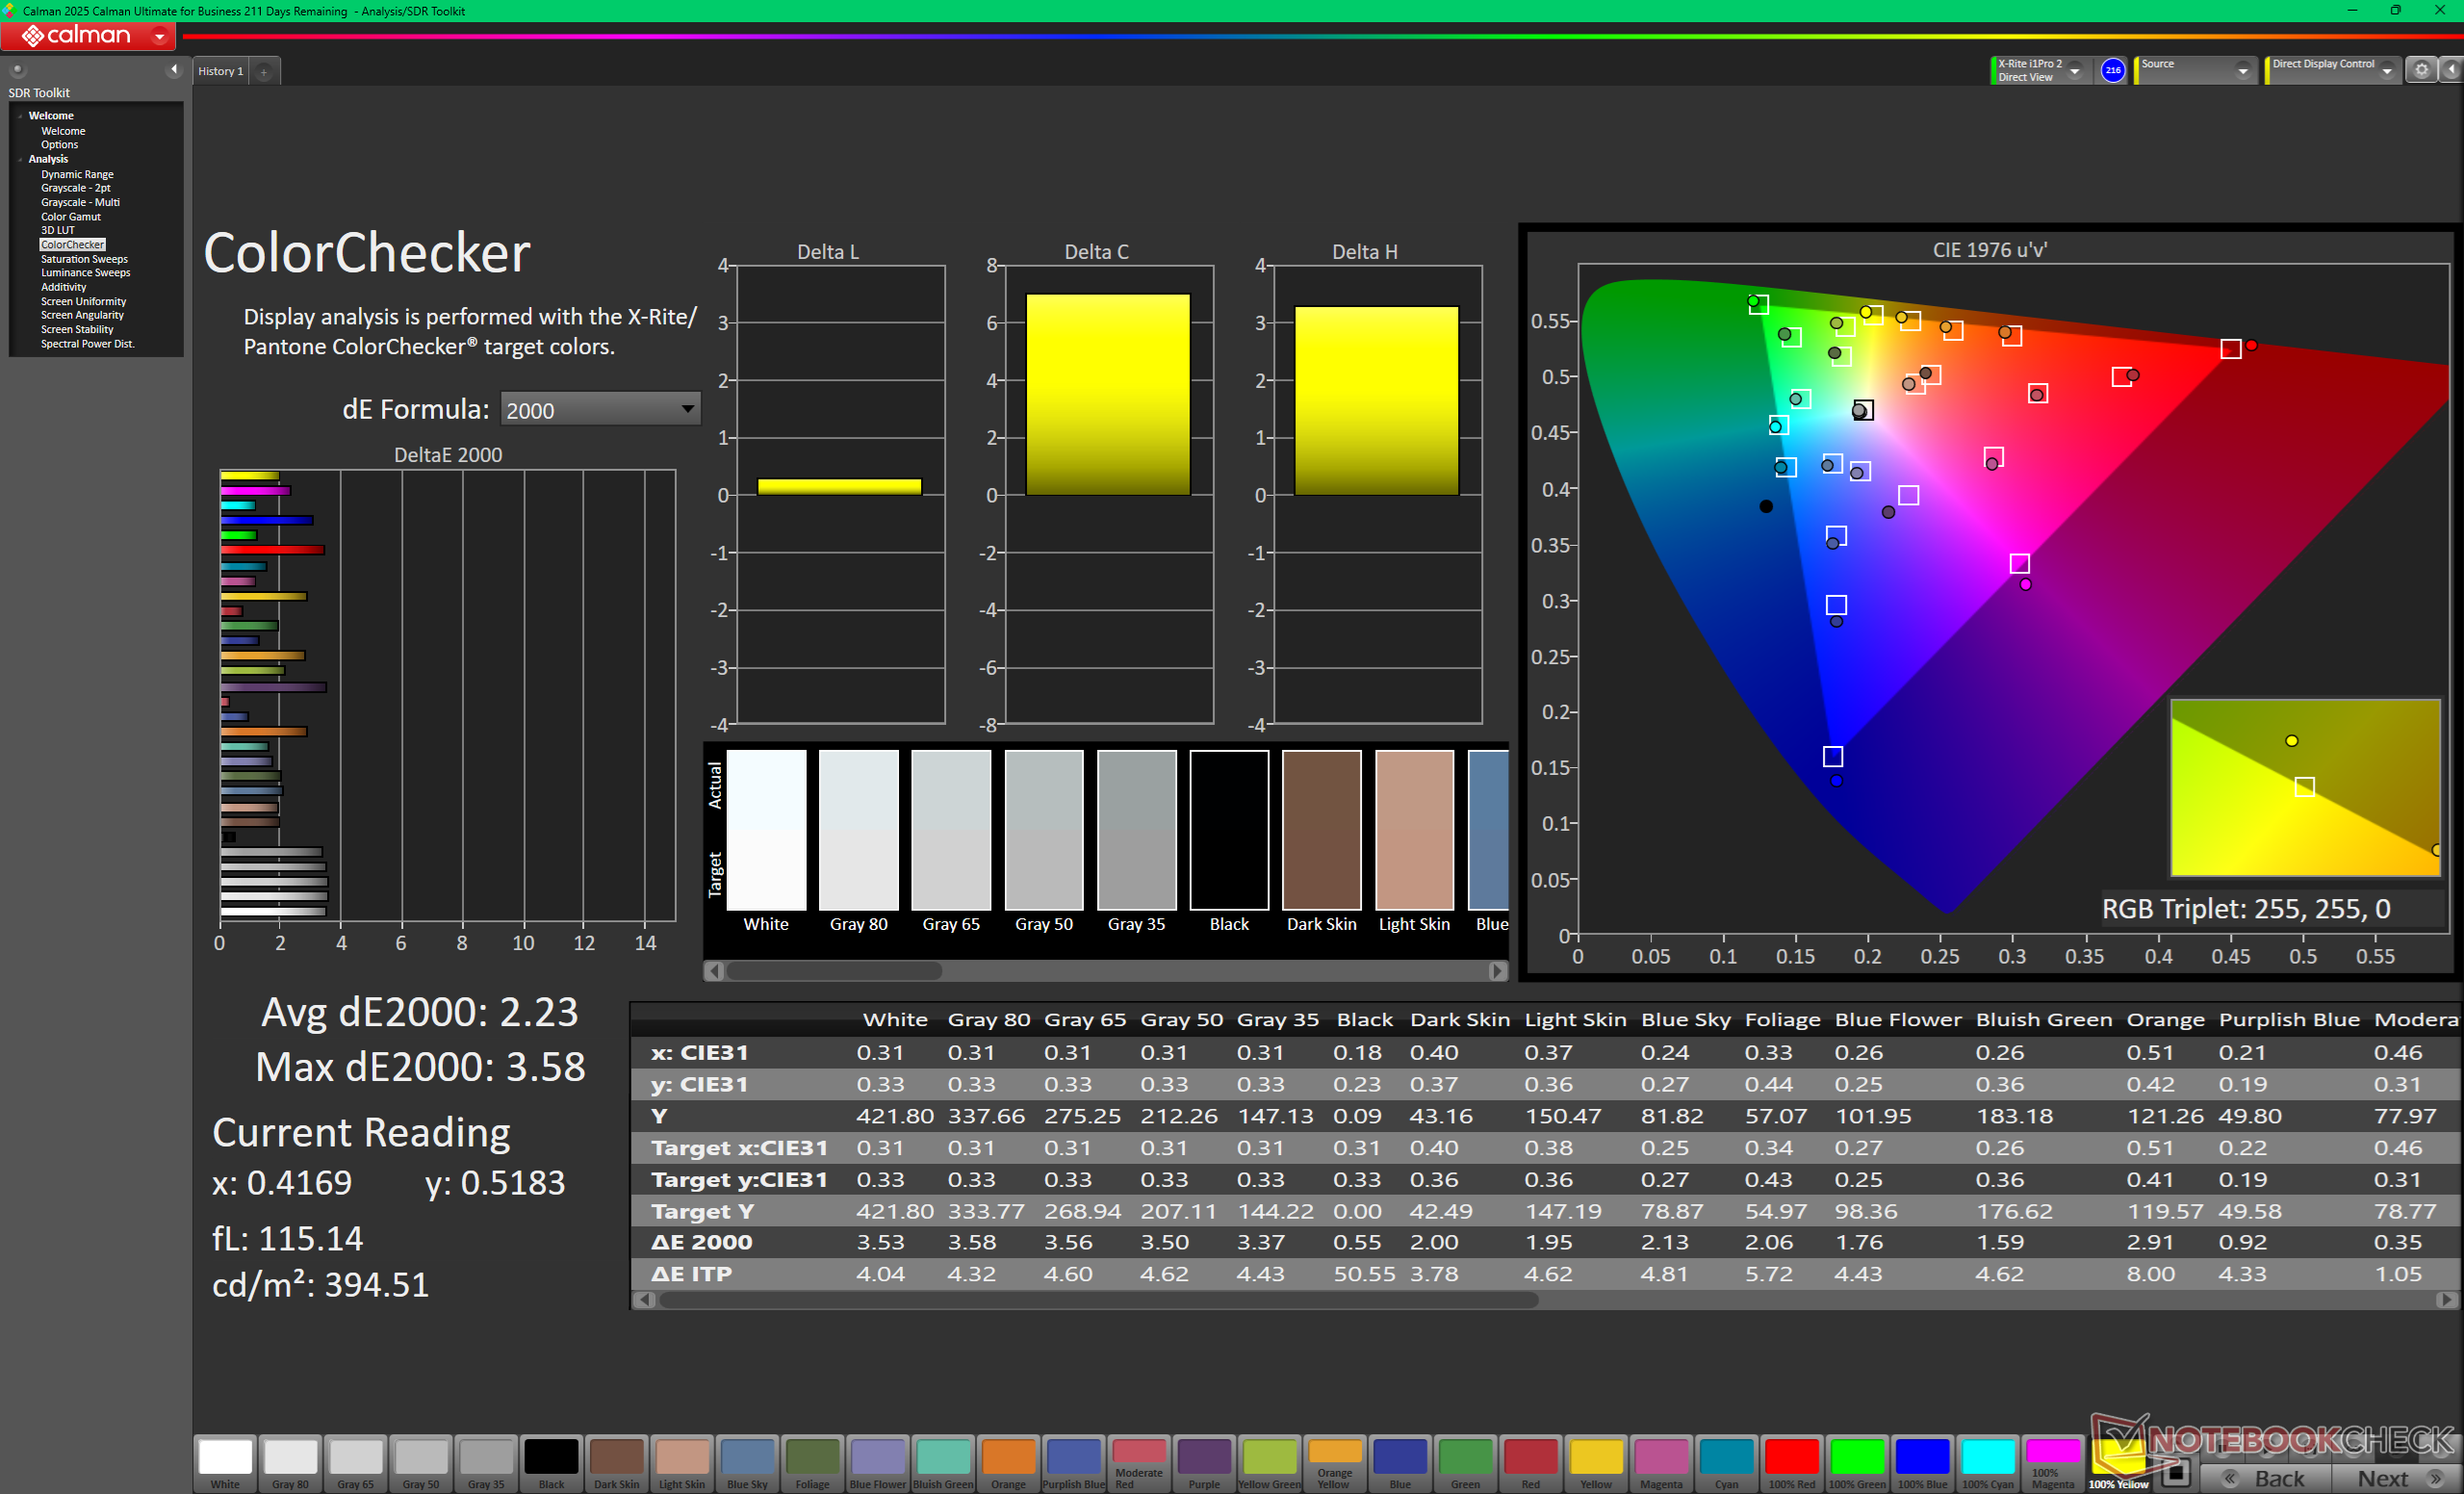
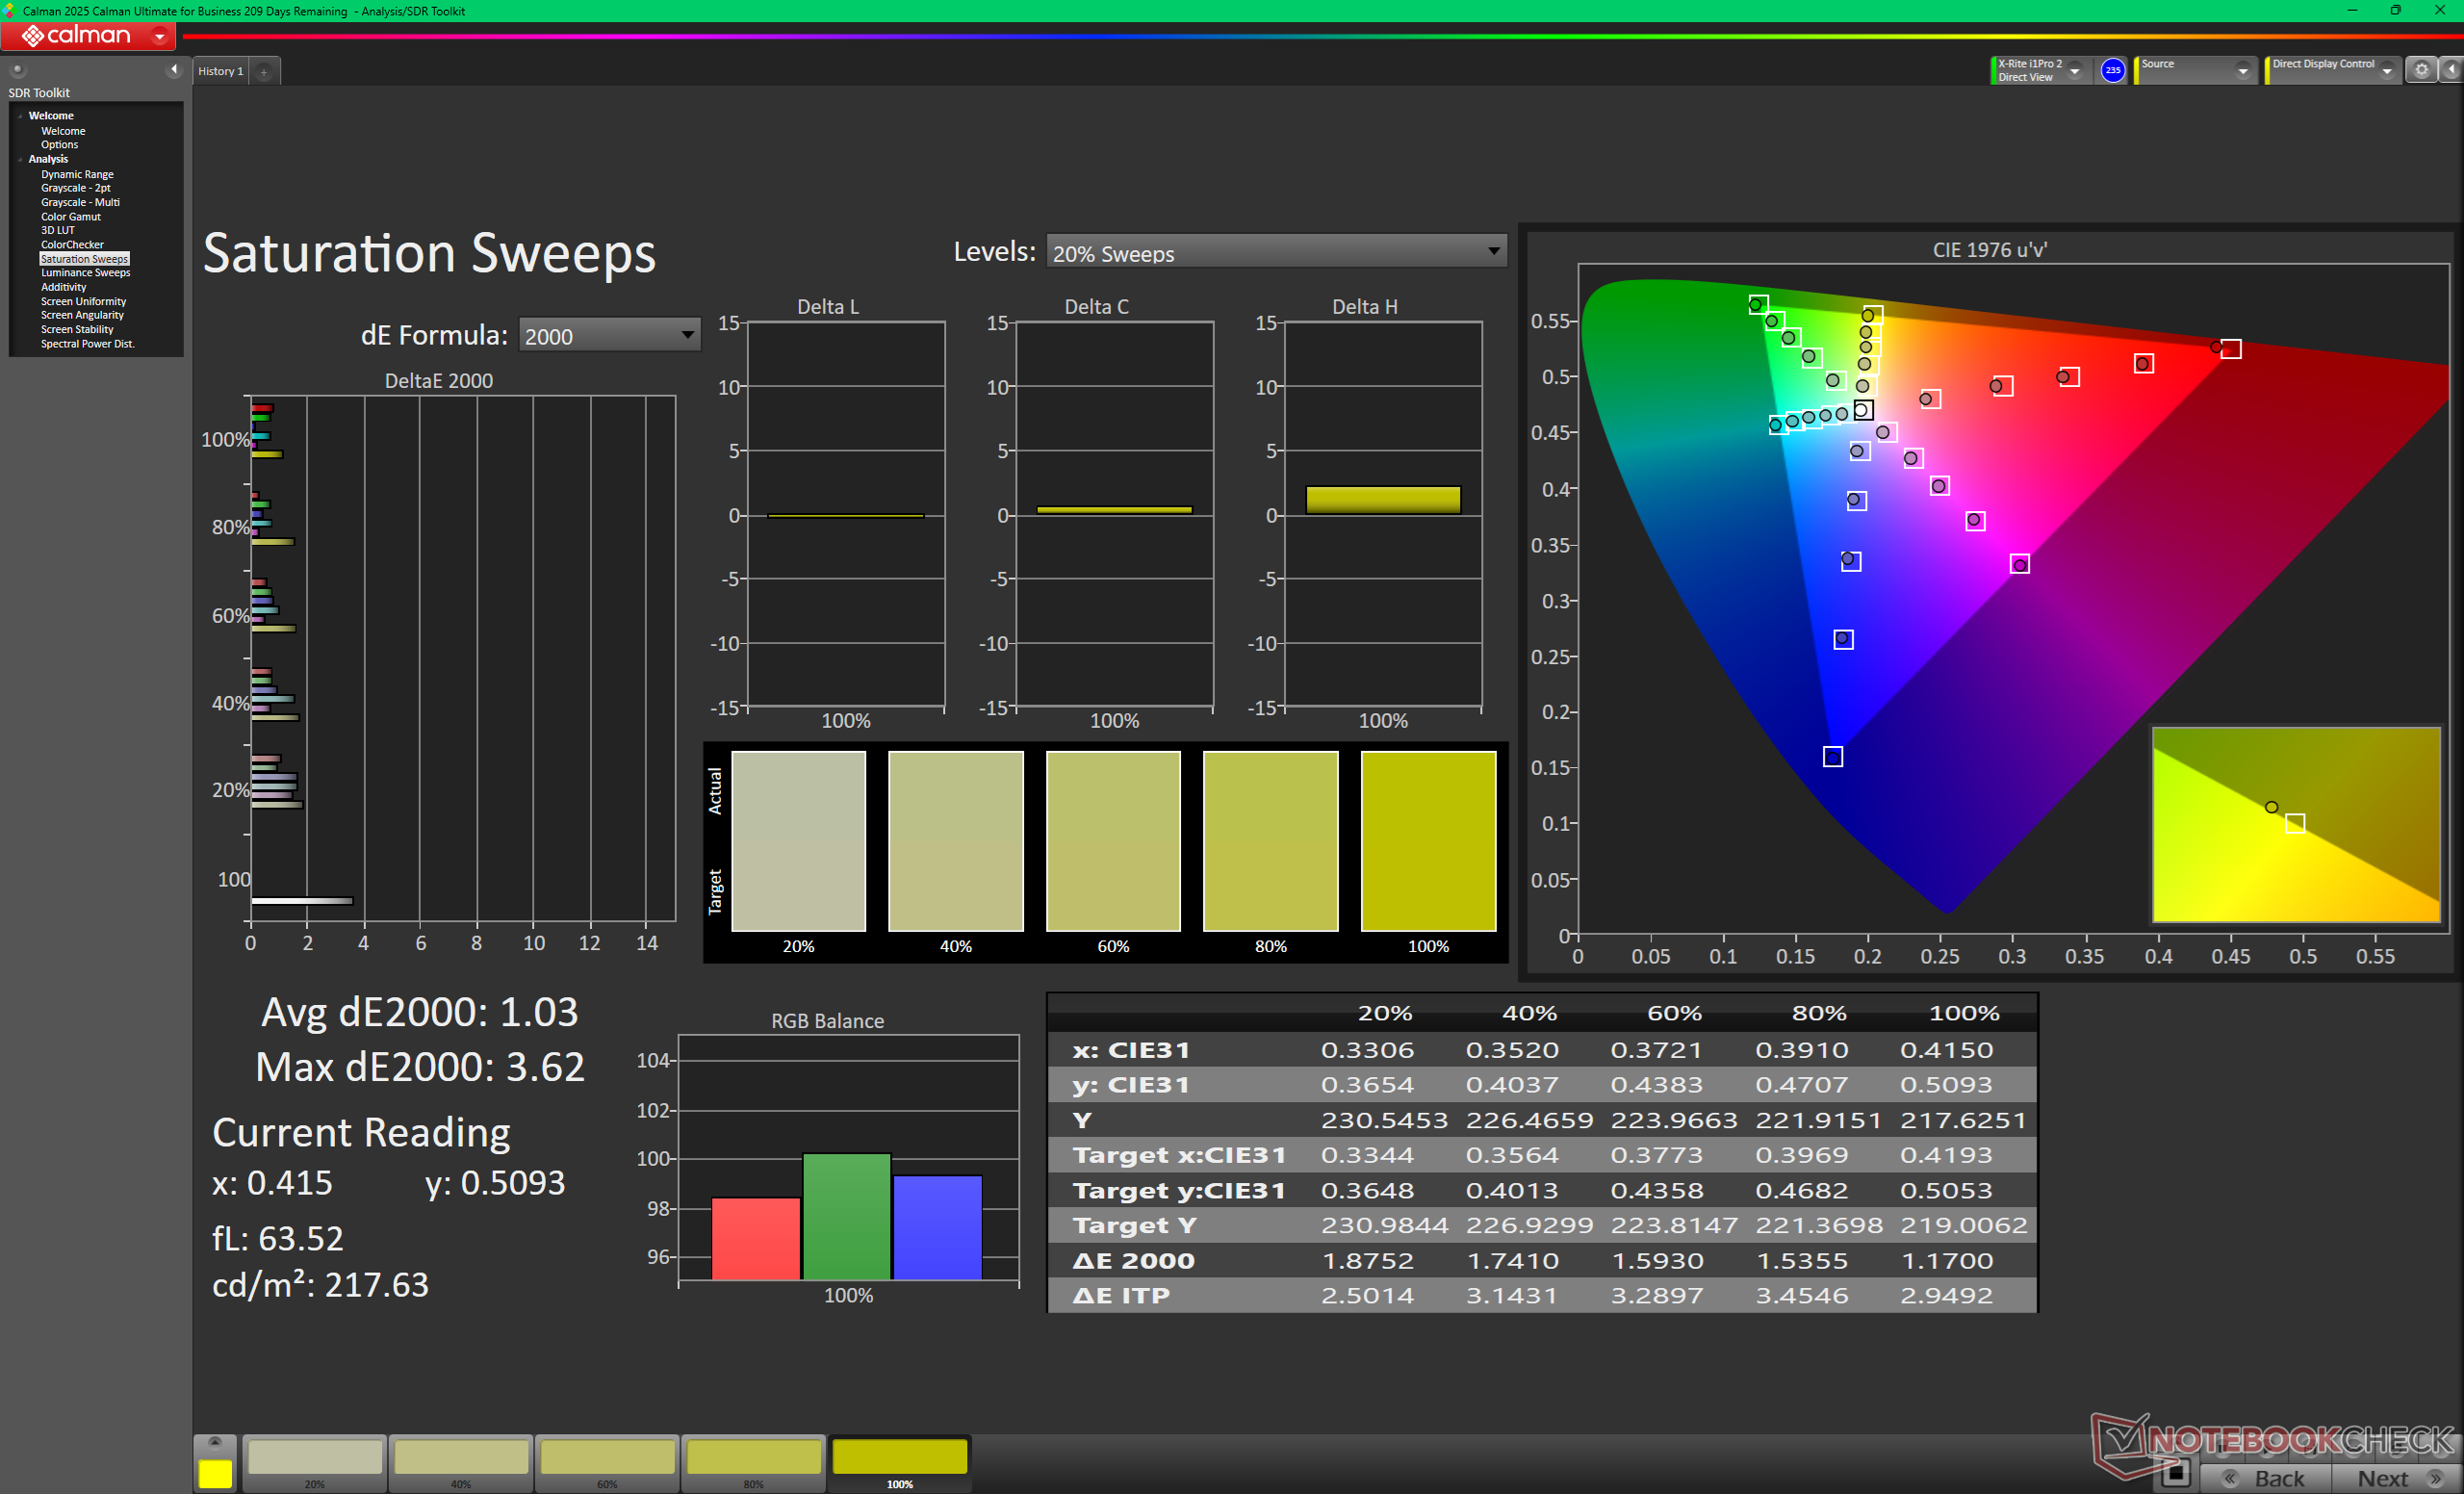
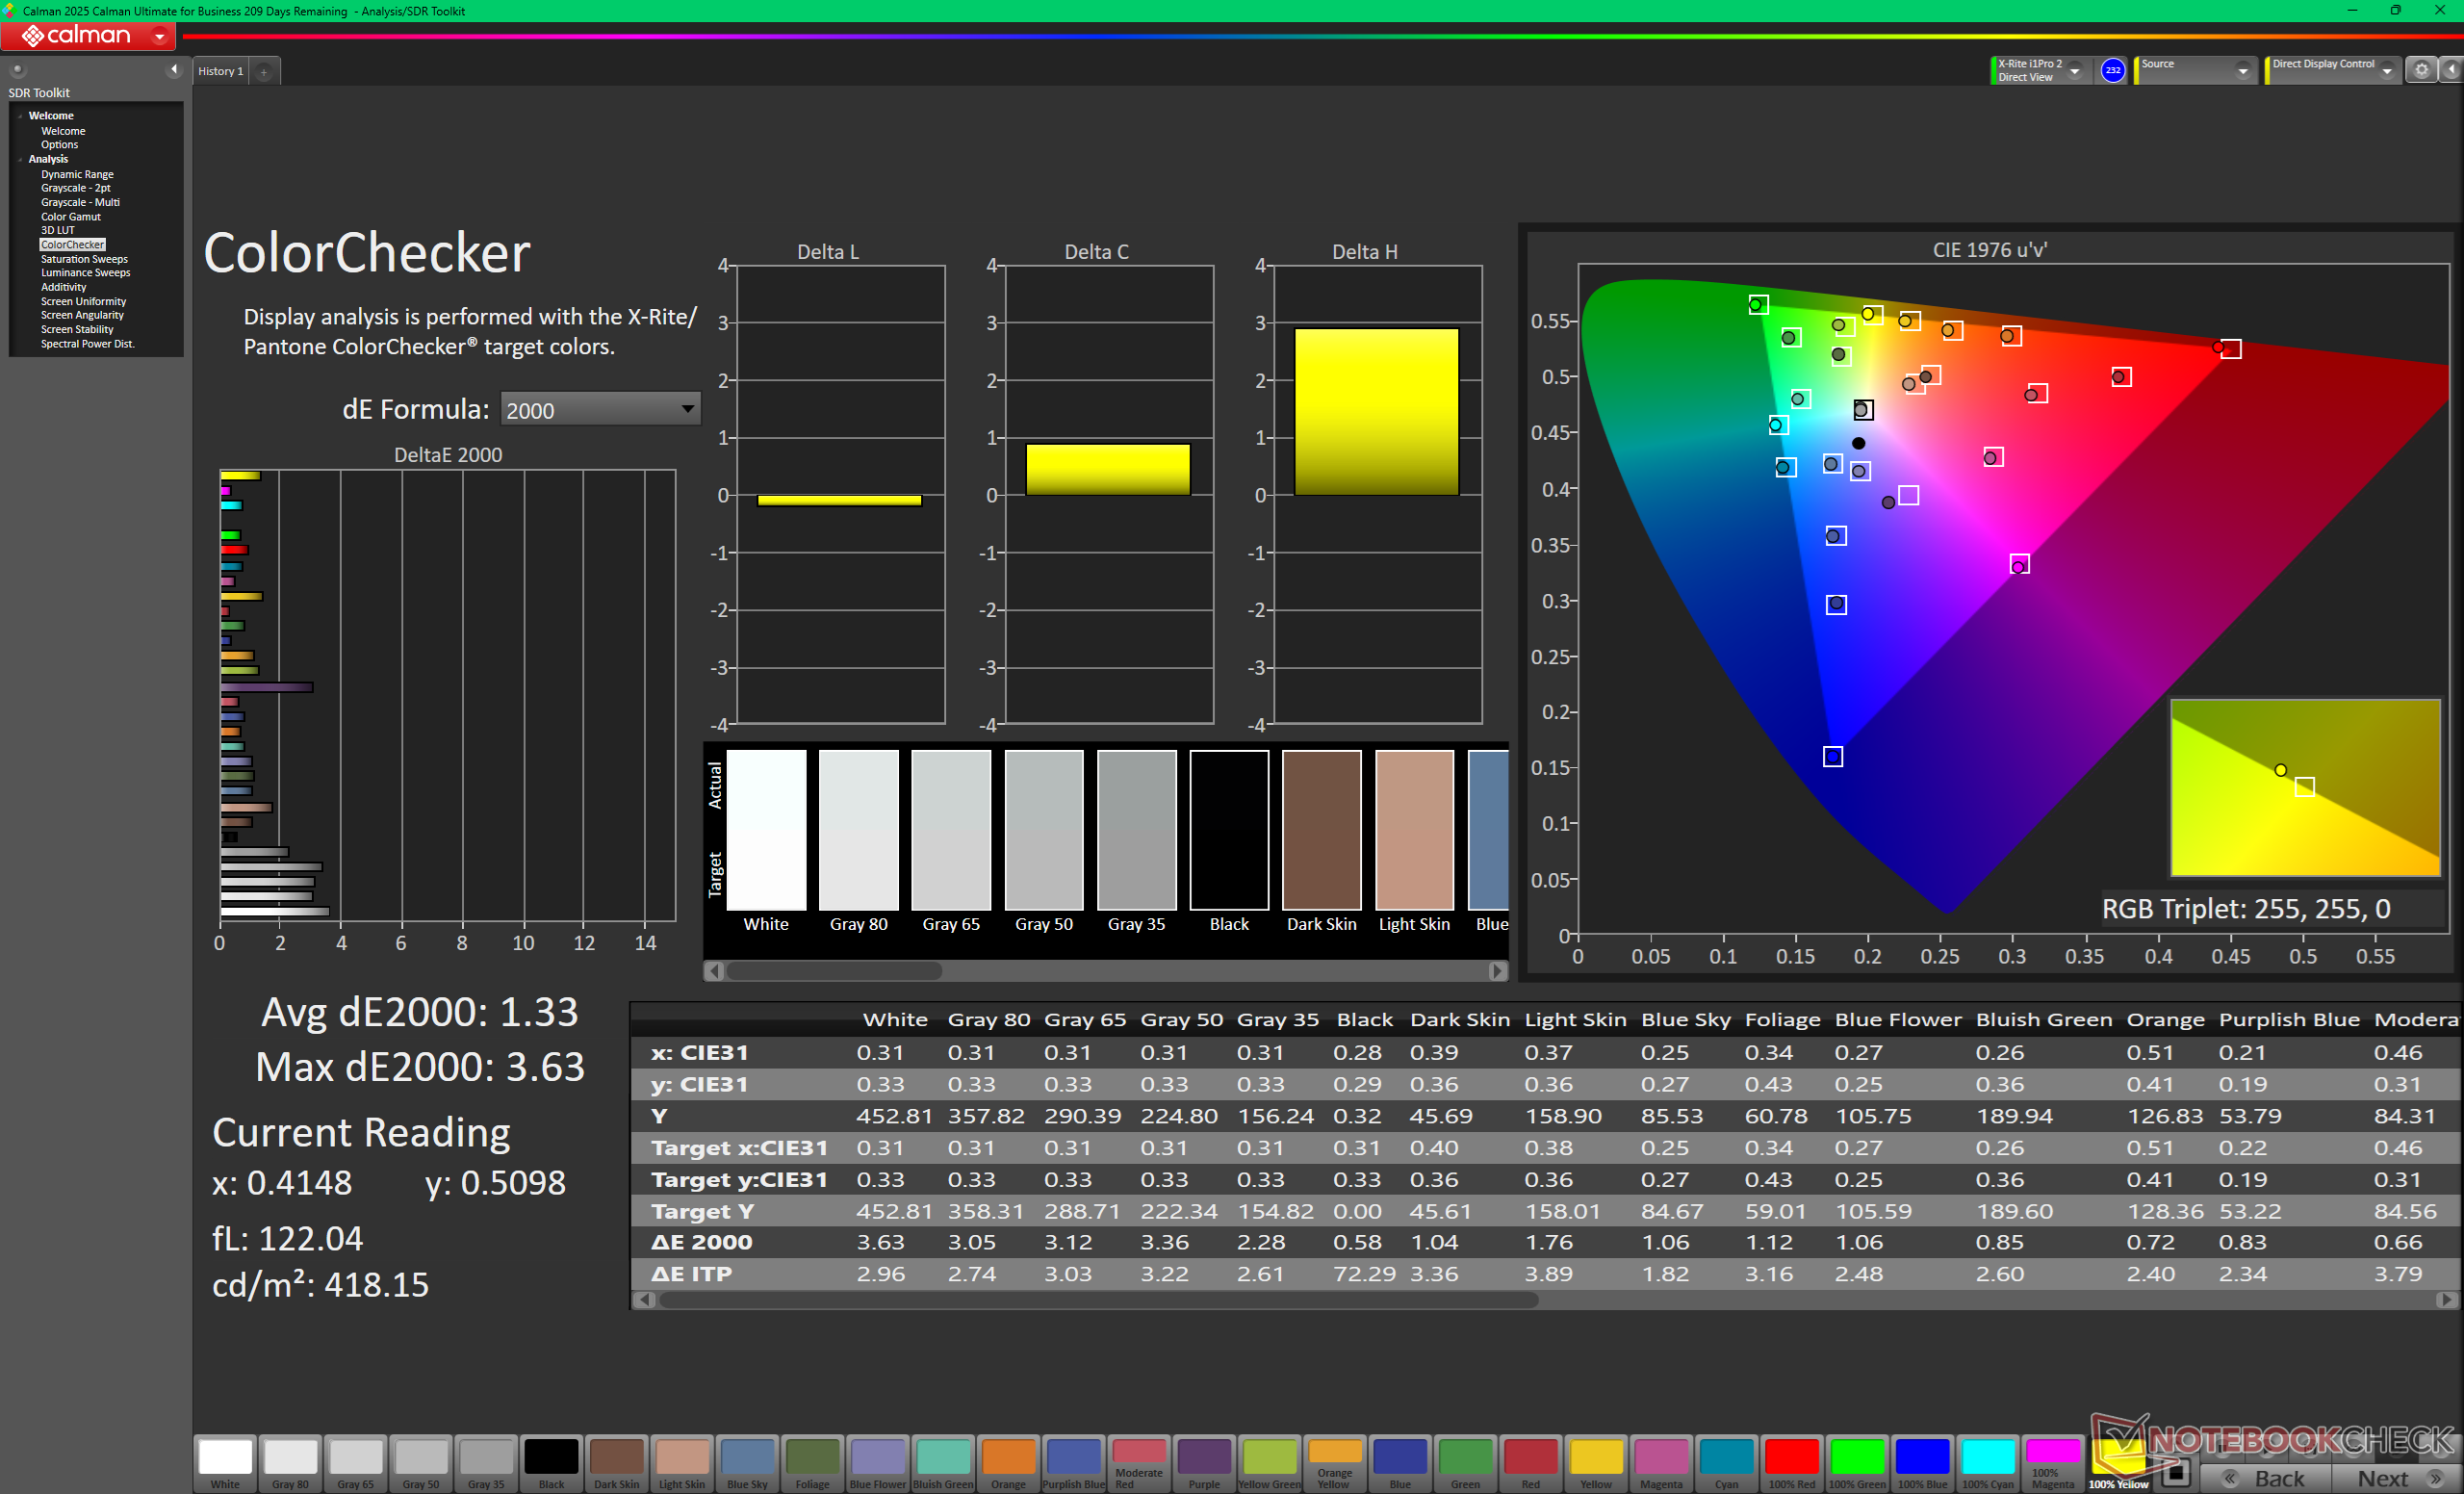
ΔE ColorChecker Calman: 2.23 | ∀{0.5-29.43 Ø4.73}
calibrated: 1.33
ΔE Greyscale Calman: 8.2 | ∀{0.09-98 Ø4.97}
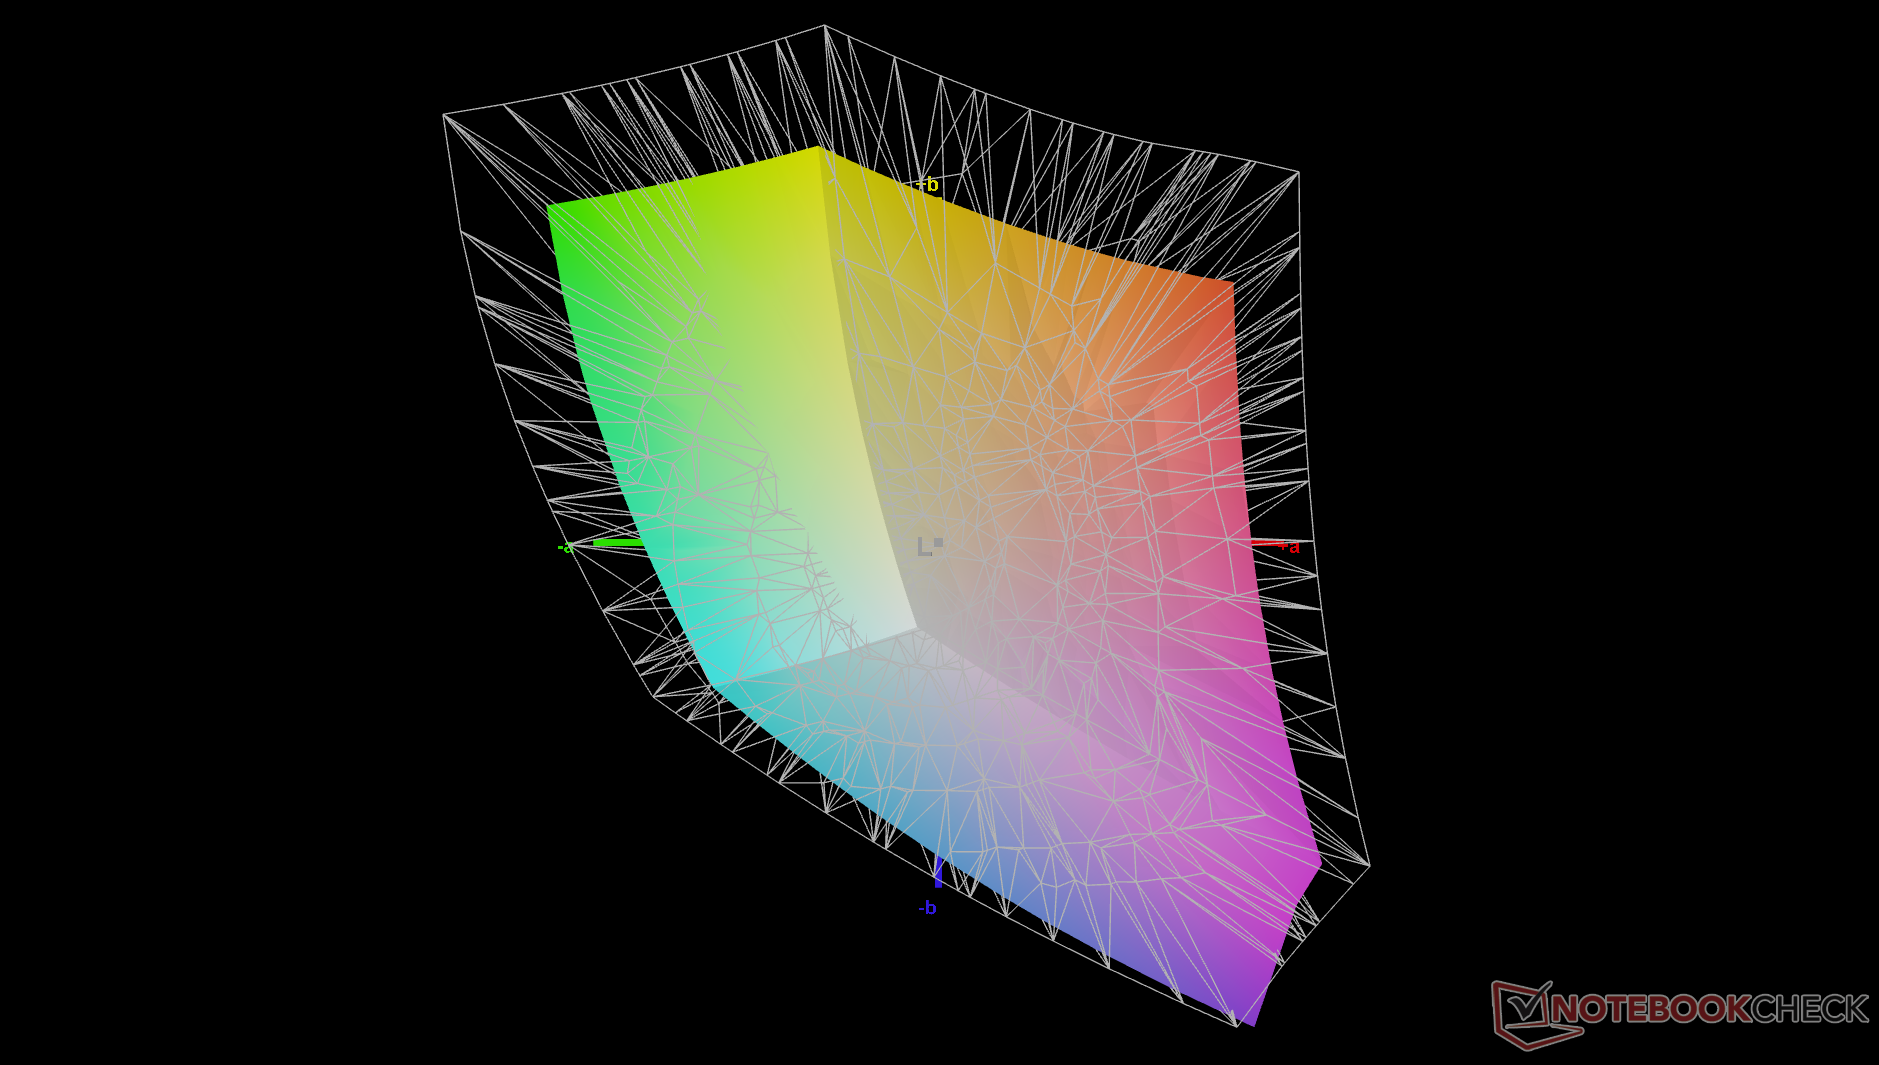
71.3% AdobeRGB 1998 (Argyll 3D)
98.5% sRGB (Argyll 3D)
69.8% Display P3 (Argyll 3D)
Gamma: 2.16
CCT: 7210 K
| Lenovo ThinkPad X1 2-in-1 Gen 11 AUO B140UAN10.0, IPS, 1920x1200, 14", 60 Hz | Lenovo ThinkPad X1 2-in-1 Gen 10 N140JLG-GT3, IPS, 1920x1200, 14", 60 Hz | Lenovo Yoga Book 9 14IAH10 LEN140WQ+, 2x, OLED, 2880x1800, 14", 120 Hz | HP EliteBook X Flip G1i 14 AI AUO8FB5, IPS, 1920x1200, 14", 60 Hz | Dell Latitude 7450 2-in-1 BOE NV140WU, IPS, 1920x1200, 14", 60 Hz | Asus ExpertBook Ultra B9406CAA Samsung ATNA40LE01-0, OLED, 2880x1800, 14", 120 Hz | |
|---|---|---|---|---|---|---|
| Display | -2% | 25% | 7% | 6% | 21% | |
| Display P3 Coverage (%) | 69.8 | 67.8 -3% | 99.9 43% | 76.7 10% | 76.5 10% | 96.2 38% |
| sRGB Coverage (%) | 98.5 | 97.2 -1% | 100 2% | 98.2 0% | 100 2% | 100 2% |
| AdobeRGB 1998 Coverage (%) | 71.3 | 69.8 -2% | 92.2 29% | 78.2 10% | 76 7% | 86.7 22% |
| Response Times | -17% | 97% | -17% | 3% | 97% | |
| Response Time Grey 50% / Grey 80% * (ms) | 41.2 ? | 44.6 ? -8% | 0.6 ? 99% | 49.2 ? -19% | 35.65 ? 13% | 0.71 ? 98% |
| Response Time Black / White * (ms) | 21.6 ? | 27.1 ? -25% | 1 ? 95% | 24.8 ? -15% | 23.35 ? -8% | 0.94 ? 96% |
| PWM Frequency (Hz) | 480 ? | 968.8 ? | ||||
| PWM Amplitude * (%) | 43 | 20 | ||||
| Screen | -2% | 1% | -19% | -7% | 34% | |
| Brightness middle (cd/m²) | 527.7 | 459 -13% | 381.7 -28% | 572 8% | 333 -37% | 600.5 14% |
| Brightness (cd/m²) | 490 | 455 -7% | 398 -19% | 541 10% | 326 -33% | 612 25% |
| Brightness Distribution (%) | 86 | 89 3% | 94 9% | 78 -9% | 85 -1% | 96 12% |
| Black Level * (cd/m²) | 0.28 | 0.24 14% | 0.2 29% | 0.27 4% | ||
| Contrast (:1) | 1885 | 1913 1% | 2860 52% | 1233 -35% | ||
| Colorchecker dE 2000 * | 2.23 | 3.14 -41% | 2.93 -31% | 4.19 -88% | 2.46 -10% | 1.18 47% |
| Colorchecker dE 2000 max. * | 3.58 | 6.55 -83% | 5.93 -66% | 8.65 -142% | 4.58 -28% | 3.4 5% |
| Colorchecker dE 2000 calibrated * | 1.33 | 0.58 56% | 0.61 54% | 2.11 -59% | 1.31 2% | 0.73 45% |
| Greyscale dE 2000 * | 8.2 | 3.9 52% | 0.8 90% | 5.65 31% | 2.1 74% | 1 88% |
| Gamma | 2.16 102% | 2.16 102% | 2.16 102% | 2.45 90% | 2.2 100% | 2.27 97% |
| CCT | 7210 90% | 5867 111% | 6404 101% | 5959 109% | 6578 99% | 6567 99% |
| Moyenne finale (programmes/paramètres) | -7% /
-4% | 41% /
23% | -10% /
-13% | 1% /
-3% | 51% /
41% |
* ... Moindre est la valeur, meilleures sont les performances

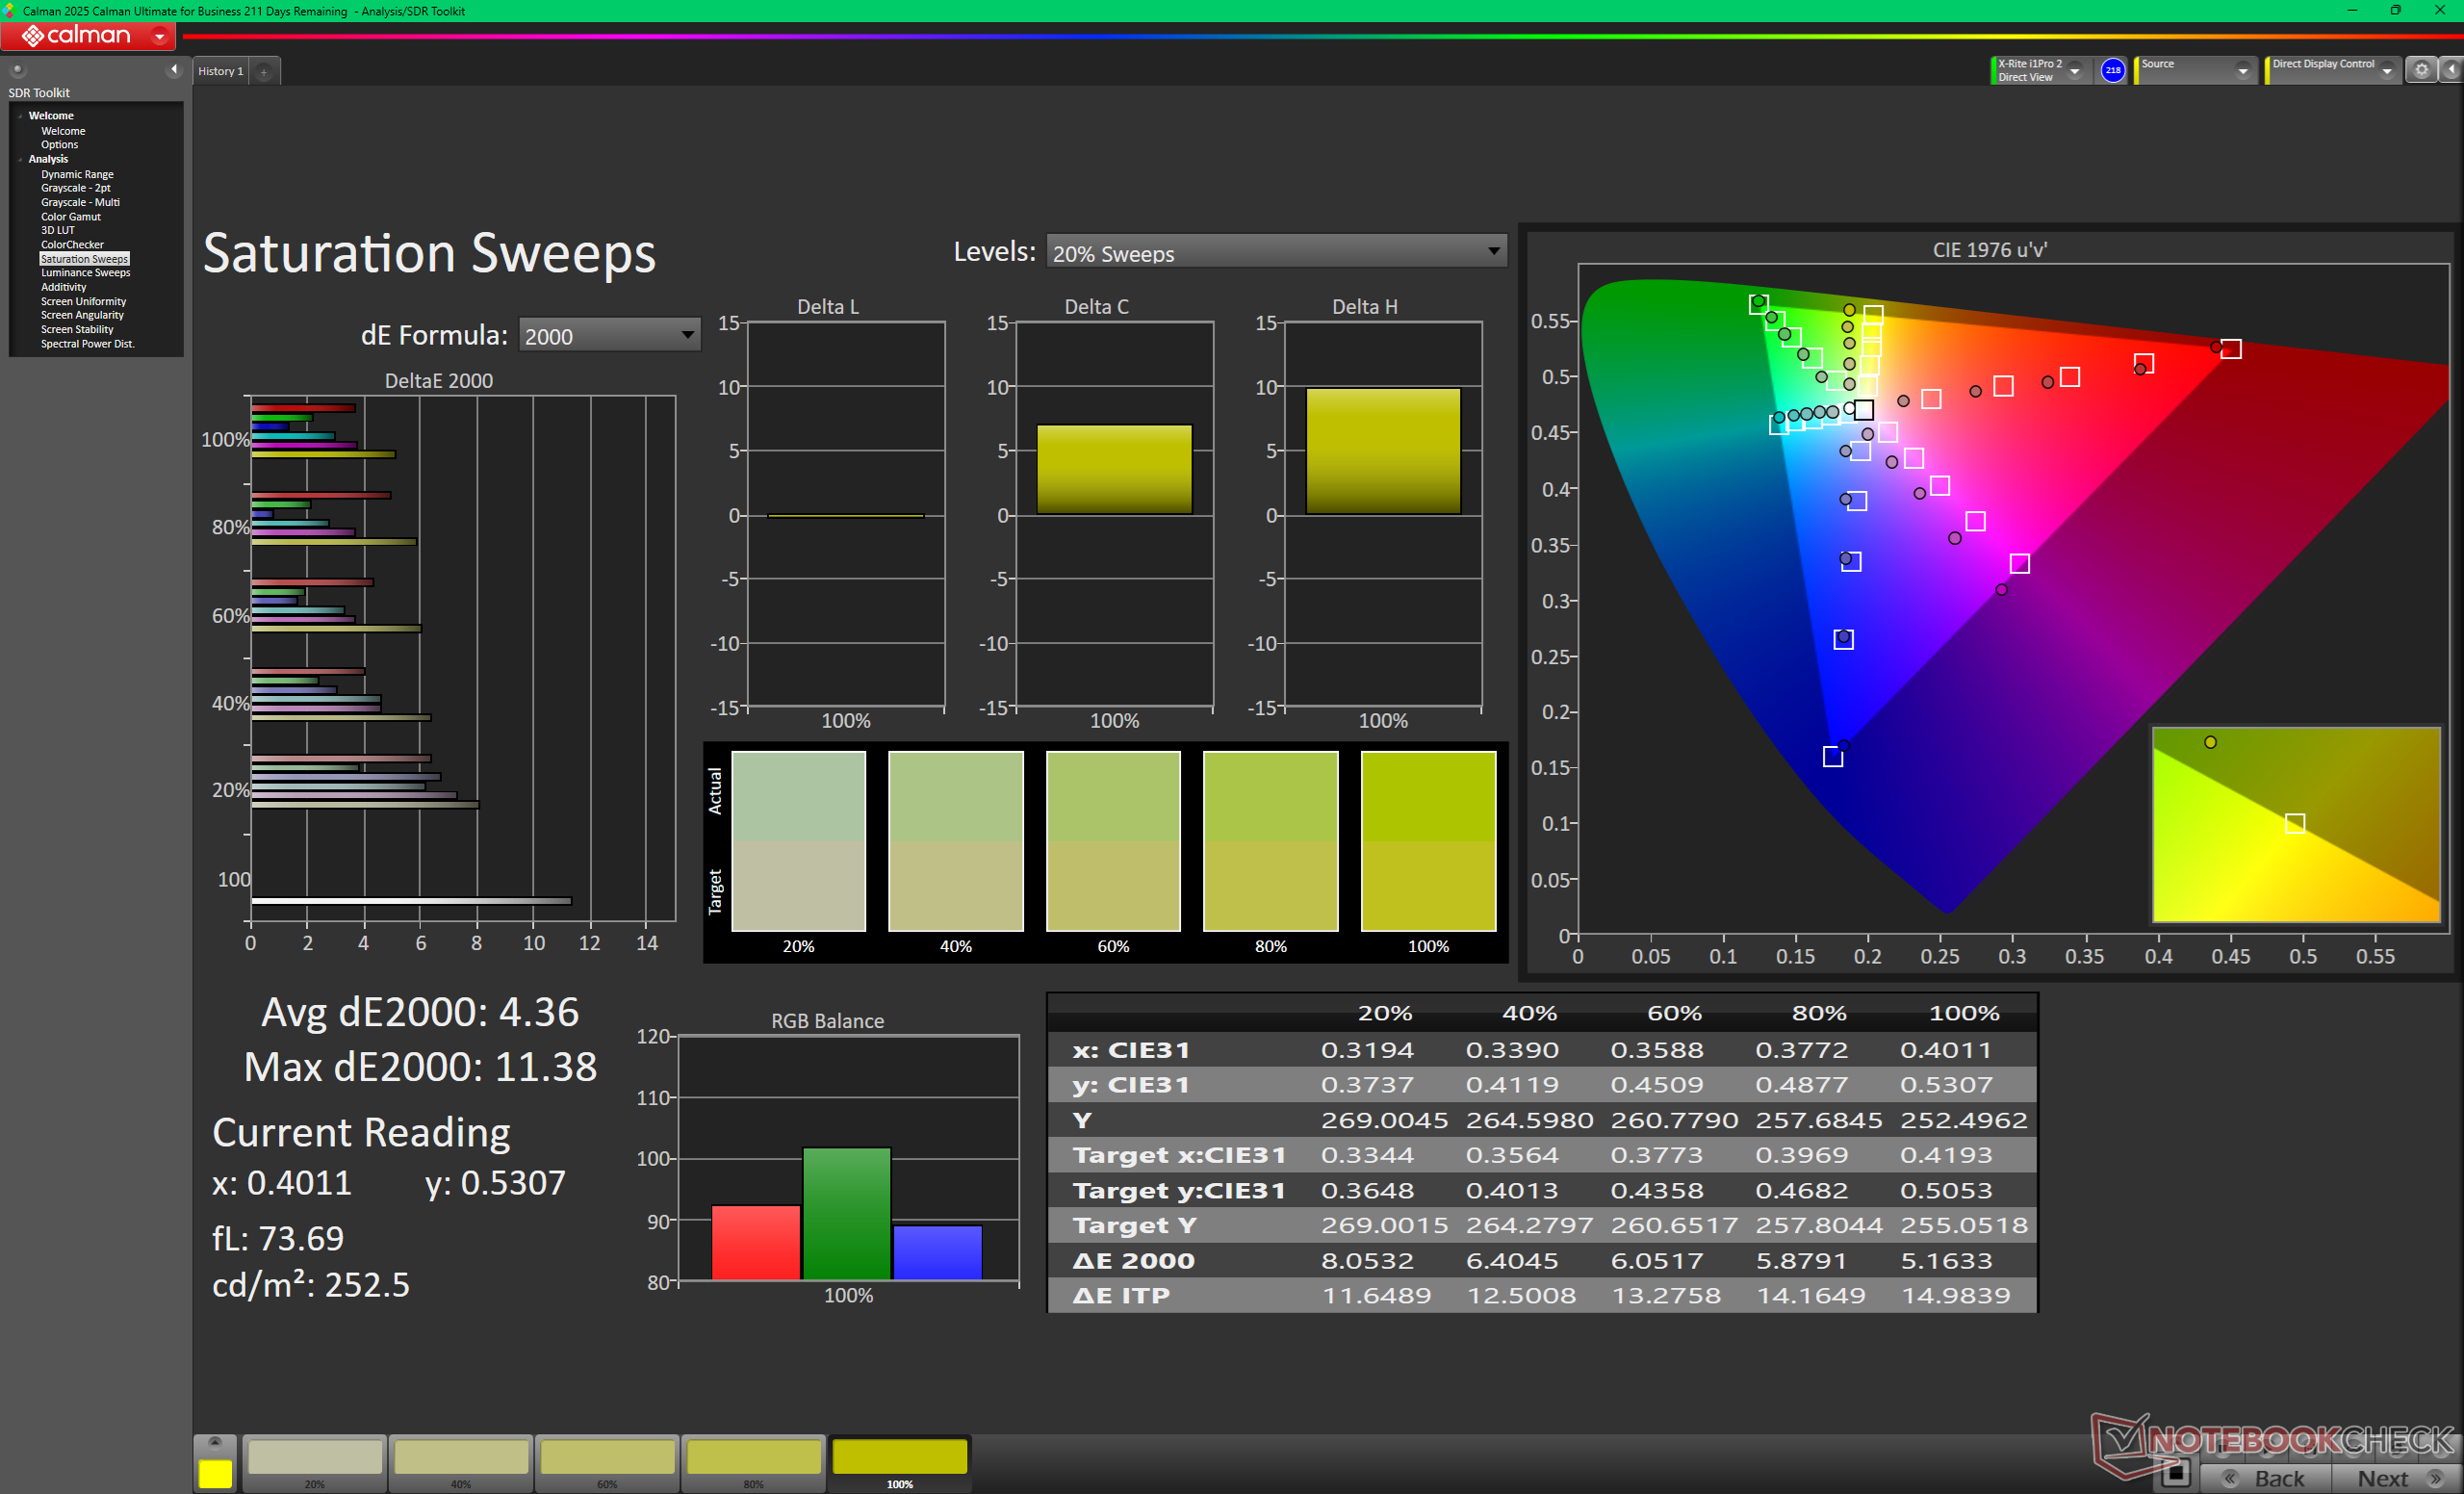
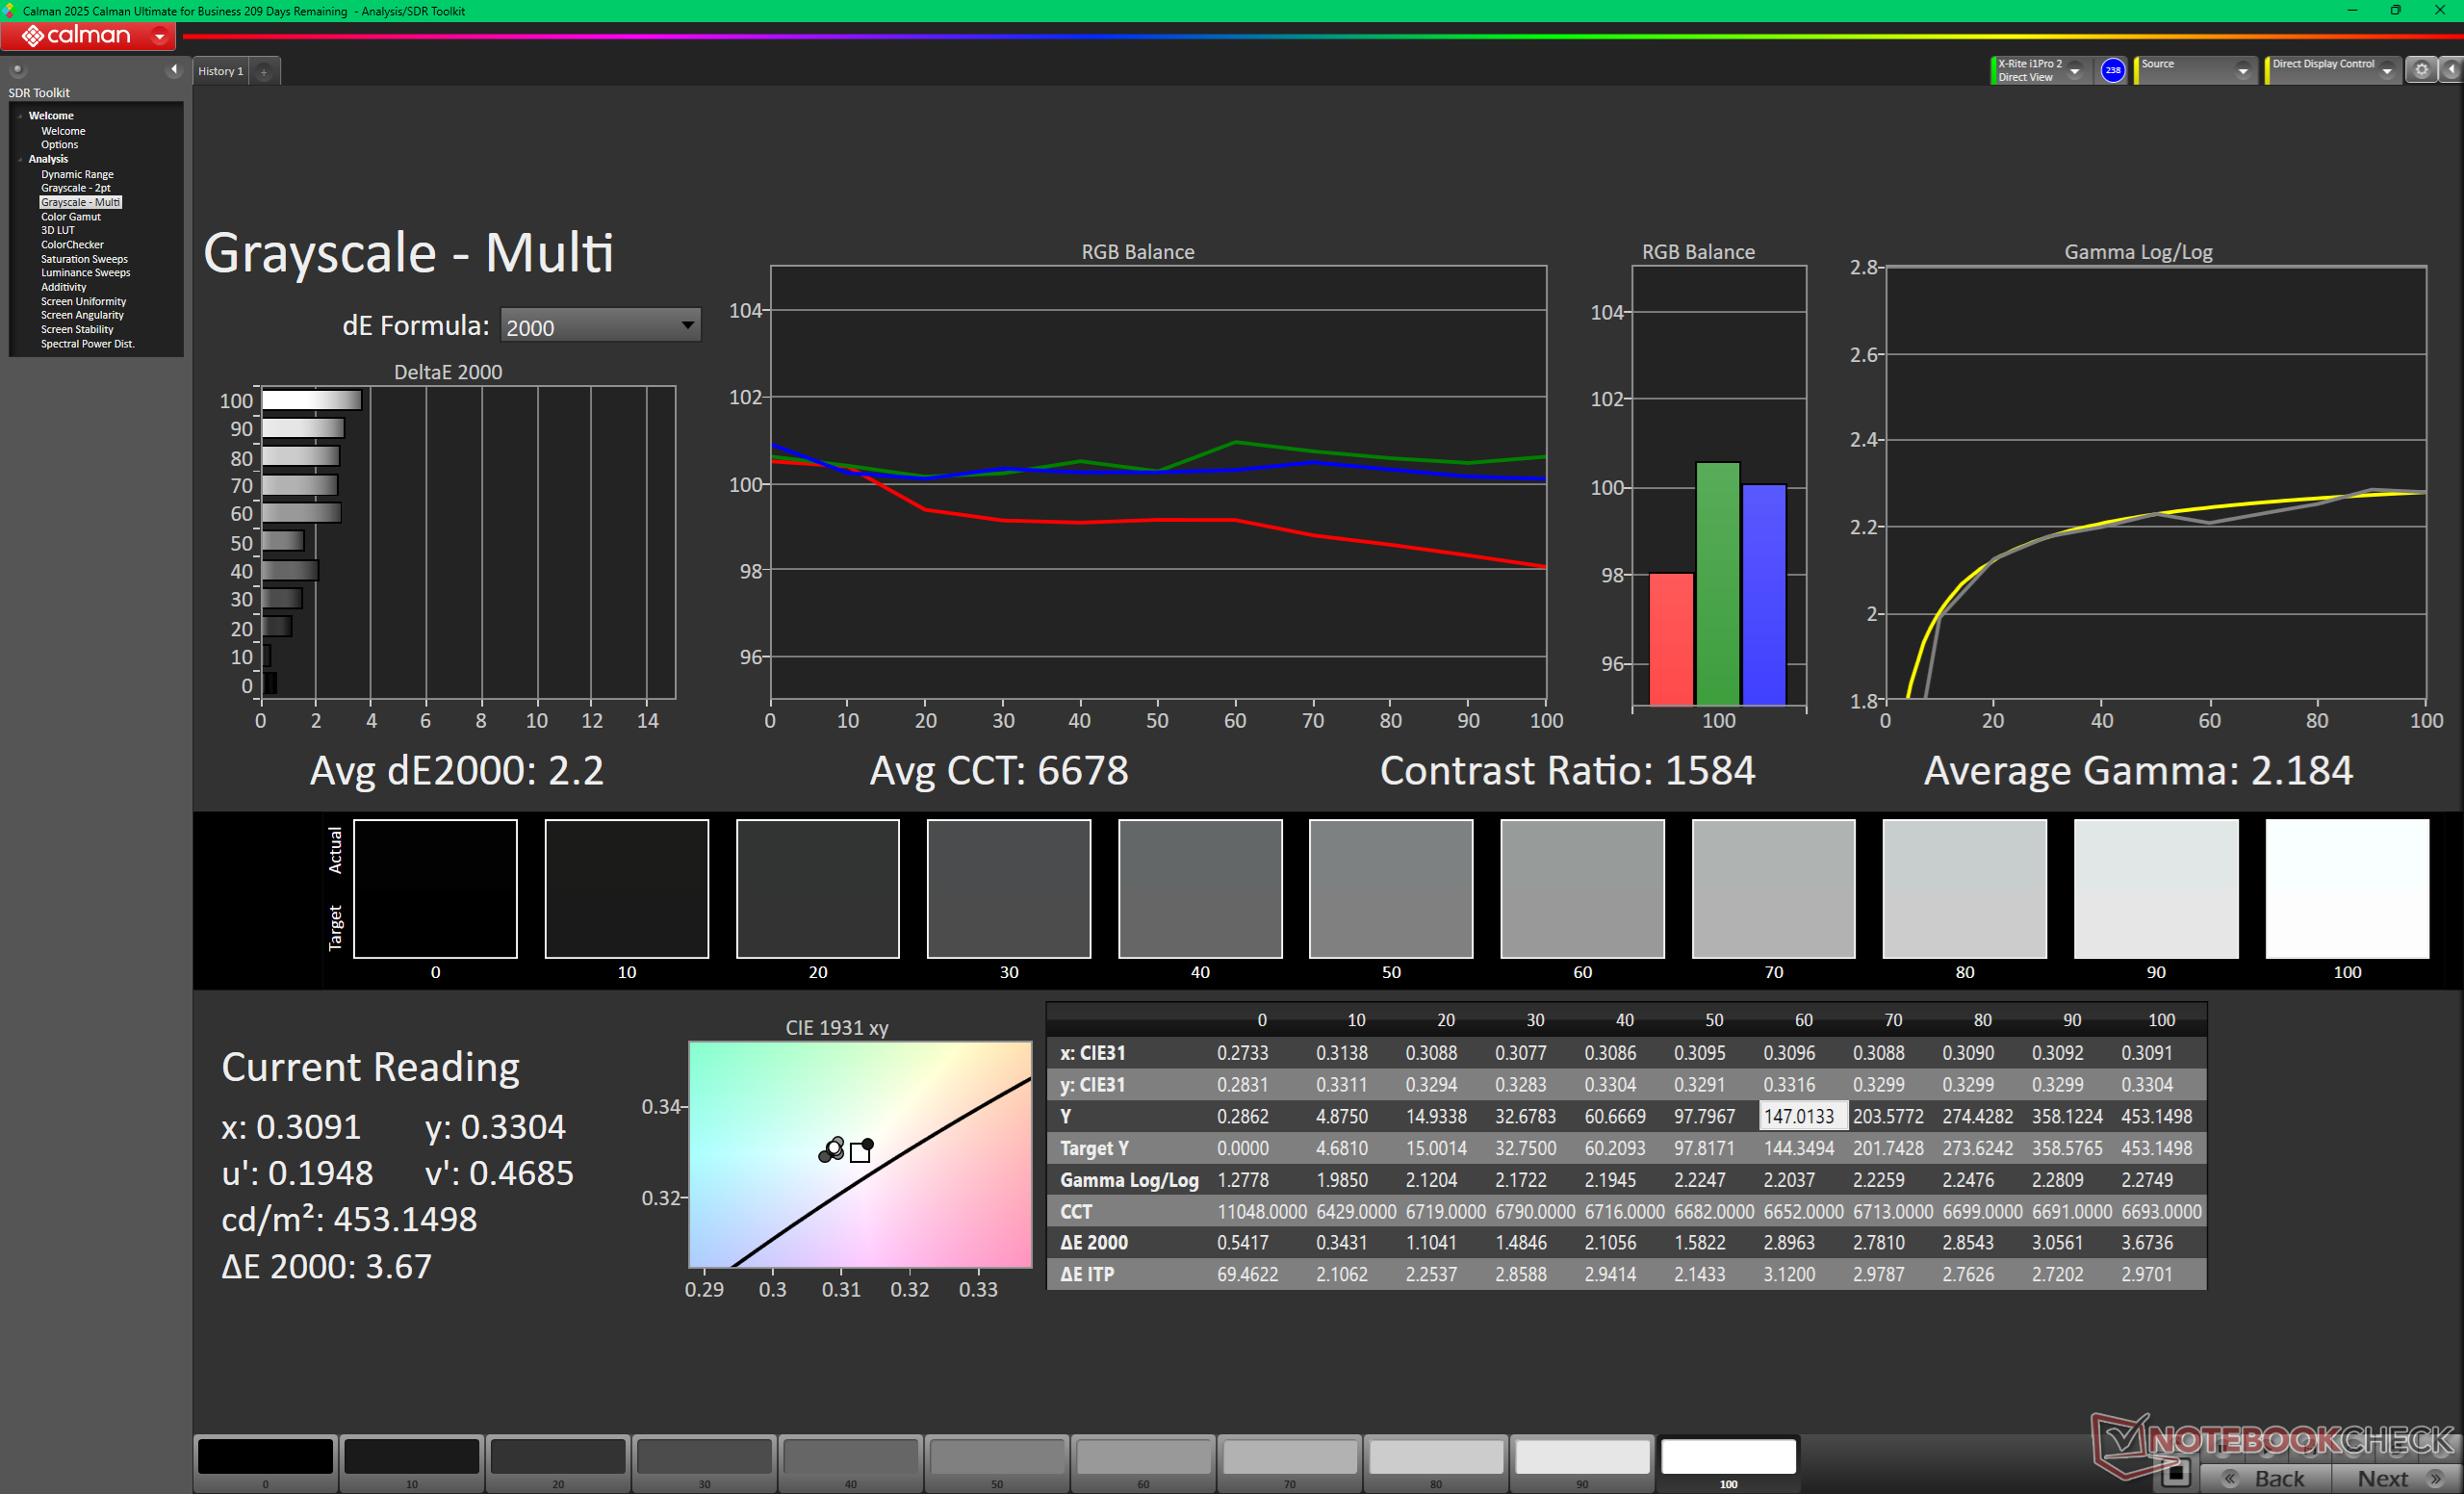
La température de couleur est bien trop froide dès la sortie de l'emballage, à 7 200 K. Un étalonnage de l'écran à l'aide de notre colorimètre X-Rite permettrait d'améliorer considérablement les valeurs moyennes de deltaE pour l'échelle de gris et les couleurs, qui passeraient respectivement de 8,2 et 2,23 à seulement 2,2 et 1,33.
Temps de réponse de l'écran
| ↔ Temps de réponse noir à blanc | ||
|---|---|---|
| 21.6 ms ... hausse ↗ et chute ↘ combinées | ↗ 10.7 ms hausse | 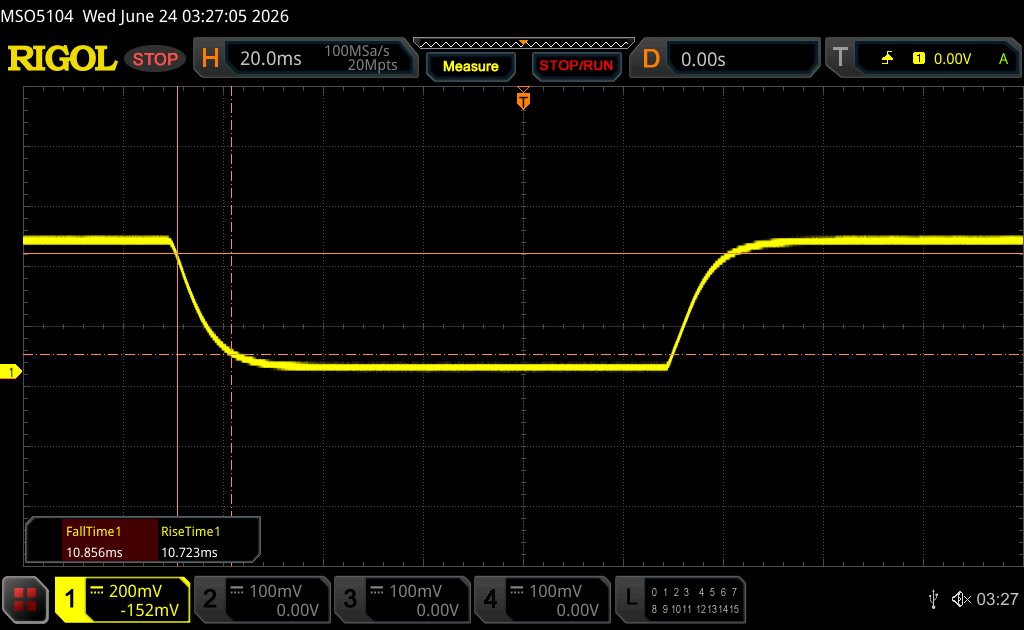 |
| ↘ 10.9 ms chute | ||
| L'écran montre de bons temps de réponse, mais insuffisant pour du jeu compétitif. En comparaison, tous les appareils testés affichent entre 0.1 (minimum) et 240 (maximum) ms. » 48 % des appareils testés affichent de meilleures performances. Cela signifie que les latences relevées sont similaires à la moyenne (19.9 ms) de tous les appareils testés. | ||
| ↔ Temps de réponse gris 50% à gris 80% | ||
| 41.2 ms ... hausse ↗ et chute ↘ combinées | ↗ 18.8 ms hausse | 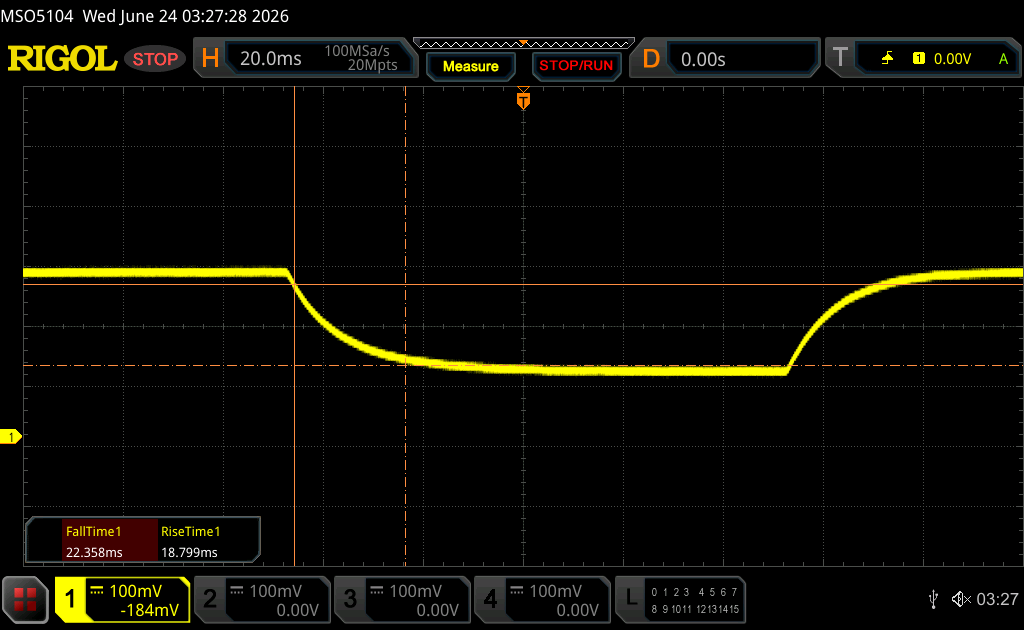 |
| ↘ 22.4 ms chute | ||
| L'écran souffre de latences très élevées, à éviter pour le jeu. En comparaison, tous les appareils testés affichent entre 0.165 (minimum) et 636 (maximum) ms. » 66 % des appareils testés affichent de meilleures performances. Cela signifie que les latences relevées sont moins bonnes que la moyenne (31.1 ms) de tous les appareils testés. | ||
Scintillement / MLI (Modulation de largeur d'impulsion)
| Scintillement / MLI (Modulation de largeur d'impulsion) non décelé |  | ||
En comparaison, 52 % des appareils testés n'emploient pas MDI pour assombrir leur écran. Nous avons relevé une moyenne à 7784 (minimum : 5 - maximum : 343500) Hz dans le cas où une MDI était active. | |||


Performances
Conditions d'essai
Nous avons configuré Windows en mode « Performances » avant d'exécuter les tests de performance ci-dessous.
Performances du processeur
Le Core Ultra 7 355 est environ 10 à 15 % plus rapide et offre des performances plus stables que le Core Ultra 7 258V du modèle de l’année dernière. En optant pour le modèle haut de gamme Core Ultra X7 368H peut augmenter les performances multithread de près de 70 %. Les performances du NPU restent toutefois pratiquement identiques sur toutes les références actuelles du ThinkPad X1 2-en-1 Gen 11.
Cinebench R15 Multi Loop
Cinebench R23: Multi Core | Single Core
Cinebench R20: CPU (Multi Core) | CPU (Single Core)
Cinebench R15: CPU Multi 64Bit | CPU Single 64Bit
Blender: v2.79 BMW27 CPU
7-Zip 18.03: 7z b 4 | 7z b 4 -mmt1
Geekbench 6.7: Multi-Core | Single-Core
Geekbench 5.5: Multi-Core | Single-Core
HWBOT x265 Benchmark v2.2: 4k Preset
LibreOffice : 20 Documents To PDF
R Benchmark 2.5: Overall mean
* ... Moindre est la valeur, meilleures sont les performances
AIDA64: FP32 Ray-Trace | FPU Julia | CPU SHA3 | CPU Queen | FPU SinJulia | FPU Mandel | CPU AES | CPU ZLib | FP64 Ray-Trace | CPU PhotoWorxx | CPU CheckMate
| Performance rating | |
| Lenovo Yoga Book 9 14IAH10 -1! | |
| Lenovo ThinkPad X1 2-in-1 Gen 11 -1! | |
| Moyenne Intel Core Ultra 7 355 | |
| Lenovo ThinkPad X1 2-in-1 Gen 10 -1! | |
| HP EliteBook X Flip G1i 14 AI -1! | |
| Dell Latitude 7450 2-in-1 -1! | |
| Asus ExpertBook Ultra B9406CAA -1! | |
| AIDA64 / FP32 Ray-Trace | |
| Lenovo Yoga Book 9 14IAH10 (v6.92.6600) | |
| Lenovo ThinkPad X1 2-in-1 Gen 11 (v8.20.8100) | |
| Moyenne Intel Core Ultra 7 355 (12228 - 12838, n=3) | |
| Asus ExpertBook Ultra B9406CAA (v6.92.6600) | |
| Lenovo ThinkPad X1 2-in-1 Gen 10 (v6.92.6600) | |
| HP EliteBook X Flip G1i 14 AI (v6.92.6600) | |
| Dell Latitude 7450 2-in-1 (v6.92.6600) | |
| AIDA64 / FPU Julia | |
| Lenovo Yoga Book 9 14IAH10 (v6.92.6600) | |
| Lenovo ThinkPad X1 2-in-1 Gen 11 (v8.20.8100) | |
| Moyenne Intel Core Ultra 7 355 (60741 - 65963, n=3) | |
| Lenovo ThinkPad X1 2-in-1 Gen 10 (v6.92.6600) | |
| HP EliteBook X Flip G1i 14 AI (v6.92.6600) | |
| Dell Latitude 7450 2-in-1 (v6.92.6600) | |
| Asus ExpertBook Ultra B9406CAA (v6.92.6600) | |
| AIDA64 / CPU SHA3 | |
| Asus ExpertBook Ultra B9406CAA (v6.92.6600) | |
| Lenovo Yoga Book 9 14IAH10 (v6.92.6600) | |
| Lenovo ThinkPad X1 2-in-1 Gen 11 (v8.20.8100) | |
| Moyenne Intel Core Ultra 7 355 (2763 - 2845, n=3) | |
| Dell Latitude 7450 2-in-1 (v6.92.6600) | |
| Lenovo ThinkPad X1 2-in-1 Gen 10 (v6.92.6600) | |
| HP EliteBook X Flip G1i 14 AI (v6.92.6600) | |
| AIDA64 / CPU Queen | |
| Asus ExpertBook Ultra B9406CAA (v6.92.6600) | |
| Lenovo Yoga Book 9 14IAH10 (v6.92.6600) | |
| Lenovo ThinkPad X1 2-in-1 Gen 10 (v6.92.6600) | |
| HP EliteBook X Flip G1i 14 AI (v6.92.6600) | |
| Dell Latitude 7450 2-in-1 (v6.92.6600) | |
| Moyenne Intel Core Ultra 7 355 (n=1) | |
| AIDA64 / FPU SinJulia | |
| Lenovo Yoga Book 9 14IAH10 (v6.92.6600) | |
| Dell Latitude 7450 2-in-1 (v6.92.6600) | |
| Asus ExpertBook Ultra B9406CAA (v6.92.6600) | |
| Lenovo ThinkPad X1 2-in-1 Gen 11 (v8.20.8100) | |
| Moyenne Intel Core Ultra 7 355 (4597 - 4601, n=3) | |
| Lenovo ThinkPad X1 2-in-1 Gen 10 (v6.92.6600) | |
| HP EliteBook X Flip G1i 14 AI (v6.92.6600) | |
| AIDA64 / FPU Mandel | |
| Lenovo Yoga Book 9 14IAH10 (v6.92.6600) | |
| Lenovo ThinkPad X1 2-in-1 Gen 11 (v8.20.8100) | |
| Moyenne Intel Core Ultra 7 355 (32404 - 35293, n=3) | |
| HP EliteBook X Flip G1i 14 AI (v6.92.6600) | |
| Lenovo ThinkPad X1 2-in-1 Gen 10 (v6.92.6600) | |
| Dell Latitude 7450 2-in-1 (v6.92.6600) | |
| Asus ExpertBook Ultra B9406CAA (v6.92.6600) | |
| AIDA64 / CPU AES | |
| Lenovo Yoga Book 9 14IAH10 (v6.92.6600) | |
| Dell Latitude 7450 2-in-1 (v6.92.6600) | |
| Lenovo ThinkPad X1 2-in-1 Gen 10 (v6.92.6600) | |
| Lenovo ThinkPad X1 2-in-1 Gen 11 (v8.20.8100) | |
| Moyenne Intel Core Ultra 7 355 (39050 - 39424, n=3) | |
| HP EliteBook X Flip G1i 14 AI (v6.92.6600) | |
| Asus ExpertBook Ultra B9406CAA (v6.92.6600) | |
| AIDA64 / CPU ZLib | |
| Asus ExpertBook Ultra B9406CAA (v6.92.6600) | |
| Lenovo Yoga Book 9 14IAH10 (v6.92.6600) | |
| Dell Latitude 7450 2-in-1 (v6.92.6600) | |
| Lenovo ThinkPad X1 2-in-1 Gen 11 (v8.20.8100) | |
| Moyenne Intel Core Ultra 7 355 (635 - 646, n=3) | |
| Lenovo ThinkPad X1 2-in-1 Gen 10 (v6.92.6600) | |
| HP EliteBook X Flip G1i 14 AI (v6.92.6600) | |
| AIDA64 / FP64 Ray-Trace | |
| Lenovo Yoga Book 9 14IAH10 (v6.92.6600) | |
| Lenovo ThinkPad X1 2-in-1 Gen 11 (v8.20.8100) | |
| Moyenne Intel Core Ultra 7 355 (6147 - 6833, n=3) | |
| Asus ExpertBook Ultra B9406CAA (v6.92.6600) | |
| Lenovo ThinkPad X1 2-in-1 Gen 10 (v6.92.6600) | |
| HP EliteBook X Flip G1i 14 AI (v6.92.6600) | |
| Dell Latitude 7450 2-in-1 (v6.92.6600) | |
| AIDA64 / CPU PhotoWorxx | |
| Lenovo ThinkPad X1 2-in-1 Gen 11 (v8.20.8100) | |
| Lenovo Yoga Book 9 14IAH10 (v6.92.6600) | |
| Moyenne Intel Core Ultra 7 355 (57998 - 60440, n=3) | |
| Lenovo ThinkPad X1 2-in-1 Gen 10 (v6.92.6600) | |
| HP EliteBook X Flip G1i 14 AI (v6.92.6600) | |
| Dell Latitude 7450 2-in-1 (v6.92.6600) | |
| Asus ExpertBook Ultra B9406CAA (v6.92.6600) | |
| AIDA64 / CPU CheckMate | |
| Lenovo ThinkPad X1 2-in-1 Gen 11 (v8.20.8100) | |
| Moyenne Intel Core Ultra 7 355 (2790 - 2813, n=3) | |
Performances du système
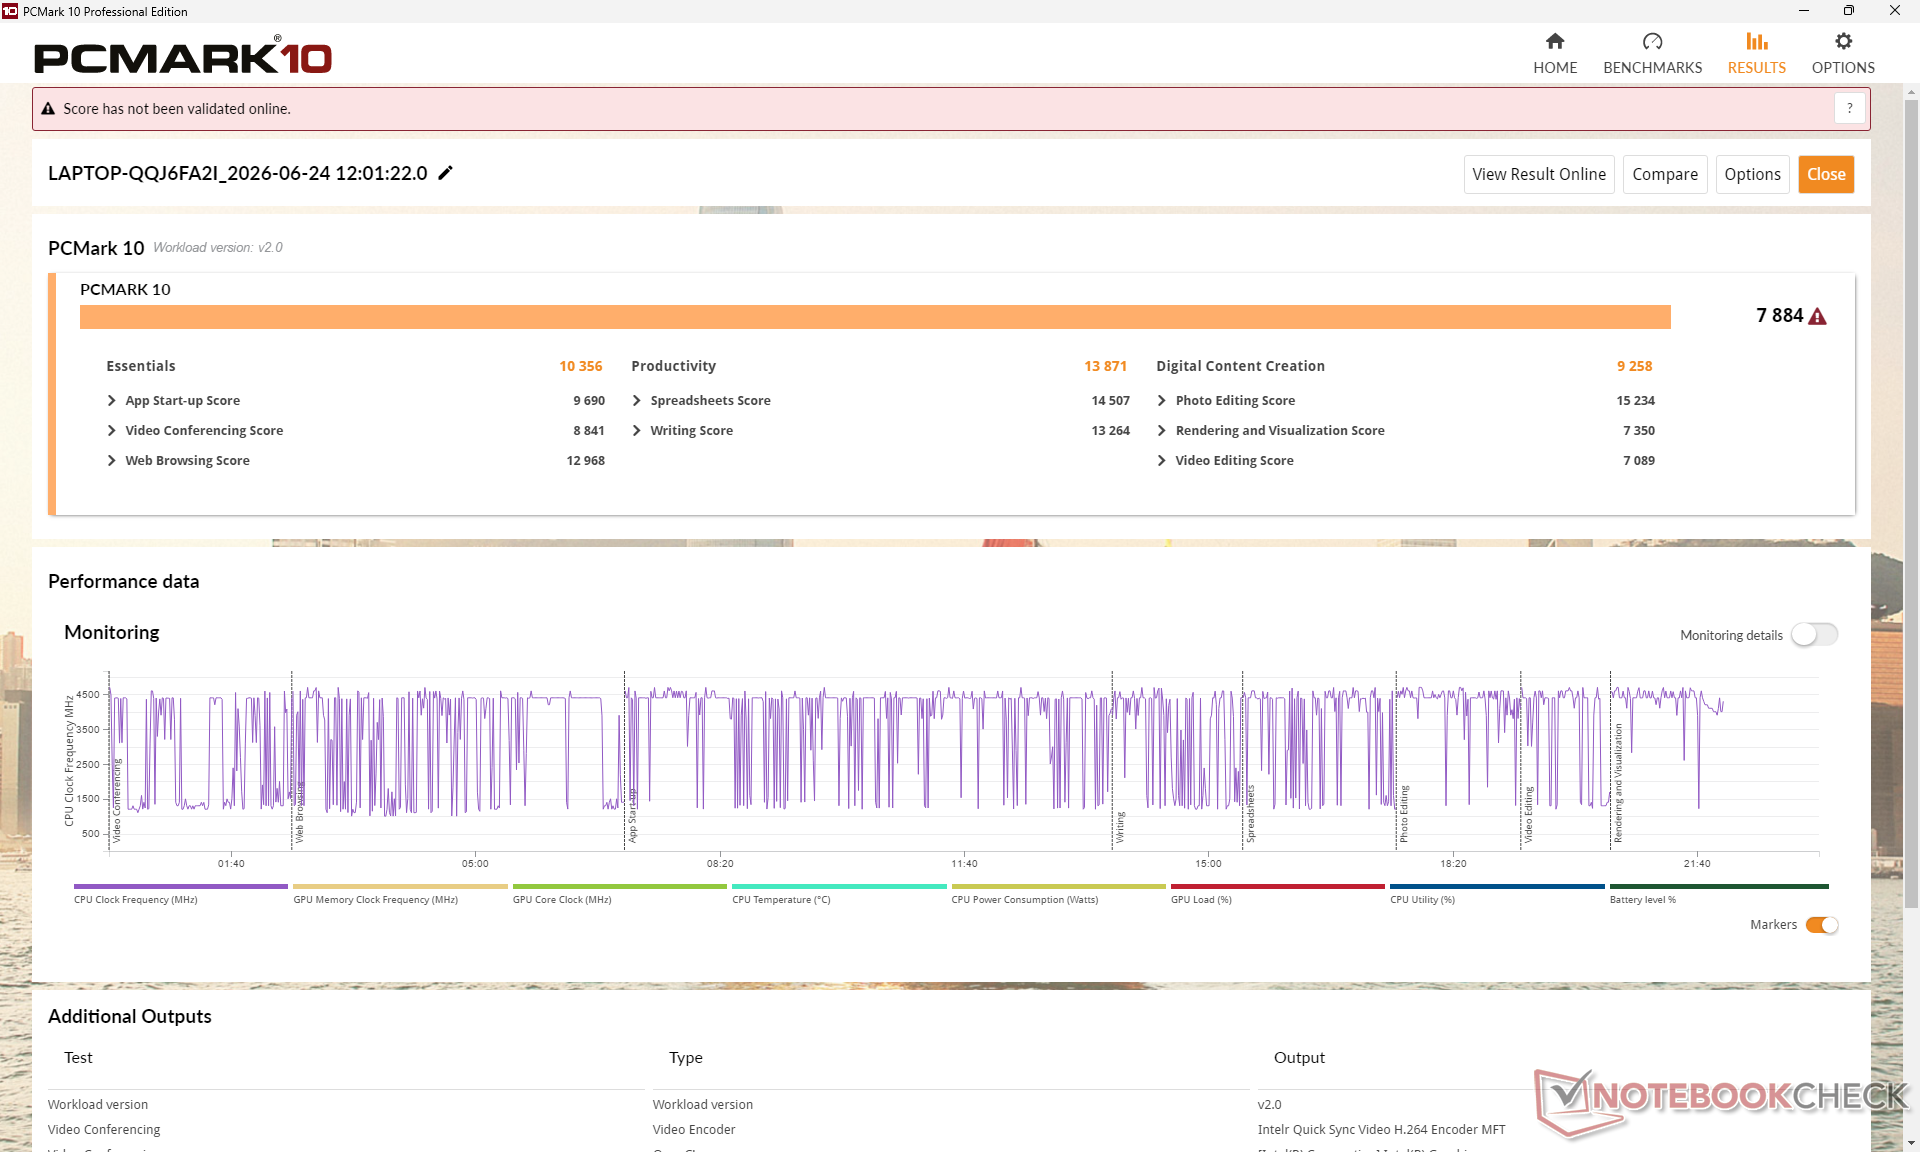
PCMark 10: Score | Essentials | Productivity | Digital Content Creation
CrossMark: Overall | Productivity | Creativity | Responsiveness
WebXPRT 3: Overall
WebXPRT 4: Overall
Mozilla Kraken 1.1: Total
Geekbench AI: Quantized GPU 1.7 | Half Precision GPU 1.7 | Single Precision GPU 1.7
| Performance rating | |
| Asus ExpertBook Ultra B9406CAA | |
| Lenovo Yoga Book 9 14IAH10 | |
| Lenovo ThinkPad X1 2-in-1 Gen 11 | |
| Dell Latitude 7450 2-in-1 -3! | |
| Moyenne Intel Core Ultra 7 355, Intel Graphics 4 Xe3 Panther Lake iGPU | |
| Lenovo ThinkPad X1 2-in-1 Gen 10 -1! | |
| HP EliteBook X Flip G1i 14 AI -3! | |
| PCMark 10 / Score | |
| Asus ExpertBook Ultra B9406CAA | |
| Moyenne Intel Core Ultra 7 355, Intel Graphics 4 Xe3 Panther Lake iGPU (7884 - 8185, n=3) | |
| Lenovo ThinkPad X1 2-in-1 Gen 11 | |
| Lenovo Yoga Book 9 14IAH10 | |
| Lenovo ThinkPad X1 2-in-1 Gen 10 | |
| HP EliteBook X Flip G1i 14 AI | |
| Dell Latitude 7450 2-in-1 | |
| PCMark 10 / Essentials | |
| Lenovo Yoga Book 9 14IAH10 | |
| Dell Latitude 7450 2-in-1 | |
| Lenovo ThinkPad X1 2-in-1 Gen 10 | |
| Asus ExpertBook Ultra B9406CAA | |
| Moyenne Intel Core Ultra 7 355, Intel Graphics 4 Xe3 Panther Lake iGPU (10356 - 10820, n=3) | |
| HP EliteBook X Flip G1i 14 AI | |
| Lenovo ThinkPad X1 2-in-1 Gen 11 | |
| PCMark 10 / Productivity | |
| Asus ExpertBook Ultra B9406CAA | |
| Moyenne Intel Core Ultra 7 355, Intel Graphics 4 Xe3 Panther Lake iGPU (13871 - 14685, n=3) | |
| Lenovo ThinkPad X1 2-in-1 Gen 11 | |
| HP EliteBook X Flip G1i 14 AI | |
| Lenovo Yoga Book 9 14IAH10 | |
| Lenovo ThinkPad X1 2-in-1 Gen 10 | |
| Dell Latitude 7450 2-in-1 | |
| PCMark 10 / Digital Content Creation | |
| Asus ExpertBook Ultra B9406CAA | |
| Lenovo Yoga Book 9 14IAH10 | |
| Lenovo ThinkPad X1 2-in-1 Gen 10 | |
| HP EliteBook X Flip G1i 14 AI | |
| Moyenne Intel Core Ultra 7 355, Intel Graphics 4 Xe3 Panther Lake iGPU (9258 - 9368, n=3) | |
| Lenovo ThinkPad X1 2-in-1 Gen 11 | |
| Dell Latitude 7450 2-in-1 | |
| CrossMark / Overall | |
| Lenovo Yoga Book 9 14IAH10 | |
| Asus ExpertBook Ultra B9406CAA | |
| Lenovo ThinkPad X1 2-in-1 Gen 11 | |
| Moyenne Intel Core Ultra 7 355, Intel Graphics 4 Xe3 Panther Lake iGPU (1627 - 1818, n=3) | |
| Lenovo ThinkPad X1 2-in-1 Gen 10 | |
| HP EliteBook X Flip G1i 14 AI | |
| Dell Latitude 7450 2-in-1 | |
| CrossMark / Productivity | |
| Lenovo Yoga Book 9 14IAH10 | |
| Lenovo ThinkPad X1 2-in-1 Gen 11 | |
| Moyenne Intel Core Ultra 7 355, Intel Graphics 4 Xe3 Panther Lake iGPU (1561 - 1755, n=3) | |
| Asus ExpertBook Ultra B9406CAA | |
| Lenovo ThinkPad X1 2-in-1 Gen 10 | |
| HP EliteBook X Flip G1i 14 AI | |
| Dell Latitude 7450 2-in-1 | |
| CrossMark / Creativity | |
| Lenovo Yoga Book 9 14IAH10 | |
| Asus ExpertBook Ultra B9406CAA | |
| Lenovo ThinkPad X1 2-in-1 Gen 11 | |
| Lenovo ThinkPad X1 2-in-1 Gen 10 | |
| Moyenne Intel Core Ultra 7 355, Intel Graphics 4 Xe3 Panther Lake iGPU (1761 - 2045, n=3) | |
| HP EliteBook X Flip G1i 14 AI | |
| Dell Latitude 7450 2-in-1 | |
| CrossMark / Responsiveness | |
| Asus ExpertBook Ultra B9406CAA | |
| Lenovo ThinkPad X1 2-in-1 Gen 11 | |
| Lenovo Yoga Book 9 14IAH10 | |
| Moyenne Intel Core Ultra 7 355, Intel Graphics 4 Xe3 Panther Lake iGPU (1458 - 1543, n=3) | |
| Dell Latitude 7450 2-in-1 | |
| Lenovo ThinkPad X1 2-in-1 Gen 10 | |
| HP EliteBook X Flip G1i 14 AI | |
| WebXPRT 3 / Overall | |
| Dell Latitude 7450 2-in-1 | |
| Lenovo Yoga Book 9 14IAH10 | |
| Lenovo ThinkPad X1 2-in-1 Gen 10 | |
| Asus ExpertBook Ultra B9406CAA | |
| Lenovo ThinkPad X1 2-in-1 Gen 11 | |
| Moyenne Intel Core Ultra 7 355, Intel Graphics 4 Xe3 Panther Lake iGPU (302 - 303, n=3) | |
| HP EliteBook X Flip G1i 14 AI | |
| WebXPRT 4 / Overall | |
| Dell Latitude 7450 2-in-1 | |
| Lenovo Yoga Book 9 14IAH10 | |
| Lenovo ThinkPad X1 2-in-1 Gen 11 | |
| Moyenne Intel Core Ultra 7 355, Intel Graphics 4 Xe3 Panther Lake iGPU (279 - 284, n=3) | |
| Asus ExpertBook Ultra B9406CAA | |
| HP EliteBook X Flip G1i 14 AI | |
| Mozilla Kraken 1.1 / Total | |
| HP EliteBook X Flip G1i 14 AI | |
| Moyenne Intel Core Ultra 7 355, Intel Graphics 4 Xe3 Panther Lake iGPU (474 - 487, n=3) | |
| Lenovo ThinkPad X1 2-in-1 Gen 11 | |
| Lenovo ThinkPad X1 2-in-1 Gen 10 | |
| Asus ExpertBook Ultra B9406CAA | |
| Lenovo Yoga Book 9 14IAH10 | |
| Dell Latitude 7450 2-in-1 | |
| Geekbench AI / Quantized GPU 1.7 | |
| Asus ExpertBook Ultra B9406CAA | |
| Lenovo ThinkPad X1 2-in-1 Gen 10 | |
| Lenovo Yoga Book 9 14IAH10 | |
| Moyenne Intel Core Ultra 7 355, Intel Graphics 4 Xe3 Panther Lake iGPU (4302 - 4449, n=3) | |
| Lenovo ThinkPad X1 2-in-1 Gen 11 | |
| Geekbench AI / Half Precision GPU 1.7 | |
| Asus ExpertBook Ultra B9406CAA | |
| Lenovo ThinkPad X1 2-in-1 Gen 10 | |
| Moyenne Intel Core Ultra 7 355, Intel Graphics 4 Xe3 Panther Lake iGPU (12274 - 12681, n=3) | |
| Lenovo ThinkPad X1 2-in-1 Gen 11 | |
| Lenovo Yoga Book 9 14IAH10 | |
| Geekbench AI / Single Precision GPU 1.7 | |
| Asus ExpertBook Ultra B9406CAA | |
| Lenovo ThinkPad X1 2-in-1 Gen 10 | |
| Lenovo Yoga Book 9 14IAH10 | |
| Moyenne Intel Core Ultra 7 355, Intel Graphics 4 Xe3 Panther Lake iGPU (6316 - 6555, n=3) | |
| Lenovo ThinkPad X1 2-in-1 Gen 11 | |
* ... Moindre est la valeur, meilleures sont les performances
| PCMark 10 Score | 7884 points | |
Aide | ||
| AIDA64 / Memory Copy | |
| HP EliteBook X Flip G1i 14 AI | |
| Lenovo ThinkPad X1 2-in-1 Gen 10 | |
| Lenovo ThinkPad X1 2-in-1 Gen 11 | |
| Moyenne Intel Core Ultra 7 355 (97301 - 105135, n=3) | |
| Lenovo Yoga Book 9 14IAH10 | |
| Dell Latitude 7450 2-in-1 | |
| AIDA64 / Memory Read | |
| Asus ExpertBook Ultra B9406CAA | |
| Lenovo ThinkPad X1 2-in-1 Gen 10 | |
| HP EliteBook X Flip G1i 14 AI | |
| Lenovo ThinkPad X1 2-in-1 Gen 11 | |
| Lenovo Yoga Book 9 14IAH10 | |
| Moyenne Intel Core Ultra 7 355 (79551 - 85021, n=3) | |
| Dell Latitude 7450 2-in-1 | |
| AIDA64 / Memory Write | |
| Asus ExpertBook Ultra B9406CAA | |
| Lenovo ThinkPad X1 2-in-1 Gen 10 | |
| HP EliteBook X Flip G1i 14 AI | |
| Lenovo ThinkPad X1 2-in-1 Gen 11 | |
| Moyenne Intel Core Ultra 7 355 (103056 - 108621, n=3) | |
| Lenovo Yoga Book 9 14IAH10 | |
| Dell Latitude 7450 2-in-1 | |
| AIDA64 / Memory Latency | |
| Dell Latitude 7450 2-in-1 | |
| Lenovo Yoga Book 9 14IAH10 | |
| Moyenne Intel Core Ultra 7 355 (99.7 - 105.8, n=3) | |
| Lenovo ThinkPad X1 2-in-1 Gen 11 | |
| HP EliteBook X Flip G1i 14 AI | |
| Lenovo ThinkPad X1 2-in-1 Gen 10 | |
* ... Moindre est la valeur, meilleures sont les performances
Latence DPC
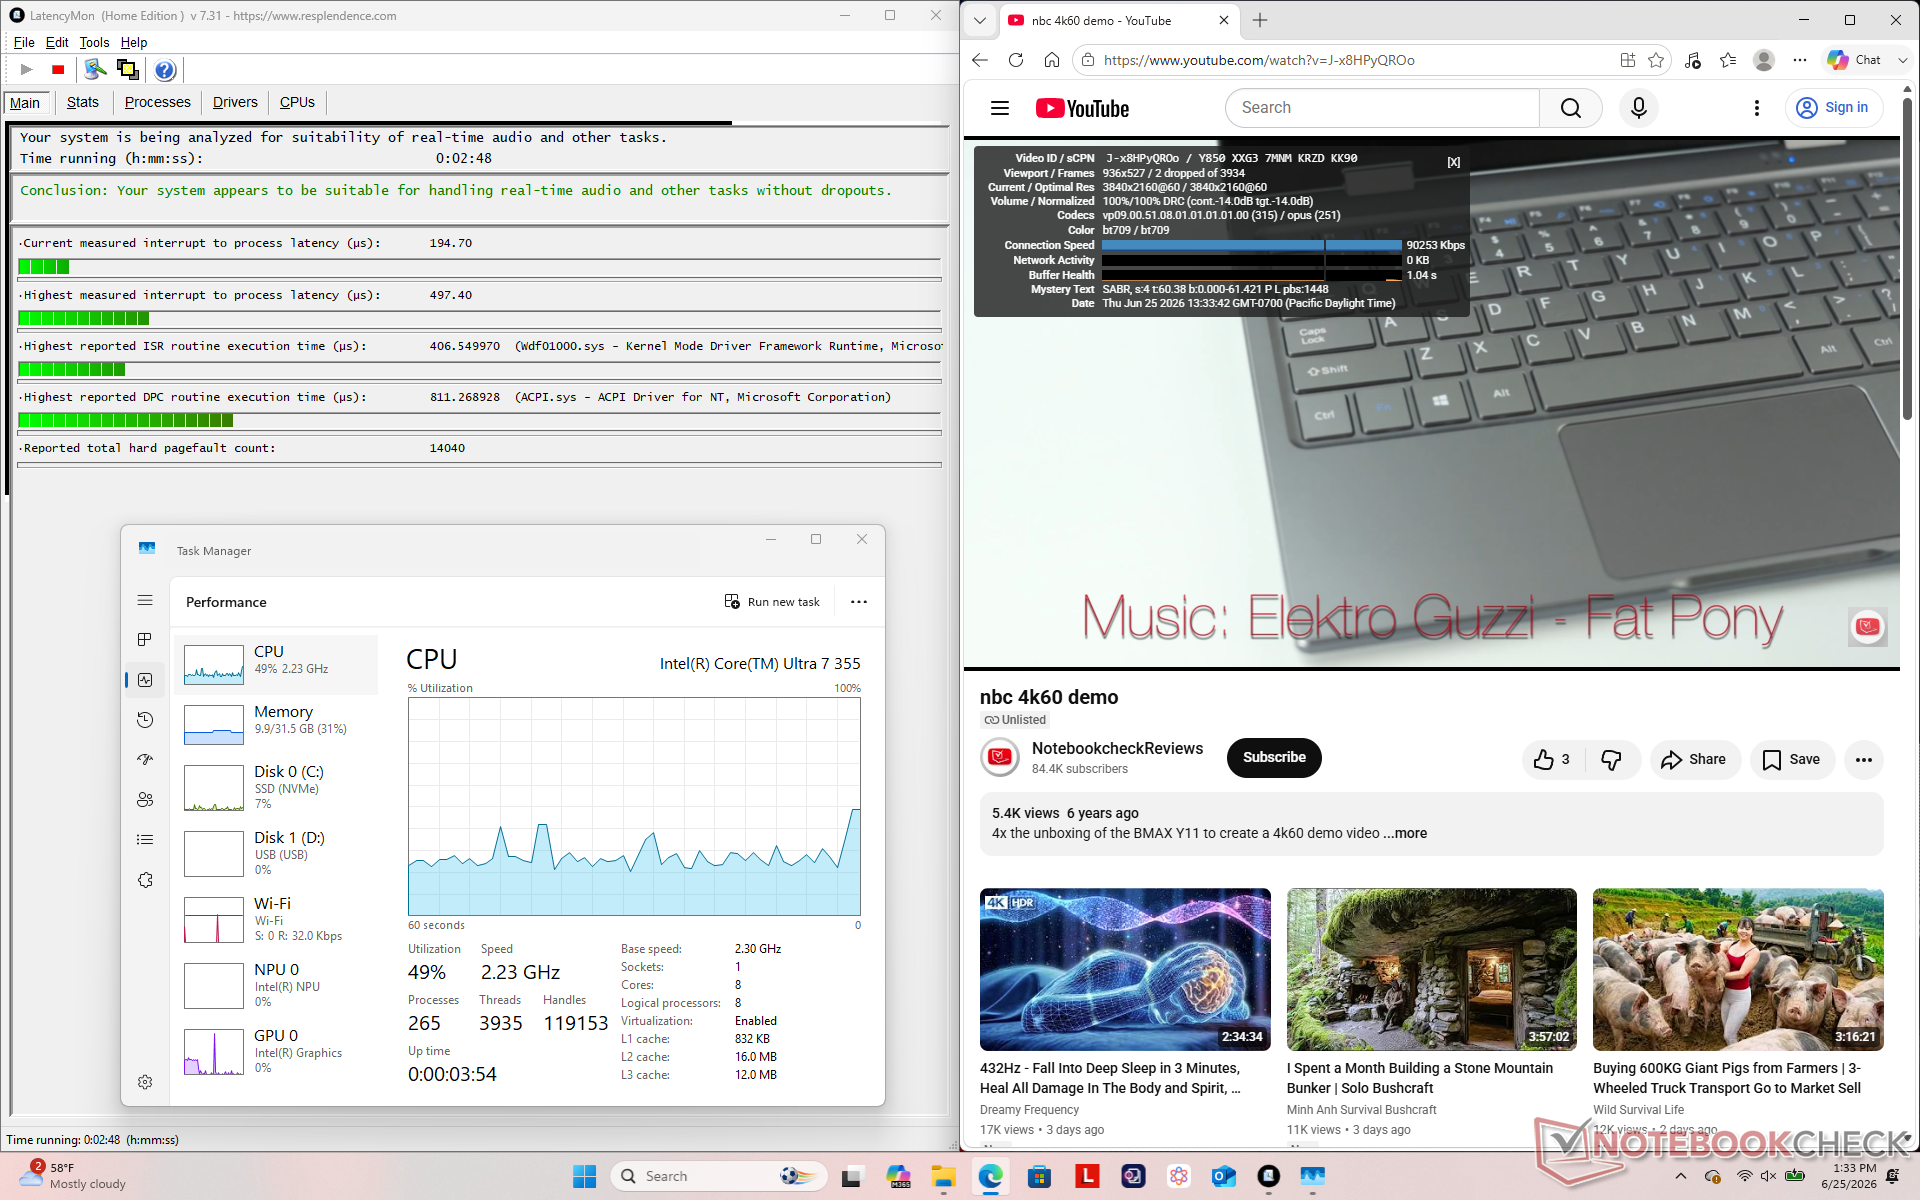
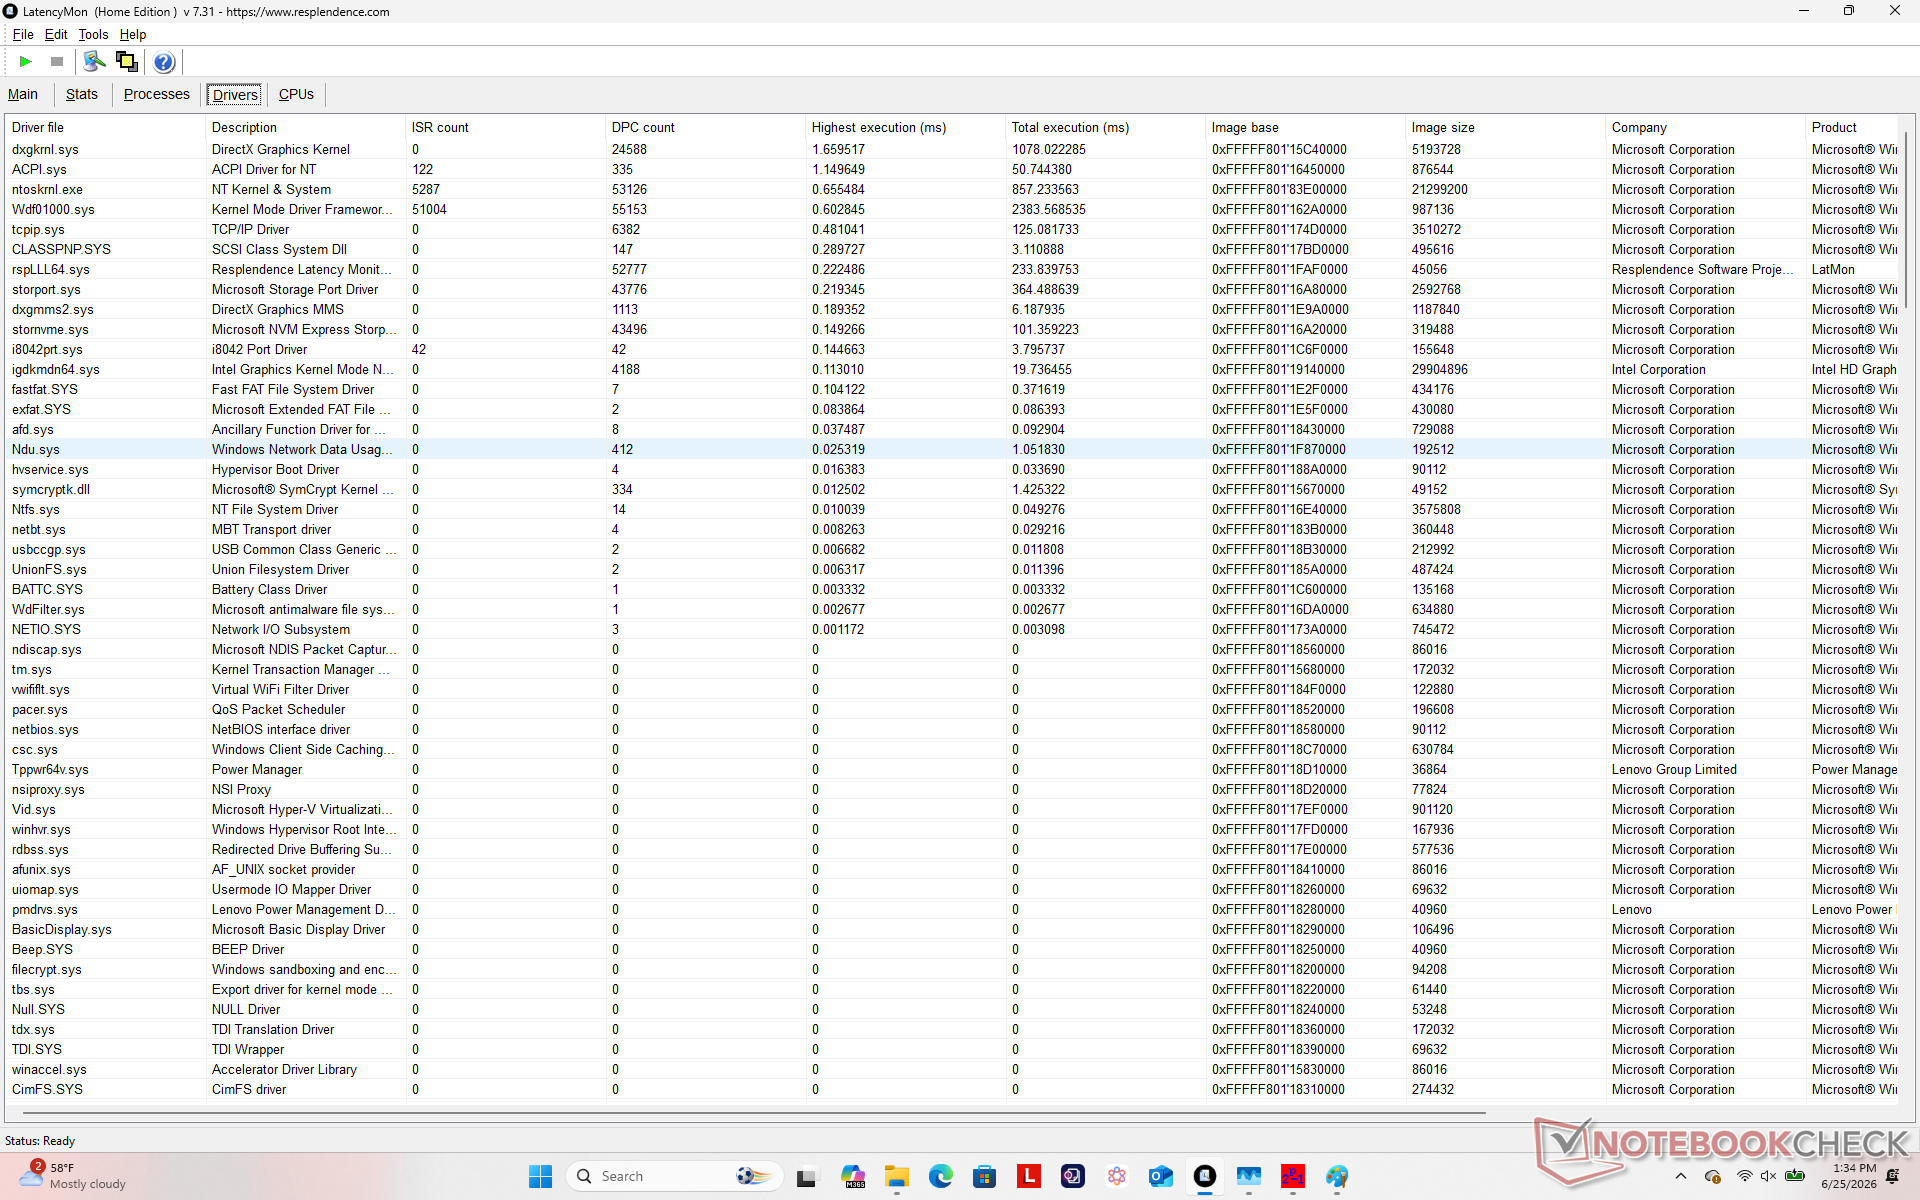
| DPC Latencies / LatencyMon - interrupt to process latency (max), Web, Youtube, Prime95 | |
| Lenovo Yoga Book 9 14IAH10 | |
| HP EliteBook X Flip G1i 14 AI | |
| Dell Latitude 7450 2-in-1 | |
| Lenovo ThinkPad X1 2-in-1 Gen 10 | |
| Asus ExpertBook Ultra B9406CAA | |
* ... Moindre est la valeur, meilleures sont les performances
Périphériques de stockage
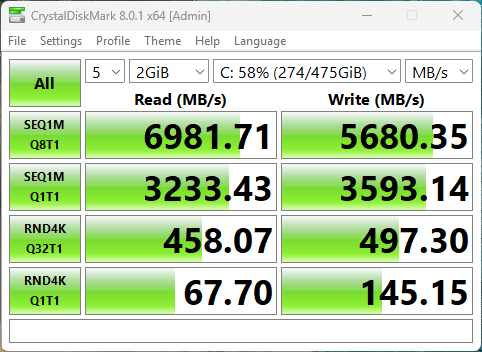
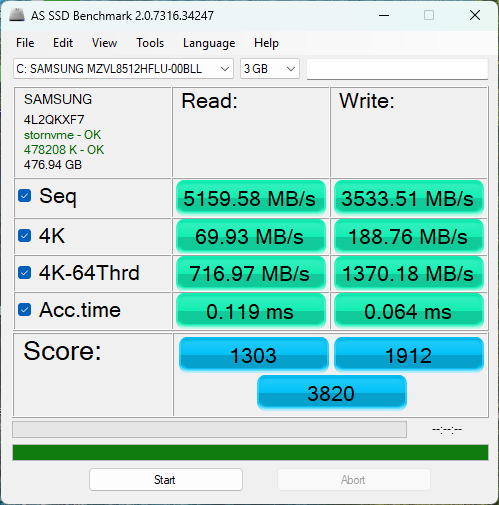

* ... Moindre est la valeur, meilleures sont les performances
Limitation du disque : boucle de lecture DiskSpd, profondeur de file d'attente 8
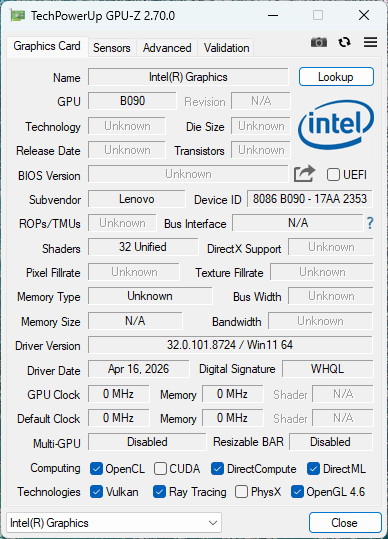
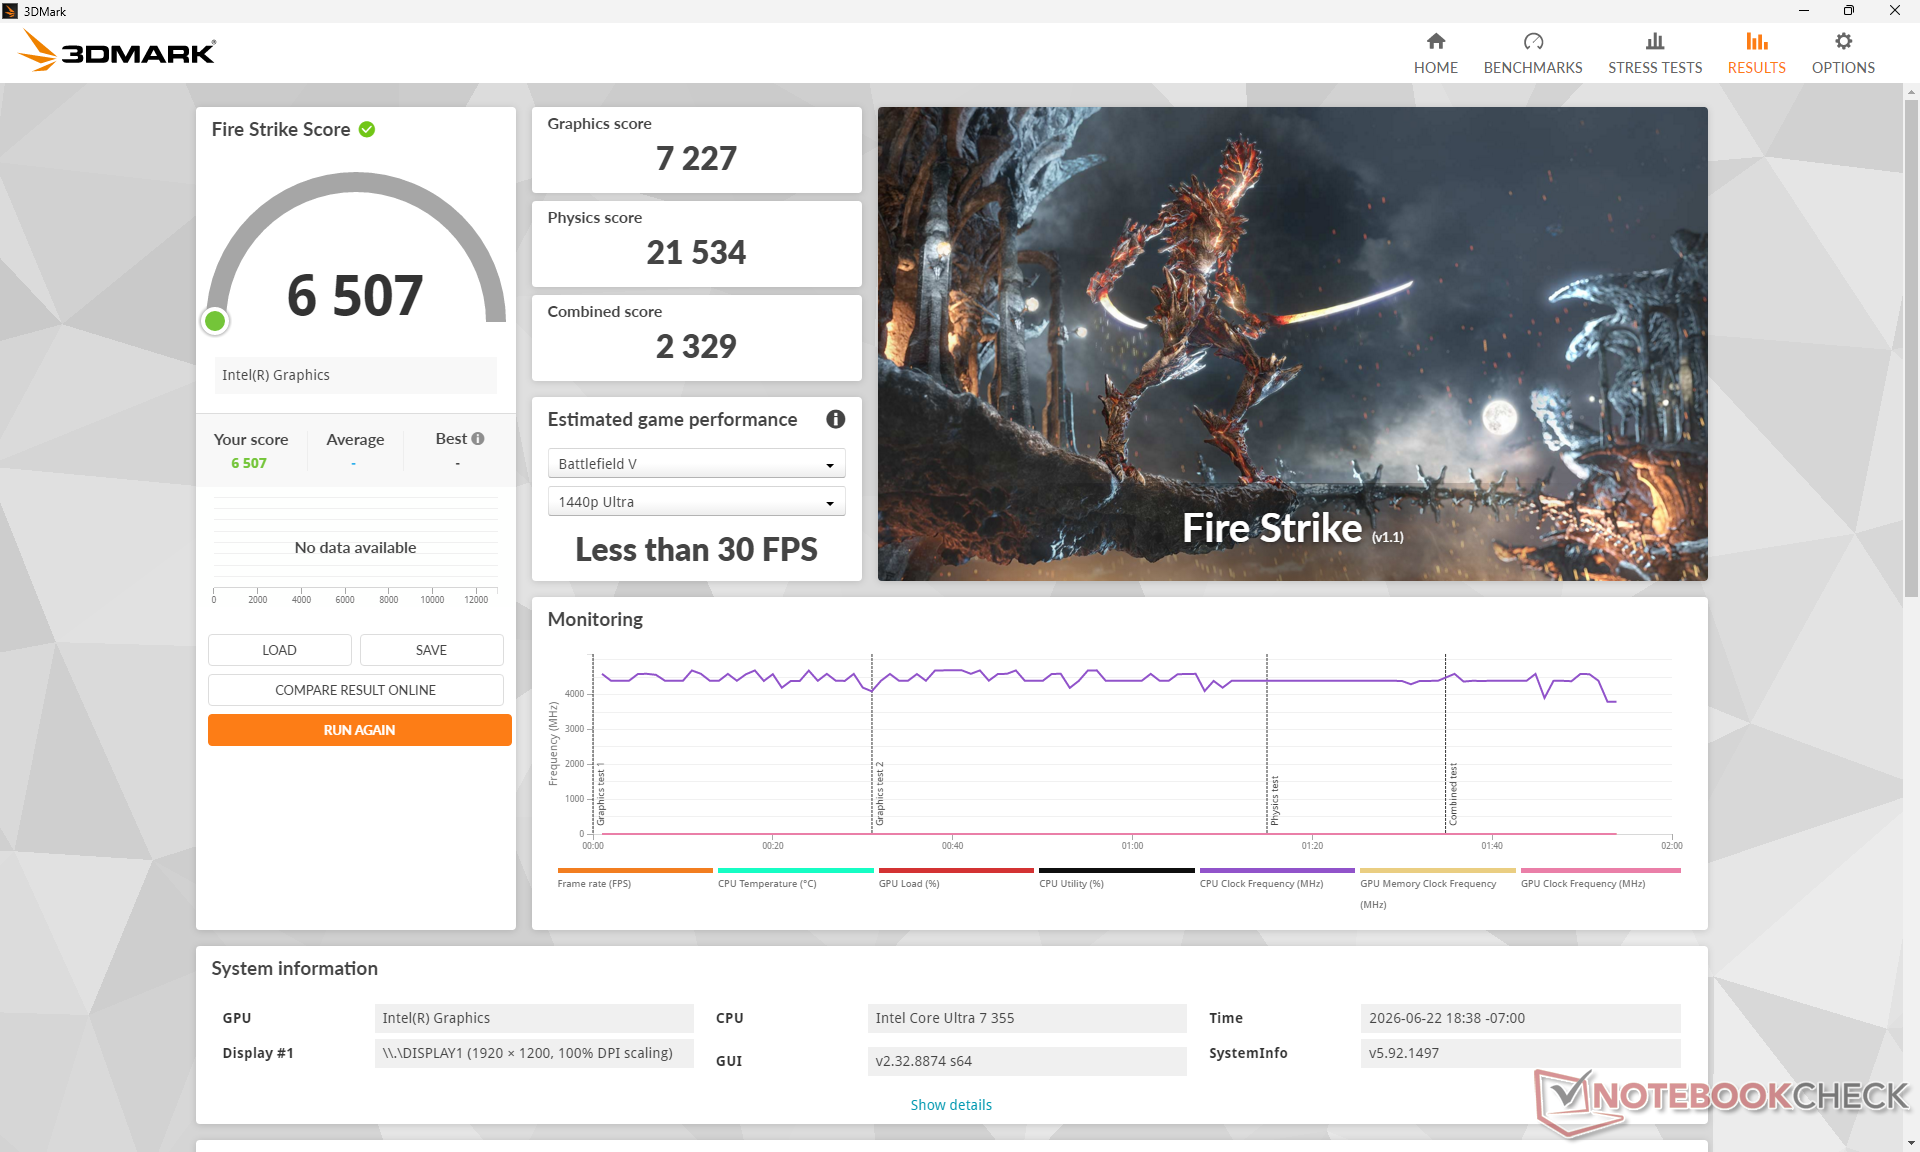
Performances du GPU
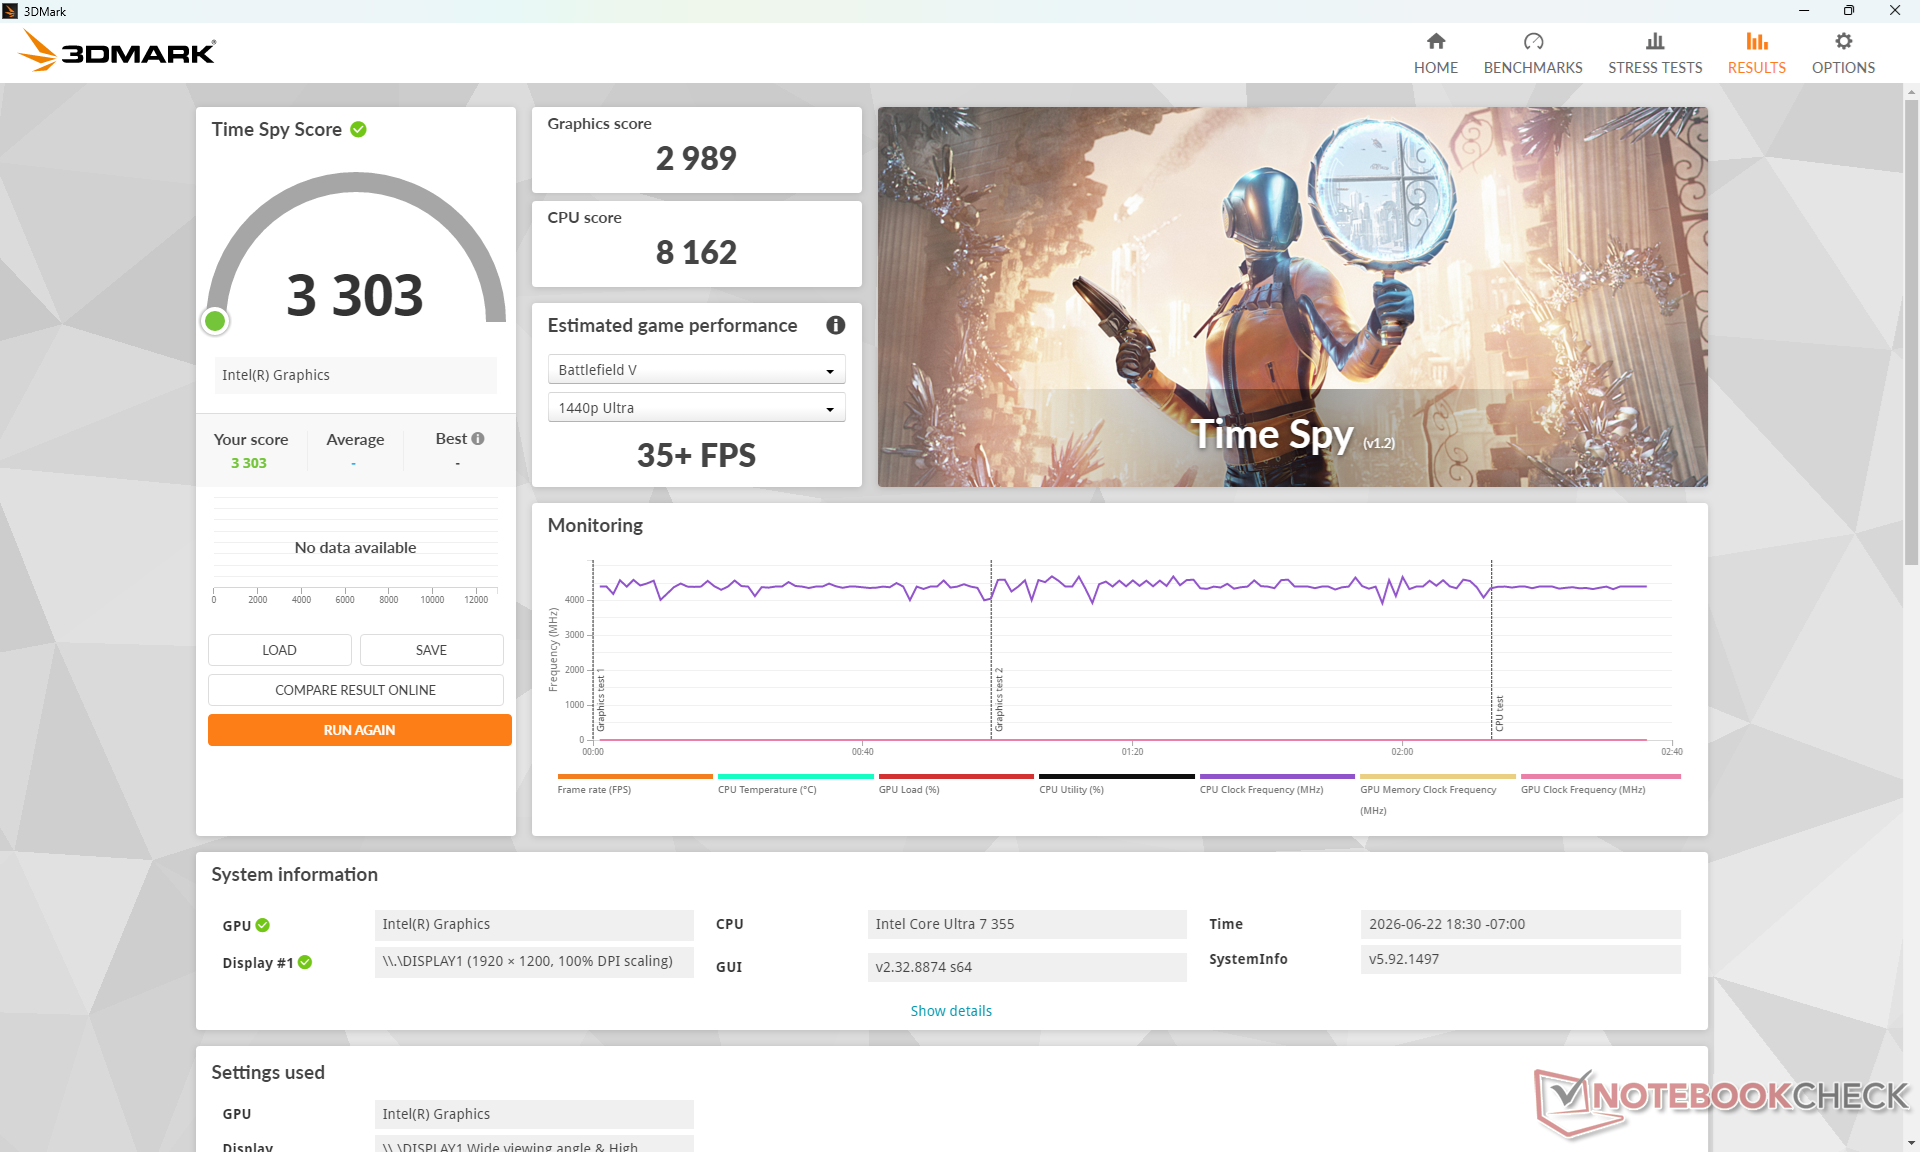
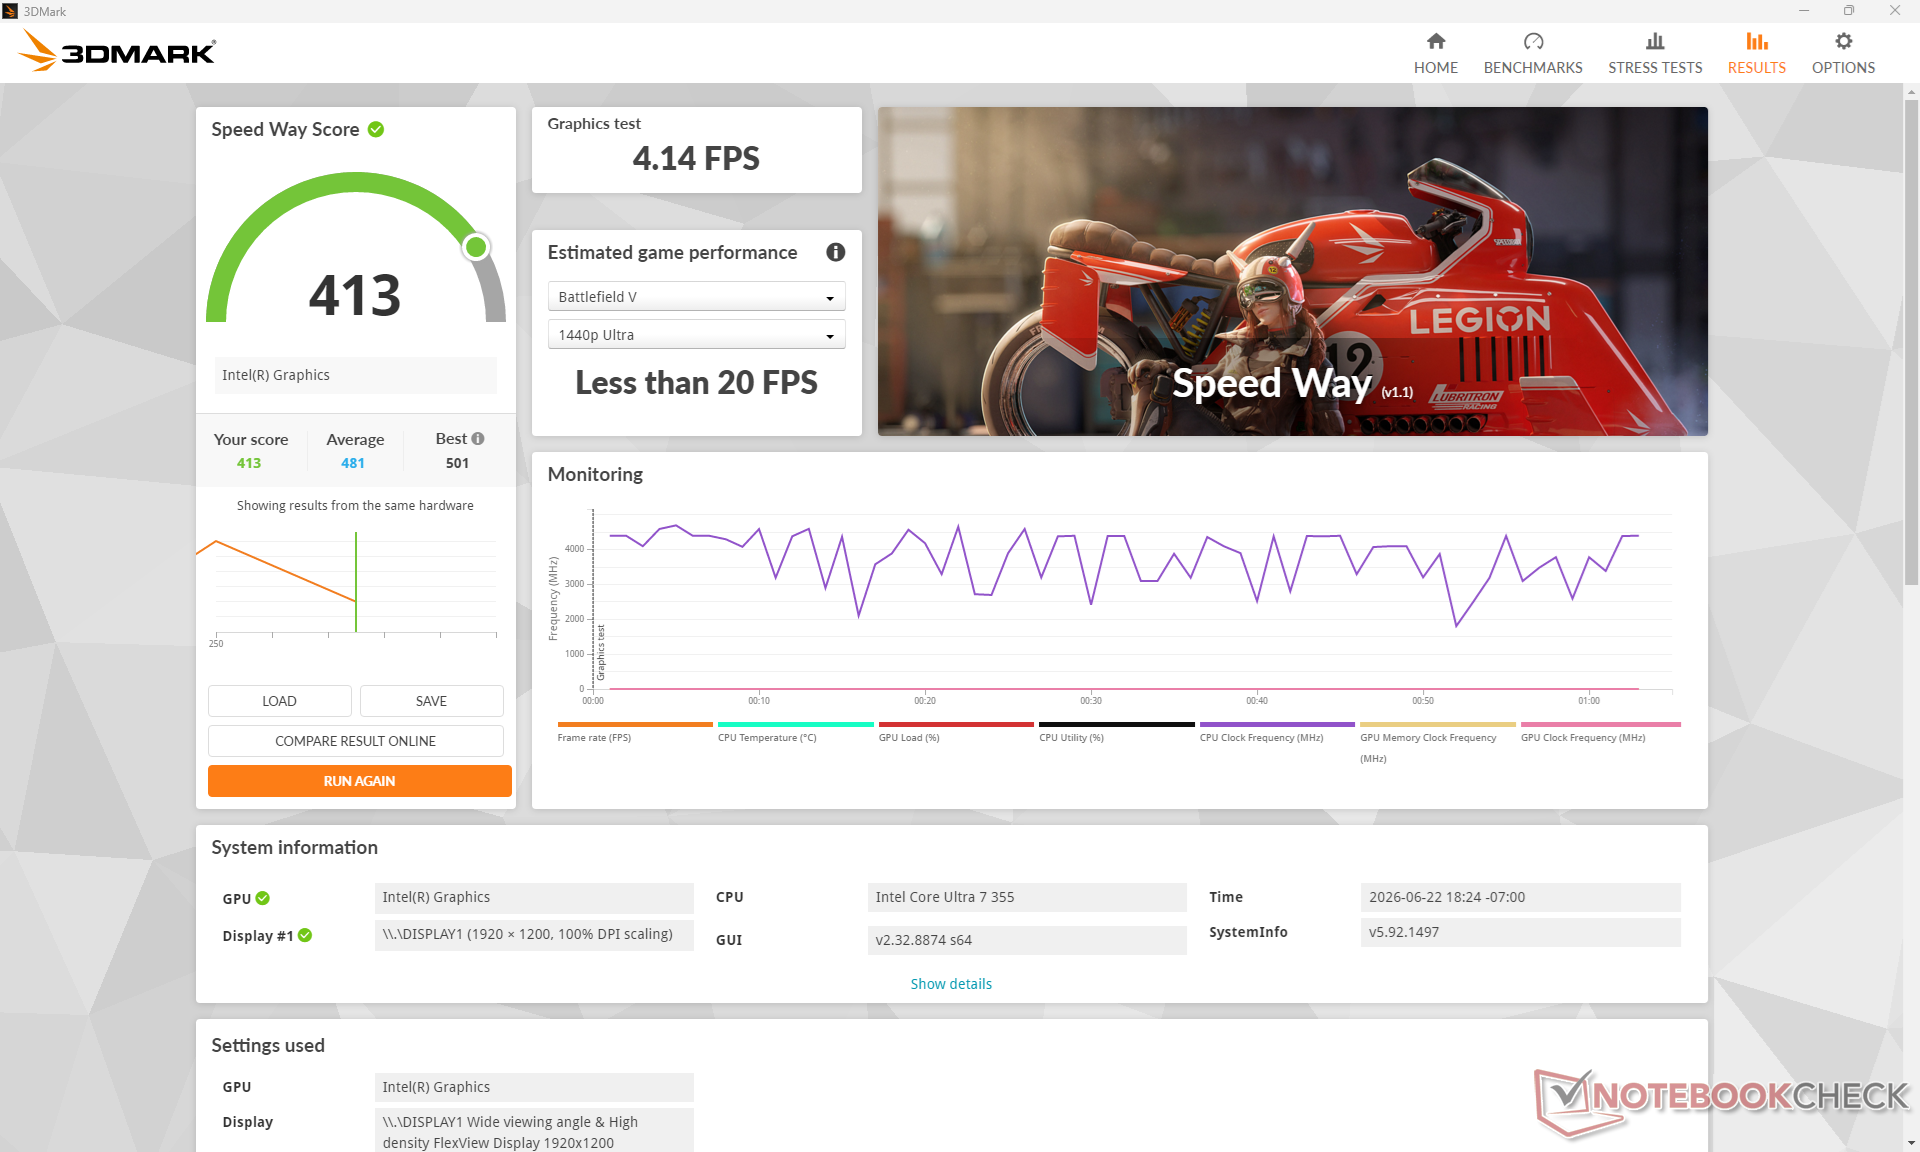
La carte graphique intégrée carte graphique Intel Graphics 4 Xe3 est plus lente que la Arc 140V du modèle de l’année dernière, mais ses performances globales sont plus régulières, comme le montre notre graphique Cyberpunk 2077 ci-dessous. Les utilisateurs souhaitant des performances graphiques plus de deux fois supérieures peuvent opter pour la référence Core Ultra X7 368H, équipée de la très appréciée Arc B390.
| Profil de consommation | Score graphique | Score physique | Score combiné |
| Mode Performance | 7227 | 21 534 | 2 329 |
| Mode Équilibré | 7 093 (-2 %) | 21 207 (-2 %) | 2 351 |
| Alimentation par batterie | 7 003 (-3 %) | 21 193 (-2 %) | 2336 |
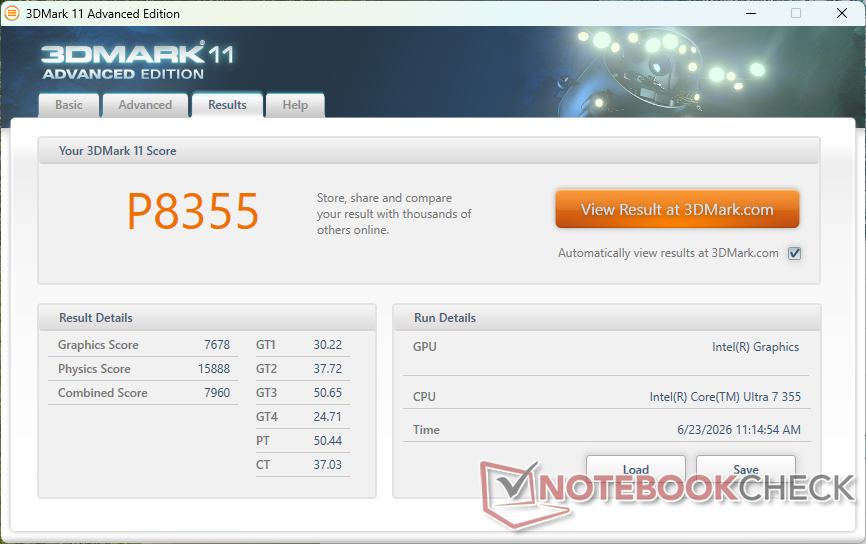
| 3DMark 11 Performance | 8355 points | |
| 3DMark Cloud Gate Standard Score | 29665 points | |
| 3DMark Fire Strike Score | 6507 points | |
| 3DMark Time Spy Score | 3303 points | |
Aide | ||
* ... Moindre est la valeur, meilleures sont les performances
| Cyberpunk 2077 - 1920x1080 Ultra Preset (FSR off) | |
| Asus ExpertBook Ultra B9406CAA | |
| HP EliteBook X Flip G1i 14 AI | |
| Lenovo ThinkPad X1 2-in-1 Gen 10 | |
| Lenovo Yoga Book 9 14IAH10 | |
| Lenovo ThinkPad X1 2-in-1 Gen 11 | |
| Dell Latitude 7450 2-in-1 | |
| Baldur's Gate 3 - 1920x1080 Ultra Preset AA:T | |
| Asus ExpertBook Ultra B9406CAA | |
| HP EliteBook X Flip G1i 14 AI | |
| Lenovo ThinkPad X1 2-in-1 Gen 10 | |
| Lenovo Yoga Book 9 14IAH10 | |
| Lenovo ThinkPad X1 2-in-1 Gen 11 | |
| Dell Latitude 7450 2-in-1 | |
| Final Fantasy XV Benchmark - 1920x1080 High Quality | |
| Asus ExpertBook Ultra B9406CAA | |
| HP EliteBook X Flip G1i 14 AI | |
| Lenovo ThinkPad X1 2-in-1 Gen 10 | |
| Lenovo Yoga Book 9 14IAH10 | |
| Lenovo ThinkPad X1 2-in-1 Gen 11 | |
| Dell Latitude 7450 2-in-1 | |
| Strange Brigade - 1920x1080 ultra AA:ultra AF:16 | |
| Asus ExpertBook Ultra B9406CAA | |
| Lenovo ThinkPad X1 2-in-1 Gen 10 | |
| HP EliteBook X Flip G1i 14 AI | |
| Lenovo ThinkPad X1 2-in-1 Gen 11 | |
| Lenovo Yoga Book 9 14IAH10 | |
| Dell Latitude 7450 2-in-1 | |
| Dota 2 Reborn - 1920x1080 ultra (3/3) best looking | |
| Asus ExpertBook Ultra B9406CAA | |
| Lenovo ThinkPad X1 2-in-1 Gen 11 | |
| HP EliteBook X Flip G1i 14 AI | |
| Lenovo Yoga Book 9 14IAH10 | |
| Lenovo ThinkPad X1 2-in-1 Gen 10 | |
| Dell Latitude 7450 2-in-1 | |
| X-Plane 11.11 - 1920x1080 high (fps_test=3) | |
| Asus ExpertBook Ultra B9406CAA | |
| Lenovo Yoga Book 9 14IAH10 | |
| Lenovo ThinkPad X1 2-in-1 Gen 10 | |
| HP EliteBook X Flip G1i 14 AI | |
| Dell Latitude 7450 2-in-1 | |
| Lenovo ThinkPad X1 2-in-1 Gen 11 | |
Tableau des FPS en mode « Ultra » de Cyberpunk 2077
| Bas | Moyen | Élevé | Ultra | |
|---|---|---|---|---|
| GTA V (2015) | 169.3 | 161.6 | 54.8 | 21.8 |
| Dota 2 Reborn (2015) | 128.1 | 99.2 | 82.1 | 84.9 |
| Final Fantasy XV Benchmark (2018) | 69 | 36.3 | 25.9 | |
| X-Plane 11.11 (2018) | 33 | 27.2 | 24.7 | |
| Strange Brigade (2018) | 192.1 | 76.2 | 62.1 | 53 |
| Baldur's Gate 3 (2023) | 32.5 | 27 | 23.7 | 23.1 |
| Cyberpunk 2077 (2023) | 39.4 | 29.8 | 26.1 | 21.8 |
| F1 24 (2024) | 68 | 63.8 | 46.7 | 14.8 |
Émissions
Bruit du système
Le bruit et le fonctionnement des ventilateurs sont pratiquement inchangés par rapport au modèle de l'année dernière, qui présentait des caractéristiques similaires.
Degré de la nuisance sonore
| Au repos |
| 23.3 / 23.3 / 23.3 dB(A) |
| Fortement sollicité |
| 38.1 / 38.1 dB(A) |
 | ||
30 dB silencieux 40 dB(A) audible 50 dB(A) bruyant |
||
min: | ||
| Lenovo ThinkPad X1 2-in-1 Gen 11 Ultra 7 355, Intel Graphics 4 Xe3 PTL | Lenovo ThinkPad X1 2-in-1 Gen 10 Core Ultra 7 258V, Arc 140V | Lenovo Yoga Book 9 14IAH10 Ultra 7 255H, Arc 140T | HP EliteBook X Flip G1i 14 AI Core Ultra 7 258V, Arc 140V | Dell Latitude 7450 2-in-1 Ultra 7 165U, Graphics 4-Core iGPU (Arrow Lake) | Asus ExpertBook Ultra B9406CAA Ultra X7 358H, Arc B390 Panther Lake iGPU | |
|---|---|---|---|---|---|---|
| Noise | -1% | -6% | 10% | -0% | -1% | |
| arrêt / environnement * (dB) | 23.3 | 23.3 -0% | 23.9 -3% | 23 1% | 23.03 1% | 22.9 2% |
| Idle Minimum * (dB) | 23.3 | 23.3 -0% | 23.9 -3% | 23 1% | 23.53 -1% | 23.4 -0% |
| Idle Average * (dB) | 23.3 | 23.3 -0% | 23.9 -3% | 23 1% | 23.53 -1% | 23.4 -0% |
| Idle Maximum * (dB) | 23.3 | 23.3 -0% | 23.9 -3% | 23 1% | 23.53 -1% | 23.4 -0% |
| Load Average * (dB) | 38.1 | 38 -0% | 39.1 -3% | 27.14 29% | 38.54 -1% | 28.6 25% |
| Cyberpunk 2077 ultra * (dB) | 38.1 | 37.8 1% | 42 -10% | 31.65 17% | 38.2 -0% | 42.8 -12% |
| Load Maximum * (dB) | 38.1 | 40.6 -7% | 44.5 -17% | 31.65 17% | 38.21 -0% | 45.2 -19% |
* ... Moindre est la valeur, meilleures sont les performances
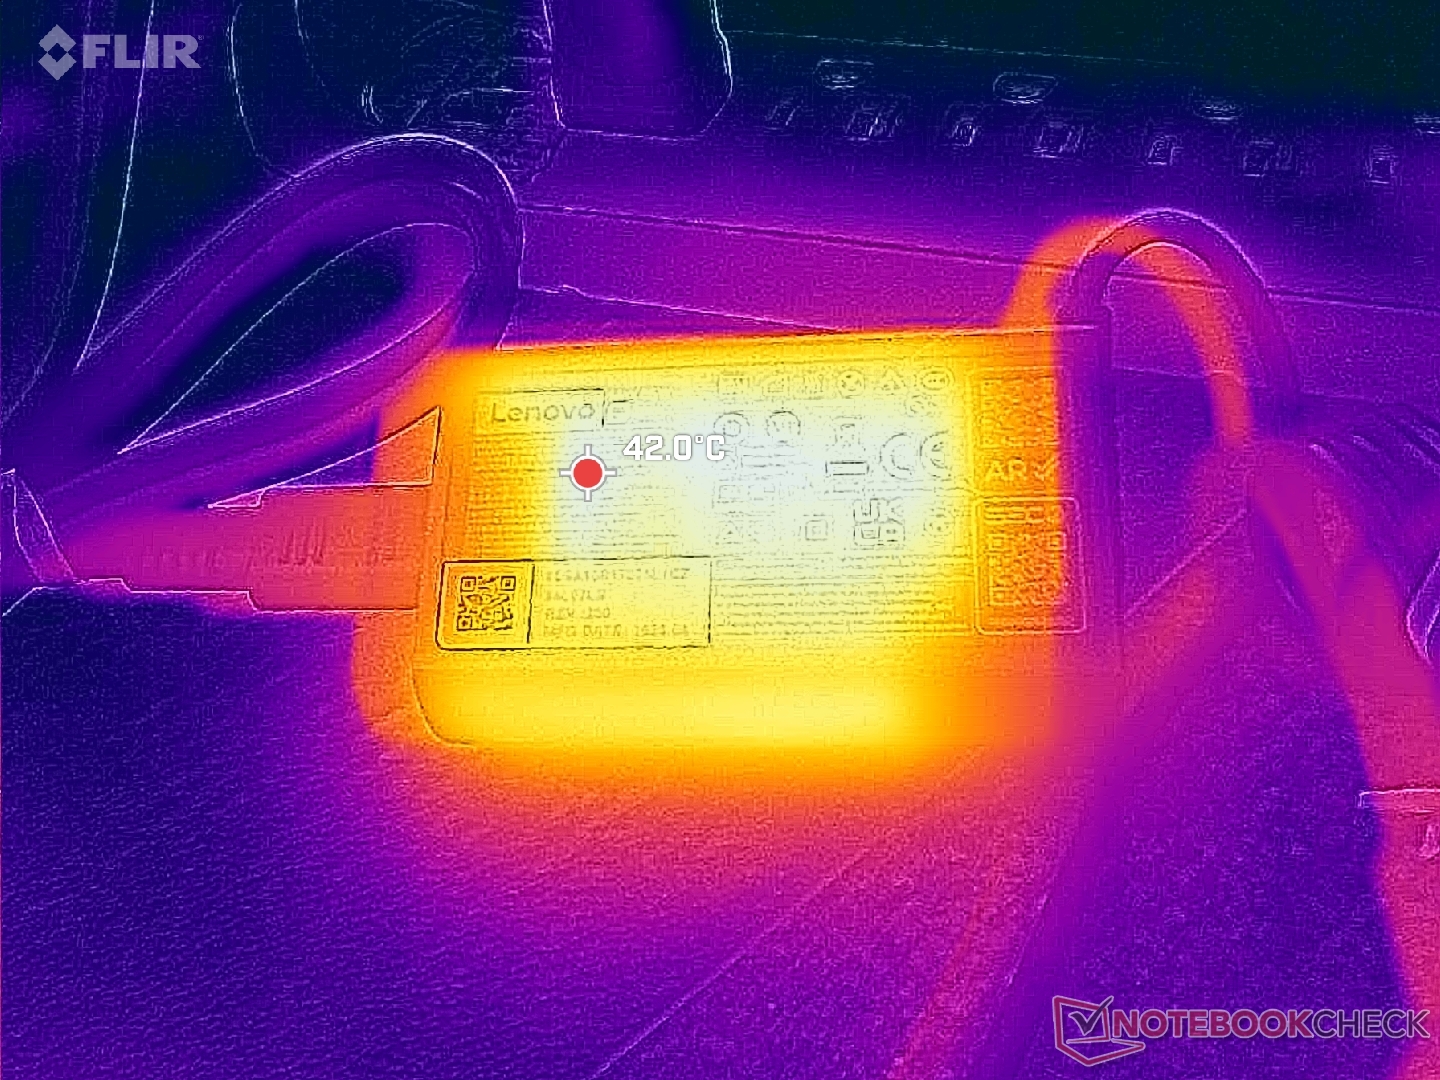
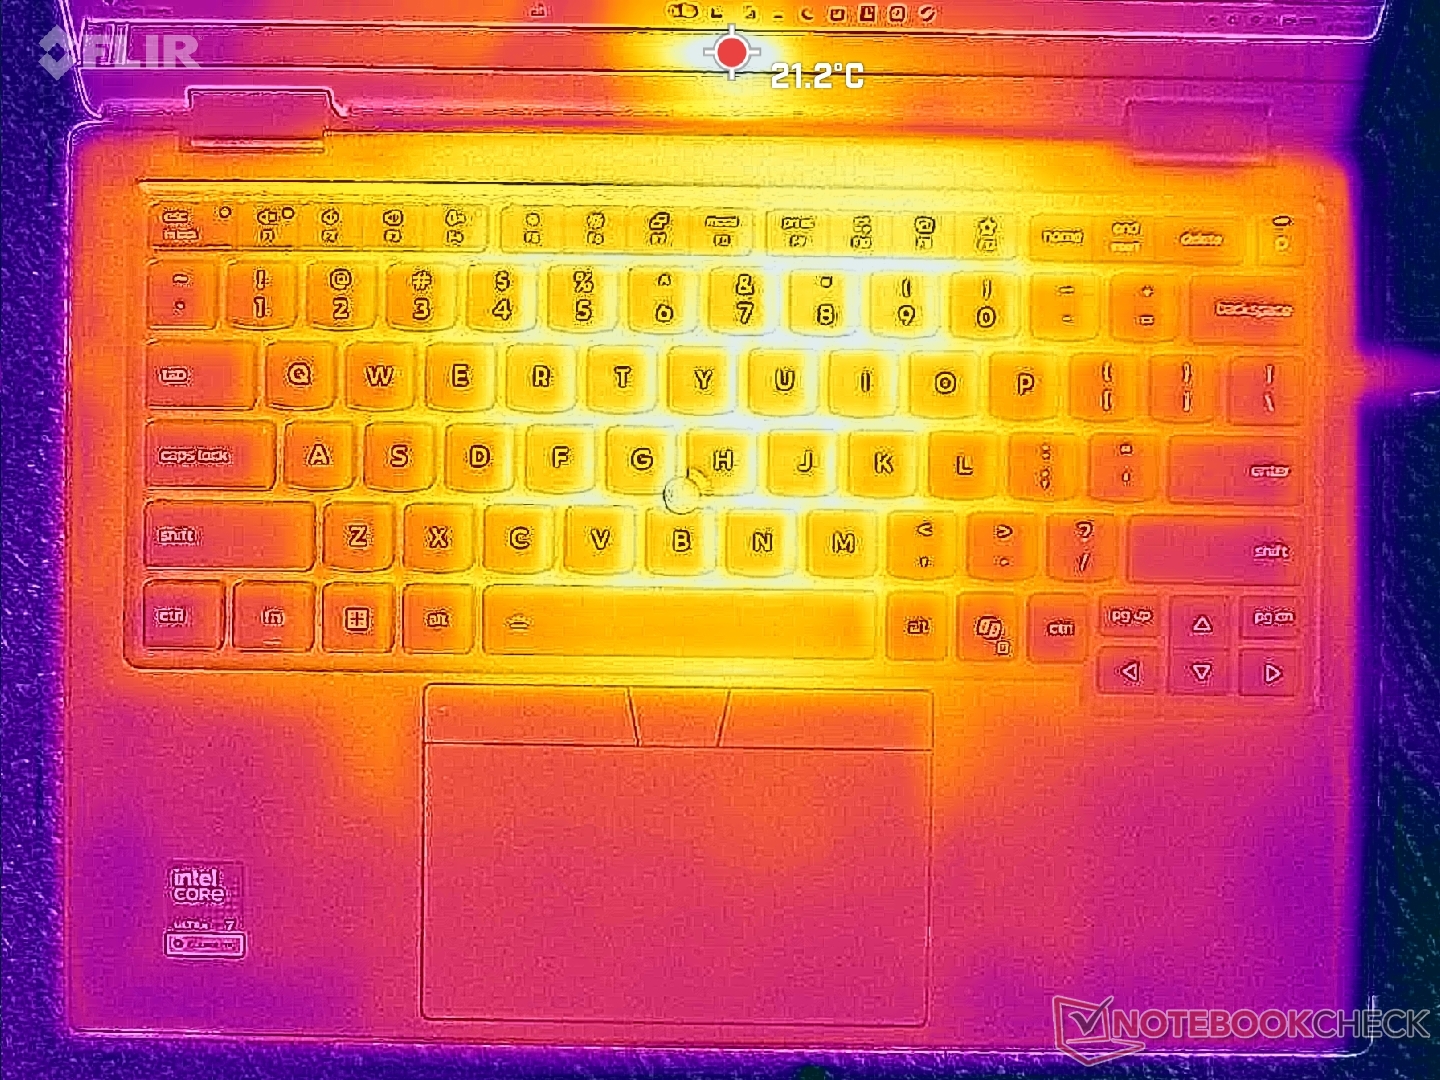
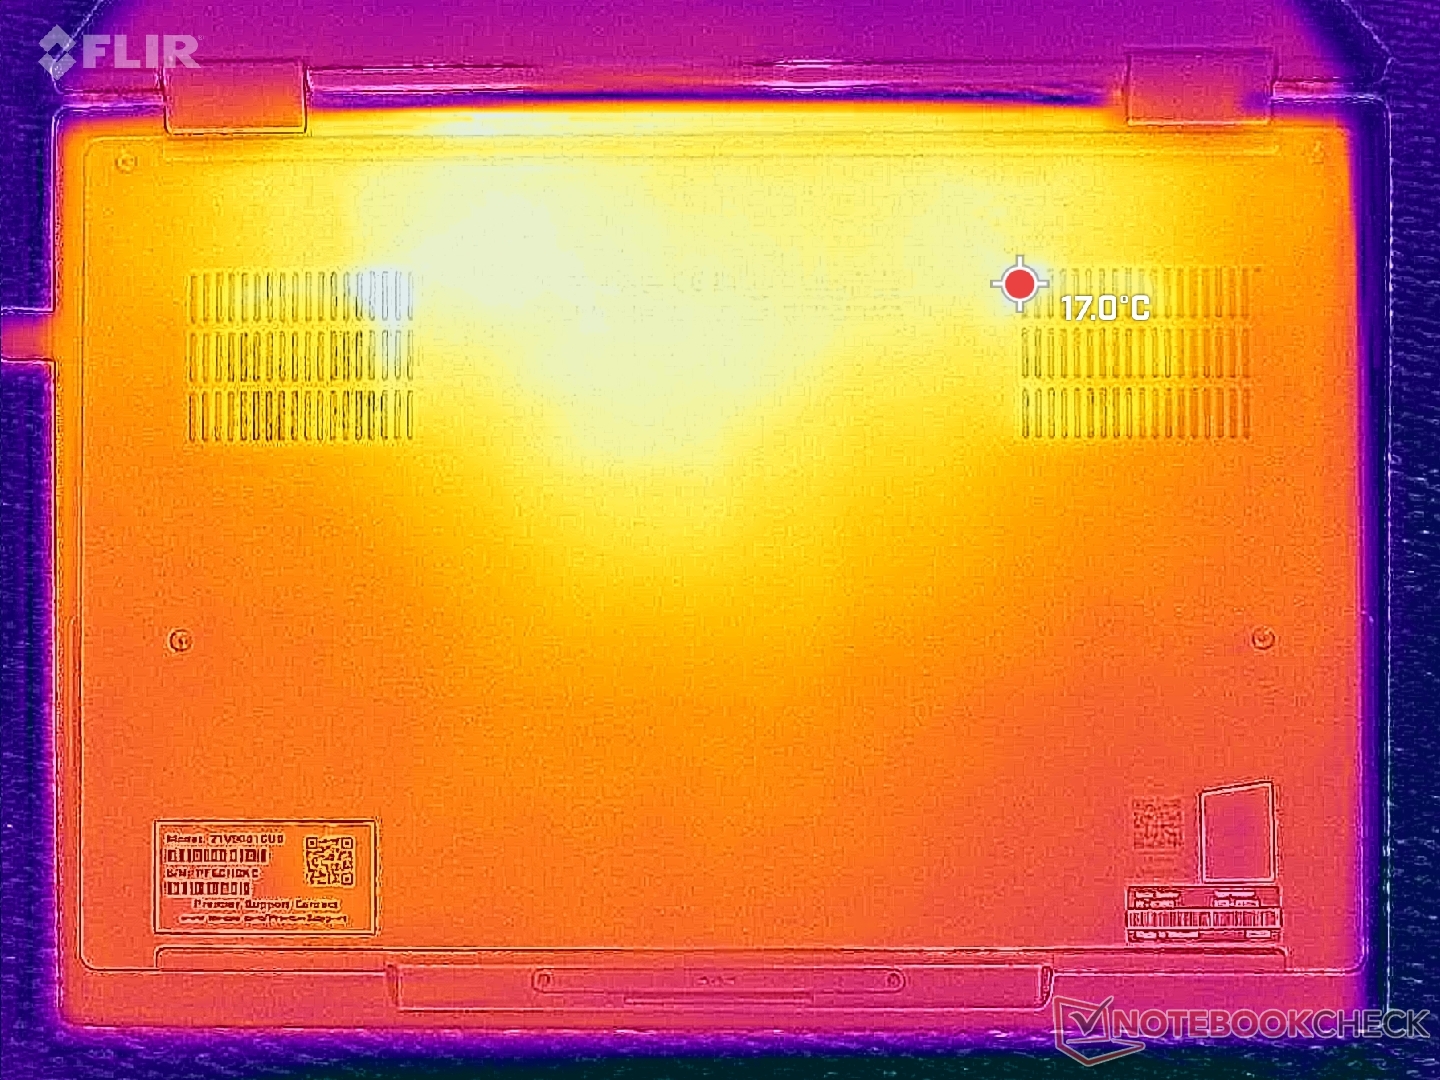
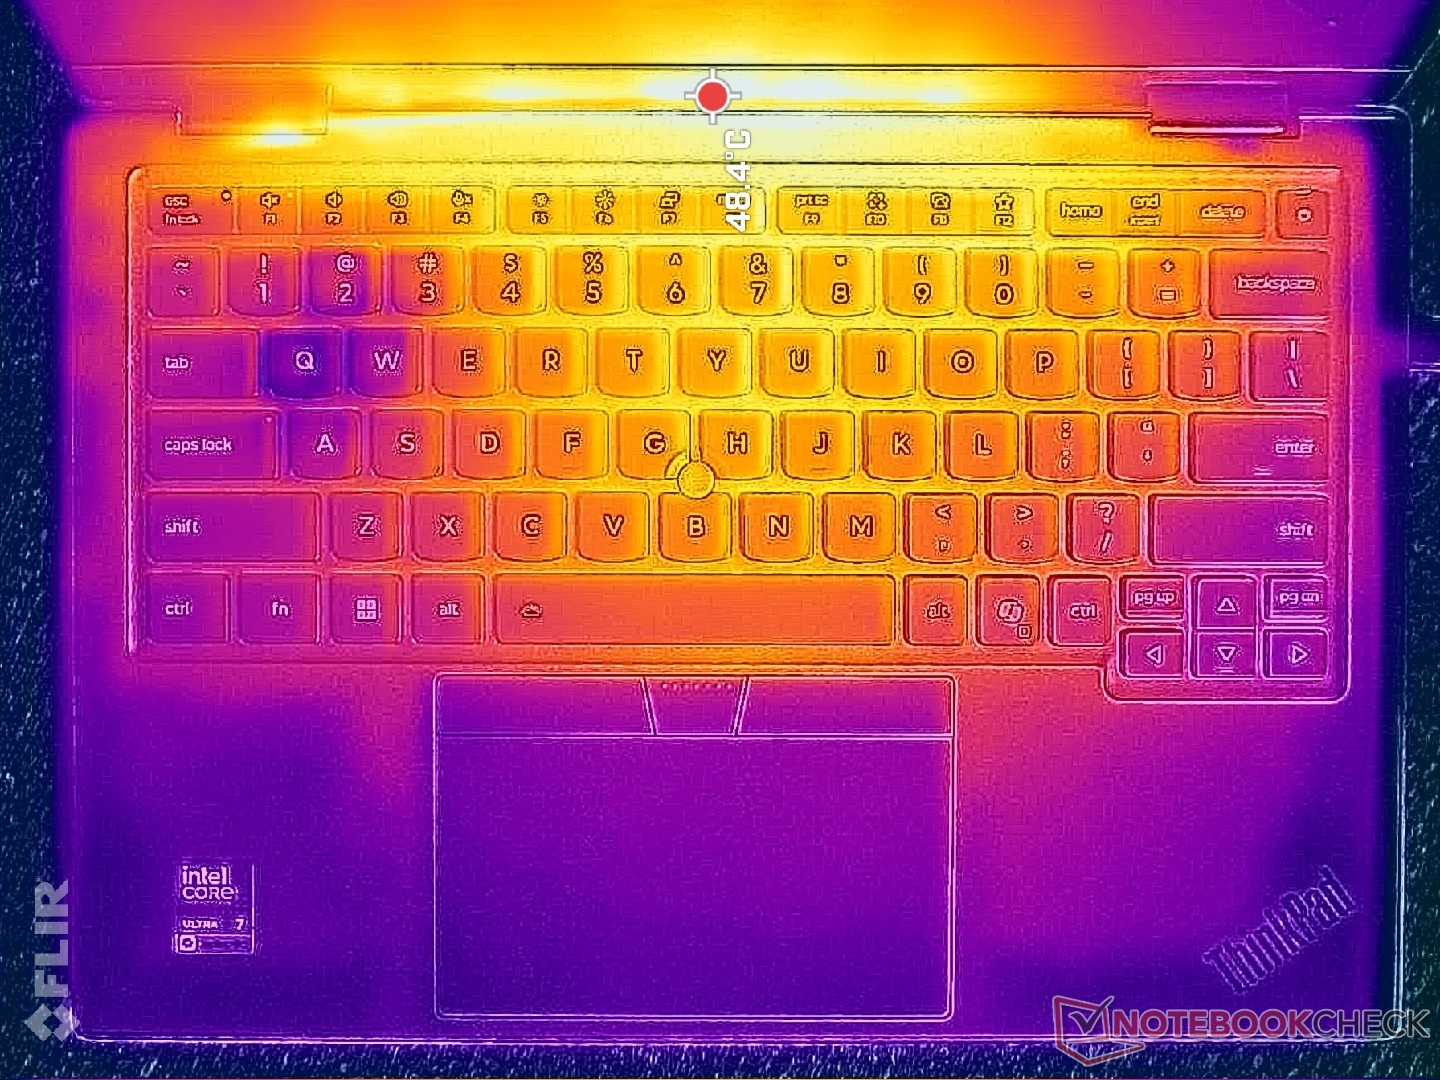
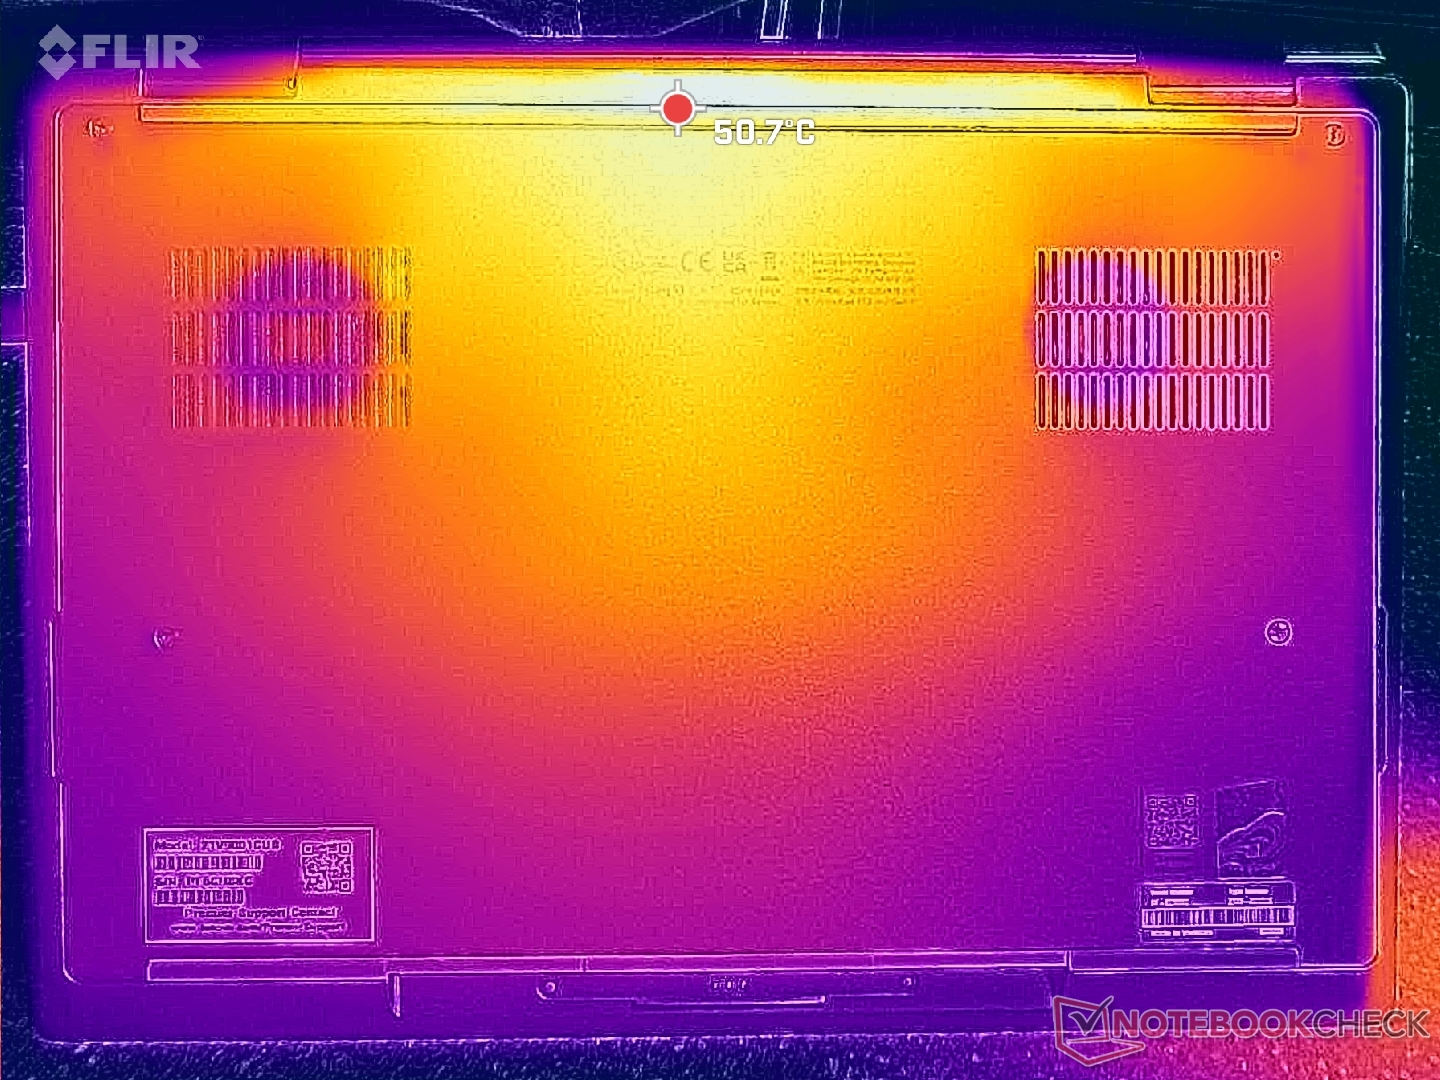
Température
Les températures de surface sont à nouveau très similaires à celles du modèle de l'année dernière, malgré les révisions externes et internes.
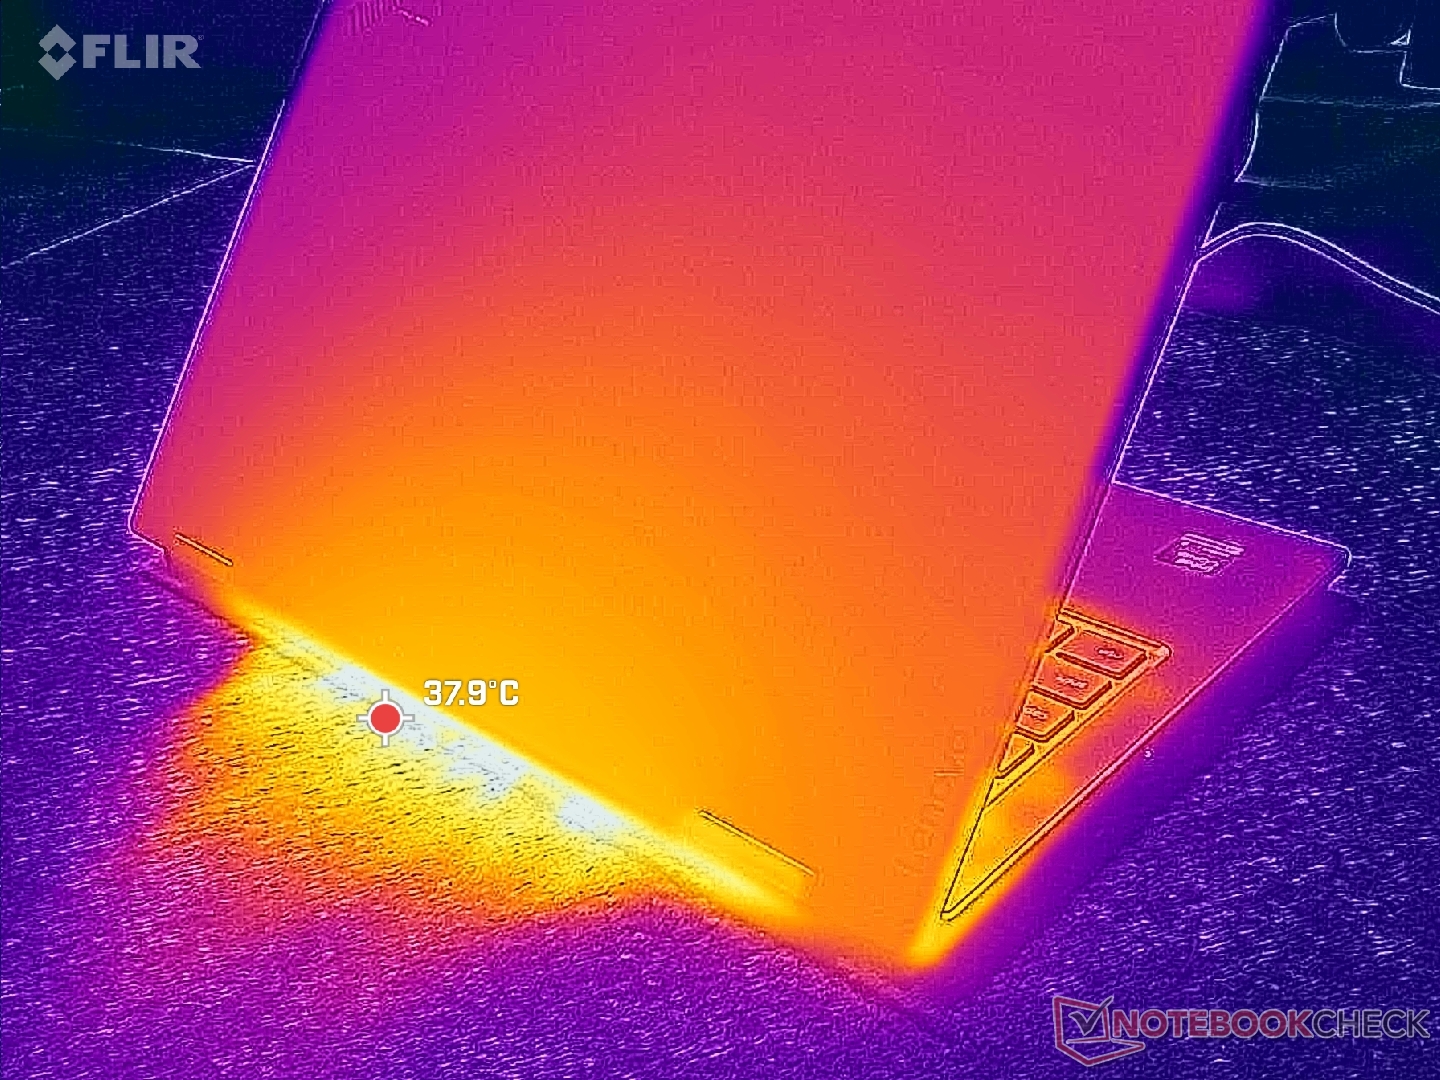
(±) La température maximale du côté supérieur est de 44.2 °C / 112 F, par rapport à la moyenne de 35.4 °C / 96 F, allant de 19.6 à 60 °C pour la classe Convertible.
(+) Le fond chauffe jusqu'à un maximum de 34.6 °C / 94 F, contre une moyenne de 36.9 °C / 98 F
(+) En utilisation inactive, la température moyenne du côté supérieur est de 24.7 °C / 76 F, par rapport à la moyenne du dispositif de 30.3 °C / 87 F.
(+) Les repose-poignets et le pavé tactile sont plus froids que la température de la peau avec un maximum de 28 °C / 82.4 F et sont donc froids au toucher.
(±) La température moyenne de la zone de l'appui-paume de dispositifs similaires était de 28 °C / 82.4 F (0 °C / #0 F).
| Lenovo ThinkPad X1 2-in-1 Gen 11 Ultra 7 355, Intel Graphics 4 Xe3 PTL | Lenovo ThinkPad X1 2-in-1 Gen 10 Core Ultra 7 258V, Arc 140V | Lenovo Yoga Book 9 14IAH10 Ultra 7 255H, Arc 140T | HP EliteBook X Flip G1i 14 AI Core Ultra 7 258V, Arc 140V | Dell Latitude 7450 2-in-1 Ultra 7 165U, Graphics 4-Core iGPU (Arrow Lake) | Asus ExpertBook Ultra B9406CAA Ultra X7 358H, Arc B390 Panther Lake iGPU | |
|---|---|---|---|---|---|---|
| Heat | 2% | -11% | 1% | -5% | 4% | |
| Maximum Upper Side * (°C) | 44.2 | 40 10% | 38.2 14% | 36 19% | 41.2 7% | 38.6 13% |
| Maximum Bottom * (°C) | 34.6 | 38.6 -12% | 38.8 -12% | 41 -18% | 45 -30% | 38.4 -11% |
| Idle Upper Side * (°C) | 26.2 | 25 5% | 32.6 -24% | 26 1% | 27.2 -4% | 24.6 6% |
| Idle Bottom * (°C) | 27.8 | 26.6 4% | 33.8 -22% | 27 3% | 26.2 6% | 26 6% |
* ... Moindre est la valeur, meilleures sont les performances
Test de résistance
Le processeur atteignait 3,7 GHz, 64 W et 96 °C pendant quelques secondes seulement, avant de redescendre légèrement à 3,5 GHz et 45 W. La température du cœur en charge oscillait entre 80 °C et 90 °C.
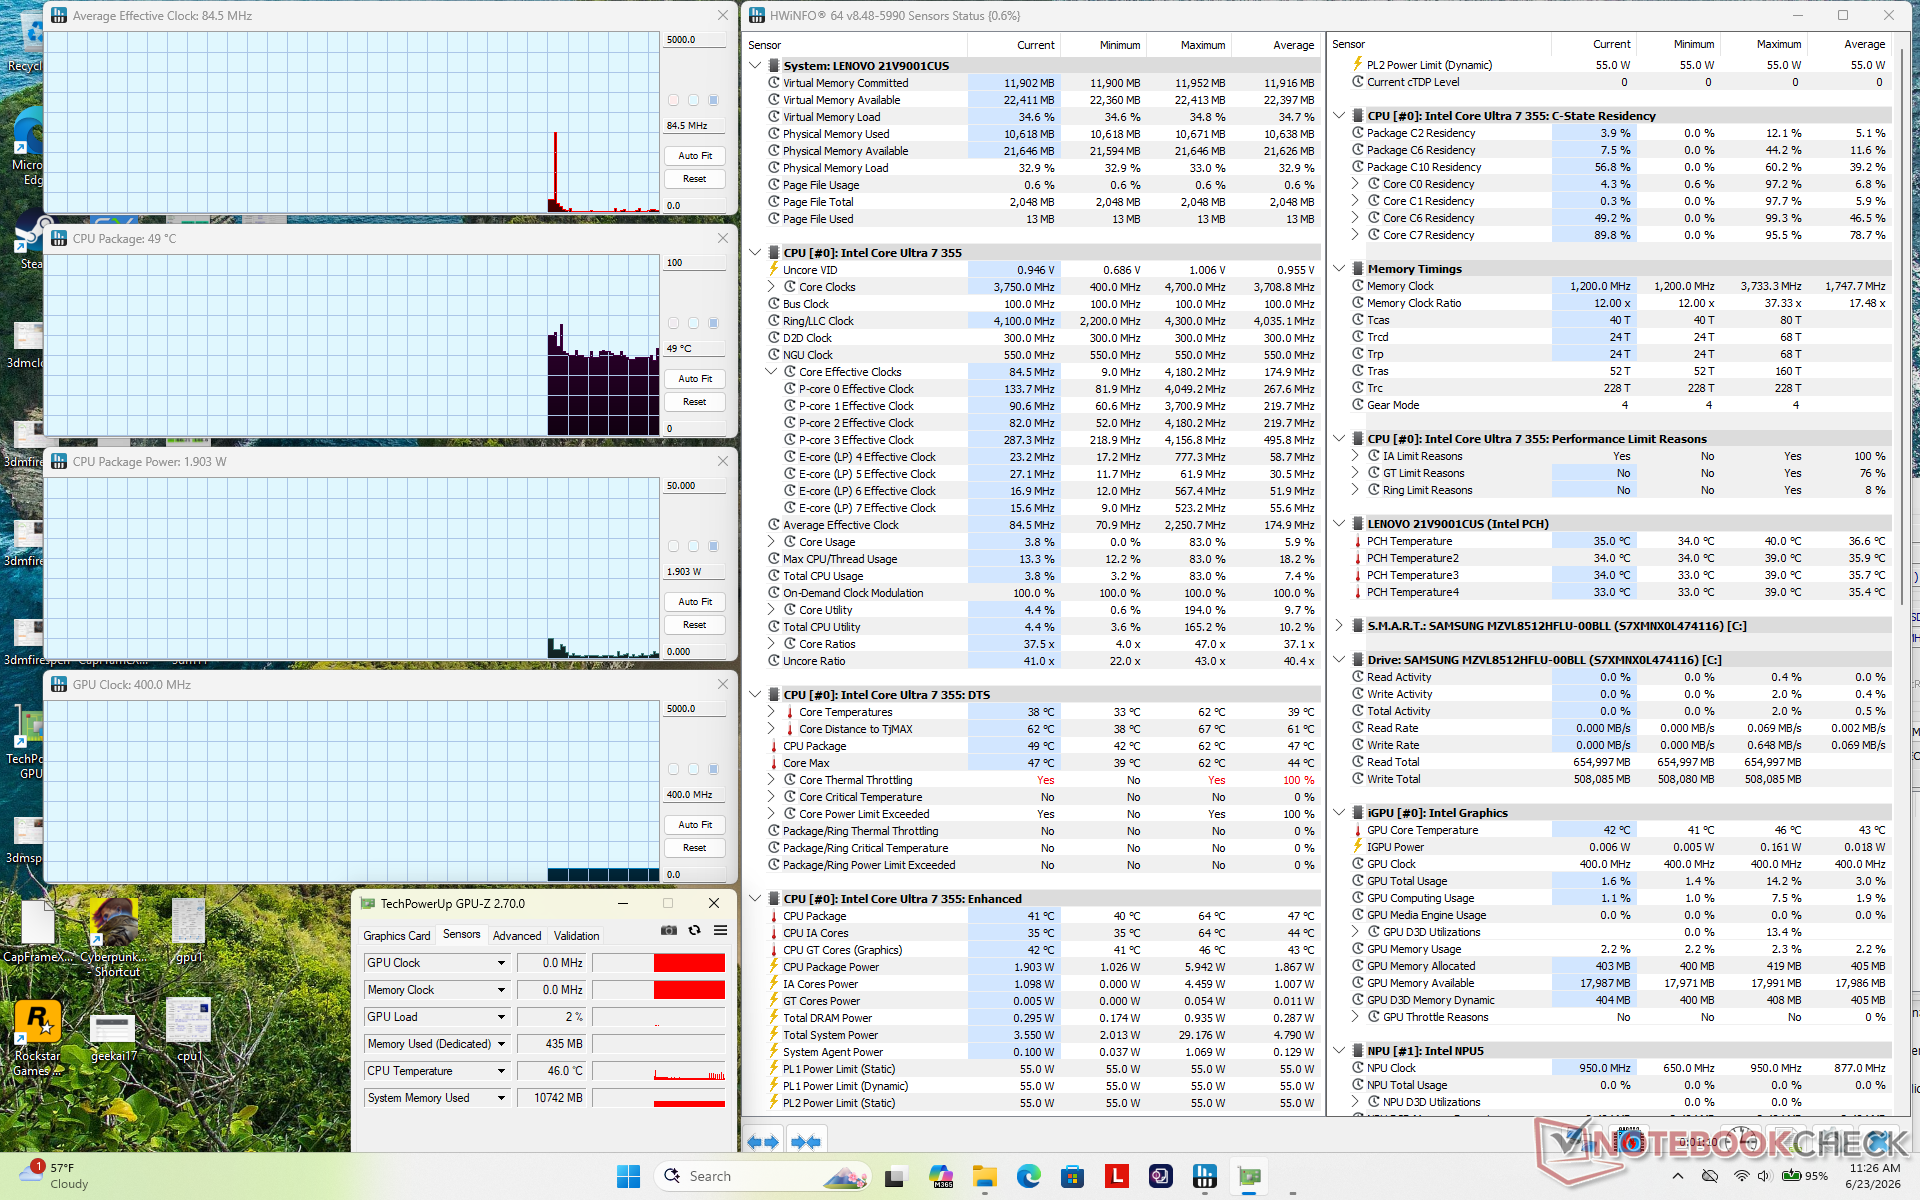
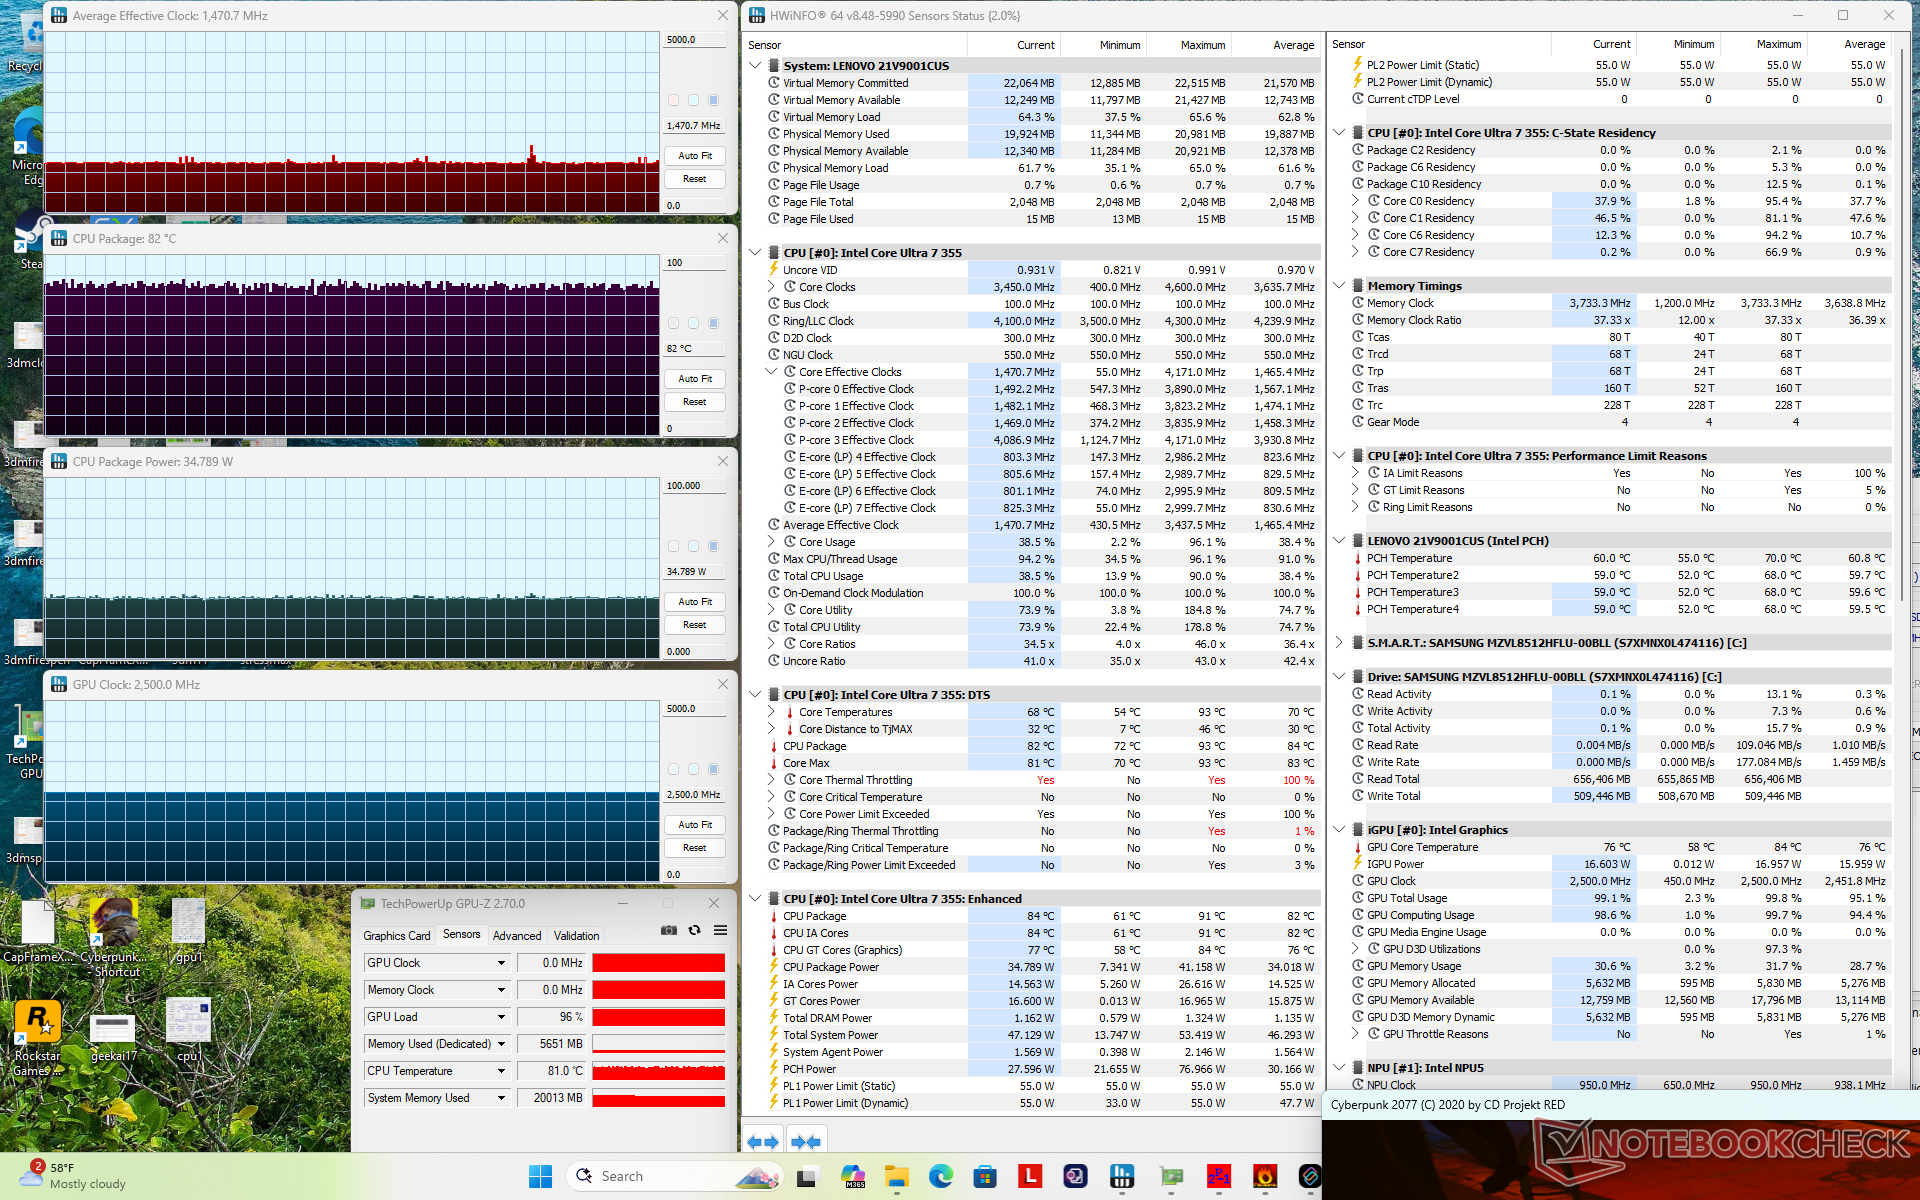
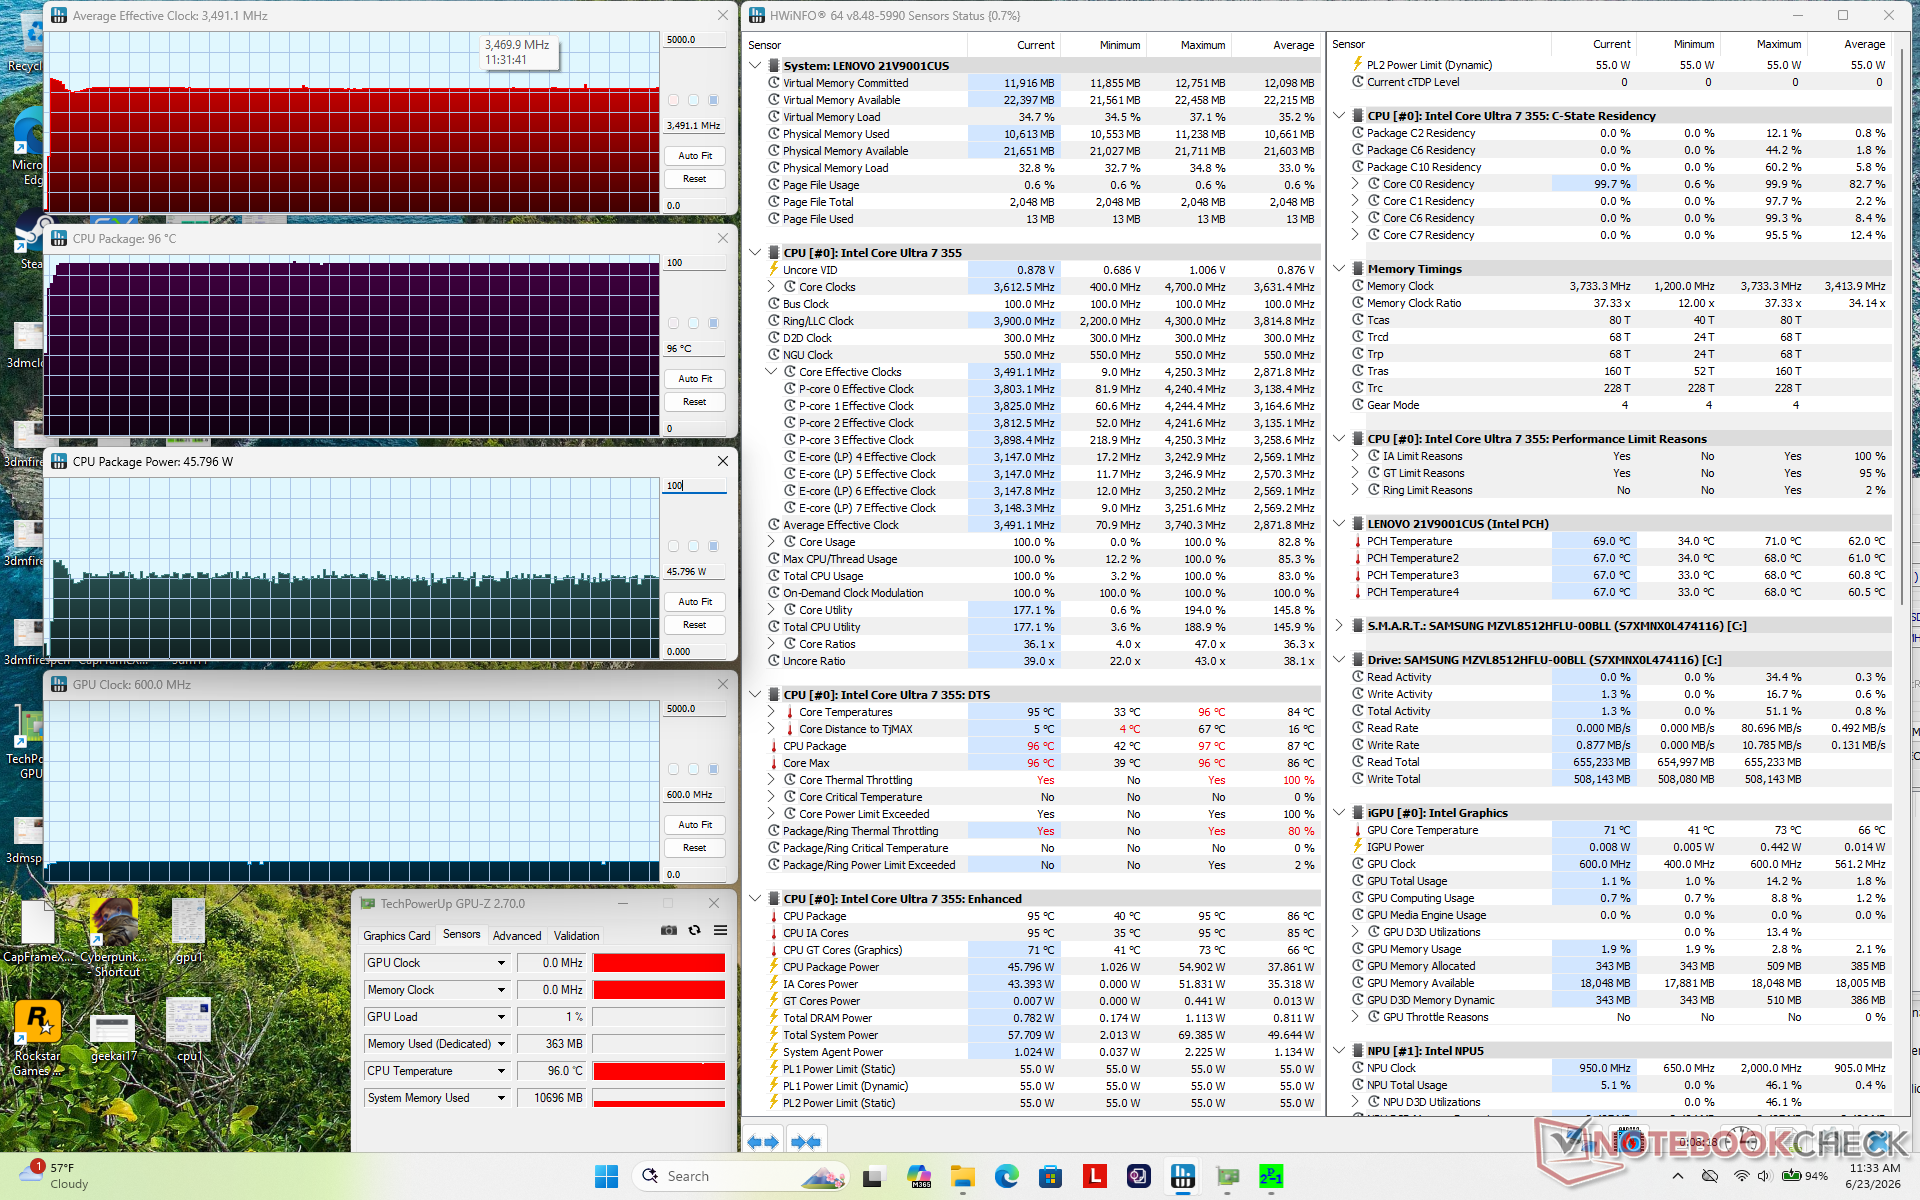
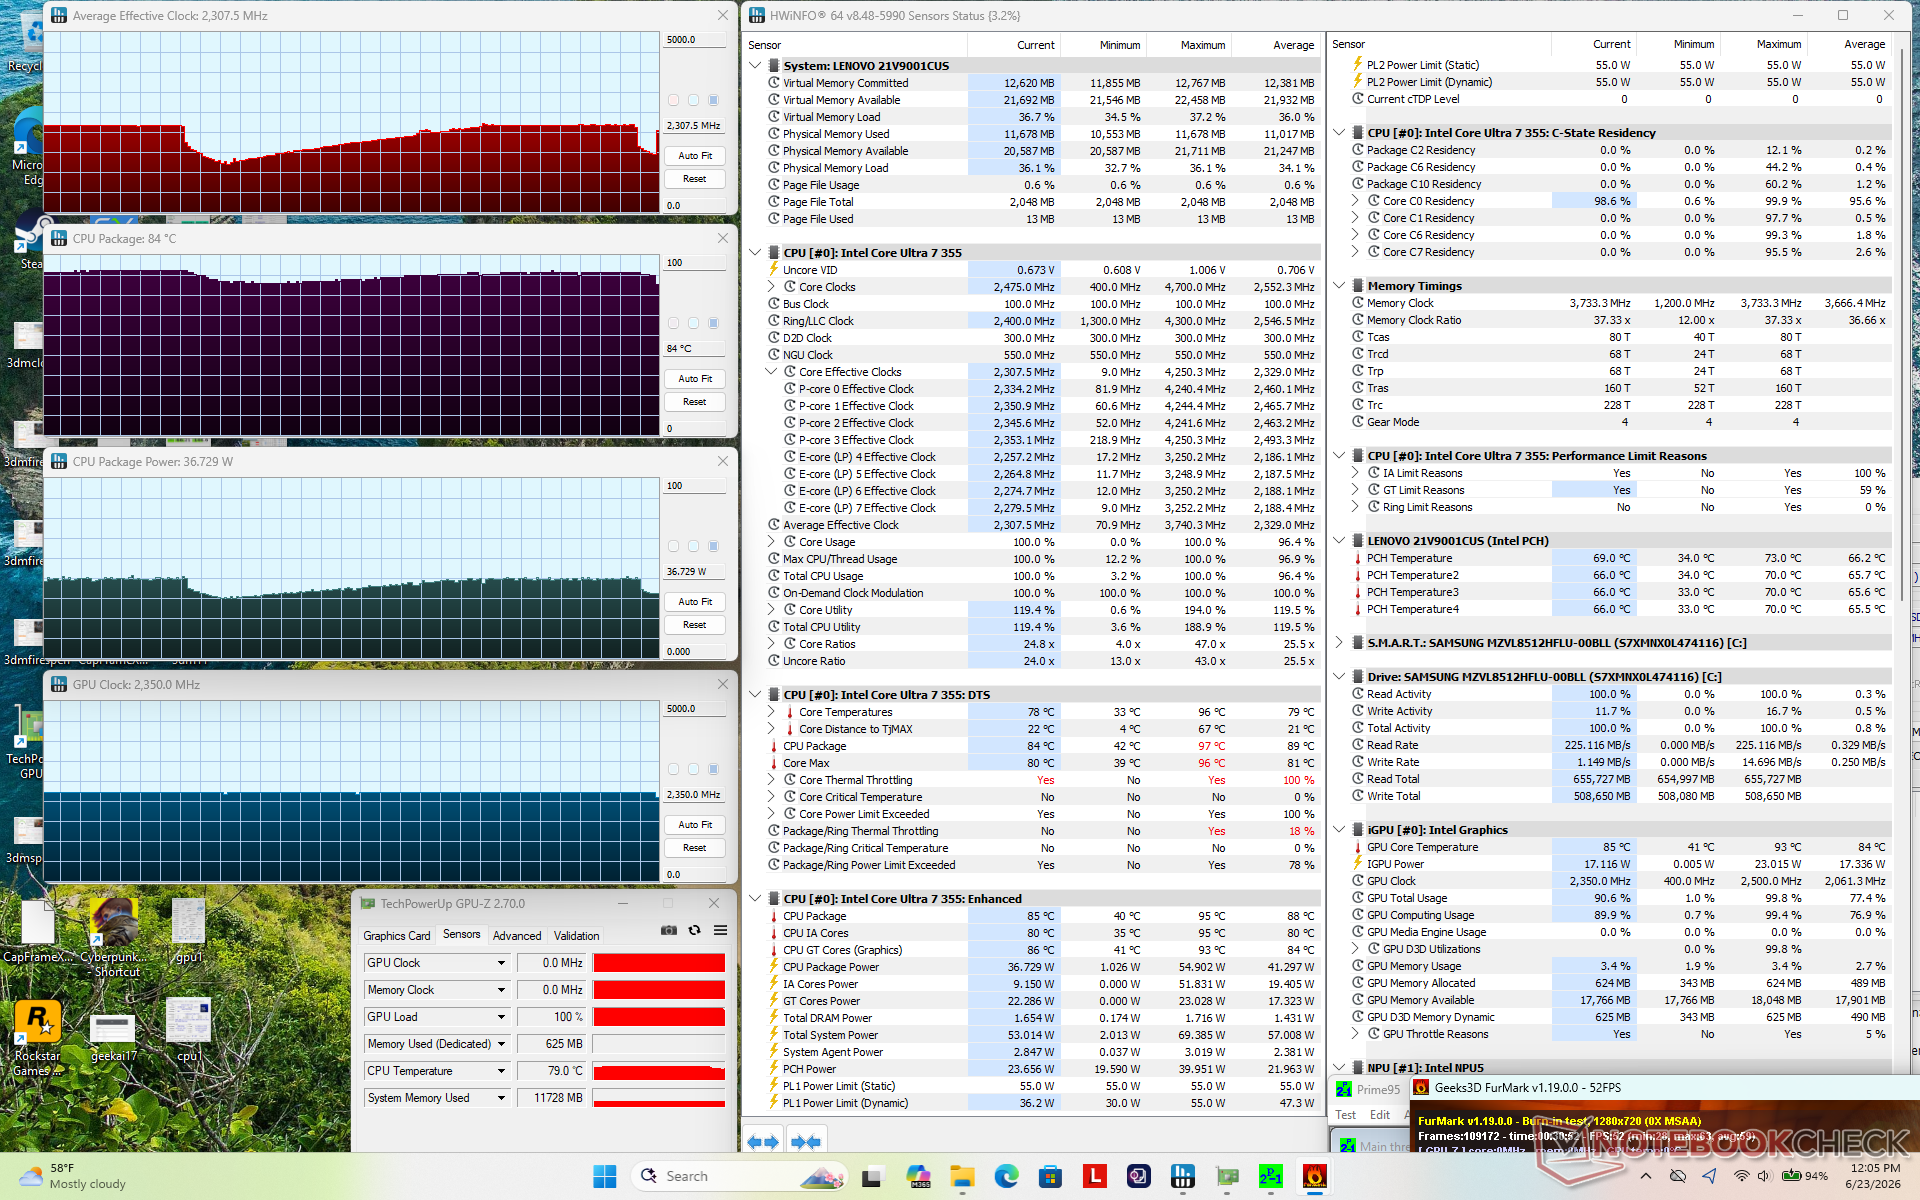
| Fréquence moyenne du processeur (GHz) | Fréquence du GPU (MHz) | Température moyenne du processeur (°C) | |
| Système au repos | -- | -- | 49 |
| Test de charge Prime95 | 3,5 | -- | 96 |
| Test de charge Prime95 + FurMark | 1,4 - 2,5 | 2500 | 84 - 91 |
| Test de charge Cyberpunk 2077 | 1,5 | 2500 | 82 |
Intervenants
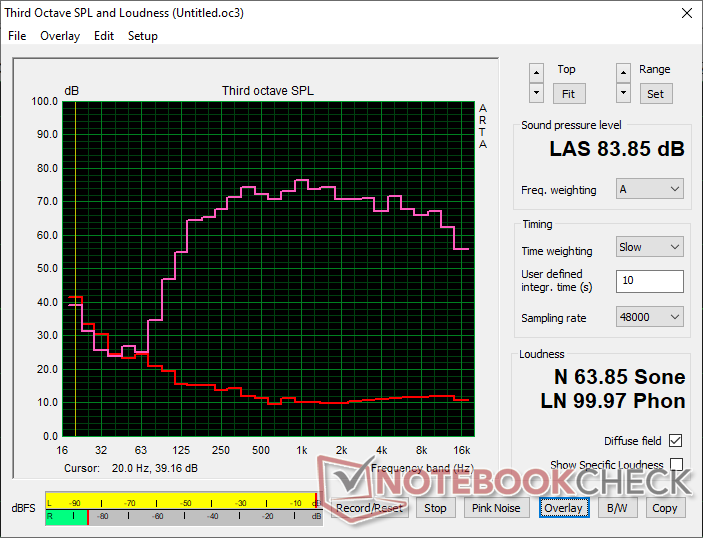
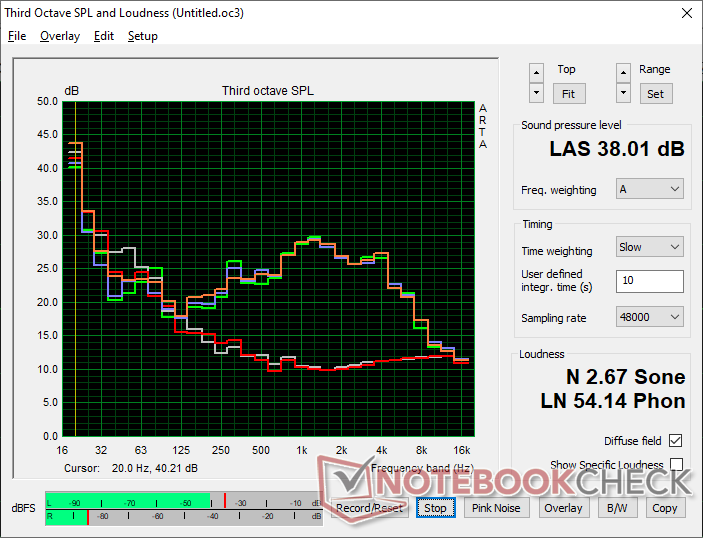
Lenovo ThinkPad X1 2-in-1 Gen 11 analyse audio
(+) | les haut-parleurs peuvent jouer relativement fort (83.9# dB)
Basses 100 - 315 Hz
(±) | basse réduite - en moyenne 9.2% inférieure à la médiane
(±) | la linéarité des basses est moyenne (10.3% delta à la fréquence précédente)
Médiums 400 - 2000 Hz
(+) | médiane équilibrée - seulement 2.5% de la médiane
(+) | les médiums sont linéaires (4.1% delta à la fréquence précédente)
Aiguës 2 - 16 kHz
(+) | des sommets équilibrés - à seulement 2.3% de la médiane
(+) | les aigus sont linéaires (3.7% delta à la fréquence précédente)
Globalement 100 - 16 000 Hz
(+) | le son global est linéaire (9% différence à la médiane)
Par rapport à la même classe
» 4% de tous les appareils testés de cette catégorie étaient meilleurs, 1% similaires, 95% pires
» Le meilleur avait un delta de 6%, la moyenne était de 20%, le pire était de 57%.
Par rapport à tous les appareils testés
» 3% de tous les appareils testés étaient meilleurs, 1% similaires, 96% pires
» Le meilleur avait un delta de 4%, la moyenne était de 24%, le pire était de 134%.
Apple MacBook Pro 16 2021 M1 Pro analyse audio
(+) | les haut-parleurs peuvent jouer relativement fort (84.7# dB)
Basses 100 - 315 Hz
(+) | bonne basse - seulement 3.8% loin de la médiane
(+) | les basses sont linéaires (5.2% delta à la fréquence précédente)
Médiums 400 - 2000 Hz
(+) | médiane équilibrée - seulement 1.3% de la médiane
(+) | les médiums sont linéaires (2.1% delta à la fréquence précédente)
Aiguës 2 - 16 kHz
(+) | des sommets équilibrés - à seulement 1.9% de la médiane
(+) | les aigus sont linéaires (2.7% delta à la fréquence précédente)
Globalement 100 - 16 000 Hz
(+) | le son global est linéaire (4.6% différence à la médiane)
Par rapport à la même classe
» 0% de tous les appareils testés de cette catégorie étaient meilleurs, 0% similaires, 100% pires
» Le meilleur avait un delta de 5%, la moyenne était de 17%, le pire était de 45%.
Par rapport à tous les appareils testés
» 0% de tous les appareils testés étaient meilleurs, 0% similaires, 100% pires
» Le meilleur avait un delta de 4%, la moyenne était de 24%, le pire était de 134%.
Gestion de l'énergie
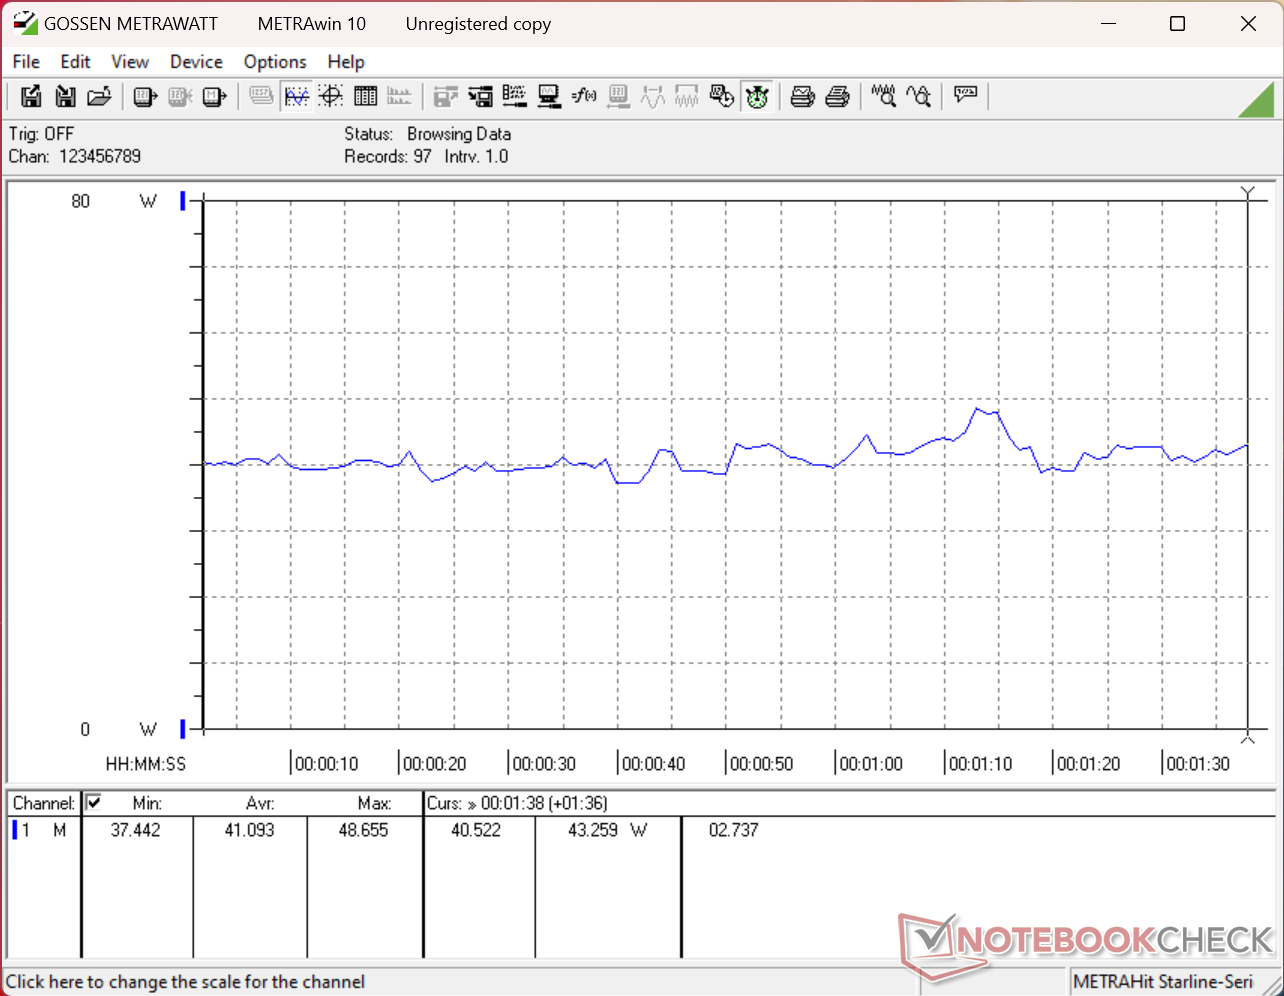
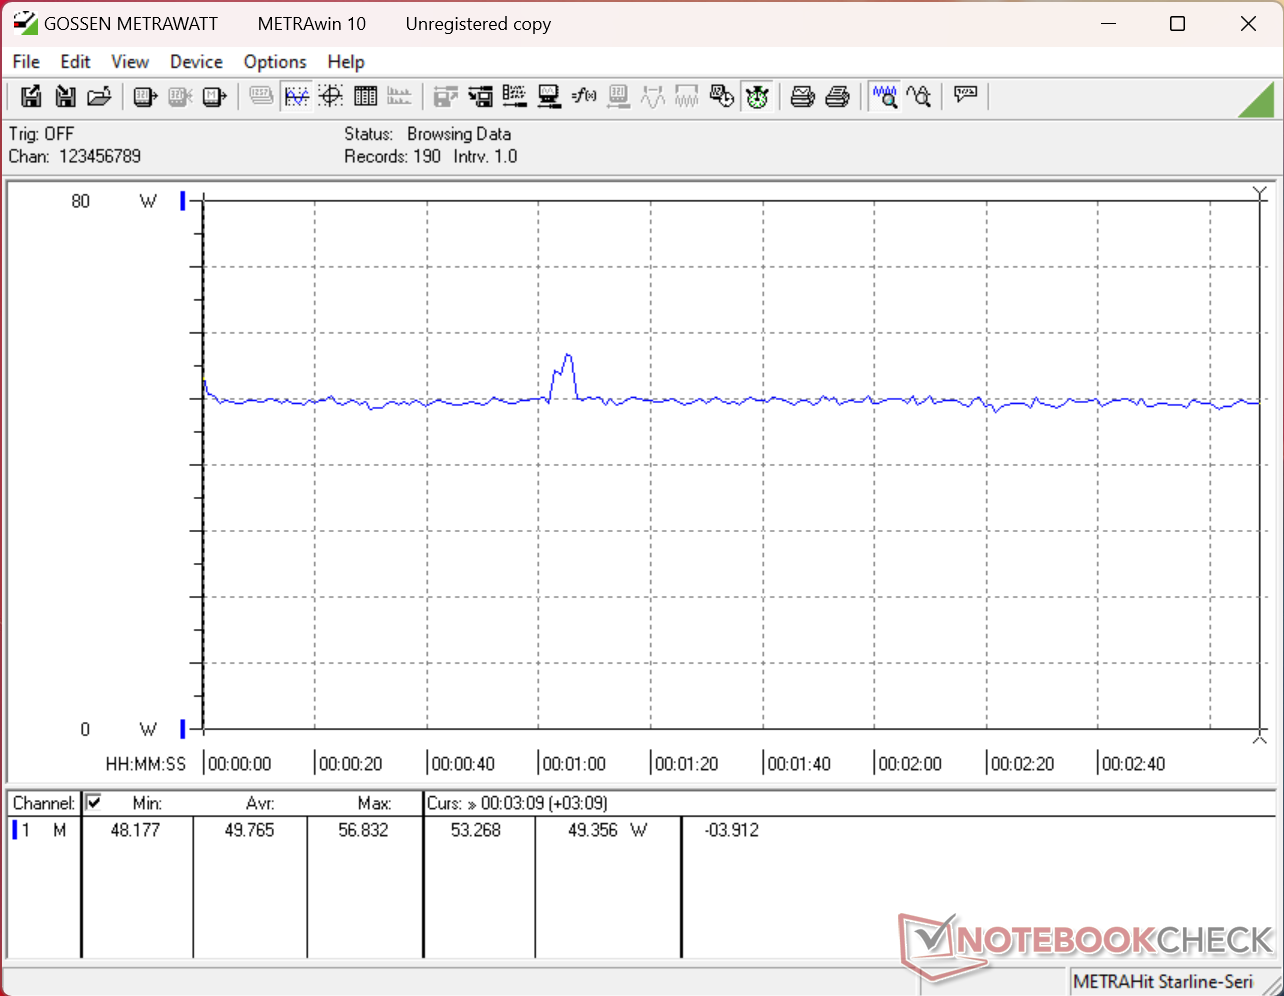
Consommation électrique
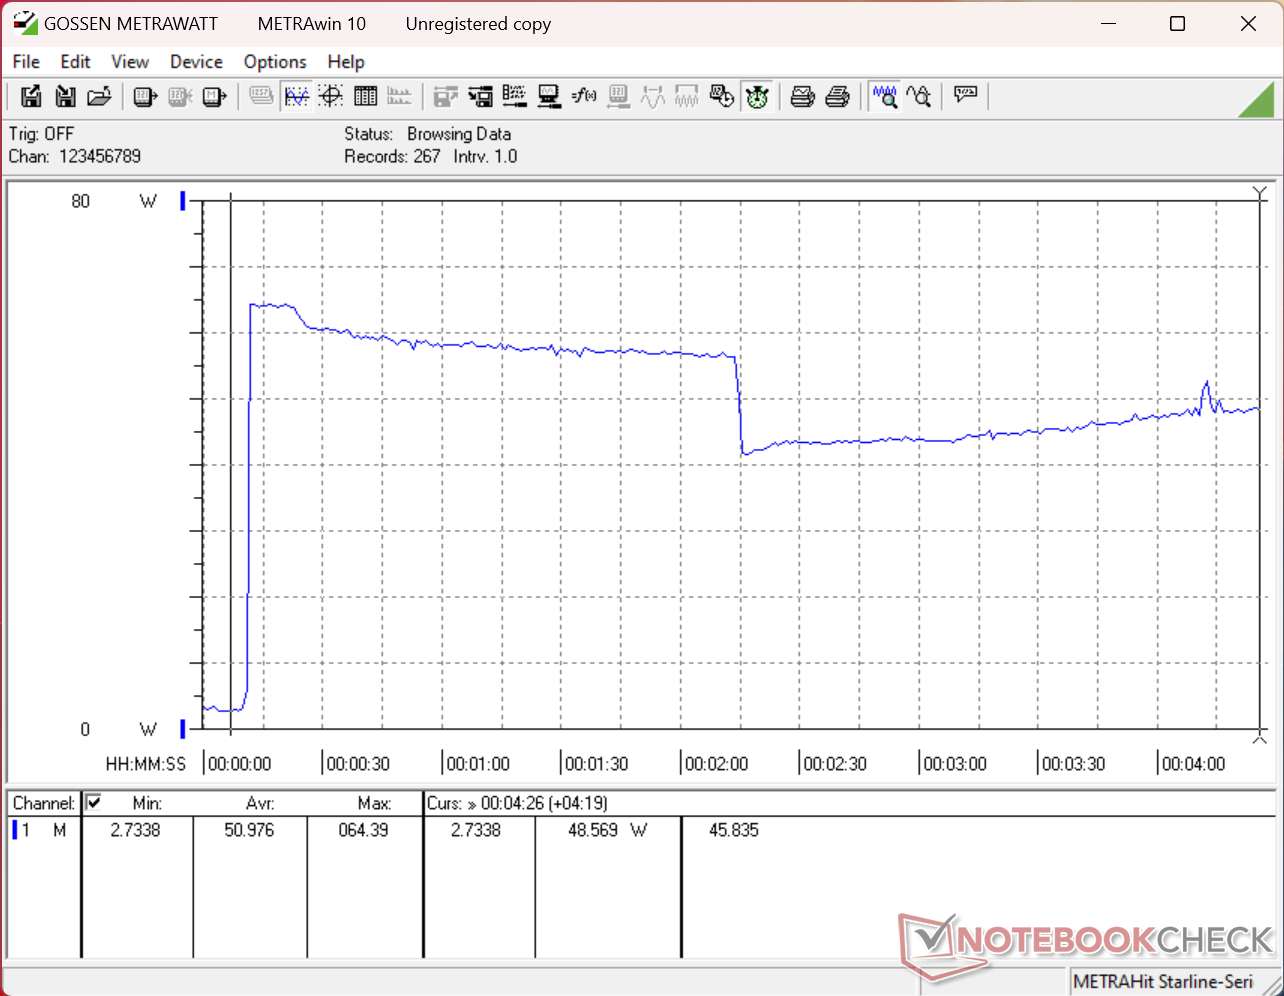
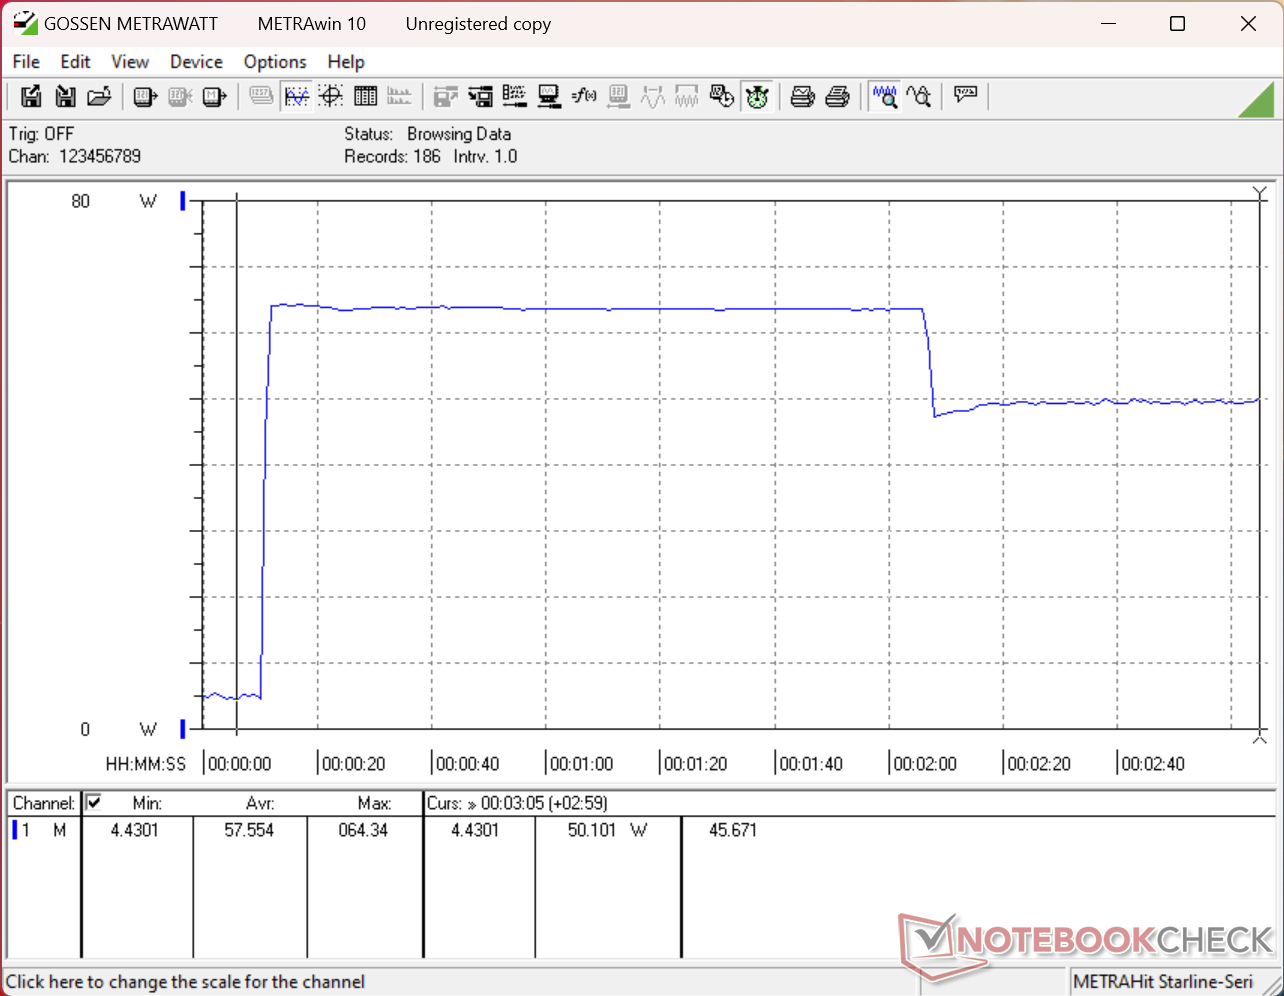
La consommation électrique en charge est plus élevée, bien que plus stable, que celle que nous avions enregistrée sur le modèle de l'année dernière, ce qui correspond aux performances plus rapides et plus stables du processeur et de la carte graphique mentionnées plus haut. La consommation moyenne reste néanmoins assez similaire lors de l'exécution de tâches peu exigeantes, pour des autonomies en Wi-Fi comparables.
| Éteint/en veille | |
| Au repos | |
| Fortement sollicité |
|
Légende:
min: | |
| Lenovo ThinkPad X1 2-in-1 Gen 11 Ultra 7 355, Intel Graphics 4 Xe3 PTL, Samsung PM9C1b MZVL8512HFLU-00BLL, IPS, 1920x1200, 14" | Lenovo ThinkPad X1 2-in-1 Gen 10 Core Ultra 7 258V, Arc 140V, , IPS, 1920x1200, 14" | Lenovo Yoga Book 9 14IAH10 Ultra 7 255H, Arc 140T, Samsung PM9C1a MZAL81T0HDLB, OLED, 2880x1800, 14" | HP EliteBook X Flip G1i 14 AI Core Ultra 7 258V, Arc 140V, Western Digital PC SN5000S SDEPNSJ-1T00-1006, IPS, 1920x1200, 14" | Dell Latitude 7450 2-in-1 Ultra 7 165U, Graphics 4-Core iGPU (Arrow Lake), Micron 2550 512GB, IPS, 1920x1200, 14" | Asus ExpertBook Ultra B9406CAA Ultra X7 358H, Arc B390 Panther Lake iGPU, Samsung PM9E1 MZVLC2T0HBLD, OLED, 2880x1800, 14" | |
|---|---|---|---|---|---|---|
| Power Consumption | 5% | -146% | -24% | -5% | -19% | |
| Idle Minimum * (Watt) | 1.9 | 1.5 21% | 9.9 -421% | 2.9 -53% | 2.23 -17% | 3.5 -84% |
| Idle Average * (Watt) | 4.7 | 4.8 -2% | 11.6 -147% | 8.2 -74% | 5.36 -14% | 4 15% |
| Idle Maximum * (Watt) | 5 | 5 -0% | 23.2 -364% | 8.6 -72% | 6.8 -36% | 5.3 -6% |
| Load Average * (Watt) | 41 | 44.2 -8% | 58.5 -43% | 39.6 3% | 51.2 -25% | 43.7 -7% |
| Cyberpunk 2077 ultra * (Watt) | 49.8 | 47.8 4% | 58.5 -17% | 41.9 16% | 29.5 41% | 61.3 -23% |
| Cyberpunk 2077 ultra external monitor * (Watt) | 47.4 | 39.3 17% | 56.6 -19% | 36.4 23% | 34.6 27% | 61.4 -30% |
| Load Maximum * (Watt) | 64.3 | 60.2 6% | 70.1 -9% | 70 -9% | 69.9 -9% | 63.4 1% |
* ... Moindre est la valeur, meilleures sont les performances
Consommation électrique : Cyberpunk / Test de charge
Consommation électrique du moniteur externe
Autonomie de la batterie
| Lenovo ThinkPad X1 2-in-1 Gen 11 Ultra 7 355, Intel Graphics 4 Xe3 PTL, 58 Wh | Lenovo ThinkPad X1 2-in-1 Gen 10 Core Ultra 7 258V, Arc 140V, 57 Wh | Lenovo Yoga Book 9 14IAH10 Ultra 7 255H, Arc 140T, 88 Wh | HP EliteBook X Flip G1i 14 AI Core Ultra 7 258V, Arc 140V, 68 Wh | Dell Latitude 7450 2-in-1 Ultra 7 165U, Graphics 4-Core iGPU (Arrow Lake), 57 Wh | Asus ExpertBook Ultra B9406CAA Ultra X7 358H, Arc B390 Panther Lake iGPU, 70 Wh | |
|---|---|---|---|---|---|---|
| Autonomie de la batterie | 0% | -72% | -16% | -50% | -26% | |
| WiFi v1.3 (h) | 21.9 | 22 0% | 6.1 -72% | 18.4 -16% | 11 -50% | 16.1 -26% |
| H.264 (h) | 20.6 | 12.4 | ||||
| Load (h) | 2.1 |
Note de Notebookcheck
Le ThinkPad X1 2-en-1 de 11e génération, dans sa nouvelle version, présente un design plus professionnel et peut s'avérer nettement plus rapide qu'auparavant, selon la configuration choisie. Toutefois, le stylet, de par sa finesse, n'est pas idéal d'un point de vue ergonomique.
Lenovo ThinkPad X1 2-in-1 Gen 11
- 06/27/2026 v8
Allen Ngo
 Total Sustainability Score:
 Comparaison des concurrents potentiels
Image | Modèle | Prix | Poids | Épaisseur | Écran |
|---|---|---|---|---|---|
1. 89.5%  | Lenovo ThinkPad X1 2-in-1 Gen 11 Intel Core Ultra 7 355 ⎘ Intel Graphics 4 Xe3 Panther Lake iGPU ⎘ 32 Go Mémoire, 512 Go SSD | Amazon: Prix de liste: 2700 USD | 1.3 kg | 17.9 mm | 14.00" 1920x1200 162 PPI IPS |
2. 88.8%  | Lenovo ThinkPad X1 2-in-1 Gen 10 Intel Core Ultra 7 258V ⎘ Intel Arc Graphics 140V ⎘ 32 Go Mémoire | Amazon: Prix de liste: 2300 USD | 1.4 kg | 18.3 mm | 14.00" 1920x1200 162 PPI IPS |
3. 83.4%  | Lenovo Yoga Book 9 14IAH10 Intel Core Ultra 7 255H ⎘ Intel Arc Graphics 140T ⎘ 16 Go Mémoire, 1024 Go SSD | Amazon: | 1.2 kg | 15.5 mm | 14.00" 2880x1800 243 PPI OLED |
4. 89.9%  | HP EliteBook X Flip G1i 14 AI Intel Core Ultra 7 258V ⎘ Intel Arc Graphics 140V ⎘ 32 Go Mémoire, 1000 Go SSD | Amazon: Prix de liste: 2889 Euro | 1.5 kg | 14.7 mm | 14.00" 1920x1200 162 PPI IPS |
5. 87.7%  | Dell Latitude 7450 2-in-1 Intel Core Ultra 7 165U ⎘ Intel Graphics 4-Core iGPU (Meteor / Arrow Lake) ⎘ 32 Go Mémoire, 512 Go SSD | Amazon: $1,019.95 Prix de liste: 2279 USD | 1.5 kg | 17.1 mm | 14.00" 1920x1200 162 PPI IPS |
6. 87.6%  | Asus ExpertBook Ultra B9406CAA Intel Core Ultra X7 358H ⎘ Intel Arc B390 12 Xe3 Panther Lake iGPU ⎘ 32 Go Mémoire, 2048 Go SSD | Amazon: | 1.1 kg | 15.9 mm | 14.00" 2880x1800 243 PPI OLED |
Transparency
La sélection des appareils à examiner est effectuée par notre équipe éditoriale. L'échantillon de test a été prêté à l'auteur par le fabricant ou le détaillant pour les besoins de cet examen. Le prêteur n'a pas eu d'influence sur cette évaluation et le fabricant n'a pas reçu de copie de cette évaluation avant sa publication. Il n'y avait aucune obligation de publier cet article. En tant que média indépendant, Notebookcheck n'est pas soumis à l'autorité des fabricants, des détaillants ou des éditeurs.
Voici comment Notebookcheck teste
Chaque année, Notebookcheck examine de manière indépendante des centaines d'ordinateurs portables et de smartphones en utilisant des procédures standardisées afin de garantir que tous les résultats sont comparables. Nous avons continuellement développé nos méthodes de test depuis environ 20 ans et avons établi des normes industrielles dans le processus. Dans nos laboratoires de test, des équipements de mesure de haute qualité sont utilisés par des techniciens et des rédacteurs expérimentés. Ces tests impliquent un processus de validation en plusieurs étapes. Notre système d'évaluation complexe repose sur des centaines de mesures et de points de référence bien fondés, ce qui garantit l'objectivité.
