Test du MSI Raider GE78 HX 13VH : Core i9-13950HX de 13e génération et GeForce RTX 4080
Dévoilé au CES 2023le Raider GE78 16:10 17,0 pouces succède au Raider GE77 16:9 17,3 pouces de 2022 avec des composants internes améliorés et un tout nouveau design de châssis. Il est équipé de CPU Intel Raptor Lake-H et de GPU mobiles GeForce 40 parmi les plus puissants actuellement disponibles sur un modèle d'ordinateur portable. La série GE de MSI se situe juste en dessous de la série GT77 Titan, encore plus chère et plus grande, en termes de classification.
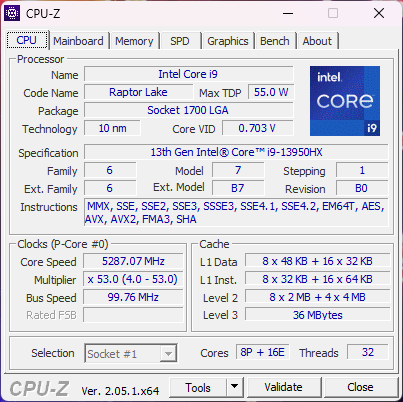
Les SKU vont du CPU Core i9-13950HX de 13e génération, du GPU RTX 4070 de 140 W GeForce et de l'écran IPS 1920 x 1200 165 Hz jusqu'au Core i9-13980HX, RTX 4090 de 175 W et écran IPS 2560 x 1600 240 Hz pour environ 4200 USD. Notre unité de test spécifique est une configuration de milieu de gamme supérieure avec le Core i9-13950HX, 175 W RTX 4080, et un écran 1600p pour environ $3700 USD.
Les concurrents du GE78 comprennent d'autres ordinateurs portables de jeu haut de gamme de 17 pouces comme le Razer Blade 17, Asus ROG Strix Scar 17,Alienware m17 R5ou leEluktronics Mech-17 GP2. Une version 16,0 pouces est également disponible sous le nom de Raider GE68.
Plus d'avis sur MSI :
Comparaison avec les concurrents potentiels
Note | Date | Modèle | Poids | Épaisseur | Taille | Résolution | Prix |
|---|---|---|---|---|---|---|---|
| 88.3 % v7 (old) | 03/23 | MSI GE78HX 13VH-070US i9-13950HX, GeForce RTX 4080 Laptop GPU | 3 kg | 23 mm | 17.00" | 2560x1600 | |
| 89.9 % v7 (old) | 03/23 | Eluktronics Mech-17 GP2 i9-13900HX, GeForce RTX 4090 Laptop GPU | 2.9 kg | 27 mm | 17.00" | 2560x1600 | |
| 88.4 % v7 (old) | 04/23 | Asus ROG Strix G17 G713PI R9 7945HX, GeForce RTX 4070 Laptop GPU | 2.8 kg | 30.7 mm | 17.30" | 2560x1440 | |
| 89 % v7 (old) | 02/23 | MSI Titan GT77 HX 13VI i9-13950HX, GeForce RTX 4090 Laptop GPU | 3.5 kg | 23 mm | 17.30" | 3840x2160 | |
| 86.8 % v7 (old) | 07/22 | MSI Raider GE77 HX 12UHS i9-12900HX, GeForce RTX 3080 Ti Laptop GPU | 3.1 kg | 25.9 mm | 17.30" | 3840x2160 | |
| 89.9 % v7 (old) | 07/22 | Razer Blade 17 Early 2022 i9-12900H, GeForce RTX 3080 Ti Laptop GPU | 2.8 kg | 19.9 mm | 17.30" | 3840x2160 |
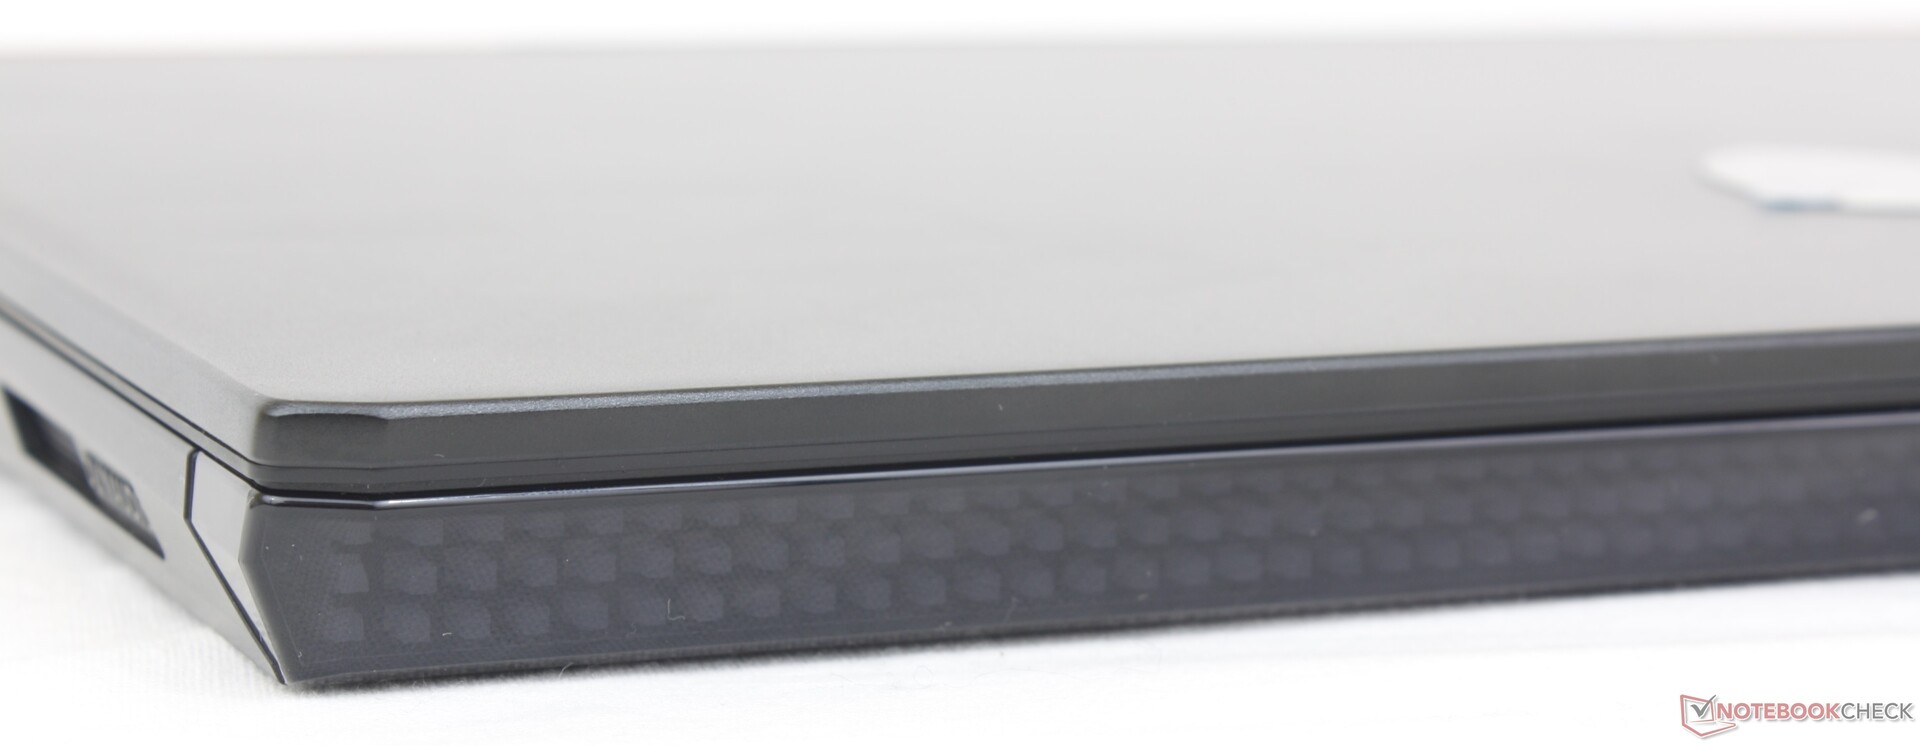
Mallette - Rétro-futuriste
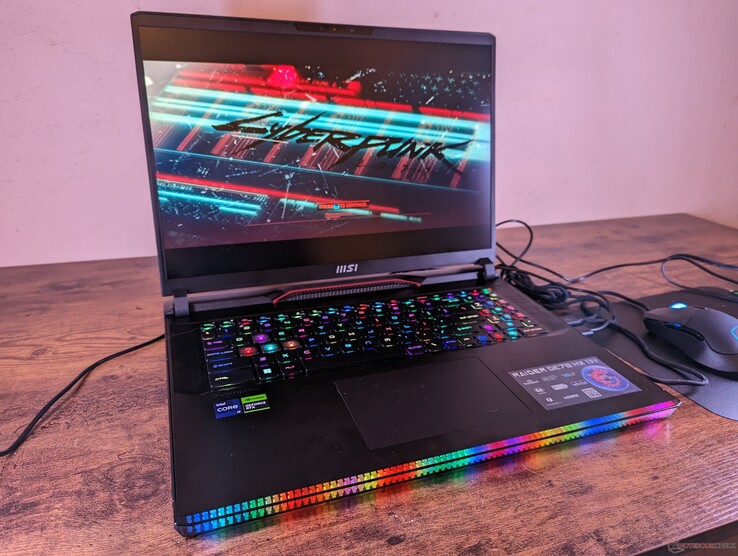
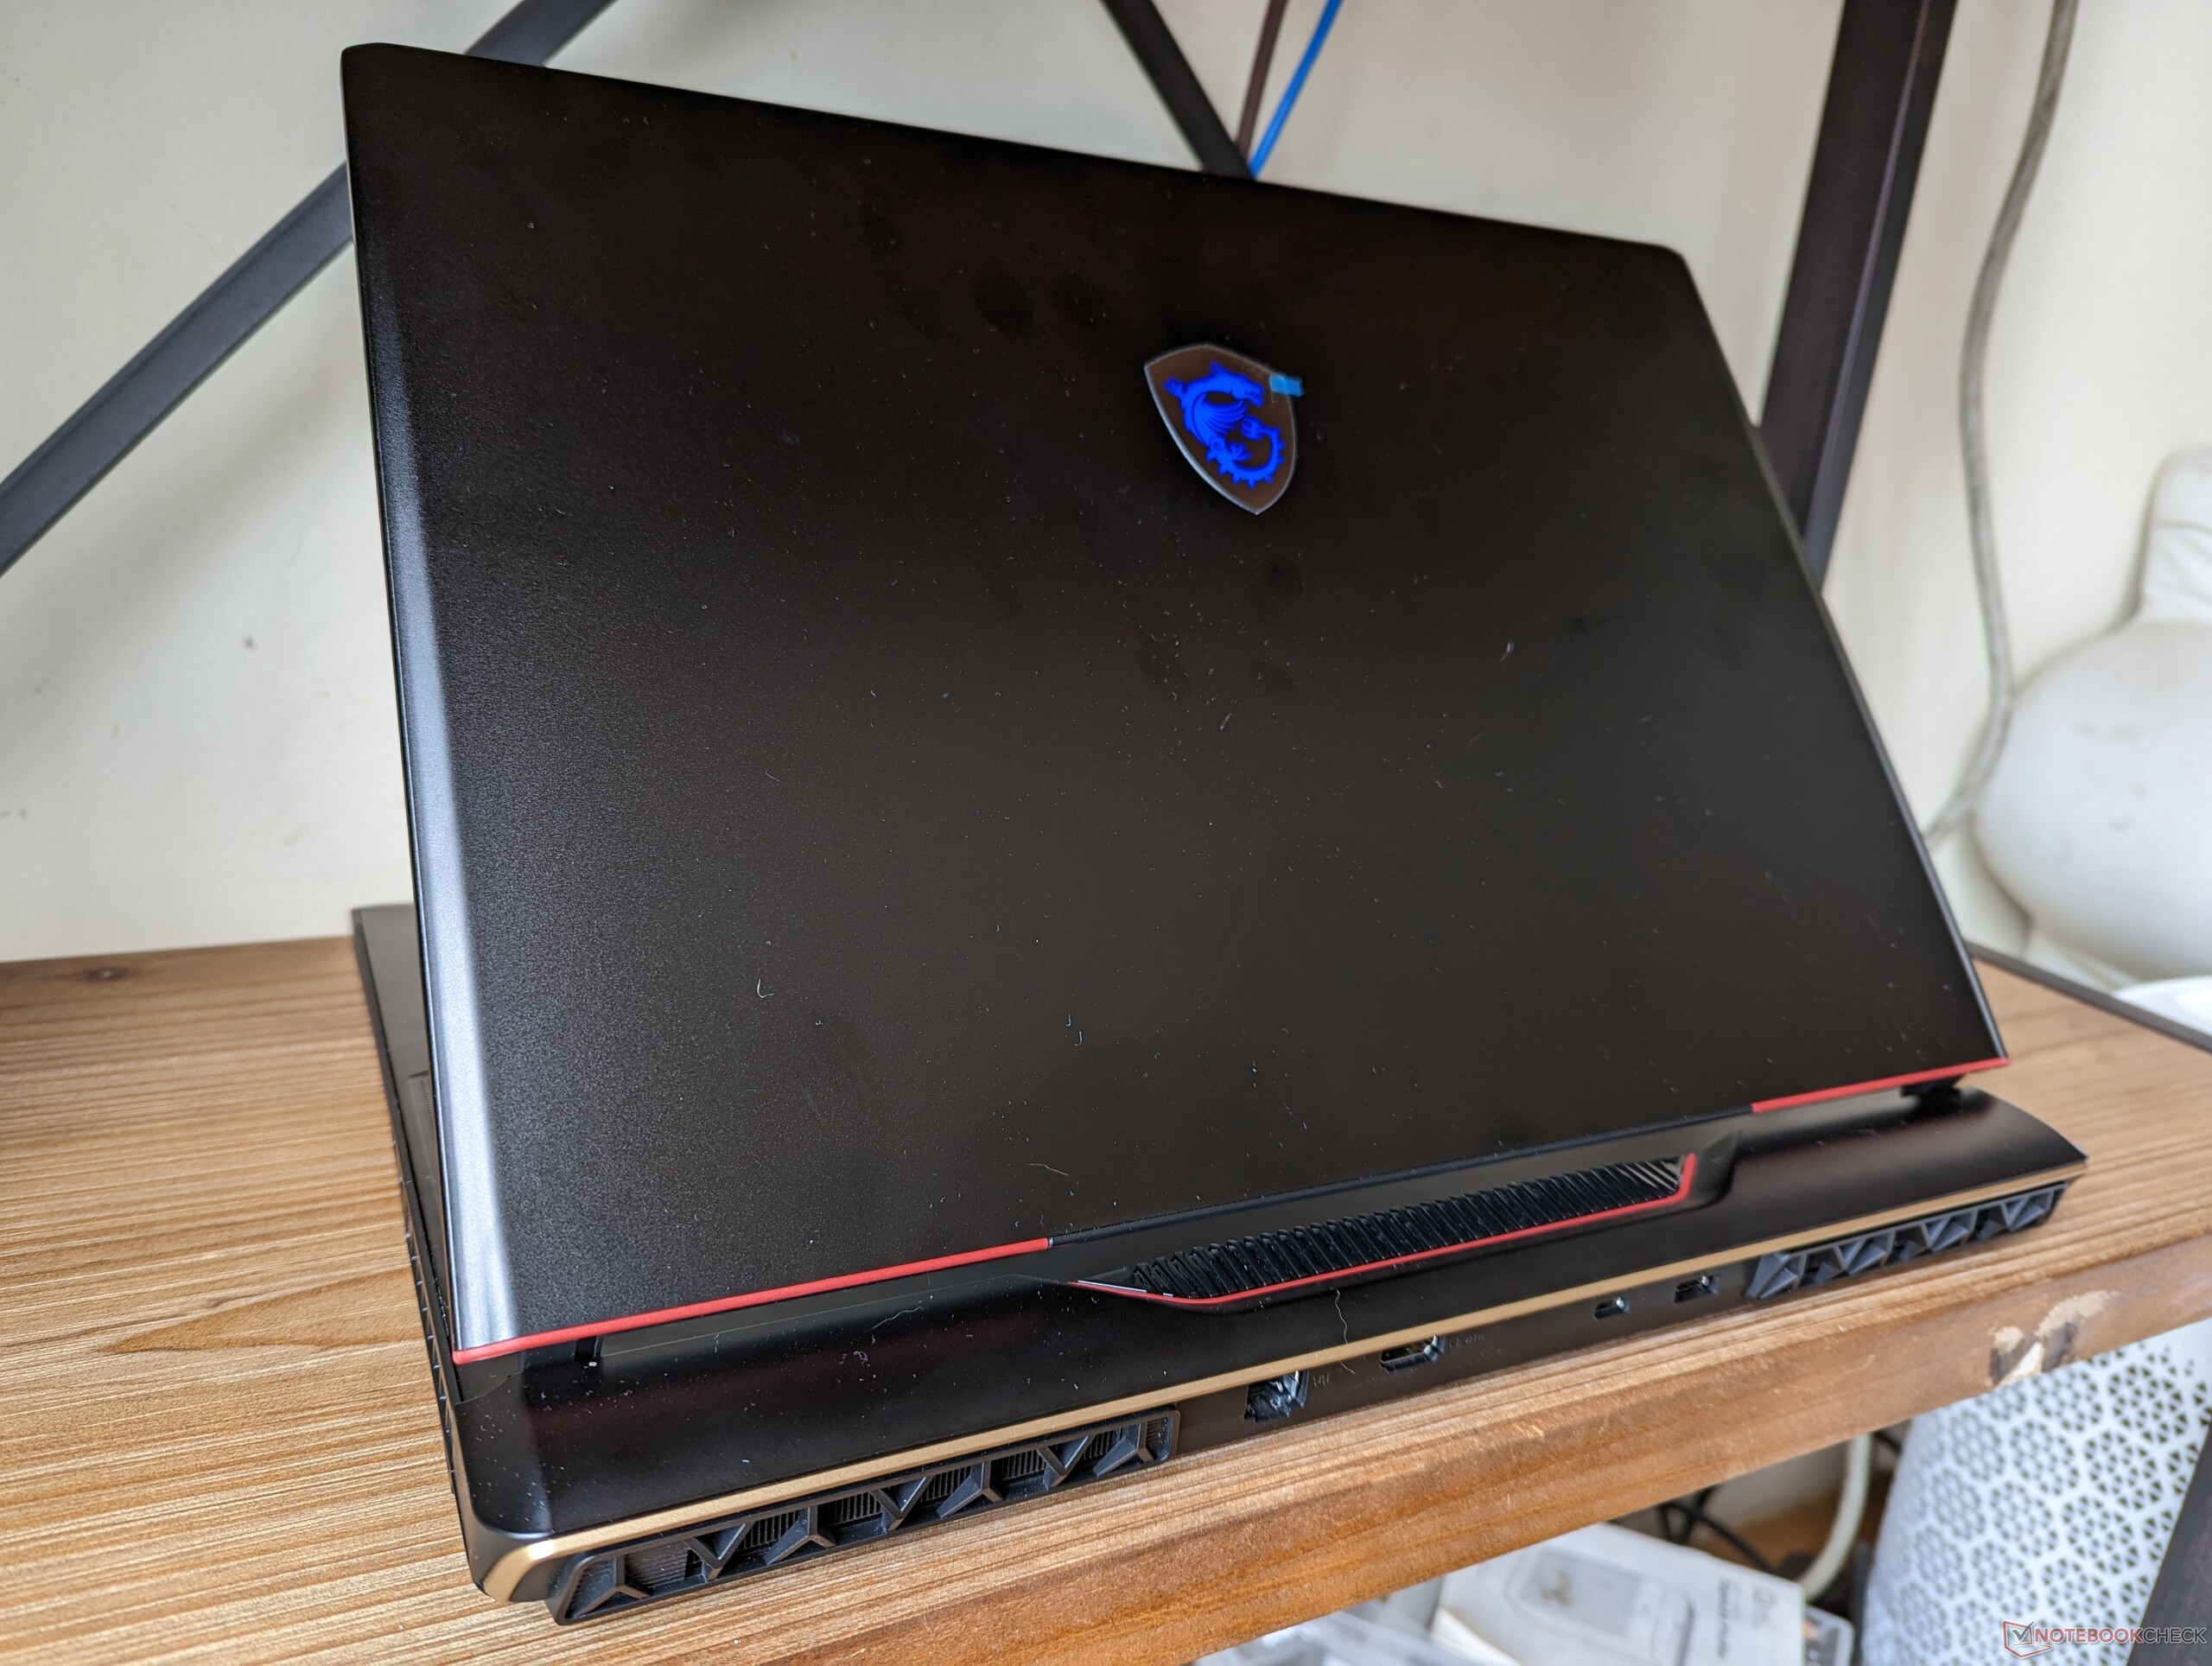
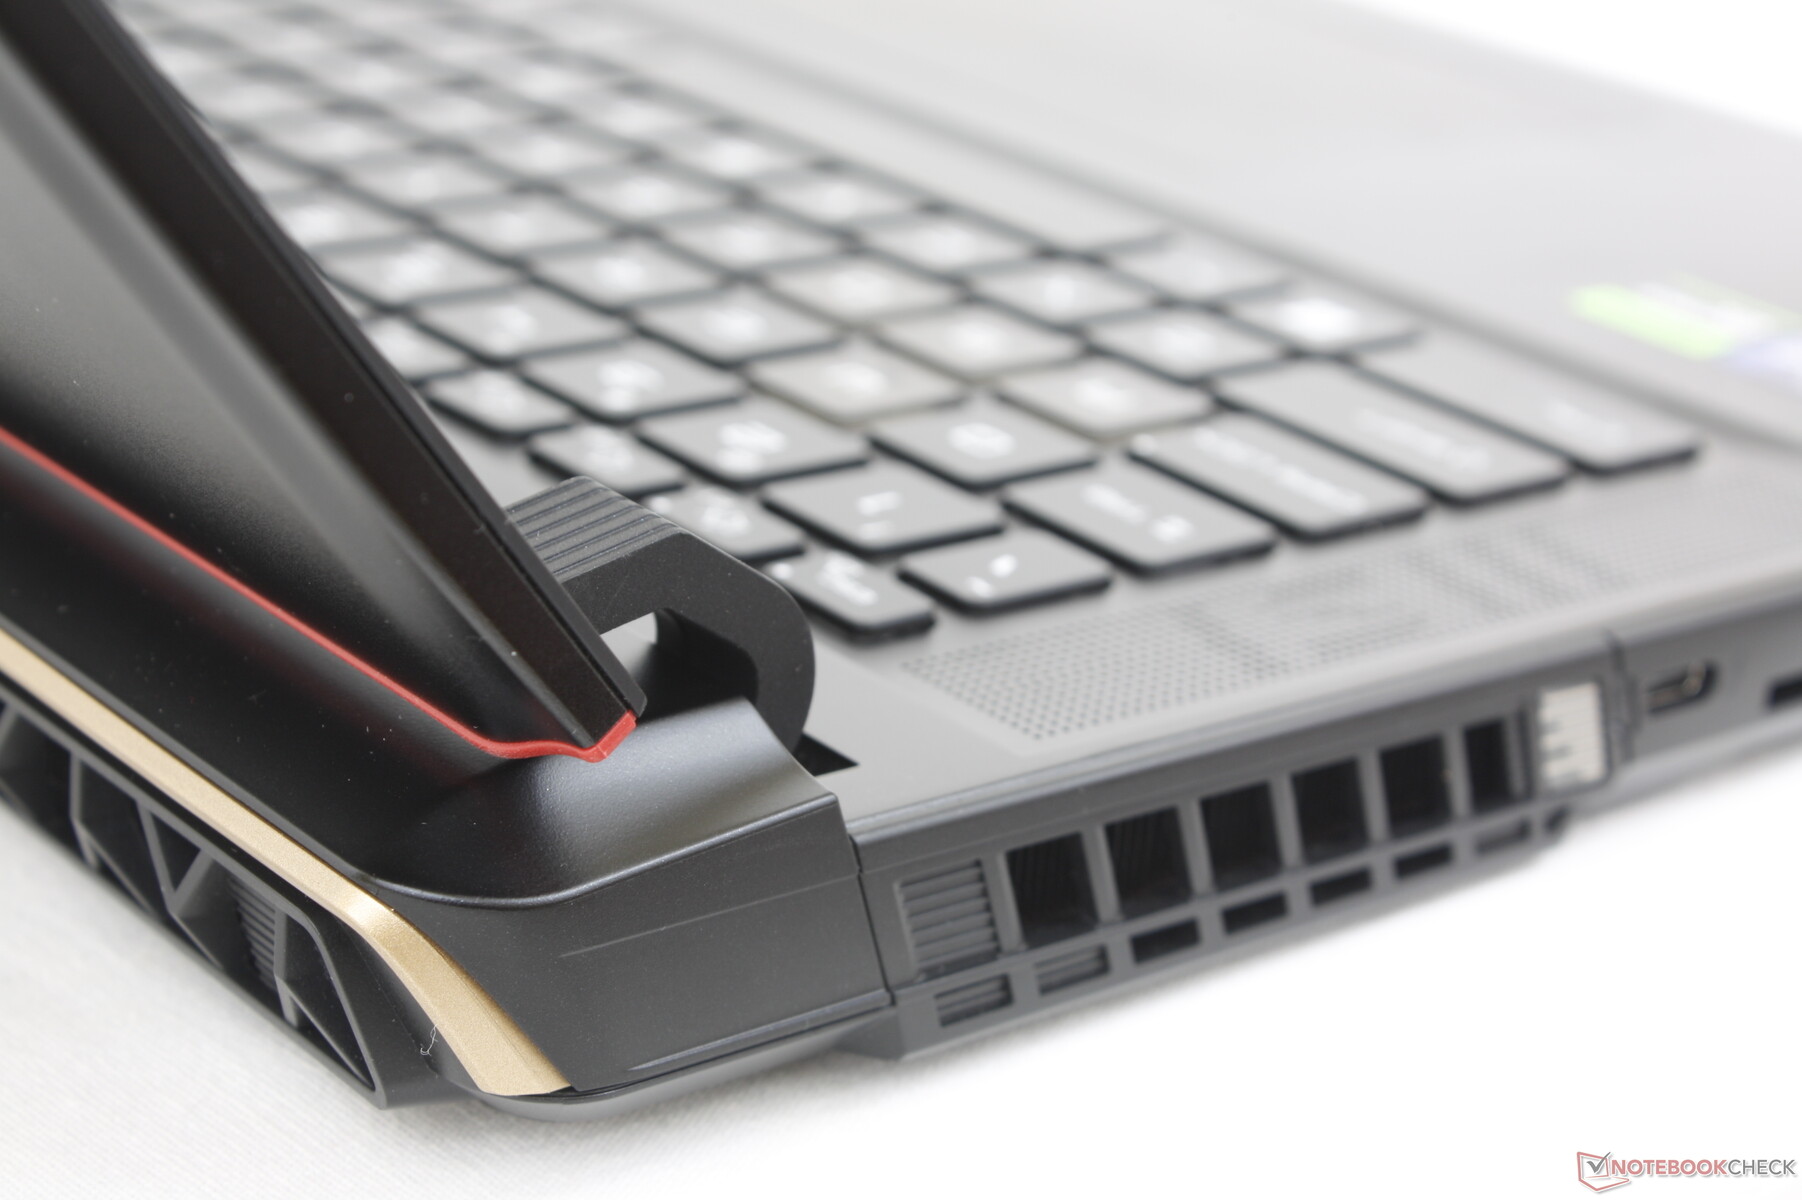
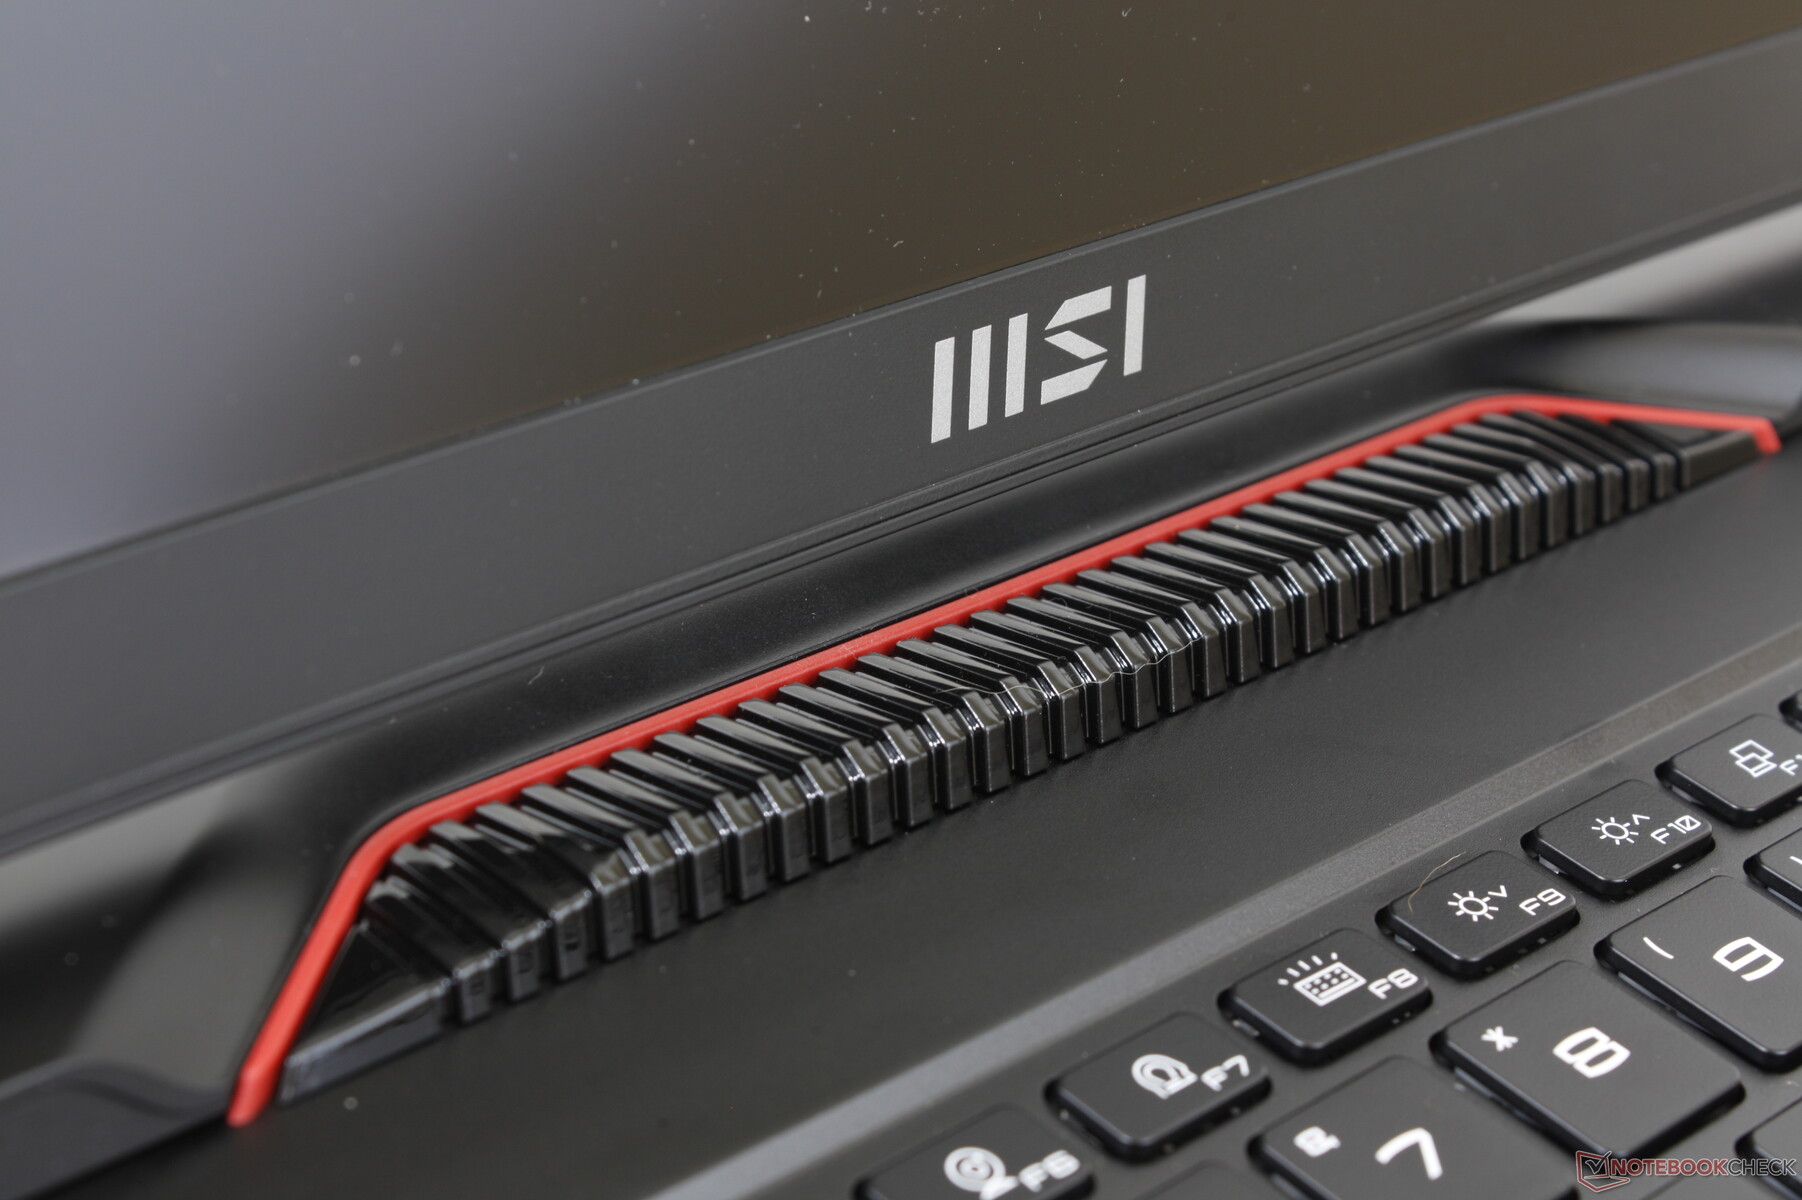
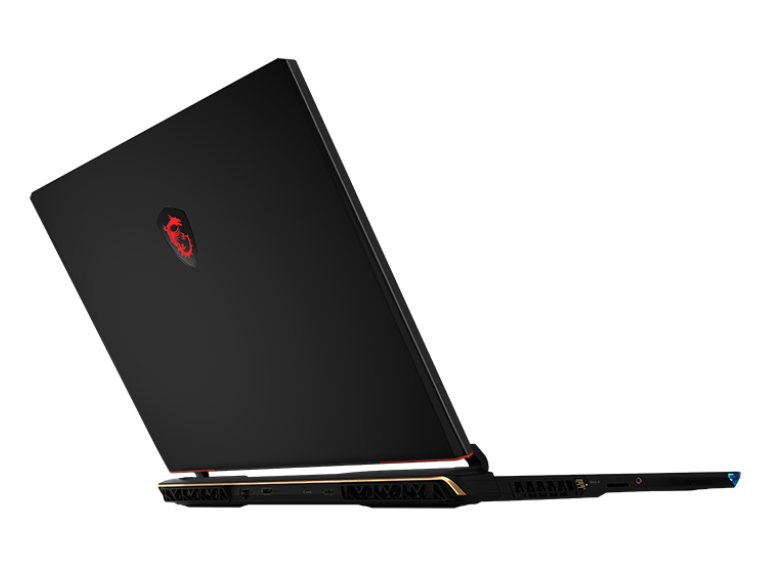
Selon MSI, le design du dernier modèle GE privilégiait le minimalisme avec des surfaces planes et lisses. Afin de redonner du style à la série, le design du GE78 a été inspiré par les jeux 8 bits et l'esthétique des années 80. Ainsi, le dernier modèle incorpore plus de courbes à l'arrière et une barre lumineuse réimaginée le long du bord avant, composée de "pixels" LED RVB individuels. Les feux pixellisés sont similaires au style de la Hyundai Ioniq 6, qui s'inspire également de l'esthétique rétro. Le résultat final est un look unique qui aide à distinguer visuellement le GE78 de la multitude d'autres ordinateurs portables de jeu sur le marché. Quant à savoir si le nouveau GE78 est plus beau que l'ancien GE77, c'est une question de goût.
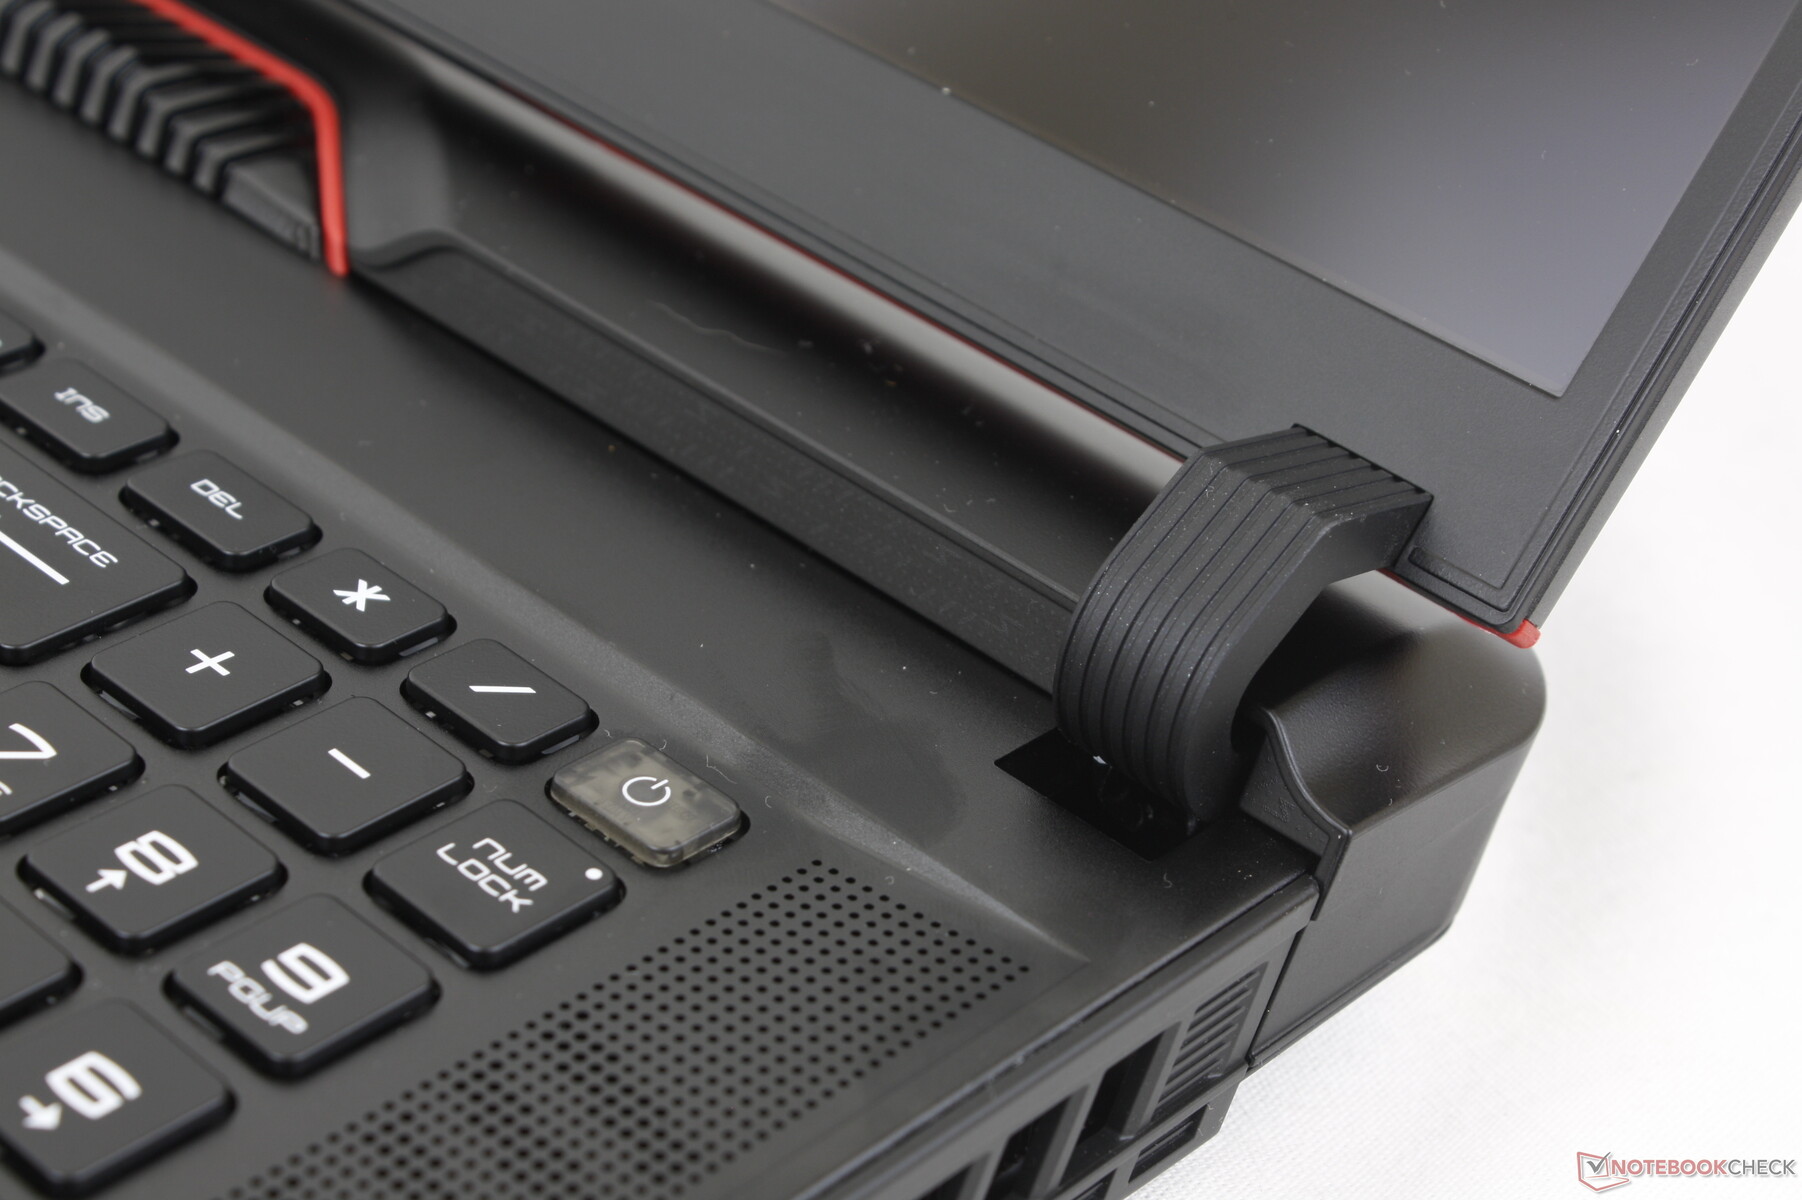
La qualité de fabrication n'est pas en reste avec tous les changements esthétiques. Les nouvelles charnières, par exemple, sont désormais plus grandes et plus fermes que celles du GE77 et devraient donc durer plus longtemps. En fait, elles ressemblent beaucoup aux charnières des modèles de la série Asus Strix Scar. La rigidité du châssis est par ailleurs similaire à celle du GE77, avec un minimum de craquements et juste un peu de déformation lorsque l'on applique une pression sur le couvercle extérieur.
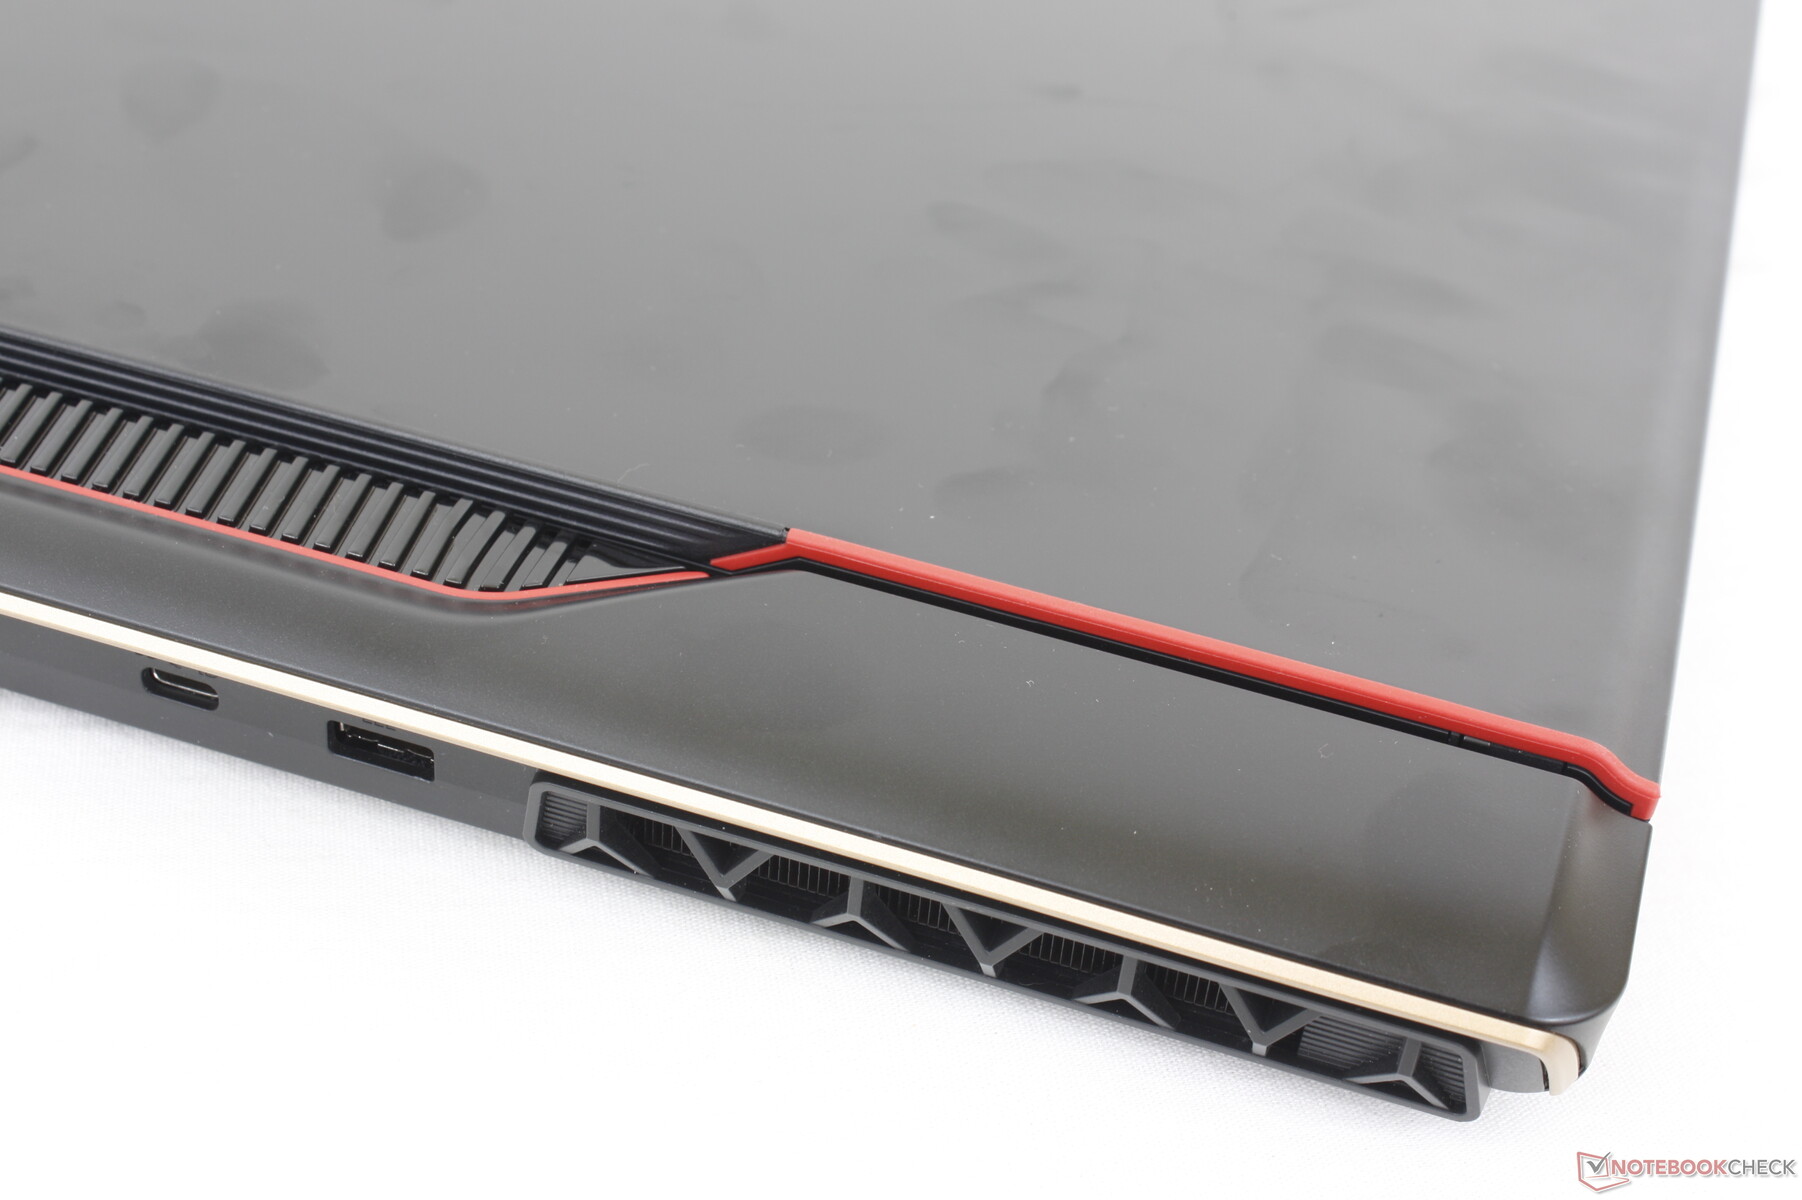
Il y a plus de chance qu'il y ait des écarts entre les matériaux puisque le squelette du GE78 est composé de plus de pièces individuelles qu'un design unibody typique comme le Razer Blade. C'est particulièrement vrai à l'arrière et sur les bords où l'on peut remarquer un espace légèrement plus large d'un côté que de l'autre sur notre unité de test. Ce n'est pas un problème, mais il faut tout de même le vérifier.
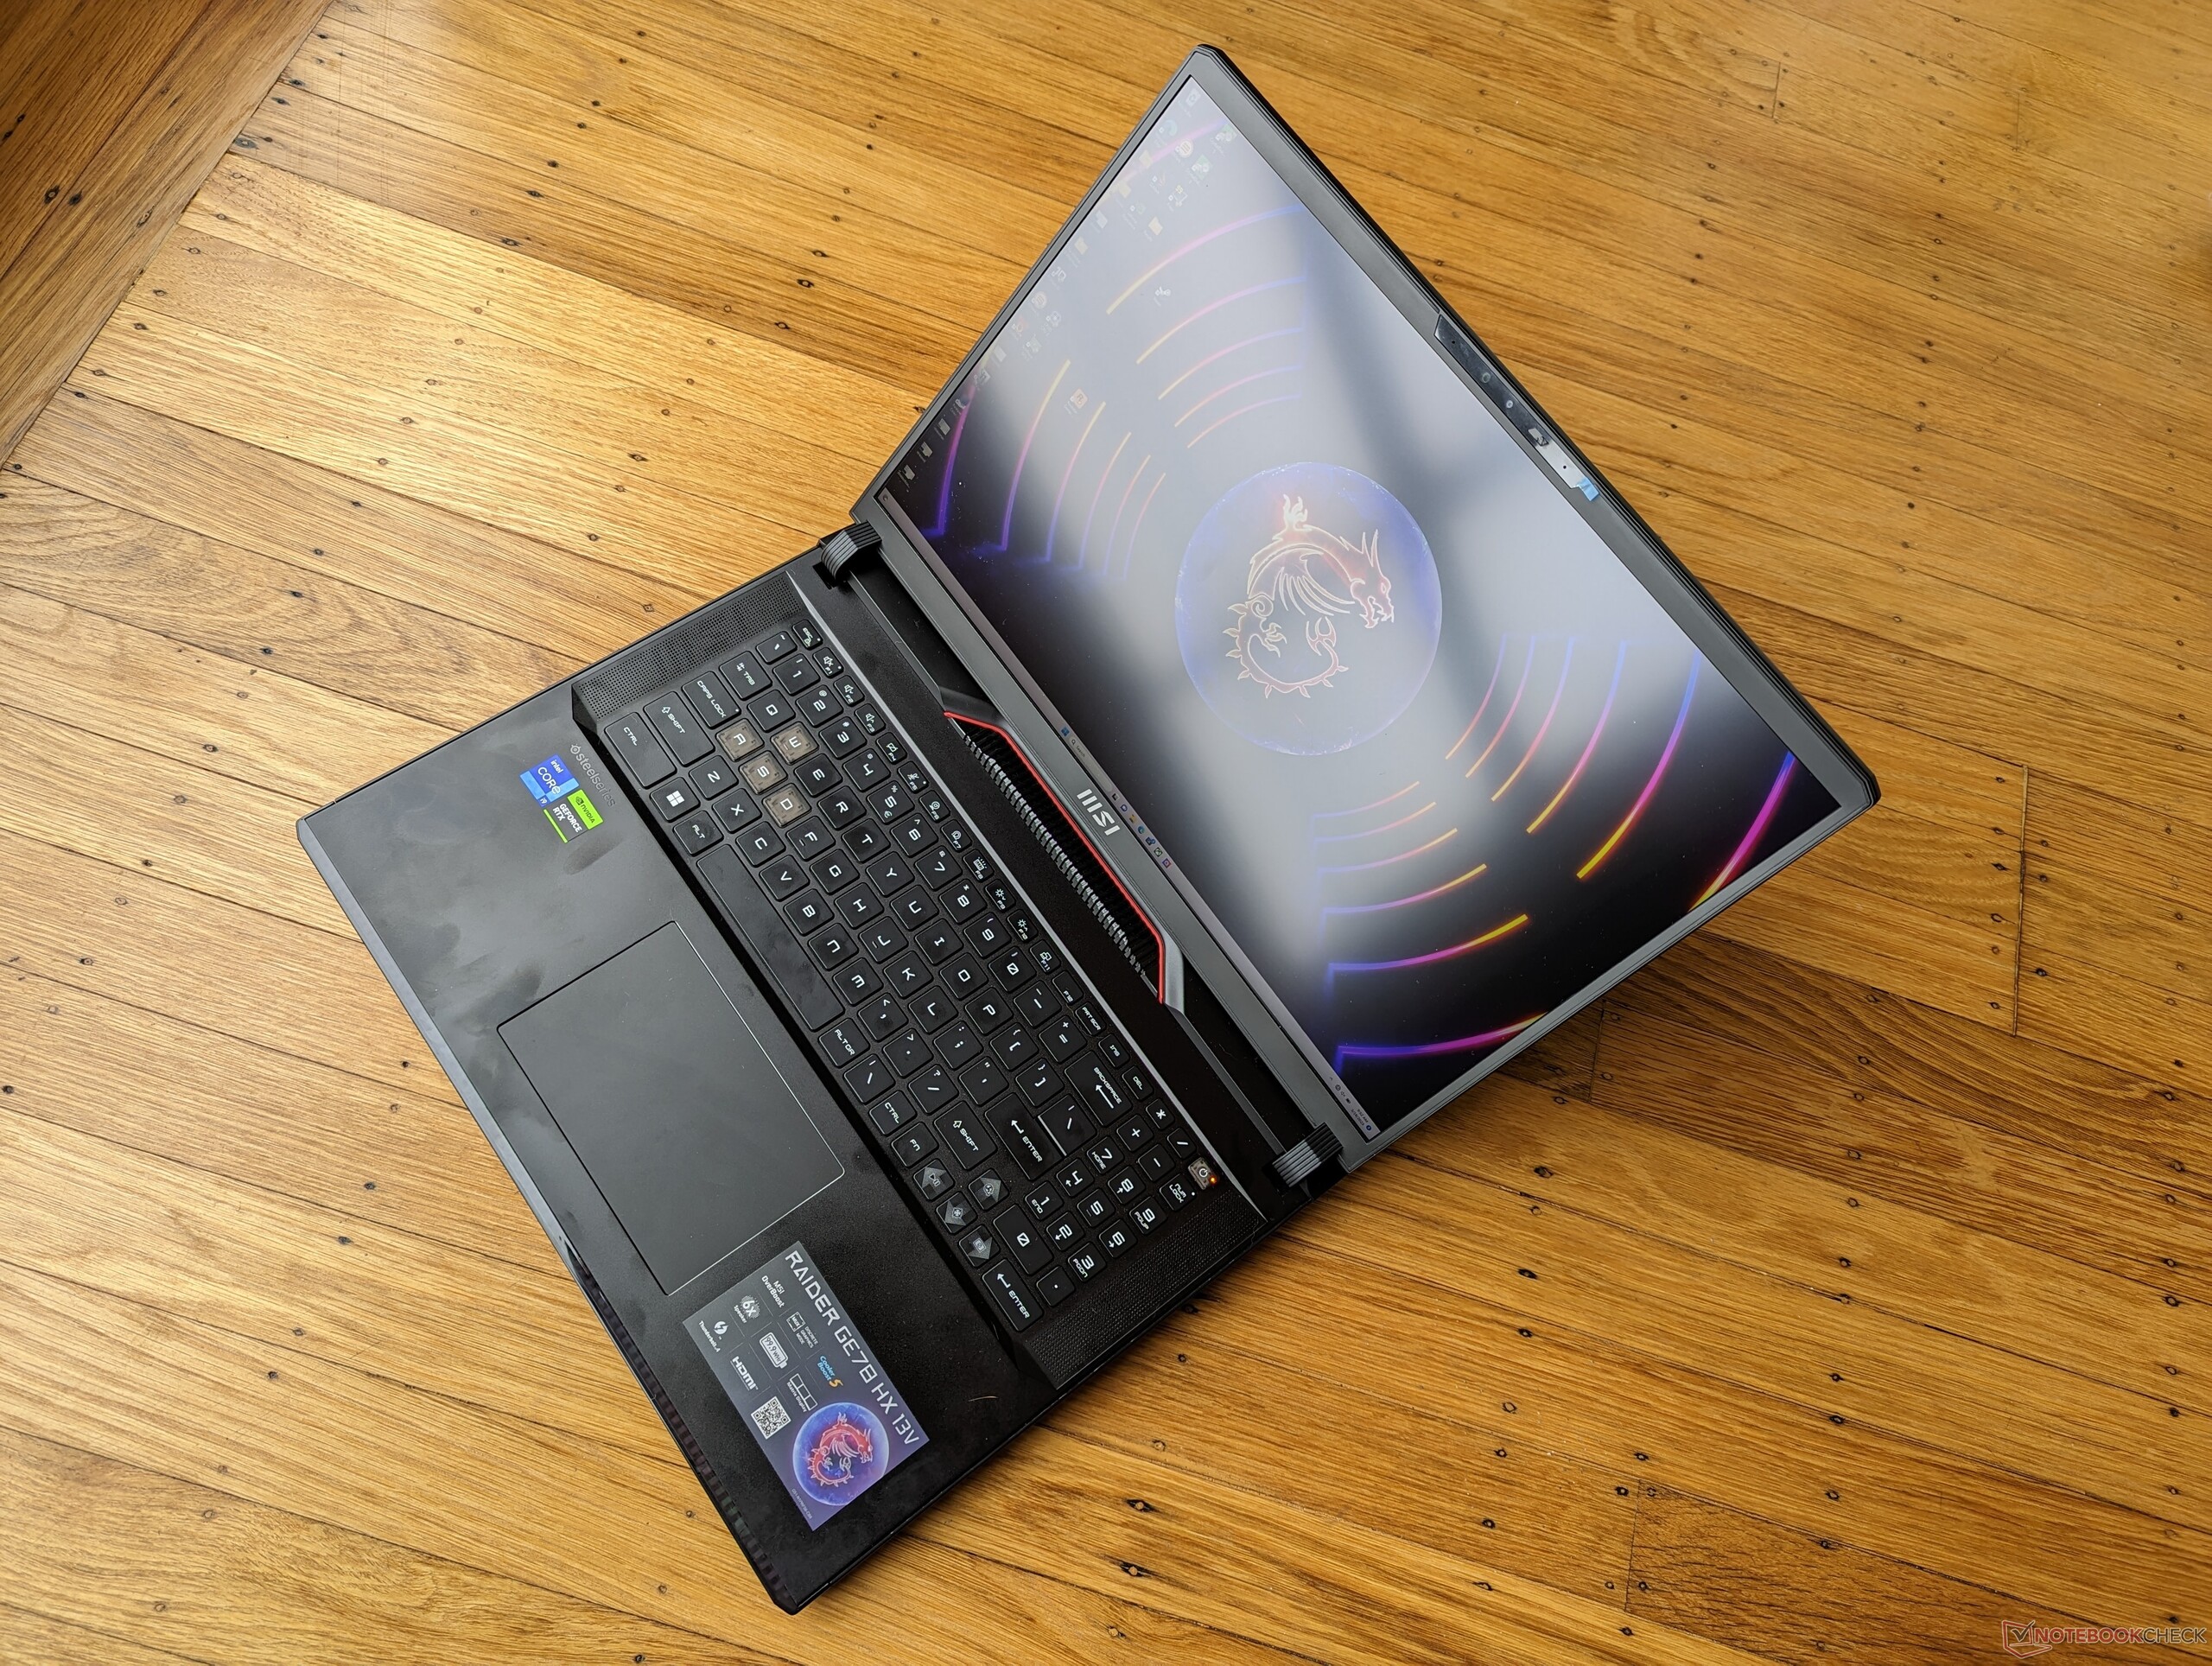
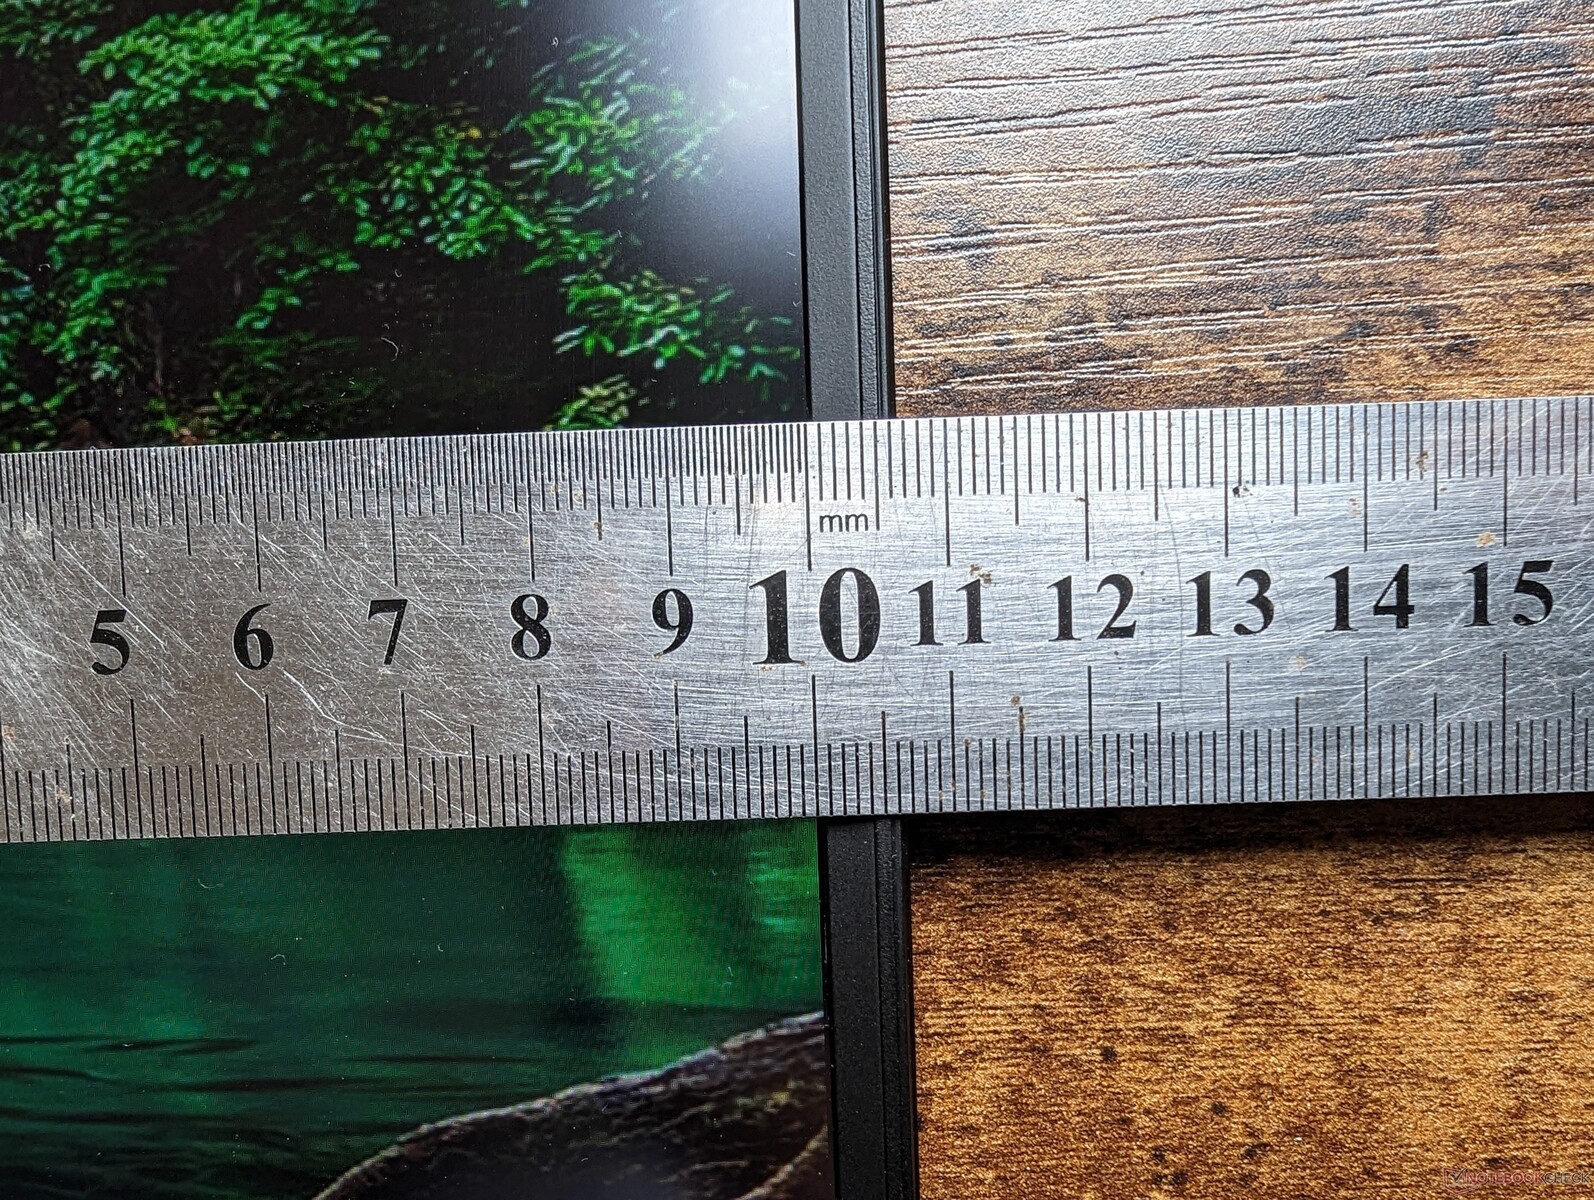
En raison du passage du format 16:9 au format 16:10, le GE78 est plus court en longueur mais plus large en largeur, pour un encombrement plus carré que son prédécesseur. Il est toutefois plus fin de quelques millimètres. Ne pensez donc pas que le GE78 est plus épais uniquement en raison de son esthétique d'inspiration rétro. Le poids total est supérieur d'environ 200 grammes à celui du Razer Blade 17.
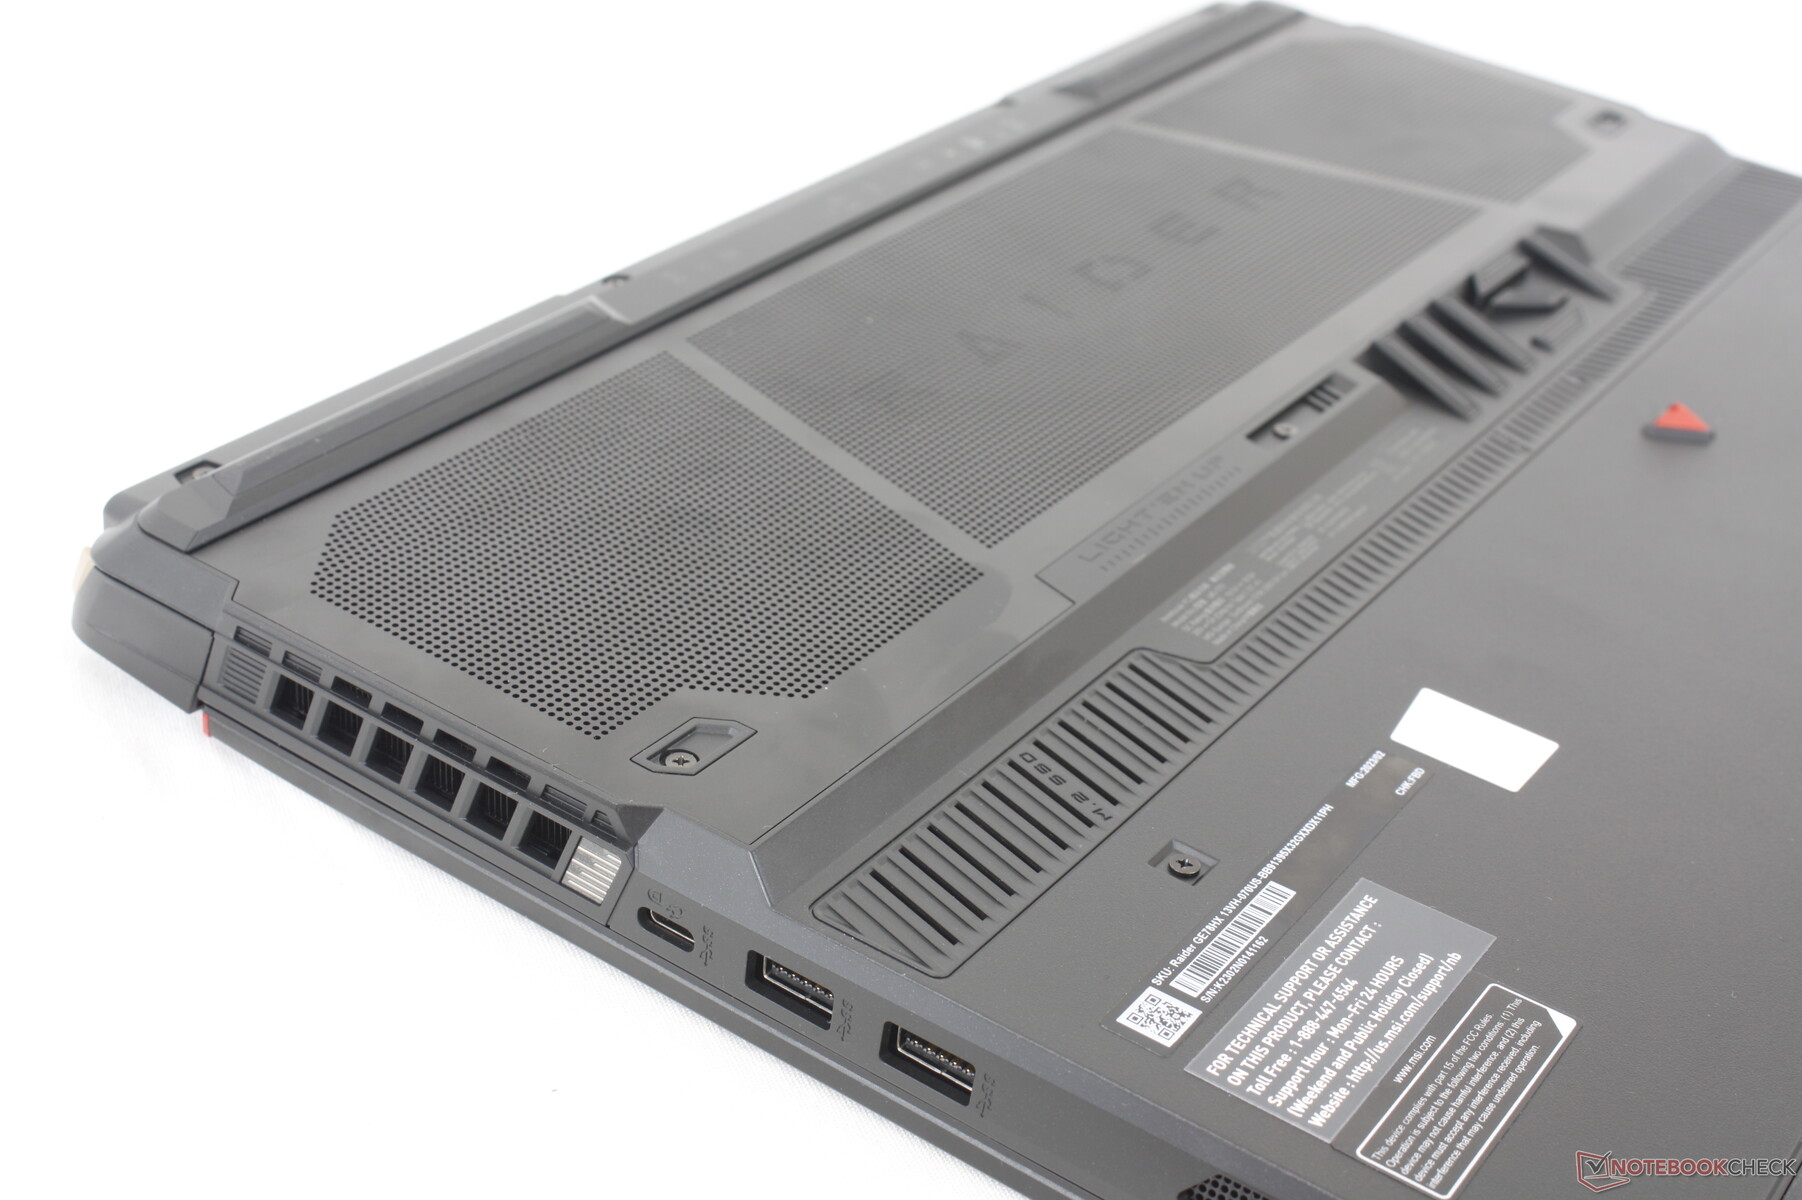
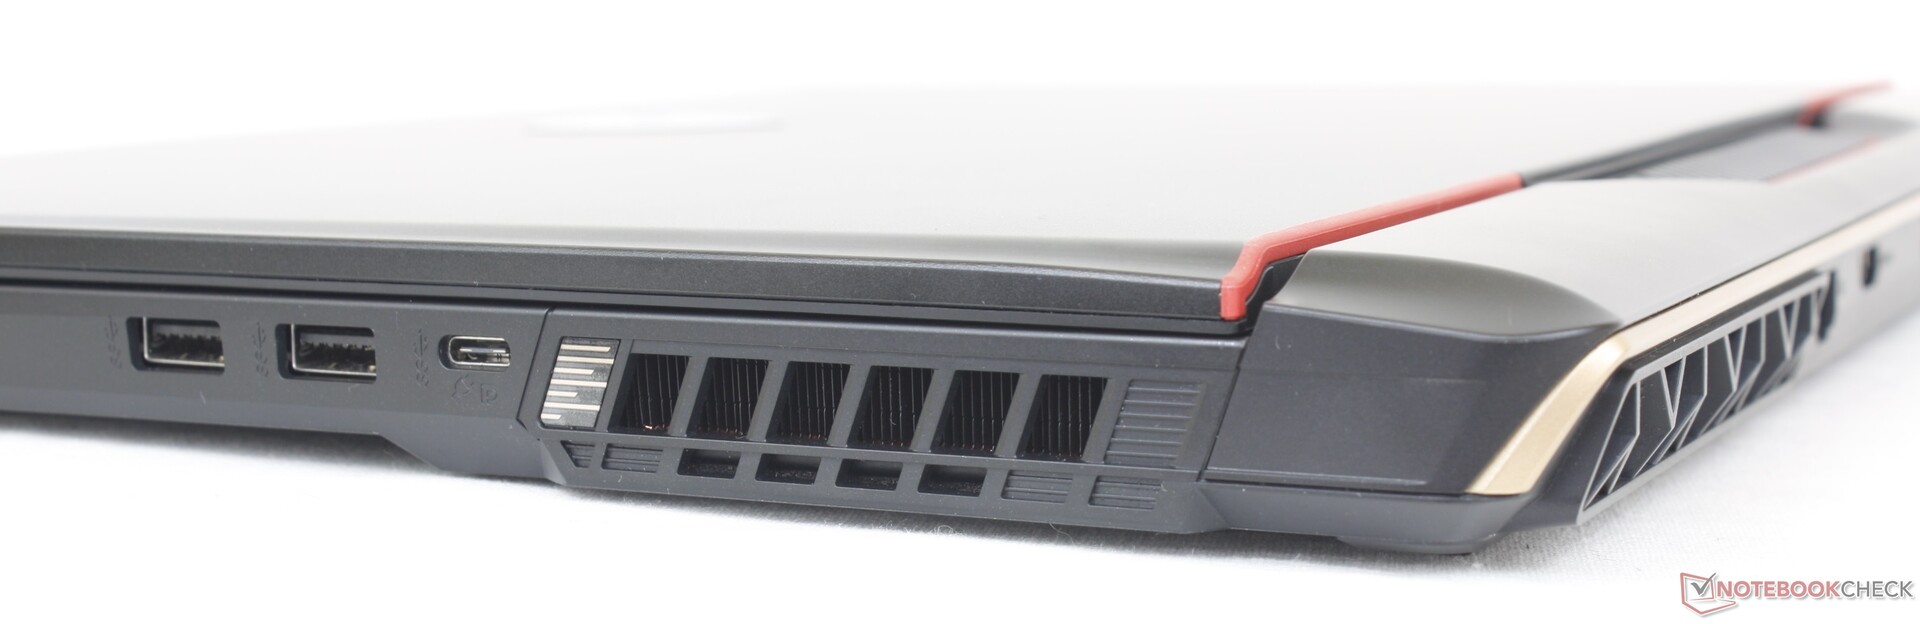
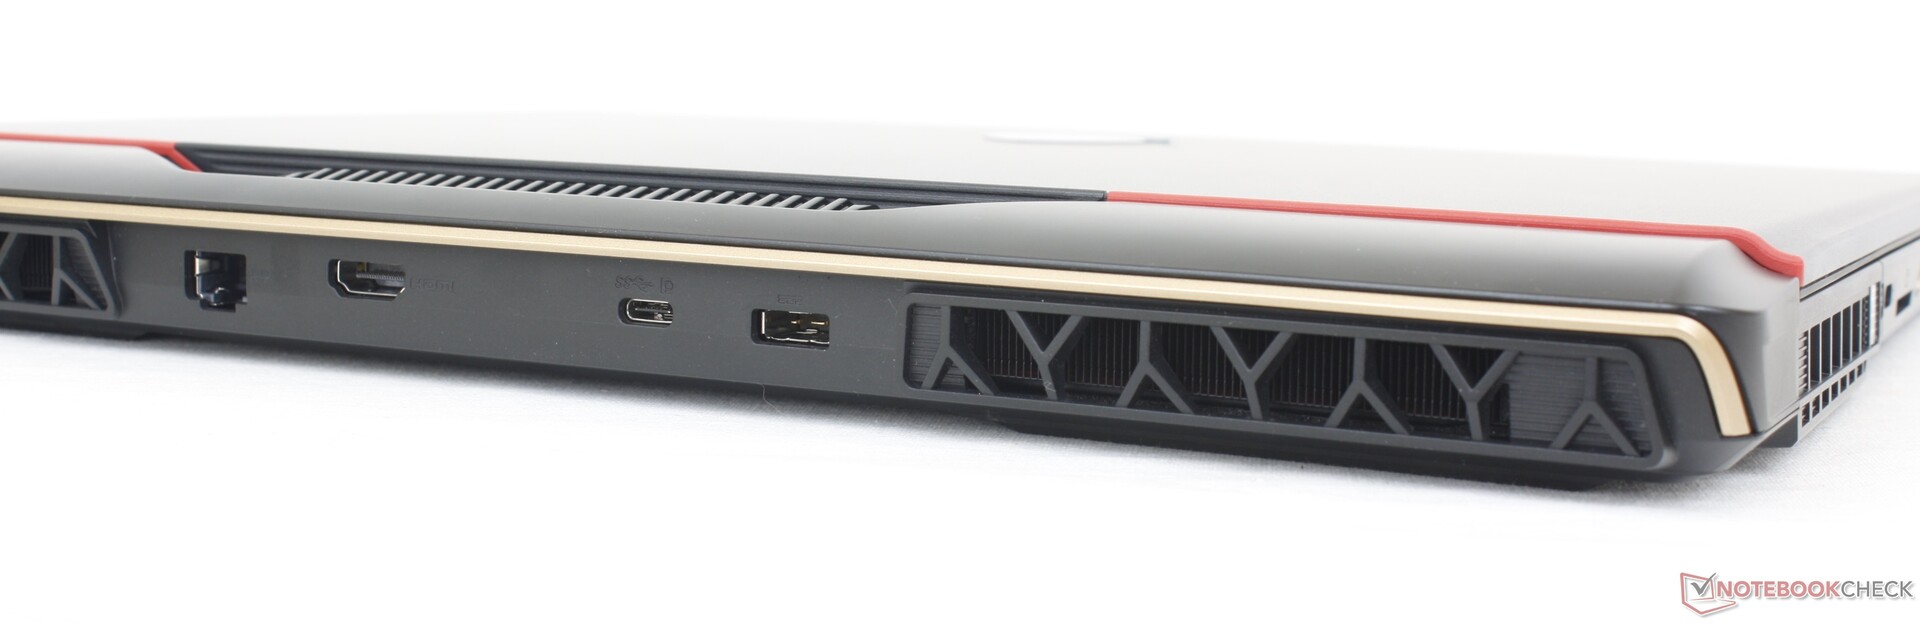
Connectivité - USB-C dans tous les sens
Les options et le positionnement des ports ont changé par rapport au GE77. Le GE78 remplace notamment un port USB-A par un troisième port USB-C. Il y a donc désormais un port USB-C de chaque côté du châssis.
Malheureusement, les trois ports USB-C ne sont pas tous égaux. Tout d'abord, les périphériques Thunderbolt ne sont pris en charge que par le port USB-C de gauche. D'autre part, leurs fonctionnalités DisplayPort sont liées au paramètre MUX. Lorsque le dGPU est actif, par exemple, notre moniteur externe DP ne fonctionnerait que sur le port USB-C situé le long du bord droit, alors qu'il ne fonctionnerait pas sur les ports USB-C de gauche ou de l'arrière. Si le mode iGPU ou GPU hybride est actif, notre moniteur externe DP ne fonctionnera que sur le port USB-C du bord gauche, tandis qu'il ne fonctionnera pas sur les ports USB-C du bord arrière ou du bord droit. Nous n'avons pas réussi à faire fonctionner DP sur le port USB-C arrière.
Troisièmement, MSI annonce Power Delivery, mais nous n'avons pas réussi à le faire fonctionner non plus. Notre unité ne pouvait pas se recharger via l'USB-C, quel que soit le port ou le nombre d'adaptateurs USB-C que nous avons testés.
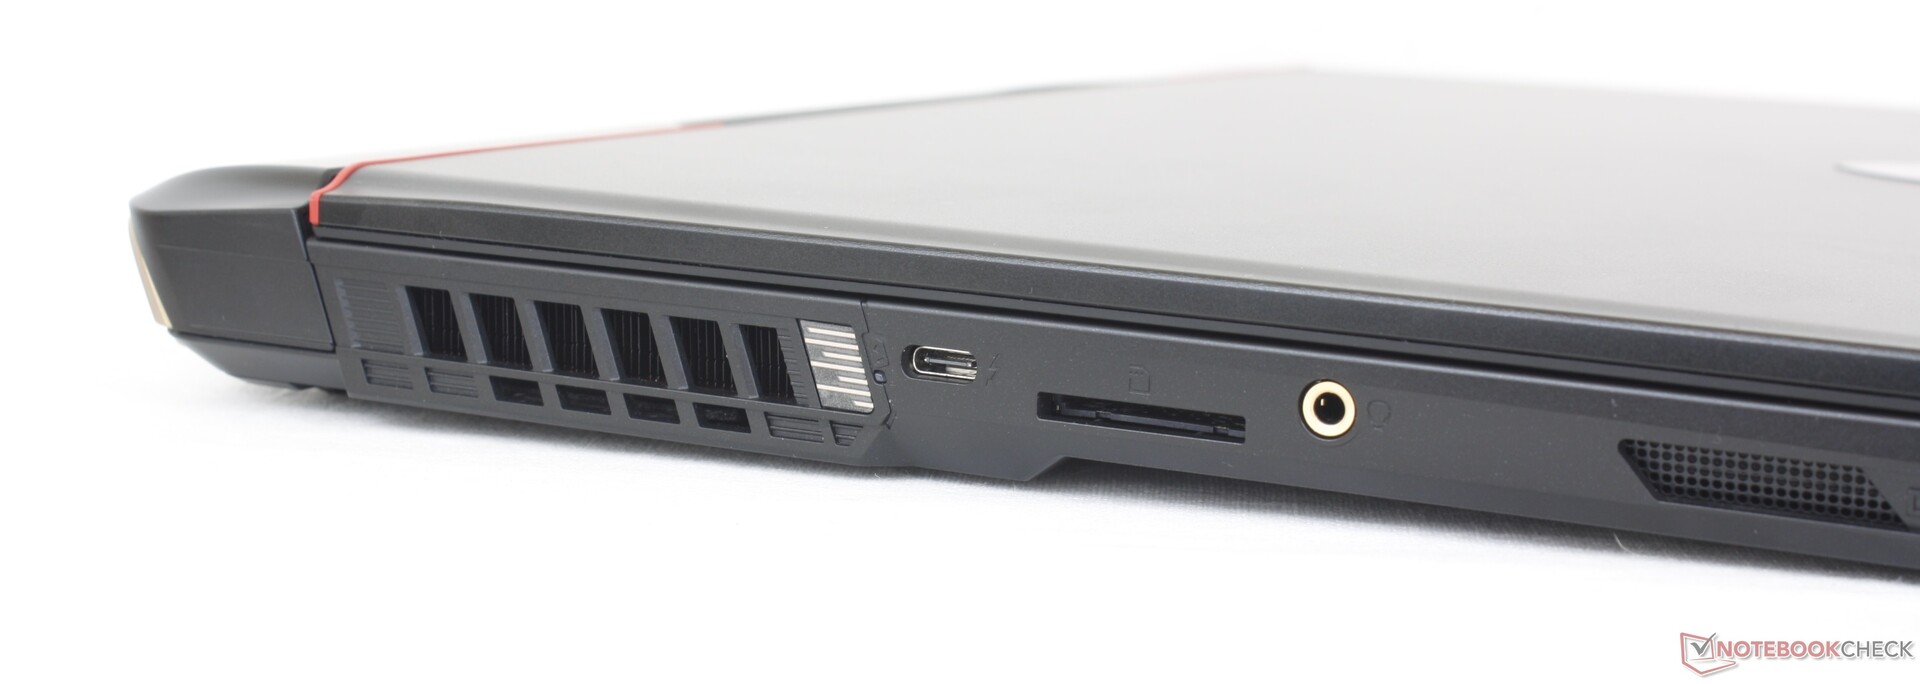
Lecteur de carte SD
Les taux de transfert à partir du lecteur SD intégré sont décevants compte tenu du prix élevé du GE78. Transférer 1 Go de photos de notre carte de test UHS-II vers le bureau prend environ 16 secondes, contre la moitié sur le Razer Blade 17.
| SD Card Reader | |
| average JPG Copy Test (av. of 3 runs) | |
| Razer Blade 17 Early 2022 (AV PRO microSD 128 GB V60) | |
| MSI Titan GT77 HX 13VI (Angelibird AV Pro V60) | |
| Eluktronics Mech-17 GP2 (Angelibird AV Pro V60) | |
| MSI GE78HX 13VH-070US (Angelibird AV Pro V60) | |
| MSI Raider GE77 HX 12UHS (AV PRO microSD 128 GB V60) | |
| maximum AS SSD Seq Read Test (1GB) | |
| Eluktronics Mech-17 GP2 (Angelibird AV Pro V60) | |
| MSI GE78HX 13VH-070US (Angelibird AV Pro V60) | |
| MSI Titan GT77 HX 13VI (Angelibird AV Pro V60) | |
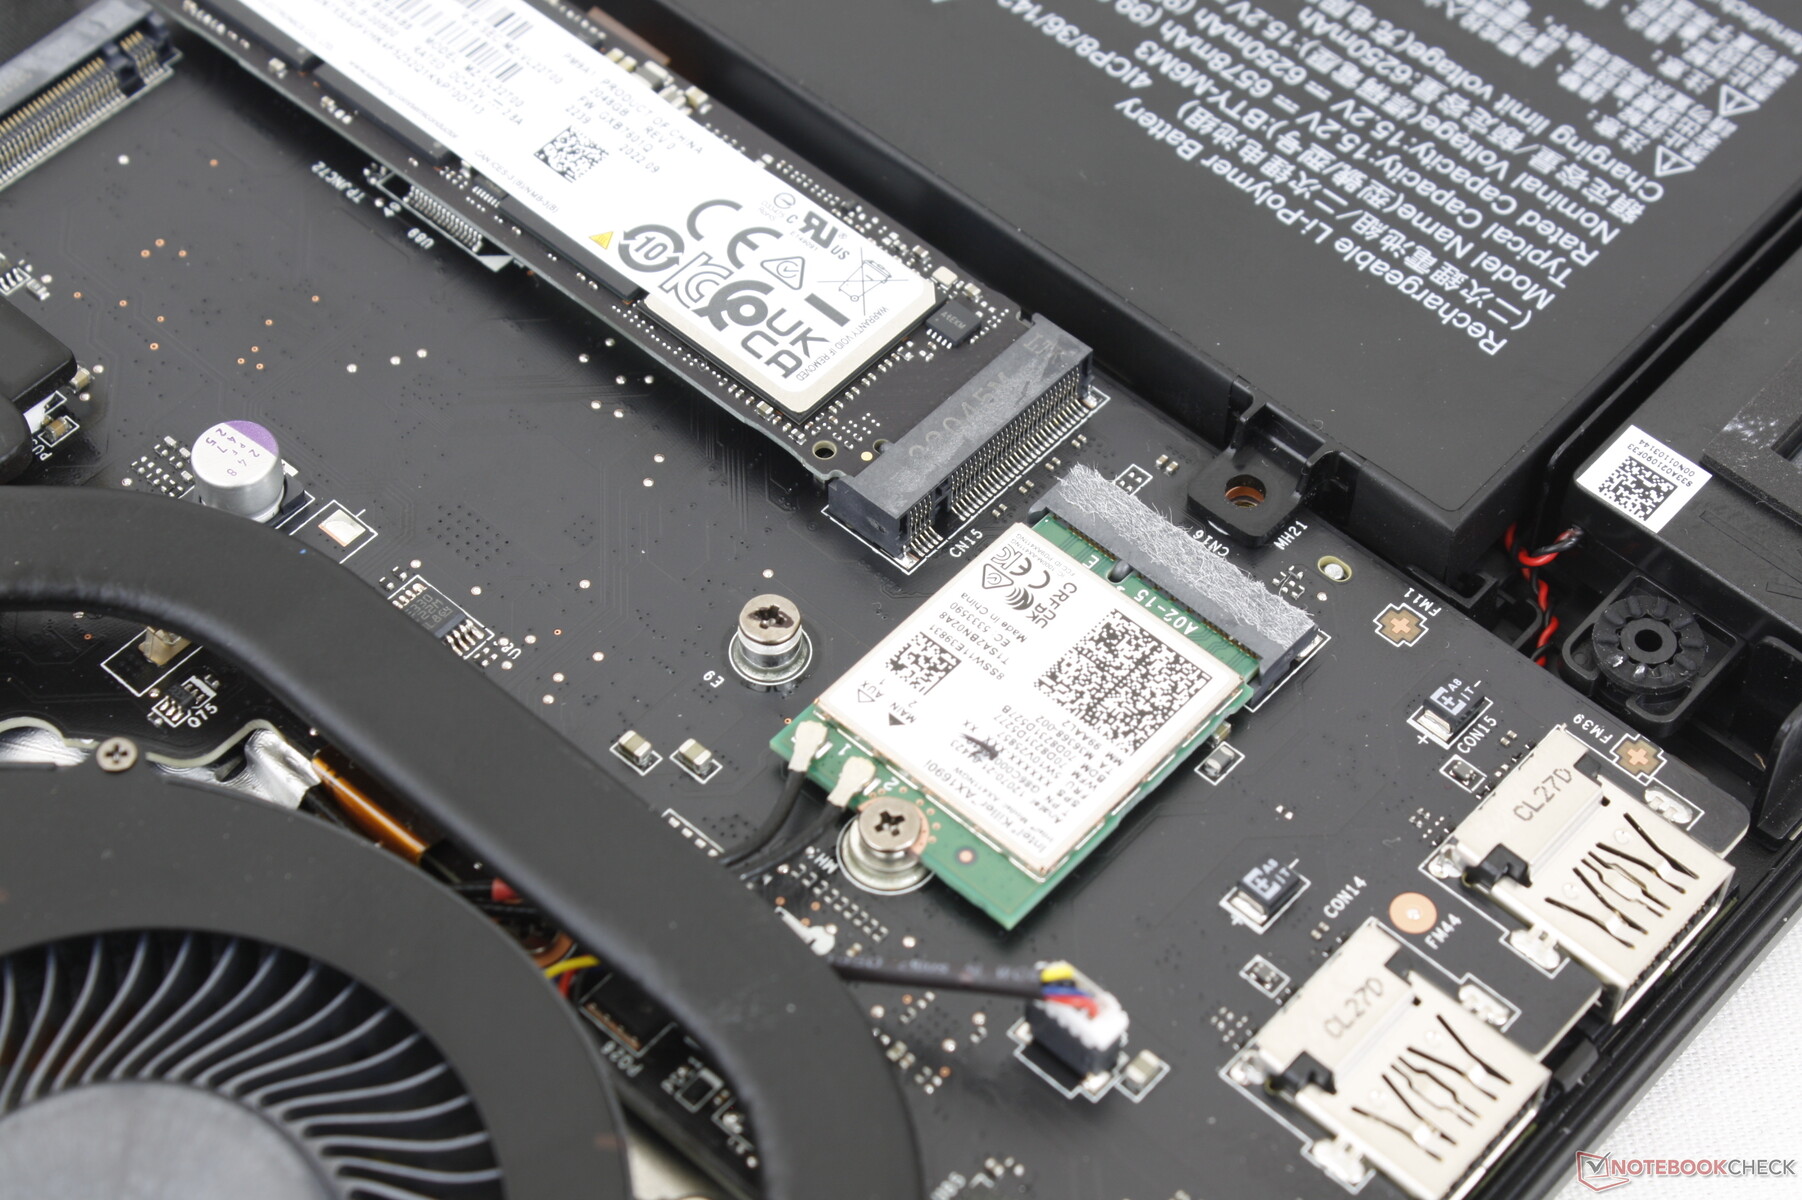
Communication
Un Killer AX1690i est livré en standard pour la connectivité Wi-Fi 6E et Bluetooth 5.3. Le module Killer est essentiellement un Intel AX210/211 rebrandé et optimisé pour les ordinateurs portables de jeu. Nous n'avons rencontré aucun problème lorsque nous l'avons couplé à notre routeur de test Asus AXE11000 6 GHz.
| Networking | |
| iperf3 transmit AXE11000 | |
| Asus ROG Strix G17 G713PI | |
| MSI Titan GT77 HX 13VI | |
| Eluktronics Mech-17 GP2 | |
| MSI GE78HX 13VH-070US | |
| iperf3 receive AXE11000 | |
| Asus ROG Strix G17 G713PI | |
| Razer Blade 17 Early 2022 | |
| MSI Titan GT77 HX 13VI | |
| Eluktronics Mech-17 GP2 | |
| MSI GE78HX 13VH-070US | |
| iperf3 transmit AXE11000 6GHz | |
| MSI GE78HX 13VH-070US | |
| iperf3 receive AXE11000 6GHz | |
| MSI Raider GE77 HX 12UHS | |
| MSI GE78HX 13VH-070US | |
Webcam
La webcam intégrée de 2 MP sur le GE78 reste un standard sur la plupart des ordinateurs portables de jeu. D'autres fabricants, comme Razer, l'ont portée à 5 MP pour une image plus nette.
L'infrarouge et l'obturateur physique de la webcam sont fournis en standard pour la prise en charge de Hello et l'amélioration de la confidentialité, respectivement.


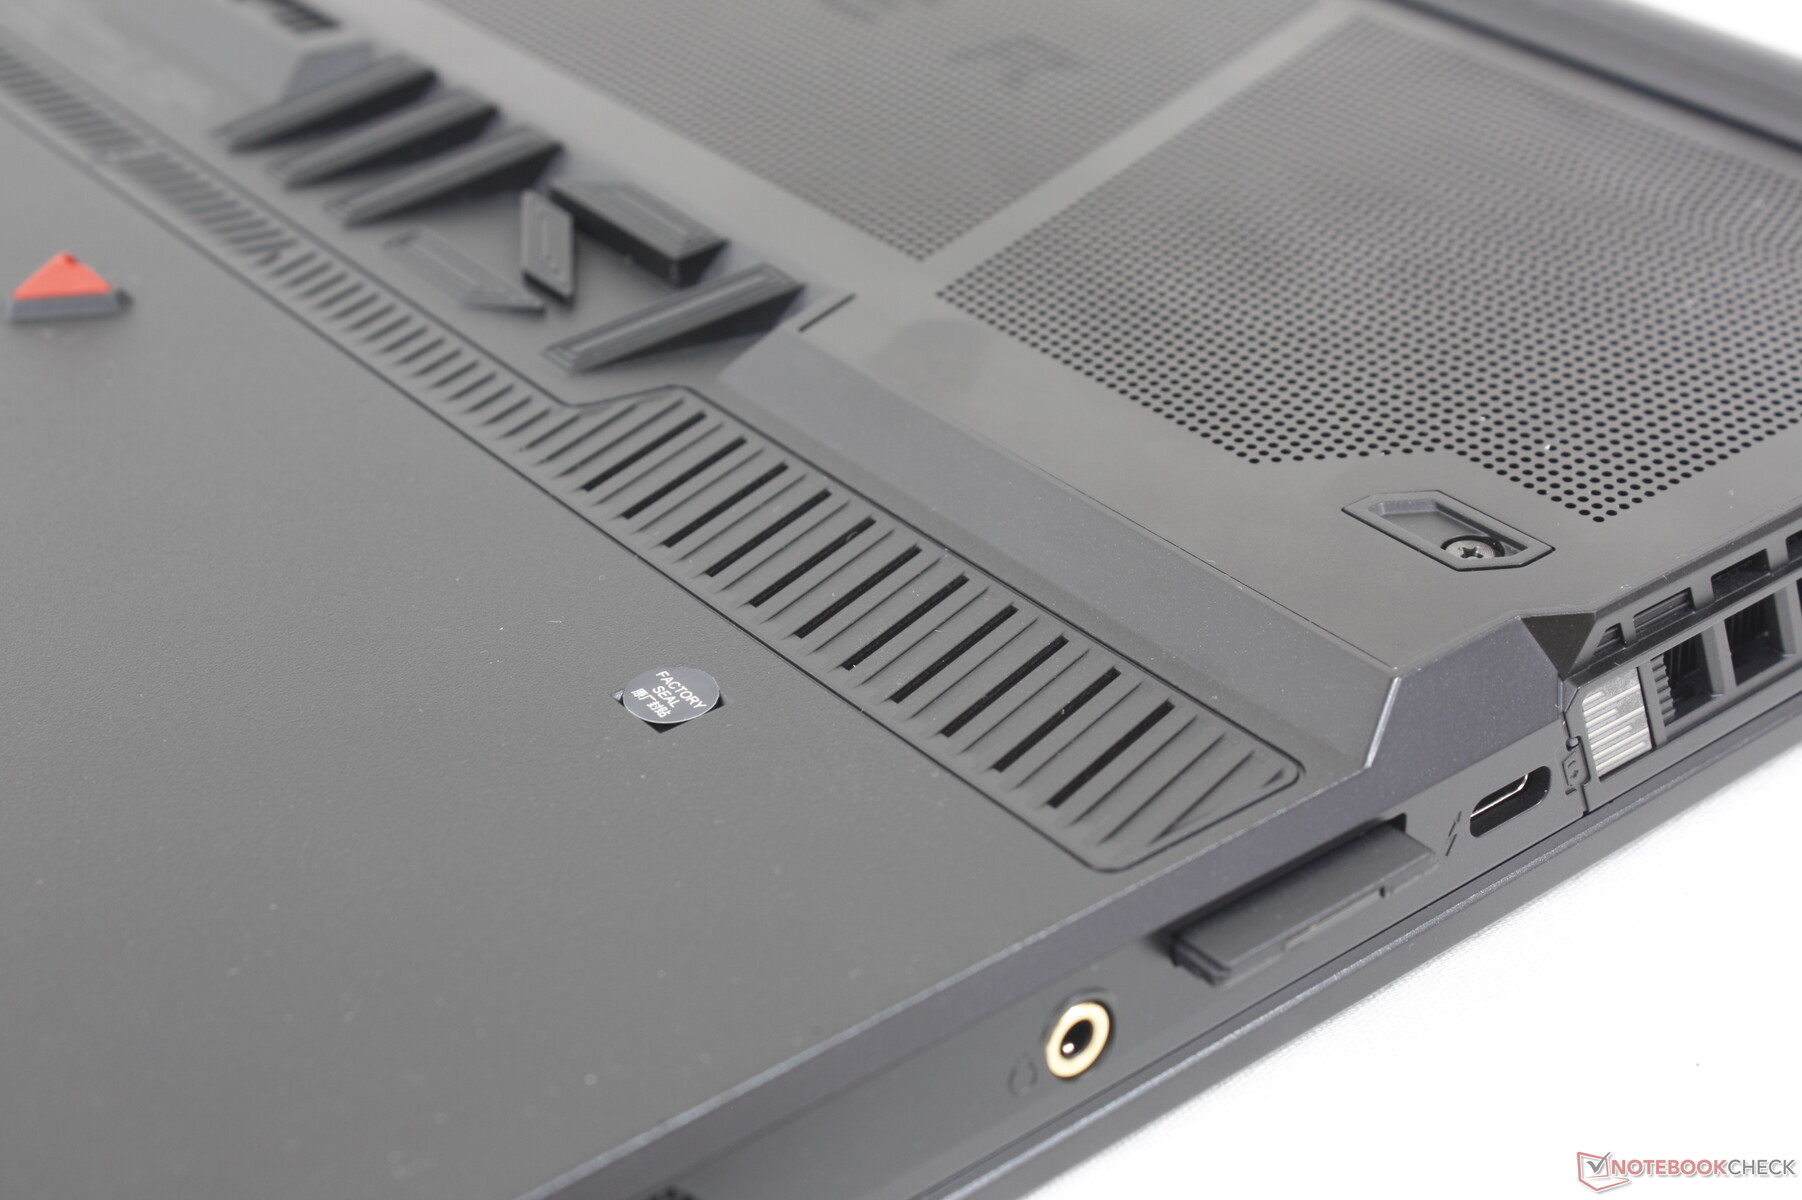
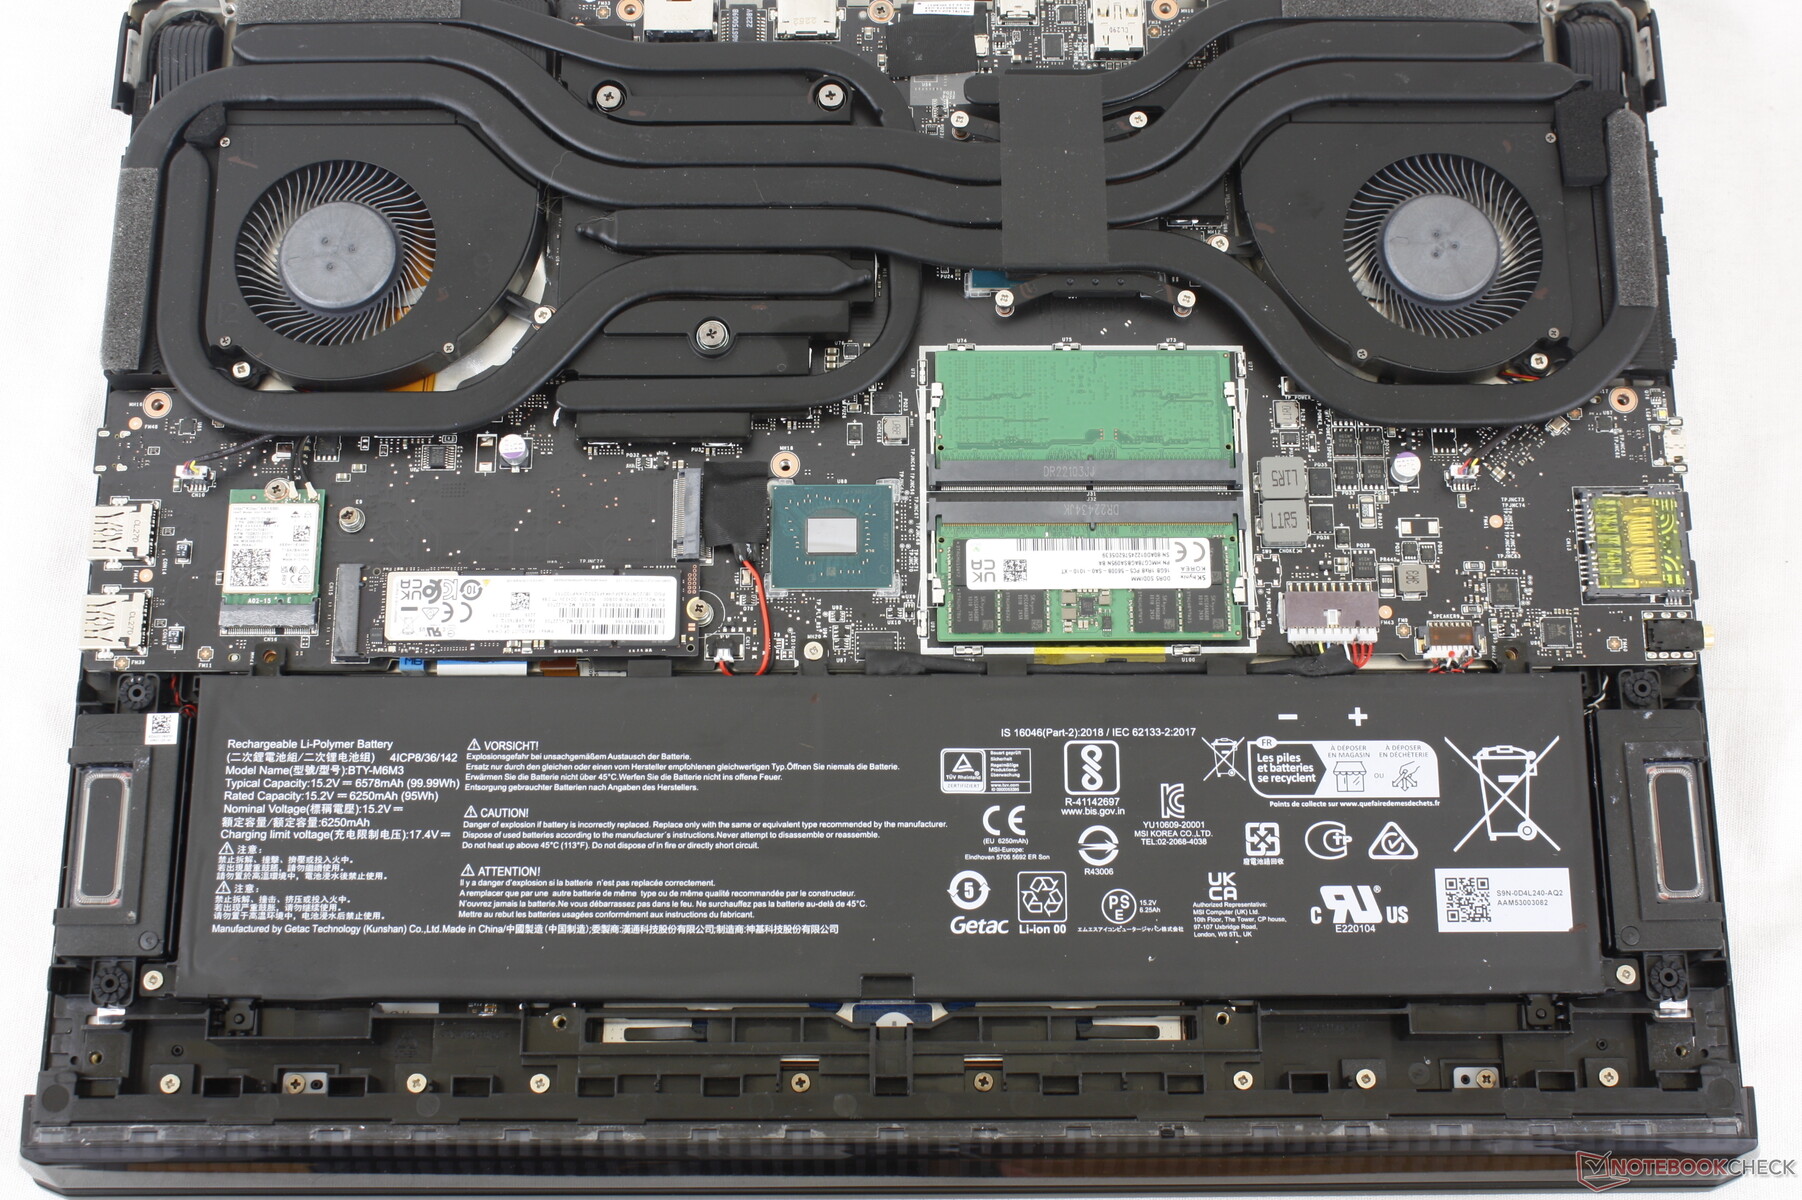
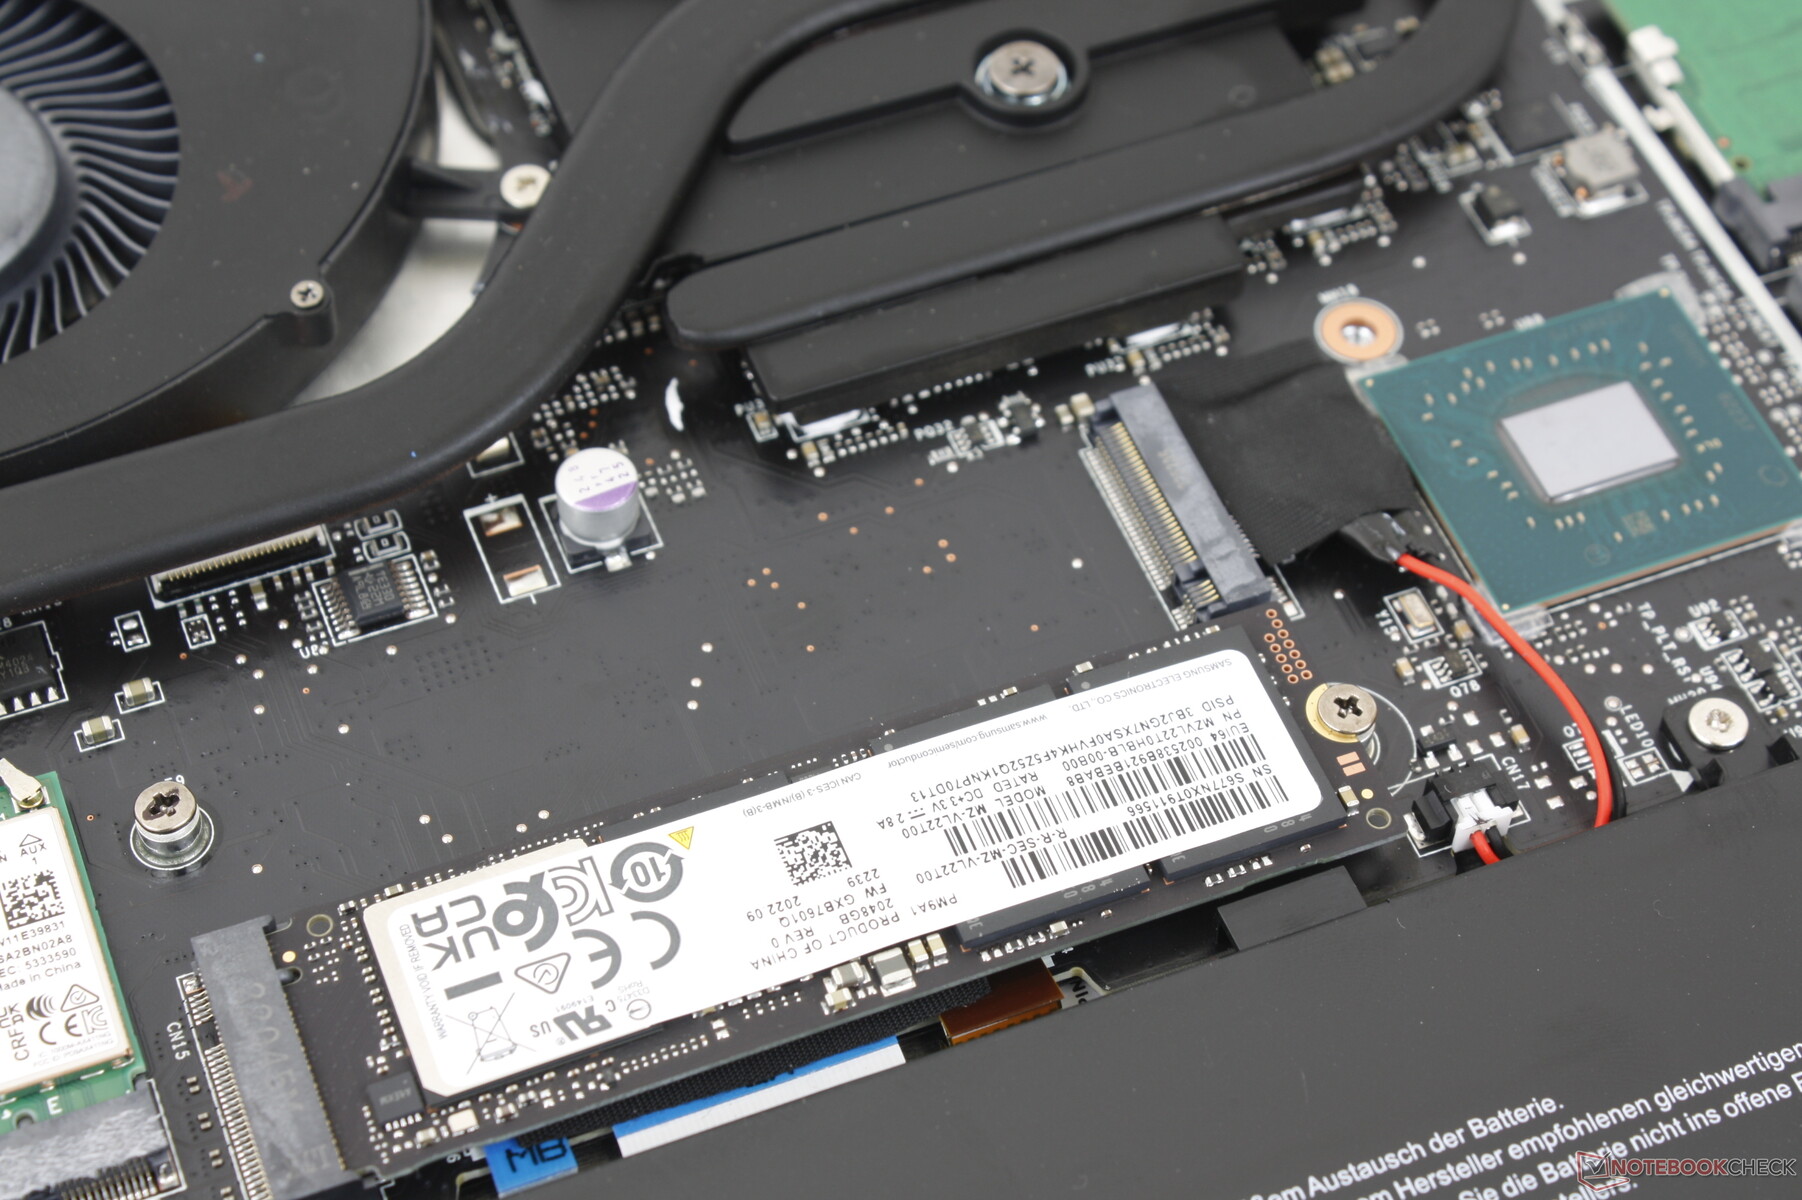
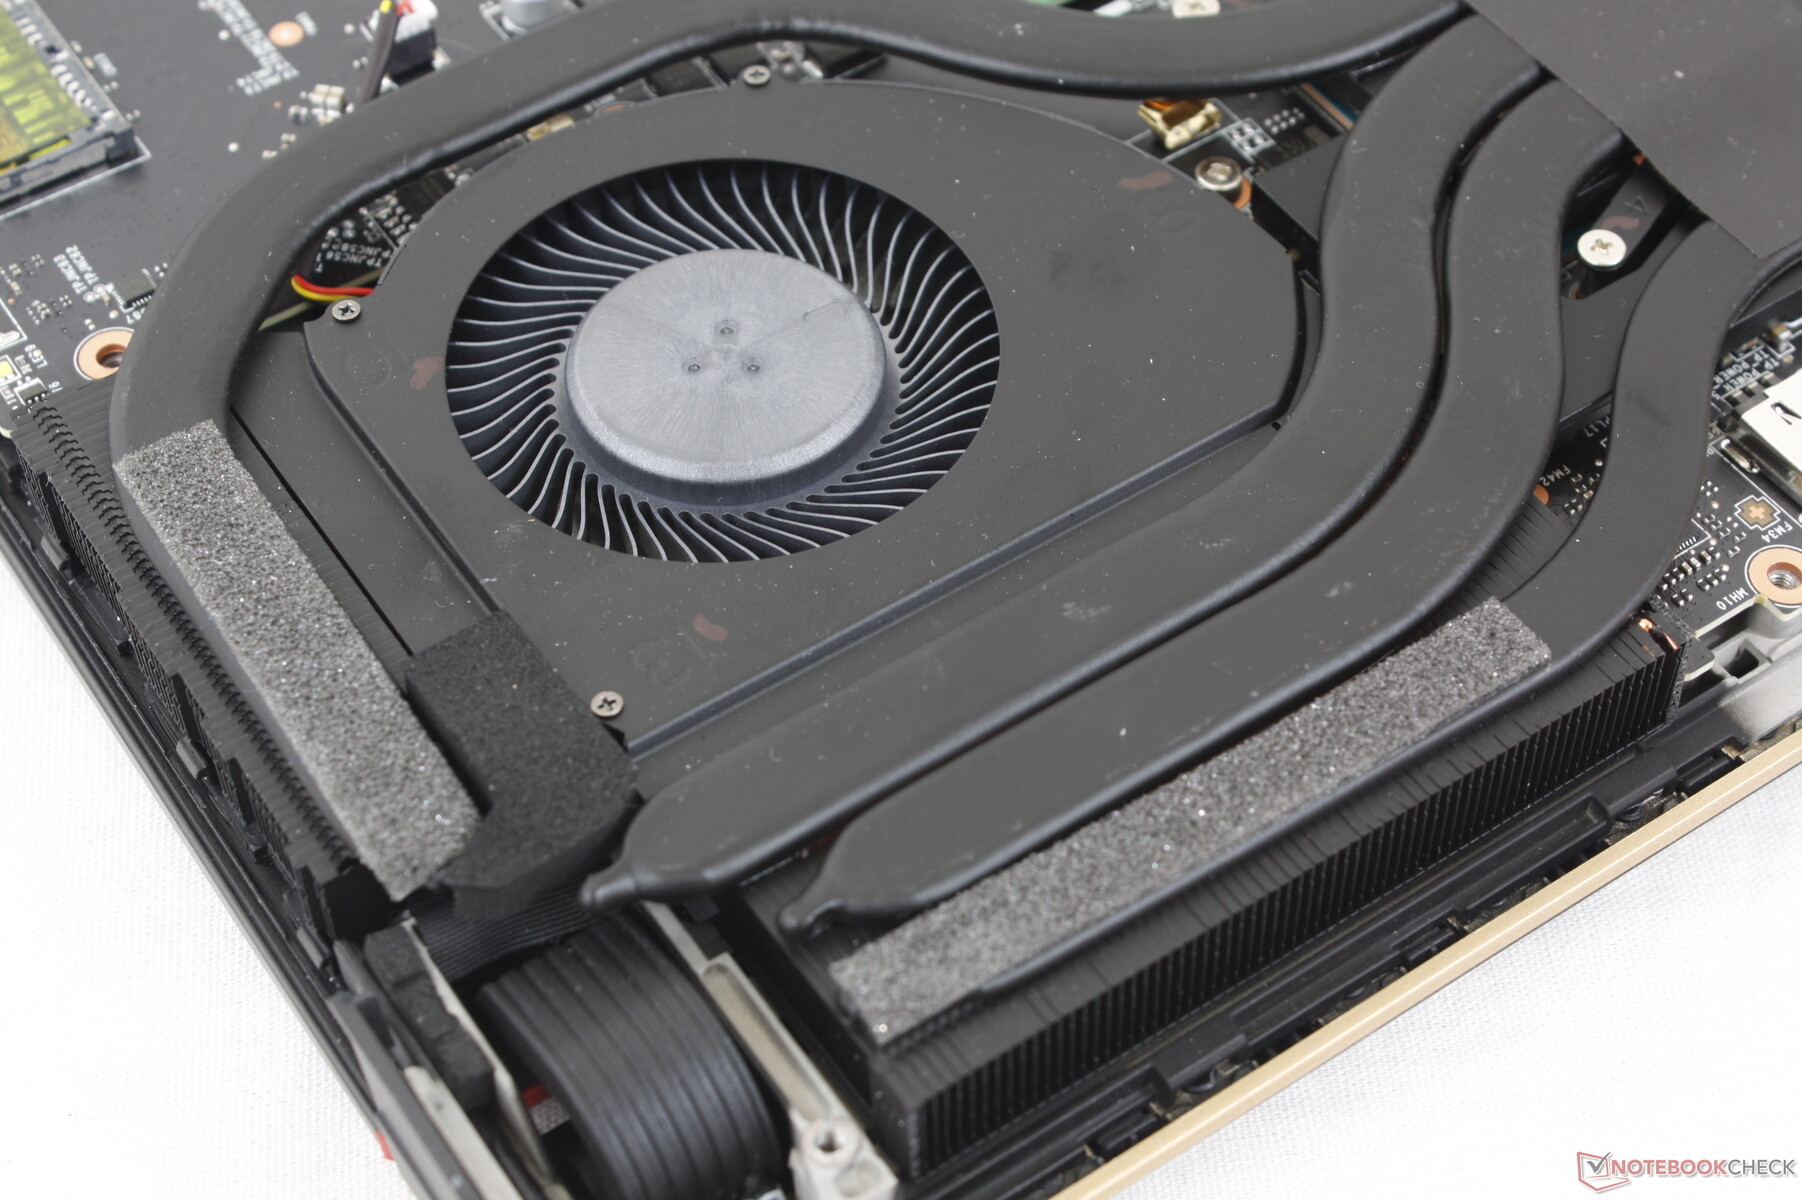
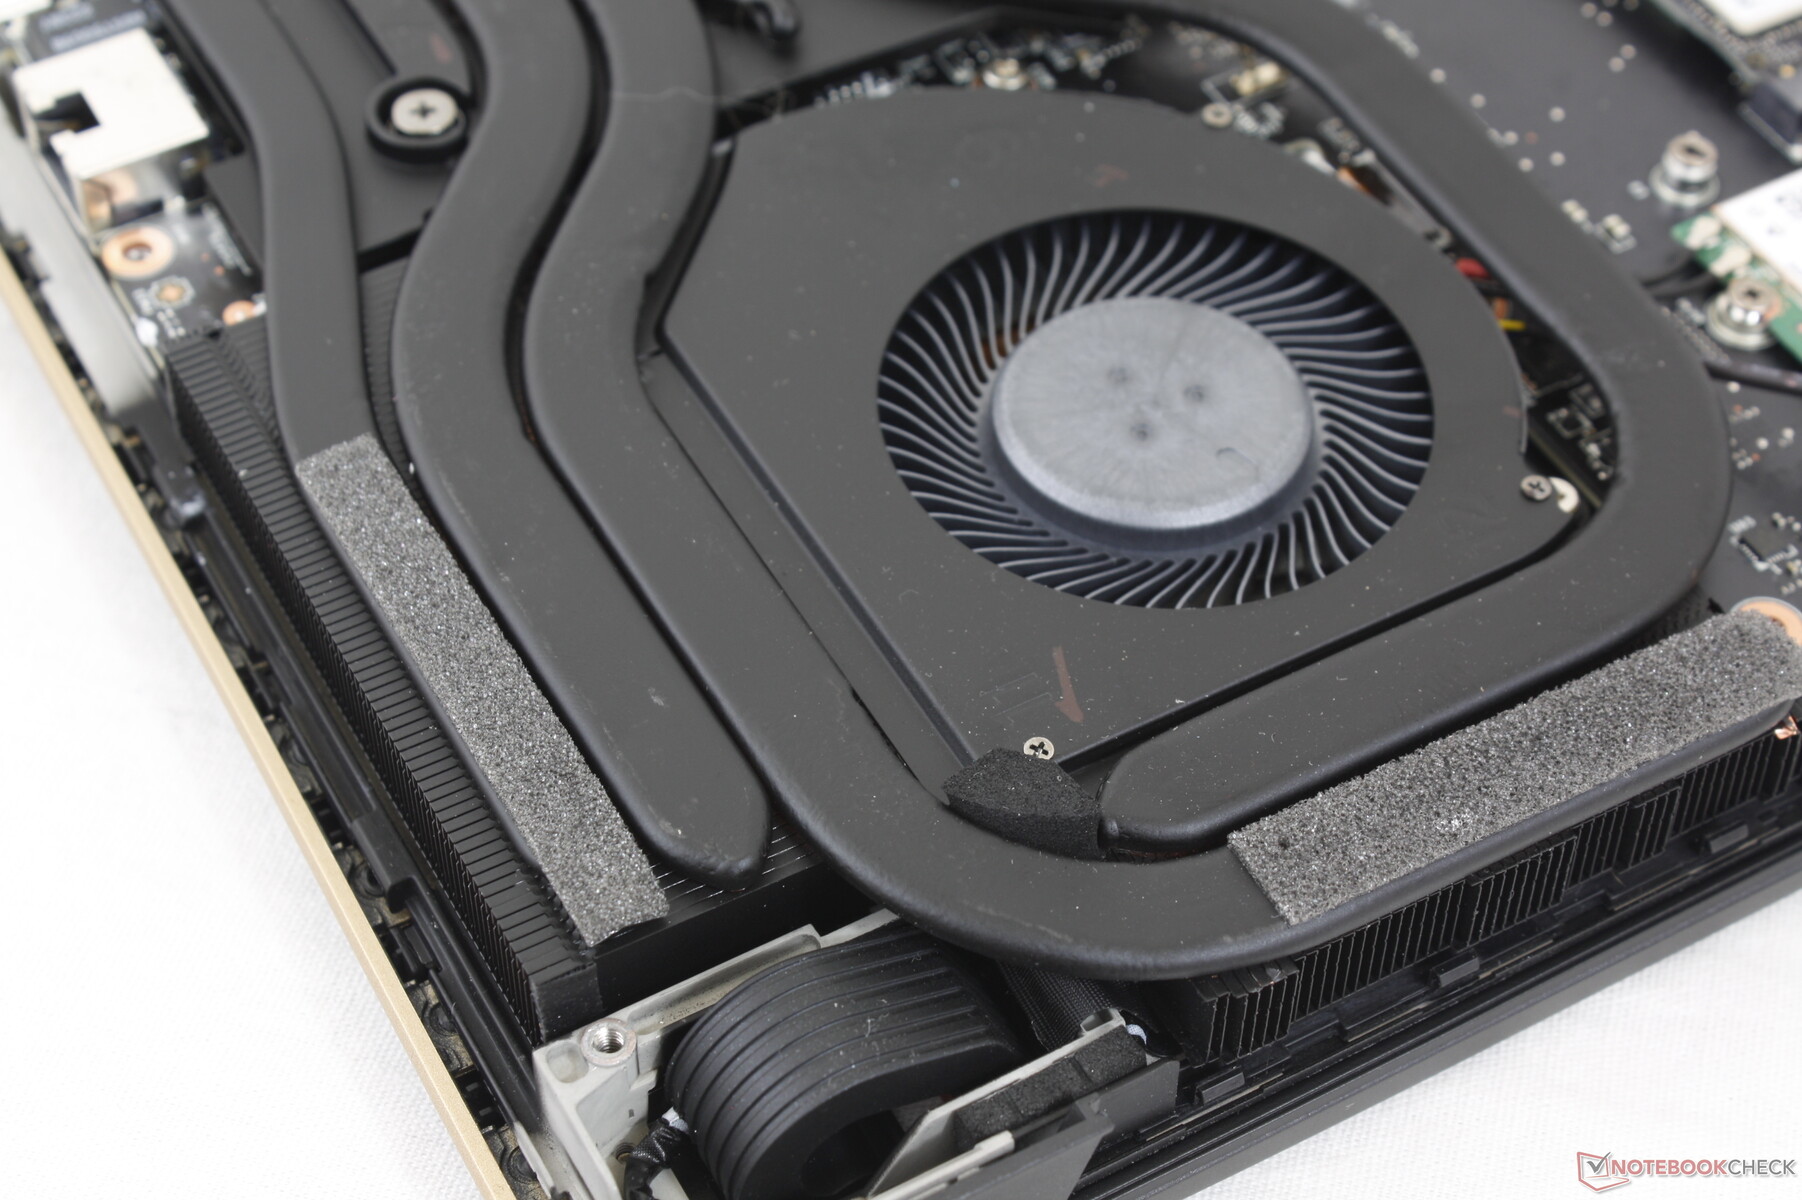
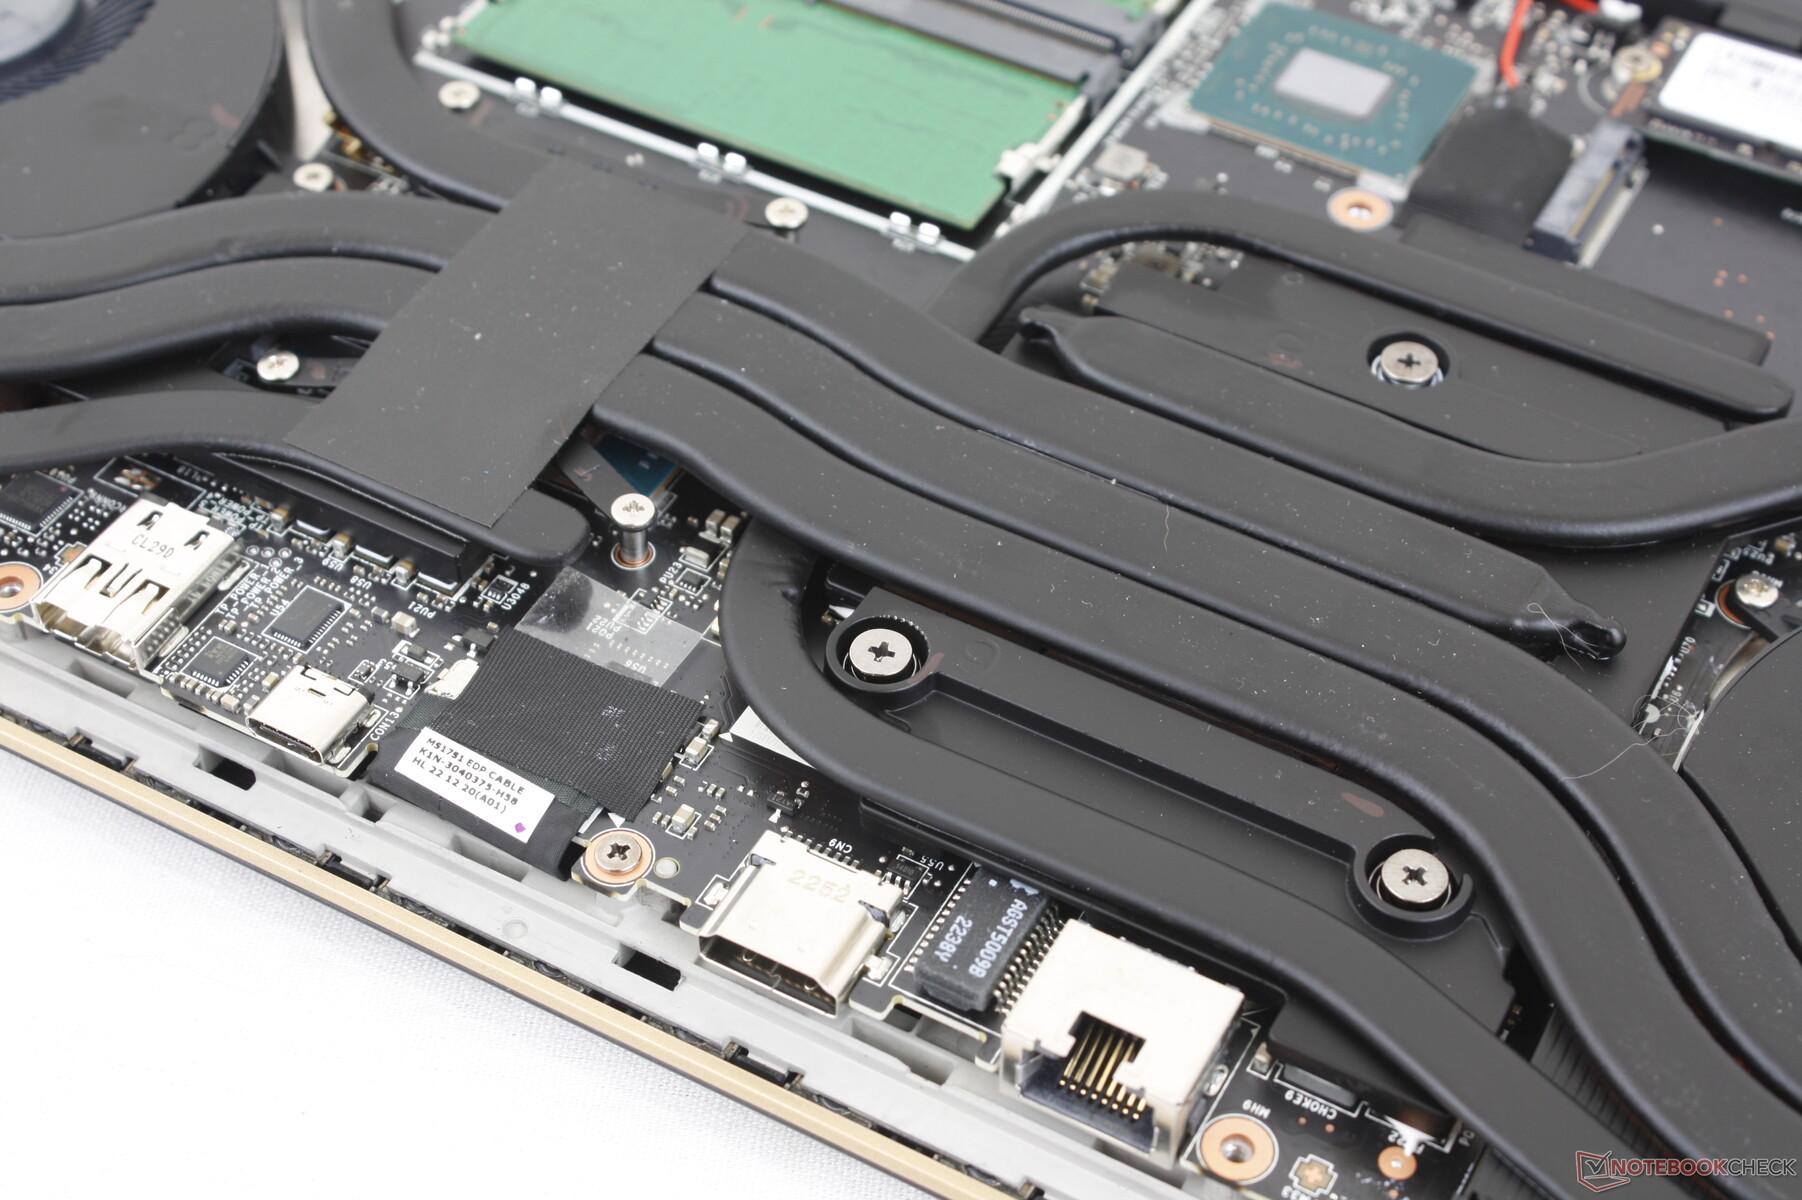
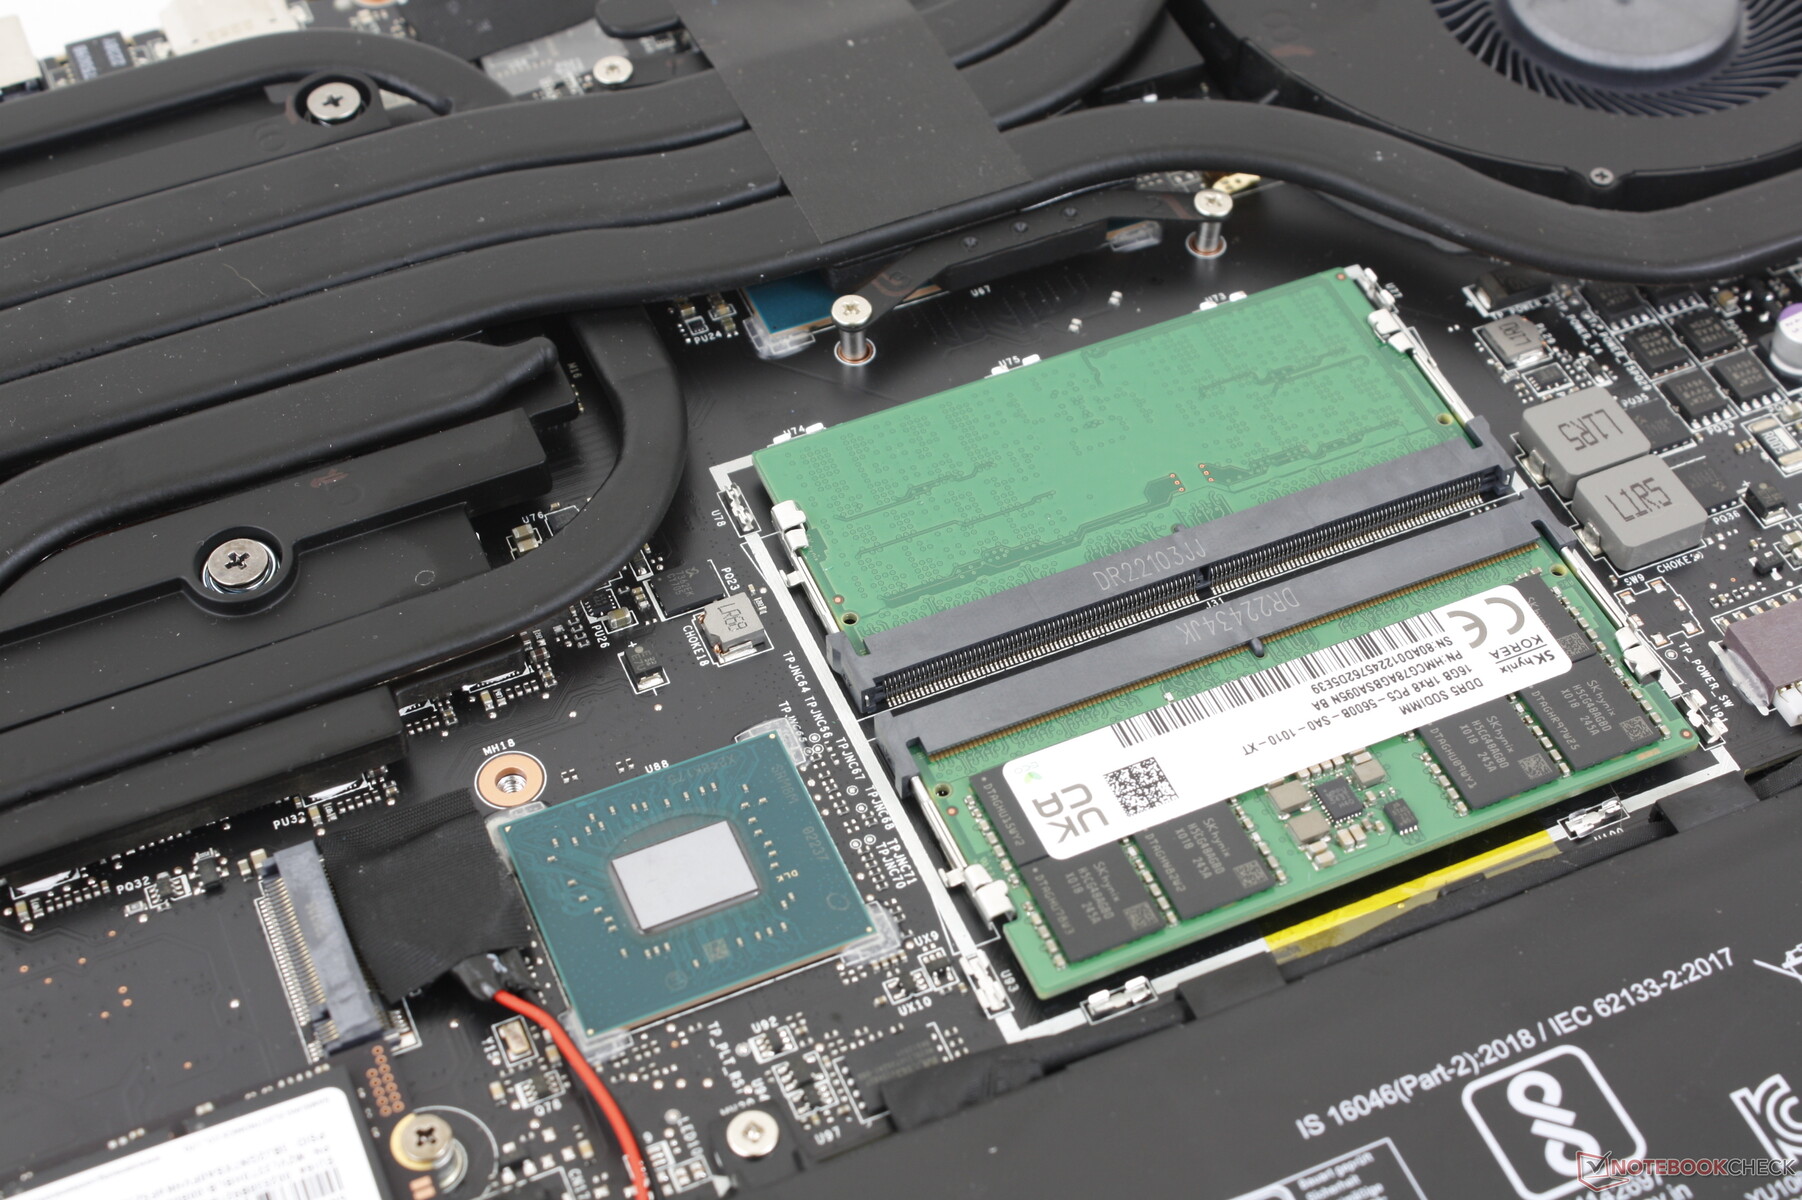
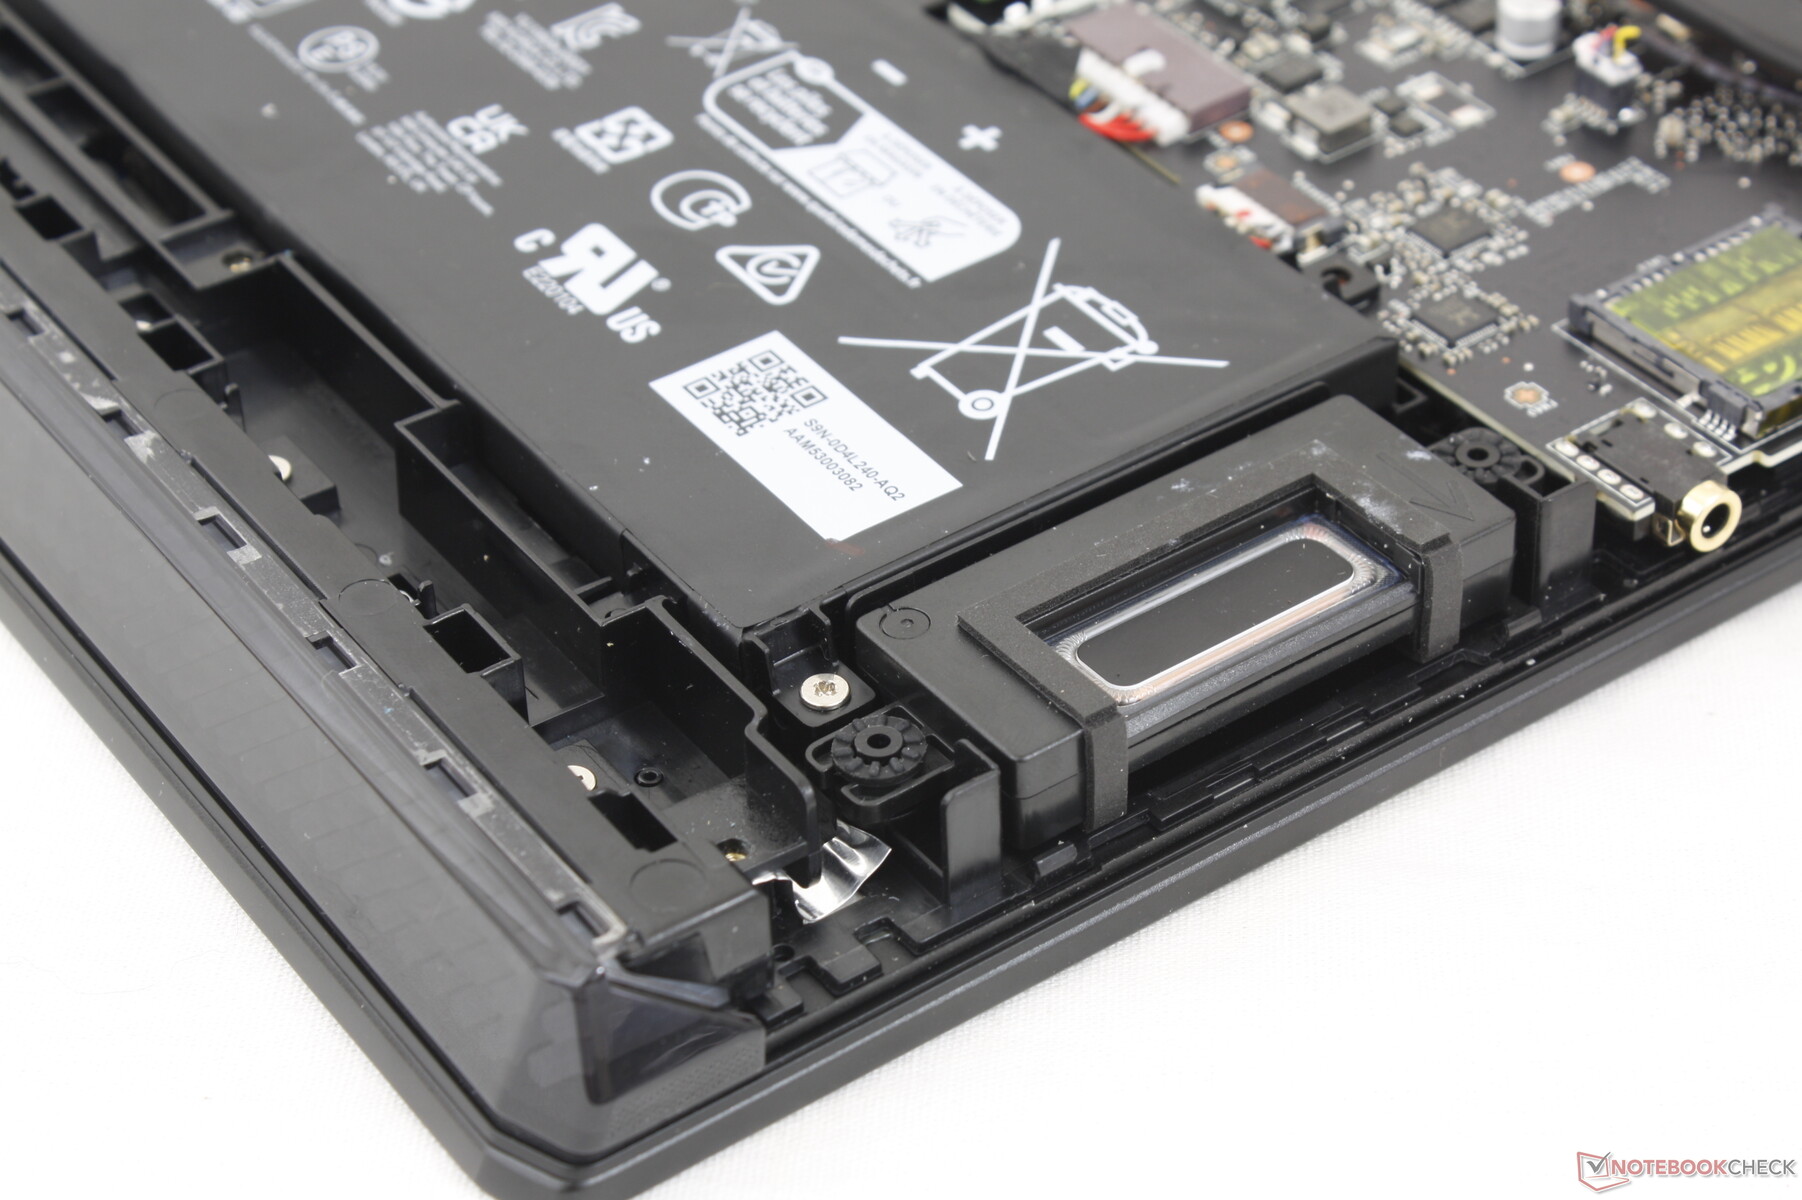
Maintenance - Un peu plus difficile qu'avant
Le panneau inférieur est fixé par 12 vis Philips. Comme d'habitude chez MSI, un autocollant "sceau d'usine" doit être brisé si l'on veut retirer le panneau inférieur pour effectuer des réparations.
Il est recommandé d'utiliser un bord en plastique tranchant pour retirer le panneau inférieur car les loquets autour des bords peuvent être assez serrés. Une fois le panneau enlevé, les utilisateurs auront un accès direct aux 2 emplacements SODIMM, aux 2 emplacements SSD M.2, au module WLAN et à la batterie.
Accessoires et garantie
La boîte ne contient pas d'autres éléments que l'adaptateur secteur et la documentation. La garantie limitée standard d'un an s'applique si l'appareil est acheté aux États-Unis.
Dispositifs d'entrée - plus grands et plus raffinés
Clavier
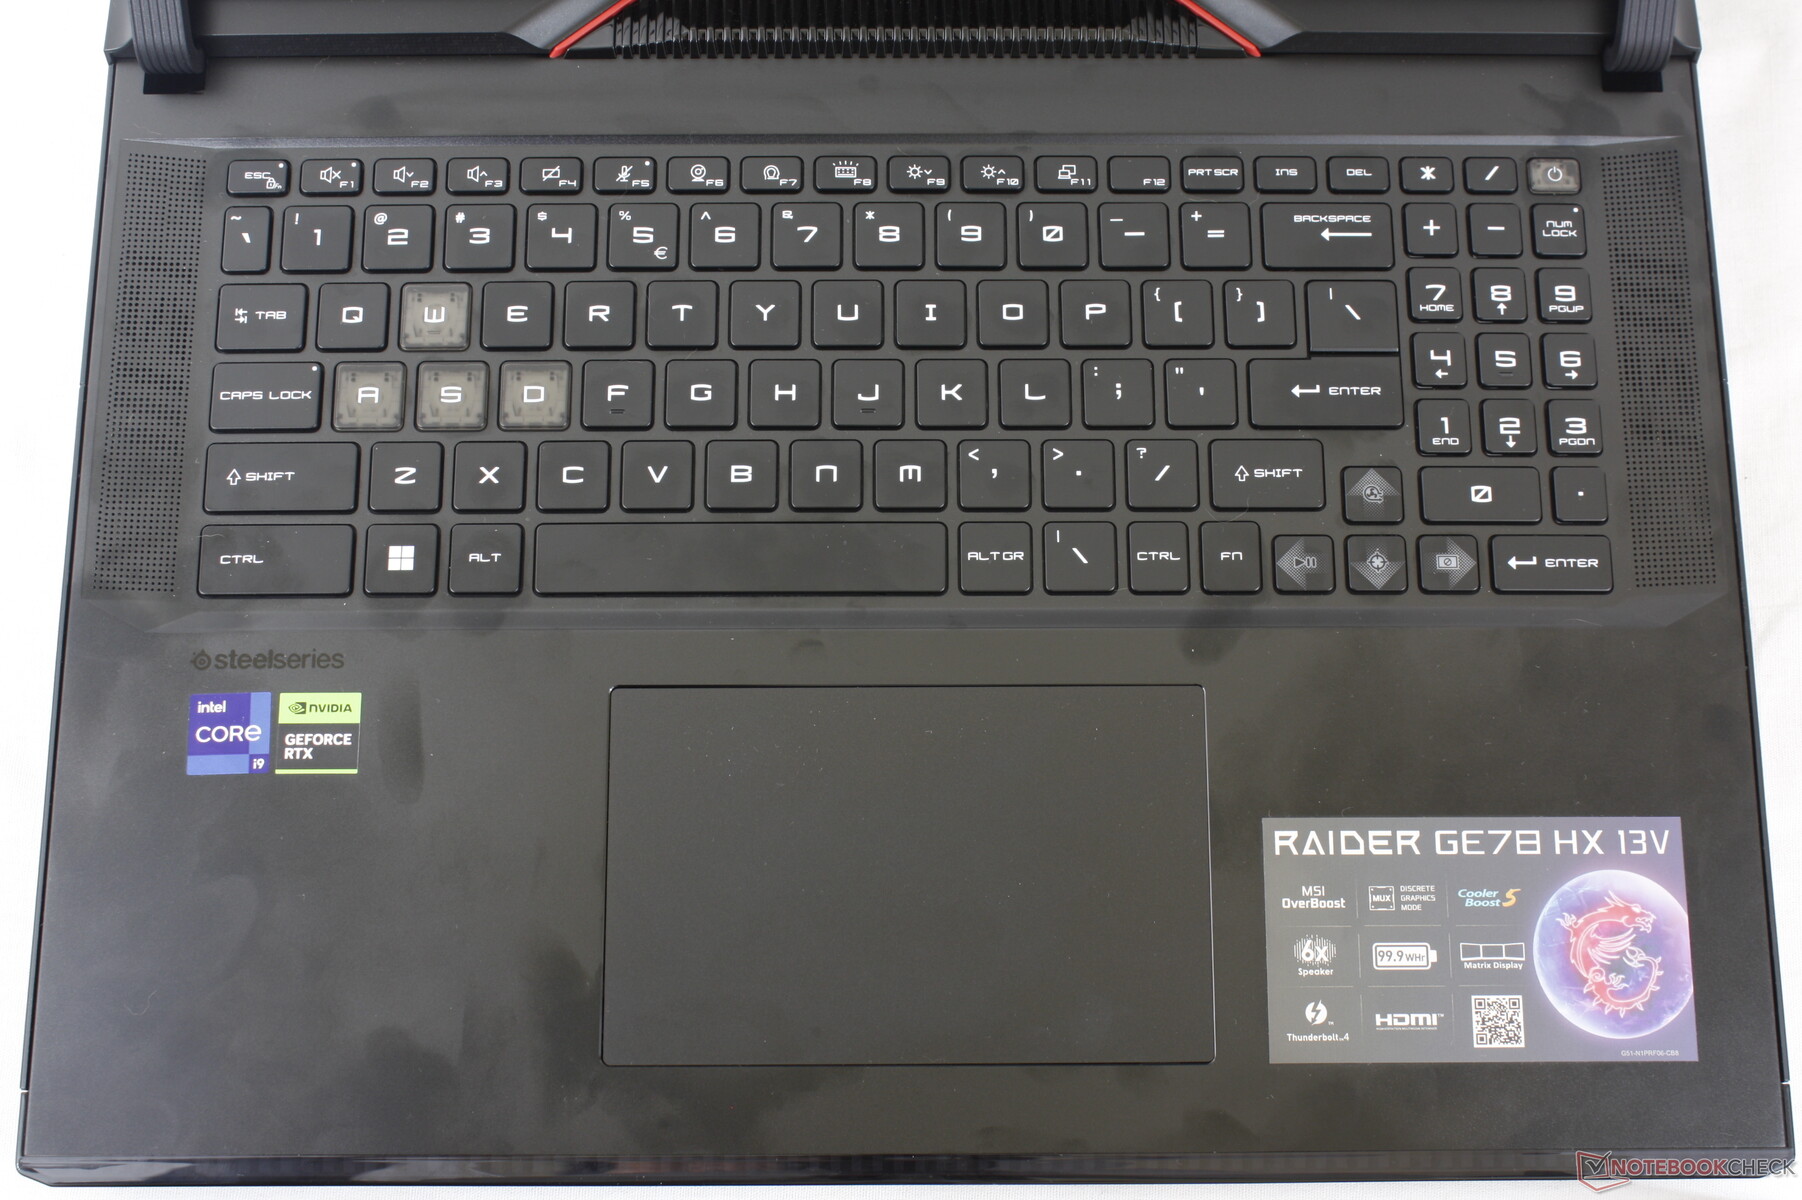
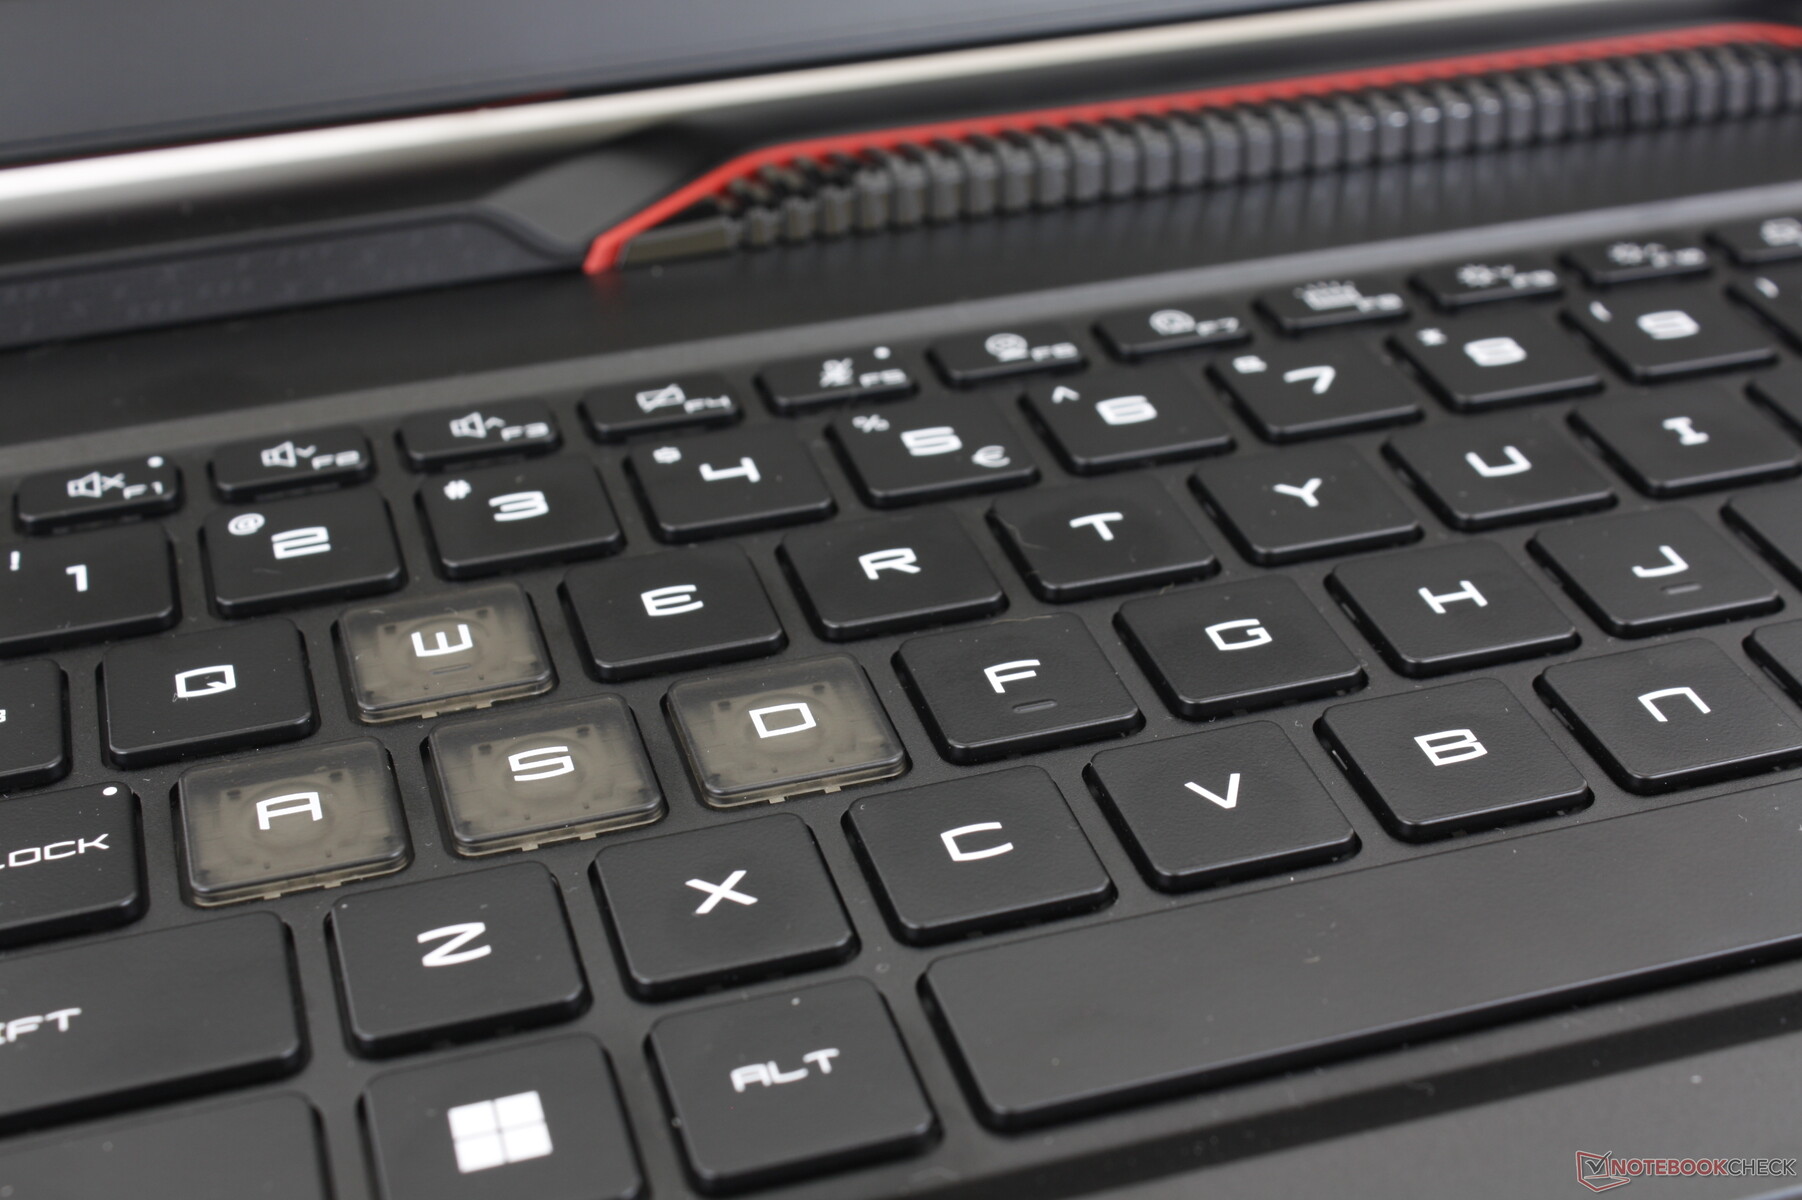
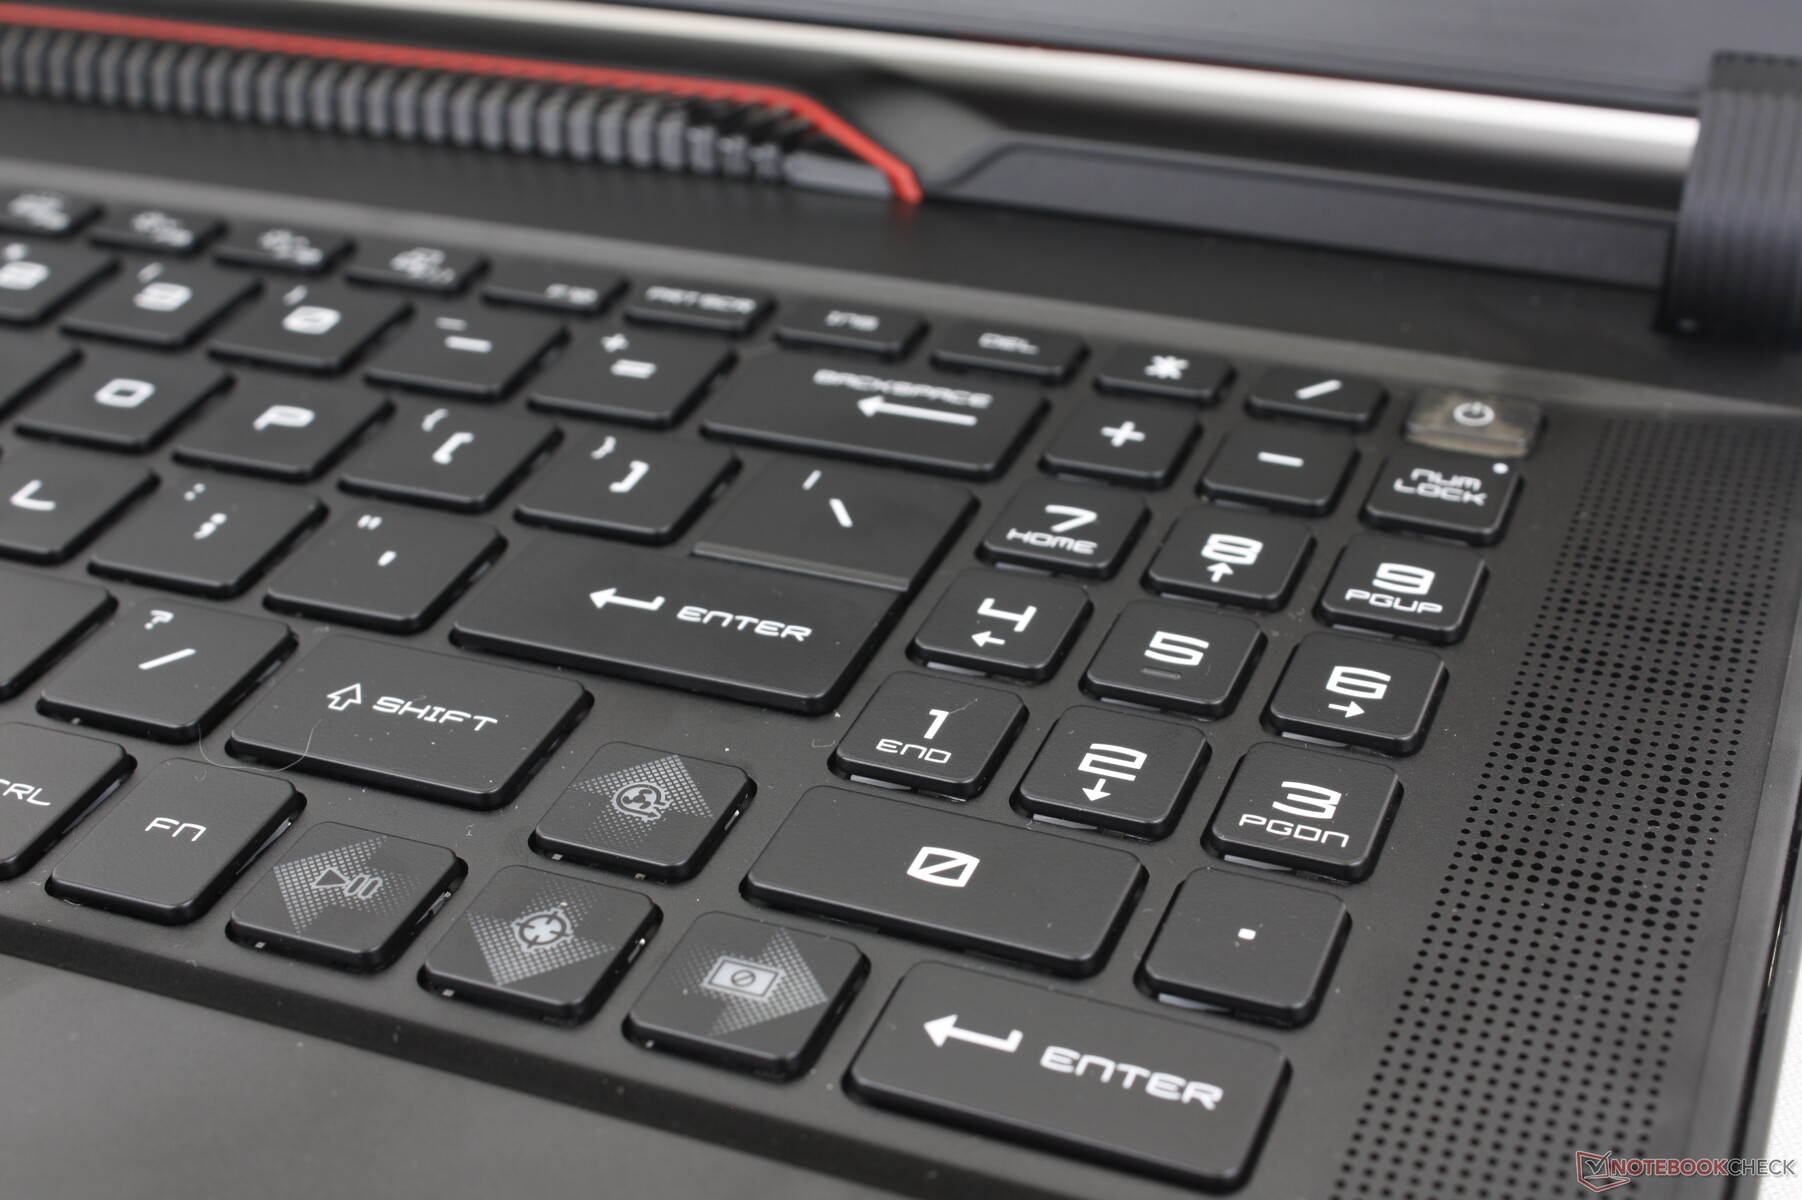
MSI a revu les capuchons de touches et l'étiquetage des touches par rapport au GE77. Les touches Espace et Entrée en particulier sont plus bruyantes et cliquantes cette fois-ci, pour une expérience de frappe plus satisfaisante.
Les touches fléchées et le pavé numérique mériteraient d'être améliorés. Malgré la taille de l'ordinateur de 17 pouces, ces touches sont petites et exiguës. En comparaison, les touches fléchées et le pavé numérique des ordinateurs de la série Lenovo Legion sont plus grandes et plus spacieuses. Les jeux qui utilisent souvent les touches fléchées, comme les jeux de course, peuvent être plus difficiles à jouer sur le système MSI.
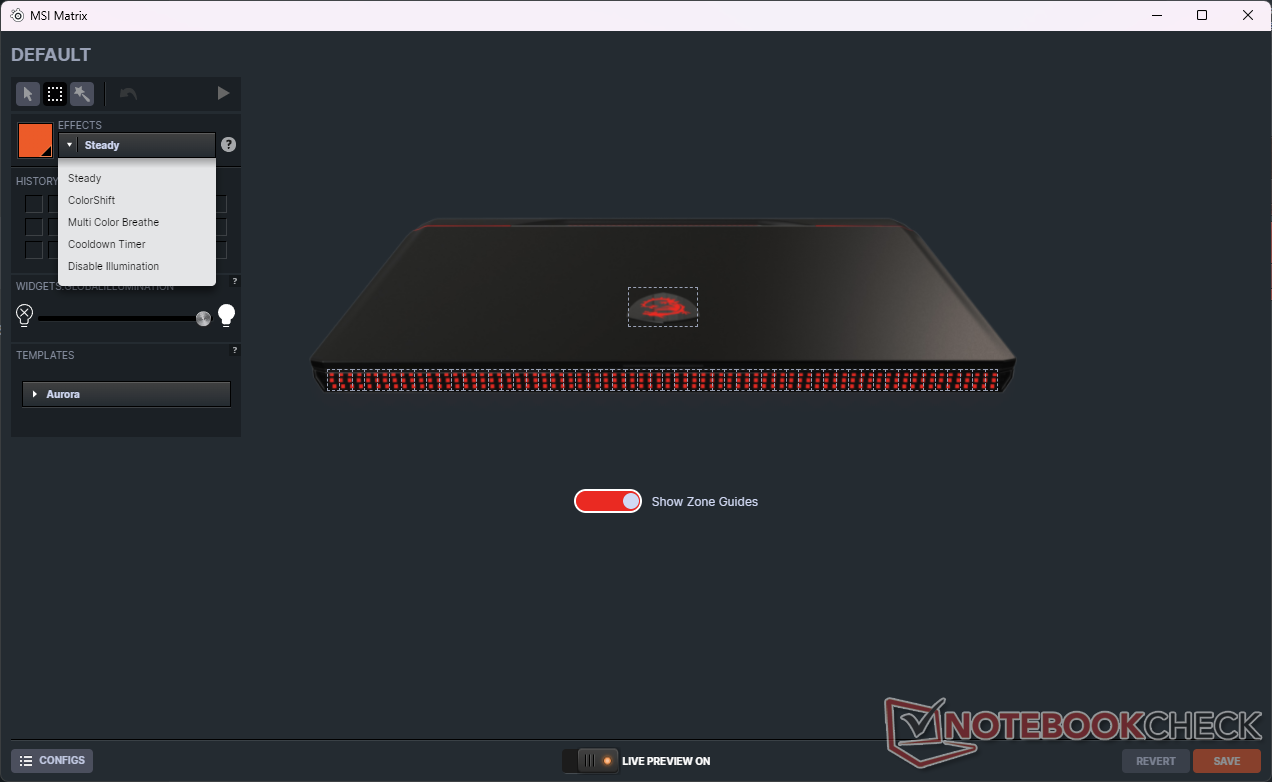
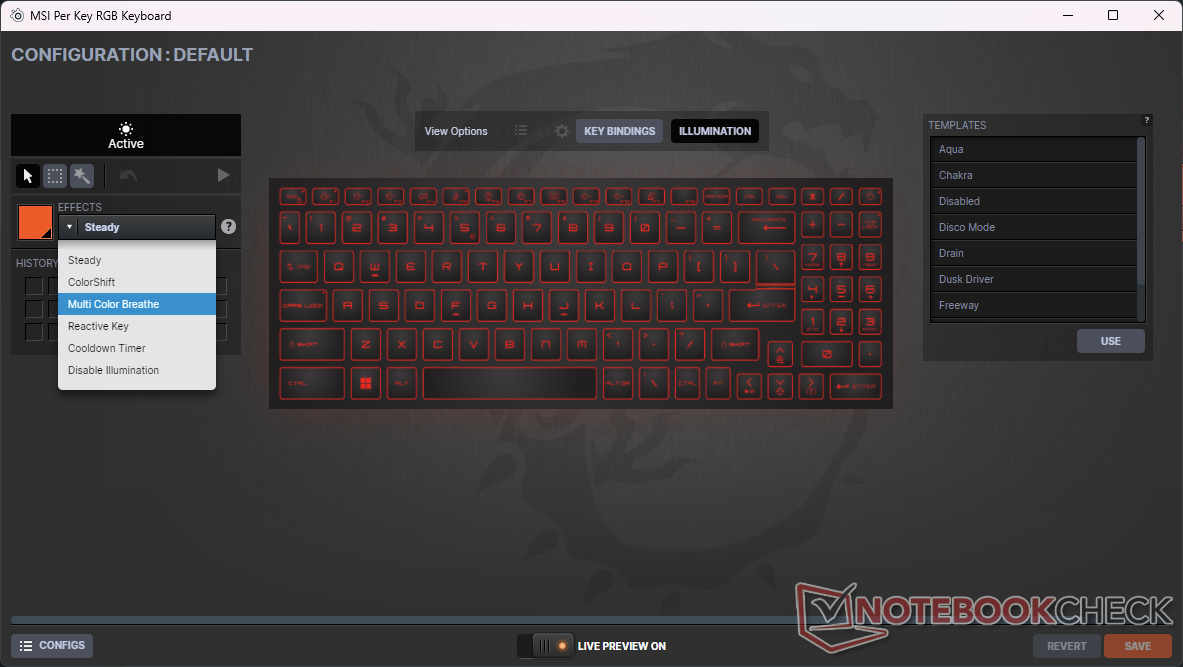
Les effets d'éclairage RVB par touche sont contrôlés par le logiciel SteelSeries GG préinstallé, comme le montrent les captures d'écran ci-dessous. L'application contrôle également la barre lumineuse pixellisée "matrix" le long du bord avant du châssis.
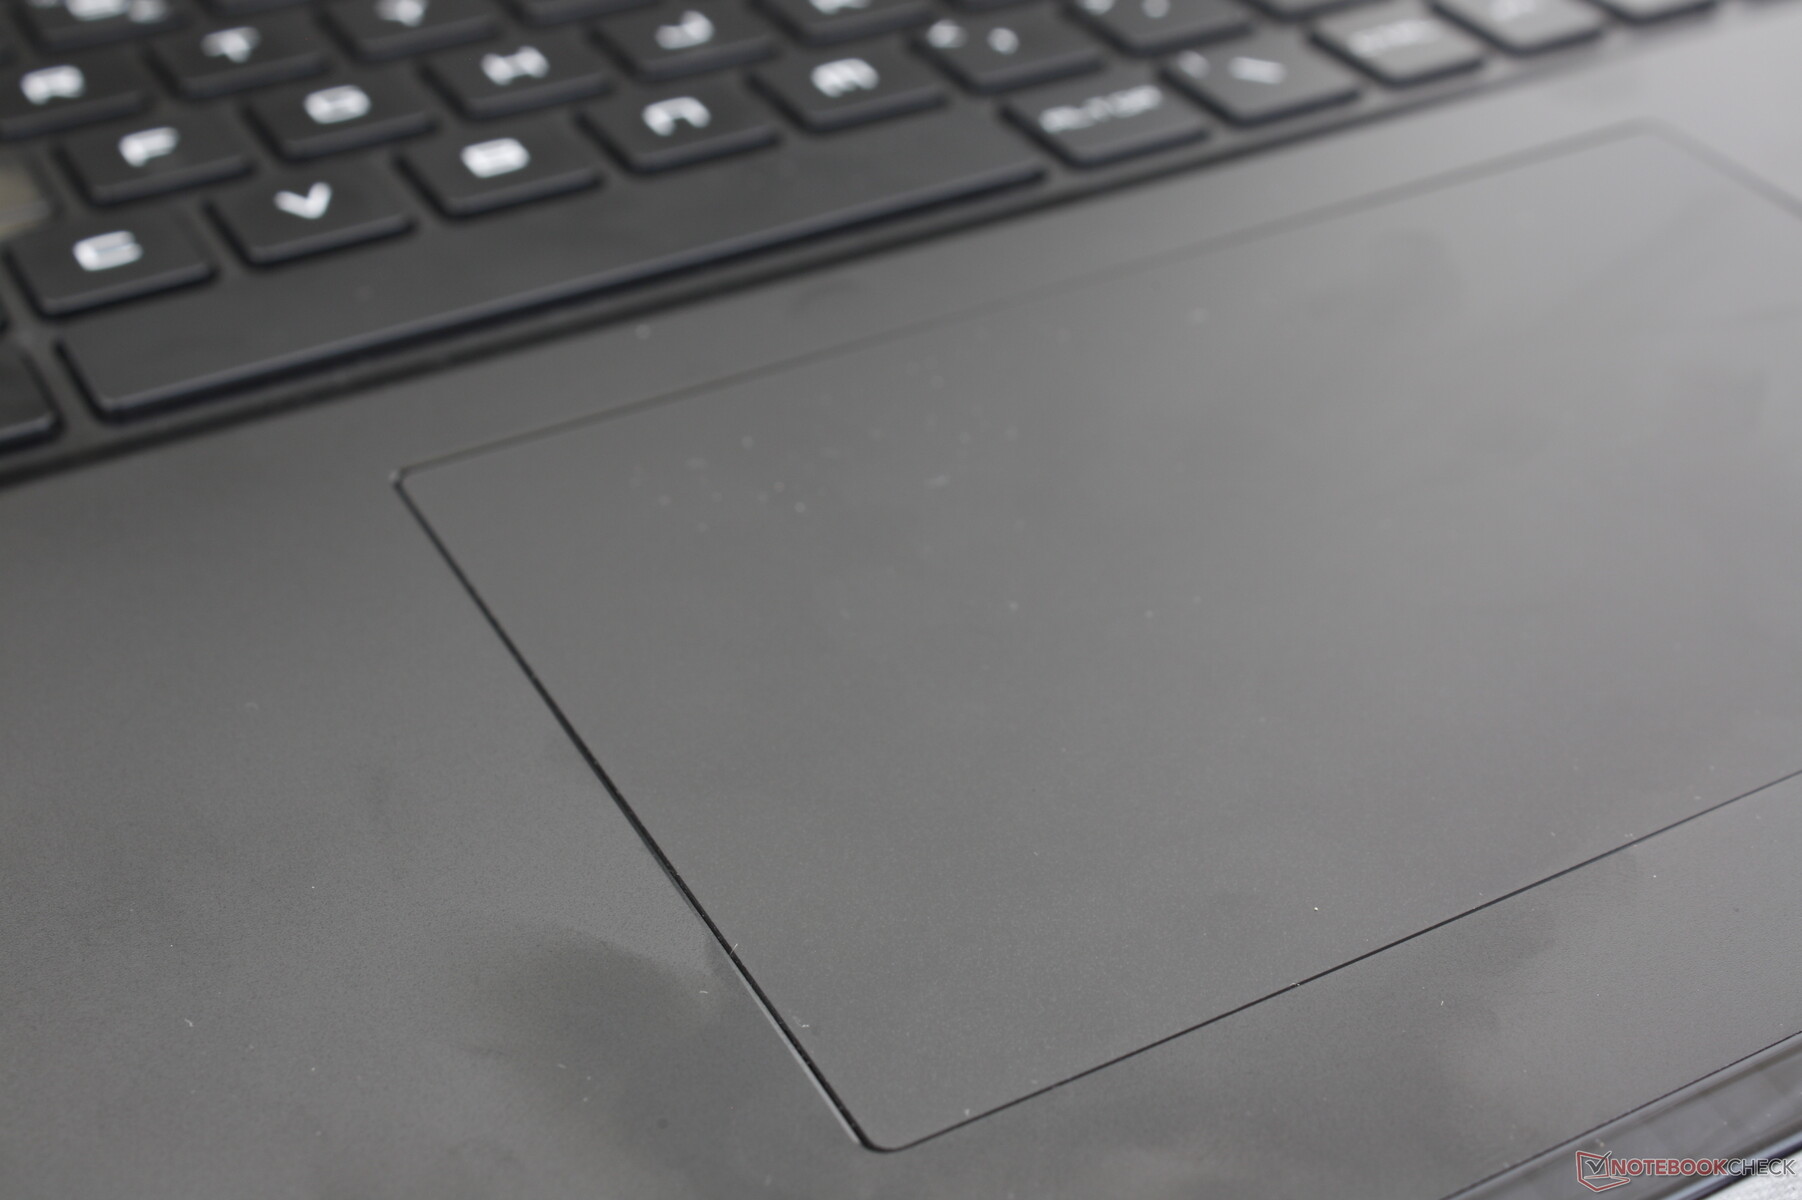
Pavé tactile
Le pavé tactile est passé d'une surface minuscule de 10,5 x 6,5 cm sur le GE77 à une surface beaucoup plus spacieuse de 13 x 8,2 cm sur le GE78. Le glissement sur la surface en plastique est plus collant que prévu, cependant, et il y a donc un peu plus de résistance lorsque l'on glisse à des vitesses plus rapides. Le retour d'information lors de la pression est silencieux, mais trop superficiel et trop faible, ce qui donne une sensation générale insatisfaisante.
Affichage - Où est le support G-Sync ?
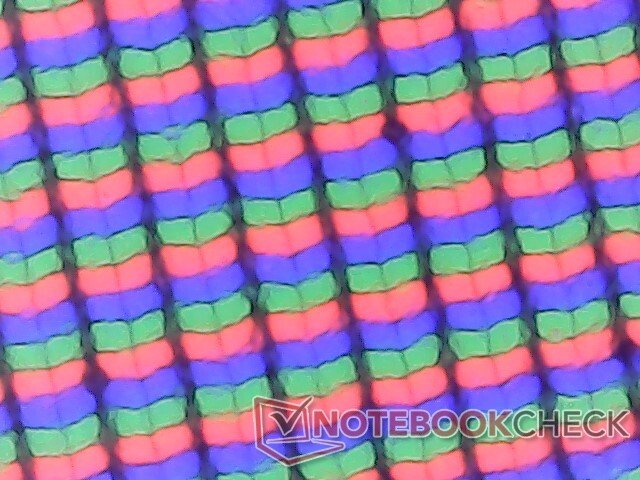
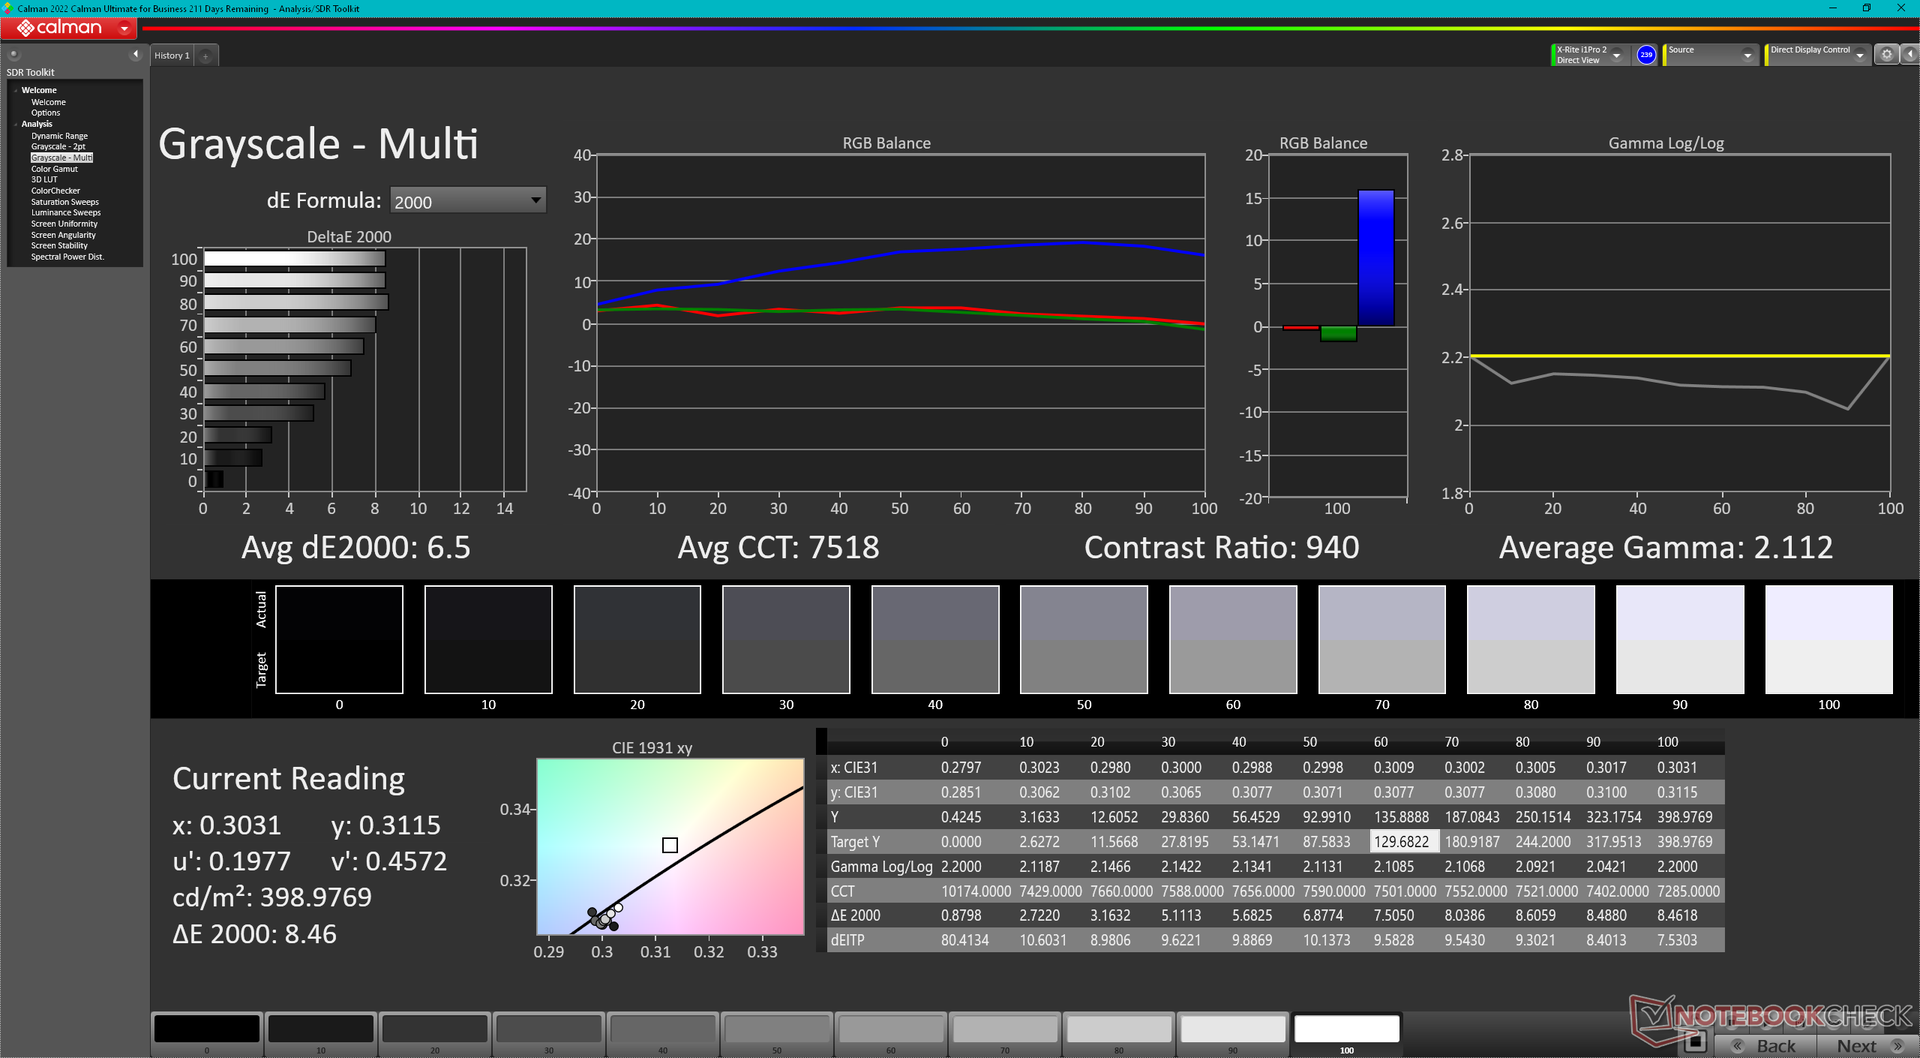
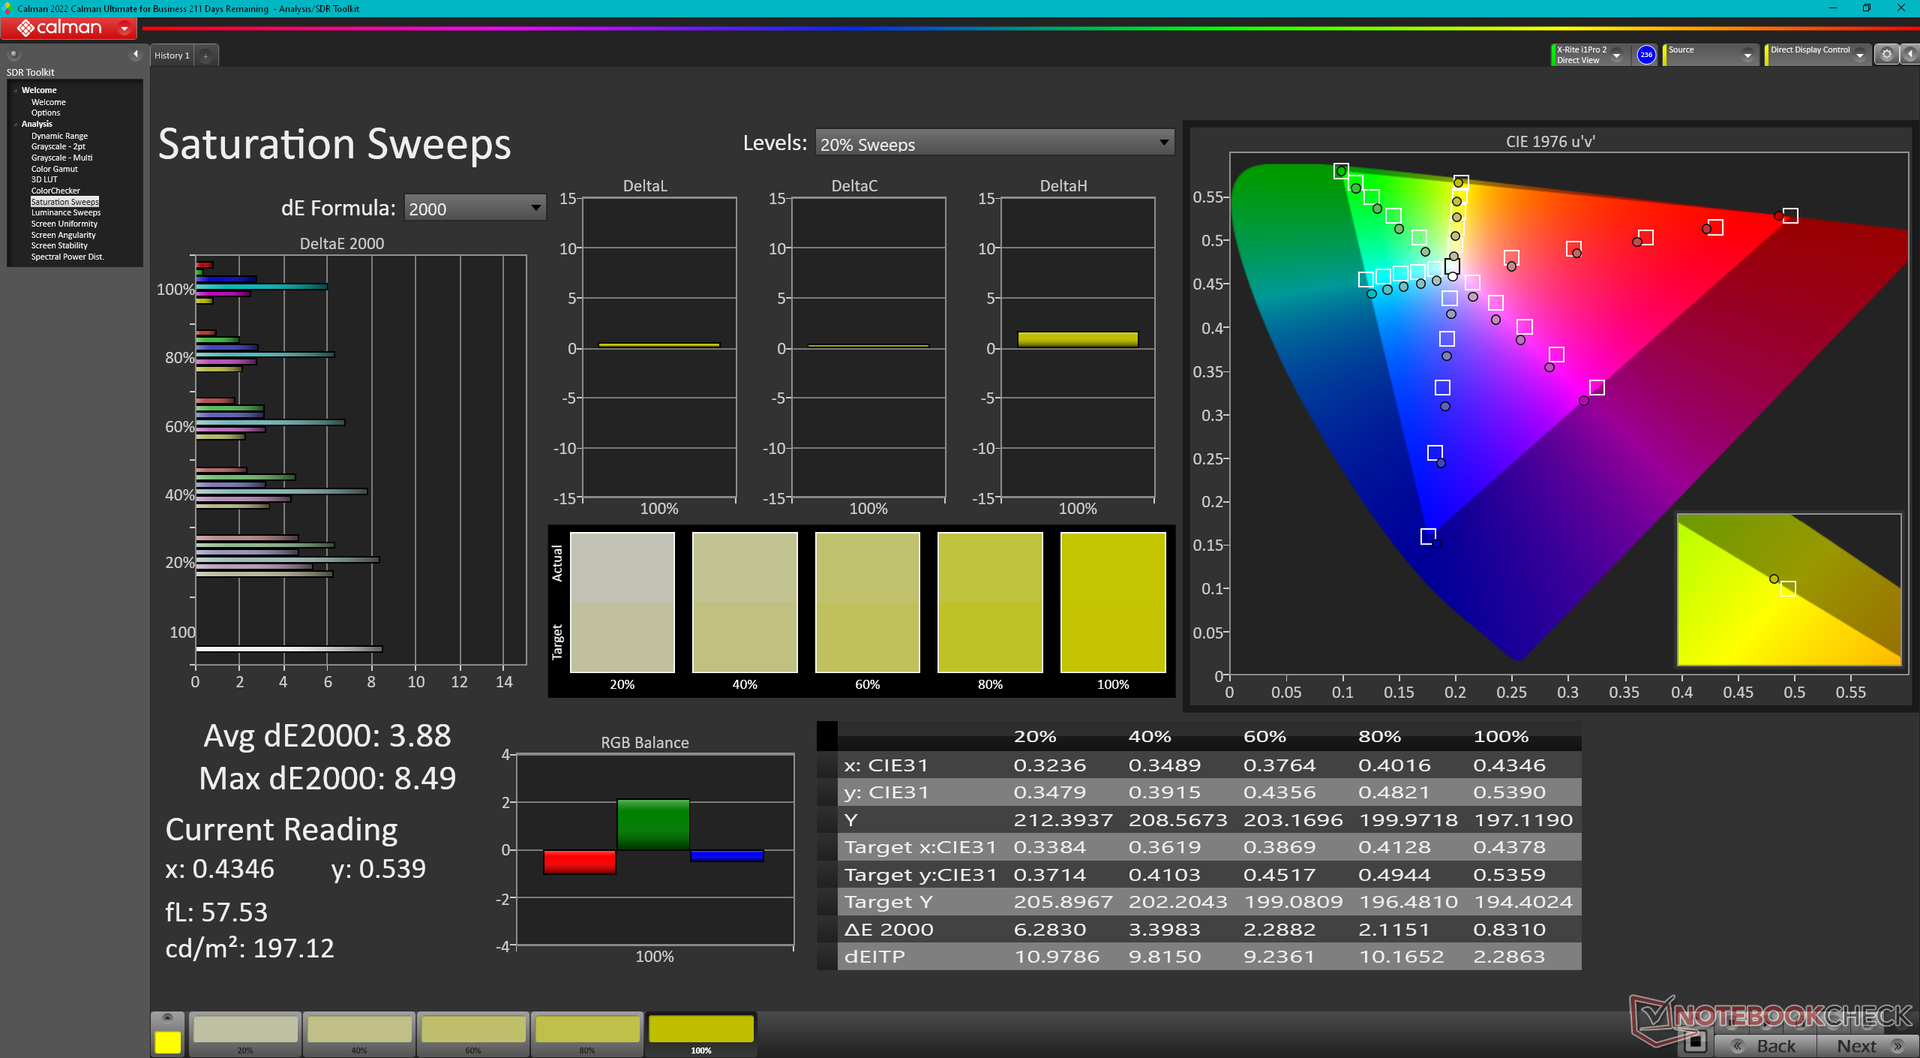
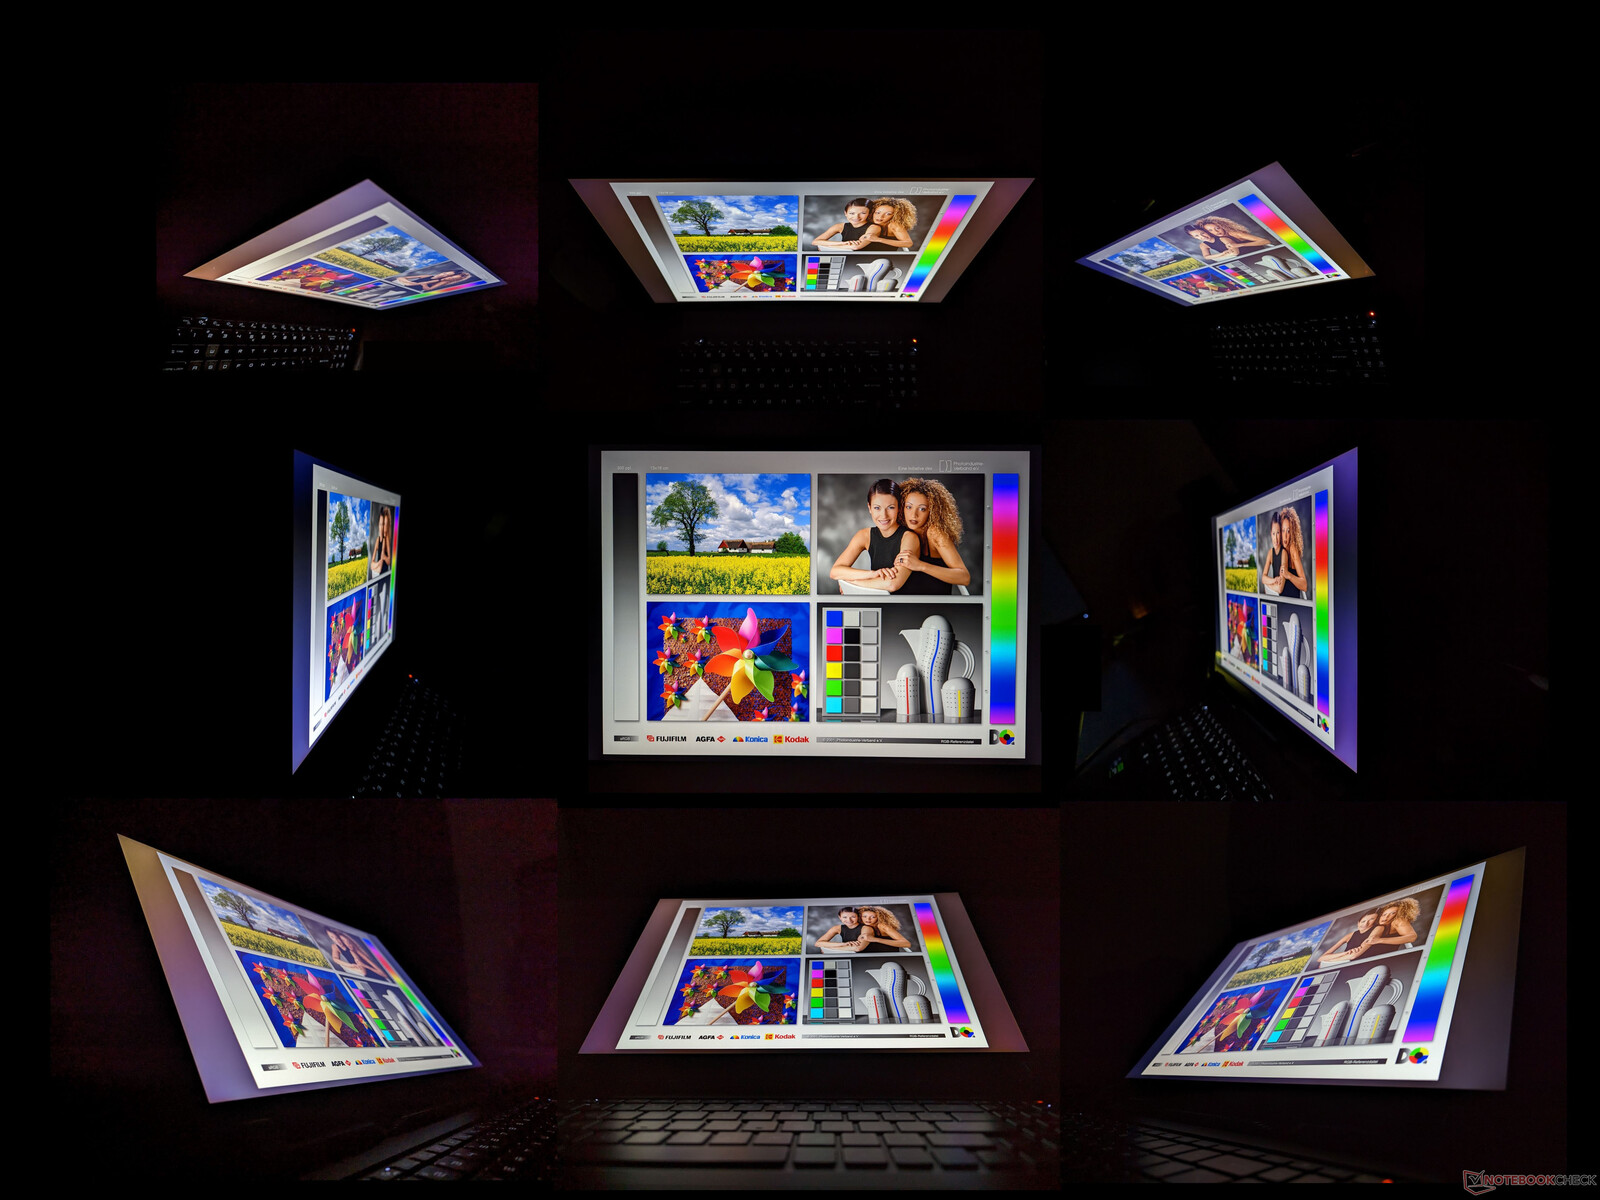
Le GE78 est le premier ordinateur portable de notre base de données à être équipé de l'écran IPS AU Optronics B170QAN01.2. Cependant, toutes nos mesures internes montrent qu'elle est essentiellement identique à la dalle AU Optronics B173ZAN06.1 du GE77 de l'année dernière, à l'exception de la taille (17,0 pouces contre 17,3 pouces), du format (16:10 contre 16:9) et du taux de rafraîchissement (240 Hz contre 120 Hz). Les attributs principaux tels que les couleurs P3 étendues, les temps de réponse rapides, la luminosité de 400 nits et le rapport de contraste décent restent à peu près les mêmes pour une expérience visuelle similaire entre les deux.
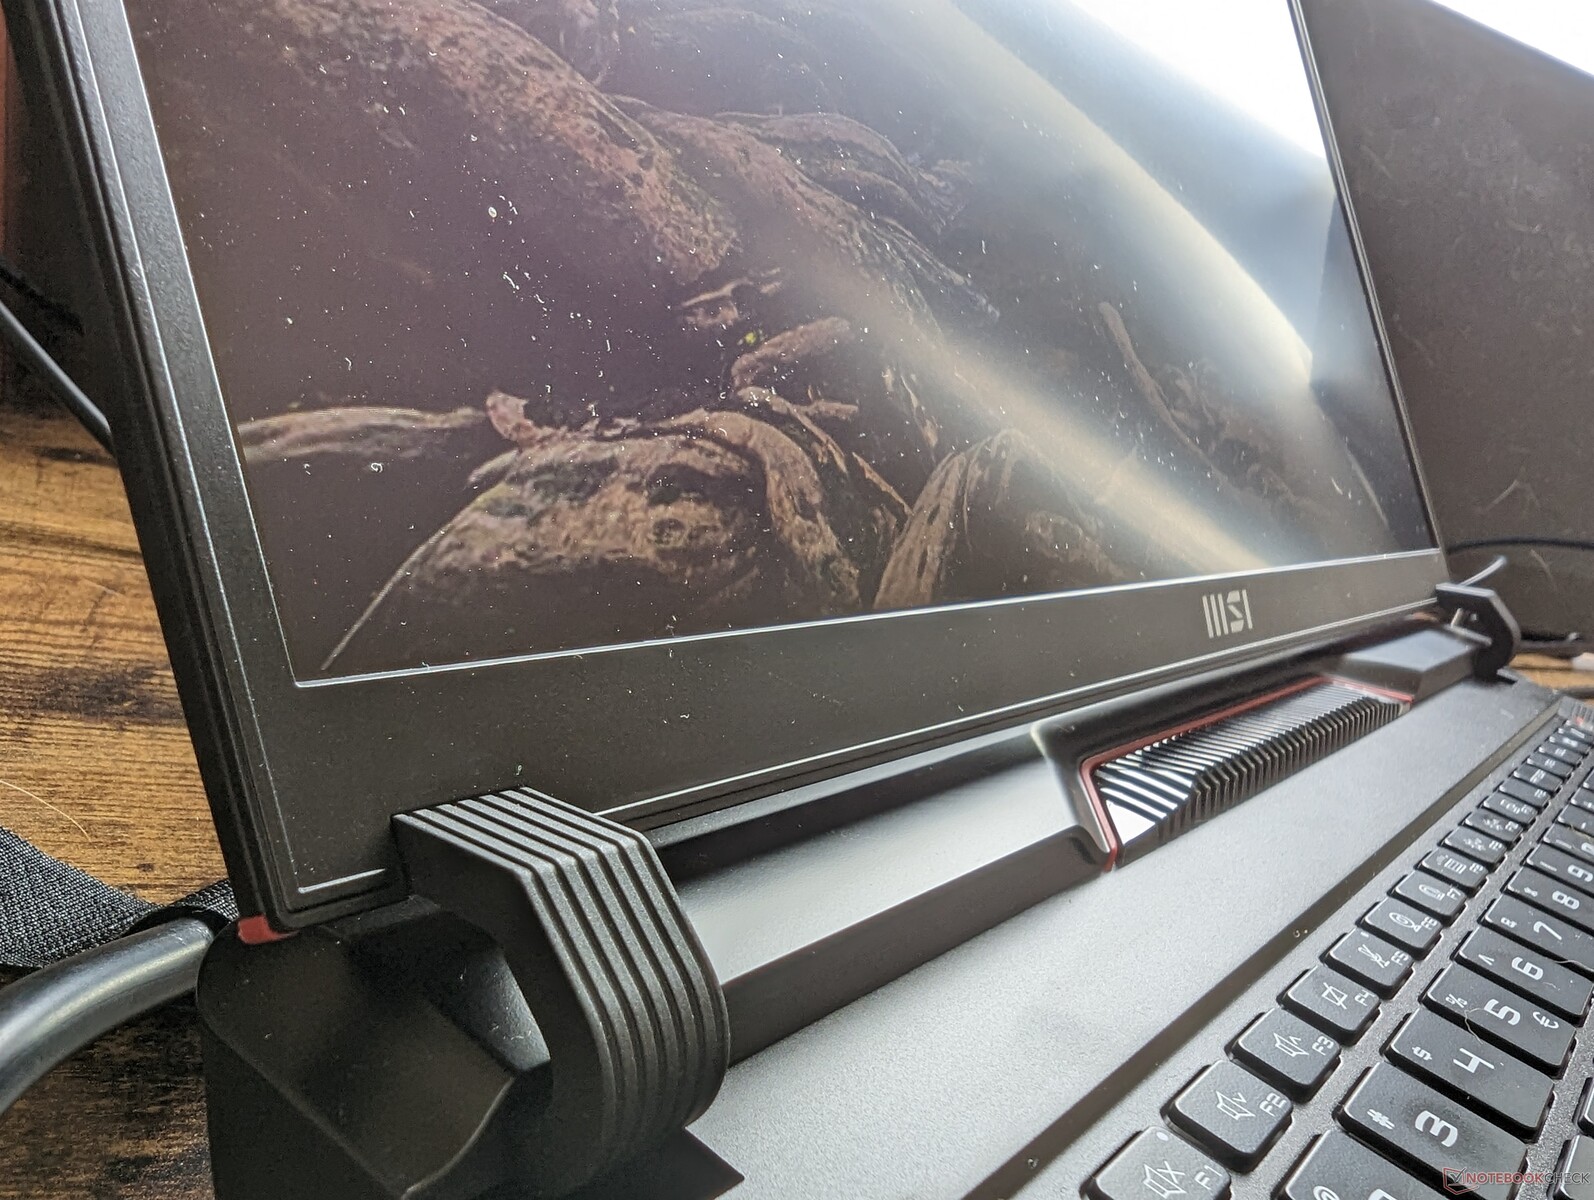
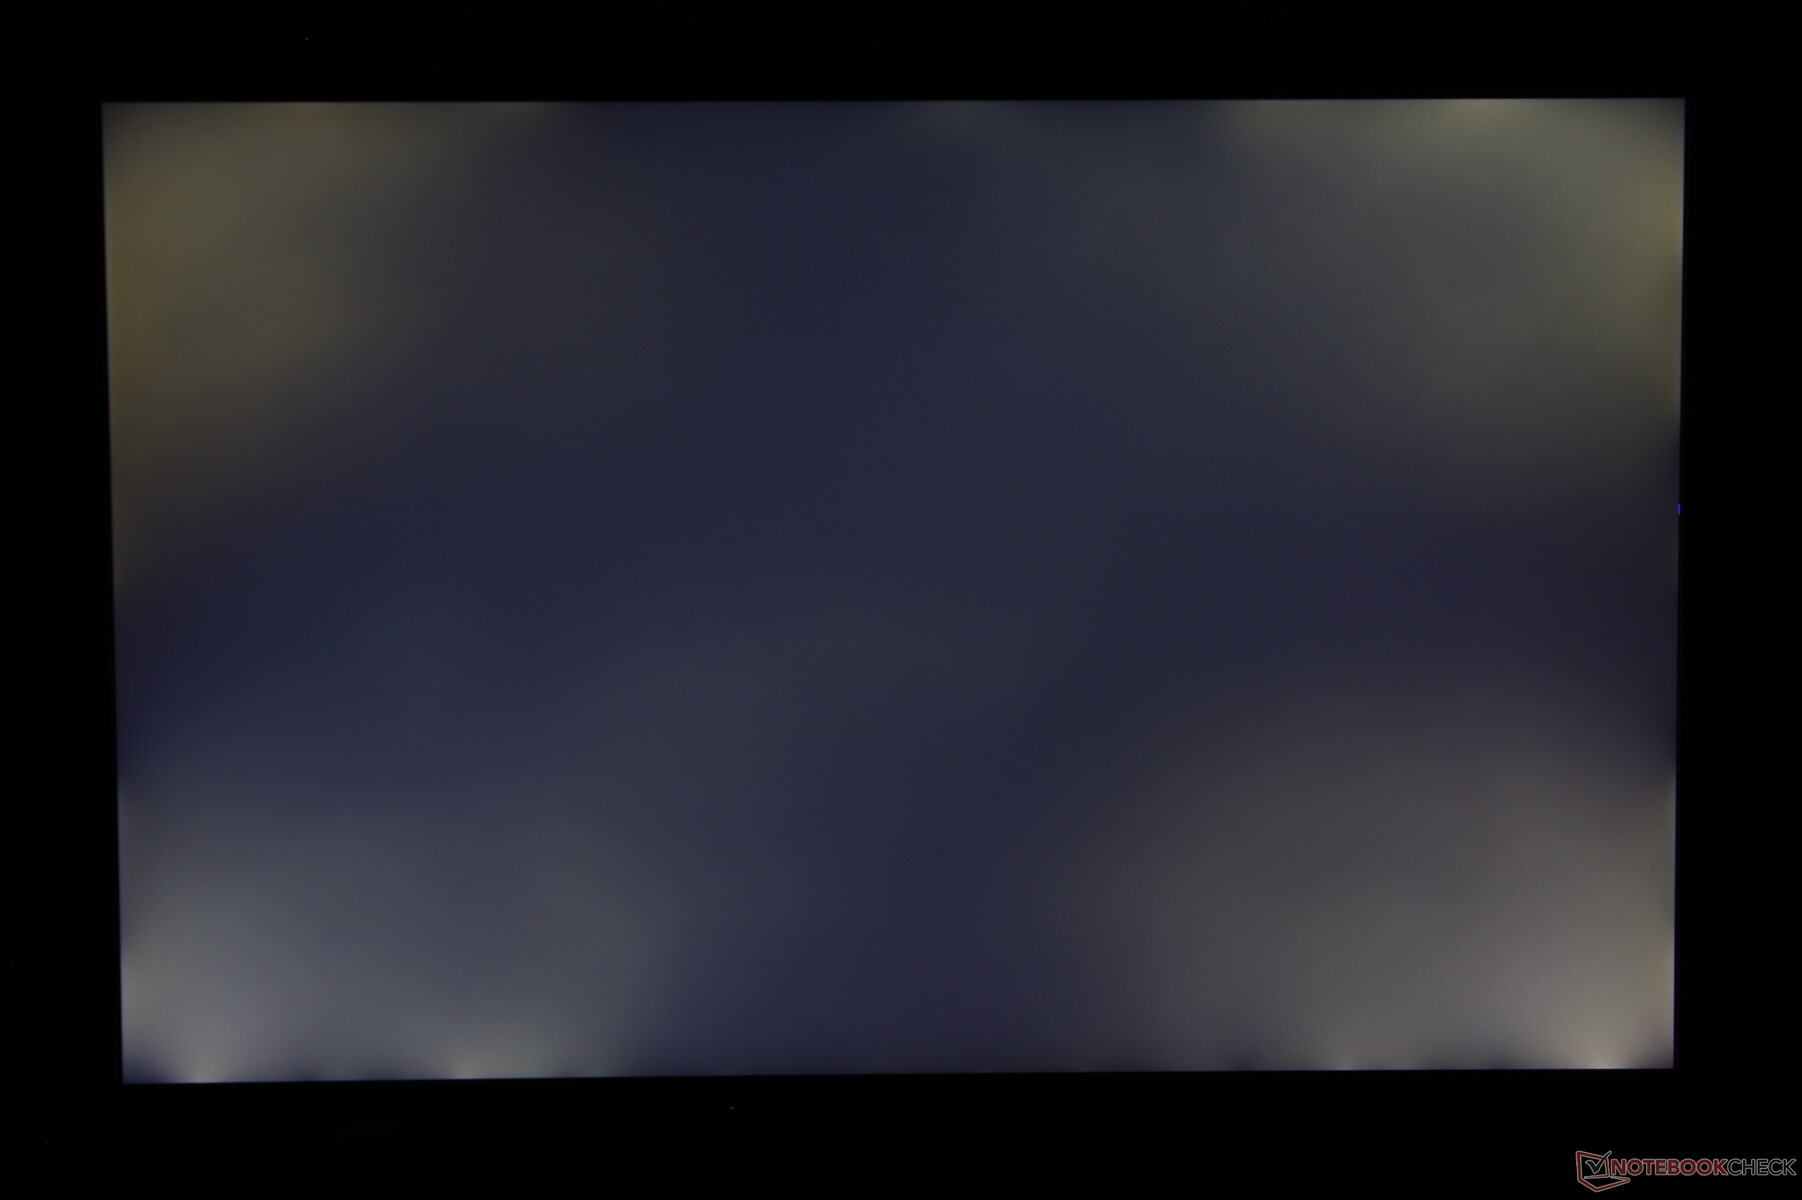
L'aspect le plus flagrant de l'écran est sans doute le mauvais contrôle de la décoloration du rétroéclairage sur notre unité de test spécifique. Comme le montre la capture d'écran ci-dessous, la perte de lumière est particulièrement visible lors de la lecture de films avec des bordures noires ou lors de certains jeux. On peut s'attendre à un certain niveau de rétro-éclairage sur la plupart des écrans IPS, mais il est beaucoup trop important sur un ordinateur portable haut de gamme comme notre GE78.
| |||||||||||||||||||||||||
Homogénéité de la luminosité: 89 %
Valeur mesurée au centre, sur batterie: 398.6 cd/m²
Contraste: 867:1 (Valeurs des noirs: 0.46 cd/m²)
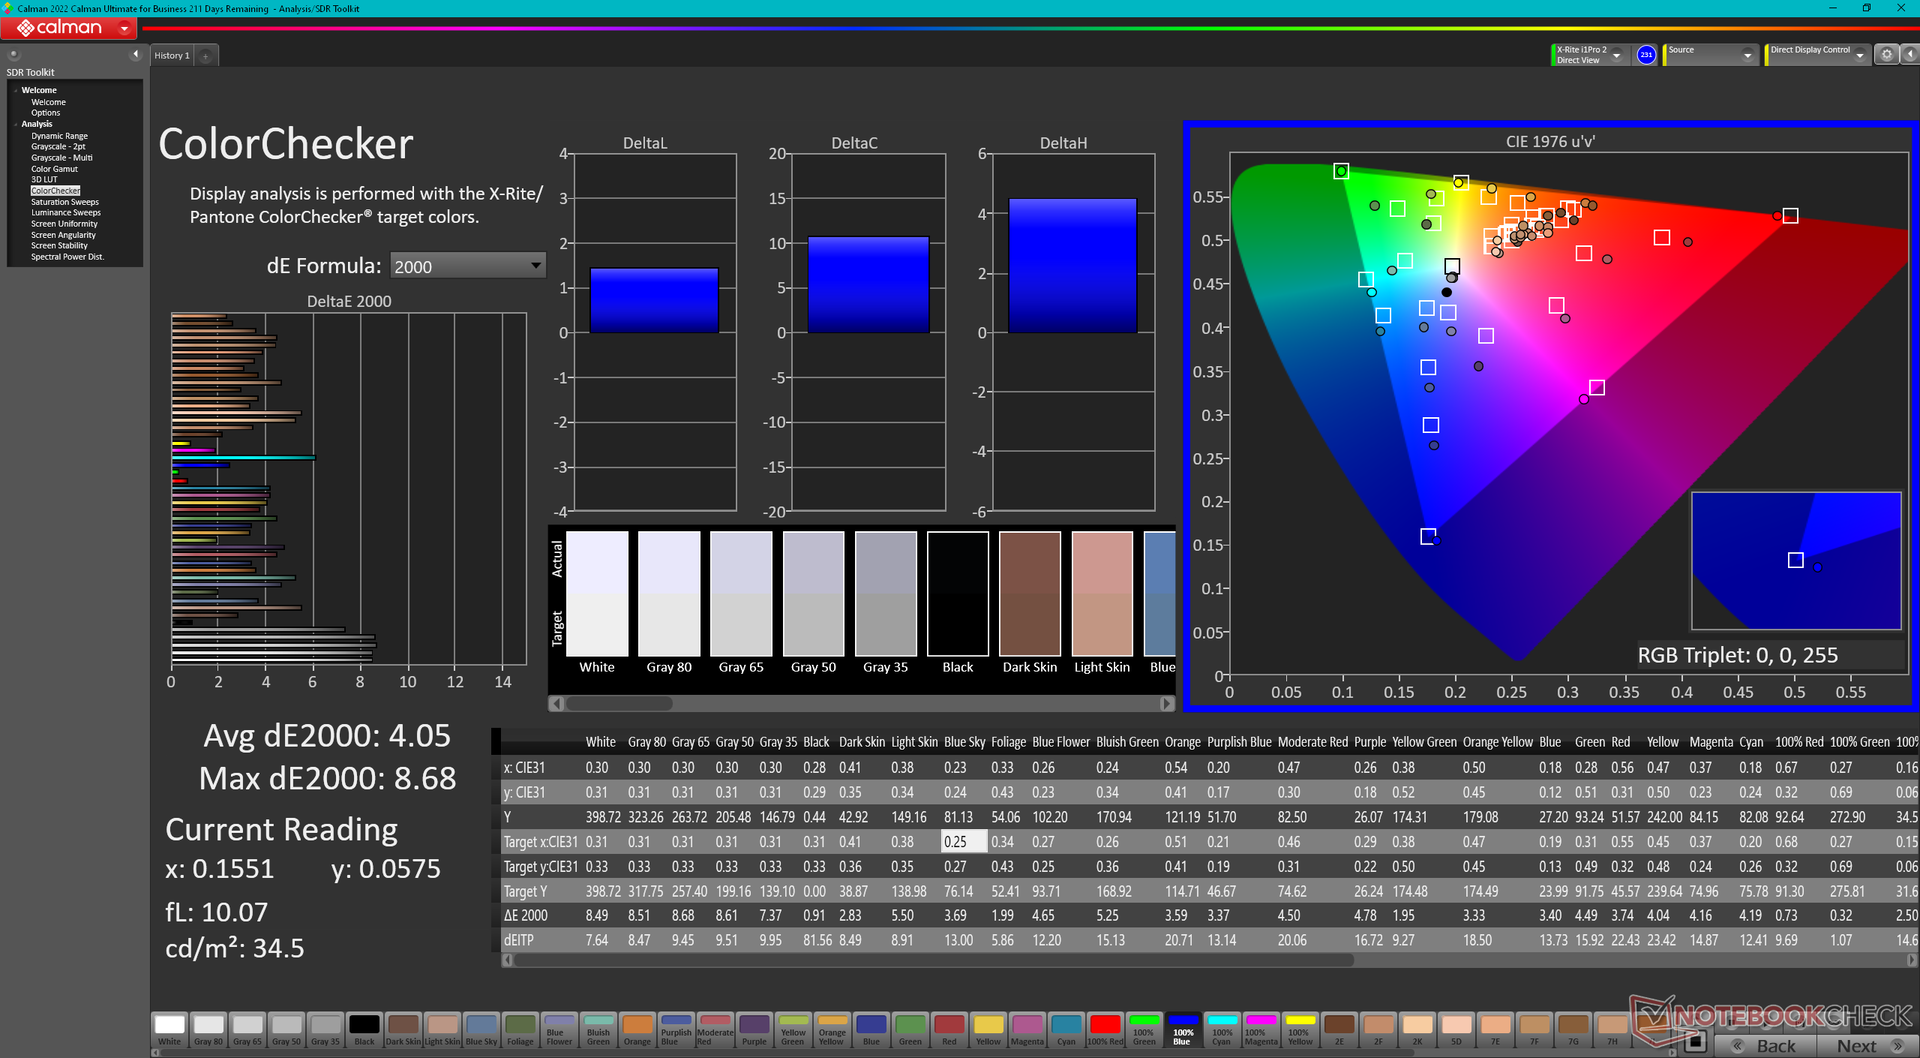
ΔE ColorChecker Calman: 4.05 | ∀{0.5-29.43 Ø4.72}
calibrated: 1.02
ΔE Greyscale Calman: 6.5 | ∀{0.09-98 Ø4.97}
86.5% AdobeRGB 1998 (Argyll 3D)
99.9% sRGB (Argyll 3D)
97.6% Display P3 (Argyll 3D)
Gamma: 2.11
CCT: 7518 K
| MSI GE78HX 13VH-070US AU Optronics B170QAN01.2, IPS, 2560x1600, 17" | Eluktronics Mech-17 GP2 BOE NE170QDM-NZ1, IPS, 2560x1600, 17" | Asus ROG Strix G17 G713PI BOE0B69, IPS, 2560x1440, 17.3" | MSI Titan GT77 HX 13VI B173ZAN06.C, Mini-LED, 3840x2160, 17.3" | MSI Raider GE77 HX 12UHS AU Optronics B173ZAN06.1, IPS, 3840x2160, 17.3" | Razer Blade 17 Early 2022 AU Optronics B173ZAN06.9, IPS, 3840x2160, 17.3" | |
|---|---|---|---|---|---|---|
| Display | -16% | 0% | 1% | -1% | 1% | |
| Display P3 Coverage (%) | 97.6 | 69.1 -29% | 98.3 1% | 94.9 -3% | 96.6 -1% | 99.4 2% |
| sRGB Coverage (%) | 99.9 | 99.7 0% | 100 0% | 99.9 0% | 99.8 0% | 100 0% |
| AdobeRGB 1998 Coverage (%) | 86.5 | 69.8 -19% | 85.9 -1% | 92.4 7% | 85.8 -1% | 87.3 1% |
| Response Times | -117% | -30% | -565% | -13% | -33% | |
| Response Time Grey 50% / Grey 80% * (ms) | 4.2 ? | 12 ? -186% | 5.3 ? -26% | 38.4 ? -814% | 5.8 ? -38% | 7.5 ? -79% |
| Response Time Black / White * (ms) | 6.4 ? | 9.4 ? -47% | 8.6 ? -34% | 26.6 ? -316% | 5.6 ? 13% | 5.6 ? 13% |
| PWM Frequency (Hz) | 2380 ? | |||||
| Screen | 27% | 27% | 77665% | -32% | 36% | |
| Brightness middle (cd/m²) | 398.6 | 417.3 5% | 327 -18% | 606 52% | 381 -4% | 503 26% |
| Brightness (cd/m²) | 384 | 387 1% | 320 -17% | 602 57% | 371 -3% | 486 27% |
| Brightness Distribution (%) | 89 | 87 -2% | 89 0% | 93 4% | 84 -6% | 84 -6% |
| Black Level * (cd/m²) | 0.46 | 0.42 9% | 0.38 17% | 0.0001 100% | 0.52 -13% | 0.44 4% |
| Contrast (:1) | 867 | 994 15% | 861 -1% | 6060000 698862% | 733 -15% | 1143 32% |
| Colorchecker dE 2000 * | 4.05 | 2.14 47% | 1.01 75% | 4.8 -19% | 1.08 73% | |
| Colorchecker dE 2000 max. * | 8.68 | 4.09 53% | 4.01 54% | 8.2 6% | 4.54 48% | |
| Colorchecker dE 2000 calibrated * | 1.02 | 0.42 59% | 0.41 60% | 1.8 -76% | 2.53 -148% | 0.6 41% |
| Greyscale dE 2000 * | 6.5 | 3.1 52% | 1.6 75% | 6.5 -0% | 1.3 80% | |
| Gamma | 2.11 104% | 2.19 100% | 2.168 101% | 2.63 84% | 2.151 102% | |
| CCT | 7518 86% | 6040 108% | 6659 98% | 6596 99% | 6541 99% | |
| Moyenne finale (programmes/paramètres) | -35% /
-3% | -1% /
13% | 25700% /
49847% | -15% /
-20% | 1% /
19% |
* ... Moindre est la valeur, meilleures sont les performances
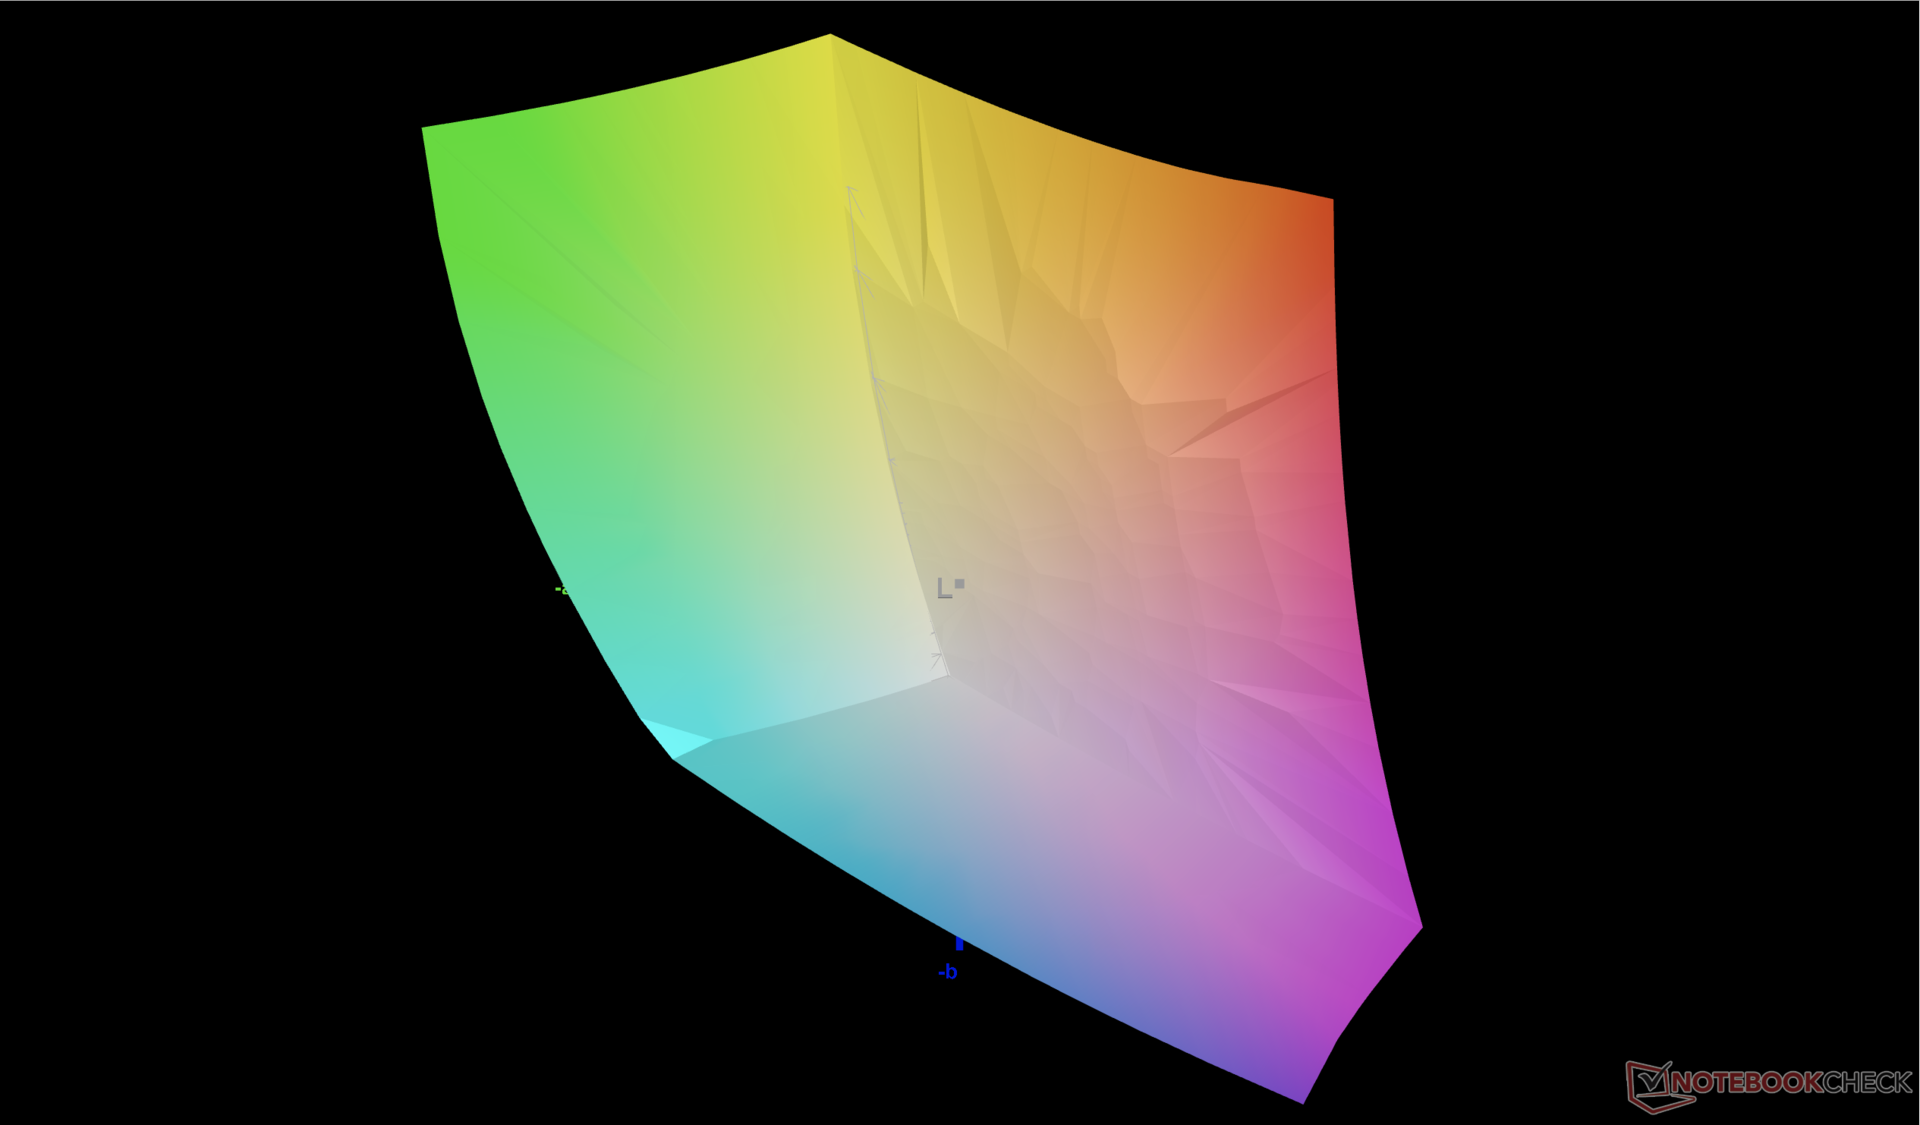
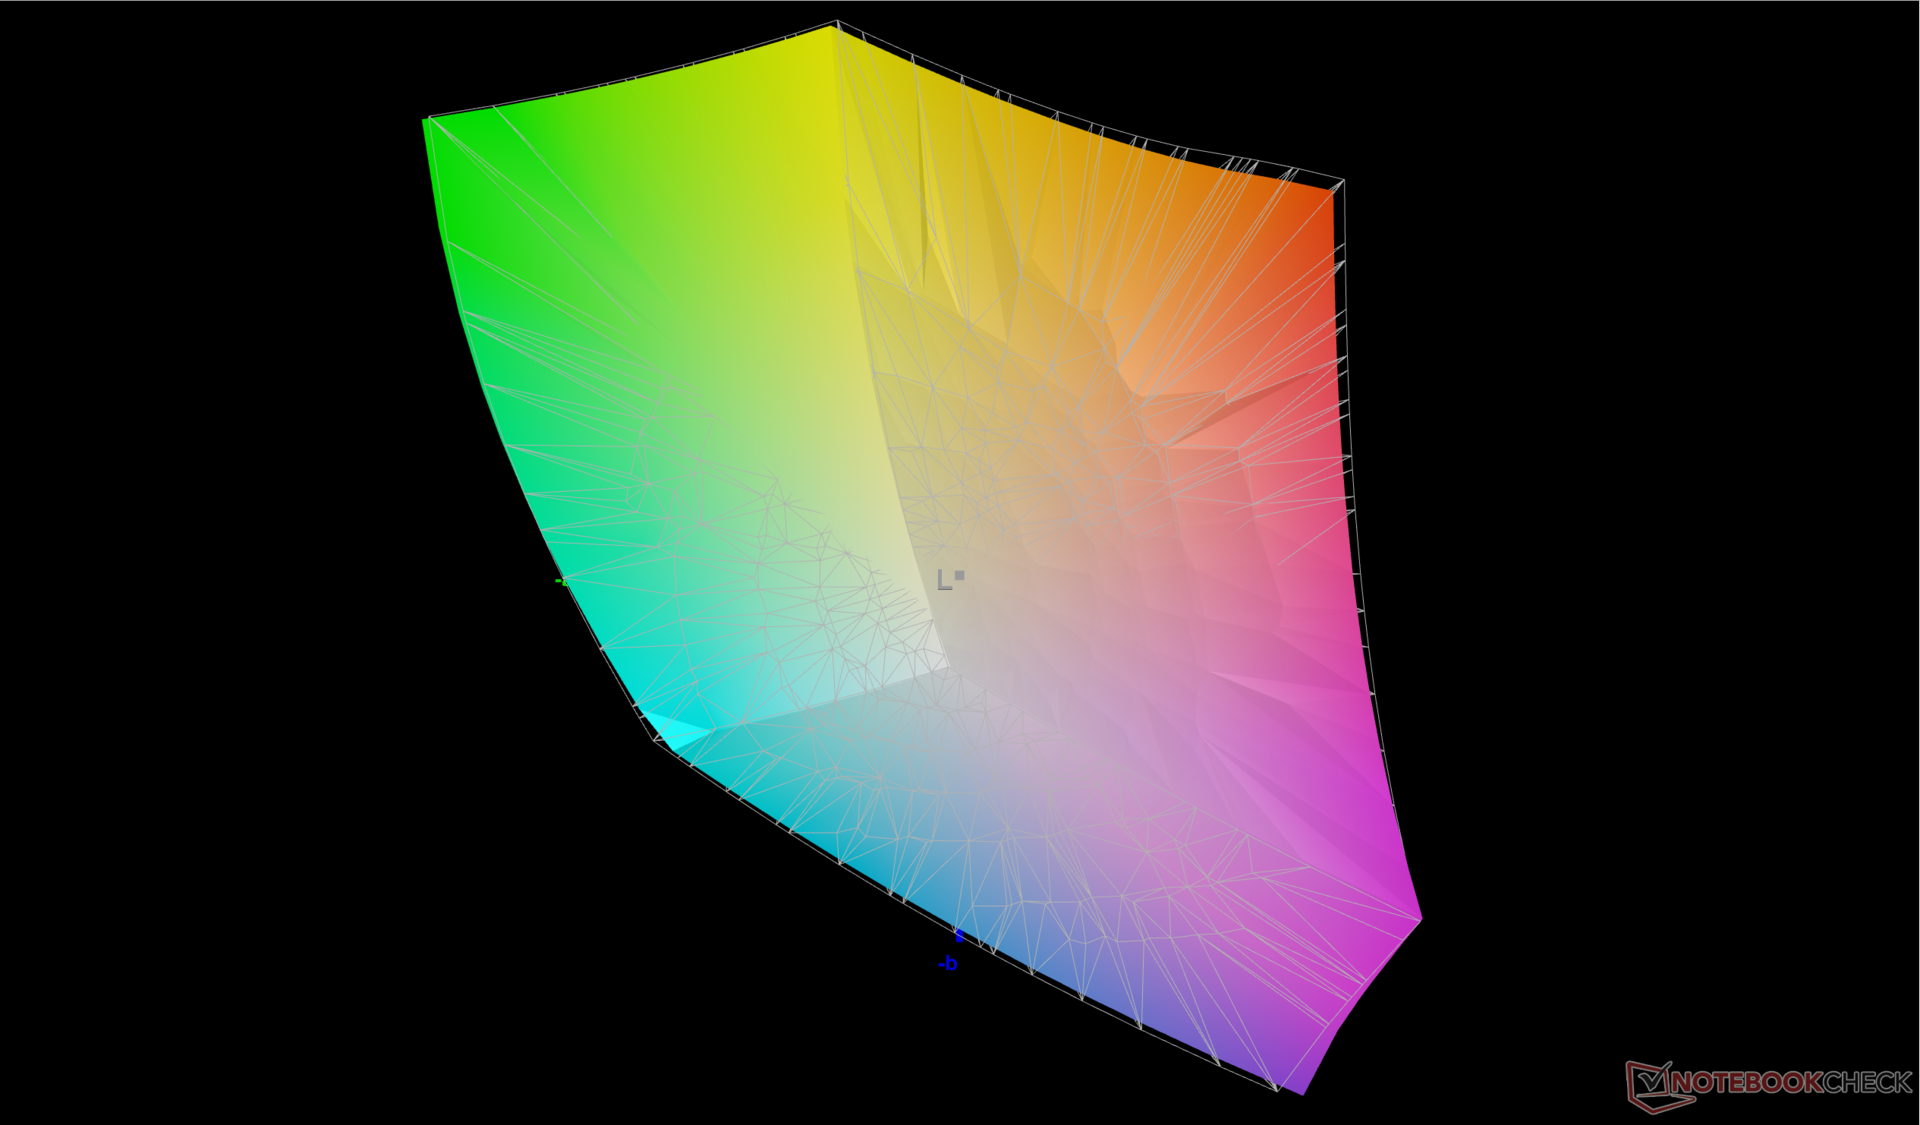
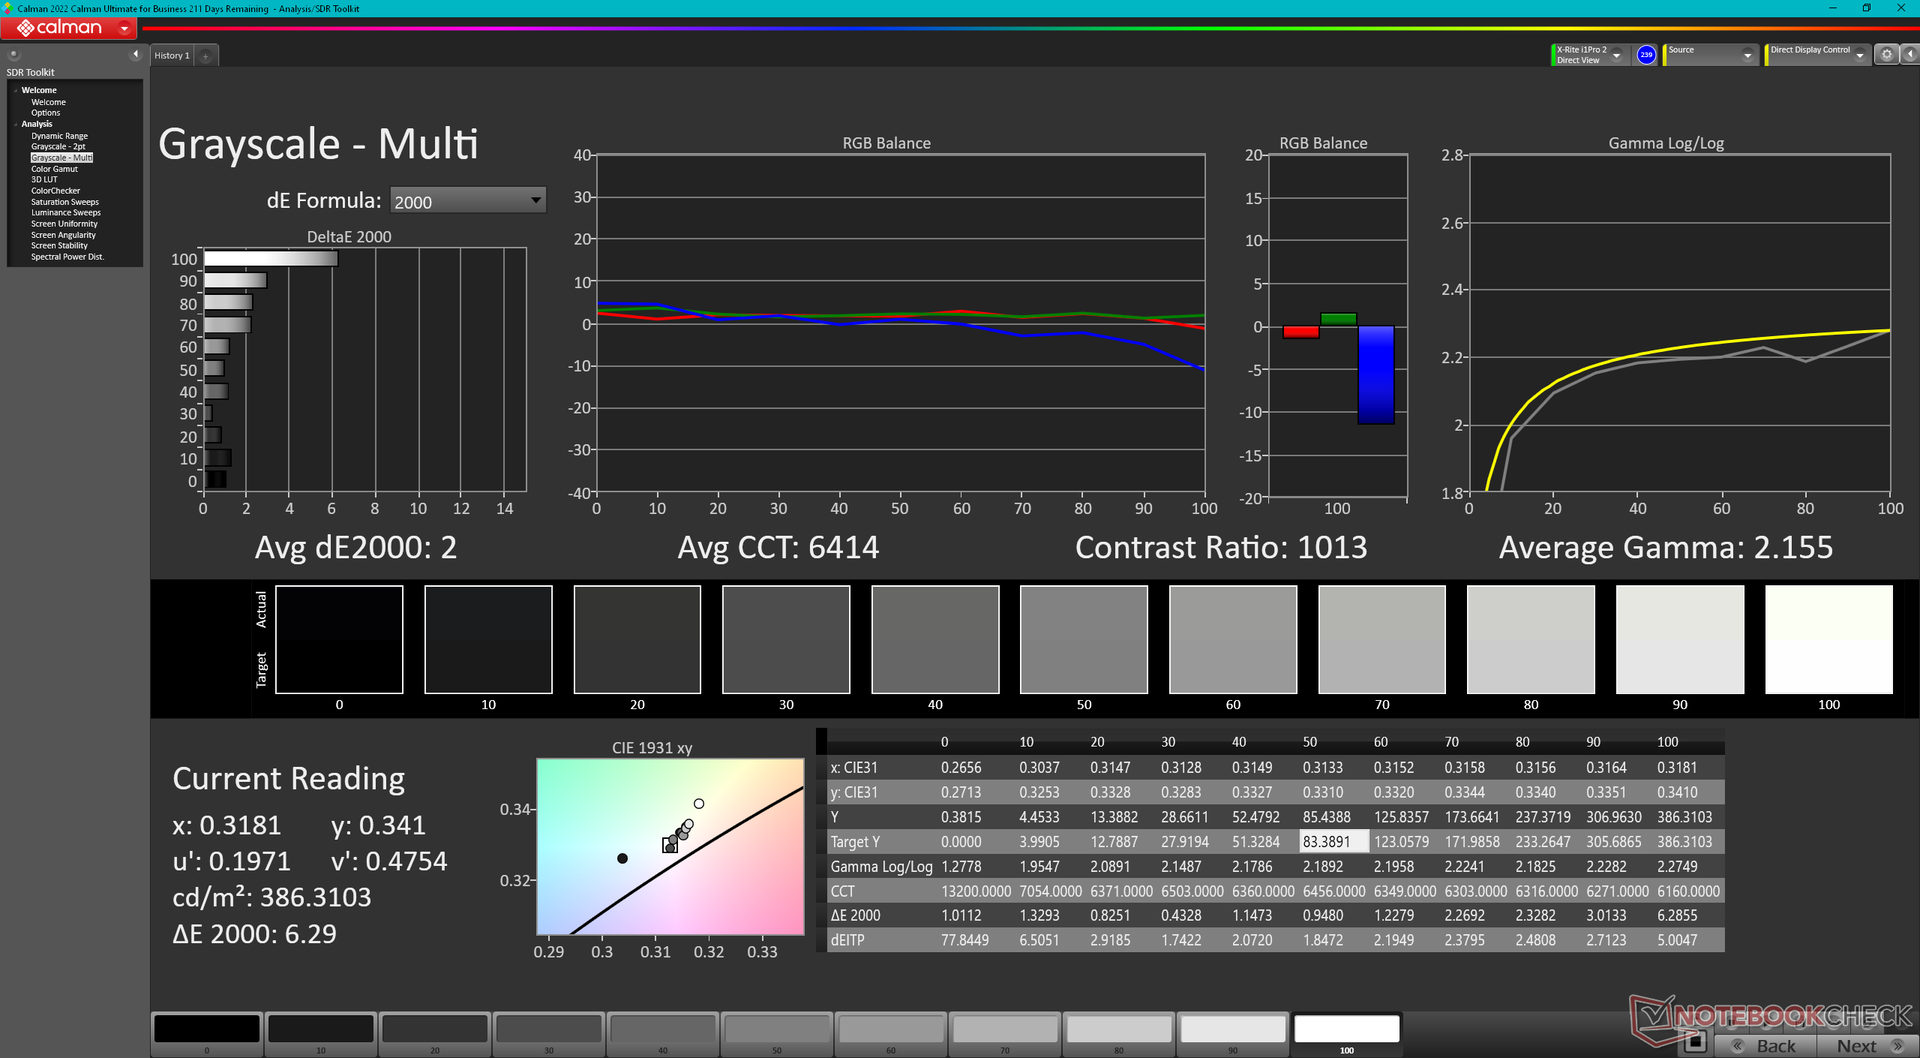
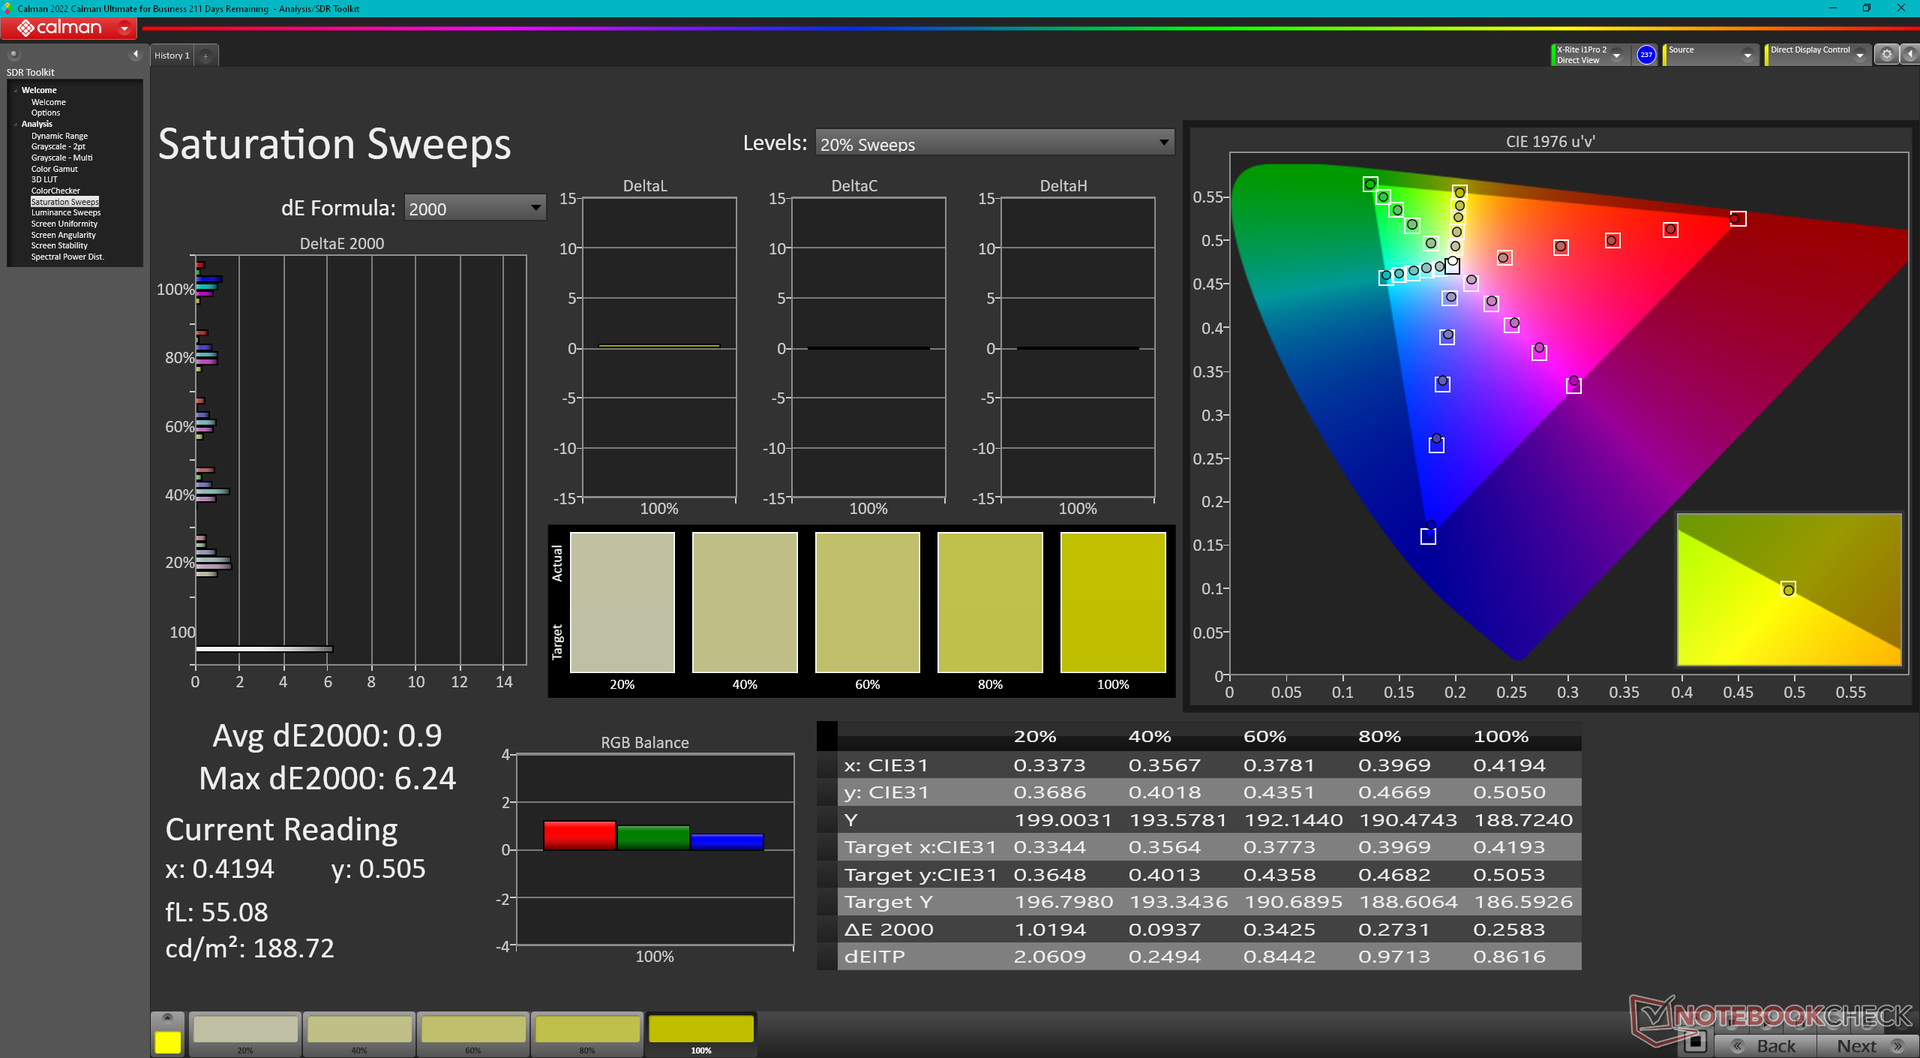
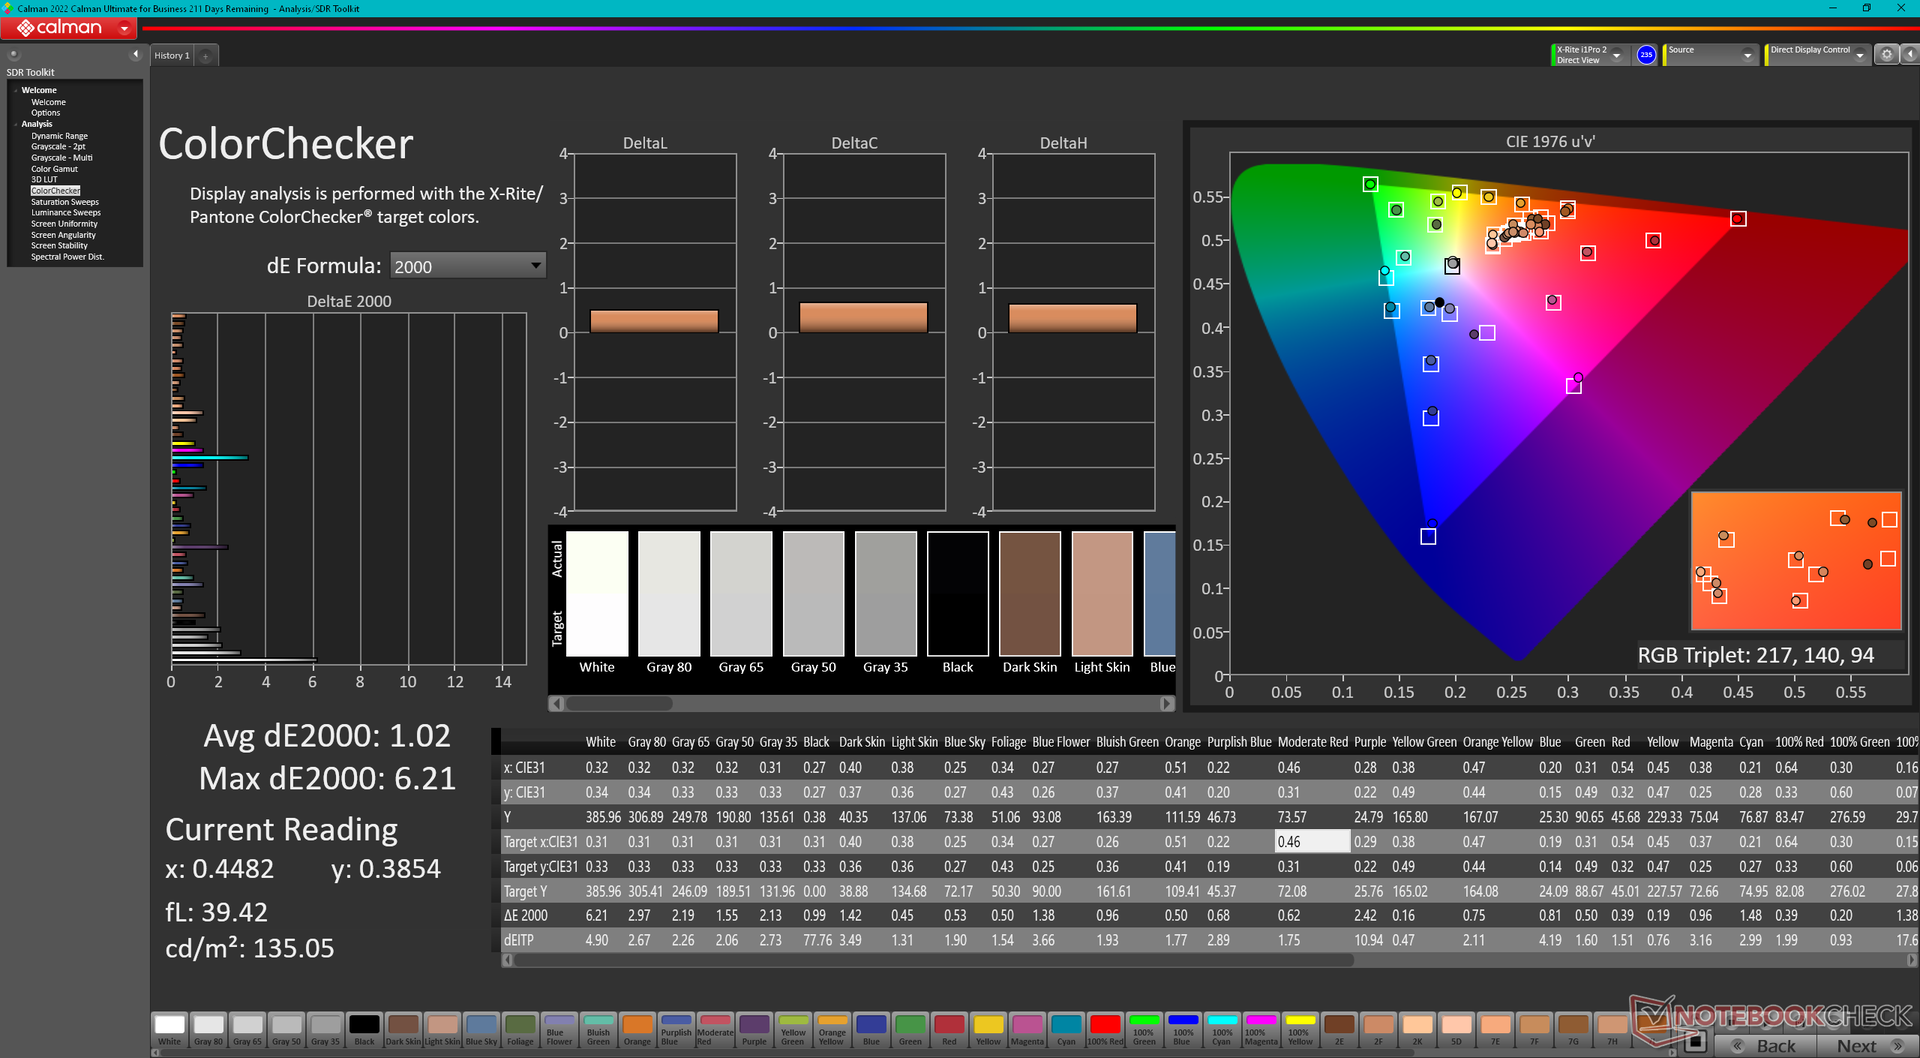
L'écran est réglé par défaut sur les couleurs P3. La précision des couleurs n'est pas mauvaise, mais le modèle n'est pas calibré en usine, contrairement aux modèles de la série Creator de MSI Creator series. Nous recommandons d'appliquer notre profil ICM calibré ci-dessus pour obtenir des couleurs plus précises de la dalle, d'autant plus qu'il couvre entièrement sRGB et P3. Notre colorimètre X-Rite nous a permis de réduire les valeurs moyennes de DeltaE en niveaux de gris et en couleurs à seulement 2 et 1,02, respectivement.
Temps de réponse de l'écran
| ↔ Temps de réponse noir à blanc | ||
|---|---|---|
| 6.4 ms ... hausse ↗ et chute ↘ combinées | ↗ 2.8 ms hausse | 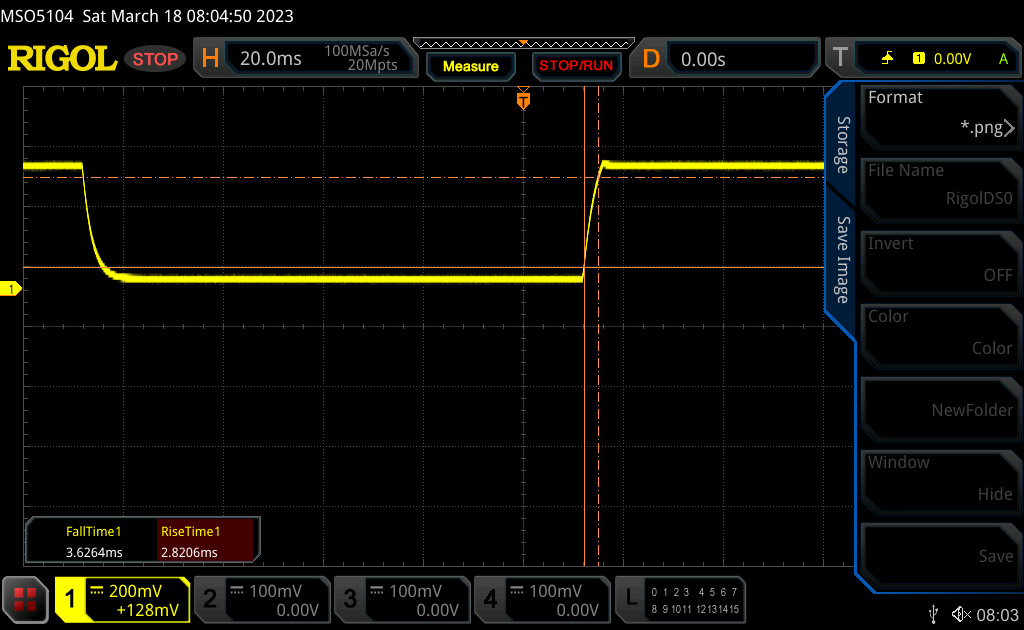 |
| ↘ 3.6 ms chute | ||
| L'écran montre de très faibles temps de réponse, parfait pour le jeu. En comparaison, tous les appareils testés affichent entre 0.1 (minimum) et 240 (maximum) ms. » 20 % des appareils testés affichent de meilleures performances. Cela signifie que les latences relevées sont meilleures que la moyenne (19.9 ms) de tous les appareils testés. | ||
| ↔ Temps de réponse gris 50% à gris 80% | ||
| 4.2 ms ... hausse ↗ et chute ↘ combinées | ↗ 1.9 ms hausse | 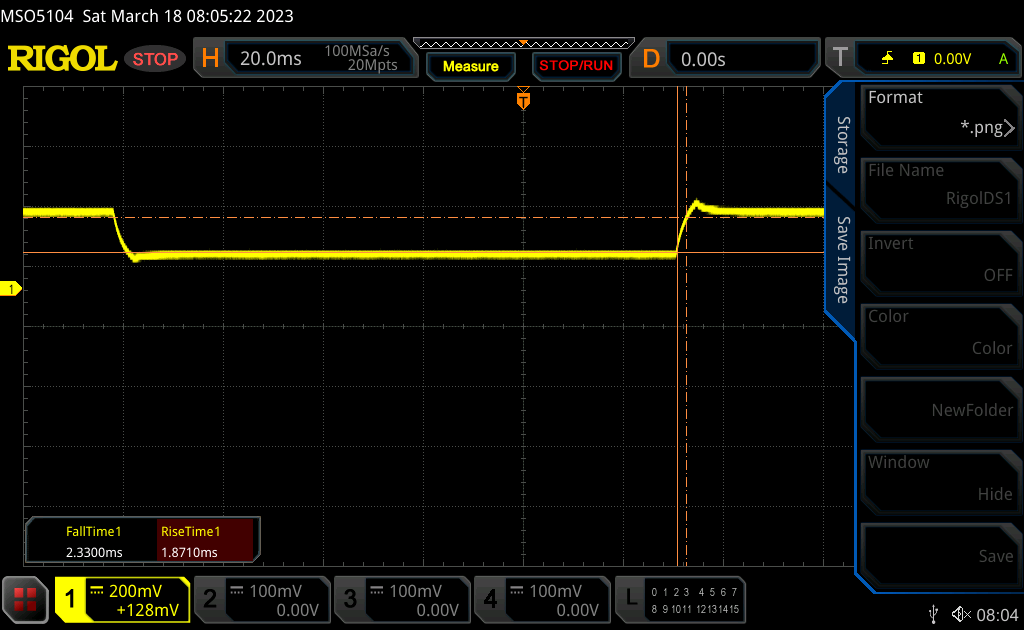 |
| ↘ 2.3 ms chute | ||
| L'écran montre de très faibles temps de réponse, parfait pour le jeu. En comparaison, tous les appareils testés affichent entre 0.165 (minimum) et 636 (maximum) ms. » 16 % des appareils testés affichent de meilleures performances. Cela signifie que les latences relevées sont meilleures que la moyenne (31.1 ms) de tous les appareils testés. | ||
Scintillement / MLI (Modulation de largeur d'impulsion)
| Scintillement / MLI (Modulation de largeur d'impulsion) non décelé |  | ||
En comparaison, 52 % des appareils testés n'emploient pas MDI pour assombrir leur écran. Nous avons relevé une moyenne à 7784 (minimum : 5 - maximum : 343500) Hz dans le cas où une MDI était active. | |||
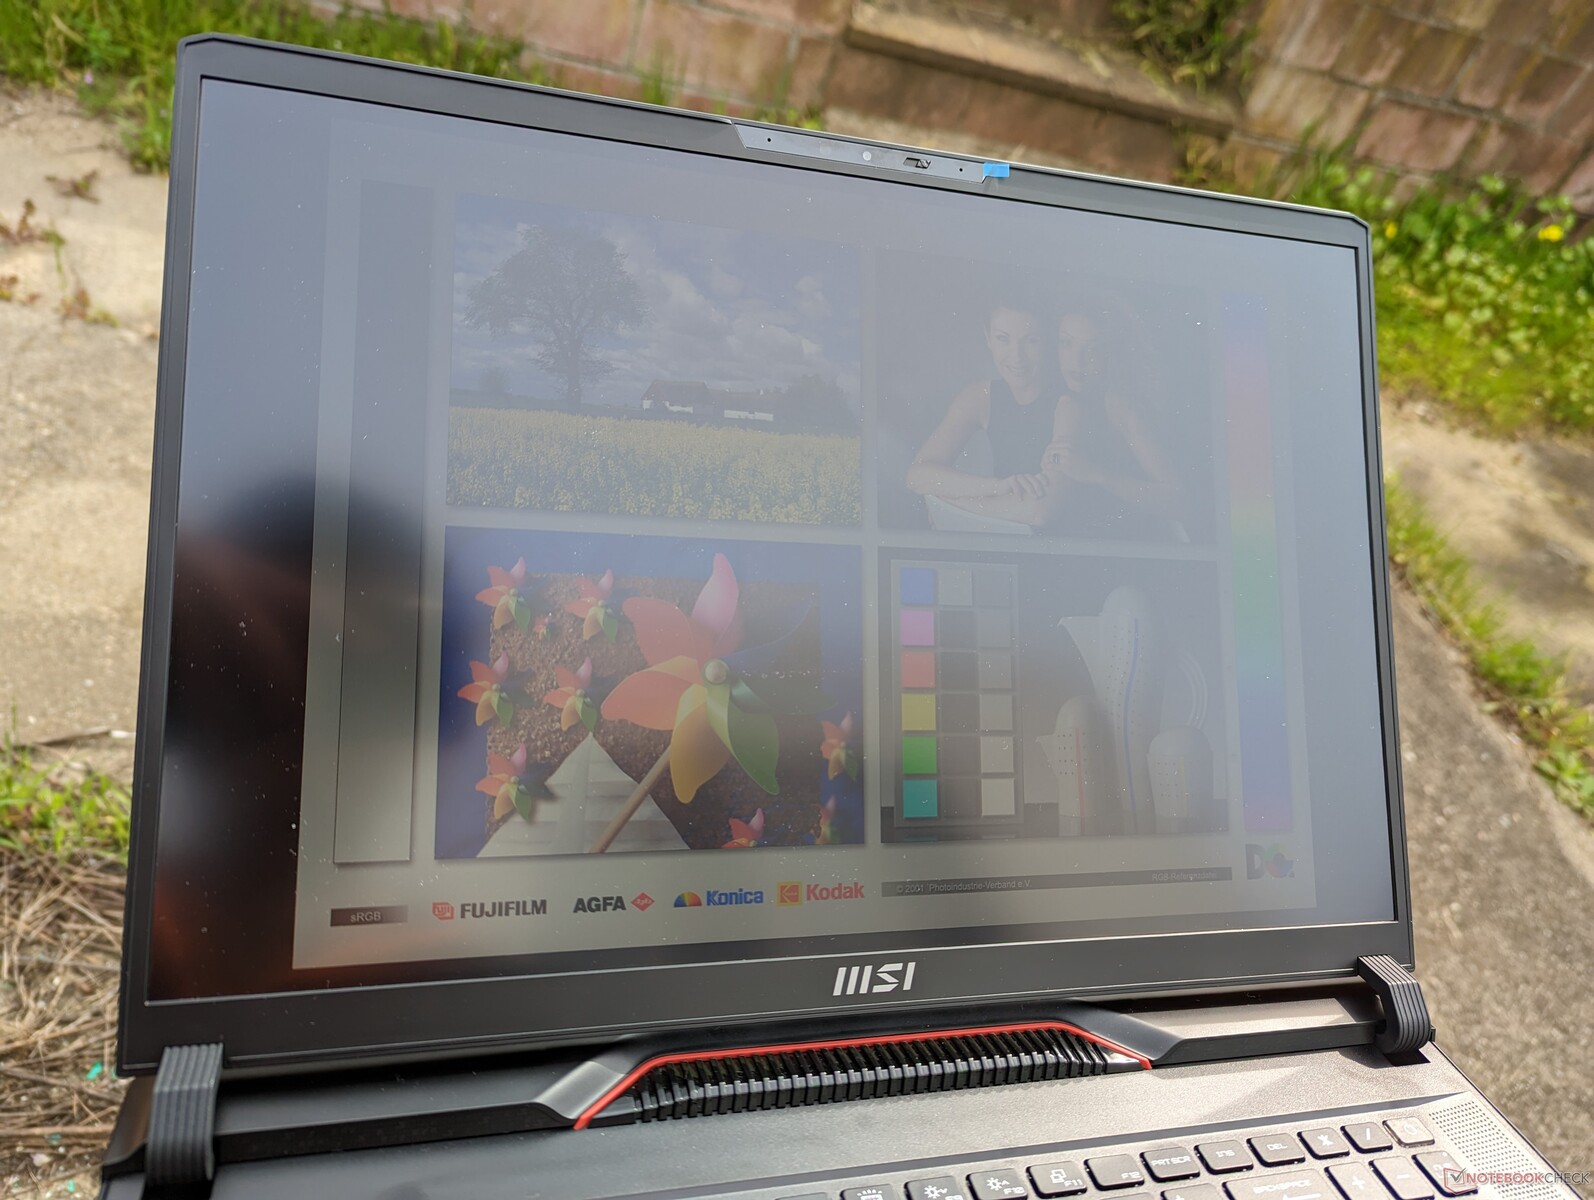
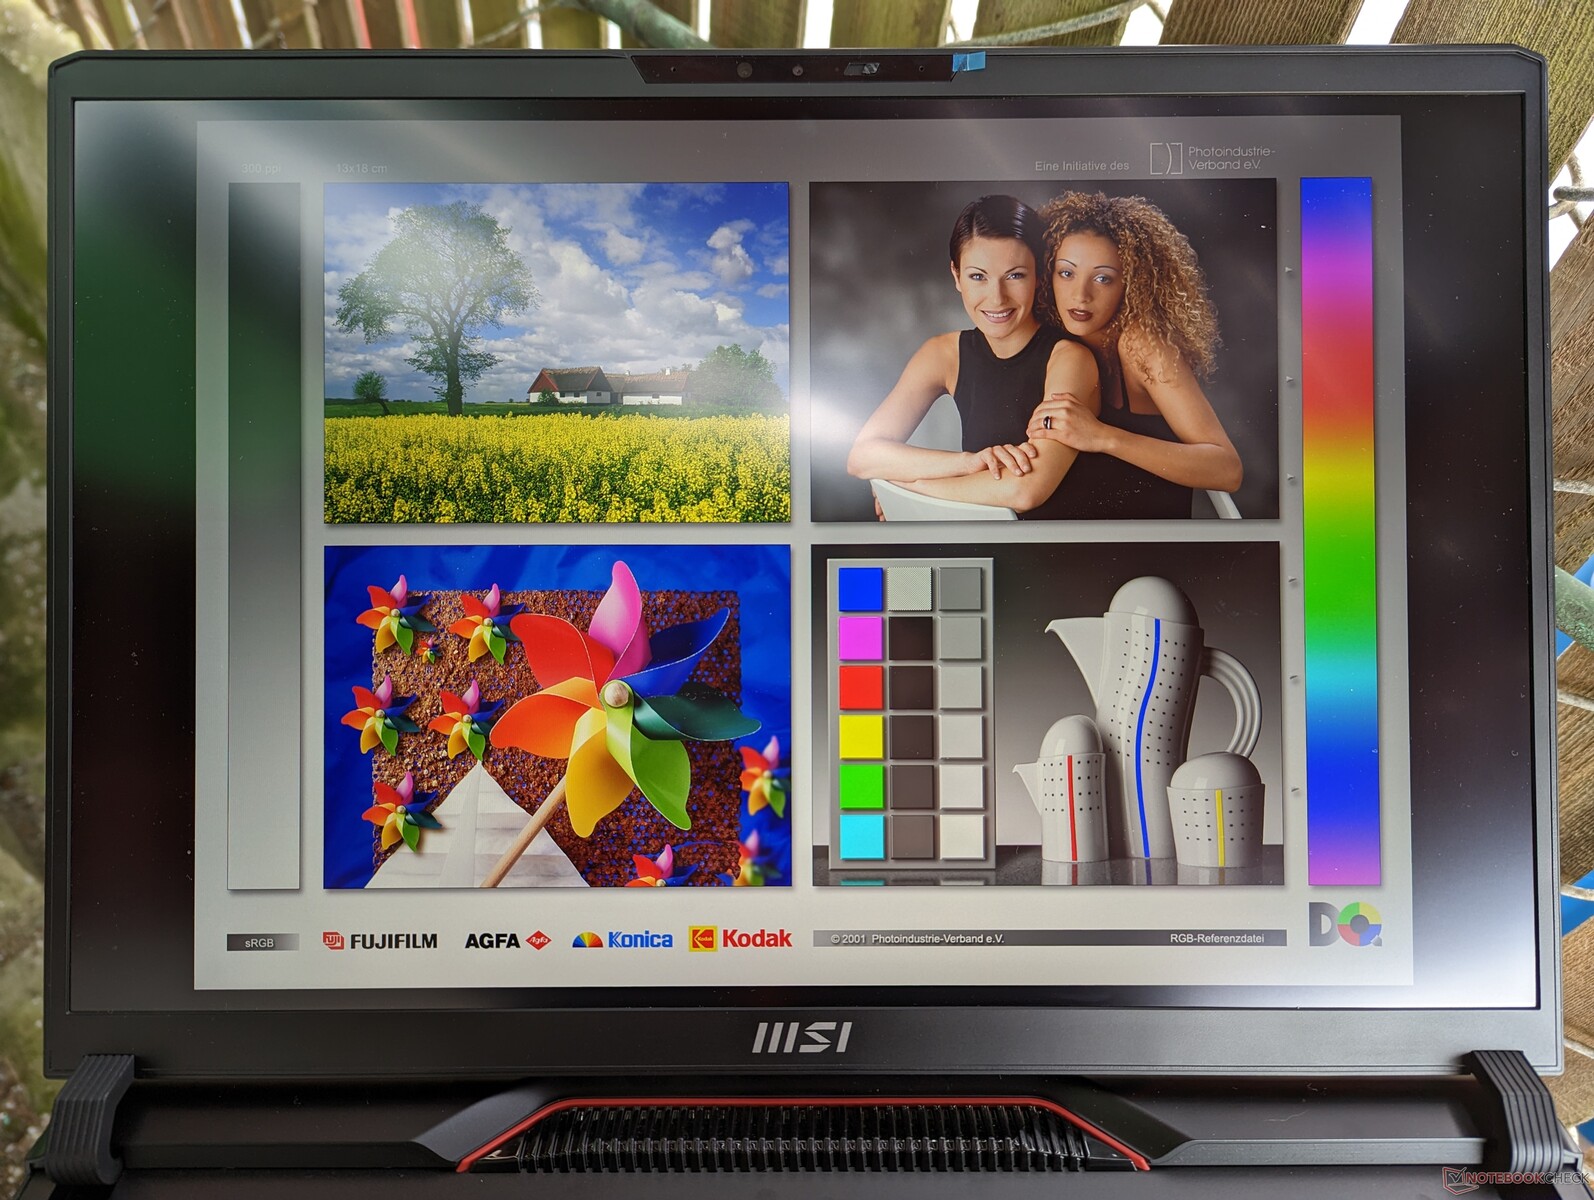
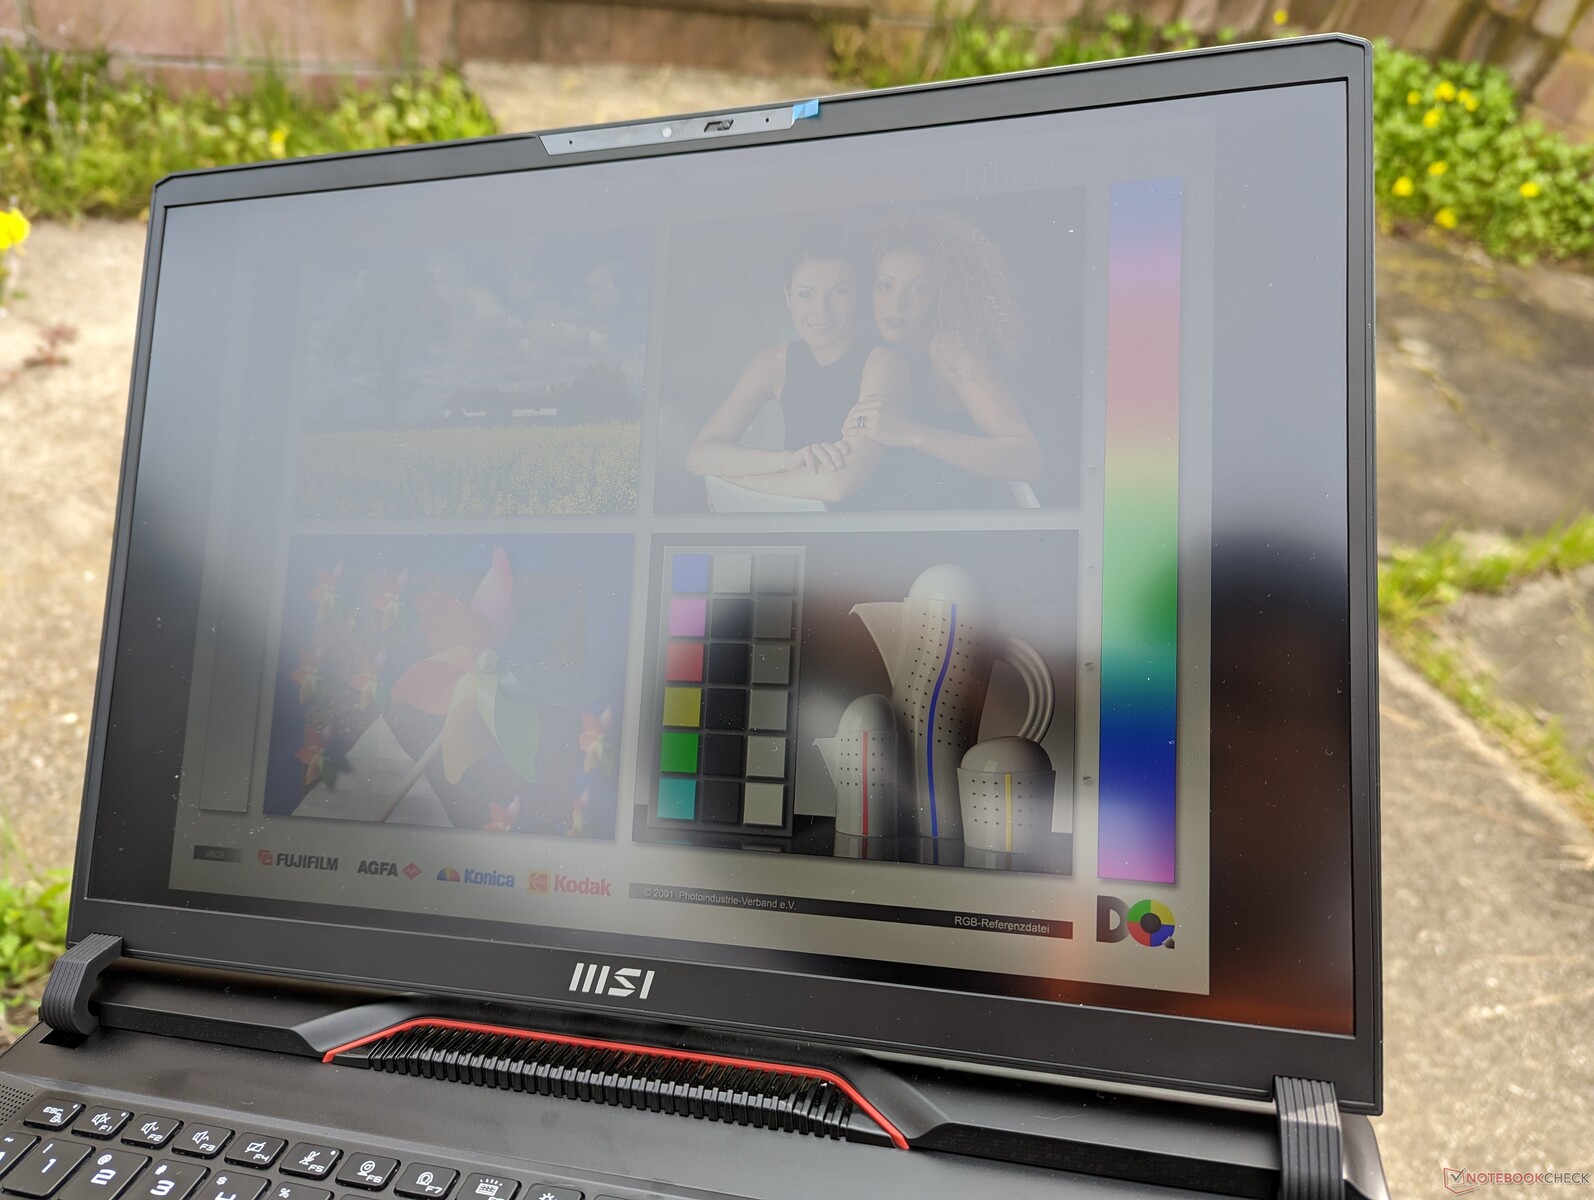
La visibilité en extérieur reste à peu près la même que sur le GE77. Le panneau mini-LED duTitan GT77 est encore plus lumineux (1,5 fois) pour une meilleure visibilité à l'extérieur, mais le modèle lui-même est beaucoup plus grand que notre GE78.
Performance - Intel 13th Gen + Mobile GeForce RTX 40
Conditions d'essai
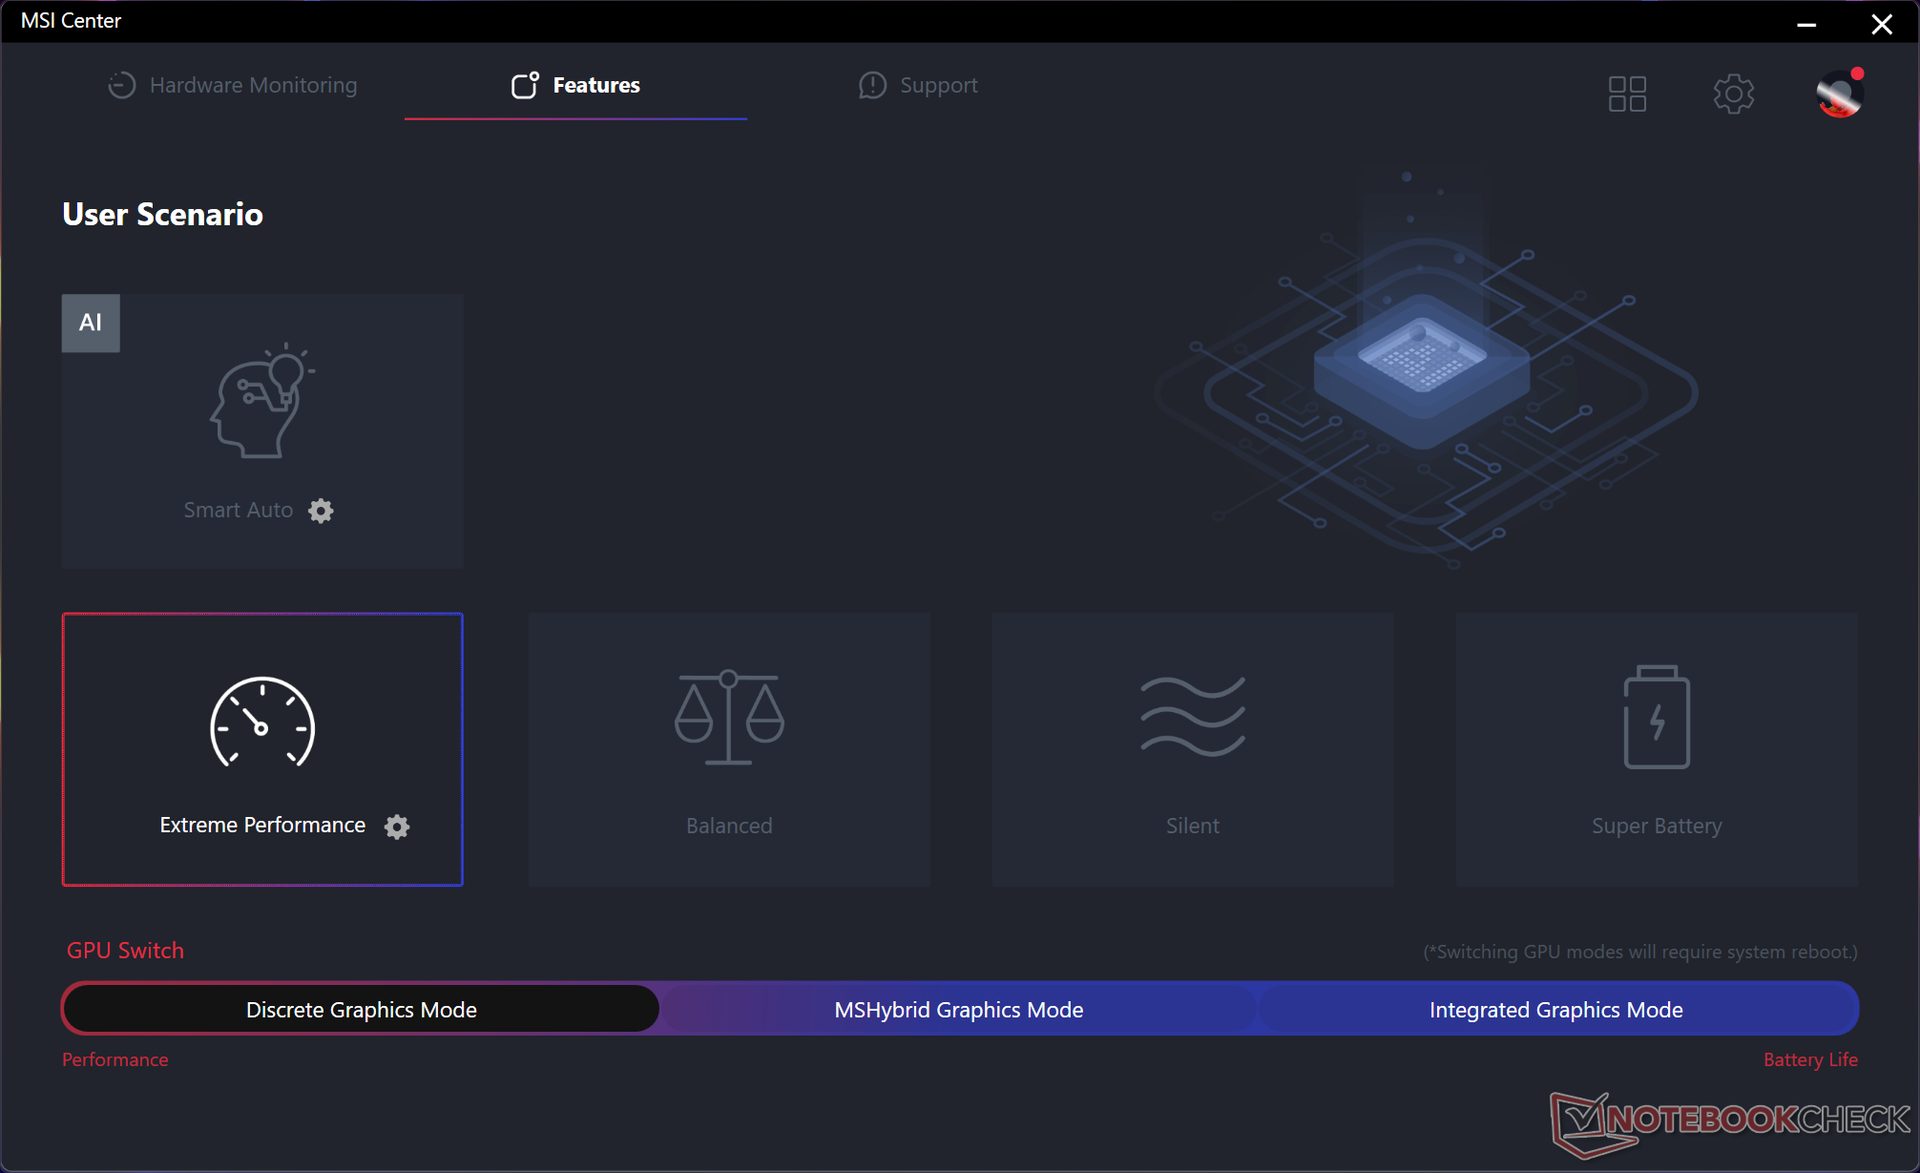
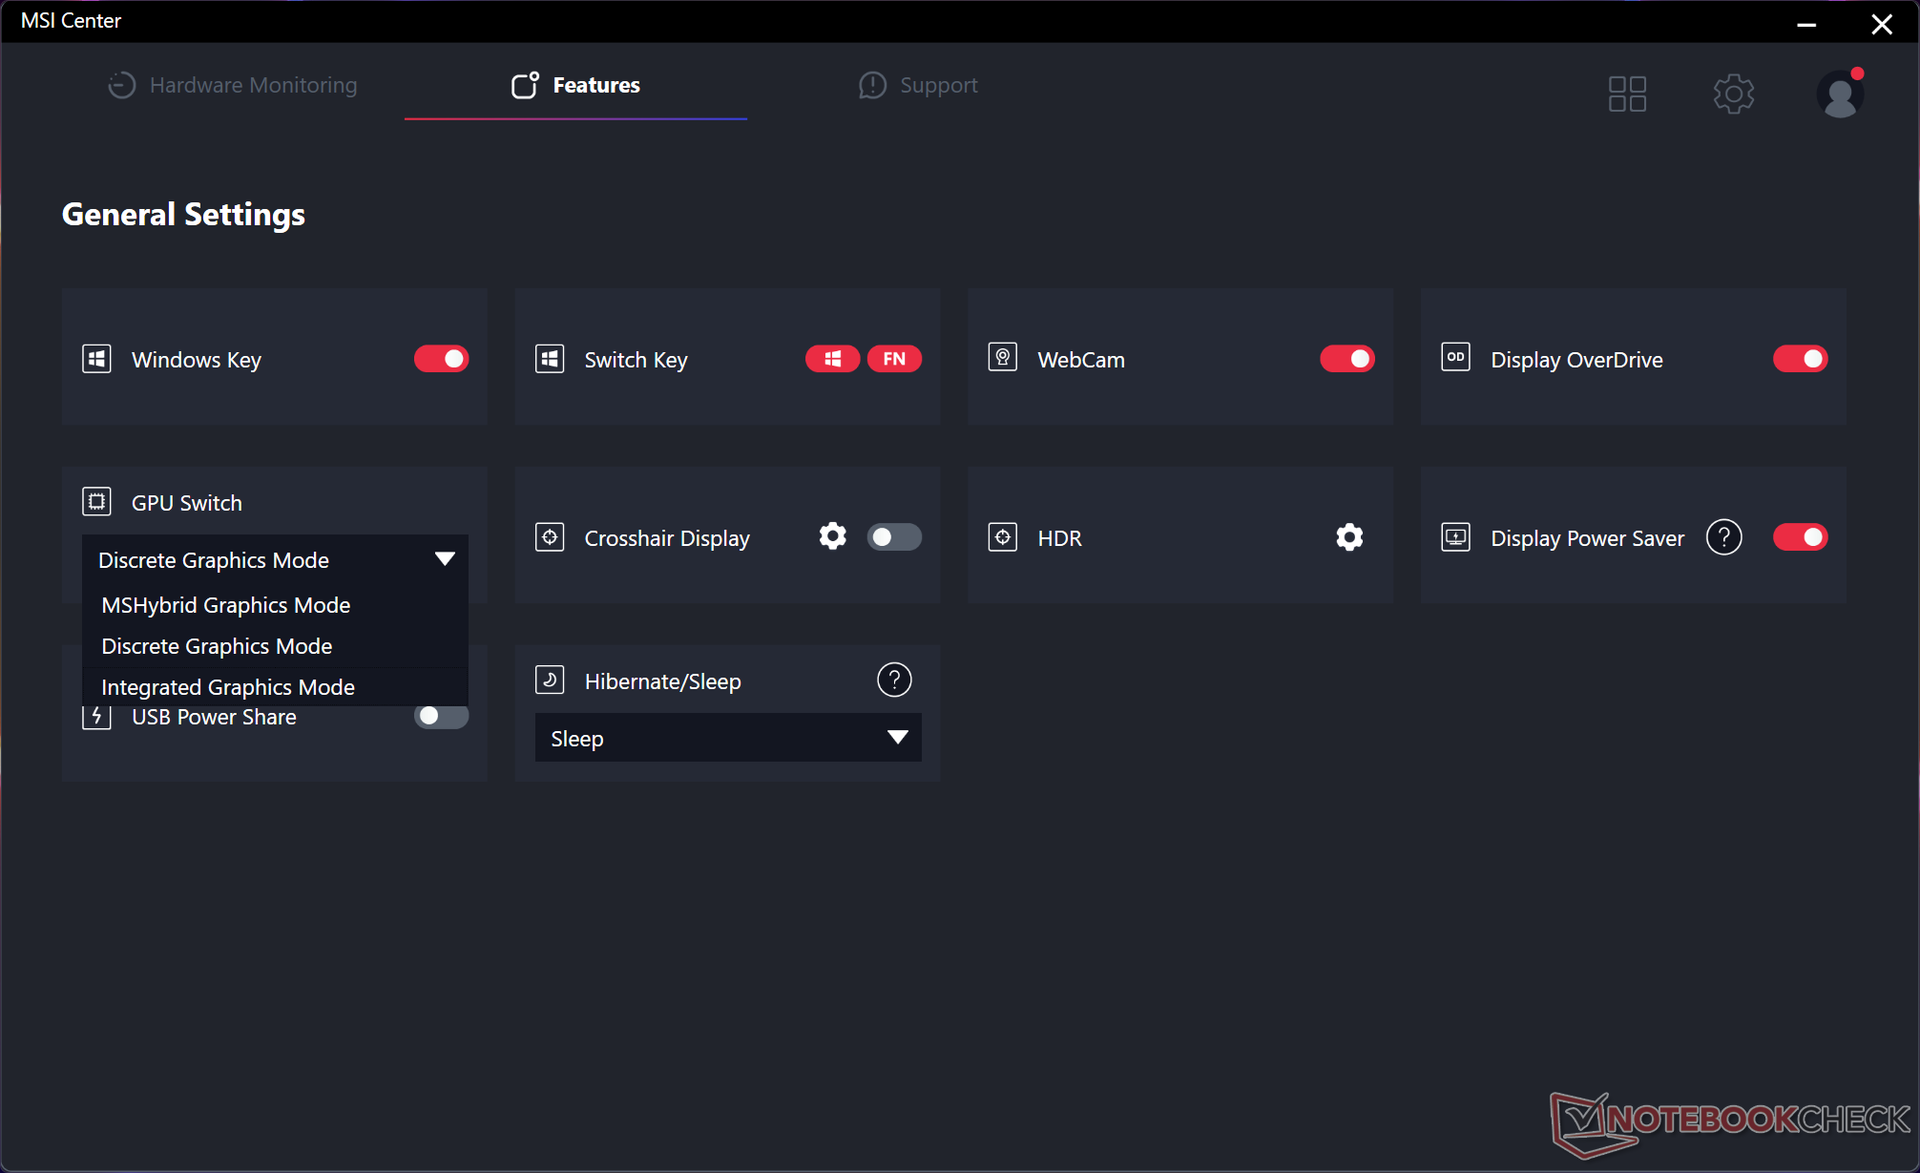
Nous avons réglé notre appareil en mode Performances extrêmes, en mode Ventilateur automatique, en mode Graphiques discrets et en mode Meilleures performances de Windows avant d'effectuer les tests ci-dessous. Malheureusement, les modes d'alimentation de MSI ne sont pas synchronisés avec Windows et il est donc possible que le centre MSI soit réglé sur le mode Performances extrêmes et que Windows soit réglé sur le mode Economiseur d'énergie en même temps.
Un autre mode de ventilation est disponible, le mode Cooler Boost, qui fait monter les ventilateurs à leur vitesse maximale, quelle que soit l'activité à l'écran. Cependant, cela n'améliore pas nécessairement les performances, comme le montre notre section Stress Test ci-dessous.
Notez que MSI Center se met automatiquement en mode Extreme Performance lorsqu'il fonctionne en mode Discrete Graphics, même si vous demandez au logiciel de fonctionner en mode Balanced. Pour éviter toute confusion, il est préférable de griser les options du mode Performance si elles sont incompatibles avec la sélection actuelle du GPU.
Advanced Optimus n'est pas pris en charge et un redémarrage est donc nécessaire pour passer du GPU discret (MUX) au mode MS Hybrid. G-Sync n'est pas pris en charge sur l'écran interne.
Processeur
La performance brute du processeur est l'une des plus rapides sur un ordinateur portable, quelle que soit sa taille ou son fabricant. Le processeur de 13e génération Core i9-13950HX de notre MSI surpasserait le dernier Zen 4 Ryzen 9 7945HX du modèle concurrent Asus ROG Strix G17 G713PI de 5 % et 15 % respectivement dans les tests multithread et single-thread. Les gains d'une année sur l'autre par rapport aux précédents Core i9-12900HX de 12e génération sont les suivants Core i9-12900HX de la GE77 de l'année dernière, est également significative (45 %).
Aussi impressionnant que soit le Core i9-13950HX, les acheteurs potentiels peuvent toujours considérer le Core i9-13900HX moins performant Core i9-13900HX car les différences de performances entre les deux processeurs ne sont que de 5 %.
Cinebench R15 Multi Loop
Cinebench R23: Multi Core | Single Core
Cinebench R20: CPU (Multi Core) | CPU (Single Core)
Cinebench R15: CPU Multi 64Bit | CPU Single 64Bit
Blender: v2.79 BMW27 CPU
7-Zip 18.03: 7z b 4 | 7z b 4 -mmt1
Geekbench 5.5: Multi-Core | Single-Core
HWBOT x265 Benchmark v2.2: 4k Preset
LibreOffice : 20 Documents To PDF
R Benchmark 2.5: Overall mean
| HWBOT x265 Benchmark v2.2 / 4k Preset | |
| MSI GE78HX 13VH-070US | |
| Eluktronics Mech-17 GP2 | |
| Asus ROG Strix G17 G713PI | |
| Moyenne Intel Core i9-13950HX (26 - 34.5, n=7) | |
| MSI Raider GE77 HX 12UHS | |
| Asus ROG Strix Scar 17 SE G733CX-LL014W | |
| Schenker XMG Core 15 (M22) | |
| Corsair Voyager a1600 | |
| Alienware m17 R5 (R9 6900HX, RX 6850M XT) | |
| Razer Blade 17 Early 2022 | |
| Schenker Compact 17 | |
* ... Moindre est la valeur, meilleures sont les performances
AIDA64: FP32 Ray-Trace | FPU Julia | CPU SHA3 | CPU Queen | FPU SinJulia | FPU Mandel | CPU AES | CPU ZLib | FP64 Ray-Trace | CPU PhotoWorxx
| Performance rating | |
| Asus ROG Strix G17 G713PI | |
| Eluktronics Mech-17 GP2 | |
| MSI GE78HX 13VH-070US | |
| MSI Titan GT77 HX 13VI | |
| Moyenne Intel Core i9-13950HX | |
| MSI Raider GE77 HX 12UHS | |
| Razer Blade 17 Early 2022 | |
| AIDA64 / FP32 Ray-Trace | |
| Asus ROG Strix G17 G713PI | |
| MSI Titan GT77 HX 13VI | |
| MSI GE78HX 13VH-070US | |
| Eluktronics Mech-17 GP2 | |
| Moyenne Intel Core i9-13950HX (17993 - 28957, n=9) | |
| MSI Raider GE77 HX 12UHS | |
| Razer Blade 17 Early 2022 | |
| AIDA64 / FPU Julia | |
| Asus ROG Strix G17 G713PI | |
| MSI Titan GT77 HX 13VI | |
| MSI GE78HX 13VH-070US | |
| Eluktronics Mech-17 GP2 | |
| Moyenne Intel Core i9-13950HX (89362 - 144303, n=9) | |
| MSI Raider GE77 HX 12UHS | |
| Razer Blade 17 Early 2022 | |
| AIDA64 / CPU SHA3 | |
| Asus ROG Strix G17 G713PI | |
| MSI Titan GT77 HX 13VI | |
| Eluktronics Mech-17 GP2 | |
| MSI GE78HX 13VH-070US | |
| Moyenne Intel Core i9-13950HX (4518 - 7093, n=9) | |
| MSI Raider GE77 HX 12UHS | |
| Razer Blade 17 Early 2022 | |
| AIDA64 / CPU Queen | |
| Asus ROG Strix G17 G713PI | |
| Eluktronics Mech-17 GP2 | |
| MSI GE78HX 13VH-070US | |
| MSI Titan GT77 HX 13VI | |
| Moyenne Intel Core i9-13950HX (131931 - 140103, n=8) | |
| MSI Raider GE77 HX 12UHS | |
| Razer Blade 17 Early 2022 | |
| AIDA64 / FPU SinJulia | |
| Asus ROG Strix G17 G713PI | |
| Eluktronics Mech-17 GP2 | |
| MSI Titan GT77 HX 13VI | |
| MSI GE78HX 13VH-070US | |
| Moyenne Intel Core i9-13950HX (12318 - 17057, n=9) | |
| MSI Raider GE77 HX 12UHS | |
| Razer Blade 17 Early 2022 | |
| AIDA64 / FPU Mandel | |
| Asus ROG Strix G17 G713PI | |
| MSI Titan GT77 HX 13VI | |
| MSI GE78HX 13VH-070US | |
| Eluktronics Mech-17 GP2 | |
| Moyenne Intel Core i9-13950HX (44372 - 71038, n=9) | |
| MSI Raider GE77 HX 12UHS | |
| Razer Blade 17 Early 2022 | |
| AIDA64 / CPU AES | |
| Eluktronics Mech-17 GP2 | |
| MSI Raider GE77 HX 12UHS | |
| Asus ROG Strix G17 G713PI | |
| Moyenne Intel Core i9-13950HX (99981 - 204491, n=9) | |
| MSI Titan GT77 HX 13VI | |
| MSI GE78HX 13VH-070US | |
| Razer Blade 17 Early 2022 | |
| AIDA64 / CPU ZLib | |
| Asus ROG Strix G17 G713PI | |
| MSI GE78HX 13VH-070US | |
| MSI Titan GT77 HX 13VI | |
| Eluktronics Mech-17 GP2 | |
| Moyenne Intel Core i9-13950HX (1263 - 2069, n=9) | |
| MSI Raider GE77 HX 12UHS | |
| Razer Blade 17 Early 2022 | |
| AIDA64 / FP64 Ray-Trace | |
| Asus ROG Strix G17 G713PI | |
| MSI Titan GT77 HX 13VI | |
| MSI GE78HX 13VH-070US | |
| Eluktronics Mech-17 GP2 | |
| Moyenne Intel Core i9-13950HX (9649 - 15573, n=9) | |
| MSI Raider GE77 HX 12UHS | |
| Razer Blade 17 Early 2022 | |
| AIDA64 / CPU PhotoWorxx | |
| MSI GE78HX 13VH-070US | |
| Moyenne Intel Core i9-13950HX (40233 - 50864, n=9) | |
| MSI Raider GE77 HX 12UHS | |
| Eluktronics Mech-17 GP2 | |
| MSI Titan GT77 HX 13VI | |
| Razer Blade 17 Early 2022 | |
| Asus ROG Strix G17 G713PI | |
Performance du système
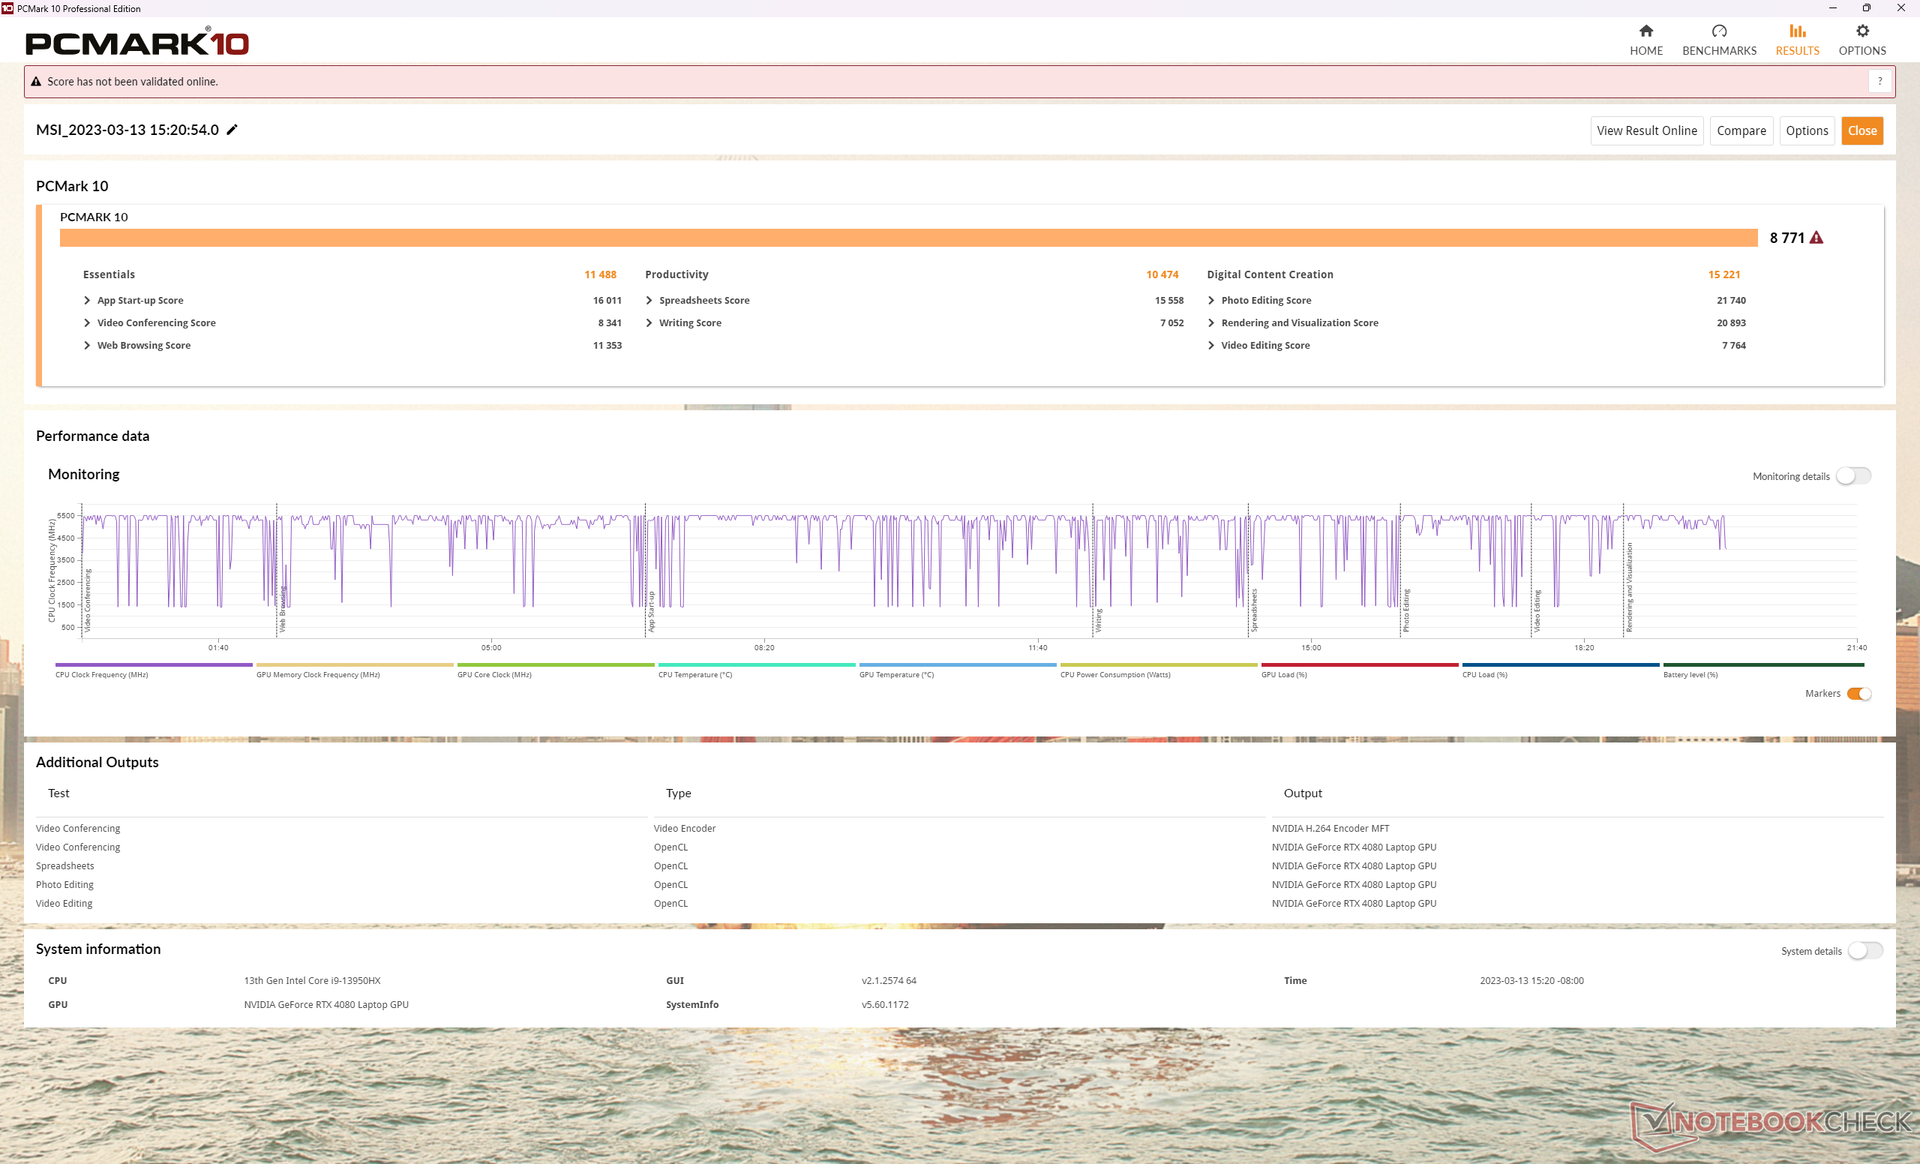
Les résultats de PCMark 10 sont systématiquement supérieurs à ceux de la GE77 fonctionnant sur du matériel de dernière génération, en particulier dans le sous-test Digital Content où les performances du GPU sont favorisées.
Nous avons rencontré un problème sur notre unité : il arrivait qu'elle ne se réveille pas de la veille, ce qui nécessitait un redémarrage brutal à chaque fois. Ce problème semble se produire plus souvent en mode dGPU qu'en mode MS Hybrid.
CrossMark: Overall | Productivity | Creativity | Responsiveness
| PCMark 10 / Score | |
| Eluktronics Mech-17 GP2 | |
| MSI Titan GT77 HX 13VI | |
| MSI GE78HX 13VH-070US | |
| Moyenne Intel Core i9-13950HX, NVIDIA GeForce RTX 4080 Laptop GPU (7888 - 8771, n=2) | |
| Asus ROG Strix G17 G713PI | |
| Razer Blade 17 Early 2022 | |
| MSI Raider GE77 HX 12UHS | |
| PCMark 10 / Essentials | |
| Eluktronics Mech-17 GP2 | |
| MSI Titan GT77 HX 13VI | |
| MSI GE78HX 13VH-070US | |
| Moyenne Intel Core i9-13950HX, NVIDIA GeForce RTX 4080 Laptop GPU (11078 - 11488, n=2) | |
| Asus ROG Strix G17 G713PI | |
| Razer Blade 17 Early 2022 | |
| MSI Raider GE77 HX 12UHS | |
| PCMark 10 / Productivity | |
| Asus ROG Strix G17 G713PI | |
| Eluktronics Mech-17 GP2 | |
| MSI GE78HX 13VH-070US | |
| MSI Titan GT77 HX 13VI | |
| MSI Raider GE77 HX 12UHS | |
| Moyenne Intel Core i9-13950HX, NVIDIA GeForce RTX 4080 Laptop GPU (8271 - 10474, n=2) | |
| Razer Blade 17 Early 2022 | |
| PCMark 10 / Digital Content Creation | |
| MSI Titan GT77 HX 13VI | |
| Eluktronics Mech-17 GP2 | |
| MSI GE78HX 13VH-070US | |
| Moyenne Intel Core i9-13950HX, NVIDIA GeForce RTX 4080 Laptop GPU (14535 - 15221, n=2) | |
| Razer Blade 17 Early 2022 | |
| MSI Raider GE77 HX 12UHS | |
| Asus ROG Strix G17 G713PI | |
| CrossMark / Overall | |
| Eluktronics Mech-17 GP2 | |
| MSI Raider GE77 HX 12UHS | |
| MSI Titan GT77 HX 13VI | |
| Asus ROG Strix G17 G713PI | |
| MSI GE78HX 13VH-070US | |
| Razer Blade 17 Early 2022 | |
| Moyenne Intel Core i9-13950HX, NVIDIA GeForce RTX 4080 Laptop GPU (1592 - 1899, n=2) | |
| CrossMark / Productivity | |
| MSI Raider GE77 HX 12UHS | |
| Eluktronics Mech-17 GP2 | |
| MSI Titan GT77 HX 13VI | |
| Asus ROG Strix G17 G713PI | |
| MSI GE78HX 13VH-070US | |
| Razer Blade 17 Early 2022 | |
| Moyenne Intel Core i9-13950HX, NVIDIA GeForce RTX 4080 Laptop GPU (1509 - 1846, n=2) | |
| CrossMark / Creativity | |
| Eluktronics Mech-17 GP2 | |
| MSI Titan GT77 HX 13VI | |
| MSI Raider GE77 HX 12UHS | |
| Asus ROG Strix G17 G713PI | |
| MSI GE78HX 13VH-070US | |
| Moyenne Intel Core i9-13950HX, NVIDIA GeForce RTX 4080 Laptop GPU (1780 - 2035, n=2) | |
| Razer Blade 17 Early 2022 | |
| CrossMark / Responsiveness | |
| MSI Raider GE77 HX 12UHS | |
| MSI Titan GT77 HX 13VI | |
| Eluktronics Mech-17 GP2 | |
| MSI GE78HX 13VH-070US | |
| Asus ROG Strix G17 G713PI | |
| Razer Blade 17 Early 2022 | |
| Moyenne Intel Core i9-13950HX, NVIDIA GeForce RTX 4080 Laptop GPU (1342 - 1681, n=2) | |
| PCMark 10 Score | 8771 points | |
Aide | ||
| AIDA64 / Memory Copy | |
| MSI GE78HX 13VH-070US | |
| Moyenne Intel Core i9-13950HX (61938 - 78813, n=9) | |
| MSI Raider GE77 HX 12UHS | |
| Eluktronics Mech-17 GP2 | |
| MSI Titan GT77 HX 13VI | |
| Razer Blade 17 Early 2022 | |
| Asus ROG Strix G17 G713PI | |
| AIDA64 / Memory Read | |
| MSI GE78HX 13VH-070US | |
| Moyenne Intel Core i9-13950HX (62368 - 86831, n=9) | |
| Eluktronics Mech-17 GP2 | |
| MSI Raider GE77 HX 12UHS | |
| MSI Titan GT77 HX 13VI | |
| Razer Blade 17 Early 2022 | |
| Asus ROG Strix G17 G713PI | |
| AIDA64 / Memory Write | |
| MSI GE78HX 13VH-070US | |
| Moyenne Intel Core i9-13950HX (59501 - 80441, n=9) | |
| Eluktronics Mech-17 GP2 | |
| MSI Raider GE77 HX 12UHS | |
| MSI Titan GT77 HX 13VI | |
| Asus ROG Strix G17 G713PI | |
| Razer Blade 17 Early 2022 | |
| AIDA64 / Memory Latency | |
| MSI Titan GT77 HX 13VI | |
| Moyenne Intel Core i9-13950HX (84.4 - 99.5, n=9) | |
| Eluktronics Mech-17 GP2 | |
| Asus ROG Strix G17 G713PI | |
| MSI GE78HX 13VH-070US | |
| MSI Raider GE77 HX 12UHS | |
* ... Moindre est la valeur, meilleures sont les performances
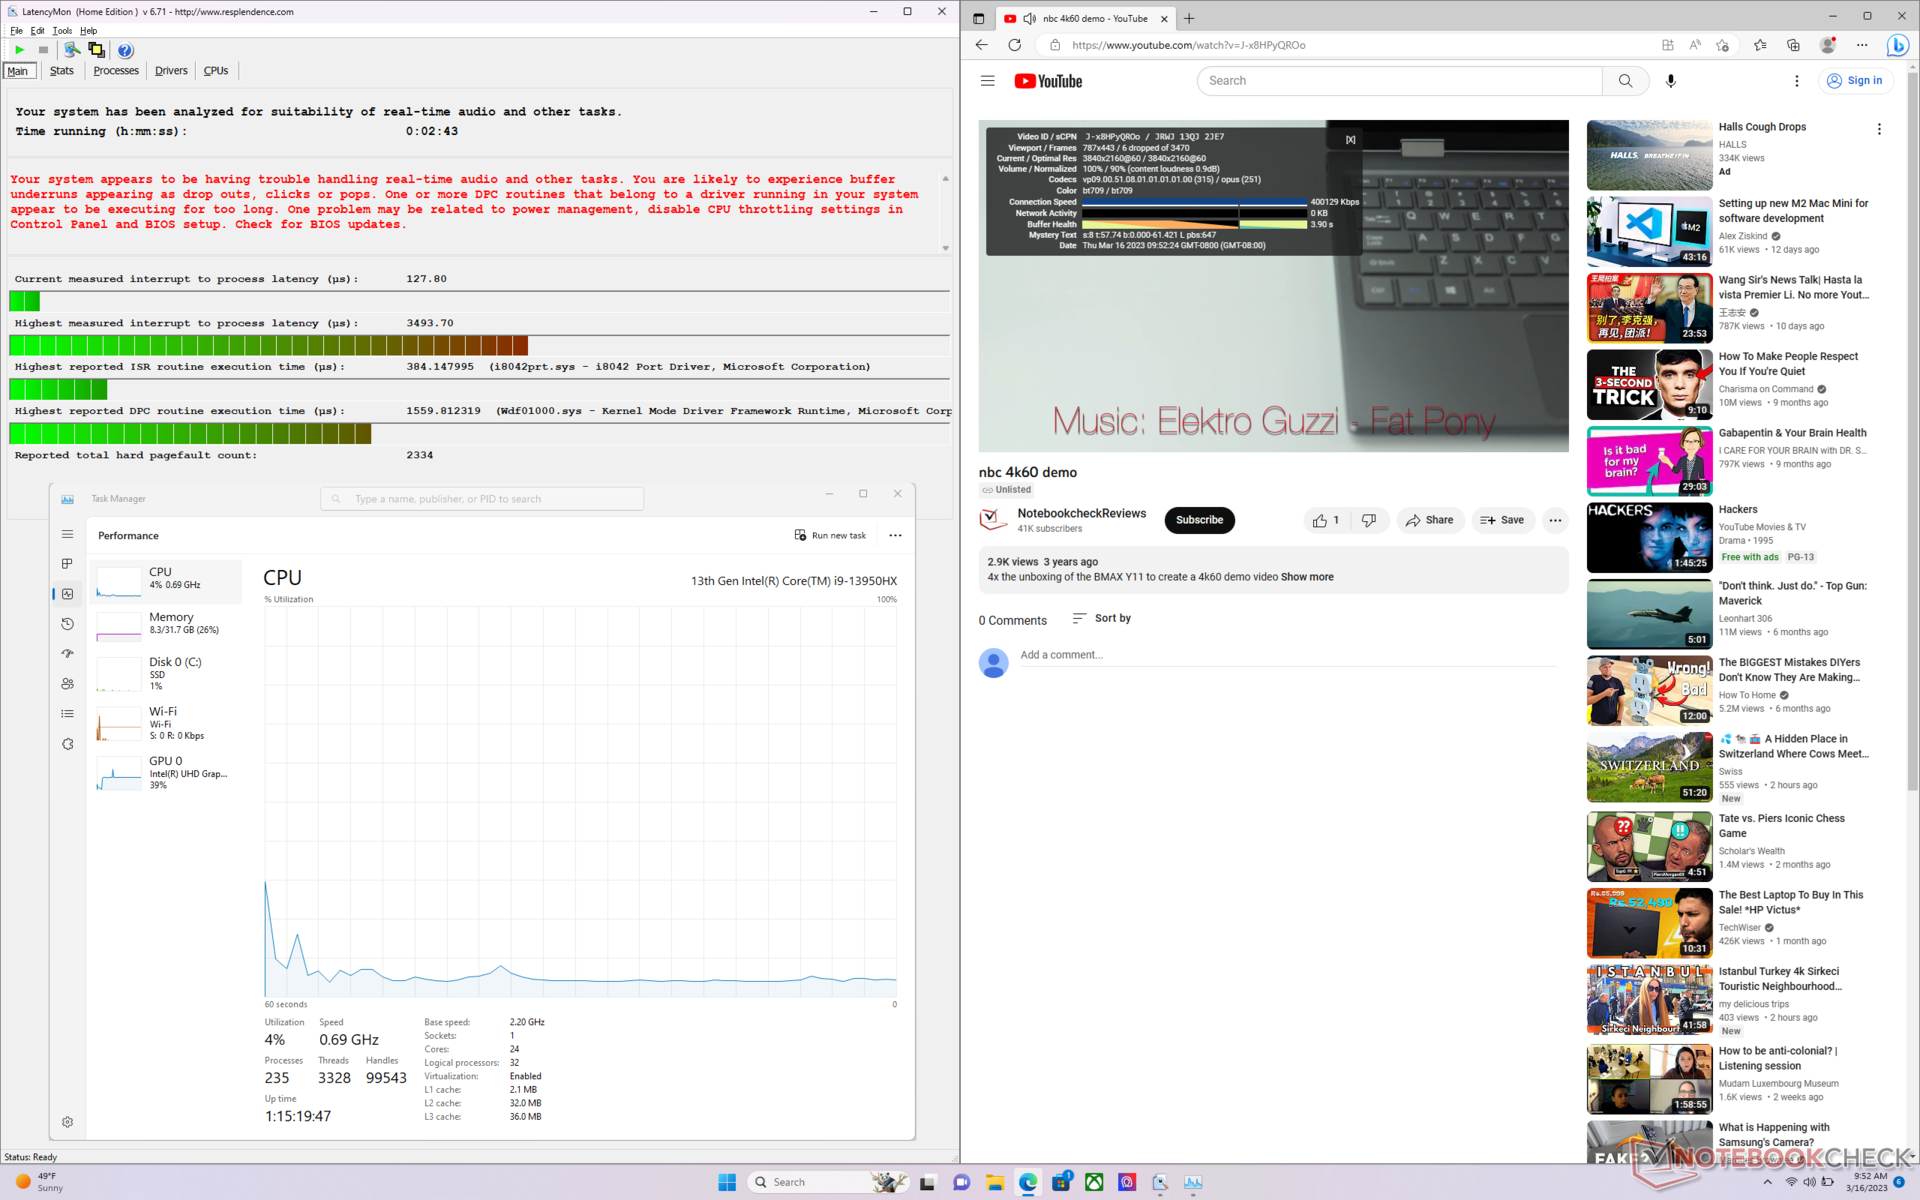
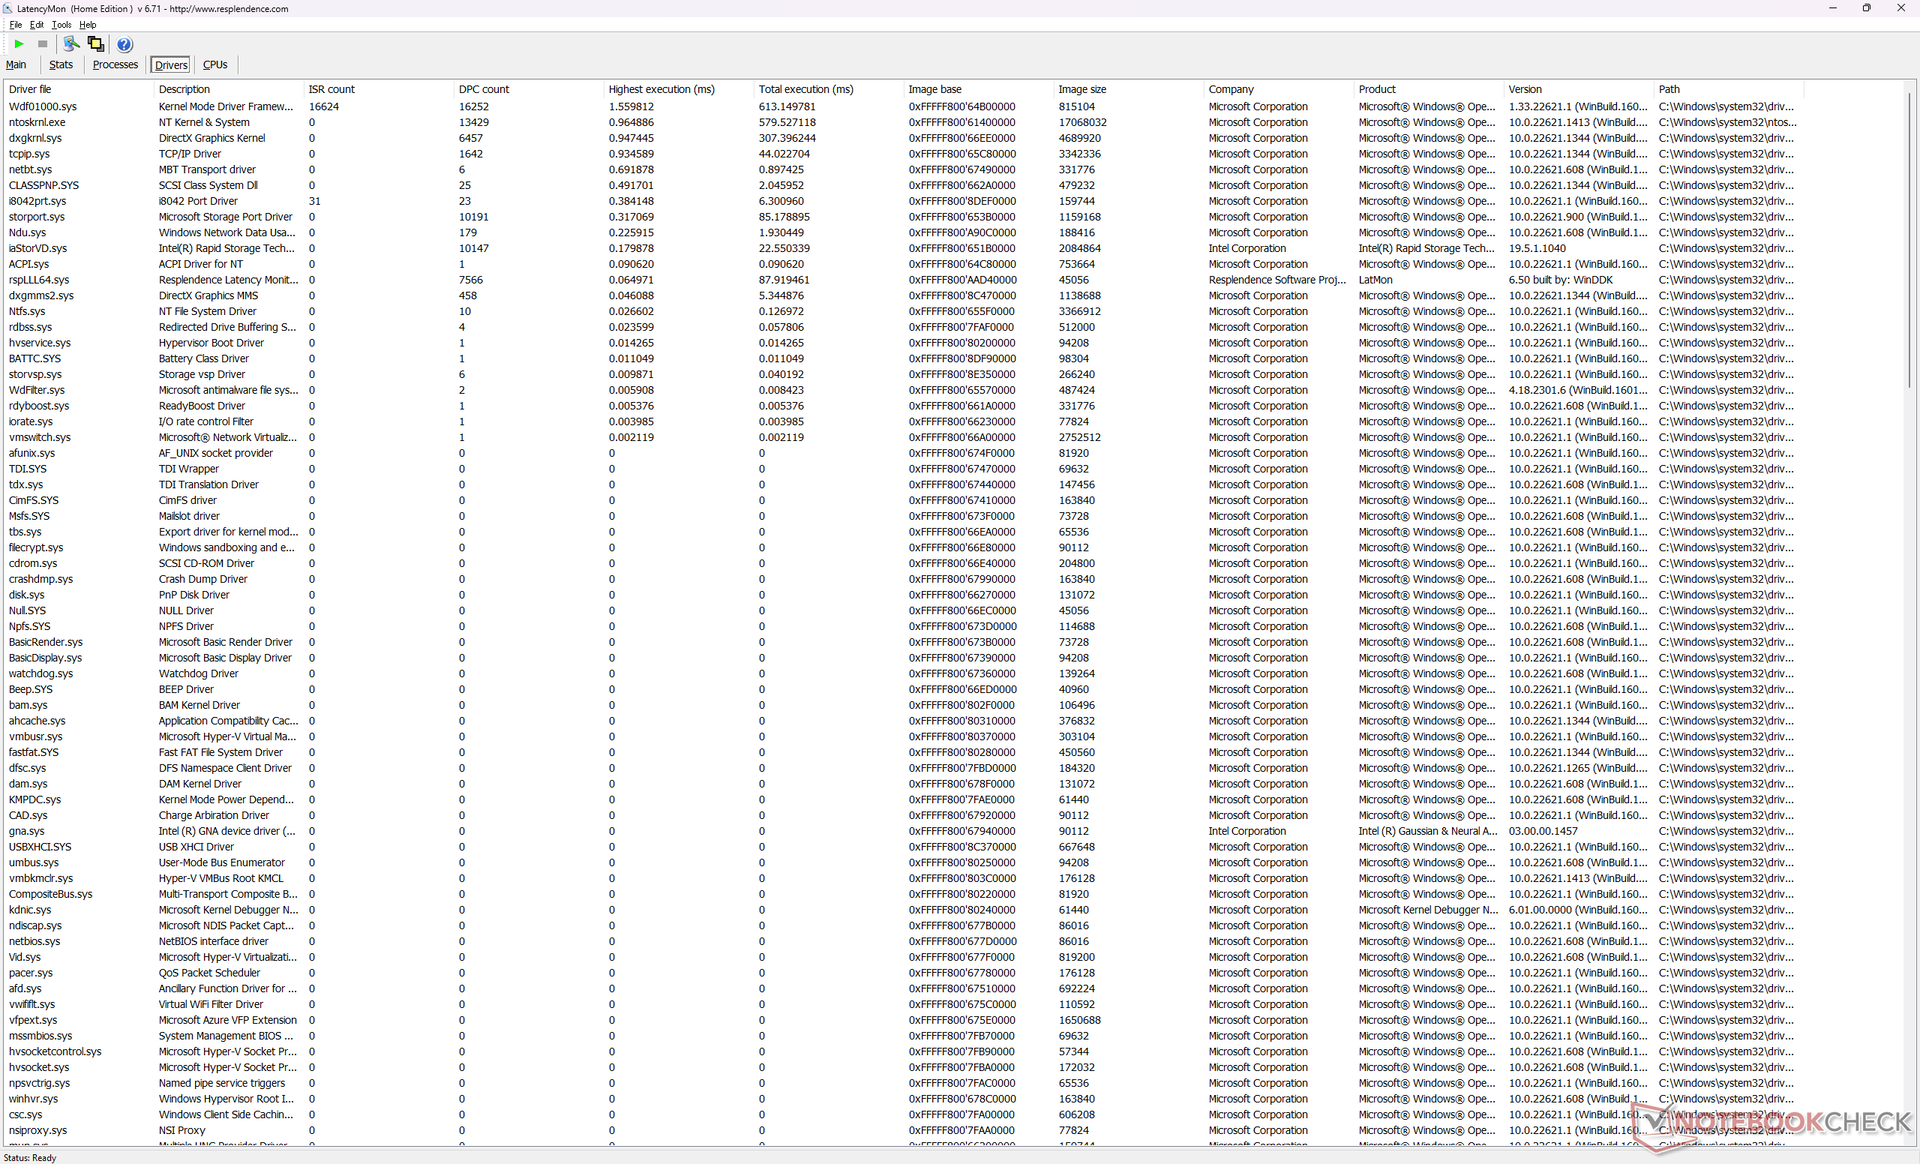
Latence DPC
LatencyMon révèle des problèmes de DPC lors de l'ouverture de plusieurs onglets de notre page d'accueil, même lorsqu'ils sont configurés pour l'iGPU uniquement. Nvidia a reconnu l'existence d'un bogue dans ses derniers pilotes graphiques, entraînant également des latences DPC élevées.
la lecture de vidéos 4K à 60 FPS est imparfaite avec 6 images perdues pendant notre vidéo de test d'une minute. Répéter le test n'a pas amélioré nos résultats.
| DPC Latencies / LatencyMon - interrupt to process latency (max), Web, Youtube, Prime95 | |
| MSI Titan GT77 HX 13VI | |
| MSI GE78HX 13VH-070US | |
| MSI Raider GE77 HX 12UHS | |
| Asus ROG Strix G17 G713PI | |
| Eluktronics Mech-17 GP2 | |
| Razer Blade 17 Early 2022 | |
* ... Moindre est la valeur, meilleures sont les performances
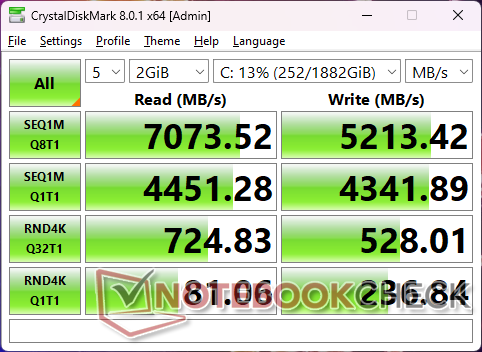
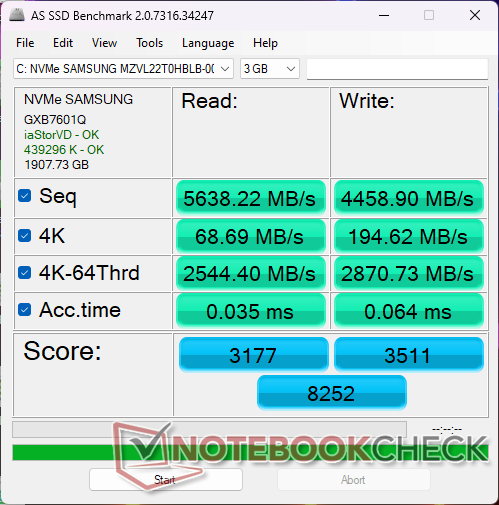
Périphériques de stockage - Prêt pour les disques SSD PCIe5
Notre unité de test est livrée avec un disque dur de samsung PM9A1 de 2 To qui est l'un des disques SSD NVMe PCIe4 x4 les plus rapides disponibles. Le disque n'aurait aucun problème à maintenir des taux de transfert de plus de 7000 Mo/s, même lorsqu'il est sollicité, comme le montrent les résultats de notre boucle DiskSpd ci-dessous. Il faut s'y attendre puisque le GE78 peut prendre en charge des disques SSD PCIe5 encore plus rapides une fois qu'ils seront largement disponibles.

| Drive Performance rating - Percent | |
| MSI Raider GE77 HX 12UHS | |
| Razer Blade 17 Early 2022 | |
| MSI GE78HX 13VH-070US | |
| MSI Titan GT77 HX 13VI | |
| Eluktronics Mech-17 GP2 | |
| Asus ROG Strix G17 G713PI | |
* ... Moindre est la valeur, meilleures sont les performances
Disk Throttling: DiskSpd Read Loop, Queue Depth 8
Performance du GPU - 175 W Graphique
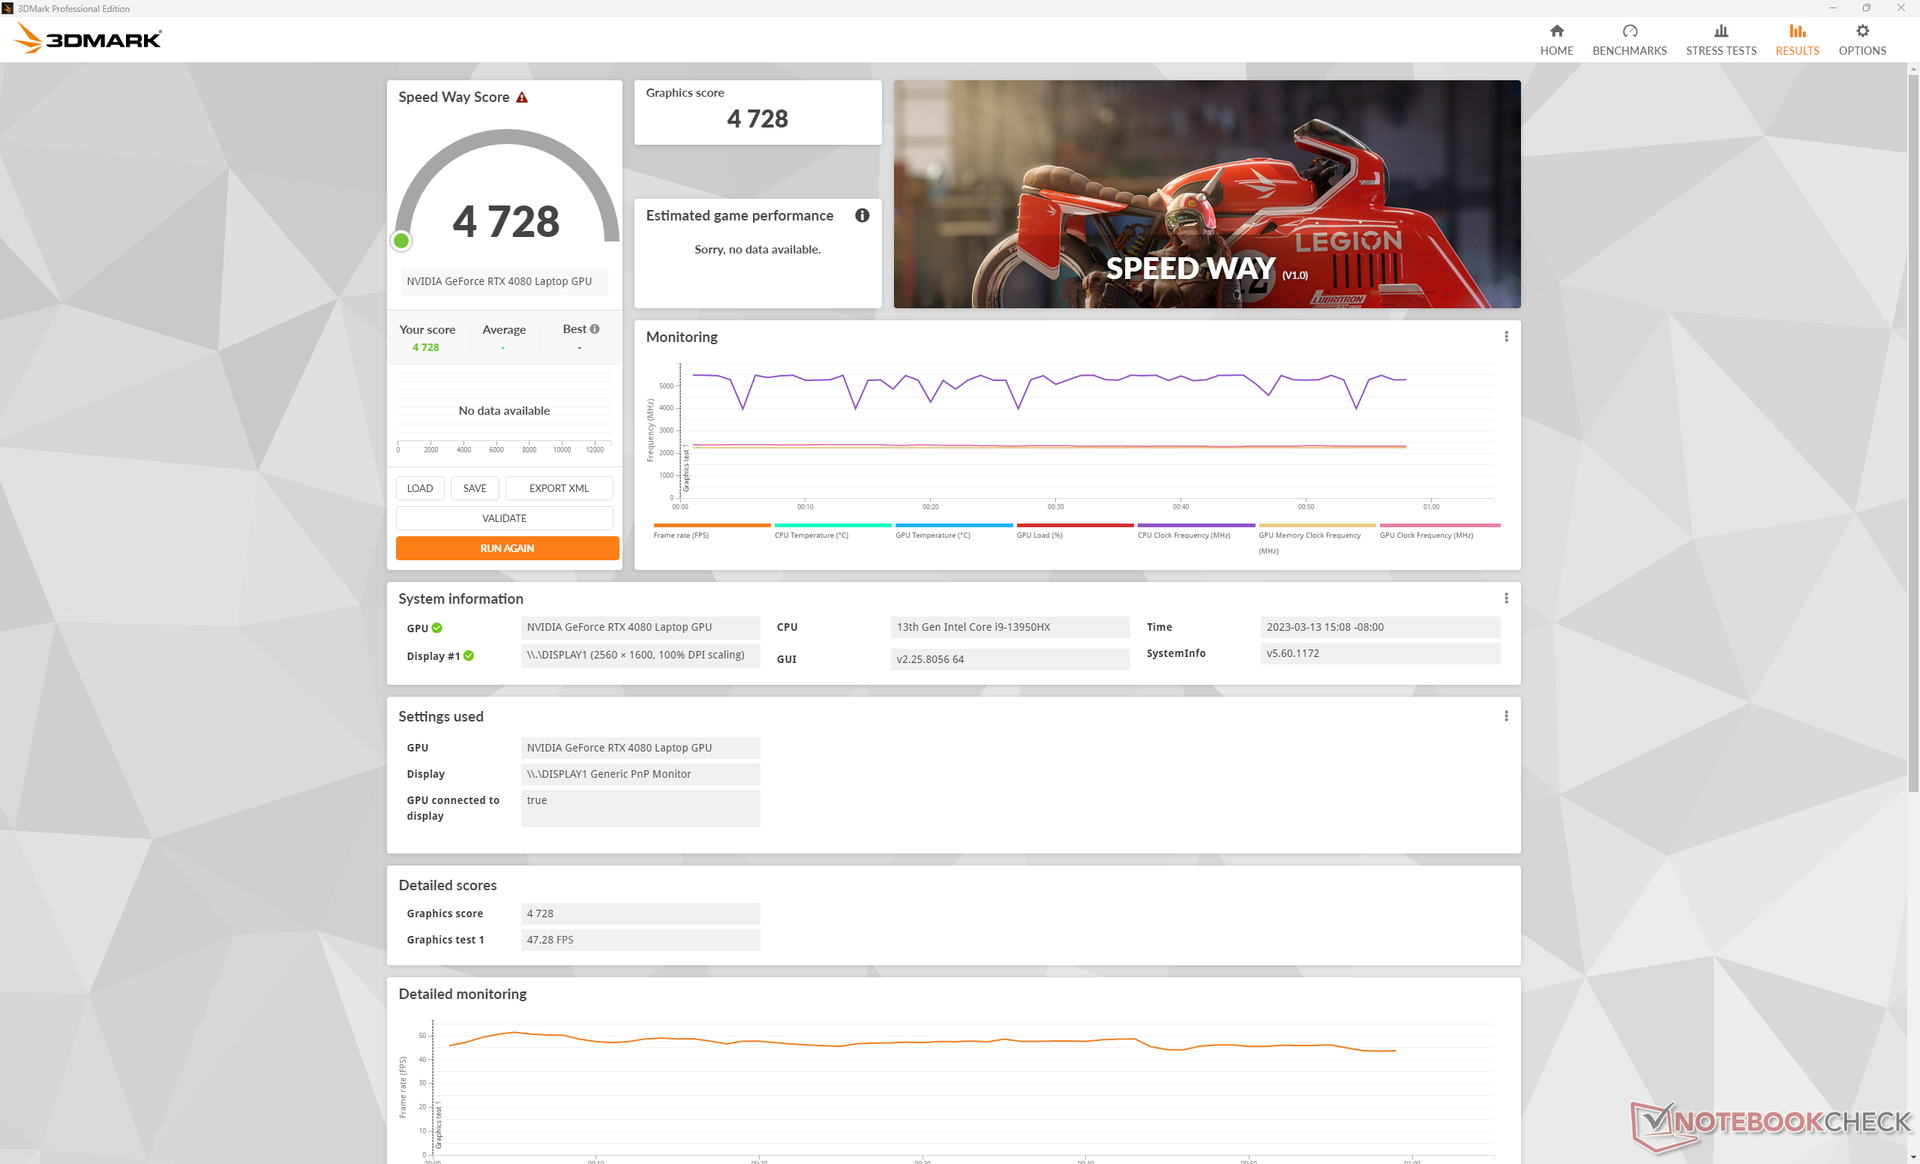
Le modèle propose actuellement trois options de GPU mobiles : la GeForce RTX 4070, 4080ou 4090. Le passage du mobile 4070 au mobile 4080 augmentera les performances de 40 à 60 %, tandis que le passage du mobile 4080 au mobile 4090 n'augmentera les performances que d'environ 10 %. Savoir comment ces trois GPU mobiles se comparent les uns aux autres devrait vous aider à décider quelle configuration GE78 acheter.
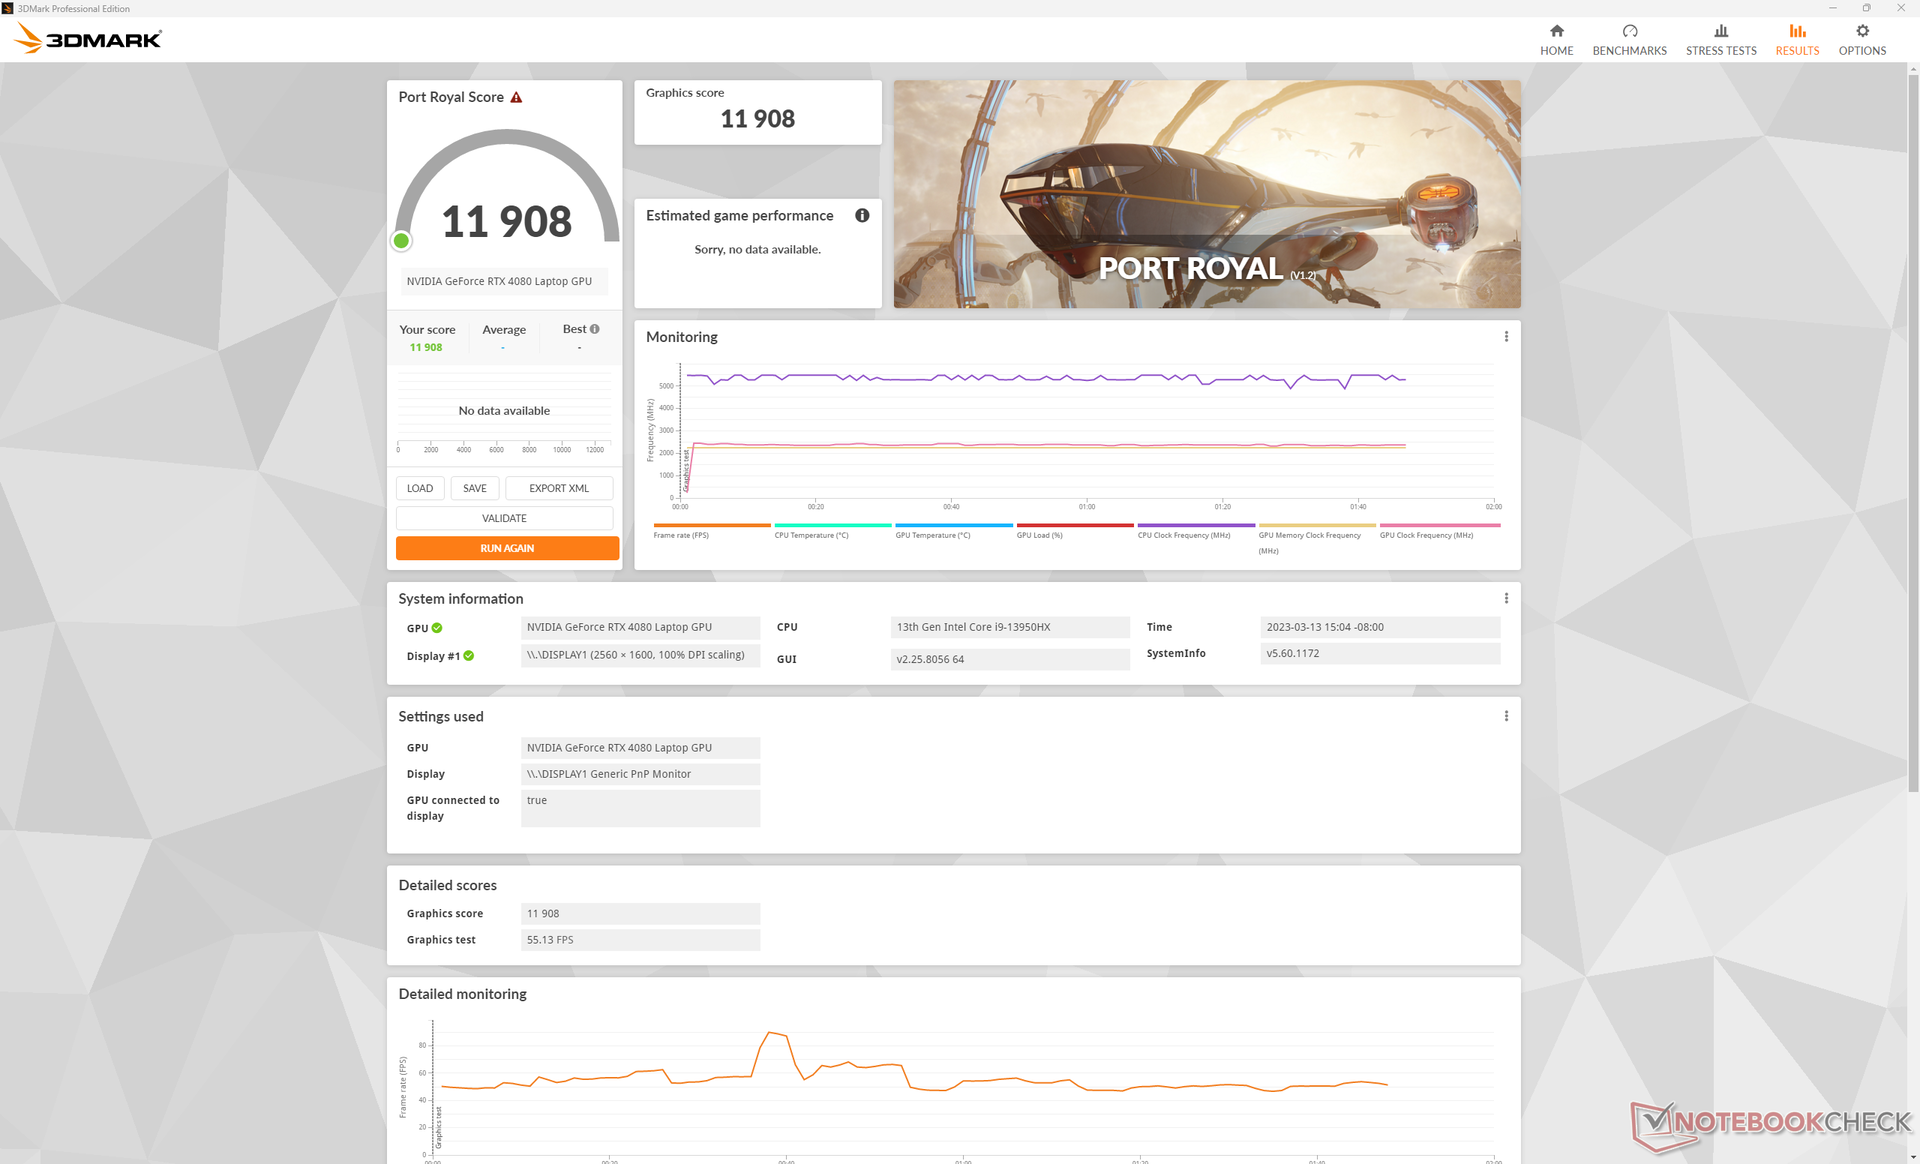
Notre configuration RTX 4080 offre des performances brutes de 30 à 50 % supérieures à celles de la rTX 3080 Ti de la GE77 de l'année dernière. Si le titre prend en charge DLSS 3, comme Cyberpunk 2077, les performances peuvent être deux à trois fois plus rapides. Nous vous recommandons de consulter notre page dédiée à la RTX 4080 mobile pour plus de benchmarks et de comparaisons concernant la série mobile GeForce 40.
La RTX 4080 mobile ne doit pas être directement comparée à la rTX 4080 de bureau qui est nettement plus gourmande en énergie et encore plus rapide d'environ 1,5 fois.
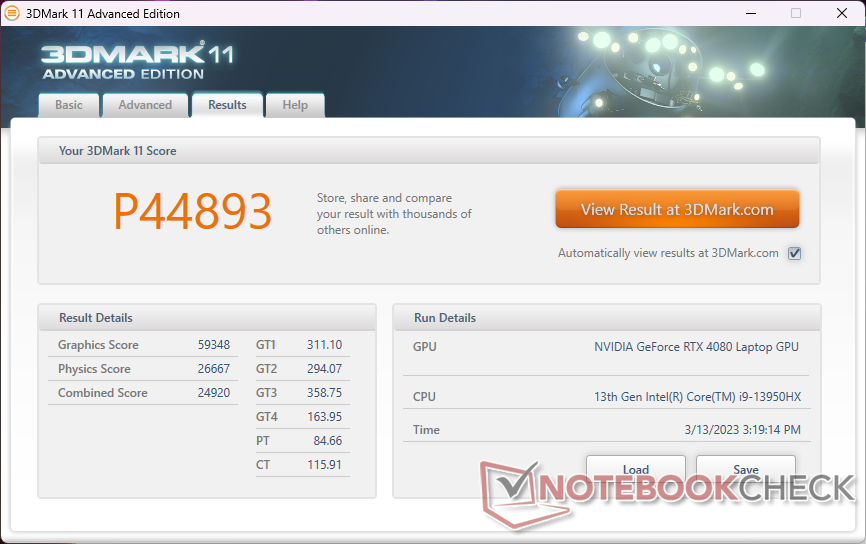
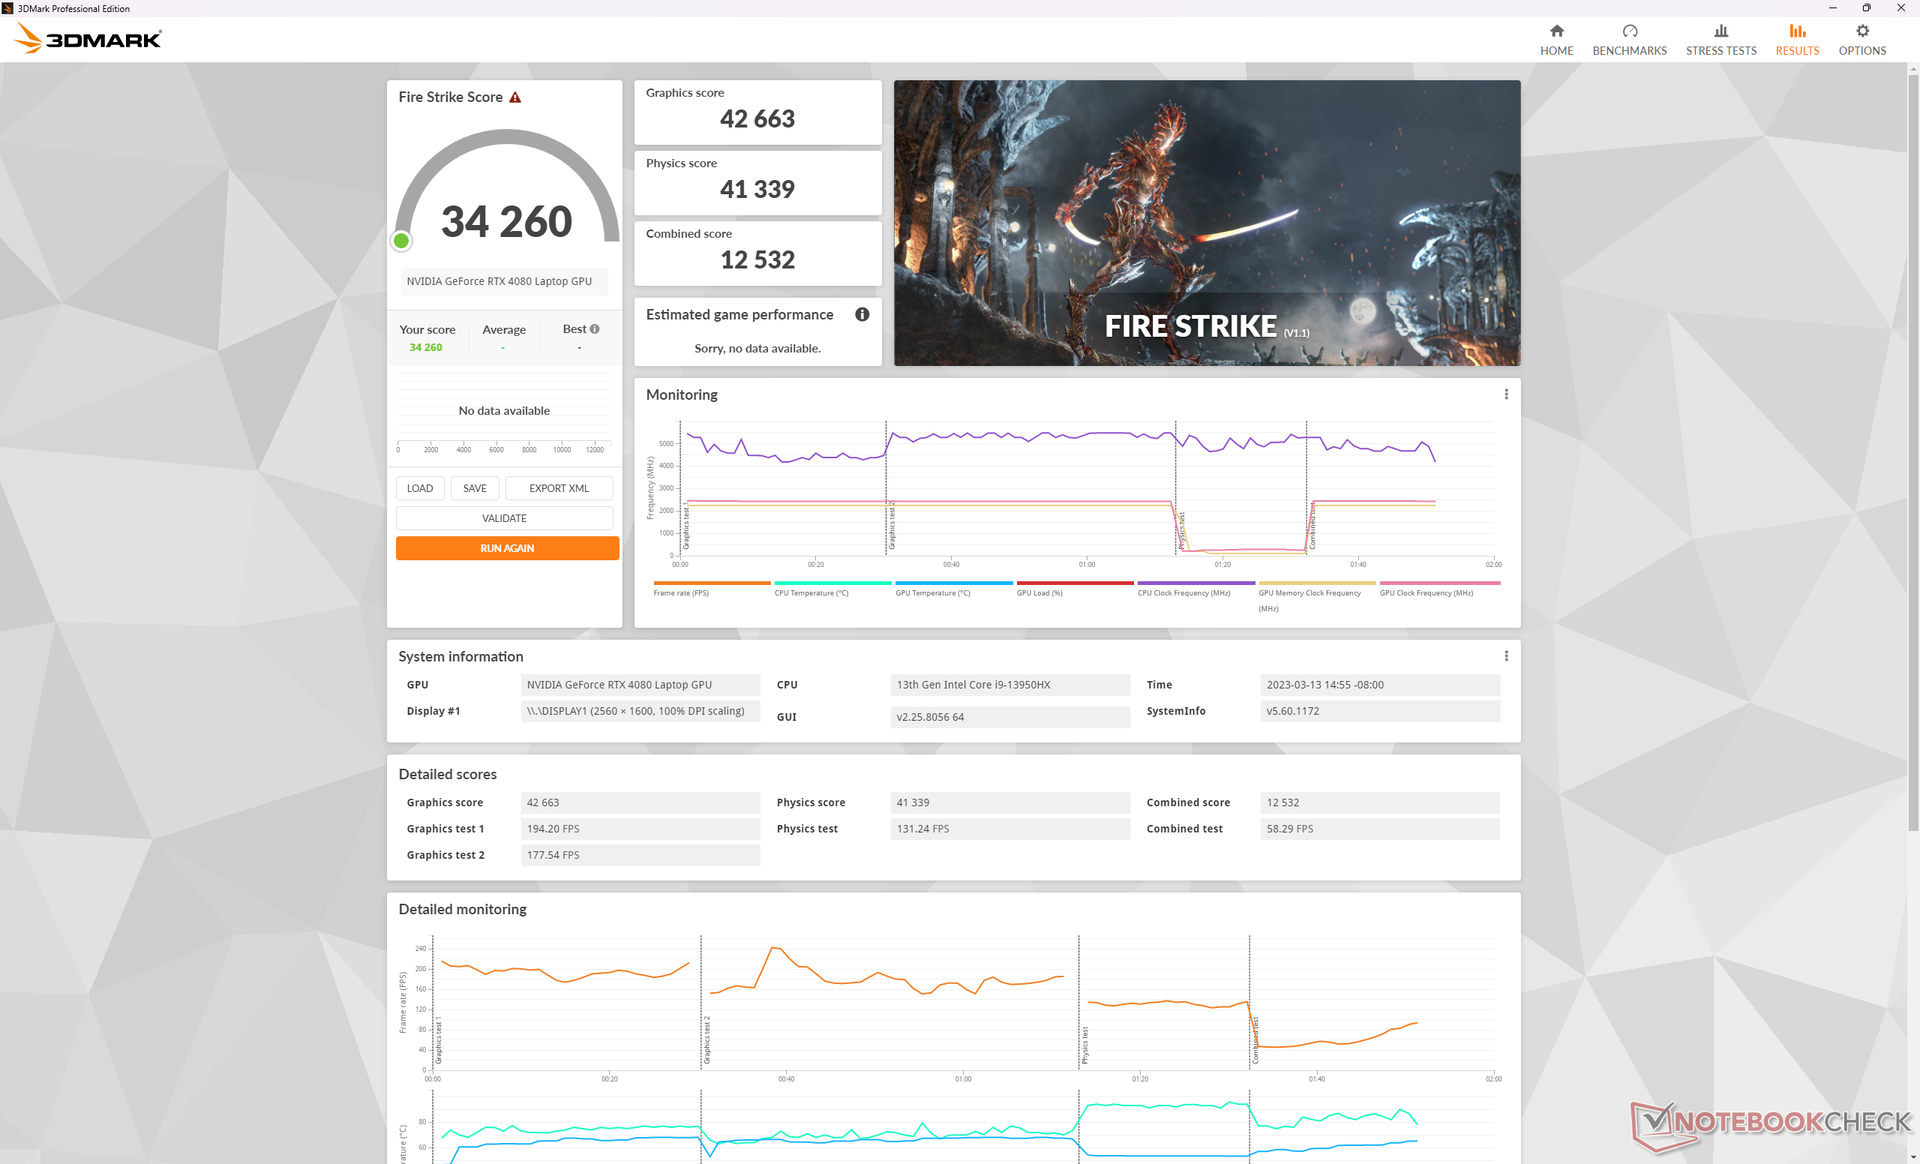
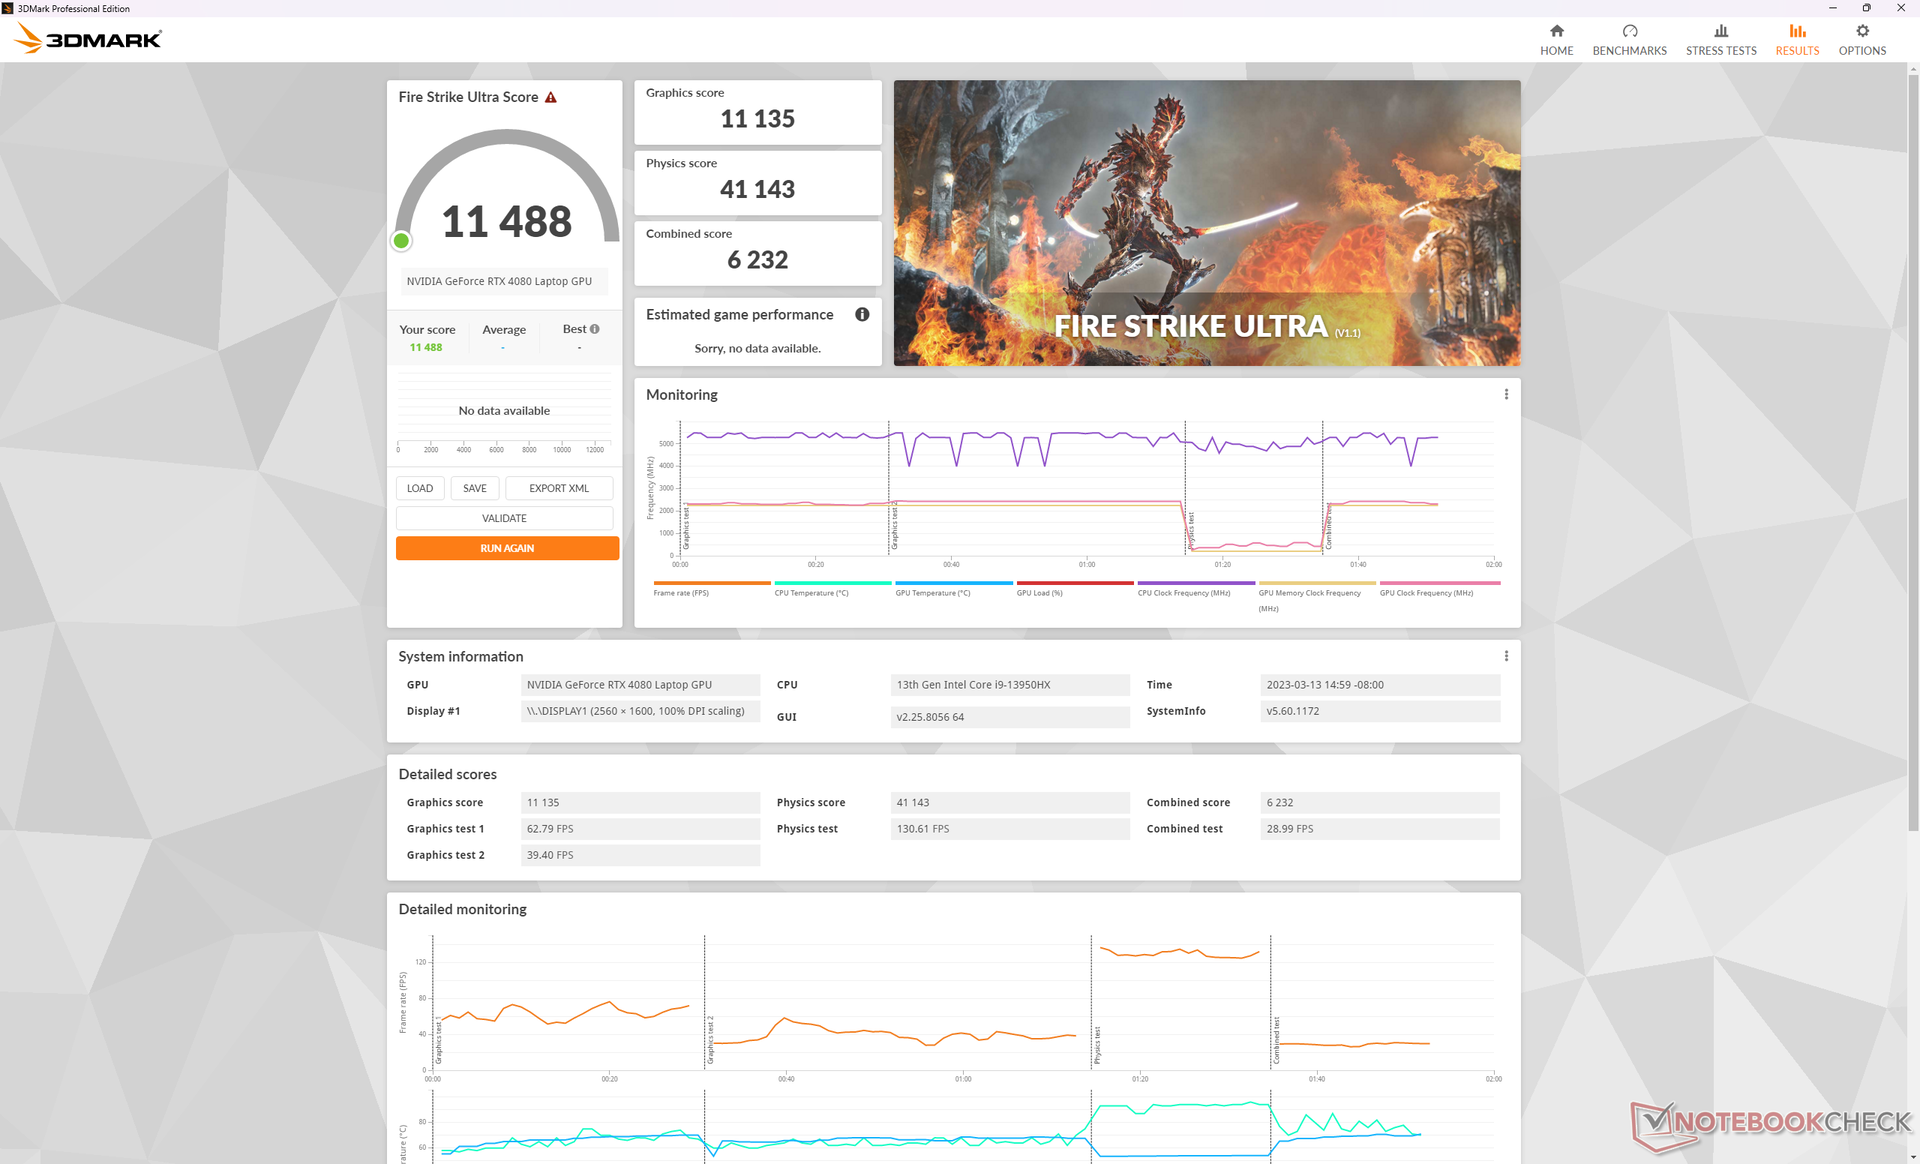
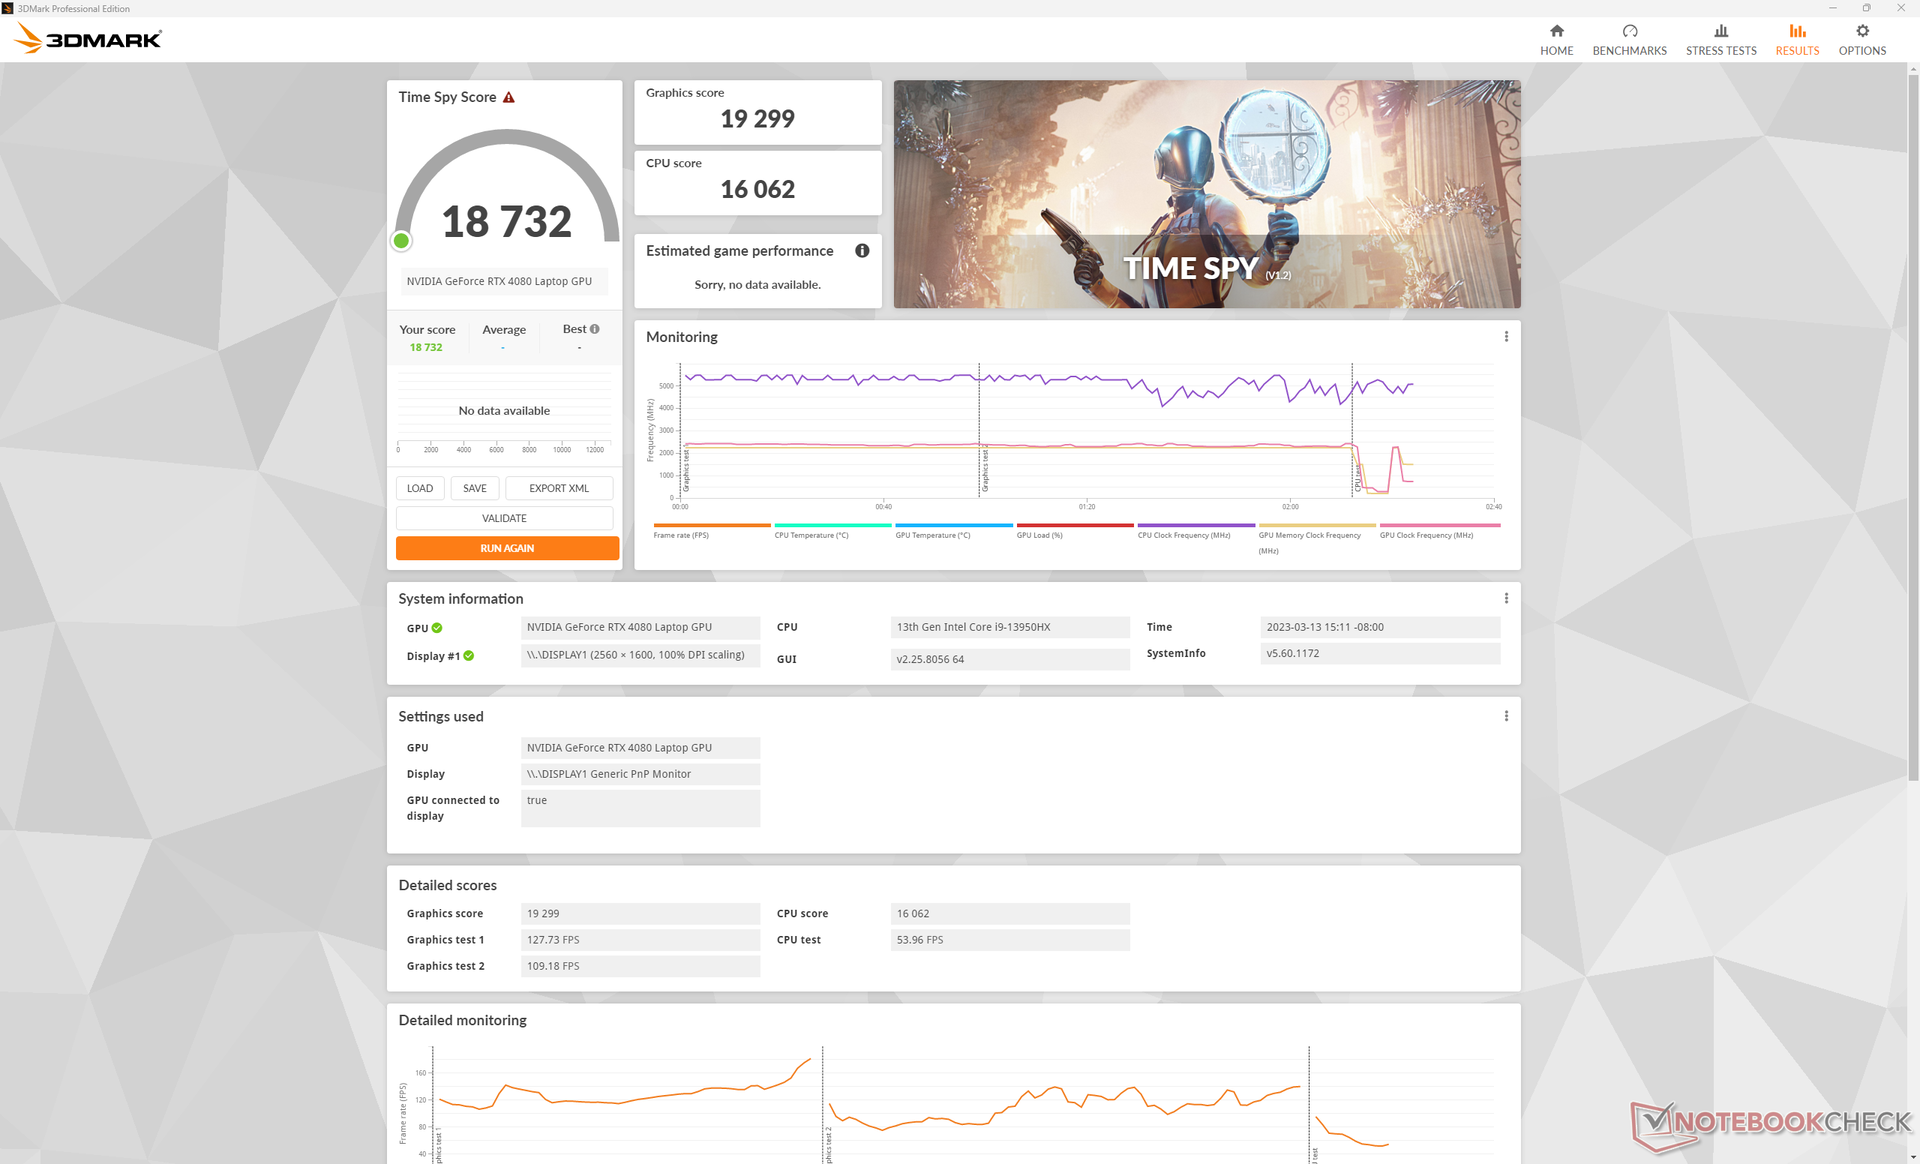
| 3DMark 11 Performance | 44893 points | |
| 3DMark Fire Strike Score | 34260 points | |
| 3DMark Time Spy Score | 18732 points | |
Aide | ||
* ... Moindre est la valeur, meilleures sont les performances
| The Witcher 3 - 1920x1080 Ultra Graphics & Postprocessing (HBAO+) | |
| KFA2 GeForce RTX 4080 SG | |
| Eluktronics Mech-17 GP2 | |
| MSI GE78HX 13VH-070US | |
| MSI Raider GE77 HX 12UHS | |
| Alienware m17 R5 (R9 6900HX, RX 6850M XT) | |
| Asus ROG Strix G17 G713PI | |
| Corsair Voyager a1600 | |
| MSI Katana 17 B13VFK | |
| Schenker Compact 17 | |
| Schenker XMG Core 15 (M22) | |
| HP Omen 15-en0375ng | |
Witcher 3 FPS Chart
| Bas | Moyen | Élevé | Ultra | QHD | 4K | |
|---|---|---|---|---|---|---|
| GTA V (2015) | 172.9 | 170 | 164.7 | 102.9 | 103.7 | 144.6 |
| The Witcher 3 (2015) | 605.7 | 539.8 | 382.9 | 175.9 | 129.4 | |
| Dota 2 Reborn (2015) | 180.4 | 161.7 | 154.8 | 145.6 | 142.6 | |
| Final Fantasy XV Benchmark (2018) | 180.4 | 166.9 | 148.5 | 131.6 | 76.2 | |
| X-Plane 11.11 (2018) | 174.1 | 157.4 | 126.8 | 110 | ||
| Strange Brigade (2018) | 324 | 272 | 267 | 258 | 237 | 121.5 |
| Cyberpunk 2077 1.6 (2022) | 149.2 | 142.6 | 136.8 | 135.8 | 88.6 | 40.2 |
| F1 22 (2022) | 237 | 235 | 228 | 115.4 | 77.4 | 39 |
Emissions - One Loud Gamer
Bruit du système
Les ventilateurs internes sont presque toujours actifs, quelle que soit la charge à l'écran. Nous avons pu enregistrer un bourdonnement silencieux de 24,2 dB(A) sur un fond silencieux de 23,4 dB(A) lorsque l'ordinateur tourne simplement au ralenti en mode économie d'énergie. En cas de navigation sur le web ou de streaming vidéo, le bruit du ventilateur oscille entre 25 et 31 dB(A). Ce n'est pas assez fort pour être gênant, mais c'est tout de même perceptible. Des machines concurrentes comme leEluktronics Mech-17 ou l'Asus ROG Strix G17 G713PI.
En mode Performance (ou Extrême), le bruit du ventilateur dépasse les 56 dB(A), ce qui est très élevé pour un ordinateur portable de jeu. Les ordinateurs portables Eluktronics et Asus mentionnés plus haut, par exemple, sont nettement plus silencieux, avec respectivement 51 et 46 dB(A), dans des conditions de jeu similaires.
L'activation du mode Cooler Boost augmente le nombre de tours/minute du ventilateur jusqu'à la limite absolue, quelle que soit la charge à l'écran, pour un niveau sonore proche de 60 dB(A). Cependant, les performances de jeu ne sont pas nécessairement plus rapides et le mode Cooler Boost permet donc davantage de contrôler la température que les performances. Nous avons eu des observations similaires sur d'autres portables MSI avec la même fonction Cooler Boost.
Degré de la nuisance sonore
| Au repos |
| 24.2 / 25.6 / 31 dB(A) |
| Fortement sollicité |
| 43.3 / 59.1 dB(A) |
 | ||
30 dB silencieux 40 dB(A) audible 50 dB(A) bruyant |
||
min: | ||
| MSI GE78HX 13VH-070US GeForce RTX 4080 Laptop GPU, i9-13950HX, Samsung PM9A1 MZVL22T0HBLB | Eluktronics Mech-17 GP2 GeForce RTX 4090 Laptop GPU, i9-13900HX, Samsung PM9A1 MZVL21T0HCLR | Asus ROG Strix G17 G713PI GeForce RTX 4070 Laptop GPU, R9 7945HX, WD PC SN560 SDDPNQE-1T00 | MSI Titan GT77 HX 13VI GeForce RTX 4090 Laptop GPU, i9-13950HX, Samsung PM9A1 MZVL22T0HBLB | MSI Raider GE77 HX 12UHS GeForce RTX 3080 Ti Laptop GPU, i9-12900HX, Samsung PM9A1 MZVL22T0HBLB | Razer Blade 17 Early 2022 GeForce RTX 3080 Ti Laptop GPU, i9-12900H, Samsung PM9A1 MZVL21T0HCLR | |
|---|---|---|---|---|---|---|
| Noise | -1% | 1% | -7% | -15% | -3% | |
| arrêt / environnement * (dB) | 23.4 | 25.2 -8% | 25 -7% | 24.6 -5% | 26 -11% | 26 -11% |
| Idle Minimum * (dB) | 24.2 | 28 -16% | 26 -7% | 29.2 -21% | 26 -7% | 26 -7% |
| Idle Average * (dB) | 25.6 | 28 -9% | 29 -13% | 29.2 -14% | 34 -33% | 27 -5% |
| Idle Maximum * (dB) | 31 | 30.4 2% | 30 3% | 29.2 6% | 46 -48% | 32 -3% |
| Load Average * (dB) | 43.3 | 41 5% | 46 -6% | 50.7 -17% | 50 -15% | 50 -15% |
| Witcher 3 ultra * (dB) | 56.3 | 50.7 10% | 46 18% | 53.3 5% | 55 2% | 51 9% |
| Load Maximum * (dB) | 59.1 | 52.6 11% | 47 20% | 61 -3% | 57 4% | 51 14% |
* ... Moindre est la valeur, meilleures sont les performances
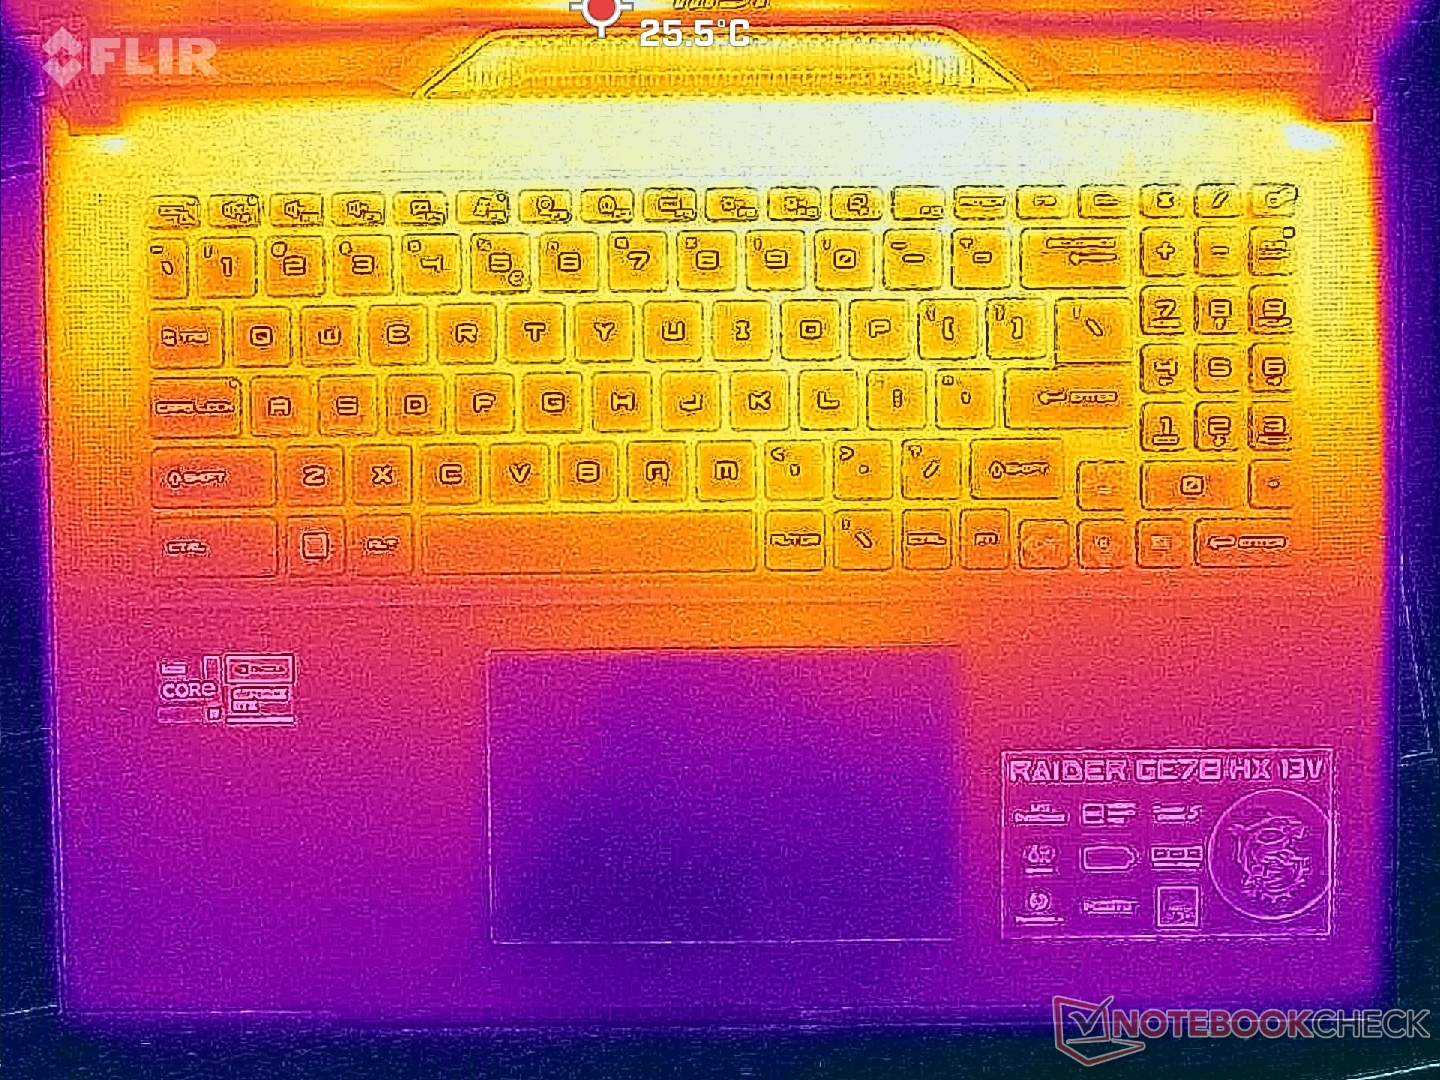
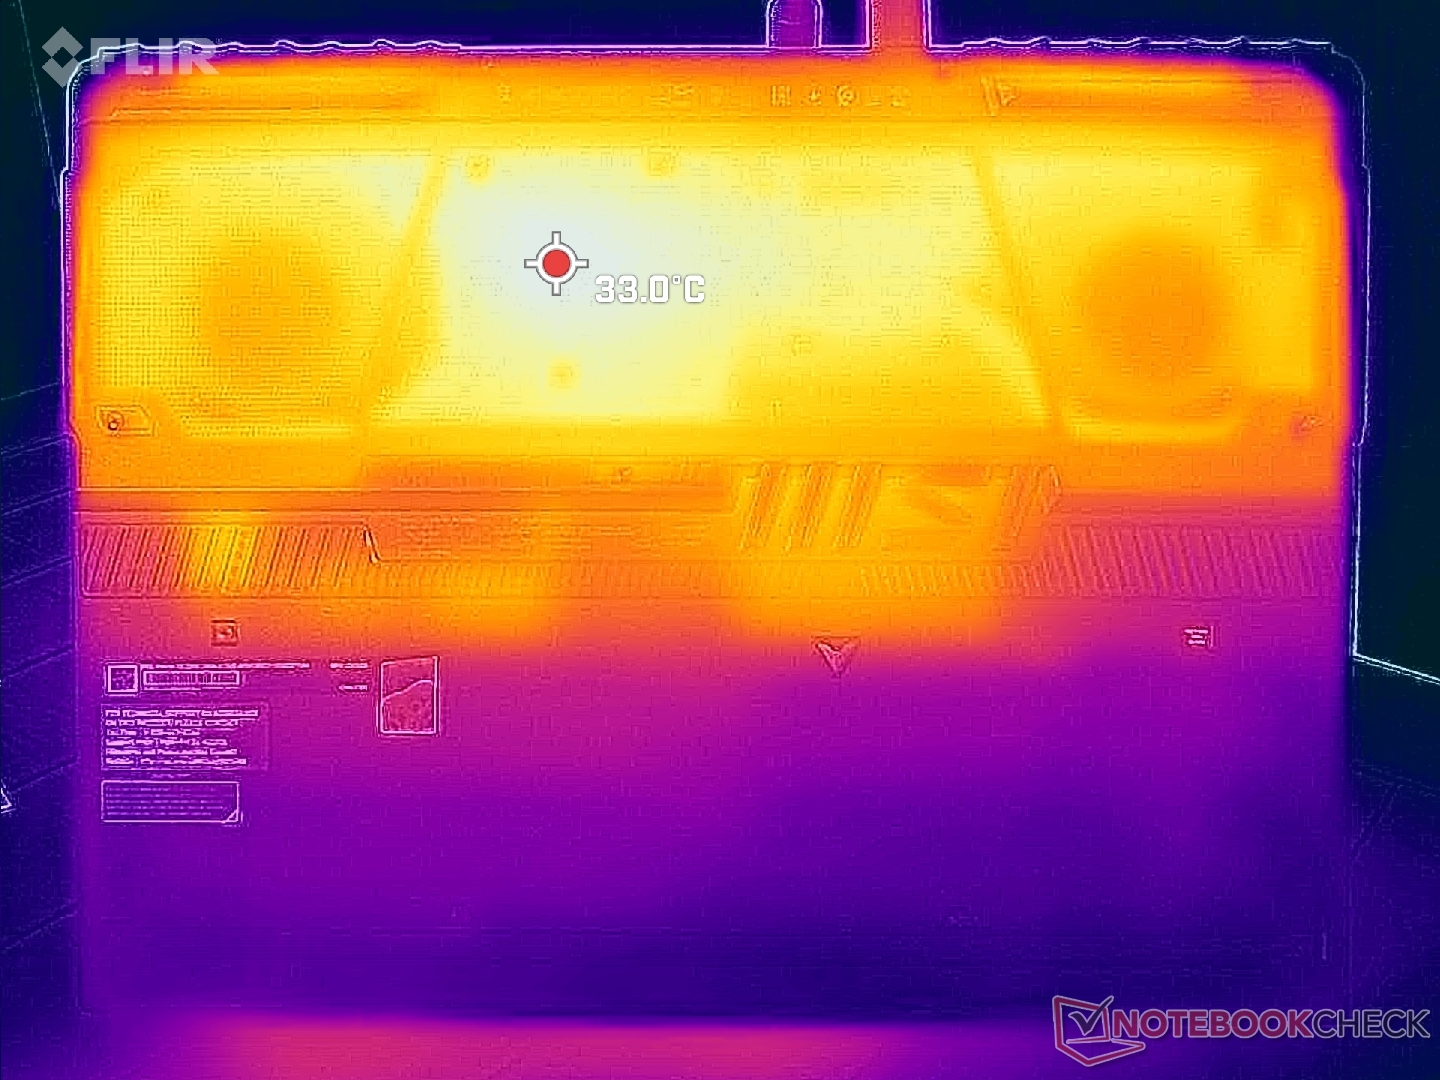
Température
Les températures de surface ne posent généralement pas de problème sur les modèles GE et GT de MSI, car ils sont essentiellement en plastique et plus épais. La température de surface moyenne sur le GE78, par exemple, est d'environ 32°C sur le dessus et le dessous, contre 43°C à 44°C sur le Razer Blade 17.
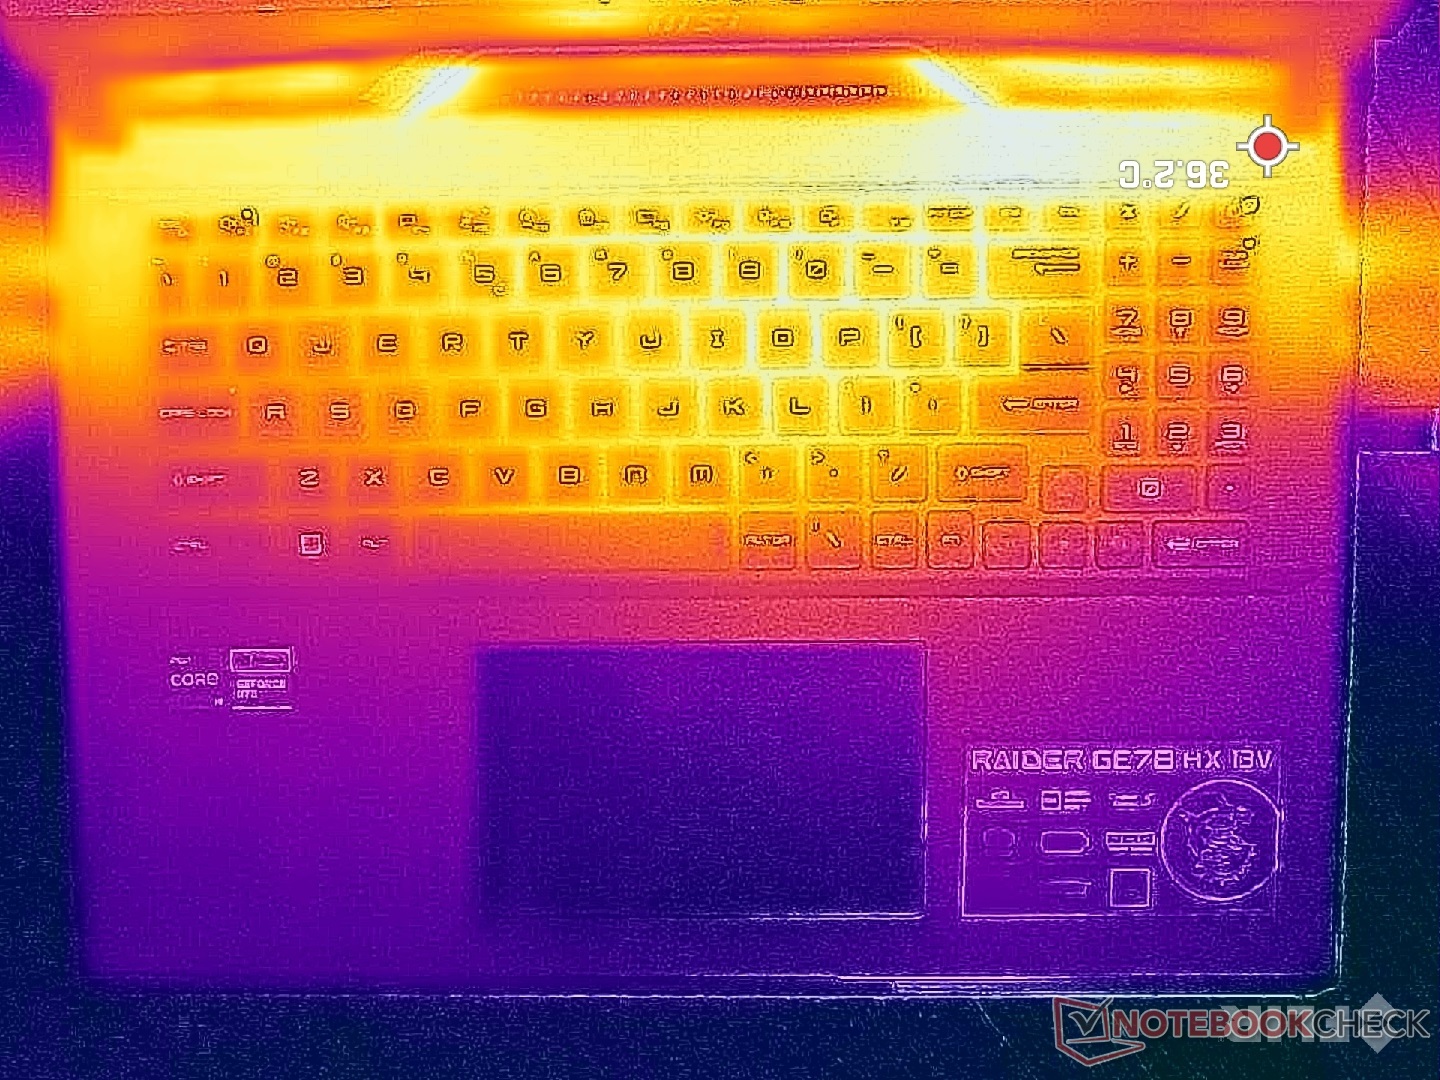
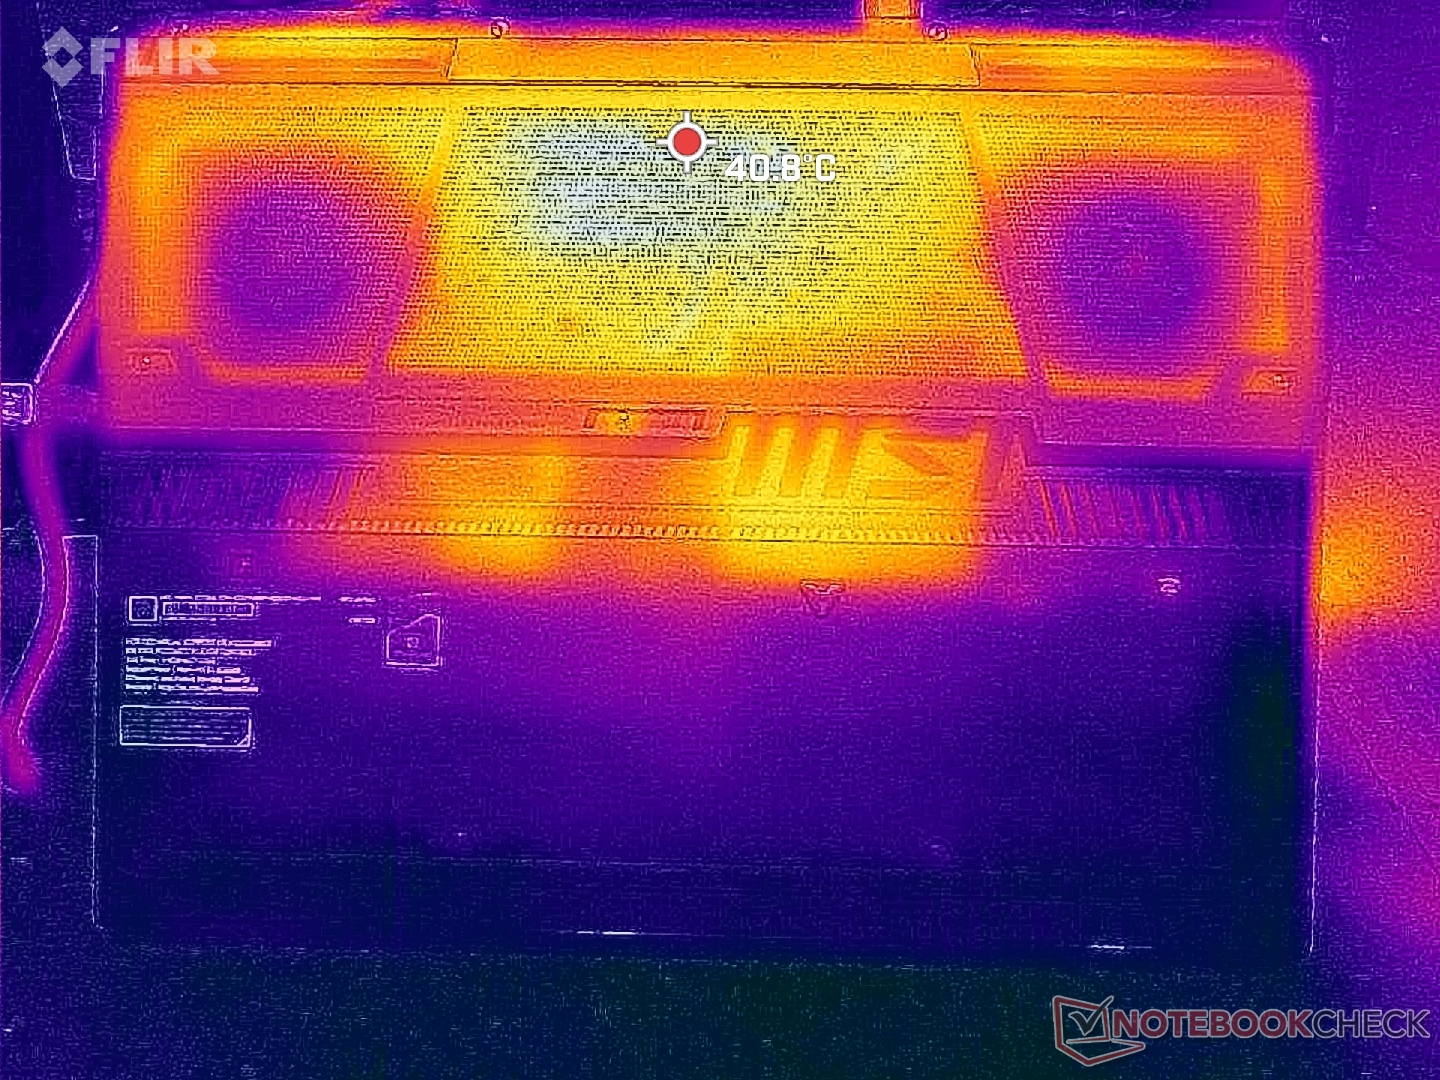
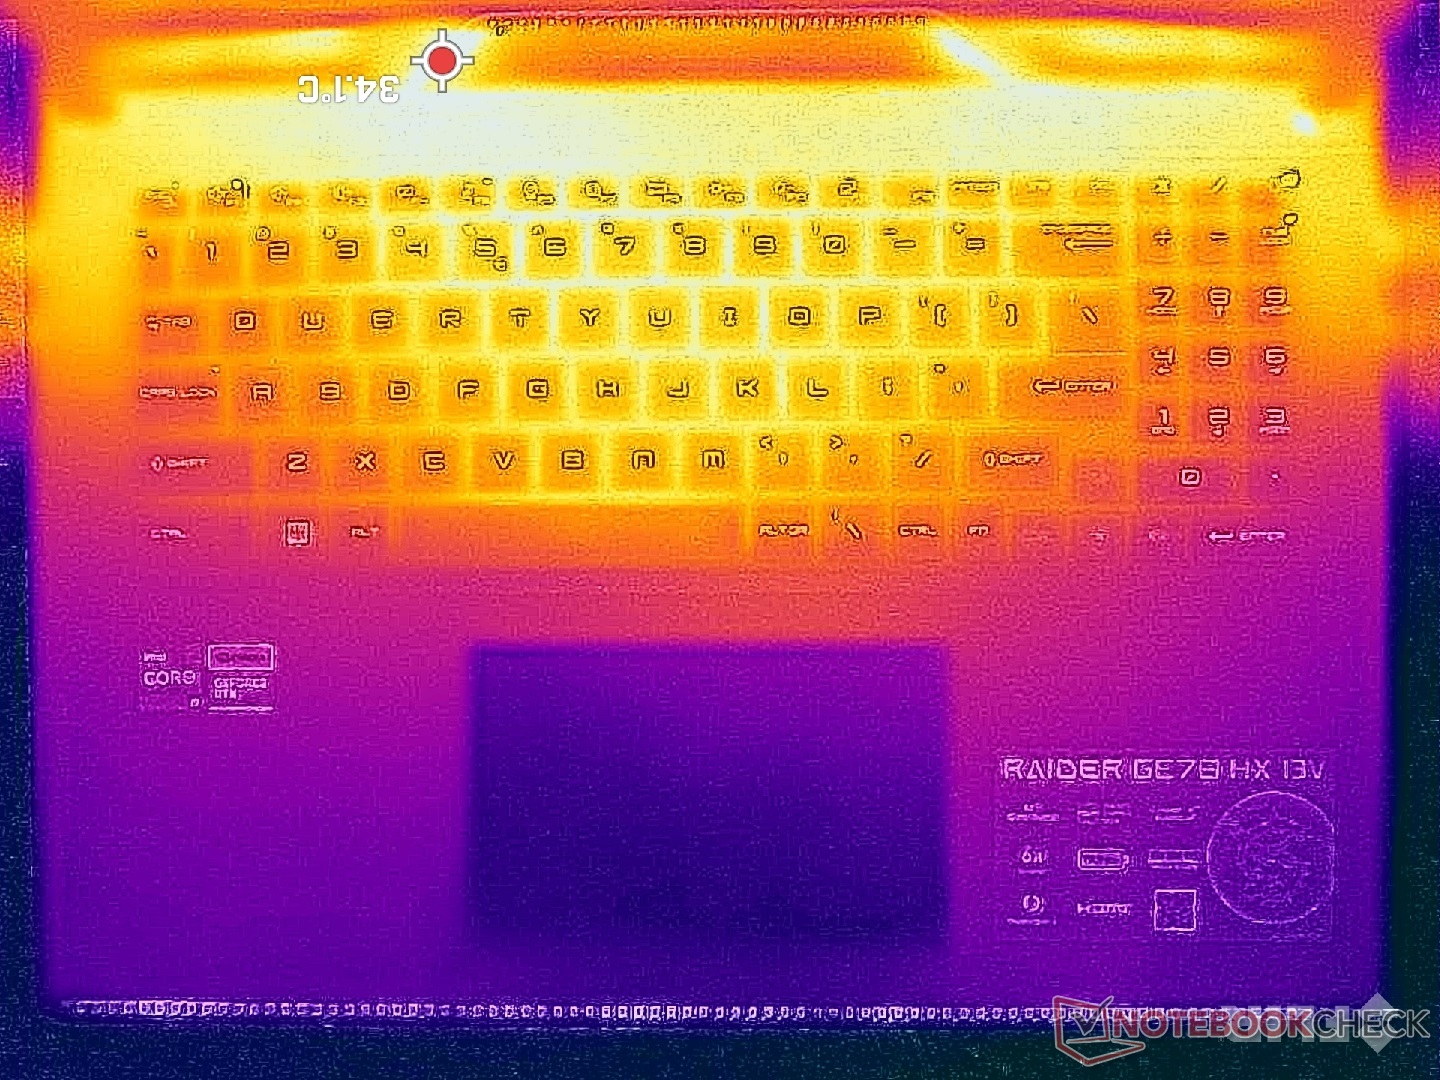
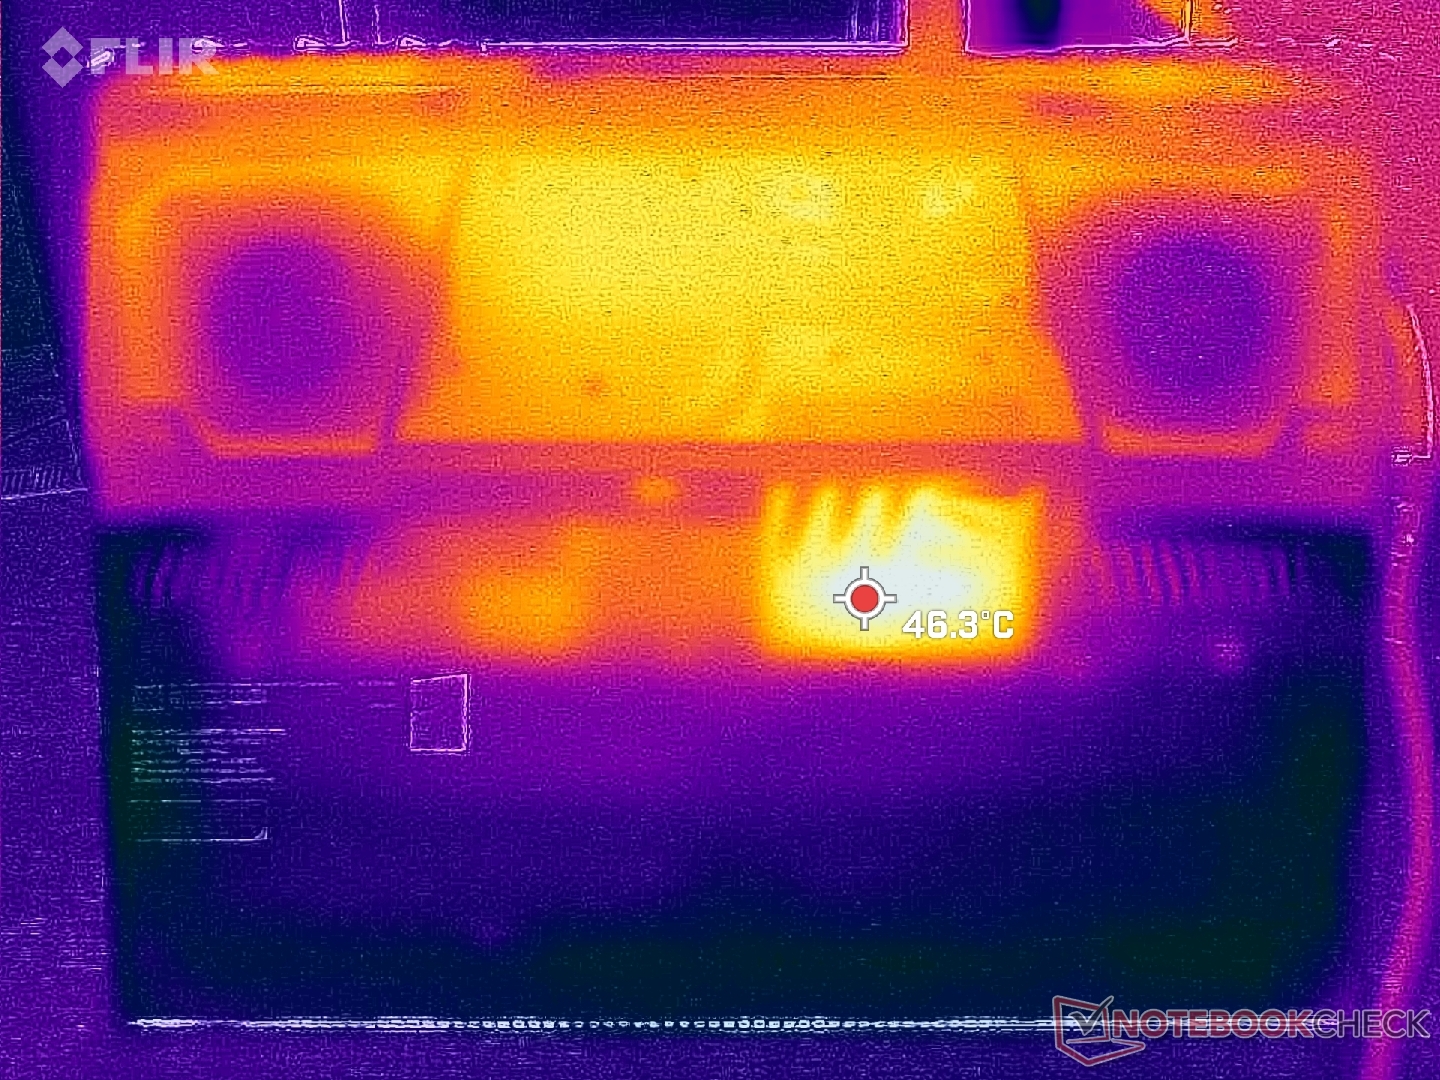
Les points chauds du système se situent à l'arrière du châssis et à l'opposé de l'avant, comme le montrent les cartes de température ci-dessous. Les paumes et les doigts ne devraient donc pas ressentir une chaleur inconfortable lors de la frappe ou du jeu.
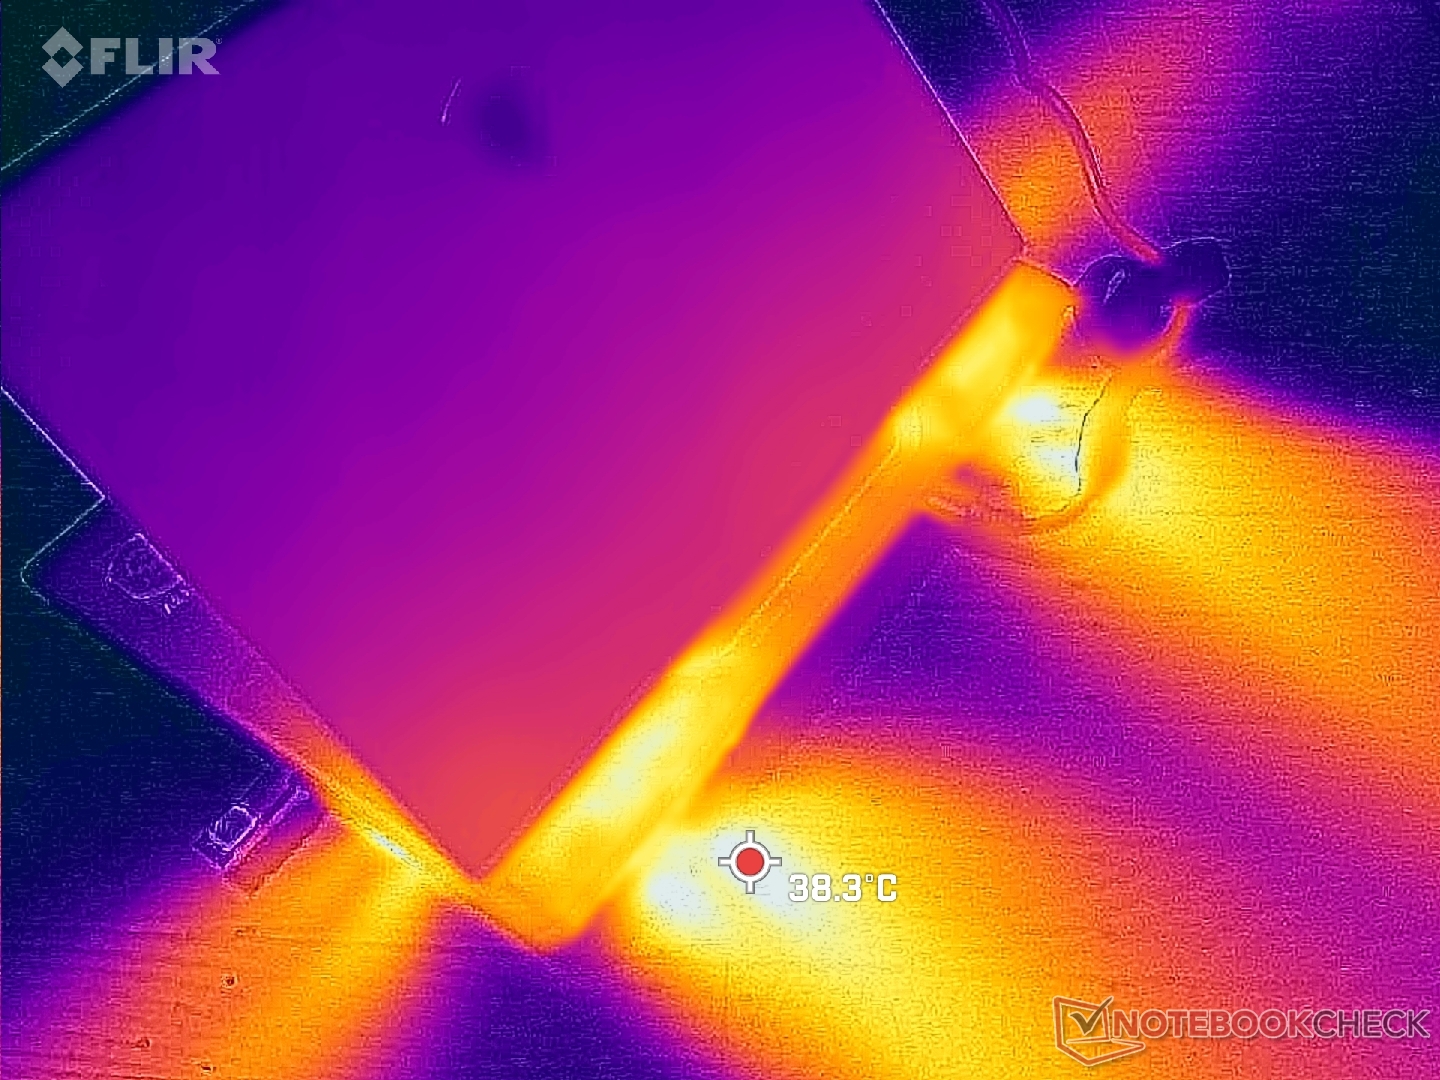
(+) La température maximale du côté supérieur est de 37.4 °C / 99 F, par rapport à la moyenne de 40.4 °C / 105 F, allant de 21.2 à 68.8 °C pour la classe Gaming.
(±) Le fond chauffe jusqu'à un maximum de 45 °C / 113 F, contre une moyenne de 43.2 °C / 110 F
(+) En utilisation inactive, la température moyenne du côté supérieur est de 25.7 °C / 78 F, par rapport à la moyenne du dispositif de 33.9 °C / 93 F.
(+) En jouant à The Witcher 3, la température moyenne du côté supérieur est de 30.5 °C / 87 F, alors que la moyenne de l'appareil est de 33.9 °C / 93 F.
(+) Les repose-poignets et le pavé tactile sont plus froids que la température de la peau avec un maximum de 24.6 °C / 76.3 F et sont donc froids au toucher.
(+) La température moyenne de la zone de l'appui-paume de dispositifs similaires était de 28.8 °C / 83.8 F (+4.2 °C / #7.5 F).
| MSI GE78HX 13VH-070US Intel Core i9-13950HX, NVIDIA GeForce RTX 4080 Laptop GPU | Eluktronics Mech-17 GP2 Intel Core i9-13900HX, NVIDIA GeForce RTX 4090 Laptop GPU | Asus ROG Strix G17 G713PI AMD Ryzen 9 7945HX, NVIDIA GeForce RTX 4070 Laptop GPU | MSI Titan GT77 HX 13VI Intel Core i9-13950HX, NVIDIA GeForce RTX 4090 Laptop GPU | MSI Raider GE77 HX 12UHS Intel Core i9-12900HX, NVIDIA GeForce RTX 3080 Ti Laptop GPU | Razer Blade 17 Early 2022 Intel Core i9-12900H, NVIDIA GeForce RTX 3080 Ti Laptop GPU | |
|---|---|---|---|---|---|---|
| Heat | 1% | -5% | 5% | -33% | -24% | |
| Maximum Upper Side * (°C) | 37.4 | 39 -4% | 42 -12% | 40.6 -9% | 53 -42% | 50 -34% |
| Maximum Bottom * (°C) | 45 | 44 2% | 41 9% | 41.1 9% | 58 -29% | 56 -24% |
| Idle Upper Side * (°C) | 29.8 | 31 -4% | 33 -11% | 26.2 12% | 38 -28% | 36 -21% |
| Idle Bottom * (°C) | 32.4 | 29.8 8% | 34 -5% | 30.3 6% | 43 -33% | 38 -17% |
* ... Moindre est la valeur, meilleures sont les performances
Test de stress
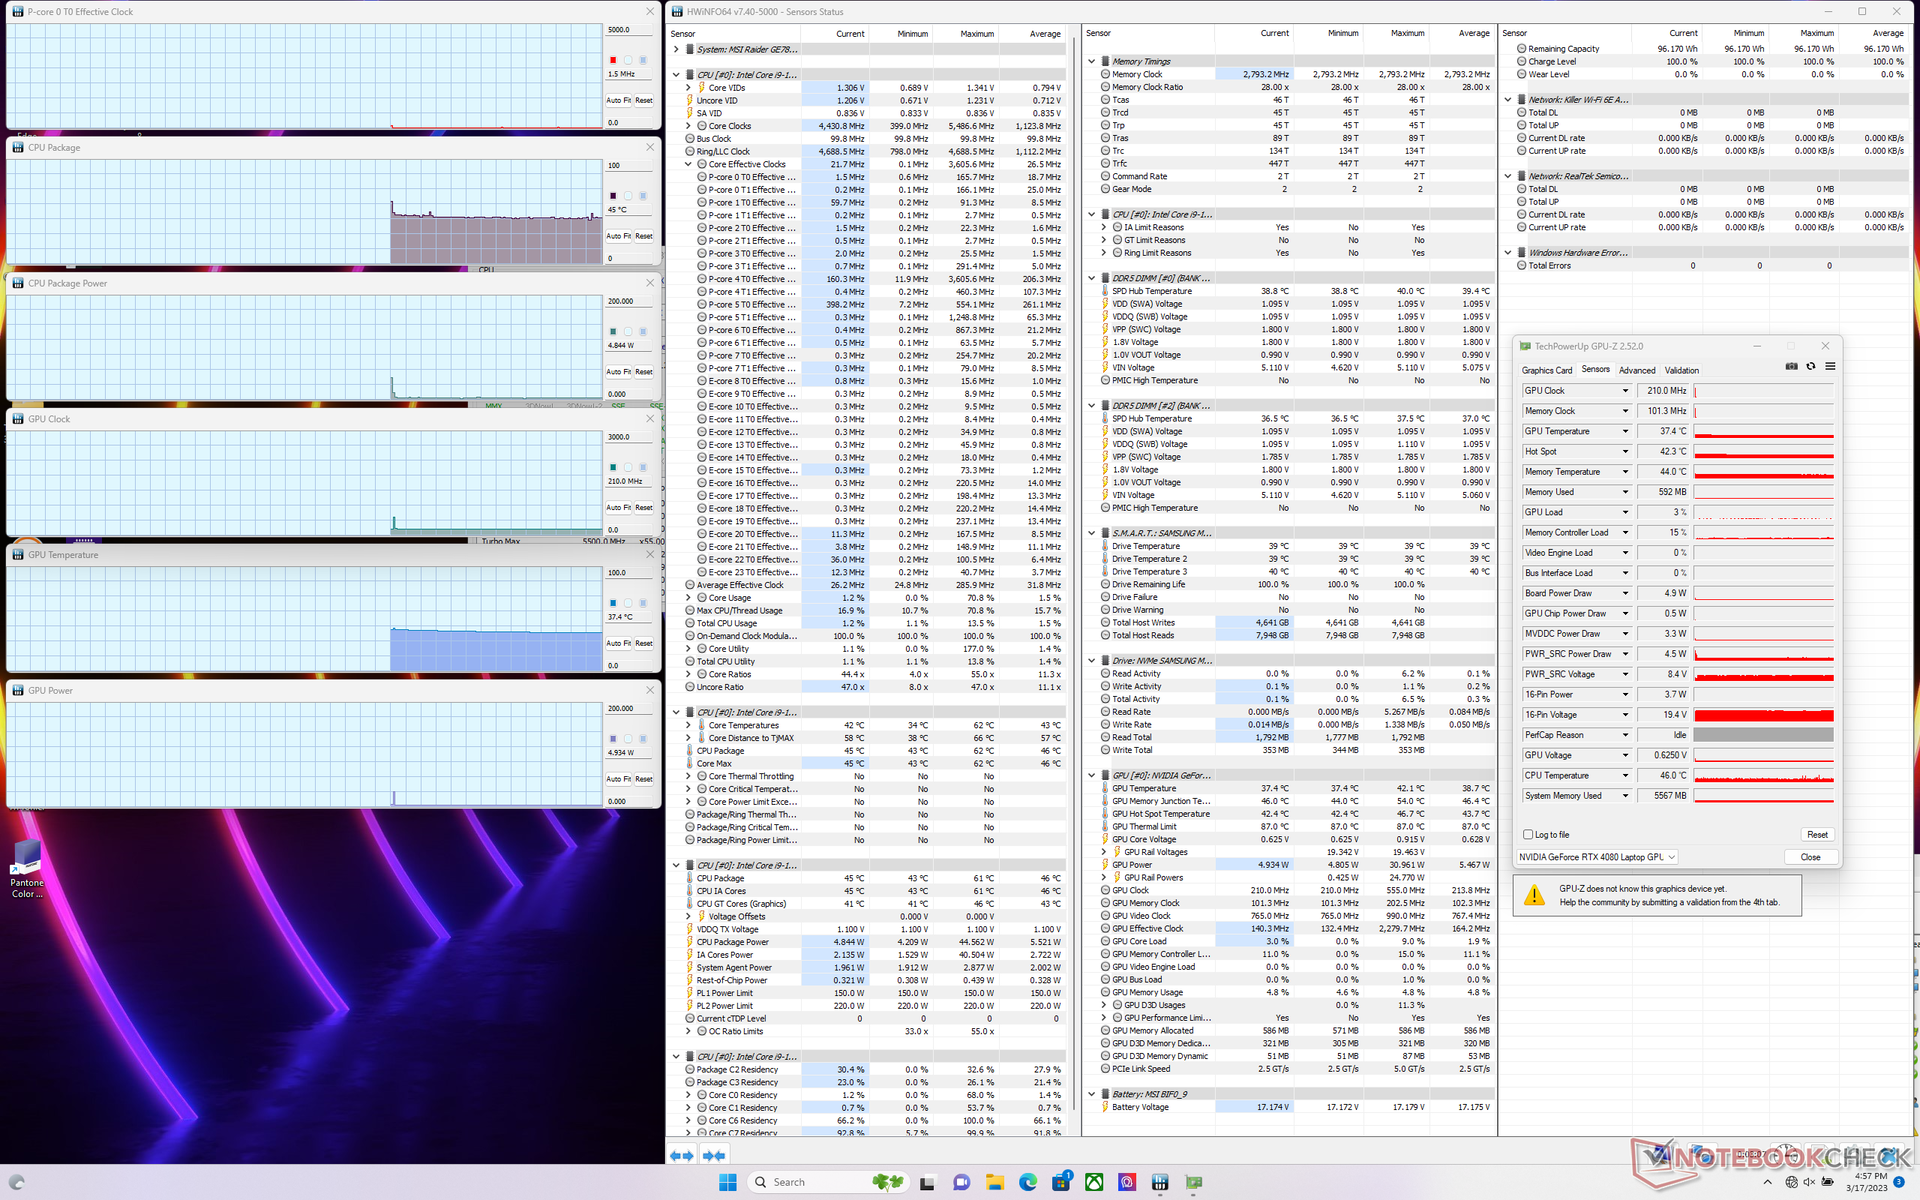
Lors de l'exécution de Prime95 pour stresser le CPU, les fréquences d'horloge et la consommation d'énergie de la carte augmentent jusqu'à 4,5 GHz et 173 W, respectivement, pendant quelques secondes ou jusqu'à ce que la température du cœur atteigne 95 C. Ensuite, les fréquences d'horloge et la consommation d'énergie de la carte diminuent régulièrement jusqu'à ce qu'elles se stabilisent à environ 3,7 GHz et 144 W, respectivement. La température du cœur reste très élevée à 91°C, ce qui signifie qu'il y a très peu de marge de manœuvre pour des performances supplémentaires du processeur. En répétant ce même test sur leRazer Blade 16 avec un processeur Core i9 similaire, la fréquence d'horloge moyenne serait plus lente et la température du cœur plus basse, à savoir ~3,2 GHz et 82 °C, respectivement. La série Intel Core i9 de 13ème génération peut être rapide, mais il faut s'attendre à des températures élevées sur l'ensemble des processeurs.
L'exécution de Witcher 3 pour représenter des charges de jeu typiques se traduirait par une fréquence d'horloge GPU stable, une température GPU et une consommation d'énergie de la carte de 2430 MHz, 73 C et 156 W, respectivement. Les résultats seraient identiques si Cooler Boost était activé. Nous nous attendons à ce que la consommation électrique de la carte soit plus proche de 175 W si elle est configurée avec le GPU RTX 4090 plus rapide.
L'utilisation de la batterie limite les performances, comme on pouvait s'y attendre. Fire Strike sur batterie donne des résultats physiques et graphiques de seulement 18881 et 22232 points, respectivement, par rapport à 41339 et 42663 points sur le secteur.
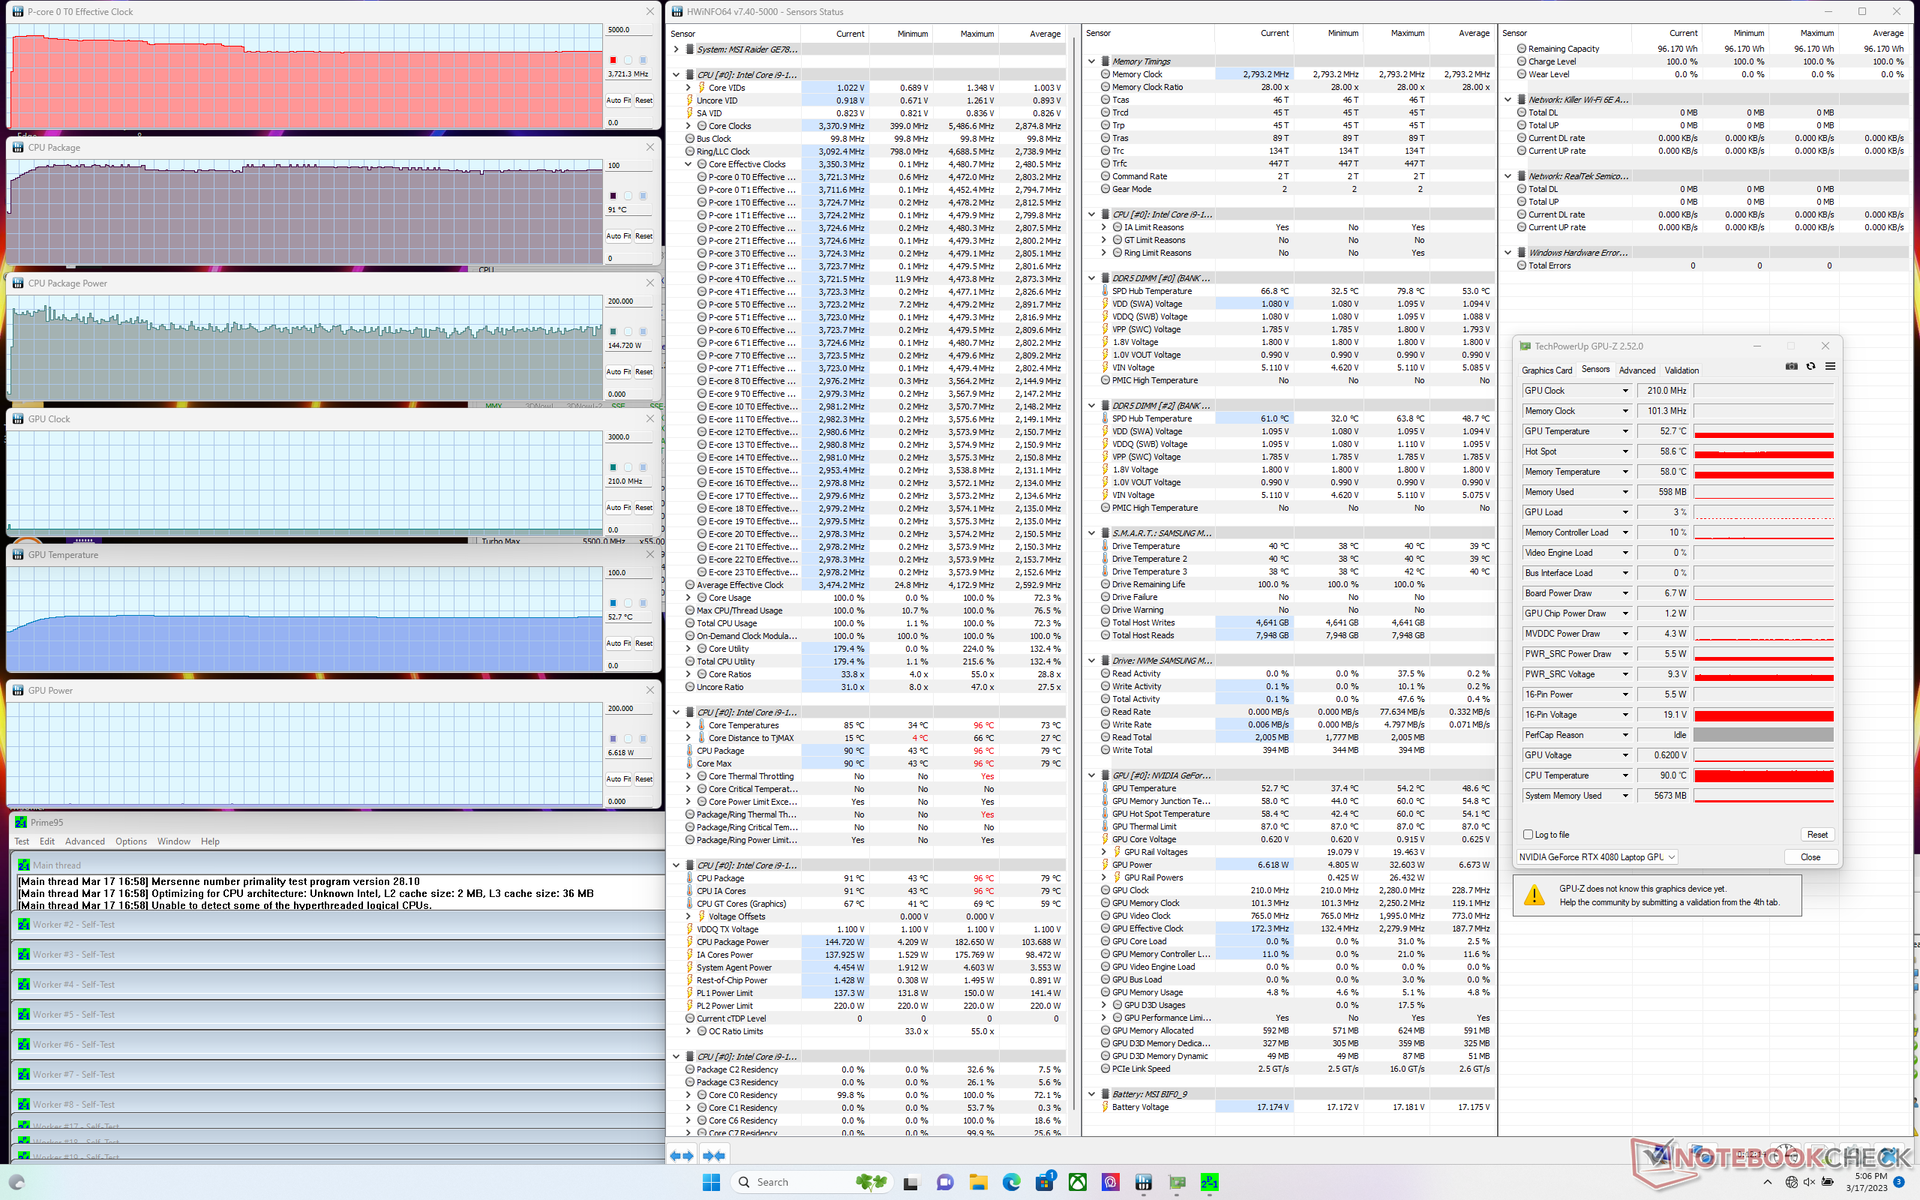
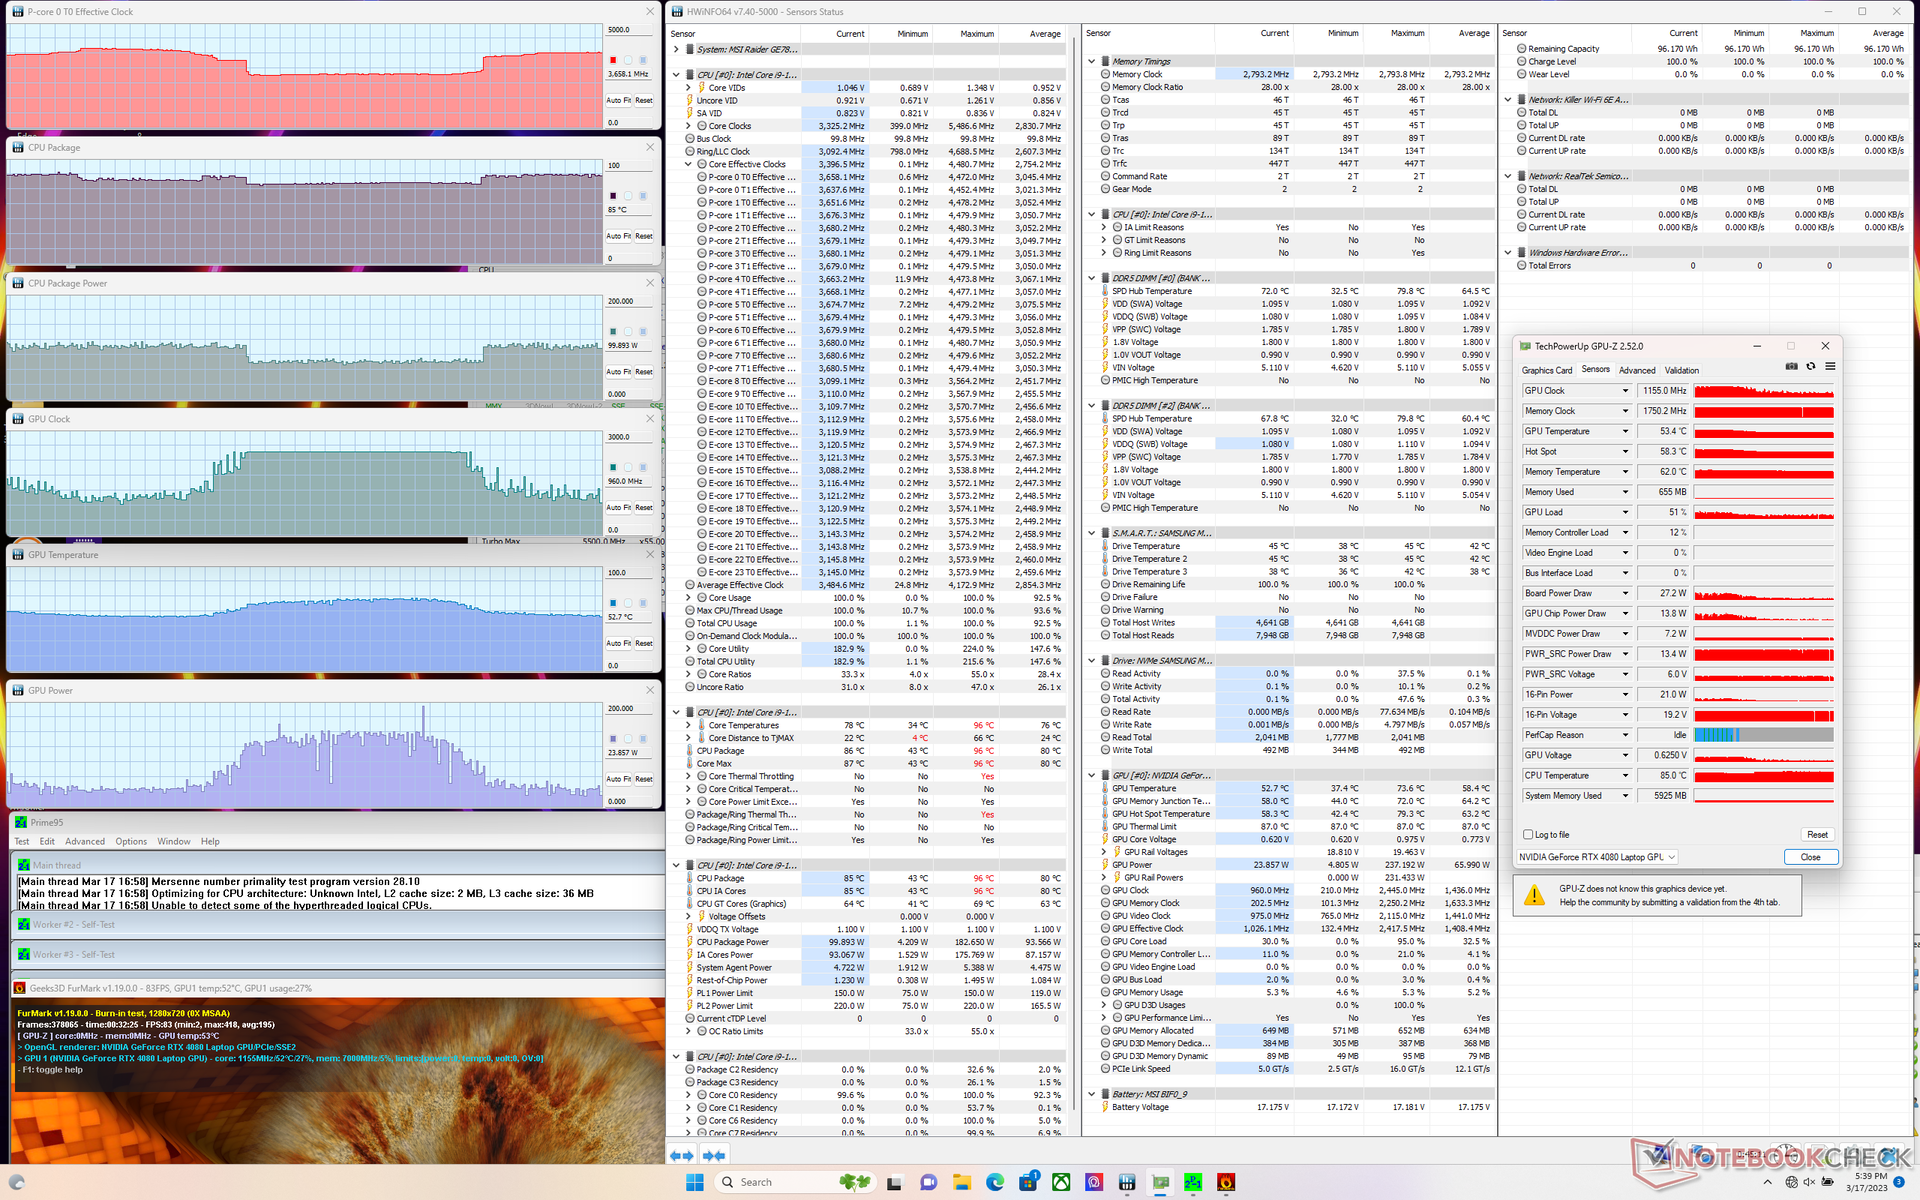
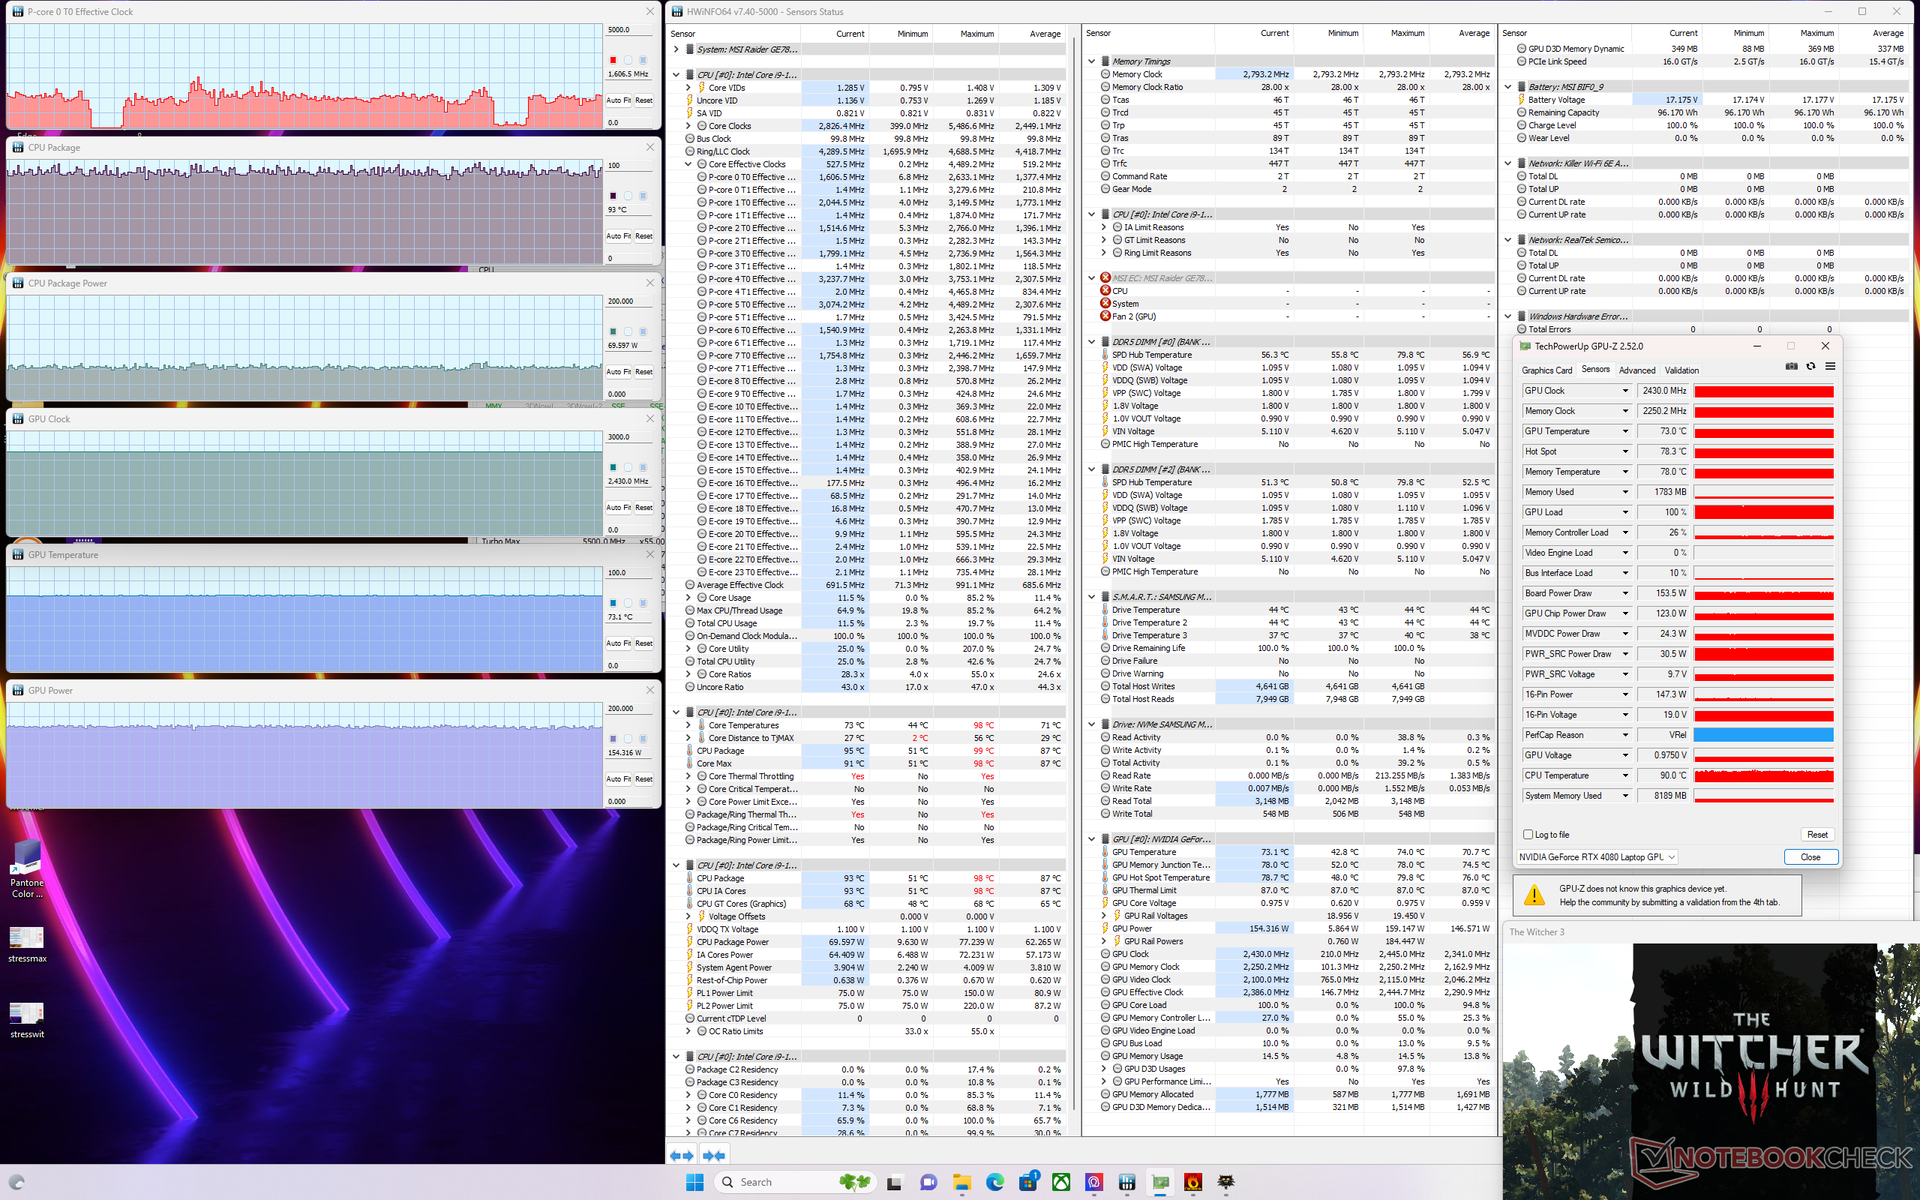
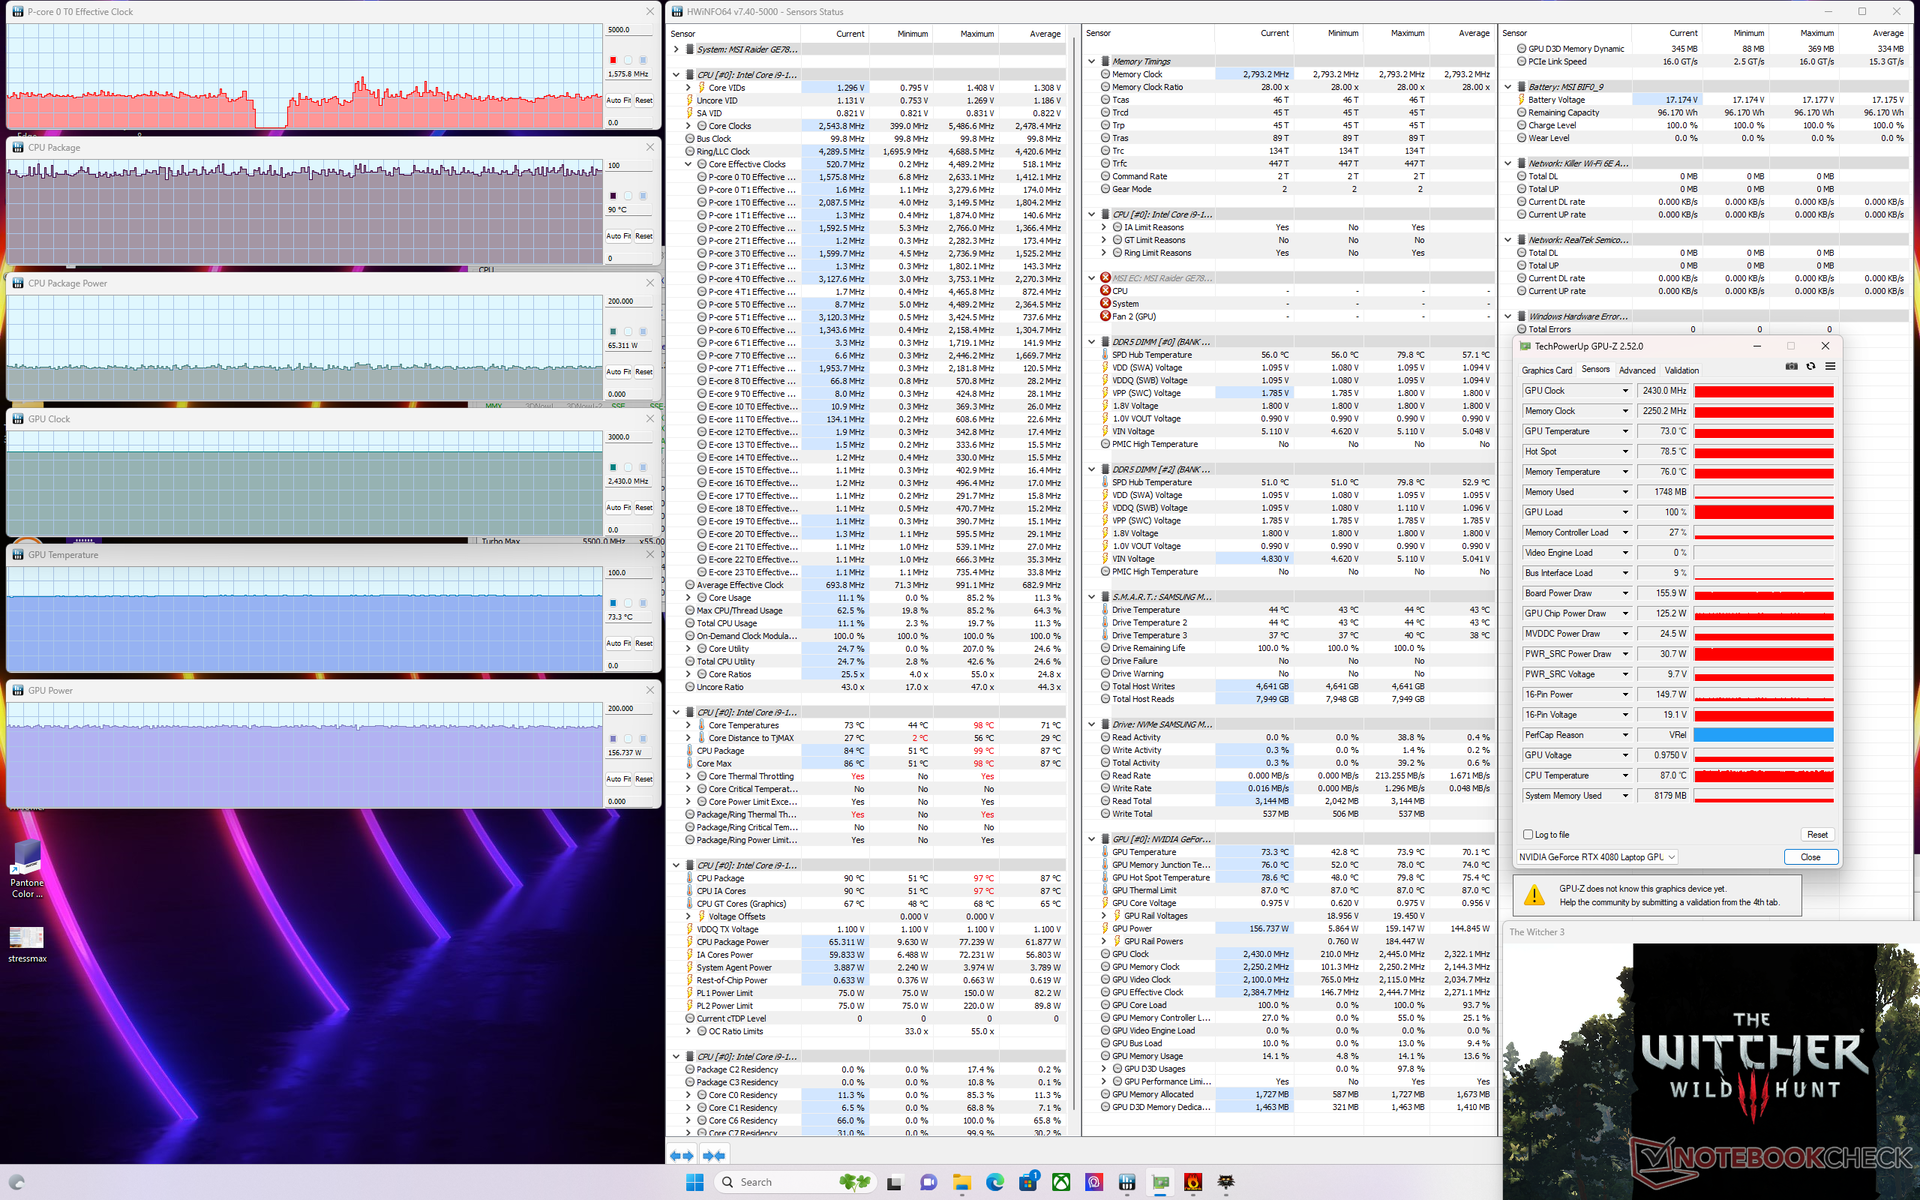
| Horloge du CPU (GHz) | Horloge du GPU (MHz) | Température moyenne du CPU (°C) | Température moyenne du GPU (°C) | |
| Système en veille | -- | -- | 45 | 37 |
| Prime95 Stress | 3.7 | -- | 91 | 53 |
| Prime95 + FurMark Stress | 2.4 - 3.7 | 960 - 2360 | 82 - 85 | 53 - 60 |
| Witcher 3 Stress | ~1.6 | 2430 | 93 | 73 |
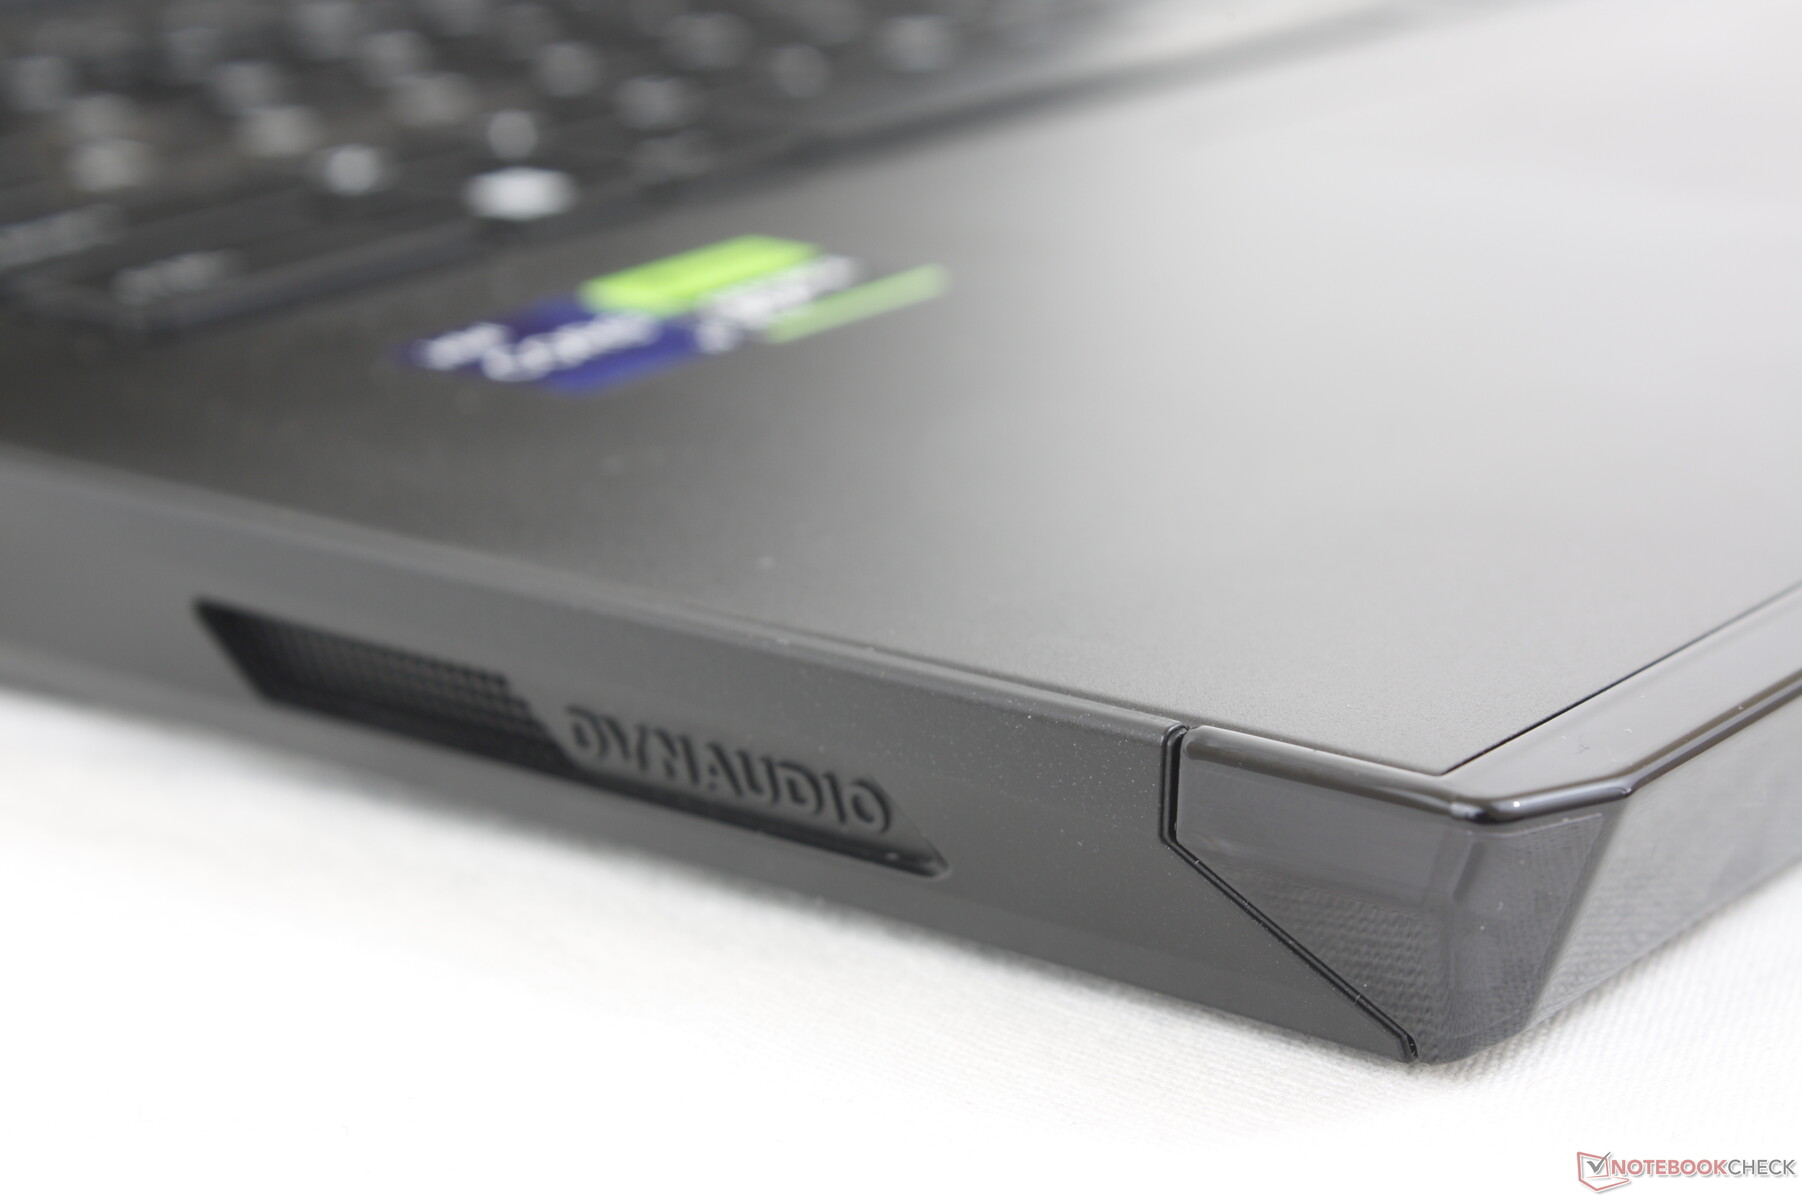
Intervenants
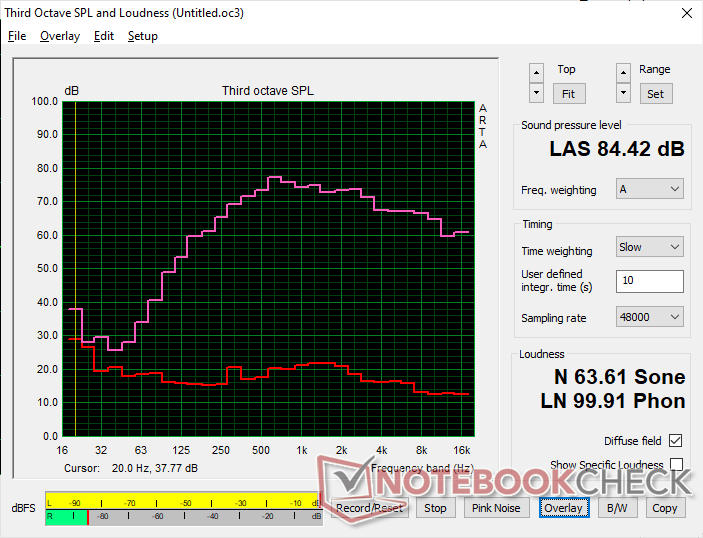
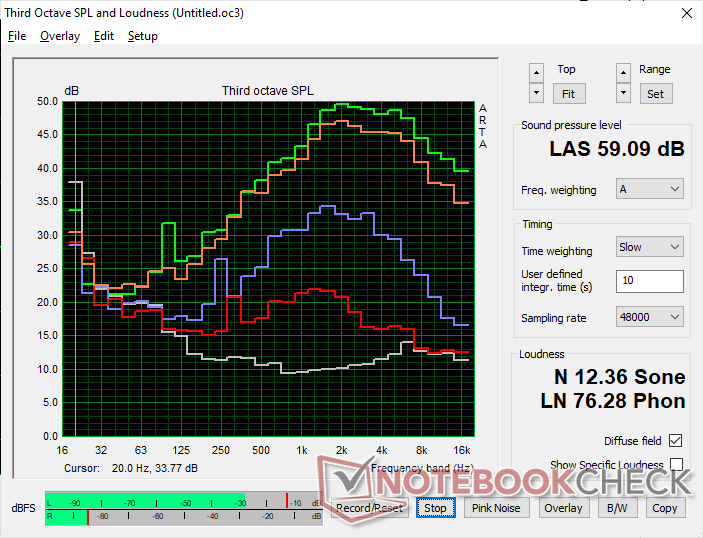
MSI GE78HX 13VH-070US analyse audio
(+) | les haut-parleurs peuvent jouer relativement fort (84.4# dB)
Basses 100 - 315 Hz
(±) | basse réduite - en moyenne 8.3% inférieure à la médiane
(±) | la linéarité des basses est moyenne (9.3% delta à la fréquence précédente)
Médiums 400 - 2000 Hz
(±) | médiane supérieure - en moyenne 6.8% supérieure à la médiane
(+) | les médiums sont linéaires (3.4% delta à la fréquence précédente)
Aiguës 2 - 16 kHz
(+) | des sommets équilibrés - à seulement 2% de la médiane
(+) | les aigus sont linéaires (2.6% delta à la fréquence précédente)
Globalement 100 - 16 000 Hz
(+) | le son global est linéaire (12% différence à la médiane)
Par rapport à la même classe
» 12% de tous les appareils testés de cette catégorie étaient meilleurs, 4% similaires, 84% pires
» Le meilleur avait un delta de 6%, la moyenne était de 18%, le pire était de 132%.
Par rapport à tous les appareils testés
» 9% de tous les appareils testés étaient meilleurs, 2% similaires, 88% pires
» Le meilleur avait un delta de 4%, la moyenne était de 24%, le pire était de 134%.
Apple MacBook Pro 16 2021 M1 Pro analyse audio
(+) | les haut-parleurs peuvent jouer relativement fort (84.7# dB)
Basses 100 - 315 Hz
(+) | bonne basse - seulement 3.8% loin de la médiane
(+) | les basses sont linéaires (5.2% delta à la fréquence précédente)
Médiums 400 - 2000 Hz
(+) | médiane équilibrée - seulement 1.3% de la médiane
(+) | les médiums sont linéaires (2.1% delta à la fréquence précédente)
Aiguës 2 - 16 kHz
(+) | des sommets équilibrés - à seulement 1.9% de la médiane
(+) | les aigus sont linéaires (2.7% delta à la fréquence précédente)
Globalement 100 - 16 000 Hz
(+) | le son global est linéaire (4.6% différence à la médiane)
Par rapport à la même classe
» 0% de tous les appareils testés de cette catégorie étaient meilleurs, 0% similaires, 100% pires
» Le meilleur avait un delta de 5%, la moyenne était de 17%, le pire était de 45%.
Par rapport à tous les appareils testés
» 0% de tous les appareils testés étaient meilleurs, 0% similaires, 100% pires
» Le meilleur avait un delta de 4%, la moyenne était de 24%, le pire était de 134%.
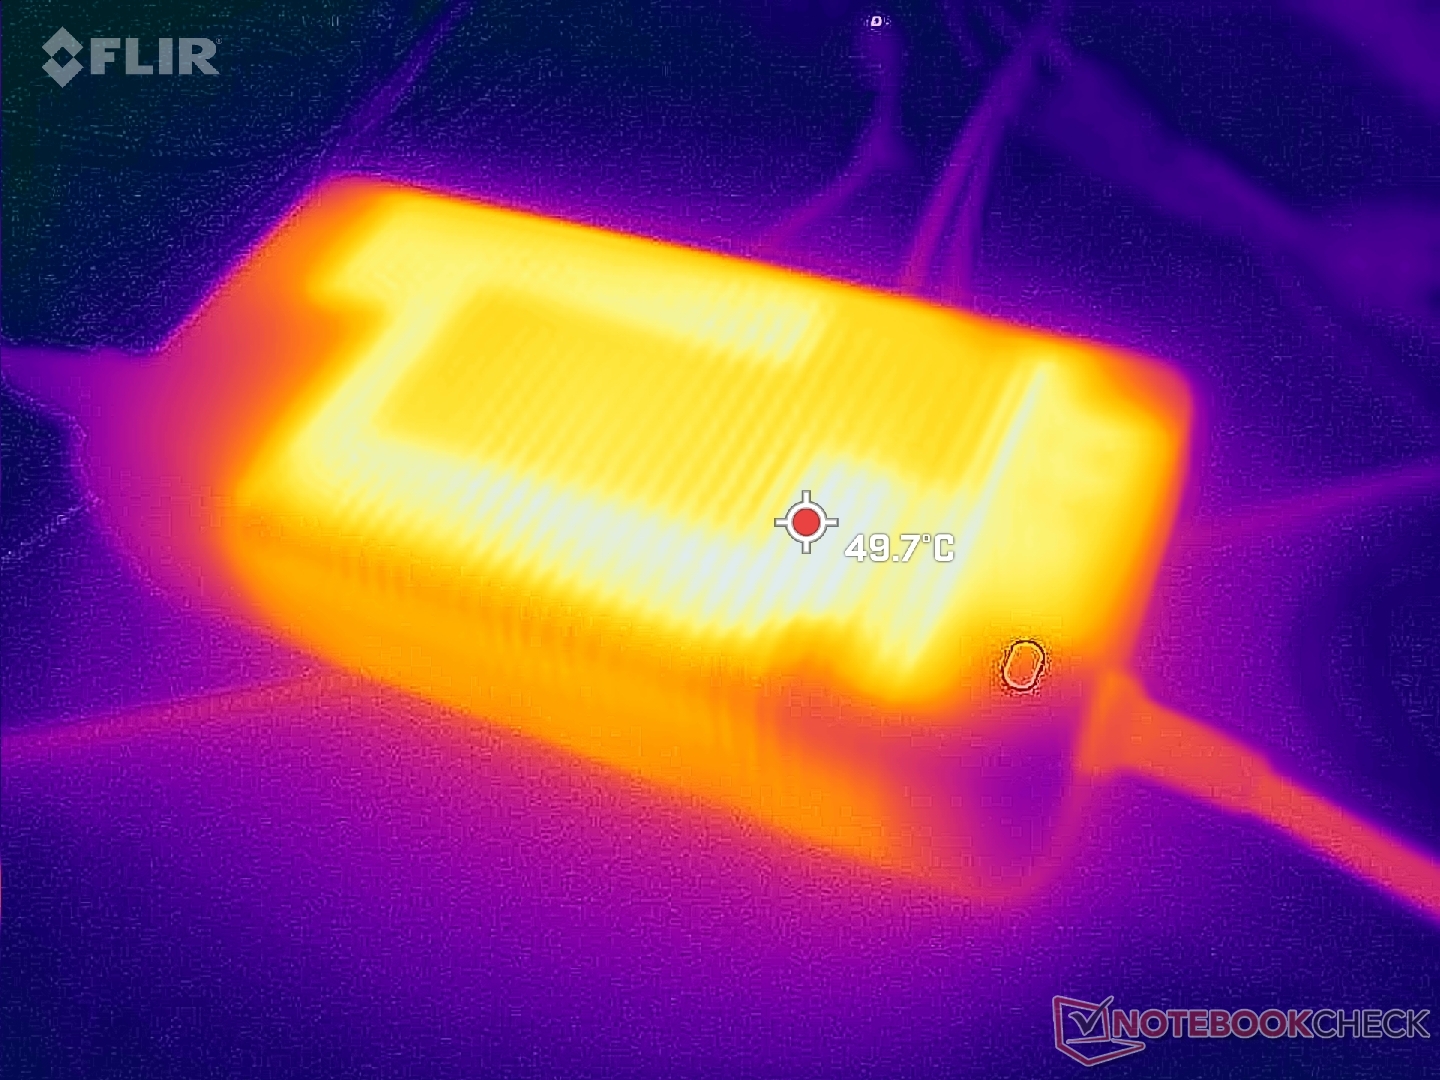
Gestion de l'énergie - Brique d'alimentation en graisse à forte consommation
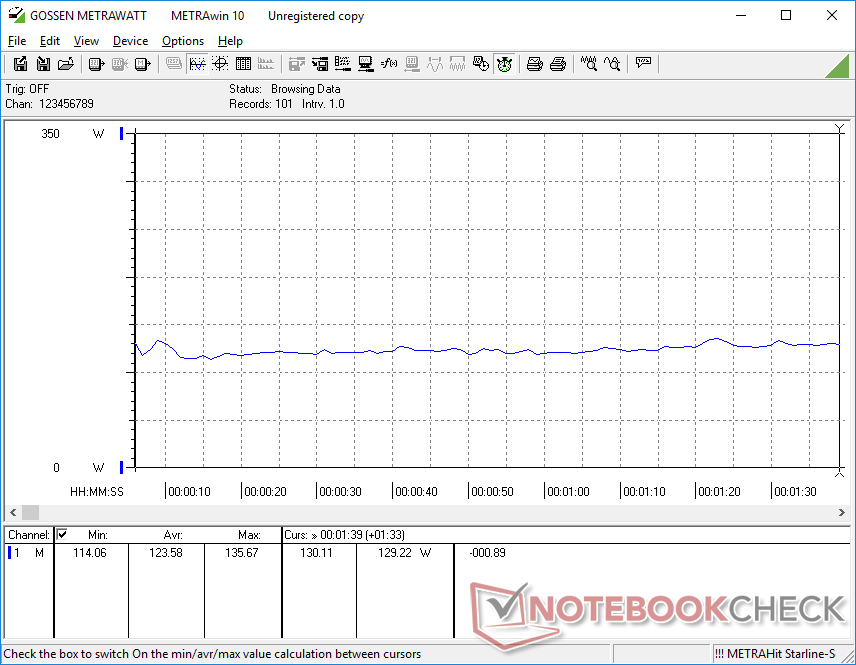
Consommation électrique
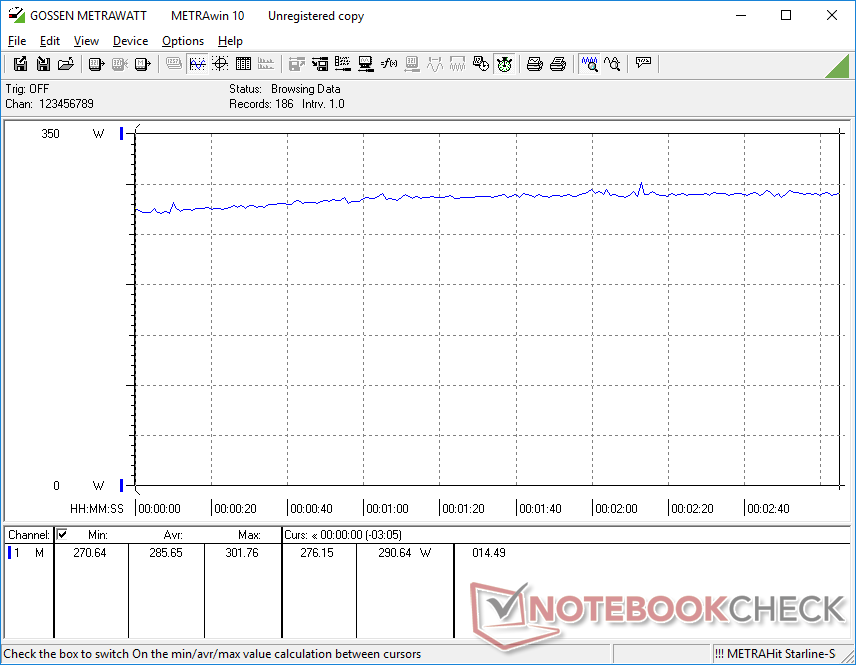
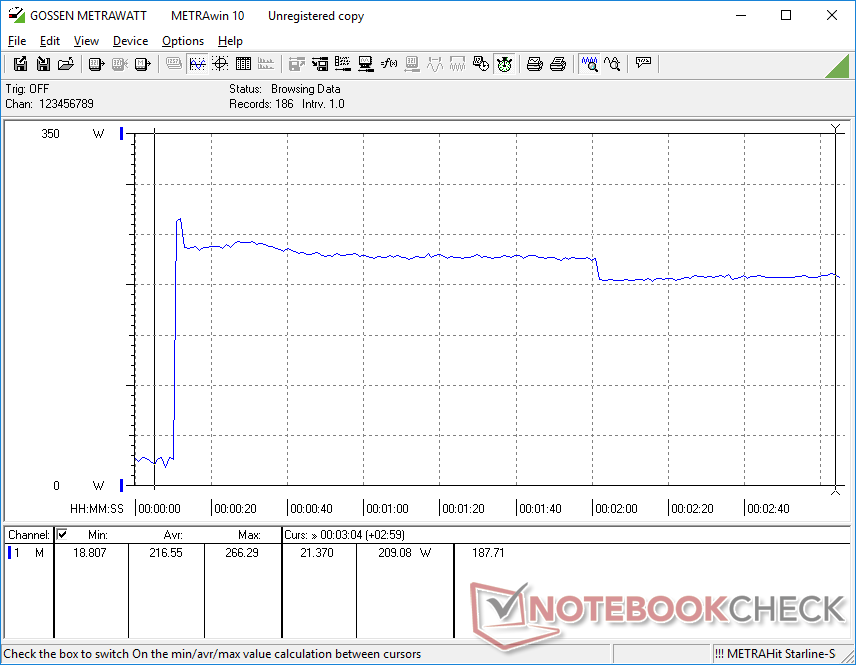
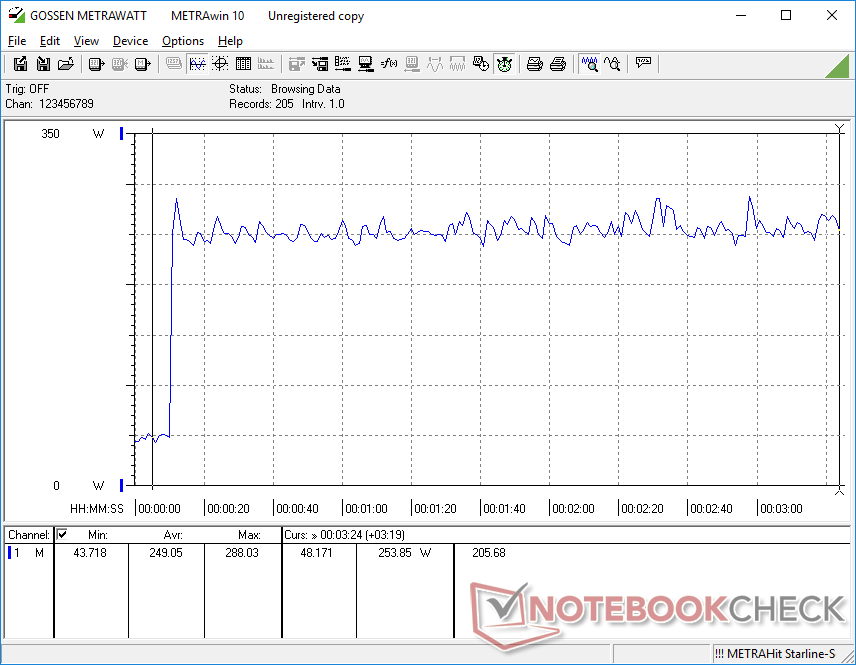
La consommation d'énergie est maintenant encore plus élevée que sur les ordinateurs portables fonctionnant avec des CPU Intel de 12e génération et des GPU GeForce 30, ce qui était déjà très élevé. Par exemple, les jeux consomment 286 W contre 247 W sur le GE77. Les performances du GPU par watt sont toutefois meilleures sur la série GeForce 40, de sorte que l'augmentation de la consommation est relativement mineure
en fin de compte.L'exécution de Prime95 sur un moniteur externe consommerait 32 % d'énergie en plus que sur le GE77 avec des charges similaires, pour une augmentation de 40 à 45 % des performances brutes du processeur. Les performances du processeur par watt sont donc à peine plus élevées lorsque l'on passe de la série Core-H 12e génération à la série Core-H 13e génération.
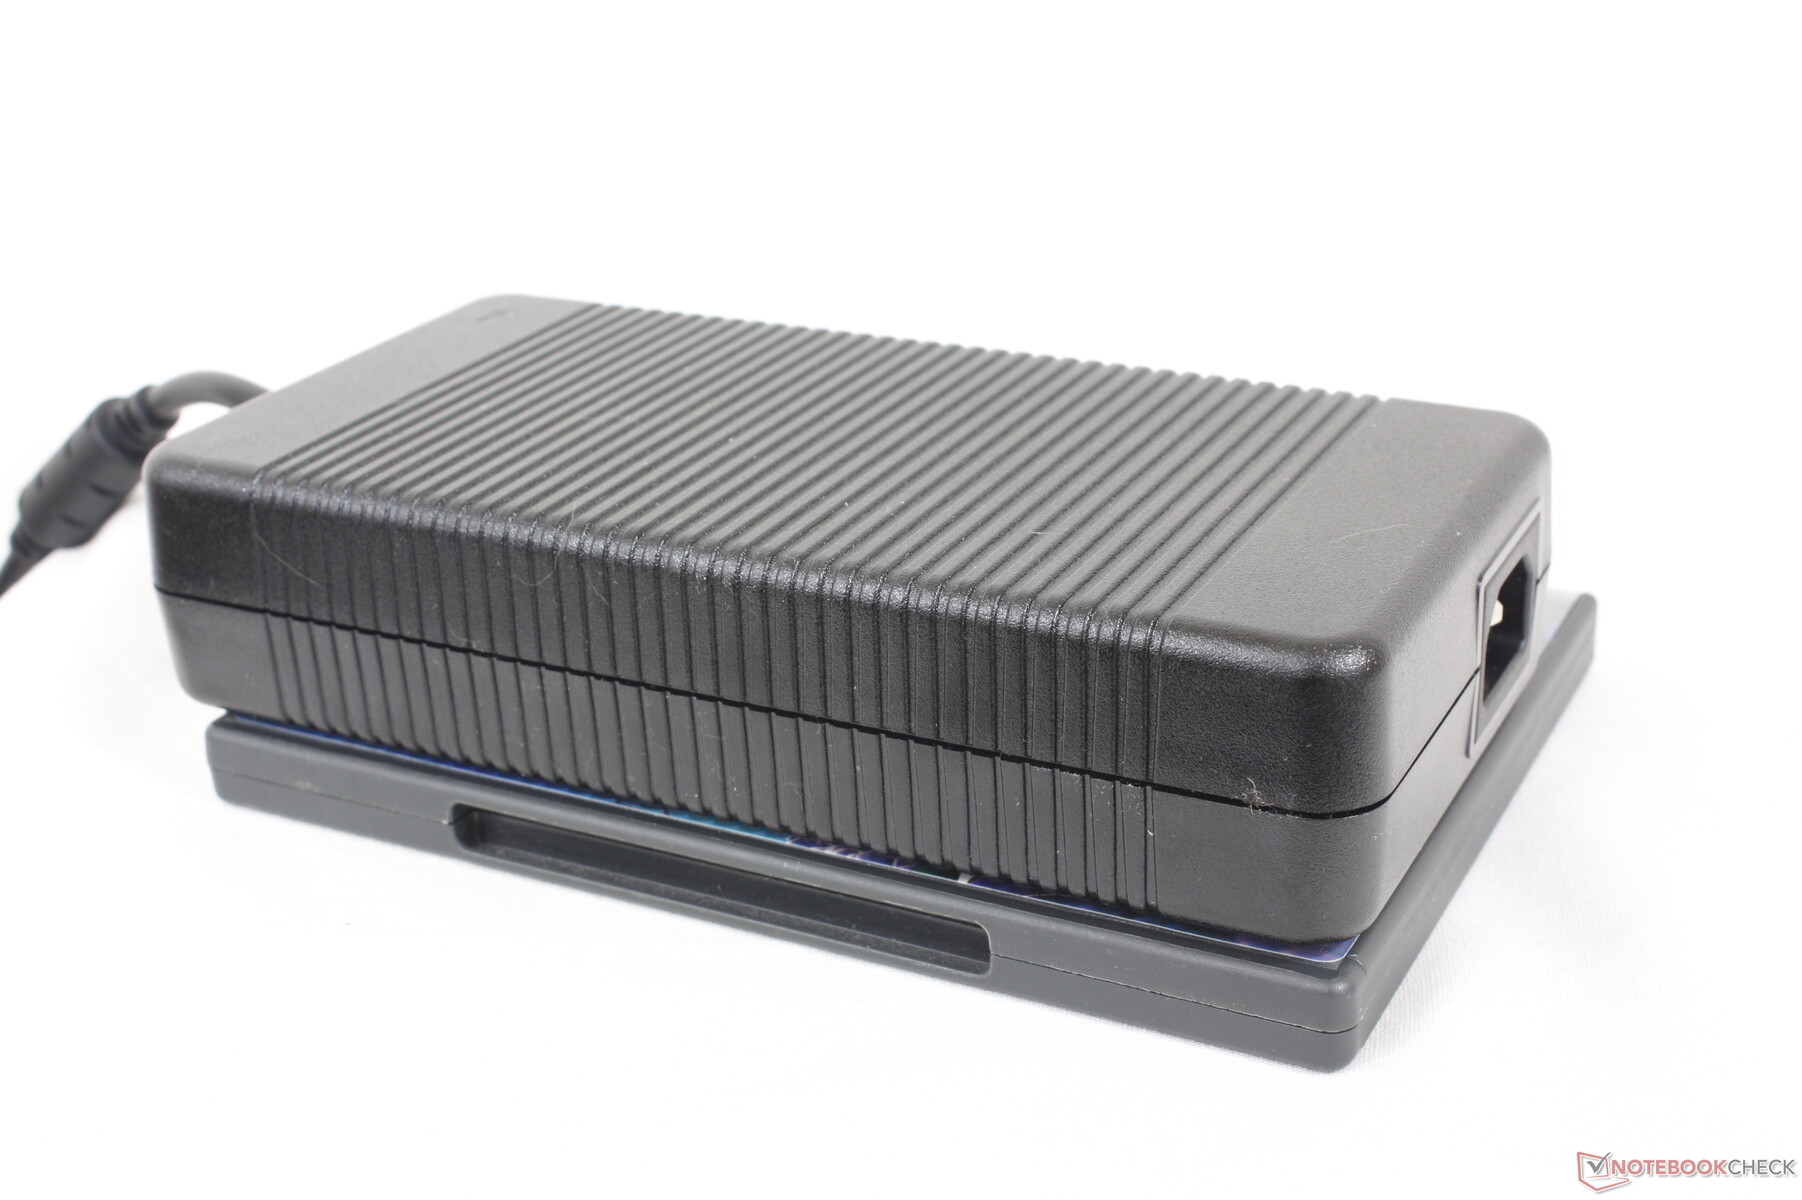
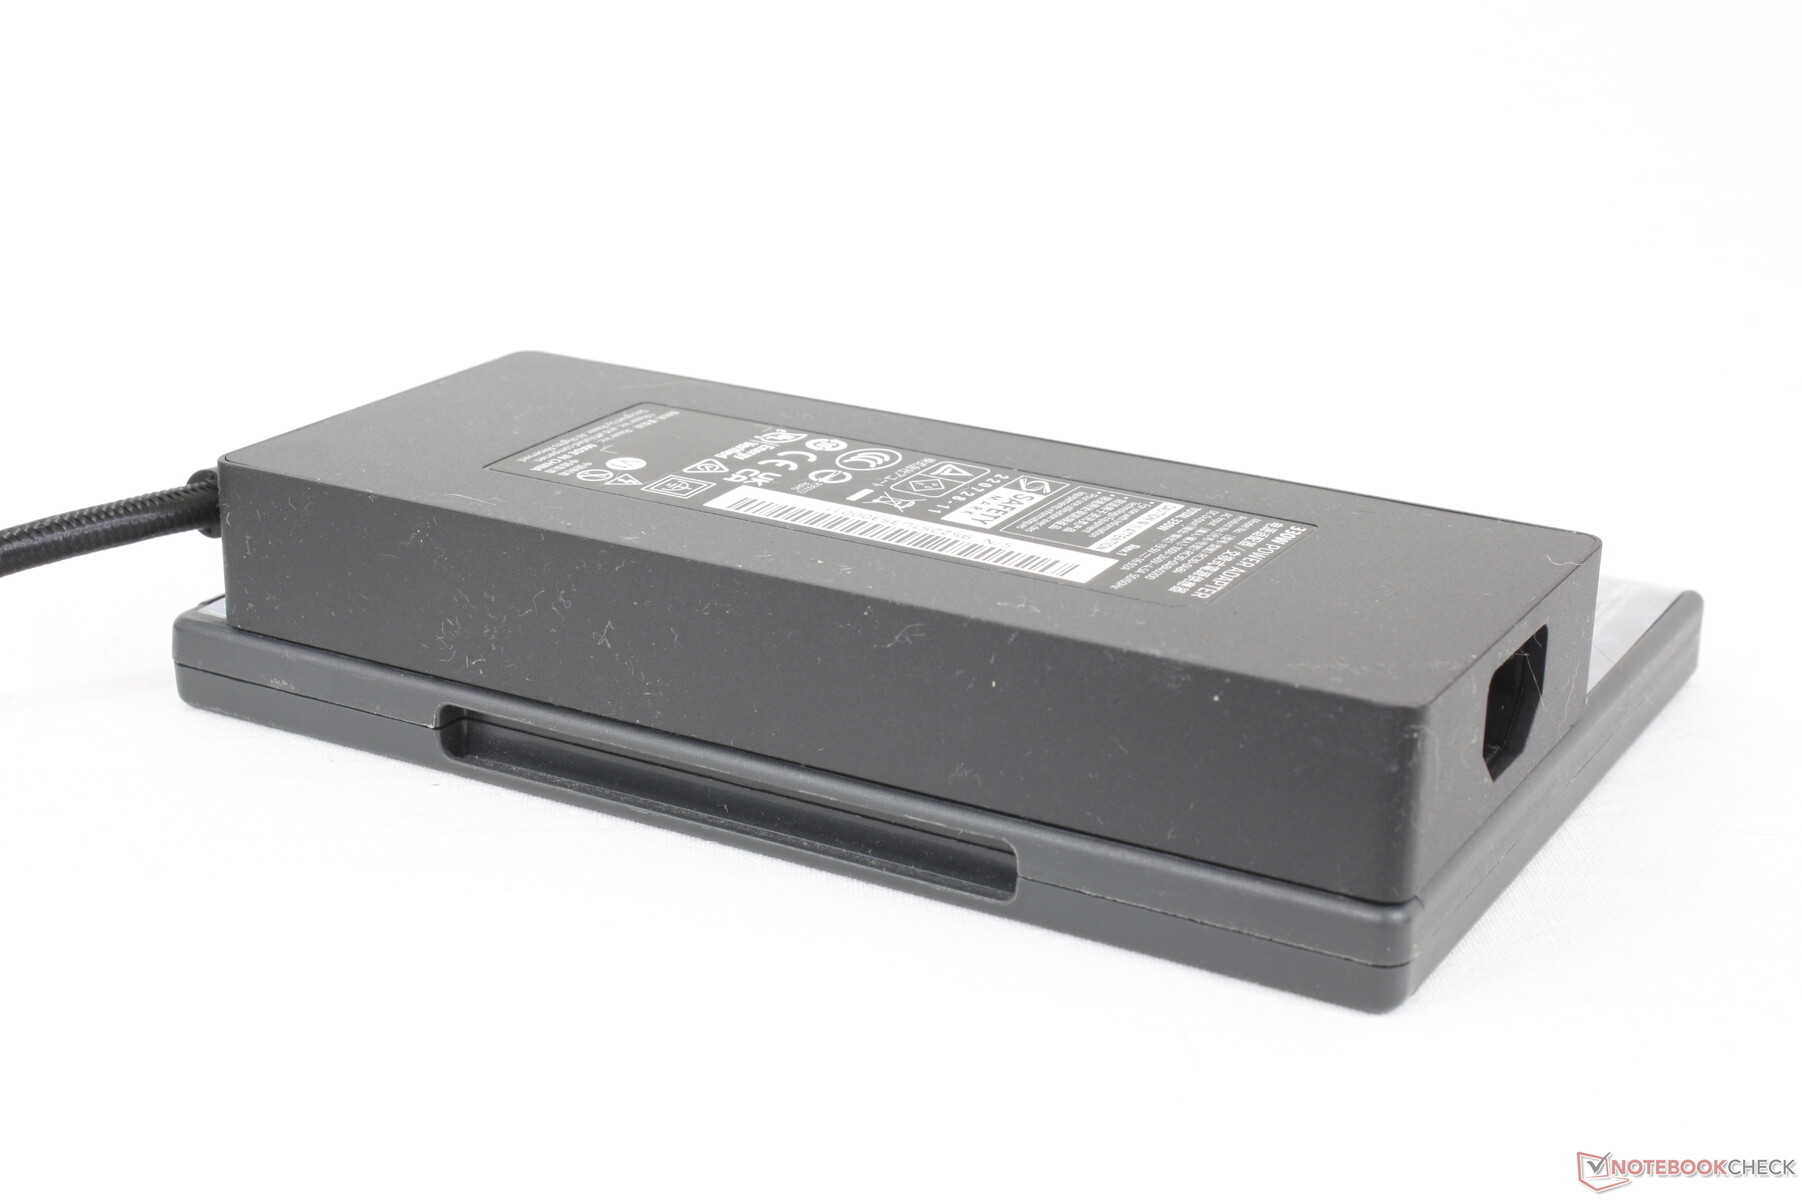
Nous avons pu enregistrer une consommation maximale temporaire de 288 W sur l'adaptateur secteur 330 W (~19,9 x 9,8 x 4,2 cm) lorsque le CPU et le GPU sont sollicités simultanément sous Prime95 et FurMark. Contrairement à Razer, MSI n'a pas encore migré vers la charge GaN et sa brique d'alimentation de 330 W est donc sensiblement plus grande et plus lourde que la solution 330 W de Razer.
| Éteint/en veille | |
| Au repos | |
| Fortement sollicité |
|
Légende:
min: | |
| MSI GE78HX 13VH-070US i9-13950HX, GeForce RTX 4080 Laptop GPU, Samsung PM9A1 MZVL22T0HBLB, IPS, 2560x1600, 17" | Eluktronics Mech-17 GP2 i9-13900HX, GeForce RTX 4090 Laptop GPU, Samsung PM9A1 MZVL21T0HCLR, IPS, 2560x1600, 17" | Asus ROG Strix G17 G713PI R9 7945HX, GeForce RTX 4070 Laptop GPU, WD PC SN560 SDDPNQE-1T00, IPS, 2560x1440, 17.3" | MSI Titan GT77 HX 13VI i9-13950HX, GeForce RTX 4090 Laptop GPU, Samsung PM9A1 MZVL22T0HBLB, Mini-LED, 3840x2160, 17.3" | MSI Raider GE77 HX 12UHS i9-12900HX, GeForce RTX 3080 Ti Laptop GPU, Samsung PM9A1 MZVL22T0HBLB, IPS, 3840x2160, 17.3" | Razer Blade 17 Early 2022 i9-12900H, GeForce RTX 3080 Ti Laptop GPU, Samsung PM9A1 MZVL21T0HCLR, IPS, 3840x2160, 17.3" | |
|---|---|---|---|---|---|---|
| Power Consumption | 1% | 15% | 2% | 5% | 6% | |
| Idle Minimum * (Watt) | 16.1 | 14 13% | 15 7% | 14 13% | 13 19% | 17 -6% |
| Idle Average * (Watt) | 24 | 19.3 20% | 20 17% | 21.6 10% | 19 21% | 23 4% |
| Idle Maximum * (Watt) | 34 | 36.8 -8% | 29 15% | 24.8 27% | 29 15% | 34 -0% |
| Load Average * (Watt) | 123.6 | 117.2 5% | 121 2% | 122.5 1% | 143 -16% | 120 3% |
| Witcher 3 ultra * (Watt) | 286 | 304 -6% | 179.8 37% | 265 7% | 247 14% | 229 20% |
| Load Maximum * (Watt) | 285.7 | 342.5 -20% | 246 14% | 418 -46% | 352 -23% | 243 15% |
* ... Moindre est la valeur, meilleures sont les performances
Power Consumption Witcher 3 / Stresstest
Power Consumption external Monitor
Autonomie de la batterie
Les durées d'exécution sont plutôt bonnes compte tenu du matériel exigeant qui se trouve à l'intérieur. Nous avons pu enregistrer un peu plus de 6 heures de navigation WLAN dans le monde réel avec le profil d'alimentation équilibré et l'iGPU actif. Des concurrents comme leEluktronics Mech-17 GP2 ou l'Asus ROG Strix G17 G713PI durent respectivement une à deux heures de moins dans des conditions similaires.
Le chargement d'une batterie vide à sa pleine capacité prend environ 2,5 heures, soit une heure de plus que sur la plupart des ultrabooks. Bien que MSI indique que la charge PD est prise en charge, nous n'avons pas été en mesure de charger notre unité de test via l'un des trois ports USB-C.
| MSI GE78HX 13VH-070US i9-13950HX, GeForce RTX 4080 Laptop GPU, 99 Wh | Eluktronics Mech-17 GP2 i9-13900HX, GeForce RTX 4090 Laptop GPU, 99 Wh | Asus ROG Strix G17 G713PI R9 7945HX, GeForce RTX 4070 Laptop GPU, 90 Wh | MSI Titan GT77 HX 13VI i9-13950HX, GeForce RTX 4090 Laptop GPU, 99.9 Wh | MSI Raider GE77 HX 12UHS i9-12900HX, GeForce RTX 3080 Ti Laptop GPU, 99.99 Wh | Razer Blade 17 Early 2022 i9-12900H, GeForce RTX 3080 Ti Laptop GPU, 82 Wh | |
|---|---|---|---|---|---|---|
| Autonomie de la batterie | -16% | -32% | -10% | 19% | -9% | |
| Reader / Idle (h) | 7.3 | 9.8 34% | 7.1 -3% | |||
| WiFi v1.3 (h) | 6.1 | 5.1 -16% | 4.3 -30% | 5.3 -13% | 5.4 -11% | 3.8 -38% |
| Load (h) | 1.5 | 1 -33% | 1.4 -7% | 2 33% | 1.7 13% | |
| H.264 (h) | 2.8 | 6 | 6.5 | 4.8 | ||
| Witcher 3 ultra (h) | 1.1 |
Points positifs
Points négatifs
Verdict - Excellente progression des performances d'une année sur l'autre
Du point de vue des performances, le GE78 offre une amélioration significative par rapport au GE77 pour une consommation d'énergie légèrement supérieure. Vous devrez cependant vous procurer les configurations RTX 4080 ou 4090 pour profiter des avantages en termes de performances, car la RTX 4070 est plus proche des performances de l'ancienne RTX 3080 Ti.
En termes de design, certains utilisateurs pourraient préférer le look minimaliste 16:9 de l'ancienne GE77 à la GE78 d'inspiration rétro 16:10, et vice versa. Nous ne dirions pas que l'un est meilleur que l'autre en termes d'esthétique, mais nous donnerons l'avantage au GE78 pour ses charnières plus solides et ses touches et son pavé tactile plus grands.
Le MSI GE78 est un grand pas en avant par rapport au GE77 en termes de performances. Cependant, certaines de ses caractéristiques sont insuffisantes par rapport à la concurrence, surtout si l'on considère la fourchette de prix >3000 USD.
Espérons que les problèmes que nous avons rencontrés sur notre unité ne soient pas généralisés sur les unités de vente au détail. Le gel au réveil, les saignements importants et les problèmes de latence du DPC sont des problèmes qui ne devraient pas être présents sur un modèle aussi cher que le GE78. L'absence de G-Sync, d'Advanced Optimus, et de chargeur GaN plus fin sont également regrettables quand des alternatives comme la Razer Blade les proposent par défaut.
Prix et disponibilité
MSI GE78HX 13VH-070US
- 03/21/2023 v7 (old)
Allen Ngo
Transparency
La sélection des appareils à examiner est effectuée par notre équipe éditoriale. L'échantillon de test a été prêté à l'auteur par le fabricant ou le détaillant pour les besoins de cet examen. Le prêteur n'a pas eu d'influence sur cette évaluation et le fabricant n'a pas reçu de copie de cette évaluation avant sa publication. Il n'y avait aucune obligation de publier cet article. En tant que média indépendant, Notebookcheck n'est pas soumis à l'autorité des fabricants, des détaillants ou des éditeurs.
Voici comment Notebookcheck teste
Chaque année, Notebookcheck examine de manière indépendante des centaines d'ordinateurs portables et de smartphones en utilisant des procédures standardisées afin de garantir que tous les résultats sont comparables. Nous avons continuellement développé nos méthodes de test depuis environ 20 ans et avons établi des normes industrielles dans le processus. Dans nos laboratoires de test, des équipements de mesure de haute qualité sont utilisés par des techniciens et des rédacteurs expérimentés. Ces tests impliquent un processus de validation en plusieurs étapes. Notre système d'évaluation complexe repose sur des centaines de mesures et de points de référence bien fondés, ce qui garantit l'objectivité.Price comparison

