Intel Core i9-13950HX
L'Intel Core i9-13950HX est un processeur mobile haut de gamme rapide de la série Raptor Lake-HX. Il a été annoncé au début de l'année 2023 et est basé sur le processeur de bureau Core i9-13000K avec 24 cœurs et 32 threads combinés. Huit cœurs de performance Raptor Lake (P-cores) cadencés de 2,2 à 5,5 GHz (un seul cœur, tous les cœurs cadencés à 4,9 GHz) avec HyperThreading et seize cœurs d'efficacité Gracemont sans HyperThreading cadencés de 1,6 à 4 GHz. Le 13950HX est très similaire au Core i9-13980HX mais avec la prise en charge de vPro Enterprise et un boost réduit de 100 MHz pour les cœurs P.
Par rapport à Alder Lake, Raptor Lake offre des cœurs P améliorés (micro-architecture Raptor Cove) avec des caches plus importants et plus de cœurs E (même micro-architecture Gracemont). En outre, la puce prend en charge une mémoire DDR5 plus rapide (jusqu'à 5600 MHz pour la 13980HX).
Performances
Le 13950HX moyen de notre base de données est dans la même catégorie que le i9-13980HX et l'i9-13900HX i9-13900HX tout en étant sensiblement plus rapide que le Ryzen 9 7845HX en ce qui concerne les résultats des tests multithread. Il s'agit d'une puce très, très rapide, à partir de la mi-2023.
Grâce à sa puissante solution de refroidissement et à la limitation à long terme de la puissance du processeur à 145 W, le MSI GE78HX 13VH-070US est l'un des ordinateurs portables les plus rapides construits autour du 13950HX que nous connaissons.
Consommation d'énergie
La consommation "minimum assurée" de la puce est de 45 W, tandis que sa consommation Turbo ne doit pas dépasser 157 W. Intel suggère que la consommation "de base" soit fixée à 55 W, ce que les fabricants d'ordinateurs portables ne sont pas vraiment obligés de faire. La plupart d'entre eux opteront pour une valeur plus élevée afin d'obtenir de meilleures performances.
Ce processeur de la série i9 est fabriqué sur le processus 10 nm de 4e génération d'Intel, commercialisé sous le nom d'Intel 7 pour une efficacité énergétique moyenne, à partir de début 2023.
Gamme Intel Raptor Lake-HX Nom de code Raptor Lake-HX Gamme: Raptor Lake-HX Raptor Lake-HX Fréquence 1600 - 5500 MHz Cache de Niveau 2 (L2) 32 MB Cache de Niveau 3 (L3) 36 MB Nombres de cœurs/threads simultanés supportés 24 / 32 8 x 5.5 GHz Intel Raptor Cove P-Core 16 x 4.0 GHz Intel Gracemont E-Core Consommation énergétique maximale (TDP) 55 Watt(s) Lithographie (procédé de fabrication) 10 nm Taille du Die 257 mm2 Température maximale 100 °C Socket BGA1964 Fonctionnalités DDR4-3200/DDR5-5600 RAM, PCIe 5, Thr. Director, DL Boost, GNA, vPro Enterp., MMX, SSE, SSE2, SSE3, SSSE3, SSE4.1, SSE4.2, AVX, AVX2, BMI2, ABM, FMA, ADX, SMEP, SMAP, EIST, TM1, TM2, HT, Turbo, SST, AES-NI, RDRAND, RDSEED, SHA, TME Carte graphique Intel UHD Graphics 770 ( - 1650 MHz)64 Bit Prend en charge les instructions 64 Bit Architecture x86 Date de présentation 01/04/2023 Lien redirigeant vers une page externe du produit ark.intel.com
Benchmarks Performance Rating - CB R15 + R20 + 7-Zip + X265 + Blender + 3DM11 CPU
45.6 pt (75%)
...
max:
Cinebench R23 - Cinebench R23 Multi Core
min: 24560 moyenne: 29352 médian: 28681 (27%) maximum: 33277 Points
CPU TDP 48 W TDP 109 W TDP 110 W TDP 114 W TDP 134 W TDP 145 W TDP 150 W 74% 80% 85% 86% 94% 98% 100%
...
...
max:
Cinebench R23 - Cinebench R23 Single Core
min: 1952 moyenne: 2067 médian: 2096 (89%) maximum: 2113 Points
CPU TDP 48 W TDP 109 W TDP 110 W TDP 114 W TDP 134 W TDP 145 W TDP 150 W 100% 96% 92% 98% 99% 100% 99%
...
...
max:
Intel Core i9-14900
Cinebench R20 - Cinebench R20 CPU (Single Core)
min: 742 moyenne: 788 médian: 801 (89%) maximum: 816 Points
CPU TDP 48 W TDP 109 W TDP 110 W TDP 114 W TDP 134 W TDP 145 W TDP 150 W 100% 91% 92% 98% 98% 98% 98%
...
...
max:
Cinebench R20 - Cinebench R20 CPU (Multi Core)
min: 8697 moyenne: 10973 médian: 10919 (27%) maximum: 12648 Points
CPU TDP 48 W TDP 109 W TDP 110 W TDP 114 W TDP 134 W TDP 145 W TDP 150 W 74% 69% 85% 86% 94% 99% 100%
...
max:
Cinebench R15 - Cinebench R15 CPU Multi 64 Bit
min: 3625 moyenne: 4565 médian: 4529 (29%) maximum: 5227 Points
CPU TDP 48 W TDP 109 W TDP 110 W TDP 114 W TDP 134 W TDP 145 W TDP 150 W 69% 87% 83% 86% 89% 98% 100%
...
max:
0 265 530 795 1060 1325 1590 1855 2120 2385 2650 2915 3180 3445 3710 3975 4240 4505 4770 5035 Tooltip HP ZBook Fury 16 G10: Ø3353 (3034.67-3625.49)
Razer Blade 16 Early 2023 RTX 4090: Ø3945 (3056-4339.34)
Razer Blade 16 Early 2023: Ø4512 (4463.29-4528.99)
MSI Raider GE68HX 13VF: Ø4437 (4343.11-4631.77)
MSI GE78HX 13VH-070US: Ø4856 (4818.7-5120.98)
MSI Titan GT77 HX 13VI: Ø4980 (4889.98-5226.71)
Cinebench R15 - Cinebench R15 CPU Single 64 Bit
min: 274 moyenne: 292.9 médian: 297 (86%) maximum: 303 Points
CPU TDP 48 W TDP 109 W TDP 110 W TDP 114 W TDP 134 W TDP 145 W TDP 150 W 99% 90% 92% 98% 98% 100% 99%
...
max:
Cinebench R11.5 - Cinebench R11.5 CPU Multi 64 Bit
60 Points (78%)
...
...
max:
Cinebench R11.5 - Cinebench R11.5 CPU Single 64 Bit
3.6 Points (88%)
...
max:
Cinebench R10 - Cinebench R10 Rend. Single (32bit)
11424 points (69%)
...
max:
Cinebench R10 - Cinebench R10 Rend. Multi (32bit)
80693 points (58%)
...
max:
7-Zip 18.03 - 7-Zip 18.03 Multli Thread 4 runs
min: 99351 moyenne: 115415 médian: 116665 (67%) maximum: 127295 MIPS
CPU TDP 48 W TDP 109 W TDP 110 W TDP 114 W TDP 134 W TDP 145 W TDP 150 W 78% 86% 86% 92% 94% 100% 100%
...
max:
7-Zip 18.03 - 7-Zip 18.03 Single Thread 4 runs
min: 6445 moyenne: 6775 médian: 6754 (81%) maximum: 7064 MIPS
CPU TDP 48 W TDP 109 W TDP 110 W TDP 114 W TDP 134 W TDP 145 W TDP 150 W 94% 91% 95% 97% 96% 100% 98%
...
max:
HWBOT x265 Benchmark v2.2 - HWBOT x265 4k Preset
min: 26 moyenne: 30.7 médian: 31 (54%) maximum: 34.5 fps
CPU TDP 48 W TDP 109 W TDP 110 W TDP 114 W TDP 134 W TDP 145 W TDP 150 W 75% 83% 88% 90% 92% 100% 95%
...
max:
0 5 10 15 20 25 30 35 40 45 Tooltip HP ZBook Fury 16 G10: Ø22.9 (0.25-26)
Razer Blade 16 Early 2023: Ø25.1 (0.25-28.6)
Razer Blade 16 Early 2023 RTX 4090: Ø30.7 (1.6-42.4)
Razer Blade 18 RTX 4070: Ø29.9 (0.93-34.8)
MSI Raider GE68HX 13VF: Ø27.4 (0.23-31.6)
MSI Titan GT77 HX 13VI: Ø28.5 (0.27-32.3)
MSI GE78HX 13VH-070US: Ø34.8 (1.93-47.6)
Blender - Blender 3.3 Classroom CPU *
min: 175 moyenne: 203.1 médian: 196 (2%) maximum: 254 Seconds
CPU TDP 48 W TDP 109 W TDP 110 W TDP 114 W TDP 134 W TDP 145 W TDP 150 W 100% 101% 100% 101% 101% 101% 101%
...
...
Blender - Blender 2.79 BMW27 CPU *
min: 100 moyenne: 112.4 médian: 111 (1%) maximum: 137 Seconds
CPU TDP 48 W TDP 109 W TDP 110 W TDP 114 W TDP 134 W TDP 145 W TDP 150 W 100% 100% 100% 100% 100% 100% 100%
...
R Benchmark 2.5 - R Benchmark 2.5 *
min: 0.3823 moyenne: 0.4 médian: 0.4 (9%) maximum: 0.4121 sec
CPU TDP 48 W TDP 109 W TDP 110 W TDP 114 W TDP 134 W TDP 145 W TDP 150 W 101% 100% 100% 100% 100% 101% 100%
...
...
3DMark 06 - CPU - 3DMark 06 - CPU
19311 Points (41%)
...
max:
Super Pi mod 1.5 XS 1M - Super Pi mod 1.5 XS 1M *
6.2 s (1%)
...
VIA C3-M C3-M-1200
Super Pi Mod 1.5 XS 32M - Super Pi mod 1.5 XS 32M *
322.8 s (1%)
...
VIA C3-M C3-M-1200
3DMark Vantage - 3DM Vant. Perf. CPU no Physx
79200 Points (69%)
...
max:
3DMark 11 - 3DM11 Performance Physics
min: 19337 moyenne: 23708 médian: 23960 (65%) maximum: 27078 Points
CPU TDP ? TDP 48 W TDP 109 W TDP 110 W TDP 114 W TDP 134 W TDP 145 W TDP 150 W 71% 80% 81% 78% 96% 96% 98% 100%
...
max:
3DMark - 3DMark Ice Storm Physics
81602 Points (66%)
...
AMD Ryzen 7 7735H
...
max:
3DMark - 3DMark Ice Storm Extreme Physics
77857 Points (63%)
...
AMD Ryzen 7 7735H
...
max:
3DMark - 3DMark Ice Storm Unlimited Physics
81621 Points (69%)
...
AMD Ryzen 7 7735H
...
max:
3DMark - 3DMark Cloud Gate Physics
16332 Points (41%)
...
AMD Ryzen 7 7735H
...
max:
3DMark - 3DMark Fire Strike Standard Physics
min: 31279 moyenne: 37843 médian: 39372 (70%) maximum: 42199 Points
CPU TDP 48 W TDP 109 W TDP 110 W TDP 114 W TDP 134 W TDP 145 W TDP 150 W 82% 83% 74% 93% 98% 98% 100%
...
...
max:
3DMark - 3DMark Time Spy CPU
min: 13744 moyenne: 15379 médian: 14805 (62%) maximum: 18867 Points
CPU TDP 48 W TDP 109 W TDP 110 W TDP 114 W TDP 134 W TDP 145 W TDP 150 W 78% 74% 73% 78% 100% 85% 82%
...
max:
Intel Core i9-14900
Geekbench 6.2 - Geekbench 6.2 Single-Core
min: 2890 moyenne: 2920 médian: 2919.5 (79%) maximum: 2949 points
CPU TDP 48 W TDP 134 W 100% 98%
...
Geekbench 6.2 - Geekbench 6.2 Multi-Core
min: 15878 moyenne: 16928 médian: 16927.5 (67%) maximum: 17977 points
CPU TDP 48 W TDP 134 W 88% 100%
...
max:
Geekbench 5.5 - Geekbench 5.1 - 5.5 64 Bit Single-Core
min: 1805 moyenne: 2013 médian: 2043 (81%) maximum: 2097 points
CPU TDP 48 W TDP 109 W TDP 110 W TDP 114 W TDP 134 W TDP 145 W TDP 150 W 100% 86% 93% 97% 98% 100% 97%
...
...
max:
Geekbench 5.5 - Geekbench 5.1 - 5.5 64 Bit Multi-Core
min: 16776 moyenne: 19501 médian: 20036 (36%) maximum: 21853 points
CPU TDP 48 W TDP 109 W TDP 110 W TDP 114 W TDP 134 W TDP 145 W TDP 150 W 80% 83% 77% 92% 99% 100% 94%
...
max:
Geekbench 5.0 - Geekbench 5.0 64 Bit Single-Core
min: 1856 moyenne: 1979 médian: 2006 (9%) maximum: 2048 points
CPU TDP 48 W TDP 109 W TDP 114 W TDP 145 W 99% 91% 97% 100%
...
max:
Geekbench 5.0 - Geekbench 5.0 64 Bit Multi-Core
min: 16846 moyenne: 18847 médian: 18486.5 (58%) maximum: 21567 points
CPU TDP 48 W TDP 109 W TDP 114 W TDP 145 W 78% 80% 91% 100%
...
max:
Mozilla Kraken 1.1 - Kraken 1.1 Total Score *
min: 451 moyenne: 466.6 médian: 468 (1%) maximum: 478 ms
CPU TDP 48 W TDP 109 W TDP 110 W TDP 114 W TDP 134 W TDP 145 W TDP 150 W 100% 100% 100% 100% 100% 100% 100%
...
Apple M2
Apple M1
...
max:
Octane V2 - Octane V2 Total Score
103911 Points (91%)
...
Intel Core Ultra 7 258V
...
WebXPRT 4 - WebXPRT 4 Score
min: 279 moyenne: 290.9 médian: 291 (84%) maximum: 302 Points
CPU TDP 48 W TDP 109 W TDP 110 W TDP 114 W TDP 134 W TDP 145 W TDP 150 W 100% 92% 94% 100% 98% 96% 99%
...
max:
WebXPRT 3 - WebXPRT 3 Score
min: 266 moyenne: 306.3 médian: 318.5 (66%) maximum: 346 Points
CPU TDP 48 W TDP 109 W TDP 110 W TDP 114 W TDP 134 W TDP 145 W TDP 150 W 98% 78% 77% 100% 95% 91% 93%
...
...
CrossMark - CrossMark Overall
min: 1592 moyenne: 1950 médian: 1964 (75%) maximum: 2139 Points
CPU TDP 48 W TDP 109 W TDP 110 W TDP 114 W TDP 134 W TDP 145 W TDP 150 W 89% 74% 94% 99% 92% 89% 100%
...
...
max:
Power Consumption - Prime95 Power Consumption - external Monitor *
min: 134.5 moyenne: 188.3 médian: 205 (35%) maximum: 223 Watt
CPU TDP 48 W TDP 109 W TDP 110 W TDP 114 W TDP 134 W TDP 145 W TDP 150 W 123% 111% 125% 105% 102% 100% 101%
...
max:
0 15 30 45 60 75 90 105 120 135 150 165 180 195 210 225 240 255 Tooltip Razer Blade 16 Early 2023 RTX 4090: Ø134.5 (105.2-223)
HP ZBook Fury 16 G10: Ø139.2 (116.3-160.2)
Razer Blade 16 Early 2023: Ø182.4 (173.7-211)
Razer Blade 18 RTX 4070: Ø205 (199-216)
MSI Raider GE68HX 13VF: Ø215 (199.8-249)
MSI Titan GT77 HX 13VI: Ø219 (204-262)
MSI GE78HX 13VH-070US: Ø223 (204-266)
Power Consumption - Cinebench R15 Multi Power Consumption - external Monitor *
min: 145 moyenne: 212.8 médian: 204 (37%) maximum: 259 Watt
CPU TDP 48 W TDP 109 W TDP 110 W TDP 114 W TDP 134 W TDP 145 W TDP 150 W 139% 123% 121% 119% 104% 104% 100%
...
...
max:
0 15 30 45 60 75 90 105 120 135 150 165 180 195 210 225 240 255 Tooltip HP ZBook Fury 16 G10: Ø145 (143-148.3)
Razer Blade 16 Early 2023: Ø191.7 (184.9-193.8)
Razer Blade 16 Early 2023 RTX 4090: Ø197 (194.3-198.3)
Razer Blade 18 RTX 4070: Ø204 (201-210)
MSI Raider GE68HX 13VF: Ø246 (244-248)
MSI GE78HX 13VH-070US: Ø247 (244-251)
MSI Titan GT77 HX 13VI: Ø259 (253-262)
Power Consumption - Idle Power Consumption - external Monitor *
min: 14.2 moyenne: 20 médian: 15.5 (10%) maximum: 35 Watt
CPU TDP 48 W TDP 109 W TDP 110 W TDP 114 W TDP 134 W TDP 145 W 117% 118% 100% 109% 117% 117%
...
...
max:
0 5 10 15 20 25 30 35 40 Tooltip Razer Blade 16 Early 2023: Ø14.2 (11.6-16.9)
MSI GE78HX 13VH-070US: Ø15 (8.34-24.8)
HP ZBook Fury 16 G10: Ø15.1 (9.53-21.5)
MSI Raider GE68HX 13VF: Ø15.8 (12.7-19.1)
Razer Blade 18 RTX 4070: Ø25.1 (22.7-44.2)
Razer Blade 16 Early 2023 RTX 4090: Ø35 (31.2-39.4)
Power Consumption - Idle Power Consumption 150cd 1min *
min: 15 moyenne: 18.5 médian: 17 (19%) maximum: 27.1 Watt
CPU TDP 48 W TDP 109 W TDP 114 W TDP 134 W TDP 145 W 119% 118% 100% 114% 116%
...
max:
0 5 10 15 20 25 Tooltip HP ZBook Fury 16 G10: Ø15 (9.7-24.9)
Razer Blade 16 Early 2023: Ø15.5 (11.1-24.6)
MSI GE78HX 13VH-070US: Ø17 (14.8-24.9)
MSI Raider GE68HX 13VF: Ø18 (13.8-25.6)
Razer Blade 18 RTX 4070: Ø27.1 (25.5-29.7)
Power Consumption - Cinebench R15 Multi Power Efficiency - external Monitor
min: 18.8 moyenne: 21.5 médian: 21.4 (16%) maximum: 25 Points per Watt
CPU TDP 48 W TDP 110 W TDP 114 W TDP 134 W TDP 145 W TDP 150 W 100% 88% 88% 75% 83% 81%
...
...
- Amplitude des valeurs obtenues dans le benchmark avec cette carte graphique
- Valeur moyenne obtenue dans le benchmark avec cette carte graphique
* Plus les chiffres sont petits, plus les performances sont élevées
v1.28
log 01. 15:09:27
#0 ran 0s before starting gpusingle class +0s ... 0s
#1 no ids found in url (should be separated by "_") +0s ... 0s
#2 not redirecting to Ajax server +0s ... 0s
#3 did not recreate cache, as it is less than 5 days old! Created at Tue, 01 Oct 2024 05:31:39 +0200 +0.001s ... 0.001s
#4 no comparison url found in template nbc.compare_page_2 needed +0.015s ... 0.016s
#5 no comparison url found in template nbc.compare_page_2 needed +0s ... 0.016s
#6 no comparison url found in template nbc.compare_page_2 needed +0s ... 0.016s
#7 no comparison url found in template nbc.compare_page_2 needed +0s ... 0.016s
#8 no comparison url found in template nbc.compare_page_2 needed +0s ... 0.017s
#9 no comparison url found in template nbc.compare_page_2 needed +0s ... 0.017s
#10 no comparison url found in template nbc.compare_page_2 needed +0s ... 0.017s
#11 no comparison url found in template nbc.compare_page_2 needed +0s ... 0.017s
#12 composed specs +0.001s ... 0.018s
#13 did output specs +0s ... 0.018s
#14 getting avg benchmarks for device 14671 +0.016s ... 0.034s
#15 got single benchmarks 14671 +0.031s ... 0.065s
#16 got avg benchmarks for devices +0s ... 0.065s
#17 min, max, avg, median took s +0.738s ... 0.804s
#18 no comparison url found in template nbc.compare_page_2 needed +0s ... 0.804s
#19 return log +0s ... 0.804s
Critiques du Intel Core i9-13950HX processeur
Test du MSI Raider GE68 HX 13VF : un changement complet de design MSI reprend le design du GE78 de 17 pouces pour le GE68 de 16 pouces, plus petit. Le nouveau look ne plaira peut-être pas à tout le monde, mais les performances...
Intel Core i9-13950HX | NVIDIA GeForce RTX 4060 Laptop GPU | 16.00" | 2.7 kg
Test du HP ZBook Fury 16 G10 : 100 W Nvidia RTX 5000 Ada L'extérieur n'a pas beaucoup changé, mais les mises à jour Raptor Lake-HX et Nvidia RTX Ada à l'intérieur sont significatives et valent la peine d'être prises e...
Intel Core i9-13950HX | NVIDIA RTX 5000 Ada Generation Laptop GPU | 16.00" | 2.6 kg
Test du Razer Blade 16 Early 2023 RTX 4090 : la bête avec i9-13950HX et 1er écran mini-LED UHD+ dual-mode Le Razer Blade 16 Early 2023 est une nouvelle offre pour les joueurs intéressés par un ordinateur portable de jeu 16:10 de 16 pouces. Doté d'un Core i9-13950HX ...
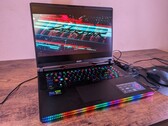
Intel Core i9-13950HX | NVIDIA GeForce RTX 4090 Laptop GPU | 16.00" | 2.5 kg
Test du MSI Raider GE78 HX 13VH : Core i9-13950HX de 13e génération et GeForce RTX 4080 Vous en avez assez des ordinateurs portables au design minimaliste ? MSI tente quelque chose de nouveau avec son dernier GE78 en mélangeant l'esthétique rétro a...
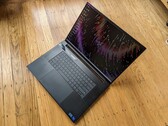
Intel Core i9-13950HX | NVIDIA GeForce RTX 4080 Laptop GPU | 17.00" | 3 kg
Test du Razer Blade 18 : plus petit que de nombreux portables de jeu de 17 pouces Le spacieux Blade 18 de 18 pouces est commercialisé comme un remplacement d'ordinateur de bureau sans le facteur de forme. Il vous faudra toutefois accorder une...
Intel Core i9-13950HX | NVIDIA GeForce RTX 4070 Laptop GPU | 18.00" | 3 kg
MSI Titan GT77 HX 13VI : NVIDIA GeForce RTX 4090 Laptop GPU, 17.30", 3.5 kg
Critique » Test de la Nvidia Ada RTX 40 : la RTX 4090 de 175 W surpasse la RTX 3090 de 350 W pour les performances comme pour l'efficacité énergétique
Razer Blade 16 Early 2023 : NVIDIA GeForce RTX 4080 Laptop GPU, 16.00", 2.4 kg
Critique » Test de la Nvidia Ada RTX 40 : la RTX 4090 de 175 W surpasse la RTX 3090 de 350 W pour les performances comme pour l'efficacité énergétique
MSI Titan GT77 HX 13VI : NVIDIA GeForce RTX 4090 Laptop GPU, 17.30", 3.5 kg
Critique » Test du MSI Titan GT77 HX 13V : le PC portable de jeu ultime avec RTX 4090 et Core i9-13950HX
Razer Blade 16 Early 2023 : NVIDIA GeForce RTX 4080 Laptop GPU, 16.00", 2.4 kg
Critique » Test du Razer Blade 16 Early 2023 : les débuts de la GeForce RTX 4080 Mobile
HP ZBook Fury 16 G10 : NVIDIA RTX 5000 Ada Generation Laptop GPU, 16.00", 2.6 kg
Autres tests » HP ZBook Fury 16 G10
MSI Vector GP68 HX 13VH : NVIDIA GeForce RTX 4080 Laptop GPU, 16.00", 2.7 kg
Autres tests » MSI Vector GP68 HX 13VH
MSI Raider GE68 HX 13VF : NVIDIA GeForce RTX 4060 Laptop GPU, 16.00", 2.7 kg
Autres tests » MSI Raider GE68 HX 13VF
Razer Blade 16 Early 2023 RTX 4060 : NVIDIA GeForce RTX 4060, 16.00", 2.5 kg
Autres tests » Razer Blade 16 Early 2023 RTX 4060
MSI Creator Z17 HX Studio A13VGT : NVIDIA GeForce RTX 4070 Laptop GPU, 17.00", 2.5 kg
Autres tests » MSI Creator Z17 HX Studio A13VGT
Razer Blade 18 2023 RTX 4060 : NVIDIA GeForce RTX 4060 Laptop GPU, 18.00", 3.2 kg
Autres tests » Razer Blade 18 2023 RTX 4060
Razer Blade 16 Early 2023 RTX 4070 : NVIDIA GeForce RTX 4070 Laptop GPU, 16.00", 2.5 kg
Autres tests » Razer Blade 16 Early 2023 RTX 4070
MSI Raider GE68 HX 13VG : NVIDIA GeForce RTX 4070 Laptop GPU, 15.60", 2.7 kg
Autres tests » MSI Raider GE68 HX 13VG
MSI GE78HX 13VH-070US : NVIDIA GeForce RTX 4080 Laptop GPU, 17.00", 3 kg
Autres tests » MSI GE78HX 13VH-070US
Razer Blade 18 2023, RTX 4080 : NVIDIA GeForce RTX 4080 Laptop GPU, 18.00", 3.2 kg
Autres tests » Razer Blade 18 2023, RTX 4080
Razer Blade 18 2023, RTX 4090 : NVIDIA GeForce RTX 4090 Laptop GPU, 18.00", 3.2 kg
Autres tests » Razer Blade 18 2023, RTX 4090
MSI Titan GT77 HX 13VI : NVIDIA GeForce RTX 4090 Laptop GPU, 17.30", 3.5 kg
Autres tests » MSI Titan GT77 HX 13VI
Razer Blade 16 Early 2023 RTX 4090 : NVIDIA GeForce RTX 4090 Laptop GPU, 16.00", 2.5 kg
Autres tests » Razer Blade 16 Early 2023 RTX 4090
Razer Blade 18 RTX 4070 : NVIDIA GeForce RTX 4070 Laptop GPU, 18.00", 3 kg
Autres tests » Razer Blade 18 RTX 4070
Razer Blade 16 Early 2023 : NVIDIA GeForce RTX 4080 Laptop GPU, 16.00", 2.4 kg
Autres tests » Razer Blade 16 Early 2023
»
La RTX 4080 mobile GeForce est 35 % plus lente que la RTX 4080 de bureau, ce qui peut poser problème aux consommateurs
Please share our article, every link counts!
Les autres processeurs de la gamme Raptor Lake-HX Processeurs similaires
Klaus Hinum (Update: 2023-11-24)