Test de l'Eurocom Raptor X17 Core i9-14900HX : GPU 175 W pour des performances maximales

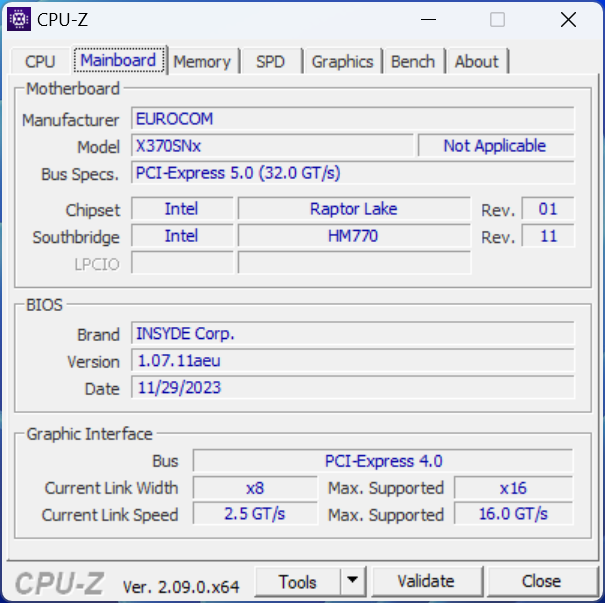
Le Raptor X17 est l'un des ordinateurs portables les plus rapides proposés par Eurocom. Le modèle de cette année a été rafraîchi avec de nouvelles options Raptor Lake-HX, mais avec le même GPU et le même châssis que l'année dernière. Nous vous recommandons donc de consulter nos tests sur le 2023 Raptor X17 et Schenker Key 17 Pro pour plus d'informations sur les caractéristiques physiques de l'ordinateur portable, car nos commentaires s'appliquent toujours.
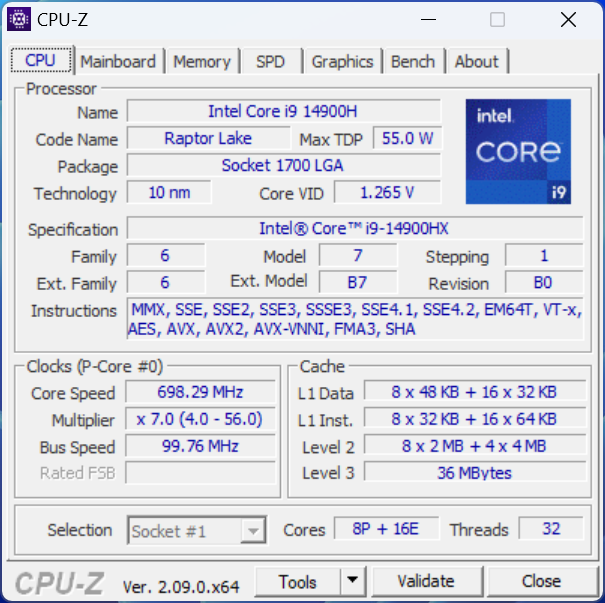
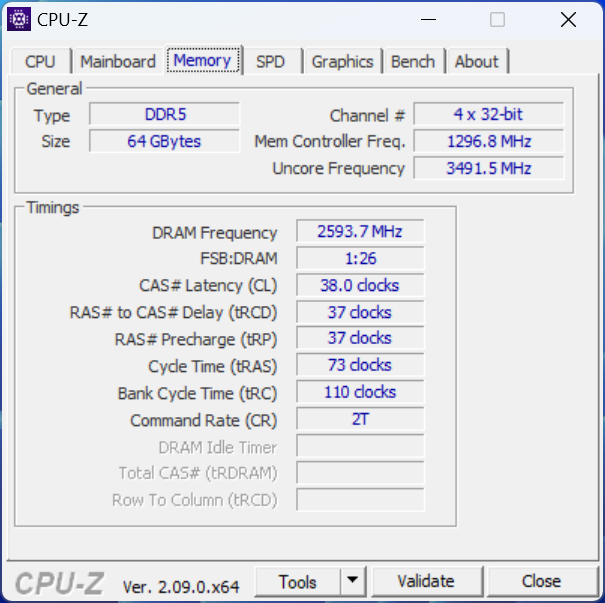
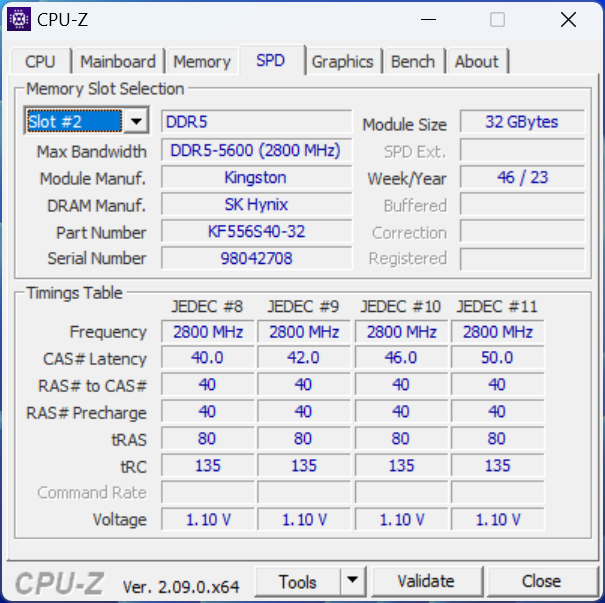
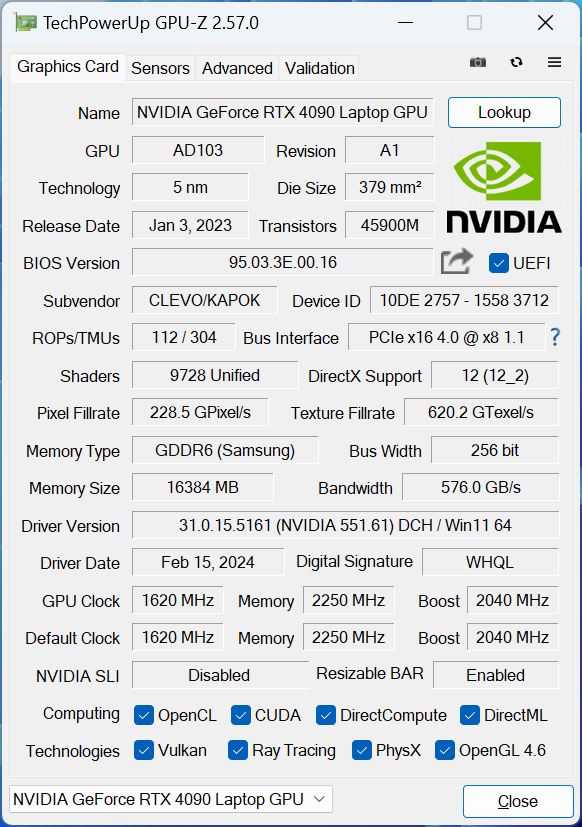
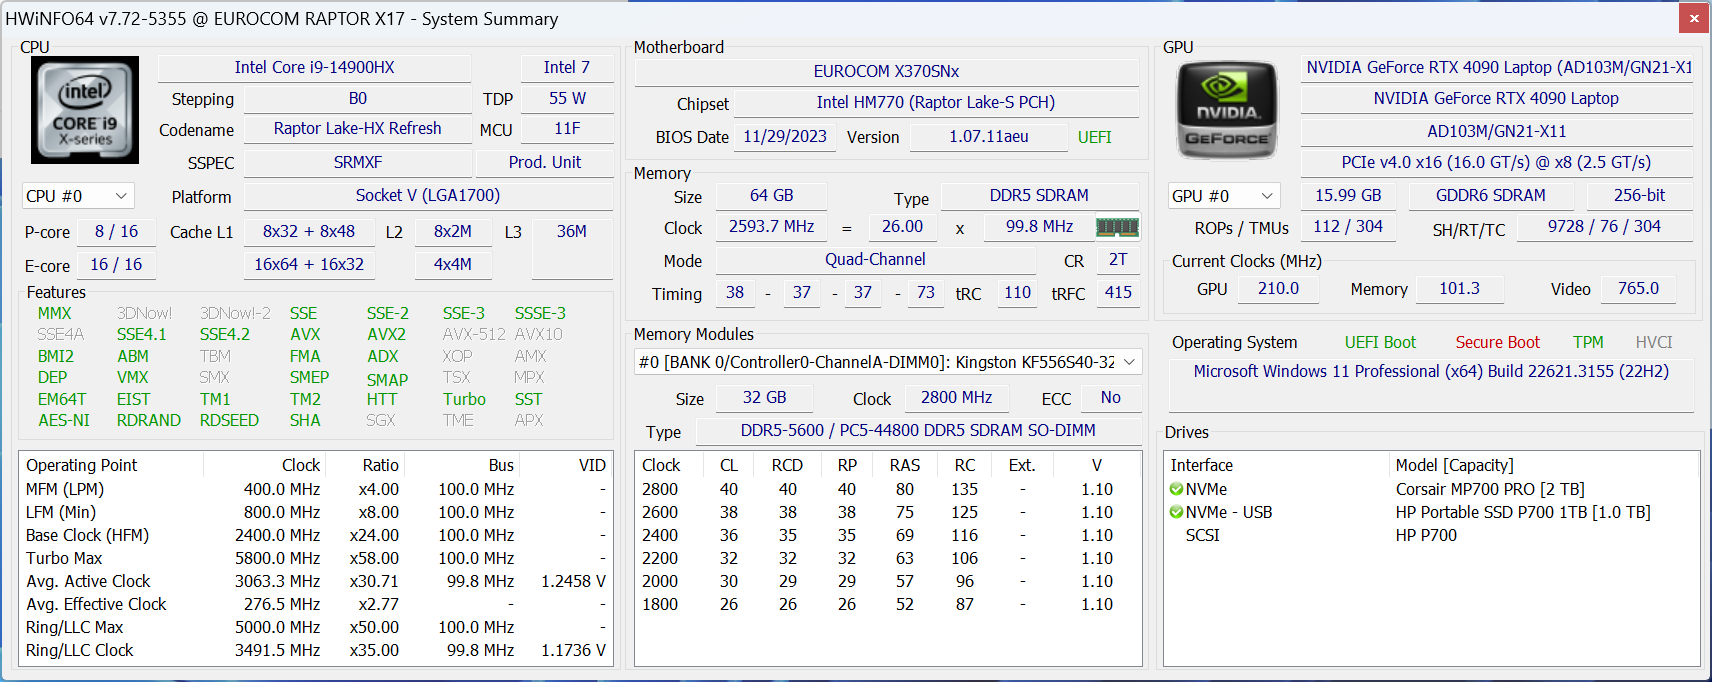
Notre Raptor X17 2024 est livré avec un Core i9-14900HX, un SSD PCIe5 et un écran 4K 144 Hz pour contraster avec le Core i9-13900HX, le SSD PCIe4 et l'écran 2K 240 Hz de notre modèle 2023. La RTX 4090 de 175 W GeForce reste inchangée.
Le Raptor X17 peut être remplacé par d'autres ordinateurs portables de jeu très performants, tels que l'Asus ROG Strix Scar 17 et le Raptor X17 Asus ROG Strix Scar 17, MSI Titan 18 HXou Alienware m18 R2. Il convient de noter que le Raptor X17 est l'un des rares ordinateurs portables de jeu RTX 4090 sur le marché à disposer d'un écran 16:9 de 17,3 pouces.
Plus d'avis Eurocom :
Comparaison avec les concurrents potentiels
Note | Date | Modèle | Poids | Épaisseur | Taille | Résolution | Prix |
|---|---|---|---|---|---|---|---|
| 85.2 % v7 (old) | 03/24 | Eurocom Raptor X17 Core i9-14900HX i9-14900HX, GeForce RTX 4090 Laptop GPU | 3.4 kg | 24.9 mm | 17.30" | 3840x2160 | |
| 82.8 % v7 (old) | 05/23 | Eurocom Raptor X17 i9-13900HX, GeForce RTX 4090 Laptop GPU | 3.5 kg | 24.9 mm | 17.30" | 2560x1440 | |
| 85.6 % v7 (old) | 01/24 | Asus TUF Gaming A17 FA707XI-NS94 R9 7940HS, GeForce RTX 4070 Laptop GPU | 2.5 kg | 25.4 mm | 17.30" | 1920x1080 | |
| 88.3 % v7 (old) | 04/23 | Asus ROG Strix Scar 17 G733PY-XS96 R9 7945HX, GeForce RTX 4090 Laptop GPU | 2.9 kg | 28.3 mm | 17.30" | 2560x1440 | |
v (old) | MSI Raider GE78 HX 13VI i9-13980HX, GeForce RTX 4090 Laptop GPU | 17.30" | 2560x1600 | ||||
| 88.8 % v7 (old) | 01/24 | MSI Titan 18 HX A14VIG i9-14900HX, GeForce RTX 4090 Laptop GPU | 3.6 kg | 32.1 mm | 18.00" | 3840x2400 |
Communication
Webcam


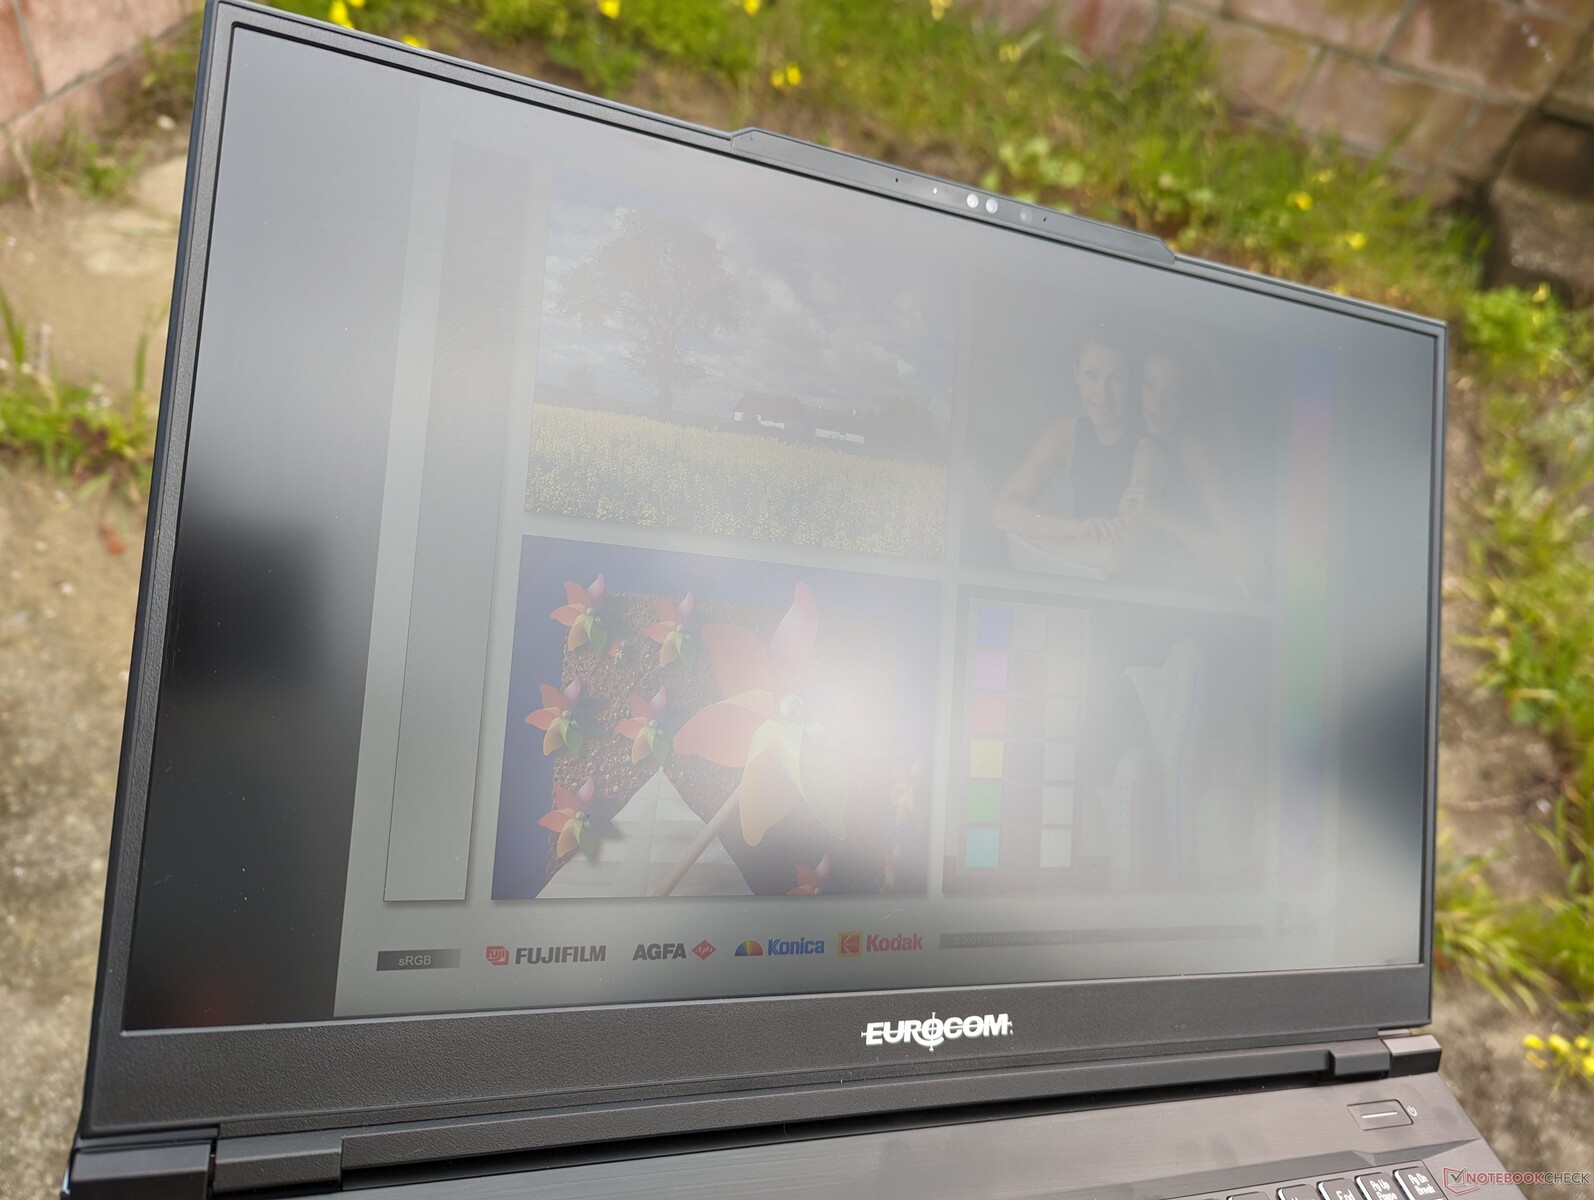
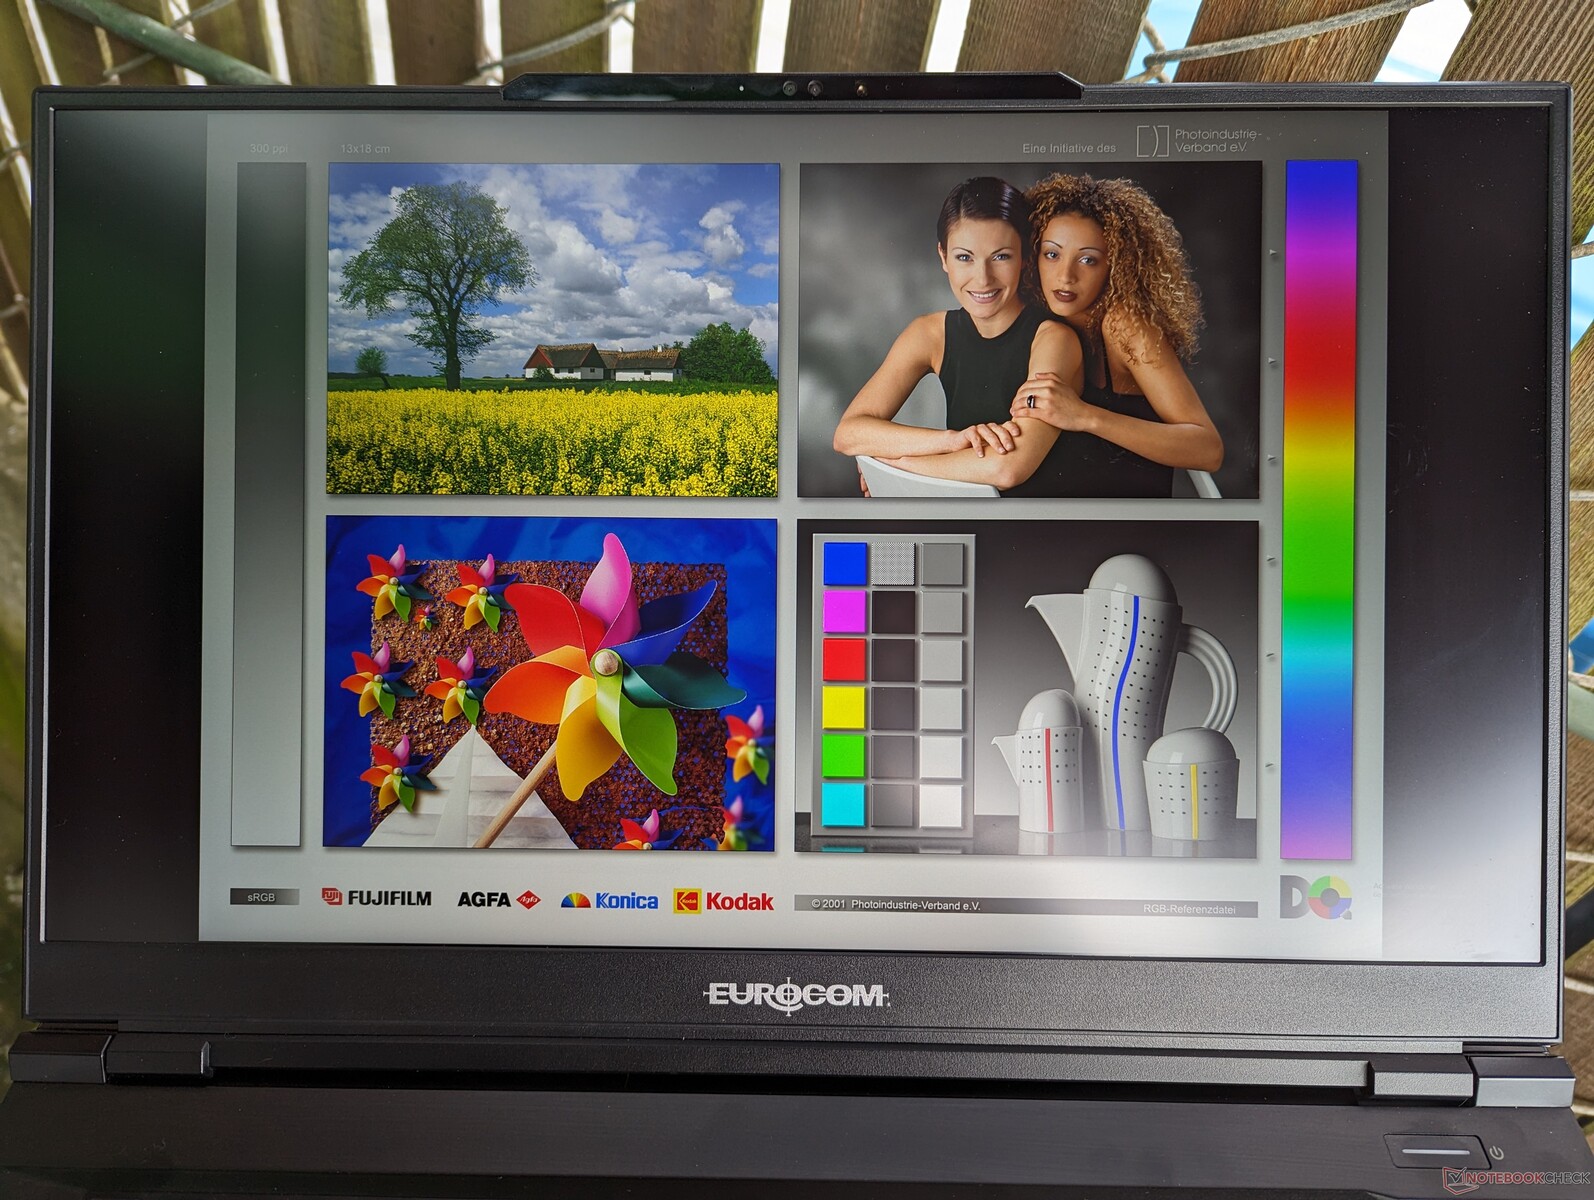
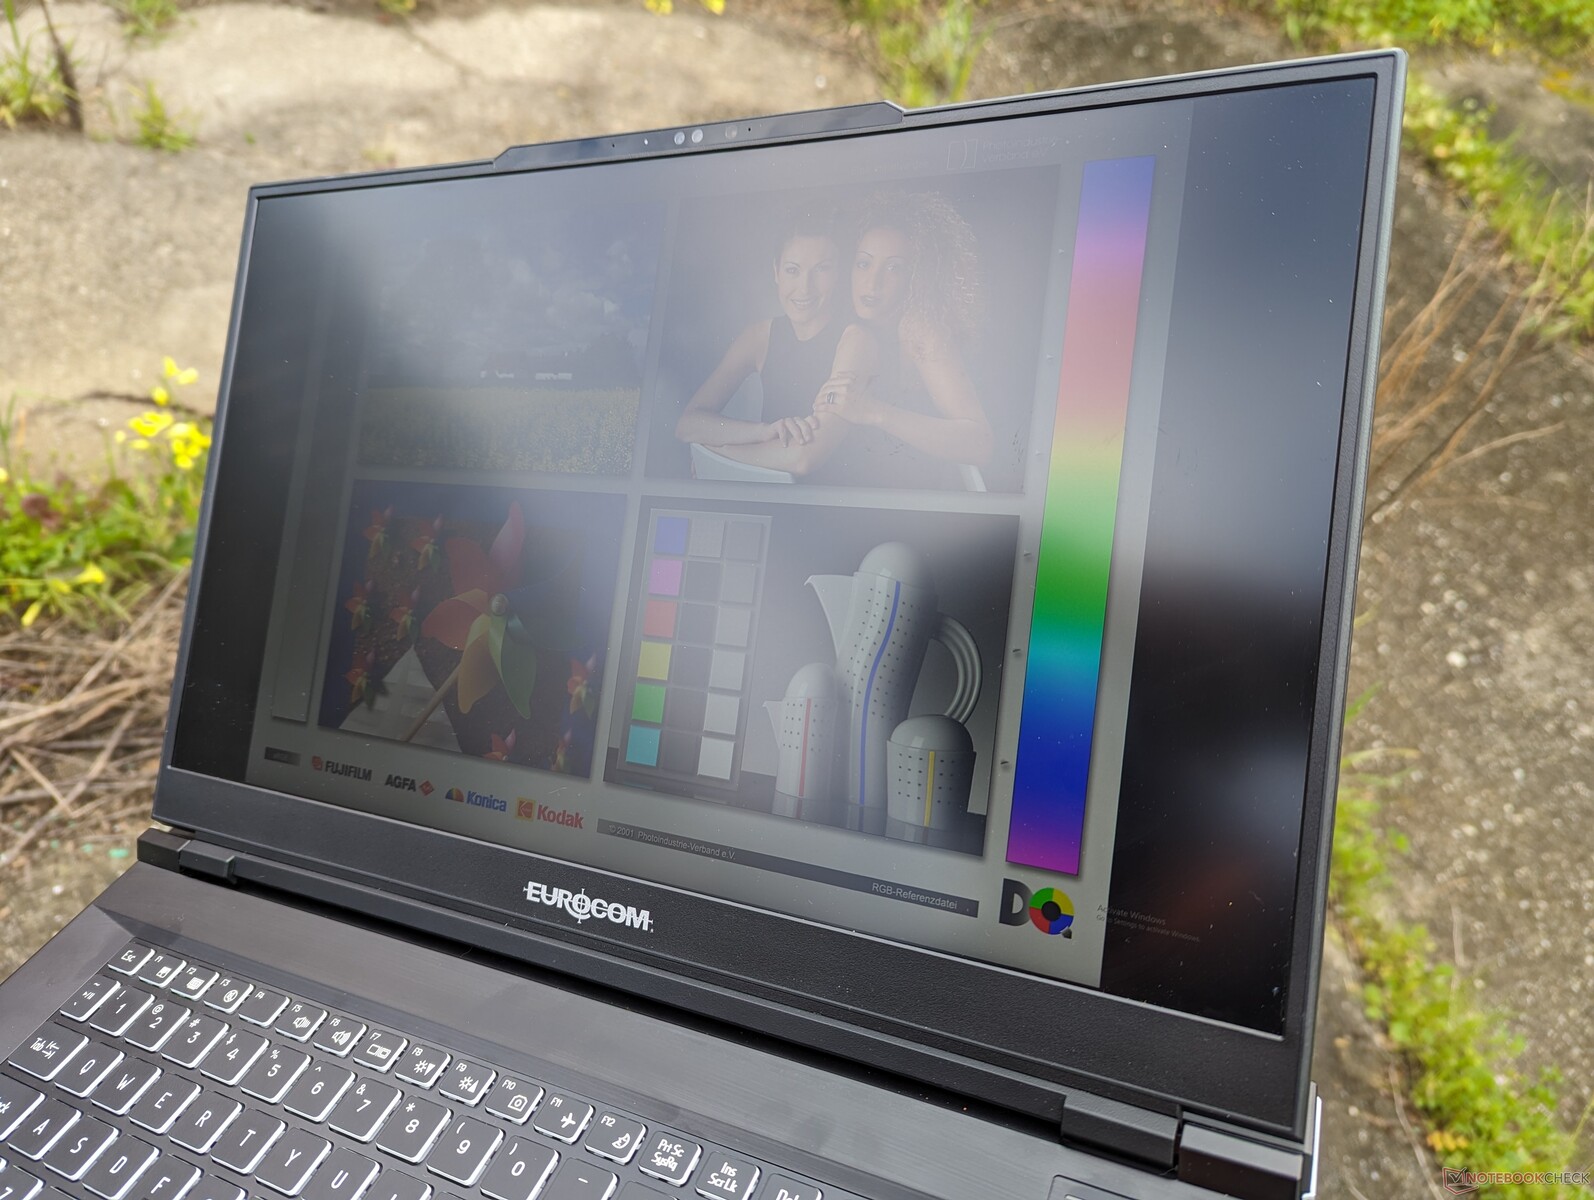
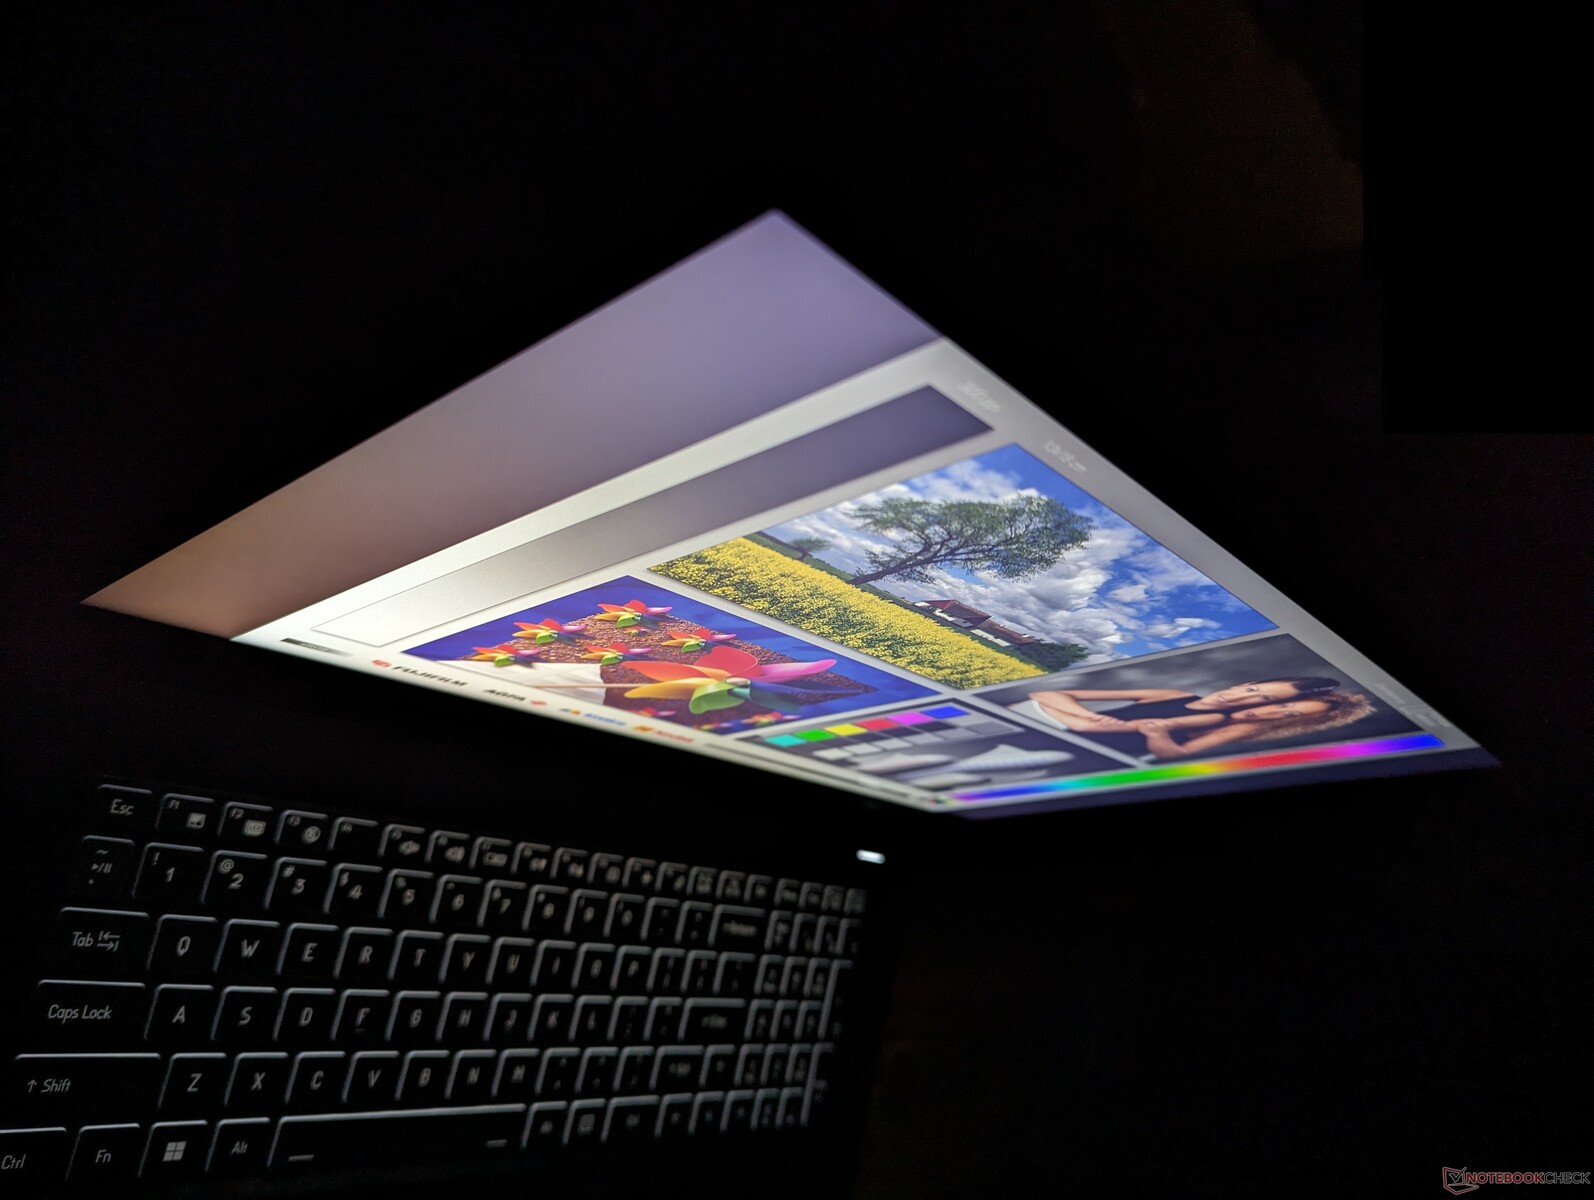
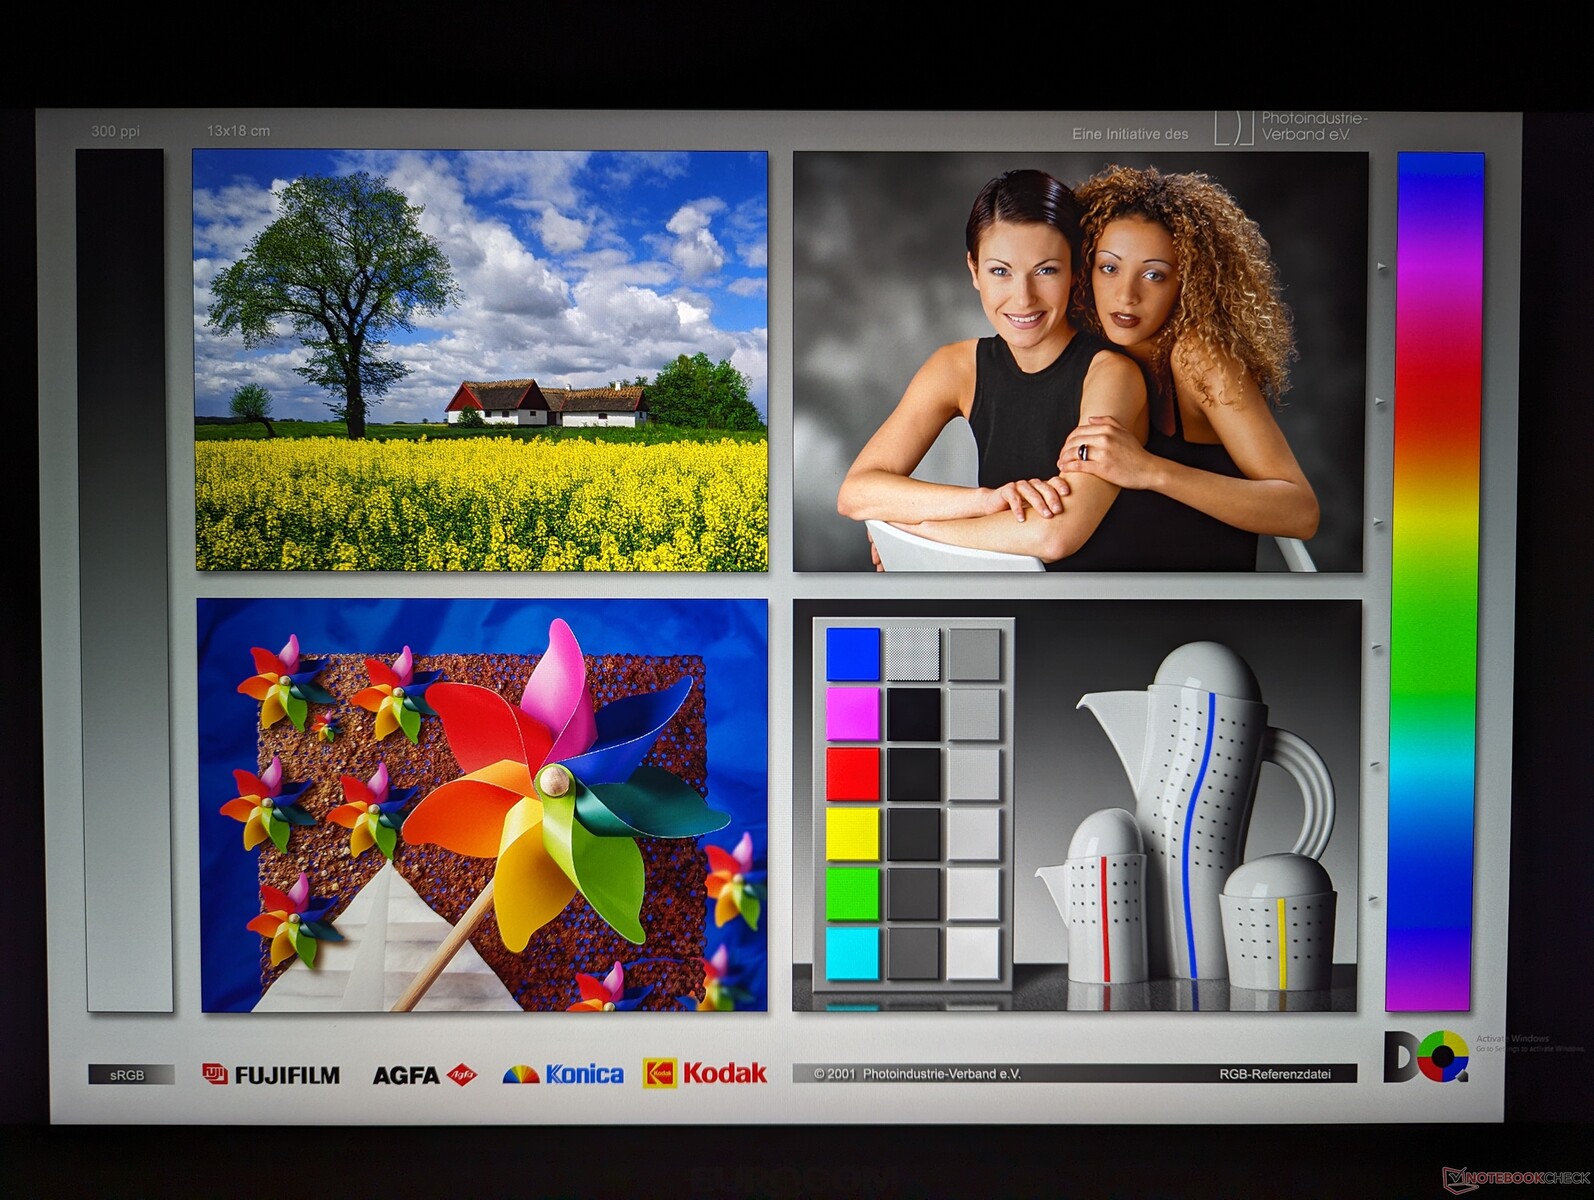
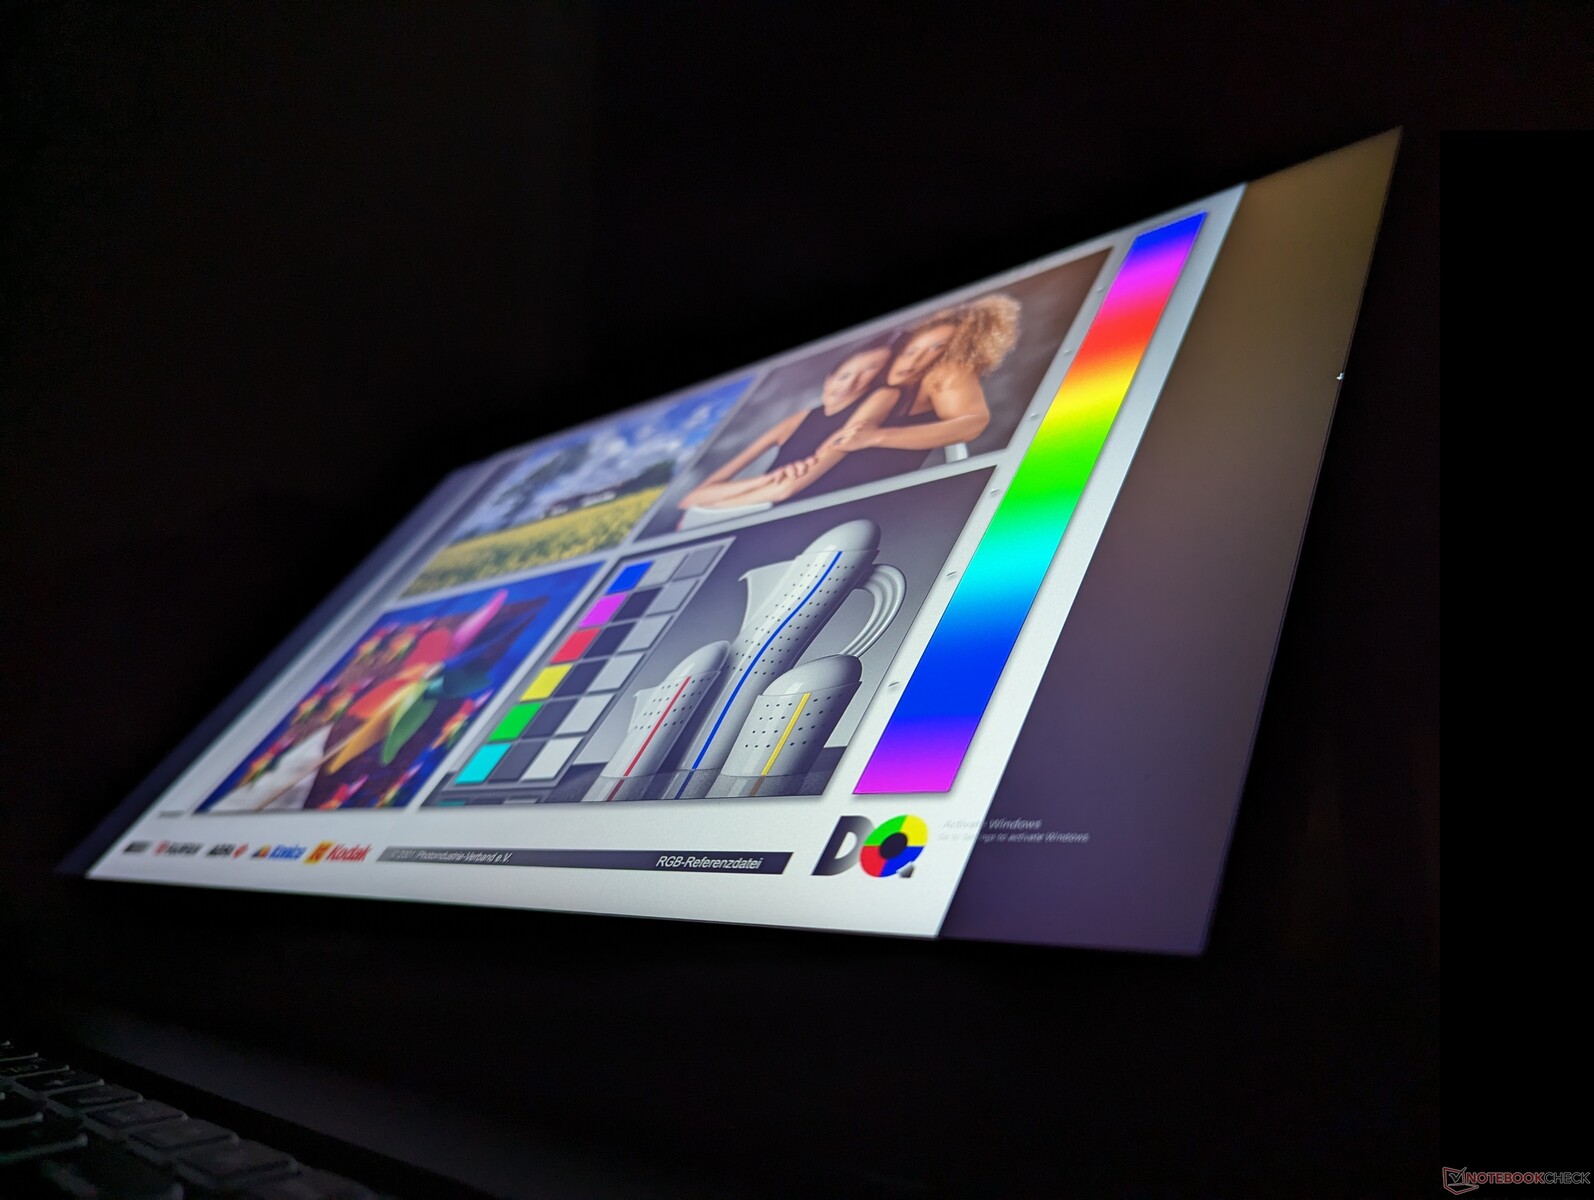
Affichage
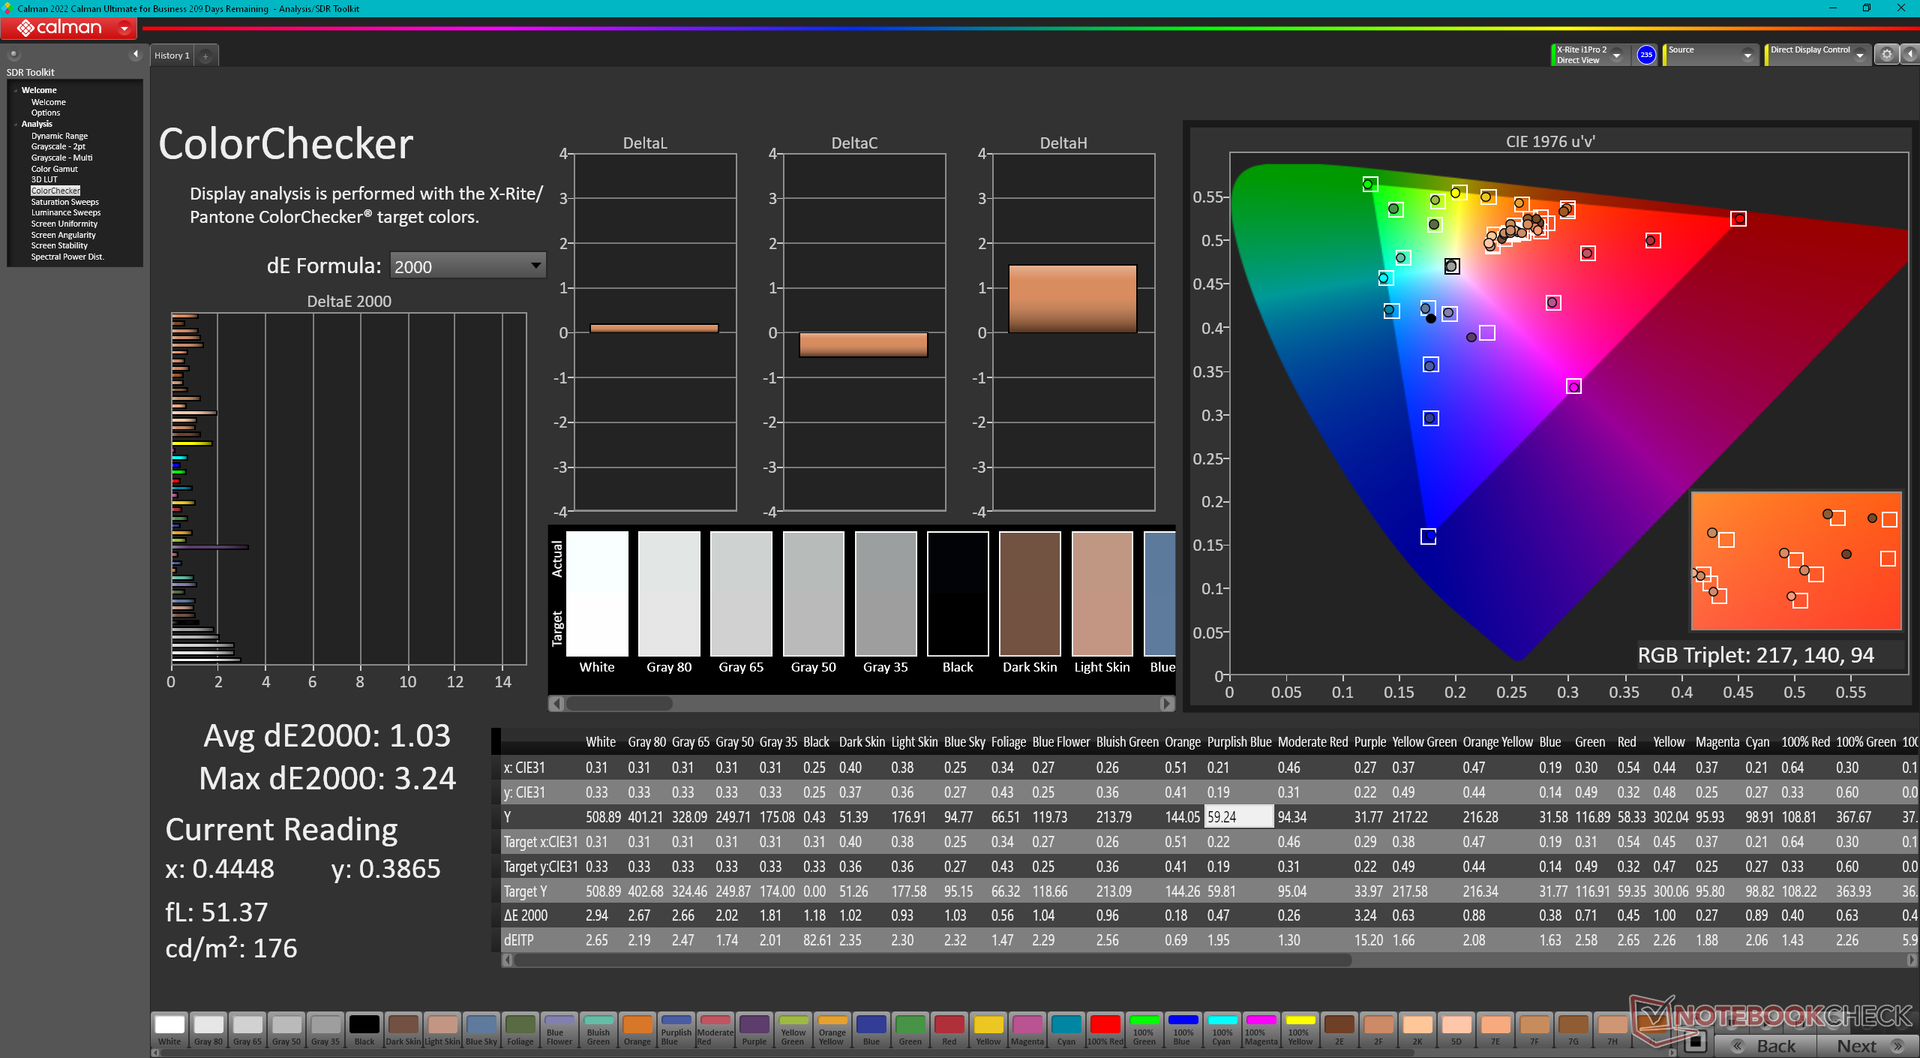
Par rapport à l'écran 2K 240 Hz de notre configuration 2023, notre configuration 2024 utilise un panneau 4K 144 Hz, mais avec des couvertures de couleurs, des rapports de contraste et des temps de réponse similaires. Notre écran à plus haute résolution est également nettement plus lumineux, avec environ 500 nits en moyenne.
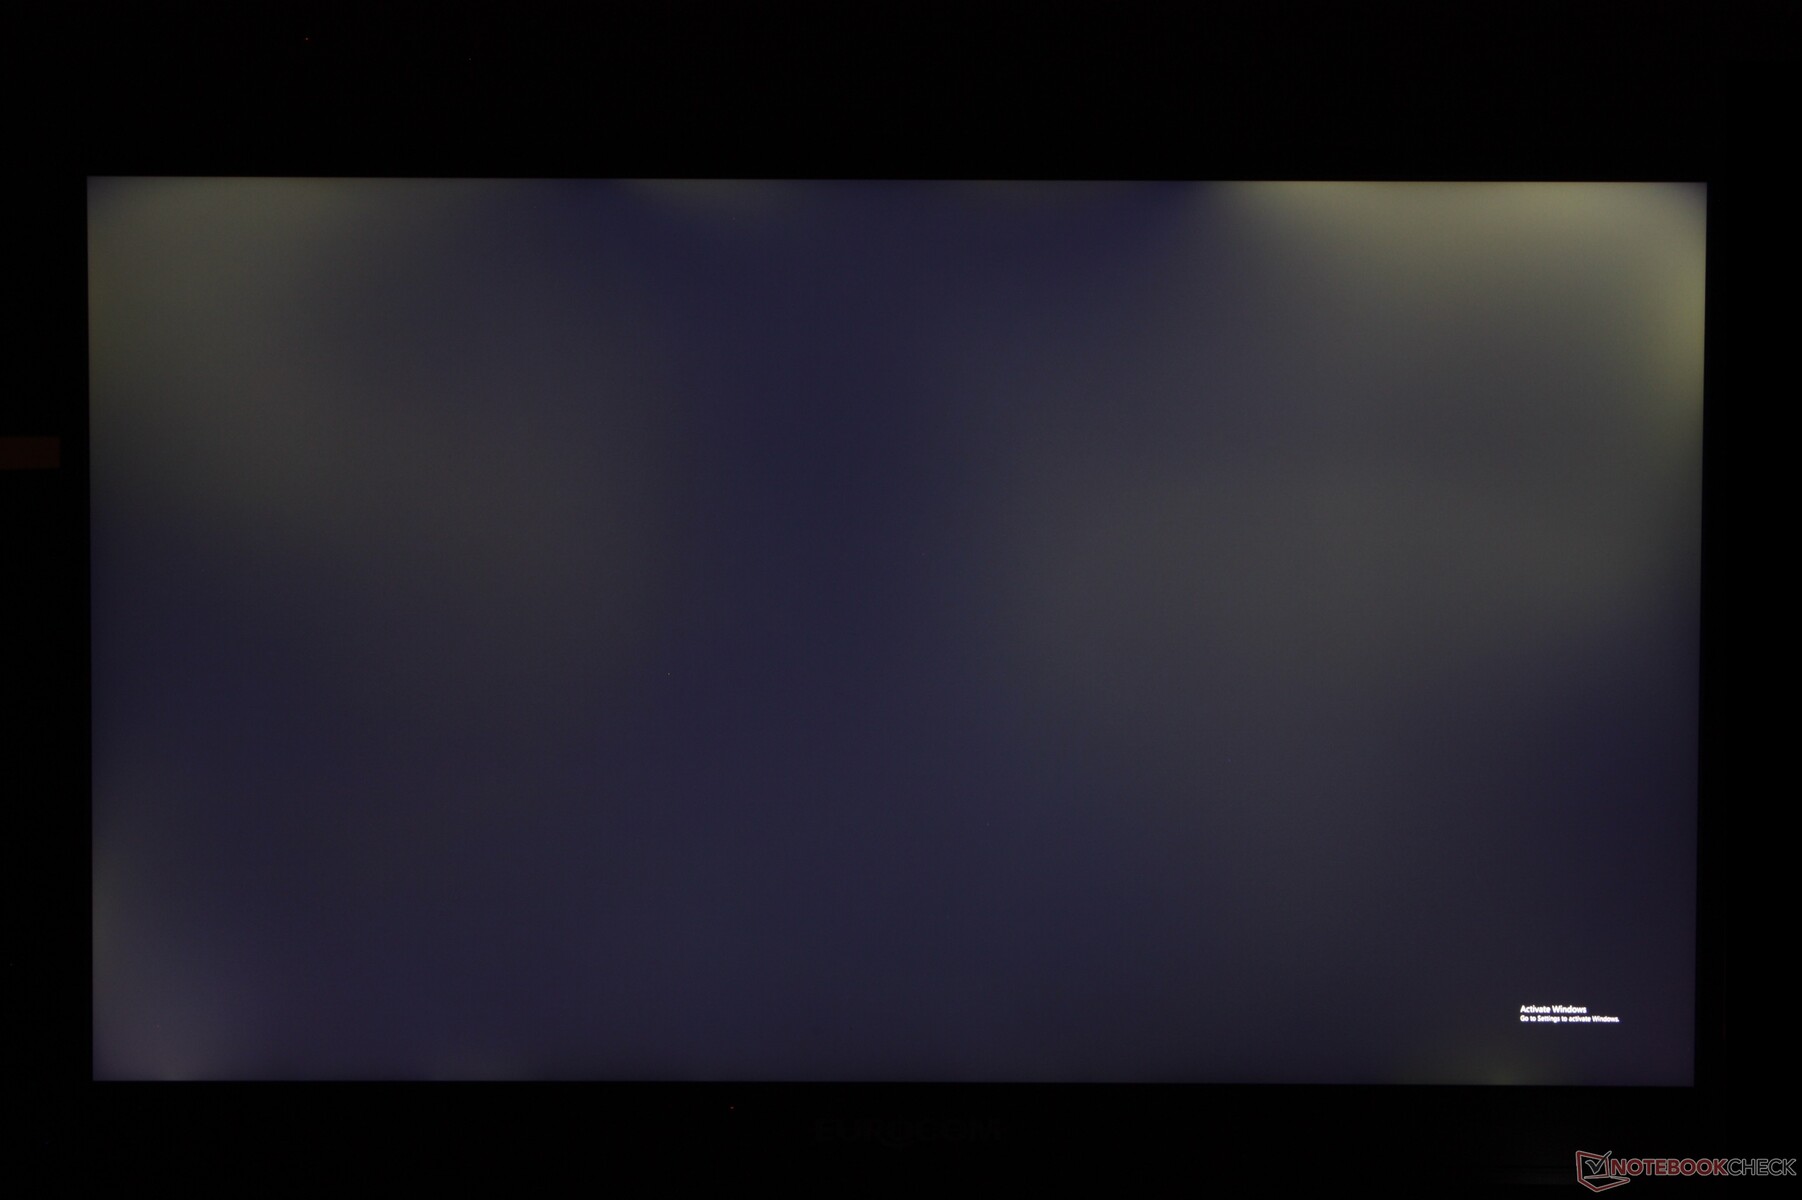
L'un des principaux inconvénients de l'écran est son panneau mat quelque peu granuleux, l'affaiblissement notable du rétroéclairage dans les scènes sombres et l'absence de prise en charge HDR. Les alternatives OLED sont beaucoup plus nettes et vibrantes que ce que le Raptor X17 a à offrir à cet égard.
La dalle BOE NE173QUM-NY1 se retrouve également sur d'autres modèles comme le Schenker Key 17 Pro.

| |||||||||||||||||||||||||
Homogénéité de la luminosité: 77 %
Valeur mesurée au centre, sur batterie: 544.6 cd/m²
Contraste: 1135:1 (Valeurs des noirs: 0.48 cd/m²)
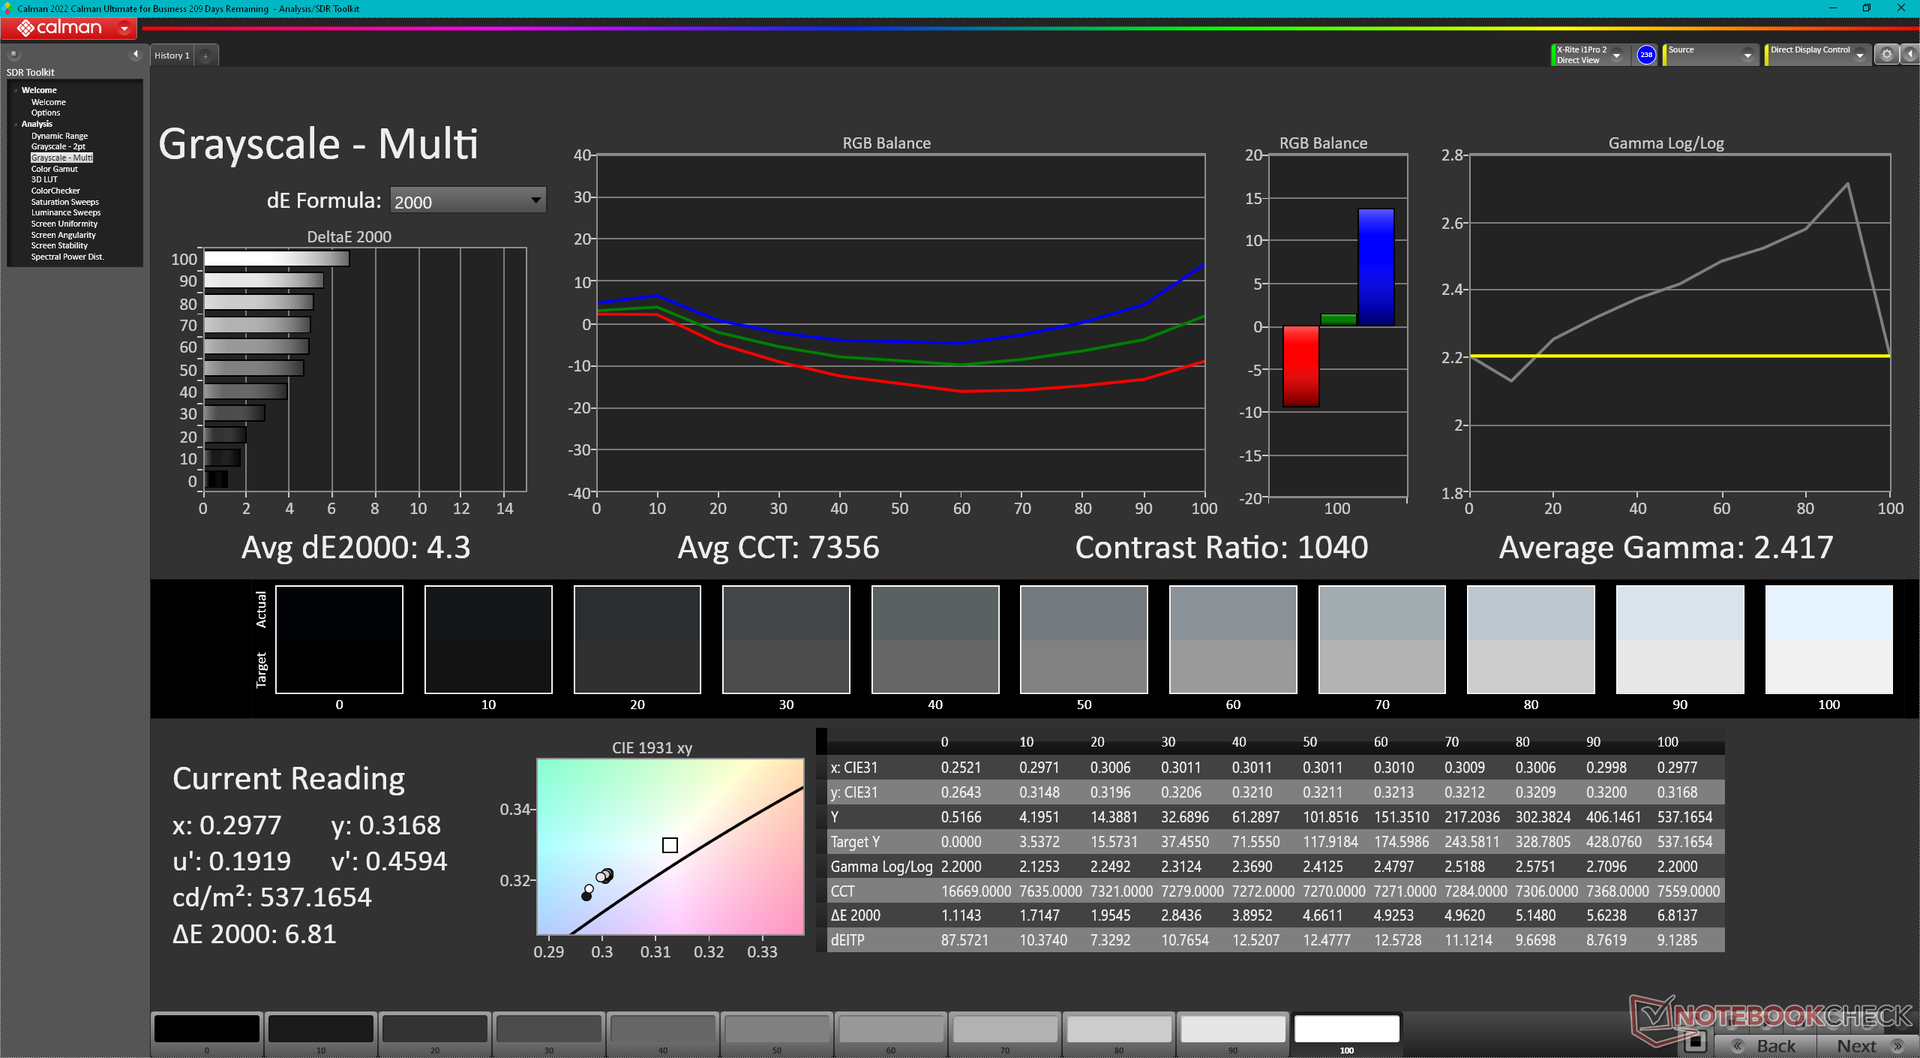
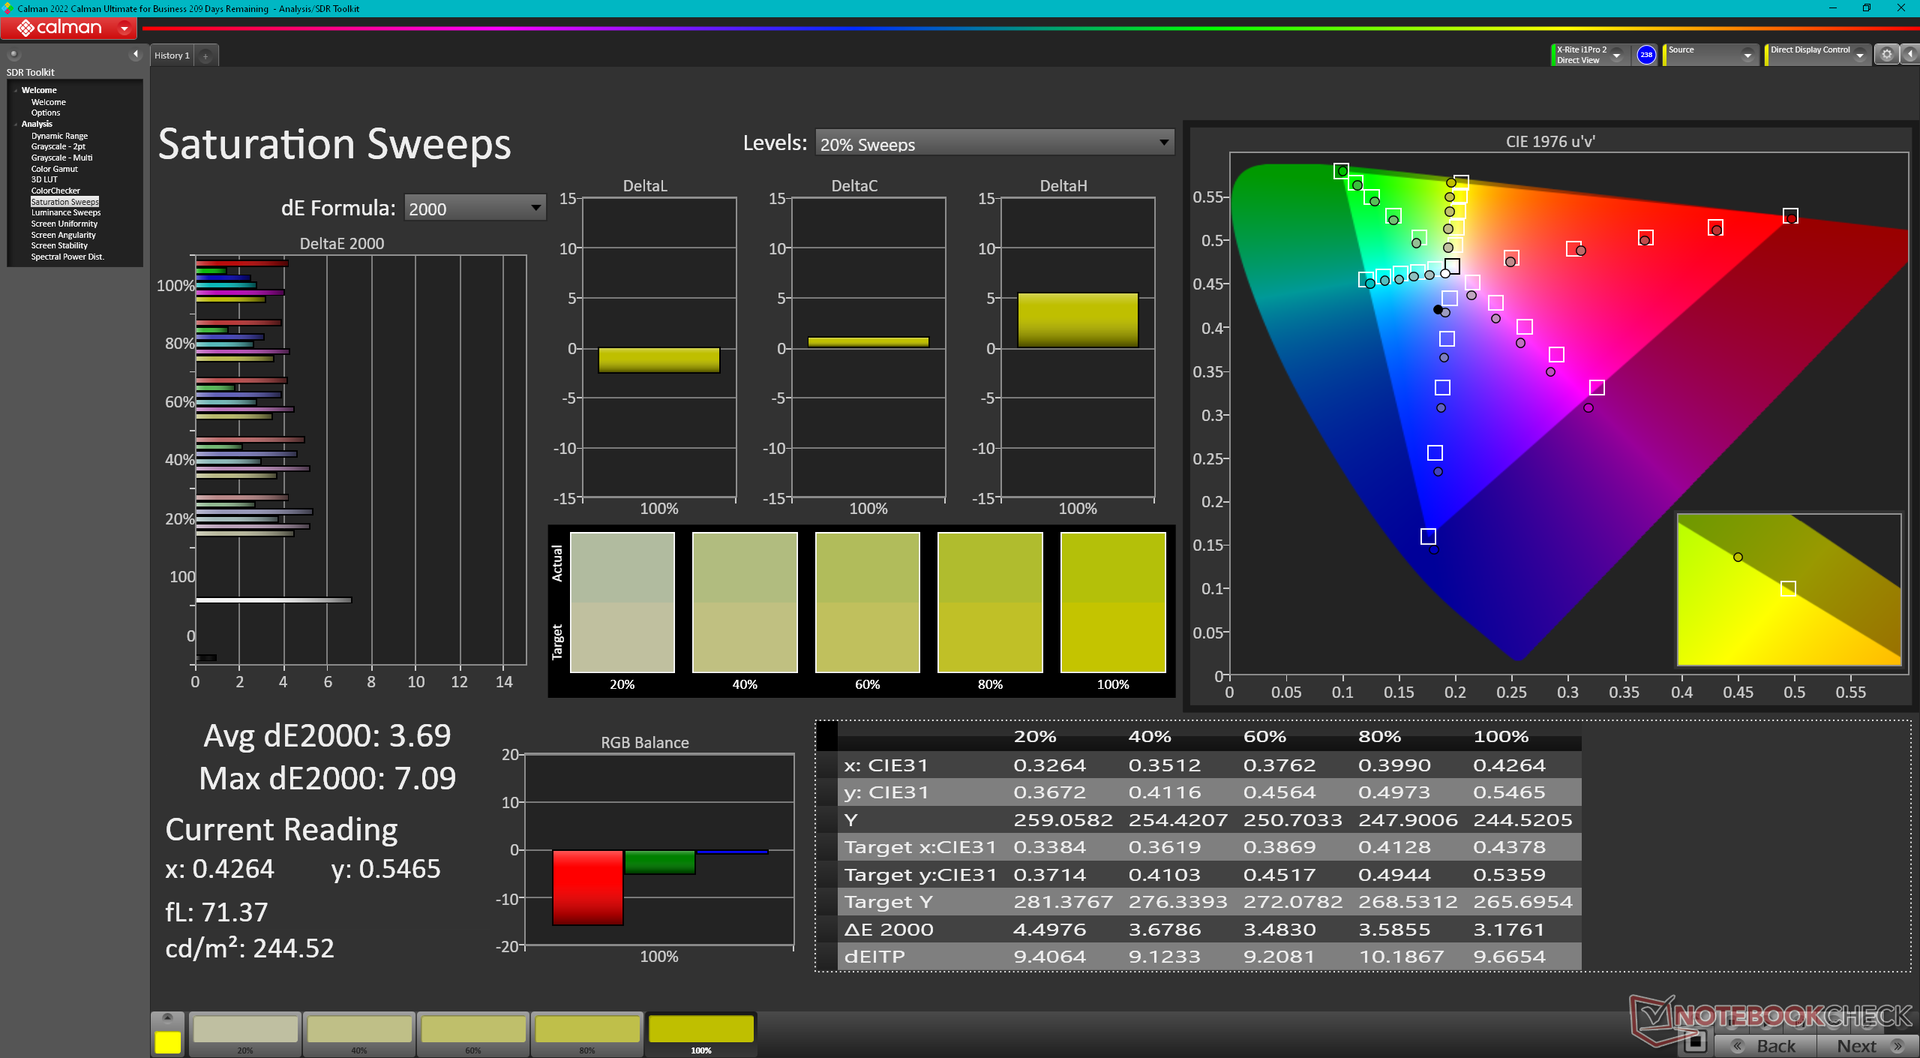
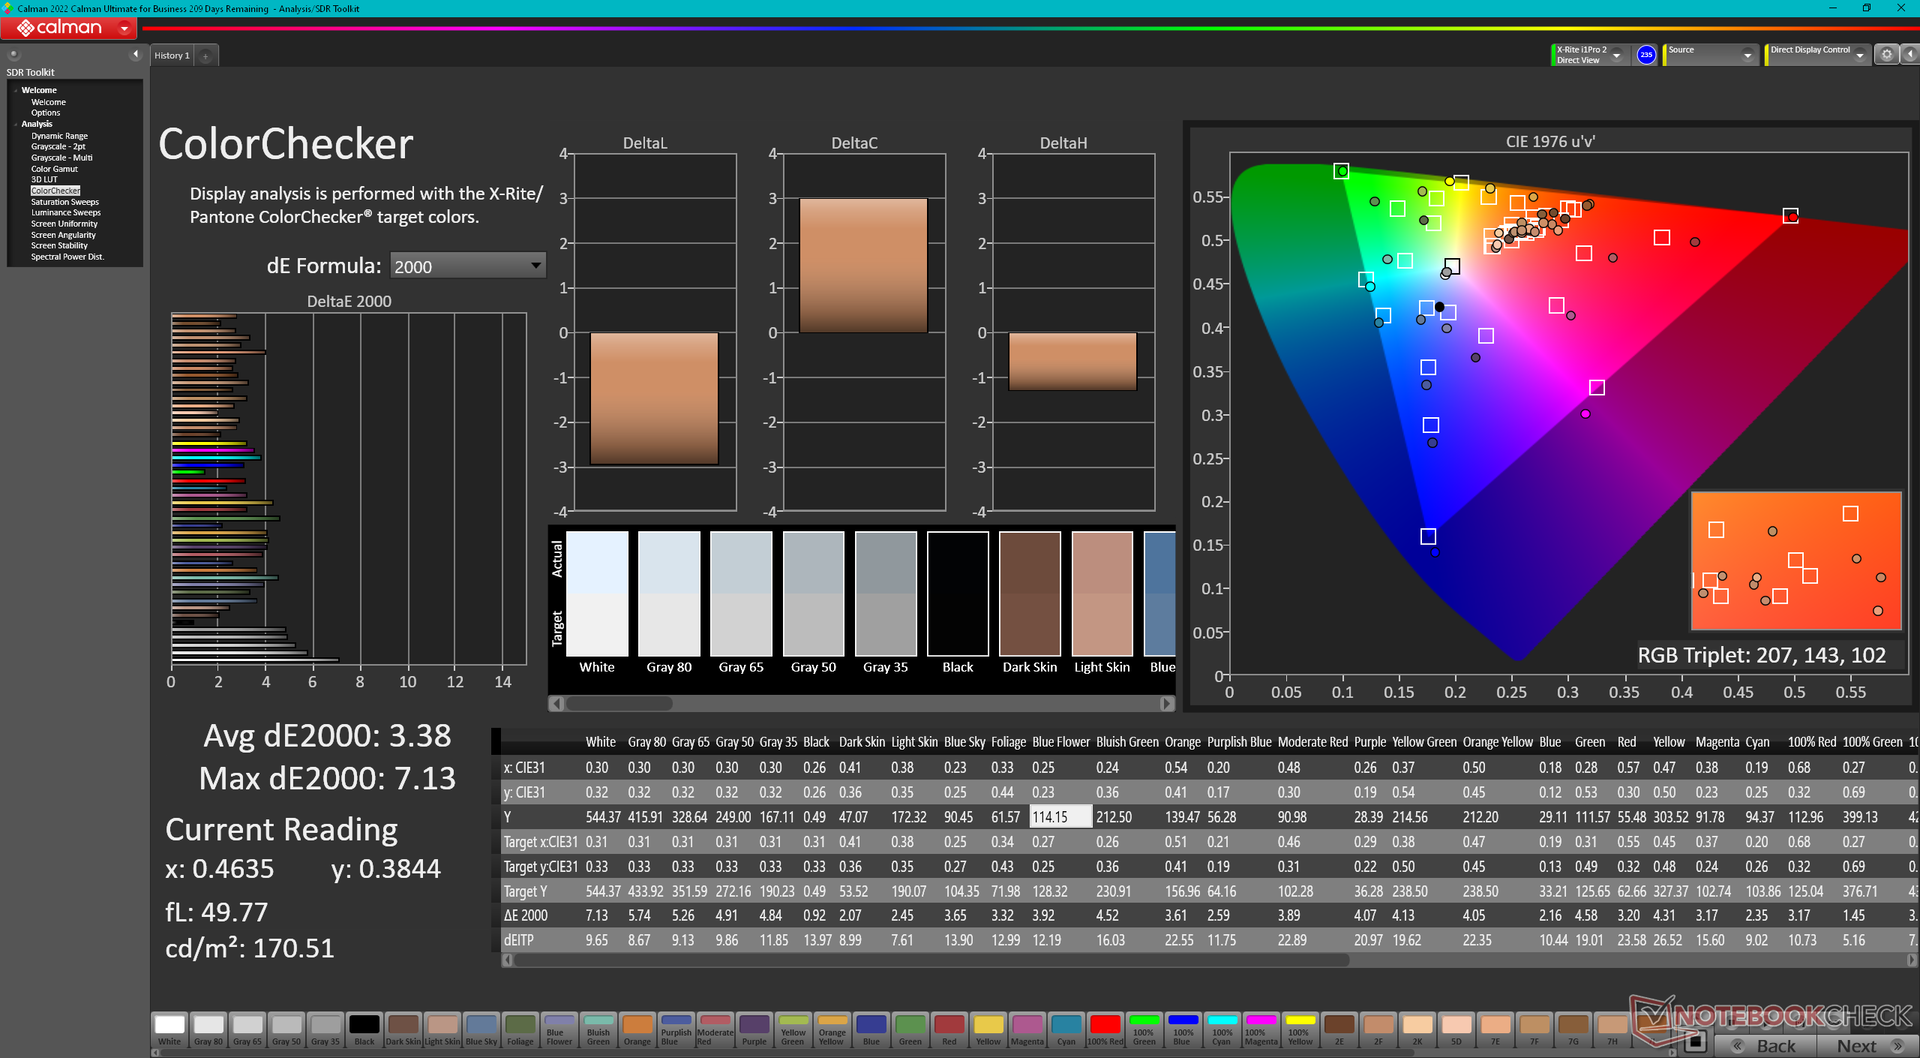
ΔE ColorChecker Calman: 3.38 | ∀{0.5-29.43 Ø4.73}
calibrated: 1.03
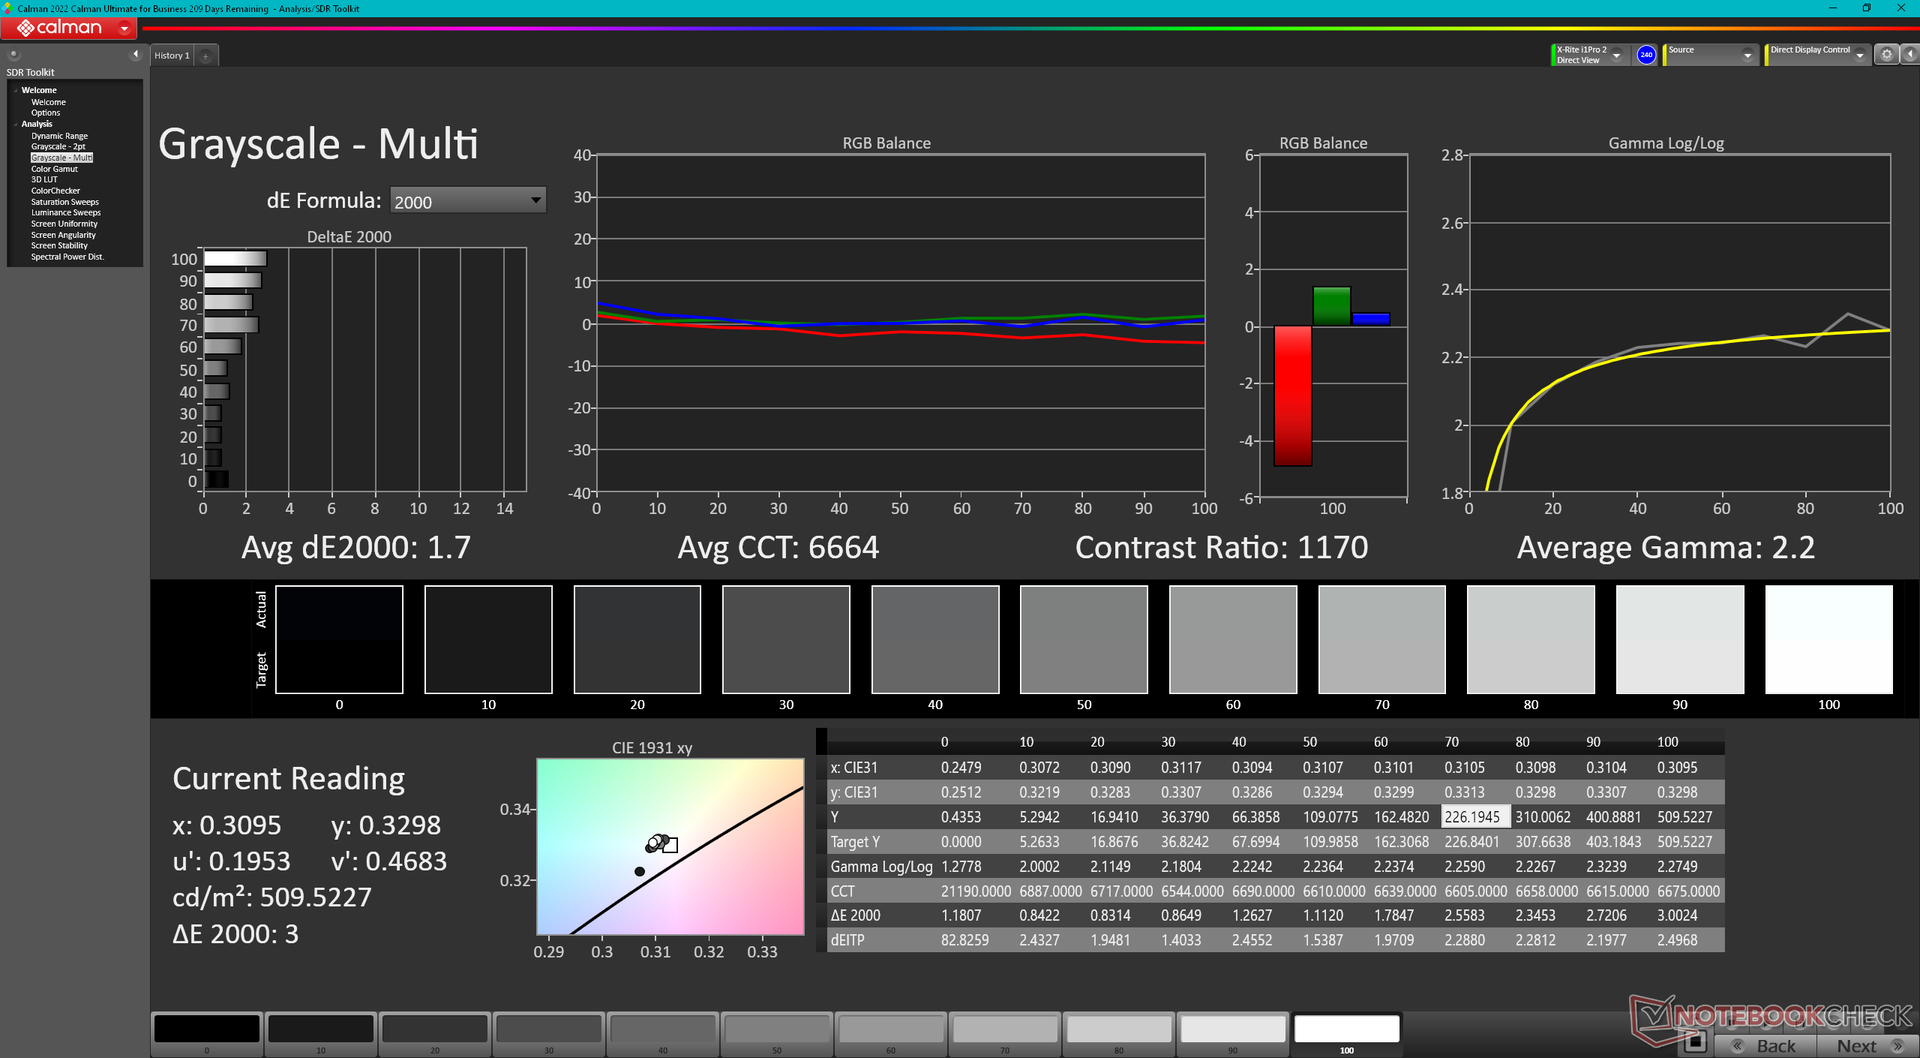
ΔE Greyscale Calman: 4.3 | ∀{0.09-98 Ø4.97}
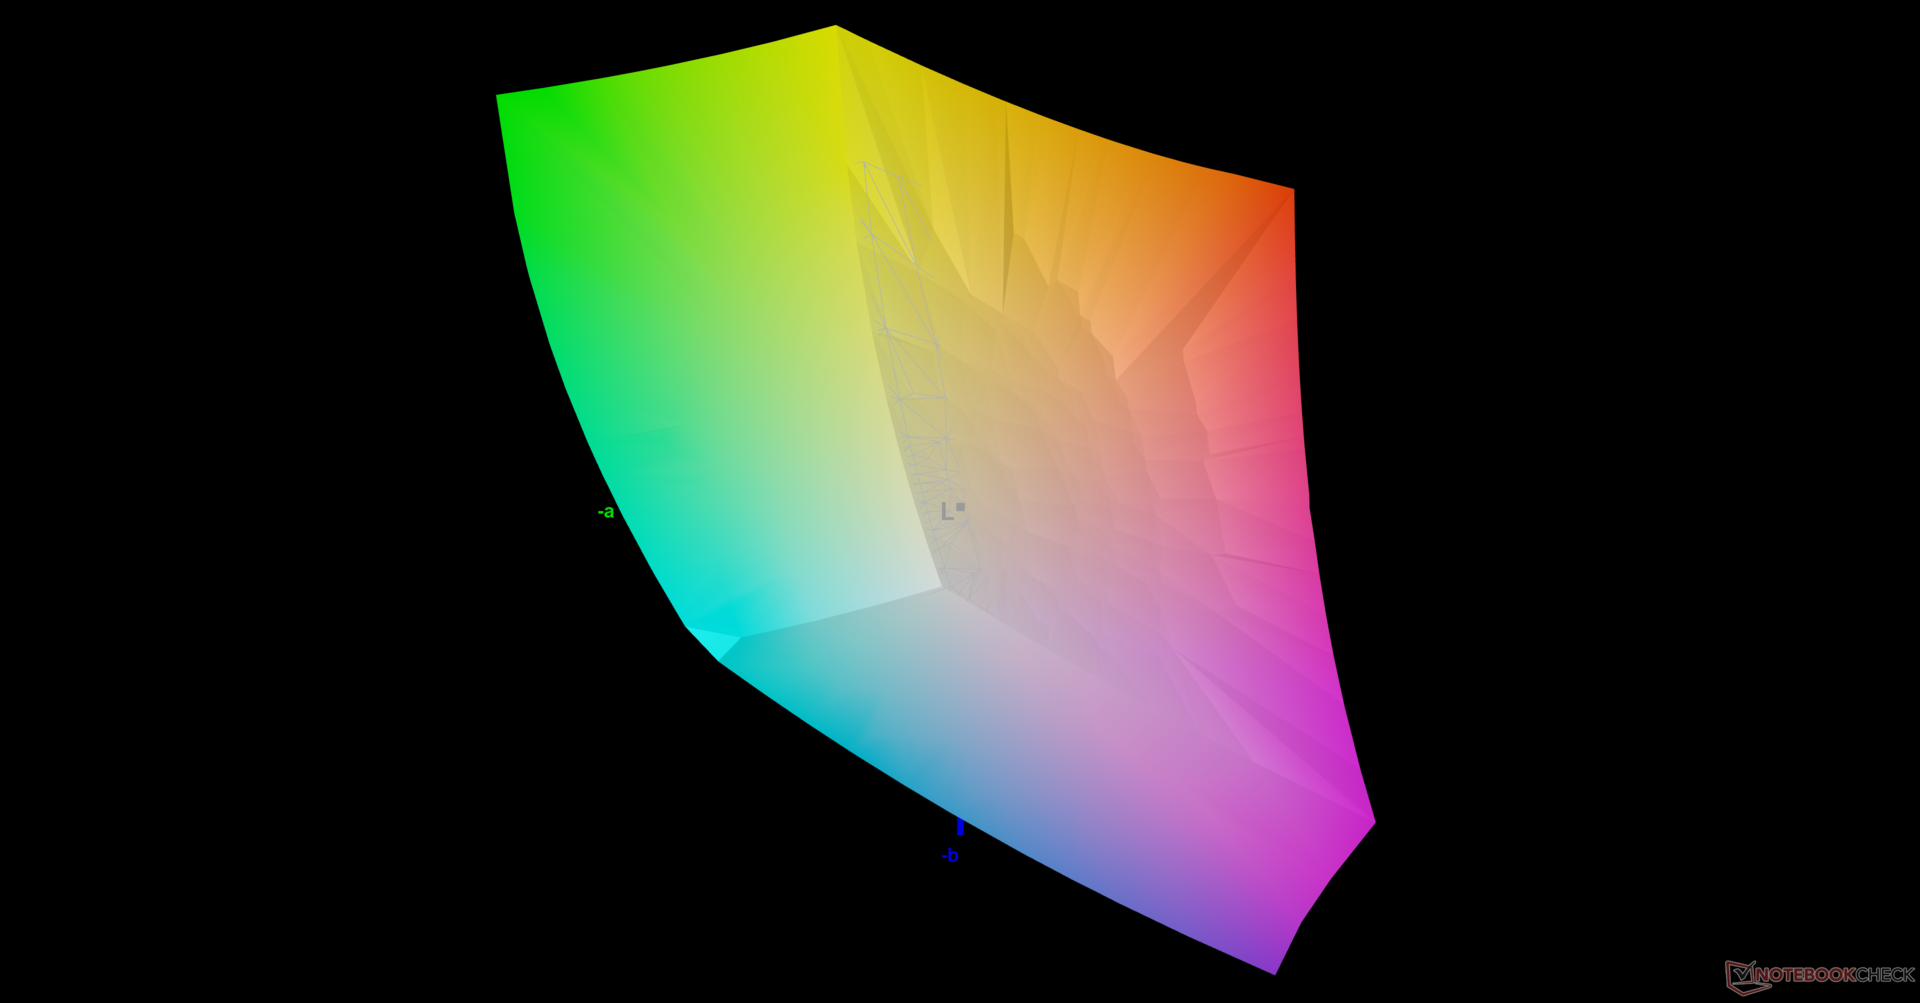
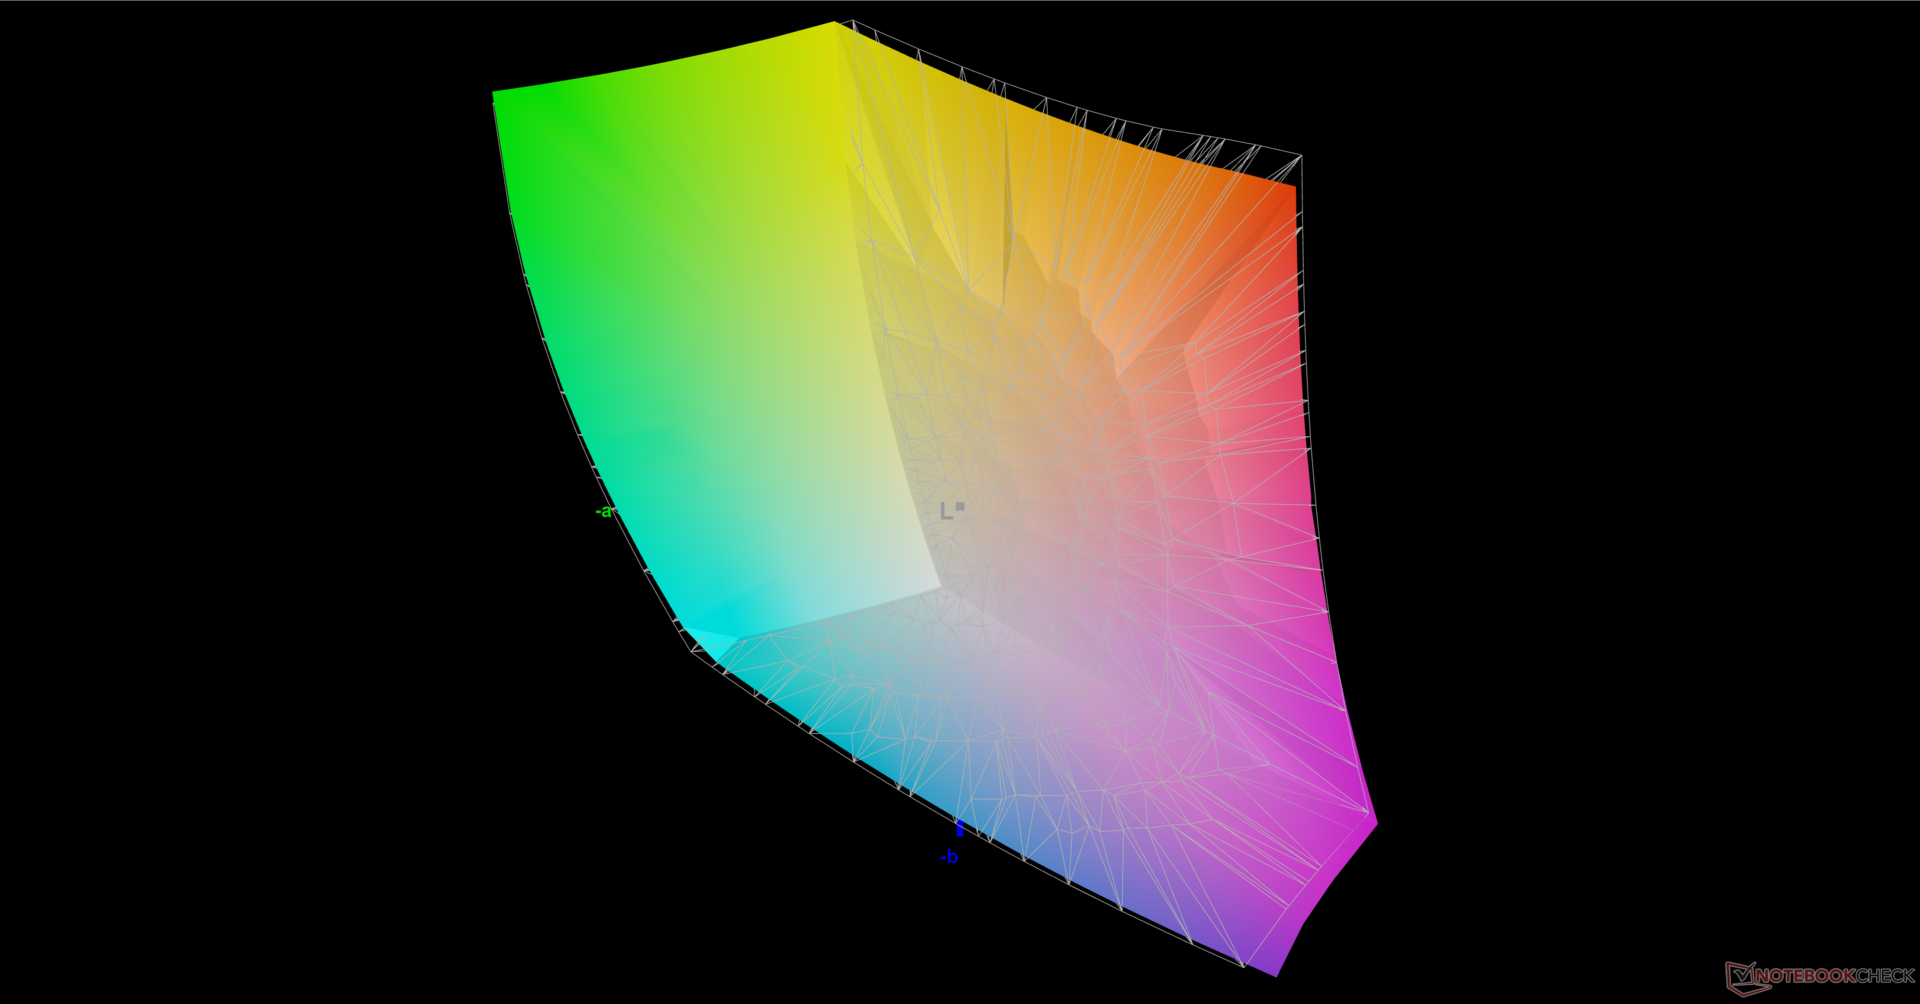
84.2% AdobeRGB 1998 (Argyll 3D)
99.8% sRGB (Argyll 3D)
95.9% Display P3 (Argyll 3D)
Gamma: 2.42
CCT: 7356 K
| Eurocom Raptor X17 Core i9-14900HX BOE CQ NE173QUM-NY1, IPS, 3840x2160, 17.3" | Eurocom Raptor X17 BOE NE173QHM-NZ1, IPS, 2560x1440, 17.3" | Asus TUF Gaming A17 FA707XI-NS94 AU Optronics B173HAN04.9, IPS, 1920x1080, 17.3" | Asus ROG Strix Scar 17 G733PY-XS96 NE173QHM-NZ2, IPS, 2560x1440, 17.3" | MSI GE78HX 13VH-070US AU Optronics B170QAN01.2, IPS, 2560x1600, 17" | MSI Titan 18 HX A14VIG AU Optronics B180ZAN01.0, Mini-LED, 3840x2400, 18" | |
|---|---|---|---|---|---|---|
| Display | 1% | -50% | 1% | 2% | 1% | |
| Display P3 Coverage (%) | 95.9 | 97.8 2% | 39.7 -59% | 98 2% | 97.6 2% | 98.1 2% |
| sRGB Coverage (%) | 99.8 | 99.9 0% | 59.1 -41% | 100 0% | 99.9 0% | 99.8 0% |
| AdobeRGB 1998 Coverage (%) | 84.2 | 85.4 1% | 41 -51% | 85.6 2% | 86.5 3% | 86.2 2% |
| Response Times | 11% | -150% | 29% | 58% | -288% | |
| Response Time Grey 50% / Grey 80% * (ms) | 14.8 ? | 13.3 ? 10% | 39 ? -164% | 6.2 ? 58% | 4.2 ? 72% | 8.6 ? 42% |
| Response Time Black / White * (ms) | 11.4 ? | 10 ? 12% | 26.9 ? -136% | 11.4 ? -0% | 6.4 ? 44% | 81.8 ? -618% |
| PWM Frequency (Hz) | 2592 ? | |||||
| Screen | -4% | -33% | 22% | -16% | -23% | |
| Brightness middle (cd/m²) | 544.6 | 312.6 -43% | 255.9 -53% | 322.5 -41% | 398.6 -27% | 467.5 -14% |
| Brightness (cd/m²) | 507 | 292 -42% | 248 -51% | 317 -37% | 384 -24% | 459 -9% |
| Brightness Distribution (%) | 77 | 75 -3% | 91 18% | 86 12% | 89 16% | 90 17% |
| Black Level * (cd/m²) | 0.48 | 0.26 46% | 0.21 56% | 0.29 40% | 0.46 4% | |
| Contrast (:1) | 1135 | 1202 6% | 1219 7% | 1112 -2% | 867 -24% | |
| Colorchecker dE 2000 * | 3.38 | 3.43 -1% | 4.51 -33% | 1.15 66% | 4.05 -20% | 3.77 -12% |
| Colorchecker dE 2000 max. * | 7.13 | 8.31 -17% | 20.77 -191% | 3.03 58% | 8.68 -22% | 6.12 14% |
| Colorchecker dE 2000 calibrated * | 1.03 | 0.74 28% | 1.82 -77% | 0.56 46% | 1.02 1% | 2.94 -185% |
| Greyscale dE 2000 * | 4.3 | 4.8 -12% | 3.2 26% | 1.7 60% | 6.5 -51% | 3.2 26% |
| Gamma | 2.42 91% | 2.12 104% | 2.08 106% | 2.27 97% | 2.11 104% | 2.43 91% |
| CCT | 7356 88% | 7082 92% | 6054 107% | 6299 103% | 7518 86% | 6478 100% |
| Moyenne finale (programmes/paramètres) | 3% /
-1% | -78% /
-54% | 17% /
19% | 15% /
-2% | -103% /
-61% |
* ... Moindre est la valeur, meilleures sont les performances
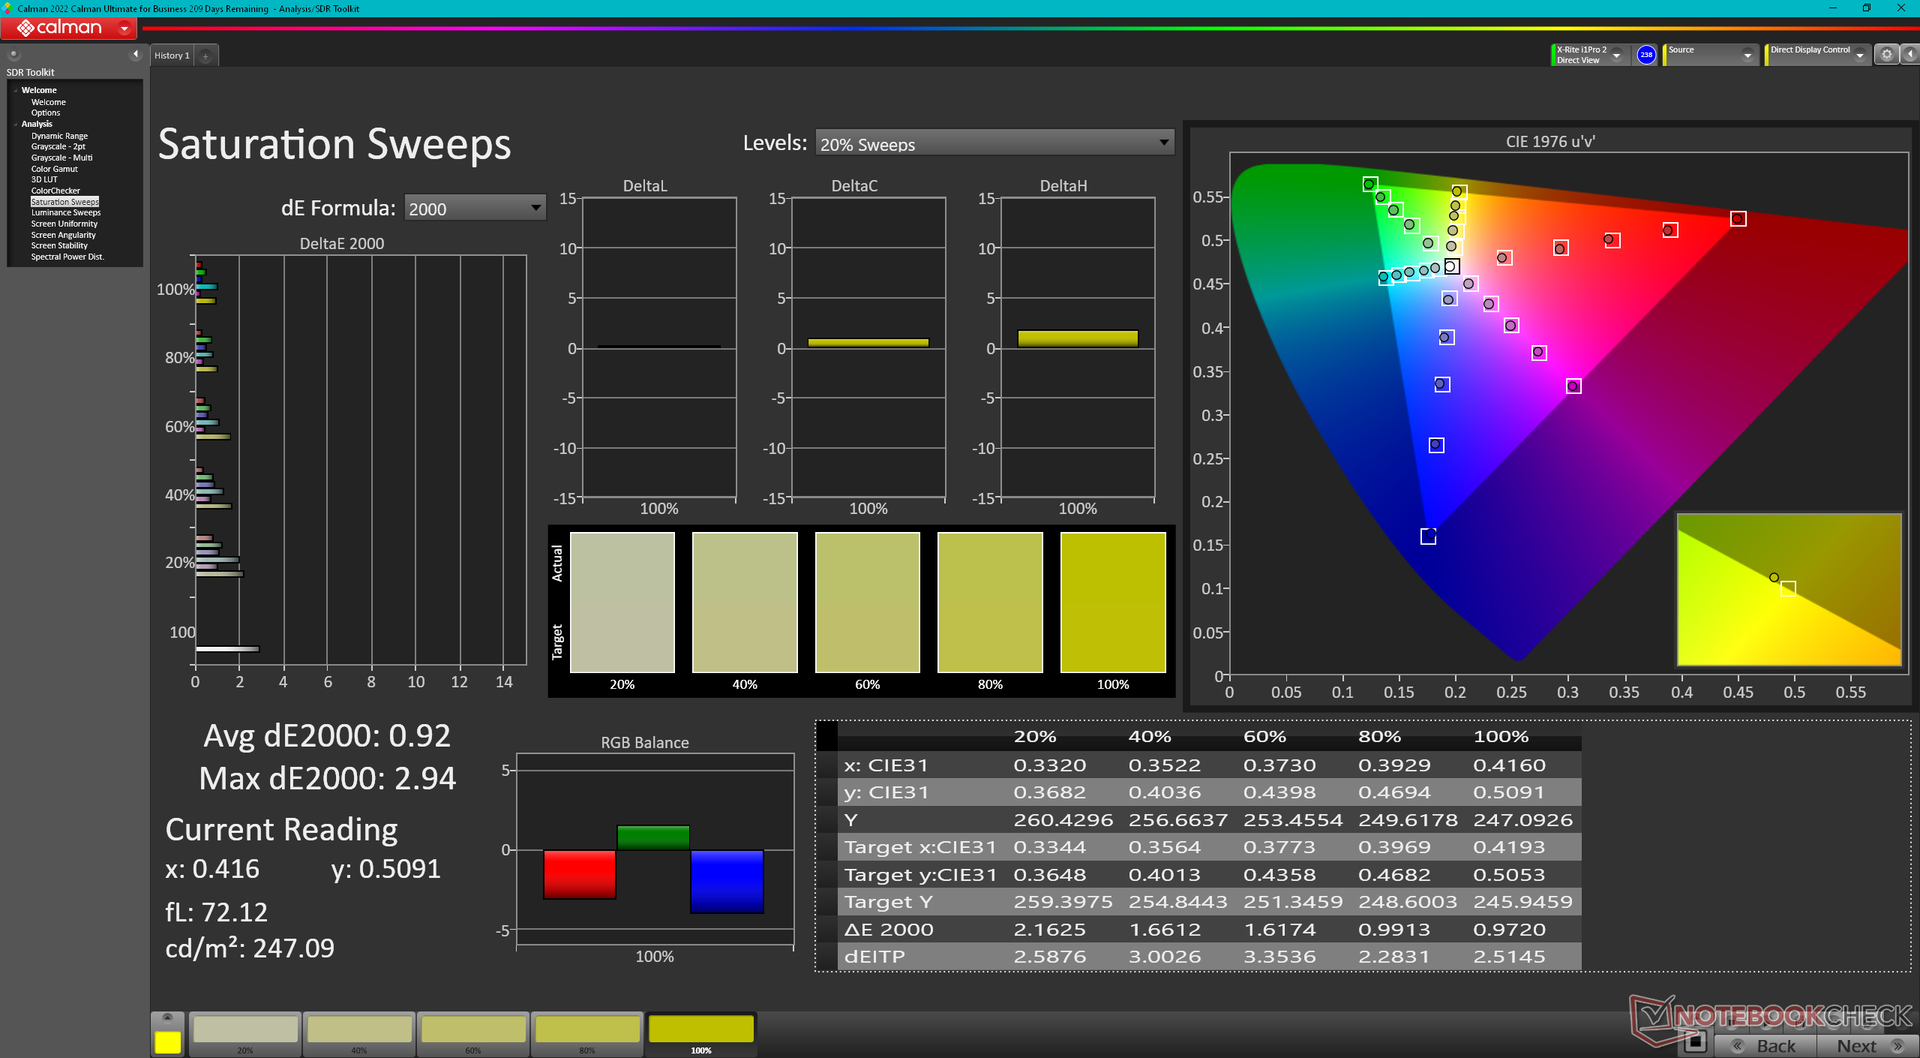
Bien que la norme P3 soit prise en charge, la précision des couleurs aurait pu être meilleure. La température des couleurs est trop froide, ce qui a un impact sur les niveaux de gris et les valeurs deltaE des couleurs. L'étalonnage avec notre colorimètre X-Rite permet de résoudre ce problème. Notre profil ICM peut être téléchargé gratuitement ci-dessus.
Temps de réponse de l'écran
| ↔ Temps de réponse noir à blanc | ||
|---|---|---|
| 11.4 ms ... hausse ↗ et chute ↘ combinées | ↗ 6.1 ms hausse | 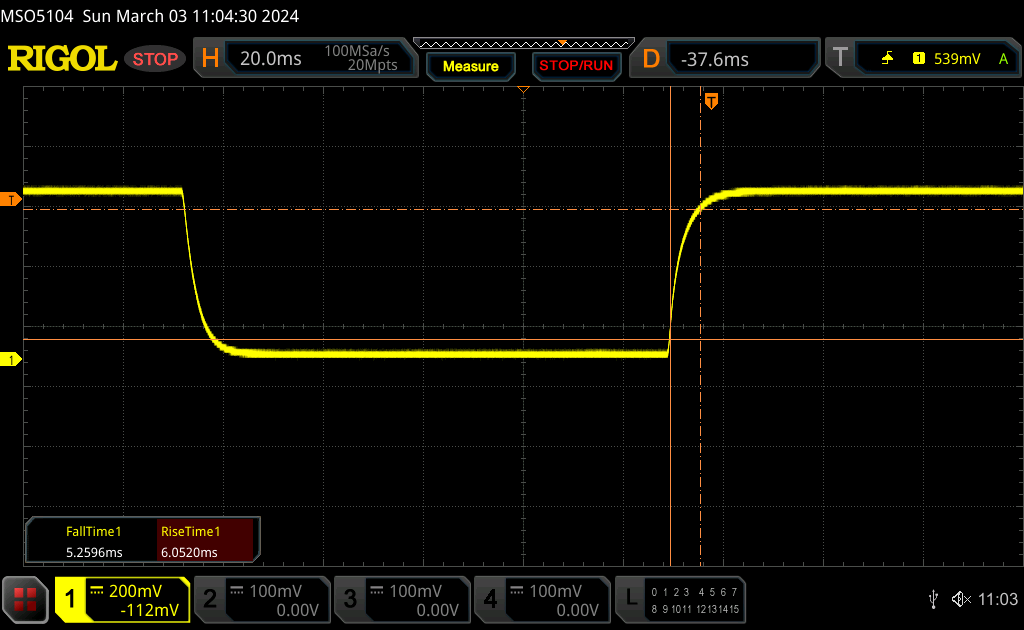 |
| ↘ 5.3 ms chute | ||
| L'écran montre de bons temps de réponse, mais insuffisant pour du jeu compétitif. En comparaison, tous les appareils testés affichent entre 0.1 (minimum) et 240 (maximum) ms. » 31 % des appareils testés affichent de meilleures performances. Cela signifie que les latences relevées sont meilleures que la moyenne (19.9 ms) de tous les appareils testés. | ||
| ↔ Temps de réponse gris 50% à gris 80% | ||
| 14.8 ms ... hausse ↗ et chute ↘ combinées | ↗ 7.2 ms hausse | 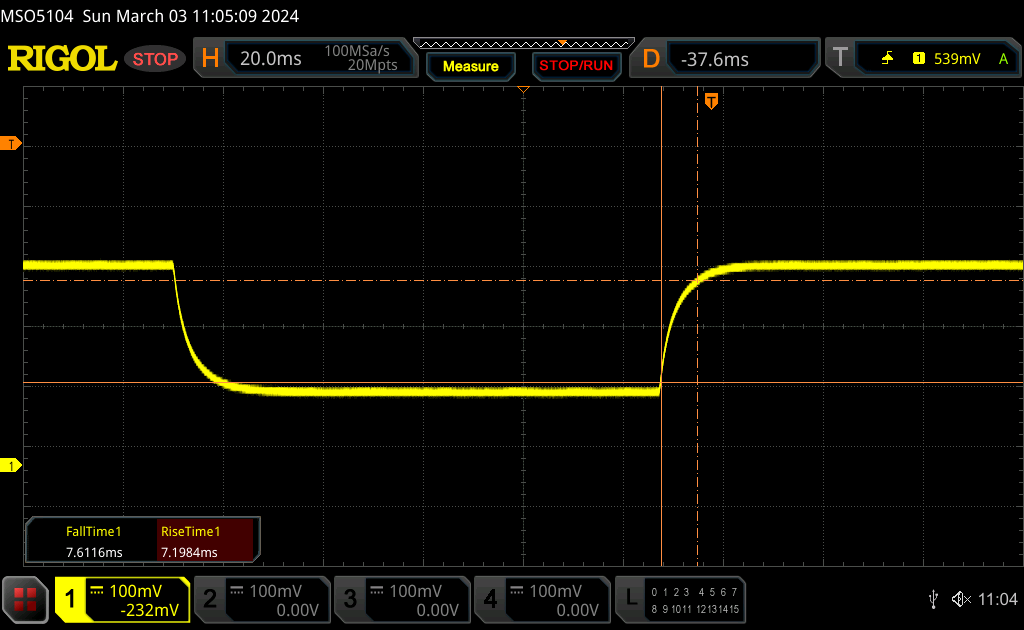 |
| ↘ 7.6 ms chute | ||
| L'écran montre de bons temps de réponse, mais insuffisant pour du jeu compétitif. En comparaison, tous les appareils testés affichent entre 0.165 (minimum) et 636 (maximum) ms. » 29 % des appareils testés affichent de meilleures performances. Cela signifie que les latences relevées sont meilleures que la moyenne (31.1 ms) de tous les appareils testés. | ||
Scintillement / MLI (Modulation de largeur d'impulsion)
| Scintillement / MLI (Modulation de largeur d'impulsion) non décelé | 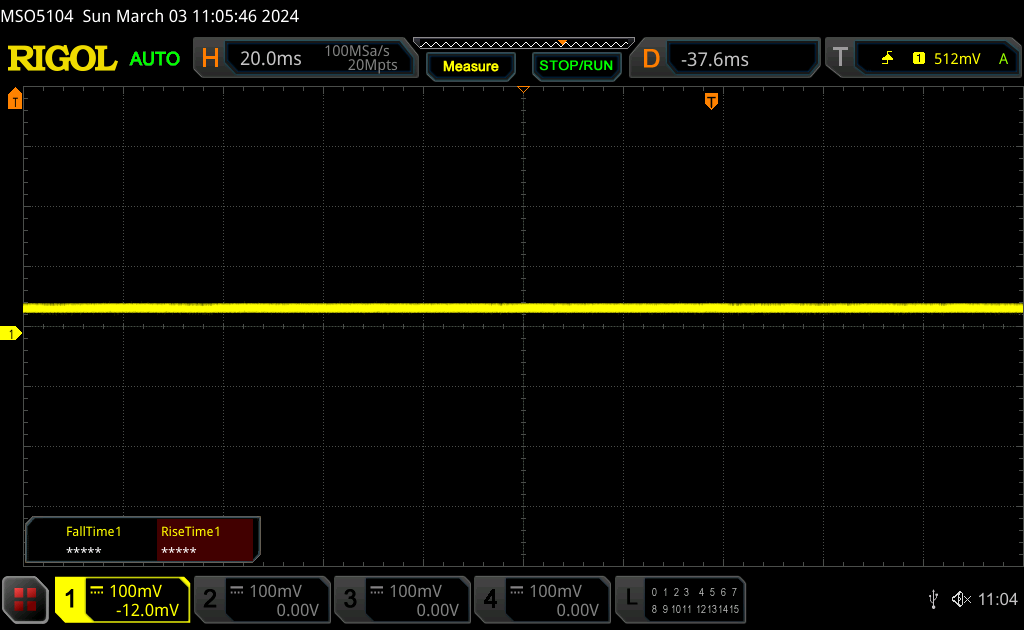 | ||
En comparaison, 52 % des appareils testés n'emploient pas MDI pour assombrir leur écran. Nous avons relevé une moyenne à 7784 (minimum : 5 - maximum : 343500) Hz dans le cas où une MDI était active. | |||
Performance - Raptor Lake-HX Refresh
Conditions d'essai
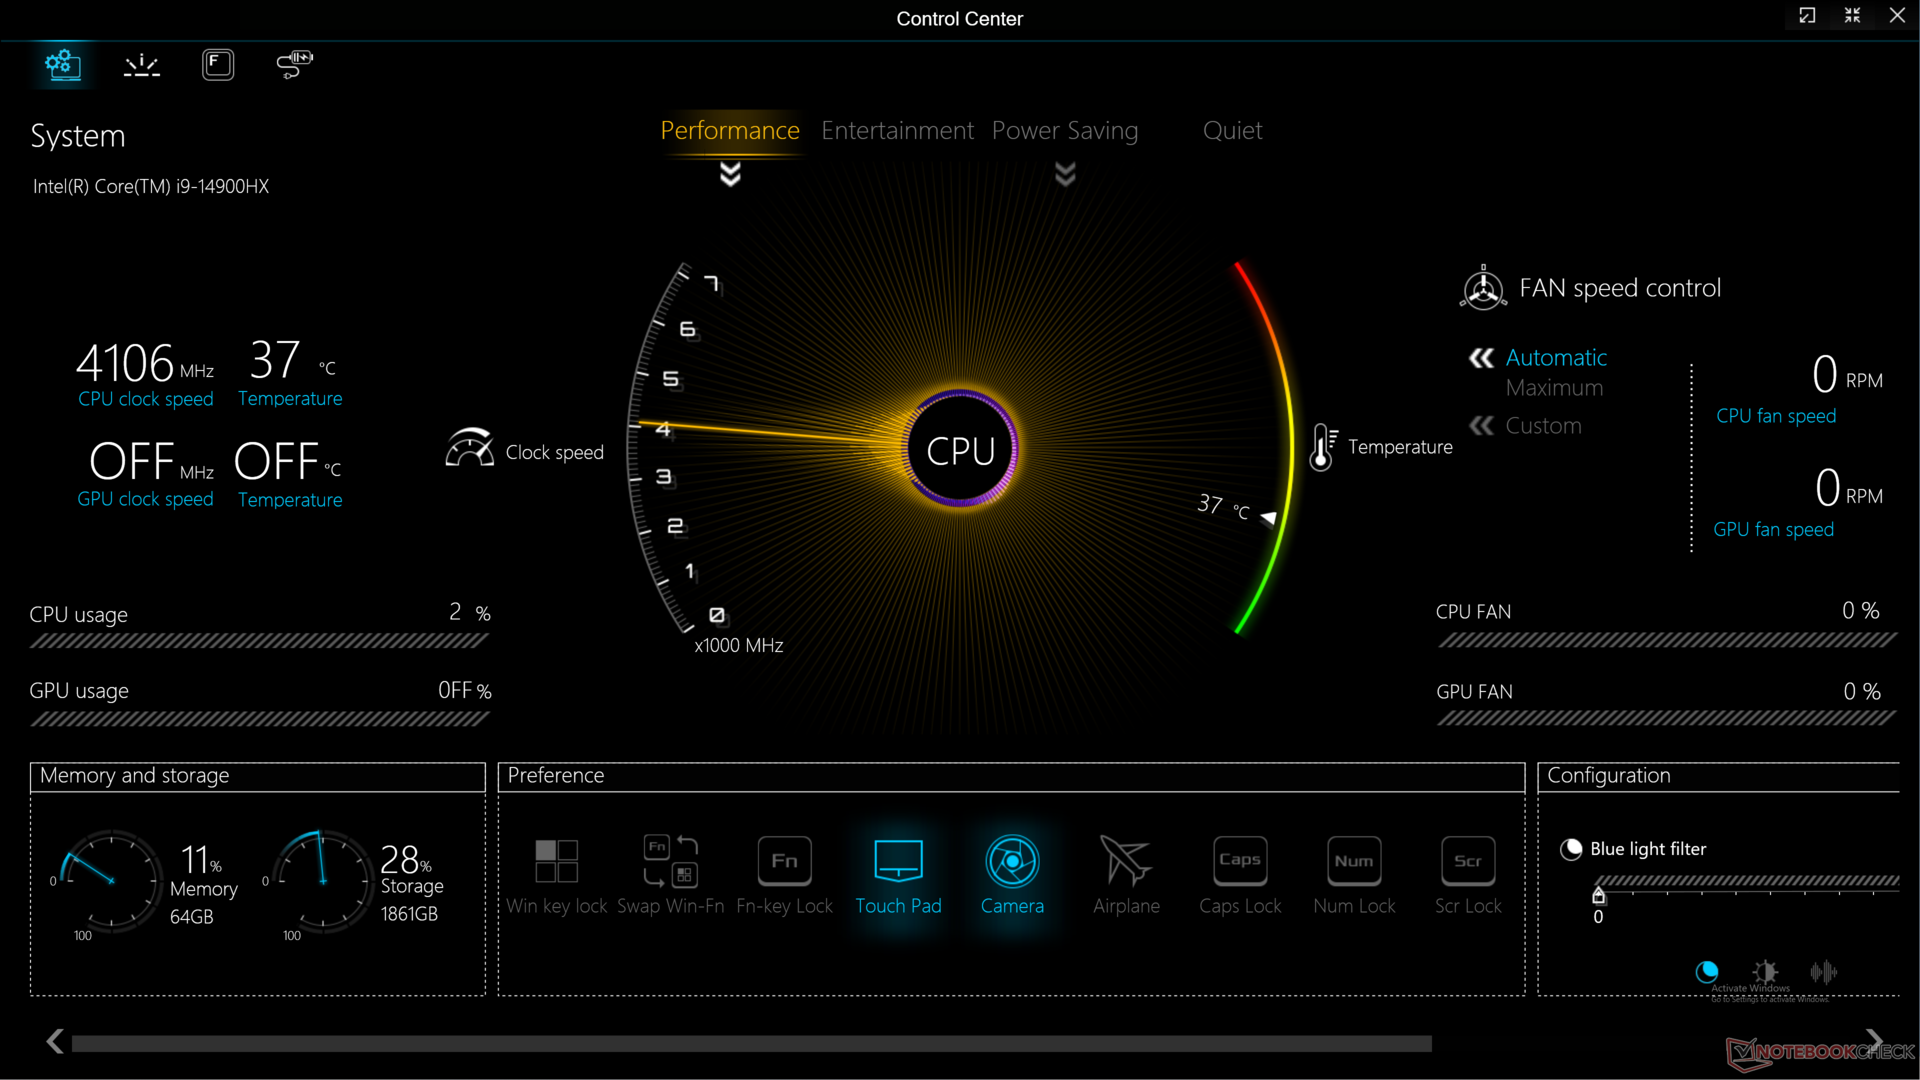
Nous avons réglé Windows et le centre de contrôle sur le mode Performance avec le ventilateur maximum activé avant d'exécuter les tests de référence ci-dessous. Le commutateur manuel du GPU peut également être trouvé dans le centre de contrôle, mais il est caché derrière une barre de défilement. G-Sync est pris en charge alors qu'Advanced Optimus ne l'est pas, ce qui signifie qu'un redémarrage est nécessaire pour passer de l'iGPU au dGPU.
Les modes "Divertissement" et "Performance" du centre de contrôle peuvent prêter à confusion. Il serait peut-être plus approprié de renommer le mode "Divertissement" en quelque chose comme "Équilibré".
Processeur
La série Raptor Lake-HX a été rafraîchie pour 2024, mais les avantages en termes de performances sont au mieux marginaux par rapport à la série 2023. En passant du Core i9-13900HX du Raptor X17 de l'année dernière au Core i9-14900HX dans cette nouvelle configuration, les performances ne sont améliorées que de 5 à 10 %. Le chipset ne comporte pas de NPU intégré, contrairement à la plateforme Meteor Lake.
Cinebench R15 Multi Loop
Cinebench R23: Multi Core | Single Core
Cinebench R20: CPU (Multi Core) | CPU (Single Core)
Cinebench R15: CPU Multi 64Bit | CPU Single 64Bit
Blender: v2.79 BMW27 CPU
7-Zip 18.03: 7z b 4 | 7z b 4 -mmt1
Geekbench 6.7: Multi-Core | Single-Core
Geekbench 5.5: Multi-Core | Single-Core
HWBOT x265 Benchmark v2.2: 4k Preset
LibreOffice : 20 Documents To PDF
R Benchmark 2.5: Overall mean
| CPU Performance rating | |
| KFA2 GeForce RTX 4080 Super SG -6! | |
| Asus ROG Strix Scar 17 G733PYV-LL053X | |
| Asus ROG Strix Scar 17 G733PY-XS96 -2! | |
| MSI GE78HX 13VH-070US -2! | |
| MSI Titan 18 HX A14VIG | |
| MSI Raider GE78 HX 13VI | |
| Moyenne Intel Core i9-14900HX | |
| Eurocom Raptor X17 Core i9-14900HX | |
| Eurocom Raptor X17 -2! | |
| Alienware x16 R1 -3! | |
| Asus TUF Gaming A17 FA707XI-NS94 | |
| Dell XPS 17 9730 RTX 4070 -2! | |
| Medion Erazer Defender P40 -2! | |
| Eurocom Nightsky TXi317 -4! | |
| Acer Nitro 17 AN17-41-R9LN | |
| Alienware m17 R5 (R9 6900HX, RX 6850M XT) -2! | |
| Cinebench R15 / CPU Single 64Bit | |
| Asus ROG Strix Scar 17 G733PYV-LL053X | |
| Asus ROG Strix Scar 17 G733PY-XS96 | |
| Moyenne Intel Core i9-14900HX (247 - 323, n=37) | |
| MSI GE78HX 13VH-070US | |
| MSI Raider GE78 HX 13VI | |
| MSI Titan 18 HX A14VIG | |
| Eurocom Raptor X17 Core i9-14900HX | |
| Eurocom Raptor X17 | |
| Asus TUF Gaming A17 FA707XI-NS94 | |
| Alienware x16 R1 | |
| Dell XPS 17 9730 RTX 4070 | |
| Acer Nitro 17 AN17-41-R9LN | |
| Alienware m17 R5 (R9 6900HX, RX 6850M XT) | |
| Medion Erazer Defender P40 | |
| Geekbench 6.7 / Multi-Core | |
| KFA2 GeForce RTX 4080 Super SG | |
| Eurocom Raptor X17 Core i9-14900HX | |
| MSI Raider GE78 HX 13VI | |
| Moyenne Intel Core i9-14900HX (13158 - 19665, n=37) | |
| Asus ROG Strix Scar 17 G733PYV-LL053X | |
| MSI Titan 18 HX A14VIG | |
| Asus TUF Gaming A17 FA707XI-NS94 | |
| Acer Nitro 17 AN17-41-R9LN | |
| Geekbench 6.7 / Single-Core | |
| KFA2 GeForce RTX 4080 Super SG | |
| Moyenne Intel Core i9-14900HX (2419 - 3129, n=37) | |
| Asus ROG Strix Scar 17 G733PYV-LL053X | |
| Eurocom Raptor X17 Core i9-14900HX | |
| MSI Titan 18 HX A14VIG | |
| MSI Raider GE78 HX 13VI | |
| Asus TUF Gaming A17 FA707XI-NS94 | |
| Acer Nitro 17 AN17-41-R9LN | |
Cinebench R23: Multi Core | Single Core
Cinebench R20: CPU (Multi Core) | CPU (Single Core)
Cinebench R15: CPU Multi 64Bit | CPU Single 64Bit
Blender: v2.79 BMW27 CPU
7-Zip 18.03: 7z b 4 | 7z b 4 -mmt1
Geekbench 6.7: Multi-Core | Single-Core
Geekbench 5.5: Multi-Core | Single-Core
HWBOT x265 Benchmark v2.2: 4k Preset
LibreOffice : 20 Documents To PDF
R Benchmark 2.5: Overall mean
* ... Moindre est la valeur, meilleures sont les performances
AIDA64: FP32 Ray-Trace | FPU Julia | CPU SHA3 | CPU Queen | FPU SinJulia | FPU Mandel | CPU AES | CPU ZLib | FP64 Ray-Trace | CPU PhotoWorxx
| Performance rating | |
| Asus ROG Strix Scar 17 G733PY-XS96 | |
| Eurocom Raptor X17 Core i9-14900HX | |
| MSI GE78HX 13VH-070US | |
| MSI Titan 18 HX A14VIG | |
| Moyenne Intel Core i9-14900HX | |
| Eurocom Raptor X17 | |
| Asus TUF Gaming A17 FA707XI-NS94 | |
| AIDA64 / FP32 Ray-Trace | |
| Asus ROG Strix Scar 17 G733PY-XS96 | |
| MSI Titan 18 HX A14VIG | |
| Asus TUF Gaming A17 FA707XI-NS94 | |
| MSI GE78HX 13VH-070US | |
| Eurocom Raptor X17 Core i9-14900HX | |
| Moyenne Intel Core i9-14900HX (13098 - 33474, n=36) | |
| Eurocom Raptor X17 | |
| AIDA64 / FPU Julia | |
| Asus ROG Strix Scar 17 G733PY-XS96 | |
| MSI Titan 18 HX A14VIG | |
| MSI GE78HX 13VH-070US | |
| Eurocom Raptor X17 Core i9-14900HX | |
| Moyenne Intel Core i9-14900HX (67573 - 166040, n=36) | |
| Asus TUF Gaming A17 FA707XI-NS94 | |
| Eurocom Raptor X17 | |
| AIDA64 / CPU SHA3 | |
| Asus ROG Strix Scar 17 G733PY-XS96 | |
| MSI Titan 18 HX A14VIG | |
| Eurocom Raptor X17 Core i9-14900HX | |
| MSI GE78HX 13VH-070US | |
| Moyenne Intel Core i9-14900HX (3589 - 7979, n=36) | |
| Eurocom Raptor X17 | |
| Asus TUF Gaming A17 FA707XI-NS94 | |
| AIDA64 / CPU Queen | |
| Asus ROG Strix Scar 17 G733PY-XS96 | |
| MSI Titan 18 HX A14VIG | |
| Eurocom Raptor X17 Core i9-14900HX | |
| MSI GE78HX 13VH-070US | |
| Moyenne Intel Core i9-14900HX (118405 - 148966, n=36) | |
| Eurocom Raptor X17 | |
| Asus TUF Gaming A17 FA707XI-NS94 | |
| AIDA64 / FPU SinJulia | |
| Asus ROG Strix Scar 17 G733PY-XS96 | |
| MSI Titan 18 HX A14VIG | |
| MSI GE78HX 13VH-070US | |
| Eurocom Raptor X17 Core i9-14900HX | |
| Asus TUF Gaming A17 FA707XI-NS94 | |
| Moyenne Intel Core i9-14900HX (10475 - 18517, n=36) | |
| Eurocom Raptor X17 | |
| AIDA64 / FPU Mandel | |
| Asus ROG Strix Scar 17 G733PY-XS96 | |
| MSI Titan 18 HX A14VIG | |
| MSI GE78HX 13VH-070US | |
| Eurocom Raptor X17 Core i9-14900HX | |
| Asus TUF Gaming A17 FA707XI-NS94 | |
| Moyenne Intel Core i9-14900HX (32543 - 83662, n=36) | |
| Eurocom Raptor X17 | |
| AIDA64 / CPU AES | |
| Eurocom Raptor X17 Core i9-14900HX | |
| Asus ROG Strix Scar 17 G733PY-XS96 | |
| Moyenne Intel Core i9-14900HX (86964 - 241777, n=36) | |
| MSI Titan 18 HX A14VIG | |
| MSI GE78HX 13VH-070US | |
| Eurocom Raptor X17 | |
| Asus TUF Gaming A17 FA707XI-NS94 | |
| AIDA64 / CPU ZLib | |
| Asus ROG Strix Scar 17 G733PY-XS96 | |
| MSI Titan 18 HX A14VIG | |
| MSI GE78HX 13VH-070US | |
| Eurocom Raptor X17 Core i9-14900HX | |
| Eurocom Raptor X17 | |
| Moyenne Intel Core i9-14900HX (1054 - 2292, n=36) | |
| Asus TUF Gaming A17 FA707XI-NS94 | |
| AIDA64 / FP64 Ray-Trace | |
| Asus ROG Strix Scar 17 G733PY-XS96 | |
| MSI Titan 18 HX A14VIG | |
| Asus TUF Gaming A17 FA707XI-NS94 | |
| MSI GE78HX 13VH-070US | |
| Eurocom Raptor X17 Core i9-14900HX | |
| Moyenne Intel Core i9-14900HX (6809 - 18349, n=36) | |
| Eurocom Raptor X17 | |
| AIDA64 / CPU PhotoWorxx | |
| Eurocom Raptor X17 | |
| Eurocom Raptor X17 Core i9-14900HX | |
| MSI GE78HX 13VH-070US | |
| Moyenne Intel Core i9-14900HX (23903 - 54702, n=36) | |
| Asus ROG Strix Scar 17 G733PY-XS96 | |
| MSI Titan 18 HX A14VIG | |
| Asus TUF Gaming A17 FA707XI-NS94 | |
Test de stress
La température du cœur lors de l'exécution du stress Prime95 est légèrement plus basse cette fois-ci, à 91°C contre 97°C sur le modèle de l'année dernière, ce qui suggère des gains d'efficacité mineurs.
L'exécution de Witcher 3 pour représenter des charges de jeu typiques avec le mode Maximum Fan activé et désactivé ne montre aucune différence de performance majeure entre les deux. Ces résultats complètent ceux que nous avons obtenus sur le site Fire Strike dans la section Performances du GPU ci-dessous. L'activation du mode Ventilateur maximum ne fait que faire tourner les ventilateurs à leur vitesse maximale, quelle que soit la charge à l'écran ; elle n'augmente pas réellement le plafond maximum du ventilateur. Par conséquent, le bruit du ventilateur lors des jeux sera le même entre les deux modes.
La consommation d'énergie de la carte GPU est stable à 169 W, ce qui correspond presque à l'objectif de 175 W maximum. Le passage en mode divertissement réduit la consommation d'énergie de la carte à 148 W pour des performances graphiques légèrement plus lentes.
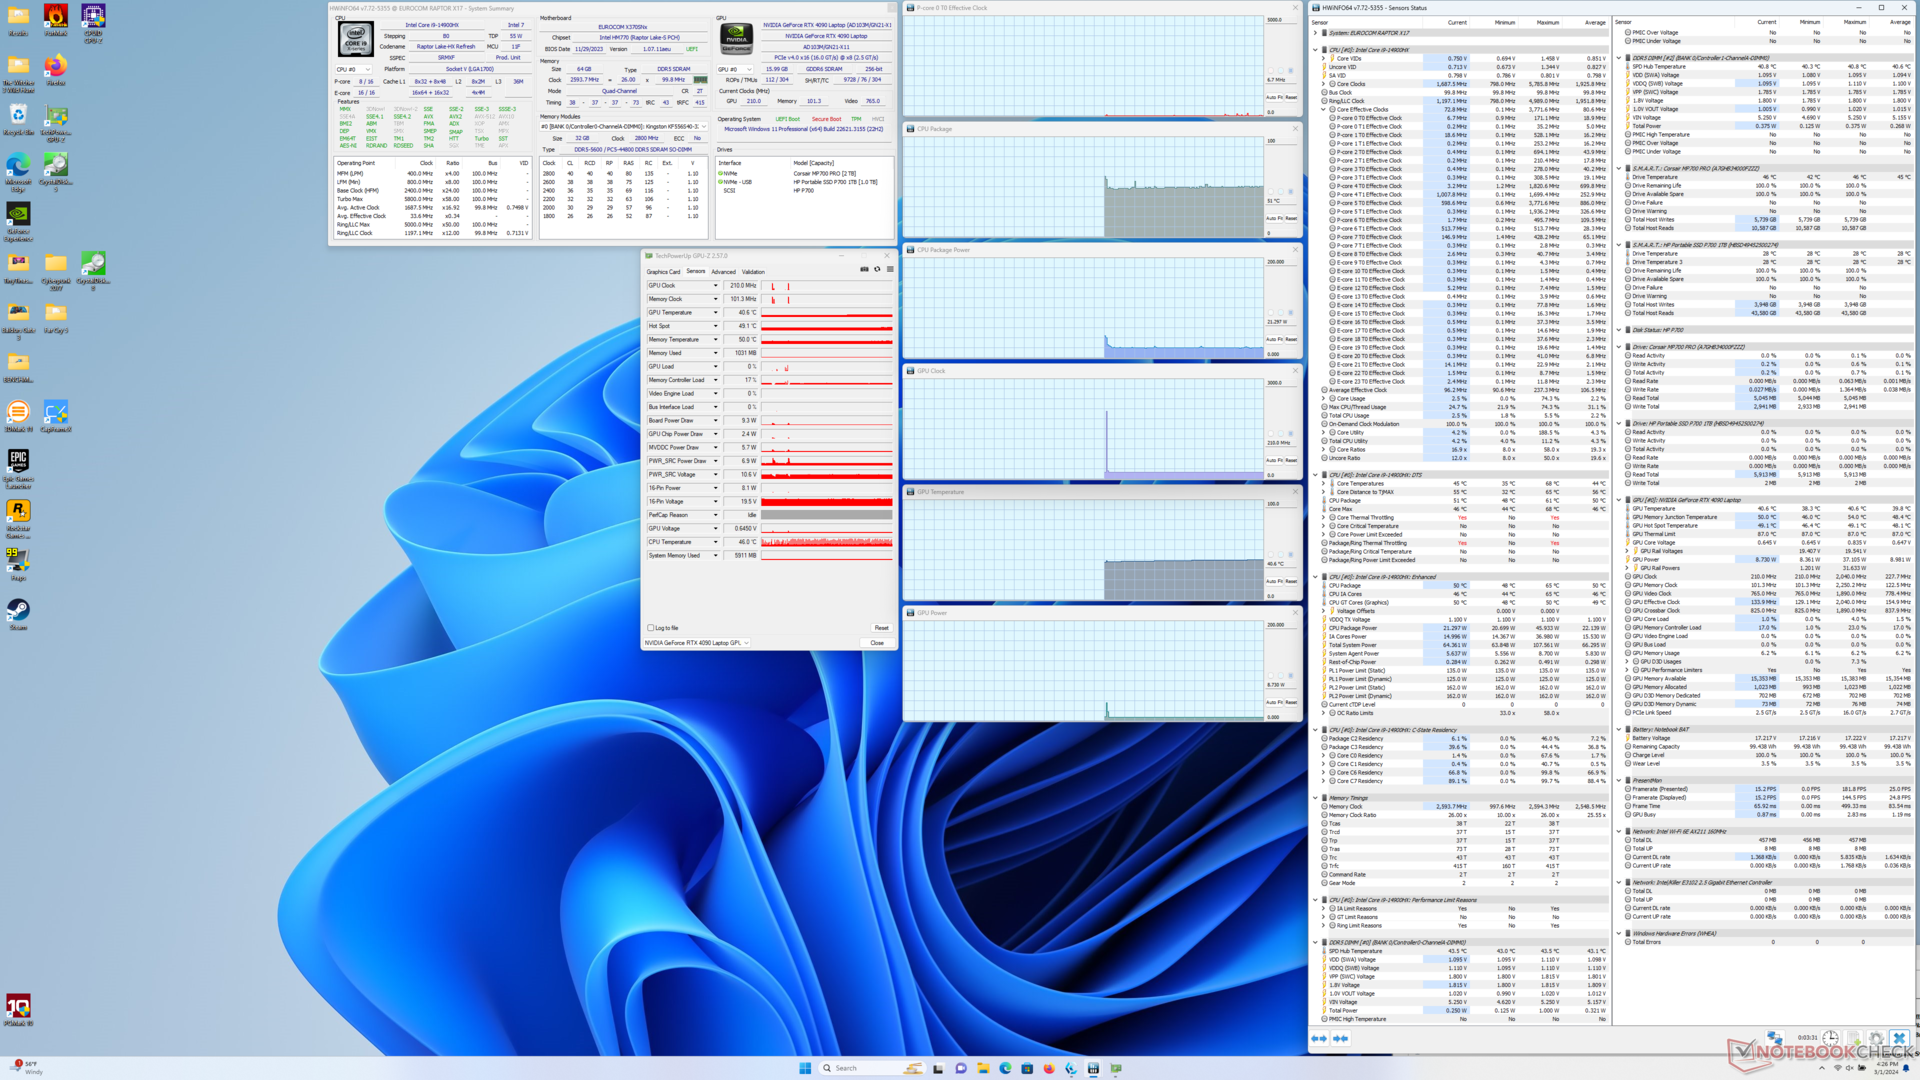
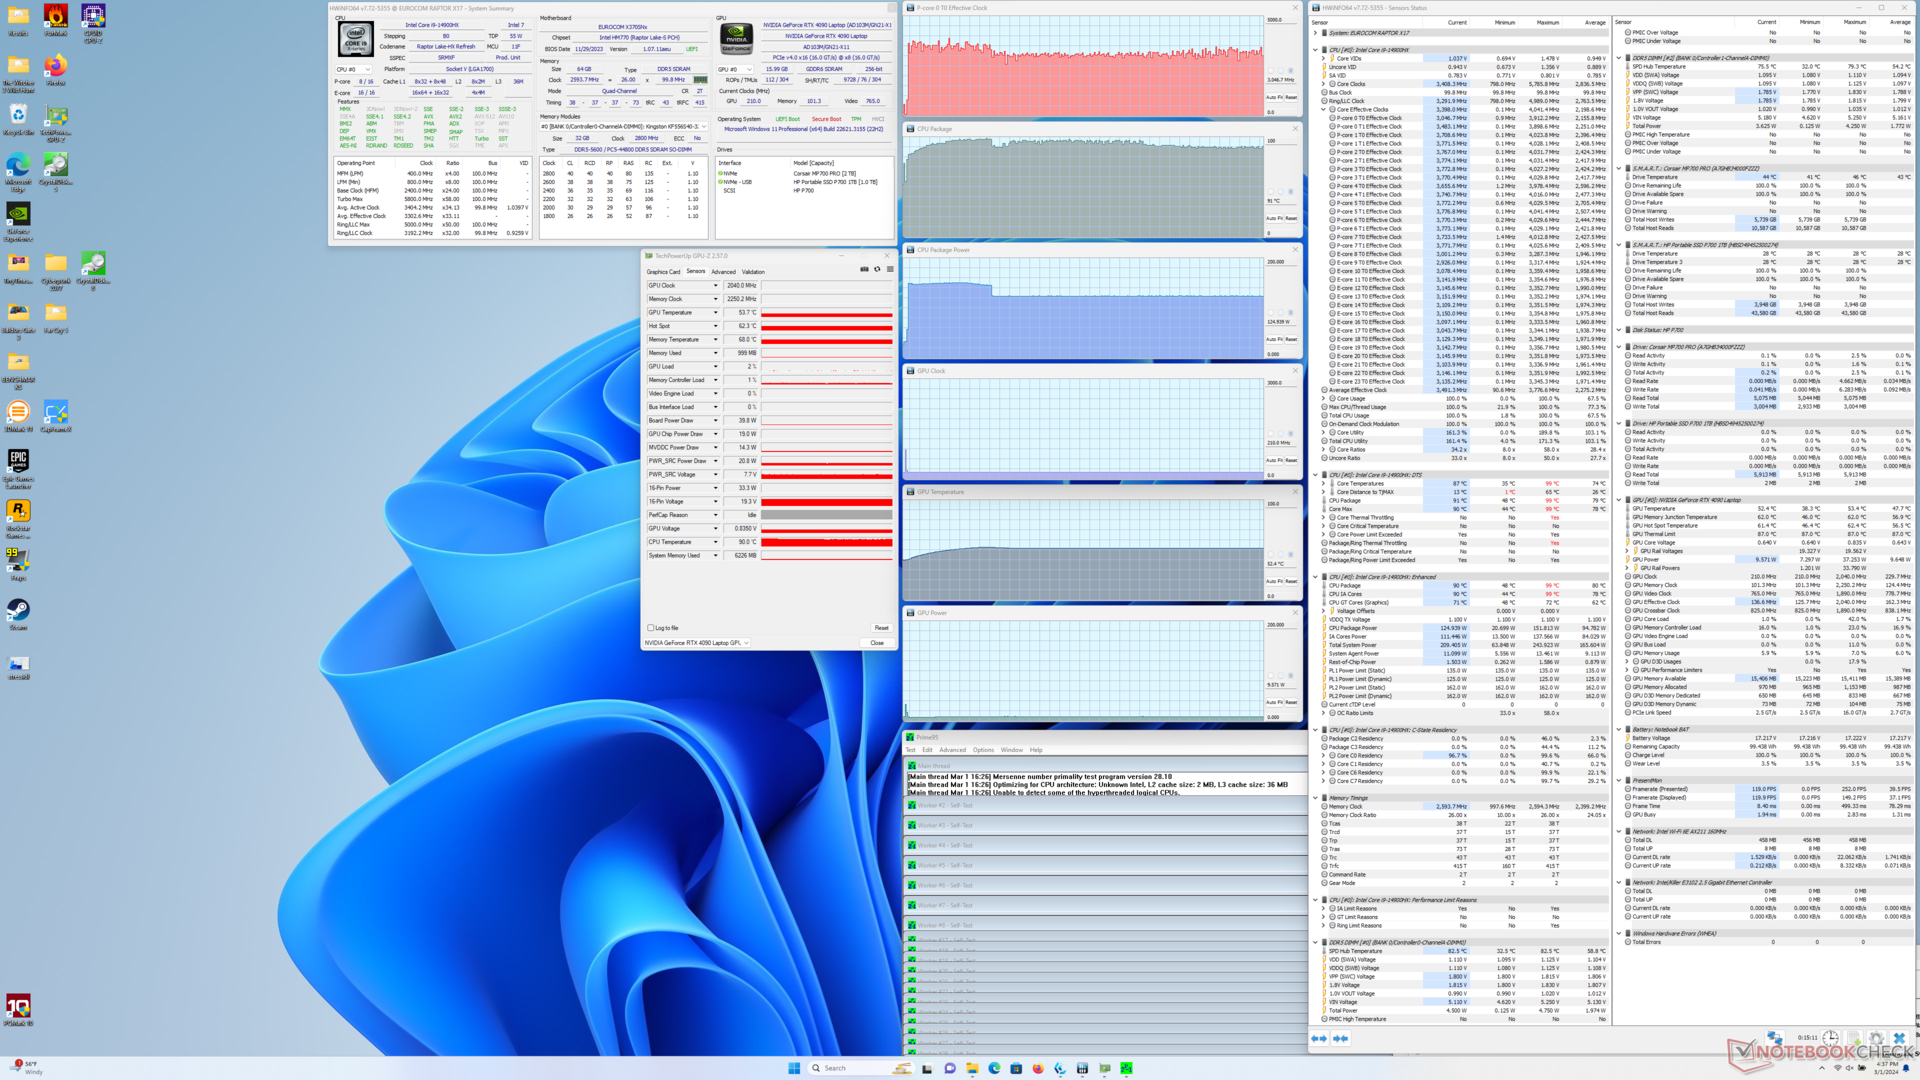
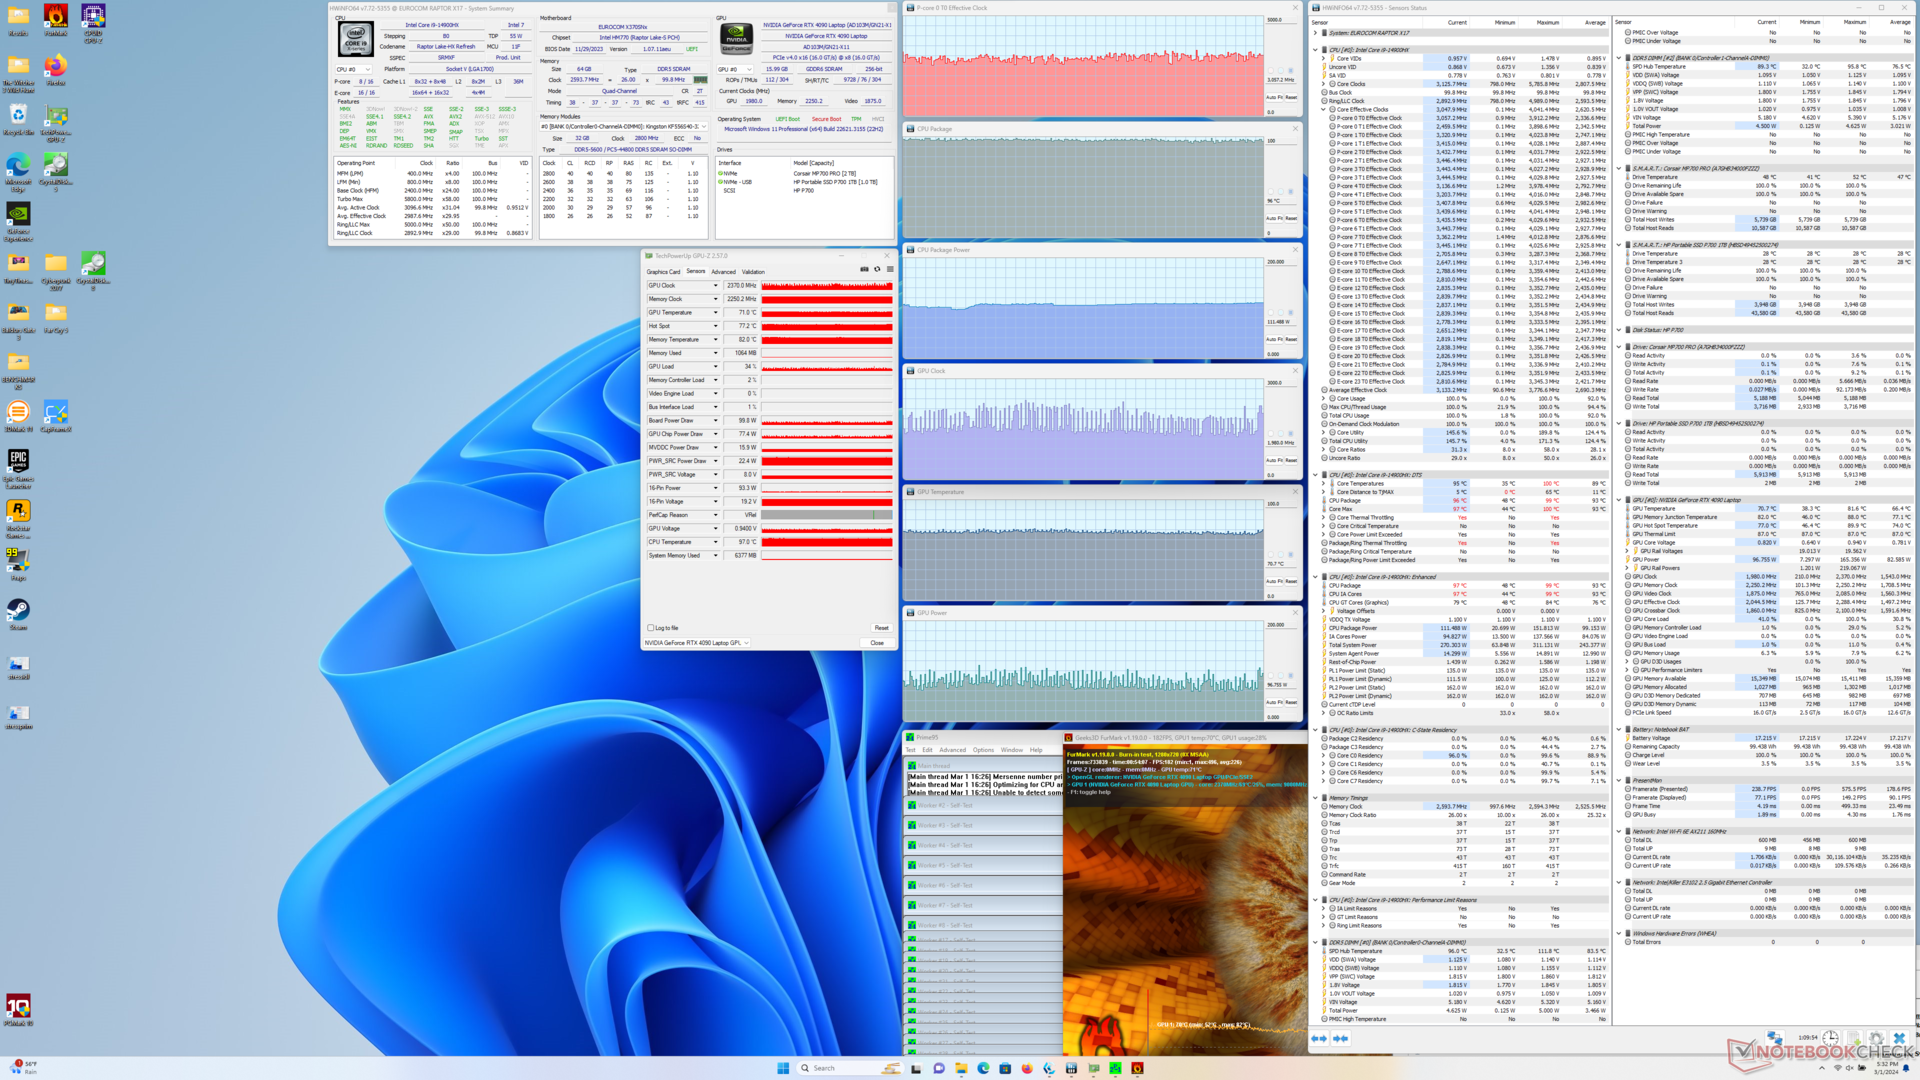
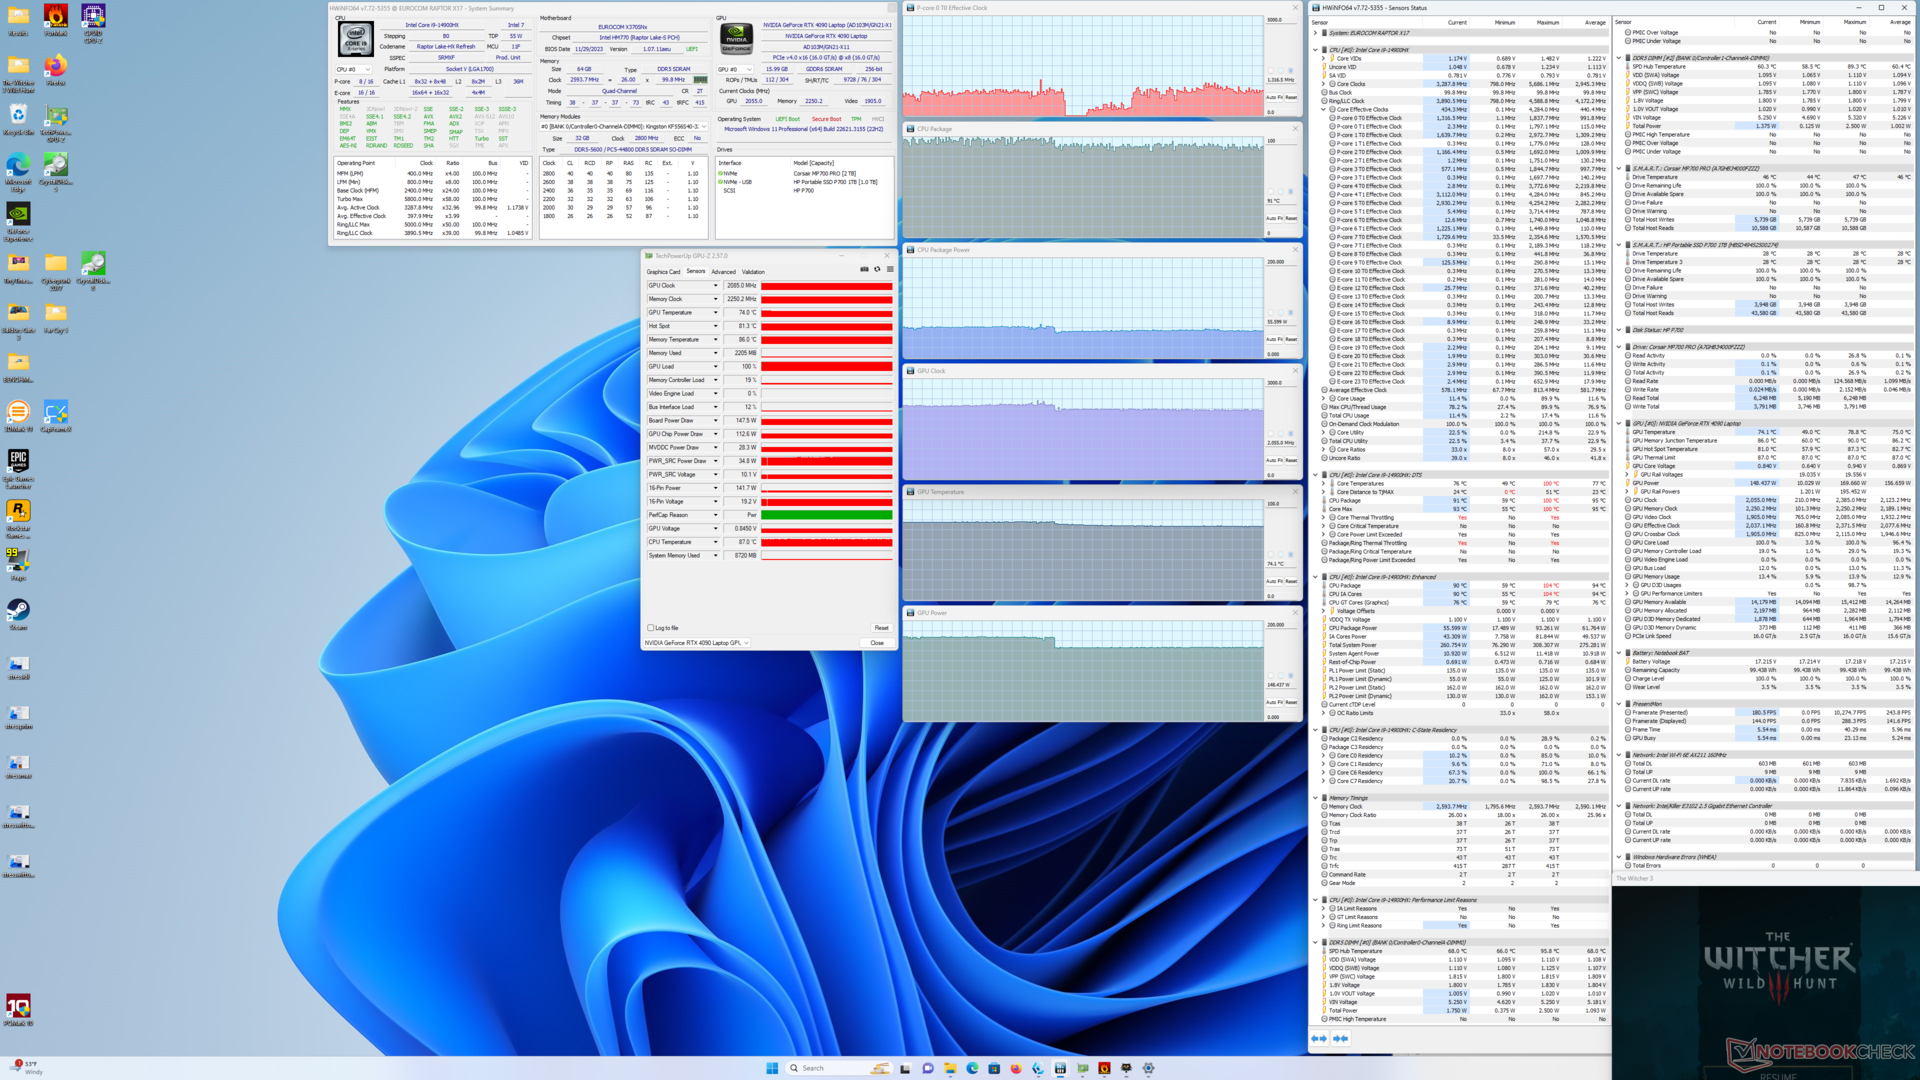

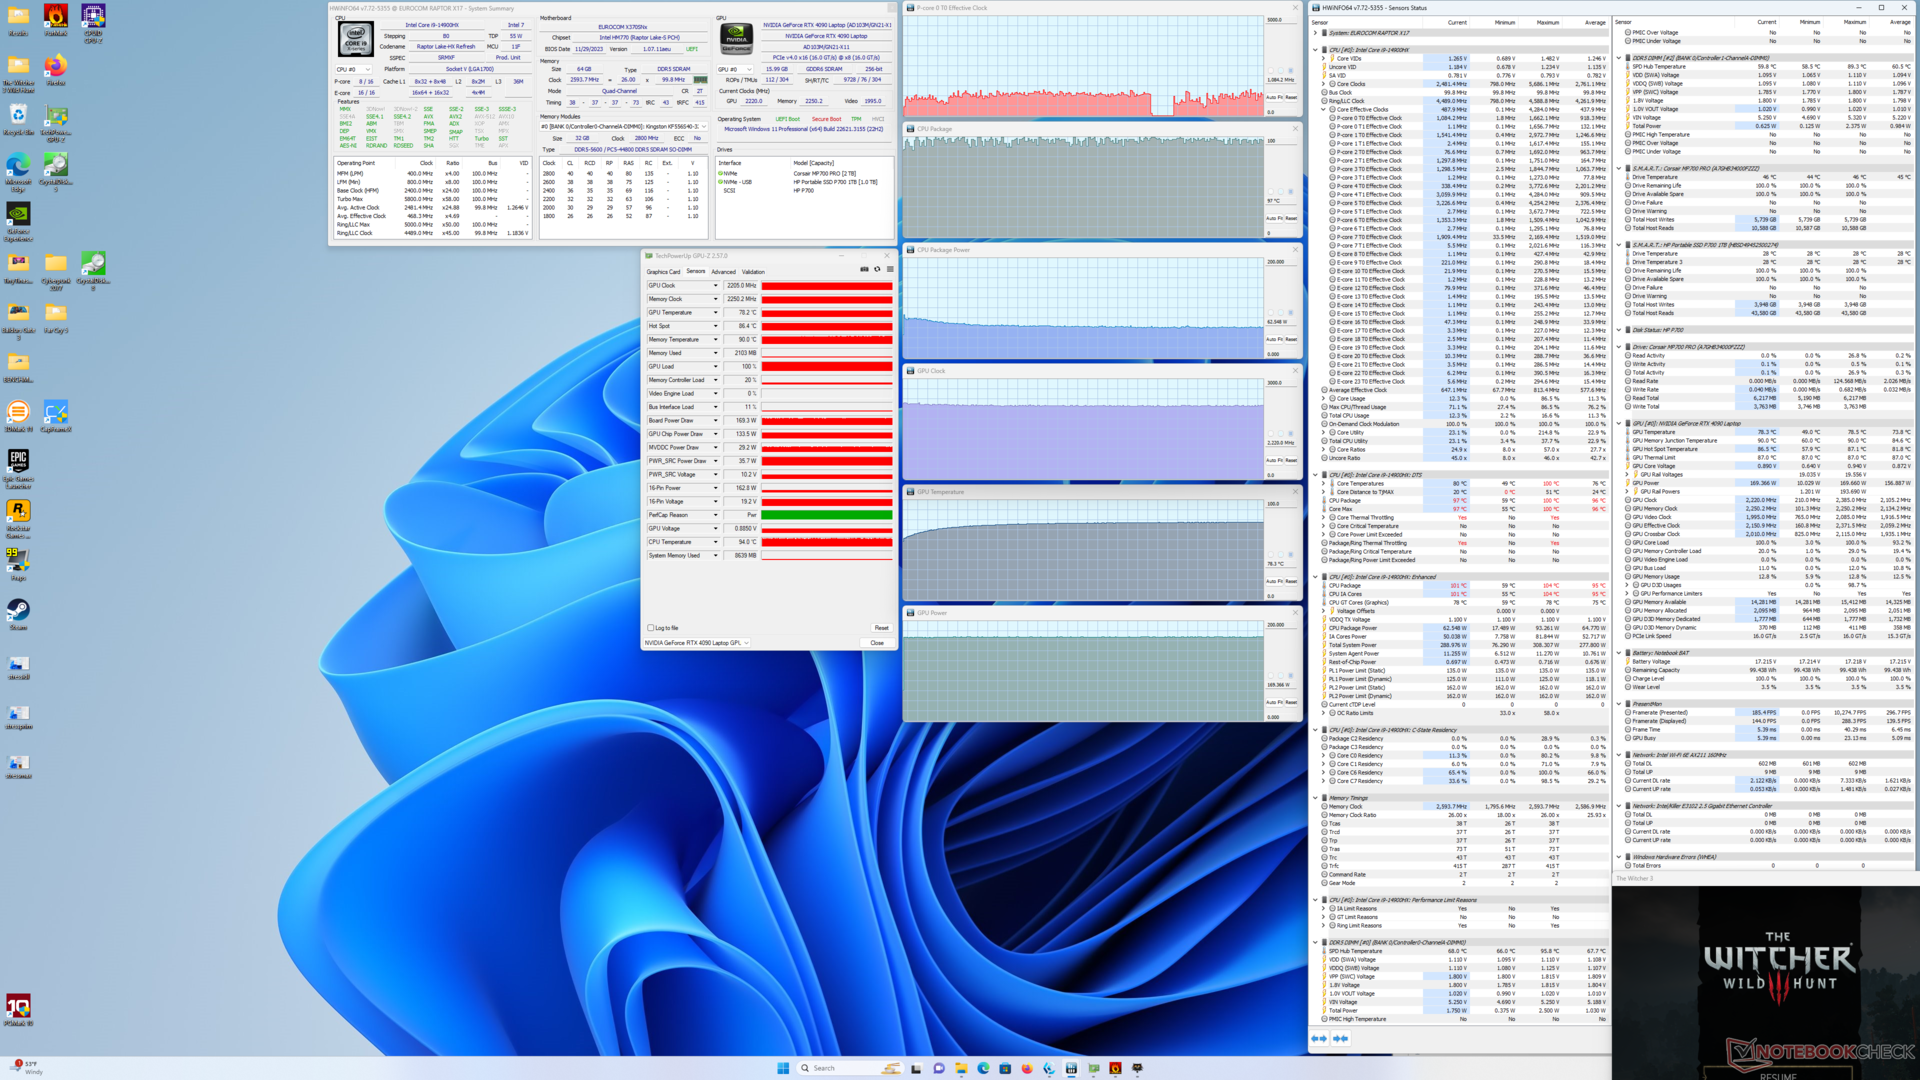
| Horloge du CPU (GHz) | Horloge du GPU (MHz) | Température moyenne du CPU (°C) | Température moyenne du GPU (°C) | |
| Système en veille | -- | -- | 51 | 41 |
| Prime95 Stress | 3.1 | -- | 91 | 52 |
| Prime95 + FurMark Stress | 3.1 | 1000 - 2300 | 96 | 71 |
| Witcher 3 Stress(mode divertissement) | ~1.3 | 2085 | 91 | 74 |
| Witcher 3 Stress(mode performance avec ventilateur maximum éteint) | 1.2 | 2250 | 99 | 78 |
| Witcher 3 Stress (mode performance avec ventilateurmaximum activé) | 1.2 | 2205 | 97 | 78 |
| AIDA64 / Memory Copy | |
| MSI GE78HX 13VH-070US | |
| Eurocom Raptor X17 | |
| Eurocom Raptor X17 Core i9-14900HX | |
| Moyenne Intel Core i9-14900HX (38028 - 83392, n=36) | |
| Asus TUF Gaming A17 FA707XI-NS94 | |
| MSI Titan 18 HX A14VIG | |
| Asus ROG Strix Scar 17 G733PY-XS96 | |
| AIDA64 / Memory Read | |
| MSI GE78HX 13VH-070US | |
| Moyenne Intel Core i9-14900HX (43306 - 87568, n=36) | |
| Eurocom Raptor X17 | |
| Eurocom Raptor X17 Core i9-14900HX | |
| Asus TUF Gaming A17 FA707XI-NS94 | |
| Asus ROG Strix Scar 17 G733PY-XS96 | |
| MSI Titan 18 HX A14VIG | |
| AIDA64 / Memory Write | |
| MSI GE78HX 13VH-070US | |
| Eurocom Raptor X17 Core i9-14900HX | |
| Eurocom Raptor X17 | |
| Asus TUF Gaming A17 FA707XI-NS94 | |
| Moyenne Intel Core i9-14900HX (37146 - 80589, n=36) | |
| Asus ROG Strix Scar 17 G733PY-XS96 | |
| MSI Titan 18 HX A14VIG | |
| AIDA64 / Memory Latency | |
| MSI Titan 18 HX A14VIG | |
| Asus TUF Gaming A17 FA707XI-NS94 | |
| Eurocom Raptor X17 Core i9-14900HX | |
| Moyenne Intel Core i9-14900HX (76.1 - 105, n=36) | |
| MSI GE78HX 13VH-070US | |
| Eurocom Raptor X17 | |
| Asus ROG Strix Scar 17 G733PY-XS96 | |
* ... Moindre est la valeur, meilleures sont les performances
Latence DPC
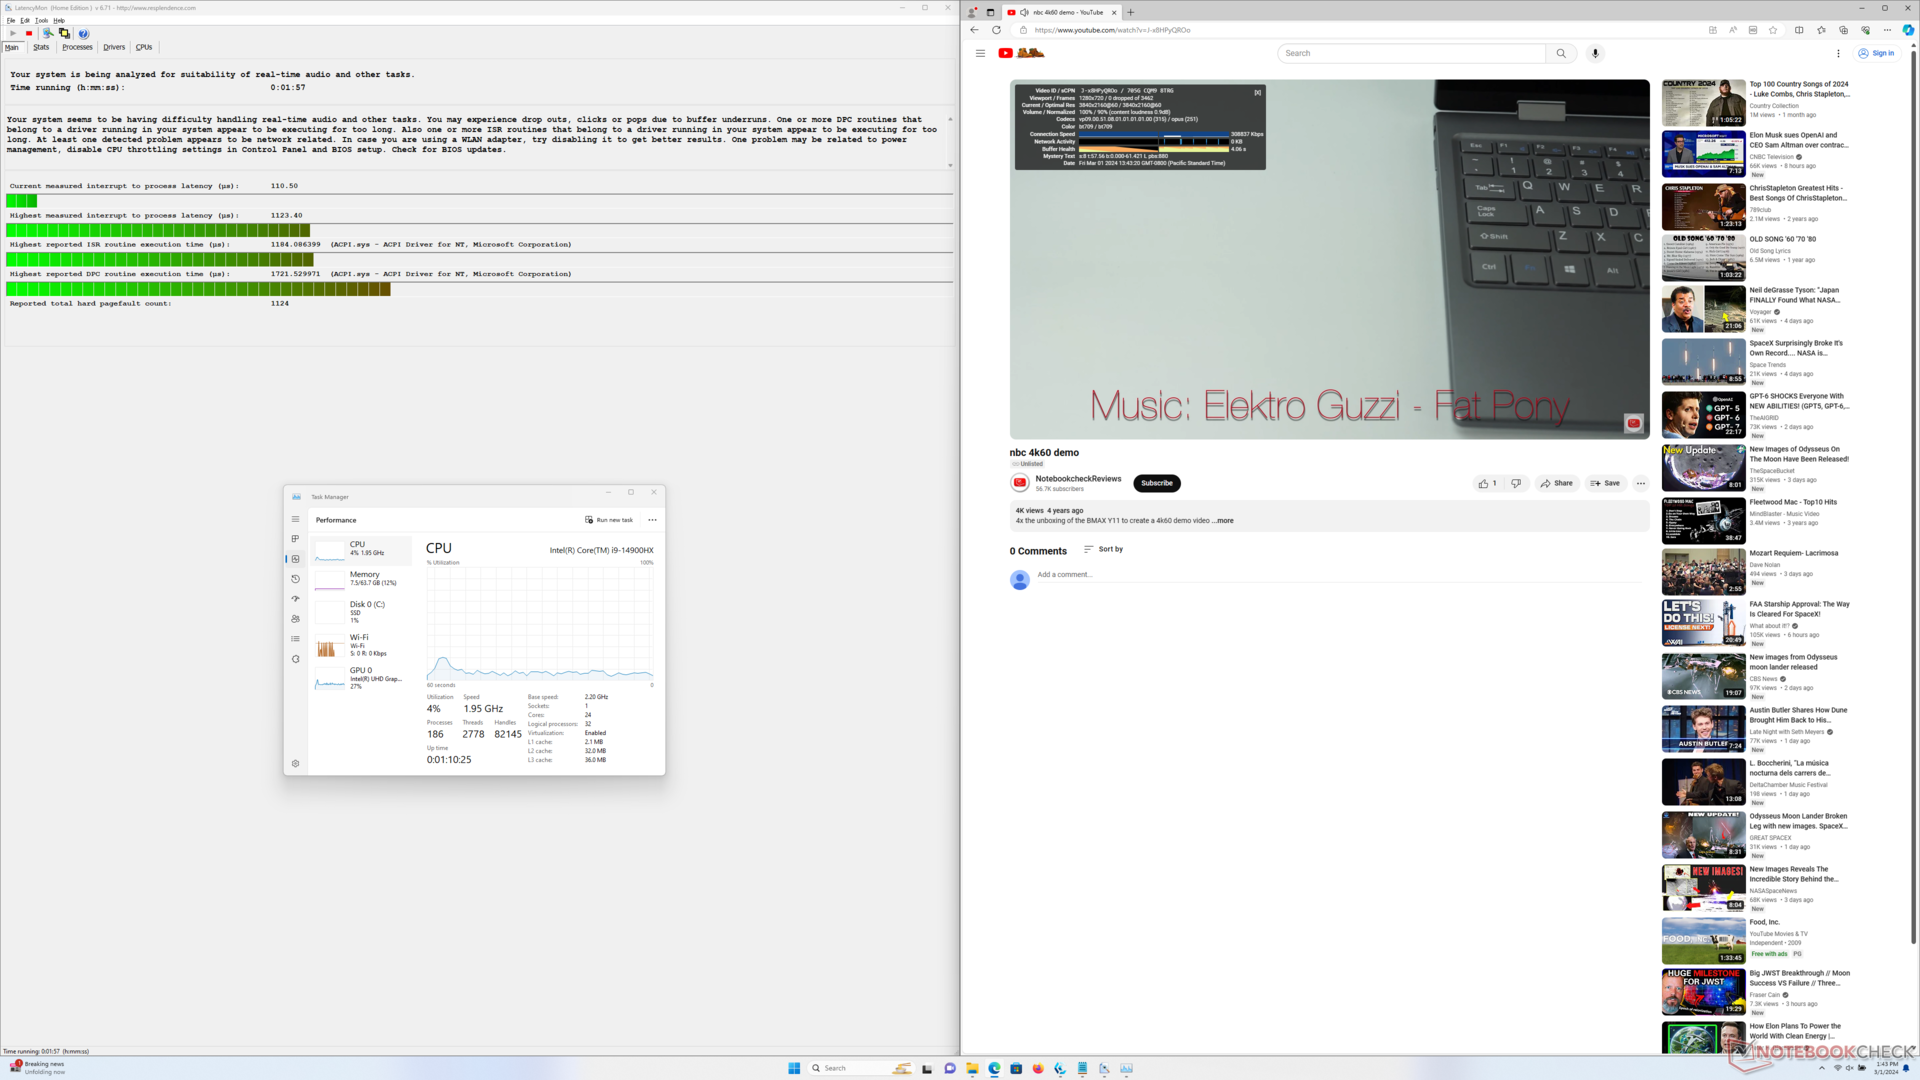
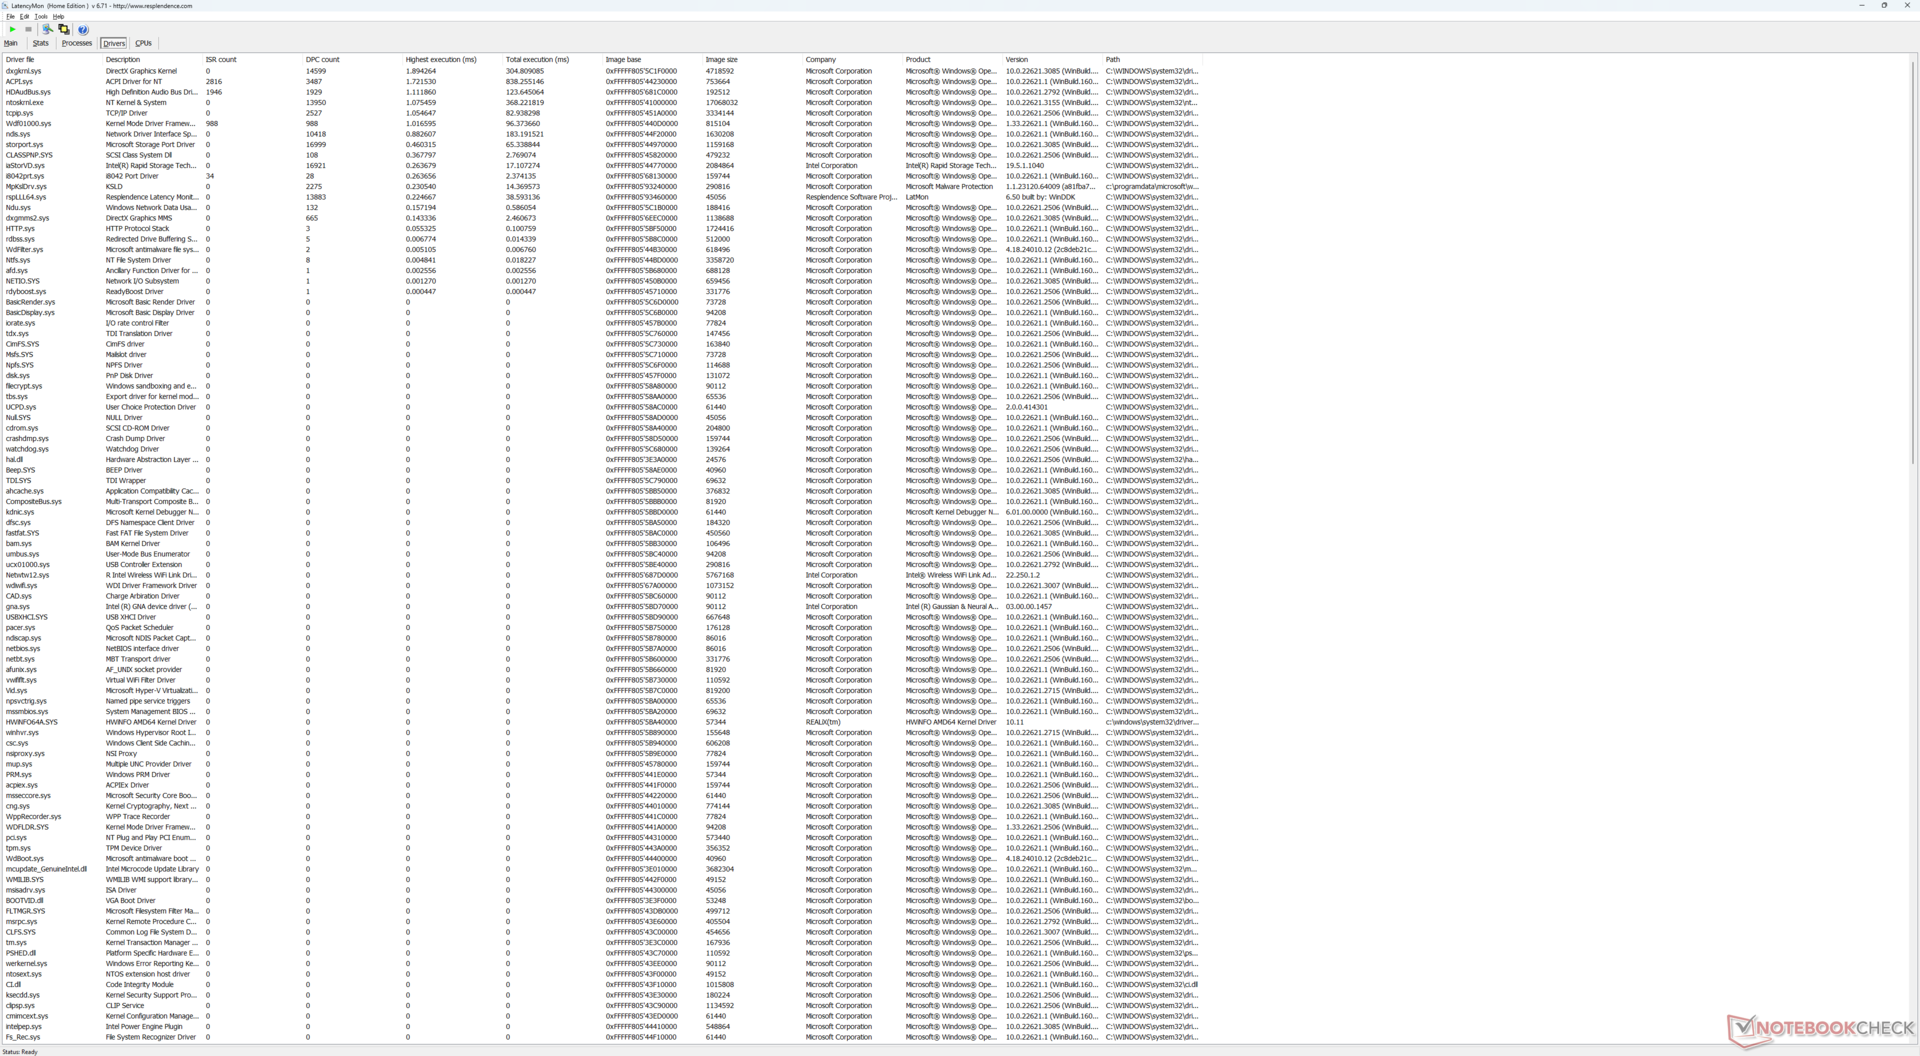
| DPC Latencies / LatencyMon - interrupt to process latency (max), Web, Youtube, Prime95 | |
| MSI GE78HX 13VH-070US | |
| Eurocom Raptor X17 | |
| MSI Titan 18 HX A14VIG | |
| Asus ROG Strix Scar 17 G733PY-XS96 | |
| Asus TUF Gaming A17 FA707XI-NS94 | |
| Eurocom Raptor X17 Core i9-14900HX | |
* ... Moindre est la valeur, meilleures sont les performances
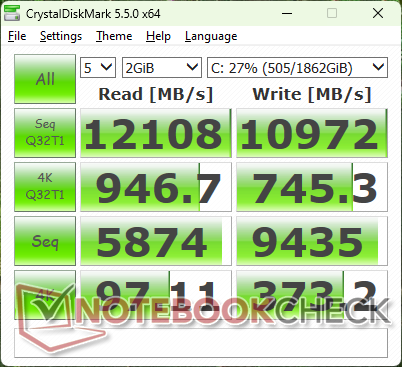
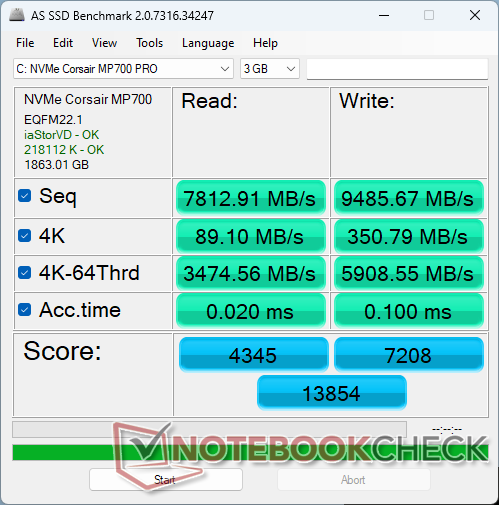
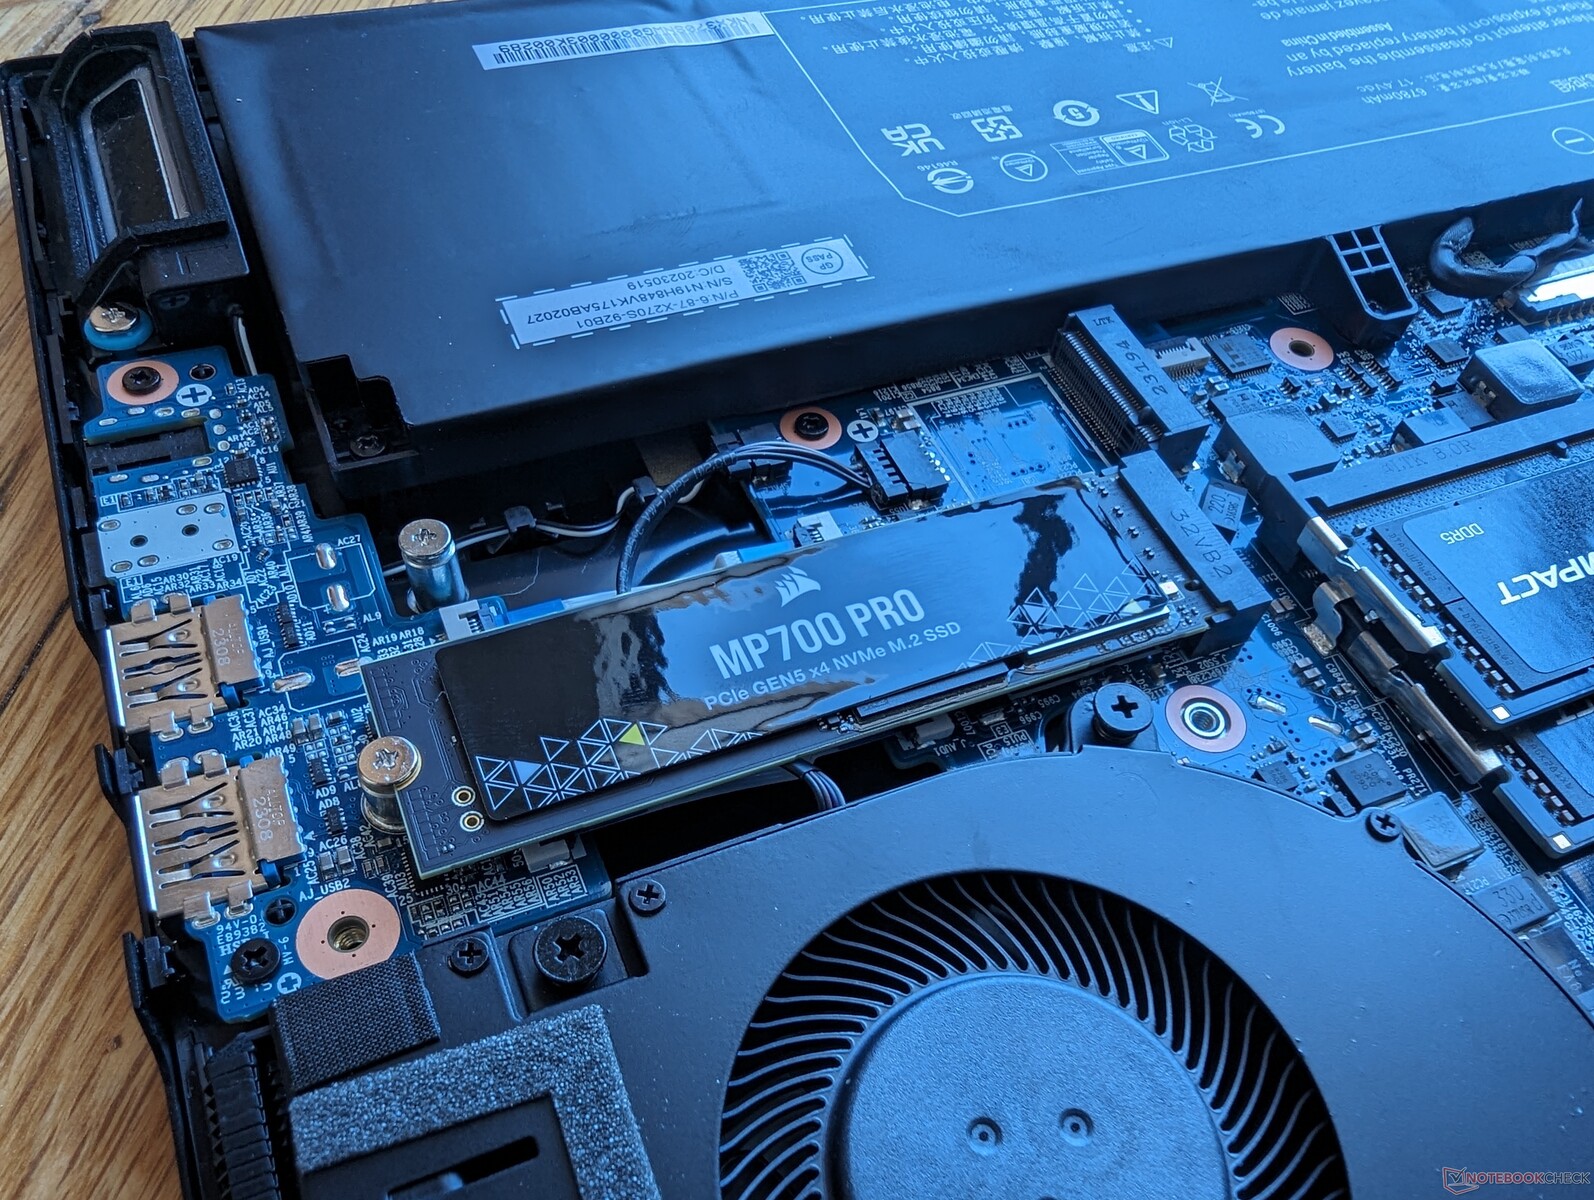
Dispositifs de stockage
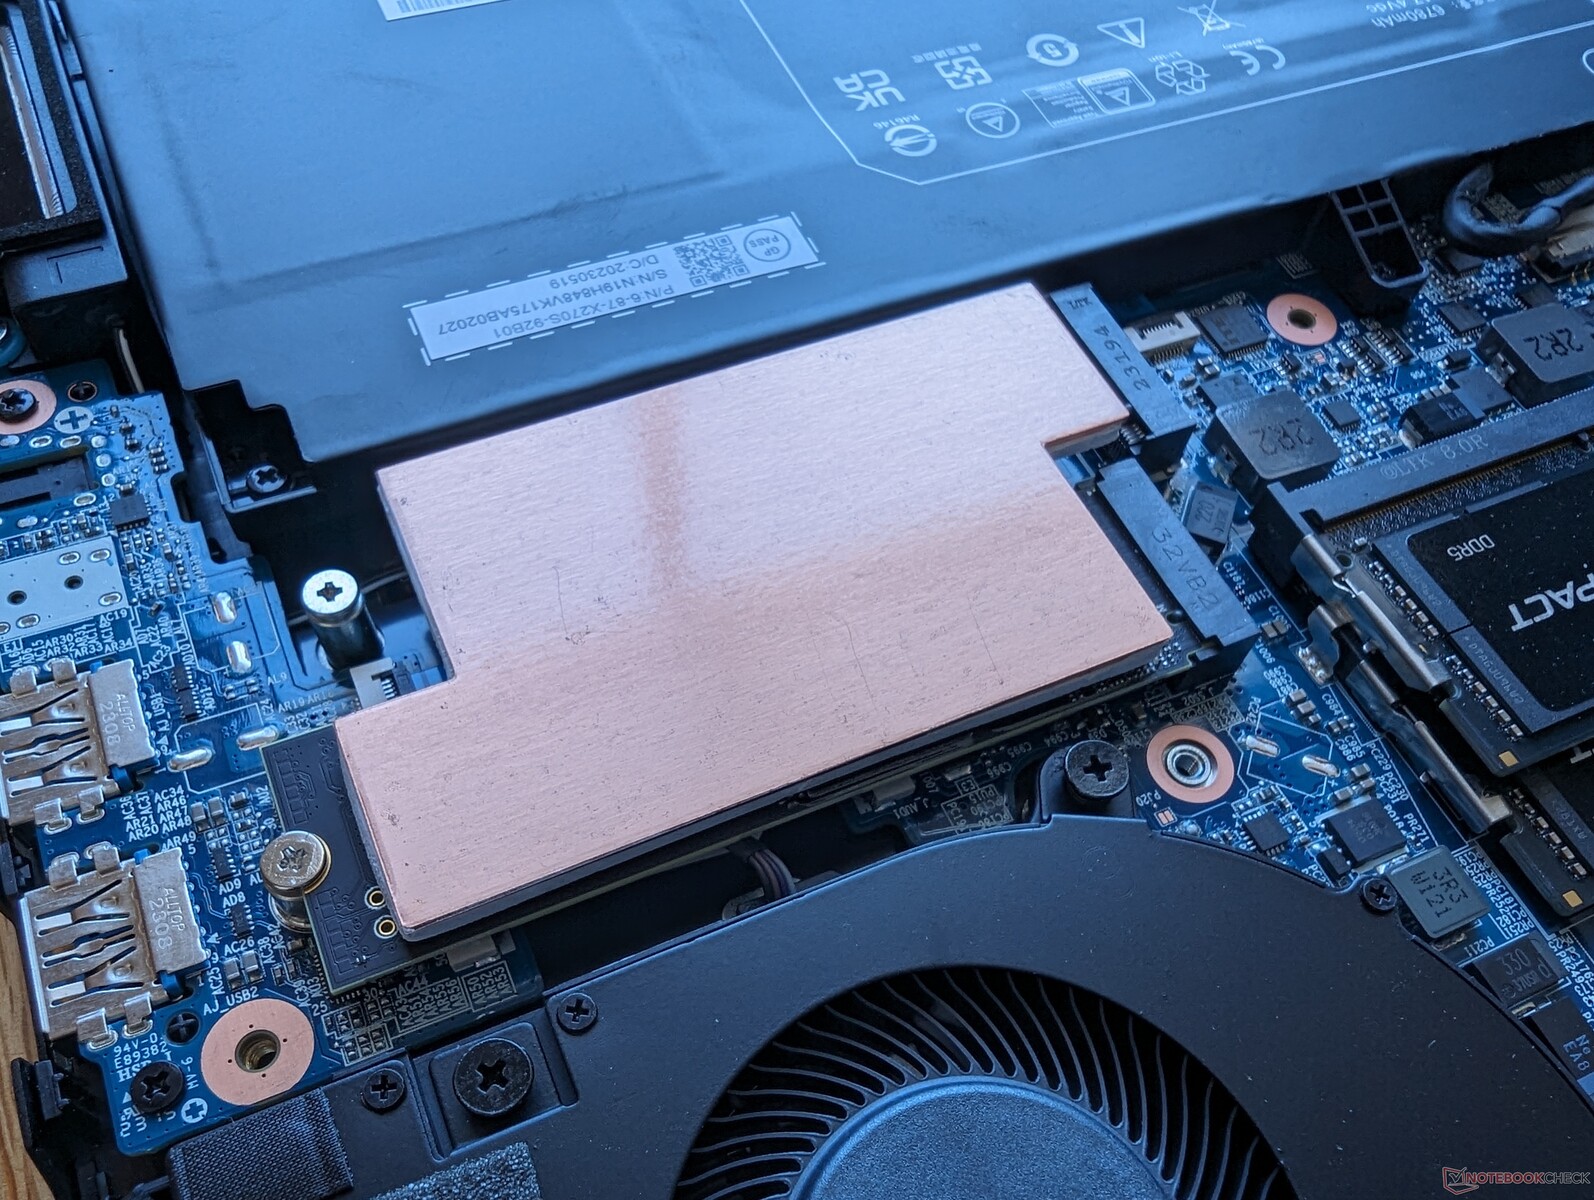
Eurocom est l'un des rares vendeurs à configurer avec un Corsair MP700 Pro PCI5 x4 NVMe SSD pour des taux de lecture séquentielle allant jusqu'à 13000 MB/s pour être presque 2x plus rapide que les disques PCIe4 les plus rapides. Pour soutenir des taux de transfert aussi élevés, un répartiteur de chaleur est toutefois nécessaire. Les résultats de notre boucle DiskSpd ci-dessous montrent les différences de performances avec et sans répartiteur de chaleur. S'il n'est pas installé, les taux de transfert maximaux ne peuvent être atteints qu'au cours de la première minute environ, avant d'être ramenés à une plage de 3500 MB/s à 6500 MB/s. L'installation d'un répartiteur de chaleur permet au lecteur de fonctionner beaucoup plus rapidement et plus longtemps.

| Drive Performance rating - Percent | |
| Eurocom Raptor X17 Core i9-14900HX | |
| Eurocom Raptor X17 | |
| MSI GE78HX 13VH-070US | |
| MSI Titan 18 HX A14VIG | |
| Asus ROG Strix Scar 17 G733PY-XS96 | |
| Asus TUF Gaming A17 FA707XI-NS94 | |
* ... Moindre est la valeur, meilleures sont les performances
Disk Throttling: DiskSpd Read Loop, Queue Depth 8
Performance du GPU
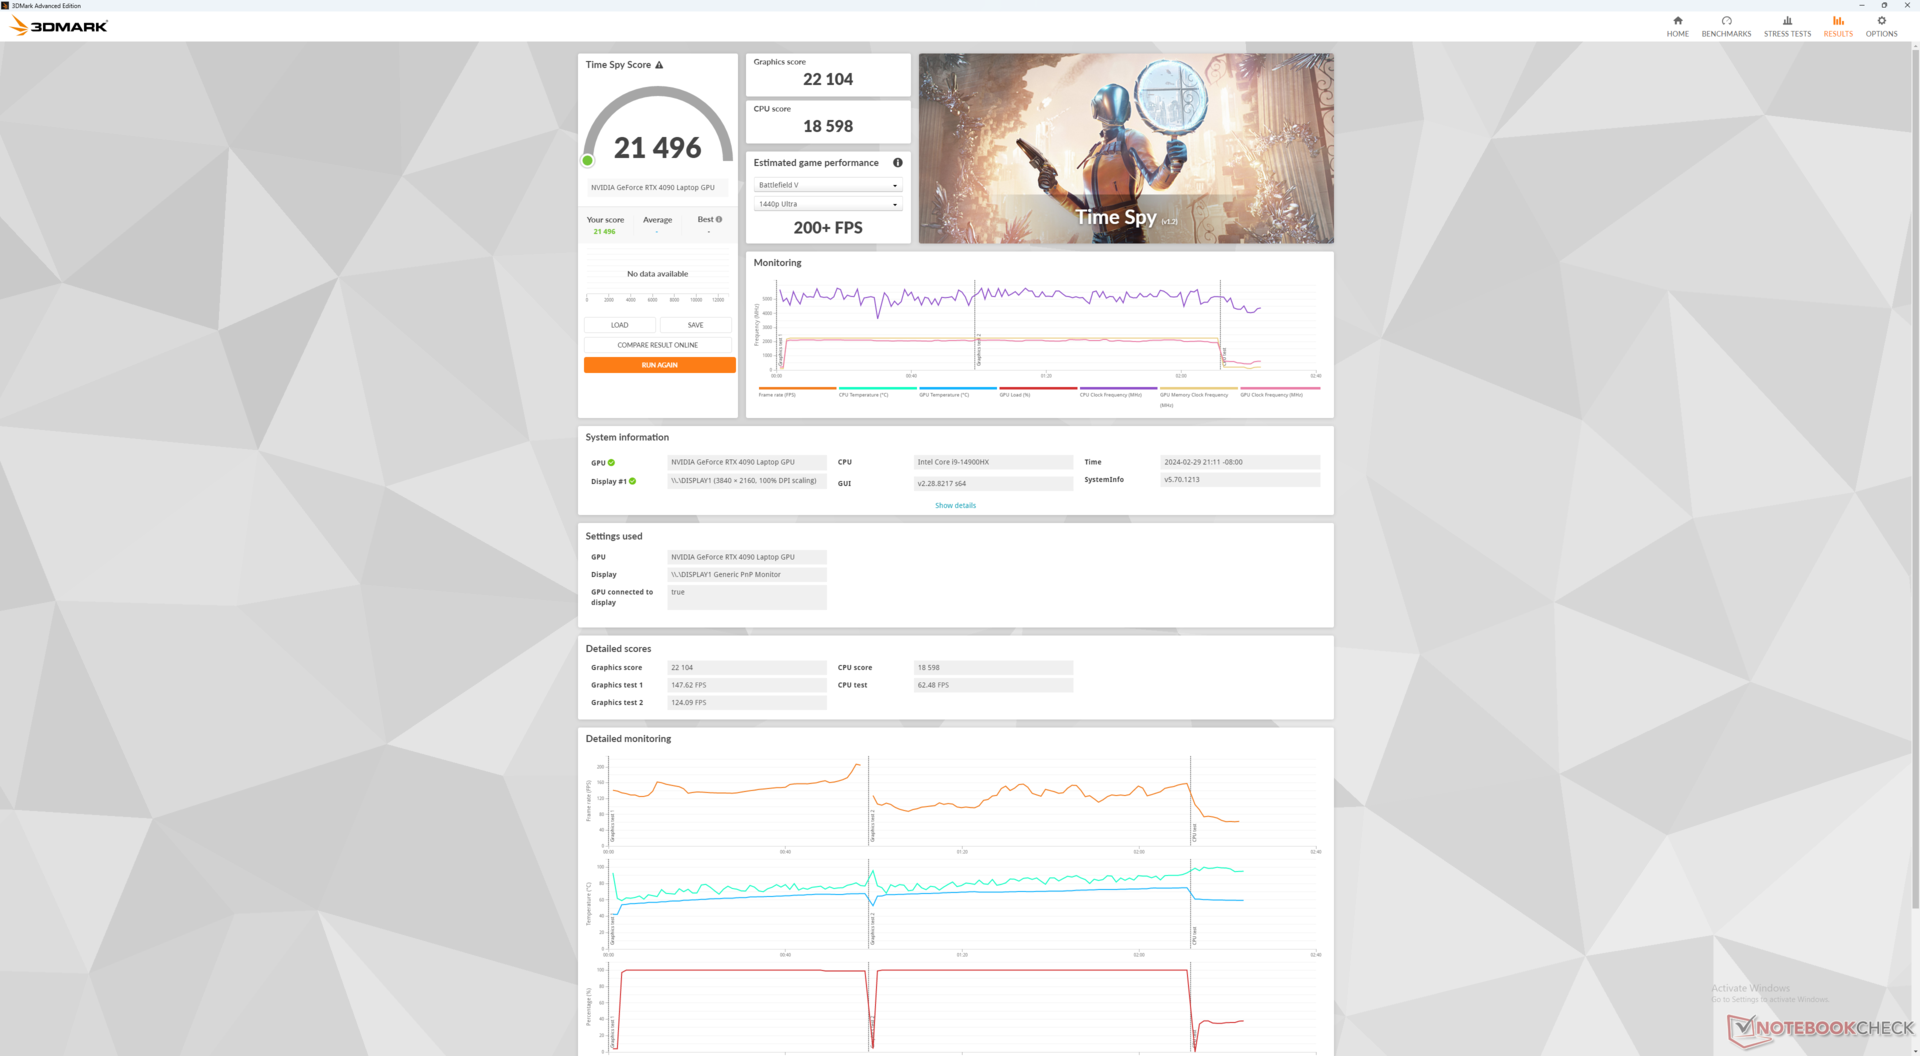
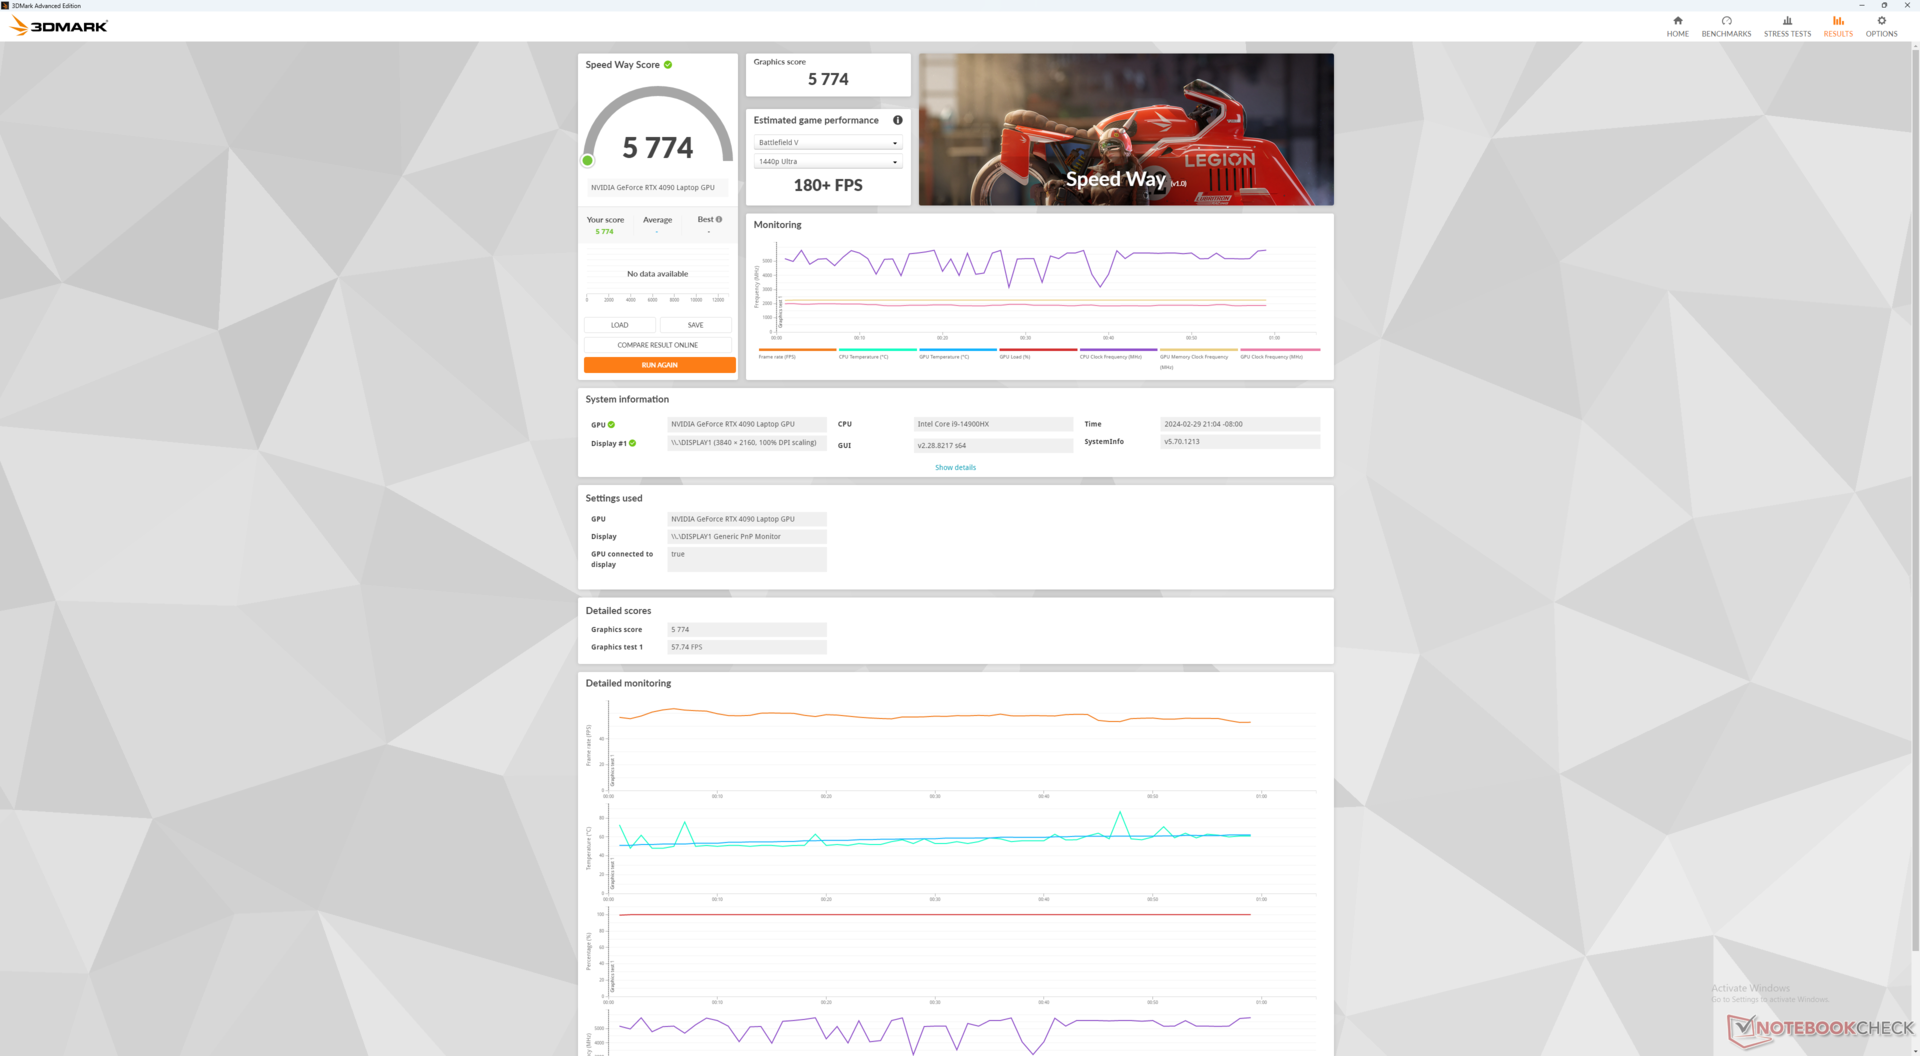
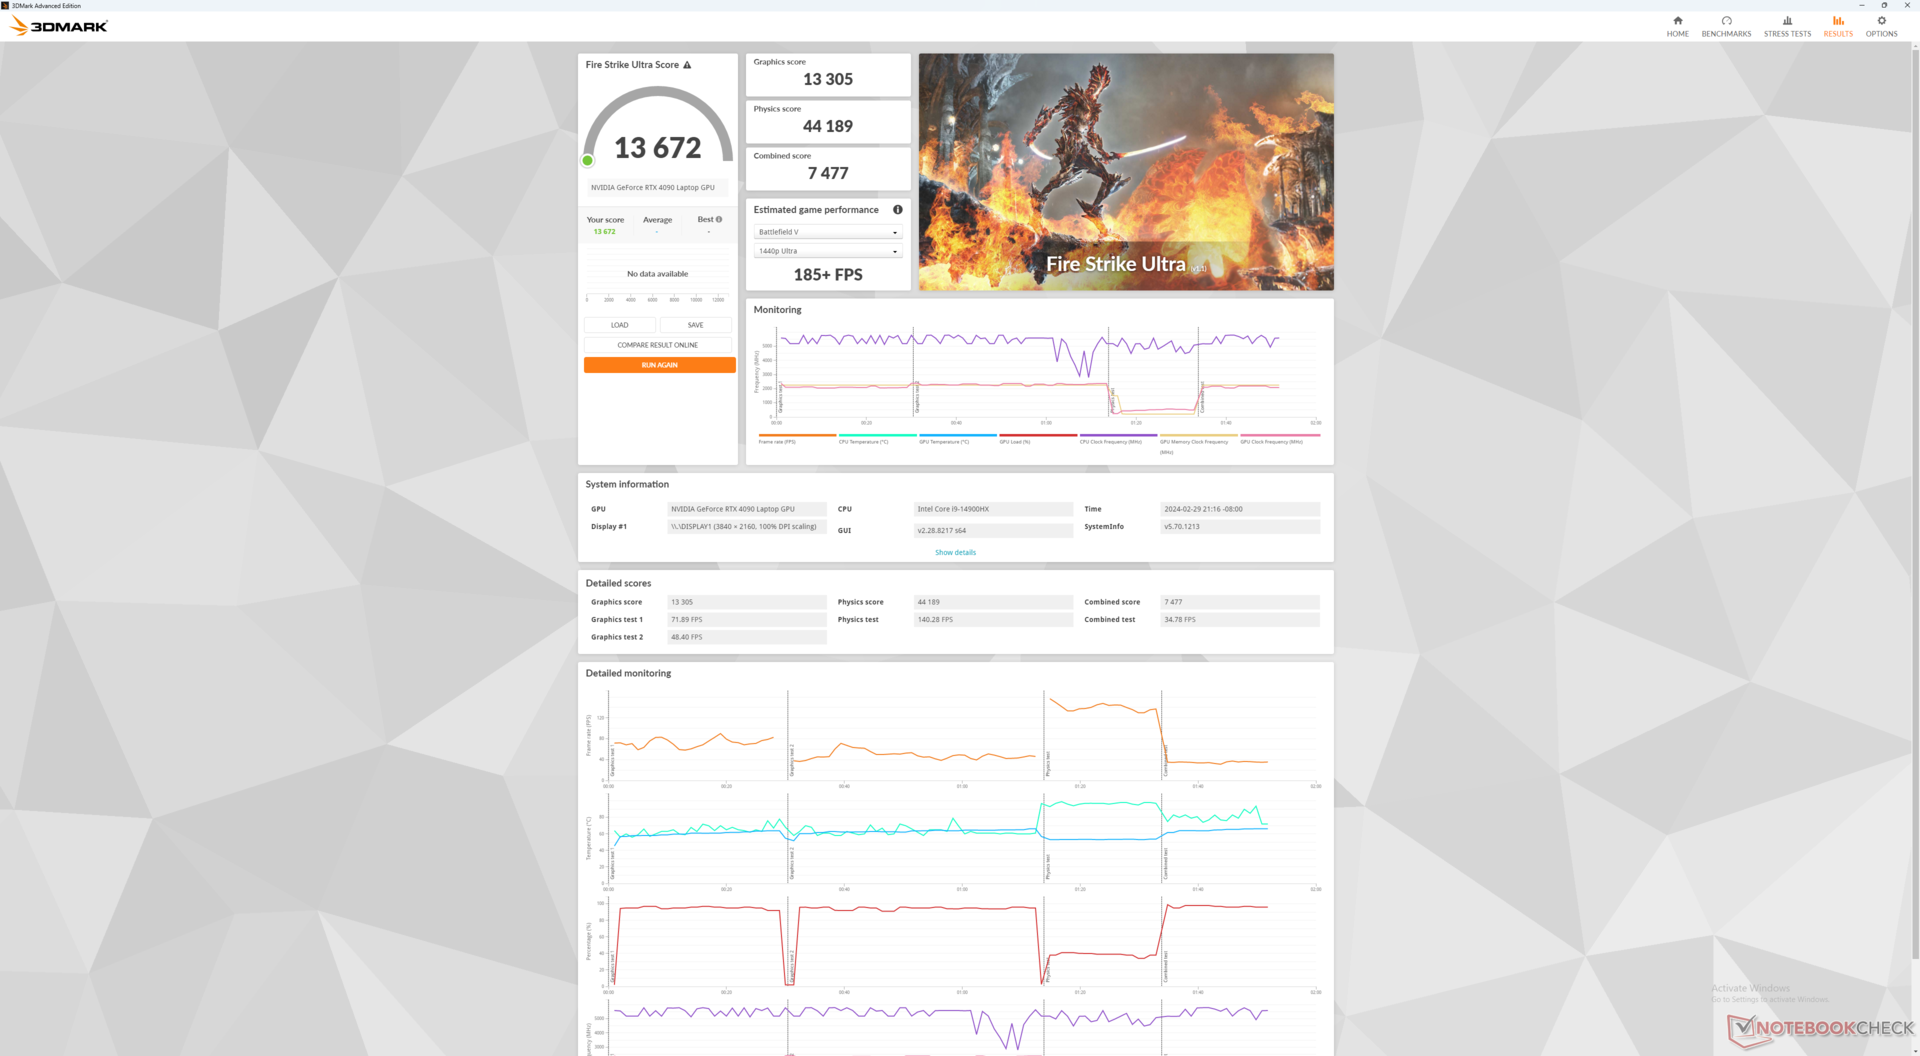
Notre 175 W GeForce RTX 4090 Est environ 5 % plus rapide que ce que nous avons enregistré sur le Raptor X17 de l'année dernière. Il rivalise plus ou moins avec la MSI Titan 18 HX qui est plus grand et plus cher que notre unité Eurocom.
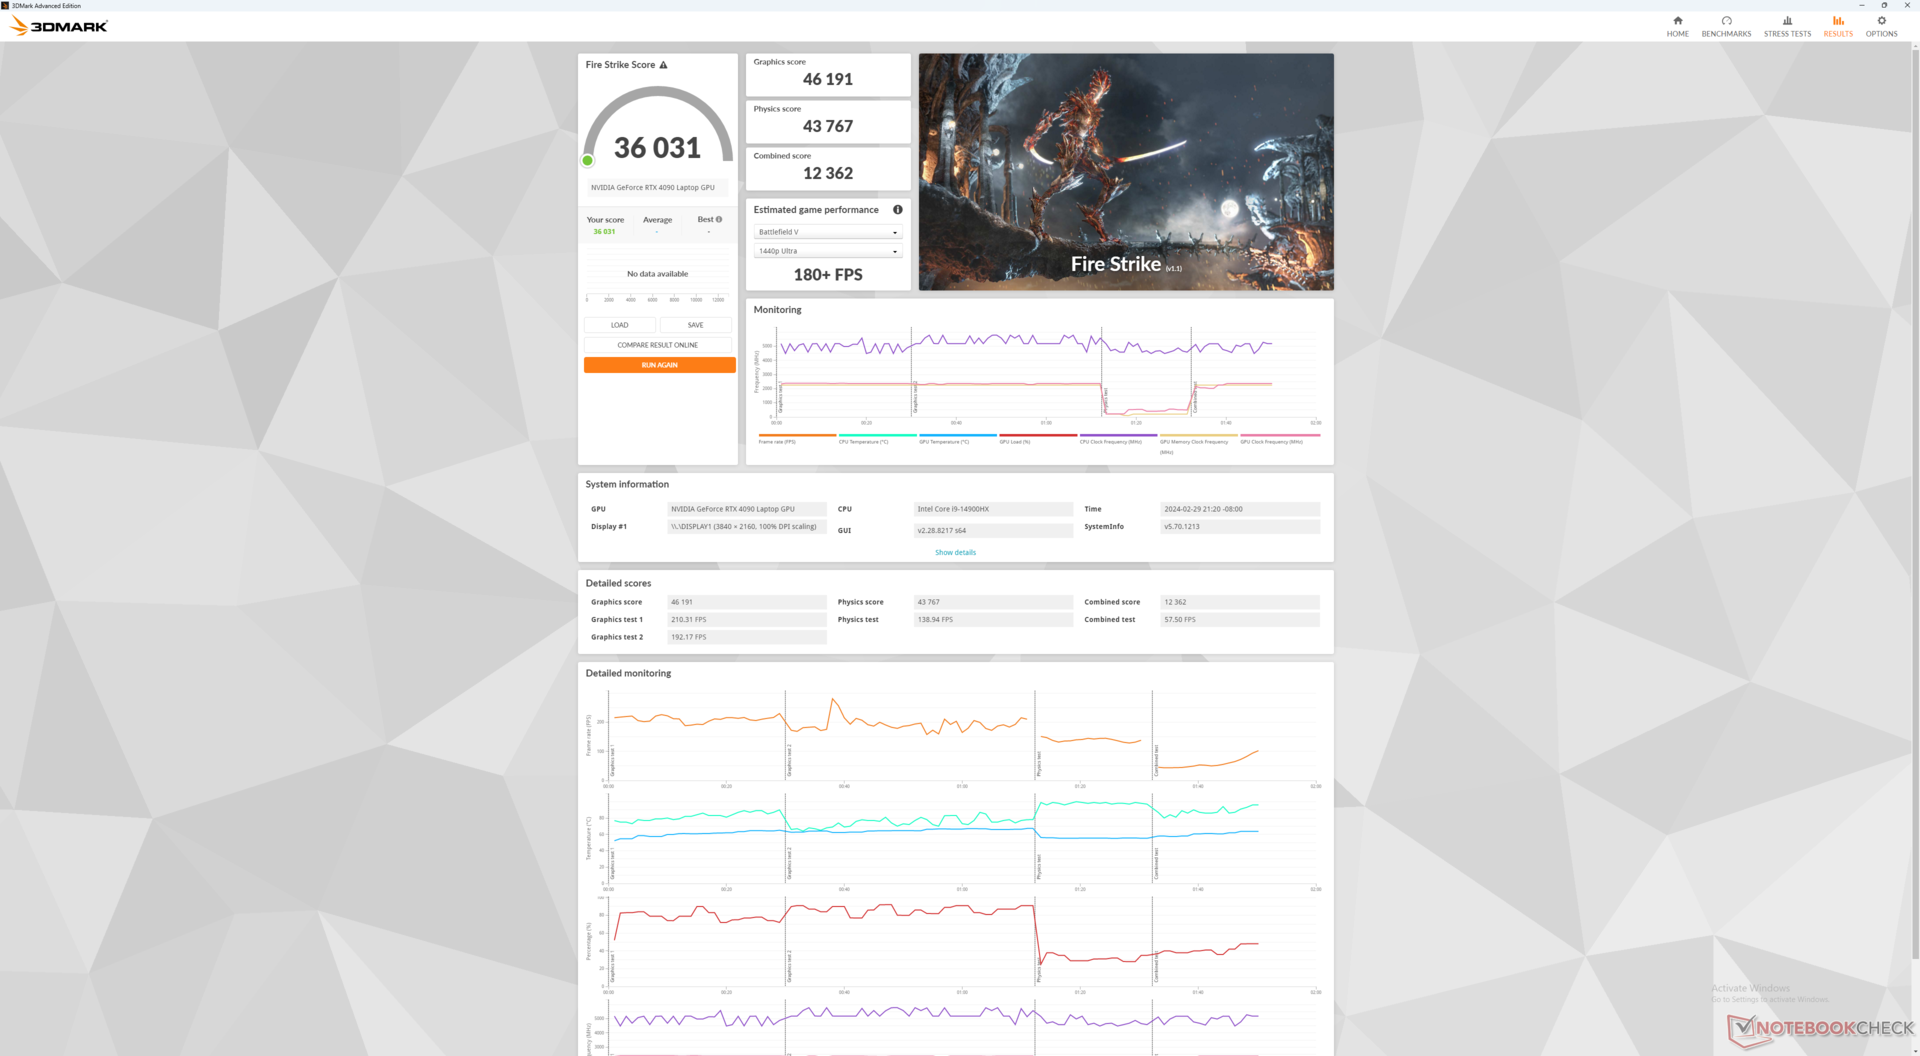
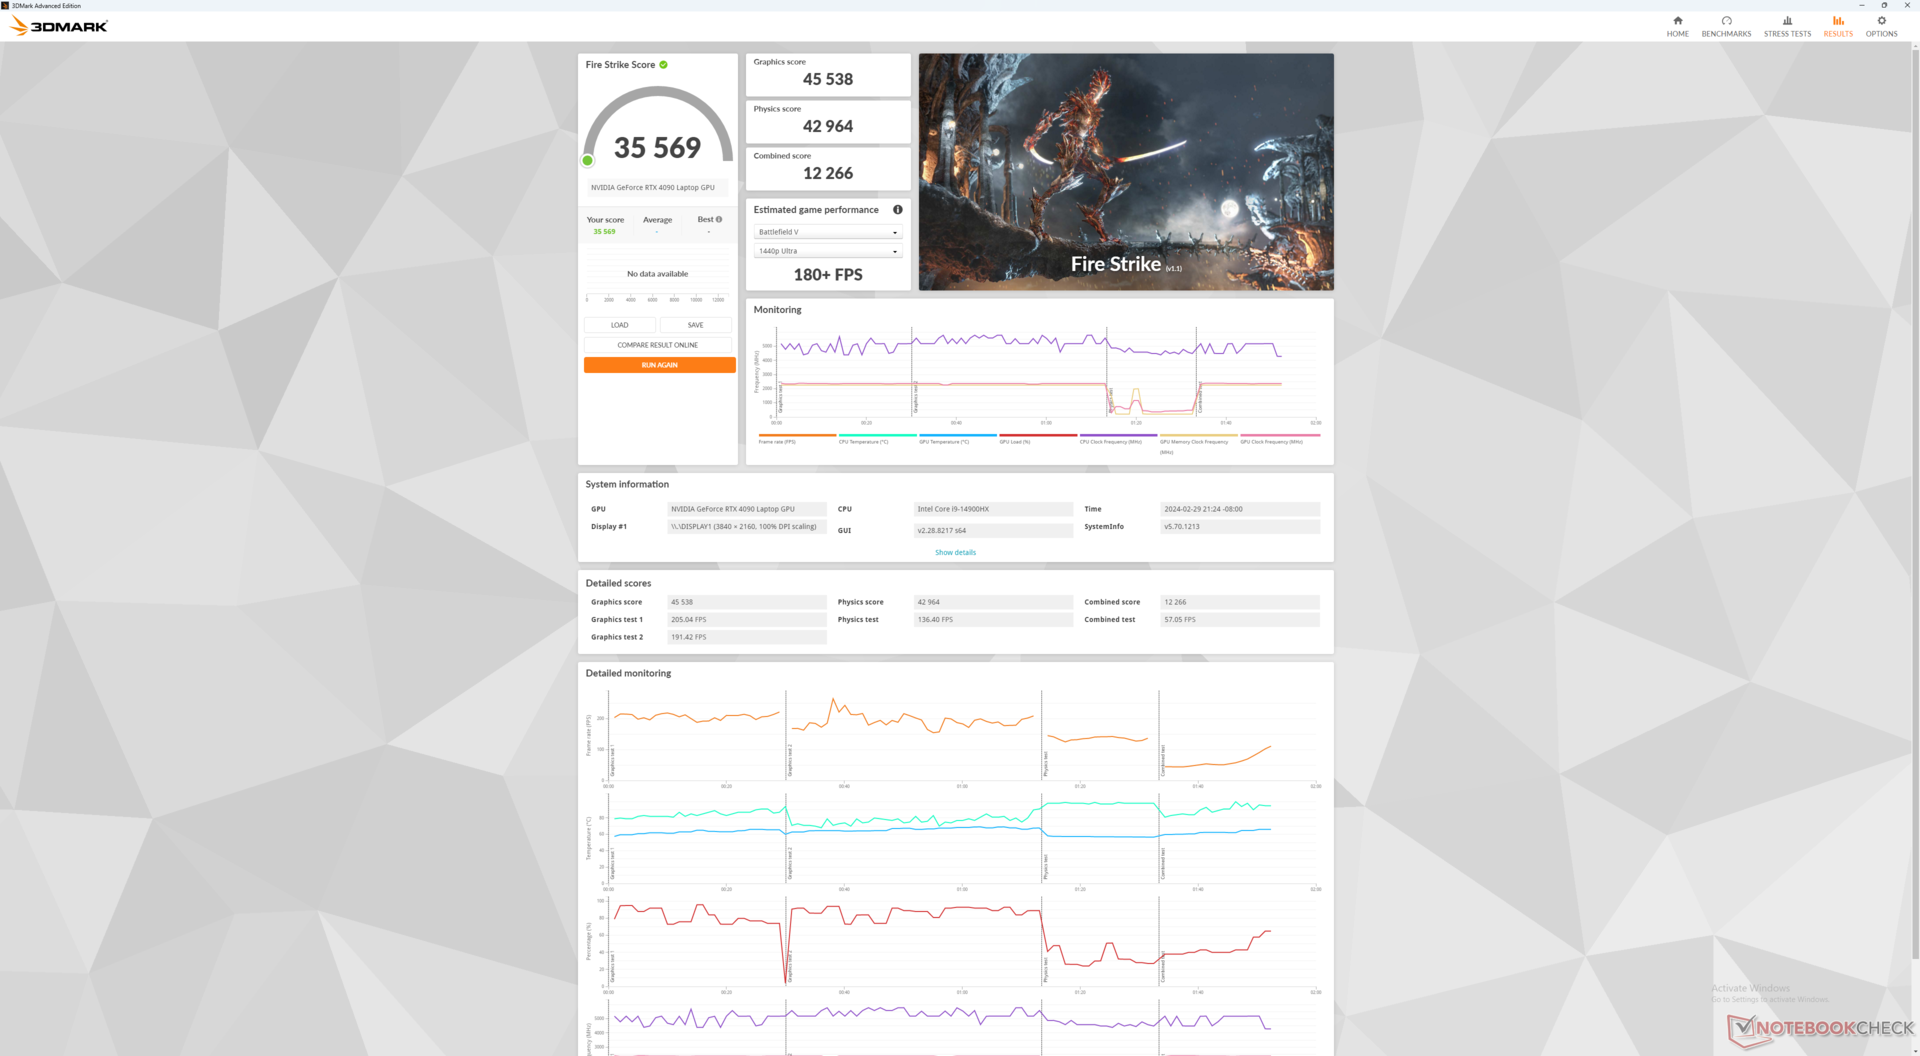
Gardez à l'esprit que l'activation du mode Maximum Fan n'augmente pas les performances de manière significative, comme le montre notre tableau de résultats Fire Strike ci-dessous. Ce mode n'est donc pas essentiel pour maximiser les performances avec les paramètres de base. En revanche, le fait de passer en mode Divertissement a un impact plus important sur les performances.
| Profil de puissance | Score graphique | Score physique | Score combiné |
| Mode Performance avec ventilateur maximum activé | 46191 | 43767 | 12362 |
| Mode performance avec ventilateur maximum éteint | 45538 (-1%) | 42964 (-2%) | 12266 (-1%) |
| Mode équilibré Windows | 45892 (-1%) | 42567 (-3%) | 13382 (-0%) |
| Mode divertissement | 44593 (-4%) | 36839 (-16%) | 9640 (-22%) |
| Batterie | 7324 (-84%) | 14932 (-66%) | 1901 (-85%) |
Nous avons néanmoins rencontré quelques problèmes qui méritent d'être mentionnés. Ubisoft Connect ne se lançait pas à chaque fois, Final Fantasy XV plantait sur les paramètres élevés, et PCMark 10 plantait également, même après la mise à jour de la dernière version.
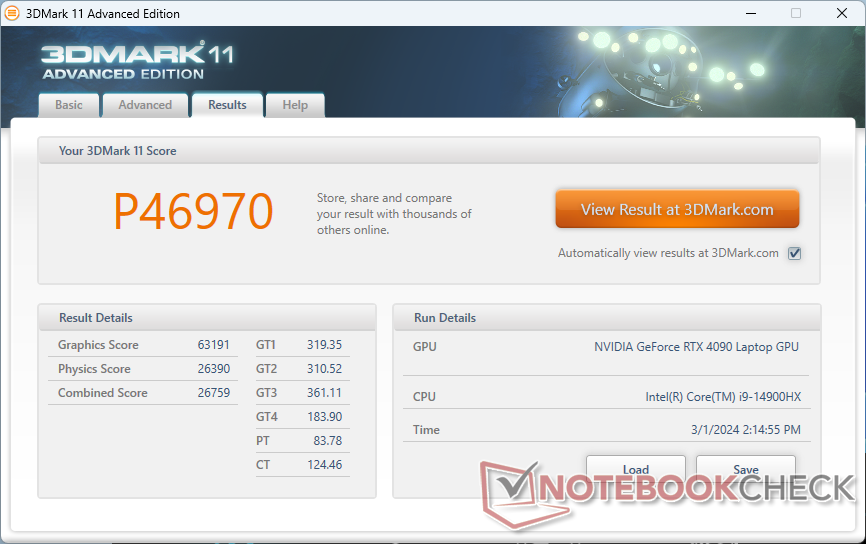
| 3DMark 11 Performance | 46970 points | |
| 3DMark Fire Strike Score | 36031 points | |
| 3DMark Time Spy Score | 21496 points | |
Aide | ||
* ... Moindre est la valeur, meilleures sont les performances
| Performance rating - Percent | |
| Eurocom Raptor X17 Core i9-14900HX -1! | |
| MSI Titan 18 HX A14VIG | |
| Eurocom Raptor X17 | |
| Asus ROG Strix Scar 17 G733PY-XS96 -1! | |
| MSI GE78HX 13VH-070US | |
| Asus TUF Gaming A17 FA707XI-NS94 -1! | |
| The Witcher 3 - 1920x1080 Ultra Graphics & Postprocessing (HBAO+) | |
| MSI Titan 18 HX A14VIG | |
| Eurocom Raptor X17 | |
| Asus ROG Strix Scar 17 G733PY-XS96 | |
| Eurocom Raptor X17 Core i9-14900HX | |
| MSI GE78HX 13VH-070US | |
| Asus TUF Gaming A17 FA707XI-NS94 | |
| GTA V - 1920x1080 Highest AA:4xMSAA + FX AF:16x | |
| Eurocom Raptor X17 Core i9-14900HX | |
| Eurocom Raptor X17 | |
| MSI Titan 18 HX A14VIG | |
| Asus ROG Strix Scar 17 G733PY-XS96 | |
| MSI GE78HX 13VH-070US | |
| Final Fantasy XV Benchmark - 1920x1080 High Quality | |
| MSI Titan 18 HX A14VIG | |
| Eurocom Raptor X17 | |
| Asus ROG Strix Scar 17 G733PY-XS96 | |
| MSI GE78HX 13VH-070US | |
| Asus TUF Gaming A17 FA707XI-NS94 | |
| Strange Brigade - 1920x1080 ultra AA:ultra AF:16 | |
| Eurocom Raptor X17 Core i9-14900HX | |
| MSI Titan 18 HX A14VIG | |
| Eurocom Raptor X17 | |
| MSI GE78HX 13VH-070US | |
| Asus TUF Gaming A17 FA707XI-NS94 | |
| Dota 2 Reborn - 1920x1080 ultra (3/3) best looking | |
| Eurocom Raptor X17 Core i9-14900HX | |
| Eurocom Raptor X17 | |
| MSI Titan 18 HX A14VIG | |
| MSI GE78HX 13VH-070US | |
| Asus ROG Strix Scar 17 G733PY-XS96 | |
| Asus TUF Gaming A17 FA707XI-NS94 | |
| X-Plane 11.11 - 1920x1080 high (fps_test=3) | |
| Eurocom Raptor X17 Core i9-14900HX | |
| Eurocom Raptor X17 | |
| MSI GE78HX 13VH-070US | |
| MSI Titan 18 HX A14VIG | |
| Asus ROG Strix Scar 17 G733PY-XS96 | |
| Asus TUF Gaming A17 FA707XI-NS94 | |
Witcher 3 FPS Chart
| Bas | Moyen | Élevé | Ultra | QHD | 4K | |
|---|---|---|---|---|---|---|
| GTA V (2015) | 187.6 | 186.9 | 185.8 | 152.2 | 145.7 | 178.8 |
| The Witcher 3 (2015) | 688.1 | 591.6 | 423.9 | 200 | 149.7 | |
| Dota 2 Reborn (2015) | 254 | 224 | 212 | 195.2 | 195 | |
| X-Plane 11.11 (2018) | 221 | 193.1 | 150.2 | 126.7 | ||
| Far Cry 5 (2018) | 222 | 195 | 186 | 174 | 171 | 113 |
| Strange Brigade (2018) | 567 | 459 | 433 | 402 | 309 | 156.8 |
| F1 22 (2022) | 360 | 331 | 116.3 | 87.8 | 44.2 | |
| Baldur's Gate 3 (2023) | 244.1 | 217.9 | 203.8 | 200.4 | 148.9 | 75.6 |
| Cyberpunk 2077 (2023) | 195.2 | 185.2 | 164.5 | 144.7 | 93.8 | 41.4 |
Émissions
Bruit du système - Plus fort que beaucoup d'autres portables de jeu
Les ventilateurs ne pulsent pas aussi fréquemment que sur le modèle de l'année dernière. Lorsque vous lancez 3DMark 06, par exemple, les ventilateurs restent silencieux pendant de longues périodes avant d'augmenter lentement, alors que le modèle 2023 atteint presque 60 dB(A). Sinon, le bruit des ventilateurs se stabilise à peu près aux mêmes valeurs entre les deux modèles lors de l'exécution de charges exigeantes comme les jeux.
Les jeux en mode Divertissement sont légèrement plus silencieux que les jeux en mode Performance (58,3 dB(A) contre 61,4 dB(A)). N'oubliez pas que le mode Divertissement a un coût en termes de performances, comme indiqué ci-dessus.
Degré de la nuisance sonore
| Au repos |
| 31.7 / 31.7 / 32.9 dB(A) |
| Fortement sollicité |
| 34 / 61.6 dB(A) |
 | ||
30 dB silencieux 40 dB(A) audible 50 dB(A) bruyant |
||
min: | ||
| Eurocom Raptor X17 Core i9-14900HX GeForce RTX 4090 Laptop GPU, i9-14900HX, Corsair MP700 Pro 2TB | Eurocom Raptor X17 GeForce RTX 4090 Laptop GPU, i9-13900HX, 3x Samsung SSD 980 Pro 1TB (RAID 0) | Asus TUF Gaming A17 FA707XI-NS94 GeForce RTX 4070 Laptop GPU, R9 7940HS, WD PC SN560 SDDPNQE-1T00 | Asus ROG Strix Scar 17 G733PY-XS96 GeForce RTX 4090 Laptop GPU, R9 7945HX, SK hynix PC801 HFS001TEJ9X101N | MSI GE78HX 13VH-070US GeForce RTX 4080 Laptop GPU, i9-13950HX, Samsung PM9A1 MZVL22T0HBLB | MSI Titan 18 HX A14VIG GeForce RTX 4090 Laptop GPU, i9-14900HX, 2x Samsung PM9A1a MZVL22T0HDLB (RAID 0) | |
|---|---|---|---|---|---|---|
| Noise | -15% | 3% | 14% | 5% | 9% | |
| arrêt / environnement * (dB) | 23.7 | 23.3 2% | 27.9 -18% | 22.7 4% | 23.4 1% | 22.8 4% |
| Idle Minimum * (dB) | 31.7 | 33.1 -4% | 28.5 10% | 23.5 26% | 24.2 24% | 23.8 25% |
| Idle Average * (dB) | 31.7 | 33.1 -4% | 29.8 6% | 27.7 13% | 25.6 19% | 23.8 25% |
| Idle Maximum * (dB) | 32.9 | 40.7 -24% | 29.8 9% | 27.7 16% | 31 6% | 28 15% |
| Load Average * (dB) | 34 | 59.9 -76% | 34.8 -2% | 30.5 10% | 43.3 -27% | 38 -12% |
| Witcher 3 ultra * (dB) | 61.6 | 60.8 1% | 57.1 7% | 51.4 17% | 56.3 9% | 57.3 7% |
| Load Maximum * (dB) | 61.6 | 61 1% | 57.3 7% | 54.1 12% | 59.1 4% | 62.8 -2% |
* ... Moindre est la valeur, meilleures sont les performances
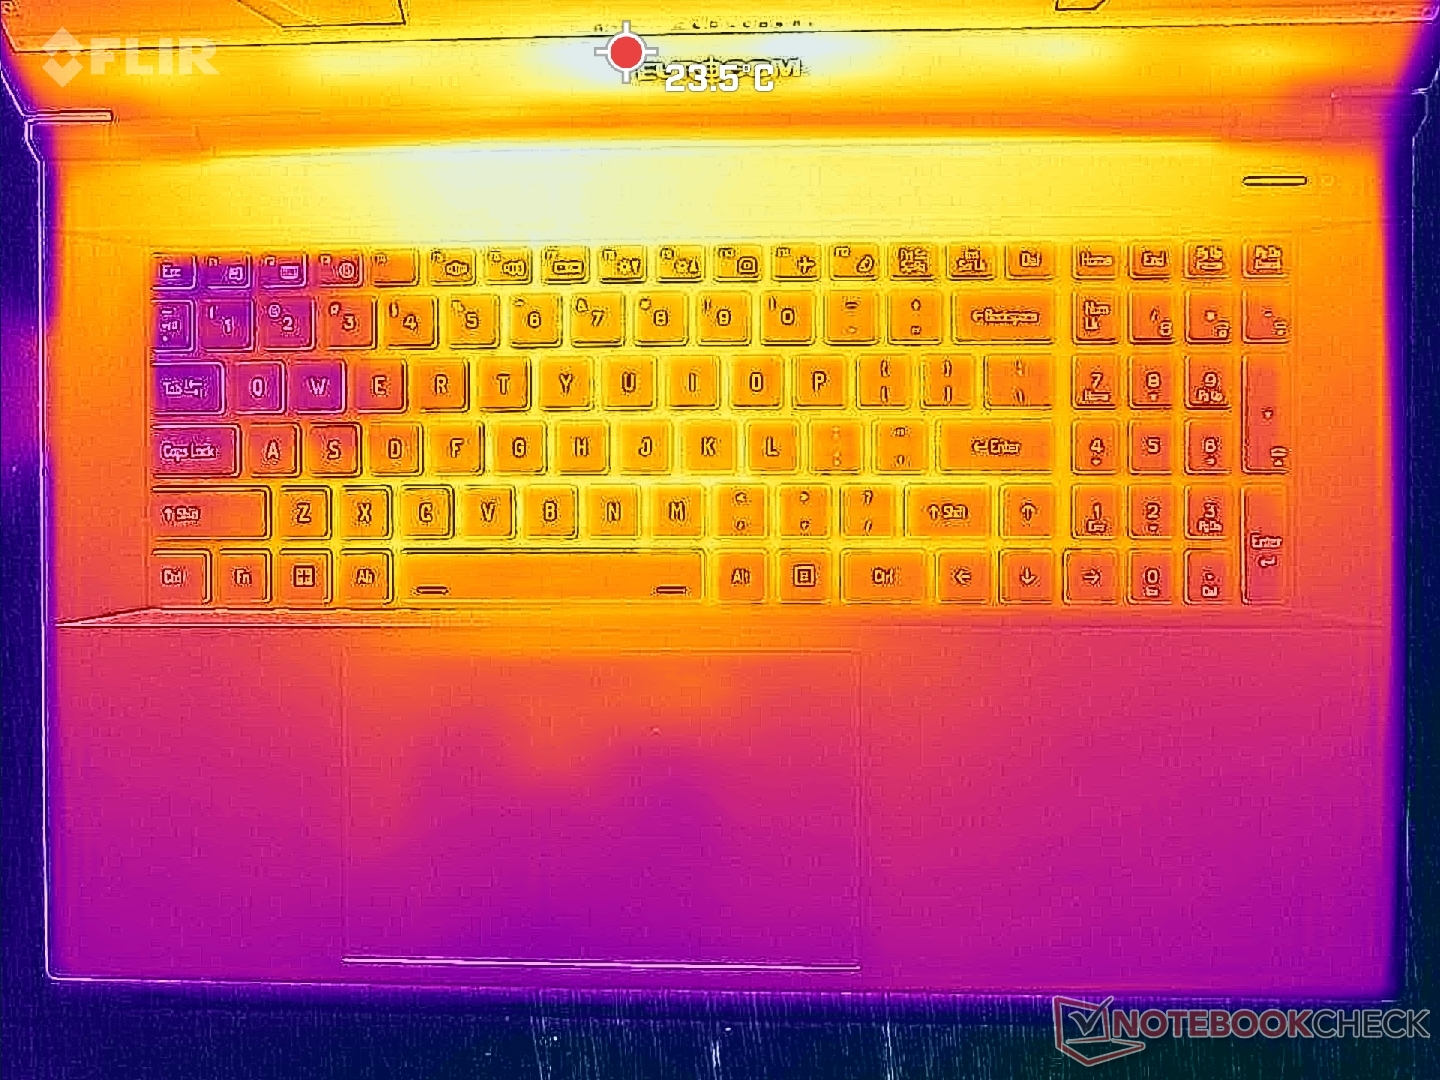
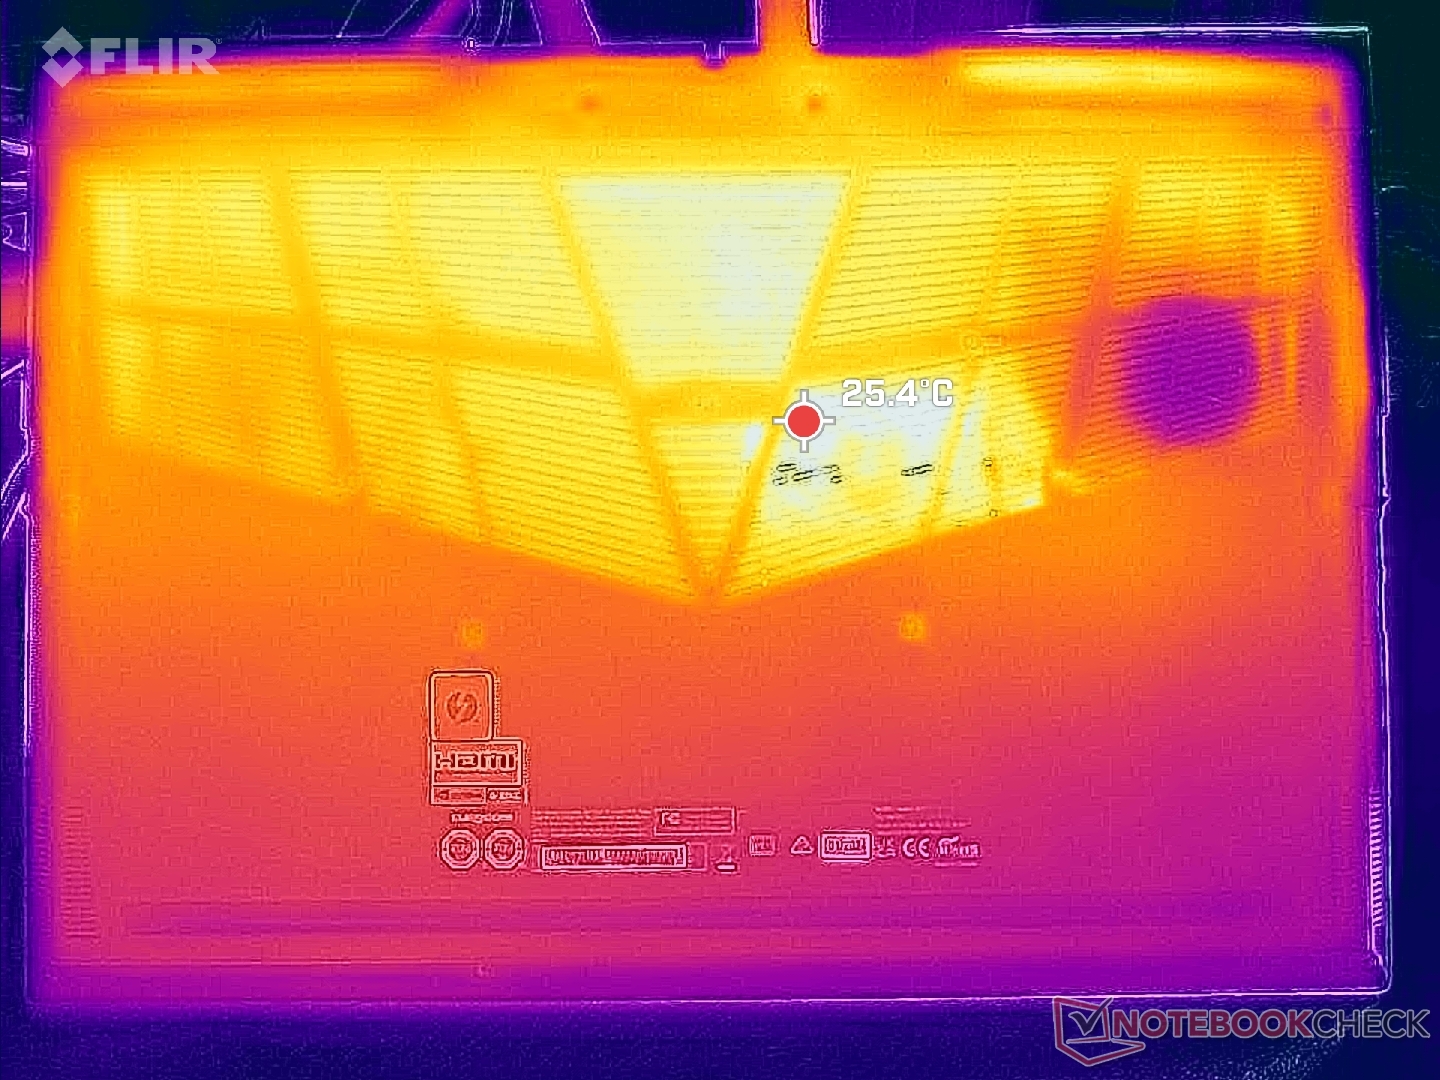
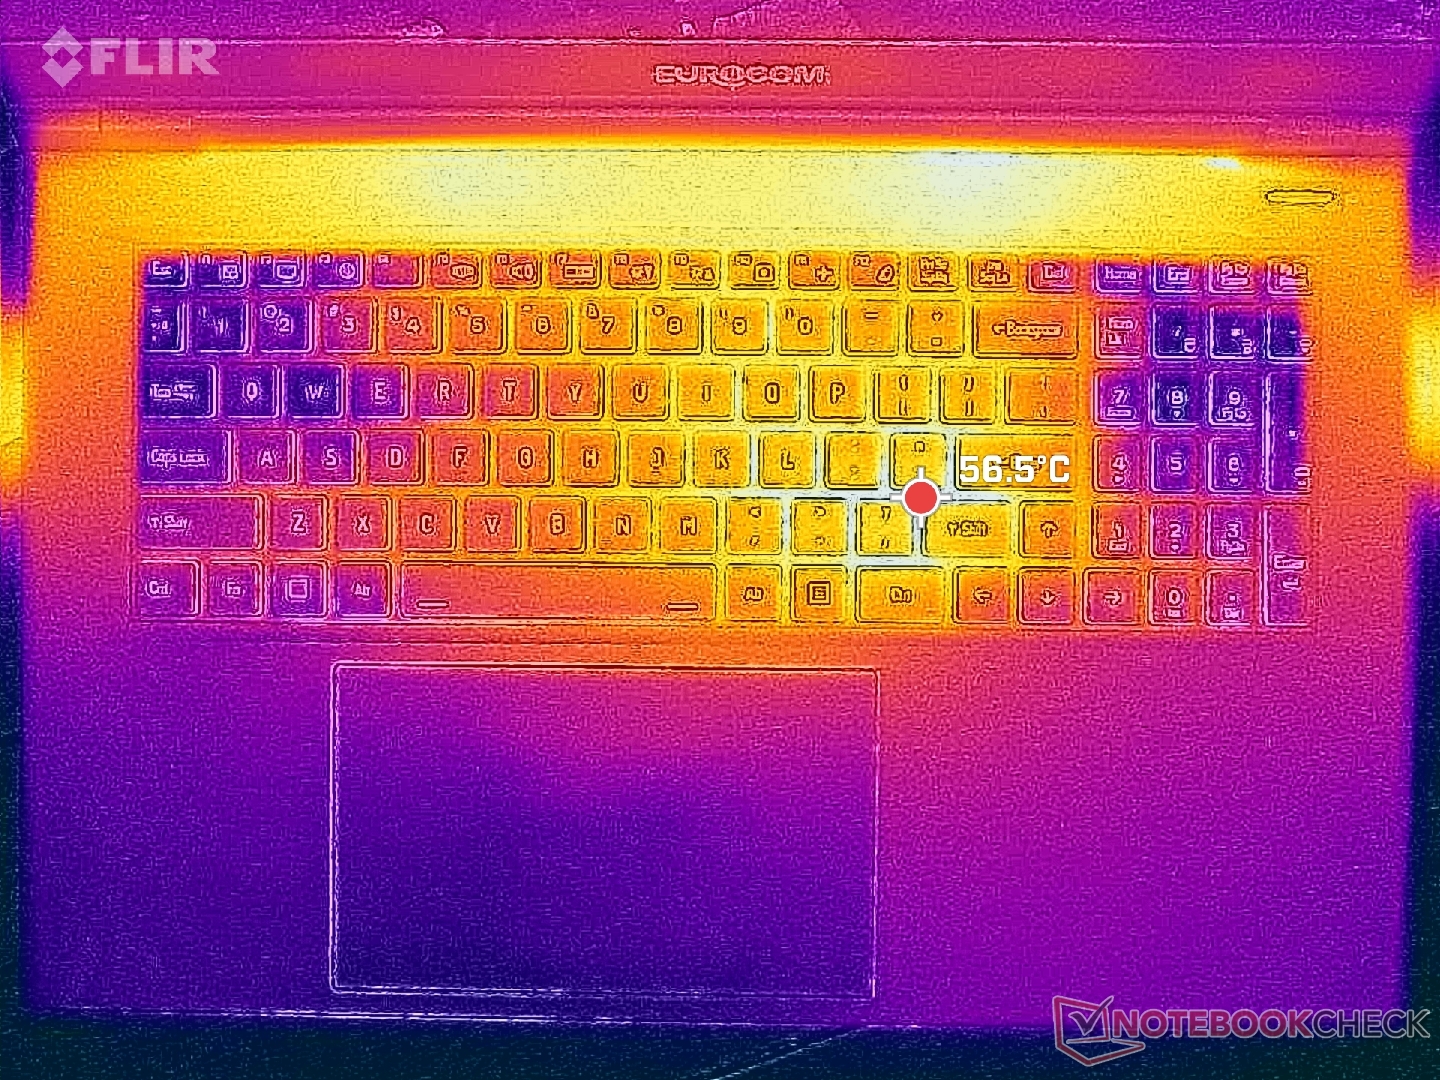
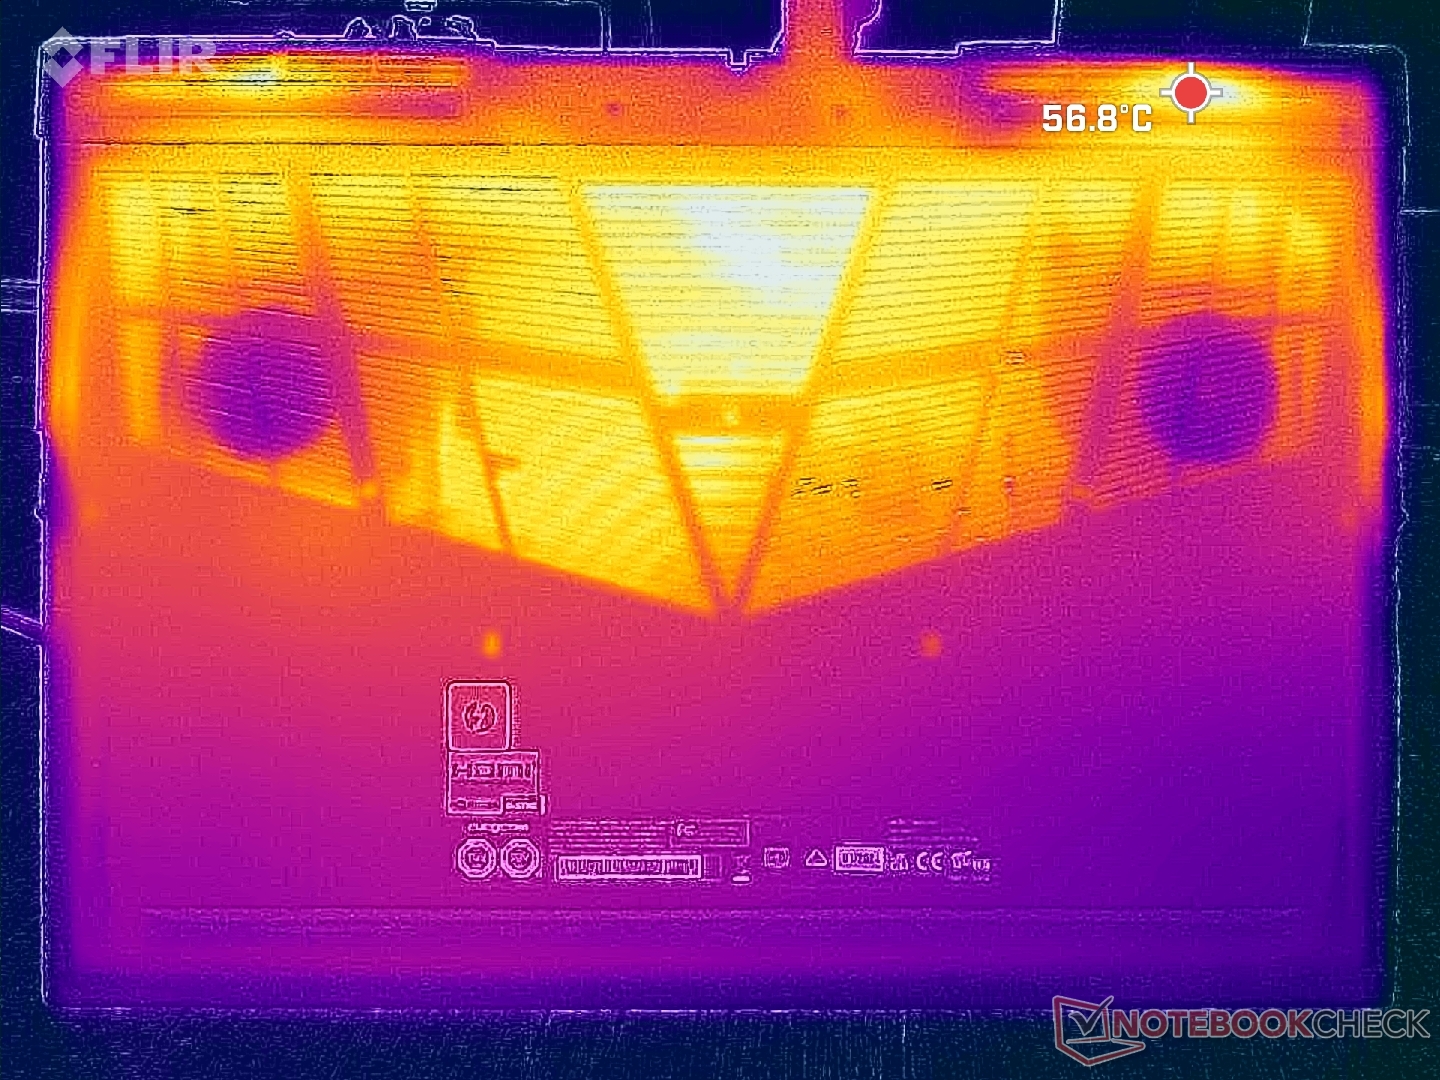
Température
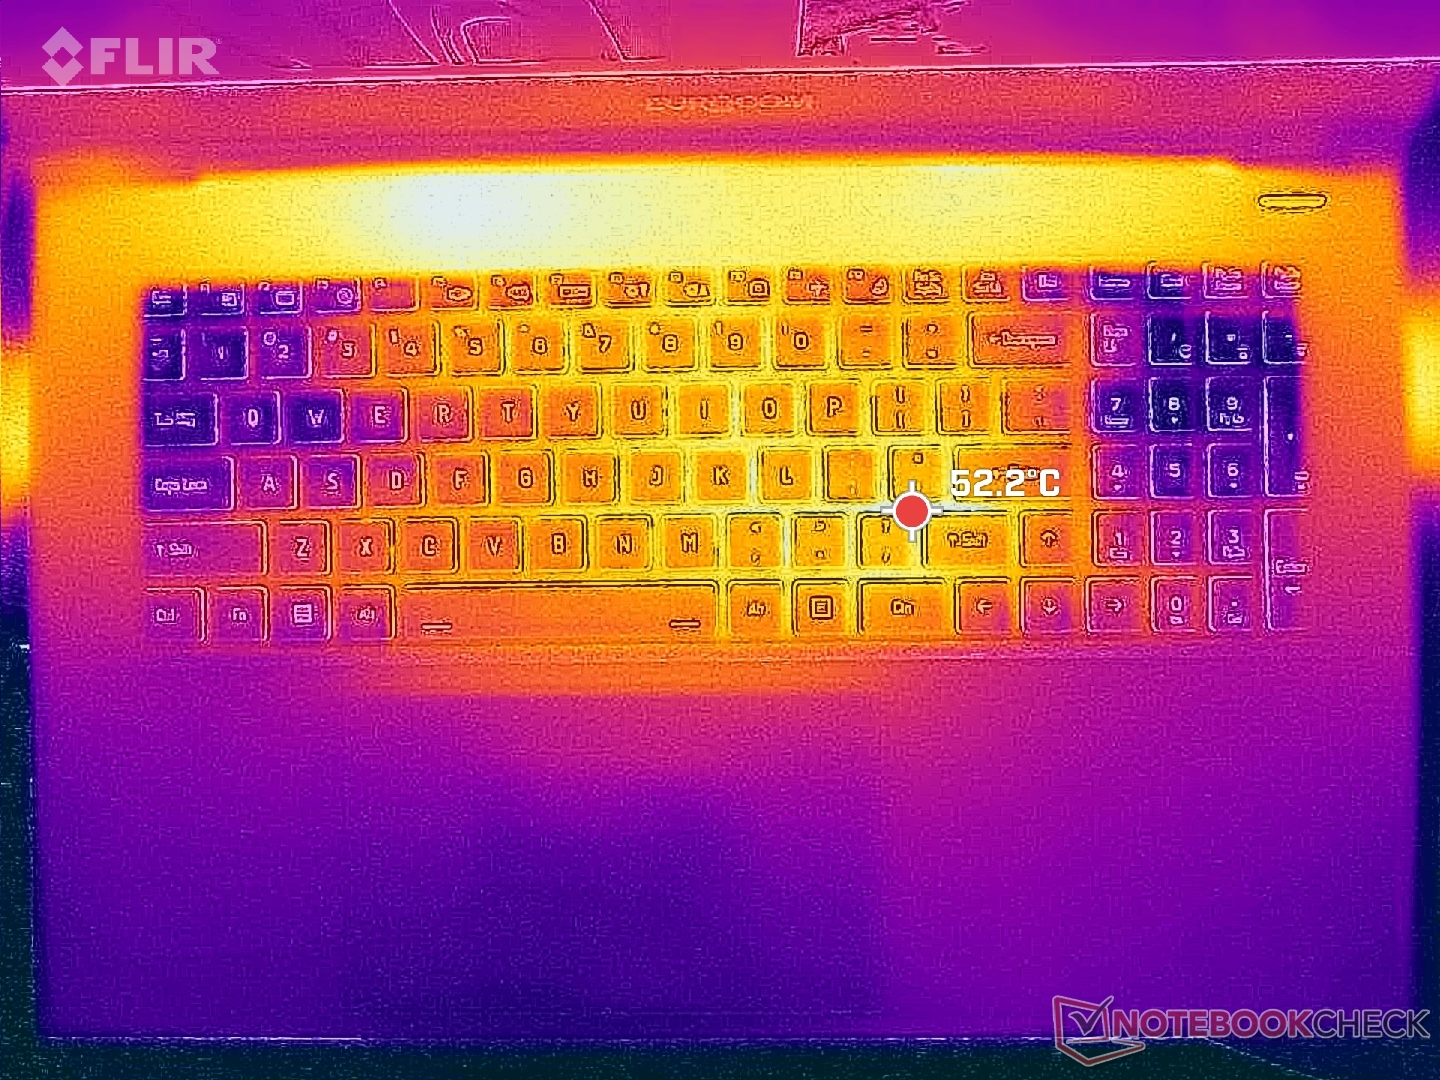
Les points chauds de la température de surface sont nettement plus chauds que sur les autres ordinateurs portables de jeu. En particulier, certaines zones du clavier peuvent atteindre 53°C pendant le jeu, contre 37°C ou 40°C sur le MSI GE78HX ou l'Asus TUF Gaming A17.
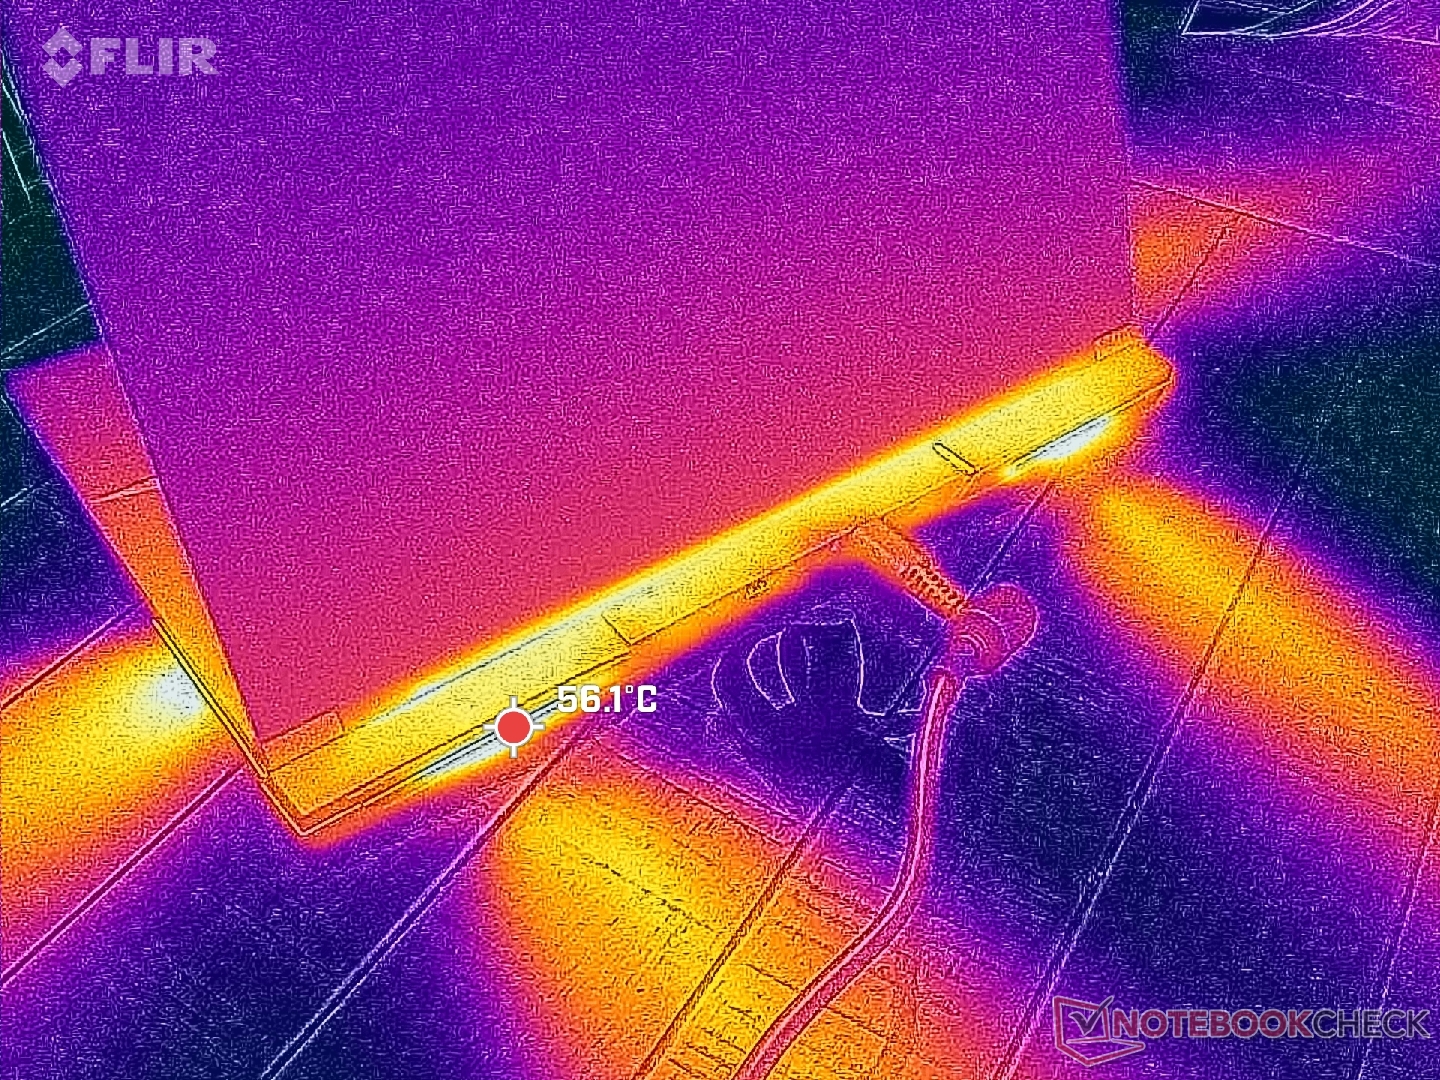
(-) La température maximale du côté supérieur est de 52.2 °C / 126 F, par rapport à la moyenne de 40.4 °C / 105 F, allant de 21.2 à 68.8 °C pour la classe Gaming.
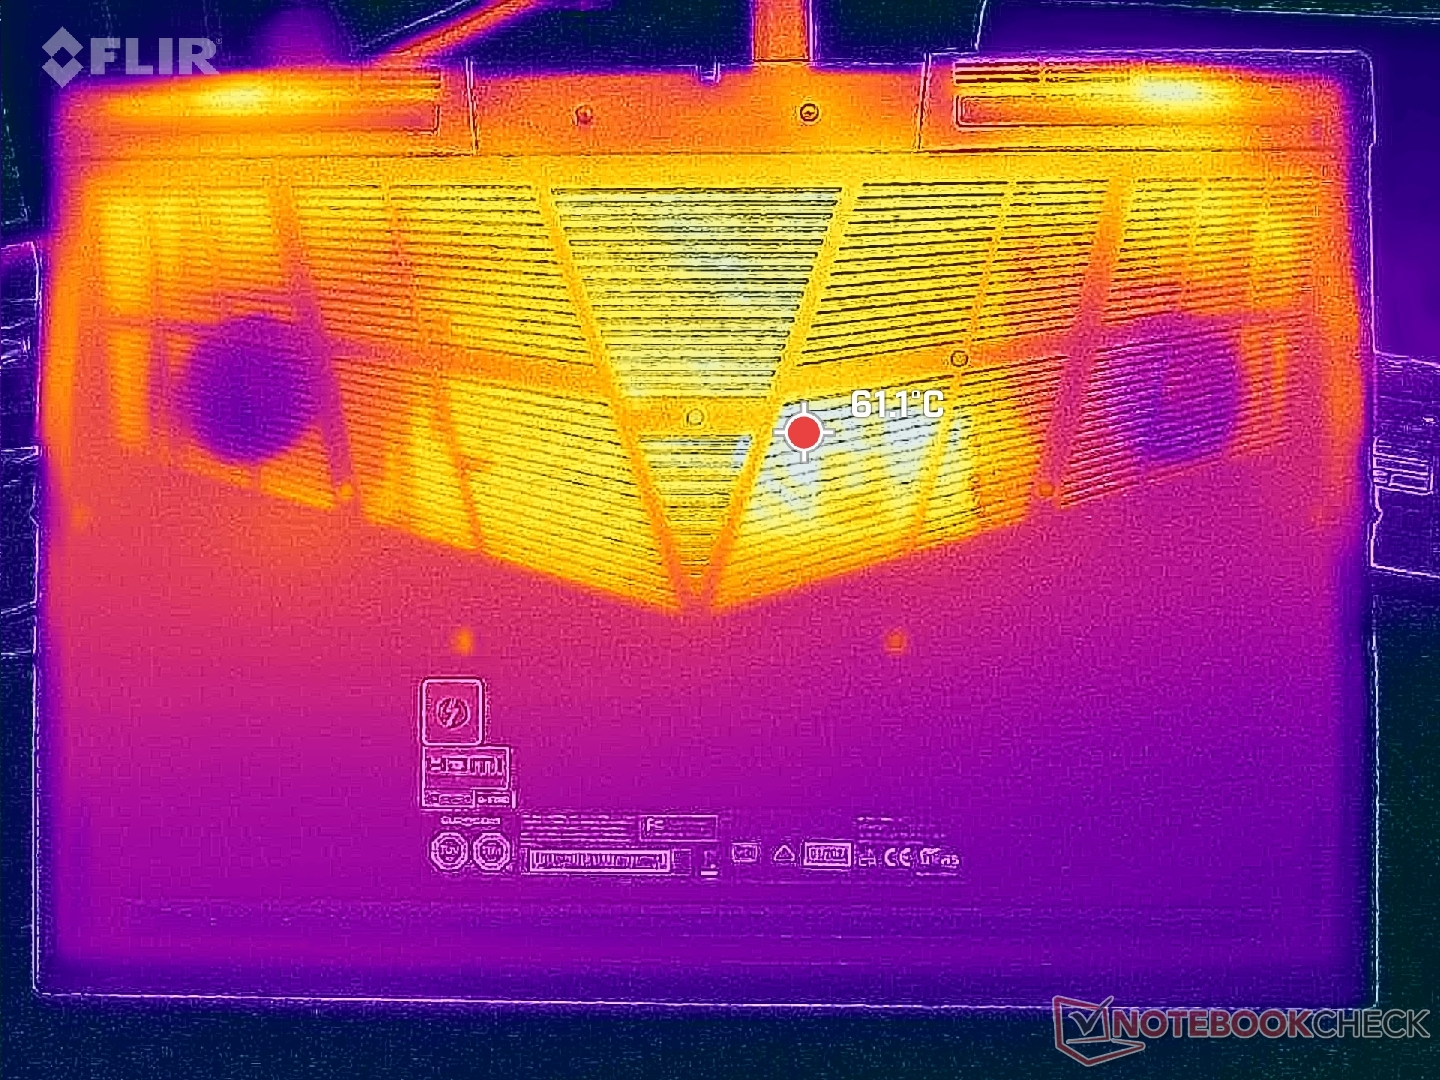
(-) Le fond chauffe jusqu'à un maximum de 53.2 °C / 128 F, contre une moyenne de 43.2 °C / 110 F
(+) En utilisation inactive, la température moyenne du côté supérieur est de 25.8 °C / 78 F, par rapport à la moyenne du dispositif de 33.9 °C / 93 F.
(±) En jouant à The Witcher 3, la température moyenne du côté supérieur est de 36.7 °C / 98 F, alors que la moyenne de l'appareil est de 33.9 °C / 93 F.
(+) Les repose-poignets et le pavé tactile sont plus froids que la température de la peau avec un maximum de 28.8 °C / 83.8 F et sont donc froids au toucher.
(±) La température moyenne de la zone de l'appui-paume de dispositifs similaires était de 28.8 °C / 83.8 F (0 °C / #0 F).
| Eurocom Raptor X17 Core i9-14900HX Intel Core i9-14900HX, NVIDIA GeForce RTX 4090 Laptop GPU | Eurocom Raptor X17 Intel Core i9-13900HX, NVIDIA GeForce RTX 4090 Laptop GPU | Asus TUF Gaming A17 FA707XI-NS94 AMD Ryzen 9 7940HS, NVIDIA GeForce RTX 4070 Laptop GPU | Asus ROG Strix Scar 17 G733PY-XS96 AMD Ryzen 9 7945HX, NVIDIA GeForce RTX 4090 Laptop GPU | MSI GE78HX 13VH-070US Intel Core i9-13950HX, NVIDIA GeForce RTX 4080 Laptop GPU | MSI Titan 18 HX A14VIG Intel Core i9-14900HX, NVIDIA GeForce RTX 4090 Laptop GPU | |
|---|---|---|---|---|---|---|
| Heat | -7% | 21% | 18% | 8% | 4% | |
| Maximum Upper Side * (°C) | 52.2 | 49.4 5% | 40 23% | 34.6 34% | 37.4 28% | 37.8 28% |
| Maximum Bottom * (°C) | 53.2 | 55.2 -4% | 33.6 37% | 35.6 33% | 45 15% | 37.6 29% |
| Idle Upper Side * (°C) | 28.6 | 33.4 -17% | 26.6 7% | 27.2 5% | 29.8 -4% | 34.8 -22% |
| Idle Bottom * (°C) | 29.8 | 33.4 -12% | 24.4 18% | 30 -1% | 32.4 -9% | 36 -21% |
* ... Moindre est la valeur, meilleures sont les performances
Intervenants
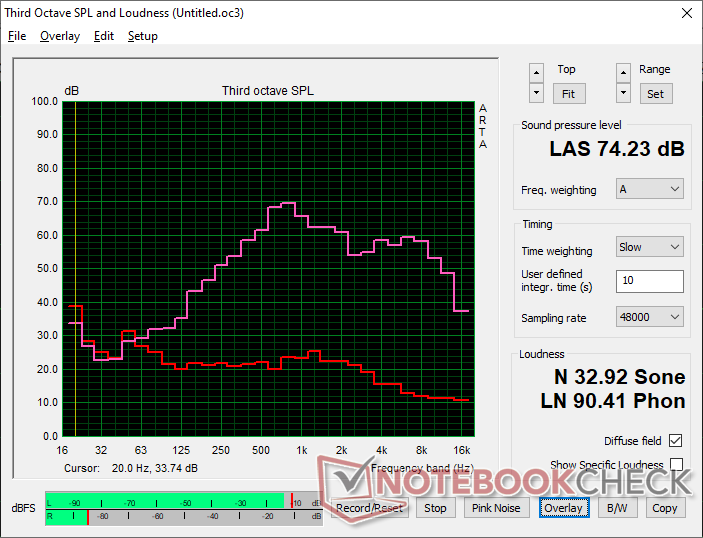
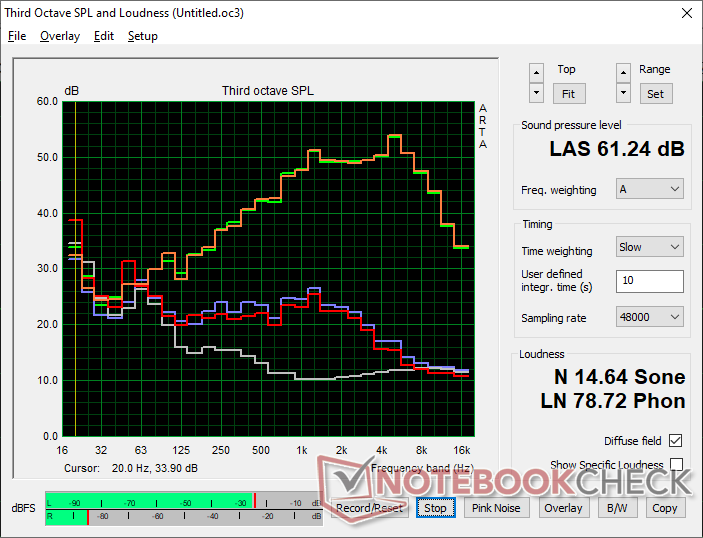
Eurocom Raptor X17 Core i9-14900HX analyse audio
(±) | le niveau sonore du haut-parleur est moyen mais bon (74.2# dB)
Basses 100 - 315 Hz
(±) | basse réduite - en moyenne 13.4% inférieure à la médiane
(±) | la linéarité des basses est moyenne (10.1% delta à la fréquence précédente)
Médiums 400 - 2000 Hz
(±) | médiane supérieure - en moyenne 6.6% supérieure à la médiane
(±) | la linéarité des médiums est moyenne (8.6% delta à la fréquence précédente)
Aiguës 2 - 16 kHz
(+) | des sommets équilibrés - à seulement 2% de la médiane
(±) | la linéarité des aigus est moyenne (8.5% delta à la fréquence précédente)
Globalement 100 - 16 000 Hz
(±) | la linéarité du son global est moyenne (24% de différence avec la médiane)
Par rapport à la même classe
» 86% de tous les appareils testés de cette catégorie étaient meilleurs, 4% similaires, 9% pires
» Le meilleur avait un delta de 6%, la moyenne était de 18%, le pire était de 132%.
Par rapport à tous les appareils testés
» 72% de tous les appareils testés étaient meilleurs, 6% similaires, 22% pires
» Le meilleur avait un delta de 4%, la moyenne était de 24%, le pire était de 134%.
Apple MacBook Pro 16 2021 M1 Pro analyse audio
(+) | les haut-parleurs peuvent jouer relativement fort (84.7# dB)
Basses 100 - 315 Hz
(+) | bonne basse - seulement 3.8% loin de la médiane
(+) | les basses sont linéaires (5.2% delta à la fréquence précédente)
Médiums 400 - 2000 Hz
(+) | médiane équilibrée - seulement 1.3% de la médiane
(+) | les médiums sont linéaires (2.1% delta à la fréquence précédente)
Aiguës 2 - 16 kHz
(+) | des sommets équilibrés - à seulement 1.9% de la médiane
(+) | les aigus sont linéaires (2.7% delta à la fréquence précédente)
Globalement 100 - 16 000 Hz
(+) | le son global est linéaire (4.6% différence à la médiane)
Par rapport à la même classe
» 0% de tous les appareils testés de cette catégorie étaient meilleurs, 0% similaires, 100% pires
» Le meilleur avait un delta de 5%, la moyenne était de 17%, le pire était de 45%.
Par rapport à tous les appareils testés
» 0% de tous les appareils testés étaient meilleurs, 0% similaires, 100% pires
» Le meilleur avait un delta de 4%, la moyenne était de 24%, le pire était de 134%.
Gestion de l'énergie
Consommation électrique
La course à pied Witcher 3 le Titan 18 HX demande un peu plus d'énergie qu'auparavant, environ 325 W, pour être presque aussi performant que le Titan 18 HX. La consommation plus élevée par rapport à notre modèle 2023 peut être attribuée à l'écran 4K plus lumineux et de meilleure résolution de notre nouvelle configuration.
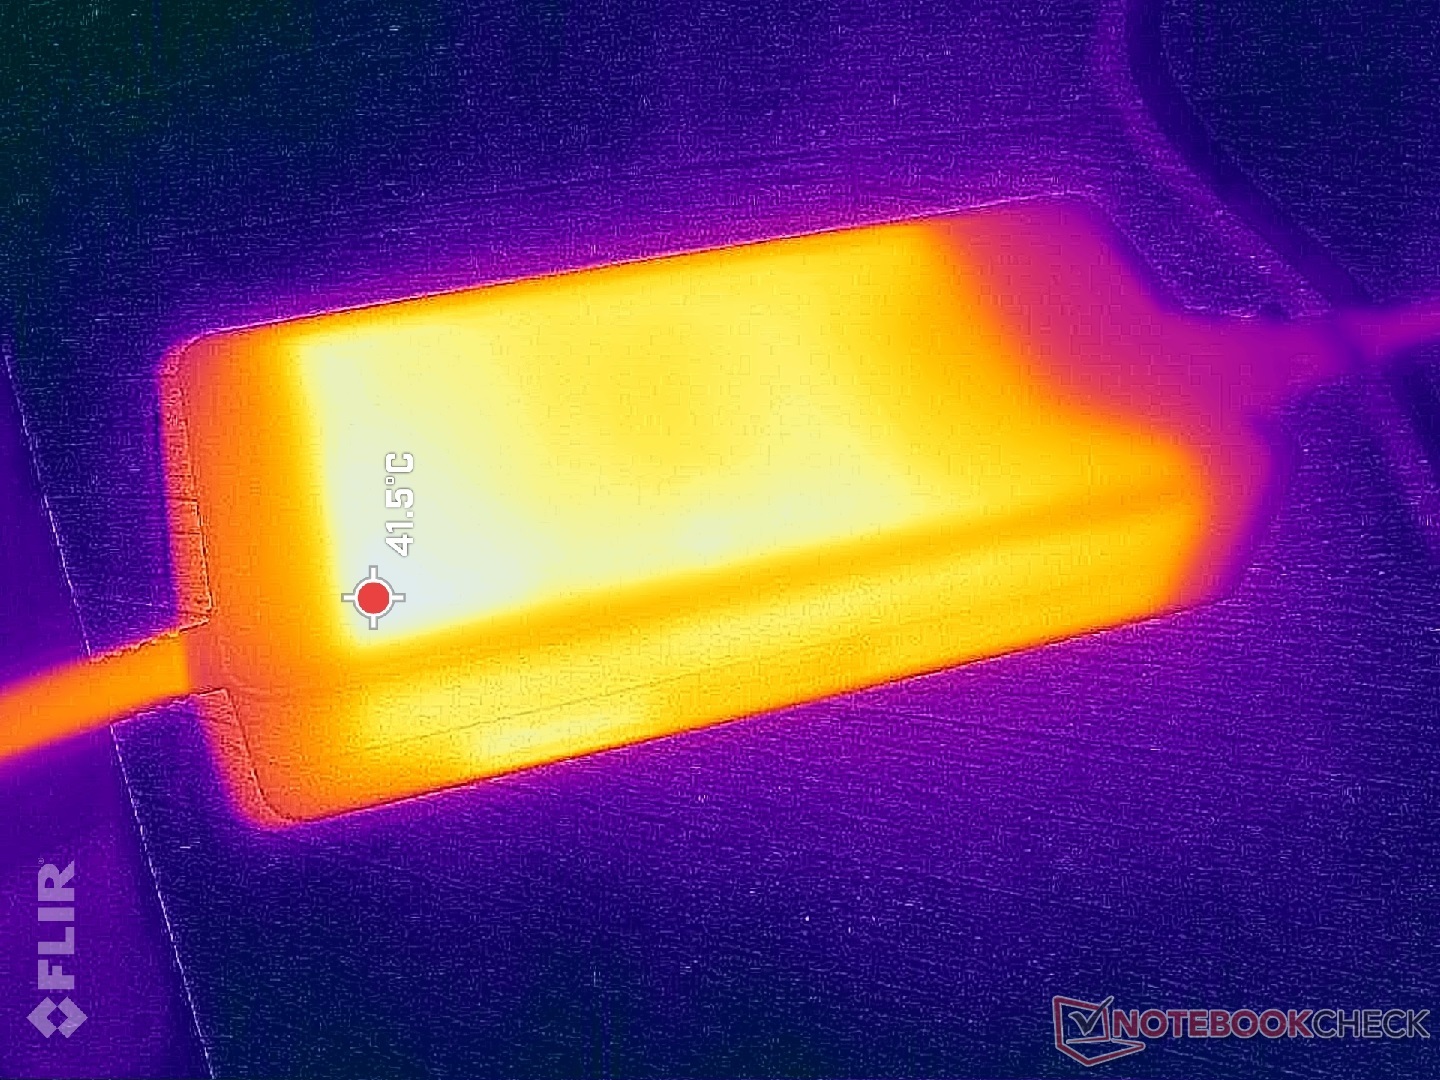
Le grand adaptateur secteur de 330 W reste le même qu'auparavant. Comme les jeux utilisent déjà la quasi-totalité de la puissance de l'adaptateur, tenter de charger la batterie pendant les jeux prendra beaucoup, beaucoup plus de temps.
(Note de la rédaction: cette section sera mise à jour lorsque les réparations de notre multimètre Metrahit Energy seront terminées. Nous vous prions de nous excuser pour ce désagrément)
| Éteint/en veille | |
| Au repos | |
| Fortement sollicité |
|
Légende:
min: | |
| Eurocom Raptor X17 Core i9-14900HX i9-14900HX, GeForce RTX 4090 Laptop GPU, Corsair MP700 Pro 2TB, IPS, 3840x2160, 17.3" | Eurocom Raptor X17 i9-13900HX, GeForce RTX 4090 Laptop GPU, 3x Samsung SSD 980 Pro 1TB (RAID 0), IPS, 2560x1440, 17.3" | Asus TUF Gaming A17 FA707XI-NS94 R9 7940HS, GeForce RTX 4070 Laptop GPU, WD PC SN560 SDDPNQE-1T00, IPS, 1920x1080, 17.3" | Asus ROG Strix Scar 17 G733PY-XS96 R9 7945HX, GeForce RTX 4090 Laptop GPU, SK hynix PC801 HFS001TEJ9X101N, IPS, 2560x1440, 17.3" | MSI GE78HX 13VH-070US i9-13950HX, GeForce RTX 4080 Laptop GPU, Samsung PM9A1 MZVL22T0HBLB, IPS, 2560x1600, 17" | MSI Titan 18 HX A14VIG i9-14900HX, GeForce RTX 4090 Laptop GPU, 2x Samsung PM9A1a MZVL22T0HDLB (RAID 0), Mini-LED, 3840x2400, 18" | |
|---|---|---|---|---|---|---|
| Power Consumption | 13% | 45% | 17% | 16% | -1% | |
| Idle Minimum * (Watt) | 18.7 | 13.4 28% | 6.2 67% | 14.5 22% | 16.1 14% | 13.2 29% |
| Idle Average * (Watt) | 29.9 | 22.2 26% | 21.8 27% | 21.1 29% | 24 20% | 25.4 15% |
| Idle Maximum * (Watt) | 43.8 | 42.4 3% | 22 50% | 42.8 2% | 34 22% | 53.5 -22% |
| Load Average * (Watt) | 148.9 | 132.8 11% | 59.2 60% | 116.7 22% | 123.6 17% | 151.4 -2% |
| Witcher 3 ultra * (Watt) | 310.5 | 304 2% | 189.7 39% | 278 10% | 286 8% | 336 -8% |
| Load Maximum * (Watt) | 340.2 | 319.8 6% | 247.8 27% | 279.6 18% | 285.7 16% | 395.2 -16% |
* ... Moindre est la valeur, meilleures sont les performances
Power Consumption Witcher 3 / Stresstest
Power Consumption external Monitor
Autonomie de la batterie
Les durées d'exécution sont légèrement inférieures à celles de la configuration de l'année dernière, probablement en raison de la résolution 4K plus exigeante.
| Eurocom Raptor X17 Core i9-14900HX i9-14900HX, GeForce RTX 4090 Laptop GPU, 99 Wh | Eurocom Raptor X17 i9-13900HX, GeForce RTX 4090 Laptop GPU, 99 Wh | Asus TUF Gaming A17 FA707XI-NS94 R9 7940HS, GeForce RTX 4070 Laptop GPU, 90 Wh | Asus ROG Strix Scar 17 G733PY-XS96 R9 7945HX, GeForce RTX 4090 Laptop GPU, 90 Wh | MSI GE78HX 13VH-070US i9-13950HX, GeForce RTX 4080 Laptop GPU, 99 Wh | MSI Titan 18 HX A14VIG i9-14900HX, GeForce RTX 4090 Laptop GPU, 99.9 Wh | |
|---|---|---|---|---|---|---|
| Autonomie de la batterie | 6% | 94% | -13% | 30% | -11% | |
| WiFi v1.3 (h) | 4.7 | 5 6% | 9.1 94% | 4.1 -13% | 6.1 30% | 4.2 -11% |
| Reader / Idle (h) | 10.2 | 19.7 | 7.3 | 5.9 | ||
| Load (h) | 1.5 | 1.7 | 1.5 | 1.2 |
Points positifs
Points négatifs
Verdict - Nouveau processeur, même apparence
Depuis que le Core i9-14900HX est en grande partie un rebrand du Core i9-13900HX d'antan, l'Eurocom Raptor X17 2024 n'offre pas grand-chose par rapport à la version 2023. Les performances du processeur sont légèrement plus élevées, mais la plupart des autres éléments restent inchangés. Les performances globales sont néanmoins comparables à celles de certains des ordinateurs portables les plus rapides du marché, notamment le MSI Titan HX ou l'Asus ROG Strix Scar 18 Asus ROG Strix Scar 18. Eurocom ne propose pas d'écran mini-LED ou OLED pour ce modèle, mais ces options s'adressent aux utilisateurs multimédias alors que le Raptor X17 est plutôt conçu pour les espaces professionnels de haute performance.
Le bruit du ventilateur est peut-être un peu plus régulier, mais ne vous attendez pas à des gains de performance significatifs par rapport aux options déjà très rapides de la génération précédente.
Les utilisateurs intensifs qui décident de configurer leur ordinateur avec un SSD PCIe5 doivent absolument envisager de commander le répartiteur de chaleur. Sinon, le disque PCIe5 se comportera davantage comme un disque PCIe4 après quelques minutes d'utilisation intensive.
Prix et disponibilité
Eurocom est maintenant en train de livrer le 2024 Raptor X17 à partir de 3500$ pour la RTX 4080 et l'écran 2K. La configuration avec la RTX 4090 et un écran 4K comme dans notre unité de test augmentera le prix à plus de 4200 $.
Eurocom Raptor X17 Core i9-14900HX
- 03/15/2024 v7 (old)
Allen Ngo
Transparency
La sélection des appareils à examiner est effectuée par notre équipe éditoriale. L'échantillon de test a été prêté à l'auteur par le fabricant ou le détaillant pour les besoins de cet examen. Le prêteur n'a pas eu d'influence sur cette évaluation et le fabricant n'a pas reçu de copie de cette évaluation avant sa publication. Il n'y avait aucune obligation de publier cet article. En tant que média indépendant, Notebookcheck n'est pas soumis à l'autorité des fabricants, des détaillants ou des éditeurs.
Voici comment Notebookcheck teste
Chaque année, Notebookcheck examine de manière indépendante des centaines d'ordinateurs portables et de smartphones en utilisant des procédures standardisées afin de garantir que tous les résultats sont comparables. Nous avons continuellement développé nos méthodes de test depuis environ 20 ans et avons établi des normes industrielles dans le processus. Dans nos laboratoires de test, des équipements de mesure de haute qualité sont utilisés par des techniciens et des rédacteurs expérimentés. Ces tests impliquent un processus de validation en plusieurs étapes. Notre système d'évaluation complexe repose sur des centaines de mesures et de points de référence bien fondés, ce qui garantit l'objectivité.Price comparison

