Notebookcheck Logo

Test des GeForce RTX 4070, 4060, 4050 : les nouveaux GPU pour PC portables de Nvidia

Parfait pour la QHD et le 1080p. Deux semaines après le lancement des nouveaux modèles haut de gamme RTX 4090 et RTX 4080, Nvidia lance les nouvelles versions pour ordinateur portable des RTX 4070, RTX 4060 et RTX 4050. Nous avons vérifié les trois nouveaux modèles et les versions plus petites offrent également des performances nettement supérieures.

Nvidia vient de lancer son nouveauGeForce Ordinateur portable RTX 4090etGeforce RTX 4080 Laptopau début du mois de février. Notre site analyses complètes ont montré que les performances étaient bien inférieures à celles de leurs homologues RTX 40 pour ordinateurs de bureau en raison des restrictions TGP, mais qu'il y avait tout de même une amélioration majeure des performances par rapport à l'ancien modèle phareGeForce Ordinateur portable RTX 3080 Ti. Les deux modèlesMSI Titan GT77(RTX 4090) ainsi que leRazer Blade 16(RTX 4080) ont également montré que les deux GPU peuvent facilement gérer des écrans à haute résolution, y compris 4K. Cependant, ces ordinateurs portables sont très chers et les nouveaux GPU grand public seront plus intéressants pour de nombreux clients.

Aujourd'hui, Nvidia lance les nouveaux modèlesGeForce Ordinateur portable RTX 4070,Ordinateur portable RTX 4060ainsi que leRTX 4050 Laptopqui sont disponibles dans de nombreux ordinateurs portables de jeu et multimédia. En plus des benchmarks synthétiques, nous vérifierons les performances de jeu, notamment le Ray Tracing et l'upscaling DLSS de Nvidia.

Aperçu - Ordinateur portable RTX 4070, 4060 et 4050

Les nouveaux modèles GeForce RTX 4070, 4060 et 4050 sont tous basés sur l'architecture Ada Lovelace et toutes les versions prennent en charge DLSS 3 ainsi que le raytracing. Il existe évidemment des différences en termes de nombre de cœurs, qui sont répertoriées dans le tableau ci-dessous. Le RTX 4070 Laptop est basé sur la puce AD106, tandis que le RTX 4060 Laptop et le RTX 4050 Laptop sont basés sur la puce AD107. Les trois GPU peuvent couvrir une large gamme de systèmes avec des réglages TGP compris entre 35 et 115 watts, avec 25 watts supplémentaires fournis par le processeur via Dynamic Boost. Cela signifie que les trois GPU pour ordinateurs portables peuvent consommer jusqu'à 140 watts.

Vue d'ensemble de l'ordinateur portable RTX 40 (Source : Nvidia)

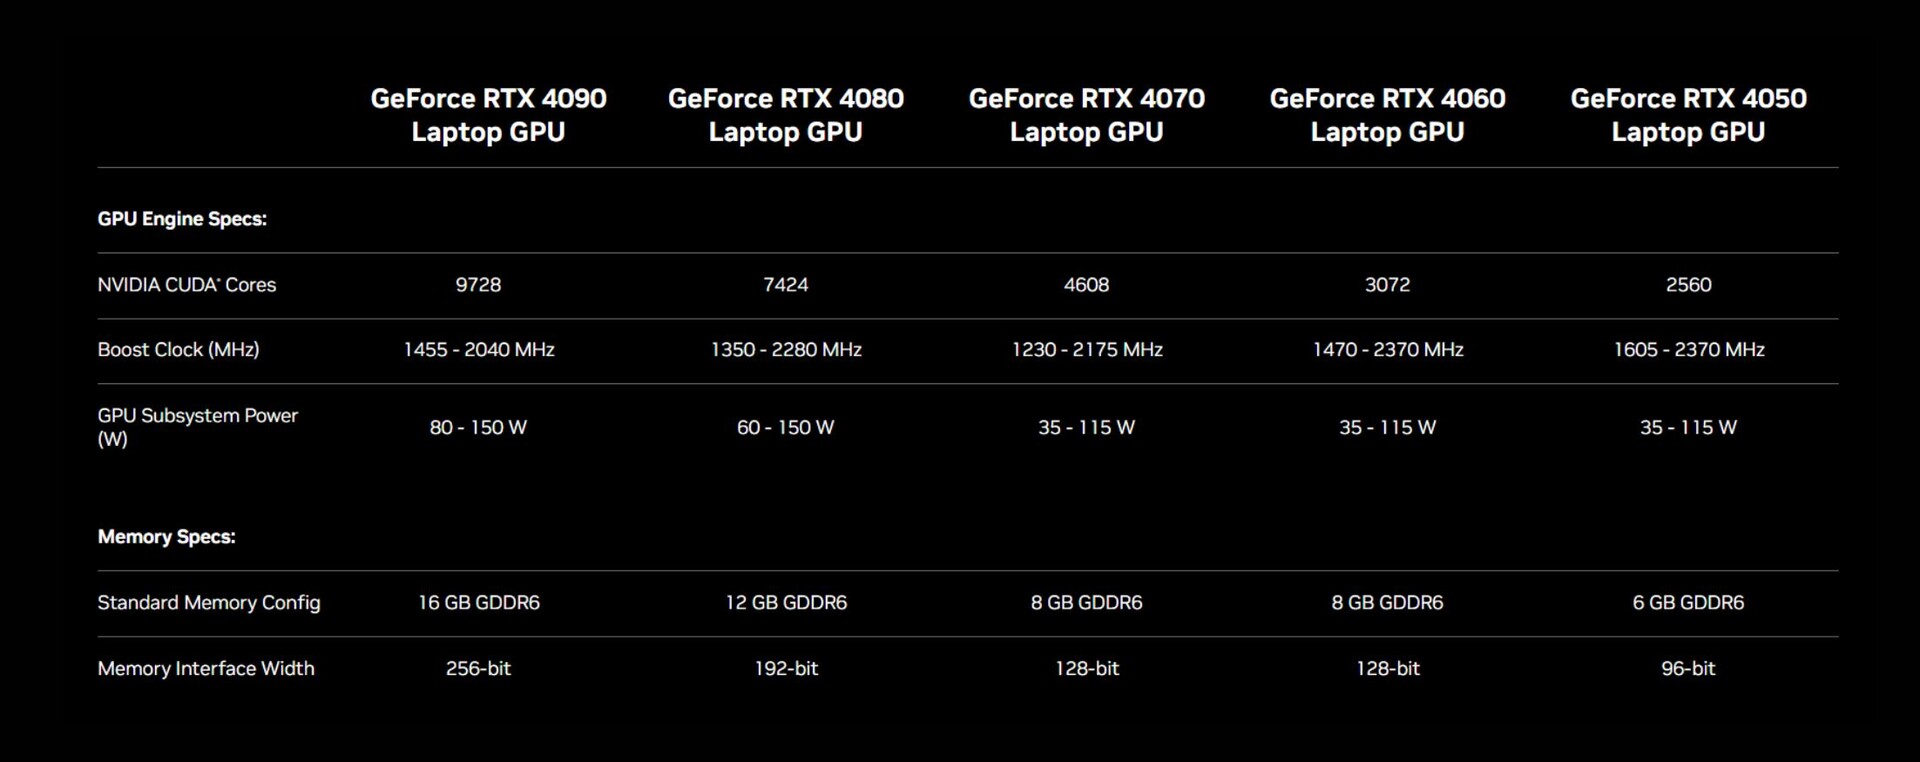
Cependant, vous ne verrez cette valeur que dans des charges de travail synthétiques comme FurMark, par exemple. La consommation d'énergie dans les scénarios de jeu réels dépendra de la charge réelle du GPU, la consommation peut donc être beaucoup plus faible. Ceci est important lorsque vous analysez des benchmarks de jeu et des données de capteur, afin de ne pas paniquer lorsque le GPU n'atteint pas sa valeur TGP maximale tout le temps puisque tout fonctionne comme prévu par Nvidia. La large plage de TGP peut également être un problème pour les clients lorsque les fabricants d'ordinateurs portables ne divulguent pas les chiffres TGP exacts de leurs produits.

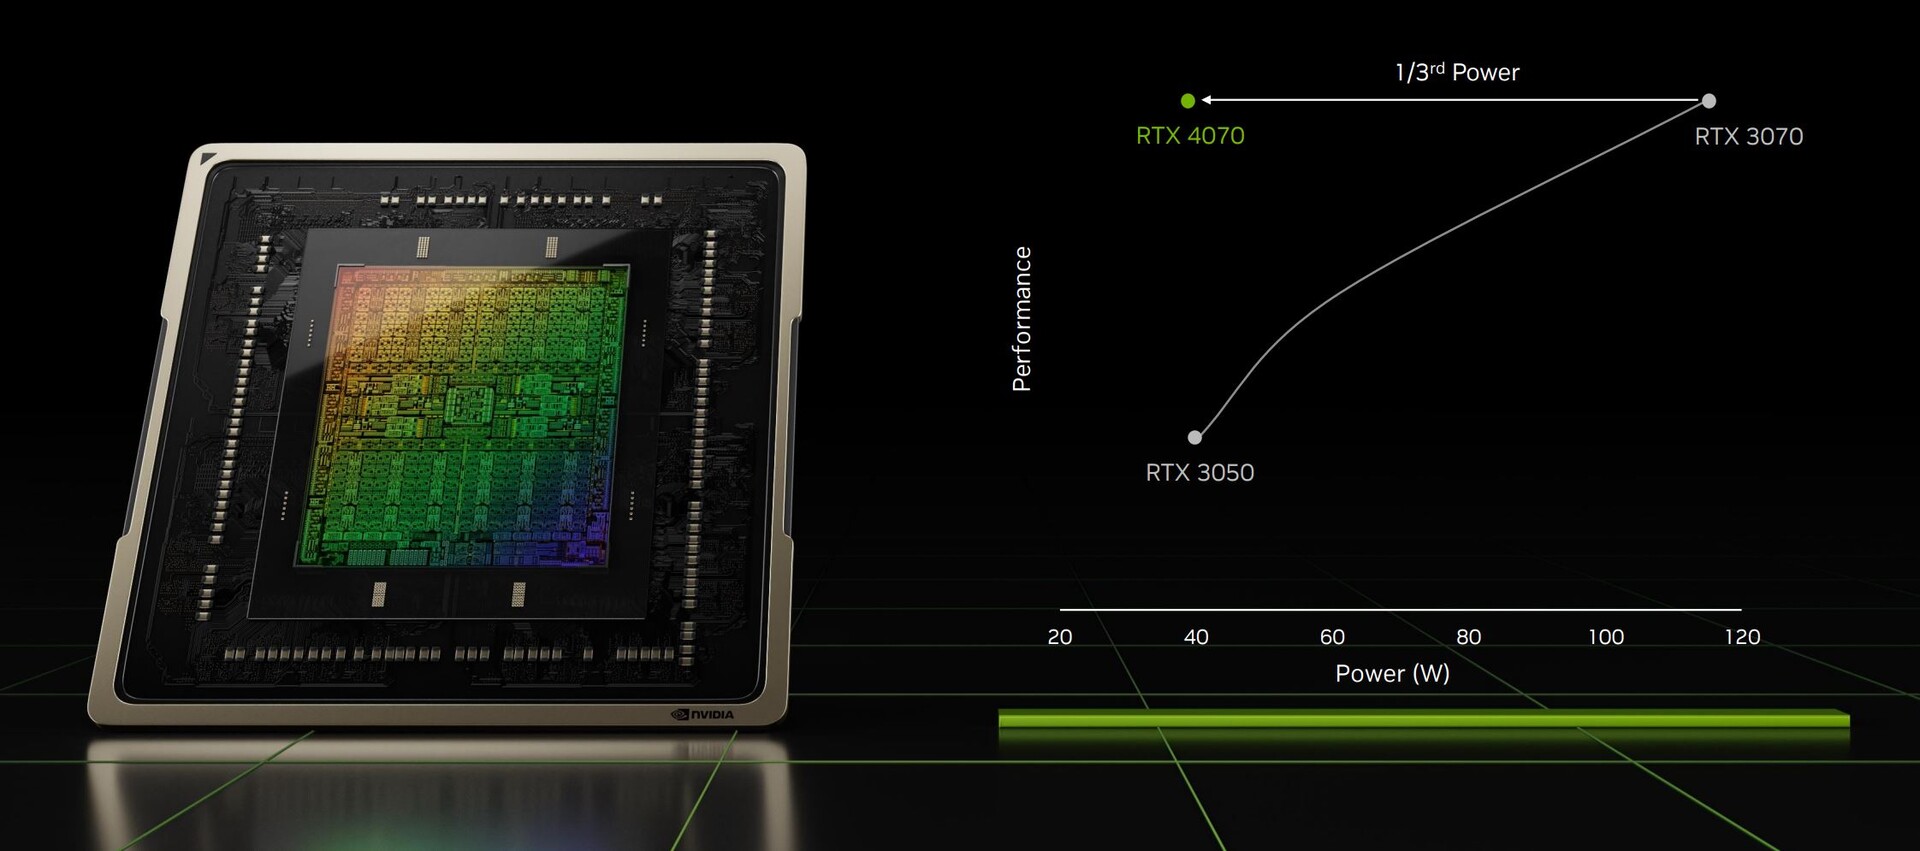
Notre analyse de l'ordinateur portable RTX 4090/480 a montré des améliorations d'efficacité de plus de 50 %, mais Nvidia annonce même des gains d'efficacité plus élevés (3x). L'information de presse montre maintenant le scénario de cette affirmation, qui n'est pas très pratique. La comparaison inclut le nouveau portable RTX 4070 fonctionnant à 40W, qui offrira les mêmes performances que l'ancien portableOrdinateur portable RTX 3070. Cependant, il n'y a pas d'autres détails sur cette comparaison (comme l'application, le jeu, les paramètres, etc.).

La plus grande amélioration de l'efficacité par rapport à Ampère est possible à 40W (Source : Nvidia)

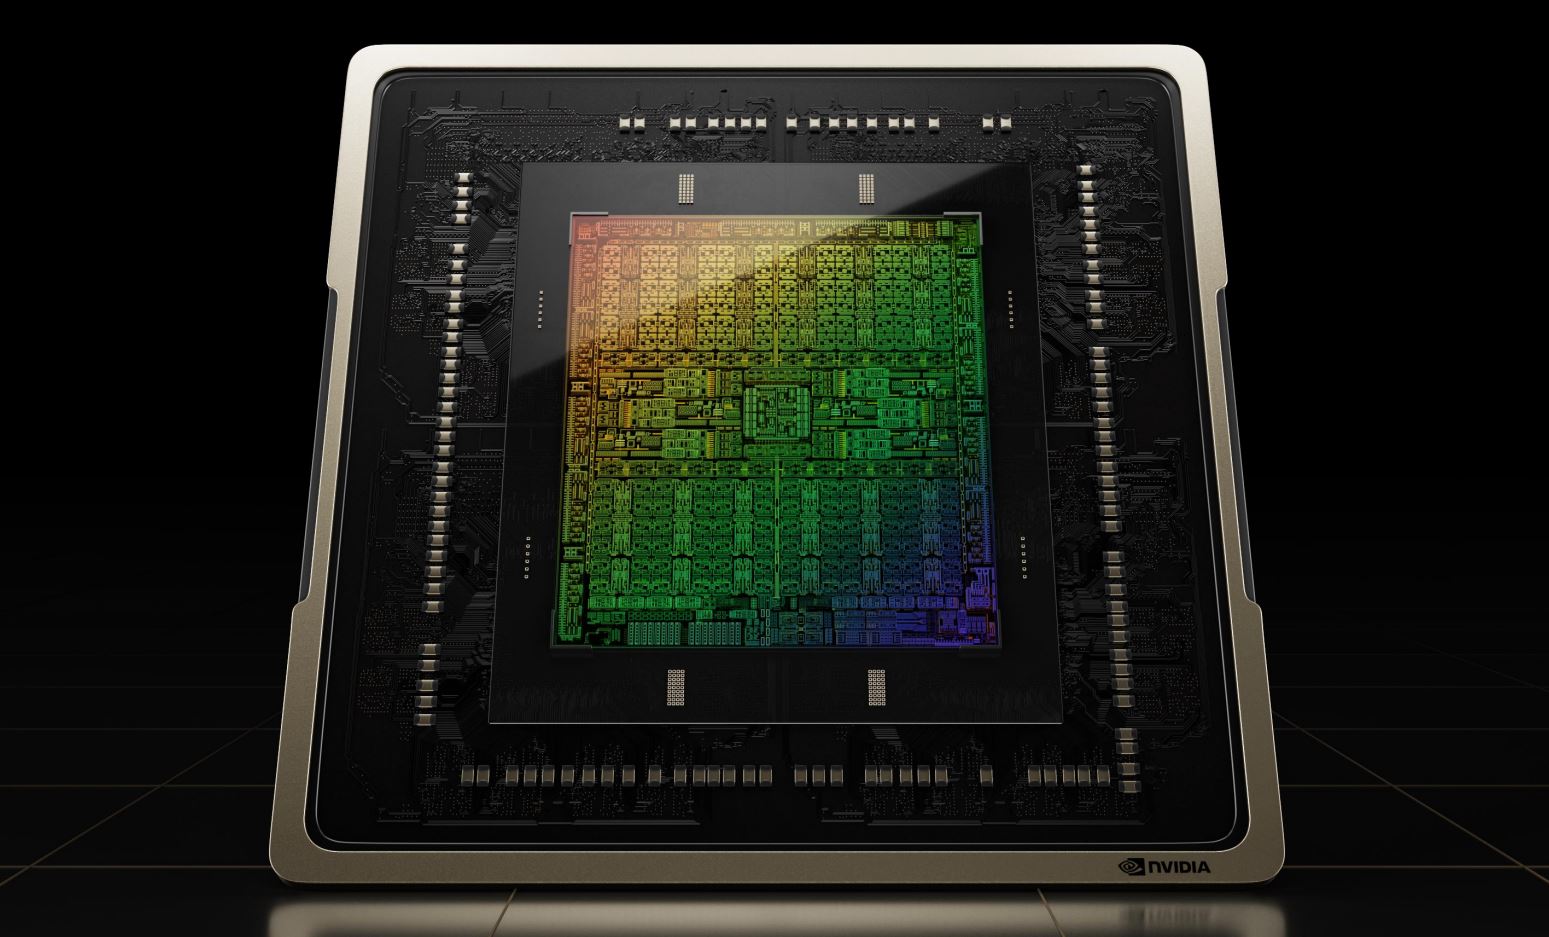
Nous avons déjà évoqué les détails techniques de l'architecture Ada Lovelace dans notre analyse de l'ordinateur portable RTX 4090/4080. Nous sommes actuellement toujours en attente de recevoir plus d'informations et de photos des nouveaux GPU AD106 et AD107 de Nvidia et nous mettrons à jour l'article dès que possible.

DLSS3 (Source : Nvidia)
max-Q de 5ème génération (Source : Nvidia)

Systèmes d'essai

Nous avons pu utiliser plusieurs systèmes pour recueillir les données de référence suivantes. En plus des unités de détail, nous avons également eu accès à des échantillons d'ingénierie, qui ne seront pas vendus aux clients. Cela signifie qu'il n'y a pas d'évaluation de ces systèmes pour le moment, mais nous testerons leurs équivalents au détail dès que nous le pourrons.

Tous les ordinateurs portables ont été testés avec les paramètres de performance maximum et (si possible) l'iGPU désactivé. Les deux modèles RTX 4070 Laptop et RTX 4050 Laptop dans les systèmes XMG ainsi que la Blade 18 sont les versions les plus rapides des GPU avec le TGP maximum et les résultats représentent la meilleure performance que vous pouvez atteindre. Gigaybte et MSI utilisent des GPU avec un TGP maximum de 105W (80W TGP + 25W Dynamic Boost).

Repères synthétiques

Nous commençons par les benchmarks synthétiques 3DMark, où la nouvelleRTX 4070 Laptopest juste devant le précédent GPU haut de gammeRTX 3080 Ti Laptopet à égalité avec leRTX 3070 de bureau. Cela signifie également qu'il y a un déficit de performance massif par rapport auOrdinateur portable RTX 4080où la version la plus puissante est environ 40 % plus rapide. La RTX 4070 avec 105W dans le Gigabyte Aero 16 d'autre part est juste 4 % plus lente.

Le portable RTX 4060 105W est aussi juste 13 % plus lent que le portable RTX 4070 dans le XMG Neo 17 dans les tests synthétiques, mais il est aussi 33 % plus rapide que l'ancien portableGeForce Ordinateur portable RTX 3060il est donc comparable à l'ordinateur portable RTX 3070 Ti dans l'ensemble.

La nouvelle RTX 4050 montre les plus grandes améliorations avec un avantage de performance de 74 % par rapport à l'ancienne RTX 3050 Ti Laptop.Ordinateur portable RTX 3050 Ti. Cependant, nous devons être un peu prudents ici car il s'agit de l'ordinateur portable RTX 4050 le plus rapide (140W), mais la plupart des unités de détail auront probablement des spécifications TGP beaucoup plus faibles.

Performance Rating - Percent
NVIDIA GeForce RTX 4070 Ti
TUF Gaming GeForce RTX 4070 Ti, i9-13900K
99.6 pt
NVIDIA GeForce RTX 4090 Laptop GPU
Titan GT77 HX 13VI, i9-13950HX
93.2 pt
Moyenne NVIDIA GeForce RTX 3090
 
83.7 pt
NVIDIA GeForce RTX 4080 Laptop GPU
Blade 16 Early 2023, i9-13950HX
76.7 pt
NVIDIA GeForce RTX 4070 Laptop GPU
XMG Neo 17 2023 Engineering Sample, i9-13900HX
55.4 pt
Moyenne NVIDIA GeForce RTX 3070
 
55.1 pt
Moyenne AMD Radeon RX 6800M
 
54.4 pt
NVIDIA GeForce RTX 4070 Laptop GPU
AERO 16 OLED BSF, i9-13900H
53.2 pt
Moyenne NVIDIA GeForce RTX 3080 Ti Laptop GPU
 
52.8 pt
NVIDIA GeForce RTX 4070 Laptop GPU
Blade 18 RTX 4070, i9-13950HX
52.2 pt
Moyenne NVIDIA GeForce RTX 3080 Laptop GPU
 
49.3 pt
Moyenne NVIDIA GeForce RTX 3070 Ti Laptop GPU
 
48.1 pt
NVIDIA GeForce RTX 4060 Laptop GPU
Katana 17 B13VFK, i7-13620H
48 pt
Moyenne AMD Radeon RX 6700M
 
45.1 pt
NVIDIA GeForce RTX 4050 Laptop GPU
XMG Focus 15 Engineering Sample, i5-13500HX
40.6 pt
Moyenne AMD Radeon RX 6600M
 
39.7 pt
Moyenne NVIDIA GeForce RTX 3060
 
37.4 pt
Moyenne NVIDIA GeForce RTX 3060 Laptop GPU
 
36.1 pt
Moyenne NVIDIA GeForce RTX 3050
 
28 pt
Moyenne NVIDIA GeForce RTX 3050 Ti Laptop GPU
 
23.3 pt
Moyenne NVIDIA GeForce RTX 3050 6GB Laptop GPU
 
21.8 pt
3DMark
2560x1440 Time Spy Graphics
NVIDIA GeForce RTX 4070 Ti
TUF Gaming GeForce RTX 4070 Ti, i9-13900K
22982 Points +83%
NVIDIA GeForce RTX 4070 Ti
TUF Gaming GeForce RTX 4070 Ti, i9-13900K
22949 Points +83%
NVIDIA GeForce RTX 4090 Laptop GPU
Titan GT77 HX 13VI, i9-13950HX
22254 Points +78%
Moyenne NVIDIA GeForce RTX 3090
  (18685 - 20433, n=17)
19266 Points +54%
NVIDIA GeForce RTX 4080 Laptop GPU
Blade 16 Early 2023, i9-13950HX
18441 Points +47%
Moyenne NVIDIA GeForce RTX 3070
  (11043 - 13961, n=8)
12784 Points +2%
NVIDIA GeForce RTX 4070 Laptop GPU
XMG Neo 17 2023 Engineering Sample, i9-13900HX
12529 Points
Moyenne NVIDIA GeForce RTX 3080 Ti Laptop GPU
  (4921 - 13835, n=43)
11850 Points -5%
NVIDIA GeForce RTX 4070 Laptop GPU
AERO 16 OLED BSF, i9-13900H
11798 Points -6%
NVIDIA GeForce RTX 4070 Laptop GPU
Blade 18 RTX 4070, i9-13950HX
11683 Points -7%
Moyenne AMD Radeon RX 6800M
  (10439 - 11316, n=4)
11067 Points -12%
Moyenne NVIDIA GeForce RTX 3080 Laptop GPU
  (6407 - 13210, n=45)
10681 Points -15%
Moyenne NVIDIA GeForce RTX 3070 Ti Laptop GPU
  (8142 - 12324, n=37)
10478 Points -16%
NVIDIA GeForce RTX 4060 Laptop GPU
Katana 17 B13VFK, i7-13620H
10299 Points -18%
Moyenne AMD Radeon RX 6700M
  (8654 - 9323, n=2)
8989 Points -28%
NVIDIA GeForce RTX 4050 Laptop GPU
XMG Focus 15 Engineering Sample, i5-13500HX
8536 Points -32%
Moyenne NVIDIA GeForce RTX 3060
  (7866 - 8600, n=5)
8426 Points -33%
Moyenne NVIDIA GeForce RTX 3060 Laptop GPU
  (6285 - 9235, n=49)
8057 Points -36%
Moyenne AMD Radeon RX 6600M
  (7200 - 8234, n=7)
7864 Points -37%
Moyenne NVIDIA GeForce RTX 3050
  (6102 - 6198, n=2)
6150 Points -51%
Moyenne NVIDIA GeForce RTX 3050 Ti Laptop GPU
  (3744 - 6122, n=27)
5177 Points -59%
Moyenne NVIDIA GeForce RTX 3050 6GB Laptop GPU
  (4501 - 4820, n=2)
4661 Points -63%
1920x1080 Fire Strike Graphics
NVIDIA GeForce RTX 4070 Ti
TUF Gaming GeForce RTX 4070 Ti, i9-13900K
53729 Points +73%
NVIDIA GeForce RTX 4070 Ti
TUF Gaming GeForce RTX 4070 Ti, i9-13900K
52903 Points +70%
NVIDIA GeForce RTX 4090 Laptop GPU
Titan GT77 HX 13VI, i9-13950HX
49247 Points +59%
Moyenne NVIDIA GeForce RTX 3090
  (41298 - 49282, n=17)
46856 Points +51%
NVIDIA GeForce RTX 4080 Laptop GPU
Blade 16 Early 2023, i9-13950HX
40570 Points +31%
Moyenne AMD Radeon RX 6800M
  (30507 - 34993, n=3)
33233 Points +7%
NVIDIA GeForce RTX 4070 Laptop GPU
XMG Neo 17 2023 Engineering Sample, i9-13900HX
31054 Points
Moyenne NVIDIA GeForce RTX 3070
  (20357 - 34047, n=8)
29587 Points -5%
Moyenne NVIDIA GeForce RTX 3080 Ti Laptop GPU
  (6928 - 34439, n=43)
29496 Points -5%
NVIDIA GeForce RTX 4070 Laptop GPU
AERO 16 OLED BSF, i9-13900H
28885 Points -7%
NVIDIA GeForce RTX 4070 Laptop GPU
Blade 18 RTX 4070, i9-13950HX
28743 Points -7%
Moyenne AMD Radeon RX 6700M
  (27449 - 28399, n=2)
27924 Points -10%
NVIDIA GeForce RTX 4060 Laptop GPU
Katana 17 B13VFK, i7-13620H
27681 Points -11%
Moyenne NVIDIA GeForce RTX 3070 Ti Laptop GPU
  (22612 - 32550, n=37)
27554 Points -11%
Moyenne NVIDIA GeForce RTX 3080 Laptop GPU
  (16455 - 32366, n=46)
27420 Points -12%
Moyenne AMD Radeon RX 6600M
  (21876 - 24788, n=7)
23563 Points -24%
NVIDIA GeForce RTX 4050 Laptop GPU
XMG Focus 15 Engineering Sample, i5-13500HX
23362 Points -25%
Moyenne NVIDIA GeForce RTX 3060
  (18711 - 21984, n=5)
20966 Points -32%
Moyenne NVIDIA GeForce RTX 3060 Laptop GPU
  (16354 - 23109, n=49)
20436 Points -34%
Moyenne NVIDIA GeForce RTX 3050
  (15545 - 15824, n=2)
15685 Points -49%
Moyenne NVIDIA GeForce RTX 3050 Ti Laptop GPU
  (7917 - 15611, n=26)
13090 Points -58%
Moyenne NVIDIA GeForce RTX 3050 6GB Laptop GPU
  (11887 - 12618, n=3)
12155 Points -61%
3DMark 11 - 1280x720 Performance GPU
NVIDIA GeForce RTX 4070 Ti
TUF Gaming GeForce RTX 4070 Ti, i9-13900K
75990 Points +85%
NVIDIA GeForce RTX 4070 Ti
TUF Gaming GeForce RTX 4070 Ti, i9-13900K
75612 Points +84%
NVIDIA GeForce RTX 4090 Laptop GPU
Titan GT77 HX 13VI, i9-13950HX
69211 Points +69%
Moyenne NVIDIA GeForce RTX 3090
  (55144 - 66934, n=17)
60853 Points +48%
NVIDIA GeForce RTX 4080 Laptop GPU
Blade 16 Early 2023, i9-13950HX
56565 Points +38%
Moyenne NVIDIA GeForce RTX 3070
  (26812 - 47892, n=10)
41541 Points +1%
NVIDIA GeForce RTX 4070 Laptop GPU
AERO 16 OLED BSF, i9-13900H
41480 Points +1%
NVIDIA GeForce RTX 4070 Laptop GPU
XMG Neo 17 2023 Engineering Sample, i9-13900HX
41027 Points
Moyenne AMD Radeon RX 6800M
  (39075 - 41706, n=2)
40391 Points -2%
NVIDIA GeForce RTX 4070 Laptop GPU
Blade 18 RTX 4070, i9-13950HX
39733 Points -3%
Moyenne NVIDIA GeForce RTX 3080 Ti Laptop GPU
  (13920 - 45841, n=45)
39402 Points -4%
Moyenne NVIDIA GeForce RTX 3080 Laptop GPU
  (31288 - 43744, n=40)
38259 Points -7%
NVIDIA GeForce RTX 4060 Laptop GPU
Katana 17 B13VFK, i7-13620H
36323 Points -11%
Moyenne NVIDIA GeForce RTX 3070 Ti Laptop GPU
  (13799 - 42569, n=36)
35944 Points -12%
Moyenne AMD Radeon RX 6700M
  ()
33497 Points -18%
NVIDIA GeForce RTX 4050 Laptop GPU
XMG Focus 15 Engineering Sample, i5-13500HX
31377 Points -24%
Moyenne AMD Radeon RX 6600M
  (27030 - 32340, n=6)
31142 Points -24%
Moyenne NVIDIA GeForce RTX 3060
  (24369 - 29172, n=5)
27785 Points -32%
Moyenne NVIDIA GeForce RTX 3060 Laptop GPU
  (13799 - 30772, n=43)
26816 Points -35%
Moyenne NVIDIA GeForce RTX 3050
  (21288 - 21427, n=2)
21358 Points -48%
Moyenne NVIDIA GeForce RTX 3050 Ti Laptop GPU
  (7952 - 20905, n=27)
17562 Points -57%
Moyenne NVIDIA GeForce RTX 3050 6GB Laptop GPU
  (15860 - 18059, n=3)
17113 Points -58%

Bancs d'essai pour les jeux

Nos benchmarks de jeu sans raytracing et upscaling montrent une situation très similaire à celle des tests synthétiques. Dans l'ensemble, leOrdinateur portable RTX 4070est une fois de plus très similaire auOrdinateur portable RTX 3080 Tiseuls les paramètres 4K montrent parfois les limites de la plus petite VRAM. le jeu en 4K est toujours possible avec le RTX 4070 Laptop dans presque tous les jeux modernes.

Le siteOrdinateur portable RTX 4060est une fois de plus comparable à l'ordinateur portableOrdinateur portable RTX 3070 Tiet convient mieux aux réglages QHD et aussi 4K dans de nombreux titres.

Notre version rapide de la RTX 4050 Laptop est comparable à la RTX 3060 Laptop GeForce dans de nombreux benchmarks de jeu, ce qui signifie qu'elle est idéale pour les jeux en 1080p et aussi en QHD dans de nombreux titres.

Note : Nous avons inclus des tableaux avec plus de benchmarks de jeu à la fin de cet article.

The Witcher 3
1920x1080 Ultra Graphics & Postprocessing (HBAO+)
Asus TUF Gaming GeForce RTX 4070 Ti
NVIDIA GeForce RTX 4070 Ti, i9-13900K
230 (207min, 208.68P1 - 258max) fps +85%
MSI Titan GT77 HX 13VI
NVIDIA GeForce RTX 4090 Laptop GPU, i9-13950HX, Samsung PM9A1 MZVL22T0HBLB
198.9 (190min, 191P1 - 214max) fps +60%
Moyenne NVIDIA GeForce RTX 3090
  (160 - 192.6, n=17)
180.3 fps +45%
Razer Blade 16 Early 2023
NVIDIA GeForce RTX 4080 Laptop GPU, i9-13950HX, SSSTC CA6-8D1024
176.8 (159min - 192max) fps +43%
SCHENKER XMG Neo 17 2023 Engineering Sample
NVIDIA GeForce RTX 4070 Laptop GPU, i9-13900HX
124 fps
Gigabyte AERO 16 OLED BSF
NVIDIA GeForce RTX 4070 Laptop GPU, i9-13900H, Gigabyte AG470S1TB-SI B10
116 (48.5P0.1, 82.5P1) fps -6%
Razer Blade 18 RTX 4070
NVIDIA GeForce RTX 4070 Laptop GPU, i9-13950HX, SSSTC CA6-8D1024
113.9 (110min - 119max) fps -8%
Moyenne NVIDIA GeForce RTX 3080 Ti Laptop GPU
  (30 - 130.6, n=43)
112.1 fps -10%
Moyenne AMD Radeon RX 6800M
  (108 - 110, n=2)
109 fps -12%
Moyenne NVIDIA GeForce RTX 3070
  (52.8 - 132.2, n=7)
106.1 fps -14%
Moyenne NVIDIA GeForce RTX 3080 Laptop GPU
  (85.1 - 123, n=40)
105.1 fps -15%
MSI Katana 17 B13VFK
NVIDIA GeForce RTX 4060 Laptop GPU, i7-13620H, Micron 2400 MTFDKBA1T0QFM
104.7 (88min - 119max) fps -16%
Moyenne NVIDIA GeForce RTX 3070 Ti Laptop GPU
  (76.8 - 124.1, n=39)
102.4 fps -17%
Moyenne AMD Radeon RX 6700M
  ()
95.4 fps -23%
SCHENKER XMG Focus 15 Engineering Sample
NVIDIA GeForce RTX 4050 Laptop GPU, i5-13500HX
89 fps -28%
Moyenne AMD Radeon RX 6600M
  (75.4 - 88.2, n=6)
84 fps -32%
Moyenne NVIDIA GeForce RTX 3060 Laptop GPU
  (58.2 - 91.5, n=48)
76.9 fps -38%
Moyenne NVIDIA GeForce RTX 3060
  (52.4 - 91.3, n=4)
72.3 fps -42%
Moyenne NVIDIA GeForce RTX 3050
  (62.8 - 67.2, n=2)
65 fps -48%
Moyenne NVIDIA GeForce RTX 3050 6GB Laptop GPU
  (43.7 - 52.9, n=3)
48.9 fps -61%
Moyenne NVIDIA GeForce RTX 3050 Ti Laptop GPU
  (19 - 58.5, n=29)
47.5 fps -62%
3840x2160 High Graphics & Postprocessing (Nvidia HairWorks Off)
MSI Titan GT77 HX 13VI
NVIDIA GeForce RTX 4090 Laptop GPU, i9-13950HX, Samsung PM9A1 MZVL22T0HBLB
160 fps +167%
Asus TUF Gaming GeForce RTX 4070 Ti
NVIDIA GeForce RTX 4070 Ti, i9-13900K
151.9 (137min, 138.12P1 - 167max) fps +153%
Moyenne NVIDIA GeForce RTX 3090
  (128 - 160.2, n=13)
151.8 fps +153%
Razer Blade 16 Early 2023
NVIDIA GeForce RTX 4080 Laptop GPU, i9-13950HX, SSSTC CA6-8D1024
120.6 (99min - 146max) fps +101%
Moyenne NVIDIA GeForce RTX 3070
  (84 - 93.9, n=5)
89.3 fps +49%
Moyenne NVIDIA GeForce RTX 3080 Ti Laptop GPU
  (62.1 - 94.3, n=8)
81.3 fps +36%
Moyenne NVIDIA GeForce RTX 3070 Ti Laptop GPU
  (73.2 - 78, n=2)
75.6 fps +26%
Razer Blade 18 RTX 4070
NVIDIA GeForce RTX 4070 Laptop GPU, i9-13950HX, SSSTC CA6-8D1024
72.5 (66min - 80max) fps +21%
Moyenne NVIDIA GeForce RTX 3080 Laptop GPU
  (60 - 82.2, n=11)
71.7 fps +20%
Moyenne NVIDIA GeForce RTX 3060
  (62.1 - 90.3, n=3)
71.6 fps +19%
MSI Katana 17 B13VFK
NVIDIA GeForce RTX 4060 Laptop GPU, i7-13620H, Micron 2400 MTFDKBA1T0QFM
62.6 (55min - 70max) fps +4%
SCHENKER XMG Neo 17 2023 Engineering Sample
NVIDIA GeForce RTX 4070 Laptop GPU, i9-13900HX
60 fps
Moyenne AMD Radeon RX 6800M
  ()
59.5 fps -1%
SCHENKER XMG Focus 15 Engineering Sample
NVIDIA GeForce RTX 4050 Laptop GPU, i5-13500HX
50 fps -17%
Moyenne NVIDIA GeForce RTX 3060 Laptop GPU
  (26 - 59.3, n=5)
45.4 fps -24%
Moyenne NVIDIA GeForce RTX 3050
  (43.8 - 44.1, n=2)
44 fps -27%
Moyenne AMD Radeon RX 6600M
  (43.6 - 44.1, n=3)
43.9 fps -27%
Moyenne NVIDIA GeForce RTX 3050 Ti Laptop GPU
  (10 - 38.4, n=4)
26.7 fps -55%
Metro Exodus
1920x1080 Ultra Quality AF:16x
Asus TUF Gaming GeForce RTX 4070 Ti
NVIDIA GeForce RTX 4070 Ti, i9-13900K
161.4 (78.05min - 296.03max) fps +77%
Moyenne NVIDIA GeForce RTX 3090
  (108 - 145, n=12)
135.3 fps +49%
MSI Titan GT77 HX 13VI
NVIDIA GeForce RTX 4090 Laptop GPU, i9-13950HX, Samsung PM9A1 MZVL22T0HBLB
132 fps +45%
Razer Blade 16 Early 2023
NVIDIA GeForce RTX 4080 Laptop GPU, i9-13950HX, SSSTC CA6-8D1024
121.7 (54.5min - 212.1max) fps +34%
Moyenne NVIDIA GeForce RTX 3070
  (91.3 - 97.7, n=5)
93.9 fps +3%
SCHENKER XMG Neo 17 2023 Engineering Sample
NVIDIA GeForce RTX 4070 Laptop GPU, i9-13900HX
91 fps
Moyenne NVIDIA GeForce RTX 3080 Ti Laptop GPU
  ()
88.1 fps -3%
Razer Blade 18 RTX 4070
NVIDIA GeForce RTX 4070 Laptop GPU, i9-13950HX, SSSTC CA6-8D1024
86.8 (45.8min - 150max) fps -5%
Moyenne AMD Radeon RX 6800M
  (78.7 - 79.3, n=3)
79 fps -13%
Moyenne NVIDIA GeForce RTX 3080 Laptop GPU
  (68.7 - 87.9, n=6)
78 fps -14%
MSI Katana 17 B13VFK
NVIDIA GeForce RTX 4060 Laptop GPU, i7-13620H, Micron 2400 MTFDKBA1T0QFM
74.3 (37.14min - 137.46max) fps -18%
Moyenne NVIDIA GeForce RTX 3070 Ti Laptop GPU
  (71 - 77.2, n=2)
74.1 fps -19%
SCHENKER XMG Focus 15 Engineering Sample
NVIDIA GeForce RTX 4050 Laptop GPU, i5-13500HX
64 fps -30%
Moyenne NVIDIA GeForce RTX 3060 Laptop GPU
  (59.4 - 63.2, n=3)
61.6 fps -32%
Moyenne AMD Radeon RX 6600M
  (55.6 - 62.3, n=4)
59.8 fps -34%
Moyenne NVIDIA GeForce RTX 3060
  (37.8 - 65.3, n=5)
56.1 fps -38%
Moyenne NVIDIA GeForce RTX 3050
  (44.8 - 47.2, n=2)
46 fps -49%
Moyenne NVIDIA GeForce RTX 3050 Ti Laptop GPU
  (43.2 - 43.5, n=2)
43.4 fps -52%
2560x1440 Ultra Quality AF:16x
Asus TUF Gaming GeForce RTX 4070 Ti
NVIDIA GeForce RTX 4070 Ti, i9-13900K
132.1 (72.92min - 245.28max) fps +83%
MSI Titan GT77 HX 13VI
NVIDIA GeForce RTX 4090 Laptop GPU, i9-13950HX, Samsung PM9A1 MZVL22T0HBLB
116 fps +61%
Moyenne NVIDIA GeForce RTX 3090
  (102 - 118.2, n=12)
113.2 fps +57%
Razer Blade 16 Early 2023
NVIDIA GeForce RTX 4080 Laptop GPU, i9-13950HX, SSSTC CA6-8D1024
102 (50.6min - 175.9max) fps +42%
Moyenne NVIDIA GeForce RTX 3070
  (74.4 - 78.3, n=5)
75.8 fps +5%
Moyenne NVIDIA GeForce RTX 3080 Ti Laptop GPU
  ()
73.2 fps +2%
SCHENKER XMG Neo 17 2023 Engineering Sample
NVIDIA GeForce RTX 4070 Laptop GPU, i9-13900HX
72 fps
Razer Blade 18 RTX 4070
NVIDIA GeForce RTX 4070 Laptop GPU, i9-13950HX, SSSTC CA6-8D1024
69 (39.5min - 112.2max) fps -4%
MSI Katana 17 B13VFK
NVIDIA GeForce RTX 4060 Laptop GPU, i7-13620H, Micron 2400 MTFDKBA1T0QFM
59 (32.33min - 97.31max) fps -18%
Moyenne AMD Radeon RX 6800M
  (55.9 - 61.4, n=2)
58.7 fps -18%
Moyenne NVIDIA GeForce RTX 3080 Laptop GPU
  (45.1 - 59.4, n=5)
55.1 fps -23%
Moyenne NVIDIA GeForce RTX 3070 Ti Laptop GPU
  ()
52.7 fps -27%
SCHENKER XMG Focus 15 Engineering Sample
NVIDIA GeForce RTX 4050 Laptop GPU, i5-13500HX
50 fps -31%
Moyenne NVIDIA GeForce RTX 3060
  (48.6 - 51.7, n=4)
49.9 fps -31%
Moyenne NVIDIA GeForce RTX 3060 Laptop GPU
  ()
49.6 fps -31%
Moyenne AMD Radeon RX 6600M
  (45.1 - 47.6, n=3)
46.5 fps -35%
Moyenne NVIDIA GeForce RTX 3050
  (35.7 - 36.9, n=2)
36.3 fps -50%
Moyenne NVIDIA GeForce RTX 3050 Ti Laptop GPU
  ()
34.2 fps -52%
3840x2160 Ultra Quality AF:16x
Asus TUF Gaming GeForce RTX 4070 Ti
NVIDIA GeForce RTX 4070 Ti, i9-13900K
84.5 (55.02min - 124.04max) fps +84%
MSI Titan GT77 HX 13VI
NVIDIA GeForce RTX 4090 Laptop GPU, i9-13950HX, Samsung PM9A1 MZVL22T0HBLB
81 fps +76%
Moyenne NVIDIA GeForce RTX 3090
  (70.6 - 77.3, n=12)
75 fps +63%
Razer Blade 16 Early 2023
NVIDIA GeForce RTX 4080 Laptop GPU, i9-13950HX, SSSTC CA6-8D1024
67 (34min - 118.9max) fps +46%
Moyenne NVIDIA GeForce RTX 3070
  (48.3 - 49.7, n=5)
48.9 fps +6%
Moyenne NVIDIA GeForce RTX 3080 Ti Laptop GPU
  ()
47.6 fps +3%
SCHENKER XMG Neo 17 2023 Engineering Sample
NVIDIA GeForce RTX 4070 Laptop GPU, i9-13900HX
46 fps
SCHENKER XMG Focus 15 Engineering Sample
NVIDIA GeForce RTX 4050 Laptop GPU, i5-13500HX
45 fps -2%
Razer Blade 18 RTX 4070
NVIDIA GeForce RTX 4070 Laptop GPU, i9-13950HX, SSSTC CA6-8D1024
44 (27.9min - 66.4max) fps -4%
Moyenne NVIDIA GeForce RTX 3080 Laptop GPU
  (35.4 - 45.1, n=5)
38.4 fps -17%
Moyenne AMD Radeon RX 6800M
  (37.1 - 39.6, n=2)
38.4 fps -17%
MSI Katana 17 B13VFK
NVIDIA GeForce RTX 4060 Laptop GPU, i7-13620H, Micron 2400 MTFDKBA1T0QFM
36.8 (22.74min - 56max) fps -20%
Moyenne NVIDIA GeForce RTX 3060
  (31.3 - 32.2, n=4)
31.7 fps -31%
Moyenne NVIDIA GeForce RTX 3060 Laptop GPU
  ()
31.4 fps -32%
Moyenne AMD Radeon RX 6600M
  (27.3 - 28.7, n=3)
28.1 fps -39%
Moyenne NVIDIA GeForce RTX 3050
  (22.4 - 22.7, n=2)
22.6 fps -51%
Moyenne NVIDIA GeForce RTX 3050 Ti Laptop GPU
  ()
21.1 fps -54%
Borderlands 3
1920x1080 Badass Overall Quality (DX11)
Asus TUF Gaming GeForce RTX 4070 Ti
NVIDIA GeForce RTX 4070 Ti, i9-13900K
186.9 fps +71%
MSI Titan GT77 HX 13VI
NVIDIA GeForce RTX 4090 Laptop GPU, i9-13950HX, Samsung PM9A1 MZVL22T0HBLB
151 fps +39%
Moyenne NVIDIA GeForce RTX 3090
  (117 - 170.1, n=13)
150.7 fps +38%
Razer Blade 16 Early 2023
NVIDIA GeForce RTX 4080 Laptop GPU, i9-13950HX, SSSTC CA6-8D1024
133.5 fps +22%
SCHENKER XMG Neo 17 2023 Engineering Sample
NVIDIA GeForce RTX 4070 Laptop GPU, i9-13900HX
109 fps
Moyenne NVIDIA GeForce RTX 3070
  (95.3 - 108.9, n=5)
100.6 fps -8%
Razer Blade 18 RTX 4070
NVIDIA GeForce RTX 4070 Laptop GPU, i9-13950HX, SSSTC CA6-8D1024
100.3 fps -8%
Moyenne NVIDIA GeForce RTX 3080 Ti Laptop GPU
  ()
90.7 fps -17%
Moyenne NVIDIA GeForce RTX 3080 Laptop GPU
  (76.5 - 91.3, n=4)
85.8 fps -21%
MSI Katana 17 B13VFK
NVIDIA GeForce RTX 4060 Laptop GPU, i7-13620H, Micron 2400 MTFDKBA1T0QFM
83.9 fps -23%
Moyenne NVIDIA GeForce RTX 3070 Ti Laptop GPU
  ()
80.9 fps -26%
Moyenne AMD Radeon RX 6800M
  (77.6 - 83.9, n=3)
80.2 fps -26%
Moyenne NVIDIA GeForce RTX 3060
  (58.5 - 100, n=5)
79.4 fps -27%
SCHENKER XMG Focus 15 Engineering Sample
NVIDIA GeForce RTX 4050 Laptop GPU, i5-13500HX
73 fps -33%
Moyenne NVIDIA GeForce RTX 3060 Laptop GPU
  (69.3 - 74.3, n=4)
72.2 fps -34%
Moyenne AMD Radeon RX 6700M
  ()
71.2 fps -35%
Moyenne AMD Radeon RX 6600M
  (59.9 - 67.3, n=5)
64.8 fps -41%
Moyenne NVIDIA GeForce RTX 3050
  (55.7 - 57.6, n=2)
56.7 fps -48%
Moyenne NVIDIA GeForce RTX 3050 Ti Laptop GPU
  (36.8 - 50.2, n=3)
44 fps -60%
2560x1440 Badass Overall Quality (DX11)
Asus TUF Gaming GeForce RTX 4070 Ti
NVIDIA GeForce RTX 4070 Ti, i9-13900K
140.6 fps +87%
MSI Titan GT77 HX 13VI
NVIDIA GeForce RTX 4090 Laptop GPU, i9-13950HX, Samsung PM9A1 MZVL22T0HBLB
130 fps +73%
Moyenne NVIDIA GeForce RTX 3090
  (105 - 131.6, n=13)
123.8 fps +65%
Razer Blade 16 Early 2023
NVIDIA GeForce RTX 4080 Laptop GPU, i9-13950HX, SSSTC CA6-8D1024
108.7 fps +45%
Moyenne NVIDIA GeForce RTX 3080 Ti Laptop GPU
  ()
78.2 fps +4%
Moyenne NVIDIA GeForce RTX 3070
  (75.1 - 82.9, n=5)
77.7 fps +4%
SCHENKER XMG Neo 17 2023 Engineering Sample
NVIDIA GeForce RTX 4070 Laptop GPU, i9-13900HX
75 fps
Razer Blade 18 RTX 4070
NVIDIA GeForce RTX 4070 Laptop GPU, i9-13950HX, SSSTC CA6-8D1024
68.7 fps -8%
Moyenne AMD Radeon RX 6800M
  (57 - 67.2, n=2)
62.1 fps -17%
Moyenne NVIDIA GeForce RTX 3080 Laptop GPU
  (55.7 - 65.2, n=4)
62 fps -17%
Moyenne NVIDIA GeForce RTX 3060
  (54 - 70.2, n=4)
59.9 fps -20%
Moyenne NVIDIA GeForce RTX 3070 Ti Laptop GPU
  ()
58.7 fps -22%
Moyenne NVIDIA GeForce RTX 3060 Laptop GPU
  (51.3 - 52.4, n=2)
51.9 fps -31%
SCHENKER XMG Focus 15 Engineering Sample
NVIDIA GeForce RTX 4050 Laptop GPU, i5-13500HX
50 fps -33%
Moyenne AMD Radeon RX 6600M
  (44.9 - 45.7, n=3)
45.2 fps -40%
Moyenne NVIDIA GeForce RTX 3050
  (40.3 - 40.4, n=2)
40.4 fps -46%
Moyenne NVIDIA GeForce RTX 3050 Ti Laptop GPU
  ()
35.6 fps -53%
3840x2160 Badass Overall Quality (DX11)
MSI Titan GT77 HX 13VI
NVIDIA GeForce RTX 4090 Laptop GPU, i9-13950HX, Samsung PM9A1 MZVL22T0HBLB
76 fps +90%
Asus TUF Gaming GeForce RTX 4070 Ti
NVIDIA GeForce RTX 4070 Ti, i9-13900K
74.1 fps +85%
Moyenne NVIDIA GeForce RTX 3090
  (68 - 75.3, n=13)
72.8 fps +82%
Razer Blade 16 Early 2023
NVIDIA GeForce RTX 4080 Laptop GPU, i9-13950HX, SSSTC CA6-8D1024
59.8 fps +50%
Moyenne NVIDIA GeForce RTX 3080 Ti Laptop GPU
  ()
46.1 fps +15%
Moyenne NVIDIA GeForce RTX 3070
  (42.7 - 46.3, n=5)
44.3 fps +11%
SCHENKER XMG Neo 17 2023 Engineering Sample
NVIDIA GeForce RTX 4070 Laptop GPU, i9-13900HX
40 fps
Razer Blade 18 RTX 4070
NVIDIA GeForce RTX 4070 Laptop GPU, i9-13950HX, SSSTC CA6-8D1024
35.7 fps -11%
Moyenne NVIDIA GeForce RTX 3080 Laptop GPU
  (32.3 - 36, n=4)
34.7 fps -13%
Moyenne AMD Radeon RX 6800M
  (30.3 - 35.8, n=2)
33.1 fps -17%
Moyenne NVIDIA GeForce RTX 3060
  (29.5 - 36.8, n=4)
32.4 fps -19%
Moyenne NVIDIA GeForce RTX 3060 Laptop GPU
  ()
28.5 fps -29%
SCHENKER XMG Focus 15 Engineering Sample
NVIDIA GeForce RTX 4050 Laptop GPU, i5-13500HX
26 fps -35%
Moyenne AMD Radeon RX 6600M
  (23.7 - 24.1, n=3)
23.9 fps -40%
Moyenne NVIDIA GeForce RTX 3050
  (21.5 - 21.8, n=2)
21.7 fps -46%
Moyenne NVIDIA GeForce RTX 3050 Ti Laptop GPU
  ()
16.3 fps -59%
GTA V
1920x1080 Highest Settings possible AA:4xMSAA + FX AF:16x
Asus TUF Gaming GeForce RTX 4070 Ti
NVIDIA GeForce RTX 4070 Ti, i9-13900K
172.3 (5.8min, 142.9P1 - 415max) fps +32%
Moyenne NVIDIA GeForce RTX 3090
  (104 - 169.8, n=17)
147.5 fps +13%
MSI Titan GT77 HX 13VI
NVIDIA GeForce RTX 4090 Laptop GPU, i9-13950HX, Samsung PM9A1 MZVL22T0HBLB
140.9 (3.54min, 83.3P1 - 244max) fps +8%
Razer Blade 16 Early 2023
NVIDIA GeForce RTX 4080 Laptop GPU, i9-13950HX, SSSTC CA6-8D1024
140.7 (3.02min, 100P1 - 272max) fps +8%
SCHENKER XMG Neo 17 2023 Engineering Sample
NVIDIA GeForce RTX 4070 Laptop GPU, i9-13900HX
130.5 (3.9min, 83.3P1 - 227max) fps
Gigabyte AERO 16 OLED BSF
NVIDIA GeForce RTX 4070 Laptop GPU, i9-13900H, Gigabyte AG470S1TB-SI B10
123.2 (3.96min, 76.9P1 - 222max) fps -6%
Razer Blade 18 RTX 4070
NVIDIA GeForce RTX 4070 Laptop GPU, i9-13950HX, SSSTC CA6-8D1024
121.4 (3.6min, 76.9P1 - 236max) fps -7%
MSI Katana 17 B13VFK
NVIDIA GeForce RTX 4060 Laptop GPU, i7-13620H, Micron 2400 MTFDKBA1T0QFM
112.1 (8min, 62.5P1 - 277max) fps -14%
Moyenne NVIDIA GeForce RTX 3080 Ti Laptop GPU
  (30 - 139.2, n=42)
111 fps -15%
Moyenne NVIDIA GeForce RTX 3070 Ti Laptop GPU
  (44 - 123.9, n=36)
106.7 fps -18%
Moyenne NVIDIA GeForce RTX 3070
  (91.1 - 122.4, n=5)
105.7 fps -19%
Moyenne NVIDIA GeForce RTX 3080 Laptop GPU
  (68.6 - 114.6, n=34)
97.7 fps -25%
Moyenne NVIDIA GeForce RTX 3060
  (77.1 - 111, n=5)
97.3 fps -25%
SCHENKER XMG Focus 15 Engineering Sample
NVIDIA GeForce RTX 4050 Laptop GPU, i5-13500HX
92.4 (4.29min, 58.8P1 - 168.7max) fps -29%
Moyenne NVIDIA GeForce RTX 3060 Laptop GPU
  (69.2 - 109.8, n=46)
89.7 fps -31%
Moyenne AMD Radeon RX 6700M
  ()
86.2 fps -34%
Moyenne AMD Radeon RX 6800M
  (75.1 - 92.8, n=2)
84 fps -36%
Moyenne NVIDIA GeForce RTX 3050
  (78.2 - 83.6, n=2)
80.9 fps -38%
Moyenne AMD Radeon RX 6600M
  (65.9 - 88.7, n=6)
78.6 fps -40%
Moyenne NVIDIA GeForce RTX 3050 Ti Laptop GPU
  (27.8 - 75.6, n=26)
63.3 fps -51%
Moyenne NVIDIA GeForce RTX 3050 6GB Laptop GPU
  (53 - 63.8, n=3)
59.8 fps -54%
2560x1440 Highest Settings possible AA:4xMSAA + FX AF:16x
Asus TUF Gaming GeForce RTX 4070 Ti
NVIDIA GeForce RTX 4070 Ti, i9-13900K
158.4 (2.83min, 111.1P1 - 308max) fps +72%
Moyenne NVIDIA GeForce RTX 3090
  (99.3 - 160, n=15)
141.6 fps +54%
MSI Titan GT77 HX 13VI
NVIDIA GeForce RTX 4090 Laptop GPU, i9-13950HX, Samsung PM9A1 MZVL22T0HBLB
138.5 (3.45min, 76.9P1 - 256max) fps +50%
Razer Blade 16 Early 2023
NVIDIA GeForce RTX 4080 Laptop GPU, i9-13950HX, SSSTC CA6-8D1024
125.2 (3.73min, 83.3P1 - 206max) fps +36%
Moyenne NVIDIA GeForce RTX 3070
  (86.5 - 113.1, n=5)
99.7 fps +8%
Moyenne NVIDIA GeForce RTX 3080 Ti Laptop GPU
  (30 - 121.2, n=28)
98.2 fps +7%
Moyenne NVIDIA GeForce RTX 3070 Ti Laptop GPU
  (72.7 - 108.7, n=22)
92.9 fps +1%
SCHENKER XMG Neo 17 2023 Engineering Sample
NVIDIA GeForce RTX 4070 Laptop GPU, i9-13900HX
92.2 (5.62min, 58.8P1 - 182max) fps
Moyenne NVIDIA GeForce RTX 3080 Laptop GPU
  (82.2 - 99.1, n=12)
91.6 fps -1%
Gigabyte AERO 16 OLED BSF
NVIDIA GeForce RTX 4070 Laptop GPU, i9-13900H, Gigabyte AG470S1TB-SI B10
90.6 (6.42min, 55.6P1 - 175.3max) fps -2%
Razer Blade 18 RTX 4070
NVIDIA GeForce RTX 4070 Laptop GPU, i9-13950HX, SSSTC CA6-8D1024
87.6 (4.62min, 55.6P1 - 218max) fps -5%
Moyenne AMD Radeon RX 6800M
  ()
84 fps -9%
MSI Katana 17 B13VFK
NVIDIA GeForce RTX 4060 Laptop GPU, i7-13620H, Micron 2400 MTFDKBA1T0QFM
83 (5.89min, 45.5P1 - 161.1max) fps -10%
Moyenne NVIDIA GeForce RTX 3060
  (77.5 - 82.9, n=4)
80.8 fps -12%
Moyenne NVIDIA GeForce RTX 3060 Laptop GPU
  (52 - 86.5, n=23)
74.3 fps -19%
SCHENKER XMG Focus 15 Engineering Sample
NVIDIA GeForce RTX 4050 Laptop GPU, i5-13500HX
64.1 (3.43min, 41.7P1 - 136.8max) fps -30%
Moyenne AMD Radeon RX 6600M
  (49.3 - 63.8, n=4)
58.8 fps -36%
Moyenne NVIDIA GeForce RTX 3050
  (54.7 - 59.1, n=2)
56.9 fps -38%
Moyenne NVIDIA GeForce RTX 3050 Ti Laptop GPU
  (22.8 - 53.4, n=9)
41.4 fps -55%
Moyenne NVIDIA GeForce RTX 3050 6GB Laptop GPU
  (36.5 - 42.7, n=2)
39.6 fps -57%
3840x2160 High/On (Advanced Graphics Off) AA:FX AF:8x
Moyenne NVIDIA GeForce RTX 3090
  (151 - 184.2, n=15)
176.5 fps +91%
MSI Titan GT77 HX 13VI
NVIDIA GeForce RTX 4090 Laptop GPU, i9-13950HX, Samsung PM9A1 MZVL22T0HBLB
175.7 (2.91min, 111.1P1 - 424max) fps +90%
Asus TUF Gaming GeForce RTX 4070 Ti
NVIDIA GeForce RTX 4070 Ti, i9-13900K
171.8 (4.03min, 111.1P1 - 586max) fps +86%
Razer Blade 16 Early 2023
NVIDIA GeForce RTX 4080 Laptop GPU, i9-13950HX, SSSTC CA6-8D1024
143.7 (4.72min, 62.5P1 - 291max) fps +55%
Moyenne NVIDIA GeForce RTX 3070
  (110 - 129, n=5)
118.8 fps +28%
Moyenne NVIDIA GeForce RTX 3080 Ti Laptop GPU
  (78.2 - 134.4, n=12)
115.4 fps +25%
Moyenne NVIDIA GeForce RTX 3070 Ti Laptop GPU
  (92.1 - 98, n=2)
95.1 fps +3%
SCHENKER XMG Neo 17 2023 Engineering Sample
NVIDIA GeForce RTX 4070 Laptop GPU, i9-13900HX
92.5 (11min, 62.5P1 - 233max) fps
Moyenne NVIDIA GeForce RTX 3080 Laptop GPU
  (64.8 - 112, n=11)
92.4 fps 0%
Razer Blade 18 RTX 4070
NVIDIA GeForce RTX 4070 Laptop GPU, i9-13950HX, SSSTC CA6-8D1024
88.5 (5.15min, 58.8P1 - 280max) fps -4%
Moyenne AMD Radeon RX 6800M
  ()
85.4 fps -8%
Moyenne NVIDIA GeForce RTX 3060
  (82 - 82.8, n=4)
82.4 fps -11%
MSI Katana 17 B13VFK
NVIDIA GeForce RTX 4060 Laptop GPU, i7-13620H, Micron 2400 MTFDKBA1T0QFM
82.1 (5.63min, 50P1 - 264max) fps -11%
Gigabyte AERO 16 OLED BSF
NVIDIA GeForce RTX 4070 Laptop GPU, i9-13900H, Gigabyte AG470S1TB-SI B10
75 (22.1min, 47.6P1 - 242max) fps -19%
Moyenne NVIDIA GeForce RTX 3060 Laptop GPU
  (42.8 - 80.5, n=4)
67.4 fps -27%
SCHENKER XMG Focus 15 Engineering Sample
NVIDIA GeForce RTX 4050 Laptop GPU, i5-13500HX
63.5 (7.33min, 43.5P1 - 255max) fps -31%
Moyenne AMD Radeon RX 6600M
  (57.6 - 58.7, n=3)
58.1 fps -37%
Moyenne NVIDIA GeForce RTX 3050
  (55.8 - 58.3, n=2)
57.1 fps -38%
Moyenne NVIDIA GeForce RTX 3050 Ti Laptop GPU
  ()
43.9 fps -53%
Cyberpunk 2077 1.6
1920x1080 Ultra Preset
Asus TUF Gaming GeForce RTX 4070 Ti
NVIDIA GeForce RTX 4070 Ti, i9-13900K
167.4 (70.9min - 228max) fps +84%
MSI Titan GT77 HX 13VI
NVIDIA GeForce RTX 4090 Laptop GPU, i9-13950HX, Samsung PM9A1 MZVL22T0HBLB
135 fps +48%
Moyenne NVIDIA GeForce RTX 3090
  (78.6 - 173, n=10)
130.4 fps +43%
Razer Blade 16 Early 2023
NVIDIA GeForce RTX 4080 Laptop GPU, i9-13950HX, SSSTC CA6-8D1024
106.2 (47.5min - 153.9max) fps +17%
Moyenne NVIDIA GeForce RTX 3070
  (90.3 - 114, n=2)
102.2 fps +12%
Moyenne AMD Radeon RX 6800M
  (76.9 - 119, n=2)
98 fps +8%
Moyenne NVIDIA GeForce RTX 3080 Ti Laptop GPU
  (54 - 144.1, n=16)
93.6 fps +3%
Razer Blade 18 RTX 4070
NVIDIA GeForce RTX 4070 Laptop GPU, i9-13950HX, SSSTC CA6-8D1024
92.1 (17.3min - 159max) fps +1%
SCHENKER XMG Neo 17 2023 Engineering Sample
NVIDIA GeForce RTX 4070 Laptop GPU, i9-13900HX
91 fps
Gigabyte AERO 16 OLED BSF
NVIDIA GeForce RTX 4070 Laptop GPU, i9-13900H, Gigabyte AG470S1TB-SI B10
84.75 (28.94min - 126.38max) fps -7%
Moyenne NVIDIA GeForce RTX 3080 Laptop GPU
  (75 - 89.8, n=3)
80.1 fps -12%
Moyenne NVIDIA GeForce RTX 3070 Ti Laptop GPU
  (48.5 - 104, n=13)
79.2 fps -13%
MSI Katana 17 B13VFK
NVIDIA GeForce RTX 4060 Laptop GPU, i7-13620H, Micron 2400 MTFDKBA1T0QFM
73.81 (36.7min - 103.1max) fps -19%
SCHENKER XMG Focus 15 Engineering Sample
NVIDIA GeForce RTX 4050 Laptop GPU, i5-13500HX
65 fps -29%
Moyenne NVIDIA GeForce RTX 3060
  ()
64.2 fps -29%
Moyenne NVIDIA GeForce RTX 3060 Laptop GPU
  (40 - 78.8, n=16)
61.1 fps -33%
Moyenne NVIDIA GeForce RTX 3050
  ()
60.5 fps -34%
Moyenne AMD Radeon RX 6600M
  (55 - 61.2, n=3)
59 fps -35%
Moyenne NVIDIA GeForce RTX 3050 Ti Laptop GPU
  (31 - 50.5, n=9)
40.9 fps -55%
Moyenne NVIDIA GeForce RTX 3050 6GB Laptop GPU
  ()
38.5 fps -58%
2560x1440 Ultra Preset
Asus TUF Gaming GeForce RTX 4070 Ti
NVIDIA GeForce RTX 4070 Ti, i9-13900K
122.9 (100.2min - 174.9max) fps +116%
MSI Titan GT77 HX 13VI
NVIDIA GeForce RTX 4090 Laptop GPU, i9-13950HX, Samsung PM9A1 MZVL22T0HBLB
98 fps +72%
Moyenne NVIDIA GeForce RTX 3090
  (78 - 96, n=8)
90.6 fps +59%
Razer Blade 16 Early 2023
NVIDIA GeForce RTX 4080 Laptop GPU, i9-13950HX, SSSTC CA6-8D1024
81.2 (32.5min - 122.6max) fps +42%
Moyenne NVIDIA GeForce RTX 3070
  (60.6 - 62.7, n=2)
61.7 fps +8%
SCHENKER XMG Neo 17 2023 Engineering Sample
NVIDIA GeForce RTX 4070 Laptop GPU, i9-13900HX
57 fps
Moyenne NVIDIA GeForce RTX 3080 Ti Laptop GPU
  (36 - 69.6, n=13)
55.4 fps -3%
Razer Blade 18 RTX 4070
NVIDIA GeForce RTX 4070 Laptop GPU, i9-13950HX, SSSTC CA6-8D1024
54 (35.6min - 99.5max) fps -5%
Gigabyte AERO 16 OLED BSF
NVIDIA GeForce RTX 4070 Laptop GPU, i9-13900H, Gigabyte AG470S1TB-SI B10
53.28 (28.06min - 87.11max) fps -7%
Moyenne AMD Radeon RX 6800M
  (48.1 - 53.3, n=2)
50.7 fps -11%
Moyenne NVIDIA GeForce RTX 3070 Ti Laptop GPU
  (40 - 62, n=10)
50.1 fps -12%
Moyenne NVIDIA GeForce RTX 3080 Laptop GPU
  (47.9 - 48.1, n=2)
48 fps -16%
MSI Katana 17 B13VFK
NVIDIA GeForce RTX 4060 Laptop GPU, i7-13620H, Micron 2400 MTFDKBA1T0QFM
45.9 (34.7min - 59.9max) fps -19%
Moyenne NVIDIA GeForce RTX 3060
  ()
39.1 fps -31%
Moyenne AMD Radeon RX 6600M
  (36 - 41.5, n=2)
38.8 fps -32%
Moyenne NVIDIA GeForce RTX 3060 Laptop GPU
  (23 - 45.8, n=9)
36.5 fps -36%
SCHENKER XMG Focus 15 Engineering Sample
NVIDIA GeForce RTX 4050 Laptop GPU, i5-13500HX
32 fps -44%
Moyenne NVIDIA GeForce RTX 3050
  ()
29.8 fps -48%
Moyenne NVIDIA GeForce RTX 3050 Ti Laptop GPU
  (20 - 25, n=4)
22.2 fps -61%
3840x2160 Ultra Preset
MSI Titan GT77 HX 13VI
NVIDIA GeForce RTX 4090 Laptop GPU, i9-13950HX, Samsung PM9A1 MZVL22T0HBLB
56 fps +115%
Asus TUF Gaming GeForce RTX 4070 Ti
NVIDIA GeForce RTX 4070 Ti, i9-13900K
50.1 (42min - 64.5max) fps +93%
Moyenne NVIDIA GeForce RTX 3090
  (43.9 - 48.6, n=8)
46.4 fps +78%
Razer Blade 16 Early 2023
NVIDIA GeForce RTX 4080 Laptop GPU, i9-13950HX, SSSTC CA6-8D1024
40 (20.8min - 74.9max) fps +54%
Moyenne NVIDIA GeForce RTX 3070
  (29 - 30.2, n=2)
29.6 fps +14%
Moyenne NVIDIA GeForce RTX 3080 Ti Laptop GPU
  (19.6 - 32.4, n=6)
27.1 fps +4%
Moyenne NVIDIA GeForce RTX 3070 Ti Laptop GPU
  (24.6 - 28.1, n=2)
26.4 fps +2%
SCHENKER XMG Neo 17 2023 Engineering Sample
NVIDIA GeForce RTX 4070 Laptop GPU, i9-13900HX
26 fps
Razer Blade 18 RTX 4070
NVIDIA GeForce RTX 4070 Laptop GPU, i9-13950HX, SSSTC CA6-8D1024
23.3 (15.6min - 32.1max) fps -10%
Moyenne AMD Radeon RX 6800M
  (22.1 - 23.4, n=2)
22.8 fps -12%
Moyenne NVIDIA GeForce RTX 3080 Laptop GPU
  (22.4 - 23, n=2)
22.7 fps -13%
MSI Katana 17 B13VFK
NVIDIA GeForce RTX 4060 Laptop GPU, i7-13620H, Micron 2400 MTFDKBA1T0QFM
21.1 (17min - 28.5max) fps -19%
Gigabyte AERO 16 OLED BSF
NVIDIA GeForce RTX 4070 Laptop GPU, i9-13900H, Gigabyte AG470S1TB-SI B10
19.59 (5.98min - 27.64max) fps -25%
Moyenne AMD Radeon RX 6600M
  (14.4 - 23.2, n=2)
18.8 fps -28%
SCHENKER XMG Focus 15 Engineering Sample
NVIDIA GeForce RTX 4050 Laptop GPU, i5-13500HX
18 fps -31%
Moyenne NVIDIA GeForce RTX 3060
  ()
17.7 fps -32%
Moyenne NVIDIA GeForce RTX 3060 Laptop GPU
  (11 - 17.9, n=4)
14.6 fps -44%
Moyenne NVIDIA GeForce RTX 3050
  ()
12.2 fps -53%
Moyenne NVIDIA GeForce RTX 3050 Ti Laptop GPU
  ()
10.4 fps -60%
Dota 2 Reborn
1920x1080 ultra (3/3) best looking
Asus TUF Gaming GeForce RTX 4070 Ti
NVIDIA GeForce RTX 4070 Ti, i9-13900K
245.5 (204.7min) fps +36%
Moyenne NVIDIA GeForce RTX 3090
  (134.3 - 244, n=16)
203 fps +12%
Razer Blade 16 Early 2023
NVIDIA GeForce RTX 4080 Laptop GPU, i9-13950HX, SSSTC CA6-8D1024
194.7 (160min) fps +8%
MSI Titan GT77 HX 13VI
NVIDIA GeForce RTX 4090 Laptop GPU, i9-13950HX, Samsung PM9A1 MZVL22T0HBLB
185.9 (157.5min) fps +3%
Moyenne NVIDIA GeForce RTX 3050
  (154.7 - 208, n=2)
181.3 fps 0%
SCHENKER XMG Neo 17 2023 Engineering Sample
NVIDIA GeForce RTX 4070 Laptop GPU, i9-13900HX
180.6 (157.3min) fps
Razer Blade 18 RTX 4070
NVIDIA GeForce RTX 4070 Laptop GPU, i9-13950HX, SSSTC CA6-8D1024
178.6 (153.9min) fps -1%
SCHENKER XMG Focus 15 Engineering Sample
NVIDIA GeForce RTX 4050 Laptop GPU, i5-13500HX
161.7 (139.6min) fps -10%
MSI Katana 17 B13VFK
NVIDIA GeForce RTX 4060 Laptop GPU, i7-13620H, Micron 2400 MTFDKBA1T0QFM
156.3 (132.3min) fps -13%
Gigabyte AERO 16 OLED BSF
NVIDIA GeForce RTX 4070 Laptop GPU, i9-13900H, Gigabyte AG470S1TB-SI B10
144.5 (123.6min) fps -20%
Moyenne NVIDIA GeForce RTX 3080 Ti Laptop GPU
  (29.9 - 170.5, n=45)
141.1 fps -22%
Moyenne NVIDIA GeForce RTX 3060
  (110.5 - 159.7, n=5)
135.7 fps -25%
Moyenne NVIDIA GeForce RTX 3070 Ti Laptop GPU
  (68.7 - 160.5, n=38)
135.6 fps -25%
Moyenne NVIDIA GeForce RTX 3080 Laptop GPU
  (98 - 156, n=45)
126.5 fps -30%
Moyenne NVIDIA GeForce RTX 3060 Laptop GPU
  (90.7 - 154.8, n=49)
125.9 fps -30%
Moyenne NVIDIA GeForce RTX 3070
  (92.1 - 149.3, n=7)
123.5 fps -32%
Moyenne AMD Radeon RX 6800M
  ()
114.8 fps -36%
Moyenne NVIDIA GeForce RTX 3050 Ti Laptop GPU
  (67.3 - 145, n=27)
113 fps -37%
Moyenne AMD Radeon RX 6700M
  ()
112 fps -38%
Moyenne NVIDIA GeForce RTX 3050 6GB Laptop GPU
  (98 - 116.9, n=3)
104.8 fps -42%
Moyenne AMD Radeon RX 6600M
  (91.4 - 110.1, n=8)
100.9 fps -44%
3840x2160 ultra (3/3) best looking
Asus TUF Gaming GeForce RTX 4070 Ti
NVIDIA GeForce RTX 4070 Ti, i9-13900K
231.5 (185.5min) fps +54%
Moyenne NVIDIA GeForce RTX 3090
  (138.6 - 222, n=16)
191.3 fps +27%
MSI Titan GT77 HX 13VI
NVIDIA GeForce RTX 4090 Laptop GPU, i9-13950HX, Samsung PM9A1 MZVL22T0HBLB
178.9 (144.9min) fps +19%
Razer Blade 16 Early 2023
NVIDIA GeForce RTX 4080 Laptop GPU, i9-13950HX, SSSTC CA6-8D1024
176.7 (125min) fps +17%
SCHENKER XMG Neo 17 2023 Engineering Sample
NVIDIA GeForce RTX 4070 Laptop GPU, i9-13900HX
150.7 (130.6min) fps
Razer Blade 18 RTX 4070
NVIDIA GeForce RTX 4070 Laptop GPU, i9-13950HX, SSSTC CA6-8D1024
145.5 (109.1min) fps -3%
Moyenne NVIDIA GeForce RTX 3070
  (122.7 - 144.3, n=5)
129.3 fps -14%
Gigabyte AERO 16 OLED BSF
NVIDIA GeForce RTX 4070 Laptop GPU, i9-13900H, Gigabyte AG470S1TB-SI B10
128.3 (108.4min) fps -15%
MSI Katana 17 B13VFK
NVIDIA GeForce RTX 4060 Laptop GPU, i7-13620H, Micron 2400 MTFDKBA1T0QFM
126 (105.9min) fps -16%
Moyenne NVIDIA GeForce RTX 3080 Ti Laptop GPU
  (70.8 - 155.6, n=19)
124.8 fps -17%
Moyenne NVIDIA GeForce RTX 3070 Ti Laptop GPU
  (58.3 - 148.9, n=5)
117.6 fps -22%
SCHENKER XMG Focus 15 Engineering Sample
NVIDIA GeForce RTX 4050 Laptop GPU, i5-13500HX
115.2 (100.5min) fps -24%
Moyenne NVIDIA GeForce RTX 3060
  (109.3 - 116.1, n=4)
113.7 fps -25%
Moyenne NVIDIA GeForce RTX 3080 Laptop GPU
  (55.2 - 128, n=17)
106 fps -30%
Moyenne AMD Radeon RX 6800M
  ()
95.2 fps -37%
Moyenne NVIDIA GeForce RTX 3050
  (93.1 - 94.4, n=2)
93.8 fps -38%
Moyenne NVIDIA GeForce RTX 3060 Laptop GPU
  (46.9 - 107, n=11)
89 fps -41%
Moyenne AMD Radeon RX 6600M
  (79.2 - 81.7, n=3)
80.7 fps -46%
Moyenne NVIDIA GeForce RTX 3050 Ti Laptop GPU
  (31.9 - 76.6, n=6)
55.9 fps -63%
F1 22
1920x1080 Ultra High Preset AA:T AF:16x
Asus TUF Gaming GeForce RTX 4070 Ti
NVIDIA GeForce RTX 4070 Ti, i9-13900K
143.5 (124min, 105P1 - 166max) fps +76%
MSI Titan GT77 HX 13VI
NVIDIA GeForce RTX 4090 Laptop GPU, i9-13950HX, Samsung PM9A1 MZVL22T0HBLB
138.2 (118min, 84P1 - 161max) fps +69%
Moyenne NVIDIA GeForce RTX 3090
  (122.6 - 136.9, n=13)
128.9 fps +58%
Moyenne NVIDIA GeForce RTX 3070
  (81 - 91.8, n=2)
86.4 fps +6%
Moyenne NVIDIA GeForce RTX 3080 Ti Laptop GPU
  (78.9 - 91, n=4)
82.7 fps +1%
SCHENKER XMG Neo 17 2023 Engineering Sample
NVIDIA GeForce RTX 4070 Laptop GPU, i9-13900HX
81.7 (70min, 68P1 - 97max) fps
Moyenne NVIDIA GeForce RTX 3070 Ti Laptop GPU
  (58.1 - 80, n=8)
67.3 fps -18%
Gigabyte AERO 16 OLED BSF
NVIDIA GeForce RTX 4070 Laptop GPU, i9-13900H, Gigabyte AG470S1TB-SI B10
66.6 (58min, 47P1 - 76max) fps -18%
Moyenne NVIDIA GeForce RTX 3080 Laptop GPU
  (64.1 - 70, n=3)
66.4 fps -19%
MSI Katana 17 B13VFK
NVIDIA GeForce RTX 4060 Laptop GPU, i7-13620H, Micron 2400 MTFDKBA1T0QFM
65.4 (52min, 44P1 - 76max) fps -20%
SCHENKER XMG Focus 15 Engineering Sample
NVIDIA GeForce RTX 4050 Laptop GPU, i5-13500HX
53.8 (46min, 44P1 - 63max) fps -34%
Moyenne AMD Radeon RX 6800M
  (49.7 - 56, n=2)
52.9 fps -35%
Moyenne NVIDIA GeForce RTX 3060 Laptop GPU
  (36.6 - 55.9, n=8)
51 fps -38%
Moyenne AMD Radeon RX 6600M
  (39 - 43.4, n=4)
40.8 fps -50%
Moyenne NVIDIA GeForce RTX 3050
  ()
39.9 fps -51%
Moyenne NVIDIA GeForce RTX 3050 6GB Laptop GPU
  (30.7 - 34, n=3)
32.8 fps -60%
Moyenne NVIDIA GeForce RTX 3050 Ti Laptop GPU
  (16 - 35, n=7)
27.5 fps -66%
2560x1440 Ultra High Preset AA:T AF:16x
Asus TUF Gaming GeForce RTX 4070 Ti
NVIDIA GeForce RTX 4070 Ti, i9-13900K
92.4 (80min, 78P1 - 108max) fps +78%
MSI Titan GT77 HX 13VI
NVIDIA GeForce RTX 4090 Laptop GPU, i9-13950HX, Samsung PM9A1 MZVL22T0HBLB
90.1 (78min, 71P1 - 104max) fps +74%
Moyenne NVIDIA GeForce RTX 3090
  (82.5 - 89.9, n=12)
85.3 fps +64%
Moyenne NVIDIA GeForce RTX 3080 Ti Laptop GPU
  (52.9 - 62, n=2)
57.5 fps +11%
Moyenne NVIDIA GeForce RTX 3070
  (52 - 58.8, n=2)
55.4 fps +7%
SCHENKER XMG Neo 17 2023 Engineering Sample
NVIDIA GeForce RTX 4070 Laptop GPU, i9-13900HX
51.9 (45min, 44P1 - 61max) fps
Gigabyte AERO 16 OLED BSF
NVIDIA GeForce RTX 4070 Laptop GPU, i9-13900H, Gigabyte AG470S1TB-SI B10
44.3 (38min, 31P1 - 50max) fps -15%
Moyenne NVIDIA GeForce RTX 3070 Ti Laptop GPU
  (36.8 - 50.5, n=7)
42.9 fps -17%
Moyenne NVIDIA GeForce RTX 3080 Laptop GPU
  (41.8 - 43, n=3)
42.3 fps -18%
MSI Katana 17 B13VFK
NVIDIA GeForce RTX 4060 Laptop GPU, i7-13620H, Micron 2400 MTFDKBA1T0QFM
41 (35min, 33P1 - 48max) fps -21%
SCHENKER XMG Focus 15 Engineering Sample
NVIDIA GeForce RTX 4050 Laptop GPU, i5-13500HX
33.2 (28min, 26P1 - 38max) fps -36%
Moyenne AMD Radeon RX 6800M
  (29.9 - 34, n=2)
32 fps -38%
Moyenne NVIDIA GeForce RTX 3060 Laptop GPU
  (14.4 - 34.8, n=5)
27.3 fps -47%
Moyenne AMD Radeon RX 6600M
  (24.4 - 25.9, n=3)
25.2 fps -51%
Moyenne NVIDIA GeForce RTX 3050
  ()
24.9 fps -52%
Moyenne NVIDIA GeForce RTX 3050 6GB Laptop GPU
  (18.1 - 20.1, n=2)
19.1 fps -63%
Moyenne NVIDIA GeForce RTX 3050 Ti Laptop GPU
  (10 - 17.4, n=4)
14.3 fps -72%
3840x2160 Ultra High Preset AA:T AF:16x
Asus TUF Gaming GeForce RTX 4070 Ti
NVIDIA GeForce RTX 4070 Ti, i9-13900K
47 (40min, 37P1 - 54max) fps +81%
MSI Titan GT77 HX 13VI
NVIDIA GeForce RTX 4090 Laptop GPU, i9-13950HX, Samsung PM9A1 MZVL22T0HBLB
44.9 (38min, 37P1 - 52max) fps +73%
Moyenne NVIDIA GeForce RTX 3090
  (41.8 - 45.7, n=12)
43.1 fps +66%
Moyenne NVIDIA GeForce RTX 3080 Ti Laptop GPU
  ()
32 fps +24%
Moyenne NVIDIA GeForce RTX 3070
  (25 - 28.8, n=2)
26.9 fps +4%
SCHENKER XMG Neo 17 2023 Engineering Sample
NVIDIA GeForce RTX 4070 Laptop GPU, i9-13900HX
25.9 (21min, 21P1 - 31max) fps
Gigabyte AERO 16 OLED BSF
NVIDIA GeForce RTX 4070 Laptop GPU, i9-13900H, Gigabyte AG470S1TB-SI B10
21.5 (18min, 15P1 - 24max) fps -17%
Moyenne NVIDIA GeForce RTX 3080 Laptop GPU
  (20 - 22, n=3)
20.7 fps -20%
MSI Katana 17 B13VFK
NVIDIA GeForce RTX 4060 Laptop GPU, i7-13620H, Micron 2400 MTFDKBA1T0QFM
19.7 (17min, 16P1 - 23max) fps -24%
SCHENKER XMG Focus 15 Engineering Sample
NVIDIA GeForce RTX 4050 Laptop GPU, i5-13500HX
15.9 (14min, 13P1 - 18max) fps -39%
Moyenne AMD Radeon RX 6800M
  (13.8 - 16, n=2)
14.9 fps -42%
Moyenne NVIDIA GeForce RTX 3060 Laptop GPU
  (10.6 - 16, n=2)
13.3 fps -49%
Moyenne NVIDIA GeForce RTX 3050
  ()
12 fps -54%
Moyenne AMD Radeon RX 6600M
  (11.3 - 12.1, n=3)
11.7 fps -55%
Moyenne NVIDIA GeForce RTX 3050 Ti Laptop GPU
  ()
4 fps -85%
F1 2021
1920x1080 Ultra High Preset + Raytracing AA:T AF:16x
Asus TUF Gaming GeForce RTX 4070 Ti
NVIDIA GeForce RTX 4070 Ti, i9-13900K
263 (218min, 204P1 - 293max) fps +67%
Moyenne NVIDIA GeForce RTX 3090
  (154 - 244, n=13)
218 fps +38%
MSI Titan GT77 HX 13VI
NVIDIA GeForce RTX 4090 Laptop GPU, i9-13950HX, Samsung PM9A1 MZVL22T0HBLB
209 (170min, 105P1 - 225max) fps +33%
SCHENKER XMG Neo 17 2023 Engineering Sample
NVIDIA GeForce RTX 4070 Laptop GPU, i9-13900HX
157.5 (131min, 123P1 - 175max) fps
Moyenne NVIDIA GeForce RTX 3070
  (148 - 158, n=2)
153 fps -3%
MSI Katana 17 B13VFK
NVIDIA GeForce RTX 4060 Laptop GPU, i7-13620H, Micron 2400 MTFDKBA1T0QFM
128.9 (106min, 81P1 - 145max) fps -18%
Moyenne NVIDIA GeForce RTX 3080 Ti Laptop GPU
  (30.2 - 160.6, n=30)
126.1 fps -20%
Moyenne AMD Radeon RX 6800M
  (114 - 124.1, n=2)
119.1 fps -24%
Moyenne NVIDIA GeForce RTX 3070 Ti Laptop GPU
  (67.3 - 134.2, n=13)
110.2 fps -30%
SCHENKER XMG Focus 15 Engineering Sample
NVIDIA GeForce RTX 4050 Laptop GPU, i5-13500HX
109.7 (92min, 90P1 - 123max) fps -30%
Moyenne NVIDIA GeForce RTX 3080 Laptop GPU
  (74.9 - 123.7, n=9)
108.6 fps -31%
Moyenne AMD Radeon RX 6700M
  ()
100 fps -37%
Moyenne NVIDIA GeForce RTX 3060
  (75.1 - 105.9, n=5)
95.8 fps -39%
Moyenne NVIDIA GeForce RTX 3060 Laptop GPU
  (67 - 112.8, n=9)
92.4 fps -41%
Moyenne AMD Radeon RX 6600M
  (80.9 - 95.9, n=5)
91.8 fps -42%
Moyenne NVIDIA GeForce RTX 3050
  (81.6 - 82.2, n=2)
81.9 fps -48%
Moyenne NVIDIA GeForce RTX 3050 6GB Laptop GPU
  ()
61.9 fps -61%
Moyenne NVIDIA GeForce RTX 3050 Ti Laptop GPU
  (44.4 - 69, n=11)
54 fps -66%
2560x1440 Ultra High Preset + Raytracing AA:T AF:16x
Asus TUF Gaming GeForce RTX 4070 Ti
NVIDIA GeForce RTX 4070 Ti, i9-13900K
199.8 (168min, 154P1 - 221max) fps +74%
MSI Titan GT77 HX 13VI
NVIDIA GeForce RTX 4090 Laptop GPU, i9-13950HX, Samsung PM9A1 MZVL22T0HBLB
192.4 (146min, 114P1 - 209max) fps +68%
Moyenne NVIDIA GeForce RTX 3090
  (153 - 186.2, n=13)
172.4 fps +50%
Moyenne NVIDIA GeForce RTX 3070
  (113 - 118, n=2)
115.5 fps +1%
SCHENKER XMG Neo 17 2023 Engineering Sample
NVIDIA GeForce RTX 4070 Laptop GPU, i9-13900HX
114.7 (98min, 95P1 - 127max) fps
Moyenne NVIDIA GeForce RTX 3080 Ti Laptop GPU
  (30 - 120.1, n=19)
94.1 fps -18%
MSI Katana 17 B13VFK
NVIDIA GeForce RTX 4060 Laptop GPU, i7-13620H, Micron 2400 MTFDKBA1T0QFM
93 (78min, 64P1 - 103max) fps -19%
Moyenne AMD Radeon RX 6800M
  ()
88.2 fps -23%
Moyenne NVIDIA GeForce RTX 3080 Laptop GPU
  (84 - 90.4, n=4)
88 fps -23%
Moyenne NVIDIA GeForce RTX 3070 Ti Laptop GPU
  (47.5 - 99.2, n=11)
82.9 fps -28%
SCHENKER XMG Focus 15 Engineering Sample
NVIDIA GeForce RTX 4050 Laptop GPU, i5-13500HX
76.1 (64min, 63P1 - 87max) fps -34%
Moyenne NVIDIA GeForce RTX 3060
  (72 - 78.8, n=4)
75.2 fps -34%
Moyenne AMD Radeon RX 6600M
  (63 - 66.1, n=3)
64.9 fps -43%
Moyenne NVIDIA GeForce RTX 3050
  (59 - 59.2, n=2)
59.1 fps -48%
Moyenne NVIDIA GeForce RTX 3060 Laptop GPU
  (47.5 - 70.2, n=2)
58.9 fps -49%
Moyenne NVIDIA GeForce RTX 3050 6GB Laptop GPU
  ()
40 fps -65%
Moyenne NVIDIA GeForce RTX 3050 Ti Laptop GPU
  (30.9 - 43.1, n=5)
37.9 fps -67%
3840x2160 Ultra High Preset + Raytracing AA:T AF:16x
Asus TUF Gaming GeForce RTX 4070 Ti
NVIDIA GeForce RTX 4070 Ti, i9-13900K
114.4 (98min, 97P1 - 129max) fps +80%
MSI Titan GT77 HX 13VI
NVIDIA GeForce RTX 4090 Laptop GPU, i9-13950HX, Samsung PM9A1 MZVL22T0HBLB
114.4 (99min, 96P1 - 129max) fps +80%
Moyenne NVIDIA GeForce RTX 3090
  (100.4 - 110, n=13)
103.5 fps +63%
Moyenne NVIDIA GeForce RTX 3070
  (64 - 67.3, n=2)
65.7 fps +4%
SCHENKER XMG Neo 17 2023 Engineering Sample
NVIDIA GeForce RTX 4070 Laptop GPU, i9-13900HX
63.4 (46min, 53P1 - 73max) fps
Moyenne NVIDIA GeForce RTX 3080 Ti Laptop GPU
  (41.1 - 70.2, n=18)
60.9 fps -4%
Moyenne NVIDIA GeForce RTX 3070 Ti Laptop GPU
  (47 - 56.8, n=3)
52.4 fps -17%
MSI Katana 17 B13VFK
NVIDIA GeForce RTX 4060 Laptop GPU, i7-13620H, Micron 2400 MTFDKBA1T0QFM
50.2 (42min, 42P1 - 57max) fps -21%
Moyenne AMD Radeon RX 6800M
  ()
47.6 fps -25%
Moyenne NVIDIA GeForce RTX 3080 Laptop GPU
  (32.5 - 51.5, n=7)
45.9 fps -28%
Moyenne NVIDIA GeForce RTX 3060
  (40.9 - 44.4, n=4)
42.6 fps -33%
SCHENKER XMG Focus 15 Engineering Sample
NVIDIA GeForce RTX 4050 Laptop GPU, i5-13500HX
38 (31min, 30P1 - 45max) fps -40%
Moyenne AMD Radeon RX 6600M
  (31.6 - 35.4, n=3)
33.2 fps -48%
Moyenne NVIDIA GeForce RTX 3050
  (32 - 32.4, n=2)
32.2 fps -49%
Moyenne NVIDIA GeForce RTX 3060 Laptop GPU
  (25.9 - 38, n=2)
32 fps -50%
Moyenne NVIDIA GeForce RTX 3050 Ti Laptop GPU
  ()
14.4 fps -77%
Final Fantasy XV Benchmark
1920x1080 High Quality
Asus TUF Gaming GeForce RTX 4070 Ti
NVIDIA GeForce RTX 4070 Ti, i9-13900K
209 fps +75%
MSI Titan GT77 HX 13VI
NVIDIA GeForce RTX 4090 Laptop GPU, i9-13950HX, Samsung PM9A1 MZVL22T0HBLB
187.4 fps +57%
Moyenne NVIDIA GeForce RTX 3090
  (153 - 229, n=16)
184.1 fps +54%
Razer Blade 16 Early 2023
NVIDIA GeForce RTX 4080 Laptop GPU, i9-13950HX, SSSTC CA6-8D1024
157.8 fps +32%
Moyenne NVIDIA GeForce RTX 3070
  (112 - 138.7, n=5)
123.5 fps +3%
SCHENKER XMG Focus 15 Engineering Sample
NVIDIA GeForce RTX 4050 Laptop GPU, i5-13500HX
122.3 fps +2%
SCHENKER XMG Neo 17 2023 Engineering Sample
NVIDIA GeForce RTX 4070 Laptop GPU, i9-13900HX
119.4 fps
Gigabyte AERO 16 OLED BSF
NVIDIA GeForce RTX 4070 Laptop GPU, i9-13900H, Gigabyte AG470S1TB-SI B10
116.2 fps -3%
Razer Blade 18 RTX 4070
NVIDIA GeForce RTX 4070 Laptop GPU, i9-13950HX, SSSTC CA6-8D1024
115.2 fps -4%
Moyenne NVIDIA GeForce RTX 3080 Ti Laptop GPU
  (30.7 - 140.6, n=42)
113.8 fps -5%
Moyenne NVIDIA GeForce RTX 3080 Laptop GPU
  (55.5 - 115, n=34)
99.2 fps -17%
Moyenne AMD Radeon RX 6800M
  (97.5 - 99.7, n=2)
98.6 fps -17%
Moyenne NVIDIA GeForce RTX 3070 Ti Laptop GPU
  (49.5 - 122.4, n=35)
98.5 fps -18%
MSI Katana 17 B13VFK
NVIDIA GeForce RTX 4060 Laptop GPU, i7-13620H, Micron 2400 MTFDKBA1T0QFM
96.1 fps -20%
Moyenne NVIDIA GeForce RTX 3060
  (70.8 - 88.6, n=5)
84.3 fps -29%
Moyenne AMD Radeon RX 6700M
  ()
83.8 fps -30%
Moyenne NVIDIA GeForce RTX 3060 Laptop GPU
  (55 - 100.9, n=42)
79.4 fps -34%
Moyenne AMD Radeon RX 6600M
  (72.1 - 82, n=6)
78.8 fps -34%
Moyenne NVIDIA GeForce RTX 3050
  (66.5 - 67.3, n=2)
66.9 fps -44%
Moyenne NVIDIA GeForce RTX 3050 Ti Laptop GPU
  (23.5 - 106, n=24)
51.2 fps -57%
Moyenne NVIDIA GeForce RTX 3050 6GB Laptop GPU
  (44.2 - 52, n=3)
49.1 fps -59%
2560x1440 High Quality
Asus TUF Gaming GeForce RTX 4070 Ti
NVIDIA GeForce RTX 4070 Ti, i9-13900K
167 fps +94%
MSI Titan GT77 HX 13VI
NVIDIA GeForce RTX 4090 Laptop GPU, i9-13950HX, Samsung PM9A1 MZVL22T0HBLB
162.9 fps +89%
Moyenne NVIDIA GeForce RTX 3090
  (128 - 153, n=15)
143.1 fps +66%
Razer Blade 16 Early 2023
NVIDIA GeForce RTX 4080 Laptop GPU, i9-13950HX, SSSTC CA6-8D1024
120.1 fps +39%
Moyenne NVIDIA GeForce RTX 3070
  (89.2 - 104.9, n=5)
96.3 fps +12%
SCHENKER XMG Neo 17 2023 Engineering Sample
NVIDIA GeForce RTX 4070 Laptop GPU, i9-13900HX
86.1 fps
Moyenne NVIDIA GeForce RTX 3080 Ti Laptop GPU
  (30.8 - 105.8, n=34)
85.9 fps 0%
Gigabyte AERO 16 OLED BSF
NVIDIA GeForce RTX 4070 Laptop GPU, i9-13900H, Gigabyte AG470S1TB-SI B10
84.7 fps -2%
Razer Blade 18 RTX 4070
NVIDIA GeForce RTX 4070 Laptop GPU, i9-13950HX, SSSTC CA6-8D1024
82 fps -5%
Moyenne NVIDIA GeForce RTX 3080 Laptop GPU
  (61.6 - 90.3, n=18)
79.4 fps -8%
Moyenne NVIDIA GeForce RTX 3070 Ti Laptop GPU
  (57.9 - 93, n=24)
76 fps -12%
Moyenne AMD Radeon RX 6800M
  ()
71 fps -18%
MSI Katana 17 B13VFK
NVIDIA GeForce RTX 4060 Laptop GPU, i7-13620H, Micron 2400 MTFDKBA1T0QFM
70.1 fps -19%
Moyenne NVIDIA GeForce RTX 3060
  (63.6 - 64.8, n=4)
64.3 fps -25%
SCHENKER XMG Focus 15 Engineering Sample
NVIDIA GeForce RTX 4050 Laptop GPU, i5-13500HX
60 fps -30%
Moyenne NVIDIA GeForce RTX 3060 Laptop GPU
  (41.1 - 73.7, n=25)
59.5 fps -31%
Moyenne AMD Radeon RX 6600M
  (54.8 - 58.2, n=4)
56.4 fps -34%
Moyenne NVIDIA GeForce RTX 3050
  (48.6 - 48.9, n=2)
48.8 fps -43%
Moyenne NVIDIA GeForce RTX 3050 6GB Laptop GPU
  (32 - 37.4, n=2)
34.7 fps -60%
Moyenne NVIDIA GeForce RTX 3050 Ti Laptop GPU
  (18.4 - 53.1, n=11)
33.9 fps -61%
3840x2160 High Quality
MSI Titan GT77 HX 13VI
NVIDIA GeForce RTX 4090 Laptop GPU, i9-13950HX, Samsung PM9A1 MZVL22T0HBLB
94.7 fps +99%
Asus TUF Gaming GeForce RTX 4070 Ti
NVIDIA GeForce RTX 4070 Ti, i9-13900K
90.5 fps +91%
Moyenne NVIDIA GeForce RTX 3090
  (81.5 - 92.4, n=15)
87.5 fps +84%
Razer Blade 16 Early 2023
NVIDIA GeForce RTX 4080 Laptop GPU, i9-13950HX, SSSTC CA6-8D1024
74.1 fps +56%
Moyenne NVIDIA GeForce RTX 3070
  (54.8 - 61.5, n=5)
57.8 fps +22%
Moyenne NVIDIA GeForce RTX 3080 Ti Laptop GPU
  (35.1 - 61.2, n=18)
52.7 fps +11%
SCHENKER XMG Neo 17 2023 Engineering Sample
NVIDIA GeForce RTX 4070 Laptop GPU, i9-13900HX
47.5 fps
Razer Blade 18 RTX 4070
NVIDIA GeForce RTX 4070 Laptop GPU, i9-13950HX, SSSTC CA6-8D1024
46.6 fps -2%
Gigabyte AERO 16 OLED BSF
NVIDIA GeForce RTX 4070 Laptop GPU, i9-13900H, Gigabyte AG470S1TB-SI B10
46.1 fps -3%
Moyenne NVIDIA GeForce RTX 3070 Ti Laptop GPU
  (39.6 - 46.6, n=5)
43.9 fps -8%
Moyenne NVIDIA GeForce RTX 3080 Laptop GPU
  (28.4 - 53.2, n=16)
43.5 fps -8%
Moyenne AMD Radeon RX 6800M
  ()
41.3 fps -13%
MSI Katana 17 B13VFK
NVIDIA GeForce RTX 4060 Laptop GPU, i7-13620H, Micron 2400 MTFDKBA1T0QFM
40.2 fps -15%
Moyenne NVIDIA GeForce RTX 3060
  (37 - 38.2, n=4)
37.8 fps -20%
SCHENKER XMG Focus 15 Engineering Sample
NVIDIA GeForce RTX 4050 Laptop GPU, i5-13500HX
33.3 fps -30%
Moyenne NVIDIA GeForce RTX 3060 Laptop GPU
  (22.9 - 37.8, n=11)
33.2 fps -30%
Moyenne AMD Radeon RX 6600M
  (30.2 - 30.6, n=3)
30.5 fps -36%
Moyenne NVIDIA GeForce RTX 3050
  (28.2 - 28.2, n=2)
28.2 fps -41%
Moyenne NVIDIA GeForce RTX 3050 Ti Laptop GPU
  (12.8 - 21.4, n=3)
16.9 fps -64%

Bancs d'essai pour le raytracing

Les résultats changent un peu lorsque vous commencez à utiliser le raytracing et l'ordinateur portable RTX 4070 est légèrement derrière l'ordinateur portable RTX 3080 Ti. Vous êtes essentiellement limité à la résolution 1080p si vous voulez activer le raytracing ; les paramètres 4K souffrent souvent de faibles fps.

Les capacités de raytracing de la RTX 4050 sont encore plus limitées et même les paramètres 1080p sont parfois trop difficiles, vous devez donc utiliser l'upscaling pour obtenir des taux de trame fluides (nous allons couvrir cela dans la section suivante).

Note : Nous ajouterons bientôt des benchmarks de raytracing pour l'ordinateur portable RTX 4060.
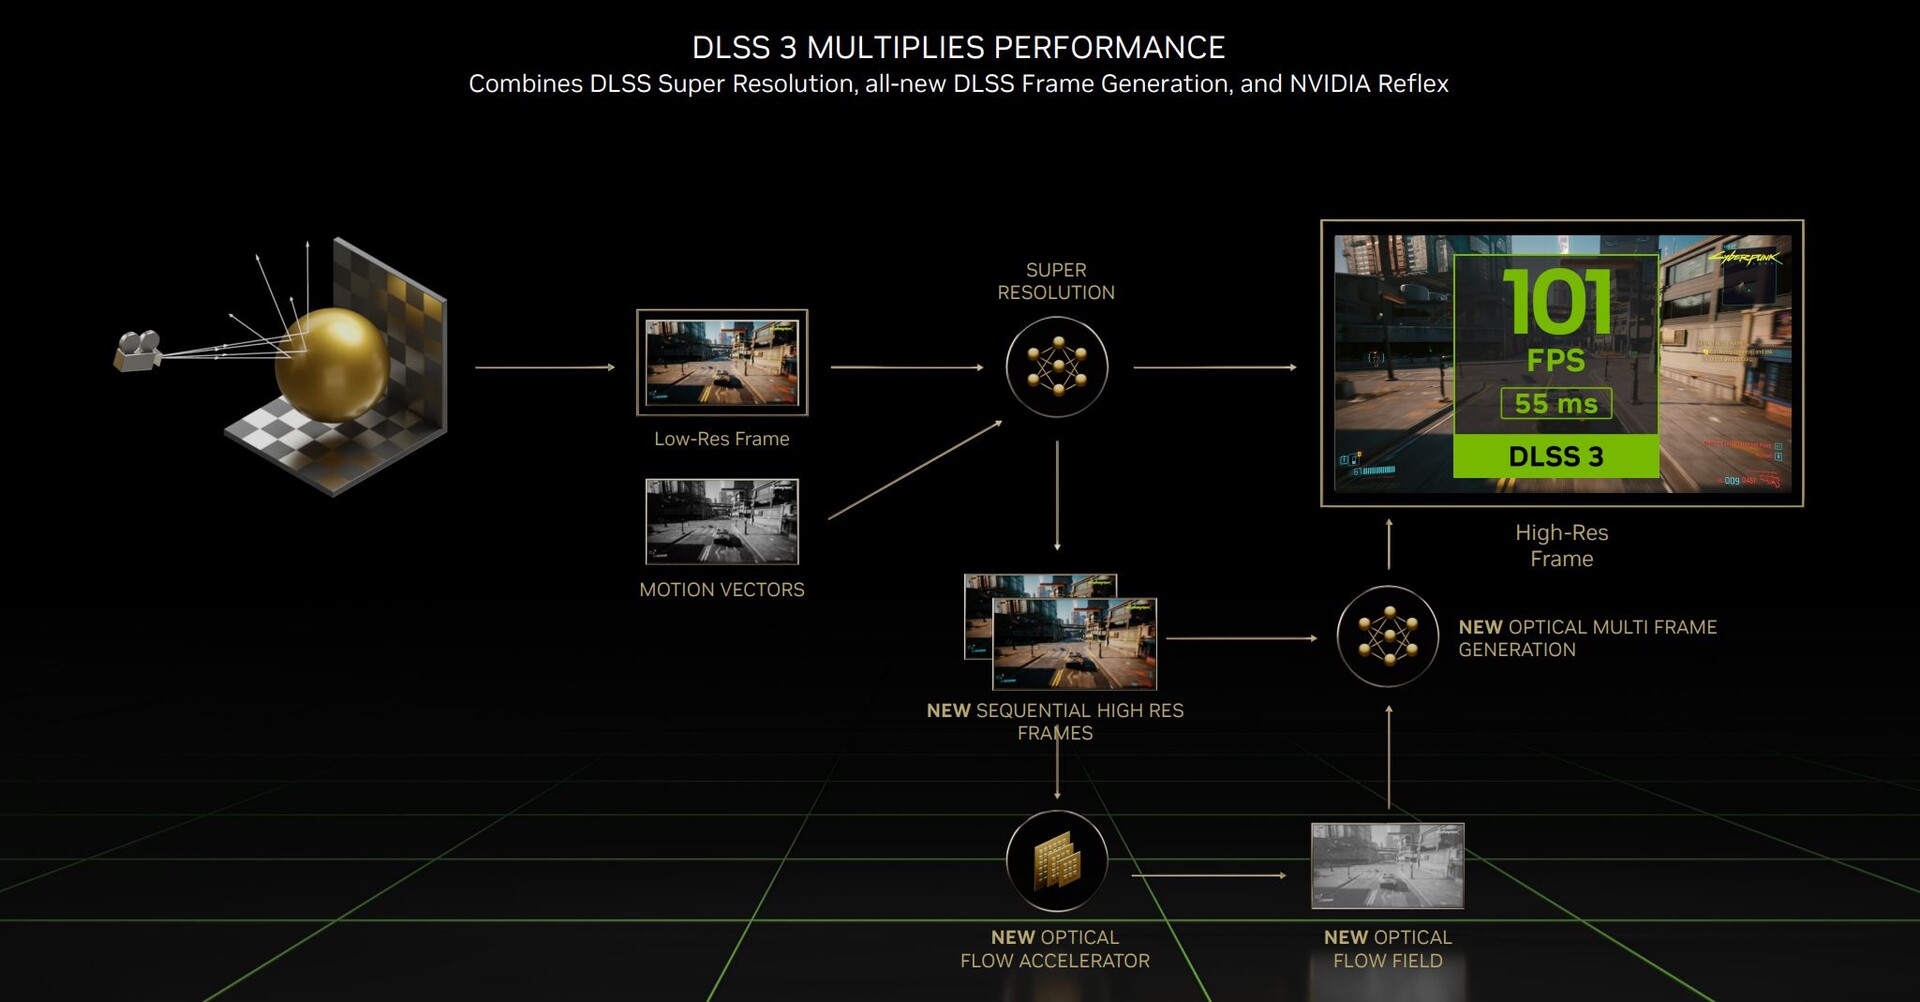
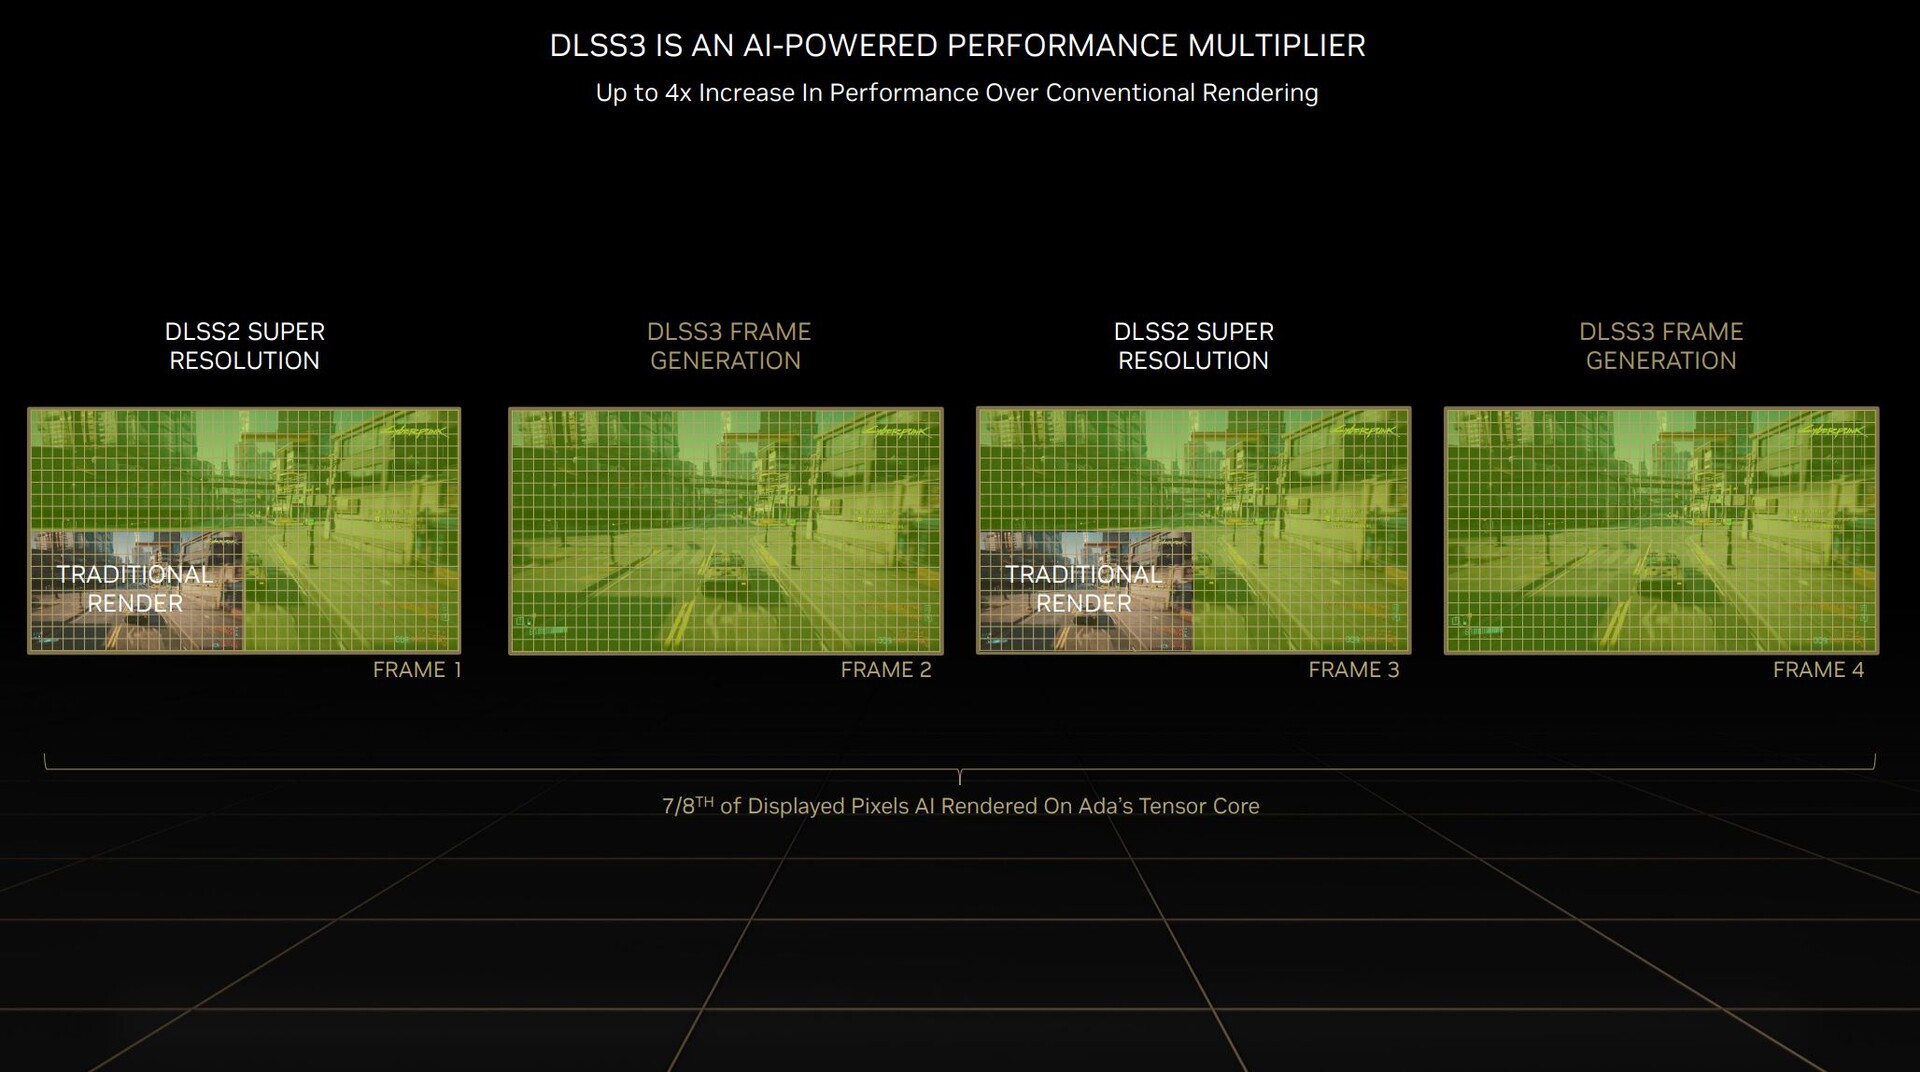
Performance Rating - Percent
Asus TUF Gaming GeForce RTX 4070 Ti
NVIDIA GeForce RTX 4070 Ti, i9-13900K
99.4 pt
Moyenne NVIDIA GeForce RTX 3090
 
86.1 pt
MSI Titan GT77 HX 13VI
NVIDIA GeForce RTX 4090 Laptop GPU, i9-13950HX, Samsung PM9A1 MZVL22T0HBLB
85.9 pt
Razer Blade 16 Early 2023
NVIDIA GeForce RTX 4080 Laptop GPU, i9-13950HX, SSSTC CA6-8D1024
81.9 pt
Moyenne NVIDIA GeForce RTX 3080 Ti Laptop GPU
 
54.8 pt
Moyenne NVIDIA GeForce RTX 3070
 
54.1 pt
SCHENKER XMG Neo 17 2023 Engineering Sample
NVIDIA GeForce RTX 4070 Laptop GPU, i9-13900HX
52.1 pt
Moyenne NVIDIA GeForce RTX 3080 Laptop GPU
 
47.4 pt
Moyenne NVIDIA GeForce RTX 3070 Ti Laptop GPU
 
43.8 pt
Moyenne NVIDIA GeForce RTX 3060
 
41.7 pt
SCHENKER XMG Focus 15 Engineering Sample -1!
NVIDIA GeForce RTX 4050 Laptop GPU, i5-13500HX
32.6 pt
Moyenne NVIDIA GeForce RTX 3060 Laptop GPU
 
31.7 pt
Moyenne AMD Radeon RX 6800M -1!
 
31.2 pt
Moyenne NVIDIA GeForce RTX 3050 -1!
 
31 pt
Moyenne AMD Radeon RX 6600M -2!
 
29.4 pt
Moyenne AMD Radeon RX 6700M -4!
 
27.6 pt
Moyenne NVIDIA GeForce RTX 3050 Ti Laptop GPU
 
15.6 pt
Metro Exodus - 1920x1080 Ultra Quality DXR AF:16x
Asus TUF Gaming GeForce RTX 4070 Ti
NVIDIA GeForce RTX 4070 Ti, i9-13900K
128.8 (62.96min - 211.1max) fps +65%
Moyenne NVIDIA GeForce RTX 3090
  (68.6 - 122.2, n=12)
111.4 fps +43%
MSI Titan GT77 HX 13VI
NVIDIA GeForce RTX 4090 Laptop GPU, i9-13950HX, Samsung PM9A1 MZVL22T0HBLB
108 fps +38%
Razer Blade 16 Early 2023
NVIDIA GeForce RTX 4080 Laptop GPU, i9-13950HX, SSSTC CA6-8D1024
104.4 (50.2min - 162.5max) fps +34%
Moyenne NVIDIA GeForce RTX 3070
  (80.4 - 83, n=5)
81.6 fps +5%
SCHENKER XMG Neo 17 2023 Engineering Sample
NVIDIA GeForce RTX 4070 Laptop GPU, i9-13900HX
78 fps
Moyenne NVIDIA GeForce RTX 3080 Ti Laptop GPU
  ()
77.9 fps 0%
Moyenne NVIDIA GeForce RTX 3080 Laptop GPU
  (59.1 - 74.5, n=6)
68.1 fps -13%
Moyenne NVIDIA GeForce RTX 3070 Ti Laptop GPU
  (61.3 - 65.1, n=2)
63.2 fps -19%
Moyenne AMD Radeon RX 6800M
  (54.9 - 57.4, n=3)
56.1 fps -28%
SCHENKER XMG Focus 15 Engineering Sample
NVIDIA GeForce RTX 4050 Laptop GPU, i5-13500HX
54 fps -31%
Moyenne NVIDIA GeForce RTX 3060
  (52.1 - 55.1, n=4)
53.4 fps -32%
Moyenne NVIDIA GeForce RTX 3060 Laptop GPU
  (50.9 - 54.4, n=3)
52.9 fps -32%
Moyenne AMD Radeon RX 6600M
  (43.8 - 54.4, n=3)
47.5 fps -39%
Moyenne NVIDIA GeForce RTX 3050
  (37.9 - 39.2, n=2)
38.6 fps -51%
Moyenne NVIDIA GeForce RTX 3050 Ti Laptop GPU
  ()
36.8 fps -53%
Watch Dogs Legion - 1920x1080 Ultra Preset + Ultra Ray Tracing (DX12)
Asus TUF Gaming GeForce RTX 4070 Ti
NVIDIA GeForce RTX 4070 Ti, i9-13900K
98.9 (72.06min, 82.17P1 - 137.41max) fps +120%
Moyenne NVIDIA GeForce RTX 3090
  (75.7 - 110, n=3)
88 fps +96%
MSI Titan GT77 HX 13VI
NVIDIA GeForce RTX 4090 Laptop GPU, i9-13950HX, Samsung PM9A1 MZVL22T0HBLB
84 fps +87%
Razer Blade 16 Early 2023
NVIDIA GeForce RTX 4080 Laptop GPU, i9-13950HX, SSSTC CA6-8D1024
80 (58min - 115max) fps +78%
Moyenne NVIDIA GeForce RTX 3080 Ti Laptop GPU
  (50 - 70, n=3)
58.6 fps +30%
Moyenne NVIDIA GeForce RTX 3070
  (51.7 - 61, n=4)
55.1 fps +22%
Moyenne NVIDIA GeForce RTX 3060
  ()
49.9 fps +11%
Moyenne NVIDIA GeForce RTX 3080 Laptop GPU
  (41 - 61, n=6)
48.7 fps +8%
SCHENKER XMG Neo 17 2023 Engineering Sample
NVIDIA GeForce RTX 4070 Laptop GPU, i9-13900HX
45 fps
Moyenne NVIDIA GeForce RTX 3050
  ()
44 fps -2%
Moyenne NVIDIA GeForce RTX 3070 Ti Laptop GPU
  (36 - 41.2, n=2)
38.6 fps -14%
Moyenne AMD Radeon RX 6800M
  ()
29 fps -36%
Moyenne NVIDIA GeForce RTX 3060 Laptop GPU
  (15.4 - 27, n=2)
21.2 fps -53%
SCHENKER XMG Focus 15 Engineering Sample
NVIDIA GeForce RTX 4050 Laptop GPU, i5-13500HX
18 fps -60%
Moyenne AMD Radeon RX 6700M
  ()
18 fps -60%
Moyenne AMD Radeon RX 6600M
  ()
17.5 fps -61%
Moyenne NVIDIA GeForce RTX 3050 Ti Laptop GPU
  ()
11 fps -76%
Far Cry 6 - 1920x1080 Ultra Graphics Quality + HD Textures + DXR AA:T
Asus TUF Gaming GeForce RTX 4070 Ti
NVIDIA GeForce RTX 4070 Ti, i9-13900K
146 (122min - 194max) fps +87%
Razer Blade 16 Early 2023
NVIDIA GeForce RTX 4080 Laptop GPU, i9-13950HX, SSSTC CA6-8D1024
119 (88min - 165max) fps +53%
MSI Titan GT77 HX 13VI
NVIDIA GeForce RTX 4090 Laptop GPU, i9-13950HX, Samsung PM9A1 MZVL22T0HBLB
116 fps +49%
Moyenne NVIDIA GeForce RTX 3090
  (76 - 138.2, n=8)
112.6 fps +44%
Moyenne NVIDIA GeForce RTX 3080 Ti Laptop GPU
  (91 - 92, n=3)
91.3 fps +17%
SCHENKER XMG Neo 17 2023 Engineering Sample
NVIDIA GeForce RTX 4070 Laptop GPU, i9-13900HX
78 fps
Moyenne NVIDIA GeForce RTX 3080 Laptop GPU
  (59 - 84.7, n=4)
72.2 fps -7%
Moyenne NVIDIA GeForce RTX 3070
  ()
71 fps -9%
Moyenne NVIDIA GeForce RTX 3060
  ()
71 fps -9%
Moyenne NVIDIA GeForce RTX 3070 Ti Laptop GPU
  (59 - 77.7, n=2)
68.4 fps -12%
Moyenne AMD Radeon RX 6700M
  ()
54 fps -31%
Moyenne AMD Radeon RX 6600M
  (45.6 - 66.8, n=4)
53.8 fps -31%
Moyenne NVIDIA GeForce RTX 3060 Laptop GPU
  (34 - 66, n=2)
50 fps -36%
SCHENKER XMG Focus 15 Engineering Sample
NVIDIA GeForce RTX 4050 Laptop GPU, i5-13500HX
48 fps -38%
Moyenne NVIDIA GeForce RTX 3050
  (25.8 - 53.1, n=2)
39.5 fps -49%
Moyenne NVIDIA GeForce RTX 3050 Ti Laptop GPU
  ()
8 fps -90%
Dying Light 2 - 1920x1080 High Quality Raytracing
Moyenne NVIDIA GeForce RTX 3090
  (67.9 - 109.9, n=3)
86 fps +105%
Razer Blade 16 Early 2023
NVIDIA GeForce RTX 4080 Laptop GPU, i9-13950HX, SSSTC CA6-8D1024
83.9 (66.4min - 121.8max) fps +100%
Asus TUF Gaming GeForce RTX 4070 Ti
NVIDIA GeForce RTX 4070 Ti, i9-13900K
82.9 (36.6min, 45.4P0.1, 69.2P1 - 247max) fps +97%
MSI Titan GT77 HX 13VI
NVIDIA GeForce RTX 4090 Laptop GPU, i9-13950HX, Samsung PM9A1 MZVL22T0HBLB
73 fps +74%
Moyenne NVIDIA GeForce RTX 3070
  ()
42.2 fps 0%
SCHENKER XMG Neo 17 2023 Engineering Sample
NVIDIA GeForce RTX 4070 Laptop GPU, i9-13900HX
42 fps
Moyenne NVIDIA GeForce RTX 3080 Ti Laptop GPU
  (33.4 - 42.3, n=5)
38.5 fps -8%
Moyenne NVIDIA GeForce RTX 3070 Ti Laptop GPU
  (28.7 - 54.9, n=6)
36.6 fps -13%
Moyenne NVIDIA GeForce RTX 3080 Laptop GPU
  ()
36 fps -14%
Moyenne NVIDIA GeForce RTX 3060
  ()
34.2 fps -19%
Moyenne NVIDIA GeForce RTX 3060 Laptop GPU
  ()
26.1 fps -38%
Moyenne AMD Radeon RX 6800M
  ()
17.8 fps -58%
Moyenne NVIDIA GeForce RTX 3050 Ti Laptop GPU
  ()
6.75 fps -84%
Cyberpunk 2077 1.6 - 1920x1080 Ray Tracing Ultra Preset (DLSS off)
Asus TUF Gaming GeForce RTX 4070 Ti
NVIDIA GeForce RTX 4070 Ti, i9-13900K
81 (62.6min - 103.6max) fps +93%
MSI Titan GT77 HX 13VI
NVIDIA GeForce RTX 4090 Laptop GPU, i9-13950HX, Samsung PM9A1 MZVL22T0HBLB
74 fps +76%
Moyenne NVIDIA GeForce RTX 3090
  (61.3 - 70.4, n=6)
66.3 fps +58%
Razer Blade 16 Early 2023
NVIDIA GeForce RTX 4080 Laptop GPU, i9-13950HX, SSSTC CA6-8D1024
65.3 (31.7min - 96.9max) fps +55%
Moyenne NVIDIA GeForce RTX 3080 Ti Laptop GPU
  (39.2 - 49.9, n=7)
43.3 fps +3%
Moyenne NVIDIA GeForce RTX 3070
  (41.6 - 43.9, n=2)
42.8 fps +2%
SCHENKER XMG Neo 17 2023 Engineering Sample
NVIDIA GeForce RTX 4070 Laptop GPU, i9-13900HX
42 fps
Moyenne NVIDIA GeForce RTX 3070 Ti Laptop GPU
  (27.9 - 63, n=7)
36.8 fps -12%
Moyenne NVIDIA GeForce RTX 3080 Laptop GPU
  (34.6 - 37.8, n=3)
35.7 fps -15%
Moyenne NVIDIA GeForce RTX 3060
  ()
28.3 fps -33%
SCHENKER XMG Focus 15 Engineering Sample
NVIDIA GeForce RTX 4050 Laptop GPU, i5-13500HX
27 fps -36%
Moyenne NVIDIA GeForce RTX 3060 Laptop GPU
  (12.6 - 28.9, n=7)
23.9 fps -43%
Moyenne AMD Radeon RX 6800M
  ()
23.5 fps -44%
Moyenne NVIDIA GeForce RTX 3050
  ()
21.2 fps -50%
Moyenne AMD Radeon RX 6600M
  (15.6 - 26.6, n=2)
21.1 fps -50%
Moyenne NVIDIA GeForce RTX 3050 Ti Laptop GPU
  ()
14.1 fps -66%
Ghostwire Tokyo - 1920x1080 Highest Settings + Maximum Ray Tracing
Asus TUF Gaming GeForce RTX 4070 Ti
NVIDIA GeForce RTX 4070 Ti, i9-13900K
139.3 (31.3min, 53.2P0.1, 89.7P1 - 236max) fps +91%
MSI Titan GT77 HX 13VI
NVIDIA GeForce RTX 4090 Laptop GPU, i9-13950HX, Samsung PM9A1 MZVL22T0HBLB
127 fps +74%
Moyenne NVIDIA GeForce RTX 3090
  (106 - 122, n=4)
114.1 fps +56%
Razer Blade 16 Early 2023
NVIDIA GeForce RTX 4080 Laptop GPU, i9-13950HX, SSSTC CA6-8D1024
97 fps +33%
Moyenne NVIDIA GeForce RTX 3070
  ()
76.3 fps +5%
SCHENKER XMG Neo 17 2023 Engineering Sample
NVIDIA GeForce RTX 4070 Laptop GPU, i9-13900HX
73 fps
Moyenne NVIDIA GeForce RTX 3080 Ti Laptop GPU
  (66.1 - 68.3, n=2)
67.2 fps -8%
Moyenne NVIDIA GeForce RTX 3080 Laptop GPU
  (64.7 - 65.9, n=3)
65.3 fps -11%
Moyenne NVIDIA GeForce RTX 3070 Ti Laptop GPU
  (48.9 - 59.9, n=3)
55.3 fps -24%
SCHENKER XMG Focus 15 Engineering Sample
NVIDIA GeForce RTX 4050 Laptop GPU, i5-13500HX
51 fps -30%
Moyenne NVIDIA GeForce RTX 3060
  ()
48.5 fps -34%
Moyenne NVIDIA GeForce RTX 3060 Laptop GPU
  ()
46.6 fps -36%
Moyenne AMD Radeon RX 6800M
  ()
46.6 fps -36%
Moyenne NVIDIA GeForce RTX 3050
  ()
38.1 fps -48%
Moyenne NVIDIA GeForce RTX 3050 Ti Laptop GPU
  ()
32.2 fps -56%

Repères DLSS

Nous effectuons généralement nos benchmarks de jeux sans technologies d'upscaling comme Nvidia DLSS ou AMD FSR. Cependant, les performances peuvent bénéficier d'un grand avantage lorsque le titre le supporte et nous avons remarqué quelques améliorations majeures avec DLSS 3.0 activé sans aucun déficit visuel. Nous avons répertorié les résultats pour les trois nouveaux GPU pour ordinateurs portables dans les tableaux suivants.

DLSS Benchmarks RTX 4070 Laptop

Titre Paramètres DLSS désactivé DLSS activé (équilibré) Différence
Spider-Man Miles Morales 4K Ultra 44 FPS 57 FPS +30 %
The Witcher 3 4.00 1080p RT Ultra 36 FPS 45 FPS +25 %
Cyberpunk 2077 1.5 1080p RT Ultra 42 FPS 115 FPS +157 %
God of War 4K Ultra 43 FPS 59 FPS +37 %
Horizon Zero Dawn 4K Ultra 52 FPS 83 FPS +60 %

DLSS Benchmarks RTX 4060 Laptop

Titre Paramètres DLSS désactivé DLSS activé (équilibré) Différence
Spider-Man Miles Morales 4K Ultra 35 FPS 55 FPS +57 %
The Witcher 3 4.00 4K Ultra 21 FPS 32 FPS +52 %
Cyberpunk 2077 1.5 4K Ultra 21 FPS 43 FPS +104 %
God of War 4K Ultra 35 FPS 51 FPS +46 %
Horizon Zero Dawn 4K Ultra 47 FPS 74 FPS +57 %

Les benchmarks DLSS pour les portables RTX 4050

Titre Paramètres DLSS désactivé DLSS activé (équilibré) Différence
Spider-Man Miles Morales 4K Ultra 26 FPS 36 FPS +38 %
Spider-Man Miles Morales 1080p RT Ultra 44 FPS 55 FPS +25 %
The Witcher 3 4.00 1080p RT Ultra 21 FPS 29 FPS +38 %
Cyberpunk 2077 1.5 1080p RT Ultra 27 FPS 85 FPS +214 %
God of War 4K Ultra 28 FPS 41 FPS + 46%
Horizon Zero Dawn 4K Ultra 39 FPS 62 FPS +58 %
Call of Duty Modern Warfare 2 4K Ultra 31 FPS 50 FPS + 61 %
Dying Light 2 1080p RT Ultra 52 FPS 77 FPS +48 %

OpenGL, OpenCL et calcul

Nos benchmarks OpenGL, OpenCL et de calcul ne révèlent aucune surprise et le classement est à peu près similaire à celui des tests synthétiques et de jeu. Les modèles grand public sont également très performants dans certains des scénarios SPECviewperf professionnels et peuvent rivaliser avec les GPU professionnels.

Unigine Valley 1.0
1920x1080 Extreme HD Preset OpenGL AA:x8
MSI Titan GT77 HX 13VI
NVIDIA GeForce RTX 4090 Laptop GPU, i9-13950HX, Samsung PM9A1 MZVL22T0HBLB
216.6 fps +93%
Asus TUF Gaming GeForce RTX 4070 Ti
NVIDIA GeForce RTX 4070 Ti, i9-13900K
206.8 (64.6min - 374.1max) fps +84%
Moyenne NVIDIA GeForce RTX 3090
  (158.8 - 226, n=10)
203 fps +80%
Moyenne NVIDIA GeForce RTX 3080 Laptop GPU
  (117.1 - 124.9, n=4)
119.3 fps +6%
SCHENKER XMG Neo 17 2023 Engineering Sample
NVIDIA GeForce RTX 4070 Laptop GPU, i9-13900HX
112.5 fps
Moyenne AMD Radeon RX 6800M
  (92.4 - 93.7, n=2)
93.1 fps -17%
Moyenne NVIDIA GeForce RTX 3060 Laptop GPU
  ()
92.6 fps -18%
Moyenne AMD Radeon RX 6600M
  (64.8 - 93.8, n=4)
85.5 fps -24%
1920x1080 Extreme HD DirectX AA:x8
MSI Titan GT77 HX 13VI
NVIDIA GeForce RTX 4090 Laptop GPU, i9-13950HX, Samsung PM9A1 MZVL22T0HBLB
232 fps +91%
Asus TUF Gaming GeForce RTX 4070 Ti
NVIDIA GeForce RTX 4070 Ti, i9-13900K
230.3 (78.9min - 451.1max) fps +89%
Moyenne NVIDIA GeForce RTX 3090
  (184.2 - 247, n=11)
225 fps +85%
Moyenne NVIDIA GeForce RTX 3080 Laptop GPU
  (124.6 - 129.8, n=4)
128.3 fps +5%
SCHENKER XMG Neo 17 2023 Engineering Sample
NVIDIA GeForce RTX 4070 Laptop GPU, i9-13900HX
121.7 fps
Moyenne AMD Radeon RX 6800M
  (117.2 - 117.7, n=2)
117.5 fps -3%
Moyenne NVIDIA GeForce RTX 3060 Laptop GPU
  ()
97.4 fps -20%
Moyenne AMD Radeon RX 6600M
  (83.6 - 94.5, n=4)
91.1 fps -25%
Unigine Heaven 4.0
Extreme Preset OpenGL
MSI Titan GT77 HX 13VI
NVIDIA GeForce RTX 4090 Laptop GPU, i9-13950HX, Samsung PM9A1 MZVL22T0HBLB
305.1 fps +91%
Asus TUF Gaming GeForce RTX 4070 Ti
NVIDIA GeForce RTX 4070 Ti, i9-13900K
292.6 (15.2min - 600.3max) fps +84%
Moyenne NVIDIA GeForce RTX 3090
  (188.2 - 284, n=10)
270 fps +69%
SCHENKER XMG Neo 17 2023 Engineering Sample
NVIDIA GeForce RTX 4070 Laptop GPU, i9-13900HX
159.4 fps
Moyenne NVIDIA GeForce RTX 3080 Laptop GPU
  (149.1 - 152.7, n=4)
150.4 fps -6%
MSI Katana 17 B13VFK
NVIDIA GeForce RTX 4060 Laptop GPU, i7-13620H, Micron 2400 MTFDKBA1T0QFM
142.6 fps -11%
Moyenne AMD Radeon RX 6600M
  (92.2 - 140.4, n=4)
126.3 fps -21%
Moyenne AMD Radeon RX 6800M
  (122.6 - 125.8, n=2)
124.2 fps -22%
Moyenne NVIDIA GeForce RTX 3060 Laptop GPU
  ()
119.4 fps -25%
SCHENKER XMG Focus 15 Engineering Sample
NVIDIA GeForce RTX 4050 Laptop GPU, i5-13500HX
118.1 fps -26%
Extreme Preset DX11
MSI Titan GT77 HX 13VI
NVIDIA GeForce RTX 4090 Laptop GPU, i9-13950HX, Samsung PM9A1 MZVL22T0HBLB
324.1 fps +98%
Asus TUF Gaming GeForce RTX 4070 Ti
NVIDIA GeForce RTX 4070 Ti, i9-13900K
317.6 (57.8min - 692.1max) fps +94%
Moyenne NVIDIA GeForce RTX 3090
  (272 - 315, n=11)
300 fps +83%
Lenovo Legion Pro 7 16IRX8H
NVIDIA GeForce RTX 4080 Laptop GPU, i9-13900HX, Samsung PM9A1 MZVL21T0HCLR
249.4 fps +52%
Moyenne NVIDIA GeForce RTX 3080 Ti Laptop GPU
  ()
205 fps +25%
SCHENKER XMG Neo 17 2023 Engineering Sample
NVIDIA GeForce RTX 4070 Laptop GPU, i9-13900HX
164 fps
Moyenne NVIDIA GeForce RTX 3080 Laptop GPU
  (158.2 - 160.5, n=4)
159.6 fps -3%
Moyenne AMD Radeon RX 6800M
  (150.4 - 159.5, n=2)
155 fps -5%
Moyenne NVIDIA GeForce RTX 3070 Ti Laptop GPU
  ()
148.8 fps -9%
MSI Katana 17 B13VFK
NVIDIA GeForce RTX 4060 Laptop GPU, i7-13620H, Micron 2400 MTFDKBA1T0QFM
137.6 fps -16%
Moyenne AMD Radeon RX 6600M
  (114.8 - 130.2, n=4)
125.4 fps -24%
Moyenne NVIDIA GeForce RTX 3060 Laptop GPU
  ()
121.6 fps -26%
Moyenne AMD Radeon RX 6700M
  ()
118.9 fps -27%
SCHENKER XMG Focus 15 Engineering Sample
NVIDIA GeForce RTX 4050 Laptop GPU, i5-13500HX
114.6 fps -30%
Asus TUF Gaming A16 FA617
Radeon RX 7600S, R7 7735HS, Micron 2400 MTFDKBA1T0QFM
107.8 fps -34%
LuxMark v2.0 64Bit
Room GPUs-only
MSI Titan GT77 HX 13VI
NVIDIA GeForce RTX 4090 Laptop GPU, i9-13950HX, Samsung PM9A1 MZVL22T0HBLB
8614 Samples/s +82%
Asus TUF Gaming GeForce RTX 4070 Ti
NVIDIA GeForce RTX 4070 Ti, i9-13900K
8413 Samples/s +78%
Lenovo Legion Pro 7 16IRX8H
NVIDIA GeForce RTX 4080 Laptop GPU, i9-13900HX, Samsung PM9A1 MZVL21T0HCLR
7487 Samples/s +58%
Moyenne NVIDIA GeForce RTX 3090
  (5727 - 5985, n=9)
5893 Samples/s +25%
Razer Blade 16 Early 2023
NVIDIA GeForce RTX 4080 Laptop GPU, i9-13950HX, SSSTC CA6-8D1024
5882 Samples/s +24%
Moyenne NVIDIA GeForce RTX 3080 Laptop GPU
  (4895 - 5062, n=6)
4937 Samples/s +4%
SCHENKER XMG Neo 17 2023 Engineering Sample
NVIDIA GeForce RTX 4070 Laptop GPU, i9-13900HX
4727 Samples/s
Moyenne NVIDIA GeForce RTX 3080 Ti Laptop GPU
  ()
4296 Samples/s -9%
Moyenne NVIDIA GeForce RTX 3070 Ti Laptop GPU
  ()
3623 Samples/s -23%
Moyenne AMD Radeon RX 6800M
  ()
3360 Samples/s -29%
SCHENKER XMG Focus 15 Engineering Sample
NVIDIA GeForce RTX 4050 Laptop GPU, i5-13500HX
2967 Samples/s -37%
Moyenne AMD Radeon RX 6700M
  ()
2847 Samples/s -40%
Moyenne AMD Radeon RX 6600M
  ()
2294 Samples/s -51%
MSI Katana 17 B13VFK
NVIDIA GeForce RTX 4060 Laptop GPU, i7-13620H, Micron 2400 MTFDKBA1T0QFM
Samples/s -100%
Sala GPUs-only
Asus TUF Gaming GeForce RTX 4070 Ti
NVIDIA GeForce RTX 4070 Ti, i9-13900K
20171 Samples/s +87%
MSI Titan GT77 HX 13VI
NVIDIA GeForce RTX 4090 Laptop GPU, i9-13950HX, Samsung PM9A1 MZVL22T0HBLB
20001 Samples/s +85%
Lenovo Legion Pro 7 16IRX8H
NVIDIA GeForce RTX 4080 Laptop GPU, i9-13900HX, Samsung PM9A1 MZVL21T0HCLR
17111 Samples/s +58%
Moyenne NVIDIA GeForce RTX 3090
  (14590 - 15242, n=9)
14945 Samples/s +38%
Moyenne AMD Radeon RX 6800M
  ()
14770 Samples/s +37%
Razer Blade 16 Early 2023
NVIDIA GeForce RTX 4080 Laptop GPU, i9-13950HX, SSSTC CA6-8D1024
12572 Samples/s +16%
Moyenne AMD Radeon RX 6700M
  ()
12486 Samples/s +16%
Moyenne NVIDIA GeForce RTX 3080 Laptop GPU
  (11081 - 11844, n=6)
11447 Samples/s +6%
SCHENKER XMG Neo 17 2023 Engineering Sample
NVIDIA GeForce RTX 4070 Laptop GPU, i9-13900HX
10800 Samples/s
Moyenne NVIDIA GeForce RTX 3080 Ti Laptop GPU
  ()
10333 Samples/s -4%
SCHENKER XMG Focus 15 Engineering Sample
NVIDIA GeForce RTX 4050 Laptop GPU, i5-13500HX
8036 Samples/s -26%
Moyenne NVIDIA GeForce RTX 3070 Ti Laptop GPU
  ()
8022 Samples/s -26%
Moyenne AMD Radeon RX 6600M
  ()
5564 Samples/s -48%
MSI Katana 17 B13VFK
NVIDIA GeForce RTX 4060 Laptop GPU, i7-13620H, Micron 2400 MTFDKBA1T0QFM
Samples/s -100%
Blender
v3.3 Classroom OPTIX/RTX
Moyenne NVIDIA GeForce RTX 3050 6GB Laptop GPU
  (68 - 72, n=3)
69.3 Seconds * -230%
Moyenne NVIDIA GeForce RTX 3050 Ti Laptop GPU
  (48 - 60, n=7)
52.3 Seconds * -149%
Moyenne NVIDIA GeForce RTX 3060 Laptop GPU
  (30 - 56, n=15)
34.2 Seconds * -63%
Asus ROG Zephyrus M16 GU603Z
GeForce RTX 3070 Ti Laptop GPU, i9-12900H, Micron 3400 1TB MTFDKBA1T0TFH
28 Seconds * -33%
SCHENKER XMG Focus 15 Engineering Sample
NVIDIA GeForce RTX 4050 Laptop GPU, i5-13500HX
27 Seconds * -29%
Moyenne NVIDIA GeForce RTX 3070 Ti Laptop GPU
  (22 - 30, n=15)
25.3 Seconds * -20%
MSI Katana 17 B13VFK
NVIDIA GeForce RTX 4060 Laptop GPU, i7-13620H, Micron 2400 MTFDKBA1T0QFM
25 Seconds * -19%
Moyenne NVIDIA GeForce RTX 3080 Laptop GPU
  (23 - 25, n=4)
23.8 Seconds * -13%
Moyenne NVIDIA GeForce RTX 3080 Ti Laptop GPU
  (20 - 28, n=13)
23.1 Seconds * -10%
Lenovo ThinkPad P16 G1 RTX A5500
RTX A5500 Laptop GPU, i9-12950HX, WDC PC SN810 2TB
21 Seconds * -0%
Gigabyte AERO 16 OLED BSF
NVIDIA GeForce RTX 4070 Laptop GPU, i9-13900H, Gigabyte AG470S1TB-SI B10
21 Seconds * -0%
SCHENKER XMG Neo 17 2023 Engineering Sample
NVIDIA GeForce RTX 4070 Laptop GPU, i9-13900HX
21 Seconds *
Razer Blade 18 RTX 4070
NVIDIA GeForce RTX 4070 Laptop GPU, i9-13950HX, SSSTC CA6-8D1024
20 Seconds * +5%
Razer Blade 16 Early 2023
NVIDIA GeForce RTX 4080 Laptop GPU, i9-13950HX, SSSTC CA6-8D1024
15 Seconds * +29%
Lenovo Legion Pro 7 16IRX8H
NVIDIA GeForce RTX 4080 Laptop GPU, i9-13900HX, Samsung PM9A1 MZVL21T0HCLR
15 Seconds * +29%
Moyenne NVIDIA GeForce RTX 3090
  (13 - 14, n=12)
13.3 Seconds * +37%
Asus TUF Gaming GeForce RTX 4070 Ti
NVIDIA GeForce RTX 4070 Ti, i9-13900K
12 Seconds * +43%
MSI Titan GT77 HX 13VI
NVIDIA GeForce RTX 4090 Laptop GPU, i9-13950HX, Samsung PM9A1 MZVL22T0HBLB
11 Seconds * +48%
v3.3 Classroom CUDA
Moyenne NVIDIA GeForce RTX 3050 6GB Laptop GPU
  (107 - 115, n=3)
110.7 Seconds * -220%
Moyenne NVIDIA GeForce RTX 3050 Ti Laptop GPU
  (83 - 104, n=7)
90 Seconds * -160%
Moyenne NVIDIA GeForce RTX 3060 Laptop GPU
  (51 - 89, n=15)
57.6 Seconds * -66%
SCHENKER XMG Focus 15 Engineering Sample
NVIDIA GeForce RTX 4050 Laptop GPU, i5-13500HX
53.4 Seconds * -54%
Asus ROG Zephyrus M16 GU603Z
GeForce RTX 3070 Ti Laptop GPU, i9-12900H, Micron 3400 1TB MTFDKBA1T0TFH
45 Seconds * -30%
MSI Katana 17 B13VFK
NVIDIA GeForce RTX 4060 Laptop GPU, i7-13620H, Micron 2400 MTFDKBA1T0QFM
44 Seconds * -27%
Moyenne NVIDIA GeForce RTX 3070 Ti Laptop GPU
  (36 - 46, n=16)
41.4 Seconds * -20%
Moyenne NVIDIA GeForce RTX 3080 Laptop GPU
  (41 - 42, n=4)
41.3 Seconds * -19%
Razer Blade 18 RTX 4070
NVIDIA GeForce RTX 4070 Laptop GPU, i9-13950HX, SSSTC CA6-8D1024
36 Seconds * -4%
Lenovo ThinkPad P16 G1 RTX A5500
RTX A5500 Laptop GPU, i9-12950HX, WDC PC SN810 2TB
35 Seconds * -1%
Moyenne NVIDIA GeForce RTX 3080 Ti Laptop GPU
  (32 - 41, n=13)
35 Seconds * -1%
SCHENKER XMG Neo 17 2023 Engineering Sample
NVIDIA GeForce RTX 4070 Laptop GPU, i9-13900HX
34.6 Seconds *
Gigabyte AERO 16 OLED BSF
NVIDIA GeForce RTX 4070 Laptop GPU, i9-13900H, Gigabyte AG470S1TB-SI B10
34 Seconds * +2%
Lenovo Legion Pro 7 16IRX8H
NVIDIA GeForce RTX 4080 Laptop GPU, i9-13900HX, Samsung PM9A1 MZVL21T0HCLR
23 Seconds * +34%
Razer Blade 16 Early 2023
NVIDIA GeForce RTX 4080 Laptop GPU, i9-13950HX, SSSTC CA6-8D1024
22 Seconds * +36%
Moyenne NVIDIA GeForce RTX 3090
  (20 - 22, n=12)
21.4 Seconds * +38%
MSI Titan GT77 HX 13VI
NVIDIA GeForce RTX 4090 Laptop GPU, i9-13950HX, Samsung PM9A1 MZVL22T0HBLB
17 Seconds * +51%
v3.3 Classroom HIP/AMD
Moyenne NVIDIA GeForce RTX 3060 Laptop GPU
  (393 - 481, n=2)
437 Seconds *
Moyenne NVIDIA GeForce RTX 3070 Ti Laptop GPU
  ()
380 Seconds *
Asus TUF Gaming A16 FA617
Radeon RX 7600S, R7 7735HS, Micron 2400 MTFDKBA1T0QFM
74 Seconds *
Moyenne AMD Radeon RX 6800M
  ()
63 Seconds *
Moyenne AMD Radeon RX 6600M
  (4 - 87, n=3)
52 Seconds *
v3.3 Classroom METAL
Apple MacBook Pro 16 2023 M2 Max
M2 Max 38-Core GPU, M2 Max, Apple SSD AP2048Z
51.2 Seconds *
GFXBench
3840x2160 4K Aztec Ruins High Tier Offscreen
MSI Titan GT77 HX 13VI
NVIDIA GeForce RTX 4090 Laptop GPU, i9-13950HX, Samsung PM9A1 MZVL22T0HBLB
239.5 fps +88%
Razer Blade 16 Early 2023
NVIDIA GeForce RTX 4080 Laptop GPU, i9-13950HX, SSSTC CA6-8D1024
212 fps +66%
Lenovo Legion Pro 7 16IRX8H
NVIDIA GeForce RTX 4080 Laptop GPU, i9-13900HX, Samsung PM9A1 MZVL21T0HCLR
197.2 fps +55%
Apple MacBook Pro 16 2023 M2 Max
M2 Max 38-Core GPU, M2 Max, Apple SSD AP2048Z
179.9 fps +41%
SCHENKER XMG Neo 17 2023 Engineering Sample
NVIDIA GeForce RTX 4070 Laptop GPU, i9-13900HX
127.6 fps
MSI Katana 17 B13VFK
NVIDIA GeForce RTX 4060 Laptop GPU, i7-13620H, Micron 2400 MTFDKBA1T0QFM
107 fps -16%
SCHENKER XMG Focus 15 Engineering Sample
NVIDIA GeForce RTX 4050 Laptop GPU, i5-13500HX
90 fps -29%
Asus TUF Gaming A16 FA617
Radeon RX 7600S, R7 7735HS, Micron 2400 MTFDKBA1T0QFM
16.3 fps -87%
2560x1440 Aztec Ruins High Tier Offscreen
MSI Titan GT77 HX 13VI
NVIDIA GeForce RTX 4090 Laptop GPU, i9-13950HX, Samsung PM9A1 MZVL22T0HBLB
522 fps +81%
Razer Blade 16 Early 2023
NVIDIA GeForce RTX 4080 Laptop GPU, i9-13950HX, SSSTC CA6-8D1024
485 fps +68%
Lenovo Legion Pro 7 16IRX8H
NVIDIA GeForce RTX 4080 Laptop GPU, i9-13900HX, Samsung PM9A1 MZVL21T0HCLR
446.1 fps +55%
Apple MacBook Pro 16 2023 M2 Max
M2 Max 38-Core GPU, M2 Max, Apple SSD AP2048Z
397.6 fps +38%
SCHENKER XMG Neo 17 2023 Engineering Sample
NVIDIA GeForce RTX 4070 Laptop GPU, i9-13900HX
288.5 fps
Moyenne NVIDIA GeForce RTX 3080 Ti Laptop GPU
  ()
262 fps -9%
MSI Katana 17 B13VFK
NVIDIA GeForce RTX 4060 Laptop GPU, i7-13620H, Micron 2400 MTFDKBA1T0QFM
248.5 fps -14%
SCHENKER XMG Focus 15 Engineering Sample
NVIDIA GeForce RTX 4050 Laptop GPU, i5-13500HX
208 fps -28%
Moyenne NVIDIA GeForce RTX 3050 Ti Laptop GPU
  ()
108 fps -63%
Asus TUF Gaming A16 FA617
Radeon RX 7600S, R7 7735HS, Micron 2400 MTFDKBA1T0QFM
45 fps -84%
1920x1080 Car Chase Offscreen
MSI Titan GT77 HX 13VI
NVIDIA GeForce RTX 4090 Laptop GPU, i9-13950HX, Samsung PM9A1 MZVL22T0HBLB
888 fps +44%
SCHENKER XMG Neo 17 2023 Engineering Sample
NVIDIA GeForce RTX 4070 Laptop GPU, i9-13900HX
616.7 fps
Apple MacBook Pro 16 2023 M2 Max
M2 Max 38-Core GPU, M2 Max, Apple SSD AP2048Z
585.2 fps -5%
MSI Katana 17 B13VFK
NVIDIA GeForce RTX 4060 Laptop GPU, i7-13620H, Micron 2400 MTFDKBA1T0QFM
547.5 fps -11%
SCHENKER XMG Focus 15 Engineering Sample
NVIDIA GeForce RTX 4050 Laptop GPU, i5-13500HX
470 fps -24%
Moyenne NVIDIA GeForce RTX 3050 Ti Laptop GPU
  ()
252 fps -59%
SPECviewperf 13
Solidworks (sw-04)
Lenovo ThinkPad P16 G1 RTX A5500
RTX A5500 Laptop GPU, i9-12950HX, WDC PC SN810 2TB
206.94 fps +79%
Moyenne AMD Radeon RX 6600M
  (127 - 201, n=4)
170.8 fps +48%
Moyenne AMD Radeon RX 6800M
  (143 - 179, n=2)
161 fps +39%
MSI Titan GT77 HX 13VI
NVIDIA GeForce RTX 4090 Laptop GPU, i9-13950HX, Samsung PM9A1 MZVL22T0HBLB
159.12 fps +38%
Moyenne NVIDIA GeForce RTX 3090
  (82.9 - 160, n=11)
136.3 fps +18%
Razer Blade 16 Early 2023
NVIDIA GeForce RTX 4080 Laptop GPU, i9-13950HX, SSSTC CA6-8D1024
134.49 fps +17%
SCHENKER XMG Neo 17 2023 Engineering Sample
NVIDIA GeForce RTX 4070 Laptop GPU, i9-13900HX
115.44 fps
Moyenne NVIDIA GeForce RTX 3080 Ti Laptop GPU
  (62.9 - 133.4, n=8)
108.8 fps -6%
MSI Katana 17 B13VFK
NVIDIA GeForce RTX 4060 Laptop GPU, i7-13620H, Micron 2400 MTFDKBA1T0QFM
108.18 fps -6%
Moyenne NVIDIA GeForce RTX 3080 Laptop GPU
  (98.6 - 115, n=4)
104.2 fps -10%
Moyenne NVIDIA GeForce RTX 3070 Ti Laptop GPU
  ()
103.4 fps -10%
SCHENKER XMG Focus 15 Engineering Sample
NVIDIA GeForce RTX 4050 Laptop GPU, i5-13500HX
93.4 fps -19%
Moyenne NVIDIA GeForce RTX 3060 Laptop GPU
  (87.4 - 97.6, n=3)
92.7 fps -20%
Moyenne NVIDIA GeForce RTX 3050 Ti Laptop GPU
  ()
79.5 fps -31%
Siemens NX (snx-03)
Lenovo ThinkPad P16 G1 RTX A5500
RTX A5500 Laptop GPU, i9-12950HX, WDC PC SN810 2TB
413.09 fps +1698%
Moyenne AMD Radeon RX 6600M
  (64.2 - 344, n=4)
263 fps +1045%
Moyenne AMD Radeon RX 6800M
  (65.6 - 79.4, n=2)
72.5 fps +216%
MSI Titan GT77 HX 13VI
NVIDIA GeForce RTX 4090 Laptop GPU, i9-13950HX, Samsung PM9A1 MZVL22T0HBLB
34.38 fps +50%
Razer Blade 16 Early 2023
NVIDIA GeForce RTX 4080 Laptop GPU, i9-13950HX, SSSTC CA6-8D1024
28.76 fps +25%
Moyenne NVIDIA GeForce RTX 3090
  (15.6 - 33.3, n=11)
28.1 fps +22%
Moyenne NVIDIA GeForce RTX 3080 Laptop GPU
  (23 - 23.2, n=4)
23.1 fps +1%
SCHENKER XMG Neo 17 2023 Engineering Sample
NVIDIA GeForce RTX 4070 Laptop GPU, i9-13900HX
22.97 fps
Moyenne NVIDIA GeForce RTX 3080 Ti Laptop GPU
  (18.3 - 25.3, n=8)
22.3 fps -3%
MSI Katana 17 B13VFK
NVIDIA GeForce RTX 4060 Laptop GPU, i7-13620H, Micron 2400 MTFDKBA1T0QFM
21.83 fps -5%
SCHENKER XMG Focus 15 Engineering Sample
NVIDIA GeForce RTX 4050 Laptop GPU, i5-13500HX
21 fps -9%
Moyenne NVIDIA GeForce RTX 3070 Ti Laptop GPU
  ()
19.2 fps -16%
Moyenne NVIDIA GeForce RTX 3060 Laptop GPU
  (16.2 - 17.7, n=3)
16.9 fps -26%
Moyenne NVIDIA GeForce RTX 3050 Ti Laptop GPU
  ()
13.3 fps -42%
Showcase (showcase-02)
MSI Titan GT77 HX 13VI
NVIDIA GeForce RTX 4090 Laptop GPU, i9-13950HX, Samsung PM9A1 MZVL22T0HBLB
281.1 fps +130%
Moyenne NVIDIA GeForce RTX 3090
  (114 - 268, n=11)
246 fps +101%
Razer Blade 16 Early 2023
NVIDIA GeForce RTX 4080 Laptop GPU, i9-13950HX, SSSTC CA6-8D1024
203.33 fps +66%
Moyenne NVIDIA GeForce RTX 3080 Ti Laptop GPU
  (110 - 175, n=8)
146.6 fps +20%
Lenovo ThinkPad P16 G1 RTX A5500
RTX A5500 Laptop GPU, i9-12950HX, WDC PC SN810 2TB
142.9 fps +17%
Moyenne AMD Radeon RX 6800M
  (132 - 149, n=2)
140.5 fps +15%
Moyenne NVIDIA GeForce RTX 3070 Ti Laptop GPU
  ()
130.4 fps +7%
Moyenne NVIDIA GeForce RTX 3080 Laptop GPU
  (120 - 133, n=4)
123.3 fps +1%
SCHENKER XMG Neo 17 2023 Engineering Sample
NVIDIA GeForce RTX 4070 Laptop GPU, i9-13900HX
122.16 fps
Moyenne AMD Radeon RX 6600M
  (98.5 - 129, n=4)
117.6 fps -4%
Moyenne NVIDIA GeForce RTX 3060 Laptop GPU
  (98.1 - 110, n=3)
105.7 fps -13%
MSI Katana 17 B13VFK
NVIDIA GeForce RTX 4060 Laptop GPU, i7-13620H, Micron 2400 MTFDKBA1T0QFM
105.23 fps -14%
SCHENKER XMG Focus 15 Engineering Sample
NVIDIA GeForce RTX 4050 Laptop GPU, i5-13500HX
78.3 fps -36%
Moyenne NVIDIA GeForce RTX 3050 Ti Laptop GPU
  ()
68.9 fps -44%
Medical (medical-02)
Lenovo ThinkPad P16 G1 RTX A5500
RTX A5500 Laptop GPU, i9-12950HX, WDC PC SN810 2TB
140.01 fps +75%
MSI Titan GT77 HX 13VI
NVIDIA GeForce RTX 4090 Laptop GPU, i9-13950HX, Samsung PM9A1 MZVL22T0HBLB
122.82 fps +53%
Razer Blade 16 Early 2023
NVIDIA GeForce RTX 4080 Laptop GPU, i9-13950HX, SSSTC CA6-8D1024
107.84 fps +35%
Moyenne NVIDIA GeForce RTX 3090
  (49.3 - 109, n=11)
100.6 fps +26%
Moyenne AMD Radeon RX 6600M
  (63 - 130, n=4)
85.4 fps +7%
SCHENKER XMG Neo 17 2023 Engineering Sample
NVIDIA GeForce RTX 4070 Laptop GPU, i9-13900HX
80.13 fps
Moyenne NVIDIA GeForce RTX 3080 Ti Laptop GPU
  (65.3 - 79.1, n=8)
74.5 fps -7%
Moyenne AMD Radeon RX 6800M
  (69.4 - 78.7, n=2)
74.1 fps -8%
MSI Katana 17 B13VFK
NVIDIA GeForce RTX 4060 Laptop GPU, i7-13620H, Micron 2400 MTFDKBA1T0QFM
67.75 fps -15%
Moyenne NVIDIA GeForce RTX 3070 Ti Laptop GPU
  ()
67.4 fps -16%
SCHENKER XMG Focus 15 Engineering Sample
NVIDIA GeForce RTX 4050 Laptop GPU, i5-13500HX
59.9 fps -25%
Moyenne NVIDIA GeForce RTX 3080 Laptop GPU
  (58.9 - 59.2, n=4)
59 fps -26%
Moyenne NVIDIA GeForce RTX 3060 Laptop GPU
  (57.2 - 58.6, n=3)
57.8 fps -28%
Moyenne NVIDIA GeForce RTX 3050 Ti Laptop GPU
  ()
42.2 fps -47%
Maya (maya-05)
MSI Titan GT77 HX 13VI
NVIDIA GeForce RTX 4090 Laptop GPU, i9-13950HX, Samsung PM9A1 MZVL22T0HBLB
600.78 fps +69%
Moyenne NVIDIA GeForce RTX 3090
  (253 - 595, n=11)
522 fps +46%
Razer Blade 16 Early 2023
NVIDIA GeForce RTX 4080 Laptop GPU, i9-13950HX, SSSTC CA6-8D1024
494.88 fps +39%
Lenovo ThinkPad P16 G1 RTX A5500
RTX A5500 Laptop GPU, i9-12950HX, WDC PC SN810 2TB
362.87 fps +2%
SCHENKER XMG Neo 17 2023 Engineering Sample
NVIDIA GeForce RTX 4070 Laptop GPU, i9-13900HX
356.37 fps
Moyenne NVIDIA GeForce RTX 3080 Ti Laptop GPU
  (212 - 430, n=8)
321 fps -10%
Moyenne NVIDIA GeForce RTX 3080 Laptop GPU
  (304 - 311, n=4)
308 fps -14%
MSI Katana 17 B13VFK
NVIDIA GeForce RTX 4060 Laptop GPU, i7-13620H, Micron 2400 MTFDKBA1T0QFM
299.64 fps -16%
Moyenne AMD Radeon RX 6600M
  (187 - 340, n=4)
283 fps -21%
Moyenne NVIDIA GeForce RTX 3070 Ti Laptop GPU
  ()
270 fps -24%
Moyenne AMD Radeon RX 6800M
  (228 - 279, n=2)
254 fps -29%
SCHENKER XMG Focus 15 Engineering Sample
NVIDIA GeForce RTX 4050 Laptop GPU, i5-13500HX
253.7 fps -29%
Moyenne NVIDIA GeForce RTX 3060 Laptop GPU
  (198 - 264, n=3)
234 fps -34%
Moyenne NVIDIA GeForce RTX 3050 Ti Laptop GPU
  ()
157 fps -56%
Energy (energy-02)
MSI Titan GT77 HX 13VI
NVIDIA GeForce RTX 4090 Laptop GPU, i9-13950HX, Samsung PM9A1 MZVL22T0HBLB
74.73 fps +78%
Lenovo ThinkPad P16 G1 RTX A5500
RTX A5500 Laptop GPU, i9-12950HX, WDC PC SN810 2TB
69.02 fps +65%
Razer Blade 16 Early 2023
NVIDIA GeForce RTX 4080 Laptop GPU, i9-13950HX, SSSTC CA6-8D1024
61.32 fps +46%
Moyenne NVIDIA GeForce RTX 3090
  (26.6 - 45.2, n=11)
42.8 fps +2%
SCHENKER XMG Neo 17 2023 Engineering Sample
NVIDIA GeForce RTX 4070 Laptop GPU, i9-13900HX
41.89 fps
MSI Katana 17 B13VFK
NVIDIA GeForce RTX 4060 Laptop GPU, i7-13620H, Micron 2400 MTFDKBA1T0QFM
35.21 fps -16%
Moyenne AMD Radeon RX 6600M
  (2.05 - 43.5, n=4)
32.2 fps -23%
SCHENKER XMG Focus 15 Engineering Sample
NVIDIA GeForce RTX 4050 Laptop GPU, i5-13500HX
31.8 fps -24%
Moyenne NVIDIA GeForce RTX 3080 Laptop GPU
  (24.6 - 24.8, n=4)
24.7 fps -41%
Moyenne NVIDIA GeForce RTX 3080 Ti Laptop GPU
  (19.3 - 27.3, n=8)
24.5 fps -42%
Moyenne NVIDIA GeForce RTX 3070 Ti Laptop GPU
  ()
23 fps -45%
Moyenne NVIDIA GeForce RTX 3060 Laptop GPU
  (20.3 - 20.7, n=3)
20.6 fps -51%
Moyenne AMD Radeon RX 6800M
  (2.98 - 35.1, n=2)
19 fps -55%
Moyenne NVIDIA GeForce RTX 3050 Ti Laptop GPU
  ()
12.8 fps -69%
Creo (creo-02)
MSI Titan GT77 HX 13VI
NVIDIA GeForce RTX 4090 Laptop GPU, i9-13950HX, Samsung PM9A1 MZVL22T0HBLB
461.26 fps +75%
Razer Blade 16 Early 2023
NVIDIA GeForce RTX 4080 Laptop GPU, i9-13950HX, SSSTC CA6-8D1024
377.58 fps +43%
Moyenne NVIDIA GeForce RTX 3090
  (176 - 417, n=11)
366 fps +39%
Lenovo ThinkPad P16 G1 RTX A5500
RTX A5500 Laptop GPU, i9-12950HX, WDC PC SN810 2TB
330.97 fps +26%
SCHENKER XMG Neo 17 2023 Engineering Sample
NVIDIA GeForce RTX 4070 Laptop GPU, i9-13900HX
263.41 fps
Moyenne NVIDIA GeForce RTX 3080 Ti Laptop GPU
  (177.4 - 311, n=8)
249 fps -5%
Moyenne AMD Radeon RX 6600M
  (166 - 273, n=4)
228 fps -13%
Moyenne NVIDIA GeForce RTX 3080 Laptop GPU
  (215 - 218, n=4)
216 fps -18%
Moyenne AMD Radeon RX 6800M
  (179 - 247, n=2)
213 fps -19%
Moyenne NVIDIA GeForce RTX 3070 Ti Laptop GPU
  ()
205 fps -22%
MSI Katana 17 B13VFK
NVIDIA GeForce RTX 4060 Laptop GPU, i7-13620H, Micron 2400 MTFDKBA1T0QFM
199.33 fps -24%
Moyenne NVIDIA GeForce RTX 3060 Laptop GPU
  (156.6 - 192, n=3)
175.9 fps -33%
SCHENKER XMG Focus 15 Engineering Sample
NVIDIA GeForce RTX 4050 Laptop GPU, i5-13500HX
173 fps -34%
Moyenne NVIDIA GeForce RTX 3050 Ti Laptop GPU
  ()
120 fps -54%
Catia (catia-05)
Lenovo ThinkPad P16 G1 RTX A5500
RTX A5500 Laptop GPU, i9-12950HX, WDC PC SN810 2TB
369.46 fps +133%
Moyenne AMD Radeon RX 6600M
  (211 - 381, n=4)
318 fps +100%
Moyenne AMD Radeon RX 6800M
  (260 - 344, n=2)
302 fps +90%
MSI Titan GT77 HX 13VI
NVIDIA GeForce RTX 4090 Laptop GPU, i9-13950HX, Samsung PM9A1 MZVL22T0HBLB
281.44 fps +77%
Razer Blade 16 Early 2023
NVIDIA GeForce RTX 4080 Laptop GPU, i9-13950HX, SSSTC CA6-8D1024
233.27 fps +47%
Moyenne NVIDIA GeForce RTX 3090
  (111 - 260, n=11)
232 fps +46%
Moyenne NVIDIA GeForce RTX 3080 Ti Laptop GPU
  (130.4 - 190.3, n=8)
170 fps +7%
SCHENKER XMG Neo 17 2023 Engineering Sample
NVIDIA GeForce RTX 4070 Laptop GPU, i9-13900HX
158.82 fps
Moyenne NVIDIA GeForce RTX 3080 Laptop GPU
  (158 - 159, n=4)
158.8 fps 0%
Moyenne NVIDIA GeForce RTX 3070 Ti Laptop GPU
  ()
150.6 fps -5%
MSI Katana 17 B13VFK
NVIDIA GeForce RTX 4060 Laptop GPU, i7-13620H, Micron 2400 MTFDKBA1T0QFM
145.49 fps -8%
SCHENKER XMG Focus 15 Engineering Sample
NVIDIA GeForce RTX 4050 Laptop GPU, i5-13500HX
124.6 fps -22%
Moyenne NVIDIA GeForce RTX 3060 Laptop GPU
  (47.7 - 118.1, n=3)
94.3 fps -41%
Moyenne NVIDIA GeForce RTX 3050 Ti Laptop GPU
  ()
82.8 fps -48%
3ds Max (3dsmax-06)
MSI Titan GT77 HX 13VI
NVIDIA GeForce RTX 4090 Laptop GPU, i9-13950HX, Samsung PM9A1 MZVL22T0HBLB
372.51 fps +53%
Moyenne NVIDIA GeForce RTX 3090
  (180 - 387, n=11)
348 fps +43%
Razer Blade 16 Early 2023
NVIDIA GeForce RTX 4080 Laptop GPU, i9-13950HX, SSSTC CA6-8D1024
346.23 fps +42%
SCHENKER XMG Neo 17 2023 Engineering Sample
NVIDIA GeForce RTX 4070 Laptop GPU, i9-13900HX
243.42 fps
Lenovo ThinkPad P16 G1 RTX A5500
RTX A5500 Laptop GPU, i9-12950HX, WDC PC SN810 2TB
241.24 fps -1%
Moyenne AMD Radeon RX 6800M
  (226 - 231, n=2)
229 fps -6%
Moyenne NVIDIA GeForce RTX 3080 Ti Laptop GPU
  (161 - 260, n=8)
223 fps -8%
Moyenne NVIDIA GeForce RTX 3080 Laptop GPU
  (215 - 217, n=4)
216 fps -11%
MSI Katana 17 B13VFK
NVIDIA GeForce RTX 4060 Laptop GPU, i7-13620H, Micron 2400 MTFDKBA1T0QFM
206.17 fps -15%
Moyenne NVIDIA GeForce RTX 3070 Ti Laptop GPU
  ()
195.1 fps -20%
Moyenne AMD Radeon RX 6600M
  (156 - 246, n=4)
194.5 fps -20%
SCHENKER XMG Focus 15 Engineering Sample
NVIDIA GeForce RTX 4050 Laptop GPU, i5-13500HX
164.7 fps -32%
Moyenne NVIDIA GeForce RTX 3060 Laptop GPU
  (49.1 - 193.9, n=3)
141 fps -42%
Moyenne NVIDIA GeForce RTX 3050 Ti Laptop GPU
  ()
133 fps -45%
SPECviewperf 2020
1920x1080 Solidworks (solidworks-05)
MSI Titan GT77 HX 13VI
NVIDIA GeForce RTX 4090 Laptop GPU, i9-13950HX, Samsung PM9A1 MZVL22T0HBLB
499.25 fps +90%
Razer Blade 16 Early 2023
NVIDIA GeForce RTX 4080 Laptop GPU, i9-13950HX, SSSTC CA6-8D1024
420.83 fps +60%
SCHENKER XMG Neo 17 2023 Engineering Sample
NVIDIA GeForce RTX 4070 Laptop GPU, i9-13900HX
262.82 fps
Lenovo ThinkPad P16 G1 RTX A5500
RTX A5500 Laptop GPU, i9-12950HX, WDC PC SN810 2TB
258.01 fps -2%
MSI Katana 17 B13VFK
NVIDIA GeForce RTX 4060 Laptop GPU, i7-13620H, Micron 2400 MTFDKBA1T0QFM
235 fps -11%
Moyenne NVIDIA GeForce RTX 3070 Ti Laptop GPU
  ()
226 fps -14%
Moyenne NVIDIA GeForce RTX 3080 Ti Laptop GPU
  (174.7 - 211, n=3)
198.6 fps -24%
Moyenne NVIDIA GeForce RTX 3060 Laptop GPU
  ()
196 fps -25%
SCHENKER XMG Focus 15 Engineering Sample
NVIDIA GeForce RTX 4050 Laptop GPU, i5-13500HX
188.3 fps -28%
1920x1080 Siemens NX (snx-04)
Lenovo ThinkPad P16 G1 RTX A5500
RTX A5500 Laptop GPU, i9-12950HX, WDC PC SN810 2TB
410.78 fps +1718%
MSI Titan GT77 HX 13VI
NVIDIA GeForce RTX 4090 Laptop GPU, i9-13950HX, Samsung PM9A1 MZVL22T0HBLB
34.28 fps +52%
Razer Blade 16 Early 2023
NVIDIA GeForce RTX 4080 Laptop GPU, i9-13950HX, SSSTC CA6-8D1024
30 fps +33%
Moyenne NVIDIA GeForce RTX 3080 Laptop GPU
  ()
23.1 fps +2%
SCHENKER XMG Neo 17 2023 Engineering Sample
NVIDIA GeForce RTX 4070 Laptop GPU, i9-13900HX
22.59 fps
Moyenne NVIDIA GeForce RTX 3080 Ti Laptop GPU
  (18.1 - 25, n=6)
21.8 fps -3%
MSI Katana 17 B13VFK
NVIDIA GeForce RTX 4060 Laptop GPU, i7-13620H, Micron 2400 MTFDKBA1T0QFM
21.7 fps -4%
SCHENKER XMG Focus 15 Engineering Sample
NVIDIA GeForce RTX 4050 Laptop GPU, i5-13500HX
21.4 fps -5%
Moyenne NVIDIA GeForce RTX 3070 Ti Laptop GPU
  (19.9 - 20.4, n=2)
20.2 fps -11%
Moyenne NVIDIA GeForce RTX 3060 Laptop GPU
  (16.2 - 17.5, n=2)
16.9 fps -25%
1920x1080 Medical (medical-03)
Lenovo ThinkPad P16 G1 RTX A5500
RTX A5500 Laptop GPU, i9-12950HX, WDC PC SN810 2TB
68.3 fps +85%
MSI Titan GT77 HX 13VI
NVIDIA GeForce RTX 4090 Laptop GPU, i9-13950HX, Samsung PM9A1 MZVL22T0HBLB
56.7 fps +54%
Razer Blade 16 Early 2023
NVIDIA GeForce RTX 4080 Laptop GPU, i9-13950HX, SSSTC CA6-8D1024
49.97 fps +35%
Moyenne NVIDIA GeForce RTX 3080 Ti Laptop GPU
  (33 - 40.2, n=6)
37.4 fps +1%
SCHENKER XMG Neo 17 2023 Engineering Sample
NVIDIA GeForce RTX 4070 Laptop GPU, i9-13900HX
36.9 fps
Moyenne NVIDIA GeForce RTX 3070 Ti Laptop GPU
  (32.1 - 33.1, n=2)
32.6 fps -12%
MSI Katana 17 B13VFK
NVIDIA GeForce RTX 4060 Laptop GPU, i7-13620H, Micron 2400 MTFDKBA1T0QFM
32.2 fps -13%
Moyenne NVIDIA GeForce RTX 3080 Laptop GPU
  ()
29.6 fps -20%
Moyenne NVIDIA GeForce RTX 3060 Laptop GPU
  (27.6 - 30, n=2)
28.8 fps -22%
SCHENKER XMG Focus 15 Engineering Sample
NVIDIA GeForce RTX 4050 Laptop GPU, i5-13500HX
28.7 fps -22%
1920x1080 Maya (maya-06)
MSI Titan GT77 HX 13VI
NVIDIA GeForce RTX 4090 Laptop GPU, i9-13950HX, Samsung PM9A1 MZVL22T0HBLB
610.71 fps +50%
Razer Blade 16 Early 2023
NVIDIA GeForce RTX 4080 Laptop GPU, i9-13950HX, SSSTC CA6-8D1024
555.93 fps +36%
SCHENKER XMG Neo 17 2023 Engineering Sample
NVIDIA GeForce RTX 4070 Laptop GPU, i9-13900HX
407.77 fps
Lenovo ThinkPad P16 G1 RTX A5500
RTX A5500 Laptop GPU, i9-12950HX, WDC PC SN810 2TB
403.83 fps -1%
MSI Katana 17 B13VFK
NVIDIA GeForce RTX 4060 Laptop GPU, i7-13620H, Micron 2400 MTFDKBA1T0QFM
371 fps -9%
Moyenne NVIDIA GeForce RTX 3080 Laptop GPU
  ()
360 fps -12%
Moyenne NVIDIA GeForce RTX 3080 Ti Laptop GPU
  (248 - 456, n=6)
351 fps -14%
Moyenne NVIDIA GeForce RTX 3070 Ti Laptop GPU
  ()
334 fps -18%
SCHENKER XMG Focus 15 Engineering Sample
NVIDIA GeForce RTX 4050 Laptop GPU, i5-13500HX
333.9 fps -18%
Moyenne NVIDIA GeForce RTX 3060 Laptop GPU
  (202 - 299, n=2)
250 fps -39%
1920x1080 Energy (energy-03)
MSI Titan GT77 HX 13VI
NVIDIA GeForce RTX 4090 Laptop GPU, i9-13950HX, Samsung PM9A1 MZVL22T0HBLB
74.95 fps +80%
Lenovo ThinkPad P16 G1 RTX A5500
RTX A5500 Laptop GPU, i9-12950HX, WDC PC SN810 2TB
69.15 fps +66%
Razer Blade 16 Early 2023
NVIDIA GeForce RTX 4080 Laptop GPU, i9-13950HX, SSSTC CA6-8D1024
62.41 fps +50%
SCHENKER XMG Neo 17 2023 Engineering Sample
NVIDIA GeForce RTX 4070 Laptop GPU, i9-13900HX
41.73 fps
MSI Katana 17 B13VFK
NVIDIA GeForce RTX 4060 Laptop GPU, i7-13620H, Micron 2400 MTFDKBA1T0QFM
34.1 fps -18%
SCHENKER XMG Focus 15 Engineering Sample
NVIDIA GeForce RTX 4050 Laptop GPU, i5-13500HX
28.7 fps -31%
Moyenne NVIDIA GeForce RTX 3080 Laptop GPU
  ()
24.7 fps -41%
Moyenne NVIDIA GeForce RTX 3080 Ti Laptop GPU
  (19.6 - 27, n=6)
23.7 fps -43%
Moyenne NVIDIA GeForce RTX 3070 Ti Laptop GPU
  (23.6 - 23.8, n=2)
23.7 fps -43%
Moyenne NVIDIA GeForce RTX 3060 Laptop GPU
  (20.6 - 20.7, n=2)
20.7 fps -50%
1920x1080 Creo (creo-03)
Lenovo ThinkPad P16 G1 RTX A5500
RTX A5500 Laptop GPU, i9-12950HX, WDC PC SN810 2TB
165.08 fps +41%
MSI Titan GT77 HX 13VI
NVIDIA GeForce RTX 4090 Laptop GPU, i9-13950HX, Samsung PM9A1 MZVL22T0HBLB
138.99 fps +18%
Razer Blade 16 Early 2023
NVIDIA GeForce RTX 4080 Laptop GPU, i9-13950HX, SSSTC CA6-8D1024
130.27 fps +11%
SCHENKER XMG Neo 17 2023 Engineering Sample
NVIDIA GeForce RTX 4070 Laptop GPU, i9-13900HX
117.49 fps
MSI Katana 17 B13VFK
NVIDIA GeForce RTX 4060 Laptop GPU, i7-13620H, Micron 2400 MTFDKBA1T0QFM
100 fps -15%
Moyenne NVIDIA GeForce RTX 3080 Laptop GPU
  ()
98.9 fps -16%
Moyenne NVIDIA GeForce RTX 3070 Ti Laptop GPU
  ()
95 fps -19%
SCHENKER XMG Focus 15 Engineering Sample
NVIDIA GeForce RTX 4050 Laptop GPU, i5-13500HX
94.5 fps -20%
Moyenne NVIDIA GeForce RTX 3080 Ti Laptop GPU
  (55.3 - 114.7, n=6)
92.3 fps -21%
Moyenne NVIDIA GeForce RTX 3060 Laptop GPU
  (81.5 - 86.5, n=2)
84 fps -29%
1920x1080 CATIA (catia-06)
MSI Titan GT77 HX 13VI
NVIDIA GeForce RTX 4090 Laptop GPU, i9-13950HX, Samsung PM9A1 MZVL22T0HBLB
116.64 fps +70%
Lenovo ThinkPad P16 G1 RTX A5500
RTX A5500 Laptop GPU, i9-12950HX, WDC PC SN810 2TB
109.77 fps +60%
Razer Blade 16 Early 2023
NVIDIA GeForce RTX 4080 Laptop GPU, i9-13950HX, SSSTC CA6-8D1024
98.79 fps +44%
SCHENKER XMG Neo 17 2023 Engineering Sample
NVIDIA GeForce RTX 4070 Laptop GPU, i9-13900HX
68.6 fps
Moyenne NVIDIA GeForce RTX 3080 Ti Laptop GPU
  (51.8 - 78.7, n=6)
67.4 fps -2%
Moyenne NVIDIA GeForce RTX 3080 Laptop GPU
  ()
64.8 fps -6%
Moyenne NVIDIA GeForce RTX 3070 Ti Laptop GPU
  (63.6 - 65.5, n=2)
64.5 fps -6%
MSI Katana 17 B13VFK
NVIDIA GeForce RTX 4060 Laptop GPU, i7-13620H, Micron 2400 MTFDKBA1T0QFM
61 fps -11%
Moyenne NVIDIA GeForce RTX 3060 Laptop GPU
  (51.7 - 53.9, n=2)
52.8 fps -23%
SCHENKER XMG Focus 15 Engineering Sample
NVIDIA GeForce RTX 4050 Laptop GPU, i5-13500HX
50.7 fps -26%
1920x1080 3ds Max (3dsmax-07)
MSI Titan GT77 HX 13VI
NVIDIA GeForce RTX 4090 Laptop GPU, i9-13950HX, Samsung PM9A1 MZVL22T0HBLB
212.6 fps +113%
Razer Blade 16 Early 2023
NVIDIA GeForce RTX 4080 Laptop GPU, i9-13950HX, SSSTC CA6-8D1024
177.9 fps +78%
Lenovo ThinkPad P16 G1 RTX A5500
RTX A5500 Laptop GPU, i9-12950HX, WDC PC SN810 2TB
144.56 fps +45%
Moyenne NVIDIA GeForce RTX 3080 Ti Laptop GPU
  (99.2 - 153, n=6)
128.4 fps +29%
Moyenne NVIDIA GeForce RTX 3080 Laptop GPU
  ()
126 fps +26%
SCHENKER XMG Neo 17 2023 Engineering Sample
NVIDIA GeForce RTX 4070 Laptop GPU, i9-13900HX
99.85 fps
Moyenne NVIDIA GeForce RTX 3070 Ti Laptop GPU
  (95.6 - 98.5, n=2)
97 fps -3%
MSI Katana 17 B13VFK
NVIDIA GeForce RTX 4060 Laptop GPU, i7-13620H, Micron 2400 MTFDKBA1T0QFM
89.6 fps -10%
Moyenne NVIDIA GeForce RTX 3060 Laptop GPU
  (85.3 - 89.4, n=2)
87.4 fps -12%
SCHENKER XMG Focus 15 Engineering Sample
NVIDIA GeForce RTX 4050 Laptop GPU, i5-13500HX
79.7 fps -20%
3840x2160 Solidworks (solidworks-05)
MSI Titan GT77 HX 13VI
NVIDIA GeForce RTX 4090 Laptop GPU, i9-13950HX, Samsung PM9A1 MZVL22T0HBLB
207.55 fps +80%
Moyenne NVIDIA GeForce RTX 3060 Laptop GPU
  ()
182 fps +58%
Moyenne NVIDIA GeForce RTX 3090
  (93.1 - 194, n=8)
178 fps +55%
Razer Blade 16 Early 2023
NVIDIA GeForce RTX 4080 Laptop GPU, i9-13950HX, SSSTC CA6-8D1024
164.32 fps +43%
Moyenne AMD Radeon RX 6800M
  ()
146 fps +27%
Moyenne NVIDIA GeForce RTX 3080 Ti Laptop GPU
  (87.9 - 255, n=4)
137.6 fps +20%
SCHENKER XMG Neo 17 2023 Engineering Sample
NVIDIA GeForce RTX 4070 Laptop GPU, i9-13900HX
115.11 fps
Moyenne NVIDIA GeForce RTX 3050 Ti Laptop GPU
  (113 - 113, n=2)
113 fps -2%
Lenovo ThinkPad P16 G1 RTX A5500
RTX A5500 Laptop GPU, i9-12950HX, WDC PC SN810 2TB
109.04 fps -5%
Moyenne NVIDIA GeForce RTX 3080 Laptop GPU
  (102 - 105, n=4)
104 fps -10%
Moyenne AMD Radeon RX 6600M
  (71 - 129, n=5)
101 fps -12%
MSI Katana 17 B13VFK
NVIDIA GeForce RTX 4060 Laptop GPU, i7-13620H, Micron 2400 MTFDKBA1T0QFM
97.2 fps -16%
SCHENKER XMG Focus 15 Engineering Sample
NVIDIA GeForce RTX 4050 Laptop GPU, i5-13500HX
73.4 fps -36%
3840x2160 Siemens NX (snx-04)
Lenovo ThinkPad P16 G1 RTX A5500
RTX A5500 Laptop GPU, i9-12950HX, WDC PC SN810 2TB
301.3 fps +1578%
Moyenne AMD Radeon RX 6600M
  (62.5 - 226, n=6)
143.3 fps +698%
Moyenne AMD Radeon RX 6800M
  (64.4 - 67.8, n=2)
66.1 fps +268%
MSI Titan GT77 HX 13VI
NVIDIA GeForce RTX 4090 Laptop GPU, i9-13950HX, Samsung PM9A1 MZVL22T0HBLB
28.23 fps +57%
Razer Blade 16 Early 2023
NVIDIA GeForce RTX 4080 Laptop GPU, i9-13950HX, SSSTC CA6-8D1024
23.93 fps +33%
Moyenne NVIDIA GeForce RTX 3090
  (13.2 - 27, n=10)
23.7 fps +32%
Moyenne NVIDIA GeForce RTX 3080 Ti Laptop GPU
  (15.5 - 21.1, n=7)
18.9 fps +5%
Moyenne NVIDIA GeForce RTX 3080 Laptop GPU
  (18.5 - 18.8, n=4)
18.7 fps +4%
SCHENKER XMG Neo 17 2023 Engineering Sample
NVIDIA GeForce RTX 4070 Laptop GPU, i9-13900HX
17.96 fps
MSI Katana 17 B13VFK
NVIDIA GeForce RTX 4060 Laptop GPU, i7-13620H, Micron 2400 MTFDKBA1T0QFM
17.5 fps -3%
Moyenne NVIDIA GeForce RTX 3060 Laptop GPU
  ()
16.8 fps -6%
SCHENKER XMG Focus 15 Engineering Sample
NVIDIA GeForce RTX 4050 Laptop GPU, i5-13500HX
16.2 fps -10%
Moyenne NVIDIA GeForce RTX 3050 Ti Laptop GPU
  (13.2 - 13.2, n=2)
13.2 fps -27%
3840x2160 Medical (medical-03)
Moyenne AMD Radeon RX 6800M
  (16.9 - 42.6, n=2)
29.8 fps +115%
Moyenne NVIDIA GeForce RTX 3060 Laptop GPU
  ()
26.5 fps +91%
Lenovo ThinkPad P16 G1 RTX A5500
RTX A5500 Laptop GPU, i9-12950HX, WDC PC SN810 2TB
25.78 fps +86%
Moyenne AMD Radeon RX 6600M
  (18.1 - 34, n=6)
25 fps +80%
MSI Titan GT77 HX 13VI
NVIDIA GeForce RTX 4090 Laptop GPU, i9-13950HX, Samsung PM9A1 MZVL22T0HBLB
24.42 fps +76%
Moyenne NVIDIA GeForce RTX 3050 Ti Laptop GPU
  (20.2 - 20.2, n=2)
20.2 fps +46%
Moyenne NVIDIA GeForce RTX 3090
  (9.95 - 23, n=10)
19.8 fps +43%
Razer Blade 16 Early 2023
NVIDIA GeForce RTX 4080 Laptop GPU, i9-13950HX, SSSTC CA6-8D1024
19.3 fps +39%
Moyenne NVIDIA GeForce RTX 3080 Ti Laptop GPU
  (13.2 - 34.3, n=7)
17.9 fps +29%
SCHENKER XMG Neo 17 2023 Engineering Sample
NVIDIA GeForce RTX 4070 Laptop GPU, i9-13900HX
13.87 fps
MSI Katana 17 B13VFK
NVIDIA GeForce RTX 4060 Laptop GPU, i7-13620H, Micron 2400 MTFDKBA1T0QFM
10.9 fps -21%
Moyenne NVIDIA GeForce RTX 3080 Laptop GPU
  (9.84 - 10.5, n=4)
10.3 fps -26%
SCHENKER XMG Focus 15 Engineering Sample
NVIDIA GeForce RTX 4050 Laptop GPU, i5-13500HX
9.2 fps -34%
3840x2160 Maya (maya-06)
MSI Titan GT77 HX 13VI
NVIDIA GeForce RTX 4090 Laptop GPU, i9-13950HX, Samsung PM9A1 MZVL22T0HBLB
371.75 fps +74%
Moyenne NVIDIA GeForce RTX 3090
  (181 - 369, n=10)
339 fps +59%
Razer Blade 16 Early 2023
NVIDIA GeForce RTX 4080 Laptop GPU, i9-13950HX, SSSTC CA6-8D1024
302.82 fps +42%
Moyenne NVIDIA GeForce RTX 3060 Laptop GPU
  ()
264 fps +23%
Lenovo ThinkPad P16 G1 RTX A5500
RTX A5500 Laptop GPU, i9-12950HX, WDC PC SN810 2TB
218.16 fps +2%
SCHENKER XMG Neo 17 2023 Engineering Sample
NVIDIA GeForce RTX 4070 Laptop GPU, i9-13900HX
213.77 fps
Moyenne NVIDIA GeForce RTX 3080 Ti Laptop GPU
  (137.4 - 345, n=7)
208 fps -3%
MSI Katana 17 B13VFK
NVIDIA GeForce RTX 4060 Laptop GPU, i7-13620H, Micron 2400 MTFDKBA1T0QFM
188 fps -12%
Moyenne NVIDIA GeForce RTX 3080 Laptop GPU
  (186 - 190, n=4)
187.8 fps -12%
Moyenne AMD Radeon RX 6600M
  (143 - 266, n=6)
186.5 fps -13%
Moyenne AMD Radeon RX 6800M
  (137 - 229, n=2)
183 fps -14%
Moyenne NVIDIA GeForce RTX 3050 Ti Laptop GPU
  (180 - 180, n=2)
180 fps -16%
SCHENKER XMG Focus 15 Engineering Sample
NVIDIA GeForce RTX 4050 Laptop GPU, i5-13500HX
154.4 fps -28%
3840x2160 Energy (energy-03)
MSI Titan GT77 HX 13VI
NVIDIA GeForce RTX 4090 Laptop GPU, i9-13950HX, Samsung PM9A1 MZVL22T0HBLB
112.25 fps +297%
Moyenne NVIDIA GeForce RTX 3080 Ti Laptop GPU
  (27.7 - 118.7, n=7)
65.1 fps +130%
Moyenne NVIDIA GeForce RTX 3090
  (22.3 - 101, n=10)
63.1 fps +123%
Razer Blade 16 Early 2023
NVIDIA GeForce RTX 4080 Laptop GPU, i9-13950HX, SSSTC CA6-8D1024
30.03 fps +6%
Moyenne NVIDIA GeForce RTX 3080 Laptop GPU
  (29.1 - 29.6, n=4)
29.5 fps +4%
SCHENKER XMG Neo 17 2023 Engineering Sample
NVIDIA GeForce RTX 4070 Laptop GPU, i9-13900HX
28.25 fps
Lenovo ThinkPad P16 G1 RTX A5500
RTX A5500 Laptop GPU, i9-12950HX, WDC PC SN810 2TB
24.11 fps -15%
Moyenne NVIDIA GeForce RTX 3060 Laptop GPU
  ()
20.4 fps -28%
Moyenne AMD Radeon RX 6600M
  (2.05 - 47.9, n=6)
20.4 fps -28%
MSI Katana 17 B13VFK
NVIDIA GeForce RTX 4060 Laptop GPU, i7-13620H, Micron 2400 MTFDKBA1T0QFM
20 fps -29%
SCHENKER XMG Focus 15 Engineering Sample
NVIDIA GeForce RTX 4050 Laptop GPU, i5-13500HX
17.2 fps -39%
Moyenne NVIDIA GeForce RTX 3050 Ti Laptop GPU
  (12.8 - 12.8, n=2)
12.8 fps -55%
Moyenne AMD Radeon RX 6800M
  (1.83 - 2.77, n=2)
2.3 fps -92%
3840x2160 Creo (creo-03)
MSI Titan GT77 HX 13VI
NVIDIA GeForce RTX 4090 Laptop GPU, i9-13950HX, Samsung PM9A1 MZVL22T0HBLB
117.51 fps +29%
Lenovo ThinkPad P16 G1 RTX A5500
RTX A5500 Laptop GPU, i9-12950HX, WDC PC SN810 2TB
117.5 fps +29%
Moyenne NVIDIA GeForce RTX 3090
  (68.1 - 122, n=10)
107.1 fps +18%
Razer Blade 16 Early 2023
NVIDIA GeForce RTX 4080 Laptop GPU, i9-13950HX, SSSTC CA6-8D1024
105.26 fps +16%
SCHENKER XMG Neo 17 2023 Engineering Sample
NVIDIA GeForce RTX 4070 Laptop GPU, i9-13900HX
90.79 fps
Moyenne NVIDIA GeForce RTX 3060 Laptop GPU
  ()
84.5 fps -7%
MSI Katana 17 B13VFK
NVIDIA GeForce RTX 4060 Laptop GPU, i7-13620H, Micron 2400 MTFDKBA1T0QFM
78 fps -14%
Moyenne NVIDIA GeForce RTX 3080 Laptop GPU
  (75.7 - 79.7, n=4)
77.7 fps -14%
Moyenne NVIDIA GeForce RTX 3080 Ti Laptop GPU
  (49 - 93.3, n=7)
77.4 fps -15%
Moyenne AMD Radeon RX 6600M
  (65 - 88.4, n=6)
72.9 fps -20%
SCHENKER XMG Focus 15 Engineering Sample
NVIDIA GeForce RTX 4050 Laptop GPU, i5-13500HX
70 fps -23%
Moyenne NVIDIA GeForce RTX 3050 Ti Laptop GPU
  (69.2 - 69.2, n=2)
69.2 fps -24%
Moyenne AMD Radeon RX 6800M
  (60.8 - 64.3, n=2)
62.6 fps -31%
3840x2160 CATIA (catia-06)
Lenovo ThinkPad P16 G1 RTX A5500
RTX A5500 Laptop GPU, i9-12950HX, WDC PC SN810 2TB
68.64 fps +82%
MSI Titan GT77 HX 13VI
NVIDIA GeForce RTX 4090 Laptop GPU, i9-13950HX, Samsung PM9A1 MZVL22T0HBLB
65.16 fps +73%
Moyenne NVIDIA GeForce RTX 3090
  (32.3 - 61.3, n=10)
56.8 fps +51%
Razer Blade 16 Early 2023
NVIDIA GeForce RTX 4080 Laptop GPU, i9-13950HX, SSSTC CA6-8D1024
52.5 fps +39%
Moyenne NVIDIA GeForce RTX 3060 Laptop GPU
  ()
52.3 fps +39%
Moyenne NVIDIA GeForce RTX 3080 Ti Laptop GPU
  (30.3 - 69.6, n=7)
43.7 fps +16%
Moyenne NVIDIA GeForce RTX 3080 Laptop GPU
  (37.6 - 38.1, n=4)
37.9 fps 0%
SCHENKER XMG Neo 17 2023 Engineering Sample
NVIDIA GeForce RTX 4070 Laptop GPU, i9-13900HX
37.72 fps
Moyenne AMD Radeon RX 6600M
  (16.8 - 57.9, n=6)
37.7 fps 0%
Moyenne NVIDIA GeForce RTX 3050 Ti Laptop GPU
  (37.6 - 37.6, n=2)
37.6 fps 0%
MSI Katana 17 B13VFK
NVIDIA GeForce RTX 4060 Laptop GPU, i7-13620H, Micron 2400 MTFDKBA1T0QFM
33.8 fps -10%
SCHENKER XMG Focus 15 Engineering Sample
NVIDIA GeForce RTX 4050 Laptop GPU, i5-13500HX
27.9 fps -26%
Moyenne AMD Radeon RX 6800M
  (13.5 - 15.6, n=2)
14.6 fps -61%
3840x2160 3ds Max (3dsmax-07)
MSI Titan GT77 HX 13VI
NVIDIA GeForce RTX 4090 Laptop GPU, i9-13950HX, Samsung PM9A1 MZVL22T0HBLB
147.71 fps +111%
Moyenne NVIDIA GeForce RTX 3090
  (70.2 - 143, n=10)
134.3 fps +92%
Razer Blade 16 Early 2023
NVIDIA GeForce RTX 4080 Laptop GPU, i9-13950HX, SSSTC CA6-8D1024
117.66 fps +68%
Moyenne AMD Radeon RX 6800M
  (69.2 - 127, n=2)
98.1 fps +40%
Moyenne NVIDIA GeForce RTX 3080 Ti Laptop GPU
  (69.5 - 144, n=7)
95.7 fps +37%
Moyenne NVIDIA GeForce RTX 3080 Laptop GPU
  (84.5 - 87.5, n=4)
86.5 fps +24%
Moyenne NVIDIA GeForce RTX 3060 Laptop GPU
  ()
82.5 fps +18%
Lenovo ThinkPad P16 G1 RTX A5500
RTX A5500 Laptop GPU, i9-12950HX, WDC PC SN810 2TB
79.63 fps +14%
SCHENKER XMG Neo 17 2023 Engineering Sample
NVIDIA GeForce RTX 4070 Laptop GPU, i9-13900HX
69.84 fps
MSI Katana 17 B13VFK
NVIDIA GeForce RTX 4060 Laptop GPU, i7-13620H, Micron 2400 MTFDKBA1T0QFM
61.6 fps -12%
Moyenne NVIDIA GeForce RTX 3050 Ti Laptop GPU
  (58.9 - 58.9, n=2)
58.9 fps -16%
Moyenne AMD Radeon RX 6600M
  (37.5 - 66.5, n=6)
53.7 fps -23%
SCHENKER XMG Focus 15 Engineering Sample
NVIDIA GeForce RTX 4050 Laptop GPU, i5-13500HX
52.2 fps -25%

* ... Moindre est la valeur, meilleures sont les performances

Efficacité du GPU

Nous utilisons le test Witcher 3 avec un écran externe pour notre test d'efficacité, ce qui nous permet d'éliminer l'influence du panneau intégré. Witcher 3 n'est pas non plus très exigeant pour le processeur, donc l'impact sur le CPU est également très faible. Nous voyons les nouveaux modèles RTX 40 en tête du classement avec le portable RTX 4090 en haut, suivi du nouveau portable RTX 4060. Nous pensons que les versions des nouveaux GPU avec des paramètres TGP plus bas seront encore meilleures à cet égard. La seule aberration est le GeForce RTX 4050 Laptop, qui se situe juste entre les GPU Ampere précédents. Cela montre clairement que des valeurs TGP élevées n'ont pas beaucoup de sens pour la RTX 4050.

De manière générale, on constate une amélioration sensible de l'efficacité des nouvelles puces Ada par rapport aux GPU Ampere précédents. La comparaison entre le RTX 4070 Laptop/RTX 3080 Ti Laptop et le RTX 4060 Laptop/RTX 3070 Ti laptop montre une amélioration de l'efficacité de 23-24 %, ce qui signifie que l'avantage des GPU Ada plus lents est plus faible comparé aux modèles haut de gamme, où nous avons remarqué des améliorations de l'efficacité allant jusqu'à 53 %.

Power Consumption - Witcher 3 ultra Efficiency (external Monitor)
MSI Titan GT77 HX 13VI
NVIDIA GeForce RTX 4090 Laptop GPU, i9-13950HX, Samsung PM9A1 MZVL22T0HBLB
0.796 fps per Watt +17%
Gigabyte AERO 16 OLED BSF
NVIDIA GeForce RTX 4070 Laptop GPU, i9-13900H, Gigabyte AG470S1TB-SI B10
0.73 fps per Watt +7%
MSI Katana 17 B13VFK
NVIDIA GeForce RTX 4060 Laptop GPU, i7-13620H, Micron 2400 MTFDKBA1T0QFM
0.717 fps per Watt +5%
Razer Blade 16 Early 2023
NVIDIA GeForce RTX 4080 Laptop GPU, i9-13950HX, SSSTC CA6-8D1024
0.71 fps per Watt +4%
SCHENKER XMG Neo 17 2023 Engineering Sample
NVIDIA GeForce RTX 4070 Laptop GPU, i9-13900HX
0.68 fps per Watt
Razer Blade 18 RTX 4070
NVIDIA GeForce RTX 4070 Laptop GPU, i9-13950HX, SSSTC CA6-8D1024
0.587 fps per Watt -14%
Moyenne NVIDIA GeForce RTX 3080 Laptop GPU
  (0.4696 - 0.736, n=24)
0.58 fps per Watt -15%
Moyenne NVIDIA GeForce RTX 3070 Ti Laptop GPU
  (0.4399 - 0.97, n=24)
0.579 fps per Watt -15%
Moyenne NVIDIA GeForce RTX 3080 Ti Laptop GPU
  (0.4432 - 0.69, n=26)
0.555 fps per Watt -18%
SCHENKER XMG Focus 15 Engineering Sample
NVIDIA GeForce RTX 4050 Laptop GPU, i5-13500HX
0.548 fps per Watt -19%
Asus TUF Gaming GeForce RTX 4070 Ti
NVIDIA GeForce RTX 4070 Ti, i9-13900K
0.545 fps per Watt -20%
Moyenne NVIDIA GeForce RTX 3060 Laptop GPU
  (0.4181 - 0.651, n=33)
0.538 fps per Watt -21%
Moyenne AMD Radeon RX 6700M
  ()
0.524 fps per Watt -23%
Moyenne AMD Radeon RX 6600M
  (0.4398 - 0.608, n=6)
0.519 fps per Watt -24%
Moyenne NVIDIA GeForce RTX 3090
  (0.268 - 0.3954, n=14)
0.3429 fps per Watt -50%

Aperçu Benchmarks de jeux

Schenker XMG Neo 17 Engineering Sample RTX 4070 Laptop

BasMoyenÉlevéUltraQHD4K DLSS4K
GTA V (2015) 187.1 184.1 182.9 130.5 92.2 92.5
The Witcher 3 (2015) 258 124 60
Dota 2 Reborn (2015) 233 206 195.4 180.6 150.7
Final Fantasy XV Benchmark (2018) 227 173.7 119.4 86.1 47.5
X-Plane 11.11 (2018) 212 187.1 144.4 122.7
Far Cry 5 (2018) 179 169 158 118 60
Strange Brigade (2018) 476 326 252 214 139.8 74.7
Shadow of the Tomb Raider (2018) 172 158 107 53
Metro Exodus (2019) 117 91 72 46
Borderlands 3 (2019) 139 109 75 40
Horizon Zero Dawn (2020) 143 126 98 52
Watch Dogs Legion (2020) 130 89 64 33
F1 2021 (2021) 520 407 306 157.5 114.7 63.4
Far Cry 6 (2021) 144 126 91
God of War (2022) 109 80 65 43
Rainbow Six Extraction (2022) 253 240 188 125 64
Dying Light 2 (2022) 95 64 32
Cyberpunk 2077 1.6 (2022) 98 91 57 26
Ghostwire Tokyo (2022)
F1 22 (2022) 275 275 222 81.7 51.9 25.9
Call of Duty Modern Warfare 2 2022 (2022) 111 105 76 71 47
Spider-Man Miles Morales (2022) 115 110 86 44
The Witcher 3 v4.00 (2023) 101 85 54 28
Dead Space Remake (2023) 97 94 81 80 51 26

Razer Blade 18 RTX 4070 Laptop

BasMoyenÉlevéUltraQHD4K
GTA V (2015) 186.1 184.7 181.6 121.4 87.6 88.5
The Witcher 3 (2015) 617 405.9 240.9 113.9 72.5
Dota 2 Reborn (2015) 225 200 191 178.6 145.5
Final Fantasy XV Benchmark (2018) 231 166.9 115.2 82 46.6
X-Plane 11.11 (2018) 203 178.9 137.9 117.7
Strange Brigade (2018) 464 315 243 208 136.7 71.9
Metro Exodus (2019) 208.9 139.8 109.7 86.8 69 44
Borderlands 3 (2019) 258.5 200.1 131.8 100.3 68.7 35.7
Hitman 3 (2021) 294.3 234 208.4 197.4 129.9 68.5
Cyberpunk 2077 1.6 (2022) 147.8 125.7 111.5 92.1 54 23.3

Gigabyte Aero 16 RTX 4070 Laptop

BasMoyenÉlevéUltraQHD4K
GTA V (2015) 185.3 186.4 183.1 123.2 90.6 75
The Witcher 3 (2015) 236 116
Dota 2 Reborn (2015) 164.7 157 150.9 144.5 128.3
Final Fantasy XV Benchmark (2018) 132.3 116.2 84.7 46.1
X-Plane 11.11 (2018) 169.3 148 115.3 98.5
Far Cry 5 (2018) 202 168 159 149 115 55
Strange Brigade (2018) 481 300 237 204 138.8 67.6
Shadow of the Tomb Raider (2018) 158 129 70
Assassin´s Creed Valhalla (2020) 106 78 41
Cyberpunk 2077 1.6 (2022) 84.75 53.28 19.59
F1 22 (2022) 220 214 173.8 66.6 44.3 21.5
Call of Duty Modern Warfare 2 2022 (2022) 101 72 39
Spider-Man Miles Morales (2022) 90.5 68.9 40.5
The Callisto Protocol (2022) 78.86 59.07 32.96

MSI Katana 17 RTX 4060 Laptop

BasMoyenÉlevéUltraQHD4K DLSS4K
GTA V (2015) 186.1 184.7 180.2 112.1 83 82.1
The Witcher 3 (2015) 435 322 206 104.7 62.6
Dota 2 Reborn (2015) 184.6 171 164.1 156.3 126
Final Fantasy XV Benchmark (2018) 204 135.1 96.1 70.1 40.2
X-Plane 11.11 (2018) 178.6 154.9 118.9 98.9
Far Cry 5 (2018) 134 99 51
Strange Brigade (2018) 508 270 216 185.1 126.4 67.2
Shadow of the Tomb Raider (2018) 155.6 120.7 67.2
Metro Exodus (2019) 74.3 59 36.8
Control (2019) 238 119 89
Borderlands 3 (2019) 171.3 144.6 106.5 83.9
Death Stranding (2020) 200 158.9 150.3 146.7
Horizon Zero Dawn (2020) 108.3 85.9 46.5
Flight Simulator 2020 (2020) 96.9 69.4 52.5
Crysis Remastered (2020) 312 224 85.9 72.5
Watch Dogs Legion (2020) 65 44 25
Dirt 5 (2020) 218 147.2 116.1 89.5
Assassin´s Creed Valhalla (2020) 135 111 96
Yakuza Like a Dragon (2020) 131.7 123.2 117.4 109.6
Hitman 3 (2021) 267.5 197.7 172.7 163.5
Days Gone (2021) 148 131.4 100.2
F1 2021 (2021) 389 312 244 128.9 93 50.2
Alan Wake Remastered (2021) 149.8 144.9
Far Cry 6 (2021) 97.2 32.6 3.38
Back 4 Blood (2021) 245 197.5 188.2
Guardians of the Galaxy (2021) 134 135 133
Riders Republic (2021) 177 145 122 112
Forza Horizon 5 (2021) 137 125 84
Battlefield 2042 (2021) 145.6 123 106.1
Halo Infinite (2021) 144.9 123.6 114.2
God of War (2022) 67.5 55.6 34.7
Rainbow Six Extraction (2022) 149.1 106 52.4
Dying Light 2 (2022) 64.7 43.8 23
GRID Legends (2022) 126.4 102.2 63.9
Elden Ring (2022) 59.5
Cyberpunk 2077 1.6 (2022) 73.81 45.9 21.1
Elex 2 (2022) 115.4 115.4 113.5 96
Ghostwire Tokyo (2022) 68.6 65.9 36.8 29.6
Tiny Tina's Wonderlands (2022) 198.6 164.9 110 85.2
Vampire Bloodhunt (2022) 220 201 185.7
F1 22 (2022) 247 240 179.2 65.4 41 19.7
The Quarry (2022) 154.8 121.3 100.5 77.9
A Plague Tale Requiem (2022) 100.7 84.9 73 63.3
Uncharted Legacy of Thieves Collection (2022) 87.9 85.1 79.1 76.9
Call of Duty Modern Warfare 2 2022 (2022) 87 59 55 34
Spider-Man Miles Morales (2022) 77.3 59.7 35.3
The Callisto Protocol (2022) 68.9 48.6 27
Need for Speed Unbound (2022) 127.4 117.2 98.9 98.6
High On Life (2023) 220 165.8 125.6 99.9
The Witcher 3 v4.00 (2023) 66.3 40.5 21.4
Dead Space Remake (2023) 67 43.4 20.6
Hogwarts Legacy (2023) 150 126.7 107.7 91.6
Returnal (2023)
Atomic Heart (2023) 167.3 129.2 81.6 66.8
Company of Heroes 3 (2023) 202.7 182.1 133.3 131.3
Sons of the Forest (2023) 82 79.1 73.3 71.8

Schenker XMG Focus 15 Engineering Sample RTX 4050 Laptop

BasMoyenÉlevéUltraQHD4K DLSS4K
GTA V (2015) 186.6 184.2 177.3 92.4 64.1 63.5
The Witcher 3 (2015) 465 319 175 89 50
Dota 2 Reborn (2015) 192.6 176.1 169.1 161.7 115.2
Final Fantasy XV Benchmark (2018) 214 122.3 122.3 60 33.3
X-Plane 11.11 (2018) 161 142.3 113.1 97.9
Far Cry 5 (2018) 197 146 135 127 87 43
Strange Brigade (2018) 481 221 178 153 100 53
Shadow of the Tomb Raider (2018) 215 150 134 116 73 33
Metro Exodus (2019) 199 109 82 64 50 45
Control (2019) 100 74 48 24
Borderlands 3 (2019) 171 139 96 73 50 26
Horizon Zero Dawn (2020) 170 131 114 98 72 39
Watch Dogs Legion (2020) 138 120 105 49 37 26
F1 2021 (2021) 377 292 219 109.7 76.1 38
Far Cry 6 (2021) 166 133 114 82 58
God of War (2022) 121 102 81 55 44 28
Dying Light 2 (2022) 88 74 62 41 21
Cyberpunk 2077 1.6 (2022) 108 83 72 65 32 18
Ghostwire Tokyo (2022)
F1 22 (2022) 232 223 167.3 53.8 33.2 15.9
Call of Duty Modern Warfare 2 2022 (2022) 128 109 81 77 53 50 31
Spider-Man Miles Morales (2022) 112 101 96 85 53 26
The Callisto Protocol (2022) 137 97 60 59 42 21
The Witcher 3 v4.00 (2023) 106 76 68 59 37 17
Dead Space Remake (2023) 67 64 55 54 35 17

Verdict : des GPU Ada grand public avec des gains de performance significatifs

L'ordinateur portable Nvidia RTX 40 en revue.

Notre verdict concernant les nouveaux GPU grand public (supérieurs) basés sur l'architecture Ada Lovelace n'est pas aussi bon que celui de la version haut de gamme. Nvidia a pu améliorer les performances et le nouveau GPU RTX 4070 Laptop à des valeurs TGP élevées est à peu près à égalité avec l'ancien RTX 3080 Ti Laptop. Il y a quelques exceptions dans les titres 4K où la VRAM plus petite du RTX 4070 Laptop a un impact. L'ordinateur portable RTX 4060 est comparable à l'ancien ordinateur portable RTX 3070 Ti et l'ordinateur portable RTX 4050 le plus testé est similaire à un ordinateur portable RTX 3060 ou même un peu plus rapide.

Plus de performances pour les GPU grand public : Les nouveaux RTX 4070 Laptop et RTX 4060 Laptop de Nvidia remplacent respectivement les anciens GeForce RTX 3080 Ti Laptop et RTX 3070 Ti Laptop. Ils offrent beaucoup de performances pour les panneaux QHD et même 4K dans certains jeux, mais les performances de raytracing sont encore limitées et vous devez souvent réduire les paramètres ou utiliser l'upscaling DLSS pour obtenir des taux d'images fluides.

Ce sont de bonnes nouvelles, mais les améliorations de l'efficacité sont plus faibles par rapport aux modèles haut de gamme RTX 4090 Laptop/RTX 4080 Laptop. Nous constatons une amélioration de 23-24 % pour le RTX 4070Laptop/RTX 4060 Laptop, mais nous pouvons aussi clairement voir que la version TGP élevée du RTX 4050 Laptop n'a pas beaucoup de sens et que l'efficacité tombe à des niveaux d'Ampère. Nous n'avons tout simplement pas assez de données pour les versions plus lentes du GPU pour évaluer l'efficacité. L'annonce de Nvidia avec une efficacité 3x plus élevée est limitée à un scénario très spécifique selon l'information de presse, donc nous ne pouvons pas confirmer cette déclaration.

Le nouveau portable GeForce RTX 4050 offre les mêmes performances de jeu que l'ancien GeForce RTX 3060 et est mieux adapté aux écrans 1080p. Les capacités de raytracing sont toutefois limitées.

Le plus gros problème avec le nouveau GPU pour ordinateur portable est la large gamme de TGP et les fabricants peuvent configurer les trois GPU (RTX 4070, RTX 4060 et RTX 4050) entre 35-115 Watts ou 140W en considérant jusqu'à 25W de Dynamic Boost, respectivement. Il sera extrêmement important que les fabricants divulguent les chiffres exacts de TGP pour leurs produits, sinon il peut y avoir des héros de la feuille de spécifications qui seront décevants dans la pratique, en particulier dans les ordinateurs portables minces avec des capacités de refroidissement limitées.

Nous nous attendons à ce que le RTX 4070 Laptop et le RTX 4060 Laptop offrent des performances très similaires et vous pouvez généralement économiser l'argent supplémentaire pour le RTX 4070 Laptop, surtout sur les appareils avec des écrans 1080p ou QHD.

Please share our article, every link counts!
> Revues et rapports de ordinateurs portatifs et smartphones, ordiphones > Critiques > Test des GeForce RTX 4070, 4060, 4050 : les nouveaux GPU pour PC portables de Nvidia
Andreas Osthoff, 2023-02-22 (Update: 2023-02-22)