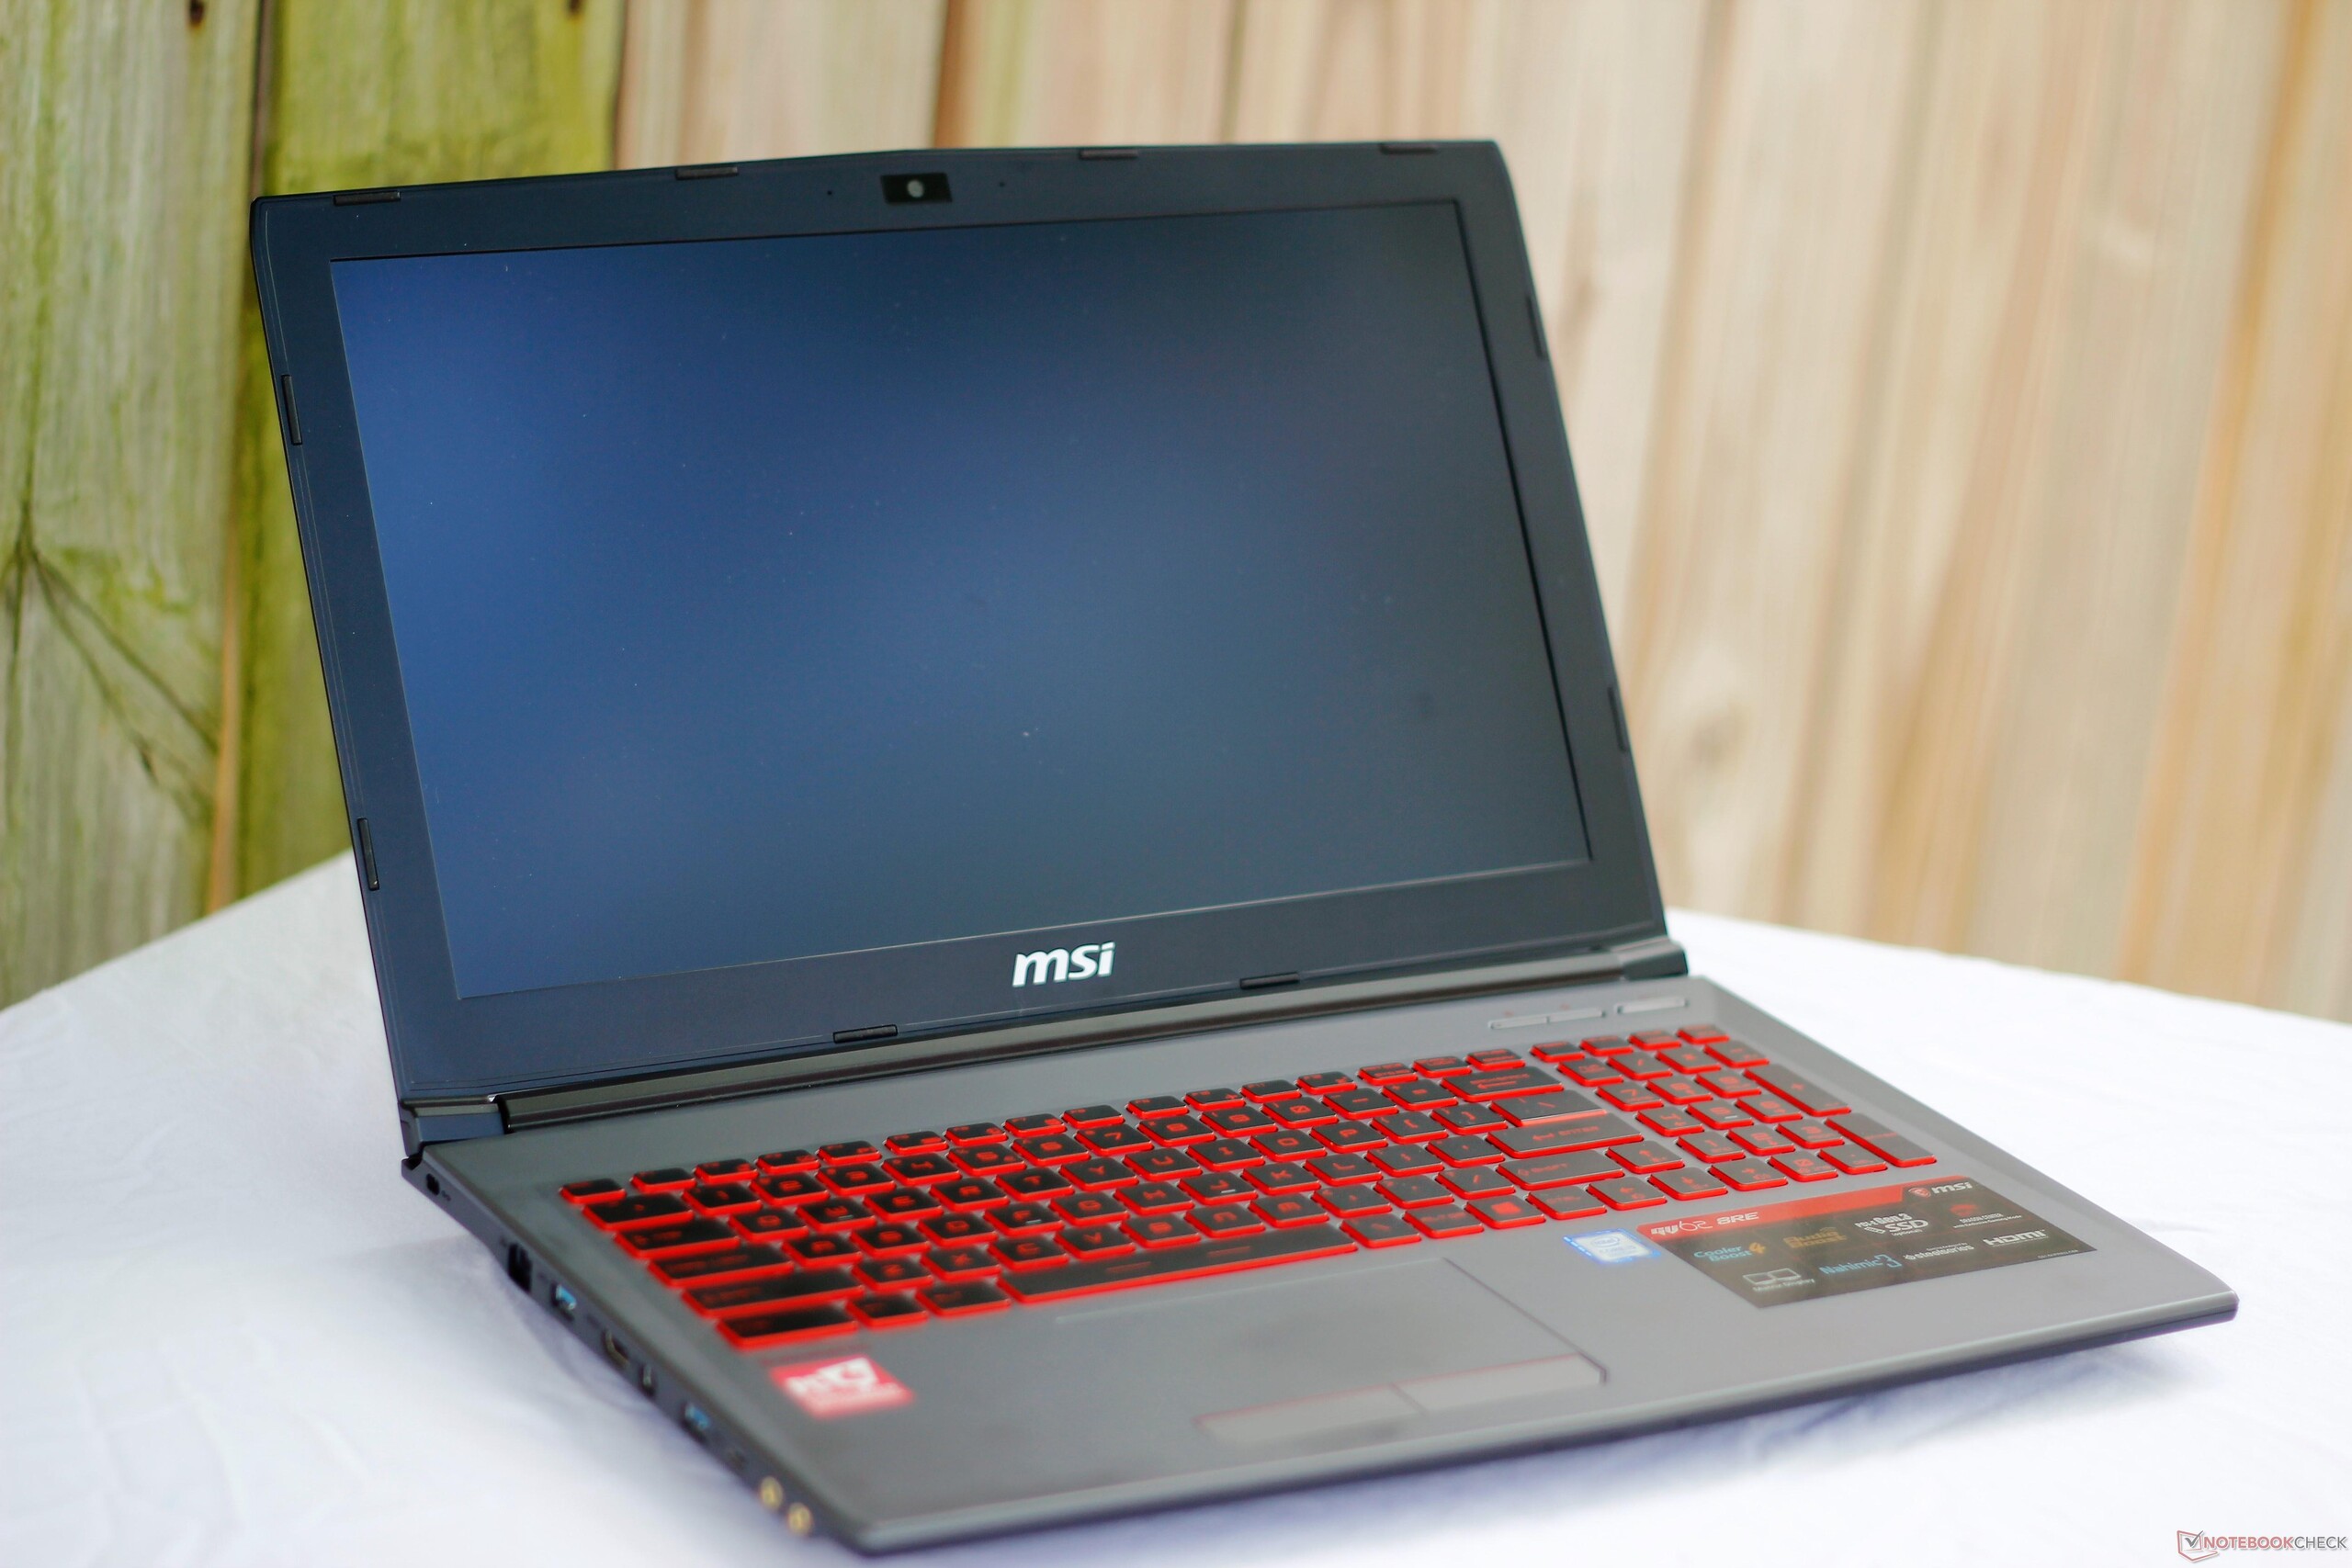
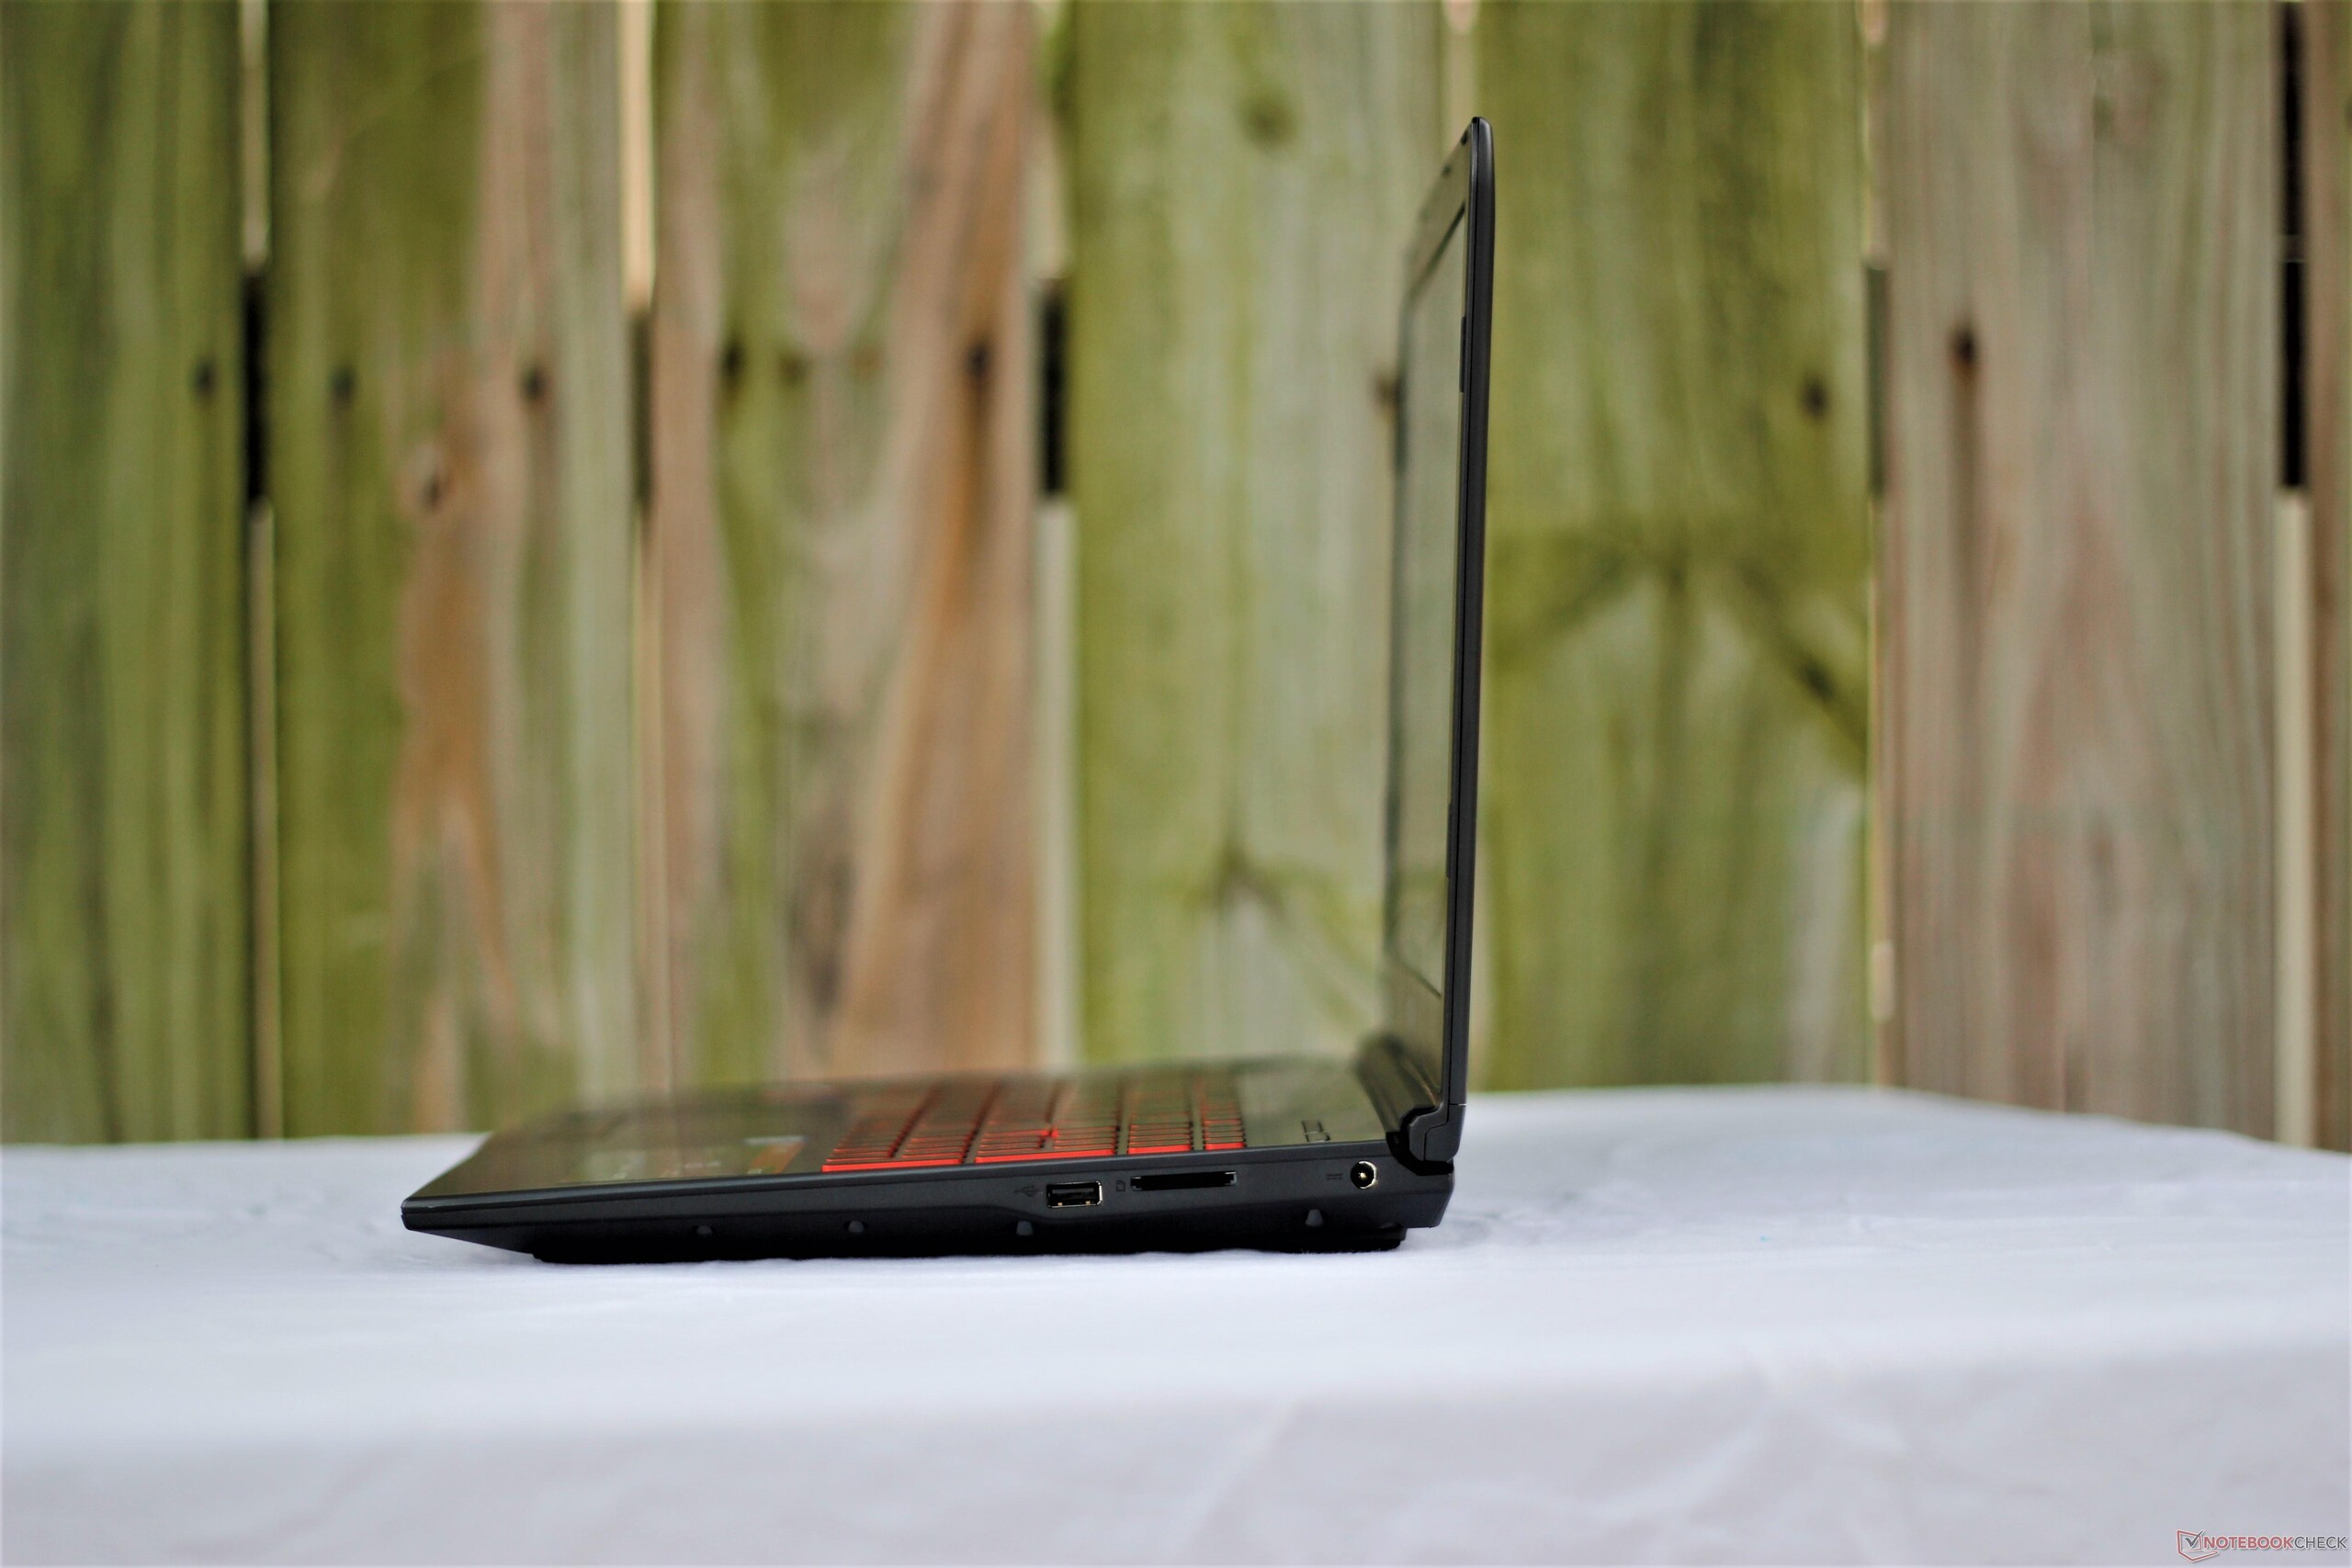
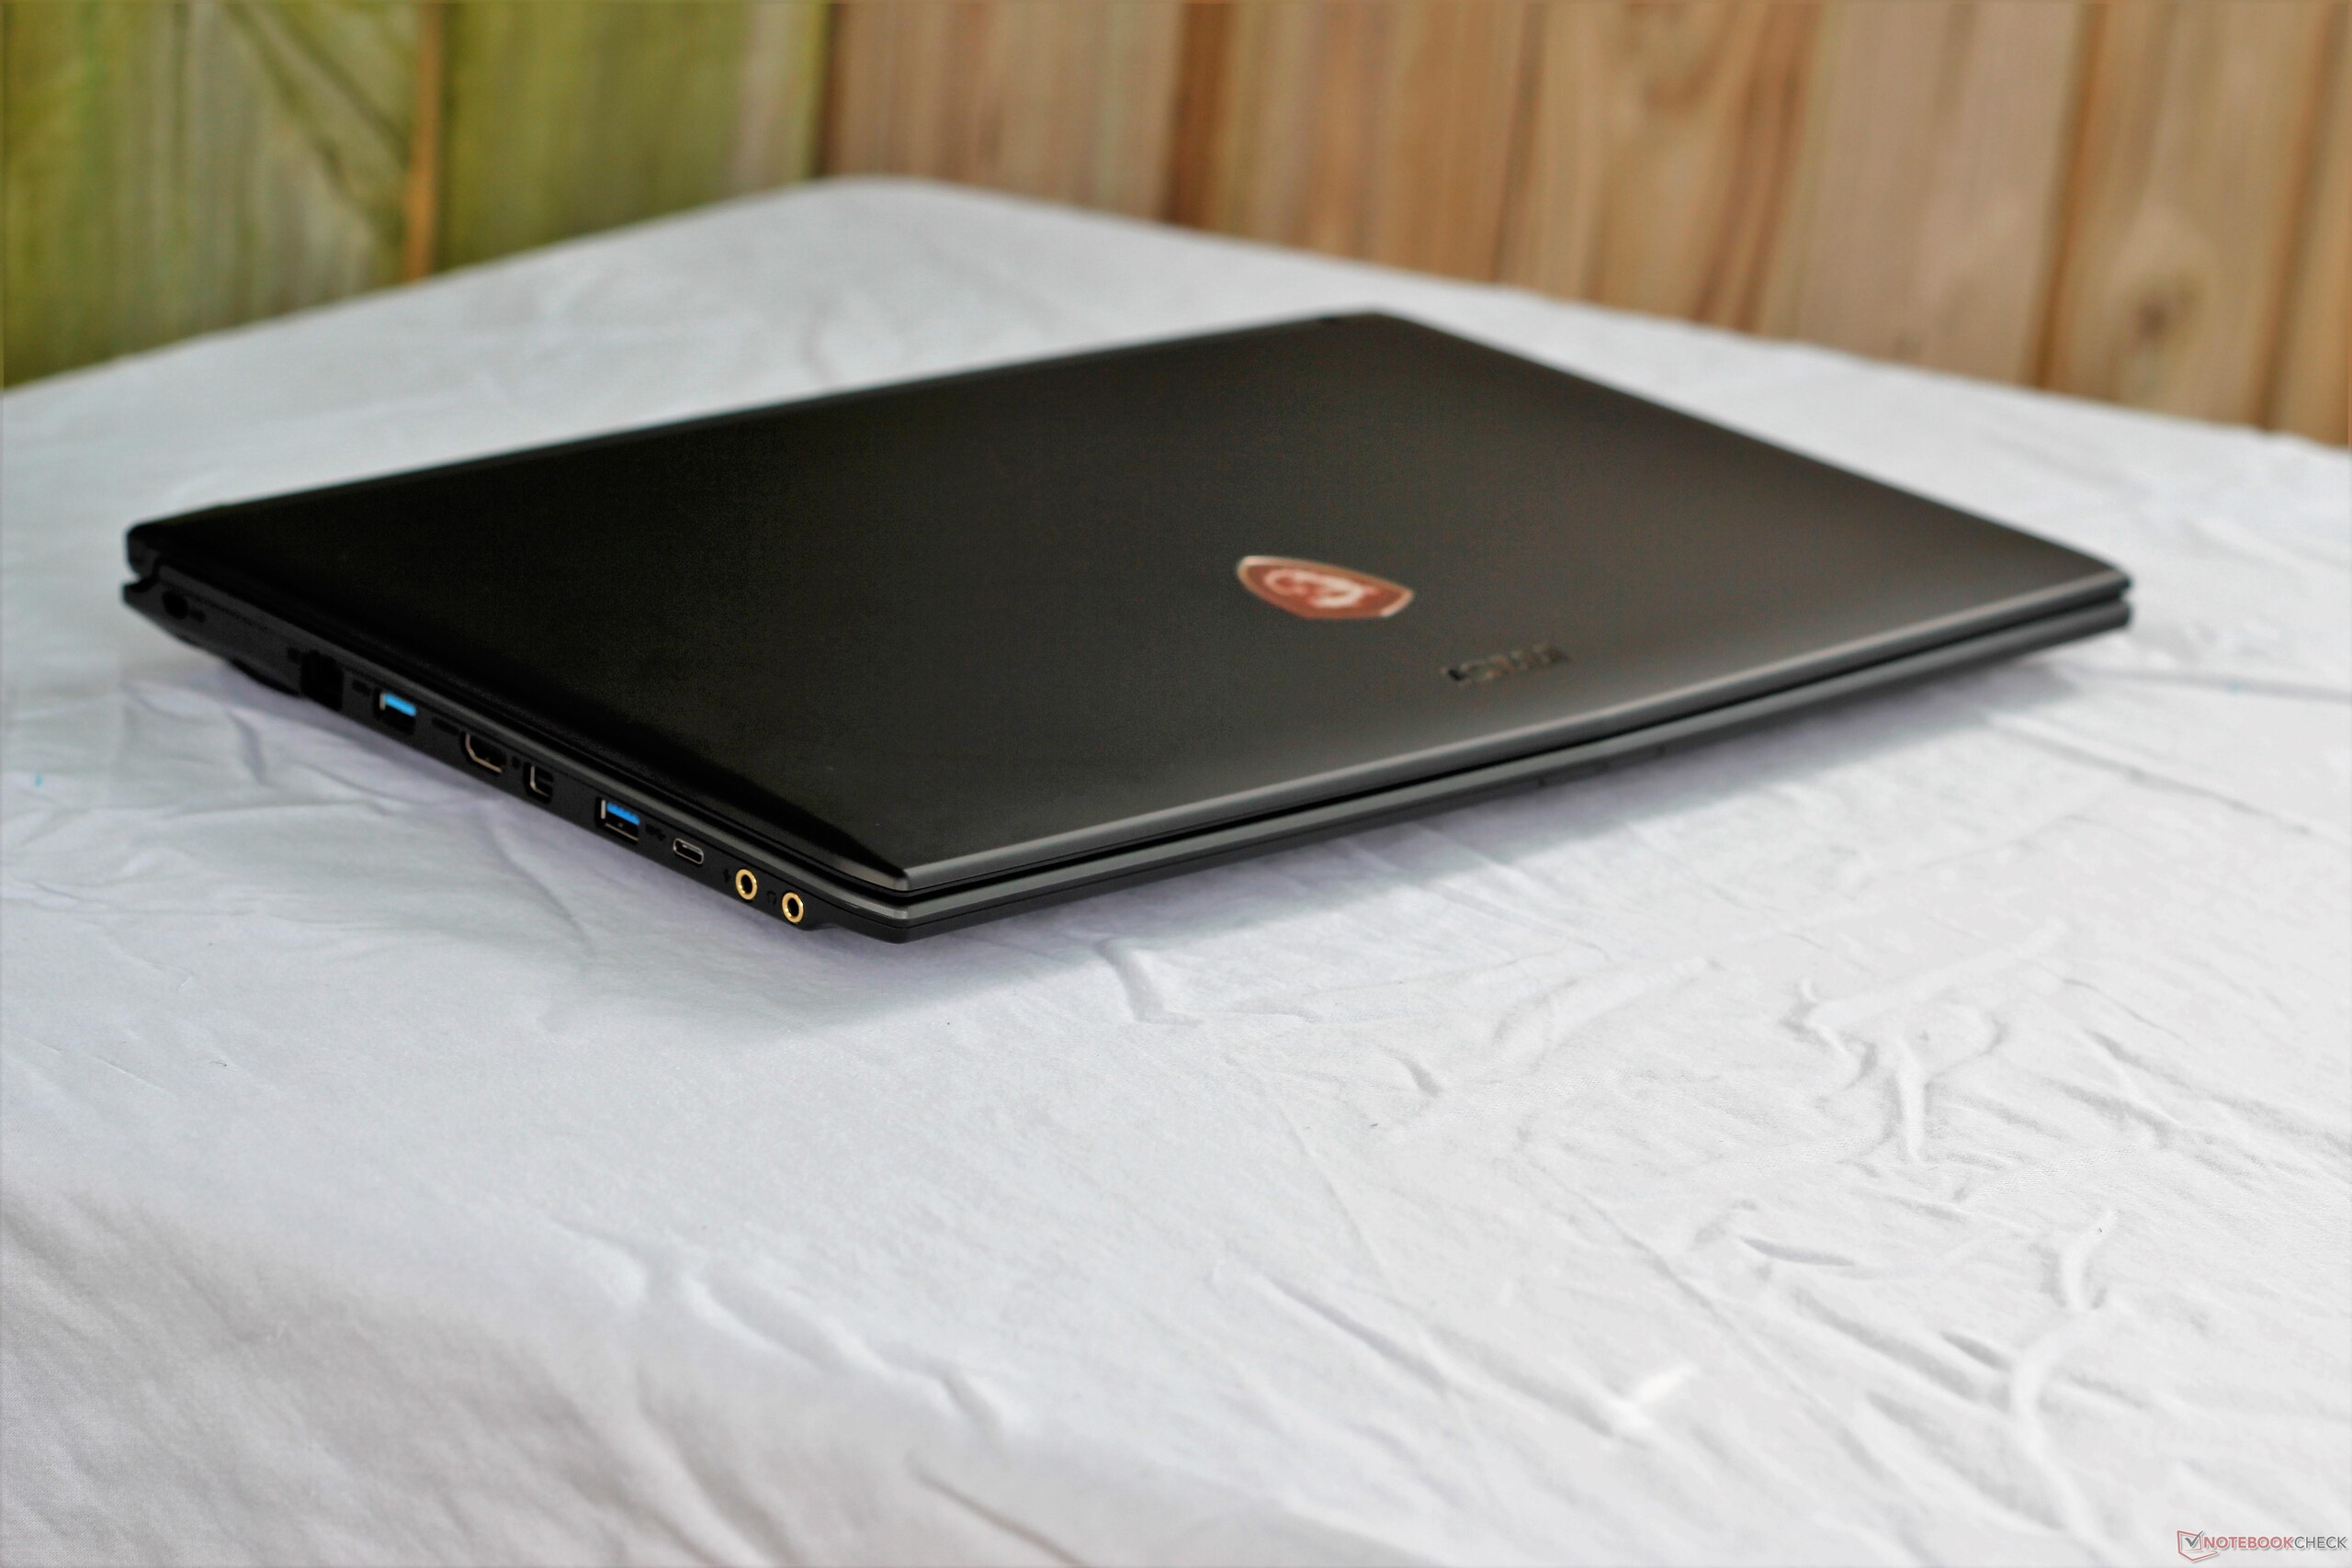
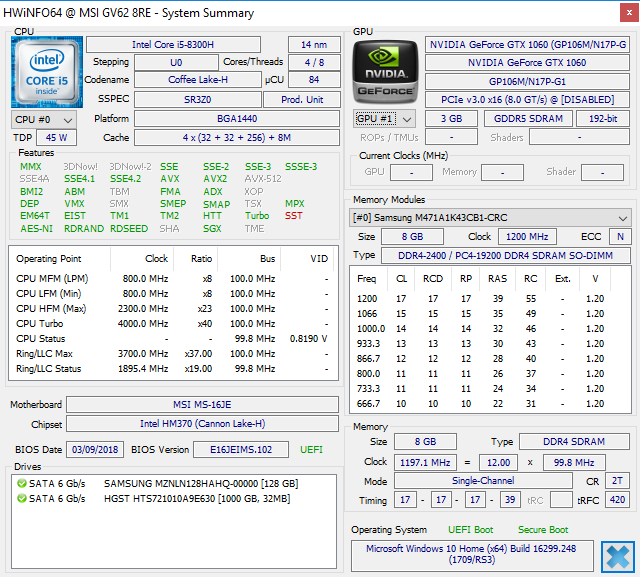
Courte critique du PC portable MSI GV62 8RE (i5-8300H, GTX 1060, FHD)
| SD Card Reader | |
| average JPG Copy Test (av. of 3 runs) | |
| Moyenne de la classe Gaming (20.9 - 210, n=54, 2 dernières années) | |
| Acer Predator Helios 300 PH317-52-51M6 (Toshiba Exceria Pro SDXC 64 GB UHS-II) | |
| Dell Inspiron 15 7000 7577 4K (Toshiba Exceria Pro SDXC 64 GB UHS-II) | |
| MSI GV62 8RE-016US (Toshiba Exceria Pro SDXC 64 GB UHS-II) | |
| MSI GF62VR 7RF-877 (Toshiba Exceria Pro SDXC 64 GB UHS-II) | |
| Dell G5 15 5587 (Toshiba Exceria Pro SDXC 64 GB UHS-II) | |
| maximum AS SSD Seq Read Test (1GB) | |
| Moyenne de la classe Gaming (25.5 - 261, n=51, 2 dernières années) | |
| Acer Predator Helios 300 PH317-52-51M6 (Toshiba Exceria Pro SDXC 64 GB UHS-II) | |
| Dell G5 15 5587 (Toshiba Exceria Pro SDXC 64 GB UHS-II) | |
| MSI GV62 8RE-016US (Toshiba Exceria Pro SDXC 64 GB UHS-II) | |
| Dell Inspiron 15 7000 7577 4K (Toshiba Exceria Pro SDXC 64 GB UHS-II) | |
| MSI GF62VR 7RF-877 (Toshiba Exceria Pro SDXC 64 GB UHS-II) | |
| |||||||||||||||||||||||||
Homogénéité de la luminosité: 82 %
Valeur mesurée au centre, sur batterie: 268.7 cd/m²
Contraste: 640:1 (Valeurs des noirs: 0.42 cd/m²)
ΔE ColorChecker Calman: 4.79 | ∀{0.5-29.43 Ø4.72}
calibrated: 4.31
ΔE Greyscale Calman: 3.1 | ∀{0.09-98 Ø4.97}
59% sRGB (Argyll 1.6.3 3D)
38% AdobeRGB 1998 (Argyll 1.6.3 3D)
40.91% AdobeRGB 1998 (Argyll 3D)
59.5% sRGB (Argyll 3D)
39.58% Display P3 (Argyll 3D)
Gamma: 2.28
CCT: 7049 K
| MSI GV62 8RE-016US LG Philips LGD0590, IPS, 15.6", 1920x1080 | Dell Inspiron 15 7000 7577 4K Name: AU Optronics B156ZAN, IPS, 15.6", 3840x2160 | MSI GF62VR 7RF-877 Chi Mei N156HGA-EAL, TN LED, 15.6", 1920x1080 | Lenovo Legion Y520-15IKBN 80WK0042GE LG Philips LP156WF6-SPK3, IPS, 15.6", 1920x1080 | Acer Predator Helios 300 PH317-52-51M6 LG Philips LP173WF4-SPF5 (LGD056D), IPS, 17.3", 1920x1080 | Dell G5 15 5587 LGD053F, 156WF6, IPS, 15.6", 1920x1080 | |
|---|---|---|---|---|---|---|
| Display | 69% | 96% | -1% | 56% | -4% | |
| Display P3 Coverage (%) | 39.58 | 68.4 73% | 85.6 116% | 39.01 -1% | 67.1 70% | 38.13 -4% |
| sRGB Coverage (%) | 59.5 | 97.1 63% | 99.9 68% | 58.4 -2% | 86.1 45% | 56.8 -5% |
| AdobeRGB 1998 Coverage (%) | 40.91 | 69.6 70% | 83.9 105% | 40.34 -1% | 63 54% | 39.47 -4% |
| Response Times | -11% | -25% | -18% | 1% | 2% | |
| Response Time Grey 50% / Grey 80% * (ms) | 33.2 ? | 35.2 ? -6% | 49.6 ? -49% | 39 ? -17% | 36 ? -8% | 33 ? 1% |
| Response Time Black / White * (ms) | 24.4 ? | 28.4 ? -16% | 24.4 ? -0% | 29 ? -19% | 22 ? 10% | 24 ? 2% |
| PWM Frequency (Hz) | 25510 ? | 21000 ? | 122000 ? | |||
| Screen | 24% | -36% | -3% | 15% | -8% | |
| Brightness middle (cd/m²) | 268.7 | 322.9 20% | 223.9 -17% | 283 5% | 365 36% | 229 -15% |
| Brightness (cd/m²) | 246 | 309 26% | 208 -15% | 281 14% | 341 39% | 224 -9% |
| Brightness Distribution (%) | 82 | 90 10% | 88 7% | 91 11% | 89 9% | 87 6% |
| Black Level * (cd/m²) | 0.42 | 0.36 14% | 0.56 -33% | 0.39 7% | 0.32 24% | 0.28 33% |
| Contrast (:1) | 640 | 897 40% | 400 -37% | 726 13% | 1141 78% | 818 28% |
| Colorchecker dE 2000 * | 4.79 | 3.99 17% | 9.7 -103% | 6.1 -27% | 6.51 -36% | 6.1 -27% |
| Colorchecker dE 2000 max. * | 18.13 | 8.97 51% | 19.7 -9% | 11.08 39% | 12.32 32% | 12.2 33% |
| Colorchecker dE 2000 calibrated * | 4.31 | 2.9 33% | 6.12 -42% | |||
| Greyscale dE 2000 * | 3.1 | 5.3 -71% | 12.9 -316% | 5.69 -84% | 7.65 -147% | 5.68 -83% |
| Gamma | 2.28 96% | 2.041 108% | 2.18 101% | 2.44 90% | 2.64 83% | 2.4 92% |
| CCT | 7049 92% | 6941 94% | 15225 43% | 6702 97% | 8066 81% | 6989 93% |
| Color Space (Percent of AdobeRGB 1998) (%) | 38 | 62.9 66% | 75 97% | 37 -3% | 56 47% | 36 -5% |
| Color Space (Percent of sRGB) (%) | 59 | 96.8 64% | 100 69% | 58 -2% | 86 46% | 57 -3% |
| Moyenne finale (programmes/paramètres) | 27% /
28% | 12% /
-8% | -7% /
-4% | 24% /
21% | -3% /
-6% |
* ... Moindre est la valeur, meilleures sont les performances
Temps de réponse de l'écran
| ↔ Temps de réponse noir à blanc | ||
|---|---|---|
| 24.4 ms ... hausse ↗ et chute ↘ combinées | ↗ 13.6 ms hausse | 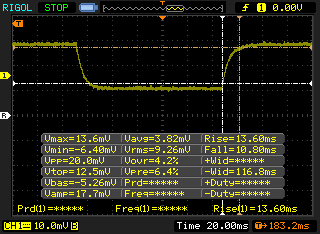 |
| ↘ 10.8 ms chute | ||
| L'écran montre de bons temps de réponse, mais insuffisant pour du jeu compétitif. En comparaison, tous les appareils testés affichent entre 0.1 (minimum) et 240 (maximum) ms. » 57 % des appareils testés affichent de meilleures performances. Cela signifie que les latences relevées sont moins bonnes que la moyenne (19.9 ms) de tous les appareils testés. | ||
| ↔ Temps de réponse gris 50% à gris 80% | ||
| 33.2 ms ... hausse ↗ et chute ↘ combinées | ↗ 16.4 ms hausse | 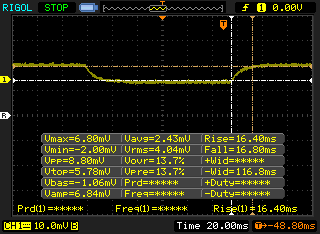 |
| ↘ 16.8 ms chute | ||
| L'écran souffre de latences très élevées, à éviter pour le jeu. En comparaison, tous les appareils testés affichent entre 0.165 (minimum) et 636 (maximum) ms. » 46 % des appareils testés affichent de meilleures performances. Cela signifie que les latences relevées sont similaires à la moyenne (31.1 ms) de tous les appareils testés. | ||
Scintillement / MLI (Modulation de largeur d'impulsion)
| Scintillement / MLI (Modulation de largeur d'impulsion) non décelé | 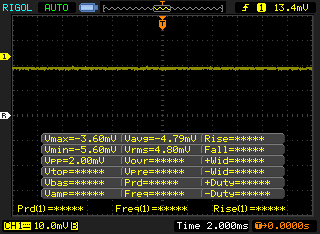 | ||
En comparaison, 52 % des appareils testés n'emploient pas MDI pour assombrir leur écran. Nous avons relevé une moyenne à 7784 (minimum : 5 - maximum : 343500) Hz dans le cas où une MDI était active. | |||
* ... Moindre est la valeur, meilleures sont les performances
| PCMark 8 Home Score Accelerated v2 | 3896 points | |
| PCMark 8 Creative Score Accelerated v2 | 5251 points | |
| PCMark 8 Work Score Accelerated v2 | 5098 points | |
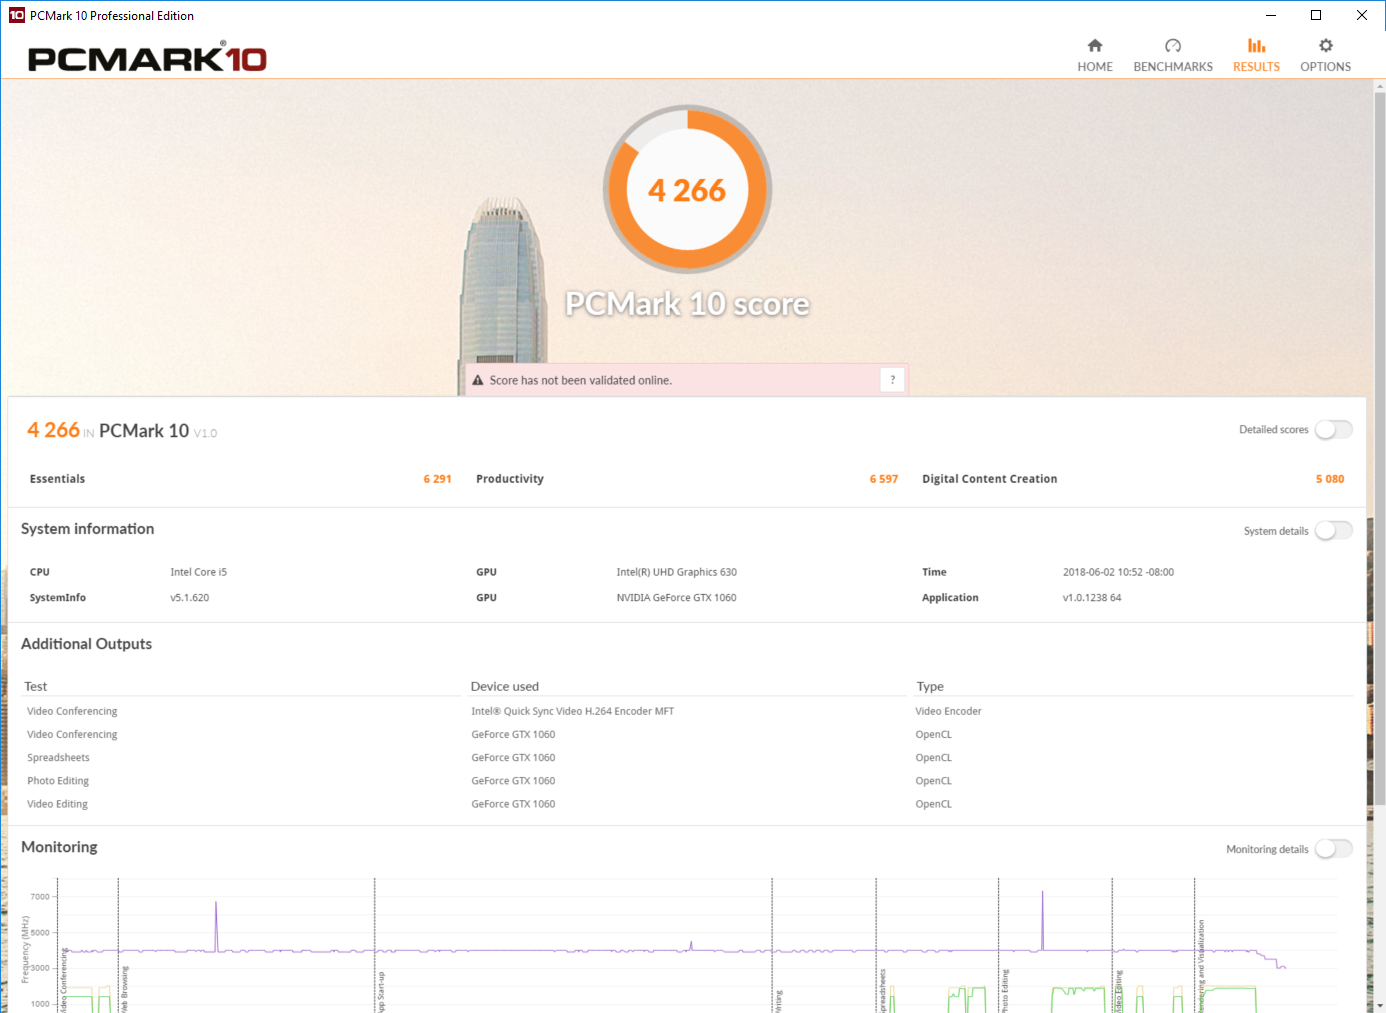
| PCMark 10 Score | 4266 points | |
Aide | ||
| MSI GV62 8RE-016US Samsung PM871b MZNLN128HAHQ | MSI GF62VR 7RF-877 Intel SSD 600p SSDPEKKW256G7 | Dell Inspiron 15 7000 7577 4K SK hynix SC311 M.2 | Lenovo Legion Y520-15IKBN 80WK0042GE Samsung PM961 NVMe MZVLW128HEGR | Acer Predator Helios 300 PH317-52-51M6 Hynix HFS128G39TND | Dell G5 15 5587 SK hynix SC311 M.2 | Moyenne Samsung PM871b MZNLN128HAHQ | |
|---|---|---|---|---|---|---|---|
| AS SSD | 160% | 20% | 133% | -30% | -2% | 34% | |
| Copy Game MB/s (MB/s) | 122.6 | 471.7 285% | 185.4 51% | 197.3 61% | 130.9 7% | 160.6 ? 31% | |
| Copy Program MB/s (MB/s) | 69.2 | 286.5 314% | 142.2 105% | 127.3 84% | 95.7 38% | 134.7 ? 95% | |
| Copy ISO MB/s (MB/s) | 170.5 | 1069 527% | 363.6 113% | 497.6 192% | 146.6 -14% | 299 ? 75% | |
| Score Total (Points) | 703 | 1324 88% | 578 -18% | 1434 104% | 811 15% | 557 -21% | 774 ? 10% |
| Score Write (Points) | 207 | 693 235% | 227 10% | 368 78% | 196 -5% | 199 -4% | 262 ? 27% |
| Score Read (Points) | 334 | 448 34% | 234 -30% | 746 123% | 414 24% | 240 -28% | 335 ? 0% |
| Access Time Write * (ms) | 0.057 | 0.03 47% | 0.058 -2% | 0.032 44% | 0.259 -354% | 0.066 -16% | 0.05417 ? 5% |
| Access Time Read * (ms) | 0.113 | 0.09 20% | 0.126 -12% | 0.07 38% | 0.128 -13% | 0.1102 ? 2% | |
| 4K-64 Write (MB/s) | 129.4 | 551 326% | 127.2 -2% | 158.6 23% | 120.1 -7% | 112.4 -13% | 149.2 ? 15% |
| 4K-64 Read (MB/s) | 257.7 | 280.1 9% | 156.6 -39% | 463.2 80% | 336.6 31% | 164.1 -36% | 256 ? -1% |
| 4K Write (MB/s) | 63.5 | 118.3 86% | 74 17% | 127.9 101% | 62.7 -1% | 62.2 -2% | 73.1 ? 15% |
| 4K Read (MB/s) | 26.23 | 31.27 19% | 26.24 0% | 46.98 79% | 26.5 1% | 24.44 -7% | 29.1 ? 11% |
| Seq Write (MB/s) | 138.1 | 234.9 70% | 259.9 88% | 814 489% | 128.2 -7% | 243.7 76% | 398 ? 188% |
| Seq Read (MB/s) | 503 | 1371 173% | 508 1% | 2362 370% | 513 2% | 511 2% | 496 ? -1% |
* ... Moindre est la valeur, meilleures sont les performances

| 3DMark 11 Performance | 12532 points | |
| 3DMark Cloud Gate Standard Score | 27973 points | |
| 3DMark Fire Strike Score | 10198 points | |
Aide | ||
| Rise of the Tomb Raider | |
| 1920x1080 Very High Preset AA:FX AF:16x (Classer selon les valeurs) | |
| MSI GV62 8RE-016US | |
| Dell Inspiron 15 7000 7577 4K | |
| MSI GF62VR 7RF-877 | |
| Dell G5 15 5587 | |
| Moyenne NVIDIA GeForce GTX 1060 Mobile (51 - 68.8, n=37) | |
| 1920x1080 High Preset AA:FX AF:4x (Classer selon les valeurs) | |
| MSI GV62 8RE-016US | |
| MSI GF62VR 7RF-877 | |
| Dell G5 15 5587 | |
| Moyenne NVIDIA GeForce GTX 1060 Mobile (65.3 - 82, n=24) | |
| 1366x768 Medium Preset AF:2x (Classer selon les valeurs) | |
| MSI GV62 8RE-016US | |
| Dell G5 15 5587 | |
| Moyenne NVIDIA GeForce GTX 1060 Mobile (82.2 - 140, n=14) | |
| Middle-earth: Shadow of War | |
| 1920x1080 Ultra Preset AA:T (Classer selon les valeurs) | |
| MSI GV62 8RE-016US | |
| Dell Inspiron 15 7000 7577 4K | |
| Moyenne NVIDIA GeForce GTX 1060 Mobile (52 - 54, n=5) | |
| 1920x1080 High Preset AA:T (Classer selon les valeurs) | |
| MSI GV62 8RE-016US | |
| Dell Inspiron 15 7000 7577 4K | |
| Moyenne NVIDIA GeForce GTX 1060 Mobile (58 - 74, n=4) | |
| 1920x1080 Medium Preset AA:T (Classer selon les valeurs) | |
| MSI GV62 8RE-016US | |
| Dell Inspiron 15 7000 7577 4K | |
| Moyenne NVIDIA GeForce GTX 1060 Mobile (79 - 97, n=2) | |
| Bas | Moyen | Élevé | Ultra | |
|---|---|---|---|---|
| BioShock Infinite (2013) | 234 | 205 | 187 | 112 |
| The Witcher 3 (2015) | 163 | 121 | 67 | 42 |
| Rise of the Tomb Raider (2016) | 162 | 125 | 73 | 59 |
| Middle-earth: Shadow of War (2017) | 110 | 79 | 58 | 52 |
Degré de la nuisance sonore
| Au repos |
| 33.5 / 33.5 / 33.7 dB(A) |
| Fortement sollicité |
| 41 / 52.3 dB(A) |
 | ||
30 dB silencieux 40 dB(A) audible 50 dB(A) bruyant |
||
min: | ||
| MSI GV62 8RE-016US GeForce GTX 1060 Mobile, i5-8300H, Samsung PM871b MZNLN128HAHQ | MSI GF62VR 7RF-877 GeForce GTX 1060 Mobile, i7-7700HQ, Intel SSD 600p SSDPEKKW256G7 | Dell Inspiron 15 7000 7577 4K GeForce GTX 1060 Max-Q, i7-7700HQ, SK hynix SC311 M.2 | Lenovo Legion Y520-15IKBN 80WK0042GE GeForce GTX 1050 Ti Mobile, i5-7300HQ, Samsung PM961 NVMe MZVLW128HEGR | Acer Predator Helios 300 PH317-52-51M6 GeForce GTX 1050 Ti Mobile, i5-8300H, Hynix HFS128G39TND | Dell G5 15 5587 GeForce GTX 1060 Max-Q, i5-8300H, SK hynix SC311 M.2 | |
|---|---|---|---|---|---|---|
| Noise | 1% | 11% | 10% | 4% | 8% | |
| arrêt / environnement * (dB) | 28.2 | 28.1 -0% | 28.5 -1% | 30.6 -9% | 29 -3% | 30.3 -7% |
| Idle Minimum * (dB) | 33.5 | 33.5 -0% | 28.8 14% | 31.9 5% | 29 13% | 31.1 7% |
| Idle Average * (dB) | 33.5 | 33.5 -0% | 29.2 13% | 31.9 5% | 31 7% | 31.1 7% |
| Idle Maximum * (dB) | 33.7 | 33.5 1% | 29.2 13% | 31.9 5% | 33 2% | 34.2 -1% |
| Load Average * (dB) | 41 | 41.3 -1% | 34.6 16% | 34.6 16% | 45 -10% | 34.9 15% |
| Witcher 3 ultra * (dB) | 52.3 | 48.5 7% | 44.1 16% | 39.3 25% | 45 14% | 42.7 18% |
| Load Maximum * (dB) | 52.3 | 53.5 -2% | 49.3 6% | 41.7 20% | 51 2% | 44 16% |
* ... Moindre est la valeur, meilleures sont les performances
(-) La température maximale du côté supérieur est de 47 °C / 117 F, par rapport à la moyenne de 40.4 °C / 105 F, allant de 21.2 à 68.8 °C pour la classe Gaming.
(-) Le fond chauffe jusqu'à un maximum de 45.6 °C / 114 F, contre une moyenne de 43.2 °C / 110 F
(+) En utilisation inactive, la température moyenne du côté supérieur est de 27.2 °C / 81 F, par rapport à la moyenne du dispositif de 33.9 °C / 93 F.
(±) En jouant à The Witcher 3, la température moyenne du côté supérieur est de 36.3 °C / 97 F, alors que la moyenne de l'appareil est de 33.9 °C / 93 F.
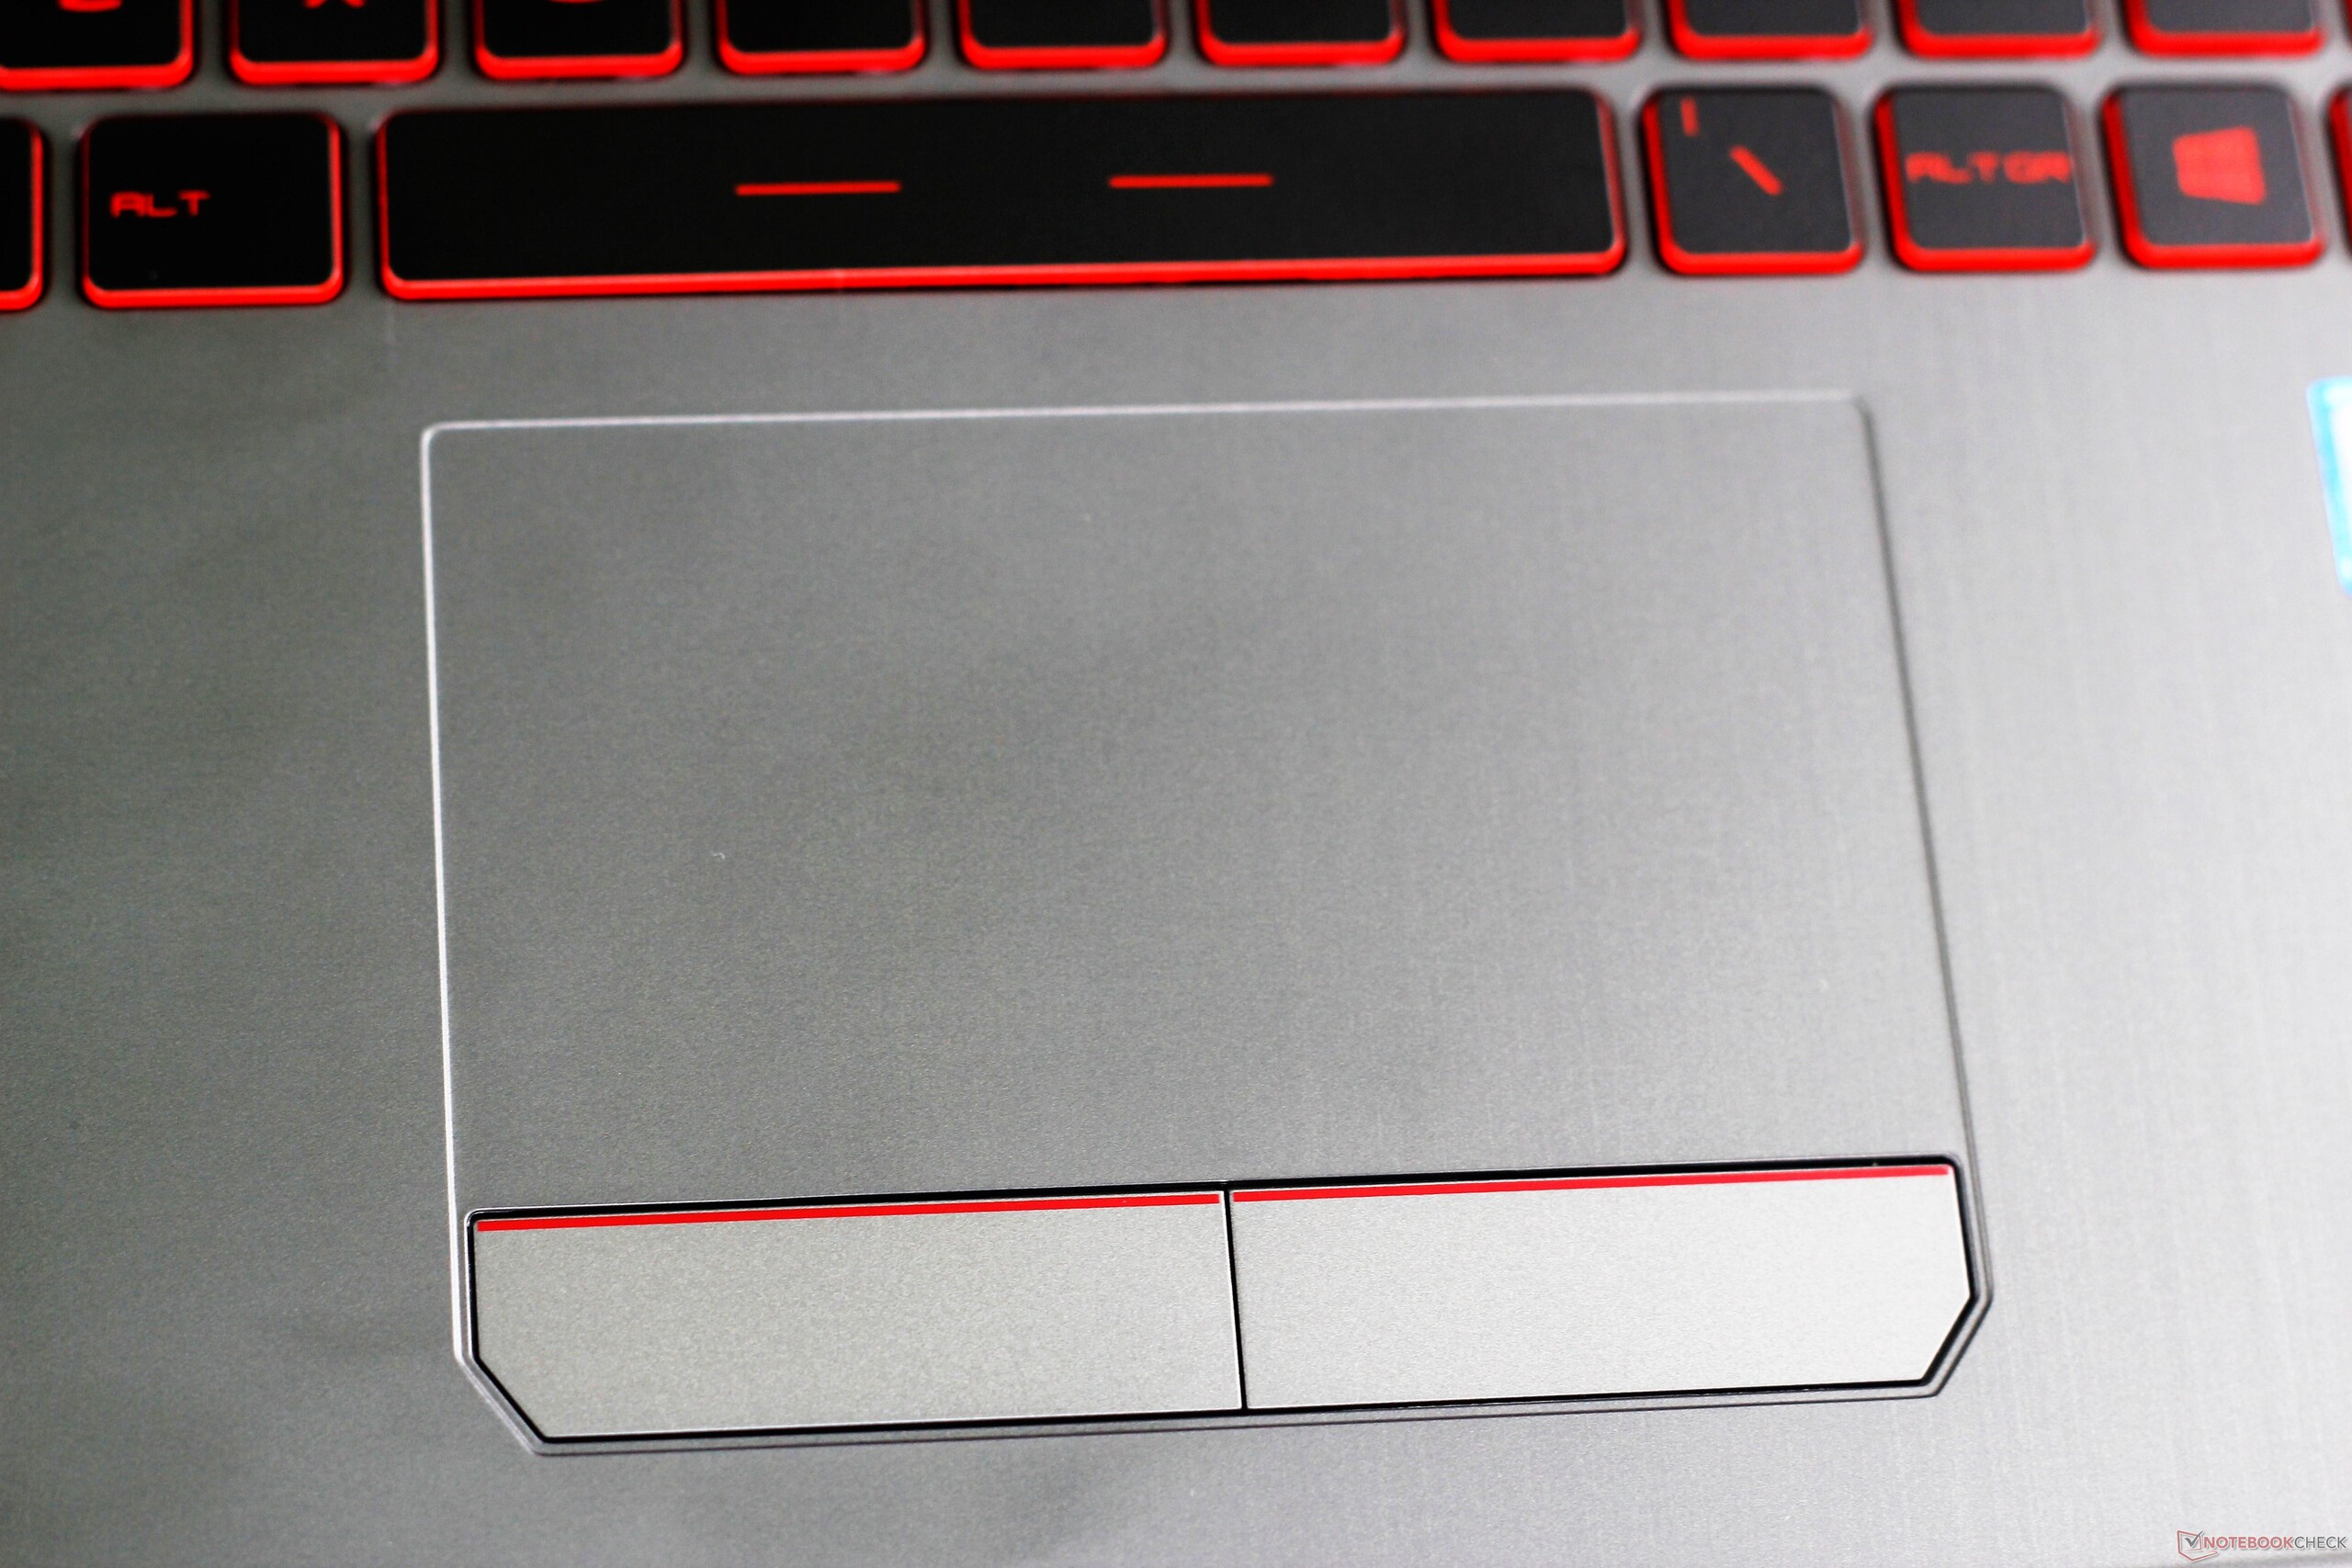
(±) Les repose-poignets et le pavé tactile peuvent devenir très chauds au toucher, avec un maximum de 38.4 °C / 101.1# F.
(-) La température moyenne de la zone de l'appui-paume de dispositifs similaires était de 28.8 °C / 83.8 F (-9.6 °C / #-17.3 F).
MSI GV62 8RE-016US analyse audio
(±) | le niveau sonore du haut-parleur est moyen mais bon (81.1# dB)
Basses 100 - 315 Hz
(-) | presque aucune basse - en moyenne 28.2% plus bas que la médiane
(±) | la linéarité des basses est moyenne (11% delta à la fréquence précédente)
Médiums 400 - 2000 Hz
(±) | médiane supérieure - en moyenne 6.4% supérieure à la médiane
(±) | la linéarité des médiums est moyenne (8.9% delta à la fréquence précédente)
Aiguës 2 - 16 kHz
(±) | sommets plus élevés - en moyenne 5.6% plus élevés que la médiane
(±) | la linéarité des aigus est moyenne (7.6% delta à la fréquence précédente)
Globalement 100 - 16 000 Hz
(±) | la linéarité du son global est moyenne (27.3% de différence avec la médiane)
Par rapport à la même classe
» 93% de tous les appareils testés de cette catégorie étaient meilleurs, 1% similaires, 6% pires
» Le meilleur avait un delta de 6%, la moyenne était de 18%, le pire était de 132%.
Par rapport à tous les appareils testés
» 83% de tous les appareils testés étaient meilleurs, 4% similaires, 13% pires
» Le meilleur avait un delta de 4%, la moyenne était de 24%, le pire était de 134%.
Dell G5 15 5587 analyse audio
(-) | haut-parleurs pas très forts (68.5 dB)
Basses 100 - 315 Hz
(±) | basse réduite - en moyenne 12.5% inférieure à la médiane
(+) | les basses sont linéaires (5.9% delta à la fréquence précédente)
Médiums 400 - 2000 Hz
(+) | médiane équilibrée - seulement 4.6% de la médiane
(+) | les médiums sont linéaires (5.1% delta à la fréquence précédente)
Aiguës 2 - 16 kHz
(+) | des sommets équilibrés - à seulement 1.1% de la médiane
(+) | les aigus sont linéaires (3.6% delta à la fréquence précédente)
Globalement 100 - 16 000 Hz
(+) | le son global est linéaire (14.9% différence à la médiane)
Par rapport à la même classe
» 30% de tous les appareils testés de cette catégorie étaient meilleurs, 7% similaires, 63% pires
» Le meilleur avait un delta de 6%, la moyenne était de 18%, le pire était de 132%.
Par rapport à tous les appareils testés
» 20% de tous les appareils testés étaient meilleurs, 4% similaires, 76% pires
» Le meilleur avait un delta de 4%, la moyenne était de 24%, le pire était de 134%.
| Éteint/en veille | |
| Au repos | |
| Fortement sollicité |
|
Légende:
min: | |
| MSI GV62 8RE-016US i5-8300H, GeForce GTX 1060 Mobile, Samsung PM871b MZNLN128HAHQ, IPS, 1920x1080, 15.6" | MSI GF62VR 7RF-877 i7-7700HQ, GeForce GTX 1060 Mobile, Intel SSD 600p SSDPEKKW256G7, TN LED, 1920x1080, 15.6" | Dell Inspiron 15 7000 7577 4K i7-7700HQ, GeForce GTX 1060 Max-Q, SK hynix SC311 M.2, IPS, 3840x2160, 15.6" | Lenovo Legion Y520-15IKBN 80WK0042GE i5-7300HQ, GeForce GTX 1050 Ti Mobile, Samsung PM961 NVMe MZVLW128HEGR, IPS, 1920x1080, 15.6" | Acer Predator Helios 300 PH317-52-51M6 i5-8300H, GeForce GTX 1050 Ti Mobile, Hynix HFS128G39TND, IPS, 1920x1080, 17.3" | Dell G5 15 5587 i5-8300H, GeForce GTX 1060 Max-Q, SK hynix SC311 M.2, IPS, 1920x1080, 15.6" | |
|---|---|---|---|---|---|---|
| Power Consumption | -12% | 31% | 40% | 25% | 30% | |
| Idle Minimum * (Watt) | 9.38 | 16.2 -73% | 5.5 41% | 5.2 45% | 6 36% | 4.9 48% |
| Idle Average * (Watt) | 15.95 | 18.2 -14% | 10.5 34% | 8.3 48% | 9 44% | 8.5 47% |
| Idle Maximum * (Watt) | 18.46 | 18.9 -2% | 10.9 41% | 10.1 45% | 13 30% | 9.1 51% |
| Load Average * (Watt) | 95.68 | 82.7 14% | 72 25% | 62.7 34% | 95 1% | 90.7 5% |
| Witcher 3 ultra * (Watt) | 135.6 | 125.7 7% | 97.4 28% | 94 31% | 102 25% | 110 19% |
| Load Maximum * (Watt) | 156.98 | 162.3 -3% | 130.4 17% | 100 36% | 134 15% | 144 8% |
* ... Moindre est la valeur, meilleures sont les performances
| MSI GV62 8RE-016US i5-8300H, GeForce GTX 1060 Mobile, 41 Wh | MSI GF62VR 7RF-877 i7-7700HQ, GeForce GTX 1060 Mobile, 41 Wh | Dell Inspiron 15 7000 7577 4K i7-7700HQ, GeForce GTX 1060 Max-Q, 56 Wh | Lenovo Legion Y520-15IKBN 80WK0042GE i5-7300HQ, GeForce GTX 1050 Ti Mobile, 45 Wh | Acer Predator Helios 300 PH317-52-51M6 i5-8300H, GeForce GTX 1050 Ti Mobile, 48 Wh | Dell G5 15 5587 i5-8300H, GeForce GTX 1060 Max-Q, 56 Wh | |
|---|---|---|---|---|---|---|
| Autonomie de la batterie | -31% | 86% | 83% | 112% | 141% | |
| Reader / Idle (h) | 5.3 | 2.8 -47% | 10 89% | 10.6 100% | 11.8 123% | 11.8 123% |
| WiFi v1.3 (h) | 3.5 | 1.9 -46% | 5.4 54% | 5.2 49% | 5.9 69% | 6.5 86% |
| Load (h) | 0.7 | 0.7 0% | 1.5 114% | 1.4 100% | 1.7 143% | 2.2 214% |
Points positifs
Points négatifs
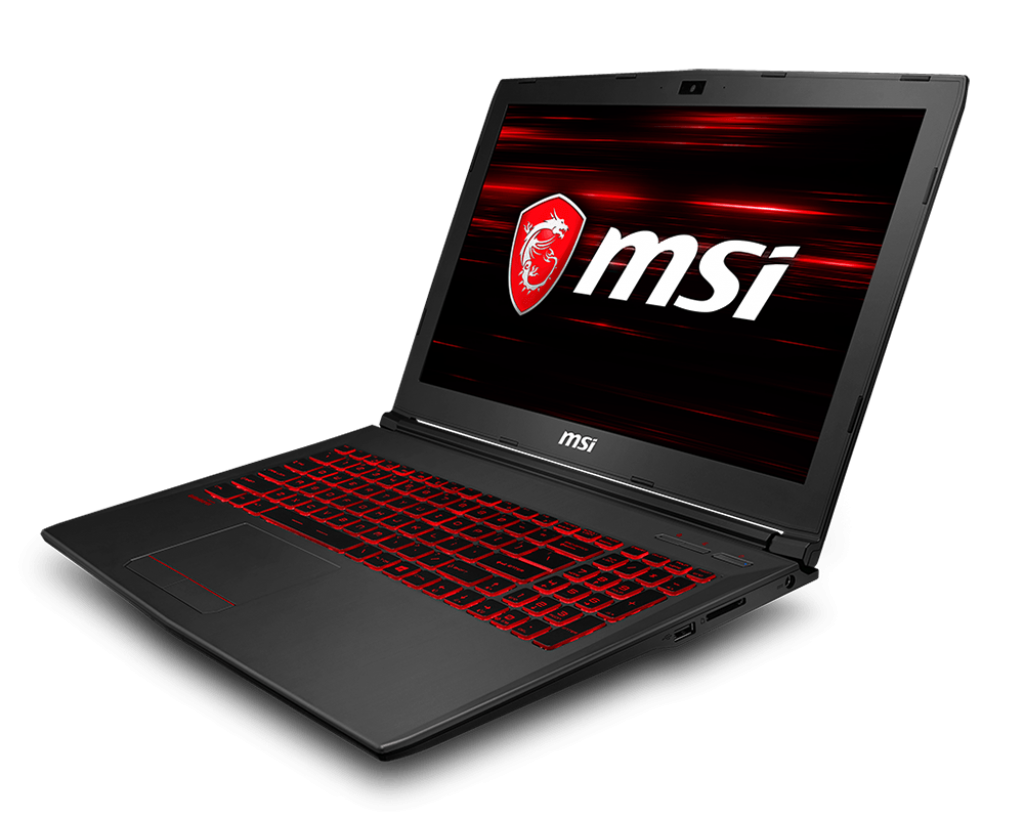
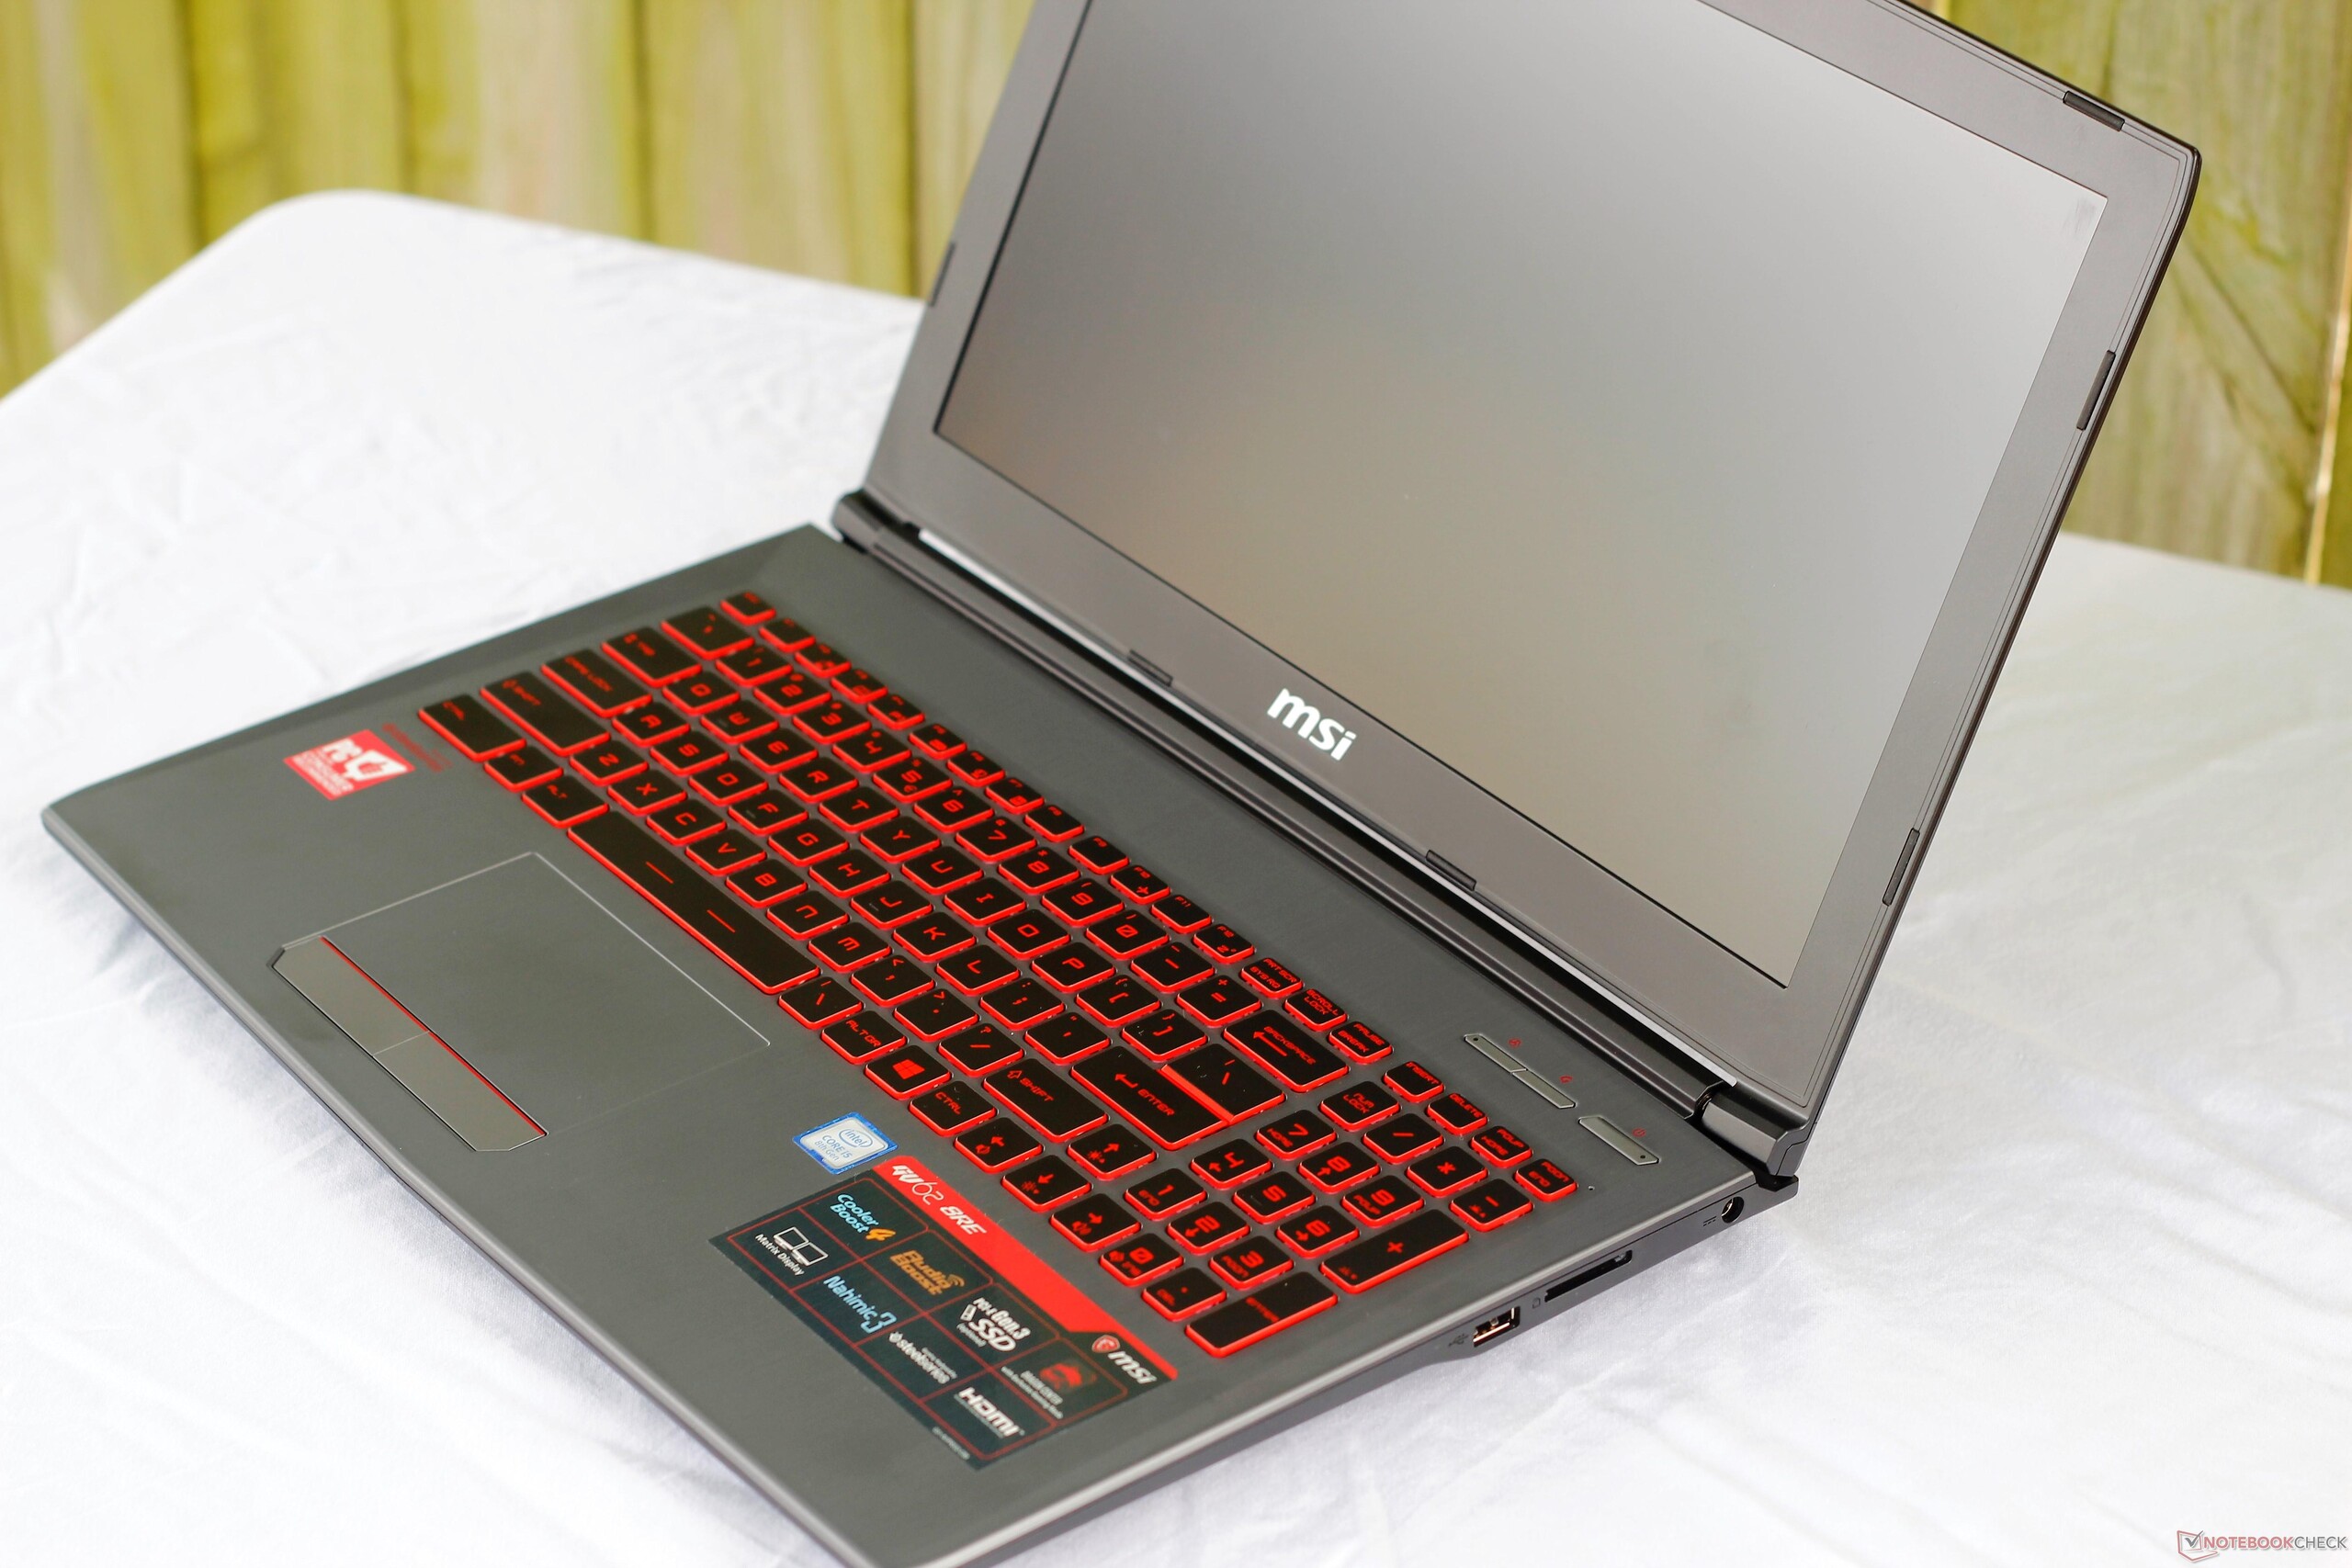
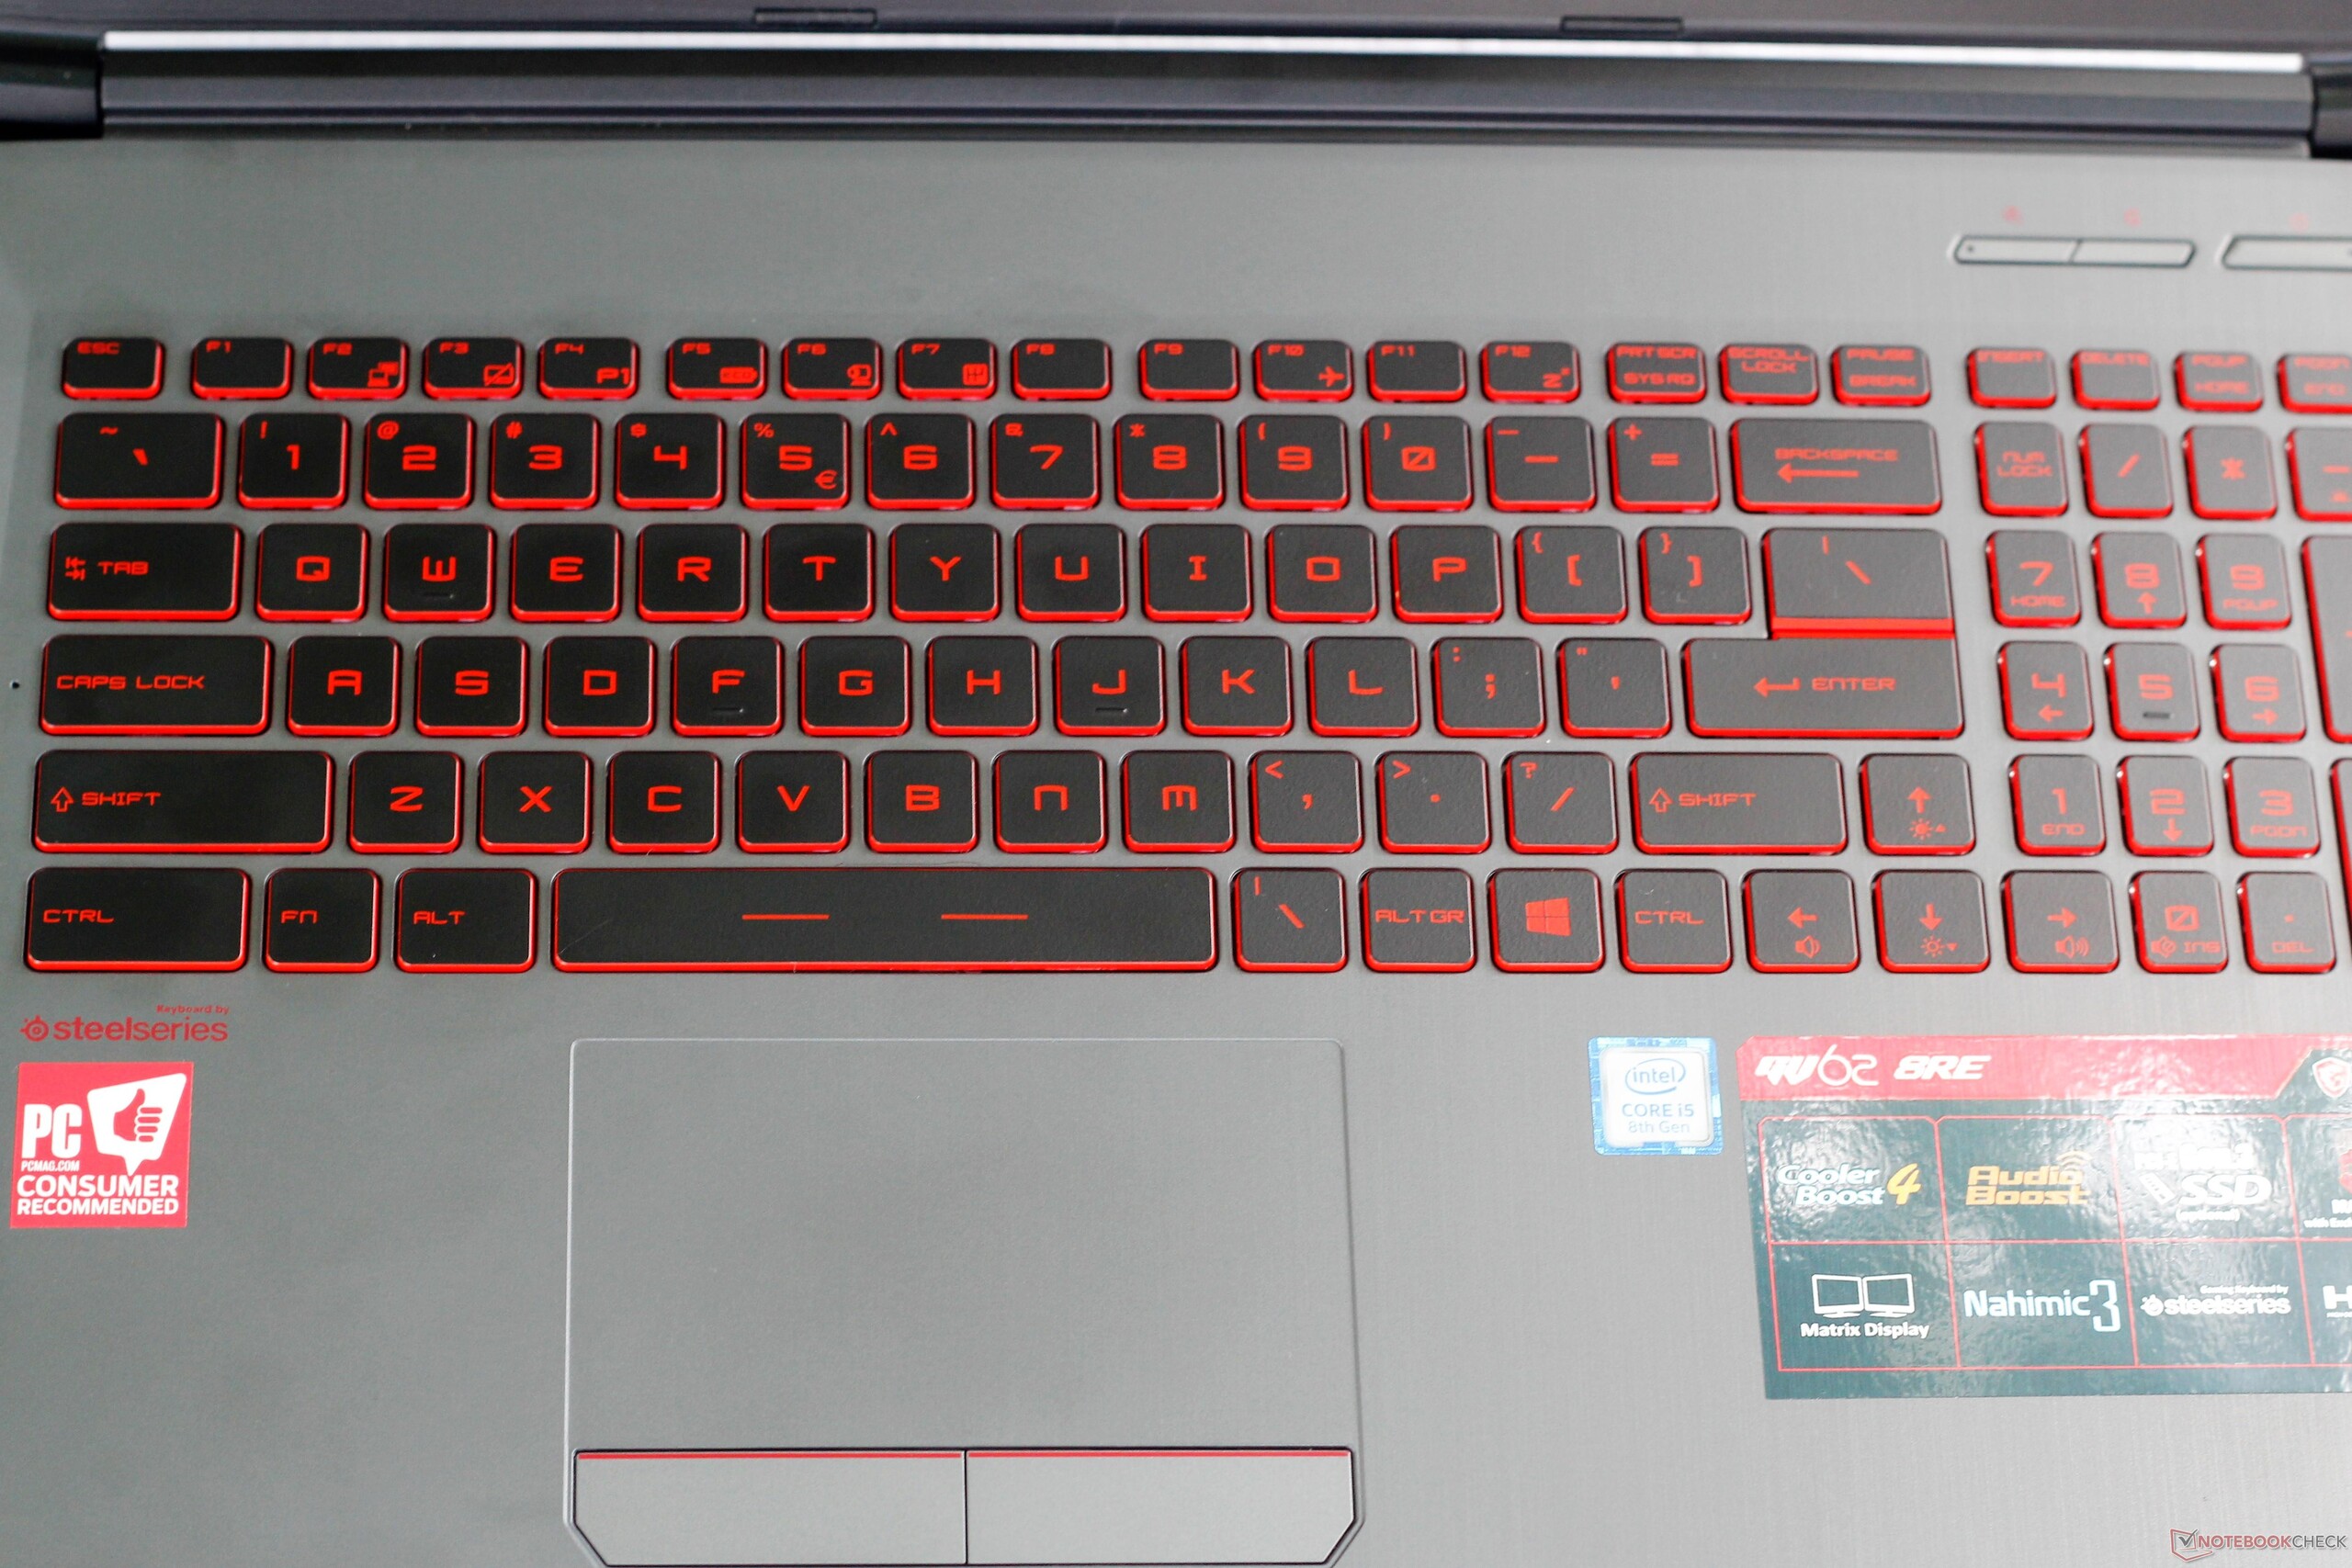
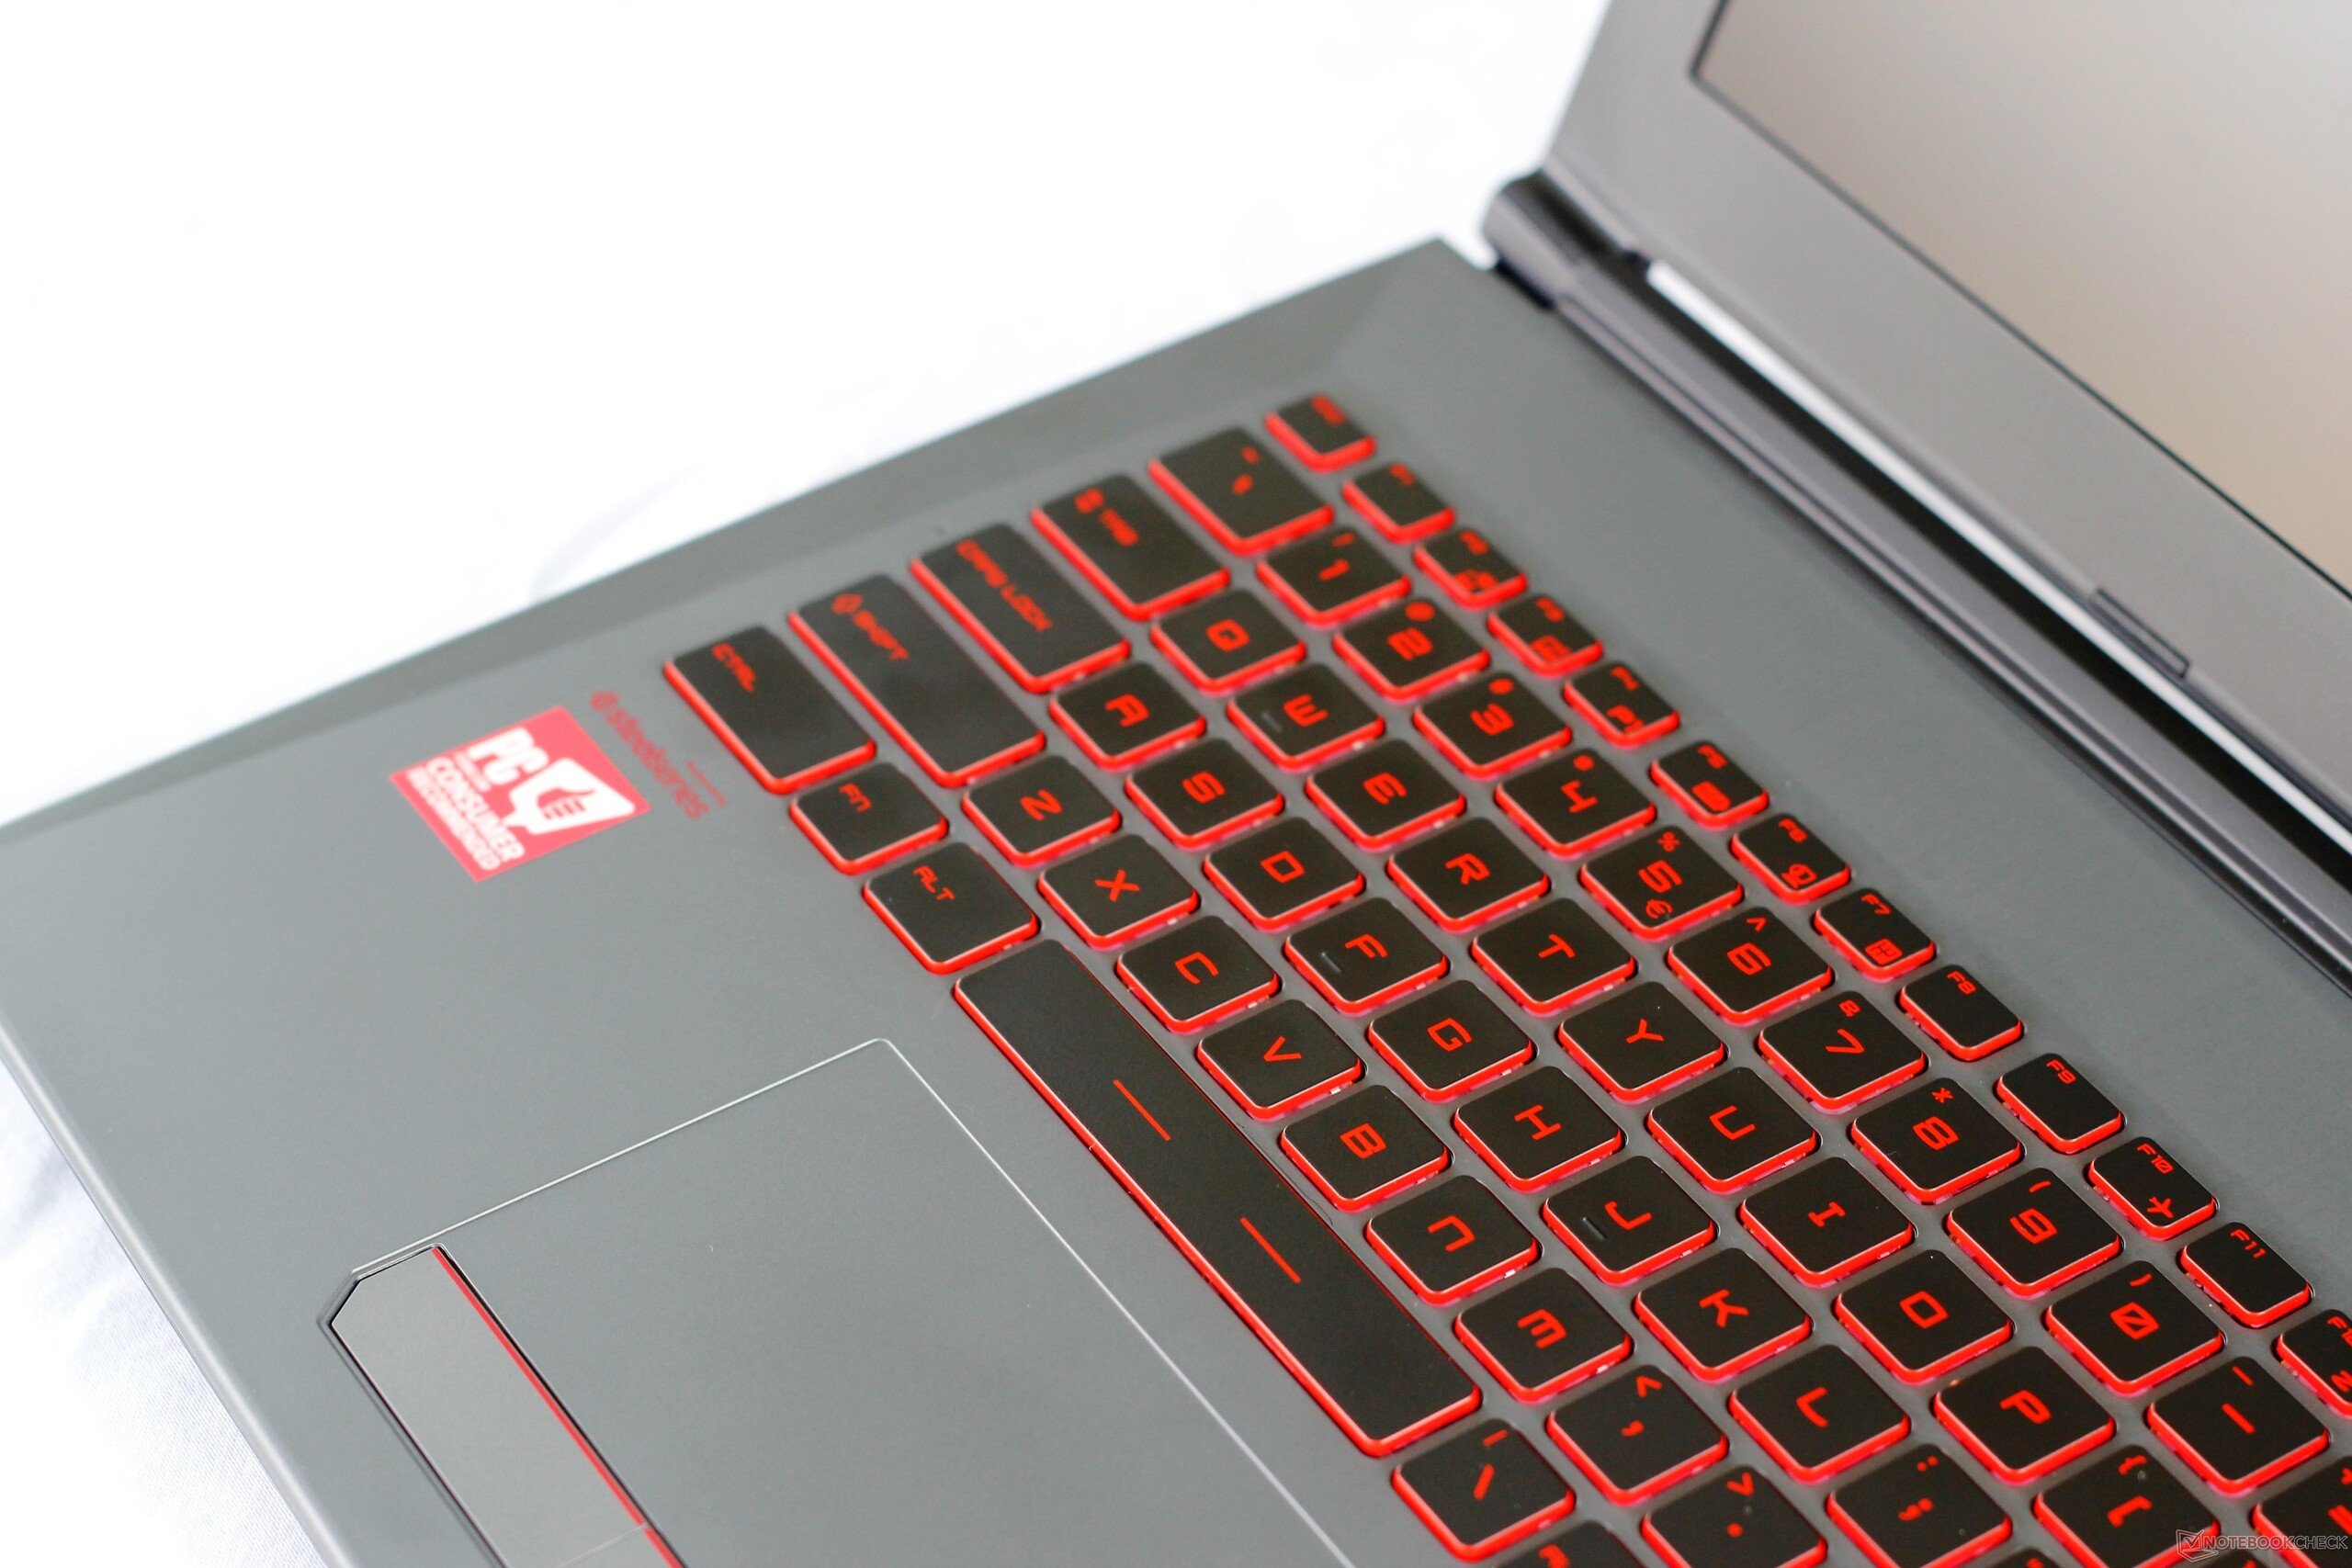
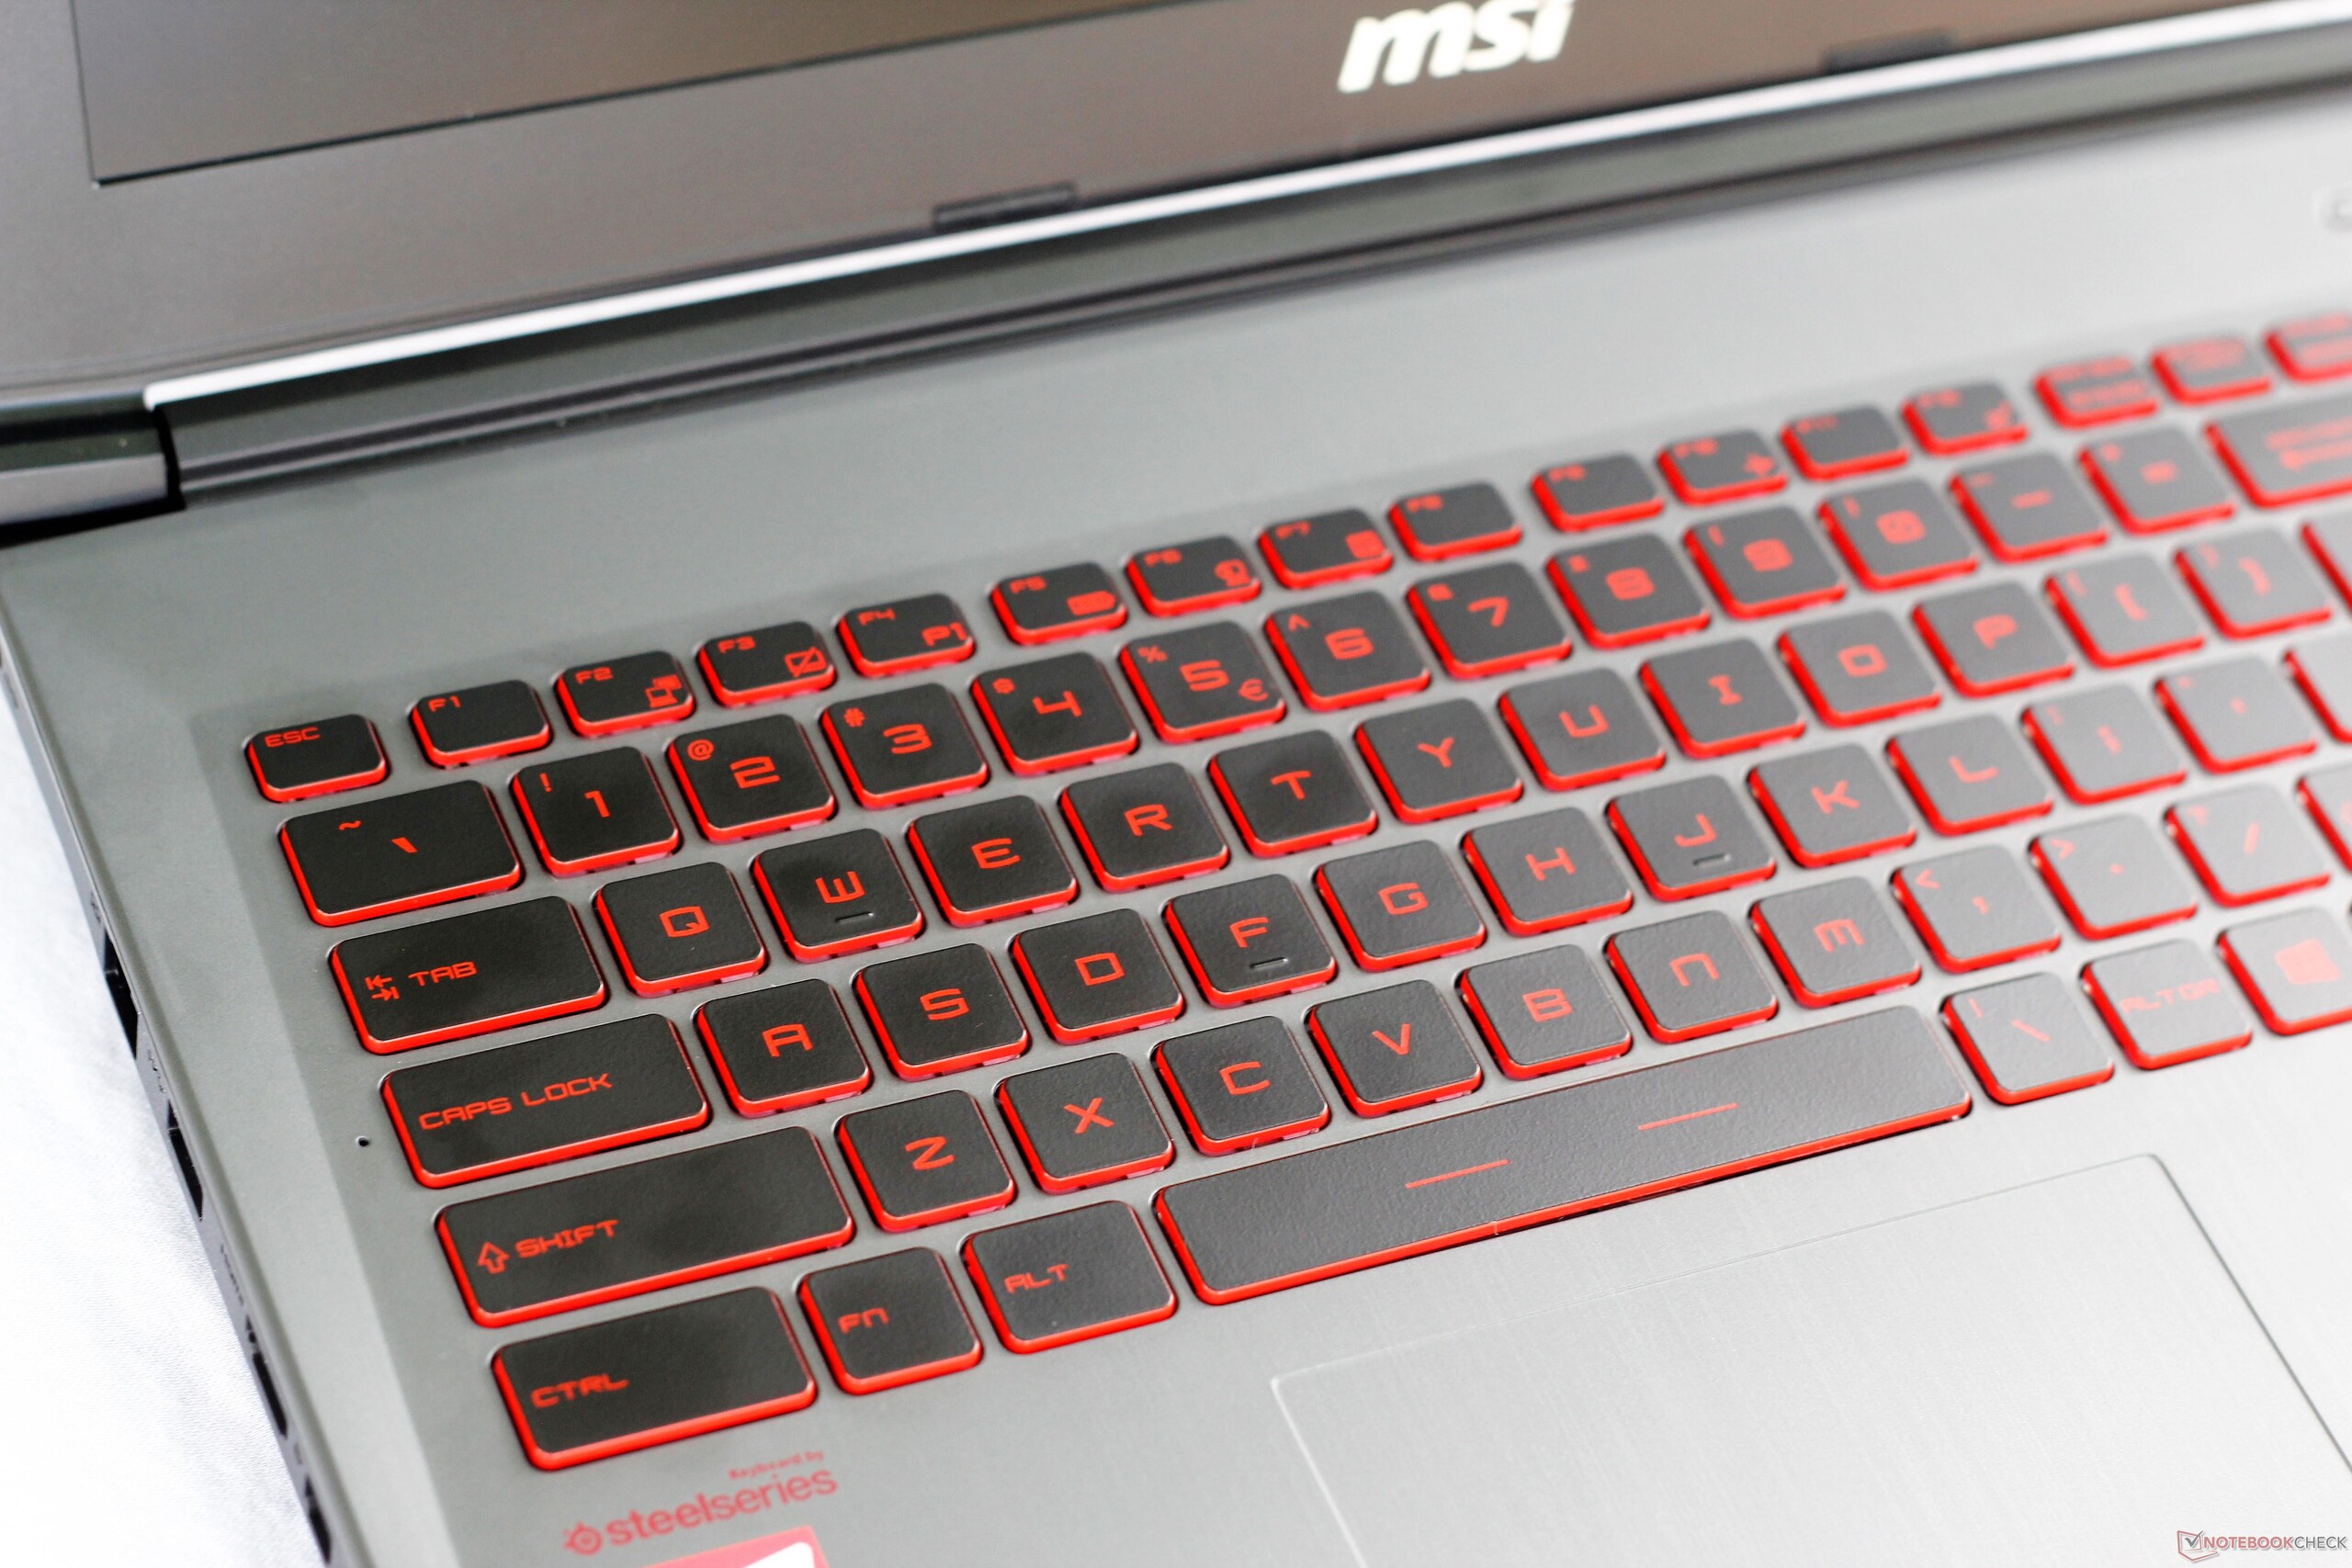
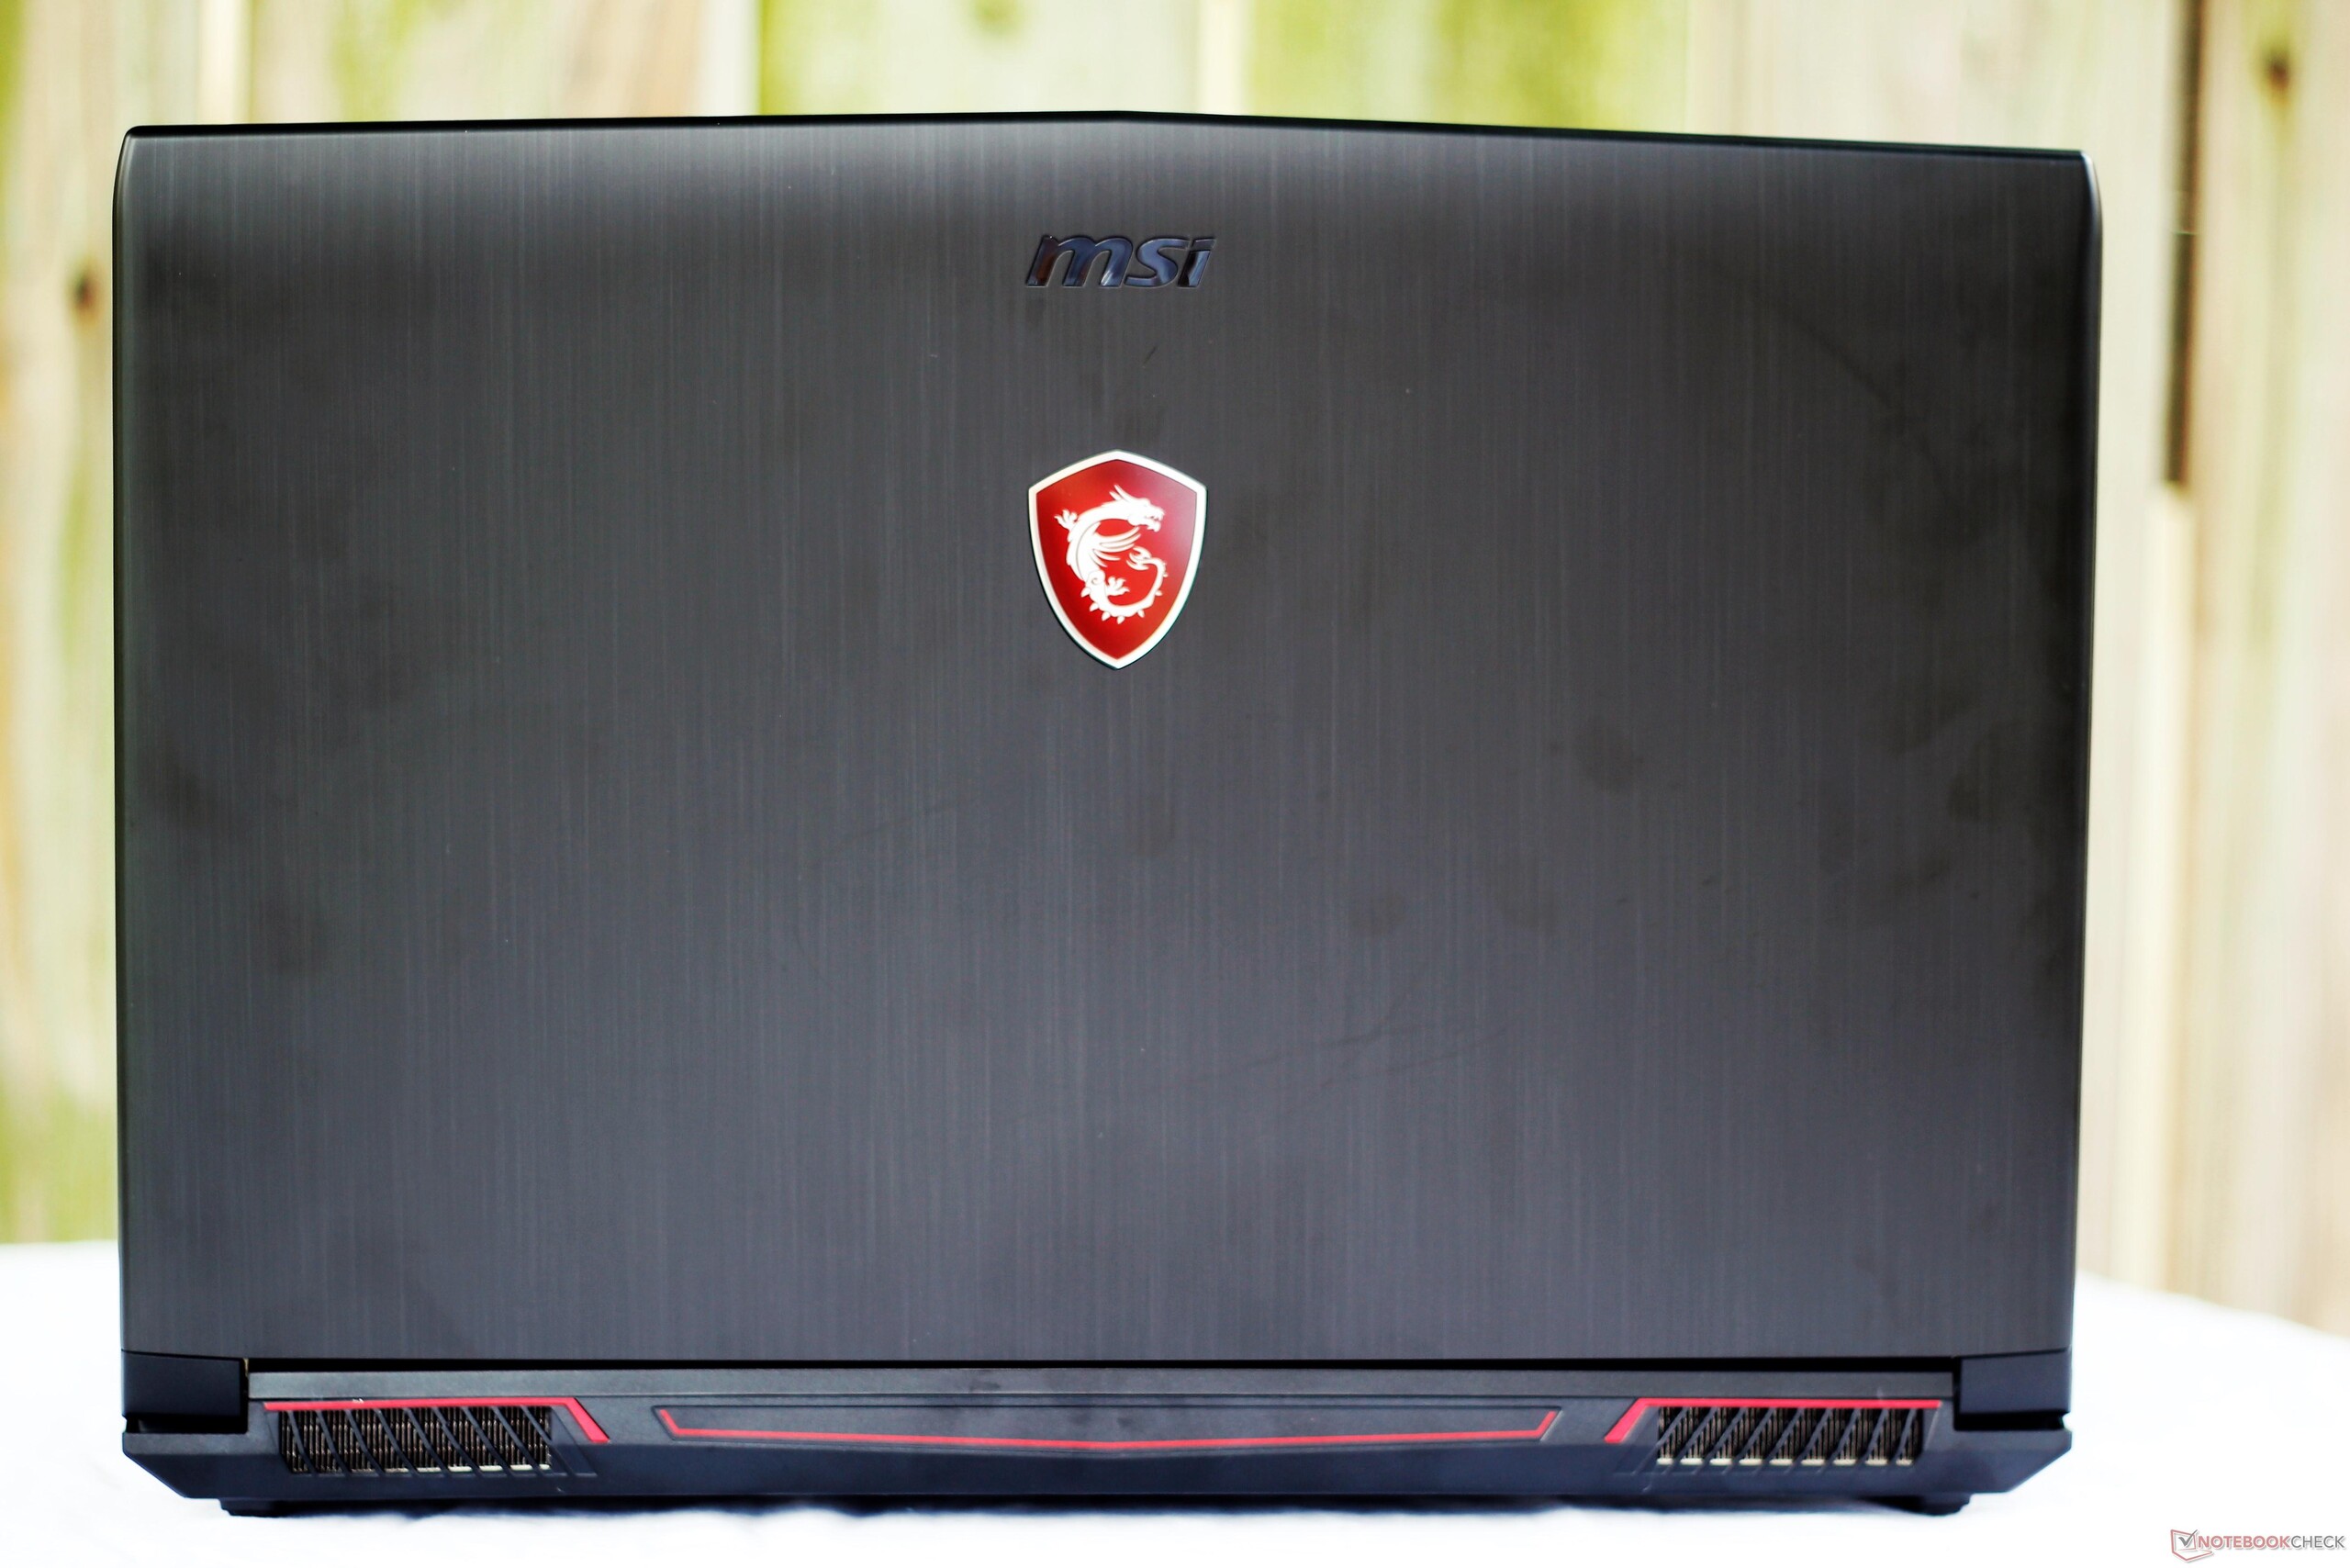
MSI est connu pour proposer un choix abondant de portables pour couvrir presque tous les besoins, mais il est peut-être en train de sursaturer son propre marché. Exemple, le modèle testé aujourd’hui. Le GV62 ne proposer rien qui ne peut être trouvé dans d’autres gammes de la marque. C’est une copie quasi-identique des GF62VR, GE62VR, GL62VR et GP62VR, tous proposés par MSI via diverses boutiques en ligne. Les châssis sont identiques, ainsi que les claviers, les systèmes de refroidissement, la sélection de ports, etc. La différence majeure réside dans les spécifications - même si toutes les séries proposent des configurations similaires - à défaut d’être parfaitement identiques.
Mis à part les autres portables MSI, le GV62 est un ordinateur portable de jeu d’entrée de gamme tout à fait acceptable. Pour 1 050 $, il remplit bien ses fonctions, surtout en ce qui concerne les performances. Le Core i5-8300H est bien adapté à la GTX 1060, une carte graphique difficile à trouver dans des portables à moins de 1 200 $. Par rapport aux autres portables de jeu d’entrée de gamme, le GV62 possède un meilleur rapport prix / performances pour les jeux et les tâches multithread. Mais cette amélioration des performances vient au prix du design du châssis, de la qualité d’écran, et de l’autonomie.
Le GV62 a beau être un appareil surnuméraire, il n’en demeure pas moins un bon choix pour les joueurs au budget serré. MSI tient là une bonne réplique aux seigneurs du jeu à budget serré que sont l’Acer Predator Helios 300 ou le Dell Inspiron 15 7577, qui sont tous bons pour leur prix. Les portable de jeu à petit budget ne se sont jamais aussi bien portés.
L’intégralité de cette critique est disponible en anglais en suivant ce lien.
MSI GV62 8RE-016US
- 06/21/2018 v6 (old)
Sam Medley
Price comparison
