Verdict : le strict minimum pour le bureau
En tant qu'ordinateur portable de bureau d'entrée de gamme, le MSI Venture 16 couvre la plupart des éléments de base attendus pour la catégorie, y compris la facilité d'entretien, un pavé numérique intégré, et un design gris et inoffensif. Sa construction relativement épaisse permet au processeur Core-H de fonctionner plus froidement que d'habitude, alors que beaucoup d'autres ordinateurs portables professionnels à petit budget sont équipés d'options Core-U ou Core-V plus lentes. Des alternatives comme le Dell 16 Plus ou le Lenovo ThinkPad E16 G3 sont plus légers et disposent de plus d'options d'affichage que notre MSI, mais ils sont également équipés de processeurs plus lents.
D'un autre côté, plusieurs aspects du Venture 16 peuvent sembler décevants, même d'un point de vue bureautique. Le poids relativement lourd, la terrible webcam 720p, la dépendance aux anciens adaptateurs secteur à barillet et l'absence de plusieurs ports USB-C peuvent rebuter les voyageurs qui cherchent à augmenter leur productivité mobile. En outre, les couleurs de l'écran IPS de base sont impropres à la plupart des éditions graphiques et nous recommandons donc de considérer le panneau OLED bien supérieur pour environ 200 $ de plus.
Points positifs
Points négatifs
Prix et disponibilité
Le MSI 16 AI avec Core Ultra 7 255H, écran tactile 1200p IPS, 32 Go de RAM et 512 Go de SSD est disponible sur Amazon pour 1030 $. Une configuration similaire, mais avec un écran OLED, est disponible sur Best Buy pour 1200 $.
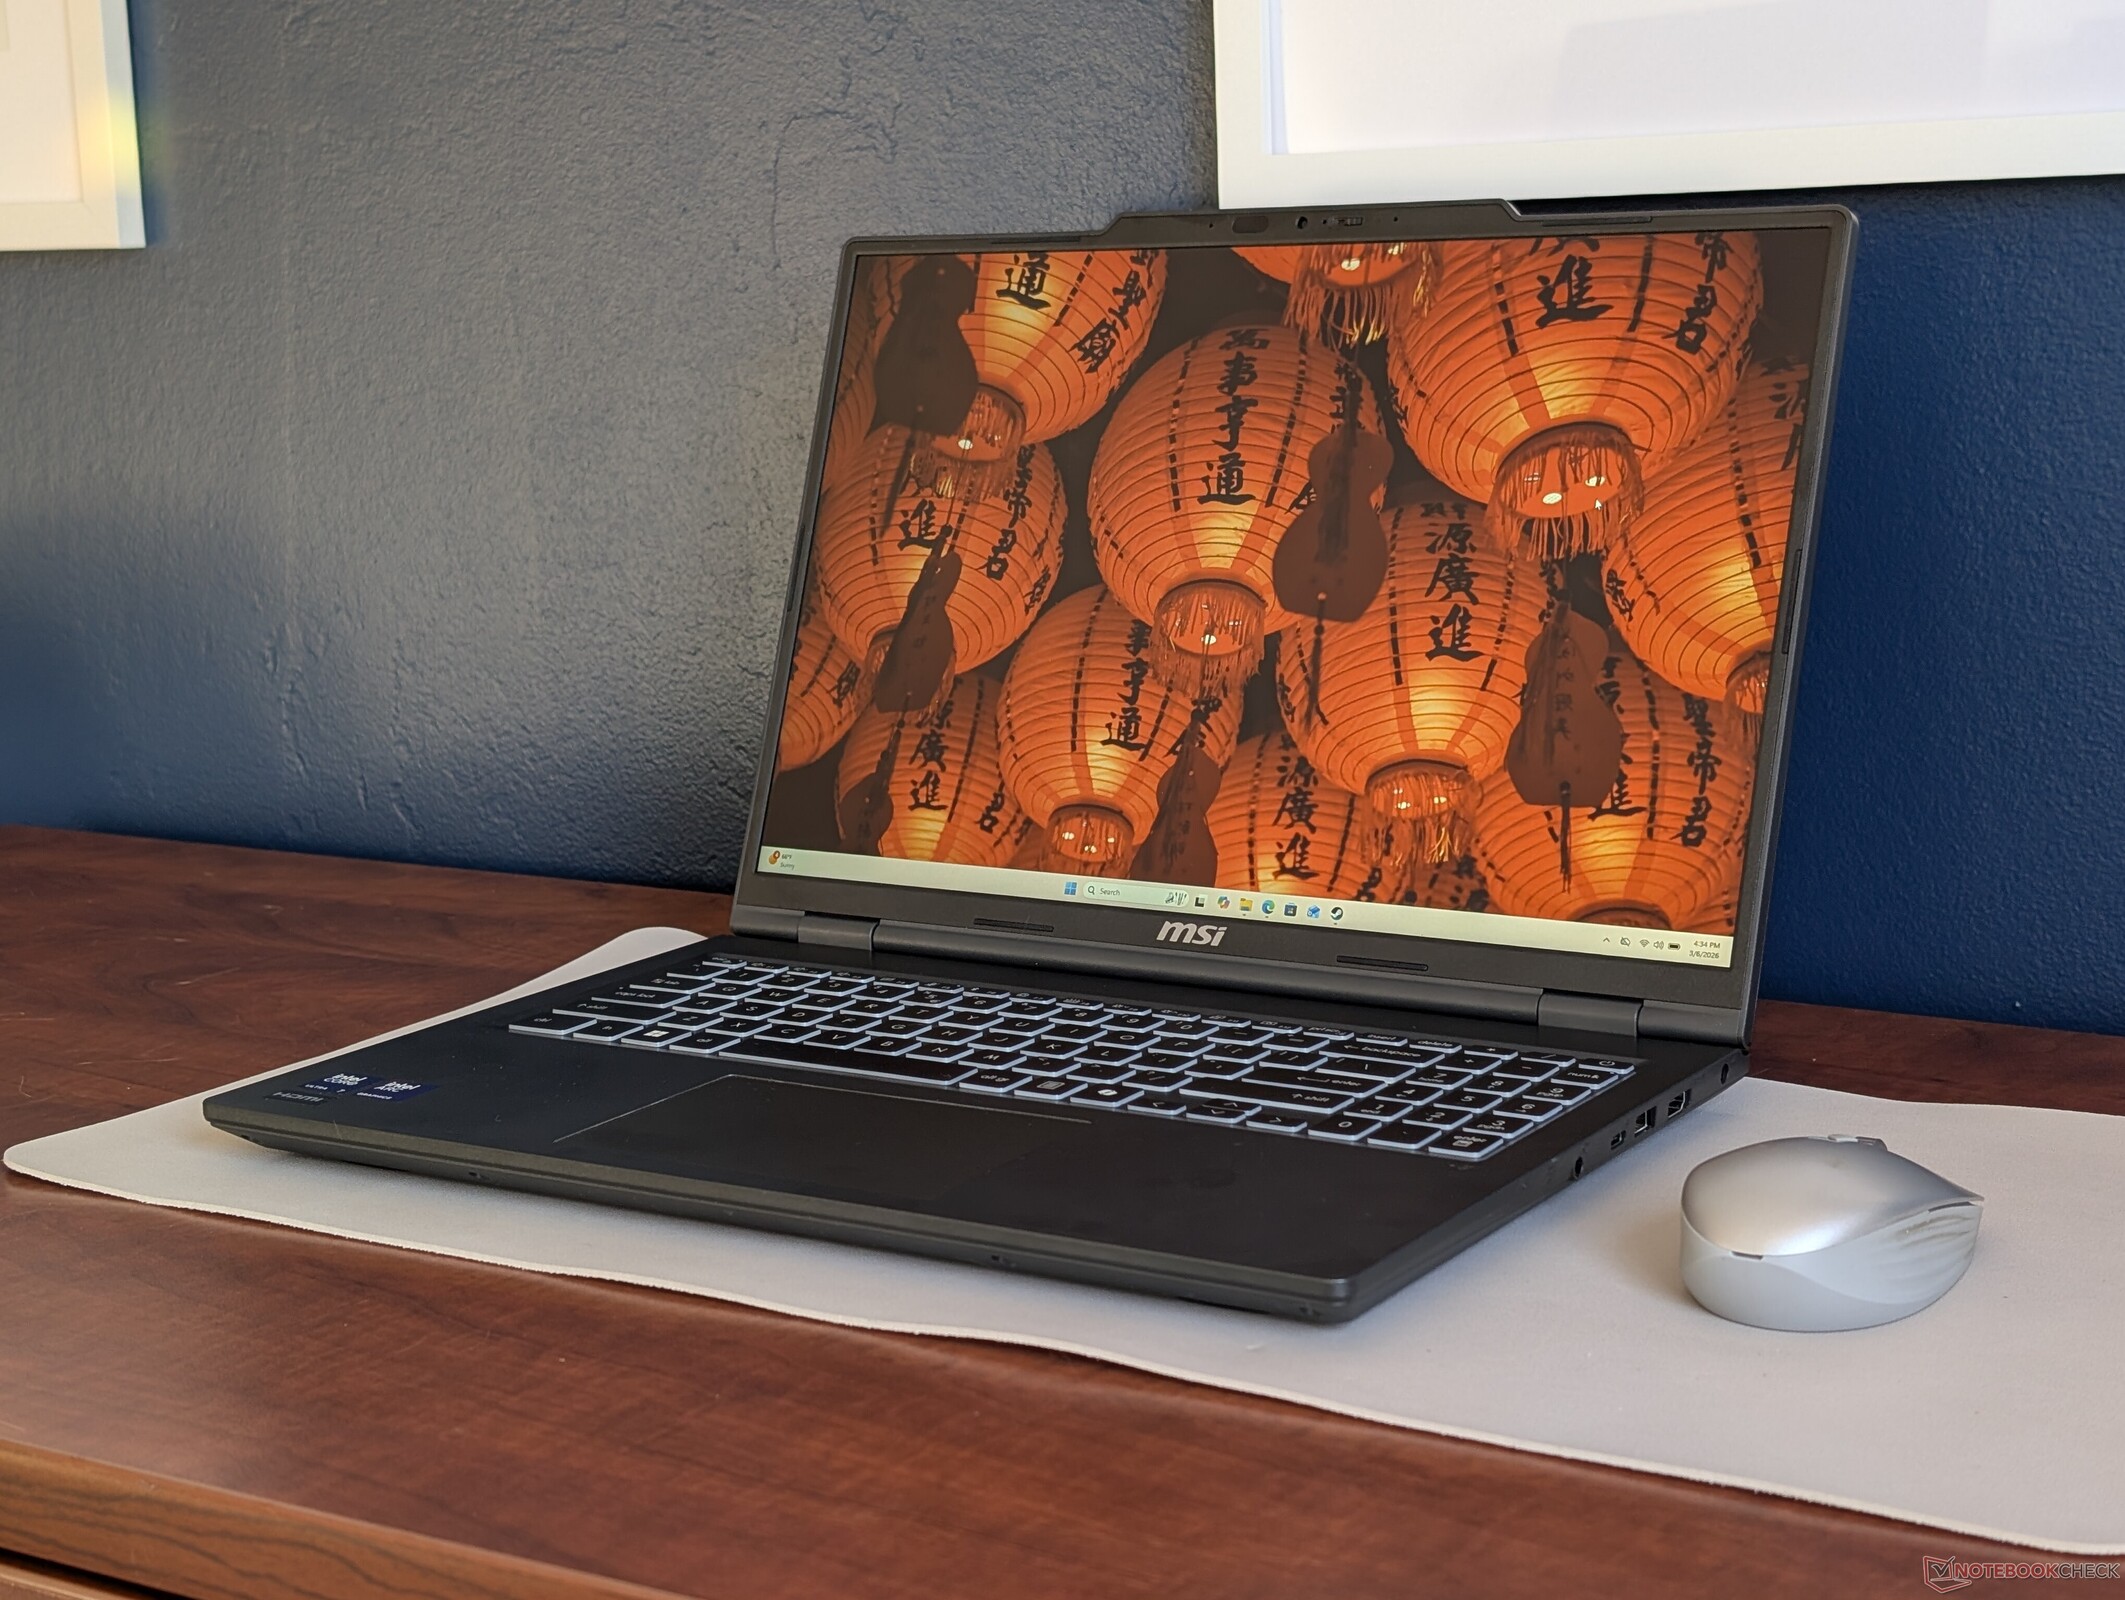
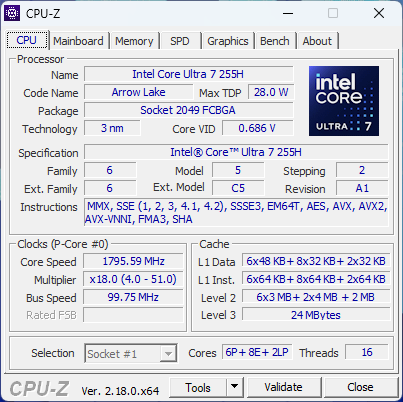
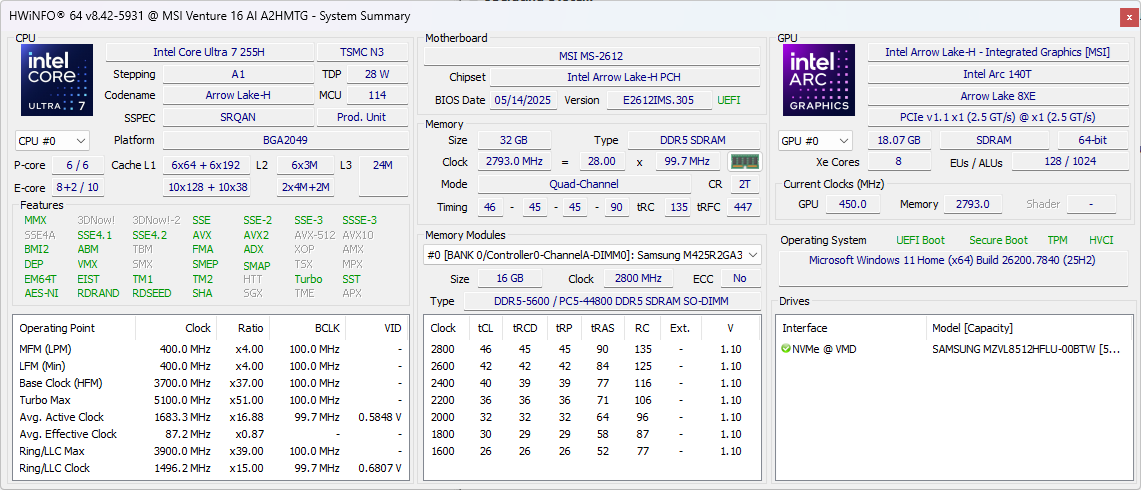
Le Venture 16 est l'ordinateur portable de bureau d'entrée de gamme de MSI, conçu pour compléter la série Prestige plus haut de gamme. Notre modèle de test est équipé du processeur Core Ultra 7 255H d'Arrow Lake et d'un écran tactile IPS 1200p pour un prix de détail d'environ 900 USD. Les configurations plus haut de gamme peuvent être livrées avec le Core Ultra 9 285H et un écran OLED 1280p à la place.
Le Venture 16 peut être remplacé par d'autres ordinateurs portables de bureau bon marché comme les séries Dell Inspiron, HP ProBook ou Pavilion, ou encore la série Lenovo ThinkPad E.
Plus d'avis sur MSI :
Spécifications
Cas
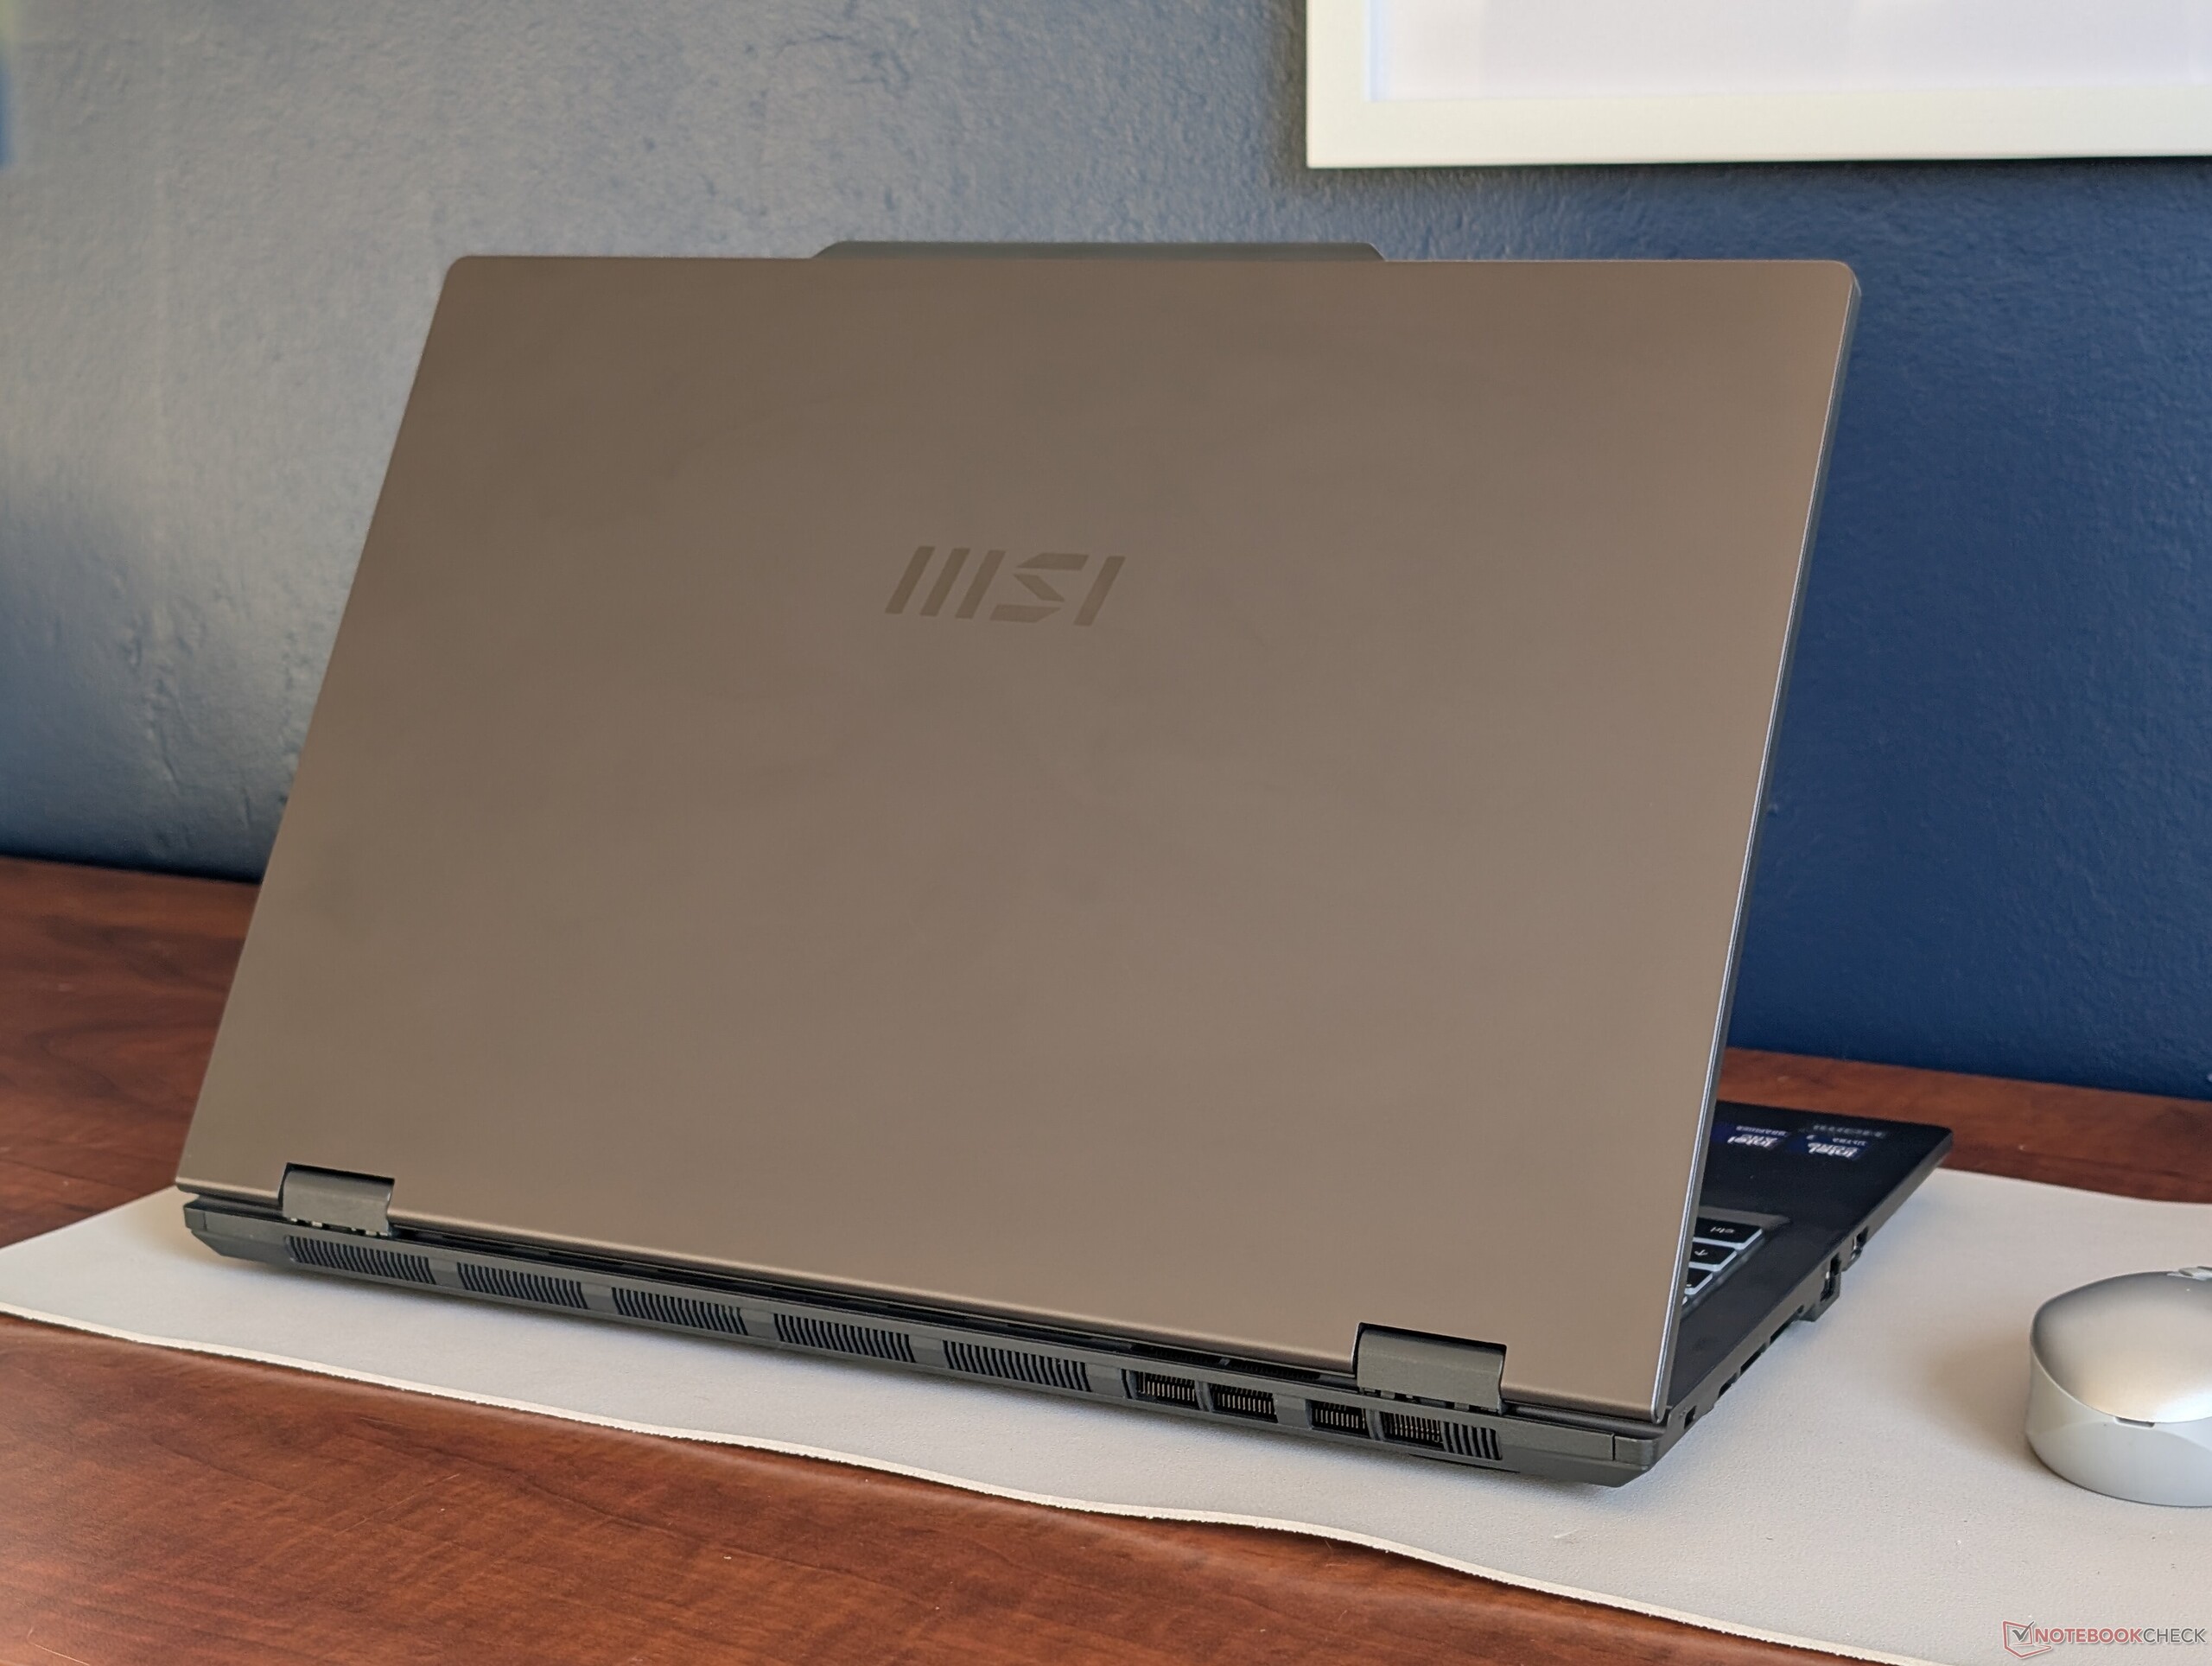
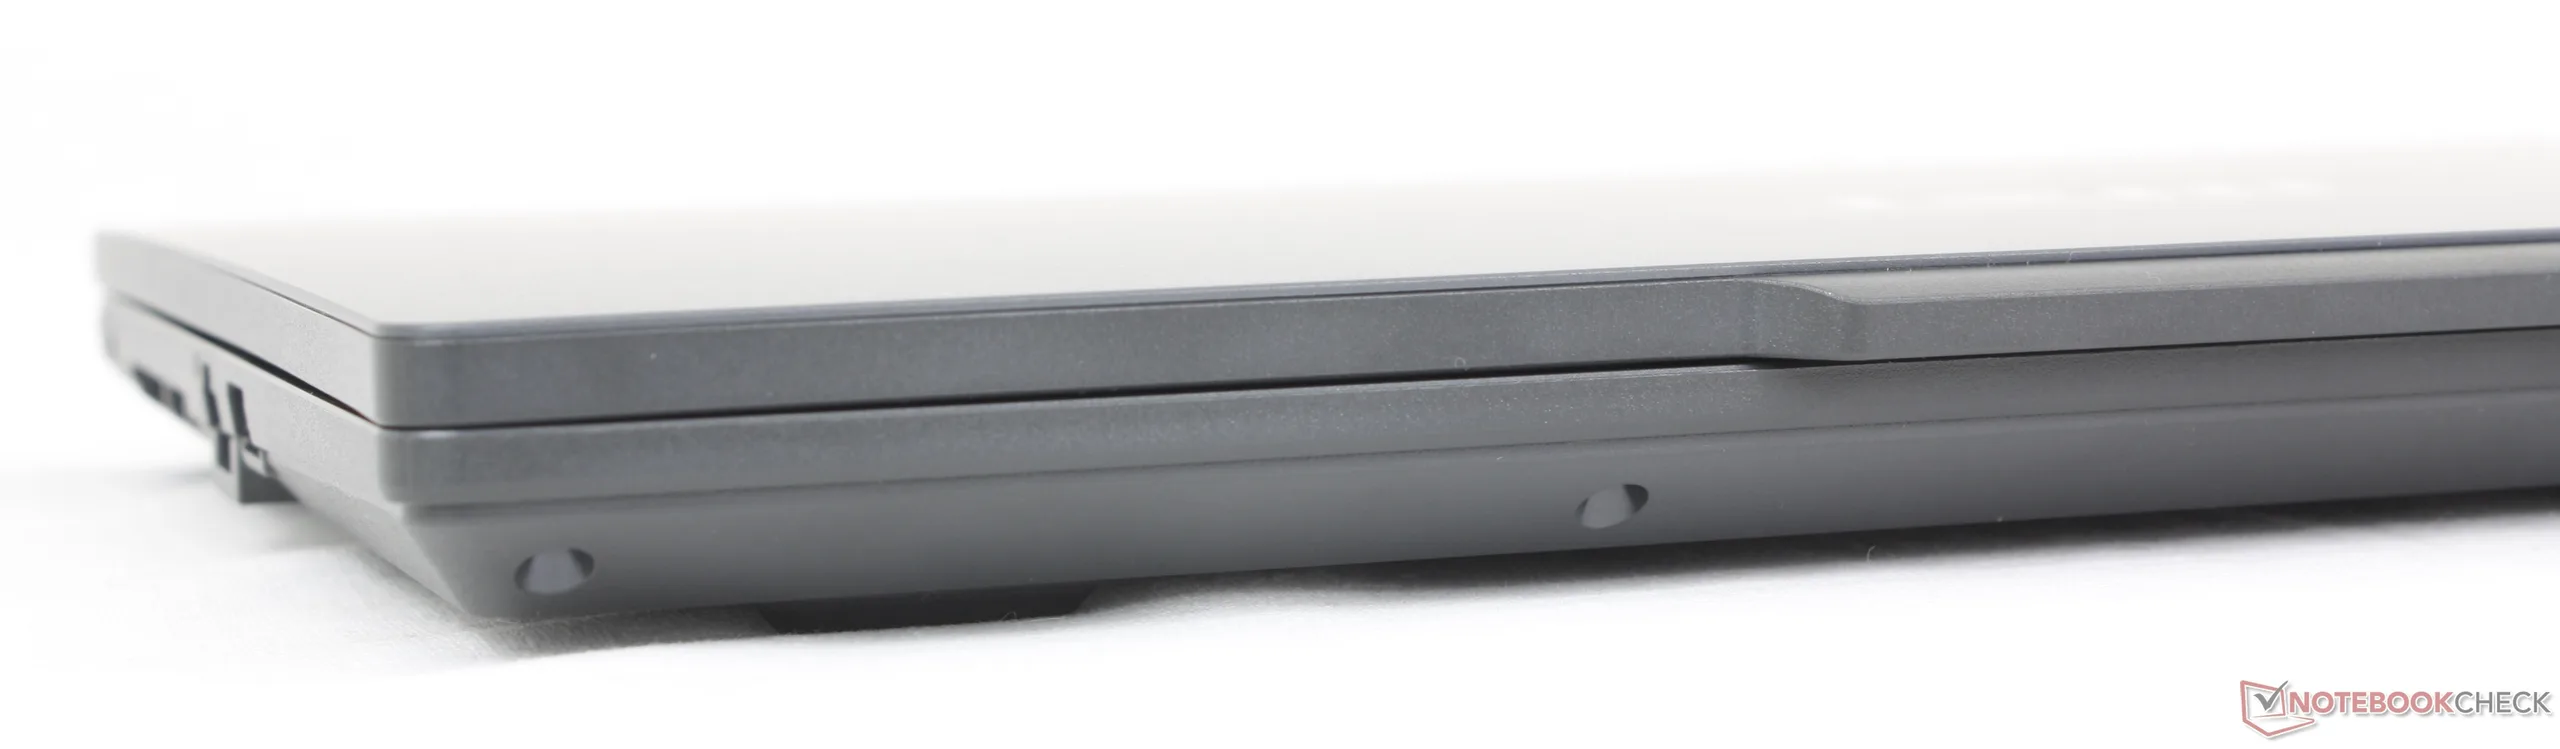
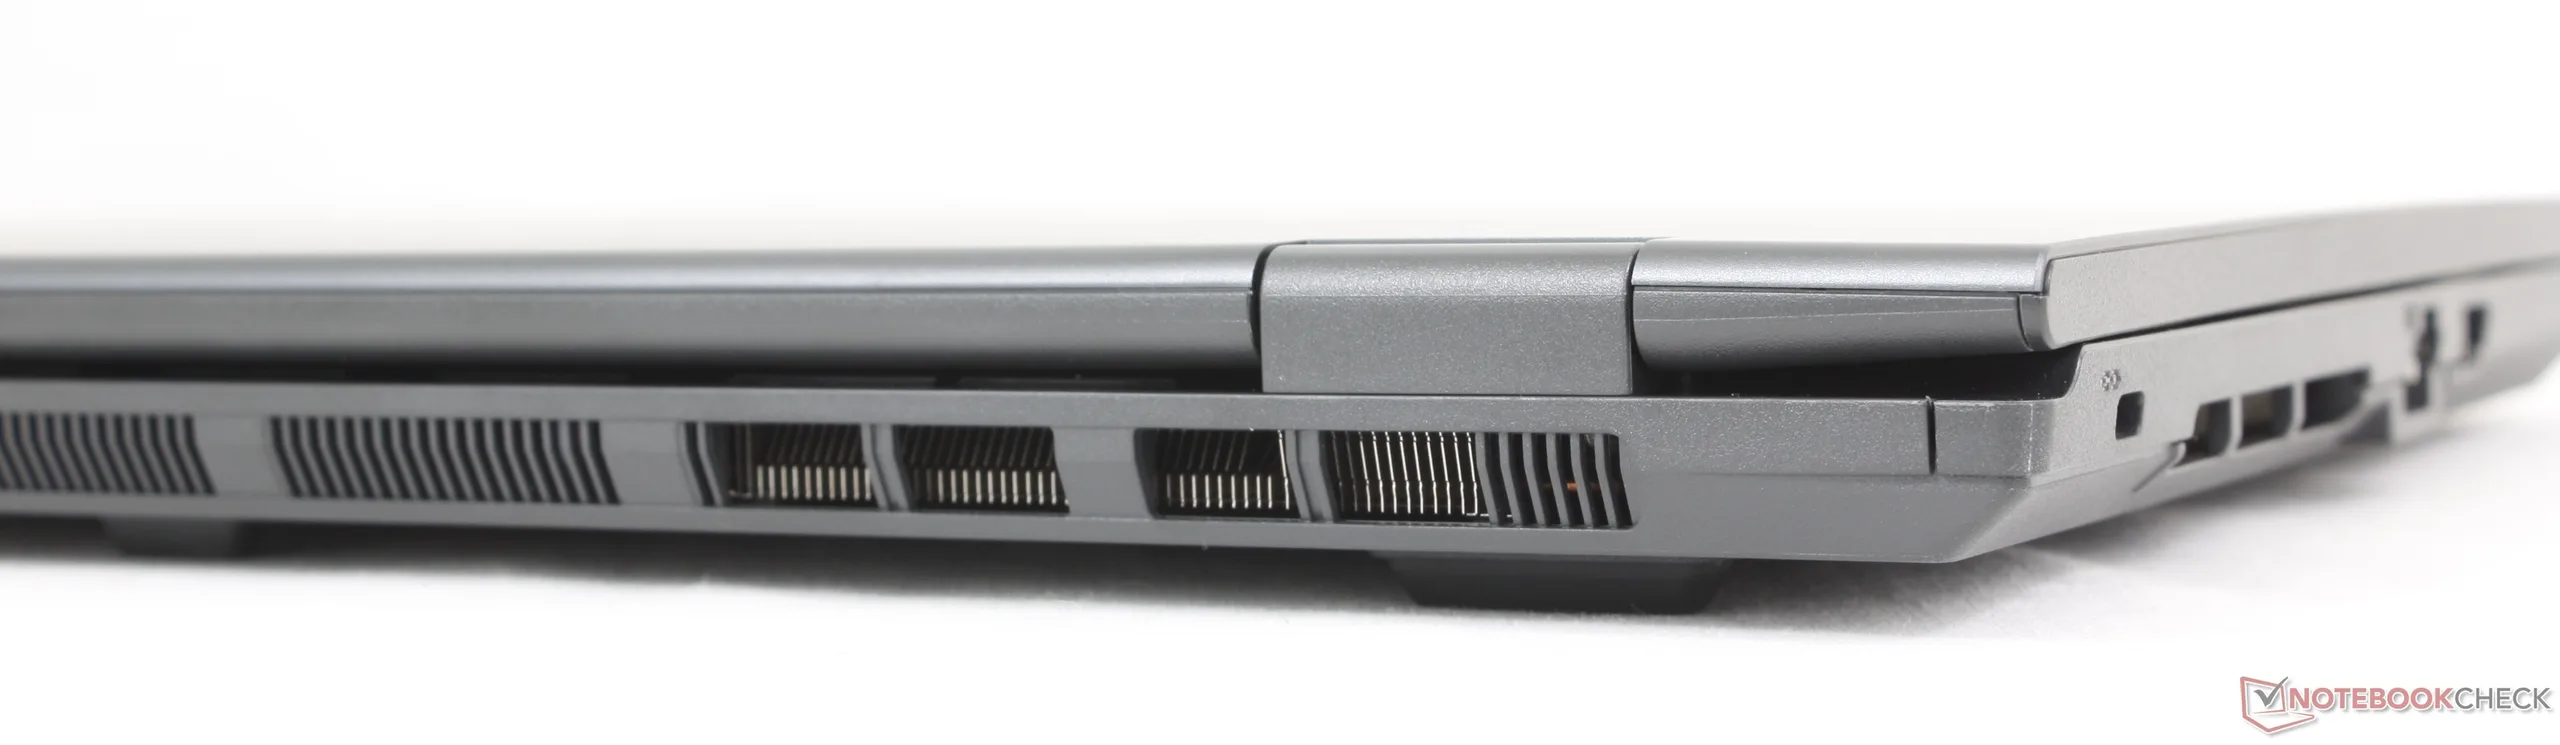
Le châssis est principalement constitué de plastique mat et lisse avec une rigidité décente pour maintenir les coûts à un niveau bas. Il est intéressant de noter que le système est plus lourd et plus épais que beaucoup d'autres ordinateurs portables de 16 pouces, mais qu'il est moins encombrant grâce à ses bords plus étroits.
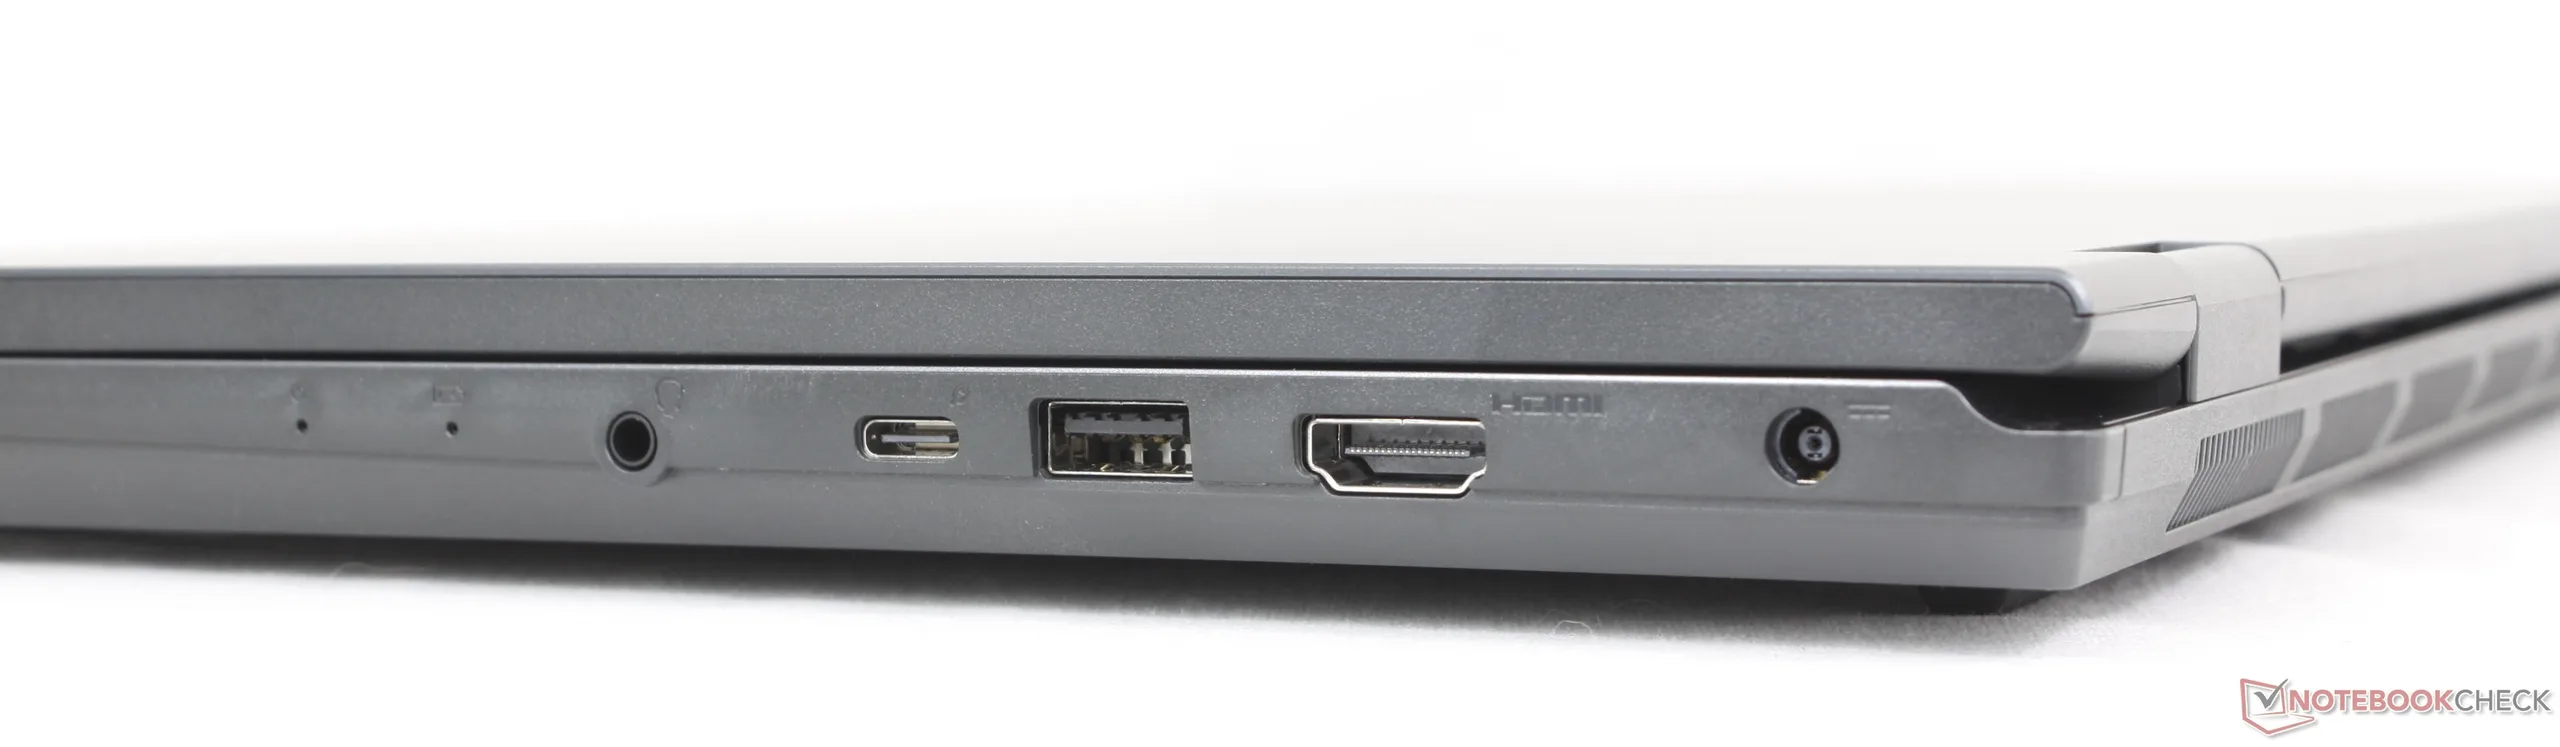
Connectivité
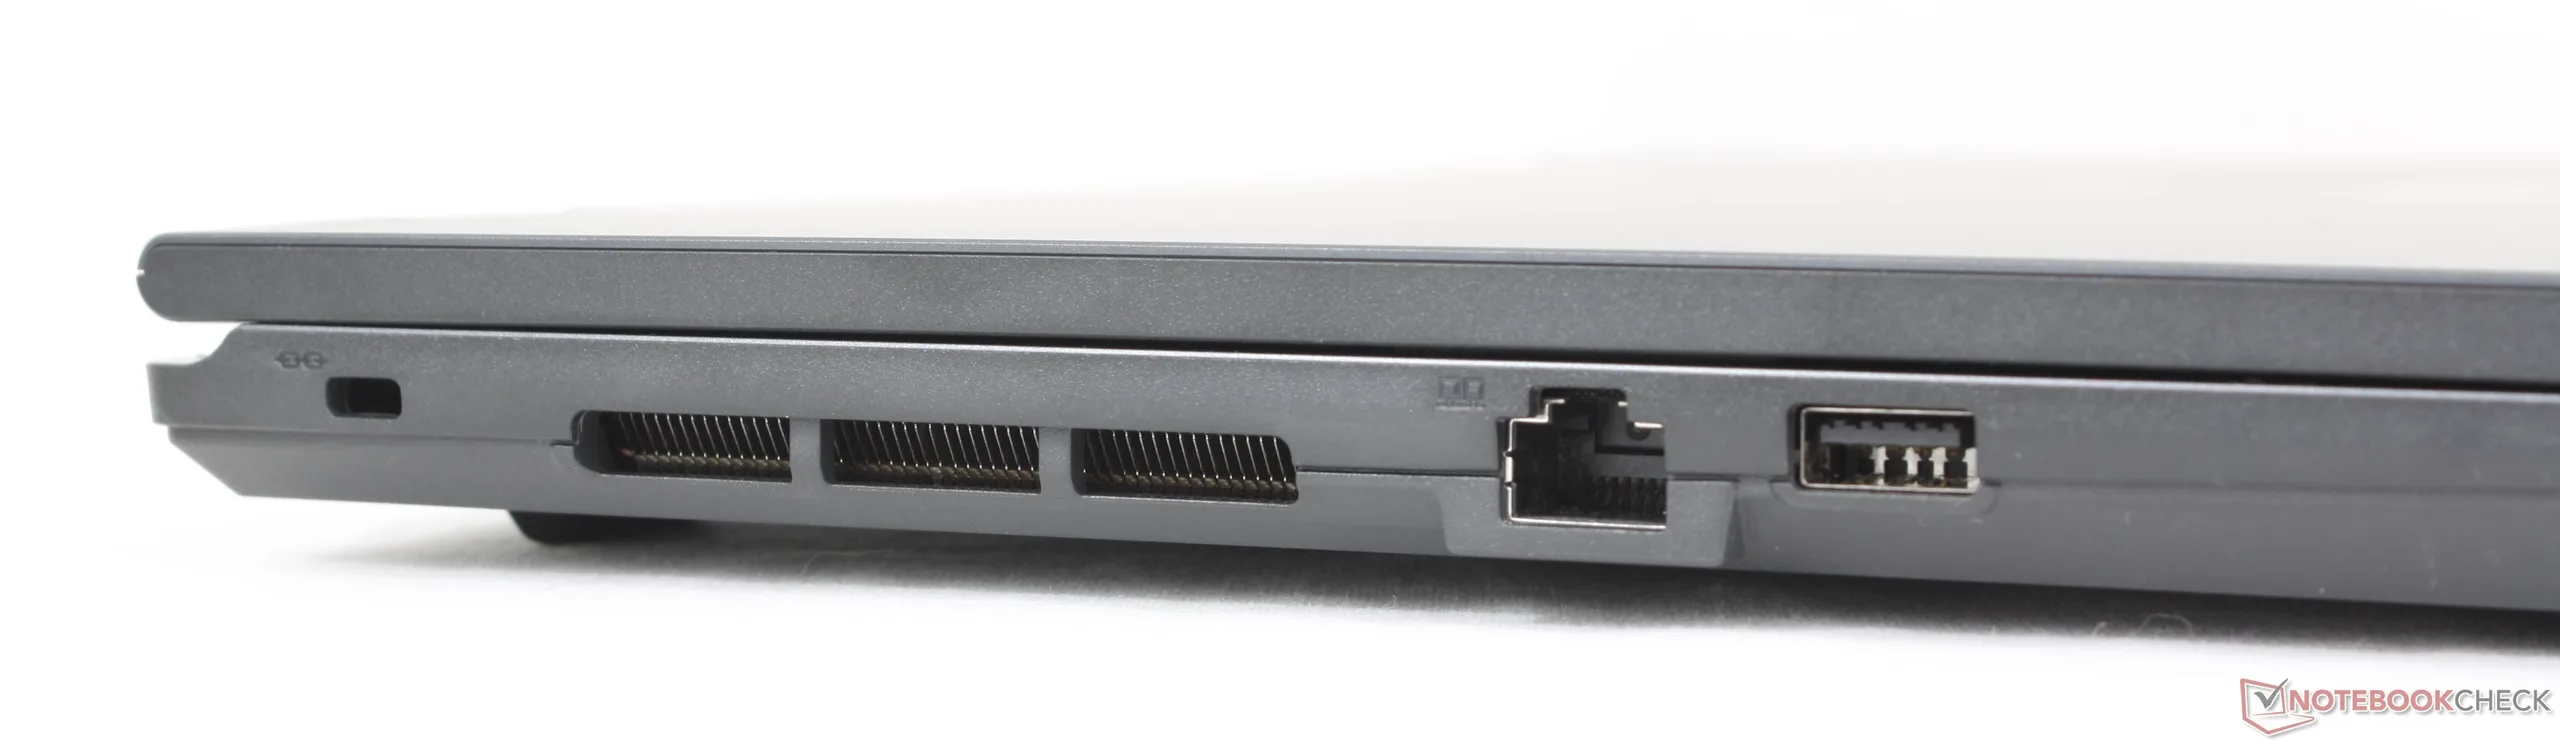
Les options de port pourraient être meilleures compte tenu du grand facteur de forme de 16 pouces. Par exemple, il n'y a qu'un seul port USB-C, contre deux sur la plupart des autres ordinateurs portables, y compris le Dell 16 Plus.
Communication
| Networking | |
| iperf3 transmit AXE11000 | |
| Lenovo IdeaPad Slim 5 16AKP10 | |
| Dell 16 Plus 2-in-1 | |
| MSI Prestige 16 B1MG-001US | |
| HP Pavilion 16-ag0057ng | |
| Asus V16 V3607V | |
| MSI Venture 16 AI A2HMTG | |
| iperf3 receive AXE11000 | |
| Lenovo IdeaPad Slim 5 16AKP10 | |
| MSI Prestige 16 B1MG-001US | |
| Dell 16 Plus 2-in-1 | |
| HP Pavilion 16-ag0057ng | |
| Asus V16 V3607V | |
| MSI Venture 16 AI A2HMTG | |
| iperf3 transmit AXE11000 6GHz | |
| Dell 16 Plus 2-in-1 | |
| MSI Prestige 16 B1MG-001US | |
| MSI Venture 16 AI A2HMTG | |
| iperf3 receive AXE11000 6GHz | |
| Dell 16 Plus 2-in-1 | |
| MSI Venture 16 AI A2HMTG | |
| MSI Prestige 16 B1MG-001US | |
Webcam


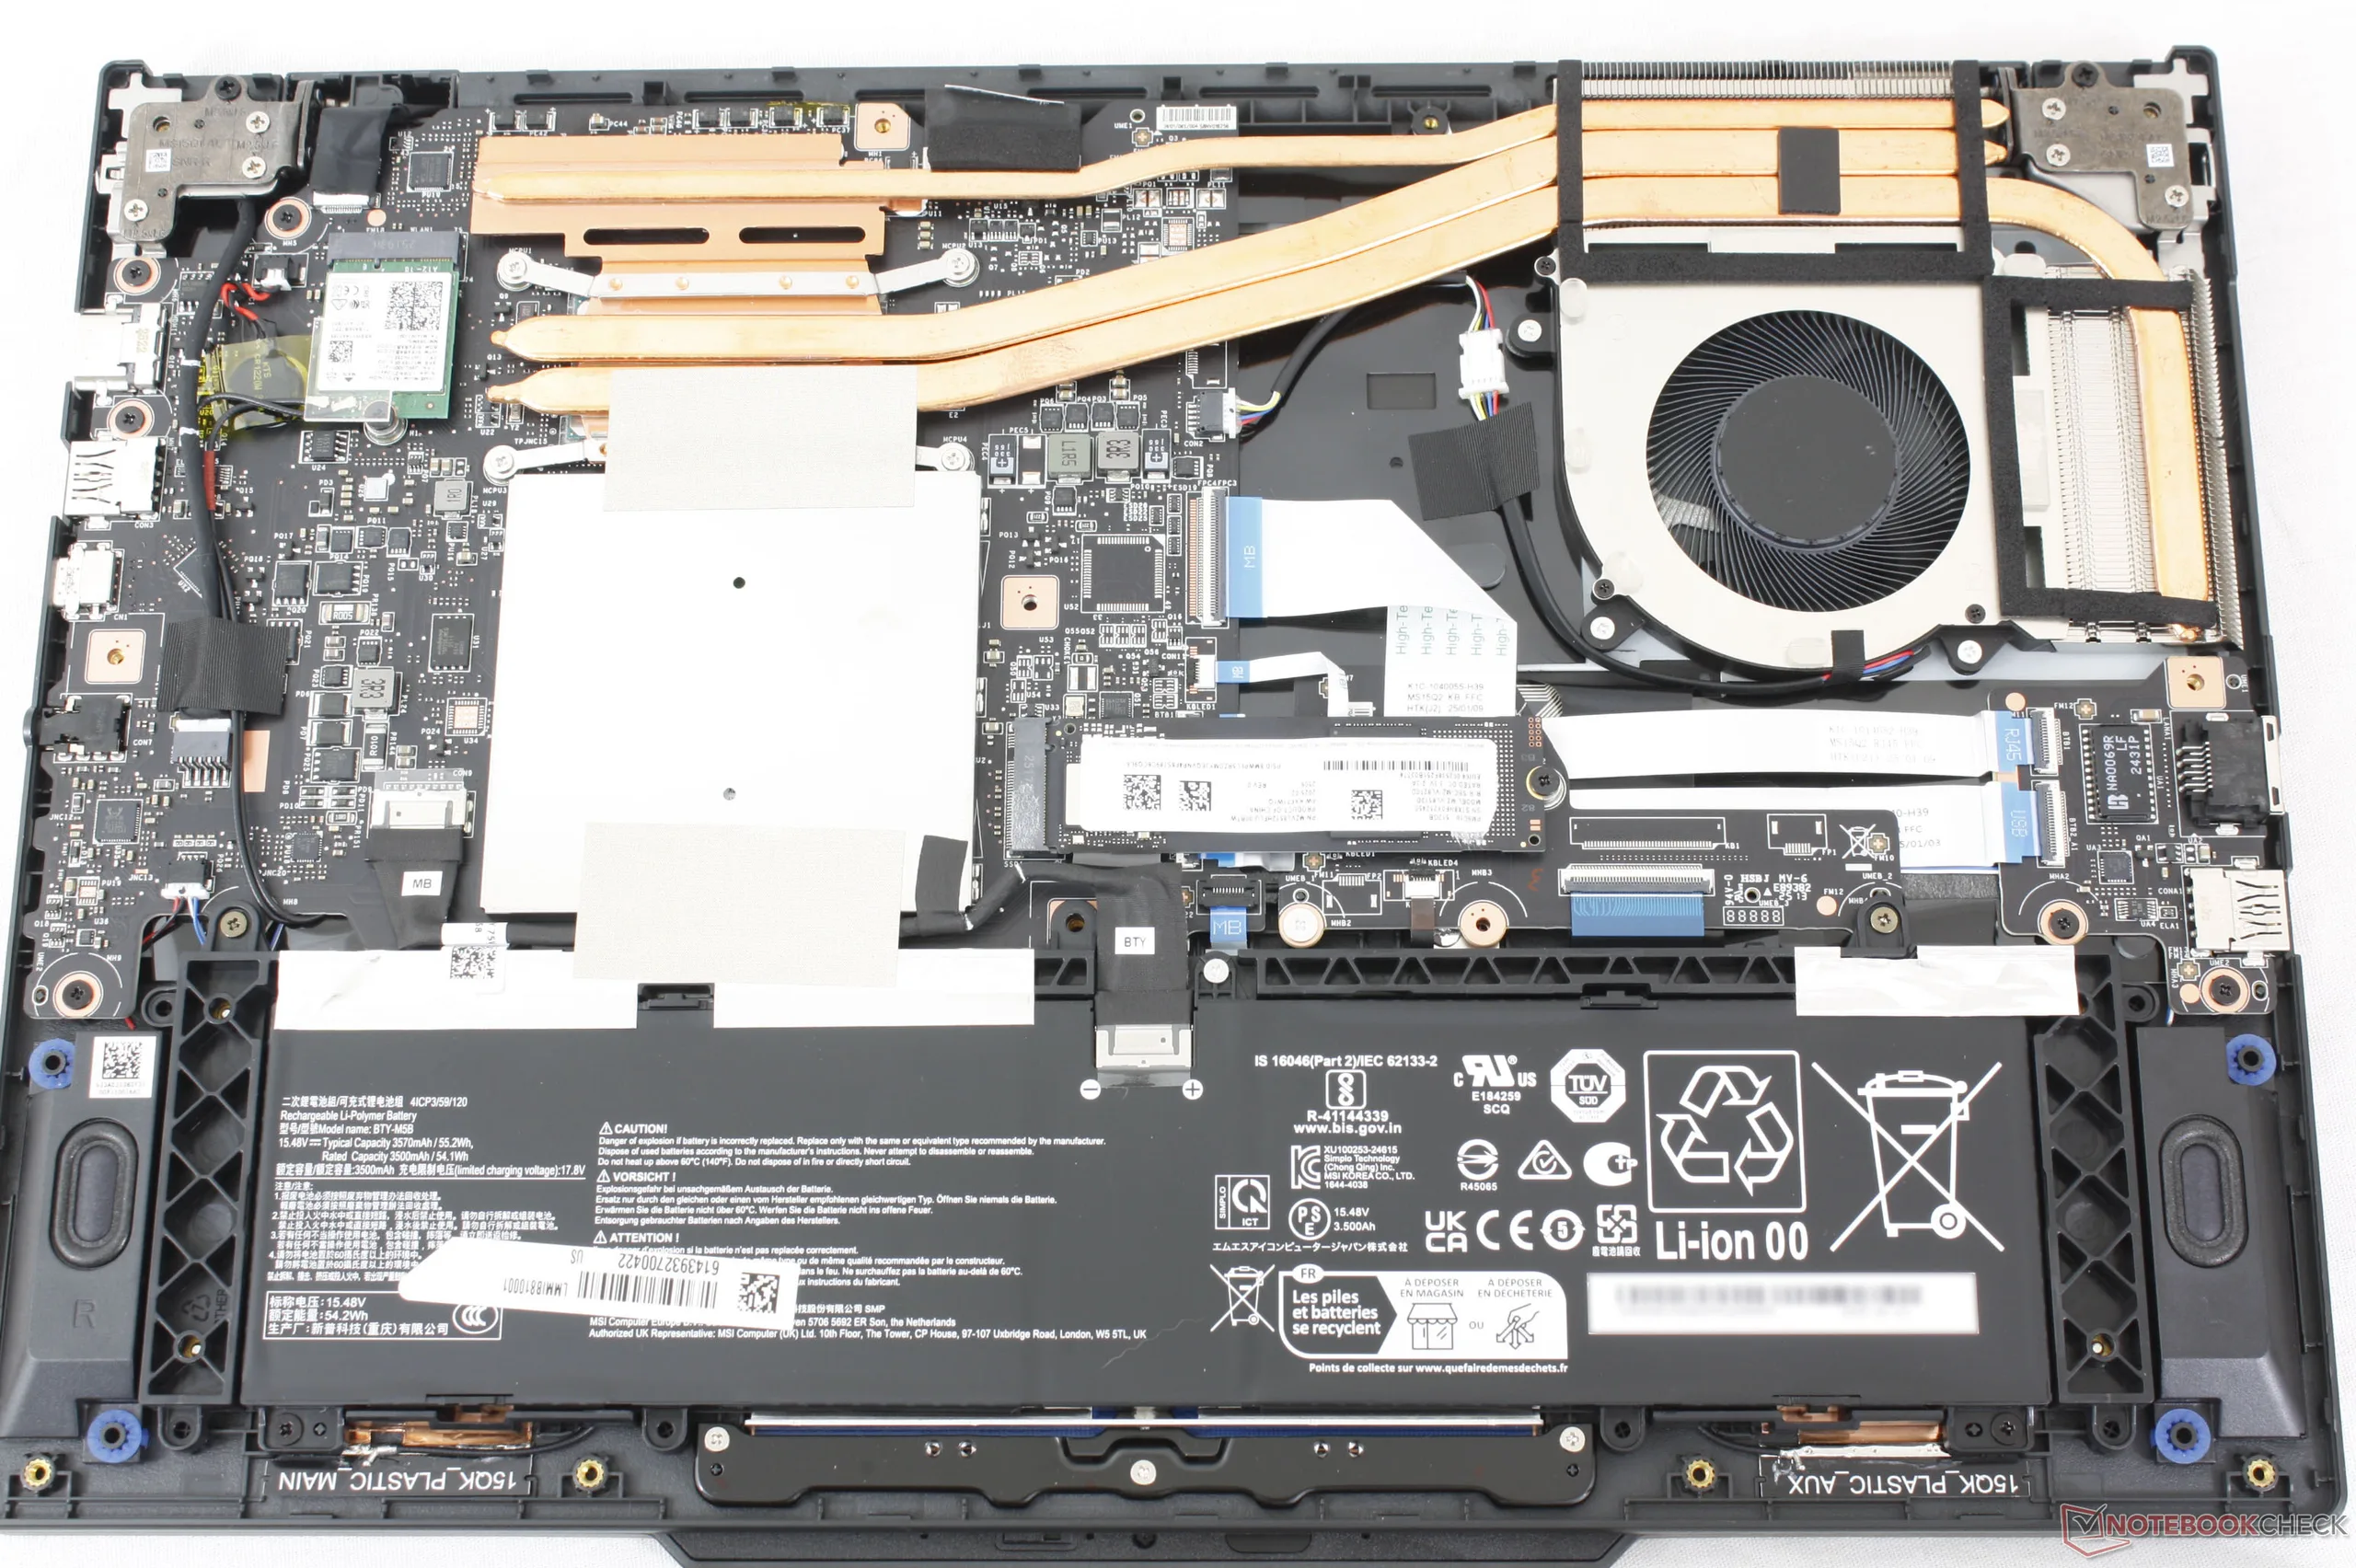
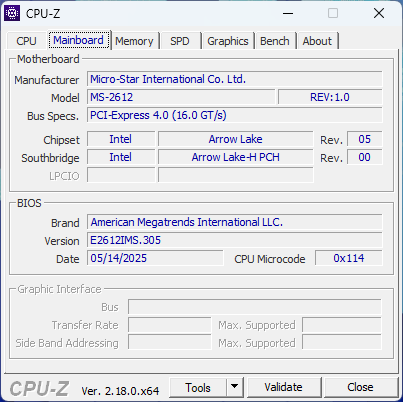
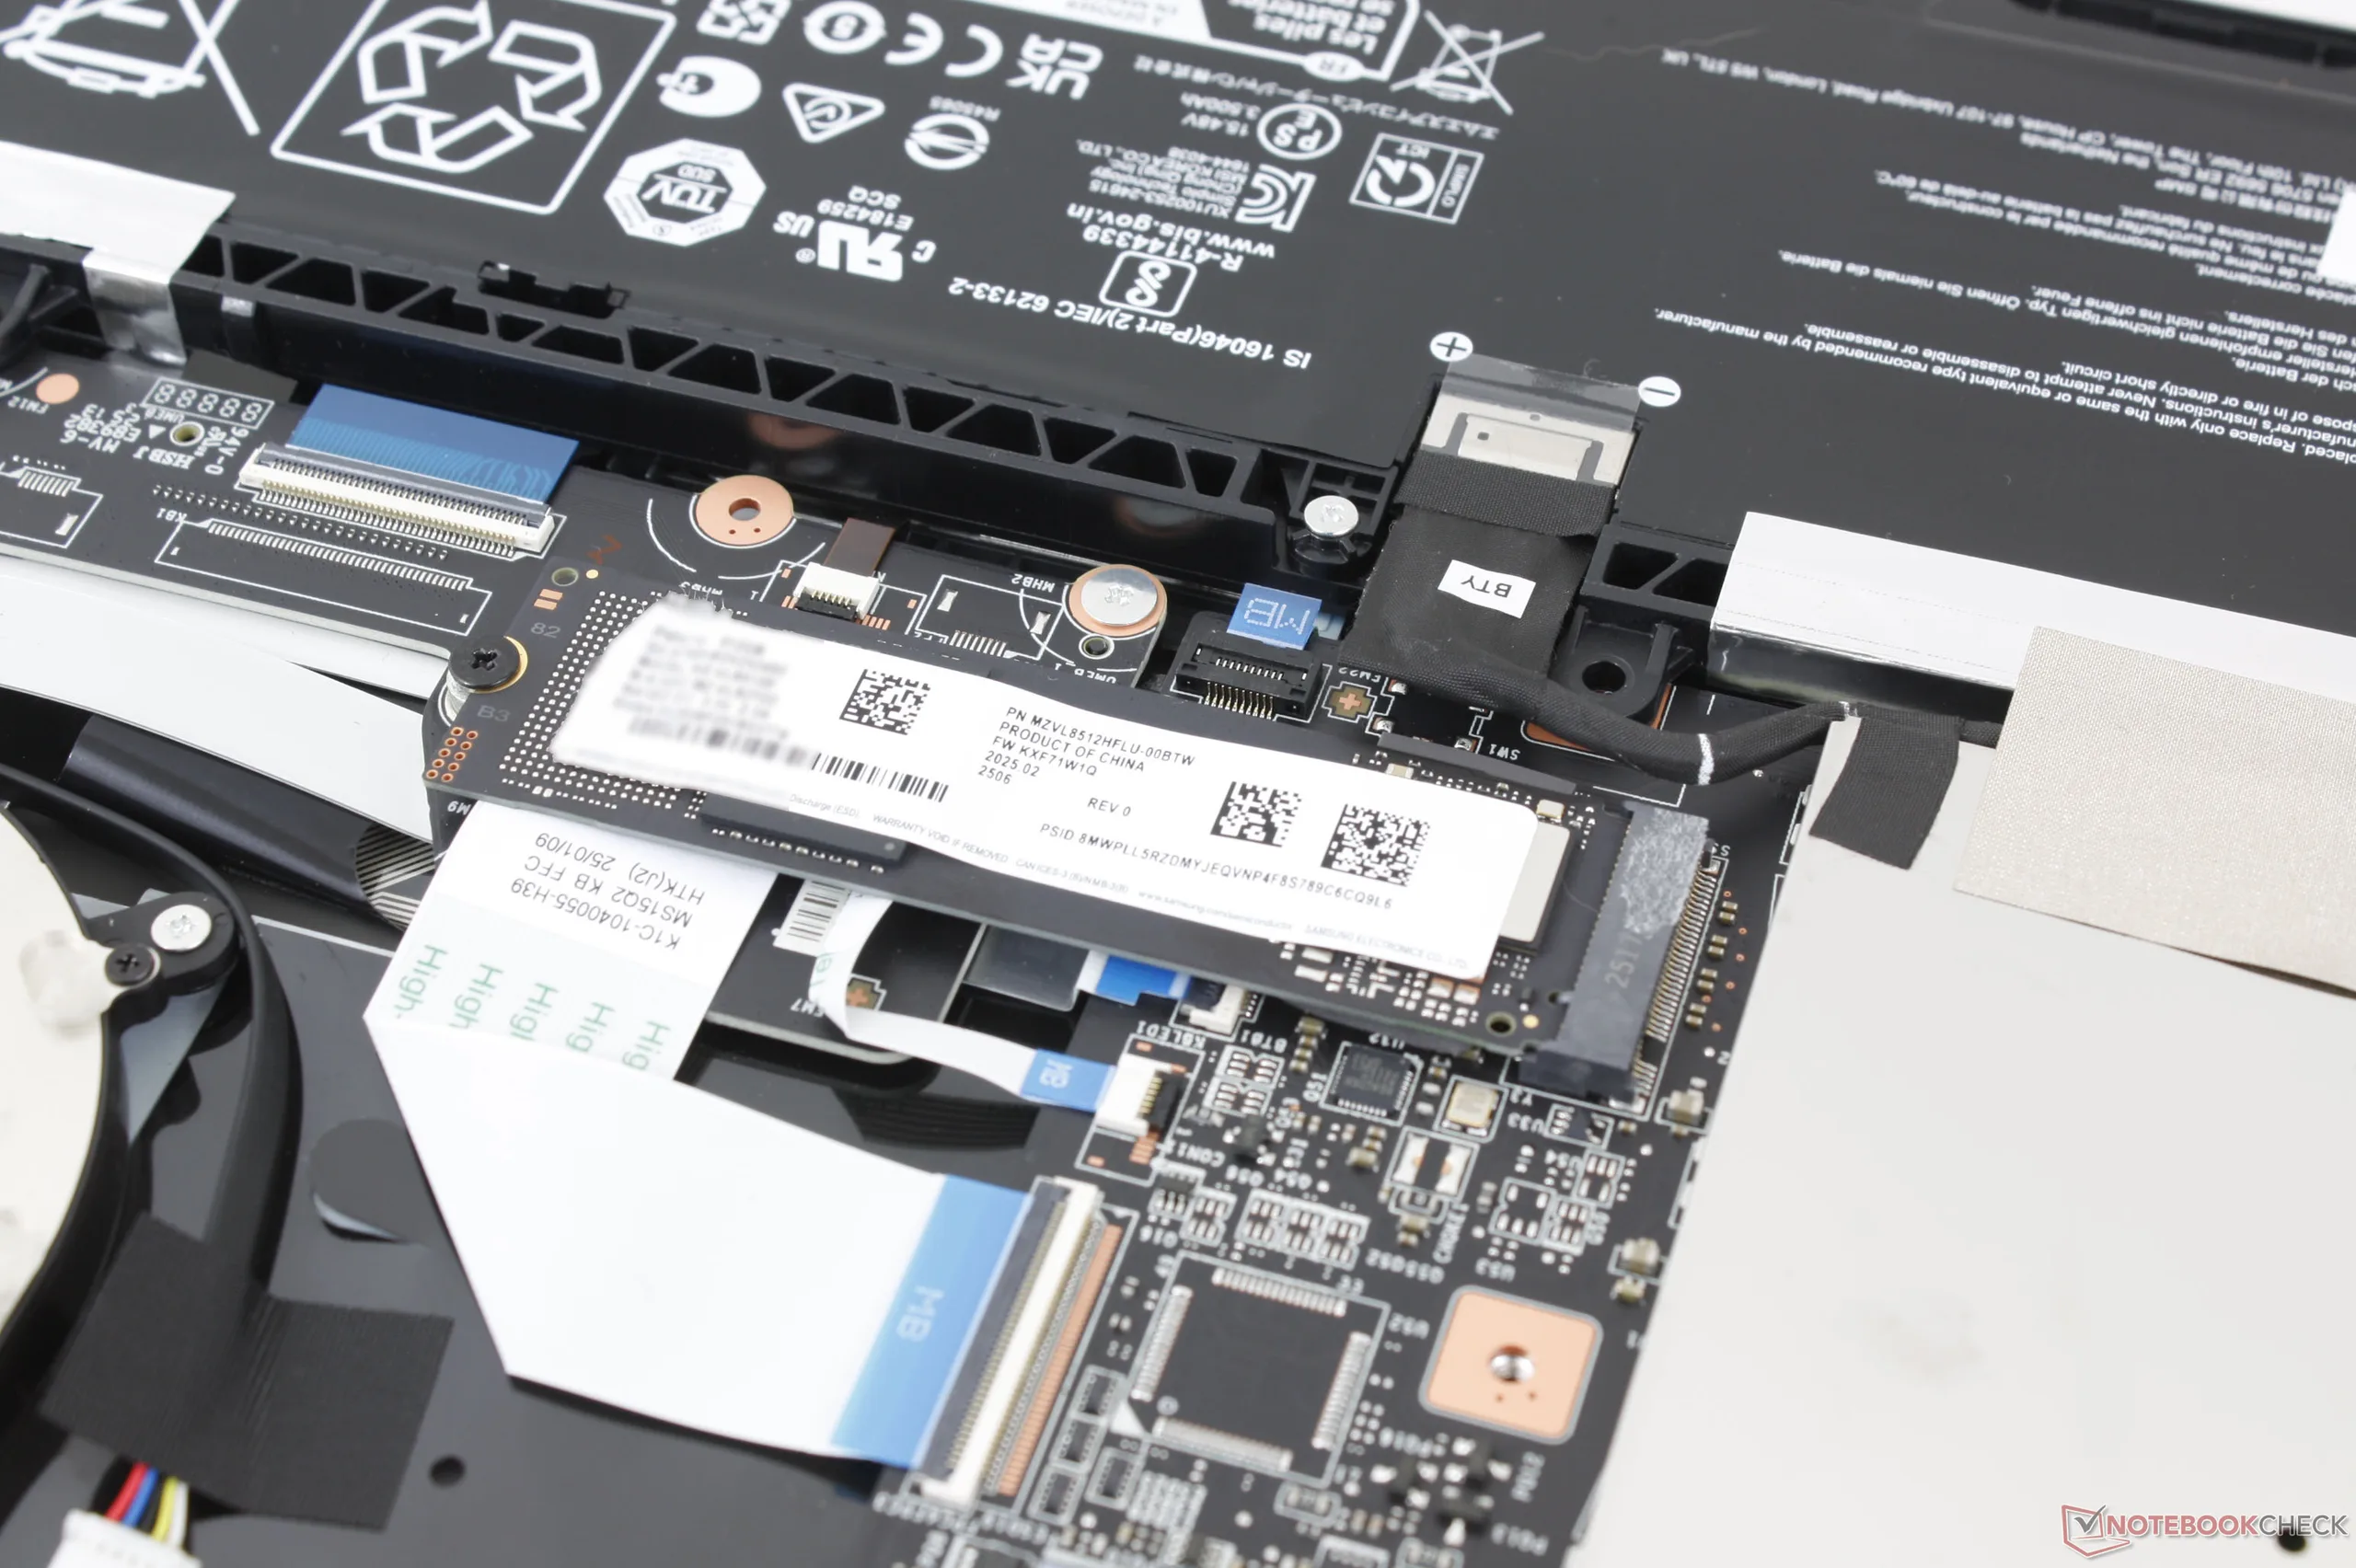
Maintenance
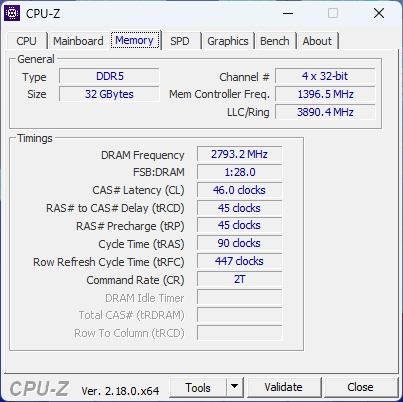
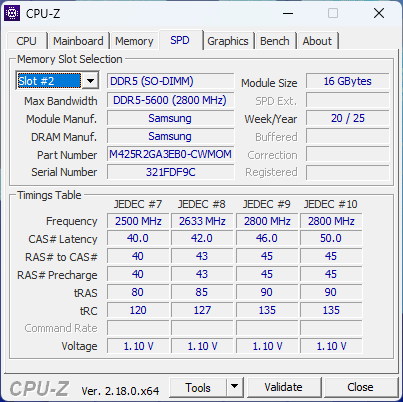
Le panneau inférieur peut être facilement retiré à l'aide d'un simple tournevis Philips. La RAM est extensible via deux emplacements DDR5 SODIMM, tandis qu'un seul SSD M.2 2280 est pris en charge.
Durabilité
Bien que MSI ne mentionne pas explicitement les matériaux recyclés lors de la fabrication, la société reconnaît néanmoins les certifications Energy Star et FSC. L'emballage utilise du plastique pour l'ordinateur portable et l'adaptateur secteur.
Accessoires et garantie
La boîte ne contient pas d'autres éléments que l'adaptateur secteur et la documentation. La garantie limitée habituelle d'un an du fabricant s'applique si l'appareil est acheté aux États-Unis.
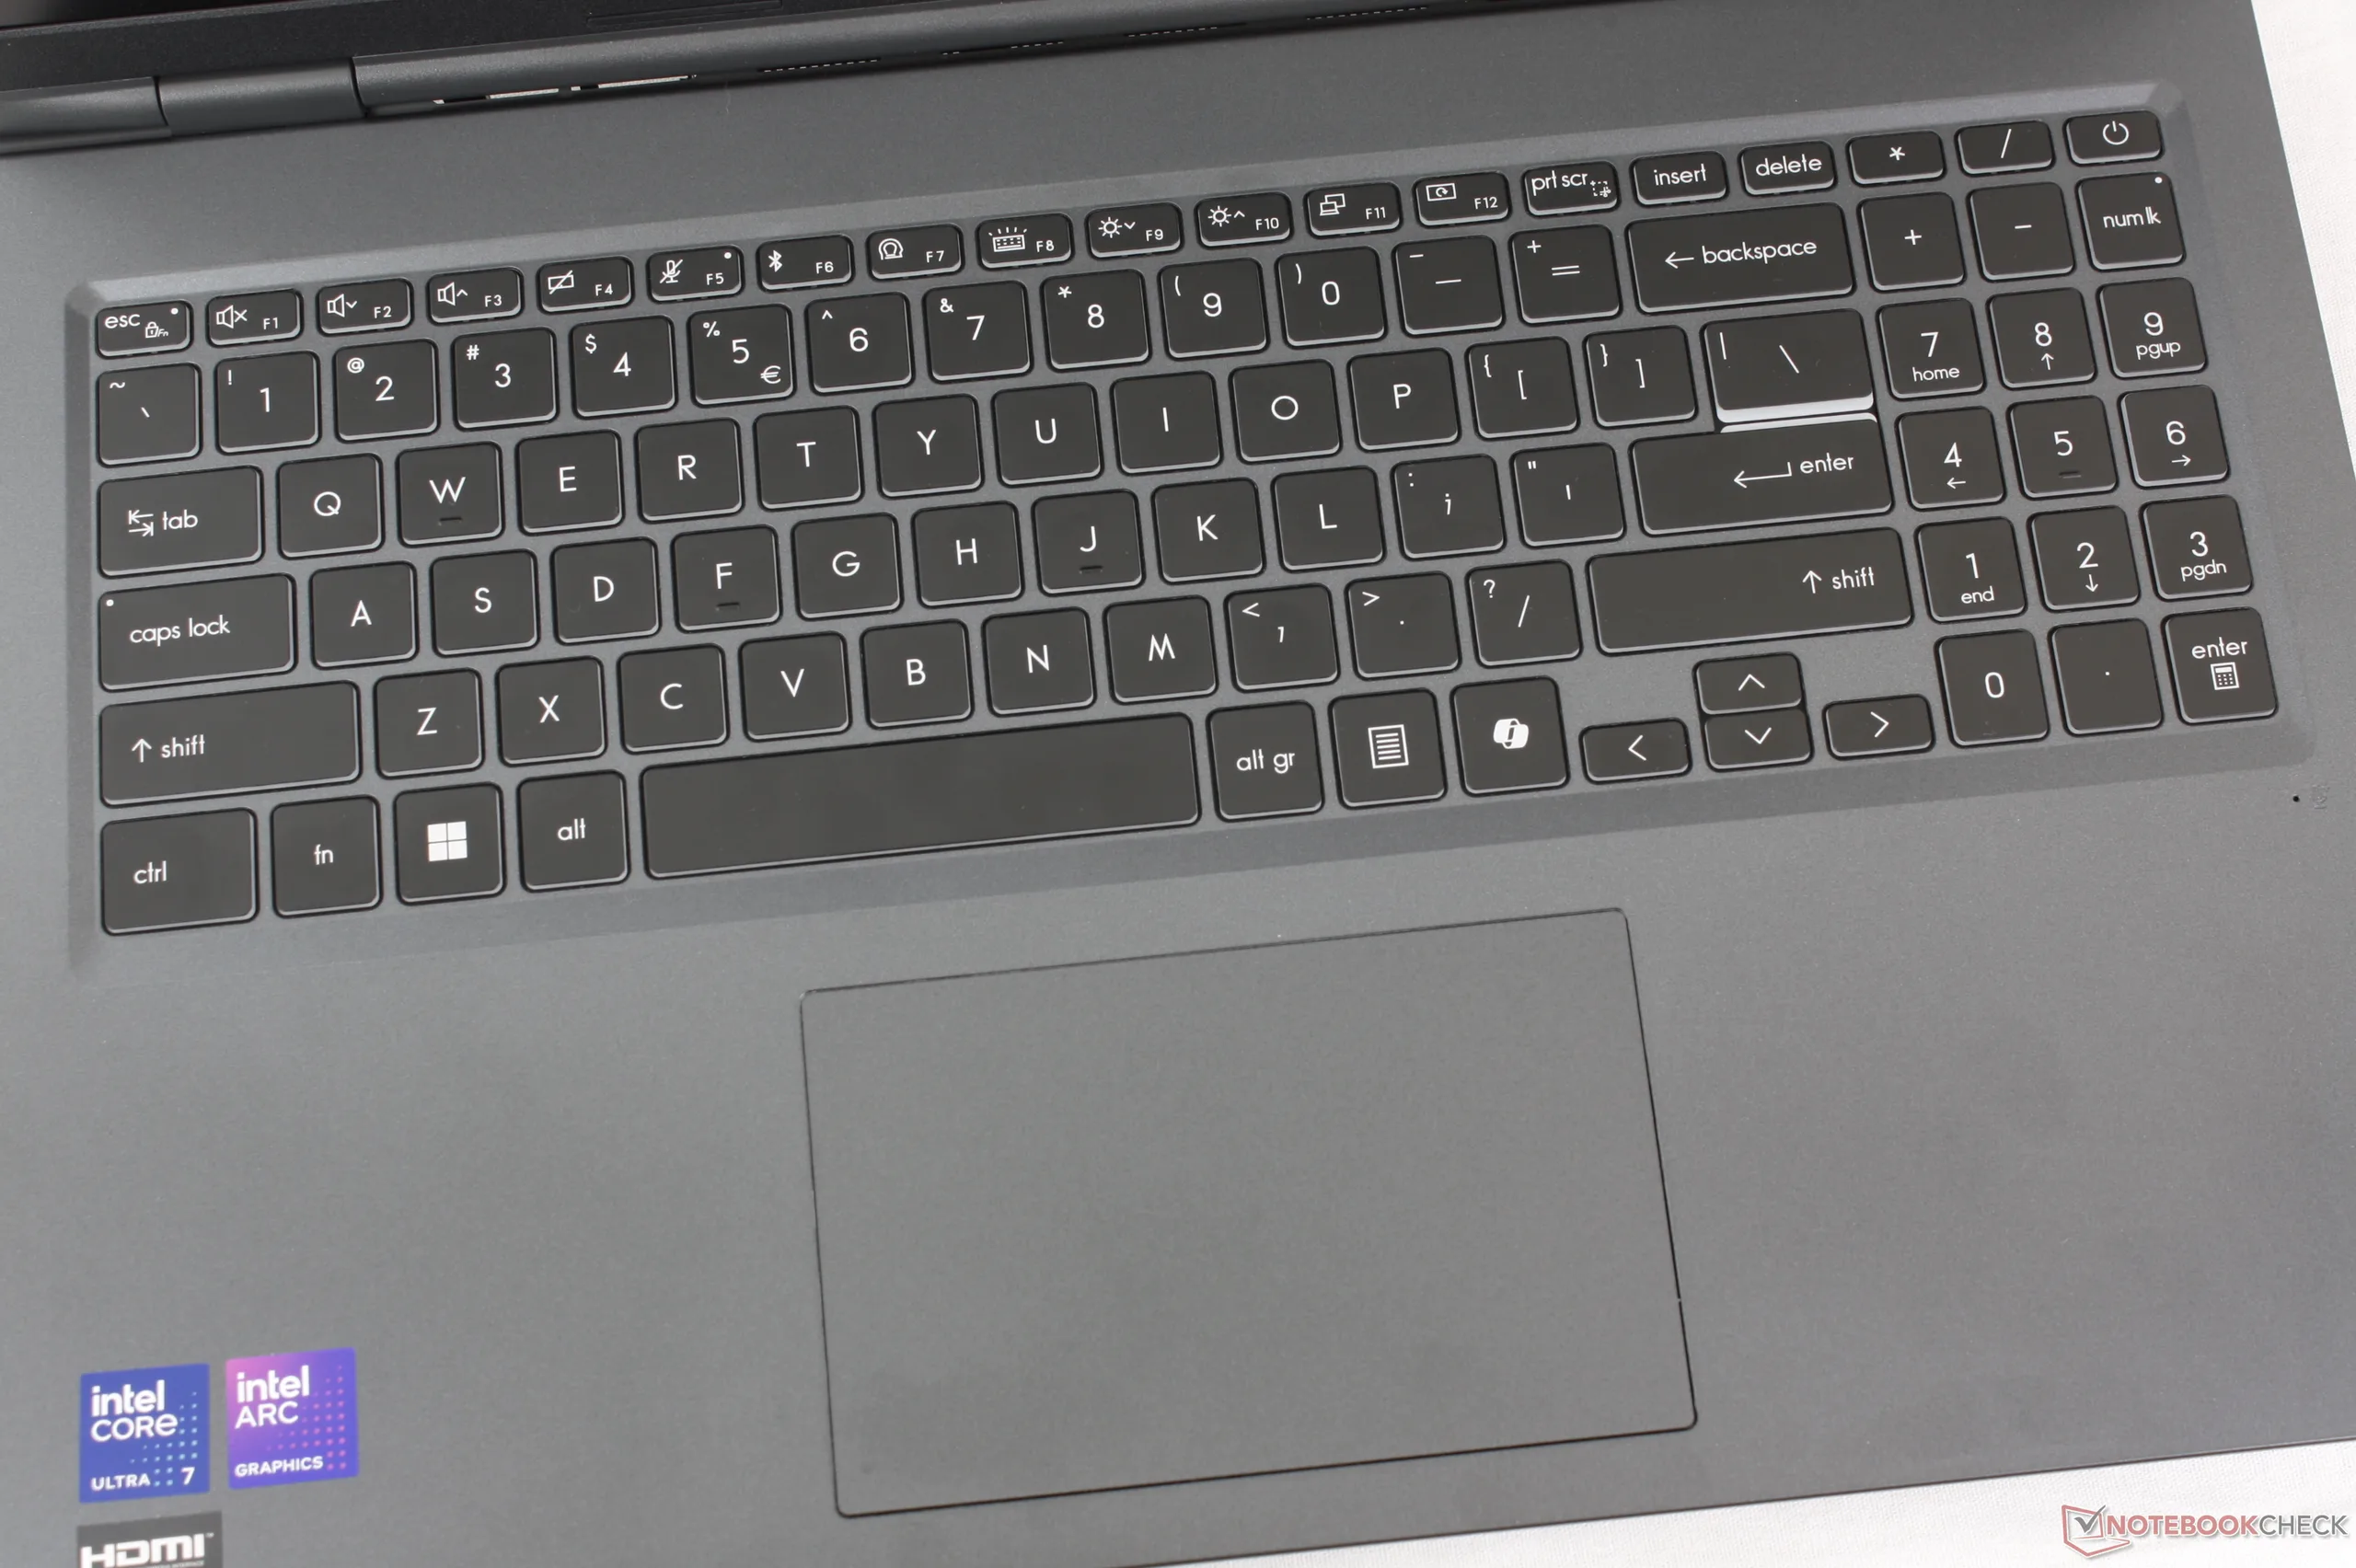
Périphériques d'entrée
L'expérience de frappe est pratiquement la même que sur la Prestige 16 car le Venture 16 utilise des claviers et des composants similaires. Le retour d'information est relativement léger, avec un claquement silencieux et une course moins profonde que sur un ThinkPad traditionnel.
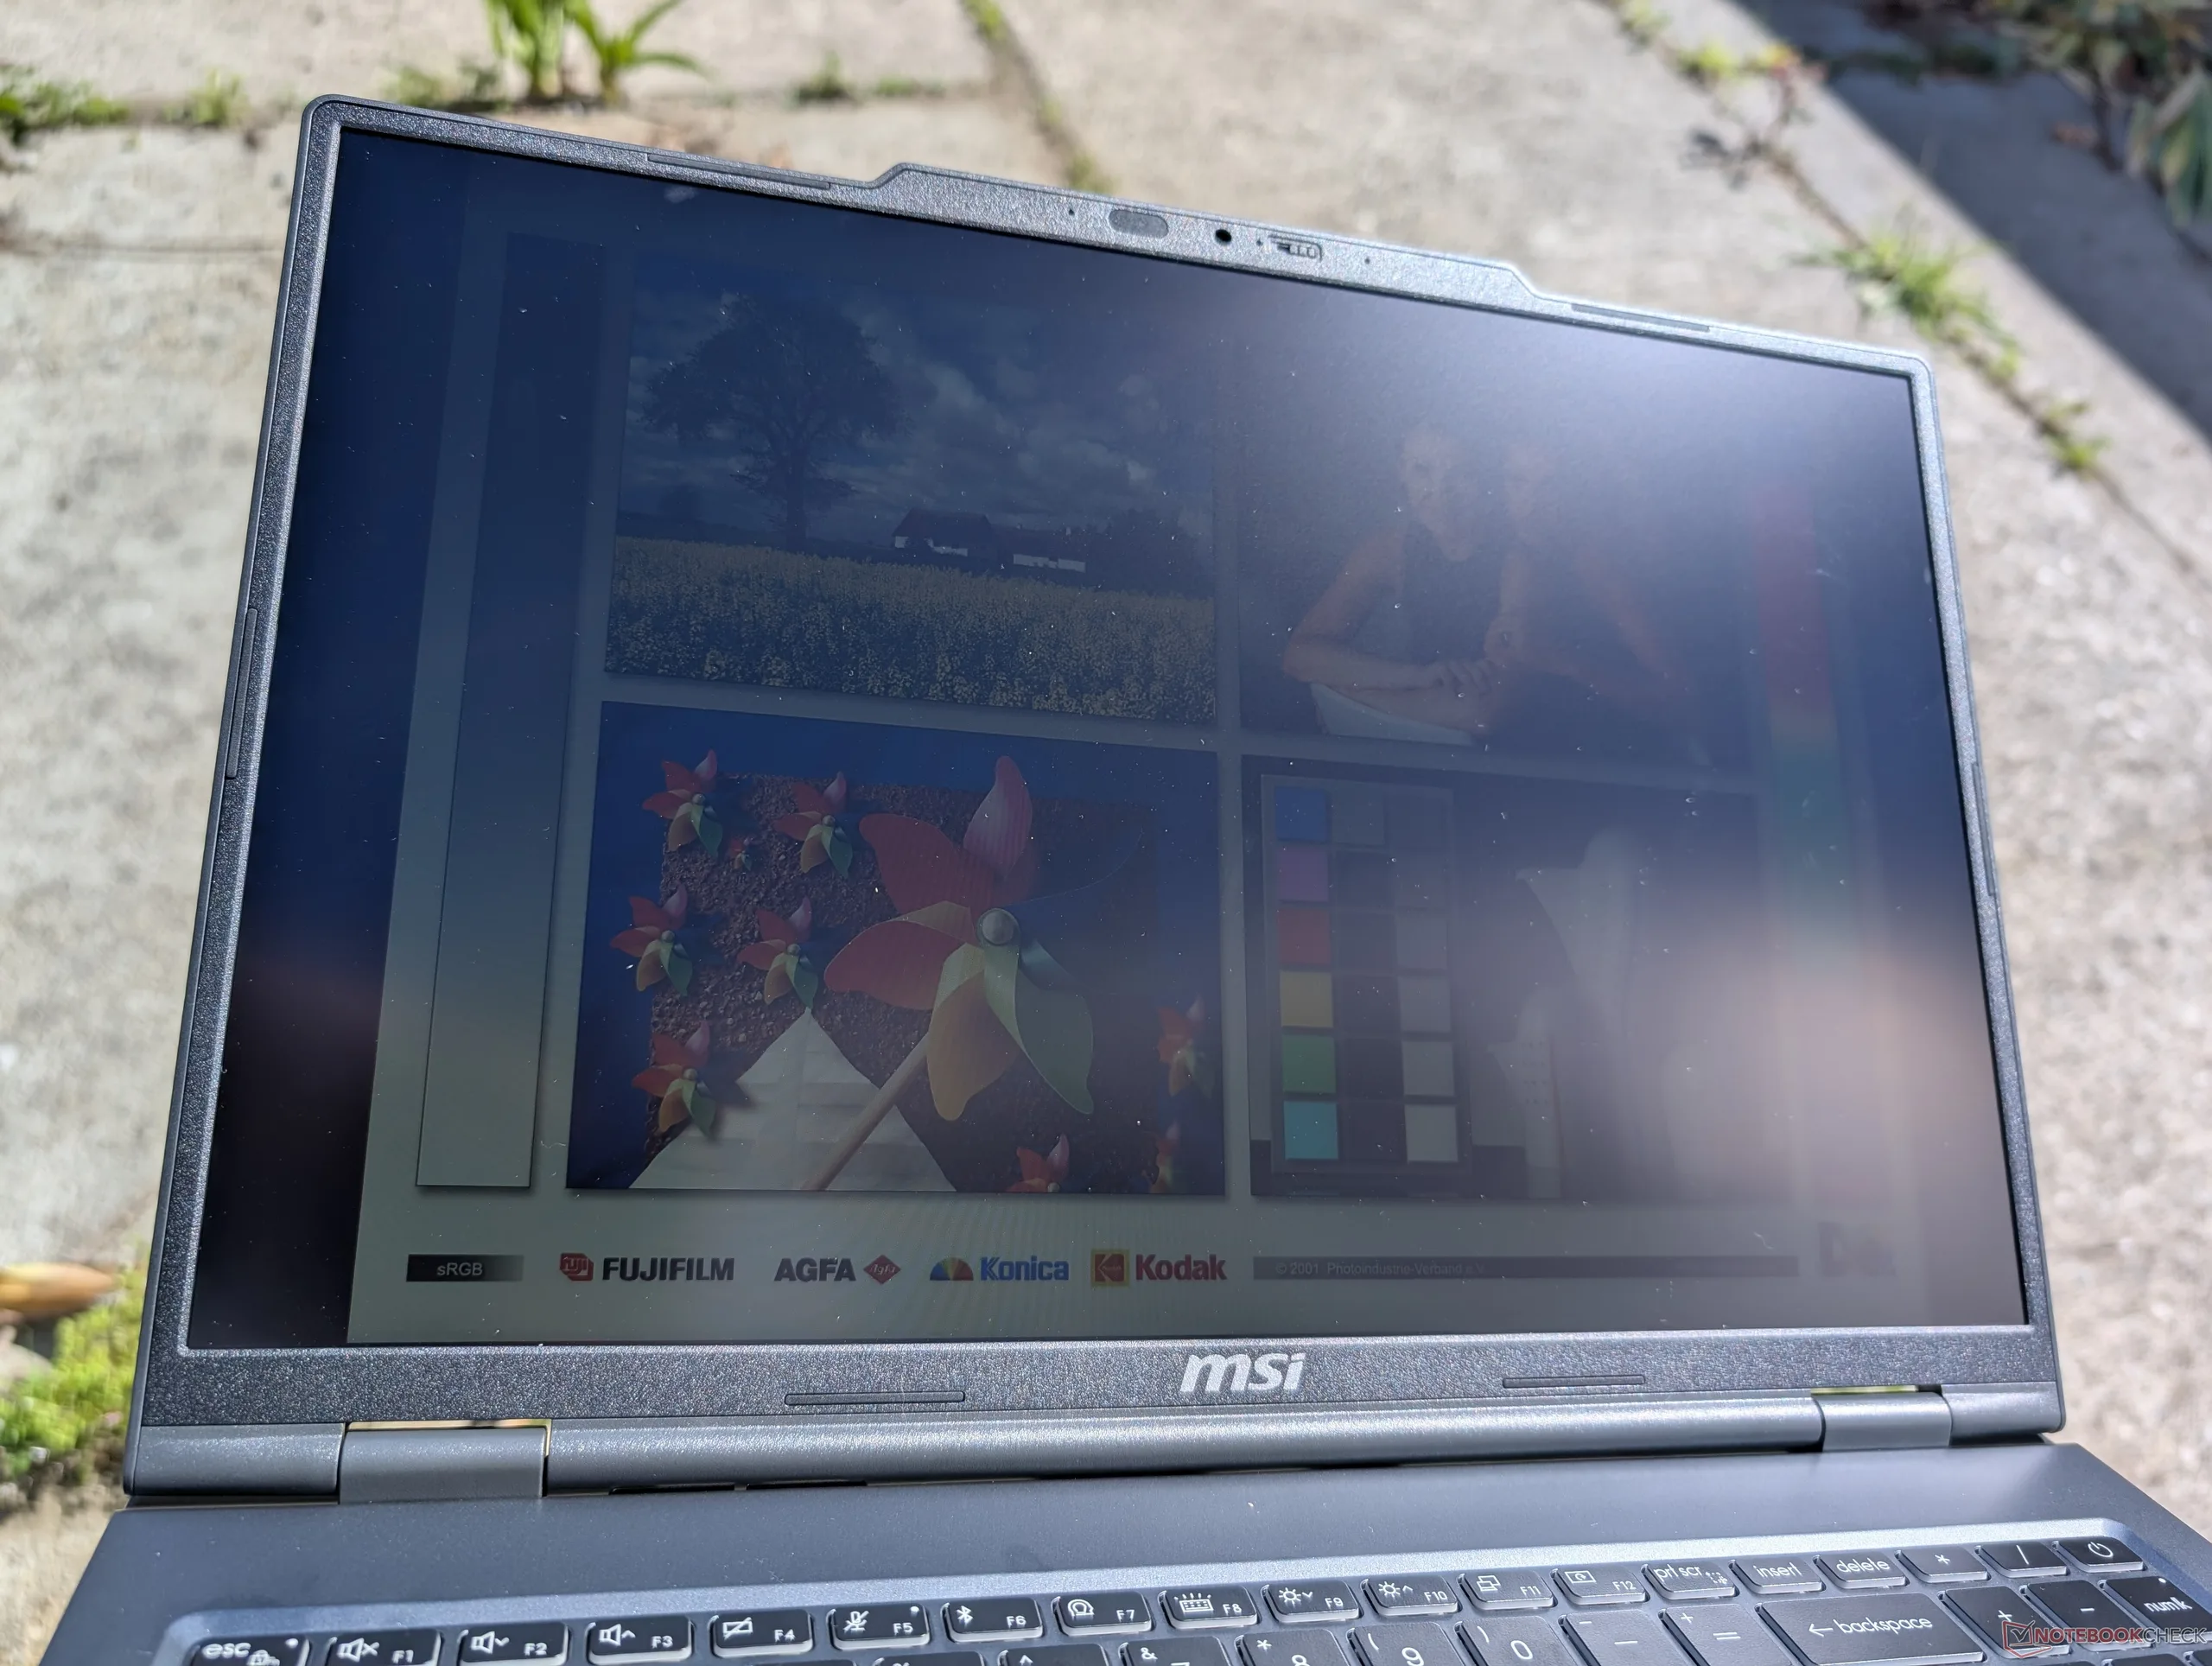
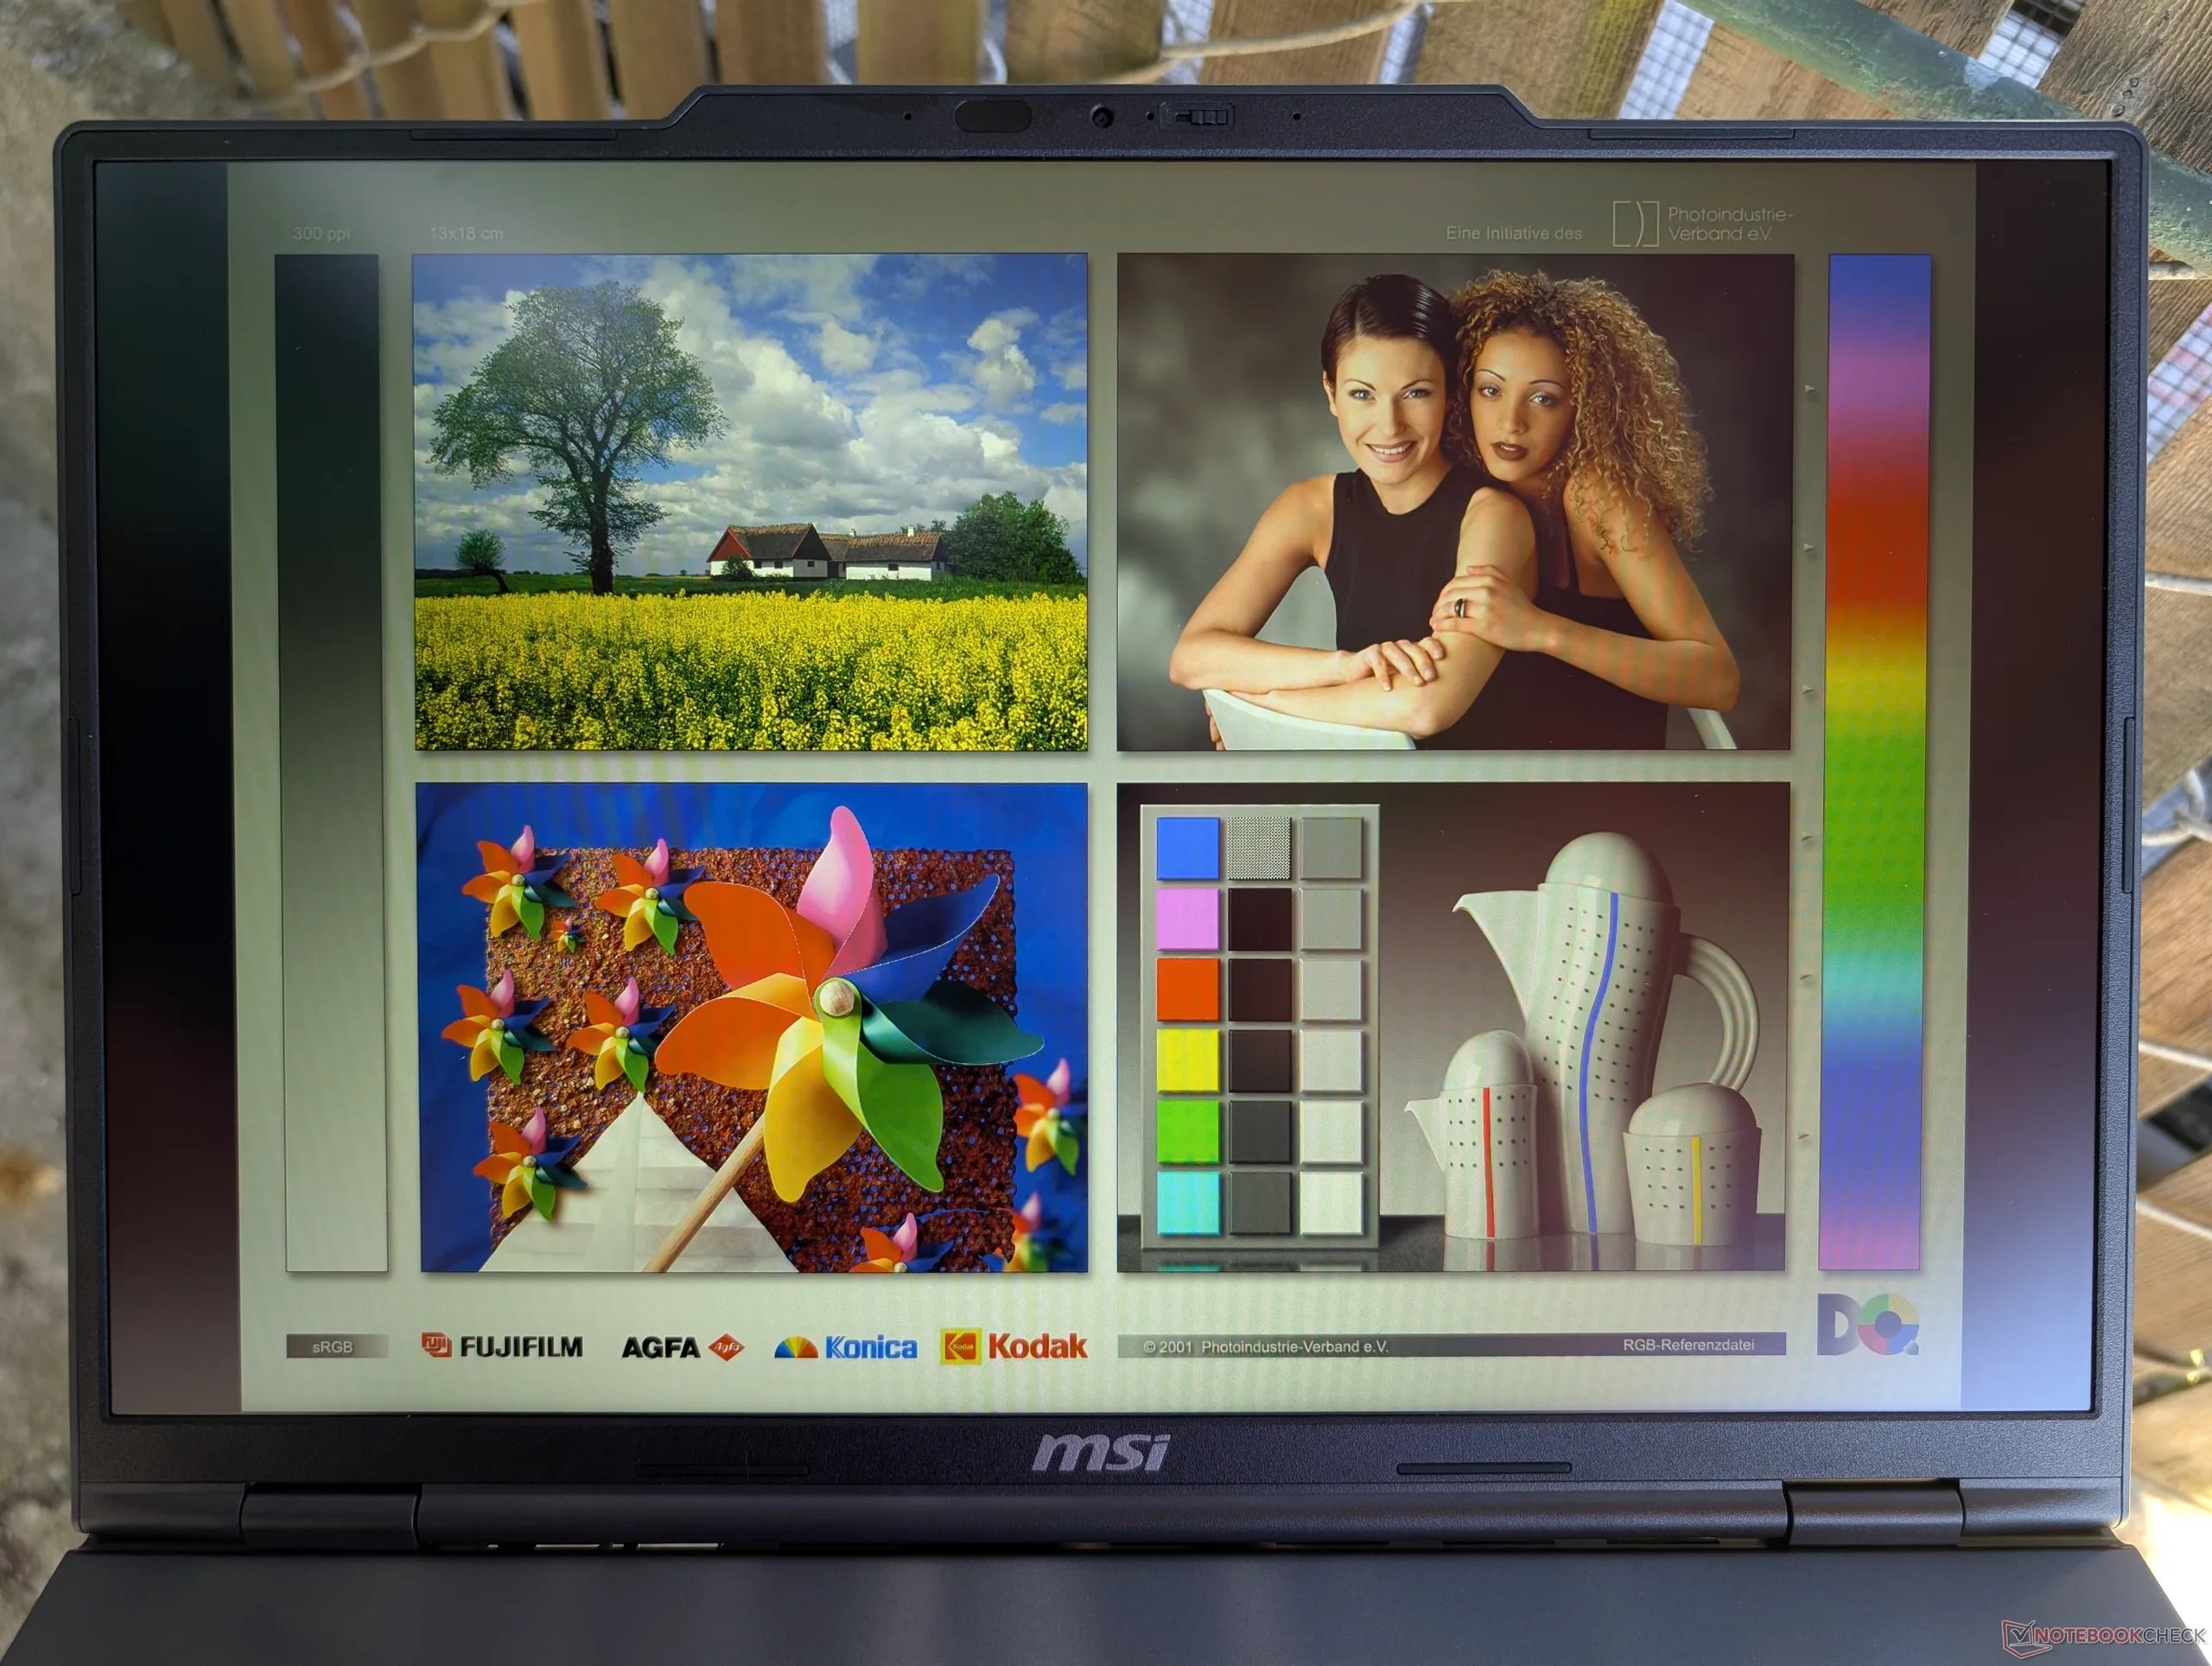
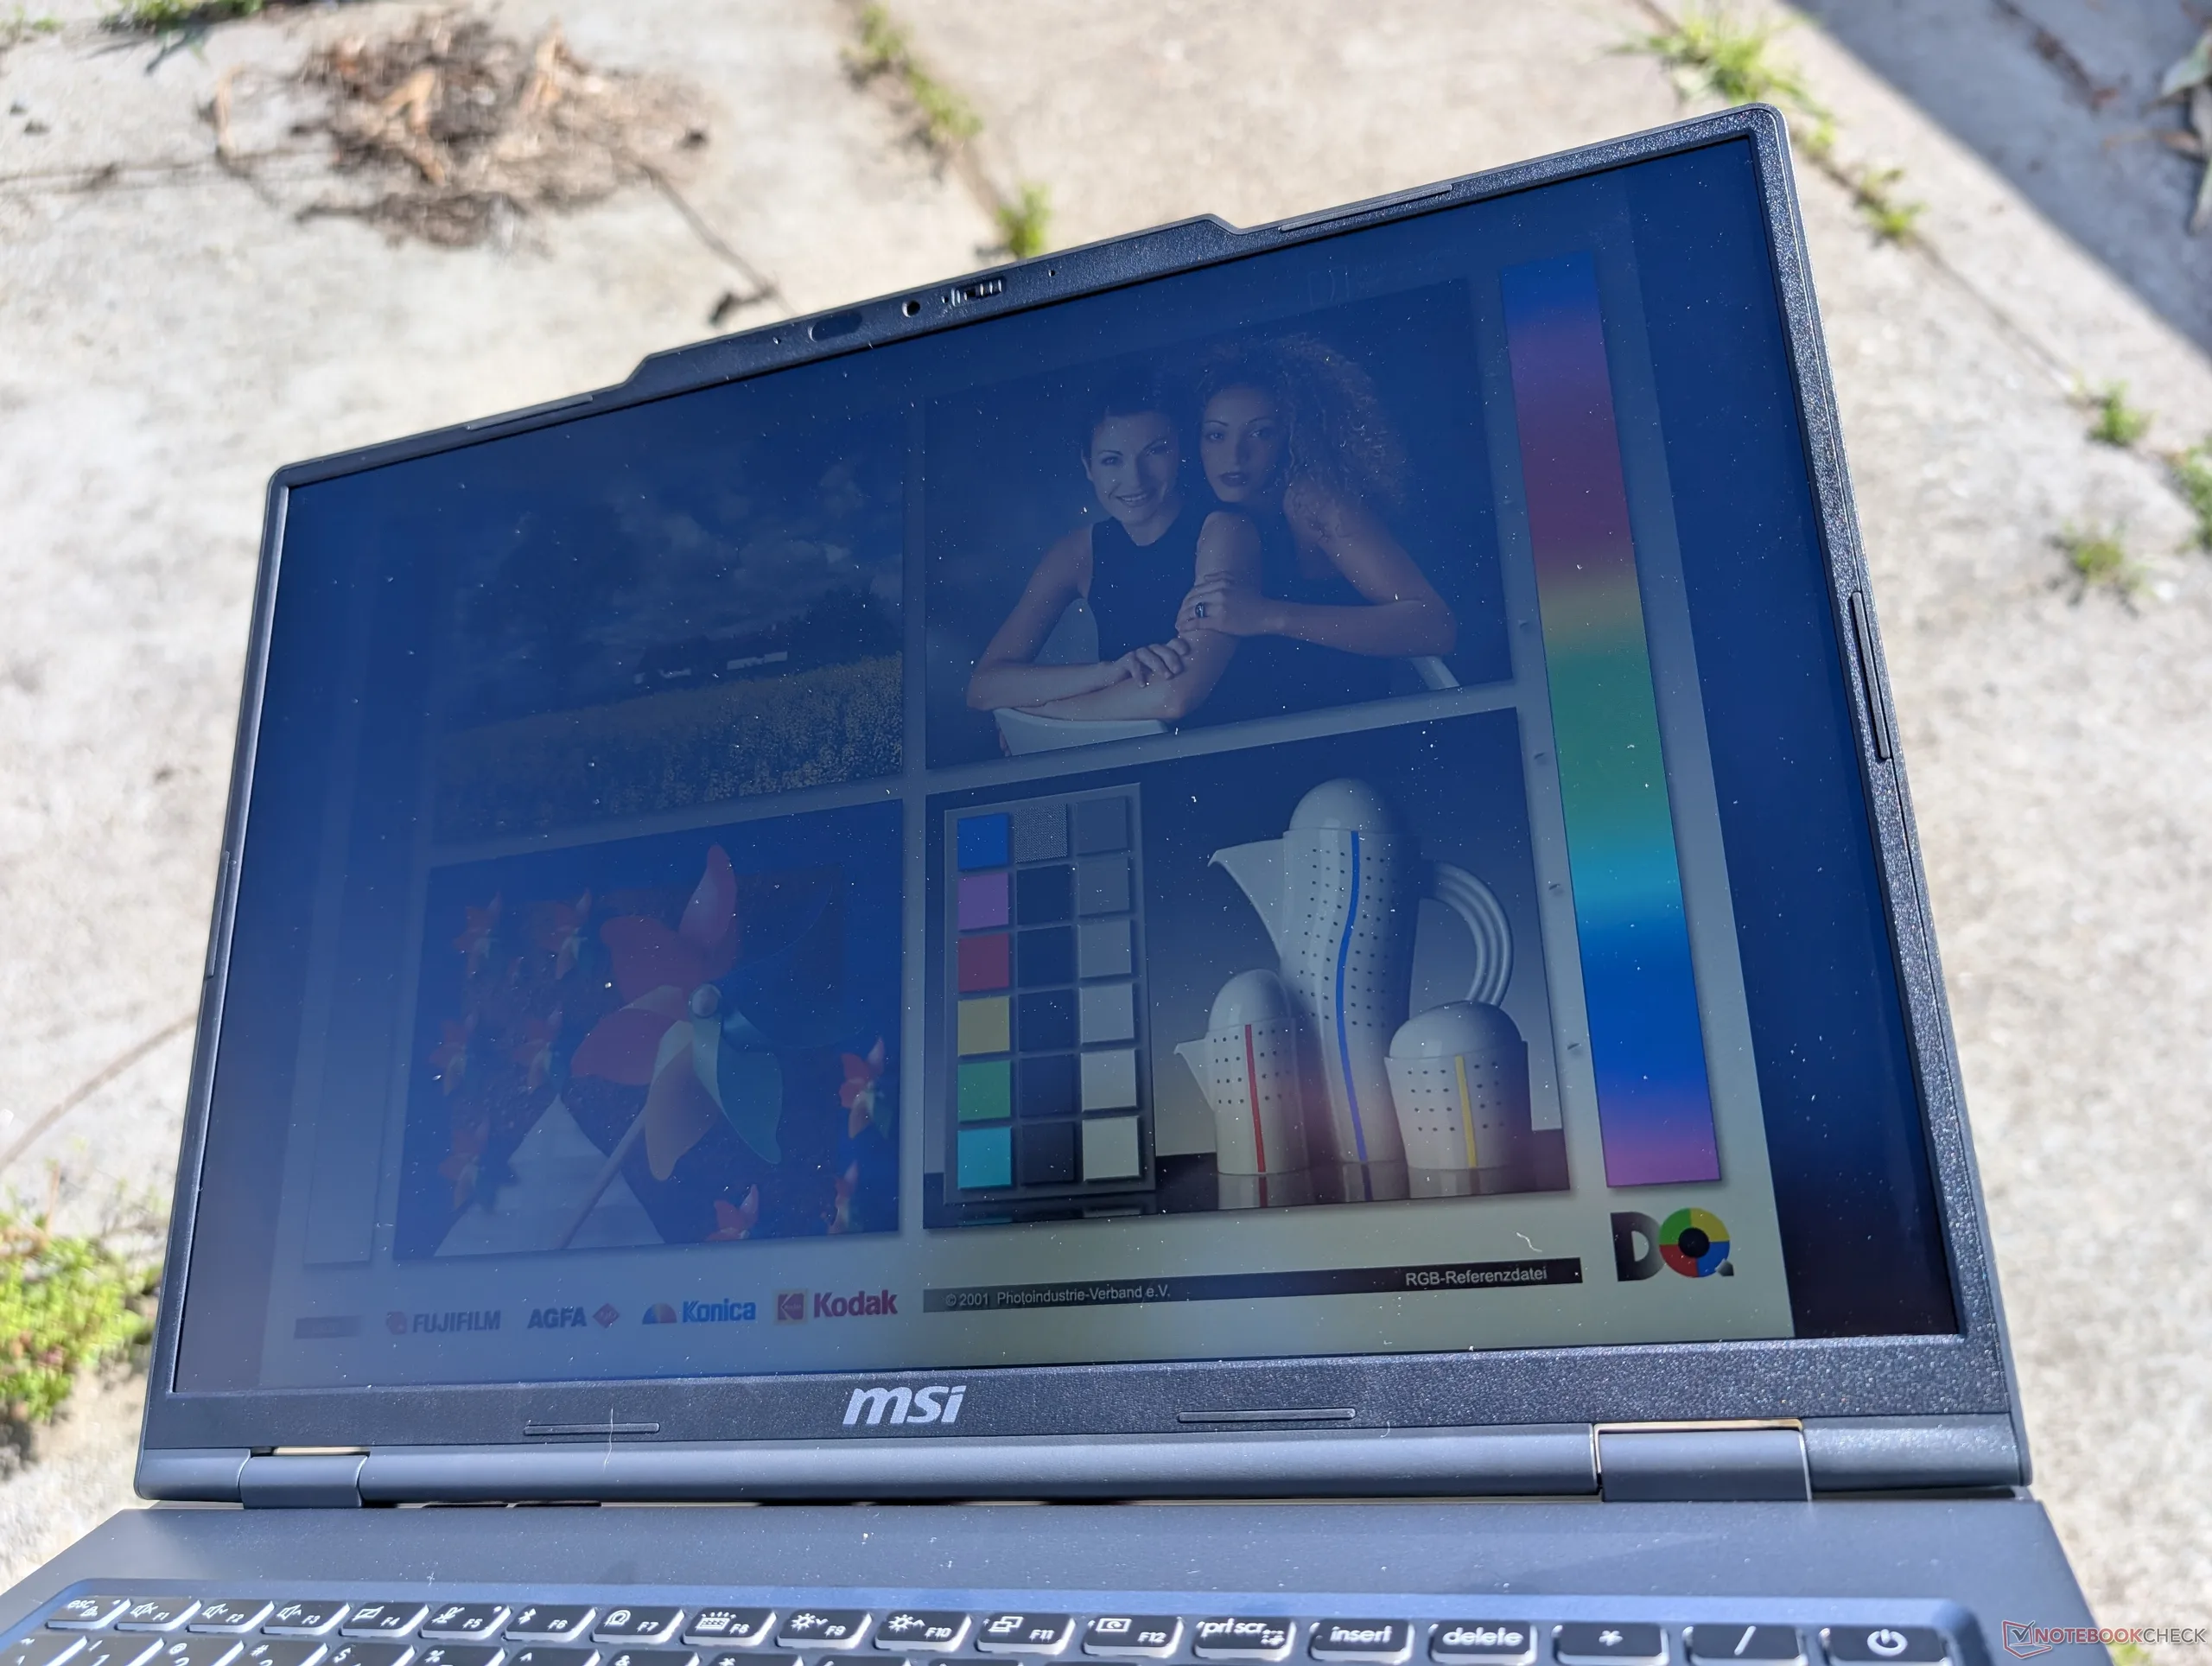
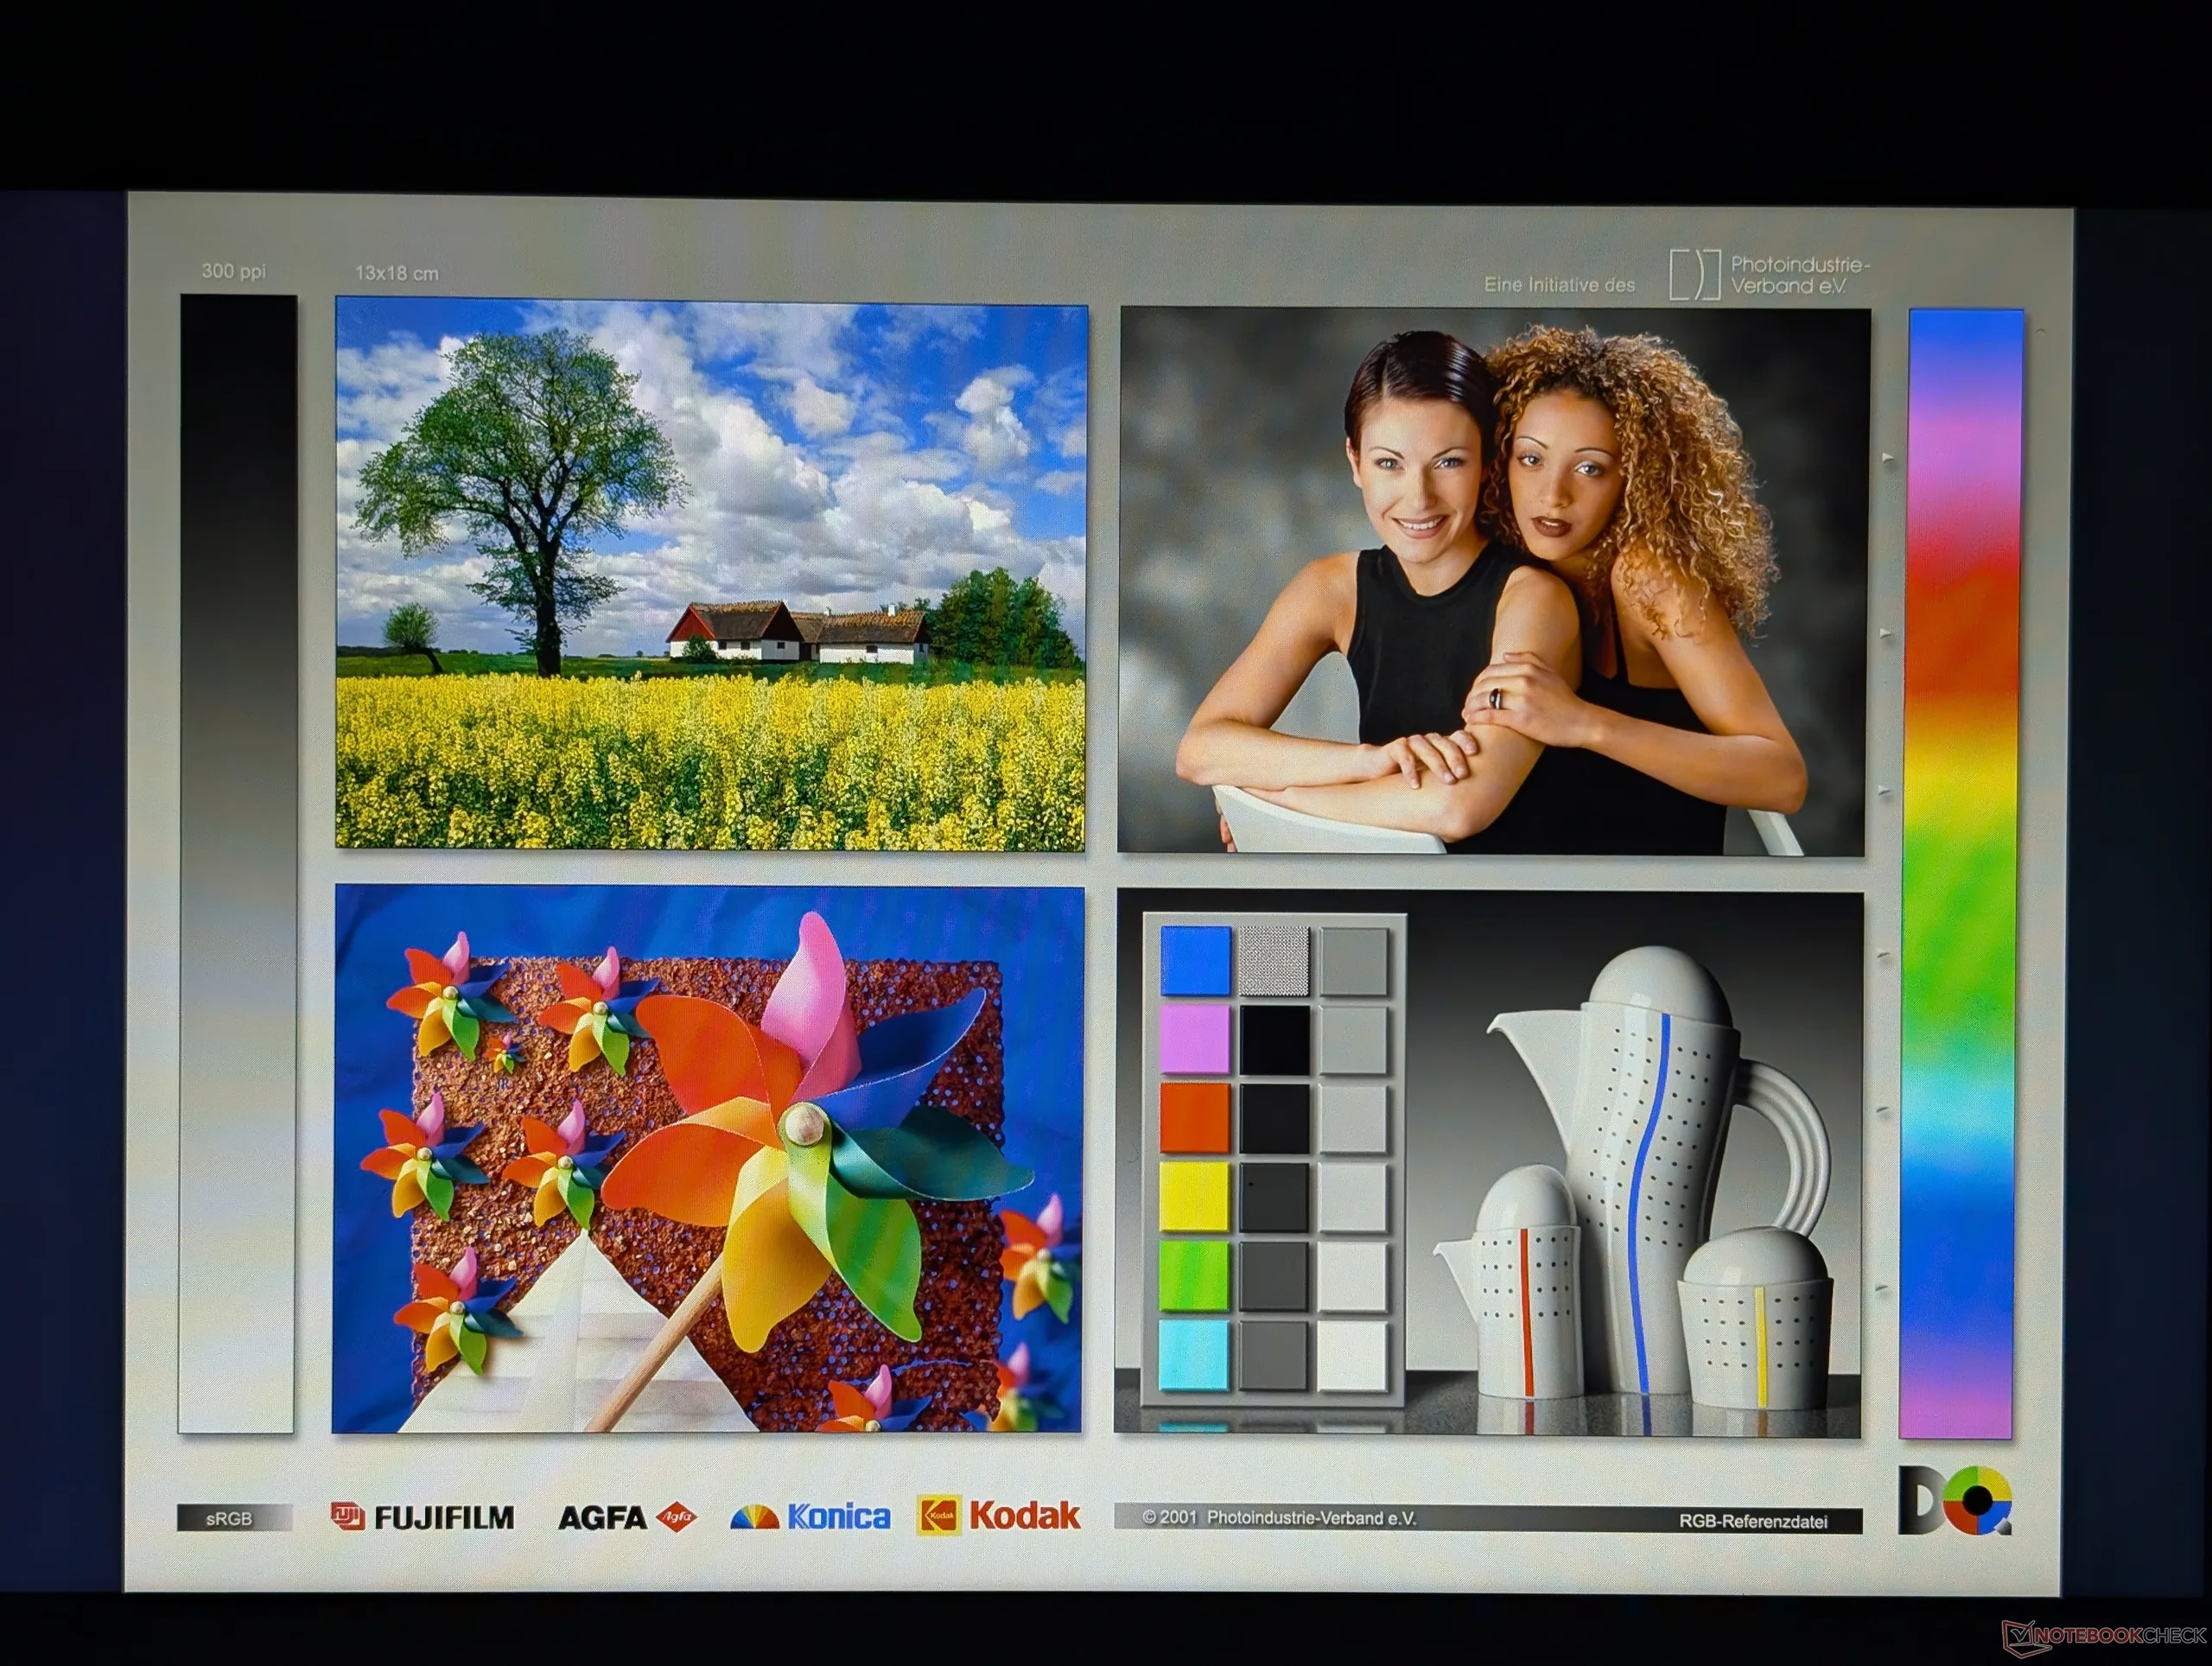
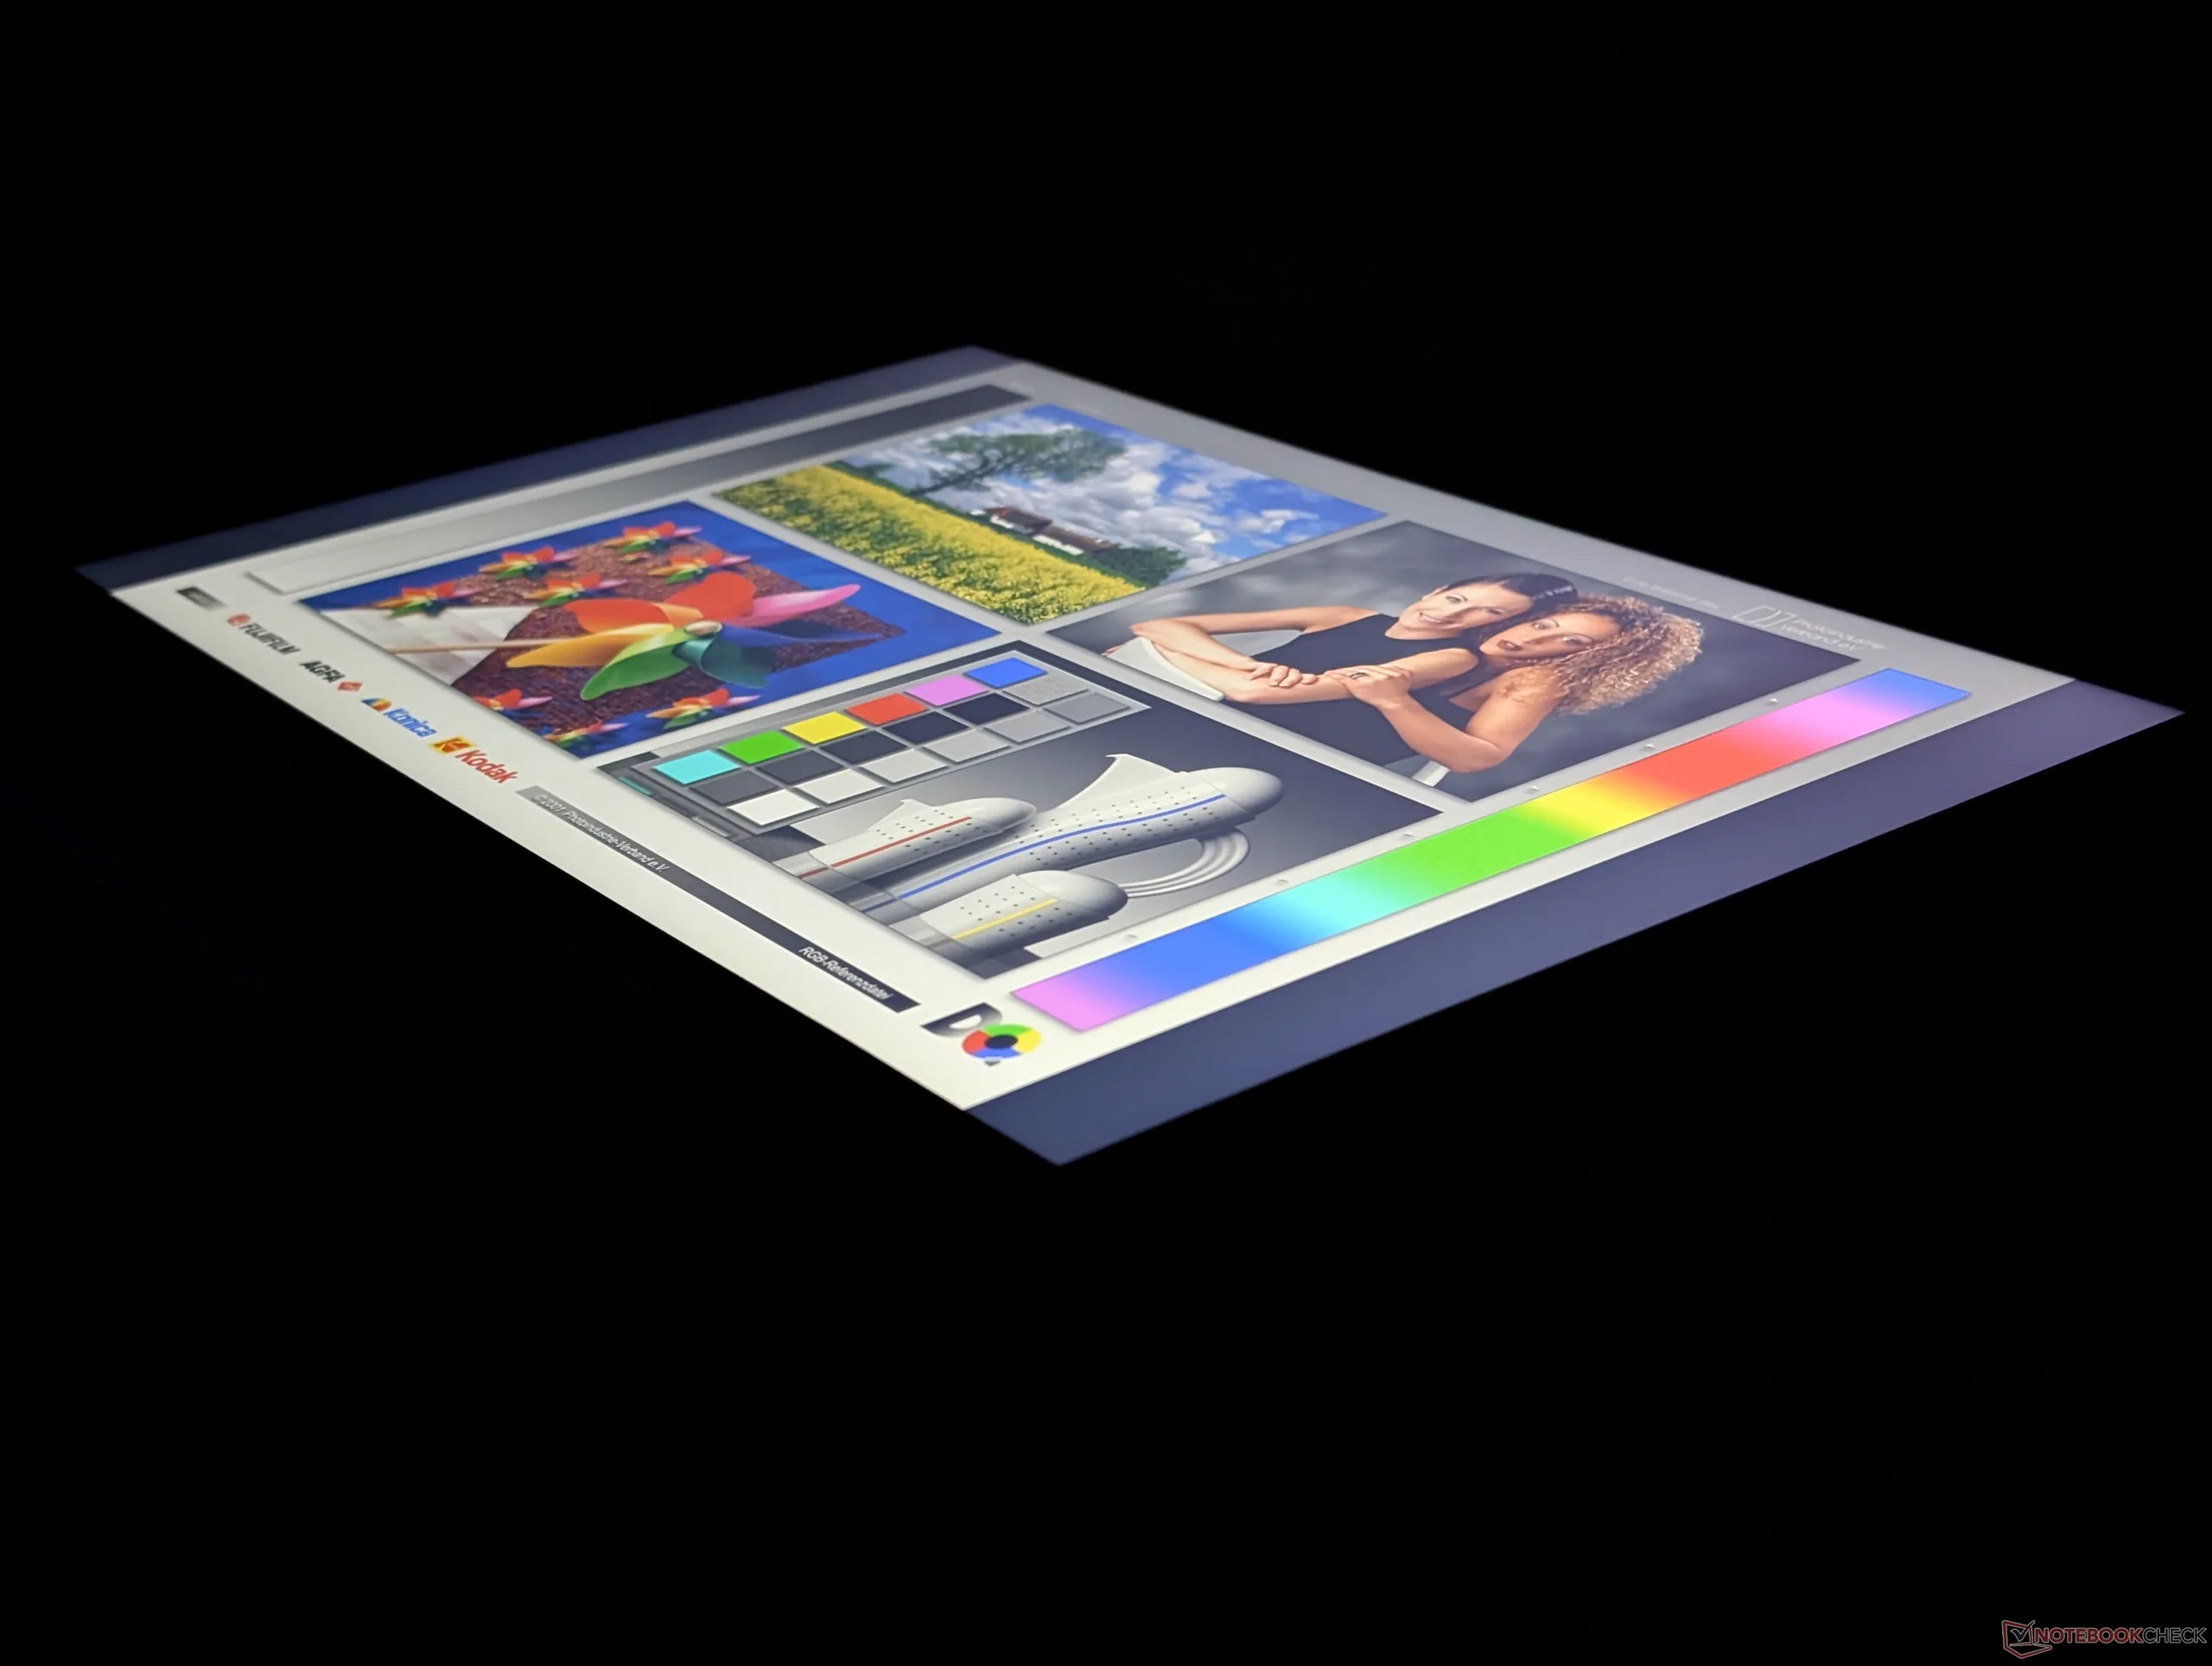
Affichage
Deux options d'affichage sont disponibles :
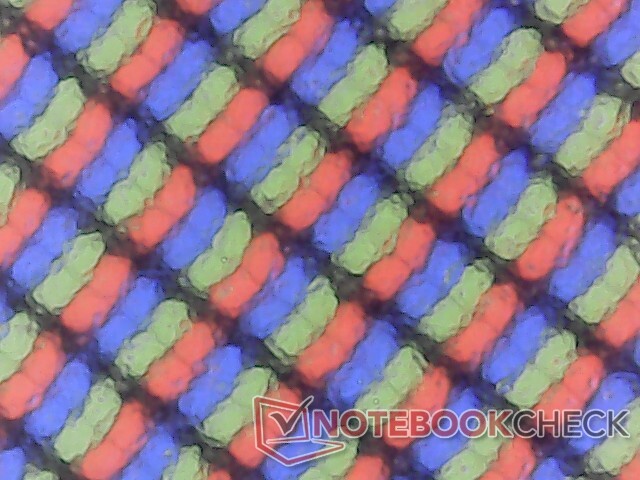
- 1920 x 1200, IPS, 60% sRGB, 60 Hz, écran tactile
- 2048 x 1280, OLED, 100% DCI-P3, 120 Hz, non tactile
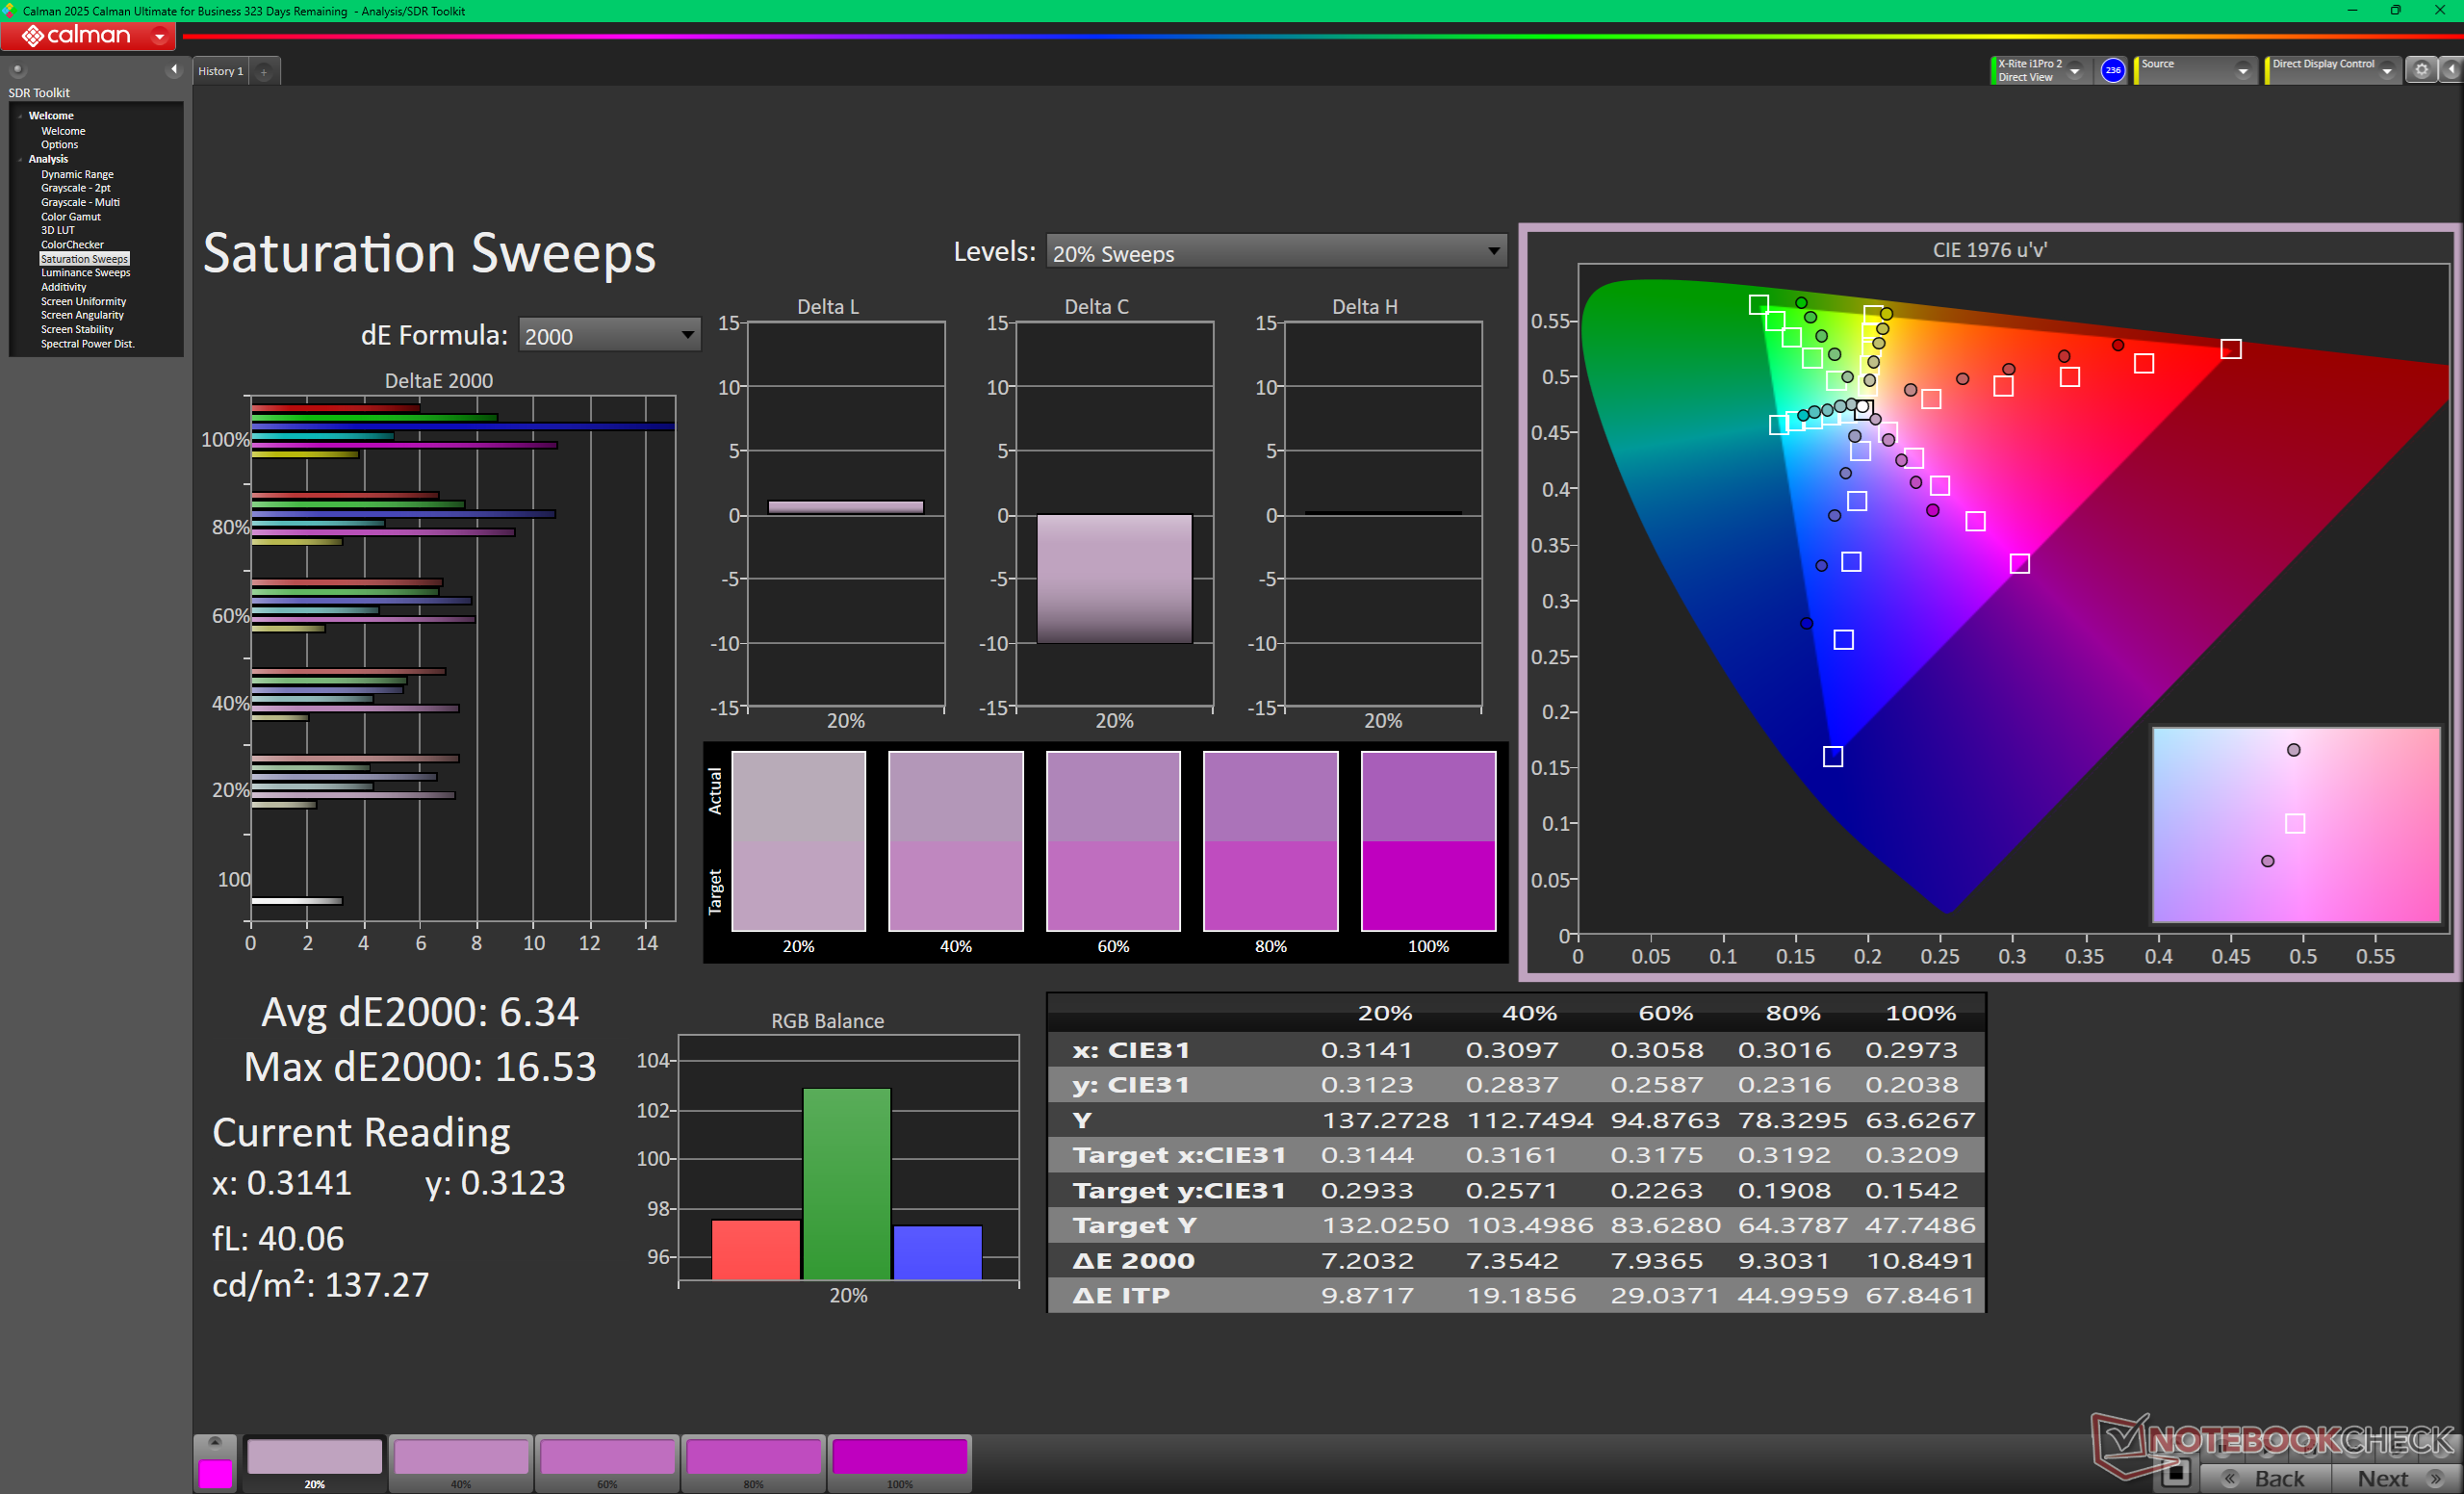
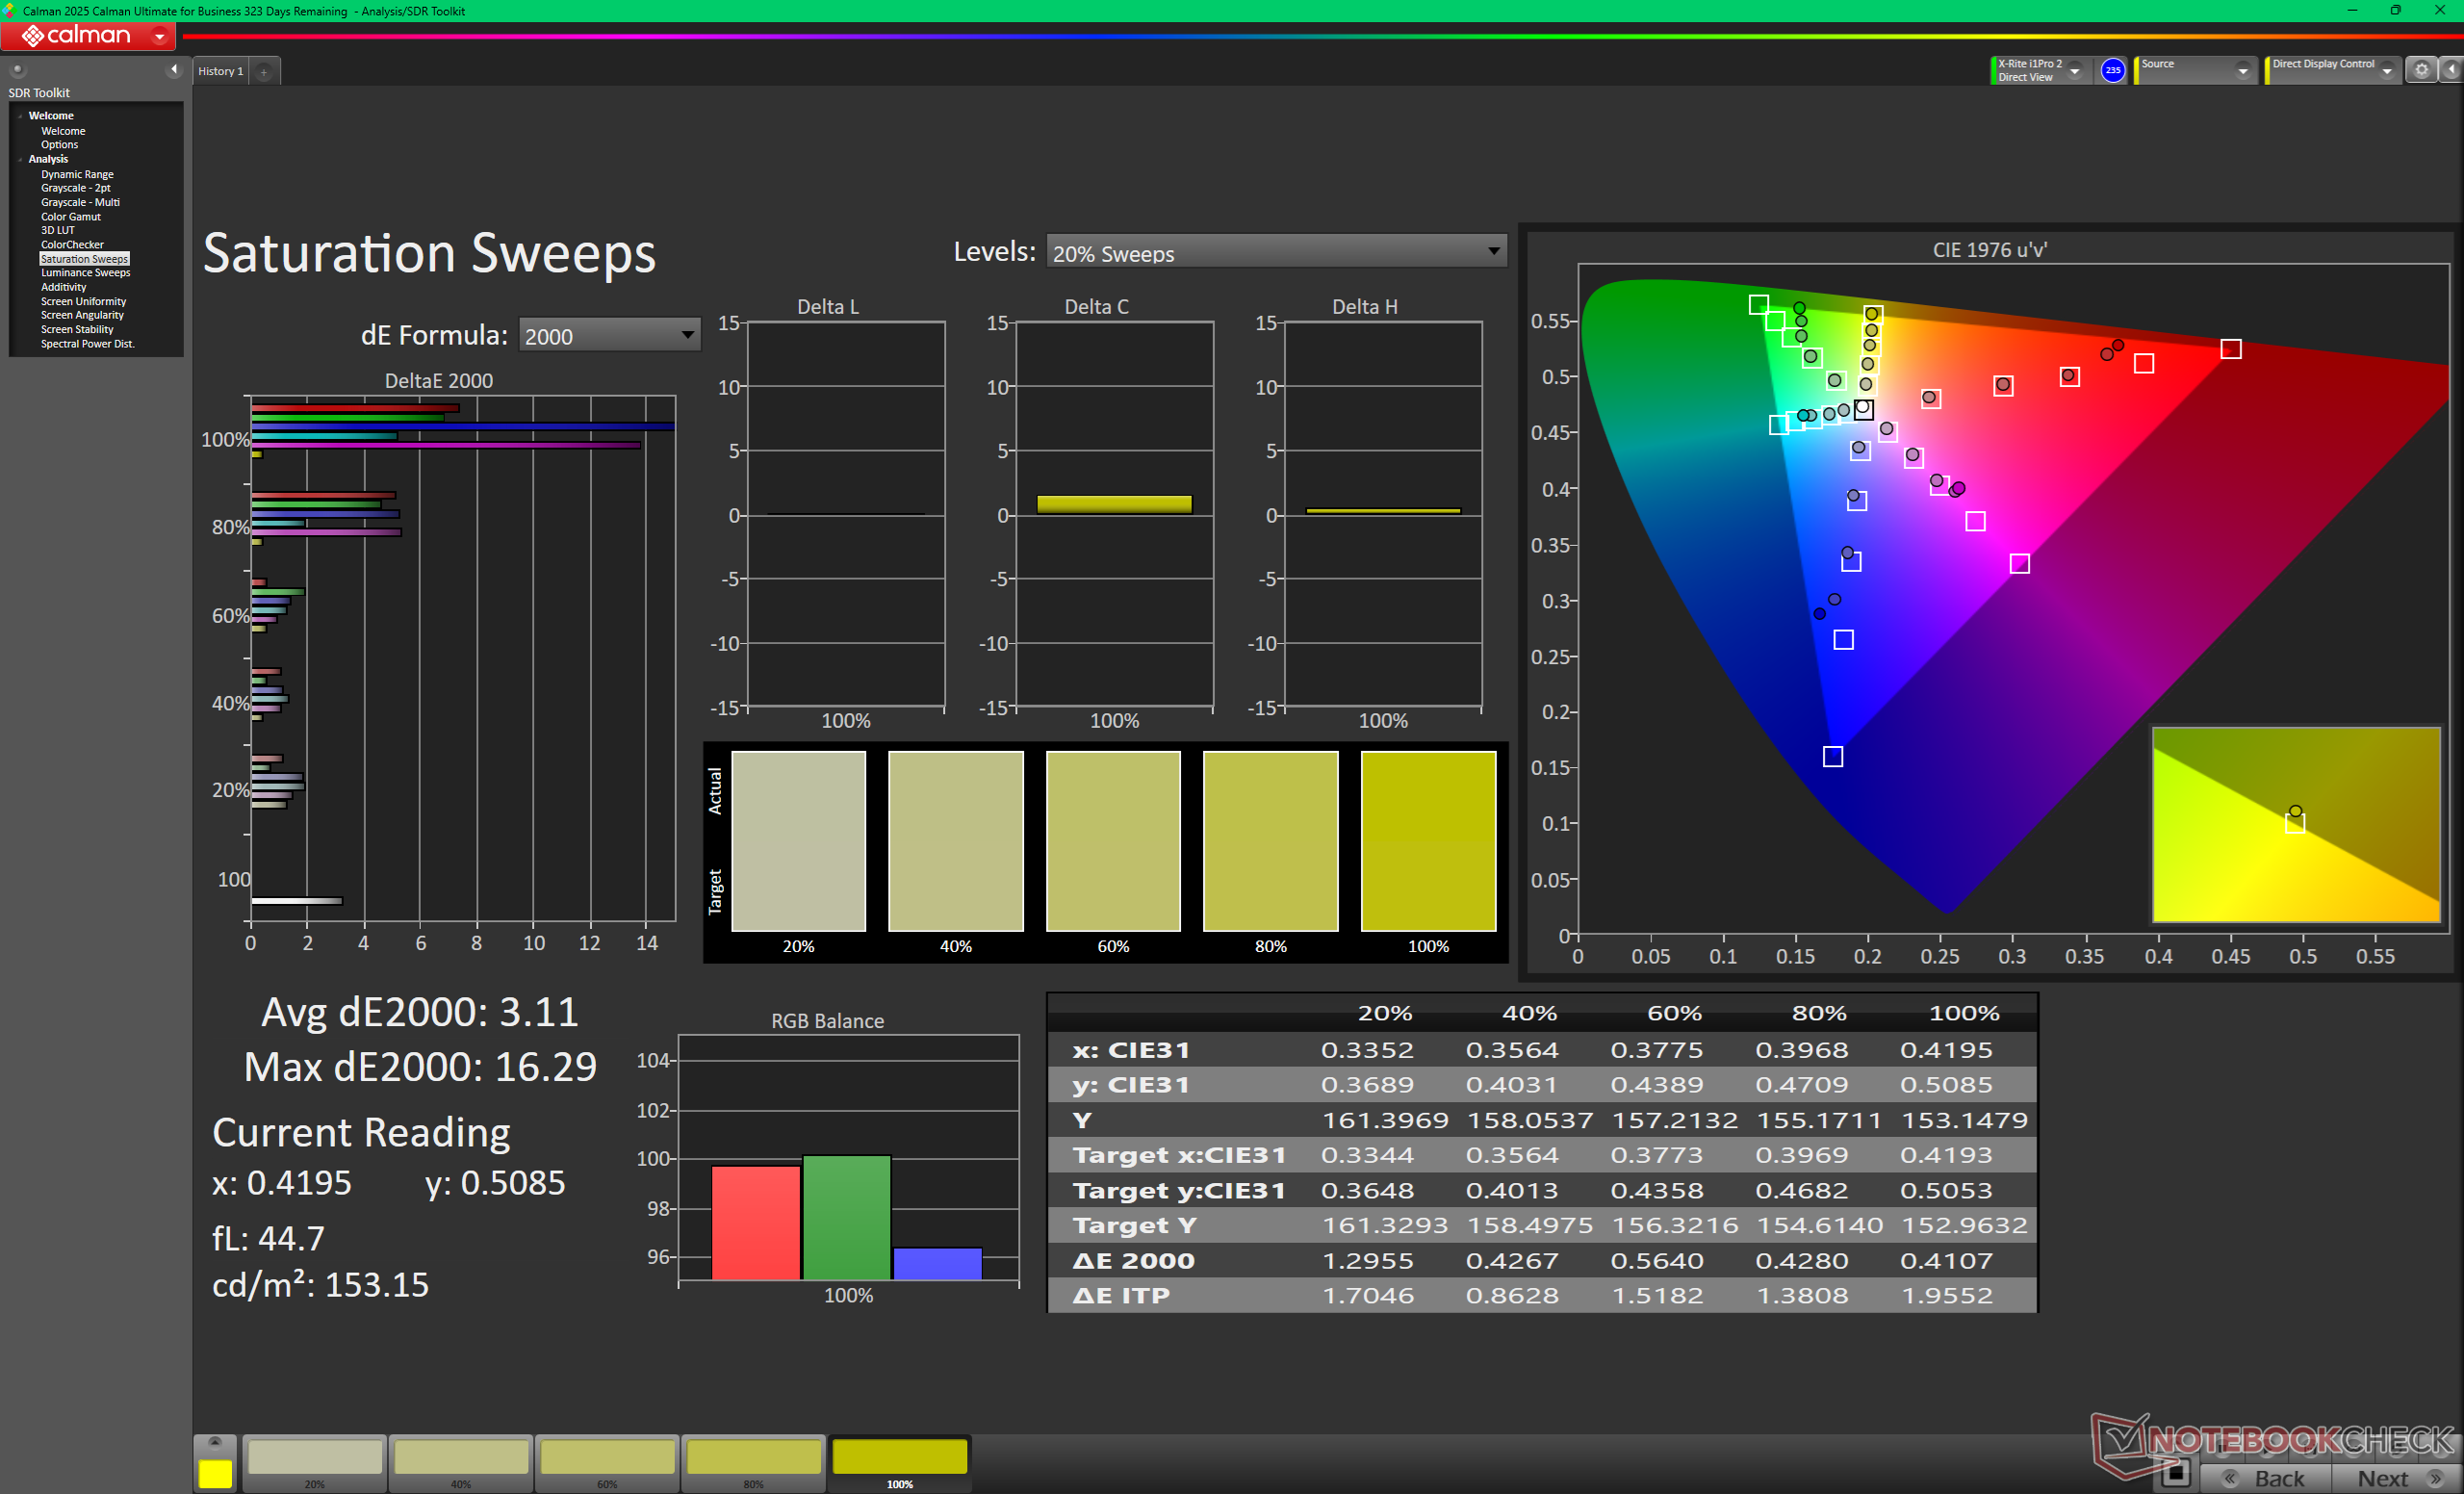
L'option de base manque de couverture sRGB et est limitée à un taux de rafraîchissement de 60 Hz, contrairement à l'option OLED qui est bien supérieure. Le contraste est par ailleurs assez bon pour un écran IPS, avec un rapport de plus de 1500:1.

| |||||||||||||||||||||||||
Homogénéité de la luminosité: 91 %
Valeur mesurée au centre, sur batterie: 321.7 cd/m²
Contraste: 1787:1 (Valeurs des noirs: 0.18 cd/m²)
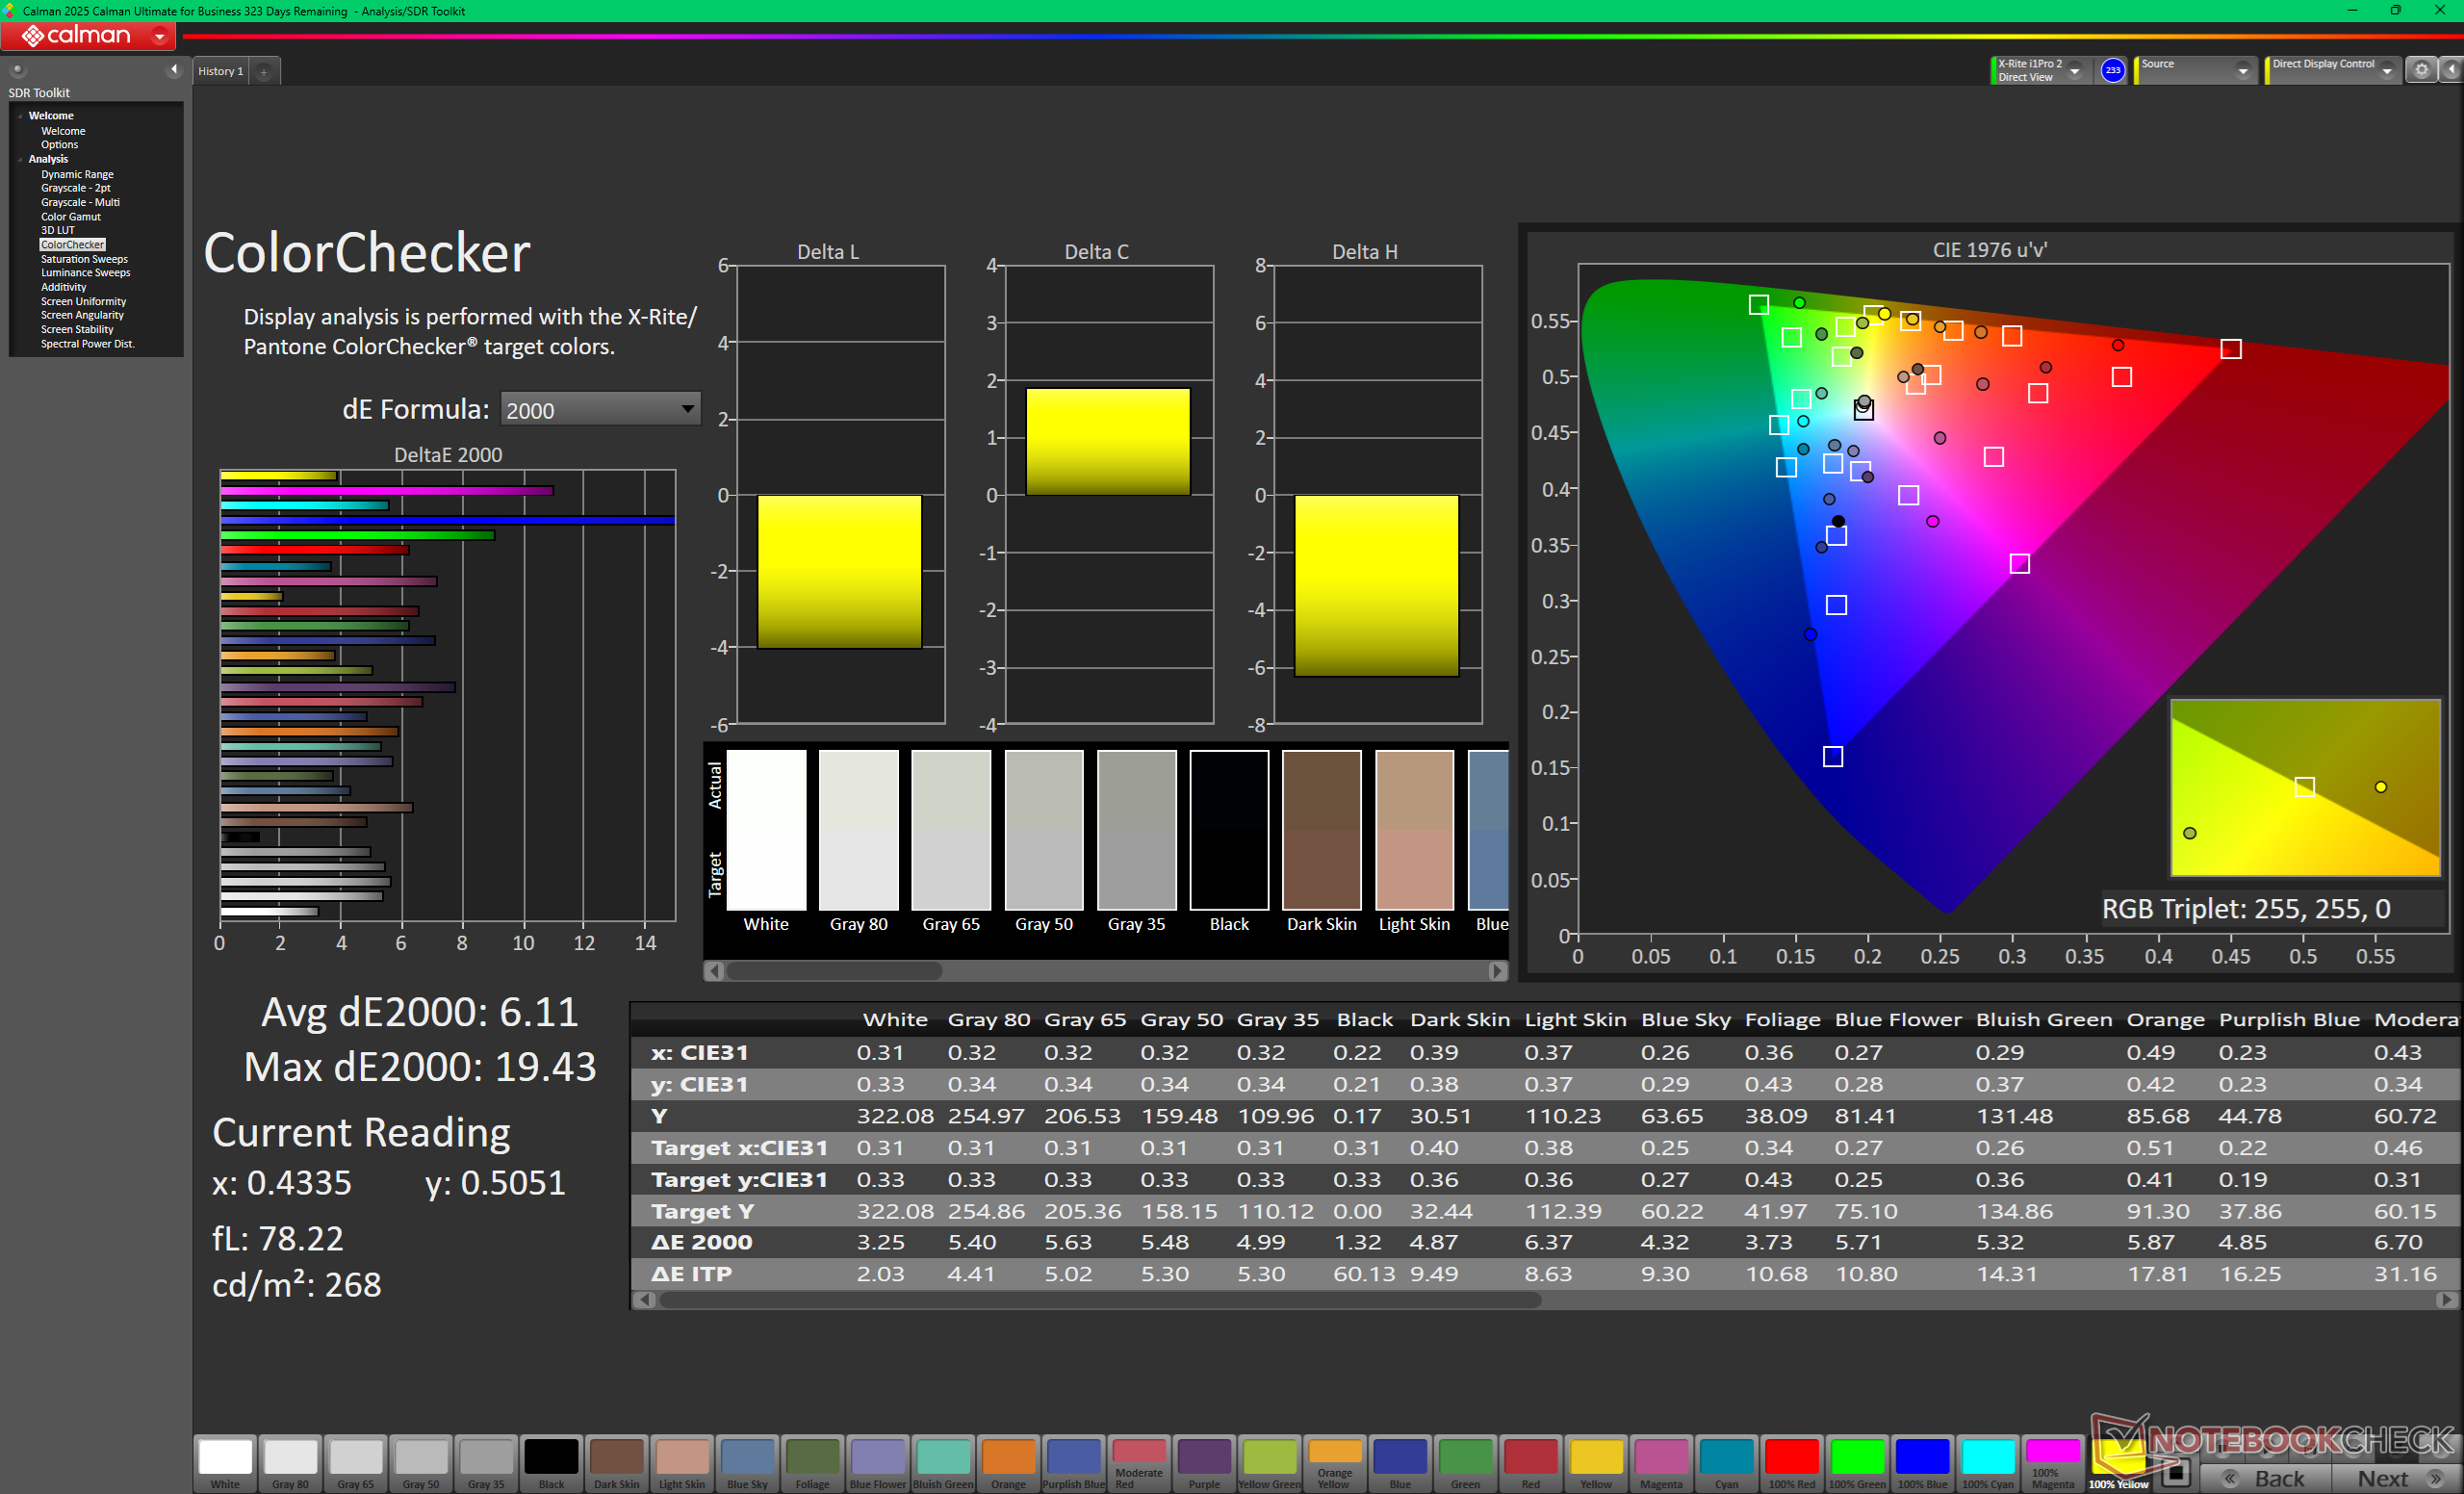
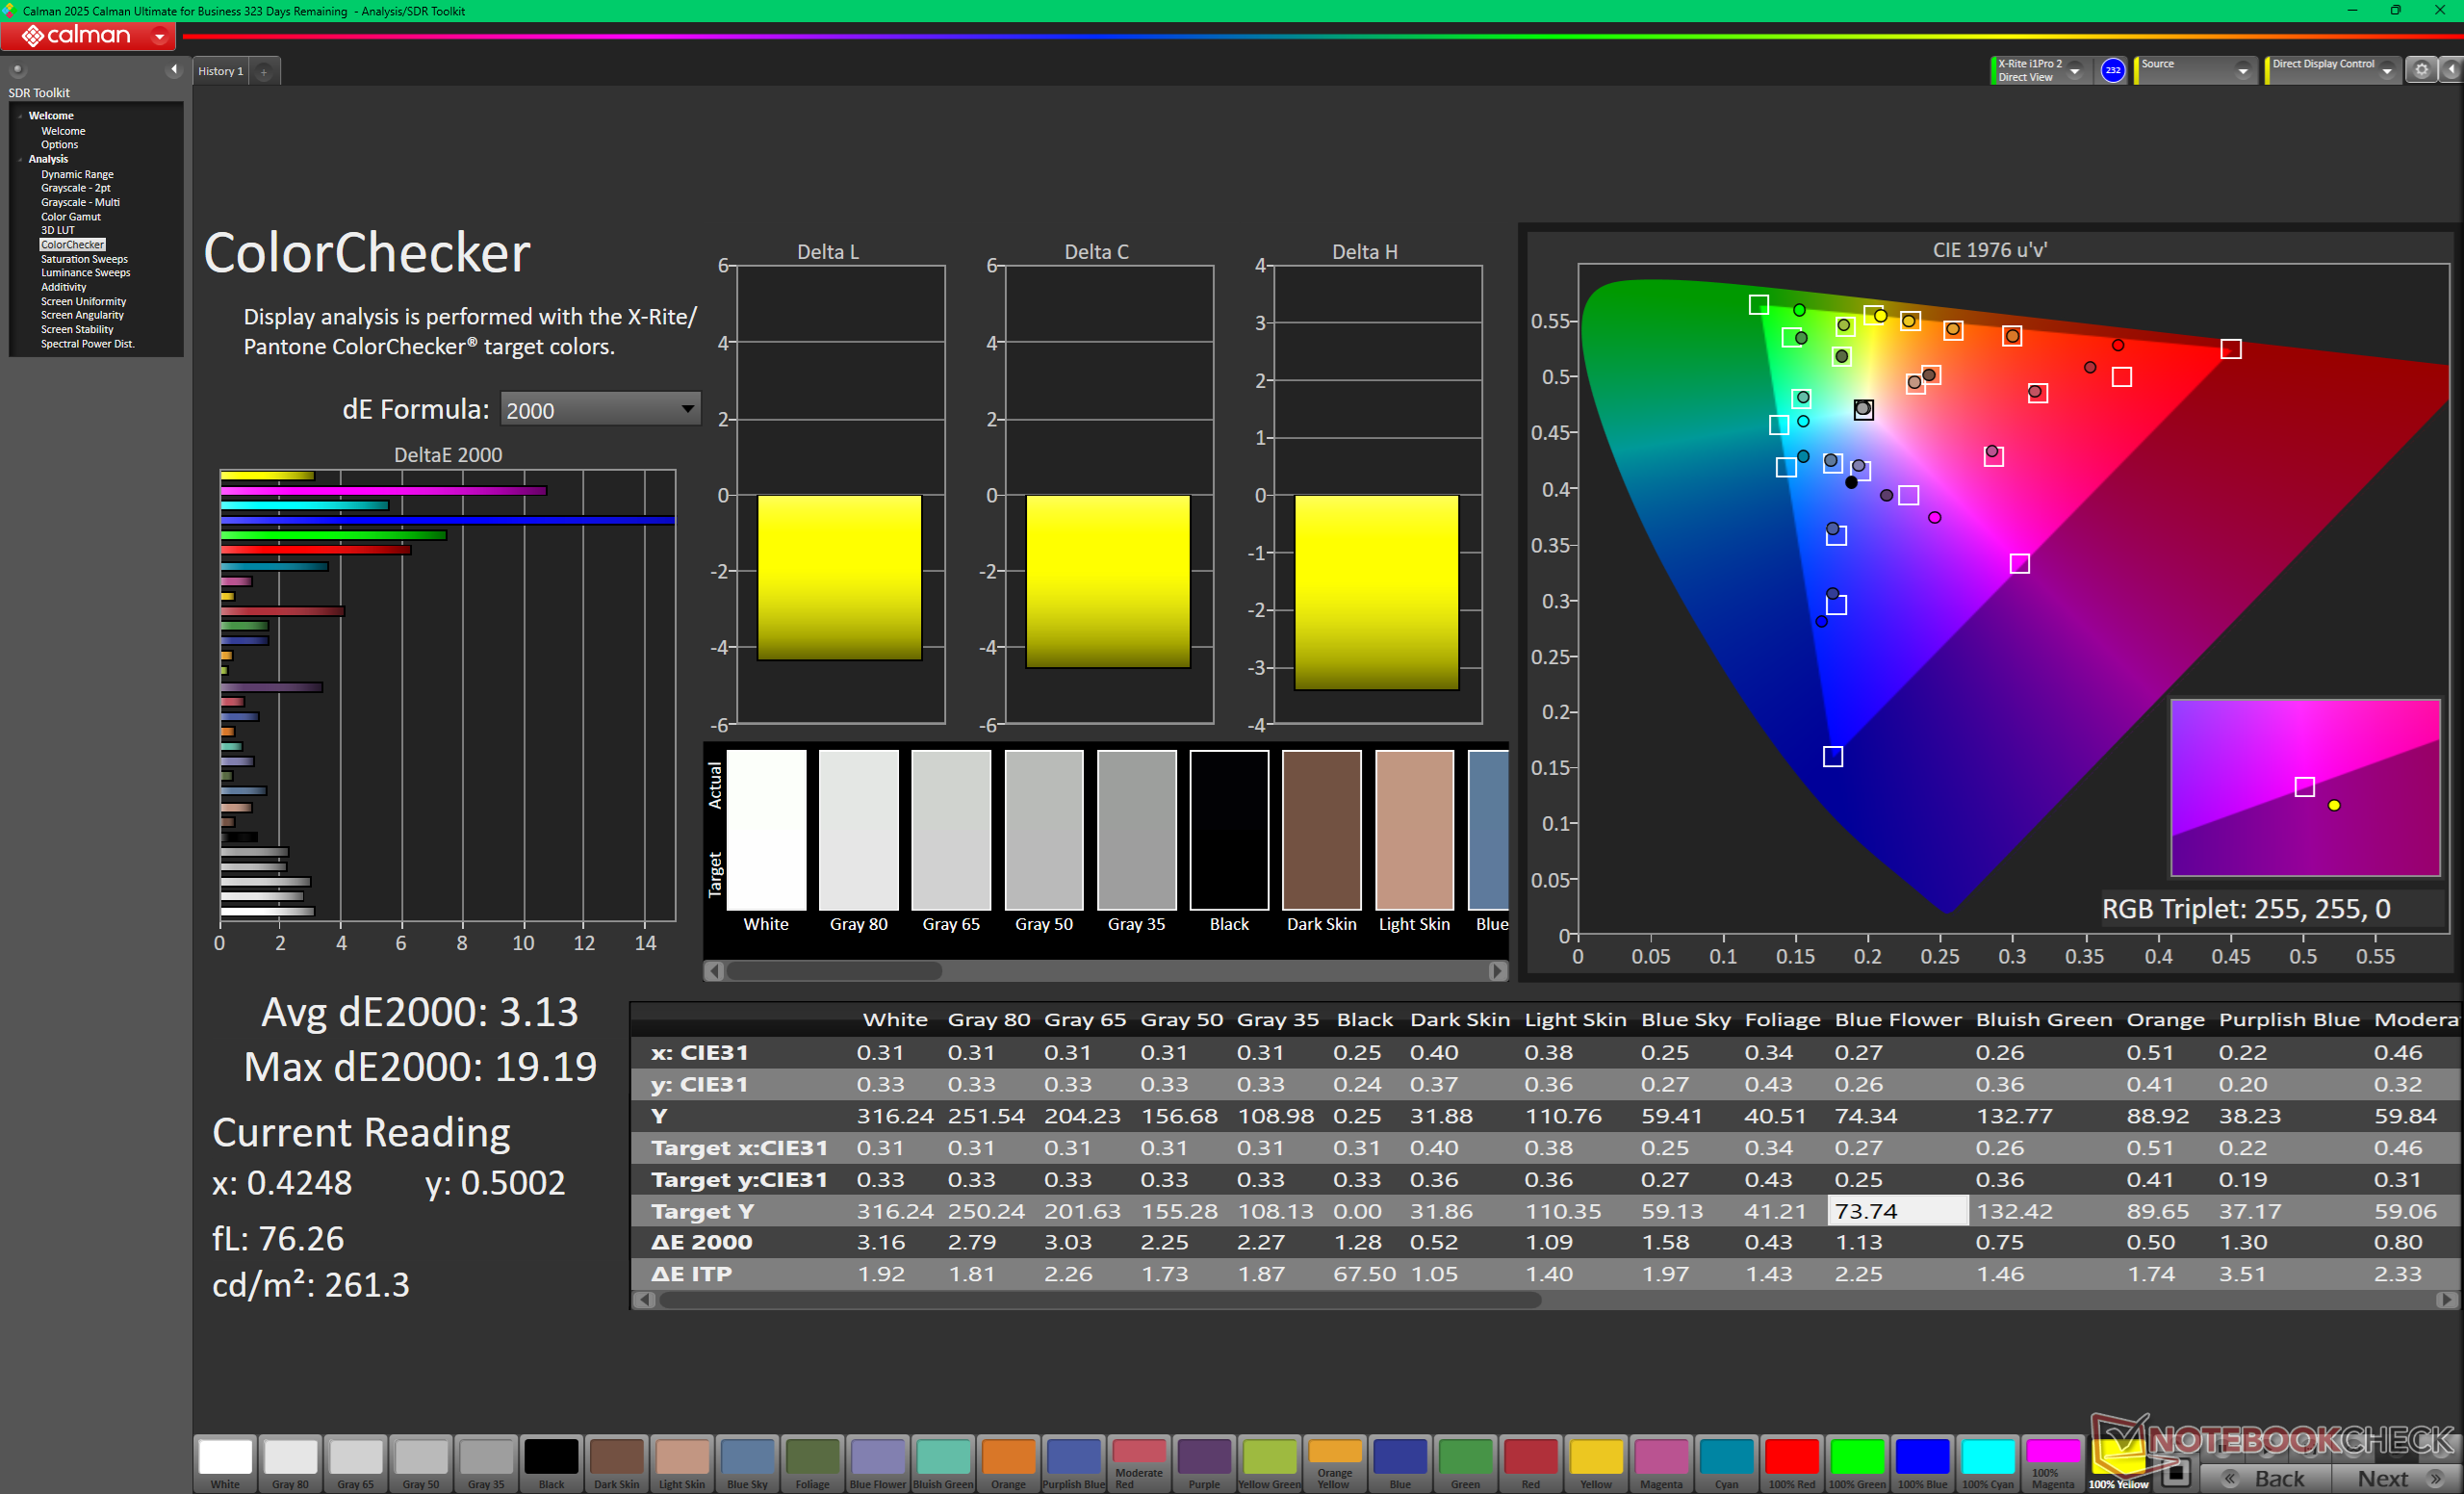
ΔE ColorChecker Calman: 6.11 | ∀{0.5-29.43 Ø4.74}
calibrated: 3.13
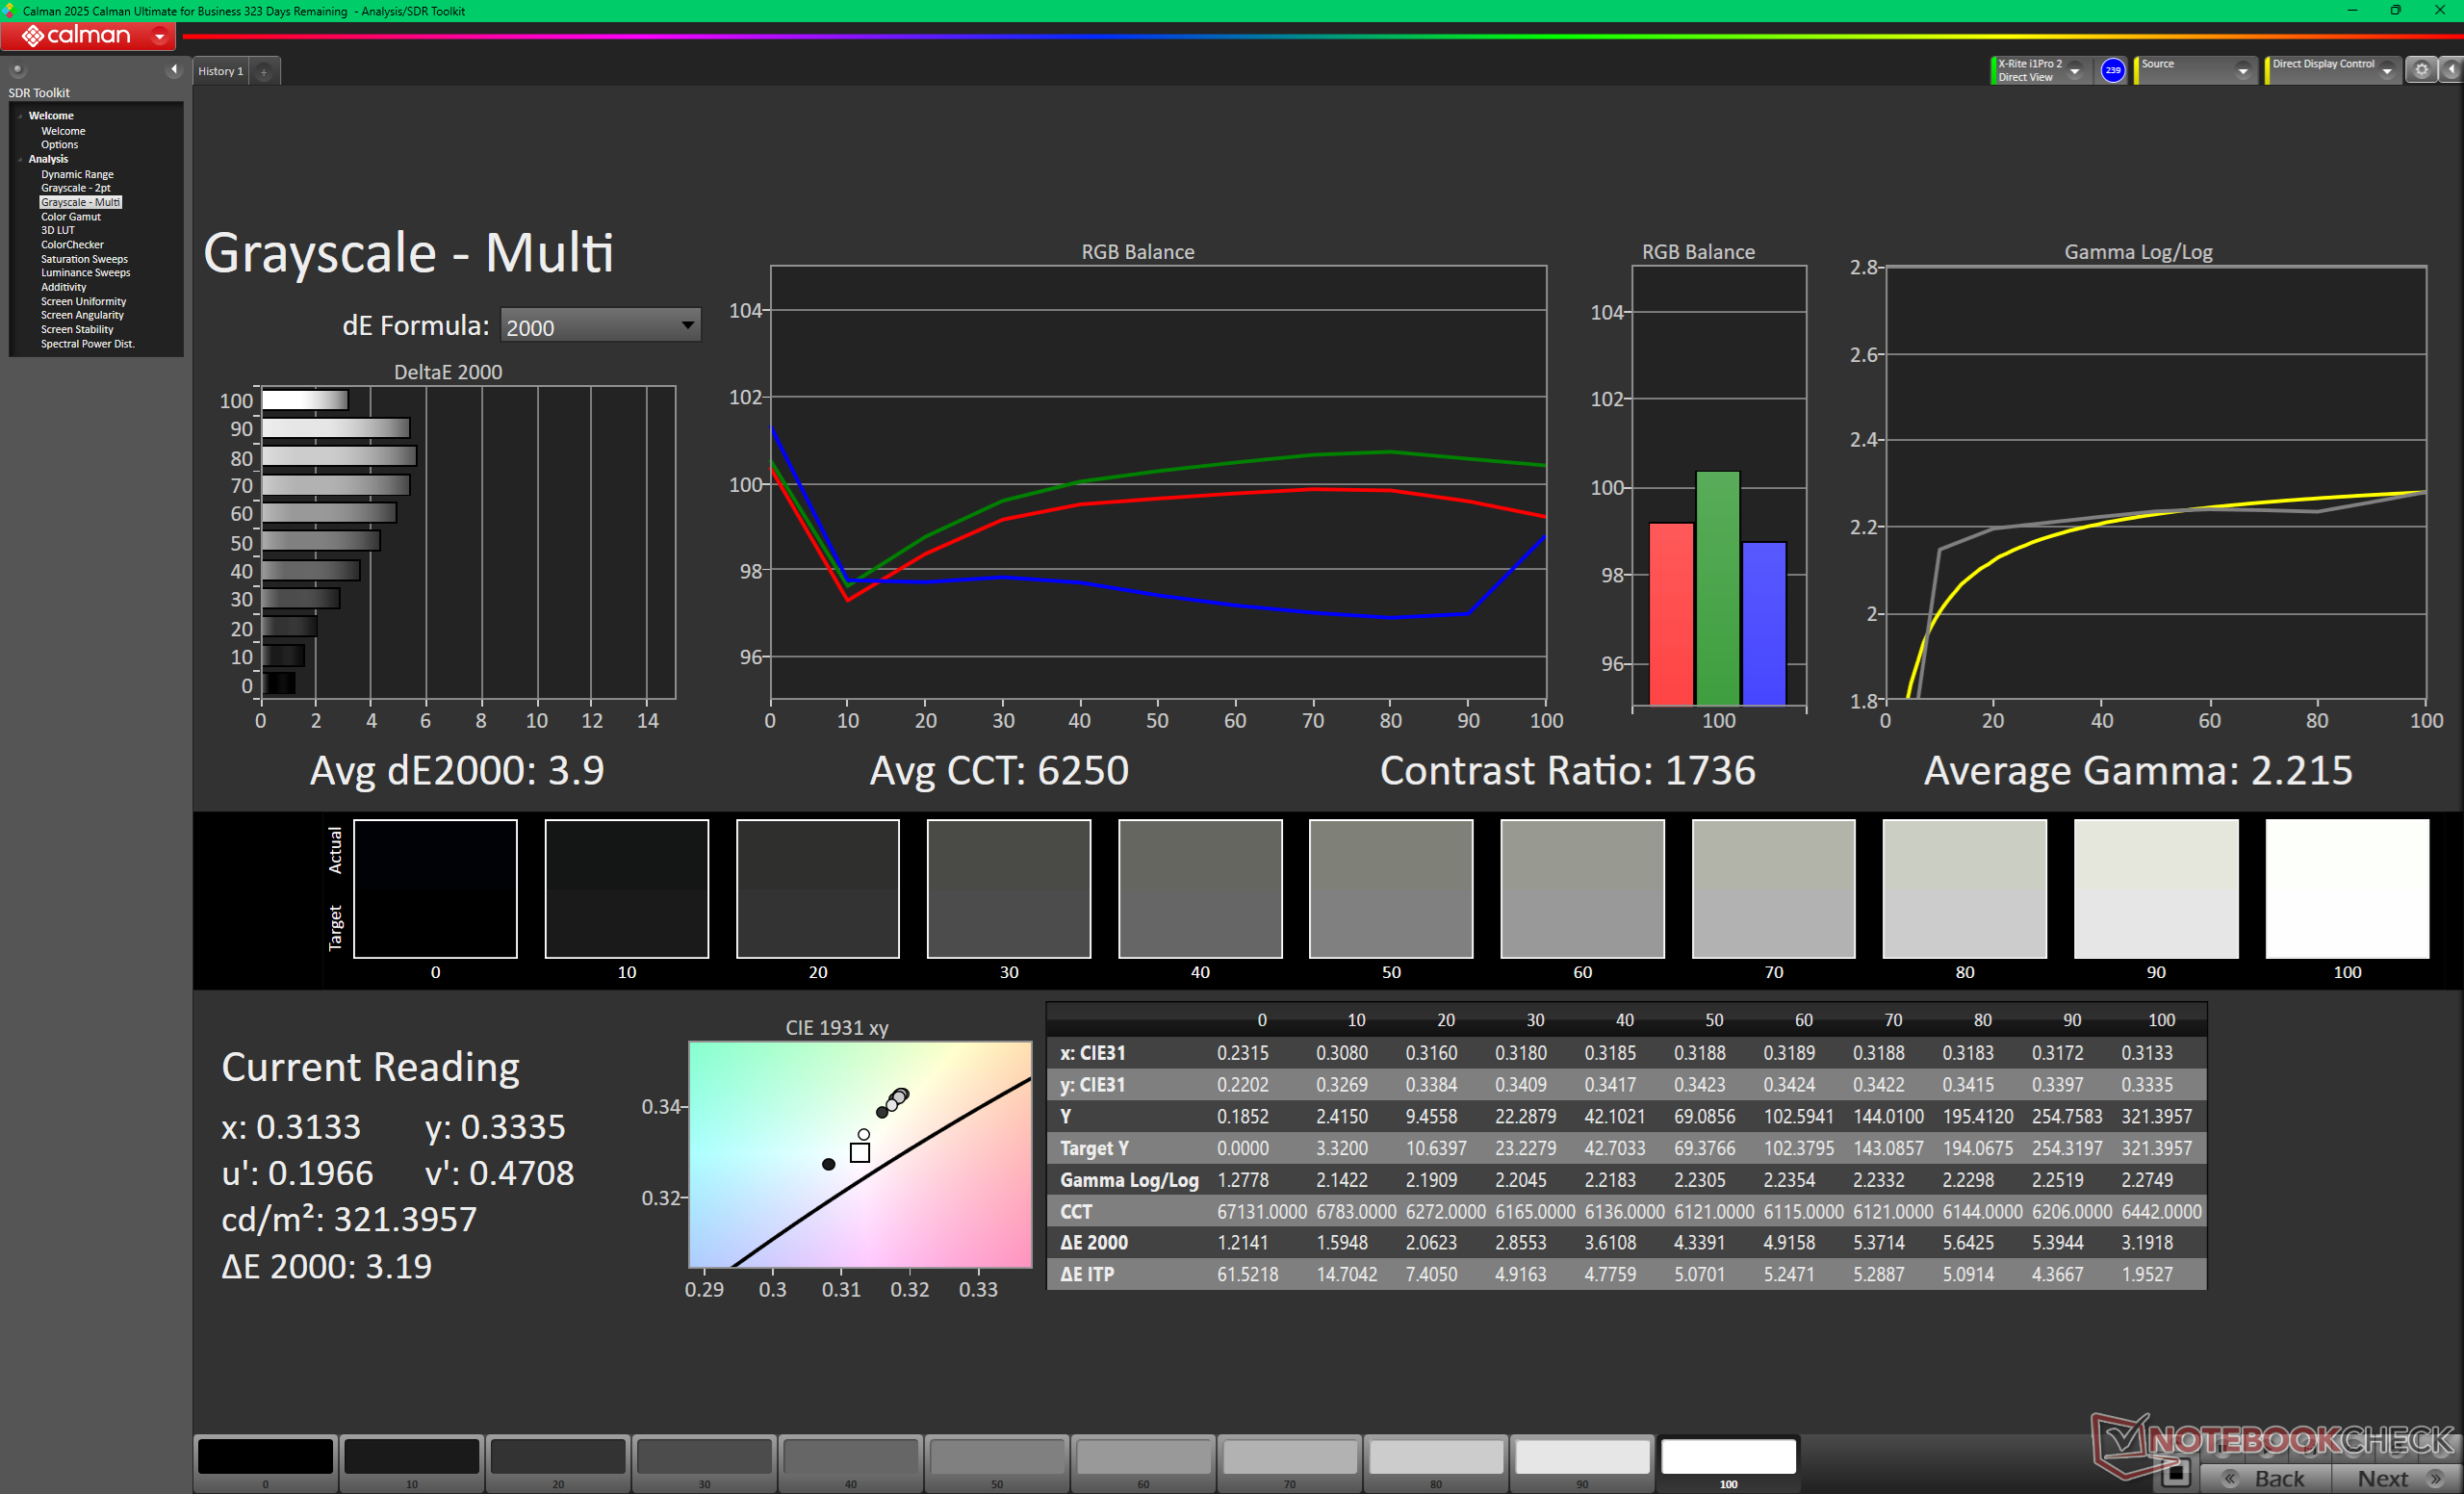
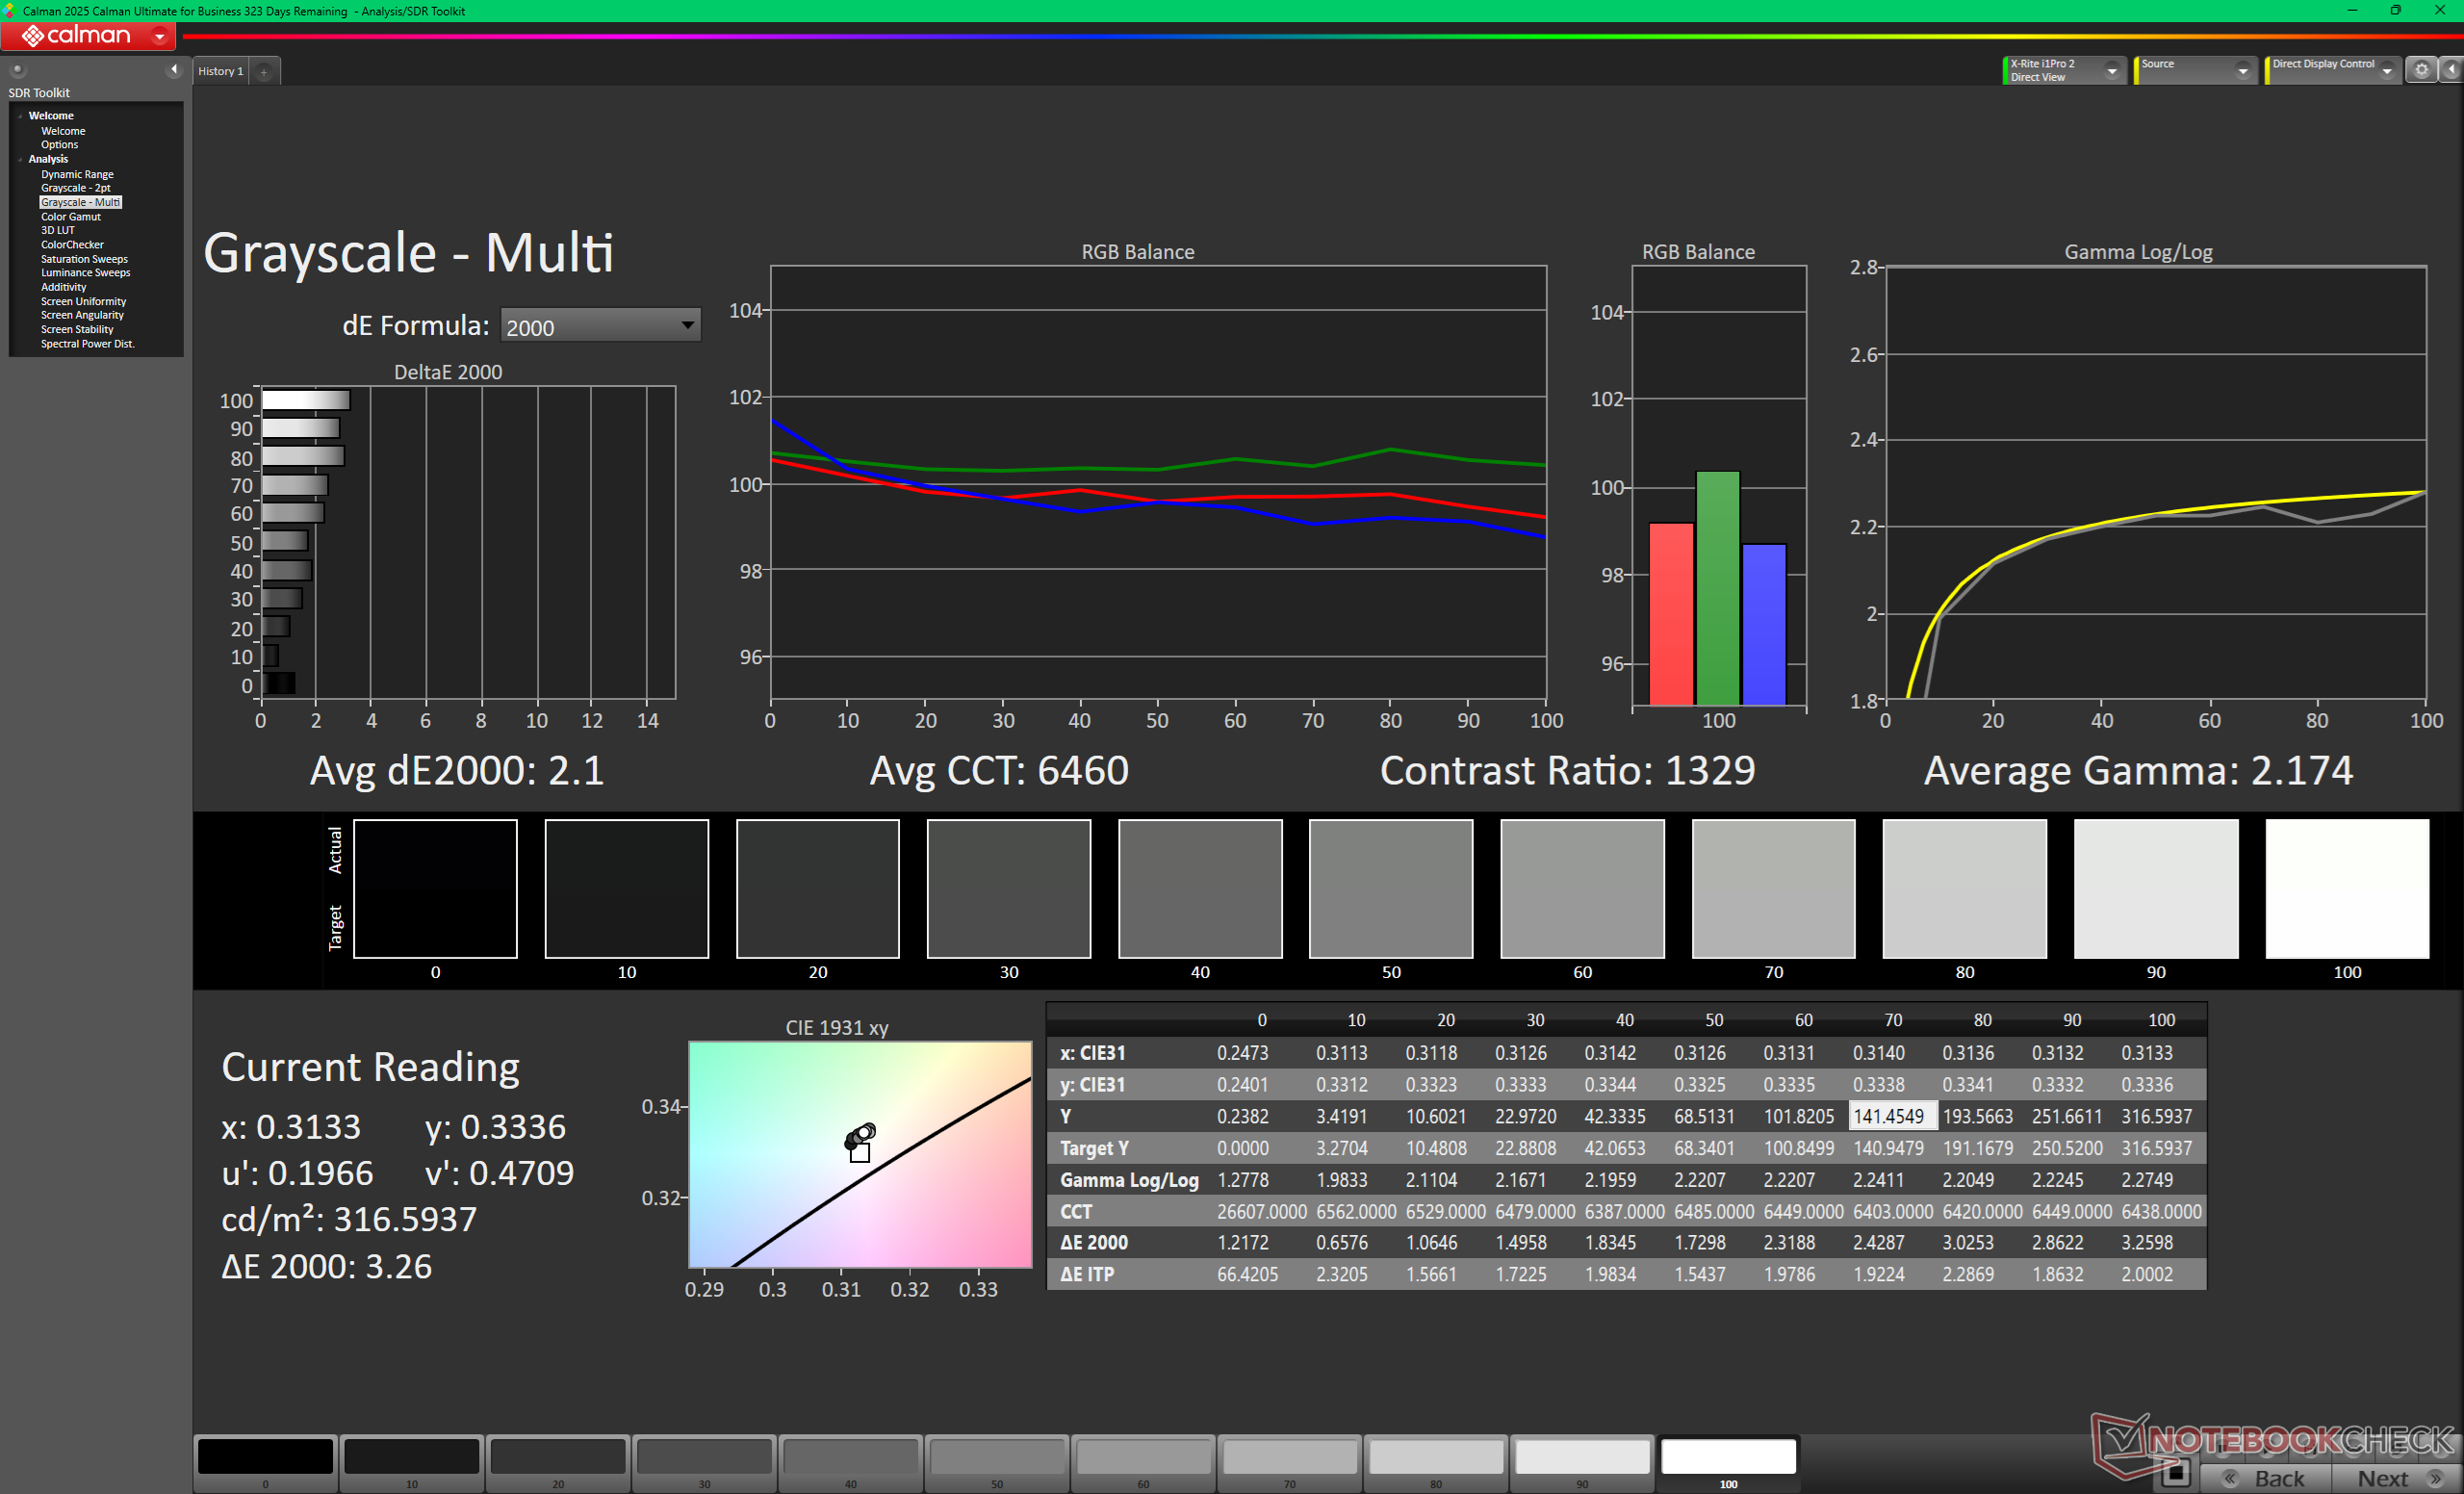
ΔE Greyscale Calman: 3.9 | ∀{0.09-98 Ø4.98}
40.7% AdobeRGB 1998 (Argyll 3D)
57.4% sRGB (Argyll 3D)
39.4% Display P3 (Argyll 3D)
Gamma: 2.22
CCT: 6250 K
| MSI Venture 16 AI A2HMTG BOE0D3E, IPS, 1920x1200, 16", 60 Hz | MSI Prestige 16 B1MG-001US AU Optronics B160QAN03.R, IPS, 2560x1600, 16", 60 Hz | Dell 16 Plus 2-in-1 AU Optronics B160QAT, Mini-LED, 2560x1600, 16", 90 Hz | Asus V16 V3607V MNG007QX2-2, IPS, 1920x1200, 16", 144 Hz | HP Pavilion 16-ag0057ng CMN1640, IPS, 1920x1200, 16", 60 Hz | Lenovo IdeaPad Slim 5 16AKP10 Lenovo LEN160WUM, IPS, 1920x1200, 16", 60 Hz | |
|---|---|---|---|---|---|---|
| Display | 109% | 119% | 4% | 7% | -1% | |
| Display P3 Coverage (%) | 39.4 | 96.7 145% | 99.5 153% | 40.9 4% | 41.6 6% | 39.1 -1% |
| sRGB Coverage (%) | 57.4 | 99.8 74% | 100 74% | 59.7 4% | 62.4 9% | 57.6 0% |
| AdobeRGB 1998 Coverage (%) | 40.7 | 84.6 108% | 94.2 131% | 42.2 4% | 43 6% | 40.4 -1% |
| Response Times | -85% | -148% | 13% | -14% | -16% | |
| Response Time Grey 50% / Grey 80% * (ms) | 26.7 ? | 49.4 ? -85% | 48.8 ? -83% | 22.9 ? 14% | 30.7 ? -15% | 31.9 ? -19% |
| Response Time Black / White * (ms) | 18.4 ? | 33.9 ? -84% | 57.6 ? -213% | 16.1 ? 12% | 20.8 ? -13% | 20.6 ? -12% |
| PWM Frequency (Hz) | 2807 ? | |||||
| PWM Amplitude * (%) | 50 | |||||
| Screen | 18% | 49% | -27% | 0% | -13% | |
| Brightness middle (cd/m²) | 321.7 | 473.6 47% | 432.1 34% | 313.3 -3% | 324 1% | 349 8% |
| Brightness (cd/m²) | 306 | 456 49% | 426 39% | 298 -3% | 295 -4% | 332 8% |
| Brightness Distribution (%) | 91 | 87 -4% | 97 7% | 88 -3% | 88 -3% | 91 0% |
| Black Level * (cd/m²) | 0.18 | 0.19 -6% | 0.5 -178% | 0.2 -11% | 0.33 -83% | |
| Contrast (:1) | 1787 | 2493 40% | 627 -65% | 1620 -9% | 1058 -41% | |
| Colorchecker dE 2000 * | 6.11 | 5.9 3% | 1.95 68% | 6.09 -0% | 5.13 16% | 5.57 9% |
| Colorchecker dE 2000 max. * | 19.43 | 9.37 52% | 3.87 80% | 19.31 1% | 16.11 17% | 19.96 -3% |
| Colorchecker dE 2000 calibrated * | 3.13 | 0.89 72% | 1.16 63% | 2.63 16% | 2.99 4% | 4.52 -44% |
| Greyscale dE 2000 * | 3.9 | 7.3 -87% | 2 49% | 4.1 -5% | 4.24 -9% | 2.7 31% |
| Gamma | 2.22 99% | 1.9 116% | 2.3 96% | 2.18 101% | 2.3 96% | 2.129 103% |
| CCT | 6250 104% | 7260 90% | 6222 104% | 6031 108% | 7318 89% | 6656 98% |
| Moyenne finale (programmes/paramètres) | 14% /
23% | 7% /
34% | -3% /
-14% | -2% /
-0% | -10% /
-11% |
* ... Moindre est la valeur, meilleures sont les performances
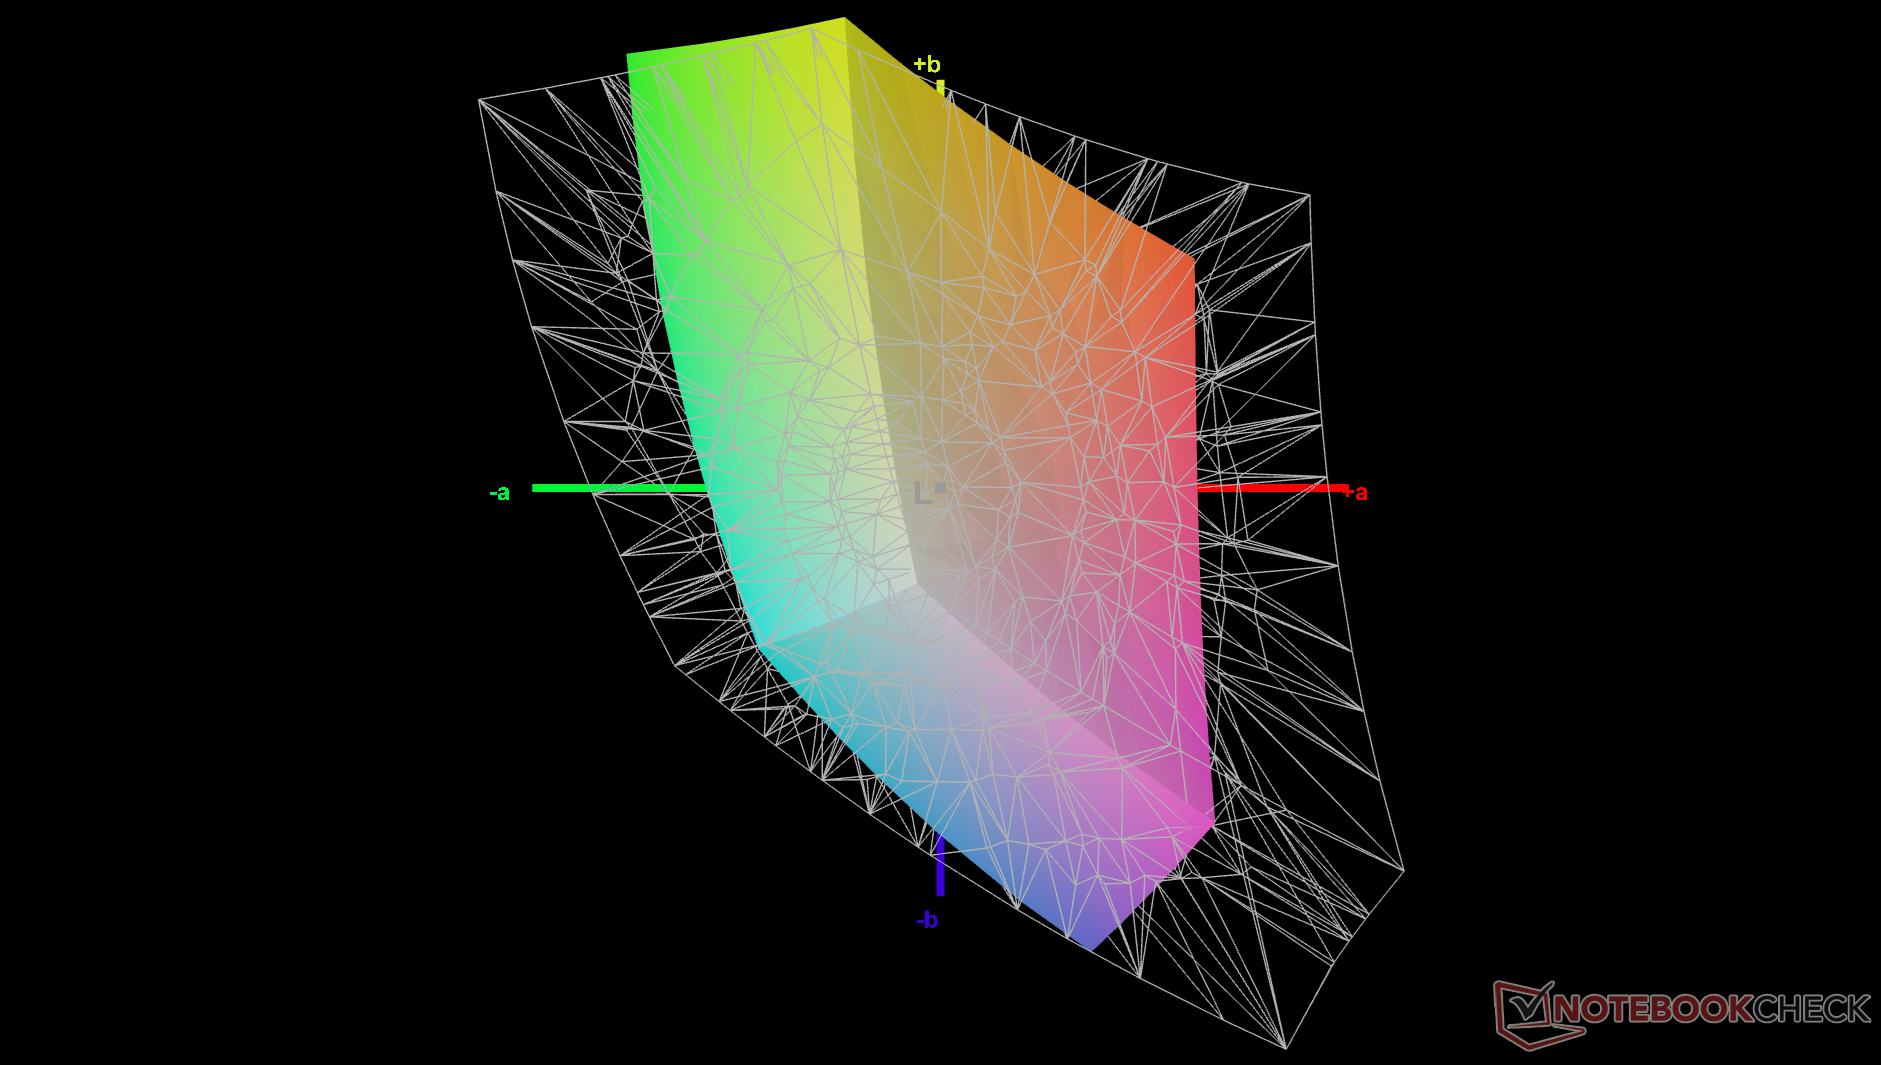
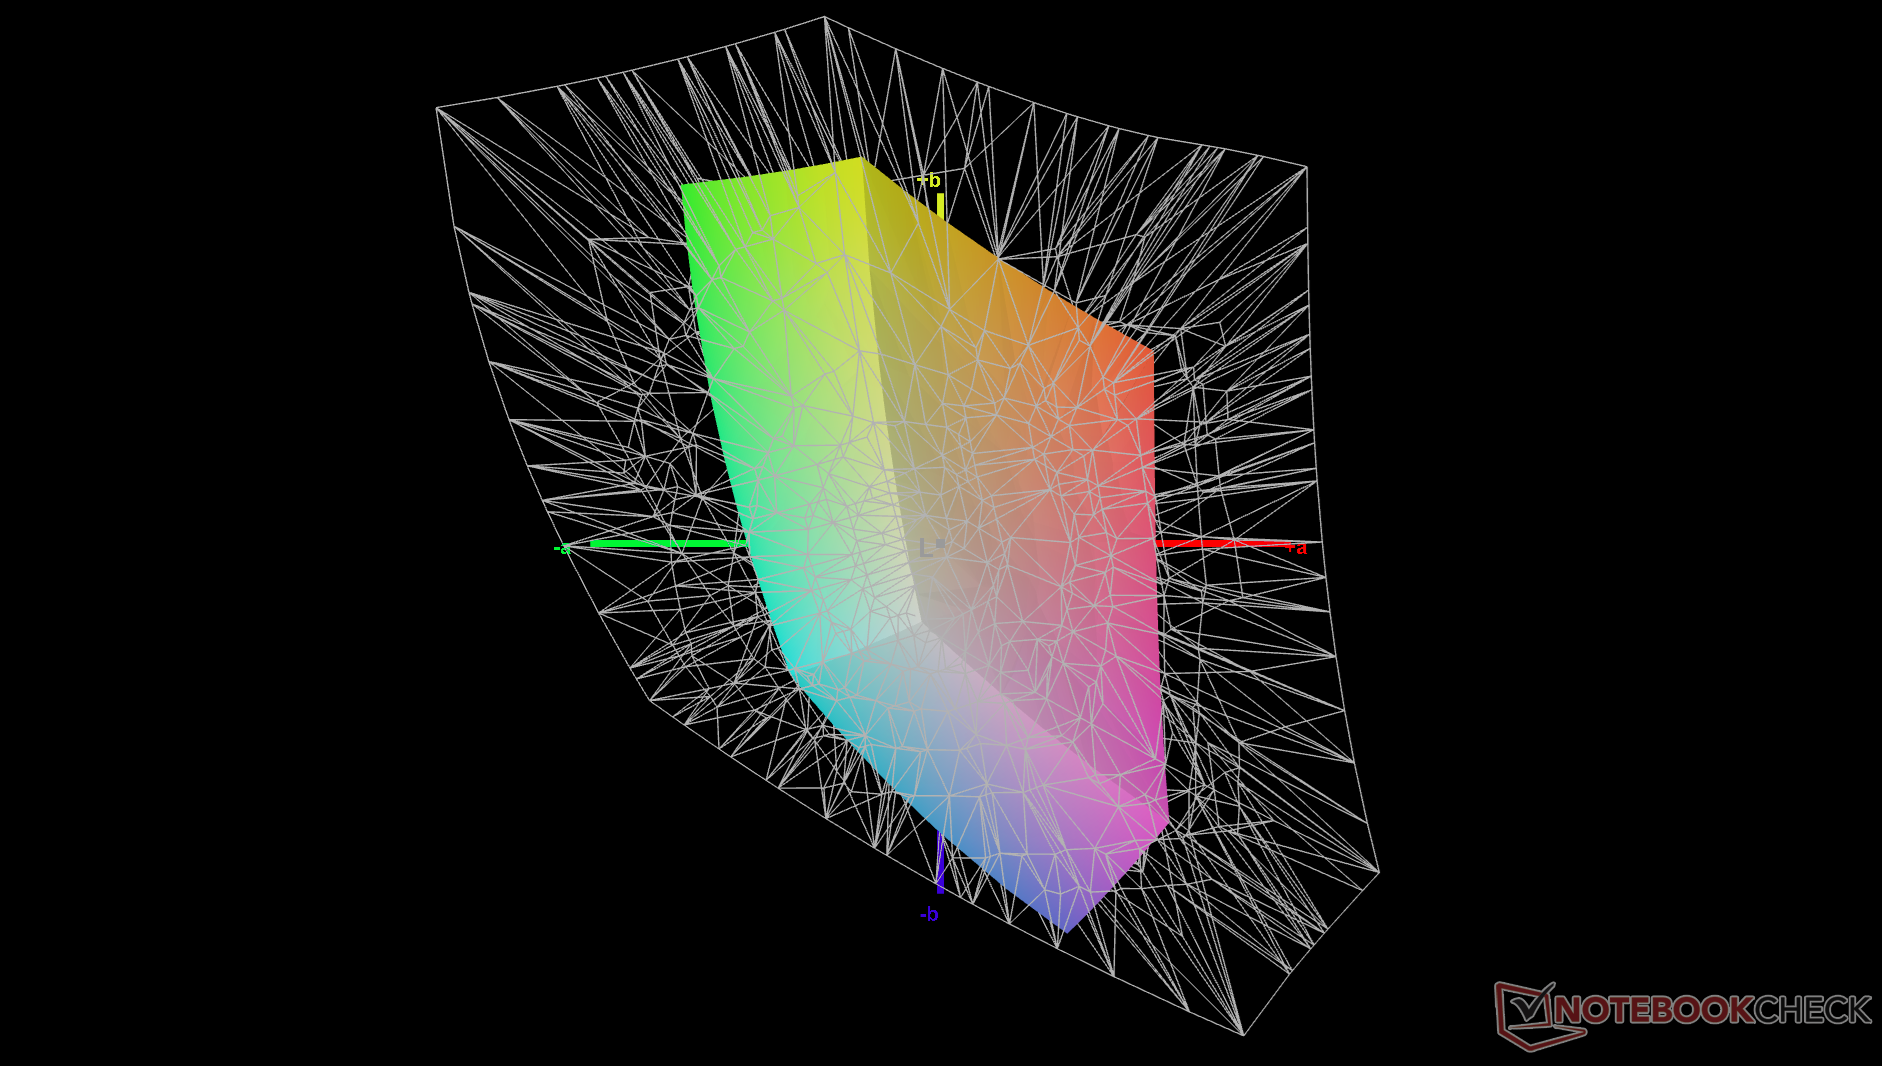
L'écran n'est pas calibré, ce qui est normal pour un modèle économique. La température des couleurs, en particulier, est un peu chaude à 6250K, même si le deltaE de l'échelle de gris est relativement bas à 3,9. L'étalonnage de la dalle par nos soins résout ces problèmes, mais pas complètement en raison de la couverture sRGB limitée, comme le montrent les captures d'écran CalMAN ci-dessous. Notre profil ICM calibré peut être téléchargé gratuitement ci-dessus.
Temps de réponse de l'écran
| ↔ Temps de réponse noir à blanc | ||
|---|---|---|
| 18.4 ms ... hausse ↗ et chute ↘ combinées | ↗ 9.9 ms hausse | 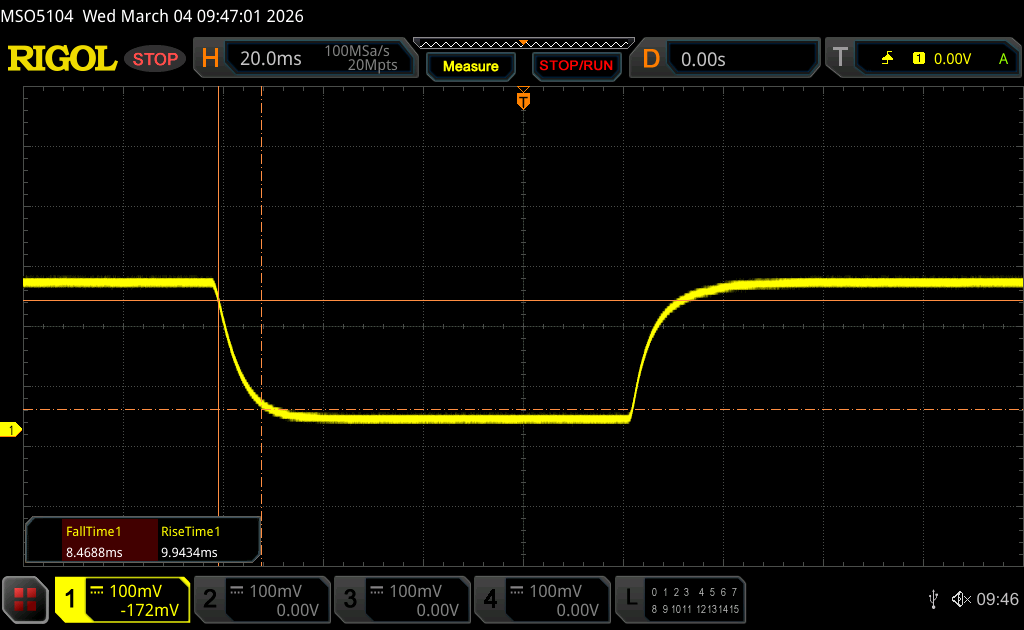 |
| ↘ 8.5 ms chute | ||
| L'écran montre de bons temps de réponse, mais insuffisant pour du jeu compétitif. En comparaison, tous les appareils testés affichent entre 0.1 (minimum) et 240 (maximum) ms. » 41 % des appareils testés affichent de meilleures performances. Cela signifie que les latences relevées sont similaires à la moyenne (19.9 ms) de tous les appareils testés. | ||
| ↔ Temps de réponse gris 50% à gris 80% | ||
| 26.7 ms ... hausse ↗ et chute ↘ combinées | ↗ 12.9 ms hausse | 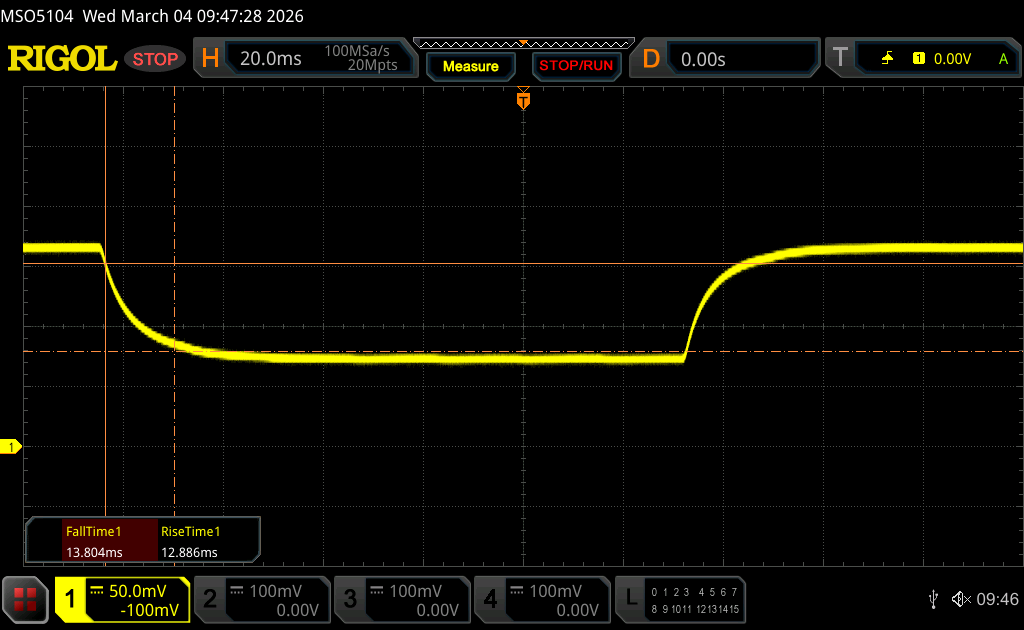 |
| ↘ 13.8 ms chute | ||
| L'écran souffre de latences relativement élevées, insuffisant pour le jeu. En comparaison, tous les appareils testés affichent entre 0.165 (minimum) et 636 (maximum) ms. » 36 % des appareils testés affichent de meilleures performances. Cela signifie que les latences relevées sont meilleures que la moyenne (31.2 ms) de tous les appareils testés. | ||
Scintillement / MLI (Modulation de largeur d'impulsion)
| Scintillement / MLI (Modulation de largeur d'impulsion) non décelé | 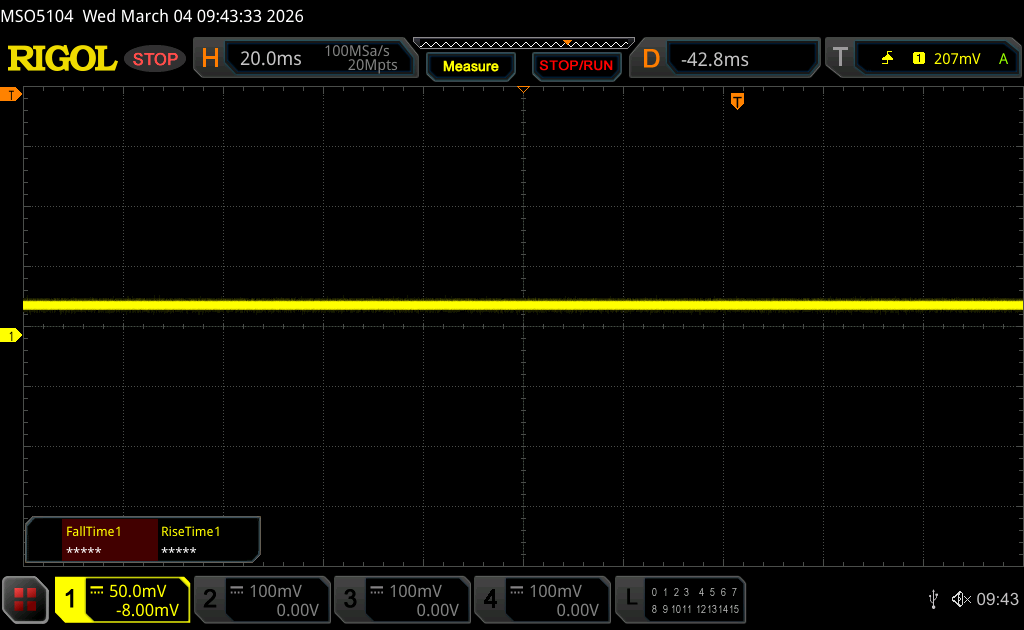 | ||
En comparaison, 52 % des appareils testés n'emploient pas MDI pour assombrir leur écran. Nous avons relevé une moyenne à 7879 (minimum : 5 - maximum : 343500) Hz dans le cas où une MDI était active. | |||
Performance
Conditions d'essai
Nous avons réglé Windows et MSI Center en mode Performance avant d'effectuer les tests ci-dessous.
Processeur
Les performances multithread brutes de notre Core Ultra 7 255H est environ 15 à 20 % plus rapide que celle du Core Ultra 7 155H du Prestige 16, ce qui représente un gain raisonnable d'une année sur l'autre. Cependant, par rapport aux autres ordinateurs portables équipés du même processeur Core Ultra 7 255H, le MSI est légèrement en retrait de quelques points de pourcentage.
En passant au processeur Core Ultra 9 285H devrait améliorer les performances multithread de 15 à 25 %, comme le montre le tableau comparatif ci-dessous.
Cinebench R15 Multi Loop
Cinebench R23: Multi Core | Single Core
Cinebench R20: CPU (Multi Core) | CPU (Single Core)
Cinebench R15: CPU Multi 64Bit | CPU Single 64Bit
Blender: v2.79 BMW27 CPU
7-Zip 18.03: 7z b 4 | 7z b 4 -mmt1
Geekbench 6.6: Multi-Core | Single-Core
Geekbench 5.5: Multi-Core | Single-Core
HWBOT x265 Benchmark v2.2: 4k Preset
LibreOffice : 20 Documents To PDF
R Benchmark 2.5: Overall mean
* ... Moindre est la valeur, meilleures sont les performances
AIDA64: FP32 Ray-Trace | FPU Julia | CPU SHA3 | CPU Queen | FPU SinJulia | FPU Mandel | CPU AES | CPU ZLib | FP64 Ray-Trace | CPU PhotoWorxx | CPU CheckMate
| Performance rating | |
| MSI Venture 16 AI A2HMTG -1! | |
| Moyenne Intel Core Ultra 7 255H | |
| MSI Prestige 16 B1MG-001US -1! | |
| HP Pavilion 16-ag0057ng -1! | |
| Asus V16 V3607V -1! | |
| Dell 16 Plus 2-in-1 -1! | |
| Lenovo IdeaPad Slim 5 16AKP10 -1! | |
| AIDA64 / FP32 Ray-Trace | |
| Moyenne Intel Core Ultra 7 255H (13863 - 24741, n=17) | |
| MSI Venture 16 AI A2HMTG (v8.20.8100) | |
| HP Pavilion 16-ag0057ng (v6.92.6600) | |
| MSI Prestige 16 B1MG-001US (v6.92.6600) | |
| Asus V16 V3607V (v6.92.6600) | |
| Lenovo IdeaPad Slim 5 16AKP10 (v6.92.6600) | |
| Dell 16 Plus 2-in-1 (v6.92.6600) | |
| AIDA64 / FPU Julia | |
| MSI Venture 16 AI A2HMTG (v8.20.8100) | |
| Moyenne Intel Core Ultra 7 255H (71030 - 119222, n=17) | |
| MSI Prestige 16 B1MG-001US (v6.92.6600) | |
| HP Pavilion 16-ag0057ng (v6.92.6600) | |
| Asus V16 V3607V (v6.92.6600) | |
| Dell 16 Plus 2-in-1 (v6.92.6600) | |
| Lenovo IdeaPad Slim 5 16AKP10 (v6.92.6600) | |
| AIDA64 / CPU SHA3 | |
| Moyenne Intel Core Ultra 7 255H (3408 - 5548, n=17) | |
| MSI Venture 16 AI A2HMTG (v8.20.8100) | |
| MSI Prestige 16 B1MG-001US (v6.92.6600) | |
| HP Pavilion 16-ag0057ng (v6.92.6600) | |
| Asus V16 V3607V (v6.92.6600) | |
| Dell 16 Plus 2-in-1 (v6.92.6600) | |
| Lenovo IdeaPad Slim 5 16AKP10 (v6.92.6600) | |
| AIDA64 / CPU Queen | |
| MSI Prestige 16 B1MG-001US (v6.92.6600) | |
| Asus V16 V3607V (v6.92.6600) | |
| HP Pavilion 16-ag0057ng (v6.92.6600) | |
| Moyenne Intel Core Ultra 7 255H (59098 - 68460, n=16) | |
| Dell 16 Plus 2-in-1 (v6.92.6600) | |
| Lenovo IdeaPad Slim 5 16AKP10 (v6.92.6600) | |
| AIDA64 / FPU SinJulia | |
| MSI Prestige 16 B1MG-001US (v6.92.6600) | |
| HP Pavilion 16-ag0057ng (v6.92.6600) | |
| Asus V16 V3607V (v6.92.6600) | |
| MSI Venture 16 AI A2HMTG (v8.20.8100) | |
| Moyenne Intel Core Ultra 7 255H (6716 - 9006, n=17) | |
| Lenovo IdeaPad Slim 5 16AKP10 (v6.92.6600) | |
| Dell 16 Plus 2-in-1 (v6.92.6600) | |
| AIDA64 / FPU Mandel | |
| MSI Venture 16 AI A2HMTG (v8.20.8100) | |
| Moyenne Intel Core Ultra 7 255H (37031 - 63347, n=17) | |
| MSI Prestige 16 B1MG-001US (v6.92.6600) | |
| HP Pavilion 16-ag0057ng (v6.92.6600) | |
| Asus V16 V3607V (v6.92.6600) | |
| Dell 16 Plus 2-in-1 (v6.92.6600) | |
| Lenovo IdeaPad Slim 5 16AKP10 (v6.92.6600) | |
| AIDA64 / CPU AES | |
| MSI Prestige 16 B1MG-001US (v6.92.6600) | |
| Moyenne Intel Core Ultra 7 255H (58402 - 83568, n=17) | |
| MSI Venture 16 AI A2HMTG (v8.20.8100) | |
| Asus V16 V3607V (v6.92.6600) | |
| HP Pavilion 16-ag0057ng (v6.92.6600) | |
| Dell 16 Plus 2-in-1 (v6.92.6600) | |
| Lenovo IdeaPad Slim 5 16AKP10 (v6.92.6600) | |
| AIDA64 / CPU ZLib | |
| Moyenne Intel Core Ultra 7 255H (822 - 1316, n=17) | |
| MSI Prestige 16 B1MG-001US (v6.92.6600) | |
| MSI Venture 16 AI A2HMTG (v8.20.8100) | |
| Asus V16 V3607V (v6.92.6600) | |
| HP Pavilion 16-ag0057ng (v6.92.6600) | |
| Dell 16 Plus 2-in-1 (v6.92.6600) | |
| Lenovo IdeaPad Slim 5 16AKP10 (v6.92.6600) | |
| AIDA64 / FP64 Ray-Trace | |
| Moyenne Intel Core Ultra 7 255H (7384 - 13231, n=17) | |
| MSI Venture 16 AI A2HMTG (v8.20.8100) | |
| HP Pavilion 16-ag0057ng (v6.92.6600) | |
| MSI Prestige 16 B1MG-001US (v6.92.6600) | |
| Asus V16 V3607V (v6.92.6600) | |
| Lenovo IdeaPad Slim 5 16AKP10 (v6.92.6600) | |
| Dell 16 Plus 2-in-1 (v6.92.6600) | |
| AIDA64 / CPU PhotoWorxx | |
| Moyenne Intel Core Ultra 7 255H (23836 - 65787, n=17) | |
| Dell 16 Plus 2-in-1 (v6.92.6600) | |
| MSI Venture 16 AI A2HMTG (v8.20.8100) | |
| MSI Prestige 16 B1MG-001US (v6.92.6600) | |
| Lenovo IdeaPad Slim 5 16AKP10 (v6.92.6600) | |
| HP Pavilion 16-ag0057ng (v6.92.6600) | |
| Asus V16 V3607V (v6.92.6600) | |
| AIDA64 / CPU CheckMate | |
| MSI Venture 16 AI A2HMTG (v8.20.8100) | |
| Moyenne Intel Core Ultra 7 255H (n=1) | |
Performance du système
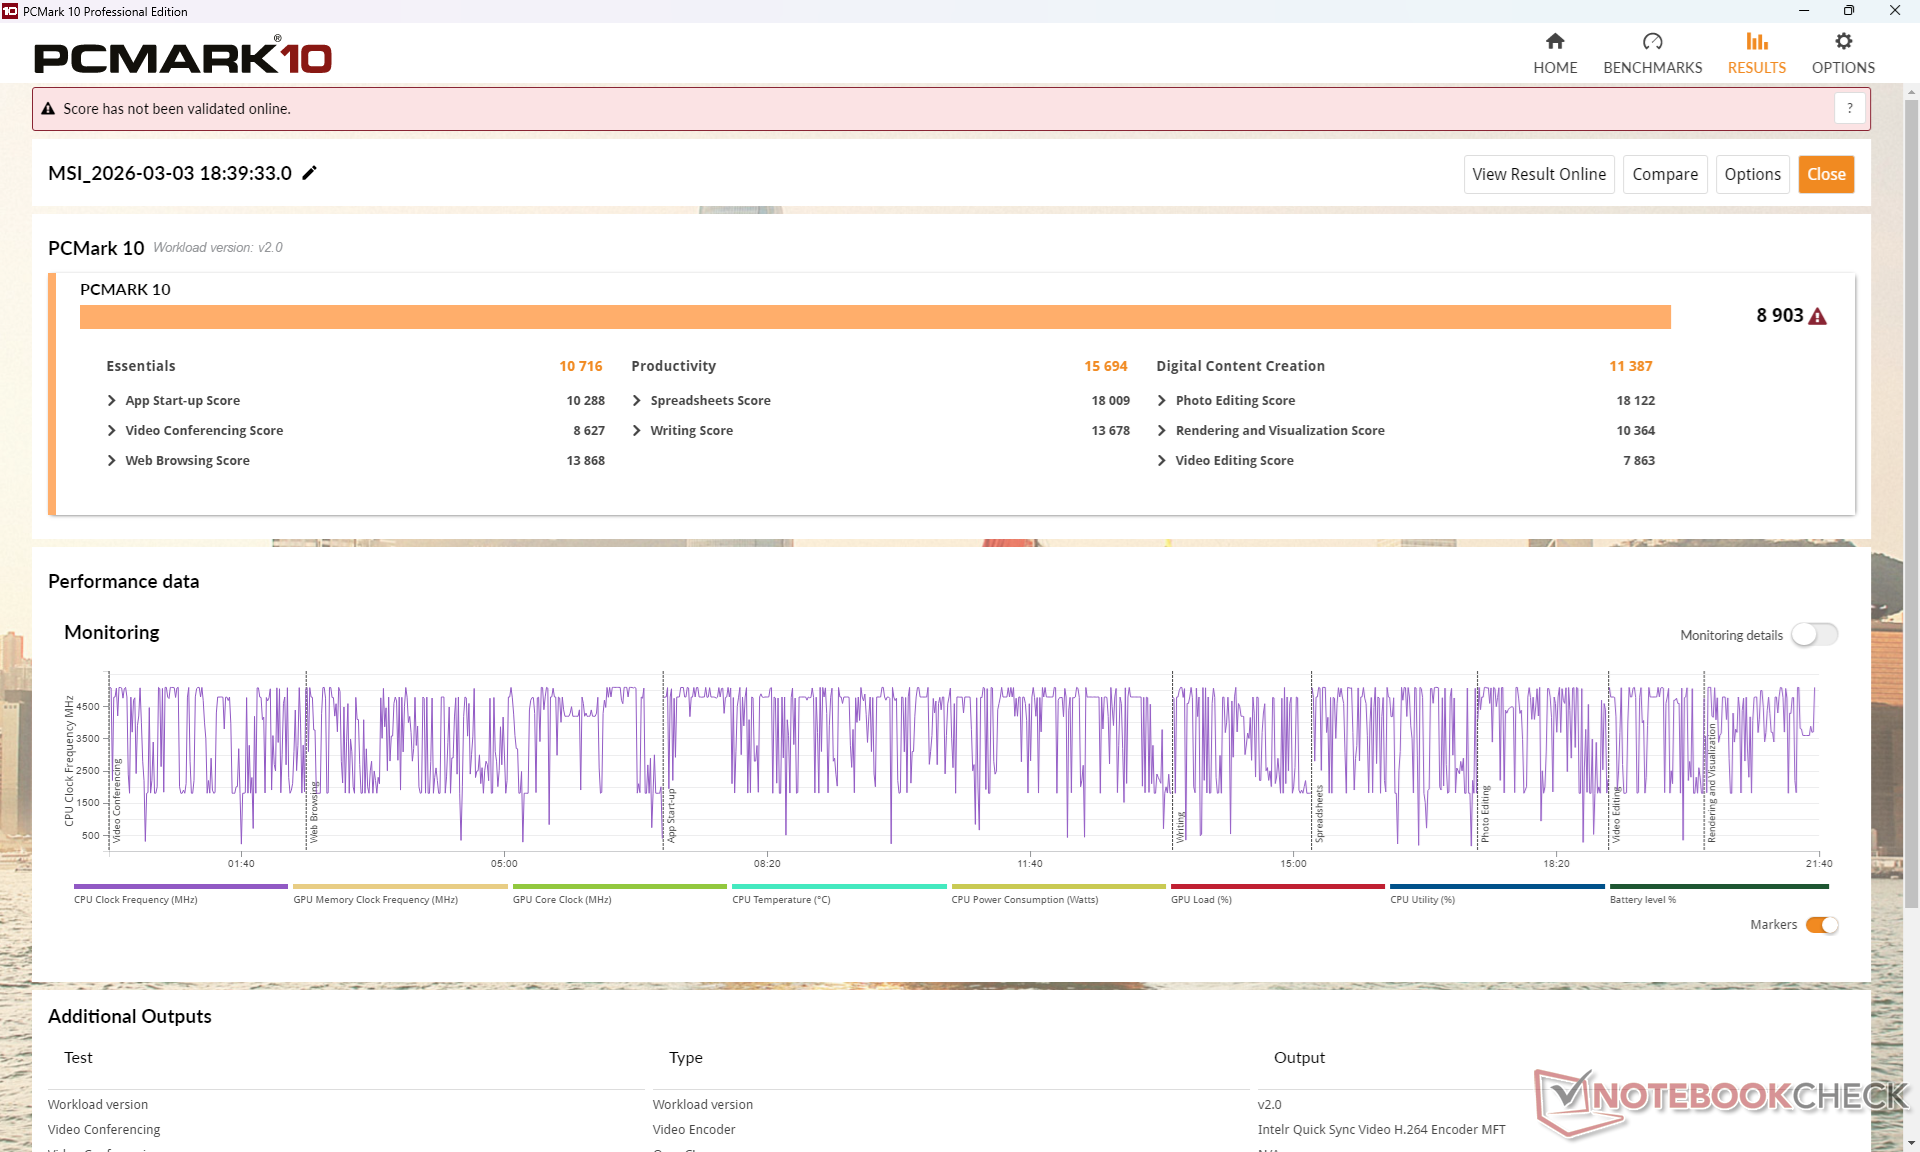
Les résultats de PCMark 10 sont nettement supérieurs à la moyenne en raison d'un score de productivité anormalement élevé, même après des mises à jour et de multiples tests. Il s'agit très certainement d'un bogue et les résultats comparatifs ci-dessous sont donc à prendre avec des pincettes.
PCMark 10: Score | Essentials | Productivity | Digital Content Creation
CrossMark: Overall | Productivity | Creativity | Responsiveness
WebXPRT 3: Overall
WebXPRT 4: Overall
Mozilla Kraken 1.1: Total
Geekbench AI: Single Precision GPU 1.7 | Half Precision GPU 1.7 | Quantized GPU 1.7
| Performance rating | |
| MSI Venture 16 AI A2HMTG | |
| Moyenne Intel Core Ultra 7 255H, Intel Arc Graphics 140T | |
| Dell 16 Plus 2-in-1 | |
| MSI Prestige 16 B1MG-001US -3! | |
| Asus V16 V3607V -4! | |
| HP Pavilion 16-ag0057ng -7! | |
| Lenovo IdeaPad Slim 5 16AKP10 -4! | |
| PCMark 10 / Score | |
| MSI Venture 16 AI A2HMTG | |
| Moyenne Intel Core Ultra 7 255H, Intel Arc Graphics 140T (6878 - 9156, n=13) | |
| MSI Prestige 16 B1MG-001US | |
| Dell 16 Plus 2-in-1 | |
| Asus V16 V3607V | |
| HP Pavilion 16-ag0057ng | |
| Lenovo IdeaPad Slim 5 16AKP10 | |
| PCMark 10 / Essentials | |
| MSI Prestige 16 B1MG-001US | |
| Moyenne Intel Core Ultra 7 255H, Intel Arc Graphics 140T (10637 - 11556, n=13) | |
| MSI Venture 16 AI A2HMTG | |
| Dell 16 Plus 2-in-1 | |
| HP Pavilion 16-ag0057ng | |
| Asus V16 V3607V | |
| Lenovo IdeaPad Slim 5 16AKP10 | |
| PCMark 10 / Productivity | |
| MSI Venture 16 AI A2HMTG | |
| Moyenne Intel Core Ultra 7 255H, Intel Arc Graphics 140T (7598 - 15694, n=13) | |
| Asus V16 V3607V | |
| Lenovo IdeaPad Slim 5 16AKP10 | |
| HP Pavilion 16-ag0057ng | |
| MSI Prestige 16 B1MG-001US | |
| Dell 16 Plus 2-in-1 | |
| PCMark 10 / Digital Content Creation | |
| Moyenne Intel Core Ultra 7 255H, Intel Arc Graphics 140T (10461 - 12552, n=13) | |
| MSI Venture 16 AI A2HMTG | |
| MSI Prestige 16 B1MG-001US | |
| Dell 16 Plus 2-in-1 | |
| Asus V16 V3607V | |
| HP Pavilion 16-ag0057ng | |
| Lenovo IdeaPad Slim 5 16AKP10 | |
| CrossMark / Overall | |
| MSI Venture 16 AI A2HMTG | |
| Moyenne Intel Core Ultra 7 255H, Intel Arc Graphics 140T (1610 - 2018, n=13) | |
| Asus V16 V3607V | |
| MSI Prestige 16 B1MG-001US | |
| Dell 16 Plus 2-in-1 | |
| Lenovo IdeaPad Slim 5 16AKP10 | |
| CrossMark / Productivity | |
| MSI Venture 16 AI A2HMTG | |
| Moyenne Intel Core Ultra 7 255H, Intel Arc Graphics 140T (1566 - 1908, n=13) | |
| Asus V16 V3607V | |
| MSI Prestige 16 B1MG-001US | |
| Dell 16 Plus 2-in-1 | |
| Lenovo IdeaPad Slim 5 16AKP10 | |
| CrossMark / Creativity | |
| MSI Venture 16 AI A2HMTG | |
| Moyenne Intel Core Ultra 7 255H, Intel Arc Graphics 140T (1827 - 2396, n=13) | |
| Asus V16 V3607V | |
| MSI Prestige 16 B1MG-001US | |
| Dell 16 Plus 2-in-1 | |
| Lenovo IdeaPad Slim 5 16AKP10 | |
| CrossMark / Responsiveness | |
| MSI Prestige 16 B1MG-001US | |
| Asus V16 V3607V | |
| Moyenne Intel Core Ultra 7 255H, Intel Arc Graphics 140T (1194 - 1781, n=13) | |
| MSI Venture 16 AI A2HMTG | |
| Dell 16 Plus 2-in-1 | |
| Lenovo IdeaPad Slim 5 16AKP10 | |
| WebXPRT 3 / Overall | |
| MSI Venture 16 AI A2HMTG | |
| Moyenne Intel Core Ultra 7 255H, Intel Arc Graphics 140T (273 - 327, n=13) | |
| MSI Prestige 16 B1MG-001US | |
| Dell 16 Plus 2-in-1 | |
| HP Pavilion 16-ag0057ng | |
| HP Pavilion 16-ag0057ng | |
| Lenovo IdeaPad Slim 5 16AKP10 | |
| WebXPRT 4 / Overall | |
| MSI Venture 16 AI A2HMTG | |
| Moyenne Intel Core Ultra 7 255H, Intel Arc Graphics 140T (247 - 317, n=13) | |
| Dell 16 Plus 2-in-1 | |
| Asus V16 V3607V | |
| MSI Prestige 16 B1MG-001US | |
| HP Pavilion 16-ag0057ng | |
| HP Pavilion 16-ag0057ng | |
| Mozilla Kraken 1.1 / Total | |
| Lenovo IdeaPad Slim 5 16AKP10 | |
| HP Pavilion 16-ag0057ng | |
| HP Pavilion 16-ag0057ng | |
| MSI Prestige 16 B1MG-001US | |
| Asus V16 V3607V | |
| Dell 16 Plus 2-in-1 | |
| MSI Venture 16 AI A2HMTG | |
| Moyenne Intel Core Ultra 7 255H, Intel Arc Graphics 140T (427 - 510, n=13) | |
| Geekbench AI / Single Precision GPU 1.7 | |
| Dell 16 Plus 2-in-1 | |
| Moyenne Intel Core Ultra 7 255H, Intel Arc Graphics 140T (6840 - 8478, n=7) | |
| MSI Venture 16 AI A2HMTG | |
| Geekbench AI / Half Precision GPU 1.7 | |
| Dell 16 Plus 2-in-1 | |
| Moyenne Intel Core Ultra 7 255H, Intel Arc Graphics 140T (8108 - 12393, n=7) | |
| MSI Venture 16 AI A2HMTG | |
| Geekbench AI / Quantized GPU 1.7 | |
| Dell 16 Plus 2-in-1 | |
| Moyenne Intel Core Ultra 7 255H, Intel Arc Graphics 140T (4705 - 5621, n=7) | |
| MSI Venture 16 AI A2HMTG | |
* ... Moindre est la valeur, meilleures sont les performances
| PCMark 10 Score | 8903 points | |
Aide | ||
| AIDA64 / Memory Copy | |
| Dell 16 Plus 2-in-1 | |
| Moyenne Intel Core Ultra 7 255H (39188 - 110930, n=17) | |
| MSI Prestige 16 B1MG-001US | |
| HP Pavilion 16-ag0057ng | |
| MSI Venture 16 AI A2HMTG | |
| Lenovo IdeaPad Slim 5 16AKP10 | |
| Asus V16 V3607V | |
| AIDA64 / Memory Read | |
| Dell 16 Plus 2-in-1 | |
| MSI Venture 16 AI A2HMTG | |
| Moyenne Intel Core Ultra 7 255H (43703 - 90552, n=17) | |
| MSI Prestige 16 B1MG-001US | |
| Lenovo IdeaPad Slim 5 16AKP10 | |
| HP Pavilion 16-ag0057ng | |
| Asus V16 V3607V | |
| AIDA64 / Memory Write | |
| Dell 16 Plus 2-in-1 | |
| HP Pavilion 16-ag0057ng | |
| Lenovo IdeaPad Slim 5 16AKP10 | |
| MSI Venture 16 AI A2HMTG | |
| MSI Prestige 16 B1MG-001US | |
| Moyenne Intel Core Ultra 7 255H (36438 - 87199, n=17) | |
| Asus V16 V3607V | |
| AIDA64 / Memory Latency | |
| MSI Prestige 16 B1MG-001US | |
| Moyenne Intel Core Ultra 7 255H (107.6 - 147.2, n=17) | |
| HP Pavilion 16-ag0057ng | |
| MSI Venture 16 AI A2HMTG | |
| Dell 16 Plus 2-in-1 | |
| Asus V16 V3607V | |
| Lenovo IdeaPad Slim 5 16AKP10 | |
* ... Moindre est la valeur, meilleures sont les performances
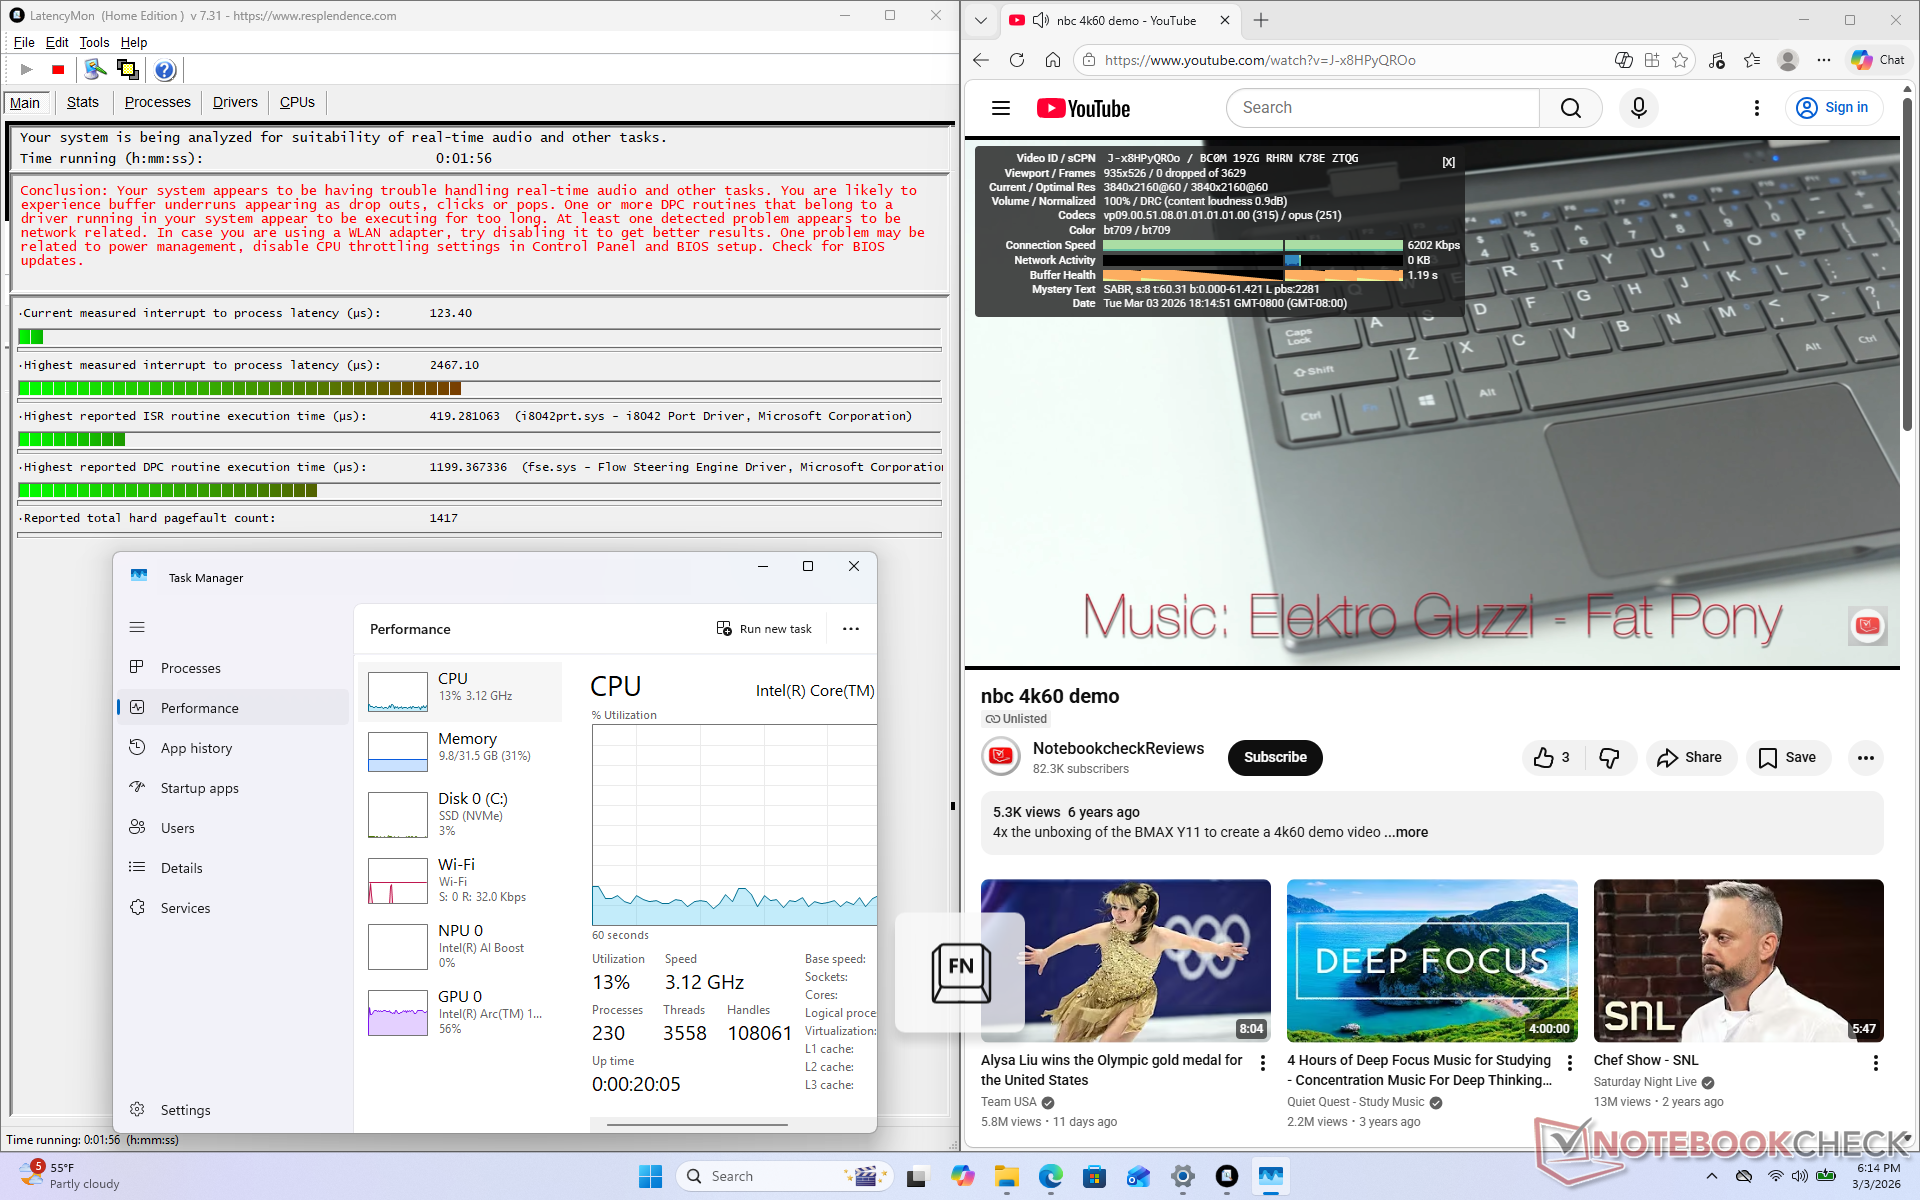
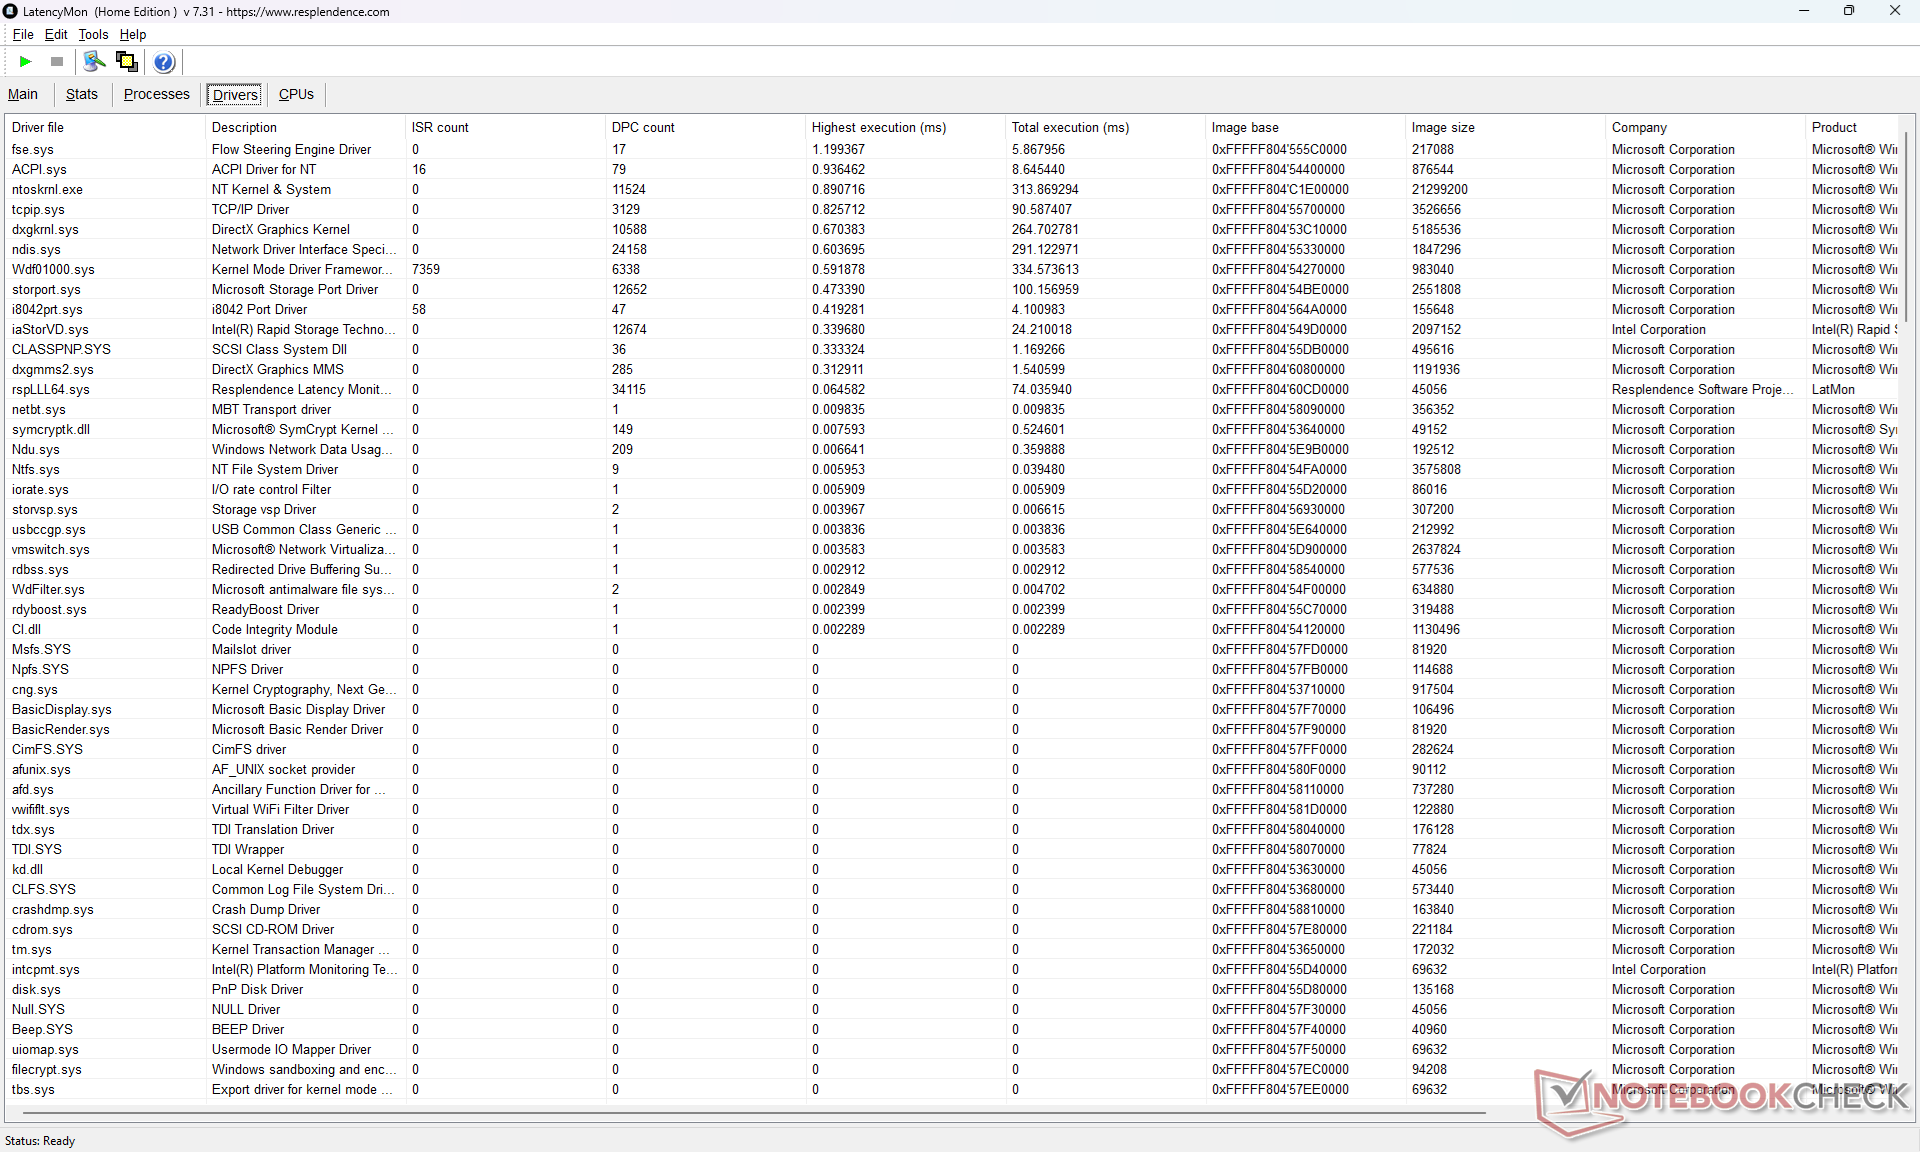
Latence DPC
LatencyMon révèle des problèmes mineurs de DPC, mais sans aucune perte d'images lors de la lecture de vidéos en 4K60.
| DPC Latencies / LatencyMon - interrupt to process latency (max), Web, Youtube, Prime95 | |
| Lenovo IdeaPad Slim 5 16AKP10 | |
| Asus V16 V3607V | |
| MSI Venture 16 AI A2HMTG | |
| Dell 16 Plus 2-in-1 | |
| HP Pavilion 16-ag0057ng | |
| MSI Prestige 16 B1MG-001US | |
* ... Moindre est la valeur, meilleures sont les performances
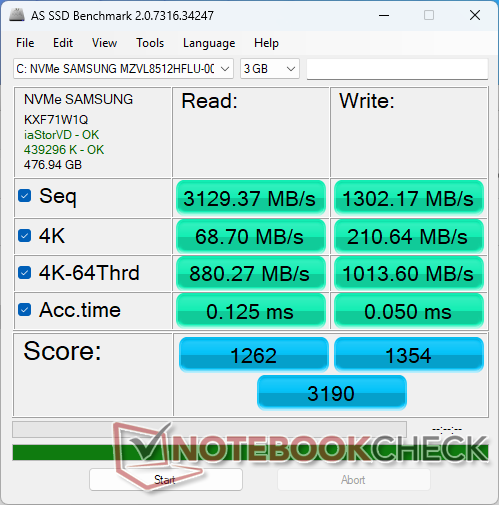
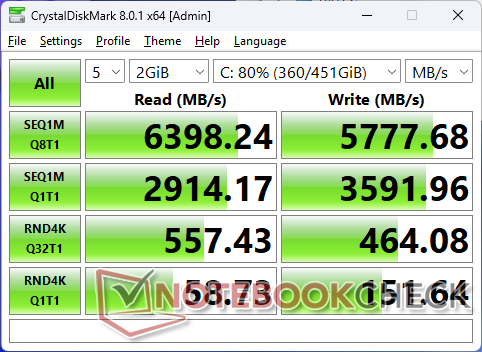
Dispositifs de stockage
Le Samsung MZVL8512HFLU PCIe4 x4 NVMe SSD peut supporter des taux de transfert allant jusqu'à 7000 Mo/s, même sans dissipateur thermique dédié.

| Drive Performance rating - Percent | |
| MSI Prestige 16 B1MG-001US | |
| Asus V16 V3607V | |
| MSI Venture 16 AI A2HMTG | |
| HP Pavilion 16-ag0057ng | |
| Lenovo IdeaPad Slim 5 16AKP10 | |
| Dell 16 Plus 2-in-1 | |
* ... Moindre est la valeur, meilleures sont les performances
Throttoir de disque : Boucle de lecture DiskSpd, profondeur de la file d'attente 8
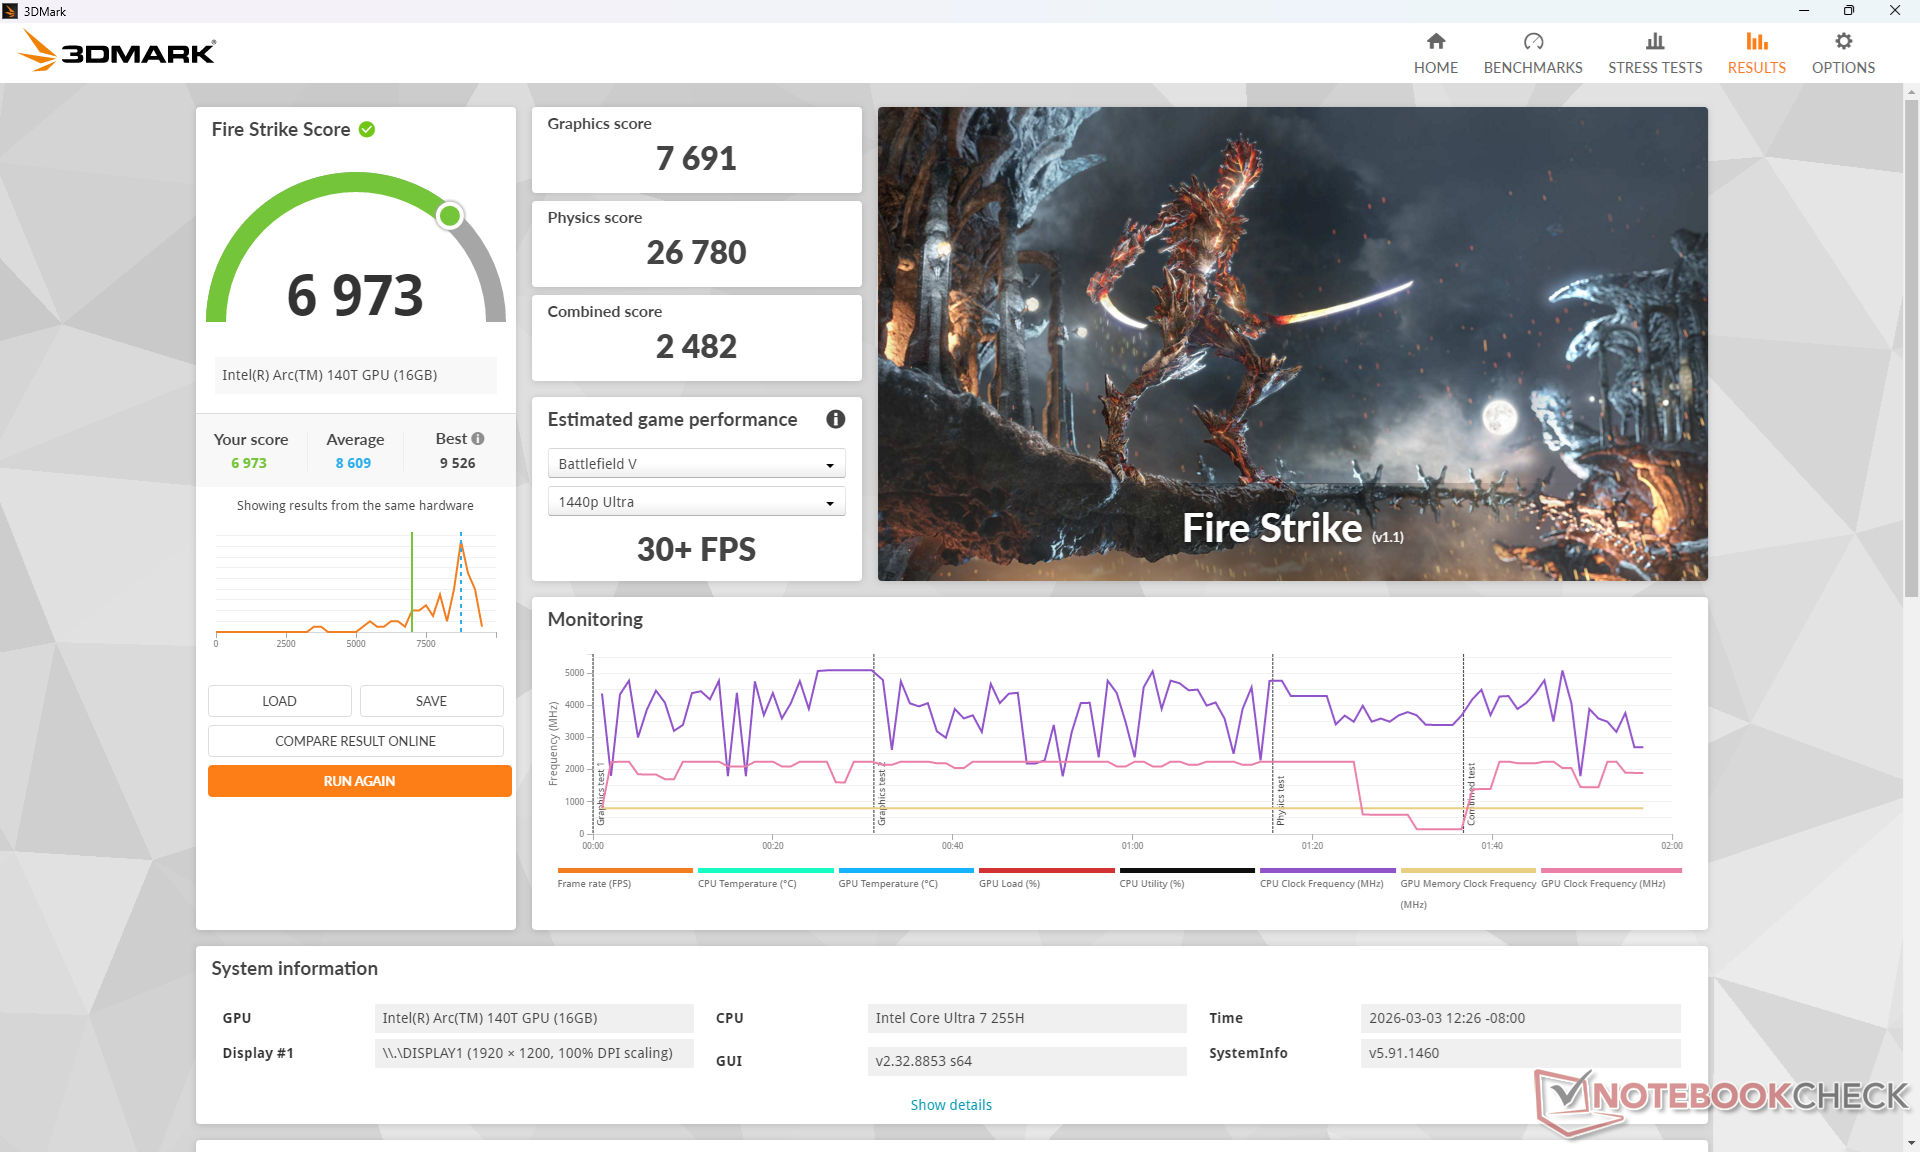
Performance du GPU
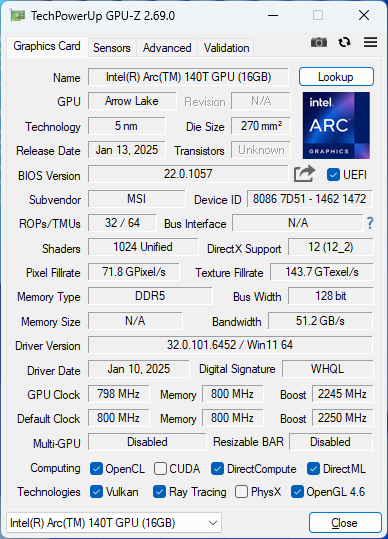
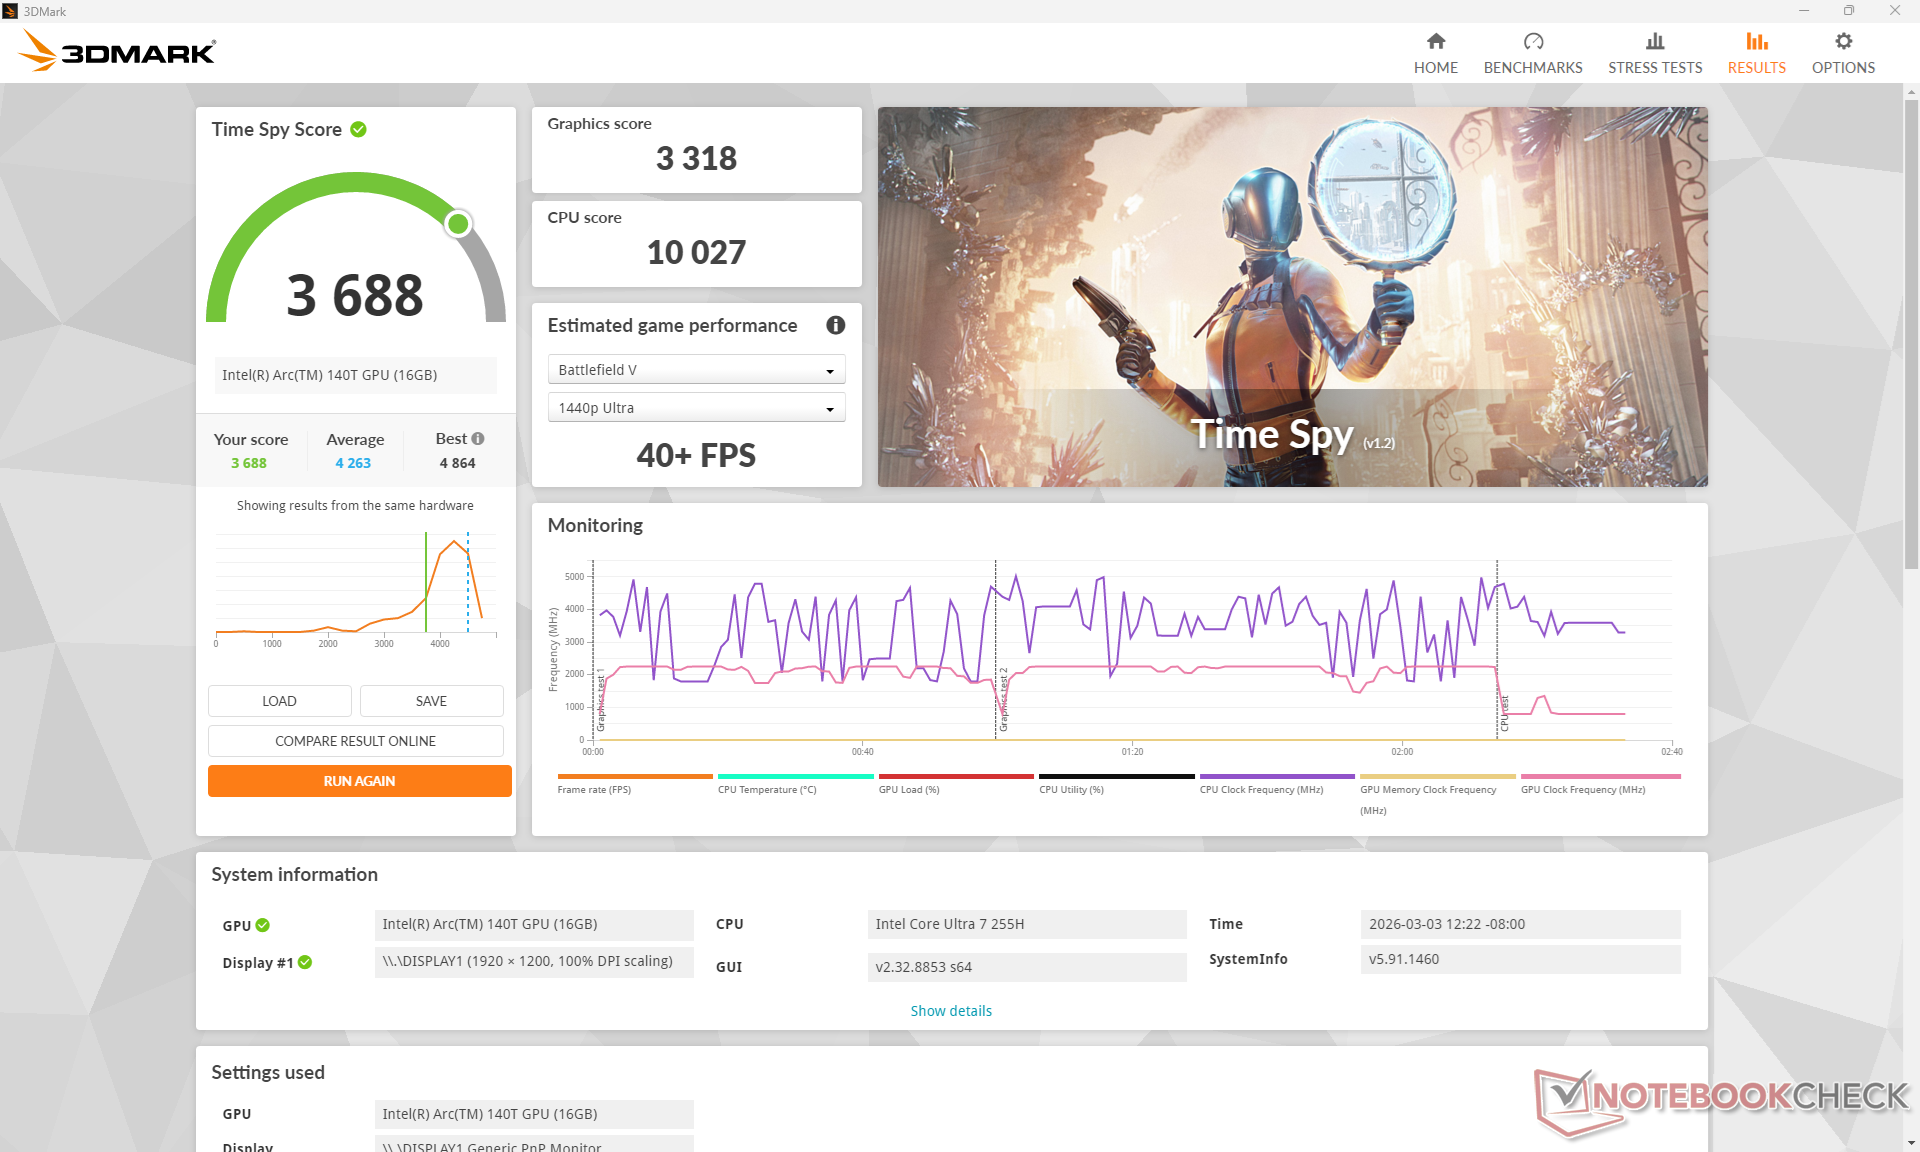
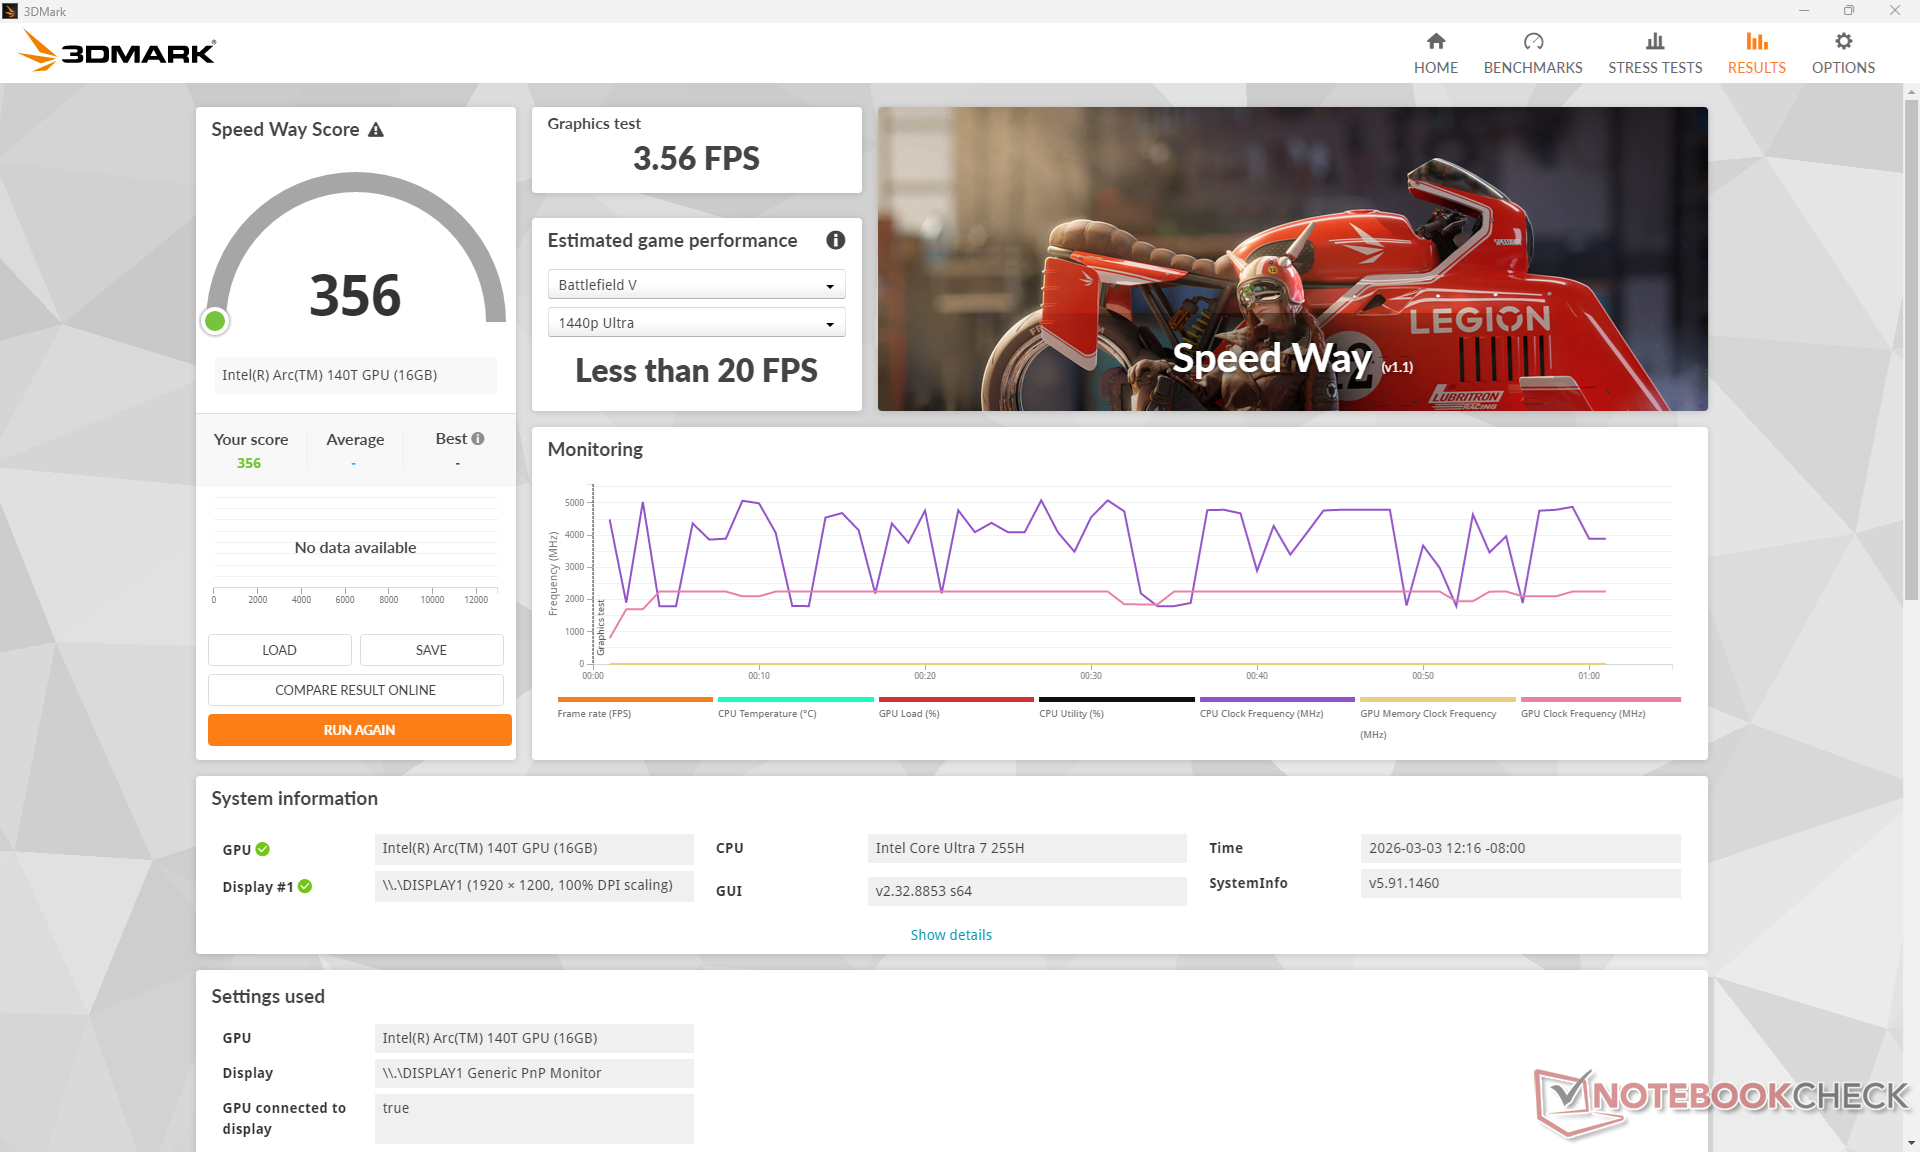
Les performances graphiques, bien que correctes pour un iGPU, sont malheureusement 10 % plus lentes que celles de la moyenne des ordinateurs portables de notre base de données ayant les mêmes caractéristiques Arc 140T. Le MSI Prestige 16 de l'année dernière, équipé de l'ancien processeur Arc 8 est donc comparable à notre MSI en ce qui concerne les jeux et les tâches gourmandes en GPU.
| Profil de puissance | Score graphique | Score physique | Score combiné |
| Mode Performance | 7691 | 26780 | 2482 |
| Mode équilibré | 7416 (-4%) | 26626 (-1%) | 2521 (-0%) |
| Alimentation par batterie | 7319 (-5%) | 25231 (-6%) | 2459 (-0%) |
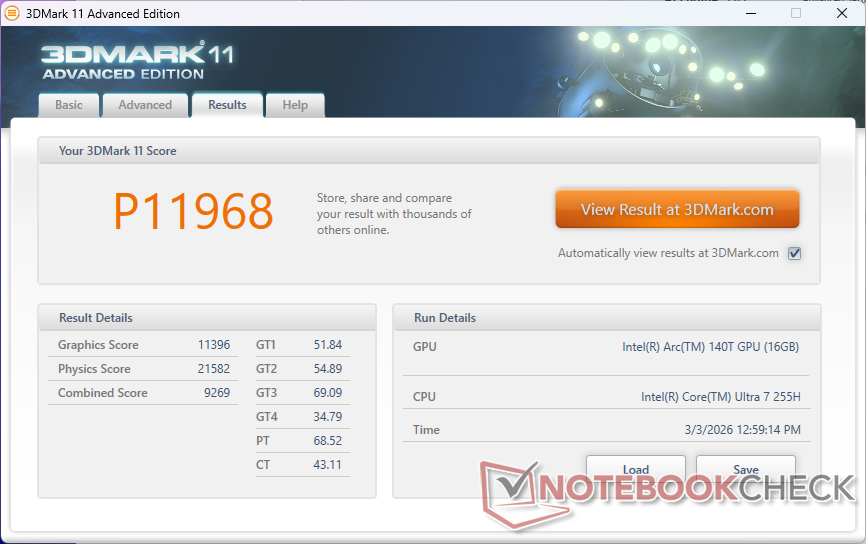
| 3DMark 11 Performance | 11968 points | |
| 3DMark Cloud Gate Standard Score | 35142 points | |
| 3DMark Fire Strike Score | 6973 points | |
| 3DMark Time Spy Score | 3688 points | |
Aide | ||
| Blender | |
| v3.3 Classroom OPTIX/RTX | |
| Asus V16 V3607V | |
| v3.3 Classroom CUDA | |
| Asus V16 V3607V | |
| v3.3 Classroom CPU | |
| Lenovo IdeaPad Slim 5 16AKP10 | |
| Dell 16 Plus 2-in-1 | |
| HP Pavilion 16-ag0057ng | |
| Dynabook Tecra A60 A65-M | |
| Asus V16 V3607V | |
| MSI Prestige 16 B1MG-001US | |
| Asus ExpertBook B5 B5605CCA | |
| Moyenne Intel Arc Graphics 140T (254 - 492, n=20) | |
| Acer Swift Go 16 AI SFG16-61-R5Y5 | |
| Acer Swift Go 16 AI SFG16-61-R5Y5 | |
| MSI Venture 16 AI A2HMTG | |
| Asus ZenBook S16 UM5606GA | |
| v3.3 Classroom oneAPI/Intel | |
| Moyenne Intel Arc Graphics 140T (147 - 396, n=6) | |
| Dell 16 Plus 2-in-1 | |
| MSI Venture 16 AI A2HMTG | |
| v4.3 Barbershop CPU | |
| Dell 16 Plus 2-in-1 | |
| Asus V16 V3607V | |
| Dynabook Tecra A60 A65-M | |
| Acer Swift Go 16 AI SFG16-61-R5Y5 | |
| Moyenne Intel Arc Graphics 140T (1349 - 1839, n=9) | |
| MSI Venture 16 AI A2HMTG | |
| v4.3 Barbershop oneAPI | |
| Dell 16 Plus 2-in-1 | |
| Moyenne Intel Arc Graphics 140T (533 - 1037, n=5) | |
| MSI Venture 16 AI A2HMTG | |
| v4.3 Barbershop HIP | |
| Acer Swift Go 16 AI SFG16-61-R5Y5 | |
| v4.3 Barbershop OPTIX | |
| Asus V16 V3607V | |
* ... Moindre est la valeur, meilleures sont les performances
| Performance rating - Percent | |
| Asus V16 V3607V | |
| Dell 16 Plus 2-in-1 -1! | |
| MSI Prestige 16 B1MG-001US -1! | |
| MSI Venture 16 AI A2HMTG | |
| HP Pavilion 16-ag0057ng | |
| Lenovo IdeaPad Slim 5 16AKP10 | |
| Cyberpunk 2077 - 1920x1080 Ultra Preset (FSR off) | |
| Asus V16 V3607V | |
| Dell 16 Plus 2-in-1 | |
| MSI Venture 16 AI A2HMTG | |
| MSI Prestige 16 B1MG-001US | |
| HP Pavilion 16-ag0057ng | |
| Lenovo IdeaPad Slim 5 16AKP10 | |
| Baldur's Gate 3 - 1920x1080 Ultra Preset AA:T | |
| Asus V16 V3607V | |
| Dell 16 Plus 2-in-1 | |
| MSI Venture 16 AI A2HMTG | |
| MSI Prestige 16 B1MG-001US | |
| HP Pavilion 16-ag0057ng | |
| Lenovo IdeaPad Slim 5 16AKP10 | |
| GTA V - 1920x1080 Highest AA:4xMSAA + FX AF:16x | |
| Asus V16 V3607V | |
| MSI Venture 16 AI A2HMTG | |
| HP Pavilion 16-ag0057ng | |
| Lenovo IdeaPad Slim 5 16AKP10 | |
| Final Fantasy XV Benchmark - 1920x1080 High Quality | |
| Asus V16 V3607V | |
| Dell 16 Plus 2-in-1 | |
| MSI Venture 16 AI A2HMTG | |
| MSI Prestige 16 B1MG-001US | |
| HP Pavilion 16-ag0057ng | |
| Lenovo IdeaPad Slim 5 16AKP10 | |
| Strange Brigade - 1920x1080 ultra AA:ultra AF:16 | |
| Asus V16 V3607V | |
| Dell 16 Plus 2-in-1 | |
| MSI Venture 16 AI A2HMTG | |
| MSI Prestige 16 B1MG-001US | |
| HP Pavilion 16-ag0057ng | |
| Lenovo IdeaPad Slim 5 16AKP10 | |
| Dota 2 Reborn - 1920x1080 ultra (3/3) best looking | |
| Asus V16 V3607V | |
| Dell 16 Plus 2-in-1 | |
| MSI Venture 16 AI A2HMTG | |
| MSI Prestige 16 B1MG-001US | |
| HP Pavilion 16-ag0057ng | |
| Lenovo IdeaPad Slim 5 16AKP10 | |
| X-Plane 11.11 - 1920x1080 high (fps_test=3) | |
| Asus V16 V3607V | |
| MSI Venture 16 AI A2HMTG | |
| MSI Prestige 16 B1MG-001US | |
| Dell 16 Plus 2-in-1 | |
| Lenovo IdeaPad Slim 5 16AKP10 | |
| HP Pavilion 16-ag0057ng | |
| F1 24 | |
| 1920x1080 Low Preset AA:T AF:16x | |
| Dell 16 Plus 2-in-1 | |
| Asus ZenBook S16 UM5606GA | |
| Moyenne Intel Arc Graphics 140T (53.5 - 93.4, n=15) | |
| MSI Venture 16 AI A2HMTG | |
| Asus ExpertBook B5 B5605CCA | |
| Dynabook Tecra A60 A65-M | |
| 1920x1080 Medium Preset AA:T AF:16x | |
| Dell 16 Plus 2-in-1 | |
| Asus ZenBook S16 UM5606GA | |
| Moyenne Intel Arc Graphics 140T (47.4 - 85.7, n=15) | |
| MSI Venture 16 AI A2HMTG | |
| Asus ExpertBook B5 B5605CCA | |
| Dynabook Tecra A60 A65-M | |
| 1920x1080 High Preset AA:T AF:16x | |
| Dell 16 Plus 2-in-1 | |
| Asus ZenBook S16 UM5606GA | |
| Moyenne Intel Arc Graphics 140T (37.5 - 64.9, n=14) | |
| MSI Venture 16 AI A2HMTG | |
| Asus ExpertBook B5 B5605CCA | |
| 1920x1080 Ultra High Preset AA:T AF:16x | |
| Dell 16 Plus 2-in-1 | |
| Moyenne Intel Arc Graphics 140T (15.7 - 20.8, n=12) | |
| MSI Venture 16 AI A2HMTG | |
| Asus ZenBook S16 UM5606GA | |
Cyberpunk 2077 ultra FPS Chart
| Bas | Moyen | Élevé | Ultra | |
|---|---|---|---|---|
| GTA V (2015) | 167.9 | 155 | 41.1 | 16.7 |
| Dota 2 Reborn (2015) | 103.6 | 86.5 | 79.4 | 75.8 |
| Final Fantasy XV Benchmark (2018) | 68 | 39.2 | 26 | |
| X-Plane 11.11 (2018) | 55.8 | 44.6 | 39.7 | |
| Strange Brigade (2018) | 167.5 | 70.6 | 60.2 | 50.1 |
| Baldur's Gate 3 (2023) | 36.7 | 31 | 26.5 | 26.1 |
| Cyberpunk 2077 (2023) | 36.2 | 29.6 | 25.5 | 23 |
| F1 24 (2024) | 76.1 | 69.9 | 48 | 15.7 |
Émissions
Bruit du système
Le bruit du ventilateur tend à se situer autour de 27 dB(A) lors de l'exécution de tâches quotidiennes telles que la navigation, mais des tâches plus importantes telles que les jeux peuvent induire un niveau de bruit de 45 dB(A). Le ventilateur est malheureusement très aigu et toute pulsation peut être très perceptible.
Degré de la nuisance sonore
| Au repos |
| 23.1 / 23.1 / 24.1 dB(A) |
| Fortement sollicité |
| 45.2 / 44.7 dB(A) |
 | ||
30 dB silencieux 40 dB(A) audible 50 dB(A) bruyant |
||
min: | ||
| MSI Venture 16 AI A2HMTG Ultra 7 255H, Arc 140T | MSI Prestige 16 B1MG-001US Ultra 7 155H, Arc 8-Core | Dell 16 Plus 2-in-1 Core Ultra 7 258V, Arc 140V | Asus V16 V3607V Core 7 240H, GeForce RTX 3050 6GB Laptop GPU | HP Pavilion 16-ag0057ng R5 8540U, Radeon 740M | Lenovo IdeaPad Slim 5 16AKP10 Ryzen AI 5 330, Radeon 820M | |
|---|---|---|---|---|---|---|
| Noise | -6% | 2% | -4% | 1% | -3% | |
| arrêt / environnement * (dB) | 22.9 | 24.5 -7% | 23.2 -1% | 23.3 -2% | 24 -5% | 24 -5% |
| Idle Minimum * (dB) | 23.1 | 24.5 -6% | 23 -0% | 23.5 -2% | 24 -4% | 24 -4% |
| Idle Average * (dB) | 23.1 | 26.3 -14% | 23 -0% | 23.7 -3% | 25 -8% | 25 -8% |
| Idle Maximum * (dB) | 24.1 | 26.3 -9% | 24.7 -2% | 23.7 2% | 26 -8% | 26 -8% |
| Load Average * (dB) | 45.2 | 36.5 19% | 32.5 28% | 48 -6% | 38 16% | 43 5% |
| Cyberpunk 2077 ultra * (dB) | 39.4 | 42.6 -8% | 40.5 -3% | 37 6% | 42 -7% | |
| Load Maximum * (dB) | 44.7 | 52.9 -18% | 45.6 -2% | 51 -14% | 39 13% | 43 4% |
| Witcher 3 ultra * (dB) | 46.3 |
* ... Moindre est la valeur, meilleures sont les performances
Température
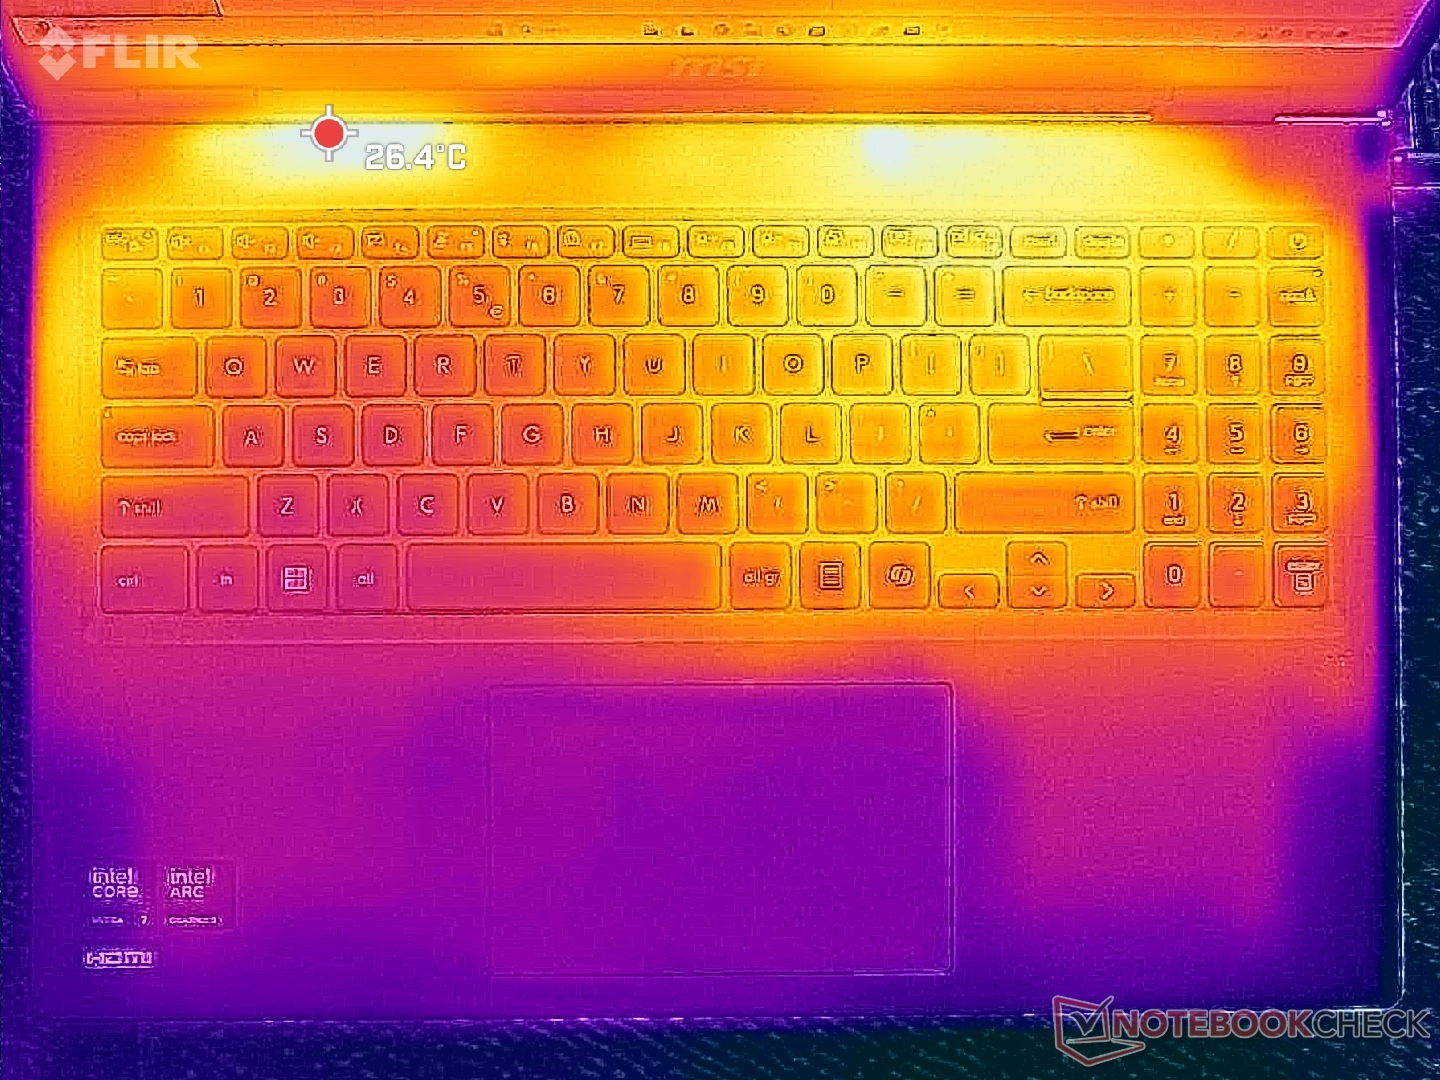
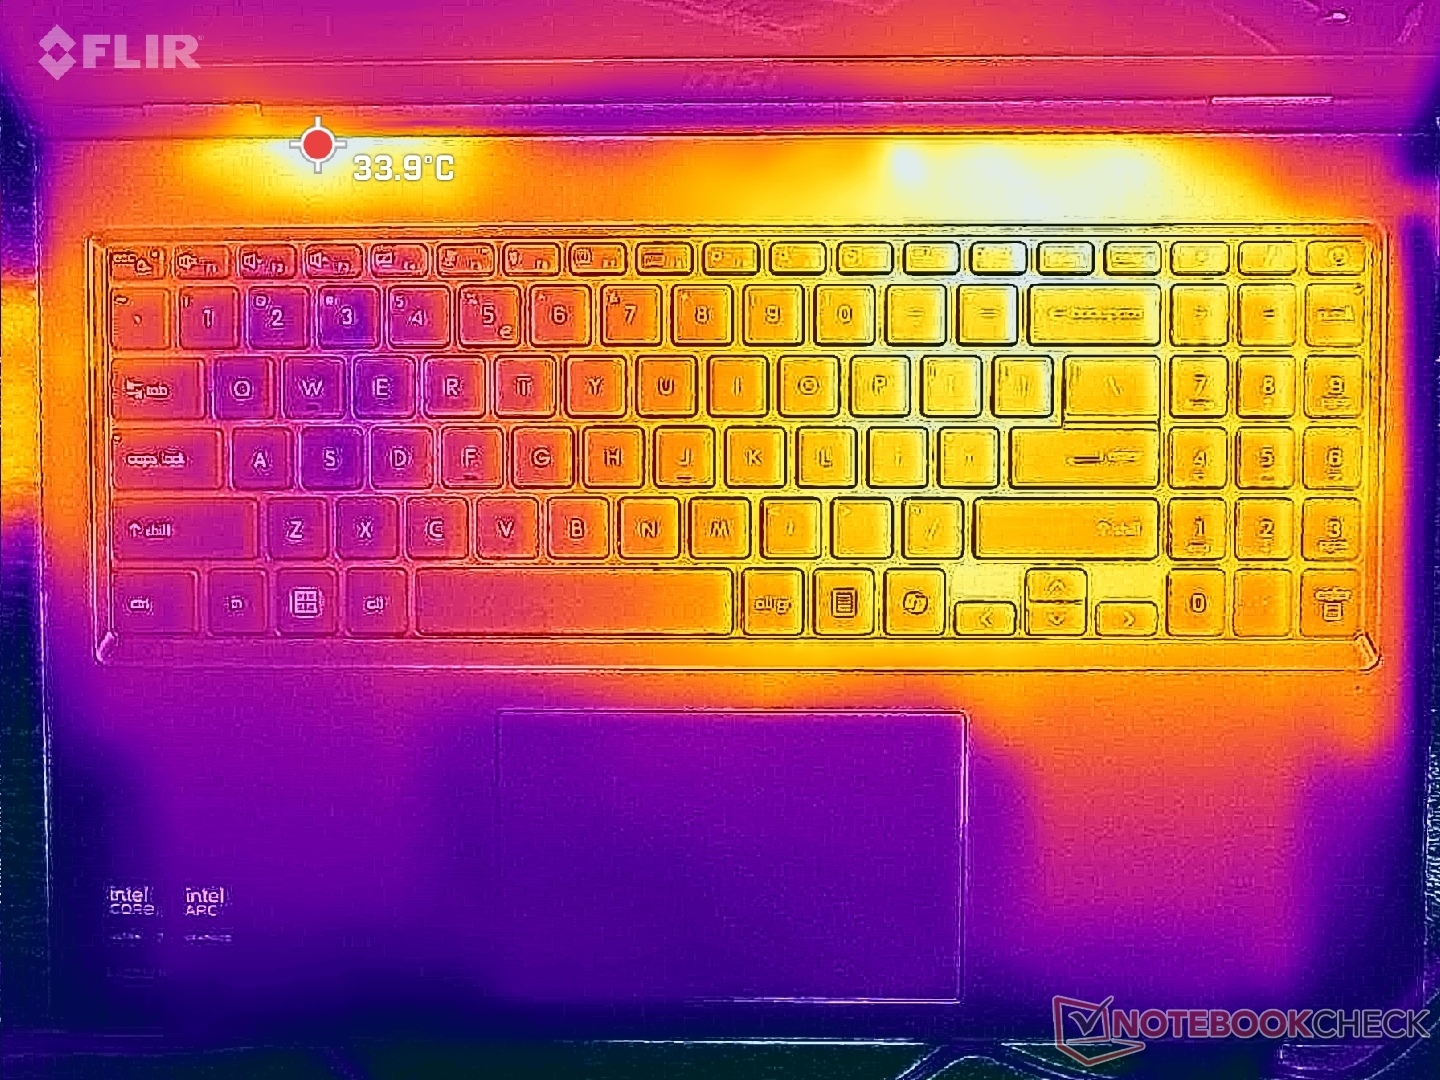
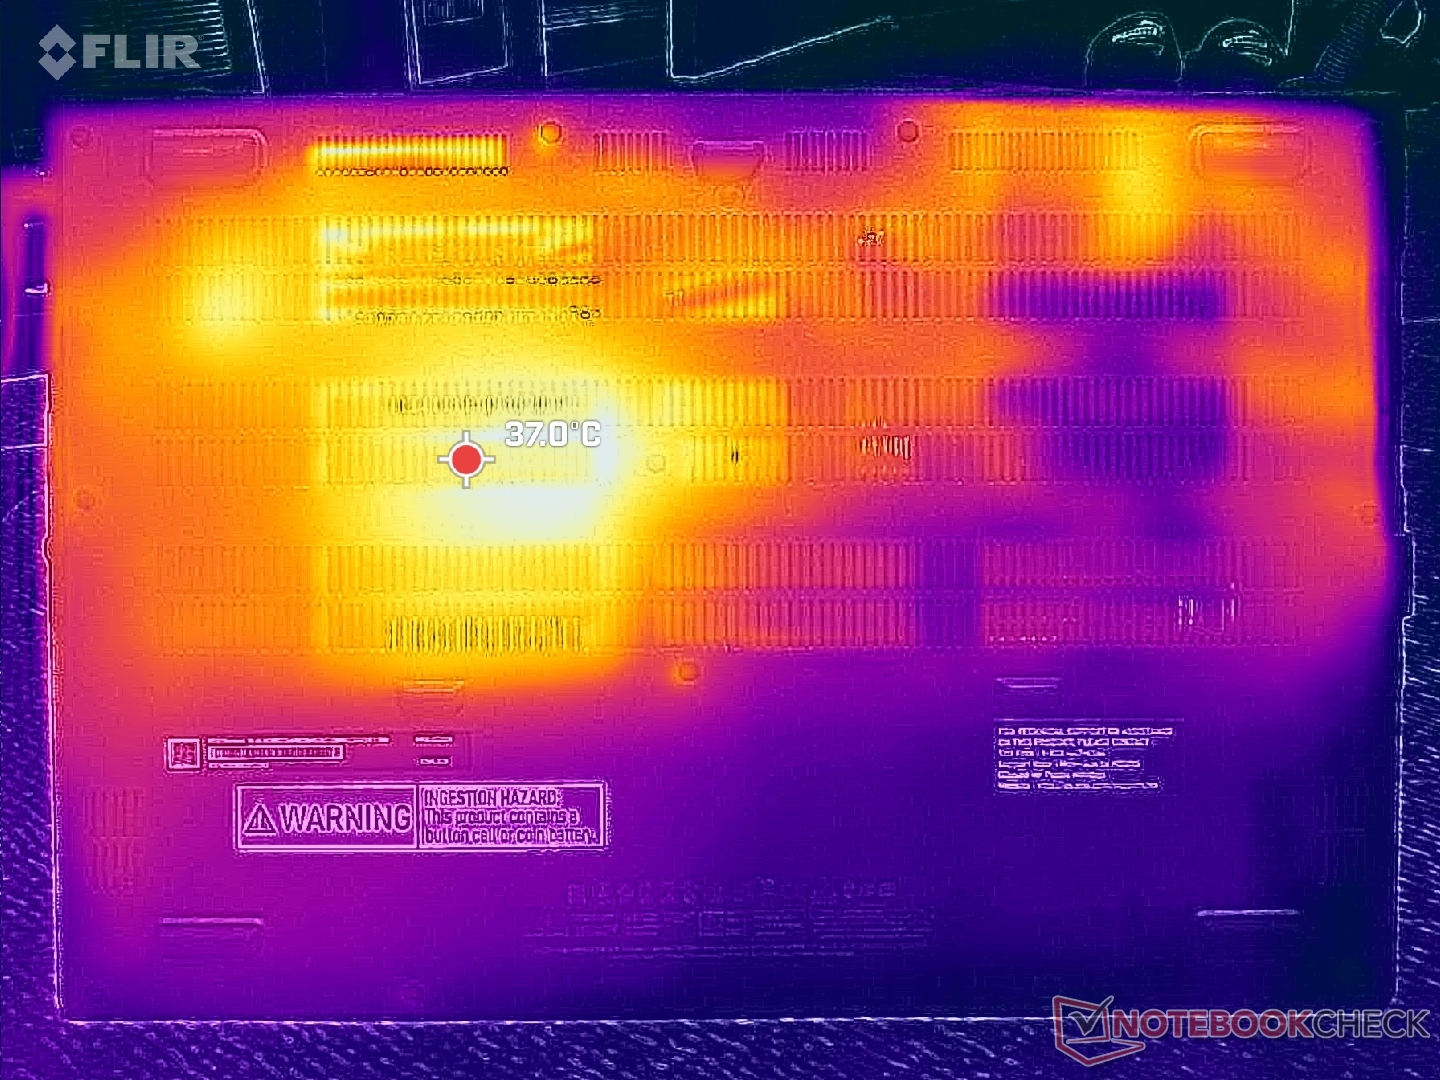
La température de surface est plus élevée dans la moitié droite du système que dans la moitié gauche. Malgré cela, les points chauds n'atteignent que 35°C à 37°C, en partie à cause de l'épaisseur relative du profil.
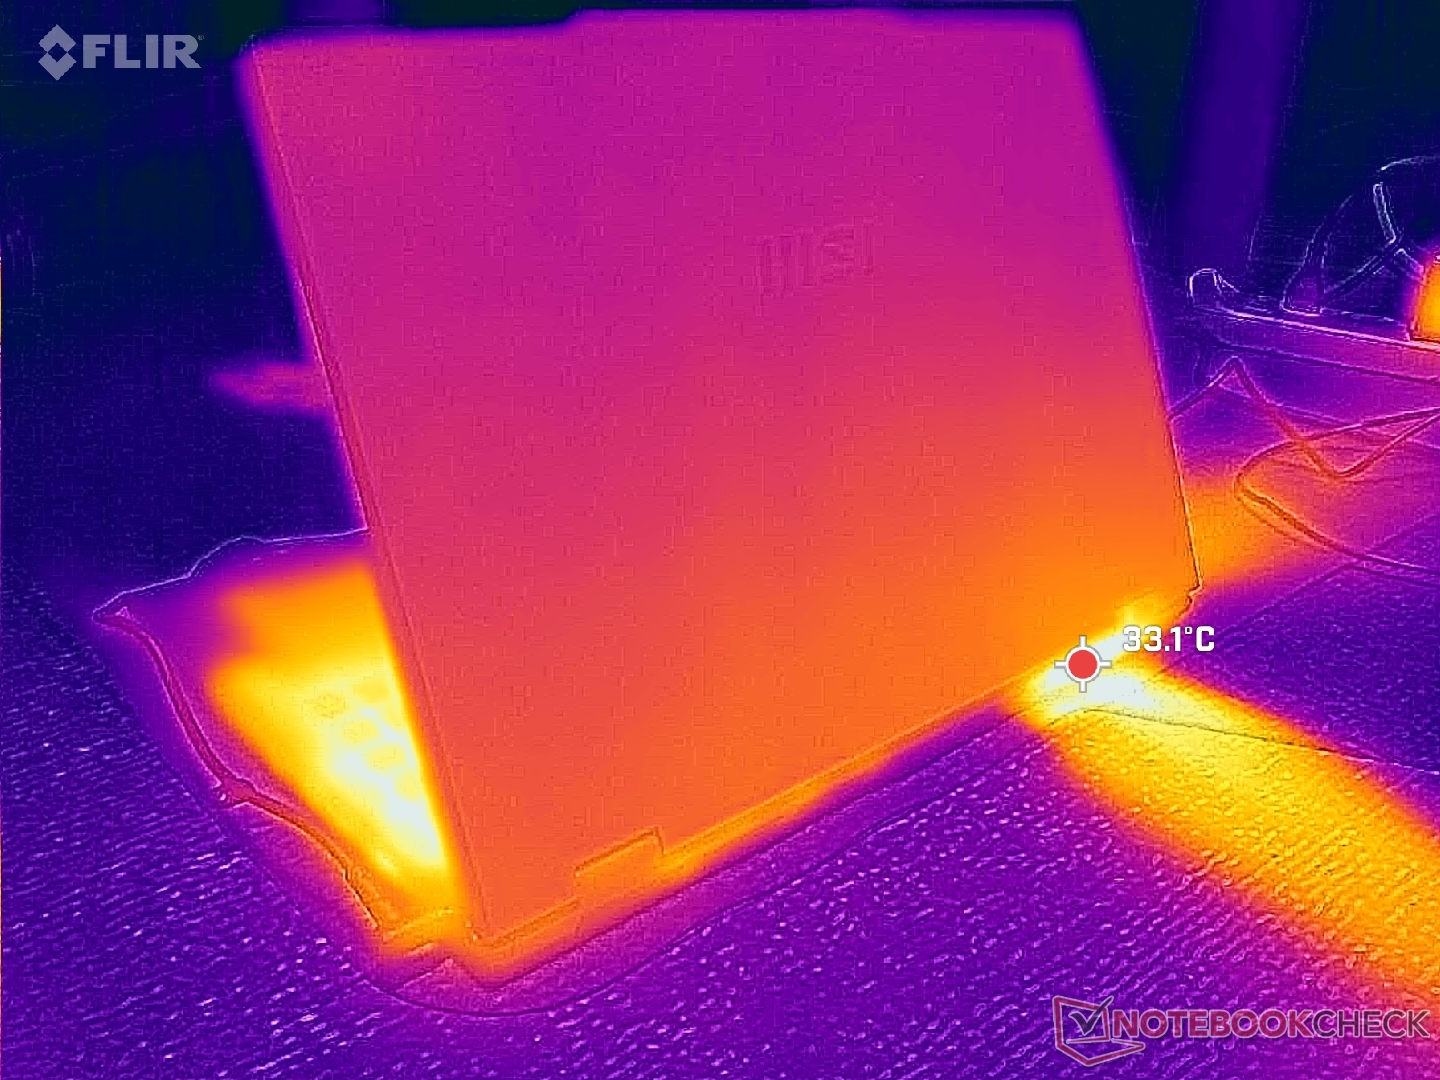
(+) La température maximale du côté supérieur est de 35 °C / 95 F, par rapport à la moyenne de 34.3 °C / 94 F, allant de 21.2 à 62.5 °C pour la classe Office.
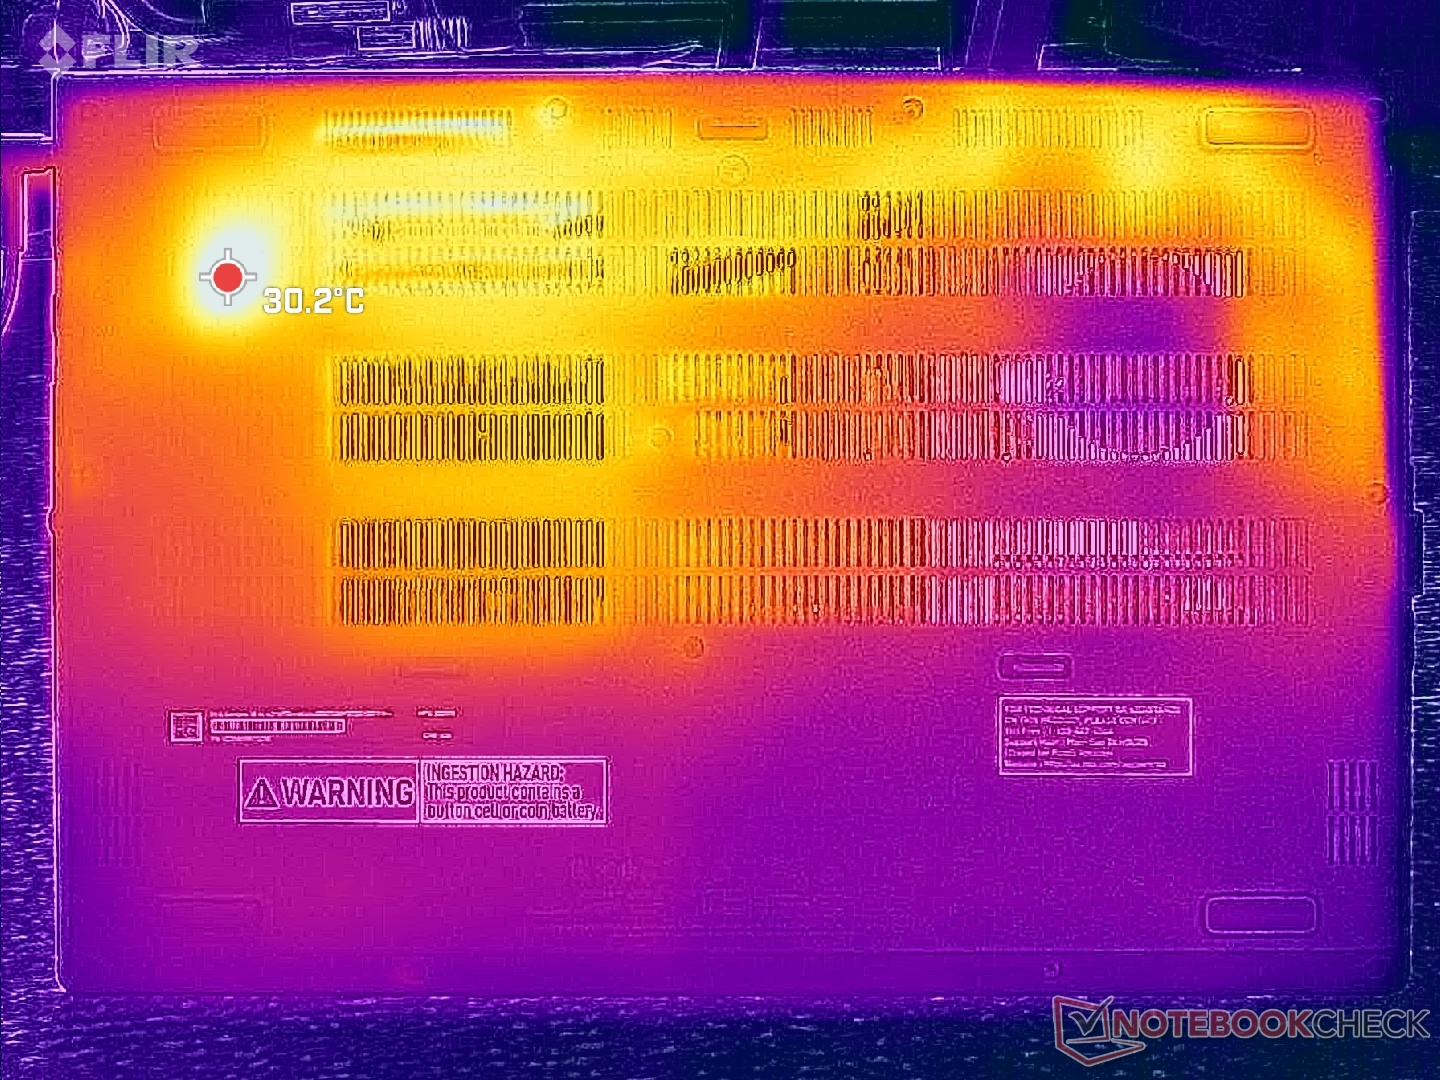
(+) Le fond chauffe jusqu'à un maximum de 37.4 °C / 99 F, contre une moyenne de 36.8 °C / 98 F
(+) En utilisation inactive, la température moyenne du côté supérieur est de 26.8 °C / 80 F, par rapport à la moyenne du dispositif de 29.5 °C / 85 F.
(+) Les repose-poignets et le pavé tactile sont plus froids que la température de la peau avec un maximum de 30.6 °C / 87.1 F et sont donc froids au toucher.
(-) La température moyenne de la zone de l'appui-paume de dispositifs similaires était de 27.5 °C / 81.5 F (-3.1 °C / #-5.6 F).
| MSI Venture 16 AI A2HMTG Ultra 7 255H, Arc 140T | MSI Prestige 16 B1MG-001US Ultra 7 155H, Arc 8-Core | Dell 16 Plus 2-in-1 Core Ultra 7 258V, Arc 140V | Asus V16 V3607V Core 7 240H, GeForce RTX 3050 6GB Laptop GPU | HP Pavilion 16-ag0057ng R5 8540U, Radeon 740M | Lenovo IdeaPad Slim 5 16AKP10 Ryzen AI 5 330, Radeon 820M | |
|---|---|---|---|---|---|---|
| Heat | -5% | -10% | 2% | -2% | 8% | |
| Maximum Upper Side * (°C) | 35 | 48.8 -39% | 44 -26% | 41.2 -18% | 42 -20% | 35 -0% |
| Maximum Bottom * (°C) | 37.4 | 47.6 -27% | 39.4 -5% | 34.4 8% | 44 -18% | 37 1% |
| Idle Upper Side * (°C) | 30.2 | 24.2 20% | 31.8 -5% | 28.8 5% | 26 14% | 26 14% |
| Idle Bottom * (°C) | 33 | 23.6 28% | 34.2 -4% | 29 12% | 28 15% | 27 18% |
* ... Moindre est la valeur, meilleures sont les performances
Test de stress
Le processeur s'est stabilisé à 2,7 GHz, 71 C et 44 W lors de l'initialisation du stress Prime95. La température du cœur reste dans la plage inférieure de 70 °C, même en cas de stress, par rapport à la plage moyenne de 80 °C sur le Prestige 16 équipé d'un processeur Core de la série H similaire.
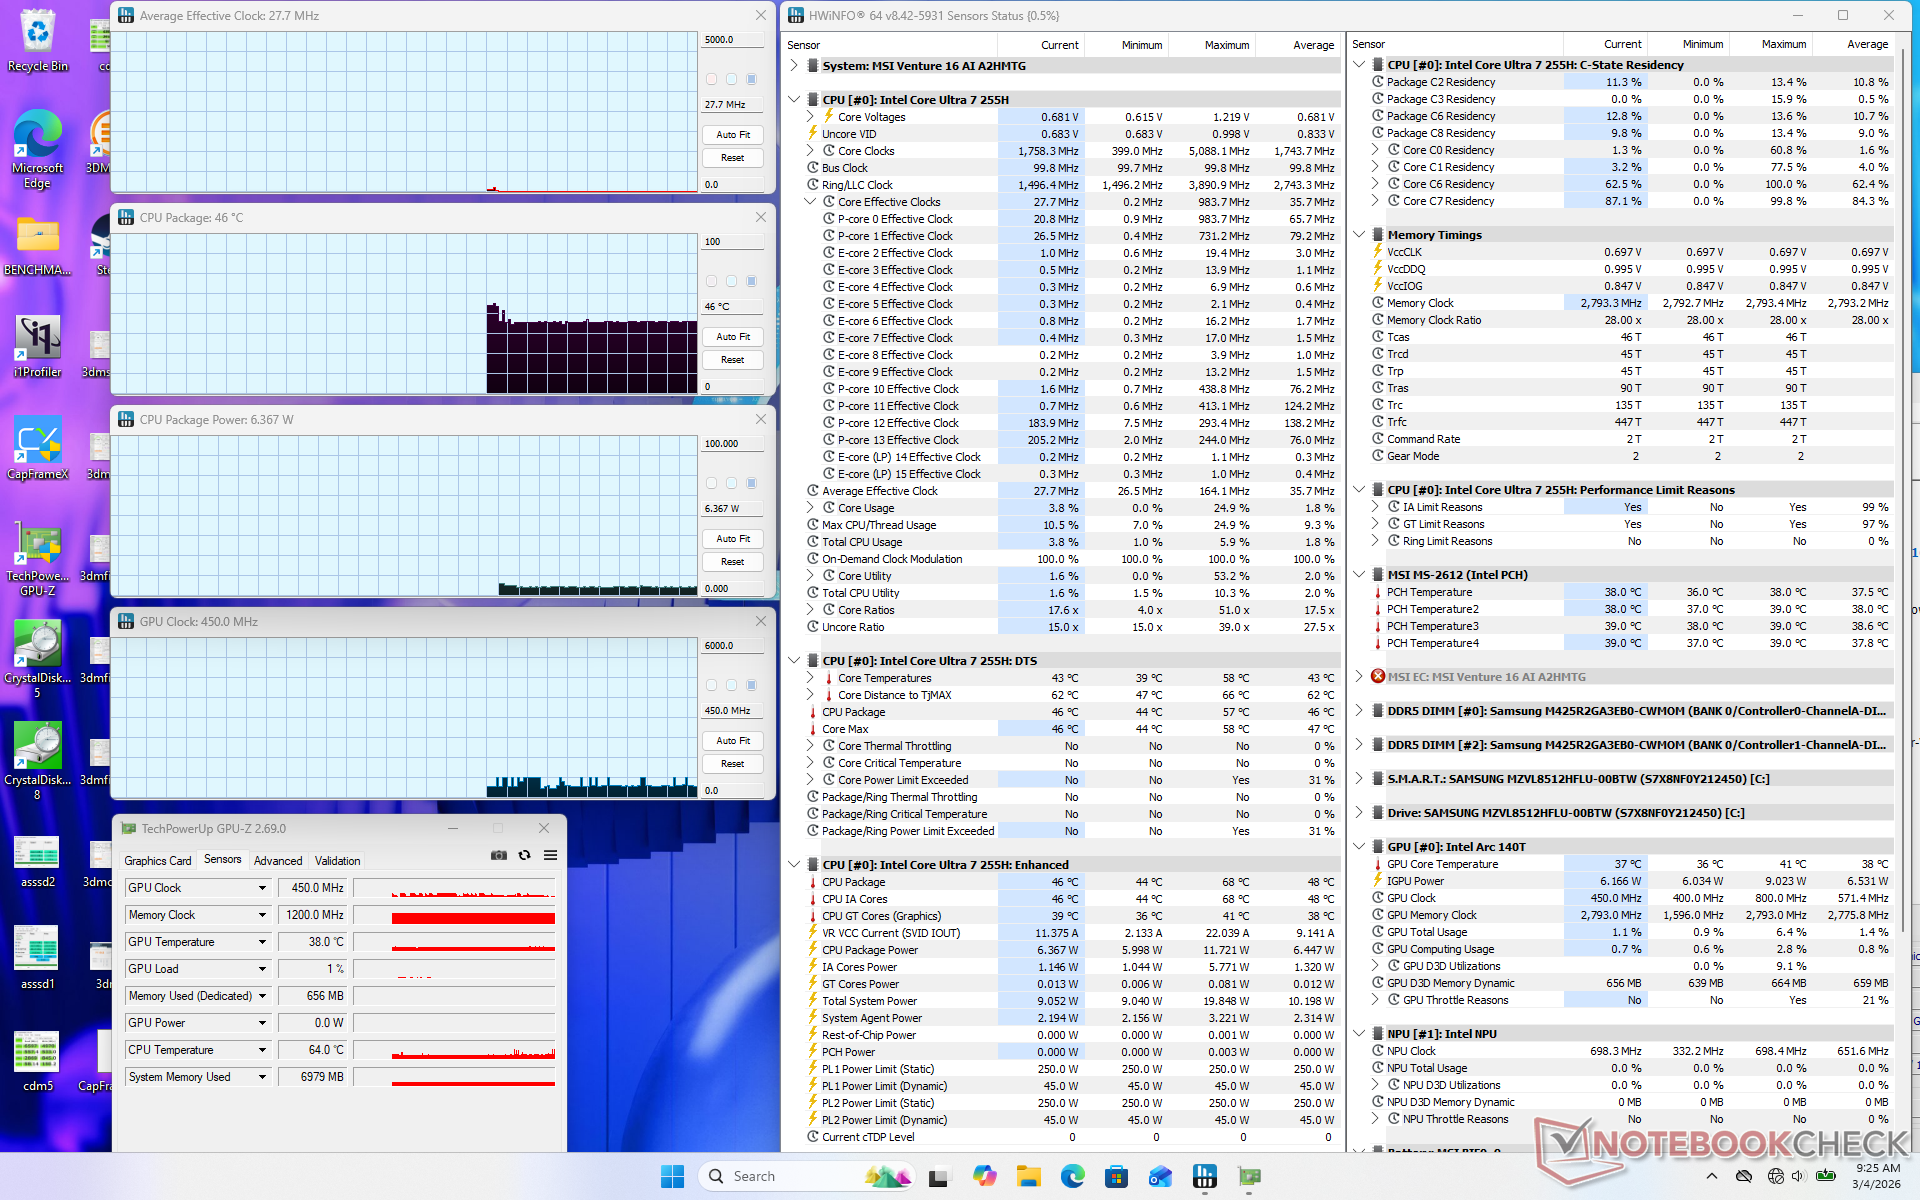
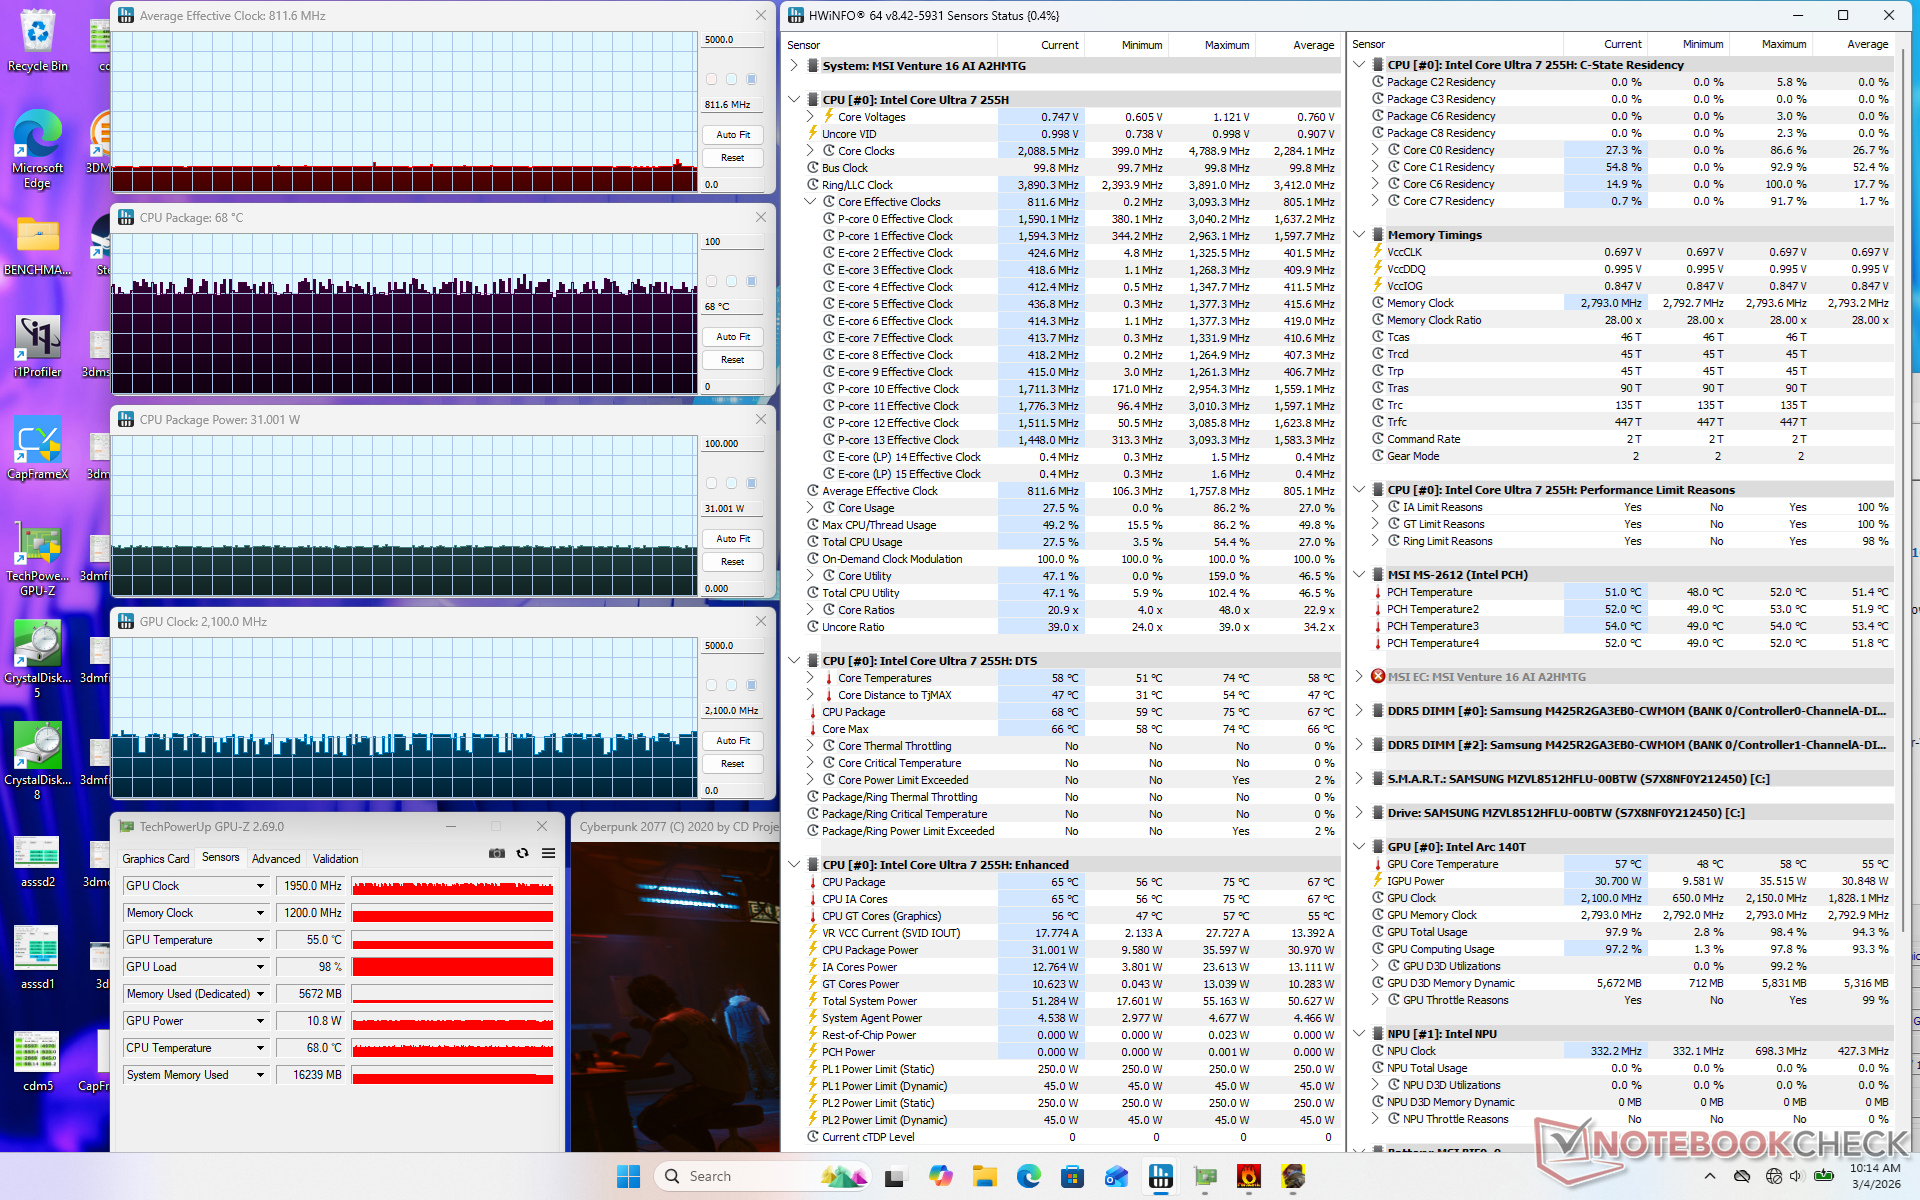
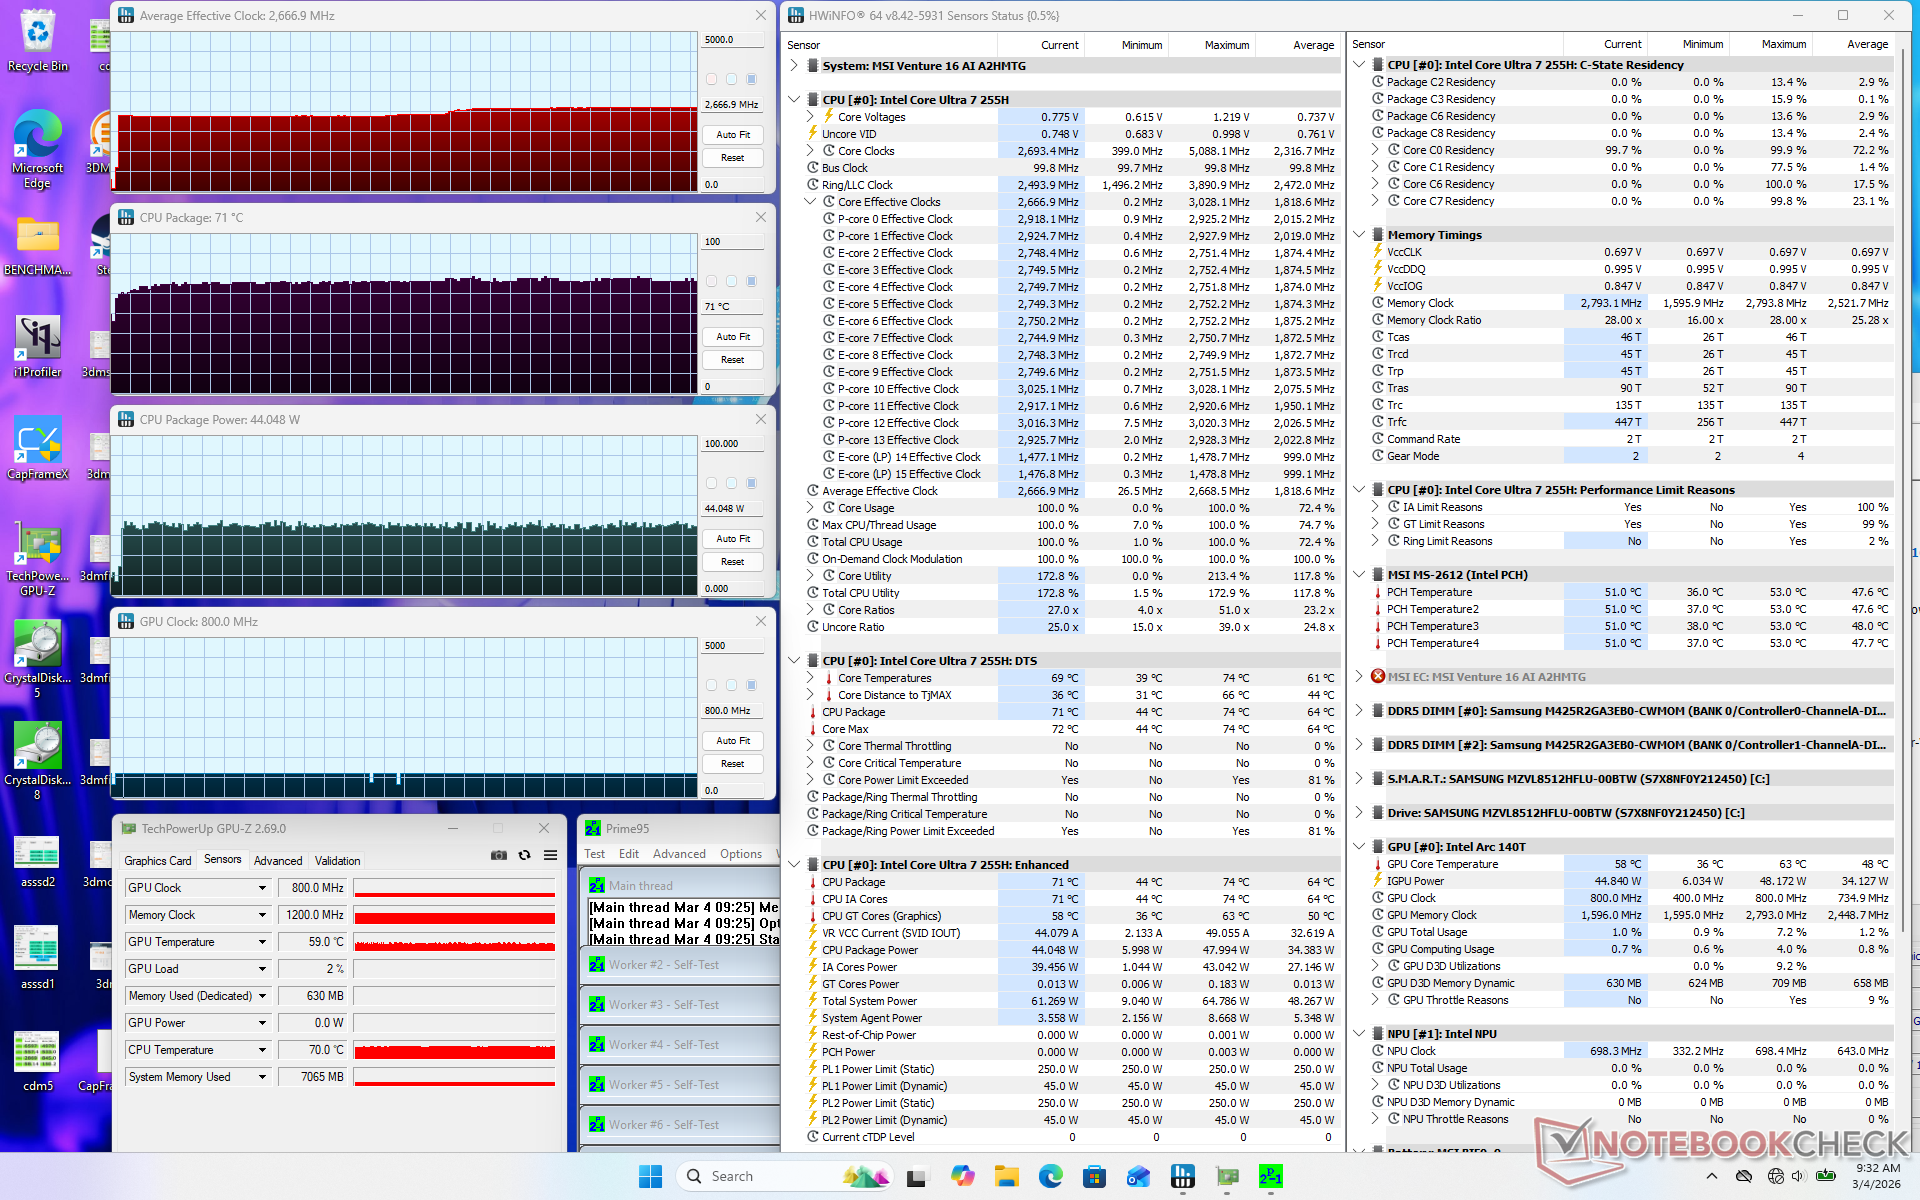
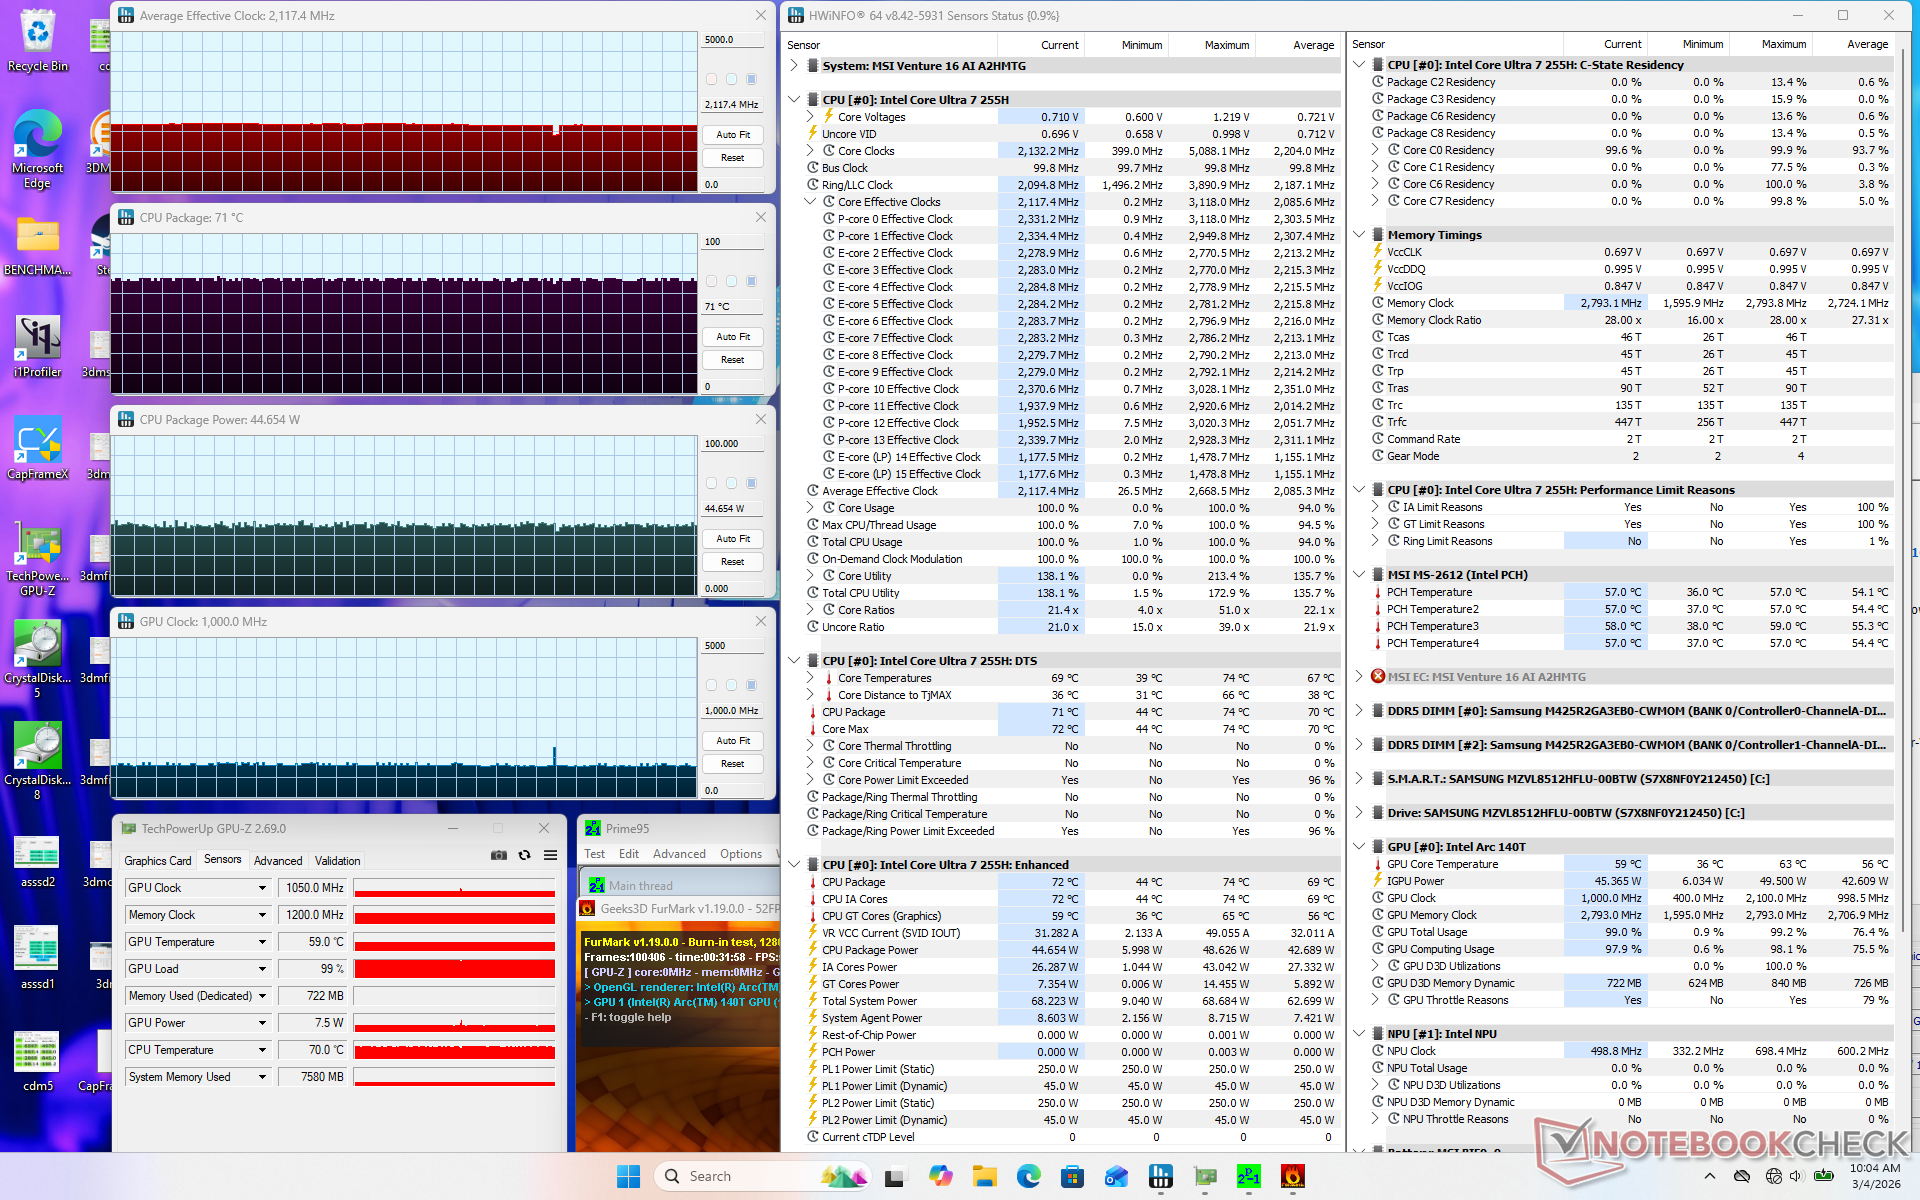
| Horloge moyenne du CPU (GHz) | Horloge du GPU (MHz) | Température moyenne du CPU (°C) | |
| Système au repos | -- | -- | 46 |
| Prime95 Stress | 2.7 | -- | 71 |
| Prime95 + FurMark Stress | 2.1 | 1000 | 71 |
| Cyberpunk 2077 Stress | 0.8 | 1400 - 2100 | 68 |
Intervenants
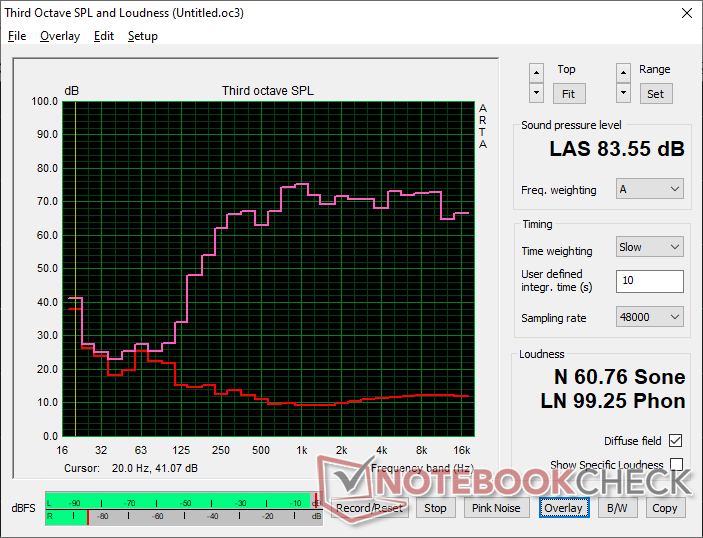
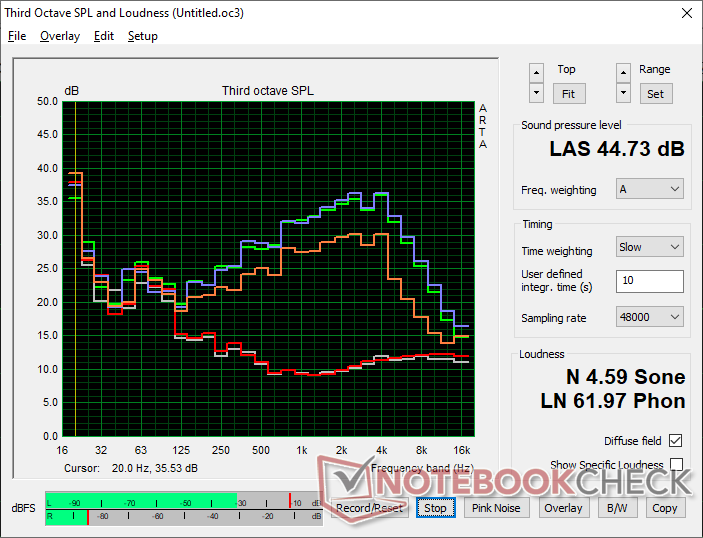
MSI Venture 16 AI A2HMTG analyse audio
(+) | les haut-parleurs peuvent jouer relativement fort (83.6# dB)
Basses 100 - 315 Hz
(-) | presque aucune basse - en moyenne 19.3% plus bas que la médiane
(±) | la linéarité des basses est moyenne (12.2% delta à la fréquence précédente)
Médiums 400 - 2000 Hz
(+) | médiane équilibrée - seulement 3.6% de la médiane
(+) | les médiums sont linéaires (5.8% delta à la fréquence précédente)
Aiguës 2 - 16 kHz
(+) | des sommets équilibrés - à seulement 3.5% de la médiane
(+) | les aigus sont linéaires (2.8% delta à la fréquence précédente)
Globalement 100 - 16 000 Hz
(+) | le son global est linéaire (14% différence à la médiane)
Par rapport à la même classe
» 9% de tous les appareils testés de cette catégorie étaient meilleurs, 5% similaires, 87% pires
» Le meilleur avait un delta de 7%, la moyenne était de 21%, le pire était de 53%.
Par rapport à tous les appareils testés
» 16% de tous les appareils testés étaient meilleurs, 4% similaires, 80% pires
» Le meilleur avait un delta de 4%, la moyenne était de 24%, le pire était de 134%.
Apple MacBook Pro 16 2021 M1 Pro analyse audio
(+) | les haut-parleurs peuvent jouer relativement fort (84.7# dB)
Basses 100 - 315 Hz
(+) | bonne basse - seulement 3.8% loin de la médiane
(+) | les basses sont linéaires (5.2% delta à la fréquence précédente)
Médiums 400 - 2000 Hz
(+) | médiane équilibrée - seulement 1.3% de la médiane
(+) | les médiums sont linéaires (2.1% delta à la fréquence précédente)
Aiguës 2 - 16 kHz
(+) | des sommets équilibrés - à seulement 1.9% de la médiane
(+) | les aigus sont linéaires (2.7% delta à la fréquence précédente)
Globalement 100 - 16 000 Hz
(+) | le son global est linéaire (4.6% différence à la médiane)
Par rapport à la même classe
» 0% de tous les appareils testés de cette catégorie étaient meilleurs, 0% similaires, 100% pires
» Le meilleur avait un delta de 5%, la moyenne était de 17%, le pire était de 45%.
Par rapport à tous les appareils testés
» 0% de tous les appareils testés étaient meilleurs, 0% similaires, 100% pires
» Le meilleur avait un delta de 4%, la moyenne était de 24%, le pire était de 134%.
Gestion de l'énergie
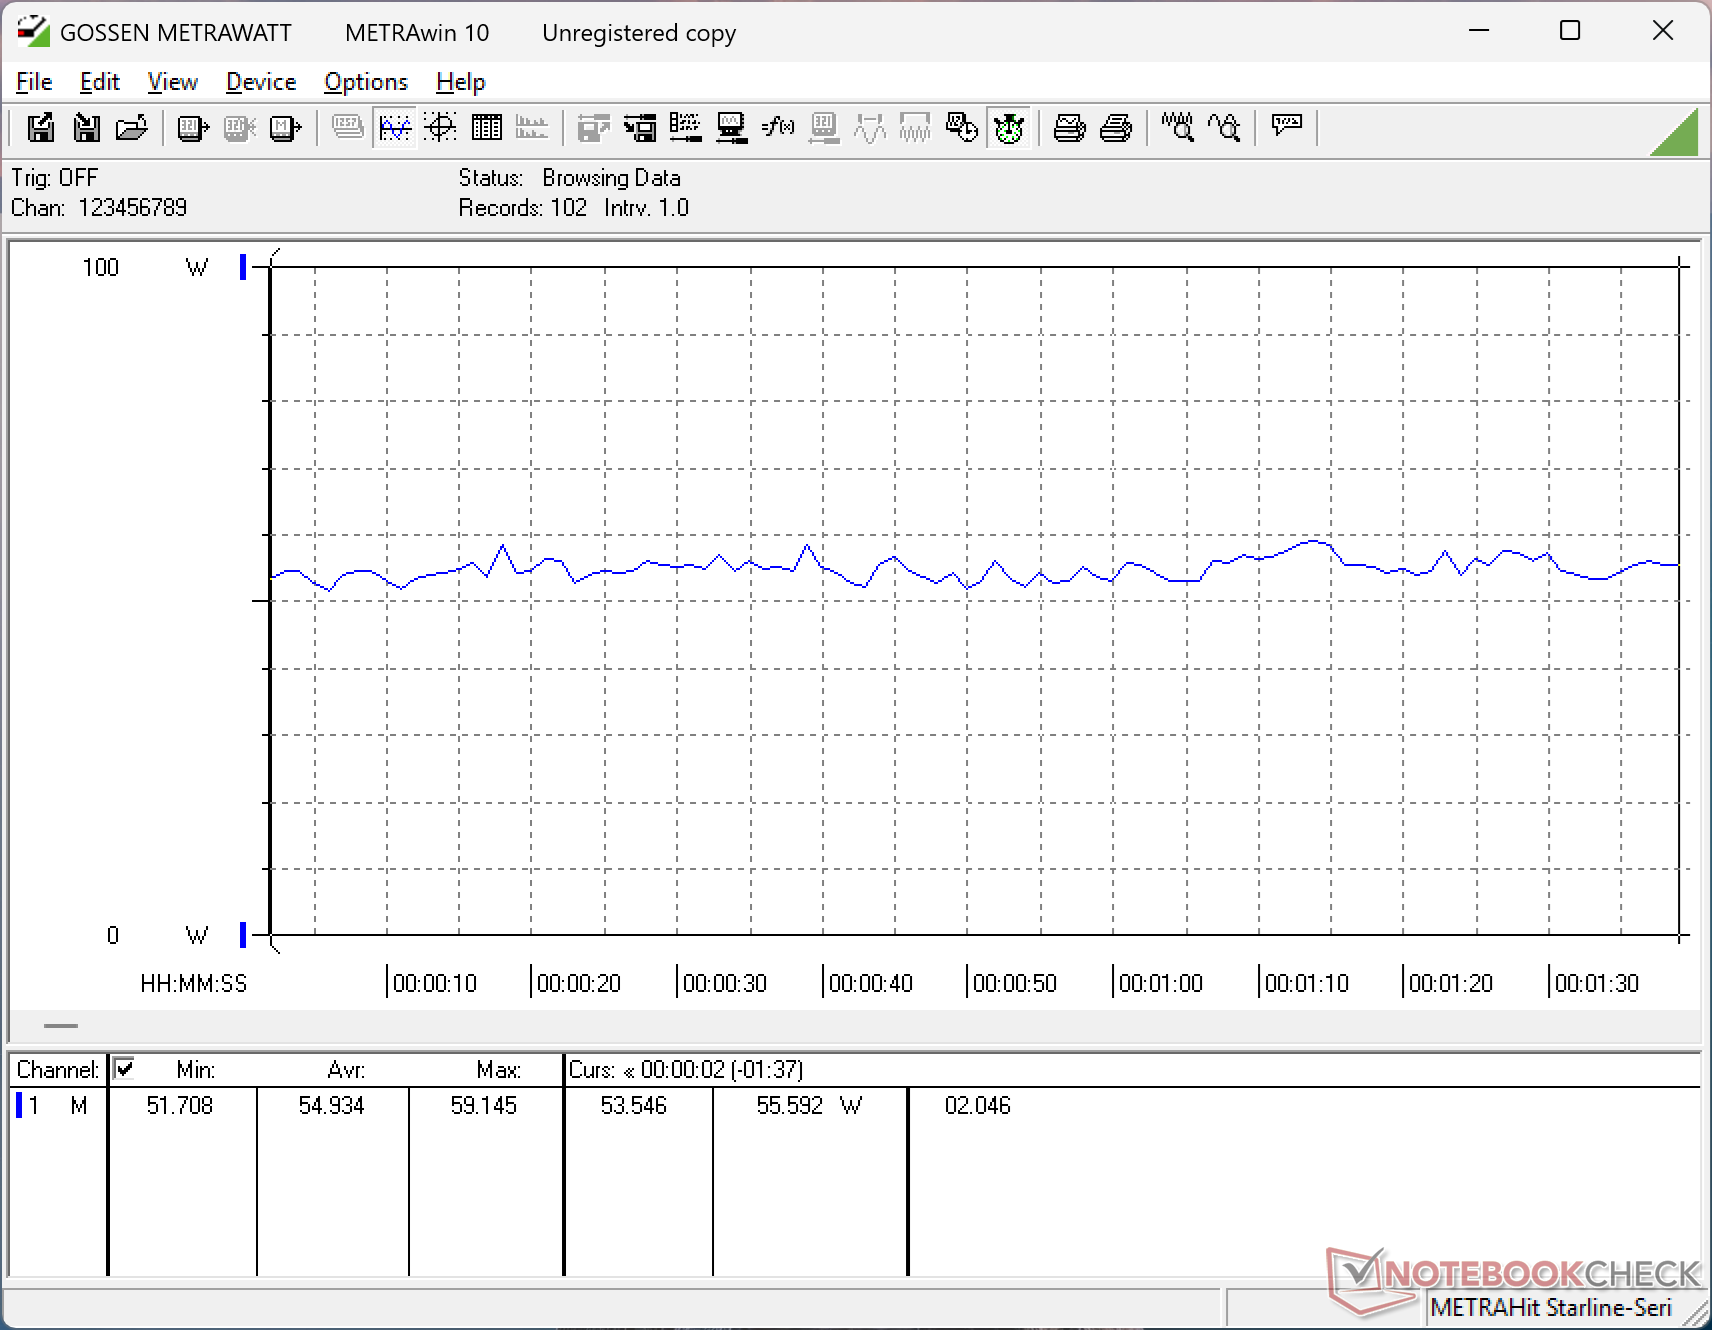
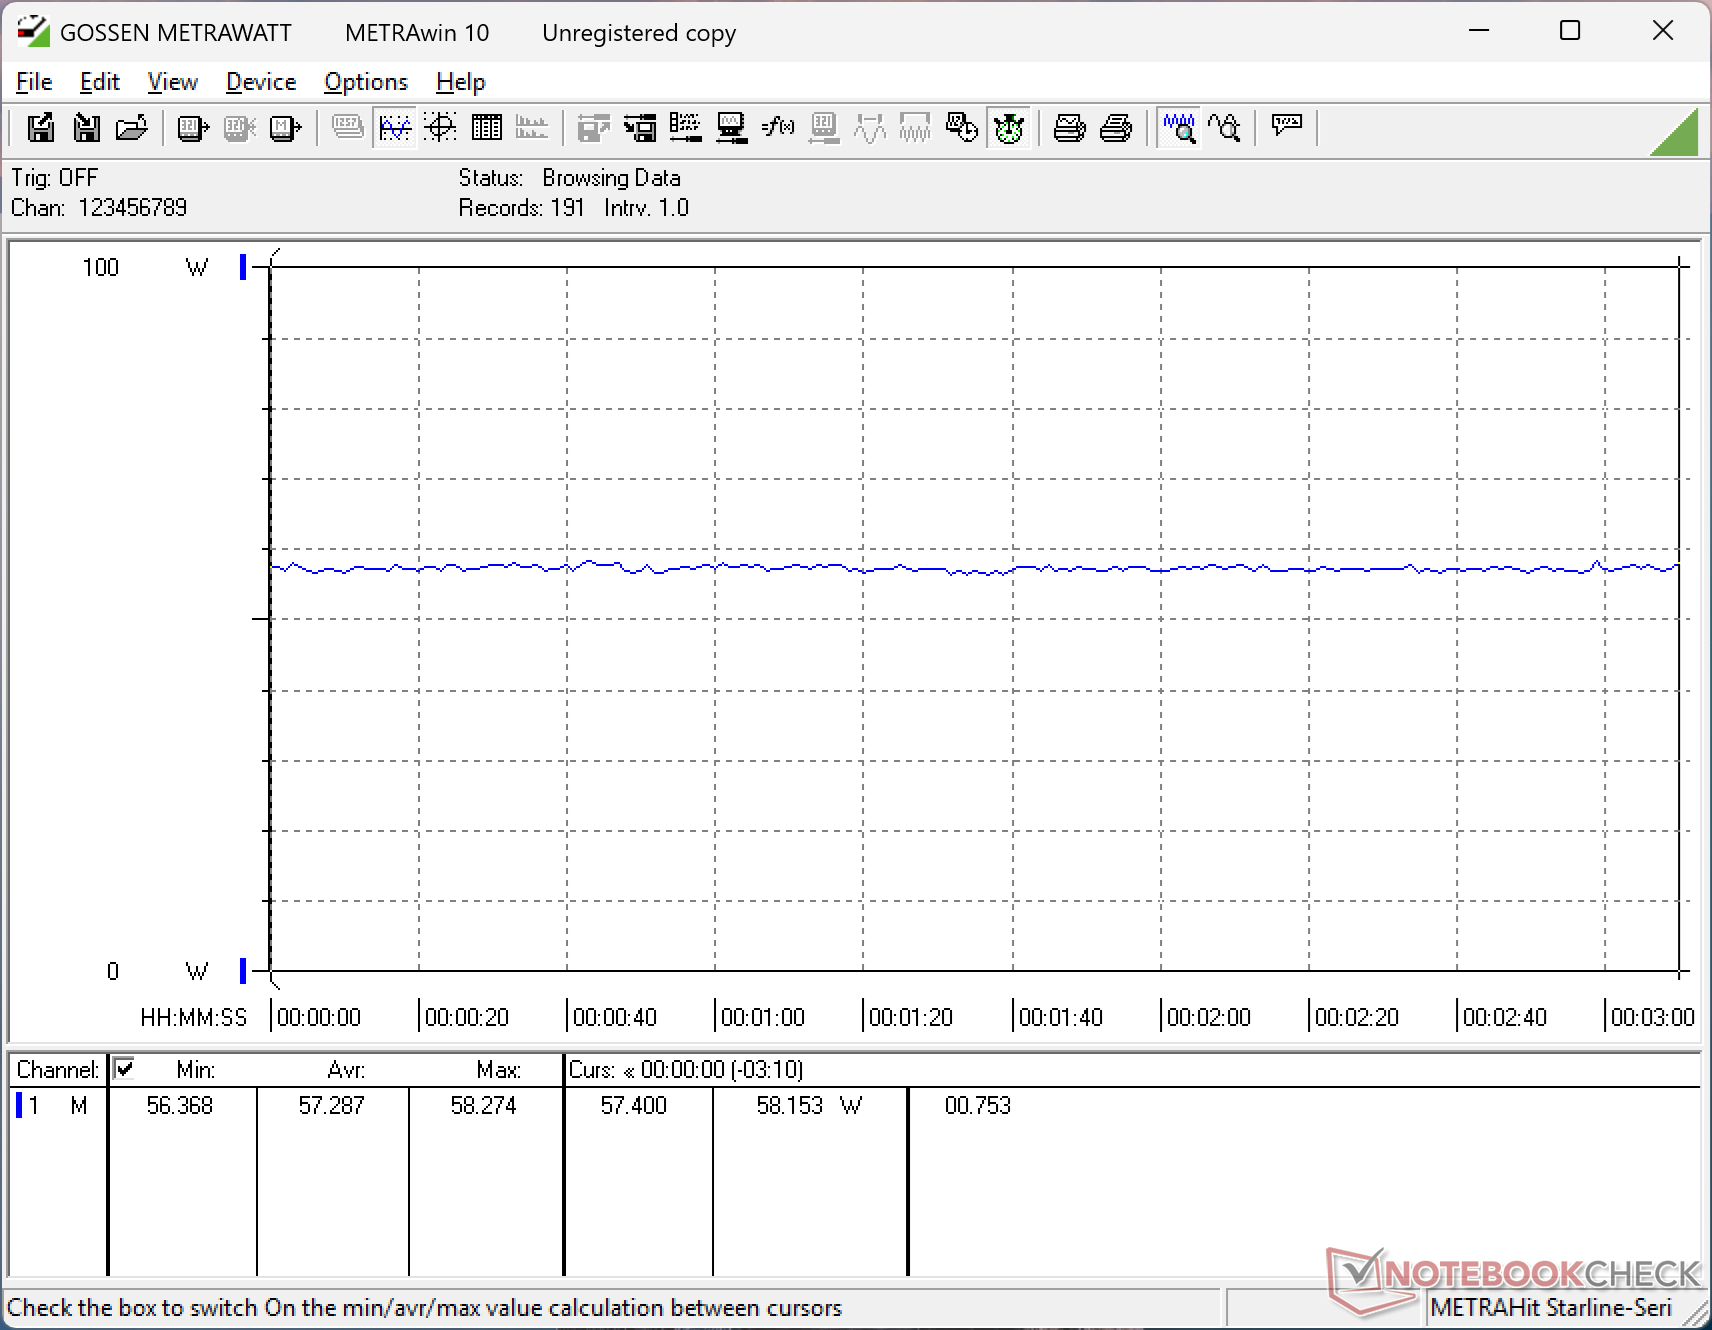
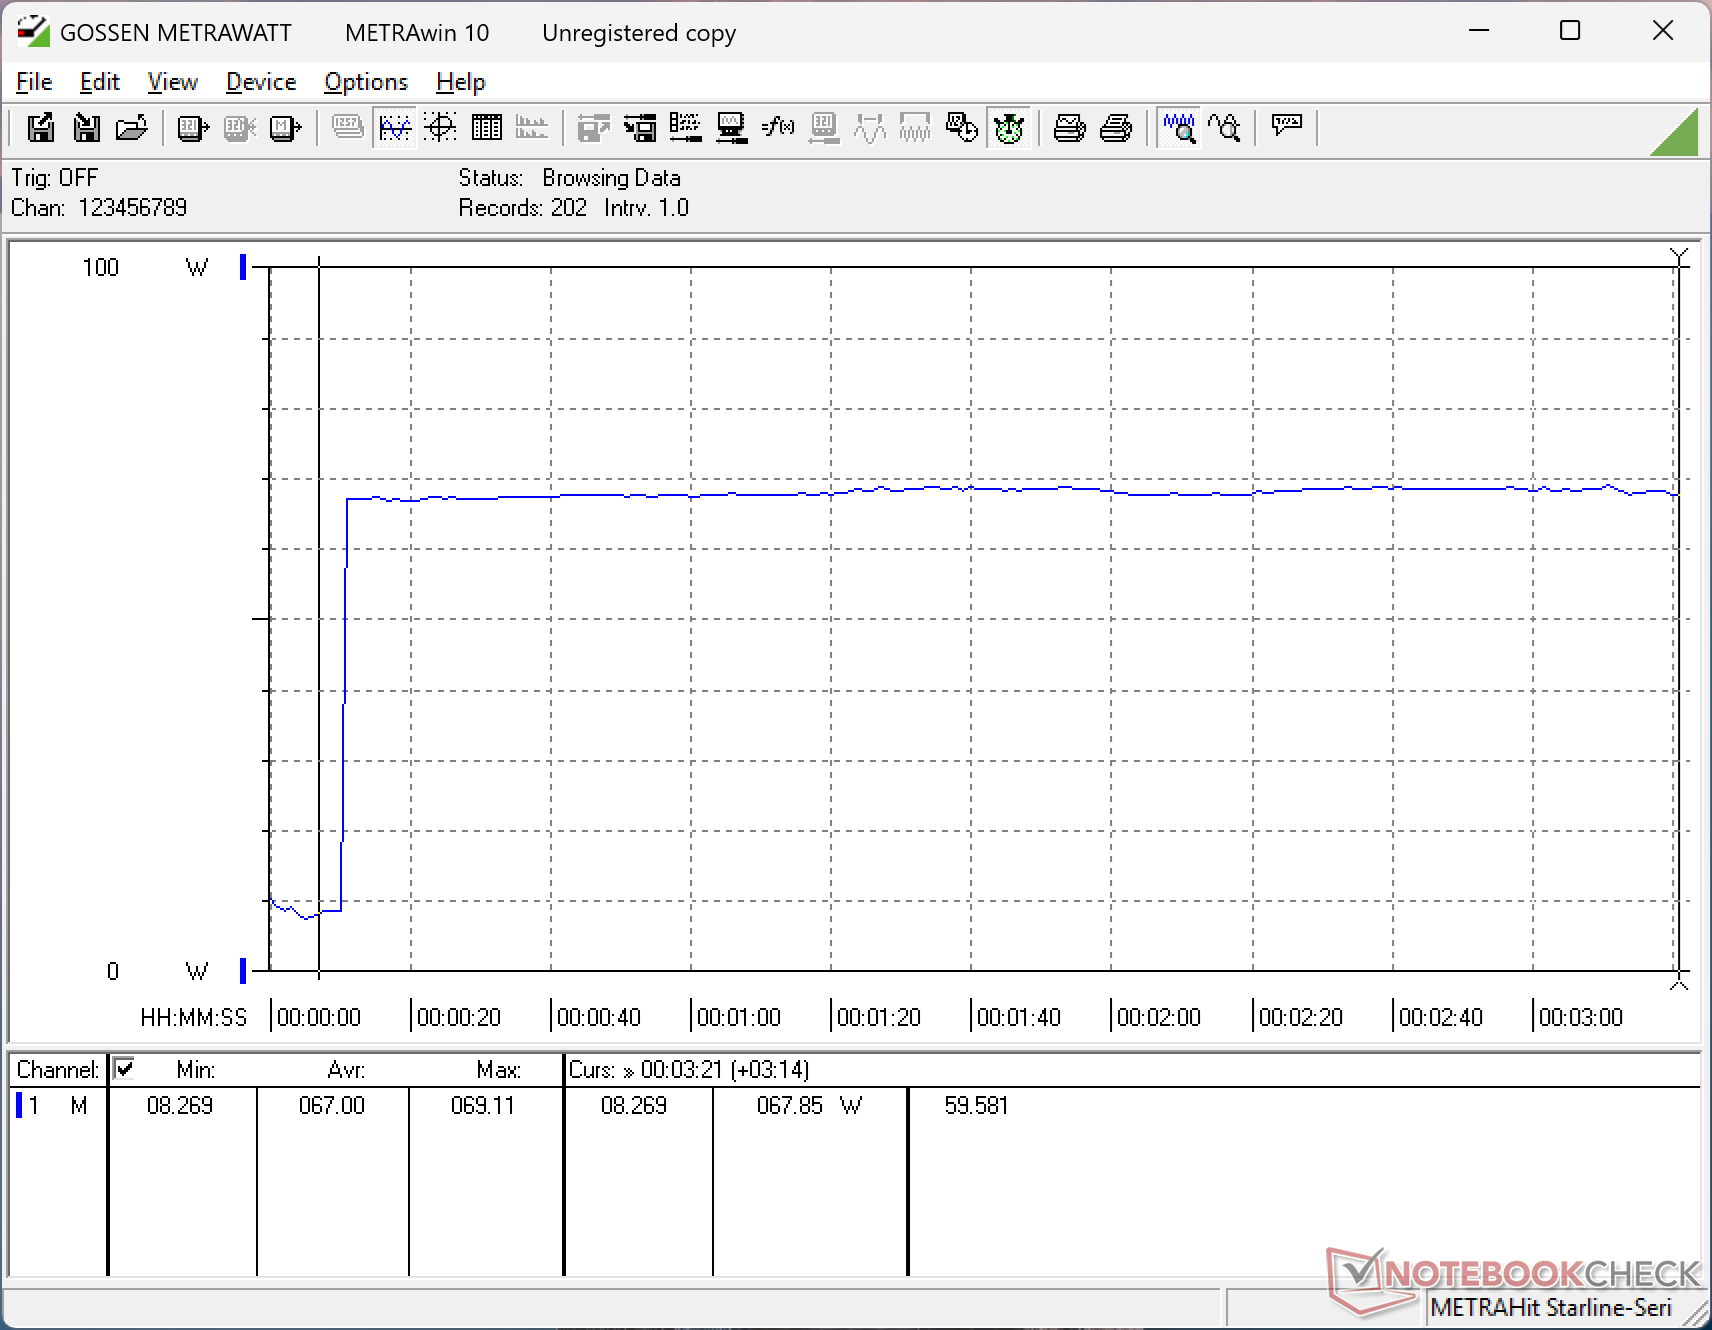
Consommation électrique
La consommation globale est généralement plus élevée que celle de nombreux autres ordinateurs portables 16 pouces orientés budget, en grande partie grâce au processeur Core-H plus rapide. Par exemple, l'exécution de Prime95 nécessiterait près de 70 W, contre seulement 40 W pour le modèle Dell 16 Plus alimenté par Lunar Lake-V Dell 16 Plus.
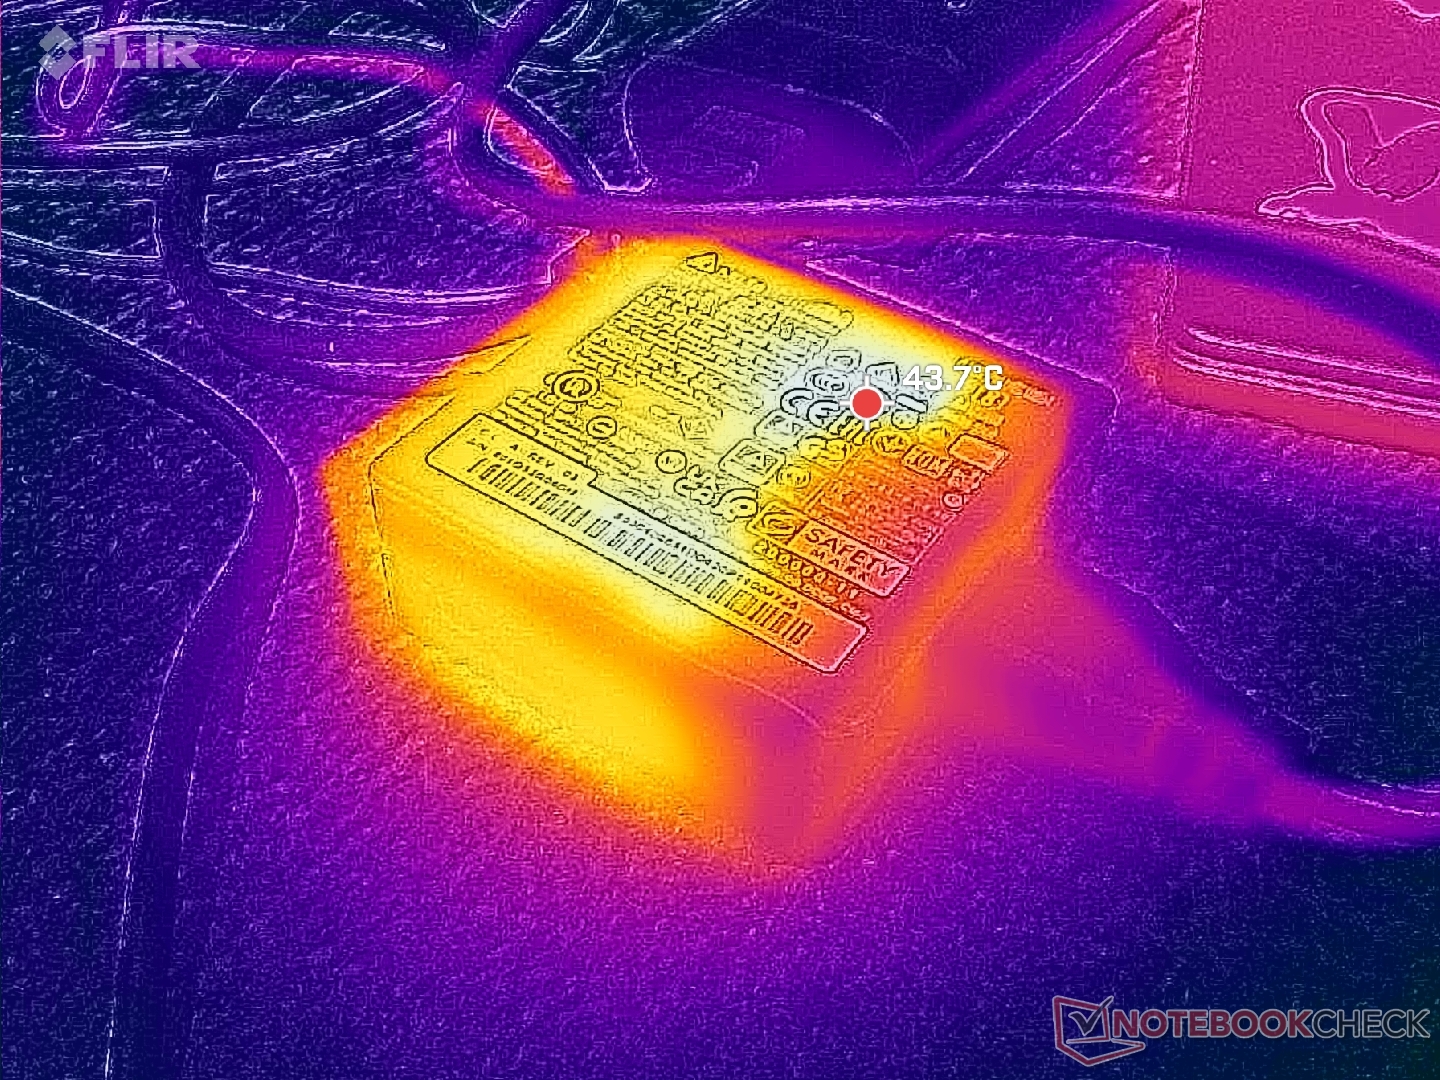
L'adaptateur secteur de 90 W est assez compact (~7,5 x 7,5 x 2,8 cm). Cependant, il est décevant que le modèle s'appuie sur un chargeur AC à barillet au lieu d'un USB-C universel.
| Éteint/en veille | |
| Au repos | |
| Fortement sollicité |
|
Légende:
min: | |
| MSI Venture 16 AI A2HMTG Ultra 7 255H, Arc 140T, , IPS, 1920x1200, 16" | MSI Prestige 16 B1MG-001US Ultra 7 155H, Arc 8-Core, Samsung PM9A1 MZVL22T0HBLB, IPS, 2560x1600, 16" | Dell 16 Plus 2-in-1 Core Ultra 7 258V, Arc 140V, Samsung BM9C1 1024GB, Mini-LED, 2560x1600, 16" | Asus V16 V3607V Core 7 240H, GeForce RTX 3050 6GB Laptop GPU, Samsung PM9C1 MZVL8512HELU, IPS, 1920x1200, 16" | HP Pavilion 16-ag0057ng R5 8540U, Radeon 740M, SK hynix BC901 HFS001TEJ4X164N, IPS, 1920x1200, 16" | Lenovo IdeaPad Slim 5 16AKP10 Ryzen AI 5 330, Radeon 820M, Western Digital PC SN5000S SDEPMSJ-512G, IPS, 1920x1200, 16" | |
|---|---|---|---|---|---|---|
| Power Consumption | -10% | -4% | -32% | 33% | 22% | |
| Idle Minimum * (Watt) | 5.9 | 3 49% | 7 -19% | 2.1 64% | 4 32% | 5.2 12% |
| Idle Average * (Watt) | 9 | 9.5 -6% | 13.2 -47% | 7.2 20% | 5 44% | 6 33% |
| Idle Maximum * (Watt) | 9.7 | 12 -24% | 13.4 -38% | 10.7 -10% | 6 38% | 7.7 21% |
| Load Average * (Watt) | 54.9 | 68.3 -24% | 43.9 20% | 99.4 -81% | 40 27% | 44 20% |
| Cyberpunk 2077 ultra * (Watt) | 57.3 | 44.9 22% | 92.1 -61% | 43 25% | 43 25% | |
| Cyberpunk 2077 ultra external monitor * (Watt) | 54.2 | 40.7 25% | 88.7 -64% | 39.1 28% | 40.4 25% | |
| Load Maximum * (Watt) | 72.3 | 104.8 -45% | 67.8 6% | 137.8 -91% | 46 36% | 58 20% |
| Witcher 3 ultra * (Watt) | 59.8 |
* ... Moindre est la valeur, meilleures sont les performances
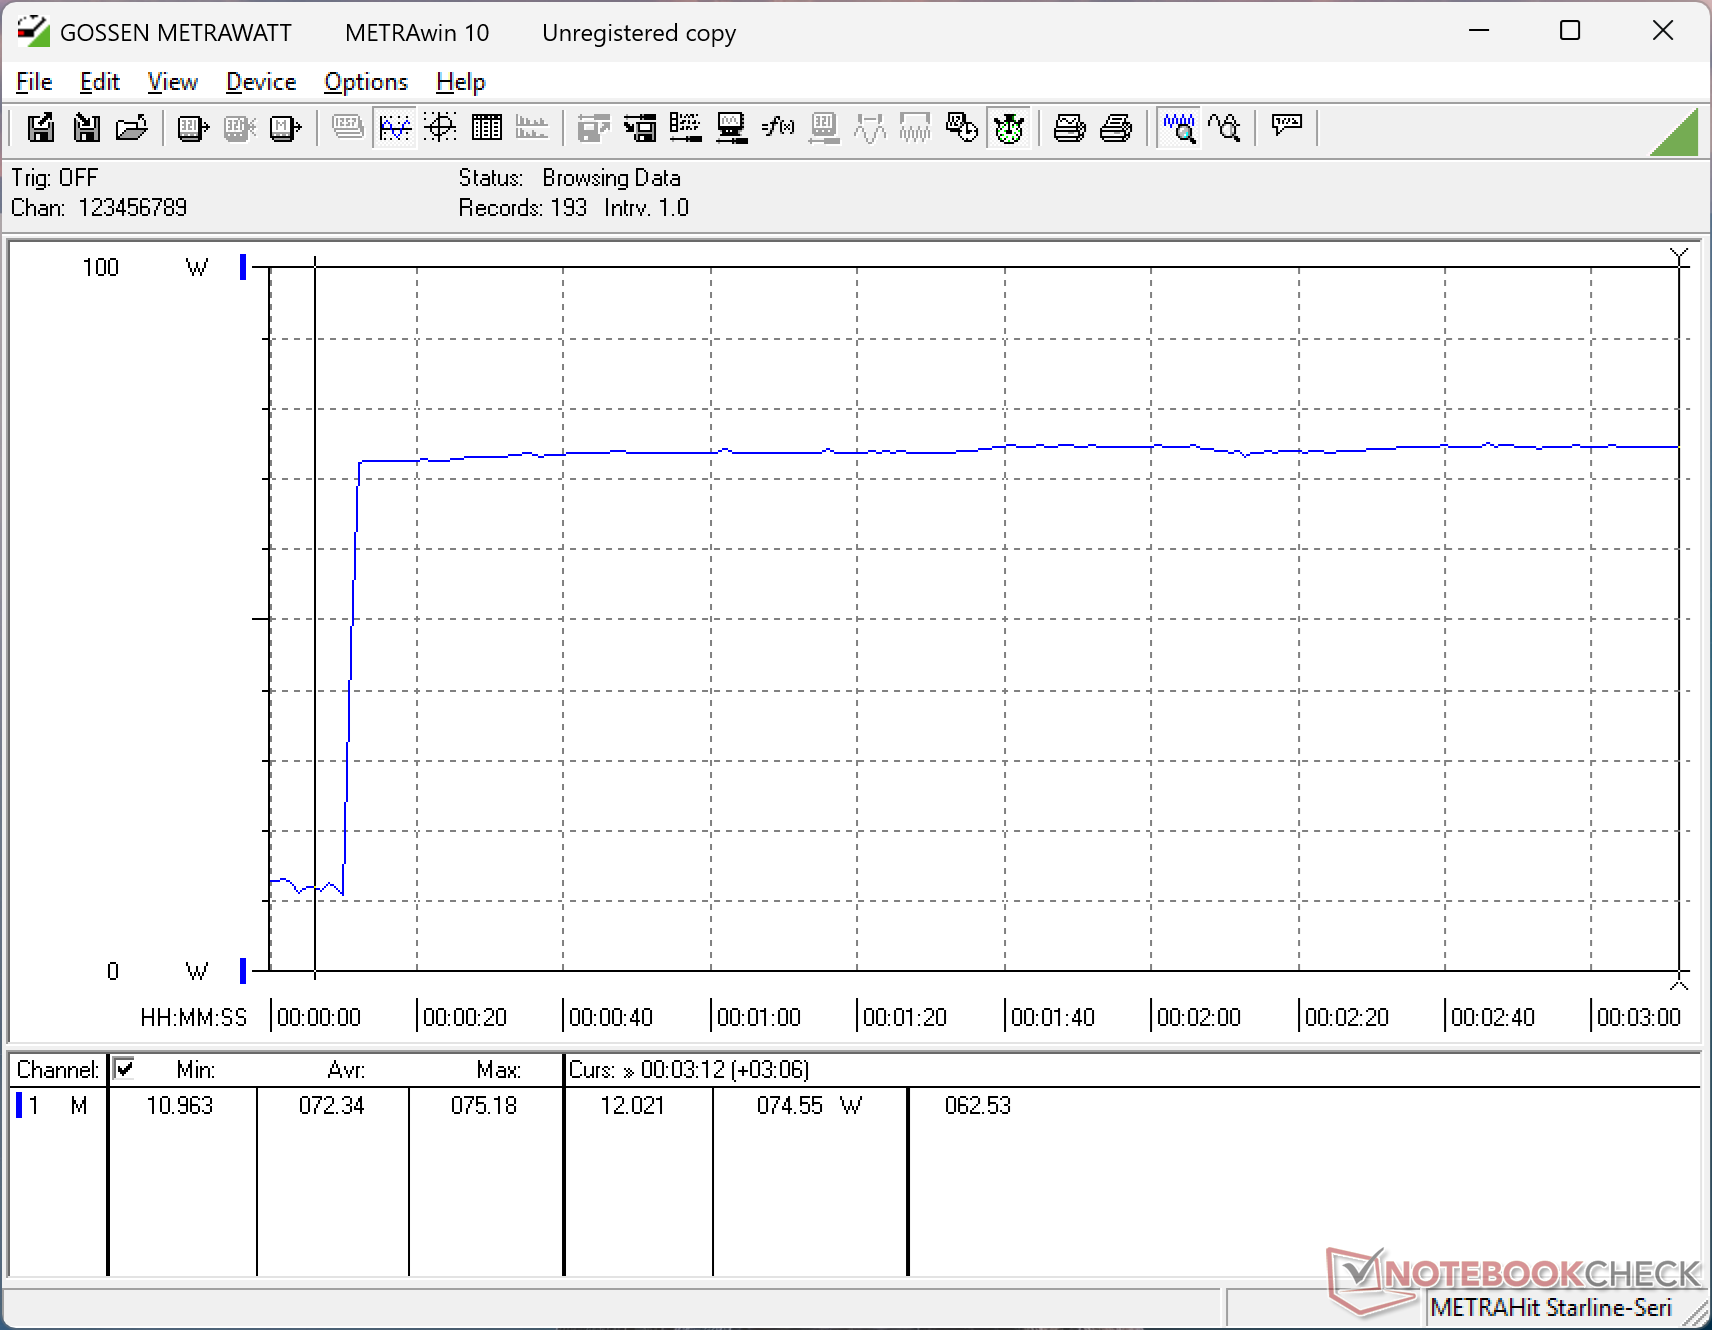
Consommation électrique Cyberpunk / Stress Test
Consommation électrique du moniteur externe
Autonomie de la batterie
L'autonomie du réseau local sans fil est satisfaisante (environ 7 heures) grâce à la capacité relativement faible de la batterie (55 Wh).
| MSI Venture 16 AI A2HMTG Ultra 7 255H, Arc 140T, 55.2 Wh | MSI Prestige 16 B1MG-001US Ultra 7 155H, Arc 8-Core, 99.9 Wh | Dell 16 Plus 2-in-1 Core Ultra 7 258V, Arc 140V, 64 Wh | Asus V16 V3607V Core 7 240H, GeForce RTX 3050 6GB Laptop GPU, 63 Wh | HP Pavilion 16-ag0057ng R5 8540U, Radeon 740M, 59 Wh | Lenovo IdeaPad Slim 5 16AKP10 Ryzen AI 5 330, Radeon 820M, 60 Wh | |
|---|---|---|---|---|---|---|
| Autonomie de la batterie | 161% | 27% | 29% | 63% | 50% | |
| WiFi v1.3 (h) | 7 | 18.3 161% | 8.9 27% | 9 29% | 11.4 63% | 10.5 50% |
| Reader / Idle (h) | 25.1 | |||||
| Load (h) | 2.8 |
Notebookcheck Rating
Le Venture 16 AI est l'une des offres les plus basiques de MSI, avec une bonne facilité d'entretien mais des capacités limitées, en particulier dans la configuration de base.
MSI Venture 16 AI A2HMTG
- 03/06/2026 v8
Allen Ngo
 Total Sustainability Score:
 Comparaison avec des concurrents potentiels
Image | Modèle | Prix | Poids | Épaisseur | Écran |
|---|---|---|---|---|---|
1. 80.7%  | MSI Venture 16 AI A2HMTG Intel Core Ultra 7 255H ⎘ Intel Arc Graphics 140T ⎘ 32 Go Mémoire | Amazon: Prix de liste: 1000 USD | 2.1 kg | 23.15 mm | 16.00" 1920x1200 142 PPI IPS |
2. 88.1% v7 (old)  | MSI Prestige 16 B1MG-001US Intel Core Ultra 7 155H ⎘ Intel Arc 8-Core iGPU ⎘ 32 Go Mémoire, 2048 Go SSD | Amazon: 1. $1,595.00 MSI Prestige 16 AI Evo Lapto... 2. $43.99 AC Adapter Charger Compatibl... 3. $1,486.99 MSI Prestige 16 AI+ Evo 16" ... Prix de liste: 1300 USD | 1.6 kg | 19.1 mm | 16.00" 2560x1600 189 PPI IPS |
3. 83.5%  | Dell 16 Plus 2-in-1 Intel Core Ultra 7 258V ⎘ Intel Arc Graphics 140V ⎘ 32 Go Mémoire, 1024 Go SSD | Amazon: $1,099.99 Prix de liste: 1500 USD | 2 kg | 16.99 mm | 16.00" 2560x1600 189 PPI Mini-LED |
4. 78.5%  | Asus V16 V3607V Intel Core 7 240H ⎘ NVIDIA GeForce RTX 3050 6GB Laptop GPU ⎘ 16 Go Mémoire, 512 Go SSD | Amazon: 1. $49.99 180W 150W 20V 9A Charger for... 2. $53.99 LNBUK 180W Laptop Charger Co... 3. $125.98 KrystalPix Replacement LCD f... Prix de liste: 900 USD | 2 kg | 22 mm | 16.00" 1920x1200 142 PPI IPS |
5. 77.3%  | HP Pavilion 16-ag0057ng AMD Ryzen 5 8540U ⎘ AMD Radeon 740M ⎘ 16 Go Mémoire, 1024 Go SSD | Amazon: Prix de liste: 730 EUR | 1.7 kg | 18.6 mm | 16.00" 1920x1200 142 PPI IPS |
6. 80.8%  | Lenovo IdeaPad Slim 5 16AKP10 AMD Ryzen AI 5 330 ⎘ AMD Radeon 820M ⎘ 16 Go Mémoire, 512 Go SSD | Amazon: Prix de liste: 700 EUR | 1.9 kg | 18.4 mm | 16.00" 1920x1200 142 PPI IPS |
Transparency
La sélection des appareils à examiner est effectuée par notre équipe éditoriale. L'échantillon de test a été prêté à l'auteur par le fabricant ou le détaillant pour les besoins de cet examen. Le prêteur n'a pas eu d'influence sur cette évaluation et le fabricant n'a pas reçu de copie de cette évaluation avant sa publication. Il n'y avait aucune obligation de publier cet article. En tant que média indépendant, Notebookcheck n'est pas soumis à l'autorité des fabricants, des détaillants ou des éditeurs.
Voici comment Notebookcheck teste
Chaque année, Notebookcheck examine de manière indépendante des centaines d'ordinateurs portables et de smartphones en utilisant des procédures standardisées afin de garantir que tous les résultats sont comparables. Nous avons continuellement développé nos méthodes de test depuis environ 20 ans et avons établi des normes industrielles dans le processus. Dans nos laboratoires de test, des équipements de mesure de haute qualité sont utilisés par des techniciens et des rédacteurs expérimentés. Ces tests impliquent un processus de validation en plusieurs étapes. Notre système d'évaluation complexe repose sur des centaines de mesures et de points de référence bien fondés, ce qui garantit l'objectivité.
