

Verdict - Simple, mais peut-être trop simple
En tant que mini-PC pour les entreprises, le Cubi NUC 2MG est une option simple et fiable, sans esthétique tape-à-l'œil. Son haut-parleur intégré, ses microphones, le support Co-Pilot+ et la fonction Power Link peuvent s'avérer utiles dans certaines conditions ou scénarios d'utilisation, tandis que le CPU Lunar Lake-V est généralement plus froid et plus efficace que les alternatives AMD actuelles. Nous apprécions particulièrement le lecteur MicroSD intégré, car beaucoup d'autres mini PC n'ont pas de lecteur de carte.
Notre principal reproche au Cubi 2MG est son prix relativement élevé de 900 USD, alors que des mini PC AMD plus rapides comme le Beelink SER9 Pro ou GMK NucBox K12 sont disponibles pour des centaines de dollars de moins. Ces alternatives sont également dotées de fonctionnalités utiles telles que la RAM amovible et la prise en charge d'un plus grand nombre de disques SSD internes. MSI affirme offrir un meilleur support client et une garantie plus longue de trois ans en standard pour justifier le prix demandé, mais la performance par dollar est néanmoins relativement faible.
Le comportement du ventilateur pourrait également être amélioré. A moins que vous ne soyez en mode silencieux, le ventilateur a tendance à pulser et à être plus perceptible même lorsque vous exécutez des charges peu exigeantes. Les cycles d'horloge du GPU, bien qu'ils ne soient pas un problème pour la plupart des environnements professionnels, sont tout de même étranges à voir alors que la plupart des autres mini PC ne présentent pas le même problème.
Points positifs
Points négatifs
Le Cubi NUC 2MG succède au Cubi NUC 1MG de l'année dernière Cubi NUC 1M. Il remplace l'ancien CPU Raptor Lake-U Core Ultra 7 150U par les nouvelles options Lunar Lake-V tout en apportant d'autres changements auxiliaires mineurs. La série Cubi est optimisée pour les entreprises et les environnements de vente au détail, par opposition aux bureaux à domicile ou aux applications HTPC.
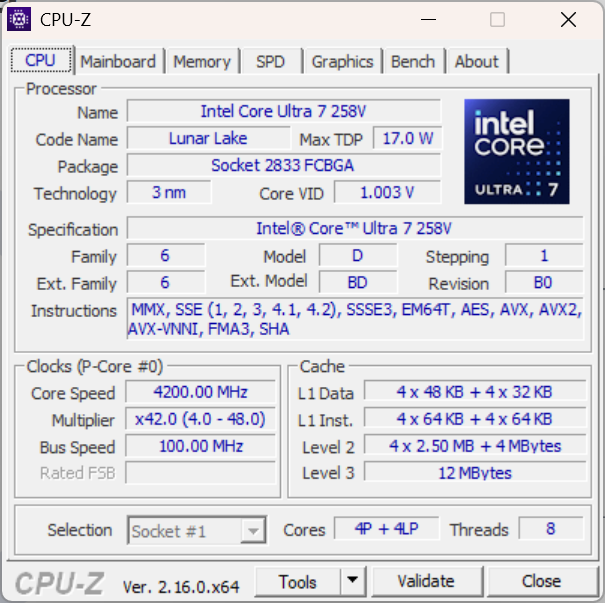
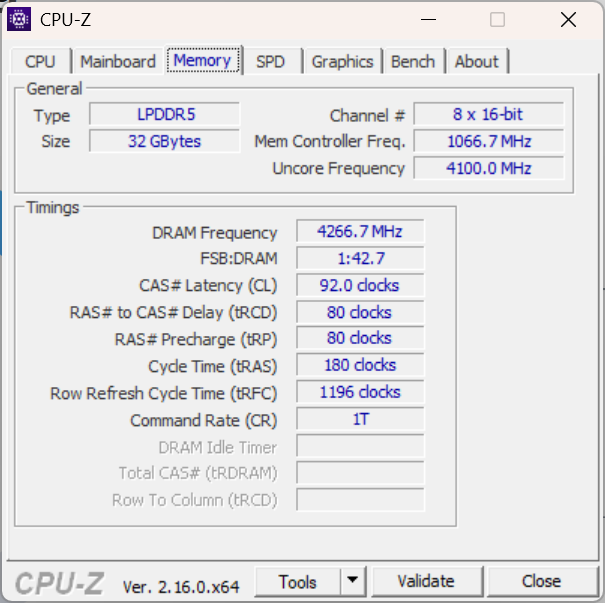
Notre unité de test est une configuration de milieu de gamme avec le CPU Core Ultra 7 258V, 32 Go de RAM soudée et un SSD de 1 To pour environ 900 USD. Les SKUs inférieurs commencent avec le Core Ultra 5 226V tandis que l'option la plus haut de gamme est livrée avec le Core Ultra 9 288V. Une version blanche est disponible dans certaines régions.
Plus d'avis sur MSI :
Spécifications
Cas
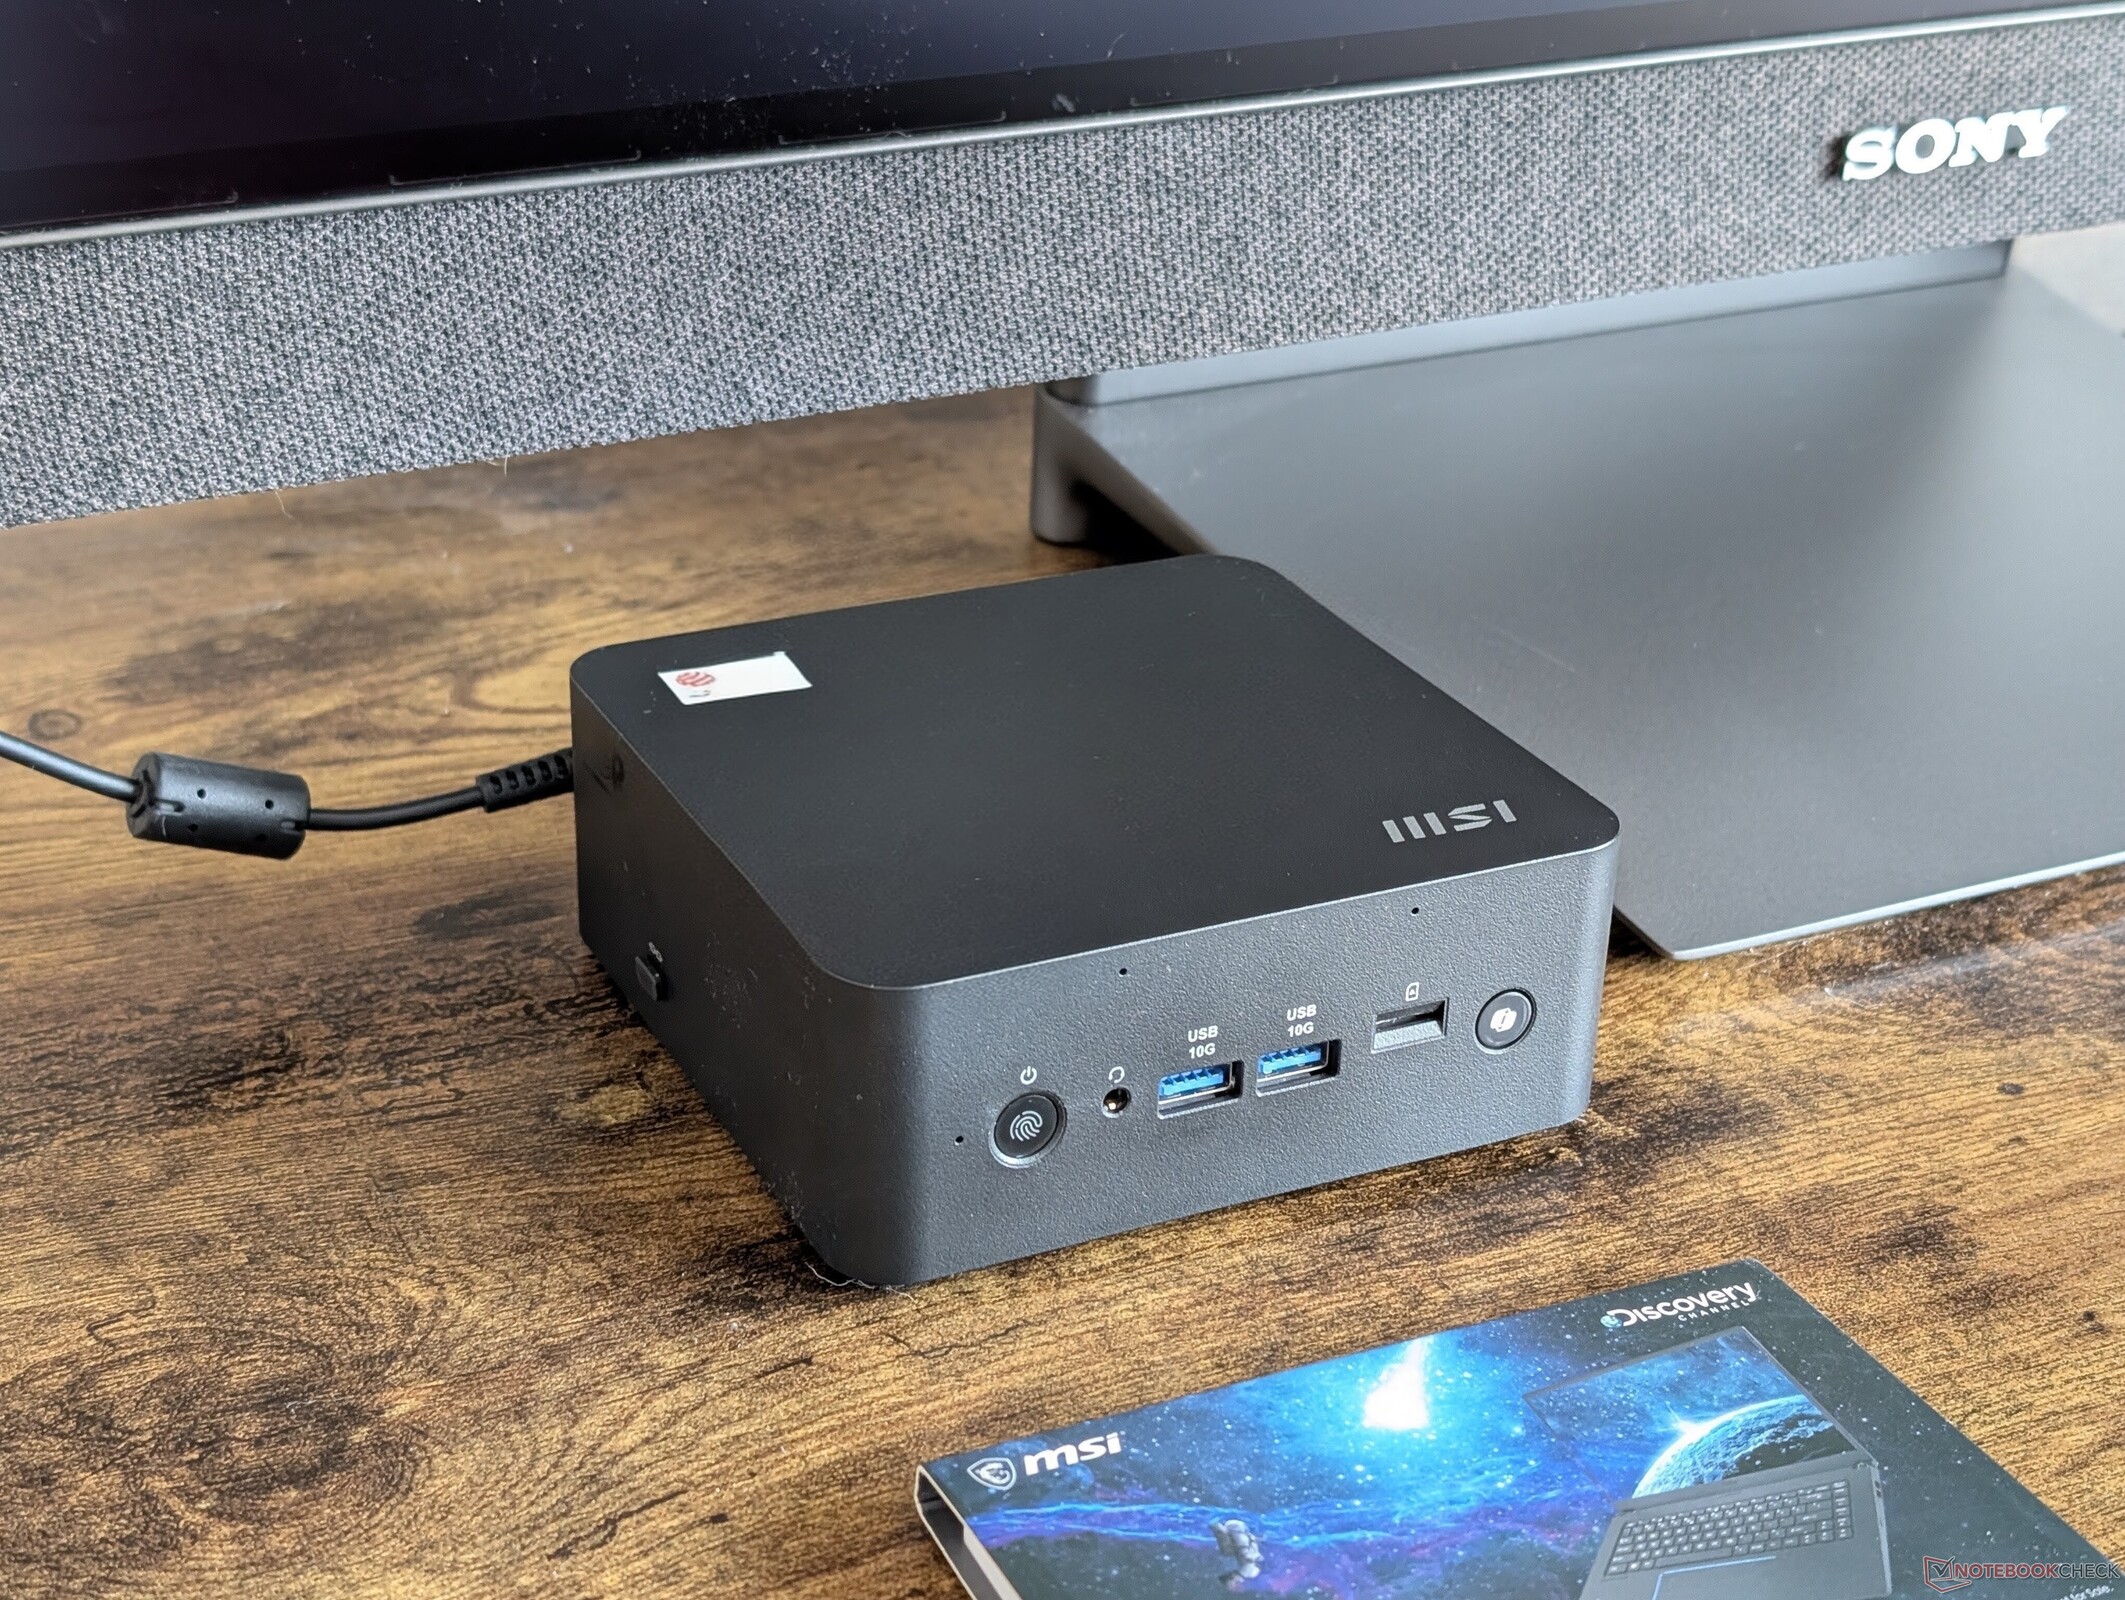
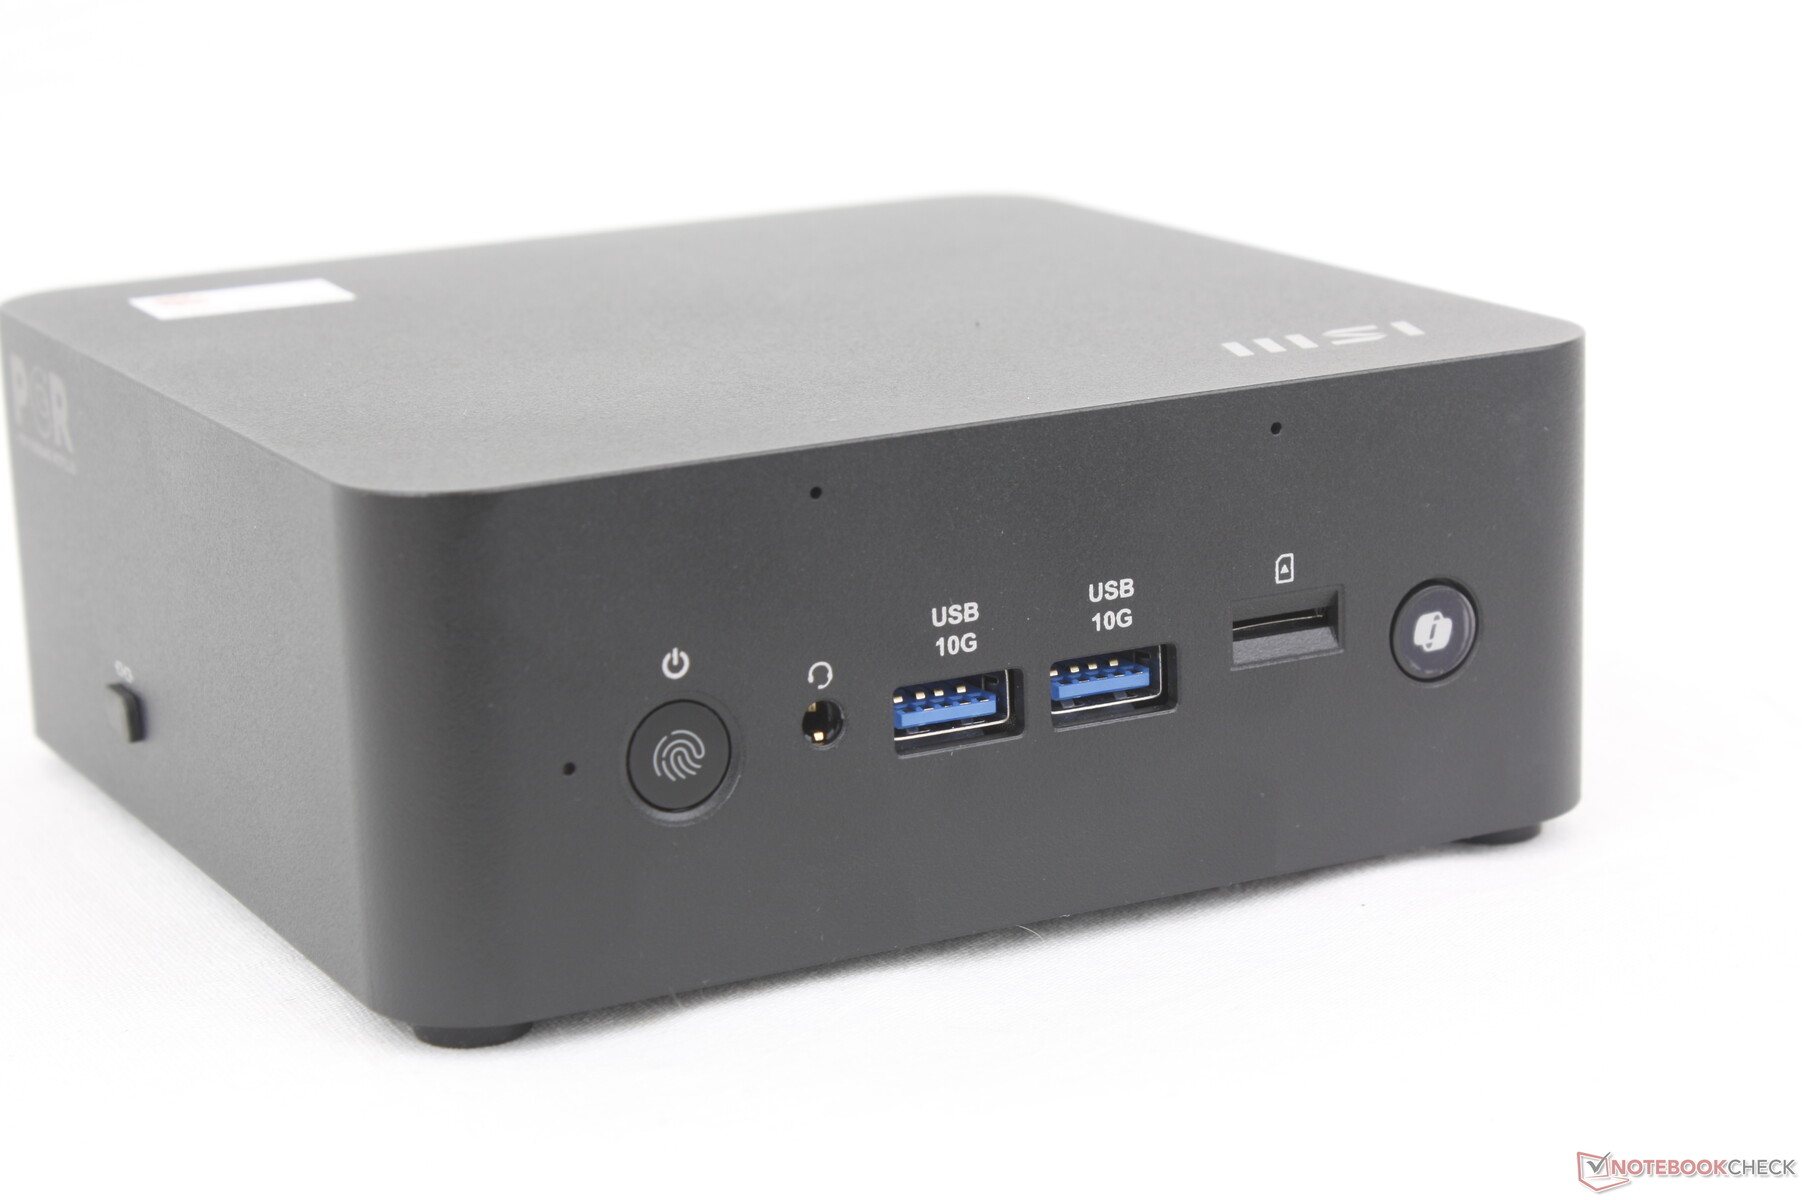
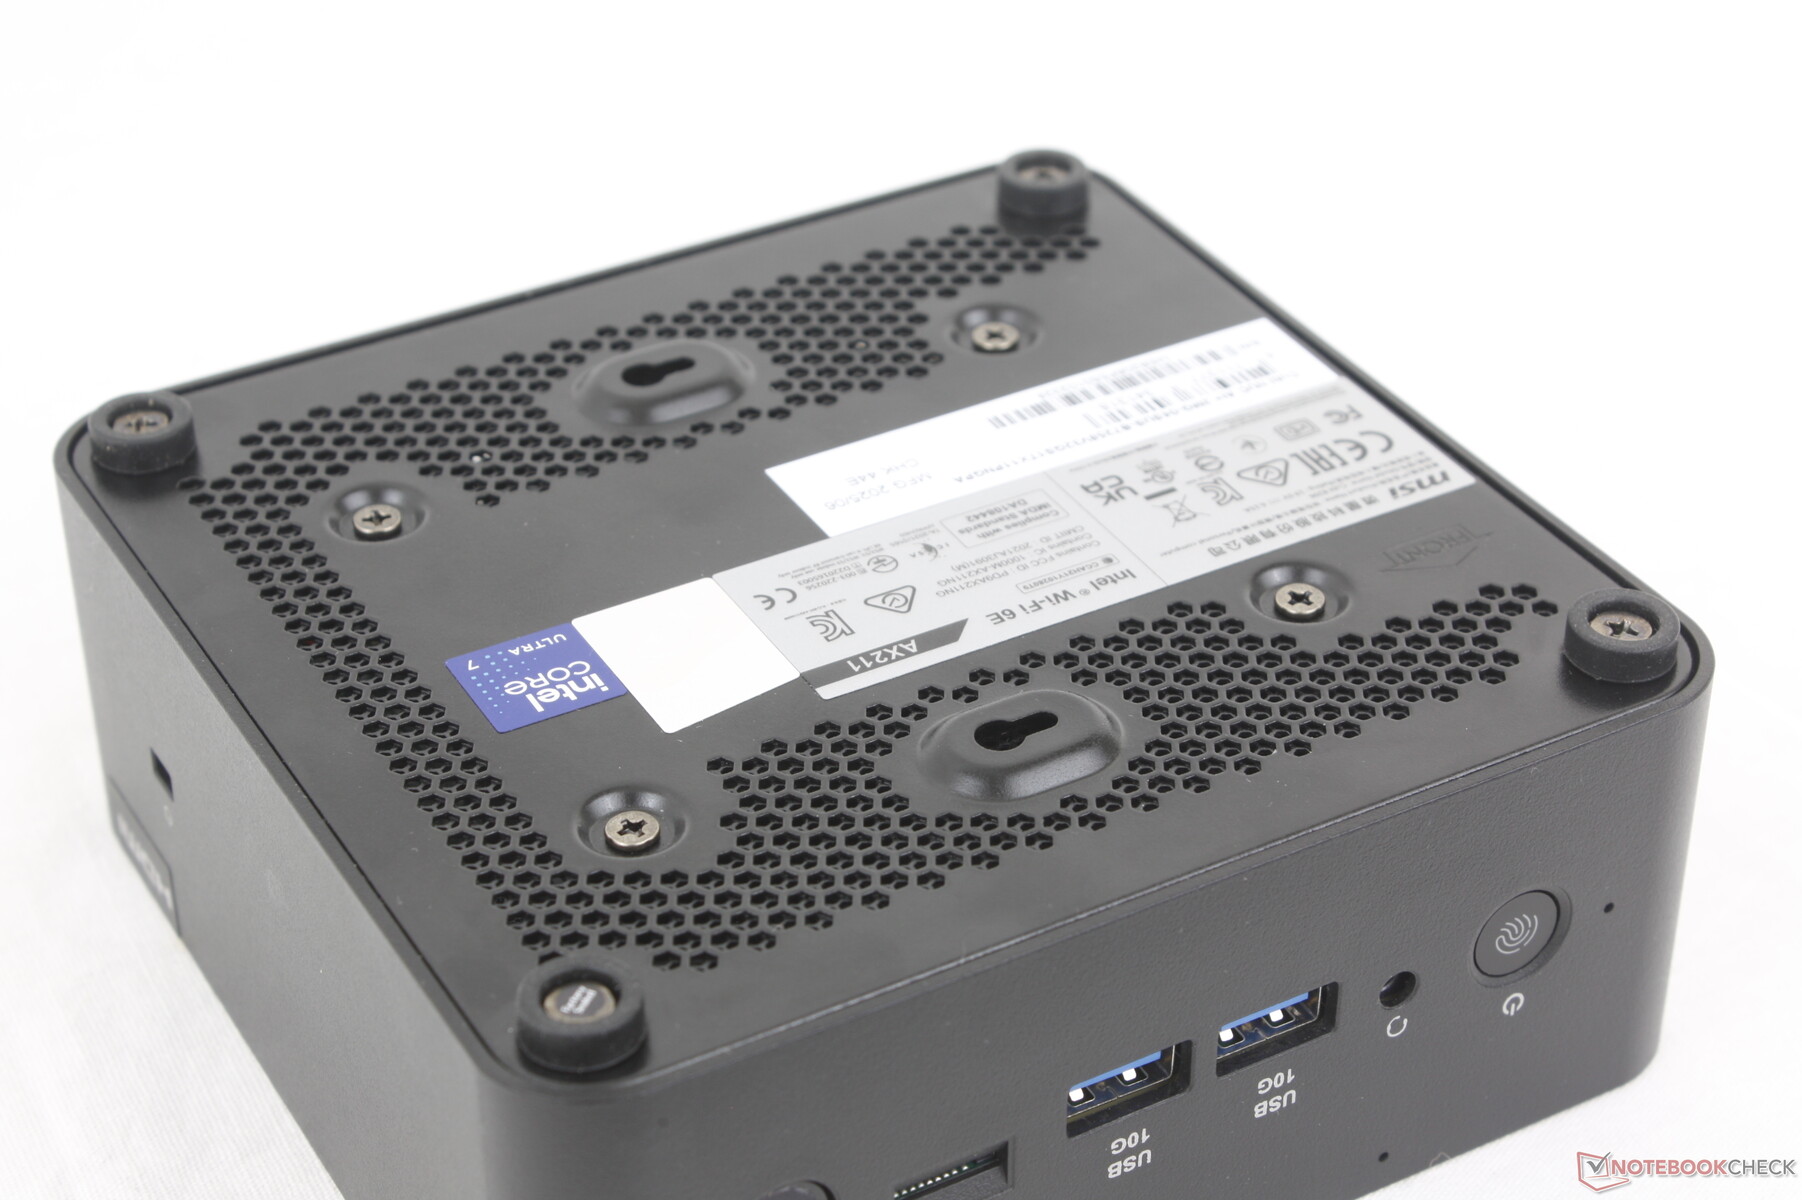
Le châssis et les dimensions restent pour l'essentiel inchangés par rapport au Cubi 1M. La nouveauté du Cubi 2MG réside dans le bouton CoPilot situé sur la face avant de l'appareil. Le problème de cette fonctionnalité est que le bouton physique peut être difficile d'accès selon la façon dont vous positionnez le système sur votre bureau.
La fonction Power Link permet d'allumer l'appareil via certains moniteurs MSI pour plus de commodité. Vous trouverez la liste des moniteurs compatibles à l'adresse https://www.msi.com/blog/a-look-at-msi-power-link-conquering-convenience. Malheureusement, Power Link nécessite toujours un adaptateur secteur pour le mini-PC et n'est donc pas une véritable solution "à un seul câble".
Connectivité
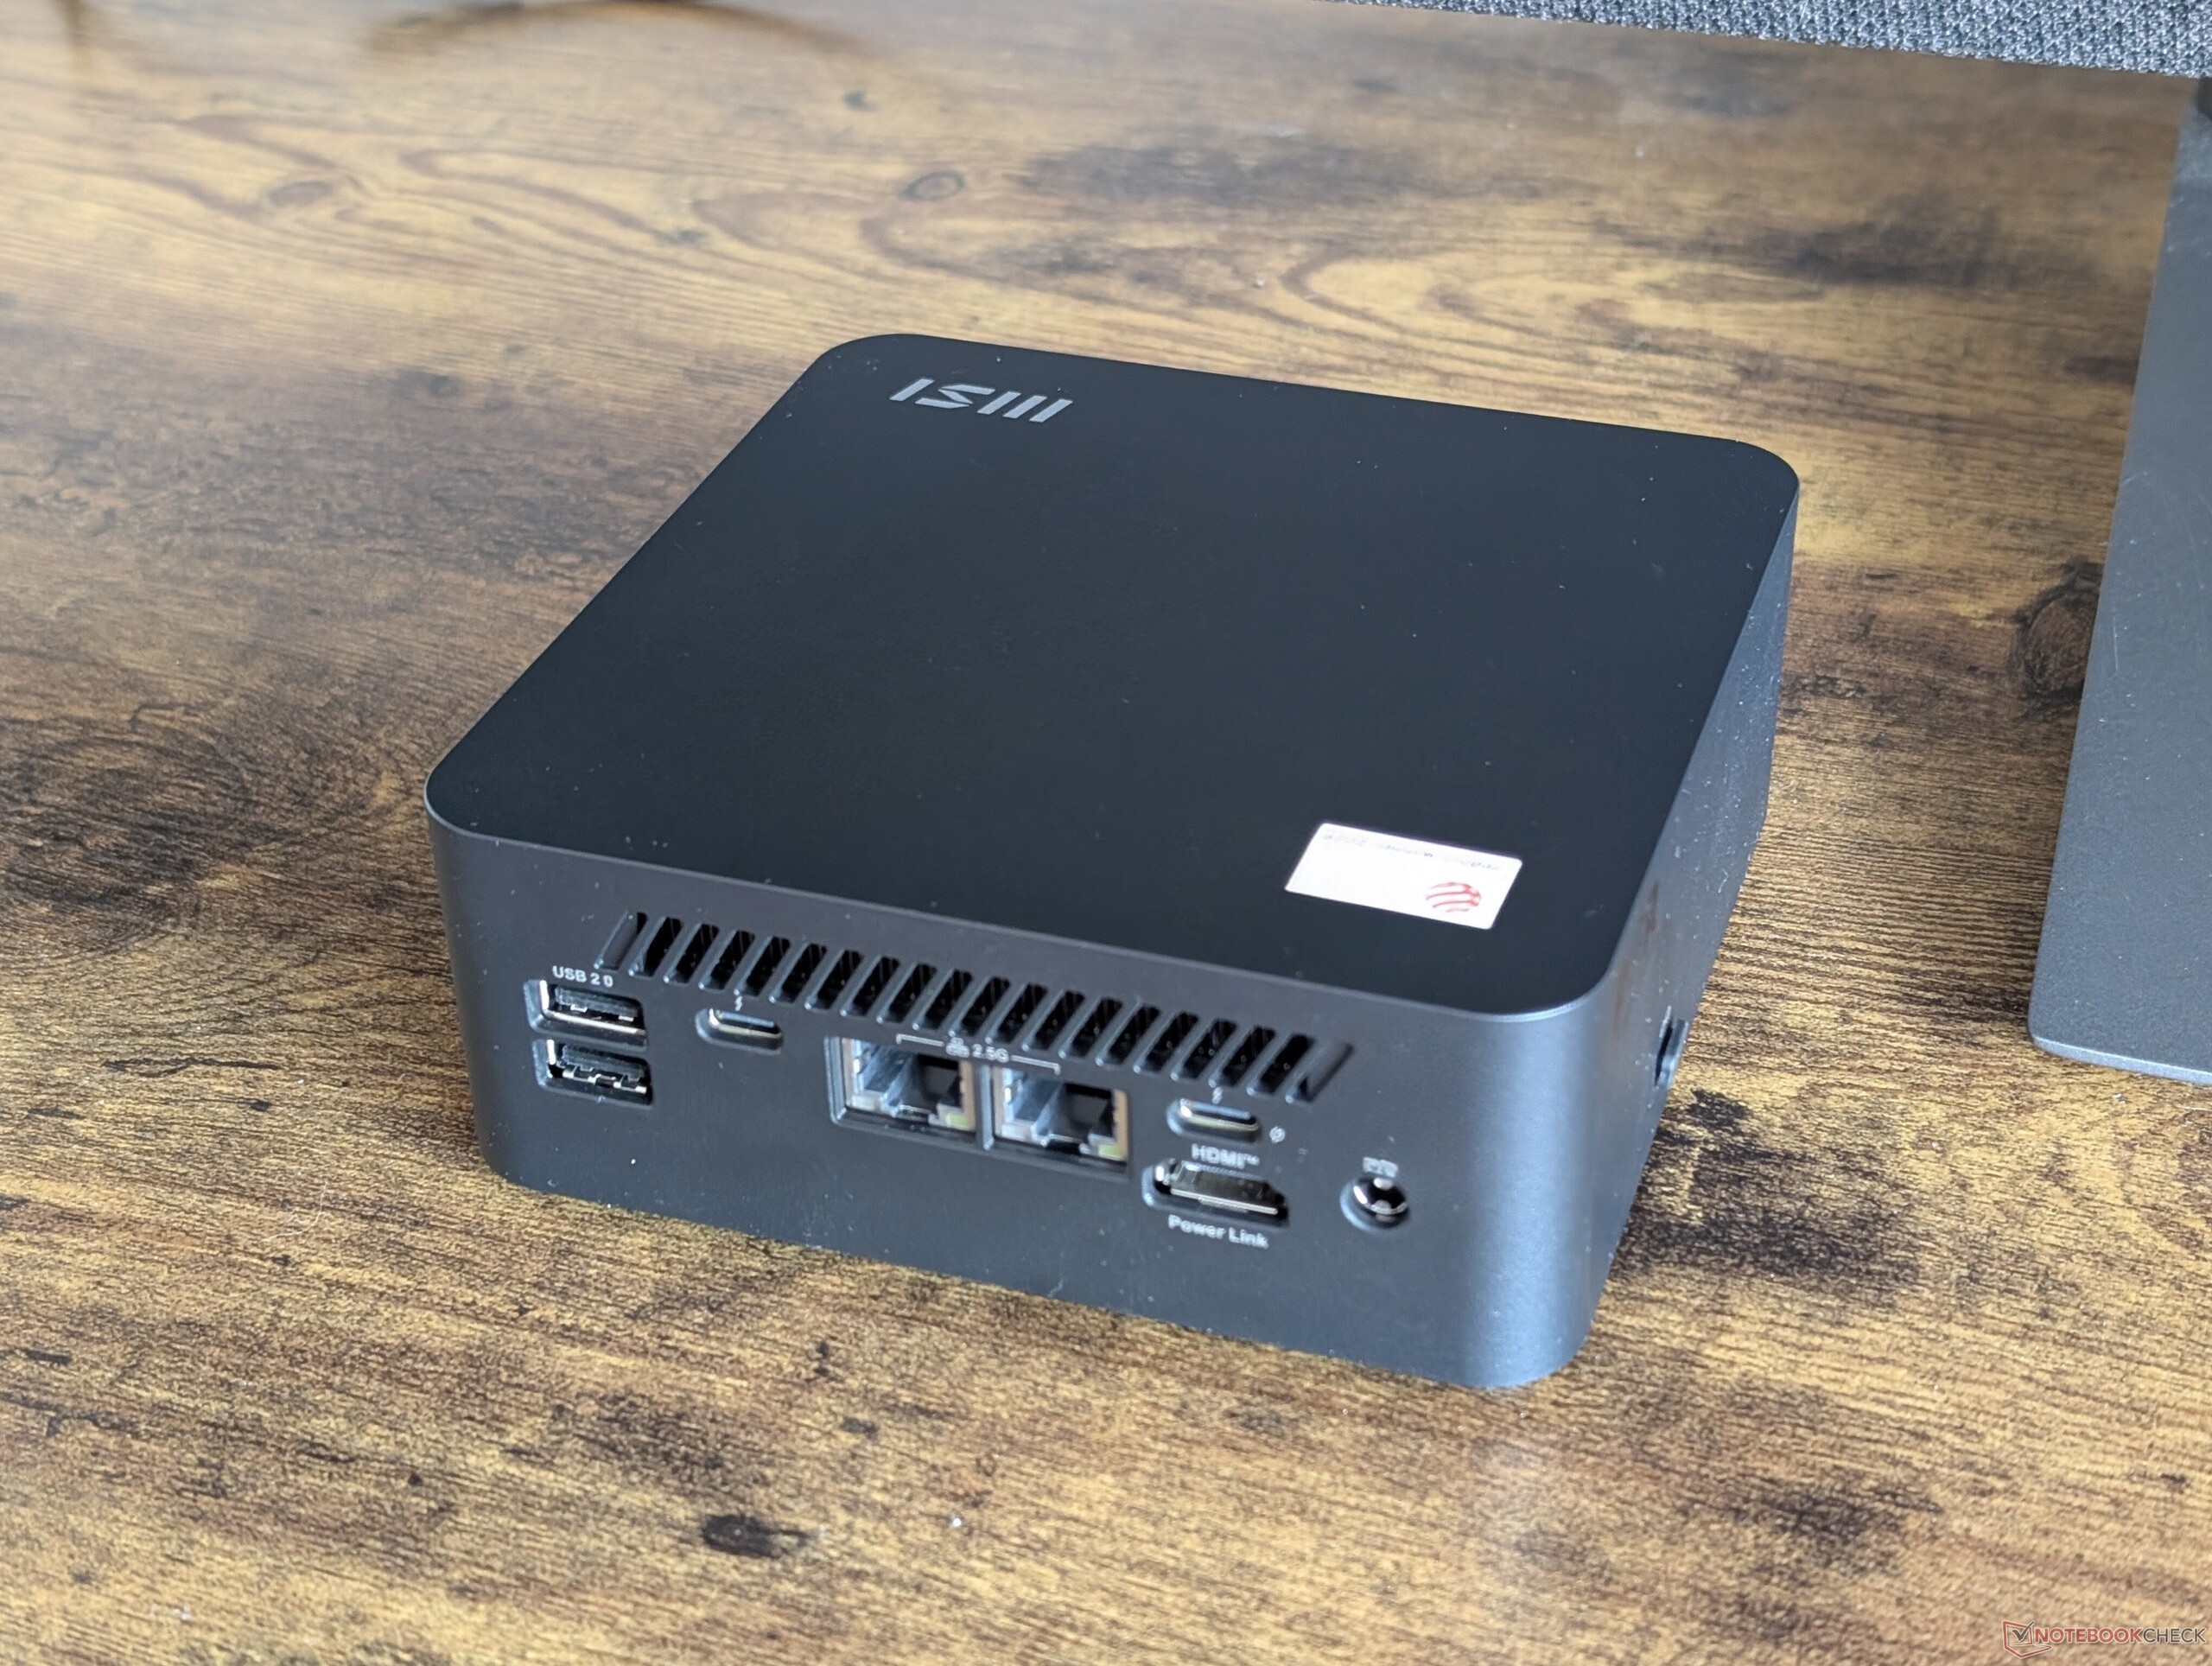
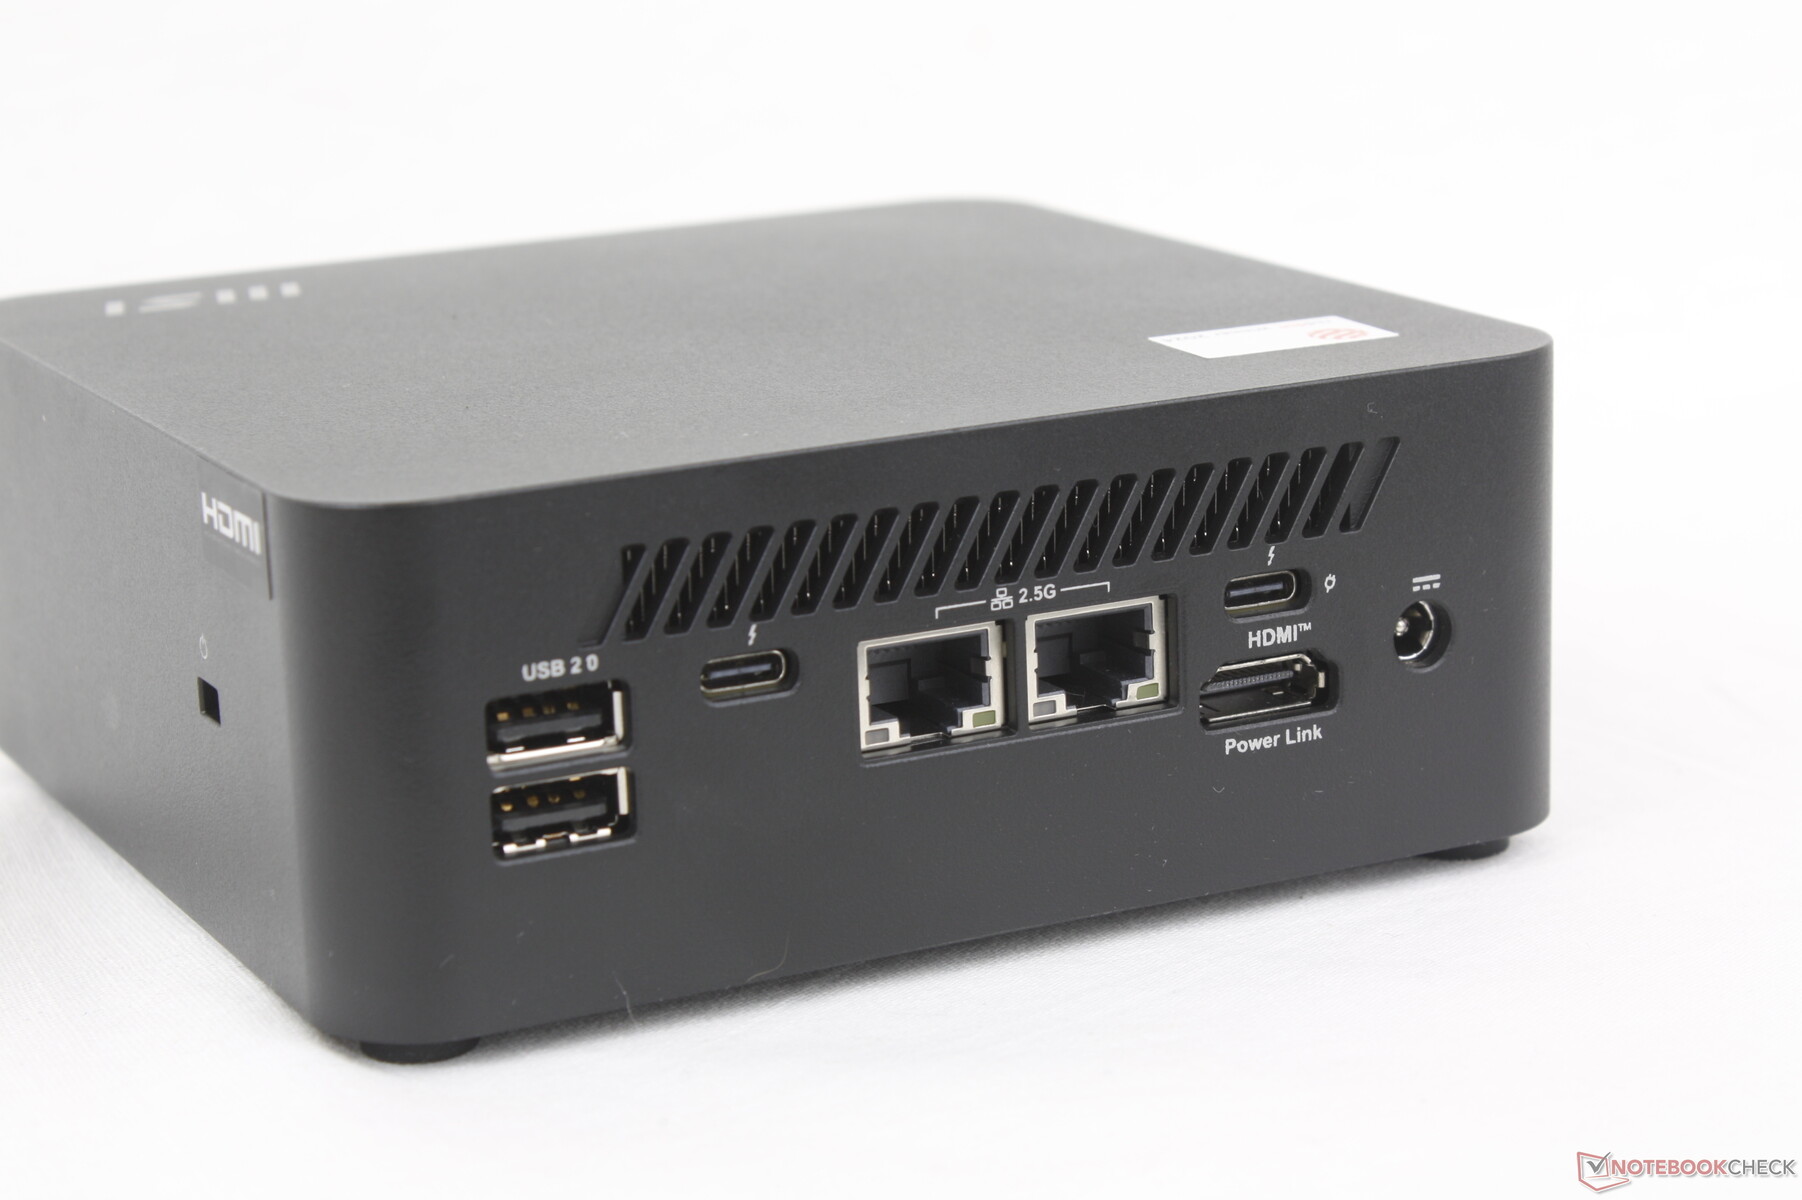
Les options de port ont légèrement changé par rapport au Cubi 1M. Il n'y a plus qu'un seul port HDMI au lieu de deux, et moins de ports USB 3.0.
Notez que bien qu'il y ait deux ports Thunderbolt 4 USB-C, seul l'un d'entre eux prend en charge l'alimentation jusqu'à 100 W si l'adaptateur secteur principal n'est pas disponible.
Lecteur de carte SD
| SD Card Reader | |
| average JPG Copy Test (av. of 3 runs) | |
| MSI Cubi NUC 1M (Angelbird AV Pro V60) | |
| MSI Cubi NUC AI+ 2MG (Angelbird AV Pro V60) | |
| maximum AS SSD Seq Read Test (1GB) | |
| MSI Cubi NUC AI+ 2MG (Angelbird AV Pro V60) | |
| MSI Cubi NUC 1M (Angelbird AV Pro V60) | |
Communication
| Networking | |
| iperf3 transmit AXE11000 | |
| MSI Cubi NUC AI+ 2MG | |
| GMK NucBox K12 | |
| Minisforum MS-A1 | |
| MSI Cubi NUC 1M | |
| Beelink SER9 Pro | |
| iperf3 receive AXE11000 | |
| MSI Cubi NUC AI+ 2MG | |
| Minisforum MS-A1 | |
| Beelink SER9 Pro | |
| GMK NucBox K12 | |
| MSI Cubi NUC 1M | |
| iperf3 transmit AXE11000 6GHz | |
| Minisforum MS-A1 | |
| MSI Cubi NUC 1M | |
| MSI Cubi NUC AI+ 2MG | |
| GMK NucBox K12 | |
| iperf3 receive AXE11000 6GHz | |
| Minisforum MS-A1 | |
| MSI Cubi NUC AI+ 2MG | |
| MSI Cubi NUC 1M | |
| GMK NucBox K12 | |
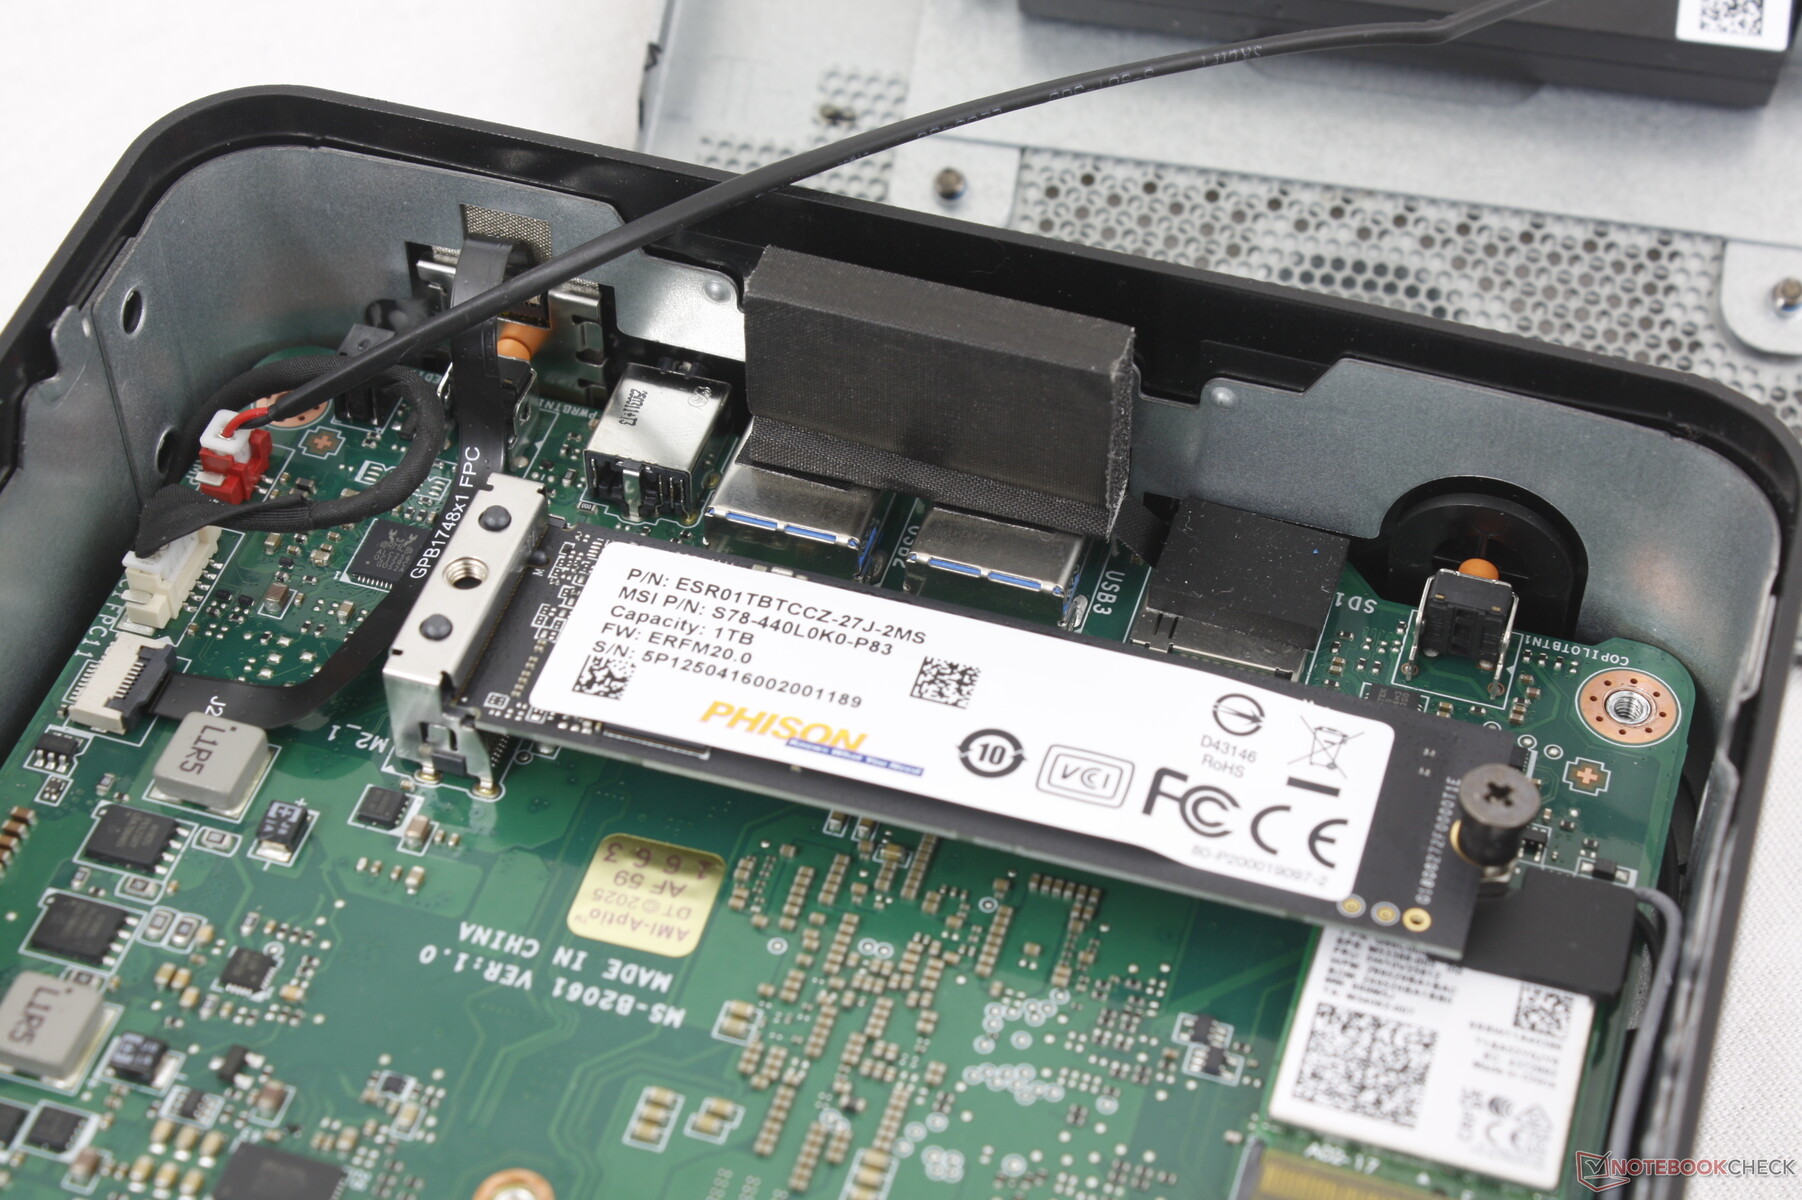
Maintenance
Le panneau inférieur se détache facilement à l'aide d'un simple tournevis Phillips pour un entretien rapide. Malheureusement, seul un SSD M.280 PCIe4 x4 interne est pris en charge, sans RAM amovible. En revanche, la NucBox K12 supporte jusqu'à trois SSD M.2 et deux modules de RAM SODIMM amovibles.

Durabilité
Le châssis est composé de 37,25 % de plastique recyclé après consommation, tandis que l'emballage intérieur est constitué de cartons certifiés FSC fabriqués à partir de pâte de bois provenant de sources durables.
Accessoires et garantie
La boîte comprend un support de montage VESA amovible et un bouton d'alimentation pratique avec cordon de 19 pouces pour allumer le PC s'il est situé dans un endroit difficile d'accès.
Une garantie limitée de trois ans est offerte par le fabricant, contre un an pour la plupart des autres mini-PC aux États-Unis.
Performance
Conditions d'essai
Nous avons réglé MSI Center sur le mode Performance avant d'exécuter les tests ci-dessous.
Processeur
Le Core Ultra 7 258V est presque 50 % plus rapide que l'ancien Core 7 150U du Cubi NUC 1M de l'année dernière en ce qui concerne les performances multithread brutes. Il est également équipé d'un NPU intégré, alors que le NUC 1M n'en avait pas pour le support Co-Pilot+.
En passant au Core Ultra 9 288V Ne devrait pas améliorer les performances de manière significative, tandis que le passage au modèle Core Ultra 5 226V ne réduira les performances que de quelques points de pourcentage.
Cinebench R15 Multi Loop
Cinebench R23: Multi Core | Single Core
Cinebench R20: CPU (Multi Core) | CPU (Single Core)
Cinebench R15: CPU Multi 64Bit | CPU Single 64Bit
Blender: v2.79 BMW27 CPU
7-Zip 18.03: 7z b 4 | 7z b 4 -mmt1
Geekbench 6.5: Multi-Core | Single-Core
Geekbench 5.5: Multi-Core | Single-Core
HWBOT x265 Benchmark v2.2: 4k Preset
LibreOffice : 20 Documents To PDF
R Benchmark 2.5: Overall mean
| CPU Performance rating | |
| Minisforum MS-A1 | |
| Asus NUC 14 Pro+ | |
| Beelink SER9 Pro | |
| Intel NUC 13 Pro Kit NUC13ANK -2! | |
| MSI Cubi NUC AI+ 2MG | |
| Moyenne Intel Core Ultra 7 258V | |
| MSI Cubi NUC 1M | |
| Ninkear M7, (16+512) | |
| GMK NucBox M5 | |
| Asus NUC 14 Essential | |
| BMAX B4 Turbo | |
| Cinebench R23 / Multi Core | |
| Asus NUC 14 Pro+ | |
| Minisforum MS-A1 | |
| Beelink SER9 Pro | |
| Intel NUC 13 Pro Kit NUC13ANK | |
| MSI Cubi NUC AI+ 2MG | |
| Moyenne Intel Core Ultra 7 258V (7920 - 11097, n=21) | |
| MSI Cubi NUC 1M | |
| GMK NucBox M5 | |
| Ninkear M7, (16+512) | |
| Asus NUC 14 Essential | |
| BMAX B4 Turbo | |
| Cinebench R23 / Single Core | |
| MSI Cubi NUC AI+ 2MG | |
| Intel NUC 13 Pro Kit NUC13ANK | |
| MSI Cubi NUC 1M | |
| Moyenne Intel Core Ultra 7 258V (1664 - 1957, n=21) | |
| Minisforum MS-A1 | |
| Asus NUC 14 Pro+ | |
| Beelink SER9 Pro | |
| Ninkear M7, (16+512) | |
| GMK NucBox M5 | |
| Asus NUC 14 Essential | |
| BMAX B4 Turbo | |
| Cinebench R20 / CPU (Multi Core) | |
| Asus NUC 14 Pro+ | |
| Minisforum MS-A1 | |
| Beelink SER9 Pro | |
| Intel NUC 13 Pro Kit NUC13ANK | |
| MSI Cubi NUC AI+ 2MG | |
| Moyenne Intel Core Ultra 7 258V (3130 - 4314, n=21) | |
| Ninkear M7, (16+512) | |
| MSI Cubi NUC 1M | |
| GMK NucBox M5 | |
| Asus NUC 14 Essential | |
| BMAX B4 Turbo | |
| Cinebench R20 / CPU (Single Core) | |
| MSI Cubi NUC AI+ 2MG | |
| Intel NUC 13 Pro Kit NUC13ANK | |
| MSI Cubi NUC 1M | |
| Moyenne Intel Core Ultra 7 258V (643 - 749, n=21) | |
| Minisforum MS-A1 | |
| Asus NUC 14 Pro+ | |
| Beelink SER9 Pro | |
| Ninkear M7, (16+512) | |
| GMK NucBox M5 | |
| Asus NUC 14 Essential | |
| BMAX B4 Turbo | |
| Cinebench R15 / CPU Multi 64Bit | |
| Asus NUC 14 Pro+ | |
| Minisforum MS-A1 | |
| Beelink SER9 Pro | |
| Intel NUC 13 Pro Kit NUC13ANK | |
| Moyenne Intel Core Ultra 7 258V (1280 - 1656, n=21) | |
| MSI Cubi NUC AI+ 2MG | |
| Ninkear M7, (16+512) | |
| GMK NucBox M5 | |
| MSI Cubi NUC 1M | |
| Asus NUC 14 Essential | |
| BMAX B4 Turbo | |
| Cinebench R15 / CPU Single 64Bit | |
| MSI Cubi NUC AI+ 2MG | |
| Minisforum MS-A1 | |
| Moyenne Intel Core Ultra 7 258V (258 - 298, n=21) | |
| Beelink SER9 Pro | |
| Intel NUC 13 Pro Kit NUC13ANK | |
| Asus NUC 14 Pro+ | |
| MSI Cubi NUC 1M | |
| Ninkear M7, (16+512) | |
| GMK NucBox M5 | |
| Asus NUC 14 Essential | |
| BMAX B4 Turbo | |
| Blender / v2.79 BMW27 CPU | |
| BMAX B4 Turbo | |
| Asus NUC 14 Essential | |
| MSI Cubi NUC 1M | |
| Ninkear M7, (16+512) | |
| GMK NucBox M5 | |
| Moyenne Intel Core Ultra 7 258V (315 - 452, n=21) | |
| MSI Cubi NUC AI+ 2MG | |
| Intel NUC 13 Pro Kit NUC13ANK | |
| Beelink SER9 Pro | |
| Minisforum MS-A1 | |
| Asus NUC 14 Pro+ | |
| 7-Zip 18.03 / 7z b 4 | |
| Minisforum MS-A1 | |
| Beelink SER9 Pro | |
| Asus NUC 14 Pro+ | |
| Intel NUC 13 Pro Kit NUC13ANK | |
| Ninkear M7, (16+512) | |
| Moyenne Intel Core Ultra 7 258V (28482 - 36724, n=21) | |
| MSI Cubi NUC AI+ 2MG | |
| GMK NucBox M5 | |
| MSI Cubi NUC 1M | |
| Asus NUC 14 Essential | |
| BMAX B4 Turbo | |
| 7-Zip 18.03 / 7z b 4 -mmt1 | |
| Minisforum MS-A1 | |
| Beelink SER9 Pro | |
| Intel NUC 13 Pro Kit NUC13ANK | |
| MSI Cubi NUC 1M | |
| MSI Cubi NUC AI+ 2MG | |
| Asus NUC 14 Pro+ | |
| Moyenne Intel Core Ultra 7 258V (5265 - 5869, n=21) | |
| Ninkear M7, (16+512) | |
| GMK NucBox M5 | |
| Asus NUC 14 Essential | |
| BMAX B4 Turbo | |
| Geekbench 6.5 / Multi-Core | |
| Asus NUC 14 Pro+ | |
| Minisforum MS-A1 | |
| Beelink SER9 Pro | |
| Moyenne Intel Core Ultra 7 258V (8964 - 11334, n=21) | |
| MSI Cubi NUC AI+ 2MG | |
| MSI Cubi NUC 1M | |
| GMK NucBox M5 | |
| Ninkear M7, (16+512) | |
| Asus NUC 14 Essential | |
| BMAX B4 Turbo | |
| Geekbench 6.5 / Single-Core | |
| MSI Cubi NUC AI+ 2MG | |
| Moyenne Intel Core Ultra 7 258V (2593 - 2795, n=21) | |
| Minisforum MS-A1 | |
| MSI Cubi NUC 1M | |
| Beelink SER9 Pro | |
| Asus NUC 14 Pro+ | |
| Ninkear M7, (16+512) | |
| GMK NucBox M5 | |
| Asus NUC 14 Essential | |
| BMAX B4 Turbo | |
| Geekbench 5.5 / Multi-Core | |
| Asus NUC 14 Pro+ | |
| Minisforum MS-A1 | |
| Beelink SER9 Pro | |
| Intel NUC 13 Pro Kit NUC13ANK | |
| Moyenne Intel Core Ultra 7 258V (7574 - 9864, n=21) | |
| MSI Cubi NUC 1M | |
| MSI Cubi NUC AI+ 2MG | |
| GMK NucBox M5 | |
| Ninkear M7, (16+512) | |
| Asus NUC 14 Essential | |
| BMAX B4 Turbo | |
| Geekbench 5.5 / Single-Core | |
| MSI Cubi NUC AI+ 2MG | |
| Minisforum MS-A1 | |
| Moyenne Intel Core Ultra 7 258V (1891 - 2046, n=21) | |
| MSI Cubi NUC 1M | |
| Intel NUC 13 Pro Kit NUC13ANK | |
| Beelink SER9 Pro | |
| Asus NUC 14 Pro+ | |
| Ninkear M7, (16+512) | |
| GMK NucBox M5 | |
| Asus NUC 14 Essential | |
| BMAX B4 Turbo | |
| HWBOT x265 Benchmark v2.2 / 4k Preset | |
| Minisforum MS-A1 | |
| Beelink SER9 Pro | |
| Asus NUC 14 Pro+ | |
| Intel NUC 13 Pro Kit NUC13ANK | |
| MSI Cubi NUC AI+ 2MG | |
| Moyenne Intel Core Ultra 7 258V (9.65 - 14.2, n=21) | |
| MSI Cubi NUC 1M | |
| Ninkear M7, (16+512) | |
| GMK NucBox M5 | |
| Asus NUC 14 Essential | |
| BMAX B4 Turbo | |
| LibreOffice / 20 Documents To PDF | |
| Asus NUC 14 Essential | |
| BMAX B4 Turbo | |
| Ninkear M7, (16+512) | |
| GMK NucBox M5 | |
| Asus NUC 14 Pro+ | |
| Beelink SER9 Pro | |
| Moyenne Intel Core Ultra 7 258V (41.1 - 59.3, n=21) | |
| Minisforum MS-A1 | |
| MSI Cubi NUC AI+ 2MG | |
| Intel NUC 13 Pro Kit NUC13ANK | |
| MSI Cubi NUC 1M | |
| R Benchmark 2.5 / Overall mean | |
| BMAX B4 Turbo | |
| Asus NUC 14 Essential | |
| Ninkear M7, (16+512) | |
| GMK NucBox M5 | |
| Beelink SER9 Pro | |
| Moyenne Intel Core Ultra 7 258V (0.443 - 0.4852, n=21) | |
| MSI Cubi NUC AI+ 2MG | |
| Asus NUC 14 Pro+ | |
| Intel NUC 13 Pro Kit NUC13ANK | |
| MSI Cubi NUC 1M | |
| Minisforum MS-A1 | |
* ... Moindre est la valeur, meilleures sont les performances
AIDA64: FP32 Ray-Trace | FPU Julia | CPU SHA3 | CPU Queen | FPU SinJulia | FPU Mandel | CPU AES | CPU ZLib | FP64 Ray-Trace | CPU PhotoWorxx
| Performance rating | |
| Minisforum MS-A1 | |
| Beelink SER9 Pro | |
| GMK NucBox K12 | |
| MSI Cubi NUC AI+ 2MG | |
| Moyenne Intel Core Ultra 7 258V | |
| Ninkear M7, (16+512) | |
| MSI Cubi NUC 1M | |
| AIDA64 / FP32 Ray-Trace | |
| Minisforum MS-A1 | |
| Beelink SER9 Pro | |
| GMK NucBox K12 | |
| MSI Cubi NUC AI+ 2MG | |
| Moyenne Intel Core Ultra 7 258V (8454 - 12781, n=21) | |
| Ninkear M7, (16+512) | |
| MSI Cubi NUC 1M | |
| AIDA64 / FPU Julia | |
| Minisforum MS-A1 | |
| Beelink SER9 Pro | |
| GMK NucBox K12 | |
| MSI Cubi NUC AI+ 2MG | |
| Moyenne Intel Core Ultra 7 258V (40875 - 63401, n=21) | |
| Ninkear M7, (16+512) | |
| MSI Cubi NUC 1M | |
| AIDA64 / CPU SHA3 | |
| Minisforum MS-A1 | |
| Beelink SER9 Pro | |
| GMK NucBox K12 | |
| MSI Cubi NUC AI+ 2MG | |
| Moyenne Intel Core Ultra 7 258V (1930 - 2817, n=21) | |
| Ninkear M7, (16+512) | |
| MSI Cubi NUC 1M | |
| AIDA64 / CPU Queen | |
| Minisforum MS-A1 | |
| Beelink SER9 Pro | |
| GMK NucBox K12 | |
| Ninkear M7, (16+512) | |
| MSI Cubi NUC 1M | |
| Moyenne Intel Core Ultra 7 258V (49084 - 49818, n=21) | |
| MSI Cubi NUC AI+ 2MG | |
| AIDA64 / FPU SinJulia | |
| Minisforum MS-A1 | |
| Beelink SER9 Pro | |
| GMK NucBox K12 | |
| Ninkear M7, (16+512) | |
| MSI Cubi NUC AI+ 2MG | |
| MSI Cubi NUC 1M | |
| Moyenne Intel Core Ultra 7 258V (3817 - 4440, n=21) | |
| AIDA64 / FPU Mandel | |
| Minisforum MS-A1 | |
| Beelink SER9 Pro | |
| GMK NucBox K12 | |
| MSI Cubi NUC AI+ 2MG | |
| Moyenne Intel Core Ultra 7 258V (21670 - 33565, n=21) | |
| Ninkear M7, (16+512) | |
| MSI Cubi NUC 1M | |
| AIDA64 / CPU AES | |
| Minisforum MS-A1 | |
| Beelink SER9 Pro | |
| GMK NucBox K12 | |
| MSI Cubi NUC AI+ 2MG | |
| Moyenne Intel Core Ultra 7 258V (30957 - 40753, n=21) | |
| Ninkear M7, (16+512) | |
| MSI Cubi NUC 1M | |
| AIDA64 / CPU ZLib | |
| Minisforum MS-A1 | |
| Beelink SER9 Pro | |
| GMK NucBox K12 | |
| MSI Cubi NUC AI+ 2MG | |
| Moyenne Intel Core Ultra 7 258V (422 - 632, n=21) | |
| MSI Cubi NUC 1M | |
| Ninkear M7, (16+512) | |
| AIDA64 / FP64 Ray-Trace | |
| Minisforum MS-A1 | |
| Beelink SER9 Pro | |
| GMK NucBox K12 | |
| MSI Cubi NUC AI+ 2MG | |
| Moyenne Intel Core Ultra 7 258V (4258 - 6930, n=21) | |
| Ninkear M7, (16+512) | |
| MSI Cubi NUC 1M | |
| AIDA64 / CPU PhotoWorxx | |
| MSI Cubi NUC AI+ 2MG | |
| Moyenne Intel Core Ultra 7 258V (44223 - 54971, n=21) | |
| Beelink SER9 Pro | |
| Minisforum MS-A1 | |
| GMK NucBox K12 | |
| MSI Cubi NUC 1M | |
| Ninkear M7, (16+512) | |
Test de stress
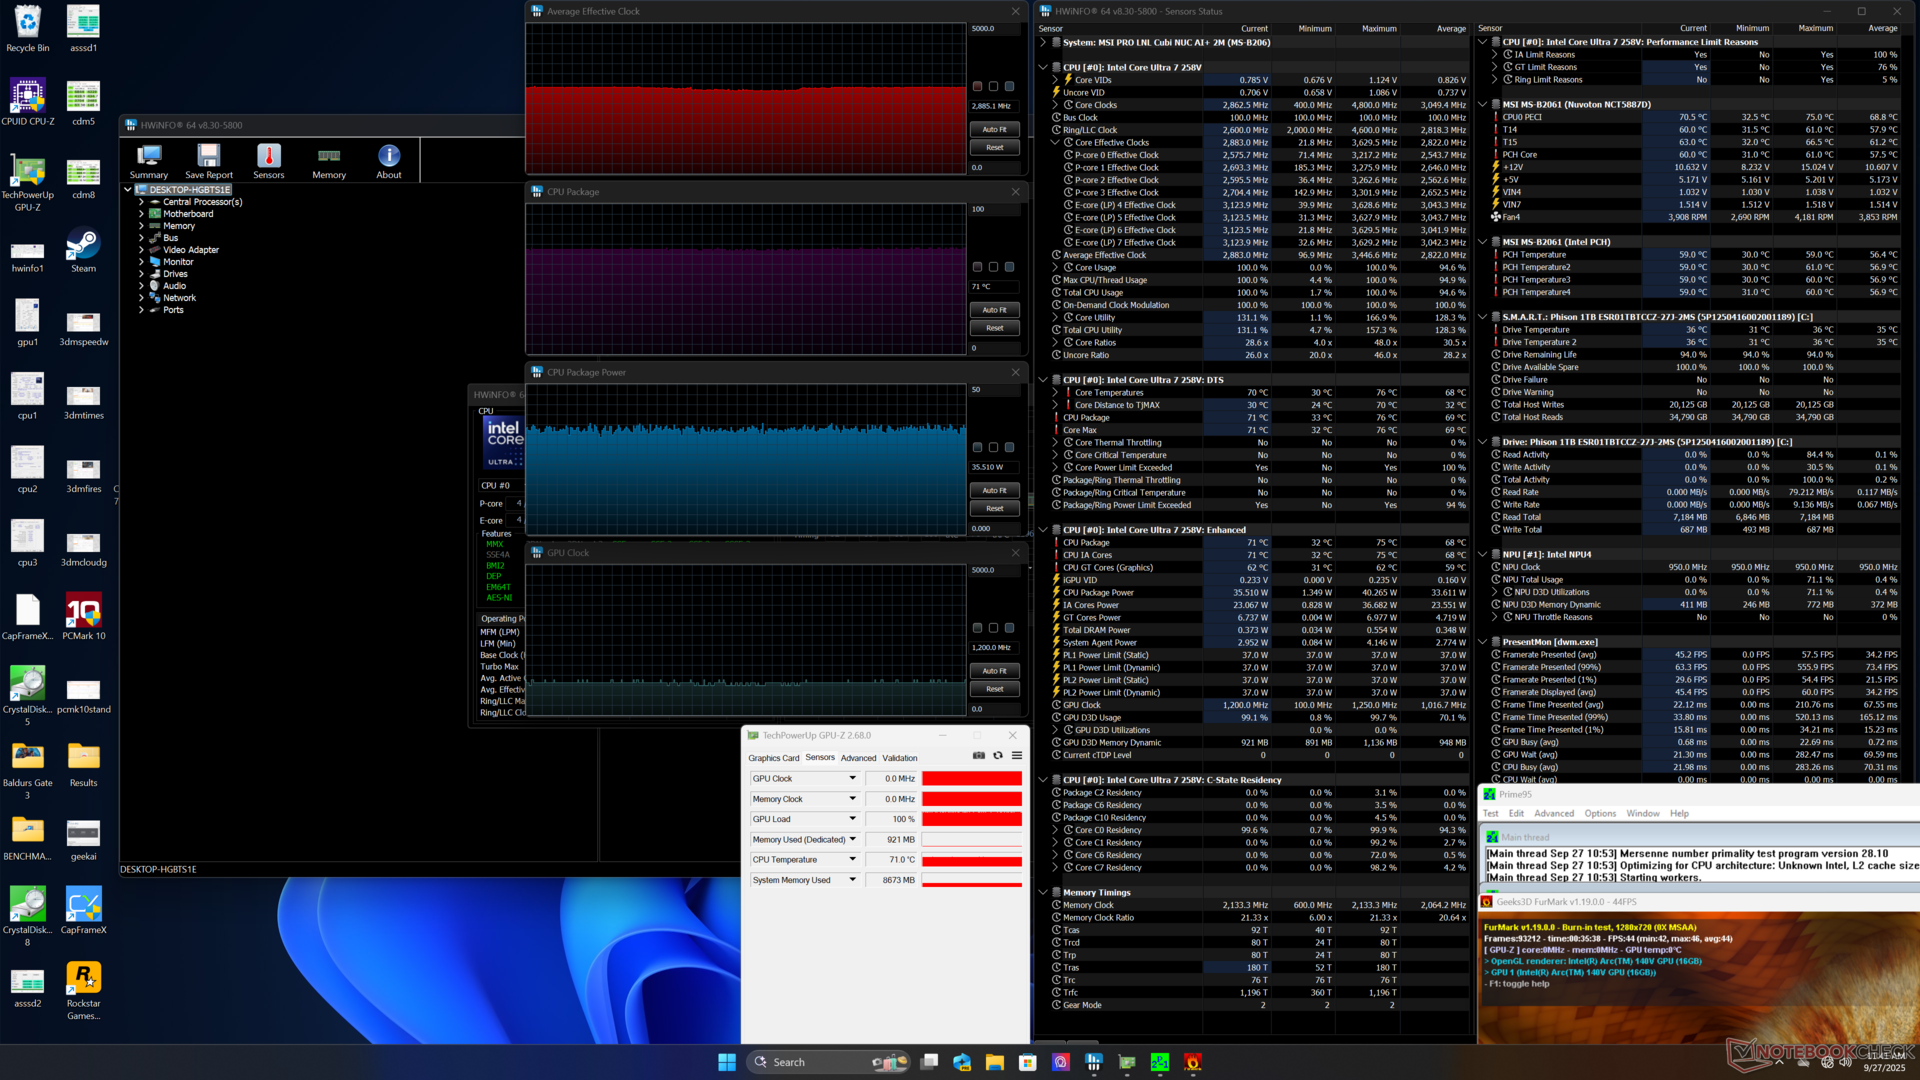
Le CPU s'est stabilisé à 3,2 GHz, 66 C et environ 38 W lors de l'exécution du stress Prime95. Cependant, lors de l'exécution de Cyberpunk 2077 pour représenter un stress de jeu typique, les fréquences d'horloge du GPU oscillent entre 800 MHz et 1950 MHz, ce qui entraîne des temps d'images instables lors des jeux, comme le montre notre section sur les performances du GPU ci-dessous, même si le taux d'images moyen est normal. Ce comportement de bégaiement se produit aussi bien en mode équilibré qu'en mode performance.
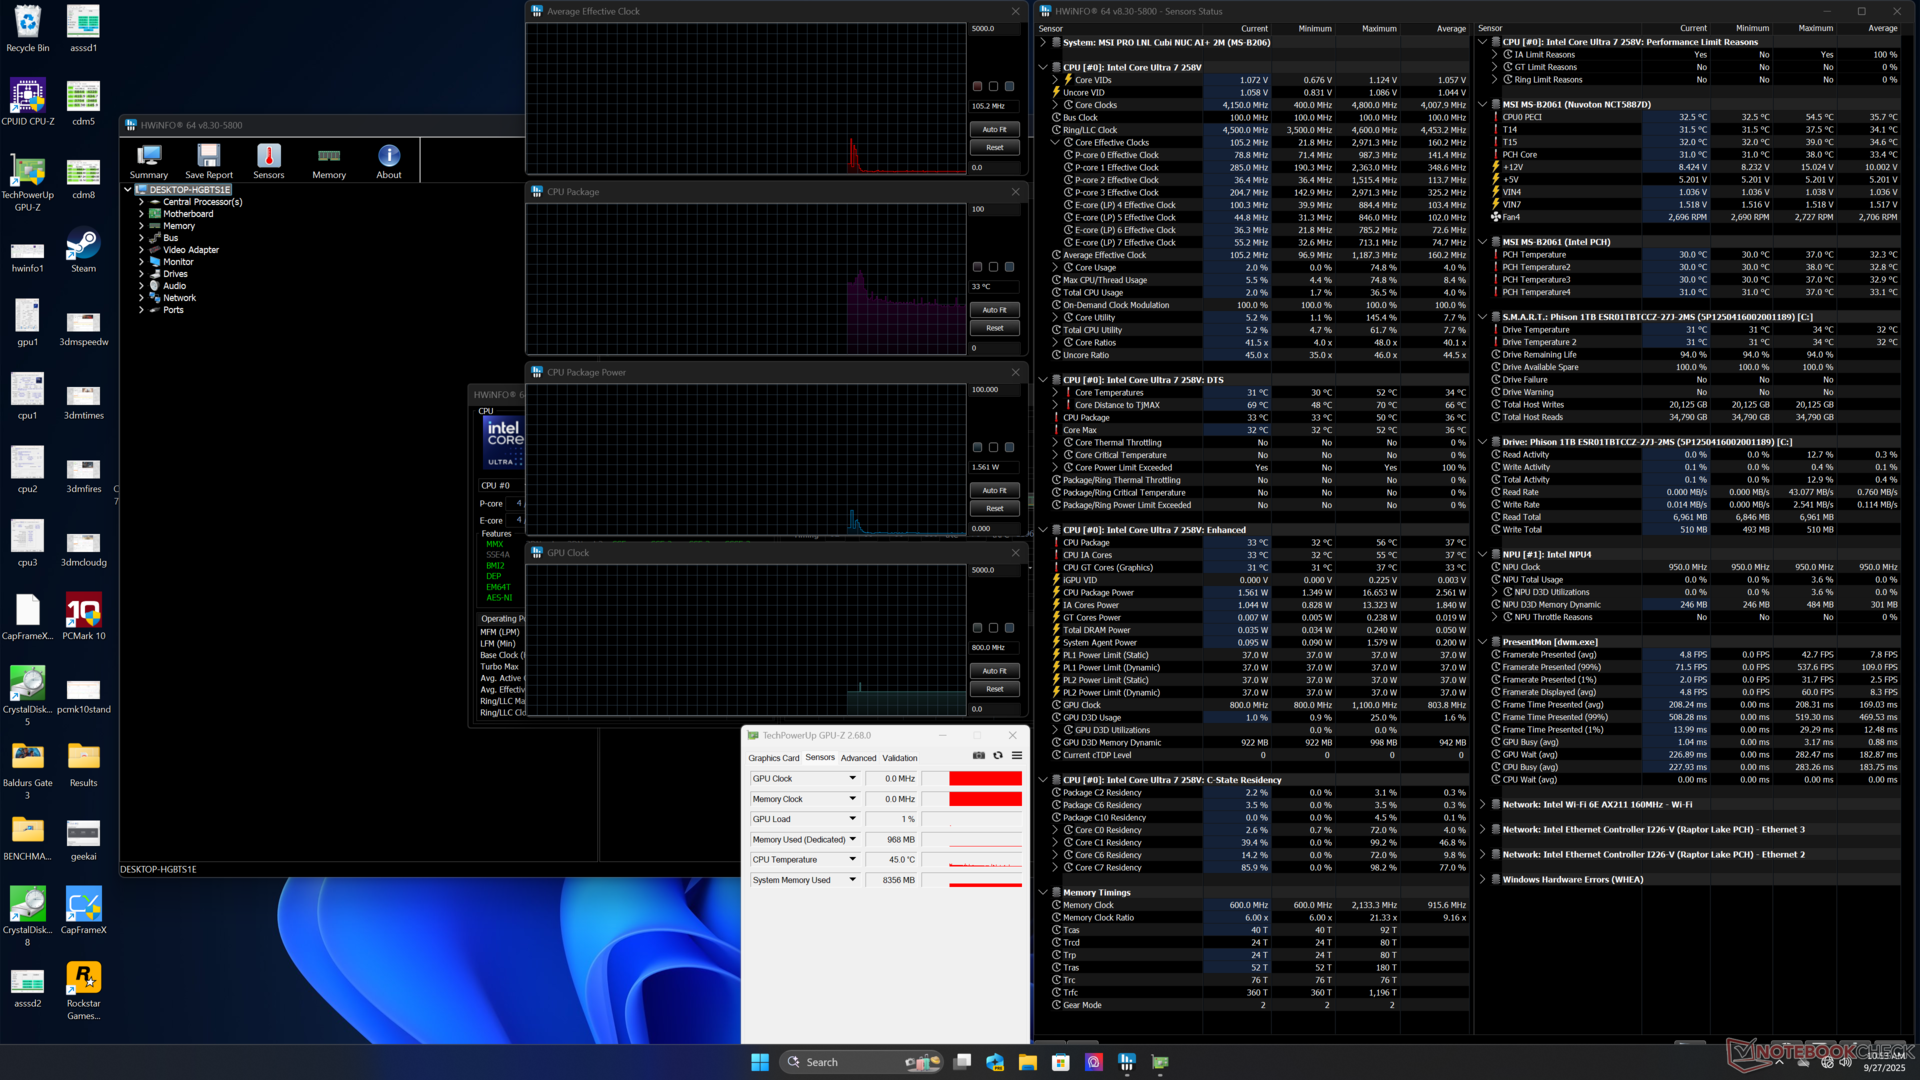
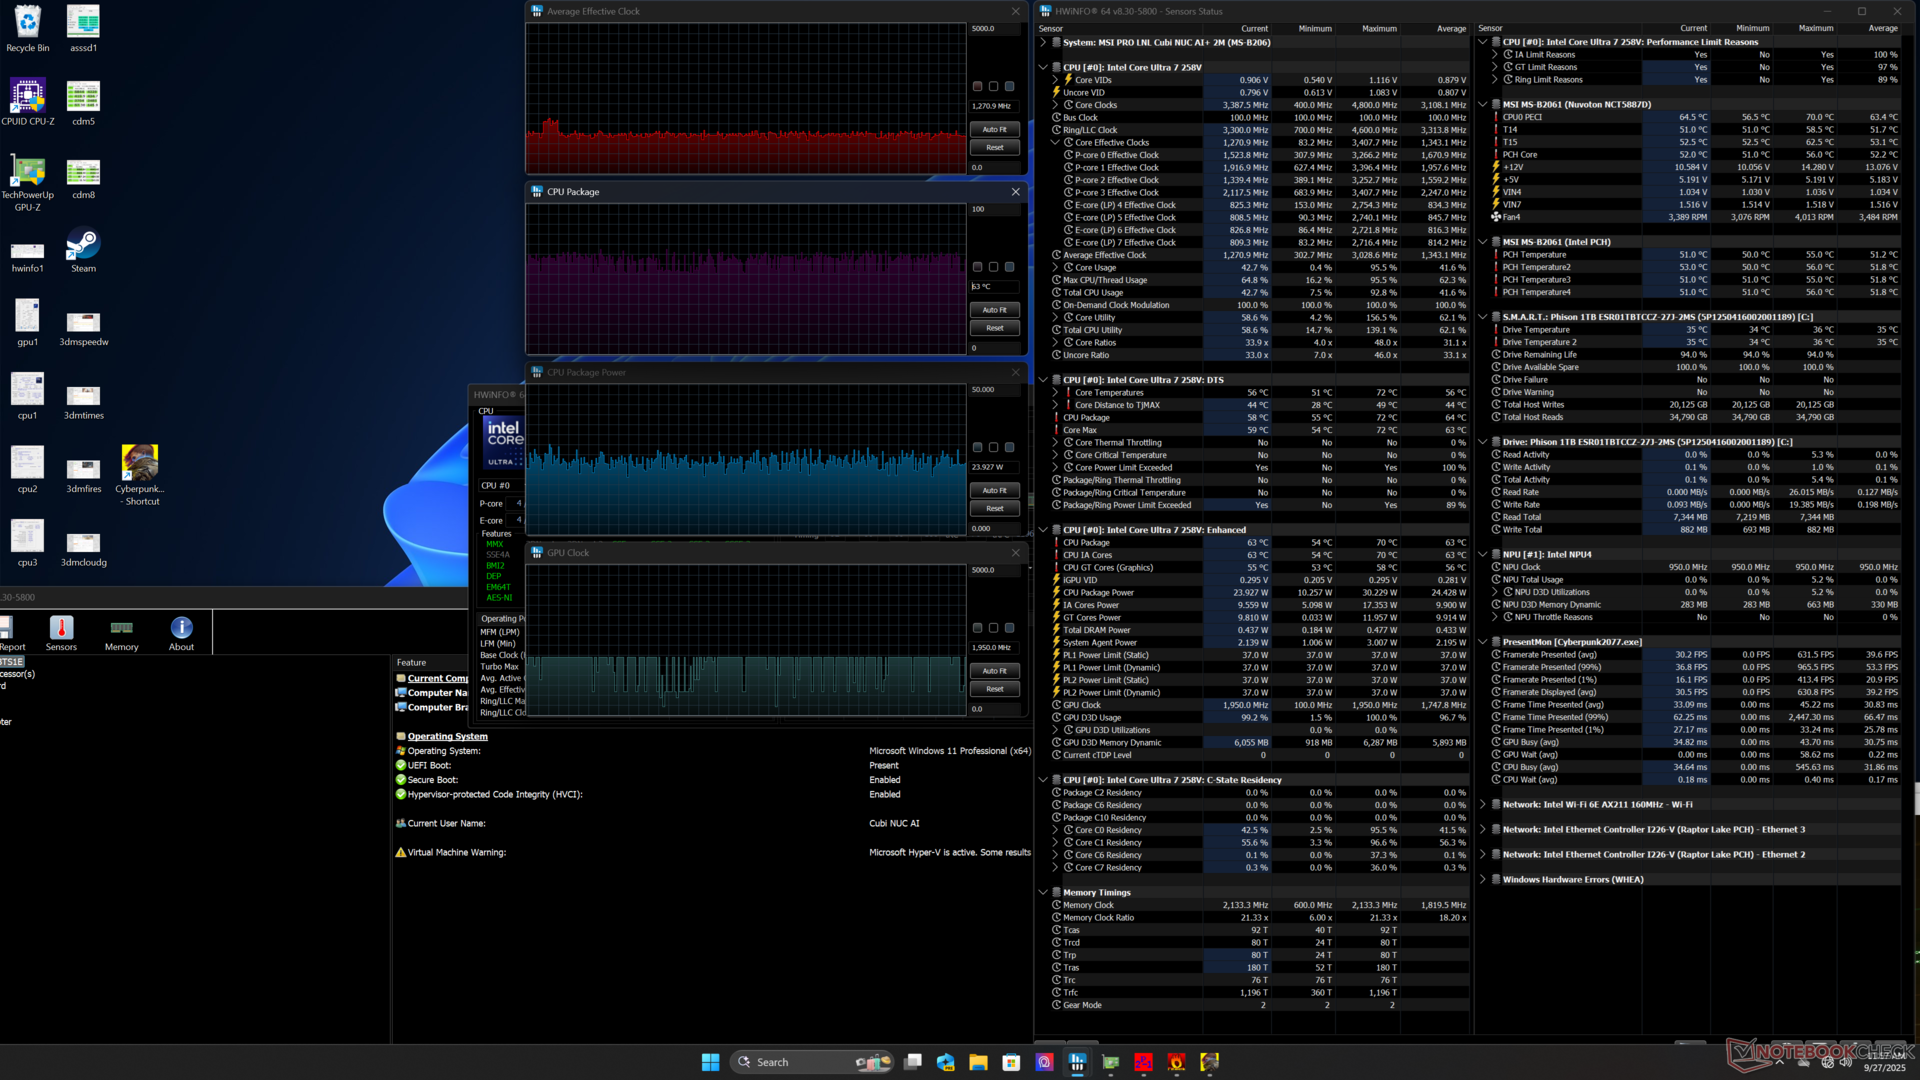
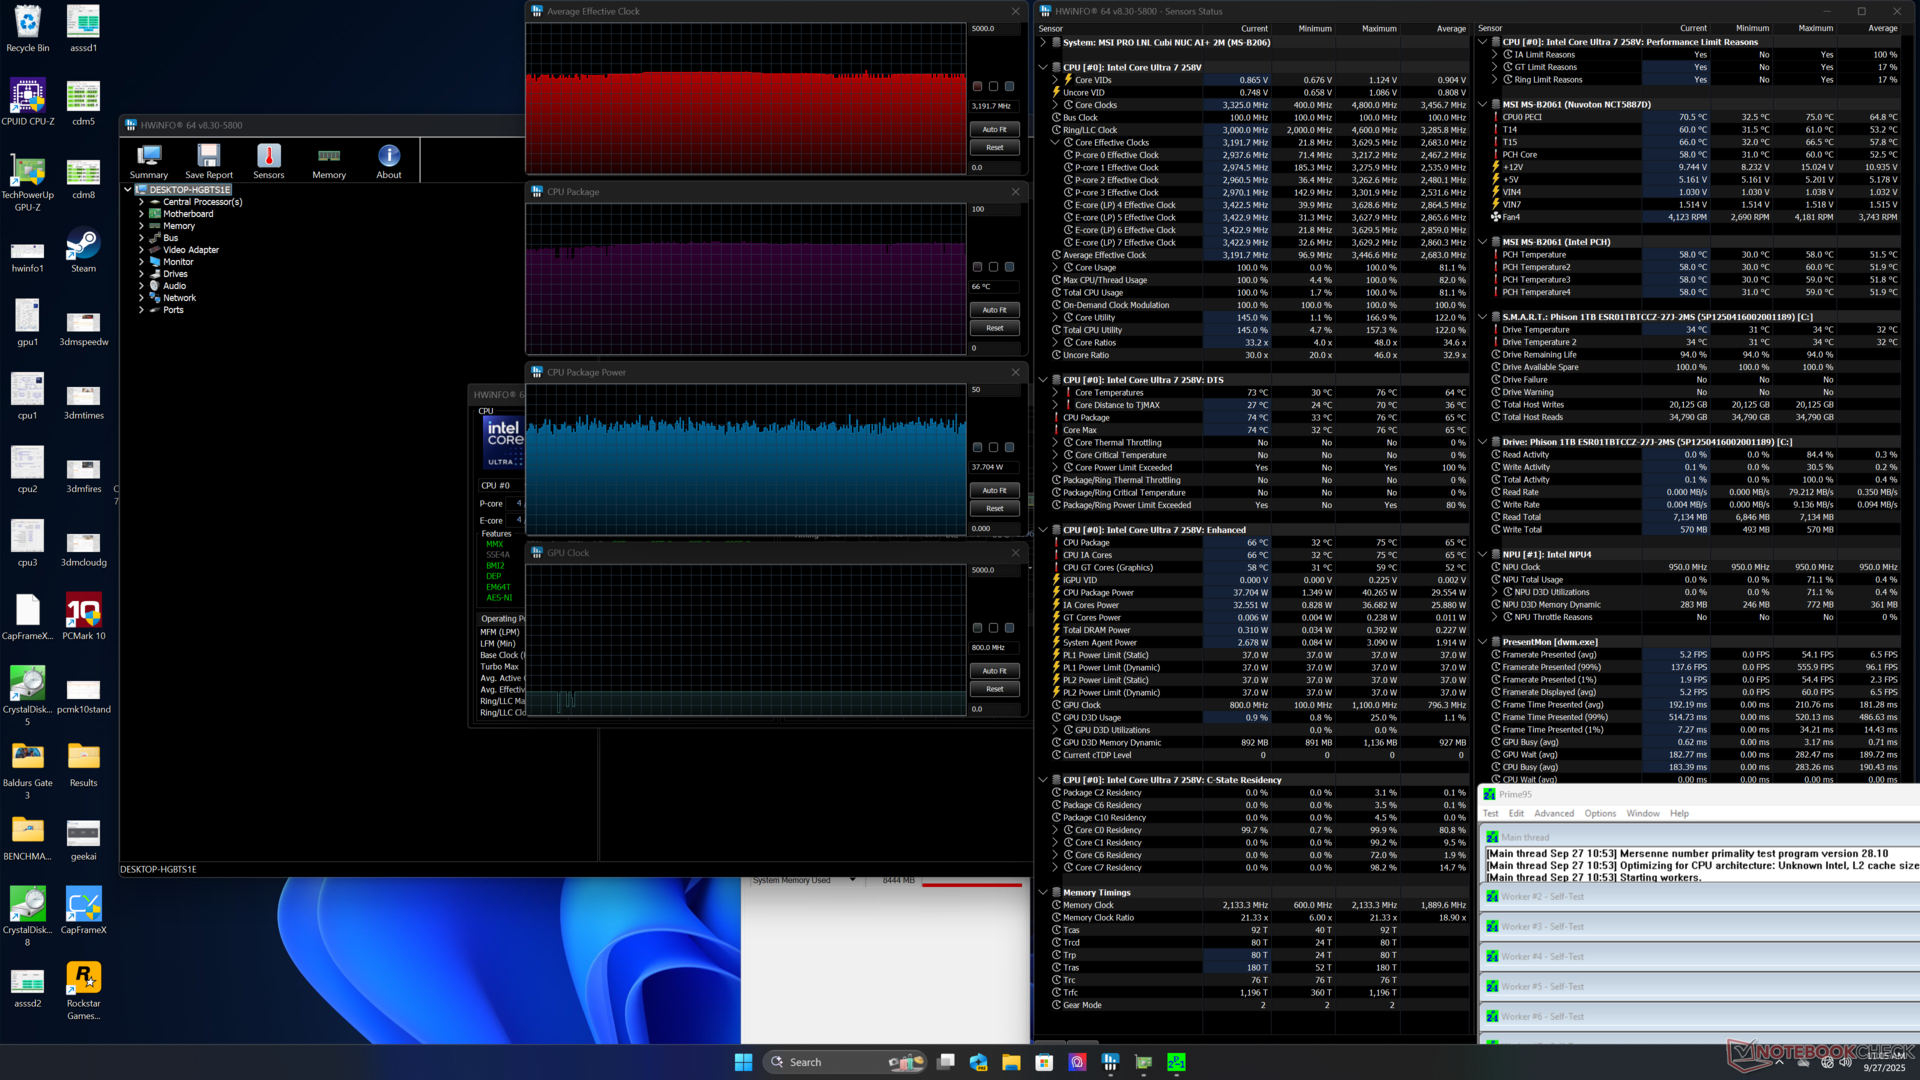
| Horloge moyenne du CPU (GHz) | Horloge du GPU (MHz) | Température moyenne du CPU (°C) | |
| Système au repos | -- | -- | 33 |
| Prime95 Stress | 3.2 | -- | 66 |
| Prime95 + FurMark Stress | 2.9 | 1200 | 71 |
| Cyberpunk 2077 Stress | 1.3 | 800 - 1950 | 63 |
Performance du système
PCMark 10: Score | Essentials | Productivity | Digital Content Creation
CrossMark: Overall | Productivity | Creativity | Responsiveness
WebXPRT 3: Overall
WebXPRT 4: Overall
Mozilla Kraken 1.1: Total
| Performance rating | |
| Minisforum MS-A1 | |
| Beelink SER9 Pro | |
| GMK NucBox K12 | |
| Moyenne Intel Core Ultra 7 258V, Intel Arc Graphics 140V | |
| MSI Cubi NUC 1M | |
| MSI Cubi NUC AI+ 2MG | |
| Ninkear M7, (16+512) | |
| PCMark 10 / Score | |
| Minisforum MS-A1 | |
| GMK NucBox K12 | |
| Moyenne Intel Core Ultra 7 258V, Intel Arc Graphics 140V (6265 - 7314, n=20) | |
| Beelink SER9 Pro | |
| MSI Cubi NUC AI+ 2MG | |
| MSI Cubi NUC 1M | |
| Ninkear M7, (16+512) | |
| PCMark 10 / Essentials | |
| Minisforum MS-A1 | |
| MSI Cubi NUC 1M | |
| GMK NucBox K12 | |
| Moyenne Intel Core Ultra 7 258V, Intel Arc Graphics 140V (9295 - 11467, n=20) | |
| Beelink SER9 Pro | |
| MSI Cubi NUC AI+ 2MG | |
| Ninkear M7, (16+512) | |
| PCMark 10 / Productivity | |
| Minisforum MS-A1 | |
| GMK NucBox K12 | |
| Beelink SER9 Pro | |
| Moyenne Intel Core Ultra 7 258V, Intel Arc Graphics 140V (7357 - 9619, n=20) | |
| MSI Cubi NUC AI+ 2MG | |
| Ninkear M7, (16+512) | |
| MSI Cubi NUC 1M | |
| PCMark 10 / Digital Content Creation | |
| Minisforum MS-A1 | |
| Moyenne Intel Core Ultra 7 258V, Intel Arc Graphics 140V (8914 - 10216, n=20) | |
| MSI Cubi NUC AI+ 2MG | |
| Beelink SER9 Pro | |
| GMK NucBox K12 | |
| MSI Cubi NUC 1M | |
| Ninkear M7, (16+512) | |
| CrossMark / Overall | |
| Minisforum MS-A1 | |
| Beelink SER9 Pro | |
| GMK NucBox K12 | |
| MSI Cubi NUC 1M | |
| Moyenne Intel Core Ultra 7 258V, Intel Arc Graphics 140V (1551 - 1742, n=19) | |
| MSI Cubi NUC AI+ 2MG | |
| Ninkear M7, (16+512) | |
| CrossMark / Productivity | |
| Minisforum MS-A1 | |
| MSI Cubi NUC 1M | |
| Beelink SER9 Pro | |
| GMK NucBox K12 | |
| Moyenne Intel Core Ultra 7 258V, Intel Arc Graphics 140V (1479 - 1684, n=19) | |
| MSI Cubi NUC AI+ 2MG | |
| Ninkear M7, (16+512) | |
| CrossMark / Creativity | |
| Minisforum MS-A1 | |
| Moyenne Intel Core Ultra 7 258V, Intel Arc Graphics 140V (1727 - 1977, n=19) | |
| Beelink SER9 Pro | |
| GMK NucBox K12 | |
| MSI Cubi NUC AI+ 2MG | |
| MSI Cubi NUC 1M | |
| Ninkear M7, (16+512) | |
| CrossMark / Responsiveness | |
| MSI Cubi NUC 1M | |
| Beelink SER9 Pro | |
| Minisforum MS-A1 | |
| GMK NucBox K12 | |
| Moyenne Intel Core Ultra 7 258V, Intel Arc Graphics 140V (1246 - 1411, n=19) | |
| MSI Cubi NUC AI+ 2MG | |
| Ninkear M7, (16+512) | |
| WebXPRT 3 / Overall | |
| Minisforum MS-A1 | |
| MSI Cubi NUC AI+ 2MG | |
| MSI Cubi NUC 1M | |
| Beelink SER9 Pro | |
| GMK NucBox K12 | |
| Moyenne Intel Core Ultra 7 258V, Intel Arc Graphics 140V (219 - 317, n=19) | |
| Ninkear M7, (16+512) | |
| WebXPRT 4 / Overall | |
| MSI Cubi NUC AI+ 2MG | |
| Minisforum MS-A1 | |
| MSI Cubi NUC 1M | |
| Moyenne Intel Core Ultra 7 258V, Intel Arc Graphics 140V (199.5 - 291, n=19) | |
| Beelink SER9 Pro | |
| GMK NucBox K12 | |
| Ninkear M7, (16+512) | |
| Mozilla Kraken 1.1 / Total | |
| Ninkear M7, (16+512) | |
| GMK NucBox K12 | |
| Beelink SER9 Pro | |
| MSI Cubi NUC 1M | |
| Minisforum MS-A1 | |
| Moyenne Intel Core Ultra 7 258V, Intel Arc Graphics 140V (468 - 559, n=21) | |
| MSI Cubi NUC AI+ 2MG | |
* ... Moindre est la valeur, meilleures sont les performances
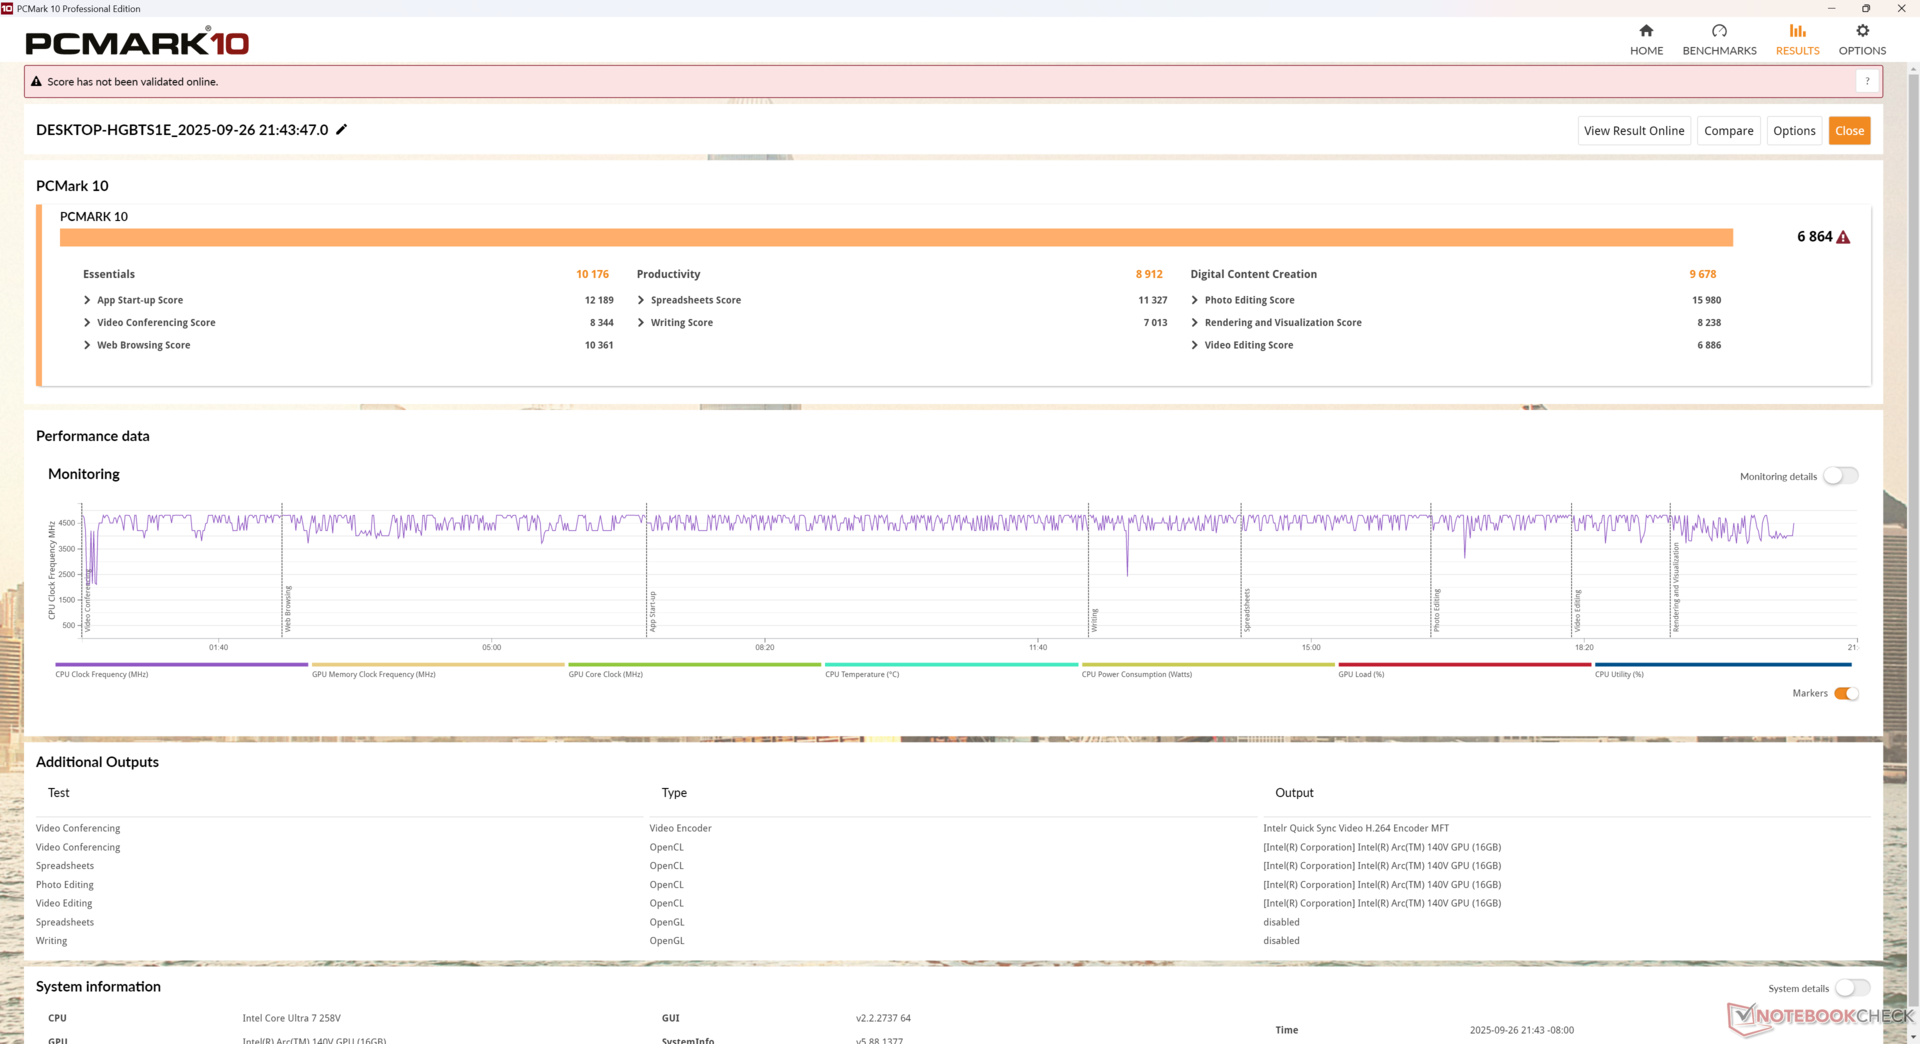
| PCMark 10 Score | 6864 points | |
Aide | ||
| AIDA64 / Memory Copy | |
| Moyenne Intel Core Ultra 7 258V (104408 - 114336, n=21) | |
| MSI Cubi NUC AI+ 2MG | |
| Beelink SER9 Pro | |
| GMK NucBox K12 | |
| Minisforum MS-A1 | |
| MSI Cubi NUC 1M | |
| Ninkear M7, (16+512) | |
| AIDA64 / Memory Read | |
| MSI Cubi NUC AI+ 2MG | |
| Moyenne Intel Core Ultra 7 258V (82846 - 89417, n=21) | |
| MSI Cubi NUC 1M | |
| Minisforum MS-A1 | |
| GMK NucBox K12 | |
| Beelink SER9 Pro | |
| Ninkear M7, (16+512) | |
| AIDA64 / Memory Write | |
| MSI Cubi NUC AI+ 2MG | |
| Moyenne Intel Core Ultra 7 258V (108842 - 117935, n=21) | |
| Beelink SER9 Pro | |
| GMK NucBox K12 | |
| Minisforum MS-A1 | |
| MSI Cubi NUC 1M | |
| Ninkear M7, (16+512) | |
| AIDA64 / Memory Latency | |
| Beelink SER9 Pro | |
| Moyenne Intel Core Ultra 7 258V (95 - 101.1, n=21) | |
| MSI Cubi NUC AI+ 2MG | |
| Ninkear M7, (16+512) | |
| GMK NucBox K12 | |
| Minisforum MS-A1 | |
| MSI Cubi NUC 1M | |
* ... Moindre est la valeur, meilleures sont les performances
Latence DPC
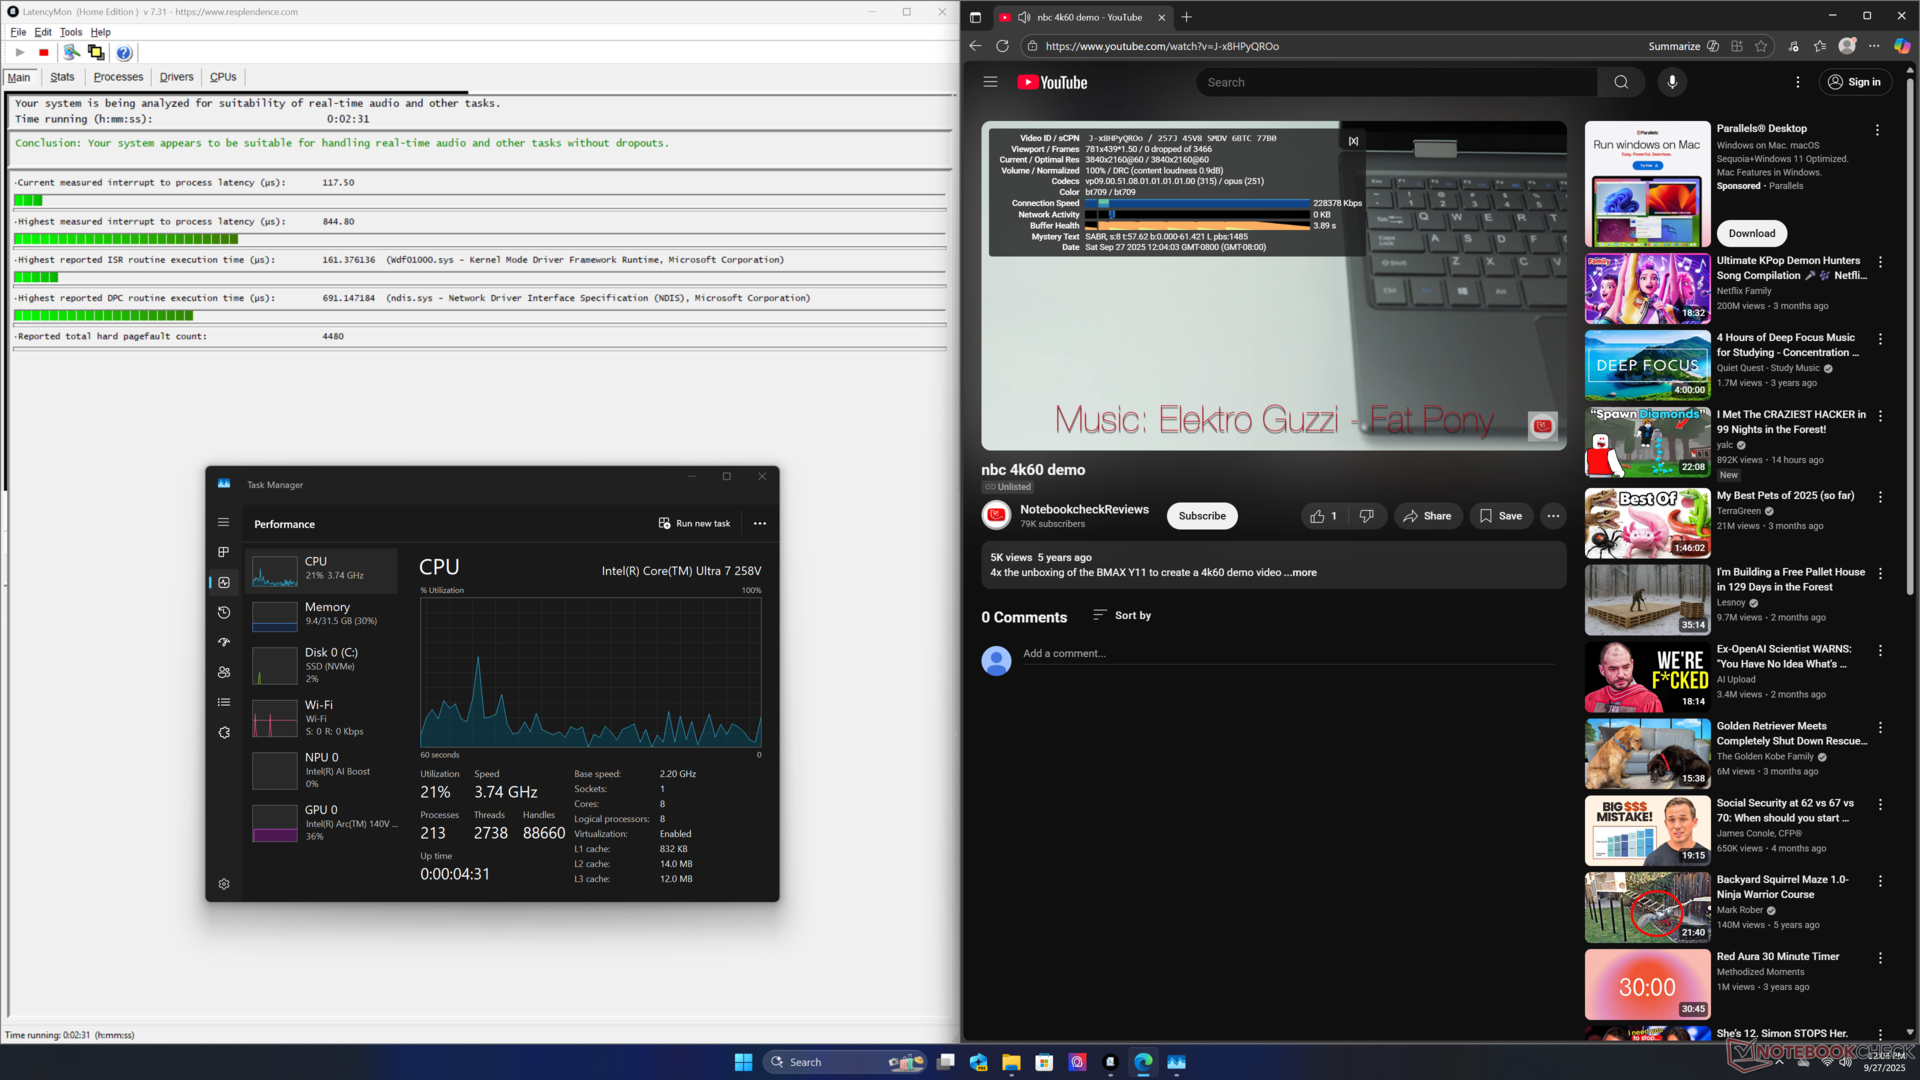
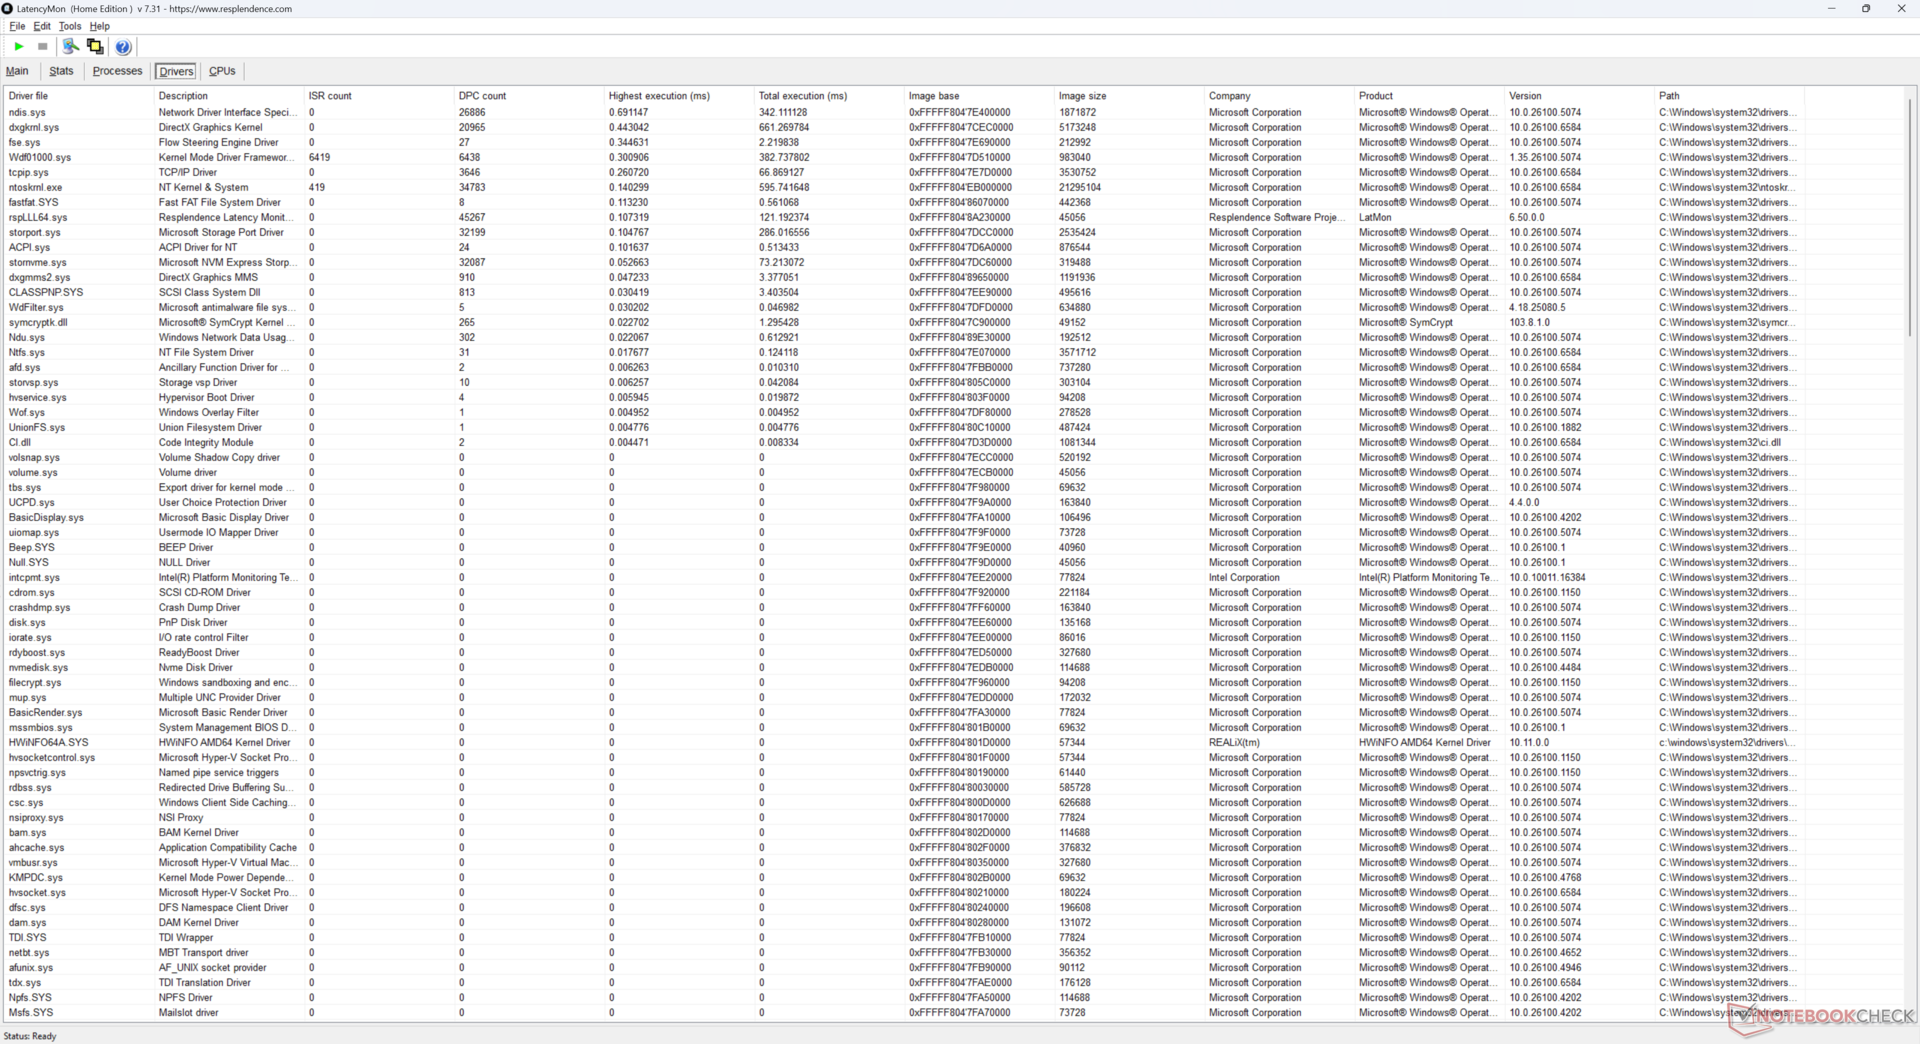
| DPC Latencies / LatencyMon - interrupt to process latency (max), Web, Youtube, Prime95 | |
| MSI Cubi NUC 1M | |
| Minisforum MS-A1 | |
| GMK NucBox K12 | |
| MSI Cubi NUC AI+ 2MG | |
| Beelink SER9 Pro | |
* ... Moindre est la valeur, meilleures sont les performances
Dispositifs de stockage
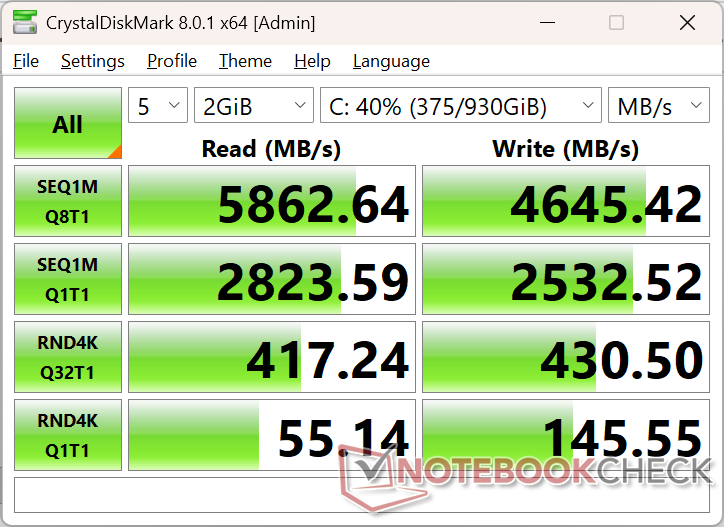
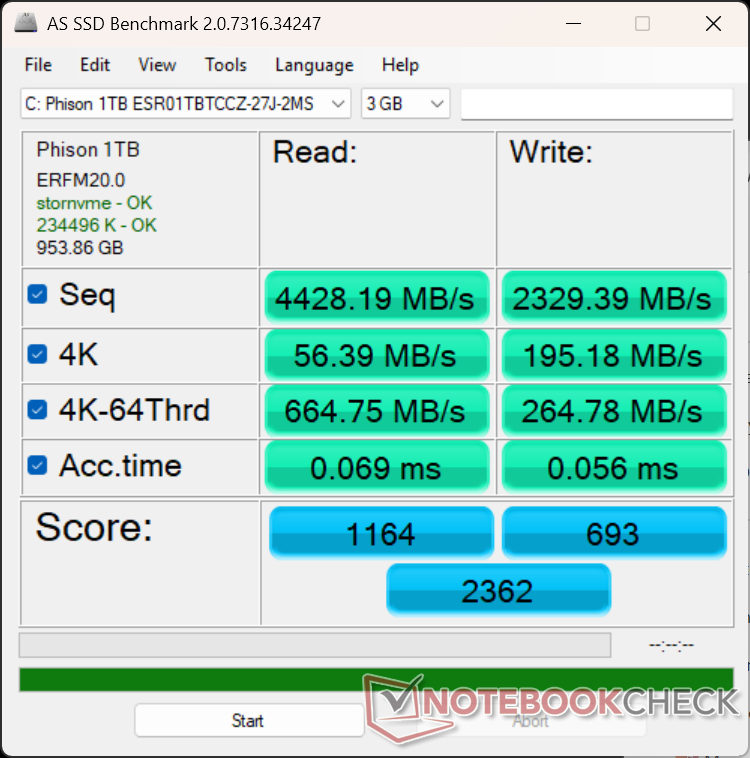
Taux de transfert des disques SSD avec le phison primaire de 1 To sont stables à près de 5900 Mo/s même en cas de stress prolongé, ce qui représente une légère amélioration par rapport au SSD WD dans le Cubi 1M original.

| Drive Performance rating - Percent | |
| Minisforum MS-A1 | |
| MSI Cubi NUC 1M | |
| Beelink SER9 Pro | |
| MSI Cubi NUC AI+ 2MG | |
| GMK NucBox K12 | |
| Ninkear M7, (16+512) | |
* ... Moindre est la valeur, meilleures sont les performances
Throttoir de disque : Boucle de lecture DiskSpd, profondeur de la file d'attente 8
Performance du GPU
L'Arc Arc 140V dans le Cubi 2MG a des performances inférieures à la moyenne d'environ 35 % selon les benchmarks 3DMark. Ces résultats décevants sont dus à la fréquence d'horloge du GPU et aux bégaiements, comme nous l'avons mentionné dans la section Test de stress ci-dessus.
Dans les charges de travail GPU où la stabilité de la fréquence d'images n'a pas d'importance, comme avec les moteurs de rendu ou oneAPI, le Cubi 2MG se comporte comme prévu par rapport à d'autres PC avec le même CPU et le même GPU. Les bégaiements ne devraient donc pas poser de problème à la plupart des professionnels ciblés.
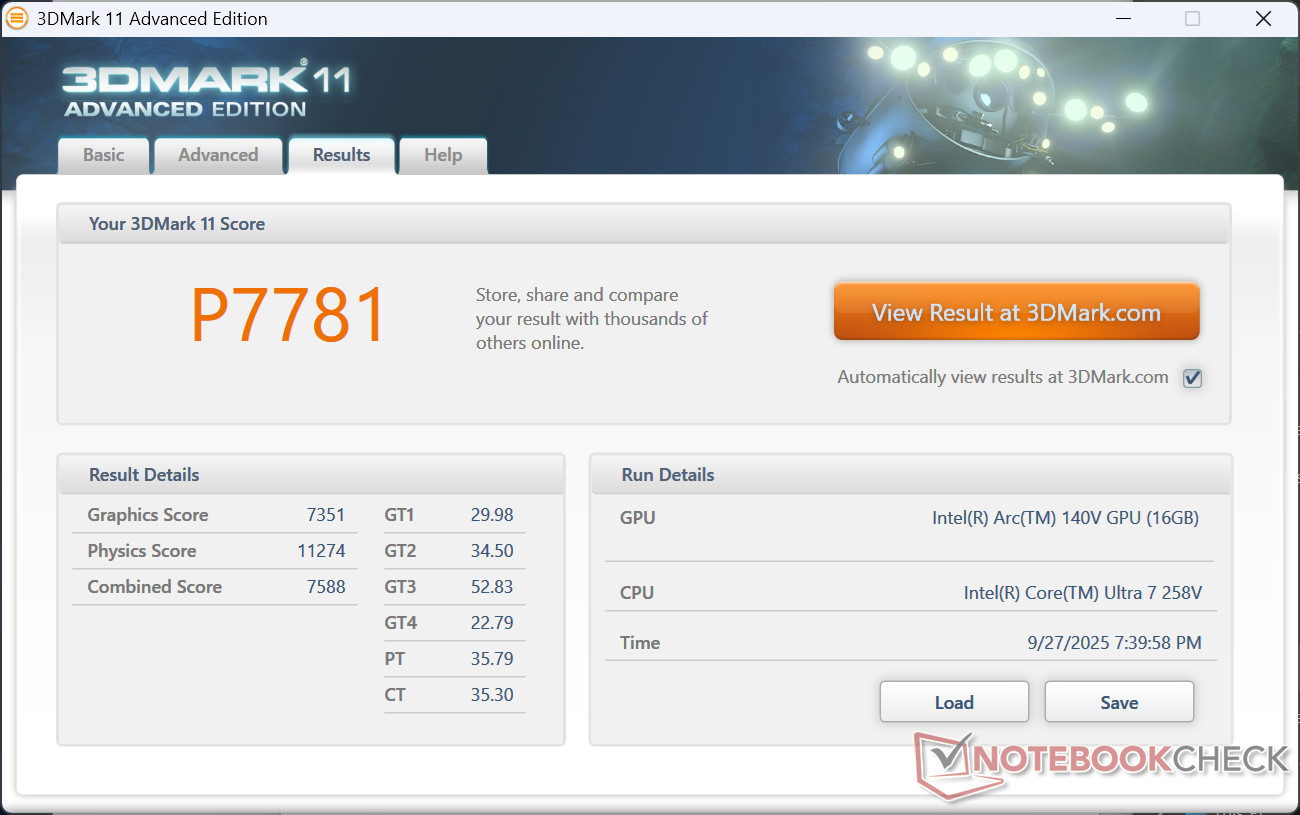
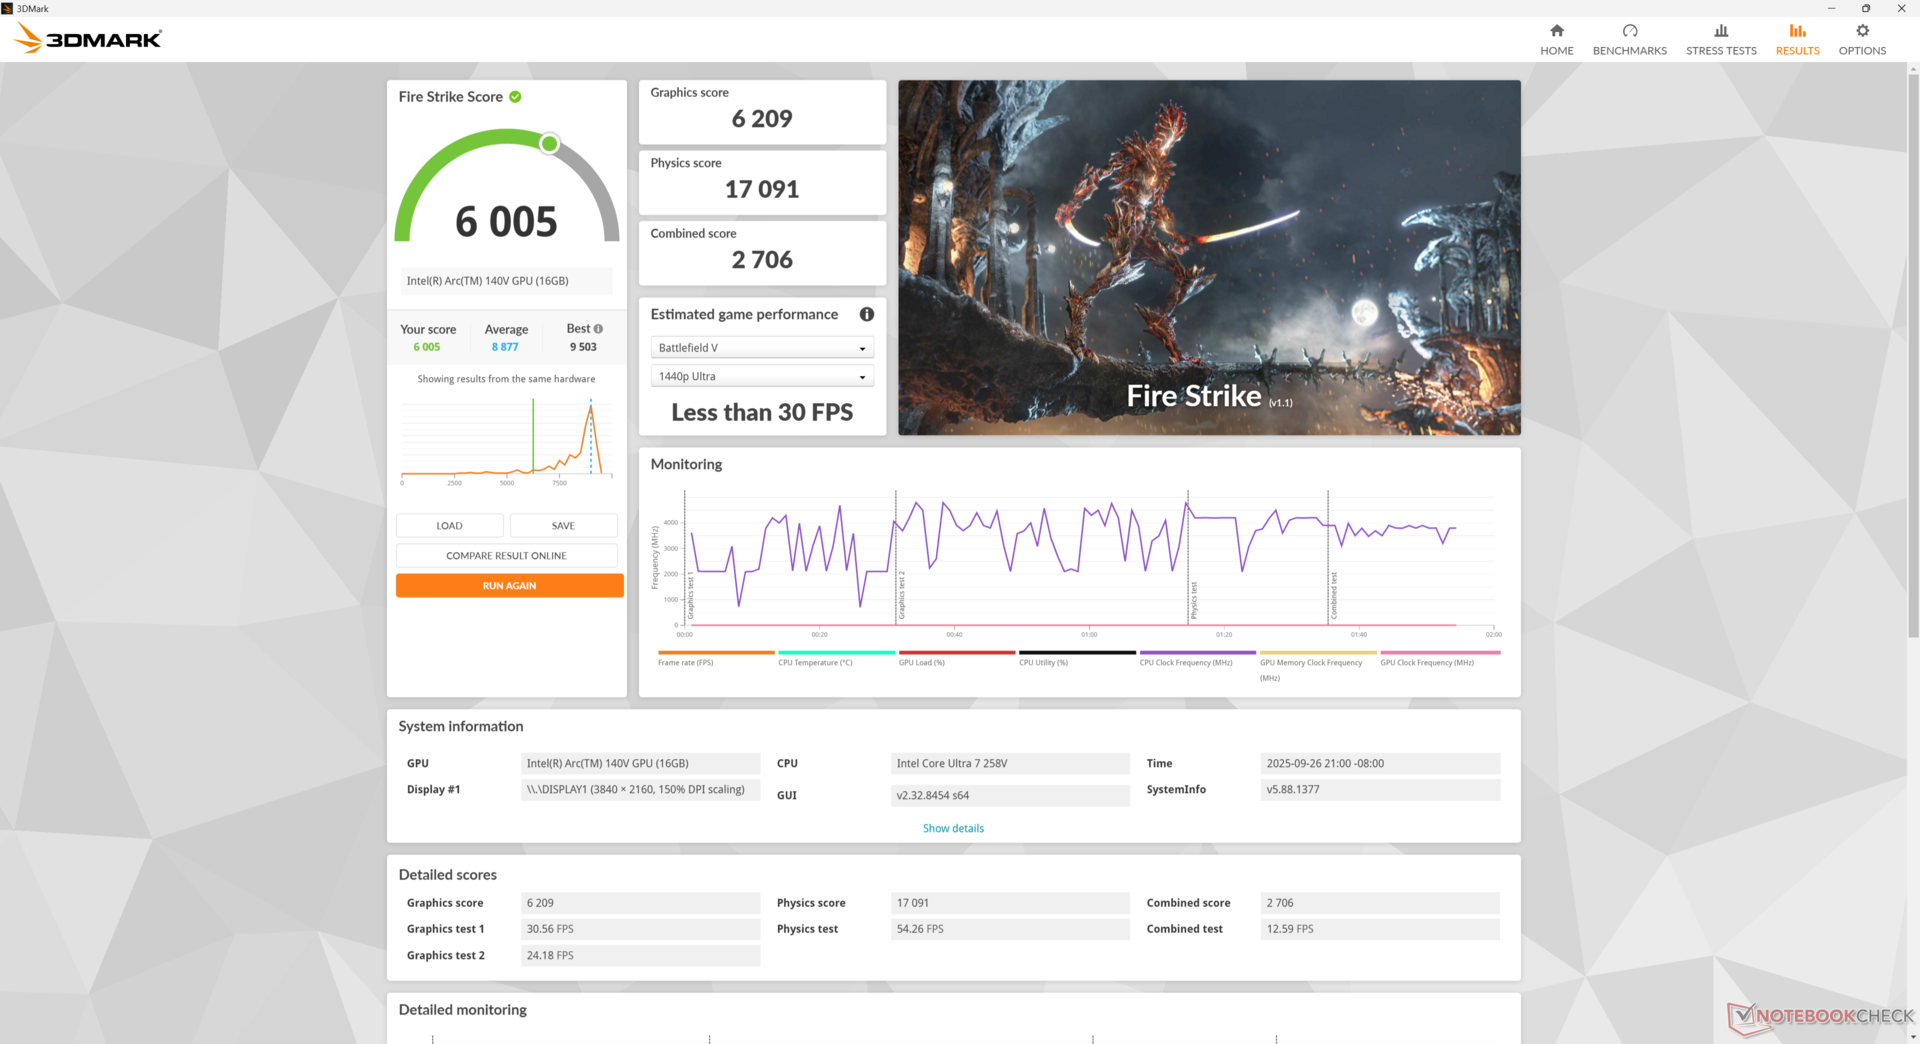
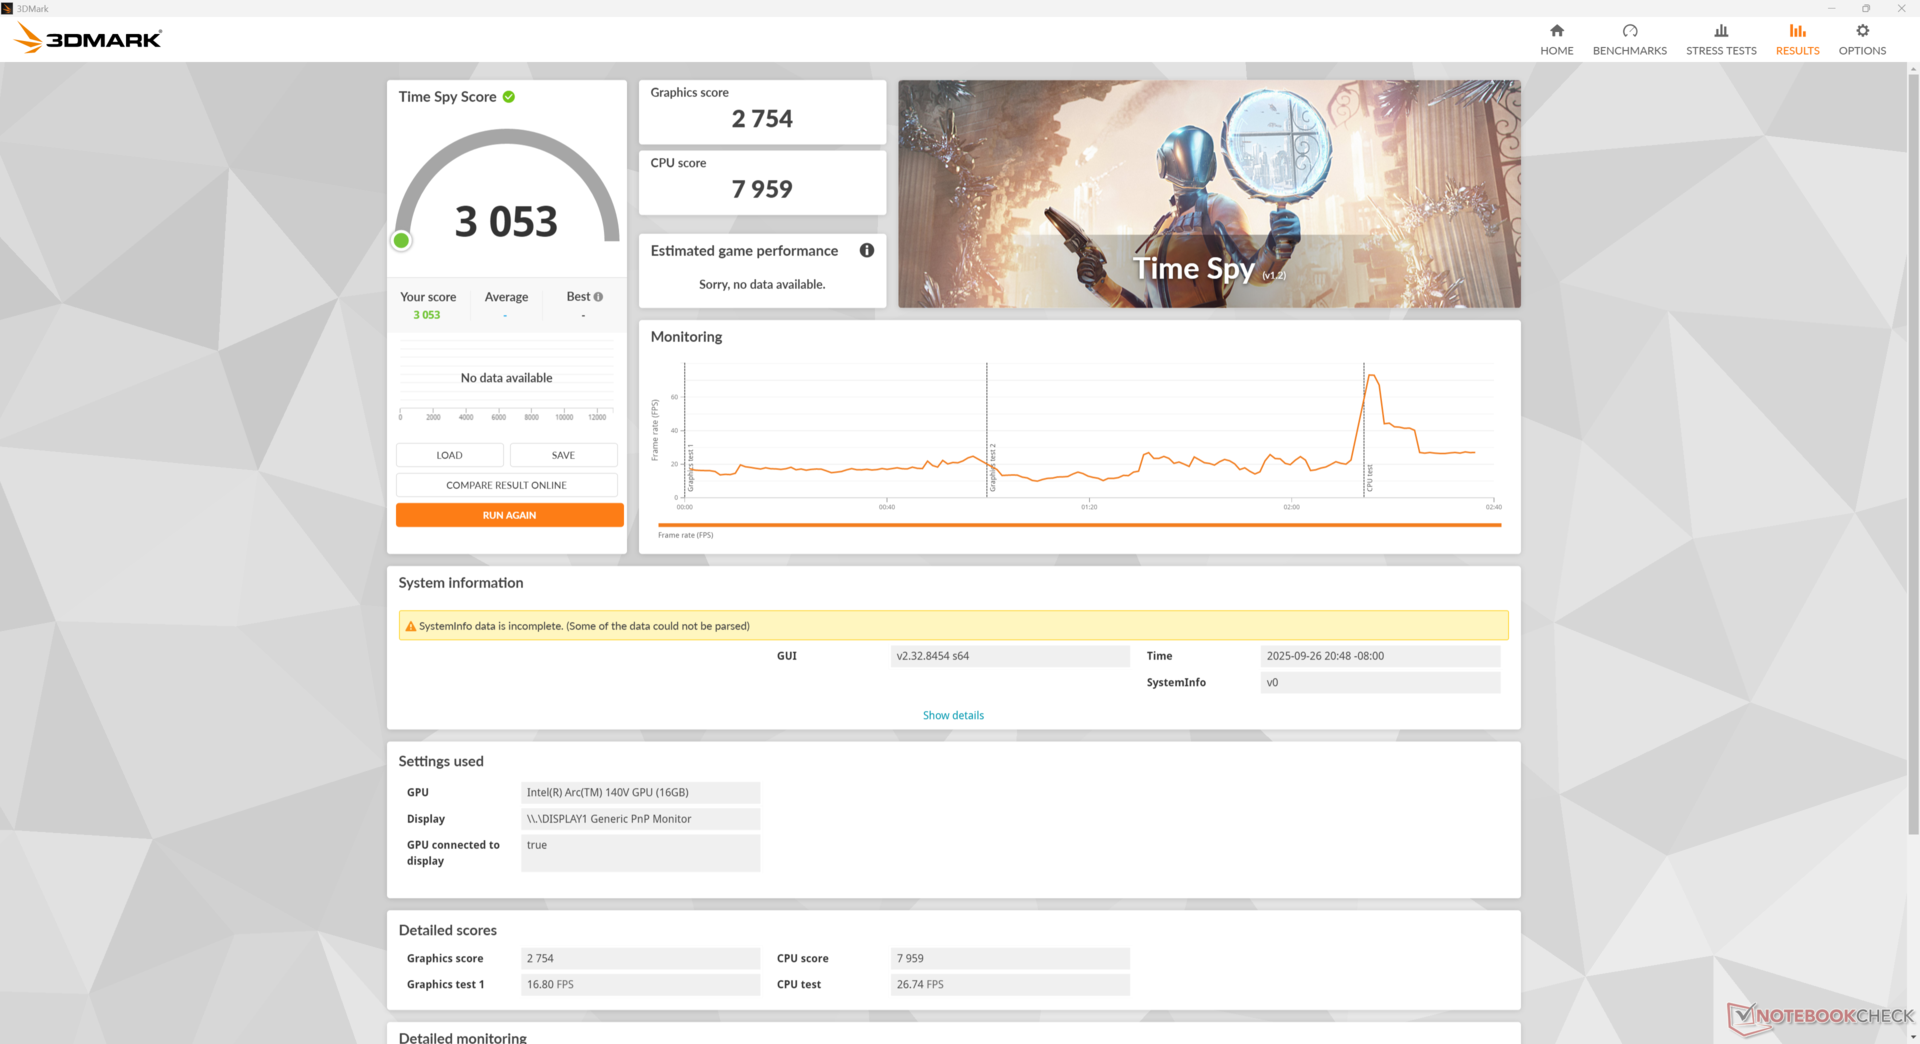
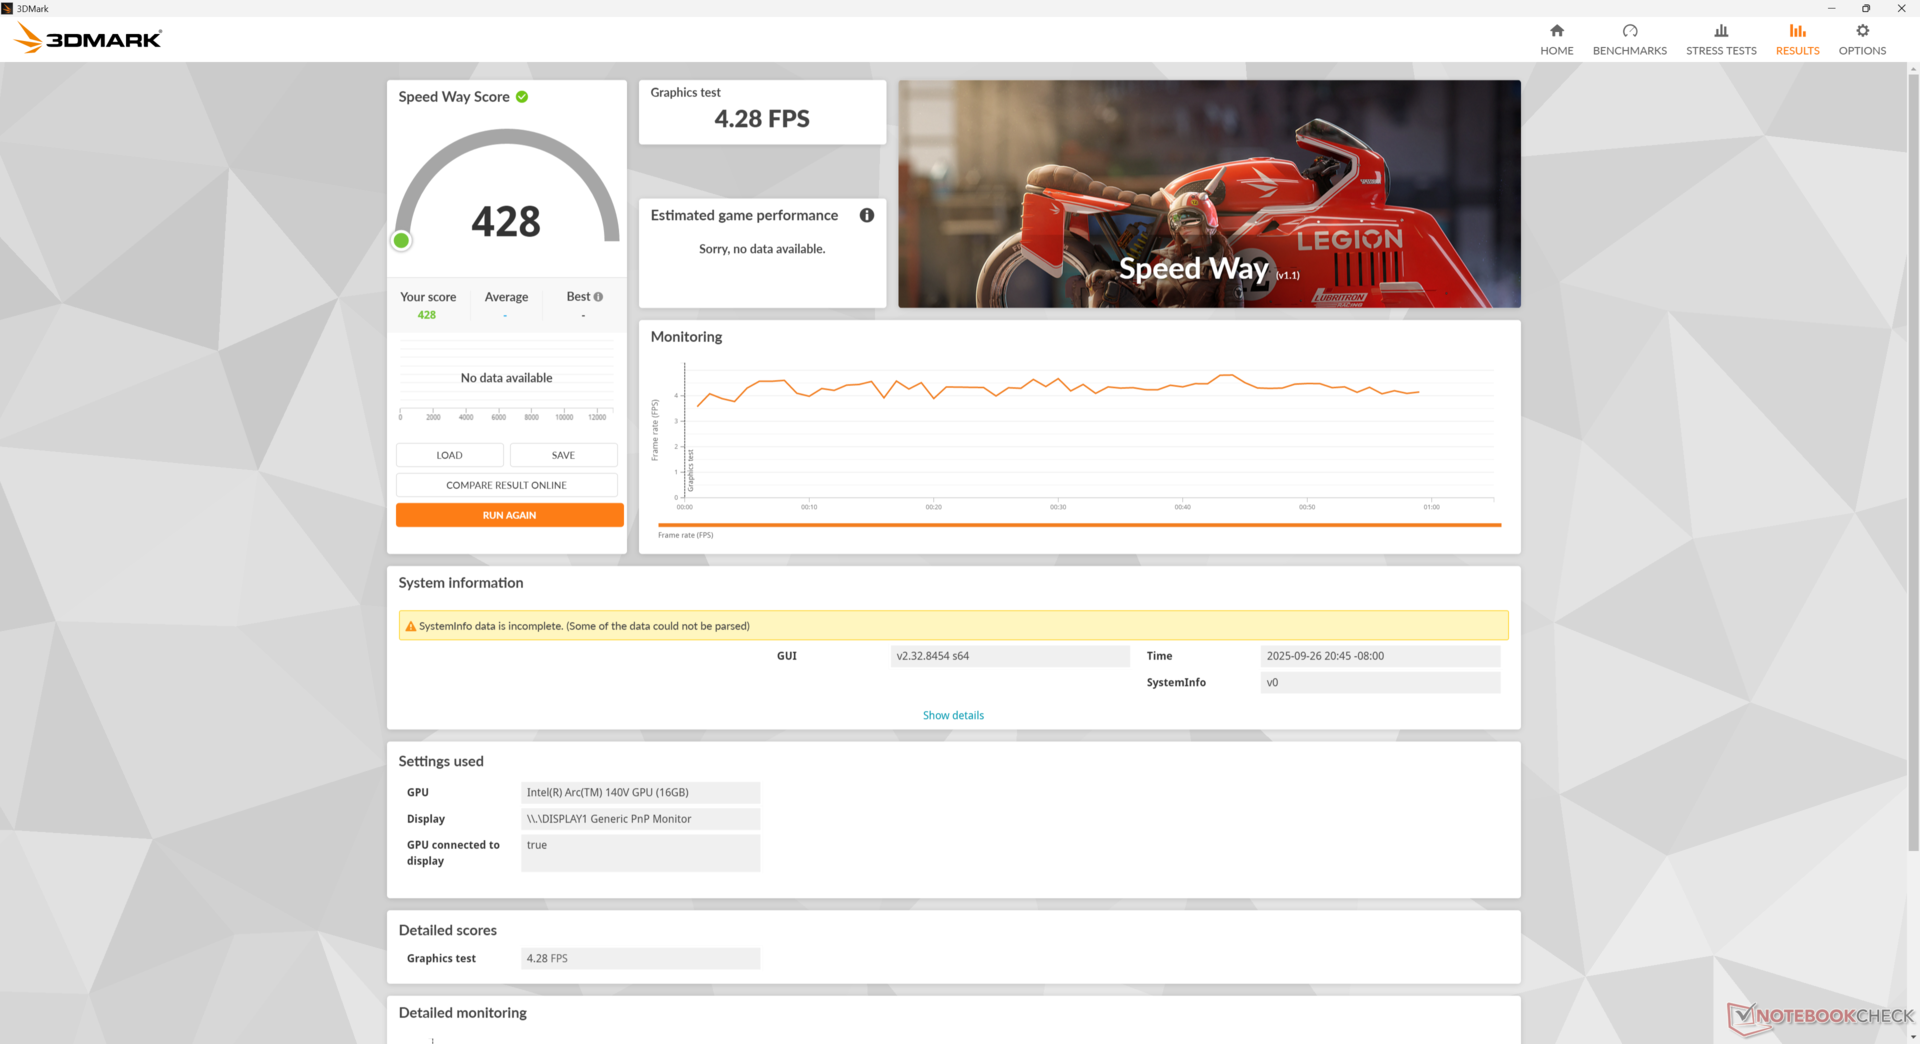
| 3DMark 11 Performance | 7781 points | |
| 3DMark Cloud Gate Standard Score | 31534 points | |
| 3DMark Fire Strike Score | 6005 points | |
| 3DMark Time Spy Score | 3053 points | |
Aide | ||
* ... Moindre est la valeur, meilleures sont les performances
| Performance rating - Percent | |
| Beelink SER9 Pro | |
| Minisforum MS-A1 -1! | |
| GMK NucBox K12 | |
| MSI Cubi NUC AI+ 2MG | |
| MSI Cubi NUC 1M -2! | |
| Ninkear M7, (16+512) -2! | |
| Cyberpunk 2077 2.2 Phantom Liberty - 1920x1080 Ultra Preset (FSR off) | |
| GMK NucBox K12 | |
| Minisforum MS-A1 | |
| Beelink SER9 Pro | |
| MSI Cubi NUC AI+ 2MG | |
| MSI Cubi NUC 1M | |
| Ninkear M7, (16+512) | |
| Baldur's Gate 3 - 1920x1080 Ultra Preset AA:T | |
| Beelink SER9 Pro | |
| GMK NucBox K12 | |
| MSI Cubi NUC AI+ 2MG | |
| Minisforum MS-A1 | |
| GTA V - 1920x1080 Highest Settings possible AA:4xMSAA + FX AF:16x | |
| Beelink SER9 Pro | |
| GMK NucBox K12 | |
| MSI Cubi NUC AI+ 2MG | |
| Minisforum MS-A1 | |
| MSI Cubi NUC 1M | |
| Ninkear M7, (16+512) | |
| Final Fantasy XV Benchmark - 1920x1080 High Quality | |
| Beelink SER9 Pro | |
| MSI Cubi NUC AI+ 2MG | |
| Minisforum MS-A1 | |
| GMK NucBox K12 | |
| MSI Cubi NUC 1M | |
| Ninkear M7, (16+512) | |
| Strange Brigade - 1920x1080 ultra AA:ultra AF:16 | |
| MSI Cubi NUC AI+ 2MG | |
| Beelink SER9 Pro | |
| GMK NucBox K12 | |
| MSI Cubi NUC 1M | |
| Dota 2 Reborn - 1920x1080 ultra (3/3) best looking | |
| Minisforum MS-A1 | |
| GMK NucBox K12 | |
| Beelink SER9 Pro | |
| MSI Cubi NUC AI+ 2MG | |
| MSI Cubi NUC 1M | |
| Ninkear M7, (16+512) | |
| X-Plane 11.11 - 1920x1080 high (fps_test=3) | |
| Minisforum MS-A1 | |
| GMK NucBox K12 | |
| Beelink SER9 Pro | |
| MSI Cubi NUC AI+ 2MG | |
| Ninkear M7, (16+512) | |
| F1 24 | |
| 1280x720 Ultra Low Preset AA:T | |
| MSI Cubi NUC AI+ 2MG | |
| Moyenne Intel Arc Graphics 140V (n=1) | |
| 1920x1080 Low Preset AA:T AF:16x | |
| Minisforum MS-A1 | |
| Beelink SER9 Pro | |
| Moyenne Intel Arc Graphics 140V (54 - 99, n=24) | |
| MSI Cubi NUC AI+ 2MG | |
| Asus NUC 14 Pro+ | |
| Ninkear M7, (16+512) | |
| 1920x1080 Medium Preset AA:T AF:16x | |
| Minisforum MS-A1 | |
| Moyenne Intel Arc Graphics 140V (49.2 - 88.2, n=23) | |
| Beelink SER9 Pro | |
| Asus NUC 14 Pro+ | |
| Ninkear M7, (16+512) | |
| 1920x1080 High Preset AA:T AF:16x | |
| Moyenne Intel Arc Graphics 140V (34.4 - 66.4, n=25) | |
| Minisforum MS-A1 | |
| Beelink SER9 Pro | |
| MSI Cubi NUC AI+ 2MG | |
| Asus NUC 14 Pro+ | |
| Ninkear M7, (16+512) | |
| 1920x1080 Ultra High Preset AA:T AF:16x | |
| Moyenne Intel Arc Graphics 140V (15.3 - 22, n=23) | |
| MSI Cubi NUC AI+ 2MG | |
| Minisforum MS-A1 | |
| Beelink SER9 Pro | |
Le nombre d'images au ralenti sur Cyberpunk 2077 à 1080p en configuration Ultra varie entre 18 et 26, alors qu'en répétant ce test sur la NucBox K12, le nombre d'images au ralenti varie entre 18 et 26 NucBox K12 a permis d'obtenir un taux de rafraîchissement moyen plus stable de 23. Ces bégaiements se produisaient également dans les autres jeux de notre test.
Cyberpunk 2077 ultra FPS Chart
| Bas | Moyen | Élevé | Ultra | |
|---|---|---|---|---|
| GTA V (2015) | 160.4 | 152.4 | 63.6 | 26.6 |
| Dota 2 Reborn (2015) | 98.1 | 80.4 | 59.9 | 65.8 |
| Final Fantasy XV Benchmark (2018) | 71.3 | 39.1 | 28.7 | |
| X-Plane 11.11 (2018) | 51.8 | 41.7 | 36 | |
| Strange Brigade (2018) | 240 | 71.8 | 59.7 | 57.3 |
| Baldur's Gate 3 (2023) | 36.1 | 29.5 | 29 | 26.7 |
| Cyberpunk 2077 2.2 Phantom Liberty (2023) | 33.9 | 26.6 | 23.2 | 19.4 |
| F1 24 (2024) | 72 | 53.8 | 16.6 |
Émissions
Bruit du système
Le bruit du ventilateur oscille autour de 25 dB(A) en mode silencieux et de 36 dB(A) en mode performance. Le système est généralement plus bruyant que ce que nous avions observé sur l'ancien Cubi 1M.
Degré de la nuisance sonore
| Au repos |
| 28 / 36.1 / 36.1 dB(A) |
| Fortement sollicité |
| 38.9 / 49.2 dB(A) |
 | ||
30 dB silencieux 40 dB(A) audible 50 dB(A) bruyant |
||
min: | ||
| MSI Cubi NUC AI+ 2MG Arc 140V, Core Ultra 7 258V | MSI Cubi NUC 1M Iris Xe G7 96EUs, Core 7 150U, WD PC SN560 SDDPNQE-1T00 | GMK NucBox K12 Radeon 780M, Ryzen 7 H 255, Crucial P3 Plus CT1000P3PSSD8 | Beelink SER9 Pro Radeon 780M, Ryzen 7 H 255, Crucial P3 Plus CT1000P3PSSD8 | Ninkear M7, (16+512) Vega 7, R5 7430U, Faspeed P8-512G-SE | Minisforum MS-A1 Radeon 780M, R7 8700G, Kingston OM8PGP41024Q-A0 | |
|---|---|---|---|---|---|---|
| Noise | 7% | -4% | 12% | 19% | -3% | |
| arrêt / environnement * (dB) | 24.8 | 23.5 5% | 23.5 5% | 23 7% | 24.8 -0% | 24.8 -0% |
| Idle Minimum * (dB) | 28 | 29.9 -7% | 35.4 -26% | 29.1 -4% | 25.3 10% | 33.9 -21% |
| Idle Average * (dB) | 36.1 | 29.9 17% | 35.4 2% | 30.1 17% | 25.7 29% | 34 6% |
| Idle Maximum * (dB) | 36.1 | 32 11% | 39 -8% | 31.7 12% | 25.7 29% | 34 6% |
| Load Average * (dB) | 38.9 | 33.5 14% | 42.4 -9% | 33.7 13% | 33.6 14% | 41.1 -6% |
| Cyberpunk 2077 ultra * (dB) | 37 | 39.1 -6% | 40.4 -9% | 33.8 9% | 28.7 22% | 42.2 -14% |
| Load Maximum * (dB) | 49.2 | 40.5 18% | 41.4 16% | 35.2 28% | 34.3 30% | 46.2 6% |
| Witcher 3 ultra * (dB) | 28.8 |
* ... Moindre est la valeur, meilleures sont les performances
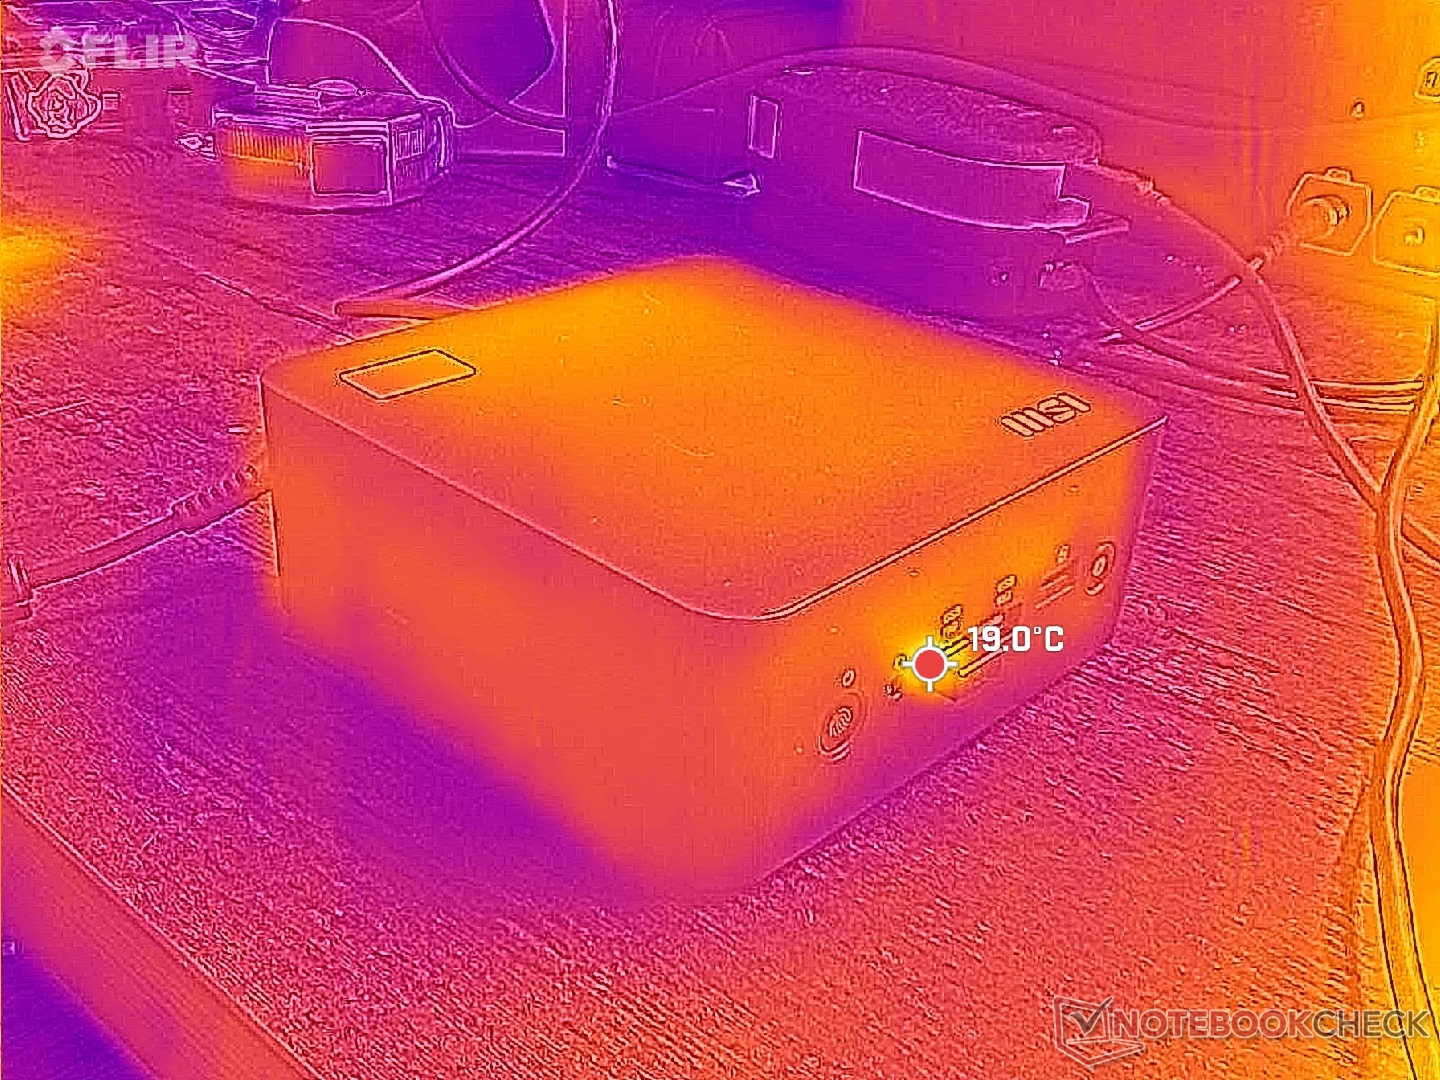
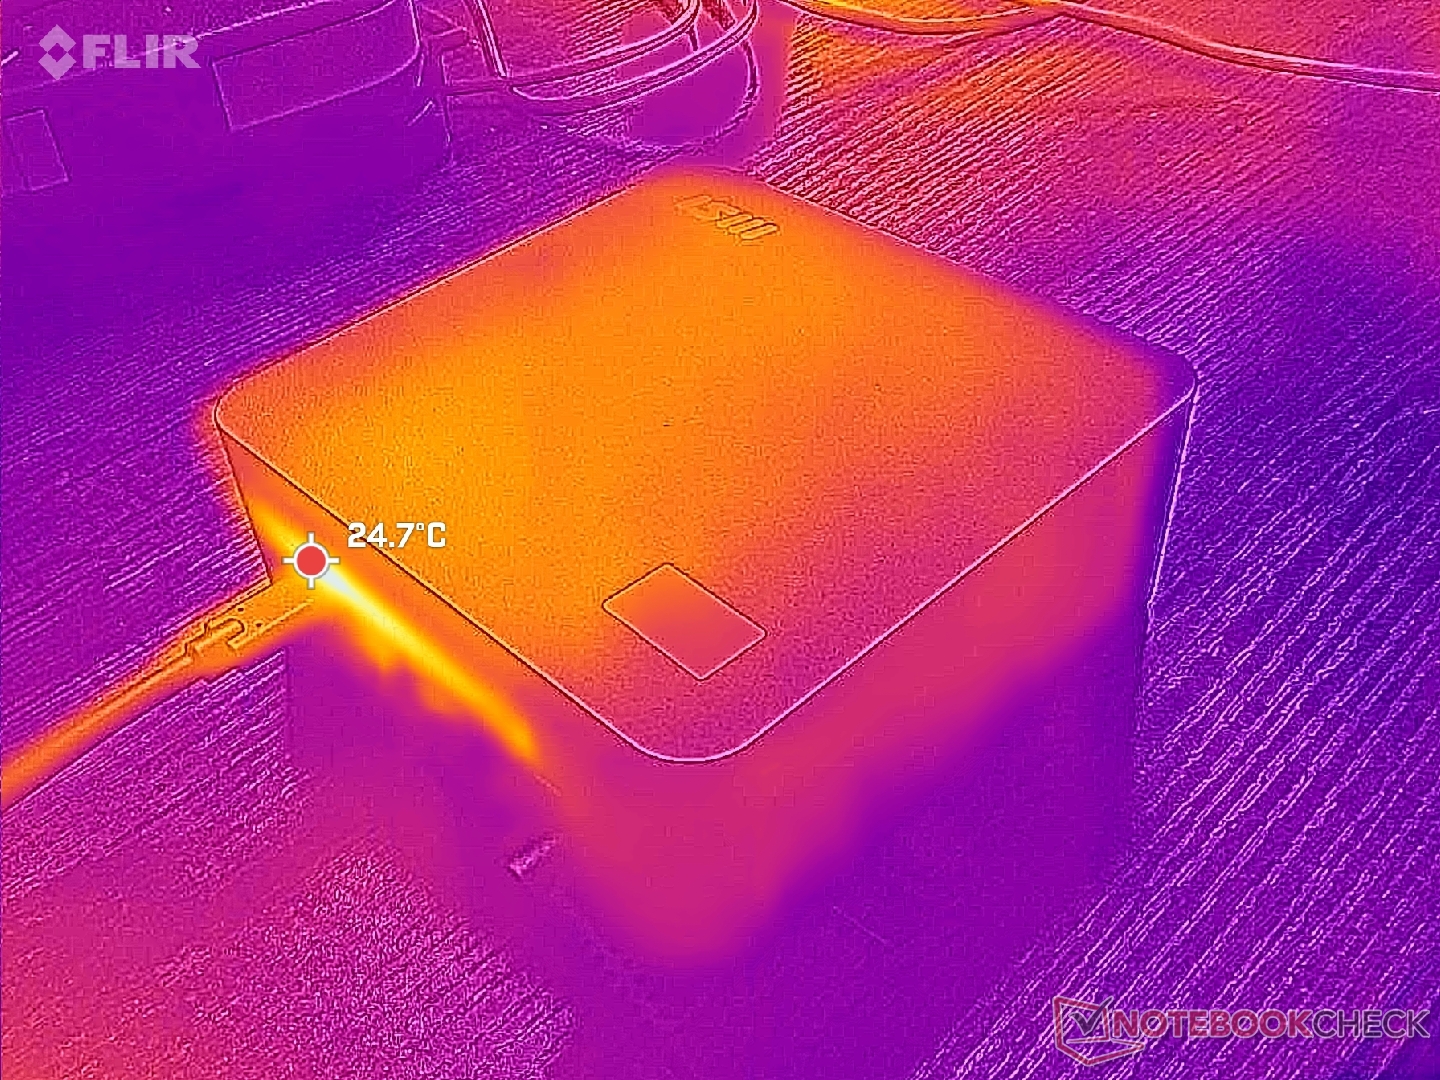
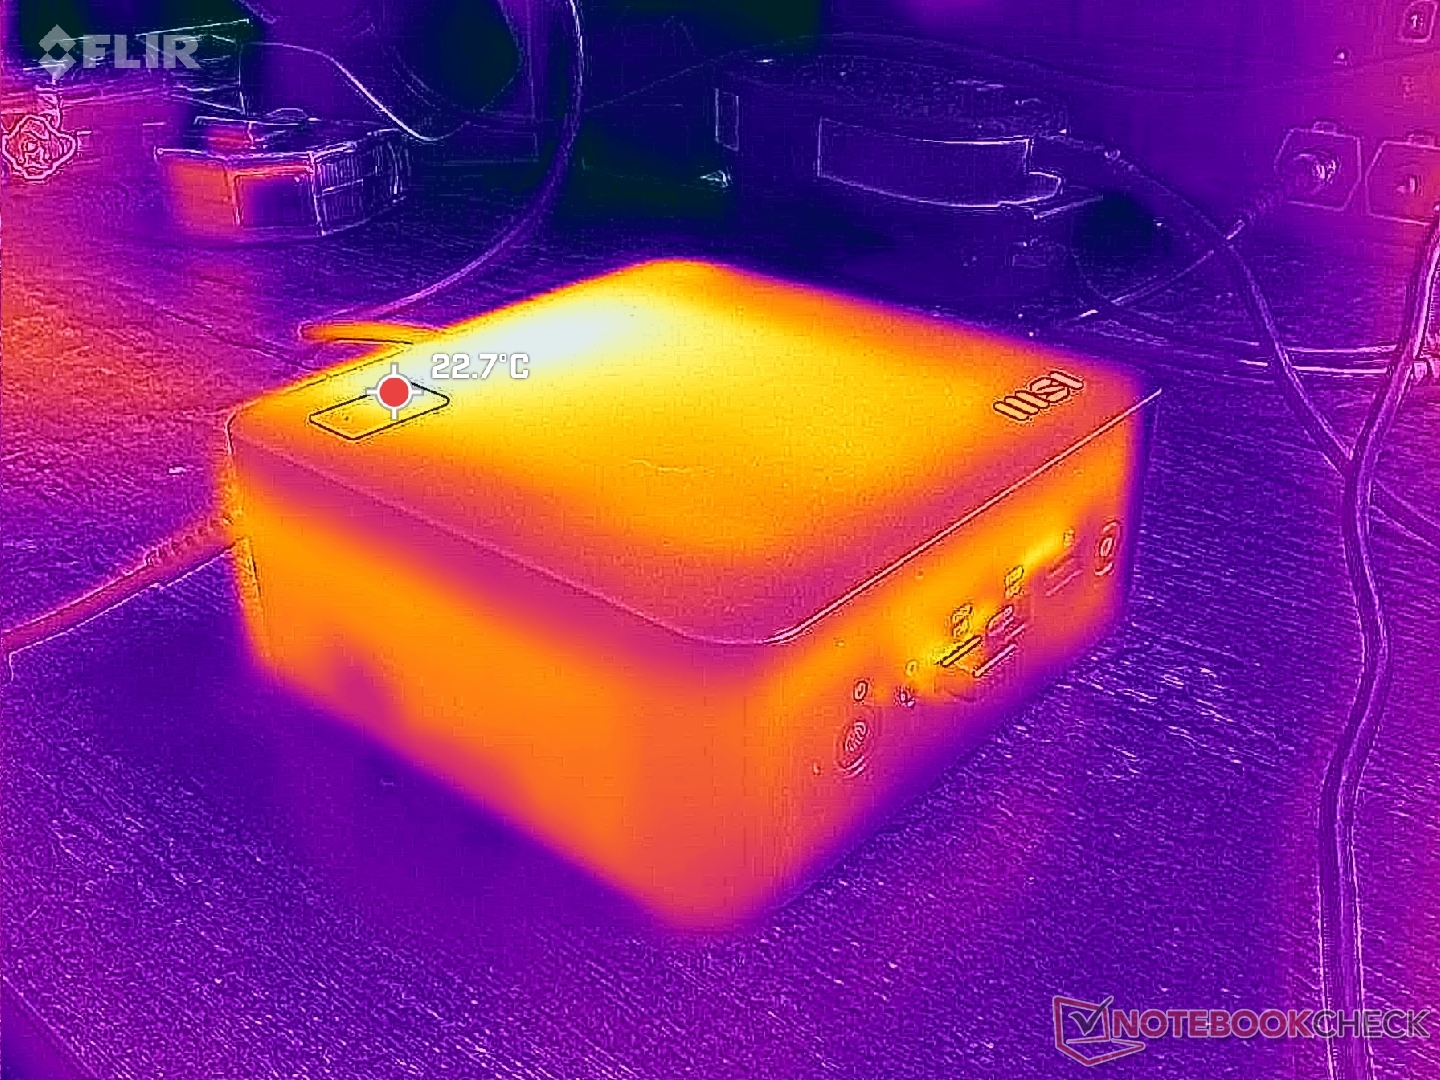
Température
Les températures de surface sont à peine chaudes (31°C), même lorsque vous utilisez des applications exigeantes, en grande partie grâce à la construction en plastique et au processeur Intel de faible puissance.
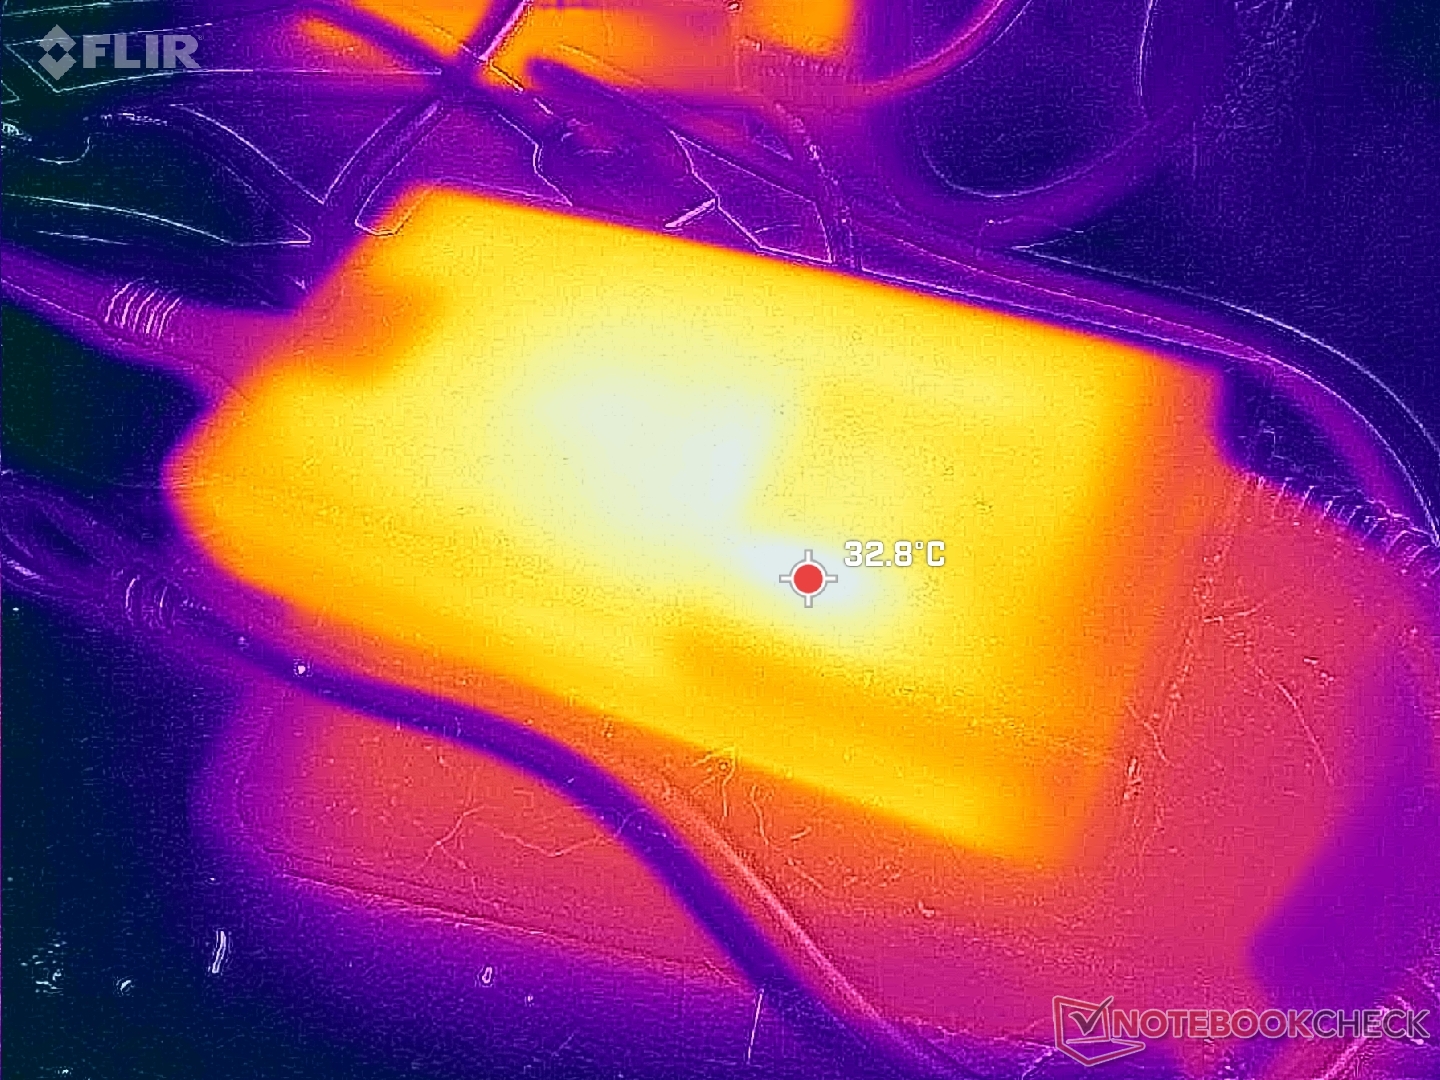
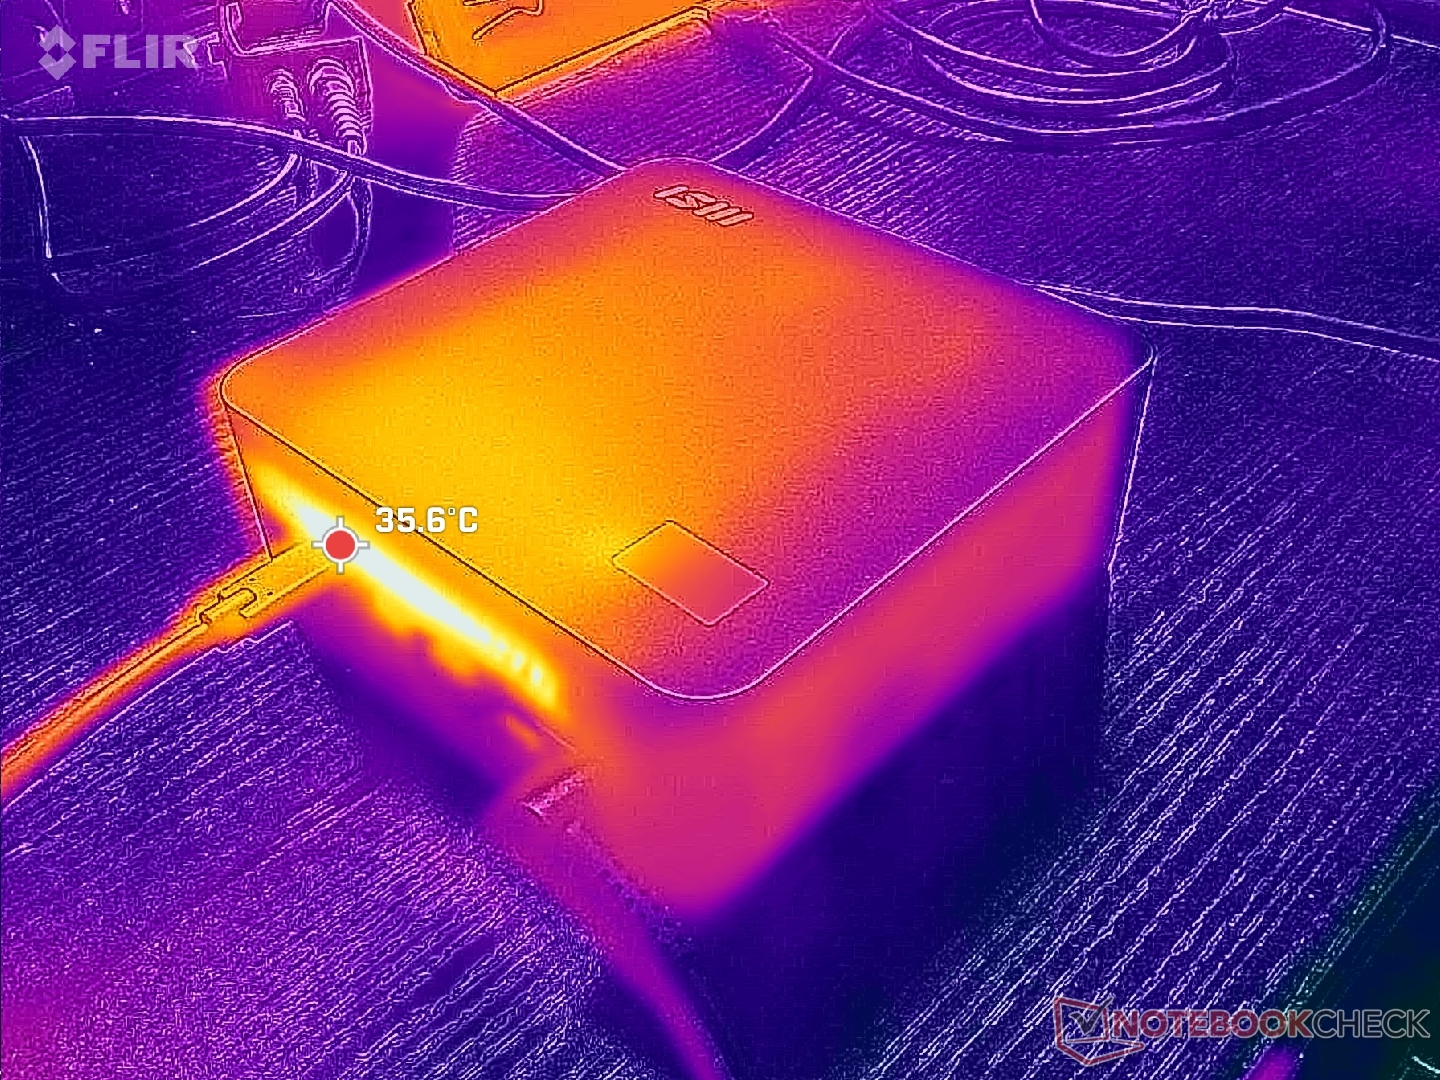
Le petit adaptateur secteur de 120 W reste relativement froid, à moins de 35 °C en charge.
Intervenants
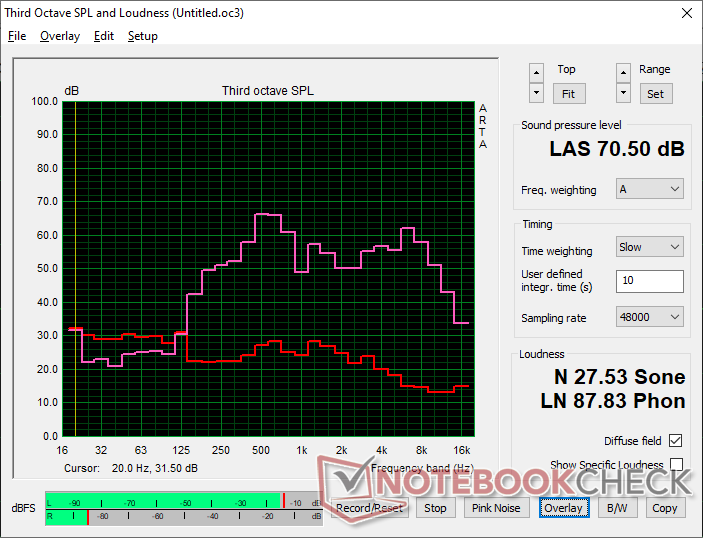
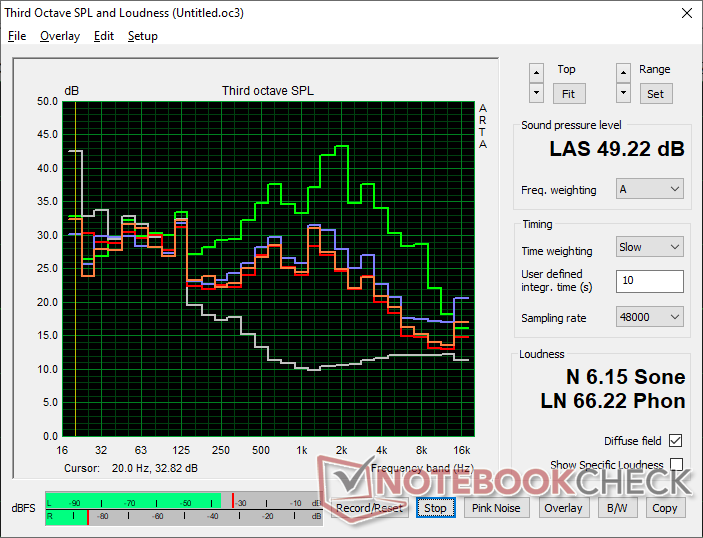
MSI Cubi NUC AI+ 2MG analyse audio
(-) | haut-parleurs pas très forts (70.5 dB)
Basses 100 - 315 Hz
(±) | basse réduite - en moyenne 10.4% inférieure à la médiane
(-) | les basses ne sont pas linéaires (16% delta à la fréquence précédente)
Médiums 400 - 2000 Hz
(±) | médiane supérieure - en moyenne 6.9% supérieure à la médiane
(-) | les médiums ne sont pas linéaires (19.7% delta à la fréquence précédente)
Aiguës 2 - 16 kHz
(+) | des sommets équilibrés - à seulement 4.3% de la médiane
(±) | la linéarité des aigus est moyenne (12.2% delta à la fréquence précédente)
Globalement 100 - 16 000 Hz
(±) | la linéarité du son global est moyenne (29.5% de différence avec la médiane)
Par rapport à la même classe
» 70% de tous les appareils testés de cette catégorie étaient meilleurs, 13% similaires, 17% pires
» Le meilleur avait un delta de 13%, la moyenne était de 25%, le pire était de 64%.
Par rapport à tous les appareils testés
» 87% de tous les appareils testés étaient meilleurs, 3% similaires, 10% pires
» Le meilleur avait un delta de 4%, la moyenne était de 24%, le pire était de 134%.
Apple MacBook Pro 16 2021 M1 Pro analyse audio
(+) | les haut-parleurs peuvent jouer relativement fort (84.7# dB)
Basses 100 - 315 Hz
(+) | bonne basse - seulement 3.8% loin de la médiane
(+) | les basses sont linéaires (5.2% delta à la fréquence précédente)
Médiums 400 - 2000 Hz
(+) | médiane équilibrée - seulement 1.3% de la médiane
(+) | les médiums sont linéaires (2.1% delta à la fréquence précédente)
Aiguës 2 - 16 kHz
(+) | des sommets équilibrés - à seulement 1.9% de la médiane
(+) | les aigus sont linéaires (2.7% delta à la fréquence précédente)
Globalement 100 - 16 000 Hz
(+) | le son global est linéaire (4.6% différence à la médiane)
Par rapport à la même classe
» 0% de tous les appareils testés de cette catégorie étaient meilleurs, 0% similaires, 100% pires
» Le meilleur avait un delta de 5%, la moyenne était de 18%, le pire était de 45%.
Par rapport à tous les appareils testés
» 0% de tous les appareils testés étaient meilleurs, 0% similaires, 100% pires
» Le meilleur avait un delta de 4%, la moyenne était de 24%, le pire était de 134%.
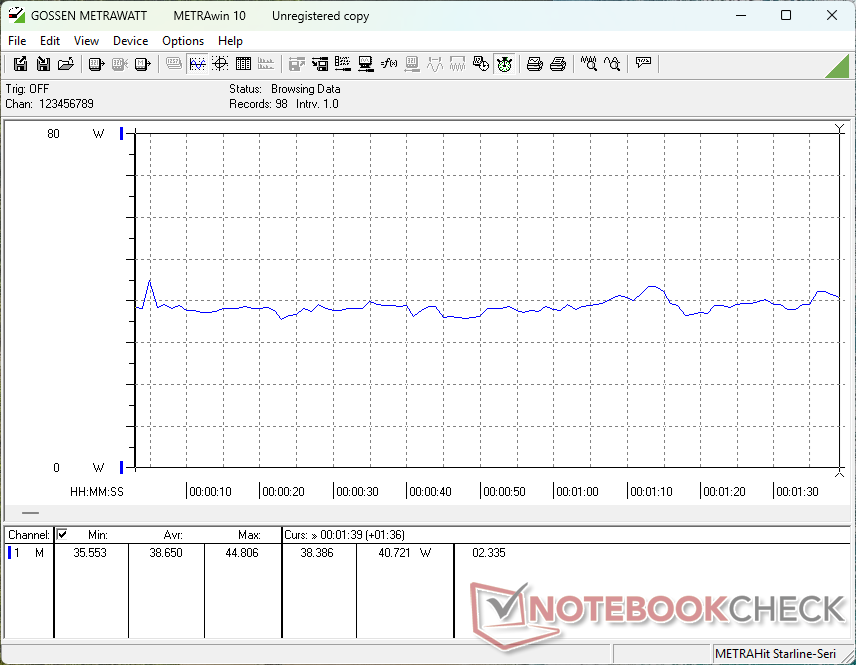
Gestion de l'énergie
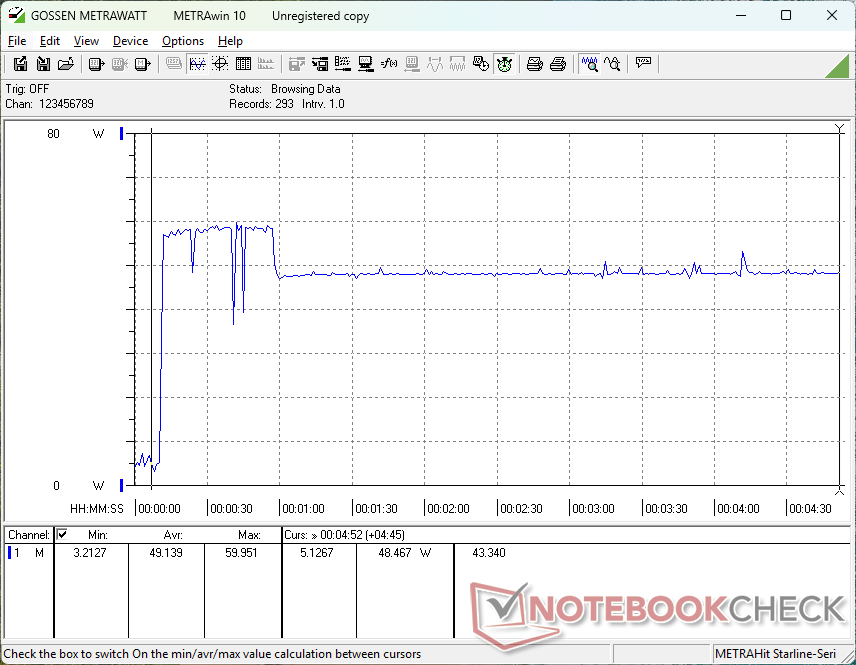
Consommation électrique
La consommation globale est nettement inférieure à celle d'un mini PC AMD de la série H comme la GMK NucBox K12 même si notre Arc 140V intégré est à peu près comparable à la Radeon 780M intégrée concurrente dans les jeux. La performance par watt favorise généralement le MSI Cubi, bien qu'au détriment de la performance brute du processeur par rapport à de nombreuses alternatives AMD Zen 4 ou Zen 5.
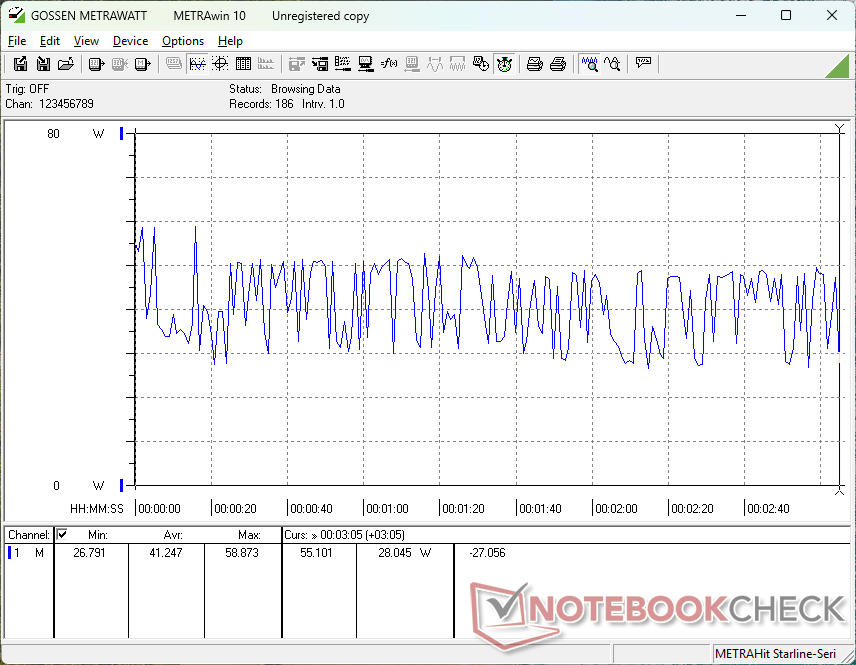
Dans Cyberpunk 2077, la consommation oscille entre 28 et 49 W sans raison apparente, ce qui correspond aux taux d'images instables et aux fréquences d'horloge du GPU mentionnés plus haut.
| Éteint/en veille | |
| Au repos | |
| Fortement sollicité |
|
Légende:
min: | |
| MSI Cubi NUC AI+ 2MG Core Ultra 7 258V, Arc 140V, , , x, | MSI Cubi NUC 1M Core 7 150U, Iris Xe G7 96EUs, WD PC SN560 SDDPNQE-1T00, , x, | GMK NucBox K12 Ryzen 7 H 255, Radeon 780M, Crucial P3 Plus CT1000P3PSSD8, , x, | Beelink SER9 Pro Ryzen 7 H 255, Radeon 780M, Crucial P3 Plus CT1000P3PSSD8, , x, | Ninkear M7, (16+512) R5 7430U, Vega 7, Faspeed P8-512G-SE, , x, | Minisforum MS-A1 R7 8700G, Radeon 780M, Kingston OM8PGP41024Q-A0, , x, | |
|---|---|---|---|---|---|---|
| Power Consumption | -24% | -99% | -56% | -47% | -121% | |
| Idle Minimum * (Watt) | 2.9 | 6.4 -121% | 9.9 -241% | 7 -141% | 9.3 -221% | 8.8 -203% |
| Idle Average * (Watt) | 5.7 | 8.3 -46% | 10.1 -77% | 7.1 -25% | 10.7 -88% | 12.6 -121% |
| Idle Maximum * (Watt) | 10.2 | 10.4 -2% | 13.1 -28% | 7.5 26% | 12.6 -24% | 14 -37% |
| Load Average * (Watt) | 38.7 | 38.5 1% | 69.8 -80% | 62.3 -61% | 37.7 3% | 93.2 -141% |
| Cyberpunk 2077 ultra external monitor * (Watt) | 41.1 | 36.1 12% | 86.3 -110% | 80.1 -95% | 32.3 21% | 102.1 -148% |
| Load Maximum * (Watt) | 60 | 52.5 12% | 92.8 -55% | 82.9 -38% | 43.4 28% | 105.4 -76% |
* ... Moindre est la valeur, meilleures sont les performances
Consommation électrique Cyberpunk / Stress Test
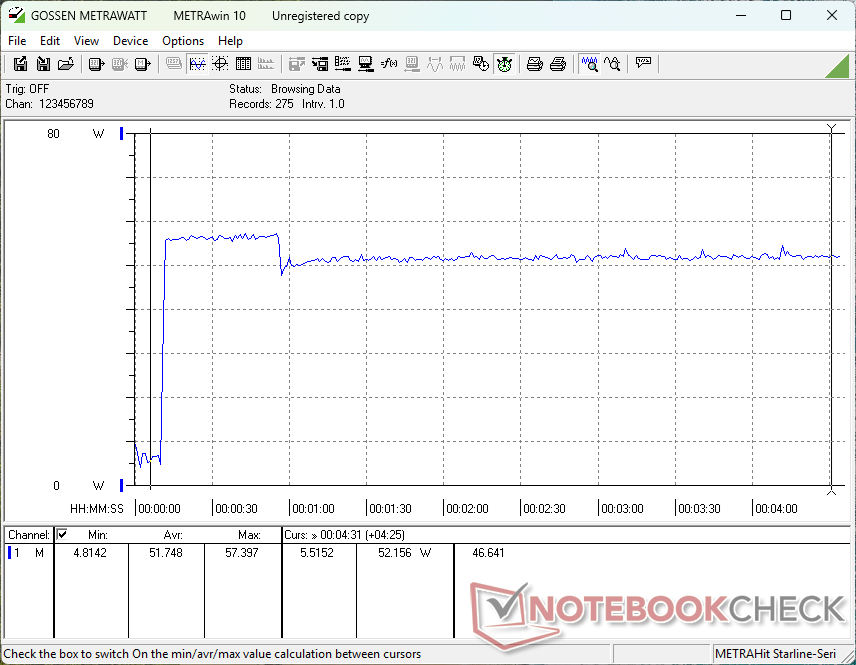
Consommation électrique du moniteur externe
Notebookcheck Rating
Un mini-PC basique et fiable pour les entreprises, mais sans doute trop basique au regard de son prix élevé.
MSI Cubi NUC AI+ 2MG
- 09/29/2025 v8
Allen Ngo
 Total Sustainability Score:
 Comparaison avec des concurrents potentiels
Image | Modèle | Prix | Poids | Épaisseur | Écran |
|---|---|---|---|---|---|
1. 75.2%  | MSI Cubi NUC AI+ 2MG Intel Core Ultra 7 258V ⎘ Intel Arc Graphics 140V ⎘ 32 Go Mémoire | Amazon: $899.00 Prix de liste: 900 USD | 669 g | 50.1 mm | x |
2. 66.1% 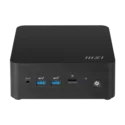 | MSI Cubi NUC 1M Intel Core 7 150U ⎘ Intel Iris Xe Graphics G7 96EUs ⎘ 16 Go Mémoire, 1024 Go SSD | Amazon: $599.00 Prix de liste: 950 USD | 660 g | 50.1 mm | x |
3. 73.7% 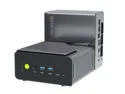 | GMK NucBox K12 AMD Ryzen 7 H 255 ⎘ AMD Radeon 780M ⎘ 32 Go Mémoire, 1024 Go SSD | Amazon: $549.98 | 938 g | 78 mm | x |
4. 80.2%  | Beelink SER9 Pro AMD Ryzen 7 H 255 ⎘ AMD Radeon 780M ⎘ 32 Go Mémoire, 1024 Go SSD | Amazon: $649.00 Prix de liste: 520 USD | 812 g | 44.7 mm | x |
5.  | Ninkear M7, (16+512) AMD Ryzen 5 7430U ⎘ AMD Radeon RX Vega 7 ⎘ 16 Go Mémoire, 512 Go SSD | Amazon: $349.99 Prix de liste: 399€ | 400 g | 36 mm | x |
6. 76.7%  | Minisforum MS-A1 AMD Ryzen 7 8700G ⎘ AMD Radeon 780M ⎘ 32 Go Mémoire, 1024 Go SSD | Amazon: 1. $239.99 MINISFORUM MS-A1 Mini Workst... 2. $687.90 MINISFORUM MS-A1 Mini Workst... 3. $638.00 MINISFORUM Mini PC MS-01-S13... Prix de liste: 829 EUR | 1.7 kg | 48 mm | x |
Transparency
La sélection des appareils à examiner est effectuée par notre équipe éditoriale. L'échantillon de test a été prêté à l'auteur par le fabricant ou le détaillant pour les besoins de cet examen. Le prêteur n'a pas eu d'influence sur cette évaluation et le fabricant n'a pas reçu de copie de cette évaluation avant sa publication. Il n'y avait aucune obligation de publier cet article. En tant que média indépendant, Notebookcheck n'est pas soumis à l'autorité des fabricants, des détaillants ou des éditeurs.
Voici comment Notebookcheck teste
Chaque année, Notebookcheck examine de manière indépendante des centaines d'ordinateurs portables et de smartphones en utilisant des procédures standardisées afin de garantir que tous les résultats sont comparables. Nous avons continuellement développé nos méthodes de test depuis environ 20 ans et avons établi des normes industrielles dans le processus. Dans nos laboratoires de test, des équipements de mesure de haute qualité sont utilisés par des techniciens et des rédacteurs expérimentés. Ces tests impliquent un processus de validation en plusieurs étapes. Notre système d'évaluation complexe repose sur des centaines de mesures et de points de référence bien fondés, ce qui garantit l'objectivité.
