

Verdict - Le XMG Focus 17 offre des performances élevées et quelques compromis
Avec la nouvelle Focus 17 M25, XMG vise clairement à offrir les meilleures performances possibles au prix le plus bas. Pour ce faire, le nouveau GPU pour ordinateur portable GeForce GPU RTX 5070 Ti pour ordinateur portable (12 Go de VRAM) dans la variante la plus rapide de 140 watts est combiné avec l'ancien Core i9-13900HX. Cependant, ses performances restent suffisantes, en particulier dans les jeux. Il est ainsi possible de jouer sans problème à des jeux en résolution native QHD. Les ventilateurs sont très bruyants lorsqu'ils sont sollicités à pleine puissance, ce qui n'est pas différent de la concurrence. L'unité de refroidissement reste néanmoins très silencieuse au quotidien, et les nombreux profils énergétiques vous permettent de configurer un système silencieux sans impact négatif sur les performances.
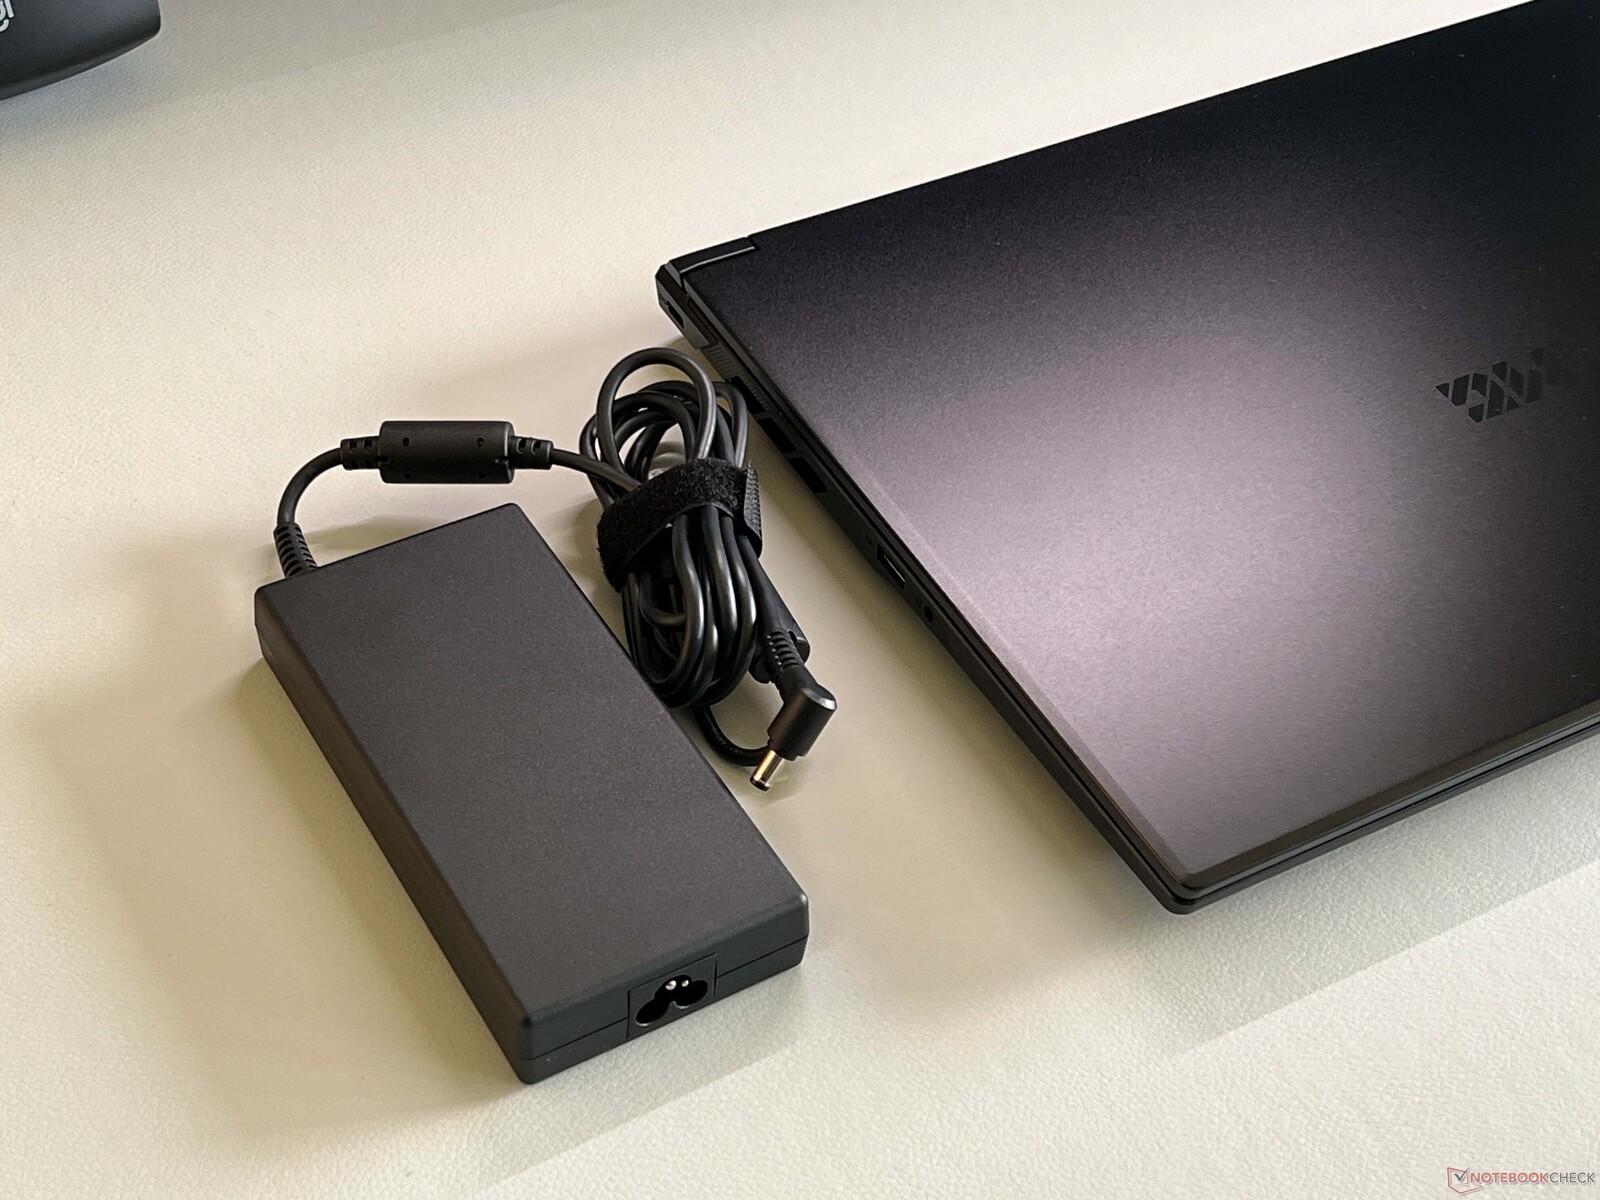
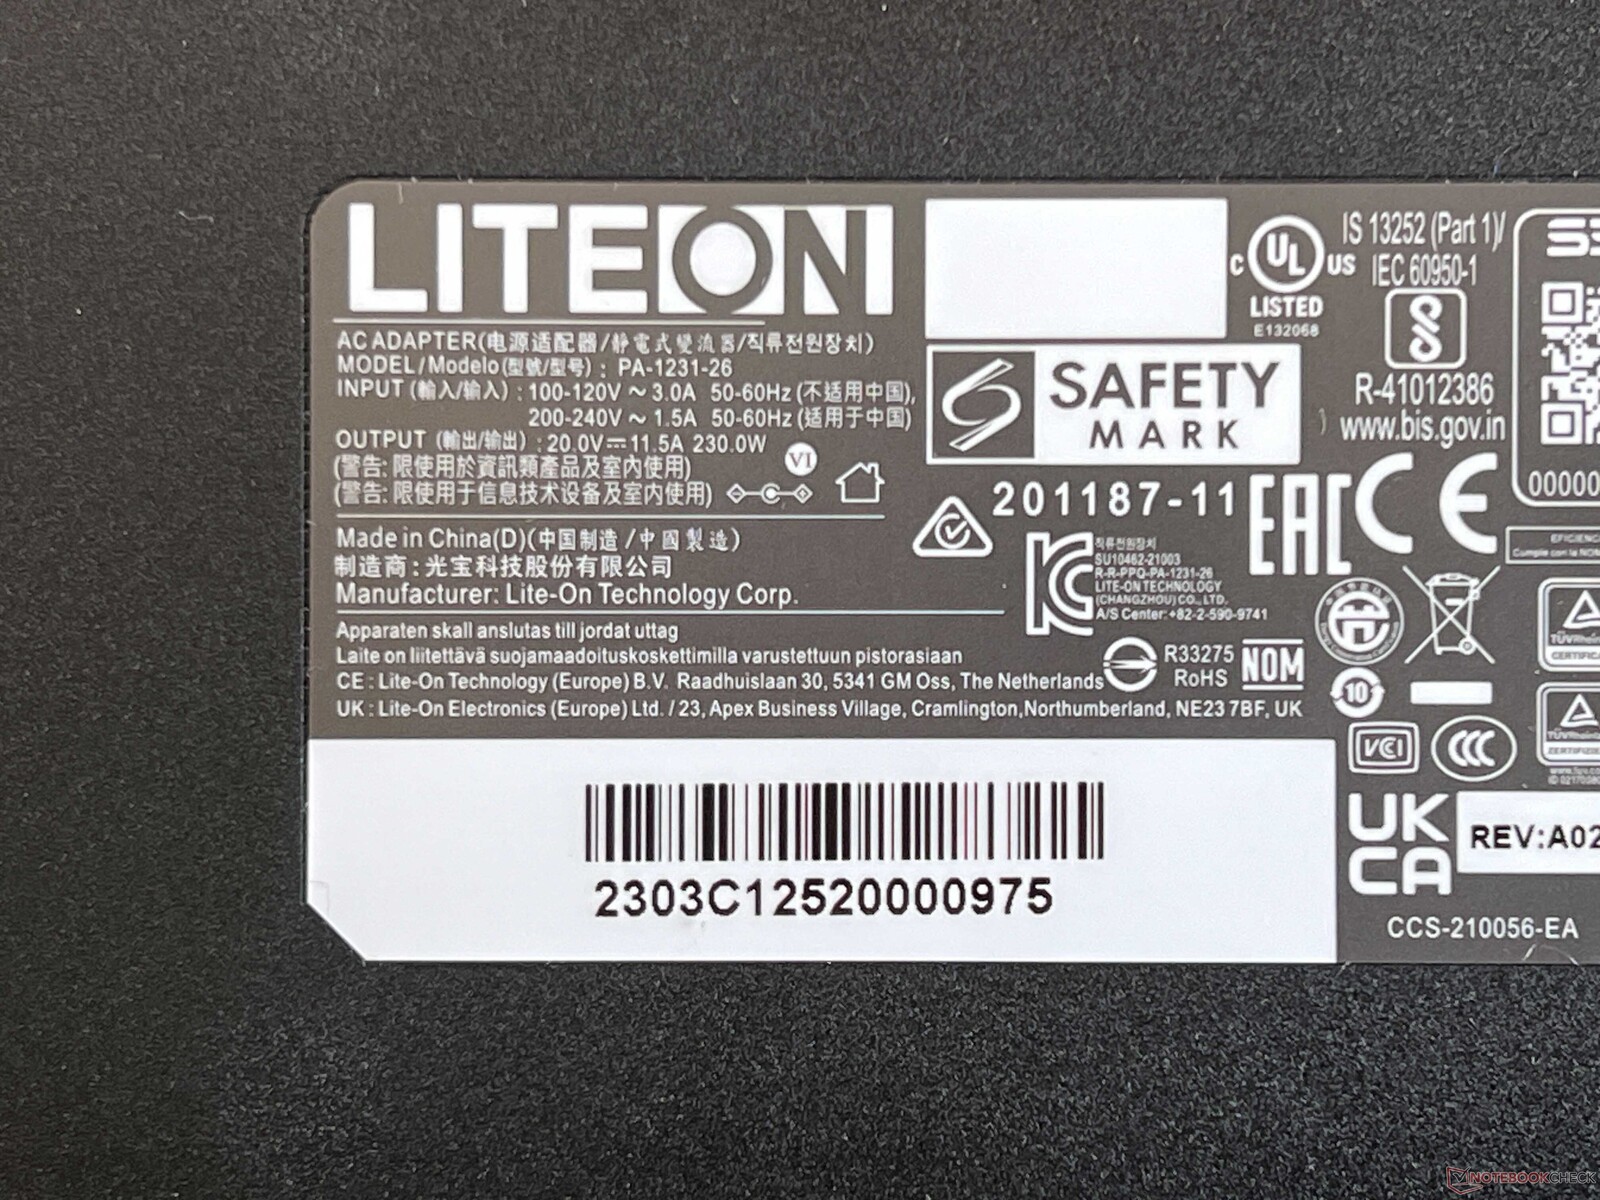
L'écran IPS mat de 240 Hz est également bien adapté aux jeux. Malheureusement, il s'agit toujours d'un écran 16:9 qui peine à atteindre la luminosité de ses concurrents. Parmi les autres compromis, citons l'absence de Thunderbolt/USB 4.0 et d'Advanced Optimus, mais ils sont gérables. Les haut-parleurs sont également assez faibles, et le bloc d'alimentation de 230 watts est à la limite du sous-dimensionnement.
Dans l'ensemble, vous obtenez une machine de jeu rapide à un excellent prix, et avec 12 Go de VRAM, le GPU est également plus évolutif que, par exemple, le GPU standard RTX 5070 d'un ordinateur portable.
Points positifs
Points négatifs
Prix et disponibilité
Le nouveau XMG Focus 17 M25 peut être commandé auprès de Bestware à partir de 1 849 $, soit environ 2 100 $ au taux de change en vigueur au moment de la rédaction de cet article.
Table des matières
- Verdict - Le XMG Focus 17 offre des performances élevées et quelques compromis
- Spécifications
- Boîtier et caractéristiques
- Dispositifs d'entrée
- Écran - IPS 240 Hz
- Performance - Un GPU 5070 Ti pour ordinateur portable avec jusqu'à 96 Go de RAM
- Émissions et énergie
- Notebookcheck note globale
- Comparaison des alternatives possibles
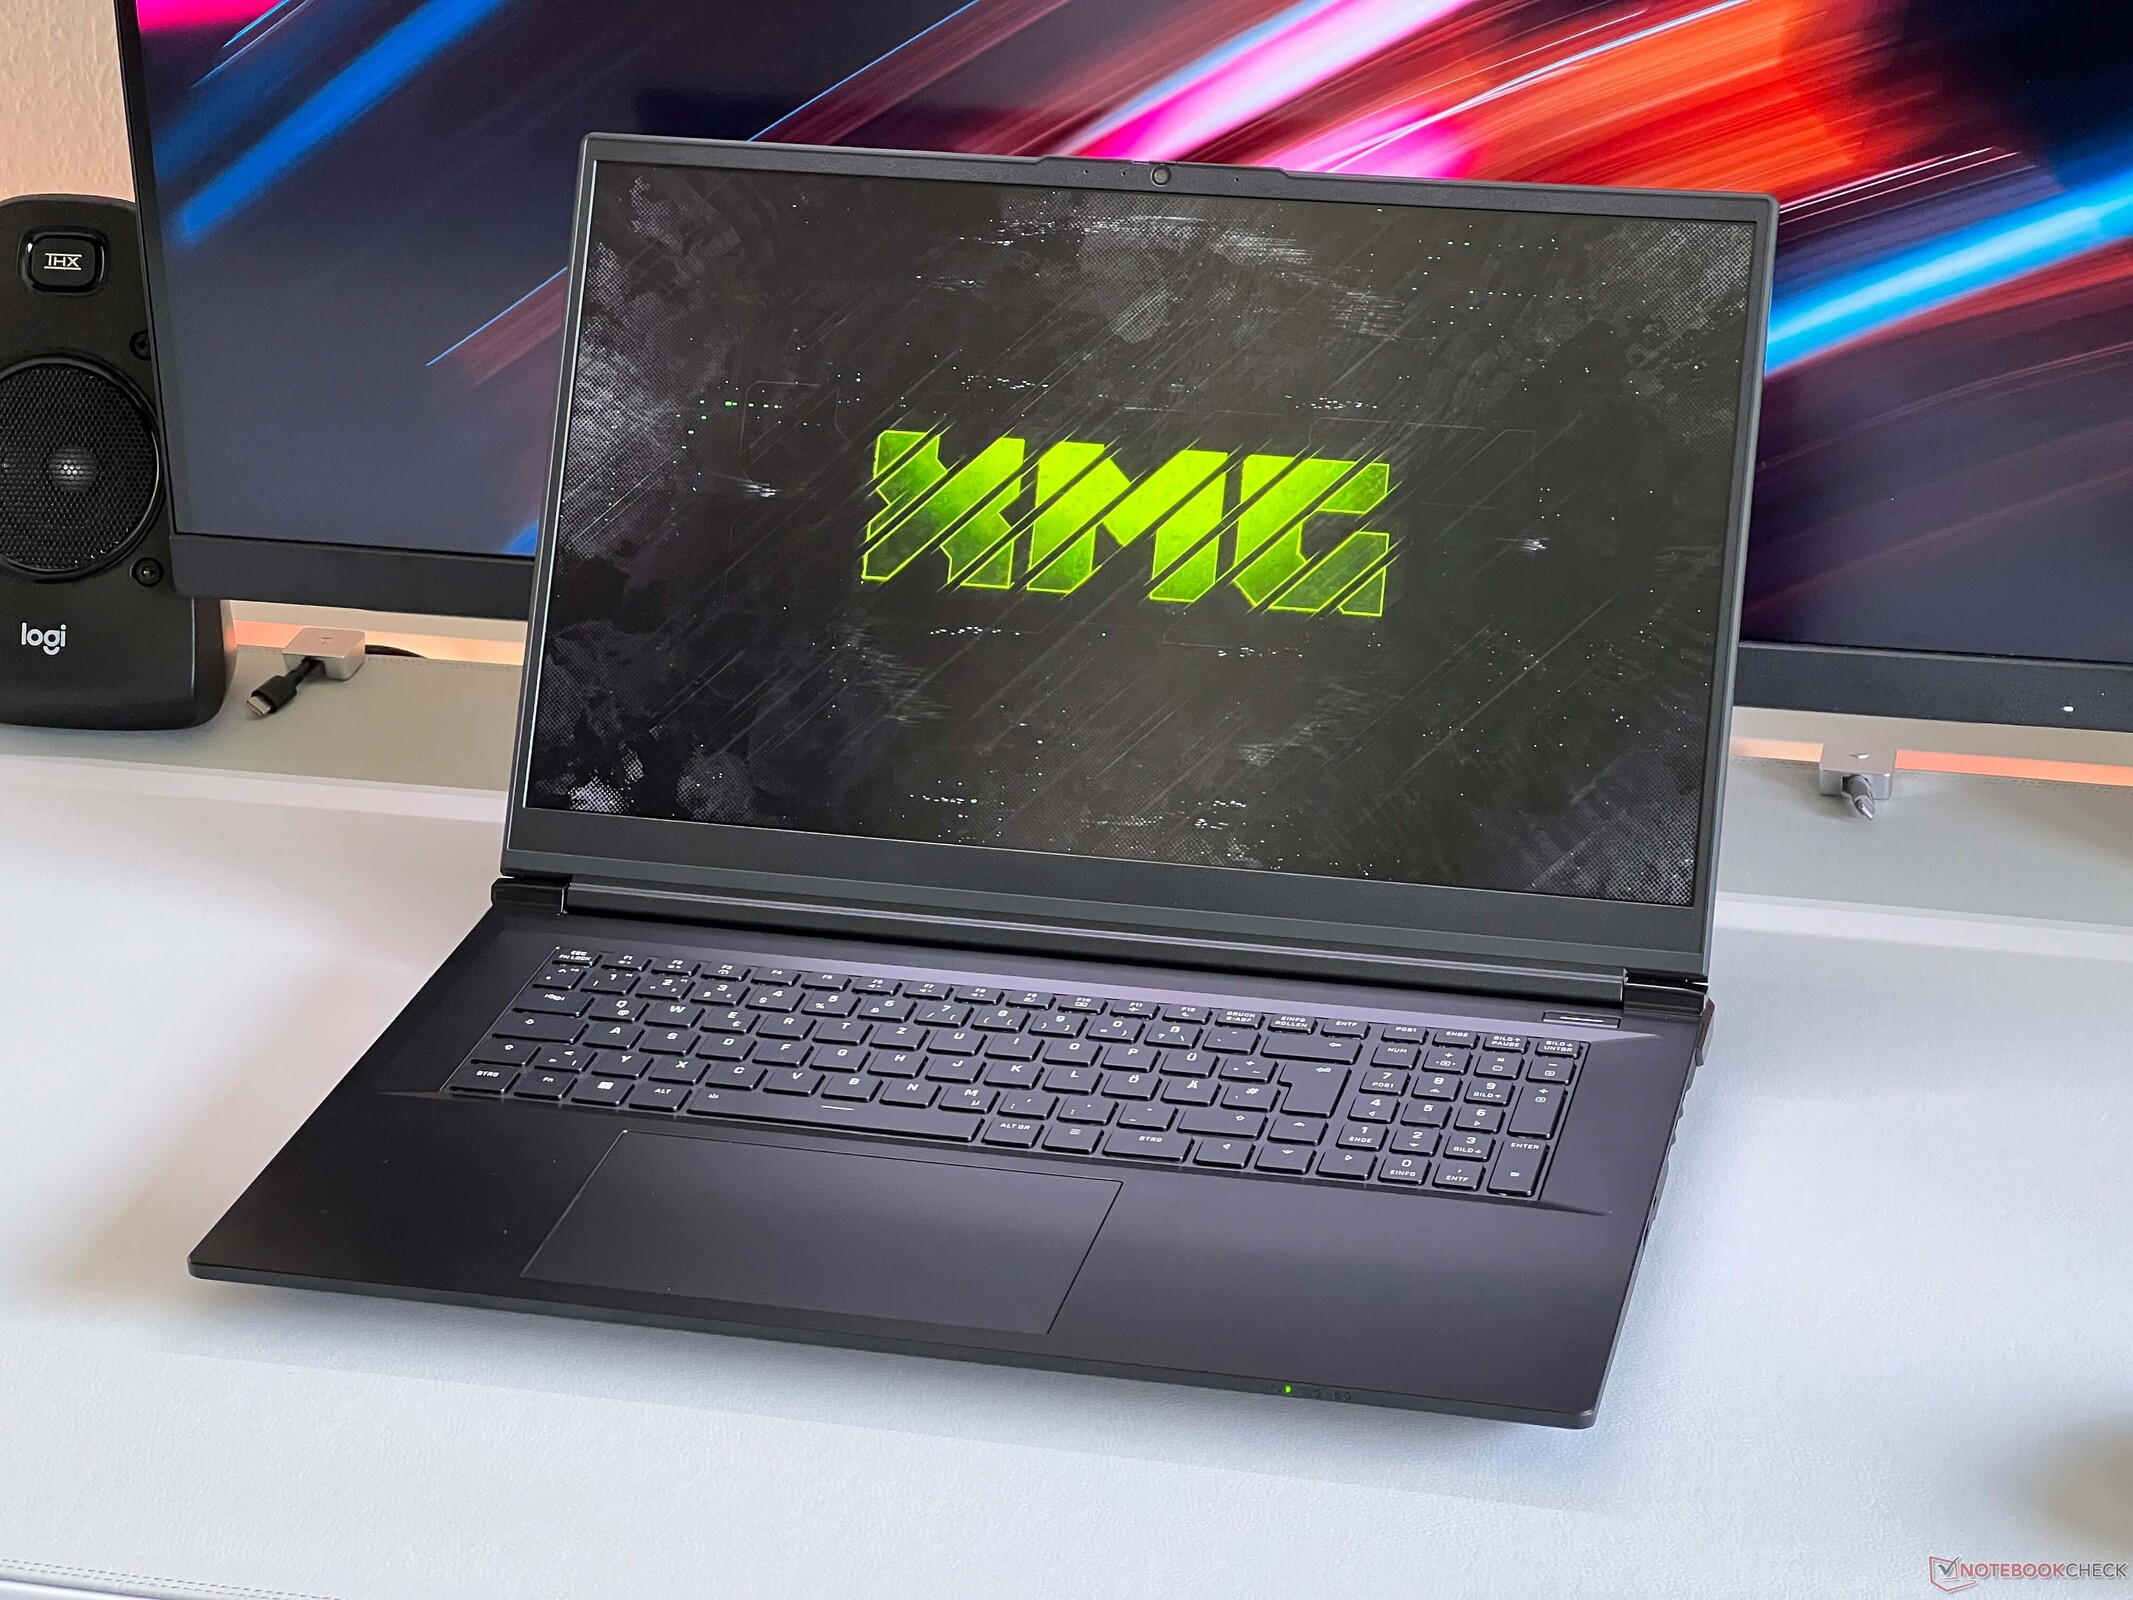
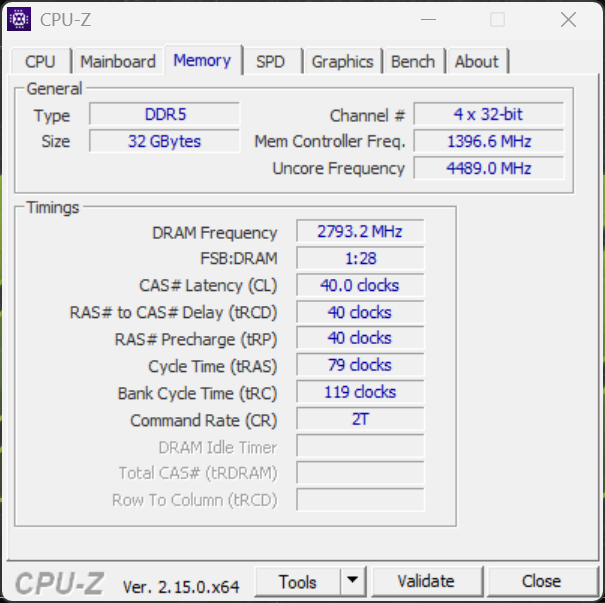
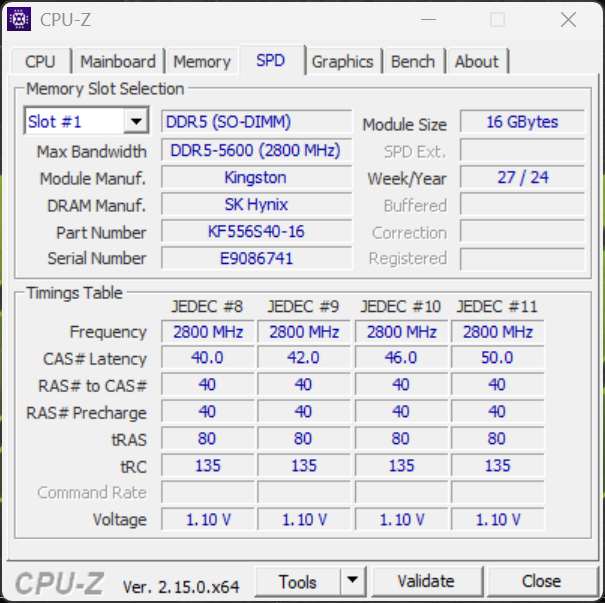
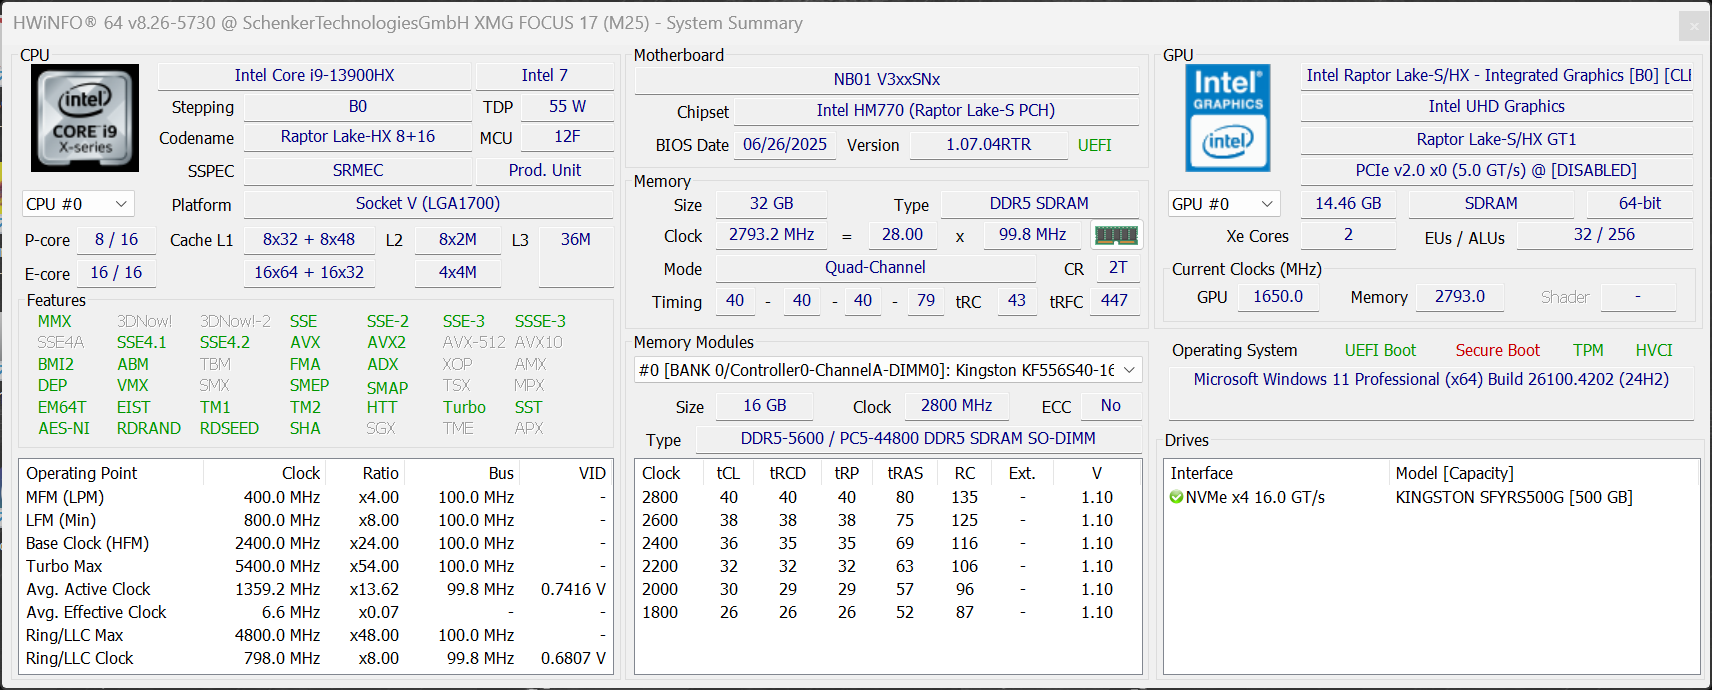
Avec le nouveau Focus 17 M25, XMG propose un ordinateur portable de jeu de 17 pouces qui vise à offrir des performances maximales à un prix bas. Le prix de départ pour le Core i9-13900HX, 16 Go de RAM, un SSD de 1 To et le nouveau GPU pour ordinateur portable GeForce GPU RTX 5070 Ti pour ordinateur portable (140 watts) est de 1 849 € (2 100 $), tandis que notre configuration avec 32 Go de RAM, Wi-Fi 7 et Windows 11 Home s'élève à 1 990 € (2 300 $).
Il n'y a guère de véritable concurrent pour le 17 pouces, puisque le MSI Vector 17 HX équipé de la RTX 5070 Ti est actuellement disponible pour environ 3 100 € (3 600 $). Il existe plusieurs appareils comparables dans le segment des 16 pouces, mais c'est aussi un domaine où le Focus 17 bénéficie d'un avantage de prix.
Spécifications
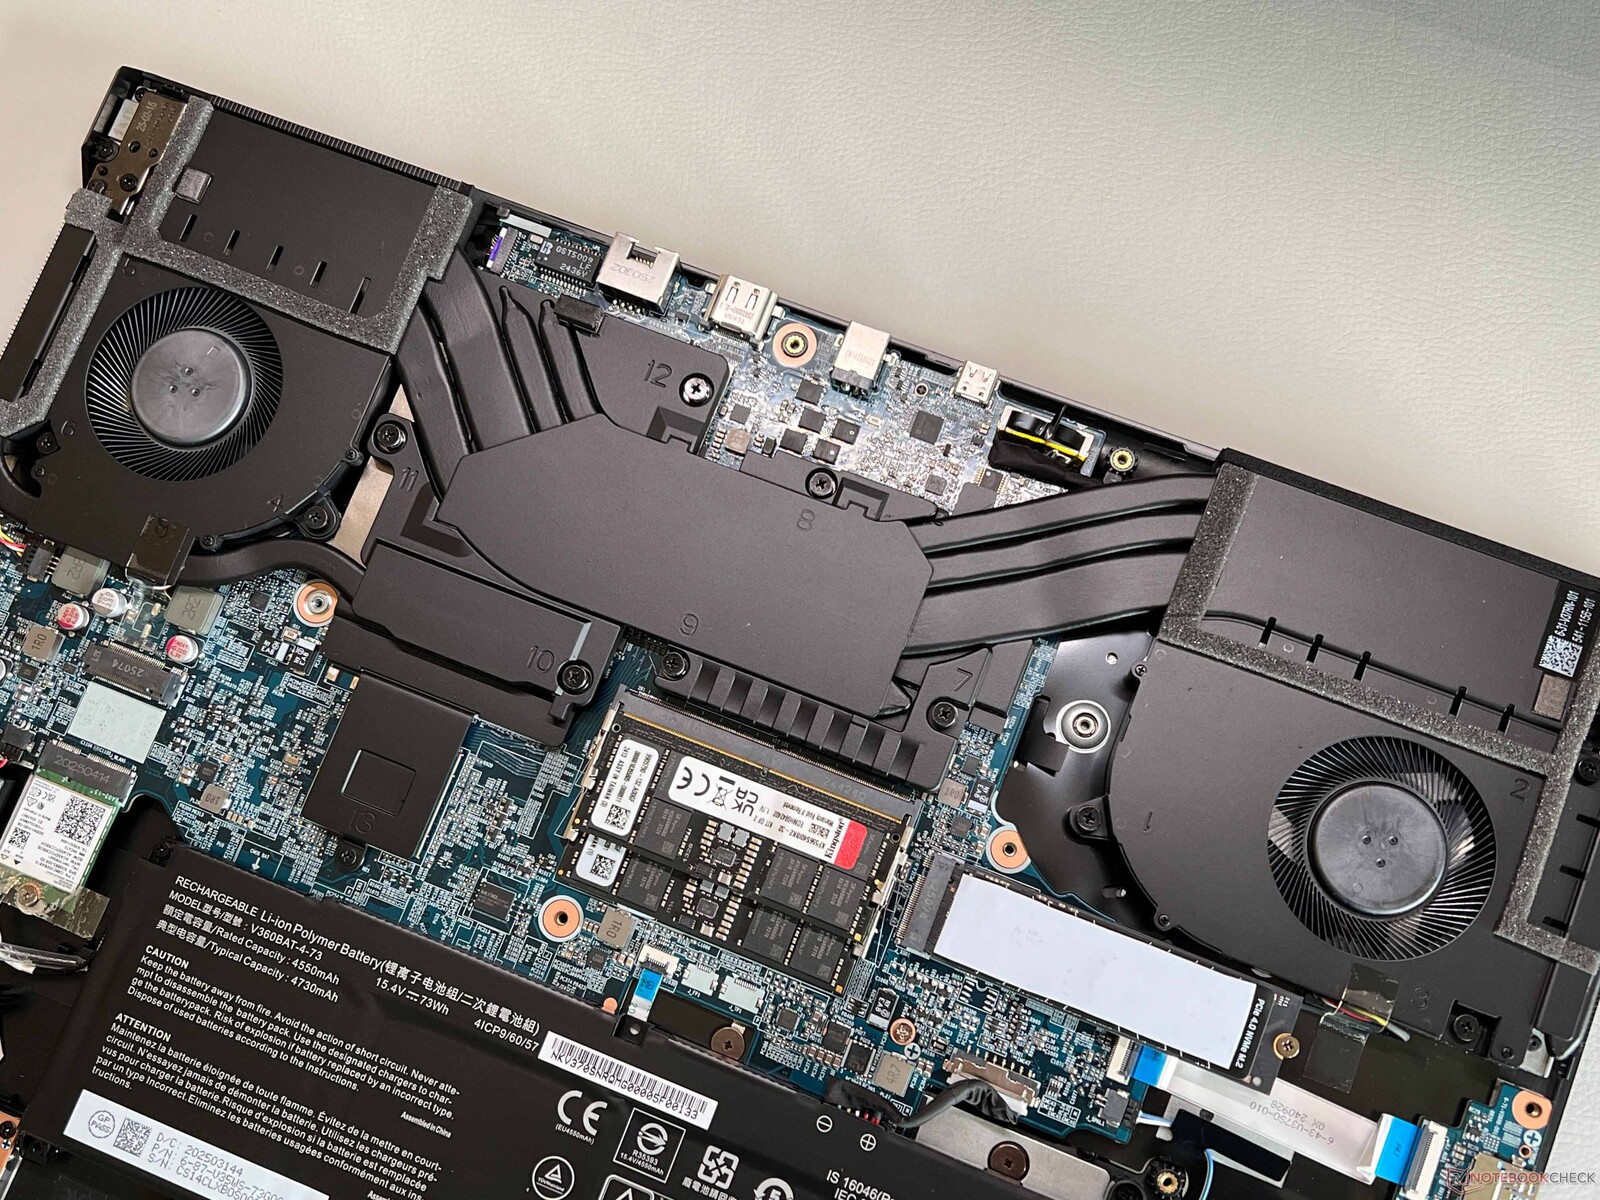
Boîtier et caractéristiques
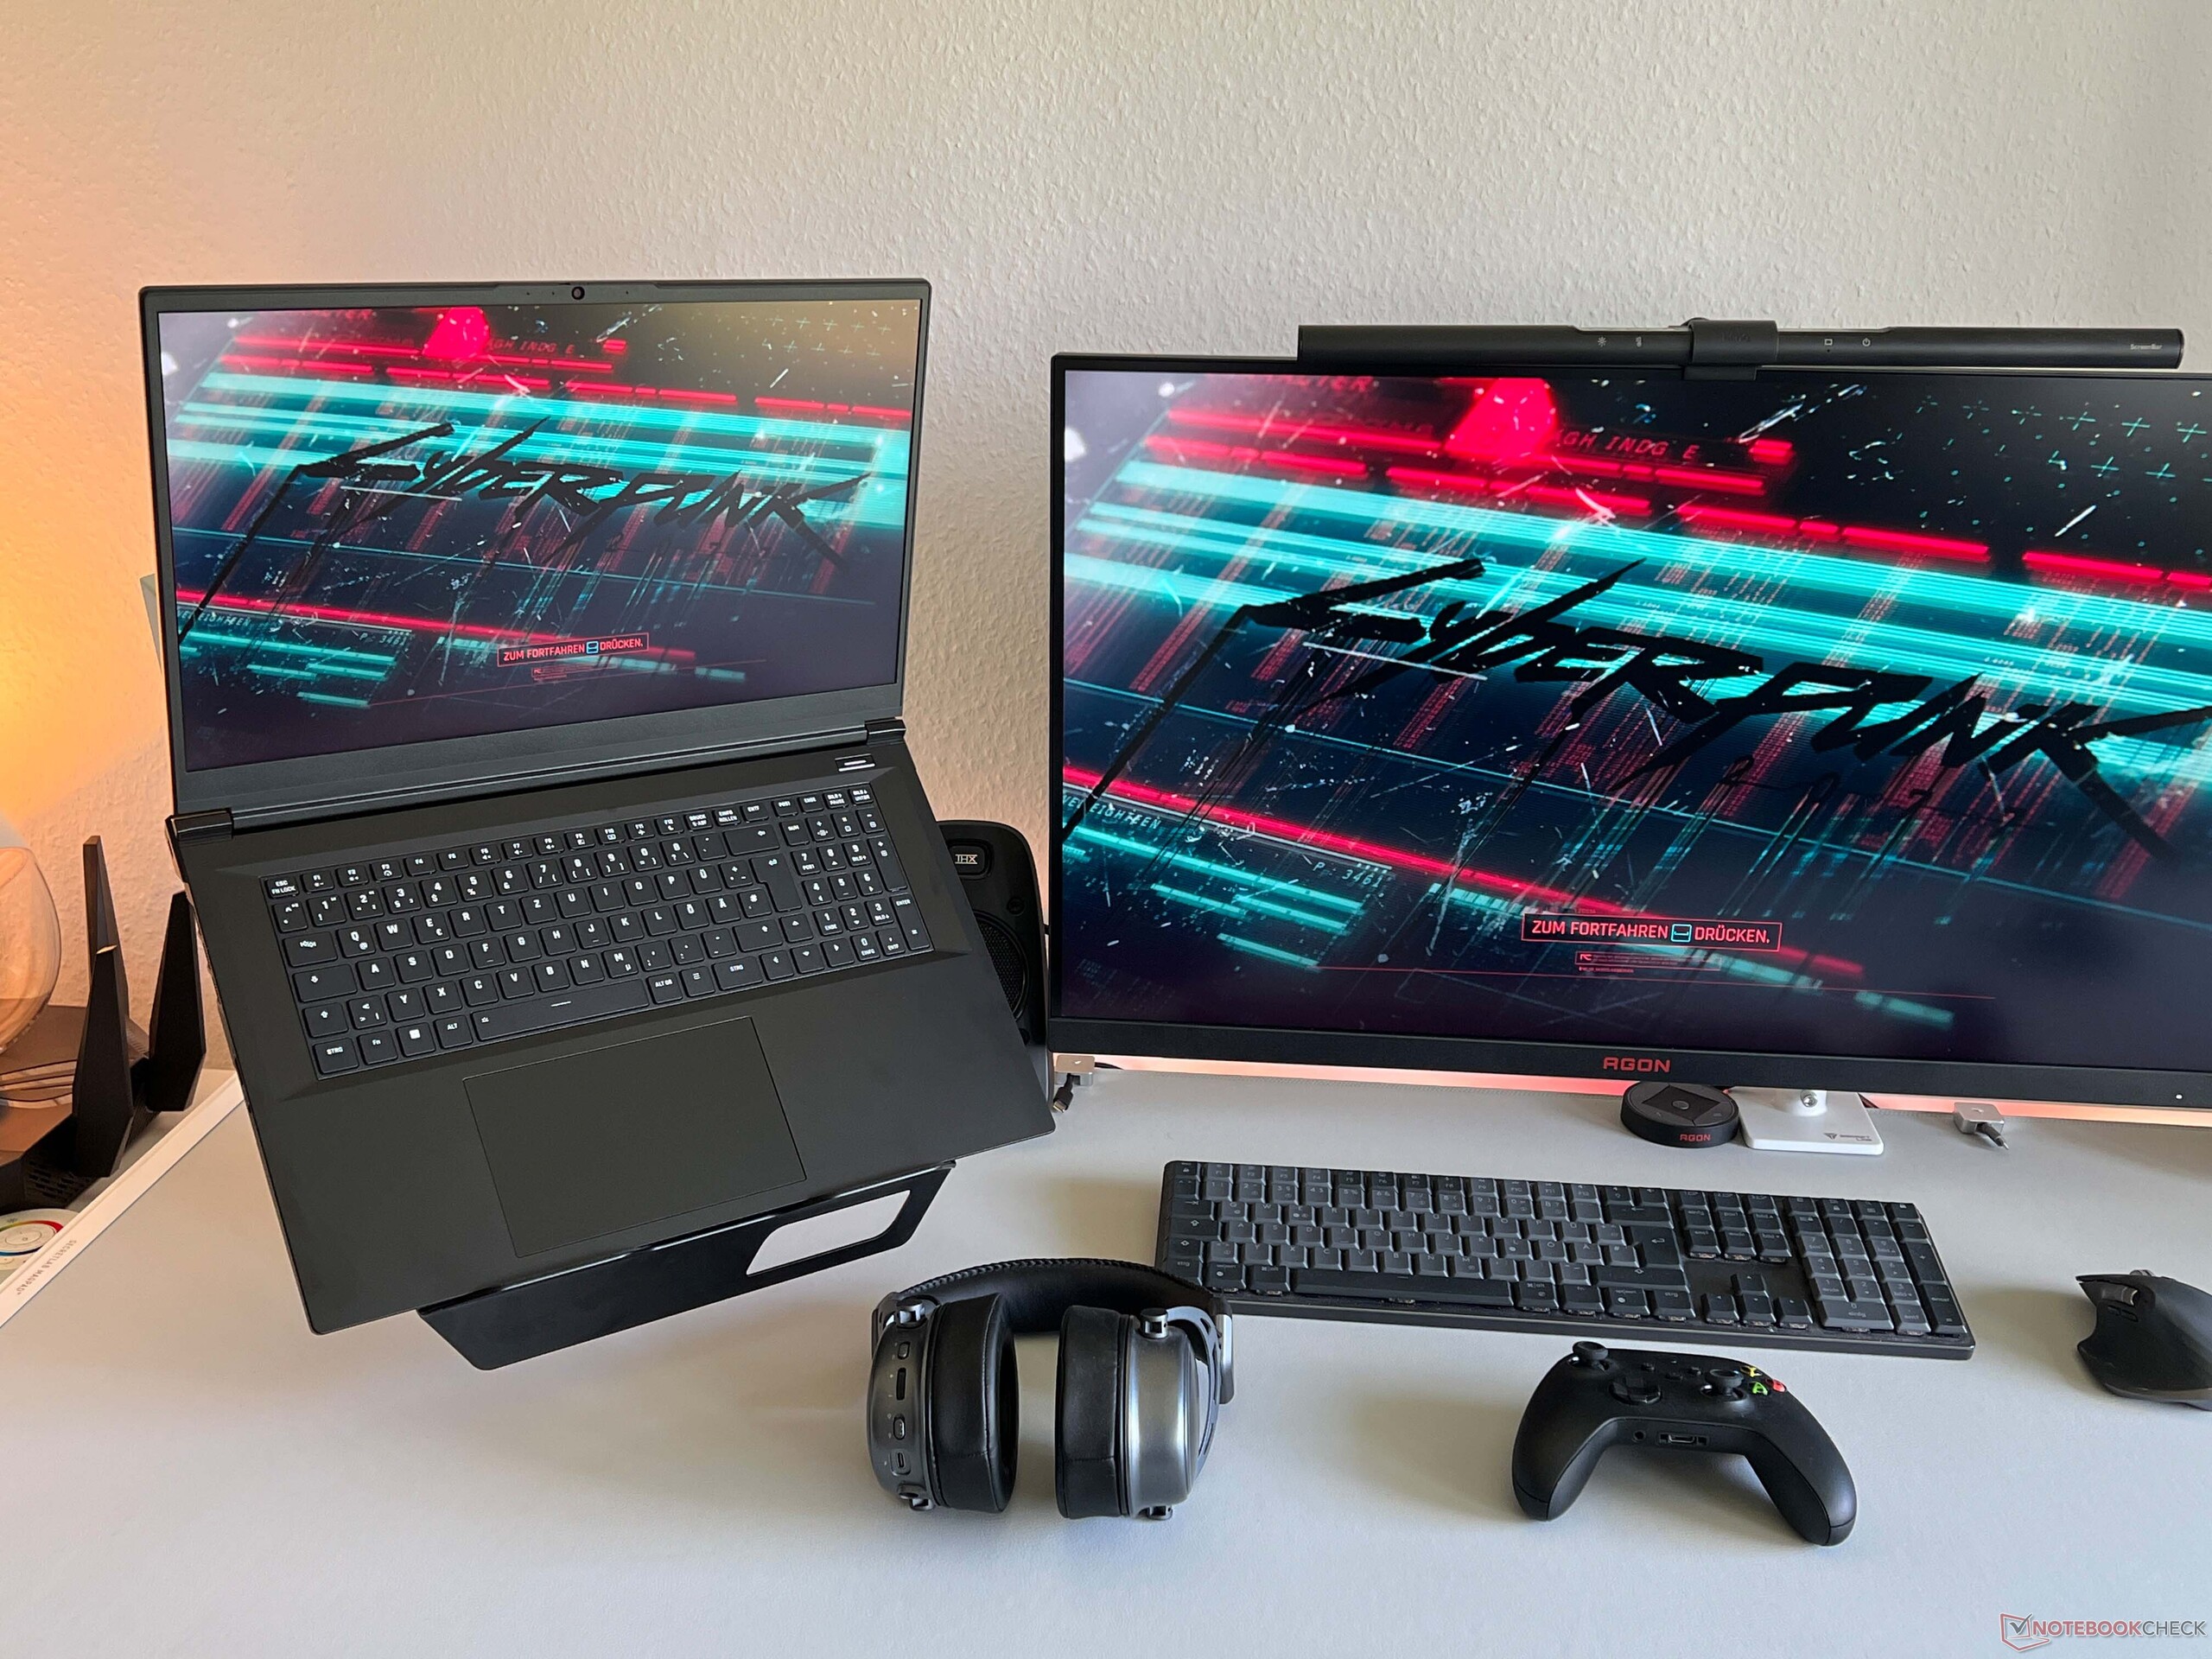
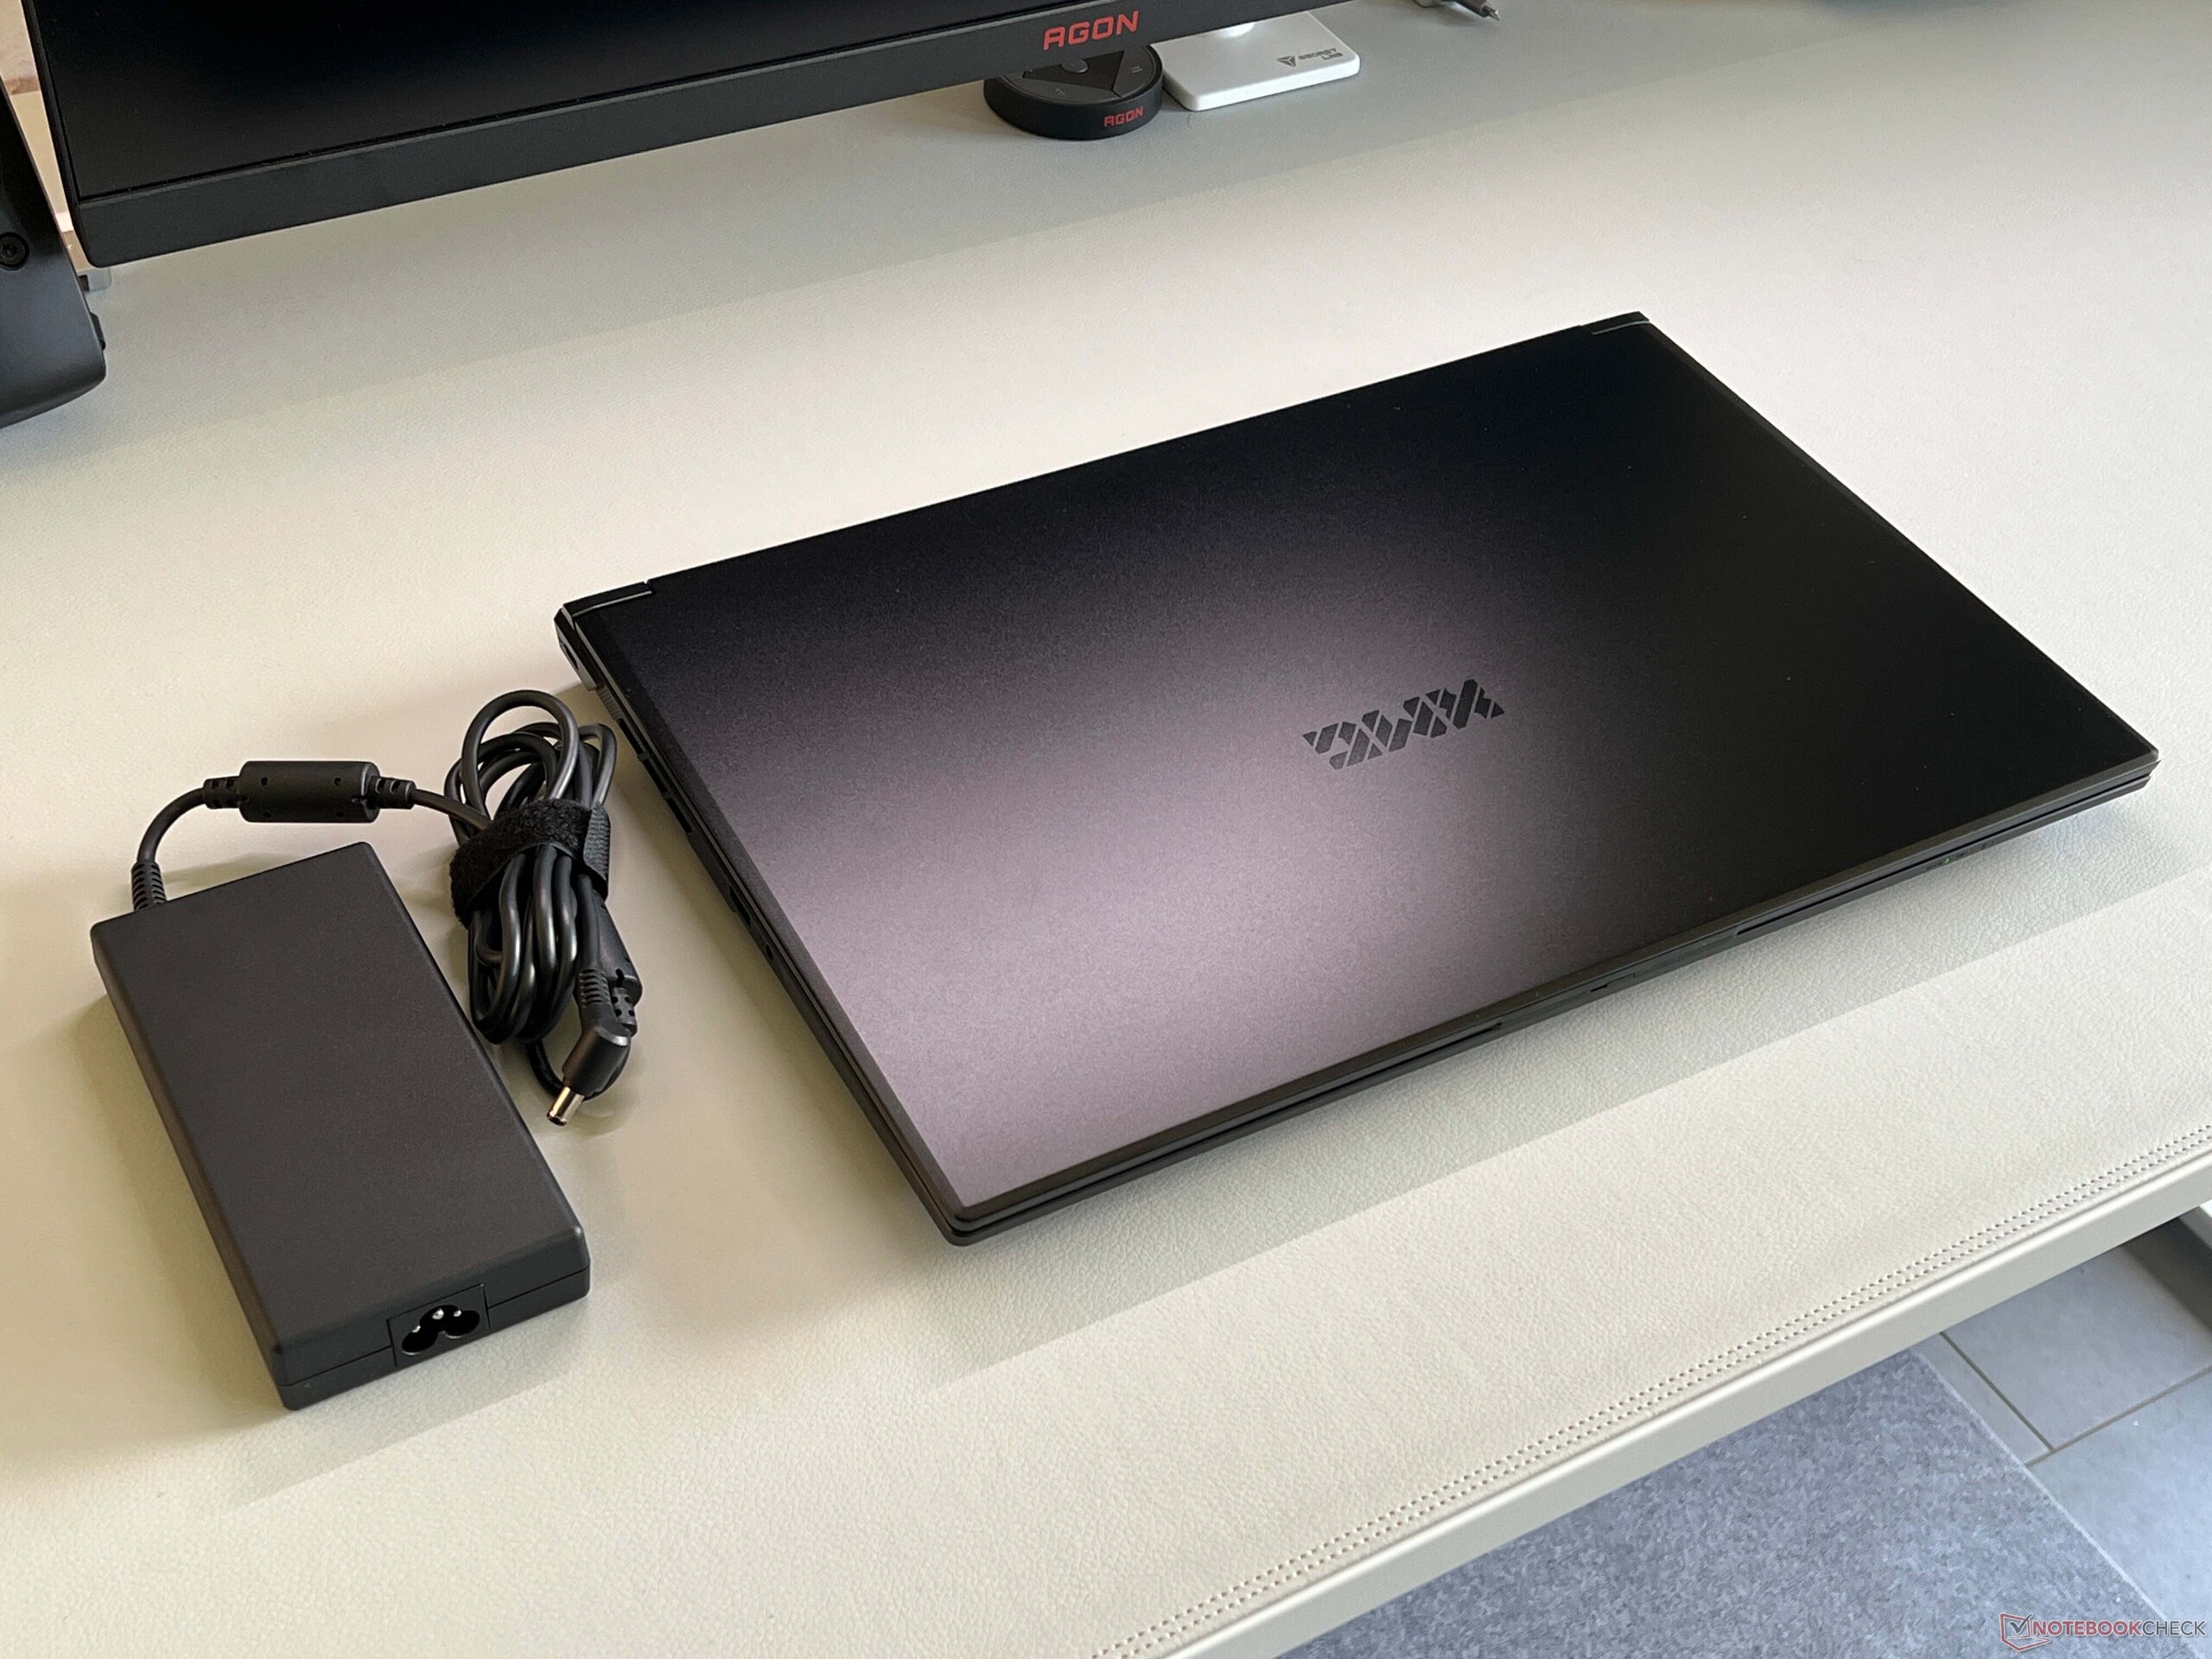
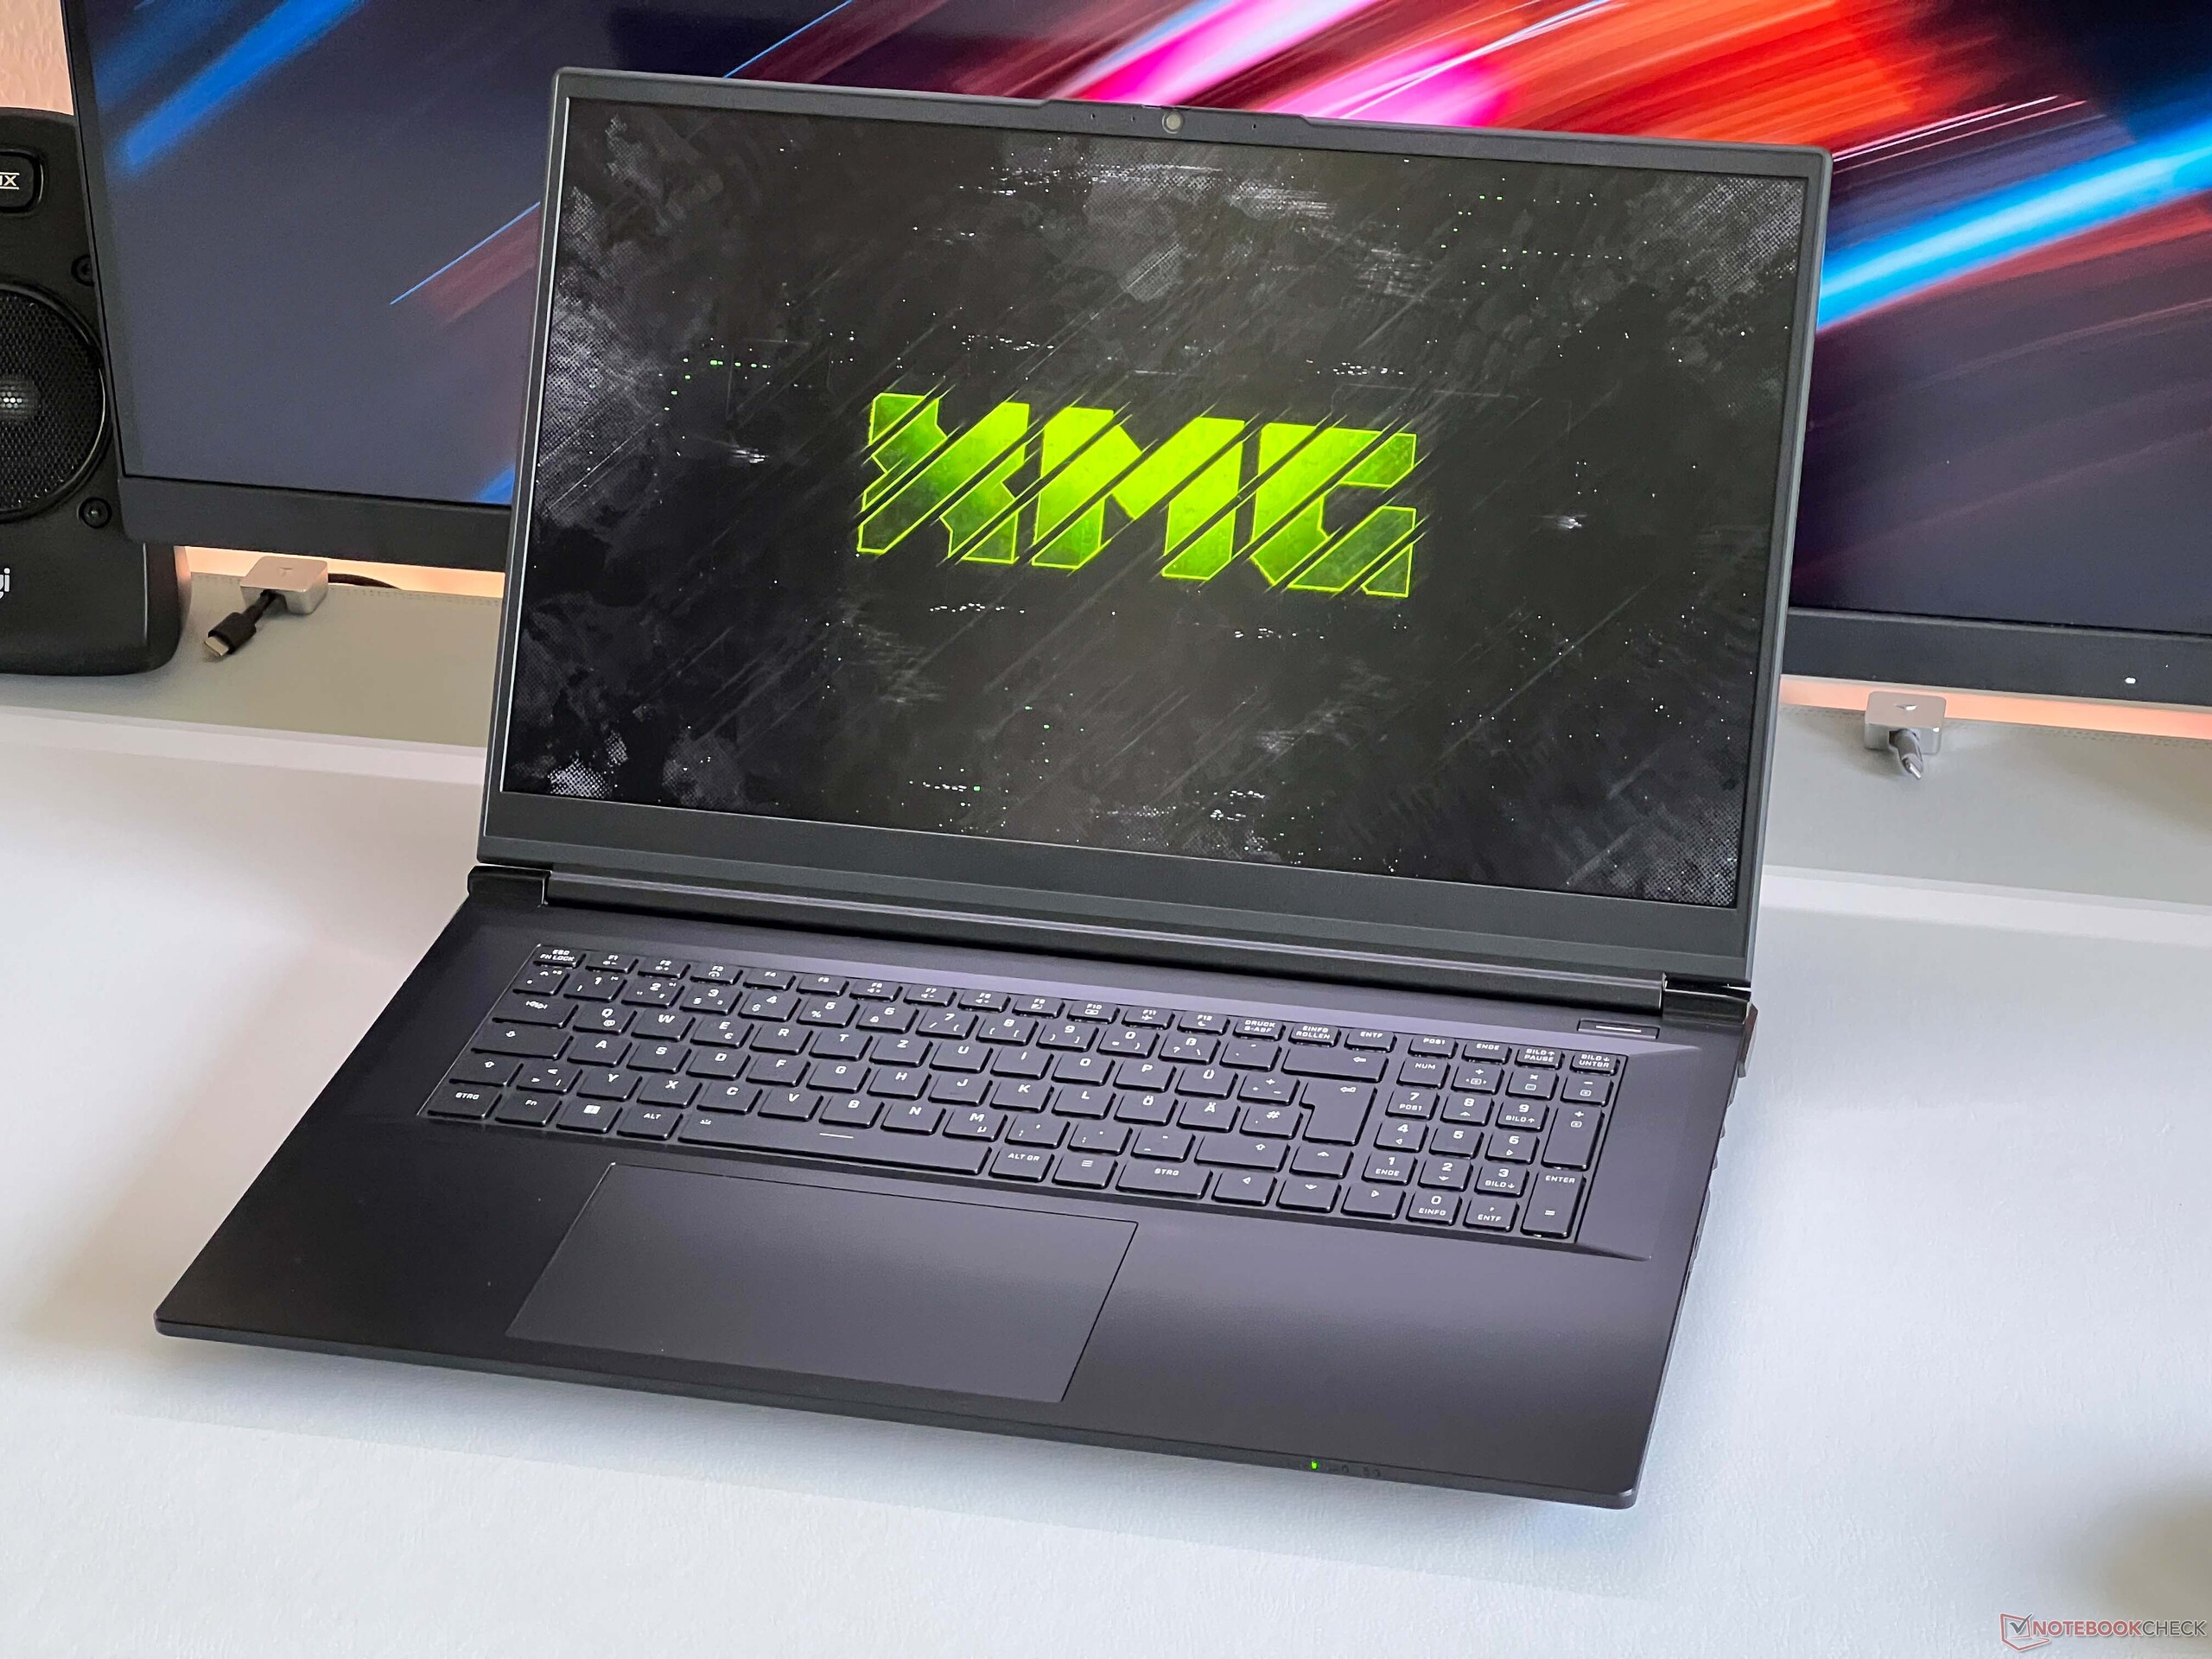
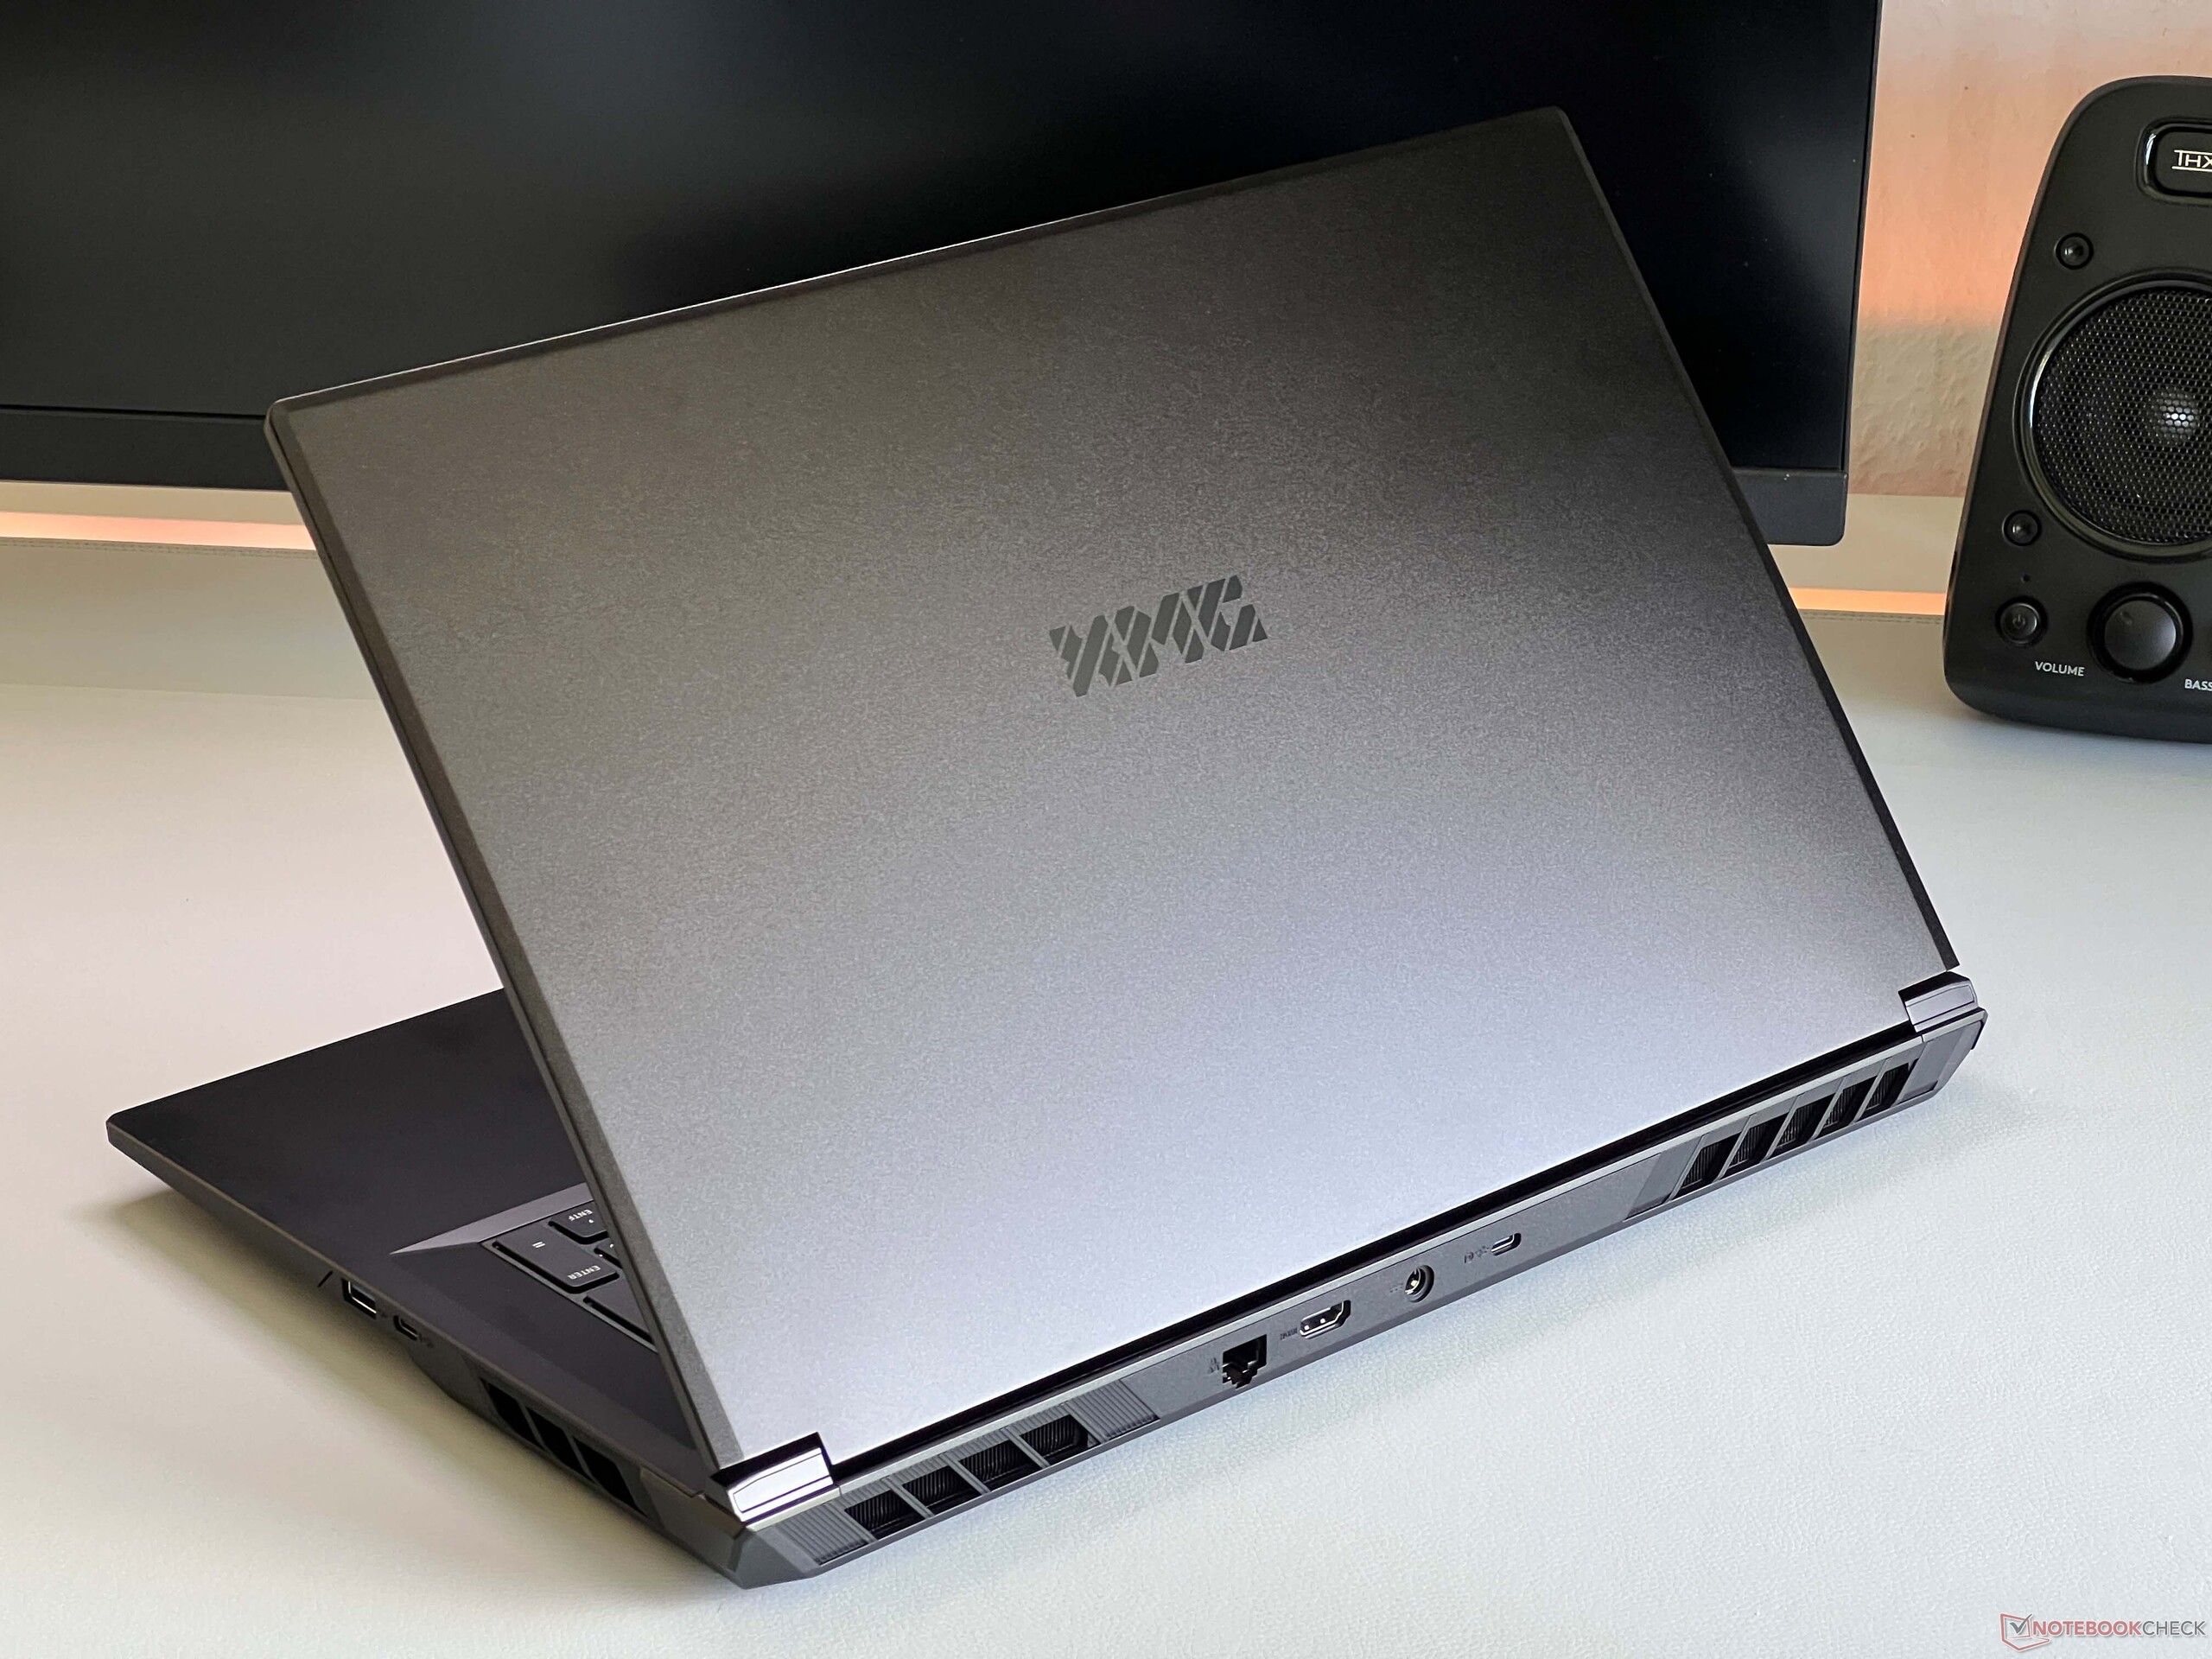
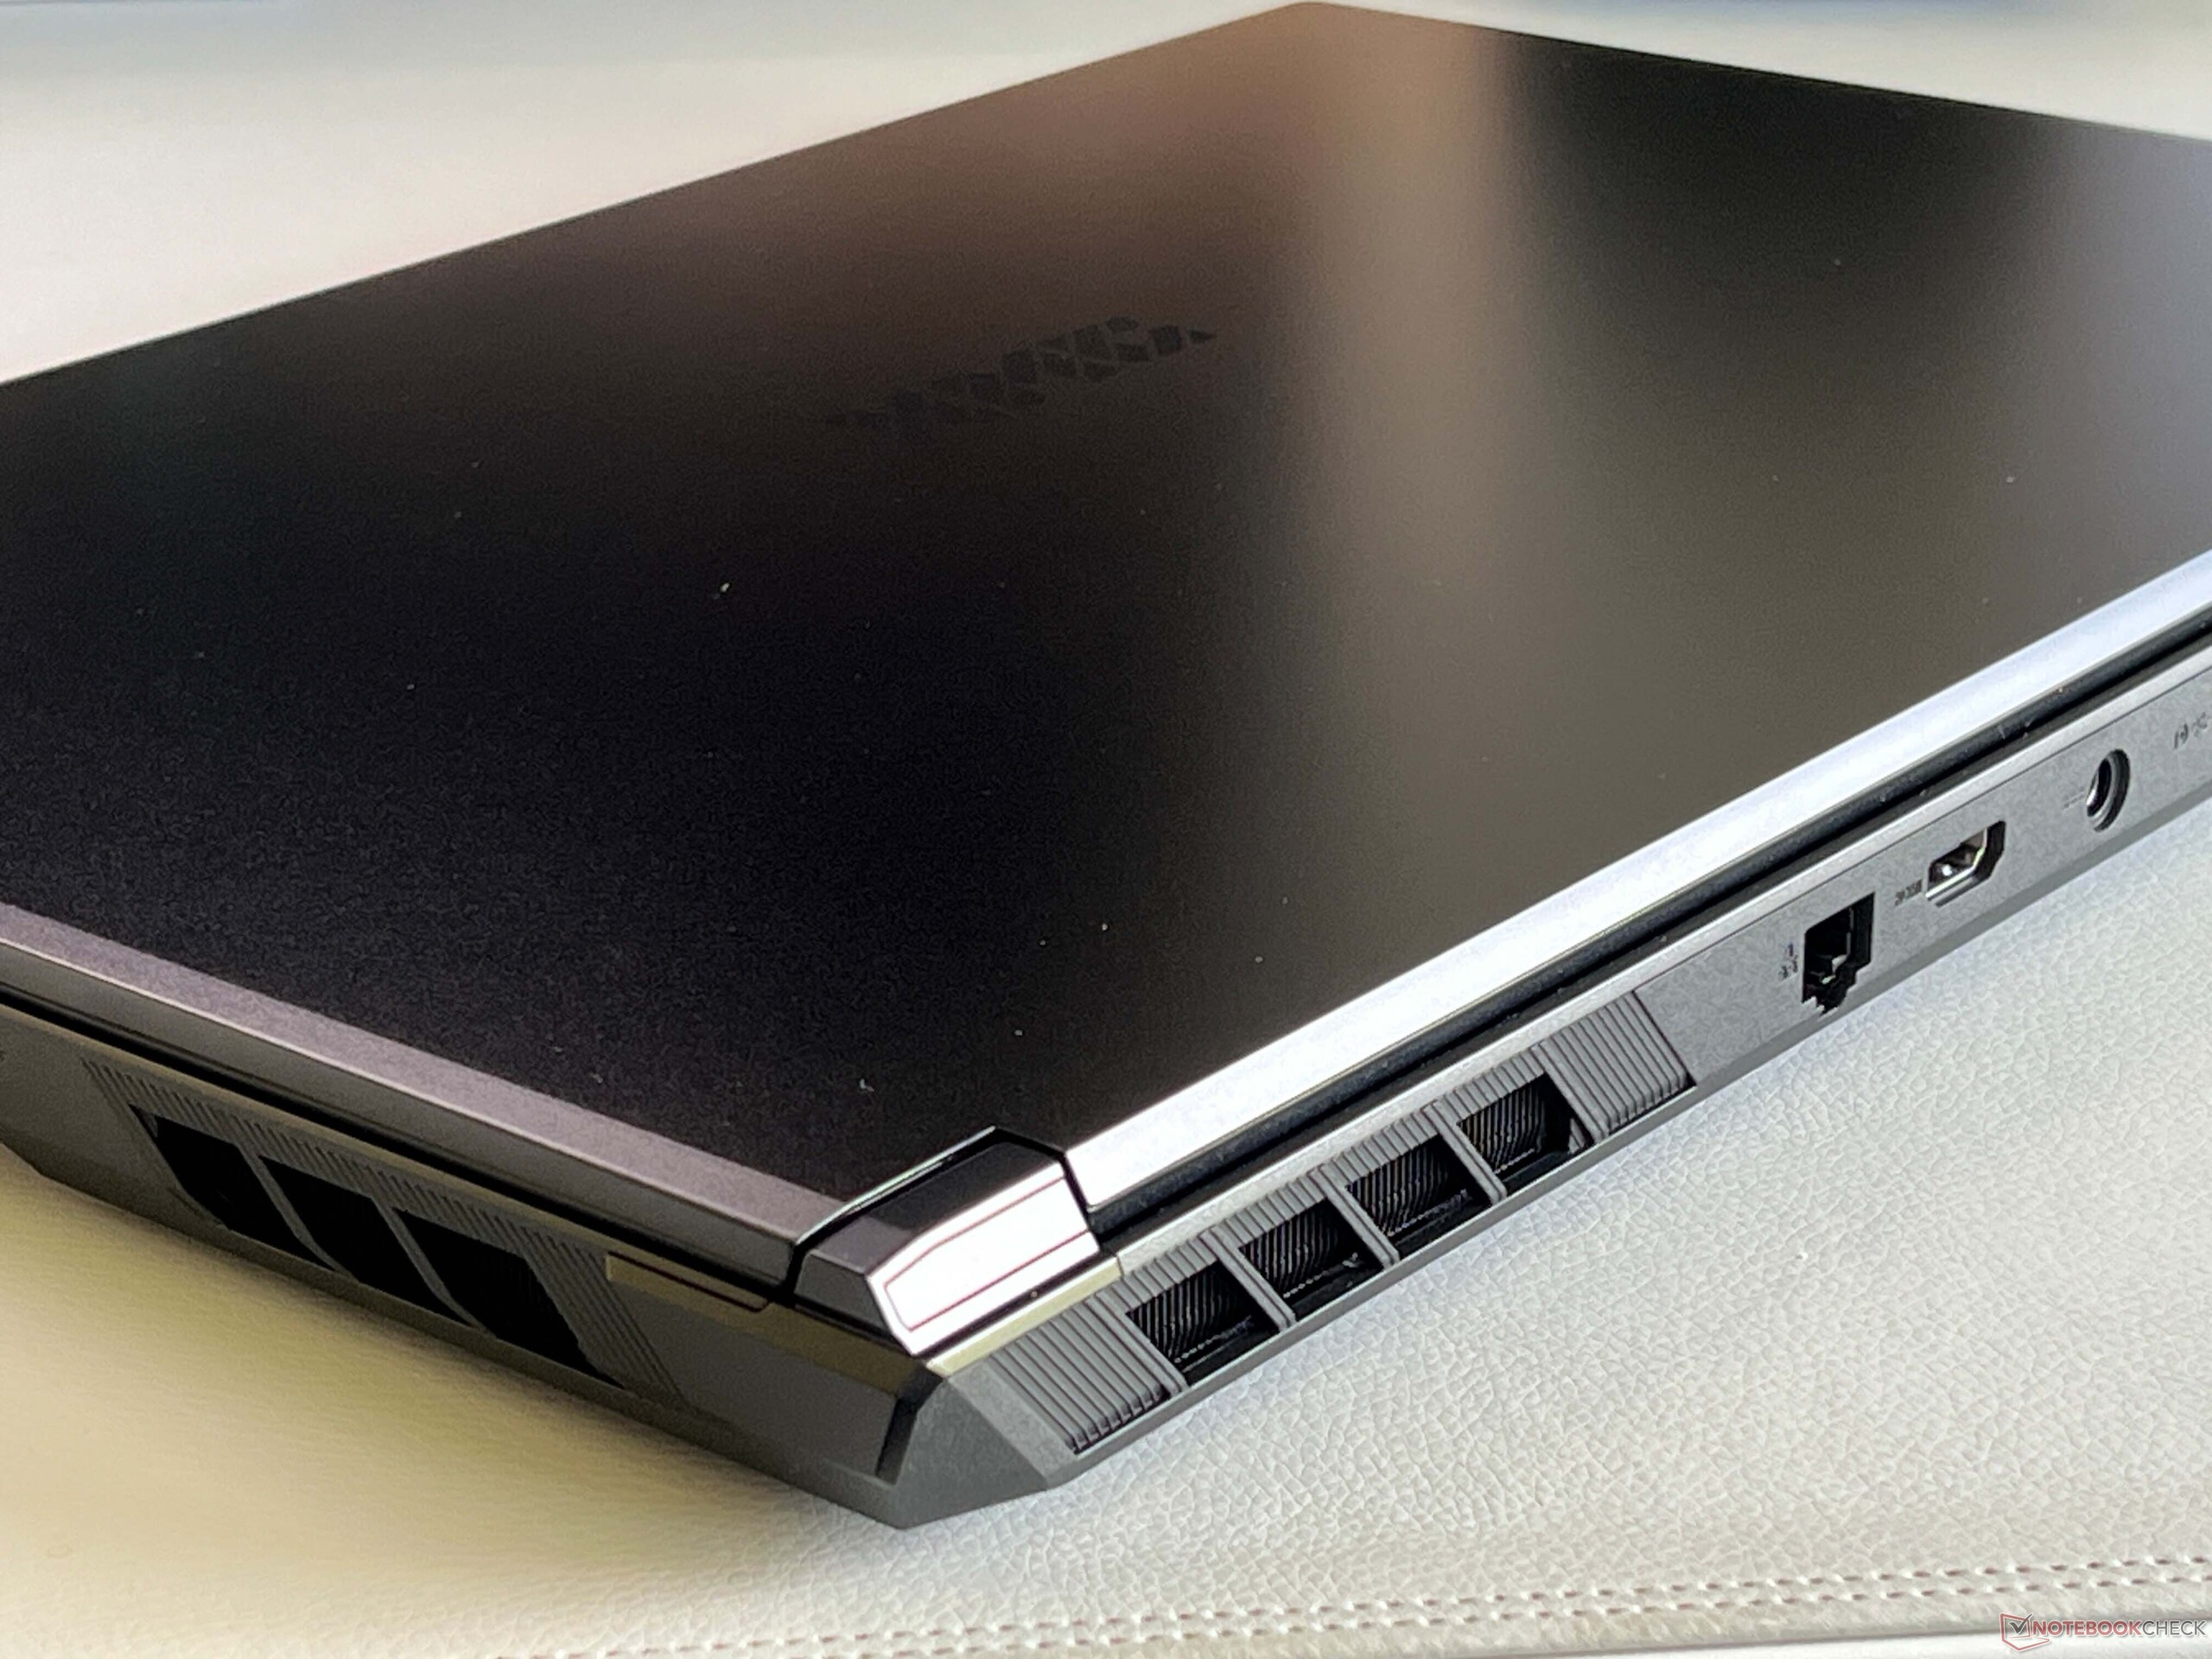
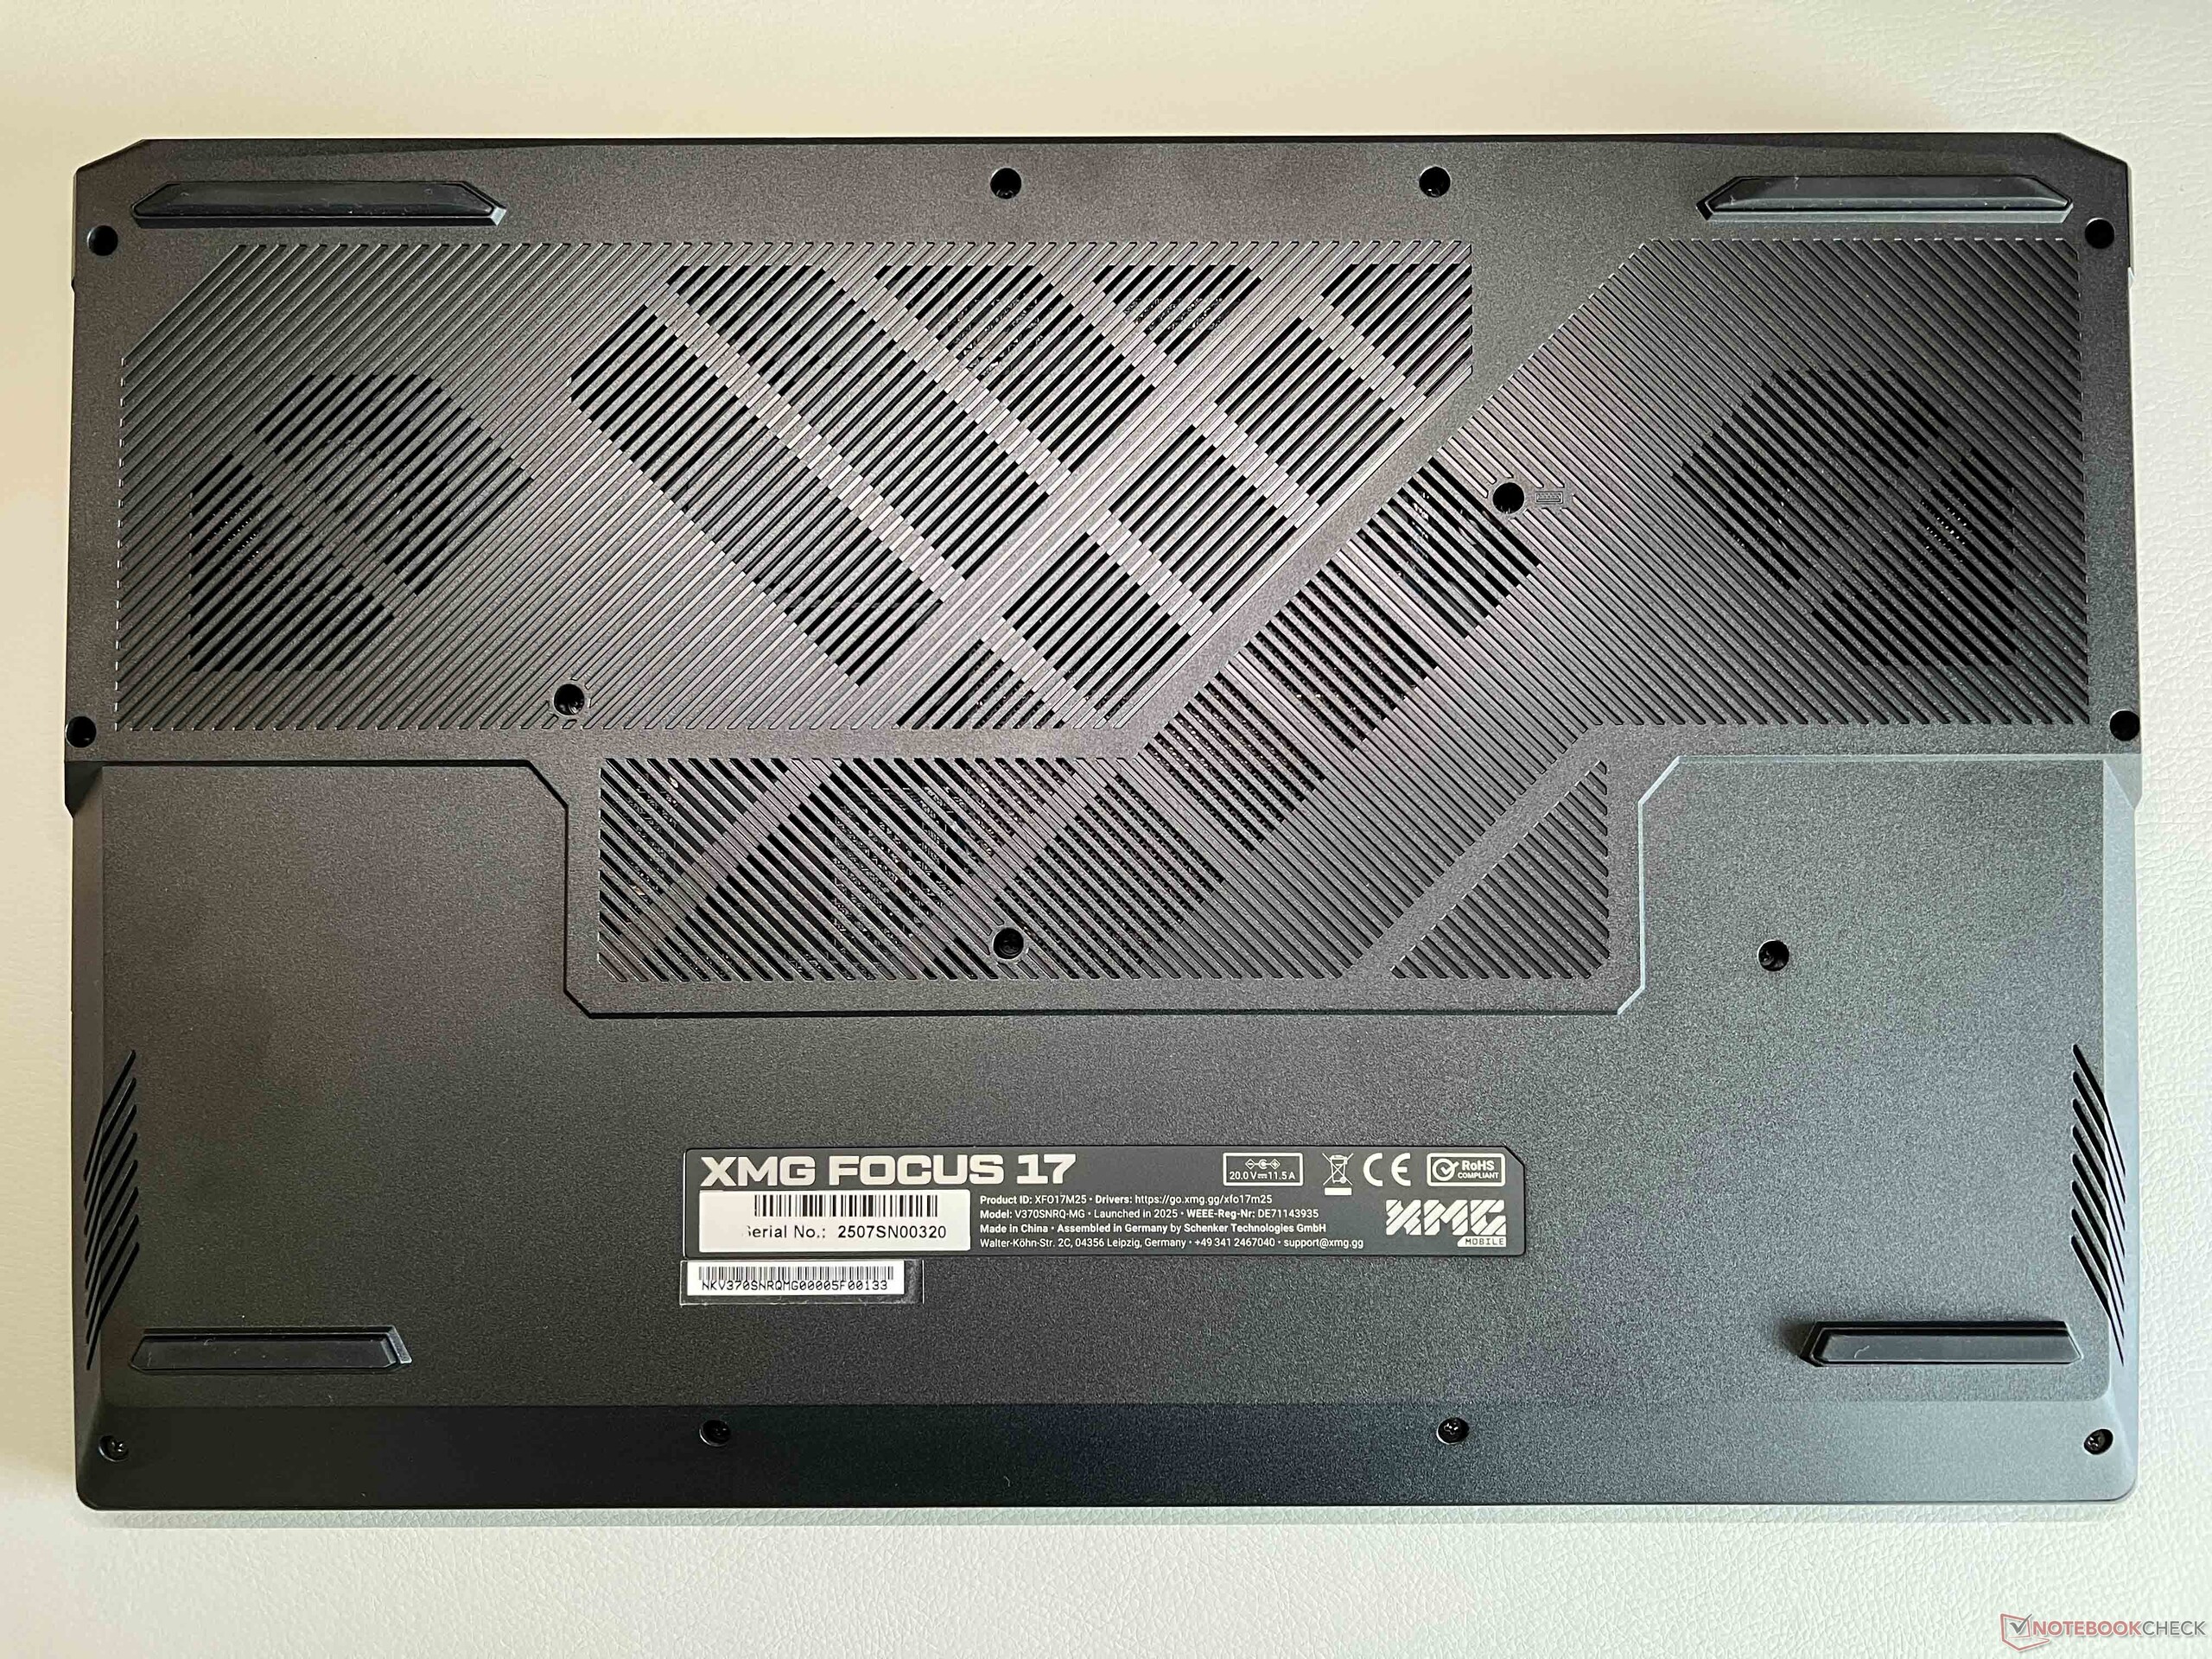
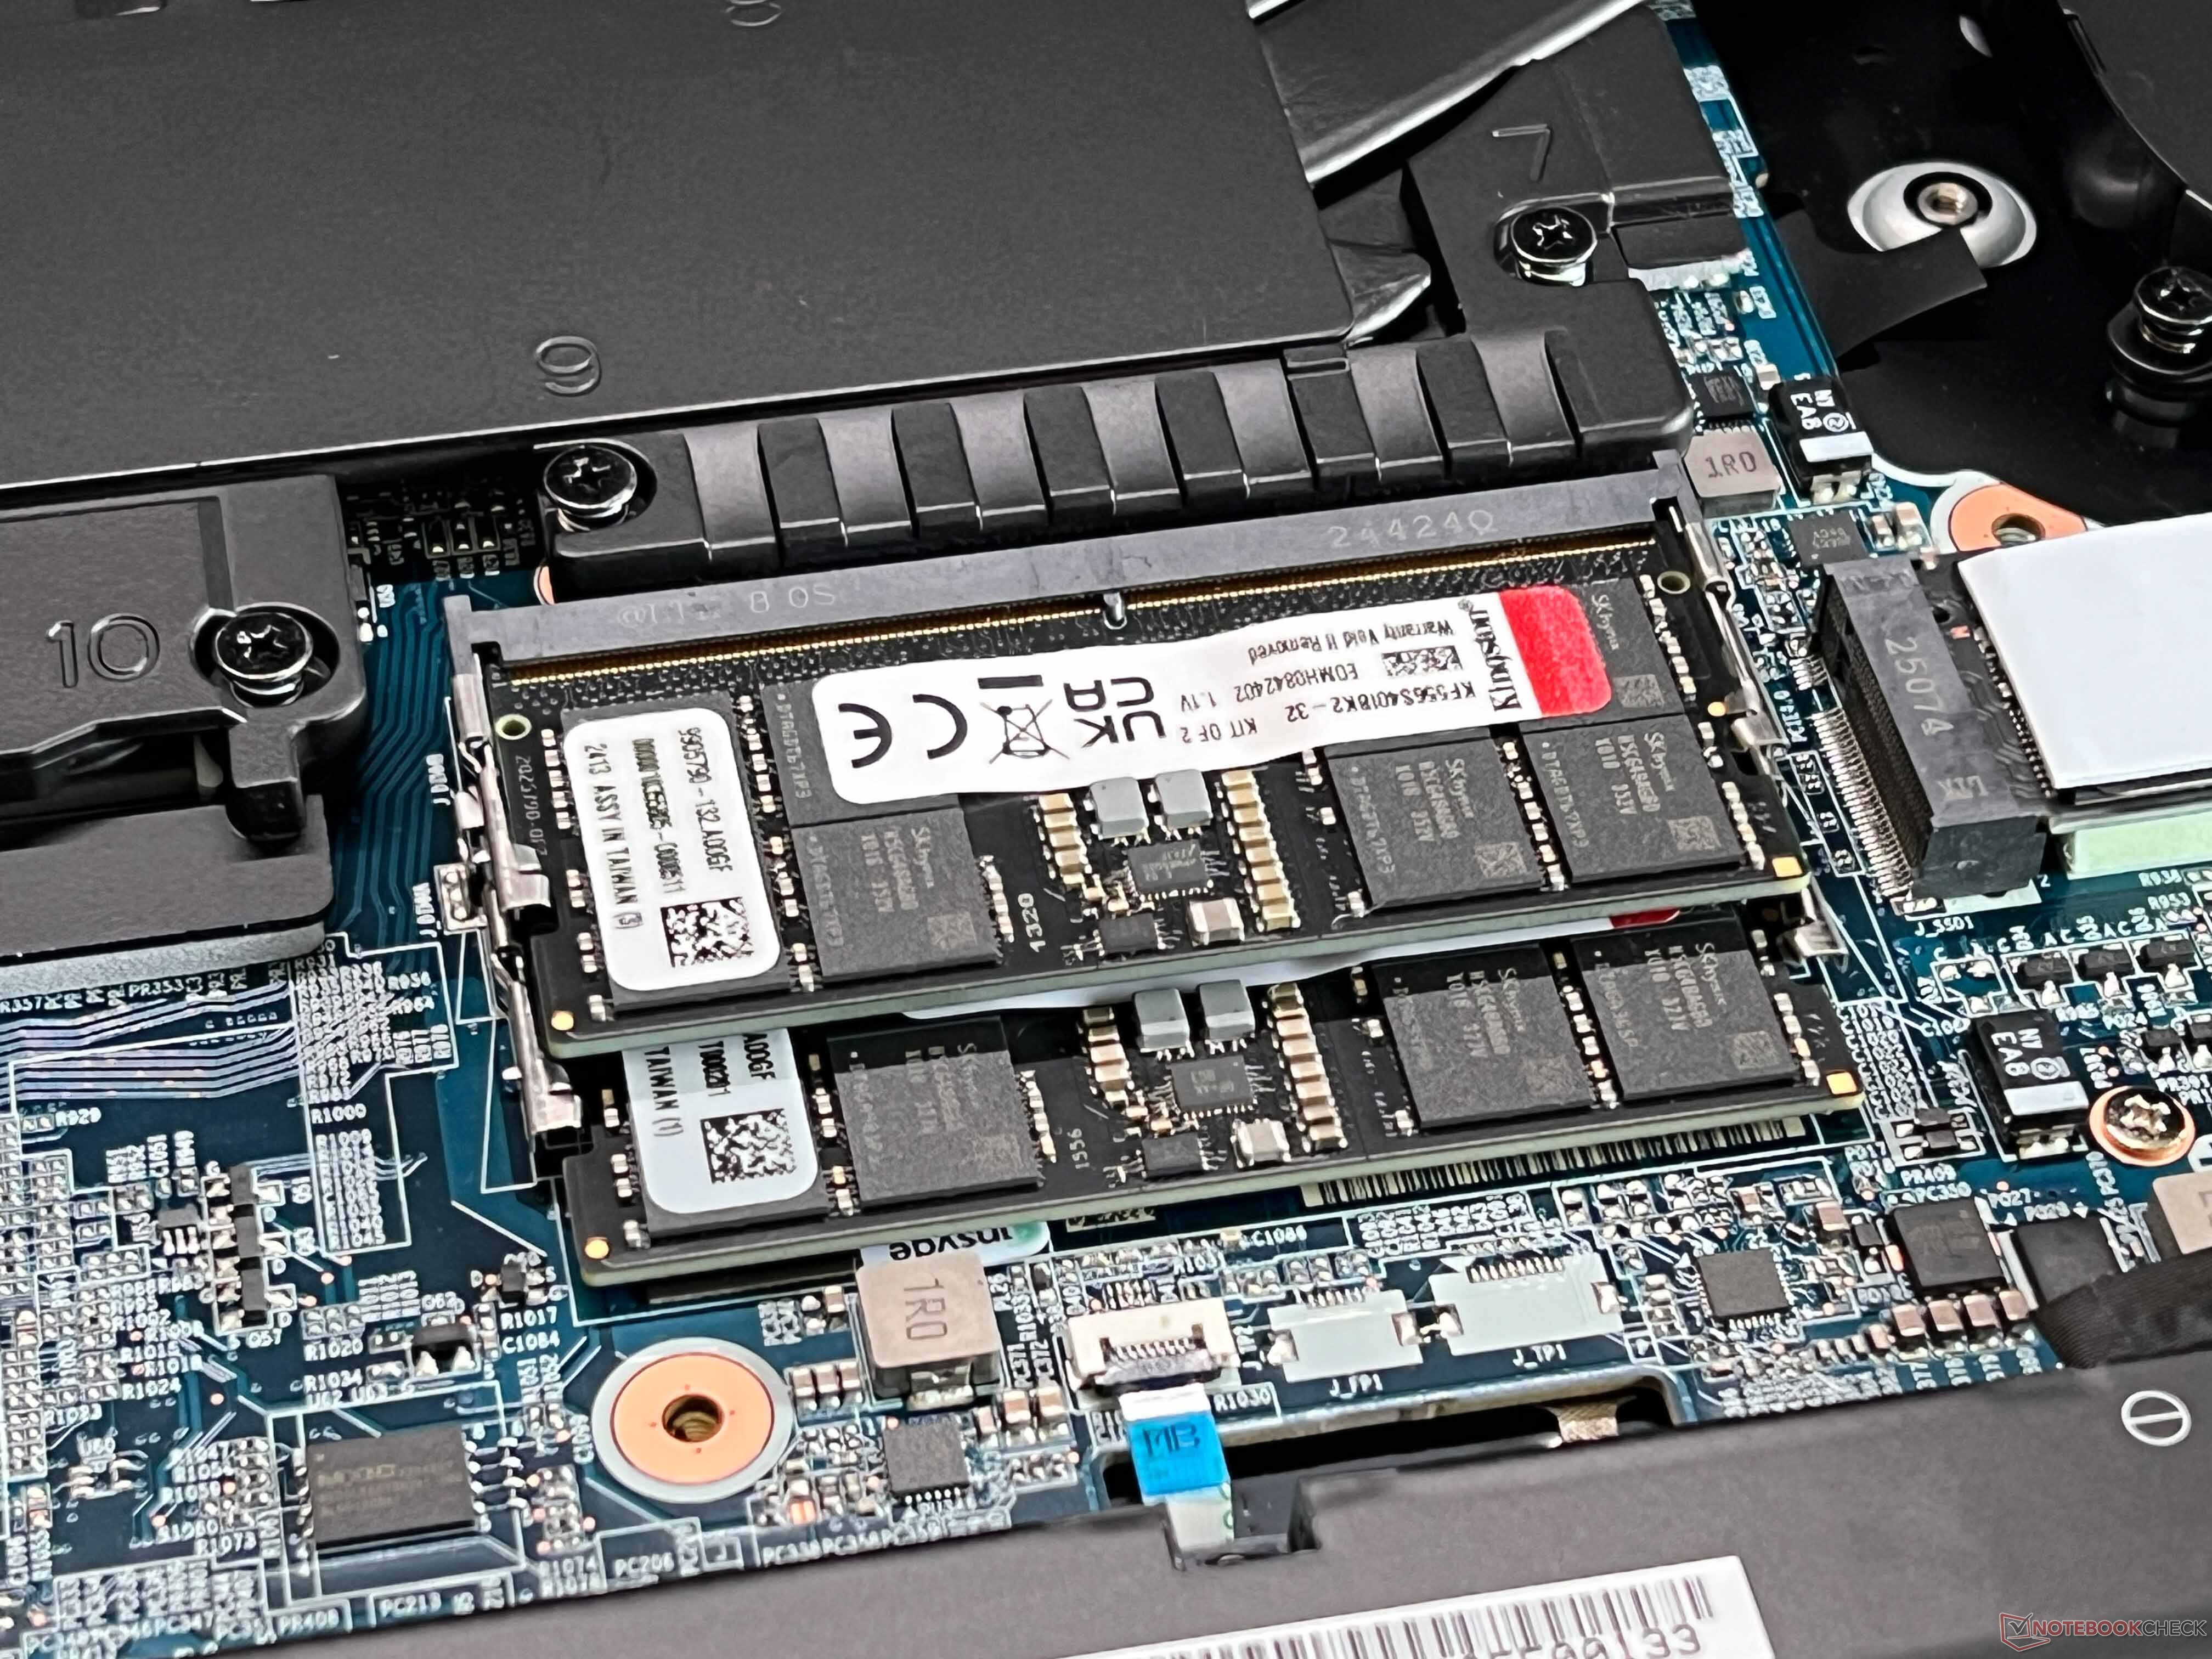
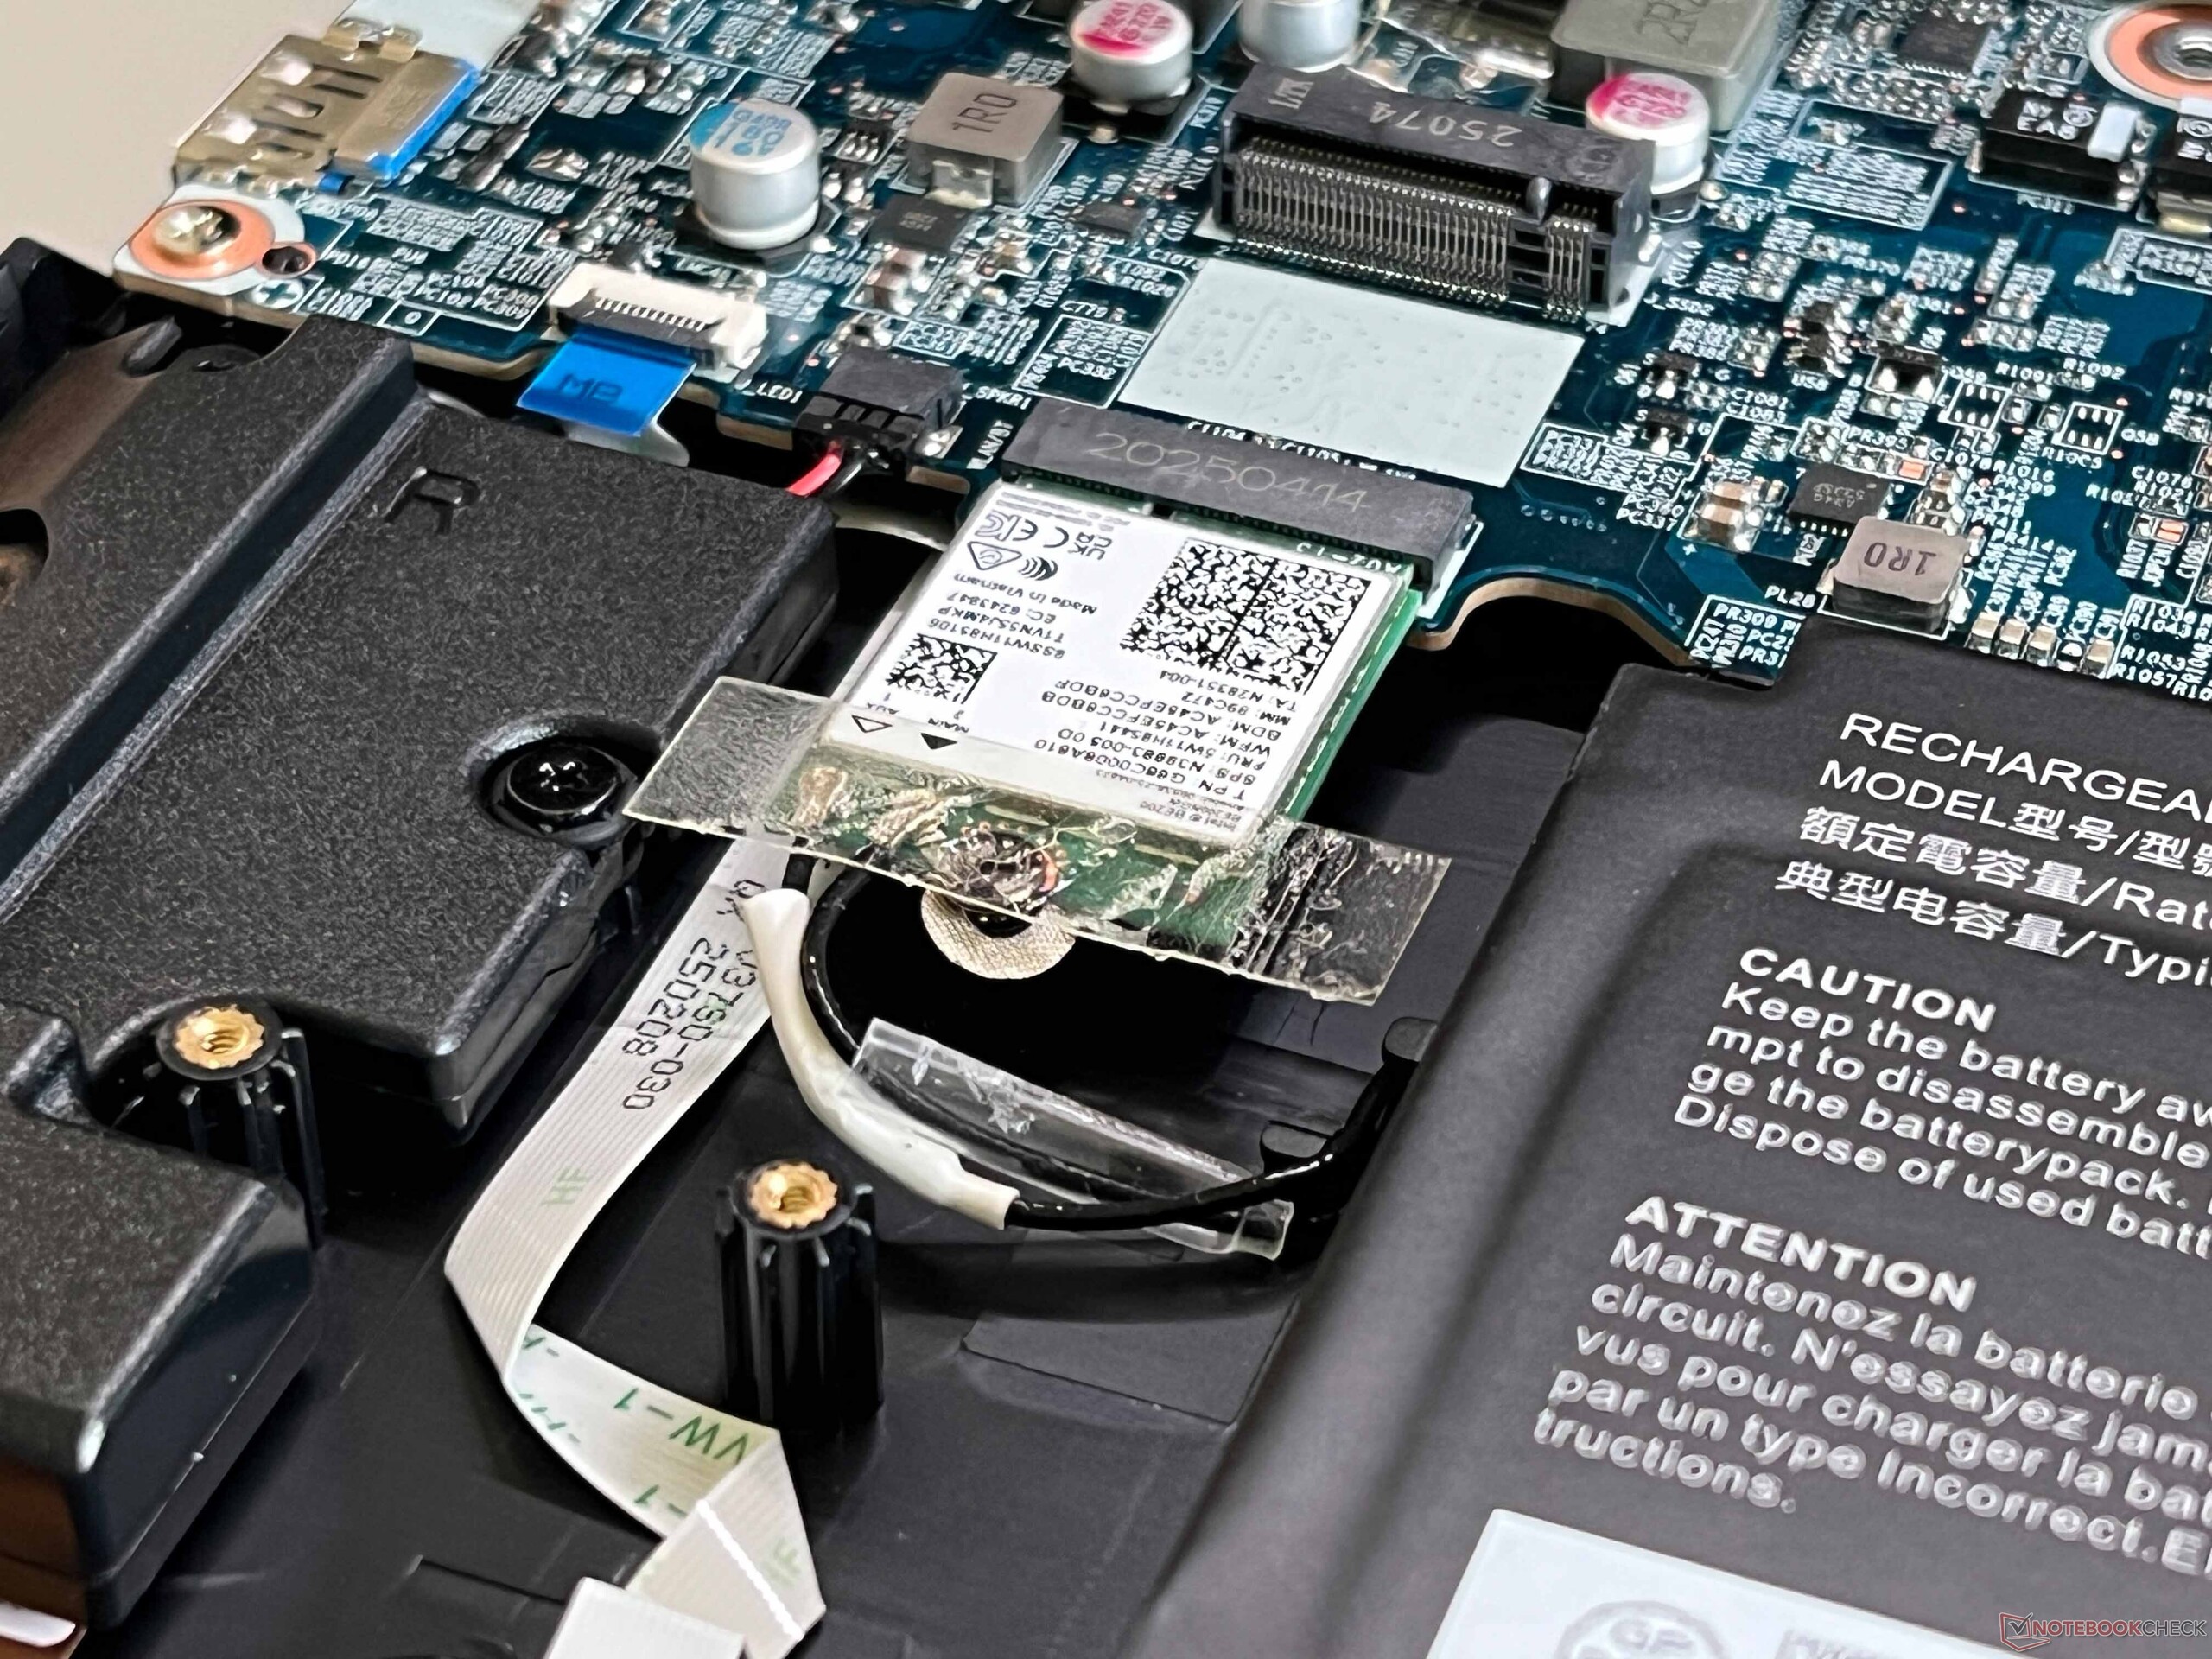
Avec ses surfaces noires, le design du boîtier est très simple, et il n'y a pas d'éléments lumineux en dehors du clavier. Le couvercle est en aluminium, mais le reste du boîtier est en plastique, et les surfaces sont généralement très sensibles à la saleté. La qualité de construction et la stabilité ne posent pas de problème majeur, bien que l'unité de base émette de légers grincements lorsqu'elle est soumise à une pression. L'angle d'ouverture maximal de l'écran est de 130 degrés, mais les charnières vacillent légèrement. Les possibilités de maintenance sont généralement très bonnes, puisqu'il y a deux emplacements pour la RAM et les SSD, que le module Wi-Fi et la batterie peuvent être remplacés si nécessaire, et que les ventilateurs sont également faciles à nettoyer.
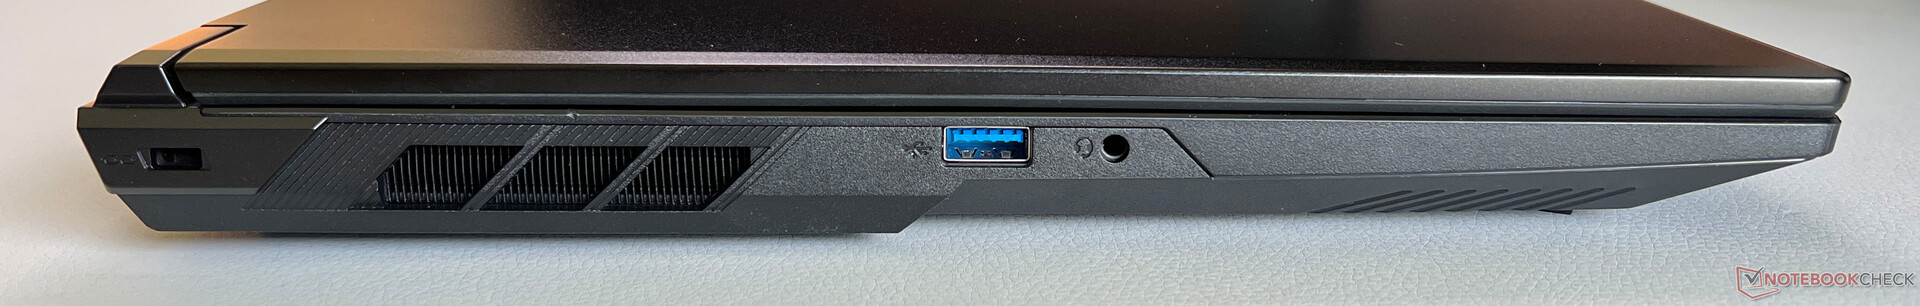
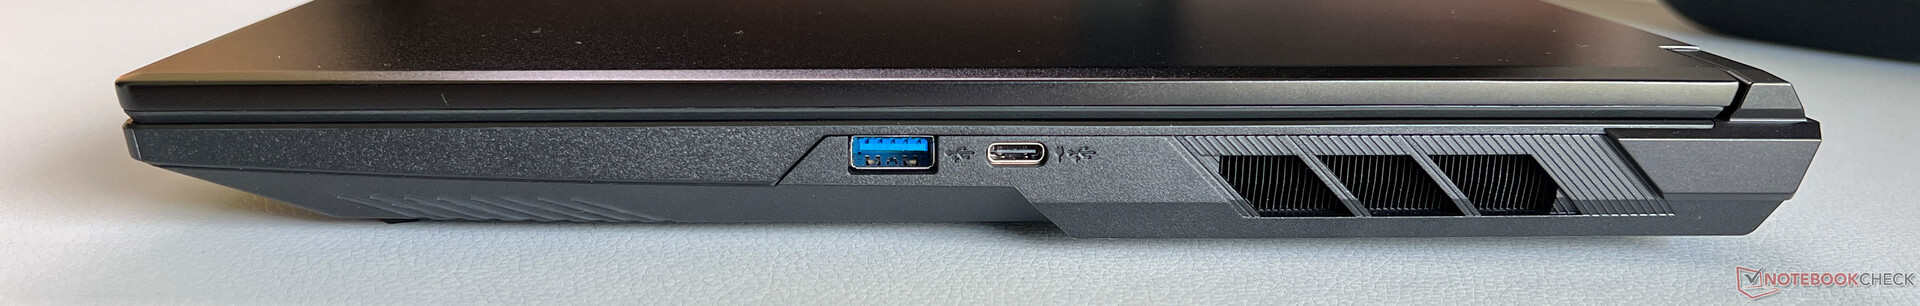
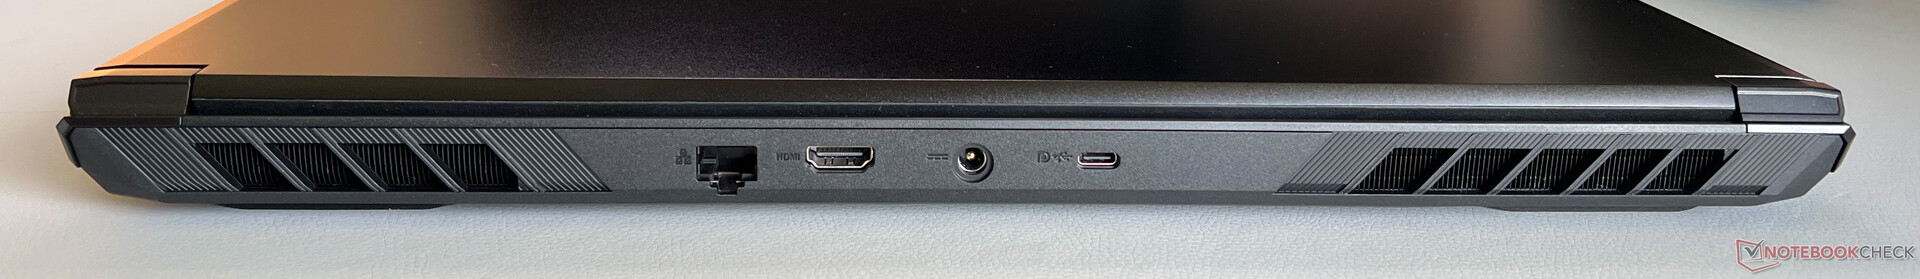
Thunderbolt est absent, mais il y a suffisamment de ports USB ainsi qu'un module Intel Wi-Fi 7, qui impressionne par ses taux de transfert bons et stables. La webcam 1080p (avec obturateur mécanique) ne prend que des photos moyennes, et il n'y a pas de module IR.


| Networking | |
| SCHENKER XMG Focus 17 M25 | |
| iperf3 transmit AXE11000 | |
| iperf3 receive AXE11000 | |
| MSI Vector 17 HX AI A2XWIG | |
| iperf3 transmit AXE11000 | |
| iperf3 receive AXE11000 | |
| iperf3 transmit AXE11000 6GHz | |
| iperf3 receive AXE11000 6GHz | |
| Lenovo Legion 5 Pro 16IAX10H | |
| iperf3 transmit AXE11000 | |
| iperf3 receive AXE11000 | |
| MSI Vector 16 HX AI A2XWHG | |
| iperf3 transmit AXE11000 | |
| iperf3 receive AXE11000 | |
| SCHENKER XMG Pro 16 (E25) | |
| iperf3 transmit AXE11000 | |
| iperf3 receive AXE11000 | |


Durabilité
Le fabricant n'a fait aucune déclaration concernant le développement durable. L'emballage est entièrement recyclable.
Dispositifs d'entrée
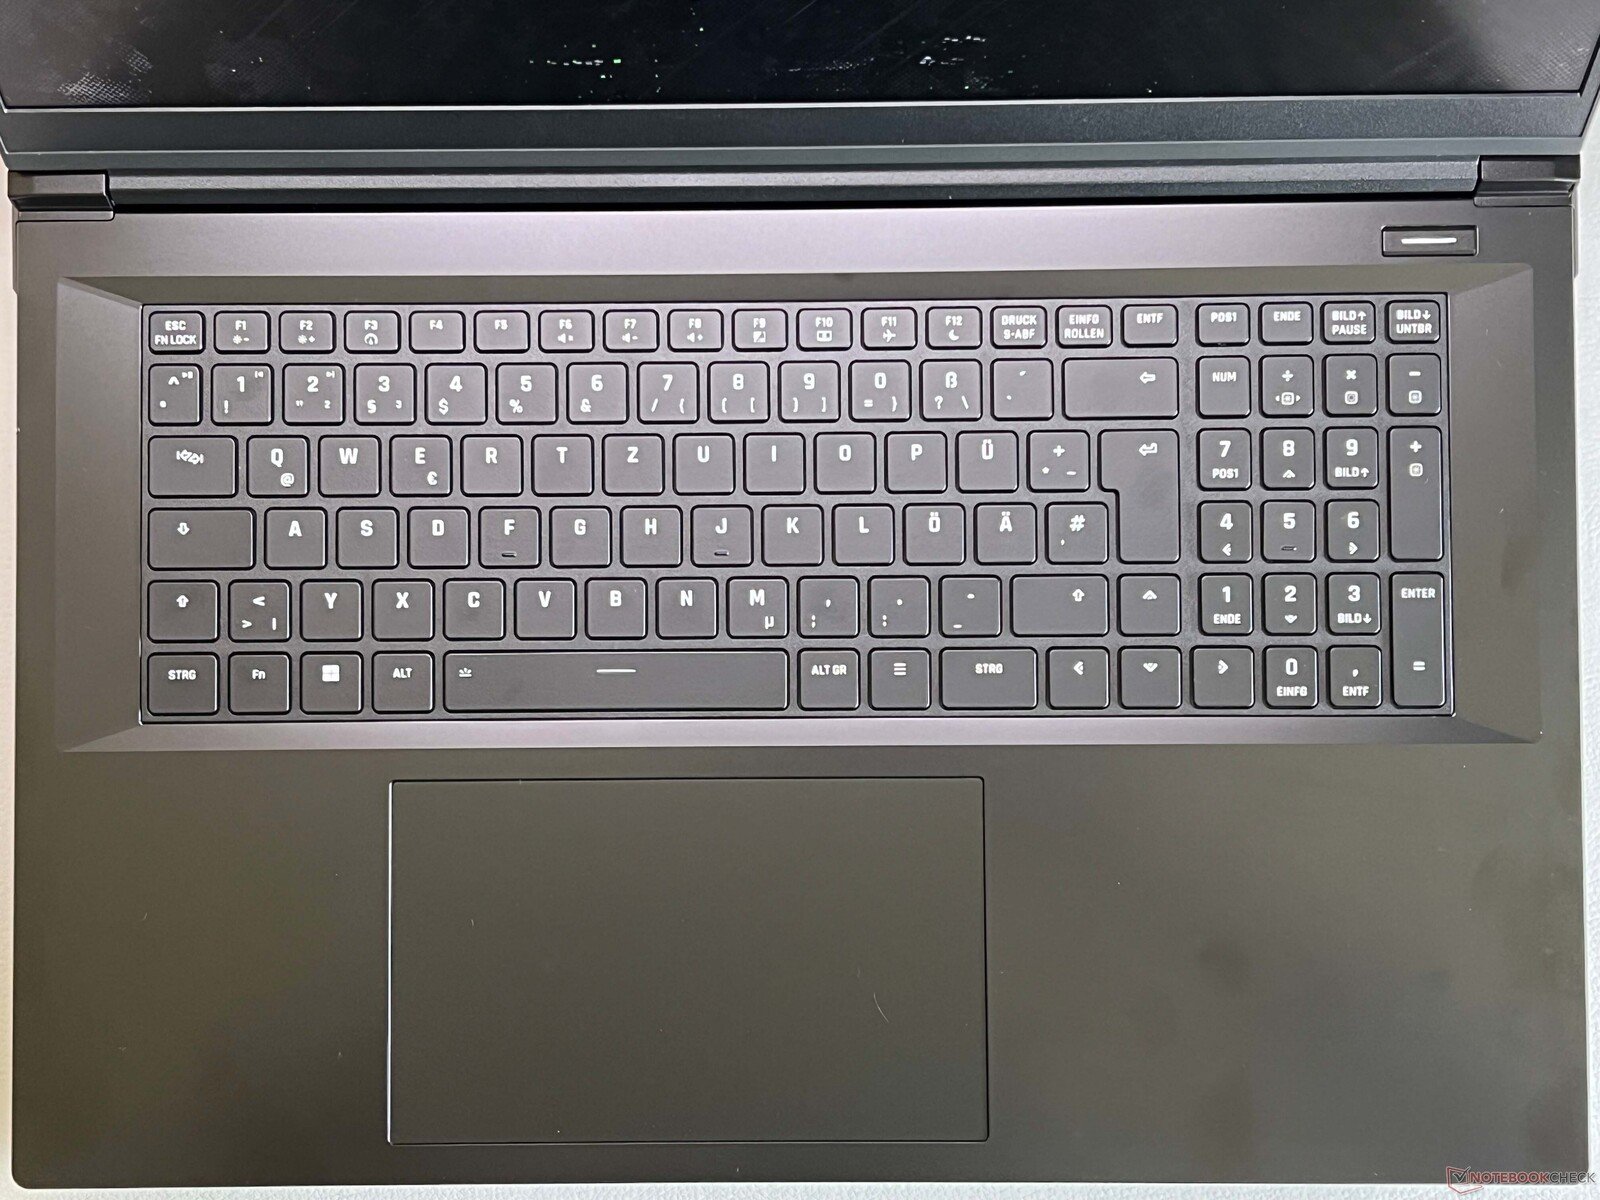
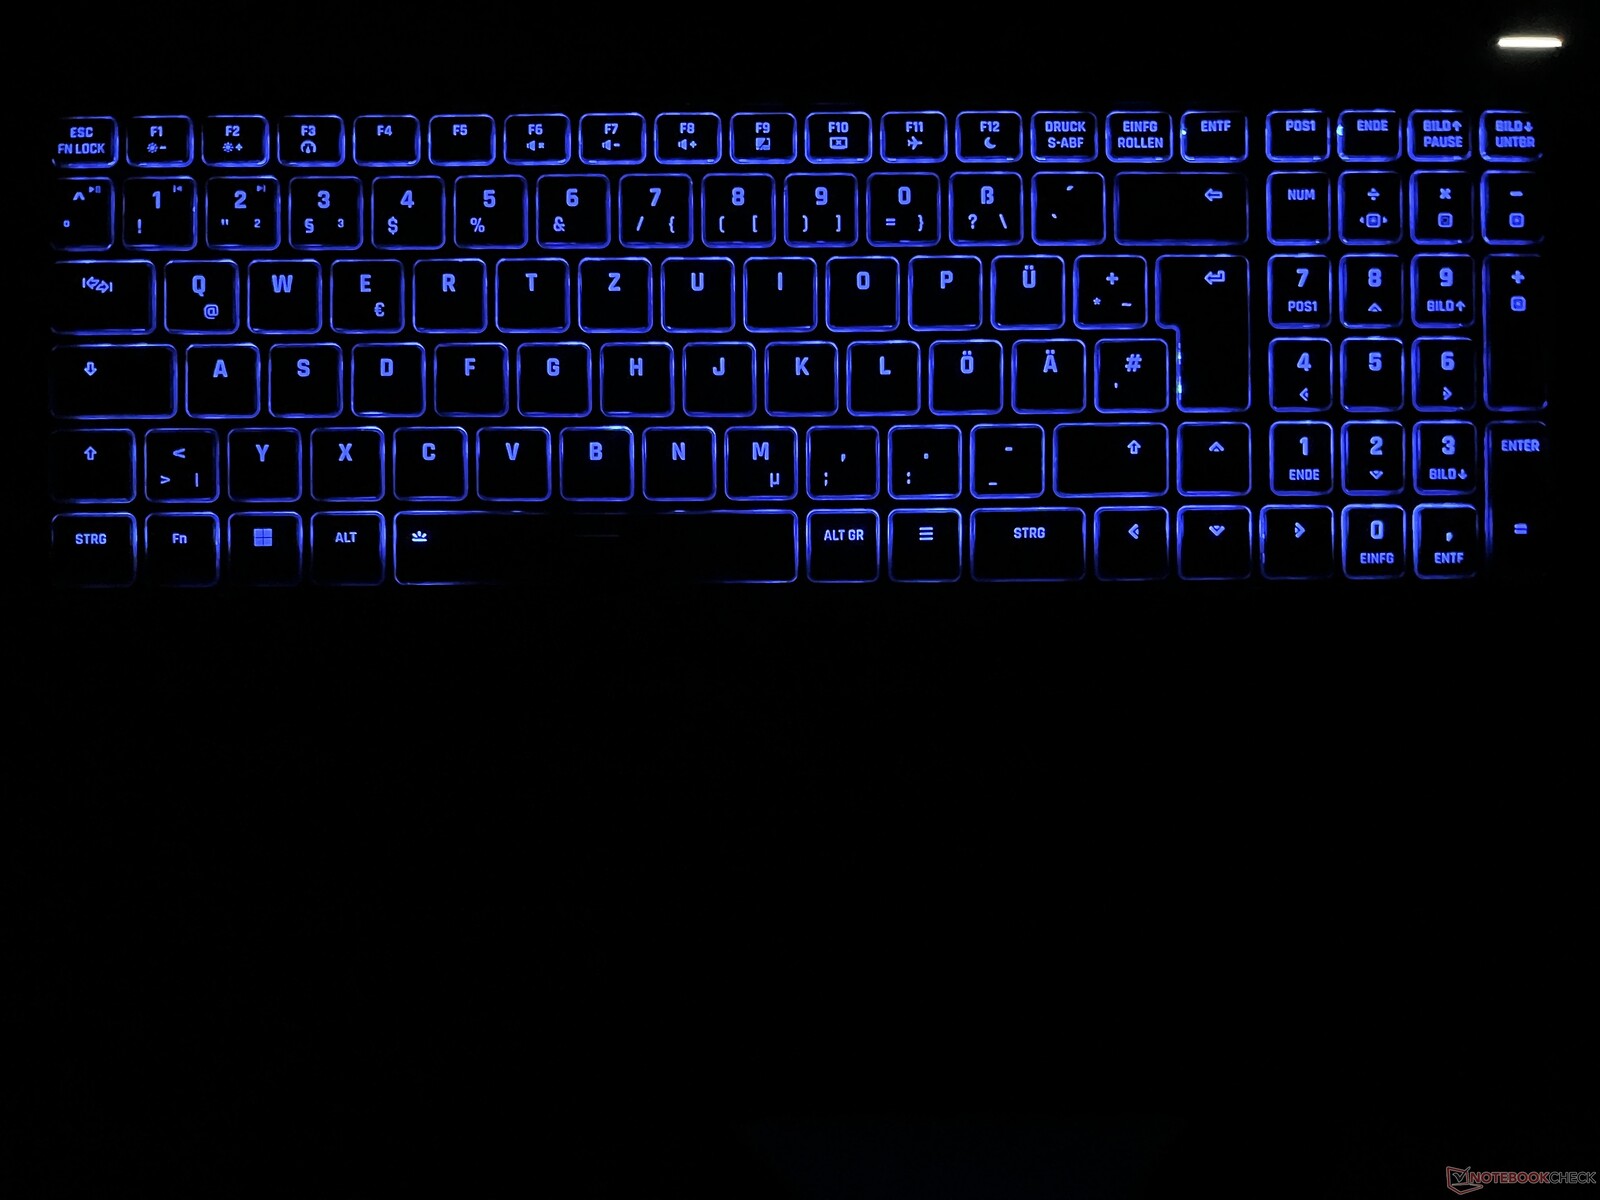
XMG a équipé son clavier d'un pavé numérique dédié et d'un éclairage RGB à zone unique. La frappe est confortable, avec une course de touche suffisante et un retour d'information précis. De plus, les touches ne sont pas trop bruyantes. Le grand pavé tactile est relativement doux au toucher. Il est suffisamment grand (15 x 9 cm) et très bien rembourré (pas de cliquetis). Seuls les clics mécaniques de la zone inférieure sont très bruyants.
Écran - IPS 240 Hz

Le Focus utilise un écran IPS de 17,3 pouces au format 16:9 avec une résolution QHD de 2 560 x 1 440 pixels. La qualité d'image de la dalle mate est bonne, les zones lumineuses ne présentant qu'un grain minime, bien que cela soit à peine perceptible dans le cadre d'une utilisation quotidienne. Les couleurs sont éclatantes et les mouvements sont fluides grâce au taux de rafraîchissement de 240 Hz. Les temps de réponse sont également rapides et il n'y a pas de scintillement PWM.
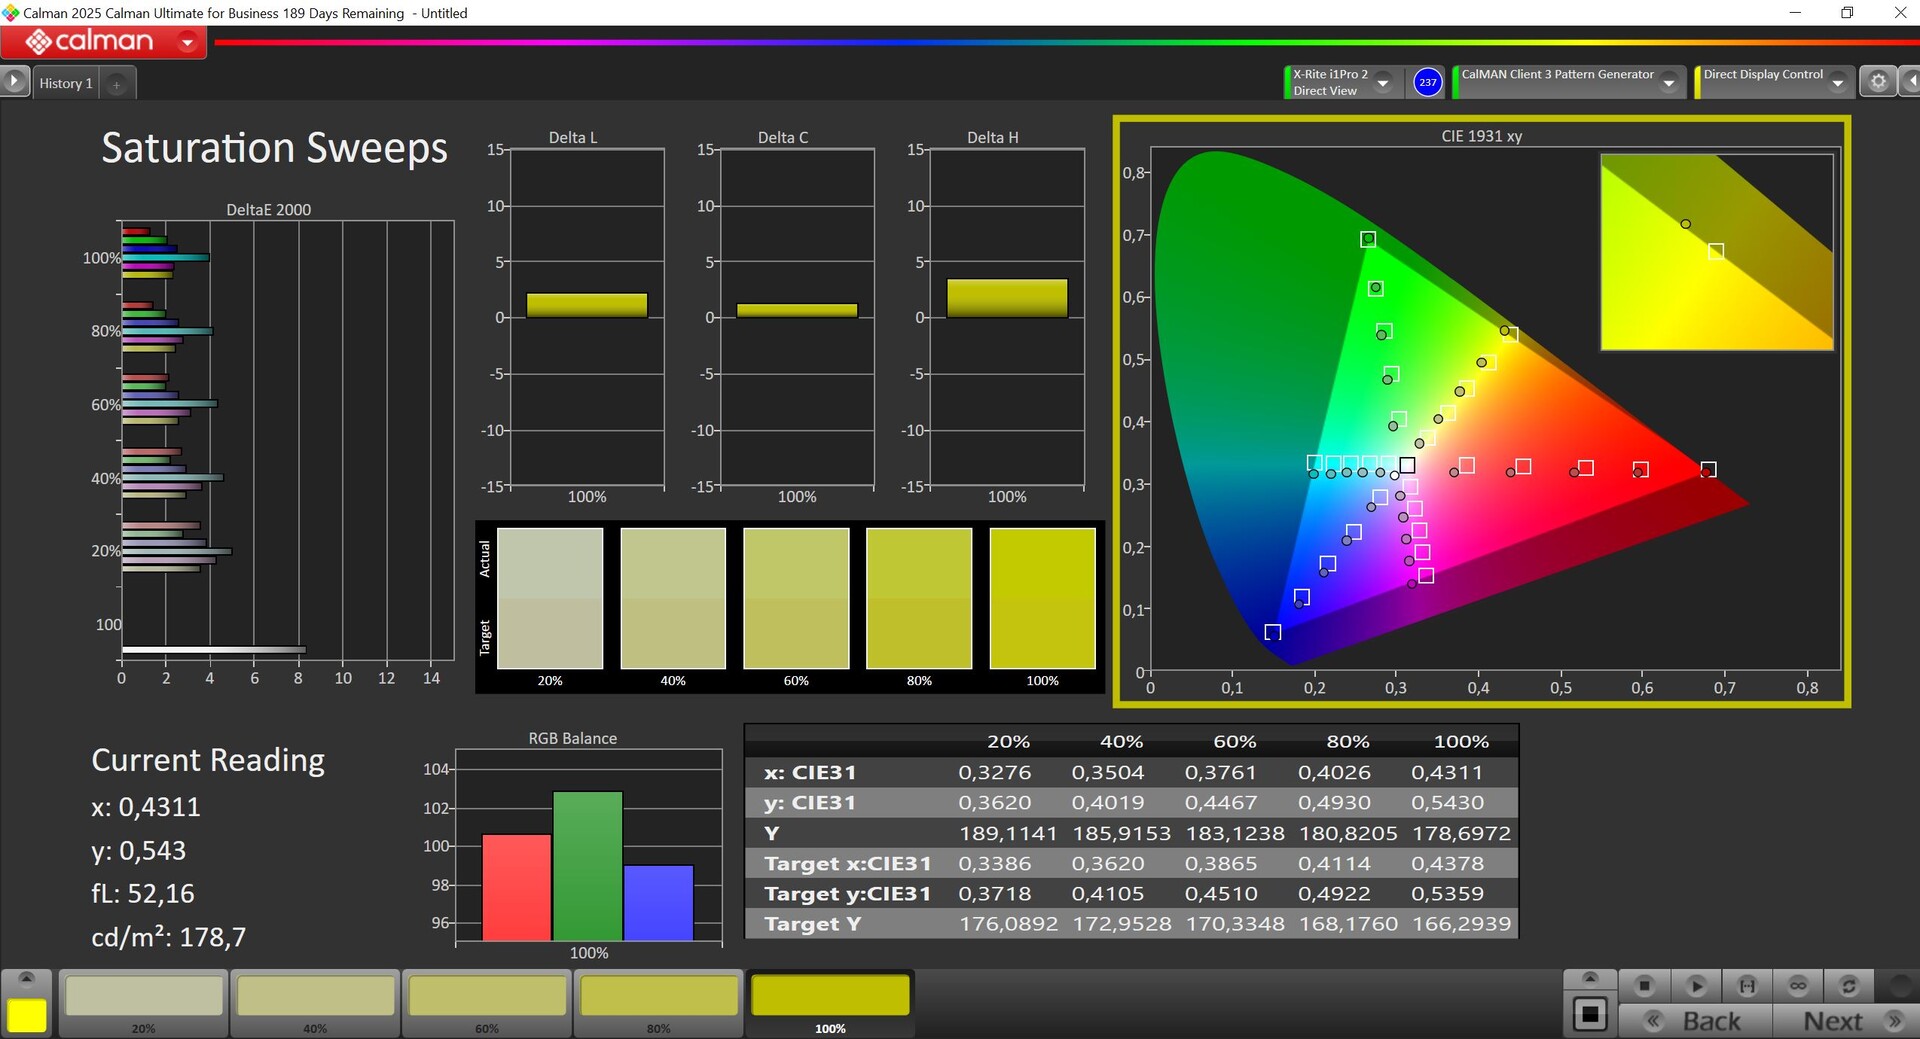
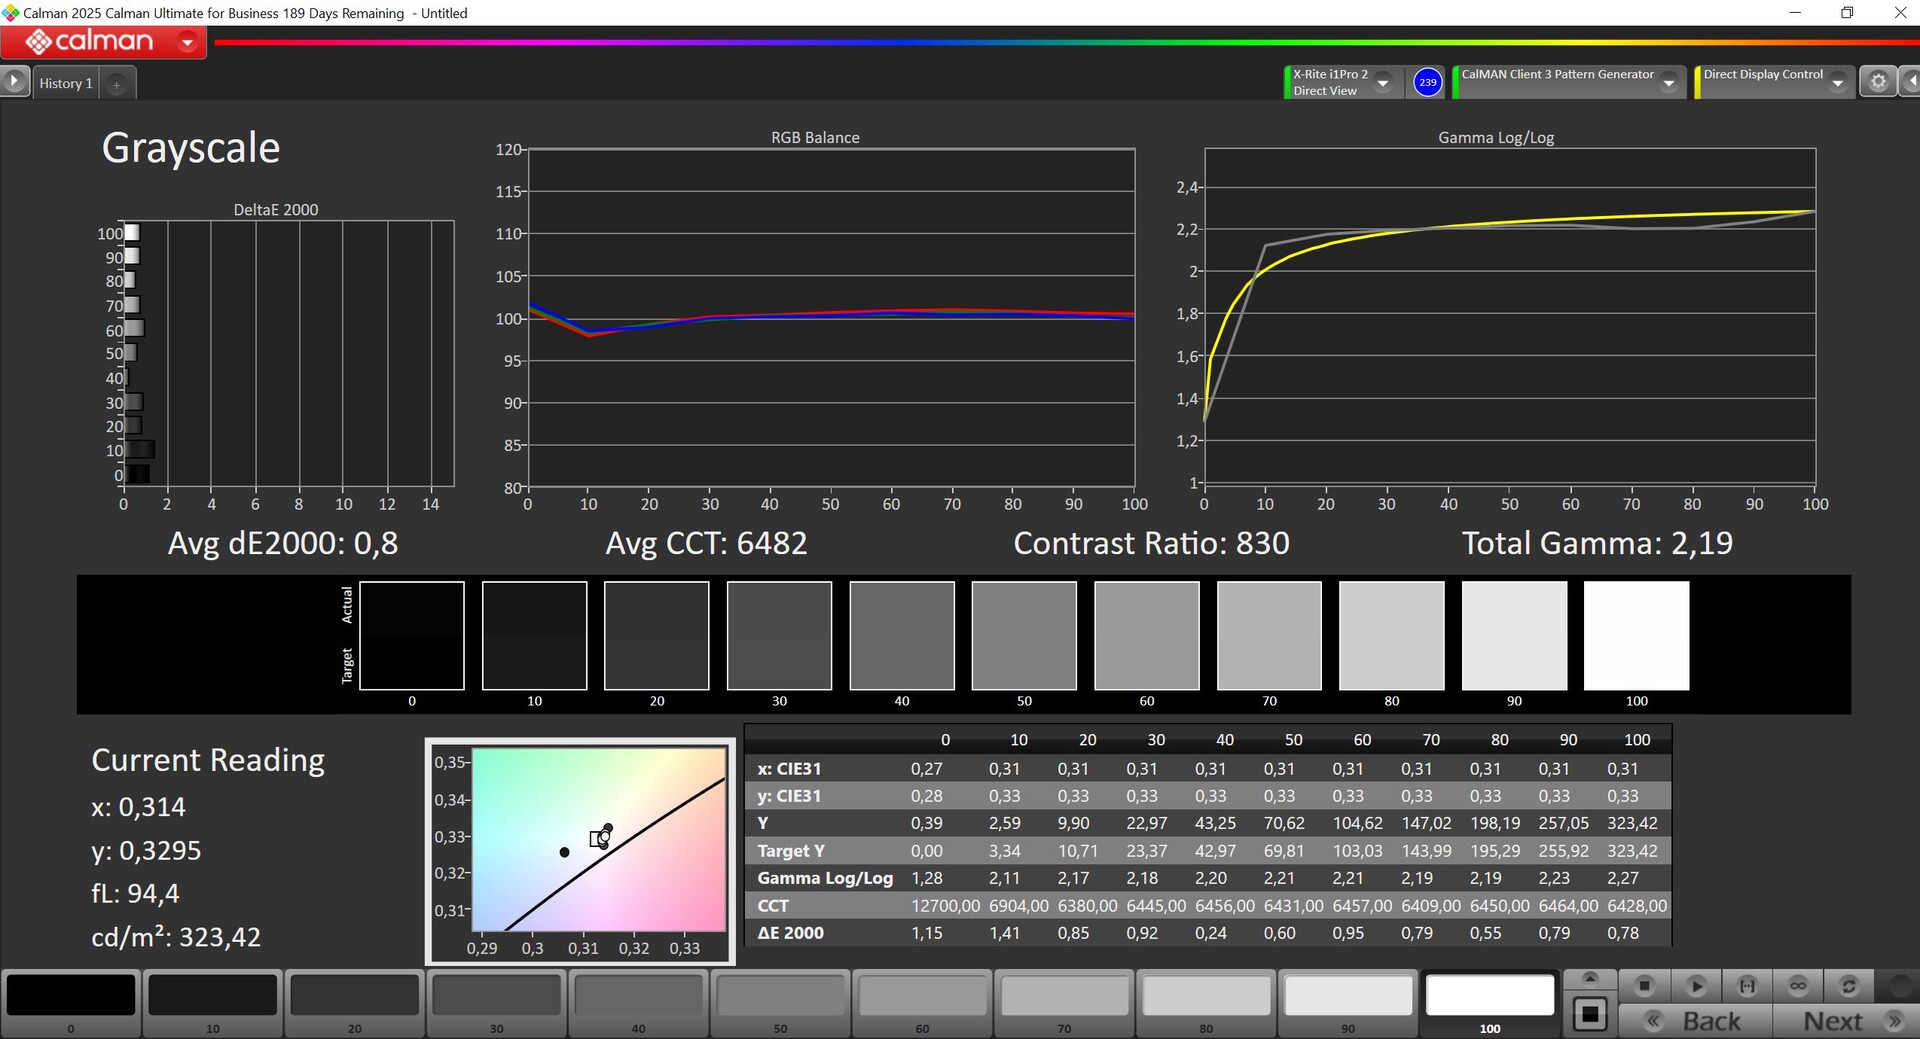
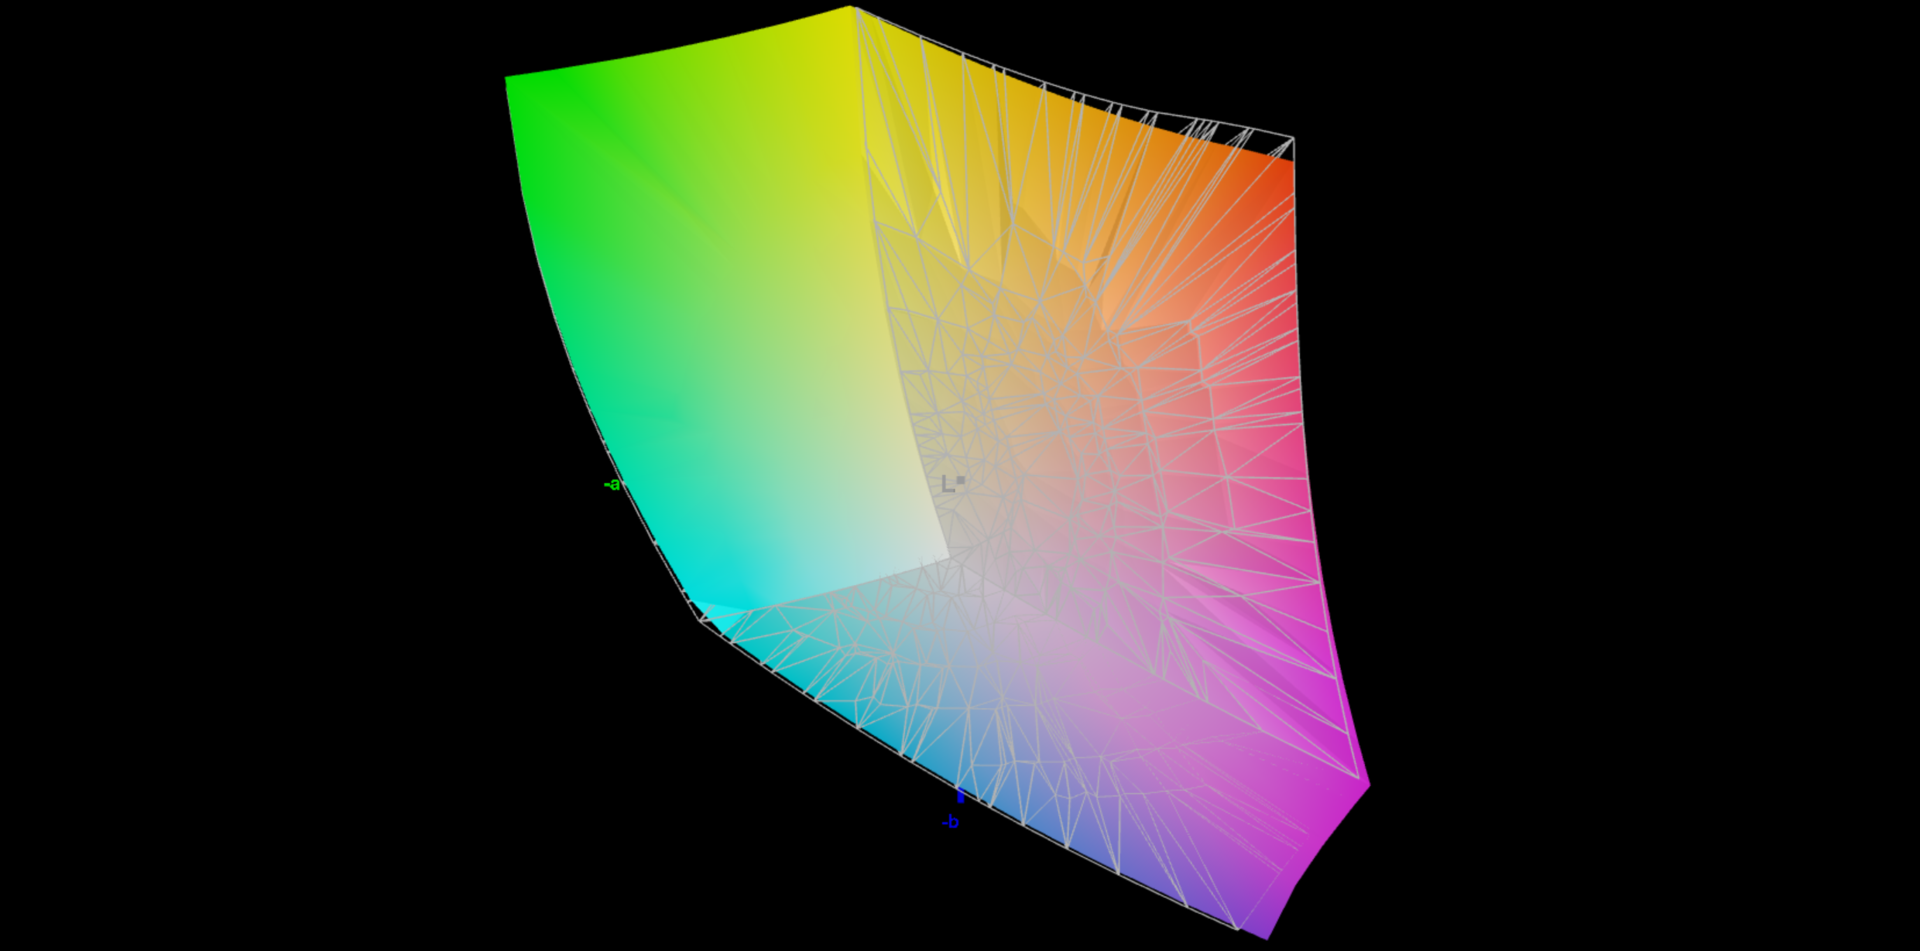
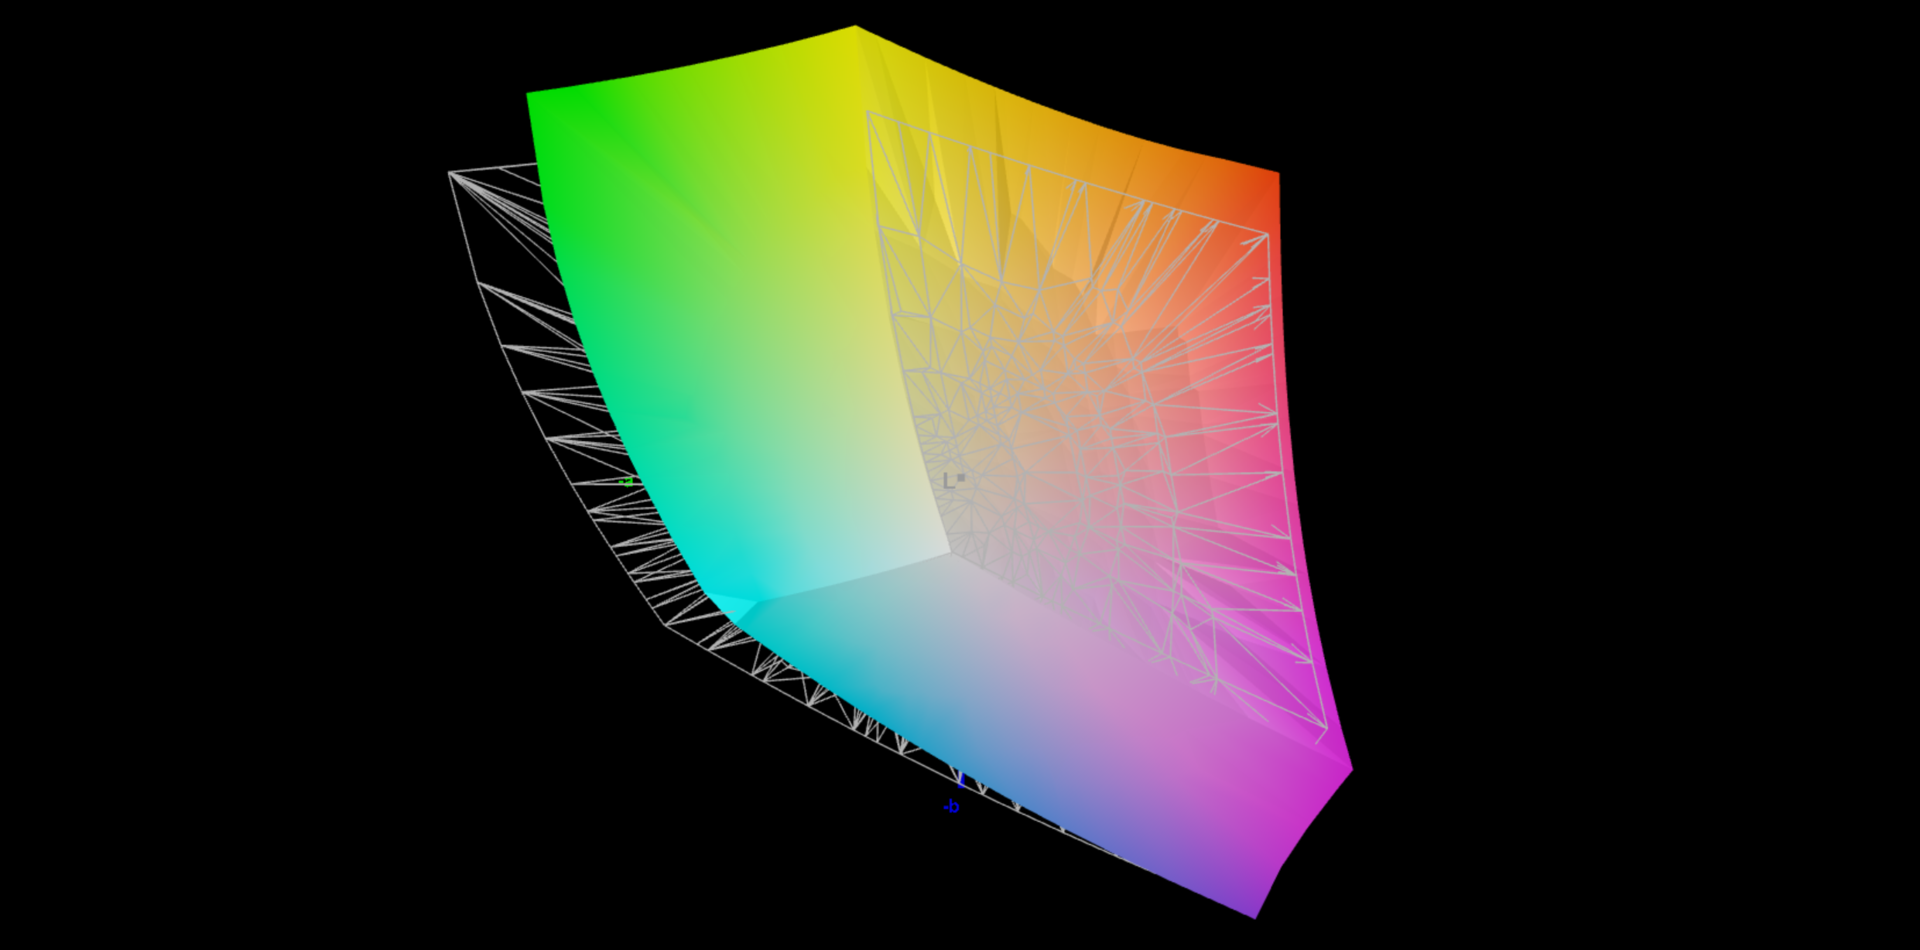
XMG a spécifié une luminosité de 300 cd/m², que notre modèle de test parvient à dépasser avec un maximum de 347 cd/m² (325 cd/m² en moyenne). Le rapport de contraste est bon avec un maximum de 1.335:1, mais notre analyse avec le logiciel professionnel CalMAN met en évidence une nette teinte bleue dans les réglages d'usine, combinée à une température de couleur trop froide. A cela s'ajoutent des écarts de couleur importants. Grâce à notre étalonnage (le profil peut être téléchargé gratuitement dans l'encadré à droite), nous avons pu améliorer de manière significative les images affichées. Les espaces colorimétriques P3 et sRGB sont entièrement couverts, mais il n'y a pas de profil sRGB. Dans l'ensemble, la dalle est bien adaptée aux jeux, mais la concurrence est supérieure, notamment en termes de luminosité.
| |||||||||||||||||||||||||
Homogénéité de la luminosité: 84 %
Valeur mesurée au centre, sur batterie: 347 cd/m²
Contraste: 1335:1 (Valeurs des noirs: 0.26 cd/m²)
ΔE ColorChecker Calman: 3.3 | ∀{0.5-29.43 Ø4.82}
calibrated: 0.9
ΔE Greyscale Calman: 4.5 | ∀{0.09-98 Ø5.1}
86% AdobeRGB 1998 (Argyll 3D)
99.9% sRGB (Argyll 3D)
98.3% Display P3 (Argyll 3D)
Gamma: 2.05
CCT: 7365 K
| SCHENKER XMG Focus 17 M25 NE173QHM-NZ1, IPS, 2560x1440, 17.3", 240 Hz | MSI Vector 17 HX AI A2XWIG B170QAN01.2 (AUO84A6), IPS, 2560x1600, 17", 240 Hz | Lenovo Legion 5 Pro 16IAX10H ATNA60HS01-0 (Samsung SDC420A), OLED, 2560x1600, 16", 165 Hz | MSI Vector 16 HX AI A2XWHG B160QAN02.3 (AUO7DB2), IPS, 2560x1600, 16", 240 Hz | SCHENKER XMG Pro 16 (E25) NE160QDM-NZL, IPS, 2560x1600, 16", 300 Hz | |
|---|---|---|---|---|---|
| Display | 1% | 4% | -1% | -12% | |
| Display P3 Coverage | 98.3 | 99.6 1% | 99.9 2% | 96.6 -2% | 74.7 -24% |
| sRGB Coverage | 99.9 | 100 0% | 100 0% | 99.8 0% | 99.8 0% |
| AdobeRGB 1998 Coverage | 86 | 87.4 2% | 94.1 9% | 84.4 -2% | 75.4 -12% |
| Response Times | 56% | 84% | 45% | 26% | |
| Response Time Grey 50% / Grey 80% * | 13.7 ? | 3.6 ? 74% | 2 ? 85% | 4.3 ? 69% | 10.5 ? 23% |
| Response Time Black / White * | 7.6 ? | 4.8 ? 37% | 1.4 ? 82% | 6 ? 21% | 5.4 ? 29% |
| PWM Frequency | 1300 | ||||
| PWM Amplitude * | 16.7 | ||||
| Screen | 4% | 12% | -2% | 19% | |
| Brightness middle | 347 | 488 41% | 518 49% | 473 36% | 538 55% |
| Brightness | 325 | 473 46% | 522 61% | 426 31% | 508 56% |
| Brightness Distribution | 84 | 91 8% | 97 15% | 85 1% | 88 5% |
| Black Level * | 0.26 | 0.74 -185% | 0.42 -62% | 0.47 -81% | |
| Contrast | 1335 | 659 -51% | 1126 -16% | 1145 -14% | |
| Colorchecker dE 2000 * | 3.3 | 1.67 49% | 2.49 25% | 3.47 -5% | 1.9 42% |
| Colorchecker dE 2000 max. * | 8.4 | 3.43 59% | 5.25 37% | 7.24 14% | 4 52% |
| Colorchecker dE 2000 calibrated * | 0.9 | 0.8 11% | 2.15 -139% | 1.36 -51% | |
| Greyscale dE 2000 * | 4.5 | 2.08 54% | 3.02 33% | 3.1 31% | 2.7 40% |
| Gamma | 2.05 107% | 2.55 86% | 2.37 93% | 2.486 88% | 2.24 98% |
| CCT | 7365 88% | 6240 104% | 6426 101% | 6832 95% | 7027 93% |
| Moyenne finale (programmes/paramètres) | 20% /
10% | 33% /
22% | 14% /
5% | 11% /
13% |
* ... Moindre est la valeur, meilleures sont les performances


Temps de réponse de l'écran
| ↔ Temps de réponse noir à blanc | ||
|---|---|---|
| 7.6 ms ... hausse ↗ et chute ↘ combinées | ↗ 3.1 ms hausse | 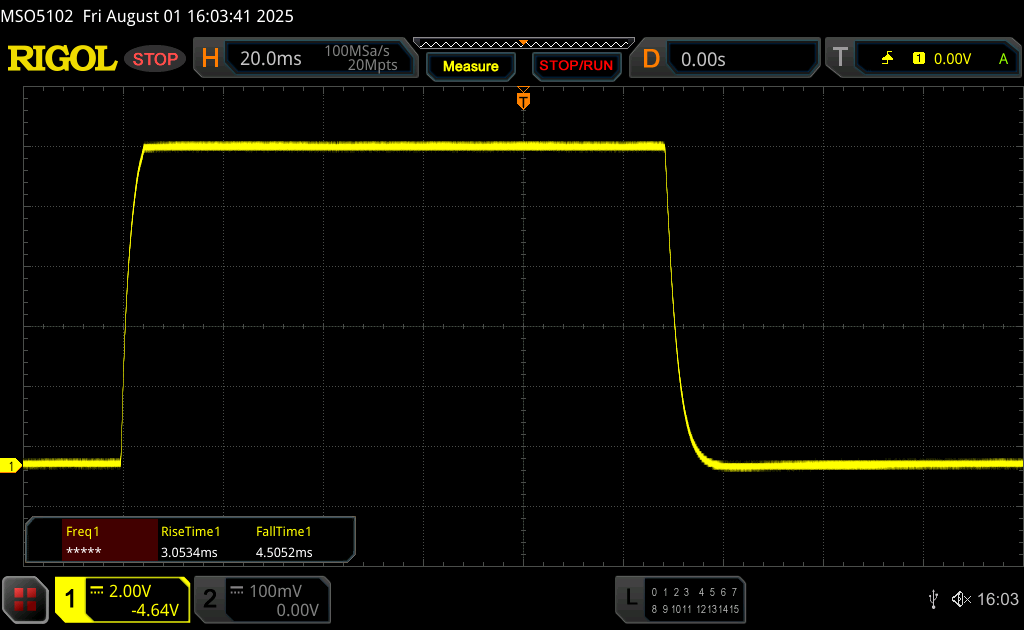 |
| ↘ 4.5 ms chute | ||
| L'écran montre de très faibles temps de réponse, parfait pour le jeu. En comparaison, tous les appareils testés affichent entre 0.1 (minimum) et 240 (maximum) ms. » 20 % des appareils testés affichent de meilleures performances. Cela signifie que les latences relevées sont meilleures que la moyenne (20.5 ms) de tous les appareils testés. | ||
| ↔ Temps de réponse gris 50% à gris 80% | ||
| 13.7 ms ... hausse ↗ et chute ↘ combinées | ↗ 6.5 ms hausse | 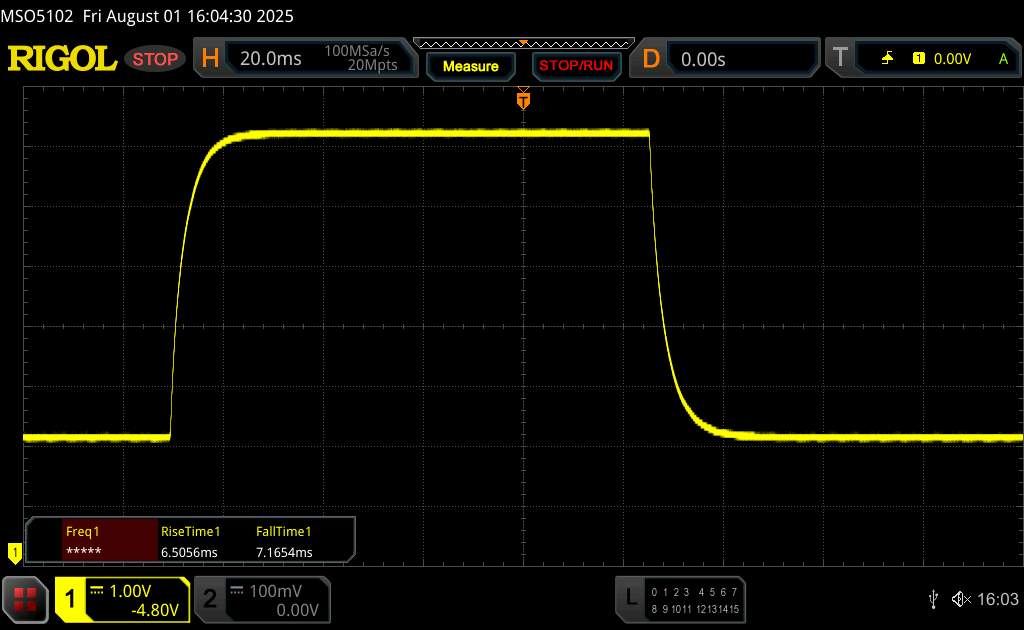 |
| ↘ 7.2 ms chute | ||
| L'écran montre de bons temps de réponse, mais insuffisant pour du jeu compétitif. En comparaison, tous les appareils testés affichent entre 0.165 (minimum) et 636 (maximum) ms. » 25 % des appareils testés affichent de meilleures performances. Cela signifie que les latences relevées sont meilleures que la moyenne (32 ms) de tous les appareils testés. | ||
Scintillement / MLI (Modulation de largeur d'impulsion)
| Scintillement / MLI (Modulation de largeur d'impulsion) non décelé | 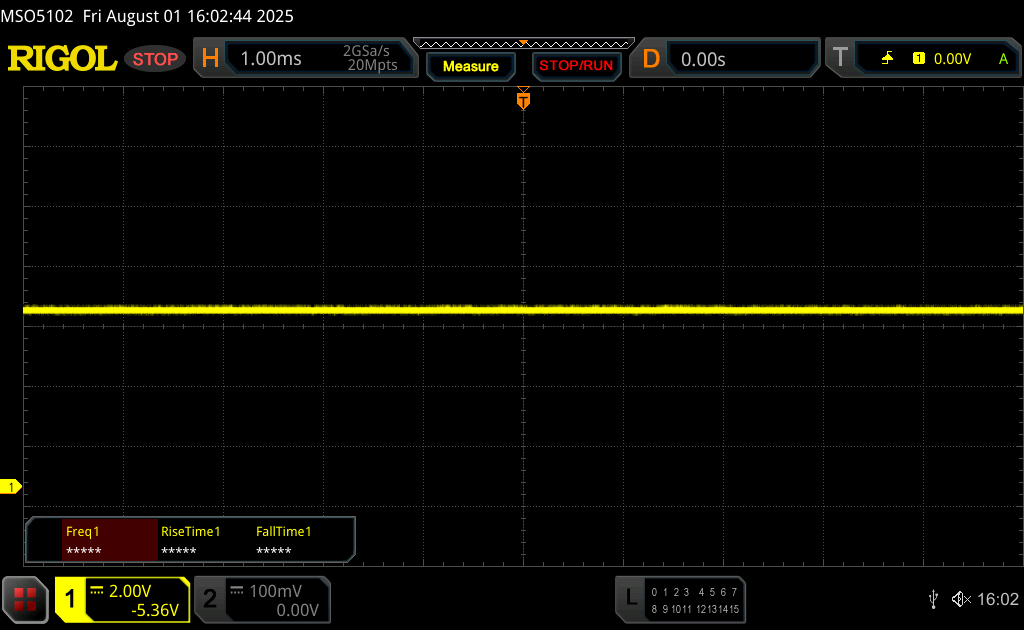 | ||
En comparaison, 53 % des appareils testés n'emploient pas MDI pour assombrir leur écran. Nous avons relevé une moyenne à 8327 (minimum : 5 - maximum : 343500) Hz dans le cas où une MDI était active. | |||


Performance - Un GPU 5070 Ti pour ordinateur portable avec jusqu'à 96 Go de RAM
Conditions d'essai
Différents profils de puissance sont disponibles dans le centre de contrôle, chacun offrant des sous-profils. Les performances de jeu maximales ne sont disponibles qu'en mode Performance/Turbo. Bien que les performances maximales du GPU soient généralement disponibles en mode Performance/Auto, les performances diffèrent lorsque vous jouez avec une charge simultanée du CPU (TGP maximum de 100 watts).
| Profil énergétique | CPU TDP | CB24 Multi | GPU TGP | Time Spy Graphics | CP2077 QHD Ultra | volume max. du ventilateur |
|---|---|---|---|---|---|---|
| Silencieux | 30/28 watts | 591 points | 100 watts | 14 202 points | 61,2fps | 37 dB(A) |
| Divertissement | 115/45 watts | 1 013 points | 100 watts | 14 463 points | 68,1fps | 46,6 dB(A) |
| Performance (Auto) | 150/120 watts | 1,624 points | 140/100 watts | 14,833 points | 69.8fps | 51.9 dB(A) |
| Performance (Turbo) | 150/135 watts | 1,675 points | 140 watts | 17,211 points | 81fps | 56.2 dB(A) |
| Batterie | 30 watts | 619 points | 35 watts | 3,423 points | 17.9fps | 33.6 dB(A) |
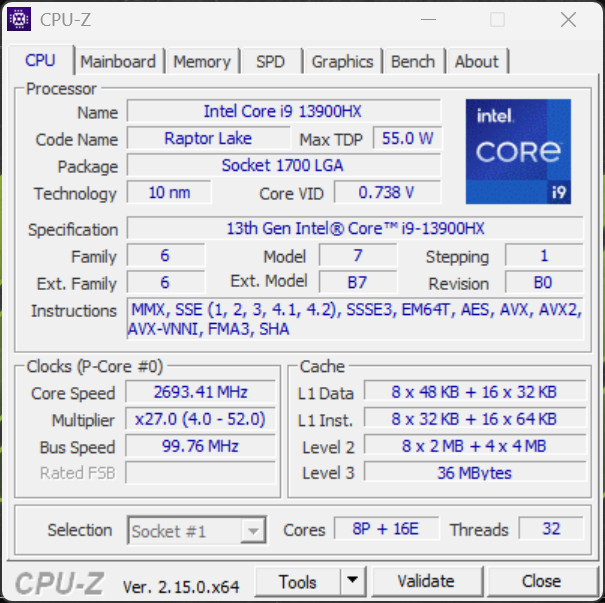
Processeur - Core i9-13900HX
En standard, le Focus 17 M25 est équipé de l'ancien processeur Core i9-13900HX. Cependant, le Core i9-14900HX est également disponible en option. Les performances du processeur restent bonnes, mais, comme prévu, le Raptor Lake n'arrive pas à la cheville du Core Ultra 9 275HX Core Ultra 9 275HX. Cependant, le Core Ultra 9 275HX, plus cher, est disponible en option Vector 17 plus cher avec le 275HX n'est que très peu plus rapide en raison des limites de puissance inférieures.
Cinebench R15 Multi Sustained Test
Cinebench 2024: CPU Multi Core | CPU Single Core
Cinebench R23: Multi Core | Single Core
Cinebench R20: CPU (Multi Core) | CPU (Single Core)
Cinebench R15: CPU Multi 64Bit | CPU Single 64Bit
Blender: v2.79 BMW27 CPU
7-Zip 18.03: 7z b 4 | 7z b 4 -mmt1
Geekbench 6.4: Multi-Core | Single-Core
Geekbench 5.5: Multi-Core | Single-Core
HWBOT x265 Benchmark v2.2: 4k Preset
LibreOffice : 20 Documents To PDF
R Benchmark 2.5: Overall mean
| CPU Performance Rating | |
| SCHENKER XMG Pro 16 (E25) | |
| Lenovo Legion 5 Pro 16IAX10H -2! | |
| MSI Vector 17 HX AI A2XWIG -2! | |
| SCHENKER XMG Focus 17 M25 | |
| Moyenne Intel Core i9-13900HX | |
| MSI Vector 16 HX AI A2XWHG | |
| Moyenne de la classe Gaming | |
| Cinebench 2024 / CPU Multi Core | |
| SCHENKER XMG Pro 16 (E25) | |
| SCHENKER XMG Focus 17 M25 | |
| Moyenne Intel Core i9-13900HX (n=1) | |
| MSI Vector 16 HX AI A2XWHG | |
| Moyenne de la classe Gaming (331 - 2298, n=90, 2 dernières années) | |
| Cinebench 2024 / CPU Single Core | |
| SCHENKER XMG Pro 16 (E25) | |
| MSI Vector 16 HX AI A2XWHG | |
| SCHENKER XMG Focus 17 M25 | |
| Moyenne Intel Core i9-13900HX (n=1) | |
| Moyenne de la classe Gaming (68.2 - 138.2, n=91, 2 dernières années) | |
| Cinebench R23 / Multi Core | |
| Lenovo Legion 5 Pro 16IAX10H | |
| SCHENKER XMG Pro 16 (E25) | |
| MSI Vector 17 HX AI A2XWIG | |
| SCHENKER XMG Focus 17 M25 | |
| Moyenne Intel Core i9-13900HX (24270 - 32623, n=23) | |
| MSI Vector 16 HX AI A2XWHG | |
| Moyenne de la classe Gaming (5668 - 40970, n=148, 2 dernières années) | |
| Cinebench R23 / Single Core | |
| Lenovo Legion 5 Pro 16IAX10H | |
| SCHENKER XMG Pro 16 (E25) | |
| MSI Vector 17 HX AI A2XWIG | |
| MSI Vector 16 HX AI A2XWHG | |
| SCHENKER XMG Focus 17 M25 | |
| Moyenne Intel Core i9-13900HX (1867 - 2105, n=20) | |
| Moyenne de la classe Gaming (1136 - 2267, n=148, 2 dernières années) | |
| Cinebench R20 / CPU (Multi Core) | |
| Lenovo Legion 5 Pro 16IAX10H | |
| SCHENKER XMG Pro 16 (E25) | |
| MSI Vector 17 HX AI A2XWIG | |
| SCHENKER XMG Focus 17 M25 | |
| Moyenne Intel Core i9-13900HX (9152 - 12541, n=21) | |
| MSI Vector 16 HX AI A2XWHG | |
| Moyenne de la classe Gaming (2179 - 16108, n=147, 2 dernières années) | |
| Cinebench R20 / CPU (Single Core) | |
| Lenovo Legion 5 Pro 16IAX10H | |
| SCHENKER XMG Pro 16 (E25) | |
| MSI Vector 17 HX AI A2XWIG | |
| MSI Vector 16 HX AI A2XWHG | |
| SCHENKER XMG Focus 17 M25 | |
| Moyenne Intel Core i9-13900HX (722 - 810, n=21) | |
| Moyenne de la classe Gaming (439 - 870, n=147, 2 dernières années) | |
| Cinebench R15 / CPU Multi 64Bit | |
| Lenovo Legion 5 Pro 16IAX10H | |
| SCHENKER XMG Pro 16 (E25) | |
| MSI Vector 17 HX AI A2XWIG | |
| Moyenne Intel Core i9-13900HX (3913 - 4970, n=22) | |
| SCHENKER XMG Focus 17 M25 | |
| MSI Vector 16 HX AI A2XWHG | |
| Moyenne de la classe Gaming (1537 - 6271, n=147, 2 dernières années) | |
| Cinebench R15 / CPU Single 64Bit | |
| MSI Vector 17 HX AI A2XWIG | |
| MSI Vector 17 HX AI A2XWIG | |
| SCHENKER XMG Pro 16 (E25) | |
| Lenovo Legion 5 Pro 16IAX10H | |
| MSI Vector 16 HX AI A2XWHG | |
| SCHENKER XMG Focus 17 M25 | |
| Moyenne Intel Core i9-13900HX (247 - 304, n=22) | |
| Moyenne de la classe Gaming (191.9 - 343, n=146, 2 dernières années) | |
| Blender / v2.79 BMW27 CPU | |
| Moyenne de la classe Gaming (80 - 517, n=143, 2 dernières années) | |
| MSI Vector 16 HX AI A2XWHG | |
| Moyenne Intel Core i9-13900HX (101 - 153, n=22) | |
| MSI Vector 17 HX AI A2XWIG | |
| SCHENKER XMG Focus 17 M25 | |
| Lenovo Legion 5 Pro 16IAX10H | |
| SCHENKER XMG Pro 16 (E25) | |
| 7-Zip 18.03 / 7z b 4 | |
| SCHENKER XMG Focus 17 M25 | |
| SCHENKER XMG Pro 16 (E25) | |
| Lenovo Legion 5 Pro 16IAX10H | |
| Moyenne Intel Core i9-13900HX (90675 - 127283, n=21) | |
| MSI Vector 17 HX AI A2XWIG | |
| Moyenne de la classe Gaming (23795 - 148086, n=145, 2 dernières années) | |
| MSI Vector 16 HX AI A2XWHG | |
| 7-Zip 18.03 / 7z b 4 -mmt1 | |
| SCHENKER XMG Focus 17 M25 | |
| SCHENKER XMG Pro 16 (E25) | |
| Moyenne Intel Core i9-13900HX (6340 - 7177, n=21) | |
| Lenovo Legion 5 Pro 16IAX10H | |
| MSI Vector 17 HX AI A2XWIG | |
| MSI Vector 16 HX AI A2XWHG | |
| Moyenne de la classe Gaming (4199 - 7573, n=145, 2 dernières années) | |
| Geekbench 6.4 / Multi-Core | |
| SCHENKER XMG Pro 16 (E25) | |
| Lenovo Legion 5 Pro 16IAX10H | |
| MSI Vector 17 HX AI A2XWIG | |
| MSI Vector 16 HX AI A2XWHG | |
| SCHENKER XMG Focus 17 M25 | |
| Moyenne Intel Core i9-13900HX (15031 - 18014, n=3) | |
| Moyenne de la classe Gaming (5340 - 22104, n=144, 2 dernières années) | |
| Geekbench 6.4 / Single-Core | |
| SCHENKER XMG Pro 16 (E25) | |
| MSI Vector 17 HX AI A2XWIG | |
| Lenovo Legion 5 Pro 16IAX10H | |
| MSI Vector 16 HX AI A2XWHG | |
| SCHENKER XMG Focus 17 M25 | |
| Moyenne Intel Core i9-13900HX (2548 - 2892, n=3) | |
| Moyenne de la classe Gaming (1490 - 3253, n=144, 2 dernières années) | |
| Geekbench 5.5 / Multi-Core | |
| SCHENKER XMG Pro 16 (E25) | |
| Lenovo Legion 5 Pro 16IAX10H | |
| MSI Vector 17 HX AI A2XWIG | |
| SCHENKER XMG Focus 17 M25 | |
| Moyenne Intel Core i9-13900HX (17614 - 21075, n=22) | |
| MSI Vector 16 HX AI A2XWHG | |
| Moyenne de la classe Gaming (4557 - 27010, n=144, 2 dernières années) | |
| Geekbench 5.5 / Single-Core | |
| SCHENKER XMG Pro 16 (E25) | |
| Lenovo Legion 5 Pro 16IAX10H | |
| MSI Vector 17 HX AI A2XWIG | |
| MSI Vector 16 HX AI A2XWHG | |
| SCHENKER XMG Focus 17 M25 | |
| Moyenne Intel Core i9-13900HX (1345 - 2093, n=22) | |
| Moyenne de la classe Gaming (986 - 2423, n=144, 2 dernières années) | |
| HWBOT x265 Benchmark v2.2 / 4k Preset | |
| SCHENKER XMG Pro 16 (E25) | |
| Lenovo Legion 5 Pro 16IAX10H | |
| MSI Vector 17 HX AI A2XWIG | |
| MSI Vector 16 HX AI A2XWHG | |
| SCHENKER XMG Focus 17 M25 | |
| Moyenne Intel Core i9-13900HX (23.5 - 34.4, n=22) | |
| Moyenne de la classe Gaming (7.7 - 44.3, n=145, 2 dernières années) | |
| LibreOffice / 20 Documents To PDF | |
| SCHENKER XMG Pro 16 (E25) | |
| SCHENKER XMG Focus 17 M25 | |
| Moyenne de la classe Gaming (19 - 96.6, n=143, 2 dernières années) | |
| Moyenne Intel Core i9-13900HX (32.8 - 51.1, n=21) | |
| MSI Vector 16 HX AI A2XWHG | |
| MSI Vector 17 HX AI A2XWIG | |
| Lenovo Legion 5 Pro 16IAX10H | |
| R Benchmark 2.5 / Overall mean | |
| Moyenne de la classe Gaming (0.3551 - 0.759, n=146, 2 dernières années) | |
| MSI Vector 16 HX AI A2XWHG | |
| MSI Vector 17 HX AI A2XWIG | |
| Lenovo Legion 5 Pro 16IAX10H | |
| SCHENKER XMG Pro 16 (E25) | |
| SCHENKER XMG Focus 17 M25 | |
| Moyenne Intel Core i9-13900HX (0.375 - 0.4564, n=22) | |
* ... Moindre est la valeur, meilleures sont les performances
AIDA64: FP32 Ray-Trace | FPU Julia | CPU SHA3 | CPU Queen | FPU SinJulia | FPU Mandel | CPU AES | CPU ZLib | FP64 Ray-Trace | CPU PhotoWorxx
| Performance Rating | |
| Lenovo Legion 5 Pro 16IAX10H | |
| SCHENKER XMG Pro 16 (E25) | |
| SCHENKER XMG Focus 17 M25 | |
| MSI Vector 17 HX AI A2XWIG | |
| Moyenne Intel Core i9-13900HX | |
| Moyenne de la classe Gaming | |
| MSI Vector 16 HX AI A2XWHG | |
| AIDA64 / FP32 Ray-Trace | |
| Lenovo Legion 5 Pro 16IAX10H | |
| SCHENKER XMG Pro 16 (E25) | |
| MSI Vector 17 HX AI A2XWIG | |
| MSI Vector 16 HX AI A2XWHG | |
| Moyenne de la classe Gaming (7192 - 85542, n=144, 2 dernières années) | |
| SCHENKER XMG Focus 17 M25 | |
| Moyenne Intel Core i9-13900HX (17589 - 27615, n=22) | |
| AIDA64 / FPU Julia | |
| Lenovo Legion 5 Pro 16IAX10H | |
| SCHENKER XMG Pro 16 (E25) | |
| MSI Vector 17 HX AI A2XWIG | |
| MSI Vector 16 HX AI A2XWHG | |
| SCHENKER XMG Focus 17 M25 | |
| Moyenne de la classe Gaming (35040 - 252486, n=144, 2 dernières années) | |
| Moyenne Intel Core i9-13900HX (88686 - 137015, n=22) | |
| AIDA64 / CPU SHA3 | |
| SCHENKER XMG Pro 16 (E25) | |
| Lenovo Legion 5 Pro 16IAX10H | |
| MSI Vector 17 HX AI A2XWIG | |
| SCHENKER XMG Focus 17 M25 | |
| MSI Vector 16 HX AI A2XWHG | |
| Moyenne Intel Core i9-13900HX (4362 - 7029, n=22) | |
| Moyenne de la classe Gaming (1728 - 10389, n=144, 2 dernières années) | |
| AIDA64 / CPU Queen | |
| Lenovo Legion 5 Pro 16IAX10H | |
| SCHENKER XMG Focus 17 M25 | |
| Moyenne Intel Core i9-13900HX (125644 - 141385, n=22) | |
| SCHENKER XMG Pro 16 (E25) | |
| MSI Vector 17 HX AI A2XWIG | |
| Moyenne de la classe Gaming (50699 - 200651, n=144, 2 dernières années) | |
| MSI Vector 16 HX AI A2XWHG | |
| AIDA64 / FPU SinJulia | |
| SCHENKER XMG Focus 17 M25 | |
| Moyenne Intel Core i9-13900HX (12334 - 17179, n=22) | |
| Moyenne de la classe Gaming (5020 - 33636, n=144, 2 dernières années) | |
| SCHENKER XMG Pro 16 (E25) | |
| Lenovo Legion 5 Pro 16IAX10H | |
| MSI Vector 17 HX AI A2XWIG | |
| MSI Vector 16 HX AI A2XWHG | |
| AIDA64 / FPU Mandel | |
| SCHENKER XMG Pro 16 (E25) | |
| Lenovo Legion 5 Pro 16IAX10H | |
| MSI Vector 17 HX AI A2XWIG | |
| MSI Vector 16 HX AI A2XWHG | |
| SCHENKER XMG Focus 17 M25 | |
| Moyenne de la classe Gaming (17585 - 134044, n=144, 2 dernières années) | |
| Moyenne Intel Core i9-13900HX (43850 - 69202, n=22) | |
| AIDA64 / CPU AES | |
| Moyenne Intel Core i9-13900HX (89413 - 237881, n=22) | |
| Lenovo Legion 5 Pro 16IAX10H | |
| SCHENKER XMG Pro 16 (E25) | |
| SCHENKER XMG Focus 17 M25 | |
| Moyenne de la classe Gaming (19065 - 328679, n=144, 2 dernières années) | |
| MSI Vector 17 HX AI A2XWIG | |
| MSI Vector 16 HX AI A2XWHG | |
| AIDA64 / CPU ZLib | |
| Lenovo Legion 5 Pro 16IAX10H | |
| SCHENKER XMG Pro 16 (E25) | |
| SCHENKER XMG Focus 17 M25 | |
| Moyenne Intel Core i9-13900HX (1284 - 1958, n=22) | |
| MSI Vector 17 HX AI A2XWIG | |
| MSI Vector 16 HX AI A2XWHG | |
| Moyenne de la classe Gaming (373 - 2531, n=144, 2 dernières années) | |
| AIDA64 / FP64 Ray-Trace | |
| Lenovo Legion 5 Pro 16IAX10H | |
| SCHENKER XMG Pro 16 (E25) | |
| MSI Vector 16 HX AI A2XWHG | |
| MSI Vector 17 HX AI A2XWIG | |
| Moyenne de la classe Gaming (3856 - 45446, n=144, 2 dernières années) | |
| SCHENKER XMG Focus 17 M25 | |
| Moyenne Intel Core i9-13900HX (9481 - 15279, n=22) | |
| AIDA64 / CPU PhotoWorxx | |
| SCHENKER XMG Pro 16 (E25) | |
| Lenovo Legion 5 Pro 16IAX10H | |
| MSI Vector 17 HX AI A2XWIG | |
| SCHENKER XMG Focus 17 M25 | |
| Moyenne Intel Core i9-13900HX (42994 - 51994, n=22) | |
| Moyenne de la classe Gaming (10805 - 62916, n=144, 2 dernières années) | |
| MSI Vector 16 HX AI A2XWHG | |
Performance du système
Le Focus 17 est un compagnon très rapide dans les situations de tous les jours, et ses résultats aux tests de référence sont également bons. Nous n'avons rencontré aucun problème de stabilité du système pendant les tests.
PCMark 10: Score | Essentials | Productivity | Digital Content Creation
CrossMark: Overall | Productivity | Creativity | Responsiveness
WebXPRT 3: Overall
WebXPRT 4: Overall
Mozilla Kraken 1.1: Total
| Performance Rating | |
| Lenovo Legion 5 Pro 16IAX10H | |
| SCHENKER XMG Pro 16 (E25) | |
| MSI Vector 17 HX AI A2XWIG | |
| SCHENKER XMG Focus 17 M25 | |
| Moyenne Intel Core i9-13900HX, Nvidia GeForce RTX 5070 Ti Laptop | |
| Moyenne de la classe Gaming | |
| MSI Vector 16 HX AI A2XWHG | |
| PCMark 10 / Score | |
| SCHENKER XMG Pro 16 (E25) | |
| MSI Vector 17 HX AI A2XWIG | |
| Lenovo Legion 5 Pro 16IAX10H | |
| Moyenne de la classe Gaming (5776 - 9852, n=131, 2 dernières années) | |
| MSI Vector 16 HX AI A2XWHG | |
| SCHENKER XMG Focus 17 M25 | |
| Moyenne Intel Core i9-13900HX, Nvidia GeForce RTX 5070 Ti Laptop (n=1) | |
| PCMark 10 / Essentials | |
| SCHENKER XMG Pro 16 (E25) | |
| SCHENKER XMG Focus 17 M25 | |
| Moyenne Intel Core i9-13900HX, Nvidia GeForce RTX 5070 Ti Laptop (n=1) | |
| MSI Vector 17 HX AI A2XWIG | |
| Moyenne de la classe Gaming (9057 - 12600, n=131, 2 dernières années) | |
| Lenovo Legion 5 Pro 16IAX10H | |
| MSI Vector 16 HX AI A2XWHG | |
| PCMark 10 / Productivity | |
| Moyenne de la classe Gaming (6662 - 14612, n=131, 2 dernières années) | |
| Lenovo Legion 5 Pro 16IAX10H | |
| SCHENKER XMG Pro 16 (E25) | |
| MSI Vector 16 HX AI A2XWHG | |
| MSI Vector 17 HX AI A2XWIG | |
| SCHENKER XMG Focus 17 M25 | |
| Moyenne Intel Core i9-13900HX, Nvidia GeForce RTX 5070 Ti Laptop (n=1) | |
| PCMark 10 / Digital Content Creation | |
| MSI Vector 17 HX AI A2XWIG | |
| SCHENKER XMG Pro 16 (E25) | |
| Lenovo Legion 5 Pro 16IAX10H | |
| SCHENKER XMG Focus 17 M25 | |
| Moyenne Intel Core i9-13900HX, Nvidia GeForce RTX 5070 Ti Laptop (n=1) | |
| Moyenne de la classe Gaming (7440 - 19351, n=131, 2 dernières années) | |
| MSI Vector 16 HX AI A2XWHG | |
| CrossMark / Overall | |
| SCHENKER XMG Focus 17 M25 | |
| Moyenne Intel Core i9-13900HX, Nvidia GeForce RTX 5070 Ti Laptop (n=1) | |
| MSI Vector 17 HX AI A2XWIG | |
| SCHENKER XMG Pro 16 (E25) | |
| Lenovo Legion 5 Pro 16IAX10H | |
| Moyenne de la classe Gaming (1247 - 2344, n=113, 2 dernières années) | |
| MSI Vector 16 HX AI A2XWHG | |
| CrossMark / Productivity | |
| MSI Vector 17 HX AI A2XWIG | |
| Lenovo Legion 5 Pro 16IAX10H | |
| SCHENKER XMG Focus 17 M25 | |
| Moyenne Intel Core i9-13900HX, Nvidia GeForce RTX 5070 Ti Laptop (n=1) | |
| SCHENKER XMG Pro 16 (E25) | |
| Moyenne de la classe Gaming (1299 - 2211, n=113, 2 dernières années) | |
| MSI Vector 16 HX AI A2XWHG | |
| CrossMark / Creativity | |
| SCHENKER XMG Pro 16 (E25) | |
| SCHENKER XMG Focus 17 M25 | |
| Moyenne Intel Core i9-13900HX, Nvidia GeForce RTX 5070 Ti Laptop (n=1) | |
| Lenovo Legion 5 Pro 16IAX10H | |
| MSI Vector 17 HX AI A2XWIG | |
| MSI Vector 16 HX AI A2XWHG | |
| Moyenne de la classe Gaming (1275 - 2729, n=113, 2 dernières années) | |
| CrossMark / Responsiveness | |
| SCHENKER XMG Focus 17 M25 | |
| Moyenne Intel Core i9-13900HX, Nvidia GeForce RTX 5070 Ti Laptop (n=1) | |
| MSI Vector 17 HX AI A2XWIG | |
| Lenovo Legion 5 Pro 16IAX10H | |
| SCHENKER XMG Pro 16 (E25) | |
| Moyenne de la classe Gaming (1030 - 2330, n=113, 2 dernières années) | |
| MSI Vector 16 HX AI A2XWHG | |
| WebXPRT 3 / Overall | |
| Lenovo Legion 5 Pro 16IAX10H | |
| SCHENKER XMG Pro 16 (E25) | |
| MSI Vector 17 HX AI A2XWIG | |
| MSI Vector 16 HX AI A2XWHG | |
| Moyenne de la classe Gaming (237 - 532, n=125, 2 dernières années) | |
| Moyenne Intel Core i9-13900HX, Nvidia GeForce RTX 5070 Ti Laptop (n=1) | |
| SCHENKER XMG Focus 17 M25 | |
| WebXPRT 4 / Overall | |
| SCHENKER XMG Pro 16 (E25) | |
| MSI Vector 17 HX AI A2XWIG | |
| Lenovo Legion 5 Pro 16IAX10H | |
| MSI Vector 16 HX AI A2XWHG | |
| SCHENKER XMG Focus 17 M25 | |
| Moyenne Intel Core i9-13900HX, Nvidia GeForce RTX 5070 Ti Laptop (n=1) | |
| Moyenne de la classe Gaming (176.4 - 341, n=112, 2 dernières années) | |
| Mozilla Kraken 1.1 / Total | |
| Moyenne de la classe Gaming (397 - 674, n=135, 2 dernières années) | |
| SCHENKER XMG Focus 17 M25 | |
| Moyenne Intel Core i9-13900HX, Nvidia GeForce RTX 5070 Ti Laptop (n=1) | |
| MSI Vector 16 HX AI A2XWHG | |
| MSI Vector 17 HX AI A2XWIG | |
| Lenovo Legion 5 Pro 16IAX10H | |
| SCHENKER XMG Pro 16 (E25) | |
* ... Moindre est la valeur, meilleures sont les performances
| PCMark 10 Score | 7560 points | |
Aide | ||
| AIDA64 / Memory Copy | |
| SCHENKER XMG Pro 16 (E25) | |
| SCHENKER XMG Focus 17 M25 | |
| Lenovo Legion 5 Pro 16IAX10H | |
| MSI Vector 17 HX AI A2XWIG | |
| Moyenne Intel Core i9-13900HX (67716 - 79193, n=22) | |
| Moyenne de la classe Gaming (21750 - 97515, n=144, 2 dernières années) | |
| MSI Vector 16 HX AI A2XWHG | |
| AIDA64 / Memory Read | |
| SCHENKER XMG Pro 16 (E25) | |
| SCHENKER XMG Focus 17 M25 | |
| Lenovo Legion 5 Pro 16IAX10H | |
| MSI Vector 17 HX AI A2XWIG | |
| Moyenne Intel Core i9-13900HX (73998 - 88462, n=22) | |
| MSI Vector 16 HX AI A2XWHG | |
| Moyenne de la classe Gaming (22956 - 104349, n=144, 2 dernières années) | |
| AIDA64 / Memory Write | |
| SCHENKER XMG Pro 16 (E25) | |
| Lenovo Legion 5 Pro 16IAX10H | |
| MSI Vector 17 HX AI A2XWIG | |
| SCHENKER XMG Focus 17 M25 | |
| Moyenne Intel Core i9-13900HX (65472 - 77045, n=22) | |
| Moyenne de la classe Gaming (22297 - 133486, n=144, 2 dernières années) | |
| MSI Vector 16 HX AI A2XWHG | |
| AIDA64 / Memory Latency | |
| MSI Vector 17 HX AI A2XWIG | |
| Lenovo Legion 5 Pro 16IAX10H | |
| MSI Vector 16 HX AI A2XWHG | |
| SCHENKER XMG Pro 16 (E25) | |
| Moyenne de la classe Gaming (59.5 - 259, n=144, 2 dernières années) | |
| Moyenne Intel Core i9-13900HX (75.3 - 91.1, n=22) | |
| SCHENKER XMG Focus 17 M25 | |
* ... Moindre est la valeur, meilleures sont les performances
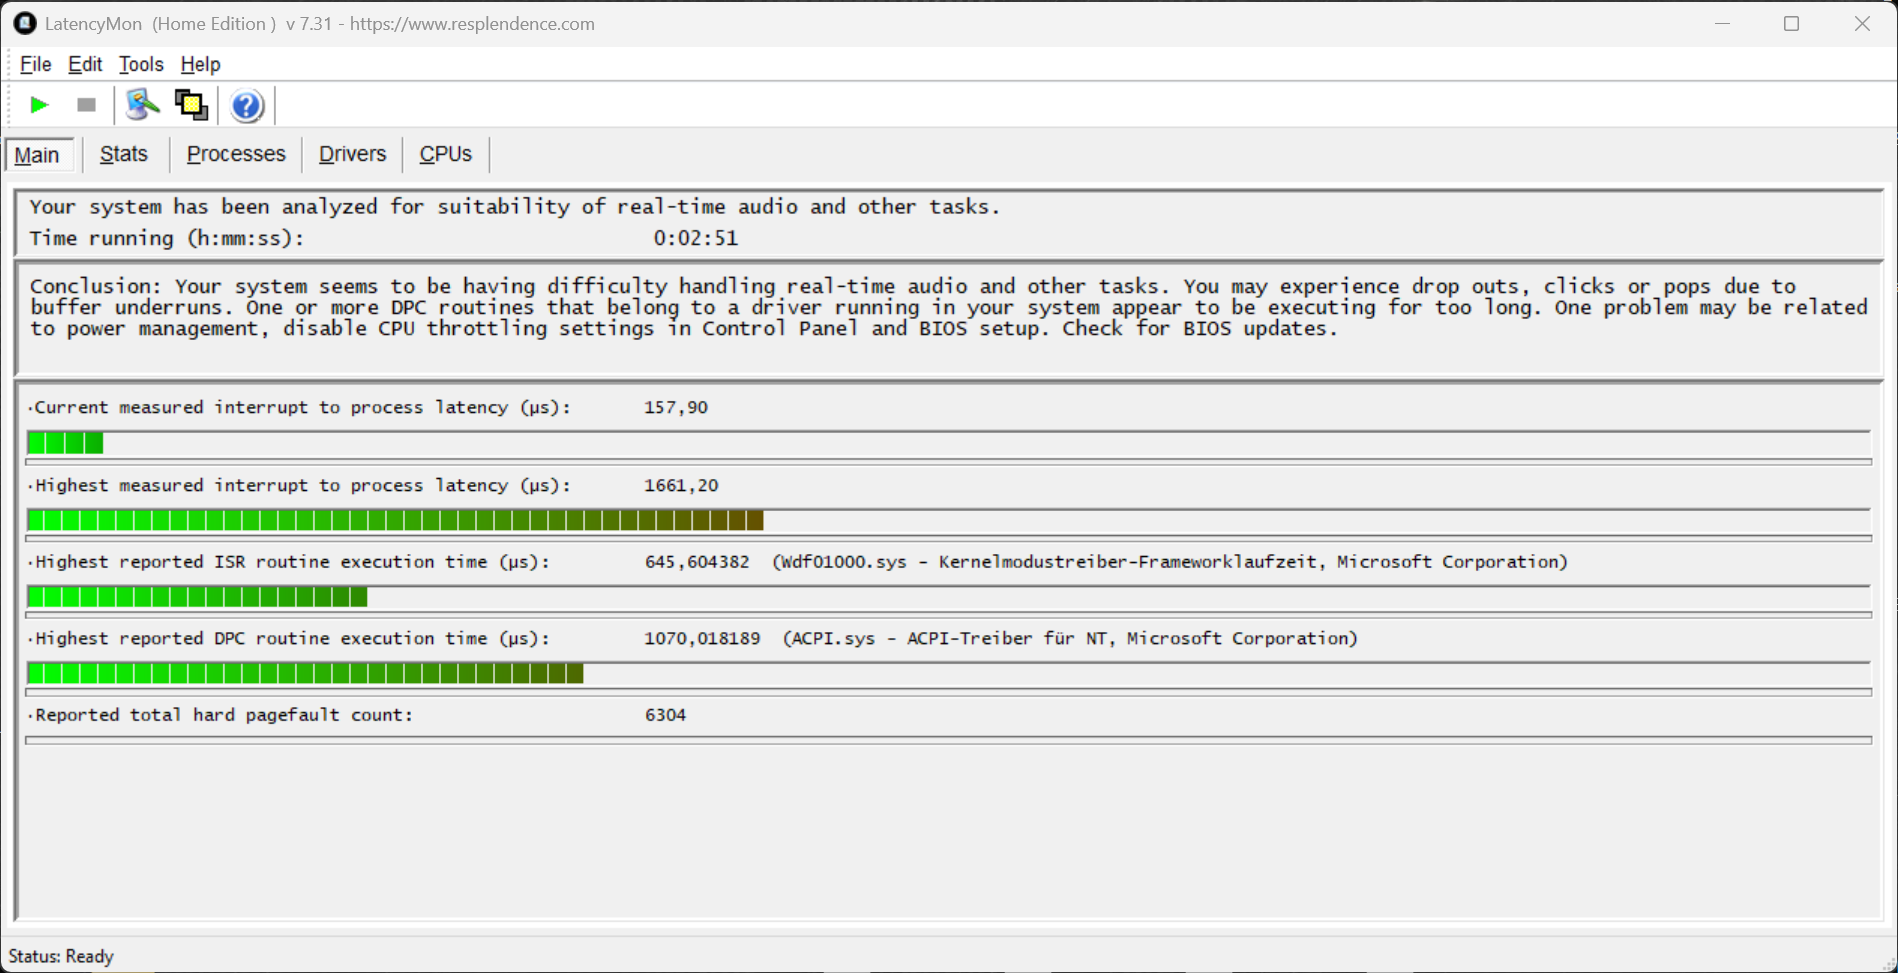
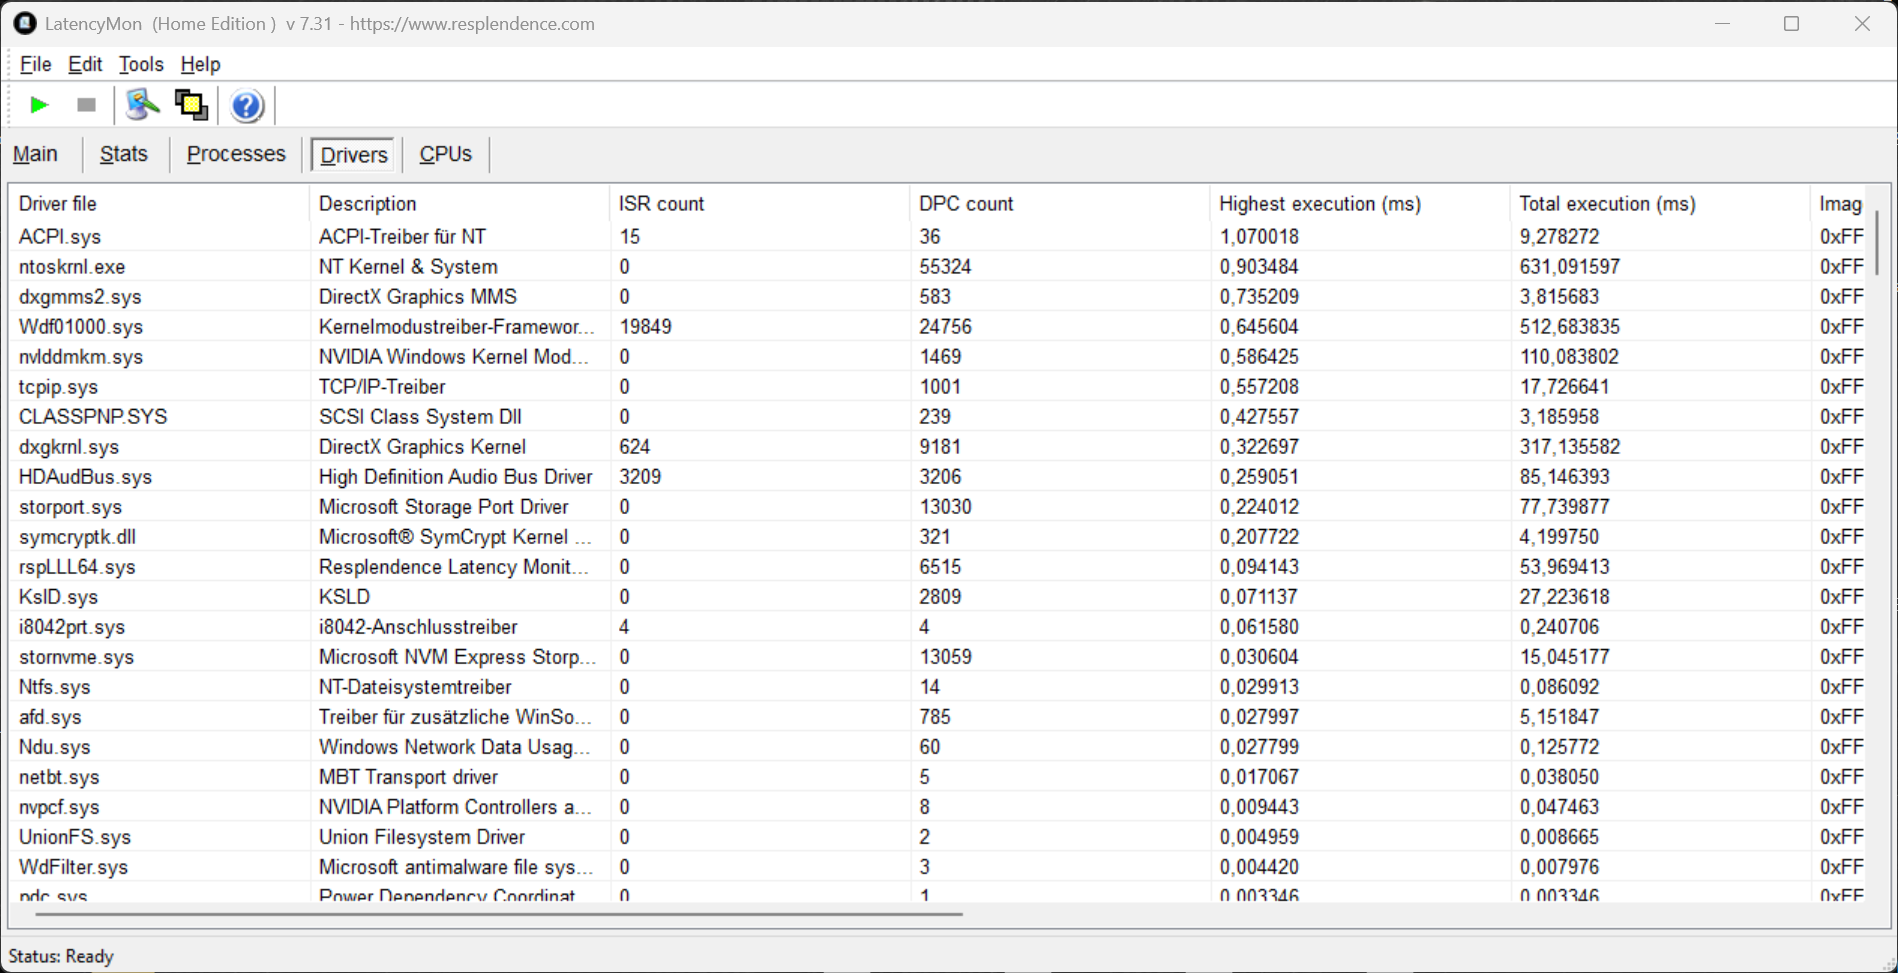
Latences DPC
Dans notre test de latence standardisé (navigation web, lecture YouTube 4K, charge CPU), l'appareil examiné (avec la version actuelle du BIOS) a montré de légères limitations lors de l'utilisation d'applications audio en temps réel.
| DPC Latencies / LatencyMon - interrupt to process latency (max), Web, Youtube, Prime95 | |
| MSI Vector 16 HX AI A2XWHG | |
| SCHENKER XMG Pro 16 (E25) | |
| SCHENKER XMG Focus 17 M25 | |
| MSI Vector 17 HX AI A2XWIG | |
| Lenovo Legion 5 Pro 16IAX10H | |
* ... Moindre est la valeur, meilleures sont les performances
Mémoire de masse
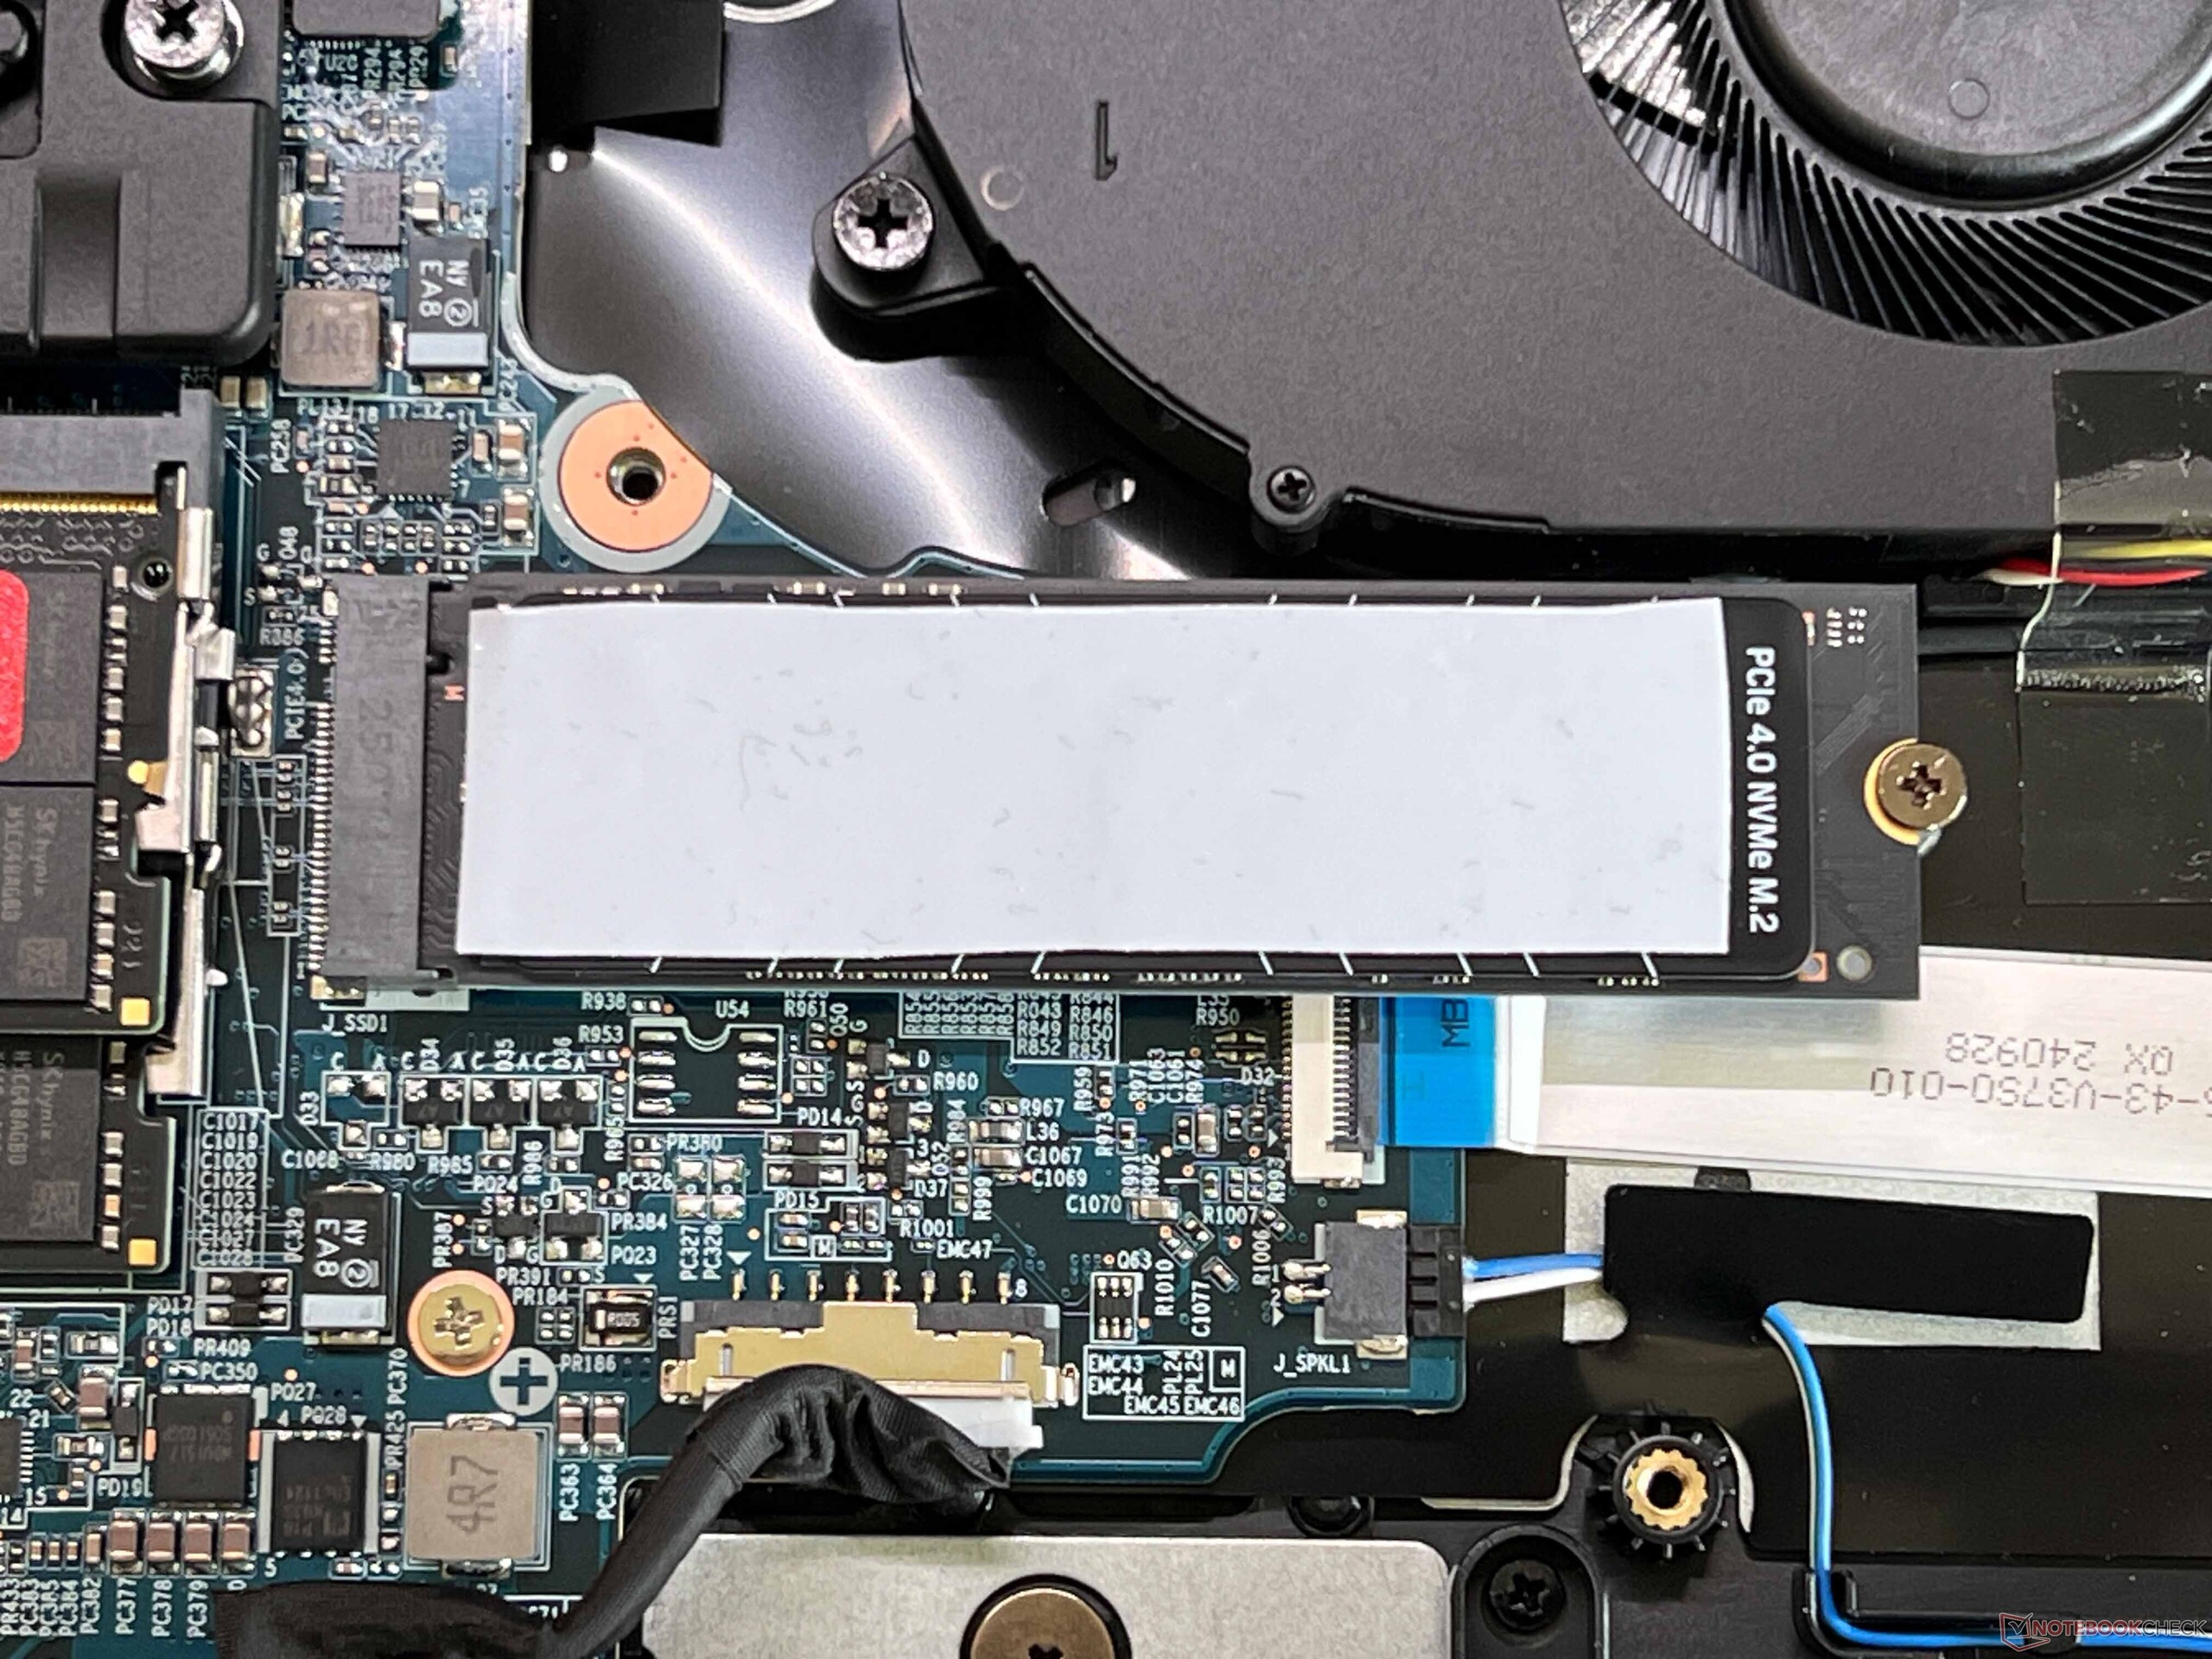
Le Focus offre deux emplacements pour des disques SSD M.2 2280 (PCIe 4.0), et notre modèle de test est équipé d'un disque Kingston de 500 Go (399 Go gratuits). Les vitesses de transfert sont très bonnes et restent stables même en cas de charge importante.

* ... Moindre est la valeur, meilleures sont les performances
Sustained Performance Read: DiskSpd Read Loop, Queue Depth 8
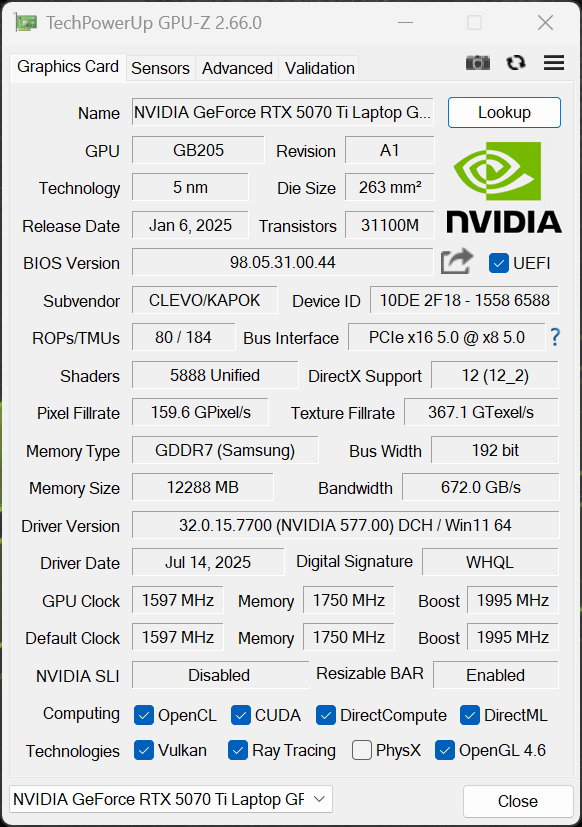
Performance du GPU
Le Das Focus 17 est exclusivement équipé du nouveau GPU pour ordinateur portable GeForce GPU RTX 5070 Ti pour ordinateur portable (TGP 140 watts, 12 Go de VRAM). La commutation graphique est gérée par la technologie Optimus, et un commutateur multithread est intégré. Les performances graphiques dans les benchmarks synthétiques sont excellentes. En outre, les performances du GPU sont restées stables en cas de charge soutenue.
Les performances de jeu sont également très bonnes, tous les titres fonctionnant sans problème en résolution QHD. Cependant, les performances n'ont pas été entièrement stables, car les performances du CPU ont légèrement baissé après quelques minutes. Il y a de légères différences en fonction du titre. Lors de notre test avec Cyberpunk 2077, par exemple, les performances ont chuté d'environ 5 % après environ 5 minutes.
| 3DMark 11 Performance | 43731 points | |
| 3DMark Fire Strike Score | 33824 points | |
| 3DMark Time Spy Score | 17276 points | |
| 3DMark Steel Nomad Score | 3932 points | |
| 3DMark Steel Nomad Light Score | 17797 points | |
| 3DMark Steel Nomad Light Unlimited Score | 18318 points | |
Aide | ||
| Blender / v3.3 Classroom OPTIX/RTX | |
| Moyenne de la classe Gaming (9 - 95, n=139, 2 dernières années) | |
| MSI Vector 16 HX AI A2XWHG | |
| Lenovo Legion 5 Pro 16IAX10H | |
| Moyenne Nvidia GeForce RTX 5070 Ti Laptop (13 - 16, n=8) | |
| SCHENKER XMG Pro 16 (E25) | |
| MSI Vector 17 HX AI A2XWIG | |
| SCHENKER XMG Focus 17 M25 | |
| Blender / v3.3 Classroom CUDA | |
| SCHENKER XMG Focus 17 M25 | |
| Moyenne de la classe Gaming (15 - 110, n=139, 2 dernières années) | |
| Moyenne Nvidia GeForce RTX 5070 Ti Laptop (24 - 33, n=8) | |
| SCHENKER XMG Pro 16 (E25) | |
| MSI Vector 16 HX AI A2XWHG | |
| Lenovo Legion 5 Pro 16IAX10H | |
| MSI Vector 17 HX AI A2XWIG | |
| Blender / v3.3 Classroom CPU | |
| Moyenne de la classe Gaming (122 - 962, n=143, 2 dernières années) | |
| MSI Vector 16 HX AI A2XWHG | |
| SCHENKER XMG Focus 17 M25 | |
| MSI Vector 17 HX AI A2XWIG | |
| Moyenne Nvidia GeForce RTX 5070 Ti Laptop (122 - 217, n=8) | |
| Lenovo Legion 5 Pro 16IAX10H | |
| SCHENKER XMG Pro 16 (E25) | |
* ... Moindre est la valeur, meilleures sont les performances
| Performance Rating - Percent | |
| MSI Vector 17 HX AI A2XWIG | |
| Lenovo Legion 5 Pro 16IAX10H | |
| SCHENKER XMG Focus 17 M25 | |
| MSI Vector 16 HX AI A2XWHG -1! | |
| SCHENKER XMG Pro 16 (E25) | |
| Moyenne de la classe Gaming | |
| Cyberpunk 2077 2.2 Phantom Liberty - 1920x1080 Ultra Preset (FSR off) | |
| MSI Vector 17 HX AI A2XWIG | |
| Lenovo Legion 5 Pro 16IAX10H | |
| SCHENKER XMG Pro 16 (E25) | |
| MSI Vector 16 HX AI A2XWHG | |
| SCHENKER XMG Focus 17 M25 | |
| Moyenne de la classe Gaming (6.76 - 166.5, n=129, 2 dernières années) | |
| Baldur's Gate 3 - 1920x1080 Ultra Preset AA:T | |
| MSI Vector 17 HX AI A2XWIG | |
| SCHENKER XMG Pro 16 (E25) | |
| SCHENKER XMG Focus 17 M25 | |
| MSI Vector 16 HX AI A2XWHG | |
| Lenovo Legion 5 Pro 16IAX10H | |
| Moyenne de la classe Gaming (34.5 - 246, n=93, 2 dernières années) | |
| GTA V - 1920x1080 Highest Settings possible AA:4xMSAA + FX AF:16x | |
| SCHENKER XMG Pro 16 (E25) | |
| MSI Vector 17 HX AI A2XWIG | |
| SCHENKER XMG Focus 17 M25 | |
| Lenovo Legion 5 Pro 16IAX10H | |
| MSI Vector 16 HX AI A2XWHG | |
| Moyenne de la classe Gaming (12.1 - 186.9, n=128, 2 dernières années) | |
| Final Fantasy XV Benchmark - 1920x1080 High Quality | |
| MSI Vector 17 HX AI A2XWIG | |
| Lenovo Legion 5 Pro 16IAX10H | |
| MSI Vector 16 HX AI A2XWHG | |
| SCHENKER XMG Focus 17 M25 | |
| SCHENKER XMG Pro 16 (E25) | |
| Moyenne de la classe Gaming (19.2 - 215, n=143, 2 dernières années) | |
| Strange Brigade - 1920x1080 ultra AA:ultra AF:16 | |
| MSI Vector 17 HX AI A2XWIG | |
| Lenovo Legion 5 Pro 16IAX10H | |
| SCHENKER XMG Focus 17 M25 | |
| Moyenne de la classe Gaming (38.9 - 456, n=132, 2 dernières années) | |
| SCHENKER XMG Pro 16 (E25) | |
| Dota 2 Reborn - 1920x1080 ultra (3/3) best looking | |
| SCHENKER XMG Pro 16 (E25) | |
| Lenovo Legion 5 Pro 16IAX10H | |
| MSI Vector 17 HX AI A2XWIG | |
| SCHENKER XMG Focus 17 M25 | |
| MSI Vector 16 HX AI A2XWHG | |
| Moyenne de la classe Gaming (65.1 - 248, n=145, 2 dernières années) | |
| Cyberpunk 2077 2.2 Phantom Liberty - 2560x1440 Ultra Preset (FSR off) | |
| MSI Vector 17 HX AI A2XWIG | |
| Lenovo Legion 5 Pro 16IAX10H | |
| SCHENKER XMG Pro 16 (E25) | |
| SCHENKER XMG Focus 17 M25 | |
| Moyenne Nvidia GeForce RTX 5070 Ti Laptop (68.4 - 87.5, n=9) | |
| MSI Vector 16 HX AI A2XWHG | |
| Moyenne de la classe Gaming (24.8 - 120.5, n=110, 2 dernières années) | |
| F1 24 - 2560x1440 Ultra High Preset AA:T AF:16x | |
| Moyenne de la classe Gaming (36.7 - 106.4, n=42, 2 dernières années) | |
| SCHENKER XMG Pro 16 (E25) | |
| SCHENKER XMG Focus 17 M25 | |
| Moyenne Nvidia GeForce RTX 5070 Ti Laptop (53.2 - 72.1, n=7) | |
| F1 25 - 2560x1440 Ultra Max Preset AA:T AF:16x | |
| Moyenne de la classe Gaming (9.33 - 37.5, n=14, 2 dernières années) | |
| Moyenne Nvidia GeForce RTX 5070 Ti Laptop (18 - 25, n=4) | |
| Lenovo Legion 5 Pro 16IAX10H | |
| Assassin's Creed Shadows - 2560x1440 Ultra High | |
| SCHENKER XMG Focus 17 M25 | |
| Moyenne de la classe Gaming (25 - 64, n=34, 2 dernières années) | |
| Lenovo Legion 5 Pro 16IAX10H | |
| Moyenne Nvidia GeForce RTX 5070 Ti Laptop (40 - 48, n=7) | |
Cyberpunk 2077 ultra FPS diagram
| Bas | Moyen | Élevé | Ultra | QHD DLSS | QHD | |
|---|---|---|---|---|---|---|
| GTA V (2015) | 152.9 | 139.1 | ||||
| Dota 2 Reborn (2015) | 223 | 192.9 | 178.8 | 165.4 | ||
| Final Fantasy XV Benchmark (2018) | 223 | 197.6 | 156.8 | 129.5 | ||
| X-Plane 11.11 (2018) | 165 | 142.2 | 124.6 | |||
| Strange Brigade (2018) | 438 | 362 | 328 | 303 | 229 | |
| Baldur's Gate 3 (2023) | 202.6 | 172.8 | 154.2 | 153.9 | 108.6 | |
| Cyberpunk 2077 2.2 Phantom Liberty (2023) | 149.4 | 139.8 | 126.4 | 115.7 | 93.9 | 81 |
| F1 24 (2024) | 247 | 236 | 232 | 98.7 | 98.4 | 66.4 |
| Assassin's Creed Shadows (2025) | 90 | 84 | 72 | 55 | 47 |
Émissions et énergie
Émissions sonores
En utilisation quotidienne, les deux ventilateurs restent généralement très silencieux, même en utilisant le profil de puissance rapide, et la vitesse du ventilateur diminue également très rapidement après la fin de la phase de charge. Avec 56,2 dB(A), le niveau sonore devient très élevé lorsque vous jouez en mode le plus rapide, et il est recommandé d'utiliser un casque. Le mode silencieux, en revanche, est très silencieux, avec un maximum de 37 dB(A), et les performances de jeu sont encore acceptables. Aucun autre bruit électronique n'a été détecté sur l'appareil testé.
Degré de la nuisance sonore
| Au repos |
| 24.8 / 24.8 / 27.7 dB(A) |
| Fortement sollicité |
| 51 / 56.2 dB(A) |
 | ||
30 dB silencieux 40 dB(A) audible 50 dB(A) bruyant |
||
min: | ||
| SCHENKER XMG Focus 17 M25 GeForce RTX 5070 Ti Laptop, i9-13900HX, Kingston Fury Renegade SFYRS500G | MSI Vector 17 HX AI A2XWIG GeForce RTX 5080 Laptop, Ultra 9 275HX, Western Digital PC SN5000S SDEPNSJ-2T00-1032 | Lenovo Legion 5 Pro 16IAX10H GeForce RTX 5070 Ti Laptop, Ultra 9 275HX, Western Digital PC SN8000S SDEPNRK-1T00 | MSI Vector 16 HX AI A2XWHG GeForce RTX 5070 Ti Laptop, Ultra 7 255HX, Micron 2400 MTFDKBA512QFM | SCHENKER XMG Pro 16 (E25) GeForce RTX 5070 Ti Laptop, Ultra 9 275HX, Samsung 9100 Pro 1 TB | |
|---|---|---|---|---|---|
| Noise | -0% | -2% | -10% | 5% | |
| arrêt / environnement * | 24.8 | 24 3% | 24 3% | 25 -1% | 23.3 6% |
| Idle Minimum * | 24.8 | 24 3% | 24 3% | 33 -33% | 25 -1% |
| Idle Average * | 24.8 | 30.82 -24% | 24 3% | 34 -37% | 25 -1% |
| Idle Maximum * | 27.7 | 31.31 -13% | 30.9 -12% | 38 -37% | 25 10% |
| Load Average * | 51 | 31.12 39% | 55.9 -10% | 46 10% | 45.5 11% |
| Cyberpunk 2077 ultra * | 56.2 | 59.24 -5% | 56.72 -1% | 47 16% | 53.3 5% |
| Load Maximum * | 56.2 | 59.24 -5% | 56.72 -1% | 49 13% | 53.3 5% |
* ... Moindre est la valeur, meilleures sont les performances
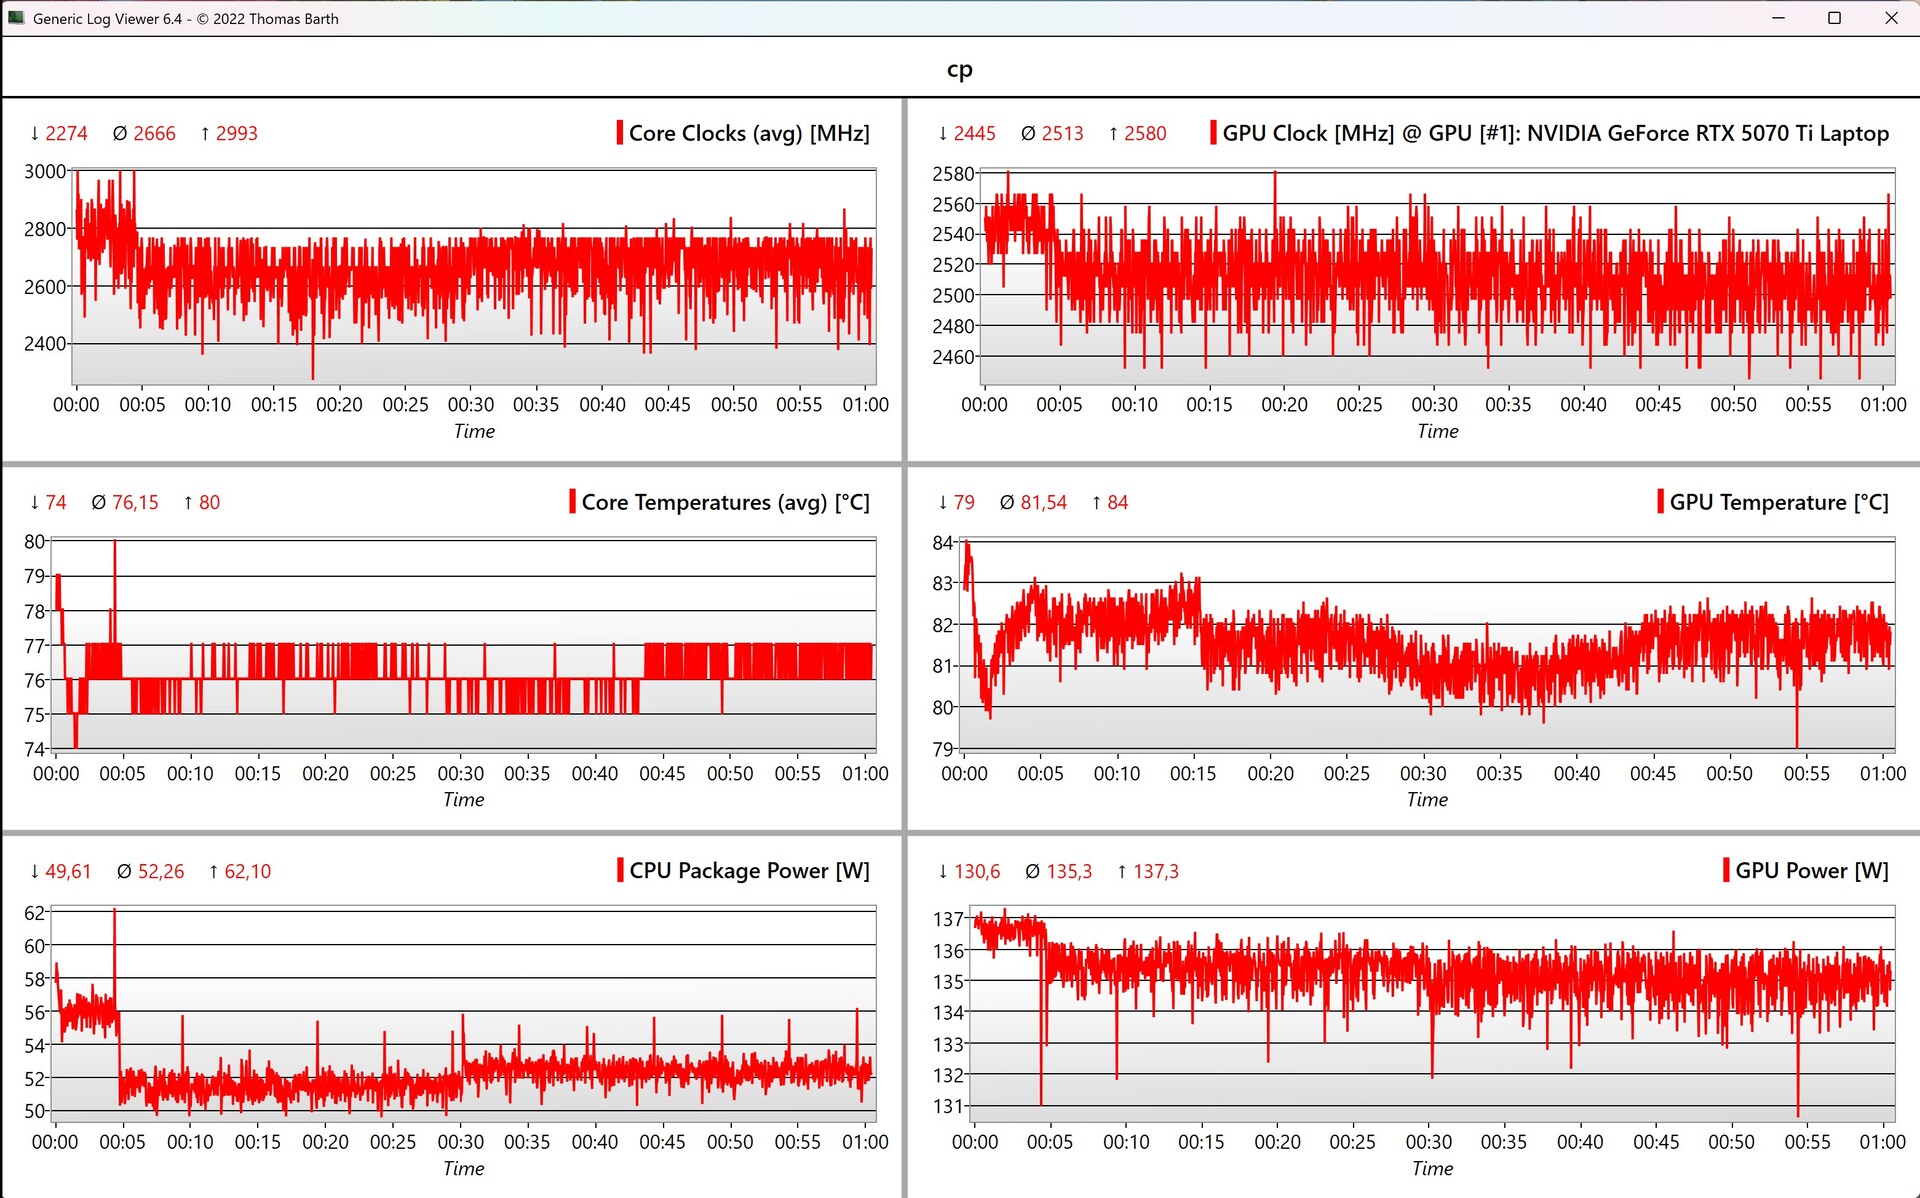
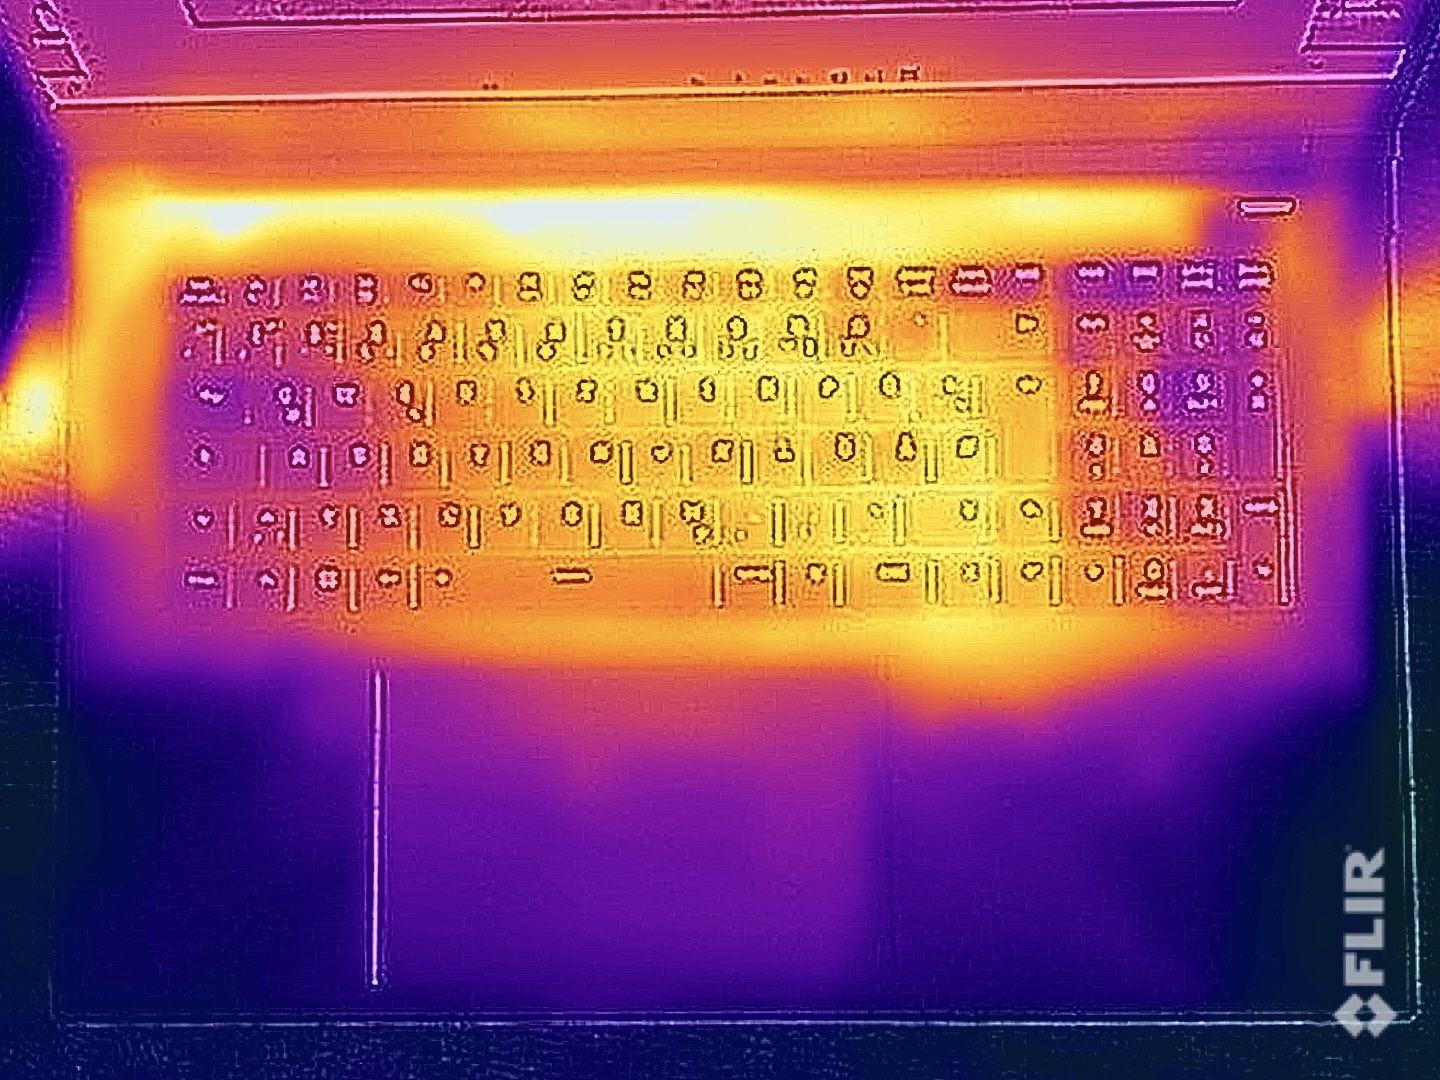
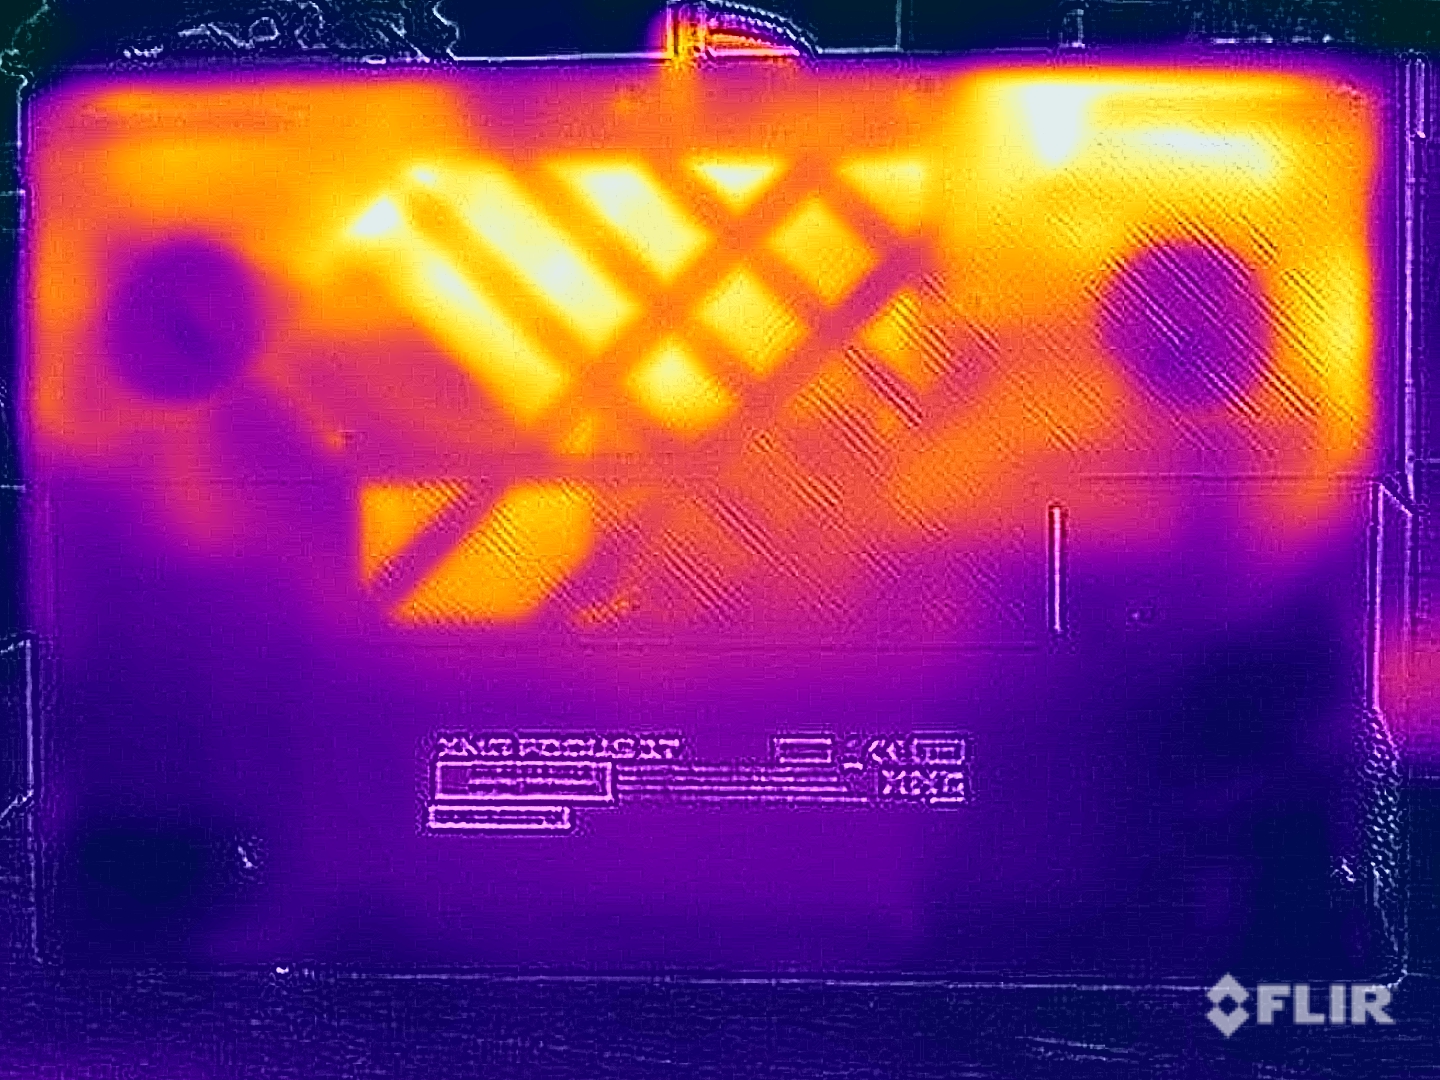
Température
Les températures de surface ne posent pas de problème, et le clavier en particulier ne chauffe pas trop, même en jouant. Le panneau inférieur atteint une température maximale de 48°C, mais compte tenu de sa taille, vous ne poserez probablement pas le Focus 17 sur vos genoux. Lors du test de stress, le GPU a fonctionné à environ 130 watts (81°C) et le CPU à 45 watts (77°C).
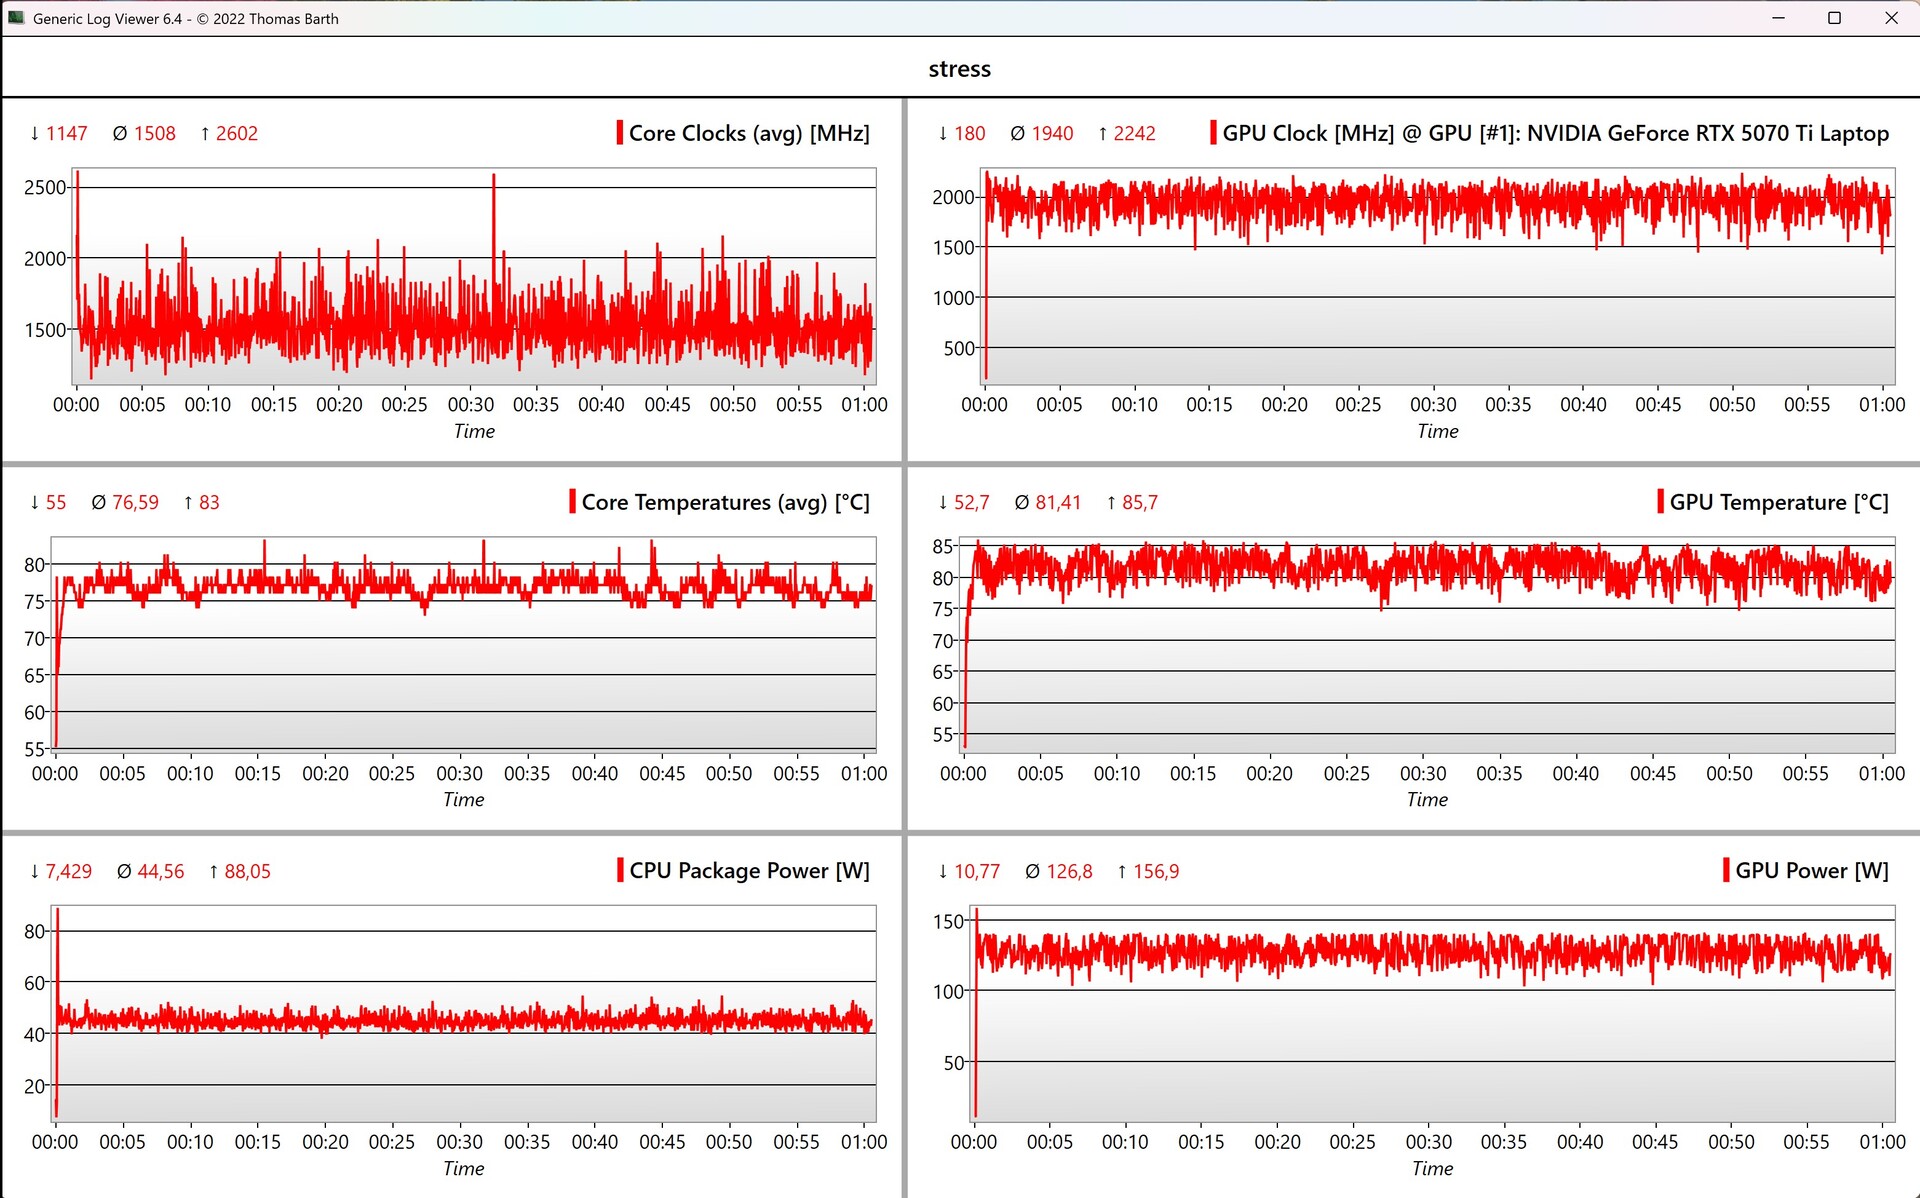
(±) La température maximale du côté supérieur est de 41.2 °C / 106 F, par rapport à la moyenne de 40.5 °C / 105 F, allant de 21.2 à 68.8 °C pour la classe Gaming.
(-) Le fond chauffe jusqu'à un maximum de 48.8 °C / 120 F, contre une moyenne de 43.3 °C / 110 F
(+) En utilisation inactive, la température moyenne du côté supérieur est de 26.6 °C / 80 F, par rapport à la moyenne du dispositif de 33.9 °C / 93 F.
(±) 3: The average temperature for the upper side is 35.6 °C / 96 F, compared to the average of 33.9 °C / 93 F for the class Gaming.
(+) Les repose-poignets et le pavé tactile sont plus froids que la température de la peau avec un maximum de 28 °C / 82.4 F et sont donc froids au toucher.
(±) La température moyenne de la zone de l'appui-paume de dispositifs similaires était de 28.9 °C / 84 F (+0.9 °C / #1.6 F).
| SCHENKER XMG Focus 17 M25 Intel Core i9-13900HX, Nvidia GeForce RTX 5070 Ti Laptop | MSI Vector 17 HX AI A2XWIG Intel Core Ultra 9 275HX, Nvidia GeForce RTX 5080 Laptop | Lenovo Legion 5 Pro 16IAX10H Intel Core Ultra 9 275HX, Nvidia GeForce RTX 5070 Ti Laptop | MSI Vector 16 HX AI A2XWHG Intel Core Ultra 7 255HX, Nvidia GeForce RTX 5070 Ti Laptop | SCHENKER XMG Pro 16 (E25) Intel Core Ultra 9 275HX, Nvidia GeForce RTX 5070 Ti Laptop | |
|---|---|---|---|---|---|
| Heat | -24% | -24% | -13% | -194% | |
| Maximum Upper Side * | 41.2 | 53 -29% | 48 -17% | 53 -29% | 43.2 -5% |
| Maximum Bottom * | 48.8 | 54 -11% | 50 -2% | 52 -7% | 46 6% |
| Idle Upper Side * | 27.6 | 39 -41% | 38 -38% | 33 -20% | 27.7 -0% |
| Idle Bottom * | 30.1 | 34 -13% | 42 -40% | 29 4% | 264 -777% |
* ... Moindre est la valeur, meilleures sont les performances
Intervenants
Les deux haut-parleurs stéréo n'impressionnent pas, le son semble très fin et le volume maximal est faible.
SCHENKER XMG Focus 17 M25 analyse audio
(±) | le niveau sonore du haut-parleur est moyen mais bon (78.5# dB)
Basses 100 - 315 Hz
(-) | presque aucune basse - en moyenne 21.9% plus bas que la médiane
(±) | la linéarité des basses est moyenne (13.4% delta à la fréquence précédente)
Médiums 400 - 2000 Hz
(+) | médiane équilibrée - seulement 2.8% de la médiane
(±) | la linéarité des médiums est moyenne (7.3% delta à la fréquence précédente)
Aiguës 2 - 16 kHz
(+) | des sommets équilibrés - à seulement 3.9% de la médiane
(+) | les aigus sont linéaires (5.8% delta à la fréquence précédente)
Globalement 100 - 16 000 Hz
(±) | la linéarité du son global est moyenne (18.8% de différence avec la médiane)
Par rapport à la même classe
» 61% de tous les appareils testés de cette catégorie étaient meilleurs, 8% similaires, 31% pires
» Le meilleur avait un delta de 6%, la moyenne était de 18%, le pire était de 132%.
Par rapport à tous les appareils testés
» 41% de tous les appareils testés étaient meilleurs, 8% similaires, 51% pires
» Le meilleur avait un delta de 4%, la moyenne était de 24%, le pire était de 134%.
MSI Vector 17 HX AI A2XWIG analyse audio
(±) | le niveau sonore du haut-parleur est moyen mais bon (80.39# dB)
Basses 100 - 315 Hz
(±) | basse réduite - en moyenne 10.4% inférieure à la médiane
(±) | la linéarité des basses est moyenne (7.4% delta à la fréquence précédente)
Médiums 400 - 2000 Hz
(±) | médiane supérieure - en moyenne 6.2% supérieure à la médiane
(+) | les médiums sont linéaires (4.7% delta à la fréquence précédente)
Aiguës 2 - 16 kHz
(+) | des sommets équilibrés - à seulement 4.3% de la médiane
(±) | la linéarité des aigus est moyenne (8.7% delta à la fréquence précédente)
Globalement 100 - 16 000 Hz
(±) | la linéarité du son global est moyenne (15.6% de différence avec la médiane)
Par rapport à la même classe
» 35% de tous les appareils testés de cette catégorie étaient meilleurs, 6% similaires, 58% pires
» Le meilleur avait un delta de 6%, la moyenne était de 18%, le pire était de 132%.
Par rapport à tous les appareils testés
» 22% de tous les appareils testés étaient meilleurs, 4% similaires, 74% pires
» Le meilleur avait un delta de 4%, la moyenne était de 24%, le pire était de 134%.
Lenovo Legion 5 Pro 16IAX10H analyse audio
(±) | le niveau sonore du haut-parleur est moyen mais bon (78.2# dB)
Basses 100 - 315 Hz
(-) | presque aucune basse - en moyenne 21.1% plus bas que la médiane
(±) | la linéarité des basses est moyenne (8% delta à la fréquence précédente)
Médiums 400 - 2000 Hz
(±) | médiane supérieure - en moyenne 6.3% supérieure à la médiane
(+) | les médiums sont linéaires (6.5% delta à la fréquence précédente)
Aiguës 2 - 16 kHz
(+) | des sommets équilibrés - à seulement 1.6% de la médiane
(+) | les aigus sont linéaires (4.9% delta à la fréquence précédente)
Globalement 100 - 16 000 Hz
(±) | la linéarité du son global est moyenne (18.3% de différence avec la médiane)
Par rapport à la même classe
» 57% de tous les appareils testés de cette catégorie étaient meilleurs, 8% similaires, 34% pires
» Le meilleur avait un delta de 6%, la moyenne était de 18%, le pire était de 132%.
Par rapport à tous les appareils testés
» 38% de tous les appareils testés étaient meilleurs, 8% similaires, 54% pires
» Le meilleur avait un delta de 4%, la moyenne était de 24%, le pire était de 134%.
MSI Vector 16 HX AI A2XWHG analyse audio
(+) | les haut-parleurs peuvent jouer relativement fort (86# dB)
Basses 100 - 315 Hz
(±) | basse réduite - en moyenne 12.3% inférieure à la médiane
(±) | la linéarité des basses est moyenne (8.5% delta à la fréquence précédente)
Médiums 400 - 2000 Hz
(±) | médiane supérieure - en moyenne 9.9% supérieure à la médiane
(+) | les médiums sont linéaires (6.8% delta à la fréquence précédente)
Aiguës 2 - 16 kHz
(+) | des sommets équilibrés - à seulement 1.8% de la médiane
(+) | les aigus sont linéaires (2.9% delta à la fréquence précédente)
Globalement 100 - 16 000 Hz
(±) | la linéarité du son global est moyenne (15.8% de différence avec la médiane)
Par rapport à la même classe
» 36% de tous les appareils testés de cette catégorie étaient meilleurs, 7% similaires, 57% pires
» Le meilleur avait un delta de 6%, la moyenne était de 18%, le pire était de 132%.
Par rapport à tous les appareils testés
» 23% de tous les appareils testés étaient meilleurs, 5% similaires, 72% pires
» Le meilleur avait un delta de 4%, la moyenne était de 24%, le pire était de 134%.
SCHENKER XMG Pro 16 (E25) analyse audio
(±) | le niveau sonore du haut-parleur est moyen mais bon (79.2# dB)
Basses 100 - 315 Hz
(±) | basse réduite - en moyenne 14.2% inférieure à la médiane
(±) | la linéarité des basses est moyenne (10.6% delta à la fréquence précédente)
Médiums 400 - 2000 Hz
(±) | médiane supérieure - en moyenne 8.2% supérieure à la médiane
(±) | la linéarité des médiums est moyenne (9.9% delta à la fréquence précédente)
Aiguës 2 - 16 kHz
(+) | des sommets équilibrés - à seulement 3.8% de la médiane
(+) | les aigus sont linéaires (5.9% delta à la fréquence précédente)
Globalement 100 - 16 000 Hz
(±) | la linéarité du son global est moyenne (18.5% de différence avec la médiane)
Par rapport à la même classe
» 59% de tous les appareils testés de cette catégorie étaient meilleurs, 9% similaires, 32% pires
» Le meilleur avait un delta de 6%, la moyenne était de 18%, le pire était de 132%.
Par rapport à tous les appareils testés
» 39% de tous les appareils testés étaient meilleurs, 8% similaires, 53% pires
» Le meilleur avait un delta de 4%, la moyenne était de 24%, le pire était de 134%.
Consommation électrique
Au ralenti, la Focus est restée assez économe avec un maximum de 18 watts. Cependant, à pleine charge, nous avons mesuré jusqu'à 290 watts, qui se sont ensuite stabilisés autour de 245 watts. Dans les jeux, la consommation a même atteint 255 watts. C'est un peu problématique, car l'emballage ne comprend qu'un bloc d'alimentation de 230 watts. Bien que la batterie ne se vide pas sous charge, une alimentation de 280 watts aurait été un meilleur choix.
| Éteint/en veille | |
| Au repos | |
| Fortement sollicité |
|
Légende:
min: | |
| SCHENKER XMG Focus 17 M25 GeForce RTX 5070 Ti Laptop, i9-13900HX, Kingston Fury Renegade SFYRS500G | MSI Vector 17 HX AI A2XWIG GeForce RTX 5080 Laptop, Ultra 9 275HX, Western Digital PC SN5000S SDEPNSJ-2T00-1032 | Lenovo Legion 5 Pro 16IAX10H GeForce RTX 5070 Ti Laptop, Ultra 9 275HX, Western Digital PC SN8000S SDEPNRK-1T00 | MSI Vector 16 HX AI A2XWHG GeForce RTX 5070 Ti Laptop, Ultra 7 255HX, Micron 2400 MTFDKBA512QFM | SCHENKER XMG Pro 16 (E25) GeForce RTX 5070 Ti Laptop, Ultra 9 275HX, Samsung 9100 Pro 1 TB | |
|---|---|---|---|---|---|
| Power Consumption | -0% | -9% | -1% | 2% | |
| Idle Minimum * | 12 | 10 17% | 14 -17% | 7.1 41% | 11.7 2% |
| Idle Average * | 17.5 | 15.4 12% | 14.3 18% | 15.9 9% | 16.6 5% |
| Idle Maximum * | 18.1 | 18.7 -3% | 20.1 -11% | 29.5 -63% | 17.1 6% |
| Load Average * | 121.1 | 89.7 26% | 177 -46% | 124 -2% | 122.4 -1% |
| Cyberpunk 2077 ultra * | 255 | 308 -21% | 255 -0% | 222 13% | 245 4% |
| Cyberpunk 2077 ultra external monitor * | 244 | 300 -23% | 255 -5% | 217 11% | 241 1% |
| Load Maximum * | 292.1 | 321 -10% | 294 -1% | 336 -15% | 291.5 -0% |
* ... Moindre est la valeur, meilleures sont les performances
Power consumption Cyberpunk / stress test
Power consumption with an external monitor
Durée de vie de la batterie
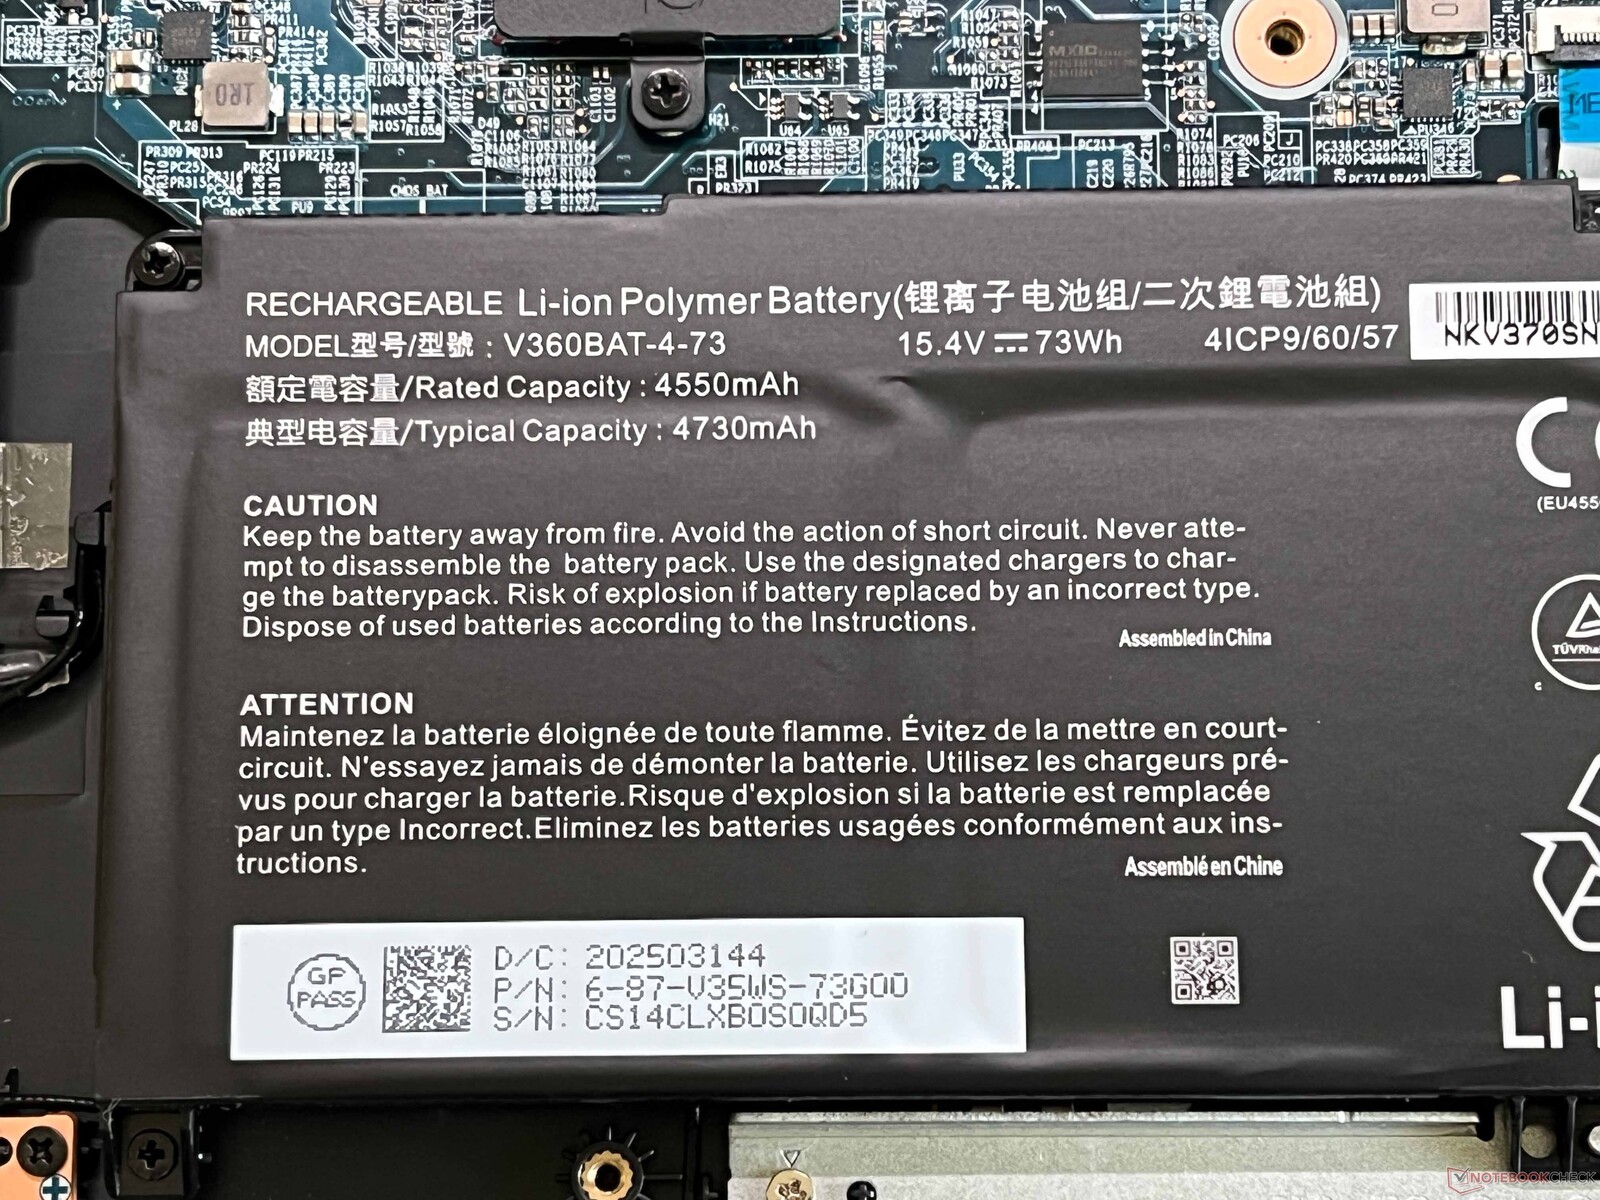
L'autonomie de la batterie de 73 Wh ne peut être qualifiée que de moyenne. Lors de notre test Wi-Fi à 150 cd/m² (35 % de la luminosité maximale), nous avons mesuré un peu moins de 6 heures, et à pleine luminosité, nous avons mesuré 4,5 heures.
Notebookcheck note globale
SCHENKER XMG Focus 17 M25
- 08/04/2025 v8
Andreas Osthoff
 Total Sustainability Score:
 Comparaison des alternatives possibles
Transparency
La sélection des appareils à examiner est effectuée par notre équipe éditoriale. L'échantillon de test a été prêté à l'auteur par le fabricant ou le détaillant pour les besoins de cet examen. Le prêteur n'a pas eu d'influence sur cette évaluation et le fabricant n'a pas reçu de copie de cette évaluation avant sa publication. Il n'y avait aucune obligation de publier cet article. Nous n'acceptons jamais de compensation ou de paiement en échange de nos commentaires. En tant que média indépendant, Notebookcheck n'est pas soumis à l'autorité des fabricants, des détaillants ou des éditeurs.
Voici comment Notebookcheck teste
Chaque année, Notebookcheck examine de manière indépendante des centaines d'ordinateurs portables et de smartphones en utilisant des procédures standardisées afin de garantir que tous les résultats sont comparables. Nous avons continuellement développé nos méthodes de test depuis environ 20 ans et avons établi des normes industrielles dans le processus. Dans nos laboratoires de test, des équipements de mesure de haute qualité sont utilisés par des techniciens et des rédacteurs expérimentés. Ces tests impliquent un processus de validation en plusieurs étapes. Notre système d'évaluation complexe repose sur des centaines de mesures et de points de référence bien fondés, ce qui garantit l'objectivité.
