

Verdict - Le Beast 18 X1 est bon, mais il peut être amélioré
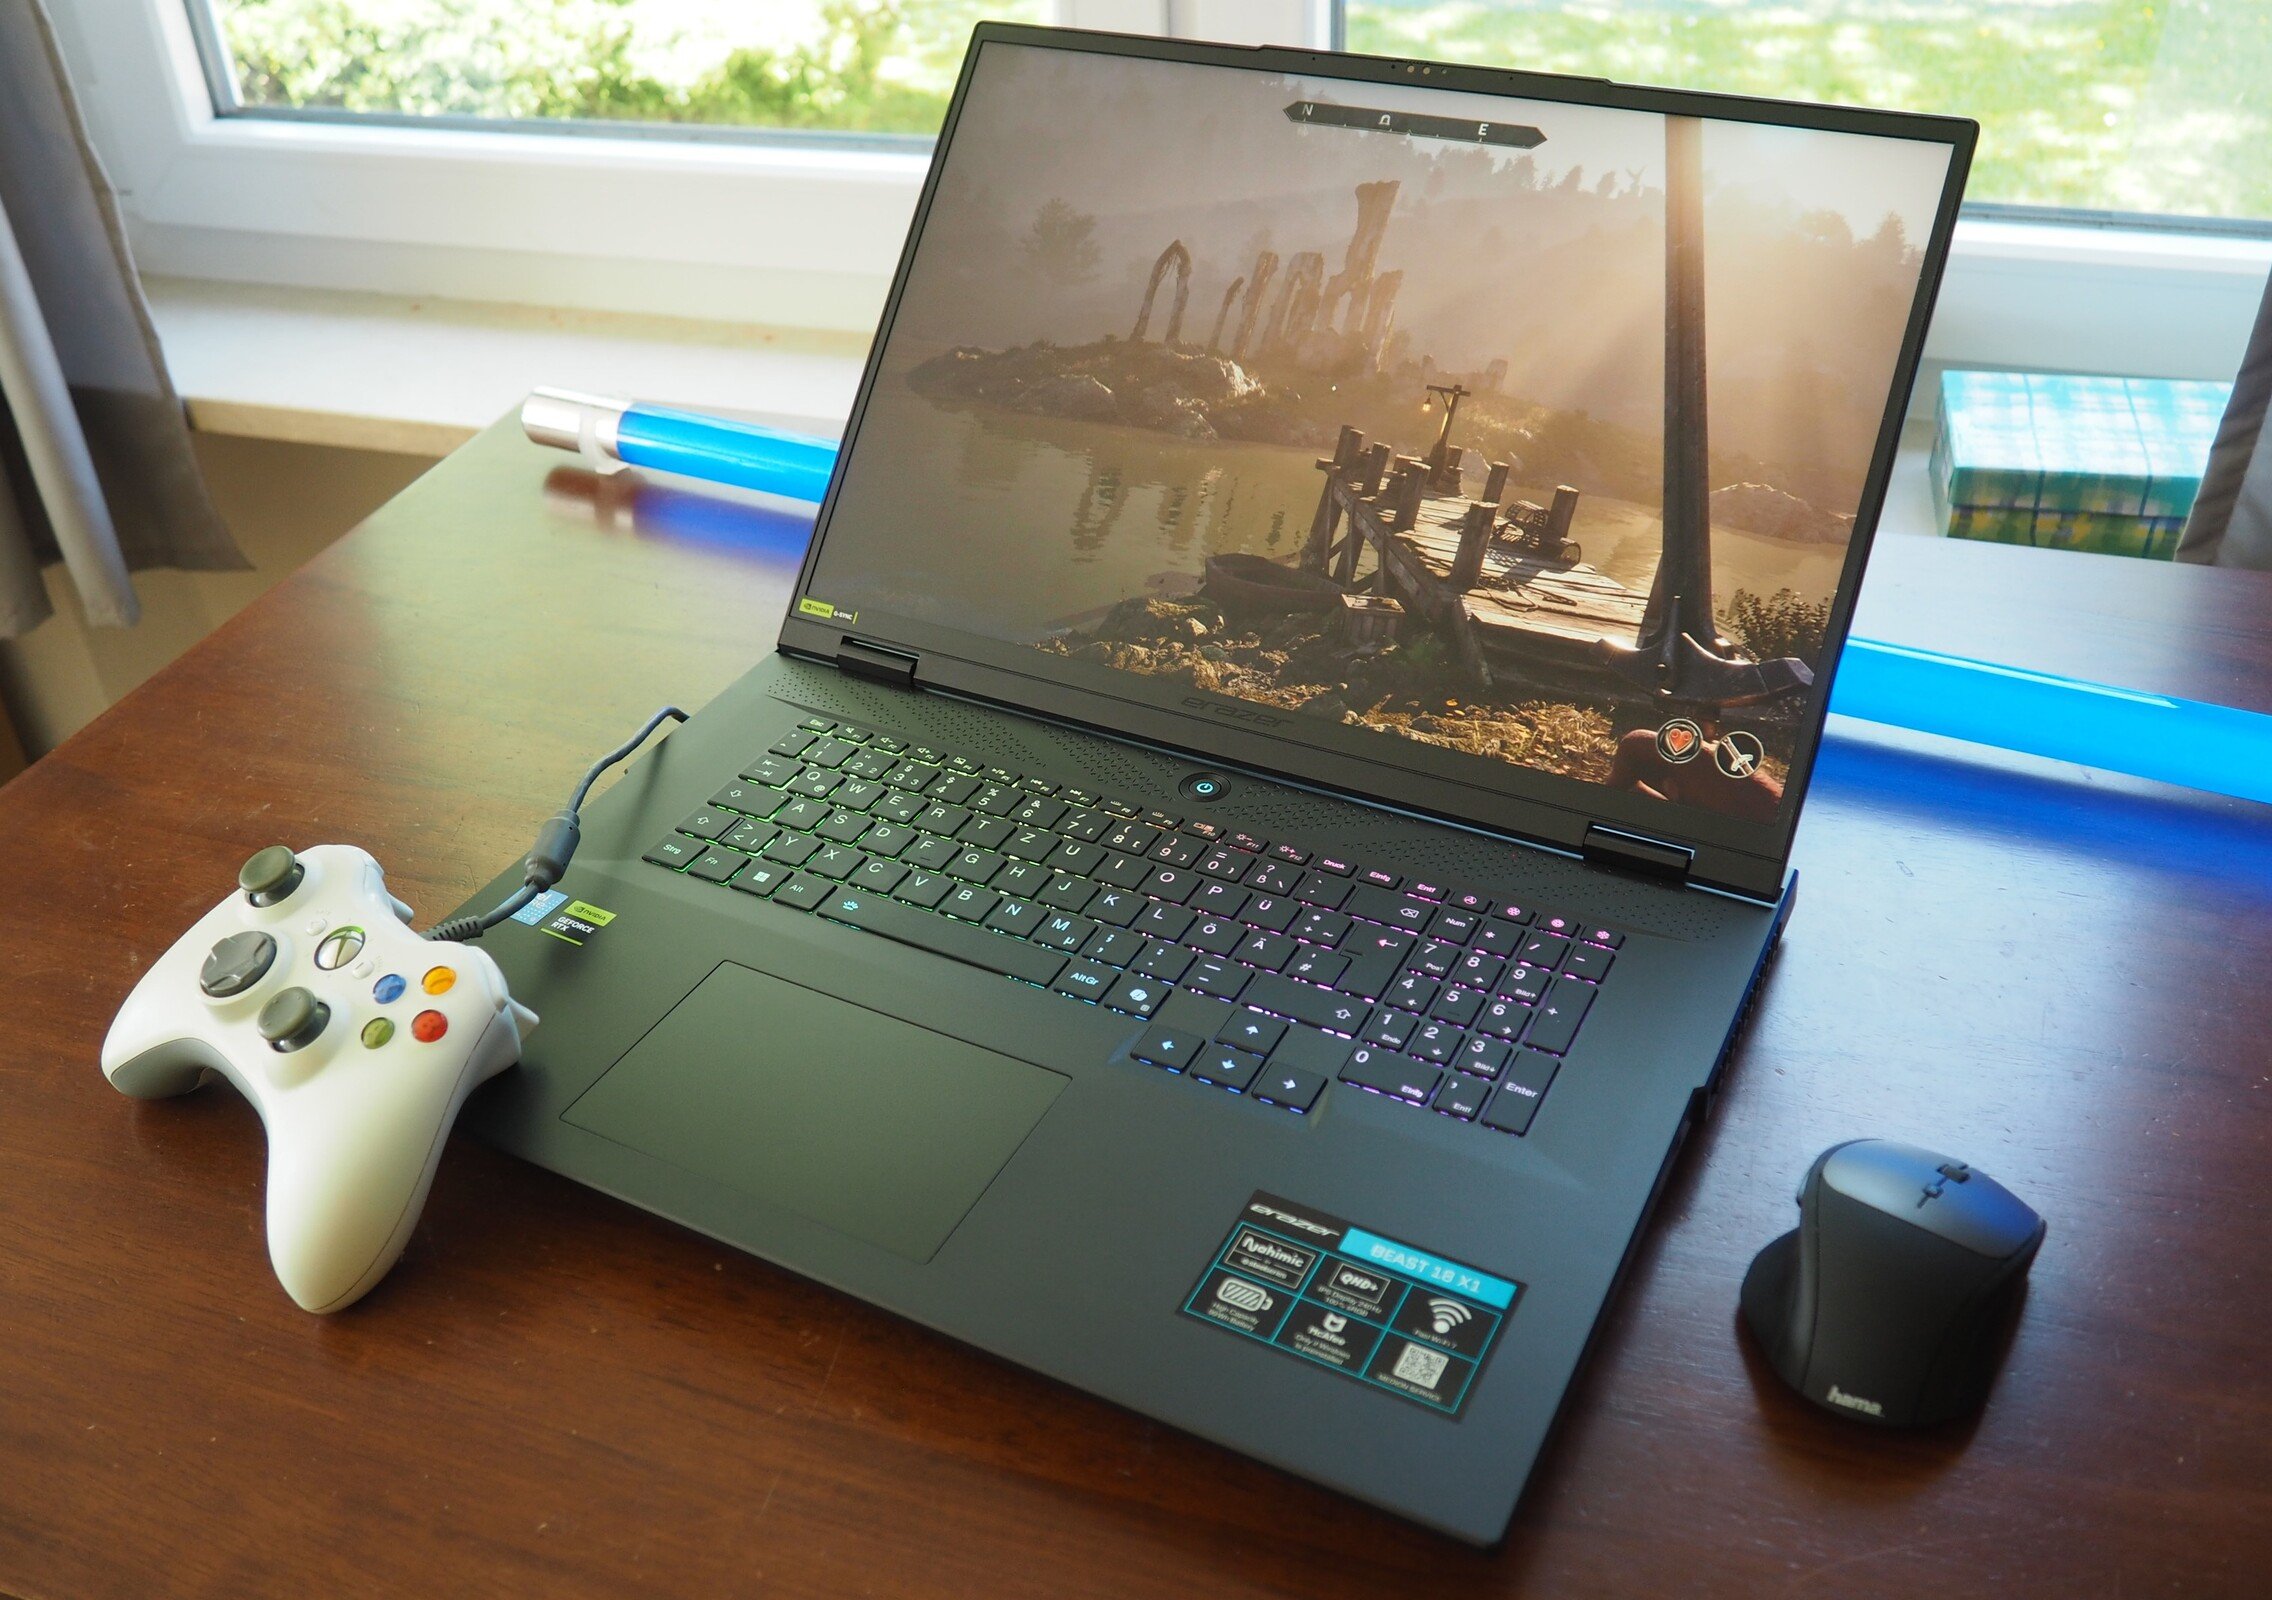
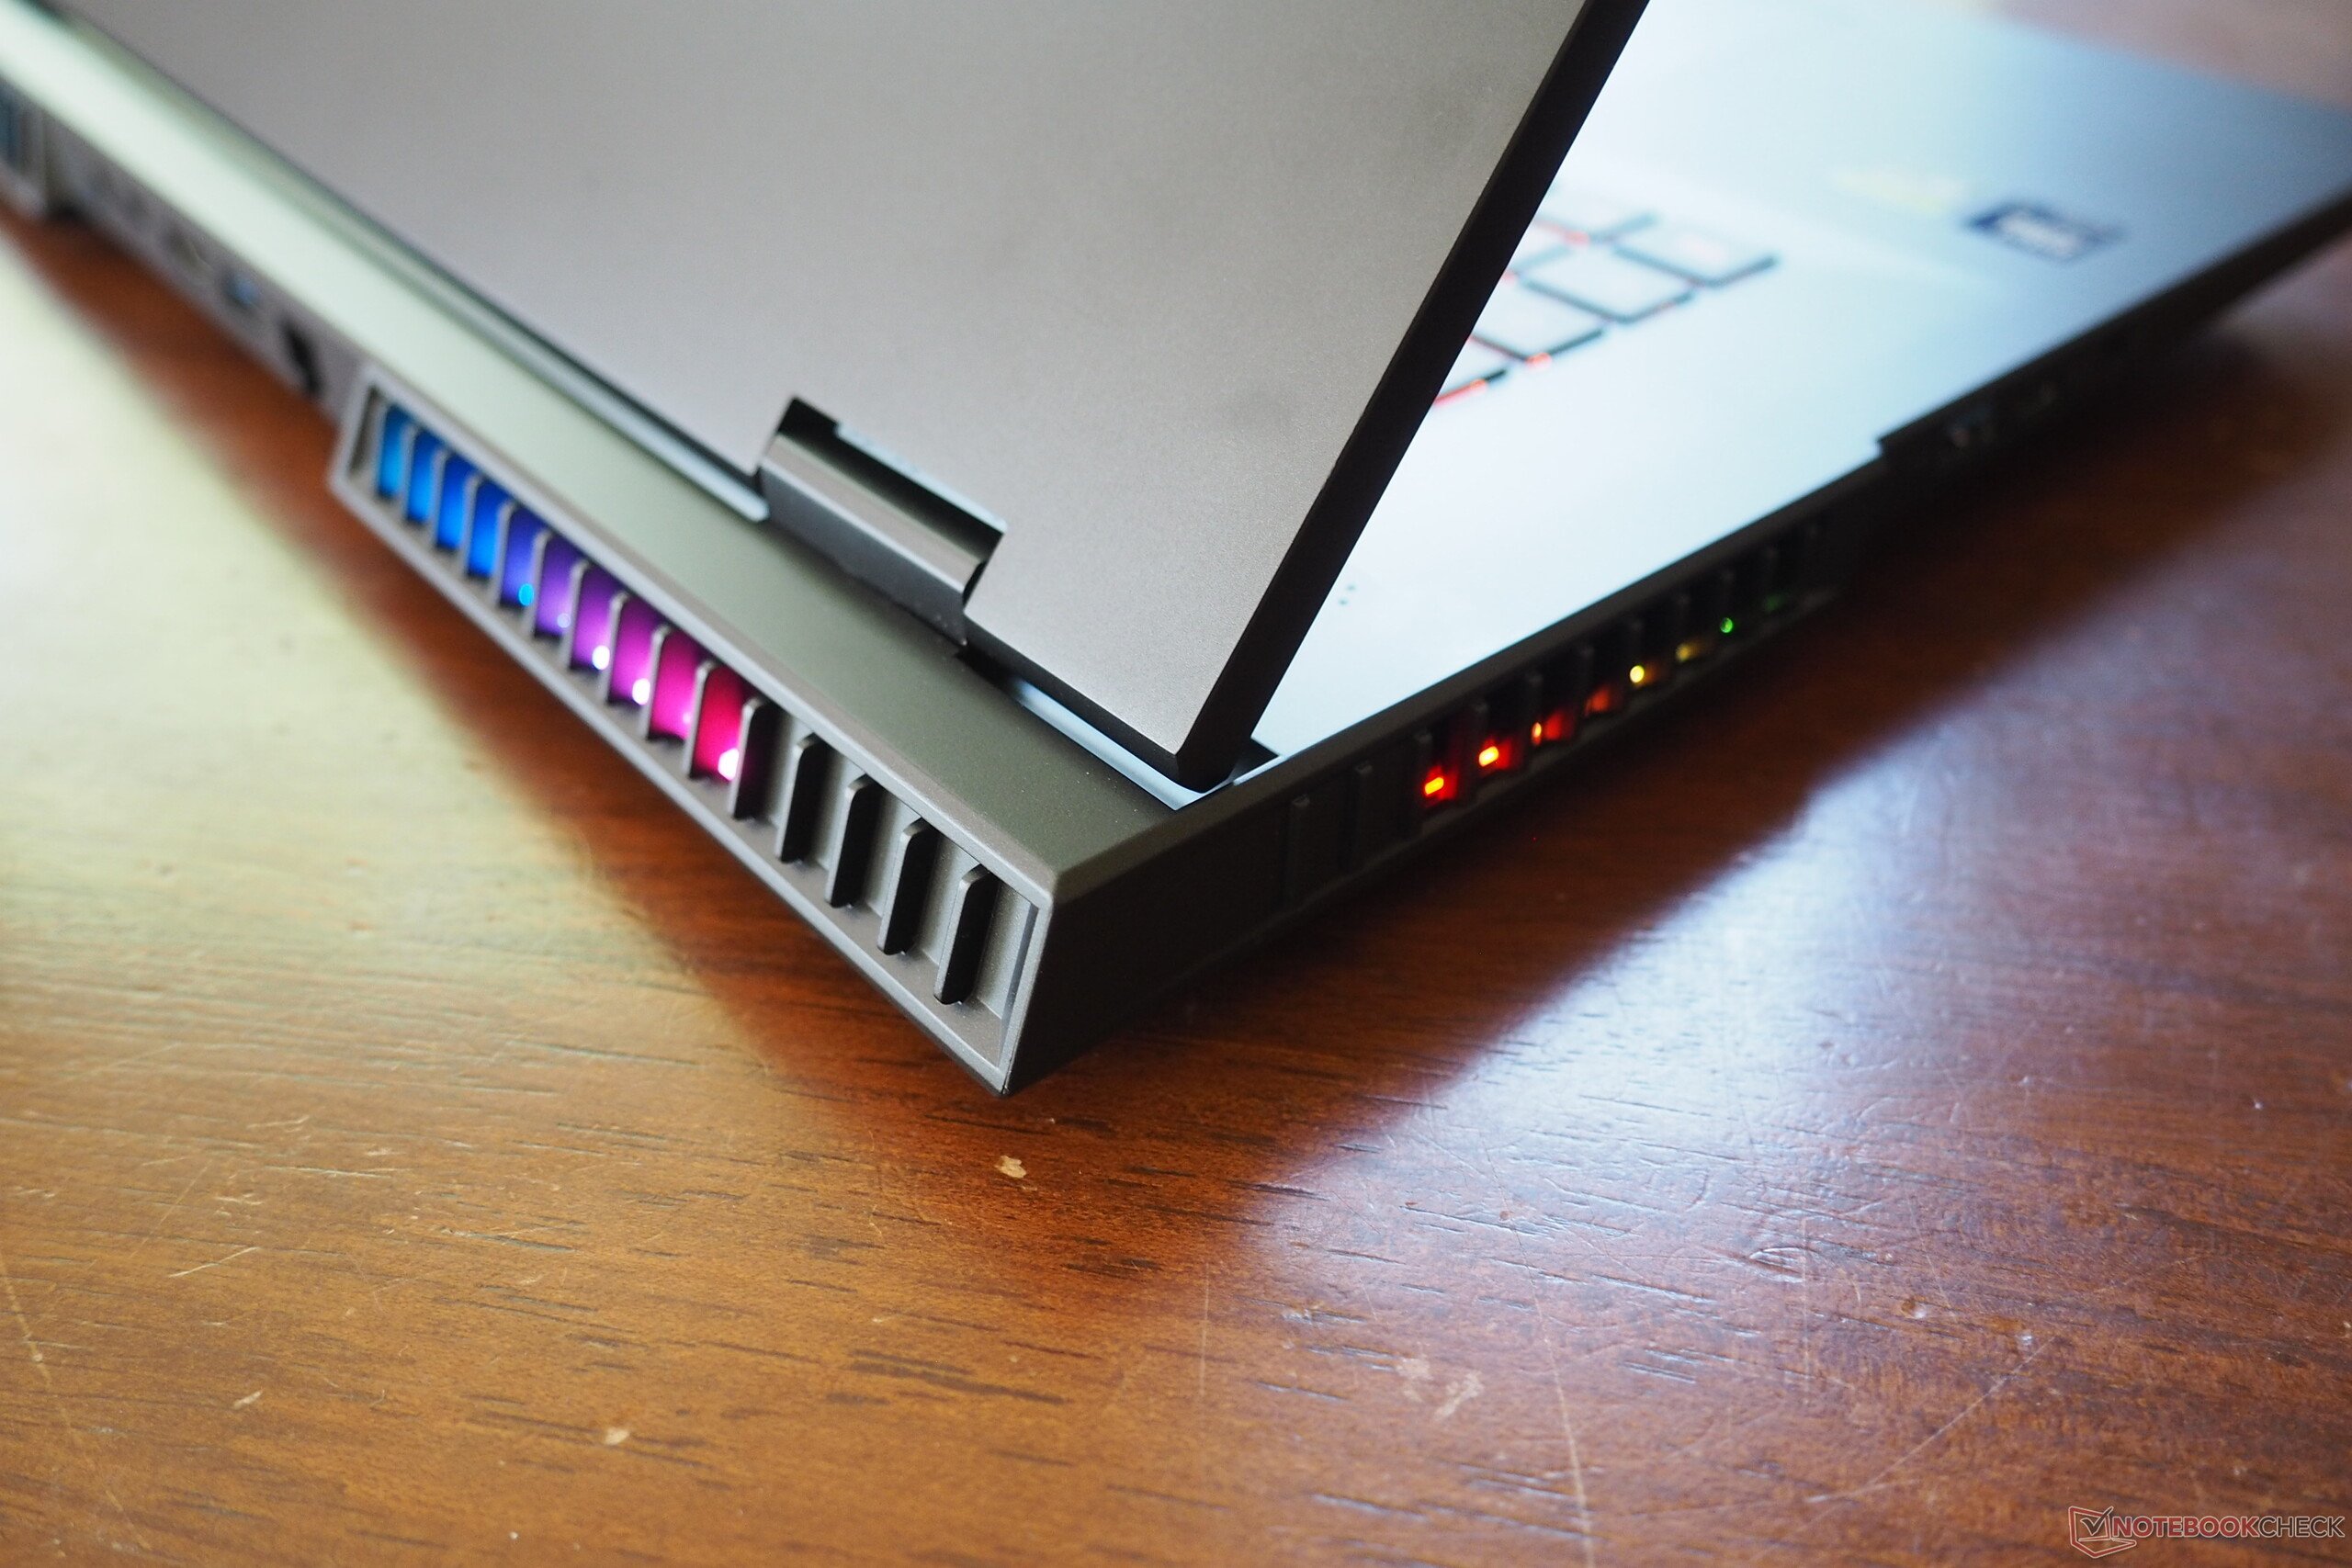
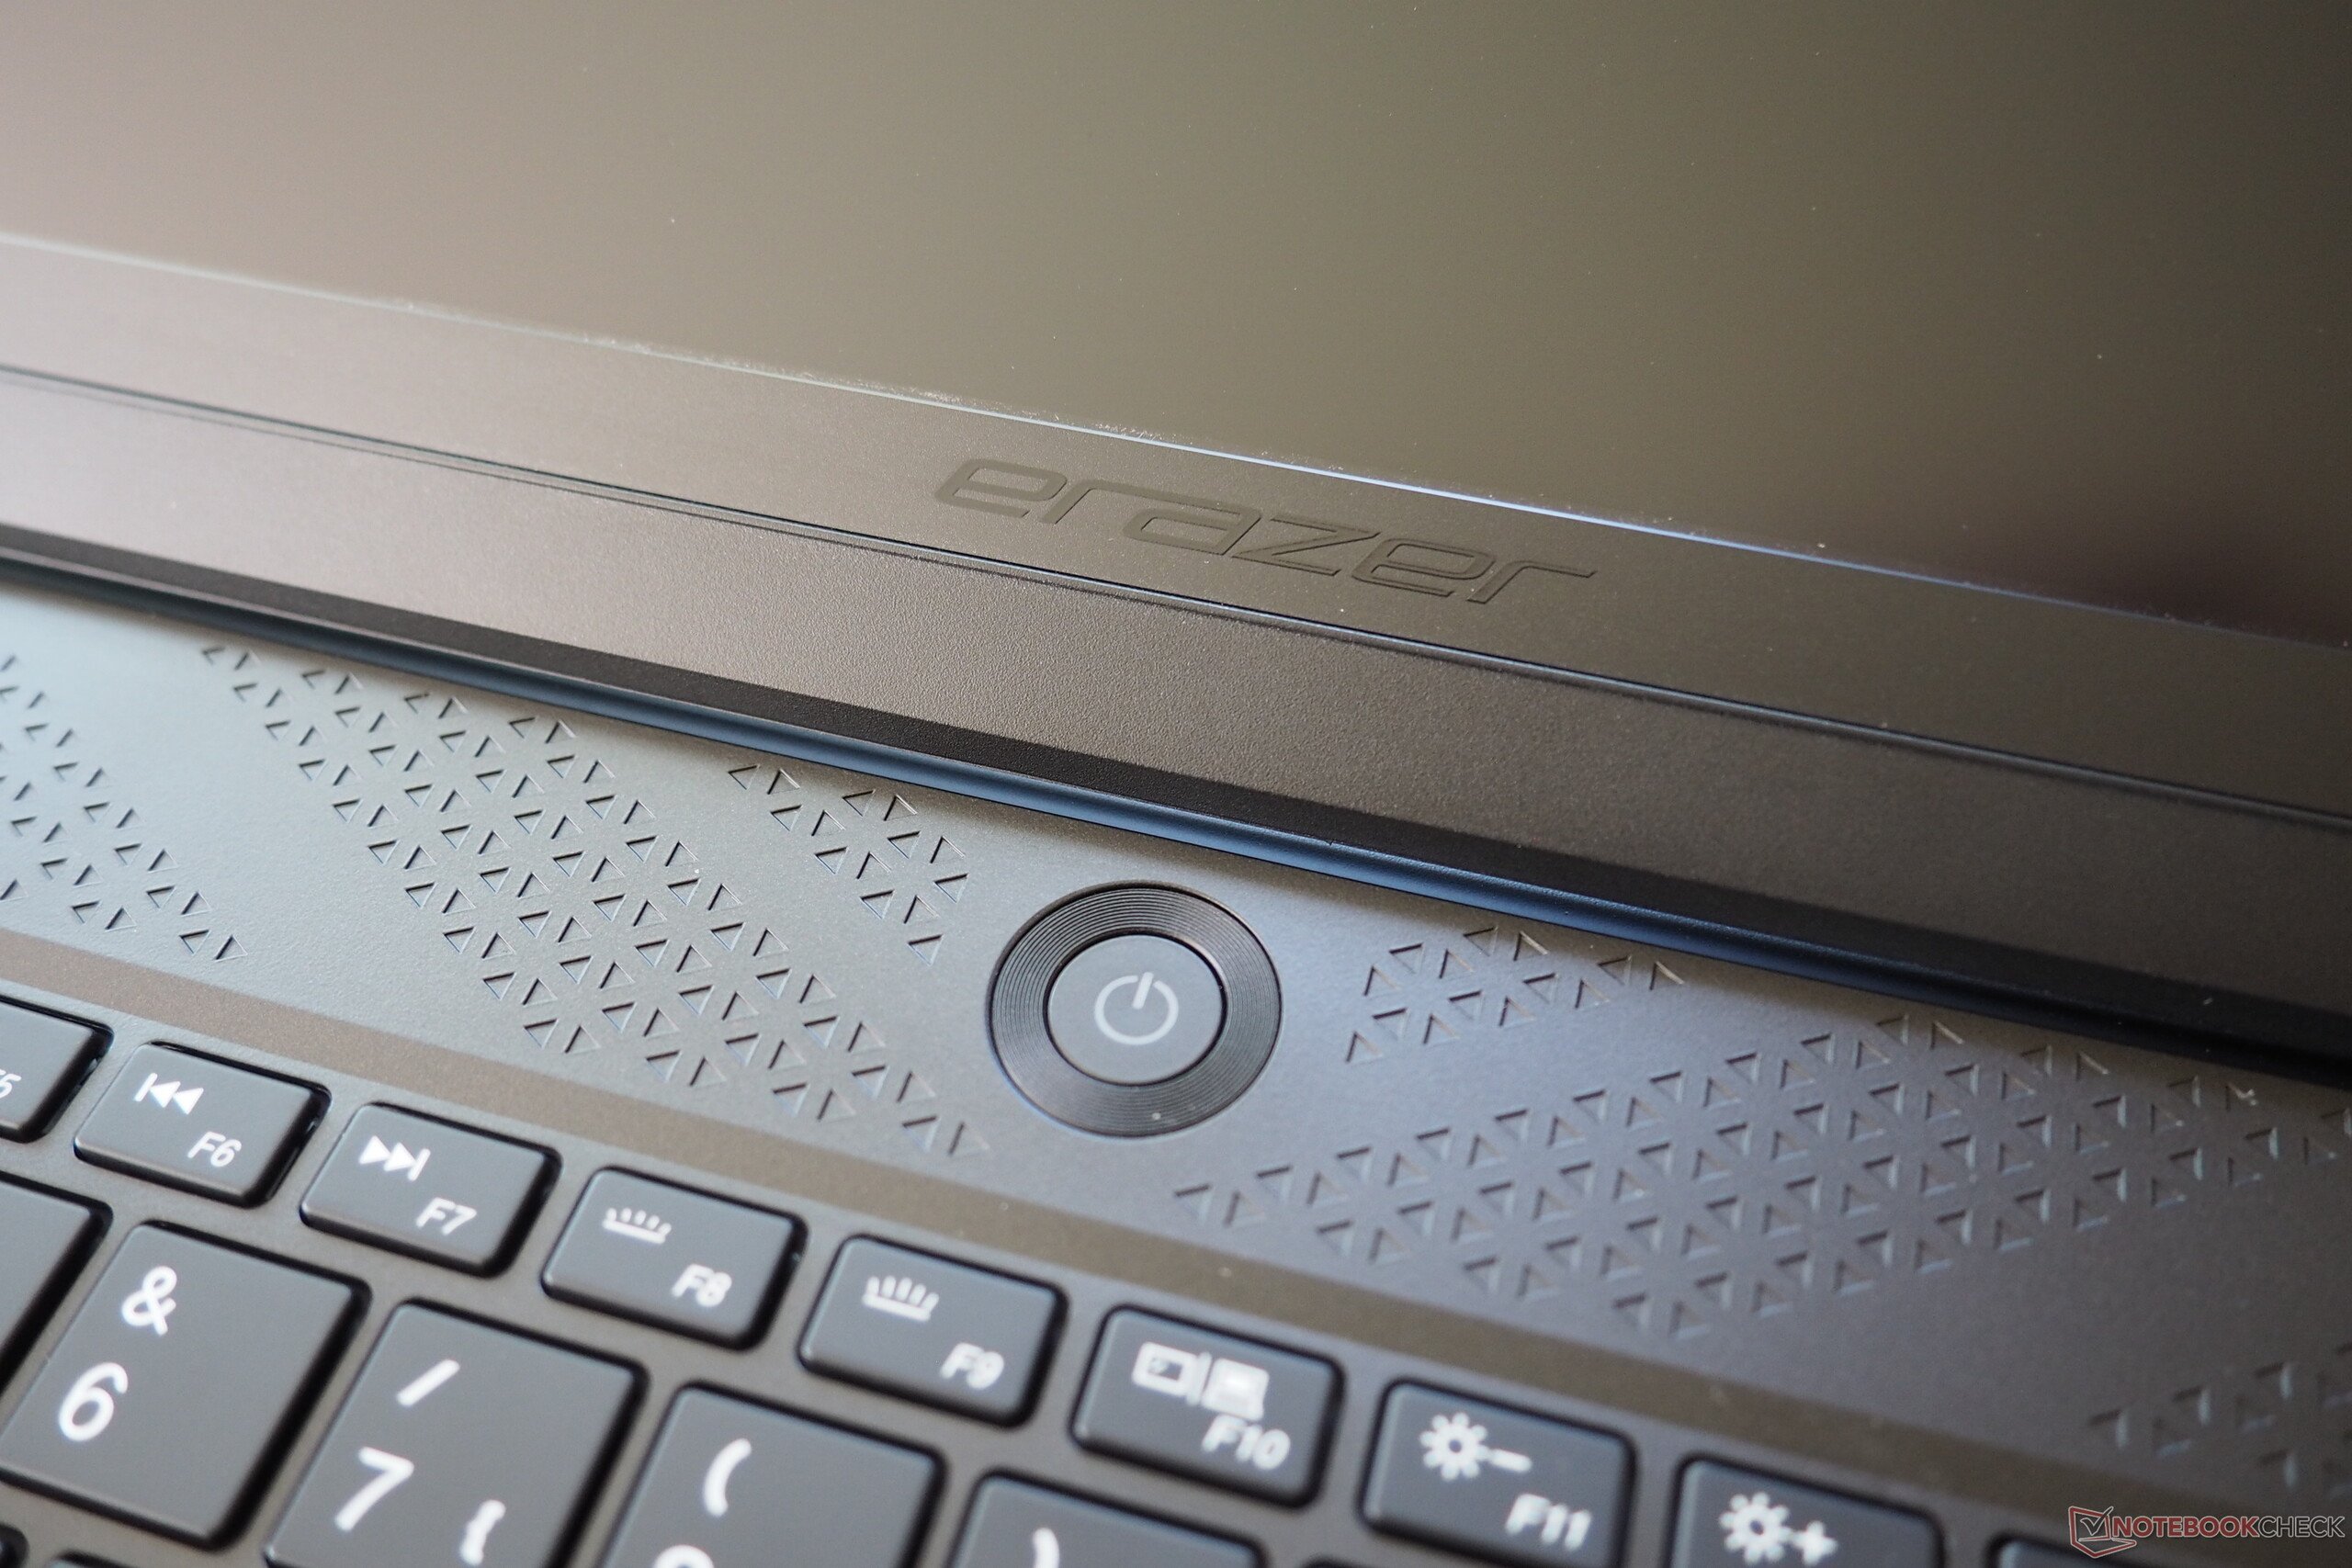
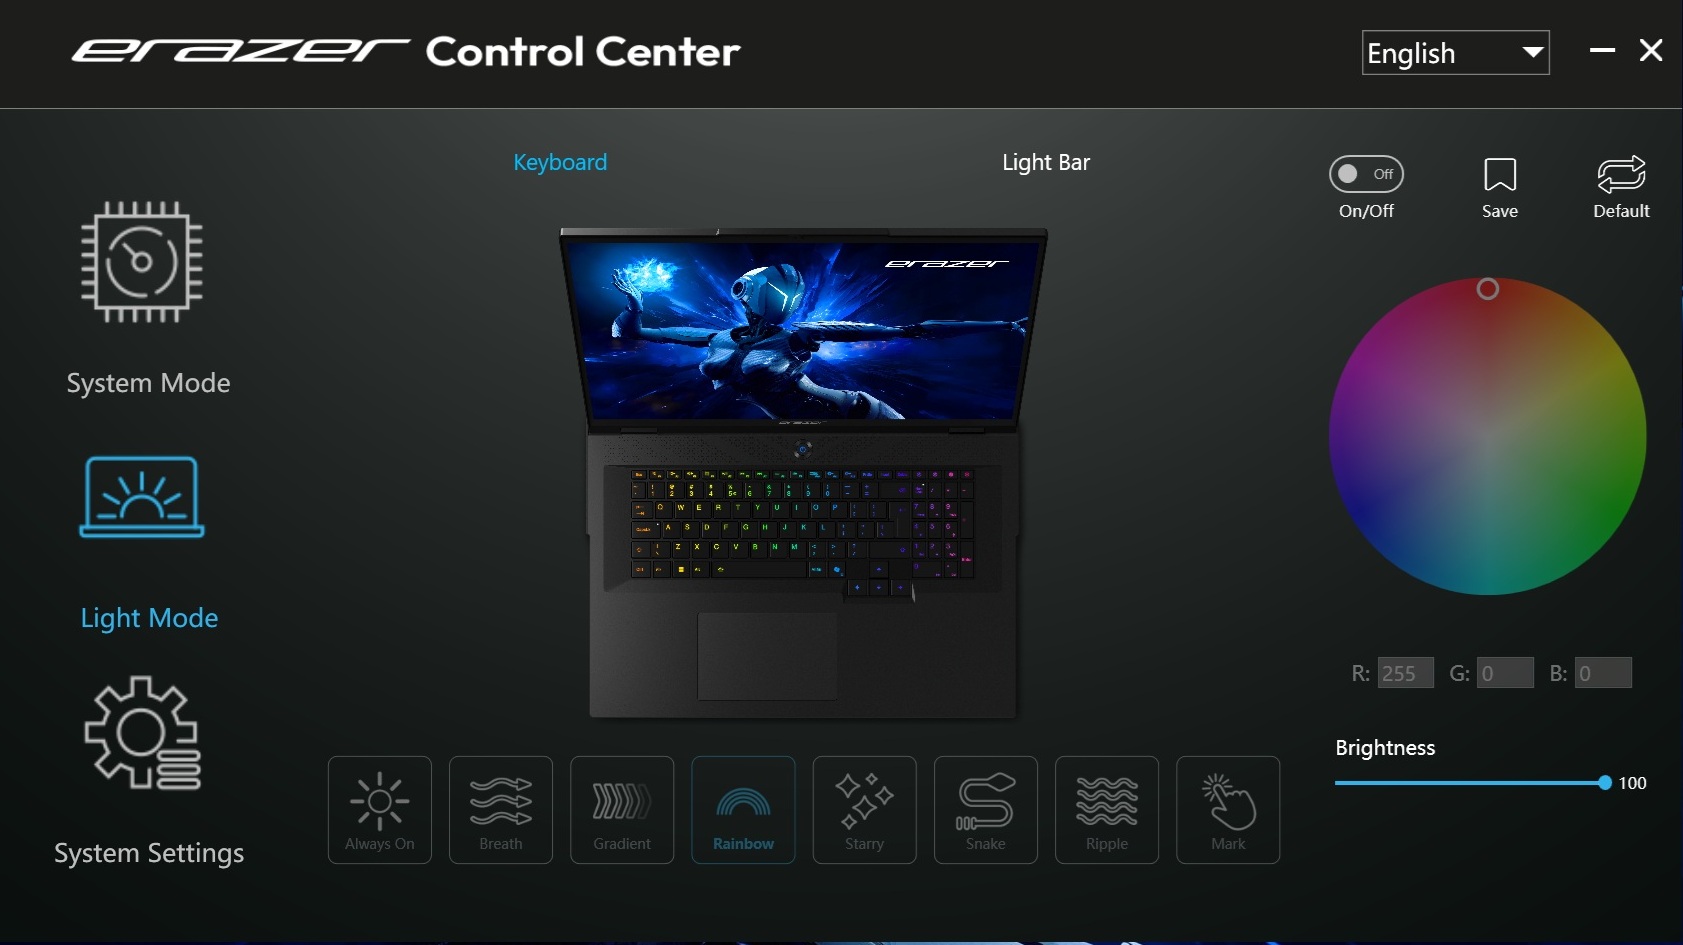
Si vous souhaitez remplacer votre ordinateur de bureau par un ordinateur puissant, le Erazer Beast 18 X1 pourrait vous intéresser. Bien que ce modèle de 18 pouces puisse devenir extrêmement bruyant sous charge (même en mode équilibré), comme beaucoup d'autres ordinateurs portables de jeu, les utilisateurs qui ne sont pas très sensibles au bruit et/ou qui jouent de toute façon avec un casque seront en mesure de supporter le volume. L'appareil massif fait bonne figure et marque des points avec une connectivité plutôt riche, y compris Thunderbolt 5, un clavier RGB et des bandes lumineuses élégantes sur les côtés et à l'arrière (voir photos). Les périphériques d'entrée sont décents, voire bons, mais le modèle n'est pas vraiment en mesure d'impressionner.
L'ordinateur portable GeForce RTX 5080 de Nvidia affiche des performances conformes aux attentes, tandis que le Core Ultra 9 275HX d'Intel perd un peu de ses performances en cas de charge prolongée (nous reviendrons sur ce point dans un instant). La concurrence comprend l'ordinateur Aorus Master 18 et le Asus ROG Strix Scar 18que nous avons testé avec l'ordinateur portable RTX 5090 le plus puissant.
Points positifs
Points négatifs
Prix et disponibilité
Le Medion Erazer Beast 18 X1 MD62731 est proposé à environ 3 700 euros sur la page d'accueil de Medion https://www.medion.com/de/shop/p/high-end-gaming-notebooks-medion-erazer-beast-18-x1-high-end-gaming-laptop-intel-core-ultra-9-prozessor-275hx-windows-11-home-45-7-cm-18--qhd-display-100-srgb-mit-240-hz-rtx-5080-2-tb-pcie-ssd-32-gb-ram-30039669A1 listé.
Spécifications
Cas
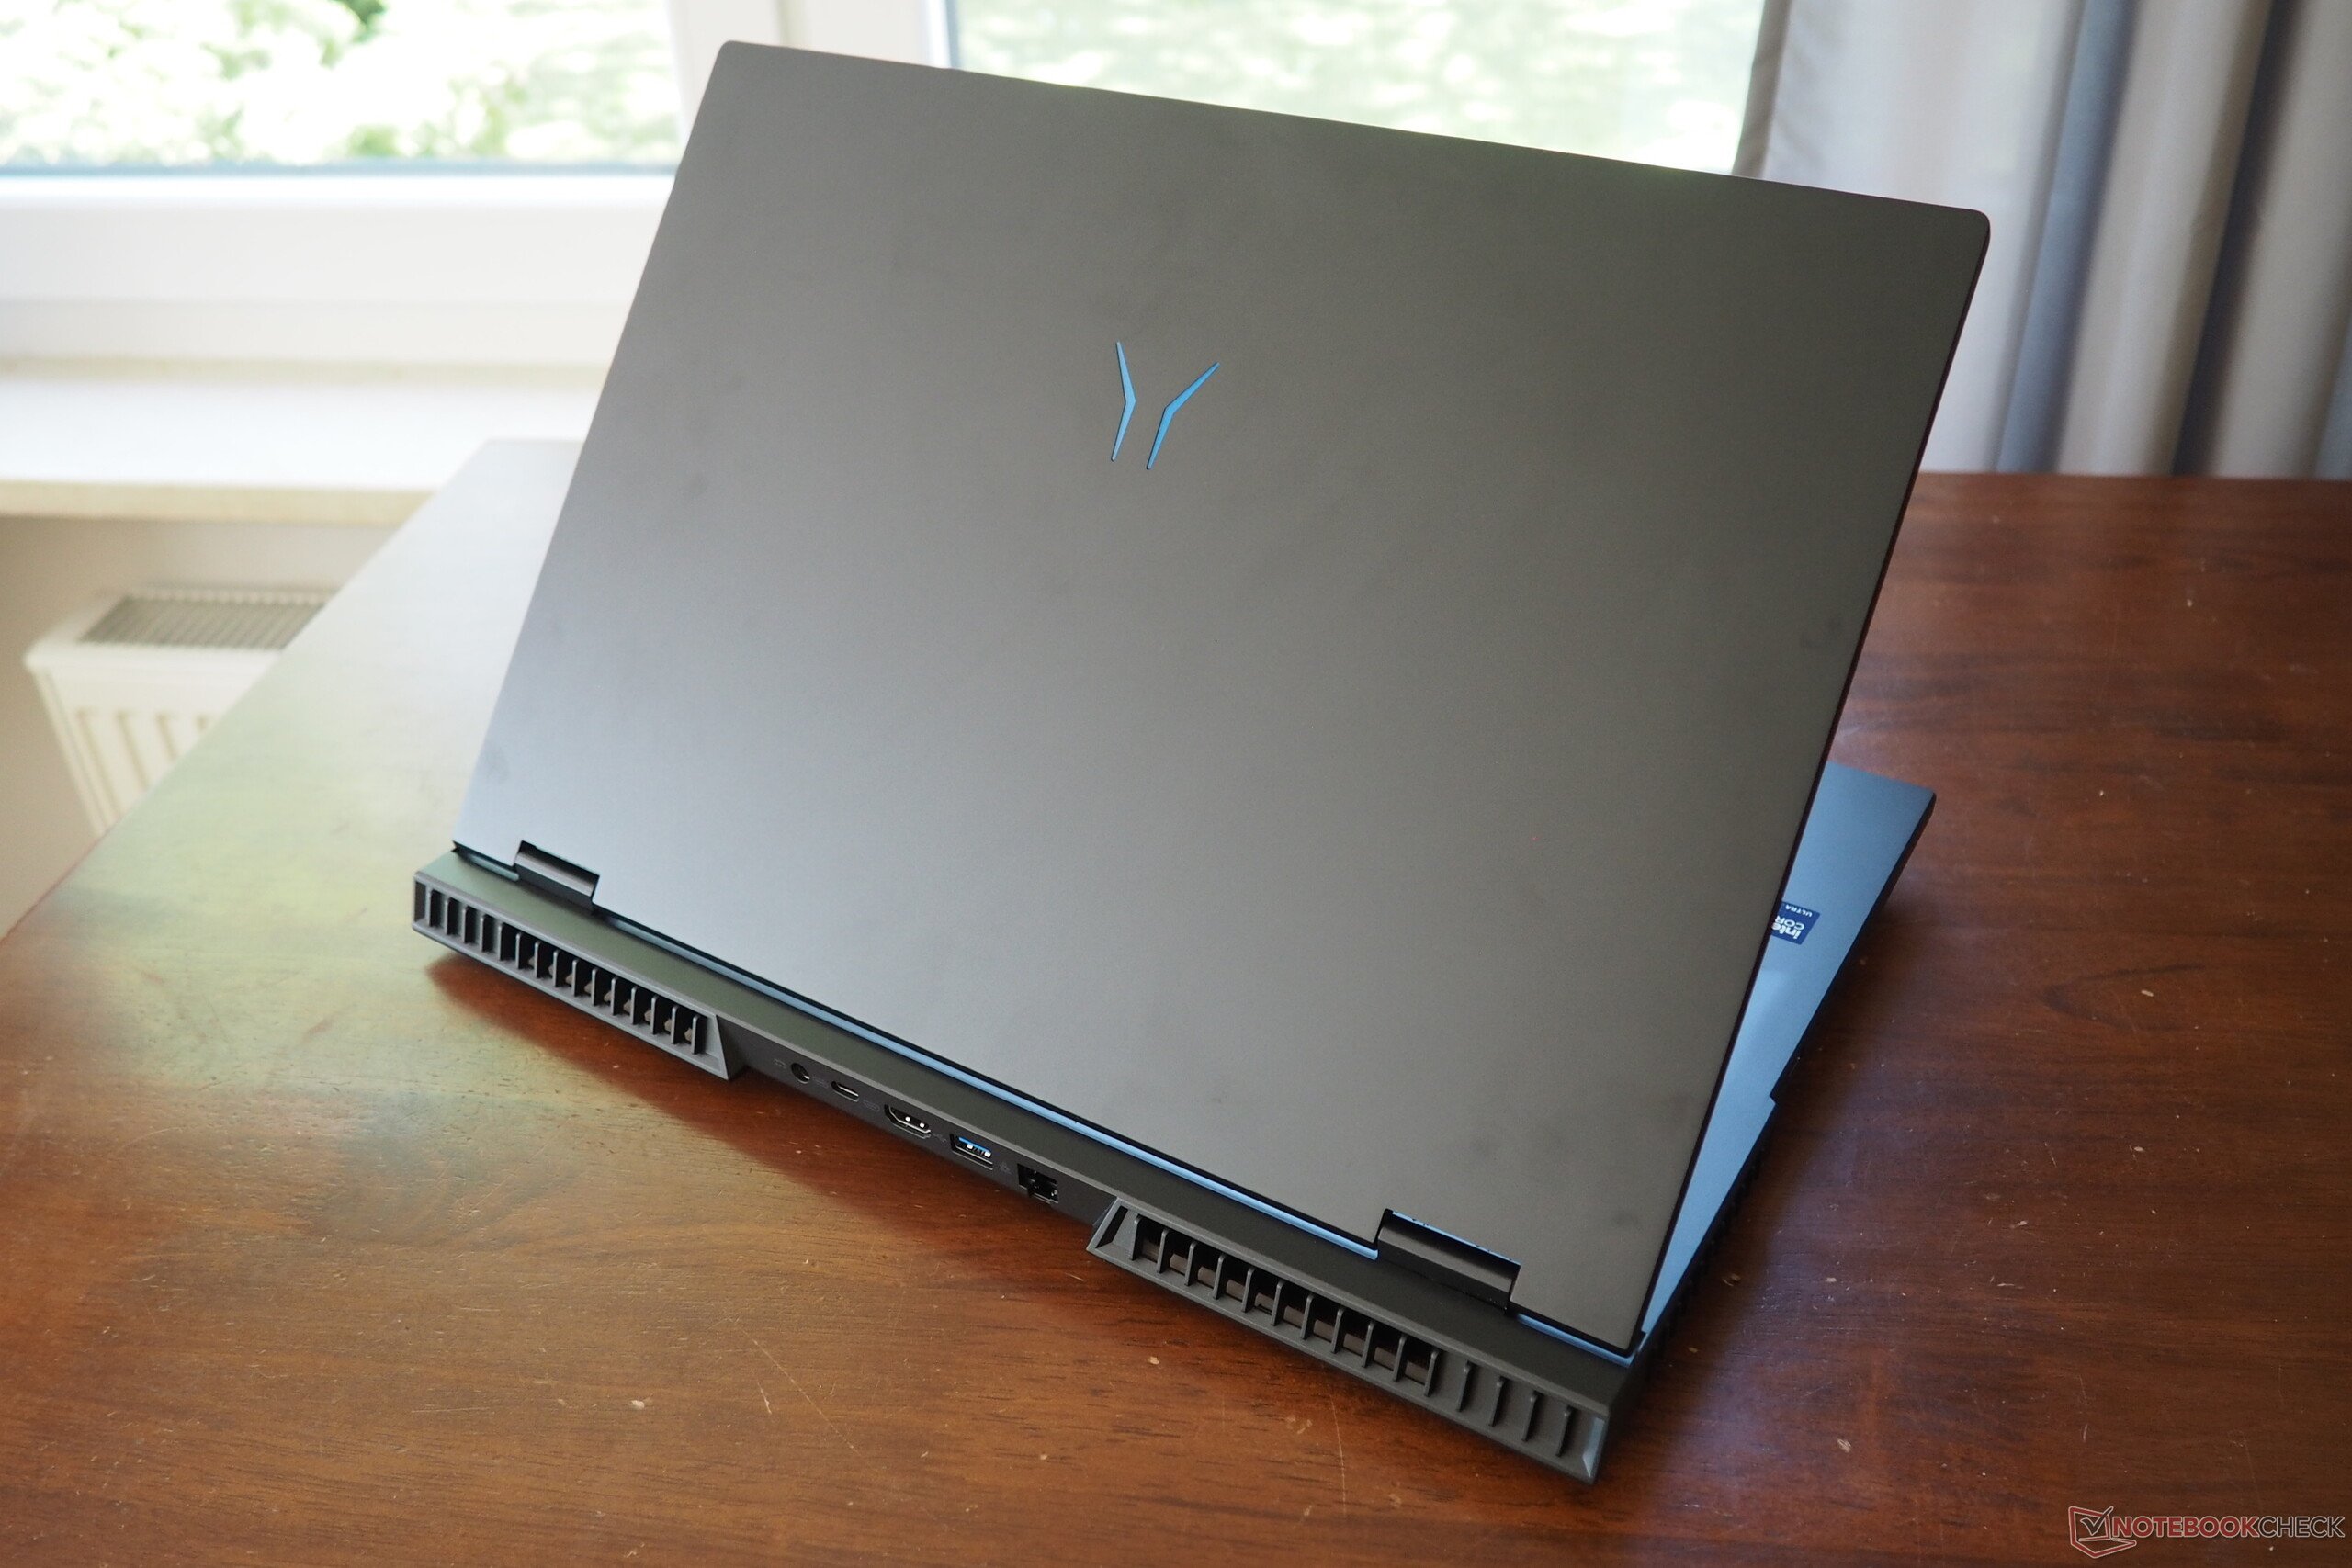
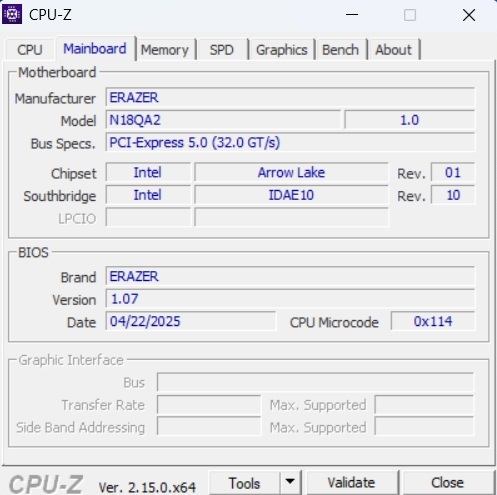
En termes de qualité, Medion livre un produit moyen. Alors que le couvercle de l'appareil de 18 pouces est en aluminium, l'unité de base est en plastique. Malgré une construction relativement plus épaisse, cette dernière peut être légèrement pliée à certains endroits, mais cela ne se produit principalement qu'en cas de pression plus forte. En revanche, l'angle d'ouverture généreux de 150° mérite des éloges, même si les charnières pourraient être un peu plus serrées. Avec une hauteur totale d'un peu moins de 3 cm (sans les pieds du boîtier), le Beast 18 X1 s'aligne sur ses homologues de la marque Aorus et Asusbien que son poids soit un peu plus élevé, de 3,6 à 3,3-3,4 kg.

Equipement
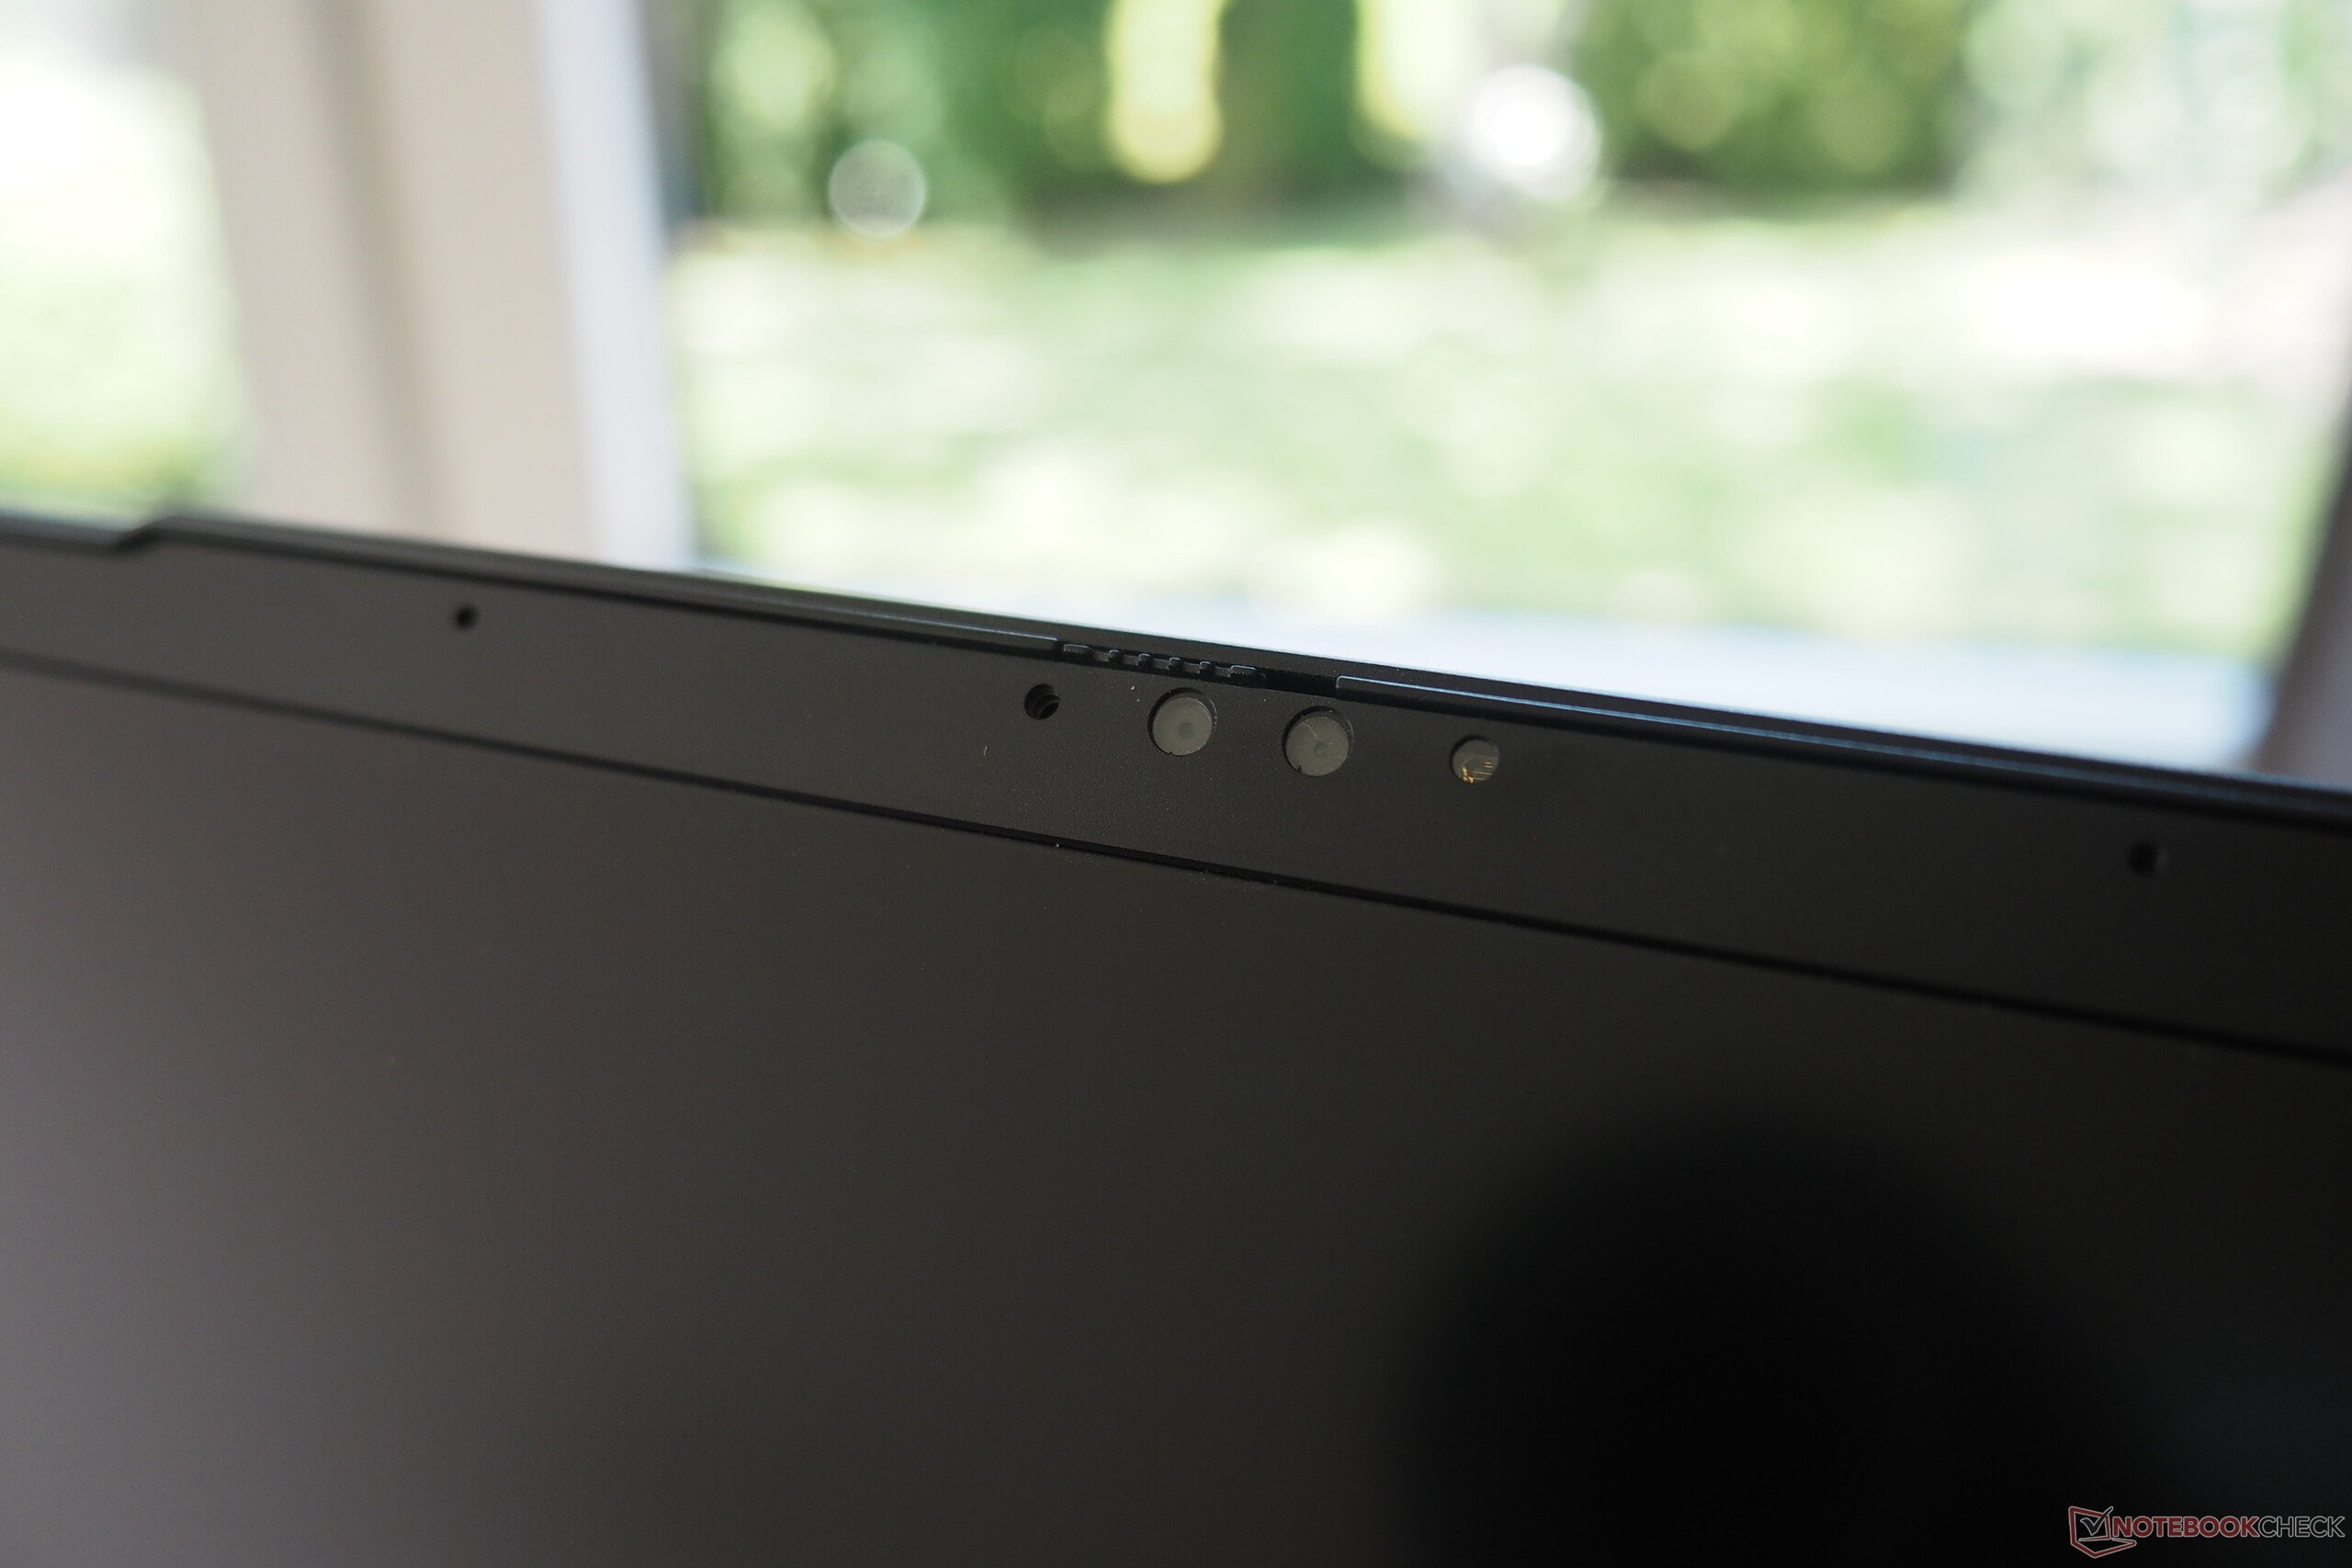
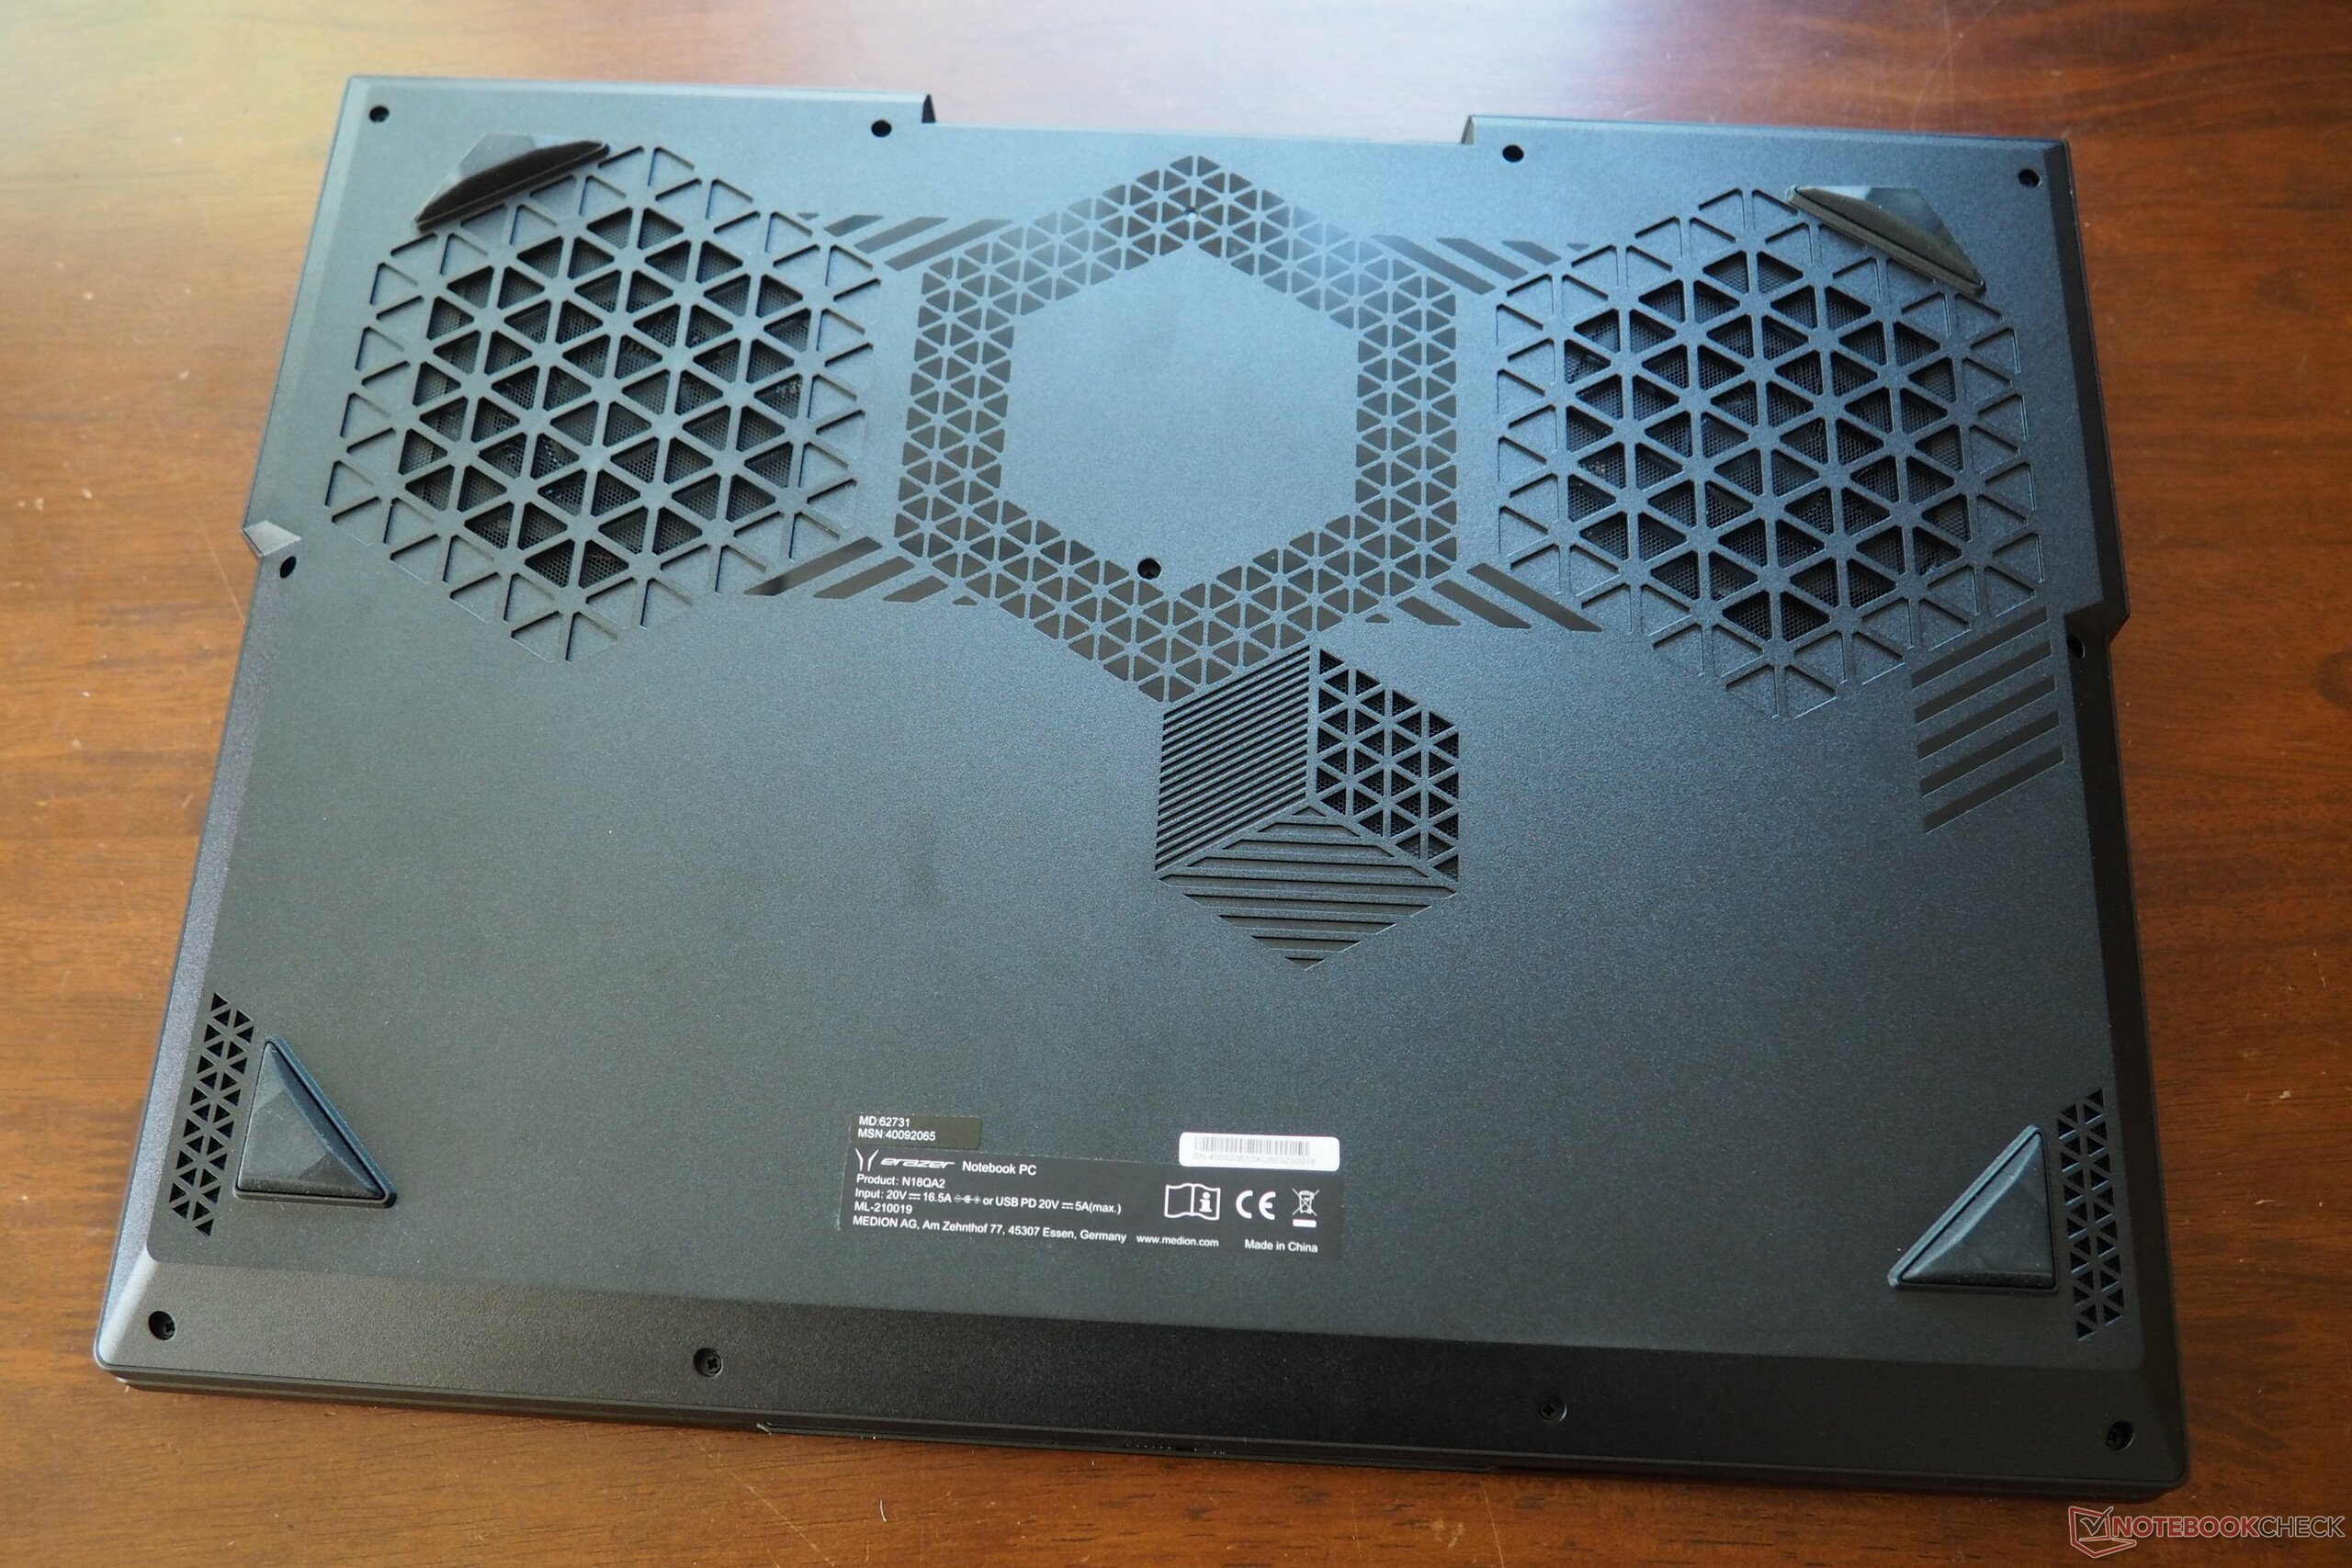
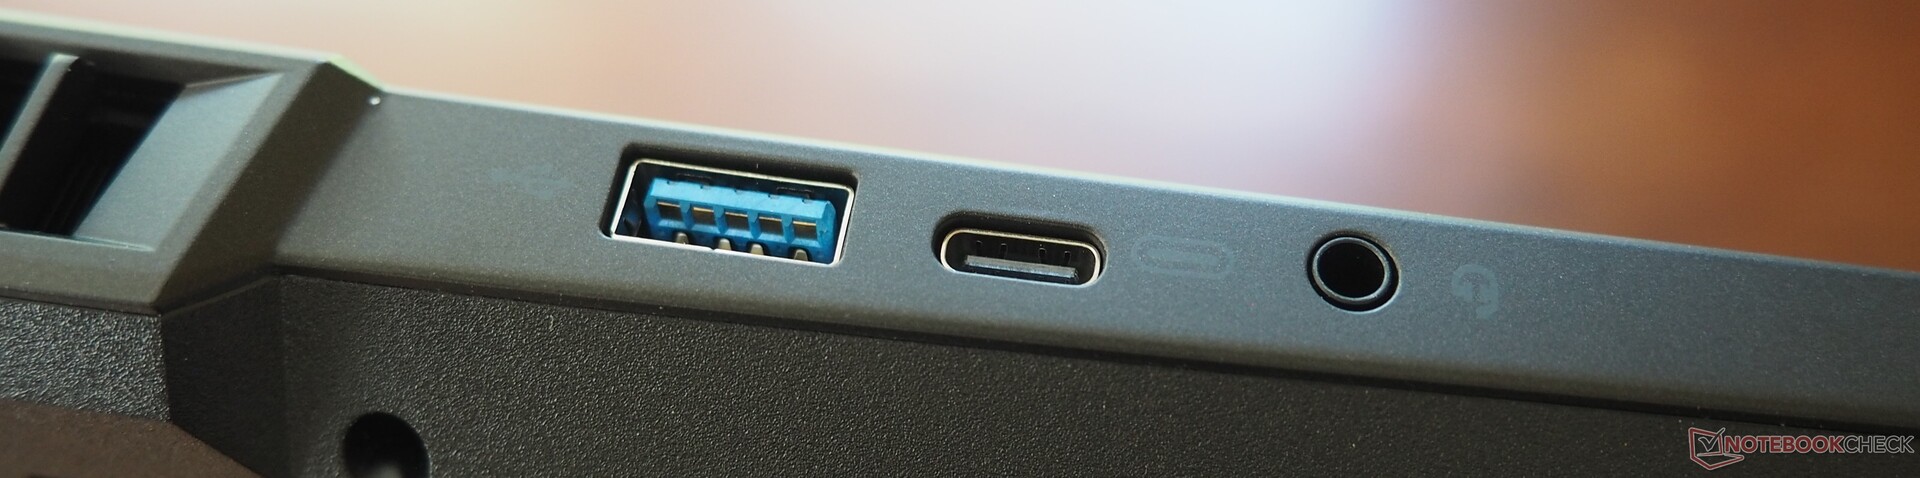
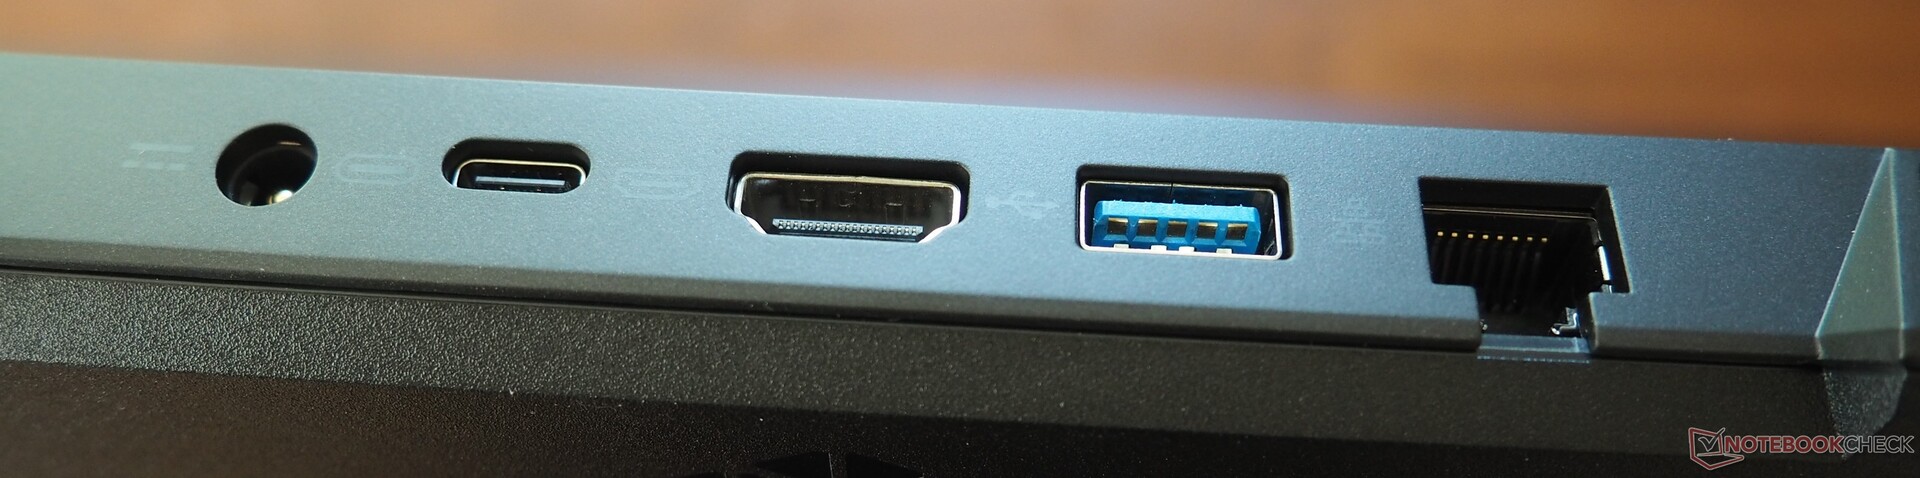
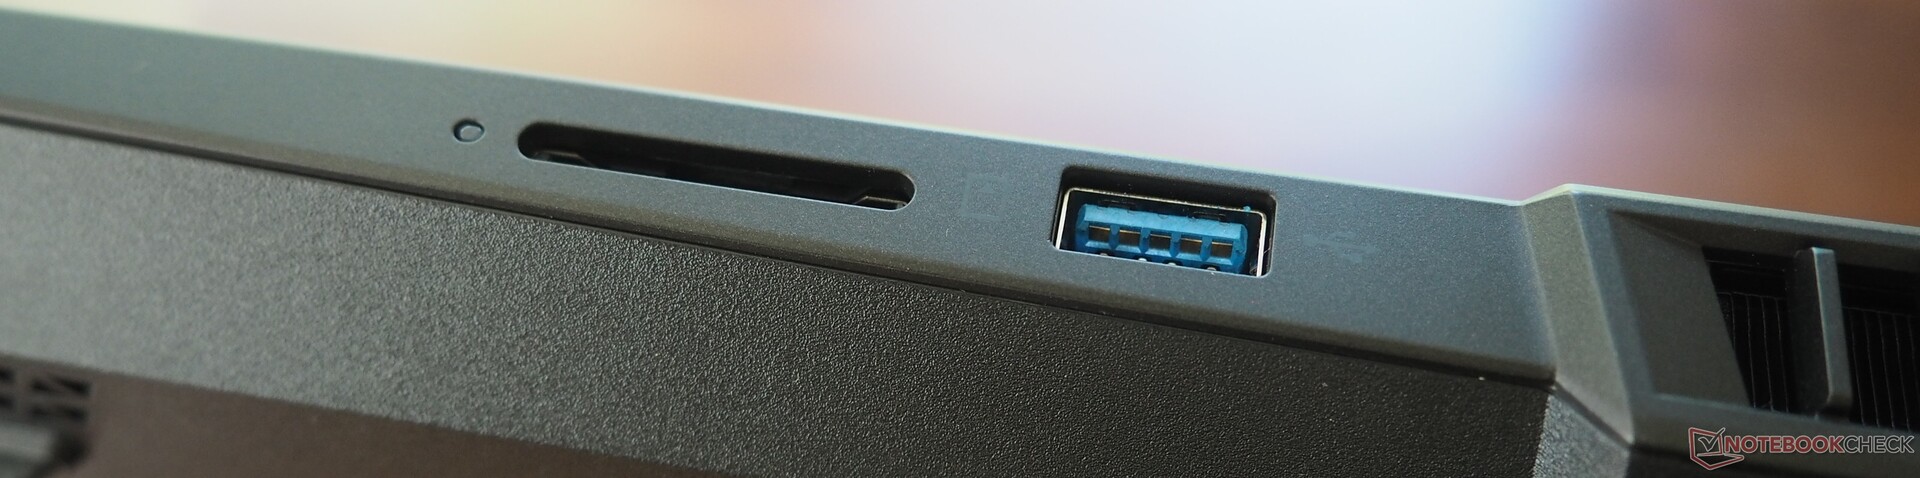
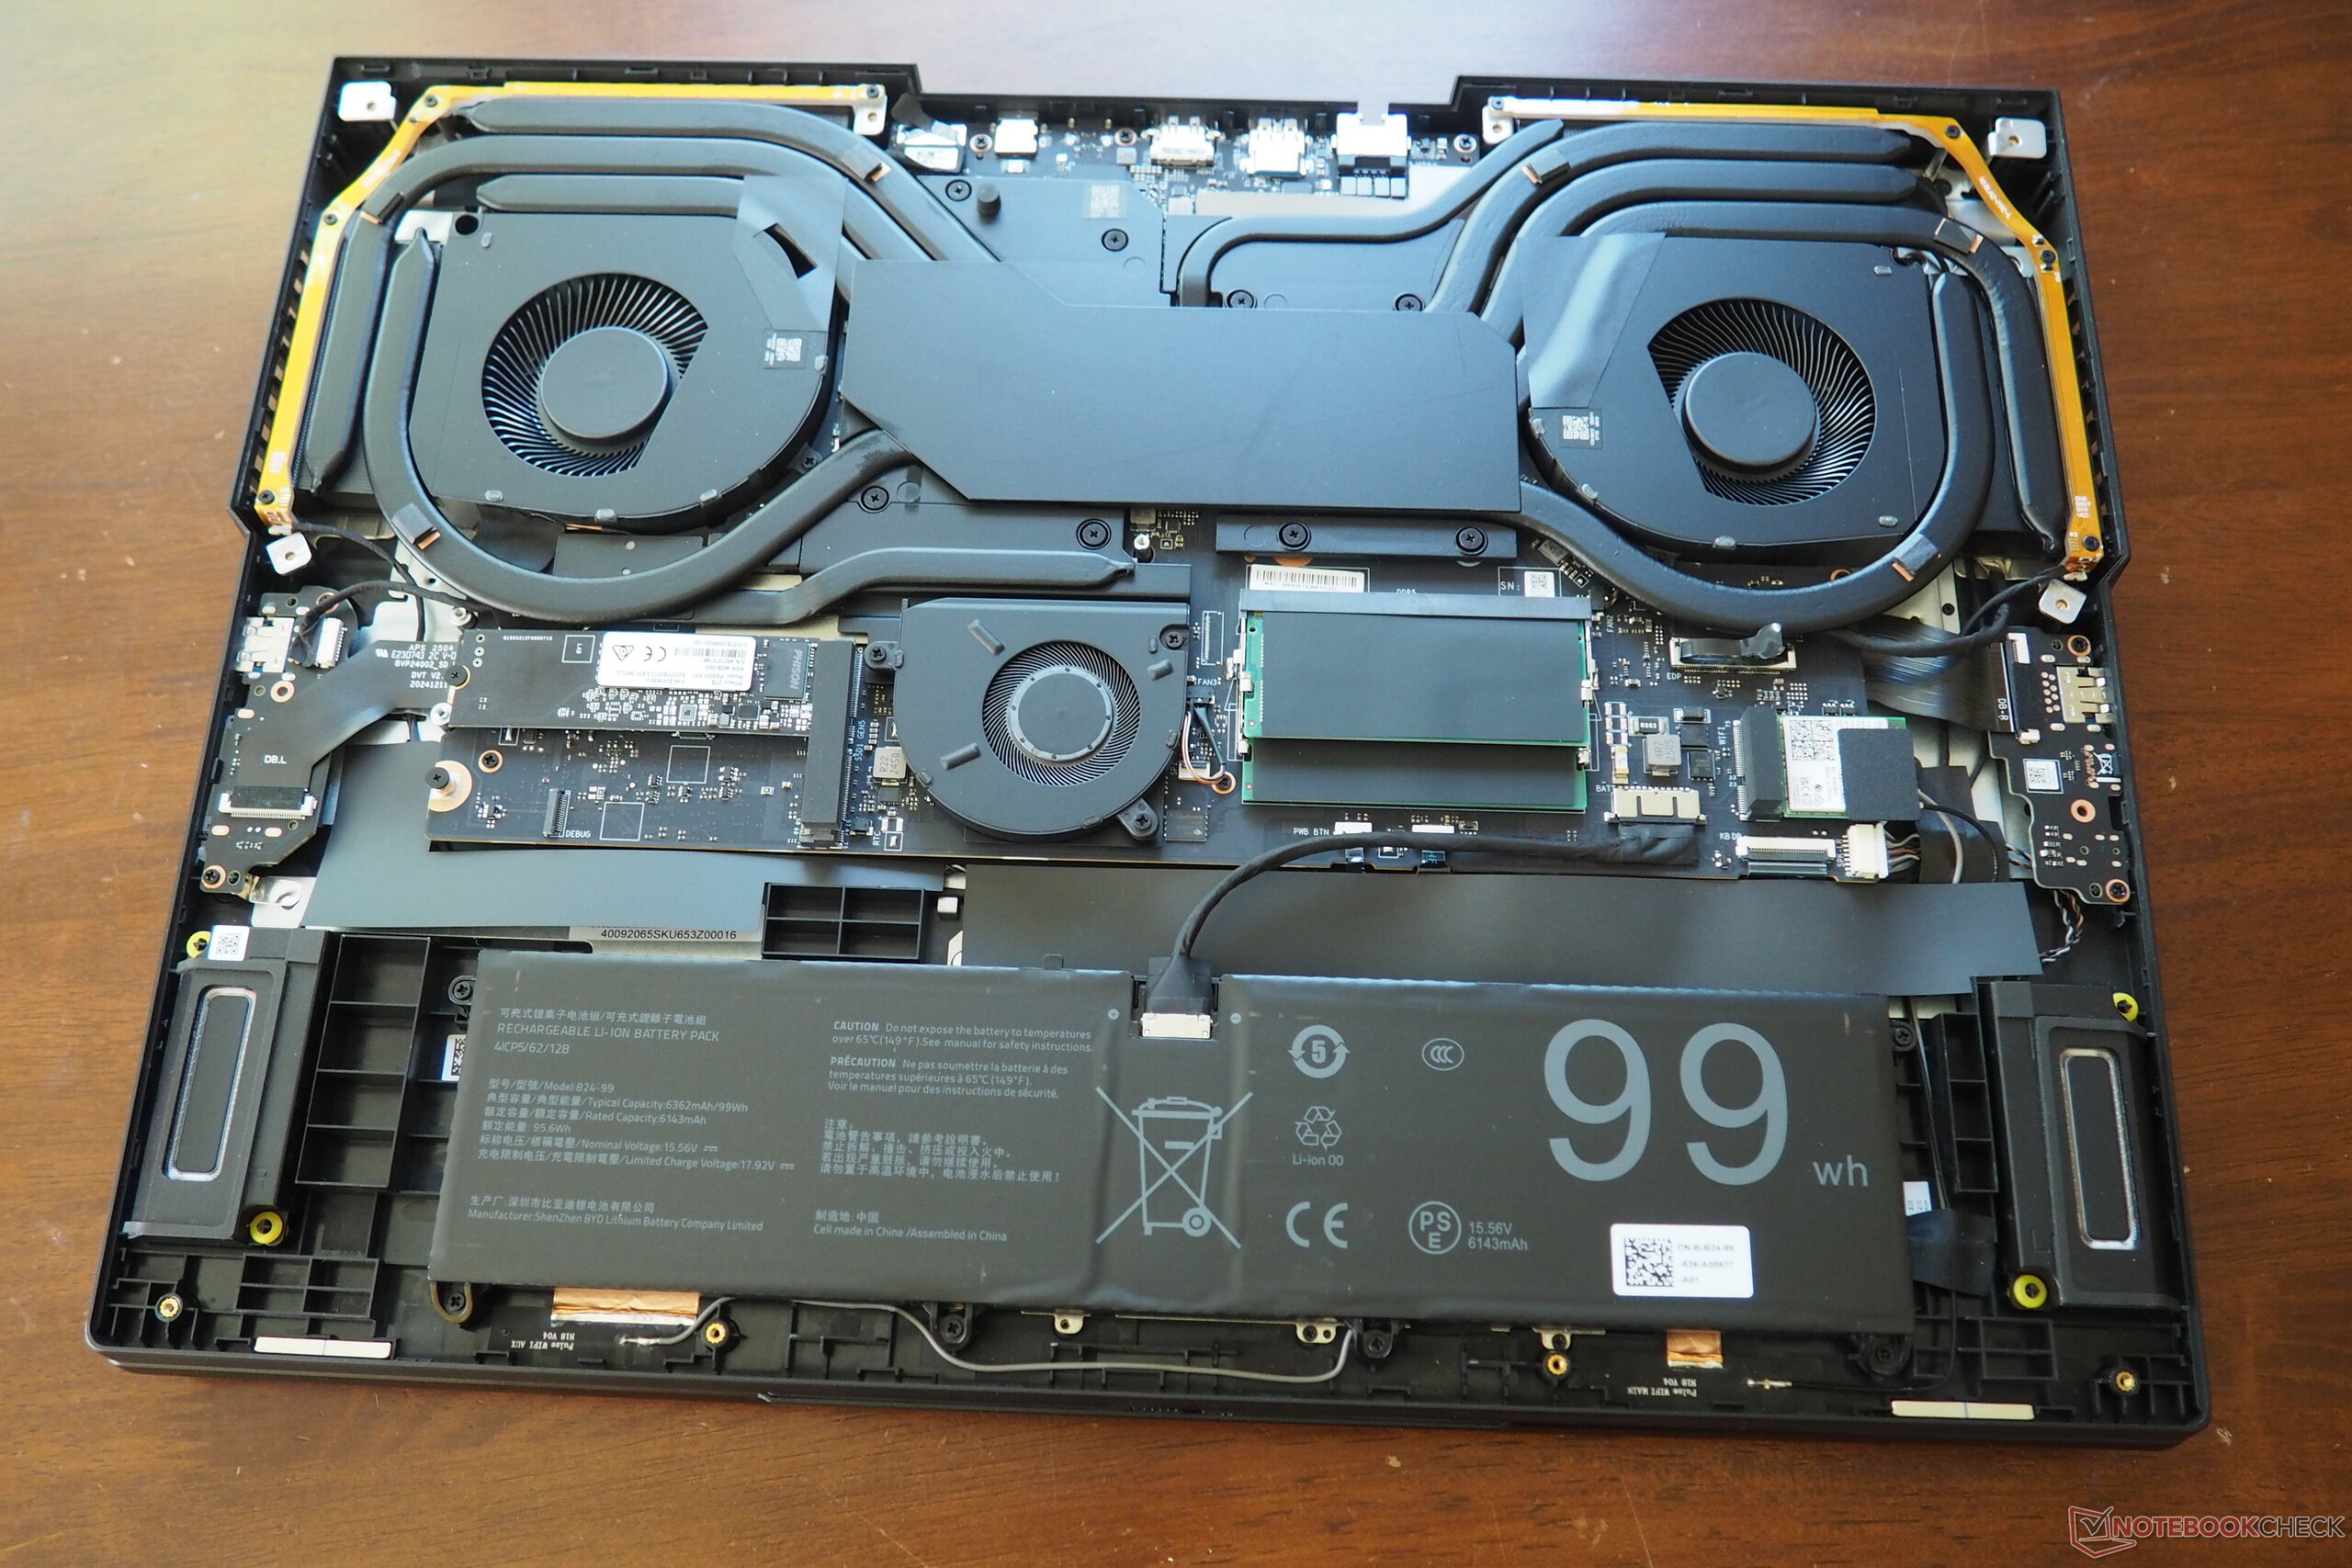
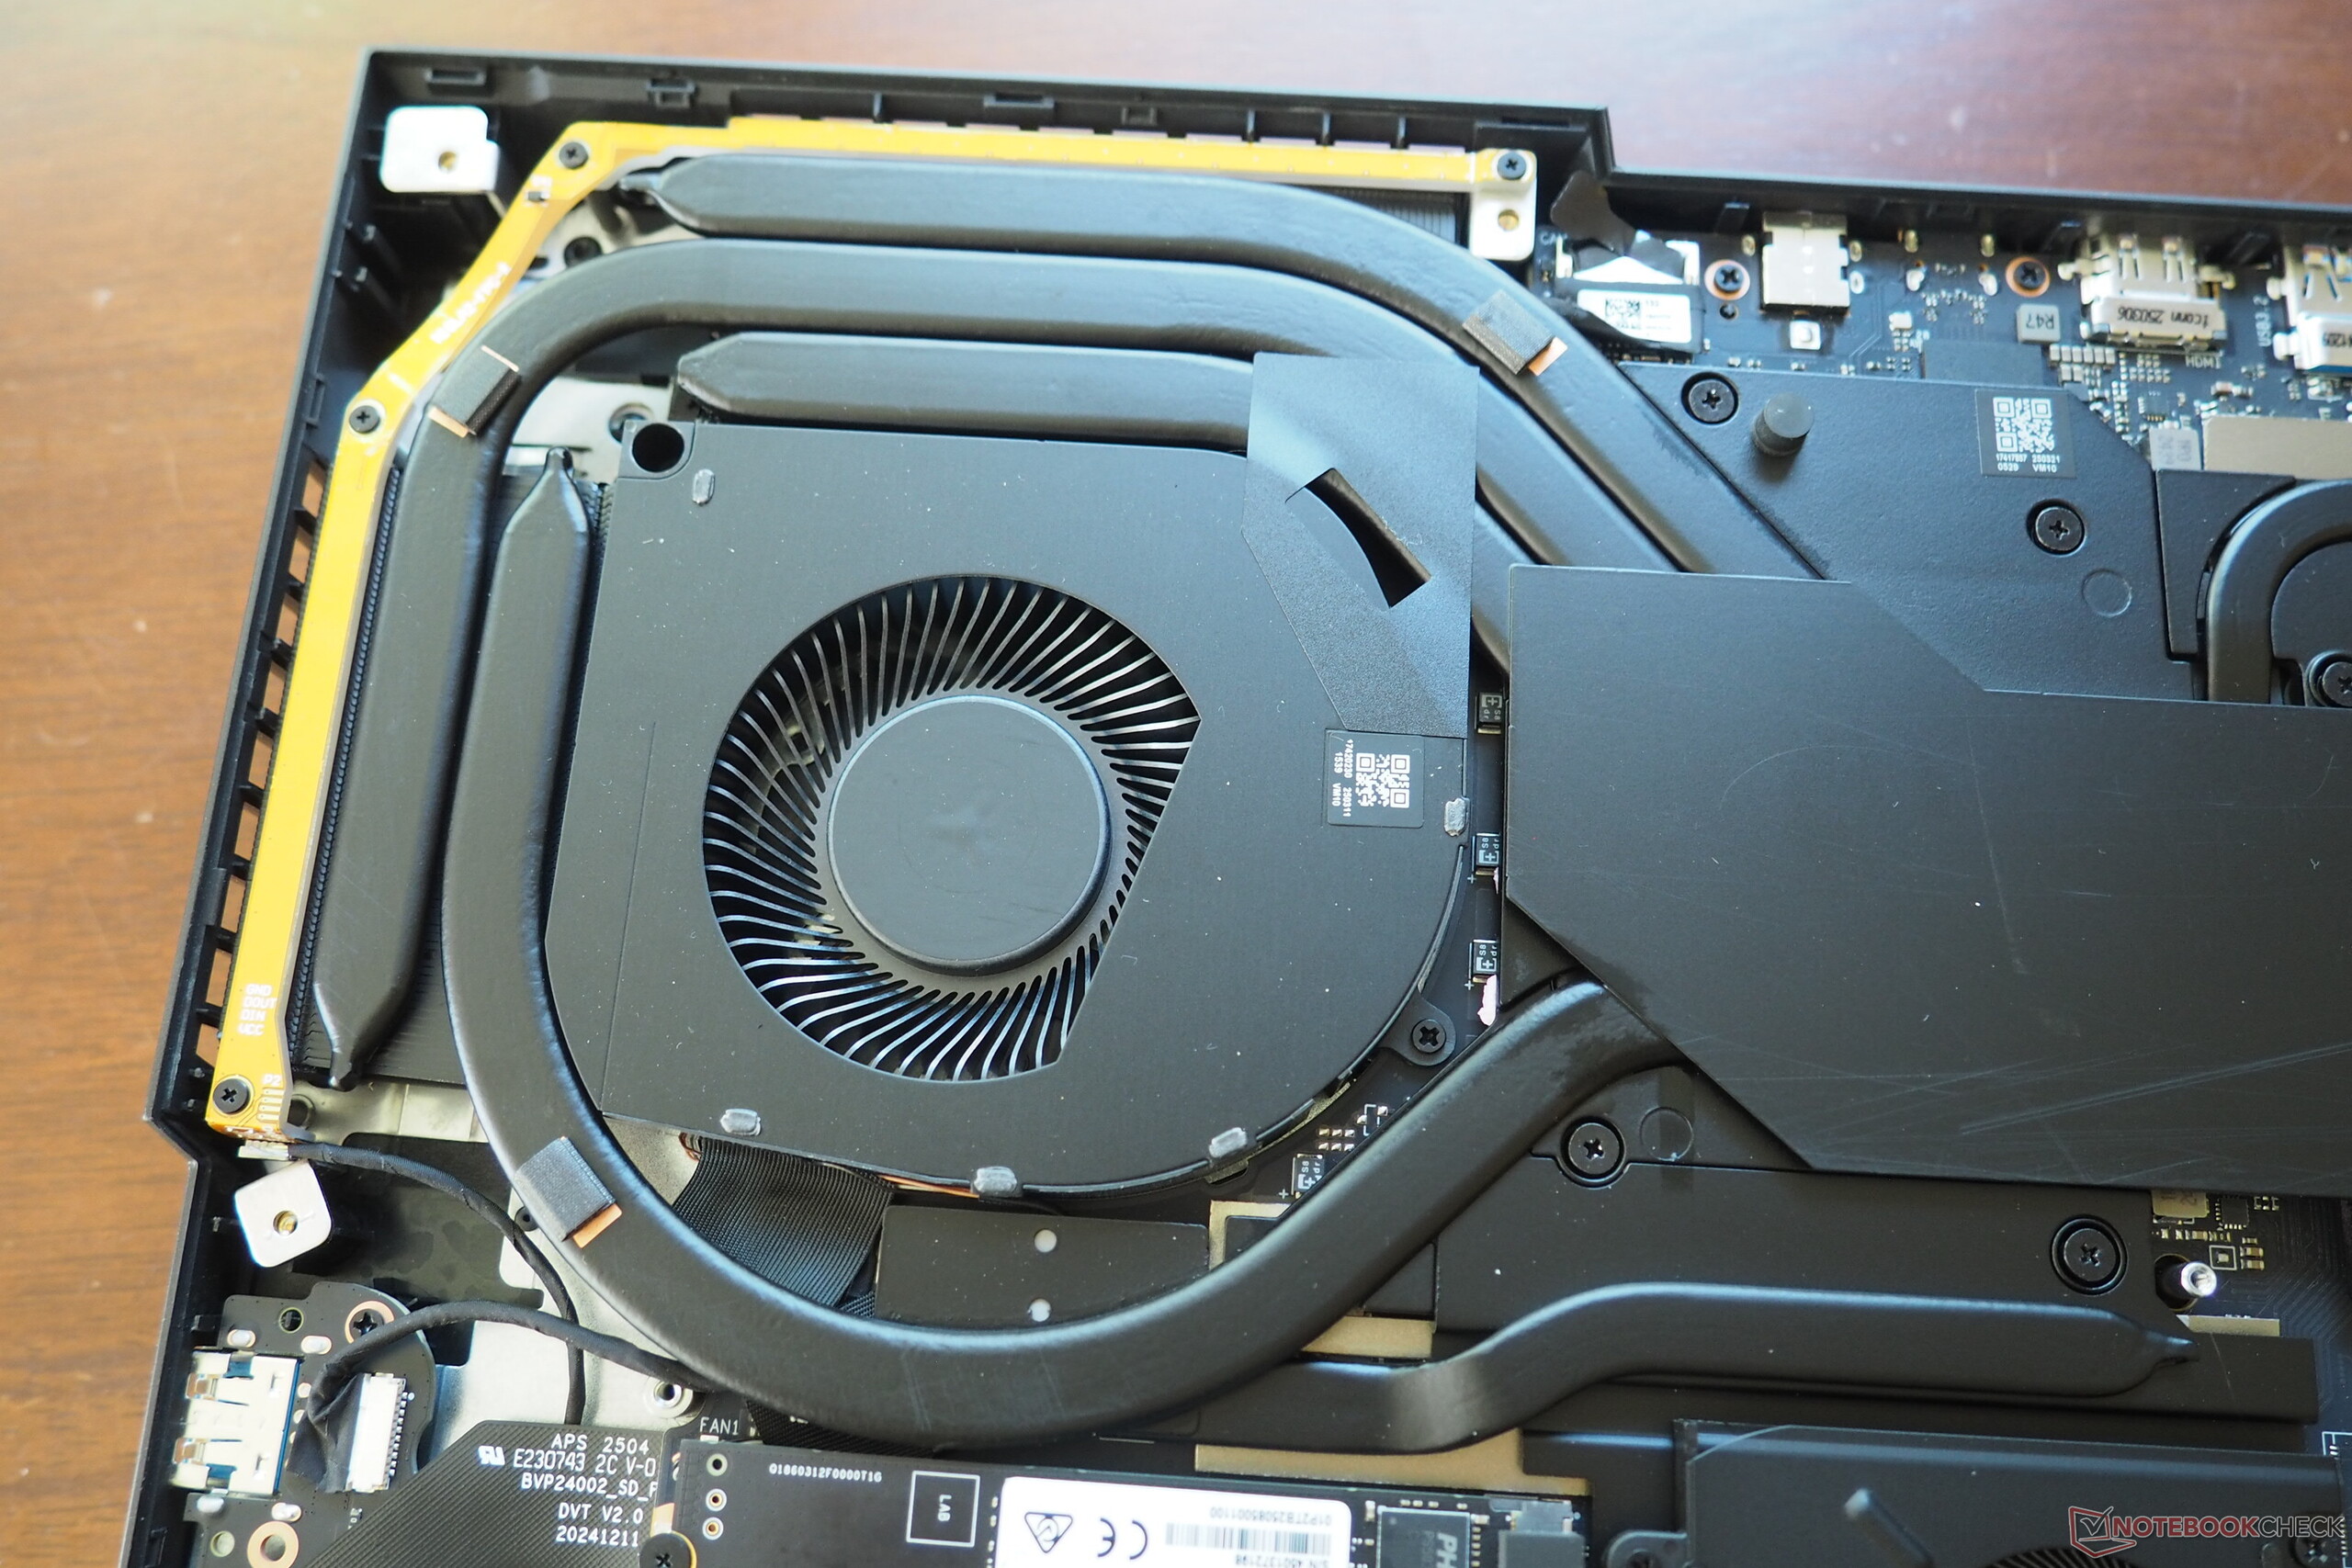
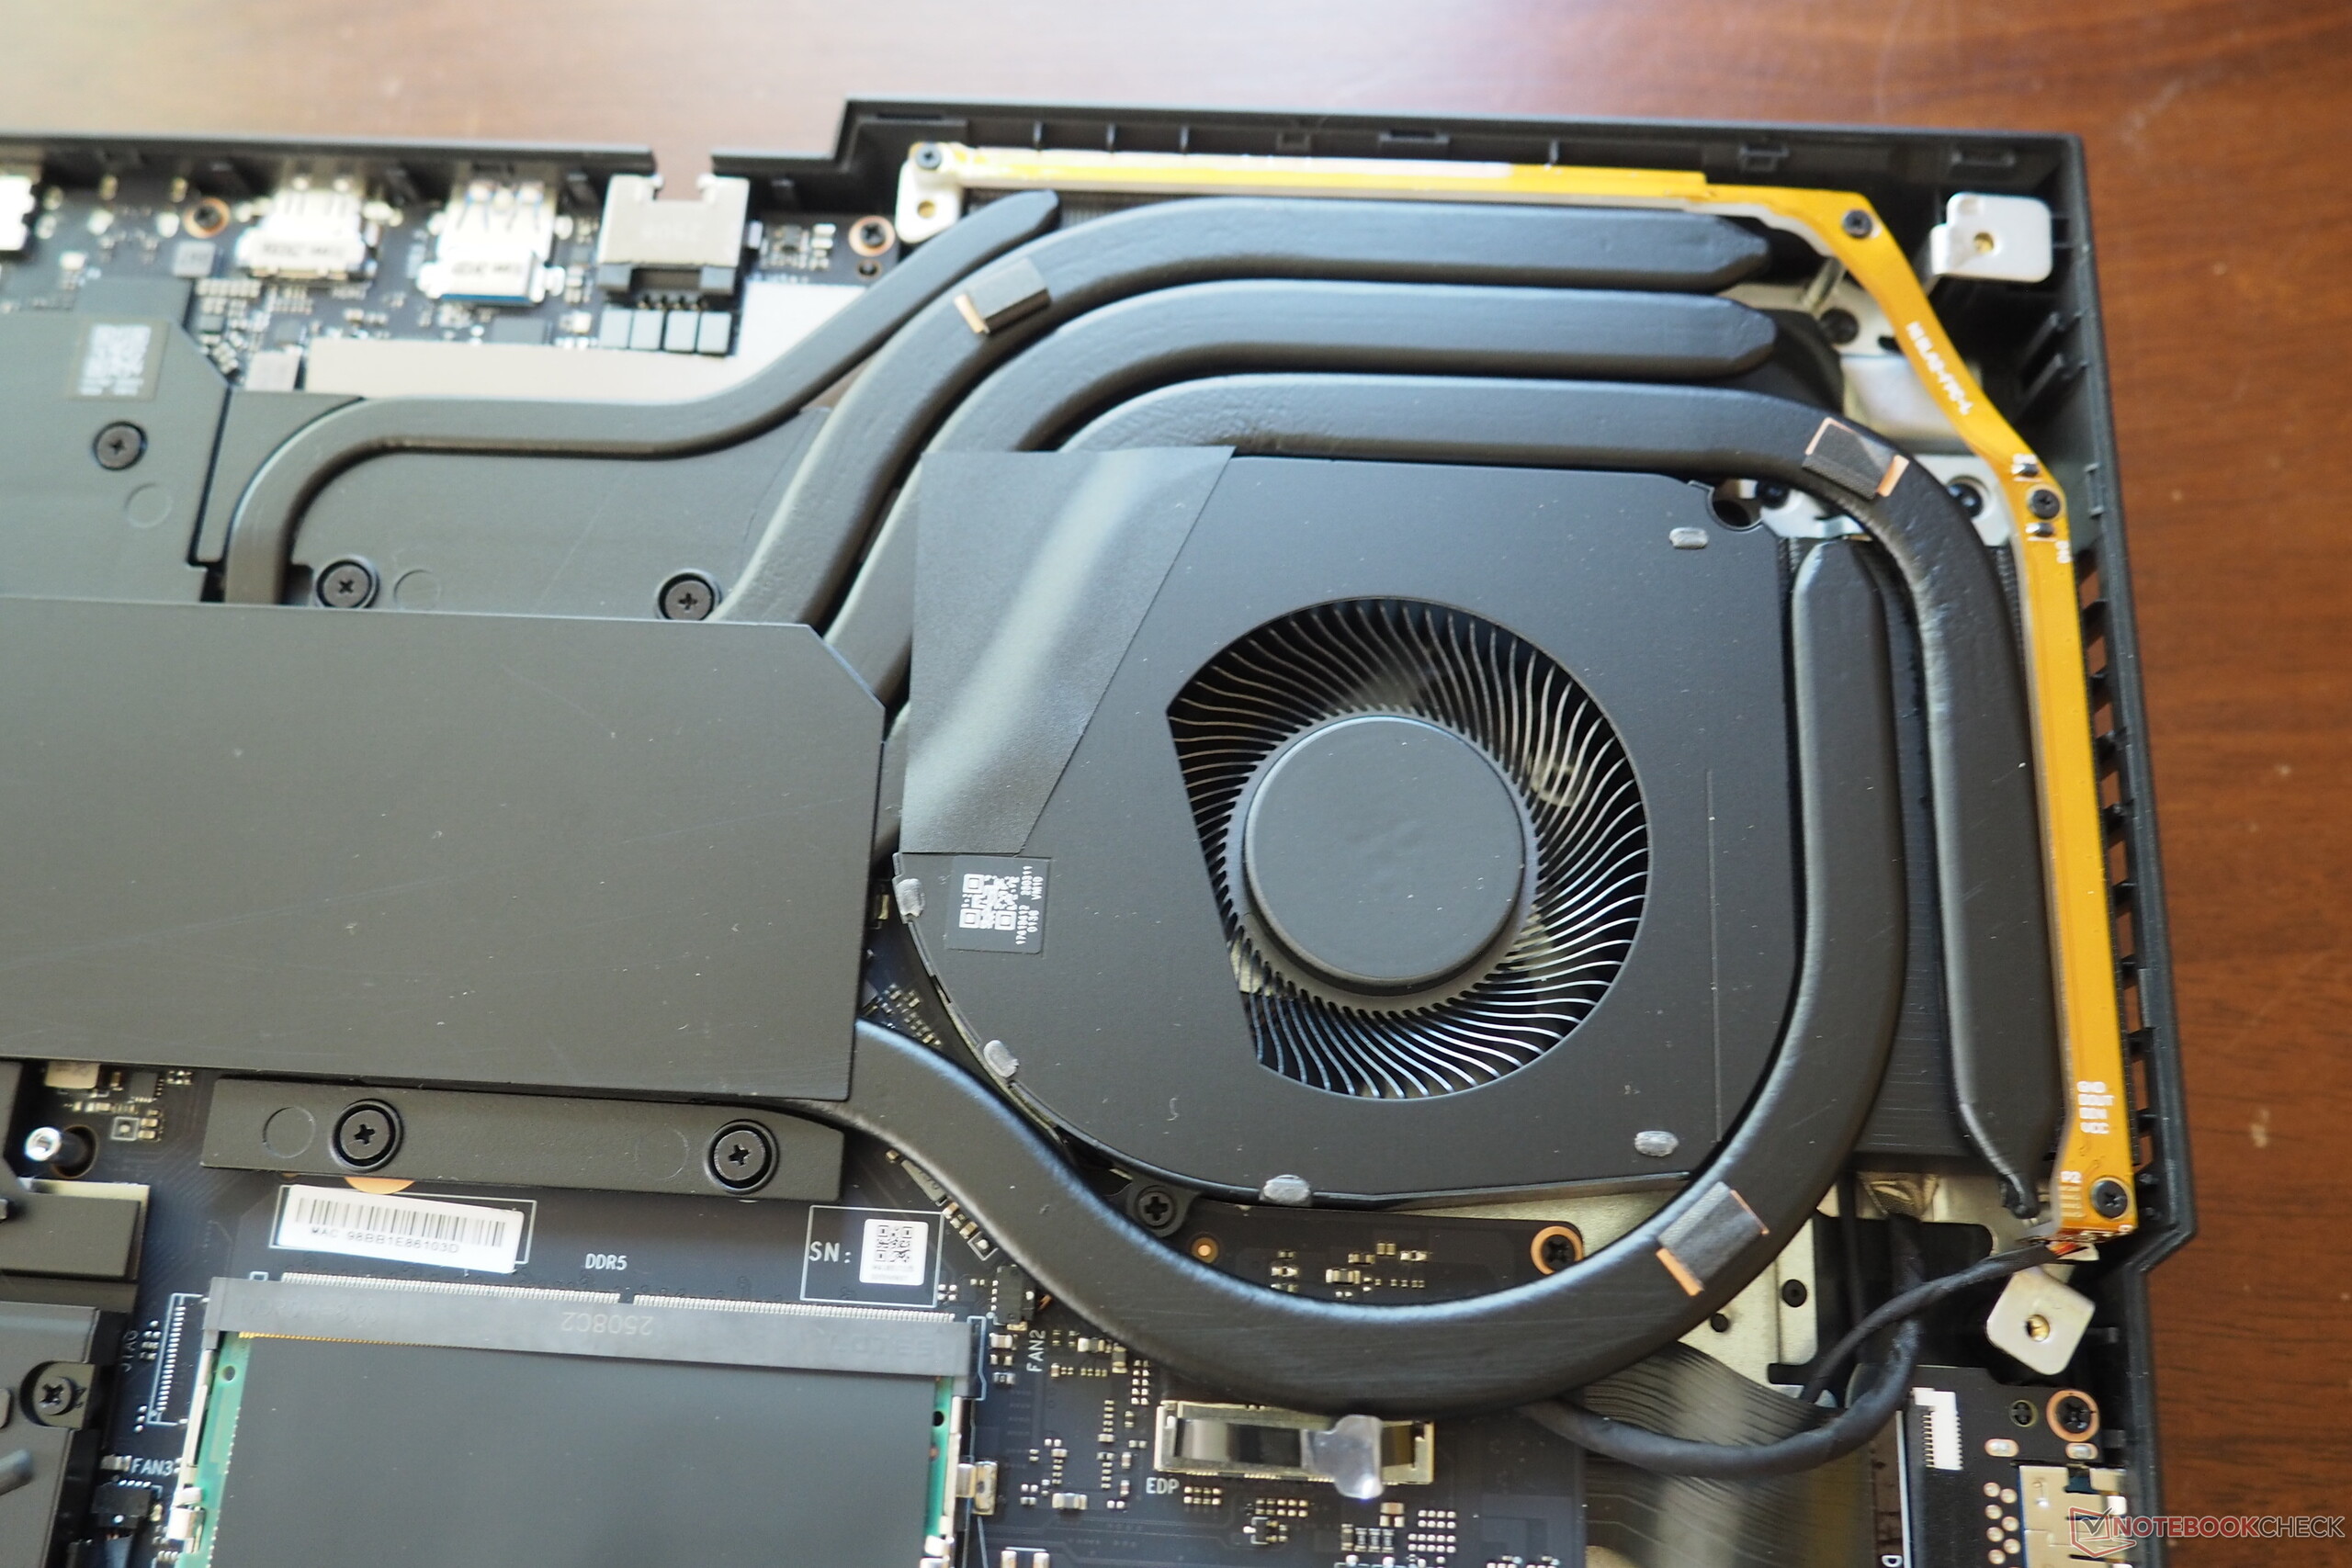
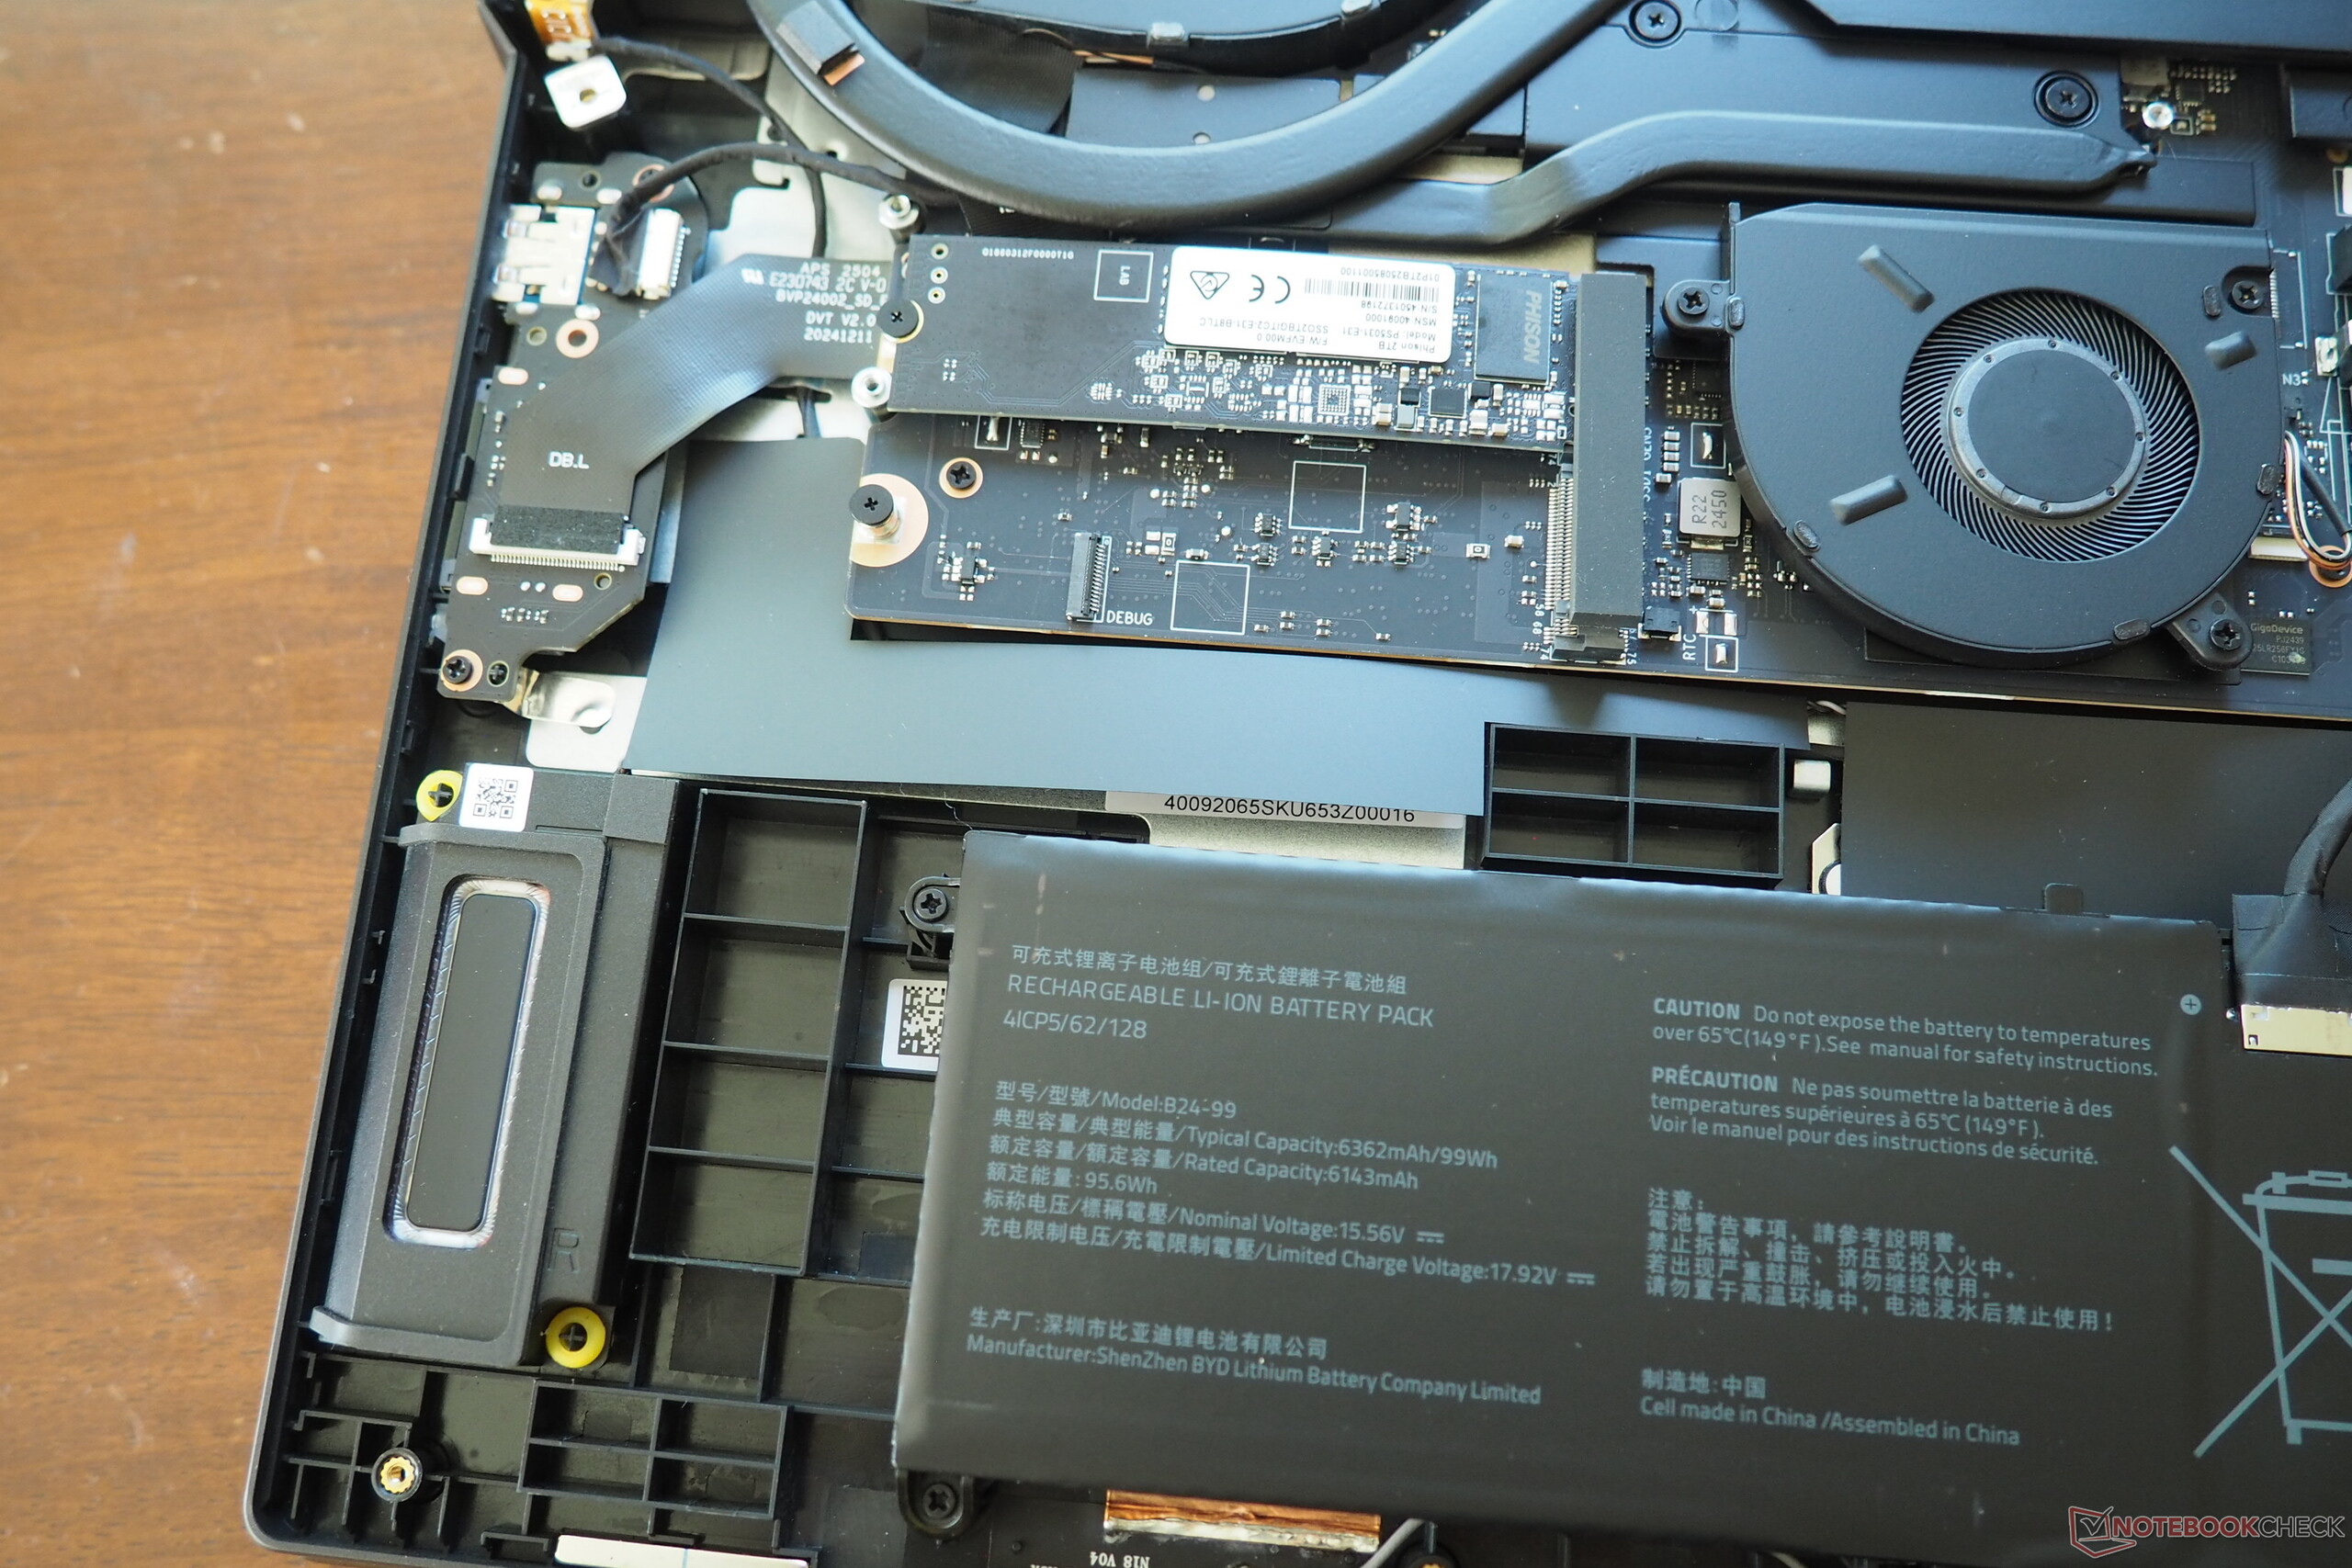
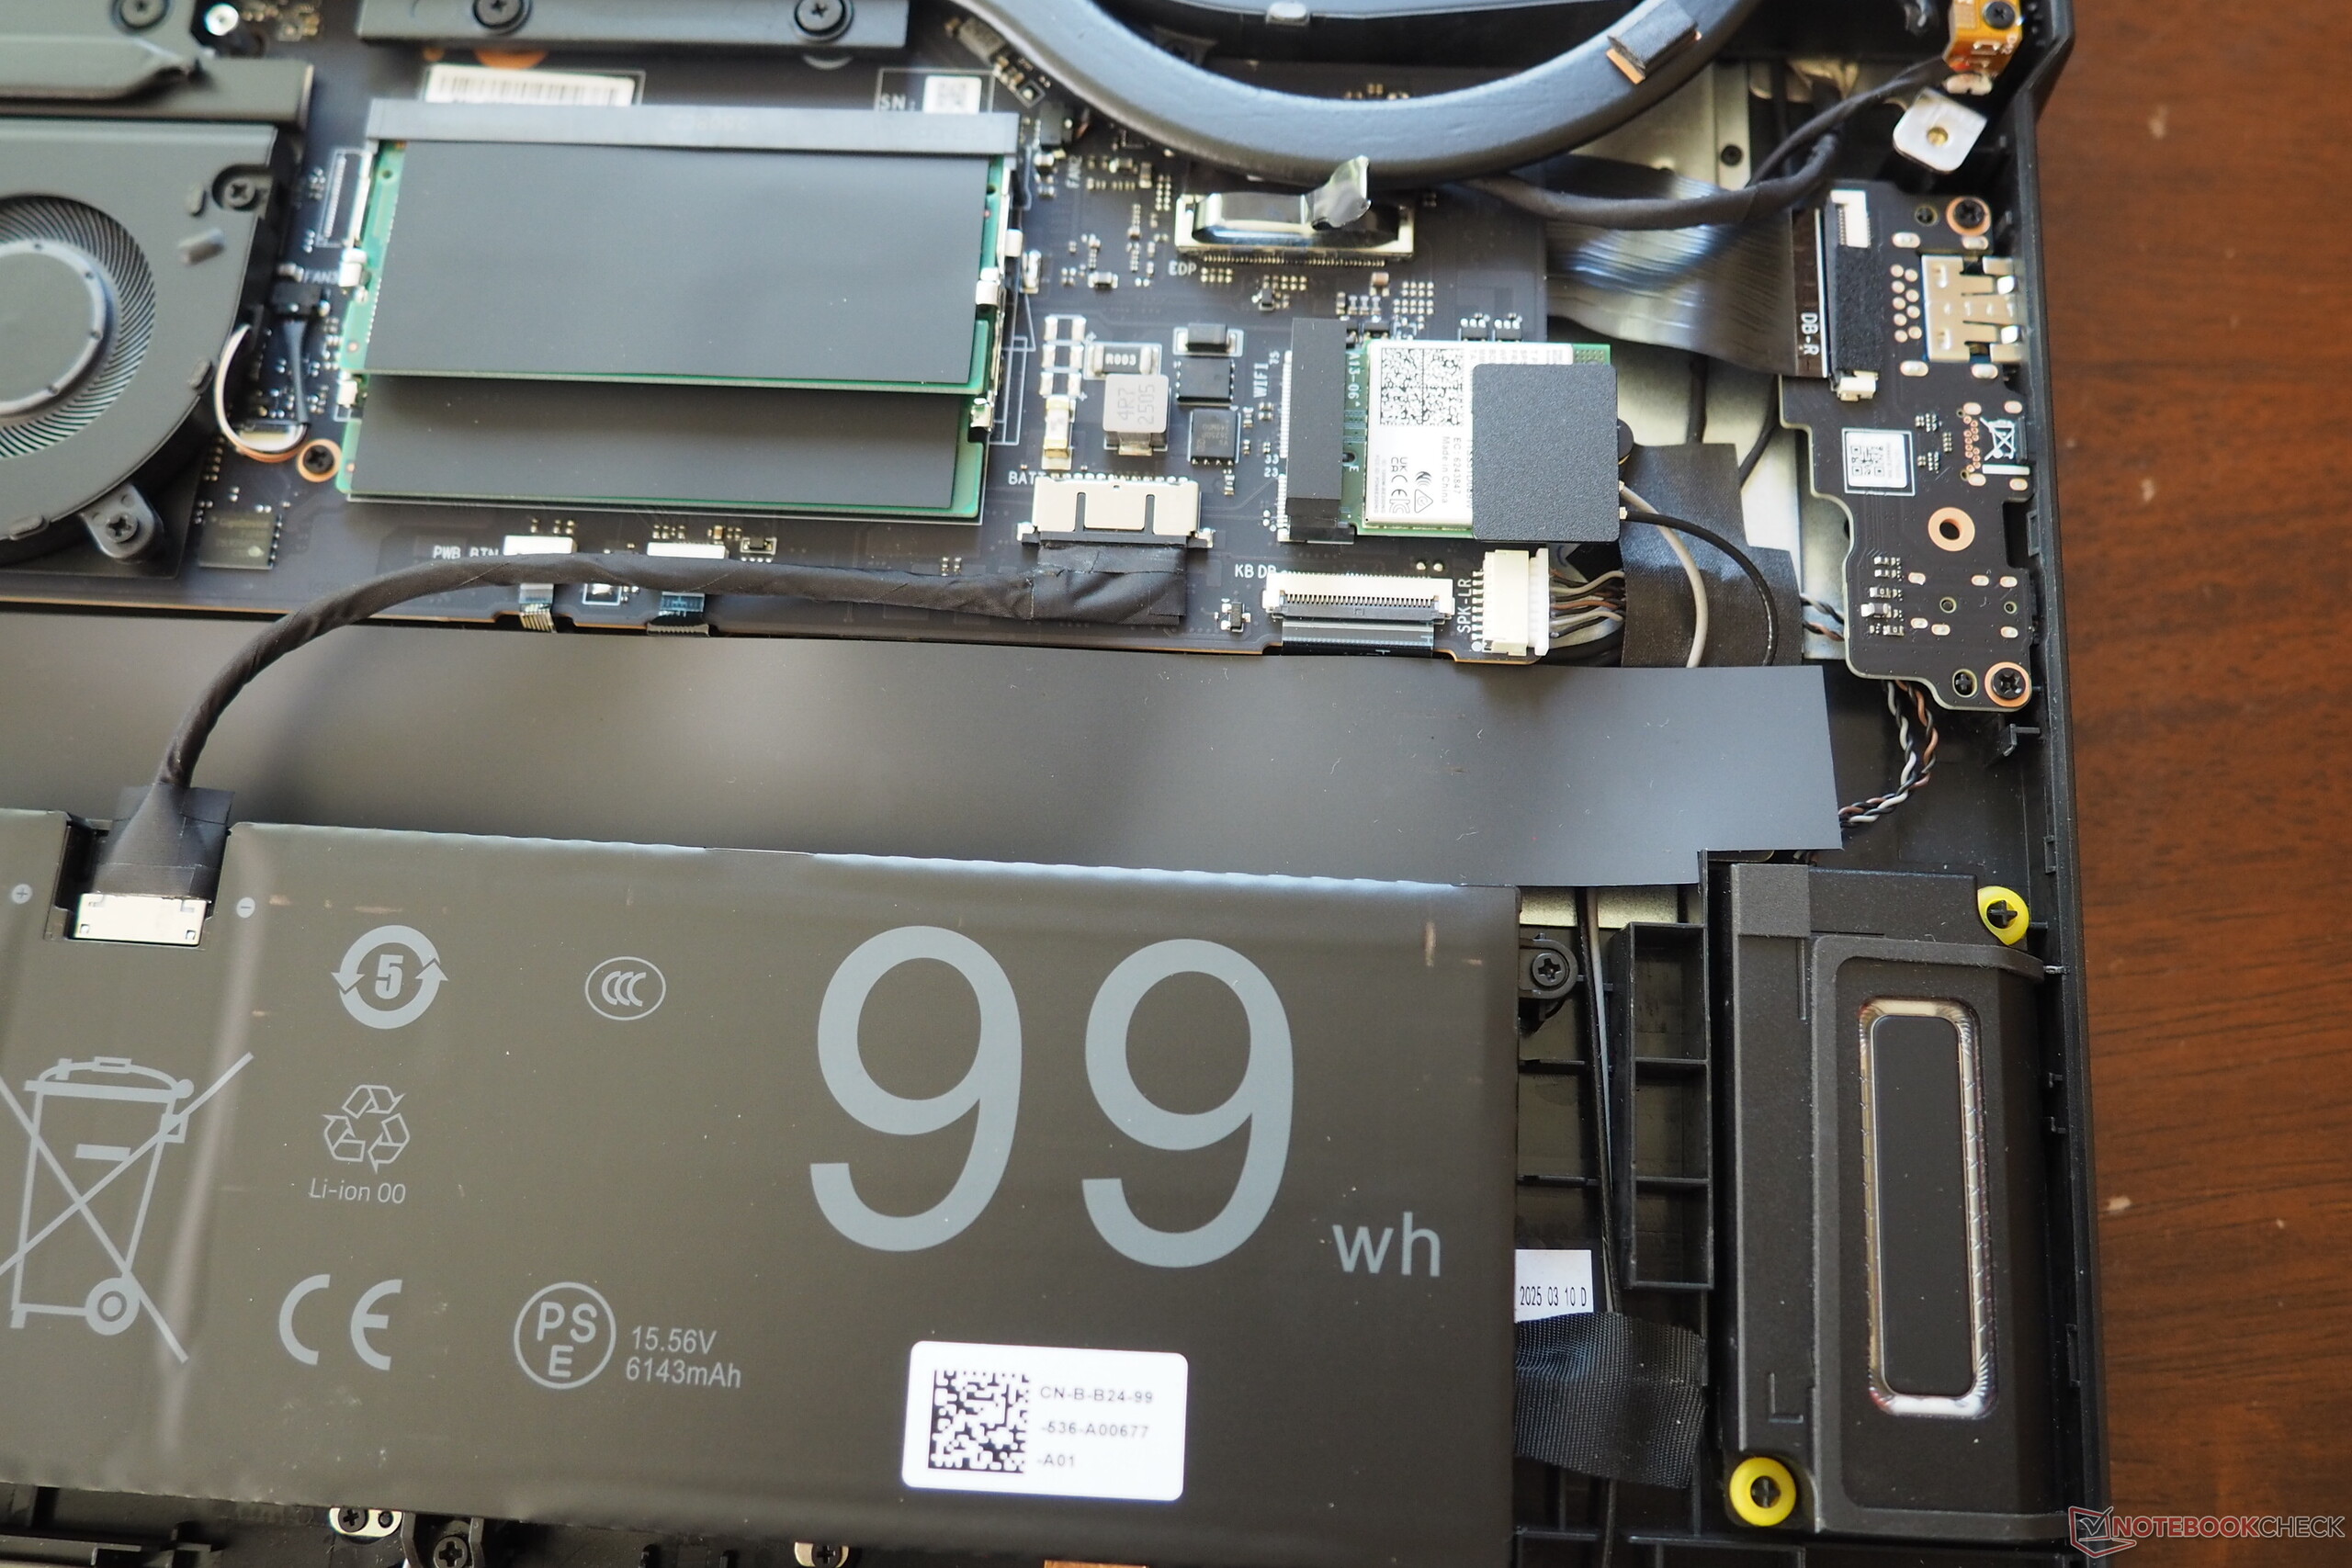
La sélection d'interfaces est impressionnante, comme il sied à un remplaçant de bureau. Outre deux ports USB-A (3.2 Gen1), il y a également deux ports Type-C, dont l'un prend en charge l'interface Thunderbolt 5. Il y a également une prise audio, une sortie HDMI 2.1, un lecteur de cartes agréablement rapide et un port réseau de 2,5 Gbit. Les connexions sans fil sont gérées par une puce Intel Wi-Fi 7 (BE200), dont la vitesse a été particulièrement bien notée lors du test. La webcam FHD ne génère pas d'applaudissements, mais offre une couverture physique, ce qui n'est pas évident. L'entretien de l'Erazer Beast 18 X1 est moyennement facile ou difficile : Après avoir retiré 11 vis Phillips, la plaque de base peut être enlevée de son ancrage, révélant un système de refroidissement avec trois ventilateurs. Les deux emplacements pour la mémoire vive sont occupés, mais il reste de la place pour les emplacements M.2.
Lecteur de carte SD
| SD Card Reader | |
| average JPG Copy Test (av. of 3 runs) | |
| Medion Erazer Beast 18 X1 MD62731 (AV PRO microSD 128 GB V60) | |
| Aorus Master 18 AM8H (AV PRO microSD 128 GB V60) | |
| Moyenne de la classe Gaming (19 - 204, n=70, 2 dernières années) | |
| Acer Predator Helios 18 N23Q2 | |
| MSI GE78HX 13VH-070US (Angelibird AV Pro V60) | |
| maximum AS SSD Seq Read Test (1GB) | |
| Aorus Master 18 AM8H (AV PRO microSD 128 GB V60) | |
| Medion Erazer Beast 18 X1 MD62731 (AV PRO microSD 128 GB V60) | |
| Moyenne de la classe Gaming (25.8 - 261, n=69, 2 dernières années) | |
| MSI GE78HX 13VH-070US (Angelibird AV Pro V60) | |
| Acer Predator Helios 18 N23Q2 | |
Communication
Webcam


Dispositifs d'entrée
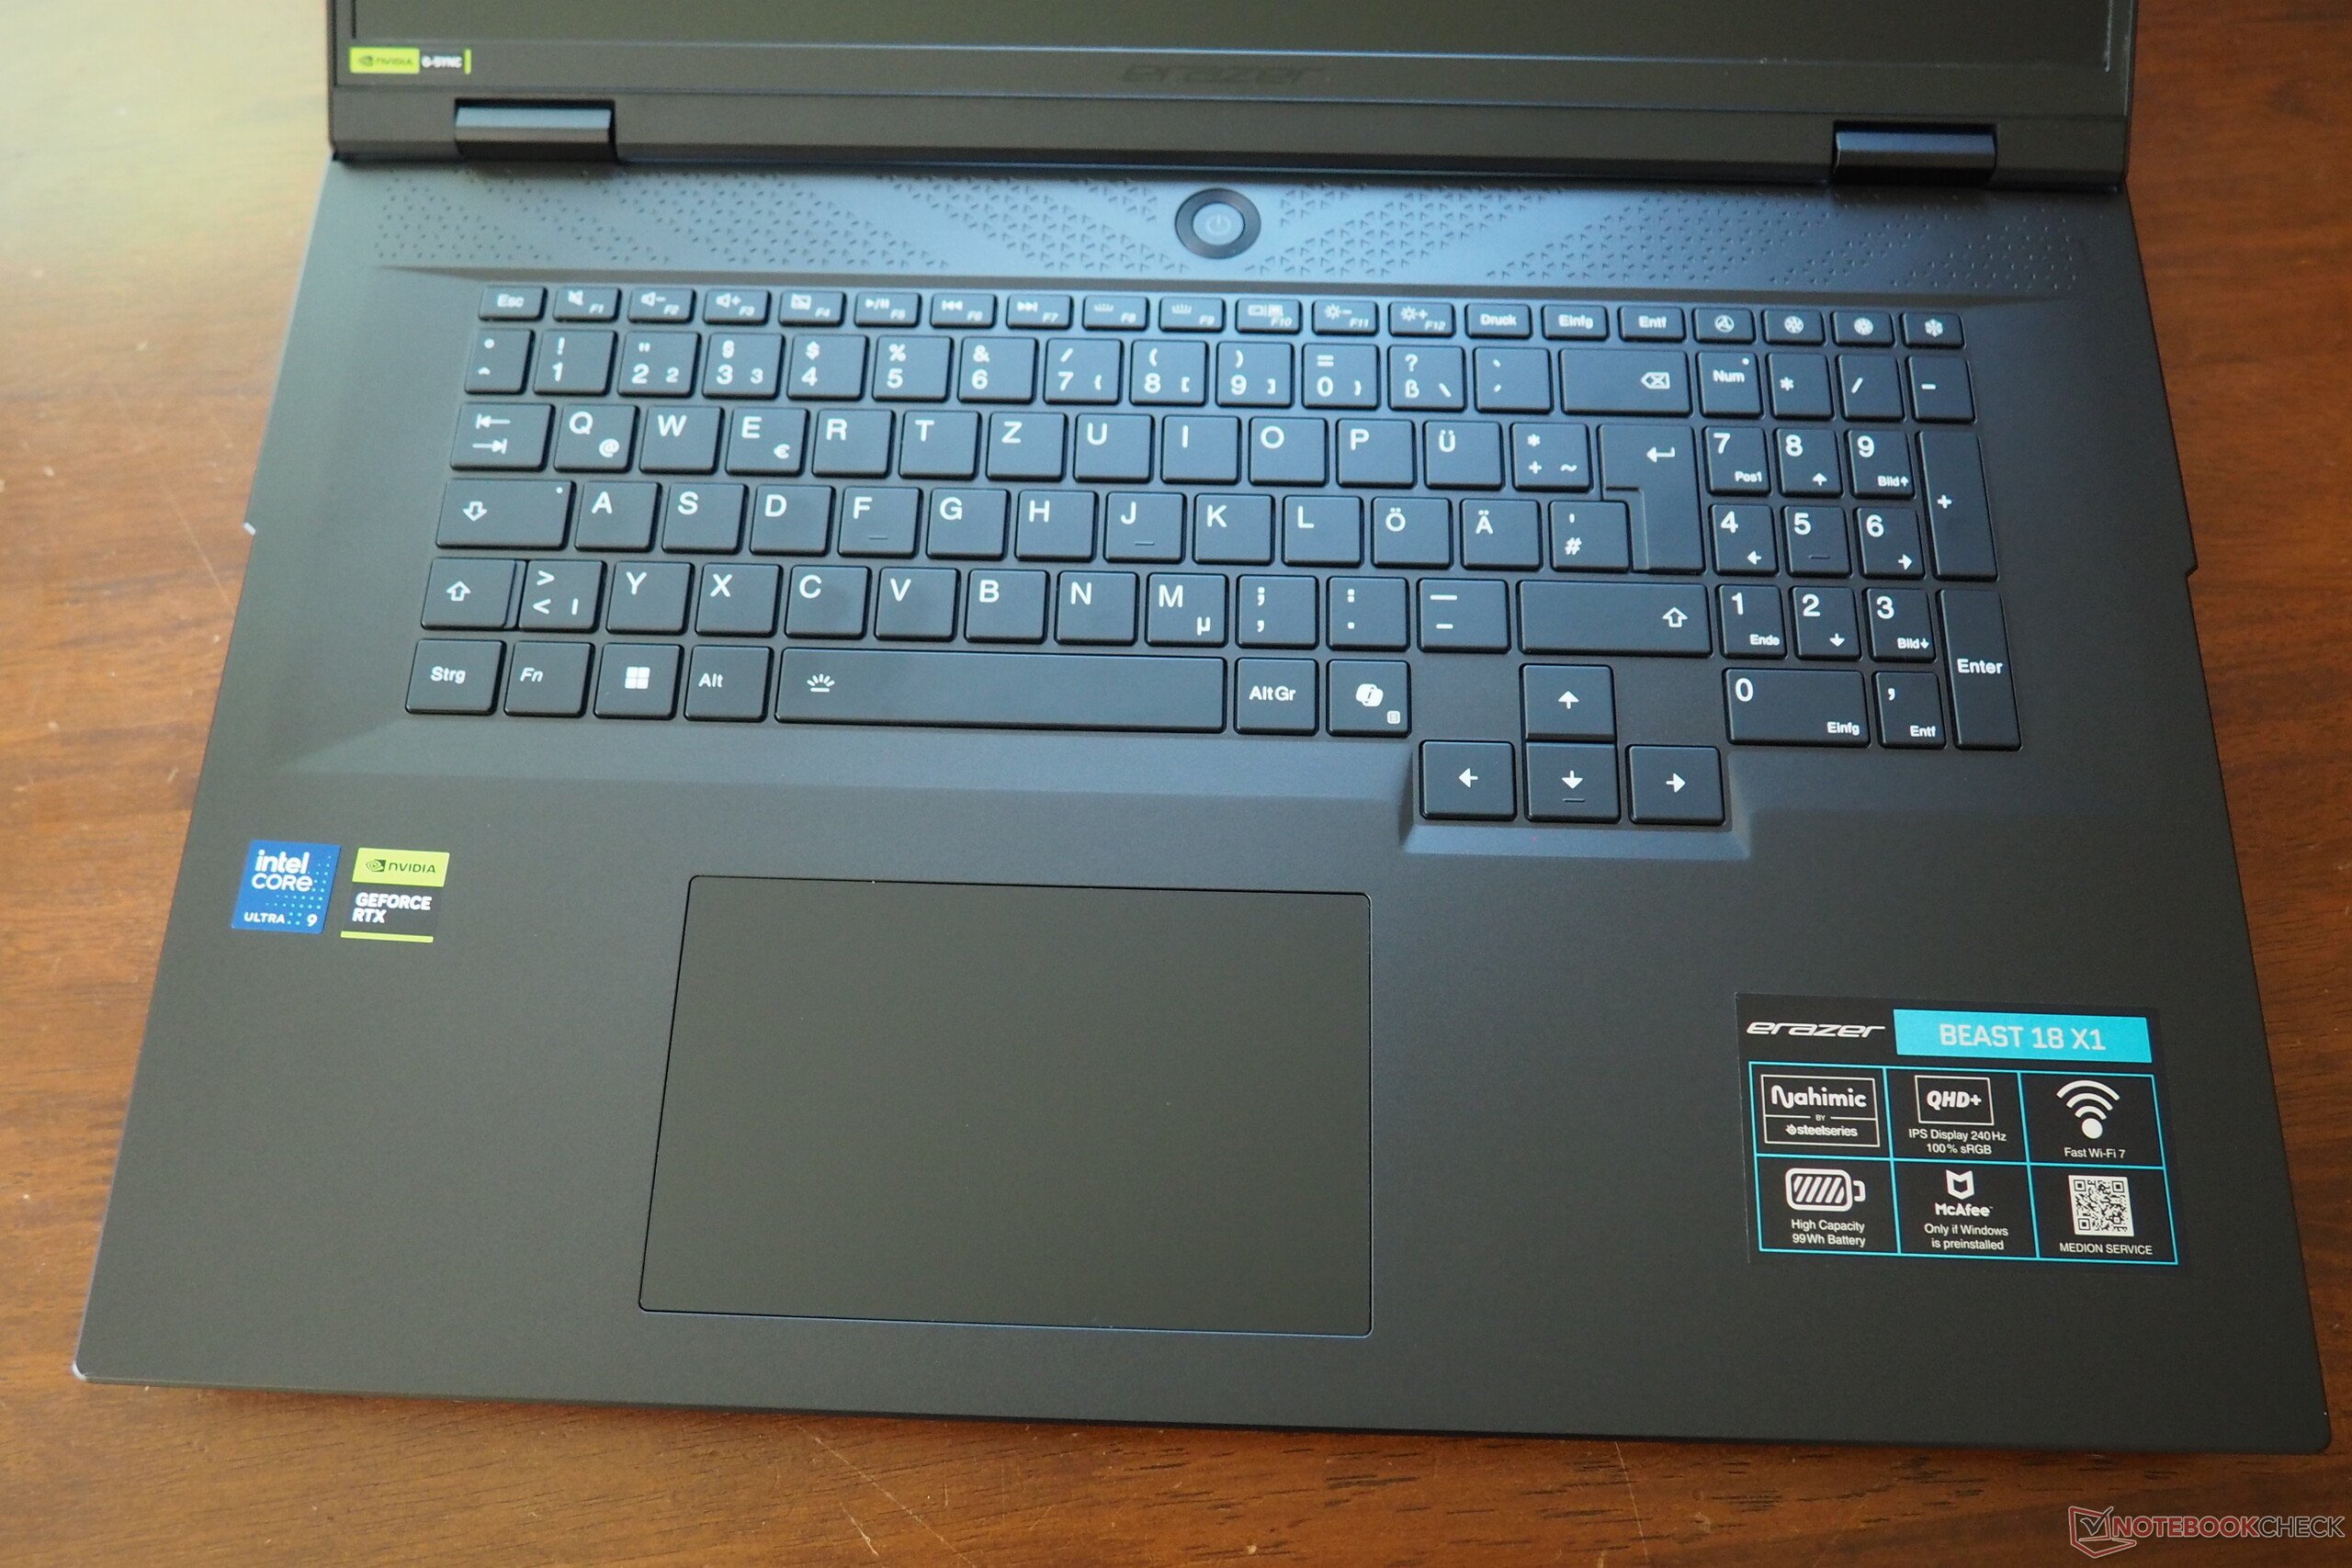
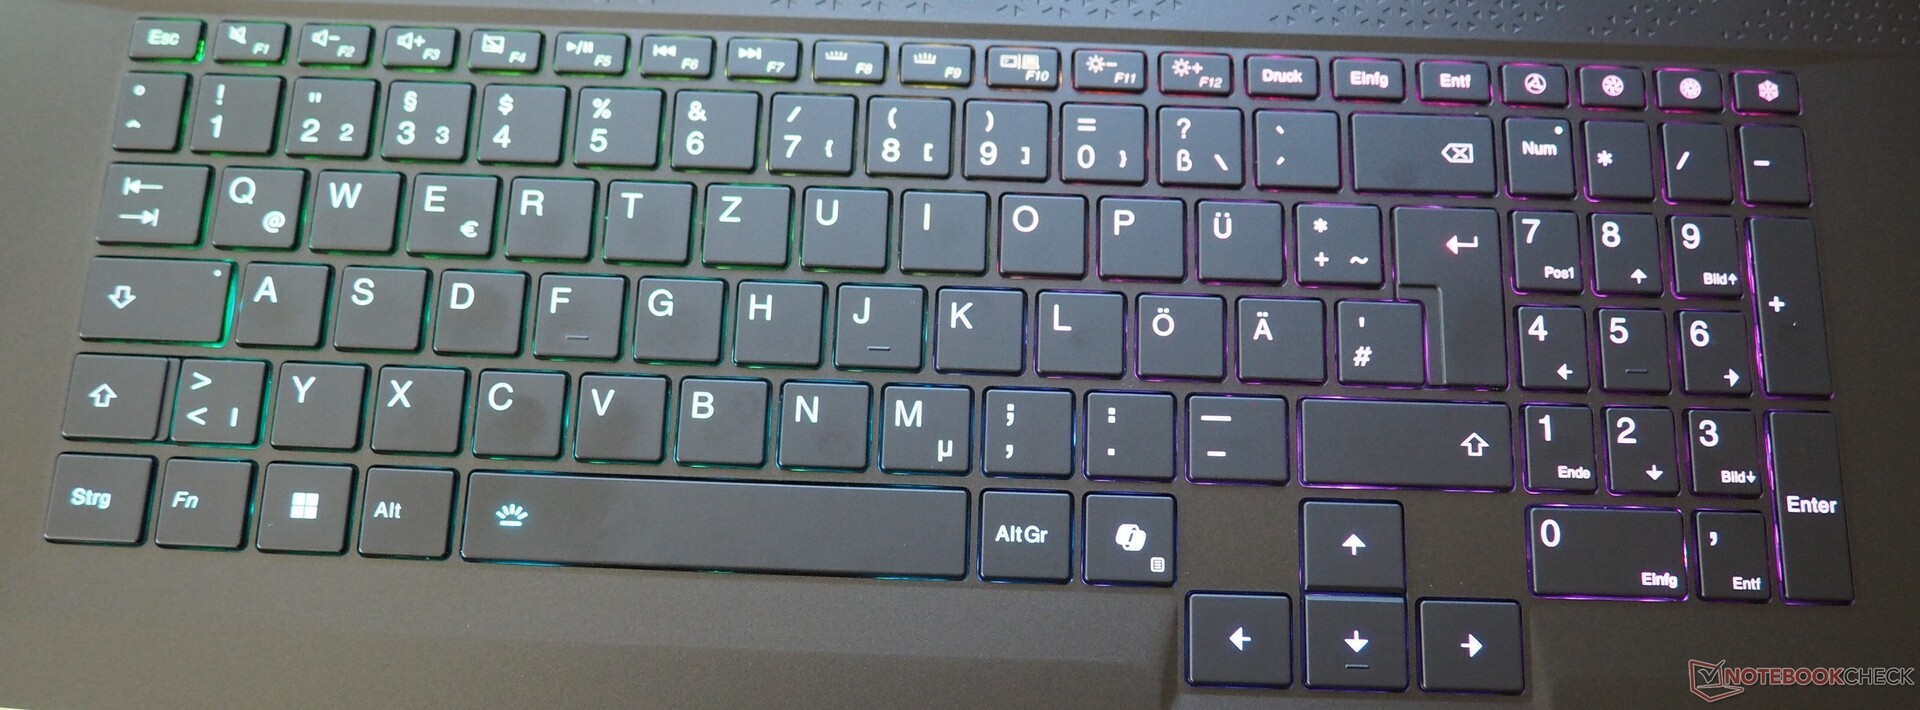
Le clavier chiclet dispose d'un pavé numérique dédié et impressionne avec des flèches directionnelles de taille normale et (dans le coin supérieur droit) des touches spéciales pratiques pour le contrôle du ventilateur. Le retour d'information et la sensation des touches nous semblent acceptables ; l'Aorus Master 18, par exemple, est encore plus performant à ce niveau. Le clickpad pourrait être plus stable ici et là, mais avec une taille d'environ 13 x 8 cm, il est de taille appropriée pour un produit de 18 pouces.
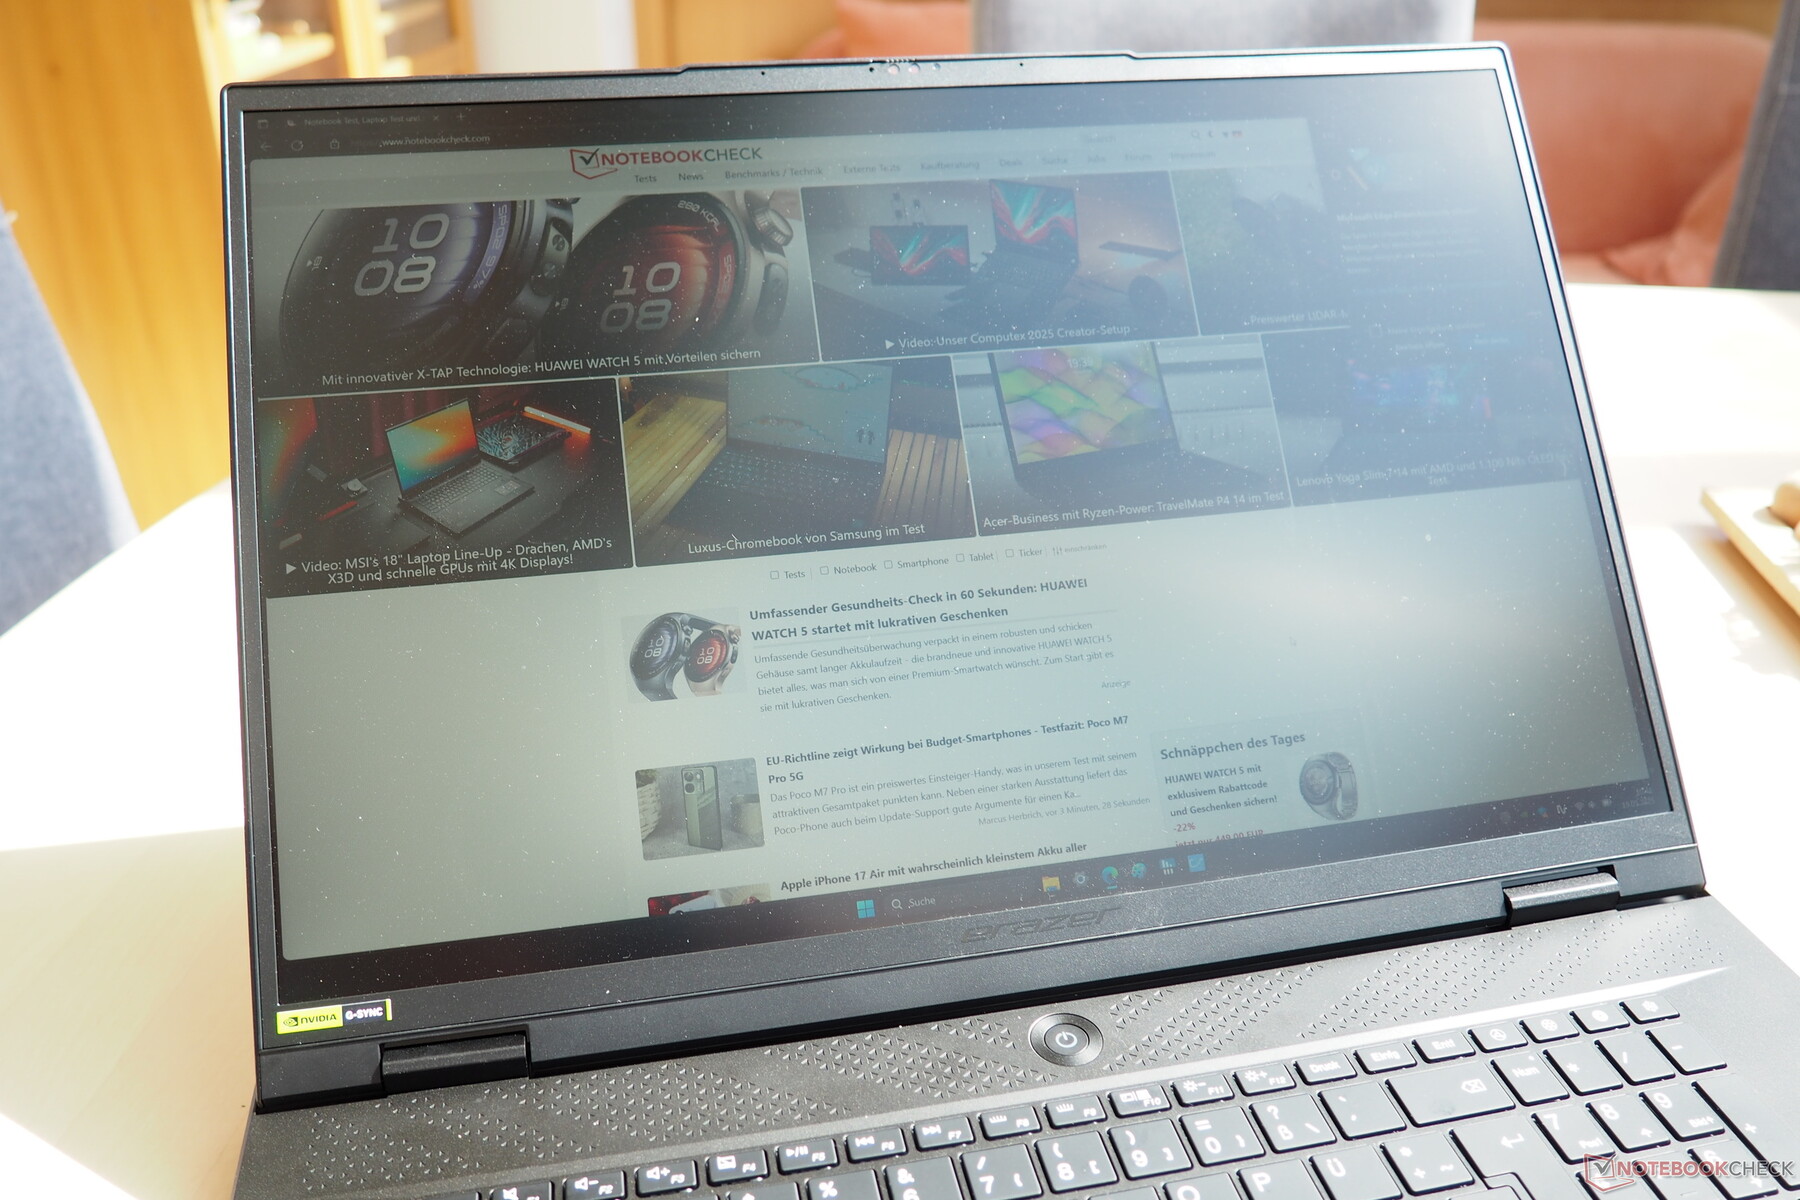
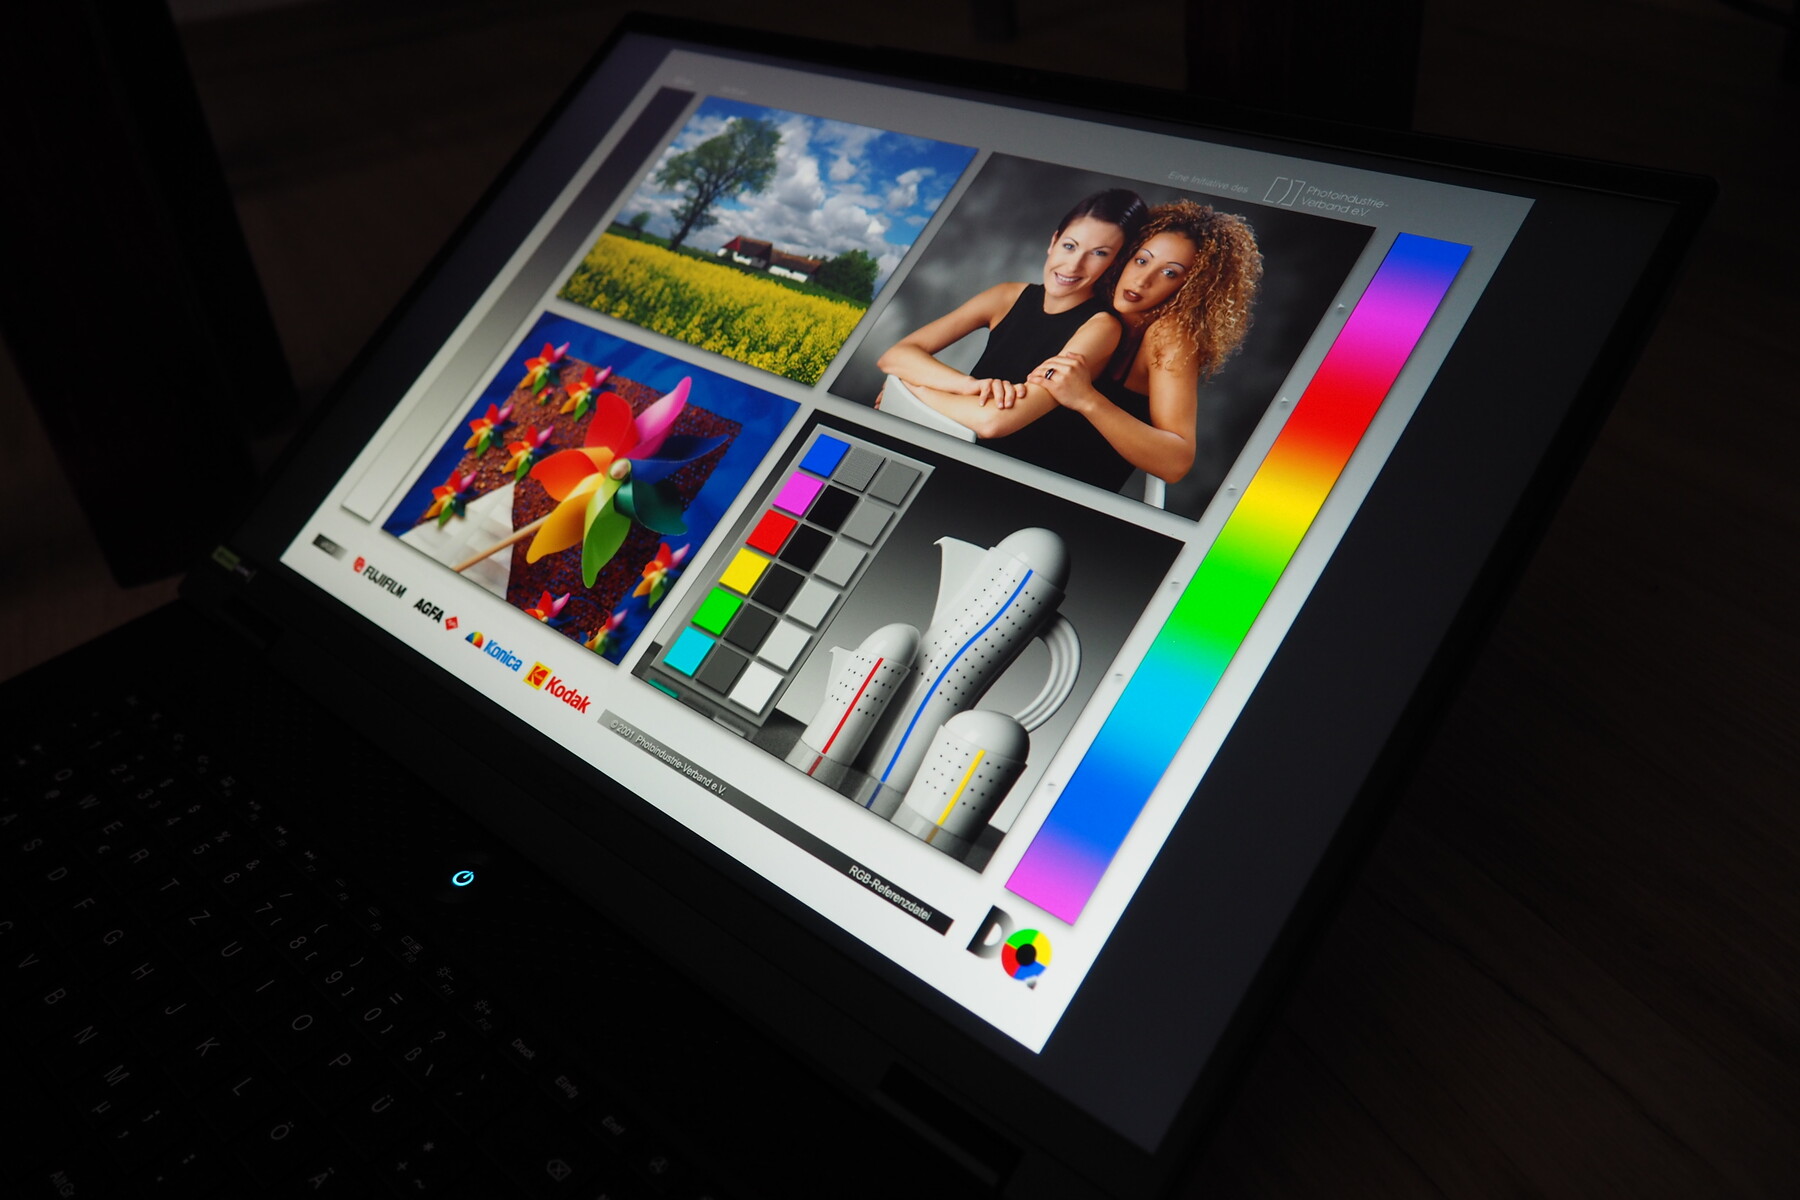
Affichage
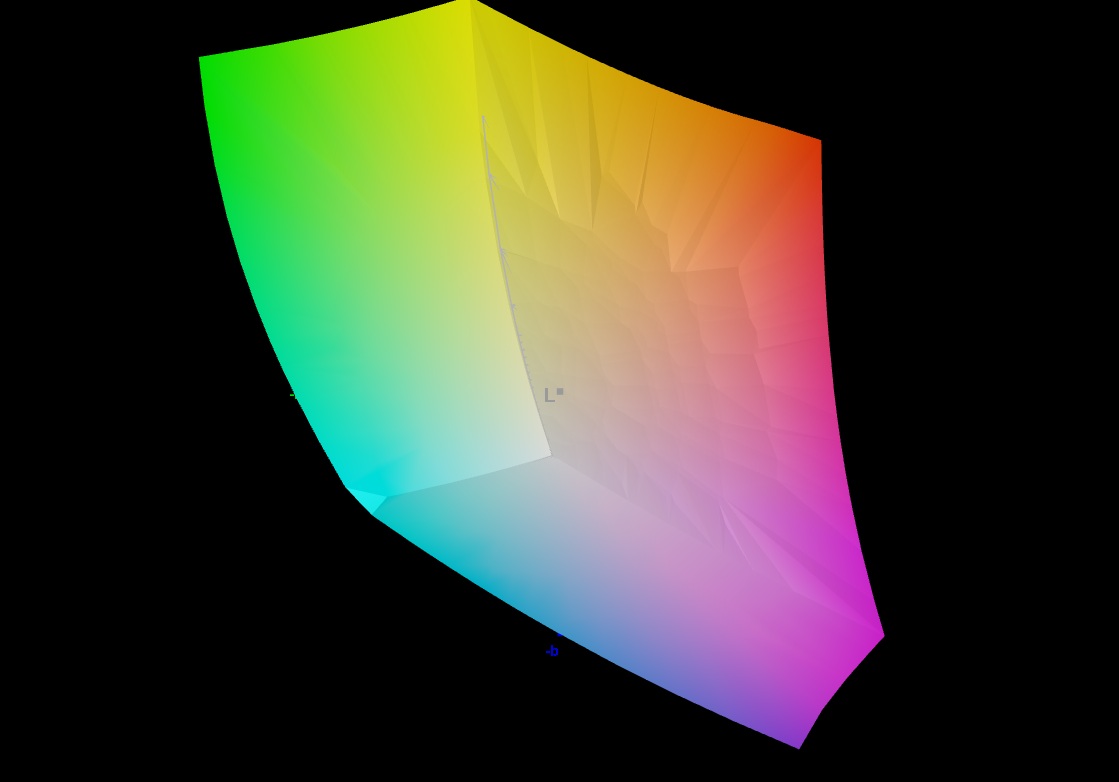
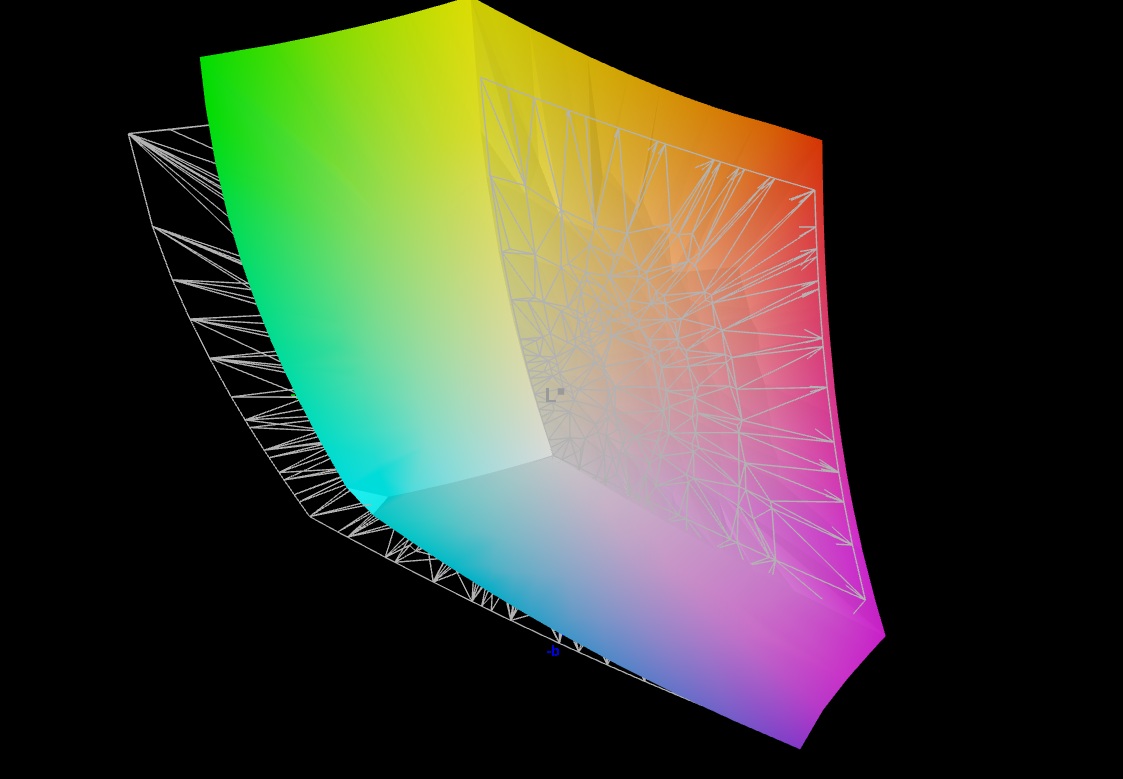
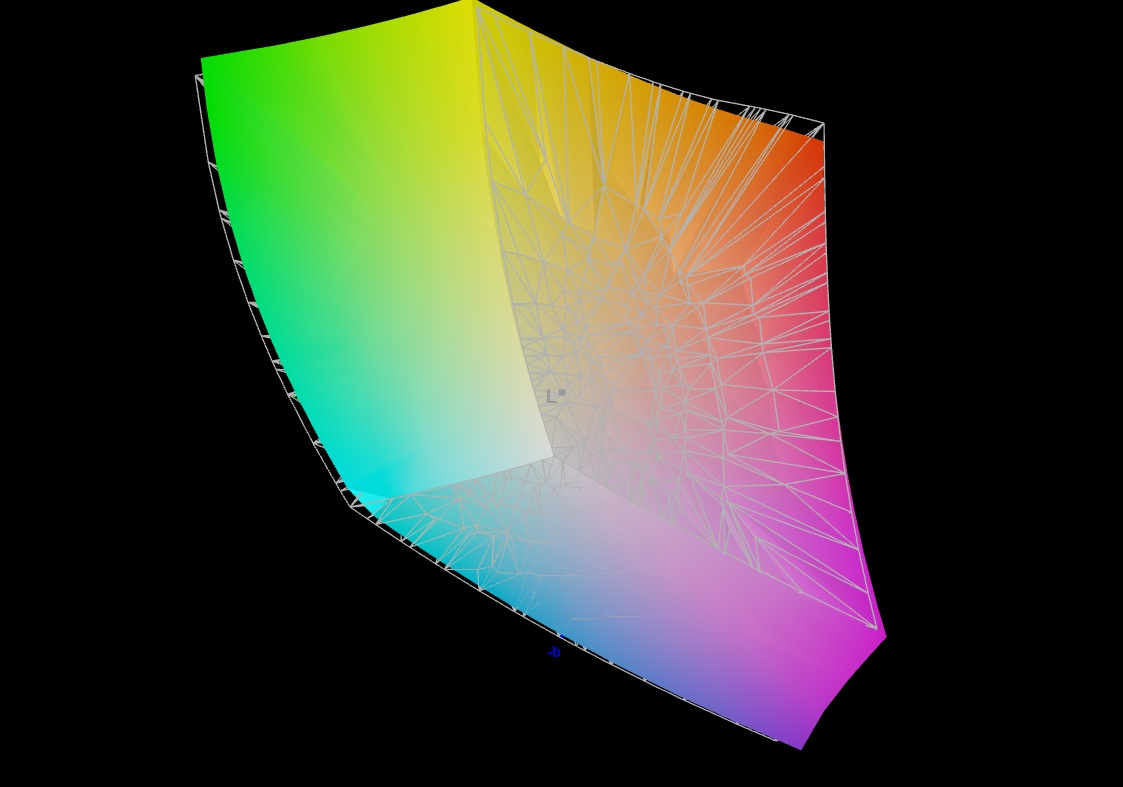
Medion n'utilise pas de panneau OLED ou mini-LED, mais un écran IPS classique, qui offre néanmoins de bonnes performances dans la plupart des disciplines.
| |||||||||||||||||||||||||
Homogénéité de la luminosité: 89 %
Valeur mesurée au centre, sur batterie: 478 cd/m²
Contraste: 1195:1 (Valeurs des noirs: 0.4 cd/m²)
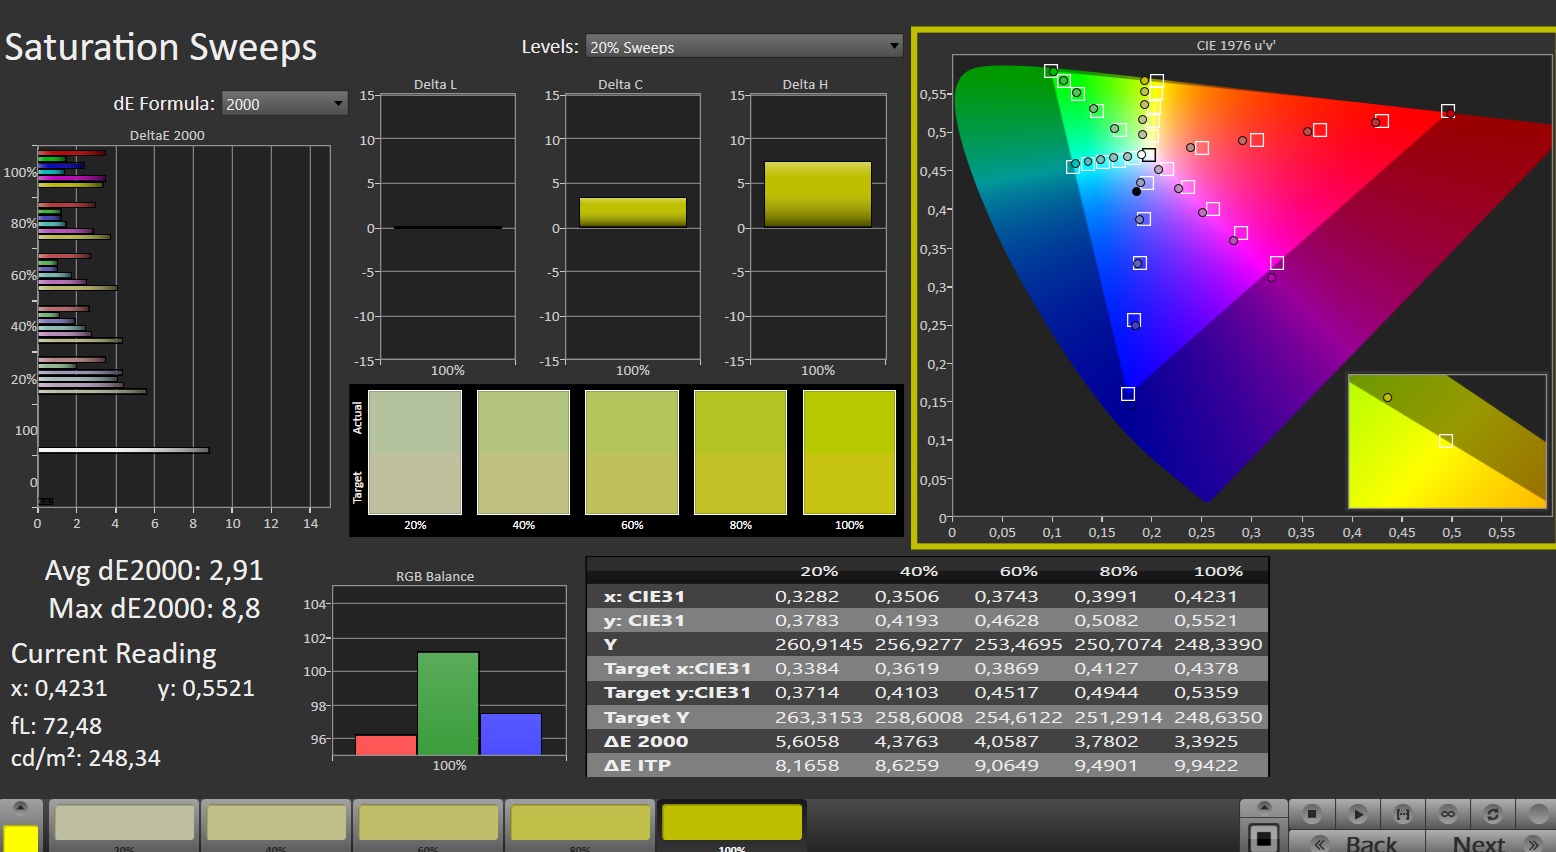
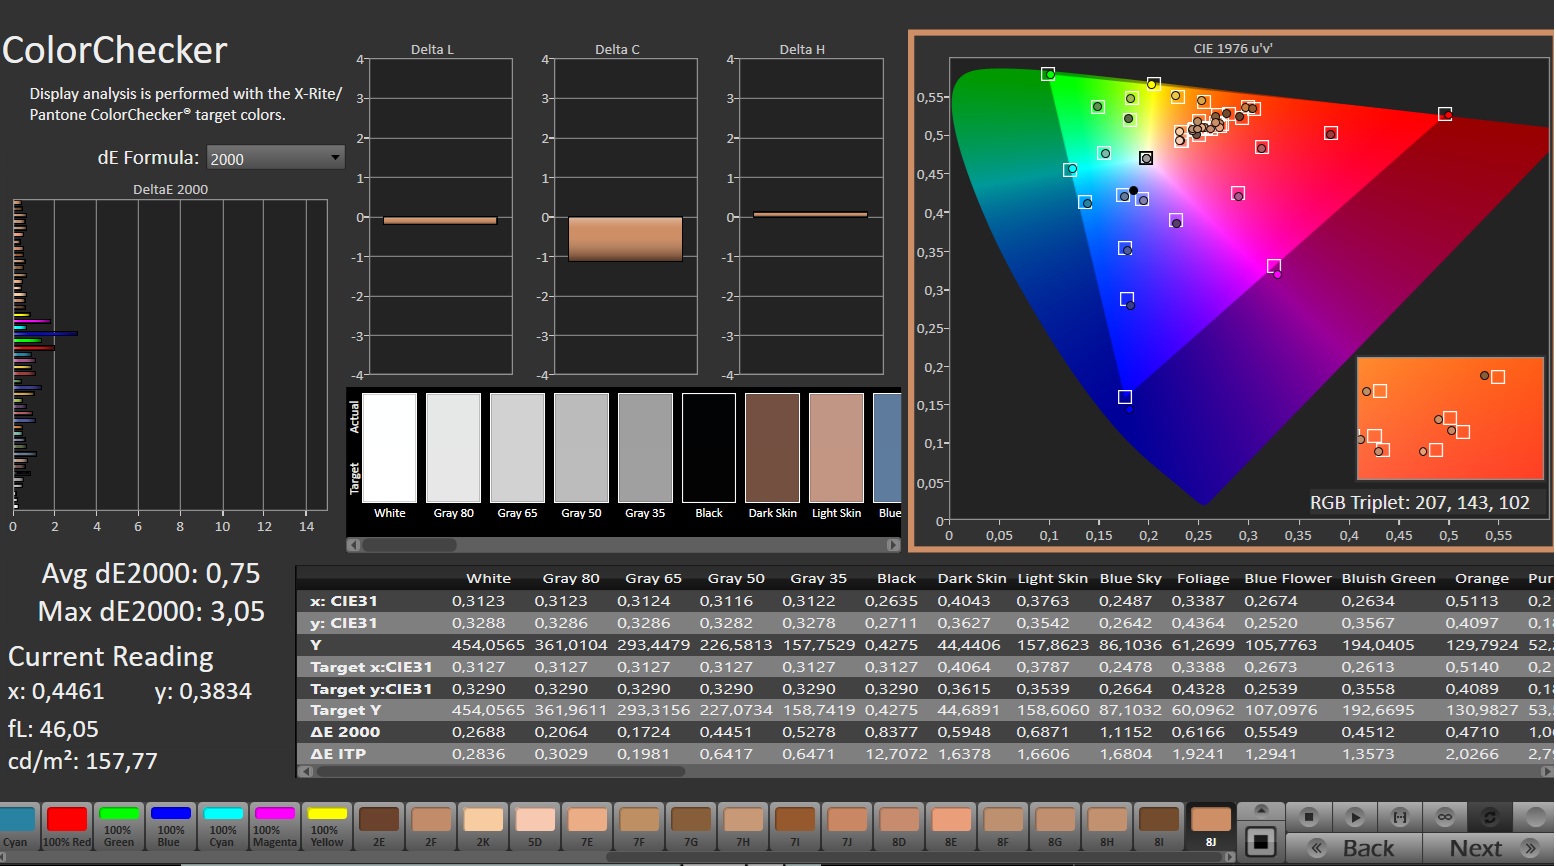
ΔE Color 3.94 | 0.5-29.43 Ø4.86, calibrated: 0.75
ΔE Greyscale 5.5 | 0.09-98 Ø5.1
84.7% AdobeRGB 1998 (Argyll 2.2.0 3D)
99.9% sRGB (Argyll 2.2.0 3D)
97.1% Display P3 (Argyll 2.2.0 3D)
Gamma: 2.212
| Medion Erazer Beast 18 X1 MD62731 BOEhydis NE180QDM-NZ2, IPS, 2560x1600, 18", 240 Hz | MSI GE78HX 13VH-070US AU Optronics B170QAN01.2, IPS, 2560x1600, 17", 240 Hz | Acer Predator Helios 18 N23Q2 AUO45A8 (B180QAN01.2), IPS, 2560x1600, 18", 250 Hz | Asus Strix Scar 18 G835LX N180QDM-NM2, Mini-LED, 2560x1600, 18", 240 Hz | Aorus Master 18 AM8H NE180QDM-NM1 (BOE0C58), Mini-LED, 2560x1600, 18", 240 Hz | Lenovo Legion Pro 7i 16 Gen 10 Samsung ATNA60HU01-0, OLED, 2560x1600, 16", 240 Hz | |
|---|---|---|---|---|---|---|
| Display | 1% | 4% | 2% | 2% | 4% | |
| Display P3 Coverage | 97.1 | 97.6 1% | 99.8 3% | 99 2% | 99.9 3% | 99.5 2% |
| sRGB Coverage | 99.9 | 99.9 0% | 100 0% | 100 0% | 100 0% | 100 0% |
| AdobeRGB 1998 Coverage | 84.7 | 86.5 2% | 91.8 8% | 87.2 3% | 87.7 4% | 94.4 11% |
| Response Times | 19% | -90% | -37% | -102% | 95% | |
| Response Time Grey 50% / Grey 80% * | 5.6 ? | 4.2 ? 25% | 7.6 ? -36% | 7.4 ? -32% | 16.4 ? -193% | 0.28 ? 95% |
| Response Time Black / White * | 7.3 ? | 6.4 ? 12% | 17.8 ? -144% | 10.4 ? -42% | 8.1 ? -11% | 0.43 ? 94% |
| PWM Frequency | 2509 | 20610 ? | 1398 ? | 1438 ? | ||
| PWM Amplitude * | 100 | 100 | 29 | |||
| Screen | -15% | -14% | 119% | 53% | 20% | |
| Brightness middle | 478 | 398.6 -17% | 360 -25% | 764 60% | 438 -8% | 490.4 3% |
| Brightness | 456 | 384 -16% | 355 -22% | 747 64% | 451 -1% | 498 9% |
| Brightness Distribution | 89 | 89 0% | 92 3% | 93 4% | 90 1% | 97 9% |
| Black Level * | 0.4 | 0.46 -15% | 0.21 47% | 0.1 75% | 0.13 67% | |
| Contrast | 1195 | 867 -27% | 1714 43% | 7640 539% | 3369 182% | |
| Colorchecker dE 2000 * | 3.94 | 4.05 -3% | 3.82 3% | 1.2 70% | 1.25 68% | 3.2 19% |
| Colorchecker dE 2000 max. * | 8.6 | 8.68 -1% | 7.38 14% | 2.8 67% | 4.93 43% | 6.04 30% |
| Colorchecker dE 2000 calibrated * | 0.75 | 1.02 -36% | 2.24 -199% | 0.84 -12% | ||
| Greyscale dE 2000 * | 5.5 | 6.5 -18% | 5.06 8% | 1.5 73% | 1.7 69% | 1 82% |
| Gamma | 2.212 99% | 2.11 104% | 2.52 87% | 2.17 101% | 2.173 101% | 2.24 98% |
| CCT | 7059 92% | 7518 86% | 5657 115% | 6556 99% | 6518 100% | 6373 102% |
| Moyenne finale (programmes/paramètres) | 2% /
-7% | -33% /
-21% | 28% /
68% | -16% /
17% | 40% /
29% |
* ... Moindre est la valeur, meilleures sont les performances
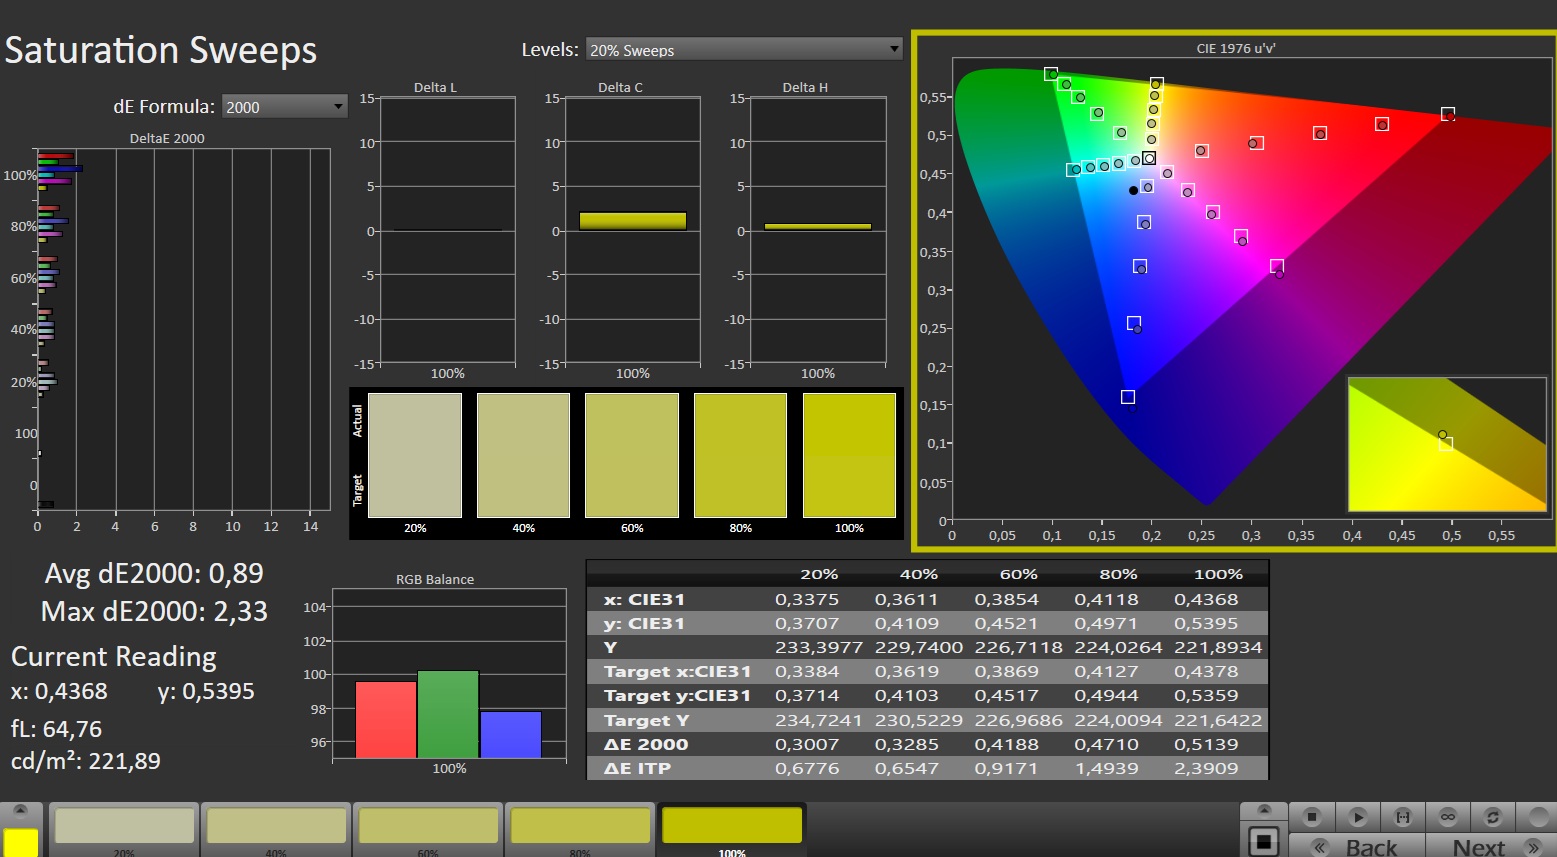
Commençons par l'espace colorimétrique, qui couvre presque 100% de sRGB et DCI-P3 (AdobeRGB est couvert à 85%). La luminosité est également bonne, avec une moyenne de 456 cd/m².
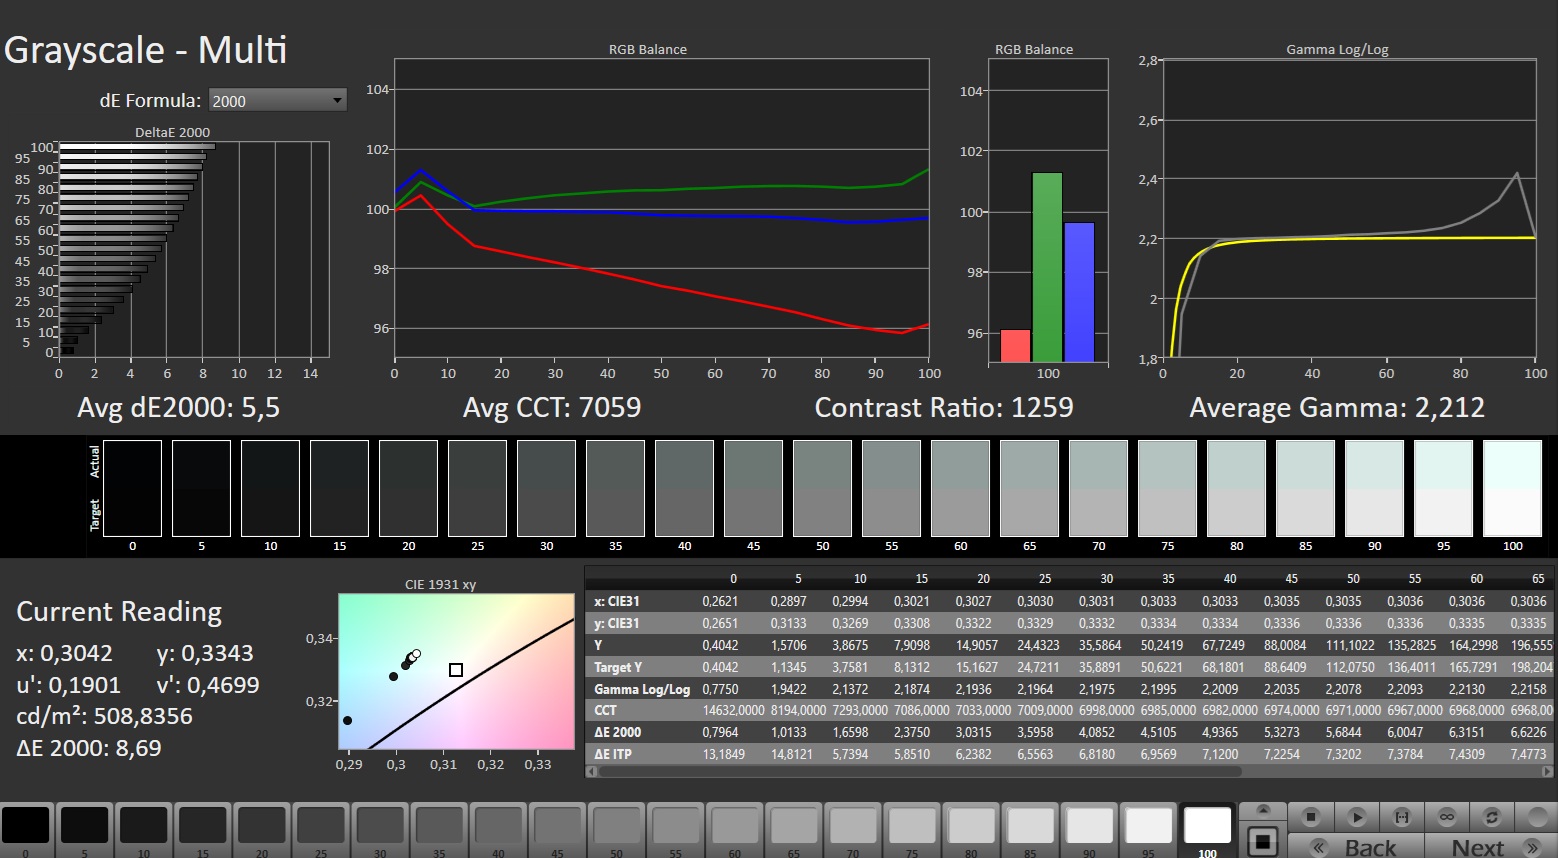
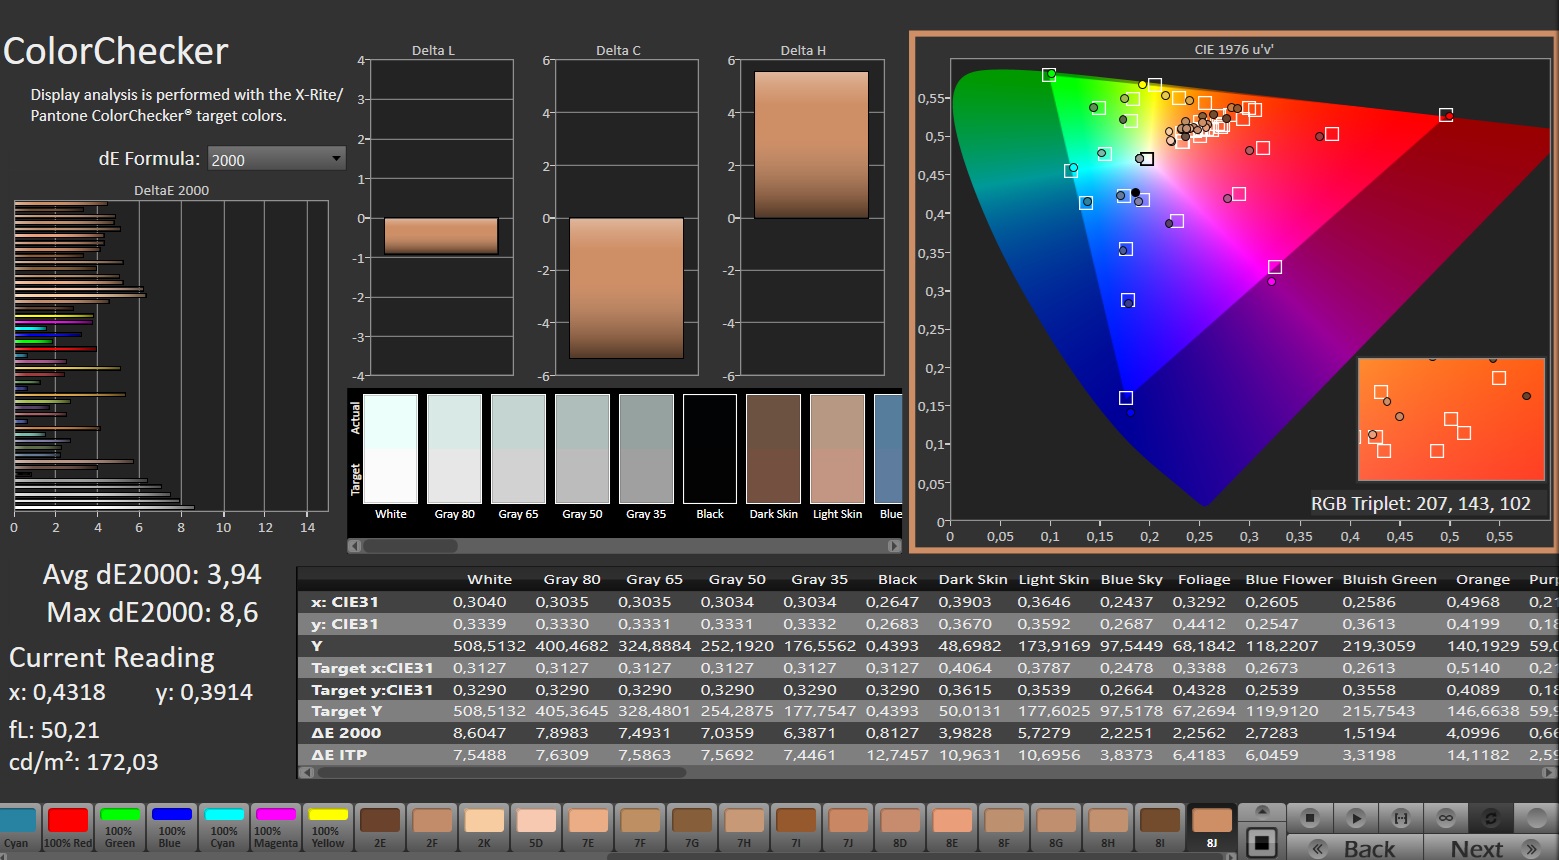
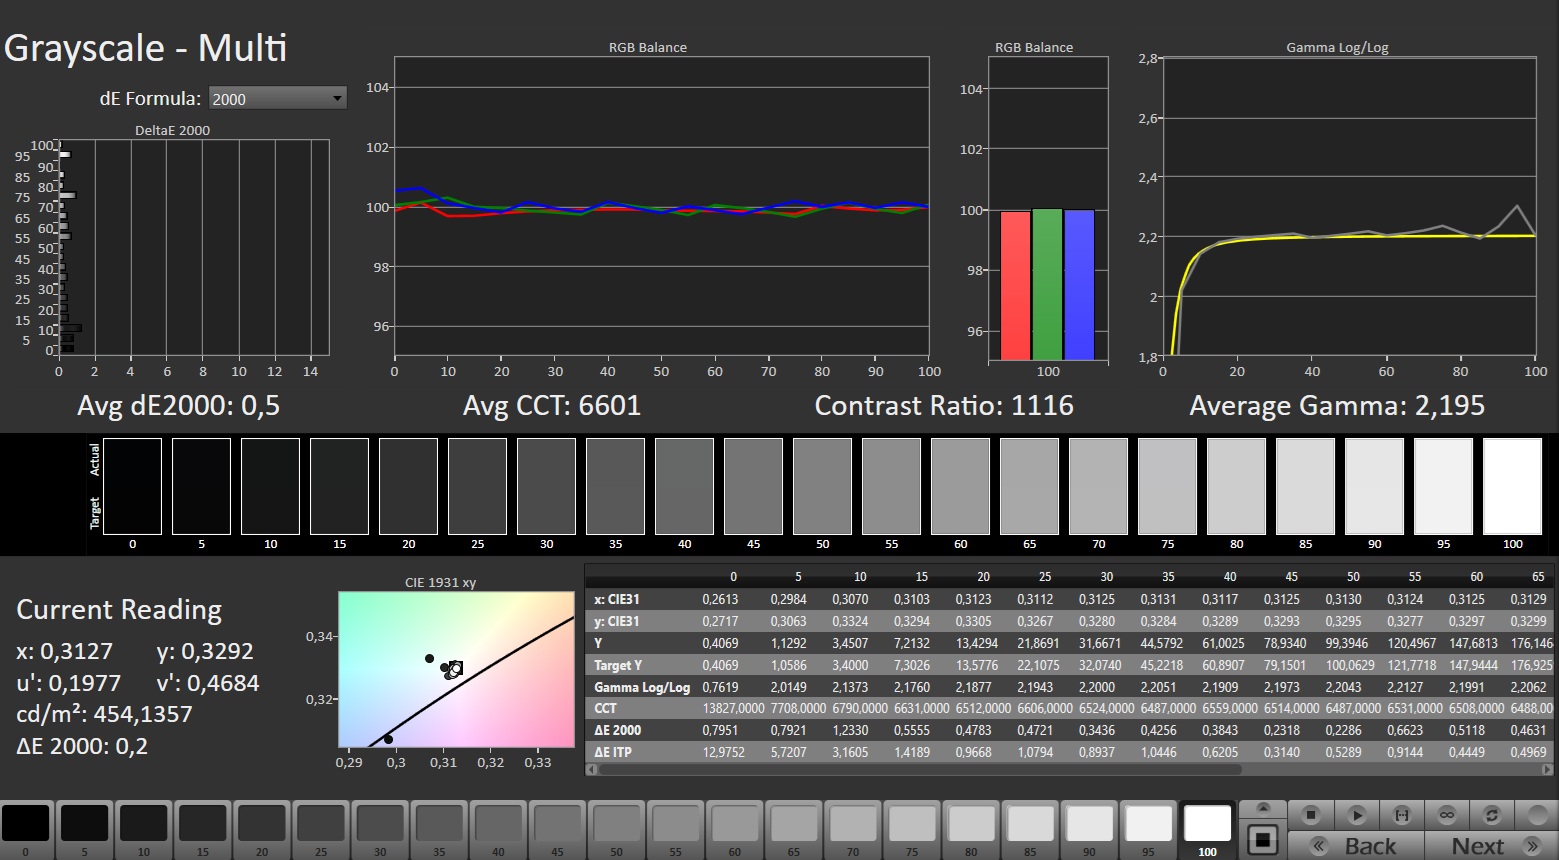
Le contraste n'est que décent en raison de la valeur noire médiocre de 0,4 cd/m², mais le rapport de 1 195:1 reste dans la fourchette habituelle des écrans IPS. Il en va de même pour les angles de vision et le temps de réponse, qui, selon nos mesures, se situe entre 5 et 7 ms.
Selon les spécifications, l'écran de 18 pouces prend également en charge un taux de rafraîchissement de 240 Hz. Il a une résolution de 2 560 x 1 600 pixels (format 16:10), ce qui n'est ni faible ni particulièrement élevé par rapport à la diagonale de l'écran.
Temps de réponse de l'écran
| ↔ Temps de réponse noir à blanc | ||
|---|---|---|
| 7.3 ms ... hausse ↗ et chute ↘ combinées | ↗ 2.2 ms hausse | 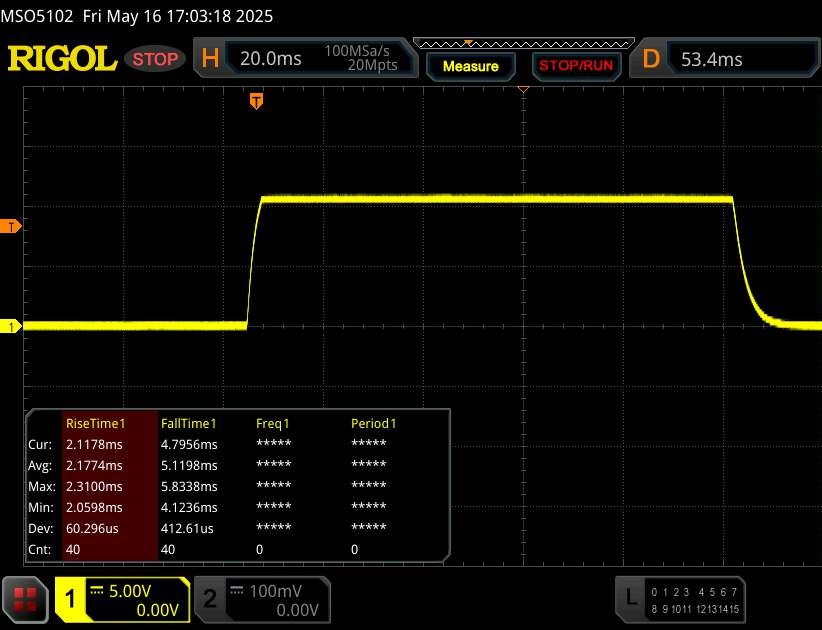 |
| ↘ 5.1 ms chute | ||
| L'écran montre de très faibles temps de réponse, parfait pour le jeu. En comparaison, tous les appareils testés affichent entre 0.1 (minimum) et 240 (maximum) ms. » 19 % des appareils testés affichent de meilleures performances. Cela signifie que les latences relevées sont meilleures que la moyenne (20.6 ms) de tous les appareils testés. | ||
| ↔ Temps de réponse gris 50% à gris 80% | ||
| 5.6 ms ... hausse ↗ et chute ↘ combinées | ↗ 2.7 ms hausse | 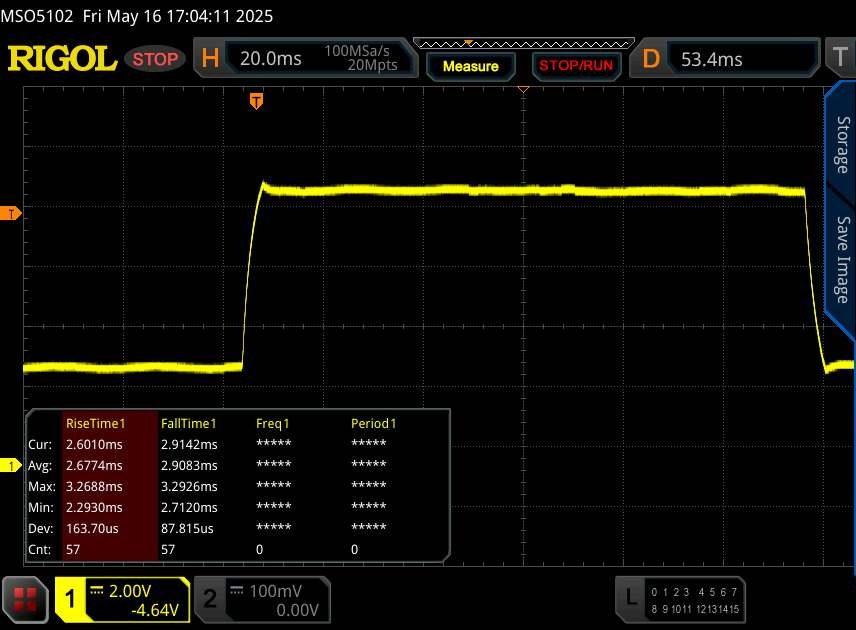 |
| ↘ 2.9 ms chute | ||
| L'écran montre de très faibles temps de réponse, parfait pour le jeu. En comparaison, tous les appareils testés affichent entre 0.165 (minimum) et 636 (maximum) ms. » 15 % des appareils testés affichent de meilleures performances. Cela signifie que les latences relevées sont meilleures que la moyenne (32.3 ms) de tous les appareils testés. | ||
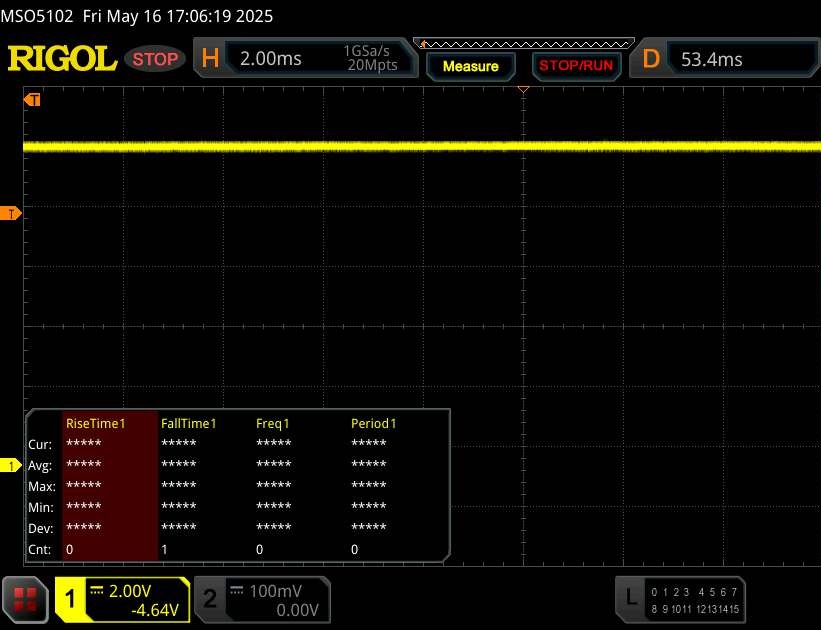
Scintillement / MLI (Modulation de largeur d'impulsion)
| Scintillement / MLI (Modulation de largeur d'impulsion) non décelé |  | ||
En comparaison, 53 % des appareils testés n'emploient pas MDI pour assombrir leur écran. Nous avons relevé une moyenne à 8426 (minimum : 5 - maximum : 343500) Hz dans le cas où une MDI était active. | |||
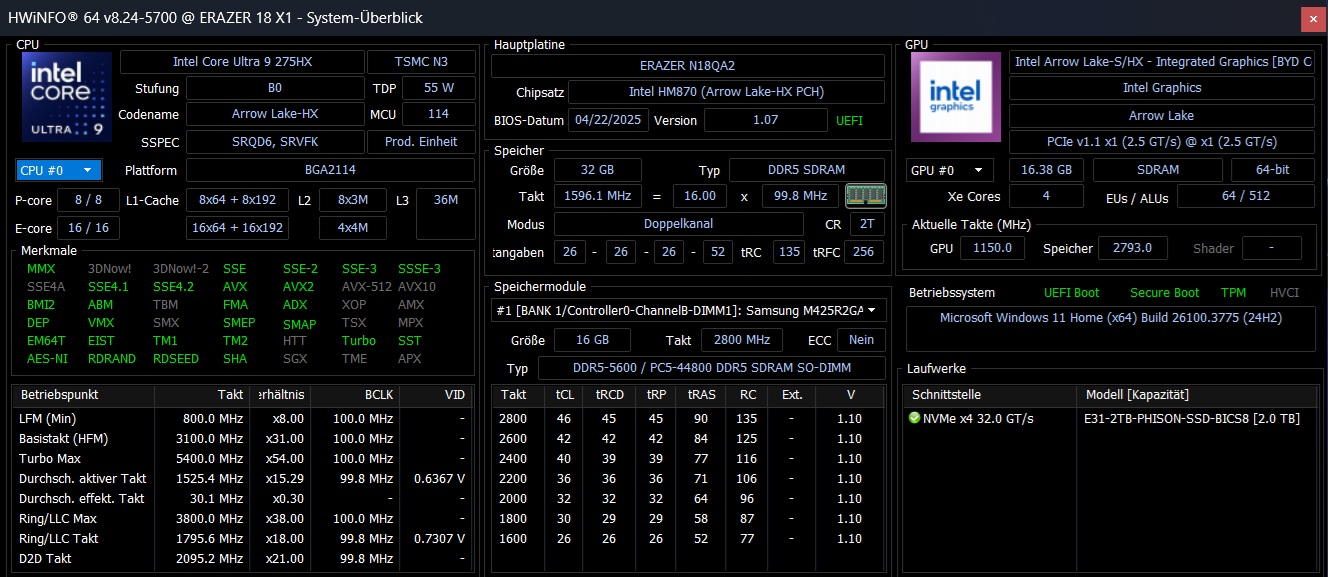
Performance
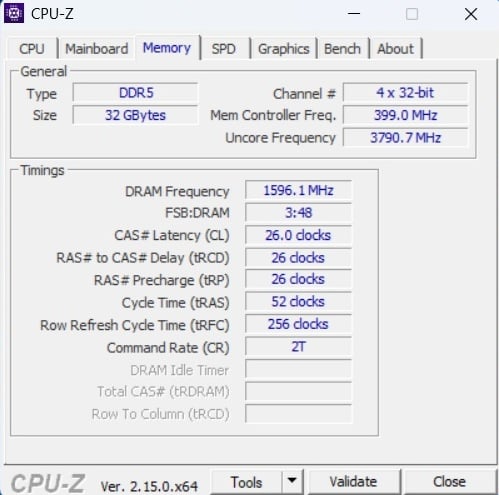
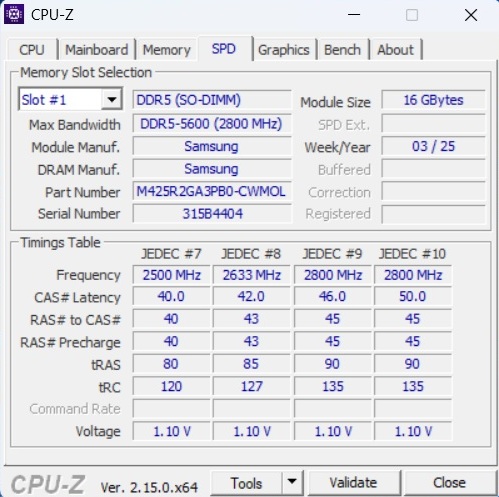
Le Beast 18 X1 n'appartient pas seulement au segment haut de gamme en termes de prix, mais aussi en termes de performances. 32 Go de RAM sont tout aussi adéquats en 2025 qu'un SSD de 2 To, bien que vous puissiez vous attendre à (encore) plus pour plus de 4 000 $. D'ailleurs, Medion propose également le Beast 18 X1 avec la RTX 5090 mobile pour ~5 650 $.
Conditions d'essai
Le centre de contrôle d'Erazer propose trois modes de fonctionnement, dont certains ont un impact significatif sur les émissions et la vitesse. Comme le 18 pouces est presque absurdement bruyant en mode Performance, avec plus de 60 dB(A) par endroits, nous nous sommes limités au mode Équilibre, tout aussi audible, pour les mesures, qui consomme un peu plus de puissance CPU que de puissance GPU (voir le tableau).
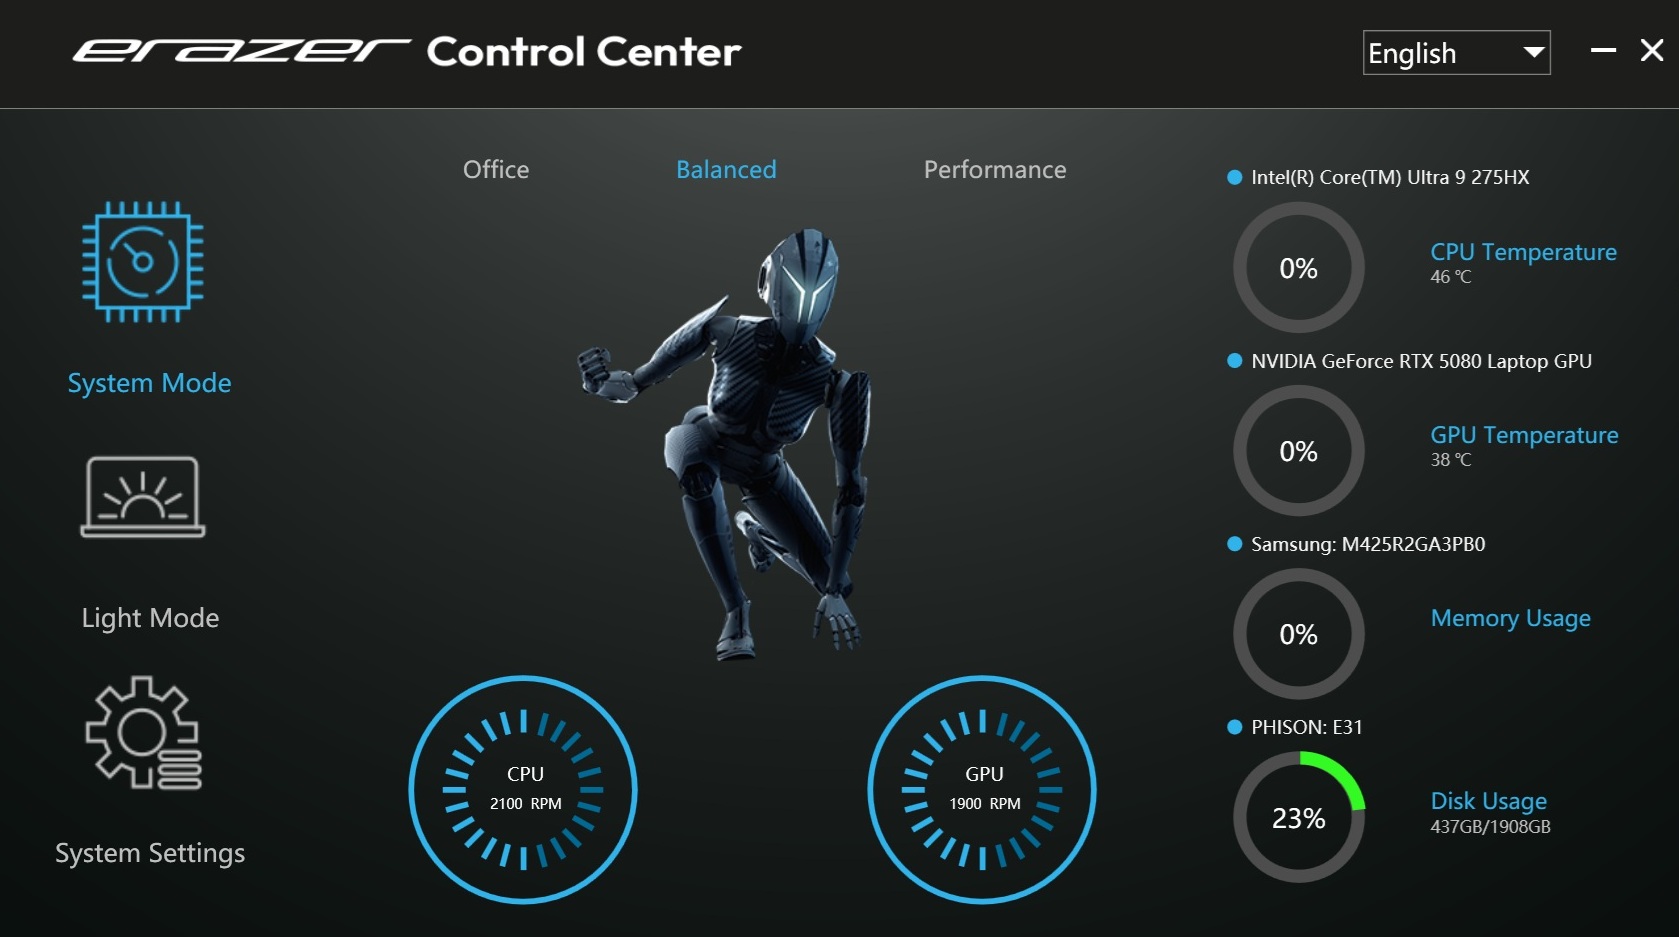
| Erazer Control Center Mode | Office | Balanced | Performance |
| Cyberpunk 2077 Bruit | max. 46 dB(A) | max. 53 dB(A) | max. 61 dB(A) |
| Performances de Cyberpunk 2077 (FHD/Ultra) | 78.8 fps | 139.8 fps | 146.5 fps |
| Cinebench R15 Multi Score | 3596 Points | 4871 Points | 6154 Points |
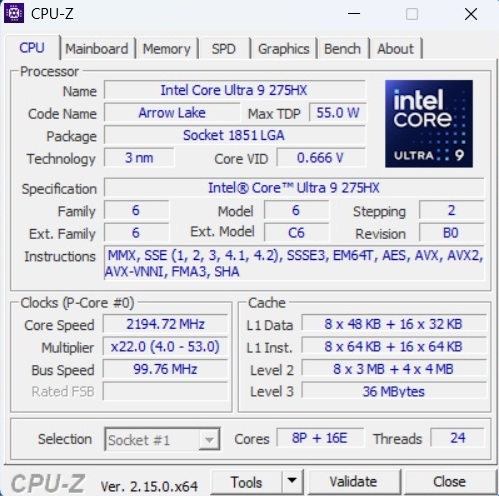
Processeur
Si vous prenez le mode équilibré comme base, le nombre d'unités installées dans le mode équilibré est de 1,5 million Core Ultra 9 275HXinstallé, qui contient 8 cœurs de performance et 16 cœurs d'efficacité (chacun sans Hyper-Threading), se situe légèrement en dessous de la valeur moyenne déterminée jusqu'à présent pour ce CPU et atteint à peu près le niveau de l'Aorus Master 18 (qui n'a pas non plus été testé en mode maximum à cause du bruit de fond important). Il est particulièrement regrettable que les résultats dans la boucle Cinebench chutent de plusieurs pour cent avec le temps, ce qui n'était pas le cas avec les appareils concurrents.
Cinebench R15 Multi loop
* ... Moindre est la valeur, meilleures sont les performances
AIDA64: FP32 Ray-Trace | FPU Julia | CPU SHA3 | CPU Queen | FPU SinJulia | FPU Mandel | CPU AES | CPU ZLib | FP64 Ray-Trace | CPU PhotoWorxx
| Performance Rating | |
| Asus Strix Scar 18 G835LX | |
| Lenovo Legion Pro 7i 16 Gen 10 | |
| Moyenne Intel Core Ultra 9 275HX | |
| Acer Predator Helios 18 N23Q2 | |
| Aorus Master 18 AM8H | |
| MSI GE78HX 13VH-070US | |
| Medion Erazer Beast 18 X1 MD62731 | |
| Moyenne de la classe Gaming | |
| AIDA64 / FP32 Ray-Trace | |
| Asus Strix Scar 18 G835LX | |
| Moyenne Intel Core Ultra 9 275HX (29330 - 39895, n=10) | |
| Lenovo Legion Pro 7i 16 Gen 10 | |
| Aorus Master 18 AM8H | |
| Medion Erazer Beast 18 X1 MD62731 | |
| MSI GE78HX 13VH-070US | |
| Acer Predator Helios 18 N23Q2 | |
| Moyenne de la classe Gaming (7192 - 85542, n=146, 2 dernières années) | |
| AIDA64 / FPU Julia | |
| Asus Strix Scar 18 G835LX | |
| Lenovo Legion Pro 7i 16 Gen 10 | |
| Moyenne Intel Core Ultra 9 275HX (140254 - 198802, n=10) | |
| Aorus Master 18 AM8H | |
| MSI GE78HX 13VH-070US | |
| Medion Erazer Beast 18 X1 MD62731 | |
| Acer Predator Helios 18 N23Q2 | |
| Moyenne de la classe Gaming (35040 - 252486, n=146, 2 dernières années) | |
| AIDA64 / CPU SHA3 | |
| Asus Strix Scar 18 G835LX | |
| Lenovo Legion Pro 7i 16 Gen 10 | |
| Moyenne Intel Core Ultra 9 275HX (6998 - 9734, n=10) | |
| Aorus Master 18 AM8H | |
| Medion Erazer Beast 18 X1 MD62731 | |
| MSI GE78HX 13VH-070US | |
| Acer Predator Helios 18 N23Q2 | |
| Moyenne de la classe Gaming (1728 - 10389, n=146, 2 dernières années) | |
| AIDA64 / CPU Queen | |
| MSI GE78HX 13VH-070US | |
| Asus Strix Scar 18 G835LX | |
| Lenovo Legion Pro 7i 16 Gen 10 | |
| Acer Predator Helios 18 N23Q2 | |
| Moyenne Intel Core Ultra 9 275HX (113887 - 140695, n=10) | |
| Aorus Master 18 AM8H | |
| Moyenne de la classe Gaming (50699 - 200651, n=146, 2 dernières années) | |
| Medion Erazer Beast 18 X1 MD62731 | |
| AIDA64 / FPU SinJulia | |
| MSI GE78HX 13VH-070US | |
| Acer Predator Helios 18 N23Q2 | |
| Asus Strix Scar 18 G835LX | |
| Lenovo Legion Pro 7i 16 Gen 10 | |
| Moyenne de la classe Gaming (5020 - 33636, n=146, 2 dernières années) | |
| Moyenne Intel Core Ultra 9 275HX (11172 - 14382, n=10) | |
| Aorus Master 18 AM8H | |
| Medion Erazer Beast 18 X1 MD62731 | |
| AIDA64 / FPU Mandel | |
| Asus Strix Scar 18 G835LX | |
| Lenovo Legion Pro 7i 16 Gen 10 | |
| Moyenne Intel Core Ultra 9 275HX (72596 - 104057, n=10) | |
| Aorus Master 18 AM8H | |
| Medion Erazer Beast 18 X1 MD62731 | |
| MSI GE78HX 13VH-070US | |
| Acer Predator Helios 18 N23Q2 | |
| Moyenne de la classe Gaming (17585 - 134044, n=146, 2 dernières années) | |
| AIDA64 / CPU AES | |
| Acer Predator Helios 18 N23Q2 | |
| Asus Strix Scar 18 G835LX | |
| MSI GE78HX 13VH-070US | |
| Lenovo Legion Pro 7i 16 Gen 10 | |
| Moyenne Intel Core Ultra 9 275HX (107858 - 136847, n=10) | |
| Aorus Master 18 AM8H | |
| Moyenne de la classe Gaming (19065 - 328679, n=146, 2 dernières années) | |
| Medion Erazer Beast 18 X1 MD62731 | |
| AIDA64 / CPU ZLib | |
| Asus Strix Scar 18 G835LX | |
| MSI GE78HX 13VH-070US | |
| Lenovo Legion Pro 7i 16 Gen 10 | |
| Moyenne Intel Core Ultra 9 275HX (1757 - 2263, n=10) | |
| Acer Predator Helios 18 N23Q2 | |
| Aorus Master 18 AM8H | |
| Medion Erazer Beast 18 X1 MD62731 | |
| Moyenne de la classe Gaming (373 - 2531, n=146, 2 dernières années) | |
| AIDA64 / FP64 Ray-Trace | |
| Asus Strix Scar 18 G835LX | |
| Lenovo Legion Pro 7i 16 Gen 10 | |
| Moyenne Intel Core Ultra 9 275HX (14847 - 21372, n=10) | |
| Aorus Master 18 AM8H | |
| MSI GE78HX 13VH-070US | |
| Acer Predator Helios 18 N23Q2 | |
| Medion Erazer Beast 18 X1 MD62731 | |
| Moyenne de la classe Gaming (3856 - 45446, n=146, 2 dernières années) | |
| AIDA64 / CPU PhotoWorxx | |
| Asus Strix Scar 18 G835LX | |
| Lenovo Legion Pro 7i 16 Gen 10 | |
| Moyenne Intel Core Ultra 9 275HX (47726 - 56613, n=10) | |
| Acer Predator Helios 18 N23Q2 | |
| MSI GE78HX 13VH-070US | |
| Aorus Master 18 AM8H | |
| Medion Erazer Beast 18 X1 MD62731 | |
| Moyenne de la classe Gaming (10805 - 62274, n=146, 2 dernières années) | |
Performance du système
En ce qui concerne les performances du système, la différence entre les concurrents est limitée. D'un point de vue subjectif, nous remarquons parfois des blocages lors de l'ouverture de programmes, ce qui, comme c'est souvent le cas, est probablement dû à la commutation graphique. La génération Blackwell de Nvidia, ou son pilote actuel, a ici un plus gros problème qu'Ada Lovelace (nous avons également remarqué la même chose avec l'Aorus Master 18).
PCMark 10: Score | Essentials | Productivity | Digital Content Creation
CrossMark: Overall | Productivity | Creativity | Responsiveness
WebXPRT 3: Overall
WebXPRT 4: Overall
Mozilla Kraken 1.1: Total
| Performance Rating | |
| Aorus Master 18 AM8H | |
| Asus Strix Scar 18 G835LX | |
| Lenovo Legion Pro 7i 16 Gen 10 | |
| Moyenne Intel Core Ultra 9 275HX, Nvidia GeForce RTX 5080 Laptop | |
| Acer Predator Helios 18 N23Q2 -1! | |
| MSI GE78HX 13VH-070US | |
| Medion Erazer Beast 18 X1 MD62731 | |
| Moyenne de la classe Gaming | |
| PCMark 10 / Score | |
| Lenovo Legion Pro 7i 16 Gen 10 | |
| Moyenne Intel Core Ultra 9 275HX, Nvidia GeForce RTX 5080 Laptop (8378 - 9153, n=3) | |
| MSI GE78HX 13VH-070US | |
| Asus Strix Scar 18 G835LX | |
| Aorus Master 18 AM8H | |
| Acer Predator Helios 18 N23Q2 | |
| Medion Erazer Beast 18 X1 MD62731 | |
| Moyenne de la classe Gaming (5776 - 9852, n=133, 2 dernières années) | |
| PCMark 10 / Essentials | |
| MSI GE78HX 13VH-070US | |
| Lenovo Legion Pro 7i 16 Gen 10 | |
| Aorus Master 18 AM8H | |
| Acer Predator Helios 18 N23Q2 | |
| Asus Strix Scar 18 G835LX | |
| Moyenne Intel Core Ultra 9 275HX, Nvidia GeForce RTX 5080 Laptop (10423 - 11215, n=3) | |
| Moyenne de la classe Gaming (9057 - 12600, n=133, 2 dernières années) | |
| Medion Erazer Beast 18 X1 MD62731 | |
| PCMark 10 / Productivity | |
| Acer Predator Helios 18 N23Q2 | |
| MSI GE78HX 13VH-070US | |
| Moyenne de la classe Gaming (6662 - 14612, n=133, 2 dernières années) | |
| Medion Erazer Beast 18 X1 MD62731 | |
| Lenovo Legion Pro 7i 16 Gen 10 | |
| Moyenne Intel Core Ultra 9 275HX, Nvidia GeForce RTX 5080 Laptop (9212 - 9704, n=3) | |
| Asus Strix Scar 18 G835LX | |
| Aorus Master 18 AM8H | |
| PCMark 10 / Digital Content Creation | |
| Lenovo Legion Pro 7i 16 Gen 10 | |
| Moyenne Intel Core Ultra 9 275HX, Nvidia GeForce RTX 5080 Laptop (15780 - 19351, n=3) | |
| Asus Strix Scar 18 G835LX | |
| Aorus Master 18 AM8H | |
| Medion Erazer Beast 18 X1 MD62731 | |
| MSI GE78HX 13VH-070US | |
| Acer Predator Helios 18 N23Q2 | |
| Moyenne de la classe Gaming (7440 - 19351, n=133, 2 dernières années) | |
| CrossMark / Overall | |
| Aorus Master 18 AM8H | |
| Asus Strix Scar 18 G835LX | |
| Acer Predator Helios 18 N23Q2 | |
| Lenovo Legion Pro 7i 16 Gen 10 | |
| Moyenne Intel Core Ultra 9 275HX, Nvidia GeForce RTX 5080 Laptop (1857 - 2165, n=3) | |
| Moyenne de la classe Gaming (1247 - 2344, n=112, 2 dernières années) | |
| MSI GE78HX 13VH-070US | |
| Medion Erazer Beast 18 X1 MD62731 | |
| CrossMark / Productivity | |
| Aorus Master 18 AM8H | |
| Acer Predator Helios 18 N23Q2 | |
| Asus Strix Scar 18 G835LX | |
| Lenovo Legion Pro 7i 16 Gen 10 | |
| Moyenne Intel Core Ultra 9 275HX, Nvidia GeForce RTX 5080 Laptop (1764 - 2014, n=3) | |
| MSI GE78HX 13VH-070US | |
| Moyenne de la classe Gaming (1299 - 2204, n=112, 2 dernières années) | |
| Medion Erazer Beast 18 X1 MD62731 | |
| CrossMark / Creativity | |
| Asus Strix Scar 18 G835LX | |
| Aorus Master 18 AM8H | |
| Acer Predator Helios 18 N23Q2 | |
| Lenovo Legion Pro 7i 16 Gen 10 | |
| Moyenne Intel Core Ultra 9 275HX, Nvidia GeForce RTX 5080 Laptop (2115 - 2451, n=3) | |
| Moyenne de la classe Gaming (1275 - 2729, n=112, 2 dernières années) | |
| Medion Erazer Beast 18 X1 MD62731 | |
| MSI GE78HX 13VH-070US | |
| CrossMark / Responsiveness | |
| Aorus Master 18 AM8H | |
| Acer Predator Helios 18 N23Q2 | |
| Asus Strix Scar 18 G835LX | |
| Moyenne de la classe Gaming (1030 - 2330, n=112, 2 dernières années) | |
| MSI GE78HX 13VH-070US | |
| Moyenne Intel Core Ultra 9 275HX, Nvidia GeForce RTX 5080 Laptop (1466 - 1853, n=3) | |
| Lenovo Legion Pro 7i 16 Gen 10 | |
| Medion Erazer Beast 18 X1 MD62731 | |
| WebXPRT 3 / Overall | |
| Lenovo Legion Pro 7i 16 Gen 10 | |
| Moyenne Intel Core Ultra 9 275HX, Nvidia GeForce RTX 5080 Laptop (339 - 359, n=3) | |
| Asus Strix Scar 18 G835LX | |
| Medion Erazer Beast 18 X1 MD62731 | |
| Acer Predator Helios 18 N23Q2 | |
| MSI GE78HX 13VH-070US | |
| Aorus Master 18 AM8H | |
| Moyenne de la classe Gaming (215 - 480, n=127, 2 dernières années) | |
| WebXPRT 4 / Overall | |
| Asus Strix Scar 18 G835LX | |
| Lenovo Legion Pro 7i 16 Gen 10 | |
| Moyenne Intel Core Ultra 9 275HX, Nvidia GeForce RTX 5080 Laptop (323 - 336, n=3) | |
| Medion Erazer Beast 18 X1 MD62731 | |
| Aorus Master 18 AM8H | |
| MSI GE78HX 13VH-070US | |
| Moyenne de la classe Gaming (176.4 - 341, n=113, 2 dernières années) | |
| Mozilla Kraken 1.1 / Total | |
| Moyenne de la classe Gaming (397 - 674, n=137, 2 dernières années) | |
| MSI GE78HX 13VH-070US | |
| Acer Predator Helios 18 N23Q2 | |
| Aorus Master 18 AM8H | |
| Medion Erazer Beast 18 X1 MD62731 | |
| Moyenne Intel Core Ultra 9 275HX, Nvidia GeForce RTX 5080 Laptop (405 - 419, n=3) | |
| Asus Strix Scar 18 G835LX | |
| Lenovo Legion Pro 7i 16 Gen 10 | |
* ... Moindre est la valeur, meilleures sont les performances
| PCMark 10 Score | 8378 points | |
Aide | ||
| AIDA64 / Memory Copy | |
| Lenovo Legion Pro 7i 16 Gen 10 | |
| Asus Strix Scar 18 G835LX | |
| Moyenne Intel Core Ultra 9 275HX (74558 - 86978, n=10) | |
| Acer Predator Helios 18 N23Q2 | |
| Medion Erazer Beast 18 X1 MD62731 | |
| MSI GE78HX 13VH-070US | |
| Aorus Master 18 AM8H | |
| Moyenne de la classe Gaming (21750 - 97515, n=146, 2 dernières années) | |
| AIDA64 / Memory Read | |
| Lenovo Legion Pro 7i 16 Gen 10 | |
| Moyenne Intel Core Ultra 9 275HX (74094 - 97151, n=10) | |
| Acer Predator Helios 18 N23Q2 | |
| Medion Erazer Beast 18 X1 MD62731 | |
| Asus Strix Scar 18 G835LX | |
| MSI GE78HX 13VH-070US | |
| Aorus Master 18 AM8H | |
| Moyenne de la classe Gaming (22956 - 103347, n=146, 2 dernières années) | |
| AIDA64 / Memory Write | |
| Lenovo Legion Pro 7i 16 Gen 10 | |
| Asus Strix Scar 18 G835LX | |
| Moyenne Intel Core Ultra 9 275HX (72929 - 85648, n=10) | |
| Medion Erazer Beast 18 X1 MD62731 | |
| MSI GE78HX 13VH-070US | |
| Acer Predator Helios 18 N23Q2 | |
| Aorus Master 18 AM8H | |
| Moyenne de la classe Gaming (22297 - 108954, n=146, 2 dernières années) | |
| AIDA64 / Memory Latency | |
| Aorus Master 18 AM8H | |
| Moyenne Intel Core Ultra 9 275HX (105.8 - 125.1, n=10) | |
| Medion Erazer Beast 18 X1 MD62731 | |
| Lenovo Legion Pro 7i 16 Gen 10 | |
| Asus Strix Scar 18 G835LX | |
| Moyenne de la classe Gaming (59.5 - 259, n=146, 2 dernières années) | |
| MSI GE78HX 13VH-070US | |
| Acer Predator Helios 18 N23Q2 | |
* ... Moindre est la valeur, meilleures sont les performances
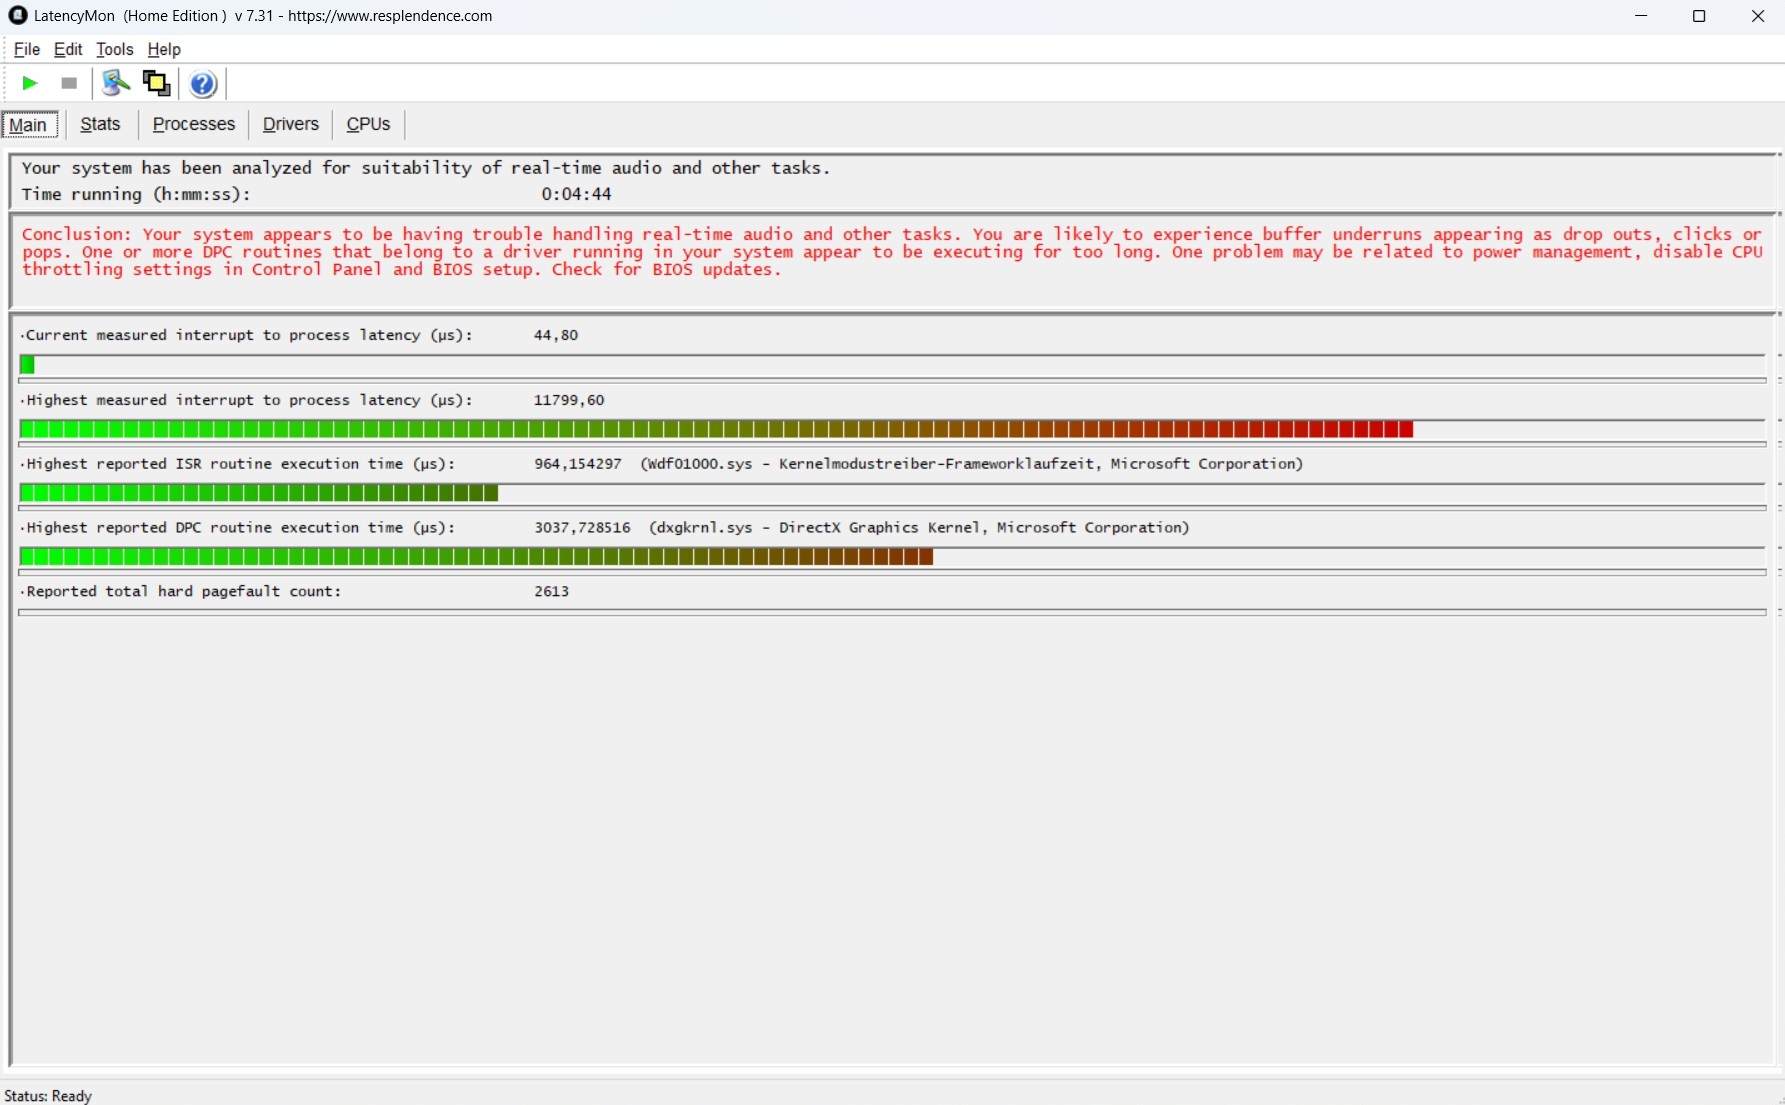
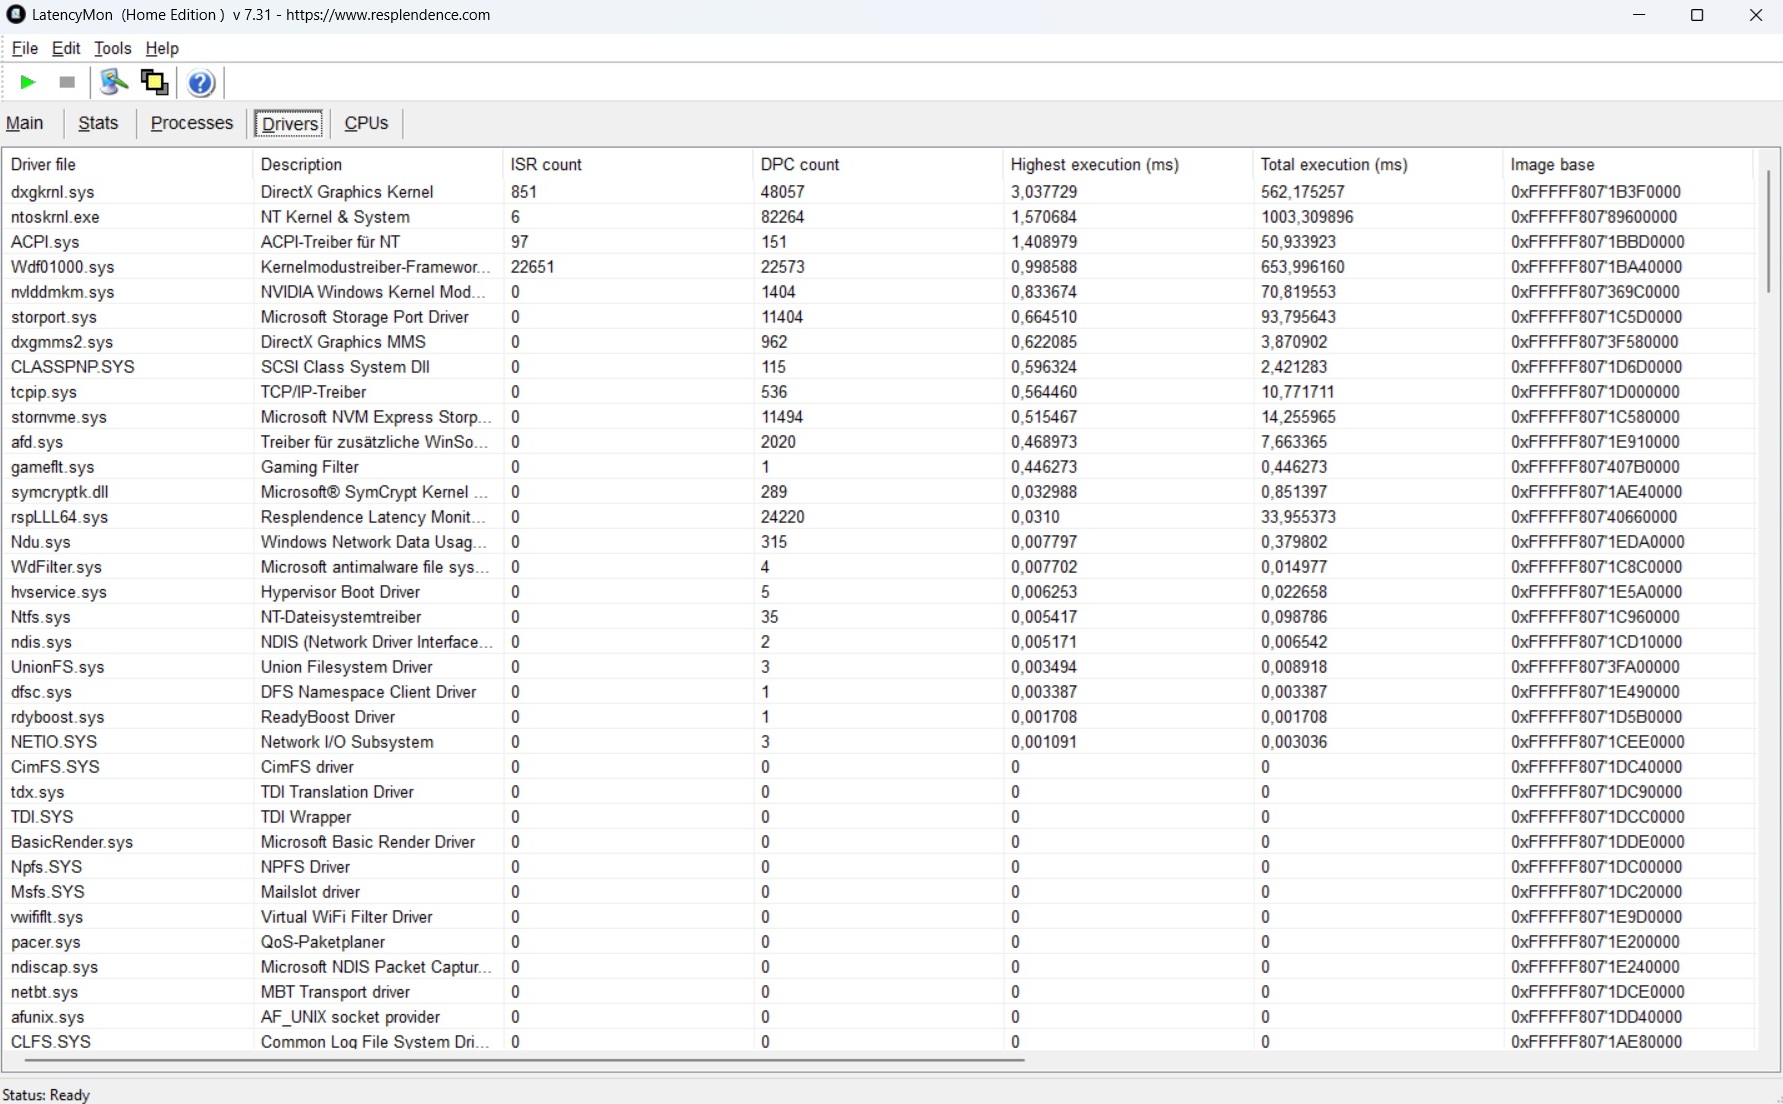
Latences DPC
En général, les temps de latence ne sont pas le point fort de la Beast 18 X1 : avec un maximum de 11 799 µs, elle est encore plus mauvaise que la Beast 18 X1 Acer Predator Helios 18 (8 290 µs).
| DPC Latencies / LatencyMon - interrupt to process latency (max), Web, Youtube, Prime95 | |
| Medion Erazer Beast 18 X1 MD62731 | |
| Acer Predator Helios 18 N23Q2 | |
| MSI GE78HX 13VH-070US | |
| Aorus Master 18 AM8H | |
| Asus Strix Scar 18 G835LX | |
| Lenovo Legion Pro 7i 16 Gen 10 | |
* ... Moindre est la valeur, meilleures sont les performances
Mémoire de masse
Cependant, le SSD PCIe Gen. 5x4, très rapide, mérite le respect. Le disque de 2 To franchit la barre des 10 000 Mo/s dans les tests séquentiels, et peut même fonctionner sans ralentissement à long terme.

* ... Moindre est la valeur, meilleures sont les performances
Continuous read: DiskSpd Read Loop, Queue Depth 8
Carte graphique
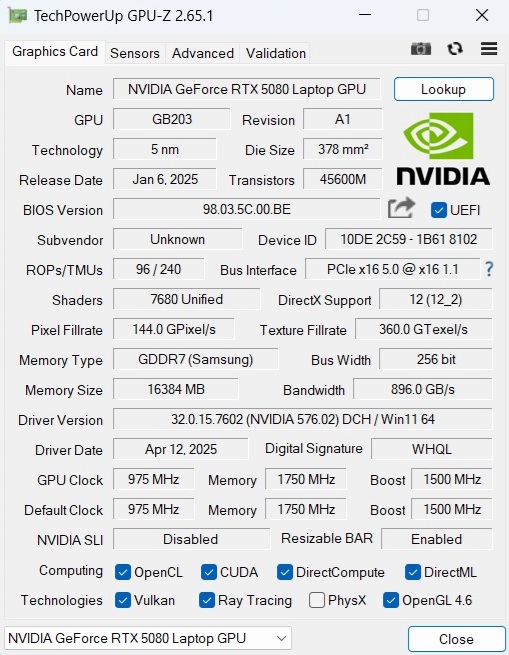
L'ordinateur portable GeForce RTX 5080 est actuellement le deuxième modèle d'ordinateur portable le plus puissant de la série Blackwell de Nvidia, après l'ordinateur portable RTX 5090. Cependant, ce dernier n'a qu'un avantage limité dans notre cours 3DMark lorsque vous regardez la concurrence. A l'inverse, la RTX 5080 n'est pas beaucoup plus rapide que l'ancienne RTX 4080qui peut au moins tenir le coup dans les tests synthétiques. La VRAM de 16 Go GDDR7 n'est pas une révélation pour la gamme de prix, mais c'est toujours mieux que les 12 Go GDDR6X du prédécesseur. Le niveau TGP peut atteindre un maximum de 175 watts.
| 3DMark 11 Performance | 44491 points | |
| 3DMark Ice Storm Standard Score | 245418 points | |
| 3DMark Cloud Gate Standard Score | 61468 points | |
| 3DMark Fire Strike Score | 30780 points | |
| 3DMark Time Spy Score | 20170 points | |
Aide | ||
* ... Moindre est la valeur, meilleures sont les performances
Performances des jeux
Dans les benchmarks de jeux, les écarts entre les appareils concurrents sont un peu plus importants, mais dans la pratique, vous n'en remarquerez pas beaucoup. En principe, la RTX 5080 mobile est suffisamment rapide pour faire tourner la plupart des jeux modernes avec le maximum de détails et la résolution native QHD+. Les choses se gâtent uniquement avec les titres très exigeants ou modérément optimisés, tels que The Elder Scrolls : Oblivion Remastered. L'utilisation de l'upscaling (mot-clé DLSS) et/ou de la génération d'images (multi) est recommandée dans ce cas. Avec la fonction Stalker 2le taux de rafraîchissement en QHD est doublé (voir tableau).
| Cyberpunk 2077 2.2 Phantom Liberty - 1920x1080 Ultra Preset (FSR off) | |
| Lenovo Legion Pro 7i 16 Gen 10 | |
| Asus Strix Scar 18 G835LX | |
| Aorus Master 18 AM8H | |
| Medion Erazer Beast 18 X1 MD62731 | |
| Moyenne Nvidia GeForce RTX 5080 Laptop (109.8 - 156.2, n=7) | |
| Acer Predator Helios 18 N23Q2 | |
| Moyenne de la classe Gaming (6.76 - 158, n=104, 2 dernières années) | |
| GTA V - 1920x1080 Highest Settings possible AA:4xMSAA + FX AF:16x | |
| Aorus Master 18 AM8H | |
| Asus Strix Scar 18 G835LX | |
| Moyenne Nvidia GeForce RTX 5080 Laptop (124.8 - 185, n=5) | |
| Acer Predator Helios 18 N23Q2 | |
| Medion Erazer Beast 18 X1 MD62731 | |
| Moyenne de la classe Gaming (12.1 - 185, n=124, 2 dernières années) | |
| MSI GE78HX 13VH-070US | |
| Stalker 2 | |
| 2560x1440 Epic Preset | |
| Aorus Master 18 AM8H | |
| Medion Erazer Beast 18 X1 MD62731 | |
| Moyenne Nvidia GeForce RTX 5080 Laptop (n=1) | |
| Moyenne de la classe Gaming (31.7 - 59.8, n=3, 2 dernières années) | |
| 2560x1440 Epic Preset + Quality DLSS + FG | |
| Aorus Master 18 AM8H | |
| Medion Erazer Beast 18 X1 MD62731 | |
| Moyenne Nvidia GeForce RTX 5080 Laptop (n=1) | |
| Moyenne de la classe Gaming (58.3 - 124.9, n=3, 2 dernières années) | |
| Horizon Forbidden West | |
| 2560x1440 Very High Preset AA:T | |
| Aorus Master 18 AM8H | |
| Medion Erazer Beast 18 X1 MD62731 | |
| Moyenne Nvidia GeForce RTX 5080 Laptop (n=1) | |
| Moyenne de la classe Gaming (24.1 - 98, n=11, 2 dernières années) | |
| 2560x1440 Very High Preset + DLSS Quality | |
| Aorus Master 18 AM8H | |
| Moyenne de la classe Gaming (110.6 - 116.6, n=2, 2 dernières années) | |
| Medion Erazer Beast 18 X1 MD62731 | |
| Moyenne Nvidia GeForce RTX 5080 Laptop (n=1) | |
| Ghost of Tsushima | |
| 2560x1440 Very High Preset AA:T | |
| Aorus Master 18 AM8H | |
| Medion Erazer Beast 18 X1 MD62731 | |
| Moyenne Nvidia GeForce RTX 5080 Laptop (n=1) | |
| Moyenne de la classe Gaming (22.7 - 84.9, n=7, 2 dernières années) | |
| 2560x1440 Very High Preset + Quality DLSS | |
| Aorus Master 18 AM8H | |
| Medion Erazer Beast 18 X1 MD62731 | |
| Moyenne Nvidia GeForce RTX 5080 Laptop (n=1) | |
| Moyenne de la classe Gaming (63.6 - 105.2, n=5, 2 dernières années) | |
| Senua's Saga Hellblade 2 | |
| 2560x1440 High Preset | |
| Aorus Master 18 AM8H | |
| Medion Erazer Beast 18 X1 MD62731 | |
| Moyenne Nvidia GeForce RTX 5080 Laptop (n=1) | |
| Moyenne de la classe Gaming (27.1 - 57.3, n=6, 2 dernières années) | |
| 2560x1440 High Preset + Quality DLSS | |
| Aorus Master 18 AM8H | |
| Medion Erazer Beast 18 X1 MD62731 | |
| Moyenne Nvidia GeForce RTX 5080 Laptop (n=1) | |
| Moyenne de la classe Gaming (42.2 - 83.1, n=5, 2 dernières années) | |
| Star Wars Outlaws | |
| 2560x1440 cinem. ultra | |
| Aorus Master 18 AM8H | |
| Medion Erazer Beast 18 X1 MD62731 | |
| Moyenne Nvidia GeForce RTX 5080 Laptop (n=1) | |
| Moyenne de la classe Gaming (23.3 - 54, n=3, 2 dernières années) | |
| 2560x1440 cinem. ultra DLSS | |
| Aorus Master 18 AM8H | |
| Medion Erazer Beast 18 X1 MD62731 | |
| Moyenne Nvidia GeForce RTX 5080 Laptop (n=1) | |
| Moyenne de la classe Gaming (34.1 - 70.9, n=3, 2 dernières années) | |
| Space Marine 2 | |
| 2560x1440 Ultra Preset AA:T | |
| Aorus Master 18 AM8H | |
| Medion Erazer Beast 18 X1 MD62731 | |
| Moyenne Nvidia GeForce RTX 5080 Laptop (n=1) | |
| Moyenne de la classe Gaming (48.2 - 98.6, n=3, 2 dernières années) | |
| 2560x1440 Ultra Preset + Quality DLSS | |
| Aorus Master 18 AM8H | |
| Medion Erazer Beast 18 X1 MD62731 | |
| Moyenne Nvidia GeForce RTX 5080 Laptop (n=1) | |
| Moyenne de la classe Gaming (65.1 - 100.8, n=3, 2 dernières années) | |
| Until Dawn | |
| 2560x1440 Ultra Preset | |
| Aorus Master 18 AM8H | |
| Medion Erazer Beast 18 X1 MD62731 | |
| Moyenne Nvidia GeForce RTX 5080 Laptop (n=1) | |
| Moyenne de la classe Gaming (32.9 - 65.6, n=3, 2 dernières années) | |
| 2560x1440 Ultra Preset + Quality DLSS + Ray Tracing | |
| Aorus Master 18 AM8H | |
| Medion Erazer Beast 18 X1 MD62731 | |
| Moyenne Nvidia GeForce RTX 5080 Laptop (n=1) | |
| Moyenne de la classe Gaming (41.5 - 79.7, n=3, 2 dernières années) | |
| Kingdom Come Deliverance 2 | |
| 2560x1440 Ultra Preset | |
| Aorus Master 18 AM8H | |
| Moyenne de la classe Gaming (74.5 - 82.6, n=2, 2 dernières années) | |
| Medion Erazer Beast 18 X1 MD62731 | |
| Moyenne Nvidia GeForce RTX 5080 Laptop (n=1) | |
| 2560x1440 Ultra Preset + Quality DLSS | |
| Medion Erazer Beast 18 X1 MD62731 | |
| Moyenne Nvidia GeForce RTX 5080 Laptop (n=1) | |
| Moyenne de la classe Gaming (98.7 - 98.9, n=2, 2 dernières années) | |
| Aorus Master 18 AM8H | |
| The Elder Scrolls IV Oblivion Remastered | |
| 2560x1440 Ultra Preset AA:T | |
| Medion Erazer Beast 18 X1 MD62731 | |
| Moyenne Nvidia GeForce RTX 5080 Laptop (n=1) | |
| Moyenne de la classe Gaming (n=12 dernières années) | |
| 2560x1440 Ultra Preset + Quality DLSS | |
| Medion Erazer Beast 18 X1 MD62731 | |
| Moyenne Nvidia GeForce RTX 5080 Laptop (n=1) | |
| Moyenne de la classe Gaming (n=12 dernières années) | |
| Bas | Moyen | Élevé | Ultra | QHD DLSS | QHD | |
|---|---|---|---|---|---|---|
| GTA V (2015) | 185.4 | 170.6 | 139.5 | 137.4 | ||
| Dota 2 Reborn (2015) | 211 | 186.4 | 175.1 | 162.3 | ||
| Final Fantasy XV Benchmark (2018) | 218 | 189.9 | 152.1 | |||
| X-Plane 11.11 (2018) | 143 | 132.2 | 108.9 | |||
| Strange Brigade (2018) | 434 | 403 | 371 | 281 | ||
| Baldur's Gate 3 (2023) | 202 | 181.6 | 179.6 | 130.5 | ||
| Cyberpunk 2077 2.2 Phantom Liberty (2023) | 157.8 | 148.1 | 139.8 | 96.4 | ||
| Counter-Strike 2 (2023) | 345 | 290 | 255 | 205 | ||
| Prince of Persia The Lost Crown (2024) | 356 | 356 | 356 | 356 | ||
| Helldivers 2 (2024) | 135.9 | 134.5 | 131.9 | 127.8 | ||
| Horizon Forbidden West (2024) | 148.2 | 117.7 | 115.5 | 110.6 | 90.7 | |
| Dragon's Dogma 2 (2024) | 84.8 | 82.3 | ||||
| Ghost of Tsushima (2024) | 110.7 | 105.7 | 97.5 | 96.1 | 76.7 | |
| Senua's Saga Hellblade 2 (2024) | 99.3 | 76 | 81 | 55.1 | ||
| Star Wars Outlaws (2024) | 79.8 | 72.7 | 67.8 | 64.8 | 51.4 | |
| Space Marine 2 (2024) | 90 | 89.7 | 88.7 | 86.9 | 86.2 | |
| Until Dawn (2024) | 92.9 | 91 | 81.6 | 74.4 | 59 | |
| Stalker 2 (2024) | 90.7 | 78.1 | 72.6 | 122.1 | 58.5 | |
| Kingdom Come Deliverance 2 (2025) | 173.8 | 145.6 | 101.6 | 98.9 | 74.5 | |
| Civilization 7 (2025) | 173.4 | 165.5 | 158 | |||
| The Elder Scrolls IV Oblivion Remastered (2025) | 106.3 | 94.1 | 50.6 | 53.2 | 36.6 |
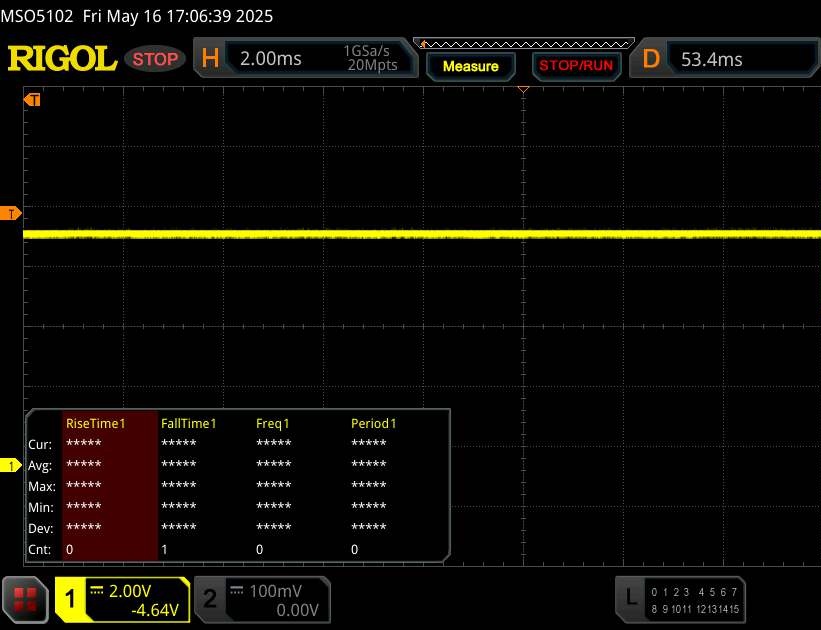
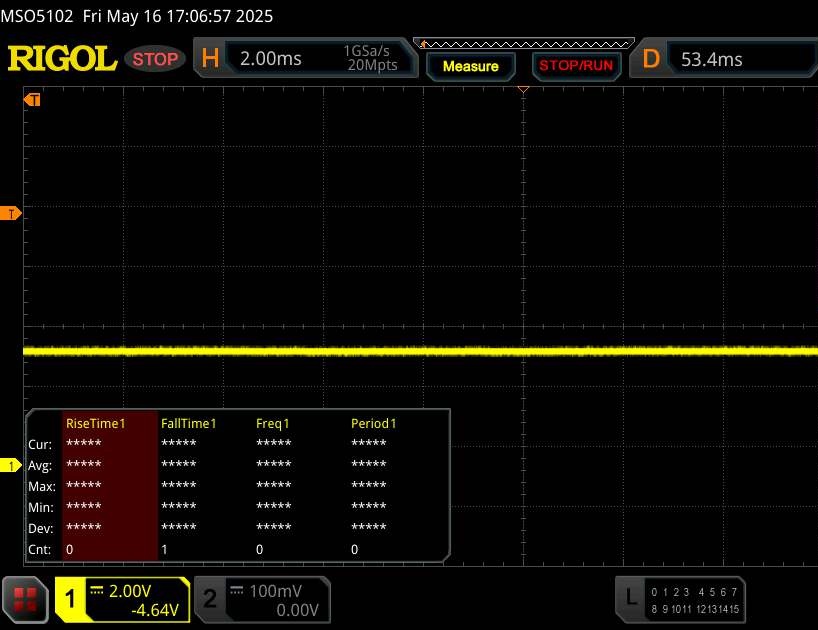
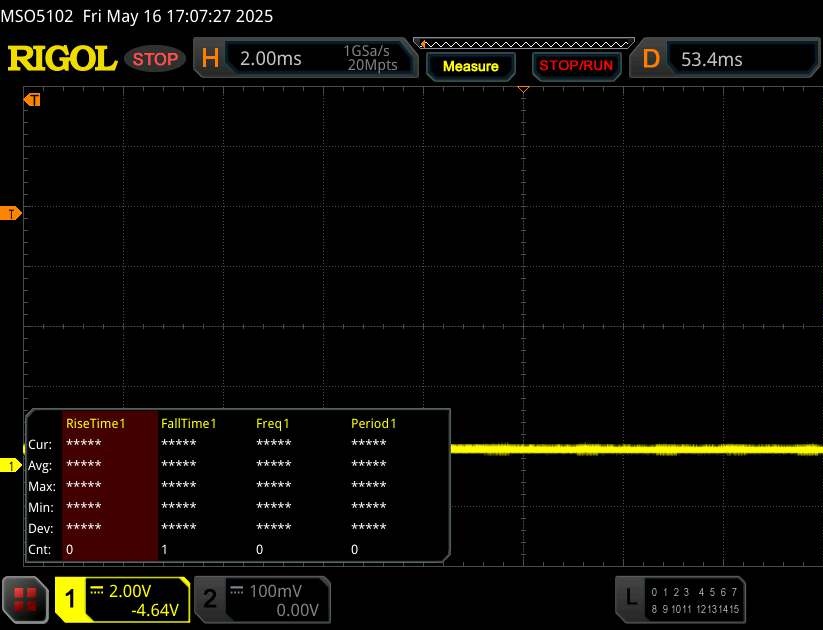
Nous avons testé le comportement des performances 3D sur une période plus longue avec Cyberpunk 2077 testé. Au cours du test, nous avons constaté de brèves baisses occasionnelles du nombre de FPS, mais elles étaient subtiles et peu importantes.
Cyberpunk 2077 Ultra FPS chart
Émissions
Émissions sonores
L'une des plus grandes critiques à l'égard du Beast 18 X1 est son faible contrôle du ventilateur. Même en mode Balanced, le système de refroidissement atteint parfois un niveau sonore désagréable de 40 dB(A), voire plus, en mode idle, ce qui pourrait gêner de nombreux utilisateurs à long terme. En charge, les valeurs sonores sont déjà atteintes avec le profil Balanced, que certains concurrents ne génèrent qu'en mode Performance (comparez le Strix Scar 18, par exemple).
Degré de la nuisance sonore
| Au repos |
| 25 / 39 / 42 dB(A) |
| Fortement sollicité |
| 52 / 55 dB(A) |
 | ||
30 dB silencieux 40 dB(A) audible 50 dB(A) bruyant |
||
min: | ||
| Medion Erazer Beast 18 X1 MD62731 Ultra 9 275HX, GeForce RTX 5080 Laptop | MSI GE78HX 13VH-070US i9-13950HX, NVIDIA GeForce RTX 4080 Laptop GPU | Acer Predator Helios 18 N23Q2 i9-13900HX, NVIDIA GeForce RTX 4080 Laptop GPU | Asus Strix Scar 18 G835LX Ultra 9 275HX, GeForce RTX 5090 Laptop | Aorus Master 18 AM8H Ultra 9 275HX, GeForce RTX 5090 Laptop | Lenovo Legion Pro 7i 16 Gen 10 Ultra 9 275HX, GeForce RTX 5080 Laptop | |
|---|---|---|---|---|---|---|
| Noise | 13% | 18% | 8% | 7% | 20% | |
| arrêt / environnement * | 25 | 23.4 6% | 23 8% | 23.3 7% | 25 -0% | 22.9 8% |
| Idle Minimum * | 25 | 24.2 3% | 23 8% | 29.8 -19% | 26 -4% | 22.9 8% |
| Idle Average * | 39 | 25.6 34% | 23 41% | 29.8 24% | 29 26% | 22.9 41% |
| Idle Maximum * | 42 | 31 26% | 23 45% | 29.8 29% | 34 19% | 26.3 37% |
| Load Average * | 52 | 43.3 17% | 45.26 13% | 42.9 17% | 50 4% | 27.8 47% |
| Cyberpunk 2077 ultra * | 53 | 53.7 -1% | 52 2% | 54.2 -2% | ||
| Load Maximum * | 55 | 59.1 -7% | 59.94 -9% | 53.7 2% | 53 4% | 53.9 2% |
| Witcher 3 ultra * | 56.3 | 59.82 |
* ... Moindre est la valeur, meilleures sont les performances
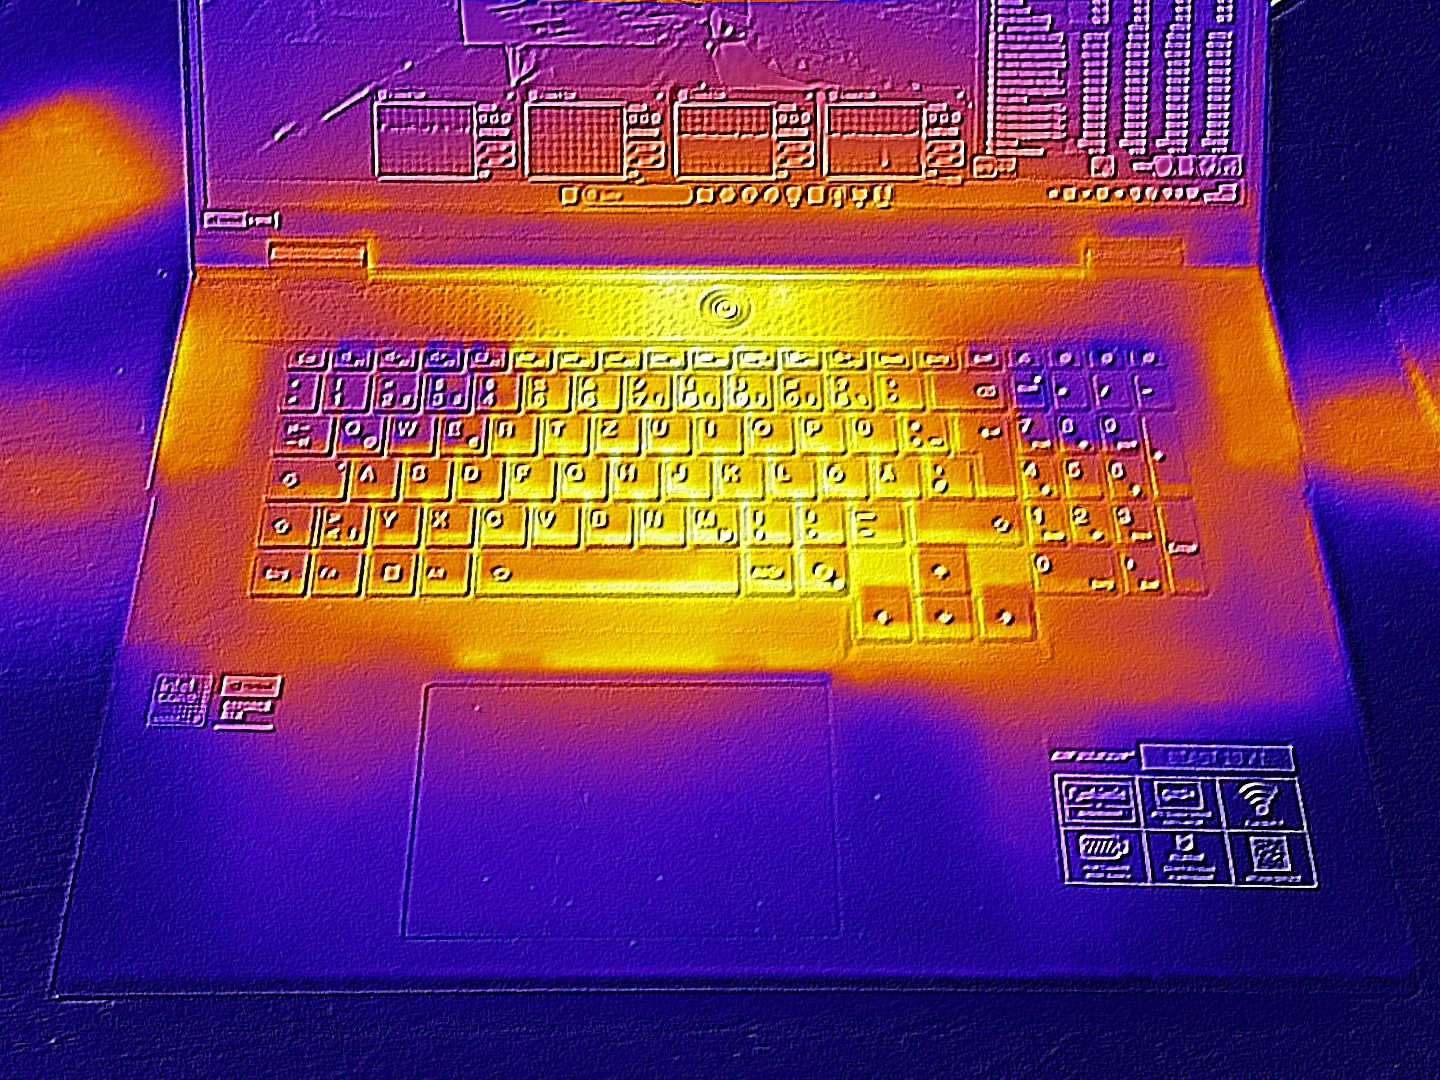
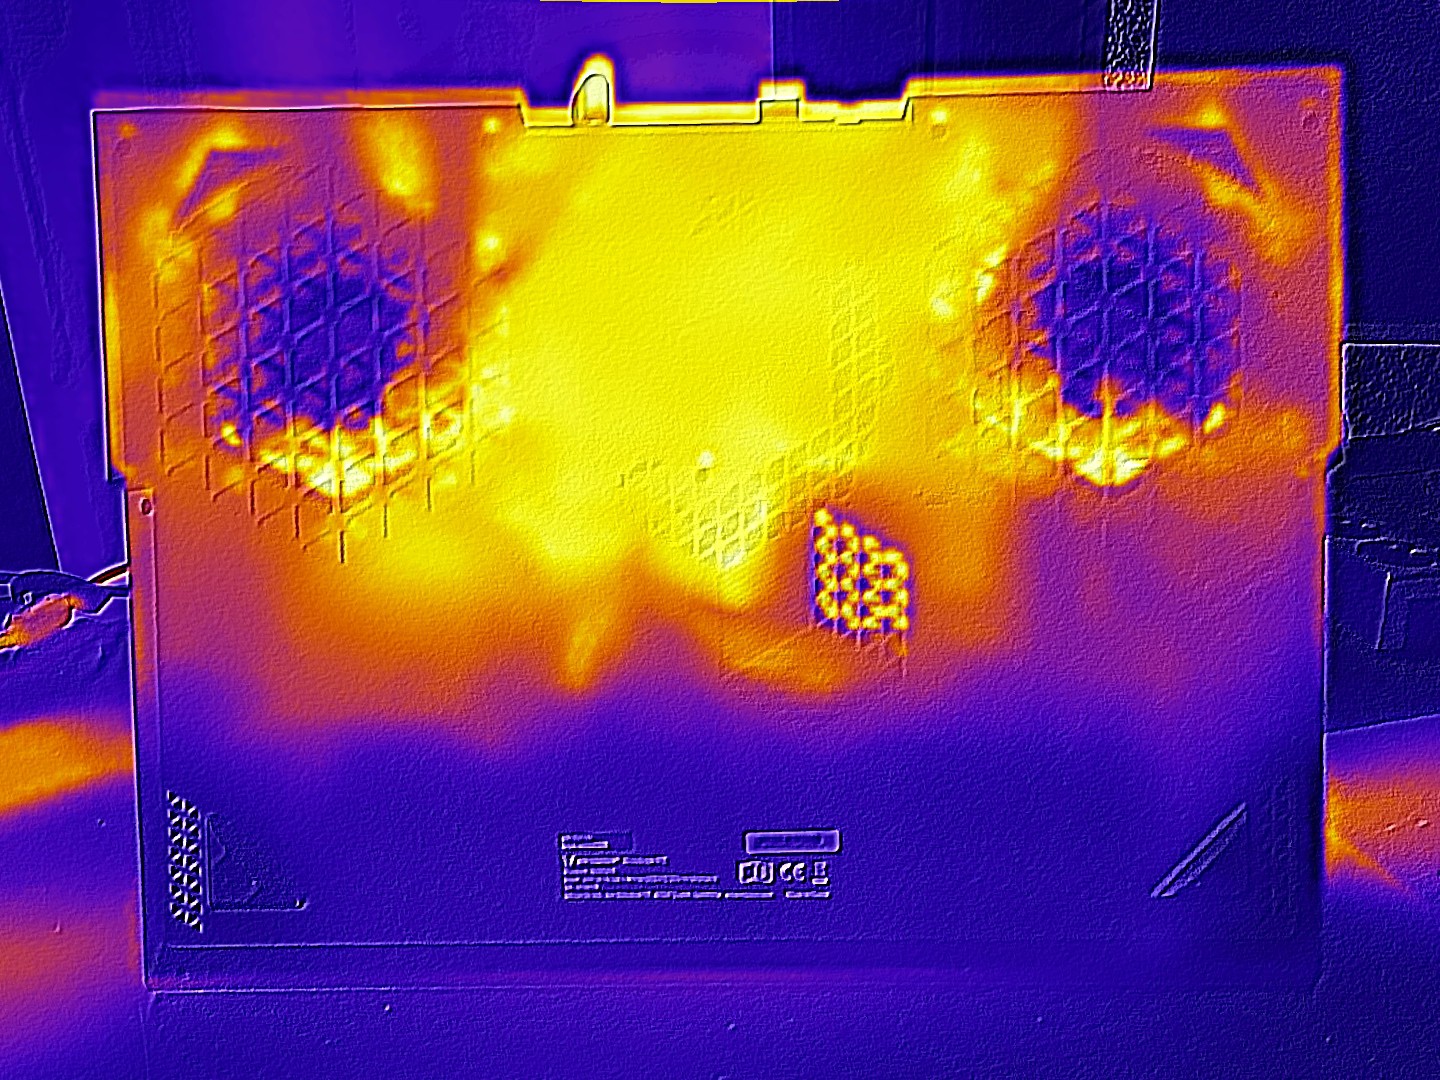
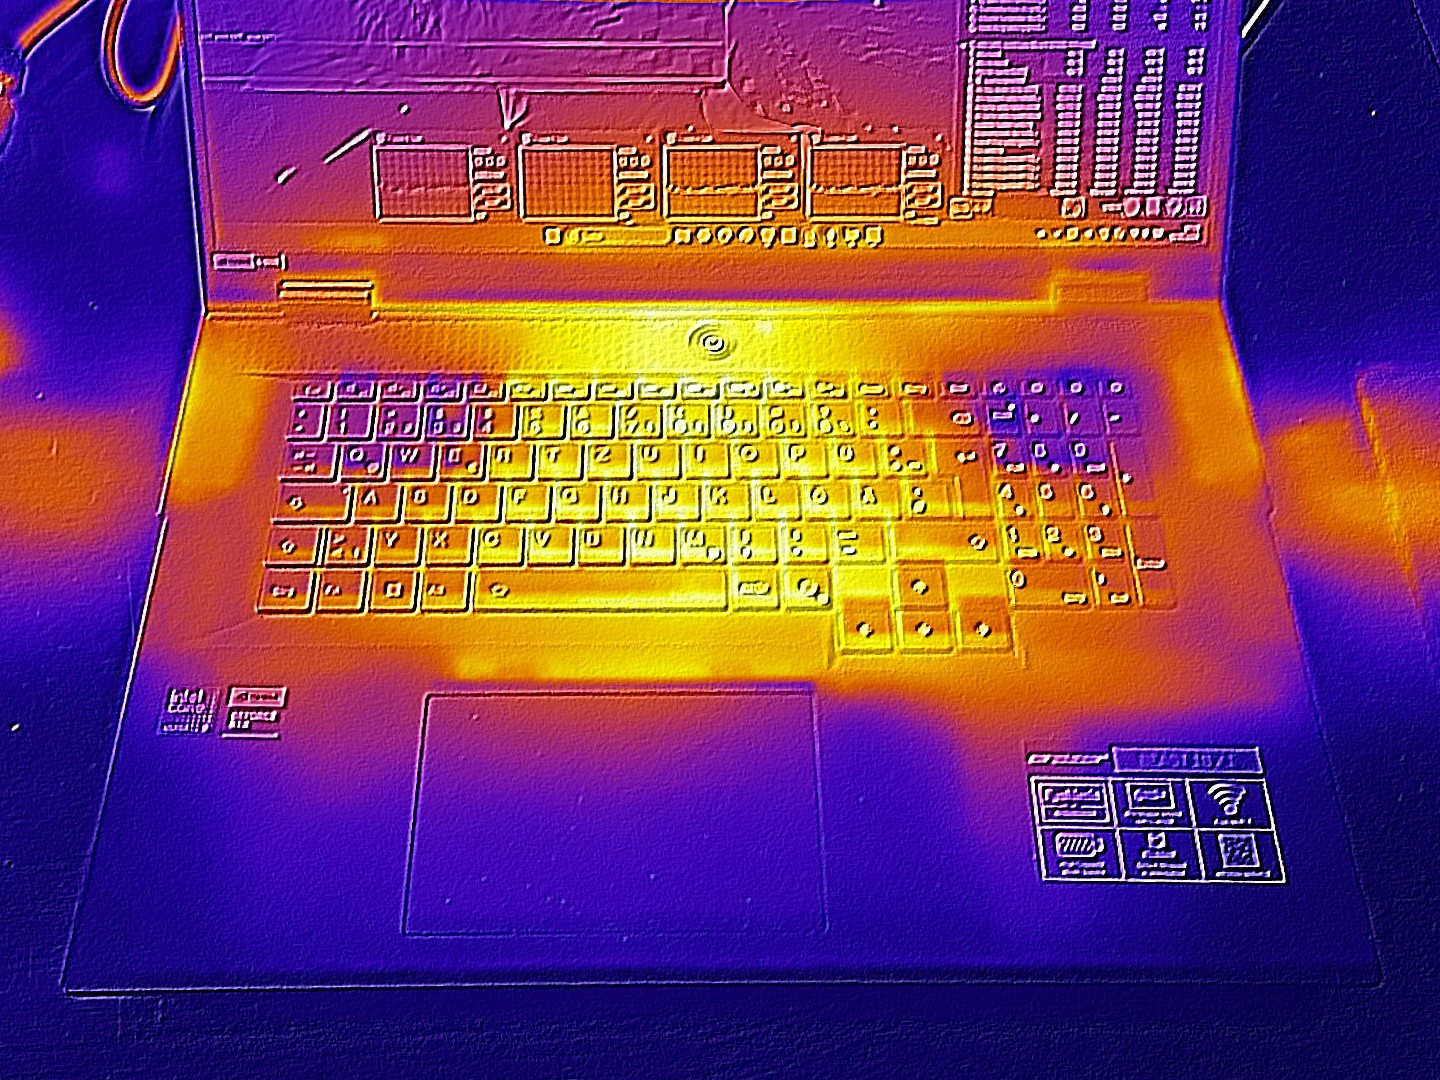
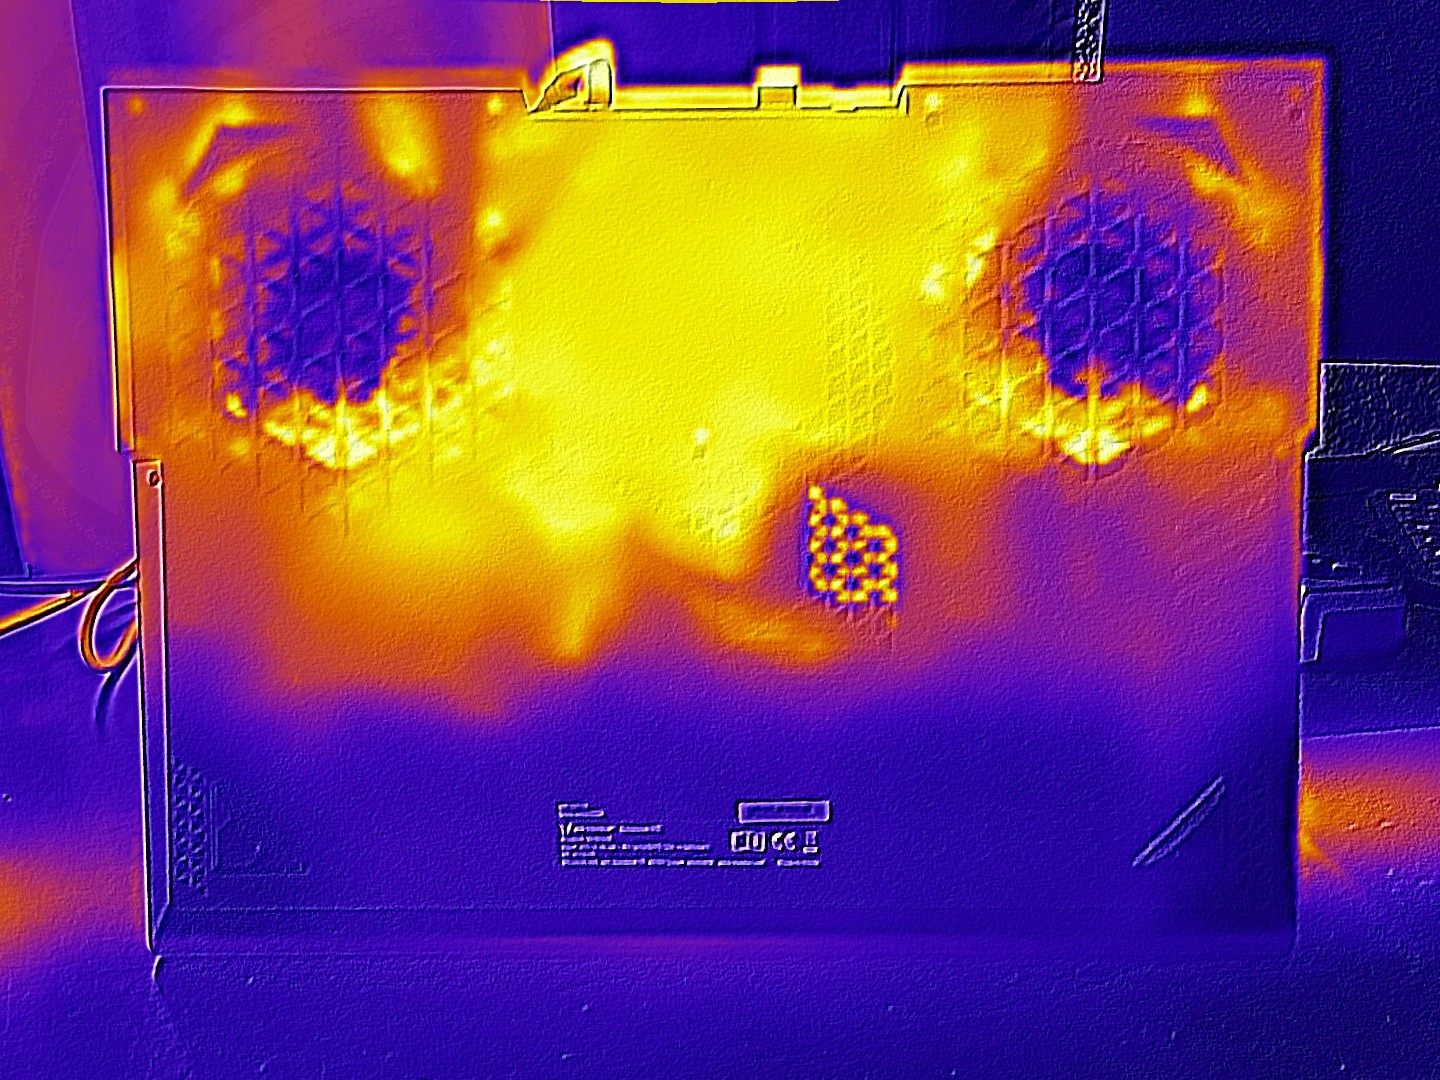
Température
Les températures du boîtier sont moins préoccupantes. Un maximum de 47 °C sur le dessus et de 48 °C sur le dessous est typique d'un ordinateur portable haut de gamme. En mode veille, les surfaces restent généralement en dessous de la barre des 30 °C, ce qui les maintient agréablement fraîches.
(-) La température maximale du côté supérieur est de 47 °C / 117 F, par rapport à la moyenne de 40.4 °C / 105 F, allant de 21.2 à 68.8 °C pour la classe Gaming.
(-) Le fond chauffe jusqu'à un maximum de 48 °C / 118 F, contre une moyenne de 43.3 °C / 110 F
(+) En utilisation inactive, la température moyenne du côté supérieur est de 27.9 °C / 82 F, par rapport à la moyenne du dispositif de 33.9 °C / 93 F.
(-) 3: The average temperature for the upper side is 42 °C / 108 F, compared to the average of 33.9 °C / 93 F for the class Gaming.
(-) Les repose-poignets et le pavé tactile peuvent devenir très chauds au toucher, avec un maximum de 41 °C / 105.8# F.
(-) La température moyenne de la zone de l'appui-paume de dispositifs similaires était de 28.9 °C / 84 F (-12.1 °C / #-21.8 F).
| Medion Erazer Beast 18 X1 MD62731 Ultra 9 275HX, GeForce RTX 5080 Laptop | MSI GE78HX 13VH-070US i9-13950HX, NVIDIA GeForce RTX 4080 Laptop GPU | Acer Predator Helios 18 N23Q2 i9-13900HX, NVIDIA GeForce RTX 4080 Laptop GPU | Asus Strix Scar 18 G835LX Ultra 9 275HX, GeForce RTX 5090 Laptop | Aorus Master 18 AM8H Ultra 9 275HX, GeForce RTX 5090 Laptop | Lenovo Legion Pro 7i 16 Gen 10 Ultra 9 275HX, GeForce RTX 5080 Laptop | |
|---|---|---|---|---|---|---|
| Heat | 6% | -7% | 5% | -8% | 3% | |
| Maximum Upper Side * | 47 | 37.4 20% | 35 26% | 45.6 3% | 50 -6% | 42.6 9% |
| Maximum Bottom * | 48 | 45 6% | 56 -17% | 46 4% | 46 4% | 41.2 14% |
| Idle Upper Side * | 29 | 29.8 -3% | 34 -17% | 28.9 -0% | 36 -24% | 32.6 -12% |
| Idle Bottom * | 33 | 32.4 2% | 39 -18% | 29.2 12% | 35 -6% | 32.4 2% |
* ... Moindre est la valeur, meilleures sont les performances
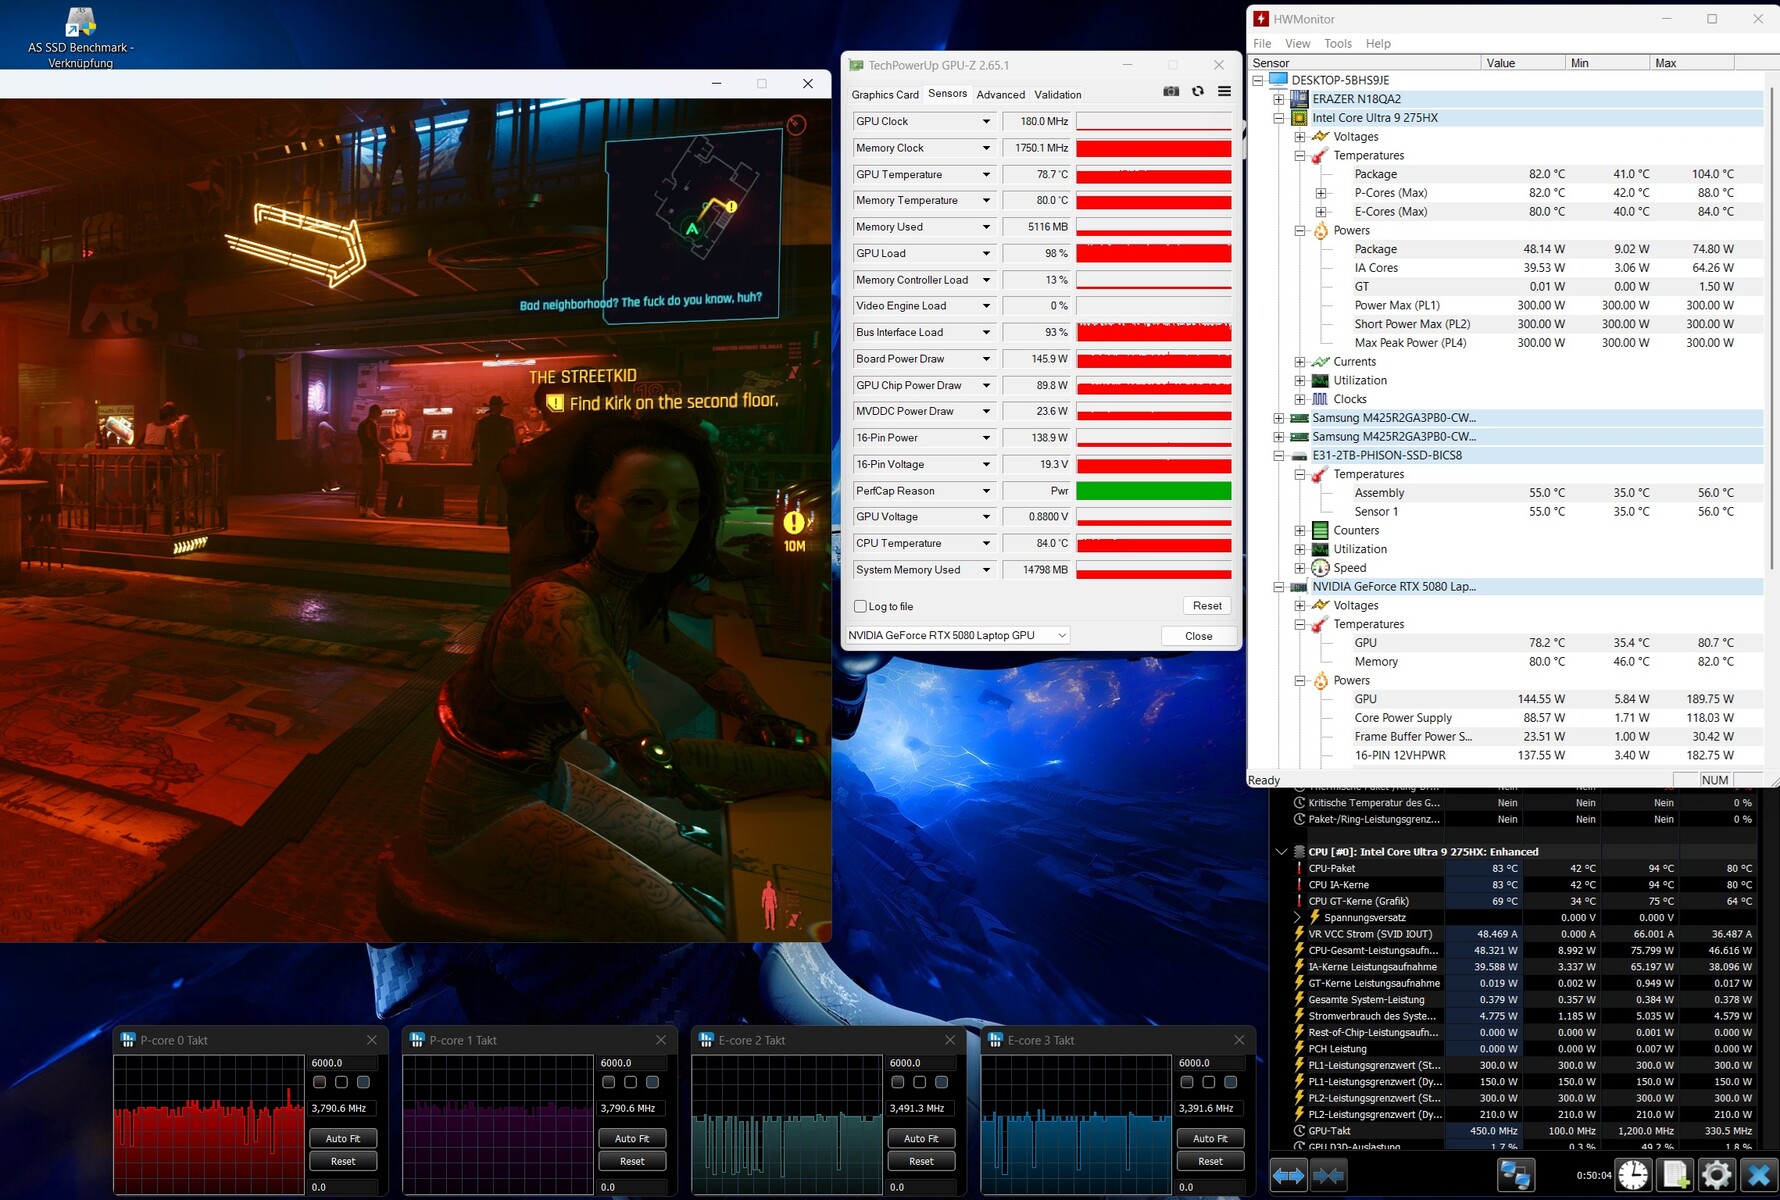
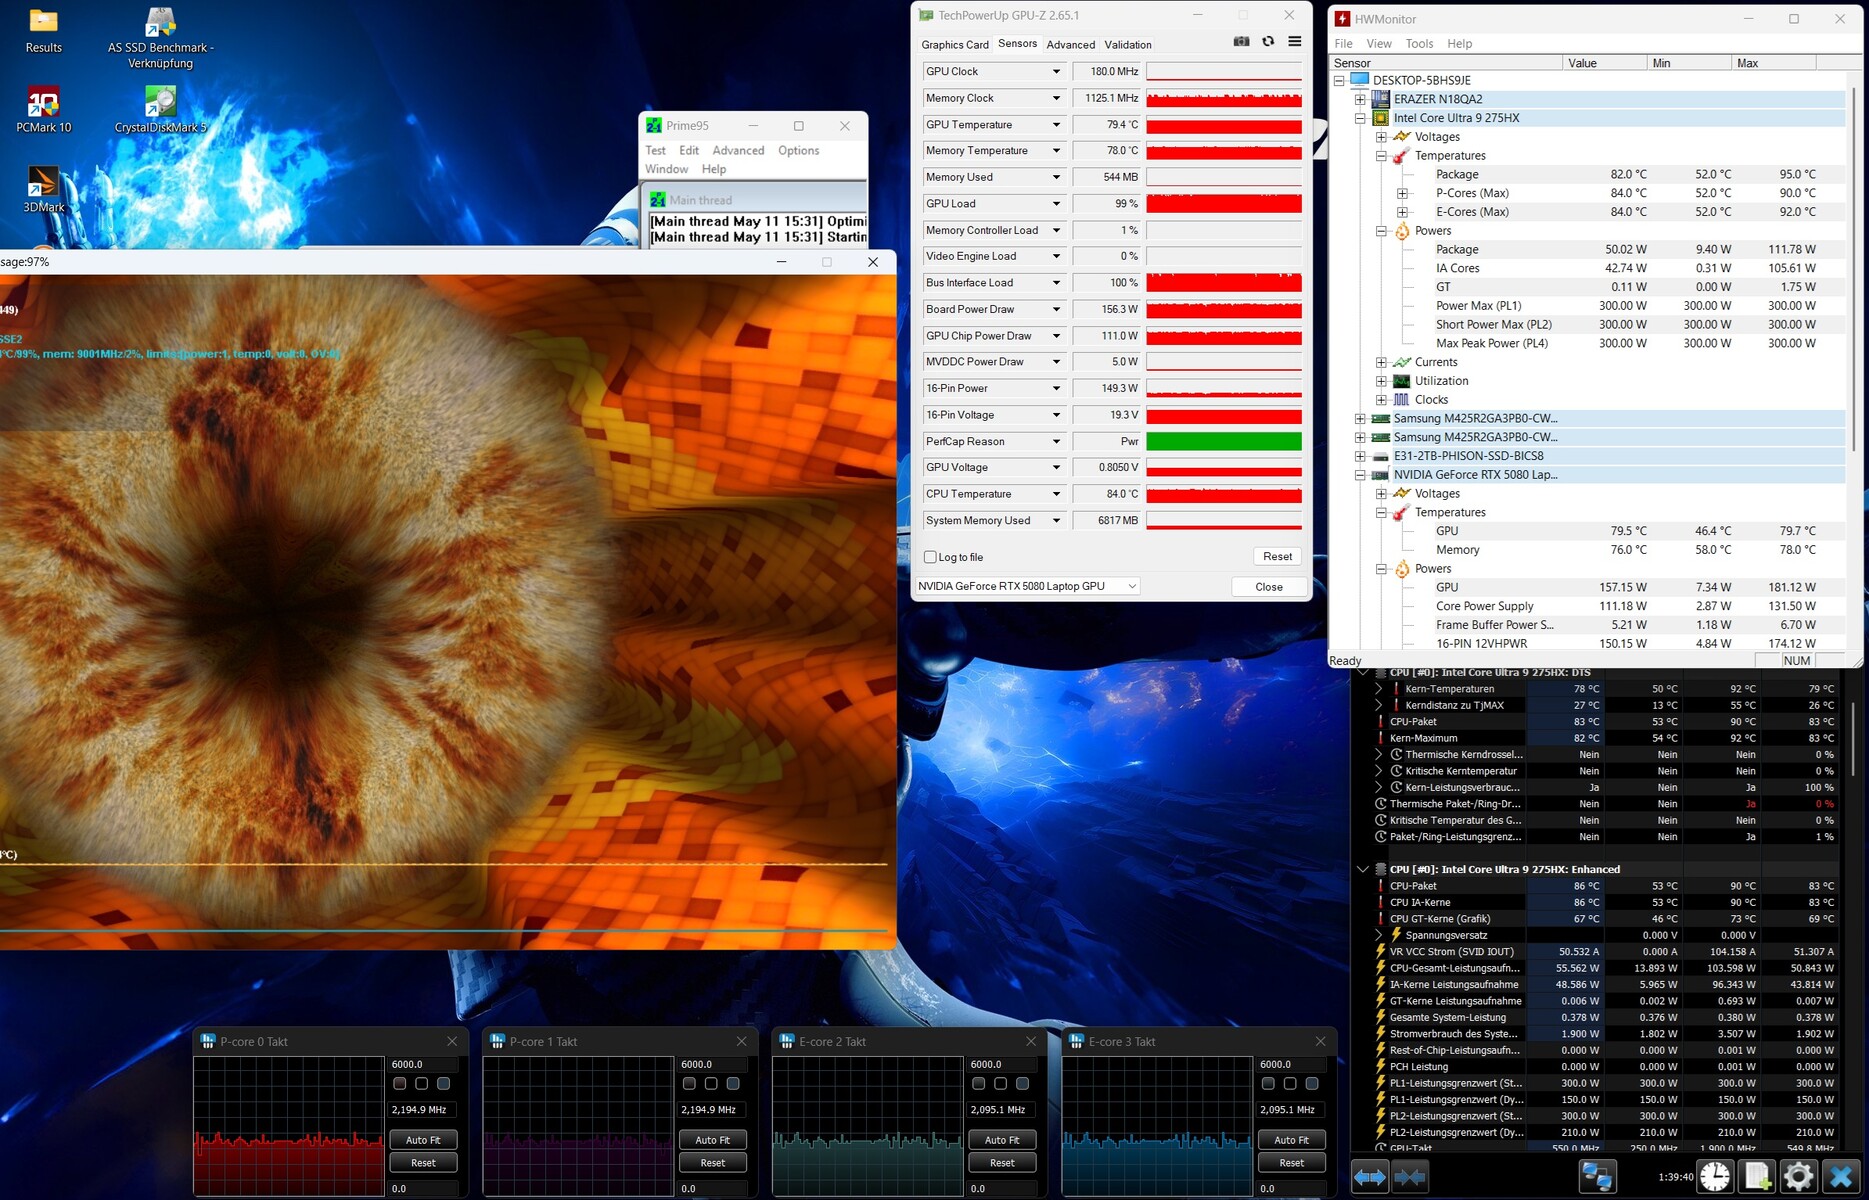
Épreuve d'effort
Notre test de stress avec Furmark et Prime95 n'a pas fait trop transpirer les composants. Une température d'environ 80 °C pour le CPU et le GPU est acceptable.
Intervenants
Le système sonore peut également remplir des pièces plus grandes avec un volume maximum de 89 dB(A). Selon l'analyse audio, la qualité sonore est légèrement inférieure à celle de l'Aorus Master 18 mais reste relativement bonne pour un ordinateur portable, malgré les faiblesses habituelles des basses.
Medion Erazer Beast 18 X1 MD62731 analyse audio
(+) | les haut-parleurs peuvent jouer relativement fort (89# dB)
Basses 100 - 315 Hz
(-) | presque aucune basse - en moyenne 18.6% plus bas que la médiane
(±) | la linéarité des basses est moyenne (13% delta à la fréquence précédente)
Médiums 400 - 2000 Hz
(+) | médiane équilibrée - seulement 2.8% de la médiane
(+) | les médiums sont linéaires (4.5% delta à la fréquence précédente)
Aiguës 2 - 16 kHz
(±) | sommets plus élevés - en moyenne 5.3% plus élevés que la médiane
(+) | les aigus sont linéaires (6.4% delta à la fréquence précédente)
Globalement 100 - 16 000 Hz
(+) | le son global est linéaire (14.2% différence à la médiane)
Par rapport à la même classe
» 24% de tous les appareils testés de cette catégorie étaient meilleurs, 7% similaires, 69% pires
» Le meilleur avait un delta de 6%, la moyenne était de 18%, le pire était de 132%.
Par rapport à tous les appareils testés
» 16% de tous les appareils testés étaient meilleurs, 4% similaires, 81% pires
» Le meilleur avait un delta de 4%, la moyenne était de 24%, le pire était de 134%.
Aorus Master 18 AM8H analyse audio
(±) | le niveau sonore du haut-parleur est moyen mais bon (77# dB)
Basses 100 - 315 Hz
(±) | basse réduite - en moyenne 8.7% inférieure à la médiane
(±) | la linéarité des basses est moyenne (10.3% delta à la fréquence précédente)
Médiums 400 - 2000 Hz
(+) | médiane équilibrée - seulement 3% de la médiane
(+) | les médiums sont linéaires (4.3% delta à la fréquence précédente)
Aiguës 2 - 16 kHz
(+) | des sommets équilibrés - à seulement 2.8% de la médiane
(+) | les aigus sont linéaires (5.4% delta à la fréquence précédente)
Globalement 100 - 16 000 Hz
(+) | le son global est linéaire (11.9% différence à la médiane)
Par rapport à la même classe
» 12% de tous les appareils testés de cette catégorie étaient meilleurs, 4% similaires, 85% pires
» Le meilleur avait un delta de 6%, la moyenne était de 18%, le pire était de 132%.
Par rapport à tous les appareils testés
» 8% de tous les appareils testés étaient meilleurs, 2% similaires, 90% pires
» Le meilleur avait un delta de 4%, la moyenne était de 24%, le pire était de 134%.
Gestion de l'énergie
Consommation électrique
Au repos, la consommation d'énergie fluctue de la même manière que le niveau de bruit. Dans le meilleur des cas, elle n'est que de 7,9 à 16,6 watts, ce qui est mieux que tous les appareils de comparaison (le dGPU est automatiquement activé lorsqu'un moniteur externe est connecté). En mode 3D, la consommation d'énergie peut atteindre 330 watts, et le bloc d'alimentation fourni est également spécifié à 330 watts.
| Éteint/en veille | |
| Au repos | |
| Fortement sollicité |
|
Légende:
min: | |
| Medion Erazer Beast 18 X1 MD62731 Ultra 9 275HX, GeForce RTX 5080 Laptop | MSI GE78HX 13VH-070US i9-13950HX, NVIDIA GeForce RTX 4080 Laptop GPU | Acer Predator Helios 18 N23Q2 i9-13900HX, NVIDIA GeForce RTX 4080 Laptop GPU | Asus Strix Scar 18 G835LX Ultra 9 275HX, GeForce RTX 5090 Laptop | Aorus Master 18 AM8H Ultra 9 275HX, GeForce RTX 5090 Laptop | Lenovo Legion Pro 7i 16 Gen 10 Ultra 9 275HX, GeForce RTX 5080 Laptop | Moyenne de la classe Gaming | |
|---|---|---|---|---|---|---|---|
| Power Consumption | -60% | -38% | -75% | -97% | -107% | -34% | |
| Idle Minimum * | 7.9 | 16.1 -104% | 16 -103% | 11.4 -44% | 29 -267% | 28.5 -261% | 13.8 ? -75% |
| Idle Average * | 11.5 | 24 -109% | 19 -65% | 39.2 -241% | 33 -187% | 38.8 -237% | 19.9 ? -73% |
| Idle Maximum * | 16.6 | 34 -105% | 21.3 -28% | 40.2 -142% | 48 -189% | 45.6 -175% | 27.1 ? -63% |
| Load Average * | 130 | 123.6 5% | 124 5% | 161.2 -24% | 141 -8% | 132.2 -2% | 105.5 ? 19% |
| Cyberpunk 2077 ultra * | 253 | 303 -20% | 283 -12% | 318 -26% | |||
| Cyberpunk 2077 ultra external monitor * | 245 | 295 -20% | 283 -16% | 319 -30% | |||
| Load Maximum * | 330 | 285.7 13% | 319 3% | 430.9 -31% | 340 -3% | 384 -16% | 251 ? 24% |
| Witcher 3 ultra * | 286 | 289 |
* ... Moindre est la valeur, meilleures sont les performances
Power consumption Cyberpunk / Stress test
Power consumption with external monitor
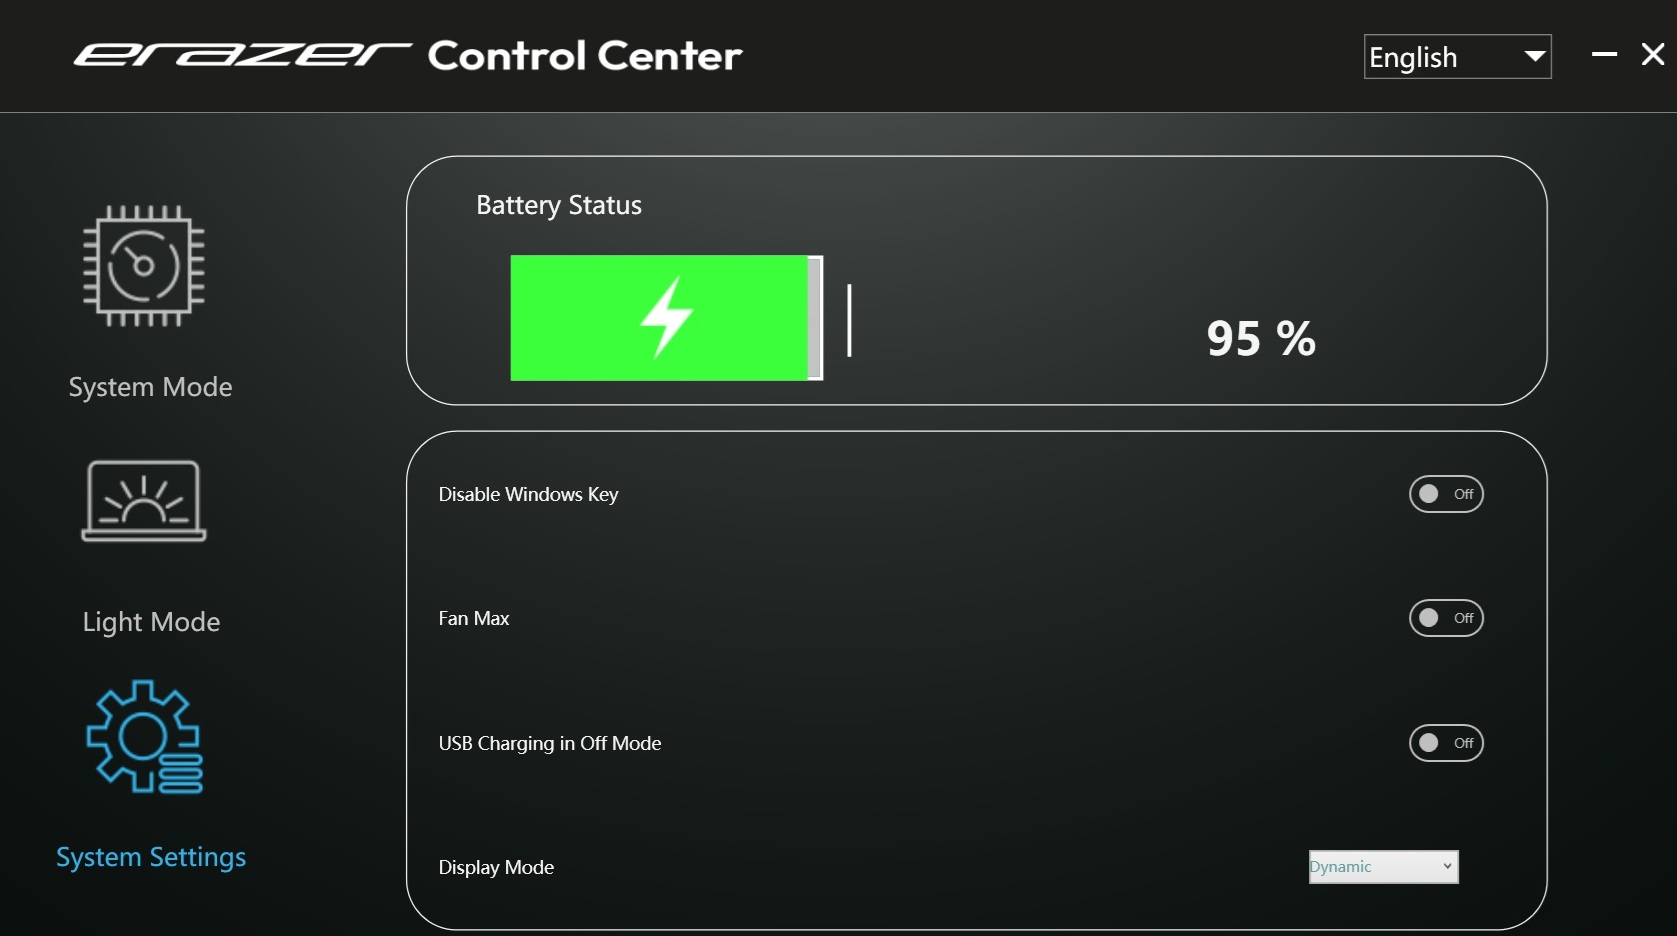
Durée de vie de la batterie
Grâce à sa consommation d'énergie modérée en mode veille, l'Erazer Beast 18 X1 offre l'autonomie la plus longue parmi les appareils testés. Environ 8 heures de navigation sur Internet avec une luminosité de 150 cd/m² est un chiffre plus que respectable.
| Medion Erazer Beast 18 X1 MD62731 Ultra 9 275HX, GeForce RTX 5080 Laptop, 99 Wh | MSI GE78HX 13VH-070US i9-13950HX, NVIDIA GeForce RTX 4080 Laptop GPU, 99 Wh | Acer Predator Helios 18 N23Q2 i9-13900HX, NVIDIA GeForce RTX 4080 Laptop GPU, 90 Wh | Asus Strix Scar 18 G835LX Ultra 9 275HX, GeForce RTX 5090 Laptop, 90 Wh | Aorus Master 18 AM8H Ultra 9 275HX, GeForce RTX 5090 Laptop, 99 Wh | Lenovo Legion Pro 7i 16 Gen 10 Ultra 9 275HX, GeForce RTX 5080 Laptop, 99 Wh | Moyenne de la classe Gaming | |
|---|---|---|---|---|---|---|---|
| Autonomie de la batterie | -24% | -45% | -30% | -38% | -32% | -18% | |
| WiFi v1.3 | 476 | 363 -24% | 264 -45% | 332 -30% | 296 -38% | 323 -32% | 390 ? -18% |
| Reader / Idle | 439 | 348 | 573 ? | ||||
| Load | 89 | 103 | 70 | 112 | 48 | 85 ? | |
| H.264 | 290 | 347 | 461 ? | ||||
| Cyberpunk 2077 ultra 150cd | 44 |
Notebookcheck note globale
Le Medion Erazer Beast 18 X1 se démarque de la concurrence avec une autonomie respectable, mais il a tendance à être plus bruyant sous charge (dans le même mode de performance) que ses homologues.
Medion Erazer Beast 18 X1 MD62731
- 05/21/2025 v8
Florian Glaser
 Total Sustainability Score:
 Comparaison des alternatives possibles
Transparency
La sélection des appareils à examiner est effectuée par notre équipe éditoriale. L'échantillon de test a été prêté à l'auteur par le fabricant ou le détaillant pour les besoins de cet examen. Le prêteur n'a pas eu d'influence sur cette évaluation et le fabricant n'a pas reçu de copie de cette évaluation avant sa publication. Il n'y avait aucune obligation de publier cet article. Nous n'acceptons jamais de compensation ou de paiement en échange de nos commentaires. En tant que média indépendant, Notebookcheck n'est pas soumis à l'autorité des fabricants, des détaillants ou des éditeurs.
Voici comment Notebookcheck teste
Chaque année, Notebookcheck examine de manière indépendante des centaines d'ordinateurs portables et de smartphones en utilisant des procédures standardisées afin de garantir que tous les résultats sont comparables. Nous avons continuellement développé nos méthodes de test depuis environ 20 ans et avons établi des normes industrielles dans le processus. Dans nos laboratoires de test, des équipements de mesure de haute qualité sont utilisés par des techniciens et des rédacteurs expérimentés. Ces tests impliquent un processus de validation en plusieurs étapes. Notre système d'évaluation complexe repose sur des centaines de mesures et de points de référence bien fondés, ce qui garantit l'objectivité.